Embed Size (px)
Citation preview
Comparing the amount and quality of information from different sequencing strategies:
A case study with amniotes
Jeremy M. Brown and Robert C. Thomson
@jembrown www.phyleauxgenetics.org
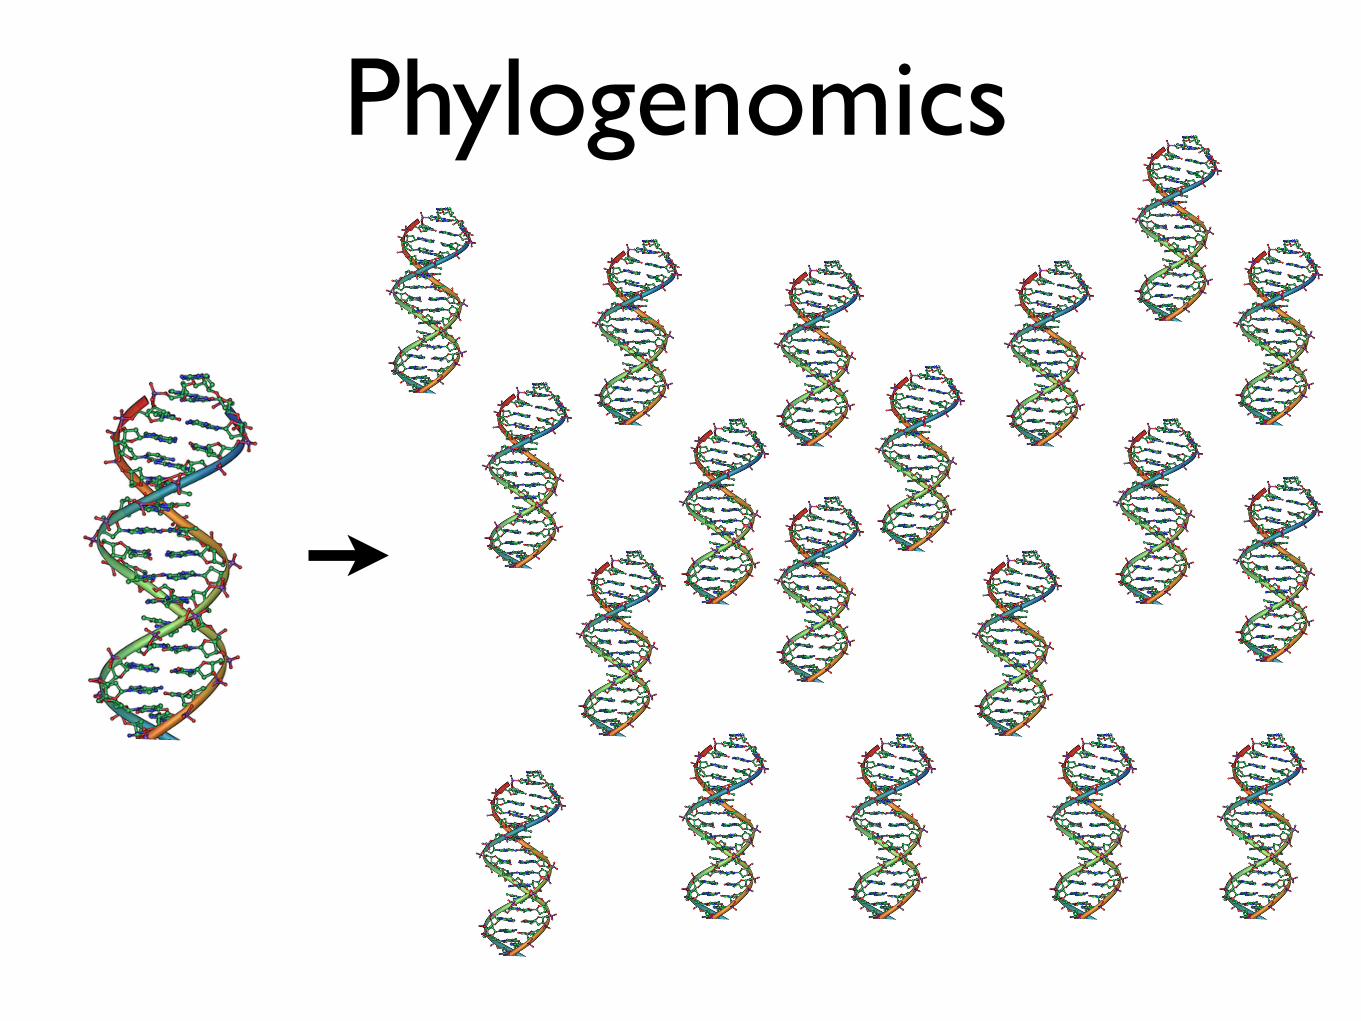
Phylogenomics
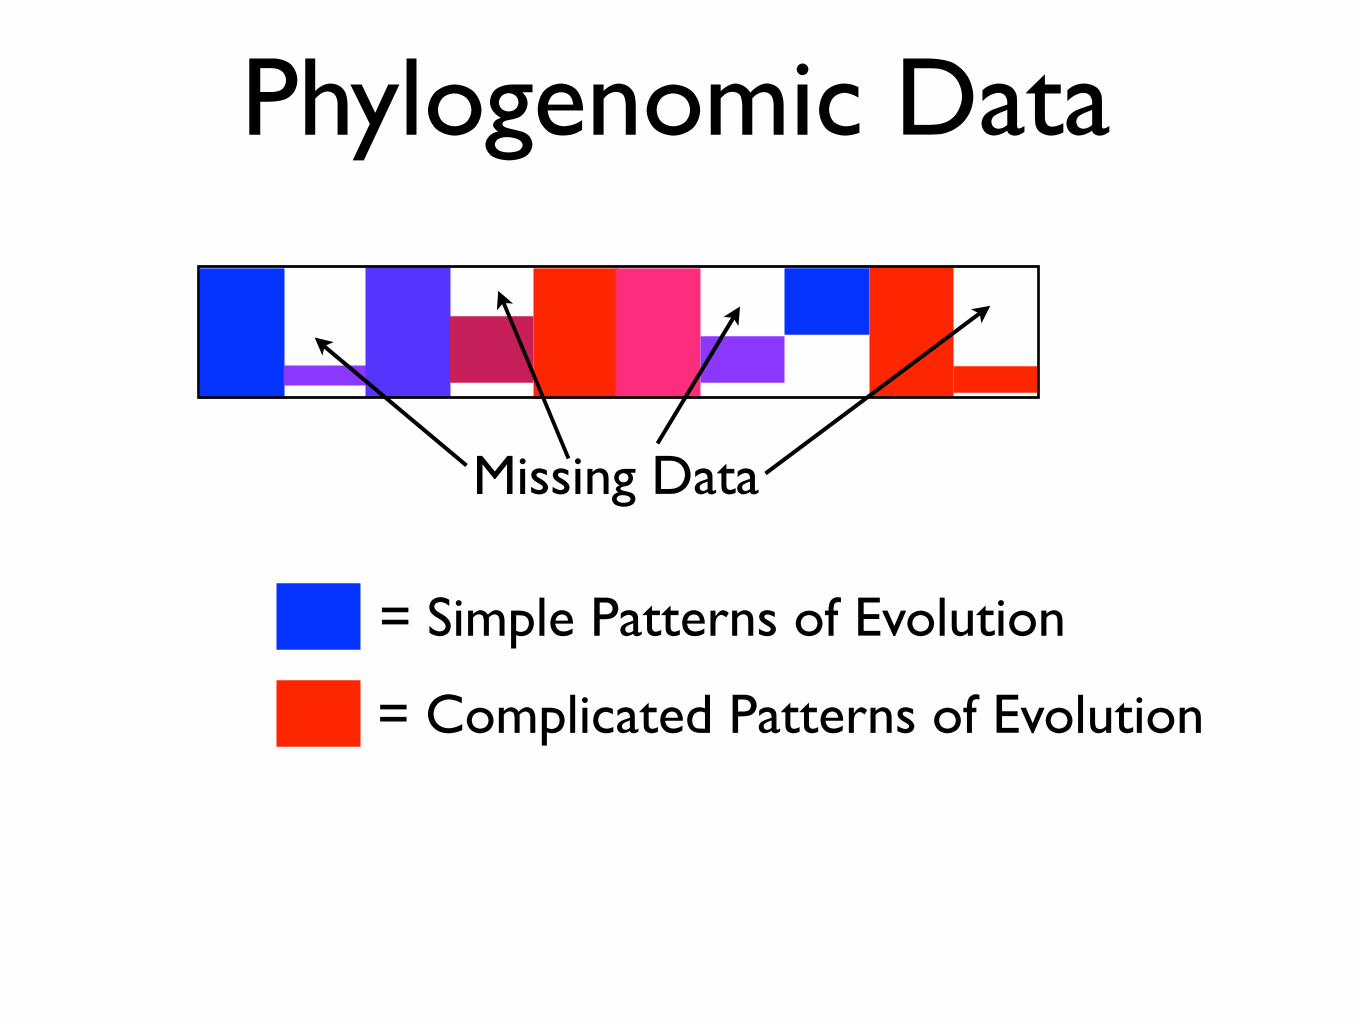
Phylogenomic Data
= Simple Patterns of Evolution
= Complicated Patterns of Evolution
Missing Data
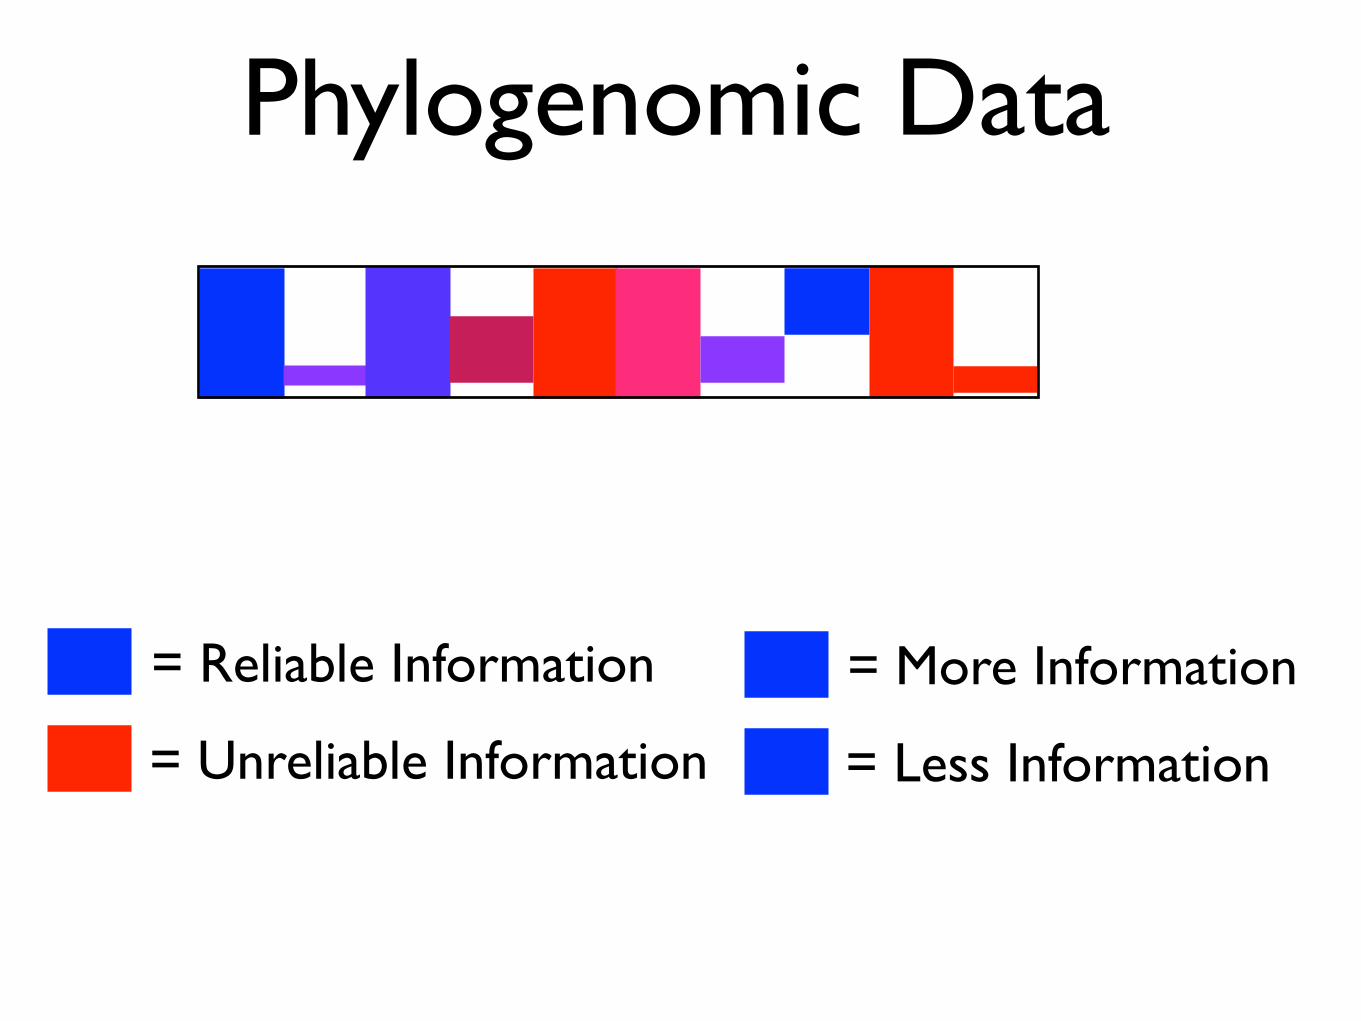
Phylogenomic Data
= Reliable Information
= Unreliable Information
= More Information
= Less Information
The Ideal
. . . . .
. . . . .
One Gene Whole Genome
Parameter Value Parameter Value
Like
lihoo
d
Like
lihoo
d
large, for navigating between the twin hazards of bias onone hand and lack of statistical power on the other andhow these relate to accurate inference. Our discussionsand examples here focus primarily on inferences drawn us-ing a frequentist approach to statistics because of its wide-spread usage in phylogenomics studies, but we also discussnewer techniques that are being developed under modernstatistical frameworks, including the Bayesian methods.Although our examples draw from phylogenomics researchin animals, the discussion presented applies to other eukar-yotes as well as to prokaryotes.
Statistical P values from the Analysis ofComplete DataAvailability of genome sequences from all species in a groupmeans that we have all of the available data on all observ-able differences to infer patterns of speciation and adapta-tion, if we assume negligible effect of within-speciespopulation variation (and horizontal gene transfer[HGT] events) on long-term historical patterns. This isa great boon to biologists because we are interested in un-derstanding patterns and processes that gave rise to thecontemporary diversity. However, when testing null hy-potheses using genomic-scale data, P values from manycommonly used statistical tests can be extremely low(highly significant). This is because P values from statisticaltests provide guidance on whether the observed deviationfrom the expectation may be explained by chance alone. Aswe sample more and more of the data, the test becomesmore powerful in rejecting the null hypothesis, even if onlysmall deviations persist. Although the null hypothesis may
be rejected with a highly significant P value for one set ofassumptions for a given data set, both the effect size andthe conclusion may change substantially when changes aremade to the assumed model.
For example, an exome-scale squared correlation coeffi-cient (r2) of 0.1 between the x (nonsynonymous to syn-onymous substitution rate ratio) and the number ofsynonymous substitutions per site was a matter of exten-sive analysis and interest because it was incredibly signifi-cant statistically (P , 10!68) (Wyckoff et al. 2005). Thecorrelation (effect size) is very small in this case, and itmay be caused by unknown confounding factors or biaseswhen estimating evolutionary distances (fig. 2) becausea substitution model is needed to convert observed differ-ences among sequences into the actual number of substi-tutions during the evolutionary history to account formultiple hits at the same site (reviewed in Yang 2006).
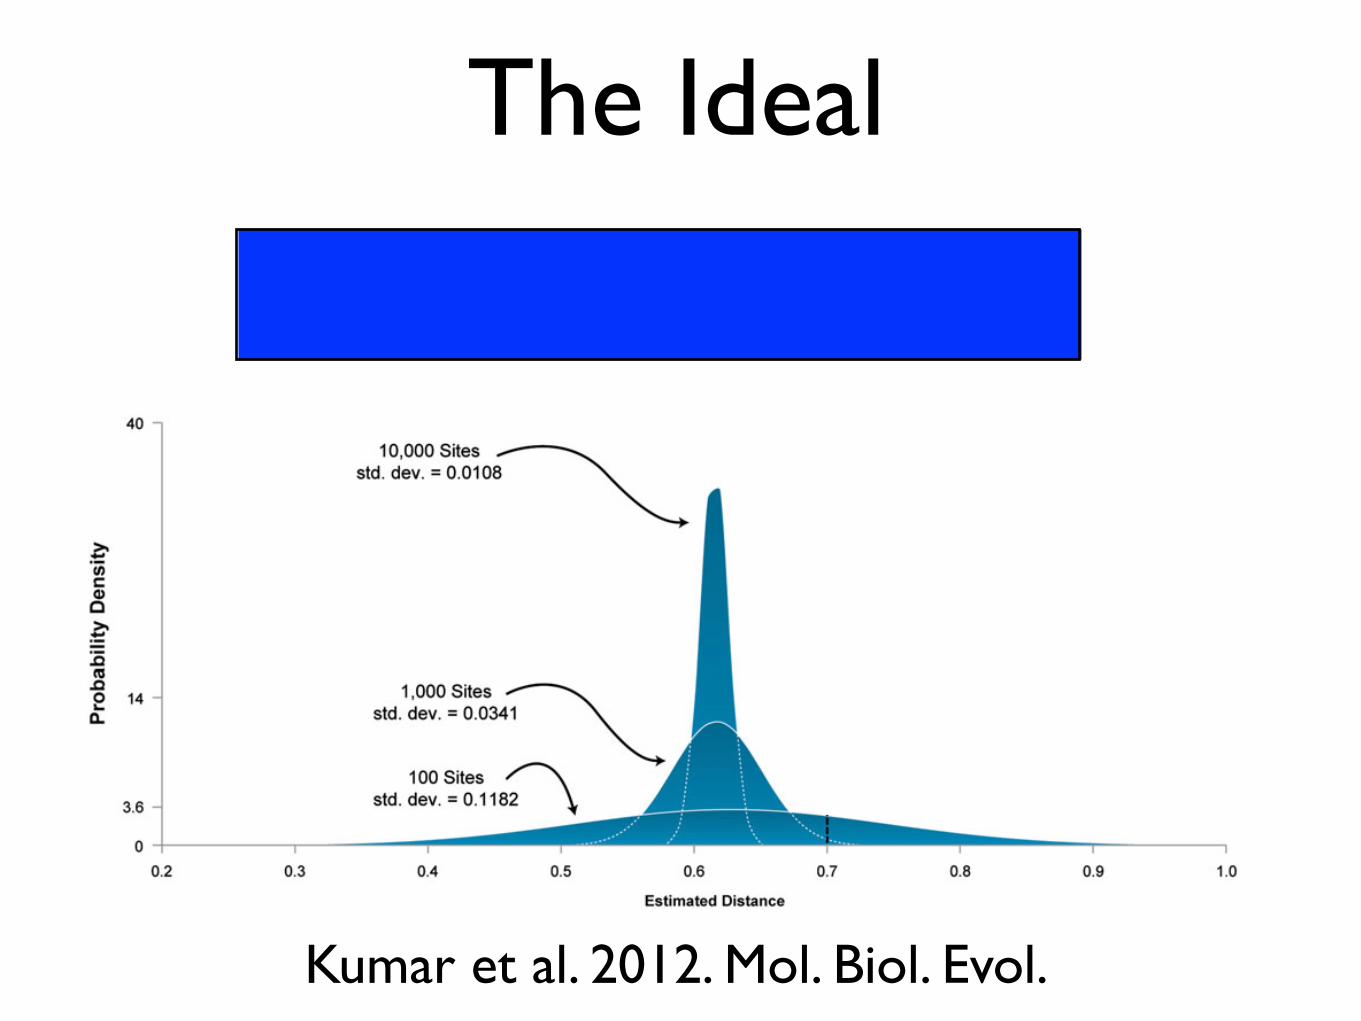
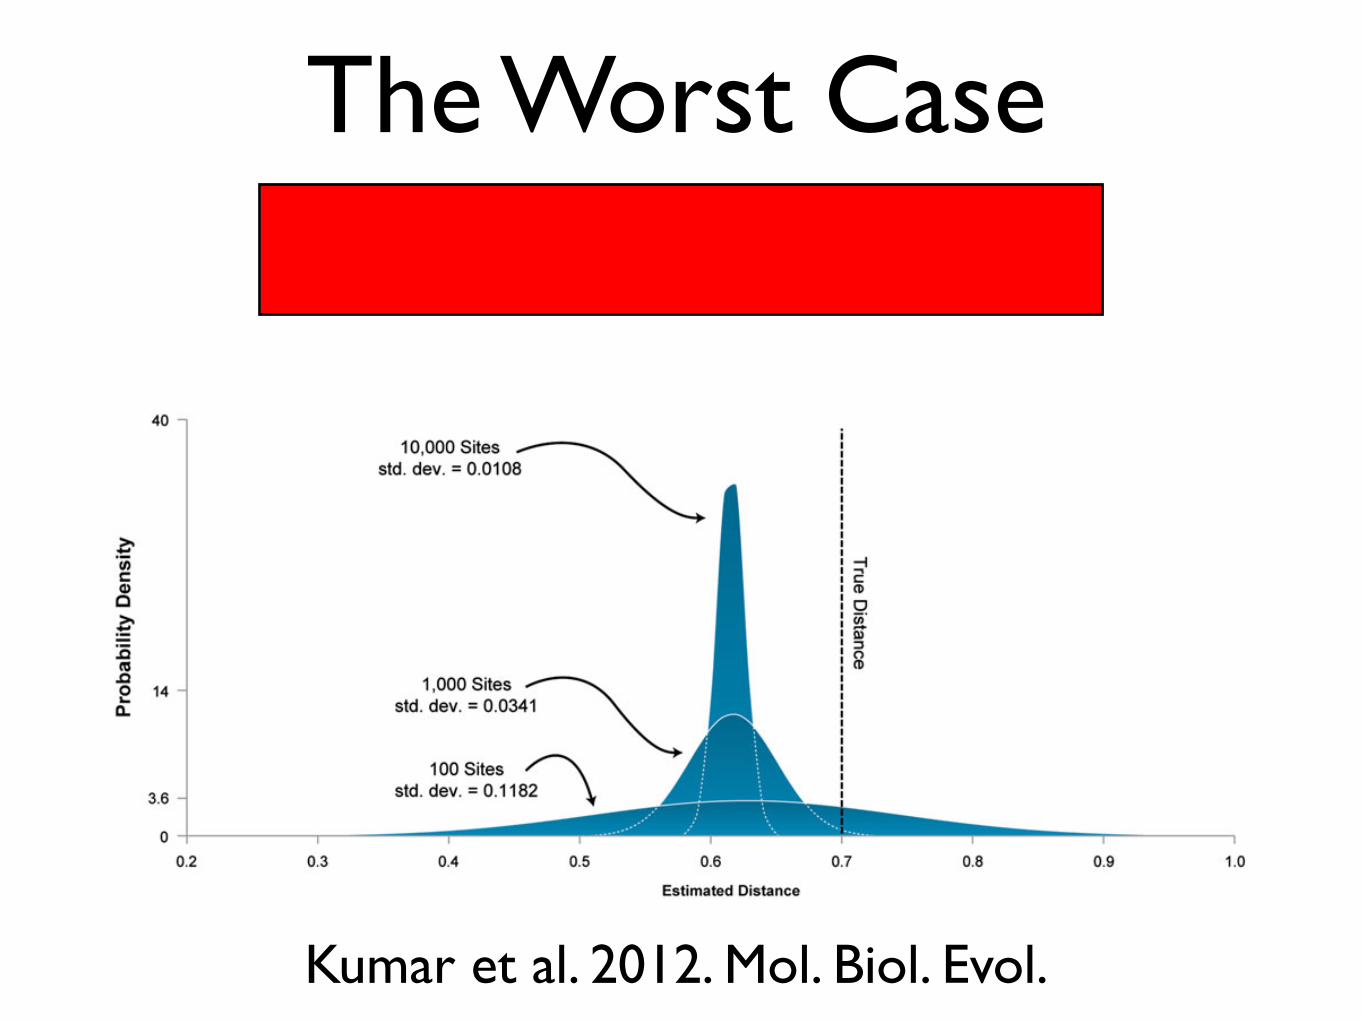
Indeed, a reanalysis of Wyckoff’s data revealed that theobserved correlation is not robust to the choice of modeland the method of analysis (Li et al. 2009). Therefore, ourenhanced ability to detect even the smallest correlationswhen using genome-scale data is hampered by a greater roleof bias caused by the use of imperfect models. This is dem-onstrated by a simple example in figure 2, where estimates ofevolutionary distances are obtained under a Jukes–Cantor(JC) model (Jukes and Cantor 1969). Pairs of DNA sequenceswith varying length (100 to 10,000 bp) with an evolutionarydistance of 0.7 substitutions per site were generated accord-ing to a general time reversible (GTR) model (Lanave et al.1984; Tavare 1986). For each sequence length, 1,000 se-quence pairs were generated and estimates plotted. JC dis-tances for different sequence pairs show a wide distribution
FIG. 2. An illustration of how large data sets allow an arbitrarily great reduction in the variance of an estimate without making it any moreaccurate. Pairs of DNA sequences with an evolutionary distance of 0.7 substitutions per site were generated according to a GTR (Lanave et al.1984; Tavare 1986) of evolution using SeqGen (Rambaut and Grassly 1997). The evolutionary distance between simulated sequences was thenestimated under the JC model (Jukes and Cantor 1969). The JC model is a special case of GTR; it does not model transition/transversion bias orbase frequency biases, both of which are present in the simulated data. Therefore, the distance estimates will be biased. The figure shows howthe distribution of estimates derived from 1,000 replicates narrows with increasing number of sites used (100 to 10,000 bp for the sequencelength, in steps of a factor of 10). Each distribution was approximately normal, so normal curves are shown for simplicity. The mean estimate ofdistance under the JC model is close to 0.62 in each case since an overly simple model tends to underestimate distances. At the same time, thedistribution of estimated distances narrows with increasing sequence length as described by the central limit theorem. As a result, the apparentprecision of the estimate improves with increasing sequence length, but this improvement is spurious, as the mean estimate remains incorrectbecause of violations of model assumptions. Indeed, as the sequence length increases, the distances become, in a sense, less truthful, as they convergeto a biased value and away from the true one. Thus, our confidence in an incorrect estimate can become arbitrarily high when bias is involved.
Statistics and Phylogenomics · doi:10.1093/molbev/msr202 MBE
3
Kumar et al. 2012. Mol. Biol. Evol.
The Worst Case
large, for navigating between the twin hazards of bias onone hand and lack of statistical power on the other andhow these relate to accurate inference. Our discussionsand examples here focus primarily on inferences drawn us-ing a frequentist approach to statistics because of its wide-spread usage in phylogenomics studies, but we also discussnewer techniques that are being developed under modernstatistical frameworks, including the Bayesian methods.Although our examples draw from phylogenomics researchin animals, the discussion presented applies to other eukar-yotes as well as to prokaryotes.
Statistical P values from the Analysis ofComplete DataAvailability of genome sequences from all species in a groupmeans that we have all of the available data on all observ-able differences to infer patterns of speciation and adapta-tion, if we assume negligible effect of within-speciespopulation variation (and horizontal gene transfer[HGT] events) on long-term historical patterns. This isa great boon to biologists because we are interested in un-derstanding patterns and processes that gave rise to thecontemporary diversity. However, when testing null hy-potheses using genomic-scale data, P values from manycommonly used statistical tests can be extremely low(highly significant). This is because P values from statisticaltests provide guidance on whether the observed deviationfrom the expectation may be explained by chance alone. Aswe sample more and more of the data, the test becomesmore powerful in rejecting the null hypothesis, even if onlysmall deviations persist. Although the null hypothesis may
be rejected with a highly significant P value for one set ofassumptions for a given data set, both the effect size andthe conclusion may change substantially when changes aremade to the assumed model.
For example, an exome-scale squared correlation coeffi-cient (r2) of 0.1 between the x (nonsynonymous to syn-onymous substitution rate ratio) and the number ofsynonymous substitutions per site was a matter of exten-sive analysis and interest because it was incredibly signifi-cant statistically (P , 10!68) (Wyckoff et al. 2005). Thecorrelation (effect size) is very small in this case, and itmay be caused by unknown confounding factors or biaseswhen estimating evolutionary distances (fig. 2) becausea substitution model is needed to convert observed differ-ences among sequences into the actual number of substi-tutions during the evolutionary history to account formultiple hits at the same site (reviewed in Yang 2006).
Indeed, a reanalysis of Wyckoff’s data revealed that theobserved correlation is not robust to the choice of modeland the method of analysis (Li et al. 2009). Therefore, ourenhanced ability to detect even the smallest correlationswhen using genome-scale data is hampered by a greater roleof bias caused by the use of imperfect models. This is dem-onstrated by a simple example in figure 2, where estimates ofevolutionary distances are obtained under a Jukes–Cantor(JC) model (Jukes and Cantor 1969). Pairs of DNA sequenceswith varying length (100 to 10,000 bp) with an evolutionarydistance of 0.7 substitutions per site were generated accord-ing to a general time reversible (GTR) model (Lanave et al.1984; Tavare 1986). For each sequence length, 1,000 se-quence pairs were generated and estimates plotted. JC dis-tances for different sequence pairs show a wide distribution
FIG. 2. An illustration of how large data sets allow an arbitrarily great reduction in the variance of an estimate without making it any moreaccurate. Pairs of DNA sequences with an evolutionary distance of 0.7 substitutions per site were generated according to a GTR (Lanave et al.1984; Tavare 1986) of evolution using SeqGen (Rambaut and Grassly 1997). The evolutionary distance between simulated sequences was thenestimated under the JC model (Jukes and Cantor 1969). The JC model is a special case of GTR; it does not model transition/transversion bias orbase frequency biases, both of which are present in the simulated data. Therefore, the distance estimates will be biased. The figure shows howthe distribution of estimates derived from 1,000 replicates narrows with increasing number of sites used (100 to 10,000 bp for the sequencelength, in steps of a factor of 10). Each distribution was approximately normal, so normal curves are shown for simplicity. The mean estimate ofdistance under the JC model is close to 0.62 in each case since an overly simple model tends to underestimate distances. At the same time, thedistribution of estimated distances narrows with increasing sequence length as described by the central limit theorem. As a result, the apparentprecision of the estimate improves with increasing sequence length, but this improvement is spurious, as the mean estimate remains incorrectbecause of violations of model assumptions. Indeed, as the sequence length increases, the distances become, in a sense, less truthful, as they convergeto a biased value and away from the true one. Thus, our confidence in an incorrect estimate can become arbitrarily high when bias is involved.
Statistics and Phylogenomics · doi:10.1093/molbev/msr202 MBE
3
Kumar et al. 2012. Mol. Biol. Evol.
Big Data = Strong Support
0.04 substitution / site
Caiman
Podarcis
Python
Phrynops
Gallus
Ornithorhynchus
Monodelphis
Taeniopygia
Alligator
Emys
Anolis
Caretta
Chelonoidis
Homo
Xenopus
Protopterus
1
1
1
1
1
1
1
0.97
1
0.84
1
1
BPML = 100 BPPARTG = 100
PPBAY = 1.0 PPCAT = 1.0
1 1
1
1
1
1
1
0.99
1
1
1
1
0.1 substitution / site
������
�� ��
BPML = - BPPARTG = -
BPPARTC = 100 PPBAY = -
PPPARTC = 1.0 PPCAT = 1.0
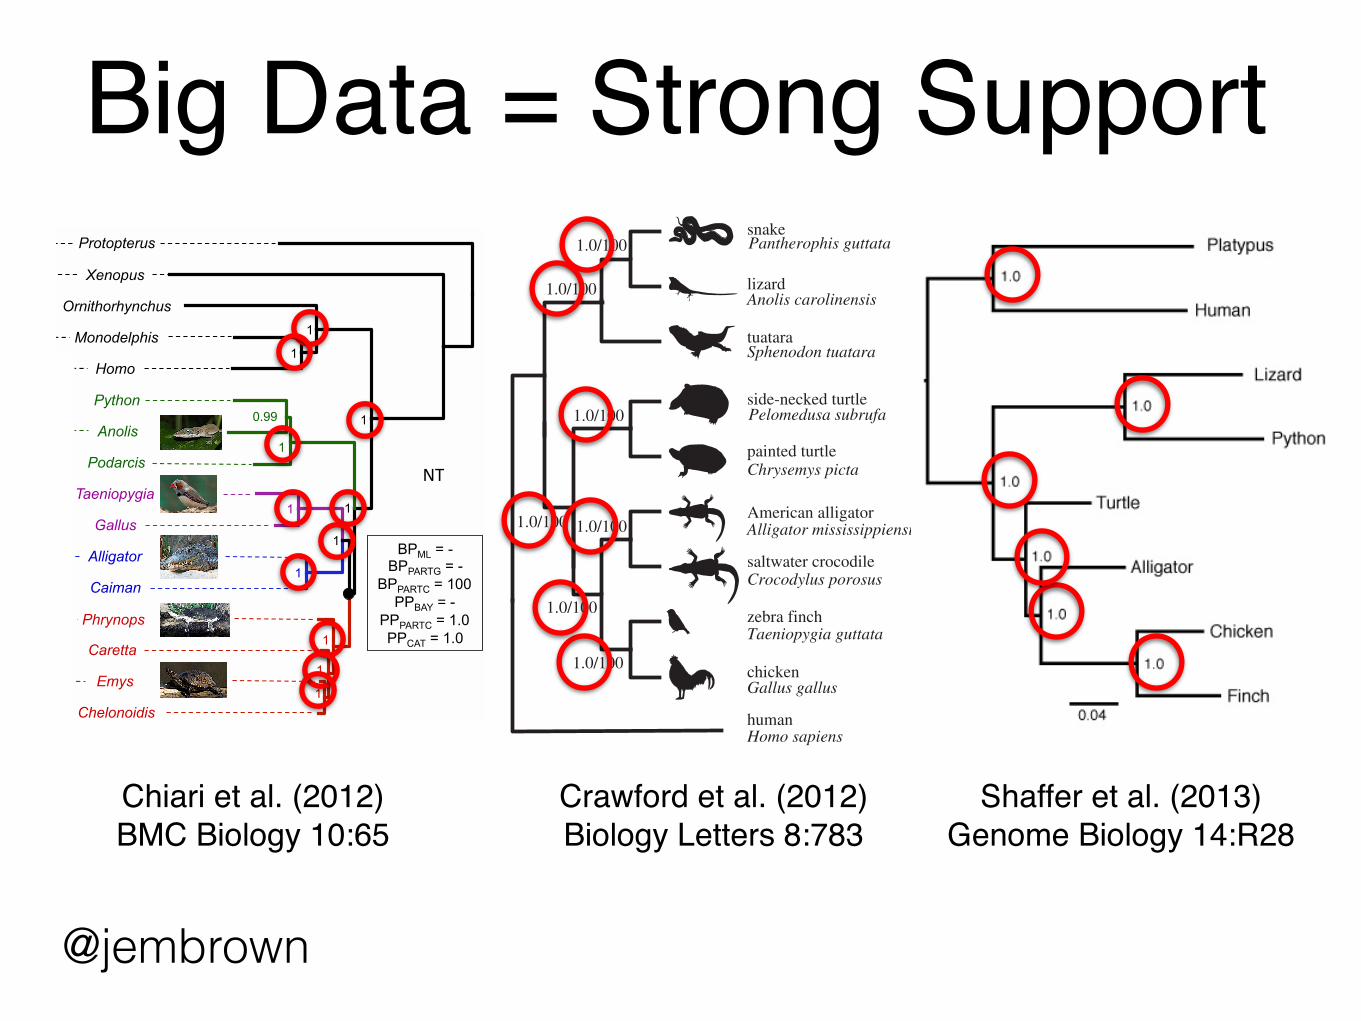
Figure 1 Phylogenetic relationships of amniotes as inferred from analyses of the 248-gene dataset. (a) Bayesian consensus topologyobtained from analyses of the amino-acid dataset (62,342 sites) under the CAT-GTR + G4 mixture model. (b) Bayesian consensus topologyobtained from analyses of the complete nucleotide dataset (187,026 sites) under the CAT-GTR + G4 mixture model. The nodal values indicatethe clade Bayesian posterior probability (PP). Statistical support values obtained with different methods, models and data partitions detailed inTable 1 are reported in boxes for turtles plus archosaurs. Note the relative incongruence between the two trees concerning the position ofPython. All pictures are from Wikimedia Commons, except for Chelonoidis from Y. Chiari. Please note also that the taxonomy of Galapagos turtlesbeing currently revised, the appropriate species name for the Chelonoidis specimen included here might be Chelonoidis sp.
Table 1 Statistical support for the phylogenetic position of turtles based on the various reconstruction methods,substitution models, and data partitions.
Amino acids Nucleotides
All positions All positions Positions 1 + 2 Positions 3
Total sites 62,342 187,026 124,684 62,342
Constant sites 41,170 (66.0%) 99,638 (53.3%) 92,128 (73.9%) 7,510 (11.2%)
Informative sites 8,749 (14.0%) 54,880 (29.3%) 14,009 (11.2%) 40,871 (65.6%)
RaxML LG + G / GTR + G Turtles + ArchosaursBPML = 100
Turtles + CrocodilesBPML = 76
Turtles + ArchosaursBPML = 100
Turtles + CrocodilesBPML = 100
RaxML GTR + G partitioned by gene Turtles + ArchosaursBPPARTG = 100
Turtles + CrocodilesBPPARTG = 54
- -
RaxML GTR + G partitioned by codon - Turtles + ArchosaursBPPARTC = 100
- -
MrBayes WAG + G / GTR + G Turtles + ArchosaursPPBAY = 1.0
Turtles + CrocodilesPPBAY = 1.0
Turtles + ArchosaursPPBAY = 1.0
Turtles + CrocodilesPPBAY = 1.0
MrBayes - Turtles + ArchosaursPPPARTC = 1.0
- -
PhyloBayes CAT-GTR + G Turtles + ArchosaursPPCAT = 1.0
Turtles + ArchosaursPPCAT = 1.0
Turtles + ArchosaursPPCAT = 1.0
Turtles + ArchosaursPPCAT = 1.0
Chiari et al. BMC Biology 2012, 10:65http://www.biomedcentral.com/1741-7007/10/65
Page 3 of 14
GTR + G partitioned by codontissue and developmental-stage-specific expression pro-files [25,26], which could make the detection of certainmiRNAs challenging. Because preparing and sequencinglibraries is a biased sampling process, the detection prob-ability for specific targets is variable, and some miRNAsare likely to be more easily detected than others. Thus,failures to detect miRNA families are not equivalent tothe absence of miRNA families [27]. We suggest that atleast some of the four miRNA families currently thoughtto be unique to lizards and turtles may be present but asyet undiscovered in other reptiles.
This work is the first to investigate the placement ofturtles within reptiles using a genomic-scale analysis ofsingle-copy DNA sequences and a complete samplingof the major relevant evolutionary lineages. BecauseUCEs are conserved across most vertebrate groups[20] and found in groups including yeast and insects[19], our framework is generalizable beyond this study
and relevant to resolving ancient phylogenetic enigmasthroughout the tree of life [28]. This approach to high-throughput phylogenomics—based on thousands ofloci—is likely to fundamentally change the way thatsystematists gather and analyse data.
(a) Additional informationWe provide all data and links to software via Dryad repo-sitory (doi:10.5061/dryad.75nv22qj) and GenBank(JQ868813–JQ885411).
We thank R. Nilsen, K. Jones, M. Harvey, R. Nussbaum,G. Schneider, D. Ray, D. Peterson, C. Moran, L. Miles,S. Isberg, C. Mancuso, S. Herke, two anonymous reviewersand the LSU Genomic Facility. National Science Foundationgrants DEB-1119734, DEB-0841729 and DEB-0956069,and an Amazon Web Services Education Grant supportedthis study. N.G.C., B.C.F., J.E.M. and T.C.G. designed thestudy; N.G.C. and B.C.F. performed phylogenetic analysis;B.C.F. created datasets; J.E.M. performed laboratory work;all authors helped write the manuscript.
1 Lee, M. S. Y., Reeder, T. W., Slowinski, J. B. & Lawson,R. 2004 Resolving reptile relationships. In Assemblingthe tree of life (eds J. Cracraft & M. J. Donoghue),pp. 451–467. Oxford, UK: Oxford University Press.
2 Lee, M. 1997 Reptile relationships turn turtle. Nature389, 245–246. (doi:10.1038/38422)
3 Rieppel, O. 1999 Turtle origins. Science 283, 945–946.(doi:10.1126/science.283.5404.945)
4 Janke, A., Erpenbeck, D., Nilsson, M. & Aranason, U.2001 The mitochondrial genomes of the iguana (Iguanaiguana) and the caiman (Caiman crocodylus): implicationsfor amniote phylogeny. Proc. R. Soc. Lond. B 268, 623–631. (doi:10.1098/rspb.2000.1402)
5 Hedges, S. & Poling, L. 1999 A molecular phylogeny ofreptiles. Science 283, 998–1001. (doi:10.1126/science.283.5404.998)
6 Rest, J. S., Ast, J. C., Austin, C. C., Waddell, P. J.,Tibbetts, E. A., Hay, J. M. & Mindell, D. P. 2003 Mol-ecular systematics of primary reptilian lineages and thetuatara mitochondrial genome. Mol. Phylogenet. Evol.29, 289–297. (doi:10.1016/S1055-7903(03)00108-8)
7 Kumazawa, Y. & Nishida, M. 1999 Complete mitochon-drial DNA sequences of the green turtle and blue-tailedmole skink: statistical evidence for archosaurian affinityof turtles. Mol. Biol. Evol. 16, 784–792. (doi:10.1093/oxfordjournals.molbev.a026163)
8 Zardoya, R. & Meyer, A. 1998 Complete mitochondrialgenome suggests diapsid affinities of turtles. Proc. NatlAcad. Sci. USA 95, 14 226–14 231. (doi:10.1073/pnas.95.24.14226)
9 Katsu, Y., Braun, E. L., Guillette Jr, L. J. & Iguchi, T.2009 From reptilian phylogenomics to reptilian genomes:analyses of c-Jun and DJ-1 proto-oncogenes. Cytogenet.Genome Res. 127, 79–93. (doi:10.1159/000297715)
10 Shedlock, A. M., Botka, C. W., Zhao, S., Shetty, J.,Zhang, T., Liu, J. S., Deschavanne, P. J. & Edwards,S. V. 2007 Phylogenomics of nonavian reptiles and thestructure of the ancestral amniote genome. Proc. NatlAcad. Sci. USA 104, 2767–2772. (doi:10.1073/pnas.0606204104)
11 Hugall, A. F., Foster, R. & Lee, M. S. Y. 2007 Cali-bration choice, rate smoothing, and the pattern oftetrapod diversification according to the long nucleargene RAG-1. Syst. Biol. 56, 543–563. (doi:10.1080/10635150701477825)
(a)
(b)
snakelizard
turtles
tuatara
crocodilians
birds
human0.03 substitutions/site
snake
lizard
tuatara
side-necked turtle
painted turtle
American alligator
saltwater crocodile
zebra finch
chicken
human
1.0/100
1.0/100
1.0/100
1.0/100
1.0/100
1.0/100
1.0/100
Pantherophis guttata
Anolis carolinensis
Sphenodon tuatara
Pelomedusa subrufa
Chrysemys picta
Alligator mississippiensis
Crocodylus porosus
Taeniopygia guttata
Gallus gallus
Homo sapiens
Figure 2. (a) Reptilian phylogeny estimated from 1145 ultra-conserved loci using Bayesian analysis of concatenated dataand species-tree methods, yielding identical topologies. Nodelabels indicate posterior probability/bootstrap support. (b)Phylogram of the UCE phylogeny generated with STEAC.
UCEs place turtles sister to archosaurs N. G. Crawford et al. 785
Biol. Lett. (2012)
on November 6, 2012rsbl.royalsocietypublishing.orgDownloaded from
Additional file 1, Tables S7, S8), mirroring previous workshowing up-regulated gene expression in response tohypoxia in other vertebrate tissues, including manycancers.The largest overall change in expression was in
APOLD1, an apolipoprotein encoding gene whose tran-script levels increased 128-fold in telencephalon and 19-fold in ventricle (see Additional file 1, Tables S7, S8;Additional file 2, Figure S10). APOLD1 expression mod-erately increases during hypoxia in human microvascularendothelial cell culture, although its exact functionremains unclear [25]. Other highly differentiallyexpressed genes (>10-fold; FOS, JUNB, ATF3, PTGS2,BTG1/2, and EGR1) encode proteins that, individuallyand in dimeric forms, have been implicated in the controlof cellular proliferation, cancers, and tumor suppression[26-29]. The 30-fold increase in a gene orthologous toSLC2A1 (see Additional file 1, Table S8, Additional file 2,Figure S11), which encodes the glucose transporterGLUT-1, is also exceptional since deficiencies in mem-brane glucose transport underlie diabetes in humans. Anunderstanding of the mechanism by which membraneGLUT-1 levels increase in the turtle would be a usefulcontribution to human diabetes research. Decreases in
gene expression were fewer and found only in ventricle(see Additional file 1, Table S9; Additional file 2, FigureS12), but included decreases in CDO, which is importantin regulating intracellular cysteine as well as levels of theendogenous metabolic depressant hydrogen sulfide[30,31], and genes involved in mRNA splicing (SRSF5)[32] and tumor proliferation (MKNK2) [33].These analyses demonstrate the power of the western
painted turtle as a model for the evolution of anoxia toler-ance by regulatory changes utilizing broadly conservedvertebrate genes, including many genes that lead to patho-genesis in humans. Clearly, further study of the processesthat link these regulatory changes to anoxia tolerance area next important step. Although this is yet to be tested, wealso note that the regulatory pathways that evolved in thewestern painted turtle could lead to the identification oftargets for therapeutic intervention in human diseasesinvolving hypoxic injury and possibly tumorigenesis.
A novel microRNA associated with freeze tolerance inhatchling painted turtlesFreeze tolerance constitutes a second suite of physiologicaladaptations that are integral to winter survival for hatchl-ing painted turtles and other species that overwinter in
Figure 2 A revised phylogeny of major amniote lineages and their rates of molecular evolution. (a) Bayesian phylogram depicting therelationships of the eight primary amniote lineages, and their rates of molecular evolution. The phylogeny demonstrates the sister grouprelationship of turtle and archosaurs (allligator plus birds). The numbers at nodes denote posterior probabilities (all are at the maximum of 1.0).(b) The histogram shows the relative rate of substitution inferred for each lineage under a relaxed clock. For analysis details, see Materials andMethods, Phylogeny and substitution rate).
Bradley Shaffer et al. Genome Biology 2013, 14:R28http://genomebiology.com/2013/14/3/R28
Page 5 of 22
Crawford et al. (2012)Biology Letters 8:783
Chiari et al. (2012) BMC Biology 10:65
Shaffer et al. (2013) Genome Biology 14:R28
@jembrown
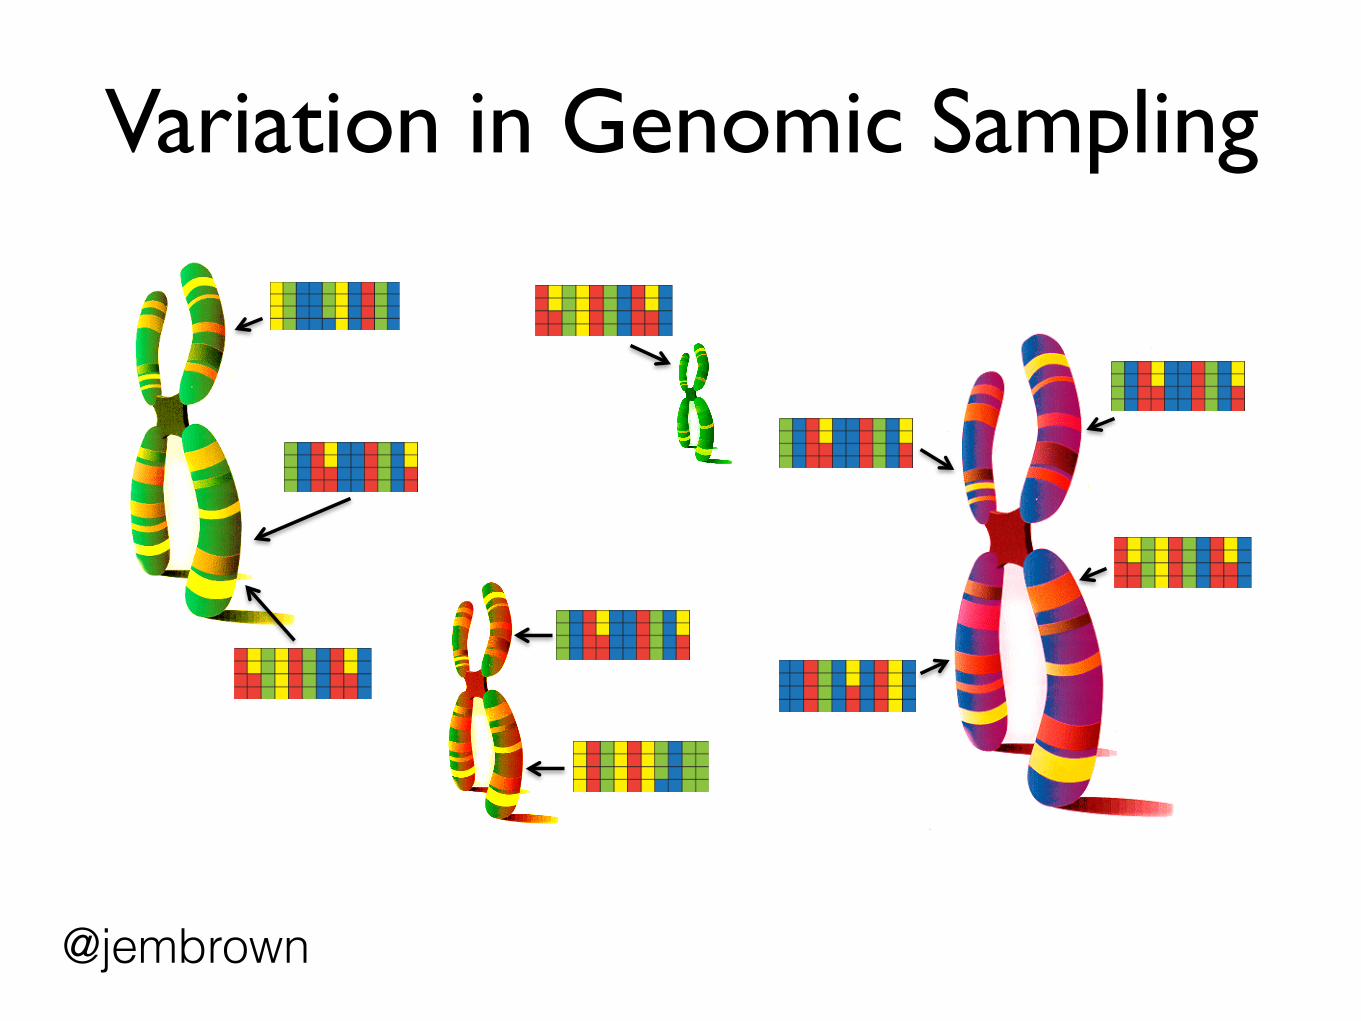
Variation in Genomic Sampling
@jembrown
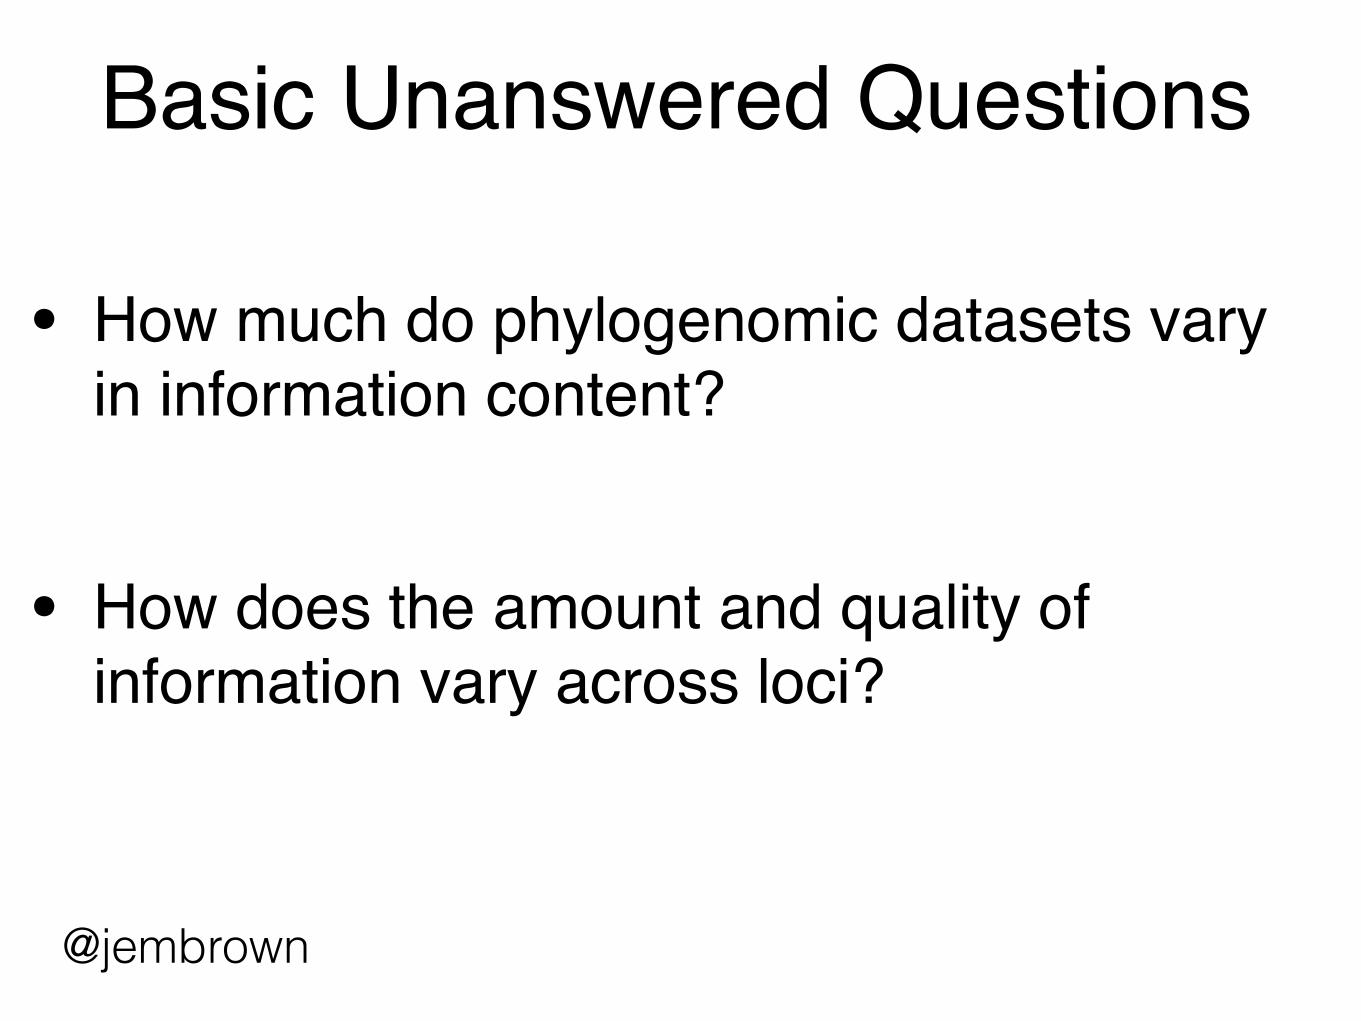
Basic Unanswered Questions
• How much do phylogenomic datasets vary in information content?
• How does the amount and quality of information vary across loci?
@jembrown
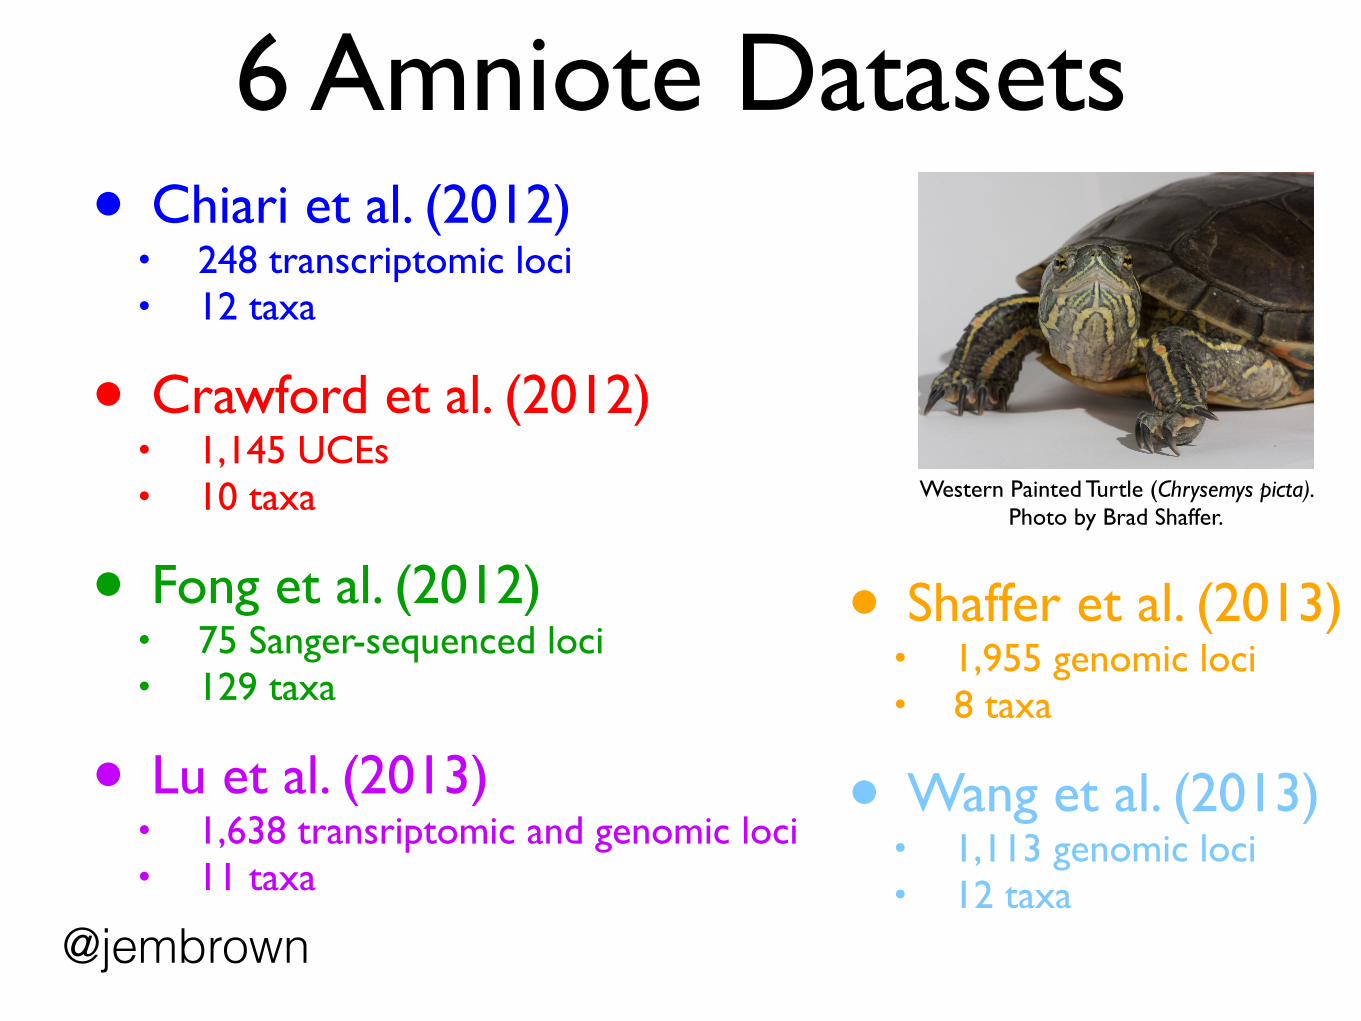
6 Amniote Datasets• Chiari et al. (2012)
• 248 transcriptomic loci• 12 taxa
• Crawford et al. (2012)• 1,145 UCEs• 10 taxa
• Fong et al. (2012)• 75 Sanger-sequenced loci• 129 taxa
• Lu et al. (2013)• 1,638 transriptomic and genomic loci• 11 taxa
Western Painted Turtle (Chrysemys picta). Photo by Brad Shaffer.
• Shaffer et al. (2013)• 1,955 genomic loci• 8 taxa
• Wang et al. (2013)• 1,113 genomic loci• 12 taxa
@jembrown
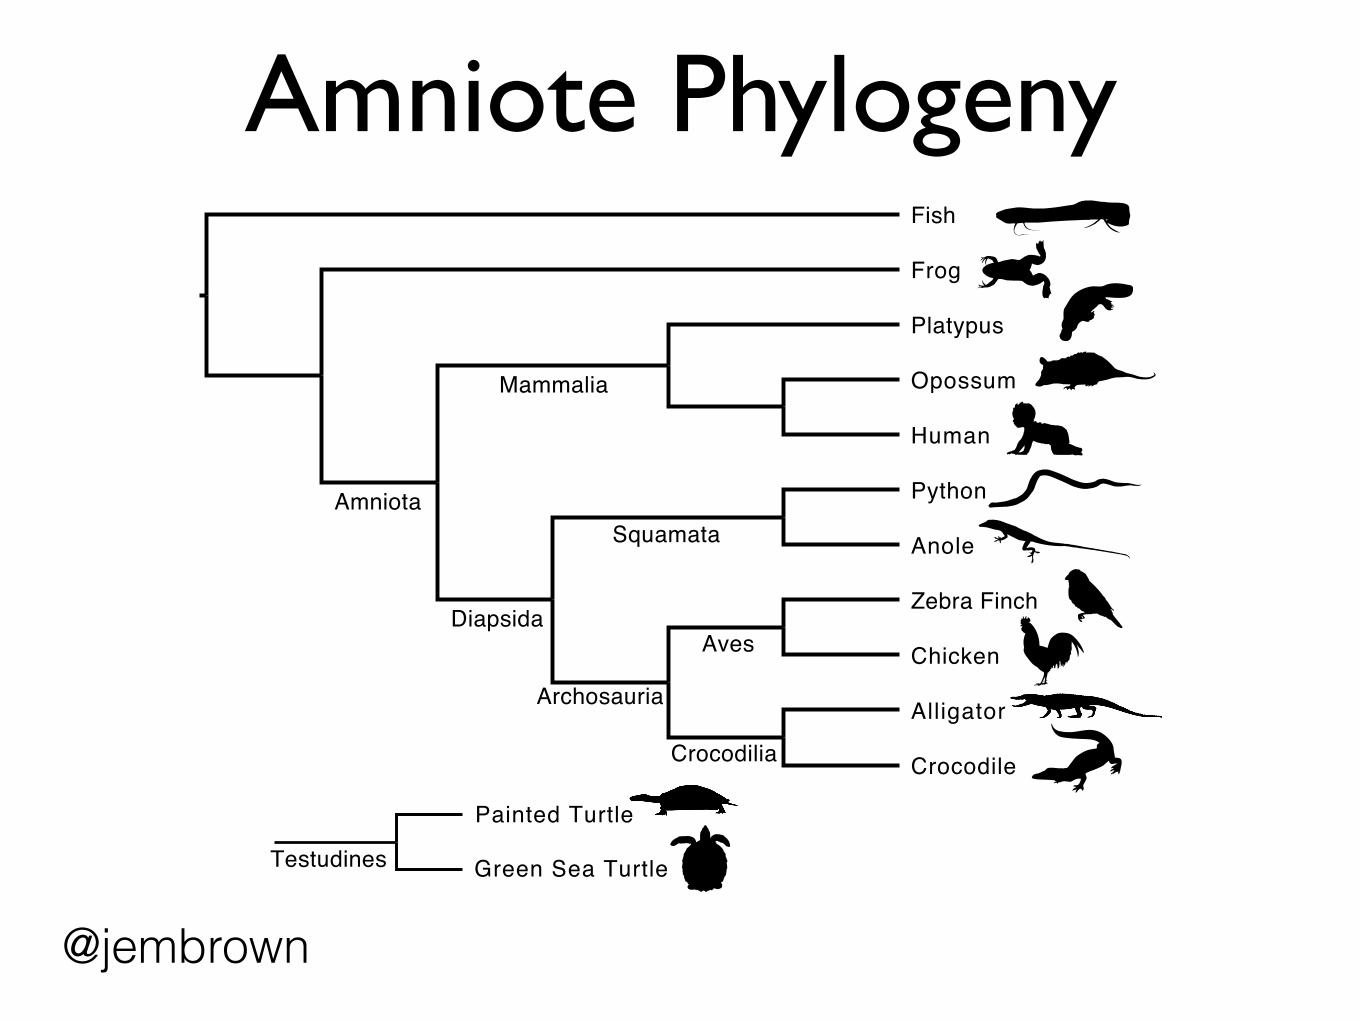
Amniote Phylogeny
Zebra Finch
Crocodile
Platypus
Python
Fish
Frog
Anole
Chicken
Opossum
Alligator
Human
Aves
Crocodilia
Archosauria
Squamata
Mammalia
Diapsida
Amniota
Painted Turtle
Green Sea TurtleTestudines
@jembrown
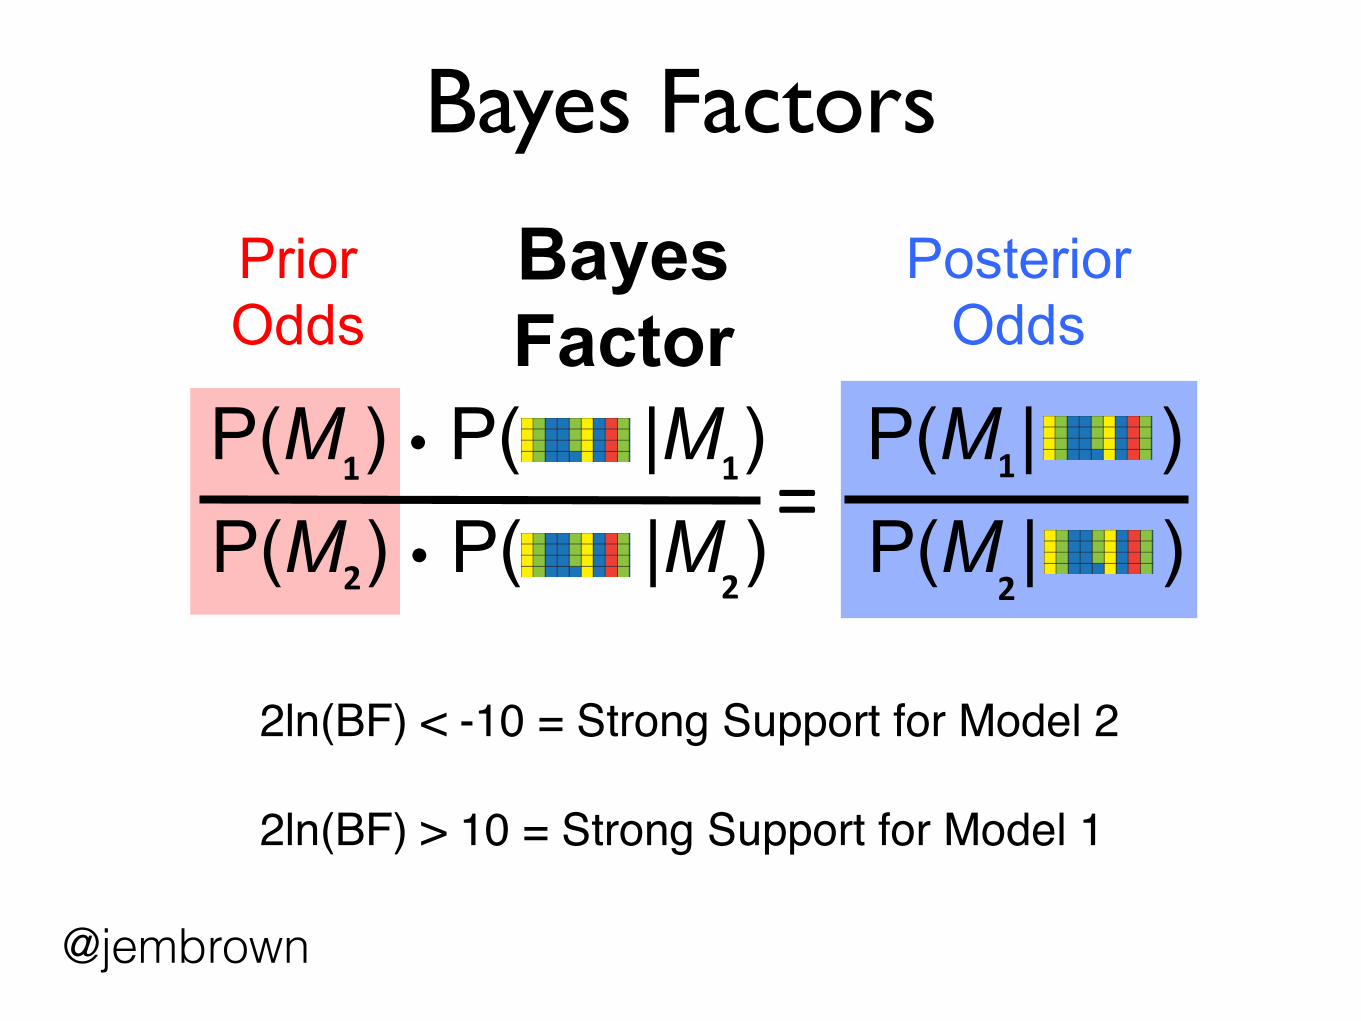
Bayes Factors
P(M ) ! P( |M ) P(M | ) P(M ) ! P( |M ) P(M | )
=" 1"
2" 2" 2"
1" 1"
Prior Odds
Posterior Odds
Bayes Factor
2ln(BF) < -10 = Strong Support for Model 2
2ln(BF) > 10 = Strong Support for Model 1
@jembrown
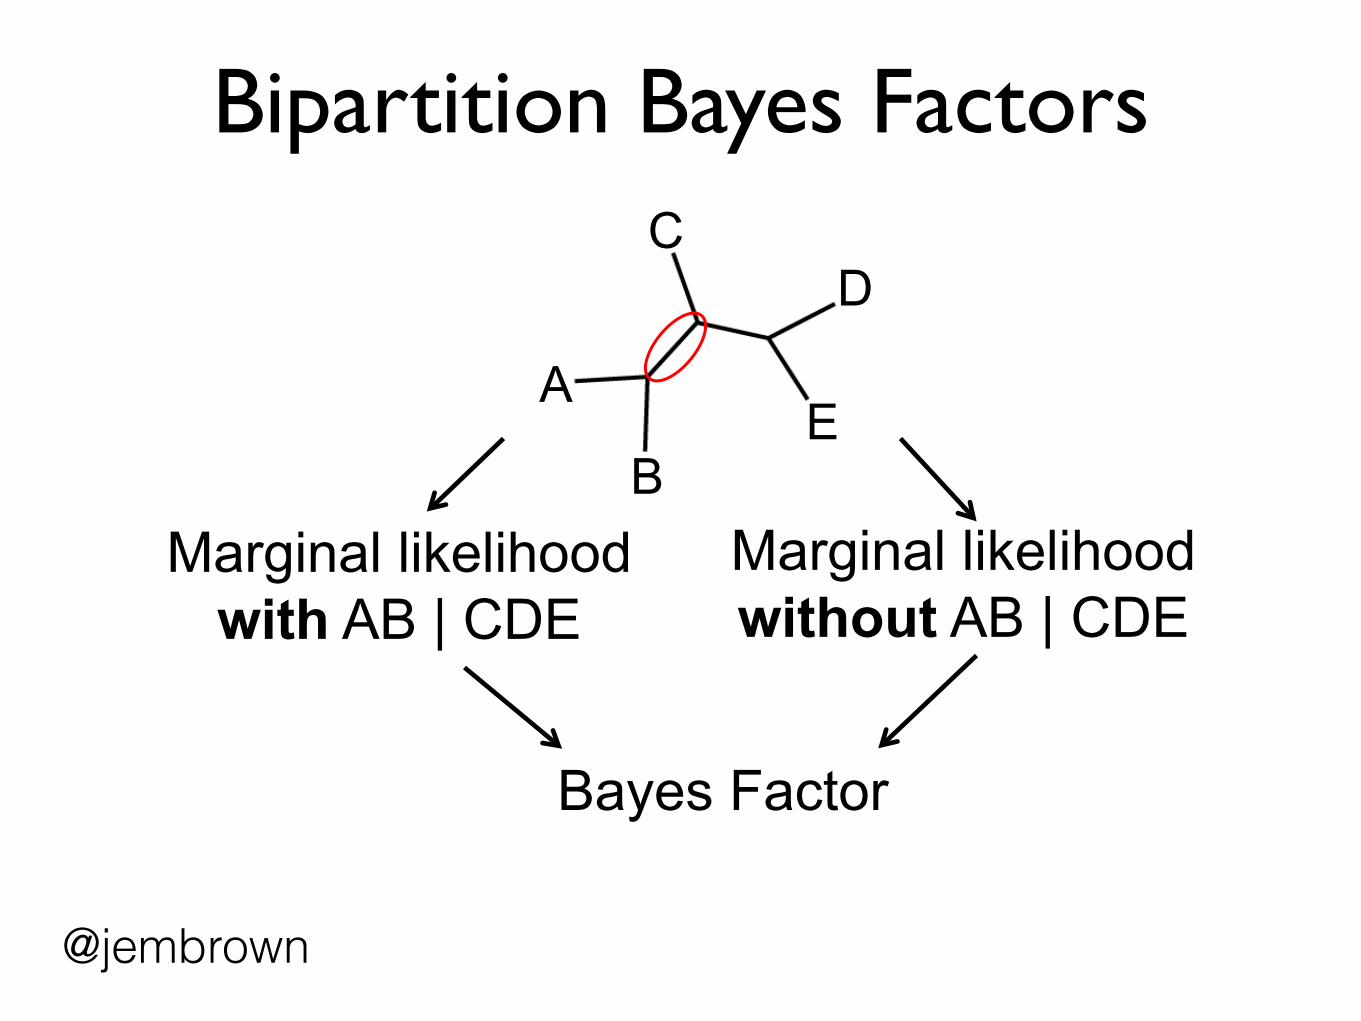
Bipartition Bayes Factors
@jembrown
A
B
C
E
D
Marginal likelihood with AB | CDE
Bayes Factor
Marginal likelihood without AB | CDE
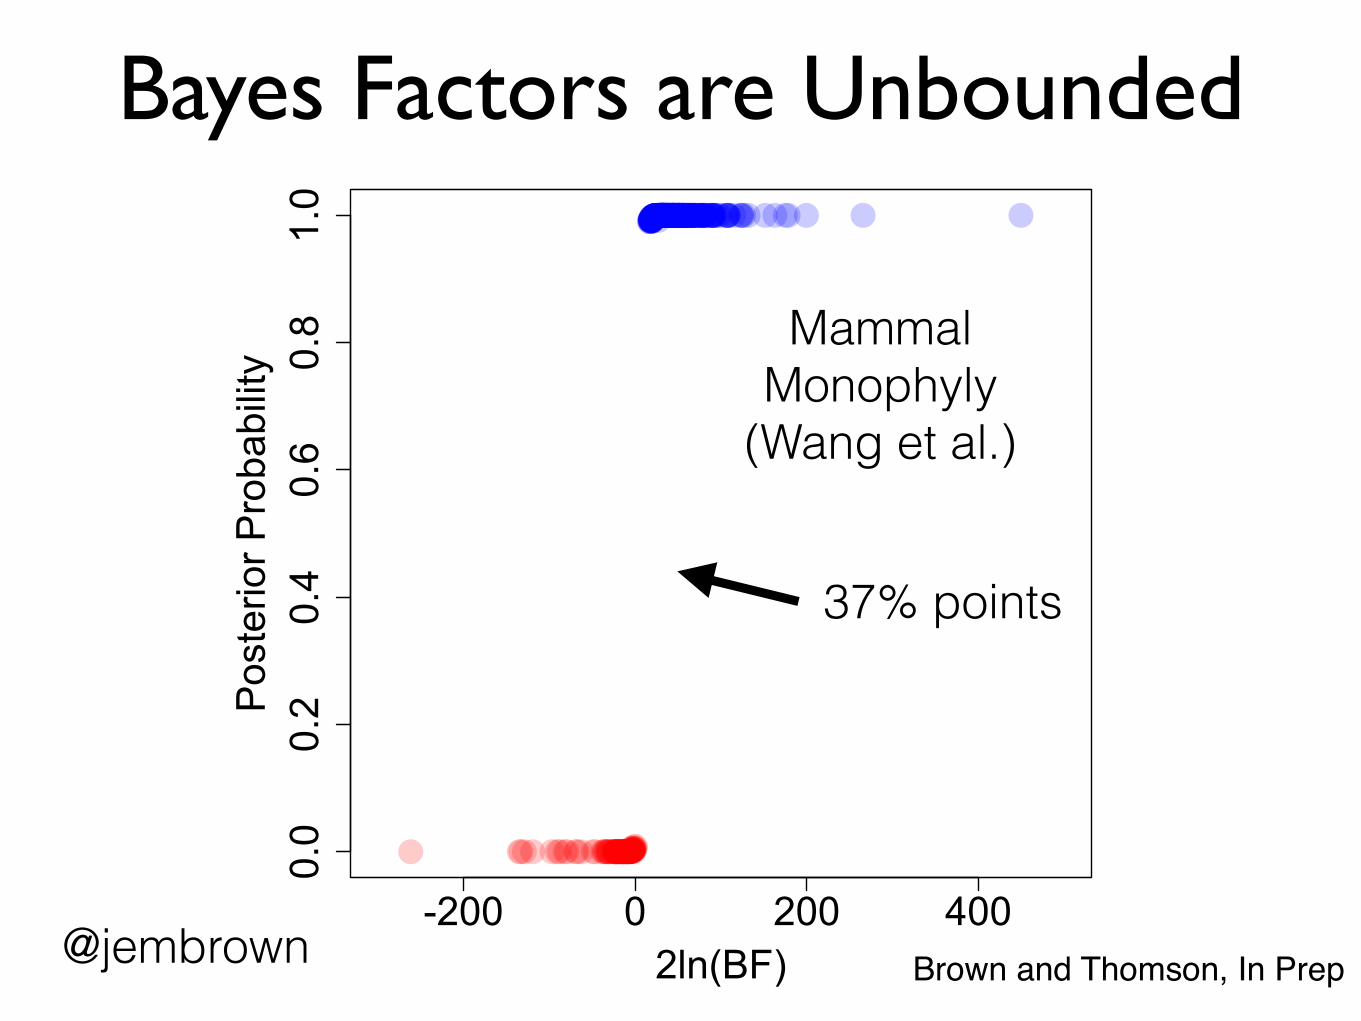
Bayes Factors are Unbounded
-200 0 200 400
0.0
0.2
0.4
0.6
0.8
1.0
2ln(BF)
Pos
terio
r Pro
babi
lity
Mammal Monophyly
(Wang et al.)
37% points
@jembrown Brown and Thomson, In Prep
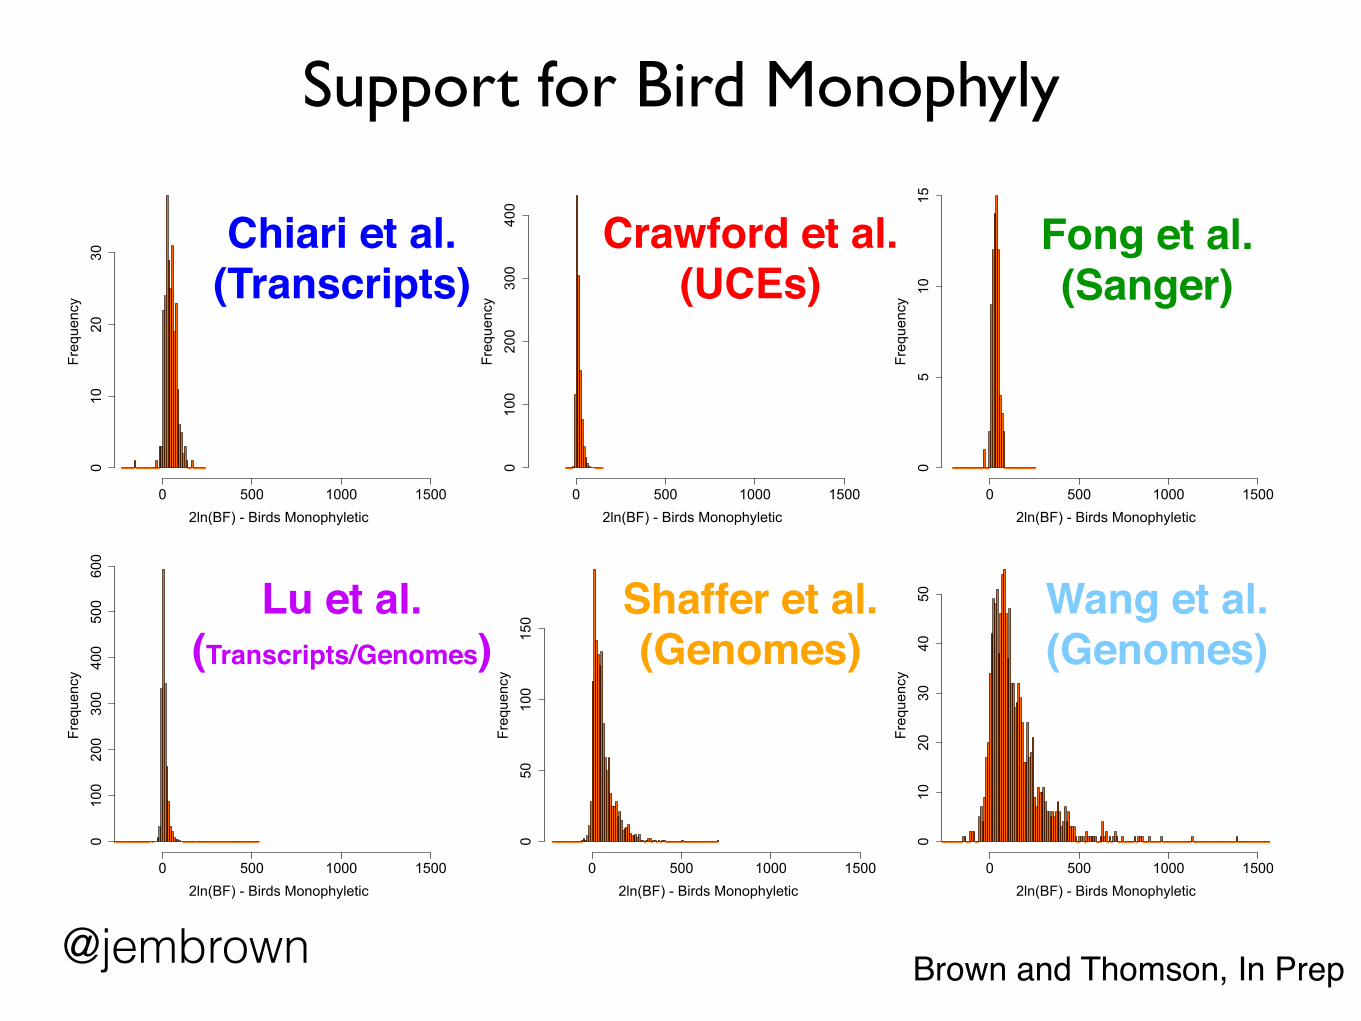
Support for Bird Monophyly
2ln(BF) - Birds Monophyletic
Frequency
0 500 1000 1500
010
2030
Chiari et al. (Transcripts)
2ln(BF) - Birds Monophyletic
Frequency
0 500 1000 15000
100
200
300
400
Crawford et al.(UCEs)
2ln(BF) - Birds Monophyletic
Frequency
0 500 1000 1500
05
1015
Fong et al.(Sanger)
2ln(BF) - Birds Monophyletic
Frequency
0 500 1000 1500
0100
200
300
400
500
600
Lu et al.(Transcripts/Genomes)
2ln(BF) - Birds Monophyletic
Frequency
0 500 1000 1500
050
100
150
Shaffer et al.(Genomes)
2ln(BF) - Birds MonophyleticFrequency
0 500 1000 1500
010
2030
4050 Wang et al.
(Genomes)
@jembrown Brown and Thomson, In Prep
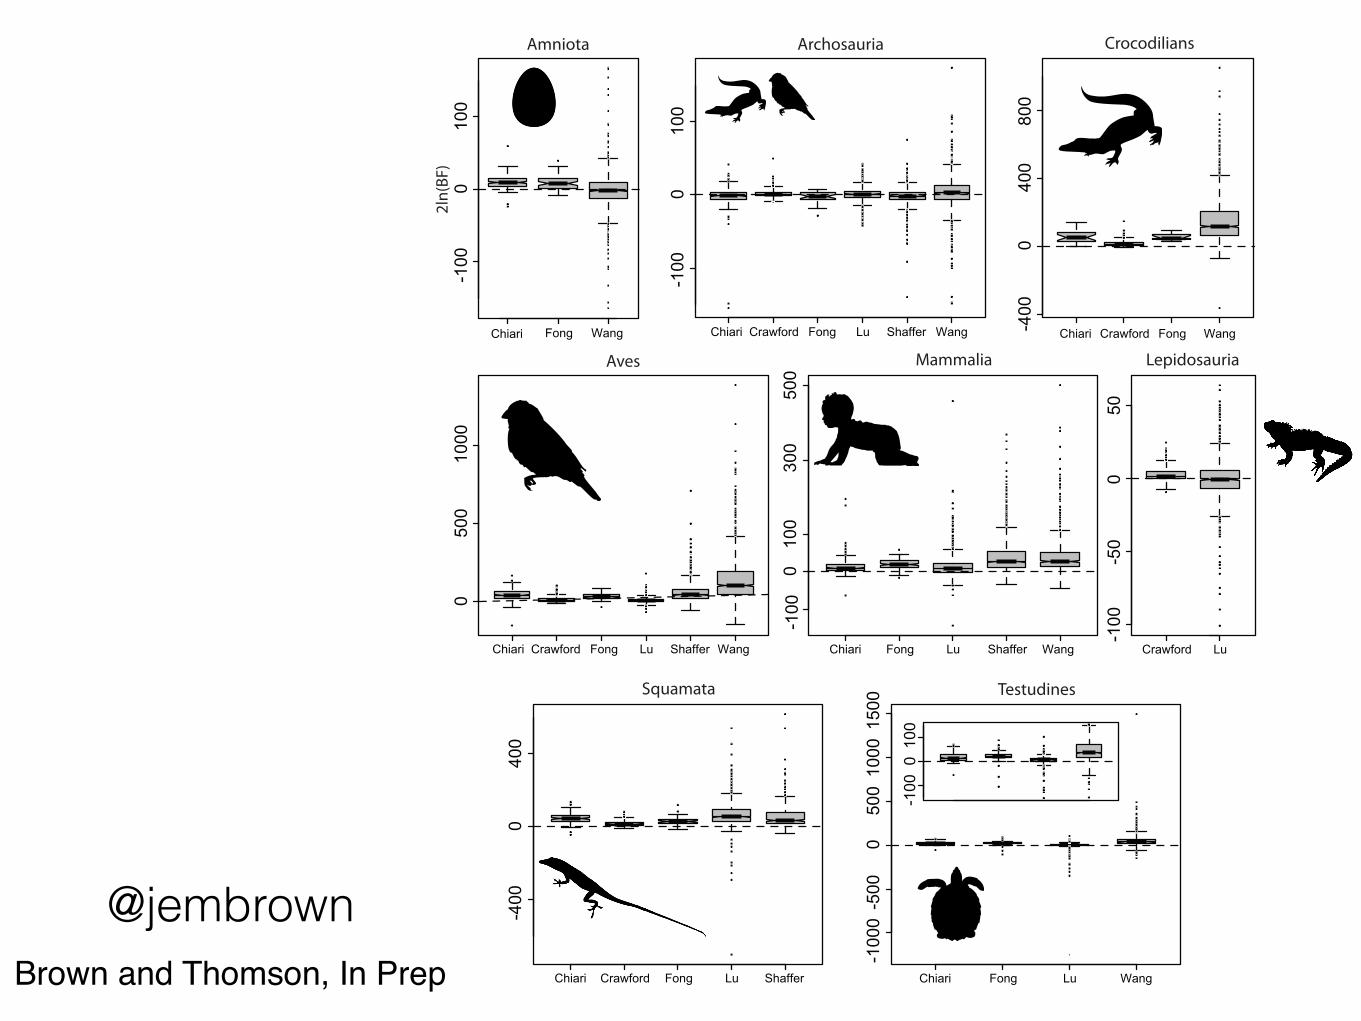
Chiari Fong Wang
-100
0100
Chiari Crawford Fong Lu Shaffer Wang
-100
0100
Amniota Archosauria
2ln(BF
)
Chiari Crawford Fong Lu Shaffer Wang
0500
1000
Aves
Chiari Crawford Fong Wang-400
0400
800
Crocodilians
Chiari Fong Lu Shaffer Wang
-100
0100
300
500
Mammalia
Crawford Lu
-100
-50
050
Lepidosauria
Chiari Crawford Fong Lu Shaffer
-400
0400
Squamata
Chiari Fong Lu Wang
-1000-500
05001000
1500
-100
100
Testudines
0@jembrown
Brown and Thomson, In Prep
Chiari Fong Wang
-100
0100
Chiari Crawford Fong Lu Shaffer Wang
-100
0100
Amniota Archosauria
2ln(BF
)
Chiari Crawford Fong Lu Shaffer Wang
0500
1000
Aves
Chiari Crawford Fong Wang-400
0400
800
Crocodilians
Chiari Fong Lu Shaffer Wang
-100
0100
300
500
Mammalia
Crawford Lu
-100
-50
050
Lepidosauria
Chiari Crawford Fong Lu Shaffer
-400
0400
Squamata
Chiari Fong Lu Wang
-1000-500
05001000
1500
-100
100
Testudines
0
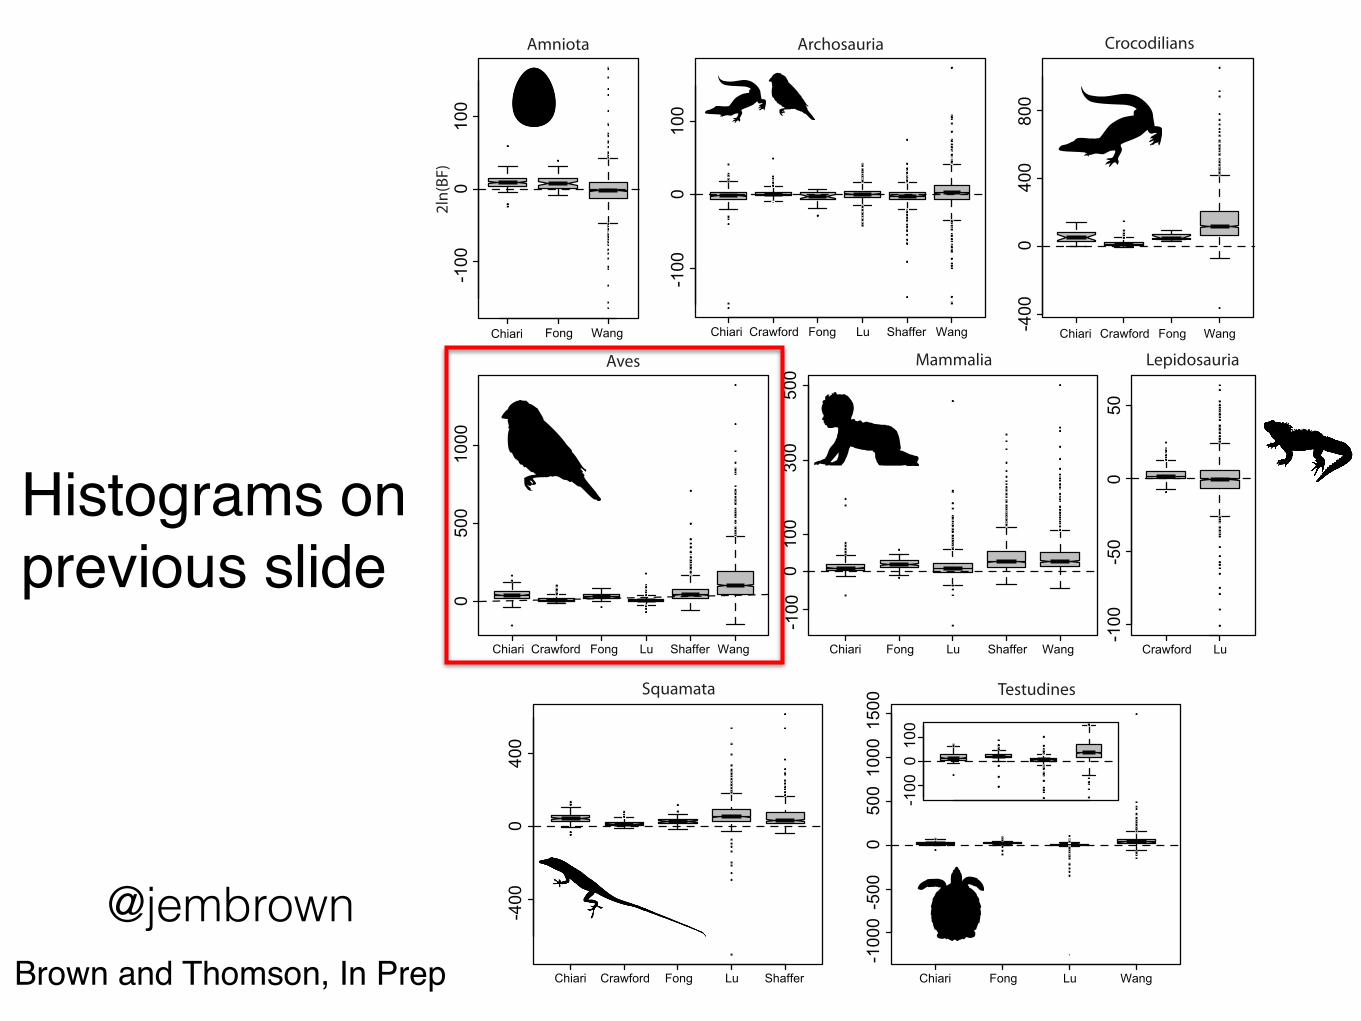
Histograms on previous slide
@jembrownBrown and Thomson, In Prep
Chiari Fong Wang
-100
0100
Chiari Crawford Fong Lu Shaffer Wang
-100
0100
Amniota Archosauria
2ln(BF
)
Chiari Crawford Fong Lu Shaffer Wang
0500
1000
Aves
Chiari Crawford Fong Wang-400
0400
800
Crocodilians
Chiari Fong Lu Shaffer Wang
-100
0100
300
500
Mammalia
Crawford Lu
-100
-50
050
Lepidosauria
Chiari Crawford Fong Lu Shaffer
-400
0400
Squamata
Chiari Fong Lu Wang
-1000-500
05001000
1500
-100
100
Testudines
0
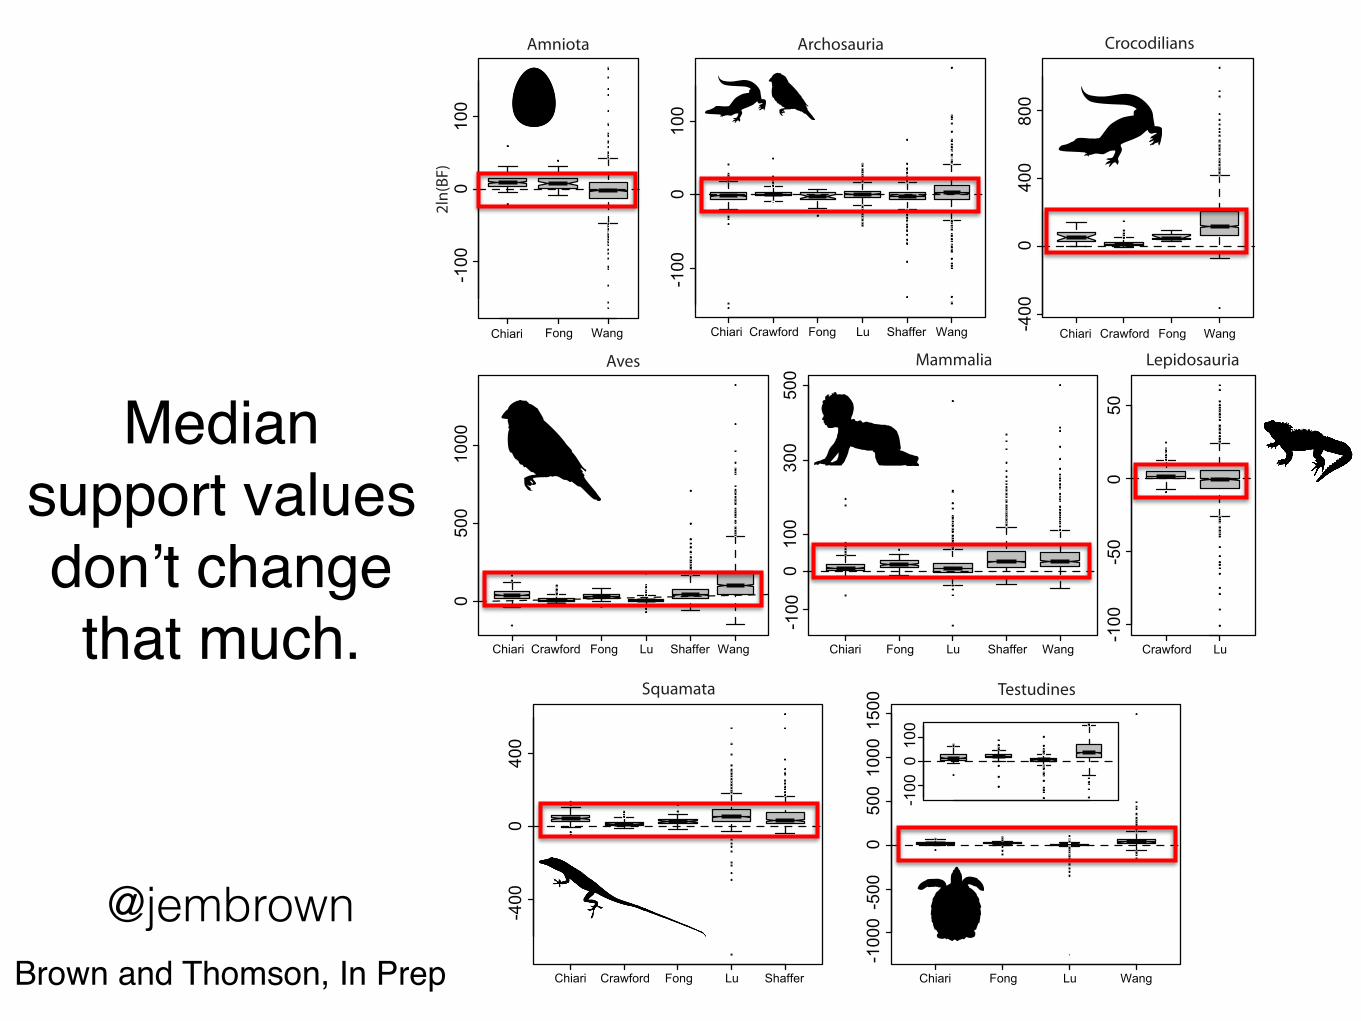
Median support values don’t change that much.
@jembrownBrown and Thomson, In Prep
Chiari Fong Wang
-100
0100
Chiari Crawford Fong Lu Shaffer Wang
-100
0100
Amniota Archosauria
2ln(BF
)
Chiari Crawford Fong Lu Shaffer Wang
0500
1000
Aves
Chiari Crawford Fong Wang-400
0400
800
Crocodilians
Chiari Fong Lu Shaffer Wang
-100
0100
300
500
Mammalia
Crawford Lu
-100
-50
050
Lepidosauria
Chiari Crawford Fong Lu Shaffer
-400
0400
Squamata
Chiari Fong Lu Wang
-1000-500
05001000
1500
-100
100
Testudines
0
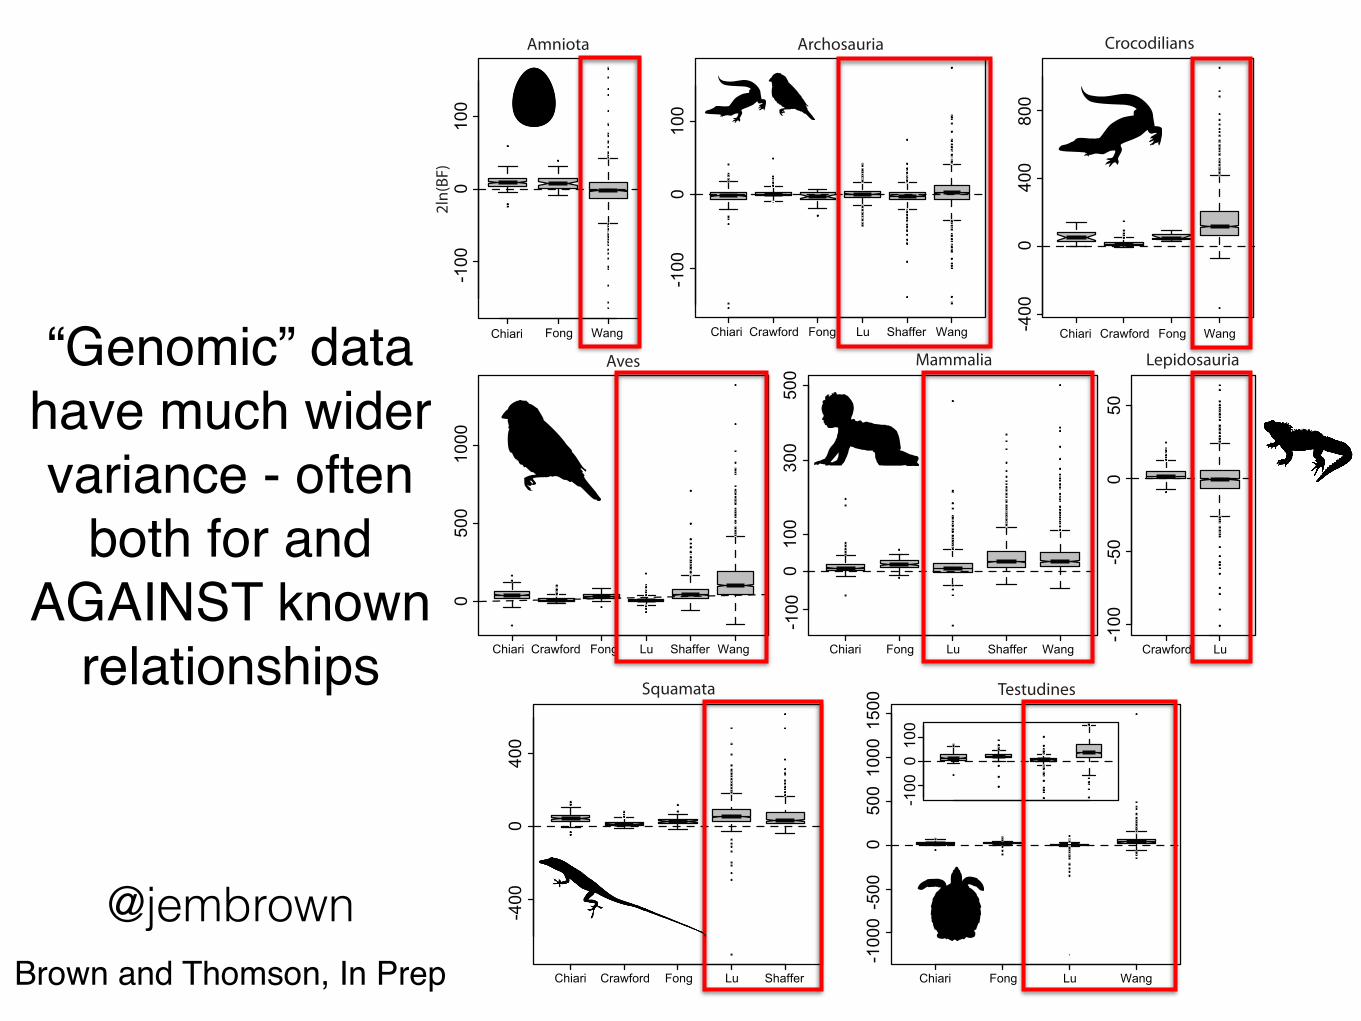
“Genomic” datahave much wider variance - often
both for and AGAINST known
relationships
@jembrownBrown and Thomson, In Prep
Chiari Fong Wang
-100
0100
Chiari Crawford Fong Lu Shaffer Wang
-100
0100
Amniota Archosauria
2ln(BF
)
Chiari Crawford Fong Lu Shaffer Wang
0500
1000
Aves
Chiari Crawford Fong Wang-400
0400
800
Crocodilians
Chiari Fong Lu Shaffer Wang
-100
0100
300
500
Mammalia
Crawford Lu
-100
-50
050
Lepidosauria
Chiari Crawford Fong Lu Shaffer
-400
0400
Squamata
Chiari Fong Lu Wang
-1000-500
05001000
1500
-100
100
Testudines
0
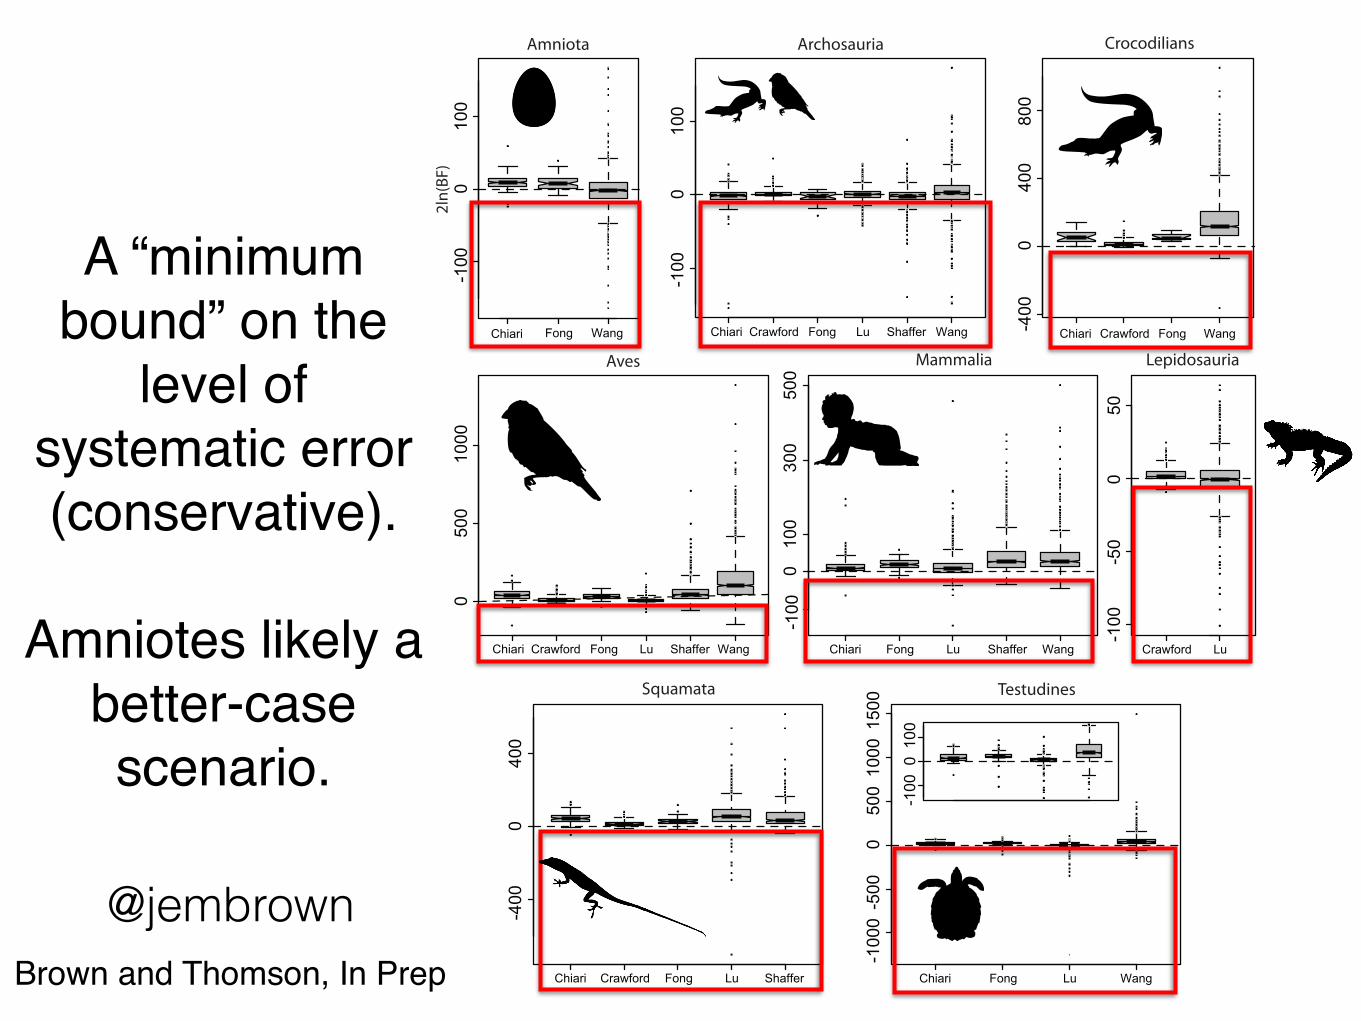
A “minimum bound” on the
level of systematic error(conservative).
Amniotes likely a better-case scenario.
@jembrownBrown and Thomson, In Prep
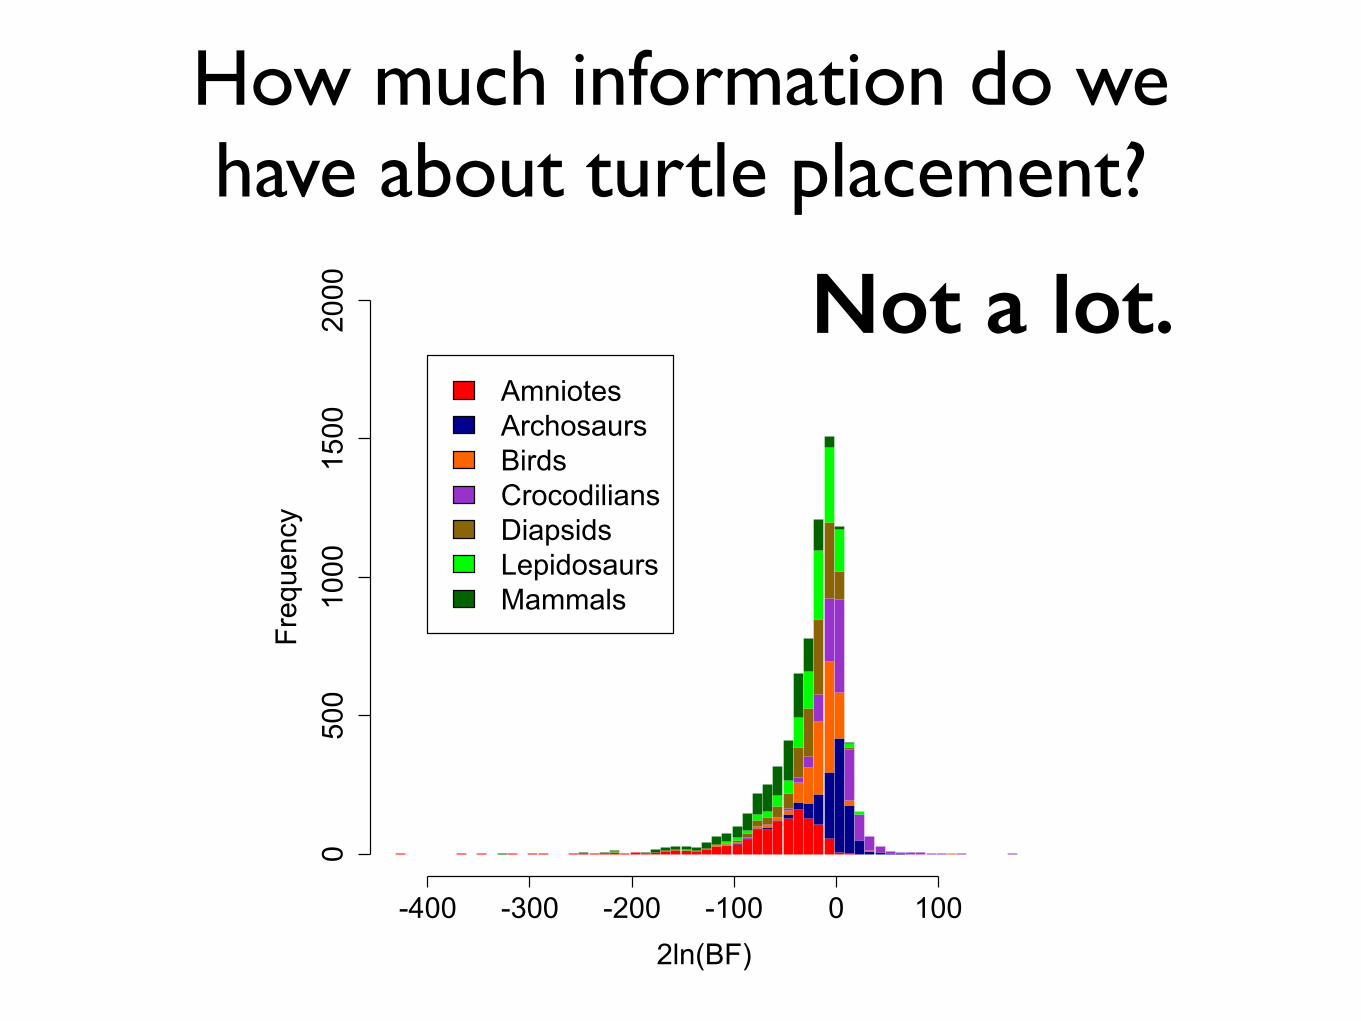
How much information do we have about turtle placement?
How much information do we have about turtle placement?
2ln(BF) - Birds Monophyletic
Frequency
0 500 1000 1500
010
2030
4050
Wang et al.(Genomes)
2ln(BF) - Crocodilians MonophyleticFrequency0 500 1000 1500
010
2030
4050
602ln(BF) - Mammals Monophyletic
Frequency
0 500 1000 1500
050
100
150
2ln(BF) - Turtles Monophyletic
Frequency
0 500 1000 1500
020
4060
80100
120
140
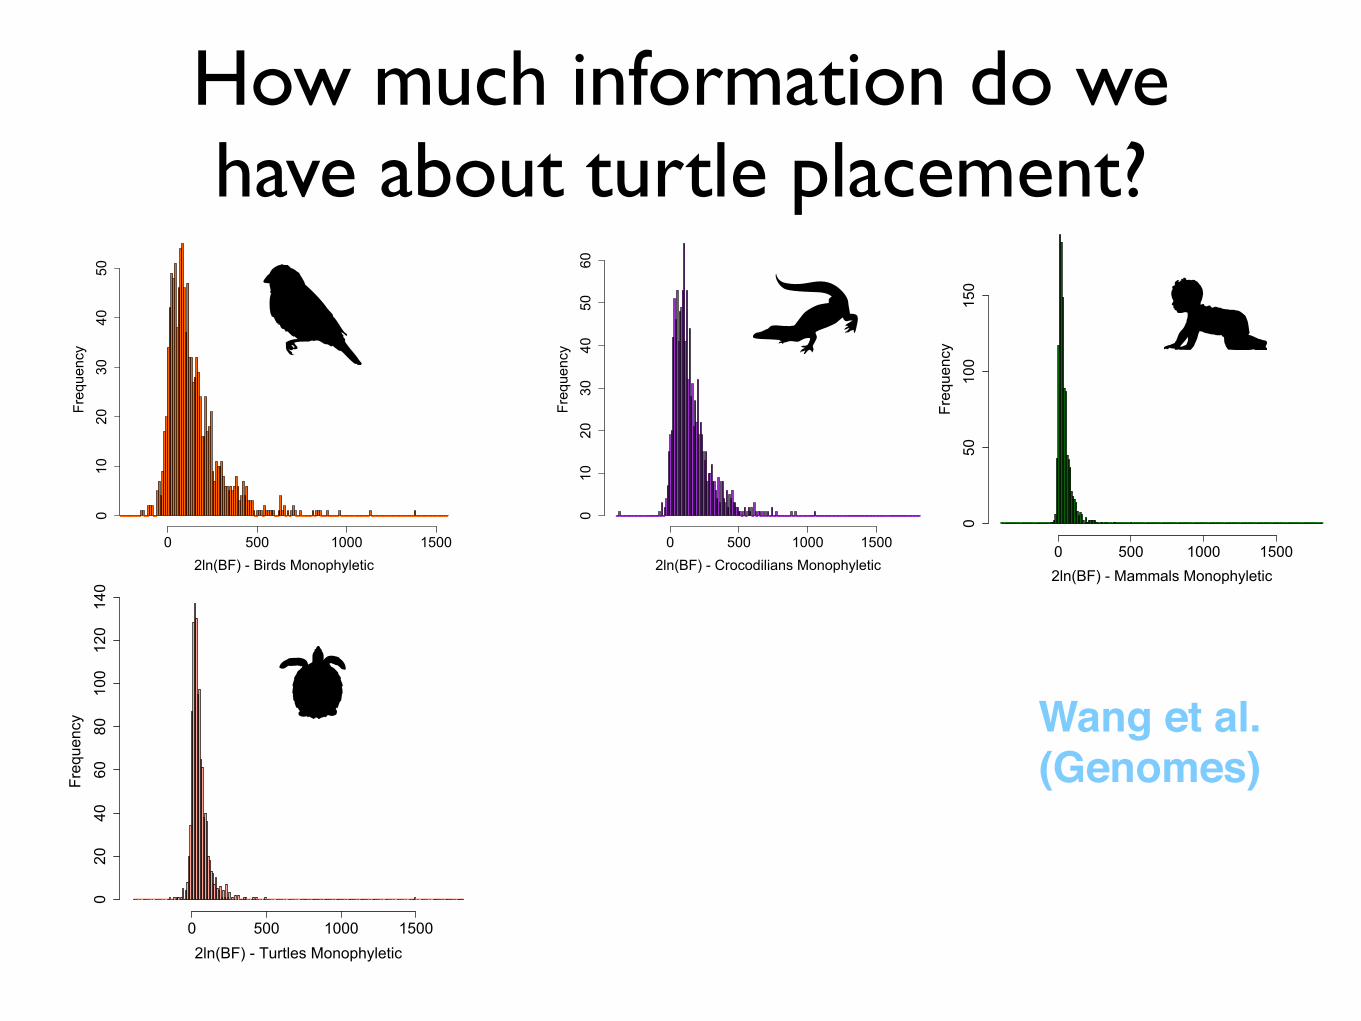
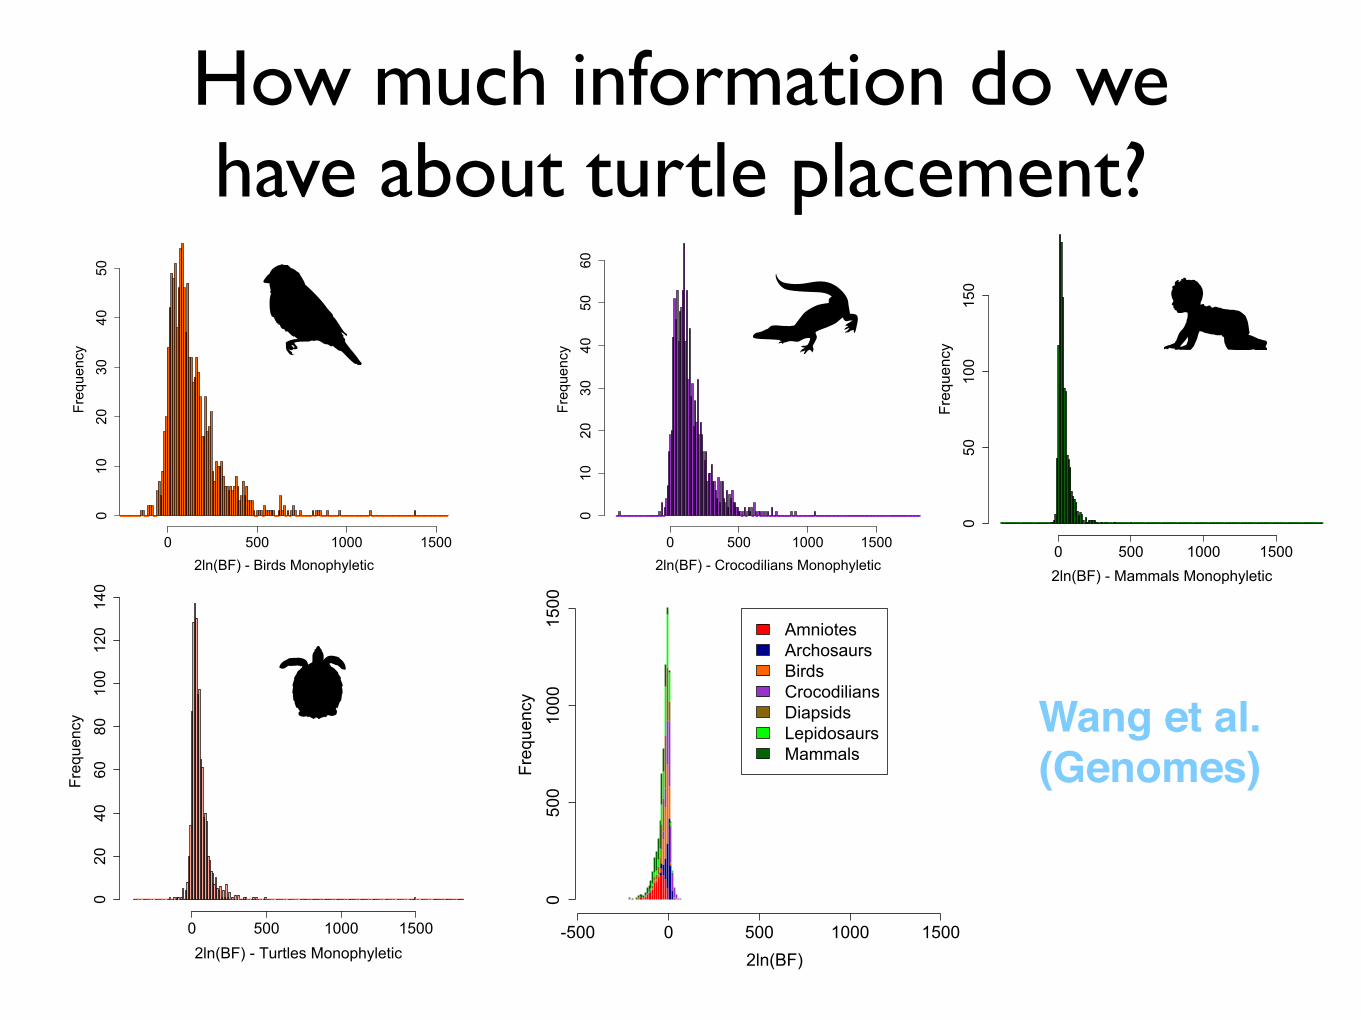
-500 0 500 1000 1500
0500
1000
1500
2ln(BF)
Frequency
AmniotesArchosaursBirdsCrocodiliansDiapsidsLepidosaursMammals
How much information do we have about turtle placement?
2ln(BF) - Birds Monophyletic
Frequency
0 500 1000 1500
010
2030
4050
Wang et al.(Genomes)
2ln(BF) - Crocodilians MonophyleticFrequency0 500 1000 1500
010
2030
4050
602ln(BF) - Mammals Monophyletic
Frequency
0 500 1000 1500
050
100
150
2ln(BF) - Turtles Monophyletic
Frequency
0 500 1000 1500
020
4060
80100
120
140
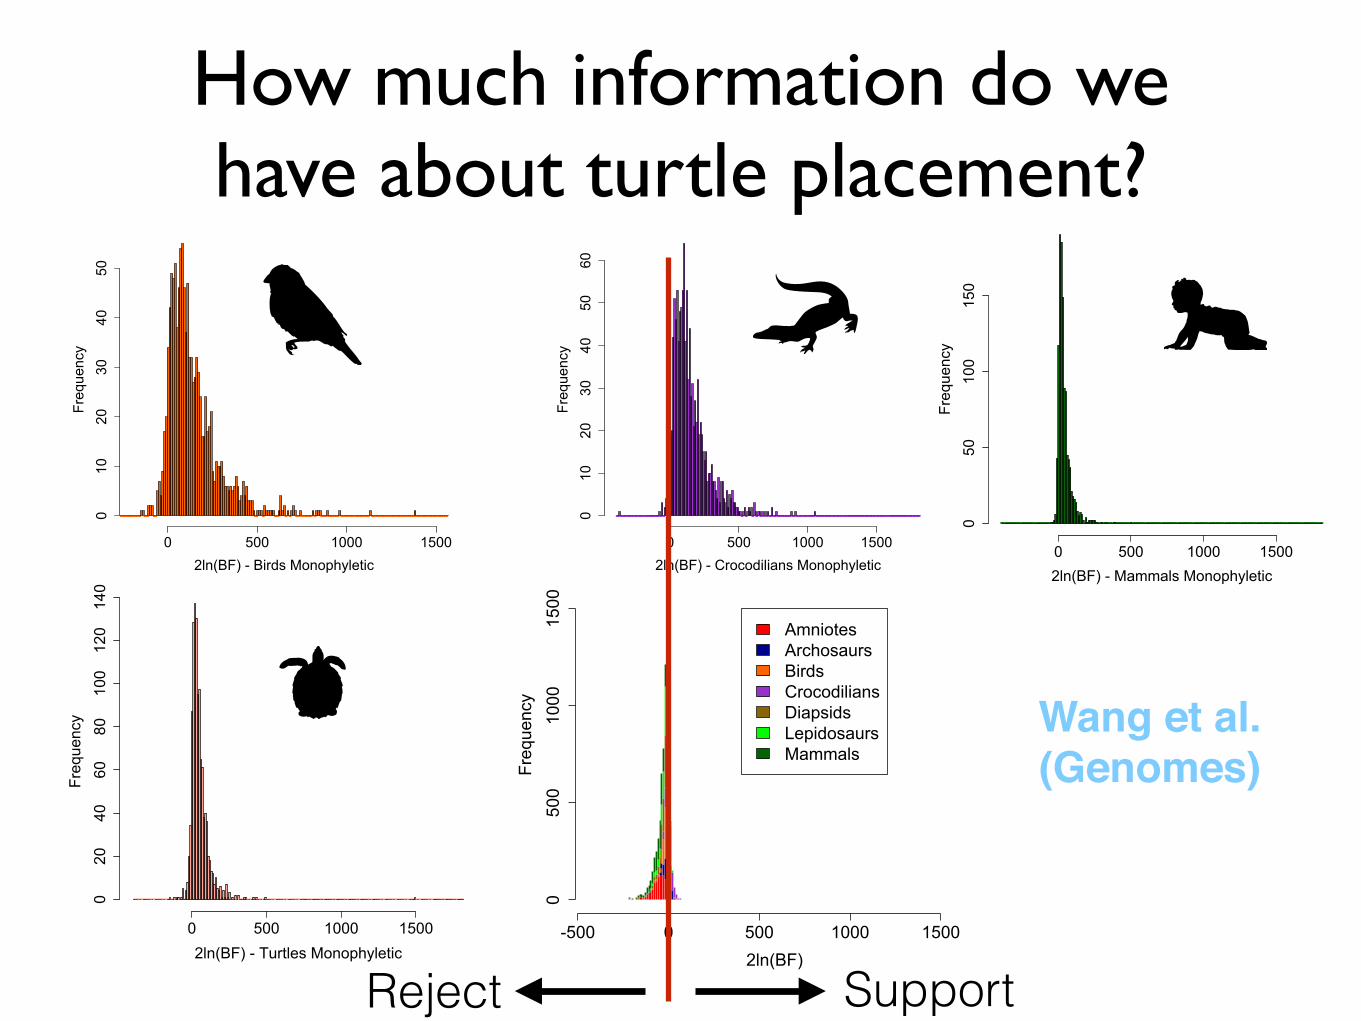
-500 0 500 1000 1500
0500
1000
1500
2ln(BF)
Frequency
AmniotesArchosaursBirdsCrocodiliansDiapsidsLepidosaursMammals
Reject Support
How much information do we have about turtle placement?
Not a lot.
-400 -300 -200 -100 0 100
0500
1000
1500
2000
2ln(BF)
Frequency
AmniotesArchosaursBirdsCrocodiliansDiapsidsLepidosaursMammals
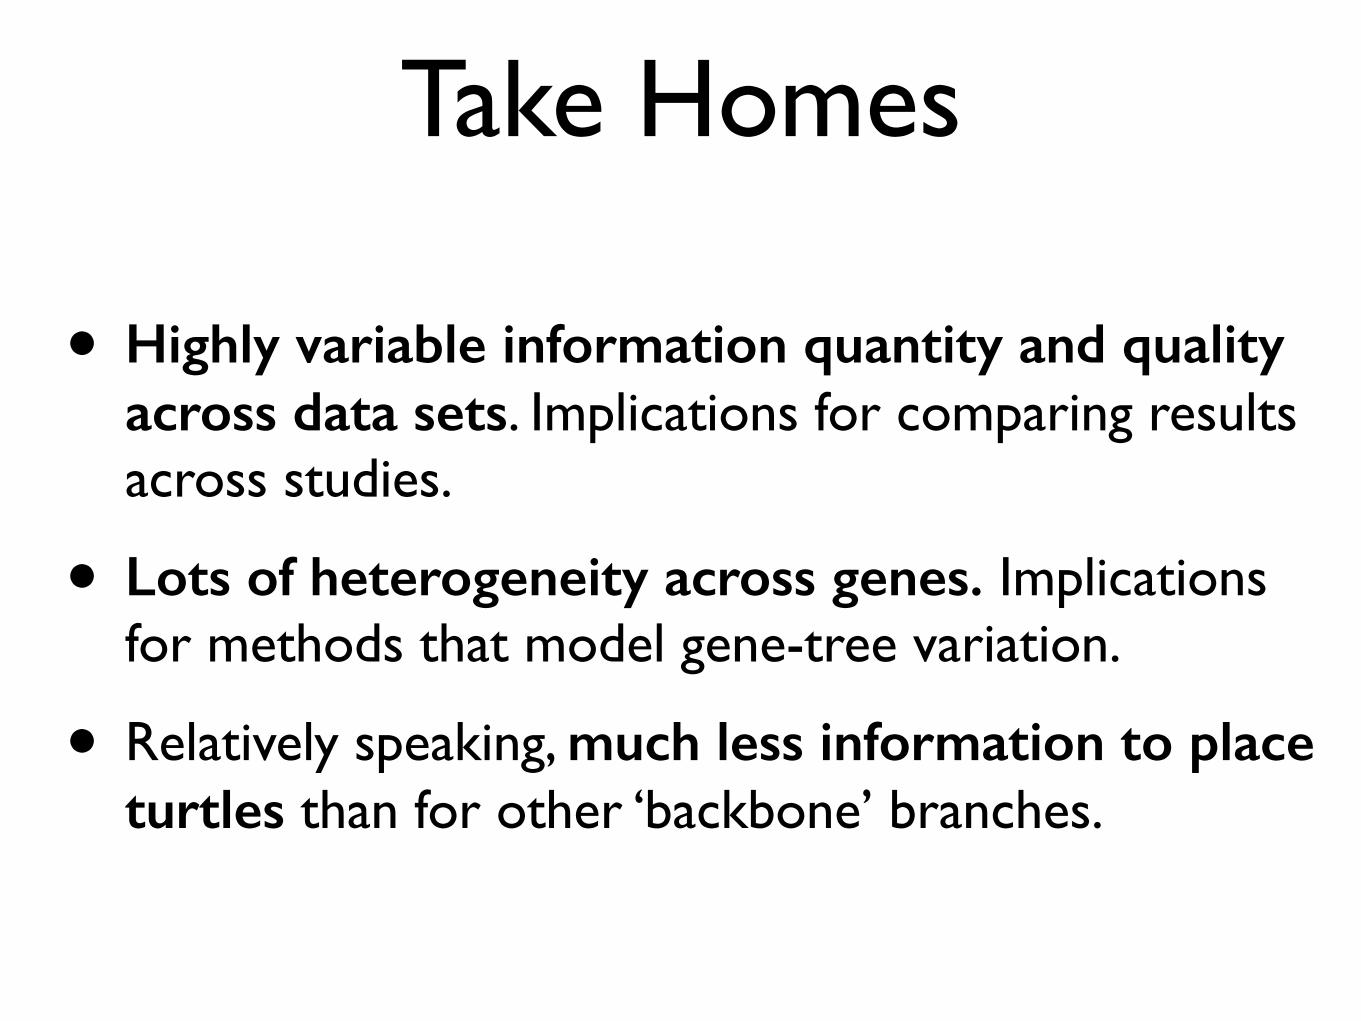
Take Homes
• Highly variable information quantity and quality across data sets. Implications for comparing results across studies.
• Lots of heterogeneity across genes. Implications for methods that model gene-tree variation.
• Relatively speaking, much less information to place turtles than for other ‘backbone’ branches.
Ongoing• How do properties of genes (rate, clockness,
alignment quality, etc.) relate to signal?
• How is the information in a gene distributed across branches?
• Can we identify genes with reliable signal? (For early results, see Doyle et al., Syst Biol., Advance Access)
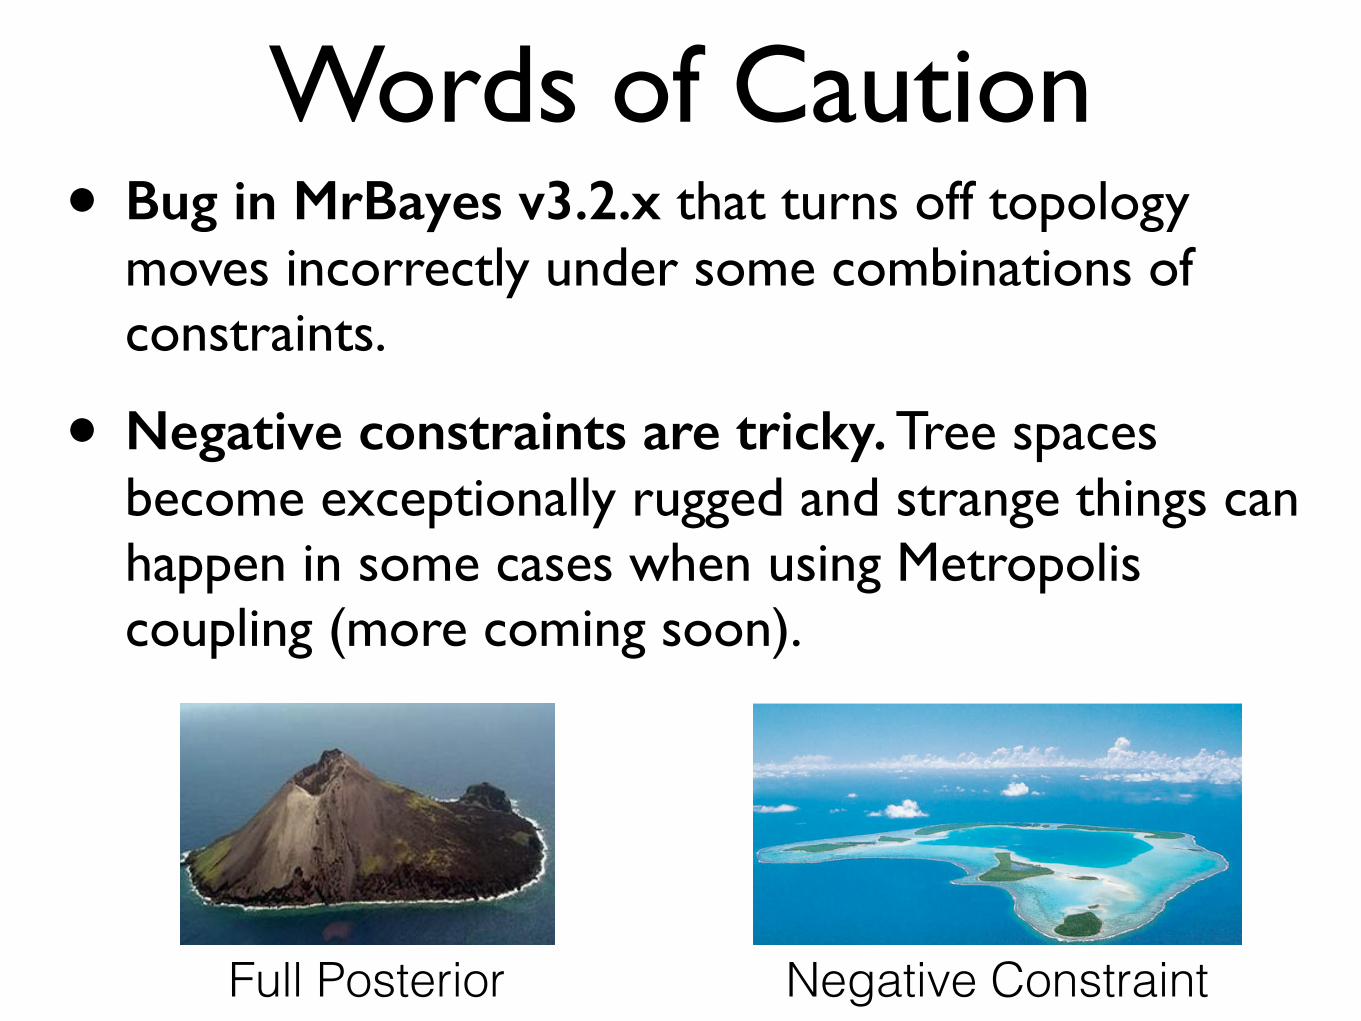
Words of Caution• Bug in MrBayes v3.2.x that turns off topology
moves incorrectly under some combinations of constraints.
• Negative constraints are tricky. Tree spaces become exceptionally rugged and strange things can happen in some cases when using Metropolis coupling (more coming soon).
Full Posterior Negative Constraint

Thank You
DEB-1355071
@jembrown