Embed Size (px)
Citation preview
Comparison of select analytes in tobacco and smoke for cigar products across a range of design features
TAYYARAH R.; ZHU J.; BROOKS C.; STEVENS R.
[email protected] CORESTA 2017 ST03
Objectives
• Evaluation of Cigar products with a range of design features
• Assessment of analytical variability across labs
2
Study Design
• 6 Cigar products of varying design and yield • Lot matched samples tested at 3 laboratories • Select tobacco and smoke analytes typical of cigarette
testing • TNCO according to CORESTA CRM 46/64/65 • Smoking for other analytes using applicable Cigar CRM
parameters • Other methodology not specified
3
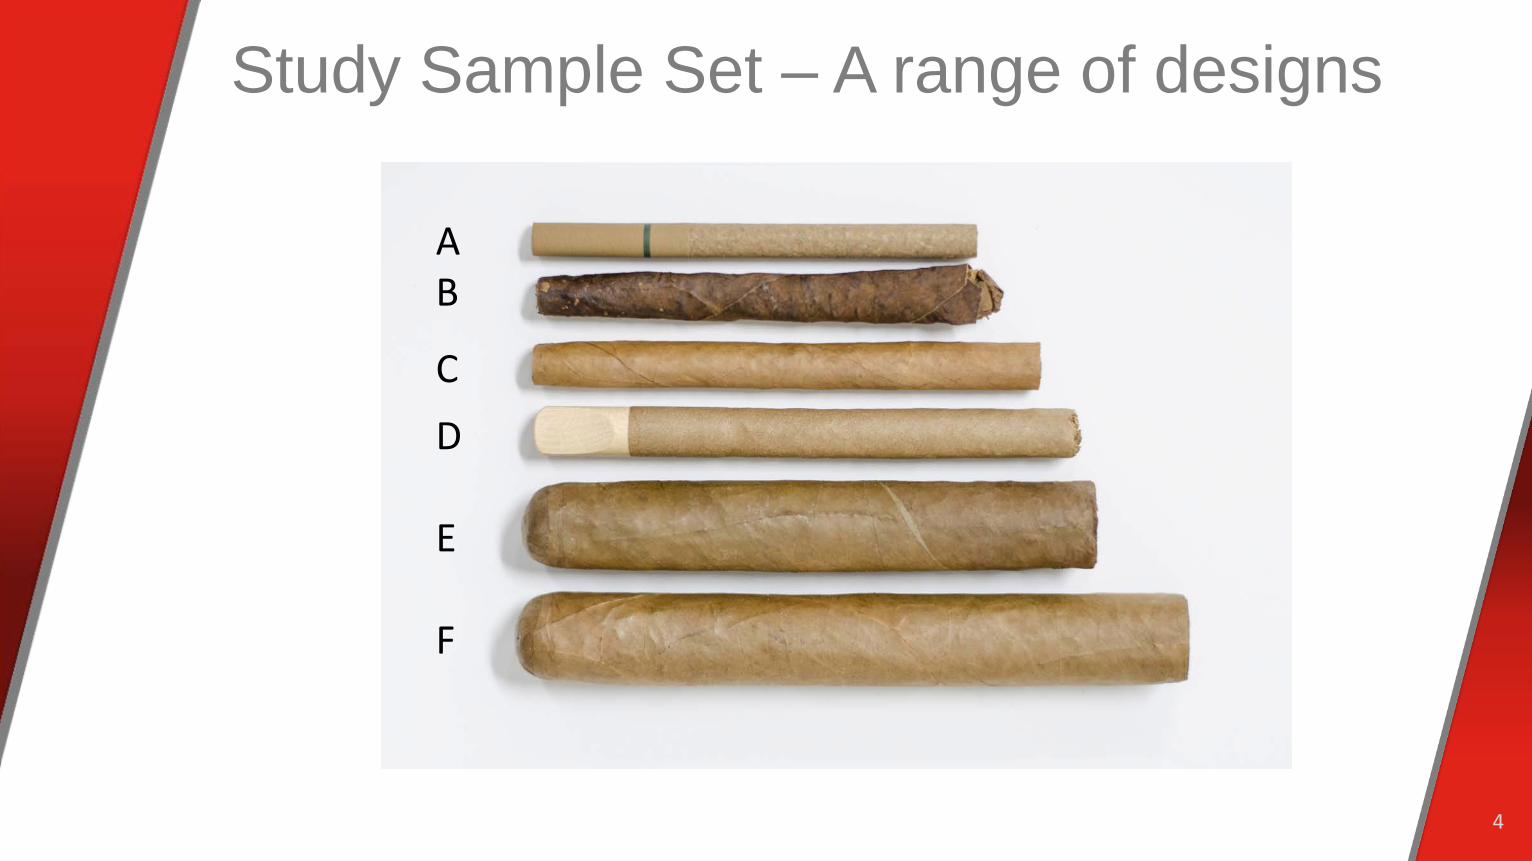
Study Sample Set – A range of designs
4
A B
C
D E F

Tobacco Measurements
5
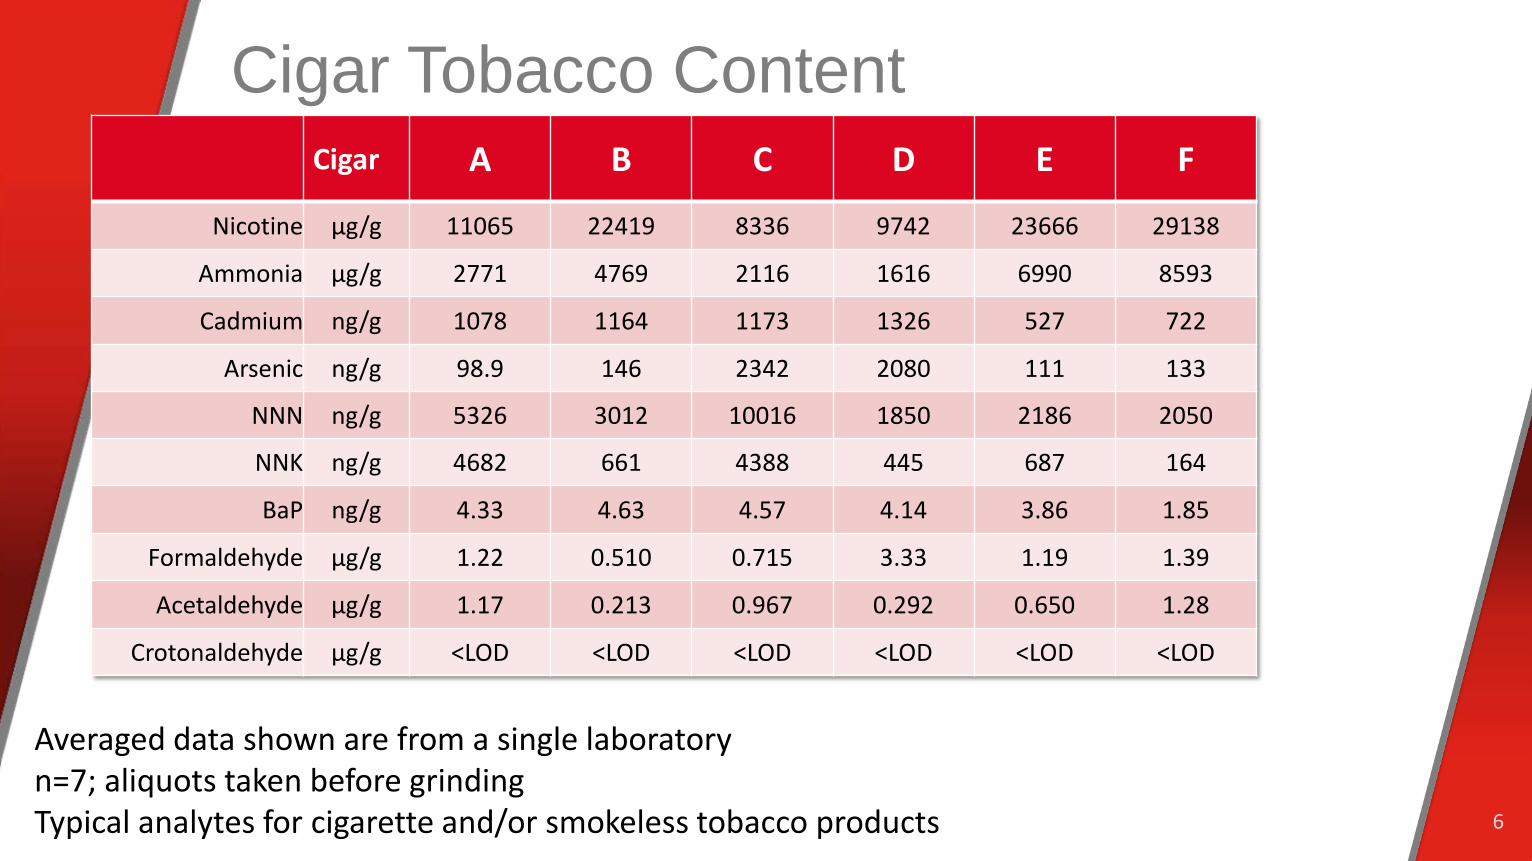
Cigar Tobacco Content Cigar A B C D E F
Nicotine µg/g 11065 22419 8336 9742 23666 29138
Ammonia µg/g 2771 4769 2116 1616 6990 8593
Cadmium ng/g 1078 1164 1173 1326 527 722
Arsenic ng/g 98.9 146 2342 2080 111 133
NNN ng/g 5326 3012 10016 1850 2186 2050
NNK ng/g 4682 661 4388 445 687 164
BaP ng/g 4.33 4.63 4.57 4.14 3.86 1.85
Formaldehyde µg/g 1.22 0.510 0.715 3.33 1.19 1.39
Acetaldehyde µg/g 1.17 0.213 0.967 0.292 0.650 1.28
Crotonaldehyde µg/g <LOD <LOD <LOD <LOD <LOD <LOD
6
Averaged data shown are from a single laboratory n=7; aliquots taken before grinding Typical analytes for cigarette and/or smokeless tobacco products
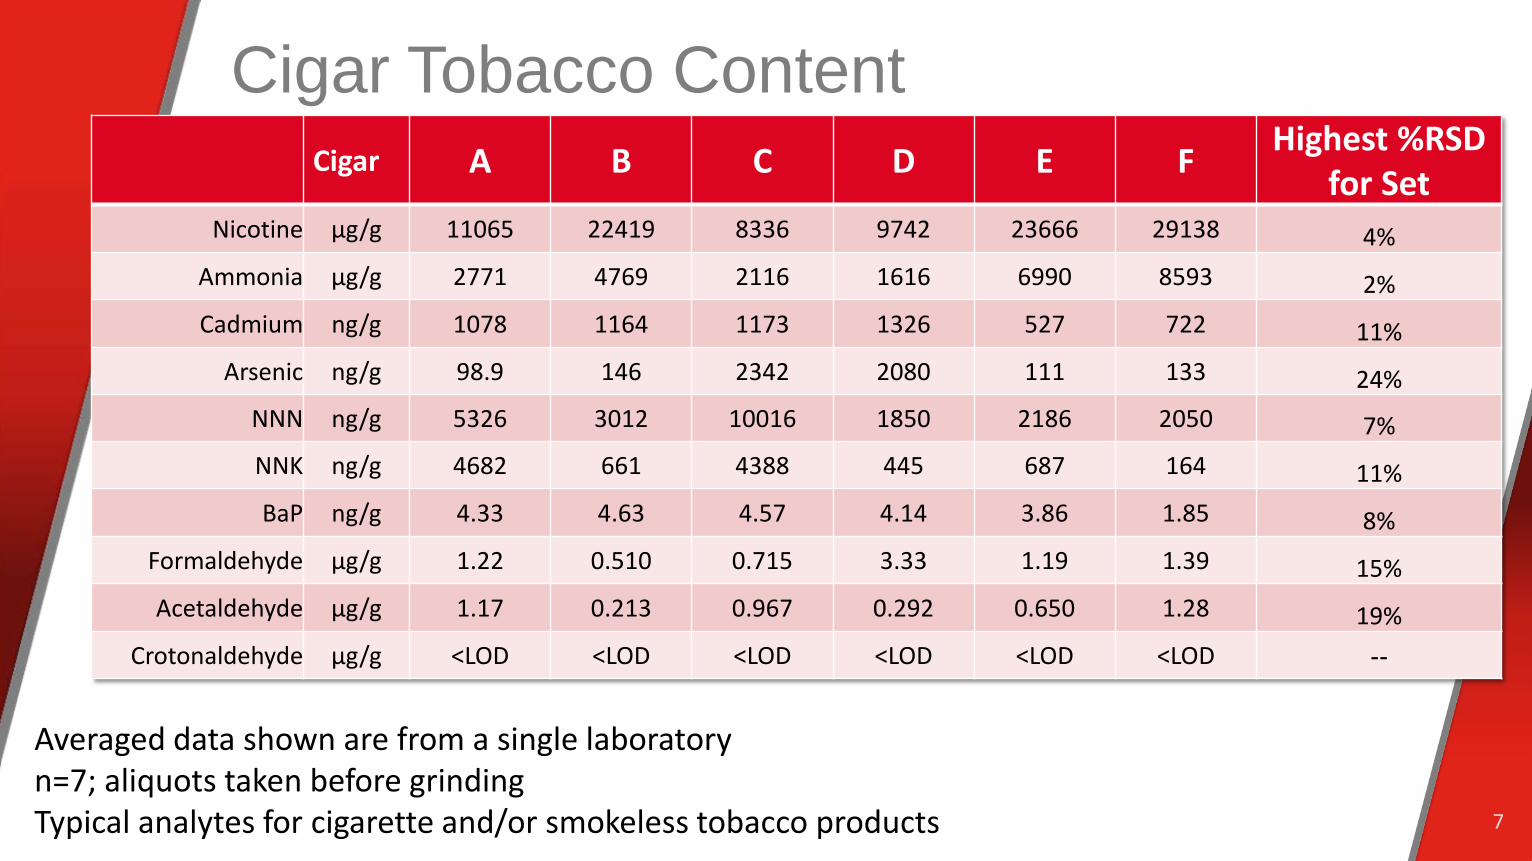
Cigar Tobacco Content Cigar A B C D E F Highest %RSD
for Set Nicotine µg/g 11065 22419 8336 9742 23666 29138 4%
Ammonia µg/g 2771 4769 2116 1616 6990 8593 2% Cadmium ng/g 1078 1164 1173 1326 527 722 11%
Arsenic ng/g 98.9 146 2342 2080 111 133 24% NNN ng/g 5326 3012 10016 1850 2186 2050 7% NNK ng/g 4682 661 4388 445 687 164 11% BaP ng/g 4.33 4.63 4.57 4.14 3.86 1.85 8%
Formaldehyde µg/g 1.22 0.510 0.715 3.33 1.19 1.39 15% Acetaldehyde µg/g 1.17 0.213 0.967 0.292 0.650 1.28 19%
Crotonaldehyde µg/g <LOD <LOD <LOD <LOD <LOD <LOD --
7
Averaged data shown are from a single laboratory n=7; aliquots taken before grinding Typical analytes for cigarette and/or smokeless tobacco products
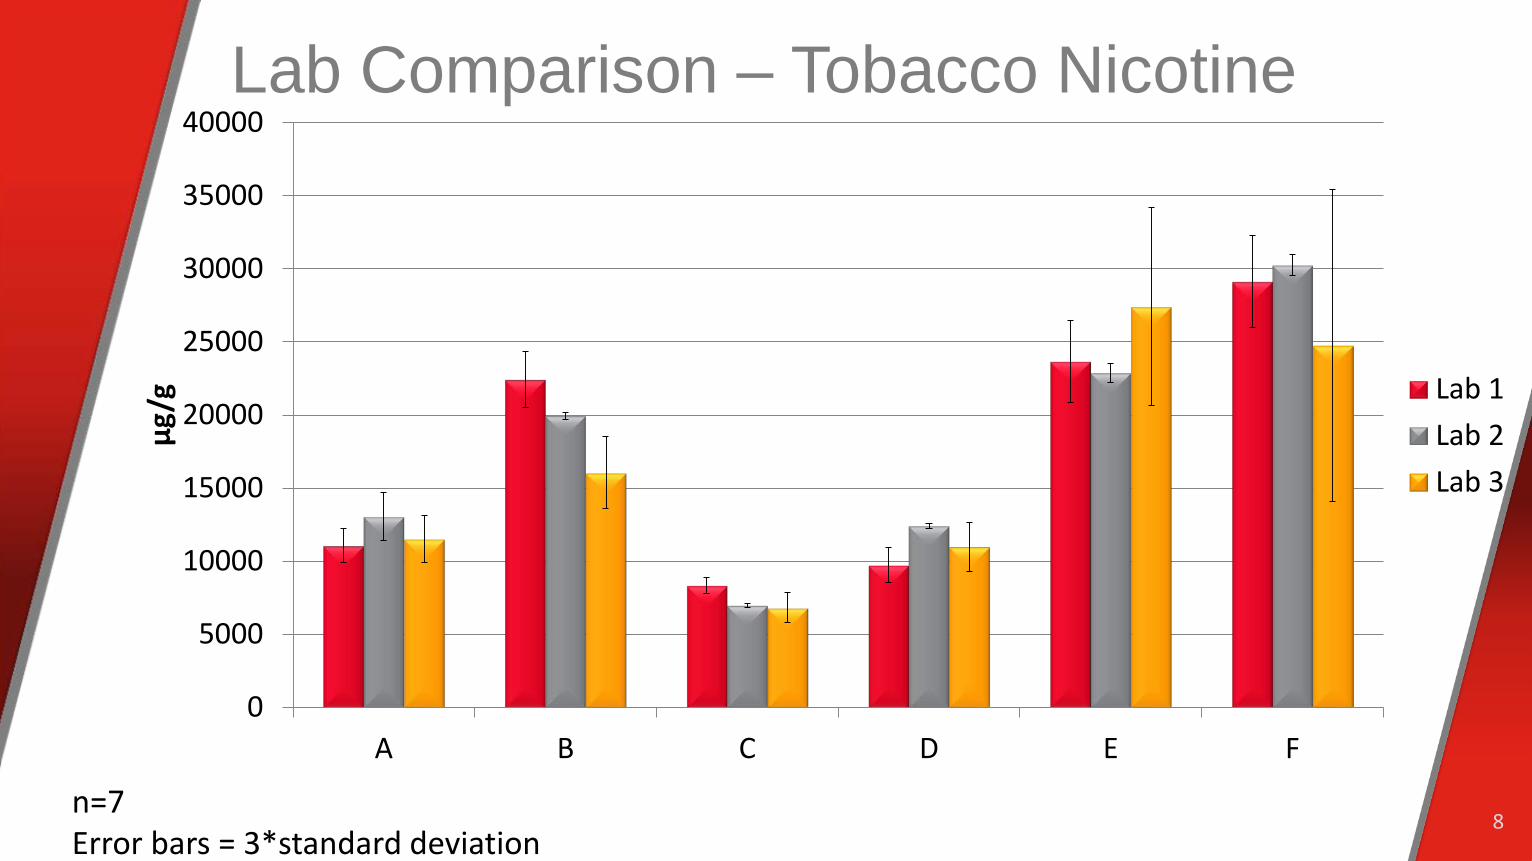
Lab Comparison – Tobacco Nicotine
8
0
5000
10000
15000
20000
25000
30000
35000
40000
A B C D E F
µg/g
Lab 1Lab 2Lab 3
n=7 Error bars = 3*standard deviation
Physical Parameters
9
Cigar Physicals – Range & Variability
10
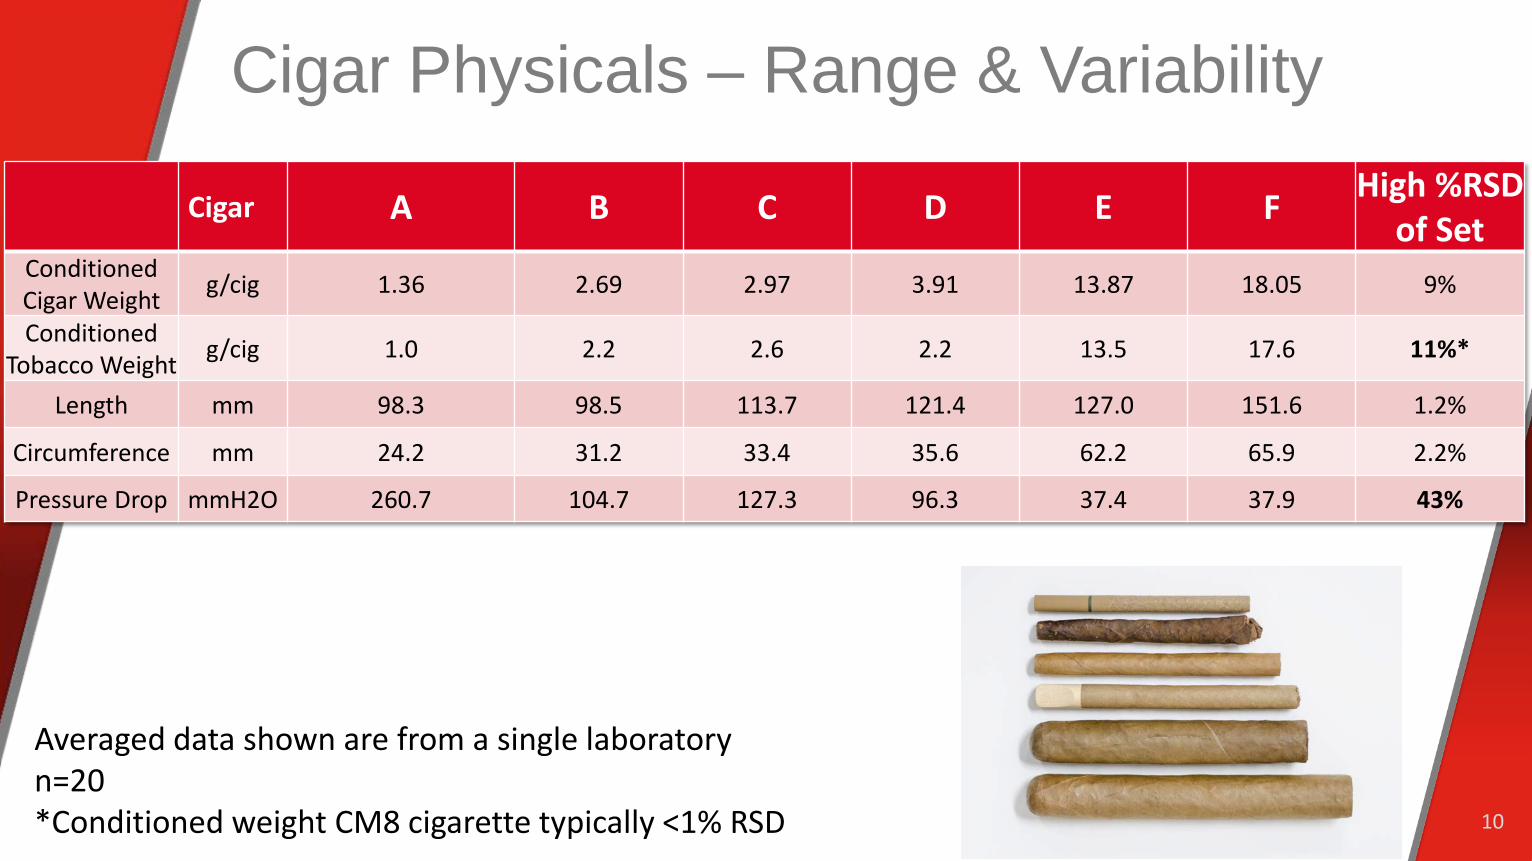
Cigar A B C D E F High %RSD of Set
Conditioned Cigar Weight g/cig 1.36 2.69 2.97 3.91 13.87 18.05 9%
Conditioned Tobacco Weight g/cig 1.0 2.2 2.6 2.2 13.5 17.6 11%*
Length mm 98.3 98.5 113.7 121.4 127.0 151.6 1.2%
Circumference mm 24.2 31.2 33.4 35.6 62.2 65.9 2.2%
Pressure Drop mmH2O 260.7 104.7 127.3 96.3 37.4 37.9 43%
Averaged data shown are from a single laboratory n=20 *Conditioned weight CM8 cigarette typically <1% RSD

Lab Comparison – Pressure Drop
11
-50
0
50
100
150
200
250
300
350
A B C D E F
mm
H2O
/cig
ar
Lab 1Lab 2Lab 3
n=20 Error bars, if shown, = 3 * standard deviation

TNCO Measurements
12
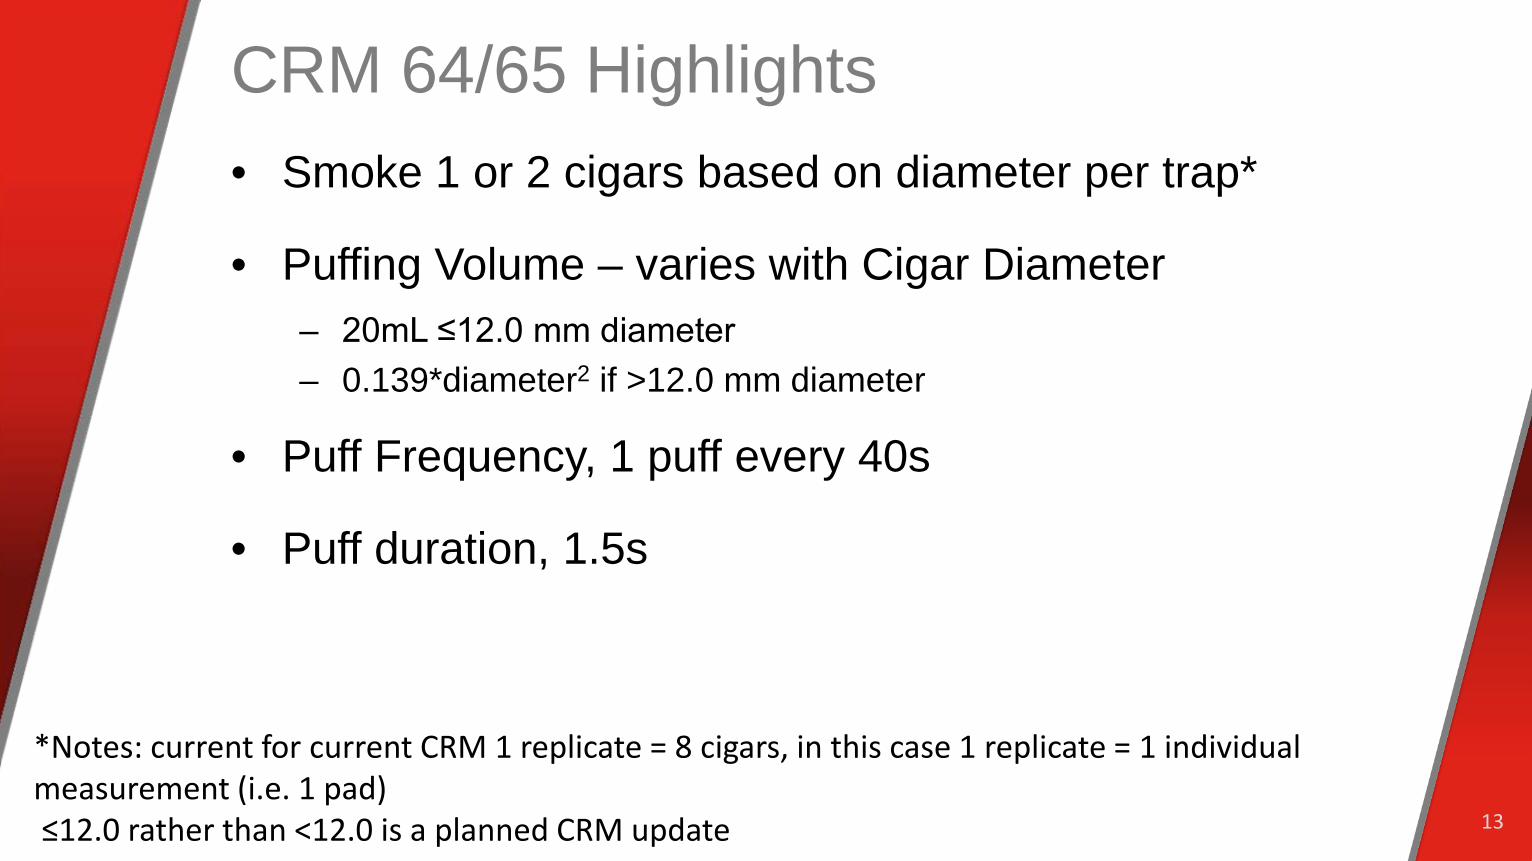
CRM 64/65 Highlights • Smoke 1 or 2 cigars based on diameter per trap*
• Puffing Volume – varies with Cigar Diameter – 20mL ≤12.0 mm diameter – 0.139*diameter2 if >12.0 mm diameter
• Puff Frequency, 1 puff every 40s
• Puff duration, 1.5s
13
*Notes: current for current CRM 1 replicate = 8 cigars, in this case 1 replicate = 1 individual measurement (i.e. 1 pad) ≤12.0 rather than <12.0 is a planned CRM update
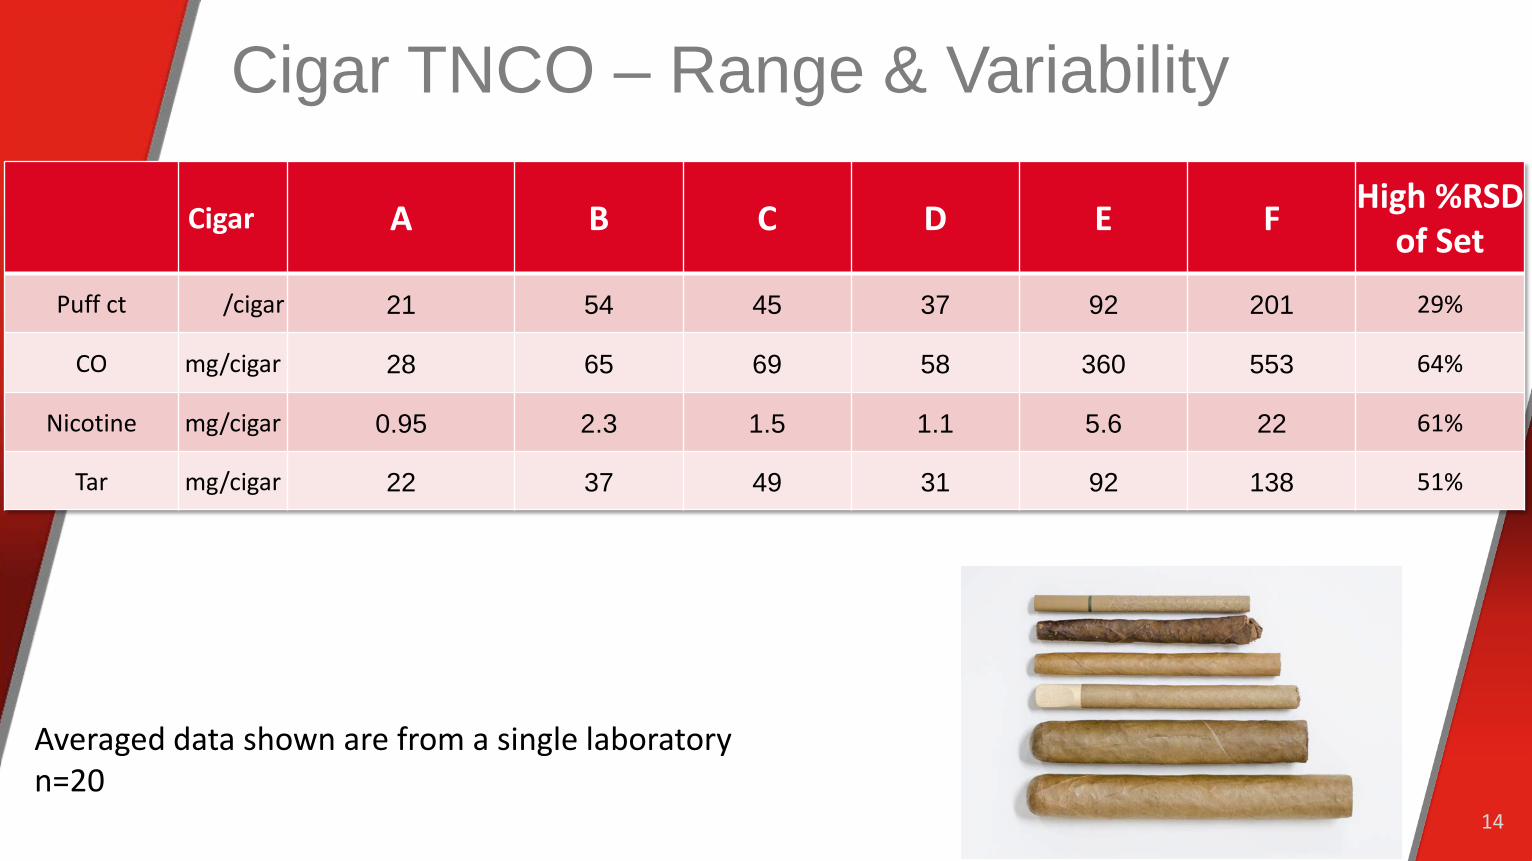
Cigar TNCO – Range & Variability
14
Cigar A B C D E F High %RSD of Set
Puff ct /cigar 21 54 45 37 92 201 29%
CO mg/cigar 28 65 69 58 360 553 64%
Nicotine mg/cigar 0.95 2.3 1.5 1.1 5.6 22 61%
Tar mg/cigar 22 37 49 31 92 138 51%
Averaged data shown are from a single laboratory n=20
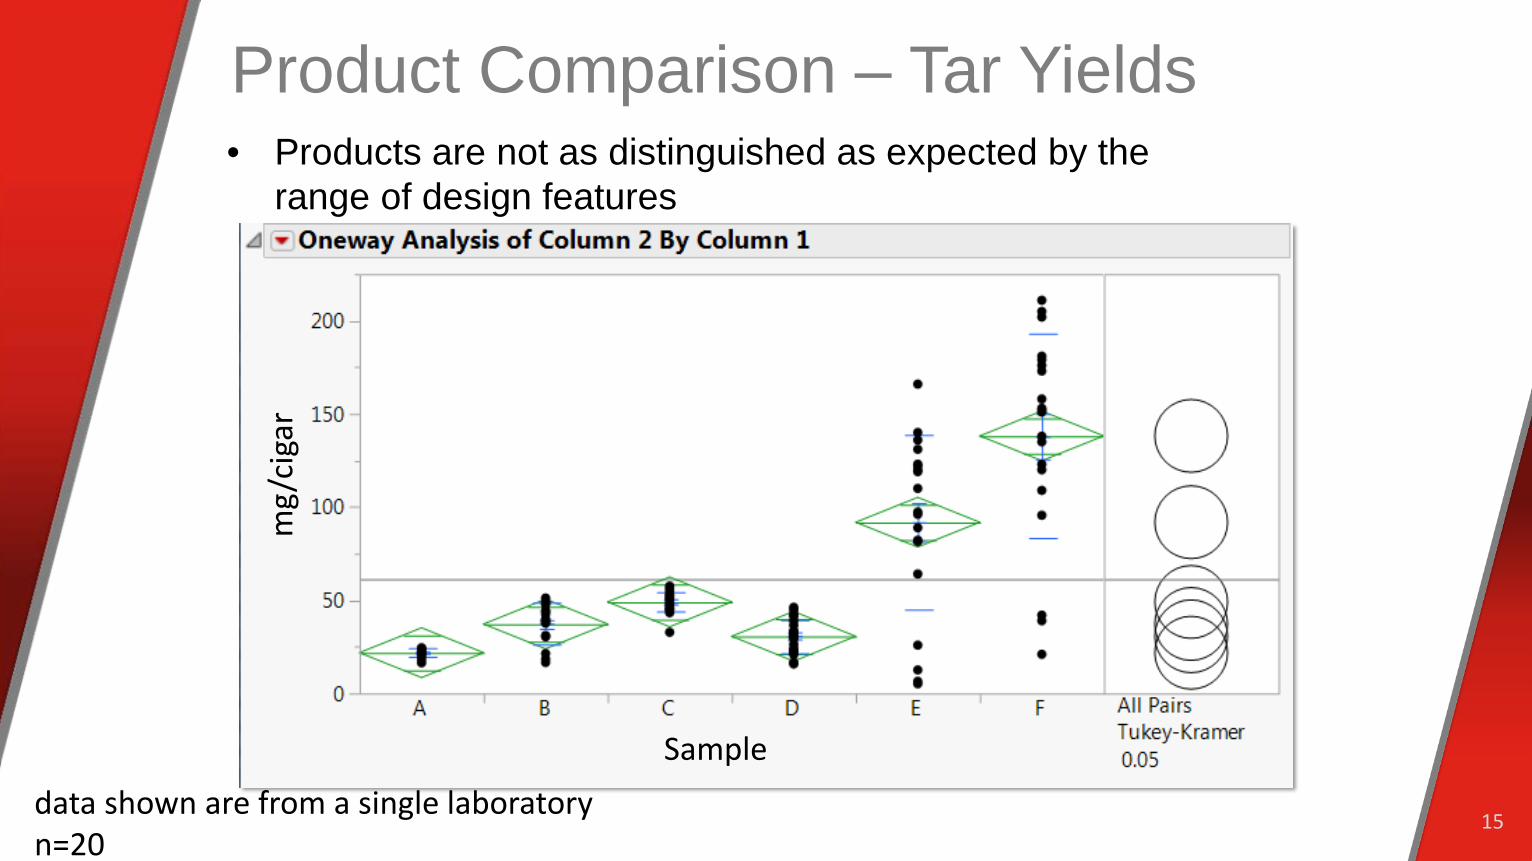
Product Comparison – Tar Yields
15
• Products are not as distinguished as expected by the range of design features
mg/
ciga
r
Sample data shown are from a single laboratory n=20
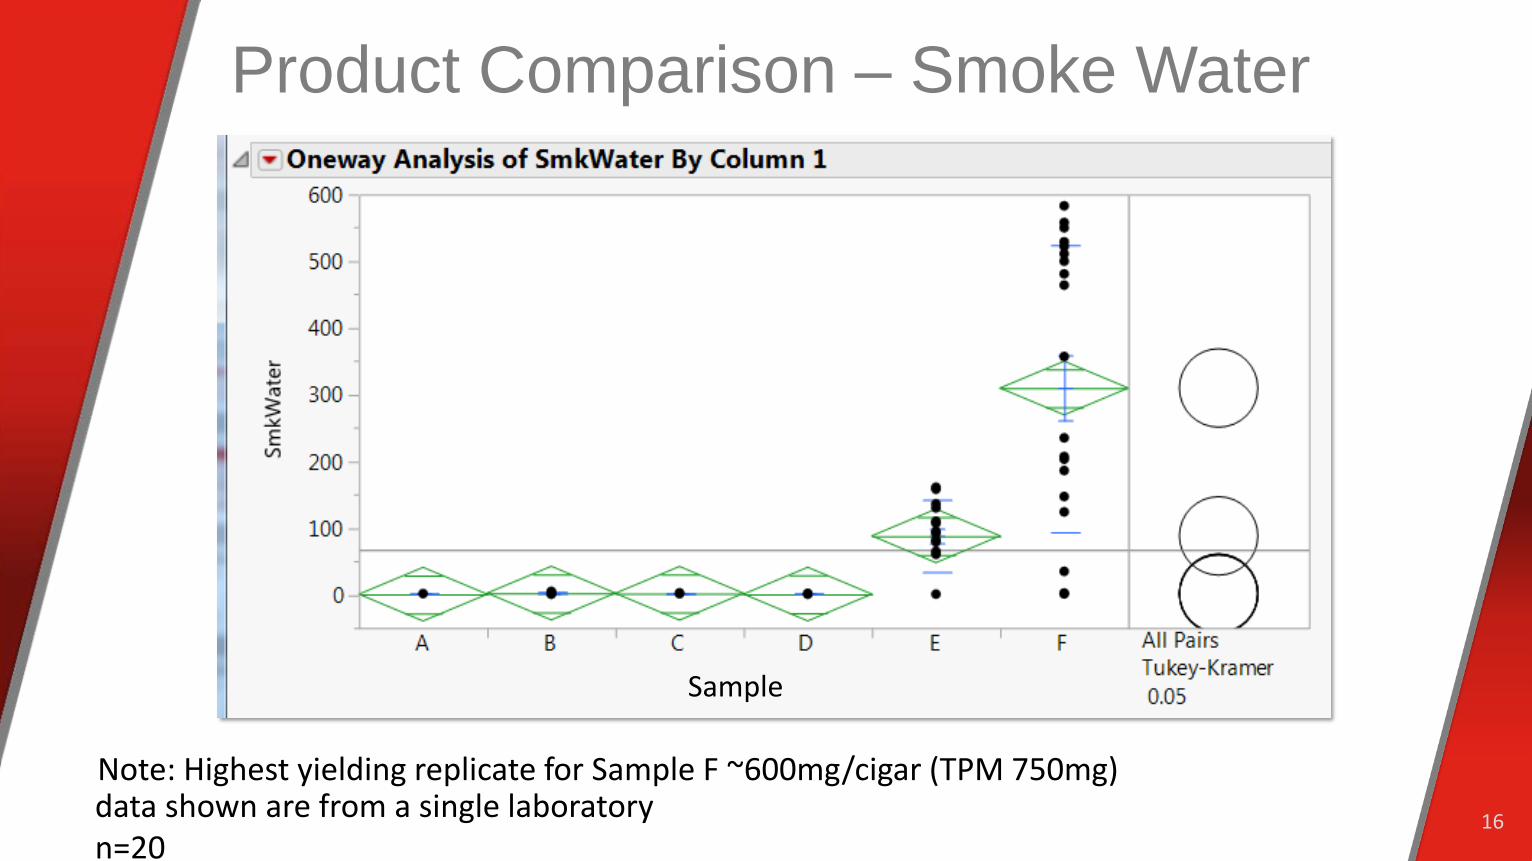
Product Comparison – Smoke Water
16
Sample
Note: Highest yielding replicate for Sample F ~600mg/cigar (TPM 750mg) data shown are from a single laboratory n=20

Smoke Constituents
17
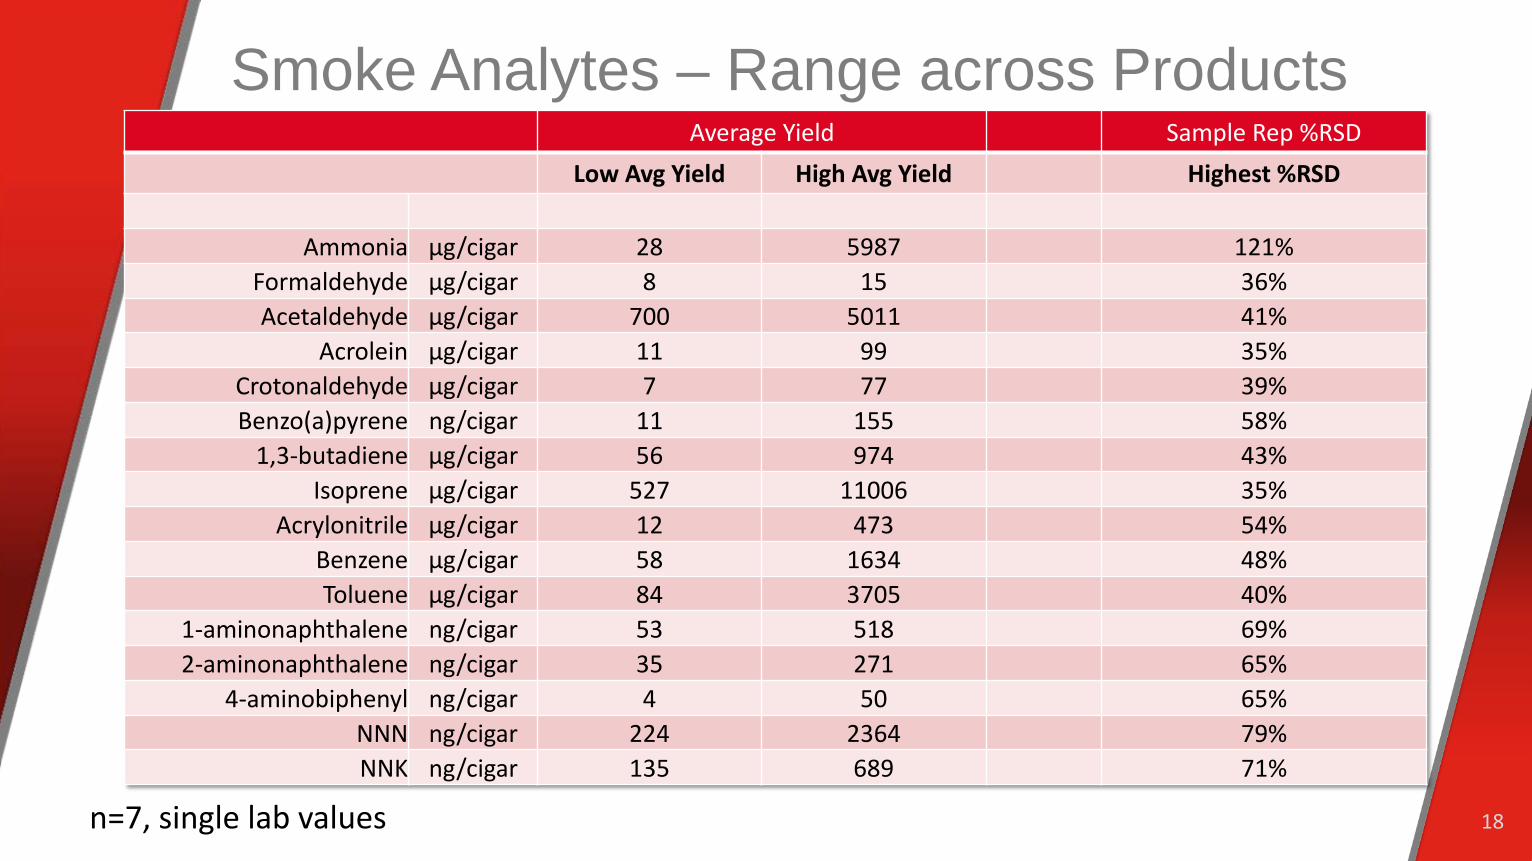
Smoke Analytes – Range across Products
18
Average Yield Sample Rep %RSD Low Avg Yield High Avg Yield Highest %RSD
Ammonia µg/cigar 28 5987 121% Formaldehyde µg/cigar 8 15 36% Acetaldehyde µg/cigar 700 5011 41%
Acrolein µg/cigar 11 99 35% Crotonaldehyde µg/cigar 7 77 39% Benzo(a)pyrene ng/cigar 11 155 58%
1,3-butadiene µg/cigar 56 974 43% Isoprene µg/cigar 527 11006 35%
Acrylonitrile µg/cigar 12 473 54% Benzene µg/cigar 58 1634 48% Toluene µg/cigar 84 3705 40%
1-aminonaphthalene ng/cigar 53 518 69% 2-aminonaphthalene ng/cigar 35 271 65%
4-aminobiphenyl ng/cigar 4 50 65% NNN ng/cigar 224 2364 79% NNK ng/cigar 135 689 71%
n=7, single lab values
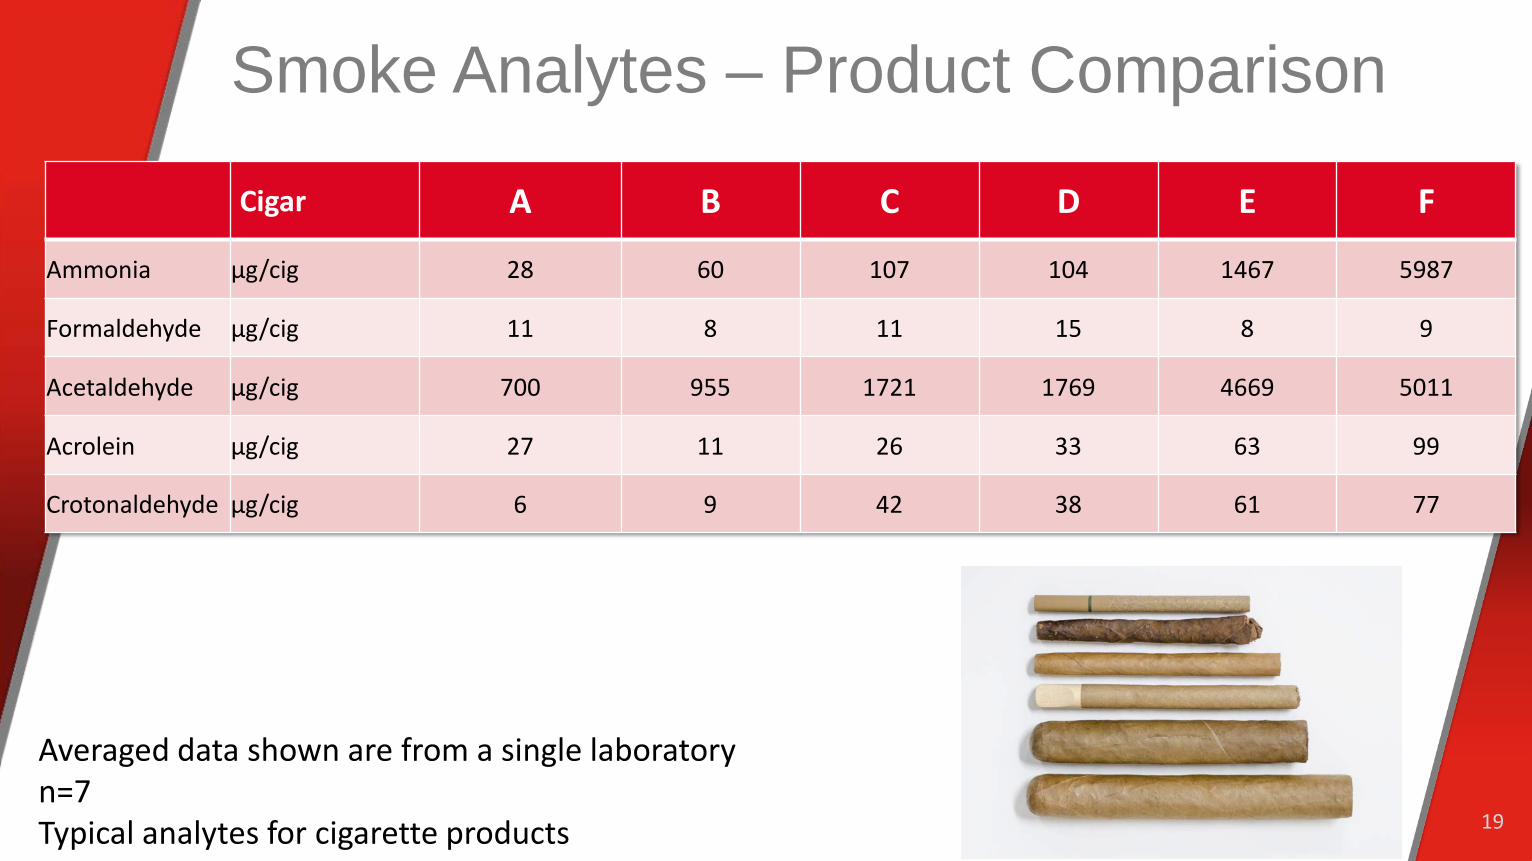
Smoke Analytes – Product Comparison
19
Cigar A B C D E F
Ammonia µg/cig 28 60 107 104 1467 5987
Formaldehyde µg/cig 11 8 11 15 8 9
Acetaldehyde µg/cig 700 955 1721 1769 4669 5011
Acrolein µg/cig 27 11 26 33 63 99
Crotonaldehyde µg/cig 6 9 42 38 61 77
Averaged data shown are from a single laboratory n=7 Typical analytes for cigarette products
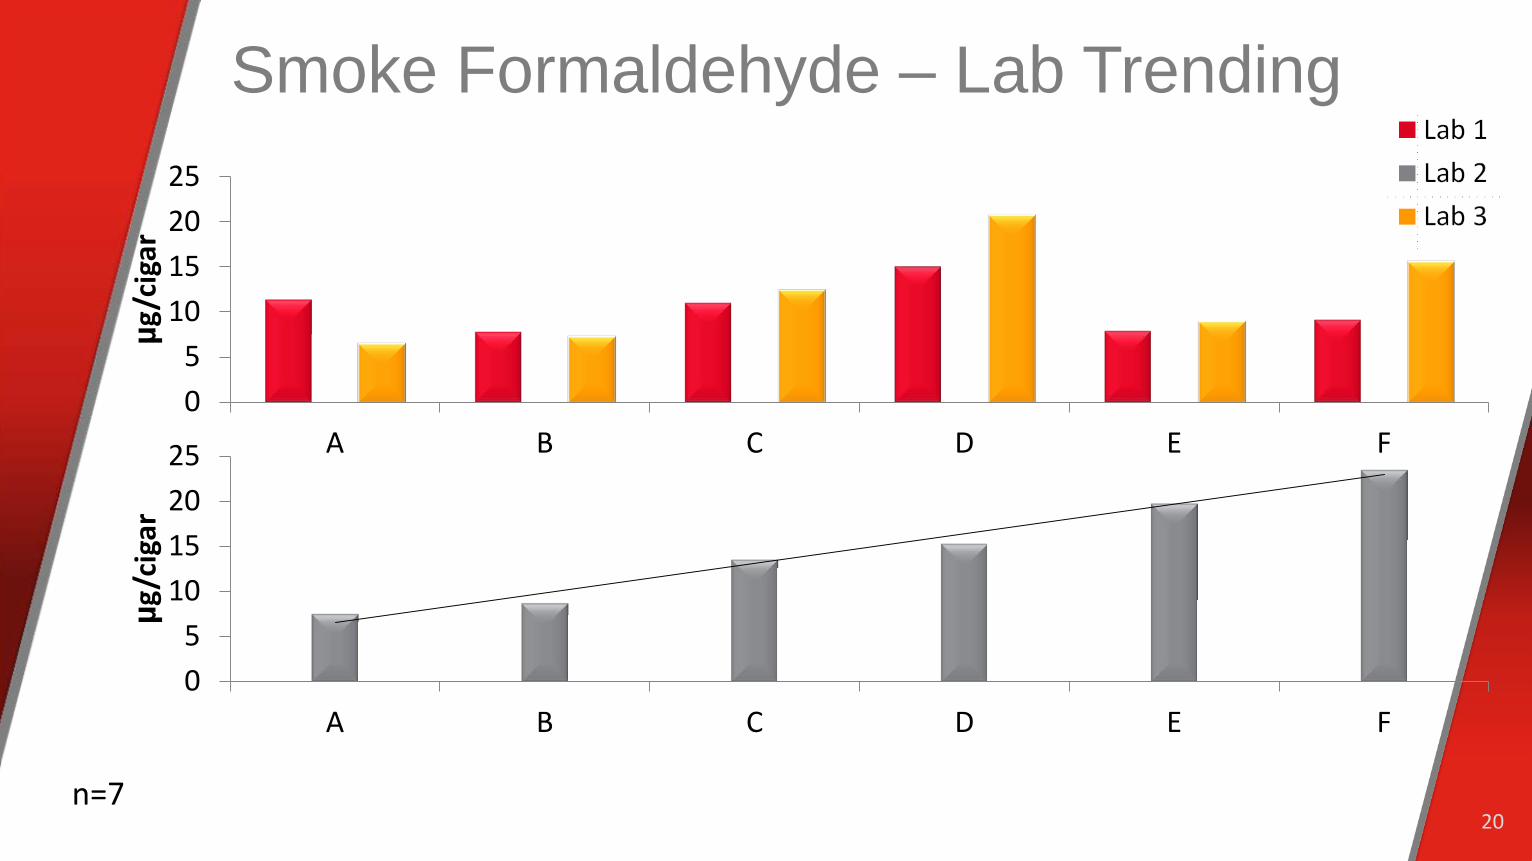
Smoke Formaldehyde – Lab Trending
20
05
10152025
A B C D E F
µg/c
igar
n=7
05
10152025
A B C D E F
µg/c
igar
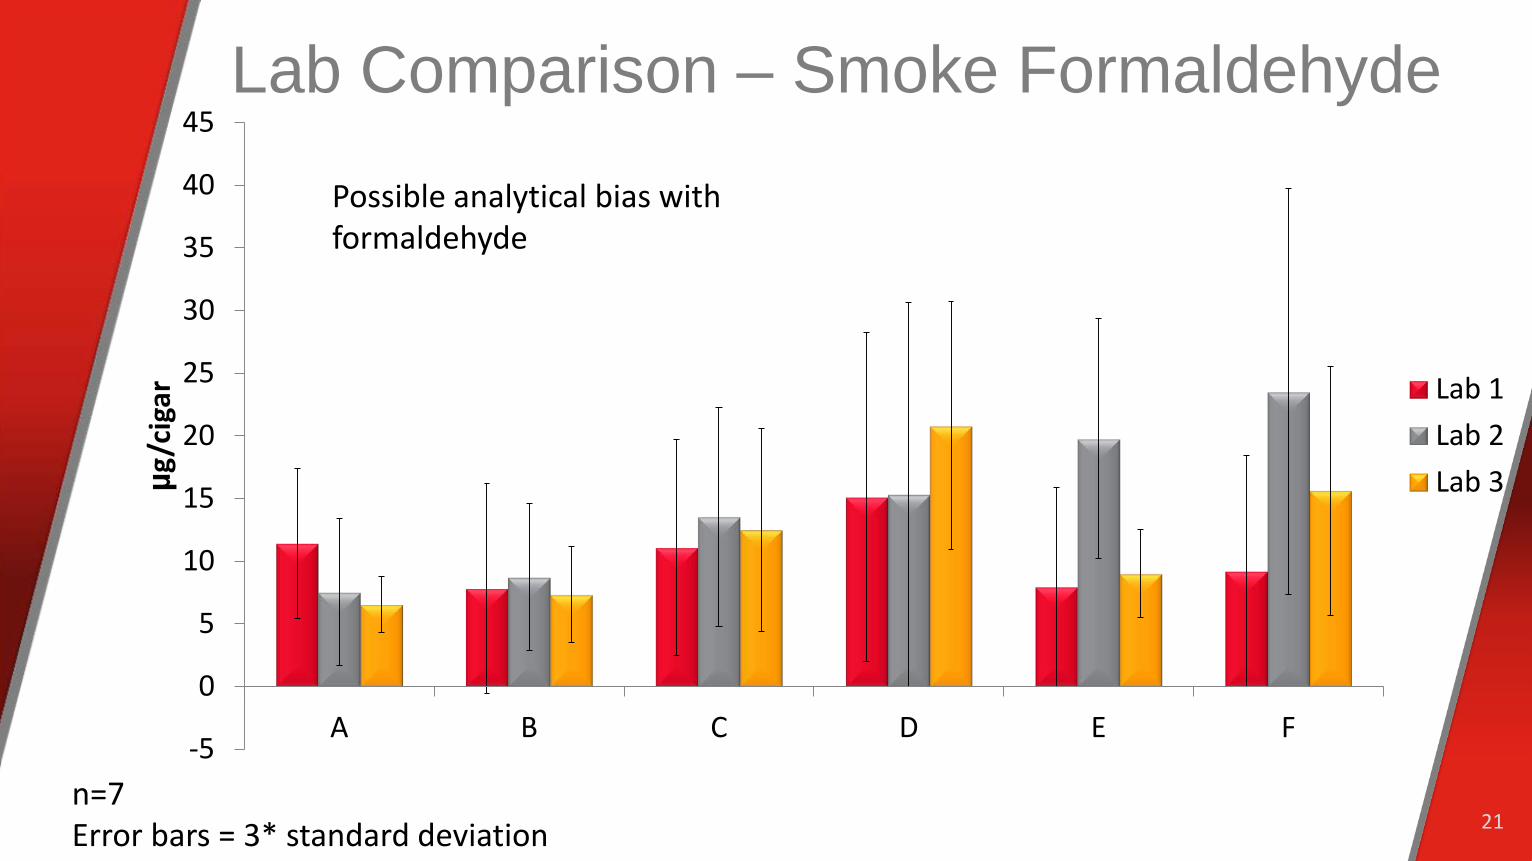
Lab Comparison – Smoke Formaldehyde
21
-5
0
5
10
15
20
25
30
35
40
45
A B C D E F
µg/c
igar
Lab 1Lab 2Lab 3
n=7 Error bars = 3* standard deviation
Possible analytical bias with formaldehyde
Smoke Analytes – Product Comparison
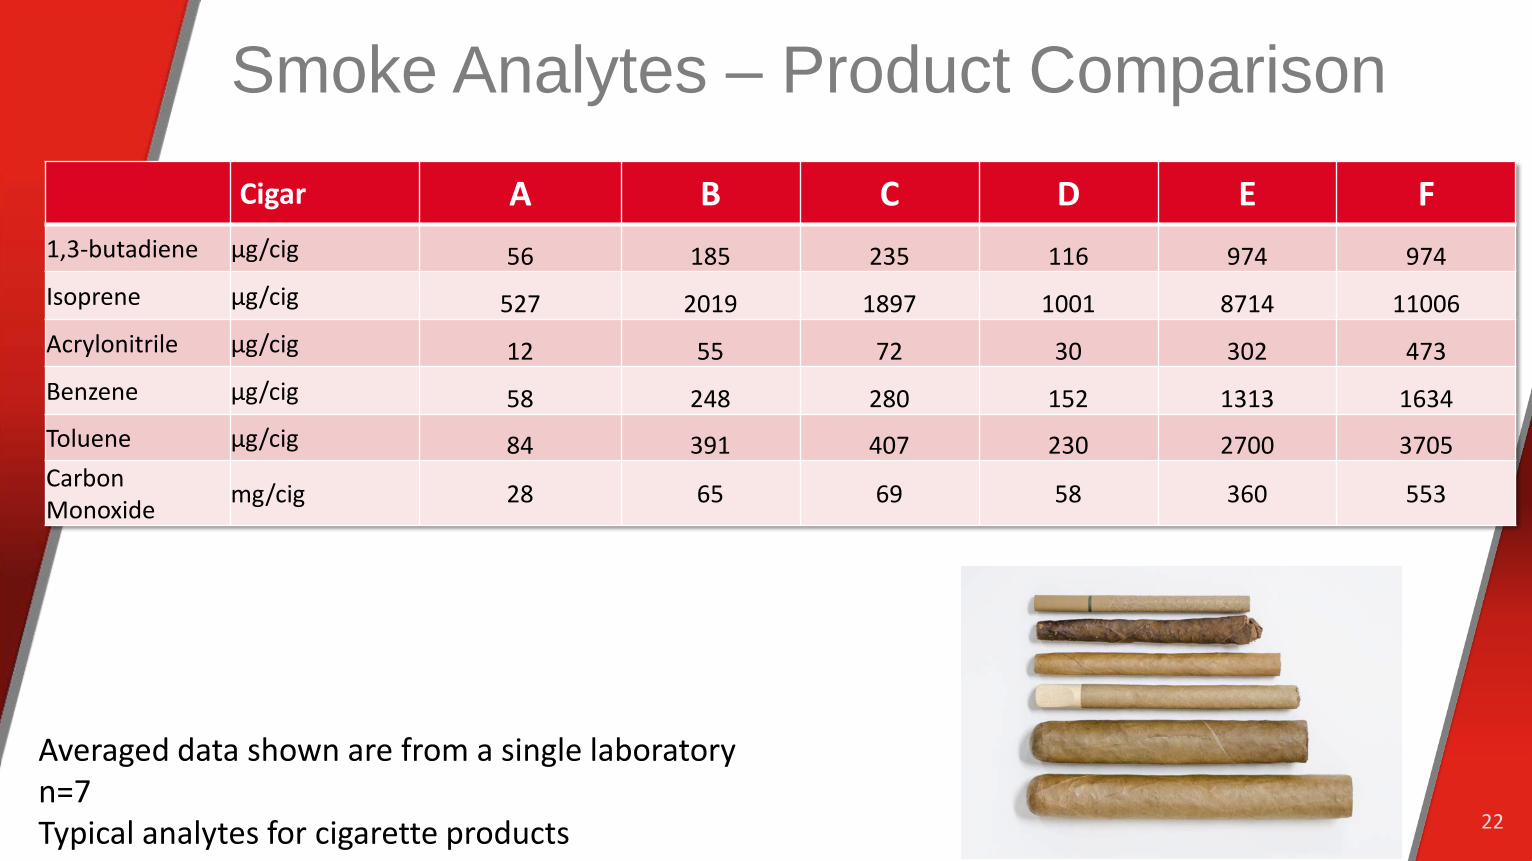
22
Cigar A B C D E F 1,3-butadiene µg/cig 56 185 235 116 974 974 Isoprene µg/cig 527 2019 1897 1001 8714 11006 Acrylonitrile µg/cig 12 55 72 30 302 473 Benzene µg/cig 58 248 280 152 1313 1634 Toluene µg/cig 84 391 407 230 2700 3705 Carbon Monoxide mg/cig 28 65 69 58 360 553
Averaged data shown are from a single laboratory n=7 Typical analytes for cigarette products
Smoke Analytes – Product Comparison
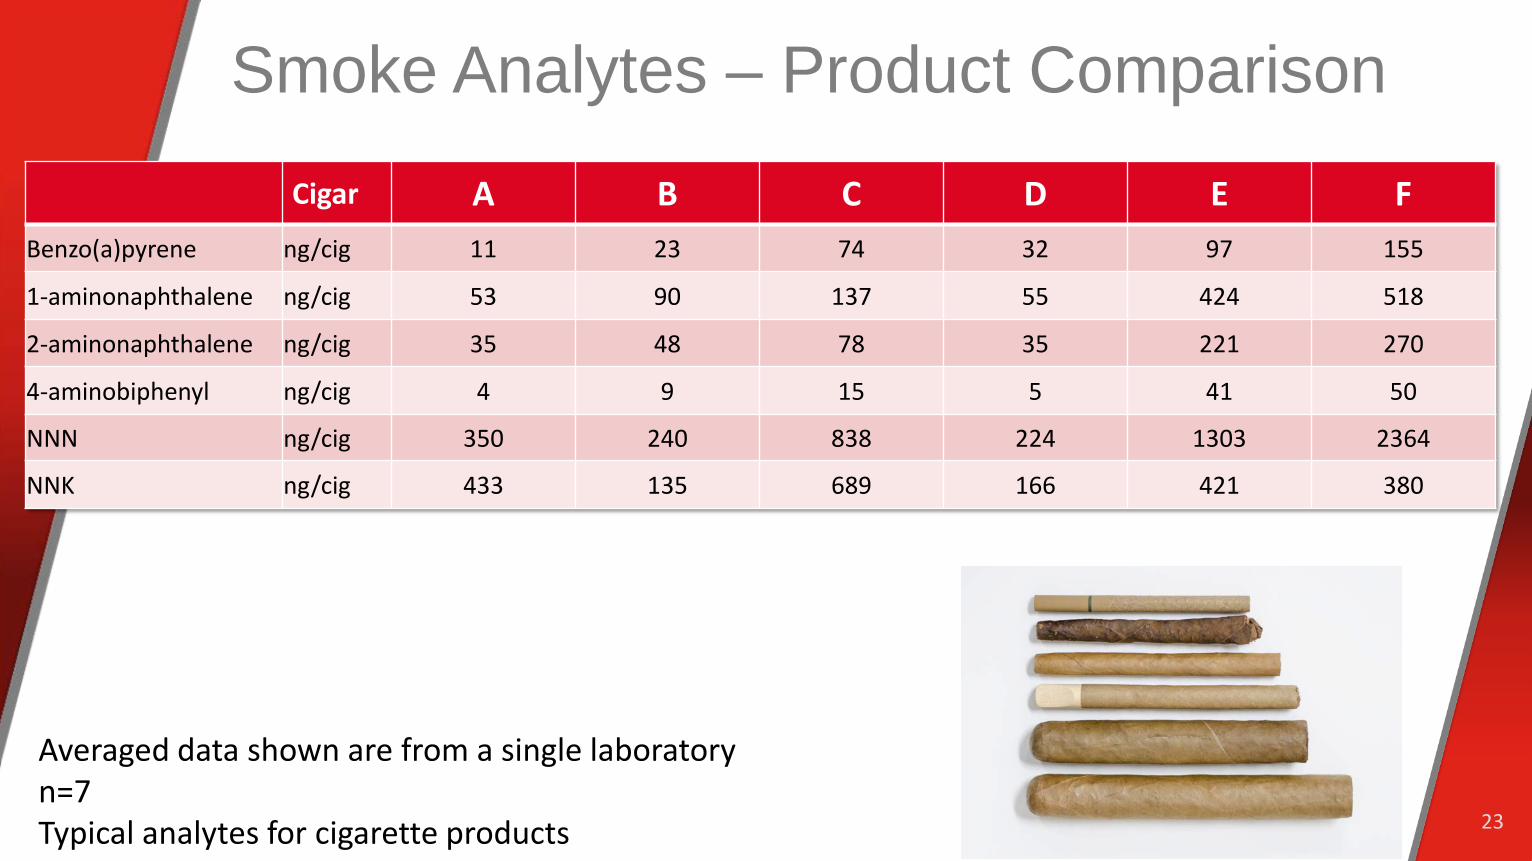
23
Cigar A B C D E F Benzo(a)pyrene ng/cig 11 23 74 32 97 155
1-aminonaphthalene ng/cig 53 90 137 55 424 518
2-aminonaphthalene ng/cig 35 48 78 35 221 270
4-aminobiphenyl ng/cig 4 9 15 5 41 50
NNN ng/cig 350 240 838 224 1303 2364
NNK ng/cig 433 135 689 166 421 380
Averaged data shown are from a single laboratory n=7 Typical analytes for cigarette products

Conclusions
• Cigars with broad design features also have widely varied analyte levels and smoking characteristics
• Variability for physical characteristics are much higher than for cigarette products
• Variability is high enough that it may be difficult to distinguish some products based on analytical data
• For the lab comparison, results appear generally consistent between the labs in the study particularly for Samples A-D
24