Embed Size (px)
Citation preview
Petteri Teikari, PhD
Sunnybrook, FUS Lab Meeting, Journal Club, Dec 1 2015
PNAS, vol. 112 no. 36:11377–11382, doi: 10.1073/pnas.15142091122014 Impact Factor: 9.674
Significance
“We introduce a two-photon imaging method with improved depth penetration for the recording of neuronal activity with single-cell resolution in the intact brain of living animals. This method relies on the use of the fluorometric Ca2+-sensitive dye Cal-590, which is effectively excited by infrared light (1,050 nm). By combining population Ca2+ imaging and electrical recordings in vivo, we demonstrate that neuronal activity can be monitored in all six layers of the mouse cortex. In combination with spectrally different Ca2+ indicators, Cal-590 can be used for the simultaneous imaging of neuronal activity in distinct neuronal populations.”
General Context
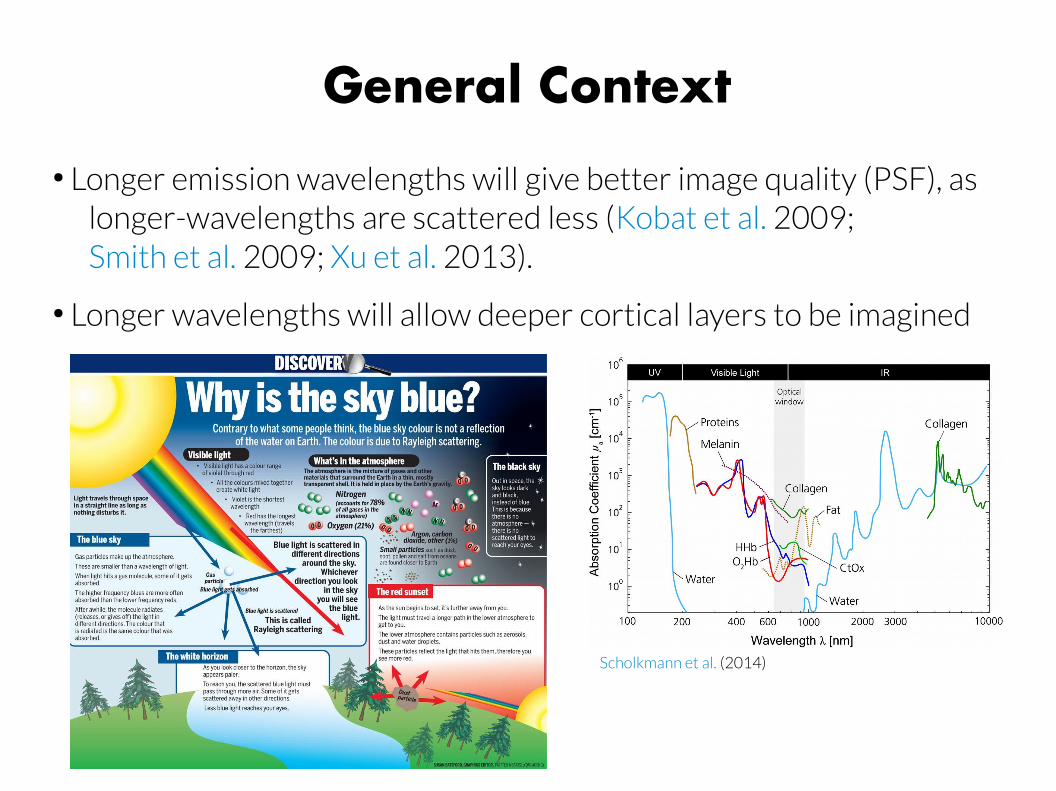
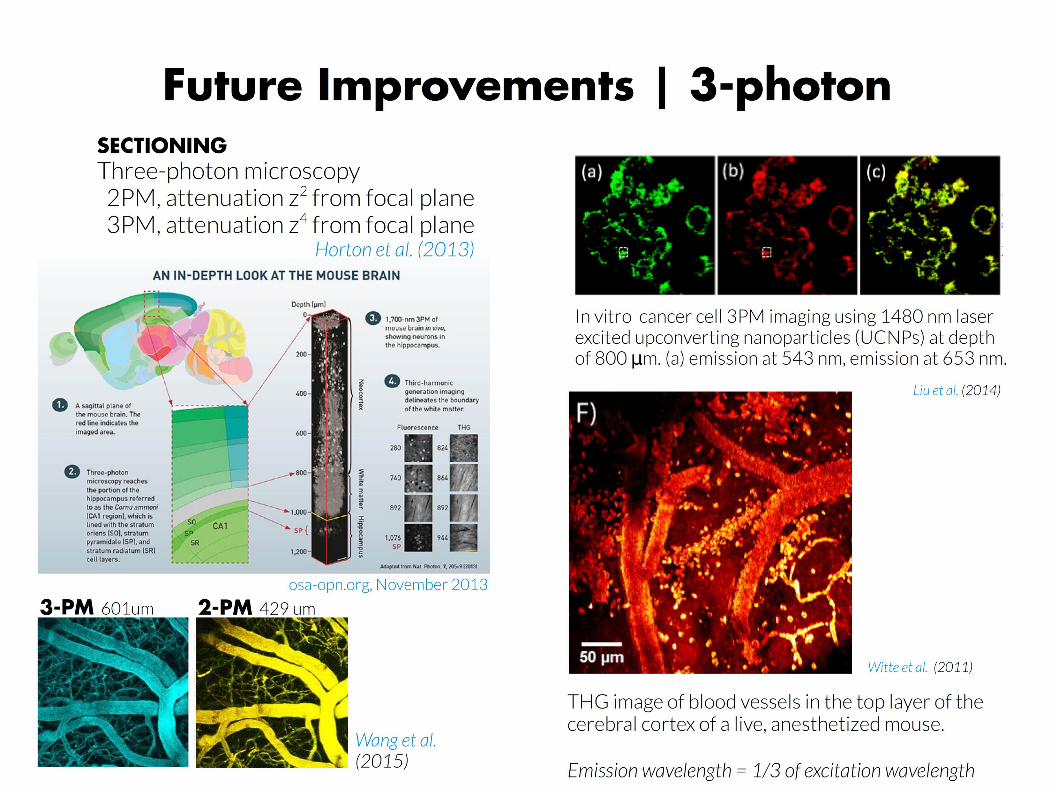
● Longer emission wavelengths will give better image quality (PSF), as longer-wavelengths are scattered less (Kobat et al. 2009; Smith et al. 2009; Xu et al. 2013).
● Longer wavelengths will allow deeper cortical layers to be imagined
Scholkmann et al. (2014)
Spectral Windows
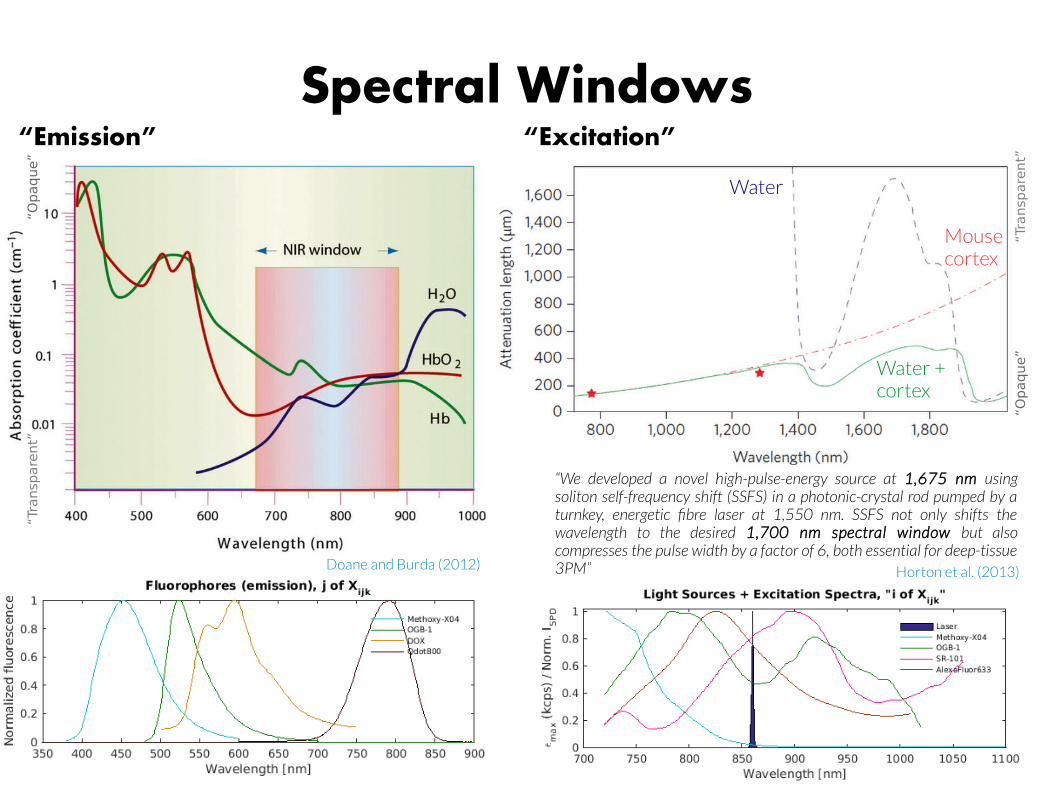
Horton et al. (2013)Doane and Burda (2012)
“Emission” “Excitation”
Water
Mousecortex
Water +cortex
“Transparent”
“Opaque”
“Transparent”
“Opaque”
“We developed a novel high-pulse-energy source at 1,675 nm using soliton self-frequency shift (SSFS) in a photonic-crystal rod pumped by a turnkey, energetic fibre laser at 1,550 nm. SSFS not only shifts the wavelength to the desired 1,700 nm spectral window but also compresses the pulse width by a factor of 6, both essential for deep-tissue 3PM”
Calcium (Ca2+) Signaling
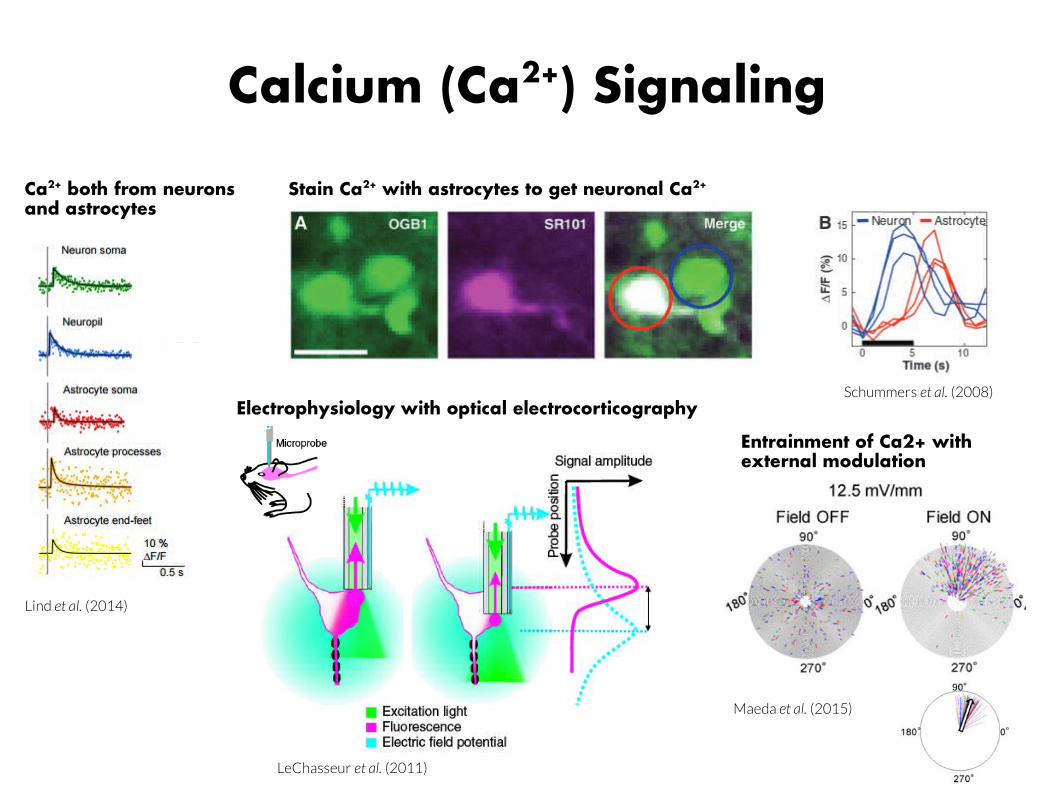
Schummers et al. (2008)
LeChasseur et al. (2011)
Stain Ca2+ with astrocytes to get neuronal Ca2+
Lind et al. (2014)
Ca2+ both from neurons and astrocytes
Electrophysiology with optical electrocorticography
Maeda et al. (2015)
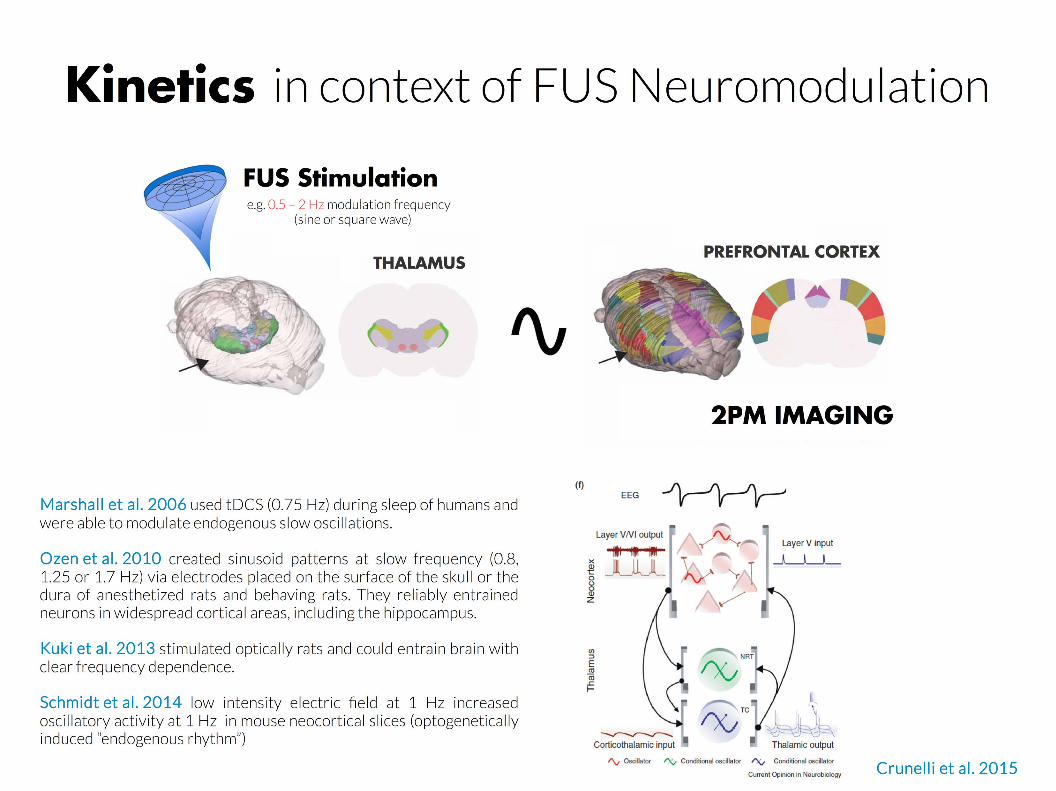
Entrainment of Ca2+ with external modulation
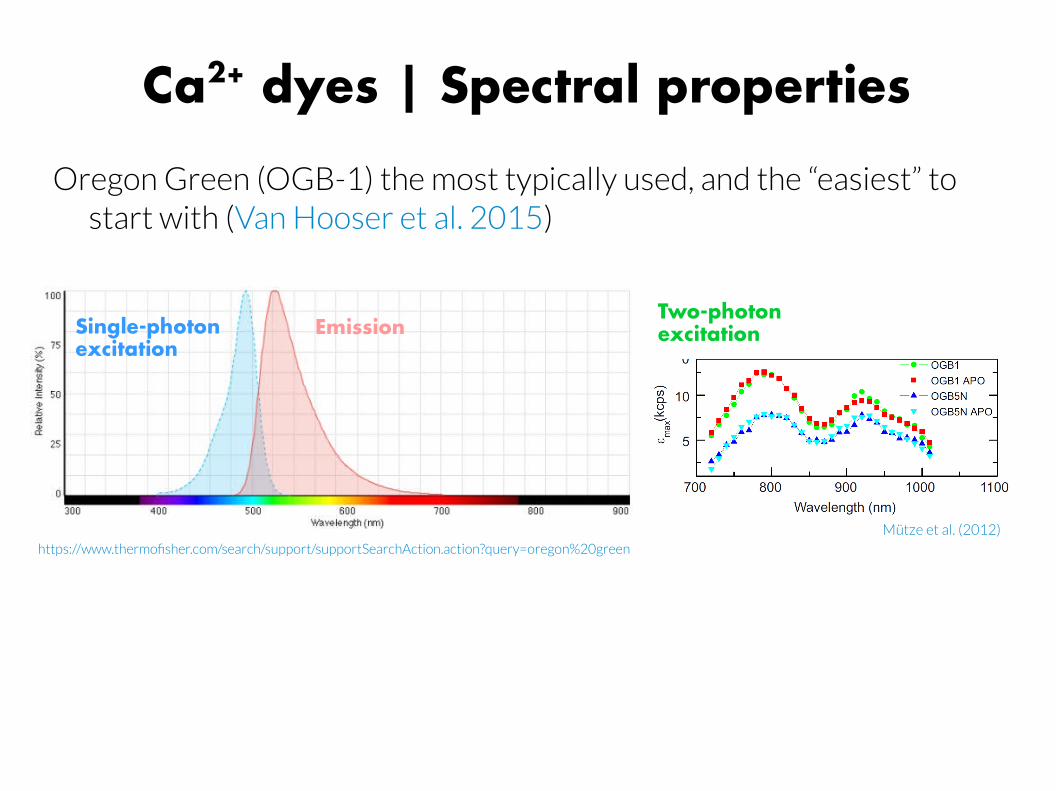
Ca2+ dyes | Spectral properties
Oregon Green (OGB-1) the most typically used, and the “easiest” to start with (Van Hooser et al. 2015)
https://www.thermofisher.com/search/support/supportSearchAction.action?query=oregon%20green
EmissionSingle-photonexcitation
Two-photonexcitation
Mütze et al. (2012)
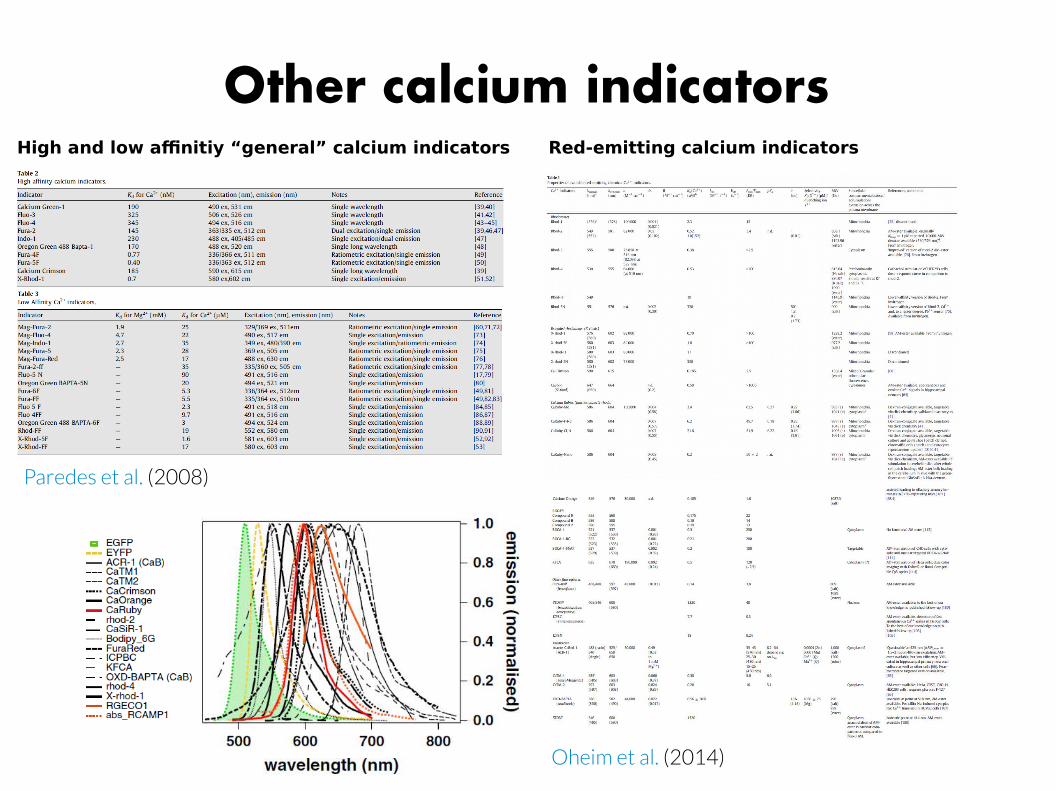
Other calcium indicators
Paredes et al. (2008)
Red-emitting calcium indicatorsHigh and low affinitiy “general” calcium indicators
Oheim et al. (2014)
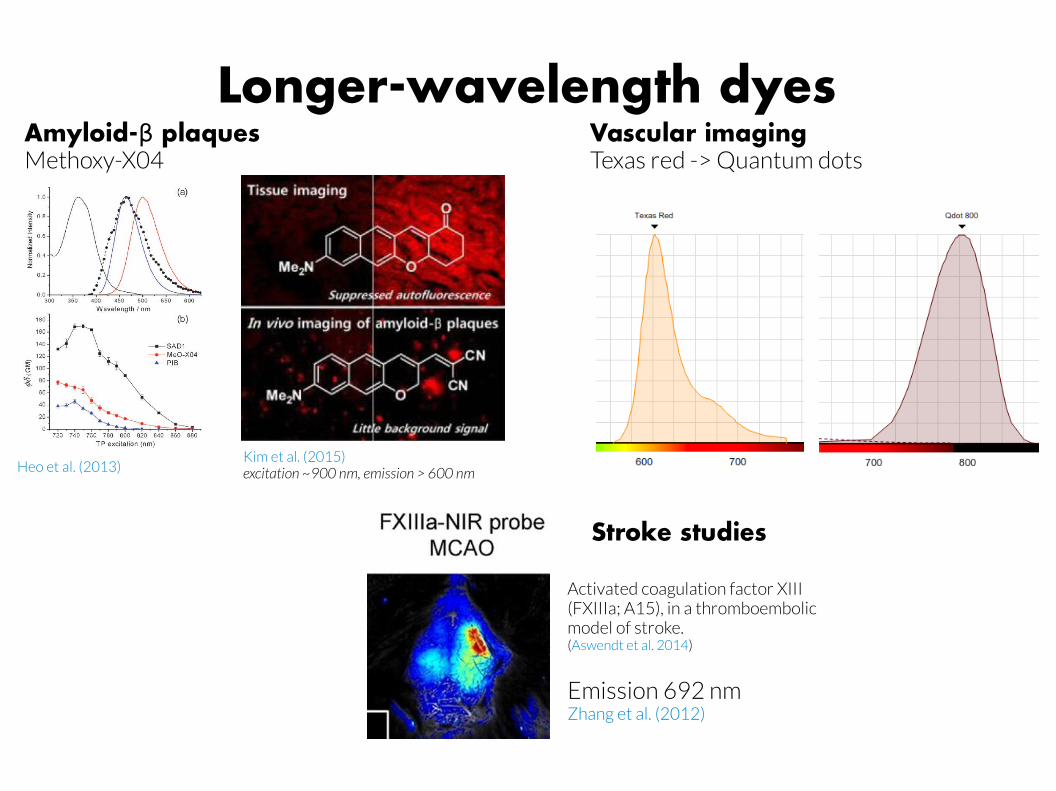
Longer-wavelength dyesAmyloid- plaquesβMethoxy-X04
Kim et al. (2015)excitation ~900 nm, emission > 600 nmHeo et al. (2013)
Vascular imagingTexas red -> Quantum dots
Activated coagulation factor XIII (FXIIIa; A15), in a thromboembolic model of stroke. (Aswendt et al. 2014)
Emission 692 nmZhang et al. (2012)
Stroke studies
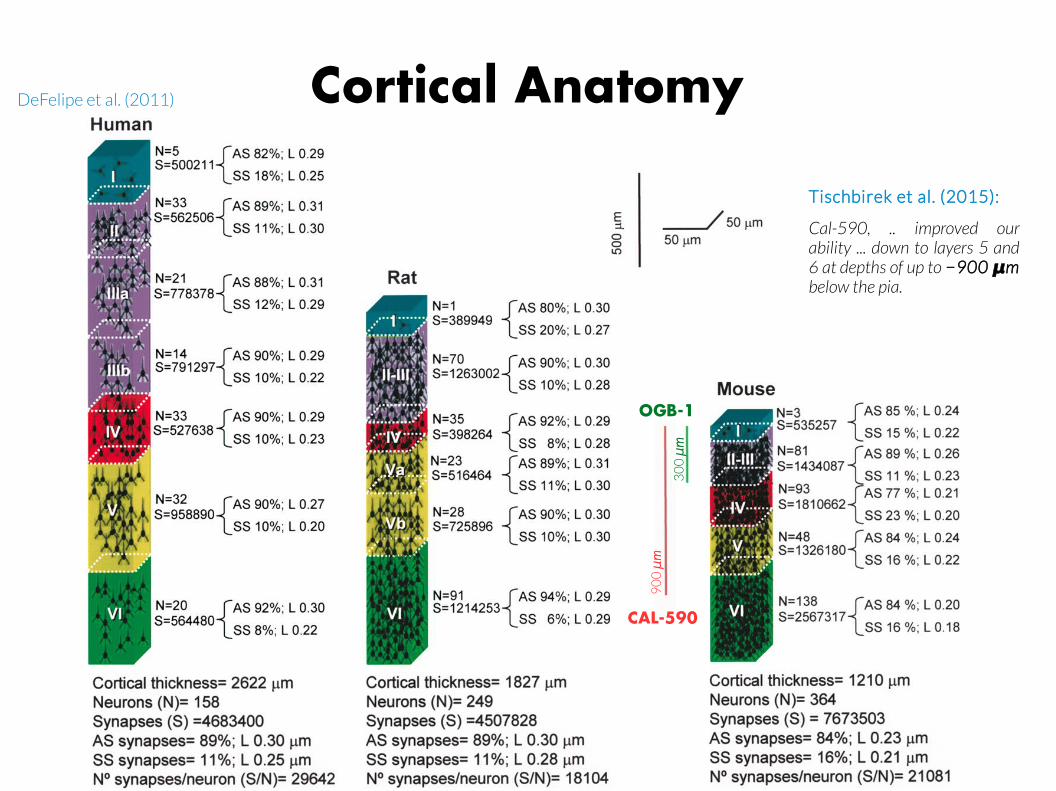
Cortical AnatomyDeFelipe et al. (2011)
Cal-590, .. improved our ability ... down to layers 5 and 6 at depths of up to −900 μm below the pia.
Tischbirek et al. (2015):
90
0 μ
m
30
0 μ
m
CAL-590
OGB-1
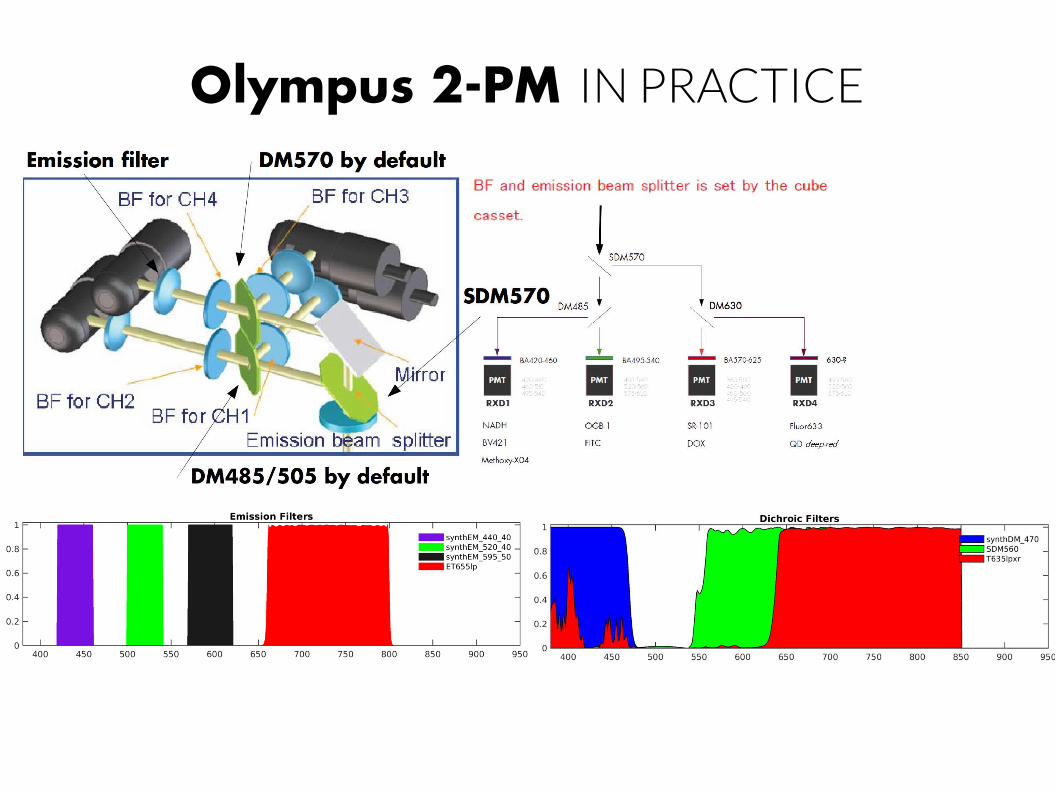
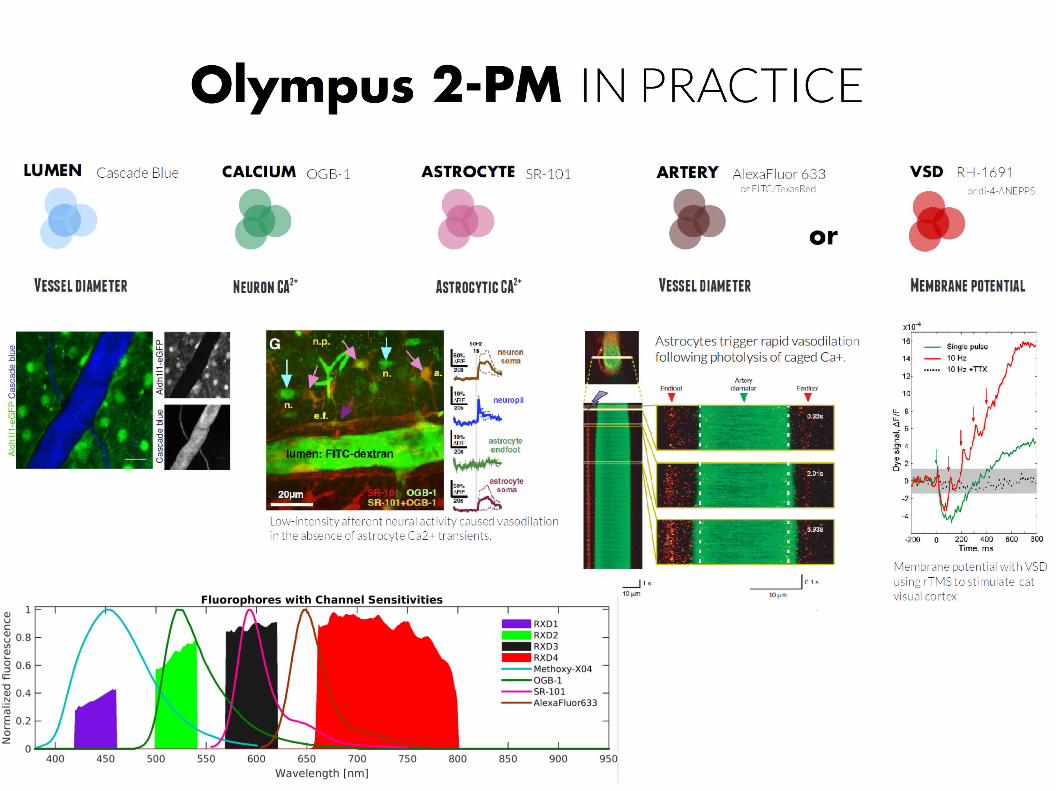
Olympus 2-PM IN PRACTICE
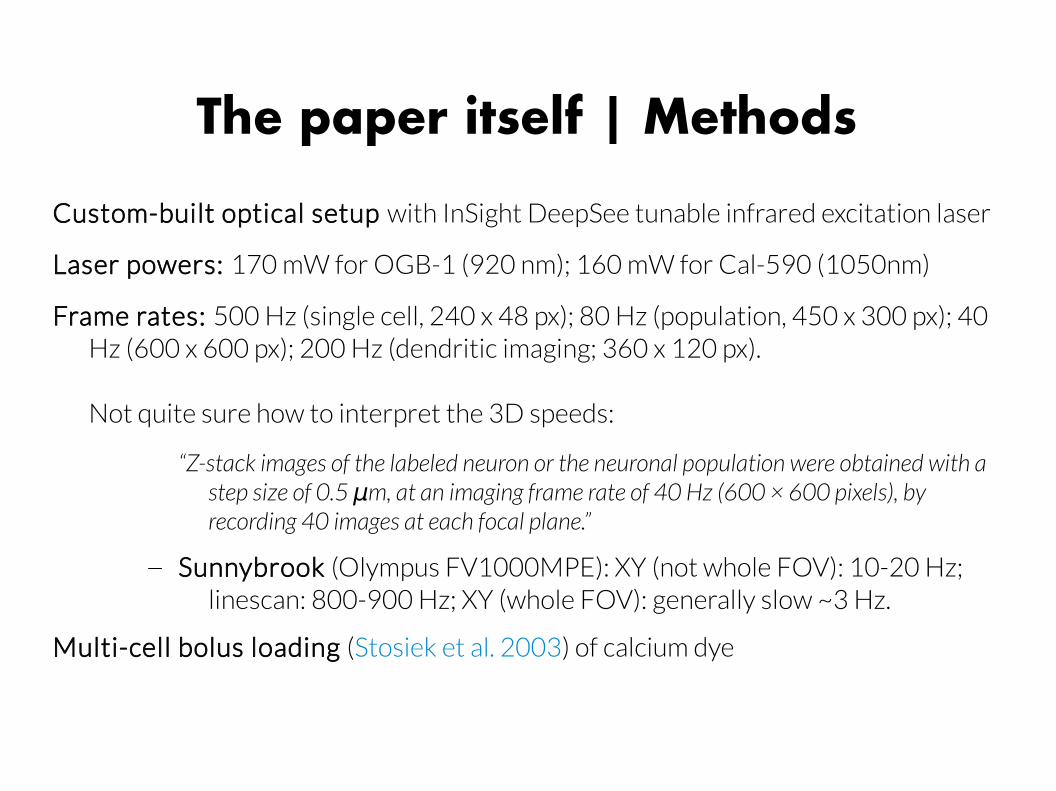
The paper itself | Methods
Custom-built optical setup with InSight DeepSee tunable infrared excitation laser
Laser powers: 170 mW for OGB-1 (920 nm); 160 mW for Cal-590 (1050nm)
Frame rates: 500 Hz (single cell, 240 x 48 px); 80 Hz (population, 450 x 300 px); 40 Hz (600 x 600 px); 200 Hz (dendritic imaging; 360 x 120 px).
Not quite sure how to interpret the 3D speeds:
“Z-stack images of the labeled neuron or the neuronal population were obtained with a step size of 0.5 m, at an imaging frame rate of 40 Hz (600 × 600 pixels), by μrecording 40 images at each focal plane.”
– Sunnybrook (Olympus FV1000MPE): XY (not whole FOV): 10-20 Hz; linescan: 800-900 Hz; XY (whole FOV): generally slow ~3 Hz.
Multi-cell bolus loading (Stosiek et al. 2003) of calcium dye
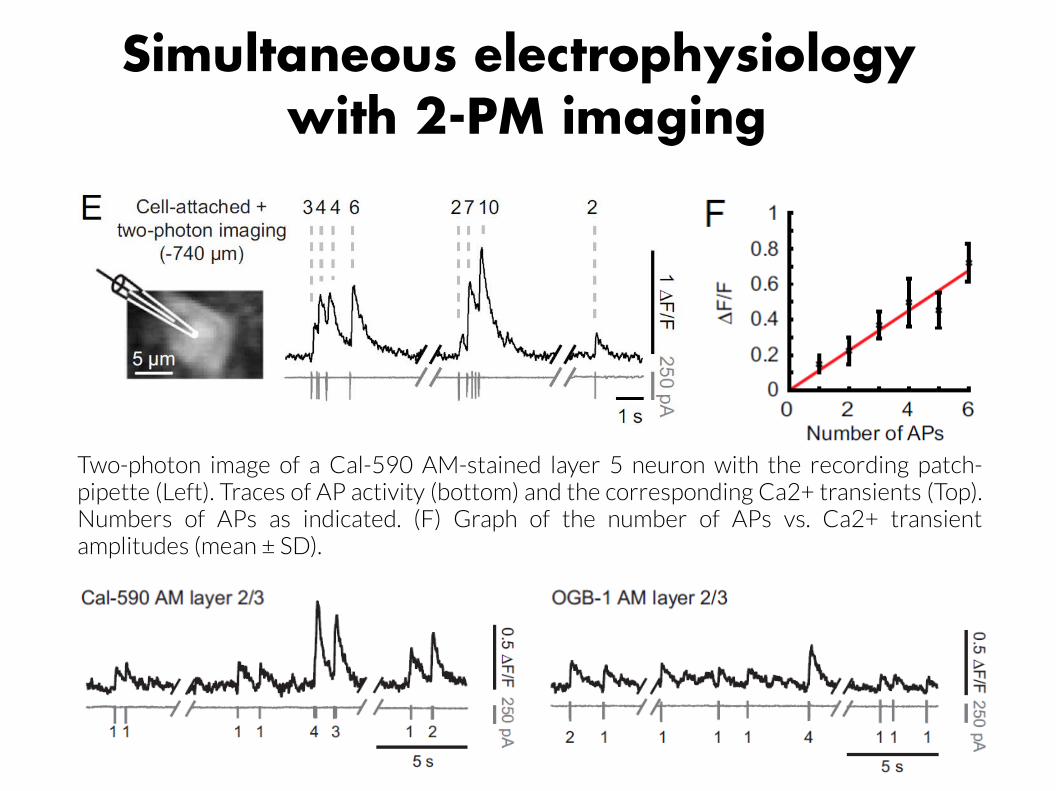
Simultaneous electrophysiology with 2-PM imaging
Two-photon image of a Cal-590 AM-stained layer 5 neuron with the recording patch-pipette (Left). Traces of AP activity (bottom) and the corresponding Ca2+ transients (Top). Numbers of APs as indicated. (F) Graph of the number of APs vs. Ca2+ transient amplitudes (mean ± SD).
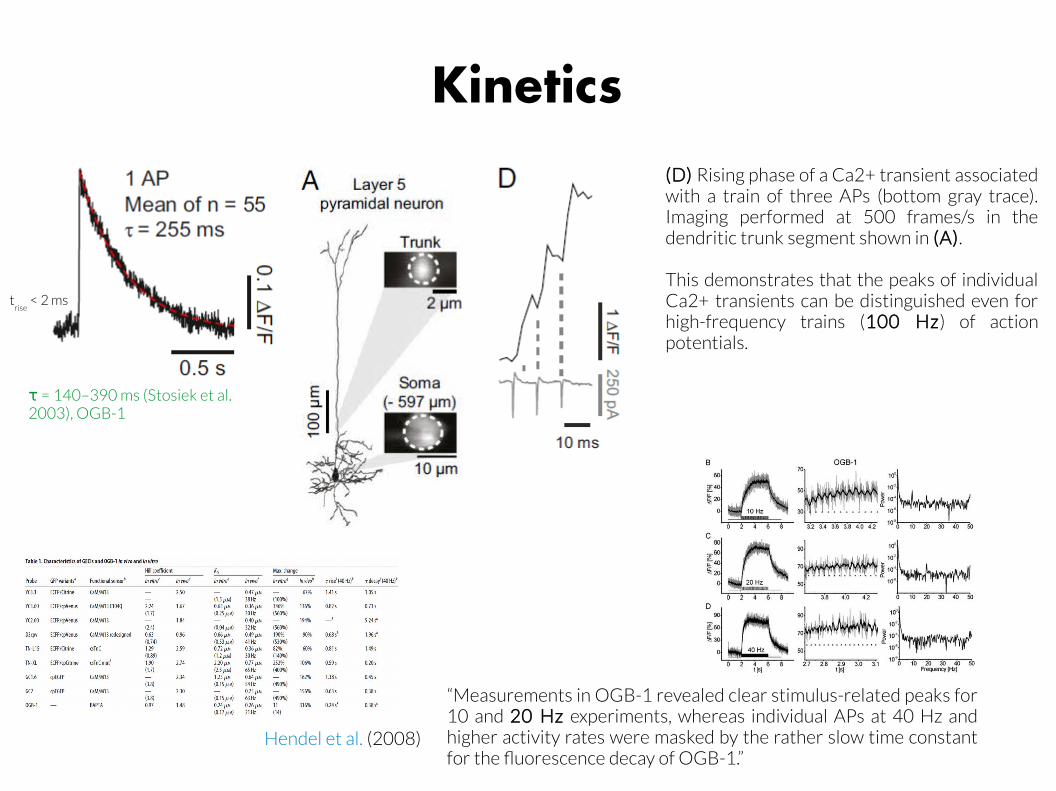
Kinetics
trise
< 2 ms
(D) Rising phase of a Ca2+ transient associated with a train of three APs (bottom gray trace). Imaging performed at 500 frames/s in the dendritic trunk segment shown in (A).
This demonstrates that the peaks of individual Ca2+ transients can be distinguished even for high-frequency trains (100 Hz) of action potentials.
τ = 140–390 ms (Stosiek et al. 2003), OGB-1
Hendel et al. (2008)
“Measurements in OGB-1 revealed clear stimulus-related peaks for 10 and 20 Hz experiments, whereas individual APs at 40 Hz and higher activity rates were masked by the rather slow time constant for the fluorescence decay of OGB-1.”
Summary
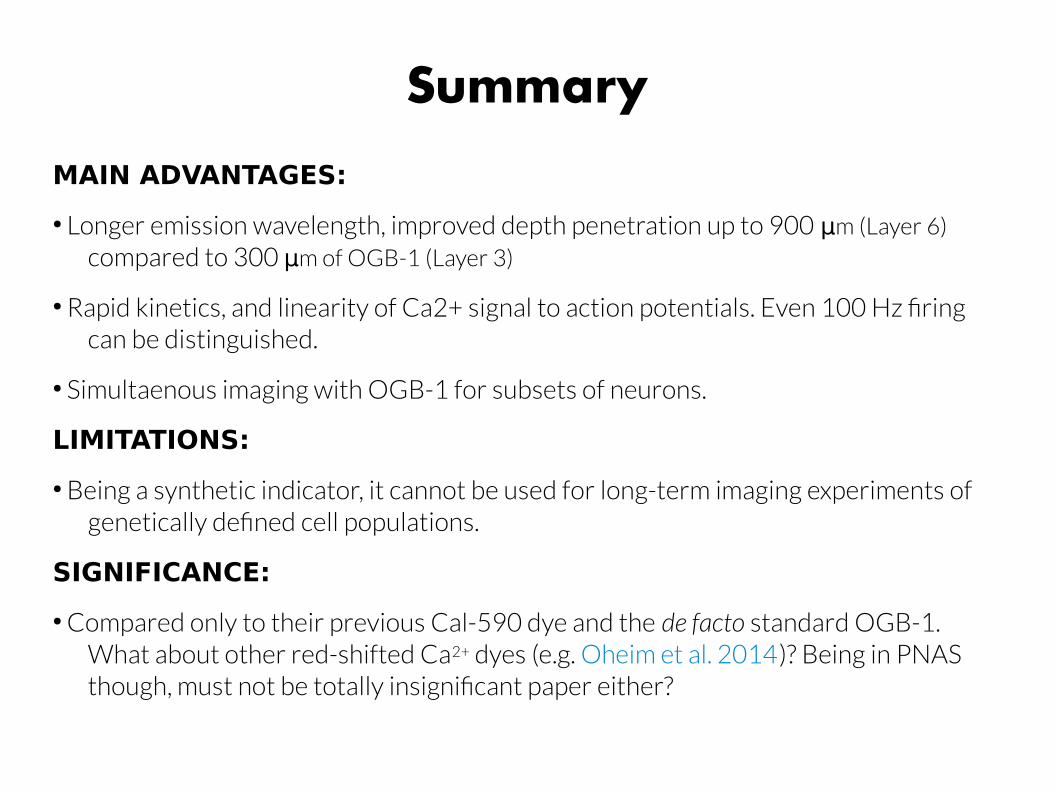
MAIN ADVANTAGES:
● Longer emission wavelength, improved depth penetration up to 900 m (Layer 6)μ compared to 300 m of OGB-1 (Layer 3)μ
● Rapid kinetics, and linearity of Ca2+ signal to action potentials. Even 100 Hz firing can be distinguished.
● Simultaenous imaging with OGB-1 for subsets of neurons.
LIMITATIONS:
● Being a synthetic indicator, it cannot be used for long-term imaging experiments of genetically defined cell populations.
SIGNIFICANCE:
● Compared only to their previous Cal-590 dye and the de facto standard OGB-1. What about other red-shifted Ca2+ dyes (e.g. Oheim et al. 2014)? Being in PNAS though, must not be totally insignificant paper either?


![Evidence of Ca2+-Dependent Carbohydrate Association ... · Ca2+I2+ and [2Lex + Ca2+]2+. The CID experiments of the [2Lex-LacCer + Ca2+I2+ dimers resulted in a neutral loss covalently](https://img.pdfslide.net/doc/110x75/5f8af1f17b5f935beb015692/evidence-of-ca2-dependent-carbohydrate-association-ca2i2-and-2lex-ca22.jpg)