Embed Size (px)
Citation preview

Parallel session : Forest landscape management to create resilience in the face
of climate change in West and Central Africa
Ida Nadia S. Djenontin, Houria Djoudi, Mathurin Zida (CIFOR)
Paris, July 07-10, 2015
Adaptive capacity and tree-based livelihood diversification strategies of smallholders in Central
Burkina Faso

Outline
1. Research context
2. Research aim and questions
3. Materials & Methods
4. Research Key findings
5. Policy implications

Research context: forest & CCA in Sahel

Increase in the implementation of forest and tree based interventions (land use options) at local level o as livelihood diversification strategies for a sustainable
management of land resources (Reij et al. 2005; Kabore and Reij 2004)
o to overcome changes in natural resources and support adaptation efforts of local communities
Research context: forest & CCA in Sahel
Research-based evidence to mainstream & strengthen the ongoing adaptation processes at farm household level Need of adequate F&T- based strategies with potentialities to help reducing household’s vulnerability and adaptive capacity
better understanding of the AC of smallholder households engaged in specific livelihood diversification strategies (land use options) is important to feed and improve policy interventions
Shed light on existing F&T-based livelihood diversification strategies (land uses options) with positive effects towards both HH and ecosystem resilience
Question: What adaptive capacity the existing F&T-based livelihood diversification strategies (land uses options) provide to help increase: o social resilience of local communities?
o ecological resilience for sustainability of forest
resources?
Research aim and questions

Identification of Liv. Divers. Strat. implemented as land use options that build on forest and trees ecosystem : considering some criteria :
o importance for Burkina Faso’s climate policies (NAPA, NAP, FIP);
o importance for ecosystem-based adaptation approach;
o level of management, and the frequency of implementation
o relevance to analyse synergies between mitigation & adaptation;
o gender sensitivity
Research work materials
Mango plantations (n=29)
Cashew plantations (n=31)
Eucalyptus plantations (n=31)
Forest Lands restoration (n=38)
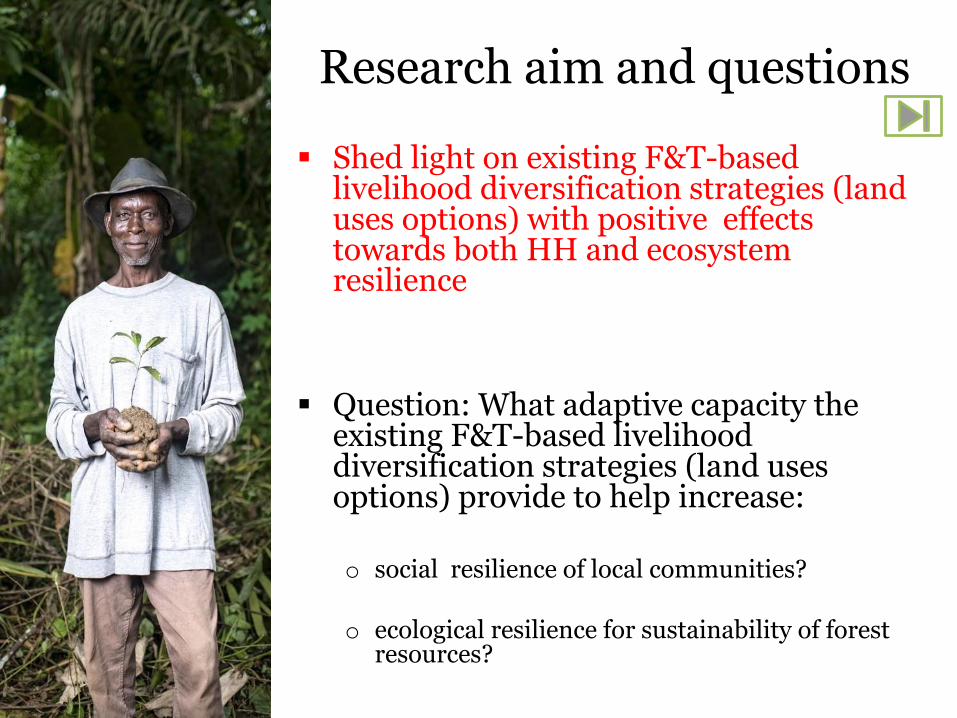
Research Methodology • Use of
Sustainable Livelihoods Framework (SLF) as theoretical background (Eakin and Bojorquez 2008; Bryan et al. 2015)
• Building an analytical framework of household’s adaptive capacity index (ACI)
Integrated approach to define and select indicators at a HH scale (Yohe and Tol 2002; Sietchiping
2007; Vincent 2007; Hahn et al. 2009; Adger (2004 & 2006) ; Brooks et al. 2005; Haddad 2005; Pelling and High 2005; Alberini et al. 2006)
o Combination of sub-aggregate and sub-composite indexes
o Aggregate adaptive capacity index (ACI) is calculated

Dimensions Components Indicators Explanation of indicators Measurement Sources
Assets-related
index
(50%)
Human Assets
(25%)
Age of household Head (20%) Age of the head of households implementing the
diversification strategy
Each strategy records its average actual value for this
continuous variable
Sustainable
Livelihoods
Framework (DFID 2000);
Yohe and Tol (2002);
Sietchiping (2007);
Vincent (2007).
Household size (20%) Number of persons living permanently in
households who implement the diversification
strategy
Each strategy records its average actual value for this
continuous variable
Household Marital status:
Polygamous status (20%)
Percentage of polygamous households using the
diversification strategy
Each strategy takes score 1 if its average percentage
is < to that of the whole sample and takes score 2 if >
Education level: Primary level
(20%)
Percentage of households with primary
education who implement the diversification strategy
Each strategy takes score 1 if its average percentage
is < to that of the whole sample and takes score 2 if >
Literacy (20%) Percentage of literate households using the
diversification strategy
Each strategy takes score 1 if its average percentage
is < to that of the whole sample and takes score 2 if >
Social Assets
and Institutions
(25%)
Membership of Association
(25%)
Percentage of Membership of association of
households who develop each diversification
strategy
Each strategy takes score 1 if its average percentage
is < to that of the whole sample and takes score 2 if >
Yohe and Tol
(2002)
Adger (2004)
Adger (2006)
Pelling and High (2005);
Sietchiping
(2007); Vincent
(2007).
Number of Social groups
around NRM (25%)
Number of agriculture and forestry cooperative
groups to which households implementing the
diversification strategy belong to.
Each strategy records its average actual value for this
continuous variable
Number of other Social groups
(Credit, sensitizing…) (25%)
Number of credit groups, sensitizing groups or
other social groups to which households
implementing the diversification strategy belong to.
Each strategy records its average actual value for this
continuous variable
Institutional rights over the
land on which the strategy is
implemented (tenure security) (25%)
Percentage of households with a legal tenure
over the land that houses the strategy (legal
tenure according to the official law.)
Each strategy takes score 1 if its average percentage
is < to that of the whole sample and takes score 2 if >
Physical Assets
(25%)
Number of Livestock-Cattle
(20%)
Number of cattle owned by households who
implement the diversification strategy
Each strategy records its average actual value for this
continuous variable
Sustainable
Livelihoods Framework
(DFID 2000);
Vincent
(2007).
Number of small ruminants (20%)
Number of sheep and goats owned by households who implement the diversification
strategy
Each strategy records its average actual value for this continuous variable
Means of Transportation: Number of Bicycle (20%)
Number of bicycle owned by households who implement the diversification strategy
Each strategy records its average actual value for this continuous variable
Production asset 1: Number of
Plough (20%)
Number of plough owned by households who
implement the diversification strategy
Each strategy records its average actual value for this
continuous variable
Production asset 2: Number of
Donkeys (20%)
Number of donkey owned by households who
implement the diversification strategy
Each strategy records its average actual value for this
continuous variable
Natural Assets (25%)
Total land size owned (100%) Hectares of farm owned by households who implement the diversification strategy
Each strategy records its average actual value for this continuous variable
Strategy
outcomes-related
index (50%)
Production
diversity (25%)
Products diversity (100/3%) The number of products harvested by
households who implement the diversification
strategy.
Each strategy records its actual value for this variable.
e.g. When households, who develop a strategy,
harvest in average 3 products, the value recorded for the strategy = 3.
-
Yohe and Tol
(2002)
Framework for calculation of the household’s adaptive capacity index

Research Methodology
• Measuring ADAPTIVE CAPACITY provided to
HHs: a scalar
that serves as an aggregate measure of the potential to cope with climate variability and change (Yohe and Tol 2002)
Aggregate adaptive capacity index:
𝐴𝐶𝐼 = 𝐴𝐶𝐼𝐴 + 𝐴𝐶𝐼𝑆
Assets-related index (ACIA):
𝐴𝐶𝐼𝐴 = 𝑊𝐴 × 𝐴𝐶𝐼𝑖4𝑖=1 (2i)
Strategy-related index (ACIS):
𝐴𝐶𝐼𝑆 = 𝑊𝑆 × 𝐴𝐶𝐼𝑗4𝑗=1 (2ii)
Indicators index (ACI):
𝐴𝐶𝐼𝑖 𝑜𝑟𝑗 = 𝑄𝑖 𝑜𝑟 𝑗 × 𝐴𝑘𝑃𝑘𝑛𝑢𝑚𝑏𝑒𝑟 𝑜𝑓 𝑖𝑛𝑑𝑖𝑐𝑎𝑡𝑜𝑟𝑠𝑘=1 (3)

Research area and data
Researches: socio-economic (HH surveys, FGDs, Interviews)
Data collected :
o Household’s socio-economic characteristics,
o Livelihood assets, o Strategy-related outcomes
(Income, Production diversification, regulation services),
o Perceptions on the sensitivity of promoted interventions to climate risks.
Statistical Analyses (Average value of the indicators; preliminary composite index for some variables )
Central-West and Centre of Burkina Faso : 4 provinces Kadiogo, Kourweogo, Oubritenga, and Ziro (Figure above). The region of the Centre (500-600 mm of rainfall) === regular droughts (Reij et al. 2005) Central-West (600-800 mm of rainfall) === opportunities for forest and trees related-activities (Ouedraogo et al. 2010).

Key Research Findings 1. Pattern in the assets endowment sheds
light on:
o reduced flexibility that some households are constrained with when opting to diversify their livelihoods and adapting themselves.:
o main constraints === total land owned as well as the physical capital indicators (livestock , transportation means, production factors)
o particularly, households implementing eucalyptus plantations strategy are very limited in lands area
Strategy Mean Std. Dev. Min Max F a Prob. a RL (38) 11.91 6.71 4.5 35 4.8 0.0034 MG (29) 11.79 6.94 2.5 36.5 CW (31) 12.30 8.88 2 36.5 EC (31) 7.41 4.86 2.6 25 TOTAL (129) 10.90 7.17 2 36.5

Key Research Findings
2. Pattern in the land tenure:
o Trees planters households rely on the customary tenure (customary power provides the basic land rights to allow
investments: Braselle et al. 2002)
o RL households are moving to legal tenure with NGO’s efforts to help acquire legal tenure over their lands to assure their investments (secure tenure has a positive effect on
agro-forestry: Wunder and Verbist 2003)
==Ccl: overlapping of the traditional and legal land rights.
o trees are often managed at the local level under customary agreements (USAID 2010; CRS 2014).
o customary tenure determines access rights to resources and actually discriminates between social categories (Brockhaus
et al, 2012).

Key Research Findings
3. Pattern in production diversification, income generation:
02
46
AV
ER
AG
E N
UM
BE
R O
F T
OT
AL P
RO
DU
CT
S H
AR
VE
ST
ED
MD MG CW EC
0,00 10000,0020000,0030000,0040000,0050000,0060000,0070000,00
HH under RL
HH under MG
HH under CW
HH under EC
ALL HH
HH under RLHH under
MGHH under CW HH under EC ALL HH
WOMEN Income/Ha 4830,44 20890,46 16889,51 2486,59 11683,22
MEN Income/Ha 28600,82 48855,75 62381,19 33386,97 52011,59
Average Total number of harvested products from the strategy by HHs
Income /ha (FCFA) generated from the tree-based adaptation strategy

Key Research Findings
3. Pattern in regulation services :
Parameters of
assessment (%)
RL MG CW EC Total
Soil Fertility conservation
Not at all 0.00 0.00 0.00 61.30 14.70
Slightly 2.60 13.80 12.90 35.50 15.50
Moderately 5.30 44.80 32.30 3.20 20.20
Strongly 92.10 41.40 54.80 0.00 49.60
Fisher’s exact = 121.6756 Pr = 0.000
Ecosystem regeneration
Not at all 0.00 3.40 0.00 22.60 6.20
Slightly 5.30 10.30 12.90 61.30 21.70
Moderately 13.20 44.80 45.20 9.70 27.10
Strongly 81.60 41.40 41.90 6.50 45.00
Fisher’s exact = 82.9678 Pr = 0.000
Erosion reduction
Slightly 10.50 17.20 9.70 67.70 25.60
Moderately 10.50 51.70 41.90 22.60 30.20
Strongly 78.90 31.00 48.40 9.70 44.20
Fisher’s exact = 60.0826 Pr = 0.000
Households’ perception on ecosystem services provided by the promoted land uses
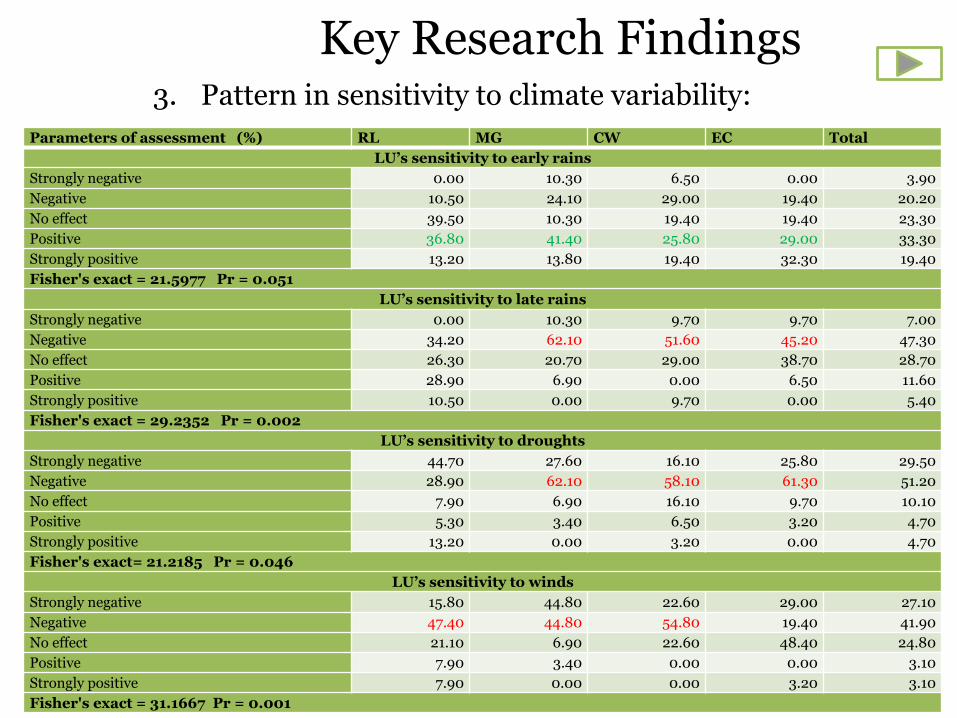
Key Research Findings 3. Pattern in sensitivity to climate variability:
Parameters of assessment (%) RL MG CW EC Total
LU’s sensitivity to early rains
Strongly negative 0.00 10.30 6.50 0.00 3.90
Negative 10.50 24.10 29.00 19.40 20.20
No effect 39.50 10.30 19.40 19.40 23.30
Positive 36.80 41.40 25.80 29.00 33.30
Strongly positive 13.20 13.80 19.40 32.30 19.40
Fisher's exact = 21.5977 Pr = 0.051
LU’s sensitivity to late rains
Strongly negative 0.00 10.30 9.70 9.70 7.00
Negative 34.20 62.10 51.60 45.20 47.30
No effect 26.30 20.70 29.00 38.70 28.70
Positive 28.90 6.90 0.00 6.50 11.60
Strongly positive 10.50 0.00 9.70 0.00 5.40
Fisher's exact = 29.2352 Pr = 0.002
LU’s sensitivity to droughts
Strongly negative 44.70 27.60 16.10 25.80 29.50
Negative 28.90 62.10 58.10 61.30 51.20
No effect 7.90 6.90 16.10 9.70 10.10
Positive 5.30 3.40 6.50 3.20 4.70
Strongly positive 13.20 0.00 3.20 0.00 4.70
Fisher's exact= 21.2185 Pr = 0.046
LU’s sensitivity to winds
Strongly negative 15.80 44.80 22.60 29.00 27.10
Negative 47.40 44.80 54.80 19.40 41.90
No effect 21.10 6.90 22.60 48.40 24.80
Positive 7.90 3.40 0.00 0.00 3.10
Strongly positive 7.90 0.00 0.00 3.20 3.10
Fisher's exact = 31.1667 Pr = 0.001

4. Household adaptive capacity index under each tree-based adaptation strategy
Notes: RL = Reforested Lands; MG = Mango Plantations; CW= Cashew Plantations; EC= Eucalyptus Plantations
Key Research Findings
any significant difference among HHs
less endowed in assets
Adaptive capacity Indexes RL MG CW EC
Assets-related Index
(ACIA) 4.336 4.330 4.091 3.014
Diversification strategy-
related Index(ACIS) 0.670 0.381 0.463 0.241
Overall AC Index 5.006 4.711 4.554 3.255
High ACI
Low ACI
Relatively good ACI

Key Research Findings RL provides good ACI for HH:
o better diversification index in terms of products (available at
different times during the year);
o income for both household head and his wives = gender disparity in income generation is low;
o less sensitive to climate risks.
EC provides low ACI for HH.
o considerable disparity in income generation between household head and the wives,
o small scale plantations perceived sensitive to climate risks especially when they are young,
o low product diversity.
Fruit trees == relatively good ACI
o generally higher economic gain
o low products diversification than the RL
o perceived as highly sensitive to climate risks.
need to consider the
overall environment
al and biodiversity
loss

What policy implications?
Improve access to land and secure land tenure at local level: enabling conditions to help households increase land-based liv. divers. strat. and assure investments on lands
Integration of vulnerability and adaptive capacity analysis to implement ecosystem based interventions
Enhance integration of FLR as a part of land use plans o To enhance climate resilience of livelihoods by increasing AC of
communities & individuals
THANK YOU

Adaptive capacity and tree-based livelihood diversification strategies of smallholders in Central
Burkina Faso
With the supports of
And the collaboration of