Embed Size (px)
Citation preview

Projection of Heat Waves over China
under Eight Different Global Warming
Targets
Xiao-jun GUO, Jian-bin HUANG, Yong LUO, Zong-ci ZHAO
Center for Earth System Science, Tsinghua University, China
Wednesday, 8 JULY 2015
Email: [email protected]
山
Our Common Future under Climate Change, Paris, 2015

Outline
1. Introduction
2. Data and Methodology
3. Evaluation of heat waves over China simulated by
12 CMIP5 models
4. Projection of heat waves over China under 8 different
warming targets and uncertainty analysis
5. The relationship between heat waves, mean surface
temperature and precipitation
6. Conclusion and discussion

Part 1:Introduction
Under global warming background , the temperature extremes are becoming more frequent and more intense. (IPCCAR5, 2013)
Distribution of Tmax (℃) average for 2013 summer over China .
In August 2013,a heat wave occurred in Eastern China has broken the heat record of Shanghai in over 141 years and pushed temperature up to 42 ℃ in some regions.
(IPCC AR5, 2013)
2003 2005 2008
2009 2009
2010
2013
2014
2015
2015
(WMO, 2010)
2015

The intensity of climate change impacts will accelerate with increasing levels of global warming.
GLOBAL WARMING TARGET
(IPCC AR4, 2007)
2013 mega-heat waves over
China
9.6 billion dollars direct economic losses

Part 2: Data and Methodology
Model and observation dataset :
(1) CMIP5 global climate models:
Daily outputs of 12 CMIP5 global climate models
(2) Observation data :
Observed daily gridded dataset CN05.1 which is derived from China Meteorological Administration
(resolution of 0.5 degree,1961-2005)
Variables:
1. Daily maximum surface air temperature
2. Monthly mean surface air temperature
3. Monthly mean surface precipitation

Model name Institute/Country Resolution Historical
period
Future
Period
ACCESS1-0 CSIRO-BOM/Australia 192×145 1850-2005 2006-2100
BNU-ESM GCESS/China 128×64 1950-2005 2006-2100
BCC-CSM1-1 BCC/China 128×64 1850-2012 2006-2100
CNRM-CM5 CNRM-CERFACS/France 256×128 1900-2005 2006-2100
CanESM2 CCCMA/Canada 128×64 1850-2005 2006-2100
CCSM4 NCAR/USA 288×192 1850-2005 2006-2100
MPI-ESM-MR MPI-M/Germany 192×96 1850-2005 2006-2100
GFDL-ESM2G NOAA GFDL/USA 144×90 1861-2005 2006-2100
HadGEM2-ES MOHC/UK 192×145 1860-2005 2006-2100
IPSL-CM5A-
LR IPSL/France 96×96
1850-2005
2006-2100
MIROC-ESM-
CHEM MIROC/Japan 128×64
1850-2005
2006-2100
NorESM1-M NCC/Norway 144×96
1850-2005
2006-2100
Main characteristics of 12 CMIP5 global climate models used

Methods:
1. Pre-industrial times: 1861-1880
The base climate period : 1971-2000
The months selected to analyze the heat waves :
May , June , July , August and September (total is 153 days).
Scenarios:RCP4.5 and RCP8.5
2. Heat waves :
2.1 The definition of heat waves:
A heat wave is defined as a consecutive period of at least three days during which the May-September daily maximum temperature exceeds the 95th percentile of the reference period (1971-2000), and the percentile threshold must be no less than 30℃.
2.2 Heat waves indices:
Part 2: Data and Methodology
Heat waves indices
Definition (Unit)
Heat wave Frequency The number of heat waves occurred each year (times)
Longest heat wave duration The duration of the longest heat wave per year (days)
Heat wave days
The cumulative number of days per year during which the
heat waves occur (days)

Part 3 : Evaluation of heat waves over China simulated by 12 CMIP5 models
1961-2005 Bias Root-mean-
square error
Temporal
Correlation
Linear trend of
ensemble (10a)
Linear trend of
observation (10a)
Frequency /times -0.10 0.22 0.57*** 0.06 0.06
Duration /d -0.42 0.61 0.57*** 0.12 0.10
Heat wave days /d -0.29 0.86 0.57*** 0.23 0.20
Statistic features of ensemble simulated and observed heat waves indices during 1961-2005
3.1 The temporal features of heat waves
(*** indicates the correlation coefficient exceeds a 99% significance level)
Heat wave frequency Heat wave days

Ensemble
Observation
R=0.78 Bias=-3.04%
The relative bias and spatial correlation for
heat wave days between model and observation
results in the base climate(1971-2000)
Model name
Relative bias(%)
(model minus
observation)
Spatial
Correlation
BNU-ESM -13.65 0.55
BCC-CSM1-1 -4.90 0.57
HadGEM2-ES -1.54 0.57 MIROC-ESM-
CHEM -3.57 0.6
GFDL-ESM2G -0.52 0.66
ACCESS1-0 14.60 0.7 IPSL-CM5A-
LR -23.64 0.7
CNRM-CM5 13.80 0.72
NorESM1-M -37.43 0.73
CanESM2 23.94 0.74
MPI-ESM-MR -22.68 0.77
CCSM4 -6.58 0.8
Ensemble -3.04 0.78
Spatial distribution of heat waves days
over China (1971-2000)
3.2 The spatial features of heat waves

Part 4:Projection of heat waves over China under 8 different warming targets
The projected timing reaching different warming targets
(relative to pre-industrial climate 1860-1880)
ENSEMBLE Warming Target
1.5 ℃ 2 ℃ 2.5 ℃ 3 ℃ 3.5 ℃ 4 ℃ 4.5 ℃ 5℃
RCP4.5
2026
2046
2072
RCP8.5
2023
2049
2059
2069
2078
1.5°C 2°C 2.5°C 3°C
2010
2020
2030
2040
2050
2060
2070
2080
2090
2100 CanESM2
CNRM-CM5
bcc-csm1-1
BNU-ESM
ACCESS1-0
GFDL-ESM2G
HadGEM2-ES
IPSL-CM5A-LR
MIROC-ESM-CHEM
NorESM1-M
CCSM4
MPI-ESM-MR
Ensemble
a
yea
r
Global warming target
1.5°C 2°C 2.5°C 3°C 3.5°C 4°C 4.5°C 5°C
2010
2020
2030
2040
2050
2060
2070
2080
2090
2100
b CanESM2
CNRM-CM5
bcc-csm1-1
BNU-ESM
ACCESS1-0
GFDL-ESM2G
HadGEM2-ES
IPSL-CM5A-LR
MIROC-ESM-CHEM
NorESM1-M
CCSM4
MPI-ESM-MR
Ensemble
yea
r
Global warming target
RCP4.5 RCP8.5
2037 2087
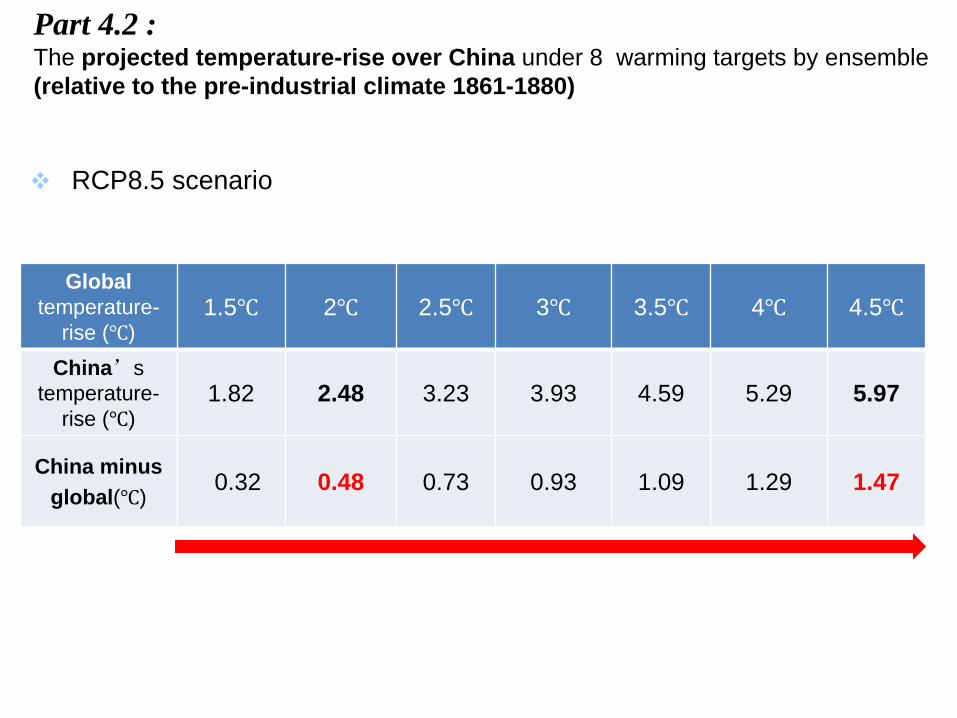
Part 4.2 : The projected temperature-rise over China under 8 warming targets by ensemble
(relative to the pre-industrial climate 1861-1880)
Global
temperature-
rise (℃) 1.5℃ 2℃ 2.5℃ 3℃ 3.5℃ 4℃ 4.5℃
China’s
temperature-
rise (℃)
1.82
2.48
3.23
3.93
4.59
5.29
5.97
China minus
global(℃) 0.32 0.48 0.73 0.93 1.09 1.29 1.47
RCP8.5 scenario
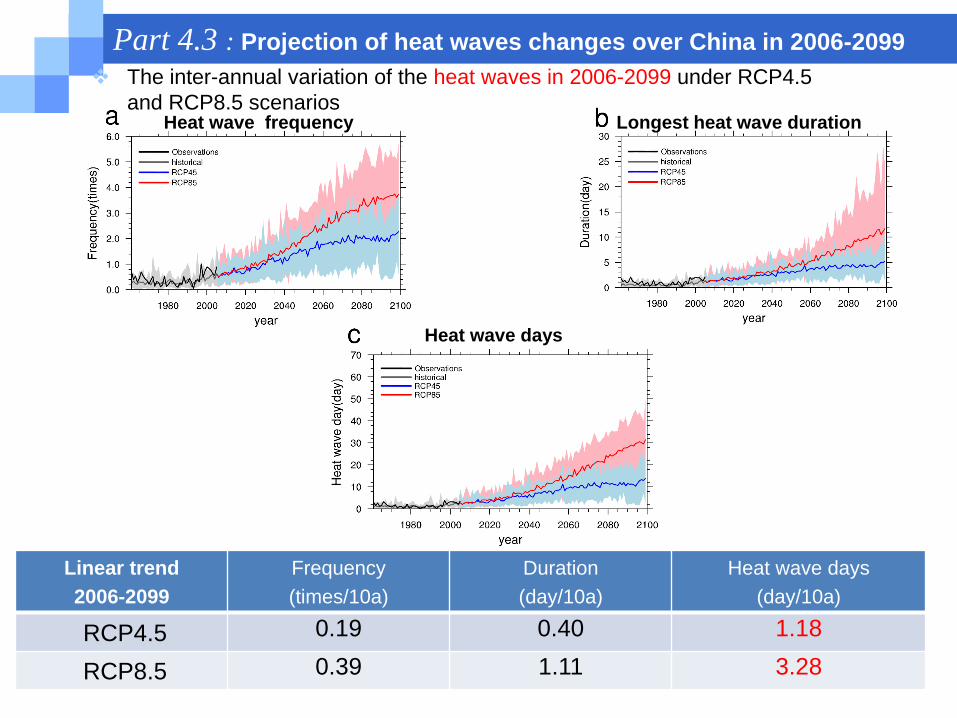
The inter-annual variation of the heat waves in 2006-2099 under RCP4.5
and RCP8.5 scenarios Heat wave frequency Longest heat wave duration
Heat wave days
Linear trend
2006-2099
Frequency
(times/10a)
Duration
(day/10a)
Heat wave days
(day/10a)
RCP4.5 0.19 0.40 1.18
RCP8.5 0.39 1.11 3.28
Part 4.3 : Projection of heat waves changes over China in 2006-2099

The spatial
distribution of
heat waves
indices
anomalies
under a 2℃
warming
target (relative to
the base
climate, RCP
8.5 scenario)
Longest heat wave duration Heat wave frequency
Heat wave days
Part 4.4 The change features of heat wave under a 2℃ warming target

The spatial distribution of heat wave days anomalies under eight
warming targets for RCP 8.5 scenario (relative to the base climate)
1.5℃ 2℃ 2.5℃ 3℃
3.5℃ 4℃ 4.5℃ 5℃
5.4 days/yr 8.6 days/yr 12.3 days/yr 16.2 days/yr
20.2 days/yr 24.5 days/yr 29.1 days/yr 32.0 days/yr
The red fonts are for the heat waves days averaged over China

The percentage of area in different segment groups for heat wave days
under eight warming targets ( for RCP 8.5 scenario)
Heat wave days Heat
wave
days (d)
(0,7] (7,14] (14,21] (21,28] >28
1.5℃ 17.36% 6.41%
2℃ 44.91% 26.04% 9.41% 6.44%
2.5℃ 32.29% 22.61% 16.23% 7.58% 9.43%
3℃ 28.35% 18.37% 13.73% 12.25% 16.06%
3.5℃ 18.15% 18.83% 11.86% 10.26% 28.21%
4℃ 16.19% 11.90% 14.03% 10.88% 35.69%
4.5℃ 15.21% 6.07% 13.48% 9.70% 43.92%
5℃ 5.12% 6.10% 11.48%
The regions with severe heat waves occurring display a vast
expansion.
( 0-7] ( 7-14] ( 14-21] ( 21-28] >280
10
20
30
40
50
60
70
d 1.5℃ 2℃ 2.5℃ 3℃ 3.5℃ 4℃ 4.5℃ 5℃
Are
a p
erce
nta
ge(
%)
High temperature days (day)
63.55%
13.11%
0.51%
52.53%

Part 5 :Analysis on relationship between heat waves,
mean surface air temperature and precipitation
5.1 Heat waves & Mean surface air temperature
5.2 Heat waves & Mean precipitation

China RegionⅠ Region Ⅱ Region Ⅲ Region Ⅳ
Correlation
(1961-2005)
0.72
0.71
0.70
0.60
0.61
Part 5.1 Heat waves & Mean surface temperature
Scatter diagram of May-September mean surface temperature
and heat waves day anomalies (relative to 1971-2000)
The increase of the mean and maximum surface air temperature can lead to the
enhancement of the heat waves
Temporal correlation coefficients between heat waves days and May-September
mean surface temperature during 1961-2005 (observation results)
1963
2003
( Linear trends are removed in both precipitation and heat wave days before computing correlation coefficients)

Part 5.2 Heat waves & Mean precipitation
The prolonged precipitation deficits help to amplify the intensity of heat waves
Temporal correlation coefficients between heat waves days and May-September
mean precipitation during 1961-2005 (observation results)
China RegionⅠ Region Ⅱ Region Ⅲ Region Ⅳ
Correlation
(1961-2005)
-0.18
-0.49***
-0.43***
-0.46***
-0.30**
Scatter diagram of May-September mean precipitation and
heat waves day anomalies (relative to 1971-2000)
1963
2003
( Linear trends are removed in both precipitation and heat wave days before computing correlation coefficients)

Part 6 : Conclusion
※ 1) Compared with the observations, the 12 CMIP5 global climate models
ensemble have remarkable simulation capabilities of reproducing the
temporal and spatial features of heat waves over China.
※ 2) With the enhancement of warming targets, the frequency and intensity
of heat waves increase more dramatically over China.
Heat waves days
5.4 days/yr
(2℃ target)
Heat waves days
32.0 days/yr
(5℃ target)
※ 3) Those regions which experience severe heat waves in the base climate
would experience more severe heat waves in the future.
※
1) Increase of the summer air temperature
2) Decrease of summer precipitation
The increase of
heat waves

Part 6 : Discussion
※ More CMIP5 models and high-resolution regional climate models will
be adopted in order to better project the heat waves over China.
※ In addition, we will go further research about the causes responsible
for the heat waves (soil moisture and temperature/precipitation feedback,
Atmospheric circulation and so on), which is beneficial to reduce
the model uncertainties.
※ Heat waves are often accompanied by “drought-like” conditions
which pose detrimental impacts on human life, the ecosystem, the
economy and so on. Thus, exploration the features of drought is
also needed.

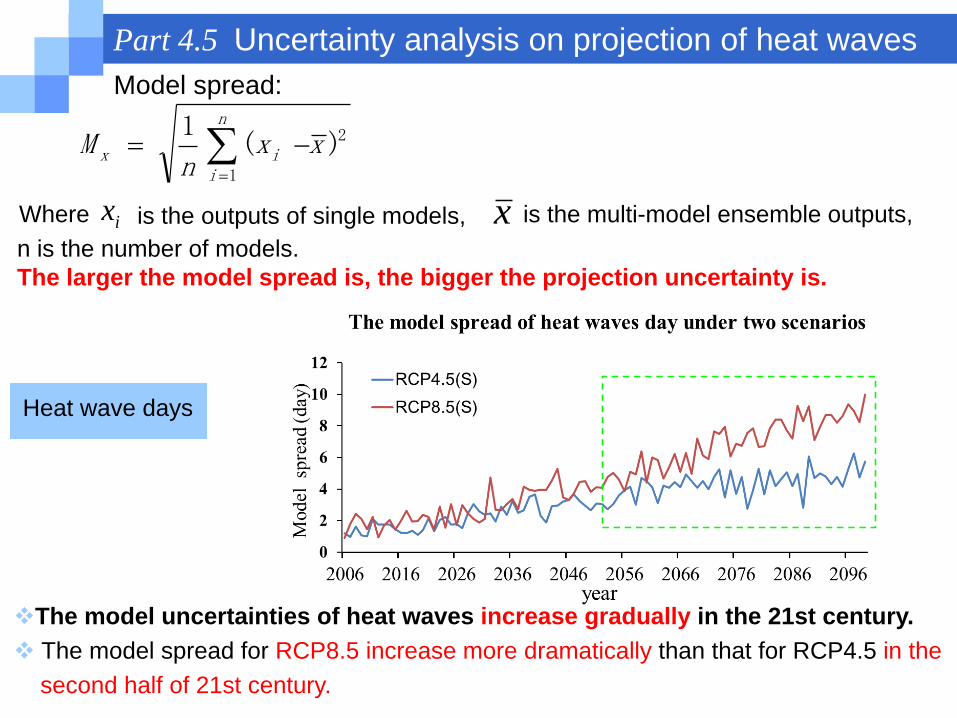
Part 4.5 Uncertainty analysis on projection of heat waves
2
1
)(1
xxn
Mn
iix
Model spread:
ix x Where is the outputs of single models, is the multi-model ensemble outputs,
n is the number of models.
The larger the model spread is, the bigger the projection uncertainty is.
Heat wave days
The model uncertainties of heat waves increase gradually in the 21st century.
The model spread for RCP8.5 increase more dramatically than that for RCP4.5 in the
second half of 21st century.