Embed Size (px)
Citation preview
Optimizing the Performance of Solid Core for Today and Tomorrow
Mike OliverProduct Manager, Sample Preparation and Accucore LC Products
Tony EdgeR&D Principal
June 2014

Introduction
• The History of Solid Core• The concept
Th i i l lid ti l d th h ll th f d• The original solid core particles and the challenges they faced
• Solid Core Chromatographyg p y• Understanding the benefits of the technology• Bar for bar greater efficiency• How to optimize the separation• How to optimize the separation
• Understanding chemistry• Optimization of the morphology
• The Future• Where will solid core take us?• Where will solid core take us?• New particle morphologies – their synthesis explained
2

Solid Core Material – The Concept
• Features• Less bed consolidation• Less bed consolidation• Better packing of particles• Less void volume in column• Reduced pore depth
• BenefitsBenefits• More efficient chromatography• Allows the use of low pressure systems
• Competitive Edge• Bar for bar gives better separations than porous materialsg p p
3

Liquid Chromatography Particle Design
2.6 µm80 Å
Solid Core Particles
80 Å
2.6 µm150 Å
Conventional Fully Porous Non-Porous Solid Core
4 µm80 Å
1.x µm80 Å
Reduce Size to improve kinetics at expense of
operating pressure
Low sample capacity
Very high pressure
Small particle kinetics
Reasonable pressureVery High Sample Capacity
Lower Efficiency
Low Sample Capacity
Very High Efficiency
High Sample Capacity
High Efficiency
4
operating pressurey y g y g y
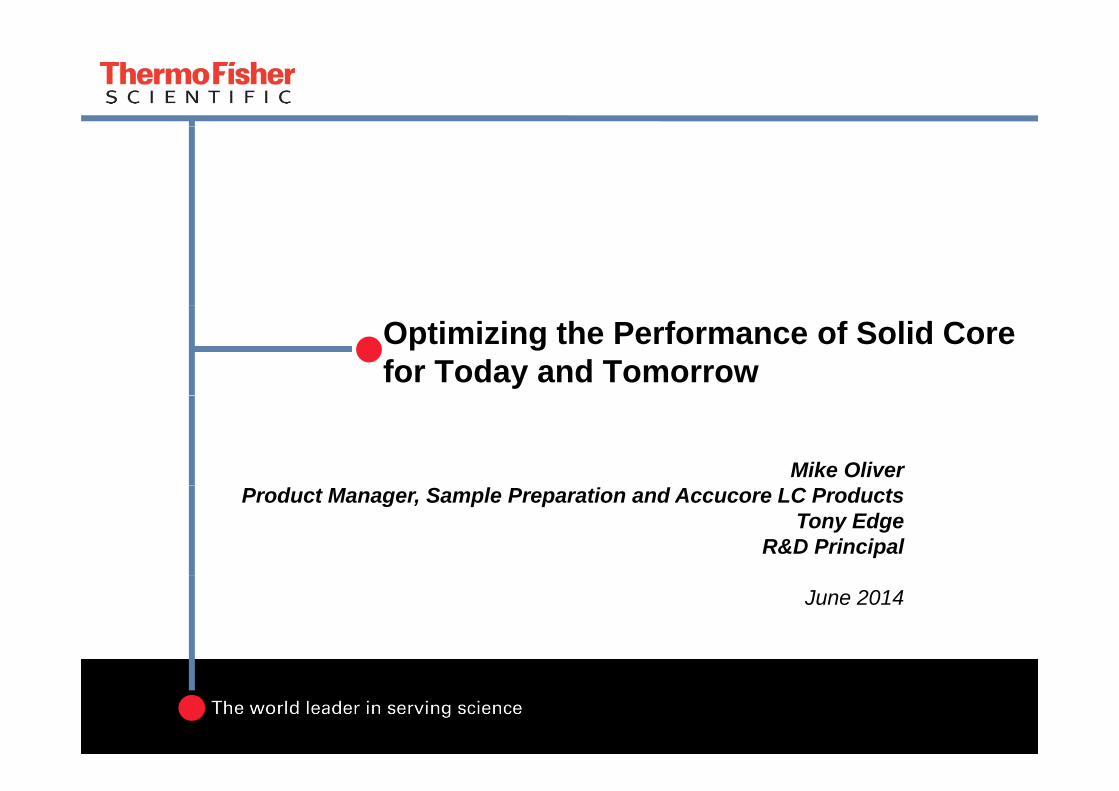
History of Solid Core Technology
• 1960s• Horvath and Lipsky introduce the concept of pellicular/shell particles
• 1970s• Core-shell particles developed:-
• Zipax (DuPont later Rockford laboratories and finally acquired by HP/Zipax (DuPont later Rockford laboratories and finally acquired by HP/ Agilent), Corasil (Waters), Perisorb (Merck)
• Improvement in the manufacturing of high-quality fully porous spherical particles• inhibits success of the shell particles• inhibits success of the shell particles• 10 μm fully porous spherical particles
• 1980s • 5 μm porous particles
• 1990s3 μm porous particles• 3 μm porous particles
• 2000−Present• sub-2 μm porous particles and core shell
5

The Theory … the Knox Equation
A term
B term
H
C term
H=Au1/3+B/u+CuCuBAuH 31
H H=Au1/3+B/u+CuCuu
AuH
Linear velocity / mm/s
6
Linear velocity / mm/s
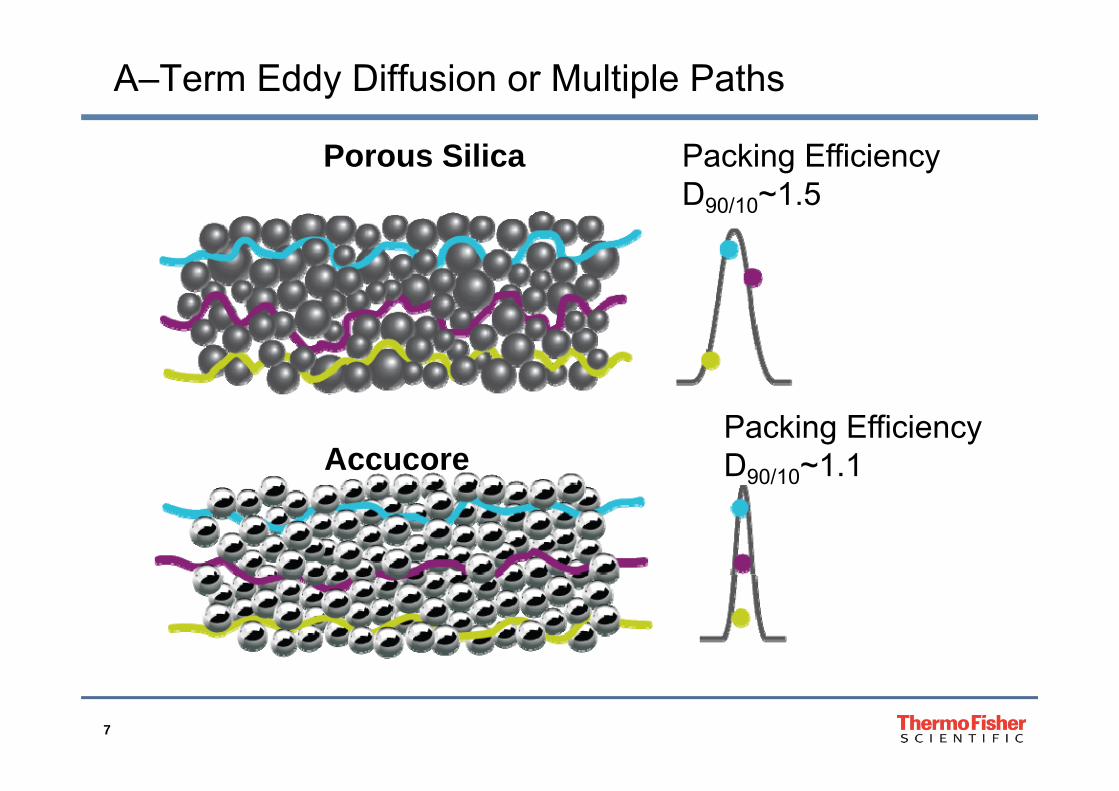
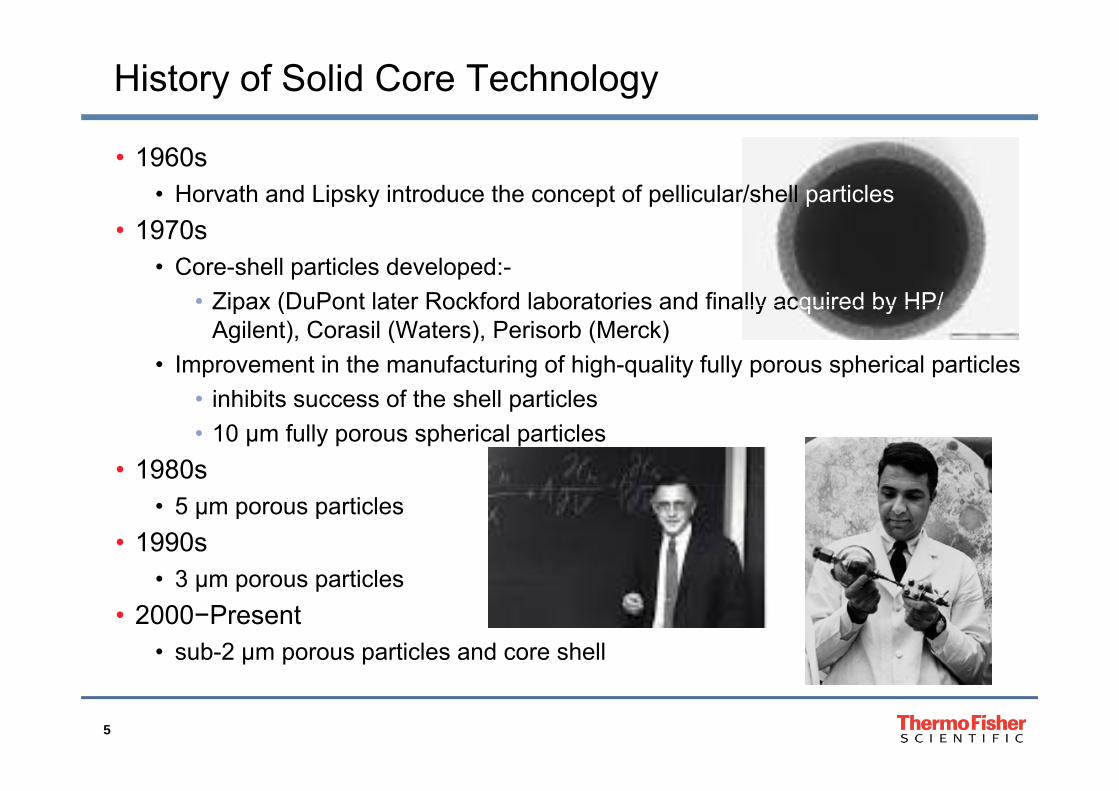
A–Term Eddy Diffusion or Multiple Paths
Packing Efficiency D90/10~1.5
Porous Silica
Packing Efficiency D90/10~1.1Accucore
7
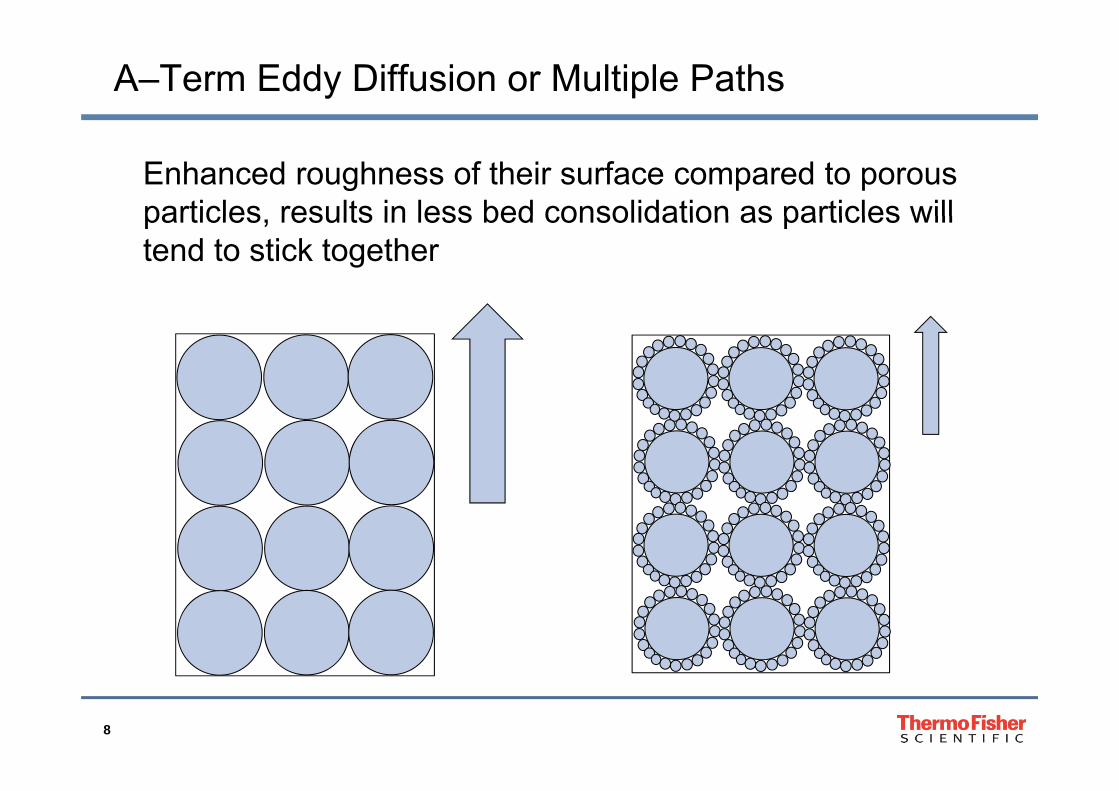
A–Term Eddy Diffusion or Multiple Paths
Enhanced roughness of their surface compared to porous particles results in less bed consolidation as particles willparticles, results in less bed consolidation as particles will tend to stick together
8
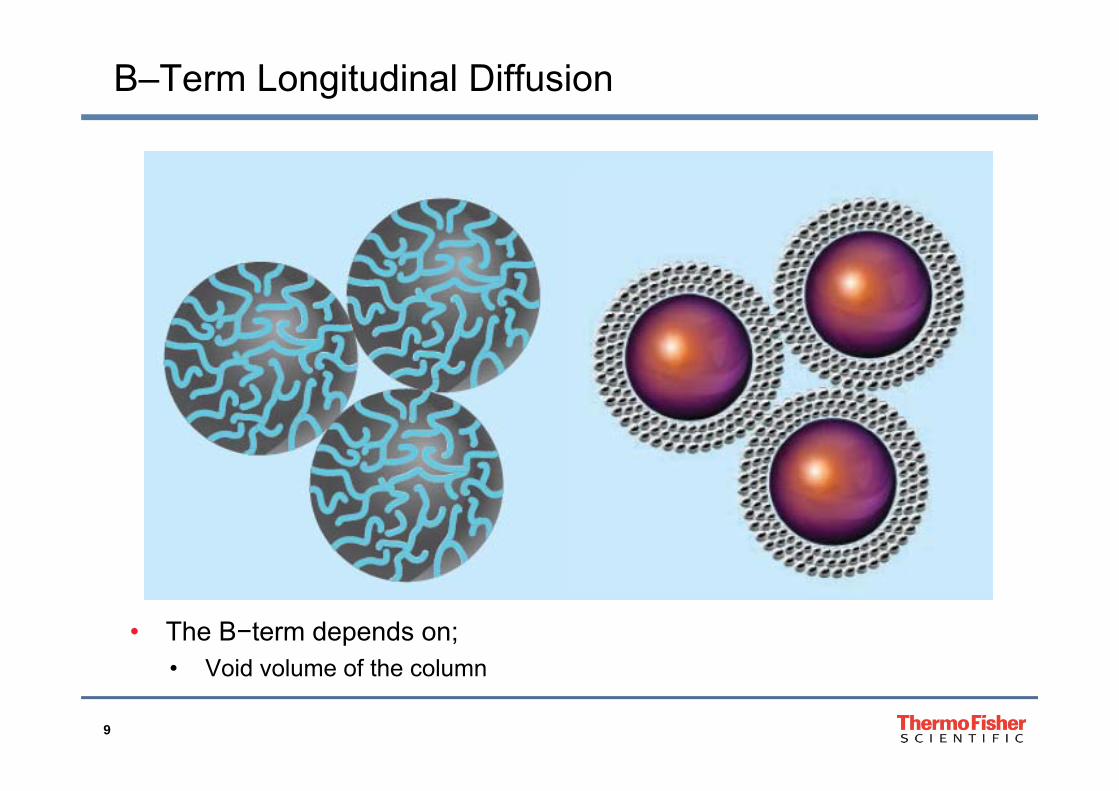
B–Term Longitudinal Diffusion
• The B−term depends on;• Void volume of the column
9
• Void volume of the column
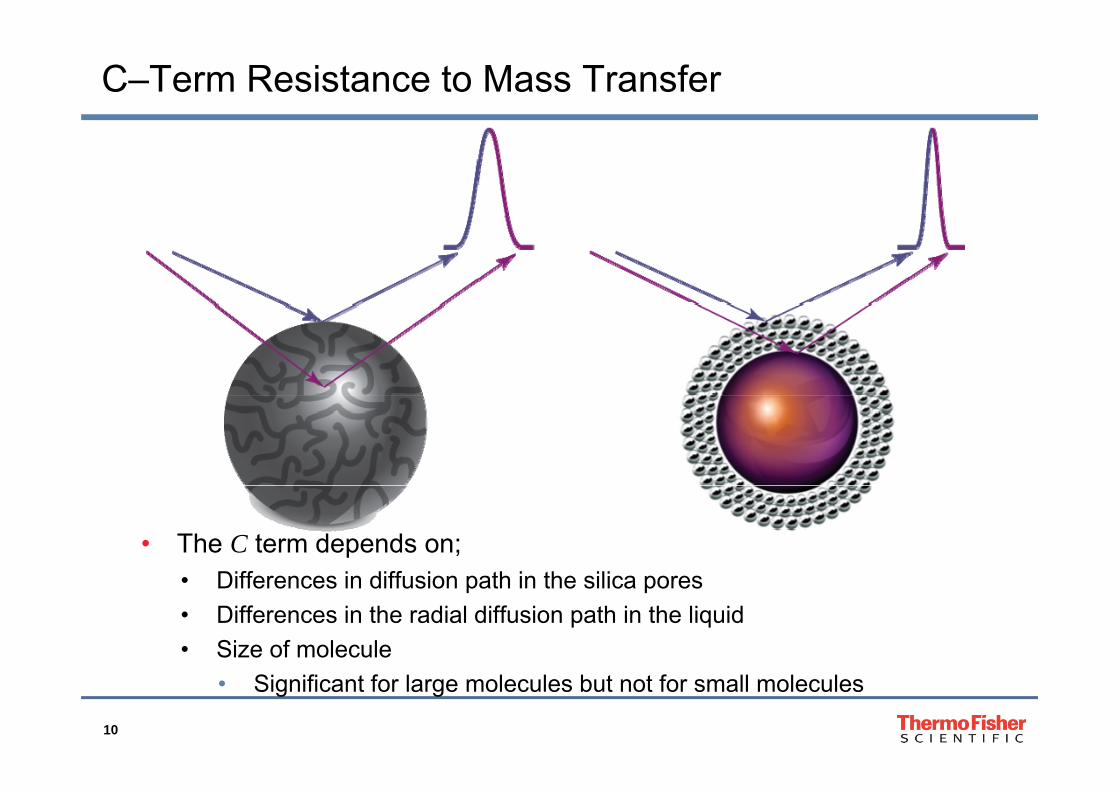
C–Term Resistance to Mass Transfer
• The C term depends on;Diff i diff i th i th ili• Differences in diffusion path in the silica pores
• Differences in the radial diffusion path in the liquid• Size of molecule
10
• Significant for large molecules but not for small molecules

Experimental Van Deemter Plots20.0
tical
10 0
15.0
Theo
ret
5.0
10.0
uiva
lent
Pl
ates
0.00 0 1 0 2 0 3 0 4 0 5 0 6 0 7 0 8 0 9 0 10 0ei
ght E
q
0.0 1.0 2.0 3.0 4.0 5.0 6.0 7.0 8.0 9.0 10.0He
Linear velocity of mobile phase (mm/s)Accucore RP-MS 2.6µm 5µm 3µm <2µm
Columns: 100 x 2.1 mmMobile phase: H2O / ACN (1:1)Temperature: 30 °CDetection: UV at 254 nm Flow rate range: 0.1 to 1.0 mL/min
Highest efficiency and lowest rate of efficiency loss with flow
rate for solid core
11
Flow rate range: 0.1 to 1.0 mL/minAnalyte: o-xylene rate for solid core
Pressure Comparison
900
1000 BAP 200
2 11
600
700
800
900
600 bar limit
pp ddL 30
230
400
500
600
ress
ure
(bar
)
HPLC pressure limit
100
200
300Pr
u = 8 7mm/s0
0 200 400 600 800 1000
Flow rate (µL/min)
Accucore RP MS 2 6µm <2µm 3µm 5µm
u = 8.7mm/s
Accucore RP-MS 2.6µm <2µm 3µm 5µm
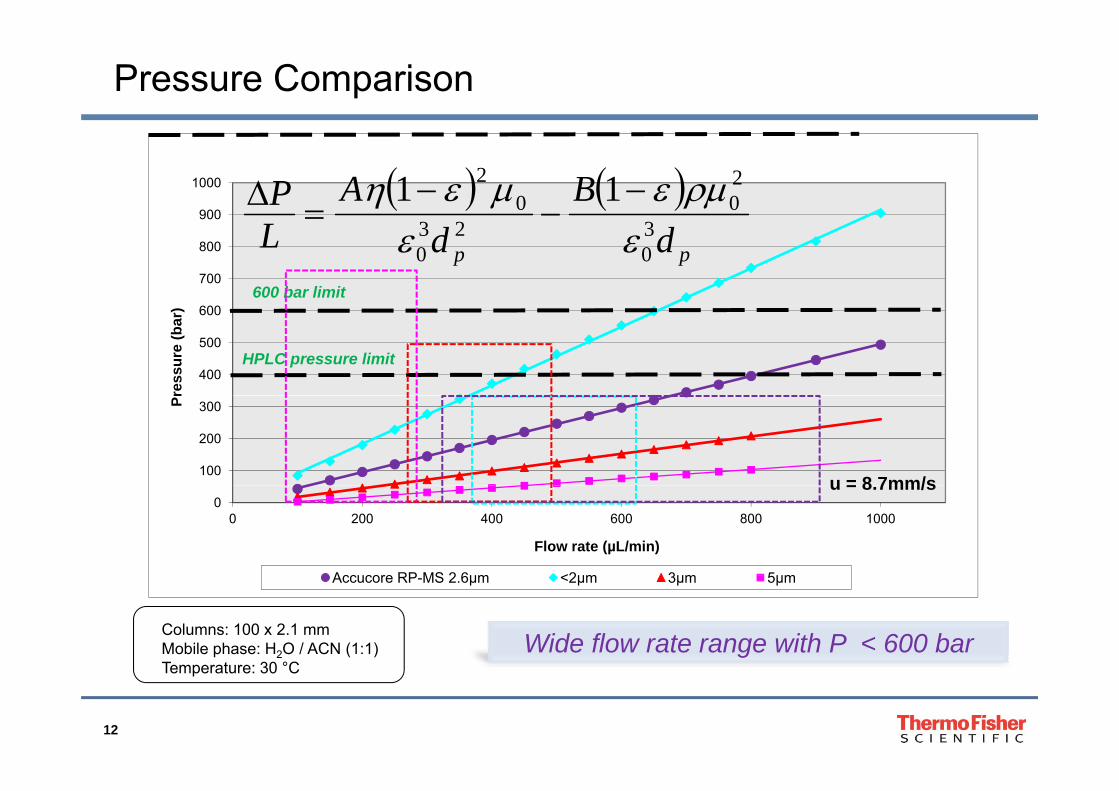
Columns: 100 x 2.1 mmMobile phase: H2O / ACN (1:1)Temperature: 30 °C
Wide flow rate range with P < 600 bar
12
Temperature: 30 °C

Van Deemter – Limitations
• Classical interpretation of how a column is performing
• 3 parameters• A – Eddy diffusiony• B – Longitudinal diffusion• C – Resistance to mass transfer
• Optimization of these parameter will give the best peak shape/efficiency
• However it does not take into account;• Analysis time
P t i ti t• Pressure restrictions on a system
13
Kinetic Plots
• Allows for fairer comparisons of analytical systems• Van Deemter just compares pure separation ability• Van Deemter just compares pure separation ability
• Incorporates time of analysisp y• Analysts want FASTER chromatography• Van Deemter plots do not specify the time of analysis
• Incorporates pressure limitations of systems• Van Deemter does not account for a pressure limitation p
on system
• Based on three very simple classical equations• Based on three very simple classical equations
14

Kinetic Plots – Retention Time1000010000
1000(s)
of p
eak(
100
ion
time
Accucore allows optimisation of retention times
Ret
enti
Solid core produces sharper peaks in less time
101,000.00 10,000.00 100,000.00
Efficiency
p
15
Accucore RP-MS 2.6µm 5µm 3µm <2µm Efficiency

Impedance
• Devised by Knox and Bristow in 1977Defines the resistance a compound has to moving• Defines the resistance a compound has to moving down a column relative to the performance of that column
• Allows for pressure to be incorporated
Often plotted with a reverse axis• Often plotted with a reverse axis• Mimics van Deemter plot• Minimum value optimum conditions 2
PtE p
• Often plotted as a dimensional form2N
E• t/N2
• t0 or tr both used
16

100,000
Kinetic Plots – Impedance100,000
20
NPtE
ce
2N
10,000
mpe
dan
Im
S lid i lSolid core requires less pressure to obtain sub 2 µm
efficiencies
1,000100.001,000.0010,000.00100,000.001,000,000.00
Accucore RP-MS 2.6µm 5µm 3µm <2µm Efficiency
17
µ µ µ µ Efficiency
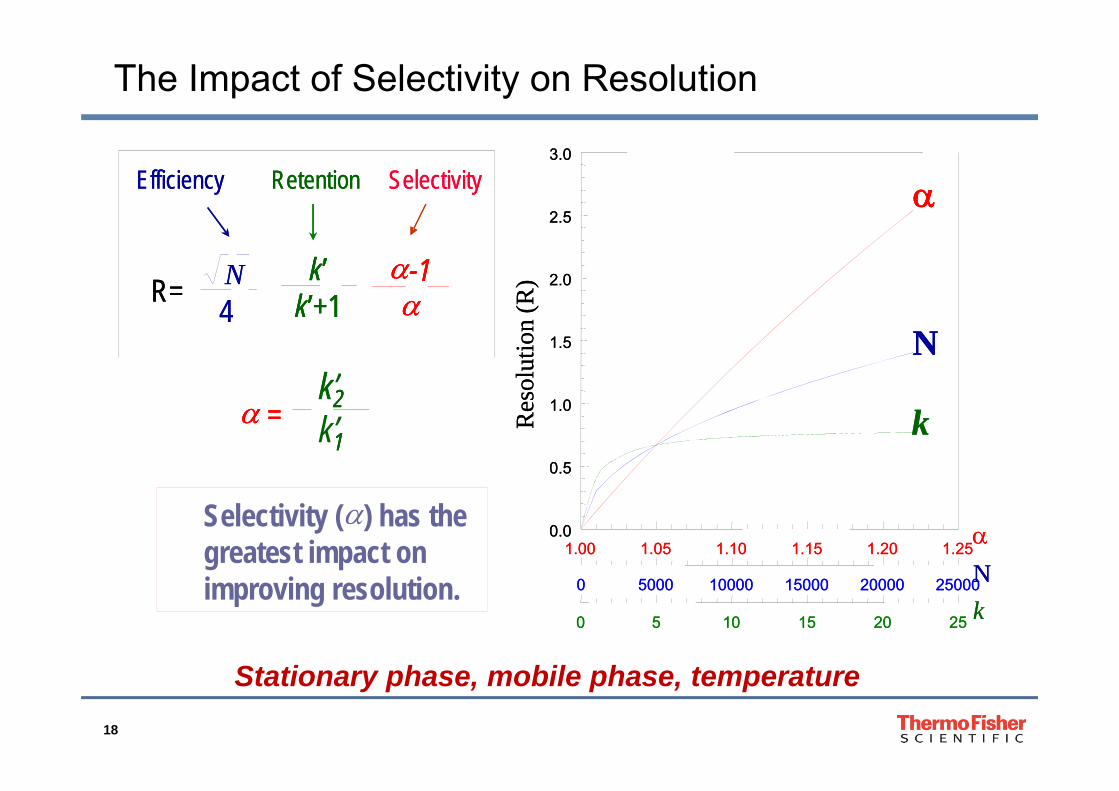
The Impact of Selectivity on Resolution
Efficiency SelectivityRetentionEfficiency SelectivityRetention2 5
3.0
2 5
3.0
NR=k’
k’+1-14
NR=k’
k’+1k’
k’+1-1-14
2.0
2.5
(R) 2.0
2.5
(R)
k +1 4
k2
k +1k +1 4
k’221.5 N
solu
tion
(
1.5 N
solu
tion
(
=k2k’1
=k2
1 = 2
10.5
1.0kR
es
0.5
1.0kR
esSelectivity () has the greatest impact on 1.00 1.05 1.10 1.15 1.20 1.25
0.0 N
1.00 1.05 1.10 1.15 1.20 1.250.0
Nimproving resolution. 0 5000 10000 15000 20000 25000
0 5 10 15 20 25
Nk
0 5000 10000 15000 20000 25000
0 5 10 15 20 25
Nk
S18
Stationary phase, mobile phase, temperature

The Growth of Solid Core Technology
• Particle sizes available• 1.3, 1.6, 1.7,2.6, 2.7, 4, 5
P i il bl• Pore sizes available• 80, 120, 150, 300
• Stationary Phases Availabley• Reversed phases
• C4, EC-C8, C8, EC-C18, SB-C18, XB-C18, C18, C18+, C30, RP-MS, AdvanceBio C18 HT C28 Peptide ES C18AdvanceBio, C18-HT, C28, Peptide ES-C18
• Polar encapped / embedded phases• Polar aQ, Polar Premium, SB-Aq, Bonus-RP, RP-Aqua
• HILIC / Normal phases• Silica, Amide, Urea-HILIC, EC-CN, Penta-HILIC
• π ‐π phasesp ases• Phenyl, Biphenyl, Phenyl-Hexyl, PFP, Phenyl-X, Diphenyl
• Currently >50 different stationary phases available
19
• >7 manufacturers
Stationary Phase Characterization
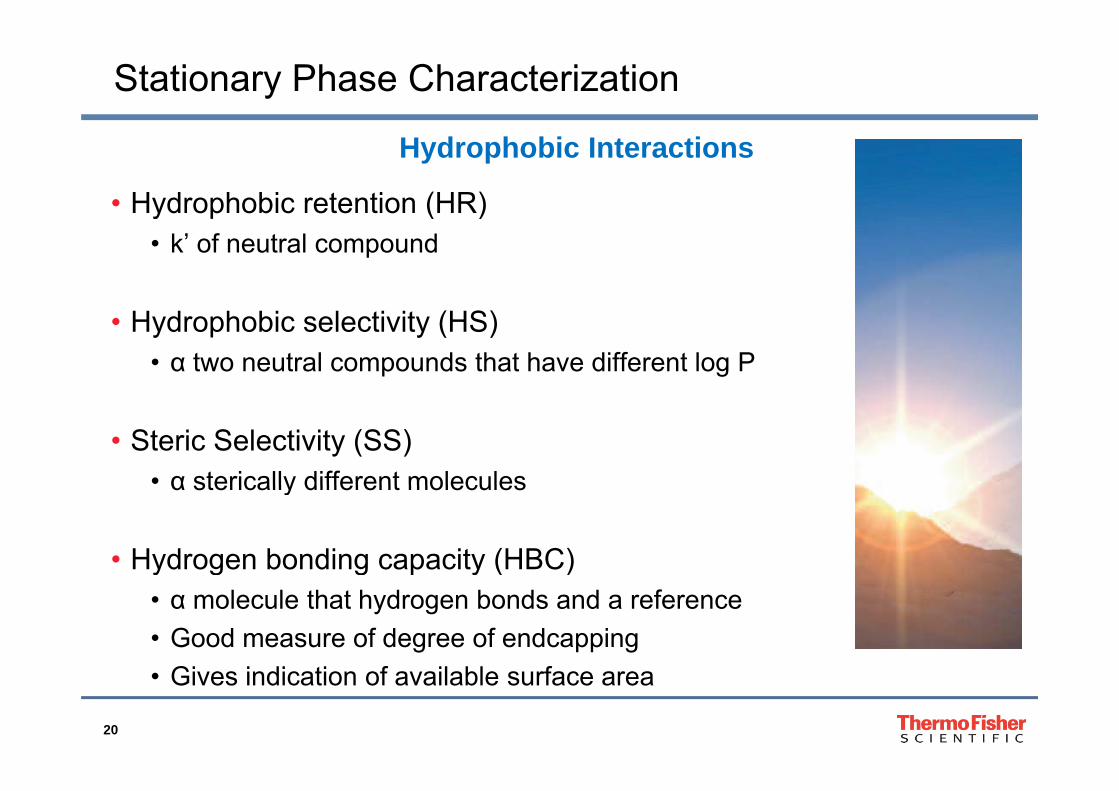
• Hydrophobic retention (HR)
Hydrophobic Interactions
y p ( )• k’ of neutral compound
• Hydrophobic selectivity (HS)• α two neutral compounds that have different log P
• Steric Selectivity (SS)• α sterically different moleculesα sterically different molecules
• Hydrogen bonding capacity (HBC)y g g y ( )• α molecule that hydrogen bonds and a reference• Good measure of degree of endcapping
20
• Gives indication of available surface area

Stationary Phase Characterization
• Activity towards bases (BA)
Interactions with Bases and Chelators
• Activity towards bases (BA)• k’, tailing factor (tf) of strong base• Indicator of free silanols
• Activity towards chelators (C)• k’, tailing factor (tf) of chelator• Indicator of silica metal content
21

Stationary Phase Characterization
Interactions with Acids and Ion Exchanges
• Activity towards acids (AI)• k’, tf acid• Indicator of interactions with acidic compounds• Indicator of interactions with acidic compounds
• Ion Exchange Capacity (IEX pH 7.6)g p y ( p )• α base / reference compound• Indicator of total silanol activity
• All silanols above pKa
I E h C it (IEX H 2 7)• Ion Exchange Capacity (IEX pH 2.7)• α base / reference compound• Indicator of acidic silanol (SiO-) activity
22
• Indicator of acidic silanol (SiO ) activity
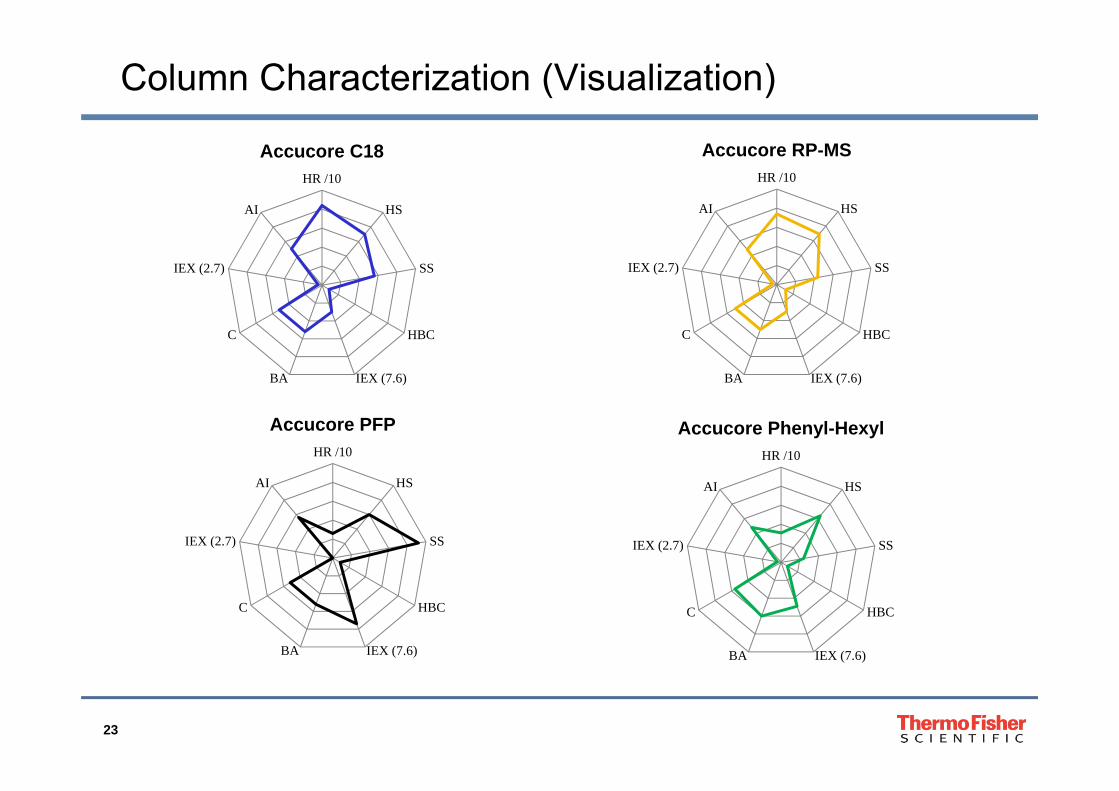
Column Characterization (Visualization)
HR /10
HSAI
Accucore C18HR /10
HSAI
Accucore RP-MS
SSIEX (2.7) SSIEX (2.7)
HBC
IEX (7.6)BA
C HBC
IEX (7.6)BA
C
HR /10
HSAI
Accucore PFPHR /10
HSAI
Accucore Phenyl-Hexyl
HS
SSIEX (2.7)
AI HS
SSIEX (2.7)
AI
HBC
IEX (7.6)BA
C HBC
IEX (7.6)BA
C
23

Widest Range of Solid Core Selectivity Options
500mAU 1,2,3 curcuminoids
2 00
2.50HR /10
HSAIAccucore RP-MS
Solid Core C18
0.50
1.00
1.50
2.00 HS
SSIEX (2.7)
AI Accucore C18
Accucore 150-C18
Accucore C8
Accucore 150-C4
Accucore Polar Premium1
0.00
HBCC
Accucore aQ
Accucore Polar Premium
Accucore Phenyl-Hexyl
Accucore PFP
23
Polar Premium shows different selectivity and separates the peaks
IEX (7.6)BA
Accucore Phenyl-X
Accucore C30
0.0 1.0 2.0 3.0
0
Minutes
24
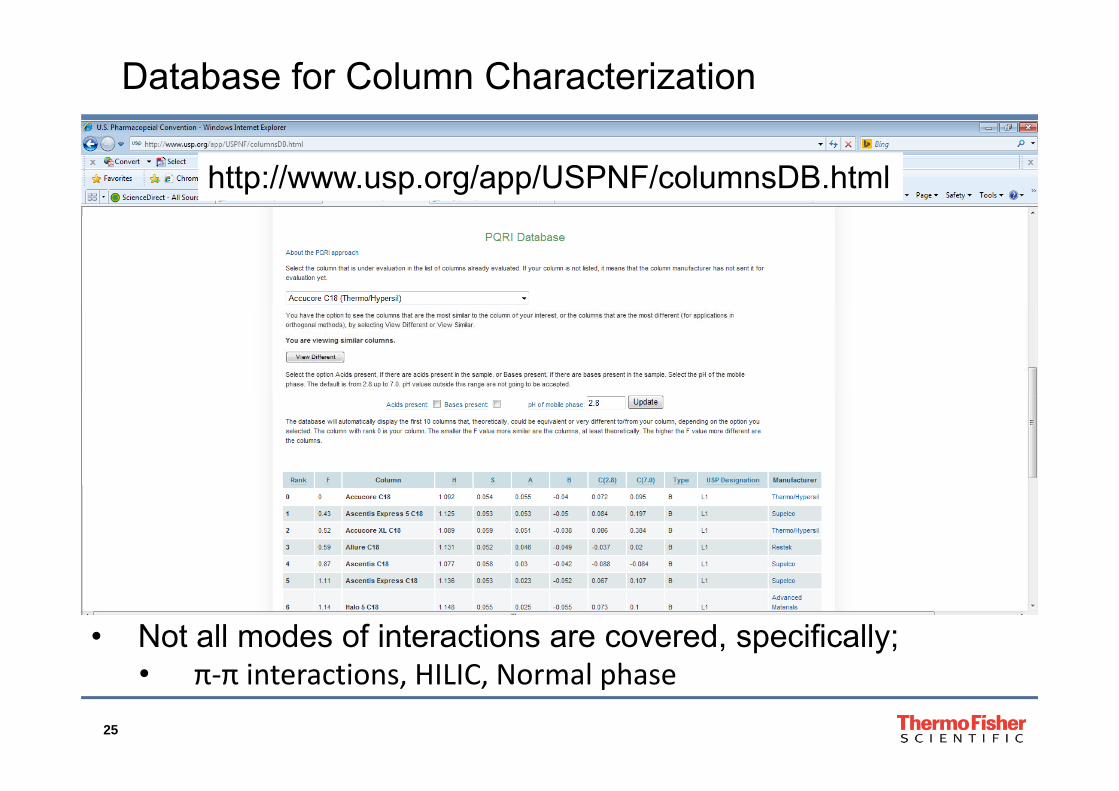
Database for Column Characterization
http://www.usp.org/app/USPNF/columnsDB.html
• Not all modes of interactions are covered, specifically;i i HILIC N l h
25
• π‐π interactions, HILIC, Normal phase

System Considerations• Column: Accucore RP-MS 2.6 μm, 100 x 2.1 mm
• Gradient: 65–95 % B in 2.1 min
Dwell volume: 100 µL
95 % B for 0.4 min
• Flow rate: 400 µL/minAccela 1250
Dwell volume: 800 L
Surveyor Accela Surveyor Agilent
800 µL
Minutes0.00 1.00 2.00 3.00 4.00
Accela1250
Surveyor Agilent 1100
Run time (min)
2.5 3.0 3.5Dwell volume: 1000 µL
min0 0 5 1 1 5 2 2 5 3 3 5
Agilent 1100 AveragePW (1/2 Height)
0.02 0.02 0.04
min0 0.5 1 1.5 2 2.5 3 3.5
Solid core can deliver performance on a b f diff t t
26
number of different systems

System Considerations
• Minimize volume dispersion
Always Optimize System Configuration
• Tubing–short L, narrow ID• Low injection volume• Low volume flow cell• Low volume flow cell
• Optimize detector sampling rate Need enough points to define
peak (minimum of 10, >20 for quantitation)
5 pts
Fast scanning MS
• Low dwell volume pump for fast45 pts
9 pts
Low dwell volume pump for fast gradients
27

Reducing the Particle Size
• Industry is fixated with pressure• This is an unwanted artefact of running with smaller particles
R d l lif ti d i t t lif ti i f i ti l h ti• Reduces column lifetime, reduces instrument lifetime, causing frictional heating
• System dispersion is critical with smaller particlesy p p• Injection volumes, connectors, detector volumes become more important
C t l f t t• Control of temperature• Increase in pressure results in greater column temperature gradients• Need to ensure that column temperature is controlled effectivelyp y
• Isothermal / adiabatic control
Is there a finite limit to particle size reduction?
28
reduction?

Analyzing Biomolecules
• Move to produce bigger molecules• Difficult to copy• Difficult to copy• Greater success rates
• Chromatography requirements• Need less retentive phase• Need wide pores to cope with larger molecules• Need wide pores to cope with larger molecules
29

Peptides – Resolution & Peak ShapeRT: 0 11 15 03RT: 0.11 - 15.03
1.12
8.743.76 7.09 13.468.9111 20
Accucore 150-C18
11.2013.63
1.01 C ti l S lid C C181.018.52
6.983.6013.13
15.0310.84
Conventional Solid Core C18
100000 10.20< 2 µm Wide Pore Fully Porous C18
0
50000
uAU
8.491.5914.4912.035.25 14.31
y
2 4 6 8 10 12 14Ti ( i )
-50000
30
Time (min)

Proteins – Excellent Resolution vs < 2 µm Wide Pore
• Sharper and higher peaks80000
100000 Accucore 150-C4Backpressure: 185 bar
higher peaks than < 2 µm Wide Pore Fully Porous C4
40000
60000
uAU
Porous C4• Better resolution
and sensitivity100000
0
20000
• Significantly lower backpressure
60000
80000
100000 < 2 µm Wide Pore Fully Porous C4Backpressure: 320 bar
p
40000
60000
0 1 2 3 4 5 6 7 8 9 10Ti ( i )
0
20000
31
Time (min)
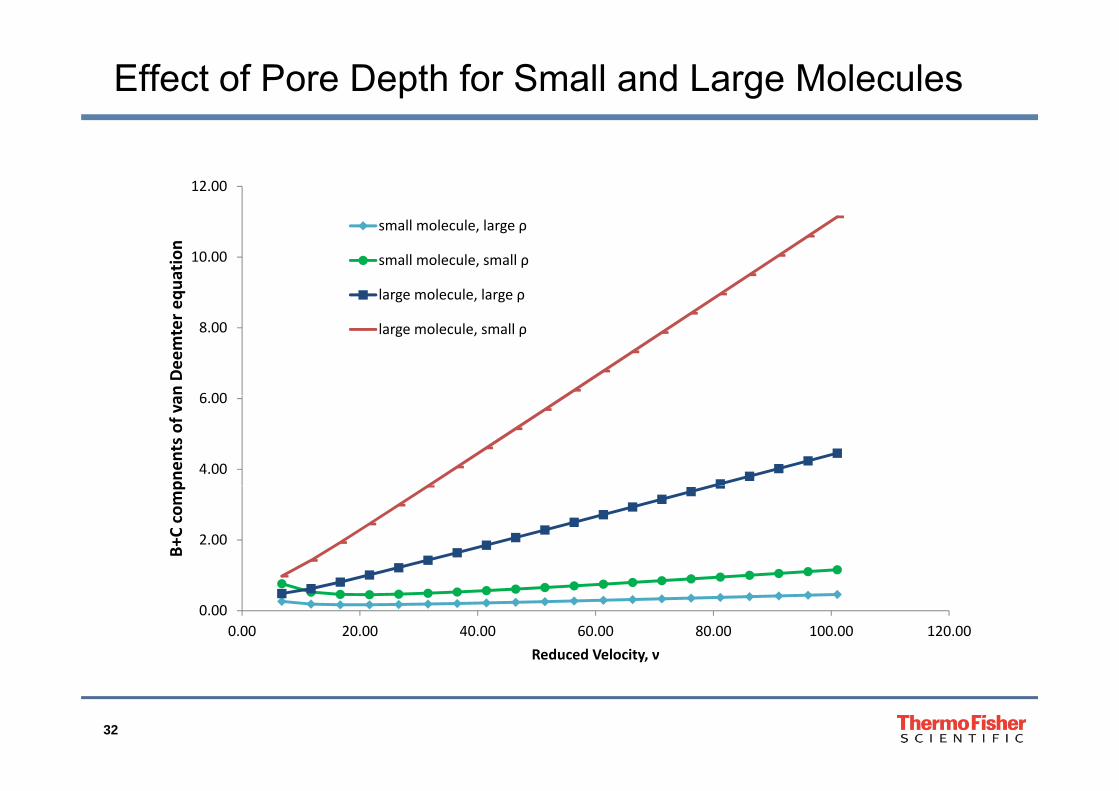
Effect of Pore Depth for Small and Large Molecules
12.00
10.00
equa
tion
small molecule, large ρ
small molecule, small ρ
large molecule, large ρ
6 00
8.00
n Deemter e
large molecule, small ρ
4.00
6.00
pnen
ts of va
2.00
B+C comp
0.000.00 20.00 40.00 60.00 80.00 100.00 120.00
Reduced Velocity, ν
32

What is the Solution?
• Fractals• Mandelbrot / Julia sets
C l t h t bl l ti i• Colors represent how stable solution is
2 czz
1
i
biac
33
1i

Increasing Surface Area
• Koch curve• A straight line has a dimension of 1• A straight line has a dimension of 1• This line is infinitely long• Curve has a dimension of 1.26
• Fractal shape• Same surface no matter what the scale• Same surface no matter what the scale
being observed• Reduced mass transfer effects?
Eff ti l if f ?• Effectively uniform surface?• Reduced issues with mass transfer
into and out of pores?
34
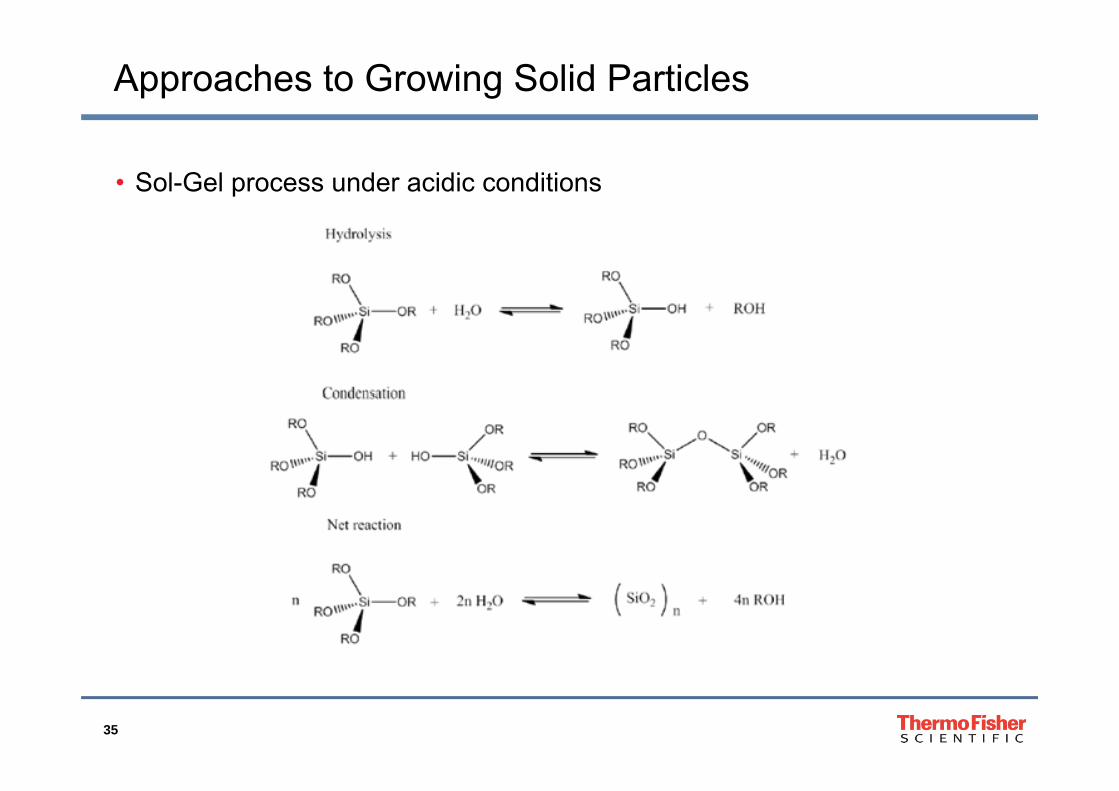
Approaches to Growing Solid Particles
• Sol-Gel process under acidic conditions
35

Growing Solid Silica
• Base activated (Stöber) Process
• Porous particles a polymeric surfactant (porogen) is typically added• e.g. Hexadecyltrimethylammonium bromide, Pluronic 123, • This allows formation of micelles which propagate pore structure on• This allows formation of micelles which propagate pore structure on
growth of particle• Surfactant washed out of end material to leave final structure which is
then calcined
36
then calcined

Growing a Particle
Solid particle grows by stages
Nanotechnology 22 (2011) 275718
37
gy ( )

The Ingredients for a New Particle
• MPTMS - (3-Mercaptopropyl)trimethoxysilane
• MPTES - (3-mercaptopropyl)triethoxysilane
• MPMDS - (3-mercaptopropyl)methyldimethoxysilane
• TEOS - tetraethyl orthosilicate• TEOS - tetraethyl orthosilicate
• TMOS - tetramethyl orthosilicate
• CTAB - (3-glycidyloxy propyl) trimethoxy silane, cetyltrimethylammonium bromidecetyltrimethylammonium bromide
• PVA - poly(vinyl alcohol) (PVA, MW 10 K)
38
p y( y ) ( , W )

The Recipe - Typically
• 0.25g PVP + 0.1g CTAB was dissolved in 5 ml DI water8 ml methanol was added with stirring and mixture left to cool to room• 8 ml methanol was added with stirring and mixture left to cool to room temperature
• 2 ml ammonium hydroxide (5.6%) was added to the reaction and stirred vigorously for 15 minutes
• 0.5 ml MPTMS was added drop wise over 30 seconds and the reaction stirred for 24 hours at room temperaturestirred for 24 hours at room temperature
• Resultant particles were collected and washed by centrifugation with DI water then ethanol (both 3×10 ml, 4500 rpm, 3 minutes)
A. Ahmed, W. Abdelmagid, H. Ritchie, P. Myers, H. ZhangJ. Chrom. A, Volume 1270 (2012) 194–203
39

40
41

Recipe Variables Already Investigated
• Increasing Stirring speed• Bigger nanospheres
200rpmBigger nanospheres
• Reduces particle size distribution 500rpm
1500rpm
• Temperature• Raising the temperature reduces
roughness of surface but provides more uniform particle sizeuniform particle size
• Microwave and conventional heating provide similar particles
42
• microwave is much quicker

Varying the Recipe
Standard Method0.25 g PVA (Mw 10k)0 10 g CTAB0.10 g CTAB5 ml DI Water8 ml Methanol2 ml NH4OH (5.6%)2 ml NH4OH (5.6%)0.5 ml MPTMS
Increasing alkalinity
Smaller, less densely packed nanospheres on surface
43

Varying the Recipe
Altering pH
Larger more densely packed nanospheresLarger, more densely packed nanosphereson surface
Altering polymer concentration
Smooth spheres, no nanospheres, poor dispersity
44

Varying the Recipe
Altering polymer concentration
Smooth spheres no nanospheres poorSmooth spheres, no nanospheres, poor dispersity
Altering additive concentrationg
Small, monodisperse, fuzzy particles
45

Varying the Recipe
Altering polymer type and concentration
Fused smooth spheresFused smooth spheres
Altering polymer type and concentrationAltering polymer type and concentration
Very small nanospheres on surface
46

Varying the Recipe
Addition of extra polymer
Very small nanospheres on surfaceVery small nanospheres on surface
Changing pH
Fused smooth spheres
47

Normal Phase Separations
48
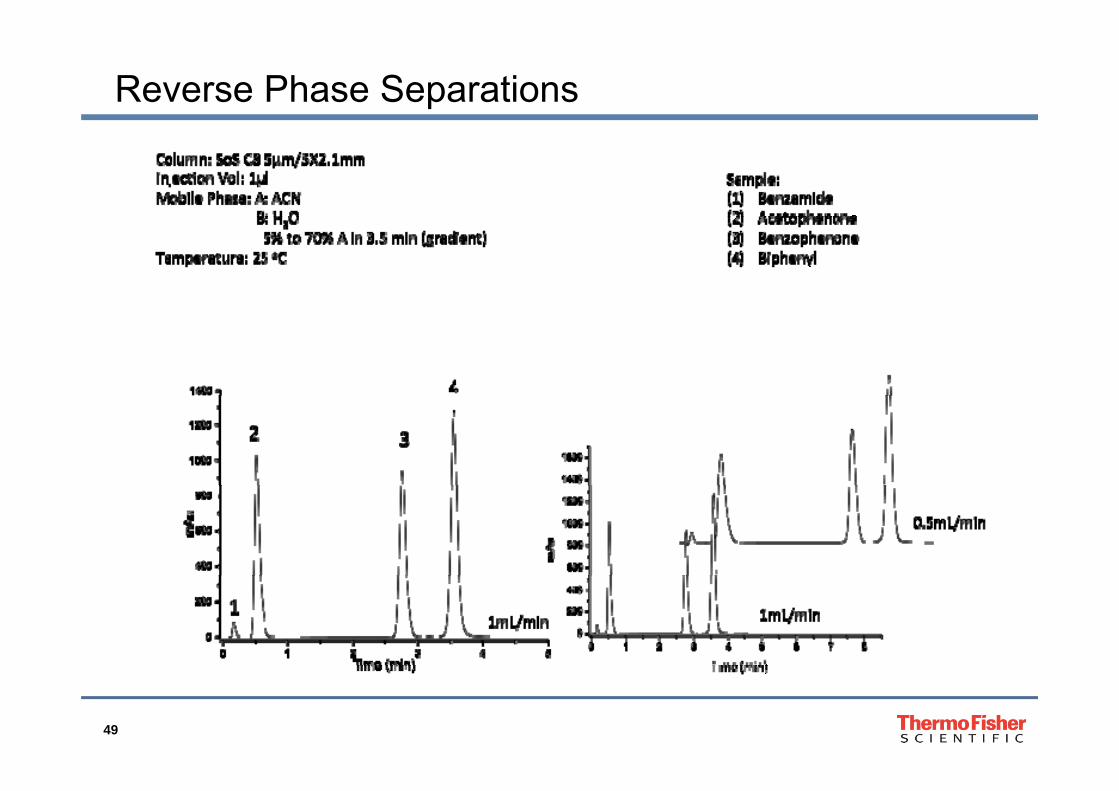
Reverse Phase Separations
49

Separation on an SoS Particle
50

Separation on an SoS Particle
Monodisperse SOS, C4 bonded, endcapped 1. GY40 °C, 300 μL/min 2. VYVGradient: 10−40% B in 4 minutes 3. met-EnkA. 0.02M KH2PO4 buffer, pH 2.7 + 0.1% TFA 4. leu-EnkB. Acetonitrile + 0.1% TFA 5. Angiotensin II
51

Conclusions
• The History of Solid Core• The concept
Th i i l lid ti l d th h ll th f d• The original solid core particles and the challenges they faced• The introduction on a new generation of solid core materials
• Solid Core Chromatography• Understanding the benefits of the technology• Bar for bar greater efficiency• Bar for bar greater efficiency• How to optimize the separation
• Understanding chemistry• Optimization of the morphology
• The Future• The Future• Where will solid core take us?• New particle morphologies – their synthesis explained
52
Acknowledgements
Haifei Zhang Adham Ahmed Kevin SkinleyHaifei Zhang Adham Ahmed Kevin Skinley, (Laura), Peter Myers Richard HayesUniversity of LiverpoolUniversity of Liverpool
Harry RitchieTrajan Scientific
53
Trajan Scientific