Embed Size (px)
Citation preview
SMART CITIES AND OPEN DATA
Dr. Leandro MadrazoHead Research GroupARC Engineering and Architecture La SalleRamon Llull University, Barcelona, Spainwww.salleurl.edu/arc
1st Summer School on Smart Cities and Linked Open Data - Madrid, 7-12 June 2015
1. Introduction group ARC: Research on energy information systems
2. Smart cities
3. Energy efficient cities: the SEMANCO project
1. Introduction group ARC: Research on energy information systems
2. Smart cities
3. Energy efficient cities: the SEMANCO project
www.salleurl.edu/arc
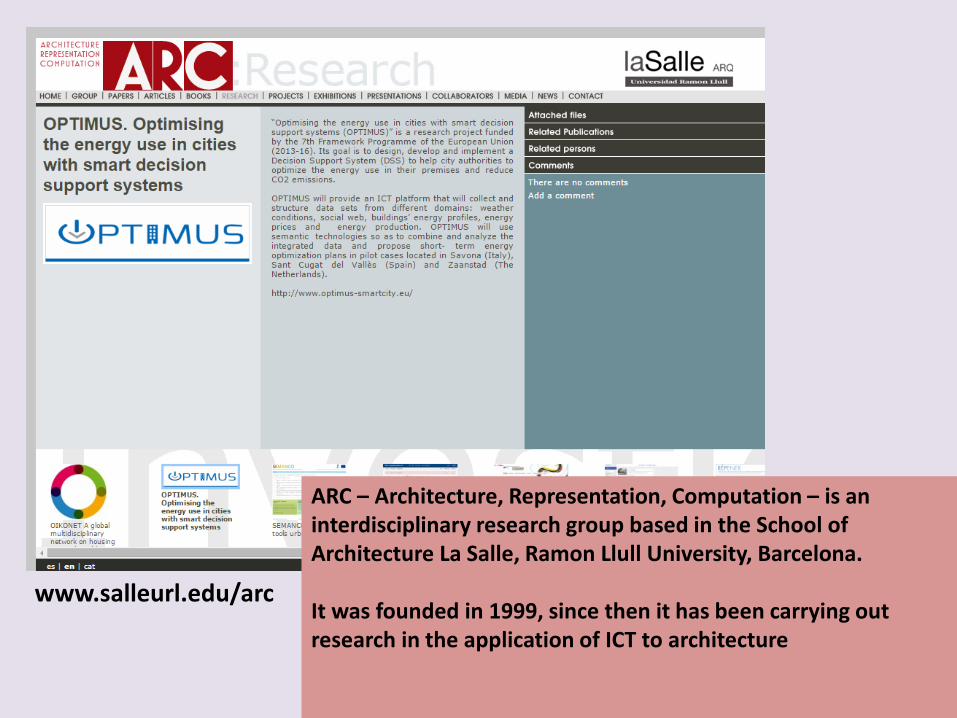
ARC – Architecture, Representation, Computation – is aninterdisciplinary research group based in the School of Architecture La Salle, Ramon Llull University, Barcelona.
It was founded in 1999, since then it has been carrying outresearch in the application of ICT to architecture
www.salleurl.edu/arc
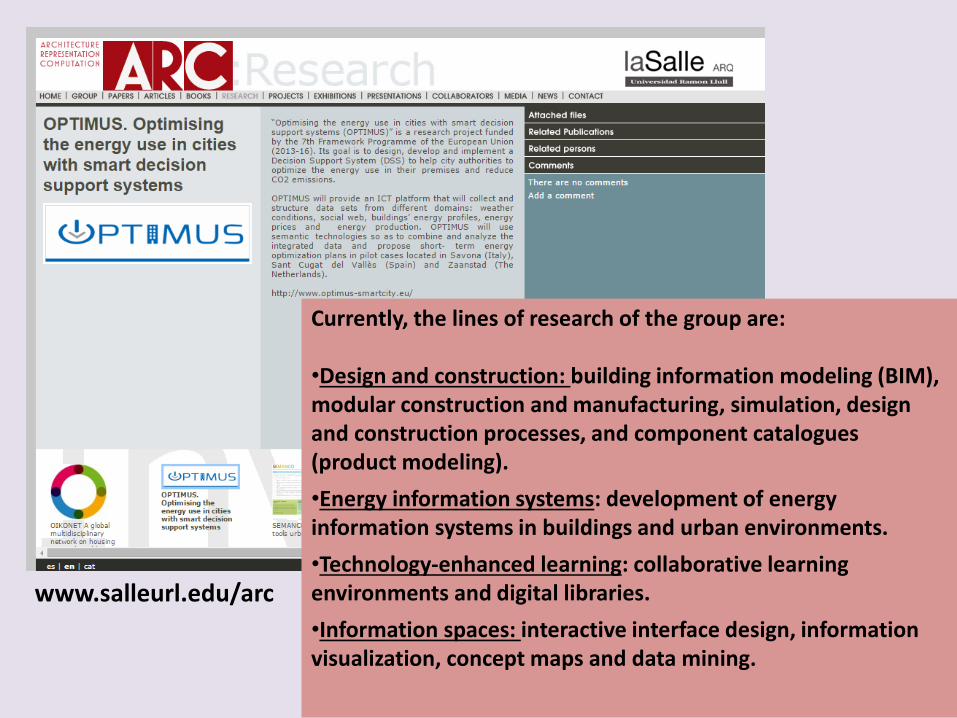
Currently, the lines of research of the group are:
•Design and construction: building information modeling (BIM), modular construction and manufacturing, simulation, design and construction processes, and component catalogues (product modeling).
•Energy information systems: development of energy information systems in buildings and urban environments.
•Technology-enhanced learning: collaborative learning environments and digital libraries.
•Information spaces: interactive interface design, information visualization, concept maps and data mining.
www.salleurl.edu/arc
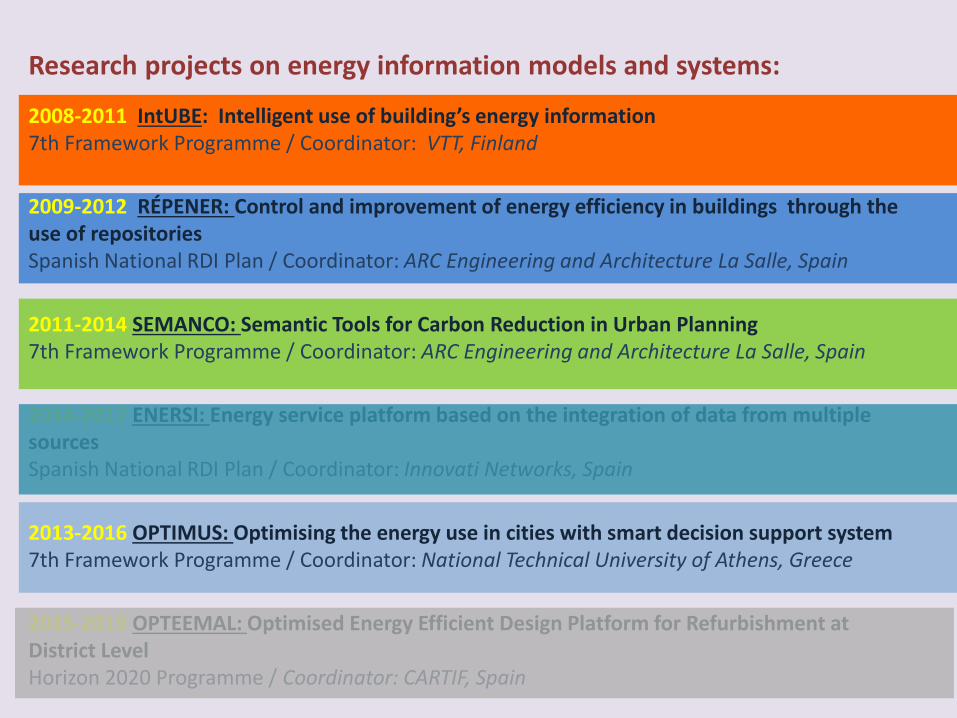
2008-2011 IntUBE: Intelligent use of building’s energy information7th Framework Programme / Coordinator: VTT, Finland
2009-2012 RÉPENER: Control and improvement of energy efficiency in buildings through the use of repositories Spanish National RDI Plan / Coordinator: ARC Engineering and Architecture La Salle, Spain
2011-2014 SEMANCO: Semantic Tools for Carbon Reduction in Urban Planning7th Framework Programme / Coordinator: ARC Engineering and Architecture La Salle, Spain
2013-2016 OPTIMUS: Optimising the energy use in cities with smart decision support system7th Framework Programme / Coordinator: National Technical University of Athens, Greece
2015-2019 OPTEEMAL: Optimised Energy Efficient Design Platform for Refurbishment at District Level Horizon 2020 Programme / Coordinator: CARTIF, Spain
2014-2017 ENERSI: Energy service platform based on the integration of data from multiple sources Spanish National RDI Plan / Coordinator: Innovati Networks, Spain
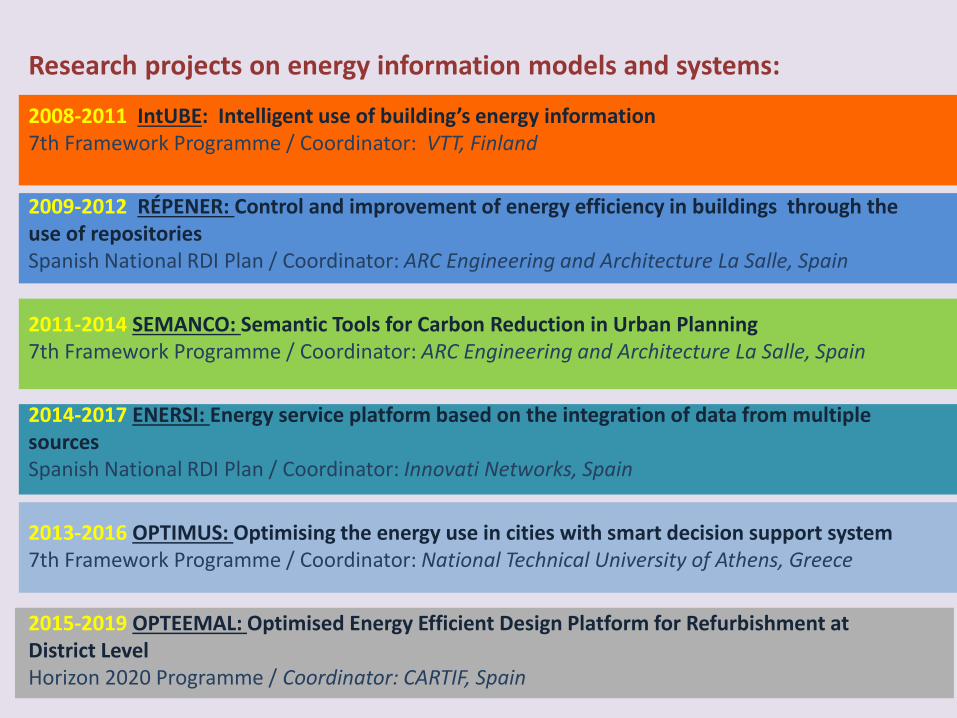
Research projects on energy information models and systems:
2008-2011 IntUBE: Intelligent use of building’s energy information7th Framework Programme / Coordinator: VTT, Finland
2009-2012 RÉPENER: Control and improvement of energy efficiency in buildings through the use of repositories Spanish National RDI Plan / Coordinator: ARC Engineering and Architecture La Salle, Spain
2011-2014 SEMANCO: Semantic Tools for Carbon Reduction in Urban Planning7th Framework Programme / Coordinator: ARC Engineering and Architecture La Salle, Spain
2013-2016 OPTIMUS: Optimising the energy use in cities with smart decision support system7th Framework Programme / Coordinator: National Technical University of Athens, Greece
2015-2019 OPTEEMAL: Optimised Energy Efficient Design Platform for Refurbishment at District Level Horizon 2020 Programme / Coordinator: CARTIF, Spain
2014-2017 ENERSI: Energy service platform based on the integration of data from multiple sources Spanish National RDI Plan / Coordinator: Innovati Networks, Spain
Research projects on energy information models and systems:
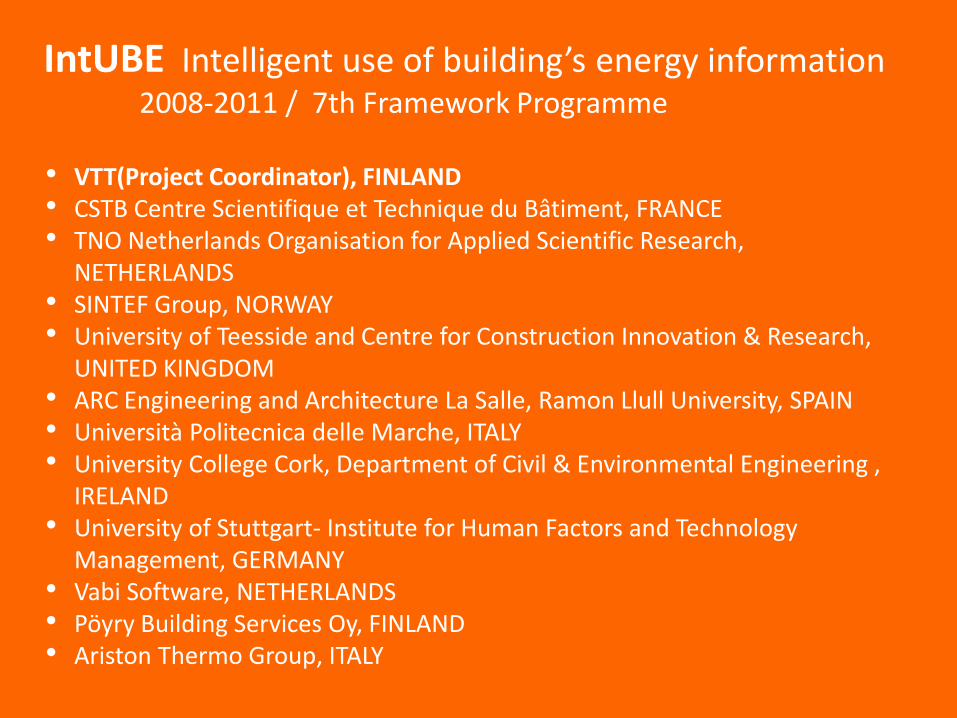
IntUBE Intelligent use of building’s energy information2008-2011 / 7th Framework Programme
• VTT(Project Coordinator), FINLAND• CSTB Centre Scientifique et Technique du Bâtiment, FRANCE• TNO Netherlands Organisation for Applied Scientific Research,
NETHERLANDS• SINTEF Group, NORWAY• University of Teesside and Centre for Construction Innovation & Research,
UNITED KINGDOM• ARC Engineering and Architecture La Salle, Ramon Llull University, SPAIN• Università Politecnica delle Marche, ITALY • University College Cork, Department of Civil & Environmental Engineering ,
IRELAND• University of Stuttgart- Institute for Human Factors and Technology
Management, GERMANY• Vabi Software, NETHERLANDS• Pöyry Building Services Oy, FINLAND• Ariston Thermo Group, ITALY
The purpose of the project was to create building models which would encompass the energy related data created during the overall design process, from design to operation. This way the simulated energy performance of the building could be taken into account in the design processes, and the actual performance could be compared to the simulated one.
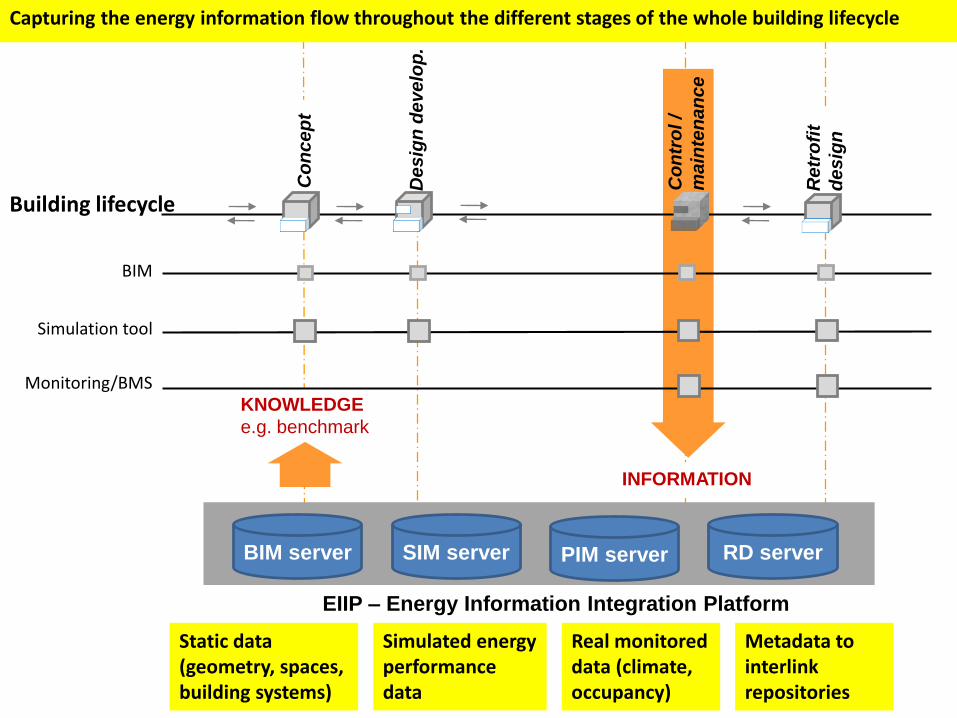
EIIP – Energy Information Integration Platform
BIM server SIM server RD serverPIM server
Co
nc
ep
t
De
sig
n d
ev
elo
p.
Simulation tool
Building lifecycle
Co
ntr
ol /
ma
inte
na
nc
e
Re
tro
fit
de
sig
n
KNOWLEDGE
e.g. benchmark
Monitoring/BMS
INFORMATION
Capturing the energy information flow throughout the different stages of the whole building lifecycle
BIM
Static data (geometry, spaces, building systems)
Simulated energy performance data
Real monitored data (climate, occupancy)
Metadata to interlink repositories
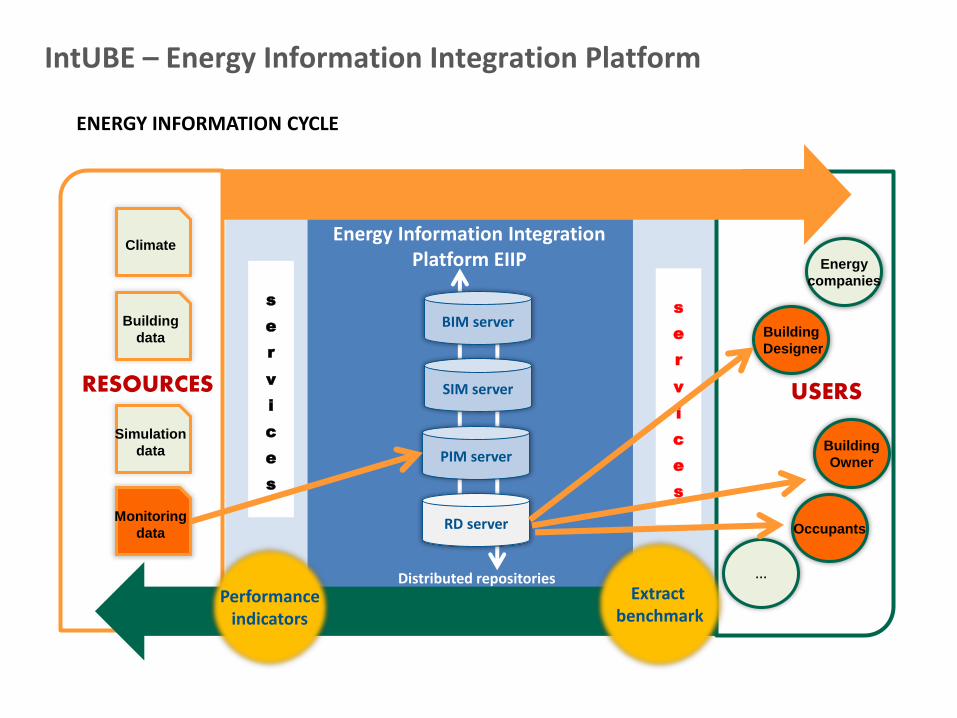
Energy Information Integration Platform EIIP
PIM server
SIM server
BIM server
RD server
Distributed repositories
s
e
r
v
i
c
e
s
Climate
Monitoring
data
Building
data
Simulation
data
ENERGY INFORMATION CYCLE
RESOURCES
s
e
r
v
i
c
e
s
USERS
Energy
companies
Building
Owner
Building
Designer
Occupants
…
IntUBE – Energy Information Integration Platform
Extract benchmark
Monitoring
data
Performanceindicators
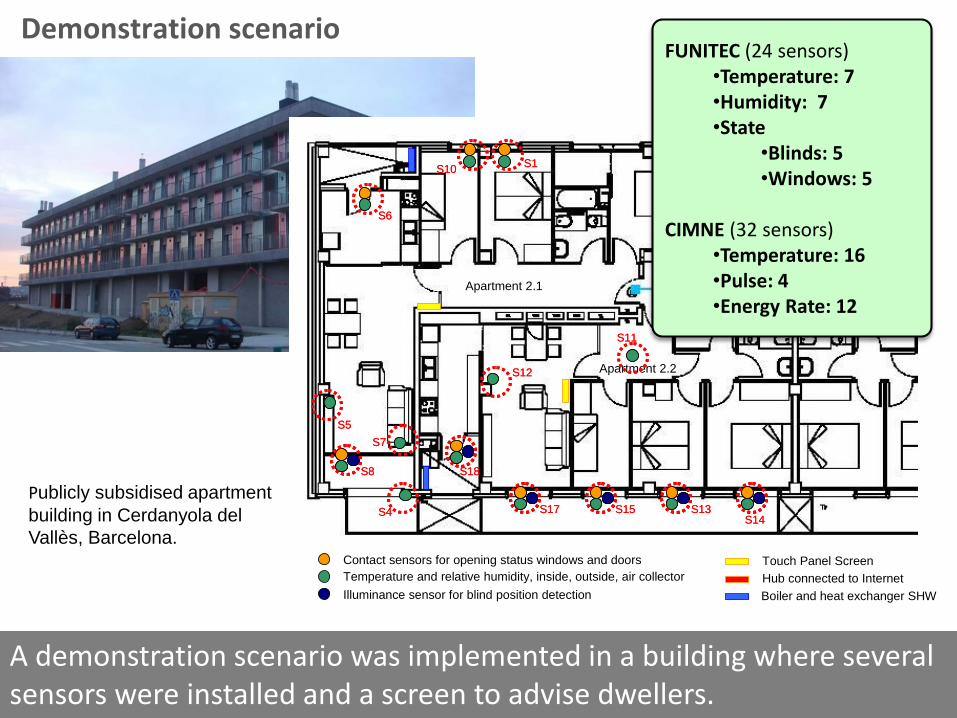
Demonstration scenario
Publicly subsidised apartment
building in Cerdanyola del
Vallès, Barcelona.Contact sensors for opening status windows and doors
Temperature and relative humidity, inside, outside, air collector
Illuminance sensor for blind position detection
Touch Panel Screen
Hub connected to Internet
Boiler and heat exchanger SHW
Apartment 2.1
Apartment 2.2
S8S8
S7S7
S4S4
S6S6
S10S10S1S1
S5S5
S17S17 S15S15 S13S13S14S14
S18S18
S11S11
S12S12
FUNITEC (24 sensors)•Temperature: 7•Humidity: 7•State
•Blinds: 5•Windows: 5
CIMNE (32 sensors)•Temperature: 16•Pulse: 4•Energy Rate: 12
A demonstration scenario was implemented in a building where several sensors were installed and a screen to advise dwellers.
kg
0.150.15
kg
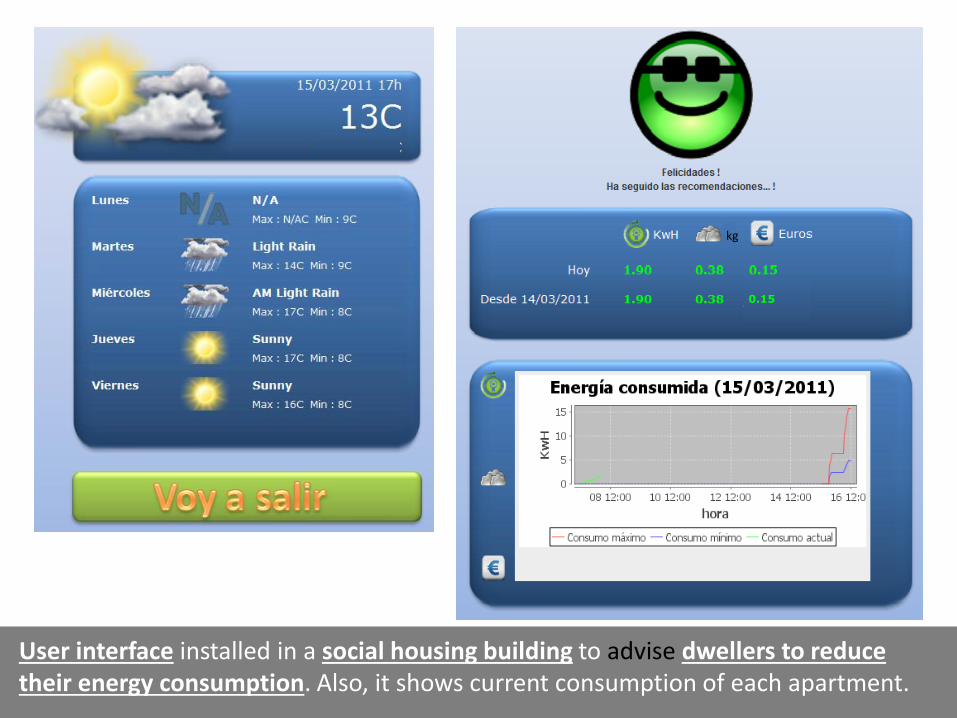
User interface installed in a social housing building to advise dwellers to reduce their energy consumption. Also, it shows current consumption of each apartment.
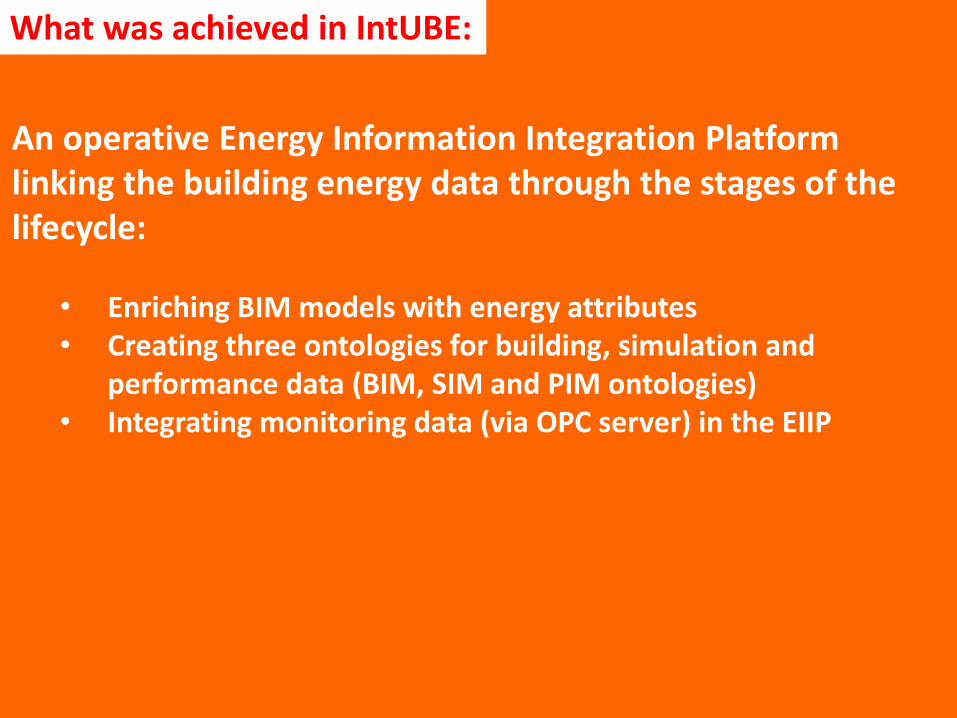
An operative Energy Information Integration Platformlinking the building energy data through the stages of the lifecycle:
• Enriching BIM models with energy attributes • Creating three ontologies for building, simulation and
performance data (BIM, SIM and PIM ontologies)• Integrating monitoring data (via OPC server) in the EIIP
What was achieved in IntUBE:
RÉPENER Control and improvement of energy efficiency in buildings through the use of repositories 2009-2012 / Spanish National RDI plan
• ARC Engineering and Architecture La Salle, Ramon LlullUniversity (Project Coordinator), SPAIN
• Faculty of Business and Computer Science, HochschuleAlbstadt-Sigmaringen, GERMANY
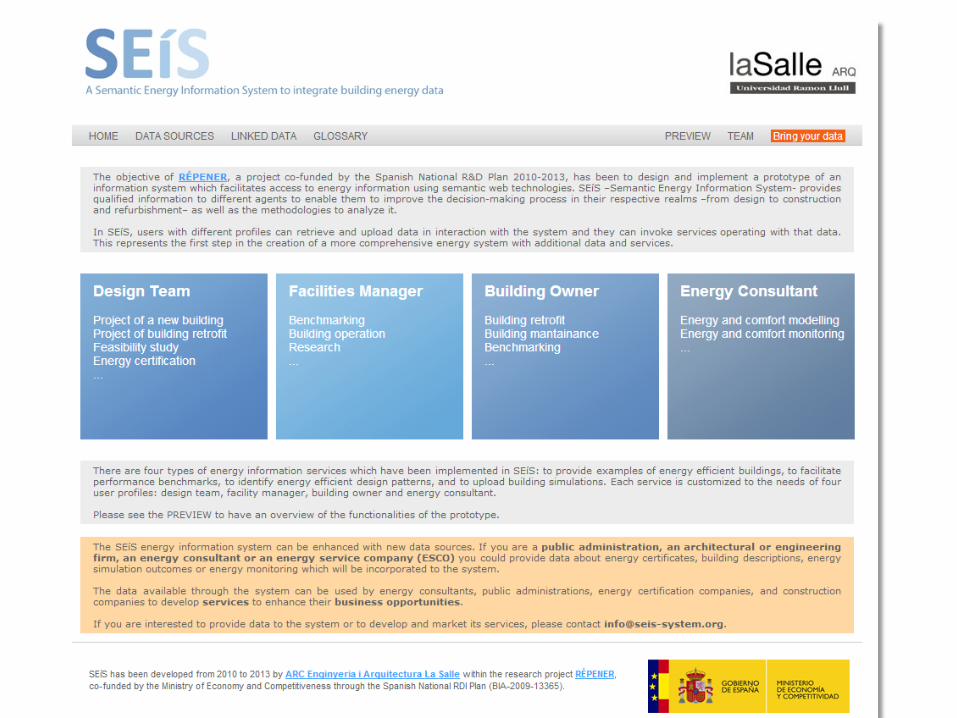
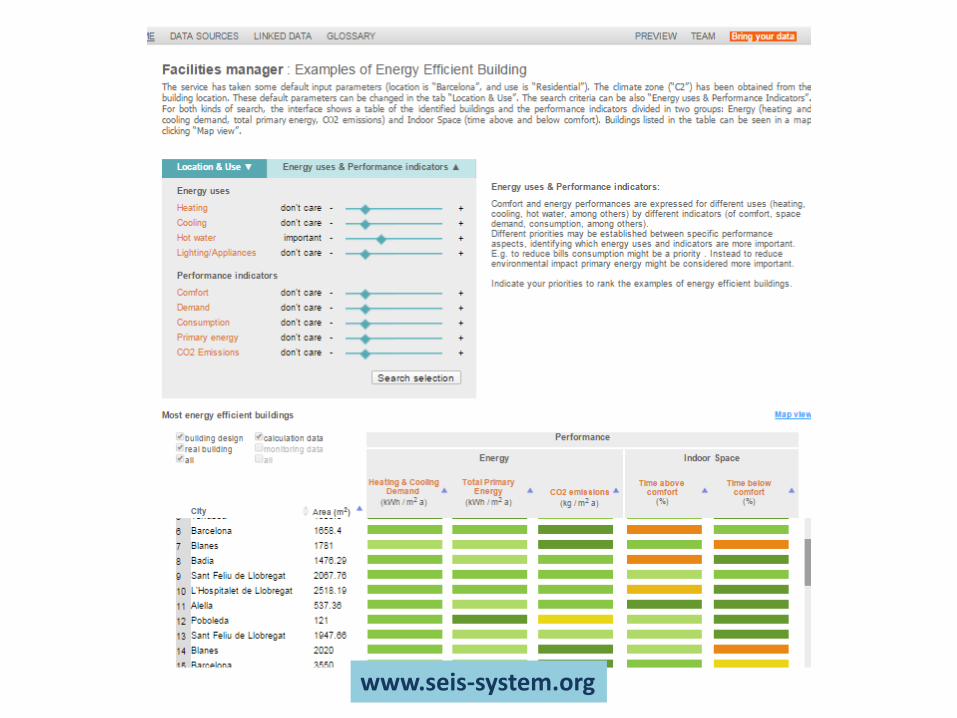
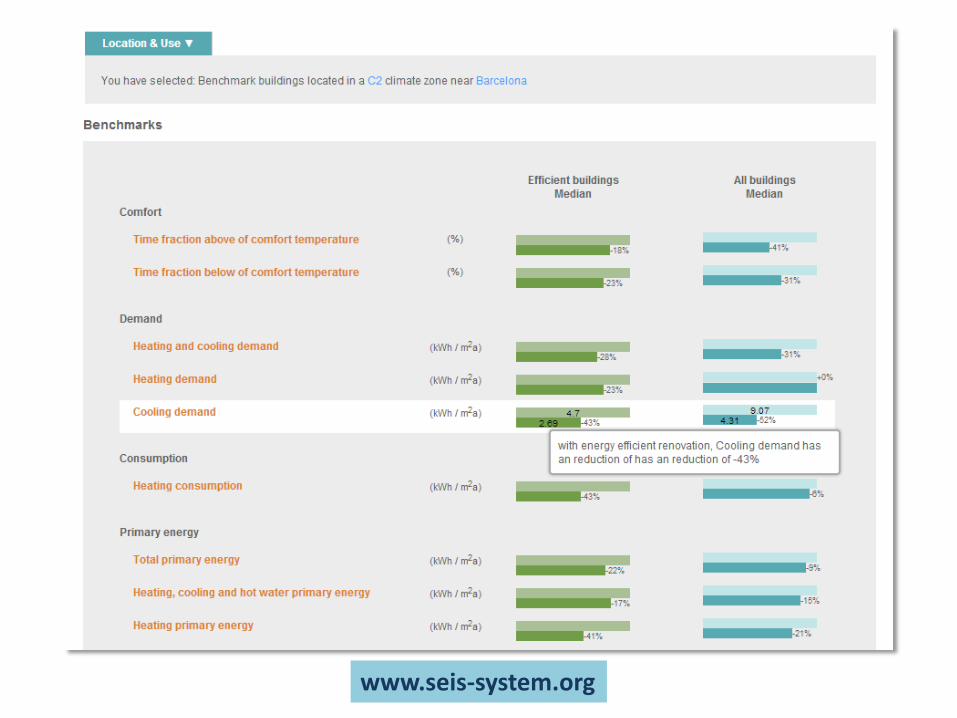
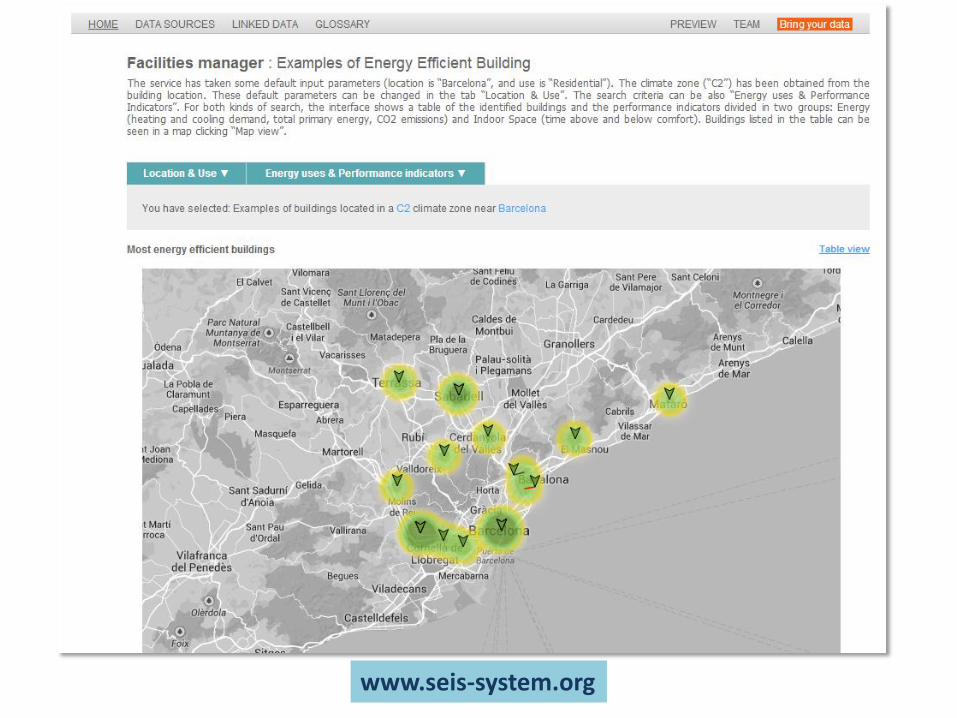
The aim of this research project has been to design and implement a prototype of a building energy information system using semantic technologies, following the philosophy of the Linked Open Data initiative.
LINKED DATA SOURCES
OFFLINE DATA SOURCES
Leako
CIMNE
Building Repository
Climate
…
Energy Model
Ontology Repository
SERVICES
Analysis
Visualization
Simulation
TOOLS
Prediction
GUI
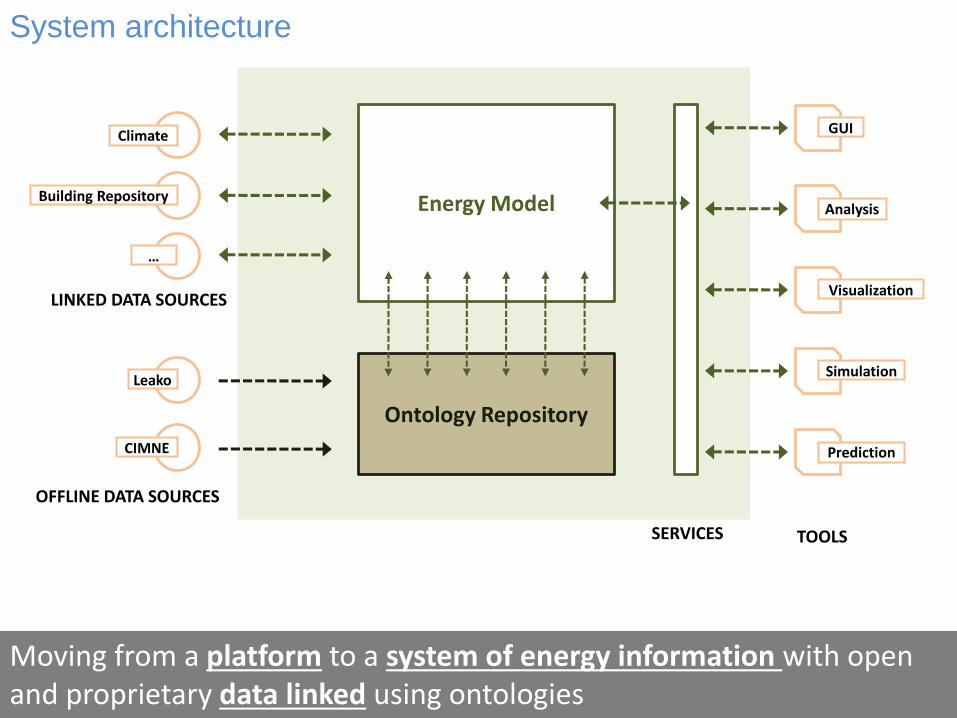
Moving from a platform to a system of energy information with open and proprietary data linked using ontologies
System architecture
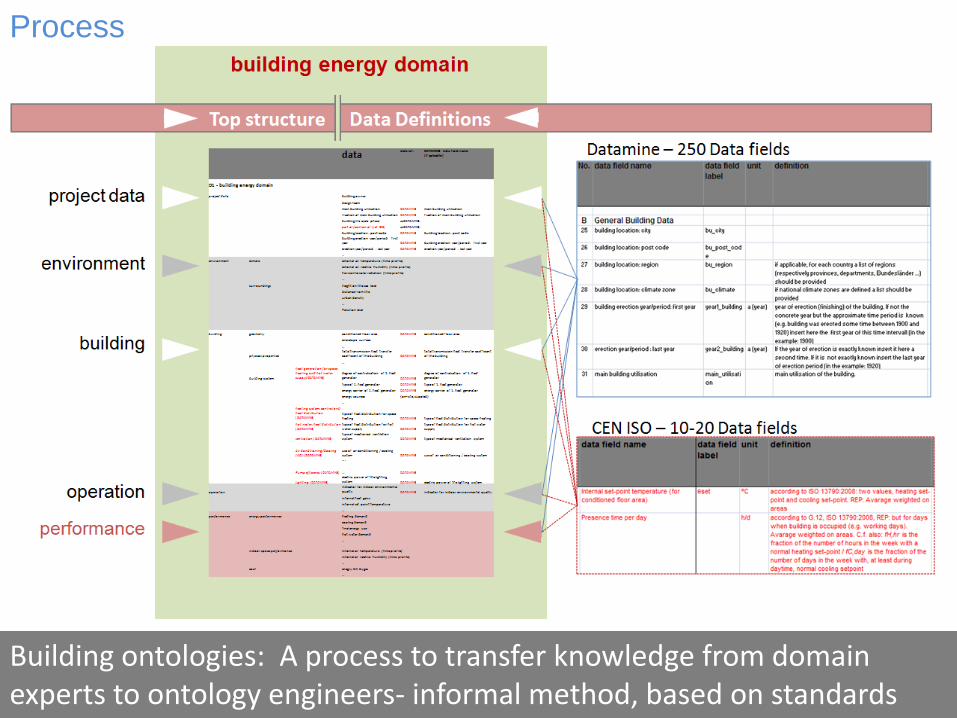
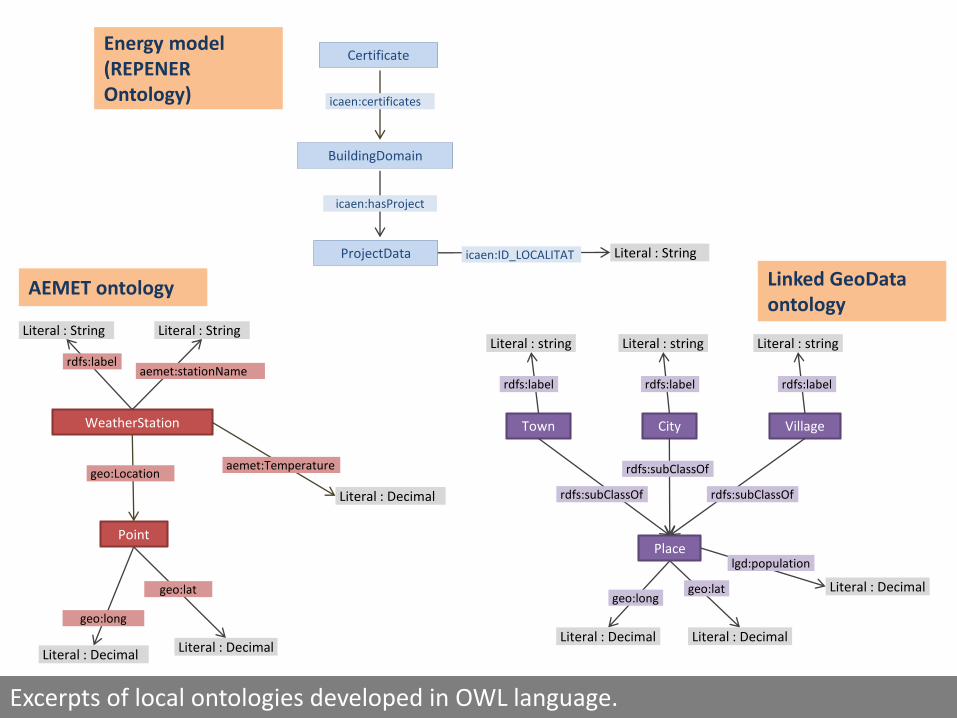
Building ontologies: A process to transfer knowledge from domain experts to ontology engineers- informal method, based on standards
Process
Certificate
BuildingDomain
icaen:certificates
ProjectData Literal : Stringicaen:ID_LOCALITAT
icaen:hasProject
WeatherStation
Point
rdfs:labelaemet:stationName
Literal : String Literal : String
geo:Location
geo:lat
geo:long
Literal : DecimalLiteral : Decimal
Town
geo:latgeo:long
Literal : Decimal Literal : Decimal
City Village
rdfs:label
Literal : string
rdfs:label
Literal : string
rdfs:label
Literal : string
Place
rdfs:subClassOf rdfs:subClassOf
rdfs:subClassOf
lgd:population
Literal : Decimal
Energy model(REPENER Ontology)
AEMET ontology Linked GeoDataontology
aemet:Temperature
Literal : Decimal
Excerpts of local ontologies developed in OWL language.
Certificate
BuildingDomain
icaen:certificates
ProjectData Literal : Stringicaen:ID_LOCALITAT
icaen:hasProject
WeatherStation
Point
rdfs:labelaemet:stationName
Literal : String Literal : String
geo:Location
geo:lat
geo:long
Literal : DecimalLiteral : Decimal
Town
geo:latgeo:long
Literal : Decimal Literal : Decimal
City Village
rdfs:label
Literal : string
rdfs:label
Literal : string
rdfs:label
Literal : string
Place
rdfs:subClassOf rdfs:subClassOf
rdfs:subClassOf
lgd:population
Literal : Decimal
aemet:Temperature
Literal : Decimal
Located
closeTo
ICAEN ontology
AEMET ontology Linked GeoDataontology
Located
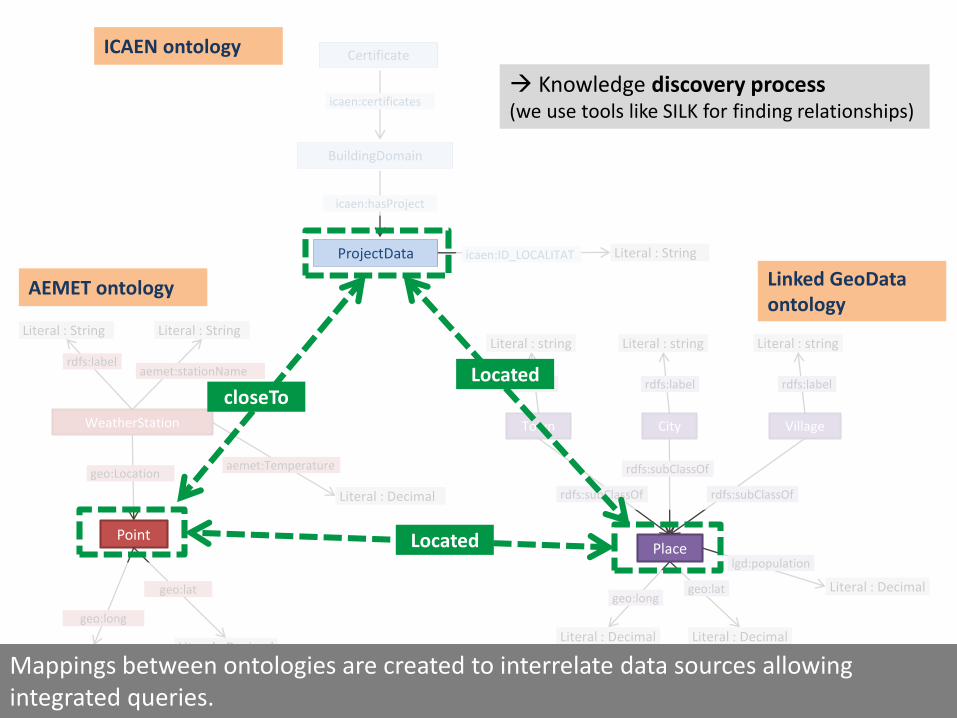
Mappings between ontologies are created to interrelate data sources allowing integrated queries.
Knowledge discovery process (we use tools like SILK for finding relationships)
www.seis-system.org
www.seis-system.org
www.seis-system.org
www.seis-system.org
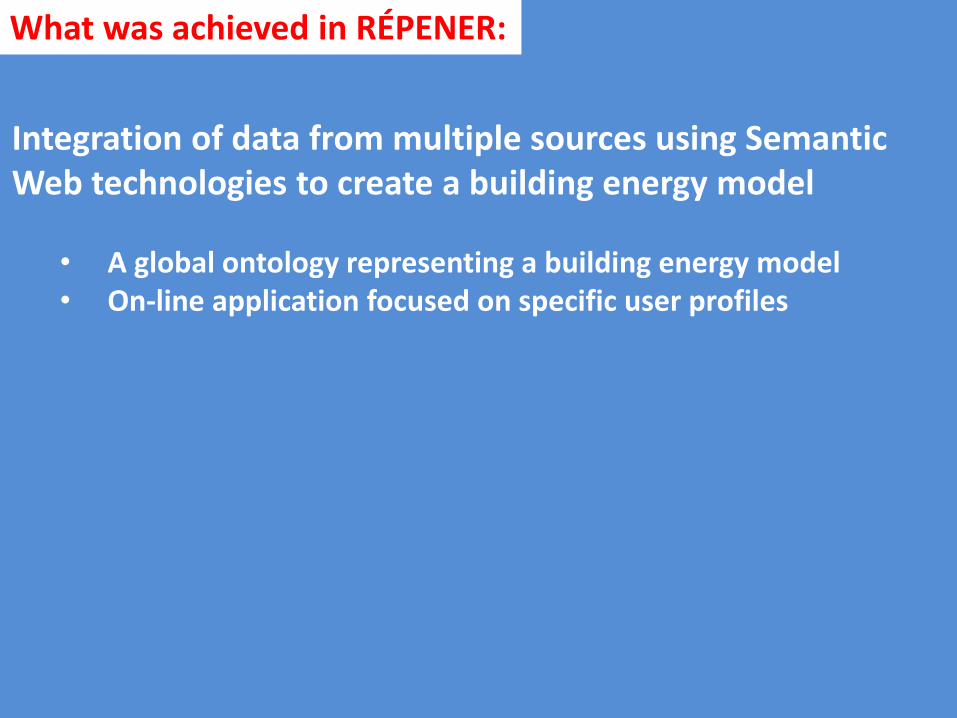
Integration of data from multiple sources using Semantic Web technologies to create a building energy model
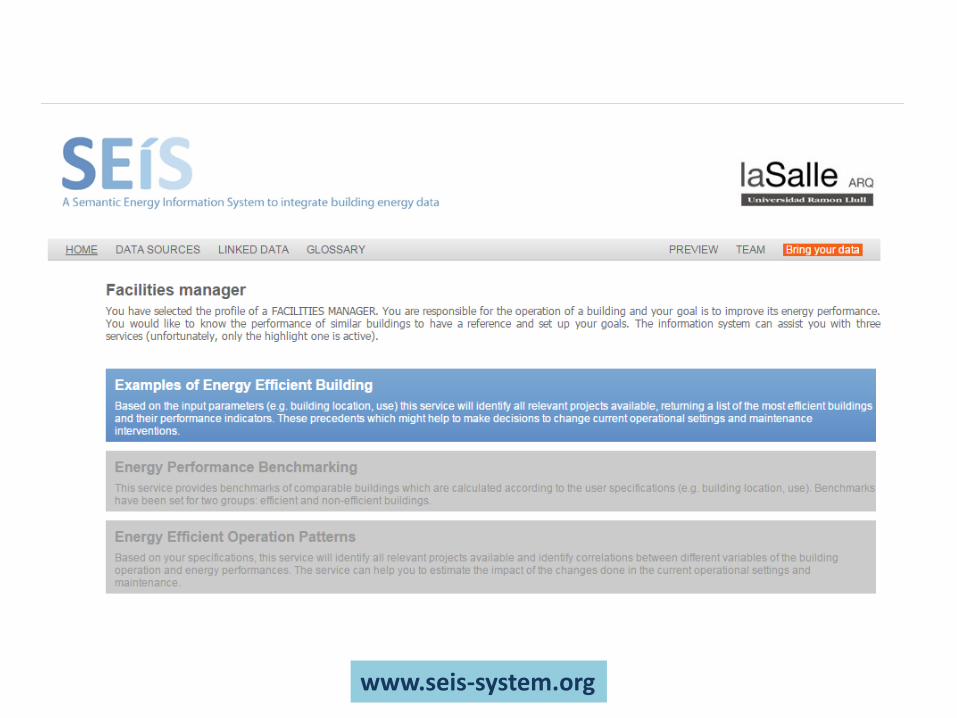
• A global ontology representing a building energy model• On-line application focused on specific user profiles
What was achieved in RÉPENER:
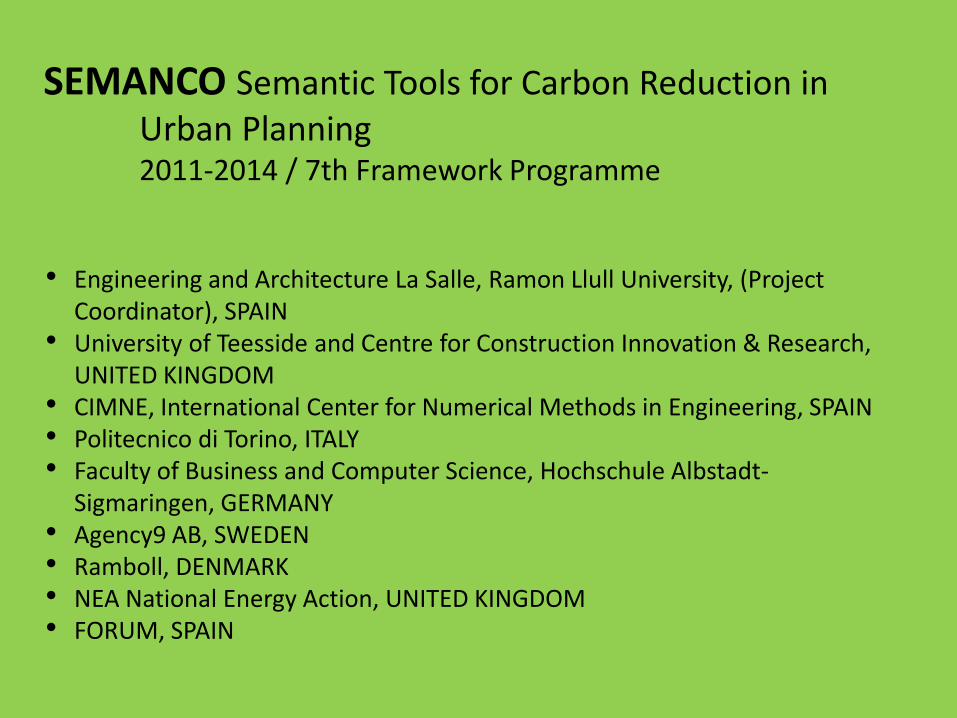
SEMANCO Semantic Tools for Carbon Reduction in Urban Planning2011-2014 / 7th Framework Programme
• Engineering and Architecture La Salle, Ramon Llull University, (Project Coordinator), SPAIN
• University of Teesside and Centre for Construction Innovation & Research, UNITED KINGDOM
• CIMNE, International Center for Numerical Methods in Engineering, SPAIN• Politecnico di Torino, ITALY• Faculty of Business and Computer Science, Hochschule Albstadt-
Sigmaringen, GERMANY• Agency9 AB, SWEDEN• Ramboll, DENMARK• NEA National Energy Action, UNITED KINGDOM• FORUM, SPAIN
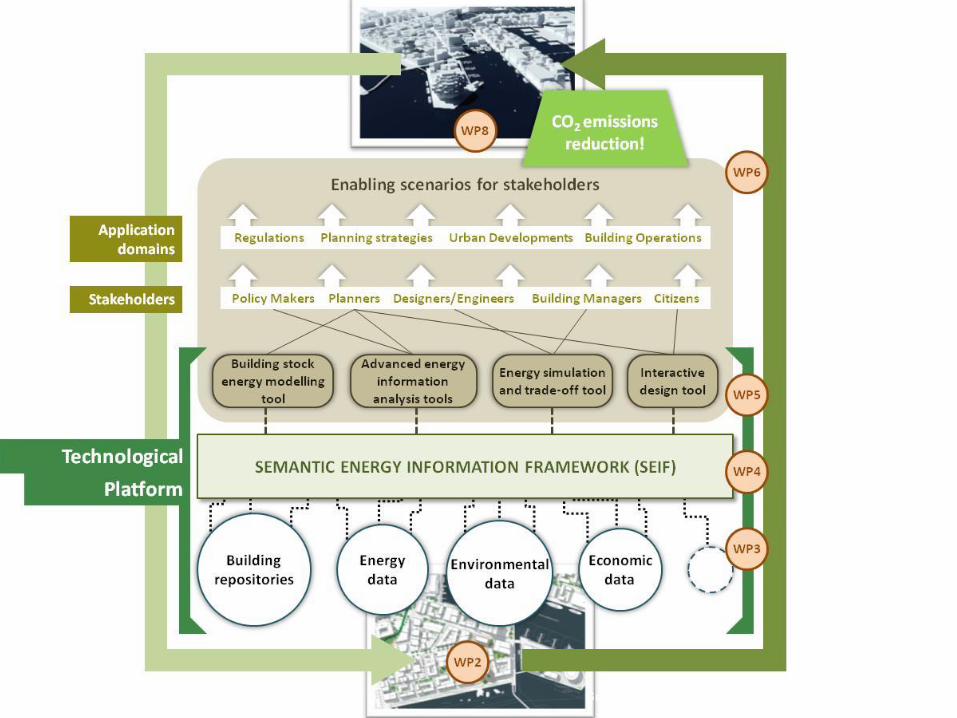
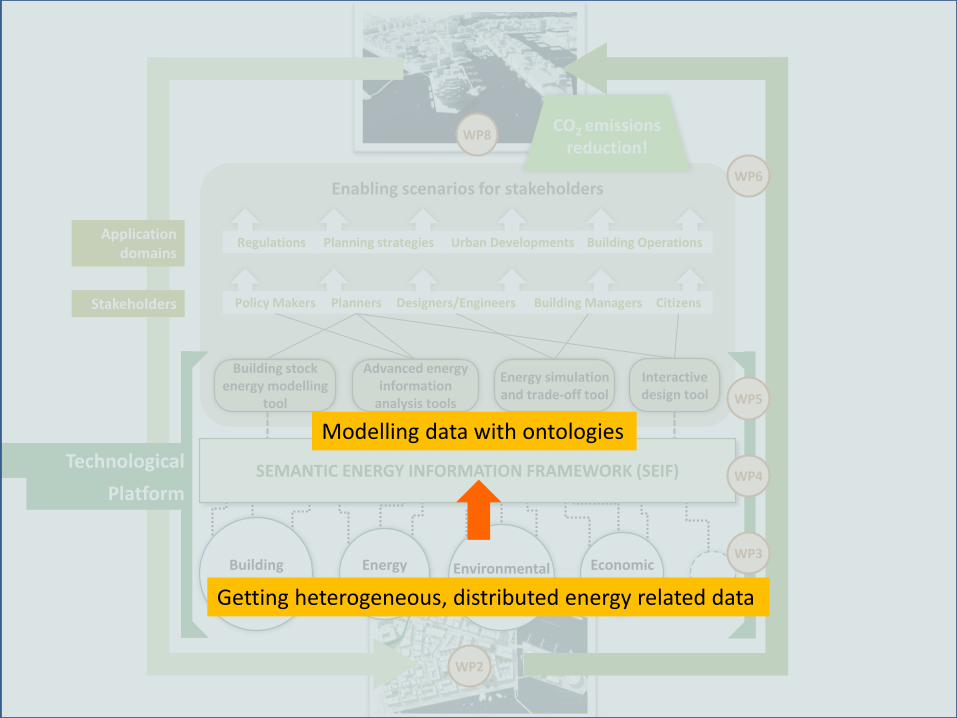
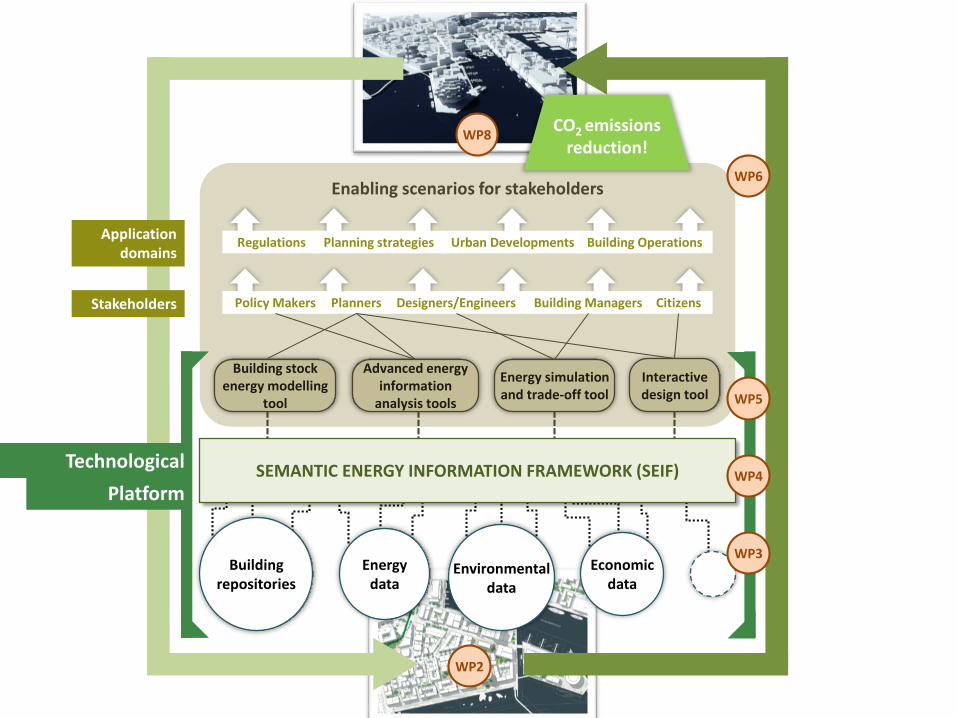
SEMANCO’s purpose is to provide semantic tools to different stakeholders involved in urban planning (architects, engineers, building managers, local administrators, citizens and policy makers) to help them make informed decisions about how to reduced carbon emissions in cities.
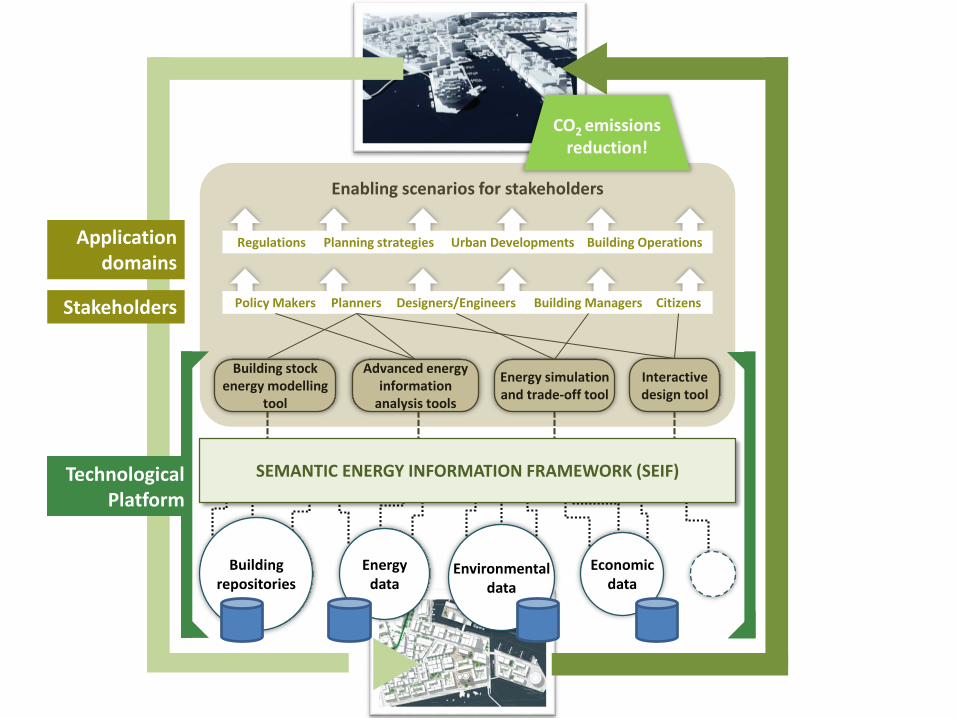
Building repositories
Energydata
Environmentaldata
Economicdata
Enabling scenarios for stakeholders
Building stock energy modelling
tool
Advanced energy information
analysis tools
Interactivedesign tool
Energy simulationand trade-off tool
Policy Makers CitizensDesigners/Engineers Building ManagersPlanners
Regulations Urban Developments Building OperationsPlanning strategies
TechnologicalPlatform
SEMANTIC ENERGY INFORMATION FRAMEWORK (SEIF)
CO2 emissions reduction!
Application domains
Stakeholders
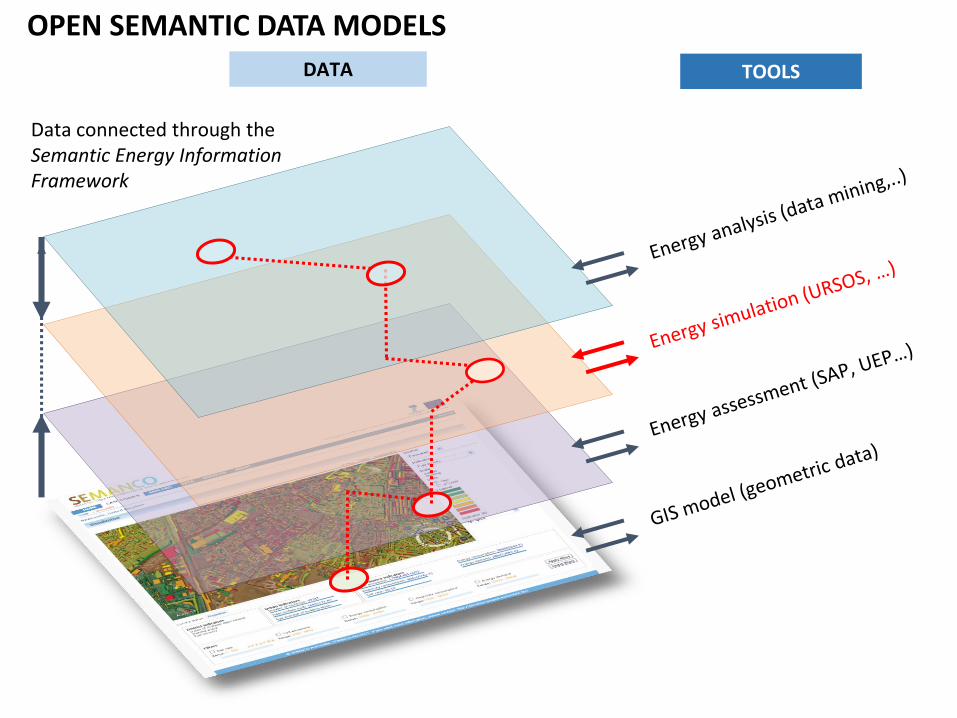
Data connected through the Semantic Energy Information Framework
OPEN SEMANTIC DATA MODELS
DATA TOOLS
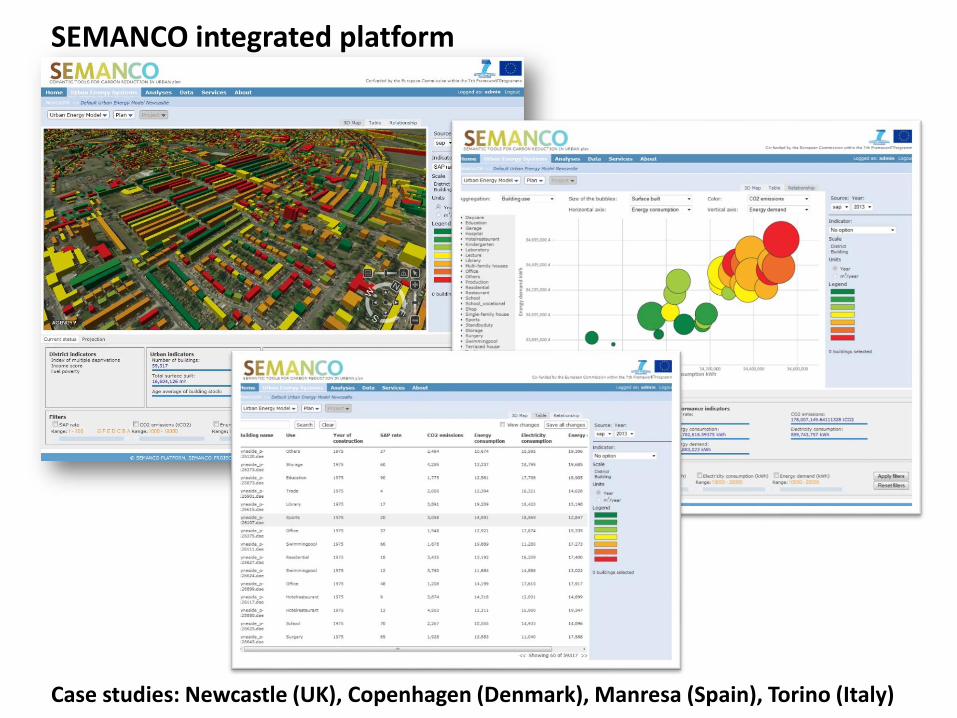
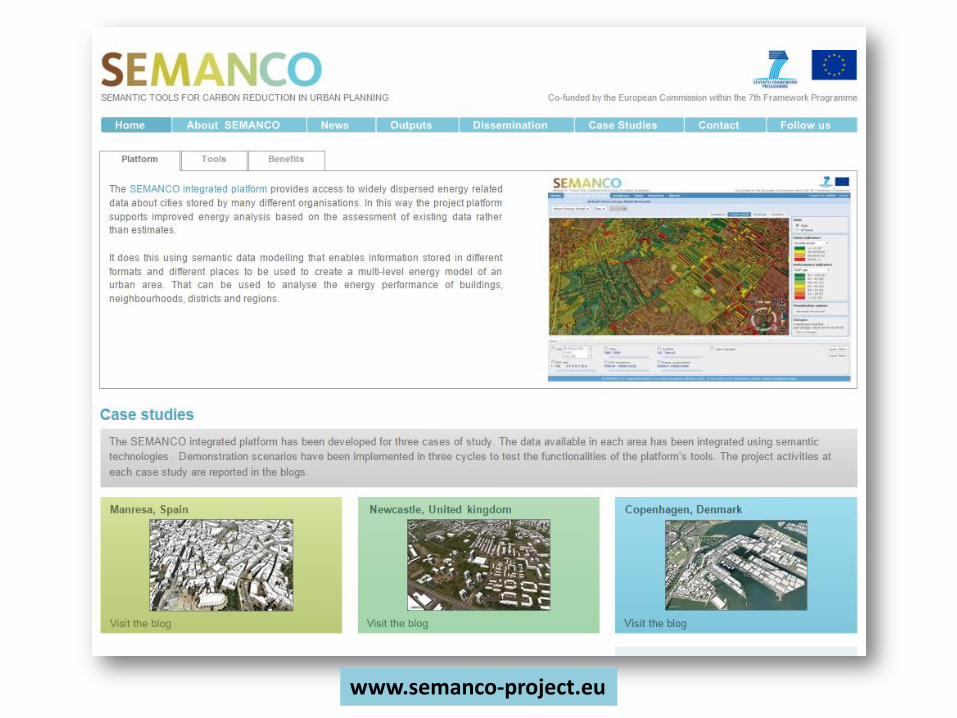
SEMANCO integrated platform
Case studies: Newcastle (UK), Copenhagen (Denmark), Manresa (Spain), Torino (Italy)
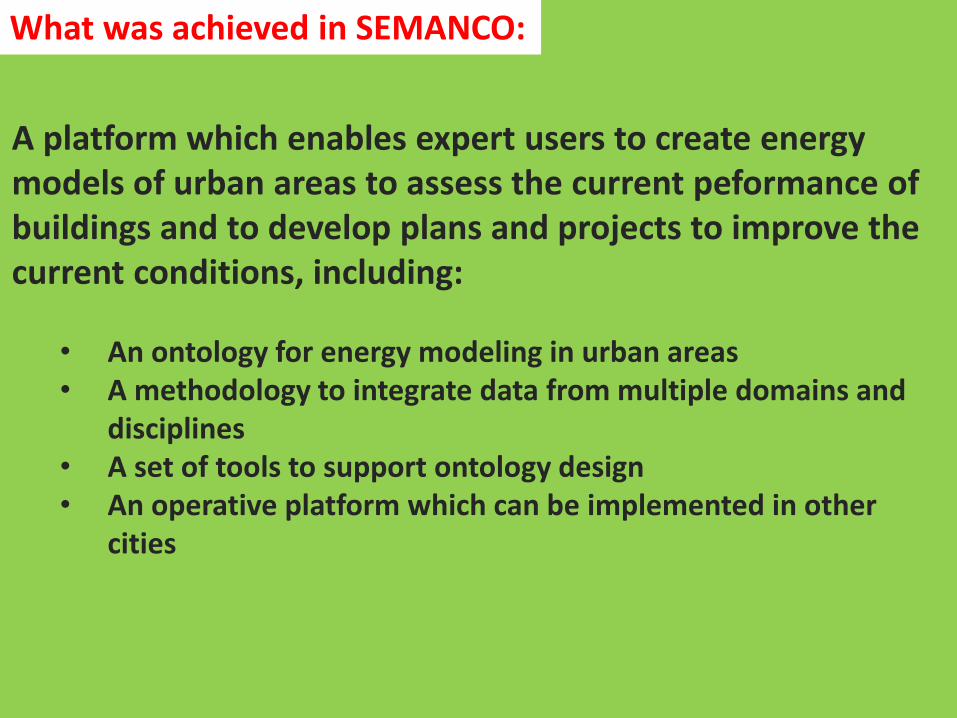
A platform which enables expert users to create energymodels of urban areas to assess the current peformance of buildings and to develop plans and projects to improve thecurrent conditions, including:
• An ontology for energy modeling in urban areas • A methodology to integrate data from multiple domains and
disciplines • A set of tools to support ontology design• An operative platform which can be implemented in other
cities
What was achieved in SEMANCO:
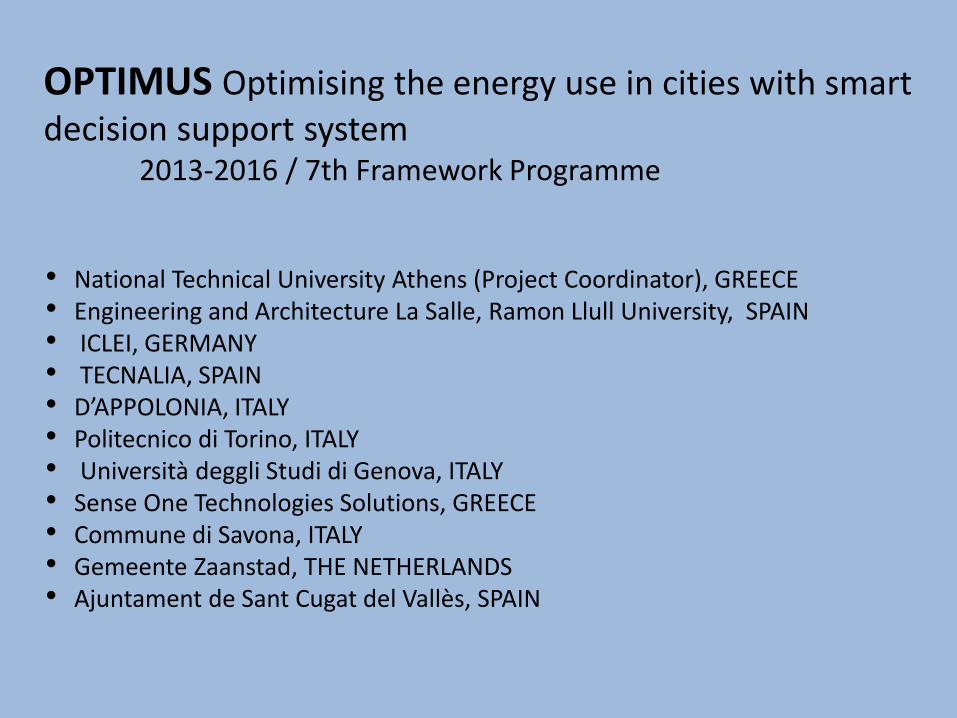
OPTIMUS Optimising the energy use in cities with smart decision support system
2013-2016 / 7th Framework Programme
• National Technical University Athens (Project Coordinator), GREECE• Engineering and Architecture La Salle, Ramon Llull University, SPAIN• ICLEI, GERMANY• TECNALIA, SPAIN• D’APPOLONIA, ITALY• Politecnico di Torino, ITALY• Università deggli Studi di Genova, ITALY• Sense One Technologies Solutions, GREECE• Commune di Savona, ITALY• Gemeente Zaanstad, THE NETHERLANDS• Ajuntament de Sant Cugat del Vallès, SPAIN
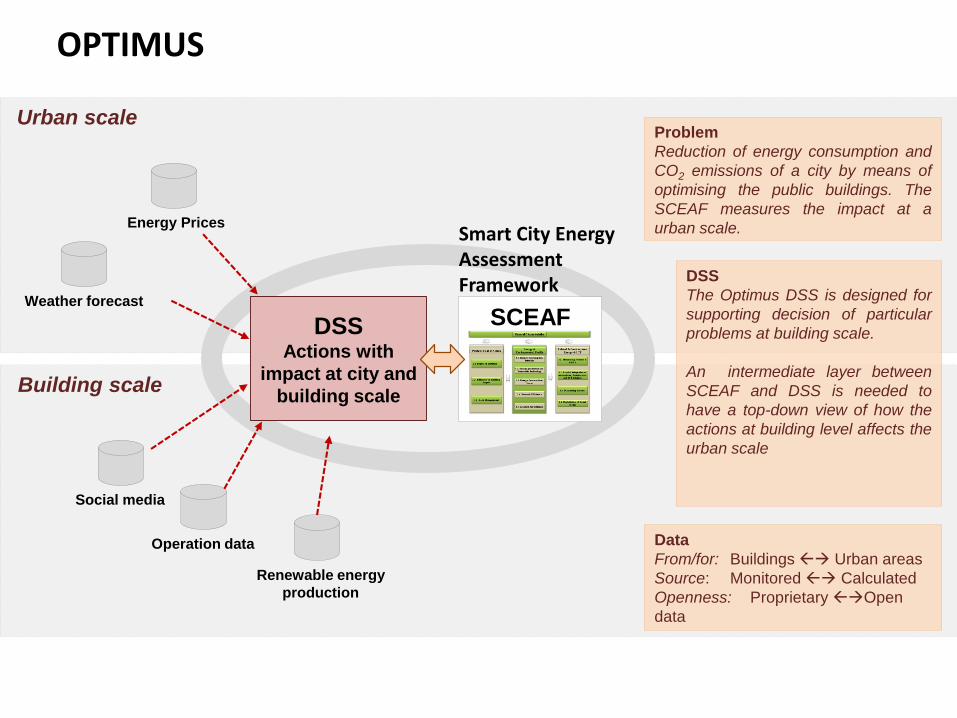
The purpose of OPTIMUS is to develop a semantic-based decision support system which integrates dynamic data from five different types / sources: climate, building operation, energy production, energy prices, user’s feedback.
OPTIMUS
Urban scale
Weather forecast
Operation data
Social media
Energy Prices
Renewable energy
production
SCEAF
Data
From/for: Buildings Urban areas
Source: Monitored Calculated
Openness: Proprietary Open
data
Problem
Reduction of energy consumption and
CO2 emissions of a city by means of
optimising the public buildings. The
SCEAF measures the impact at a
urban scale.
DSS
The Optimus DSS is designed for
supporting decision of particular
problems at building scale.
An intermediate layer between
SCEAF and DSS is needed to
have a top-down view of how the
actions at building level affects the
urban scale
DSS Actions with
impact at city and
building scaleBuilding scale
Smart City Energy Assessment Framework
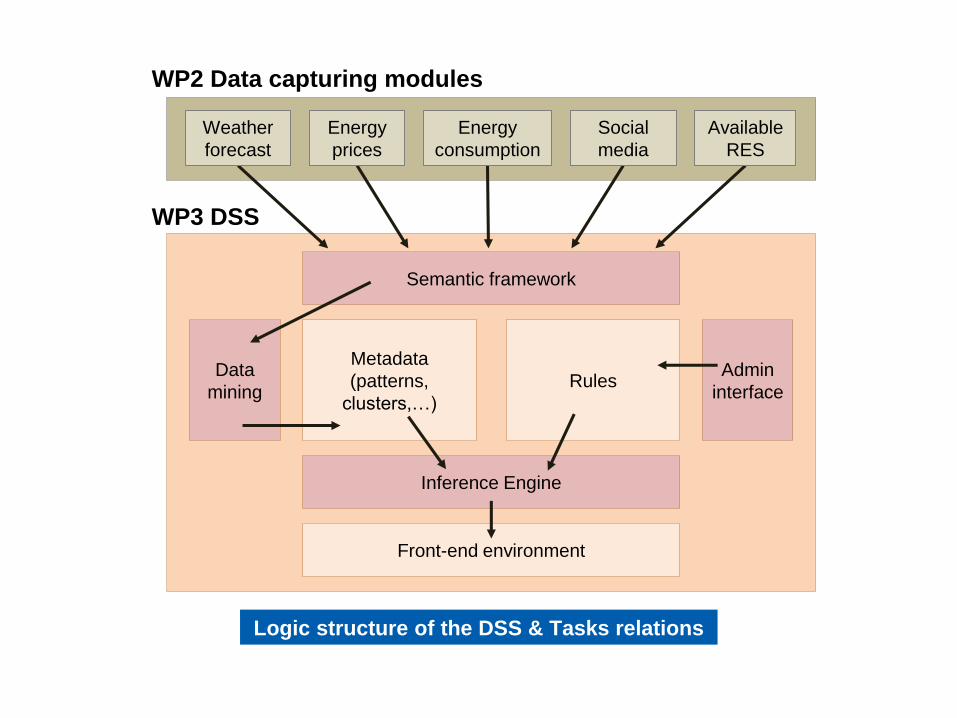
Semantic framework
Data
mining
Metadata
(patterns,
clusters,…)
Rules
Inference Engine
Front-end environment
Admin
interface
WP3 DSS
Weather
forecast
Energy
consumption
Social
media
Energy
prices
Available
RES
WP2 Data capturing modules
Logic structure of the DSS & Tasks relations
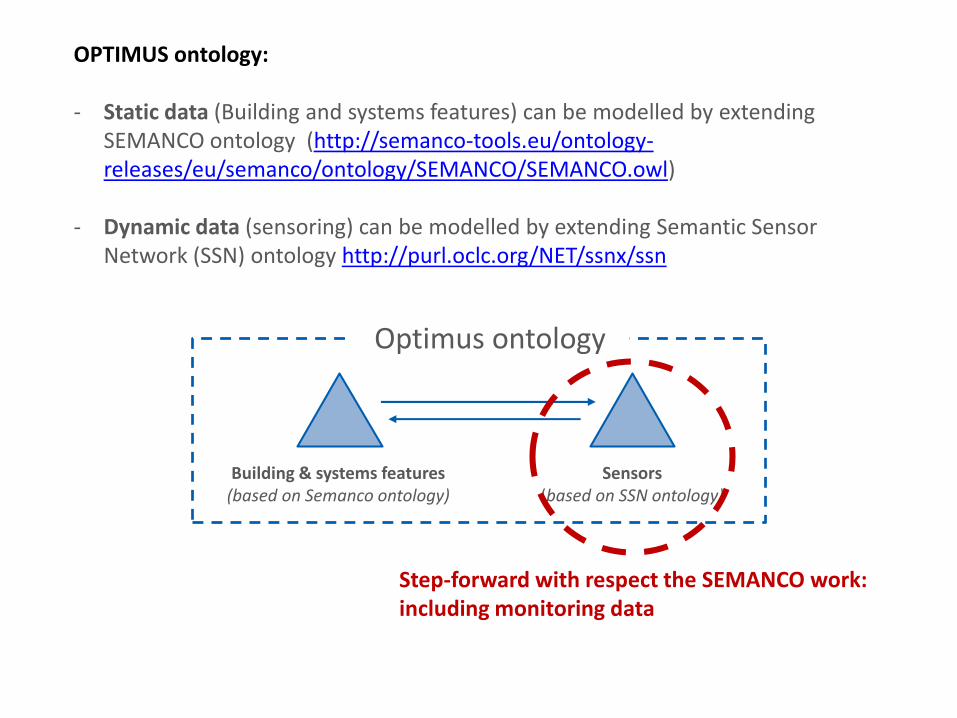
OPTIMUS ontology:
- Static data (Building and systems features) can be modelled by extending SEMANCO ontology (http://semanco-tools.eu/ontology-releases/eu/semanco/ontology/SEMANCO/SEMANCO.owl)
- Dynamic data (sensoring) can be modelled by extending Semantic Sensor Network (SSN) ontology http://purl.oclc.org/NET/ssnx/ssn
Sensors(based on SSN ontology)
Optimus ontology
Building & systems features(based on Semanco ontology)
Step-forward with respect the SEMANCO work: including monitoring data
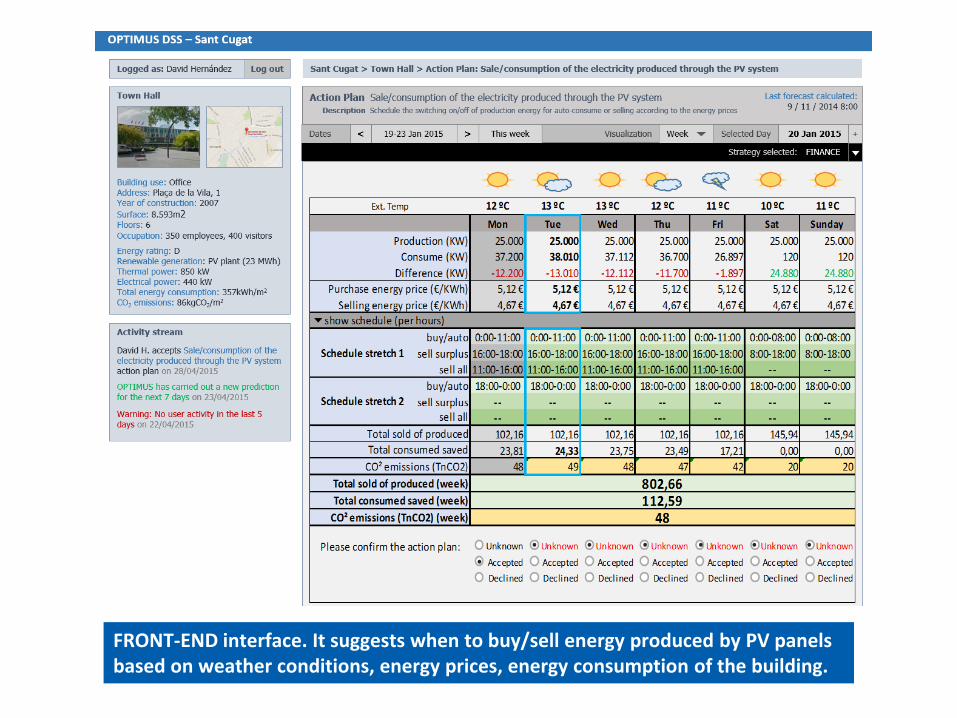
FRONT-END interface. It suggests when to buy/sell energy produced by PV panels based on weather conditions, energy prices, energy consumption of the building.
The SEMANCO ontology is being expanded with dynamic data:
• The OPTIMUS ontology includes indicators such as energy consumption and CO2 emissions, climate and socio-economic factor influencing consumption
• A front-end application will be implemented in three cities (Zaanstad, Savona, Sant Cugat)
What is being done in OPTIMUS:
1. Introduction group ARC: Research on energy information systems
2. Smart cities
3. Energy efficient cities: the SEMANCO project
Cities are complex systems made up of physical elements –buildings and streets, energy supply and communication infrastructures – in which multiple actors –citizens, companies, organizations– interact to carry out activities which put into relation the multiple subsystems –economic development with transportation networks, energy consumption with buildings energy performance – which make the city.
“Cities in fact are a ‘mess’ [a system of problems] as defined by organisational theorist and management scientist Russell Ackoff a complex system of systems where each problem interacts with others and there are no clear solutions” [M. Khawaja, 2014, Are smart cities really that smart?]
SMART CITIES
The term smart is used in everyday speech to refer to ideas and people that provide clever insights [M.Batty et al, 2012, Smart Cities of the Future]
Smart refers also to a capacity to quickly adapt to a changing environment, in the biological sense (e.g. smart growth)
SMART CITIES
Wired cities, intelligent cities, virtual cities, digital cities, information cities …
“Smart cities are often pictured as constellations of instruments across many scales that are connected through multiple networks which provide continuous dataregarding the movements of people and materials in terms of the flow of decisions about the physical and social form of the city.” [M. Batty et al. , 2012, Smart cities of the future]
SMART CITIES
ICT might improve the functioning of cities, enhancing their efficiency, improving their competitiveness, and providing new ways in which problems of poverty, social deprivation, and poor environment might be addressed
“The new intelligence of cities, then, resides in the increasingly effective combination of digital telecommunication networks (the nerves), ubiquitously embedded intelligence (the brains), sensors and tags (the sensory organs), and software (the knowledge and cognitive competence)” [T. Nam & T. A. Pardo, 2011, Conceptualizing Smart City with Dimensions of Technology, People, and Institutions]
SMART CITIES
Where does the intelligence lie?
• In the data (ontologies)?• In the processes/functions to analyze the data?• In the people who interpret the analyses?• In the city as a whole (in its infrastructure, networks,
people)?• In the overall system of the city or in each of the city’s
subsystem?
SMART CITIES
“A smarter city infuses information into its physical infrastructure to improve conveniences, facilitate mobility, add efficiencies, conserve energy, improve the quality of air and water, identify problems and fix them quickly, recover rapidly from disasters, collect data to make better decisions, deploy resources effectively, and share data to enable collaboration across entities and domains…..”[T. Nam & T. A. Pardo, 2011, Conceptualizing Smart City with Dimensions of Technology, People, and Institutions]
SMART CITIES
“…….However, infusing intelligence into each subsystem of a city, one by one–– transportation, energy, education, health care, buildings, physical infrastructure, food, water, public safety, etc.—is not enough to become a smarter city. A smarter city should be treated as an organic whole––as a network, as a linked system [T. Nam & T. A. Pardo, 2011, Conceptualizing Smart City with Dimensions of Technology, People, and Institutions]
SMART CITIES
“We believe a city to be smart when investments in human and social capital and traditional (transport) and modern (ICT) communication infrastructure fuel sustainable economic growth and a high quality of life, with a wise management of natural resources, through participatory governance.” [A. Caragliu, C. del Bo, P. Nijkamp, 2009, Smart cities in Europe]
SMART CITIES
Massive streams of data (big data) are being produced every data (transport, energy ….) captured by sensors, mobile devices,…
It is assumed that by getting real time information about the city’s subsystems we can know how the city functions, and take actions to improve its functioning. This implies:
₋ getting the data (accurate, maintained, reliable)₋ integrating data from multiples sources, types (static, dynamic) and forms₋ extracting meanings from the data
SMART CITIES : DATA
SMART CITIES : DATA : MODELS
Deriving insights and theories from continuous streaming of data (data mining/reality mining): patterns, routines, models…..
Do we need models to understand how the smart city works? Is it enough to identify correlations between phenomena without asking for the cause?
Is data derived from reality? Or is reality constructed after the data?
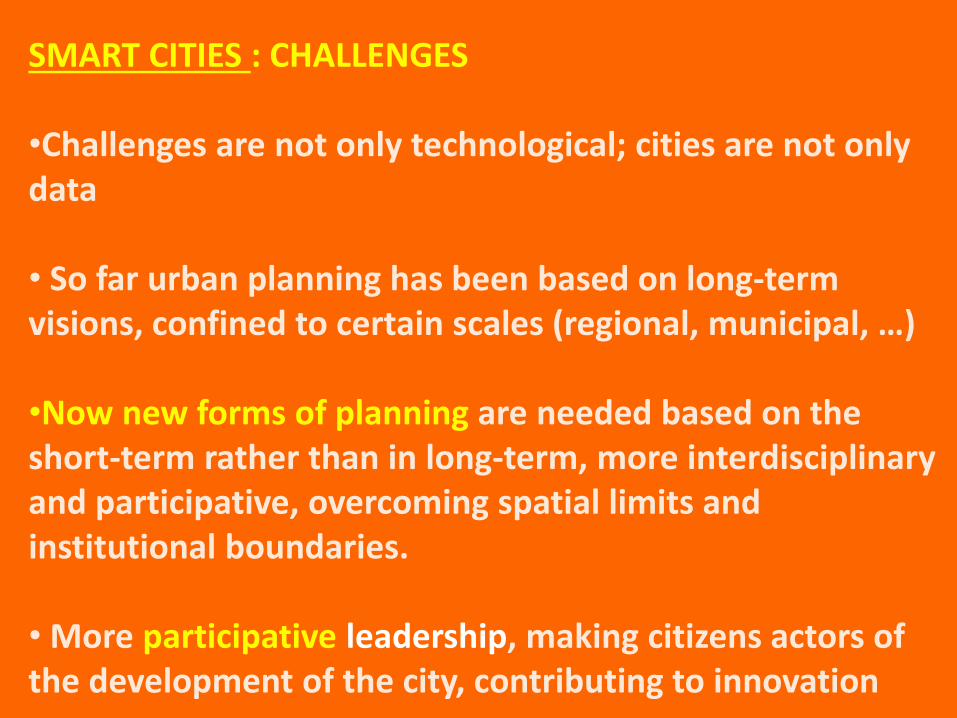
SMART CITIES : CHALLENGES
•Challenges are not only technological; cities are not only data
• So far urban planning has been based on long-term visions, confined to certain scales (regional, municipal, …)
•Now new forms of planning are needed based on the short-term rather than in long-term, more interdisciplinary and participative, overcoming spatial limits and institutional boundaries.
• More participative leadership, making citizens actors of the development of the city, contributing to innovation
SMART CITIES : CHALLENGES
“Leading a smart city initiative requires a comprehensive understanding of the complexities and interconnections among social and technical factors of services and physical environments in a city. For future research based on a socio-technical view, we must explore both ‘how do smart technologies change a city?’ and ‘how do traditional institutional and human factors in urban dynamics impact a smart city initiative leveraged by new technologies?’” [T. Nam & T. A. Pardo, 2011, Conceptualizing Smart City with Dimensions of Technology, People, and Institutions]
SMART CITIES : BUT…………
“Every technology and every ensemble of technologies encodes a hypothesis about human behaviour, and the smart city is not different” [A. Greenfield, 2013, Against the smart city]
SMART CITIES : BUT…………
“The underlying logic of computational decision-making at city level is based on a rationalistic assumption that data is impartial and it gives us facts, which leads to truth, and then wisdom, understanding and control. If data actually is impartial, then decisions based on it should be superior in every context. It is the absolutism of data that is so attractive to decision makers, because it absolves them of any moral responsibility. Sanitised data eliminates room for doubt and argument. Data being binary eradicates ethical dilemmas and obviates the need for agency, accountability and creativity.” [M. Khawaja, 2014, Are smart cities really that smart?]
1. Introduction group ARC: Research on energy information systems
2. Smart cities
3. Energy efficient cities: the SEMANCO project
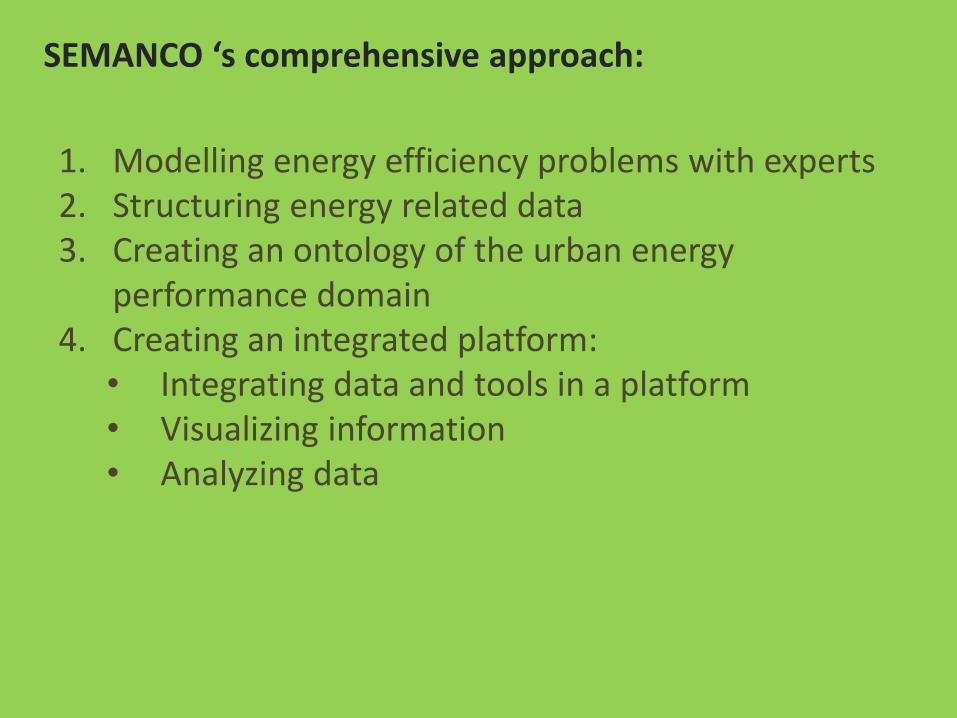
SEMANCO ‘s comprehensive approach:
1. Modelling energy efficiency problems with experts2. Structuring energy related data3. Creating an ontology of the urban energy
performance domain4. Creating an integrated platform:
• Integrating data and tools in a platform• Visualizing information• Analyzing data
Building repositories
Energydata
Environmentaldata
Economicdata
Enabling scenarios for stakeholders
Building stock energy modelling
tool
Advanced energy information
analysis tools
Interactivedesign tool
Energy simulationand trade-off tool
Policy Makers CitizensDesigners/Engineers Building ManagersPlanners
Regulations Urban Developments Building OperationsPlanning strategies
WP2
WP6
WP8
Technological
PlatformSEMANTIC ENERGY INFORMATION FRAMEWORK (SEIF)
CO2 emissions reduction!
Application domains
Stakeholders
WP3
WP5
WP4
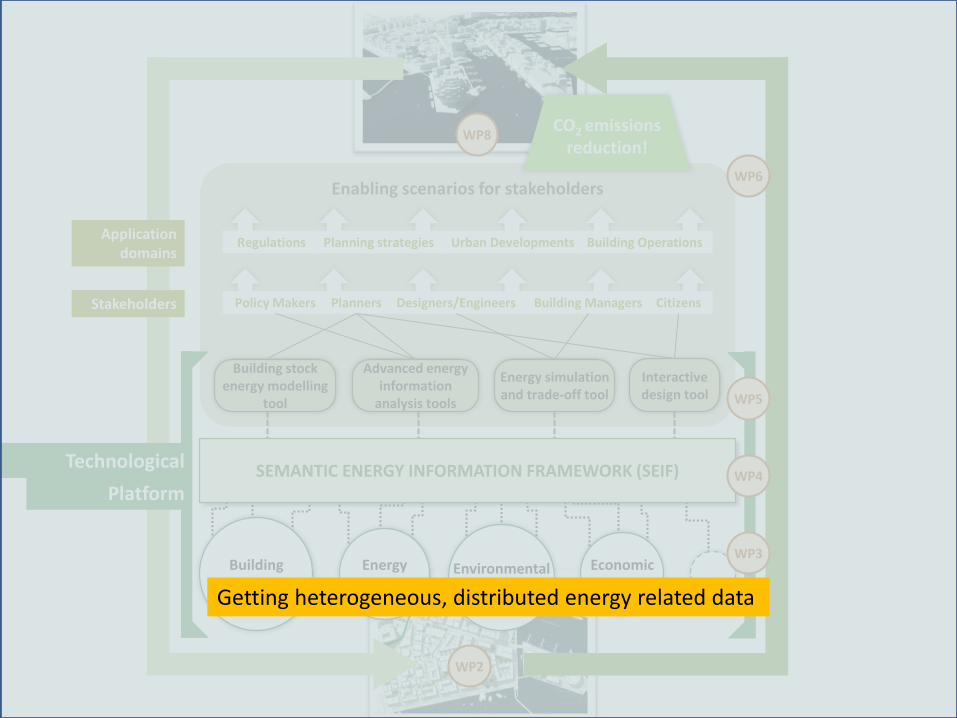
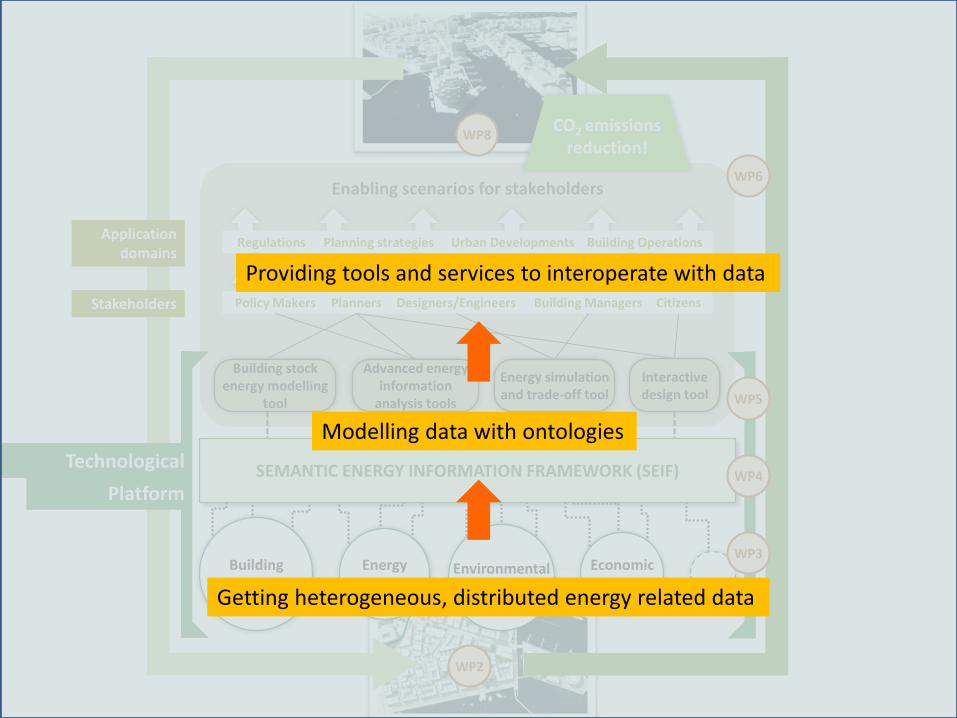
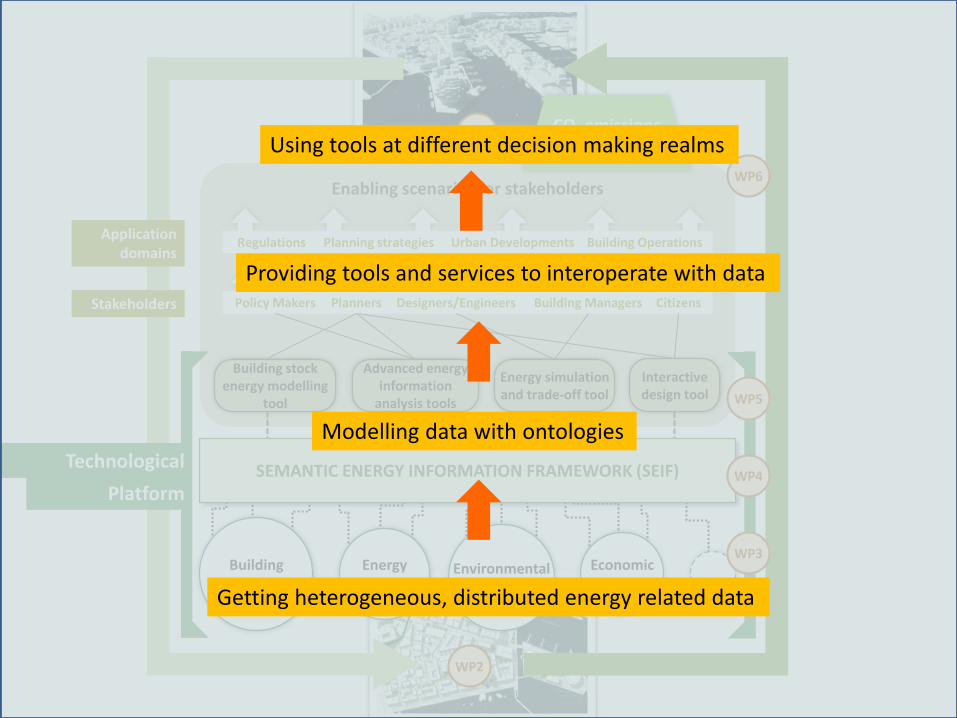
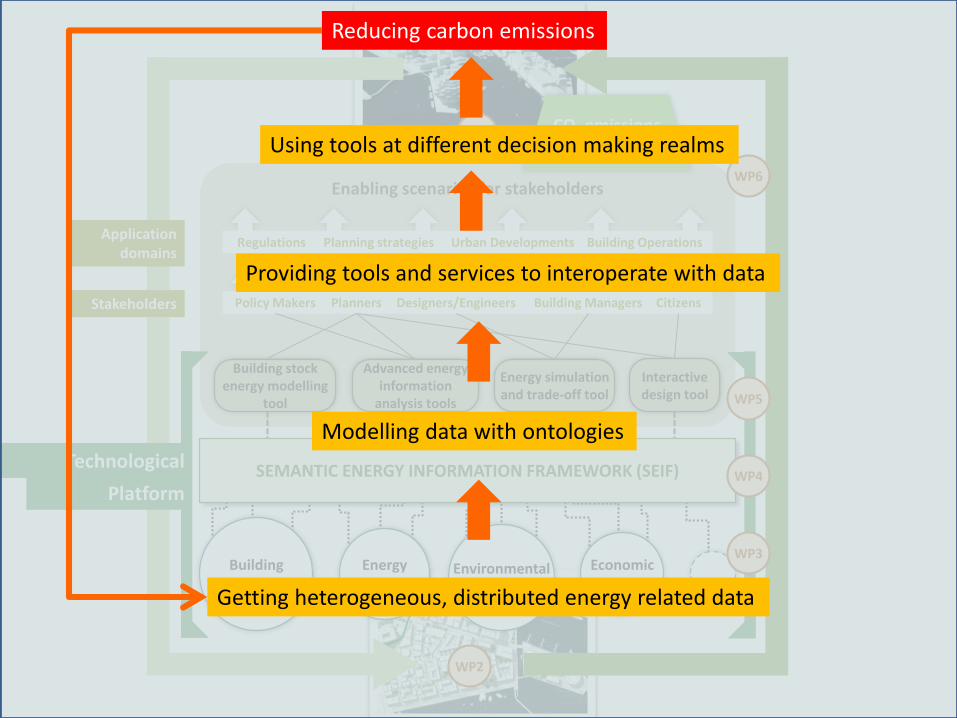
Getting heterogeneous, distributed energy related data
Building repositories
Energydata
Environmentaldata
Economicdata
Enabling scenarios for stakeholders
Building stock energy modelling
tool
Advanced energy information
analysis tools
Interactivedesign tool
Energy simulationand trade-off tool
Policy Makers CitizensDesigners/Engineers Building ManagersPlanners
Regulations Urban Developments Building OperationsPlanning strategies
WP2
WP6
WP8
Technological
PlatformSEMANTIC ENERGY INFORMATION FRAMEWORK (SEIF)
CO2 emissions reduction!
Application domains
Stakeholders
WP3
WP5
WP4
Getting heterogeneous, distributed energy related data
Modelling data with ontologies
Providing tools and services to interoperate with data
Using tools at different decision making realms
Reducing carbon emissions
Building repositories
Energydata
Environmentaldata
Economicdata
Enabling scenarios for stakeholders
Building stock energy modelling
tool
Advanced energy information
analysis tools
Interactivedesign tool
Energy simulationand trade-off tool
Policy Makers CitizensDesigners/Engineers Building ManagersPlanners
Regulations Urban Developments Building OperationsPlanning strategies
WP2
WP6
WP8
Technological
PlatformSEMANTIC ENERGY INFORMATION FRAMEWORK (SEIF)
CO2 emissions reduction!
Application domains
Stakeholders
WP3
WP5
WP4
The problem of carbon emission reduction in urban areas
cannot be constrained to a particular geographical area or scale,
nor is it the concern of a particular discipline or expert: it is a
systemic problem which involves multiple scales and domains
and the collaboration of experts from various fields.
Urban energy systems are “the combined process of acquiring
and using energy to satisfy the demands of a given urban area”
(Keirstead and Shah, 2013).
Models are created to assess the performance of an urban
system in a particular domain (building, transport, energy), or in
a combination of them. These models are abstractions of the
physical structure of the city, simplified representations of what
the city actually is. Most important, models should grasp the
activity of an urban system: the elements that come into play
with a particular purpose, the interactions among them.
An energy system model is “a formal system that represents
the combined processes of acquiring and using energy to satisfy
the energy service demands of a given urban area” (Keirstead et
al., 2012).
The goal of SEMANCO has been to create models of urban
energy systems to help different stakeholders –planners,
politicians, citizens – to assess the energy performance at the
different urban scales –building, district, neighborhood– and to
take decisions which help to improve it.
A model of an urban energy system fulfils two main purposes
(Shah, 2013):
- to understand the current state of the system
- to help to take decisions to influence its future evolution
An urban energy model provides answers to questions (e.g.
how much energy is consumed in an urban area, what is that
energy used for, what are the connections between urban
density and energy demand).
Models of urban systems rely on data: the data which is
necessary to reproduce the city’s physical structure (e.g. GIS
data) ; the data generated by the activity of people, goods, and
services.
Energy related data is dispersed in numerous databases and
open data sources and it might have different levels of quality; it is
heterogeneous since it is generated by different applications in
various domains; and it is dynamic, since urban energy systems
are dynamic entities in continuous transformation.
Semantic technologies are useful to integrate data from
multiple domains and applications.
Semantic-based models of an urban energy system
embody the combined knowledge of the experts which
analyze a complex problem from multiple perspectives. Such
models are not just a representation of a reality, but a
representation of a complex reality as conceptualised by
experts.
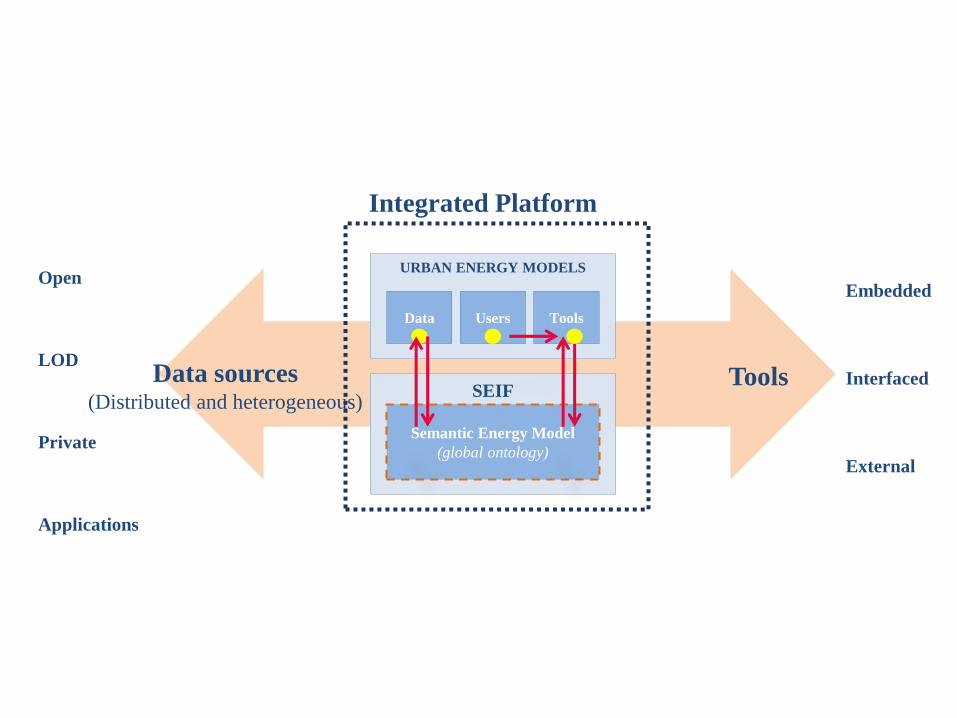
Integrated Platform
Data sources (Distributed and heterogeneous)
External
Embedded
Interfaced SEIF
Semantic Energy Model
(global ontology)
URBAN ENERGY MODELS
Data ToolsUsers
Tools
Private
Open
LOD
Applications

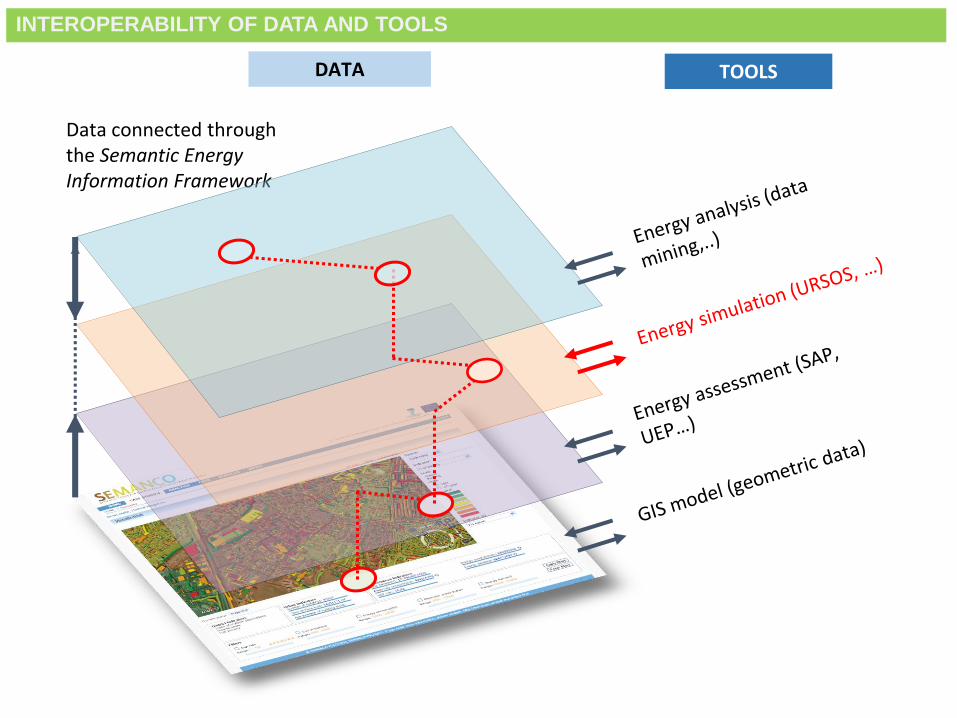
Data connected through the Semantic Energy Information Framework
DATA TOOLS
Smart City Expo World Congress, Barcelona, 18-20 November 2014
INTEROPERABILITY OF DATA AND TOOLS

Data connected through the Semantic Energy Information Framework
DATA TOOLS
Smart City Expo World Congress, Barcelona, 18-20 November 2014
INTEROPERABILITY OF DATA AND TOOLS
Data connected through the Semantic Energy Information Framework
DATA TOOLS
Smart City Expo World Congress, Barcelona, 18-20 November 2014
INTEROPERABILITY OF DATA AND TOOLS
Home Case Studies Analyses Data Services About
Newcastle United Kingdom
Legend
Source:
Indicator:
Units: - m2 year- year
Scale: - District- Building
Filters
54000
CO2 Emissions (tCO2 year)
213F
SAP Rate (u.)
G
Tenure
Private owner1234567
Energy demand (kj. year)
234210
Index of multiple deprivation(u)
3
Apply filters
Reset filters
Number of buildings: 15322 / 50200
Total surface built: 9023 / 34342 m2
Urban indicators
Age average of building stock: 77 / 42 years
Index of multiple deprivation: 4 / 15
Income score: 53 / 52
District indicators
Fuel poverty: 90 / 20 %
CO2 Emissions (tCO2 year): 234 / 3243.
Energy Consumption: 34342 / 23423
Performance indicators
Energy demand: 2343 / 234
SAP rate: 24 / 54
….
…..
Table3D Map
ProjectionCurrent status
Relationship
Building 1
Building use: Single-family houseSurface: 4234Height: 23Floors: 5
CO2 emissions: 23523Energy consumption: 4234Energy demand: 32423SAP: 2345
IMD: 12Fuel poverty: 42%Income index: 32
LinkExport
intervention
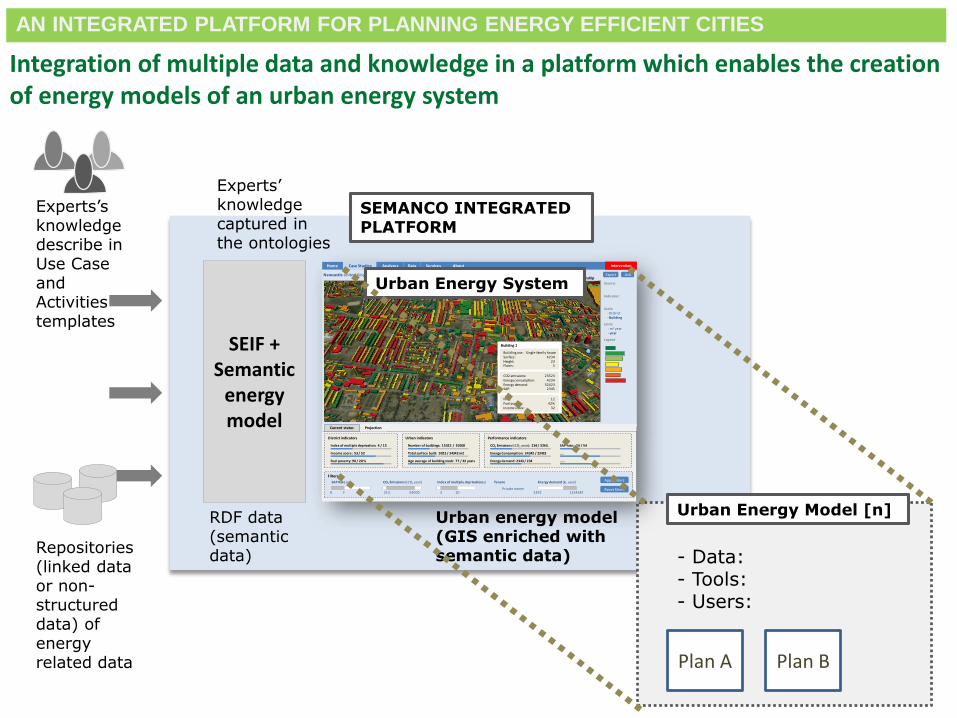
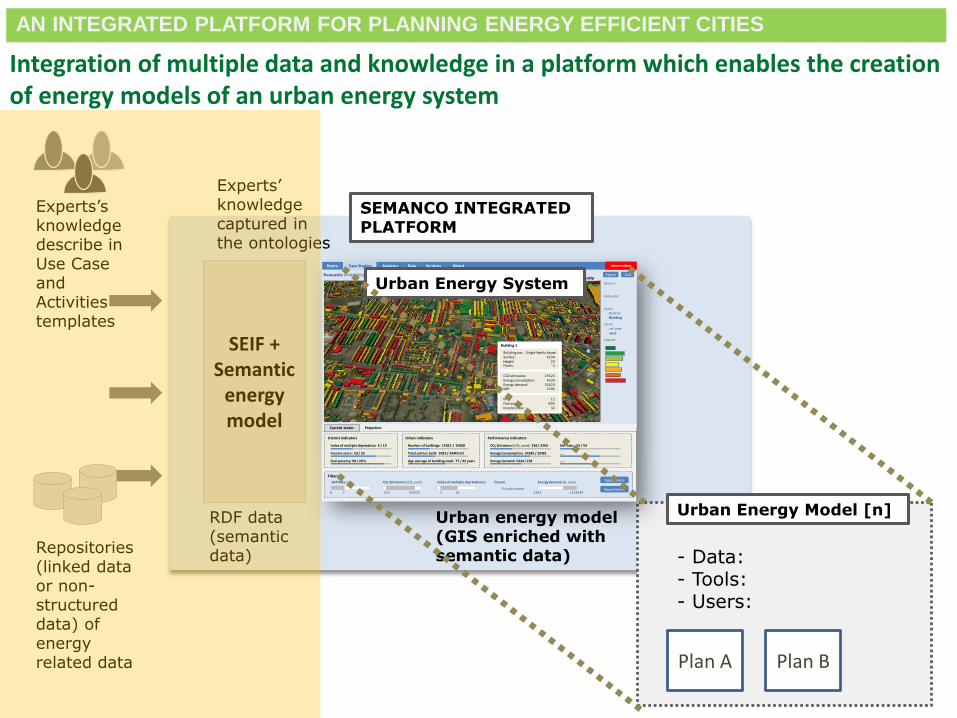
SEIF + Semantic
energymodel
SEMANCO INTEGRATED PLATFORM
- Data: - Tools: - Users:
Experts’ knowledgecaptured in the ontologies
RDF data (semanticdata)
Urban energy model(GIS enriched withsemantic data)
Experts’sknowledgedescribe in Use Case and Activitiestemplates
Repositories(linked data or non-structureddata) of energyrelated data
Urban Energy Model [n]
Urban Energy System
Smart City Expo World Congress, Barcelona, 18-20 November 2014
AN INTEGRATED PLATFORM FOR PLANNING ENERGY EFFICIENT CITIES
Integration of multiple data and knowledge in a platform which enables the creation of energy models of an urban energy system
Plan A Plan B
Home Case Studies Analyses Data Services About
Newcastle United Kingdom
Legend
Source:
Indicator:
Units: - m2 year- year
Scale: - District- Building
Filters
54000
CO2 Emissions (tCO2 year)
213F
SAP Rate (u.)
G
Tenure
Private owner1234567
Energy demand (kj. year)
234210
Index of multiple deprivation(u)
3
Apply filters
Reset filters
Number of buildings: 15322 / 50200
Total surface built: 9023 / 34342 m2
Urban indicators
Age average of building stock: 77 / 42 years
Index of multiple deprivation: 4 / 15
Income score: 53 / 52
District indicators
Fuel poverty: 90 / 20 %
CO2 Emissions (tCO2 year): 234 / 3243.
Energy Consumption: 34342 / 23423
Performance indicators
Energy demand: 2343 / 234
SAP rate: 24 / 54
….
…..
Table3D Map
ProjectionCurrent status
Relationship
Building 1
Building use: Single-family houseSurface: 4234Height: 23Floors: 5
CO2 emissions: 23523Energy consumption: 4234Energy demand: 32423SAP: 2345
IMD: 12Fuel poverty: 42%Income index: 32
LinkExport
intervention
SEIF + Semantic
energymodel
SEMANCO INTEGRATED PLATFORM
- Data: - Tools: - Users:
Experts’ knowledgecaptured in the ontologies
RDF data (semanticdata)
Urban energy model(GIS enriched withsemantic data)
Experts’sknowledgedescribe in Use Case and Activitiestemplates
Repositories(linked data or non-structureddata) of energyrelated data
Urban Energy Model [n]
Urban Energy System
Smart City Expo World Congress, Barcelona, 18-20 November 2014
AN INTEGRATED PLATFORM FOR PLANNING ENERGY EFFICIENT CITIES
Integration of multiple data and knowledge in a platform which enables the creation of energy models of an urban energy system
Plan A Plan B
Use Cases &
Activities
Standard
Tables
Data sources
mapping Table
Ontology Mapping
Semantic
Energy model
Data sources
integrated
Ontology Editor
2 4
5
S
E
I
F
6Case Study:
Newcastle
Case Study:
Manresa
Case Study:
Copenhagen
1
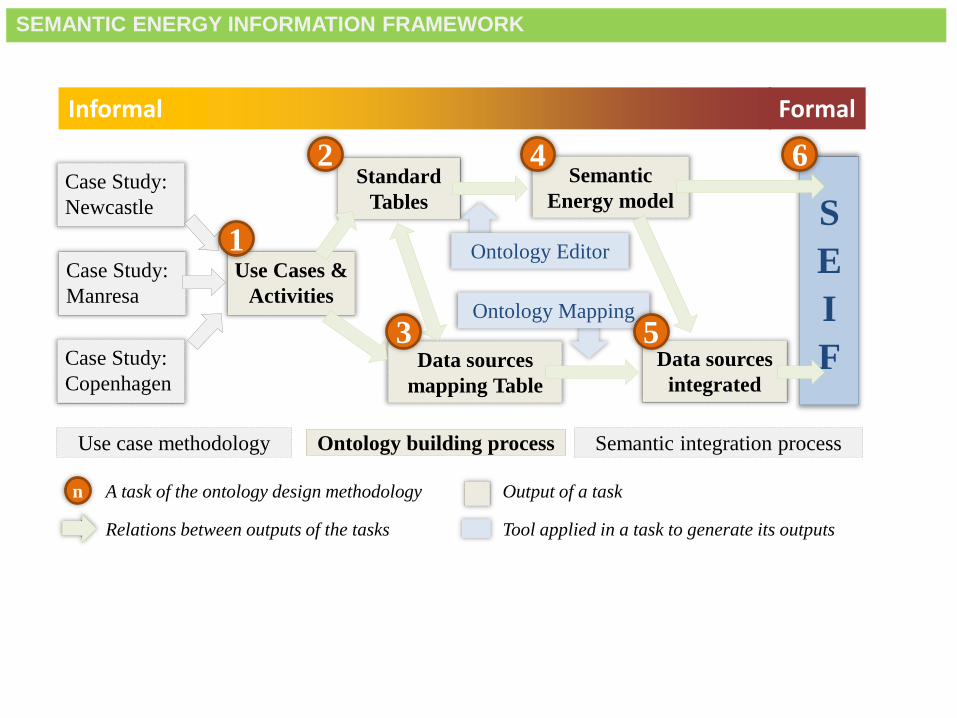
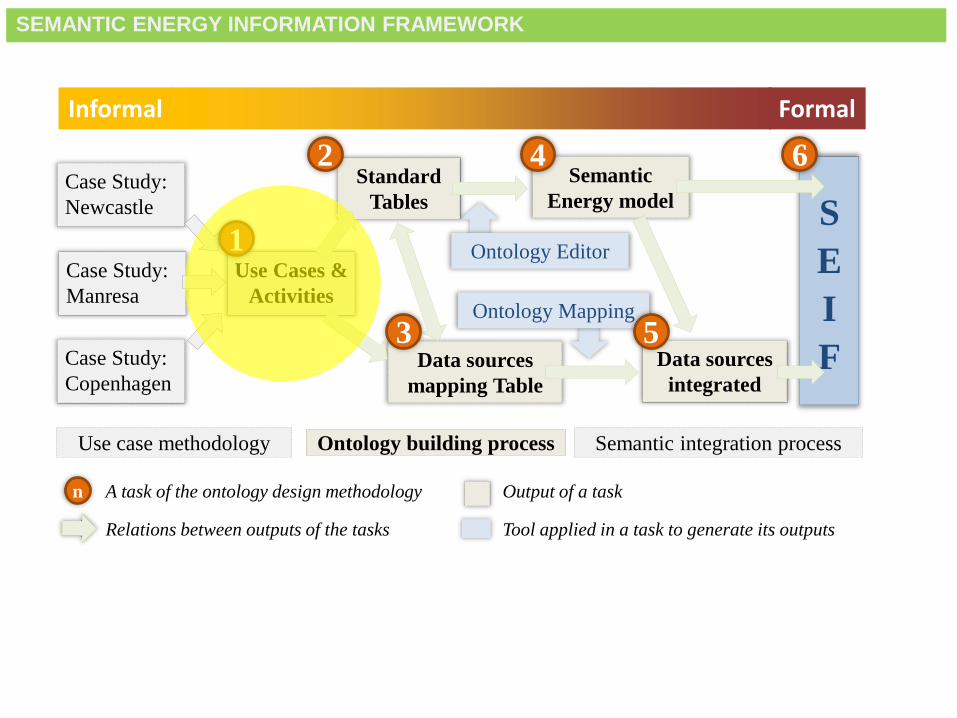
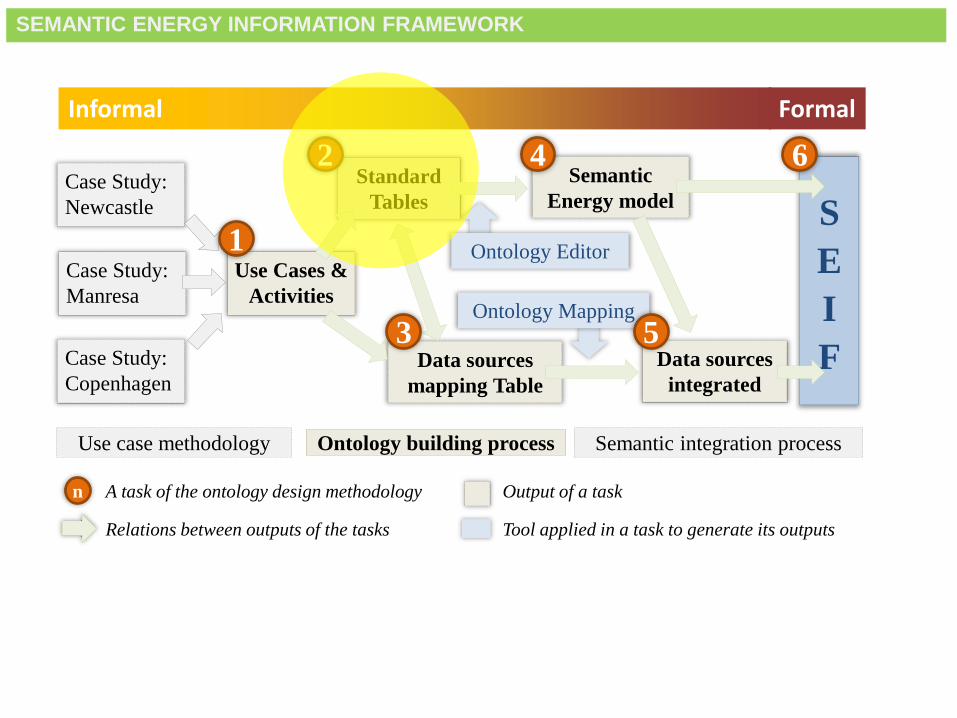
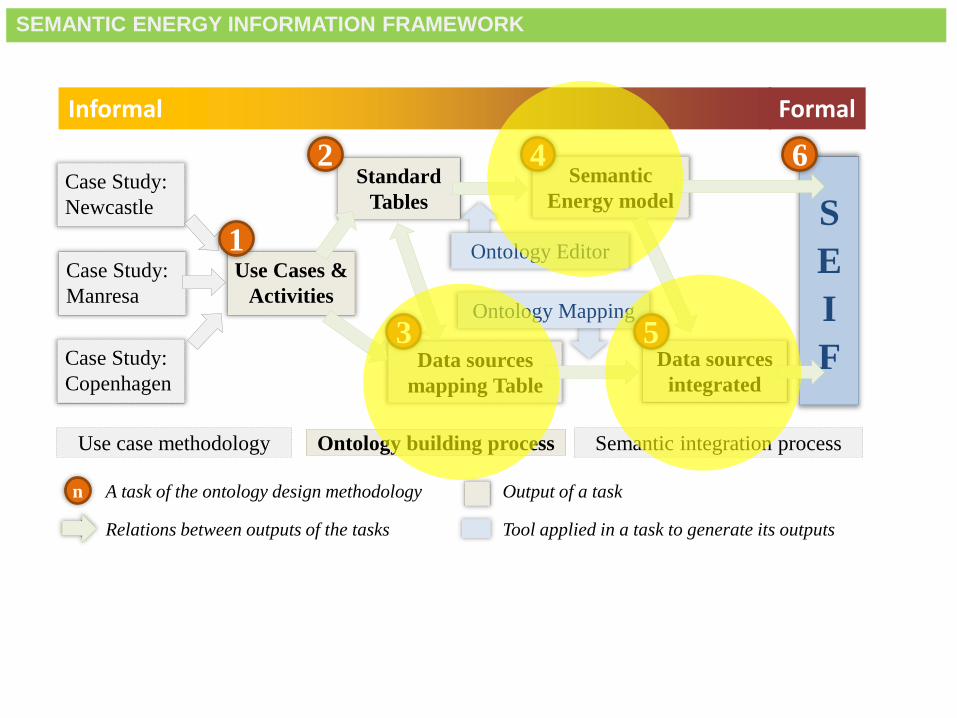
Use case methodology Semantic integration processOntology building process
n A task of the ontology design methodology
Relations between outputs of the tasks
Output of a task
Tool applied in a task to generate its outputs
Informal Formal
3
SEMANTIC ENERGY INFORMATION FRAMEWORK
Use Cases &
Activities
Standard
Tables
Data sources
mapping Table
Ontology Mapping
Semantic
Energy model
Data sources
integrated
Ontology Editor
2 4
5
S
E
I
F
6Case Study:
Newcastle
Case Study:
Manresa
Case Study:
Copenhagen
1
Use case methodology Semantic integration processOntology building process
n A task of the ontology design methodology
Relations between outputs of the tasks
Output of a task
Tool applied in a task to generate its outputs
Informal Formal
3
SEMANTIC ENERGY INFORMATION FRAMEWORK
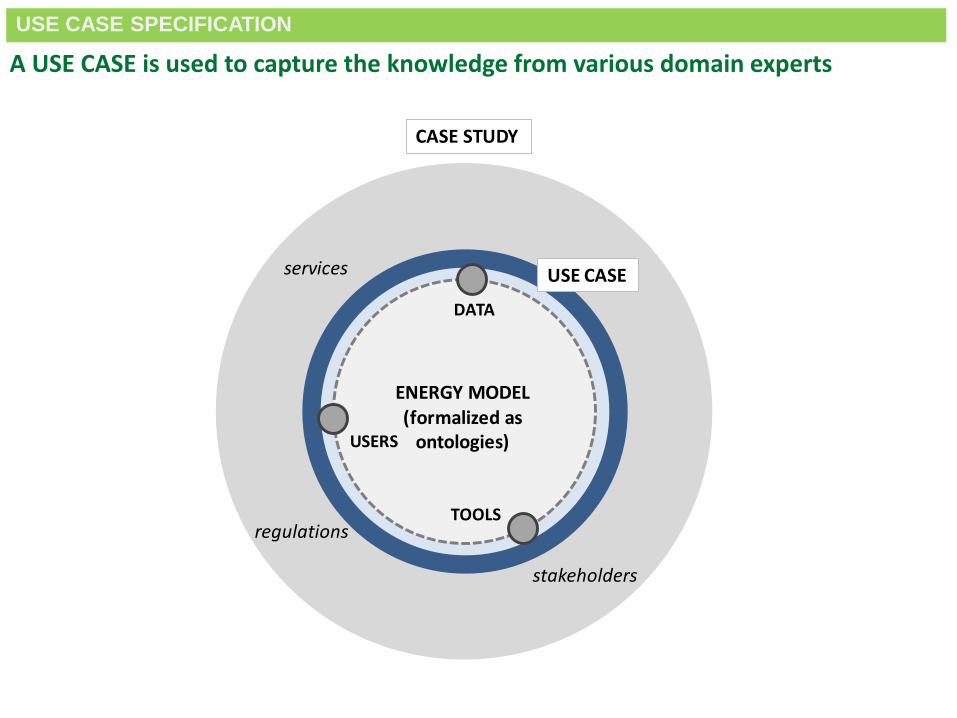
USE CASE SPECIFICATION
DATA
TOOLS
USERS
services
stakeholders
ENERGY MODEL (formalized as
ontologies)
USE CASE
CASE STUDY
regulations
A USE CASE is used to capture the knowledge from various domain experts
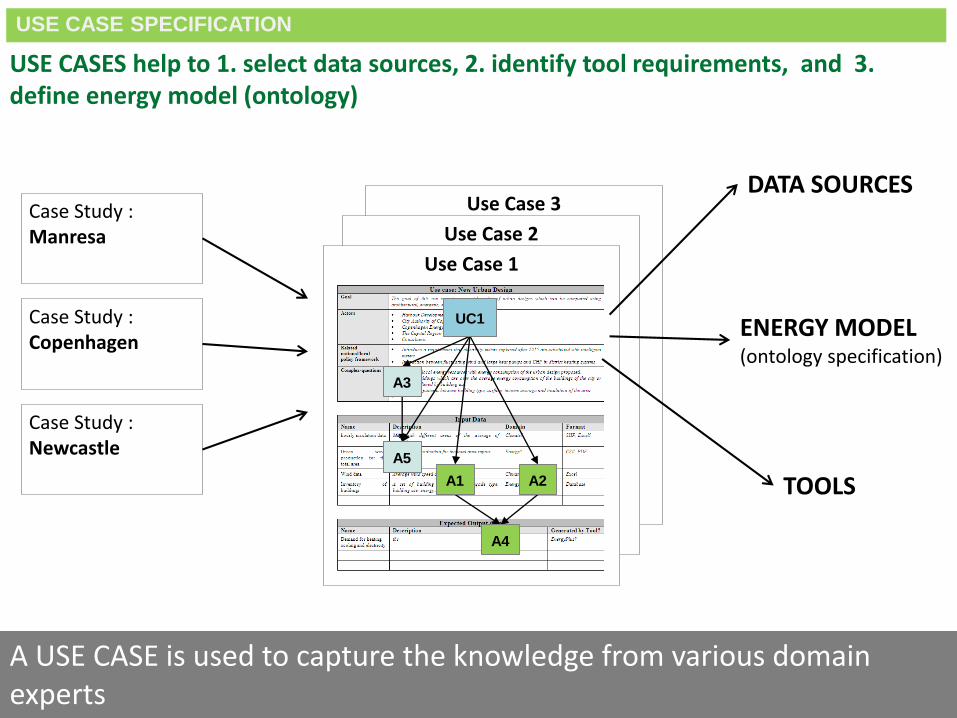
USE CASE SPECIFICATION
USE CASES help to 1. select data sources, 2. identify tool requirements, and 3. define energy model (ontology)
Use Case 3
Use Case 2
Use Case 1
Case Study : Manresa
Case Study : Copenhagen
DATA SOURCES
Case Study : Newcastle
UC1
A1 A2
A3
A5
A4
ENERGY MODEL (ontology specification)
TOOLS
A USE CASE is used to capture the knowledge from various domain experts
USE CASE SPECIFICATION
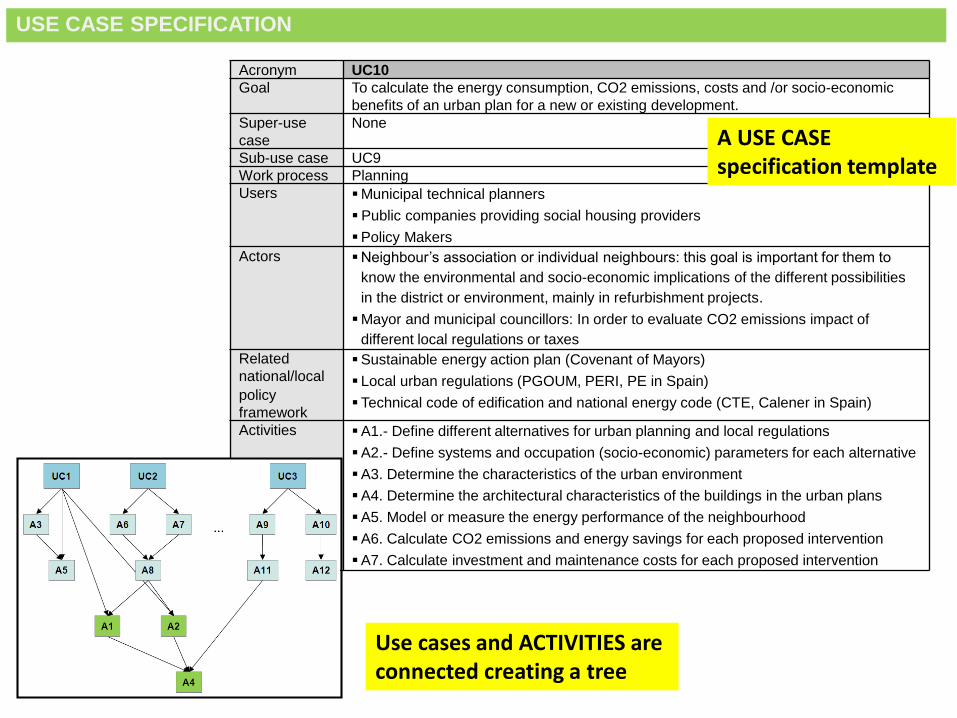
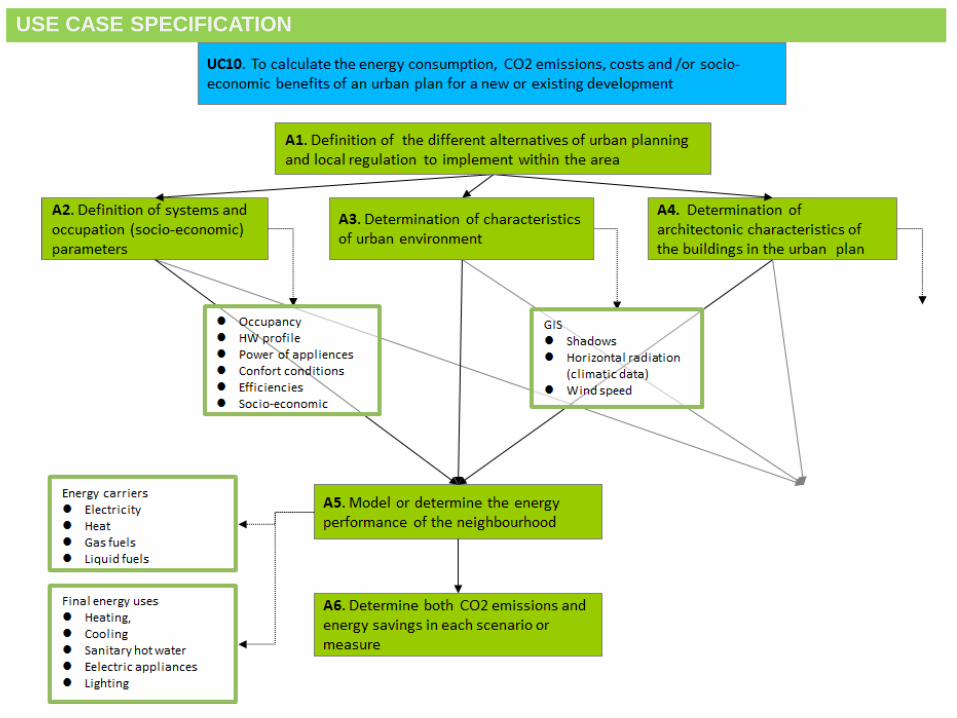
Acronym UC10
Goal To calculate the energy consumption, CO2 emissions, costs and /or socio-economic
benefits of an urban plan for a new or existing development.
Super-use
case
None
Sub-use case UC9
Work process Planning
Users Municipal technical planners
Public companies providing social housing providers
Policy Makers
Actors Neighbour’s association or individual neighbours: this goal is important for them to
know the environmental and socio-economic implications of the different possibilities
in the district or environment, mainly in refurbishment projects.
Mayor and municipal councillors: In order to evaluate CO2 emissions impact of
different local regulations or taxes
Related
national/local
policy
framework
Sustainable energy action plan (Covenant of Mayors)
Local urban regulations (PGOUM, PERI, PE in Spain)
Technical code of edification and national energy code (CTE, Calener in Spain)
Activities A1.- Define different alternatives for urban planning and local regulations
A2.- Define systems and occupation (socio-economic) parameters for each alternative
A3. Determine the characteristics of the urban environment
A4. Determine the architectural characteristics of the buildings in the urban plans
A5. Model or measure the energy performance of the neighbourhood
A6. Calculate CO2 emissions and energy savings for each proposed intervention
A7. Calculate investment and maintenance costs for each proposed intervention
Use cases and ACTIVITIES are connected creating a tree
A USE CASE specification template
USE CASE SPECIFICATION
Use Cases &
Activities
Standard
Tables
Data sources
mapping Table
Ontology Mapping
Semantic
Energy model
Data sources
integrated
Ontology Editor
2 4
5
S
E
I
F
6Case Study:
Newcastle
Case Study:
Manresa
Case Study:
Copenhagen
1
Use case methodology Semantic integration processOntology building process
n A task of the ontology design methodology
Relations between outputs of the tasks
Output of a task
Tool applied in a task to generate its outputs
Informal Formal
3
SEMANTIC ENERGY INFORMATION FRAMEWORK
Description Reference Type of data Unit Reference to other sheets
construction as a whole, including its envelope and all
technical building systems, for which energy is used to
condition the indoor climate, to provide domestic hot
water and illumination and other services related to the
use of the building
EN 15603 - - -
has name (ID) of the building - string - -
has construction period of the building - string - -
is year of construction of the building - string - -
is
period of years to be defined according to typical
construction or building properties (materials, construction
principles, building shape, ...)
TABULA string - -
first year of the age class TABULA string - -
last year of the age class TABULA string - -
specification of the region the age class is defined for TABULA string - -
- SUMO A,B,C,D - -
has use of the building - string - "b_use"
has geometry of the building - - - -
has number of floors/storeys of the building TABULA* integer - -
hasusable part of a building that is situated partly or entirely
below ground levelEN ISO 13370 string - -
has number of apartments of the building TABULA integer - -
has enclosed space within a building ANSI/ASHRAE 90.1 string - -
is heated and/or cooled space
EN 15603
EN ISO 13790
ANSI/ASHRAE 90.1
string - -
has geometry of the conditioned space of the building - - - "cs_geometry"
has
the exterior plus semi-exterior portions of a building
(separing conditioned space from external environment or
from unconditioned space)
ANSI/ASHRAE 90.1* - - "cs_envelope"
has portions of a building within the conditioned space - - - "cs_internal_partitions"
has characteristics of the conditioned space occupancy - - - "cs_occupancy"
has
arithmetic average of the air temperature and the mean
radiant temperature at the centre of a zone or conditioned
space
EN ISO 13790* - - "cs_indoor_air_temperature"
has characteristics of the ventilation of the conditioned space - - - "cs_ventilation"
has
heat provided within the building by occupants (sensible
metabolic heat) and by appliances such as domestic
appliances, office equipment, etc., other than energy
intentionally provided for heating, cooling or hot water
preparation
EN ISO 13790 - - "cs_internal_heat_gains"
has energy referred to building conditioned space - - - "energy_quantities"
Number_Of_Apartments
Number_Of_Complete_Storeys
Basement
CS_Geometry
CS_Envelope
CS_Internal_Partitions
CS_Occupancy
CS_Indoor_Air_Temperature
CS_Ventilation
CS_Internal_Heat_Gains
Energy_Quantity_Related_To_Conditioned_Space
Building_Use
Building_Geometry
Space
Name/Acronym
Building
Age
Year_Of_Construction
Age_Class
To_Year
has Allocation
has
has
Identifier
From_Year
Building_Name
has
Conditioned_Space
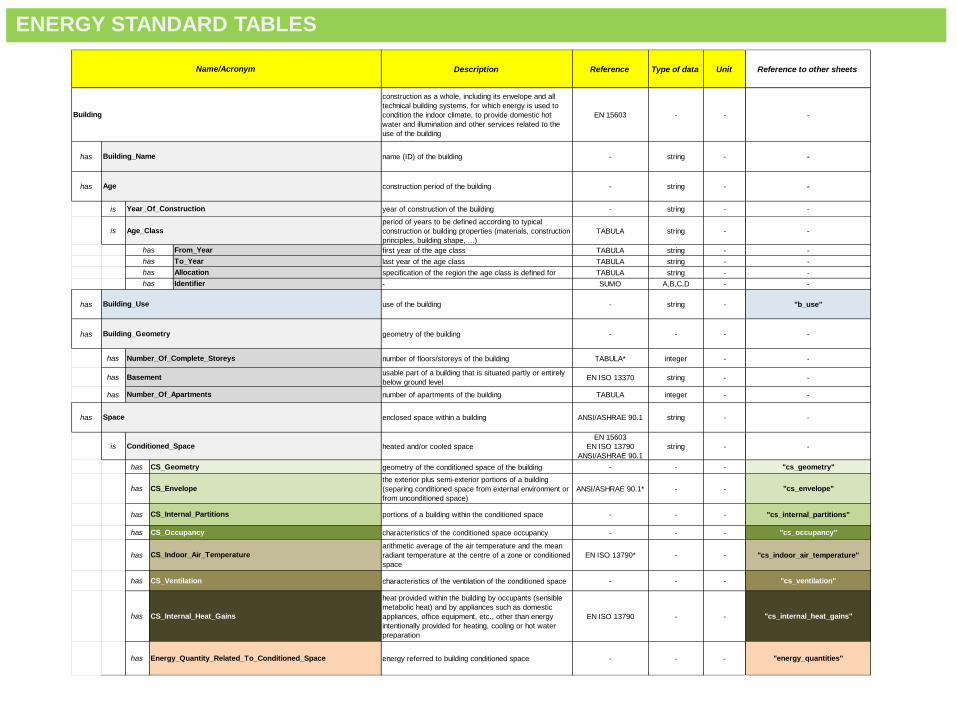
ENERGY STANDARD TABLES
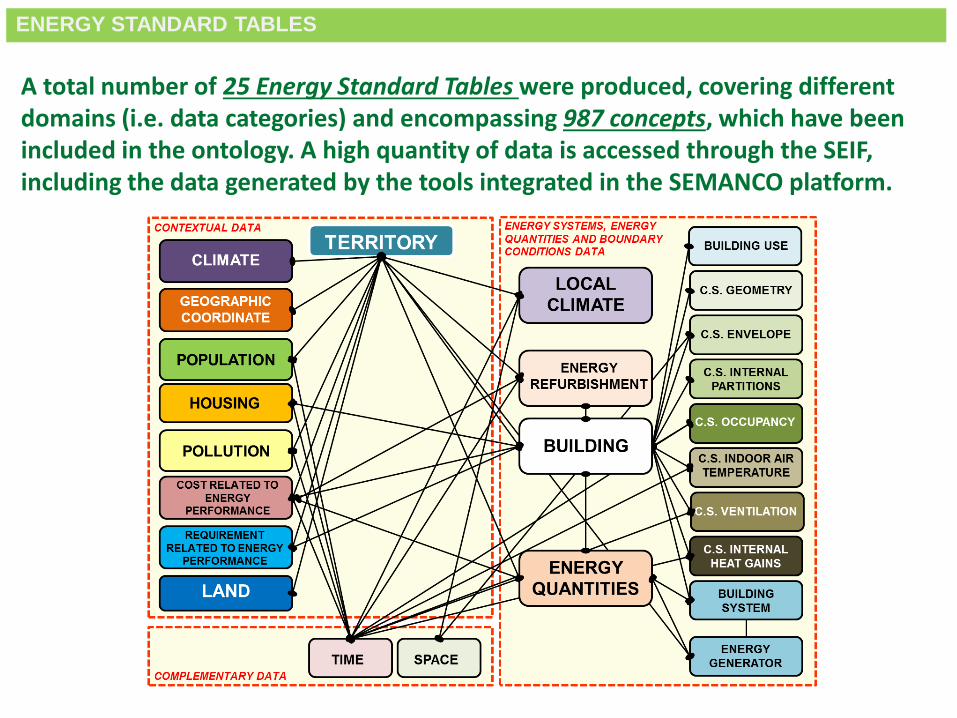
A total number of 25 Energy Standard Tables were produced, covering different domains (i.e. data categories) and encompassing 987 concepts, which have been included in the ontology. A high quantity of data is accessed through the SEIF, including the data generated by the tools integrated in the SEMANCO platform.
ENERGY STANDARD TABLES
Use Cases &
Activities
Standard
Tables
Data sources
mapping Table
Ontology Mapping
Semantic
Energy model
Data sources
integrated
Ontology Editor
2 4
5
S
E
I
F
6Case Study:
Newcastle
Case Study:
Manresa
Case Study:
Copenhagen
1
Use case methodology Semantic integration processOntology building process
n A task of the ontology design methodology
Relations between outputs of the tasks
Output of a task
Tool applied in a task to generate its outputs
Informal Formal
3
SEMANTIC ENERGY INFORMATION FRAMEWORK
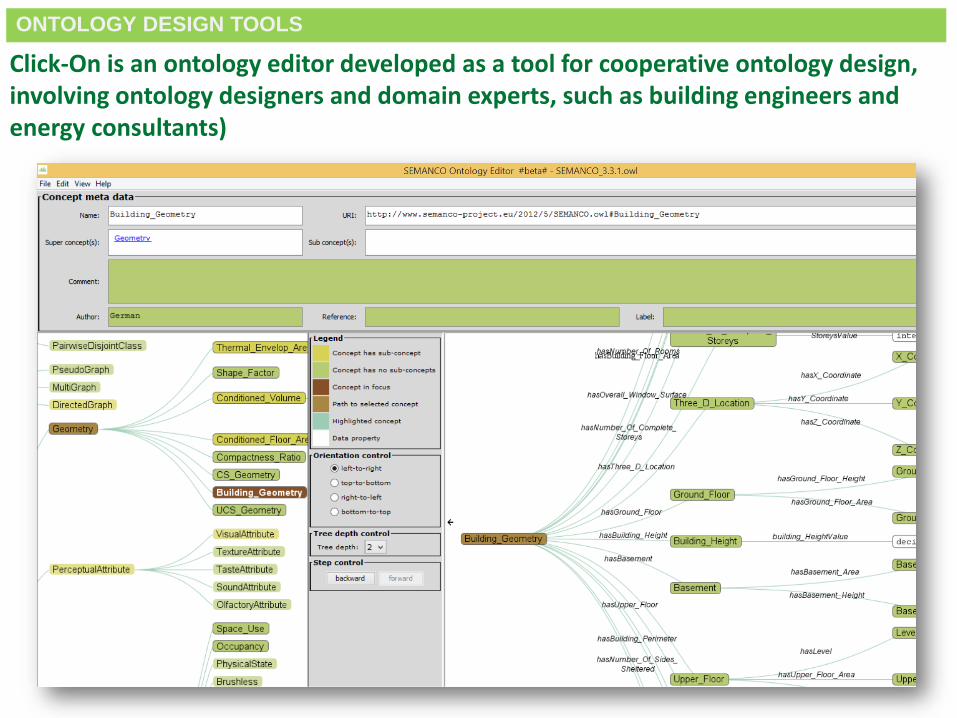
ONTOLOGY DESIGN TOOLS
Click-On is an ontology editor developed as a tool for cooperative ontology design, involving ontology designers and domain experts, such as building engineers and energy consultants)
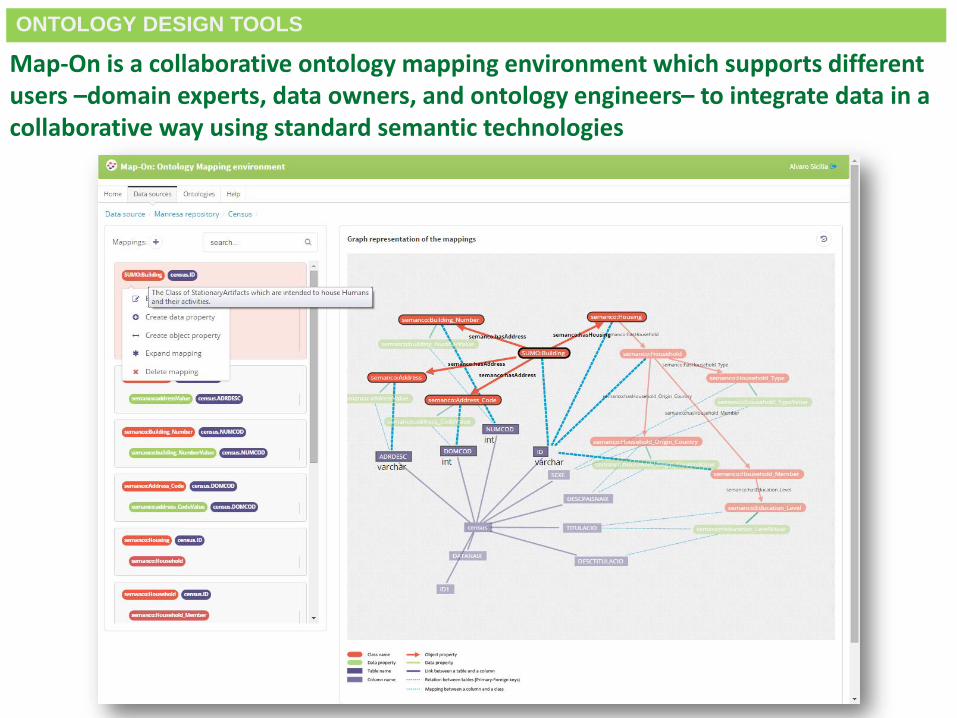
ONTOLOGY DESIGN TOOLS
Map-On is a collaborative ontology mapping environment which supports different users –domain experts, data owners, and ontology engineers– to integrate data in a collaborative way using standard semantic technologies
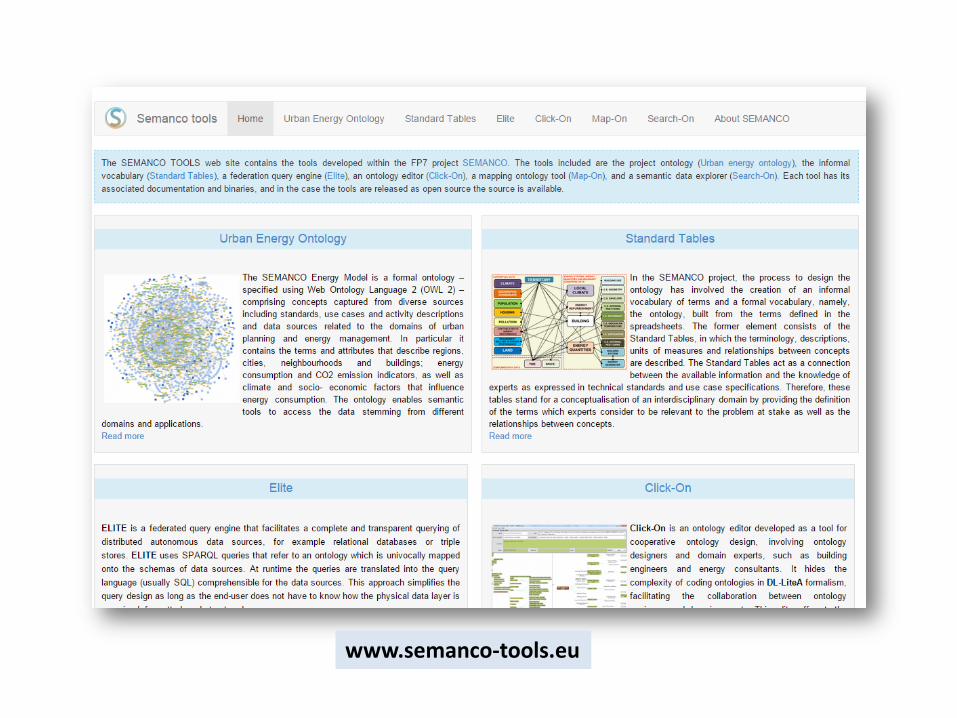
www.semanco-tools.eu
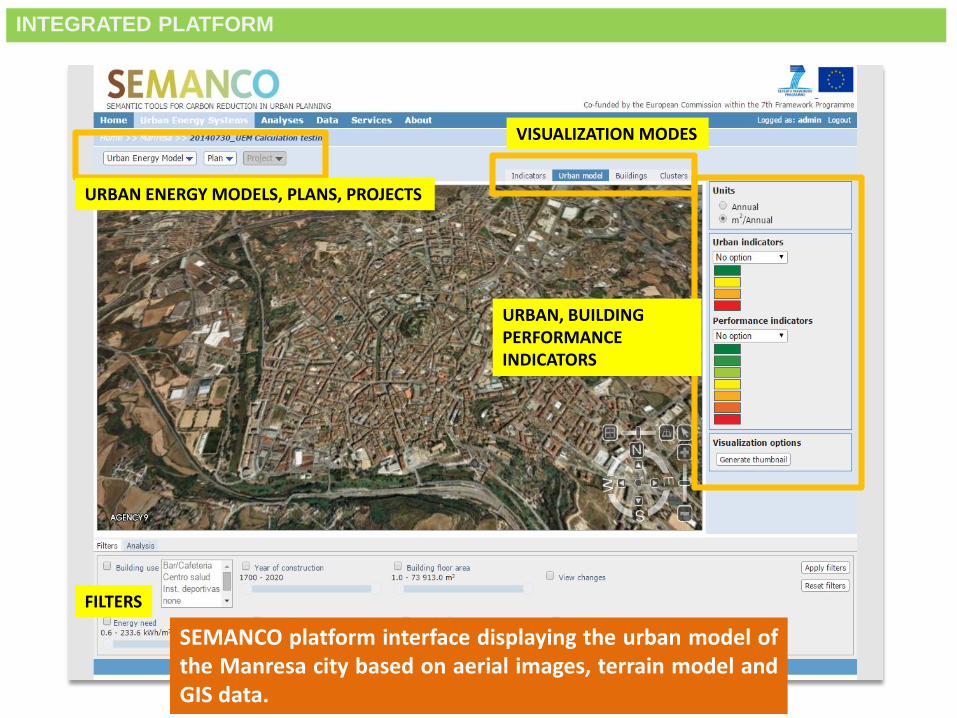
Smart City Expo World Congress, Barcelona, 18-20 November 2014
SEMANCO platform interface displaying the urban model ofthe Manresa city based on aerial images, terrain model andGIS data.
URBAN ENERGY MODELS, PLANS, PROJECTS
URBAN, BUILDING PERFORMANCE INDICATORS
VISUALIZATION MODES
FILTERS
INTEGRATED PLATFORM
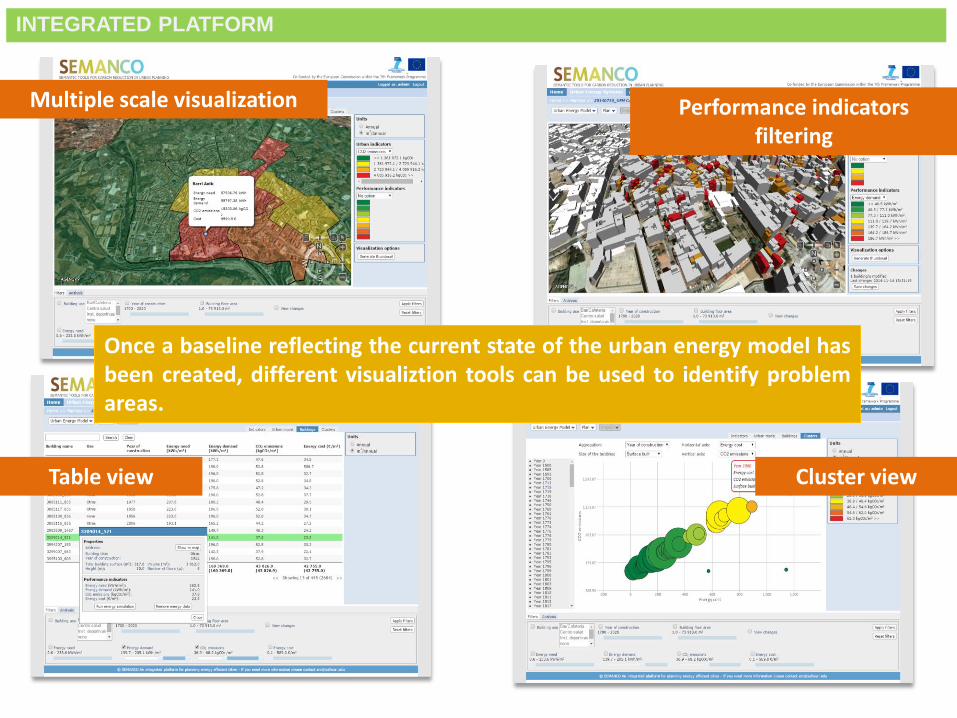
Smart City Expo World Congress, Barcelona, 18-20 November 2014
Once a baseline reflecting the current state of the urban energy model hasbeen created, different visualiztion tools can be used to identify problemareas.
Cluster viewTable view
Performance indicators filtering
Multiple scale visualization
INTEGRATED PLATFORM
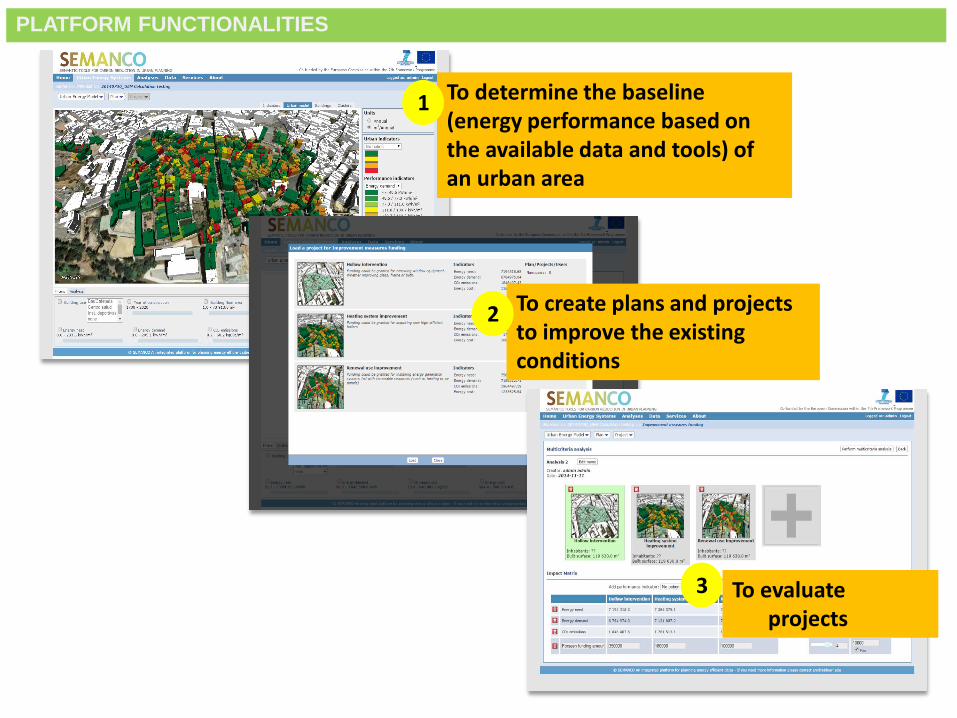
Smart City Expo World Congress, Barcelona, 18-20 November 2014
To determine the baseline(energy performance based onthe available data and tools) of an urban area
1
To create plans and projects to improve the existing conditions
2
To evaluate projects
3
PLATFORM FUNCTIONALITIES
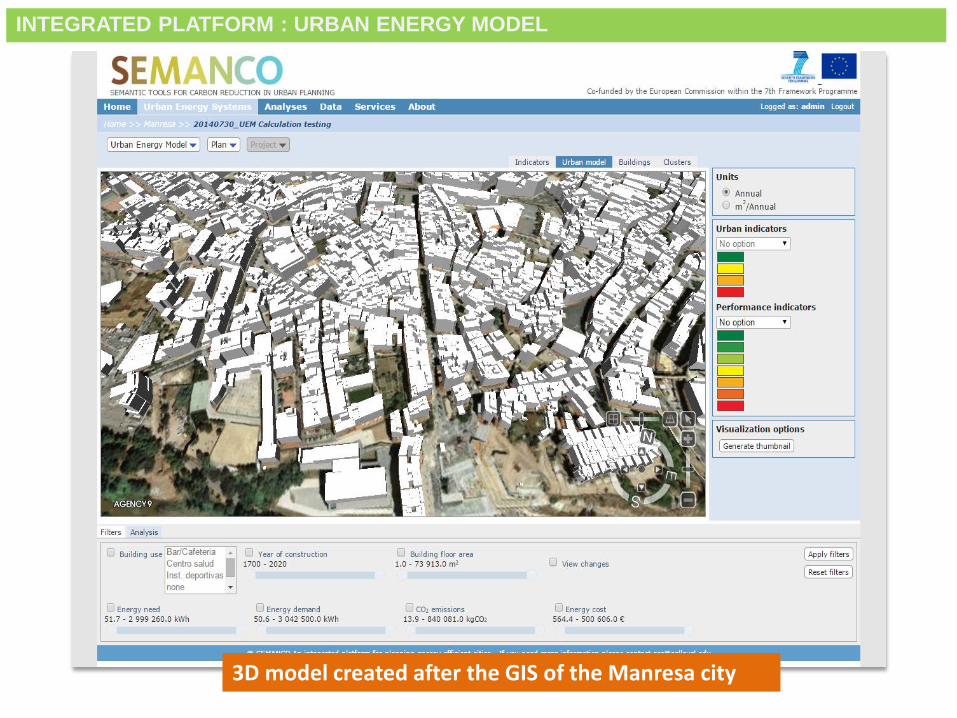
Smart City Expo World Congress, Barcelona, 18-20 November 2014
3D model created after the GIS of the Manresa city
INTEGRATED PLATFORM : URBAN ENERGY MODEL
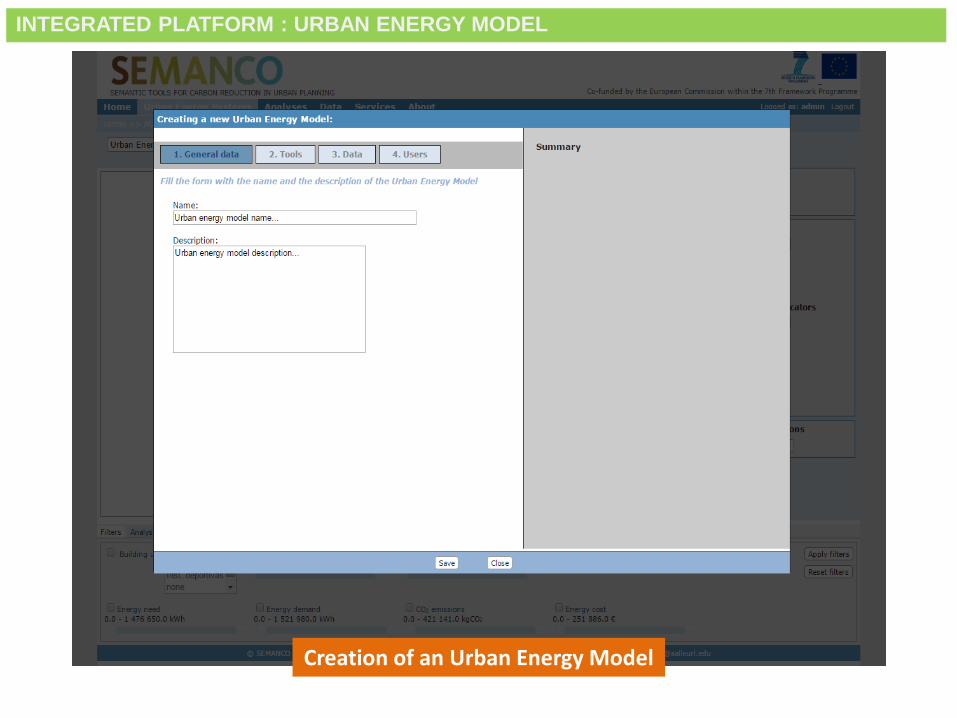
Smart City Expo World Congress, Barcelona, 18-20 November 2014
Creation of an Urban Energy Model
INTEGRATED PLATFORM : URBAN ENERGY MODEL
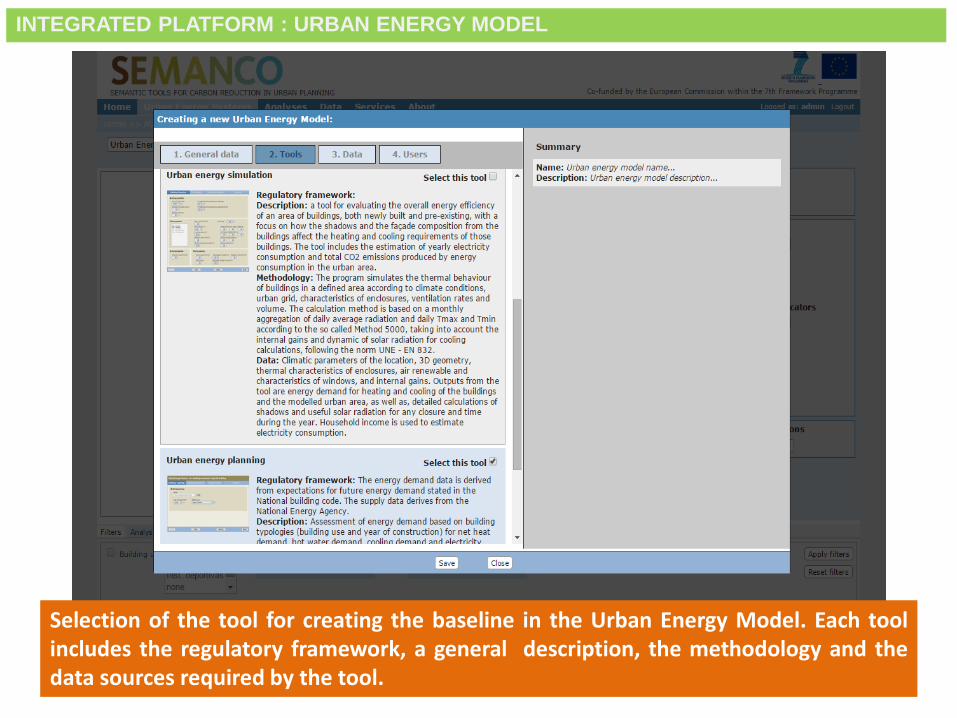
Smart City Expo World Congress, Barcelona, 18-20 November 2014
Selection of the tool for creating the baseline in the Urban Energy Model. Each toolincludes the regulatory framework, a general description, the methodology and thedata sources required by the tool.
INTEGRATED PLATFORM : URBAN ENERGY MODEL
Smart City Expo World Congress, Barcelona, 18-20 November 2014
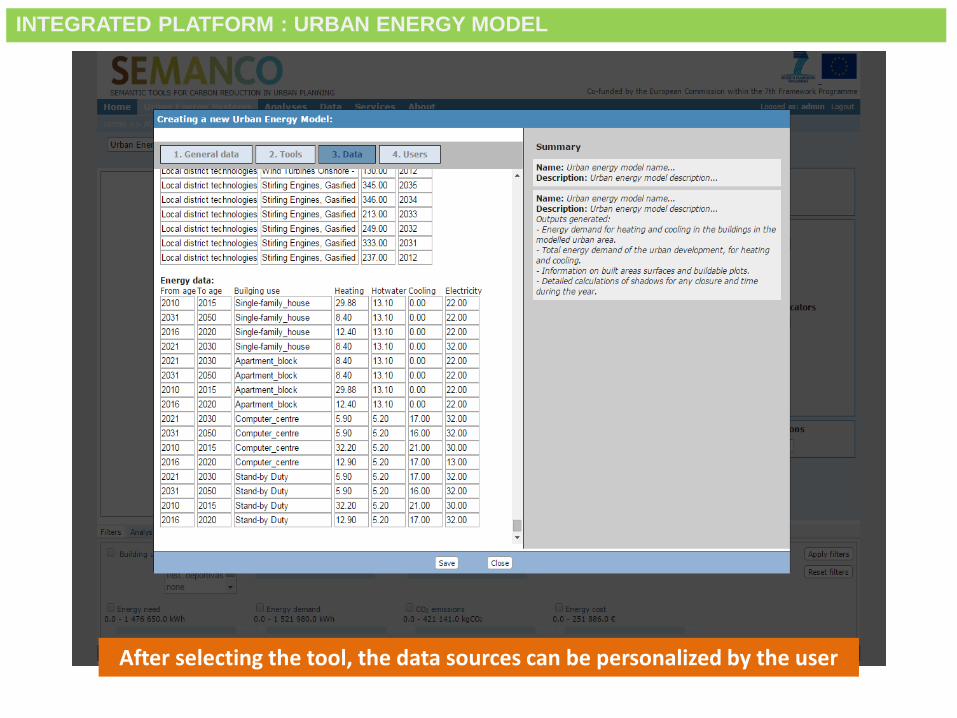
After selecting the tool, the data sources can be personalized by the user
INTEGRATED PLATFORM : URBAN ENERGY MODEL
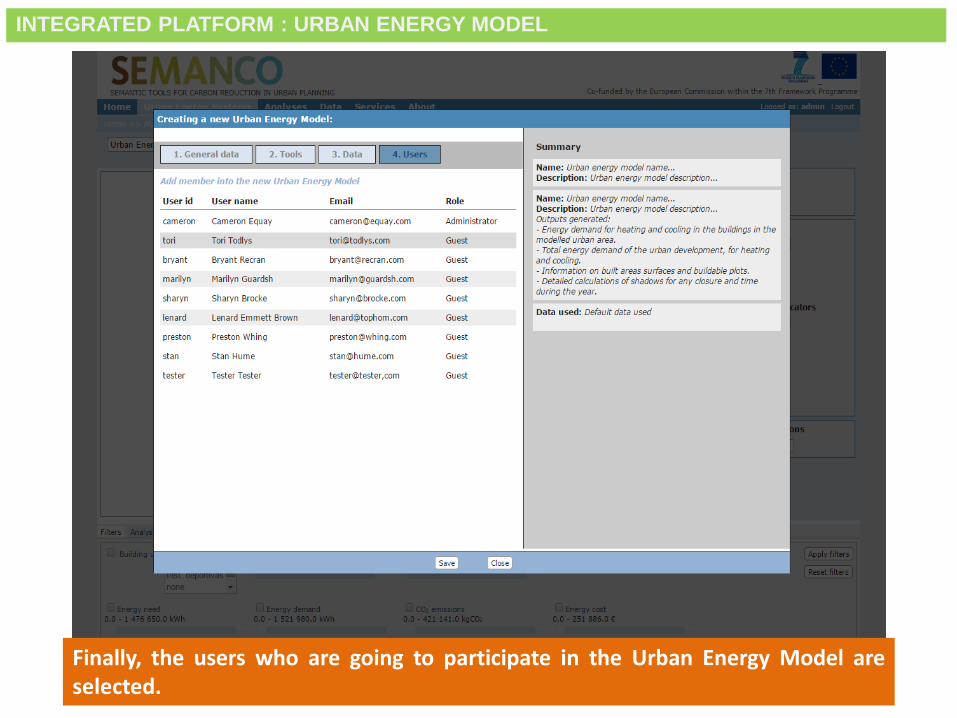
Smart City Expo World Congress, Barcelona, 18-20 November 2014
Finally, the users who are going to participate in the Urban Energy Model areselected.
INTEGRATED PLATFORM : URBAN ENERGY MODEL

Smart City Expo World Congress, Barcelona, 18-20 November 2014
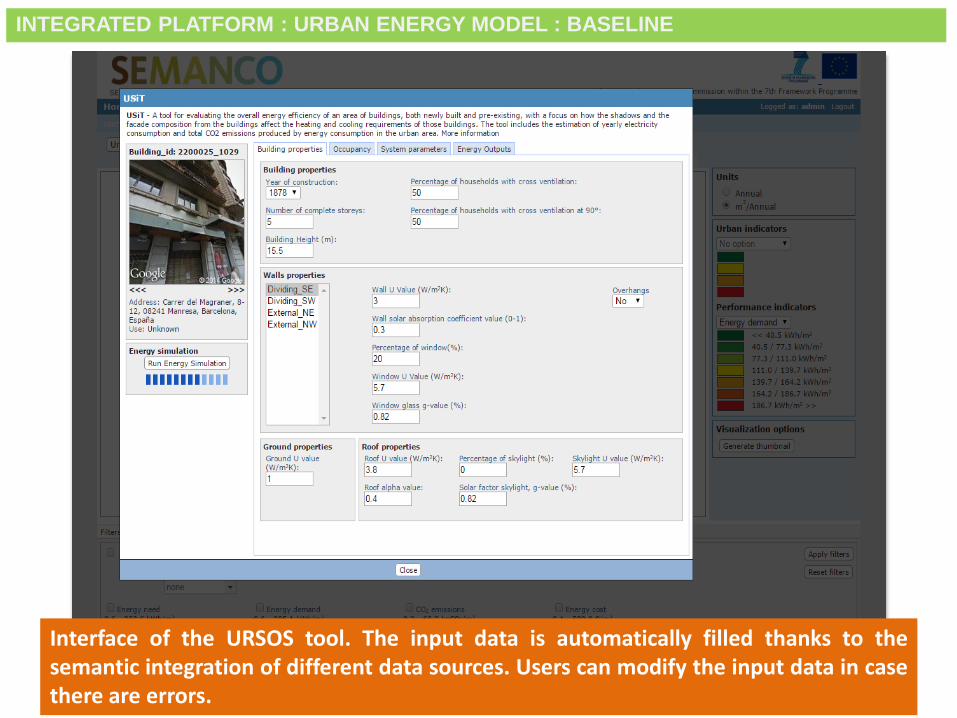
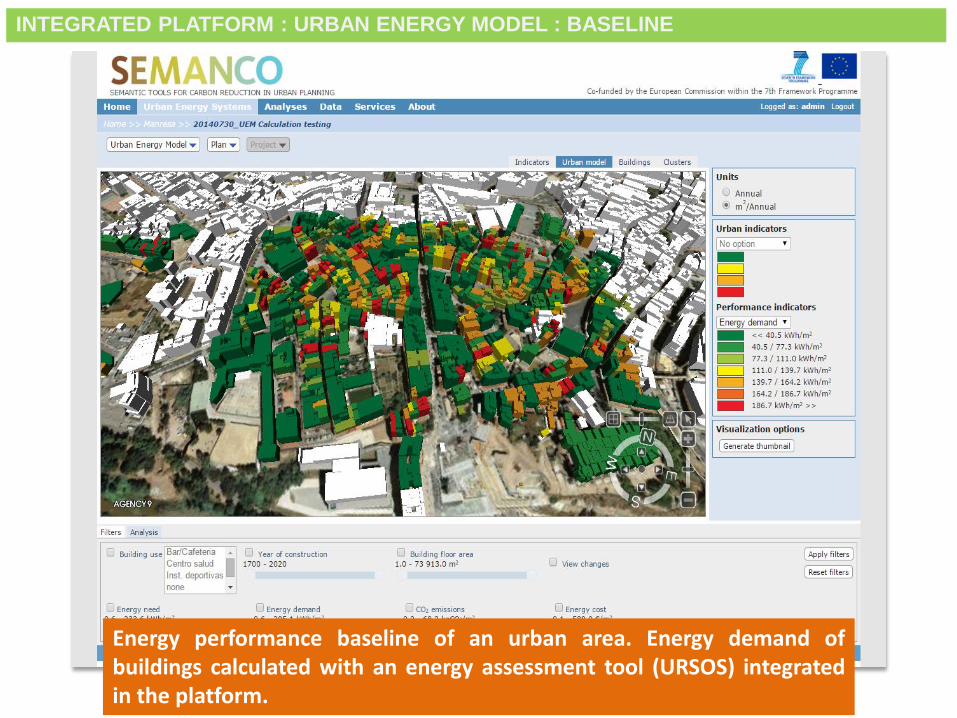
Energy performance baseline of an urban area. Energy demand ofbuildings calculated with an energy assessment tool (URSOS) integratedin the platform.
INTEGRATED PLATFORM : URBAN ENERGY MODEL : BASELINE
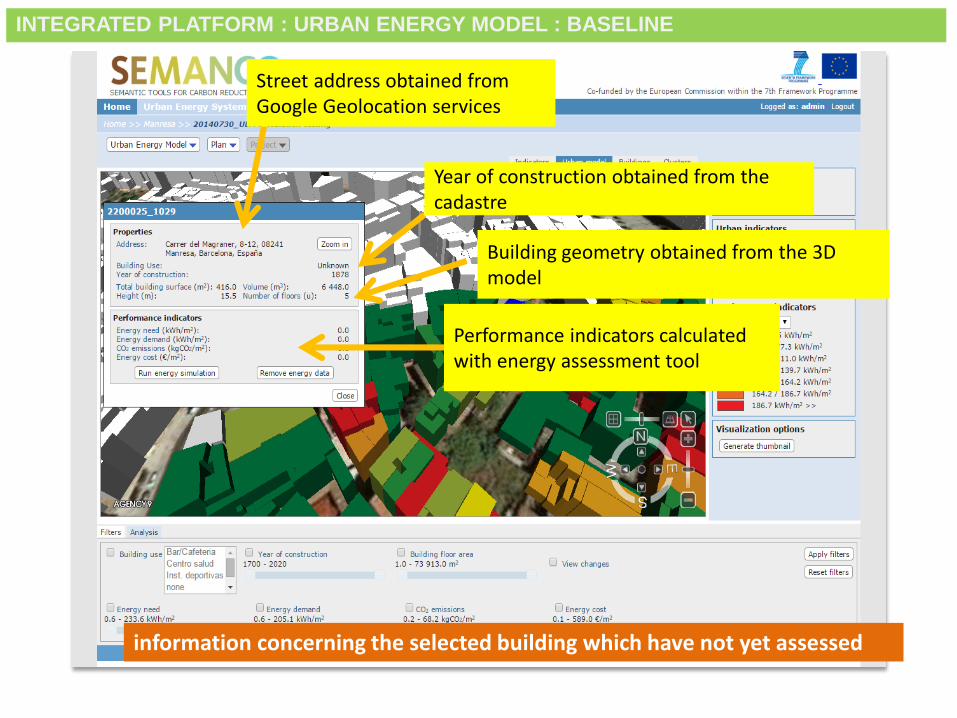
Smart City Expo World Congress, Barcelona, 18-20 November 2014
information concerning the selected building which have not yet assessed
Building geometry obtained from the 3D model
Street address obtained fromGoogle Geolocation services
Performance indicators calculatedwith energy assessment tool
Year of construction obtained from thecadastre
INTEGRATED PLATFORM : URBAN ENERGY MODEL : BASELINE
Smart City Expo World Congress, Barcelona, 18-20 November 2014
Interface of the URSOS tool. The input data is automatically filled thanks to thesemantic integration of different data sources. Users can modify the input data in casethere are errors.
INTEGRATED PLATFORM : URBAN ENERGY MODEL : BASELINE
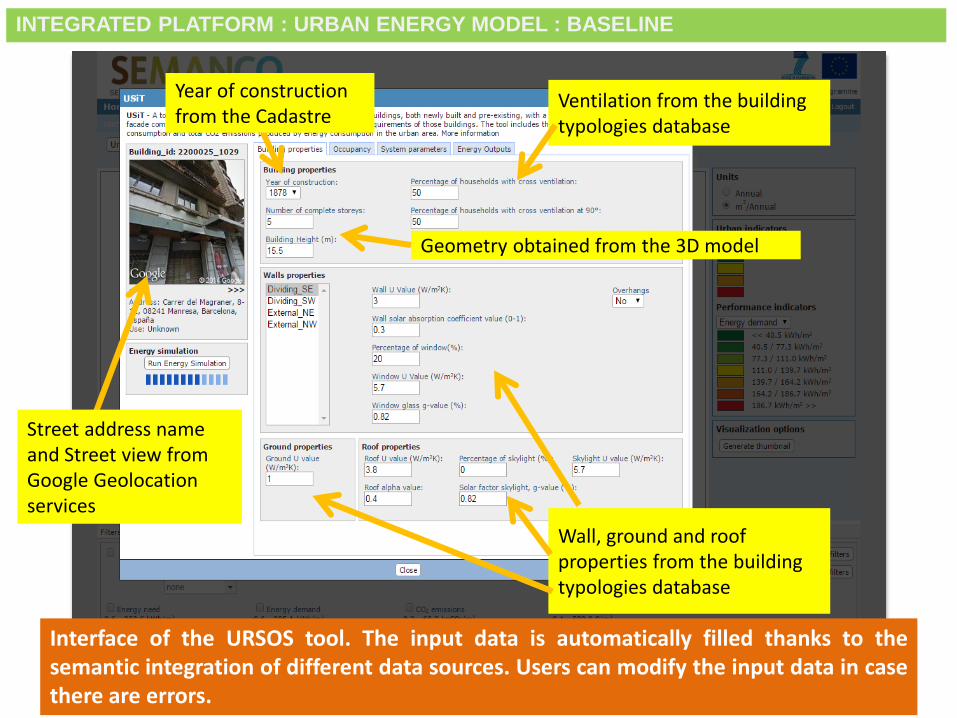
Smart City Expo World Congress, Barcelona, 18-20 November 2014
Interface of the URSOS tool. The input data is automatically filled thanks to thesemantic integration of different data sources. Users can modify the input data in casethere are errors.
Wall, ground and roofproperties from the buildingtypologies database
Year of construction from the Cadastre
Geometry obtained from the 3D model
Street address nameand Street view fromGoogle Geolocationservices
Ventilation from the buildingtypologies database
INTEGRATED PLATFORM : URBAN ENERGY MODEL : BASELINE
Smart City Expo World Congress, Barcelona, 18-20 November 2014
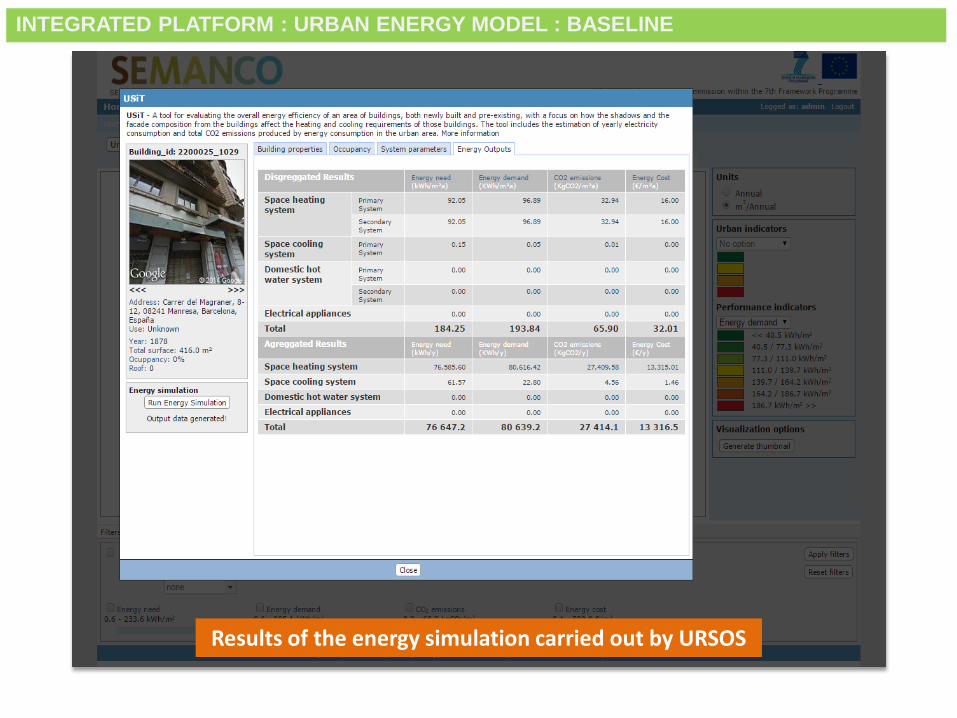
Results of the energy simulation carried out by URSOS
INTEGRATED PLATFORM : URBAN ENERGY MODEL : BASELINE
Smart City Expo World Congress, Barcelona, 18-20 November 2014
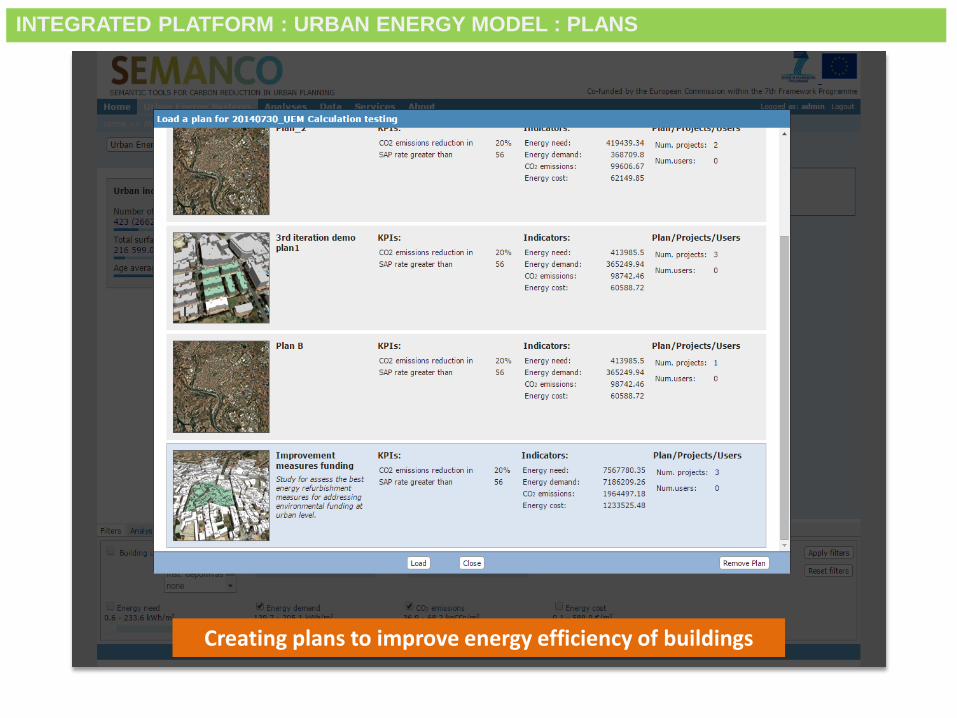
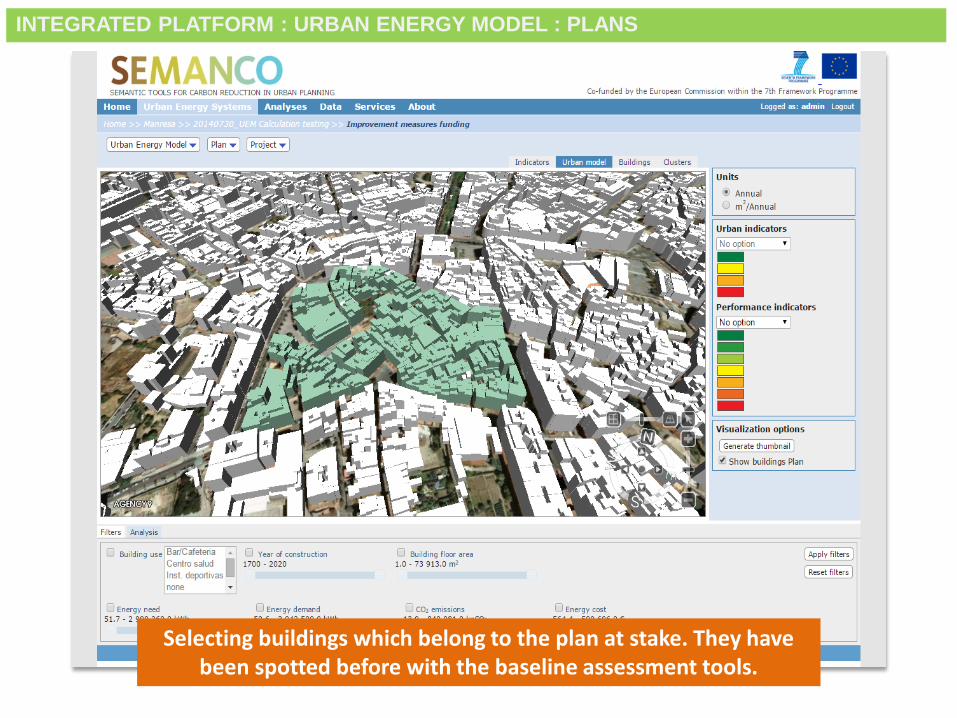
Creating plans to improve energy efficiency of buildings
INTEGRATED PLATFORM : URBAN ENERGY MODEL : PLANS
Smart City Expo World Congress, Barcelona, 18-20 November 2014
Energy performance baseline of an urban area. Energy demand ofbuildings calculated with an energy assessment tool (URSOS) integratedin the platform.
INTEGRATED PLATFORM : URBAN ENERGY MODEL : BASELINE
Smart City Expo World Congress, Barcelona, 18-20 November 2014
Selecting buildings which belong to the plan at stake. They have been spotted before with the baseline assessment tools.
INTEGRATED PLATFORM : URBAN ENERGY MODEL : PLANS
Smart City Expo World Congress, Barcelona, 18-20 November 2014
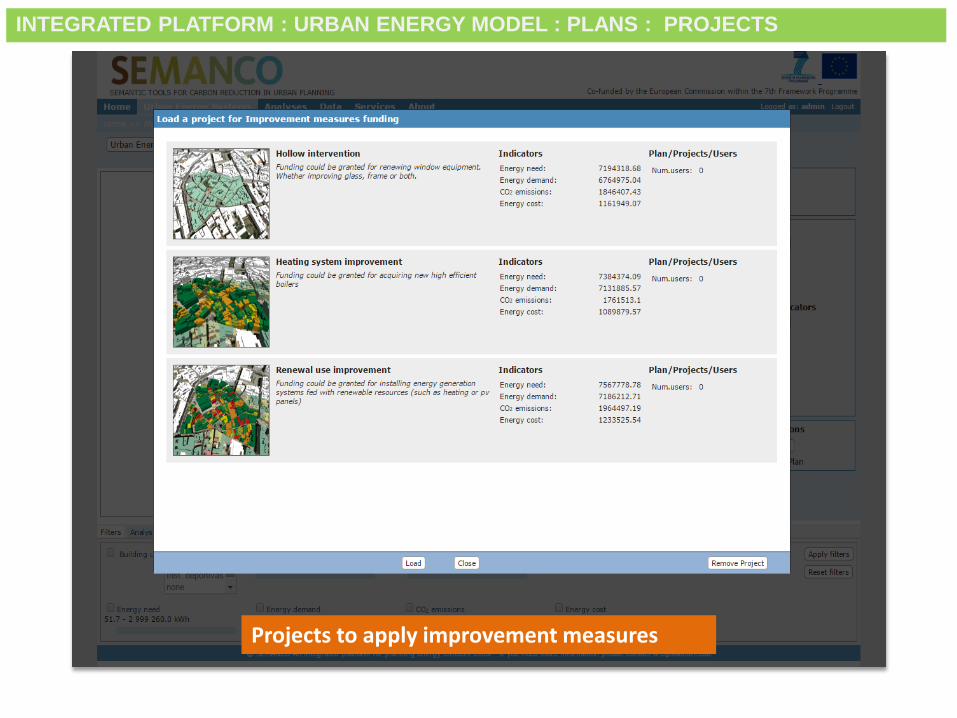
Projects to apply improvement measures
INTEGRATED PLATFORM : URBAN ENERGY MODEL : PLANS : PROJECTS
Smart City Expo World Congress, Barcelona, 18-20 November 2014
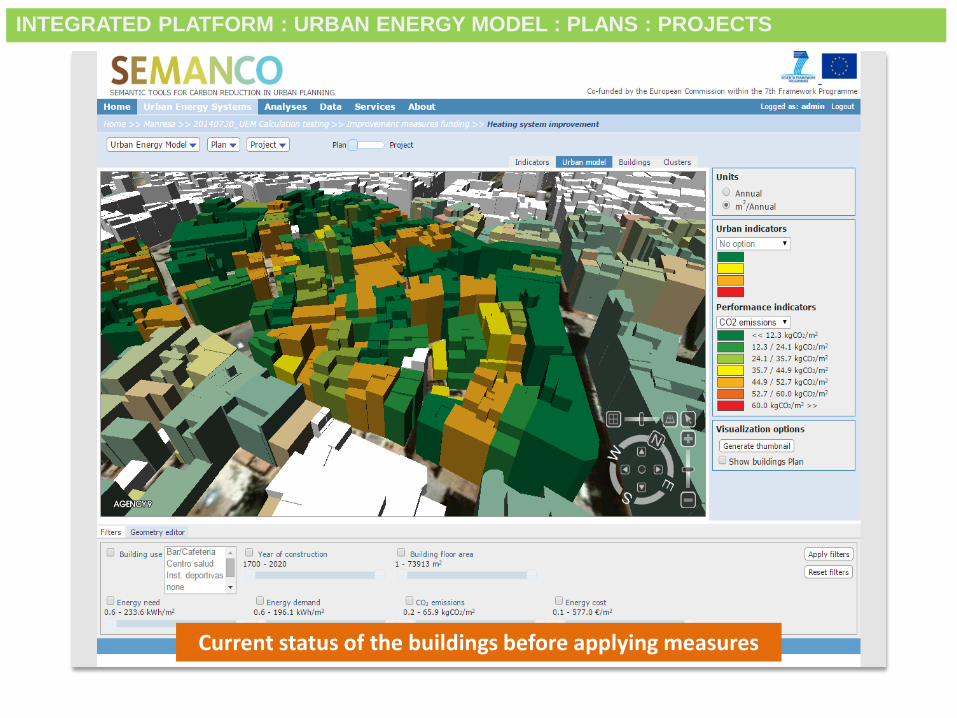
Current status of the buildings before applying measures
INTEGRATED PLATFORM : URBAN ENERGY MODEL : PLANS : PROJECTS
Smart City Expo World Congress, Barcelona, 18-20 November 2014
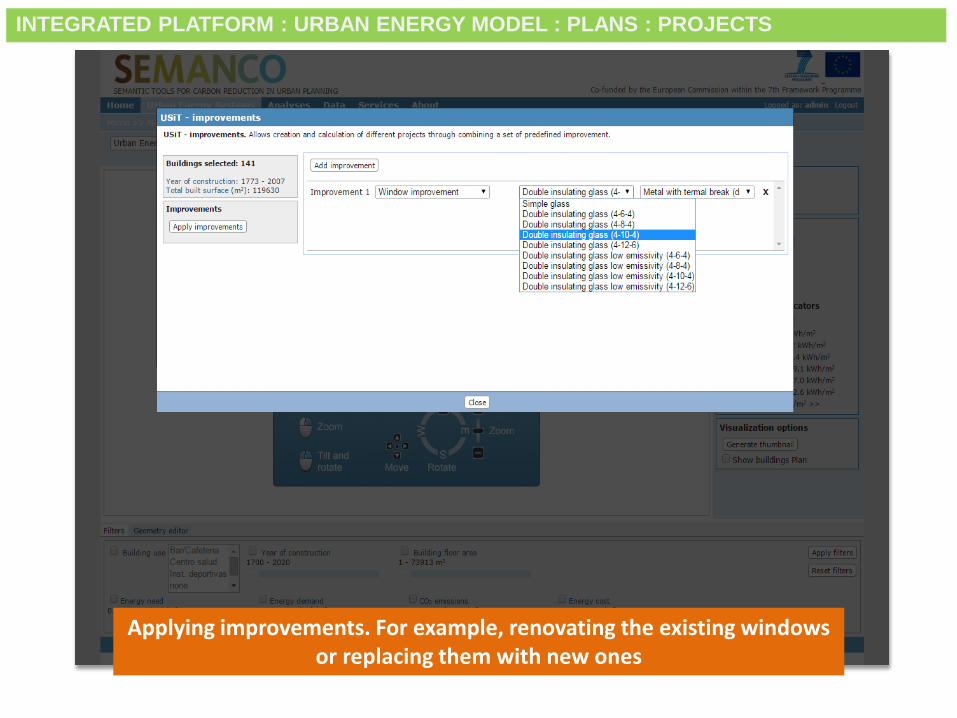
Applying improvements. For example, renovating the existing windows or replacing them with new ones
INTEGRATED PLATFORM : URBAN ENERGY MODEL : PLANS : PROJECTS
Smart City Expo World Congress, Barcelona, 18-20 November 2014
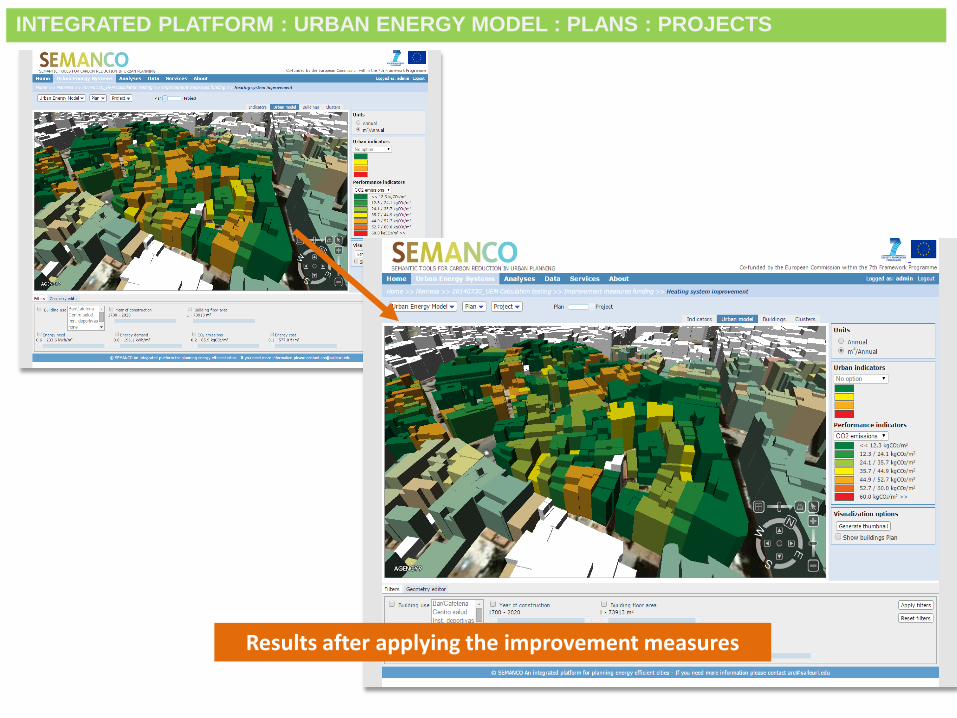
Results after applying the improvement measures
INTEGRATED PLATFORM : URBAN ENERGY MODEL : PLANS : PROJECTS
Smart City Expo World Congress, Barcelona, 18-20 November 2014
INTEGRATED PLATFORM : URBAN ENERGY MODEL : PLANS : PROJECTS : EVALUATION
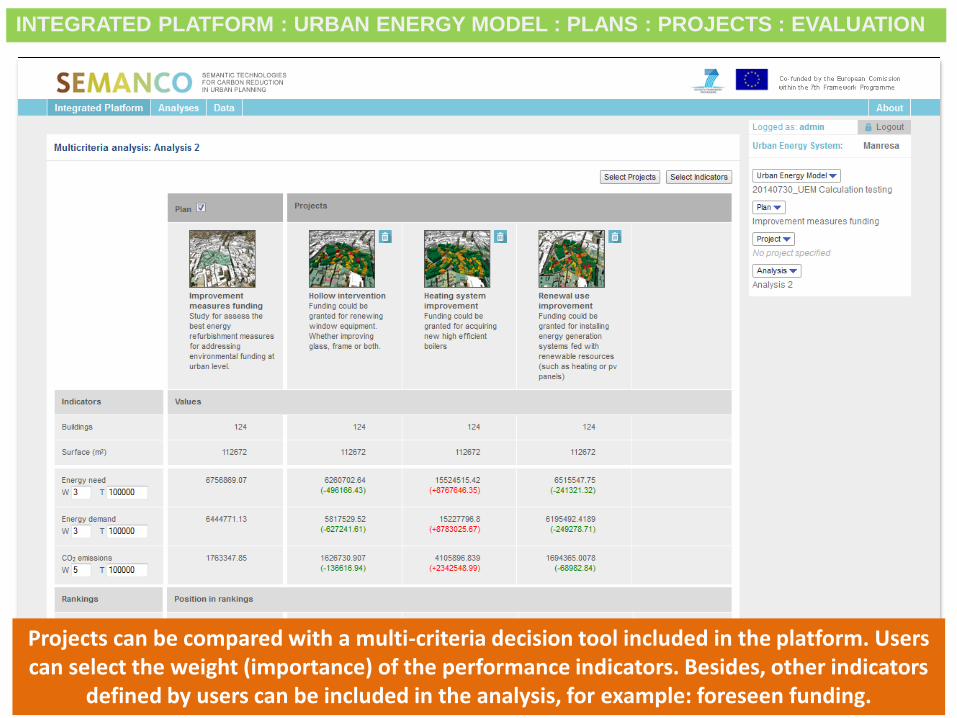
Projects can be compared with a multi-criteria decision tool included in the platform. Users can select the weight (importance) of the performance indicators. Besides, other indicators
defined by users can be included in the analysis, for example: foreseen funding.
INTEGRATED PLATFORM : URBAN ENERGY MODEL : PLANS : PROJECTS : EVALUATION
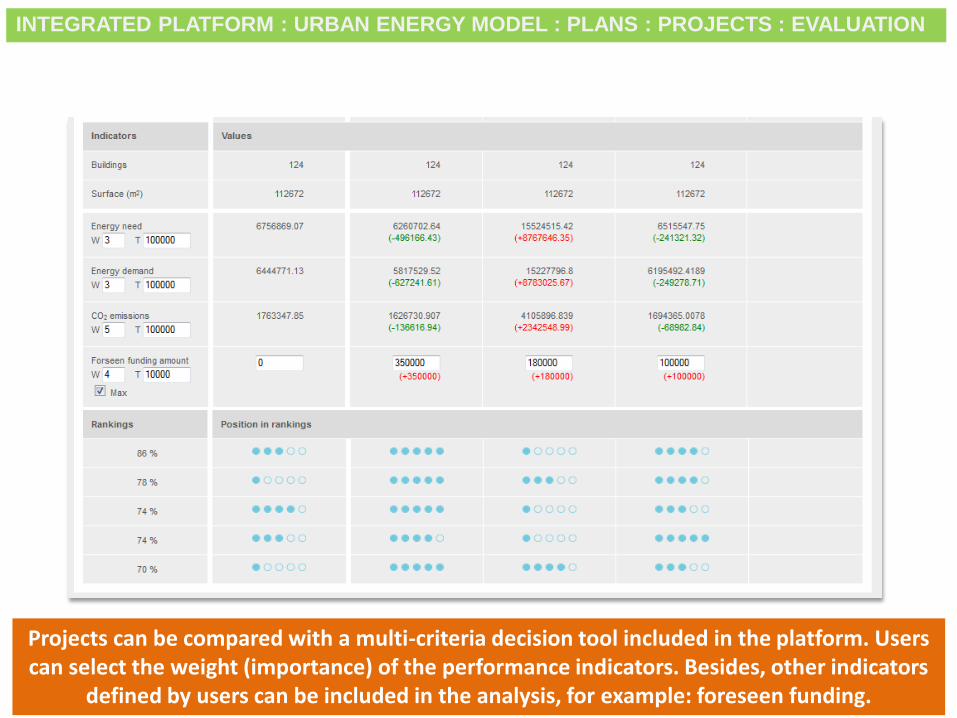
Projects can be compared with a multi-criteria decision tool included in the platform. Users can select the weight (importance) of the performance indicators. Besides, other indicators
defined by users can be included in the analysis, for example: foreseen funding.
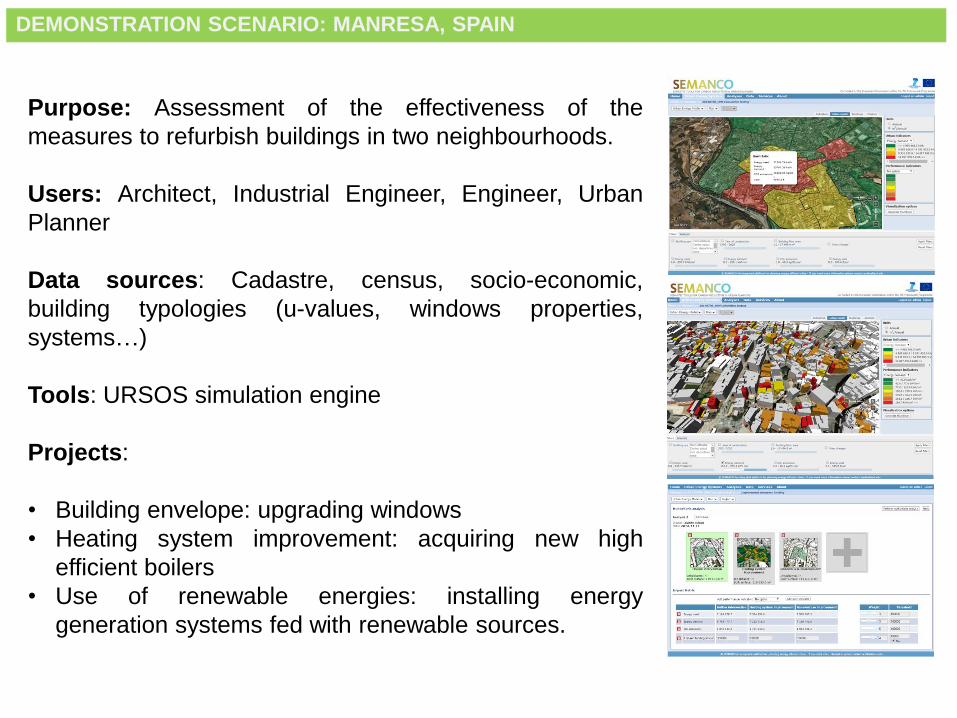
DEMONSTRATION SCENARIO: MANRESA, SPAIN
Purpose: Assessment of the effectiveness of the
measures to refurbish buildings in two neighbourhoods.
Users: Architect, Industrial Engineer, Engineer, Urban
Planner
Data sources: Cadastre, census, socio-economic,
building typologies (u-values, windows properties,
systems…)
Tools: URSOS simulation engine
Projects:
• Building envelope: upgrading windows
• Heating system improvement: acquiring new high
efficient boilers
• Use of renewable energies: installing energy
generation systems fed with renewable sources.
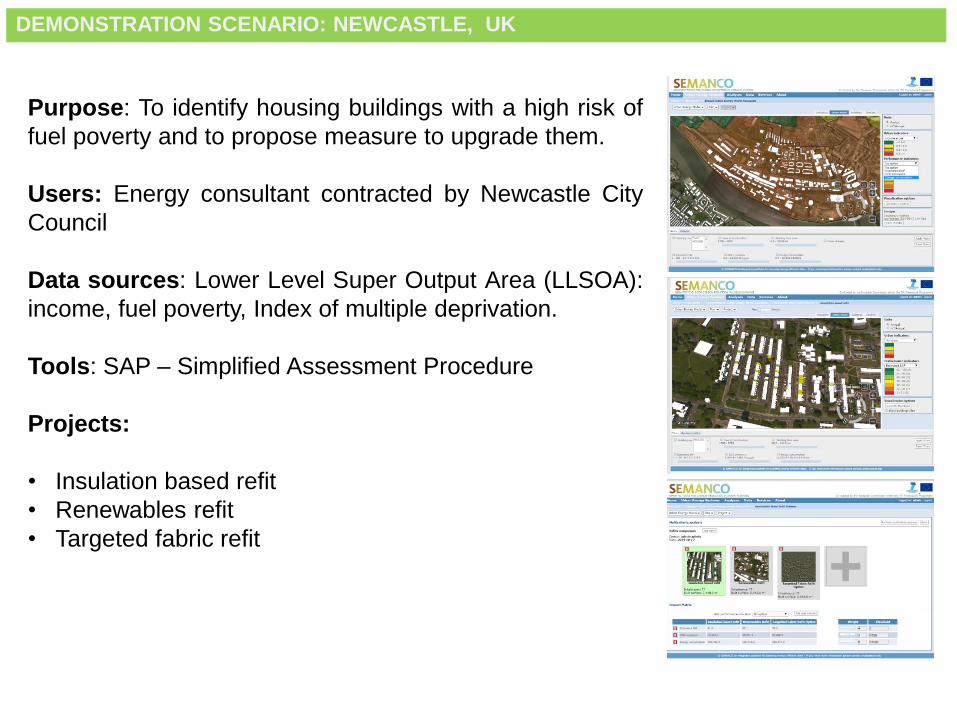
DEMONSTRATION SCENARIO: NEWCASTLE, UK
Purpose: To identify housing buildings with a high risk of
fuel poverty and to propose measure to upgrade them.
Users: Energy consultant contracted by Newcastle City
Council
Data sources: Lower Level Super Output Area (LLSOA):
income, fuel poverty, Index of multiple deprivation.
Tools: SAP – Simplified Assessment Procedure
Projects:
• Insulation based refit
• Renewables refit
• Targeted fabric refit
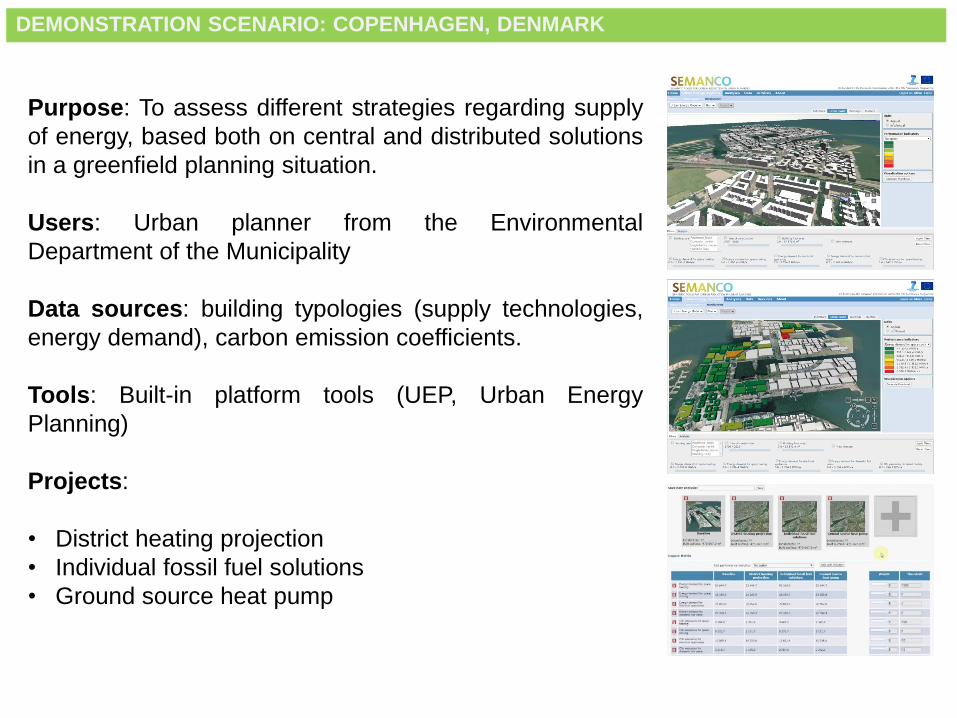
DEMONSTRATION SCENARIO: COPENHAGEN, DENMARK
Purpose: To assess different strategies regarding supply
of energy, based both on central and distributed solutions
in a greenfield planning situation.
Users: Urban planner from the Environmental
Department of the Municipality
Data sources: building typologies (supply technologies,
energy demand), carbon emission coefficients.
Tools: Built-in platform tools (UEP, Urban Energy
Planning)
Projects:
• District heating projection
• Individual fossil fuel solutions
• Ground source heat pump
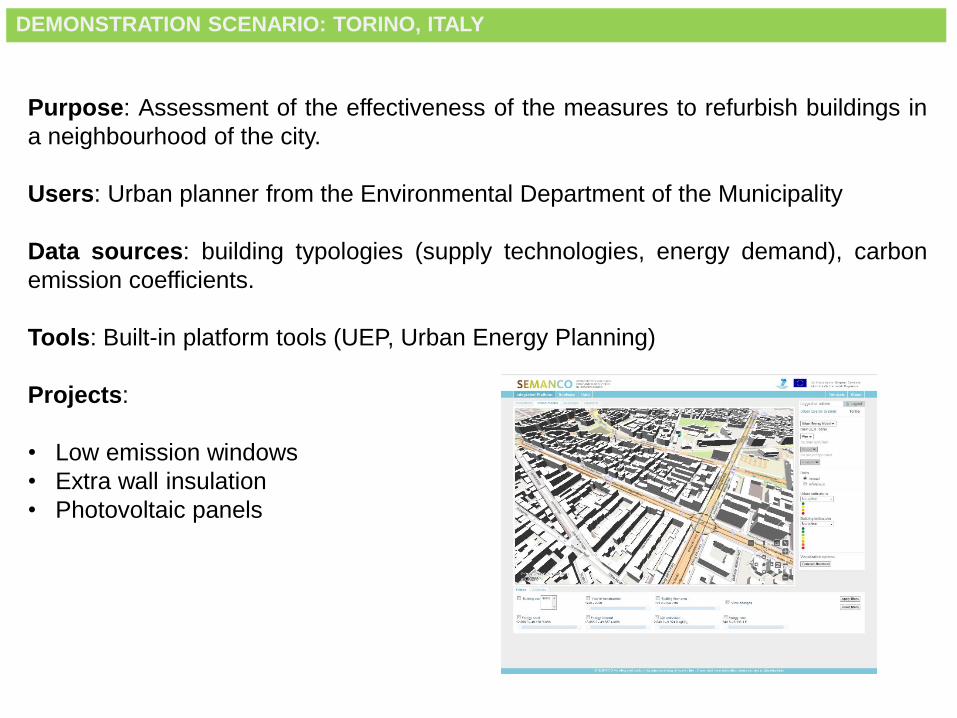
DEMONSTRATION SCENARIO: TORINO, ITALY
Purpose: Assessment of the effectiveness of the measures to refurbish buildings in
a neighbourhood of the city.
Users: Urban planner from the Environmental Department of the Municipality
Data sources: building typologies (supply technologies, energy demand), carbon
emission coefficients.
Tools: Built-in platform tools (UEP, Urban Energy Planning)
Projects:
• Low emission windows
• Extra wall insulation
• Photovoltaic panels
SERVICE PLATFORM TO SUPPORT PLANNING OF ENERGY EFFICIENT
CITIES
An energy service platform that supports planners, energy consultants, policy
makers and other stakeholders in the process of taking decisions aimed at
improving the energy efficiency of urban areas.
The services provided are based on the integration of available energy related
data from multiple sources such as geographic information, cadastre, economic
indicators, and consumption, among others.
The integrated data is analysed using assessment and simulation tools that are
specifically adapted to the needs of each case.

www.eecities.com
www.semanco-project.eu

If you would like to have more information about this presentation,
please contact us: