Embed Size (px)
Citation preview
www.edureka.co/data-visualization-with-tableau
How to Improve Data Analysis Through
Visualization in Tableau
View Data Visualization with Tableau course details at www.edureka.co/data-visualization-with-tableau
For Queries:Post on Twitter @edurekaIN: #askEdurekaPost on Facebook /edurekaIN
For more details please contact us: US : 1800 275 9730 (toll free)INDIA : +91 88808 62004Email Us : [email protected]
Slide 2 www.edureka.co/data-visualization-with-tableau
What is Visual Analytics and Data Visualization ?
How to make Direct connection with Statistical packages ?
How to Split data columns in Tableau ?
Data Interpretation in Tableau
What’s New in Tableau 9.1 ?
At the end of this session, you will be able to understand:
Objectives
Slide 3 www.edureka.co/data-visualization-with-tableau
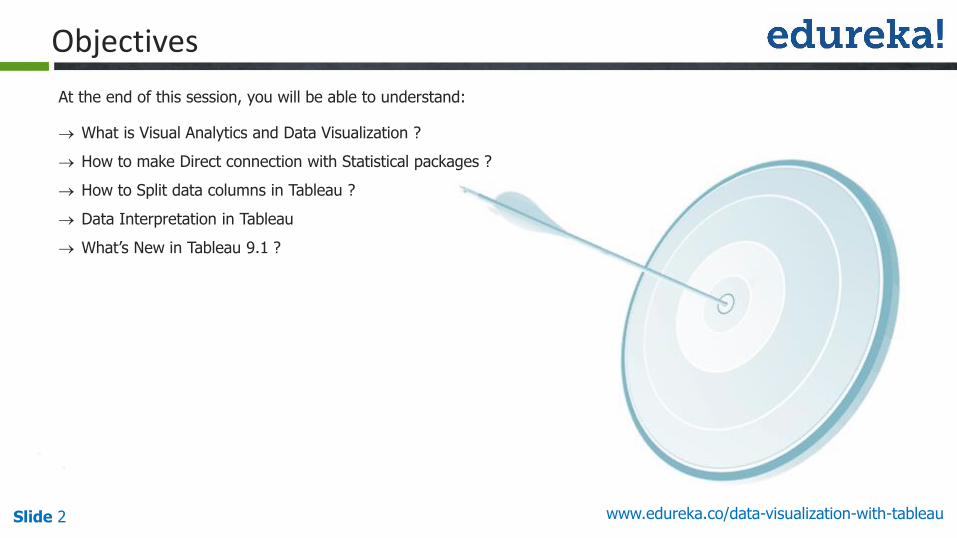
Visual analytics is a form of analytics in which interactive graphical
displays of data are used to generate analytical results and insights
It integrates new computational and theory based tools with innovative
interactive techniques to enable human-information discourse
Visual representations translate data into a visible form that highlights
important features, including commonalities and anomalies
What is Visual Analytics?
Slide 4 www.edureka.co/data-visualization-with-tableau
Data visualization refers to the techniques used to communicate data or information by encoding it as visual objects
A primary goal of data visualization is to communicate information clearly and efficiently to users via the Information
graphics selected, such as tables and charts
Data presentation architecture (DPA) is a skill-set that seeks to identify, locate, manipulate, format and present data
in such a way as to optimally communicate meaning and proffer knowledge
Data Visualization
Slide 5 www.edureka.co/data-visualization-with-tableau
A new generation of business intelligence software puts data into the hands of the people who need it
Slow, rigid systems are no longer good enough for business users or the IT teams that support them
Tableau Software was founded on the idea that data analysis and subsequent reports should not be isolated
activities but should be integrated into a single visual analysis process
Tableau combines data exploration and data visualization in an easy-to-use application that anyone can learn
quickly
IT teams can manage data and metadata centrally, control permissions and scale up to enterprise- wide
deployments
Tableau
Slide 6 www.edureka.co/data-visualization-with-tableau
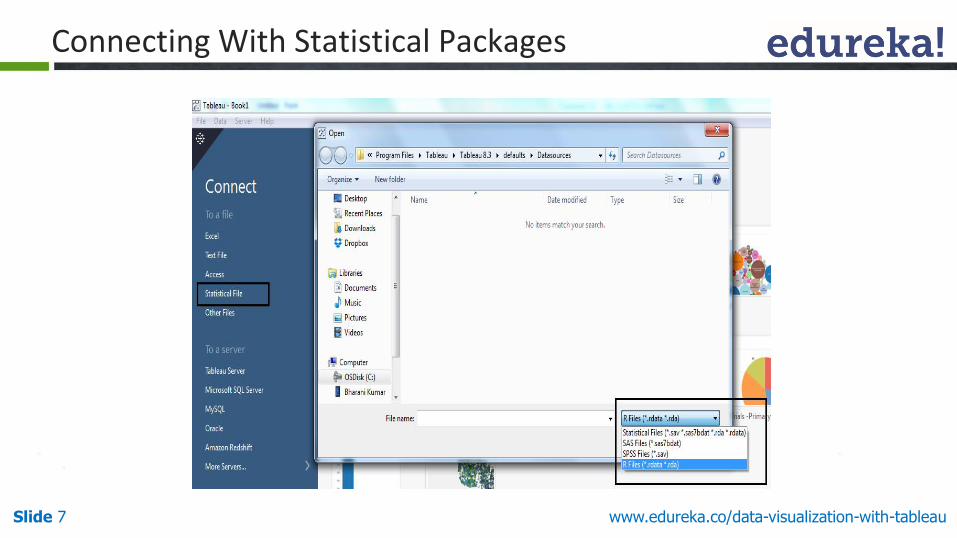
The new connector in Tableau 9.x brings native support for a number of statistical package files including:
• .sas7bdat – the file format used by SAS
• .sav – the binary file format used by SPSS
• .rdata, .rda – the file formats employed by the R statistical analysis package
Connecting With Statistical Packages
Slide 7 www.edureka.co/data-visualization-with-tableau
Connecting With Statistical Packages
Slide 8 www.edureka.co/data-visualization-with-tableau
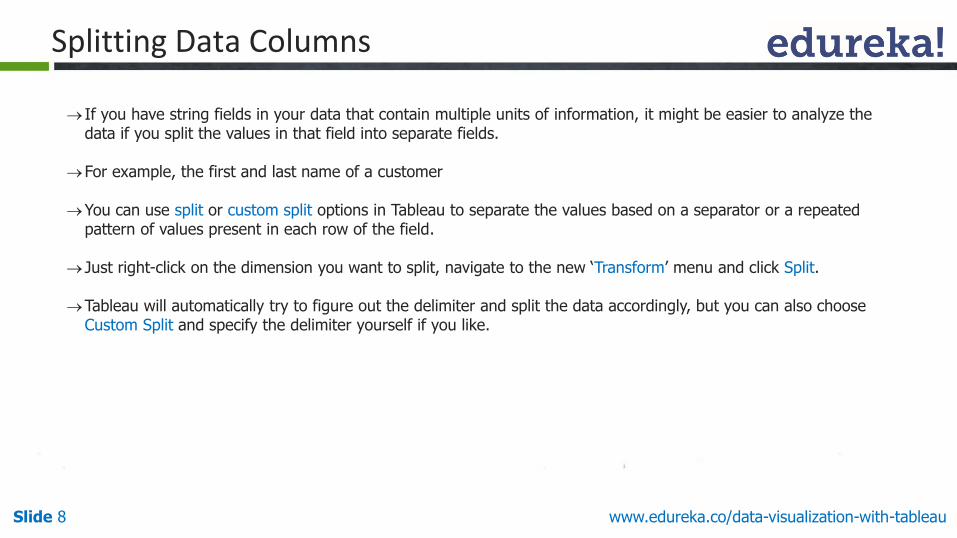
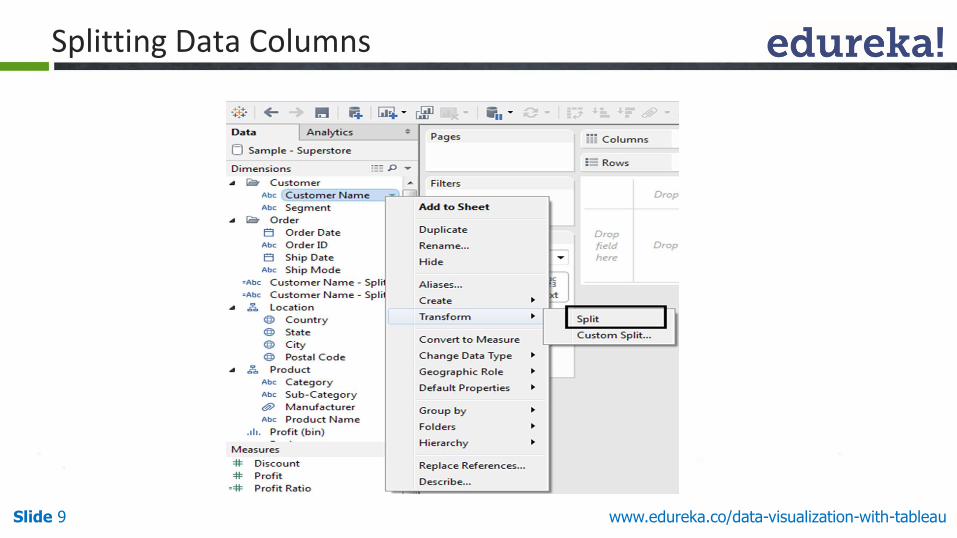
Splitting Data Columns
If you have string fields in your data that contain multiple units of information, it might be easier to analyze the data if you split the values in that field into separate fields.
For example, the first and last name of a customer
You can use split or custom split options in Tableau to separate the values based on a separator or a repeated pattern of values present in each row of the field.
Just right-click on the dimension you want to split, navigate to the new ‘Transform’ menu and click Split.
Tableau will automatically try to figure out the delimiter and split the data accordingly, but you can also choose Custom Split and specify the delimiter yourself if you like.
Slide 9 www.edureka.co/data-visualization-with-tableau
Splitting Data Columns
www.edureka.co/data-visualization-with-tableauSlide 10
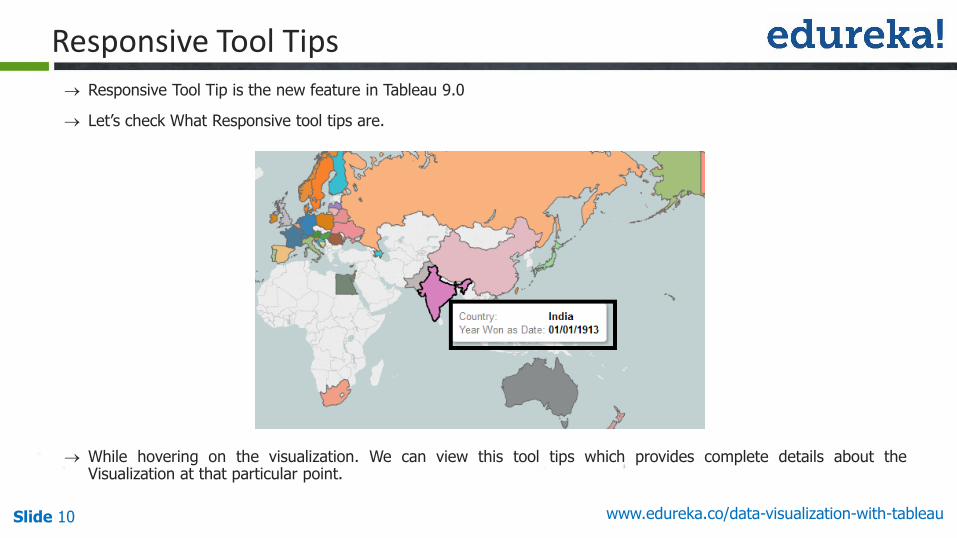
Responsive Tool Tips
Responsive Tool Tip is the new feature in Tableau 9.0
Let’s check What Responsive tool tips are.
While hovering on the visualization. We can view this tool tips which provides complete details about theVisualization at that particular point.
www.edureka.co/data-visualization-with-tableauSlide 11
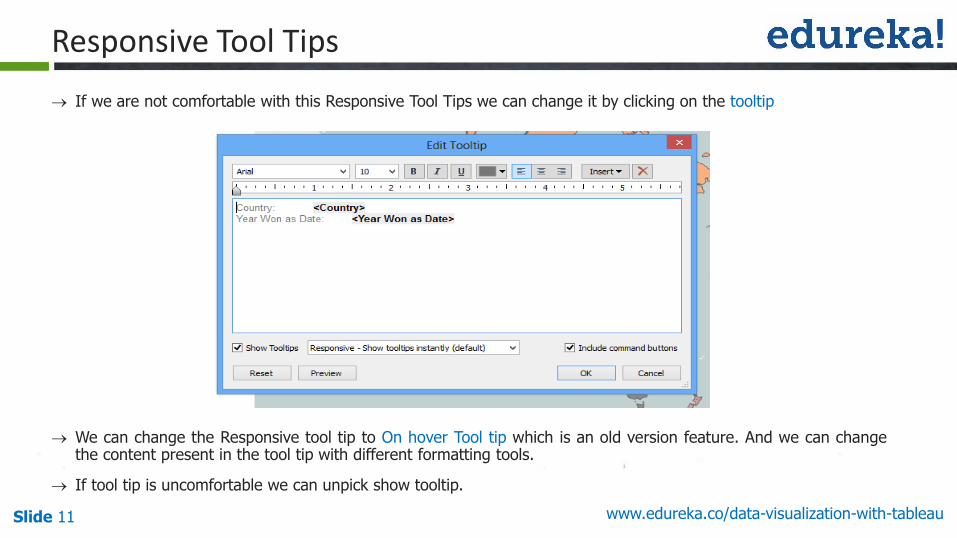
Responsive Tool Tips
If we are not comfortable with this Responsive Tool Tips we can change it by clicking on the tooltip
We can change the Responsive tool tip to On hover Tool tip which is an old version feature. And we can changethe content present in the tool tip with different formatting tools.
If tool tip is uncomfortable we can unpick show tooltip.
www.edureka.co/data-visualization-with-tableauSlide 12
Data Interpretation
Tableau 9.0 is built in with Data Interpretation option. What is Data Interpretation.
Data Interpretation:
Data Interpretation is the process of making sense of numerical Data that has been collected, analyzed and
Presented.
Let’s check how to use Data Interpretation in Tableau.
www.edureka.co/data-visualization-with-tableauSlide 13
Data Interpretation
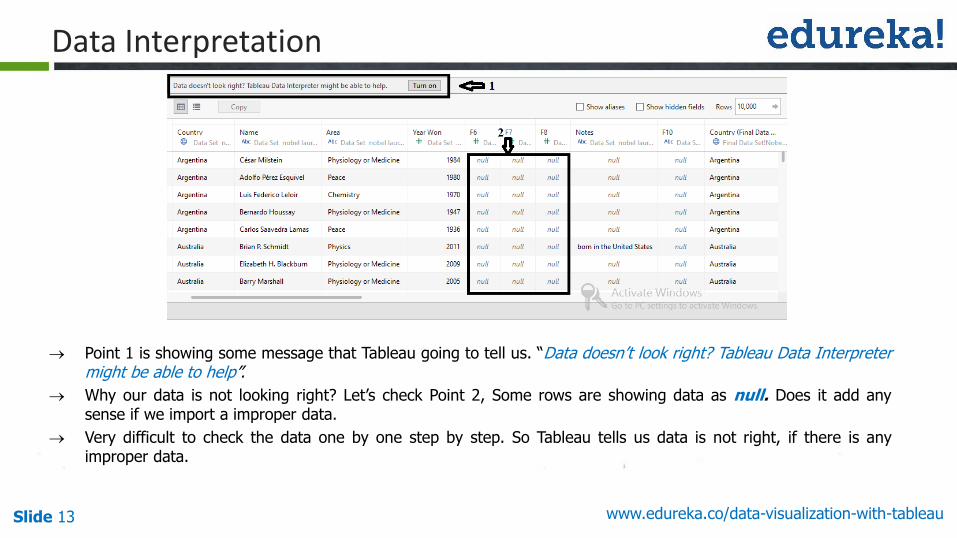
Point 1 is showing some message that Tableau going to tell us. “Data doesn’t look right? Tableau Data Interpretermight be able to help”.
Why our data is not looking right? Let’s check Point 2, Some rows are showing data as null. Does it add anysense if we import a improper data.
Very difficult to check the data one by one step by step. So Tableau tells us data is not right, if there is anyimproper data.
www.edureka.co/data-visualization-with-tableauSlide 14
Data Interpretation
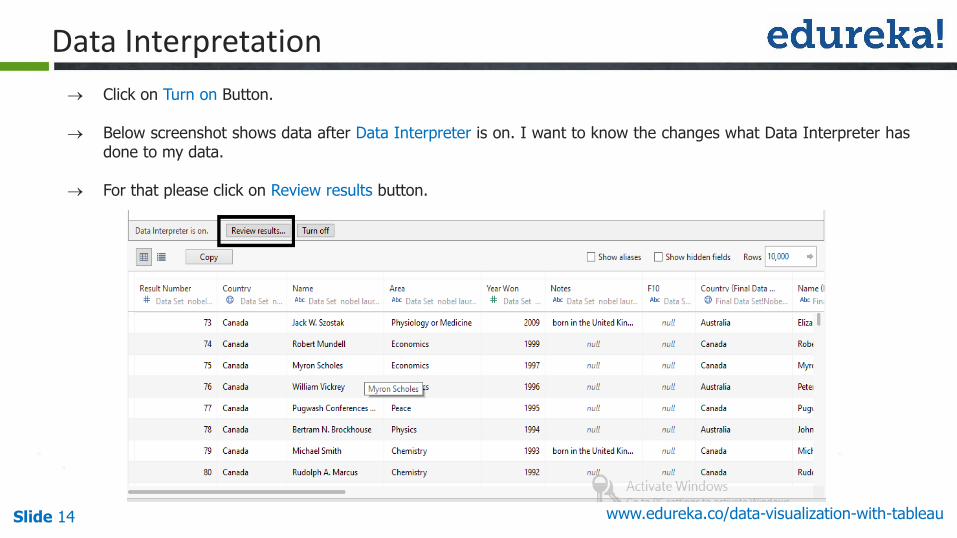
Click on Turn on Button.
Below screenshot shows data after Data Interpreter is on. I want to know the changes what Data Interpreter hasdone to my data.
For that please click on Review results button.
www.edureka.co/data-visualization-with-tableauSlide 15
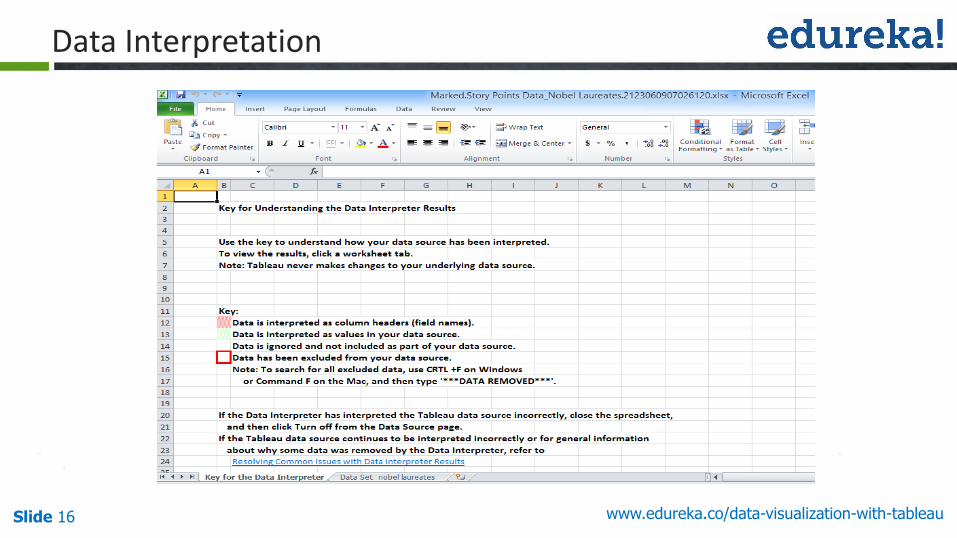
Data Interpretation
By clicking on the Review Results button. We will be redirected to an Excel Sheet.
In key points Tableau clearly mentioned what Data Interpreter has done to our data.
Check the screenshot in next slide, Now all the data is arranged same as the data present in our source data.
www.edureka.co/data-visualization-with-tableauSlide 16
Data Interpretation
www.edureka.co/data-visualization-with-tableauSlide 17
Features of Tableau 9.1
www.edureka.co/data-visualization-with-tableauSlide 18
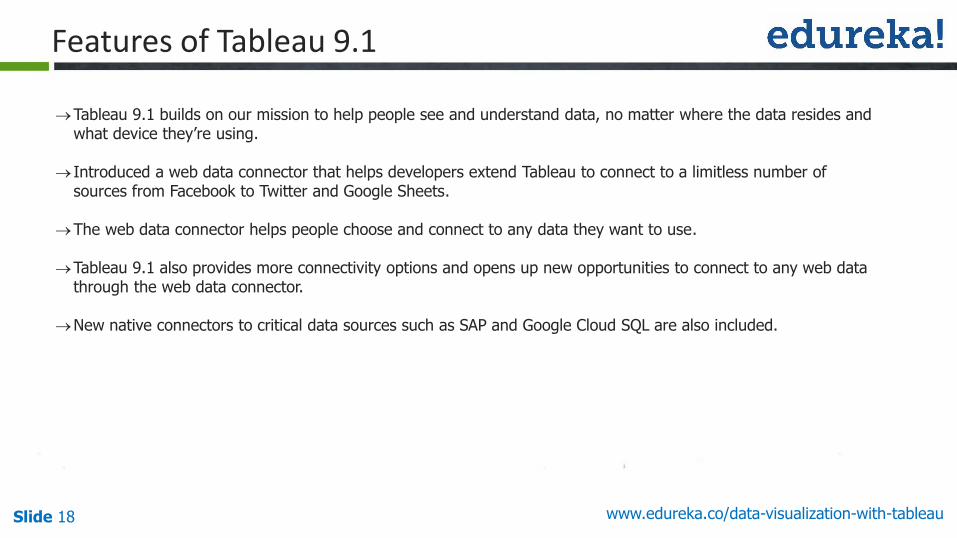
Tableau 9.1 builds on our mission to help people see and understand data, no matter where the data resides and what device they’re using.
Introduced a web data connector that helps developers extend Tableau to connect to a limitless number of sources from Facebook to Twitter and Google Sheets.
The web data connector helps people choose and connect to any data they want to use.
Tableau 9.1 also provides more connectivity options and opens up new opportunities to connect to any web data through the web data connector.
New native connectors to critical data sources such as SAP and Google Cloud SQL are also included.
Features of Tableau 9.1
www.edureka.co/data-visualization-with-tableauSlide 19
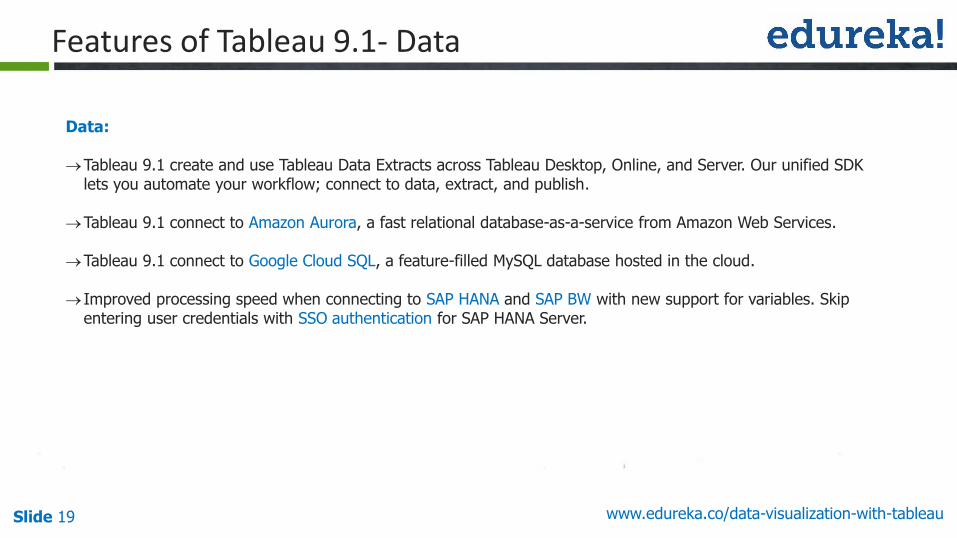
Data:
Tableau 9.1 create and use Tableau Data Extracts across Tableau Desktop, Online, and Server. Our unified SDK lets you automate your workflow; connect to data, extract, and publish.
Tableau 9.1 connect to Amazon Aurora, a fast relational database-as-a-service from Amazon Web Services.
Tableau 9.1 connect to Google Cloud SQL, a feature-filled MySQL database hosted in the cloud.
Improved processing speed when connecting to SAP HANA and SAP BW with new support for variables. Skip entering user credentials with SSO authentication for SAP HANA Server.
Features of Tableau 9.1- Data
www.edureka.co/data-visualization-with-tableauSlide 20
Visual Analytics:
In Tableau 9.1, we can view proximity in radial selection tool.
In Tableau 9.1, we can keep the focus on critical data by disabling Pan and Zoom in maps.
In Tableau 9.1, we can quickly dial into the right bin size with smart suggestions based on data.
In Tableau 9.1, we can create filters formulas quicker with auto complete, syntax highlighting, and validation support.
In Tableau 9.1, we can drag and drop median lines and confidence intervals directly from the analytics pane.
Features of Tableau 9.1 - Visual Analytics
www.edureka.co/data-visualization-with-tableauSlide 21
Mobile:
Tableau mobile is improved with High-resolution thumbnails, a new navigation experience, and improved performance bring data exploration to your fingertips.
Access your favorite vizzes and workbooks even when you're not connected. High-resolution, offline images let you view your analysis anytime, anywhere.
Authoring enhancements, including an improved Saving/Exporting experience.
Stay secure on Tableau Mobile with data encryption and support for Kerberos, SAML, and more.
Features of Tableau 9.1
Questions
Slide 22 www.edureka.co/data-visualization-with-tableau

Slide 23 Course Url


![Tableau Presantation.ppt [Kompatibilitetstilstand] · Why Tableau Tableau a great Tool for visualization, BI and data analytics. • Ideal for complex visualization • Interactive](https://img.pdfslide.net/doc/110x75/5ec5464447074405911878d3/tableau-kompatibilitetstilstand-why-tableau-tableau-a-great-tool-for-visualization.jpg)