Embed Size (px)
Citation preview
INFOGRAPHICS
TECHNICALIN
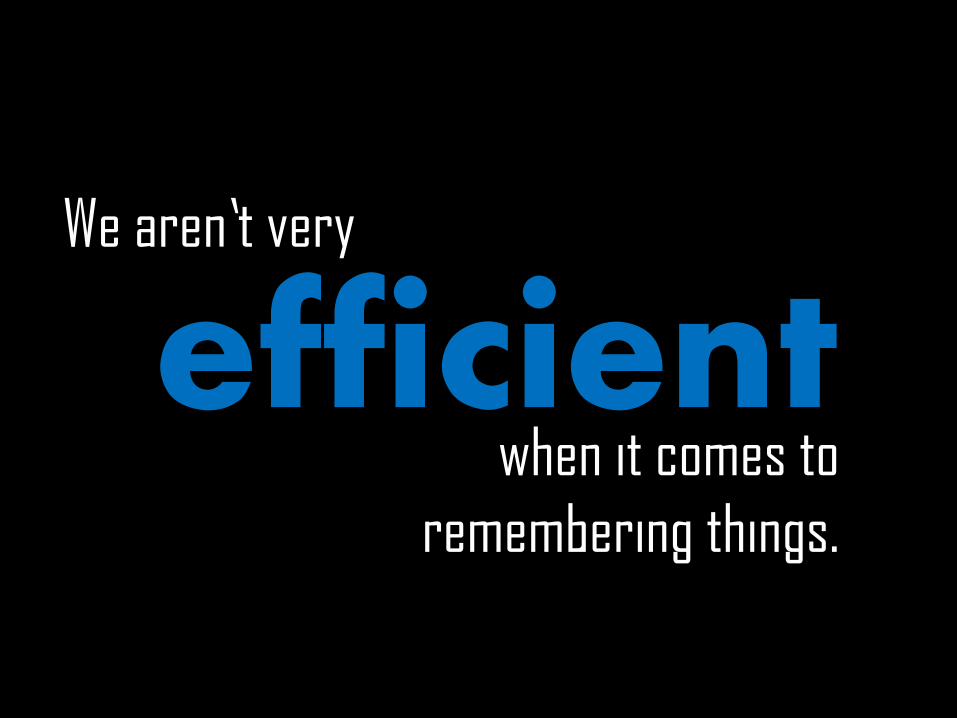
We aren’t very
when it comes to
remembering things.
efficient
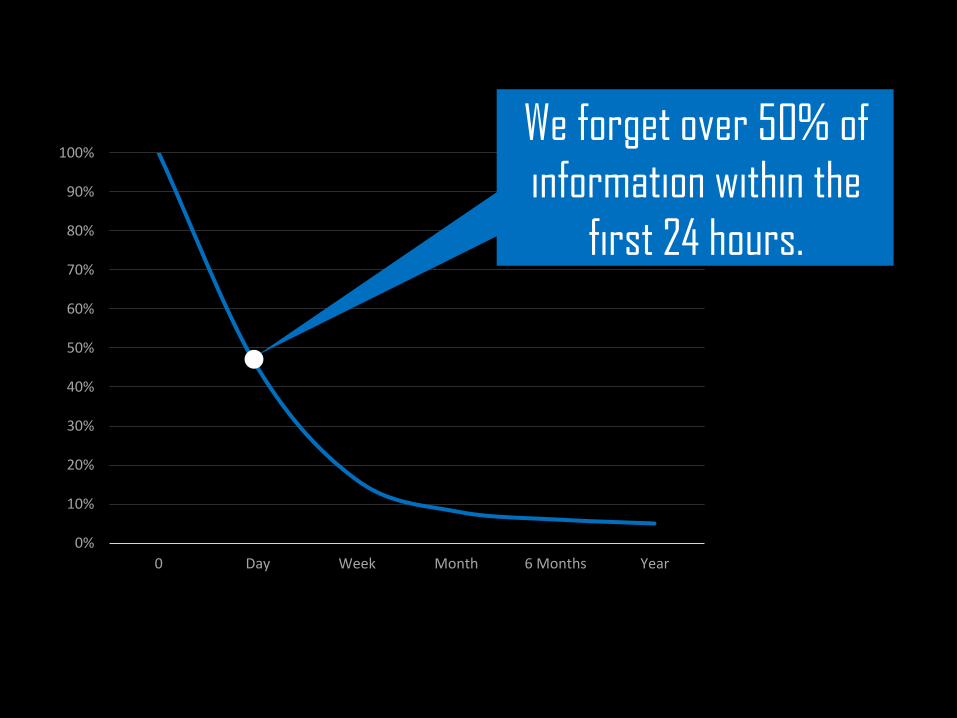
0%
10%
20%
30%
40%
50%
60%
70%
80%
90%
100%
0 Day Week Month 6 Months Year
We forget over 50% of
information within the
first 24 hours.
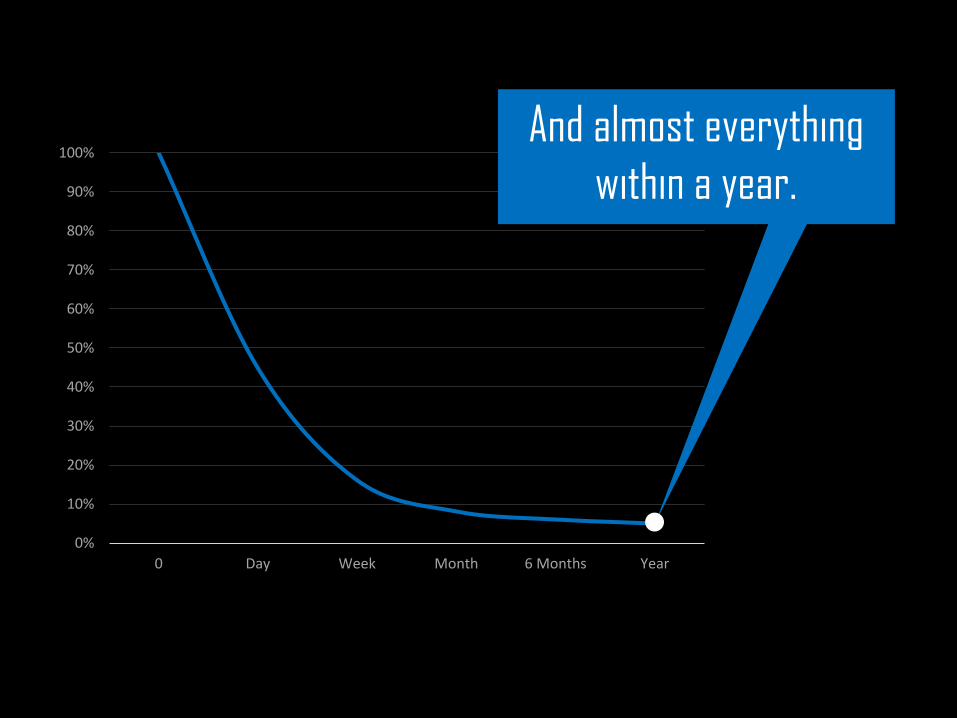
0%
10%
20%
30%
40%
50%
60%
70%
80%
90%
100%
0 Day Week Month 6 Months Year
And almost everything
within a year.
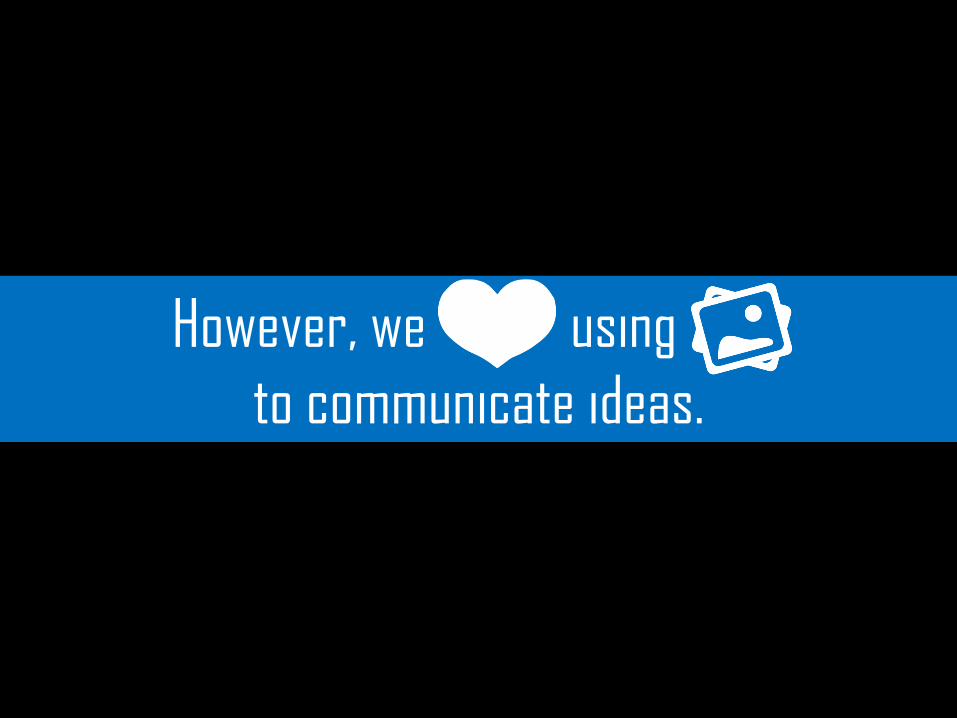
However, we love using imag
to communicate ideas.
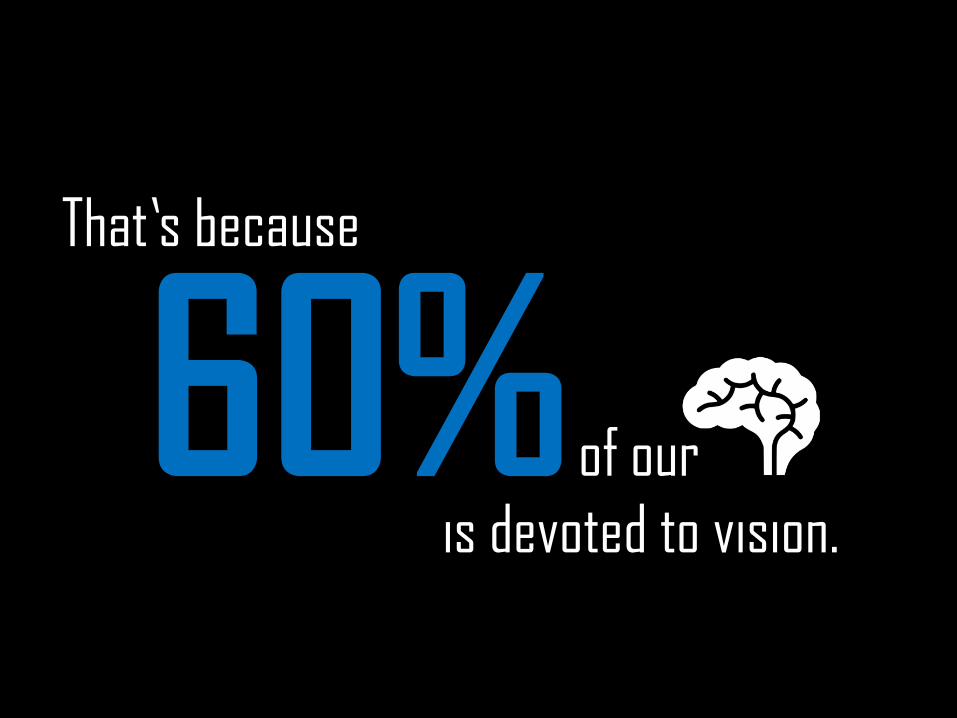
60%That’s because
of our brains
is devoted to vision.
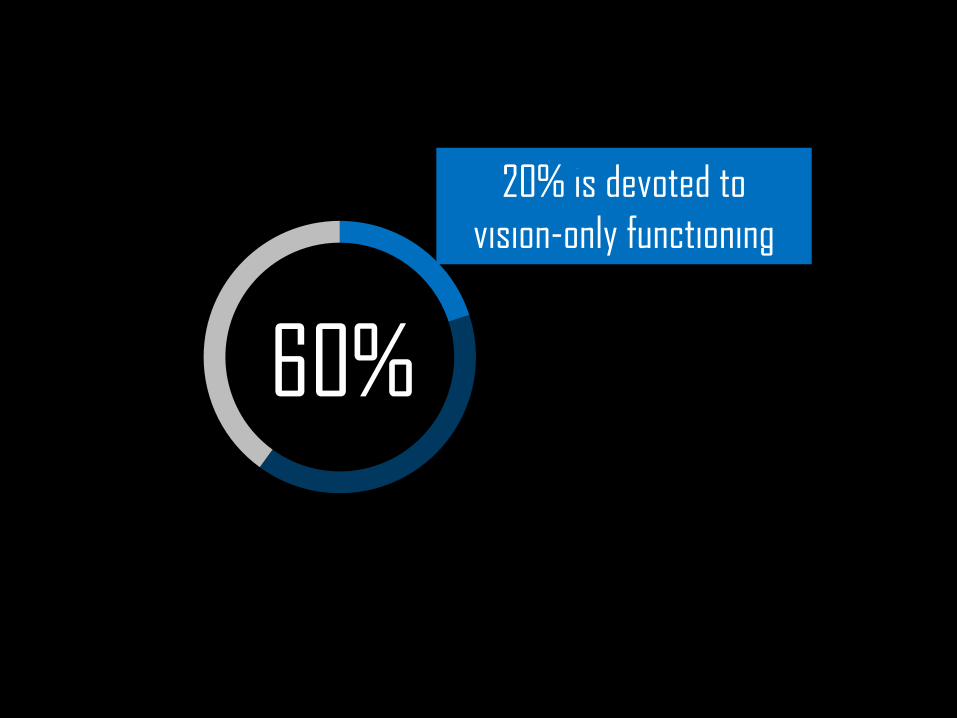
20% is devoted to
vision-only functioning
60%
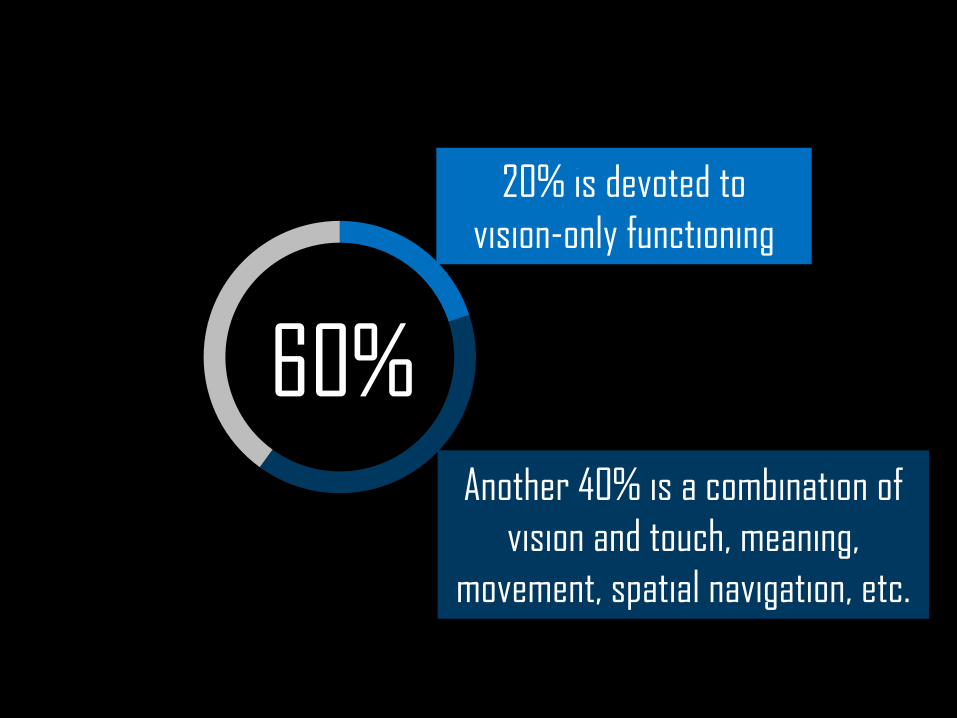
60%Another 40% is a combination of
vision and touch, meaning,
movement, spatial navigation, etc.
20% is devoted to
vision-only functioning
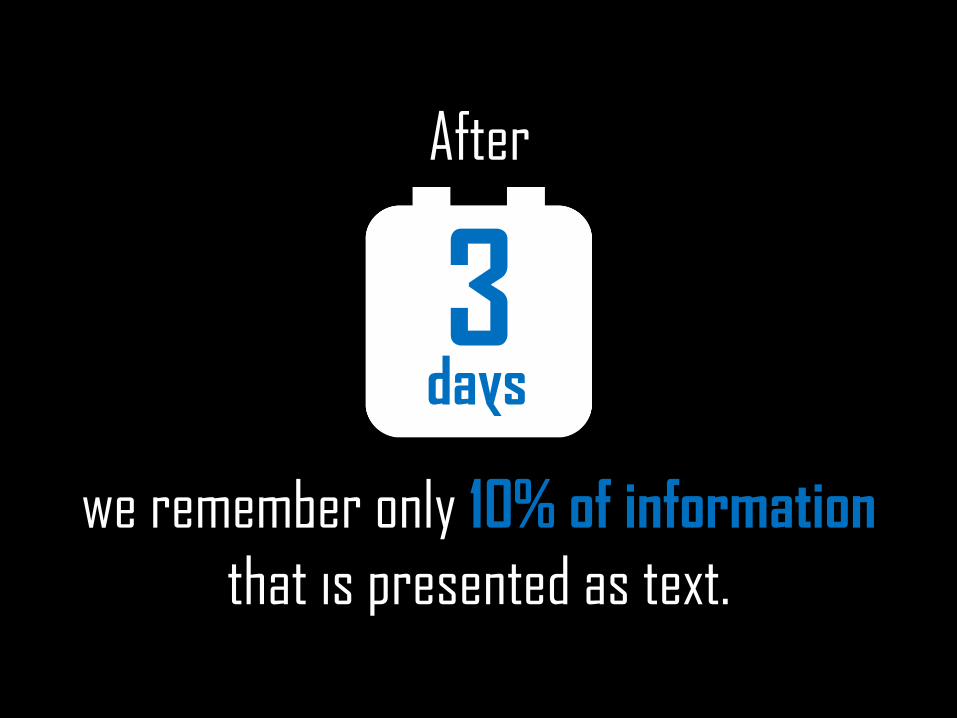
we remember only 10% of information
that is presented as text.
3days
After
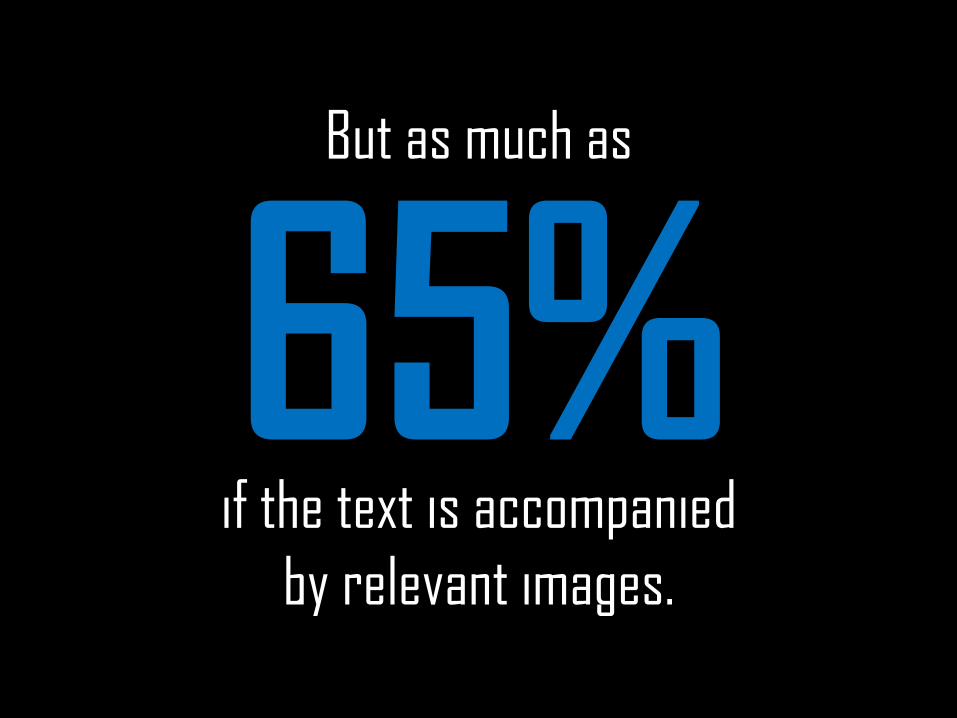
But as much as
if the text is accompanied
by relevant images.
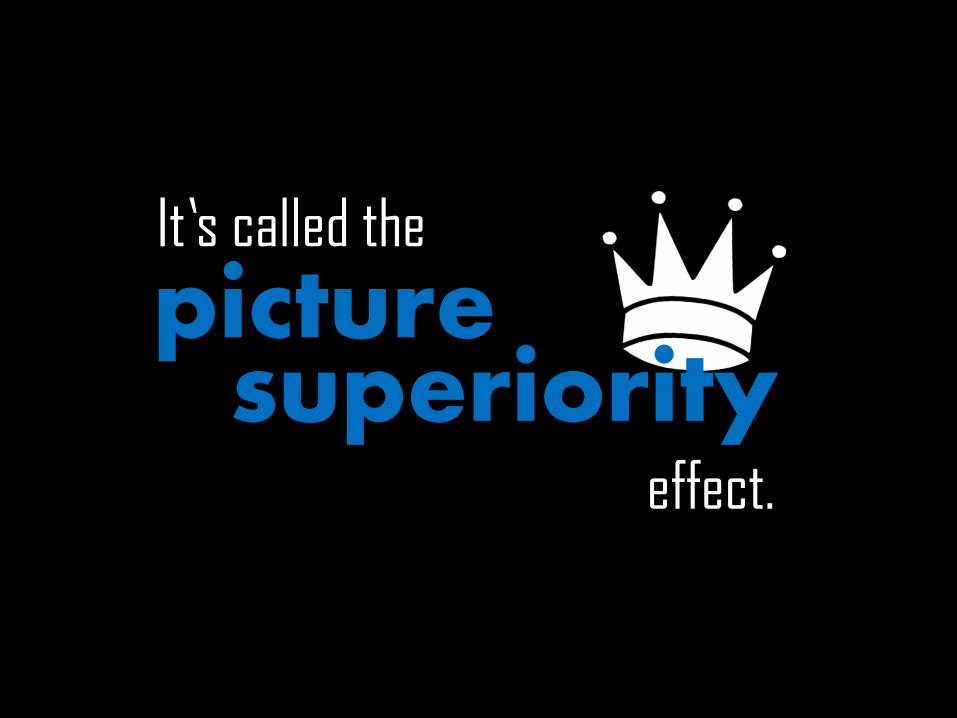
effect.
It’s called the
picturesuperiority

For the effect to work, pictures that you
choose must fulfil two conditions.
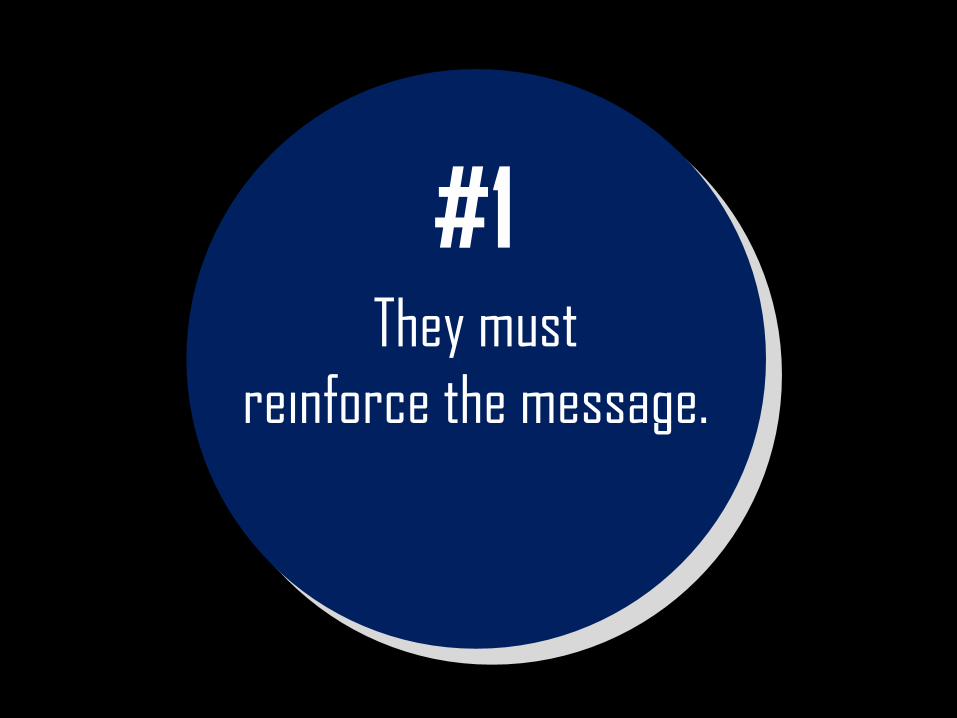
They must
reinforce the message.
#1
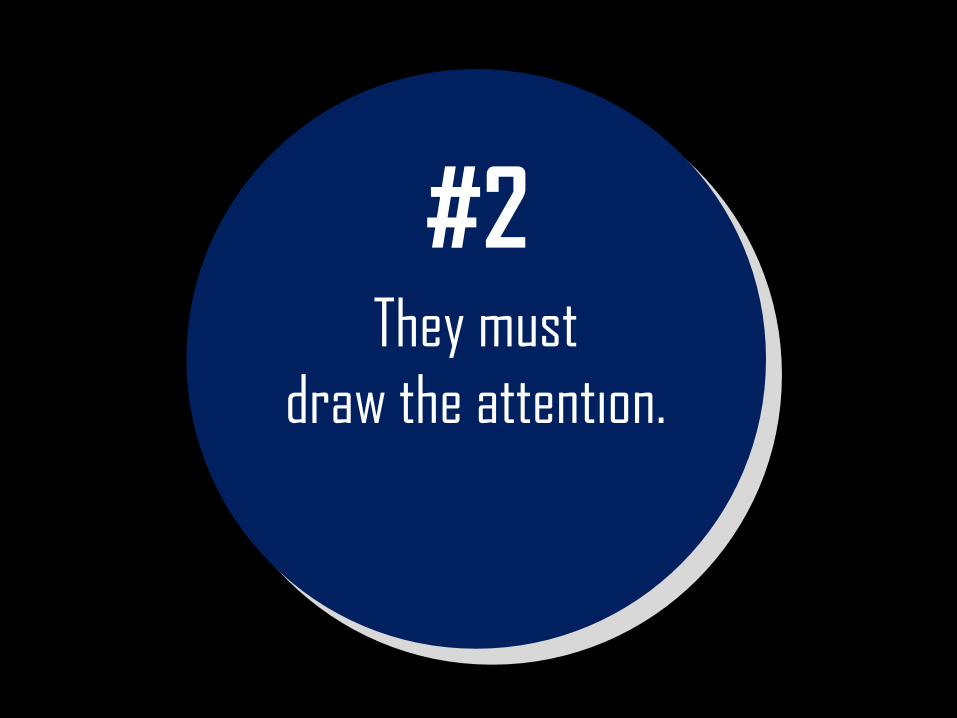
They must
draw the attention.
#2
But, what does it all have to do with
infographics?
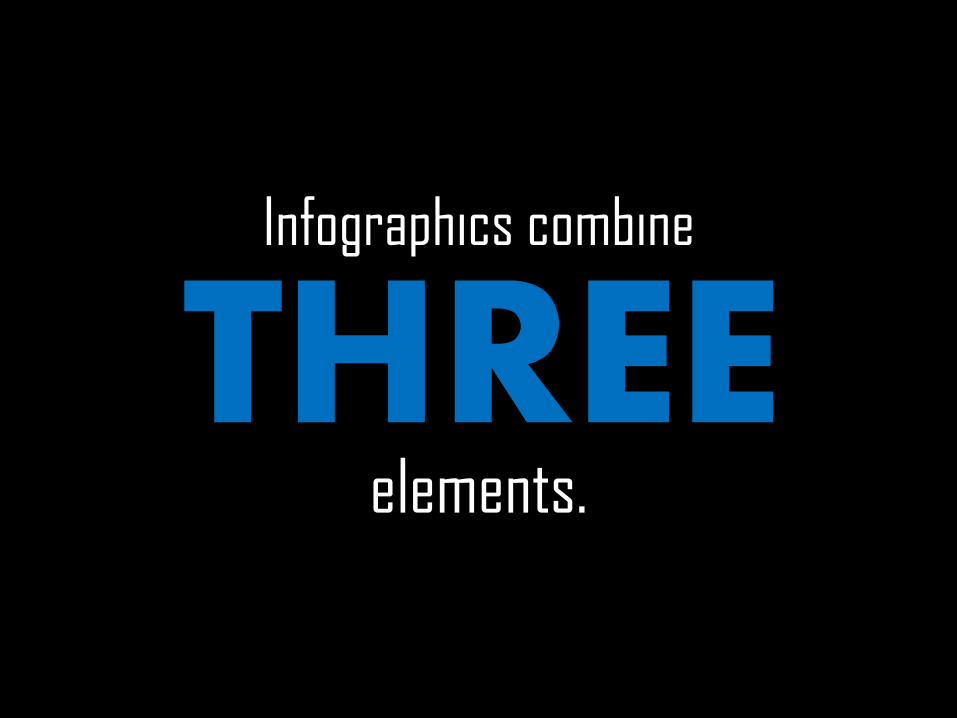
Infographics combine
elements.
THREE

1. Images
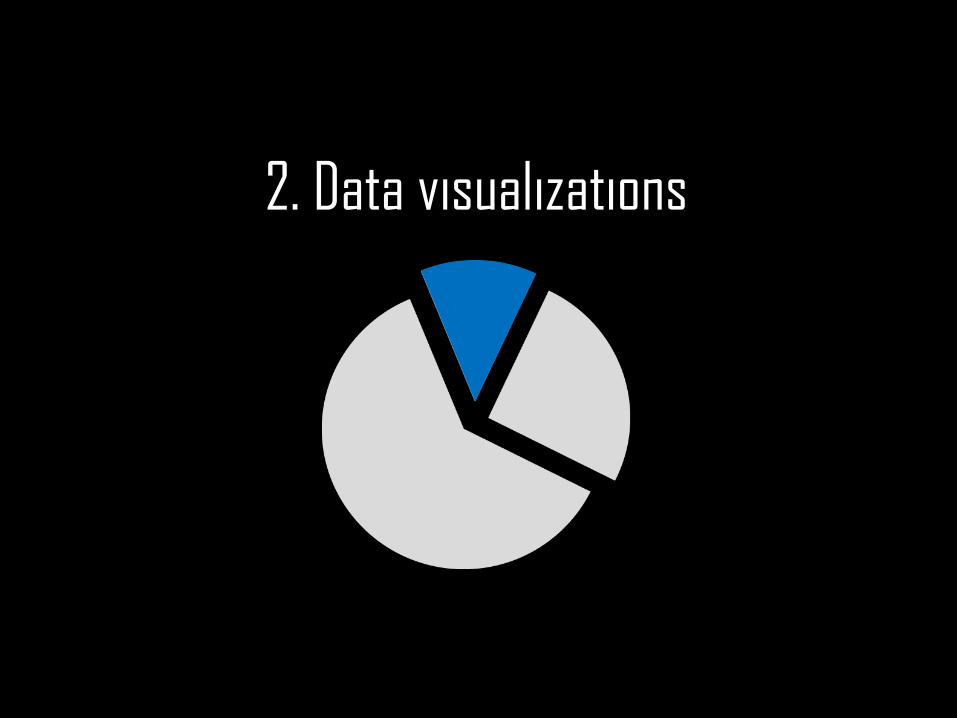
2. Data visualizations
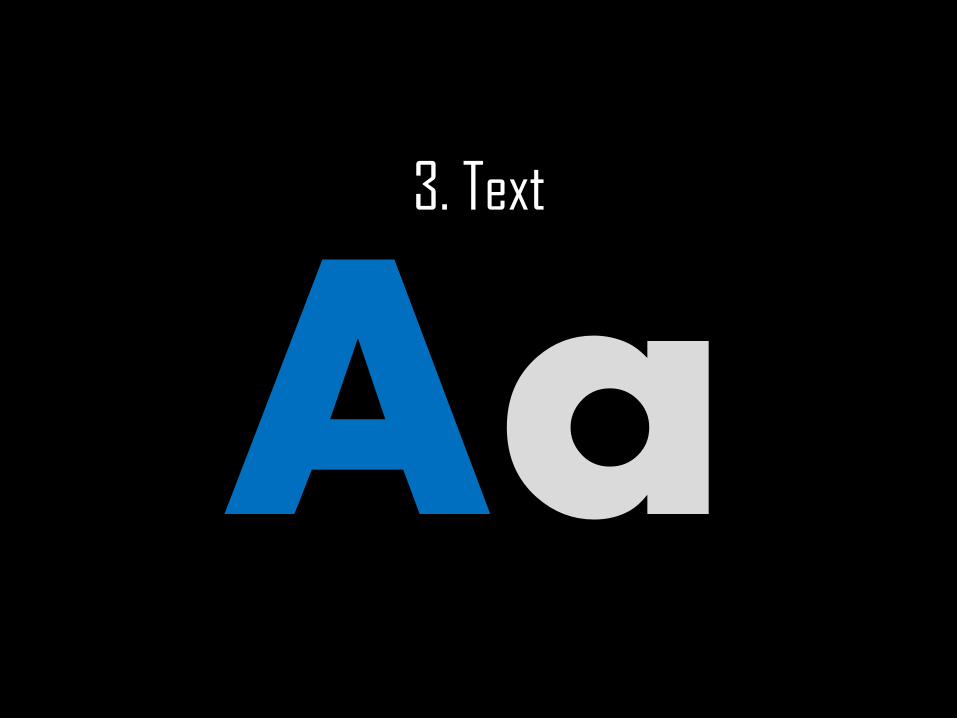
3. Text
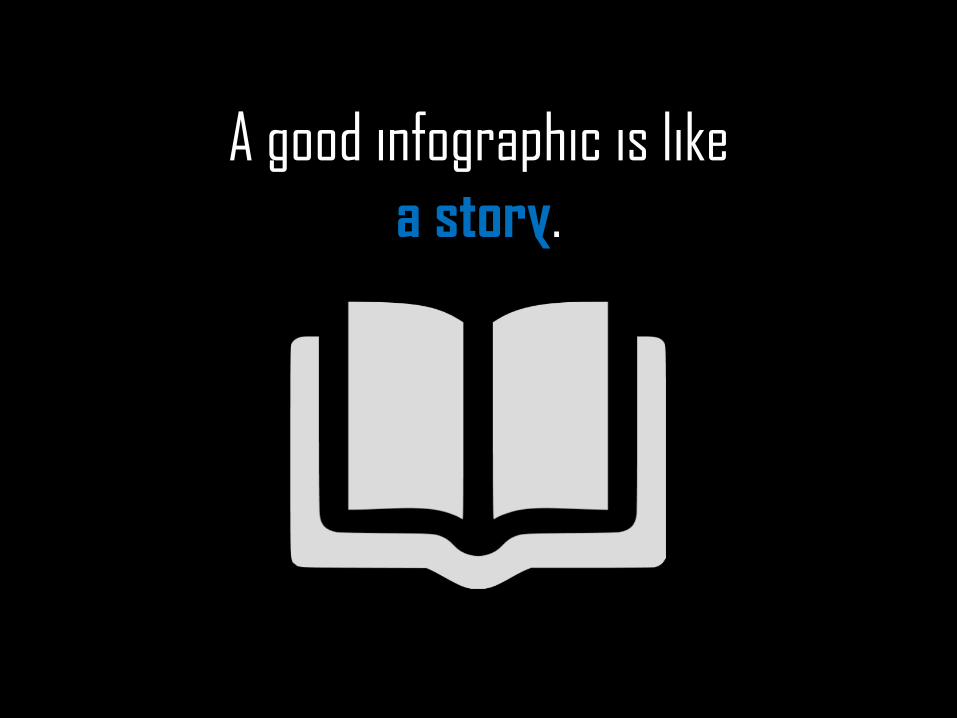
A good infographic is like
a story.

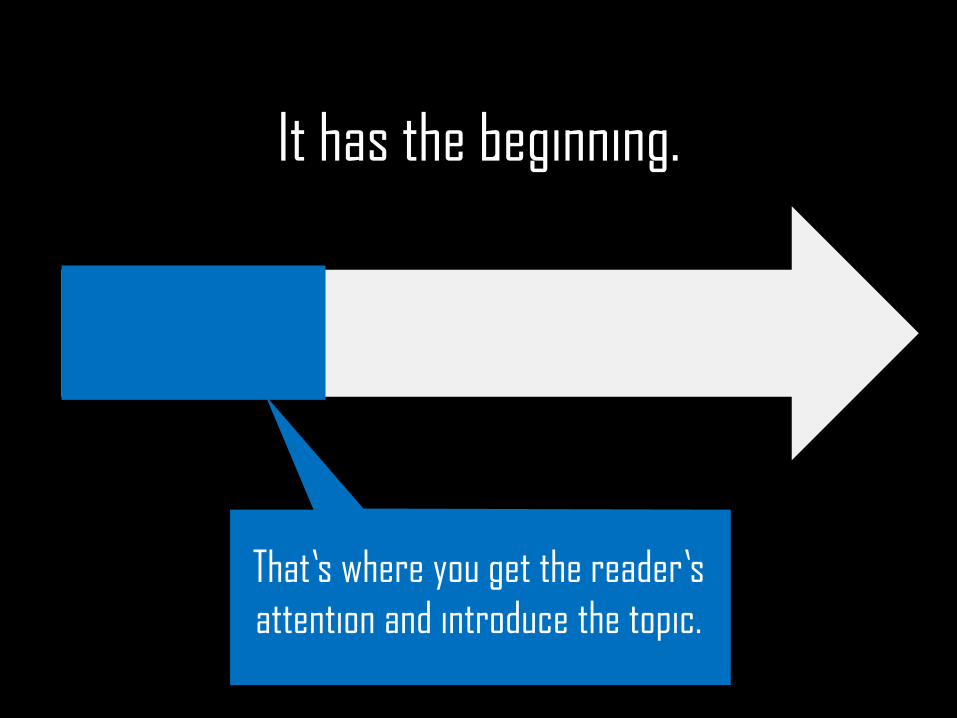
It has the beginning.
It has the beginning.
That’s where you get the reader’s
attention and introduce the topic.
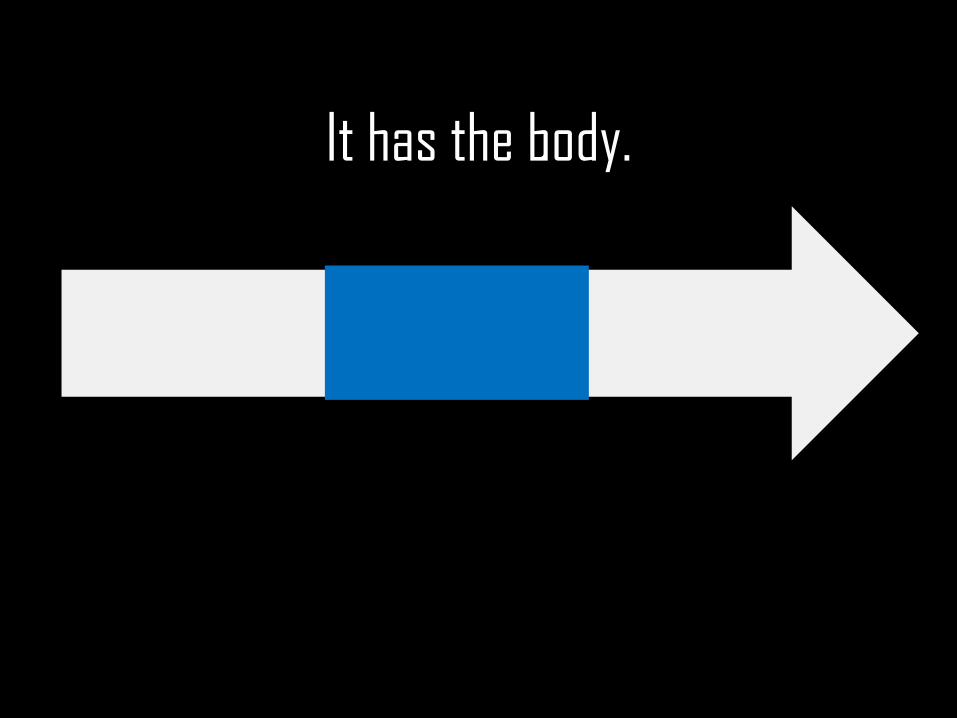
It has the body.
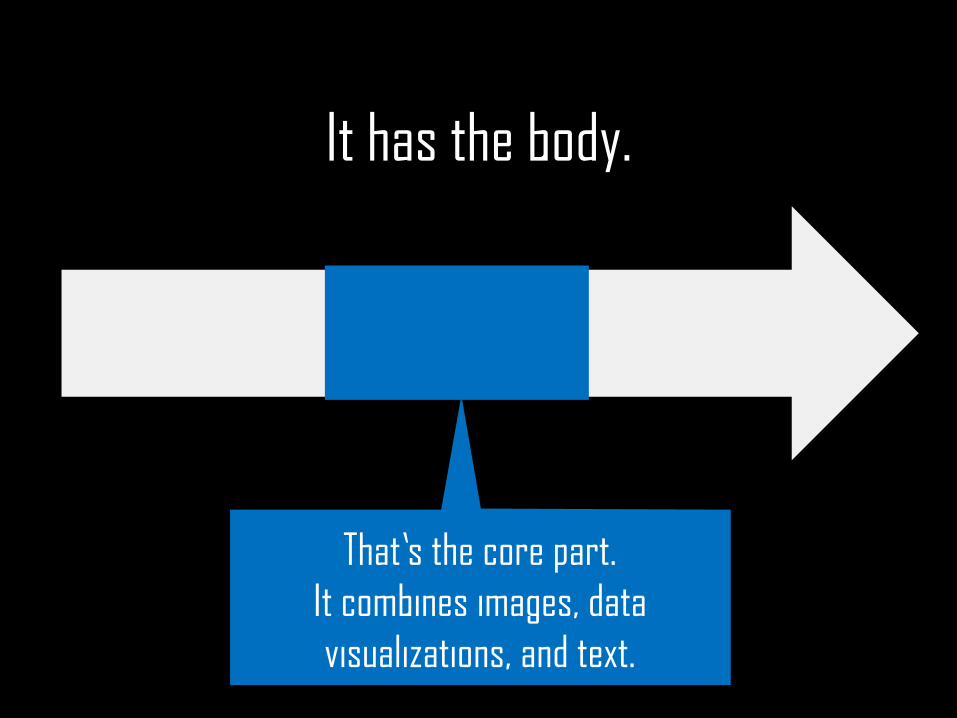
It has the body.
That’s the core part.
It combines images, data
visualizations, and text.
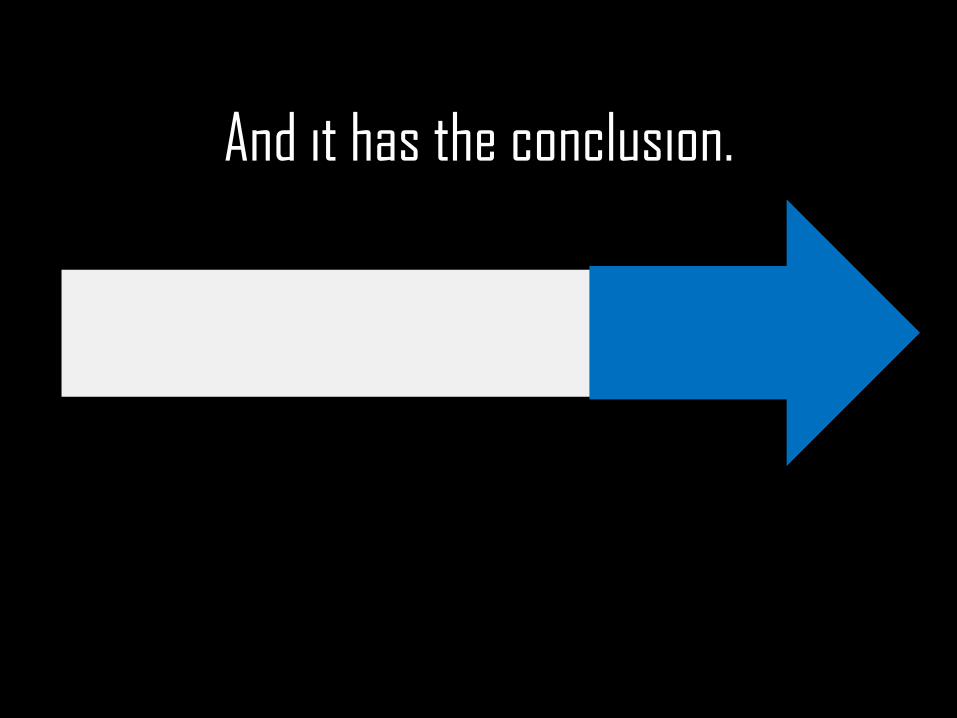
And it has the conclusion.
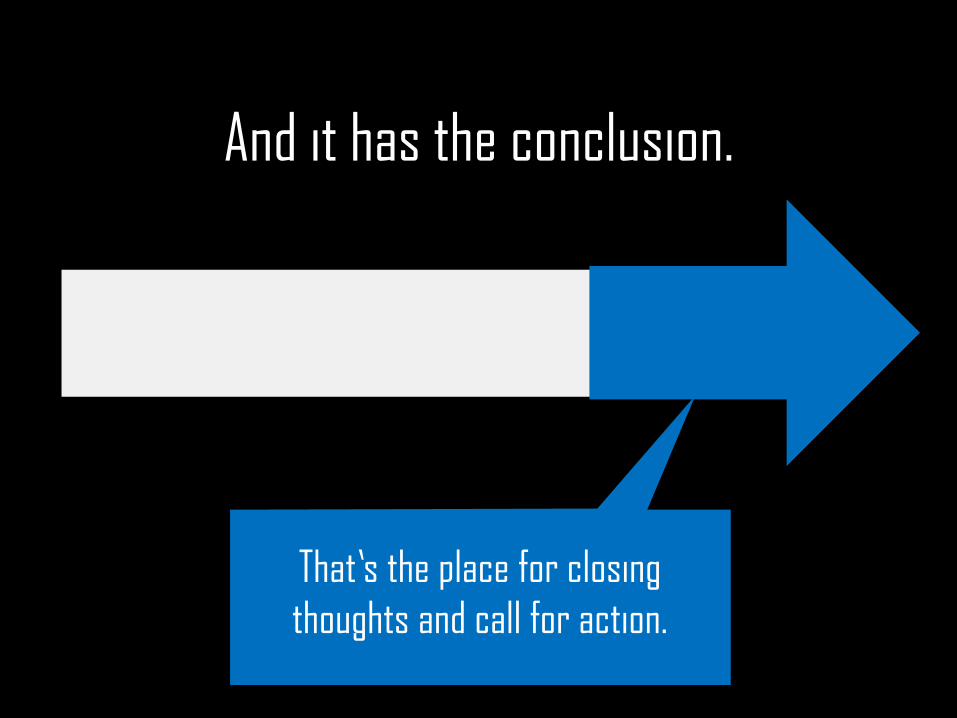
And it has the conclusion.
That’s the place for closing
thoughts and call for action.
So, how to create a good infographic?
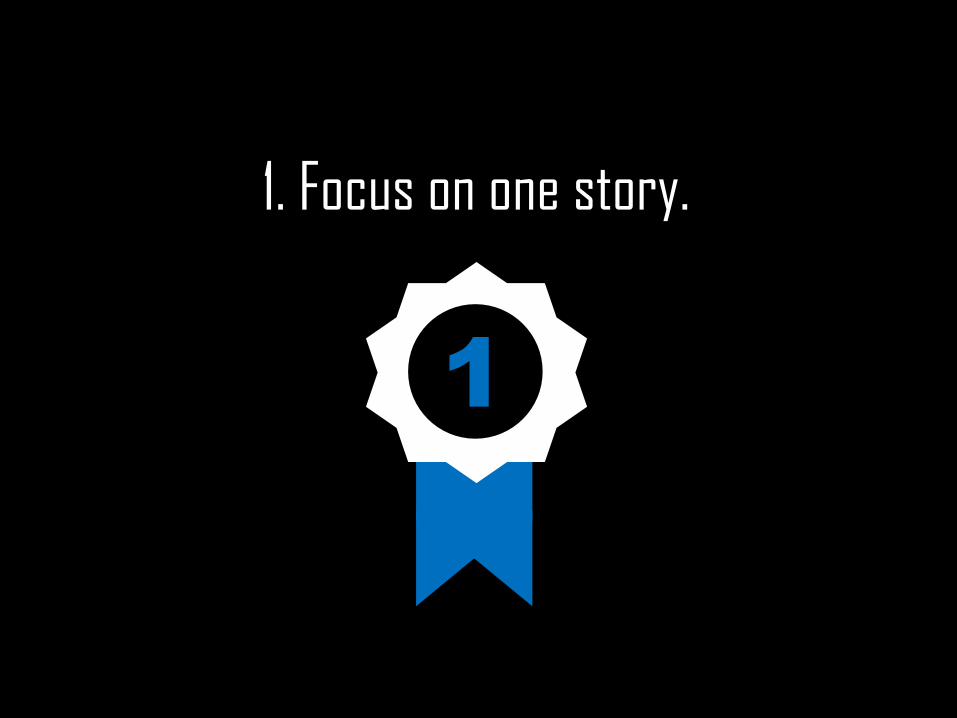
1. Focus on one story.
1
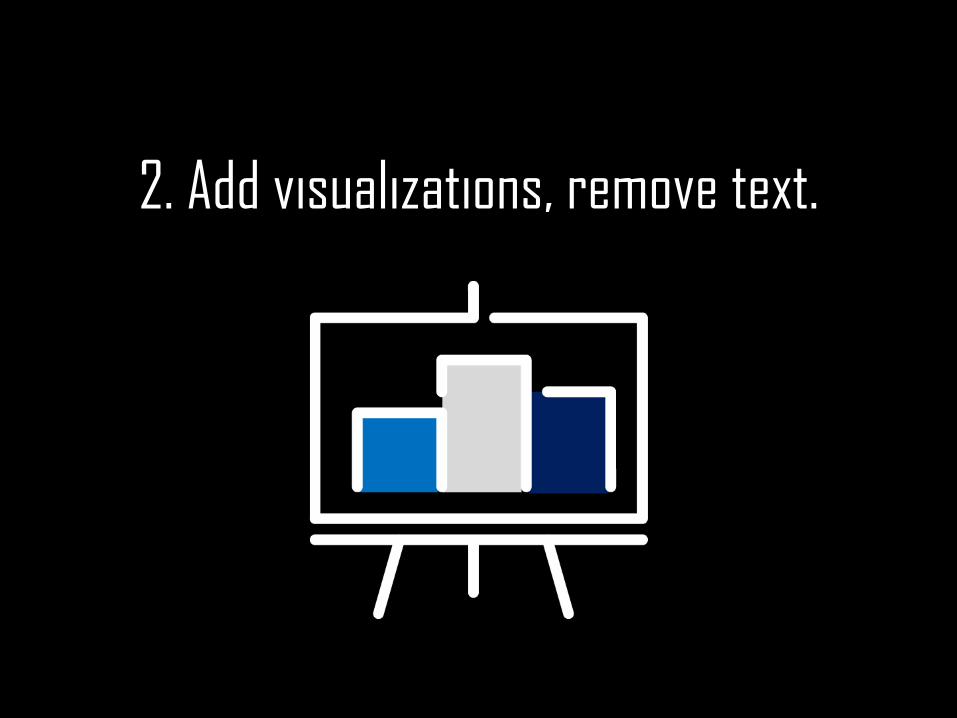
2. Add visualizations, remove text.

3. Be accurate.
What are the advantages of using
infographics?
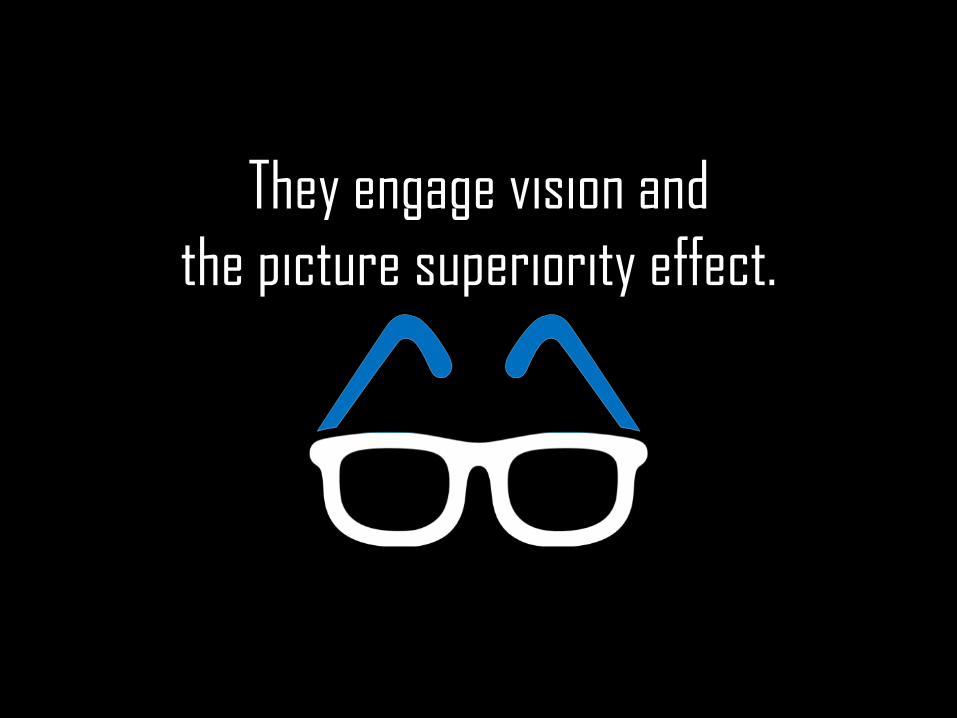
They engage vision and
the picture superiority effect.
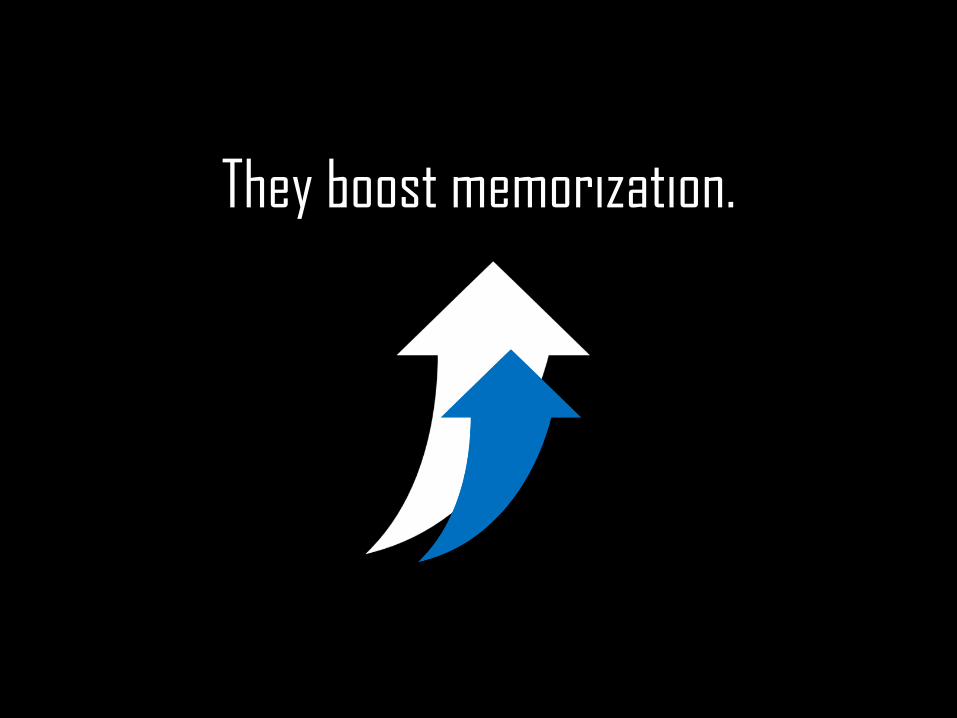
They boost memorization.

They entertain and inform.
They are also fun to create!

What are the considerations then?
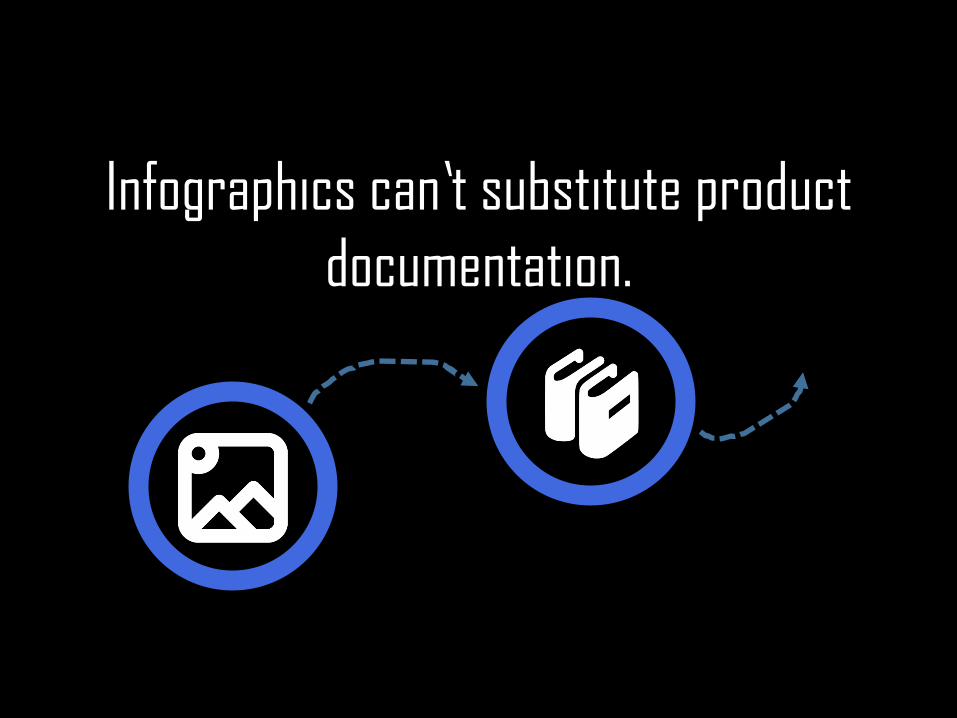
Infographics can’t substitute product
documentation.

They may not be taken seriously.
And they are time-consuming.

Want to see some examples?

Thank you@aga_tkaczyk