Embed Size (px)
Citation preview
Maximize the value ofEarth Observation Data In a Big Data World
BYTE Big Data Community Workshop
Giovanni RumWenbo ChuGEO Secretariat1 December 2016Valencia, Spain
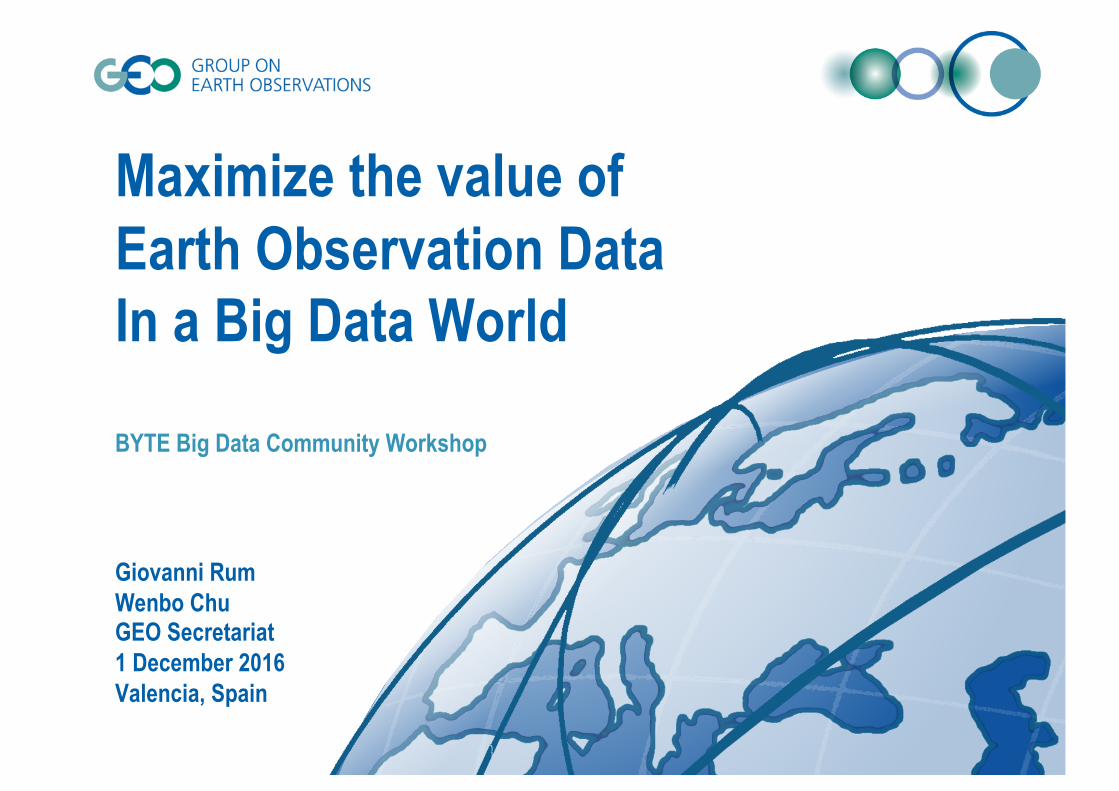
EO Data: Volume and Velocity
Jonathan T. Overpeck et al, Science 2011
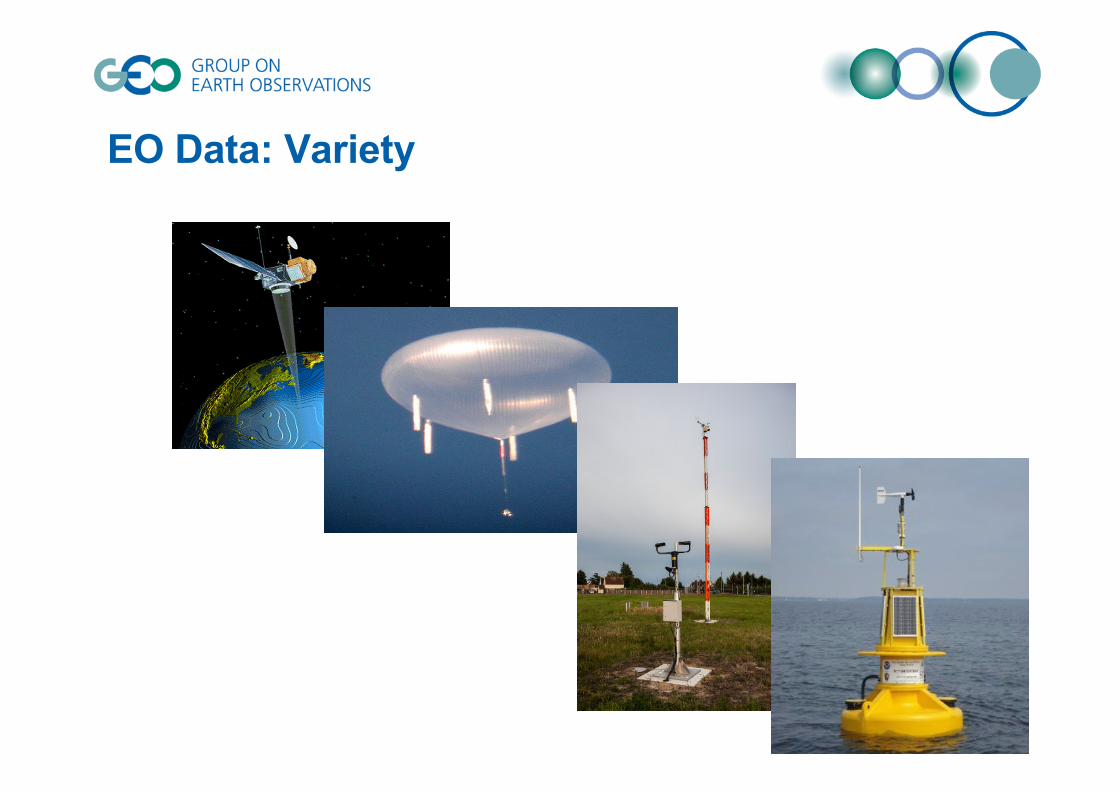
EO Data: Variety
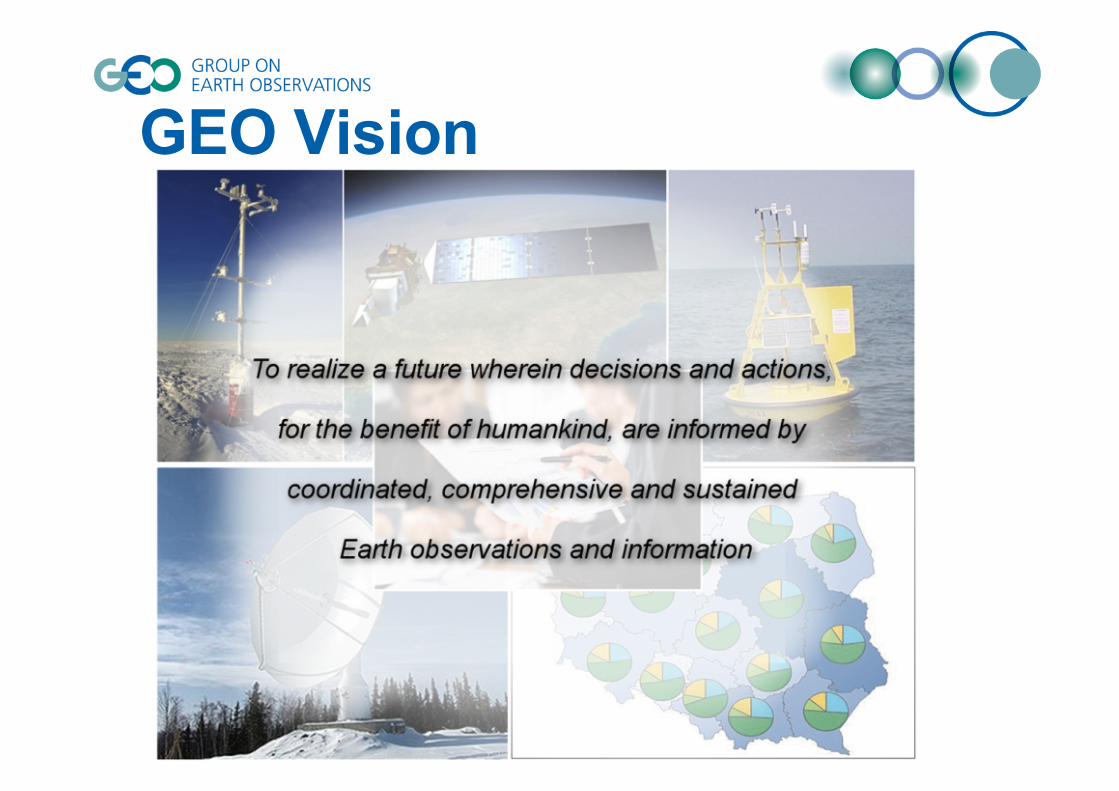
GEO Vision
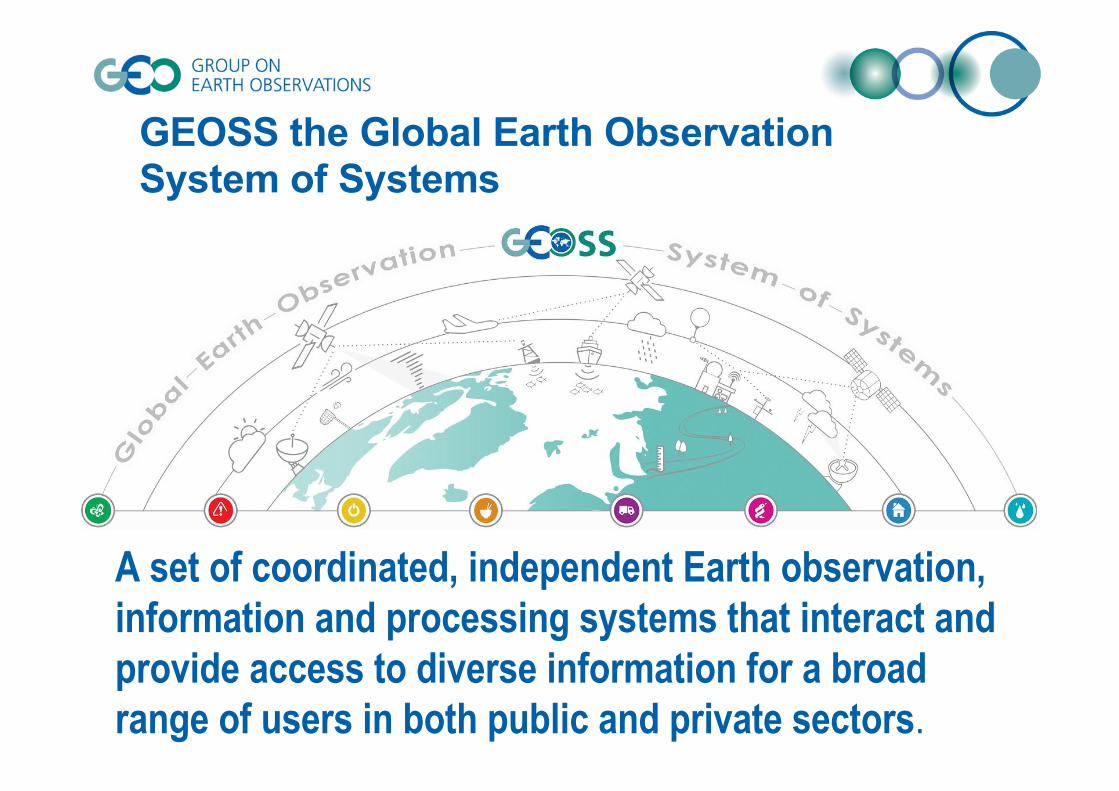
A set of coordinated, independent Earth observation, information and processing systems that interact and provide access to diverse information for a broad range of users in both public and private sectors.
GEOSS the Global Earth Observation System of Systems
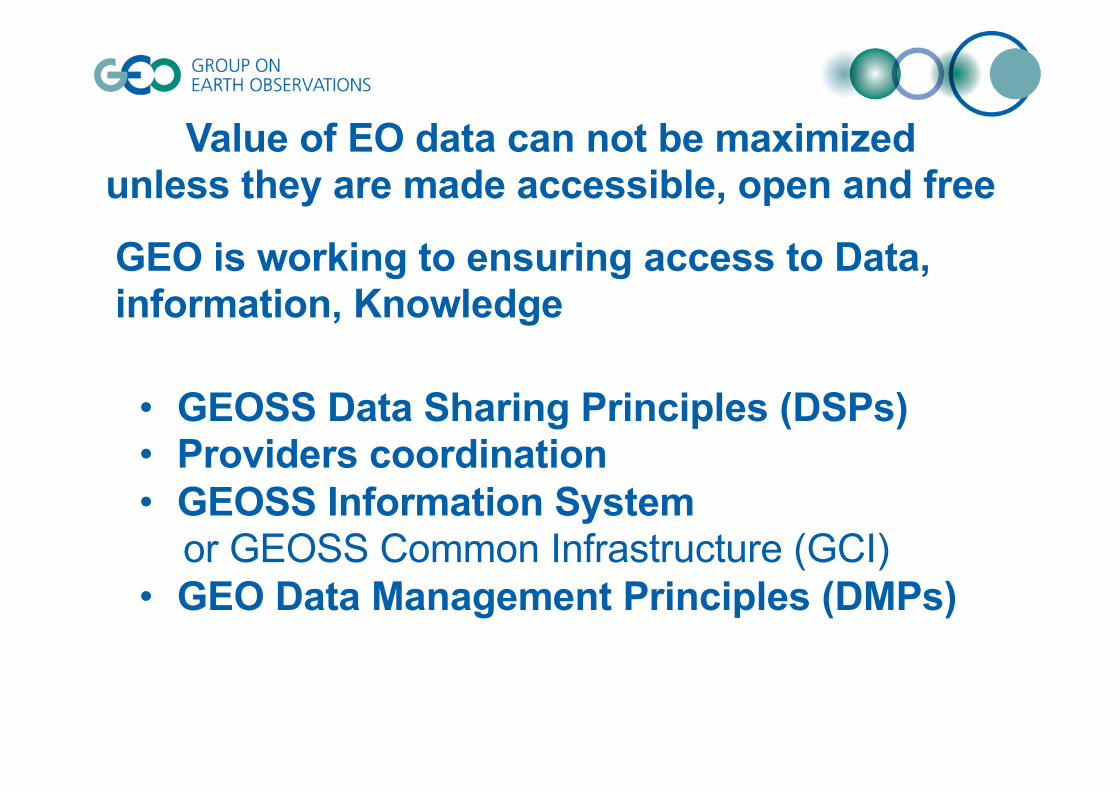
GEO is working to ensuring access to Data, information, Knowledge
• GEOSS Data Sharing Principles (DSPs)• Providers coordination• GEOSS Information System
or GEOSS Common Infrastructure (GCI)• GEO Data Management Principles (DMPs)
Value of EO data can not be maximized unless they are made accessible, open and free
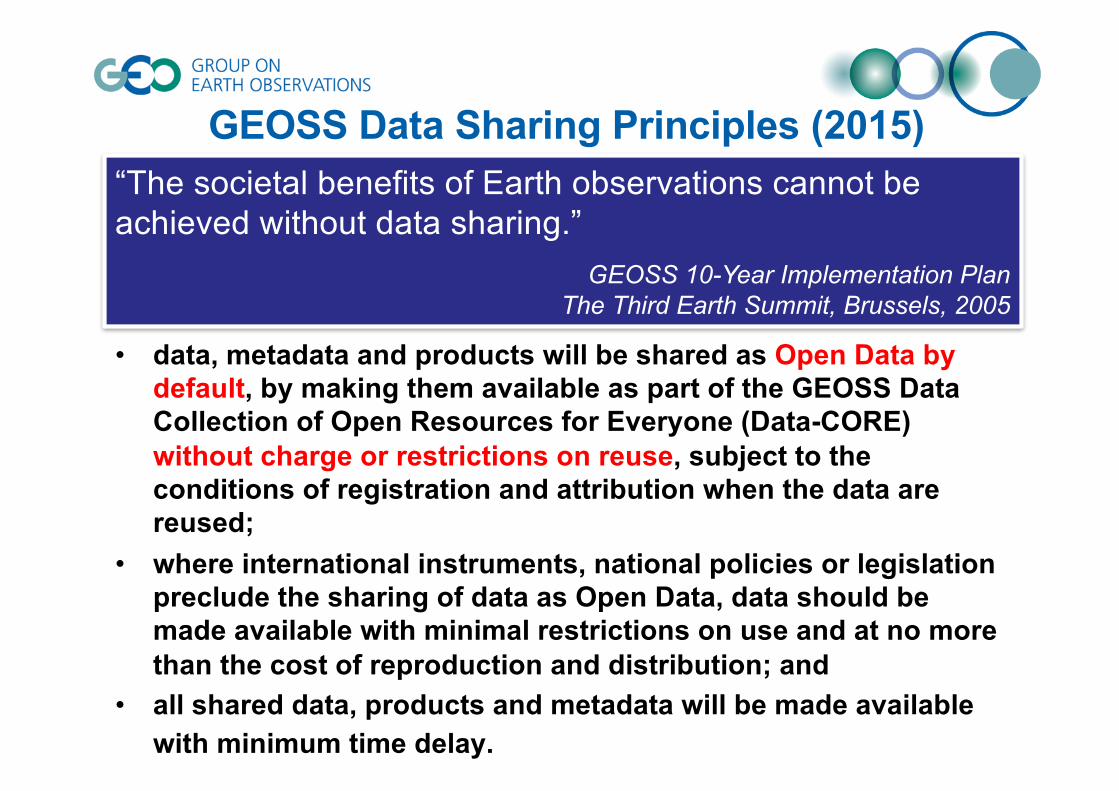
GEOSS Data Sharing Principles (2015)
• data, metadata and products will be shared as Open Data by default, by making them available as part of the GEOSS Data Collection of Open Resources for Everyone (Data-CORE) without charge or restrictions on reuse, subject to the conditions of registration and attribution when the data are reused;
• where international instruments, national policies or legislation preclude the sharing of data as Open Data, data should be made available with minimal restrictions on use and at no more than the cost of reproduction and distribution; and
• all shared data, products and metadata will be made available with minimum time delay.
“The societal benefits of Earth observations cannot beachieved without data sharing.”
GEOSS 10-Year Implementation PlanThe Third Earth Summit, Brussels, 2005
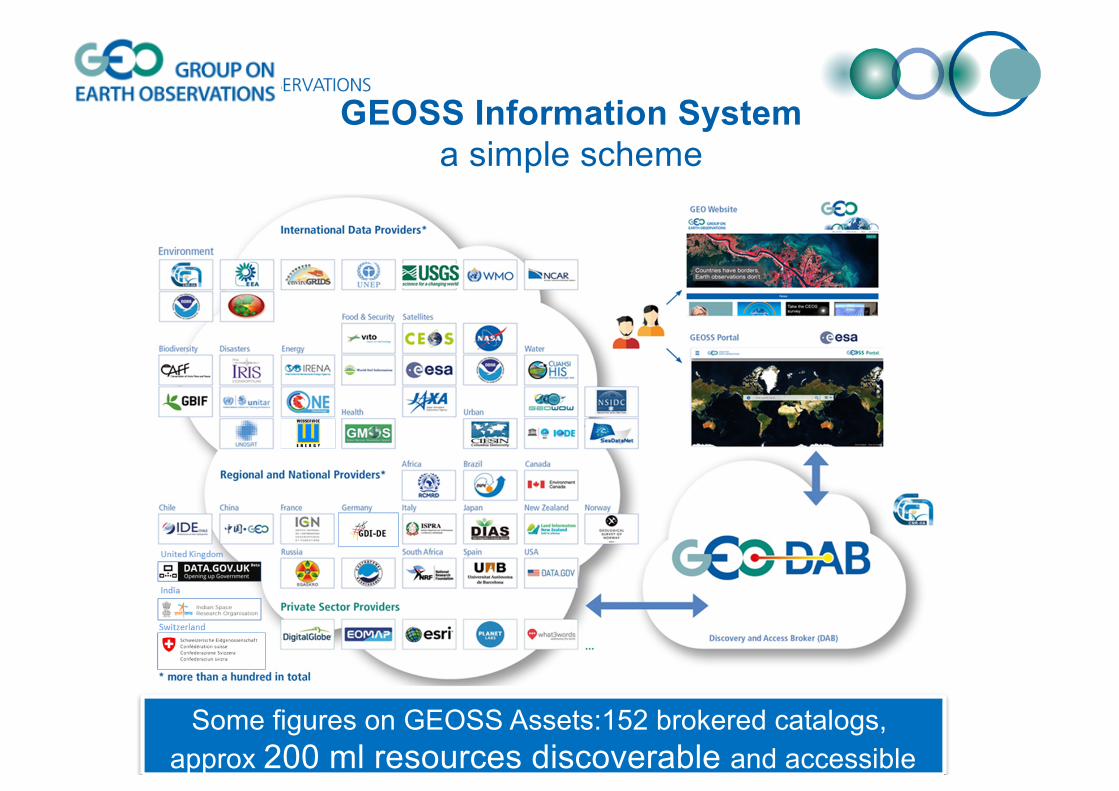
GEOSS Information Systema simple scheme
Some figures on GEOSS Assets:152 brokered catalogs, approx 200 ml resources discoverable and accessible
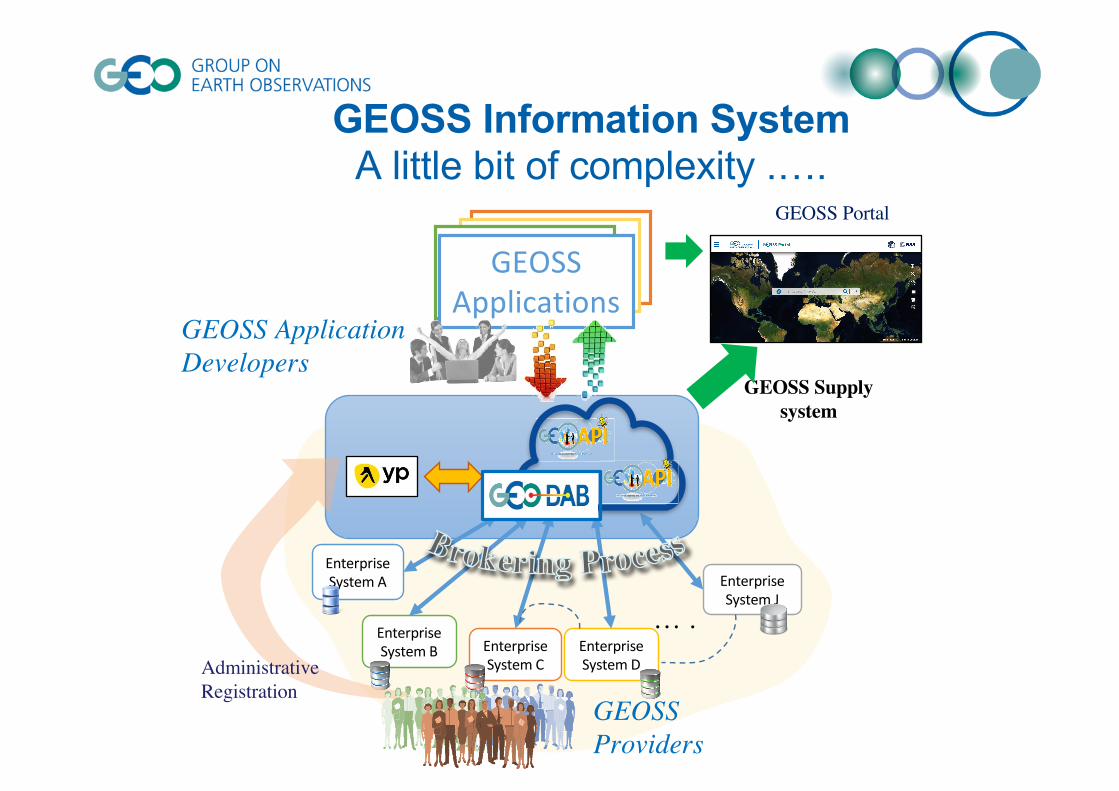
GEOSSApplication
EnterpriseSystemA
EnterpriseSystemB Enterprise
SystemCEnterpriseSystemD
EnterpriseSystemJ
… .
GEOSS Providers
GEOSS Application Developers
GEOSSApplicationGEOSS
ApplicationGEOSS
Applications
Administrative Registration
GEOSS Supply system
GEOSS Portal
GEOSS Information SystemA little bit of complexity .….
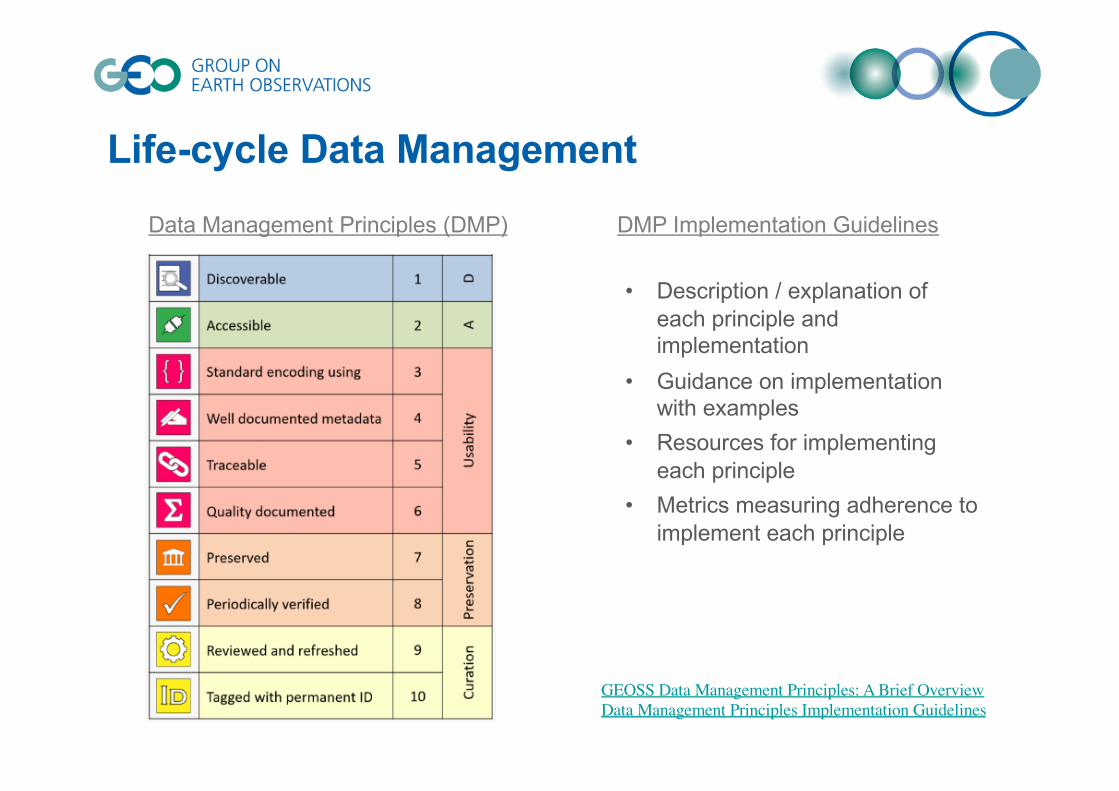
Life-cycle Data Management
GEOSS Data Management Principles: A Brief OverviewData Management Principles Implementation Guidelines
• Description / explanation of each principle and implementation
• Guidance on implementation with examples
• Resources for implementing each principle
• Metrics measuring adherence to implement each principle
DMP Implementation GuidelinesData Management Principles (DMP)
Apply Repository Certification to Data Sharing Principles and Data Management Principles
• Data sharing depends upon reliable repositories– Repository certification verifies potential for reliability– Renewal of certification affirms continuing reliability
• Data management depends on capabilities– Validated by repository certification
• Repository certification in DMP IG– DMP1: Metadata for Discovery; – DMP7: Data Preservation; – DMP8: Data and Metadata Verification;
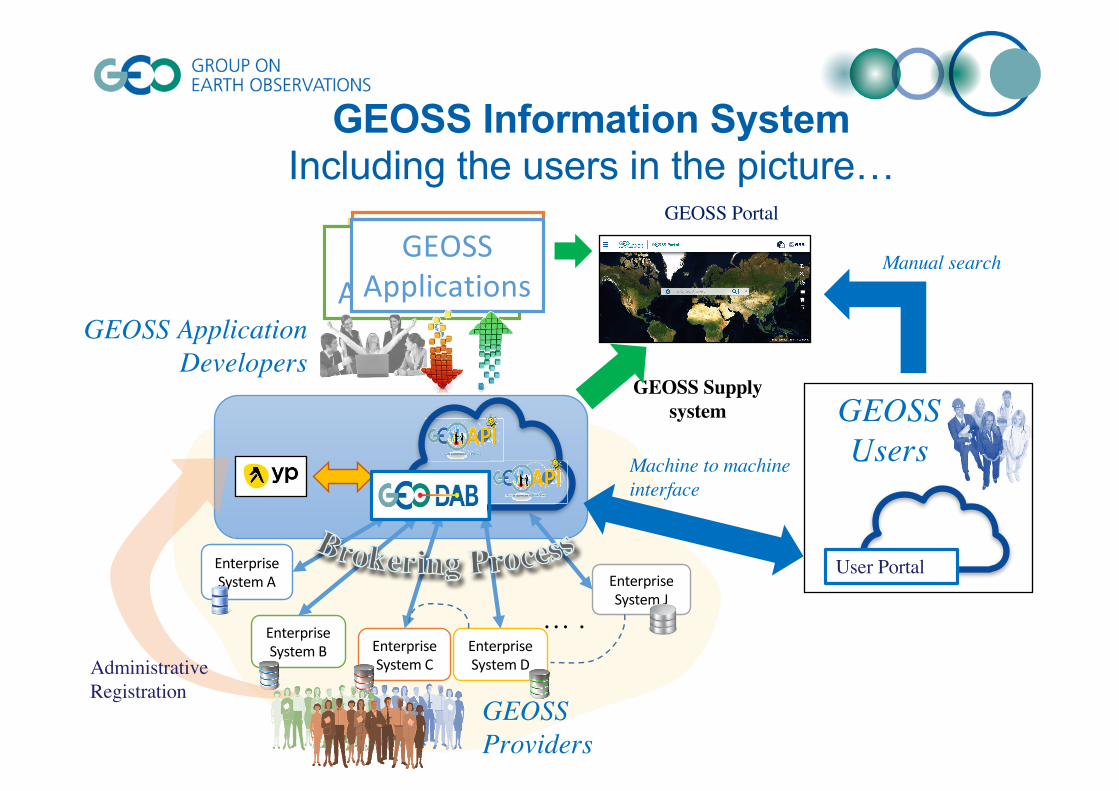
GEOSSApplications
EnterpriseSystemA
EnterpriseSystemB Enterprise
SystemCEnterpriseSystemD
EnterpriseSystemJ
… .
GEOSS Providers
GEOSS Application Developers
GEOSS Users
GEOSSApplication
s
GEOSSApplications
GEOSSApplications
Administrative Registration
GEOSS Supply system
GEOSS Portal
GEOSS Information SystemIncluding the users in the picture…
User Portal
Manual search
Machine to machine interface
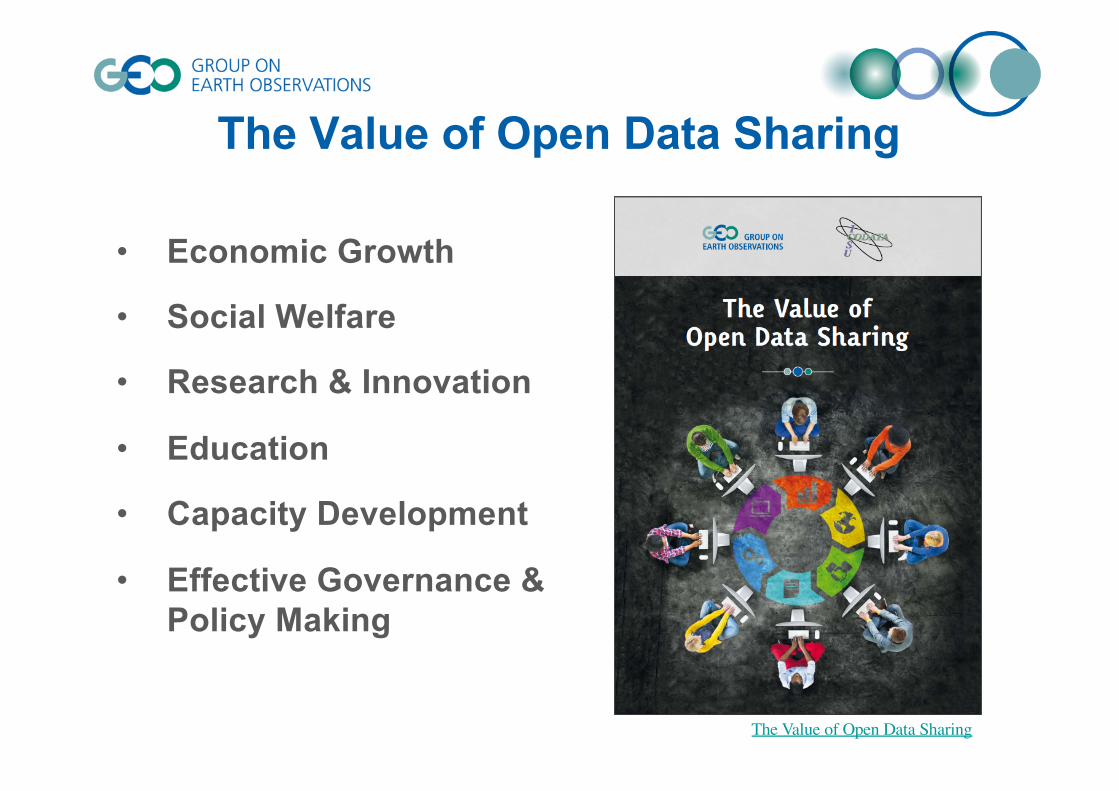
The Value of Open Data Sharing
• Economic Growth
• Social Welfare
• Research & Innovation
• Education
• Capacity Development
• Effective Governance & Policy Making
The Value of Open Data Sharing
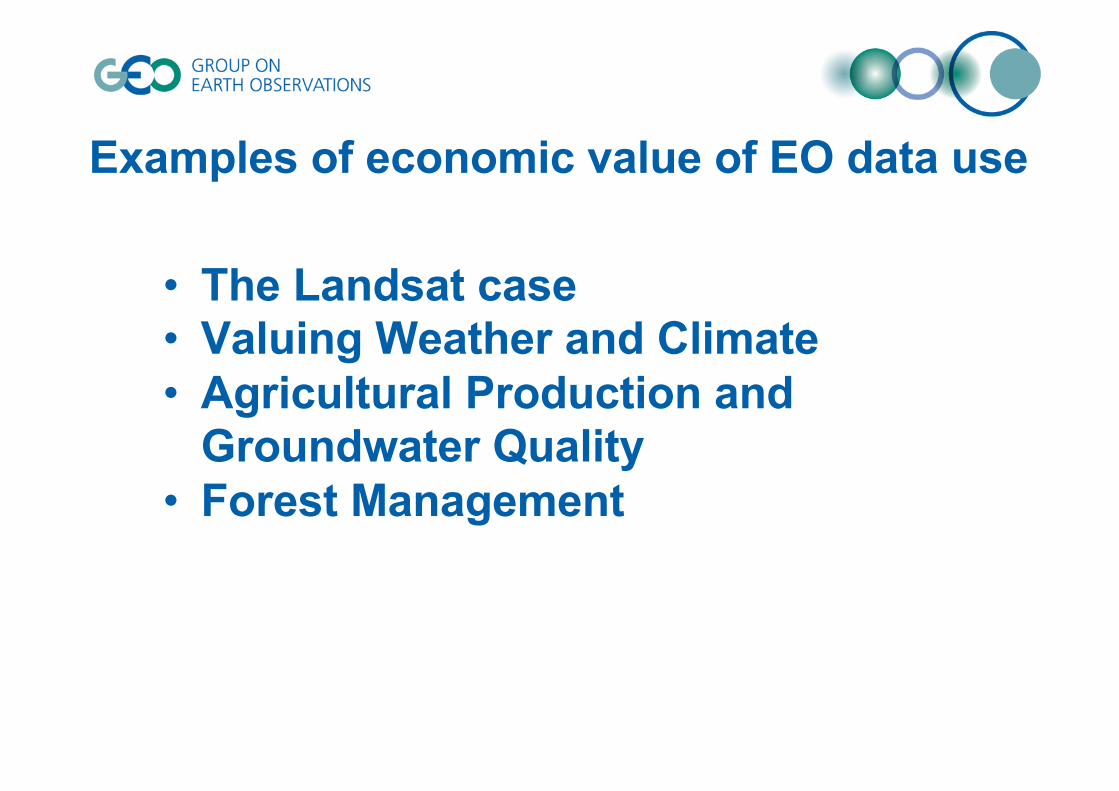
• The Landsat case• Valuing Weather and Climate• Agricultural Production and
Groundwater Quality• Forest Management
Examples of economic value of EO data use
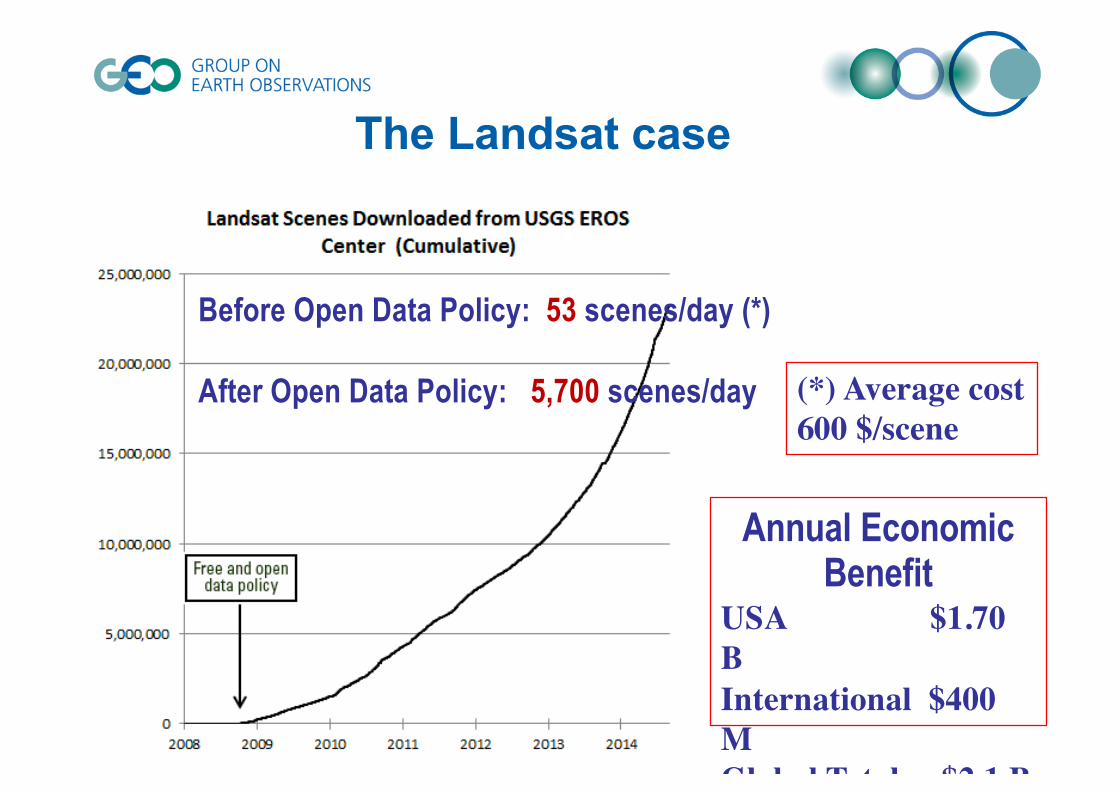
.Before Open Data Policy: 53 scenes/day (*)
After Open Data Policy: 5,700 scenes/day
Annual Economic Benefit
USA $1.70 BInternational $400 MGlobal Total $2.1 B
The Landsat case
(*) Average cost 600 $/scene
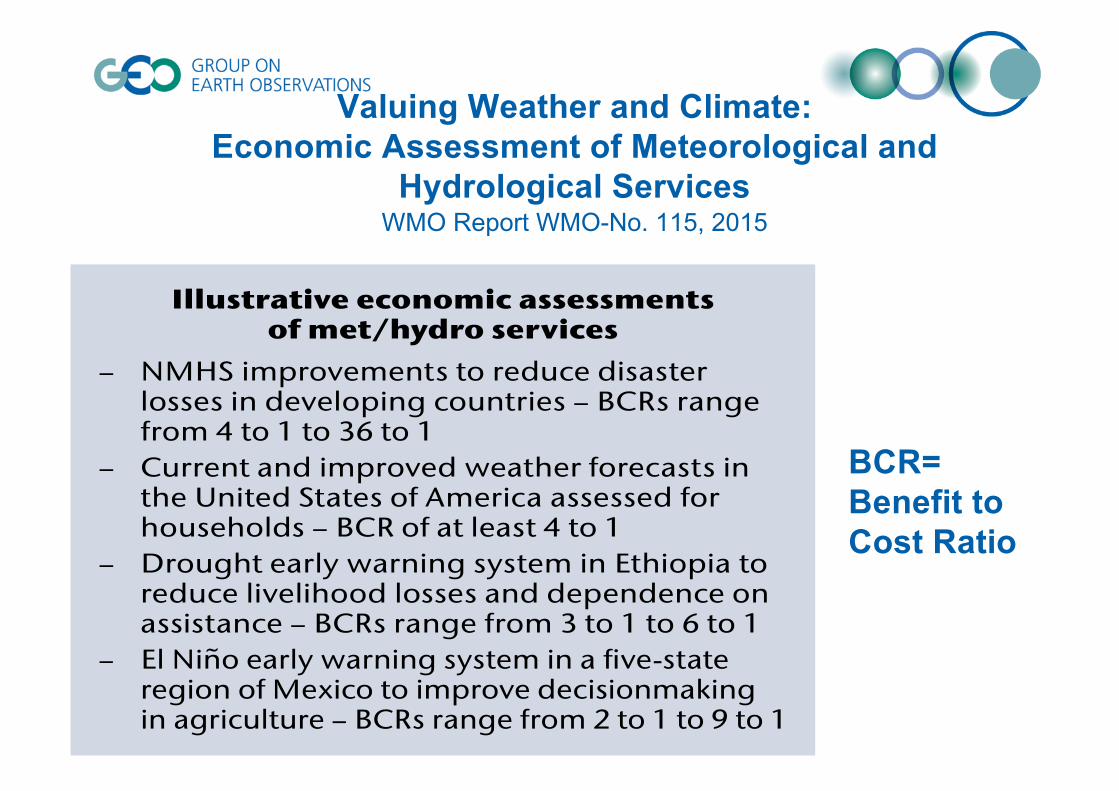
Valuing Weather and Climate:Economic Assessment of Meteorological and
Hydrological ServicesWMO Report WMO-No. 115, 2015
For more than a century, nations have equipped themselves to provide weather, climate and hydrological information, forecasts and, more recently, remotely sensed data and early warnings to the public and private sectors. These services, collectively referred to throughout this publication as met/hydro services, have increased the safety and efficiency of land, sea and air transport, helped communities prepare for and respond to extreme weather events, and facilitated improved decisionmaking in weather-sensitive economic sectors. Increasingly, it has become easier for people and businesses to access met/hydro information and products due to advances in the Internet and telecommunications.
Yet, as NMHSs strive to maintain and improve the quality, diversity, and coverage of their services, they face challenges similar to other public institutions in securing adequate and sustained funding. To compete for and optimize the use of scarce public investment resources, NMHSs may be required to demonstrate that the benefits of their services are significantly larger than the costs to produce and deliver them. Although there is not a single definitive study on the global benefits of met/hydro
services, economic studies have consistently generated benefit–cost ratios (BCRs) of greater than one (see box). This publication is intended to help NMHSs and other providers of met/hydro services develop a basic understanding of economic valuation methods to enable them to design and commission studies. It further supports utilization of the results to improve service delivery through business optimization and communication with decisionmakers, users and the public.
CREATING VALUE: LINKING PRODUCTION AND DELIVERY OF SERVICES TO VALUED OUTCOMES
Met/hydro services do not generate economic and social value unless users benefit from decisions as a result of the information provided, even if the services are of the highest quality. In addition, met/hydro services of similar quality provided in two countries can vary significantly in terms of their benefits depending on the relative nature of weather- and climate-related risks, the number and types of users and their capacity to take actions to avoid harm or increase economic output.
The generation of met/hydro services benefits can be depicted in a “value chain” linking the production and delivery of services to user decisions and the outcomes and values resulting from those decisions. The value chain presented in the figure below
EXECUTIVE SUMMARY
Illustrative economic assessments of met/hydro services
– NMHS improvements to reduce disaster losses in developing countries – BCRs range from 4 to 1 to 36 to 1
– Current and improved weather forecasts in the United States of America assessed for households – BCR of at least 4 to 1
– Drought early warning system in Ethiopia to reduce livelihood losses and dependence on assistance – BCRs range from 3 to 1 to 6 to 1
– El Niño early warning system in a five-state region of Mexico to improve decisionmaking in agriculture – BCRs range from 2 to 1 to 9 to 1
BCR= Benefit to Cost Ratio
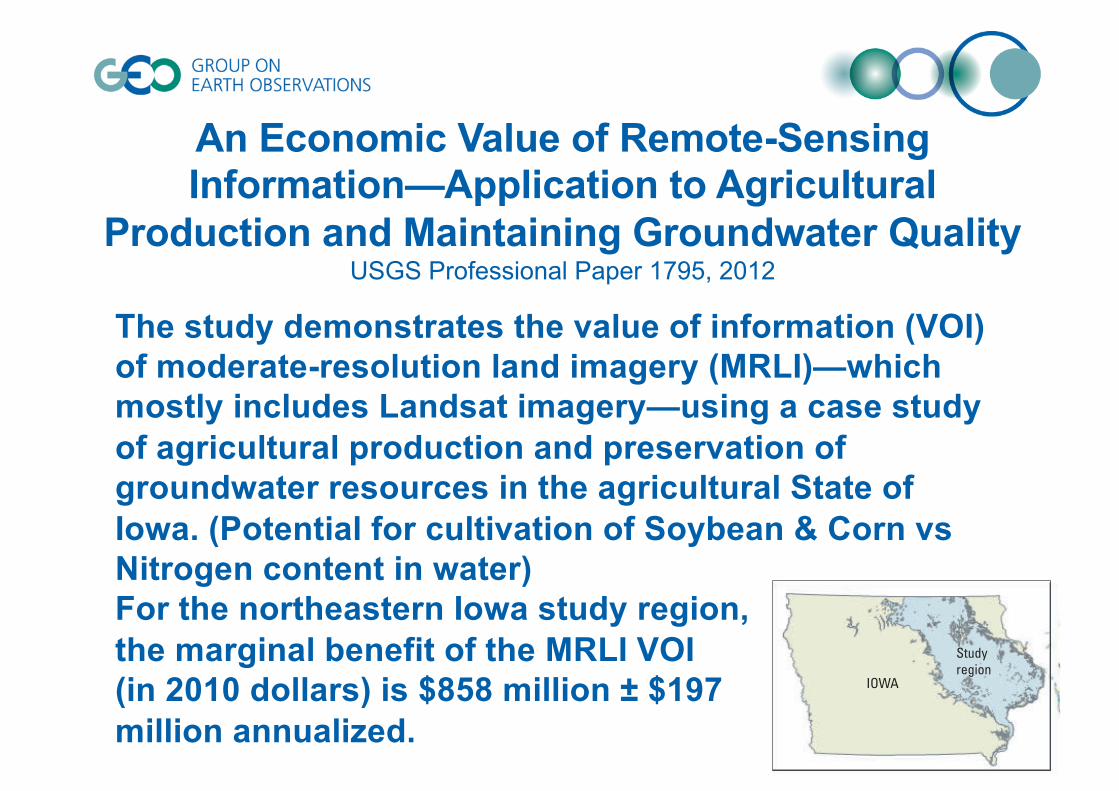
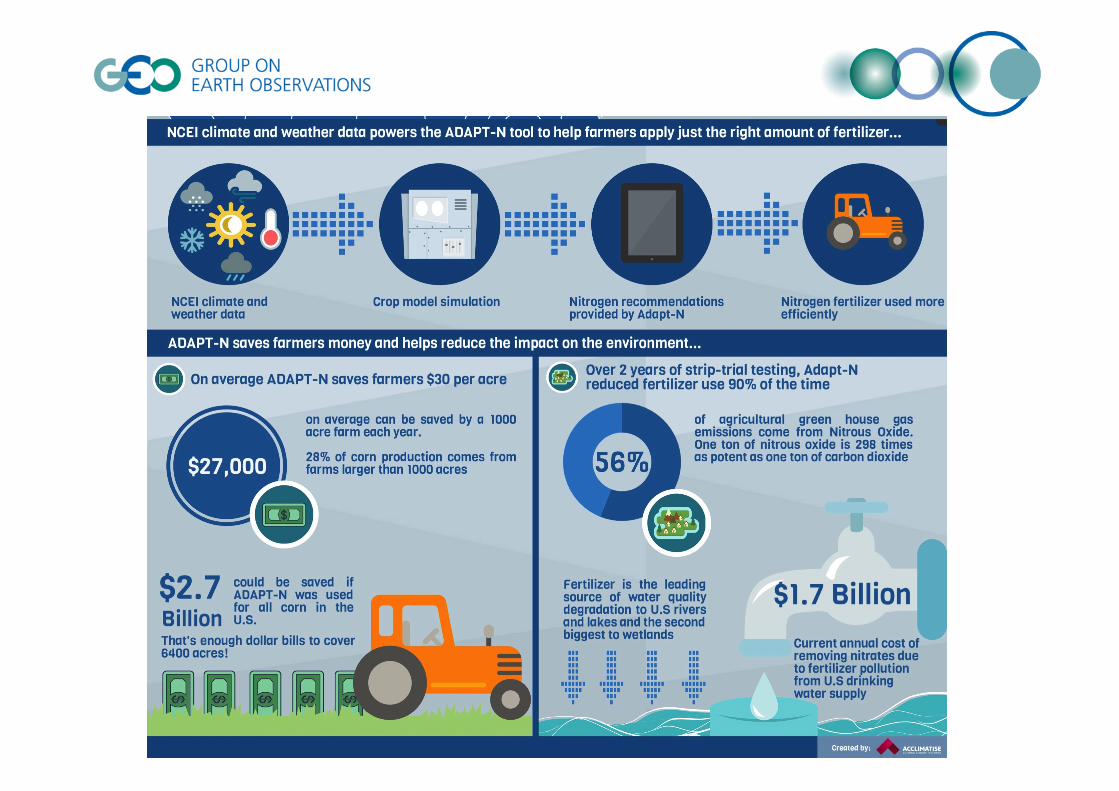
The study demonstrates the value of information (VOI) of moderate-resolution land imagery (MRLI)—which mostly includes Landsat imagery—using a case study of agricultural production and preservation of groundwater resources in the agricultural State of Iowa. (Potential for cultivation of Soybean & Corn vsNitrogen content in water)For the northeastern Iowa study region, the marginal benefit of the MRLI VOI (in 2010 dollars) is $858 million ± $197million annualized.
An Economic Value of Remote-Sensing Information—Application to Agricultural
Production and Maintaining Groundwater QualityUSGS Professional Paper 1795, 2012
28 An Economic Value of Remote-Sensing Information—Application to Agricultural Production and Maintaining Groundwater Quality
p
Thickness (feet)
0100
200300400500
600
IOWA
Study region
0
100 KILOMETERS0
25 100 MILES
25 50
50 75
75
Figure 16. Map showing derived Silurian and Devonian aquifer thicknesses in the northeastern Iowa study region. Source is Iowa Department of Natural Resources.
Th=Elt−Elb , (22)
where Elt is the elevation at the top of the aquifer and Elb is the base elevation of the aquifer. The thickness layer was derived using GIS data and the technique of map algebra (ESRI, 2012) (fig. 16), and aquifer thickness for each well was calculated using spatial join in ArcGIS. A hydraulic-conduc-tivity (HC) surface was created using the spatial interpolation method kriging (refer to appendix 3 for details).
Soil Characteristics
For the study area, the soils included in the analysis were related to natural boundaries, such as watersheds, rivers, and ridgelines. The NRCS STATSGO dataset was used (table 1). The soils database used in the analysis had a variety of important characteristics including hydrologic drainage group, texture, clay, silt, sand and rock content, number of layers in the soil, depth of specific soil layers, maximum rooting depth, moist bulk density, available water capacity, organic carbon content, saturated HC, and electrical conductivity.
Slope, Depressions, and Topographic Position
The USGS digital elevation model (DEM) of northeast-ern Iowa (table 1) and its shaded relief provides an insight to the topography and relief of the study region. We used the USGS 10-m DEM (table 1), and the 35 case-study counties had elevations that varied from 138.9 to 443.2 m above sea level (fig. 17). As mentioned previously, topographic char-acteristics play an important role in the fate and transport of nitrogen. For example, high slopes tend to have more over-land runoff and lateral movement of nitrogen, depressions and topographic convergences tend to have higher levels of percolation and infiltration, topographic position along a hillslope and across a landscape can be related to water table depths, baseflow provided to rivers, and nutrient uptake dynamics along the flowpath to a river, canal, drainage ditch, or waterway. The ArcGIS version of ArcSWAT requires DEM inputs to calculate such watershed and subbasin characteristics. For the analysis, slopes were classified into 5 ranges—0–2 percent, 2–5 percent, 5–8 percent, 8–12 percent, and greater than 12 percent.
The economic benefits have been assessed based on the transaction costs associated with government regulation. Since forestry is a strategic industry in Sweden the legislation covering it has a significant economic effect.
The result leads to a significant economic benefit of between €16.1m to €21.6m per annum
Copernicus Sentinels’ Products Economic Value: A Case Study
Forest Management in Sweden EARSC Report 2016, January 2016
Key MessagesTo maximize the value of EO data, information and Knowledge we have to• Make them openly available, - GEOSS Data Sharing
Principles• Ensure actual access – GCI -• Manage them properly to ensure data accountability -
GEOSS Data Management Principles• Showcase the value of EO data to inform the
decision-making• Foster and support integration of EO data with socio-
economic data, also through dedicated collaborative platforms
Thank you !
GEO Website
http://www.earthobservations.org/index.php