Embed Size (px)
Citation preview

Blake Stephens

• Missouri Academy of
Science Mathematics
and Computing
• Northwest Missouri State
University
• Missouri Academy
Research Summer
(MARS)
• Deanna Lankford
Graduate with:
1. High School Diploma from
Plattsburg High School
2. Associates Degree of
Science from Northwest
Missouri State University

• ATP plays an important role as an extracellular signaling molecule.
• Purinergicreceptors are responsible for extracellular ATP responses in mammals, but these same receptors seem to be lacking from plant genome.
It is apparent that
similar responses occur
in plants.
Jaffe (1973) Plant Physiol 51:17-18
ATP stimulates closure of the Venus flytrap

To contribute to the discovery and categorization of
the plant ATP response system.

• ATP-insensitive
Mutant
• Wild-Type
11-4
11-4
11-4WT

• Using a forward
genetic
approach we
are identifying
the
chromosome on
which the gene
is present.

Seeds were harvested
from decedents of
different crosses
between the WT and
11-4 organisms. The
seeds were cleaned
and then sowed in a
MS Agar Media.

Earlier we
mentioned plant
responses to ATP
similar to those
found in
mammals.
One such
response is an
increase in
cytosolic calcium
concentrations
when ATP is
released into the
plant’s
environment.

Using a computer program I wrote, the data was
normalized and converted automatically into an Excel-
readable file, saving much time on what was previously a
largely manual process.

Here are some
examples of what the
normalized data
looks like when
graphed.
Wild Type
Mutant
Non-Transgenic

Concentration (uM) Concentration (uM) Concentration (uM)
Plate 1 NoR HiR LoR NS Plate 7 NoR HiR LoR NS Plate 13 NoR HiR LoR no sig
1 = WT 3 8 0 1 = 6-2 0 5 3 4 1 = 4-1-1 0 4 8 0
2 = 11-4mut 10 2 0 2 = 6-3 1 0 1 10 2 = 4-1-2 0 4 8 0
3 = 1-1 7 3 2 3 = 6-4 0 3 6 3 3 = 4-1-3 8 1 3 0
4 = 1-2 2 5 5 4 = 7-1 2 3 3 4 4 = 4-1-4 2 5 5 0
5 = 1-3 4 3 5 5 = 7-2 4 2 3 3 5 = 4-2-1 8 0 4 0
6 = 1-4 5 2 5 6 = 8-1 0 1 7 4 6 = 4-2-2 1 5 6 0
7 = 1-5 4 5 3 7 = 8-2 2 4 4 2 7 = 4-2-3 8 1 3 0
8 = 1-6 7 4 1 8 = 8-3 0 3 5 4 8 = 4-2-4 3 1 8 0
Plate 2 NoR HiR LoR NS Plate 8 NoR HiR LoR NS Plate 14 NoR HiR LoR NS
1 = 8-4 3 2 3 4 1 = 4-3-1 4 3 3 2
2 = 9-2 0 0 2 10 2 = 2 1 6 5 0
3 = 9-4 2 5 3 2 3 = 4 8 3 1 0
4 = WQ 0 12 0 0 4 = 5-1-1 1 8 3 0
5 = 2 3 5 4 0
6 = 3 0 5 7 0
7 = 4 0 3 9 0
8 = 5-2-1 0 3 9 0
Plate 3 NoR HiR LoR NS Plate 9 NoR HiR LoR NS Plate 15 NoR HiR LoR NS
1 = W 0 0 0 12 1 = 5-2-2
Key 2 = 11-4 0 0 0 12 2 = 3
Homo Mut 3 = 2-1-1 3 = 4
Homo Wild 4 = 2-1-2
Poss. Hetero 5 = 2-1-3
6 = 2-1-4
7 = 2-2-1
Plate 4 NoR HiR LoR NS 8 = 2-2-2
1.1 = WQ 0 4 2 0 Plate 10 NoR HiR LoR NS Plate 16 NoR HiR LoR NS
1.2 = 11-4 3 2 1 0 1 = 2-2-3 0 7 5 0 1 = 3-2 8 0 1 3
2 = 2-1 2 3 5 2 2 = 2-2-4 0 12 0 0 2 = 3-7 0 0 0 12
3 = 2-2 1 7 1 3 3 = 2-3-1 0 12 0 0 3 = 4-2 2 0 3 7
4 = 2-3 1 7 2 2 4 = 2-3-2 0 12 0 0 4 = 12-2 2 3 1 6
5 = 2-4 2 2 6 2 5 = 2-3-3 0 9 3 0 5 = 12-1 9 1 2 0
6 = 2-5 1 5 3 3 6 = 2-3-4 0 11 1 0 6 = 12-3 2 2 2 6
7 = 2-6 1 7 2 2 7 = 2-4-1 0 6 6 0 7 = 12-4 9 0 2 1
8 = 2-7 2 3 4 3 8 = 2-4-2 0 5 7 0 8 = 13-1 8 1 1 2
Plate 5 NoR HiR LoR NS Plate 11 NoR HiR LoR NS Plate 17 NoR HiR LoR NS
1 = 2-9 0 0 0 12 1 = 2-4-3 3 2 7 0 1 = 14-1 7 0 2 3
2 = 2-8 5 0 0 7 2 = 2-4-4 9 3 0 0 2 = 2 6 0 5 1
3 = 2-10 3 2 1 6 3 = 3-1-1 10 1 1 0 3 = 15-1 0 0 6 6
4 = 2-11 3 2 0 7 4 = 2-5-1 9 1 2 0 4 = 2 9 1 0 2
5 = 2-12 0 11 1 0 5 = 3-1-2 12 0 0 0 5 = 3 3 2 4 3
6 = 2-13 8 0 2 2 6 = 3-1-3 6 0 6 0 6 = 4 6 2 1 3
7 = 2-14 1 9 3 0 7 = 3-1-4 7 0 5 0 7 = 16-1 6 0 1 5
8 = 2-15 5 2 1 4 8 = 3-2-1 10 0 2 0 8 = 2 5 1 0 6
Plate 6 NoR HiR LoR NS Plate 12 NoR HiR LoR NS Plate 18 NoR HiR LoR NS
1 = 2-16 3 1 6 2 1 = 3-2-2 11 0 0 1 1 = 16-6 2 3 2 5
2 = 2-17 0 6 2 4 2 = 3-2-3 8 1 3 0 2 = WQ 4 4 2 2
3 = 2-18 2 4 4 2 3 = 3-3-1 2 4 2 4
4 = 2-19 2 7 3 0 4 = 3-3-2 0 3 1 8
5 = 2-20 0 2 10 0 5 = 6-1 11 0 1 0
6 = 2-21 1 0 2 9 6 = 6-2 3 0 1 8
7 = 2-22 2 5 1 4 7 = 6-4 9 1 2 0
8 = 2-23 2 2 4 4 8 = 3-2-4 5 5 2 0
This is a
chart
descriptiv
e of the
phenotypi
c natures
of each
genetic
line.

• The specimens that were
most likely homozygous-
mutants were selected
for genetic testing.
• PCR was used to amplify
specific areas of the
gene.
• A four-percent gel-
agarose was used in a
gel electrophoresis
process to separate and
categorize each
specimen’s genotype.
Col Het Ler Col Het Col Het Het Ler Het Col Het
CONTROL
Gel from nga172

These charts represent the gene and how many of our
specimens shared the genotype of the 11-4 organism.CHROMOSOME NAME TEMP #Col #H+L #Het #Lan RECOMB CHI-SQUARE RATING Temp
nga63 55 0 #DIV/0! 0.007090101 48
ciw12 48 1 8 5 3 0.611111111 0.379589586 Great 52
SO392 55 0 #DIV/0! 0.007090101 55
CHROM 1 ciw1 48 0 #DIV/0! 0.007090101 Ind.
nga280 55 3 6 2 4 0.555555556 0.495056708 Great Rating
NF5|14 52 1 8 6 2 0.555555556 0.379589586 Great Ind. (Indescernable)
ATPase 55 2 7 1 6 0.722222222 0.848694963 Great Bad
nga1145 55 3 0 0 0 0 0.006169899 Bad Poor
CHROM 2 ciw3 48 0 0 0 0 #DIV/0! 0.002054719 Poor Ind. Good
nga1126 55 2 7 2 5 0.666666667 0.848694963 Poor Great
nga168 55 2 0 0 0 0 0.006981285 Bad
ng172 52 2 7 5 2 0.5 0.848694963 Great Gene?
nga126 52 0 0 0 0 #DIV/0! 0.002054719 Ind. LOW
CHROM 3 nga162 52 3 6 5 1 0.388888889 0.495056708 Good
ciw11 48 0 0 0 0 #DIV/0! 0.002054719 Ind.
ciw4 52 7 2 0 2 0.222222222 0.000200168 Good MED
nga6 52 3 4 0 4 0.571428571 0.191388523 Poor
ciw5 48 1 8 6 2 0.555555556 0.379589586 Great
nga8 52 6 2 2 0 0.125 0.001522054 Great HIGH
CHROM 4 ciw6 52 3 6 1 5 0.611111111 0.495056708 Great IND.
ciw7 48 0 #DIV/0! 0.007090101
nga1139 52 2 7 4 3 0.555555556 0.848694963 Good
nga1107 48 5 4 1 3 0.388888889 0.028163881 Good
nga225 52 8 1 1 0 0.055555556 7.41771E-06 Bad
nga249 52 4 5 3 2 0.388888889 0.151271016 Good
nga151 52 4 5 3 2 0.388888889 0.151271016 Great
CHROM 5 nga139 55 0 #DIV/0! 0.007090101
PHYC3 52 2 1 1 0 0.166666667 0.019956349 Bad
ciw9 52 3 5 1 4 0.5625 0.33015855 Great
ciw10 48 0 #DIV/0! 0.007090101

1-4 2-13 2-20 3-2 12-4 13-1 14-1 15-2 12-1
nga63
ciw12 c l h h h h l l h
SO392
ciw1
nga280 c l h l h c l l c
NF5|14 c h h l h h h l h
ATPase c h c l l l l l l
nga1145 c l l l l c l c
ciw3
nga1126 c h l h l l l l c
nga168 c l l l l l c l h
ng172 c h c h h l h l h
nga126
nga162 c c c h h l h h h
ciw11
ciw4 c c c l c c c c l
nga6 c c l l c? c? l c l
ciw5 c h h l h h h l h
nga8 c c c c c c c c
ciw6 c l l h l l c l c
ciw7
nga1139
nga1107 c c l h c l c c l
nga225 c c c l c c c c c
nga249 c c l l h c h c h
nga151 c h l l h c h c c
nga139
PHYC3
ciw9 c c l? h c l l l l
ciw10
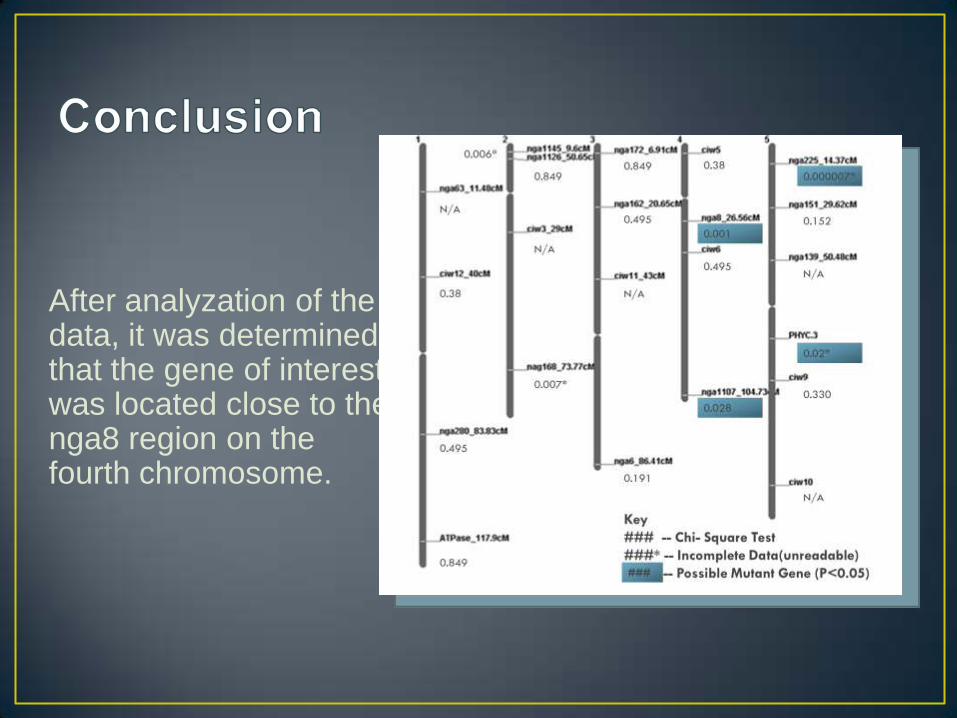
After analyzation of the data, it was determined that the gene of interest was located close to the nga8 region on the fourth chromosome.
• Continue mapping with more specimens to further clarify
the data and ensure its accuracy.
• Continue mapping with different markers to get high-
resolution mapping results.
• Engineer a program to fully automate the normalization
and graphing process used in this experiment.
• Perform whole genome sequencing using BC1F3 back-
cross line to identify mutation point.

For your time today, as well as
for these interesting and
educational past two months. I
have gained useful lab
experience, and been given a
unique insight into the world of
research.
To Kiwamu
Tanaka,
Deanna
Lankford, Gary
Stacey, and the
members of the
Stacey Lab.


![Theory of latency-insensitive design - Computer-Aided ...luca/research/lipTransactions.pdf · delay-insensitive circuits [19], [20]. A delay-insensitive circuit is designed to operate](https://img.pdfslide.net/doc/110x75/5e77b28d15933b649935c2f3/theory-of-latency-insensitive-design-computer-aided-lucaresearchliptransactionspdf.jpg)