Embed Size (px)
Citation preview
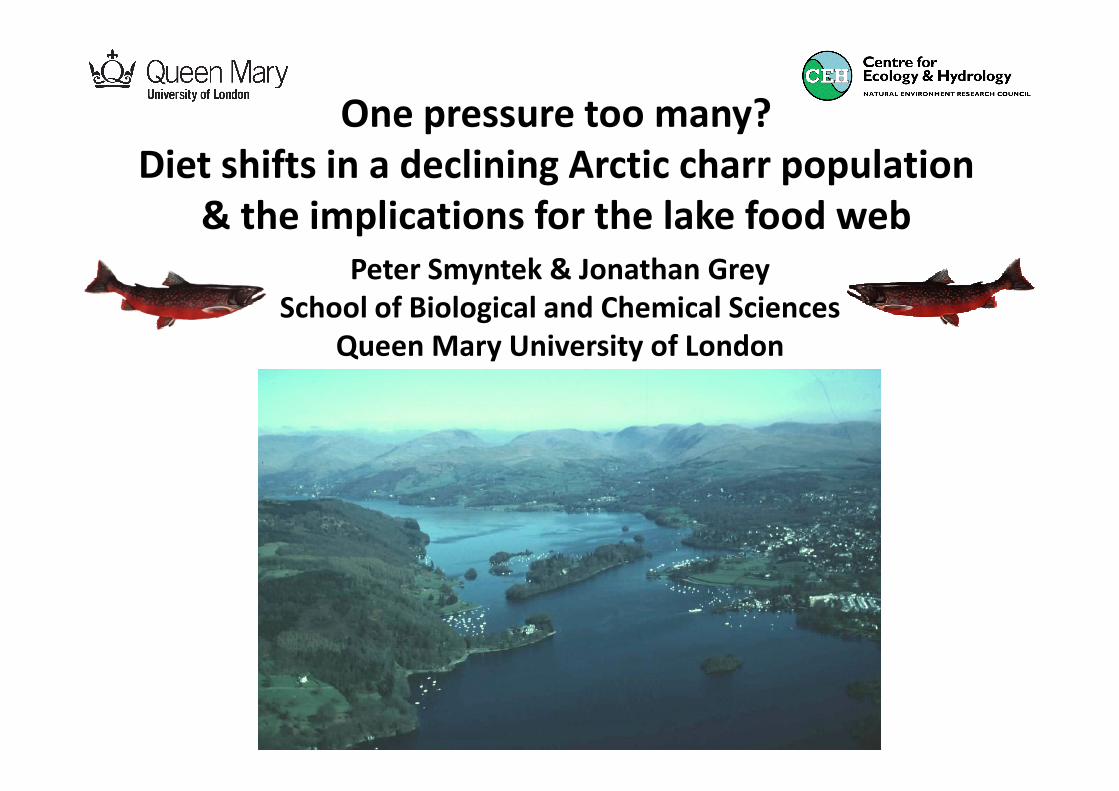
One pressure too many?
Diet shifts in a declining Arctic charr population
& the implications for the lake food web
Peter Smyntek & Jonathan Grey
School of Biological and Chemical Sciences
Queen Mary University of London
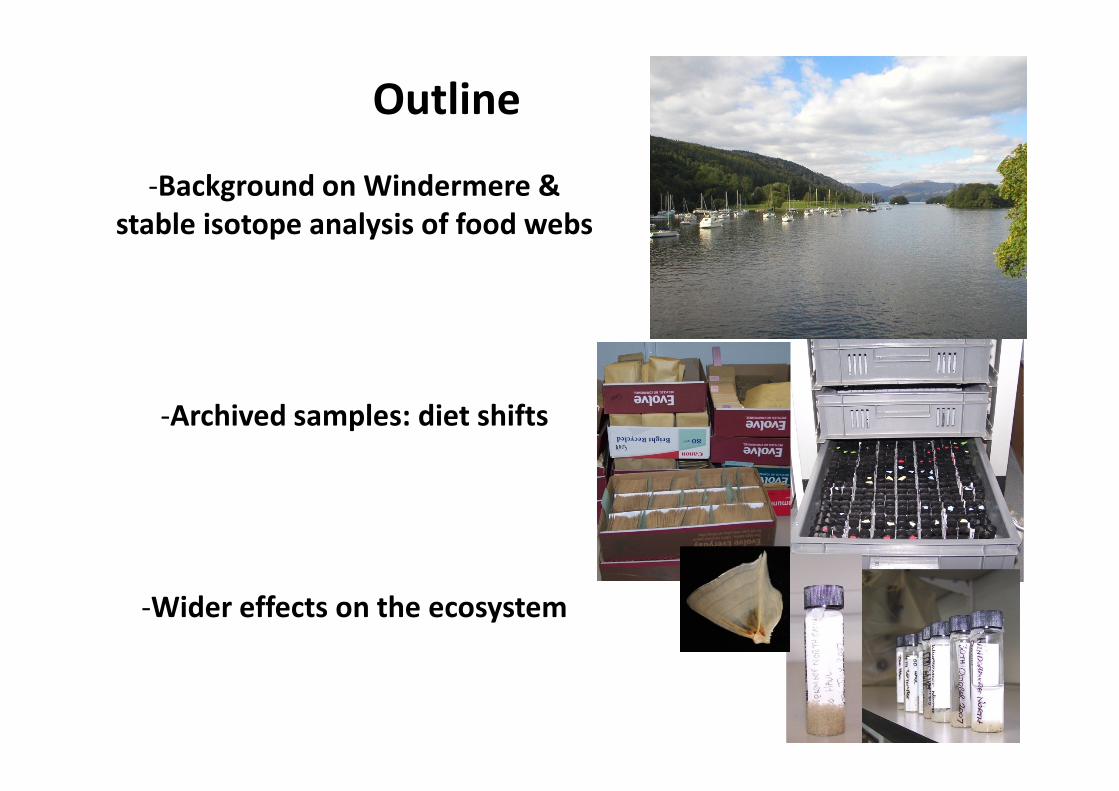
Outline
-Background on Windermere &
stable isotope analysis of food webs
-Archived samples: diet shifts-Archived samples: diet shifts
-Wider effects on the ecosystem
11
12
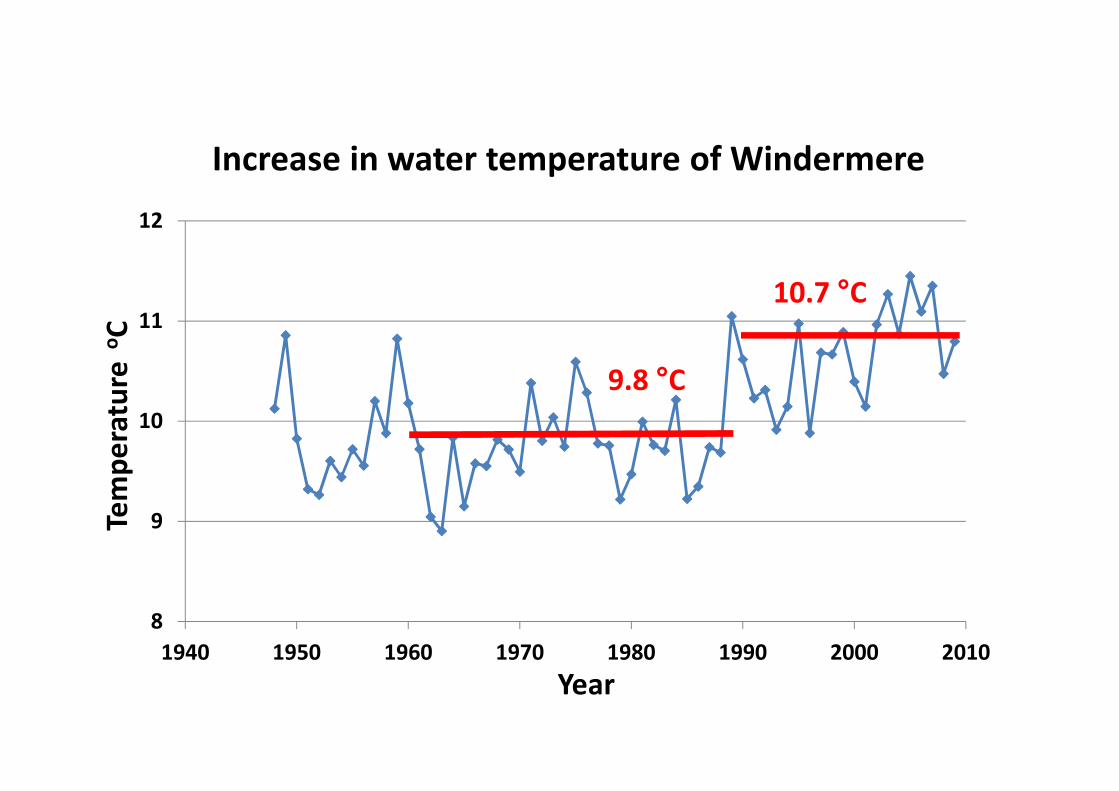
9.8 °C
10.7 °C
Increase in water temperature of Windermere
Tem
pe
ratu
re o
C
8
9
10
1940 1950 1960 1970 1980 1990 2000 2010
9.8 °C
Year
Tem
pe
ratu
re
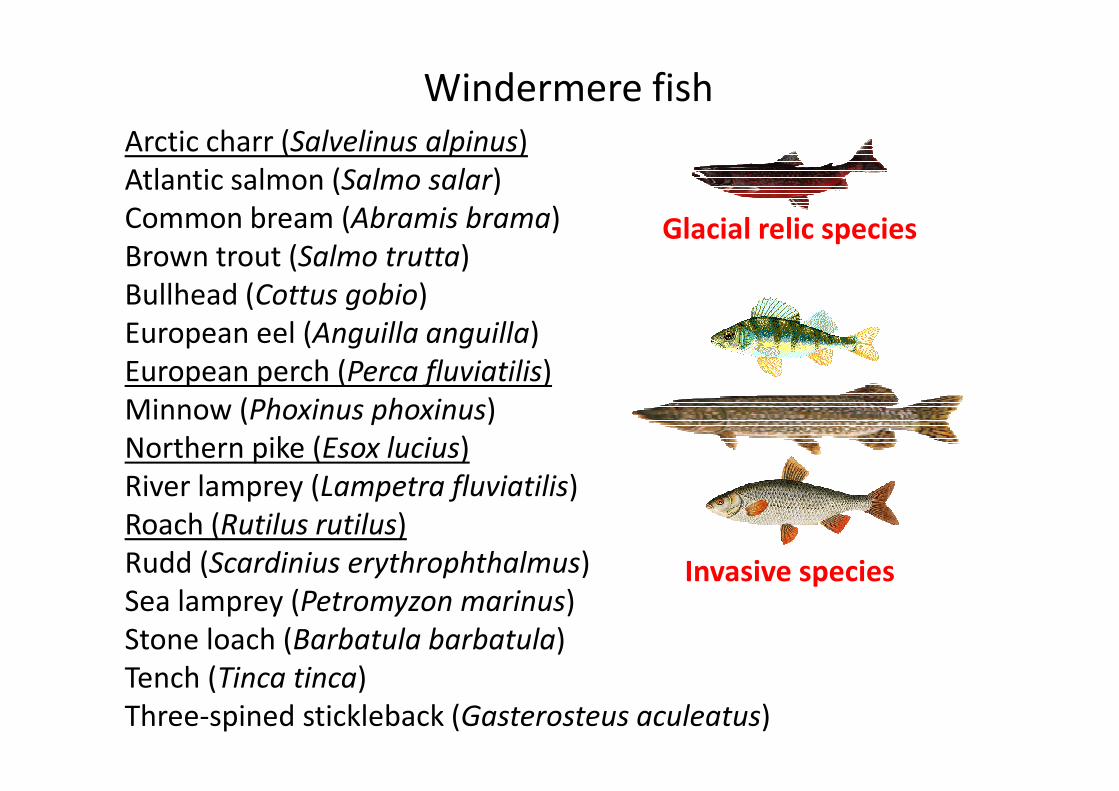
Arctic charr (Salvelinus alpinus)
Atlantic salmon (Salmo salar)
Common bream (Abramis brama)
Brown trout (Salmo trutta)
Bullhead (Cottus gobio)
European eel (Anguilla anguilla)
European perch (Perca fluviatilis)
Minnow (Phoxinus phoxinus)
Windermere fish
Glacial relic species
Minnow (Phoxinus phoxinus)
Northern pike (Esox lucius)
River lamprey (Lampetra fluviatilis)
Roach (Rutilus rutilus)
Rudd (Scardinius erythrophthalmus)
Sea lamprey (Petromyzon marinus)
Stone loach (Barbatula barbatula)
Tench (Tinca tinca)
Three-spined stickleback (Gasterosteus aculeatus)
Invasive species
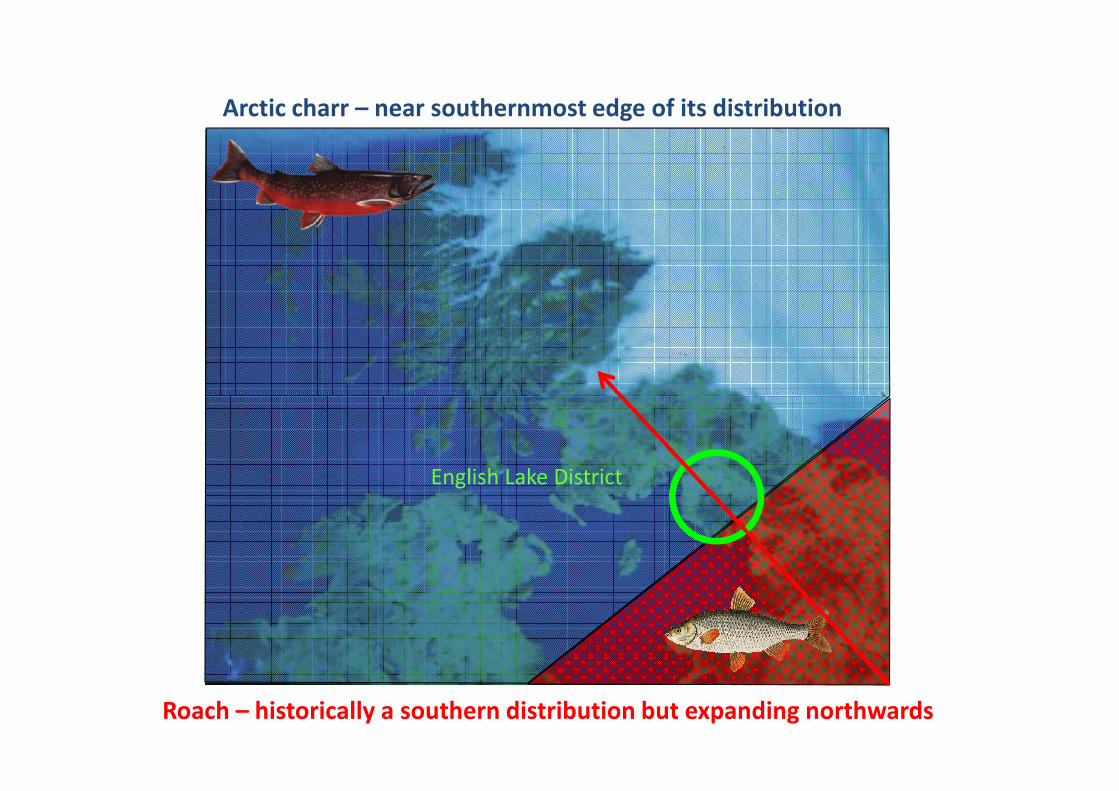
Arctic charr – near southernmost edge of its distribution
Roach – historically a southern distribution but expanding northwards
English Lake District
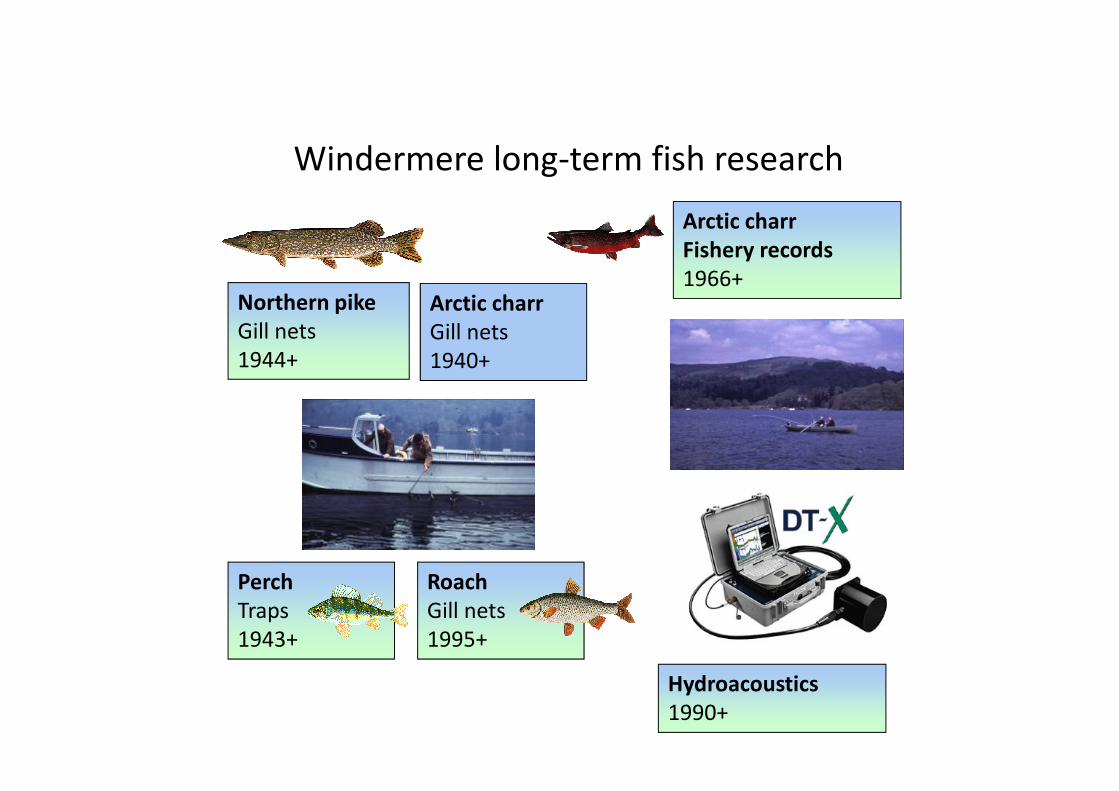
Arctic charr
Gill nets
1940+
Northern pike
Gill nets
1944+
Arctic charr
Fishery records
1966+
Windermere long-term fish research
Perch
Traps
1943+
Hydroacoustics
1990+
Roach
Gill nets
1995+
3000
4000
5000
6000
Ab
un
dan
ce (
fish
ha
-1)
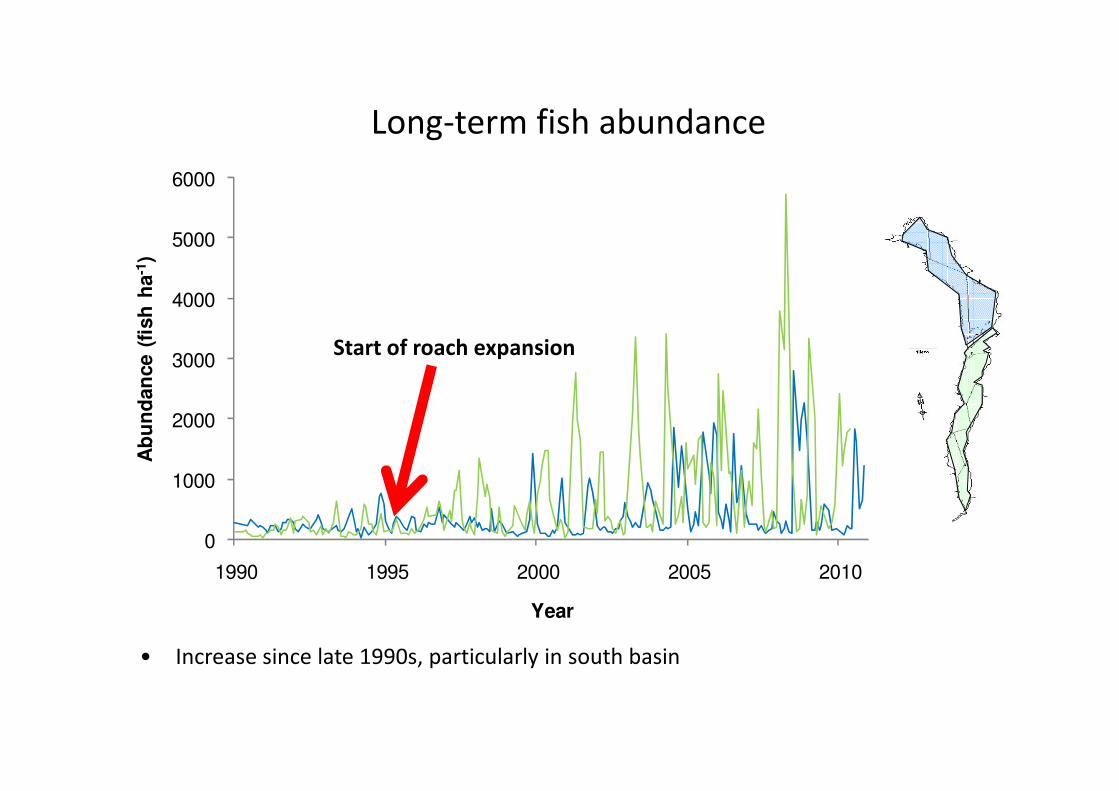
Long-term fish abundance
Start of roach expansion
0
1000
2000
1990 1995 2000 2005 2010
Ab
un
dan
ce (
fish
ha
Year
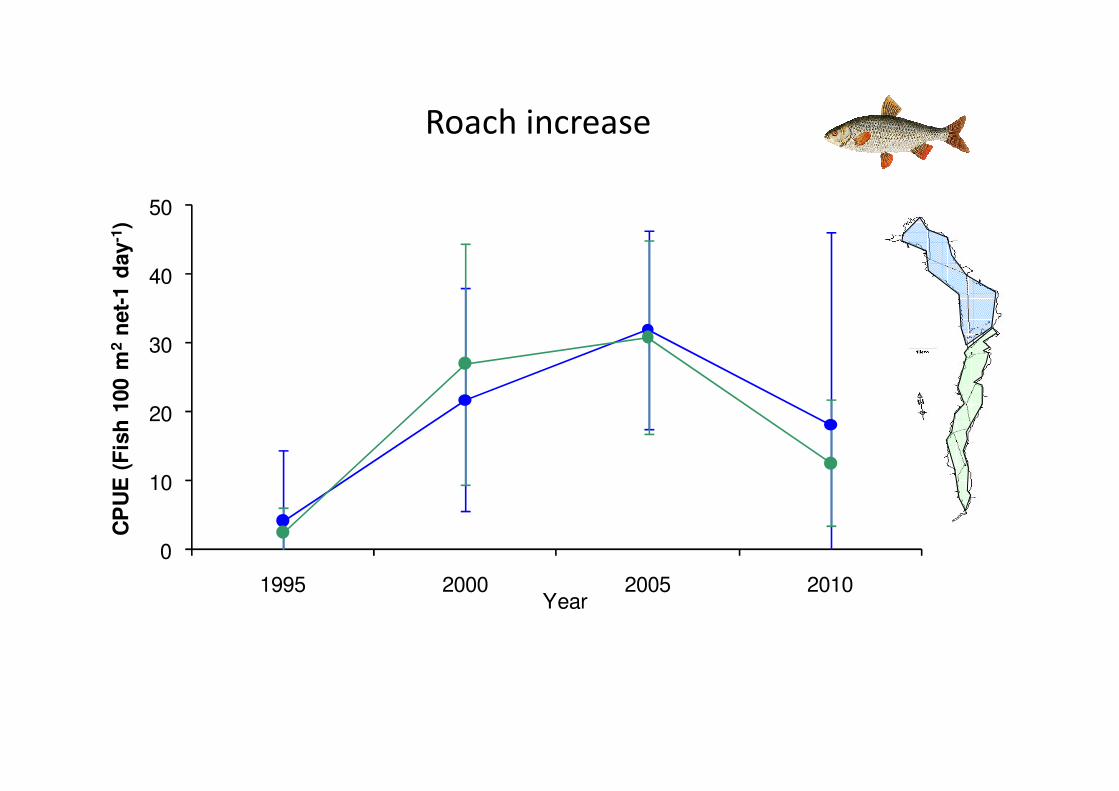
• Increase since late 1990s, particularly in south basin
30
40
50
CP
UE
(F
ish
100 m
2n
et-
1 d
ay
-1)
Roach increase
0
10
20
1995 2000 2005 2010
CP
UE
(F
ish
100 m
Year
2
3
4
5
6
CP
UE
(fi
sh
h-1
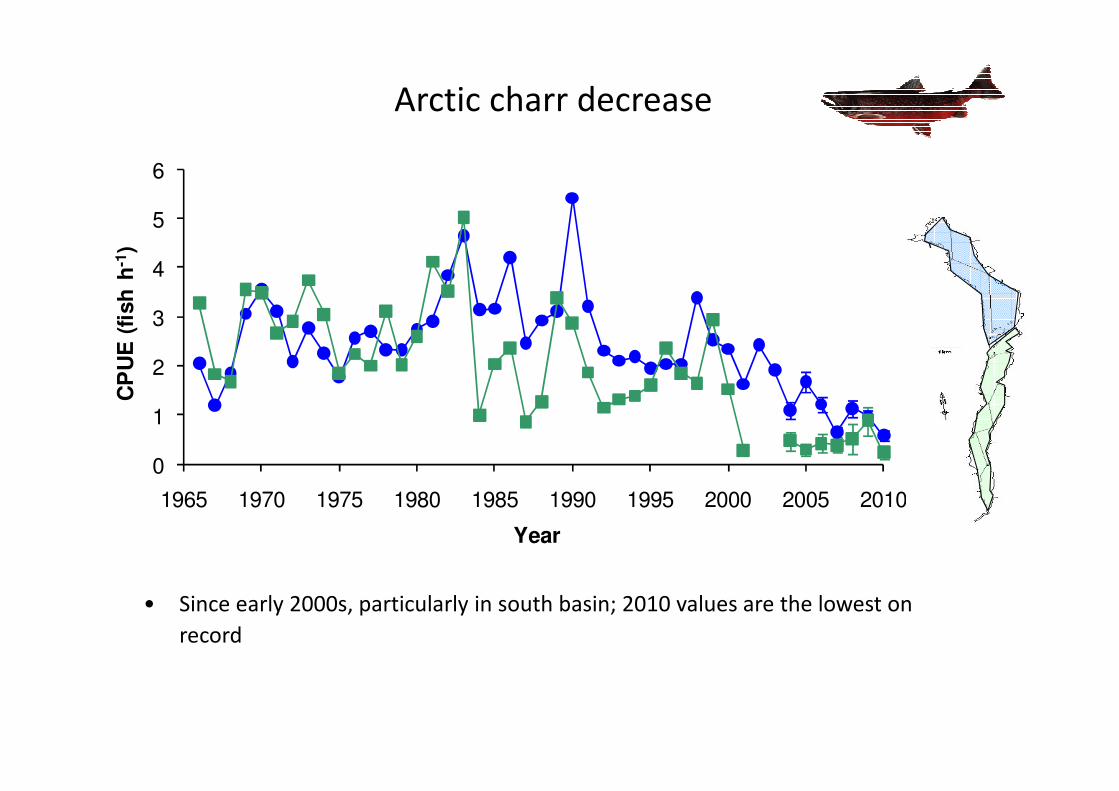
)Arctic charr decrease
0
1
1965 1970 1975 1980 1985 1990 1995 2000 2005 2010
CP
UE
(fi
sh
h
Year
• Since early 2000s, particularly in south basin; 2010 values are the lowest on
record
2.0
2.5
3.0
3.5
4.0
4.5
5.0
Nu
mb
ers
pe
r li
ter
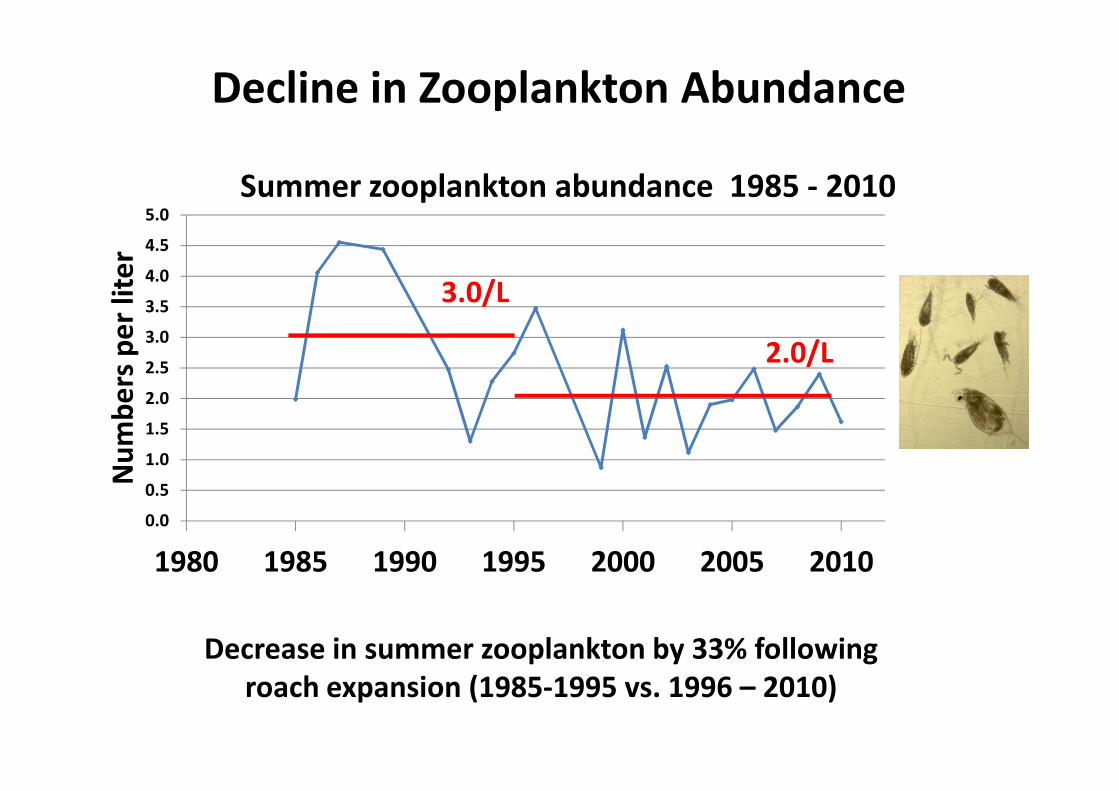
Summer zooplankton abundance 1985 - 2010
3.0/L
2.0/L
Decline in Zooplankton Abundance
0.0
0.5
1.0
1.5
2.0
1980 1985 1990 1995 2000 2005 2010
Nu
mb
ers
pe
r li
ter
Decrease in summer zooplankton by 33% following
roach expansion (1985-1995 vs. 1996 – 2010)
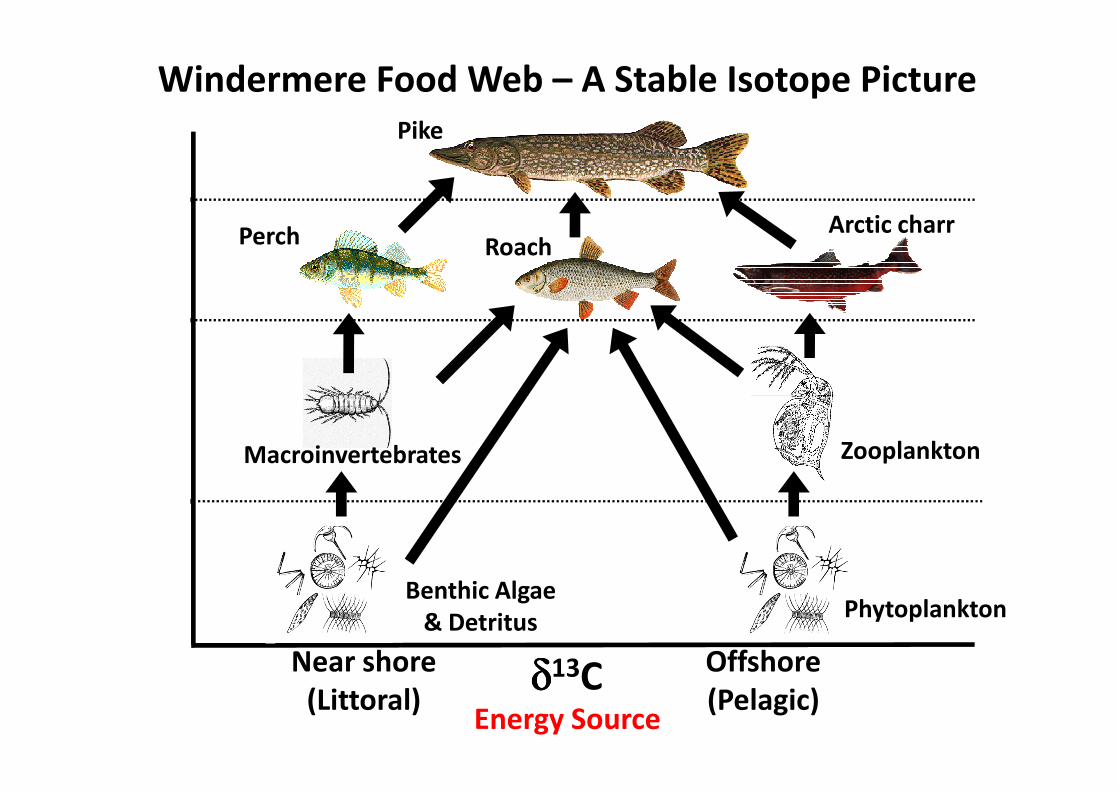
Windermere Food Web – A Stable Isotope Picture
Pike
Perch Arctic charrRoach
Tro
ph
ic L
ev
el
Ind
ica
tor
15N
Zooplankton
Phytoplankton
Offshore
(Pelagic)
Near shore
(Littoral)
Macroinvertebrates
Energy Source
Tro
ph
ic L
ev
el
Ind
ica
tor
δδ δδ1
5
δδδδ13C
Benthic Algae
& Detritus
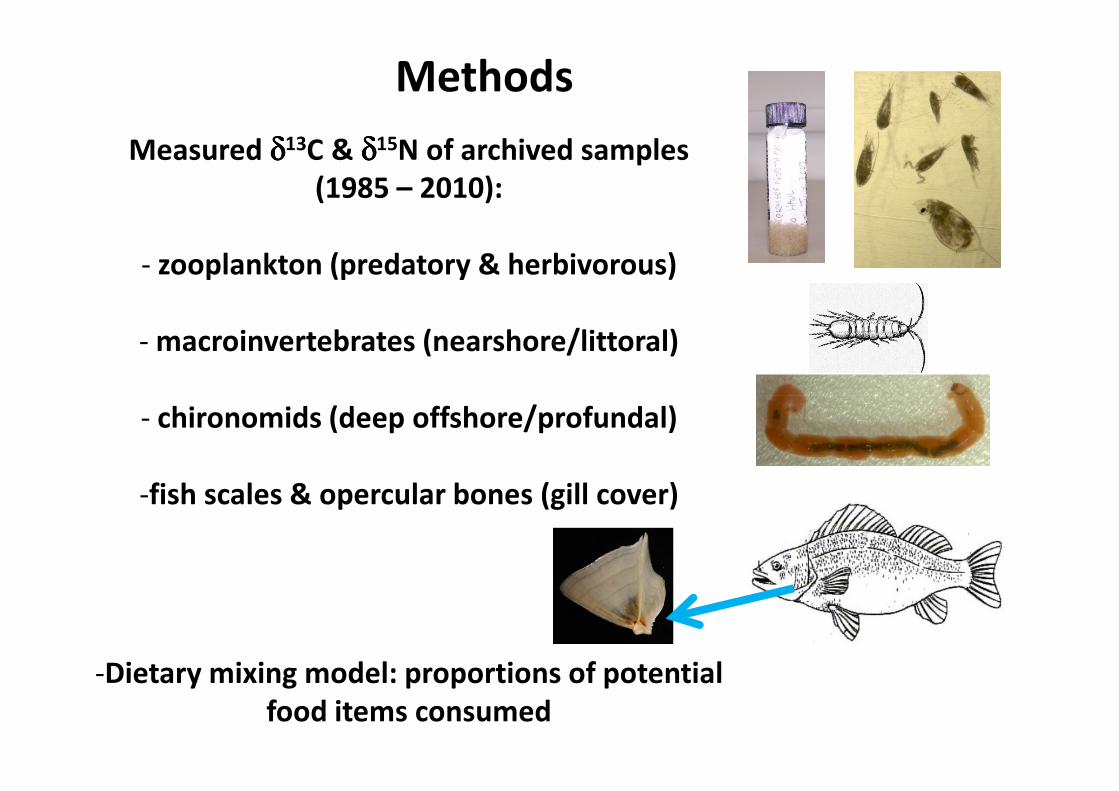
Methods
Measured δδδδ13C & δδδδ15N of archived samples
(1985 – 2010):
- zooplankton (predatory & herbivorous)
- macroinvertebrates (nearshore/littoral)
- chironomids (deep offshore/profundal)
-fish scales & opercular bones (gill cover)
-Dietary mixing model: proportions of potential
food items consumed
0.5
0.6
0.7
0.8
0.9
1
Pro
po
rtio
n i
n D
iet
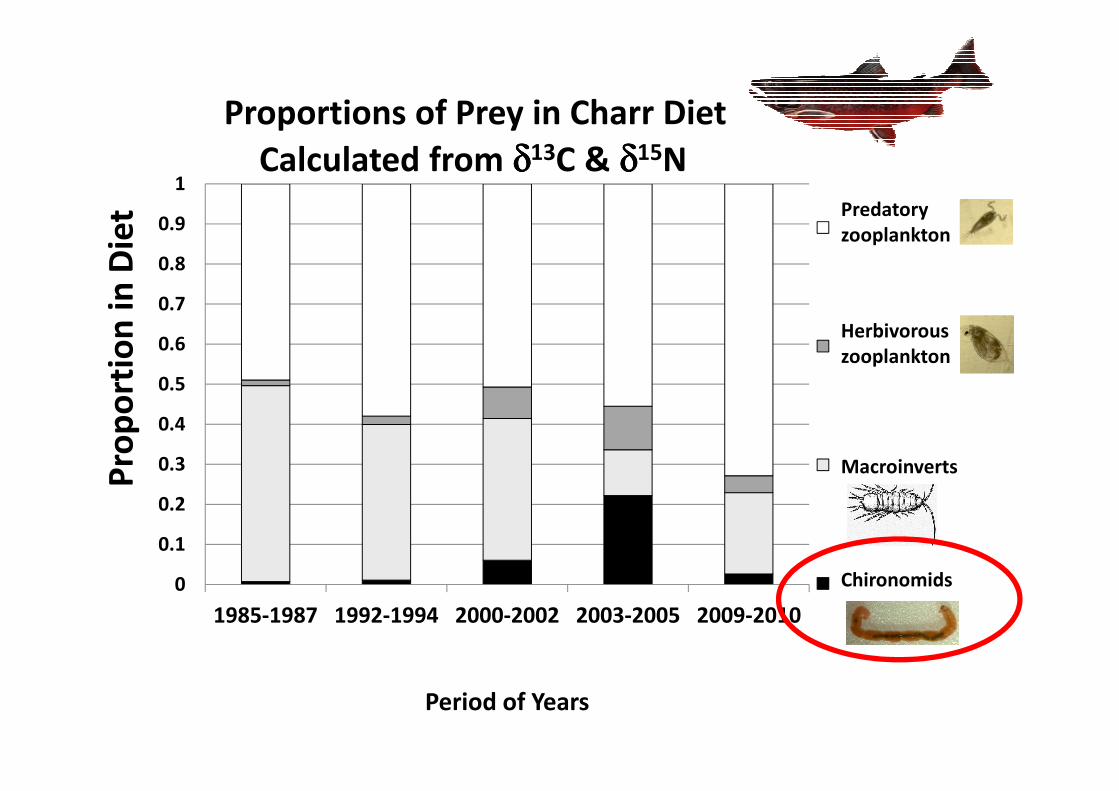
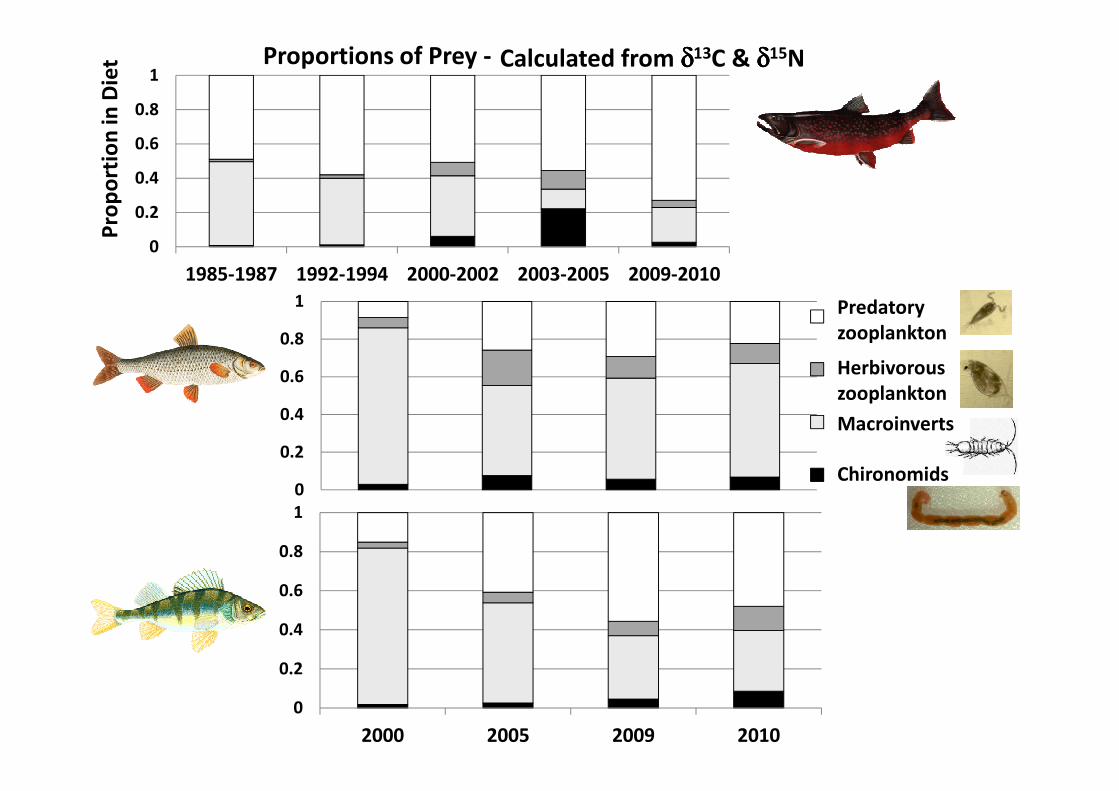
Proportions of Prey in Charr Diet
Cyclops
Daphnia
Calculated from δδδδ13C & δδδδ15N
Predatory
zooplankton
Herbivorous
zooplankton
0
0.1
0.2
0.3
0.4
1985-1987 1992-1994 2000-2002 2003-2005 2009-2010
Pro
po
rtio
n i
n D
iet
Macroinverts
Chironomids
Macroinverts
Chironomids
Period of Years
0.5
0.6
0.7
0.8
0.9
1
Pro
po
rtio
n i
n D
iet
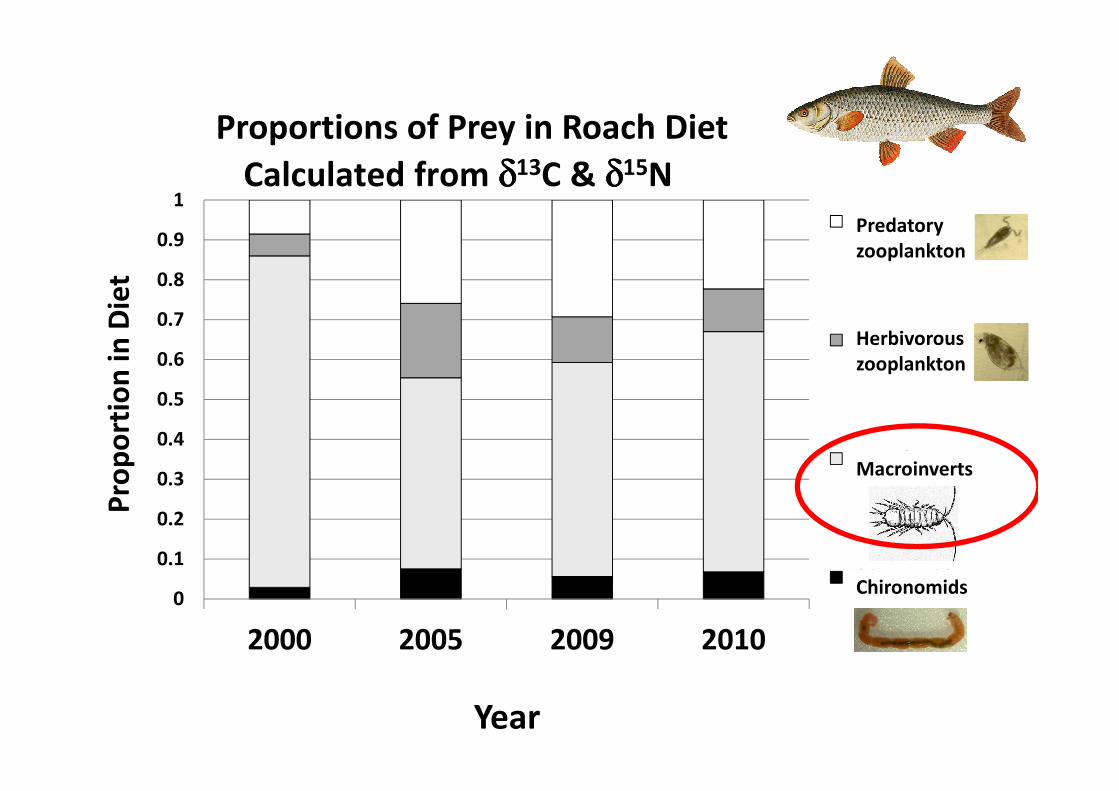
Proportions of Prey in Roach Diet
Cyclops
Daphnia
Calculated from δδδδ13C & δδδδ15N
Predatory
zooplankton
Herbivorous
zooplankton
0
0.1
0.2
0.3
0.4
0.5
2000 2005 2009 2010
Pro
po
rtio
n i
n D
iet
Macroinverts
Chironomids
Macroinverts
Chironomids
Year
0.6
0.7
0.8
0.9
1
Pro
po
rtio
n i
n D
iet
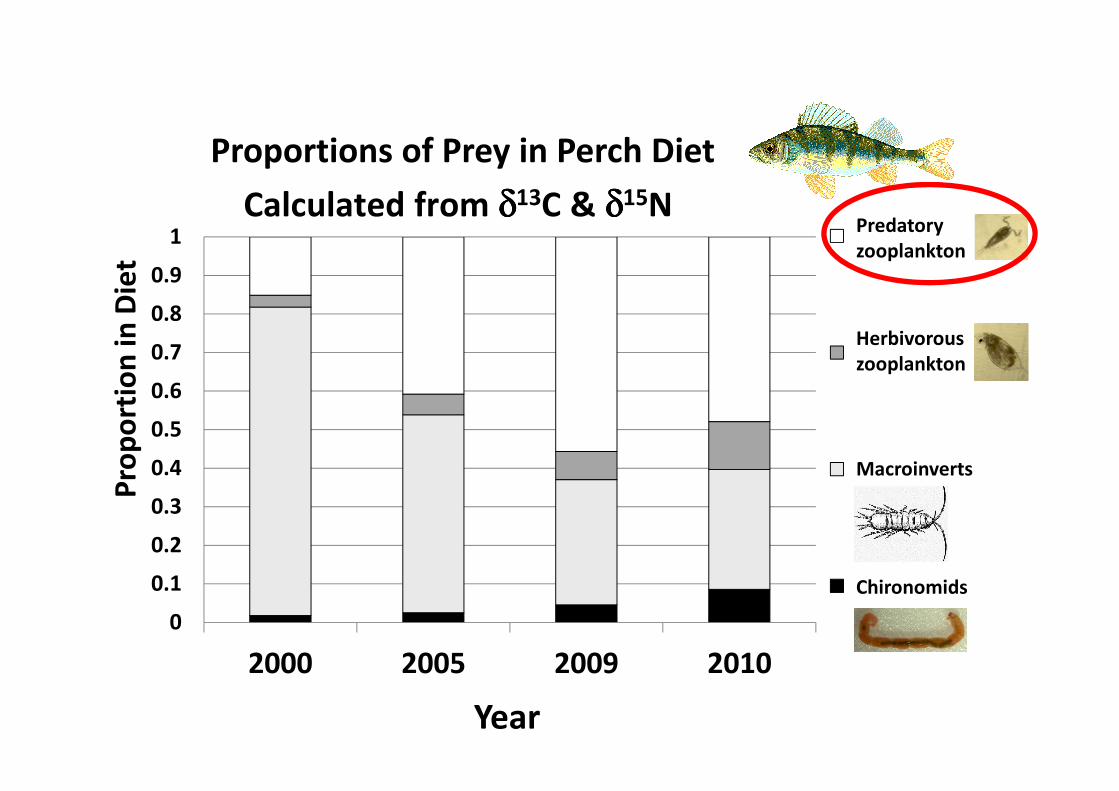
Proportions of Prey in Perch Diet
Cyclops
Daphnia
Calculated from δδδδ13C & δδδδ15NPredatory
zooplankton
Herbivorous
zooplankton
0
0.1
0.2
0.3
0.4
0.5
0.6
2000 2005 2009 2010
Pro
po
rtio
n i
n D
iet
Macroinverts
Chironomids
Macroinverts
Chironomids
Year
0
0.2
0.4
0.6
0.8
1
1985-1987 1992-1994 2000-2002 2003-2005 2009-2010
Pro
po
rtio
n i
n D
iet Proportions of Prey -
0.6
0.8
1Cyclops
Daphnia
Predatory
zooplankton
Herbivorous
zooplankton
Calculated from δδδδ13C & δδδδ15N
0
0.2
0.4 Macroinverts
Chironomids
0
0.2
0.4
0.6
0.8
1
2000 2005 2009 2010
zooplankton
Macroinverts
Chironomids
0.5
0.6
0.7
0.8
0.9
1
Pro
po
rtio
n i
n D
iet
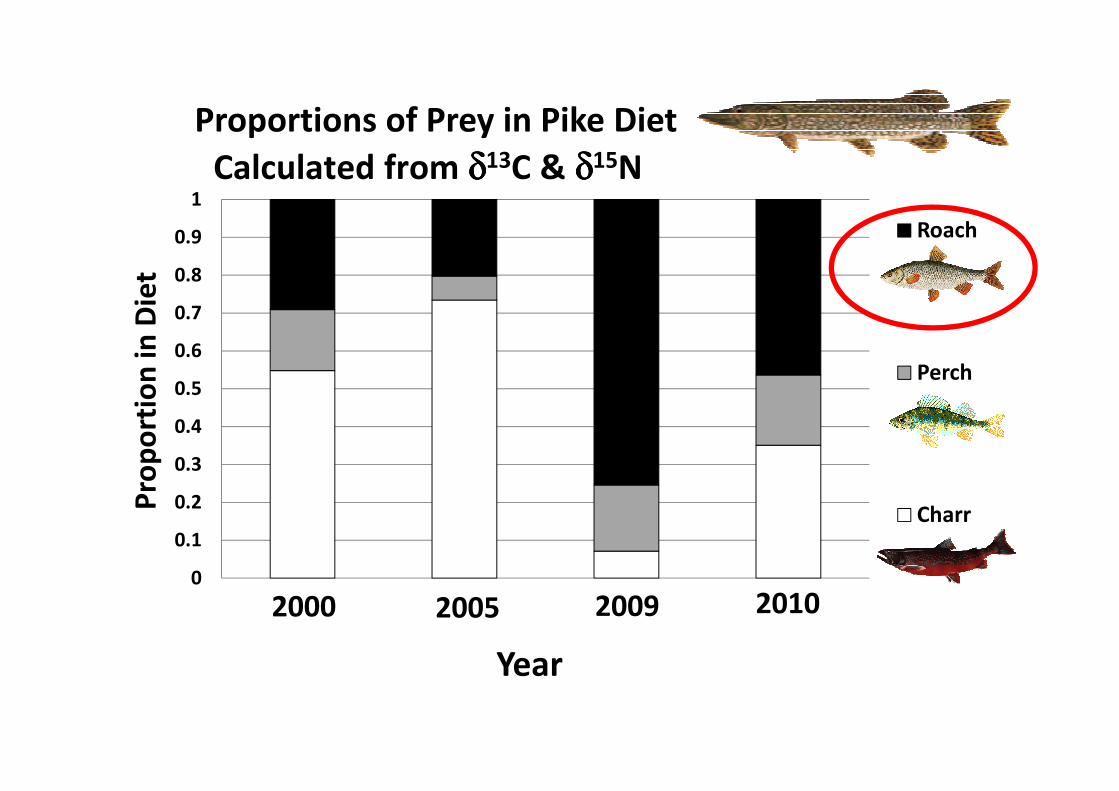
Proportions of Prey in Pike Diet
Roach
Perch
Calculated from δδδδ13C & δδδδ15N
2000 2005 2009 20100
0.1
0.2
0.3
0.4
0.5
Pro
po
rtio
n i
n D
iet
Charr
Year
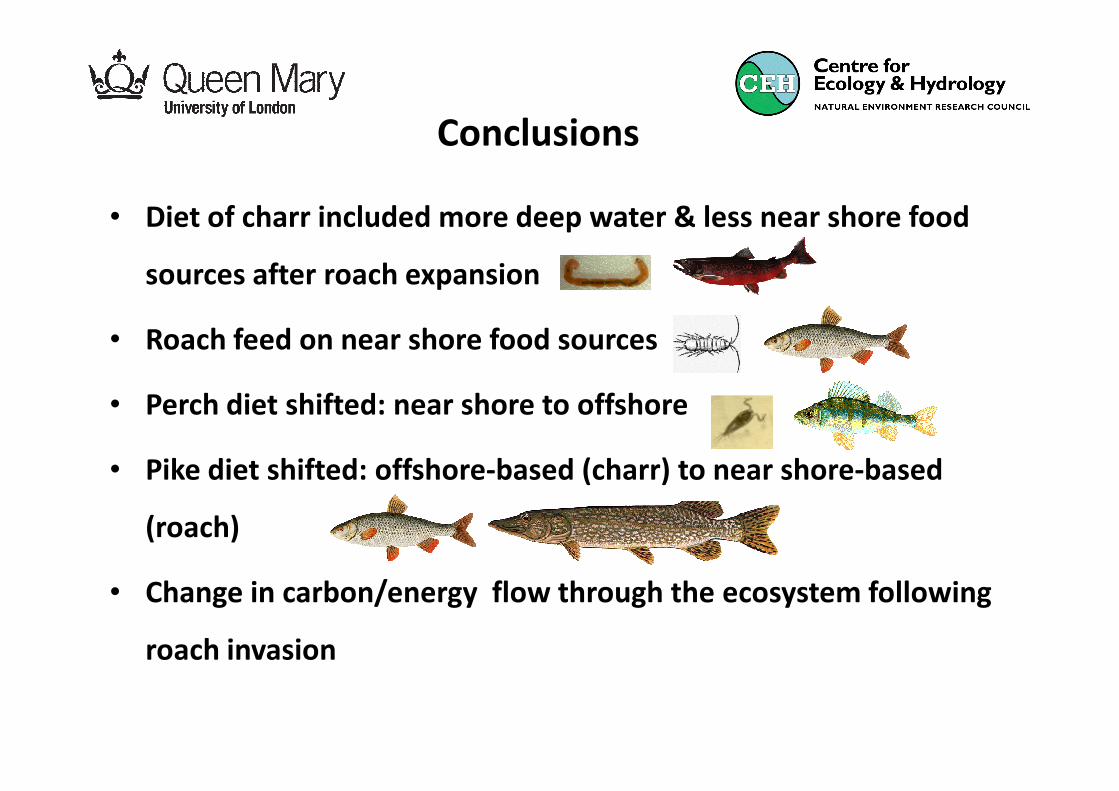
Conclusions
• Diet of charr included more deep water & less near shore food
sources after roach expansion
• Roach feed on near shore food sources
• Perch diet shifted: near shore to offshore• Perch diet shifted: near shore to offshore
• Pike diet shifted: offshore-based (charr) to near shore-based
(roach)
• Change in carbon/energy flow through the ecosystem following
roach invasion
Acknowledgements
• CEH Lake Ecosystem Group - especially: Ian Winfield, Steve
Thackeray, Stephen Maberly, Ian Jones, Mitzi DeVille, Ben James,
Janice Fletcher, Alex Elliott, Jack Kelly & Heidrun Feuchtmayr
• QMUL: Ian Sanders, Nicola Ings and Michelle Jackson• QMUL: Ian Sanders, Nicola Ings and Michelle Jackson
• CEH Lancaster: Helen Grant
• Freshwater Biological Association
& Queen’s University Belfast
• Natural Environment Research Council (NERC)