Embed Size (px)
Citation preview
© 2014 IBM Corporation
Using data to improve and predict outcomes for
nonprofitsAlex Oftelie – Subject Matter Expert, Non Profit Business Analytics, IBM
Mario Gallegos – Director of Quality and Systems Improvement, McKinley Children’s Center
© 2014 IBM Corporation2
Agenda:
Our point of view on Advanced Analytics
IBM Advanced Analytics Portfolio in Action
Advanced Analytics at McKinley Children's Place
Q&A
© 2014 IBM Corporation3
Our Point of View on
Advanced Analytics
© 2014 IBM Corporation 3
© 2014 IBM Corporation4
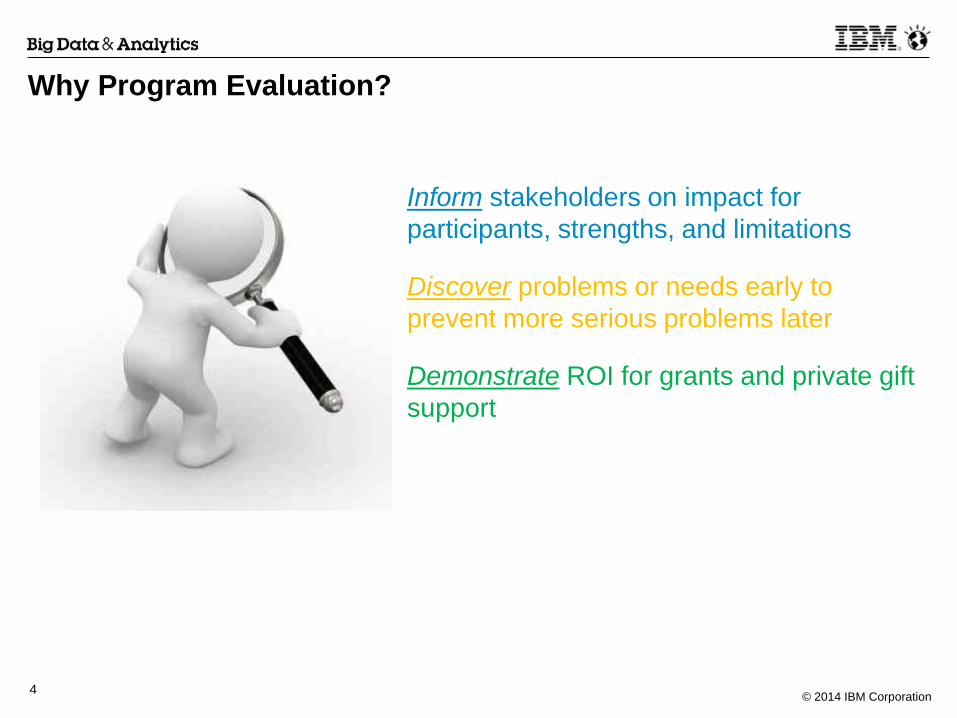
Why Program Evaluation?
Inform stakeholders on impact for
participants, strengths, and limitations
Discover problems or needs early to
prevent more serious problems later
Demonstrate ROI for grants and private gift
support
© 2014 IBM Corporation5
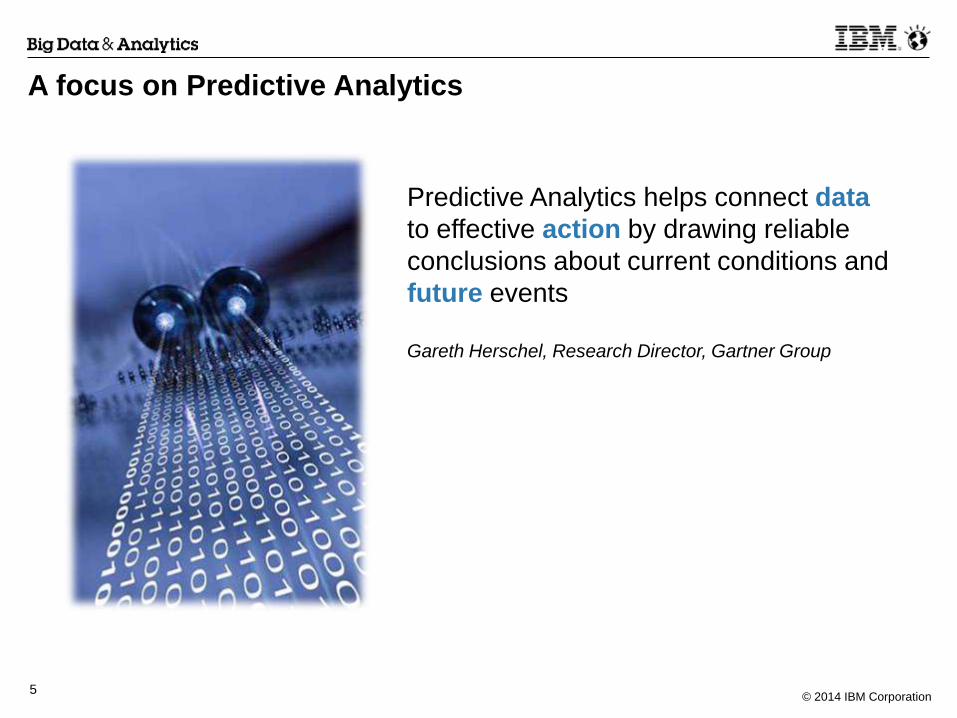
A focus on Predictive Analytics
Predictive Analytics helps connect data
to effective action by drawing reliable
conclusions about current conditions and
future events
Gareth Herschel, Research Director, Gartner Group
© 2014 IBM Corporation6
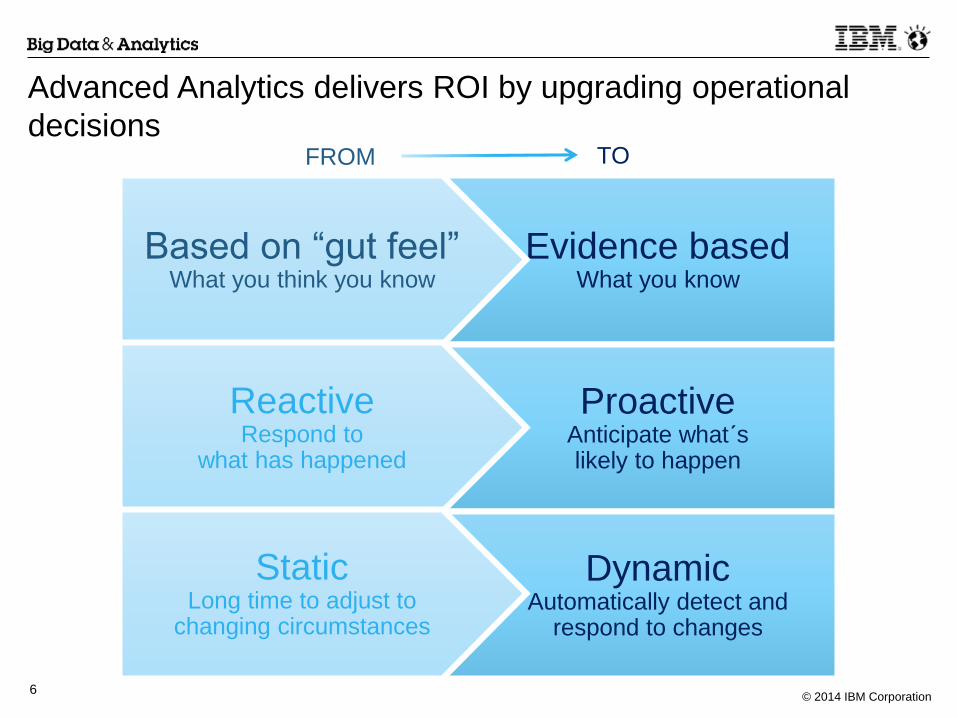
Advanced Analytics delivers ROI by upgrading operational
decisions
Evidence basedWhat you know
ProactiveAnticipate what´s likely to happen
DynamicAutomatically detect and
respond to changes
Based on “gut feel”What you think you know
ReactiveRespond to
what has happened
StaticLong time to adjust to
changing circumstances
FROM TO
© 2014 IBM Corporation7
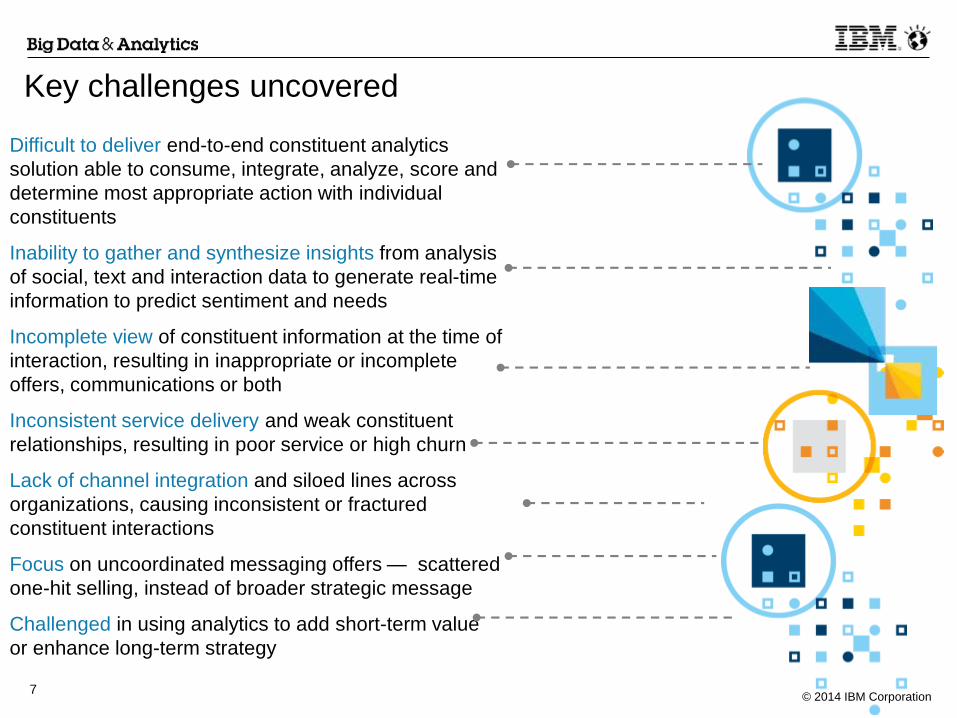
Key challenges uncovered
Difficult to deliver end-to-end constituent analytics
solution able to consume, integrate, analyze, score and
determine most appropriate action with individual
constituents
Inability to gather and synthesize insights from analysis
of social, text and interaction data to generate real-time
information to predict sentiment and needs
Incomplete view of constituent information at the time of
interaction, resulting in inappropriate or incomplete
offers, communications or both
Inconsistent service delivery and weak constituent
relationships, resulting in poor service or high churn
Lack of channel integration and siloed lines across
organizations, causing inconsistent or fractured
constituent interactions
Focus on uncoordinated messaging offers — scattered
one-hit selling, instead of broader strategic message
Challenged in using analytics to add short-term value
or enhance long-term strategy
© 2014 IBM Corporation8
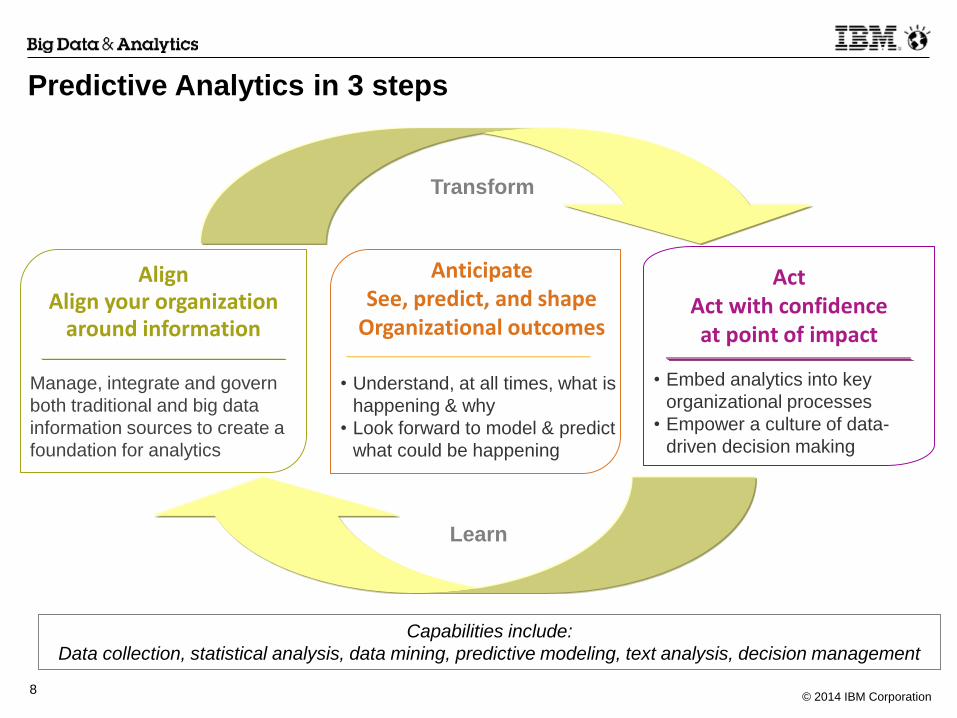
Predictive Analytics in 3 steps
AlignAlign your organization
around information
Manage, integrate and govern
both traditional and big data
information sources to create a
foundation for analytics
Anticipate See, predict, and shape
Organizational outcomes
• Understand, at all times, what is
happening & why
• Look forward to model & predict
what could be happening
ActAct with confidence at point of impact
• Embed analytics into key
organizational processes
• Empower a culture of data-
driven decision making
Transform
Learn
Capabilities include:
Data collection, statistical analysis, data mining, predictive modeling, text analysis, decision management
© 2014 IBM Corporation9
Analytics in K12
© 2014 IBM Corporation 9
© 2014 IBM Corporation10
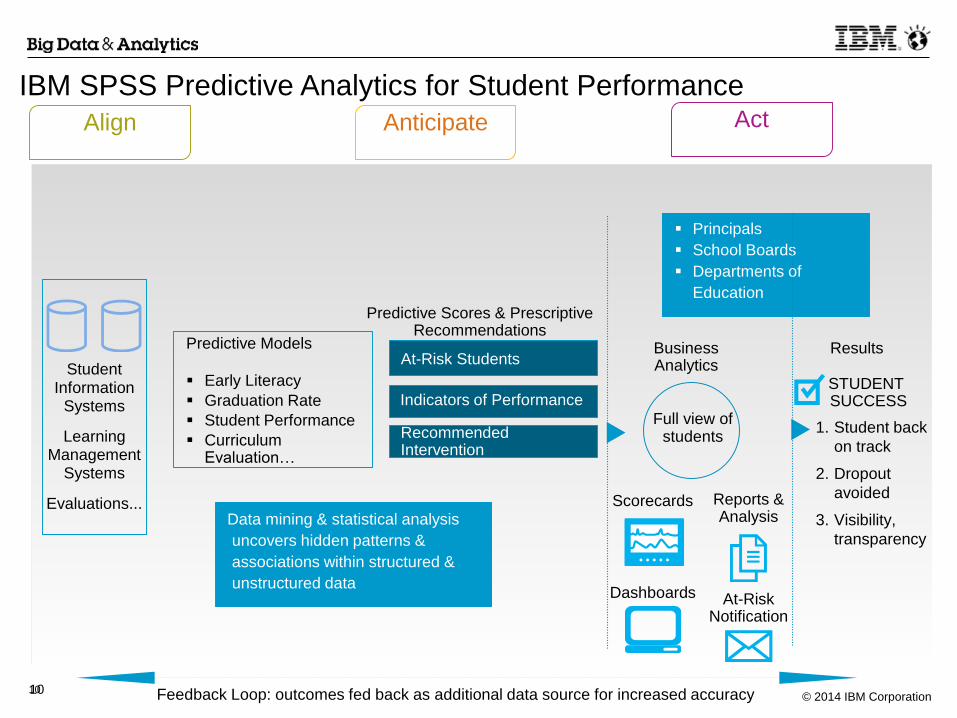
IBM SPSS Predictive Analytics for Student Performance
10
Student Information
Systems
Learning Management
Systems
Evaluations...
At-Risk Students
Indicators of Performance
Recommended Intervention
Principals
School Boards
Departments of
Education
Predictive Scores & Prescriptive Recommendations
Scorecards Reports & Analysis
Dashboards At-Risk Notification
Predictive Models
Early Literacy
Graduation Rate
Student Performance
Curriculum Evaluation…
Business Analytics
Full view of students
Results
STUDENT SUCCESS
1. Student back
on track
2. Dropout
avoided
3. Visibility,
transparency
Align Anticipate Act
Feedback Loop: outcomes fed back as additional data source for increased accuracy
Data mining & statistical analysis
uncovers hidden patterns &
associations within structured &
unstructured data
© 2014 IBM Corporation11
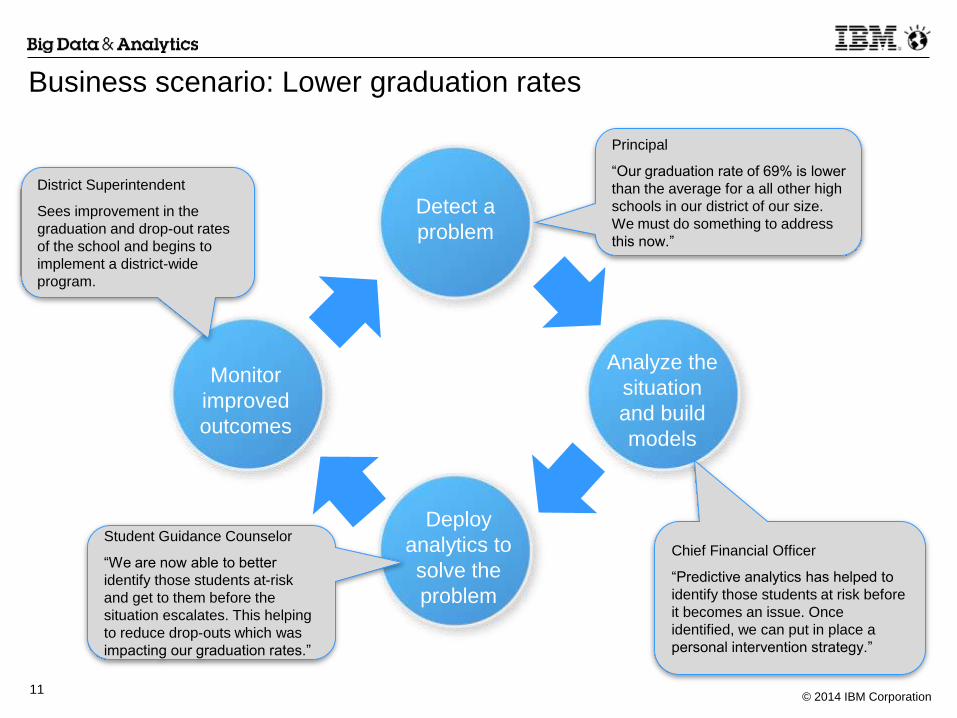
Business scenario: Lower graduation rates
Principal
“Our graduation rate of 69% is lower
than the average for a all other high
schools in our district of our size.
We must do something to address
this now.”
Student Guidance Counselor
“We are now able to better
identify those students at-risk
and get to them before the
situation escalates. This helping
to reduce drop-outs which was
impacting our graduation rates.”
District Superintendent
Sees improvement in the
graduation and drop-out rates
of the school and begins to
implement a district-wide
program.
Chief Financial Officer
“Predictive analytics has helped to
identify those students at risk before
it becomes an issue. Once
identified, we can put in place a
personal intervention strategy.”
Detect a
problem
Analyze the
situation
and build
models
Deploy
analytics to
solve the
problem
Monitor
improved
outcomes
© 2014 IBM Corporation12
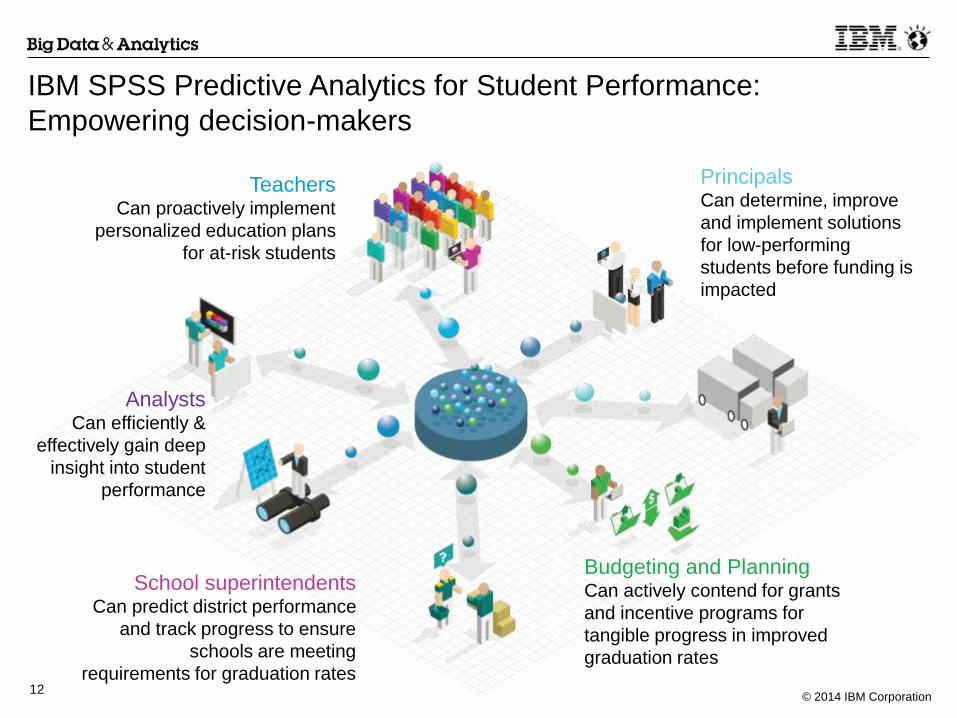
Teachers Can proactively implement
personalized education plans
for at-risk students
PrincipalsCan determine, improve
and implement solutions
for low-performing
students before funding is
impacted
Budgeting and PlanningCan actively contend for grants
and incentive programs for
tangible progress in improved
graduation rates
School superintendents Can predict district performance
and track progress to ensure
schools are meeting
requirements for graduation rates
IBM SPSS Predictive Analytics for Student Performance:
Empowering decision-makers
AnalystsCan efficiently &
effectively gain deep
insight into student
performance
© 2014 IBM Corporation13
Capabilities Overview
© 2014 IBM Corporation 13
© 2014 IBM Corporation14
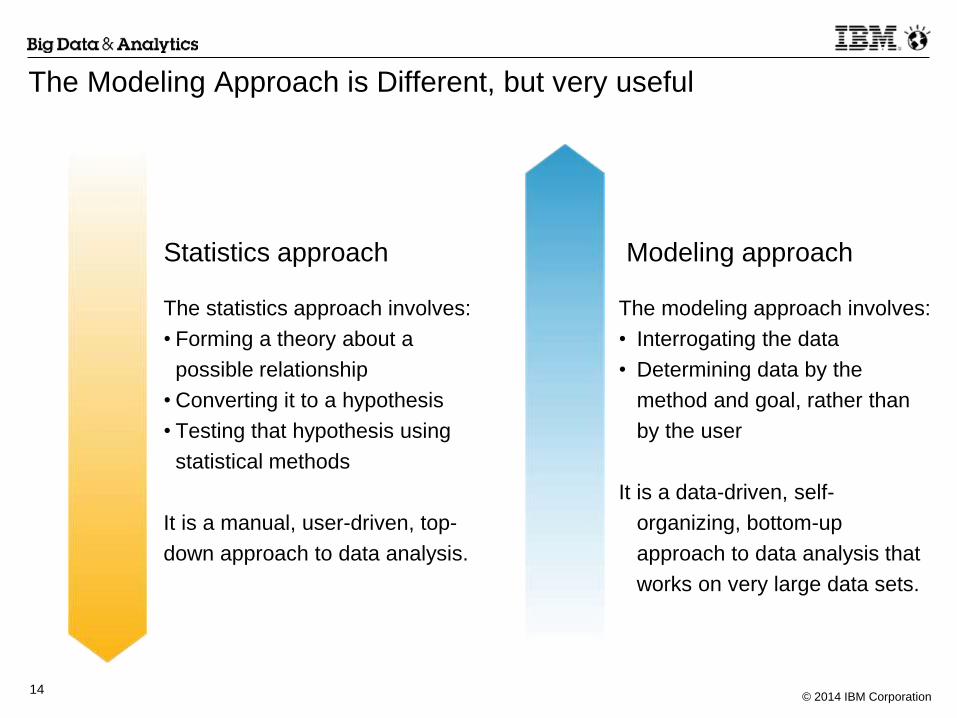
The statistics approach involves:
• Forming a theory about a
possible relationship
• Converting it to a hypothesis
• Testing that hypothesis using
statistical methods
It is a manual, user-driven, top-
down approach to data analysis.
Statistics approach
The modeling approach involves:
• Interrogating the data
• Determining data by the
method and goal, rather than
by the user
It is a data-driven, self-
organizing, bottom-up
approach to data analysis that
works on very large data sets.
Modeling approach
The Modeling Approach is Different, but very useful
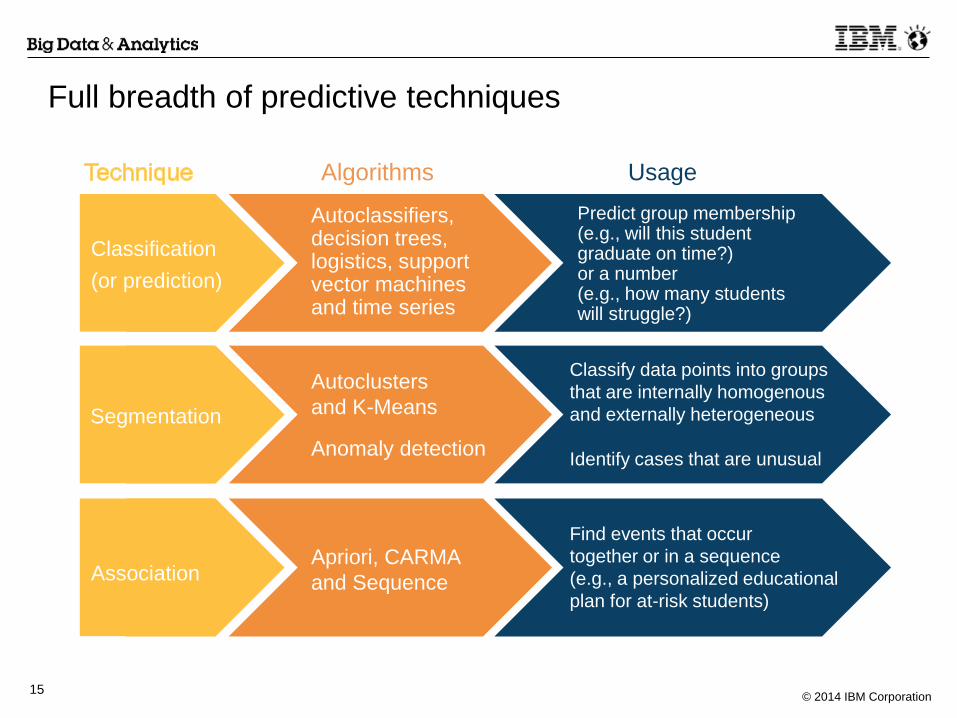
© 2014 IBM Corporation15
Classification
(or prediction)
Autoclassifiers, decision trees,logistics, supportvector machinesand time series
Predict group membership (e.g., will this student graduate on time?) or a number(e.g., how many students will struggle?)
Algorithms Usage
Segmentation
Autoclusters
and K-Means
Anomaly detection
Classify data points into groups
that are internally homogenous
and externally heterogeneous
Identify cases that are unusual
AssociationApriori, CARMA
and Sequence
Find events that occur
together or in a sequence
(e.g., a personalized educational
plan for at-risk students)
Full breadth of predictive techniques
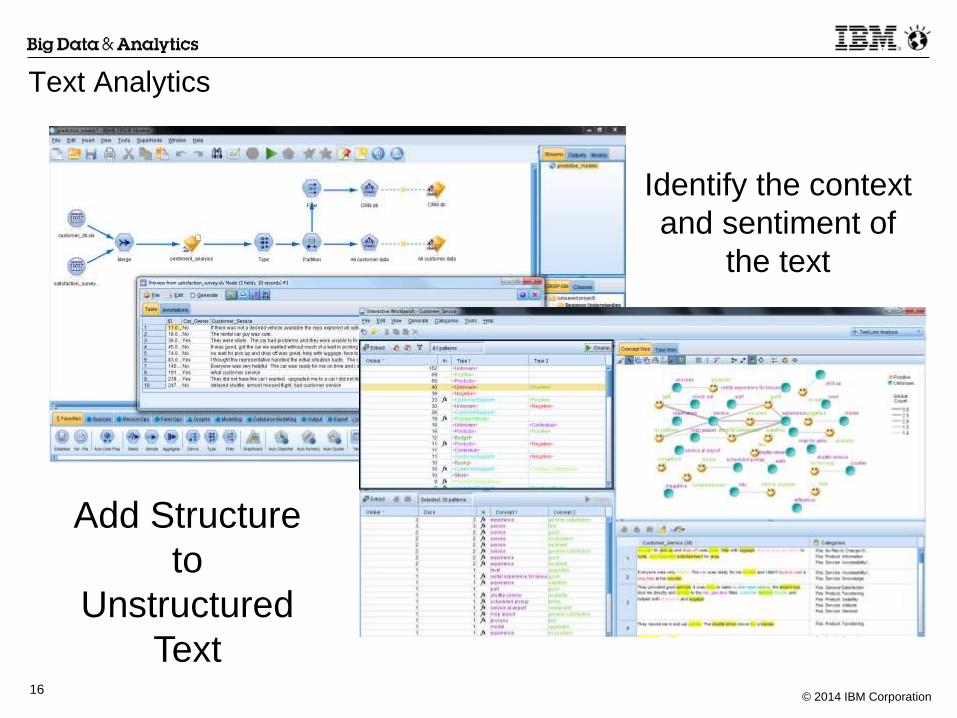
© 2014 IBM Corporation16
Identify the context
and sentiment of
the text
Add Structure
to
Unstructured
Text
Text Analytics
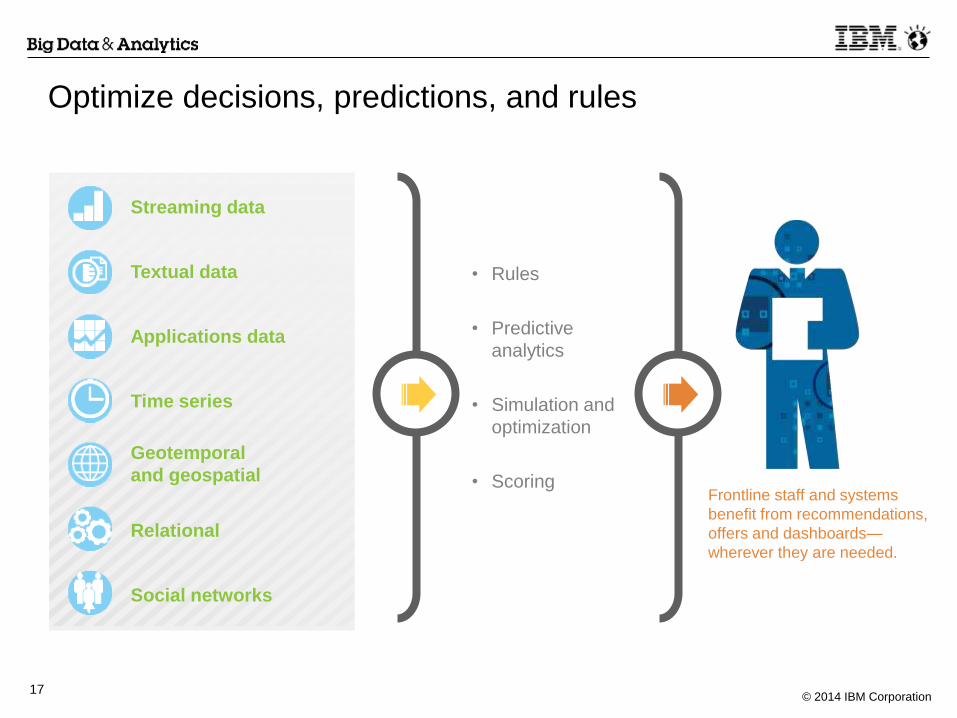
© 2014 IBM Corporation17
Frontline staff and systems
benefit from recommendations,
offers and dashboards—
wherever they are needed.
• Rules
• Predictive
analytics
• Simulation and
optimization
• Scoring
Streaming data
Textual data
Applications data
Time series
Geotemporal
and geospatial
Relational
Social networks
Optimize decisions, predictions, and rules
© 2014 IBM Corporation18 © 2014 IBM Corporation 18
McKinley Children’s Center
© 2014 IBM Corporation19
McKinley Children’s Center
Founded in 1900, McKinley serves over 600 children and
families in the community offering the following services.
Special Education Services to both community and
children living in the center
Foster Care/Adoptions- Over 300 children, and 150
families
Mental Health- Over 200 children and families in the
community
Residential Care- We serve over 40 children.
McKinley’s mission is to provide a safe environment for
children that need help, and to provide services that will
improve our communities by offering:
Loving and stable homes for children
Rehabilitative and Psychological services
Case Management services
© 2014 IBM Corporation20
Analytics at McKinley
Measure outcomes and understand the make up of
the population we serve.
How can we improve those outcomes using data?
Access to data was key
Centralizing the data
The ability to manipulate the data
The ability to interact with the Data
The Ability to visualize data
The ability to set up systems that make the process
of data collection and data analysis easy for the
business user.
© 2014 IBM Corporation21
McKinley and IBM
McKinley decided to partner up with IBM because of their reputation for excellence.
The solution components offered by IBM fit our current needs for data analysis and
reporting.
The solution components are user friendly for the business user.
IBM has been supportive through this process.
IBM introduced us to a premier partner DATA 41 which helped us set up the
infrastructure for our data.
®
© 2014 IBM Corporation22
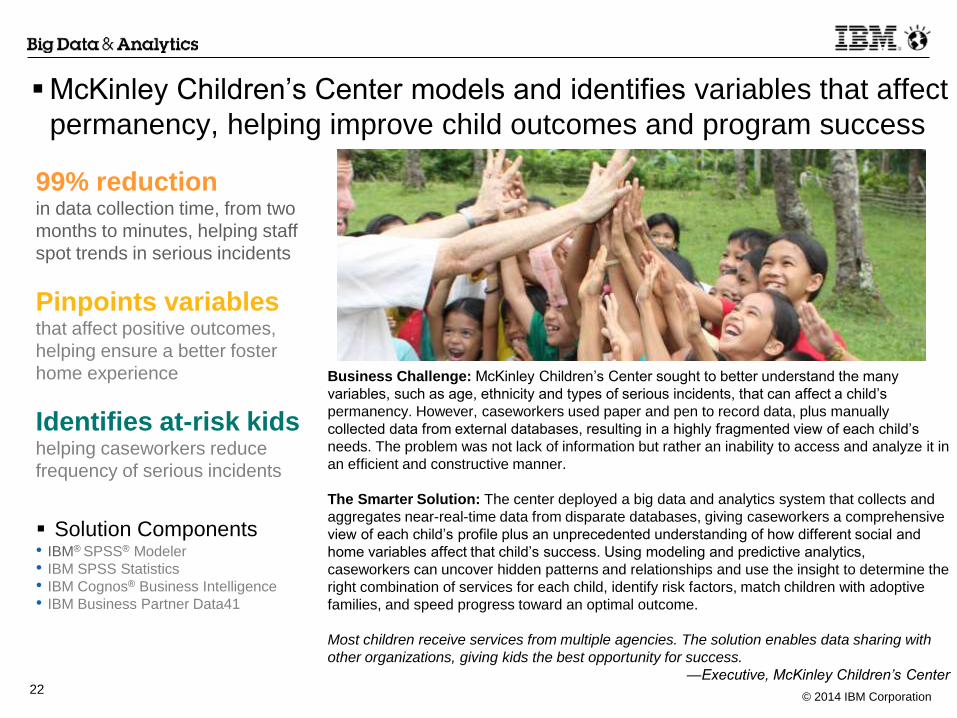
McKinley Children’s Center models and identifies variables that affect
permanency, helping improve child outcomes and program success
Solution Components
Business Challenge: McKinley Children’s Center sought to better understand the many
variables, such as age, ethnicity and types of serious incidents, that can affect a child’s
permanency. However, caseworkers used paper and pen to record data, plus manually
collected data from external databases, resulting in a highly fragmented view of each child’s
needs. The problem was not lack of information but rather an inability to access and analyze it in
an efficient and constructive manner.
The Smarter Solution: The center deployed a big data and analytics system that collects and
aggregates near-real-time data from disparate databases, giving caseworkers a comprehensive
view of each child’s profile plus an unprecedented understanding of how different social and
home variables affect that child’s success. Using modeling and predictive analytics,
caseworkers can uncover hidden patterns and relationships and use the insight to determine the
right combination of services for each child, identify risk factors, match children with adoptive
families, and speed progress toward an optimal outcome.
Most children receive services from multiple agencies. The solution enables data sharing with
other organizations, giving kids the best opportunity for success.
—Executive, McKinley Children’s Center
99% reductionin data collection time, from two
months to minutes, helping staff
spot trends in serious incidents
Pinpoints variablesthat affect positive outcomes,
helping ensure a better foster
home experience
Identifies at-risk kidshelping caseworkers reduce
frequency of serious incidents
• IBM® SPSS® Modeler
• IBM SPSS Statistics
• IBM Cognos® Business Intelligence
• IBM Business Partner Data41
© 2014 IBM Corporation23
Resources
SPSS Non Profit Resource Center
ibm.biz/smarterphilanthropy
Next Steps
Conversation
Alexander Oftelie
www.linkedin.com/in/alexoftelie/
Office: 303-353-7306
© 2014 IBM Corporation24
Questions

© 2014 IBM Corporation25