Embed Size (px)
DESCRIPTION
SurveyMonkey Audience: an on-demand group of millions of survey respondents to take your surveys. Audience allows customers to target respondents on a wide variety of demographic and behavioral traits to get fast, high quality, cost effective data.
Citation preview
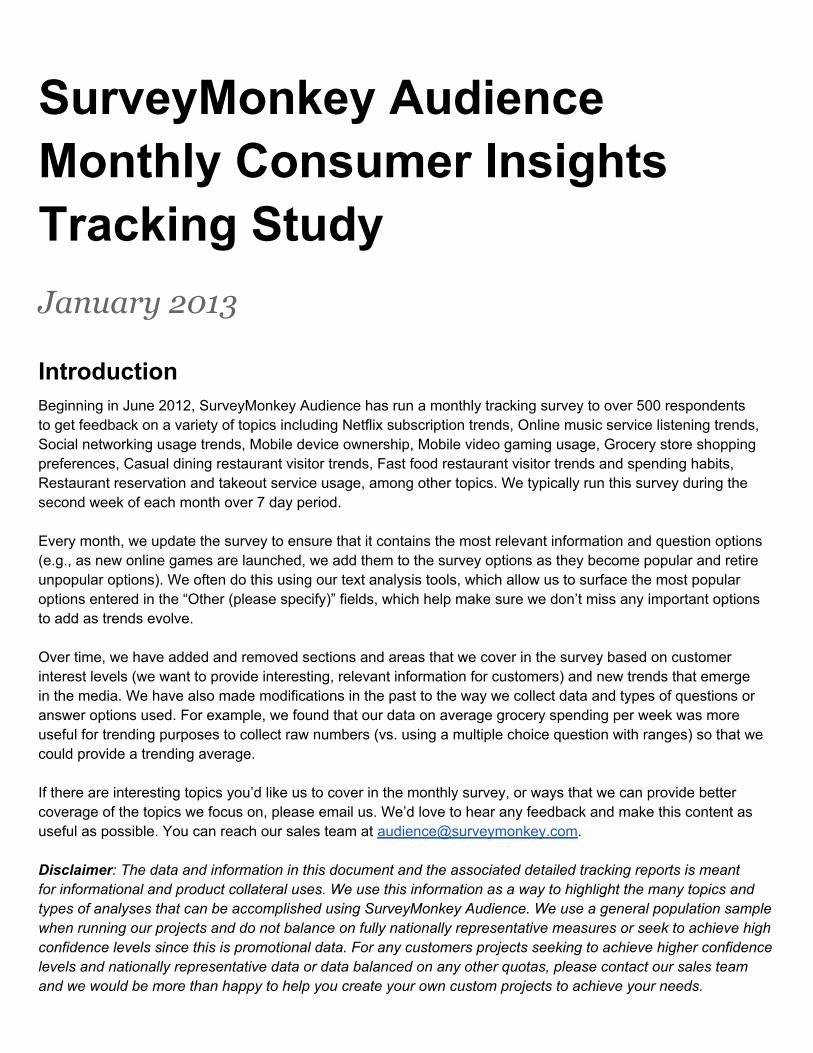
SurveyMonkey Audience Monthly Consumer Insights Tracking StudyJanuary 2013
IntroductionBeginning in June 2012, SurveyMonkey Audience has run a monthly tracking survey to over 500 respondents to get feedback on a variety of topics including Netflix subscription trends, Online music service listening trends, Social networking usage trends, Mobile device ownership, Mobile video gaming usage, Grocery store shopping preferences, Casual dining restaurant visitor trends, Fast food restaurant visitor trends and spending habits, Restaurant reservation and takeout service usage, among other topics. We typically run this survey during the second week of each month over 7 day period. Every month, we update the survey to ensure that it contains the most relevant information and question options (e.g., as new online games are launched, we add them to the survey options as they become popular and retire unpopular options). We often do this using our text analysis tools, which allow us to surface the most popular options entered in the “Other (please specify)” fields, which help make sure we don’t miss any important options to add as trends evolve. Over time, we have added and removed sections and areas that we cover in the survey based on customer interest levels (we want to provide interesting, relevant information for customers) and new trends that emerge in the media. We have also made modifications in the past to the way we collect data and types of questions or answer options used. For example, we found that our data on average grocery spending per week was more useful for trending purposes to collect raw numbers (vs. using a multiple choice question with ranges) so that we could provide a trending average. If there are interesting topics you’d like us to cover in the monthly survey, or ways that we can provide better coverage of the topics we focus on, please email us. We’d love to hear any feedback and make this content as useful as possible. You can reach our sales team at [email protected]. Disclaimer: The data and information in this document and the associated detailed tracking reports is meant for informational and product collateral uses. We use this information as a way to highlight the many topics and types of analyses that can be accomplished using SurveyMonkey Audience. We use a general population sample when running our projects and do not balance on fully nationally representative measures or seek to achieve high confidence levels since this is promotional data. For any customers projects seeking to achieve higher confidence levels and nationally representative data or data balanced on any other quotas, please contact our sales team and we would be more than happy to help you create your own custom projects to achieve your needs.

Sample Size: We sample at least 500 respondents each month and provide the number of respondents to each question in our footnotes. Since we use skip logic in our survey, not all respondents answer each questions, so the confidence levels can vary. For a guide to understanding the confidence level in any data points in our study, please refer to our guide to confidence intervals.
Focus TopicsIn this report, we will provide an overview of any key findings for each topic area and a chart depicting trends using all data we have gathered on each topic. In many cases, focus areas with more detailed analysis will include a link to additional reports focused on each topic. The focus areas in the January 2013 edition of the SurveyMonkey Audience Monthly Tracking Study include:
● Netflix Subscription Trends● Online Music Service Listening Trends● Social Networking Usage Trends● Mobile Device Ownership● Mobile Video Gaming Usage● Game Console Ownership● Casual Dining Restaurant Visitor Trends● Fast Food Restaurant Visitor Trends and Spending Habits● Restaurant Reservation and Takeout Service Usage● Daily Deal Consumption Trends● Travel Website Usage Trends
Netflix Subscription TrendsNetflix (NFLX) is always a hot topic for Internet and Media analysts and investors. The company that brought DVDs into your mailbox for years and grew to become leading a media player and innovator has a strong following and huge customer base. We track several trends on market share, cancellation likelihood and satisfaction. Below is a snapshot of our data and key topics.
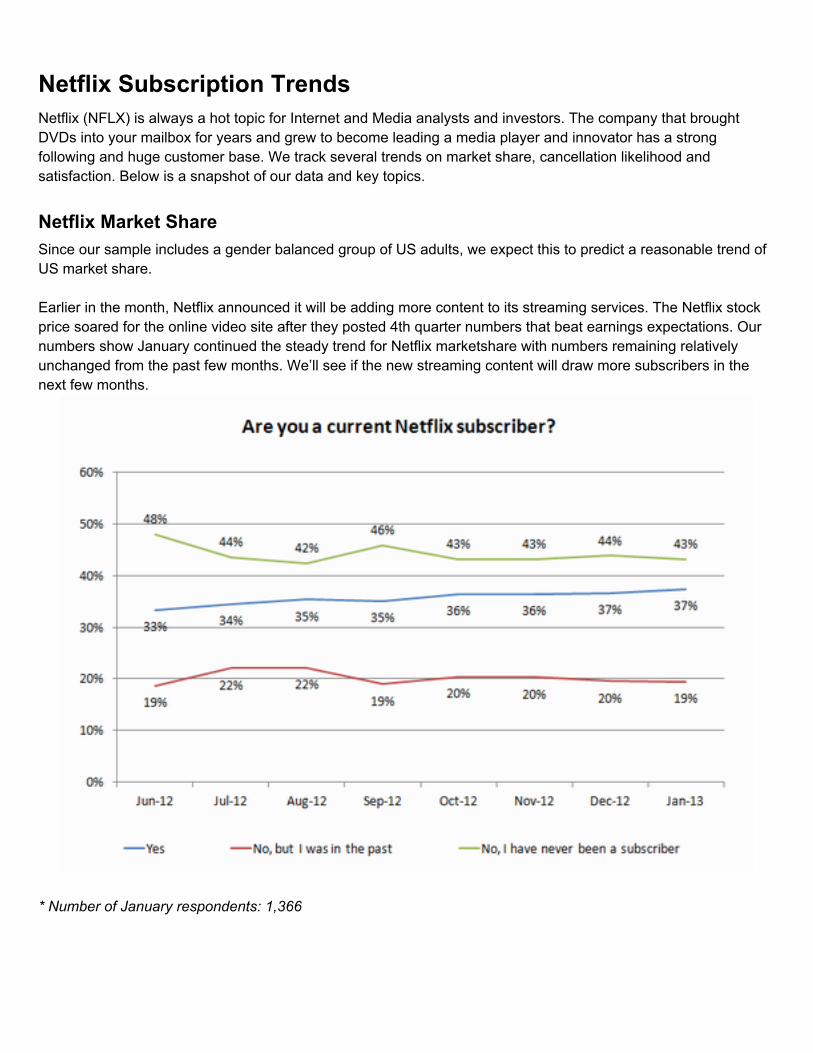
Netflix Market ShareSince our sample includes a gender balanced group of US adults, we expect this to predict a reasonable trend of US market share. Earlier in the month, Netflix announced it will be adding more content to its streaming services. The Netflix stock price soared for the online video site after they posted 4th quarter numbers that beat earnings expectations. Our numbers show January continued the steady trend for Netflix marketshare with numbers remaining relatively unchanged from the past few months. We’ll see if the new streaming content will draw more subscribers in the next few months.
* Number of January respondents: 1,366
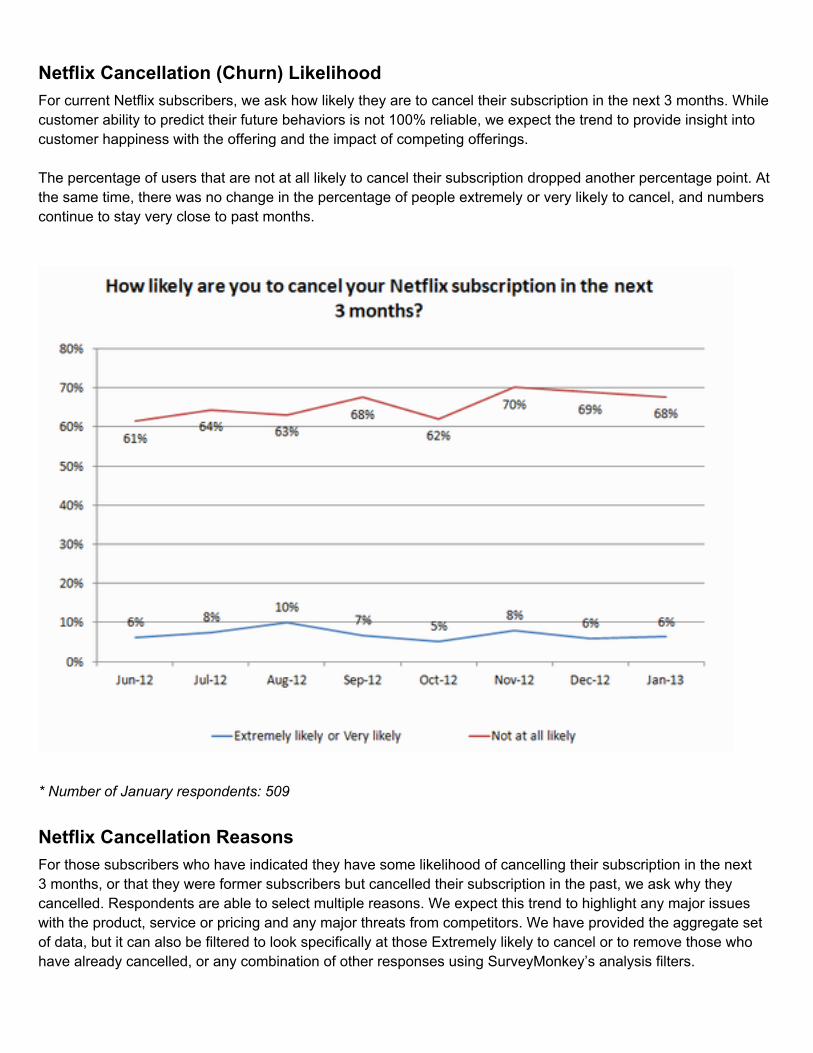
Netflix Cancellation (Churn) LikelihoodFor current Netflix subscribers, we ask how likely they are to cancel their subscription in the next 3 months. While customer ability to predict their future behaviors is not 100% reliable, we expect the trend to provide insight into customer happiness with the offering and the impact of competing offerings. The percentage of users that are not at all likely to cancel their subscription dropped another percentage point. At the same time, there was no change in the percentage of people extremely or very likely to cancel, and numbers continue to stay very close to past months.
* Number of January respondents: 509
Netflix Cancellation ReasonsFor those subscribers who have indicated they have some likelihood of cancelling their subscription in the next 3 months, or that they were former subscribers but cancelled their subscription in the past, we ask why they cancelled. Respondents are able to select multiple reasons. We expect this trend to highlight any major issues with the product, service or pricing and any major threats from competitors. We have provided the aggregate set of data, but it can also be filtered to look specifically at those Extremely likely to cancel or to remove those who have already cancelled, or any combination of other responses using SurveyMonkey’s analysis filters.
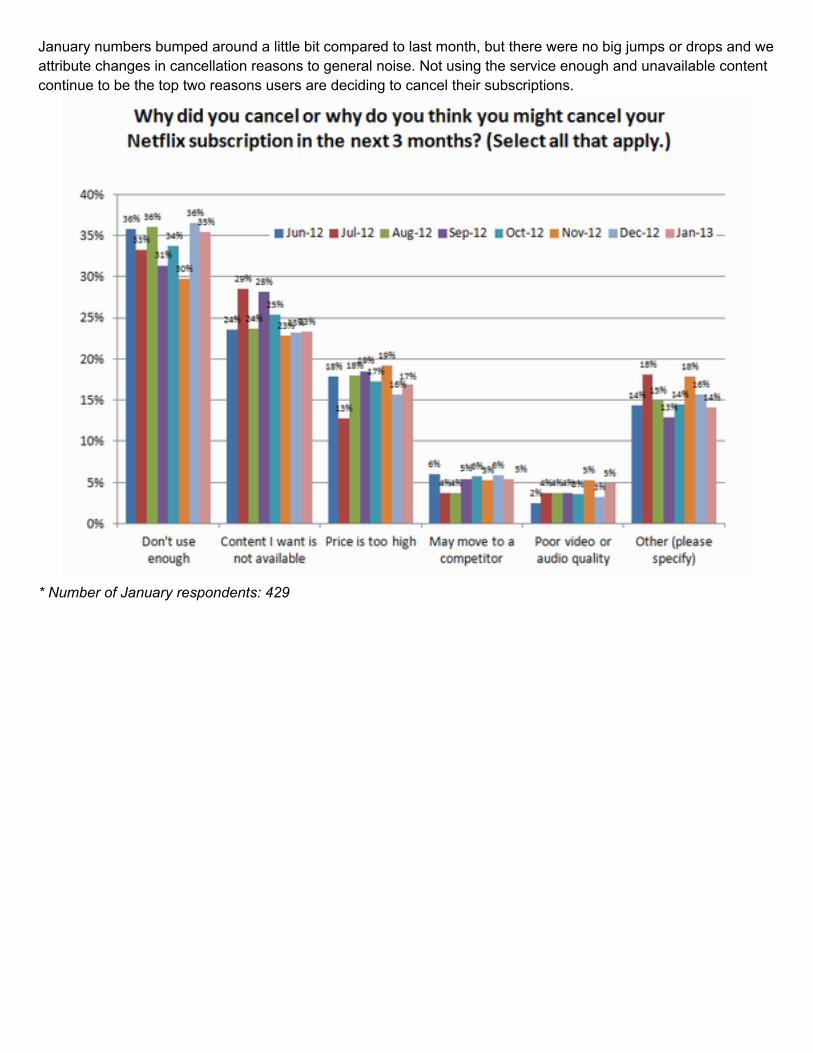
January numbers bumped around a little bit compared to last month, but there were no big jumps or drops and we attribute changes in cancellation reasons to general noise. Not using the service enough and unavailable content continue to be the top two reasons users are deciding to cancel their subscriptions.
* Number of January respondents: 429
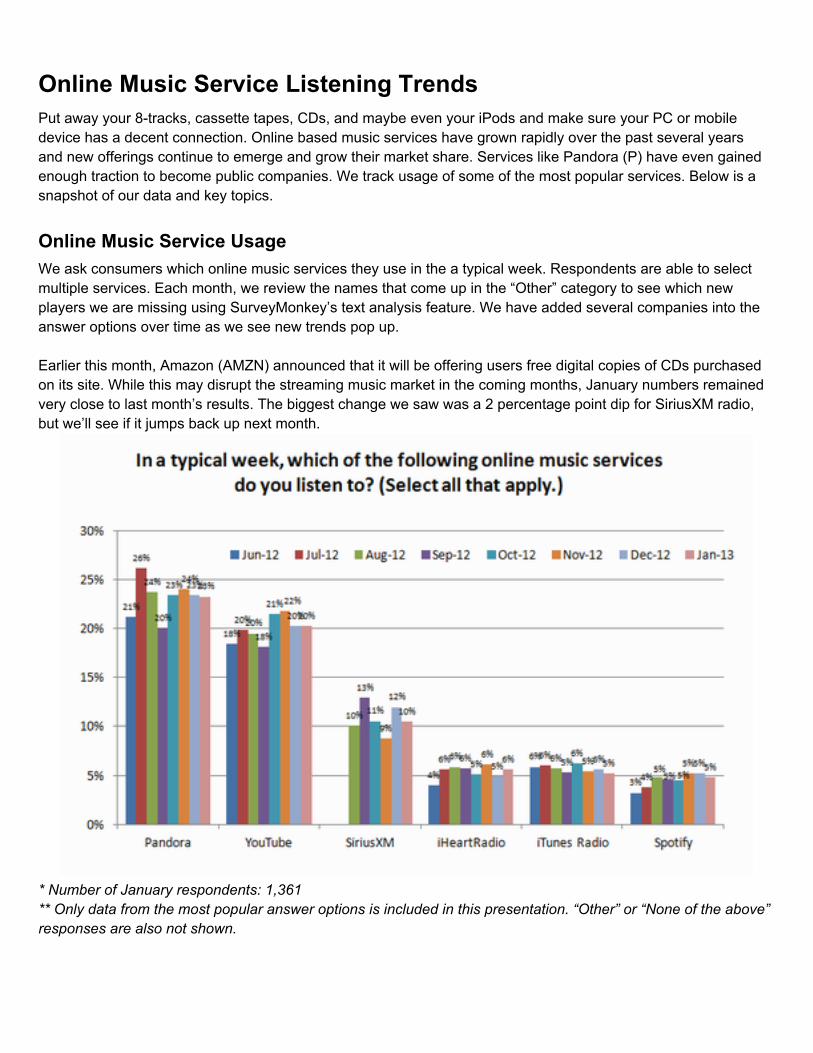
Online Music Service Listening TrendsPut away your 8-tracks, cassette tapes, CDs, and maybe even your iPods and make sure your PC or mobile device has a decent connection. Online based music services have grown rapidly over the past several years and new offerings continue to emerge and grow their market share. Services like Pandora (P) have even gained enough traction to become public companies. We track usage of some of the most popular services. Below is a snapshot of our data and key topics.
Online Music Service UsageWe ask consumers which online music services they use in the a typical week. Respondents are able to select multiple services. Each month, we review the names that come up in the “Other” category to see which new players we are missing using SurveyMonkey’s text analysis feature. We have added several companies into the answer options over time as we see new trends pop up. Earlier this month, Amazon (AMZN) announced that it will be offering users free digital copies of CDs purchased on its site. While this may disrupt the streaming music market in the coming months, January numbers remained very close to last month’s results. The biggest change we saw was a 2 percentage point dip for SiriusXM radio, but we’ll see if it jumps back up next month.
* Number of January respondents: 1,361** Only data from the most popular answer options is included in this presentation. “Other” or “None of the above” responses are also not shown.
Social Networking Usage TrendsThis social networking phenomenon has caught on, and has certainly changed how people interact with each other, and how companies need to think about interacting with their customers. We’ll be publishing this report on our social media channels and hoping that people like, G+, tweet and share it to everyone they know. We track usage of some of the most popular services. Below is a snapshot of our data and key topics.
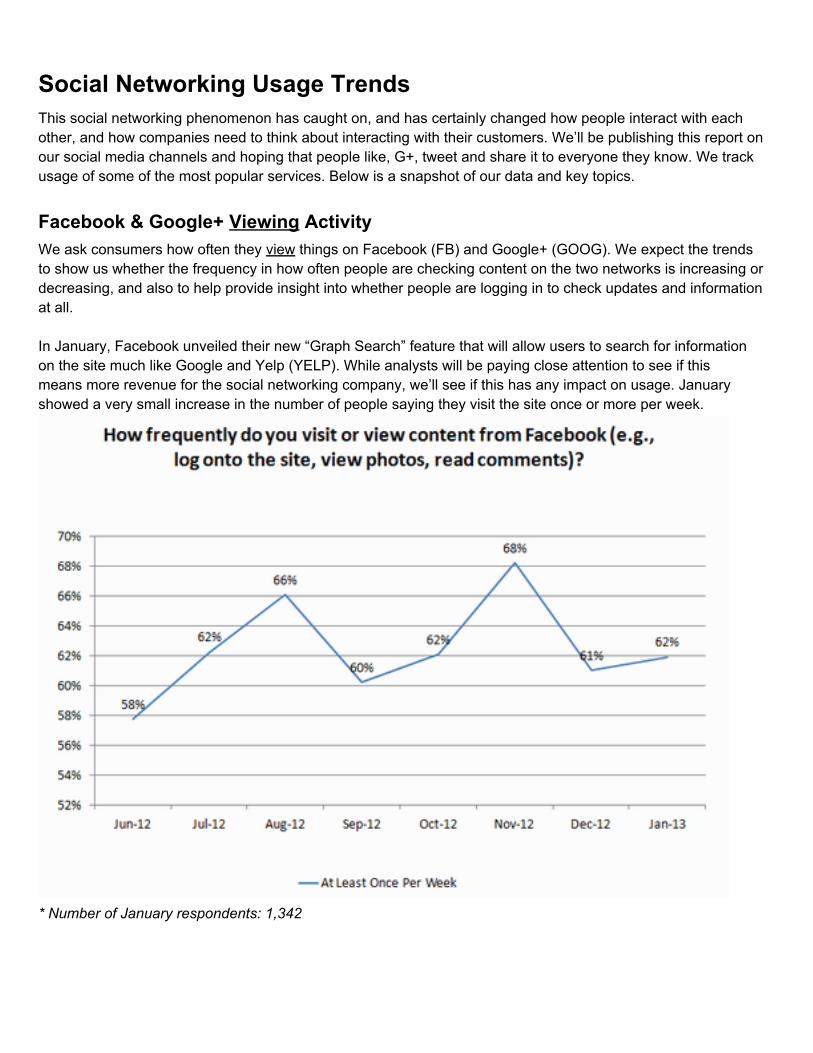
Facebook & Google+ Viewing ActivityWe ask consumers how often they view things on Facebook (FB) and Google+ (GOOG). We expect the trends to show us whether the frequency in how often people are checking content on the two networks is increasing or decreasing, and also to help provide insight into whether people are logging in to check updates and information at all. In January, Facebook unveiled their new “Graph Search” feature that will allow users to search for information on the site much like Google and Yelp (YELP). While analysts will be paying close attention to see if this means more revenue for the social networking company, we’ll see if this has any impact on usage. January showed a very small increase in the number of people saying they visit the site once or more per week.
* Number of January respondents: 1,342
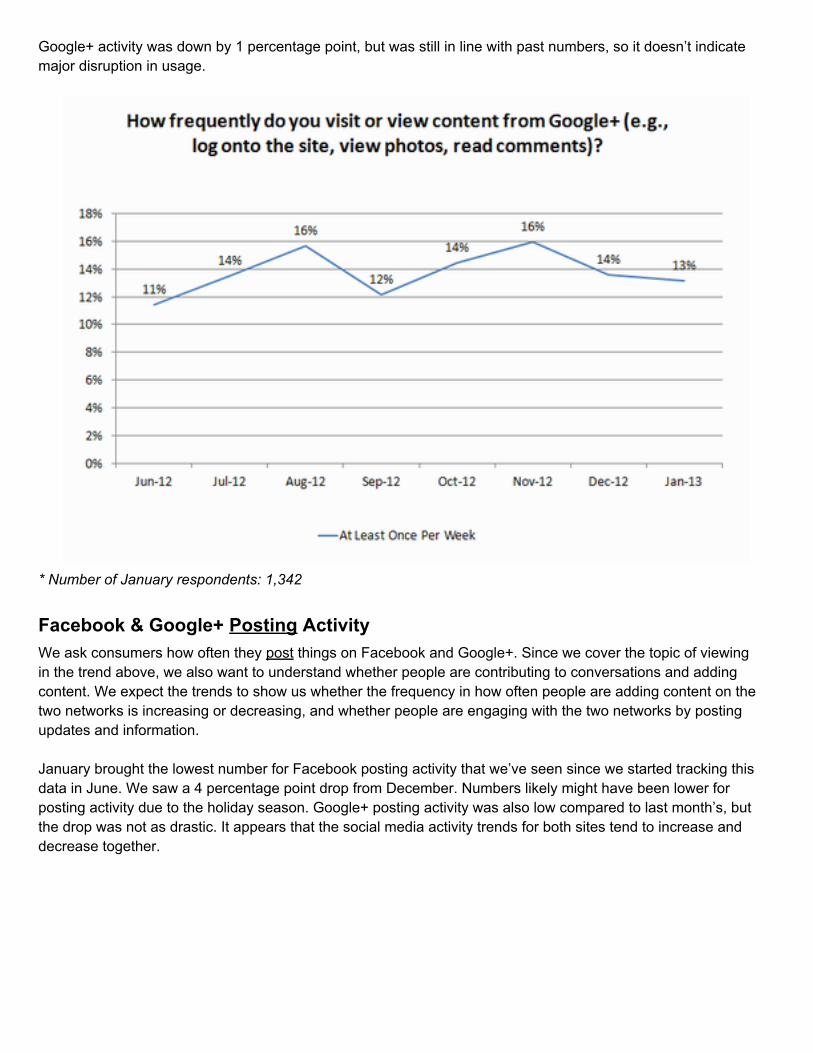
Google+ activity was down by 1 percentage point, but was still in line with past numbers, so it doesn’t indicate major disruption in usage.
* Number of January respondents: 1,342
Facebook & Google+ Posting ActivityWe ask consumers how often they post things on Facebook and Google+. Since we cover the topic of viewing in the trend above, we also want to understand whether people are contributing to conversations and adding content. We expect the trends to show us whether the frequency in how often people are adding content on the two networks is increasing or decreasing, and whether people are engaging with the two networks by posting updates and information. January brought the lowest number for Facebook posting activity that we’ve seen since we started tracking this data in June. We saw a 4 percentage point drop from December. Numbers likely might have been lower for posting activity due to the holiday season. Google+ posting activity was also low compared to last month’s, but the drop was not as drastic. It appears that the social media activity trends for both sites tend to increase and decrease together.
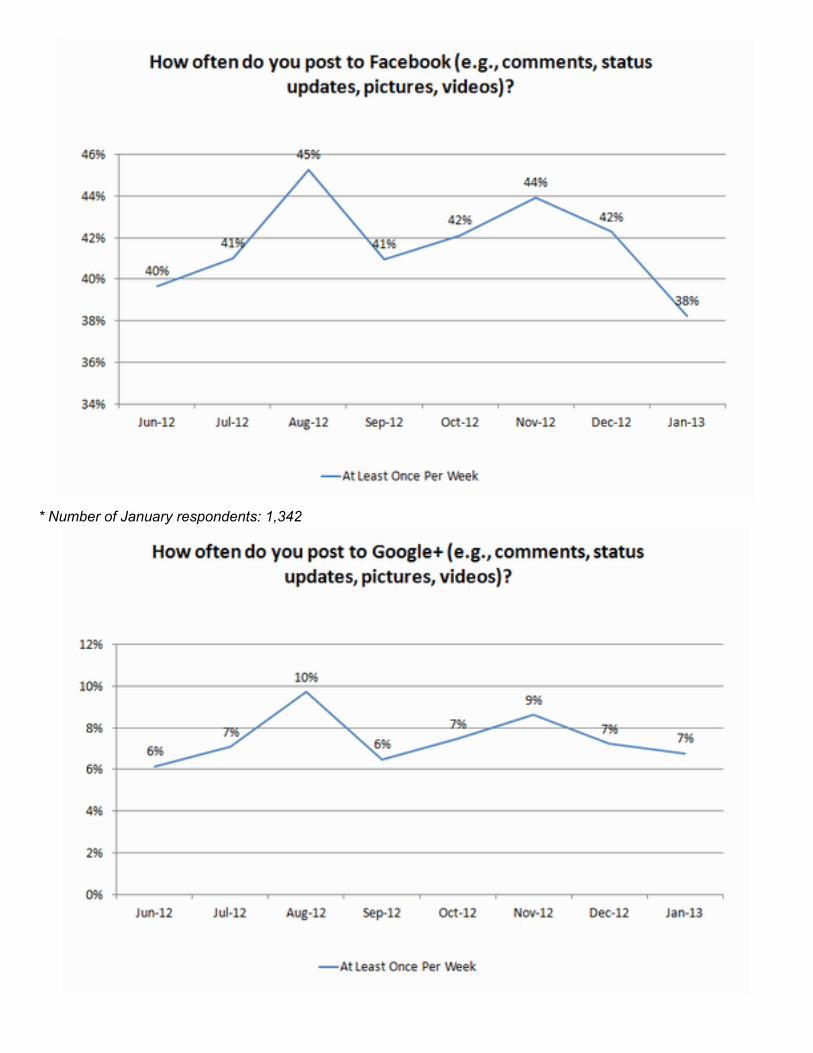
* Number of January respondents: 1,342
* Number of January respondents: 1,342
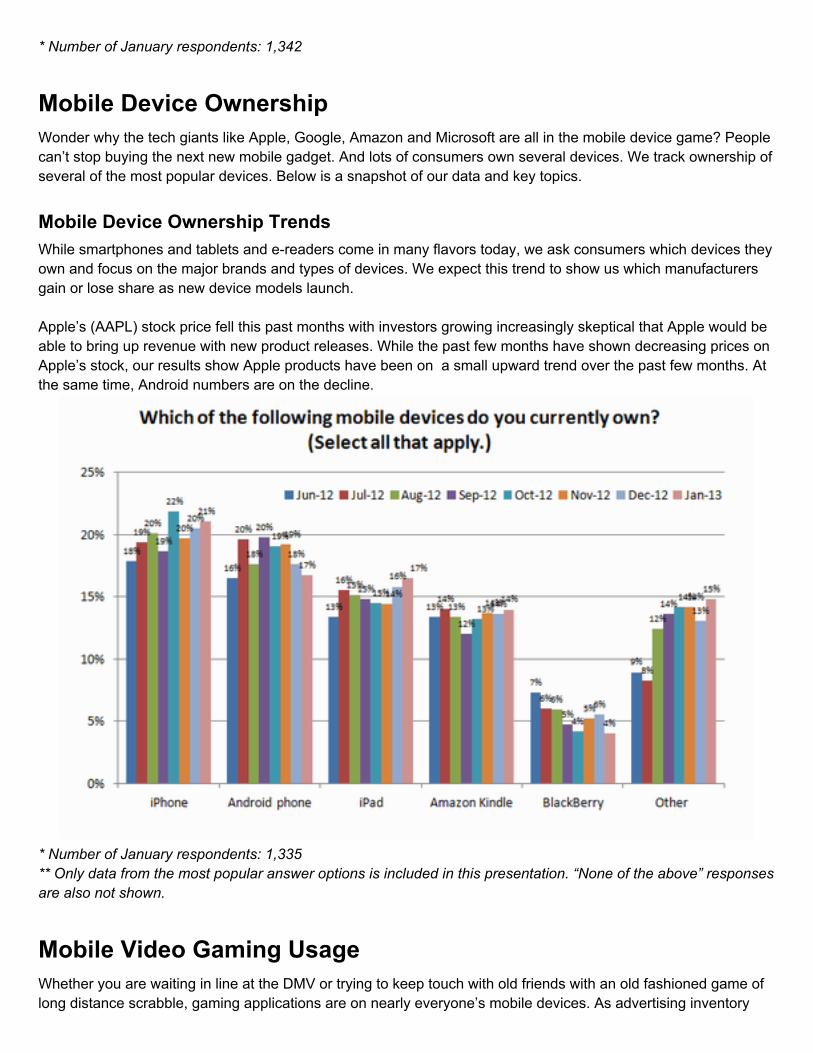
Mobile Device OwnershipWonder why the tech giants like Apple, Google, Amazon and Microsoft are all in the mobile device game? People can’t stop buying the next new mobile gadget. And lots of consumers own several devices. We track ownership of several of the most popular devices. Below is a snapshot of our data and key topics.
Mobile Device Ownership TrendsWhile smartphones and tablets and e-readers come in many flavors today, we ask consumers which devices they own and focus on the major brands and types of devices. We expect this trend to show us which manufacturers gain or lose share as new device models launch. Apple’s (AAPL) stock price fell this past months with investors growing increasingly skeptical that Apple would be able to bring up revenue with new product releases. While the past few months have shown decreasing prices on Apple’s stock, our results show Apple products have been on a small upward trend over the past few months. At the same time, Android numbers are on the decline.
* Number of January respondents: 1,335** Only data from the most popular answer options is included in this presentation. “None of the above” responses are also not shown.
Mobile Video Gaming UsageWhether you are waiting in line at the DMV or trying to keep touch with old friends with an old fashioned game of long distance scrabble, gaming applications are on nearly everyone’s mobile devices. As advertising inventory
moves toward mobile devices, gaming companies try to churn out the next big hit to get as many daily users as possible. We track some of the most popular mobile games to see how their popularity increases or decreases over time.
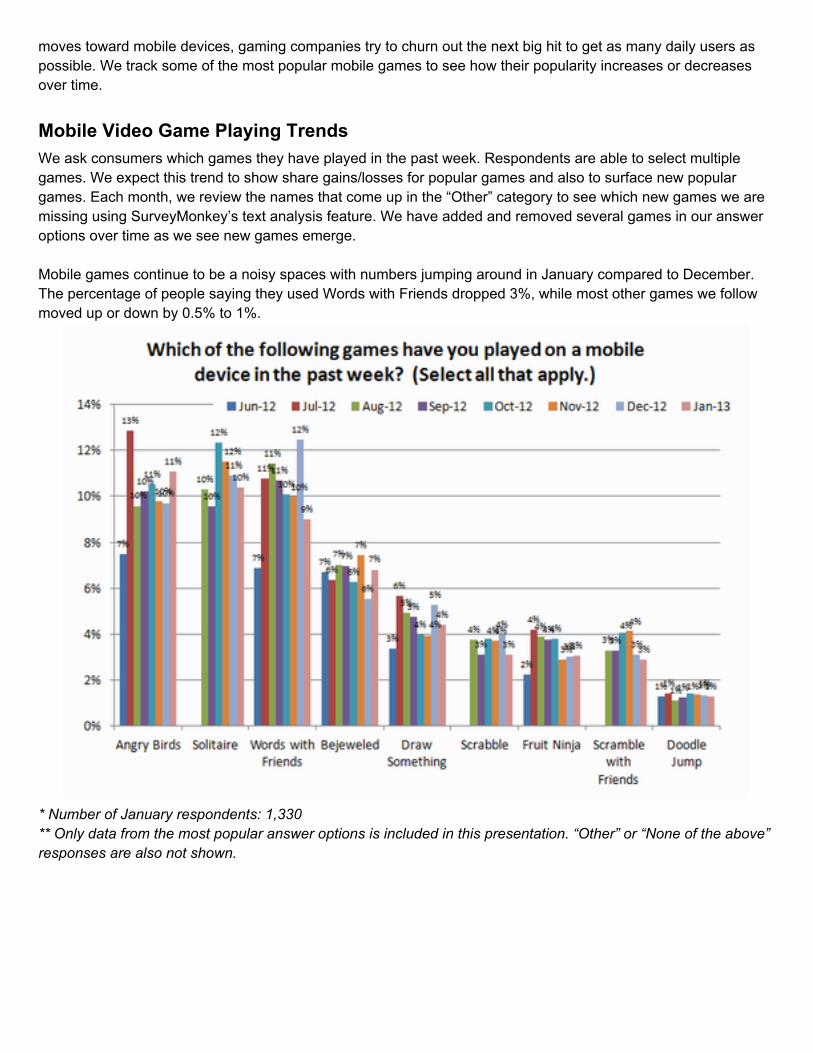
Mobile Video Game Playing TrendsWe ask consumers which games they have played in the past week. Respondents are able to select multiple games. We expect this trend to show share gains/losses for popular games and also to surface new popular games. Each month, we review the names that come up in the “Other” category to see which new games we are missing using SurveyMonkey’s text analysis feature. We have added and removed several games in our answer options over time as we see new games emerge. Mobile games continue to be a noisy spaces with numbers jumping around in January compared to December. The percentage of people saying they used Words with Friends dropped 3%, while most other games we follow moved up or down by 0.5% to 1%.
* Number of January respondents: 1,330** Only data from the most popular answer options is included in this presentation. “Other” or “None of the above” responses are also not shown.
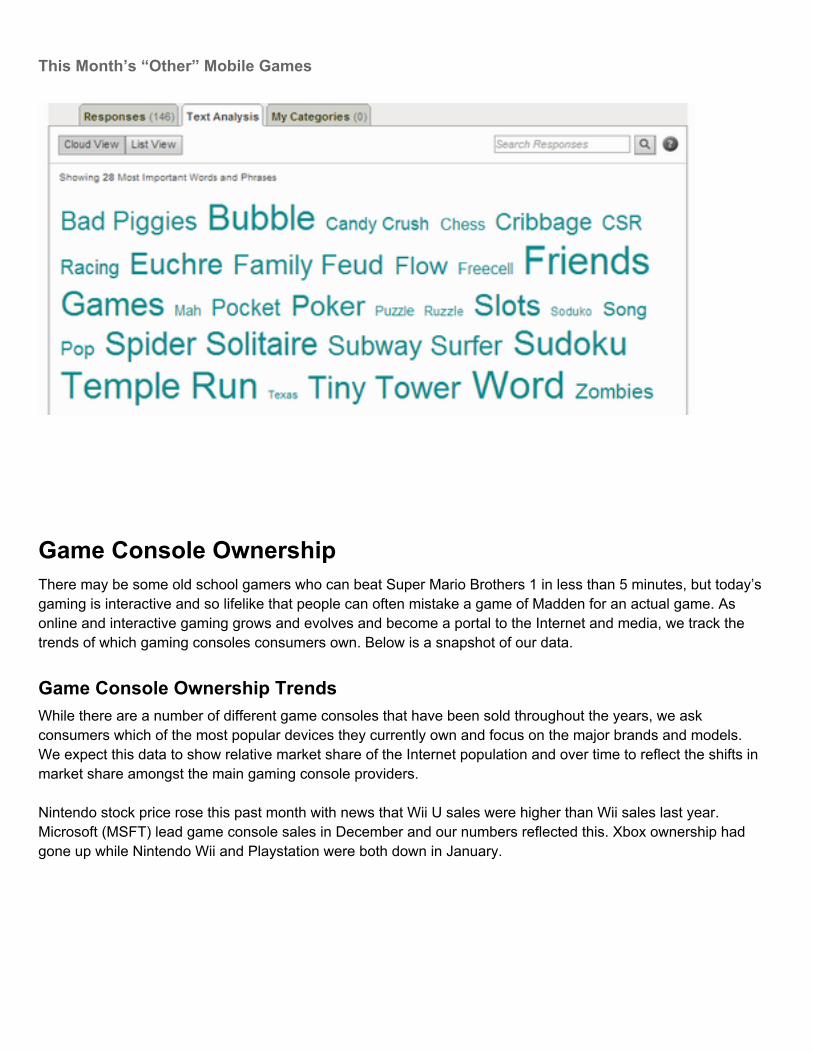
This Month’s “Other” Mobile Games
Game Console Ownership There may be some old school gamers who can beat Super Mario Brothers 1 in less than 5 minutes, but today’s gaming is interactive and so lifelike that people can often mistake a game of Madden for an actual game. As online and interactive gaming grows and evolves and become a portal to the Internet and media, we track the trends of which gaming consoles consumers own. Below is a snapshot of our data.
Game Console Ownership TrendsWhile there are a number of different game consoles that have been sold throughout the years, we ask consumers which of the most popular devices they currently own and focus on the major brands and models. We expect this data to show relative market share of the Internet population and over time to reflect the shifts in market share amongst the main gaming console providers. Nintendo stock price rose this past month with news that Wii U sales were higher than Wii sales last year. Microsoft (MSFT) lead game console sales in December and our numbers reflected this. Xbox ownership had gone up while Nintendo Wii and Playstation were both down in January.
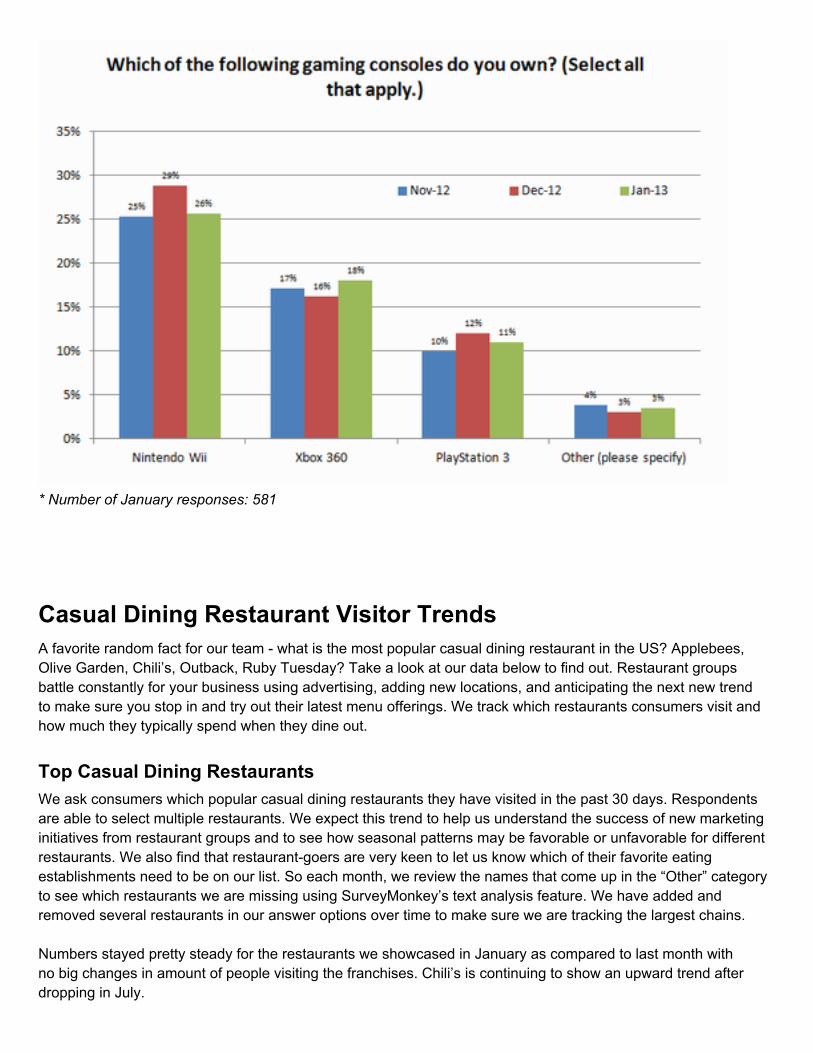
* Number of January responses: 581
Casual Dining Restaurant Visitor TrendsA favorite random fact for our team - what is the most popular casual dining restaurant in the US? Applebees, Olive Garden, Chili’s, Outback, Ruby Tuesday? Take a look at our data below to find out. Restaurant groups battle constantly for your business using advertising, adding new locations, and anticipating the next new trend to make sure you stop in and try out their latest menu offerings. We track which restaurants consumers visit and how much they typically spend when they dine out.
Top Casual Dining RestaurantsWe ask consumers which popular casual dining restaurants they have visited in the past 30 days. Respondents are able to select multiple restaurants. We expect this trend to help us understand the success of new marketing initiatives from restaurant groups and to see how seasonal patterns may be favorable or unfavorable for different restaurants. We also find that restaurant-goers are very keen to let us know which of their favorite eating establishments need to be on our list. So each month, we review the names that come up in the “Other” category to see which restaurants we are missing using SurveyMonkey’s text analysis feature. We have added and removed several restaurants in our answer options over time to make sure we are tracking the largest chains. Numbers stayed pretty steady for the restaurants we showcased in January as compared to last month with no big changes in amount of people visiting the franchises. Chili’s is continuing to show an upward trend after dropping in July.
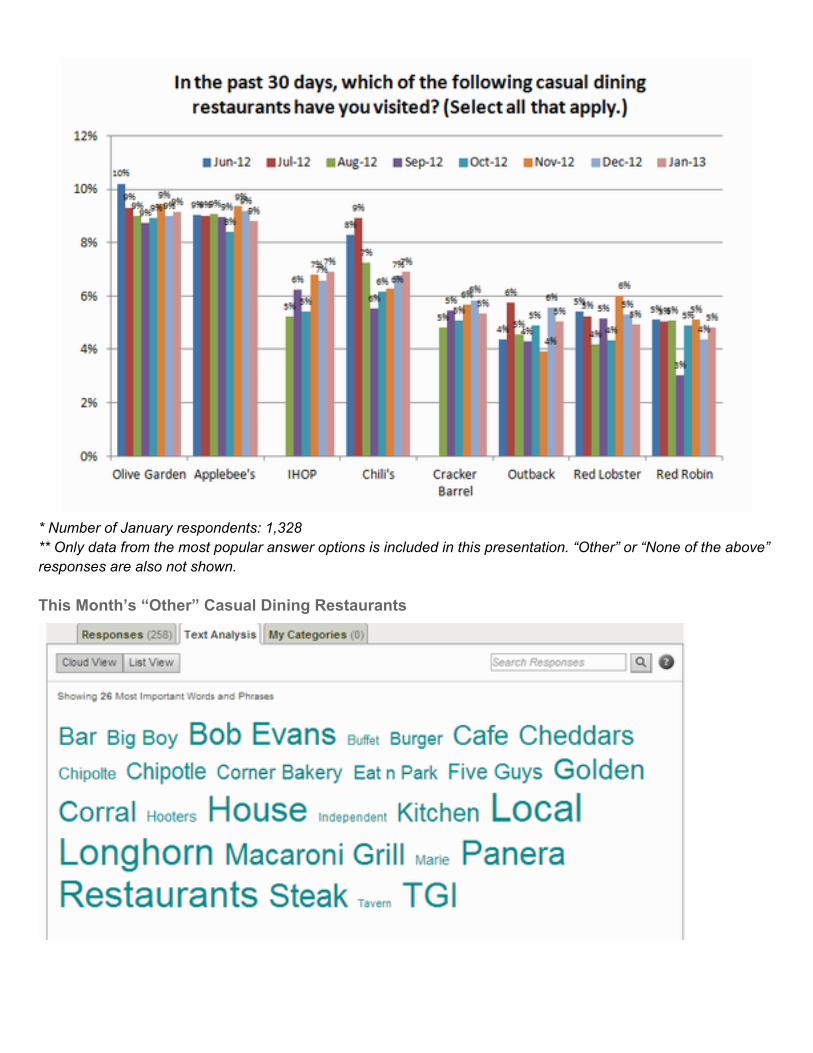
* Number of January respondents: 1,328** Only data from the most popular answer options is included in this presentation. “Other” or “None of the above” responses are also not shown.
This Month’s “Other” Casual Dining Restaurants
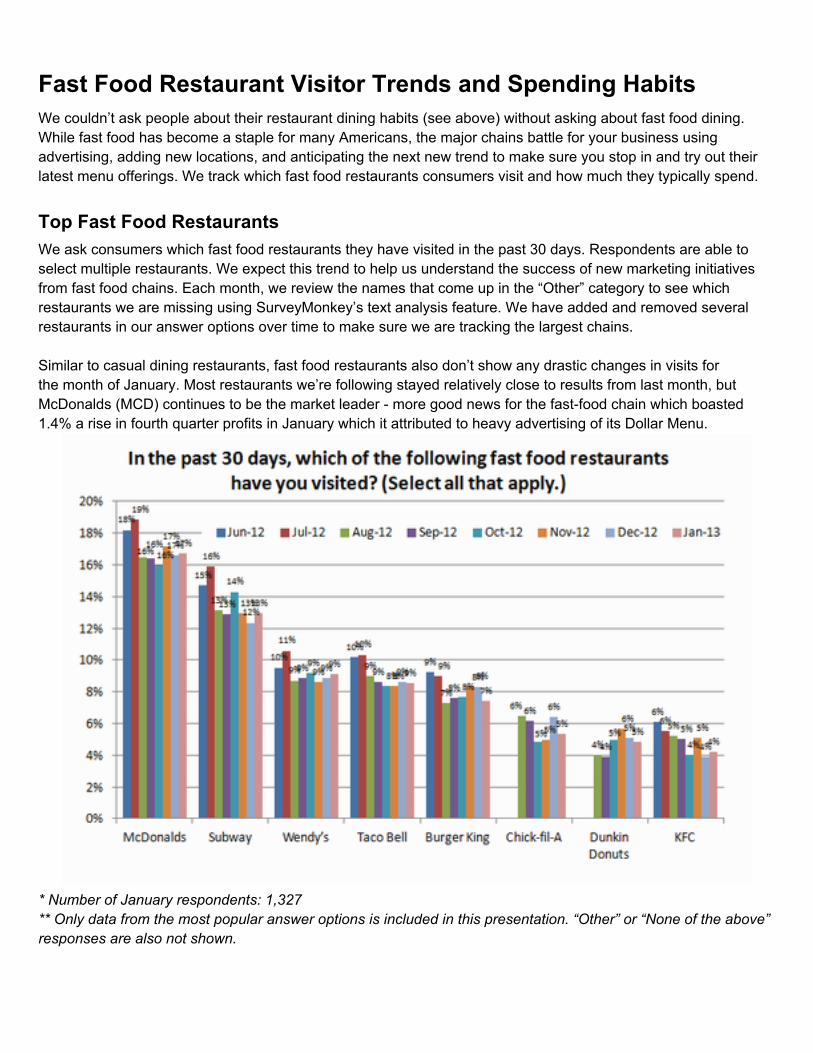
Fast Food Restaurant Visitor Trends and Spending HabitsWe couldn’t ask people about their restaurant dining habits (see above) without asking about fast food dining. While fast food has become a staple for many Americans, the major chains battle for your business using advertising, adding new locations, and anticipating the next new trend to make sure you stop in and try out their latest menu offerings. We track which fast food restaurants consumers visit and how much they typically spend.
Top Fast Food RestaurantsWe ask consumers which fast food restaurants they have visited in the past 30 days. Respondents are able to select multiple restaurants. We expect this trend to help us understand the success of new marketing initiatives from fast food chains. Each month, we review the names that come up in the “Other” category to see which restaurants we are missing using SurveyMonkey’s text analysis feature. We have added and removed several restaurants in our answer options over time to make sure we are tracking the largest chains. Similar to casual dining restaurants, fast food restaurants also don’t show any drastic changes in visits for the month of January. Most restaurants we’re following stayed relatively close to results from last month, but McDonalds (MCD) continues to be the market leader - more good news for the fast-food chain which boasted 1.4% a rise in fourth quarter profits in January which it attributed to heavy advertising of its Dollar Menu.
* Number of January respondents: 1,327** Only data from the most popular answer options is included in this presentation. “Other” or “None of the above” responses are also not shown.
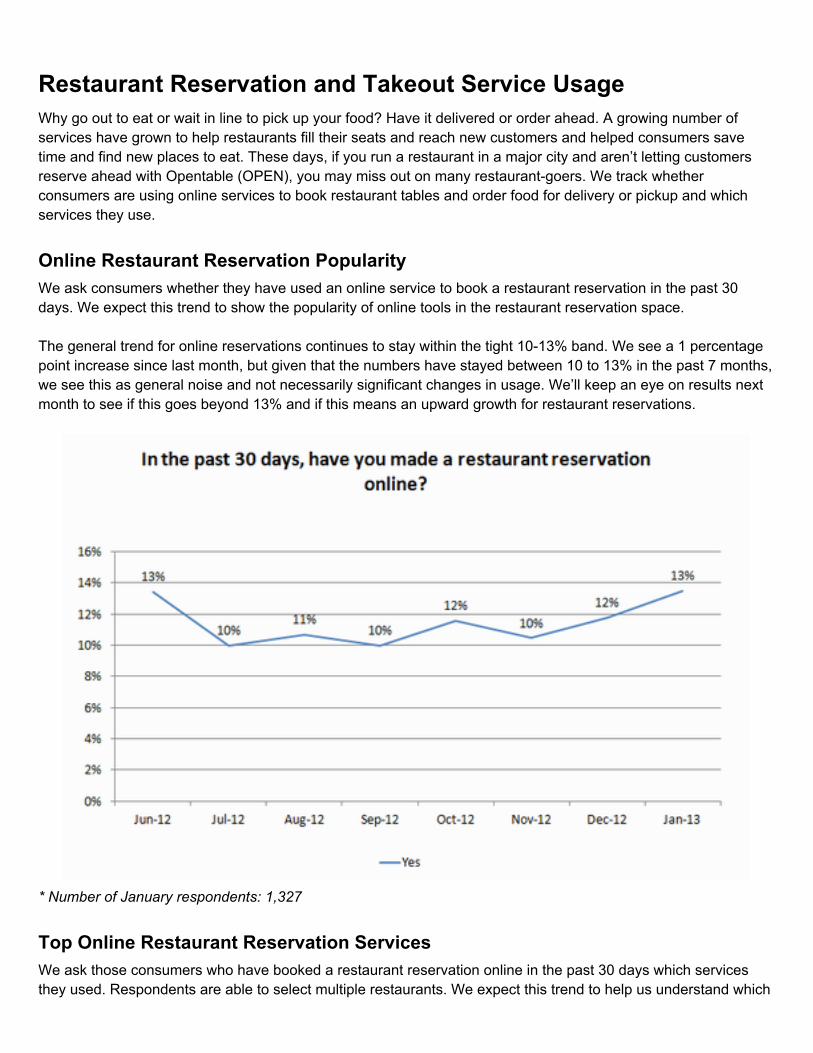
Restaurant Reservation and Takeout Service UsageWhy go out to eat or wait in line to pick up your food? Have it delivered or order ahead. A growing number of services have grown to help restaurants fill their seats and reach new customers and helped consumers save time and find new places to eat. These days, if you run a restaurant in a major city and aren’t letting customers reserve ahead with Opentable (OPEN), you may miss out on many restaurant-goers. We track whether consumers are using online services to book restaurant tables and order food for delivery or pickup and which services they use.
Online Restaurant Reservation PopularityWe ask consumers whether they have used an online service to book a restaurant reservation in the past 30 days. We expect this trend to show the popularity of online tools in the restaurant reservation space. The general trend for online reservations continues to stay within the tight 10-13% band. We see a 1 percentage point increase since last month, but given that the numbers have stayed between 10 to 13% in the past 7 months, we see this as general noise and not necessarily significant changes in usage. We’ll keep an eye on results next month to see if this goes beyond 13% and if this means an upward growth for restaurant reservations.
* Number of January respondents: 1,327
Top Online Restaurant Reservation ServicesWe ask those consumers who have booked a restaurant reservation online in the past 30 days which services they used. Respondents are able to select multiple restaurants. We expect this trend to help us understand which
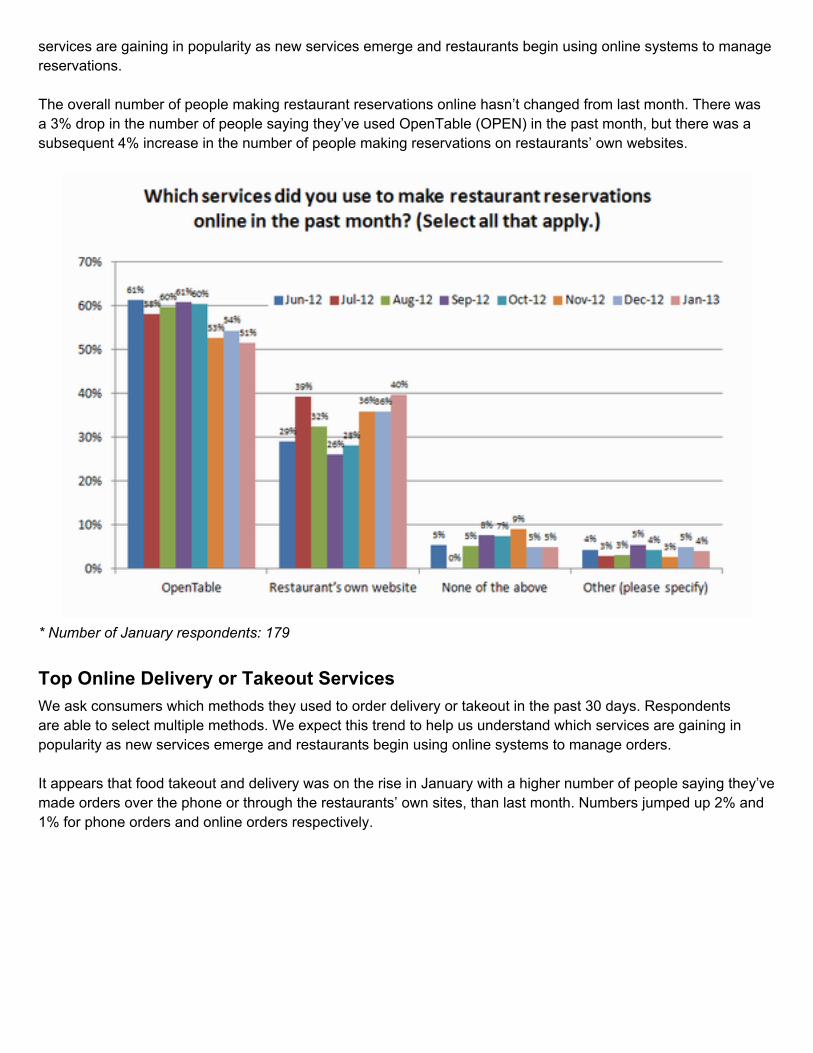
services are gaining in popularity as new services emerge and restaurants begin using online systems to manage reservations. The overall number of people making restaurant reservations online hasn’t changed from last month. There was a 3% drop in the number of people saying they’ve used OpenTable (OPEN) in the past month, but there was a subsequent 4% increase in the number of people making reservations on restaurants’ own websites.
* Number of January respondents: 179
Top Online Delivery or Takeout ServicesWe ask consumers which methods they used to order delivery or takeout in the past 30 days. Respondents are able to select multiple methods. We expect this trend to help us understand which services are gaining in popularity as new services emerge and restaurants begin using online systems to manage orders. It appears that food takeout and delivery was on the rise in January with a higher number of people saying they’ve made orders over the phone or through the restaurants’ own sites, than last month. Numbers jumped up 2% and 1% for phone orders and online orders respectively.
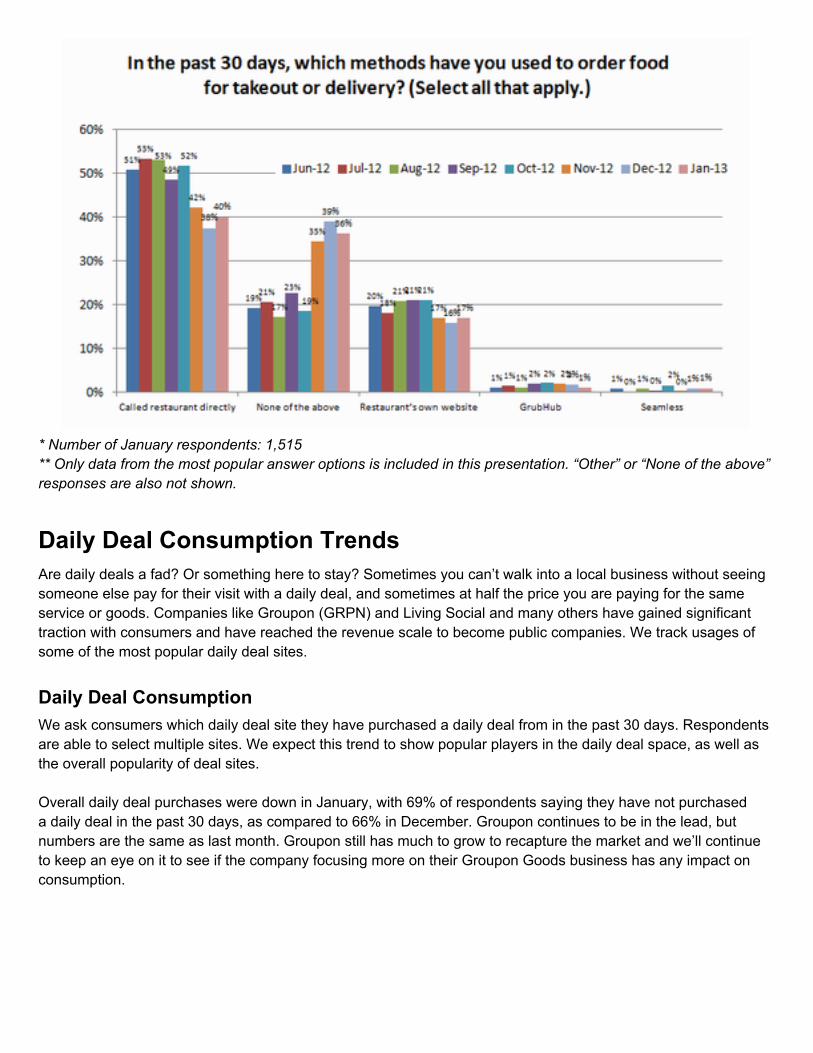
* Number of January respondents: 1,515** Only data from the most popular answer options is included in this presentation. “Other” or “None of the above” responses are also not shown.
Daily Deal Consumption TrendsAre daily deals a fad? Or something here to stay? Sometimes you can’t walk into a local business without seeing someone else pay for their visit with a daily deal, and sometimes at half the price you are paying for the same service or goods. Companies like Groupon (GRPN) and Living Social and many others have gained significant traction with consumers and have reached the revenue scale to become public companies. We track usages of some of the most popular daily deal sites.
Daily Deal ConsumptionWe ask consumers which daily deal site they have purchased a daily deal from in the past 30 days. Respondents are able to select multiple sites. We expect this trend to show popular players in the daily deal space, as well as the overall popularity of deal sites. Overall daily deal purchases were down in January, with 69% of respondents saying they have not purchased a daily deal in the past 30 days, as compared to 66% in December. Groupon continues to be in the lead, but numbers are the same as last month. Groupon still has much to grow to recapture the market and we’ll continue to keep an eye on it to see if the company focusing more on their Groupon Goods business has any impact on consumption.
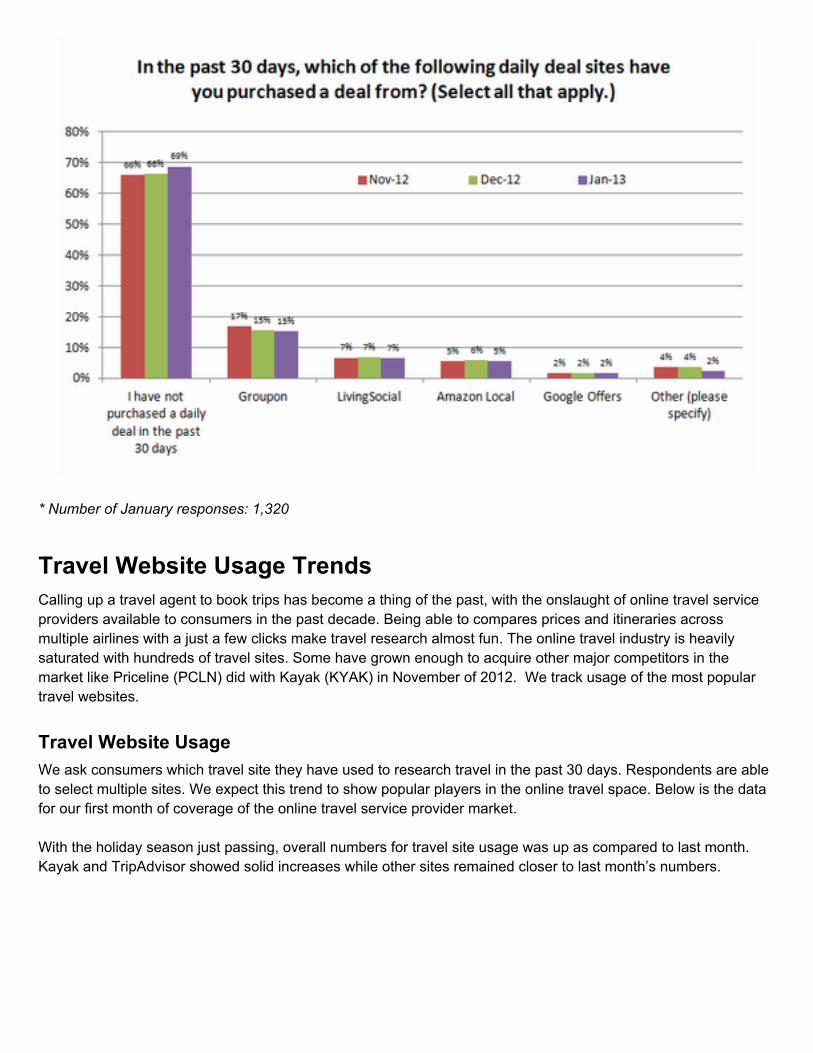
* Number of January responses: 1,320
Travel Website Usage TrendsCalling up a travel agent to book trips has become a thing of the past, with the onslaught of online travel service providers available to consumers in the past decade. Being able to compares prices and itineraries across multiple airlines with a just a few clicks make travel research almost fun. The online travel industry is heavily saturated with hundreds of travel sites. Some have grown enough to acquire other major competitors in the market like Priceline (PCLN) did with Kayak (KYAK) in November of 2012. We track usage of the most popular travel websites.
Travel Website UsageWe ask consumers which travel site they have used to research travel in the past 30 days. Respondents are able to select multiple sites. We expect this trend to show popular players in the online travel space. Below is the data for our first month of coverage of the online travel service provider market. With the holiday season just passing, overall numbers for travel site usage was up as compared to last month. Kayak and TripAdvisor showed solid increases while other sites remained closer to last month’s numbers.
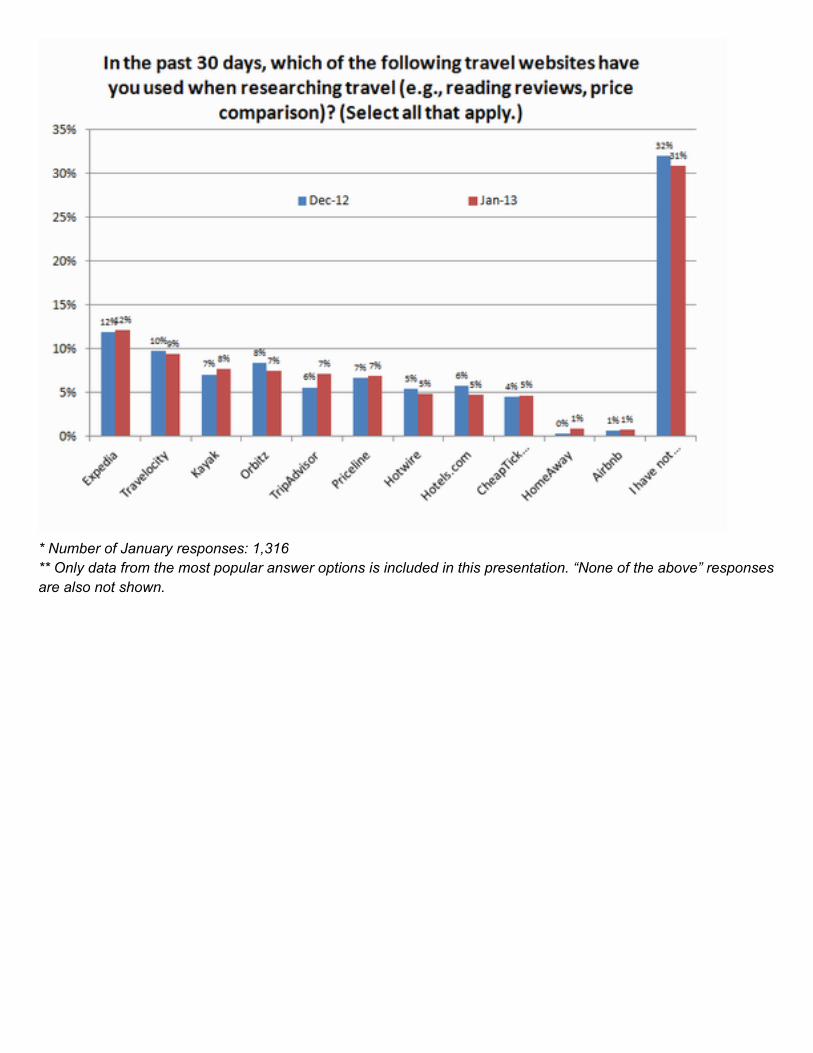
* Number of January responses: 1,316** Only data from the most popular answer options is included in this presentation. “None of the above” responses are also not shown.