Embed Size (px)
Citation preview
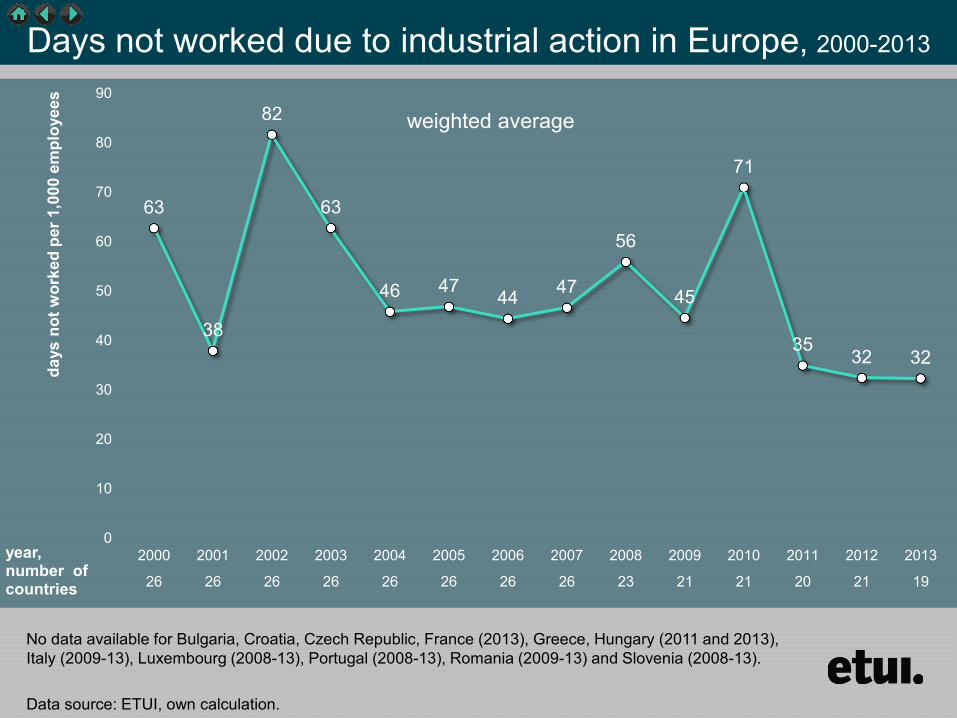
Days not worked due to industrial action in Europe 2000-2013
63
38
82
63
46 47 44 47
56
45
71
35 32 32
0
10
20
30
40
50
60
70
80
90
2000 2001 2002 2003 2004 2005 2006 2007 2008 2009 2010 2011 2012 2013
26 26 26 26 26 26 26 26 23 21 21 20 21 19
days
not
wor
ked
per 1
000
em
ploy
ees
year number of countries
weighted average
No data available for Bulgaria Croatia Czech Republic France (2013) Greece Hungary (2011 and 2013) Italy (2009-13) Luxembourg (2008-13) Portugal (2008-13) Romania (2009-13) and Slovenia (2008-13) Data source ETUI own calculation
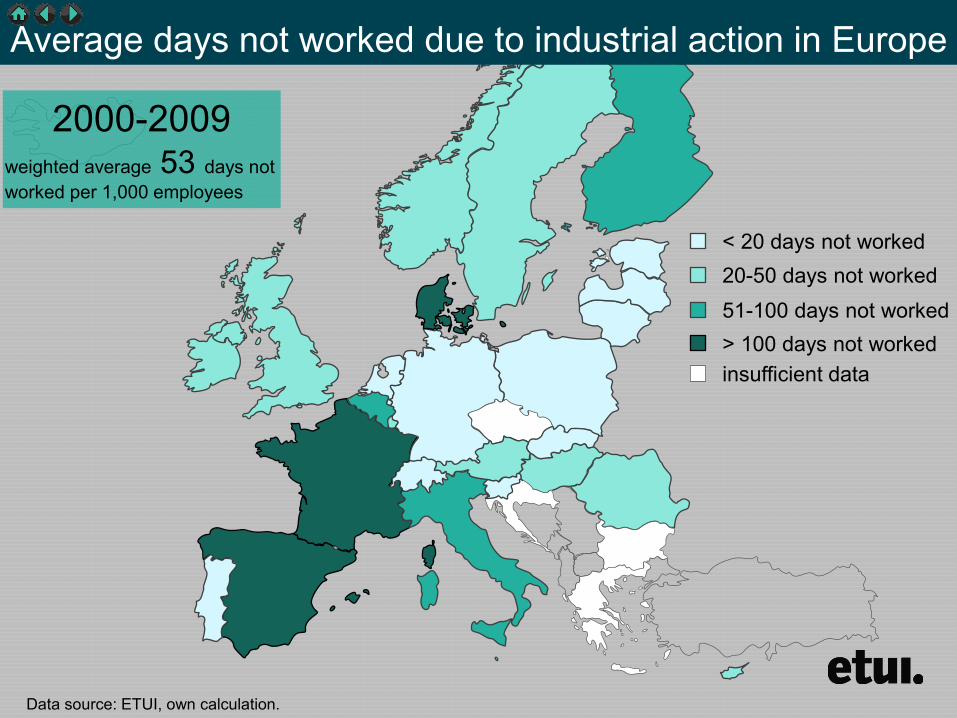
Average days not worked due to industrial action in Europe
20-50 days not worked 51-100 days not worked gt 100 days not worked insufficient data
lt 20 days not worked
Data source ETUI own calculation
2000-2009 weighted average 53 days not worked per 1000 employees
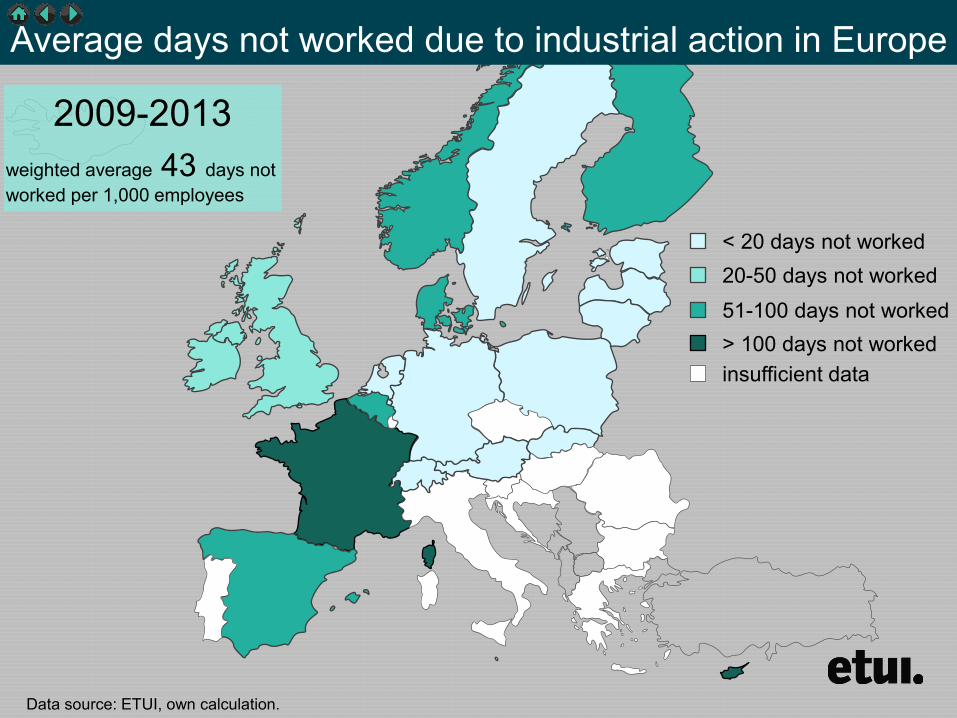
Average days not worked due to industrial action in Europe
20-50 days not worked 51-100 days not worked gt 100 days not worked insufficient data
lt 20 days not worked
Data source ETUI own calculation
2009-2013 weighted average 43 days not worked per 1000 employees
Days not worked due to industrial action comparing 1990s with 2000s
020406080
100120140160180200220240260280300320
ES FR(1)
DK IT(2)
BE(3)
FI wa NO IE AT sa LU(4)
CY UK MT RO(10)
HU(9)
SE SI(11)
PT(4)
DE NL PL LT(5)
SK(6)
EE(7)
CH LV(8)
days
not
wor
ked
per 1
000
em
ploy
ees average 1990-9 average 2000-9
Notes insufficient or no data for Bulgaria Croatia the Czech Republic and Greece (1) 1990-2012 (2) 1990-2008 (3) 1991-2013 (4) 1990-2007 (5) 2000-2013 (6) 1993-2013 (7) 1992-2013 (8) 1997-2013 (9) 1991-2010 and 2013 (10) 1990-2008 (11) 1992-2007 wa weighted average sa simple average Data source ETUI own calculation
Days not worked due to industrial action 2009-2013
514 171
82 76
66 65
56 55
46 43
24 14 13 11 9
4 3 2 1 1 1 0 0
CYFR (1)
DKNOBE
ES (2)saFIIE
waUKMTDEEENLSEAT
HU (3)PLCHLTLVSK
average days not worked per 1000 employees
Notes insufficient or no data for Bulgaria Croatia the Czech Republic Greece Italy Luxembourg Portugal Romania and Slovenia (1) 2009-2012 (2) excluding (general) strikes in 2012 and 2013 (3) 2009-10 and 2012 wa weighted average sa simple average
Data source ETUI own calculation
right to strike private sector public sector
data coverage Only strikes Workers involved excludes workers indirectly involved
0
100
200
300
400
2000
2001
2002
2003
2004
2005
2006
2007
2008
2009
2010
2011
2012
2013
days not worked (per 1000 employees)
0
50
100
150
200
250
2000
2001
2002
2003
2004
2005
2006
2007
2008
2009
2010
2011
2012
2013
workers involved in industrial action (per 1000 employees)
Austria
source Statistik Arbeiterkammer Sozialstatistik Streikstatistik OumlGB Streikstatistik
multi-employer bargaining system
Not codified in the Constitution or in national legislation No Supreme Court case law exists on the topic Since 1870 collective action has been tolerated
peak 2003 Union mobilisation against state pension reform and exceptional railway strike against its restructuring peak 2011 2-days warning strikes in the metal sector
right to strike private sector public sector
data coverage Strikes and lockout Strikes in the public sector are excluded until 2002 Since 2003 strikes in the public sector are included except for strikes in the local and county administration
0
20
40
60
80
100
120
140
160
180
200
2000
2001
2002
2003
2004
2005
2006
2007
2008
2009
2010
2011
2012
2013
days not worked (per 1000 employees)
Belgium
source Rijksdienst voor Sociale ZekerheidOffice nationale de seacutecuriteacute sociale
multi-employer bargaining system
Recognised as an individual right and developed through case law
peak 2005 Union mobilisation against early-retirement scheme reform peak 2011 Public sector strike against pension reforms peak 2012 General strike against unemployment scheme reforms pension reforms and austerity measures expected peak in 2014 Regional strikes and general strike against austerity measures
right to strike private sector public sector
data coverage Strikes and lockouts Excluding strikes that last less than 2 hours Workers involved excludes workers indirectly involved
0
500
1000
1500
2000
2000
2001
2002
2003
2004
2005
2006
2007
2008
2009
2010
2011
2012
2013
days not worked (per 1000 employees)
0
100
200
300
2000
2001
2002
2003
2004
2005
2006
2007
2008
2009
2010
2011
2012
2013
workers involved in industrial action (per 1000 employees)
Cyprus
source Department of Labour Relations Labour Disputes Statistics ILOSTAT
mixed bargaining system
Guaranteed by the Constitution peak 2006 Sectoral one-day strike in construction industry over a renewal of the industry-wide collective agreement peak 2011 Public servantsrsquo strike against a two-year pay-freeze and austerity measures peak 2012 24-hour strike in construction industry but also strikes in other industries mostly in protest to honour pay rises and cost-of-living
increases peak 2013 Open-ended strike in the construction industry over the renewal of the industry-wide collective agreement it was the longest
strike in Cyprusrsquo history since 1948
right to strike private sector public sector
data coverage Strikes and lockouts Workers involved excludes workers indirectly involved
0
200
400
600
800
2000
2001
2002
2003
2004
2005
2006
2007
2008
2009
2010
2011
2012
2013
days not worked (per 1000 employees)
0
20
40
60
2000
2001
2002
2003
2004
2005
2006
2007
2008
2009
2010
2011
2012
2013
workers involved in industrial action (per 1000 employees)
Denmark
source Danmarks Statistik Arbejdsstandsninger
multi-employer bargaining system
Guaranteed by the Constitution and developed through case-law and most importantly regulated by collective agreements between the social partners
peak 2008 Large strike in the healthcare and social work sector for a wage increase at time of the renewal of collective agreements
peak 2013 Lockout by the municipalities association in the education sector
right to strike private sector public sector
data coverage Strikes and lockouts Workers involved includes workers directly and indirectly involved in 2012 Data excludes warning and supportive strikes
0
20
40
60
2000
2001
2002
2003
2004
2005
2006
2007
2008
2009
2010
2011
2012
2013
days not worked (per 1000 employees)
0
20
40
60
2000
2001
2002
2003
2004
2005
2006
2007
2008
2009
2010
2011
2012
2013
workers involved in industrial action (per 1000 employees)
Estonia
source 2000-2009 ILOSTAT since 2010 Statistics Estonia Subject areas Economy Wages and salaries and labour costs Statistical database Strikes
single-employer bargaining system
Guaranteed by the Constitution and regulated by law
peak 2003 One-day strike in education and culture workers for pay increase peak 2012 Teachersrsquo strike and strike in health care sector both over pay increase
right to strike private sector public sector
data coverage Strikes and lockouts Workers involved excludes workers indirectly involved
0
100
200
300
2000
2001
2002
2003
2004
2005
2006
2007
2008
2009
2010
2011
2012
2013
days not worked (per 1000 employees)
0
20
40
60
80
2000
2001
2002
2003
2004
2005
2006
2007
2008
2009
2010
2011
2012
2013
workers involved in industrial action (per 1000 employees)
Finland
source Statistics Finland Labour Market Statistics on labour disputes
multi-employer bargaining system
Implicitly guaranteed by the Constitution and explicitly by law
peak 2005 Four-day strike and numerous other strikes in the paper-industry over a renewal of the collective agreement peak 2010 Large two-week strike of stevedores about severance pay and outsourcing besides several other strikes in
manufacturing and in wholesale and retail trade
right to strike private sector public sector
050
100150200250300350
2000
2001
2002
2003
2004
2005
2006
2007
2008
2009
2010
2011
2012
2013
days not worked (per 1000 employees)
0
20
40
60
80
2000
2001
2002
2003
2004
2005
2006
2007
2008
2009
2010
2011
2012
2013
workers involved in industrial action (per 1000 employees)
France
source 2000-2004 (volume) ILOSTAT Since 2005 (volume) ETUI estimate based on combining DARES data and data from the Direction geacuteneacuterale de lrsquoadministration et de la fonction publique The DARES covers industrial action in the private sector including some semi-public enterprises The data from the Direction geacuteneacuterale de lrsquoadministration covers the public sector and overlaps with the DARES data in case of some semi-public enterprises Relying only on the DARES data clearly underestimates the volume 2000-2007 (participation) Combining ILOSTAT Carley (2008) and Carley (2010)
multi-employer bargaining system
Recognised as an individual right and guaranteed by the Constitution regulated by law in the public sector and mainly developed through case law in the private sector
peak 2003 and 2010 Union mobilisation against pension reforms
right to strike private sector public sector
data coverage 2000-2003 Strikes and lockouts Excluding public administration Workers involved excludes workers indirectly involved
0
20
40
60
2000
2001
2002
2003
2004
2005
2006
2007
2008
2009
2010
2011
2012
2013
days not worked (per 1000 employees)
0
10
20
30
40
50
2000
2001
2002
2003
2004
2005
2006
2007
2008
2009
2010
2011
2012
2013
workers involved in industrial action (per 1000 employees)
Germany
source 2000-2003 ILOSTAT since 2004 WSI estimate
multi-employer bargaining system
Implicitly guaranteed by the Constitution and developed through case-law
peak 2006 Strikes in the public sector particularly health care besides short warning strikes in metal industry
right to strike private sector public sector
data coverage Strikes and lockouts 2012 Only strikes Excluding strikes that last less than 100 days workers involved includes workers directly and indirectly involved
0
50
100
150
200
2000
2001
2002
2003
2004
2005
2006
2007
2008
2009
2010
2011
2012
2013
days not worked (per 1000 employees)
0
5
10
15
20
2000
2001
2002
2003
2004
2005
2006
2007
2008
2009
2010
2011
2012
2013
workers involved in industrial action (per 1000 employees)
Hungary
source 2000-2009 Carley (2004) Carley (2008) and Carley (2010) 2010 Hungarian Statistical Office 2012 ILOSTAT
single-employer bargaining system
Guaranteed by the Constitution and by law
peak 2000 National strike in health care sector
right to strike private sector public sector
data coverage Only strikes Disputes are included if they involve a stoppage of work lasting for at least one day and the total time lost is 10 or more person-days Workers involved excludes workers indirectly involved
0
50
100
150
200
2000
2001
2002
2003
2004
2005
2006
2007
2008
2009
2010
2011
2012
2013
days not worked (per 1000 employees)
0
50
100
150
200
2000
2001
2002
2003
2004
2005
2006
2007
2008
2009
2010
2011
2012
2013
workers involved in industrial action (per 1000 employees)
Ireland
source Central Statistics Office Databank StatBank Labour Market and Earnings Labour Market Industrial Disputes
single-employer bargaining system
Guaranteed by law and developed through case-law
peak 2009 24-hour national public service strike against governmentrsquos pay cuts
right to strike private sector public sector
data coverage Strikes and lockouts Workers involved excludes workers indirectly involved
0
100
200
300
2000
2001
2002
2003
2004
2005
2006
2007
2008
2009
2010
2011
2012
2013
days not worked (per 1000 employees)
0
100
200
300
2000
2001
2002
2003
2004
2005
2006
2007
2008
2009
2010
2011
2012
2013
workers involved in industrial action (per 1000 employees)
Italy
source Istituto Nazionale di Statistica ILOSTAT Official strike data is no longer collected since 2009
multi-employer bargaining system
Recognised as an individual right and guaranteed by the Constitution and developed through case-law
peak 2002 General strike against labour market reforms
right to strike private sector public sector
data coverage Strikes and lockouts Workers involved excludes workers indirectly involved
0
1
2
3
4
2000
2001
2002
2003
2004
2005
2006
2007
2008
2009
2010
2011
2012
2013
days not worked (per 1000 employees)
0
1
2
3
2000
2001
2002
2003
2004
2005
2006
2007
2008
2009
2010
2011
2012
2013
workers involved in industrial action (per 1000 employees)
Latvia
source ILOSTAT
single-employer bargaining system
Guaranteed by the Constitution and regulated by law
peak 2008 Not attributable to a single large strike
right to strike private sector public sector
data coverage Only strikes Workers involved includes workers directly and indirectly involved
0
10
20
30
2000
2001
2002
2003
2004
2005
2006
2007
2008
2009
2010
2011
2012
2013
days not worked (per 1000 employees)
0
2
4
6
8
10
2000
2001
2002
2003
2004
2005
2006
2007
2008
2009
2010
2011
2012
2013
workers involved in industrial action (per 1000 employees)
Lithuania
source 2000-2008 2012 ILOSTAT 2009 Carley (2010) 2010-2011 and 2013 Statistics Lithuania Official Statistics Portal Population and social statistics Statistical information on strikes An estimate is also provided by Carley (2008 2010)
single-employer bargaining system
Guaranteed by the Constitution and regulated by law
peak 2008 Various teacherrsquos strike over a pay increase and other demands and other strikes in the public sector
right to strike private sector public sector
0
50
100
150
2000
2001
2002
2003
2004
2005
2006
2007
2008
2009
2010
2011
2012
2013
days not worked (per 1000 employees)
0
100
200
300
2000
2001
2002
2003
2004
2005
2006
2007
2008
2009
2010
2011
2012
2013
workers involved in industrial action (per 1000 employees)
Luxembourg
source Carley (2004) Carley (2008) and Carley (2010) Official data is no longer available since 2009
mixed bargaining system
Developed through case law
peak 2007 One-day general strike in public sector and a two-day railway strike over civil service and state employee pensions
right to strike private sector public sector
data coverage Strikes and lockouts Workers involved excludes workers indirectly involved
0
20
40
60
2000
2001
2002
2003
2004
2005
2006
2007
2008
2009
2010
2011
2012
2013
days not worked (per 1000 employees)
0
20
40
60
80
100
2000
2001
2002
2003
2004
2005
2006
2007
2008
2009
2010
2011
2012
2013
workers involved in industrial action (per 1000 employees)
Malta
source Industrial and Employment Relations Publications and Archives Archives Annual Reports ILOSTAT
single-employer bargaining system
Indirectly recognised by law
peak 2009 Not attributable to a specific large strike
right to strike private sector public sector
data coverage Only strikes Workers involved excludes workersindirectly involved
0
10
20
30
40
2000
2001
2002
2003
2004
2005
2006
2007
2008
2009
2010
2011
2012
2013
days not worked (per 1000 employees)
0
5
10
15
20
2000
2001
2002
2003
2004
2005
2006
2007
2008
2009
2010
2011
2012
2013
workers involved in industrial action (per 1000 employees)
Netherlands
source Centraal Bureau voor de Statistiek Cijfers Statline databank Thema Arbeidsmarkt Vakbeweging en stakingen Historie Werkstakingen
multi-employer bargaining system
Developed through case law
peak 2002 Strike action in construction industry peak 2012 15 weeks strike in cleaning sector over renewal of collective agreement besides strike action in the education sector
against austerity measures
right to strike private sector public sector
data coverage Strikes and lockout excluding strikes that last less than 1 day Workers involved includes workers directly and indirectly involved
0
50
100
150
200
250
2000
2001
2002
2003
2004
2005
2006
2007
2008
2009
2010
2011
2012
2013
days not worked (per 1000 employees)
0
10
20
30
40
50
2000
2001
2002
2003
2004
2005
2006
2007
2008
2009
2010
2011
2012
2013
workers involved in industrial action (per 1000 employees)
Norway
source Statistics Norway Statistics Labour market and earnings Strikes and lockouts
multi-employer bargaining system
Mainly regulated by collective agreements between the social partners
nearly two yearly peaks Negotiations about renewal of collective agreements in the economic sectors
right to strike private sector public sector
data coverage Only strikes excluding strikes that last less than 1 day workers involved excludes workers indirectly involved
0
5
10
15
20
25
2000
2001
2002
2003
2004
2005
2006
2007
2008
2009
2010
2011
2012
2013
days not worked (per 1000 employees)
0
5
10
15
20
2000
2001
2002
2003
2004
2005
2006
2007
2008
2009
2010
2011
2012
2013
workers involved in industrial action (per 1000 employees)
Poland
source ILOSTAT
single-employer bargaining system
Guaranteed by the Constitution and regulated by law
peak 2008 Various teachersrsquo strikes over a pay increase and other demands and other strikes in the public sector
right to strike private sector public sector
data coverage Only strikes excluding public administration workers involved excludes workers indirectly involved
0
10
20
30
2000
2001
2002
2003
2004
2005
2006
2007
2008
2009
2010
2011
2012
2013
days not worked (per 1000 employees)
0
5
10
15
20
25
2000
2001
2002
2003
2004
2005
2006
2007
2008
2009
2010
2011
2012
2013
workers involved in industrial action (per 1000 employees)
Portugal
source Gabinete de Estrateacutegia e Planeamento Estatiacutestica Greves Official strike data is not available after 2007
multi-employer bargaining system
Guaranteed by the Constitution and regulated by law
peak 2002 Several strike actions particularly in the public sector against changes in the Labour Code
right to strike private sector public sector
data coverage Only strikes Workers involved excludes workers indirectly involved
0
50
100
2000
2001
2002
2003
2004
2005
2006
2007
2008
2009
2010
2011
2012
2013
days not worked (per 1000 employees)
0
2
4
6
8
10
2000
2001
2002
2003
2004
2005
2006
2007
2008
2009
2010
2011
2012
2013
workers involved in industrial action (per 1000 employees)
Romania
source ILOSTAT Official data is very partial in 2009 and not available after 2010
single-employer bargaining system
Guaranteed by the Constitution and regulated by law
peaks 2000 and 2007 Several strike actions in particularly the manufacturing industry
right to strike private sector public sector
data coverage Only strikes workers involved excludes workers indirectly involved
0
10
20
30
40
2000
2001
2002
2003
2004
2005
2006
2007
2008
2009
2010
2011
2012
2013
days not worked (per 1000 employees)
0
2
4
6
8
10
2000
2001
2002
2003
2004
2005
2006
2007
2008
2009
2010
2011
2012
2013
workers involved in industrial action (per 1000 employees)
Slovakia
source 2000-2002 ILOSTAT 2003-2009 Carley (2004) Carley (2008) and Carley (2010) Since 2010 Statistical Office of the Slovak Republic (on demand)
mixed bargaining system
Guaranteed by the Constitution and regulated by law
peak 2003 Limited number of strike actions in railways and the public sector
right to strike private sector public sector
0
10
20
30
40
50
2000
2001
2002
2003
2004
2005
2006
2007
2008
2009
2010
2011
2012
2013
days not worked (per 1000 employees)
0
2
4
6
2000
2001
2002
2003
2004
2005
2006
2007
2008
2009
2010
2011
2012
2013
workers involved in industrial action (per 1000 employees)
Slovenia
source Carley (2004) Carley (2008) and Carley (2010) Trade union data (ZSSS) Official data is not available
multi-employer bargaining system
Guaranteed by the Constitution and regulated by law
peak 2005 Union mobilisation against labour market reforms
right to strike private sector public sector
data coverage Strikes and lockouts excluding strikes that last less than 1 hour workers involved excludes workers indirectly involved The 2012 data excludes the general strikes of the 29th of March and the 14th of November and the nation-wide strike in the education sector of 22nd of May In 2013 several strikes in the education sector are excluded
050
100150200250300350
2000
2001
2002
2003
2004
2005
2006
2007
2008
2009
2010
2011
2012
2013
days not worked (per 1000 employees)
050
100150200250300350
2000
2001
2002
2003
2004
2005
2006
2007
2008
2009
2010
2011
2012
2013
workers involved in industrial action (per 1000 employees)
Spain
source ILOSTAT Ministry of Employment and Social Security Statistics Condiciones de trabajo y relaciones laborales Huelgas y Cierres Patronales
multi-employer bargaining system
Guaranteed by the Constitution and regulated by law
peak 2004 Strike action in shipyards over renewal of collective agreements and against relocation decisions in mainly the manufacturing industry
underestimated peak in 2012 and 2013 General strikes in 2012 and various strikes in the public sector
right to strike private sector public sector
data coverage Strikes and lockouts Workers involved excludes workers indirectly involved
0
50
100
150
200
2000
2001
2002
2003
2004
2005
2006
2007
2008
2009
2010
2011
2012
2013
days not worked (per 1000 employees)
0
5
10
15
20
25
2000
2001
2002
2003
2004
2005
2006
2007
2008
2009
2010
2011
2012
2013
workers involved in industrial action (per 1000 employees)
Sweden
source Sweden National Mediation Office Melding amp konflikt Konfliktstatistik
multi-employer bargaining system
Guaranteed by the Constitution and regulated by law and in the 1938 collective agreement between the social partners
peak 2003 Large strike of blue-collar workers in the municipal and city council sector over a new pay agreement
right to strike private sector public sector
data coverage Strikes and lockouts Excluding strikes that last less than 1 day Workers involved includes workers directly and indirectly involved
0
5
10
15
2000
2001
2002
2003
2004
2005
2006
2007
2008
2009
2010
2011
2012
2013
days not worked (per 1000 employees)
0
2
4
6
8
10
2000
2001
2002
2003
2004
2005
2006
2007
2008
2009
2010
2011
2012
2013
workers involved in industrial action (per 1000 employees)
Switzerland
source Office feacutedeacuteral de la statistique Thegravemes Organisation du marcheacute du travail conventions collectives de travail Donneacutees deacutetailleacutees Gregraveves et lock-out
multi-employer bargaining system
Guaranteed by the Constitution and regulated by law and in the 1938 collective agreement between the social partners
peak 2004 Difficult to attribute to a specific large strike
right to strike private sector public sector
data coverage 2000-2008 Excluding political strikes Since 2009 Strikes and lockouts Excluding strikes that last less than 1 day Workers involved includes workers directly and indirectly involved
0
20
40
60
2000
2001
2002
2003
2004
2005
2006
2007
2008
2009
2010
2011
2012
2013
days not worked (per 1000 employees)
0
20
40
60
2000
2001
2002
2003
2004
2005
2006
2007
2008
2009
2010
2011
2012
2013
workers involved in industrial action (per 1000 employees)
United Kingdom
source Office for National Statistics Browse by Theme Labour Market Labour Disputes Days Lost due to Industrial Action
single-employer bargaining system
Regulated by law
peak 2004 One-day strike by civil servants to protest against governments plans to cut a large number of civil service posts peak 2007 One-day strike by postal workers in protest over pay and modernisation plans and one-day strike by prison officers
against the governmentrsquos decision to introduce a pay award in stages peak 2011 Union mobilisation against public service pension reforms in June and November
Right to strike legend
yes with minor restrictions (eg recognized union balloting proportionality respect of peace obligation)
yes with major restrictions (eg monopoly union compulsory arbitration or conciliation restrictions on issues or content major groups excluded
no
yes
private sector
yes with minor restrictions (eg recognized union balloting proportionality respect of peace obligation only military judiciary or police excluded ndash as per ILO convention)
yes with major restrictions (eg monopoly union compulsory arbitration or conciliation restrictions on issues or content major groups excluded
no
yes
public sector
source J Visser Database on Institutional Characteristics of Trade Unions Wage Setting State Intervention and Social Pacts (ICTWSS) database version 4 2013 The indicators reflect the situation in 2011
Prevelant bargaining regime legend
Single-employer bargaining system the establishment or company level is predominant
Multi-employer bargaining system sector andor the cross-sector level is predominant
Mixed bargaining system an intermediate situation where sector and company negotiations each respectively account for at least one-third of those covered by collective wage-setting arrangements
source P Marginson and C Welz (2014) Changes to wage-setting mechanisms in the context of the crisis and the EUrsquos new economic governance regime Dublin Eurofound
Average days not worked due to industrial action in Europe
20-50 days not worked 51-100 days not worked gt 100 days not worked insufficient data
lt 20 days not worked
Data source ETUI own calculation
2000-2009 weighted average 53 days not worked per 1000 employees
Average days not worked due to industrial action in Europe
20-50 days not worked 51-100 days not worked gt 100 days not worked insufficient data
lt 20 days not worked
Data source ETUI own calculation
2009-2013 weighted average 43 days not worked per 1000 employees
Days not worked due to industrial action comparing 1990s with 2000s
020406080
100120140160180200220240260280300320
ES FR(1)
DK IT(2)
BE(3)
FI wa NO IE AT sa LU(4)
CY UK MT RO(10)
HU(9)
SE SI(11)
PT(4)
DE NL PL LT(5)
SK(6)
EE(7)
CH LV(8)
days
not
wor
ked
per 1
000
em
ploy
ees average 1990-9 average 2000-9
Notes insufficient or no data for Bulgaria Croatia the Czech Republic and Greece (1) 1990-2012 (2) 1990-2008 (3) 1991-2013 (4) 1990-2007 (5) 2000-2013 (6) 1993-2013 (7) 1992-2013 (8) 1997-2013 (9) 1991-2010 and 2013 (10) 1990-2008 (11) 1992-2007 wa weighted average sa simple average Data source ETUI own calculation
Days not worked due to industrial action 2009-2013
514 171
82 76
66 65
56 55
46 43
24 14 13 11 9
4 3 2 1 1 1 0 0
CYFR (1)
DKNOBE
ES (2)saFIIE
waUKMTDEEENLSEAT
HU (3)PLCHLTLVSK
average days not worked per 1000 employees
Notes insufficient or no data for Bulgaria Croatia the Czech Republic Greece Italy Luxembourg Portugal Romania and Slovenia (1) 2009-2012 (2) excluding (general) strikes in 2012 and 2013 (3) 2009-10 and 2012 wa weighted average sa simple average
Data source ETUI own calculation
right to strike private sector public sector
data coverage Only strikes Workers involved excludes workers indirectly involved
0
100
200
300
400
2000
2001
2002
2003
2004
2005
2006
2007
2008
2009
2010
2011
2012
2013
days not worked (per 1000 employees)
0
50
100
150
200
250
2000
2001
2002
2003
2004
2005
2006
2007
2008
2009
2010
2011
2012
2013
workers involved in industrial action (per 1000 employees)
Austria
source Statistik Arbeiterkammer Sozialstatistik Streikstatistik OumlGB Streikstatistik
multi-employer bargaining system
Not codified in the Constitution or in national legislation No Supreme Court case law exists on the topic Since 1870 collective action has been tolerated
peak 2003 Union mobilisation against state pension reform and exceptional railway strike against its restructuring peak 2011 2-days warning strikes in the metal sector
right to strike private sector public sector
data coverage Strikes and lockout Strikes in the public sector are excluded until 2002 Since 2003 strikes in the public sector are included except for strikes in the local and county administration
0
20
40
60
80
100
120
140
160
180
200
2000
2001
2002
2003
2004
2005
2006
2007
2008
2009
2010
2011
2012
2013
days not worked (per 1000 employees)
Belgium
source Rijksdienst voor Sociale ZekerheidOffice nationale de seacutecuriteacute sociale
multi-employer bargaining system
Recognised as an individual right and developed through case law
peak 2005 Union mobilisation against early-retirement scheme reform peak 2011 Public sector strike against pension reforms peak 2012 General strike against unemployment scheme reforms pension reforms and austerity measures expected peak in 2014 Regional strikes and general strike against austerity measures
right to strike private sector public sector
data coverage Strikes and lockouts Excluding strikes that last less than 2 hours Workers involved excludes workers indirectly involved
0
500
1000
1500
2000
2000
2001
2002
2003
2004
2005
2006
2007
2008
2009
2010
2011
2012
2013
days not worked (per 1000 employees)
0
100
200
300
2000
2001
2002
2003
2004
2005
2006
2007
2008
2009
2010
2011
2012
2013
workers involved in industrial action (per 1000 employees)
Cyprus
source Department of Labour Relations Labour Disputes Statistics ILOSTAT
mixed bargaining system
Guaranteed by the Constitution peak 2006 Sectoral one-day strike in construction industry over a renewal of the industry-wide collective agreement peak 2011 Public servantsrsquo strike against a two-year pay-freeze and austerity measures peak 2012 24-hour strike in construction industry but also strikes in other industries mostly in protest to honour pay rises and cost-of-living
increases peak 2013 Open-ended strike in the construction industry over the renewal of the industry-wide collective agreement it was the longest
strike in Cyprusrsquo history since 1948
right to strike private sector public sector
data coverage Strikes and lockouts Workers involved excludes workers indirectly involved
0
200
400
600
800
2000
2001
2002
2003
2004
2005
2006
2007
2008
2009
2010
2011
2012
2013
days not worked (per 1000 employees)
0
20
40
60
2000
2001
2002
2003
2004
2005
2006
2007
2008
2009
2010
2011
2012
2013
workers involved in industrial action (per 1000 employees)
Denmark
source Danmarks Statistik Arbejdsstandsninger
multi-employer bargaining system
Guaranteed by the Constitution and developed through case-law and most importantly regulated by collective agreements between the social partners
peak 2008 Large strike in the healthcare and social work sector for a wage increase at time of the renewal of collective agreements
peak 2013 Lockout by the municipalities association in the education sector
right to strike private sector public sector
data coverage Strikes and lockouts Workers involved includes workers directly and indirectly involved in 2012 Data excludes warning and supportive strikes
0
20
40
60
2000
2001
2002
2003
2004
2005
2006
2007
2008
2009
2010
2011
2012
2013
days not worked (per 1000 employees)
0
20
40
60
2000
2001
2002
2003
2004
2005
2006
2007
2008
2009
2010
2011
2012
2013
workers involved in industrial action (per 1000 employees)
Estonia
source 2000-2009 ILOSTAT since 2010 Statistics Estonia Subject areas Economy Wages and salaries and labour costs Statistical database Strikes
single-employer bargaining system
Guaranteed by the Constitution and regulated by law
peak 2003 One-day strike in education and culture workers for pay increase peak 2012 Teachersrsquo strike and strike in health care sector both over pay increase
right to strike private sector public sector
data coverage Strikes and lockouts Workers involved excludes workers indirectly involved
0
100
200
300
2000
2001
2002
2003
2004
2005
2006
2007
2008
2009
2010
2011
2012
2013
days not worked (per 1000 employees)
0
20
40
60
80
2000
2001
2002
2003
2004
2005
2006
2007
2008
2009
2010
2011
2012
2013
workers involved in industrial action (per 1000 employees)
Finland
source Statistics Finland Labour Market Statistics on labour disputes
multi-employer bargaining system
Implicitly guaranteed by the Constitution and explicitly by law
peak 2005 Four-day strike and numerous other strikes in the paper-industry over a renewal of the collective agreement peak 2010 Large two-week strike of stevedores about severance pay and outsourcing besides several other strikes in
manufacturing and in wholesale and retail trade
right to strike private sector public sector
050
100150200250300350
2000
2001
2002
2003
2004
2005
2006
2007
2008
2009
2010
2011
2012
2013
days not worked (per 1000 employees)
0
20
40
60
80
2000
2001
2002
2003
2004
2005
2006
2007
2008
2009
2010
2011
2012
2013
workers involved in industrial action (per 1000 employees)
France
source 2000-2004 (volume) ILOSTAT Since 2005 (volume) ETUI estimate based on combining DARES data and data from the Direction geacuteneacuterale de lrsquoadministration et de la fonction publique The DARES covers industrial action in the private sector including some semi-public enterprises The data from the Direction geacuteneacuterale de lrsquoadministration covers the public sector and overlaps with the DARES data in case of some semi-public enterprises Relying only on the DARES data clearly underestimates the volume 2000-2007 (participation) Combining ILOSTAT Carley (2008) and Carley (2010)
multi-employer bargaining system
Recognised as an individual right and guaranteed by the Constitution regulated by law in the public sector and mainly developed through case law in the private sector
peak 2003 and 2010 Union mobilisation against pension reforms
right to strike private sector public sector
data coverage 2000-2003 Strikes and lockouts Excluding public administration Workers involved excludes workers indirectly involved
0
20
40
60
2000
2001
2002
2003
2004
2005
2006
2007
2008
2009
2010
2011
2012
2013
days not worked (per 1000 employees)
0
10
20
30
40
50
2000
2001
2002
2003
2004
2005
2006
2007
2008
2009
2010
2011
2012
2013
workers involved in industrial action (per 1000 employees)
Germany
source 2000-2003 ILOSTAT since 2004 WSI estimate
multi-employer bargaining system
Implicitly guaranteed by the Constitution and developed through case-law
peak 2006 Strikes in the public sector particularly health care besides short warning strikes in metal industry
right to strike private sector public sector
data coverage Strikes and lockouts 2012 Only strikes Excluding strikes that last less than 100 days workers involved includes workers directly and indirectly involved
0
50
100
150
200
2000
2001
2002
2003
2004
2005
2006
2007
2008
2009
2010
2011
2012
2013
days not worked (per 1000 employees)
0
5
10
15
20
2000
2001
2002
2003
2004
2005
2006
2007
2008
2009
2010
2011
2012
2013
workers involved in industrial action (per 1000 employees)
Hungary
source 2000-2009 Carley (2004) Carley (2008) and Carley (2010) 2010 Hungarian Statistical Office 2012 ILOSTAT
single-employer bargaining system
Guaranteed by the Constitution and by law
peak 2000 National strike in health care sector
right to strike private sector public sector
data coverage Only strikes Disputes are included if they involve a stoppage of work lasting for at least one day and the total time lost is 10 or more person-days Workers involved excludes workers indirectly involved
0
50
100
150
200
2000
2001
2002
2003
2004
2005
2006
2007
2008
2009
2010
2011
2012
2013
days not worked (per 1000 employees)
0
50
100
150
200
2000
2001
2002
2003
2004
2005
2006
2007
2008
2009
2010
2011
2012
2013
workers involved in industrial action (per 1000 employees)
Ireland
source Central Statistics Office Databank StatBank Labour Market and Earnings Labour Market Industrial Disputes
single-employer bargaining system
Guaranteed by law and developed through case-law
peak 2009 24-hour national public service strike against governmentrsquos pay cuts
right to strike private sector public sector
data coverage Strikes and lockouts Workers involved excludes workers indirectly involved
0
100
200
300
2000
2001
2002
2003
2004
2005
2006
2007
2008
2009
2010
2011
2012
2013
days not worked (per 1000 employees)
0
100
200
300
2000
2001
2002
2003
2004
2005
2006
2007
2008
2009
2010
2011
2012
2013
workers involved in industrial action (per 1000 employees)
Italy
source Istituto Nazionale di Statistica ILOSTAT Official strike data is no longer collected since 2009
multi-employer bargaining system
Recognised as an individual right and guaranteed by the Constitution and developed through case-law
peak 2002 General strike against labour market reforms
right to strike private sector public sector
data coverage Strikes and lockouts Workers involved excludes workers indirectly involved
0
1
2
3
4
2000
2001
2002
2003
2004
2005
2006
2007
2008
2009
2010
2011
2012
2013
days not worked (per 1000 employees)
0
1
2
3
2000
2001
2002
2003
2004
2005
2006
2007
2008
2009
2010
2011
2012
2013
workers involved in industrial action (per 1000 employees)
Latvia
source ILOSTAT
single-employer bargaining system
Guaranteed by the Constitution and regulated by law
peak 2008 Not attributable to a single large strike
right to strike private sector public sector
data coverage Only strikes Workers involved includes workers directly and indirectly involved
0
10
20
30
2000
2001
2002
2003
2004
2005
2006
2007
2008
2009
2010
2011
2012
2013
days not worked (per 1000 employees)
0
2
4
6
8
10
2000
2001
2002
2003
2004
2005
2006
2007
2008
2009
2010
2011
2012
2013
workers involved in industrial action (per 1000 employees)
Lithuania
source 2000-2008 2012 ILOSTAT 2009 Carley (2010) 2010-2011 and 2013 Statistics Lithuania Official Statistics Portal Population and social statistics Statistical information on strikes An estimate is also provided by Carley (2008 2010)
single-employer bargaining system
Guaranteed by the Constitution and regulated by law
peak 2008 Various teacherrsquos strike over a pay increase and other demands and other strikes in the public sector
right to strike private sector public sector
0
50
100
150
2000
2001
2002
2003
2004
2005
2006
2007
2008
2009
2010
2011
2012
2013
days not worked (per 1000 employees)
0
100
200
300
2000
2001
2002
2003
2004
2005
2006
2007
2008
2009
2010
2011
2012
2013
workers involved in industrial action (per 1000 employees)
Luxembourg
source Carley (2004) Carley (2008) and Carley (2010) Official data is no longer available since 2009
mixed bargaining system
Developed through case law
peak 2007 One-day general strike in public sector and a two-day railway strike over civil service and state employee pensions
right to strike private sector public sector
data coverage Strikes and lockouts Workers involved excludes workers indirectly involved
0
20
40
60
2000
2001
2002
2003
2004
2005
2006
2007
2008
2009
2010
2011
2012
2013
days not worked (per 1000 employees)
0
20
40
60
80
100
2000
2001
2002
2003
2004
2005
2006
2007
2008
2009
2010
2011
2012
2013
workers involved in industrial action (per 1000 employees)
Malta
source Industrial and Employment Relations Publications and Archives Archives Annual Reports ILOSTAT
single-employer bargaining system
Indirectly recognised by law
peak 2009 Not attributable to a specific large strike
right to strike private sector public sector
data coverage Only strikes Workers involved excludes workersindirectly involved
0
10
20
30
40
2000
2001
2002
2003
2004
2005
2006
2007
2008
2009
2010
2011
2012
2013
days not worked (per 1000 employees)
0
5
10
15
20
2000
2001
2002
2003
2004
2005
2006
2007
2008
2009
2010
2011
2012
2013
workers involved in industrial action (per 1000 employees)
Netherlands
source Centraal Bureau voor de Statistiek Cijfers Statline databank Thema Arbeidsmarkt Vakbeweging en stakingen Historie Werkstakingen
multi-employer bargaining system
Developed through case law
peak 2002 Strike action in construction industry peak 2012 15 weeks strike in cleaning sector over renewal of collective agreement besides strike action in the education sector
against austerity measures
right to strike private sector public sector
data coverage Strikes and lockout excluding strikes that last less than 1 day Workers involved includes workers directly and indirectly involved
0
50
100
150
200
250
2000
2001
2002
2003
2004
2005
2006
2007
2008
2009
2010
2011
2012
2013
days not worked (per 1000 employees)
0
10
20
30
40
50
2000
2001
2002
2003
2004
2005
2006
2007
2008
2009
2010
2011
2012
2013
workers involved in industrial action (per 1000 employees)
Norway
source Statistics Norway Statistics Labour market and earnings Strikes and lockouts
multi-employer bargaining system
Mainly regulated by collective agreements between the social partners
nearly two yearly peaks Negotiations about renewal of collective agreements in the economic sectors
right to strike private sector public sector
data coverage Only strikes excluding strikes that last less than 1 day workers involved excludes workers indirectly involved
0
5
10
15
20
25
2000
2001
2002
2003
2004
2005
2006
2007
2008
2009
2010
2011
2012
2013
days not worked (per 1000 employees)
0
5
10
15
20
2000
2001
2002
2003
2004
2005
2006
2007
2008
2009
2010
2011
2012
2013
workers involved in industrial action (per 1000 employees)
Poland
source ILOSTAT
single-employer bargaining system
Guaranteed by the Constitution and regulated by law
peak 2008 Various teachersrsquo strikes over a pay increase and other demands and other strikes in the public sector
right to strike private sector public sector
data coverage Only strikes excluding public administration workers involved excludes workers indirectly involved
0
10
20
30
2000
2001
2002
2003
2004
2005
2006
2007
2008
2009
2010
2011
2012
2013
days not worked (per 1000 employees)
0
5
10
15
20
25
2000
2001
2002
2003
2004
2005
2006
2007
2008
2009
2010
2011
2012
2013
workers involved in industrial action (per 1000 employees)
Portugal
source Gabinete de Estrateacutegia e Planeamento Estatiacutestica Greves Official strike data is not available after 2007
multi-employer bargaining system
Guaranteed by the Constitution and regulated by law
peak 2002 Several strike actions particularly in the public sector against changes in the Labour Code
right to strike private sector public sector
data coverage Only strikes Workers involved excludes workers indirectly involved
0
50
100
2000
2001
2002
2003
2004
2005
2006
2007
2008
2009
2010
2011
2012
2013
days not worked (per 1000 employees)
0
2
4
6
8
10
2000
2001
2002
2003
2004
2005
2006
2007
2008
2009
2010
2011
2012
2013
workers involved in industrial action (per 1000 employees)
Romania
source ILOSTAT Official data is very partial in 2009 and not available after 2010
single-employer bargaining system
Guaranteed by the Constitution and regulated by law
peaks 2000 and 2007 Several strike actions in particularly the manufacturing industry
right to strike private sector public sector
data coverage Only strikes workers involved excludes workers indirectly involved
0
10
20
30
40
2000
2001
2002
2003
2004
2005
2006
2007
2008
2009
2010
2011
2012
2013
days not worked (per 1000 employees)
0
2
4
6
8
10
2000
2001
2002
2003
2004
2005
2006
2007
2008
2009
2010
2011
2012
2013
workers involved in industrial action (per 1000 employees)
Slovakia
source 2000-2002 ILOSTAT 2003-2009 Carley (2004) Carley (2008) and Carley (2010) Since 2010 Statistical Office of the Slovak Republic (on demand)
mixed bargaining system
Guaranteed by the Constitution and regulated by law
peak 2003 Limited number of strike actions in railways and the public sector
right to strike private sector public sector
0
10
20
30
40
50
2000
2001
2002
2003
2004
2005
2006
2007
2008
2009
2010
2011
2012
2013
days not worked (per 1000 employees)
0
2
4
6
2000
2001
2002
2003
2004
2005
2006
2007
2008
2009
2010
2011
2012
2013
workers involved in industrial action (per 1000 employees)
Slovenia
source Carley (2004) Carley (2008) and Carley (2010) Trade union data (ZSSS) Official data is not available
multi-employer bargaining system
Guaranteed by the Constitution and regulated by law
peak 2005 Union mobilisation against labour market reforms
right to strike private sector public sector
data coverage Strikes and lockouts excluding strikes that last less than 1 hour workers involved excludes workers indirectly involved The 2012 data excludes the general strikes of the 29th of March and the 14th of November and the nation-wide strike in the education sector of 22nd of May In 2013 several strikes in the education sector are excluded
050
100150200250300350
2000
2001
2002
2003
2004
2005
2006
2007
2008
2009
2010
2011
2012
2013
days not worked (per 1000 employees)
050
100150200250300350
2000
2001
2002
2003
2004
2005
2006
2007
2008
2009
2010
2011
2012
2013
workers involved in industrial action (per 1000 employees)
Spain
source ILOSTAT Ministry of Employment and Social Security Statistics Condiciones de trabajo y relaciones laborales Huelgas y Cierres Patronales
multi-employer bargaining system
Guaranteed by the Constitution and regulated by law
peak 2004 Strike action in shipyards over renewal of collective agreements and against relocation decisions in mainly the manufacturing industry
underestimated peak in 2012 and 2013 General strikes in 2012 and various strikes in the public sector
right to strike private sector public sector
data coverage Strikes and lockouts Workers involved excludes workers indirectly involved
0
50
100
150
200
2000
2001
2002
2003
2004
2005
2006
2007
2008
2009
2010
2011
2012
2013
days not worked (per 1000 employees)
0
5
10
15
20
25
2000
2001
2002
2003
2004
2005
2006
2007
2008
2009
2010
2011
2012
2013
workers involved in industrial action (per 1000 employees)
Sweden
source Sweden National Mediation Office Melding amp konflikt Konfliktstatistik
multi-employer bargaining system
Guaranteed by the Constitution and regulated by law and in the 1938 collective agreement between the social partners
peak 2003 Large strike of blue-collar workers in the municipal and city council sector over a new pay agreement
right to strike private sector public sector
data coverage Strikes and lockouts Excluding strikes that last less than 1 day Workers involved includes workers directly and indirectly involved
0
5
10
15
2000
2001
2002
2003
2004
2005
2006
2007
2008
2009
2010
2011
2012
2013
days not worked (per 1000 employees)
0
2
4
6
8
10
2000
2001
2002
2003
2004
2005
2006
2007
2008
2009
2010
2011
2012
2013
workers involved in industrial action (per 1000 employees)
Switzerland
source Office feacutedeacuteral de la statistique Thegravemes Organisation du marcheacute du travail conventions collectives de travail Donneacutees deacutetailleacutees Gregraveves et lock-out
multi-employer bargaining system
Guaranteed by the Constitution and regulated by law and in the 1938 collective agreement between the social partners
peak 2004 Difficult to attribute to a specific large strike
right to strike private sector public sector
data coverage 2000-2008 Excluding political strikes Since 2009 Strikes and lockouts Excluding strikes that last less than 1 day Workers involved includes workers directly and indirectly involved
0
20
40
60
2000
2001
2002
2003
2004
2005
2006
2007
2008
2009
2010
2011
2012
2013
days not worked (per 1000 employees)
0
20
40
60
2000
2001
2002
2003
2004
2005
2006
2007
2008
2009
2010
2011
2012
2013
workers involved in industrial action (per 1000 employees)
United Kingdom
source Office for National Statistics Browse by Theme Labour Market Labour Disputes Days Lost due to Industrial Action
single-employer bargaining system
Regulated by law
peak 2004 One-day strike by civil servants to protest against governments plans to cut a large number of civil service posts peak 2007 One-day strike by postal workers in protest over pay and modernisation plans and one-day strike by prison officers
against the governmentrsquos decision to introduce a pay award in stages peak 2011 Union mobilisation against public service pension reforms in June and November
Right to strike legend
yes with minor restrictions (eg recognized union balloting proportionality respect of peace obligation)
yes with major restrictions (eg monopoly union compulsory arbitration or conciliation restrictions on issues or content major groups excluded
no
yes
private sector
yes with minor restrictions (eg recognized union balloting proportionality respect of peace obligation only military judiciary or police excluded ndash as per ILO convention)
yes with major restrictions (eg monopoly union compulsory arbitration or conciliation restrictions on issues or content major groups excluded
no
yes
public sector
source J Visser Database on Institutional Characteristics of Trade Unions Wage Setting State Intervention and Social Pacts (ICTWSS) database version 4 2013 The indicators reflect the situation in 2011
Prevelant bargaining regime legend
Single-employer bargaining system the establishment or company level is predominant
Multi-employer bargaining system sector andor the cross-sector level is predominant
Mixed bargaining system an intermediate situation where sector and company negotiations each respectively account for at least one-third of those covered by collective wage-setting arrangements
source P Marginson and C Welz (2014) Changes to wage-setting mechanisms in the context of the crisis and the EUrsquos new economic governance regime Dublin Eurofound
Average days not worked due to industrial action in Europe
20-50 days not worked 51-100 days not worked gt 100 days not worked insufficient data
lt 20 days not worked
Data source ETUI own calculation
2009-2013 weighted average 43 days not worked per 1000 employees
Days not worked due to industrial action comparing 1990s with 2000s
020406080
100120140160180200220240260280300320
ES FR(1)
DK IT(2)
BE(3)
FI wa NO IE AT sa LU(4)
CY UK MT RO(10)
HU(9)
SE SI(11)
PT(4)
DE NL PL LT(5)
SK(6)
EE(7)
CH LV(8)
days
not
wor
ked
per 1
000
em
ploy
ees average 1990-9 average 2000-9
Notes insufficient or no data for Bulgaria Croatia the Czech Republic and Greece (1) 1990-2012 (2) 1990-2008 (3) 1991-2013 (4) 1990-2007 (5) 2000-2013 (6) 1993-2013 (7) 1992-2013 (8) 1997-2013 (9) 1991-2010 and 2013 (10) 1990-2008 (11) 1992-2007 wa weighted average sa simple average Data source ETUI own calculation
Days not worked due to industrial action 2009-2013
514 171
82 76
66 65
56 55
46 43
24 14 13 11 9
4 3 2 1 1 1 0 0
CYFR (1)
DKNOBE
ES (2)saFIIE
waUKMTDEEENLSEAT
HU (3)PLCHLTLVSK
average days not worked per 1000 employees
Notes insufficient or no data for Bulgaria Croatia the Czech Republic Greece Italy Luxembourg Portugal Romania and Slovenia (1) 2009-2012 (2) excluding (general) strikes in 2012 and 2013 (3) 2009-10 and 2012 wa weighted average sa simple average
Data source ETUI own calculation
right to strike private sector public sector
data coverage Only strikes Workers involved excludes workers indirectly involved
0
100
200
300
400
2000
2001
2002
2003
2004
2005
2006
2007
2008
2009
2010
2011
2012
2013
days not worked (per 1000 employees)
0
50
100
150
200
250
2000
2001
2002
2003
2004
2005
2006
2007
2008
2009
2010
2011
2012
2013
workers involved in industrial action (per 1000 employees)
Austria
source Statistik Arbeiterkammer Sozialstatistik Streikstatistik OumlGB Streikstatistik
multi-employer bargaining system
Not codified in the Constitution or in national legislation No Supreme Court case law exists on the topic Since 1870 collective action has been tolerated
peak 2003 Union mobilisation against state pension reform and exceptional railway strike against its restructuring peak 2011 2-days warning strikes in the metal sector
right to strike private sector public sector
data coverage Strikes and lockout Strikes in the public sector are excluded until 2002 Since 2003 strikes in the public sector are included except for strikes in the local and county administration
0
20
40
60
80
100
120
140
160
180
200
2000
2001
2002
2003
2004
2005
2006
2007
2008
2009
2010
2011
2012
2013
days not worked (per 1000 employees)
Belgium
source Rijksdienst voor Sociale ZekerheidOffice nationale de seacutecuriteacute sociale
multi-employer bargaining system
Recognised as an individual right and developed through case law
peak 2005 Union mobilisation against early-retirement scheme reform peak 2011 Public sector strike against pension reforms peak 2012 General strike against unemployment scheme reforms pension reforms and austerity measures expected peak in 2014 Regional strikes and general strike against austerity measures
right to strike private sector public sector
data coverage Strikes and lockouts Excluding strikes that last less than 2 hours Workers involved excludes workers indirectly involved
0
500
1000
1500
2000
2000
2001
2002
2003
2004
2005
2006
2007
2008
2009
2010
2011
2012
2013
days not worked (per 1000 employees)
0
100
200
300
2000
2001
2002
2003
2004
2005
2006
2007
2008
2009
2010
2011
2012
2013
workers involved in industrial action (per 1000 employees)
Cyprus
source Department of Labour Relations Labour Disputes Statistics ILOSTAT
mixed bargaining system
Guaranteed by the Constitution peak 2006 Sectoral one-day strike in construction industry over a renewal of the industry-wide collective agreement peak 2011 Public servantsrsquo strike against a two-year pay-freeze and austerity measures peak 2012 24-hour strike in construction industry but also strikes in other industries mostly in protest to honour pay rises and cost-of-living
increases peak 2013 Open-ended strike in the construction industry over the renewal of the industry-wide collective agreement it was the longest
strike in Cyprusrsquo history since 1948
right to strike private sector public sector
data coverage Strikes and lockouts Workers involved excludes workers indirectly involved
0
200
400
600
800
2000
2001
2002
2003
2004
2005
2006
2007
2008
2009
2010
2011
2012
2013
days not worked (per 1000 employees)
0
20
40
60
2000
2001
2002
2003
2004
2005
2006
2007
2008
2009
2010
2011
2012
2013
workers involved in industrial action (per 1000 employees)
Denmark
source Danmarks Statistik Arbejdsstandsninger
multi-employer bargaining system
Guaranteed by the Constitution and developed through case-law and most importantly regulated by collective agreements between the social partners
peak 2008 Large strike in the healthcare and social work sector for a wage increase at time of the renewal of collective agreements
peak 2013 Lockout by the municipalities association in the education sector
right to strike private sector public sector
data coverage Strikes and lockouts Workers involved includes workers directly and indirectly involved in 2012 Data excludes warning and supportive strikes
0
20
40
60
2000
2001
2002
2003
2004
2005
2006
2007
2008
2009
2010
2011
2012
2013
days not worked (per 1000 employees)
0
20
40
60
2000
2001
2002
2003
2004
2005
2006
2007
2008
2009
2010
2011
2012
2013
workers involved in industrial action (per 1000 employees)
Estonia
source 2000-2009 ILOSTAT since 2010 Statistics Estonia Subject areas Economy Wages and salaries and labour costs Statistical database Strikes
single-employer bargaining system
Guaranteed by the Constitution and regulated by law
peak 2003 One-day strike in education and culture workers for pay increase peak 2012 Teachersrsquo strike and strike in health care sector both over pay increase
right to strike private sector public sector
data coverage Strikes and lockouts Workers involved excludes workers indirectly involved
0
100
200
300
2000
2001
2002
2003
2004
2005
2006
2007
2008
2009
2010
2011
2012
2013
days not worked (per 1000 employees)
0
20
40
60
80
2000
2001
2002
2003
2004
2005
2006
2007
2008
2009
2010
2011
2012
2013
workers involved in industrial action (per 1000 employees)
Finland
source Statistics Finland Labour Market Statistics on labour disputes
multi-employer bargaining system
Implicitly guaranteed by the Constitution and explicitly by law
peak 2005 Four-day strike and numerous other strikes in the paper-industry over a renewal of the collective agreement peak 2010 Large two-week strike of stevedores about severance pay and outsourcing besides several other strikes in
manufacturing and in wholesale and retail trade
right to strike private sector public sector
050
100150200250300350
2000
2001
2002
2003
2004
2005
2006
2007
2008
2009
2010
2011
2012
2013
days not worked (per 1000 employees)
0
20
40
60
80
2000
2001
2002
2003
2004
2005
2006
2007
2008
2009
2010
2011
2012
2013
workers involved in industrial action (per 1000 employees)
France
source 2000-2004 (volume) ILOSTAT Since 2005 (volume) ETUI estimate based on combining DARES data and data from the Direction geacuteneacuterale de lrsquoadministration et de la fonction publique The DARES covers industrial action in the private sector including some semi-public enterprises The data from the Direction geacuteneacuterale de lrsquoadministration covers the public sector and overlaps with the DARES data in case of some semi-public enterprises Relying only on the DARES data clearly underestimates the volume 2000-2007 (participation) Combining ILOSTAT Carley (2008) and Carley (2010)
multi-employer bargaining system
Recognised as an individual right and guaranteed by the Constitution regulated by law in the public sector and mainly developed through case law in the private sector
peak 2003 and 2010 Union mobilisation against pension reforms
right to strike private sector public sector
data coverage 2000-2003 Strikes and lockouts Excluding public administration Workers involved excludes workers indirectly involved
0
20
40
60
2000
2001
2002
2003
2004
2005
2006
2007
2008
2009
2010
2011
2012
2013
days not worked (per 1000 employees)
0
10
20
30
40
50
2000
2001
2002
2003
2004
2005
2006
2007
2008
2009
2010
2011
2012
2013
workers involved in industrial action (per 1000 employees)
Germany
source 2000-2003 ILOSTAT since 2004 WSI estimate
multi-employer bargaining system
Implicitly guaranteed by the Constitution and developed through case-law
peak 2006 Strikes in the public sector particularly health care besides short warning strikes in metal industry
right to strike private sector public sector
data coverage Strikes and lockouts 2012 Only strikes Excluding strikes that last less than 100 days workers involved includes workers directly and indirectly involved
0
50
100
150
200
2000
2001
2002
2003
2004
2005
2006
2007
2008
2009
2010
2011
2012
2013
days not worked (per 1000 employees)
0
5
10
15
20
2000
2001
2002
2003
2004
2005
2006
2007
2008
2009
2010
2011
2012
2013
workers involved in industrial action (per 1000 employees)
Hungary
source 2000-2009 Carley (2004) Carley (2008) and Carley (2010) 2010 Hungarian Statistical Office 2012 ILOSTAT
single-employer bargaining system
Guaranteed by the Constitution and by law
peak 2000 National strike in health care sector
right to strike private sector public sector
data coverage Only strikes Disputes are included if they involve a stoppage of work lasting for at least one day and the total time lost is 10 or more person-days Workers involved excludes workers indirectly involved
0
50
100
150
200
2000
2001
2002
2003
2004
2005
2006
2007
2008
2009
2010
2011
2012
2013
days not worked (per 1000 employees)
0
50
100
150
200
2000
2001
2002
2003
2004
2005
2006
2007
2008
2009
2010
2011
2012
2013
workers involved in industrial action (per 1000 employees)
Ireland
source Central Statistics Office Databank StatBank Labour Market and Earnings Labour Market Industrial Disputes
single-employer bargaining system
Guaranteed by law and developed through case-law
peak 2009 24-hour national public service strike against governmentrsquos pay cuts
right to strike private sector public sector
data coverage Strikes and lockouts Workers involved excludes workers indirectly involved
0
100
200
300
2000
2001
2002
2003
2004
2005
2006
2007
2008
2009
2010
2011
2012
2013
days not worked (per 1000 employees)
0
100
200
300
2000
2001
2002
2003
2004
2005
2006
2007
2008
2009
2010
2011
2012
2013
workers involved in industrial action (per 1000 employees)
Italy
source Istituto Nazionale di Statistica ILOSTAT Official strike data is no longer collected since 2009
multi-employer bargaining system
Recognised as an individual right and guaranteed by the Constitution and developed through case-law
peak 2002 General strike against labour market reforms
right to strike private sector public sector
data coverage Strikes and lockouts Workers involved excludes workers indirectly involved
0
1
2
3
4
2000
2001
2002
2003
2004
2005
2006
2007
2008
2009
2010
2011
2012
2013
days not worked (per 1000 employees)
0
1
2
3
2000
2001
2002
2003
2004
2005
2006
2007
2008
2009
2010
2011
2012
2013
workers involved in industrial action (per 1000 employees)
Latvia
source ILOSTAT
single-employer bargaining system
Guaranteed by the Constitution and regulated by law
peak 2008 Not attributable to a single large strike
right to strike private sector public sector
data coverage Only strikes Workers involved includes workers directly and indirectly involved
0
10
20
30
2000
2001
2002
2003
2004
2005
2006
2007
2008
2009
2010
2011
2012
2013
days not worked (per 1000 employees)
0
2
4
6
8
10
2000
2001
2002
2003
2004
2005
2006
2007
2008
2009
2010
2011
2012
2013
workers involved in industrial action (per 1000 employees)
Lithuania
source 2000-2008 2012 ILOSTAT 2009 Carley (2010) 2010-2011 and 2013 Statistics Lithuania Official Statistics Portal Population and social statistics Statistical information on strikes An estimate is also provided by Carley (2008 2010)
single-employer bargaining system
Guaranteed by the Constitution and regulated by law
peak 2008 Various teacherrsquos strike over a pay increase and other demands and other strikes in the public sector
right to strike private sector public sector
0
50
100
150
2000
2001
2002
2003
2004
2005
2006
2007
2008
2009
2010
2011
2012
2013
days not worked (per 1000 employees)
0
100
200
300
2000
2001
2002
2003
2004
2005
2006
2007
2008
2009
2010
2011
2012
2013
workers involved in industrial action (per 1000 employees)
Luxembourg
source Carley (2004) Carley (2008) and Carley (2010) Official data is no longer available since 2009
mixed bargaining system
Developed through case law
peak 2007 One-day general strike in public sector and a two-day railway strike over civil service and state employee pensions
right to strike private sector public sector
data coverage Strikes and lockouts Workers involved excludes workers indirectly involved
0
20
40
60
2000
2001
2002
2003
2004
2005
2006
2007
2008
2009
2010
2011
2012
2013
days not worked (per 1000 employees)
0
20
40
60
80
100
2000
2001
2002
2003
2004
2005
2006
2007
2008
2009
2010
2011
2012
2013
workers involved in industrial action (per 1000 employees)
Malta
source Industrial and Employment Relations Publications and Archives Archives Annual Reports ILOSTAT
single-employer bargaining system
Indirectly recognised by law
peak 2009 Not attributable to a specific large strike
right to strike private sector public sector
data coverage Only strikes Workers involved excludes workersindirectly involved
0
10
20
30
40
2000
2001
2002
2003
2004
2005
2006
2007
2008
2009
2010
2011
2012
2013
days not worked (per 1000 employees)
0
5
10
15
20
2000
2001
2002
2003
2004
2005
2006
2007
2008
2009
2010
2011
2012
2013
workers involved in industrial action (per 1000 employees)
Netherlands
source Centraal Bureau voor de Statistiek Cijfers Statline databank Thema Arbeidsmarkt Vakbeweging en stakingen Historie Werkstakingen
multi-employer bargaining system
Developed through case law
peak 2002 Strike action in construction industry peak 2012 15 weeks strike in cleaning sector over renewal of collective agreement besides strike action in the education sector
against austerity measures
right to strike private sector public sector
data coverage Strikes and lockout excluding strikes that last less than 1 day Workers involved includes workers directly and indirectly involved
0
50
100
150
200
250
2000
2001
2002
2003
2004
2005
2006
2007
2008
2009
2010
2011
2012
2013
days not worked (per 1000 employees)
0
10
20
30
40
50
2000
2001
2002
2003
2004
2005
2006
2007
2008
2009
2010
2011
2012
2013
workers involved in industrial action (per 1000 employees)
Norway
source Statistics Norway Statistics Labour market and earnings Strikes and lockouts
multi-employer bargaining system
Mainly regulated by collective agreements between the social partners
nearly two yearly peaks Negotiations about renewal of collective agreements in the economic sectors
right to strike private sector public sector
data coverage Only strikes excluding strikes that last less than 1 day workers involved excludes workers indirectly involved
0
5
10
15
20
25
2000
2001
2002
2003
2004
2005
2006
2007
2008
2009
2010
2011
2012
2013
days not worked (per 1000 employees)
0
5
10
15
20
2000
2001
2002
2003
2004
2005
2006
2007
2008
2009
2010
2011
2012
2013
workers involved in industrial action (per 1000 employees)
Poland
source ILOSTAT
single-employer bargaining system
Guaranteed by the Constitution and regulated by law
peak 2008 Various teachersrsquo strikes over a pay increase and other demands and other strikes in the public sector
right to strike private sector public sector
data coverage Only strikes excluding public administration workers involved excludes workers indirectly involved
0
10
20
30
2000
2001
2002
2003
2004
2005
2006
2007
2008
2009
2010
2011
2012
2013
days not worked (per 1000 employees)
0
5
10
15
20
25
2000
2001
2002
2003
2004
2005
2006
2007
2008
2009
2010
2011
2012
2013
workers involved in industrial action (per 1000 employees)
Portugal
source Gabinete de Estrateacutegia e Planeamento Estatiacutestica Greves Official strike data is not available after 2007
multi-employer bargaining system
Guaranteed by the Constitution and regulated by law
peak 2002 Several strike actions particularly in the public sector against changes in the Labour Code
right to strike private sector public sector
data coverage Only strikes Workers involved excludes workers indirectly involved
0
50
100
2000
2001
2002
2003
2004
2005
2006
2007
2008
2009
2010
2011
2012
2013
days not worked (per 1000 employees)
0
2
4
6
8
10
2000
2001
2002
2003
2004
2005
2006
2007
2008
2009
2010
2011
2012
2013
workers involved in industrial action (per 1000 employees)
Romania
source ILOSTAT Official data is very partial in 2009 and not available after 2010
single-employer bargaining system
Guaranteed by the Constitution and regulated by law
peaks 2000 and 2007 Several strike actions in particularly the manufacturing industry
right to strike private sector public sector
data coverage Only strikes workers involved excludes workers indirectly involved
0
10
20
30
40
2000
2001
2002
2003
2004
2005
2006
2007
2008
2009
2010
2011
2012
2013
days not worked (per 1000 employees)
0
2
4
6
8
10
2000
2001
2002
2003
2004
2005
2006
2007
2008
2009
2010
2011
2012
2013
workers involved in industrial action (per 1000 employees)
Slovakia
source 2000-2002 ILOSTAT 2003-2009 Carley (2004) Carley (2008) and Carley (2010) Since 2010 Statistical Office of the Slovak Republic (on demand)
mixed bargaining system
Guaranteed by the Constitution and regulated by law
peak 2003 Limited number of strike actions in railways and the public sector
right to strike private sector public sector
0
10
20
30
40
50
2000
2001
2002
2003
2004
2005
2006
2007
2008
2009
2010
2011
2012
2013
days not worked (per 1000 employees)
0
2
4
6
2000
2001
2002
2003
2004
2005
2006
2007
2008
2009
2010
2011
2012
2013
workers involved in industrial action (per 1000 employees)
Slovenia
source Carley (2004) Carley (2008) and Carley (2010) Trade union data (ZSSS) Official data is not available
multi-employer bargaining system
Guaranteed by the Constitution and regulated by law
peak 2005 Union mobilisation against labour market reforms
right to strike private sector public sector
data coverage Strikes and lockouts excluding strikes that last less than 1 hour workers involved excludes workers indirectly involved The 2012 data excludes the general strikes of the 29th of March and the 14th of November and the nation-wide strike in the education sector of 22nd of May In 2013 several strikes in the education sector are excluded
050
100150200250300350
2000
2001
2002
2003
2004
2005
2006
2007
2008
2009
2010
2011
2012
2013
days not worked (per 1000 employees)
050
100150200250300350
2000
2001
2002
2003
2004
2005
2006
2007
2008
2009
2010
2011
2012
2013
workers involved in industrial action (per 1000 employees)
Spain
source ILOSTAT Ministry of Employment and Social Security Statistics Condiciones de trabajo y relaciones laborales Huelgas y Cierres Patronales
multi-employer bargaining system
Guaranteed by the Constitution and regulated by law
peak 2004 Strike action in shipyards over renewal of collective agreements and against relocation decisions in mainly the manufacturing industry
underestimated peak in 2012 and 2013 General strikes in 2012 and various strikes in the public sector
right to strike private sector public sector
data coverage Strikes and lockouts Workers involved excludes workers indirectly involved
0
50
100
150
200
2000
2001
2002
2003
2004
2005
2006
2007
2008
2009
2010
2011
2012
2013
days not worked (per 1000 employees)
0
5
10
15
20
25
2000
2001
2002
2003
2004
2005
2006
2007
2008
2009
2010
2011
2012
2013
workers involved in industrial action (per 1000 employees)
Sweden
source Sweden National Mediation Office Melding amp konflikt Konfliktstatistik
multi-employer bargaining system
Guaranteed by the Constitution and regulated by law and in the 1938 collective agreement between the social partners
peak 2003 Large strike of blue-collar workers in the municipal and city council sector over a new pay agreement
right to strike private sector public sector
data coverage Strikes and lockouts Excluding strikes that last less than 1 day Workers involved includes workers directly and indirectly involved
0
5
10
15
2000
2001
2002
2003
2004
2005
2006
2007
2008
2009
2010
2011
2012
2013
days not worked (per 1000 employees)
0
2
4
6
8
10
2000
2001
2002
2003
2004
2005
2006
2007
2008
2009
2010
2011
2012
2013
workers involved in industrial action (per 1000 employees)
Switzerland
source Office feacutedeacuteral de la statistique Thegravemes Organisation du marcheacute du travail conventions collectives de travail Donneacutees deacutetailleacutees Gregraveves et lock-out
multi-employer bargaining system
Guaranteed by the Constitution and regulated by law and in the 1938 collective agreement between the social partners
peak 2004 Difficult to attribute to a specific large strike
right to strike private sector public sector
data coverage 2000-2008 Excluding political strikes Since 2009 Strikes and lockouts Excluding strikes that last less than 1 day Workers involved includes workers directly and indirectly involved
0
20
40
60
2000
2001
2002
2003
2004
2005
2006
2007
2008
2009
2010
2011
2012
2013
days not worked (per 1000 employees)
0
20
40
60
2000
2001
2002
2003
2004
2005
2006
2007
2008
2009
2010
2011
2012
2013
workers involved in industrial action (per 1000 employees)
United Kingdom
source Office for National Statistics Browse by Theme Labour Market Labour Disputes Days Lost due to Industrial Action
single-employer bargaining system
Regulated by law
peak 2004 One-day strike by civil servants to protest against governments plans to cut a large number of civil service posts peak 2007 One-day strike by postal workers in protest over pay and modernisation plans and one-day strike by prison officers
against the governmentrsquos decision to introduce a pay award in stages peak 2011 Union mobilisation against public service pension reforms in June and November
Right to strike legend
yes with minor restrictions (eg recognized union balloting proportionality respect of peace obligation)
yes with major restrictions (eg monopoly union compulsory arbitration or conciliation restrictions on issues or content major groups excluded
no
yes
private sector
yes with minor restrictions (eg recognized union balloting proportionality respect of peace obligation only military judiciary or police excluded ndash as per ILO convention)
yes with major restrictions (eg monopoly union compulsory arbitration or conciliation restrictions on issues or content major groups excluded
no
yes
public sector
source J Visser Database on Institutional Characteristics of Trade Unions Wage Setting State Intervention and Social Pacts (ICTWSS) database version 4 2013 The indicators reflect the situation in 2011
Prevelant bargaining regime legend
Single-employer bargaining system the establishment or company level is predominant
Multi-employer bargaining system sector andor the cross-sector level is predominant
Mixed bargaining system an intermediate situation where sector and company negotiations each respectively account for at least one-third of those covered by collective wage-setting arrangements
source P Marginson and C Welz (2014) Changes to wage-setting mechanisms in the context of the crisis and the EUrsquos new economic governance regime Dublin Eurofound
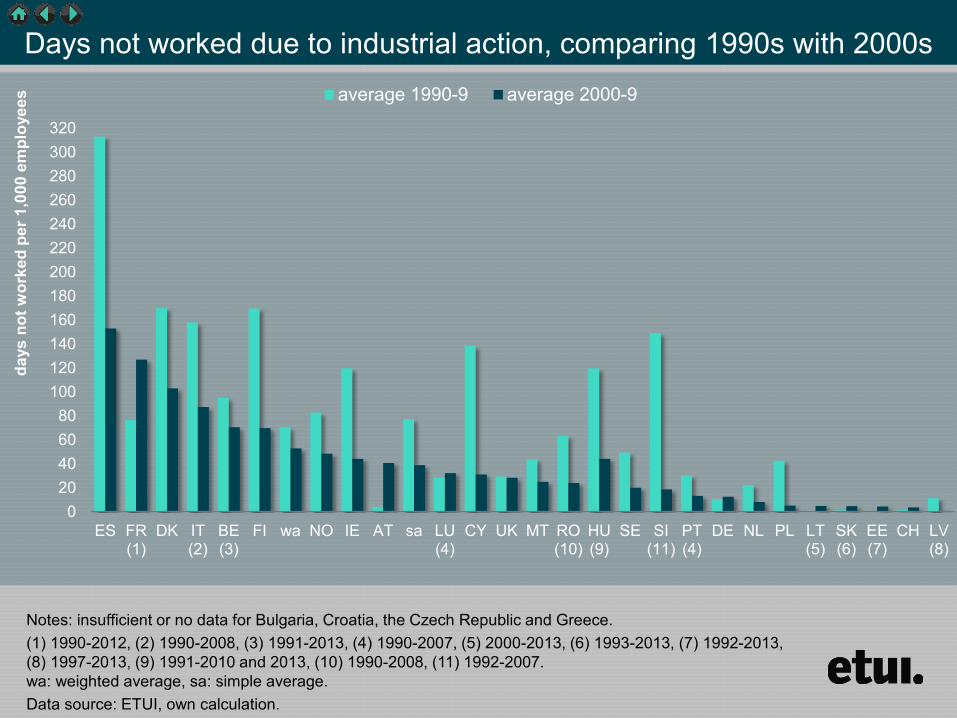

right to strike private sector public sector
data coverage Only strikes Workers involved excludes workers indirectly involved
0
100
200
300
400
2000
2001
2002
2003
2004
2005
2006
2007
2008
2009
2010
2011
2012
2013
days not worked (per 1000 employees)
0
50
100
150
200
250
2000
2001
2002
2003
2004
2005
2006
2007
2008
2009
2010
2011
2012
2013
workers involved in industrial action (per 1000 employees)
Austria
source Statistik Arbeiterkammer Sozialstatistik Streikstatistik OumlGB Streikstatistik
multi-employer bargaining system
Not codified in the Constitution or in national legislation No Supreme Court case law exists on the topic Since 1870 collective action has been tolerated
peak 2003 Union mobilisation against state pension reform and exceptional railway strike against its restructuring peak 2011 2-days warning strikes in the metal sector
right to strike private sector public sector
data coverage Strikes and lockout Strikes in the public sector are excluded until 2002 Since 2003 strikes in the public sector are included except for strikes in the local and county administration
0
20
40
60
80
100
120
140
160
180
200
2000
2001
2002
2003
2004
2005
2006
2007
2008
2009
2010
2011
2012
2013
days not worked (per 1000 employees)
Belgium
source Rijksdienst voor Sociale ZekerheidOffice nationale de seacutecuriteacute sociale
multi-employer bargaining system
Recognised as an individual right and developed through case law
peak 2005 Union mobilisation against early-retirement scheme reform peak 2011 Public sector strike against pension reforms peak 2012 General strike against unemployment scheme reforms pension reforms and austerity measures expected peak in 2014 Regional strikes and general strike against austerity measures
right to strike private sector public sector
data coverage Strikes and lockouts Excluding strikes that last less than 2 hours Workers involved excludes workers indirectly involved
0
500
1000
1500
2000
2000
2001
2002
2003
2004
2005
2006
2007
2008
2009
2010
2011
2012
2013
days not worked (per 1000 employees)
0
100
200
300
2000
2001
2002
2003
2004
2005
2006
2007
2008
2009
2010
2011
2012
2013
workers involved in industrial action (per 1000 employees)
Cyprus
source Department of Labour Relations Labour Disputes Statistics ILOSTAT
mixed bargaining system
Guaranteed by the Constitution peak 2006 Sectoral one-day strike in construction industry over a renewal of the industry-wide collective agreement peak 2011 Public servantsrsquo strike against a two-year pay-freeze and austerity measures peak 2012 24-hour strike in construction industry but also strikes in other industries mostly in protest to honour pay rises and cost-of-living
increases peak 2013 Open-ended strike in the construction industry over the renewal of the industry-wide collective agreement it was the longest
strike in Cyprusrsquo history since 1948
right to strike private sector public sector
data coverage Strikes and lockouts Workers involved excludes workers indirectly involved
0
200
400
600
800
2000
2001
2002
2003
2004
2005
2006
2007
2008
2009
2010
2011
2012
2013
days not worked (per 1000 employees)
0
20
40
60
2000
2001
2002
2003
2004
2005
2006
2007
2008
2009
2010
2011
2012
2013
workers involved in industrial action (per 1000 employees)
Denmark
source Danmarks Statistik Arbejdsstandsninger
multi-employer bargaining system
Guaranteed by the Constitution and developed through case-law and most importantly regulated by collective agreements between the social partners
peak 2008 Large strike in the healthcare and social work sector for a wage increase at time of the renewal of collective agreements
peak 2013 Lockout by the municipalities association in the education sector
right to strike private sector public sector
data coverage Strikes and lockouts Workers involved includes workers directly and indirectly involved in 2012 Data excludes warning and supportive strikes
0
20
40
60
2000
2001
2002
2003
2004
2005
2006
2007
2008
2009
2010
2011
2012
2013
days not worked (per 1000 employees)
0
20
40
60
2000
2001
2002
2003
2004
2005
2006
2007
2008
2009
2010
2011
2012
2013
workers involved in industrial action (per 1000 employees)
Estonia
source 2000-2009 ILOSTAT since 2010 Statistics Estonia Subject areas Economy Wages and salaries and labour costs Statistical database Strikes
single-employer bargaining system
Guaranteed by the Constitution and regulated by law
peak 2003 One-day strike in education and culture workers for pay increase peak 2012 Teachersrsquo strike and strike in health care sector both over pay increase
right to strike private sector public sector
data coverage Strikes and lockouts Workers involved excludes workers indirectly involved
0
100
200
300
2000
2001
2002
2003
2004
2005
2006
2007
2008
2009
2010
2011
2012
2013
days not worked (per 1000 employees)
0
20
40
60
80
2000
2001
2002
2003
2004
2005
2006
2007
2008
2009
2010
2011
2012
2013
workers involved in industrial action (per 1000 employees)
Finland
source Statistics Finland Labour Market Statistics on labour disputes
multi-employer bargaining system
Implicitly guaranteed by the Constitution and explicitly by law
peak 2005 Four-day strike and numerous other strikes in the paper-industry over a renewal of the collective agreement peak 2010 Large two-week strike of stevedores about severance pay and outsourcing besides several other strikes in
manufacturing and in wholesale and retail trade
right to strike private sector public sector
050
100150200250300350
2000
2001
2002
2003
2004
2005
2006
2007
2008
2009
2010
2011
2012
2013
days not worked (per 1000 employees)
0
20
40
60
80
2000
2001
2002
2003
2004
2005
2006
2007
2008
2009
2010
2011
2012
2013
workers involved in industrial action (per 1000 employees)
France
source 2000-2004 (volume) ILOSTAT Since 2005 (volume) ETUI estimate based on combining DARES data and data from the Direction geacuteneacuterale de lrsquoadministration et de la fonction publique The DARES covers industrial action in the private sector including some semi-public enterprises The data from the Direction geacuteneacuterale de lrsquoadministration covers the public sector and overlaps with the DARES data in case of some semi-public enterprises Relying only on the DARES data clearly underestimates the volume 2000-2007 (participation) Combining ILOSTAT Carley (2008) and Carley (2010)
multi-employer bargaining system
Recognised as an individual right and guaranteed by the Constitution regulated by law in the public sector and mainly developed through case law in the private sector
peak 2003 and 2010 Union mobilisation against pension reforms
right to strike private sector public sector
data coverage 2000-2003 Strikes and lockouts Excluding public administration Workers involved excludes workers indirectly involved
0
20
40
60
2000
2001
2002
2003
2004
2005
2006
2007
2008
2009
2010
2011
2012
2013
days not worked (per 1000 employees)
0
10
20
30
40
50
2000
2001
2002
2003
2004
2005
2006
2007
2008
2009
2010
2011
2012
2013
workers involved in industrial action (per 1000 employees)
Germany
source 2000-2003 ILOSTAT since 2004 WSI estimate
multi-employer bargaining system
Implicitly guaranteed by the Constitution and developed through case-law
peak 2006 Strikes in the public sector particularly health care besides short warning strikes in metal industry
right to strike private sector public sector
data coverage Strikes and lockouts 2012 Only strikes Excluding strikes that last less than 100 days workers involved includes workers directly and indirectly involved
0
50
100
150
200
2000
2001
2002
2003
2004
2005
2006
2007
2008
2009
2010
2011
2012
2013
days not worked (per 1000 employees)
0
5
10
15
20
2000
2001
2002
2003
2004
2005
2006
2007
2008
2009
2010
2011
2012
2013
workers involved in industrial action (per 1000 employees)
Hungary
source 2000-2009 Carley (2004) Carley (2008) and Carley (2010) 2010 Hungarian Statistical Office 2012 ILOSTAT
single-employer bargaining system
Guaranteed by the Constitution and by law
peak 2000 National strike in health care sector
right to strike private sector public sector
data coverage Only strikes Disputes are included if they involve a stoppage of work lasting for at least one day and the total time lost is 10 or more person-days Workers involved excludes workers indirectly involved
0
50
100
150
200
2000
2001
2002
2003
2004
2005
2006
2007
2008
2009
2010
2011
2012
2013
days not worked (per 1000 employees)
0
50
100
150
200
2000
2001
2002
2003
2004
2005
2006
2007
2008
2009
2010
2011
2012
2013
workers involved in industrial action (per 1000 employees)
Ireland
source Central Statistics Office Databank StatBank Labour Market and Earnings Labour Market Industrial Disputes
single-employer bargaining system
Guaranteed by law and developed through case-law
peak 2009 24-hour national public service strike against governmentrsquos pay cuts
right to strike private sector public sector
data coverage Strikes and lockouts Workers involved excludes workers indirectly involved
0
100
200
300
2000
2001
2002
2003
2004
2005
2006
2007
2008
2009
2010
2011
2012
2013
days not worked (per 1000 employees)
0
100
200
300
2000
2001
2002
2003
2004
2005
2006
2007
2008
2009
2010
2011
2012
2013
workers involved in industrial action (per 1000 employees)
Italy
source Istituto Nazionale di Statistica ILOSTAT Official strike data is no longer collected since 2009
multi-employer bargaining system
Recognised as an individual right and guaranteed by the Constitution and developed through case-law
peak 2002 General strike against labour market reforms
right to strike private sector public sector
data coverage Strikes and lockouts Workers involved excludes workers indirectly involved
0
1
2
3
4
2000
2001
2002
2003
2004
2005
2006
2007
2008
2009
2010
2011
2012
2013
days not worked (per 1000 employees)
0
1
2
3
2000
2001
2002
2003
2004
2005
2006
2007
2008
2009
2010
2011
2012
2013
workers involved in industrial action (per 1000 employees)
Latvia
source ILOSTAT
single-employer bargaining system
Guaranteed by the Constitution and regulated by law
peak 2008 Not attributable to a single large strike
right to strike private sector public sector
data coverage Only strikes Workers involved includes workers directly and indirectly involved
0
10
20
30
2000
2001
2002
2003
2004
2005
2006
2007
2008
2009
2010
2011
2012
2013
days not worked (per 1000 employees)
0
2
4
6
8
10
2000
2001
2002
2003
2004
2005
2006
2007
2008
2009
2010
2011
2012
2013
workers involved in industrial action (per 1000 employees)
Lithuania
source 2000-2008 2012 ILOSTAT 2009 Carley (2010) 2010-2011 and 2013 Statistics Lithuania Official Statistics Portal Population and social statistics Statistical information on strikes An estimate is also provided by Carley (2008 2010)
single-employer bargaining system
Guaranteed by the Constitution and regulated by law
peak 2008 Various teacherrsquos strike over a pay increase and other demands and other strikes in the public sector
right to strike private sector public sector
0
50
100
150
2000
2001
2002
2003
2004
2005
2006
2007
2008
2009
2010
2011
2012
2013
days not worked (per 1000 employees)
0
100
200
300
2000
2001
2002
2003
2004
2005
2006
2007
2008
2009
2010
2011
2012
2013
workers involved in industrial action (per 1000 employees)
Luxembourg
source Carley (2004) Carley (2008) and Carley (2010) Official data is no longer available since 2009
mixed bargaining system
Developed through case law
peak 2007 One-day general strike in public sector and a two-day railway strike over civil service and state employee pensions
right to strike private sector public sector
data coverage Strikes and lockouts Workers involved excludes workers indirectly involved
0
20
40
60
2000
2001
2002
2003
2004
2005
2006
2007
2008
2009
2010
2011
2012
2013
days not worked (per 1000 employees)
0
20
40
60
80
100
2000
2001
2002
2003
2004
2005
2006
2007
2008
2009
2010
2011
2012
2013
workers involved in industrial action (per 1000 employees)
Malta
source Industrial and Employment Relations Publications and Archives Archives Annual Reports ILOSTAT
single-employer bargaining system
Indirectly recognised by law
peak 2009 Not attributable to a specific large strike
right to strike private sector public sector
data coverage Only strikes Workers involved excludes workersindirectly involved
0
10
20
30
40
2000
2001
2002
2003
2004
2005
2006
2007
2008
2009
2010
2011
2012
2013
days not worked (per 1000 employees)
0
5
10
15
20
2000
2001
2002
2003
2004
2005
2006
2007
2008
2009
2010
2011
2012
2013
workers involved in industrial action (per 1000 employees)
Netherlands
source Centraal Bureau voor de Statistiek Cijfers Statline databank Thema Arbeidsmarkt Vakbeweging en stakingen Historie Werkstakingen
multi-employer bargaining system
Developed through case law
peak 2002 Strike action in construction industry peak 2012 15 weeks strike in cleaning sector over renewal of collective agreement besides strike action in the education sector
against austerity measures
right to strike private sector public sector
data coverage Strikes and lockout excluding strikes that last less than 1 day Workers involved includes workers directly and indirectly involved
0
50
100
150
200
250
2000
2001
2002
2003
2004
2005
2006
2007
2008
2009
2010
2011
2012
2013
days not worked (per 1000 employees)
0
10
20
30
40
50
2000
2001
2002
2003
2004
2005
2006
2007
2008
2009
2010
2011
2012
2013
workers involved in industrial action (per 1000 employees)
Norway
source Statistics Norway Statistics Labour market and earnings Strikes and lockouts
multi-employer bargaining system
Mainly regulated by collective agreements between the social partners
nearly two yearly peaks Negotiations about renewal of collective agreements in the economic sectors
right to strike private sector public sector
data coverage Only strikes excluding strikes that last less than 1 day workers involved excludes workers indirectly involved
0
5
10
15
20
25
2000
2001
2002
2003
2004
2005
2006
2007
2008
2009
2010
2011
2012
2013
days not worked (per 1000 employees)
0
5
10
15
20
2000
2001
2002
2003
2004
2005
2006
2007
2008
2009
2010
2011
2012
2013
workers involved in industrial action (per 1000 employees)
Poland
source ILOSTAT
single-employer bargaining system
Guaranteed by the Constitution and regulated by law
peak 2008 Various teachersrsquo strikes over a pay increase and other demands and other strikes in the public sector
right to strike private sector public sector
data coverage Only strikes excluding public administration workers involved excludes workers indirectly involved
0
10
20
30
2000
2001
2002
2003
2004
2005
2006
2007
2008
2009
2010
2011
2012
2013
days not worked (per 1000 employees)
0
5
10
15
20
25
2000
2001
2002
2003
2004
2005
2006
2007
2008
2009
2010
2011
2012
2013
workers involved in industrial action (per 1000 employees)
Portugal
source Gabinete de Estrateacutegia e Planeamento Estatiacutestica Greves Official strike data is not available after 2007
multi-employer bargaining system
Guaranteed by the Constitution and regulated by law
peak 2002 Several strike actions particularly in the public sector against changes in the Labour Code
right to strike private sector public sector
data coverage Only strikes Workers involved excludes workers indirectly involved
0
50
100
2000
2001
2002
2003
2004
2005
2006
2007
2008
2009
2010
2011
2012
2013
days not worked (per 1000 employees)
0
2
4
6
8
10
2000
2001
2002
2003
2004
2005
2006
2007
2008
2009
2010
2011
2012
2013
workers involved in industrial action (per 1000 employees)
Romania
source ILOSTAT Official data is very partial in 2009 and not available after 2010
single-employer bargaining system
Guaranteed by the Constitution and regulated by law
peaks 2000 and 2007 Several strike actions in particularly the manufacturing industry
right to strike private sector public sector
data coverage Only strikes workers involved excludes workers indirectly involved
0
10
20
30
40
2000
2001
2002
2003
2004
2005
2006
2007
2008
2009
2010
2011
2012
2013
days not worked (per 1000 employees)
0
2
4
6
8
10
2000
2001
2002
2003
2004
2005
2006
2007
2008
2009
2010
2011
2012
2013
workers involved in industrial action (per 1000 employees)
Slovakia
source 2000-2002 ILOSTAT 2003-2009 Carley (2004) Carley (2008) and Carley (2010) Since 2010 Statistical Office of the Slovak Republic (on demand)
mixed bargaining system
Guaranteed by the Constitution and regulated by law
peak 2003 Limited number of strike actions in railways and the public sector
right to strike private sector public sector
0
10
20
30
40
50
2000
2001
2002
2003
2004
2005
2006
2007
2008
2009
2010
2011
2012
2013
days not worked (per 1000 employees)
0
2
4
6
2000
2001
2002
2003
2004
2005
2006
2007
2008
2009
2010
2011
2012
2013
workers involved in industrial action (per 1000 employees)
Slovenia
source Carley (2004) Carley (2008) and Carley (2010) Trade union data (ZSSS) Official data is not available
multi-employer bargaining system
Guaranteed by the Constitution and regulated by law
peak 2005 Union mobilisation against labour market reforms
right to strike private sector public sector
data coverage Strikes and lockouts excluding strikes that last less than 1 hour workers involved excludes workers indirectly involved The 2012 data excludes the general strikes of the 29th of March and the 14th of November and the nation-wide strike in the education sector of 22nd of May In 2013 several strikes in the education sector are excluded
050
100150200250300350
2000
2001
2002
2003
2004
2005
2006
2007
2008
2009
2010
2011
2012
2013
days not worked (per 1000 employees)
050
100150200250300350
2000
2001
2002
2003
2004
2005
2006
2007
2008
2009
2010
2011
2012
2013
workers involved in industrial action (per 1000 employees)
Spain
source ILOSTAT Ministry of Employment and Social Security Statistics Condiciones de trabajo y relaciones laborales Huelgas y Cierres Patronales
multi-employer bargaining system
Guaranteed by the Constitution and regulated by law
peak 2004 Strike action in shipyards over renewal of collective agreements and against relocation decisions in mainly the manufacturing industry
underestimated peak in 2012 and 2013 General strikes in 2012 and various strikes in the public sector
right to strike private sector public sector
data coverage Strikes and lockouts Workers involved excludes workers indirectly involved
0
50
100
150
200
2000
2001
2002
2003
2004
2005
2006
2007
2008
2009
2010
2011
2012
2013
days not worked (per 1000 employees)
0
5
10
15
20
25
2000
2001
2002
2003
2004
2005
2006
2007
2008
2009
2010
2011
2012
2013
workers involved in industrial action (per 1000 employees)
Sweden
source Sweden National Mediation Office Melding amp konflikt Konfliktstatistik
multi-employer bargaining system
Guaranteed by the Constitution and regulated by law and in the 1938 collective agreement between the social partners
peak 2003 Large strike of blue-collar workers in the municipal and city council sector over a new pay agreement
right to strike private sector public sector
data coverage Strikes and lockouts Excluding strikes that last less than 1 day Workers involved includes workers directly and indirectly involved
0
5
10
15
2000
2001
2002
2003
2004
2005
2006
2007
2008
2009
2010
2011
2012
2013
days not worked (per 1000 employees)
0
2
4
6
8
10
2000
2001
2002
2003
2004
2005
2006
2007
2008
2009
2010
2011
2012
2013
workers involved in industrial action (per 1000 employees)
Switzerland
source Office feacutedeacuteral de la statistique Thegravemes Organisation du marcheacute du travail conventions collectives de travail Donneacutees deacutetailleacutees Gregraveves et lock-out
multi-employer bargaining system
Guaranteed by the Constitution and regulated by law and in the 1938 collective agreement between the social partners
peak 2004 Difficult to attribute to a specific large strike
right to strike private sector public sector
data coverage 2000-2008 Excluding political strikes Since 2009 Strikes and lockouts Excluding strikes that last less than 1 day Workers involved includes workers directly and indirectly involved
0
20
40
60
2000
2001
2002
2003
2004
2005
2006
2007
2008
2009
2010
2011
2012
2013
days not worked (per 1000 employees)
0
20
40
60
2000
2001
2002
2003
2004
2005
2006
2007
2008
2009
2010
2011
2012
2013
workers involved in industrial action (per 1000 employees)
United Kingdom
source Office for National Statistics Browse by Theme Labour Market Labour Disputes Days Lost due to Industrial Action
single-employer bargaining system
Regulated by law
peak 2004 One-day strike by civil servants to protest against governments plans to cut a large number of civil service posts peak 2007 One-day strike by postal workers in protest over pay and modernisation plans and one-day strike by prison officers
against the governmentrsquos decision to introduce a pay award in stages peak 2011 Union mobilisation against public service pension reforms in June and November
Right to strike legend
yes with minor restrictions (eg recognized union balloting proportionality respect of peace obligation)
yes with major restrictions (eg monopoly union compulsory arbitration or conciliation restrictions on issues or content major groups excluded
no
yes
private sector
yes with minor restrictions (eg recognized union balloting proportionality respect of peace obligation only military judiciary or police excluded ndash as per ILO convention)
yes with major restrictions (eg monopoly union compulsory arbitration or conciliation restrictions on issues or content major groups excluded
no
yes
public sector
source J Visser Database on Institutional Characteristics of Trade Unions Wage Setting State Intervention and Social Pacts (ICTWSS) database version 4 2013 The indicators reflect the situation in 2011
Prevelant bargaining regime legend
Single-employer bargaining system the establishment or company level is predominant
Multi-employer bargaining system sector andor the cross-sector level is predominant
Mixed bargaining system an intermediate situation where sector and company negotiations each respectively account for at least one-third of those covered by collective wage-setting arrangements
source P Marginson and C Welz (2014) Changes to wage-setting mechanisms in the context of the crisis and the EUrsquos new economic governance regime Dublin Eurofound
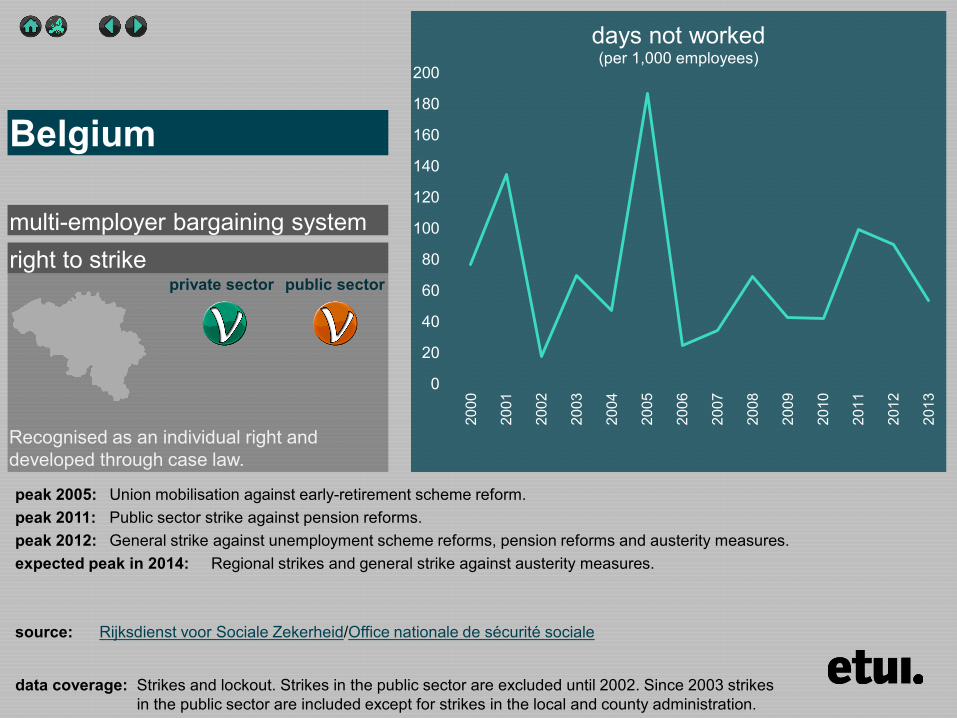
right to strike private sector public sector
data coverage Strikes and lockout Strikes in the public sector are excluded until 2002 Since 2003 strikes in the public sector are included except for strikes in the local and county administration
0
20
40
60
80
100
120
140
160
180
200
2000
2001
2002
2003
2004
2005
2006
2007
2008
2009
2010
2011
2012
2013
days not worked (per 1000 employees)
Belgium
source Rijksdienst voor Sociale ZekerheidOffice nationale de seacutecuriteacute sociale
multi-employer bargaining system
Recognised as an individual right and developed through case law
peak 2005 Union mobilisation against early-retirement scheme reform peak 2011 Public sector strike against pension reforms peak 2012 General strike against unemployment scheme reforms pension reforms and austerity measures expected peak in 2014 Regional strikes and general strike against austerity measures
right to strike private sector public sector
data coverage Strikes and lockouts Excluding strikes that last less than 2 hours Workers involved excludes workers indirectly involved
0
500
1000
1500
2000
2000
2001
2002
2003
2004
2005
2006
2007
2008
2009
2010
2011
2012
2013
days not worked (per 1000 employees)
0
100
200
300
2000
2001
2002
2003
2004
2005
2006
2007
2008
2009
2010
2011
2012
2013
workers involved in industrial action (per 1000 employees)
Cyprus
source Department of Labour Relations Labour Disputes Statistics ILOSTAT
mixed bargaining system
Guaranteed by the Constitution peak 2006 Sectoral one-day strike in construction industry over a renewal of the industry-wide collective agreement peak 2011 Public servantsrsquo strike against a two-year pay-freeze and austerity measures peak 2012 24-hour strike in construction industry but also strikes in other industries mostly in protest to honour pay rises and cost-of-living
increases peak 2013 Open-ended strike in the construction industry over the renewal of the industry-wide collective agreement it was the longest
strike in Cyprusrsquo history since 1948
right to strike private sector public sector
data coverage Strikes and lockouts Workers involved excludes workers indirectly involved
0
200
400
600
800
2000
2001
2002
2003
2004
2005
2006
2007
2008
2009
2010
2011
2012
2013
days not worked (per 1000 employees)
0
20
40
60
2000
2001
2002
2003
2004
2005
2006
2007
2008
2009
2010
2011
2012
2013
workers involved in industrial action (per 1000 employees)
Denmark
source Danmarks Statistik Arbejdsstandsninger
multi-employer bargaining system
Guaranteed by the Constitution and developed through case-law and most importantly regulated by collective agreements between the social partners
peak 2008 Large strike in the healthcare and social work sector for a wage increase at time of the renewal of collective agreements
peak 2013 Lockout by the municipalities association in the education sector
right to strike private sector public sector
data coverage Strikes and lockouts Workers involved includes workers directly and indirectly involved in 2012 Data excludes warning and supportive strikes
0
20
40
60
2000
2001
2002
2003
2004
2005
2006
2007
2008
2009
2010
2011
2012
2013
days not worked (per 1000 employees)
0
20
40
60
2000
2001
2002
2003
2004
2005
2006
2007
2008
2009
2010
2011
2012
2013
workers involved in industrial action (per 1000 employees)
Estonia
source 2000-2009 ILOSTAT since 2010 Statistics Estonia Subject areas Economy Wages and salaries and labour costs Statistical database Strikes
single-employer bargaining system
Guaranteed by the Constitution and regulated by law
peak 2003 One-day strike in education and culture workers for pay increase peak 2012 Teachersrsquo strike and strike in health care sector both over pay increase
right to strike private sector public sector
data coverage Strikes and lockouts Workers involved excludes workers indirectly involved
0
100
200
300
2000
2001
2002
2003
2004
2005
2006
2007
2008
2009
2010
2011
2012
2013
days not worked (per 1000 employees)
0
20
40
60
80
2000
2001
2002
2003
2004
2005
2006
2007
2008
2009
2010
2011
2012
2013
workers involved in industrial action (per 1000 employees)
Finland
source Statistics Finland Labour Market Statistics on labour disputes
multi-employer bargaining system
Implicitly guaranteed by the Constitution and explicitly by law
peak 2005 Four-day strike and numerous other strikes in the paper-industry over a renewal of the collective agreement peak 2010 Large two-week strike of stevedores about severance pay and outsourcing besides several other strikes in
manufacturing and in wholesale and retail trade
right to strike private sector public sector
050
100150200250300350
2000
2001
2002
2003
2004
2005
2006
2007
2008
2009
2010
2011
2012
2013
days not worked (per 1000 employees)
0
20
40
60
80
2000
2001
2002
2003
2004
2005
2006
2007
2008
2009
2010
2011
2012
2013
workers involved in industrial action (per 1000 employees)
France
source 2000-2004 (volume) ILOSTAT Since 2005 (volume) ETUI estimate based on combining DARES data and data from the Direction geacuteneacuterale de lrsquoadministration et de la fonction publique The DARES covers industrial action in the private sector including some semi-public enterprises The data from the Direction geacuteneacuterale de lrsquoadministration covers the public sector and overlaps with the DARES data in case of some semi-public enterprises Relying only on the DARES data clearly underestimates the volume 2000-2007 (participation) Combining ILOSTAT Carley (2008) and Carley (2010)
multi-employer bargaining system
Recognised as an individual right and guaranteed by the Constitution regulated by law in the public sector and mainly developed through case law in the private sector
peak 2003 and 2010 Union mobilisation against pension reforms
right to strike private sector public sector
data coverage 2000-2003 Strikes and lockouts Excluding public administration Workers involved excludes workers indirectly involved
0
20
40
60
2000
2001
2002
2003
2004
2005
2006
2007
2008
2009
2010
2011
2012
2013
days not worked (per 1000 employees)
0
10
20
30
40
50
2000
2001
2002
2003
2004
2005
2006
2007
2008
2009
2010
2011
2012
2013
workers involved in industrial action (per 1000 employees)
Germany
source 2000-2003 ILOSTAT since 2004 WSI estimate
multi-employer bargaining system
Implicitly guaranteed by the Constitution and developed through case-law
peak 2006 Strikes in the public sector particularly health care besides short warning strikes in metal industry
right to strike private sector public sector
data coverage Strikes and lockouts 2012 Only strikes Excluding strikes that last less than 100 days workers involved includes workers directly and indirectly involved
0
50
100
150
200
2000
2001
2002
2003
2004
2005
2006
2007
2008
2009
2010
2011
2012
2013
days not worked (per 1000 employees)
0
5
10
15
20
2000
2001
2002
2003
2004
2005
2006
2007
2008
2009
2010
2011
2012
2013
workers involved in industrial action (per 1000 employees)
Hungary
source 2000-2009 Carley (2004) Carley (2008) and Carley (2010) 2010 Hungarian Statistical Office 2012 ILOSTAT
single-employer bargaining system
Guaranteed by the Constitution and by law
peak 2000 National strike in health care sector
right to strike private sector public sector
data coverage Only strikes Disputes are included if they involve a stoppage of work lasting for at least one day and the total time lost is 10 or more person-days Workers involved excludes workers indirectly involved
0
50
100
150
200
2000
2001
2002
2003
2004
2005
2006
2007
2008
2009
2010
2011
2012
2013
days not worked (per 1000 employees)
0
50
100
150
200
2000
2001
2002
2003
2004
2005
2006
2007
2008
2009
2010
2011
2012
2013
workers involved in industrial action (per 1000 employees)
Ireland
source Central Statistics Office Databank StatBank Labour Market and Earnings Labour Market Industrial Disputes
single-employer bargaining system
Guaranteed by law and developed through case-law
peak 2009 24-hour national public service strike against governmentrsquos pay cuts
right to strike private sector public sector
data coverage Strikes and lockouts Workers involved excludes workers indirectly involved
0
100
200
300
2000
2001
2002
2003
2004
2005
2006
2007
2008
2009
2010
2011
2012
2013
days not worked (per 1000 employees)
0
100
200
300
2000
2001
2002
2003
2004
2005
2006
2007
2008
2009
2010
2011
2012
2013
workers involved in industrial action (per 1000 employees)
Italy
source Istituto Nazionale di Statistica ILOSTAT Official strike data is no longer collected since 2009
multi-employer bargaining system
Recognised as an individual right and guaranteed by the Constitution and developed through case-law
peak 2002 General strike against labour market reforms
right to strike private sector public sector
data coverage Strikes and lockouts Workers involved excludes workers indirectly involved
0
1
2
3
4
2000
2001
2002
2003
2004
2005
2006
2007
2008
2009
2010
2011
2012
2013
days not worked (per 1000 employees)
0
1
2
3
2000
2001
2002
2003
2004
2005
2006
2007
2008
2009
2010
2011
2012
2013
workers involved in industrial action (per 1000 employees)
Latvia
source ILOSTAT
single-employer bargaining system
Guaranteed by the Constitution and regulated by law
peak 2008 Not attributable to a single large strike
right to strike private sector public sector
data coverage Only strikes Workers involved includes workers directly and indirectly involved
0
10
20
30
2000
2001
2002
2003
2004
2005
2006
2007
2008
2009
2010
2011
2012
2013
days not worked (per 1000 employees)
0
2
4
6
8
10
2000
2001
2002
2003
2004
2005
2006
2007
2008
2009
2010
2011
2012
2013
workers involved in industrial action (per 1000 employees)
Lithuania
source 2000-2008 2012 ILOSTAT 2009 Carley (2010) 2010-2011 and 2013 Statistics Lithuania Official Statistics Portal Population and social statistics Statistical information on strikes An estimate is also provided by Carley (2008 2010)
single-employer bargaining system
Guaranteed by the Constitution and regulated by law
peak 2008 Various teacherrsquos strike over a pay increase and other demands and other strikes in the public sector
right to strike private sector public sector
0
50
100
150
2000
2001
2002
2003
2004
2005
2006
2007
2008
2009
2010
2011
2012
2013
days not worked (per 1000 employees)
0
100
200
300
2000
2001
2002
2003
2004
2005
2006
2007
2008
2009
2010
2011
2012
2013
workers involved in industrial action (per 1000 employees)
Luxembourg
source Carley (2004) Carley (2008) and Carley (2010) Official data is no longer available since 2009
mixed bargaining system
Developed through case law
peak 2007 One-day general strike in public sector and a two-day railway strike over civil service and state employee pensions
right to strike private sector public sector
data coverage Strikes and lockouts Workers involved excludes workers indirectly involved
0
20
40
60
2000
2001
2002
2003
2004
2005
2006
2007
2008
2009
2010
2011
2012
2013
days not worked (per 1000 employees)
0
20
40
60
80
100
2000
2001
2002
2003
2004
2005
2006
2007
2008
2009
2010
2011
2012
2013
workers involved in industrial action (per 1000 employees)
Malta
source Industrial and Employment Relations Publications and Archives Archives Annual Reports ILOSTAT
single-employer bargaining system
Indirectly recognised by law
peak 2009 Not attributable to a specific large strike
right to strike private sector public sector
data coverage Only strikes Workers involved excludes workersindirectly involved
0
10
20
30
40
2000
2001
2002
2003
2004
2005
2006
2007
2008
2009
2010
2011
2012
2013
days not worked (per 1000 employees)
0
5
10
15
20
2000
2001
2002
2003
2004
2005
2006
2007
2008
2009
2010
2011
2012
2013
workers involved in industrial action (per 1000 employees)
Netherlands
source Centraal Bureau voor de Statistiek Cijfers Statline databank Thema Arbeidsmarkt Vakbeweging en stakingen Historie Werkstakingen
multi-employer bargaining system
Developed through case law
peak 2002 Strike action in construction industry peak 2012 15 weeks strike in cleaning sector over renewal of collective agreement besides strike action in the education sector
against austerity measures
right to strike private sector public sector
data coverage Strikes and lockout excluding strikes that last less than 1 day Workers involved includes workers directly and indirectly involved
0
50
100
150
200
250
2000
2001
2002
2003
2004
2005
2006
2007
2008
2009
2010
2011
2012
2013
days not worked (per 1000 employees)
0
10
20
30
40
50
2000
2001
2002
2003
2004
2005
2006
2007
2008
2009
2010
2011
2012
2013
workers involved in industrial action (per 1000 employees)
Norway
source Statistics Norway Statistics Labour market and earnings Strikes and lockouts
multi-employer bargaining system
Mainly regulated by collective agreements between the social partners
nearly two yearly peaks Negotiations about renewal of collective agreements in the economic sectors
right to strike private sector public sector
data coverage Only strikes excluding strikes that last less than 1 day workers involved excludes workers indirectly involved
0
5
10
15
20
25
2000
2001
2002
2003
2004
2005
2006
2007
2008
2009
2010
2011
2012
2013
days not worked (per 1000 employees)
0
5
10
15
20
2000
2001
2002
2003
2004
2005
2006
2007
2008
2009
2010
2011
2012
2013
workers involved in industrial action (per 1000 employees)
Poland
source ILOSTAT
single-employer bargaining system
Guaranteed by the Constitution and regulated by law
peak 2008 Various teachersrsquo strikes over a pay increase and other demands and other strikes in the public sector
right to strike private sector public sector
data coverage Only strikes excluding public administration workers involved excludes workers indirectly involved
0
10
20
30
2000
2001
2002
2003
2004
2005
2006
2007
2008
2009
2010
2011
2012
2013
days not worked (per 1000 employees)
0
5
10
15
20
25
2000
2001
2002
2003
2004
2005
2006
2007
2008
2009
2010
2011
2012
2013
workers involved in industrial action (per 1000 employees)
Portugal
source Gabinete de Estrateacutegia e Planeamento Estatiacutestica Greves Official strike data is not available after 2007
multi-employer bargaining system
Guaranteed by the Constitution and regulated by law
peak 2002 Several strike actions particularly in the public sector against changes in the Labour Code
right to strike private sector public sector
data coverage Only strikes Workers involved excludes workers indirectly involved
0
50
100
2000
2001
2002
2003
2004
2005
2006
2007
2008
2009
2010
2011
2012
2013
days not worked (per 1000 employees)
0
2
4
6
8
10
2000
2001
2002
2003
2004
2005
2006
2007
2008
2009
2010
2011
2012
2013
workers involved in industrial action (per 1000 employees)
Romania
source ILOSTAT Official data is very partial in 2009 and not available after 2010
single-employer bargaining system
Guaranteed by the Constitution and regulated by law
peaks 2000 and 2007 Several strike actions in particularly the manufacturing industry
right to strike private sector public sector
data coverage Only strikes workers involved excludes workers indirectly involved
0
10
20
30
40
2000
2001
2002
2003
2004
2005
2006
2007
2008
2009
2010
2011
2012
2013
days not worked (per 1000 employees)
0
2
4
6
8
10
2000
2001
2002
2003
2004
2005
2006
2007
2008
2009
2010
2011
2012
2013
workers involved in industrial action (per 1000 employees)
Slovakia
source 2000-2002 ILOSTAT 2003-2009 Carley (2004) Carley (2008) and Carley (2010) Since 2010 Statistical Office of the Slovak Republic (on demand)
mixed bargaining system
Guaranteed by the Constitution and regulated by law
peak 2003 Limited number of strike actions in railways and the public sector
right to strike private sector public sector
0
10
20
30
40
50
2000
2001
2002
2003
2004
2005
2006
2007
2008
2009
2010
2011
2012
2013
days not worked (per 1000 employees)
0
2
4
6
2000
2001
2002
2003
2004
2005
2006
2007
2008
2009
2010
2011
2012
2013
workers involved in industrial action (per 1000 employees)
Slovenia
source Carley (2004) Carley (2008) and Carley (2010) Trade union data (ZSSS) Official data is not available
multi-employer bargaining system
Guaranteed by the Constitution and regulated by law
peak 2005 Union mobilisation against labour market reforms
right to strike private sector public sector
data coverage Strikes and lockouts excluding strikes that last less than 1 hour workers involved excludes workers indirectly involved The 2012 data excludes the general strikes of the 29th of March and the 14th of November and the nation-wide strike in the education sector of 22nd of May In 2013 several strikes in the education sector are excluded
050
100150200250300350
2000
2001
2002
2003
2004
2005
2006
2007
2008
2009
2010
2011
2012
2013
days not worked (per 1000 employees)
050
100150200250300350
2000
2001
2002
2003
2004
2005
2006
2007
2008
2009
2010
2011
2012
2013
workers involved in industrial action (per 1000 employees)
Spain
source ILOSTAT Ministry of Employment and Social Security Statistics Condiciones de trabajo y relaciones laborales Huelgas y Cierres Patronales
multi-employer bargaining system
Guaranteed by the Constitution and regulated by law
peak 2004 Strike action in shipyards over renewal of collective agreements and against relocation decisions in mainly the manufacturing industry
underestimated peak in 2012 and 2013 General strikes in 2012 and various strikes in the public sector
right to strike private sector public sector
data coverage Strikes and lockouts Workers involved excludes workers indirectly involved
0
50
100
150
200
2000
2001
2002
2003
2004
2005
2006
2007
2008
2009
2010
2011
2012
2013
days not worked (per 1000 employees)
0
5
10
15
20
25
2000
2001
2002
2003
2004
2005
2006
2007
2008
2009
2010
2011
2012
2013
workers involved in industrial action (per 1000 employees)
Sweden
source Sweden National Mediation Office Melding amp konflikt Konfliktstatistik
multi-employer bargaining system
Guaranteed by the Constitution and regulated by law and in the 1938 collective agreement between the social partners
peak 2003 Large strike of blue-collar workers in the municipal and city council sector over a new pay agreement
right to strike private sector public sector
data coverage Strikes and lockouts Excluding strikes that last less than 1 day Workers involved includes workers directly and indirectly involved
0
5
10
15
2000
2001
2002
2003
2004
2005
2006
2007
2008
2009
2010
2011
2012
2013
days not worked (per 1000 employees)
0
2
4
6
8
10
2000
2001
2002
2003
2004
2005
2006
2007
2008
2009
2010
2011
2012
2013
workers involved in industrial action (per 1000 employees)
Switzerland
source Office feacutedeacuteral de la statistique Thegravemes Organisation du marcheacute du travail conventions collectives de travail Donneacutees deacutetailleacutees Gregraveves et lock-out
multi-employer bargaining system
Guaranteed by the Constitution and regulated by law and in the 1938 collective agreement between the social partners
peak 2004 Difficult to attribute to a specific large strike
right to strike private sector public sector
data coverage 2000-2008 Excluding political strikes Since 2009 Strikes and lockouts Excluding strikes that last less than 1 day Workers involved includes workers directly and indirectly involved
0
20
40
60
2000
2001
2002
2003
2004
2005
2006
2007
2008
2009
2010
2011
2012
2013
days not worked (per 1000 employees)
0
20
40
60
2000
2001
2002
2003
2004
2005
2006
2007
2008
2009
2010
2011
2012
2013
workers involved in industrial action (per 1000 employees)
United Kingdom
source Office for National Statistics Browse by Theme Labour Market Labour Disputes Days Lost due to Industrial Action
single-employer bargaining system
Regulated by law
peak 2004 One-day strike by civil servants to protest against governments plans to cut a large number of civil service posts peak 2007 One-day strike by postal workers in protest over pay and modernisation plans and one-day strike by prison officers
against the governmentrsquos decision to introduce a pay award in stages peak 2011 Union mobilisation against public service pension reforms in June and November
Right to strike legend
yes with minor restrictions (eg recognized union balloting proportionality respect of peace obligation)
yes with major restrictions (eg monopoly union compulsory arbitration or conciliation restrictions on issues or content major groups excluded
no
yes
private sector
yes with minor restrictions (eg recognized union balloting proportionality respect of peace obligation only military judiciary or police excluded ndash as per ILO convention)
yes with major restrictions (eg monopoly union compulsory arbitration or conciliation restrictions on issues or content major groups excluded
no
yes
public sector
source J Visser Database on Institutional Characteristics of Trade Unions Wage Setting State Intervention and Social Pacts (ICTWSS) database version 4 2013 The indicators reflect the situation in 2011
Prevelant bargaining regime legend
Single-employer bargaining system the establishment or company level is predominant
Multi-employer bargaining system sector andor the cross-sector level is predominant
Mixed bargaining system an intermediate situation where sector and company negotiations each respectively account for at least one-third of those covered by collective wage-setting arrangements
source P Marginson and C Welz (2014) Changes to wage-setting mechanisms in the context of the crisis and the EUrsquos new economic governance regime Dublin Eurofound
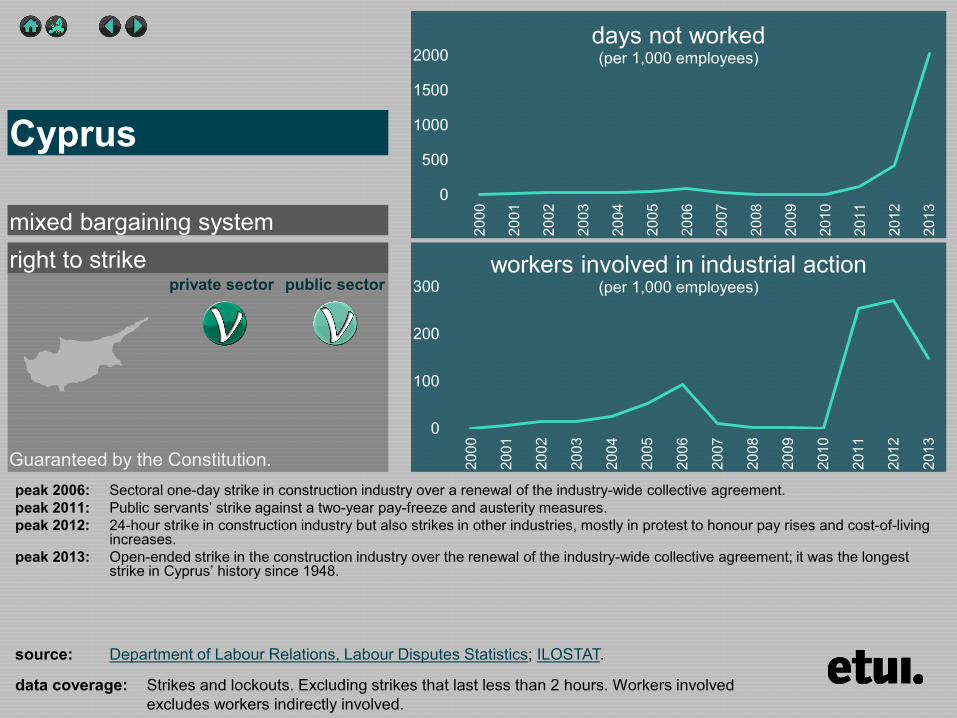
right to strike private sector public sector
data coverage Strikes and lockouts Excluding strikes that last less than 2 hours Workers involved excludes workers indirectly involved
0
500
1000
1500
2000
2000
2001
2002
2003
2004
2005
2006
2007
2008
2009
2010
2011
2012
2013
days not worked (per 1000 employees)
0
100
200
300
2000
2001
2002
2003
2004
2005
2006
2007
2008
2009
2010
2011
2012
2013
workers involved in industrial action (per 1000 employees)
Cyprus
source Department of Labour Relations Labour Disputes Statistics ILOSTAT
mixed bargaining system
Guaranteed by the Constitution peak 2006 Sectoral one-day strike in construction industry over a renewal of the industry-wide collective agreement peak 2011 Public servantsrsquo strike against a two-year pay-freeze and austerity measures peak 2012 24-hour strike in construction industry but also strikes in other industries mostly in protest to honour pay rises and cost-of-living
increases peak 2013 Open-ended strike in the construction industry over the renewal of the industry-wide collective agreement it was the longest
strike in Cyprusrsquo history since 1948
right to strike private sector public sector
data coverage Strikes and lockouts Workers involved excludes workers indirectly involved
0
200
400
600
800
2000
2001
2002
2003
2004
2005
2006
2007
2008
2009
2010
2011
2012
2013
days not worked (per 1000 employees)
0
20
40
60
2000
2001
2002
2003
2004
2005
2006
2007
2008
2009
2010
2011
2012
2013
workers involved in industrial action (per 1000 employees)
Denmark
source Danmarks Statistik Arbejdsstandsninger
multi-employer bargaining system
Guaranteed by the Constitution and developed through case-law and most importantly regulated by collective agreements between the social partners
peak 2008 Large strike in the healthcare and social work sector for a wage increase at time of the renewal of collective agreements
peak 2013 Lockout by the municipalities association in the education sector
right to strike private sector public sector
data coverage Strikes and lockouts Workers involved includes workers directly and indirectly involved in 2012 Data excludes warning and supportive strikes
0
20
40
60
2000
2001
2002
2003
2004
2005
2006
2007
2008
2009
2010
2011
2012
2013
days not worked (per 1000 employees)
0
20
40
60
2000
2001
2002
2003
2004
2005
2006
2007
2008
2009
2010
2011
2012
2013
workers involved in industrial action (per 1000 employees)
Estonia
source 2000-2009 ILOSTAT since 2010 Statistics Estonia Subject areas Economy Wages and salaries and labour costs Statistical database Strikes
single-employer bargaining system
Guaranteed by the Constitution and regulated by law
peak 2003 One-day strike in education and culture workers for pay increase peak 2012 Teachersrsquo strike and strike in health care sector both over pay increase
right to strike private sector public sector
data coverage Strikes and lockouts Workers involved excludes workers indirectly involved
0
100
200
300
2000
2001
2002
2003
2004
2005
2006
2007
2008
2009
2010
2011
2012
2013
days not worked (per 1000 employees)
0
20
40
60
80
2000
2001
2002
2003
2004
2005
2006
2007
2008
2009
2010
2011
2012
2013
workers involved in industrial action (per 1000 employees)
Finland
source Statistics Finland Labour Market Statistics on labour disputes
multi-employer bargaining system
Implicitly guaranteed by the Constitution and explicitly by law
peak 2005 Four-day strike and numerous other strikes in the paper-industry over a renewal of the collective agreement peak 2010 Large two-week strike of stevedores about severance pay and outsourcing besides several other strikes in
manufacturing and in wholesale and retail trade
right to strike private sector public sector
050
100150200250300350
2000
2001
2002
2003
2004
2005
2006
2007
2008
2009
2010
2011
2012
2013
days not worked (per 1000 employees)
0
20
40
60
80
2000
2001
2002
2003
2004
2005
2006
2007
2008
2009
2010
2011
2012
2013
workers involved in industrial action (per 1000 employees)
France
source 2000-2004 (volume) ILOSTAT Since 2005 (volume) ETUI estimate based on combining DARES data and data from the Direction geacuteneacuterale de lrsquoadministration et de la fonction publique The DARES covers industrial action in the private sector including some semi-public enterprises The data from the Direction geacuteneacuterale de lrsquoadministration covers the public sector and overlaps with the DARES data in case of some semi-public enterprises Relying only on the DARES data clearly underestimates the volume 2000-2007 (participation) Combining ILOSTAT Carley (2008) and Carley (2010)
multi-employer bargaining system
Recognised as an individual right and guaranteed by the Constitution regulated by law in the public sector and mainly developed through case law in the private sector
peak 2003 and 2010 Union mobilisation against pension reforms
right to strike private sector public sector
data coverage 2000-2003 Strikes and lockouts Excluding public administration Workers involved excludes workers indirectly involved
0
20
40
60
2000
2001
2002
2003
2004
2005
2006
2007
2008
2009
2010
2011
2012
2013
days not worked (per 1000 employees)
0
10
20
30
40
50
2000
2001
2002
2003
2004
2005
2006
2007
2008
2009
2010
2011
2012
2013
workers involved in industrial action (per 1000 employees)
Germany
source 2000-2003 ILOSTAT since 2004 WSI estimate
multi-employer bargaining system
Implicitly guaranteed by the Constitution and developed through case-law
peak 2006 Strikes in the public sector particularly health care besides short warning strikes in metal industry
right to strike private sector public sector
data coverage Strikes and lockouts 2012 Only strikes Excluding strikes that last less than 100 days workers involved includes workers directly and indirectly involved
0
50
100
150
200
2000
2001
2002
2003
2004
2005
2006
2007
2008
2009
2010
2011
2012
2013
days not worked (per 1000 employees)
0
5
10
15
20
2000
2001
2002
2003
2004
2005
2006
2007
2008
2009
2010
2011
2012
2013
workers involved in industrial action (per 1000 employees)
Hungary
source 2000-2009 Carley (2004) Carley (2008) and Carley (2010) 2010 Hungarian Statistical Office 2012 ILOSTAT
single-employer bargaining system
Guaranteed by the Constitution and by law
peak 2000 National strike in health care sector
right to strike private sector public sector
data coverage Only strikes Disputes are included if they involve a stoppage of work lasting for at least one day and the total time lost is 10 or more person-days Workers involved excludes workers indirectly involved
0
50
100
150
200
2000
2001
2002
2003
2004
2005
2006
2007
2008
2009
2010
2011
2012
2013
days not worked (per 1000 employees)
0
50
100
150
200
2000
2001
2002
2003
2004
2005
2006
2007
2008
2009
2010
2011
2012
2013
workers involved in industrial action (per 1000 employees)
Ireland
source Central Statistics Office Databank StatBank Labour Market and Earnings Labour Market Industrial Disputes
single-employer bargaining system
Guaranteed by law and developed through case-law
peak 2009 24-hour national public service strike against governmentrsquos pay cuts
right to strike private sector public sector
data coverage Strikes and lockouts Workers involved excludes workers indirectly involved
0
100
200
300
2000
2001
2002
2003
2004
2005
2006
2007
2008
2009
2010
2011
2012
2013
days not worked (per 1000 employees)
0
100
200
300
2000
2001
2002
2003
2004
2005
2006
2007
2008
2009
2010
2011
2012
2013
workers involved in industrial action (per 1000 employees)
Italy
source Istituto Nazionale di Statistica ILOSTAT Official strike data is no longer collected since 2009
multi-employer bargaining system
Recognised as an individual right and guaranteed by the Constitution and developed through case-law
peak 2002 General strike against labour market reforms
right to strike private sector public sector
data coverage Strikes and lockouts Workers involved excludes workers indirectly involved
0
1
2
3
4
2000
2001
2002
2003
2004
2005
2006
2007
2008
2009
2010
2011
2012
2013
days not worked (per 1000 employees)
0
1
2
3
2000
2001
2002
2003
2004
2005
2006
2007
2008
2009
2010
2011
2012
2013
workers involved in industrial action (per 1000 employees)
Latvia
source ILOSTAT
single-employer bargaining system
Guaranteed by the Constitution and regulated by law
peak 2008 Not attributable to a single large strike
right to strike private sector public sector
data coverage Only strikes Workers involved includes workers directly and indirectly involved
0
10
20
30
2000
2001
2002
2003
2004
2005
2006
2007
2008
2009
2010
2011
2012
2013
days not worked (per 1000 employees)
0
2
4
6
8
10
2000
2001
2002
2003
2004
2005
2006
2007
2008
2009
2010
2011
2012
2013
workers involved in industrial action (per 1000 employees)
Lithuania
source 2000-2008 2012 ILOSTAT 2009 Carley (2010) 2010-2011 and 2013 Statistics Lithuania Official Statistics Portal Population and social statistics Statistical information on strikes An estimate is also provided by Carley (2008 2010)
single-employer bargaining system
Guaranteed by the Constitution and regulated by law
peak 2008 Various teacherrsquos strike over a pay increase and other demands and other strikes in the public sector
right to strike private sector public sector
0
50
100
150
2000
2001
2002
2003
2004
2005
2006
2007
2008
2009
2010
2011
2012
2013
days not worked (per 1000 employees)
0
100
200
300
2000
2001
2002
2003
2004
2005
2006
2007
2008
2009
2010
2011
2012
2013
workers involved in industrial action (per 1000 employees)
Luxembourg
source Carley (2004) Carley (2008) and Carley (2010) Official data is no longer available since 2009
mixed bargaining system
Developed through case law
peak 2007 One-day general strike in public sector and a two-day railway strike over civil service and state employee pensions
right to strike private sector public sector
data coverage Strikes and lockouts Workers involved excludes workers indirectly involved
0
20
40
60
2000
2001
2002
2003
2004
2005
2006
2007
2008
2009
2010
2011
2012
2013
days not worked (per 1000 employees)
0
20
40
60
80
100
2000
2001
2002
2003
2004
2005
2006
2007
2008
2009
2010
2011
2012
2013
workers involved in industrial action (per 1000 employees)
Malta
source Industrial and Employment Relations Publications and Archives Archives Annual Reports ILOSTAT
single-employer bargaining system
Indirectly recognised by law
peak 2009 Not attributable to a specific large strike
right to strike private sector public sector
data coverage Only strikes Workers involved excludes workersindirectly involved
0
10
20
30
40
2000
2001
2002
2003
2004
2005
2006
2007
2008
2009
2010
2011
2012
2013
days not worked (per 1000 employees)
0
5
10
15
20
2000
2001
2002
2003
2004
2005
2006
2007
2008
2009
2010
2011
2012
2013
workers involved in industrial action (per 1000 employees)
Netherlands
source Centraal Bureau voor de Statistiek Cijfers Statline databank Thema Arbeidsmarkt Vakbeweging en stakingen Historie Werkstakingen
multi-employer bargaining system
Developed through case law
peak 2002 Strike action in construction industry peak 2012 15 weeks strike in cleaning sector over renewal of collective agreement besides strike action in the education sector
against austerity measures
right to strike private sector public sector
data coverage Strikes and lockout excluding strikes that last less than 1 day Workers involved includes workers directly and indirectly involved
0
50
100
150
200
250
2000
2001
2002
2003
2004
2005
2006
2007
2008
2009
2010
2011
2012
2013
days not worked (per 1000 employees)
0
10
20
30
40
50
2000
2001
2002
2003
2004
2005
2006
2007
2008
2009
2010
2011
2012
2013
workers involved in industrial action (per 1000 employees)
Norway
source Statistics Norway Statistics Labour market and earnings Strikes and lockouts
multi-employer bargaining system
Mainly regulated by collective agreements between the social partners
nearly two yearly peaks Negotiations about renewal of collective agreements in the economic sectors
right to strike private sector public sector
data coverage Only strikes excluding strikes that last less than 1 day workers involved excludes workers indirectly involved
0
5
10
15
20
25
2000
2001
2002
2003
2004
2005
2006
2007
2008
2009
2010
2011
2012
2013
days not worked (per 1000 employees)
0
5
10
15
20
2000
2001
2002
2003
2004
2005
2006
2007
2008
2009
2010
2011
2012
2013
workers involved in industrial action (per 1000 employees)
Poland
source ILOSTAT
single-employer bargaining system
Guaranteed by the Constitution and regulated by law
peak 2008 Various teachersrsquo strikes over a pay increase and other demands and other strikes in the public sector
right to strike private sector public sector
data coverage Only strikes excluding public administration workers involved excludes workers indirectly involved
0
10
20
30
2000
2001
2002
2003
2004
2005
2006
2007
2008
2009
2010
2011
2012
2013
days not worked (per 1000 employees)
0
5
10
15
20
25
2000
2001
2002
2003
2004
2005
2006
2007
2008
2009
2010
2011
2012
2013
workers involved in industrial action (per 1000 employees)
Portugal
source Gabinete de Estrateacutegia e Planeamento Estatiacutestica Greves Official strike data is not available after 2007
multi-employer bargaining system
Guaranteed by the Constitution and regulated by law
peak 2002 Several strike actions particularly in the public sector against changes in the Labour Code
right to strike private sector public sector
data coverage Only strikes Workers involved excludes workers indirectly involved
0
50
100
2000
2001
2002
2003
2004
2005
2006
2007
2008
2009
2010
2011
2012
2013
days not worked (per 1000 employees)
0
2
4
6
8
10
2000
2001
2002
2003
2004
2005
2006
2007
2008
2009
2010
2011
2012
2013
workers involved in industrial action (per 1000 employees)
Romania
source ILOSTAT Official data is very partial in 2009 and not available after 2010
single-employer bargaining system
Guaranteed by the Constitution and regulated by law
peaks 2000 and 2007 Several strike actions in particularly the manufacturing industry
right to strike private sector public sector
data coverage Only strikes workers involved excludes workers indirectly involved
0
10
20
30
40
2000
2001
2002
2003
2004
2005
2006
2007
2008
2009
2010
2011
2012
2013
days not worked (per 1000 employees)
0
2
4
6
8
10
2000
2001
2002
2003
2004
2005
2006
2007
2008
2009
2010
2011
2012
2013
workers involved in industrial action (per 1000 employees)
Slovakia
source 2000-2002 ILOSTAT 2003-2009 Carley (2004) Carley (2008) and Carley (2010) Since 2010 Statistical Office of the Slovak Republic (on demand)
mixed bargaining system
Guaranteed by the Constitution and regulated by law
peak 2003 Limited number of strike actions in railways and the public sector
right to strike private sector public sector
0
10
20
30
40
50
2000
2001
2002
2003
2004
2005
2006
2007
2008
2009
2010
2011
2012
2013
days not worked (per 1000 employees)
0
2
4
6
2000
2001
2002
2003
2004
2005
2006
2007
2008
2009
2010
2011
2012
2013
workers involved in industrial action (per 1000 employees)
Slovenia
source Carley (2004) Carley (2008) and Carley (2010) Trade union data (ZSSS) Official data is not available
multi-employer bargaining system
Guaranteed by the Constitution and regulated by law
peak 2005 Union mobilisation against labour market reforms
right to strike private sector public sector
data coverage Strikes and lockouts excluding strikes that last less than 1 hour workers involved excludes workers indirectly involved The 2012 data excludes the general strikes of the 29th of March and the 14th of November and the nation-wide strike in the education sector of 22nd of May In 2013 several strikes in the education sector are excluded
050
100150200250300350
2000
2001
2002
2003
2004
2005
2006
2007
2008
2009
2010
2011
2012
2013
days not worked (per 1000 employees)
050
100150200250300350
2000
2001
2002
2003
2004
2005
2006
2007
2008
2009
2010
2011
2012
2013
workers involved in industrial action (per 1000 employees)
Spain
source ILOSTAT Ministry of Employment and Social Security Statistics Condiciones de trabajo y relaciones laborales Huelgas y Cierres Patronales
multi-employer bargaining system
Guaranteed by the Constitution and regulated by law
peak 2004 Strike action in shipyards over renewal of collective agreements and against relocation decisions in mainly the manufacturing industry
underestimated peak in 2012 and 2013 General strikes in 2012 and various strikes in the public sector
right to strike private sector public sector
data coverage Strikes and lockouts Workers involved excludes workers indirectly involved
0
50
100
150
200
2000
2001
2002
2003
2004
2005
2006
2007
2008
2009
2010
2011
2012
2013
days not worked (per 1000 employees)
0
5
10
15
20
25
2000
2001
2002
2003
2004
2005
2006
2007
2008
2009
2010
2011
2012
2013
workers involved in industrial action (per 1000 employees)
Sweden
source Sweden National Mediation Office Melding amp konflikt Konfliktstatistik
multi-employer bargaining system
Guaranteed by the Constitution and regulated by law and in the 1938 collective agreement between the social partners
peak 2003 Large strike of blue-collar workers in the municipal and city council sector over a new pay agreement
right to strike private sector public sector
data coverage Strikes and lockouts Excluding strikes that last less than 1 day Workers involved includes workers directly and indirectly involved
0
5
10
15
2000
2001
2002
2003
2004
2005
2006
2007
2008
2009
2010
2011
2012
2013
days not worked (per 1000 employees)
0
2
4
6
8
10
2000
2001
2002
2003
2004
2005
2006
2007
2008
2009
2010
2011
2012
2013
workers involved in industrial action (per 1000 employees)
Switzerland
source Office feacutedeacuteral de la statistique Thegravemes Organisation du marcheacute du travail conventions collectives de travail Donneacutees deacutetailleacutees Gregraveves et lock-out
multi-employer bargaining system
Guaranteed by the Constitution and regulated by law and in the 1938 collective agreement between the social partners
peak 2004 Difficult to attribute to a specific large strike
right to strike private sector public sector
data coverage 2000-2008 Excluding political strikes Since 2009 Strikes and lockouts Excluding strikes that last less than 1 day Workers involved includes workers directly and indirectly involved
0
20
40
60
2000
2001
2002
2003
2004
2005
2006
2007
2008
2009
2010
2011
2012
2013
days not worked (per 1000 employees)
0
20
40
60
2000
2001
2002
2003
2004
2005
2006
2007
2008
2009
2010
2011
2012
2013
workers involved in industrial action (per 1000 employees)
United Kingdom
source Office for National Statistics Browse by Theme Labour Market Labour Disputes Days Lost due to Industrial Action
single-employer bargaining system
Regulated by law
peak 2004 One-day strike by civil servants to protest against governments plans to cut a large number of civil service posts peak 2007 One-day strike by postal workers in protest over pay and modernisation plans and one-day strike by prison officers
against the governmentrsquos decision to introduce a pay award in stages peak 2011 Union mobilisation against public service pension reforms in June and November
Right to strike legend
yes with minor restrictions (eg recognized union balloting proportionality respect of peace obligation)
yes with major restrictions (eg monopoly union compulsory arbitration or conciliation restrictions on issues or content major groups excluded
no
yes
private sector
yes with minor restrictions (eg recognized union balloting proportionality respect of peace obligation only military judiciary or police excluded ndash as per ILO convention)
yes with major restrictions (eg monopoly union compulsory arbitration or conciliation restrictions on issues or content major groups excluded
no
yes
public sector
source J Visser Database on Institutional Characteristics of Trade Unions Wage Setting State Intervention and Social Pacts (ICTWSS) database version 4 2013 The indicators reflect the situation in 2011
Prevelant bargaining regime legend
Single-employer bargaining system the establishment or company level is predominant
Multi-employer bargaining system sector andor the cross-sector level is predominant
Mixed bargaining system an intermediate situation where sector and company negotiations each respectively account for at least one-third of those covered by collective wage-setting arrangements
source P Marginson and C Welz (2014) Changes to wage-setting mechanisms in the context of the crisis and the EUrsquos new economic governance regime Dublin Eurofound
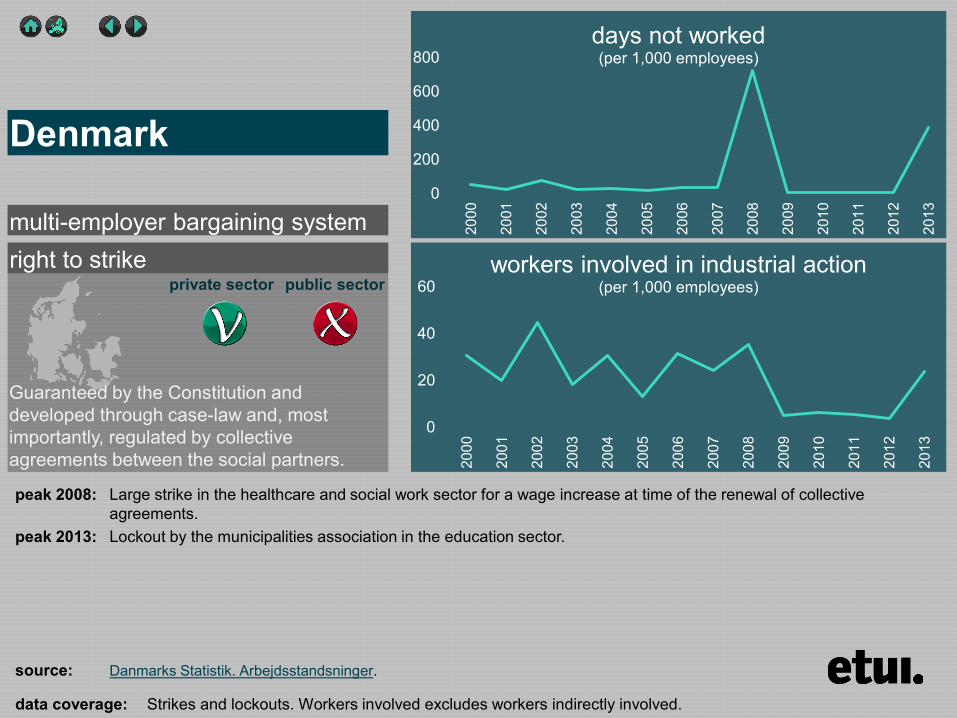
right to strike private sector public sector
data coverage Strikes and lockouts Workers involved excludes workers indirectly involved
0
200
400
600
800
2000
2001
2002
2003
2004
2005
2006
2007
2008
2009
2010
2011
2012
2013
days not worked (per 1000 employees)
0
20
40
60
2000
2001
2002
2003
2004
2005
2006
2007
2008
2009
2010
2011
2012
2013
workers involved in industrial action (per 1000 employees)
Denmark
source Danmarks Statistik Arbejdsstandsninger
multi-employer bargaining system
Guaranteed by the Constitution and developed through case-law and most importantly regulated by collective agreements between the social partners
peak 2008 Large strike in the healthcare and social work sector for a wage increase at time of the renewal of collective agreements
peak 2013 Lockout by the municipalities association in the education sector
right to strike private sector public sector
data coverage Strikes and lockouts Workers involved includes workers directly and indirectly involved in 2012 Data excludes warning and supportive strikes
0
20
40
60
2000
2001
2002
2003
2004
2005
2006
2007
2008
2009
2010
2011
2012
2013
days not worked (per 1000 employees)
0
20
40
60
2000
2001
2002
2003
2004
2005
2006
2007
2008
2009
2010
2011
2012
2013
workers involved in industrial action (per 1000 employees)
Estonia
source 2000-2009 ILOSTAT since 2010 Statistics Estonia Subject areas Economy Wages and salaries and labour costs Statistical database Strikes
single-employer bargaining system
Guaranteed by the Constitution and regulated by law
peak 2003 One-day strike in education and culture workers for pay increase peak 2012 Teachersrsquo strike and strike in health care sector both over pay increase
right to strike private sector public sector
data coverage Strikes and lockouts Workers involved excludes workers indirectly involved
0
100
200
300
2000
2001
2002
2003
2004
2005
2006
2007
2008
2009
2010
2011
2012
2013
days not worked (per 1000 employees)
0
20
40
60
80
2000
2001
2002
2003
2004
2005
2006
2007
2008
2009
2010
2011
2012
2013
workers involved in industrial action (per 1000 employees)
Finland
source Statistics Finland Labour Market Statistics on labour disputes
multi-employer bargaining system
Implicitly guaranteed by the Constitution and explicitly by law
peak 2005 Four-day strike and numerous other strikes in the paper-industry over a renewal of the collective agreement peak 2010 Large two-week strike of stevedores about severance pay and outsourcing besides several other strikes in
manufacturing and in wholesale and retail trade
right to strike private sector public sector
050
100150200250300350
2000
2001
2002
2003
2004
2005
2006
2007
2008
2009
2010
2011
2012
2013
days not worked (per 1000 employees)
0
20
40
60
80
2000
2001
2002
2003
2004
2005
2006
2007
2008
2009
2010
2011
2012
2013
workers involved in industrial action (per 1000 employees)
France
source 2000-2004 (volume) ILOSTAT Since 2005 (volume) ETUI estimate based on combining DARES data and data from the Direction geacuteneacuterale de lrsquoadministration et de la fonction publique The DARES covers industrial action in the private sector including some semi-public enterprises The data from the Direction geacuteneacuterale de lrsquoadministration covers the public sector and overlaps with the DARES data in case of some semi-public enterprises Relying only on the DARES data clearly underestimates the volume 2000-2007 (participation) Combining ILOSTAT Carley (2008) and Carley (2010)
multi-employer bargaining system
Recognised as an individual right and guaranteed by the Constitution regulated by law in the public sector and mainly developed through case law in the private sector
peak 2003 and 2010 Union mobilisation against pension reforms
right to strike private sector public sector
data coverage 2000-2003 Strikes and lockouts Excluding public administration Workers involved excludes workers indirectly involved
0
20
40
60
2000
2001
2002
2003
2004
2005
2006
2007
2008
2009
2010
2011
2012
2013
days not worked (per 1000 employees)
0
10
20
30
40
50
2000
2001
2002
2003
2004
2005
2006
2007
2008
2009
2010
2011
2012
2013
workers involved in industrial action (per 1000 employees)
Germany
source 2000-2003 ILOSTAT since 2004 WSI estimate
multi-employer bargaining system
Implicitly guaranteed by the Constitution and developed through case-law
peak 2006 Strikes in the public sector particularly health care besides short warning strikes in metal industry
right to strike private sector public sector
data coverage Strikes and lockouts 2012 Only strikes Excluding strikes that last less than 100 days workers involved includes workers directly and indirectly involved
0
50
100
150
200
2000
2001
2002
2003
2004
2005
2006
2007
2008
2009
2010
2011
2012
2013
days not worked (per 1000 employees)
0
5
10
15
20
2000
2001
2002
2003
2004
2005
2006
2007
2008
2009
2010
2011
2012
2013
workers involved in industrial action (per 1000 employees)
Hungary
source 2000-2009 Carley (2004) Carley (2008) and Carley (2010) 2010 Hungarian Statistical Office 2012 ILOSTAT
single-employer bargaining system
Guaranteed by the Constitution and by law
peak 2000 National strike in health care sector
right to strike private sector public sector
data coverage Only strikes Disputes are included if they involve a stoppage of work lasting for at least one day and the total time lost is 10 or more person-days Workers involved excludes workers indirectly involved
0
50
100
150
200
2000
2001
2002
2003
2004
2005
2006
2007
2008
2009
2010
2011
2012
2013
days not worked (per 1000 employees)
0
50
100
150
200
2000
2001
2002
2003
2004
2005
2006
2007
2008
2009
2010
2011
2012
2013
workers involved in industrial action (per 1000 employees)
Ireland
source Central Statistics Office Databank StatBank Labour Market and Earnings Labour Market Industrial Disputes
single-employer bargaining system
Guaranteed by law and developed through case-law
peak 2009 24-hour national public service strike against governmentrsquos pay cuts
right to strike private sector public sector
data coverage Strikes and lockouts Workers involved excludes workers indirectly involved
0
100
200
300
2000
2001
2002
2003
2004
2005
2006
2007
2008
2009
2010
2011
2012
2013
days not worked (per 1000 employees)
0
100
200
300
2000
2001
2002
2003
2004
2005
2006
2007
2008
2009
2010
2011
2012
2013
workers involved in industrial action (per 1000 employees)
Italy
source Istituto Nazionale di Statistica ILOSTAT Official strike data is no longer collected since 2009
multi-employer bargaining system
Recognised as an individual right and guaranteed by the Constitution and developed through case-law
peak 2002 General strike against labour market reforms
right to strike private sector public sector
data coverage Strikes and lockouts Workers involved excludes workers indirectly involved
0
1
2
3
4
2000
2001
2002
2003
2004
2005
2006
2007
2008
2009
2010
2011
2012
2013
days not worked (per 1000 employees)
0
1
2
3
2000
2001
2002
2003
2004
2005
2006
2007
2008
2009
2010
2011
2012
2013
workers involved in industrial action (per 1000 employees)
Latvia
source ILOSTAT
single-employer bargaining system
Guaranteed by the Constitution and regulated by law
peak 2008 Not attributable to a single large strike
right to strike private sector public sector
data coverage Only strikes Workers involved includes workers directly and indirectly involved
0
10
20
30
2000
2001
2002
2003
2004
2005
2006
2007
2008
2009
2010
2011
2012
2013
days not worked (per 1000 employees)
0
2
4
6
8
10
2000
2001
2002
2003
2004
2005
2006
2007
2008
2009
2010
2011
2012
2013
workers involved in industrial action (per 1000 employees)
Lithuania
source 2000-2008 2012 ILOSTAT 2009 Carley (2010) 2010-2011 and 2013 Statistics Lithuania Official Statistics Portal Population and social statistics Statistical information on strikes An estimate is also provided by Carley (2008 2010)
single-employer bargaining system
Guaranteed by the Constitution and regulated by law
peak 2008 Various teacherrsquos strike over a pay increase and other demands and other strikes in the public sector
right to strike private sector public sector
0
50
100
150
2000
2001
2002
2003
2004
2005
2006
2007
2008
2009
2010
2011
2012
2013
days not worked (per 1000 employees)
0
100
200
300
2000
2001
2002
2003
2004
2005
2006
2007
2008
2009
2010
2011
2012
2013
workers involved in industrial action (per 1000 employees)
Luxembourg
source Carley (2004) Carley (2008) and Carley (2010) Official data is no longer available since 2009
mixed bargaining system
Developed through case law
peak 2007 One-day general strike in public sector and a two-day railway strike over civil service and state employee pensions
right to strike private sector public sector
data coverage Strikes and lockouts Workers involved excludes workers indirectly involved
0
20
40
60
2000
2001
2002
2003
2004
2005
2006
2007
2008
2009
2010
2011
2012
2013
days not worked (per 1000 employees)
0
20
40
60
80
100
2000
2001
2002
2003
2004
2005
2006
2007
2008
2009
2010
2011
2012
2013
workers involved in industrial action (per 1000 employees)
Malta
source Industrial and Employment Relations Publications and Archives Archives Annual Reports ILOSTAT
single-employer bargaining system
Indirectly recognised by law
peak 2009 Not attributable to a specific large strike
right to strike private sector public sector
data coverage Only strikes Workers involved excludes workersindirectly involved
0
10
20
30
40
2000
2001
2002
2003
2004
2005
2006
2007
2008
2009
2010
2011
2012
2013
days not worked (per 1000 employees)
0
5
10
15
20
2000
2001
2002
2003
2004
2005
2006
2007
2008
2009
2010
2011
2012
2013
workers involved in industrial action (per 1000 employees)
Netherlands
source Centraal Bureau voor de Statistiek Cijfers Statline databank Thema Arbeidsmarkt Vakbeweging en stakingen Historie Werkstakingen
multi-employer bargaining system
Developed through case law
peak 2002 Strike action in construction industry peak 2012 15 weeks strike in cleaning sector over renewal of collective agreement besides strike action in the education sector
against austerity measures
right to strike private sector public sector
data coverage Strikes and lockout excluding strikes that last less than 1 day Workers involved includes workers directly and indirectly involved
0
50
100
150
200
250
2000
2001
2002
2003
2004
2005
2006
2007
2008
2009
2010
2011
2012
2013
days not worked (per 1000 employees)
0
10
20
30
40
50
2000
2001
2002
2003
2004
2005
2006
2007
2008
2009
2010
2011
2012
2013
workers involved in industrial action (per 1000 employees)
Norway
source Statistics Norway Statistics Labour market and earnings Strikes and lockouts
multi-employer bargaining system
Mainly regulated by collective agreements between the social partners
nearly two yearly peaks Negotiations about renewal of collective agreements in the economic sectors
right to strike private sector public sector
data coverage Only strikes excluding strikes that last less than 1 day workers involved excludes workers indirectly involved
0
5
10
15
20
25
2000
2001
2002
2003
2004
2005
2006
2007
2008
2009
2010
2011
2012
2013
days not worked (per 1000 employees)
0
5
10
15
20
2000
2001
2002
2003
2004
2005
2006
2007
2008
2009
2010
2011
2012
2013
workers involved in industrial action (per 1000 employees)
Poland
source ILOSTAT
single-employer bargaining system
Guaranteed by the Constitution and regulated by law
peak 2008 Various teachersrsquo strikes over a pay increase and other demands and other strikes in the public sector
right to strike private sector public sector
data coverage Only strikes excluding public administration workers involved excludes workers indirectly involved
0
10
20
30
2000
2001
2002
2003
2004
2005
2006
2007
2008
2009
2010
2011
2012
2013
days not worked (per 1000 employees)
0
5
10
15
20
25
2000
2001
2002
2003
2004
2005
2006
2007
2008
2009
2010
2011
2012
2013
workers involved in industrial action (per 1000 employees)
Portugal
source Gabinete de Estrateacutegia e Planeamento Estatiacutestica Greves Official strike data is not available after 2007
multi-employer bargaining system
Guaranteed by the Constitution and regulated by law
peak 2002 Several strike actions particularly in the public sector against changes in the Labour Code
right to strike private sector public sector
data coverage Only strikes Workers involved excludes workers indirectly involved
0
50
100
2000
2001
2002
2003
2004
2005
2006
2007
2008
2009
2010
2011
2012
2013
days not worked (per 1000 employees)
0
2
4
6
8
10
2000
2001
2002
2003
2004
2005
2006
2007
2008
2009
2010
2011
2012
2013
workers involved in industrial action (per 1000 employees)
Romania
source ILOSTAT Official data is very partial in 2009 and not available after 2010
single-employer bargaining system
Guaranteed by the Constitution and regulated by law
peaks 2000 and 2007 Several strike actions in particularly the manufacturing industry
right to strike private sector public sector
data coverage Only strikes workers involved excludes workers indirectly involved
0
10
20
30
40
2000
2001
2002
2003
2004
2005
2006
2007
2008
2009
2010
2011
2012
2013
days not worked (per 1000 employees)
0
2
4
6
8
10
2000
2001
2002
2003
2004
2005
2006
2007
2008
2009
2010
2011
2012
2013
workers involved in industrial action (per 1000 employees)
Slovakia
source 2000-2002 ILOSTAT 2003-2009 Carley (2004) Carley (2008) and Carley (2010) Since 2010 Statistical Office of the Slovak Republic (on demand)
mixed bargaining system
Guaranteed by the Constitution and regulated by law
peak 2003 Limited number of strike actions in railways and the public sector
right to strike private sector public sector
0
10
20
30
40
50
2000
2001
2002
2003
2004
2005
2006
2007
2008
2009
2010
2011
2012
2013
days not worked (per 1000 employees)
0
2
4
6
2000
2001
2002
2003
2004
2005
2006
2007
2008
2009
2010
2011
2012
2013
workers involved in industrial action (per 1000 employees)
Slovenia
source Carley (2004) Carley (2008) and Carley (2010) Trade union data (ZSSS) Official data is not available
multi-employer bargaining system
Guaranteed by the Constitution and regulated by law
peak 2005 Union mobilisation against labour market reforms
right to strike private sector public sector
data coverage Strikes and lockouts excluding strikes that last less than 1 hour workers involved excludes workers indirectly involved The 2012 data excludes the general strikes of the 29th of March and the 14th of November and the nation-wide strike in the education sector of 22nd of May In 2013 several strikes in the education sector are excluded
050
100150200250300350
2000
2001
2002
2003
2004
2005
2006
2007
2008
2009
2010
2011
2012
2013
days not worked (per 1000 employees)
050
100150200250300350
2000
2001
2002
2003
2004
2005
2006
2007
2008
2009
2010
2011
2012
2013
workers involved in industrial action (per 1000 employees)
Spain
source ILOSTAT Ministry of Employment and Social Security Statistics Condiciones de trabajo y relaciones laborales Huelgas y Cierres Patronales
multi-employer bargaining system
Guaranteed by the Constitution and regulated by law
peak 2004 Strike action in shipyards over renewal of collective agreements and against relocation decisions in mainly the manufacturing industry
underestimated peak in 2012 and 2013 General strikes in 2012 and various strikes in the public sector
right to strike private sector public sector
data coverage Strikes and lockouts Workers involved excludes workers indirectly involved
0
50
100
150
200
2000
2001
2002
2003
2004
2005
2006
2007
2008
2009
2010
2011
2012
2013
days not worked (per 1000 employees)
0
5
10
15
20
25
2000
2001
2002
2003
2004
2005
2006
2007
2008
2009
2010
2011
2012
2013
workers involved in industrial action (per 1000 employees)
Sweden
source Sweden National Mediation Office Melding amp konflikt Konfliktstatistik
multi-employer bargaining system
Guaranteed by the Constitution and regulated by law and in the 1938 collective agreement between the social partners
peak 2003 Large strike of blue-collar workers in the municipal and city council sector over a new pay agreement
right to strike private sector public sector
data coverage Strikes and lockouts Excluding strikes that last less than 1 day Workers involved includes workers directly and indirectly involved
0
5
10
15
2000
2001
2002
2003
2004
2005
2006
2007
2008
2009
2010
2011
2012
2013
days not worked (per 1000 employees)
0
2
4
6
8
10
2000
2001
2002
2003
2004
2005
2006
2007
2008
2009
2010
2011
2012
2013
workers involved in industrial action (per 1000 employees)
Switzerland
source Office feacutedeacuteral de la statistique Thegravemes Organisation du marcheacute du travail conventions collectives de travail Donneacutees deacutetailleacutees Gregraveves et lock-out
multi-employer bargaining system
Guaranteed by the Constitution and regulated by law and in the 1938 collective agreement between the social partners
peak 2004 Difficult to attribute to a specific large strike
right to strike private sector public sector
data coverage 2000-2008 Excluding political strikes Since 2009 Strikes and lockouts Excluding strikes that last less than 1 day Workers involved includes workers directly and indirectly involved
0
20
40
60
2000
2001
2002
2003
2004
2005
2006
2007
2008
2009
2010
2011
2012
2013
days not worked (per 1000 employees)
0
20
40
60
2000
2001
2002
2003
2004
2005
2006
2007
2008
2009
2010
2011
2012
2013
workers involved in industrial action (per 1000 employees)
United Kingdom
source Office for National Statistics Browse by Theme Labour Market Labour Disputes Days Lost due to Industrial Action
single-employer bargaining system
Regulated by law
peak 2004 One-day strike by civil servants to protest against governments plans to cut a large number of civil service posts peak 2007 One-day strike by postal workers in protest over pay and modernisation plans and one-day strike by prison officers
against the governmentrsquos decision to introduce a pay award in stages peak 2011 Union mobilisation against public service pension reforms in June and November
Right to strike legend
yes with minor restrictions (eg recognized union balloting proportionality respect of peace obligation)
yes with major restrictions (eg monopoly union compulsory arbitration or conciliation restrictions on issues or content major groups excluded
no
yes
private sector
yes with minor restrictions (eg recognized union balloting proportionality respect of peace obligation only military judiciary or police excluded ndash as per ILO convention)
yes with major restrictions (eg monopoly union compulsory arbitration or conciliation restrictions on issues or content major groups excluded
no
yes
public sector
source J Visser Database on Institutional Characteristics of Trade Unions Wage Setting State Intervention and Social Pacts (ICTWSS) database version 4 2013 The indicators reflect the situation in 2011
Prevelant bargaining regime legend
Single-employer bargaining system the establishment or company level is predominant
Multi-employer bargaining system sector andor the cross-sector level is predominant
Mixed bargaining system an intermediate situation where sector and company negotiations each respectively account for at least one-third of those covered by collective wage-setting arrangements
source P Marginson and C Welz (2014) Changes to wage-setting mechanisms in the context of the crisis and the EUrsquos new economic governance regime Dublin Eurofound
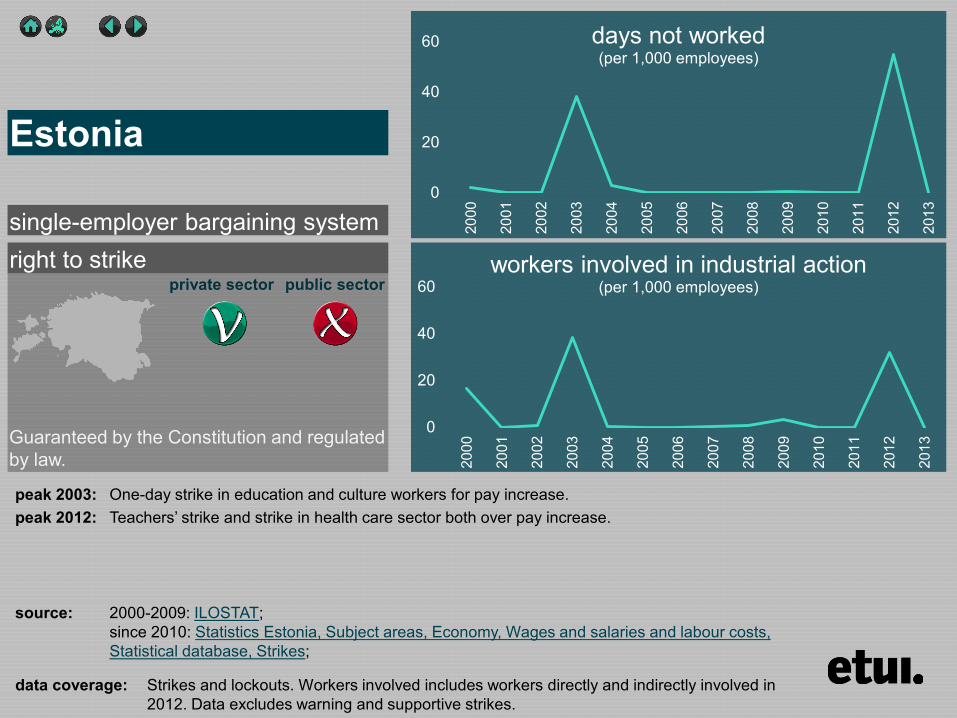
right to strike private sector public sector
data coverage Strikes and lockouts Workers involved excludes workers indirectly involved
0
100
200
300
2000
2001
2002
2003
2004
2005
2006
2007
2008
2009
2010
2011
2012
2013
days not worked (per 1000 employees)
0
20
40
60
80
2000
2001
2002
2003
2004
2005
2006
2007
2008
2009
2010
2011
2012
2013
workers involved in industrial action (per 1000 employees)
Finland
source Statistics Finland Labour Market Statistics on labour disputes
multi-employer bargaining system
Implicitly guaranteed by the Constitution and explicitly by law
peak 2005 Four-day strike and numerous other strikes in the paper-industry over a renewal of the collective agreement peak 2010 Large two-week strike of stevedores about severance pay and outsourcing besides several other strikes in
manufacturing and in wholesale and retail trade
right to strike private sector public sector
050
100150200250300350
2000
2001
2002
2003
2004
2005
2006
2007
2008
2009
2010
2011
2012
2013
days not worked (per 1000 employees)
0
20
40
60
80
2000
2001
2002
2003
2004
2005
2006
2007
2008
2009
2010
2011
2012
2013
workers involved in industrial action (per 1000 employees)
France
source 2000-2004 (volume) ILOSTAT Since 2005 (volume) ETUI estimate based on combining DARES data and data from the Direction geacuteneacuterale de lrsquoadministration et de la fonction publique The DARES covers industrial action in the private sector including some semi-public enterprises The data from the Direction geacuteneacuterale de lrsquoadministration covers the public sector and overlaps with the DARES data in case of some semi-public enterprises Relying only on the DARES data clearly underestimates the volume 2000-2007 (participation) Combining ILOSTAT Carley (2008) and Carley (2010)
multi-employer bargaining system
Recognised as an individual right and guaranteed by the Constitution regulated by law in the public sector and mainly developed through case law in the private sector
peak 2003 and 2010 Union mobilisation against pension reforms
right to strike private sector public sector
data coverage 2000-2003 Strikes and lockouts Excluding public administration Workers involved excludes workers indirectly involved
0
20
40
60
2000
2001
2002
2003
2004
2005
2006
2007
2008
2009
2010
2011
2012
2013
days not worked (per 1000 employees)
0
10
20
30
40
50
2000
2001
2002
2003
2004
2005
2006
2007
2008
2009
2010
2011
2012
2013
workers involved in industrial action (per 1000 employees)
Germany
source 2000-2003 ILOSTAT since 2004 WSI estimate
multi-employer bargaining system
Implicitly guaranteed by the Constitution and developed through case-law
peak 2006 Strikes in the public sector particularly health care besides short warning strikes in metal industry
right to strike private sector public sector
data coverage Strikes and lockouts 2012 Only strikes Excluding strikes that last less than 100 days workers involved includes workers directly and indirectly involved
0
50
100
150
200
2000
2001
2002
2003
2004
2005
2006
2007
2008
2009
2010
2011
2012
2013
days not worked (per 1000 employees)
0
5
10
15
20
2000
2001
2002
2003
2004
2005
2006
2007
2008
2009
2010
2011
2012
2013
workers involved in industrial action (per 1000 employees)
Hungary
source 2000-2009 Carley (2004) Carley (2008) and Carley (2010) 2010 Hungarian Statistical Office 2012 ILOSTAT
single-employer bargaining system
Guaranteed by the Constitution and by law
peak 2000 National strike in health care sector
right to strike private sector public sector
data coverage Only strikes Disputes are included if they involve a stoppage of work lasting for at least one day and the total time lost is 10 or more person-days Workers involved excludes workers indirectly involved
0
50
100
150
200
2000
2001
2002
2003
2004
2005
2006
2007
2008
2009
2010
2011
2012
2013
days not worked (per 1000 employees)
0
50
100
150
200
2000
2001
2002
2003
2004
2005
2006
2007
2008
2009
2010
2011
2012
2013
workers involved in industrial action (per 1000 employees)
Ireland
source Central Statistics Office Databank StatBank Labour Market and Earnings Labour Market Industrial Disputes
single-employer bargaining system
Guaranteed by law and developed through case-law
peak 2009 24-hour national public service strike against governmentrsquos pay cuts
right to strike private sector public sector
data coverage Strikes and lockouts Workers involved excludes workers indirectly involved
0
100
200
300
2000
2001
2002
2003
2004
2005
2006
2007
2008
2009
2010
2011
2012
2013
days not worked (per 1000 employees)
0
100
200
300
2000
2001
2002
2003
2004
2005
2006
2007
2008
2009
2010
2011
2012
2013
workers involved in industrial action (per 1000 employees)
Italy
source Istituto Nazionale di Statistica ILOSTAT Official strike data is no longer collected since 2009
multi-employer bargaining system
Recognised as an individual right and guaranteed by the Constitution and developed through case-law
peak 2002 General strike against labour market reforms
right to strike private sector public sector
data coverage Strikes and lockouts Workers involved excludes workers indirectly involved
0
1
2
3
4
2000
2001
2002
2003
2004
2005
2006
2007
2008
2009
2010
2011
2012
2013
days not worked (per 1000 employees)
0
1
2
3
2000
2001
2002
2003
2004
2005
2006
2007
2008
2009
2010
2011
2012
2013
workers involved in industrial action (per 1000 employees)
Latvia
source ILOSTAT
single-employer bargaining system
Guaranteed by the Constitution and regulated by law
peak 2008 Not attributable to a single large strike
right to strike private sector public sector
data coverage Only strikes Workers involved includes workers directly and indirectly involved
0
10
20
30
2000
2001
2002
2003
2004
2005
2006
2007
2008
2009
2010
2011
2012
2013
days not worked (per 1000 employees)
0
2
4
6
8
10
2000
2001
2002
2003
2004
2005
2006
2007
2008
2009
2010
2011
2012
2013
workers involved in industrial action (per 1000 employees)
Lithuania
source 2000-2008 2012 ILOSTAT 2009 Carley (2010) 2010-2011 and 2013 Statistics Lithuania Official Statistics Portal Population and social statistics Statistical information on strikes An estimate is also provided by Carley (2008 2010)
single-employer bargaining system
Guaranteed by the Constitution and regulated by law
peak 2008 Various teacherrsquos strike over a pay increase and other demands and other strikes in the public sector
right to strike private sector public sector
0
50
100
150
2000
2001
2002
2003
2004
2005
2006
2007
2008
2009
2010
2011
2012
2013
days not worked (per 1000 employees)
0
100
200
300
2000
2001
2002
2003
2004
2005
2006
2007
2008
2009
2010
2011
2012
2013
workers involved in industrial action (per 1000 employees)
Luxembourg
source Carley (2004) Carley (2008) and Carley (2010) Official data is no longer available since 2009
mixed bargaining system
Developed through case law
peak 2007 One-day general strike in public sector and a two-day railway strike over civil service and state employee pensions
right to strike private sector public sector
data coverage Strikes and lockouts Workers involved excludes workers indirectly involved
0
20
40
60
2000
2001
2002
2003
2004
2005
2006
2007
2008
2009
2010
2011
2012
2013
days not worked (per 1000 employees)
0
20
40
60
80
100
2000
2001
2002
2003
2004
2005
2006
2007
2008
2009
2010
2011
2012
2013
workers involved in industrial action (per 1000 employees)
Malta
source Industrial and Employment Relations Publications and Archives Archives Annual Reports ILOSTAT
single-employer bargaining system
Indirectly recognised by law
peak 2009 Not attributable to a specific large strike
right to strike private sector public sector
data coverage Only strikes Workers involved excludes workersindirectly involved
0
10
20
30
40
2000
2001
2002
2003
2004
2005
2006
2007
2008
2009
2010
2011
2012
2013
days not worked (per 1000 employees)
0
5
10
15
20
2000
2001
2002
2003
2004
2005
2006
2007
2008
2009
2010
2011
2012
2013
workers involved in industrial action (per 1000 employees)
Netherlands
source Centraal Bureau voor de Statistiek Cijfers Statline databank Thema Arbeidsmarkt Vakbeweging en stakingen Historie Werkstakingen
multi-employer bargaining system
Developed through case law
peak 2002 Strike action in construction industry peak 2012 15 weeks strike in cleaning sector over renewal of collective agreement besides strike action in the education sector
against austerity measures
right to strike private sector public sector
data coverage Strikes and lockout excluding strikes that last less than 1 day Workers involved includes workers directly and indirectly involved
0
50
100
150
200
250
2000
2001
2002
2003
2004
2005
2006
2007
2008
2009
2010
2011
2012
2013
days not worked (per 1000 employees)
0
10
20
30
40
50
2000
2001
2002
2003
2004
2005
2006
2007
2008
2009
2010
2011
2012
2013
workers involved in industrial action (per 1000 employees)
Norway
source Statistics Norway Statistics Labour market and earnings Strikes and lockouts
multi-employer bargaining system
Mainly regulated by collective agreements between the social partners
nearly two yearly peaks Negotiations about renewal of collective agreements in the economic sectors
right to strike private sector public sector
data coverage Only strikes excluding strikes that last less than 1 day workers involved excludes workers indirectly involved
0
5
10
15
20
25
2000
2001
2002
2003
2004
2005
2006
2007
2008
2009
2010
2011
2012
2013
days not worked (per 1000 employees)
0
5
10
15
20
2000
2001
2002
2003
2004
2005
2006
2007
2008
2009
2010
2011
2012
2013
workers involved in industrial action (per 1000 employees)
Poland
source ILOSTAT
single-employer bargaining system
Guaranteed by the Constitution and regulated by law
peak 2008 Various teachersrsquo strikes over a pay increase and other demands and other strikes in the public sector
right to strike private sector public sector
data coverage Only strikes excluding public administration workers involved excludes workers indirectly involved
0
10
20
30
2000
2001
2002
2003
2004
2005
2006
2007
2008
2009
2010
2011
2012
2013
days not worked (per 1000 employees)
0
5
10
15
20
25
2000
2001
2002
2003
2004
2005
2006
2007
2008
2009
2010
2011
2012
2013
workers involved in industrial action (per 1000 employees)
Portugal
source Gabinete de Estrateacutegia e Planeamento Estatiacutestica Greves Official strike data is not available after 2007
multi-employer bargaining system
Guaranteed by the Constitution and regulated by law
peak 2002 Several strike actions particularly in the public sector against changes in the Labour Code
right to strike private sector public sector
data coverage Only strikes Workers involved excludes workers indirectly involved
0
50
100
2000
2001
2002
2003
2004
2005
2006
2007
2008
2009
2010
2011
2012
2013
days not worked (per 1000 employees)
0
2
4
6
8
10
2000
2001
2002
2003
2004
2005
2006
2007
2008
2009
2010
2011
2012
2013
workers involved in industrial action (per 1000 employees)
Romania
source ILOSTAT Official data is very partial in 2009 and not available after 2010
single-employer bargaining system
Guaranteed by the Constitution and regulated by law
peaks 2000 and 2007 Several strike actions in particularly the manufacturing industry
right to strike private sector public sector
data coverage Only strikes workers involved excludes workers indirectly involved
0
10
20
30
40
2000
2001
2002
2003
2004
2005
2006
2007
2008
2009
2010
2011
2012
2013
days not worked (per 1000 employees)
0
2
4
6
8
10
2000
2001
2002
2003
2004
2005
2006
2007
2008
2009
2010
2011
2012
2013
workers involved in industrial action (per 1000 employees)
Slovakia
source 2000-2002 ILOSTAT 2003-2009 Carley (2004) Carley (2008) and Carley (2010) Since 2010 Statistical Office of the Slovak Republic (on demand)
mixed bargaining system
Guaranteed by the Constitution and regulated by law
peak 2003 Limited number of strike actions in railways and the public sector
right to strike private sector public sector
0
10
20
30
40
50
2000
2001
2002
2003
2004
2005
2006
2007
2008
2009
2010
2011
2012
2013
days not worked (per 1000 employees)
0
2
4
6
2000
2001
2002
2003
2004
2005
2006
2007
2008
2009
2010
2011
2012
2013
workers involved in industrial action (per 1000 employees)
Slovenia
source Carley (2004) Carley (2008) and Carley (2010) Trade union data (ZSSS) Official data is not available
multi-employer bargaining system
Guaranteed by the Constitution and regulated by law
peak 2005 Union mobilisation against labour market reforms
right to strike private sector public sector
data coverage Strikes and lockouts excluding strikes that last less than 1 hour workers involved excludes workers indirectly involved The 2012 data excludes the general strikes of the 29th of March and the 14th of November and the nation-wide strike in the education sector of 22nd of May In 2013 several strikes in the education sector are excluded
050
100150200250300350
2000
2001
2002
2003
2004
2005
2006
2007
2008
2009
2010
2011
2012
2013
days not worked (per 1000 employees)
050
100150200250300350
2000
2001
2002
2003
2004
2005
2006
2007
2008
2009
2010
2011
2012
2013
workers involved in industrial action (per 1000 employees)
Spain
source ILOSTAT Ministry of Employment and Social Security Statistics Condiciones de trabajo y relaciones laborales Huelgas y Cierres Patronales
multi-employer bargaining system
Guaranteed by the Constitution and regulated by law
peak 2004 Strike action in shipyards over renewal of collective agreements and against relocation decisions in mainly the manufacturing industry
underestimated peak in 2012 and 2013 General strikes in 2012 and various strikes in the public sector
right to strike private sector public sector
data coverage Strikes and lockouts Workers involved excludes workers indirectly involved
0
50
100
150
200
2000
2001
2002
2003
2004
2005
2006
2007
2008
2009
2010
2011
2012
2013
days not worked (per 1000 employees)
0
5
10
15
20
25
2000
2001
2002
2003
2004
2005
2006
2007
2008
2009
2010
2011
2012
2013
workers involved in industrial action (per 1000 employees)
Sweden
source Sweden National Mediation Office Melding amp konflikt Konfliktstatistik
multi-employer bargaining system
Guaranteed by the Constitution and regulated by law and in the 1938 collective agreement between the social partners
peak 2003 Large strike of blue-collar workers in the municipal and city council sector over a new pay agreement
right to strike private sector public sector
data coverage Strikes and lockouts Excluding strikes that last less than 1 day Workers involved includes workers directly and indirectly involved
0
5
10
15
2000
2001
2002
2003
2004
2005
2006
2007
2008
2009
2010
2011
2012
2013
days not worked (per 1000 employees)
0
2
4
6
8
10
2000
2001
2002
2003
2004
2005
2006
2007
2008
2009
2010
2011
2012
2013
workers involved in industrial action (per 1000 employees)
Switzerland
source Office feacutedeacuteral de la statistique Thegravemes Organisation du marcheacute du travail conventions collectives de travail Donneacutees deacutetailleacutees Gregraveves et lock-out
multi-employer bargaining system
Guaranteed by the Constitution and regulated by law and in the 1938 collective agreement between the social partners
peak 2004 Difficult to attribute to a specific large strike
right to strike private sector public sector
data coverage 2000-2008 Excluding political strikes Since 2009 Strikes and lockouts Excluding strikes that last less than 1 day Workers involved includes workers directly and indirectly involved
0
20
40
60
2000
2001
2002
2003
2004
2005
2006
2007
2008
2009
2010
2011
2012
2013
days not worked (per 1000 employees)
0
20
40
60
2000
2001
2002
2003
2004
2005
2006
2007
2008
2009
2010
2011
2012
2013
workers involved in industrial action (per 1000 employees)
United Kingdom
source Office for National Statistics Browse by Theme Labour Market Labour Disputes Days Lost due to Industrial Action
single-employer bargaining system
Regulated by law
peak 2004 One-day strike by civil servants to protest against governments plans to cut a large number of civil service posts peak 2007 One-day strike by postal workers in protest over pay and modernisation plans and one-day strike by prison officers
against the governmentrsquos decision to introduce a pay award in stages peak 2011 Union mobilisation against public service pension reforms in June and November
Right to strike legend
yes with minor restrictions (eg recognized union balloting proportionality respect of peace obligation)
yes with major restrictions (eg monopoly union compulsory arbitration or conciliation restrictions on issues or content major groups excluded
no
yes
private sector
yes with minor restrictions (eg recognized union balloting proportionality respect of peace obligation only military judiciary or police excluded ndash as per ILO convention)
yes with major restrictions (eg monopoly union compulsory arbitration or conciliation restrictions on issues or content major groups excluded
no
yes
public sector
source J Visser Database on Institutional Characteristics of Trade Unions Wage Setting State Intervention and Social Pacts (ICTWSS) database version 4 2013 The indicators reflect the situation in 2011
Prevelant bargaining regime legend
Single-employer bargaining system the establishment or company level is predominant
Multi-employer bargaining system sector andor the cross-sector level is predominant
Mixed bargaining system an intermediate situation where sector and company negotiations each respectively account for at least one-third of those covered by collective wage-setting arrangements
source P Marginson and C Welz (2014) Changes to wage-setting mechanisms in the context of the crisis and the EUrsquos new economic governance regime Dublin Eurofound
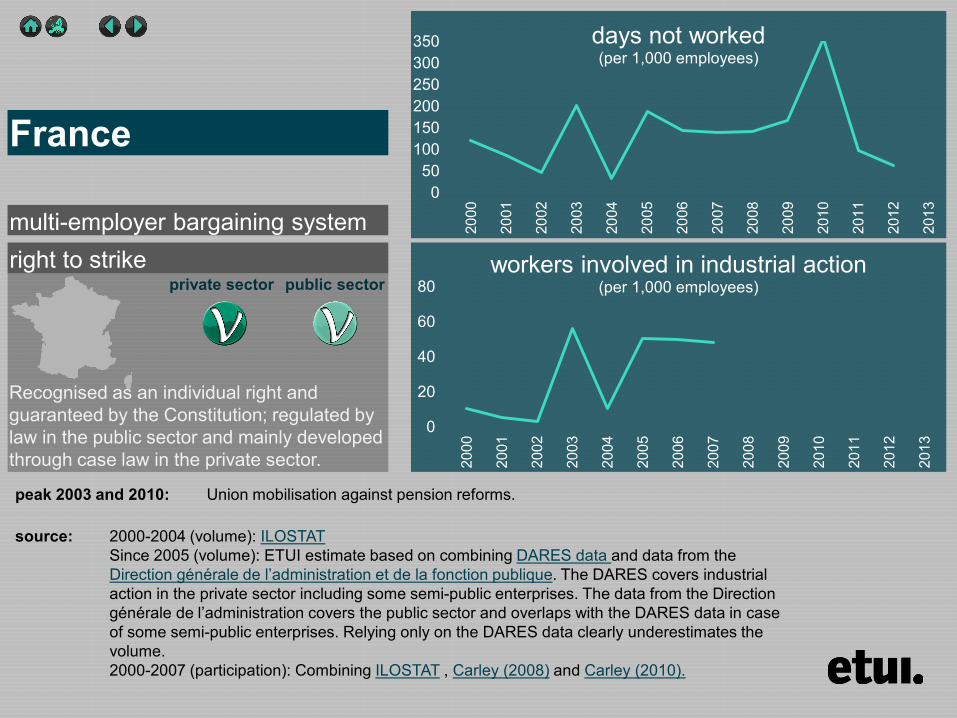
right to strike private sector public sector
050
100150200250300350
2000
2001
2002
2003
2004
2005
2006
2007
2008
2009
2010
2011
2012
2013
days not worked (per 1000 employees)
0
20
40
60
80
2000
2001
2002
2003
2004
2005
2006
2007
2008
2009
2010
2011
2012
2013
workers involved in industrial action (per 1000 employees)
France
source 2000-2004 (volume) ILOSTAT Since 2005 (volume) ETUI estimate based on combining DARES data and data from the Direction geacuteneacuterale de lrsquoadministration et de la fonction publique The DARES covers industrial action in the private sector including some semi-public enterprises The data from the Direction geacuteneacuterale de lrsquoadministration covers the public sector and overlaps with the DARES data in case of some semi-public enterprises Relying only on the DARES data clearly underestimates the volume 2000-2007 (participation) Combining ILOSTAT Carley (2008) and Carley (2010)
multi-employer bargaining system
Recognised as an individual right and guaranteed by the Constitution regulated by law in the public sector and mainly developed through case law in the private sector
peak 2003 and 2010 Union mobilisation against pension reforms
right to strike private sector public sector
data coverage 2000-2003 Strikes and lockouts Excluding public administration Workers involved excludes workers indirectly involved
0
20
40
60
2000
2001
2002
2003
2004
2005
2006
2007
2008
2009
2010
2011
2012
2013
days not worked (per 1000 employees)
0
10
20
30
40
50
2000
2001
2002
2003
2004
2005
2006
2007
2008
2009
2010
2011
2012
2013
workers involved in industrial action (per 1000 employees)
Germany
source 2000-2003 ILOSTAT since 2004 WSI estimate
multi-employer bargaining system
Implicitly guaranteed by the Constitution and developed through case-law
peak 2006 Strikes in the public sector particularly health care besides short warning strikes in metal industry
right to strike private sector public sector
data coverage Strikes and lockouts 2012 Only strikes Excluding strikes that last less than 100 days workers involved includes workers directly and indirectly involved
0
50
100
150
200
2000
2001
2002
2003
2004
2005
2006
2007
2008
2009
2010
2011
2012
2013
days not worked (per 1000 employees)
0
5
10
15
20
2000
2001
2002
2003
2004
2005
2006
2007
2008
2009
2010
2011
2012
2013
workers involved in industrial action (per 1000 employees)
Hungary
source 2000-2009 Carley (2004) Carley (2008) and Carley (2010) 2010 Hungarian Statistical Office 2012 ILOSTAT
single-employer bargaining system
Guaranteed by the Constitution and by law
peak 2000 National strike in health care sector
right to strike private sector public sector
data coverage Only strikes Disputes are included if they involve a stoppage of work lasting for at least one day and the total time lost is 10 or more person-days Workers involved excludes workers indirectly involved
0
50
100
150
200
2000
2001
2002
2003
2004
2005
2006
2007
2008
2009
2010
2011
2012
2013
days not worked (per 1000 employees)
0
50
100
150
200
2000
2001
2002
2003
2004
2005
2006
2007
2008
2009
2010
2011
2012
2013
workers involved in industrial action (per 1000 employees)
Ireland
source Central Statistics Office Databank StatBank Labour Market and Earnings Labour Market Industrial Disputes
single-employer bargaining system
Guaranteed by law and developed through case-law
peak 2009 24-hour national public service strike against governmentrsquos pay cuts
right to strike private sector public sector
data coverage Strikes and lockouts Workers involved excludes workers indirectly involved
0
100
200
300
2000
2001
2002
2003
2004
2005
2006
2007
2008
2009
2010
2011
2012
2013
days not worked (per 1000 employees)
0
100
200
300
2000
2001
2002
2003
2004
2005
2006
2007
2008
2009
2010
2011
2012
2013
workers involved in industrial action (per 1000 employees)
Italy
source Istituto Nazionale di Statistica ILOSTAT Official strike data is no longer collected since 2009
multi-employer bargaining system
Recognised as an individual right and guaranteed by the Constitution and developed through case-law
peak 2002 General strike against labour market reforms
right to strike private sector public sector
data coverage Strikes and lockouts Workers involved excludes workers indirectly involved
0
1
2
3
4
2000
2001
2002
2003
2004
2005
2006
2007
2008
2009
2010
2011
2012
2013
days not worked (per 1000 employees)
0
1
2
3
2000
2001
2002
2003
2004
2005
2006
2007
2008
2009
2010
2011
2012
2013
workers involved in industrial action (per 1000 employees)
Latvia
source ILOSTAT
single-employer bargaining system
Guaranteed by the Constitution and regulated by law
peak 2008 Not attributable to a single large strike
right to strike private sector public sector
data coverage Only strikes Workers involved includes workers directly and indirectly involved
0
10
20
30
2000
2001
2002
2003
2004
2005
2006
2007
2008
2009
2010
2011
2012
2013
days not worked (per 1000 employees)
0
2
4
6
8
10
2000
2001
2002
2003
2004
2005
2006
2007
2008
2009
2010
2011
2012
2013
workers involved in industrial action (per 1000 employees)
Lithuania
source 2000-2008 2012 ILOSTAT 2009 Carley (2010) 2010-2011 and 2013 Statistics Lithuania Official Statistics Portal Population and social statistics Statistical information on strikes An estimate is also provided by Carley (2008 2010)
single-employer bargaining system
Guaranteed by the Constitution and regulated by law
peak 2008 Various teacherrsquos strike over a pay increase and other demands and other strikes in the public sector
right to strike private sector public sector
0
50
100
150
2000
2001
2002
2003
2004
2005
2006
2007
2008
2009
2010
2011
2012
2013
days not worked (per 1000 employees)
0
100
200
300
2000
2001
2002
2003
2004
2005
2006
2007
2008
2009
2010
2011
2012
2013
workers involved in industrial action (per 1000 employees)
Luxembourg
source Carley (2004) Carley (2008) and Carley (2010) Official data is no longer available since 2009
mixed bargaining system
Developed through case law
peak 2007 One-day general strike in public sector and a two-day railway strike over civil service and state employee pensions
right to strike private sector public sector
data coverage Strikes and lockouts Workers involved excludes workers indirectly involved
0
20
40
60
2000
2001
2002
2003
2004
2005
2006
2007
2008
2009
2010
2011
2012
2013
days not worked (per 1000 employees)
0
20
40
60
80
100
2000
2001
2002
2003
2004
2005
2006
2007
2008
2009
2010
2011
2012
2013
workers involved in industrial action (per 1000 employees)
Malta
source Industrial and Employment Relations Publications and Archives Archives Annual Reports ILOSTAT
single-employer bargaining system
Indirectly recognised by law
peak 2009 Not attributable to a specific large strike
right to strike private sector public sector
data coverage Only strikes Workers involved excludes workersindirectly involved
0
10
20
30
40
2000
2001
2002
2003
2004
2005
2006
2007
2008
2009
2010
2011
2012
2013
days not worked (per 1000 employees)
0
5
10
15
20
2000
2001
2002
2003
2004
2005
2006
2007
2008
2009
2010
2011
2012
2013
workers involved in industrial action (per 1000 employees)
Netherlands
source Centraal Bureau voor de Statistiek Cijfers Statline databank Thema Arbeidsmarkt Vakbeweging en stakingen Historie Werkstakingen
multi-employer bargaining system
Developed through case law
peak 2002 Strike action in construction industry peak 2012 15 weeks strike in cleaning sector over renewal of collective agreement besides strike action in the education sector
against austerity measures
right to strike private sector public sector
data coverage Strikes and lockout excluding strikes that last less than 1 day Workers involved includes workers directly and indirectly involved
0
50
100
150
200
250
2000
2001
2002
2003
2004
2005
2006
2007
2008
2009
2010
2011
2012
2013
days not worked (per 1000 employees)
0
10
20
30
40
50
2000
2001
2002
2003
2004
2005
2006
2007
2008
2009
2010
2011
2012
2013
workers involved in industrial action (per 1000 employees)
Norway
source Statistics Norway Statistics Labour market and earnings Strikes and lockouts
multi-employer bargaining system
Mainly regulated by collective agreements between the social partners
nearly two yearly peaks Negotiations about renewal of collective agreements in the economic sectors
right to strike private sector public sector
data coverage Only strikes excluding strikes that last less than 1 day workers involved excludes workers indirectly involved
0
5
10
15
20
25
2000
2001
2002
2003
2004
2005
2006
2007
2008
2009
2010
2011
2012
2013
days not worked (per 1000 employees)
0
5
10
15
20
2000
2001
2002
2003
2004
2005
2006
2007
2008
2009
2010
2011
2012
2013
workers involved in industrial action (per 1000 employees)
Poland
source ILOSTAT
single-employer bargaining system
Guaranteed by the Constitution and regulated by law
peak 2008 Various teachersrsquo strikes over a pay increase and other demands and other strikes in the public sector
right to strike private sector public sector
data coverage Only strikes excluding public administration workers involved excludes workers indirectly involved
0
10
20
30
2000
2001
2002
2003
2004
2005
2006
2007
2008
2009
2010
2011
2012
2013
days not worked (per 1000 employees)
0
5
10
15
20
25
2000
2001
2002
2003
2004
2005
2006
2007
2008
2009
2010
2011
2012
2013
workers involved in industrial action (per 1000 employees)
Portugal
source Gabinete de Estrateacutegia e Planeamento Estatiacutestica Greves Official strike data is not available after 2007
multi-employer bargaining system
Guaranteed by the Constitution and regulated by law
peak 2002 Several strike actions particularly in the public sector against changes in the Labour Code
right to strike private sector public sector
data coverage Only strikes Workers involved excludes workers indirectly involved
0
50
100
2000
2001
2002
2003
2004
2005
2006
2007
2008
2009
2010
2011
2012
2013
days not worked (per 1000 employees)
0
2
4
6
8
10
2000
2001
2002
2003
2004
2005
2006
2007
2008
2009
2010
2011
2012
2013
workers involved in industrial action (per 1000 employees)
Romania
source ILOSTAT Official data is very partial in 2009 and not available after 2010
single-employer bargaining system
Guaranteed by the Constitution and regulated by law
peaks 2000 and 2007 Several strike actions in particularly the manufacturing industry
right to strike private sector public sector
data coverage Only strikes workers involved excludes workers indirectly involved
0
10
20
30
40
2000
2001
2002
2003
2004
2005
2006
2007
2008
2009
2010
2011
2012
2013
days not worked (per 1000 employees)
0
2
4
6
8
10
2000
2001
2002
2003
2004
2005
2006
2007
2008
2009
2010
2011
2012
2013
workers involved in industrial action (per 1000 employees)
Slovakia
source 2000-2002 ILOSTAT 2003-2009 Carley (2004) Carley (2008) and Carley (2010) Since 2010 Statistical Office of the Slovak Republic (on demand)
mixed bargaining system
Guaranteed by the Constitution and regulated by law
peak 2003 Limited number of strike actions in railways and the public sector
right to strike private sector public sector
0
10
20
30
40
50
2000
2001
2002
2003
2004
2005
2006
2007
2008
2009
2010
2011
2012
2013
days not worked (per 1000 employees)
0
2
4
6
2000
2001
2002
2003
2004
2005
2006
2007
2008
2009
2010
2011
2012
2013
workers involved in industrial action (per 1000 employees)
Slovenia
source Carley (2004) Carley (2008) and Carley (2010) Trade union data (ZSSS) Official data is not available
multi-employer bargaining system
Guaranteed by the Constitution and regulated by law
peak 2005 Union mobilisation against labour market reforms
right to strike private sector public sector
data coverage Strikes and lockouts excluding strikes that last less than 1 hour workers involved excludes workers indirectly involved The 2012 data excludes the general strikes of the 29th of March and the 14th of November and the nation-wide strike in the education sector of 22nd of May In 2013 several strikes in the education sector are excluded
050
100150200250300350
2000
2001
2002
2003
2004
2005
2006
2007
2008
2009
2010
2011
2012
2013
days not worked (per 1000 employees)
050
100150200250300350
2000
2001
2002
2003
2004
2005
2006
2007
2008
2009
2010
2011
2012
2013
workers involved in industrial action (per 1000 employees)
Spain
source ILOSTAT Ministry of Employment and Social Security Statistics Condiciones de trabajo y relaciones laborales Huelgas y Cierres Patronales
multi-employer bargaining system
Guaranteed by the Constitution and regulated by law
peak 2004 Strike action in shipyards over renewal of collective agreements and against relocation decisions in mainly the manufacturing industry
underestimated peak in 2012 and 2013 General strikes in 2012 and various strikes in the public sector
right to strike private sector public sector
data coverage Strikes and lockouts Workers involved excludes workers indirectly involved
0
50
100
150
200
2000
2001
2002
2003
2004
2005
2006
2007
2008
2009
2010
2011
2012
2013
days not worked (per 1000 employees)
0
5
10
15
20
25
2000
2001
2002
2003
2004
2005
2006
2007
2008
2009
2010
2011
2012
2013
workers involved in industrial action (per 1000 employees)
Sweden
source Sweden National Mediation Office Melding amp konflikt Konfliktstatistik
multi-employer bargaining system
Guaranteed by the Constitution and regulated by law and in the 1938 collective agreement between the social partners
peak 2003 Large strike of blue-collar workers in the municipal and city council sector over a new pay agreement
right to strike private sector public sector
data coverage Strikes and lockouts Excluding strikes that last less than 1 day Workers involved includes workers directly and indirectly involved
0
5
10
15
2000
2001
2002
2003
2004
2005
2006
2007
2008
2009
2010
2011
2012
2013
days not worked (per 1000 employees)
0
2
4
6
8
10
2000
2001
2002
2003
2004
2005
2006
2007
2008
2009
2010
2011
2012
2013
workers involved in industrial action (per 1000 employees)
Switzerland
source Office feacutedeacuteral de la statistique Thegravemes Organisation du marcheacute du travail conventions collectives de travail Donneacutees deacutetailleacutees Gregraveves et lock-out
multi-employer bargaining system
Guaranteed by the Constitution and regulated by law and in the 1938 collective agreement between the social partners
peak 2004 Difficult to attribute to a specific large strike
right to strike private sector public sector
data coverage 2000-2008 Excluding political strikes Since 2009 Strikes and lockouts Excluding strikes that last less than 1 day Workers involved includes workers directly and indirectly involved
0
20
40
60
2000
2001
2002
2003
2004
2005
2006
2007
2008
2009
2010
2011
2012
2013
days not worked (per 1000 employees)
0
20
40
60
2000
2001
2002
2003
2004
2005
2006
2007
2008
2009
2010
2011
2012
2013
workers involved in industrial action (per 1000 employees)
United Kingdom
source Office for National Statistics Browse by Theme Labour Market Labour Disputes Days Lost due to Industrial Action
single-employer bargaining system
Regulated by law
peak 2004 One-day strike by civil servants to protest against governments plans to cut a large number of civil service posts peak 2007 One-day strike by postal workers in protest over pay and modernisation plans and one-day strike by prison officers
against the governmentrsquos decision to introduce a pay award in stages peak 2011 Union mobilisation against public service pension reforms in June and November
Right to strike legend
yes with minor restrictions (eg recognized union balloting proportionality respect of peace obligation)
yes with major restrictions (eg monopoly union compulsory arbitration or conciliation restrictions on issues or content major groups excluded
no
yes
private sector
yes with minor restrictions (eg recognized union balloting proportionality respect of peace obligation only military judiciary or police excluded ndash as per ILO convention)
yes with major restrictions (eg monopoly union compulsory arbitration or conciliation restrictions on issues or content major groups excluded
no
yes
public sector
source J Visser Database on Institutional Characteristics of Trade Unions Wage Setting State Intervention and Social Pacts (ICTWSS) database version 4 2013 The indicators reflect the situation in 2011
Prevelant bargaining regime legend
Single-employer bargaining system the establishment or company level is predominant
Multi-employer bargaining system sector andor the cross-sector level is predominant
Mixed bargaining system an intermediate situation where sector and company negotiations each respectively account for at least one-third of those covered by collective wage-setting arrangements
source P Marginson and C Welz (2014) Changes to wage-setting mechanisms in the context of the crisis and the EUrsquos new economic governance regime Dublin Eurofound
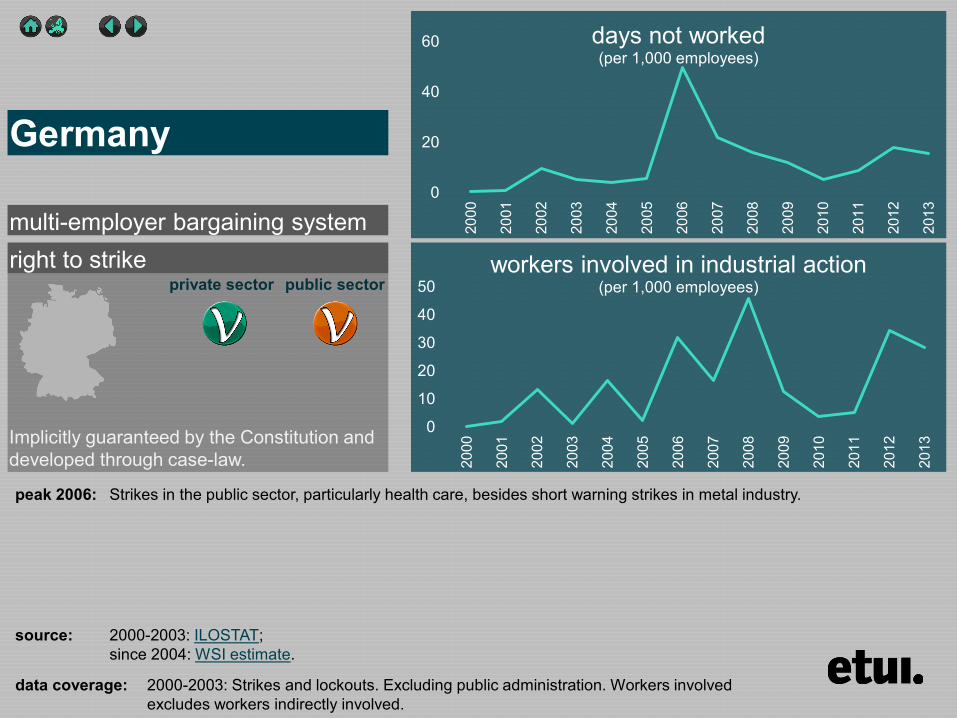
right to strike private sector public sector
data coverage 2000-2003 Strikes and lockouts Excluding public administration Workers involved excludes workers indirectly involved
0
20
40
60
2000
2001
2002
2003
2004
2005
2006
2007
2008
2009
2010
2011
2012
2013
days not worked (per 1000 employees)
0
10
20
30
40
50
2000
2001
2002
2003
2004
2005
2006
2007
2008
2009
2010
2011
2012
2013
workers involved in industrial action (per 1000 employees)
Germany
source 2000-2003 ILOSTAT since 2004 WSI estimate
multi-employer bargaining system
Implicitly guaranteed by the Constitution and developed through case-law
peak 2006 Strikes in the public sector particularly health care besides short warning strikes in metal industry
right to strike private sector public sector
data coverage Strikes and lockouts 2012 Only strikes Excluding strikes that last less than 100 days workers involved includes workers directly and indirectly involved
0
50
100
150
200
2000
2001
2002
2003
2004
2005
2006
2007
2008
2009
2010
2011
2012
2013
days not worked (per 1000 employees)
0
5
10
15
20
2000
2001
2002
2003
2004
2005
2006
2007
2008
2009
2010
2011
2012
2013
workers involved in industrial action (per 1000 employees)
Hungary
source 2000-2009 Carley (2004) Carley (2008) and Carley (2010) 2010 Hungarian Statistical Office 2012 ILOSTAT
single-employer bargaining system
Guaranteed by the Constitution and by law
peak 2000 National strike in health care sector
right to strike private sector public sector
data coverage Only strikes Disputes are included if they involve a stoppage of work lasting for at least one day and the total time lost is 10 or more person-days Workers involved excludes workers indirectly involved
0
50
100
150
200
2000
2001
2002
2003
2004
2005
2006
2007
2008
2009
2010
2011
2012
2013
days not worked (per 1000 employees)
0
50
100
150
200
2000
2001
2002
2003
2004
2005
2006
2007
2008
2009
2010
2011
2012
2013
workers involved in industrial action (per 1000 employees)
Ireland
source Central Statistics Office Databank StatBank Labour Market and Earnings Labour Market Industrial Disputes
single-employer bargaining system
Guaranteed by law and developed through case-law
peak 2009 24-hour national public service strike against governmentrsquos pay cuts
right to strike private sector public sector
data coverage Strikes and lockouts Workers involved excludes workers indirectly involved
0
100
200
300
2000
2001
2002
2003
2004
2005
2006
2007
2008
2009
2010
2011
2012
2013
days not worked (per 1000 employees)
0
100
200
300
2000
2001
2002
2003
2004
2005
2006
2007
2008
2009
2010
2011
2012
2013
workers involved in industrial action (per 1000 employees)
Italy
source Istituto Nazionale di Statistica ILOSTAT Official strike data is no longer collected since 2009
multi-employer bargaining system
Recognised as an individual right and guaranteed by the Constitution and developed through case-law
peak 2002 General strike against labour market reforms
right to strike private sector public sector
data coverage Strikes and lockouts Workers involved excludes workers indirectly involved
0
1
2
3
4
2000
2001
2002
2003
2004
2005
2006
2007
2008
2009
2010
2011
2012
2013
days not worked (per 1000 employees)
0
1
2
3
2000
2001
2002
2003
2004
2005
2006
2007
2008
2009
2010
2011
2012
2013
workers involved in industrial action (per 1000 employees)
Latvia
source ILOSTAT
single-employer bargaining system
Guaranteed by the Constitution and regulated by law
peak 2008 Not attributable to a single large strike
right to strike private sector public sector
data coverage Only strikes Workers involved includes workers directly and indirectly involved
0
10
20
30
2000
2001
2002
2003
2004
2005
2006
2007
2008
2009
2010
2011
2012
2013
days not worked (per 1000 employees)
0
2
4
6
8
10
2000
2001
2002
2003
2004
2005
2006
2007
2008
2009
2010
2011
2012
2013
workers involved in industrial action (per 1000 employees)
Lithuania
source 2000-2008 2012 ILOSTAT 2009 Carley (2010) 2010-2011 and 2013 Statistics Lithuania Official Statistics Portal Population and social statistics Statistical information on strikes An estimate is also provided by Carley (2008 2010)
single-employer bargaining system
Guaranteed by the Constitution and regulated by law
peak 2008 Various teacherrsquos strike over a pay increase and other demands and other strikes in the public sector
right to strike private sector public sector
0
50
100
150
2000
2001
2002
2003
2004
2005
2006
2007
2008
2009
2010
2011
2012
2013
days not worked (per 1000 employees)
0
100
200
300
2000
2001
2002
2003
2004
2005
2006
2007
2008
2009
2010
2011
2012
2013
workers involved in industrial action (per 1000 employees)
Luxembourg
source Carley (2004) Carley (2008) and Carley (2010) Official data is no longer available since 2009
mixed bargaining system
Developed through case law
peak 2007 One-day general strike in public sector and a two-day railway strike over civil service and state employee pensions
right to strike private sector public sector
data coverage Strikes and lockouts Workers involved excludes workers indirectly involved
0
20
40
60
2000
2001
2002
2003
2004
2005
2006
2007
2008
2009
2010
2011
2012
2013
days not worked (per 1000 employees)
0
20
40
60
80
100
2000
2001
2002
2003
2004
2005
2006
2007
2008
2009
2010
2011
2012
2013
workers involved in industrial action (per 1000 employees)
Malta
source Industrial and Employment Relations Publications and Archives Archives Annual Reports ILOSTAT
single-employer bargaining system
Indirectly recognised by law
peak 2009 Not attributable to a specific large strike
right to strike private sector public sector
data coverage Only strikes Workers involved excludes workersindirectly involved
0
10
20
30
40
2000
2001
2002
2003
2004
2005
2006
2007
2008
2009
2010
2011
2012
2013
days not worked (per 1000 employees)
0
5
10
15
20
2000
2001
2002
2003
2004
2005
2006
2007
2008
2009
2010
2011
2012
2013
workers involved in industrial action (per 1000 employees)
Netherlands
source Centraal Bureau voor de Statistiek Cijfers Statline databank Thema Arbeidsmarkt Vakbeweging en stakingen Historie Werkstakingen
multi-employer bargaining system
Developed through case law
peak 2002 Strike action in construction industry peak 2012 15 weeks strike in cleaning sector over renewal of collective agreement besides strike action in the education sector
against austerity measures
right to strike private sector public sector
data coverage Strikes and lockout excluding strikes that last less than 1 day Workers involved includes workers directly and indirectly involved
0
50
100
150
200
250
2000
2001
2002
2003
2004
2005
2006
2007
2008
2009
2010
2011
2012
2013
days not worked (per 1000 employees)
0
10
20
30
40
50
2000
2001
2002
2003
2004
2005
2006
2007
2008
2009
2010
2011
2012
2013
workers involved in industrial action (per 1000 employees)
Norway
source Statistics Norway Statistics Labour market and earnings Strikes and lockouts
multi-employer bargaining system
Mainly regulated by collective agreements between the social partners
nearly two yearly peaks Negotiations about renewal of collective agreements in the economic sectors
right to strike private sector public sector
data coverage Only strikes excluding strikes that last less than 1 day workers involved excludes workers indirectly involved
0
5
10
15
20
25
2000
2001
2002
2003
2004
2005
2006
2007
2008
2009
2010
2011
2012
2013
days not worked (per 1000 employees)
0
5
10
15
20
2000
2001
2002
2003
2004
2005
2006
2007
2008
2009
2010
2011
2012
2013
workers involved in industrial action (per 1000 employees)
Poland
source ILOSTAT
single-employer bargaining system
Guaranteed by the Constitution and regulated by law
peak 2008 Various teachersrsquo strikes over a pay increase and other demands and other strikes in the public sector
right to strike private sector public sector
data coverage Only strikes excluding public administration workers involved excludes workers indirectly involved
0
10
20
30
2000
2001
2002
2003
2004
2005
2006
2007
2008
2009
2010
2011
2012
2013
days not worked (per 1000 employees)
0
5
10
15
20
25
2000
2001
2002
2003
2004
2005
2006
2007
2008
2009
2010
2011
2012
2013
workers involved in industrial action (per 1000 employees)
Portugal
source Gabinete de Estrateacutegia e Planeamento Estatiacutestica Greves Official strike data is not available after 2007
multi-employer bargaining system
Guaranteed by the Constitution and regulated by law
peak 2002 Several strike actions particularly in the public sector against changes in the Labour Code
right to strike private sector public sector
data coverage Only strikes Workers involved excludes workers indirectly involved
0
50
100
2000
2001
2002
2003
2004
2005
2006
2007
2008
2009
2010
2011
2012
2013
days not worked (per 1000 employees)
0
2
4
6
8
10
2000
2001
2002
2003
2004
2005
2006
2007
2008
2009
2010
2011
2012
2013
workers involved in industrial action (per 1000 employees)
Romania
source ILOSTAT Official data is very partial in 2009 and not available after 2010
single-employer bargaining system
Guaranteed by the Constitution and regulated by law
peaks 2000 and 2007 Several strike actions in particularly the manufacturing industry
right to strike private sector public sector
data coverage Only strikes workers involved excludes workers indirectly involved
0
10
20
30
40
2000
2001
2002
2003
2004
2005
2006
2007
2008
2009
2010
2011
2012
2013
days not worked (per 1000 employees)
0
2
4
6
8
10
2000
2001
2002
2003
2004
2005
2006
2007
2008
2009
2010
2011
2012
2013
workers involved in industrial action (per 1000 employees)
Slovakia
source 2000-2002 ILOSTAT 2003-2009 Carley (2004) Carley (2008) and Carley (2010) Since 2010 Statistical Office of the Slovak Republic (on demand)
mixed bargaining system
Guaranteed by the Constitution and regulated by law
peak 2003 Limited number of strike actions in railways and the public sector
right to strike private sector public sector
0
10
20
30
40
50
2000
2001
2002
2003
2004
2005
2006
2007
2008
2009
2010
2011
2012
2013
days not worked (per 1000 employees)
0
2
4
6
2000
2001
2002
2003
2004
2005
2006
2007
2008
2009
2010
2011
2012
2013
workers involved in industrial action (per 1000 employees)
Slovenia
source Carley (2004) Carley (2008) and Carley (2010) Trade union data (ZSSS) Official data is not available
multi-employer bargaining system
Guaranteed by the Constitution and regulated by law
peak 2005 Union mobilisation against labour market reforms
right to strike private sector public sector
data coverage Strikes and lockouts excluding strikes that last less than 1 hour workers involved excludes workers indirectly involved The 2012 data excludes the general strikes of the 29th of March and the 14th of November and the nation-wide strike in the education sector of 22nd of May In 2013 several strikes in the education sector are excluded
050
100150200250300350
2000
2001
2002
2003
2004
2005
2006
2007
2008
2009
2010
2011
2012
2013
days not worked (per 1000 employees)
050
100150200250300350
2000
2001
2002
2003
2004
2005
2006
2007
2008
2009
2010
2011
2012
2013
workers involved in industrial action (per 1000 employees)
Spain
source ILOSTAT Ministry of Employment and Social Security Statistics Condiciones de trabajo y relaciones laborales Huelgas y Cierres Patronales
multi-employer bargaining system
Guaranteed by the Constitution and regulated by law
peak 2004 Strike action in shipyards over renewal of collective agreements and against relocation decisions in mainly the manufacturing industry
underestimated peak in 2012 and 2013 General strikes in 2012 and various strikes in the public sector
right to strike private sector public sector
data coverage Strikes and lockouts Workers involved excludes workers indirectly involved
0
50
100
150
200
2000
2001
2002
2003
2004
2005
2006
2007
2008
2009
2010
2011
2012
2013
days not worked (per 1000 employees)
0
5
10
15
20
25
2000
2001
2002
2003
2004
2005
2006
2007
2008
2009
2010
2011
2012
2013
workers involved in industrial action (per 1000 employees)
Sweden
source Sweden National Mediation Office Melding amp konflikt Konfliktstatistik
multi-employer bargaining system
Guaranteed by the Constitution and regulated by law and in the 1938 collective agreement between the social partners
peak 2003 Large strike of blue-collar workers in the municipal and city council sector over a new pay agreement
right to strike private sector public sector
data coverage Strikes and lockouts Excluding strikes that last less than 1 day Workers involved includes workers directly and indirectly involved
0
5
10
15
2000
2001
2002
2003
2004
2005
2006
2007
2008
2009
2010
2011
2012
2013
days not worked (per 1000 employees)
0
2
4
6
8
10
2000
2001
2002
2003
2004
2005
2006
2007
2008
2009
2010
2011
2012
2013
workers involved in industrial action (per 1000 employees)
Switzerland
source Office feacutedeacuteral de la statistique Thegravemes Organisation du marcheacute du travail conventions collectives de travail Donneacutees deacutetailleacutees Gregraveves et lock-out
multi-employer bargaining system
Guaranteed by the Constitution and regulated by law and in the 1938 collective agreement between the social partners
peak 2004 Difficult to attribute to a specific large strike
right to strike private sector public sector
data coverage 2000-2008 Excluding political strikes Since 2009 Strikes and lockouts Excluding strikes that last less than 1 day Workers involved includes workers directly and indirectly involved
0
20
40
60
2000
2001
2002
2003
2004
2005
2006
2007
2008
2009
2010
2011
2012
2013
days not worked (per 1000 employees)
0
20
40
60
2000
2001
2002
2003
2004
2005
2006
2007
2008
2009
2010
2011
2012
2013
workers involved in industrial action (per 1000 employees)
United Kingdom
source Office for National Statistics Browse by Theme Labour Market Labour Disputes Days Lost due to Industrial Action
single-employer bargaining system
Regulated by law
peak 2004 One-day strike by civil servants to protest against governments plans to cut a large number of civil service posts peak 2007 One-day strike by postal workers in protest over pay and modernisation plans and one-day strike by prison officers
against the governmentrsquos decision to introduce a pay award in stages peak 2011 Union mobilisation against public service pension reforms in June and November
Right to strike legend
yes with minor restrictions (eg recognized union balloting proportionality respect of peace obligation)
yes with major restrictions (eg monopoly union compulsory arbitration or conciliation restrictions on issues or content major groups excluded
no
yes
private sector
yes with minor restrictions (eg recognized union balloting proportionality respect of peace obligation only military judiciary or police excluded ndash as per ILO convention)
yes with major restrictions (eg monopoly union compulsory arbitration or conciliation restrictions on issues or content major groups excluded
no
yes
public sector
source J Visser Database on Institutional Characteristics of Trade Unions Wage Setting State Intervention and Social Pacts (ICTWSS) database version 4 2013 The indicators reflect the situation in 2011
Prevelant bargaining regime legend
Single-employer bargaining system the establishment or company level is predominant
Multi-employer bargaining system sector andor the cross-sector level is predominant
Mixed bargaining system an intermediate situation where sector and company negotiations each respectively account for at least one-third of those covered by collective wage-setting arrangements
source P Marginson and C Welz (2014) Changes to wage-setting mechanisms in the context of the crisis and the EUrsquos new economic governance regime Dublin Eurofound
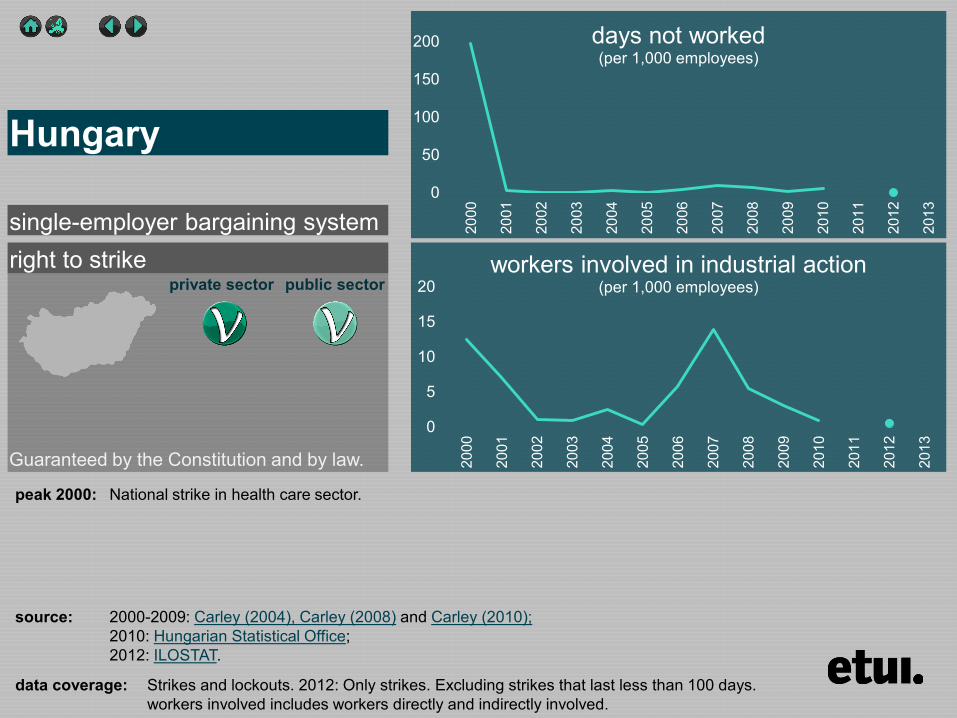
right to strike private sector public sector
data coverage Strikes and lockouts 2012 Only strikes Excluding strikes that last less than 100 days workers involved includes workers directly and indirectly involved
0
50
100
150
200
2000
2001
2002
2003
2004
2005
2006
2007
2008
2009
2010
2011
2012
2013
days not worked (per 1000 employees)
0
5
10
15
20
2000
2001
2002
2003
2004
2005
2006
2007
2008
2009
2010
2011
2012
2013
workers involved in industrial action (per 1000 employees)
Hungary
source 2000-2009 Carley (2004) Carley (2008) and Carley (2010) 2010 Hungarian Statistical Office 2012 ILOSTAT
single-employer bargaining system
Guaranteed by the Constitution and by law
peak 2000 National strike in health care sector
right to strike private sector public sector
data coverage Only strikes Disputes are included if they involve a stoppage of work lasting for at least one day and the total time lost is 10 or more person-days Workers involved excludes workers indirectly involved
0
50
100
150
200
2000
2001
2002
2003
2004
2005
2006
2007
2008
2009
2010
2011
2012
2013
days not worked (per 1000 employees)
0
50
100
150
200
2000
2001
2002
2003
2004
2005
2006
2007
2008
2009
2010
2011
2012
2013
workers involved in industrial action (per 1000 employees)
Ireland
source Central Statistics Office Databank StatBank Labour Market and Earnings Labour Market Industrial Disputes
single-employer bargaining system
Guaranteed by law and developed through case-law
peak 2009 24-hour national public service strike against governmentrsquos pay cuts
right to strike private sector public sector
data coverage Strikes and lockouts Workers involved excludes workers indirectly involved
0
100
200
300
2000
2001
2002
2003
2004
2005
2006
2007
2008
2009
2010
2011
2012
2013
days not worked (per 1000 employees)
0
100
200
300
2000
2001
2002
2003
2004
2005
2006
2007
2008
2009
2010
2011
2012
2013
workers involved in industrial action (per 1000 employees)
Italy
source Istituto Nazionale di Statistica ILOSTAT Official strike data is no longer collected since 2009
multi-employer bargaining system
Recognised as an individual right and guaranteed by the Constitution and developed through case-law
peak 2002 General strike against labour market reforms
right to strike private sector public sector
data coverage Strikes and lockouts Workers involved excludes workers indirectly involved
0
1
2
3
4
2000
2001
2002
2003
2004
2005
2006
2007
2008
2009
2010
2011
2012
2013
days not worked (per 1000 employees)
0
1
2
3
2000
2001
2002
2003
2004
2005
2006
2007
2008
2009
2010
2011
2012
2013
workers involved in industrial action (per 1000 employees)
Latvia
source ILOSTAT
single-employer bargaining system
Guaranteed by the Constitution and regulated by law
peak 2008 Not attributable to a single large strike
right to strike private sector public sector
data coverage Only strikes Workers involved includes workers directly and indirectly involved
0
10
20
30
2000
2001
2002
2003
2004
2005
2006
2007
2008
2009
2010
2011
2012
2013
days not worked (per 1000 employees)
0
2
4
6
8
10
2000
2001
2002
2003
2004
2005
2006
2007
2008
2009
2010
2011
2012
2013
workers involved in industrial action (per 1000 employees)
Lithuania
source 2000-2008 2012 ILOSTAT 2009 Carley (2010) 2010-2011 and 2013 Statistics Lithuania Official Statistics Portal Population and social statistics Statistical information on strikes An estimate is also provided by Carley (2008 2010)
single-employer bargaining system
Guaranteed by the Constitution and regulated by law
peak 2008 Various teacherrsquos strike over a pay increase and other demands and other strikes in the public sector
right to strike private sector public sector
0
50
100
150
2000
2001
2002
2003
2004
2005
2006
2007
2008
2009
2010
2011
2012
2013
days not worked (per 1000 employees)
0
100
200
300
2000
2001
2002
2003
2004
2005
2006
2007
2008
2009
2010
2011
2012
2013
workers involved in industrial action (per 1000 employees)
Luxembourg
source Carley (2004) Carley (2008) and Carley (2010) Official data is no longer available since 2009
mixed bargaining system
Developed through case law
peak 2007 One-day general strike in public sector and a two-day railway strike over civil service and state employee pensions
right to strike private sector public sector
data coverage Strikes and lockouts Workers involved excludes workers indirectly involved
0
20
40
60
2000
2001
2002
2003
2004
2005
2006
2007
2008
2009
2010
2011
2012
2013
days not worked (per 1000 employees)
0
20
40
60
80
100
2000
2001
2002
2003
2004
2005
2006
2007
2008
2009
2010
2011
2012
2013
workers involved in industrial action (per 1000 employees)
Malta
source Industrial and Employment Relations Publications and Archives Archives Annual Reports ILOSTAT
single-employer bargaining system
Indirectly recognised by law
peak 2009 Not attributable to a specific large strike
right to strike private sector public sector
data coverage Only strikes Workers involved excludes workersindirectly involved
0
10
20
30
40
2000
2001
2002
2003
2004
2005
2006
2007
2008
2009
2010
2011
2012
2013
days not worked (per 1000 employees)
0
5
10
15
20
2000
2001
2002
2003
2004
2005
2006
2007
2008
2009
2010
2011
2012
2013
workers involved in industrial action (per 1000 employees)
Netherlands
source Centraal Bureau voor de Statistiek Cijfers Statline databank Thema Arbeidsmarkt Vakbeweging en stakingen Historie Werkstakingen
multi-employer bargaining system
Developed through case law
peak 2002 Strike action in construction industry peak 2012 15 weeks strike in cleaning sector over renewal of collective agreement besides strike action in the education sector
against austerity measures
right to strike private sector public sector
data coverage Strikes and lockout excluding strikes that last less than 1 day Workers involved includes workers directly and indirectly involved
0
50
100
150
200
250
2000
2001
2002
2003
2004
2005
2006
2007
2008
2009
2010
2011
2012
2013
days not worked (per 1000 employees)
0
10
20
30
40
50
2000
2001
2002
2003
2004
2005
2006
2007
2008
2009
2010
2011
2012
2013
workers involved in industrial action (per 1000 employees)
Norway
source Statistics Norway Statistics Labour market and earnings Strikes and lockouts
multi-employer bargaining system
Mainly regulated by collective agreements between the social partners
nearly two yearly peaks Negotiations about renewal of collective agreements in the economic sectors
right to strike private sector public sector
data coverage Only strikes excluding strikes that last less than 1 day workers involved excludes workers indirectly involved
0
5
10
15
20
25
2000
2001
2002
2003
2004
2005
2006
2007
2008
2009
2010
2011
2012
2013
days not worked (per 1000 employees)
0
5
10
15
20
2000
2001
2002
2003
2004
2005
2006
2007
2008
2009
2010
2011
2012
2013
workers involved in industrial action (per 1000 employees)
Poland
source ILOSTAT
single-employer bargaining system
Guaranteed by the Constitution and regulated by law
peak 2008 Various teachersrsquo strikes over a pay increase and other demands and other strikes in the public sector
right to strike private sector public sector
data coverage Only strikes excluding public administration workers involved excludes workers indirectly involved
0
10
20
30
2000
2001
2002
2003
2004
2005
2006
2007
2008
2009
2010
2011
2012
2013
days not worked (per 1000 employees)
0
5
10
15
20
25
2000
2001
2002
2003
2004
2005
2006
2007
2008
2009
2010
2011
2012
2013
workers involved in industrial action (per 1000 employees)
Portugal
source Gabinete de Estrateacutegia e Planeamento Estatiacutestica Greves Official strike data is not available after 2007
multi-employer bargaining system
Guaranteed by the Constitution and regulated by law
peak 2002 Several strike actions particularly in the public sector against changes in the Labour Code
right to strike private sector public sector
data coverage Only strikes Workers involved excludes workers indirectly involved
0
50
100
2000
2001
2002
2003
2004
2005
2006
2007
2008
2009
2010
2011
2012
2013
days not worked (per 1000 employees)
0
2
4
6
8
10
2000
2001
2002
2003
2004
2005
2006
2007
2008
2009
2010
2011
2012
2013
workers involved in industrial action (per 1000 employees)
Romania
source ILOSTAT Official data is very partial in 2009 and not available after 2010
single-employer bargaining system
Guaranteed by the Constitution and regulated by law
peaks 2000 and 2007 Several strike actions in particularly the manufacturing industry
right to strike private sector public sector
data coverage Only strikes workers involved excludes workers indirectly involved
0
10
20
30
40
2000
2001
2002
2003
2004
2005
2006
2007
2008
2009
2010
2011
2012
2013
days not worked (per 1000 employees)
0
2
4
6
8
10
2000
2001
2002
2003
2004
2005
2006
2007
2008
2009
2010
2011
2012
2013
workers involved in industrial action (per 1000 employees)
Slovakia
source 2000-2002 ILOSTAT 2003-2009 Carley (2004) Carley (2008) and Carley (2010) Since 2010 Statistical Office of the Slovak Republic (on demand)
mixed bargaining system
Guaranteed by the Constitution and regulated by law
peak 2003 Limited number of strike actions in railways and the public sector
right to strike private sector public sector
0
10
20
30
40
50
2000
2001
2002
2003
2004
2005
2006
2007
2008
2009
2010
2011
2012
2013
days not worked (per 1000 employees)
0
2
4
6
2000
2001
2002
2003
2004
2005
2006
2007
2008
2009
2010
2011
2012
2013
workers involved in industrial action (per 1000 employees)
Slovenia
source Carley (2004) Carley (2008) and Carley (2010) Trade union data (ZSSS) Official data is not available
multi-employer bargaining system
Guaranteed by the Constitution and regulated by law
peak 2005 Union mobilisation against labour market reforms
right to strike private sector public sector
data coverage Strikes and lockouts excluding strikes that last less than 1 hour workers involved excludes workers indirectly involved The 2012 data excludes the general strikes of the 29th of March and the 14th of November and the nation-wide strike in the education sector of 22nd of May In 2013 several strikes in the education sector are excluded
050
100150200250300350
2000
2001
2002
2003
2004
2005
2006
2007
2008
2009
2010
2011
2012
2013
days not worked (per 1000 employees)
050
100150200250300350
2000
2001
2002
2003
2004
2005
2006
2007
2008
2009
2010
2011
2012
2013
workers involved in industrial action (per 1000 employees)
Spain
source ILOSTAT Ministry of Employment and Social Security Statistics Condiciones de trabajo y relaciones laborales Huelgas y Cierres Patronales
multi-employer bargaining system
Guaranteed by the Constitution and regulated by law
peak 2004 Strike action in shipyards over renewal of collective agreements and against relocation decisions in mainly the manufacturing industry
underestimated peak in 2012 and 2013 General strikes in 2012 and various strikes in the public sector
right to strike private sector public sector
data coverage Strikes and lockouts Workers involved excludes workers indirectly involved
0
50
100
150
200
2000
2001
2002
2003
2004
2005
2006
2007
2008
2009
2010
2011
2012
2013
days not worked (per 1000 employees)
0
5
10
15
20
25
2000
2001
2002
2003
2004
2005
2006
2007
2008
2009
2010
2011
2012
2013
workers involved in industrial action (per 1000 employees)
Sweden
source Sweden National Mediation Office Melding amp konflikt Konfliktstatistik
multi-employer bargaining system
Guaranteed by the Constitution and regulated by law and in the 1938 collective agreement between the social partners
peak 2003 Large strike of blue-collar workers in the municipal and city council sector over a new pay agreement
right to strike private sector public sector
data coverage Strikes and lockouts Excluding strikes that last less than 1 day Workers involved includes workers directly and indirectly involved
0
5
10
15
2000
2001
2002
2003
2004
2005
2006
2007
2008
2009
2010
2011
2012
2013
days not worked (per 1000 employees)
0
2
4
6
8
10
2000
2001
2002
2003
2004
2005
2006
2007
2008
2009
2010
2011
2012
2013
workers involved in industrial action (per 1000 employees)
Switzerland
source Office feacutedeacuteral de la statistique Thegravemes Organisation du marcheacute du travail conventions collectives de travail Donneacutees deacutetailleacutees Gregraveves et lock-out
multi-employer bargaining system
Guaranteed by the Constitution and regulated by law and in the 1938 collective agreement between the social partners
peak 2004 Difficult to attribute to a specific large strike
right to strike private sector public sector
data coverage 2000-2008 Excluding political strikes Since 2009 Strikes and lockouts Excluding strikes that last less than 1 day Workers involved includes workers directly and indirectly involved
0
20
40
60
2000
2001
2002
2003
2004
2005
2006
2007
2008
2009
2010
2011
2012
2013
days not worked (per 1000 employees)
0
20
40
60
2000
2001
2002
2003
2004
2005
2006
2007
2008
2009
2010
2011
2012
2013
workers involved in industrial action (per 1000 employees)
United Kingdom
source Office for National Statistics Browse by Theme Labour Market Labour Disputes Days Lost due to Industrial Action
single-employer bargaining system
Regulated by law
peak 2004 One-day strike by civil servants to protest against governments plans to cut a large number of civil service posts peak 2007 One-day strike by postal workers in protest over pay and modernisation plans and one-day strike by prison officers
against the governmentrsquos decision to introduce a pay award in stages peak 2011 Union mobilisation against public service pension reforms in June and November
Right to strike legend
yes with minor restrictions (eg recognized union balloting proportionality respect of peace obligation)
yes with major restrictions (eg monopoly union compulsory arbitration or conciliation restrictions on issues or content major groups excluded
no
yes
private sector
yes with minor restrictions (eg recognized union balloting proportionality respect of peace obligation only military judiciary or police excluded ndash as per ILO convention)
yes with major restrictions (eg monopoly union compulsory arbitration or conciliation restrictions on issues or content major groups excluded
no
yes
public sector
source J Visser Database on Institutional Characteristics of Trade Unions Wage Setting State Intervention and Social Pacts (ICTWSS) database version 4 2013 The indicators reflect the situation in 2011
Prevelant bargaining regime legend
Single-employer bargaining system the establishment or company level is predominant
Multi-employer bargaining system sector andor the cross-sector level is predominant
Mixed bargaining system an intermediate situation where sector and company negotiations each respectively account for at least one-third of those covered by collective wage-setting arrangements
source P Marginson and C Welz (2014) Changes to wage-setting mechanisms in the context of the crisis and the EUrsquos new economic governance regime Dublin Eurofound
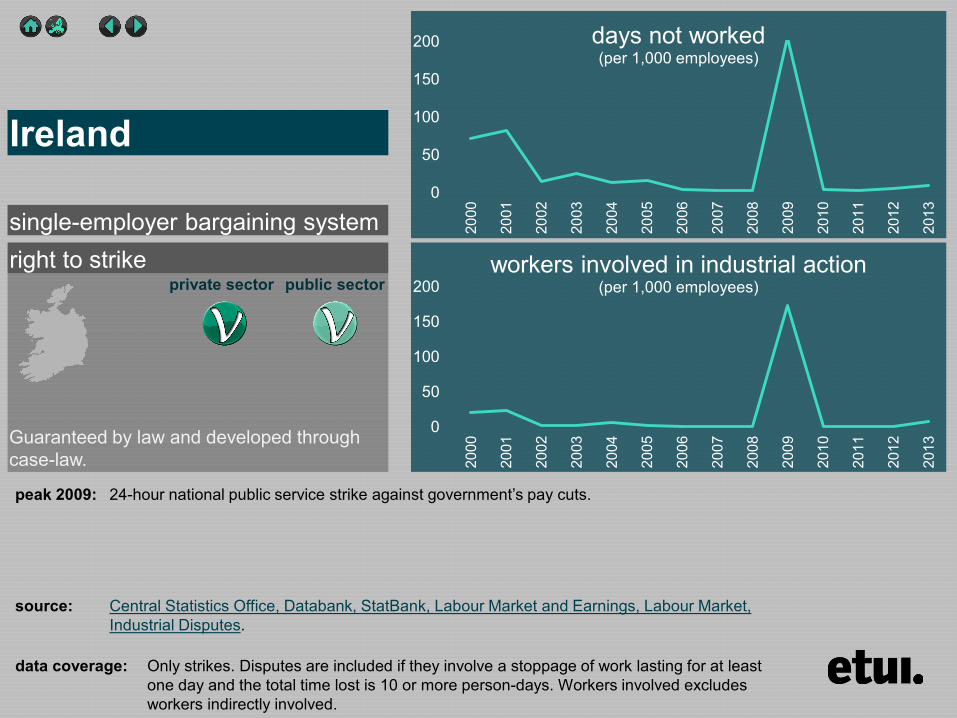
right to strike private sector public sector
data coverage Only strikes Disputes are included if they involve a stoppage of work lasting for at least one day and the total time lost is 10 or more person-days Workers involved excludes workers indirectly involved
0
50
100
150
200
2000
2001
2002
2003
2004
2005
2006
2007
2008
2009
2010
2011
2012
2013
days not worked (per 1000 employees)
0
50
100
150
200
2000
2001
2002
2003
2004
2005
2006
2007
2008
2009
2010
2011
2012
2013
workers involved in industrial action (per 1000 employees)
Ireland
source Central Statistics Office Databank StatBank Labour Market and Earnings Labour Market Industrial Disputes
single-employer bargaining system
Guaranteed by law and developed through case-law
peak 2009 24-hour national public service strike against governmentrsquos pay cuts
right to strike private sector public sector
data coverage Strikes and lockouts Workers involved excludes workers indirectly involved
0
100
200
300
2000
2001
2002
2003
2004
2005
2006
2007
2008
2009
2010
2011
2012
2013
days not worked (per 1000 employees)
0
100
200
300
2000
2001
2002
2003
2004
2005
2006
2007
2008
2009
2010
2011
2012
2013
workers involved in industrial action (per 1000 employees)
Italy
source Istituto Nazionale di Statistica ILOSTAT Official strike data is no longer collected since 2009
multi-employer bargaining system
Recognised as an individual right and guaranteed by the Constitution and developed through case-law
peak 2002 General strike against labour market reforms
right to strike private sector public sector
data coverage Strikes and lockouts Workers involved excludes workers indirectly involved
0
1
2
3
4
2000
2001
2002
2003
2004
2005
2006
2007
2008
2009
2010
2011
2012
2013
days not worked (per 1000 employees)
0
1
2
3
2000
2001
2002
2003
2004
2005
2006
2007
2008
2009
2010
2011
2012
2013
workers involved in industrial action (per 1000 employees)
Latvia
source ILOSTAT
single-employer bargaining system
Guaranteed by the Constitution and regulated by law
peak 2008 Not attributable to a single large strike
right to strike private sector public sector
data coverage Only strikes Workers involved includes workers directly and indirectly involved
0
10
20
30
2000
2001
2002
2003
2004
2005
2006
2007
2008
2009
2010
2011
2012
2013
days not worked (per 1000 employees)
0
2
4
6
8
10
2000
2001
2002
2003
2004
2005
2006
2007
2008
2009
2010
2011
2012
2013
workers involved in industrial action (per 1000 employees)
Lithuania
source 2000-2008 2012 ILOSTAT 2009 Carley (2010) 2010-2011 and 2013 Statistics Lithuania Official Statistics Portal Population and social statistics Statistical information on strikes An estimate is also provided by Carley (2008 2010)
single-employer bargaining system
Guaranteed by the Constitution and regulated by law
peak 2008 Various teacherrsquos strike over a pay increase and other demands and other strikes in the public sector
right to strike private sector public sector
0
50
100
150
2000
2001
2002
2003
2004
2005
2006
2007
2008
2009
2010
2011
2012
2013
days not worked (per 1000 employees)
0
100
200
300
2000
2001
2002
2003
2004
2005
2006
2007
2008
2009
2010
2011
2012
2013
workers involved in industrial action (per 1000 employees)
Luxembourg
source Carley (2004) Carley (2008) and Carley (2010) Official data is no longer available since 2009
mixed bargaining system
Developed through case law
peak 2007 One-day general strike in public sector and a two-day railway strike over civil service and state employee pensions
right to strike private sector public sector
data coverage Strikes and lockouts Workers involved excludes workers indirectly involved
0
20
40
60
2000
2001
2002
2003
2004
2005
2006
2007
2008
2009
2010
2011
2012
2013
days not worked (per 1000 employees)
0
20
40
60
80
100
2000
2001
2002
2003
2004
2005
2006
2007
2008
2009
2010
2011
2012
2013
workers involved in industrial action (per 1000 employees)
Malta
source Industrial and Employment Relations Publications and Archives Archives Annual Reports ILOSTAT
single-employer bargaining system
Indirectly recognised by law
peak 2009 Not attributable to a specific large strike
right to strike private sector public sector
data coverage Only strikes Workers involved excludes workersindirectly involved
0
10
20
30
40
2000
2001
2002
2003
2004
2005
2006
2007
2008
2009
2010
2011
2012
2013
days not worked (per 1000 employees)
0
5
10
15
20
2000
2001
2002
2003
2004
2005
2006
2007
2008
2009
2010
2011
2012
2013
workers involved in industrial action (per 1000 employees)
Netherlands
source Centraal Bureau voor de Statistiek Cijfers Statline databank Thema Arbeidsmarkt Vakbeweging en stakingen Historie Werkstakingen
multi-employer bargaining system
Developed through case law
peak 2002 Strike action in construction industry peak 2012 15 weeks strike in cleaning sector over renewal of collective agreement besides strike action in the education sector
against austerity measures
right to strike private sector public sector
data coverage Strikes and lockout excluding strikes that last less than 1 day Workers involved includes workers directly and indirectly involved
0
50
100
150
200
250
2000
2001
2002
2003
2004
2005
2006
2007
2008
2009
2010
2011
2012
2013
days not worked (per 1000 employees)
0
10
20
30
40
50
2000
2001
2002
2003
2004
2005
2006
2007
2008
2009
2010
2011
2012
2013
workers involved in industrial action (per 1000 employees)
Norway
source Statistics Norway Statistics Labour market and earnings Strikes and lockouts
multi-employer bargaining system
Mainly regulated by collective agreements between the social partners
nearly two yearly peaks Negotiations about renewal of collective agreements in the economic sectors
right to strike private sector public sector
data coverage Only strikes excluding strikes that last less than 1 day workers involved excludes workers indirectly involved
0
5
10
15
20
25
2000
2001
2002
2003
2004
2005
2006
2007
2008
2009
2010
2011
2012
2013
days not worked (per 1000 employees)
0
5
10
15
20
2000
2001
2002
2003
2004
2005
2006
2007
2008
2009
2010
2011
2012
2013
workers involved in industrial action (per 1000 employees)
Poland
source ILOSTAT
single-employer bargaining system
Guaranteed by the Constitution and regulated by law
peak 2008 Various teachersrsquo strikes over a pay increase and other demands and other strikes in the public sector
right to strike private sector public sector
data coverage Only strikes excluding public administration workers involved excludes workers indirectly involved
0
10
20
30
2000
2001
2002
2003
2004
2005
2006
2007
2008
2009
2010
2011
2012
2013
days not worked (per 1000 employees)
0
5
10
15
20
25
2000
2001
2002
2003
2004
2005
2006
2007
2008
2009
2010
2011
2012
2013
workers involved in industrial action (per 1000 employees)
Portugal
source Gabinete de Estrateacutegia e Planeamento Estatiacutestica Greves Official strike data is not available after 2007
multi-employer bargaining system
Guaranteed by the Constitution and regulated by law
peak 2002 Several strike actions particularly in the public sector against changes in the Labour Code
right to strike private sector public sector
data coverage Only strikes Workers involved excludes workers indirectly involved
0
50
100
2000
2001
2002
2003
2004
2005
2006
2007
2008
2009
2010
2011
2012
2013
days not worked (per 1000 employees)
0
2
4
6
8
10
2000
2001
2002
2003
2004
2005
2006
2007
2008
2009
2010
2011
2012
2013
workers involved in industrial action (per 1000 employees)
Romania
source ILOSTAT Official data is very partial in 2009 and not available after 2010
single-employer bargaining system
Guaranteed by the Constitution and regulated by law
peaks 2000 and 2007 Several strike actions in particularly the manufacturing industry
right to strike private sector public sector
data coverage Only strikes workers involved excludes workers indirectly involved
0
10
20
30
40
2000
2001
2002
2003
2004
2005
2006
2007
2008
2009
2010
2011
2012
2013
days not worked (per 1000 employees)
0
2
4
6
8
10
2000
2001
2002
2003
2004
2005
2006
2007
2008
2009
2010
2011
2012
2013
workers involved in industrial action (per 1000 employees)
Slovakia
source 2000-2002 ILOSTAT 2003-2009 Carley (2004) Carley (2008) and Carley (2010) Since 2010 Statistical Office of the Slovak Republic (on demand)
mixed bargaining system
Guaranteed by the Constitution and regulated by law
peak 2003 Limited number of strike actions in railways and the public sector
right to strike private sector public sector
0
10
20
30
40
50
2000
2001
2002
2003
2004
2005
2006
2007
2008
2009
2010
2011
2012
2013
days not worked (per 1000 employees)
0
2
4
6
2000
2001
2002
2003
2004
2005
2006
2007
2008
2009
2010
2011
2012
2013
workers involved in industrial action (per 1000 employees)
Slovenia
source Carley (2004) Carley (2008) and Carley (2010) Trade union data (ZSSS) Official data is not available
multi-employer bargaining system
Guaranteed by the Constitution and regulated by law
peak 2005 Union mobilisation against labour market reforms
right to strike private sector public sector
data coverage Strikes and lockouts excluding strikes that last less than 1 hour workers involved excludes workers indirectly involved The 2012 data excludes the general strikes of the 29th of March and the 14th of November and the nation-wide strike in the education sector of 22nd of May In 2013 several strikes in the education sector are excluded
050
100150200250300350
2000
2001
2002
2003
2004
2005
2006
2007
2008
2009
2010
2011
2012
2013
days not worked (per 1000 employees)
050
100150200250300350
2000
2001
2002
2003
2004
2005
2006
2007
2008
2009
2010
2011
2012
2013
workers involved in industrial action (per 1000 employees)
Spain
source ILOSTAT Ministry of Employment and Social Security Statistics Condiciones de trabajo y relaciones laborales Huelgas y Cierres Patronales
multi-employer bargaining system
Guaranteed by the Constitution and regulated by law
peak 2004 Strike action in shipyards over renewal of collective agreements and against relocation decisions in mainly the manufacturing industry
underestimated peak in 2012 and 2013 General strikes in 2012 and various strikes in the public sector
right to strike private sector public sector
data coverage Strikes and lockouts Workers involved excludes workers indirectly involved
0
50
100
150
200
2000
2001
2002
2003
2004
2005
2006
2007
2008
2009
2010
2011
2012
2013
days not worked (per 1000 employees)
0
5
10
15
20
25
2000
2001
2002
2003
2004
2005
2006
2007
2008
2009
2010
2011
2012
2013
workers involved in industrial action (per 1000 employees)
Sweden
source Sweden National Mediation Office Melding amp konflikt Konfliktstatistik
multi-employer bargaining system
Guaranteed by the Constitution and regulated by law and in the 1938 collective agreement between the social partners
peak 2003 Large strike of blue-collar workers in the municipal and city council sector over a new pay agreement
right to strike private sector public sector
data coverage Strikes and lockouts Excluding strikes that last less than 1 day Workers involved includes workers directly and indirectly involved
0
5
10
15
2000
2001
2002
2003
2004
2005
2006
2007
2008
2009
2010
2011
2012
2013
days not worked (per 1000 employees)
0
2
4
6
8
10
2000
2001
2002
2003
2004
2005
2006
2007
2008
2009
2010
2011
2012
2013
workers involved in industrial action (per 1000 employees)
Switzerland
source Office feacutedeacuteral de la statistique Thegravemes Organisation du marcheacute du travail conventions collectives de travail Donneacutees deacutetailleacutees Gregraveves et lock-out
multi-employer bargaining system
Guaranteed by the Constitution and regulated by law and in the 1938 collective agreement between the social partners
peak 2004 Difficult to attribute to a specific large strike
right to strike private sector public sector
data coverage 2000-2008 Excluding political strikes Since 2009 Strikes and lockouts Excluding strikes that last less than 1 day Workers involved includes workers directly and indirectly involved
0
20
40
60
2000
2001
2002
2003
2004
2005
2006
2007
2008
2009
2010
2011
2012
2013
days not worked (per 1000 employees)
0
20
40
60
2000
2001
2002
2003
2004
2005
2006
2007
2008
2009
2010
2011
2012
2013
workers involved in industrial action (per 1000 employees)
United Kingdom
source Office for National Statistics Browse by Theme Labour Market Labour Disputes Days Lost due to Industrial Action
single-employer bargaining system
Regulated by law
peak 2004 One-day strike by civil servants to protest against governments plans to cut a large number of civil service posts peak 2007 One-day strike by postal workers in protest over pay and modernisation plans and one-day strike by prison officers
against the governmentrsquos decision to introduce a pay award in stages peak 2011 Union mobilisation against public service pension reforms in June and November
Right to strike legend
yes with minor restrictions (eg recognized union balloting proportionality respect of peace obligation)
yes with major restrictions (eg monopoly union compulsory arbitration or conciliation restrictions on issues or content major groups excluded
no
yes
private sector
yes with minor restrictions (eg recognized union balloting proportionality respect of peace obligation only military judiciary or police excluded ndash as per ILO convention)
yes with major restrictions (eg monopoly union compulsory arbitration or conciliation restrictions on issues or content major groups excluded
no
yes
public sector
source J Visser Database on Institutional Characteristics of Trade Unions Wage Setting State Intervention and Social Pacts (ICTWSS) database version 4 2013 The indicators reflect the situation in 2011
Prevelant bargaining regime legend
Single-employer bargaining system the establishment or company level is predominant
Multi-employer bargaining system sector andor the cross-sector level is predominant
Mixed bargaining system an intermediate situation where sector and company negotiations each respectively account for at least one-third of those covered by collective wage-setting arrangements
source P Marginson and C Welz (2014) Changes to wage-setting mechanisms in the context of the crisis and the EUrsquos new economic governance regime Dublin Eurofound
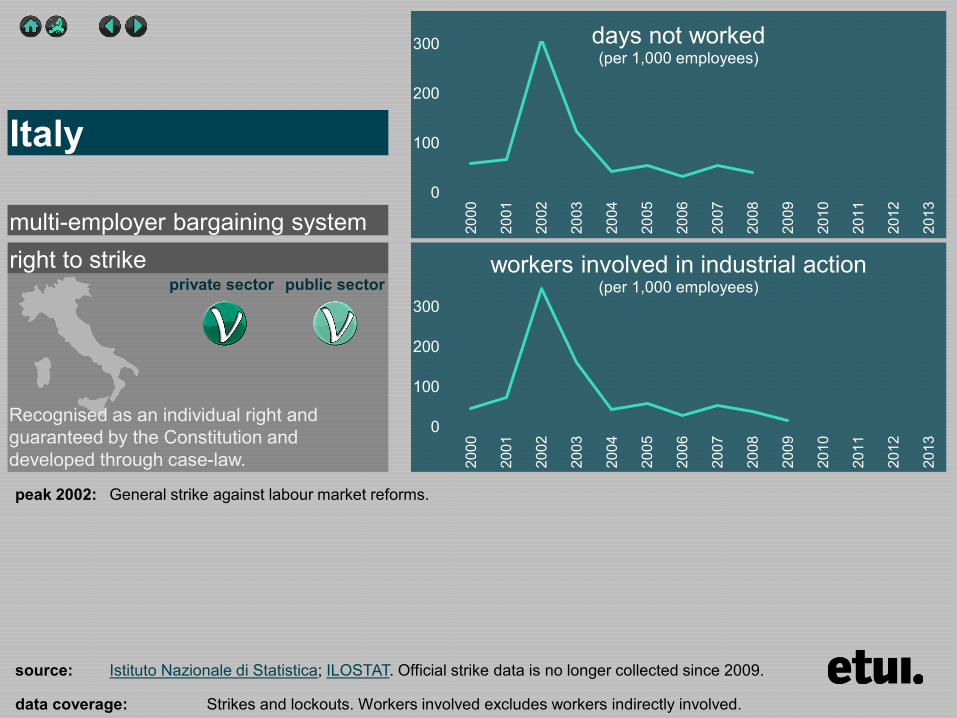
right to strike private sector public sector
data coverage Strikes and lockouts Workers involved excludes workers indirectly involved
0
100
200
300
2000
2001
2002
2003
2004
2005
2006
2007
2008
2009
2010
2011
2012
2013
days not worked (per 1000 employees)
0
100
200
300
2000
2001
2002
2003
2004
2005
2006
2007
2008
2009
2010
2011
2012
2013
workers involved in industrial action (per 1000 employees)
Italy
source Istituto Nazionale di Statistica ILOSTAT Official strike data is no longer collected since 2009
multi-employer bargaining system
Recognised as an individual right and guaranteed by the Constitution and developed through case-law
peak 2002 General strike against labour market reforms
right to strike private sector public sector
data coverage Strikes and lockouts Workers involved excludes workers indirectly involved
0
1
2
3
4
2000
2001
2002
2003
2004
2005
2006
2007
2008
2009
2010
2011
2012
2013
days not worked (per 1000 employees)
0
1
2
3
2000
2001
2002
2003
2004
2005
2006
2007
2008
2009
2010
2011
2012
2013
workers involved in industrial action (per 1000 employees)
Latvia
source ILOSTAT
single-employer bargaining system
Guaranteed by the Constitution and regulated by law
peak 2008 Not attributable to a single large strike
right to strike private sector public sector
data coverage Only strikes Workers involved includes workers directly and indirectly involved
0
10
20
30
2000
2001
2002
2003
2004
2005
2006
2007
2008
2009
2010
2011
2012
2013
days not worked (per 1000 employees)
0
2
4
6
8
10
2000
2001
2002
2003
2004
2005
2006
2007
2008
2009
2010
2011
2012
2013
workers involved in industrial action (per 1000 employees)
Lithuania
source 2000-2008 2012 ILOSTAT 2009 Carley (2010) 2010-2011 and 2013 Statistics Lithuania Official Statistics Portal Population and social statistics Statistical information on strikes An estimate is also provided by Carley (2008 2010)
single-employer bargaining system
Guaranteed by the Constitution and regulated by law
peak 2008 Various teacherrsquos strike over a pay increase and other demands and other strikes in the public sector
right to strike private sector public sector
0
50
100
150
2000
2001
2002
2003
2004
2005
2006
2007
2008
2009
2010
2011
2012
2013
days not worked (per 1000 employees)
0
100
200
300
2000
2001
2002
2003
2004
2005
2006
2007
2008
2009
2010
2011
2012
2013
workers involved in industrial action (per 1000 employees)
Luxembourg
source Carley (2004) Carley (2008) and Carley (2010) Official data is no longer available since 2009
mixed bargaining system
Developed through case law
peak 2007 One-day general strike in public sector and a two-day railway strike over civil service and state employee pensions
right to strike private sector public sector
data coverage Strikes and lockouts Workers involved excludes workers indirectly involved
0
20
40
60
2000
2001
2002
2003
2004
2005
2006
2007
2008
2009
2010
2011
2012
2013
days not worked (per 1000 employees)
0
20
40
60
80
100
2000
2001
2002
2003
2004
2005
2006
2007
2008
2009
2010
2011
2012
2013
workers involved in industrial action (per 1000 employees)
Malta
source Industrial and Employment Relations Publications and Archives Archives Annual Reports ILOSTAT
single-employer bargaining system
Indirectly recognised by law
peak 2009 Not attributable to a specific large strike
right to strike private sector public sector
data coverage Only strikes Workers involved excludes workersindirectly involved
0
10
20
30
40
2000
2001
2002
2003
2004
2005
2006
2007
2008
2009
2010
2011
2012
2013
days not worked (per 1000 employees)
0
5
10
15
20
2000
2001
2002
2003
2004
2005
2006
2007
2008
2009
2010
2011
2012
2013
workers involved in industrial action (per 1000 employees)
Netherlands
source Centraal Bureau voor de Statistiek Cijfers Statline databank Thema Arbeidsmarkt Vakbeweging en stakingen Historie Werkstakingen
multi-employer bargaining system
Developed through case law
peak 2002 Strike action in construction industry peak 2012 15 weeks strike in cleaning sector over renewal of collective agreement besides strike action in the education sector
against austerity measures
right to strike private sector public sector
data coverage Strikes and lockout excluding strikes that last less than 1 day Workers involved includes workers directly and indirectly involved
0
50
100
150
200
250
2000
2001
2002
2003
2004
2005
2006
2007
2008
2009
2010
2011
2012
2013
days not worked (per 1000 employees)
0
10
20
30
40
50
2000
2001
2002
2003
2004
2005
2006
2007
2008
2009
2010
2011
2012
2013
workers involved in industrial action (per 1000 employees)
Norway
source Statistics Norway Statistics Labour market and earnings Strikes and lockouts
multi-employer bargaining system
Mainly regulated by collective agreements between the social partners
nearly two yearly peaks Negotiations about renewal of collective agreements in the economic sectors
right to strike private sector public sector
data coverage Only strikes excluding strikes that last less than 1 day workers involved excludes workers indirectly involved
0
5
10
15
20
25
2000
2001
2002
2003
2004
2005
2006
2007
2008
2009
2010
2011
2012
2013
days not worked (per 1000 employees)
0
5
10
15
20
2000
2001
2002
2003
2004
2005
2006
2007
2008
2009
2010
2011
2012
2013
workers involved in industrial action (per 1000 employees)
Poland
source ILOSTAT
single-employer bargaining system
Guaranteed by the Constitution and regulated by law
peak 2008 Various teachersrsquo strikes over a pay increase and other demands and other strikes in the public sector
right to strike private sector public sector
data coverage Only strikes excluding public administration workers involved excludes workers indirectly involved
0
10
20
30
2000
2001
2002
2003
2004
2005
2006
2007
2008
2009
2010
2011
2012
2013
days not worked (per 1000 employees)
0
5
10
15
20
25
2000
2001
2002
2003
2004
2005
2006
2007
2008
2009
2010
2011
2012
2013
workers involved in industrial action (per 1000 employees)
Portugal
source Gabinete de Estrateacutegia e Planeamento Estatiacutestica Greves Official strike data is not available after 2007
multi-employer bargaining system
Guaranteed by the Constitution and regulated by law
peak 2002 Several strike actions particularly in the public sector against changes in the Labour Code
right to strike private sector public sector
data coverage Only strikes Workers involved excludes workers indirectly involved
0
50
100
2000
2001
2002
2003
2004
2005
2006
2007
2008
2009
2010
2011
2012
2013
days not worked (per 1000 employees)
0
2
4
6
8
10
2000
2001
2002
2003
2004
2005
2006
2007
2008
2009
2010
2011
2012
2013
workers involved in industrial action (per 1000 employees)
Romania
source ILOSTAT Official data is very partial in 2009 and not available after 2010
single-employer bargaining system
Guaranteed by the Constitution and regulated by law
peaks 2000 and 2007 Several strike actions in particularly the manufacturing industry
right to strike private sector public sector
data coverage Only strikes workers involved excludes workers indirectly involved
0
10
20
30
40
2000
2001
2002
2003
2004
2005
2006
2007
2008
2009
2010
2011
2012
2013
days not worked (per 1000 employees)
0
2
4
6
8
10
2000
2001
2002
2003
2004
2005
2006
2007
2008
2009
2010
2011
2012
2013
workers involved in industrial action (per 1000 employees)
Slovakia
source 2000-2002 ILOSTAT 2003-2009 Carley (2004) Carley (2008) and Carley (2010) Since 2010 Statistical Office of the Slovak Republic (on demand)
mixed bargaining system
Guaranteed by the Constitution and regulated by law
peak 2003 Limited number of strike actions in railways and the public sector
right to strike private sector public sector
0
10
20
30
40
50
2000
2001
2002
2003
2004
2005
2006
2007
2008
2009
2010
2011
2012
2013
days not worked (per 1000 employees)
0
2
4
6
2000
2001
2002
2003
2004
2005
2006
2007
2008
2009
2010
2011
2012
2013
workers involved in industrial action (per 1000 employees)
Slovenia
source Carley (2004) Carley (2008) and Carley (2010) Trade union data (ZSSS) Official data is not available
multi-employer bargaining system
Guaranteed by the Constitution and regulated by law
peak 2005 Union mobilisation against labour market reforms
right to strike private sector public sector
data coverage Strikes and lockouts excluding strikes that last less than 1 hour workers involved excludes workers indirectly involved The 2012 data excludes the general strikes of the 29th of March and the 14th of November and the nation-wide strike in the education sector of 22nd of May In 2013 several strikes in the education sector are excluded
050
100150200250300350
2000
2001
2002
2003
2004
2005
2006
2007
2008
2009
2010
2011
2012
2013
days not worked (per 1000 employees)
050
100150200250300350
2000
2001
2002
2003
2004
2005
2006
2007
2008
2009
2010
2011
2012
2013
workers involved in industrial action (per 1000 employees)
Spain
source ILOSTAT Ministry of Employment and Social Security Statistics Condiciones de trabajo y relaciones laborales Huelgas y Cierres Patronales
multi-employer bargaining system
Guaranteed by the Constitution and regulated by law
peak 2004 Strike action in shipyards over renewal of collective agreements and against relocation decisions in mainly the manufacturing industry
underestimated peak in 2012 and 2013 General strikes in 2012 and various strikes in the public sector
right to strike private sector public sector
data coverage Strikes and lockouts Workers involved excludes workers indirectly involved
0
50
100
150
200
2000
2001
2002
2003
2004
2005
2006
2007
2008
2009
2010
2011
2012
2013
days not worked (per 1000 employees)
0
5
10
15
20
25
2000
2001
2002
2003
2004
2005
2006
2007
2008
2009
2010
2011
2012
2013
workers involved in industrial action (per 1000 employees)
Sweden
source Sweden National Mediation Office Melding amp konflikt Konfliktstatistik
multi-employer bargaining system
Guaranteed by the Constitution and regulated by law and in the 1938 collective agreement between the social partners
peak 2003 Large strike of blue-collar workers in the municipal and city council sector over a new pay agreement
right to strike private sector public sector
data coverage Strikes and lockouts Excluding strikes that last less than 1 day Workers involved includes workers directly and indirectly involved
0
5
10
15
2000
2001
2002
2003
2004
2005
2006
2007
2008
2009
2010
2011
2012
2013
days not worked (per 1000 employees)
0
2
4
6
8
10
2000
2001
2002
2003
2004
2005
2006
2007
2008
2009
2010
2011
2012
2013
workers involved in industrial action (per 1000 employees)
Switzerland
source Office feacutedeacuteral de la statistique Thegravemes Organisation du marcheacute du travail conventions collectives de travail Donneacutees deacutetailleacutees Gregraveves et lock-out
multi-employer bargaining system
Guaranteed by the Constitution and regulated by law and in the 1938 collective agreement between the social partners
peak 2004 Difficult to attribute to a specific large strike
right to strike private sector public sector
data coverage 2000-2008 Excluding political strikes Since 2009 Strikes and lockouts Excluding strikes that last less than 1 day Workers involved includes workers directly and indirectly involved
0
20
40
60
2000
2001
2002
2003
2004
2005
2006
2007
2008
2009
2010
2011
2012
2013
days not worked (per 1000 employees)
0
20
40
60
2000
2001
2002
2003
2004
2005
2006
2007
2008
2009
2010
2011
2012
2013
workers involved in industrial action (per 1000 employees)
United Kingdom
source Office for National Statistics Browse by Theme Labour Market Labour Disputes Days Lost due to Industrial Action
single-employer bargaining system
Regulated by law
peak 2004 One-day strike by civil servants to protest against governments plans to cut a large number of civil service posts peak 2007 One-day strike by postal workers in protest over pay and modernisation plans and one-day strike by prison officers
against the governmentrsquos decision to introduce a pay award in stages peak 2011 Union mobilisation against public service pension reforms in June and November
Right to strike legend
yes with minor restrictions (eg recognized union balloting proportionality respect of peace obligation)
yes with major restrictions (eg monopoly union compulsory arbitration or conciliation restrictions on issues or content major groups excluded
no
yes
private sector
yes with minor restrictions (eg recognized union balloting proportionality respect of peace obligation only military judiciary or police excluded ndash as per ILO convention)
yes with major restrictions (eg monopoly union compulsory arbitration or conciliation restrictions on issues or content major groups excluded
no
yes
public sector
source J Visser Database on Institutional Characteristics of Trade Unions Wage Setting State Intervention and Social Pacts (ICTWSS) database version 4 2013 The indicators reflect the situation in 2011
Prevelant bargaining regime legend
Single-employer bargaining system the establishment or company level is predominant
Multi-employer bargaining system sector andor the cross-sector level is predominant
Mixed bargaining system an intermediate situation where sector and company negotiations each respectively account for at least one-third of those covered by collective wage-setting arrangements
source P Marginson and C Welz (2014) Changes to wage-setting mechanisms in the context of the crisis and the EUrsquos new economic governance regime Dublin Eurofound
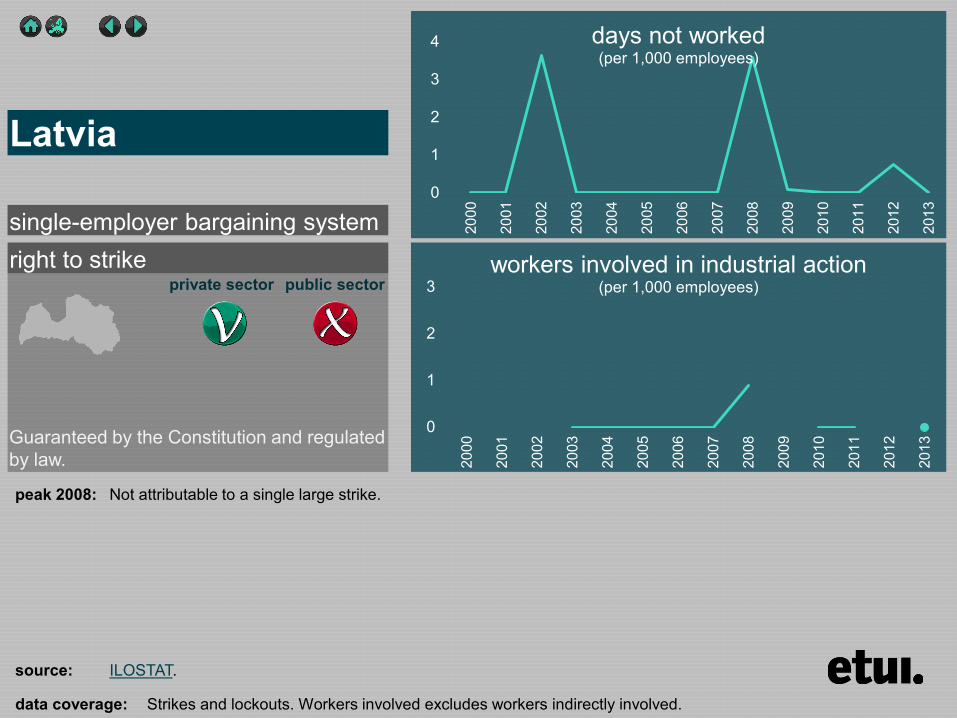
right to strike private sector public sector
data coverage Strikes and lockouts Workers involved excludes workers indirectly involved
0
1
2
3
4
2000
2001
2002
2003
2004
2005
2006
2007
2008
2009
2010
2011
2012
2013
days not worked (per 1000 employees)
0
1
2
3
2000
2001
2002
2003
2004
2005
2006
2007
2008
2009
2010
2011
2012
2013
workers involved in industrial action (per 1000 employees)
Latvia
source ILOSTAT
single-employer bargaining system
Guaranteed by the Constitution and regulated by law
peak 2008 Not attributable to a single large strike
right to strike private sector public sector
data coverage Only strikes Workers involved includes workers directly and indirectly involved
0
10
20
30
2000
2001
2002
2003
2004
2005
2006
2007
2008
2009
2010
2011
2012
2013
days not worked (per 1000 employees)
0
2
4
6
8
10
2000
2001
2002
2003
2004
2005
2006
2007
2008
2009
2010
2011
2012
2013
workers involved in industrial action (per 1000 employees)
Lithuania
source 2000-2008 2012 ILOSTAT 2009 Carley (2010) 2010-2011 and 2013 Statistics Lithuania Official Statistics Portal Population and social statistics Statistical information on strikes An estimate is also provided by Carley (2008 2010)
single-employer bargaining system
Guaranteed by the Constitution and regulated by law
peak 2008 Various teacherrsquos strike over a pay increase and other demands and other strikes in the public sector
right to strike private sector public sector
0
50
100
150
2000
2001
2002
2003
2004
2005
2006
2007
2008
2009
2010
2011
2012
2013
days not worked (per 1000 employees)
0
100
200
300
2000
2001
2002
2003
2004
2005
2006
2007
2008
2009
2010
2011
2012
2013
workers involved in industrial action (per 1000 employees)
Luxembourg
source Carley (2004) Carley (2008) and Carley (2010) Official data is no longer available since 2009
mixed bargaining system
Developed through case law
peak 2007 One-day general strike in public sector and a two-day railway strike over civil service and state employee pensions
right to strike private sector public sector
data coverage Strikes and lockouts Workers involved excludes workers indirectly involved
0
20
40
60
2000
2001
2002
2003
2004
2005
2006
2007
2008
2009
2010
2011
2012
2013
days not worked (per 1000 employees)
0
20
40
60
80
100
2000
2001
2002
2003
2004
2005
2006
2007
2008
2009
2010
2011
2012
2013
workers involved in industrial action (per 1000 employees)
Malta
source Industrial and Employment Relations Publications and Archives Archives Annual Reports ILOSTAT
single-employer bargaining system
Indirectly recognised by law
peak 2009 Not attributable to a specific large strike
right to strike private sector public sector
data coverage Only strikes Workers involved excludes workersindirectly involved
0
10
20
30
40
2000
2001
2002
2003
2004
2005
2006
2007
2008
2009
2010
2011
2012
2013
days not worked (per 1000 employees)
0
5
10
15
20
2000
2001
2002
2003
2004
2005
2006
2007
2008
2009
2010
2011
2012
2013
workers involved in industrial action (per 1000 employees)
Netherlands
source Centraal Bureau voor de Statistiek Cijfers Statline databank Thema Arbeidsmarkt Vakbeweging en stakingen Historie Werkstakingen
multi-employer bargaining system
Developed through case law
peak 2002 Strike action in construction industry peak 2012 15 weeks strike in cleaning sector over renewal of collective agreement besides strike action in the education sector
against austerity measures
right to strike private sector public sector
data coverage Strikes and lockout excluding strikes that last less than 1 day Workers involved includes workers directly and indirectly involved
0
50
100
150
200
250
2000
2001
2002
2003
2004
2005
2006
2007
2008
2009
2010
2011
2012
2013
days not worked (per 1000 employees)
0
10
20
30
40
50
2000
2001
2002
2003
2004
2005
2006
2007
2008
2009
2010
2011
2012
2013
workers involved in industrial action (per 1000 employees)
Norway
source Statistics Norway Statistics Labour market and earnings Strikes and lockouts
multi-employer bargaining system
Mainly regulated by collective agreements between the social partners
nearly two yearly peaks Negotiations about renewal of collective agreements in the economic sectors
right to strike private sector public sector
data coverage Only strikes excluding strikes that last less than 1 day workers involved excludes workers indirectly involved
0
5
10
15
20
25
2000
2001
2002
2003
2004
2005
2006
2007
2008
2009
2010
2011
2012
2013
days not worked (per 1000 employees)
0
5
10
15
20
2000
2001
2002
2003
2004
2005
2006
2007
2008
2009
2010
2011
2012
2013
workers involved in industrial action (per 1000 employees)
Poland
source ILOSTAT
single-employer bargaining system
Guaranteed by the Constitution and regulated by law
peak 2008 Various teachersrsquo strikes over a pay increase and other demands and other strikes in the public sector
right to strike private sector public sector
data coverage Only strikes excluding public administration workers involved excludes workers indirectly involved
0
10
20
30
2000
2001
2002
2003
2004
2005
2006
2007
2008
2009
2010
2011
2012
2013
days not worked (per 1000 employees)
0
5
10
15
20
25
2000
2001
2002
2003
2004
2005
2006
2007
2008
2009
2010
2011
2012
2013
workers involved in industrial action (per 1000 employees)
Portugal
source Gabinete de Estrateacutegia e Planeamento Estatiacutestica Greves Official strike data is not available after 2007
multi-employer bargaining system
Guaranteed by the Constitution and regulated by law
peak 2002 Several strike actions particularly in the public sector against changes in the Labour Code
right to strike private sector public sector
data coverage Only strikes Workers involved excludes workers indirectly involved
0
50
100
2000
2001
2002
2003
2004
2005
2006
2007
2008
2009
2010
2011
2012
2013
days not worked (per 1000 employees)
0
2
4
6
8
10
2000
2001
2002
2003
2004
2005
2006
2007
2008
2009
2010
2011
2012
2013
workers involved in industrial action (per 1000 employees)
Romania
source ILOSTAT Official data is very partial in 2009 and not available after 2010
single-employer bargaining system
Guaranteed by the Constitution and regulated by law
peaks 2000 and 2007 Several strike actions in particularly the manufacturing industry
right to strike private sector public sector
data coverage Only strikes workers involved excludes workers indirectly involved
0
10
20
30
40
2000
2001
2002
2003
2004
2005
2006
2007
2008
2009
2010
2011
2012
2013
days not worked (per 1000 employees)
0
2
4
6
8
10
2000
2001
2002
2003
2004
2005
2006
2007
2008
2009
2010
2011
2012
2013
workers involved in industrial action (per 1000 employees)
Slovakia
source 2000-2002 ILOSTAT 2003-2009 Carley (2004) Carley (2008) and Carley (2010) Since 2010 Statistical Office of the Slovak Republic (on demand)
mixed bargaining system
Guaranteed by the Constitution and regulated by law
peak 2003 Limited number of strike actions in railways and the public sector
right to strike private sector public sector
0
10
20
30
40
50
2000
2001
2002
2003
2004
2005
2006
2007
2008
2009
2010
2011
2012
2013
days not worked (per 1000 employees)
0
2
4
6
2000
2001
2002
2003
2004
2005
2006
2007
2008
2009
2010
2011
2012
2013
workers involved in industrial action (per 1000 employees)
Slovenia
source Carley (2004) Carley (2008) and Carley (2010) Trade union data (ZSSS) Official data is not available
multi-employer bargaining system
Guaranteed by the Constitution and regulated by law
peak 2005 Union mobilisation against labour market reforms
right to strike private sector public sector
data coverage Strikes and lockouts excluding strikes that last less than 1 hour workers involved excludes workers indirectly involved The 2012 data excludes the general strikes of the 29th of March and the 14th of November and the nation-wide strike in the education sector of 22nd of May In 2013 several strikes in the education sector are excluded
050
100150200250300350
2000
2001
2002
2003
2004
2005
2006
2007
2008
2009
2010
2011
2012
2013
days not worked (per 1000 employees)
050
100150200250300350
2000
2001
2002
2003
2004
2005
2006
2007
2008
2009
2010
2011
2012
2013
workers involved in industrial action (per 1000 employees)
Spain
source ILOSTAT Ministry of Employment and Social Security Statistics Condiciones de trabajo y relaciones laborales Huelgas y Cierres Patronales
multi-employer bargaining system
Guaranteed by the Constitution and regulated by law
peak 2004 Strike action in shipyards over renewal of collective agreements and against relocation decisions in mainly the manufacturing industry
underestimated peak in 2012 and 2013 General strikes in 2012 and various strikes in the public sector
right to strike private sector public sector
data coverage Strikes and lockouts Workers involved excludes workers indirectly involved
0
50
100
150
200
2000
2001
2002
2003
2004
2005
2006
2007
2008
2009
2010
2011
2012
2013
days not worked (per 1000 employees)
0
5
10
15
20
25
2000
2001
2002
2003
2004
2005
2006
2007
2008
2009
2010
2011
2012
2013
workers involved in industrial action (per 1000 employees)
Sweden
source Sweden National Mediation Office Melding amp konflikt Konfliktstatistik
multi-employer bargaining system
Guaranteed by the Constitution and regulated by law and in the 1938 collective agreement between the social partners
peak 2003 Large strike of blue-collar workers in the municipal and city council sector over a new pay agreement
right to strike private sector public sector
data coverage Strikes and lockouts Excluding strikes that last less than 1 day Workers involved includes workers directly and indirectly involved
0
5
10
15
2000
2001
2002
2003
2004
2005
2006
2007
2008
2009
2010
2011
2012
2013
days not worked (per 1000 employees)
0
2
4
6
8
10
2000
2001
2002
2003
2004
2005
2006
2007
2008
2009
2010
2011
2012
2013
workers involved in industrial action (per 1000 employees)
Switzerland
source Office feacutedeacuteral de la statistique Thegravemes Organisation du marcheacute du travail conventions collectives de travail Donneacutees deacutetailleacutees Gregraveves et lock-out
multi-employer bargaining system
Guaranteed by the Constitution and regulated by law and in the 1938 collective agreement between the social partners
peak 2004 Difficult to attribute to a specific large strike
right to strike private sector public sector
data coverage 2000-2008 Excluding political strikes Since 2009 Strikes and lockouts Excluding strikes that last less than 1 day Workers involved includes workers directly and indirectly involved
0
20
40
60
2000
2001
2002
2003
2004
2005
2006
2007
2008
2009
2010
2011
2012
2013
days not worked (per 1000 employees)
0
20
40
60
2000
2001
2002
2003
2004
2005
2006
2007
2008
2009
2010
2011
2012
2013
workers involved in industrial action (per 1000 employees)
United Kingdom
source Office for National Statistics Browse by Theme Labour Market Labour Disputes Days Lost due to Industrial Action
single-employer bargaining system
Regulated by law
peak 2004 One-day strike by civil servants to protest against governments plans to cut a large number of civil service posts peak 2007 One-day strike by postal workers in protest over pay and modernisation plans and one-day strike by prison officers
against the governmentrsquos decision to introduce a pay award in stages peak 2011 Union mobilisation against public service pension reforms in June and November
Right to strike legend
yes with minor restrictions (eg recognized union balloting proportionality respect of peace obligation)
yes with major restrictions (eg monopoly union compulsory arbitration or conciliation restrictions on issues or content major groups excluded
no
yes
private sector
yes with minor restrictions (eg recognized union balloting proportionality respect of peace obligation only military judiciary or police excluded ndash as per ILO convention)
yes with major restrictions (eg monopoly union compulsory arbitration or conciliation restrictions on issues or content major groups excluded
no
yes
public sector
source J Visser Database on Institutional Characteristics of Trade Unions Wage Setting State Intervention and Social Pacts (ICTWSS) database version 4 2013 The indicators reflect the situation in 2011
Prevelant bargaining regime legend
Single-employer bargaining system the establishment or company level is predominant
Multi-employer bargaining system sector andor the cross-sector level is predominant
Mixed bargaining system an intermediate situation where sector and company negotiations each respectively account for at least one-third of those covered by collective wage-setting arrangements
source P Marginson and C Welz (2014) Changes to wage-setting mechanisms in the context of the crisis and the EUrsquos new economic governance regime Dublin Eurofound
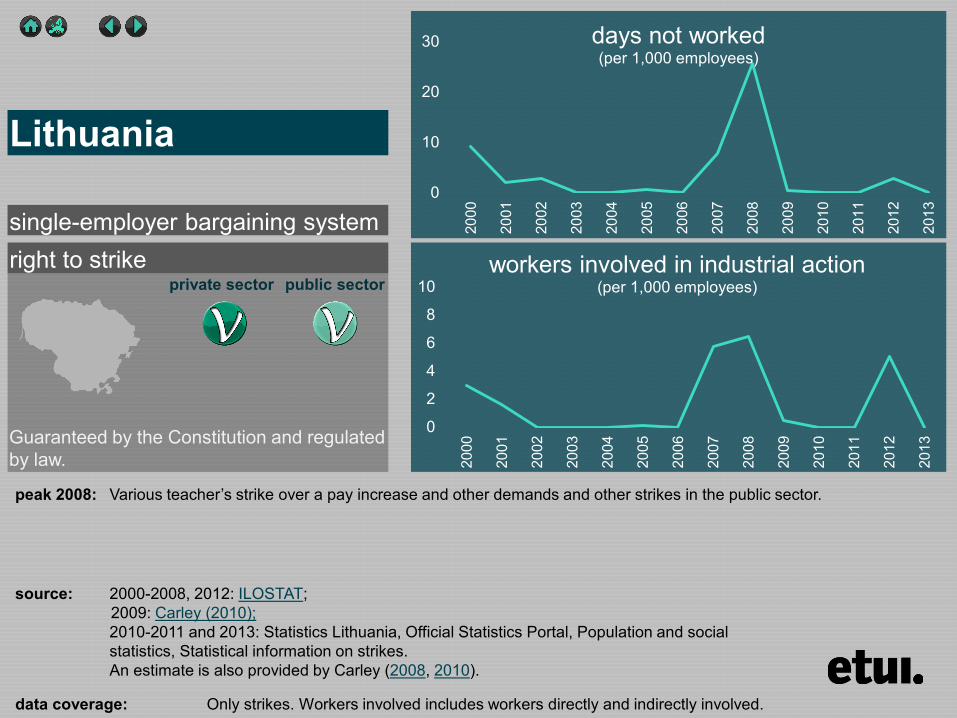
right to strike private sector public sector
data coverage Only strikes Workers involved includes workers directly and indirectly involved
0
10
20
30
2000
2001
2002
2003
2004
2005
2006
2007
2008
2009
2010
2011
2012
2013
days not worked (per 1000 employees)
0
2
4
6
8
10
2000
2001
2002
2003
2004
2005
2006
2007
2008
2009
2010
2011
2012
2013
workers involved in industrial action (per 1000 employees)
Lithuania
source 2000-2008 2012 ILOSTAT 2009 Carley (2010) 2010-2011 and 2013 Statistics Lithuania Official Statistics Portal Population and social statistics Statistical information on strikes An estimate is also provided by Carley (2008 2010)
single-employer bargaining system
Guaranteed by the Constitution and regulated by law
peak 2008 Various teacherrsquos strike over a pay increase and other demands and other strikes in the public sector
right to strike private sector public sector
0
50
100
150
2000
2001
2002
2003
2004
2005
2006
2007
2008
2009
2010
2011
2012
2013
days not worked (per 1000 employees)
0
100
200
300
2000
2001
2002
2003
2004
2005
2006
2007
2008
2009
2010
2011
2012
2013
workers involved in industrial action (per 1000 employees)
Luxembourg
source Carley (2004) Carley (2008) and Carley (2010) Official data is no longer available since 2009
mixed bargaining system
Developed through case law
peak 2007 One-day general strike in public sector and a two-day railway strike over civil service and state employee pensions
right to strike private sector public sector
data coverage Strikes and lockouts Workers involved excludes workers indirectly involved
0
20
40
60
2000
2001
2002
2003
2004
2005
2006
2007
2008
2009
2010
2011
2012
2013
days not worked (per 1000 employees)
0
20
40
60
80
100
2000
2001
2002
2003
2004
2005
2006
2007
2008
2009
2010
2011
2012
2013
workers involved in industrial action (per 1000 employees)
Malta
source Industrial and Employment Relations Publications and Archives Archives Annual Reports ILOSTAT
single-employer bargaining system
Indirectly recognised by law
peak 2009 Not attributable to a specific large strike
right to strike private sector public sector
data coverage Only strikes Workers involved excludes workersindirectly involved
0
10
20
30
40
2000
2001
2002
2003
2004
2005
2006
2007
2008
2009
2010
2011
2012
2013
days not worked (per 1000 employees)
0
5
10
15
20
2000
2001
2002
2003
2004
2005
2006
2007
2008
2009
2010
2011
2012
2013
workers involved in industrial action (per 1000 employees)
Netherlands
source Centraal Bureau voor de Statistiek Cijfers Statline databank Thema Arbeidsmarkt Vakbeweging en stakingen Historie Werkstakingen
multi-employer bargaining system
Developed through case law
peak 2002 Strike action in construction industry peak 2012 15 weeks strike in cleaning sector over renewal of collective agreement besides strike action in the education sector
against austerity measures
right to strike private sector public sector
data coverage Strikes and lockout excluding strikes that last less than 1 day Workers involved includes workers directly and indirectly involved
0
50
100
150
200
250
2000
2001
2002
2003
2004
2005
2006
2007
2008
2009
2010
2011
2012
2013
days not worked (per 1000 employees)
0
10
20
30
40
50
2000
2001
2002
2003
2004
2005
2006
2007
2008
2009
2010
2011
2012
2013
workers involved in industrial action (per 1000 employees)
Norway
source Statistics Norway Statistics Labour market and earnings Strikes and lockouts
multi-employer bargaining system
Mainly regulated by collective agreements between the social partners
nearly two yearly peaks Negotiations about renewal of collective agreements in the economic sectors
right to strike private sector public sector
data coverage Only strikes excluding strikes that last less than 1 day workers involved excludes workers indirectly involved
0
5
10
15
20
25
2000
2001
2002
2003
2004
2005
2006
2007
2008
2009
2010
2011
2012
2013
days not worked (per 1000 employees)
0
5
10
15
20
2000
2001
2002
2003
2004
2005
2006
2007
2008
2009
2010
2011
2012
2013
workers involved in industrial action (per 1000 employees)
Poland
source ILOSTAT
single-employer bargaining system
Guaranteed by the Constitution and regulated by law
peak 2008 Various teachersrsquo strikes over a pay increase and other demands and other strikes in the public sector
right to strike private sector public sector
data coverage Only strikes excluding public administration workers involved excludes workers indirectly involved
0
10
20
30
2000
2001
2002
2003
2004
2005
2006
2007
2008
2009
2010
2011
2012
2013
days not worked (per 1000 employees)
0
5
10
15
20
25
2000
2001
2002
2003
2004
2005
2006
2007
2008
2009
2010
2011
2012
2013
workers involved in industrial action (per 1000 employees)
Portugal
source Gabinete de Estrateacutegia e Planeamento Estatiacutestica Greves Official strike data is not available after 2007
multi-employer bargaining system
Guaranteed by the Constitution and regulated by law
peak 2002 Several strike actions particularly in the public sector against changes in the Labour Code
right to strike private sector public sector
data coverage Only strikes Workers involved excludes workers indirectly involved
0
50
100
2000
2001
2002
2003
2004
2005
2006
2007
2008
2009
2010
2011
2012
2013
days not worked (per 1000 employees)
0
2
4
6
8
10
2000
2001
2002
2003
2004
2005
2006
2007
2008
2009
2010
2011
2012
2013
workers involved in industrial action (per 1000 employees)
Romania
source ILOSTAT Official data is very partial in 2009 and not available after 2010
single-employer bargaining system
Guaranteed by the Constitution and regulated by law
peaks 2000 and 2007 Several strike actions in particularly the manufacturing industry
right to strike private sector public sector
data coverage Only strikes workers involved excludes workers indirectly involved
0
10
20
30
40
2000
2001
2002
2003
2004
2005
2006
2007
2008
2009
2010
2011
2012
2013
days not worked (per 1000 employees)
0
2
4
6
8
10
2000
2001
2002
2003
2004
2005
2006
2007
2008
2009
2010
2011
2012
2013
workers involved in industrial action (per 1000 employees)
Slovakia
source 2000-2002 ILOSTAT 2003-2009 Carley (2004) Carley (2008) and Carley (2010) Since 2010 Statistical Office of the Slovak Republic (on demand)
mixed bargaining system
Guaranteed by the Constitution and regulated by law
peak 2003 Limited number of strike actions in railways and the public sector
right to strike private sector public sector
0
10
20
30
40
50
2000
2001
2002
2003
2004
2005
2006
2007
2008
2009
2010
2011
2012
2013
days not worked (per 1000 employees)
0
2
4
6
2000
2001
2002
2003
2004
2005
2006
2007
2008
2009
2010
2011
2012
2013
workers involved in industrial action (per 1000 employees)
Slovenia
source Carley (2004) Carley (2008) and Carley (2010) Trade union data (ZSSS) Official data is not available
multi-employer bargaining system
Guaranteed by the Constitution and regulated by law
peak 2005 Union mobilisation against labour market reforms
right to strike private sector public sector
data coverage Strikes and lockouts excluding strikes that last less than 1 hour workers involved excludes workers indirectly involved The 2012 data excludes the general strikes of the 29th of March and the 14th of November and the nation-wide strike in the education sector of 22nd of May In 2013 several strikes in the education sector are excluded
050
100150200250300350
2000
2001
2002
2003
2004
2005
2006
2007
2008
2009
2010
2011
2012
2013
days not worked (per 1000 employees)
050
100150200250300350
2000
2001
2002
2003
2004
2005
2006
2007
2008
2009
2010
2011
2012
2013
workers involved in industrial action (per 1000 employees)
Spain
source ILOSTAT Ministry of Employment and Social Security Statistics Condiciones de trabajo y relaciones laborales Huelgas y Cierres Patronales
multi-employer bargaining system
Guaranteed by the Constitution and regulated by law
peak 2004 Strike action in shipyards over renewal of collective agreements and against relocation decisions in mainly the manufacturing industry
underestimated peak in 2012 and 2013 General strikes in 2012 and various strikes in the public sector
right to strike private sector public sector
data coverage Strikes and lockouts Workers involved excludes workers indirectly involved
0
50
100
150
200
2000
2001
2002
2003
2004
2005
2006
2007
2008
2009
2010
2011
2012
2013
days not worked (per 1000 employees)
0
5
10
15
20
25
2000
2001
2002
2003
2004
2005
2006
2007
2008
2009
2010
2011
2012
2013
workers involved in industrial action (per 1000 employees)
Sweden
source Sweden National Mediation Office Melding amp konflikt Konfliktstatistik
multi-employer bargaining system
Guaranteed by the Constitution and regulated by law and in the 1938 collective agreement between the social partners
peak 2003 Large strike of blue-collar workers in the municipal and city council sector over a new pay agreement
right to strike private sector public sector
data coverage Strikes and lockouts Excluding strikes that last less than 1 day Workers involved includes workers directly and indirectly involved
0
5
10
15
2000
2001
2002
2003
2004
2005
2006
2007
2008
2009
2010
2011
2012
2013
days not worked (per 1000 employees)
0
2
4
6
8
10
2000
2001
2002
2003
2004
2005
2006
2007
2008
2009
2010
2011
2012
2013
workers involved in industrial action (per 1000 employees)
Switzerland
source Office feacutedeacuteral de la statistique Thegravemes Organisation du marcheacute du travail conventions collectives de travail Donneacutees deacutetailleacutees Gregraveves et lock-out
multi-employer bargaining system
Guaranteed by the Constitution and regulated by law and in the 1938 collective agreement between the social partners
peak 2004 Difficult to attribute to a specific large strike
right to strike private sector public sector
data coverage 2000-2008 Excluding political strikes Since 2009 Strikes and lockouts Excluding strikes that last less than 1 day Workers involved includes workers directly and indirectly involved
0
20
40
60
2000
2001
2002
2003
2004
2005
2006
2007
2008
2009
2010
2011
2012
2013
days not worked (per 1000 employees)
0
20
40
60
2000
2001
2002
2003
2004
2005
2006
2007
2008
2009
2010
2011
2012
2013
workers involved in industrial action (per 1000 employees)
United Kingdom
source Office for National Statistics Browse by Theme Labour Market Labour Disputes Days Lost due to Industrial Action
single-employer bargaining system
Regulated by law
peak 2004 One-day strike by civil servants to protest against governments plans to cut a large number of civil service posts peak 2007 One-day strike by postal workers in protest over pay and modernisation plans and one-day strike by prison officers
against the governmentrsquos decision to introduce a pay award in stages peak 2011 Union mobilisation against public service pension reforms in June and November
Right to strike legend
yes with minor restrictions (eg recognized union balloting proportionality respect of peace obligation)
yes with major restrictions (eg monopoly union compulsory arbitration or conciliation restrictions on issues or content major groups excluded
no
yes
private sector
yes with minor restrictions (eg recognized union balloting proportionality respect of peace obligation only military judiciary or police excluded ndash as per ILO convention)
yes with major restrictions (eg monopoly union compulsory arbitration or conciliation restrictions on issues or content major groups excluded
no
yes
public sector
source J Visser Database on Institutional Characteristics of Trade Unions Wage Setting State Intervention and Social Pacts (ICTWSS) database version 4 2013 The indicators reflect the situation in 2011
Prevelant bargaining regime legend
Single-employer bargaining system the establishment or company level is predominant
Multi-employer bargaining system sector andor the cross-sector level is predominant
Mixed bargaining system an intermediate situation where sector and company negotiations each respectively account for at least one-third of those covered by collective wage-setting arrangements
source P Marginson and C Welz (2014) Changes to wage-setting mechanisms in the context of the crisis and the EUrsquos new economic governance regime Dublin Eurofound
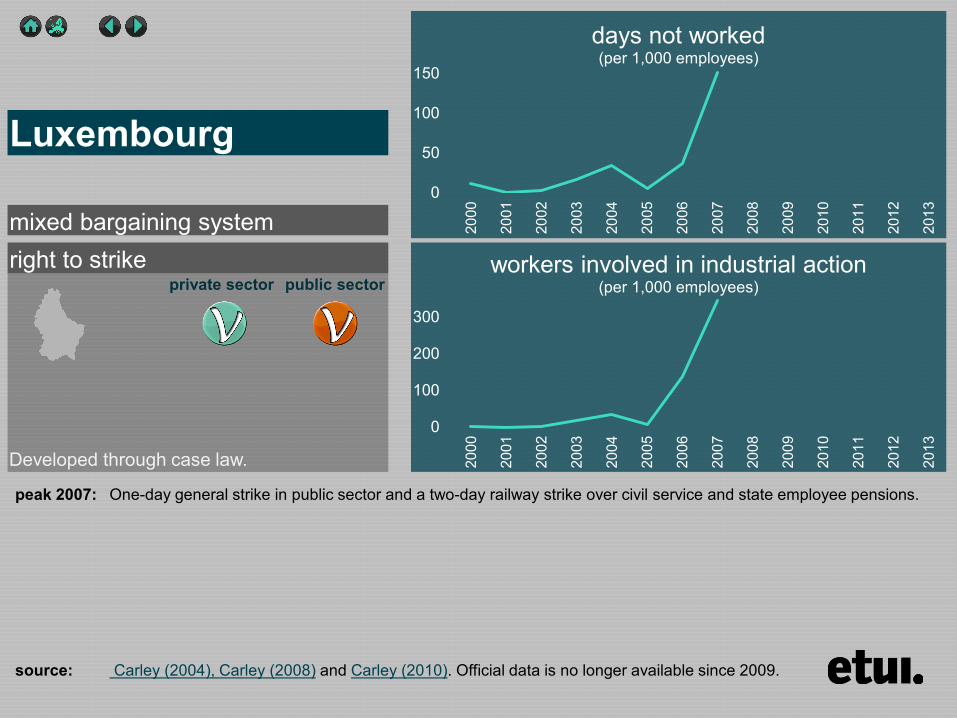
right to strike private sector public sector
0
50
100
150
2000
2001
2002
2003
2004
2005
2006
2007
2008
2009
2010
2011
2012
2013
days not worked (per 1000 employees)
0
100
200
300
2000
2001
2002
2003
2004
2005
2006
2007
2008
2009
2010
2011
2012
2013
workers involved in industrial action (per 1000 employees)
Luxembourg
source Carley (2004) Carley (2008) and Carley (2010) Official data is no longer available since 2009
mixed bargaining system
Developed through case law
peak 2007 One-day general strike in public sector and a two-day railway strike over civil service and state employee pensions
right to strike private sector public sector
data coverage Strikes and lockouts Workers involved excludes workers indirectly involved
0
20
40
60
2000
2001
2002
2003
2004
2005
2006
2007
2008
2009
2010
2011
2012
2013
days not worked (per 1000 employees)
0
20
40
60
80
100
2000
2001
2002
2003
2004
2005
2006
2007
2008
2009
2010
2011
2012
2013
workers involved in industrial action (per 1000 employees)
Malta
source Industrial and Employment Relations Publications and Archives Archives Annual Reports ILOSTAT
single-employer bargaining system
Indirectly recognised by law
peak 2009 Not attributable to a specific large strike
right to strike private sector public sector
data coverage Only strikes Workers involved excludes workersindirectly involved
0
10
20
30
40
2000
2001
2002
2003
2004
2005
2006
2007
2008
2009
2010
2011
2012
2013
days not worked (per 1000 employees)
0
5
10
15
20
2000
2001
2002
2003
2004
2005
2006
2007
2008
2009
2010
2011
2012
2013
workers involved in industrial action (per 1000 employees)
Netherlands
source Centraal Bureau voor de Statistiek Cijfers Statline databank Thema Arbeidsmarkt Vakbeweging en stakingen Historie Werkstakingen
multi-employer bargaining system
Developed through case law
peak 2002 Strike action in construction industry peak 2012 15 weeks strike in cleaning sector over renewal of collective agreement besides strike action in the education sector
against austerity measures
right to strike private sector public sector
data coverage Strikes and lockout excluding strikes that last less than 1 day Workers involved includes workers directly and indirectly involved
0
50
100
150
200
250
2000
2001
2002
2003
2004
2005
2006
2007
2008
2009
2010
2011
2012
2013
days not worked (per 1000 employees)
0
10
20
30
40
50
2000
2001
2002
2003
2004
2005
2006
2007
2008
2009
2010
2011
2012
2013
workers involved in industrial action (per 1000 employees)
Norway
source Statistics Norway Statistics Labour market and earnings Strikes and lockouts
multi-employer bargaining system
Mainly regulated by collective agreements between the social partners
nearly two yearly peaks Negotiations about renewal of collective agreements in the economic sectors
right to strike private sector public sector
data coverage Only strikes excluding strikes that last less than 1 day workers involved excludes workers indirectly involved
0
5
10
15
20
25
2000
2001
2002
2003
2004
2005
2006
2007
2008
2009
2010
2011
2012
2013
days not worked (per 1000 employees)
0
5
10
15
20
2000
2001
2002
2003
2004
2005
2006
2007
2008
2009
2010
2011
2012
2013
workers involved in industrial action (per 1000 employees)
Poland
source ILOSTAT
single-employer bargaining system
Guaranteed by the Constitution and regulated by law
peak 2008 Various teachersrsquo strikes over a pay increase and other demands and other strikes in the public sector
right to strike private sector public sector
data coverage Only strikes excluding public administration workers involved excludes workers indirectly involved
0
10
20
30
2000
2001
2002
2003
2004
2005
2006
2007
2008
2009
2010
2011
2012
2013
days not worked (per 1000 employees)
0
5
10
15
20
25
2000
2001
2002
2003
2004
2005
2006
2007
2008
2009
2010
2011
2012
2013
workers involved in industrial action (per 1000 employees)
Portugal
source Gabinete de Estrateacutegia e Planeamento Estatiacutestica Greves Official strike data is not available after 2007
multi-employer bargaining system
Guaranteed by the Constitution and regulated by law
peak 2002 Several strike actions particularly in the public sector against changes in the Labour Code
right to strike private sector public sector
data coverage Only strikes Workers involved excludes workers indirectly involved
0
50
100
2000
2001
2002
2003
2004
2005
2006
2007
2008
2009
2010
2011
2012
2013
days not worked (per 1000 employees)
0
2
4
6
8
10
2000
2001
2002
2003
2004
2005
2006
2007
2008
2009
2010
2011
2012
2013
workers involved in industrial action (per 1000 employees)
Romania
source ILOSTAT Official data is very partial in 2009 and not available after 2010
single-employer bargaining system
Guaranteed by the Constitution and regulated by law
peaks 2000 and 2007 Several strike actions in particularly the manufacturing industry
right to strike private sector public sector
data coverage Only strikes workers involved excludes workers indirectly involved
0
10
20
30
40
2000
2001
2002
2003
2004
2005
2006
2007
2008
2009
2010
2011
2012
2013
days not worked (per 1000 employees)
0
2
4
6
8
10
2000
2001
2002
2003
2004
2005
2006
2007
2008
2009
2010
2011
2012
2013
workers involved in industrial action (per 1000 employees)
Slovakia
source 2000-2002 ILOSTAT 2003-2009 Carley (2004) Carley (2008) and Carley (2010) Since 2010 Statistical Office of the Slovak Republic (on demand)
mixed bargaining system
Guaranteed by the Constitution and regulated by law
peak 2003 Limited number of strike actions in railways and the public sector
right to strike private sector public sector
0
10
20
30
40
50
2000
2001
2002
2003
2004
2005
2006
2007
2008
2009
2010
2011
2012
2013
days not worked (per 1000 employees)
0
2
4
6
2000
2001
2002
2003
2004
2005
2006
2007
2008
2009
2010
2011
2012
2013
workers involved in industrial action (per 1000 employees)
Slovenia
source Carley (2004) Carley (2008) and Carley (2010) Trade union data (ZSSS) Official data is not available
multi-employer bargaining system
Guaranteed by the Constitution and regulated by law
peak 2005 Union mobilisation against labour market reforms
right to strike private sector public sector
data coverage Strikes and lockouts excluding strikes that last less than 1 hour workers involved excludes workers indirectly involved The 2012 data excludes the general strikes of the 29th of March and the 14th of November and the nation-wide strike in the education sector of 22nd of May In 2013 several strikes in the education sector are excluded
050
100150200250300350
2000
2001
2002
2003
2004
2005
2006
2007
2008
2009
2010
2011
2012
2013
days not worked (per 1000 employees)
050
100150200250300350
2000
2001
2002
2003
2004
2005
2006
2007
2008
2009
2010
2011
2012
2013
workers involved in industrial action (per 1000 employees)
Spain
source ILOSTAT Ministry of Employment and Social Security Statistics Condiciones de trabajo y relaciones laborales Huelgas y Cierres Patronales
multi-employer bargaining system
Guaranteed by the Constitution and regulated by law
peak 2004 Strike action in shipyards over renewal of collective agreements and against relocation decisions in mainly the manufacturing industry
underestimated peak in 2012 and 2013 General strikes in 2012 and various strikes in the public sector
right to strike private sector public sector
data coverage Strikes and lockouts Workers involved excludes workers indirectly involved
0
50
100
150
200
2000
2001
2002
2003
2004
2005
2006
2007
2008
2009
2010
2011
2012
2013
days not worked (per 1000 employees)
0
5
10
15
20
25
2000
2001
2002
2003
2004
2005
2006
2007
2008
2009
2010
2011
2012
2013
workers involved in industrial action (per 1000 employees)
Sweden
source Sweden National Mediation Office Melding amp konflikt Konfliktstatistik
multi-employer bargaining system
Guaranteed by the Constitution and regulated by law and in the 1938 collective agreement between the social partners
peak 2003 Large strike of blue-collar workers in the municipal and city council sector over a new pay agreement
right to strike private sector public sector
data coverage Strikes and lockouts Excluding strikes that last less than 1 day Workers involved includes workers directly and indirectly involved
0
5
10
15
2000
2001
2002
2003
2004
2005
2006
2007
2008
2009
2010
2011
2012
2013
days not worked (per 1000 employees)
0
2
4
6
8
10
2000
2001
2002
2003
2004
2005
2006
2007
2008
2009
2010
2011
2012
2013
workers involved in industrial action (per 1000 employees)
Switzerland
source Office feacutedeacuteral de la statistique Thegravemes Organisation du marcheacute du travail conventions collectives de travail Donneacutees deacutetailleacutees Gregraveves et lock-out
multi-employer bargaining system
Guaranteed by the Constitution and regulated by law and in the 1938 collective agreement between the social partners
peak 2004 Difficult to attribute to a specific large strike
right to strike private sector public sector
data coverage 2000-2008 Excluding political strikes Since 2009 Strikes and lockouts Excluding strikes that last less than 1 day Workers involved includes workers directly and indirectly involved
0
20
40
60
2000
2001
2002
2003
2004
2005
2006
2007
2008
2009
2010
2011
2012
2013
days not worked (per 1000 employees)
0
20
40
60
2000
2001
2002
2003
2004
2005
2006
2007
2008
2009
2010
2011
2012
2013
workers involved in industrial action (per 1000 employees)
United Kingdom
source Office for National Statistics Browse by Theme Labour Market Labour Disputes Days Lost due to Industrial Action
single-employer bargaining system
Regulated by law
peak 2004 One-day strike by civil servants to protest against governments plans to cut a large number of civil service posts peak 2007 One-day strike by postal workers in protest over pay and modernisation plans and one-day strike by prison officers
against the governmentrsquos decision to introduce a pay award in stages peak 2011 Union mobilisation against public service pension reforms in June and November
Right to strike legend
yes with minor restrictions (eg recognized union balloting proportionality respect of peace obligation)
yes with major restrictions (eg monopoly union compulsory arbitration or conciliation restrictions on issues or content major groups excluded
no
yes
private sector
yes with minor restrictions (eg recognized union balloting proportionality respect of peace obligation only military judiciary or police excluded ndash as per ILO convention)
yes with major restrictions (eg monopoly union compulsory arbitration or conciliation restrictions on issues or content major groups excluded
no
yes
public sector
source J Visser Database on Institutional Characteristics of Trade Unions Wage Setting State Intervention and Social Pacts (ICTWSS) database version 4 2013 The indicators reflect the situation in 2011
Prevelant bargaining regime legend
Single-employer bargaining system the establishment or company level is predominant
Multi-employer bargaining system sector andor the cross-sector level is predominant
Mixed bargaining system an intermediate situation where sector and company negotiations each respectively account for at least one-third of those covered by collective wage-setting arrangements
source P Marginson and C Welz (2014) Changes to wage-setting mechanisms in the context of the crisis and the EUrsquos new economic governance regime Dublin Eurofound

right to strike private sector public sector
data coverage Strikes and lockouts Workers involved excludes workers indirectly involved
0
20
40
60
2000
2001
2002
2003
2004
2005
2006
2007
2008
2009
2010
2011
2012
2013
days not worked (per 1000 employees)
0
20
40
60
80
100
2000
2001
2002
2003
2004
2005
2006
2007
2008
2009
2010
2011
2012
2013
workers involved in industrial action (per 1000 employees)
Malta
source Industrial and Employment Relations Publications and Archives Archives Annual Reports ILOSTAT
single-employer bargaining system
Indirectly recognised by law
peak 2009 Not attributable to a specific large strike
right to strike private sector public sector
data coverage Only strikes Workers involved excludes workersindirectly involved
0
10
20
30
40
2000
2001
2002
2003
2004
2005
2006
2007
2008
2009
2010
2011
2012
2013
days not worked (per 1000 employees)
0
5
10
15
20
2000
2001
2002
2003
2004
2005
2006
2007
2008
2009
2010
2011
2012
2013
workers involved in industrial action (per 1000 employees)
Netherlands
source Centraal Bureau voor de Statistiek Cijfers Statline databank Thema Arbeidsmarkt Vakbeweging en stakingen Historie Werkstakingen
multi-employer bargaining system
Developed through case law
peak 2002 Strike action in construction industry peak 2012 15 weeks strike in cleaning sector over renewal of collective agreement besides strike action in the education sector
against austerity measures
right to strike private sector public sector
data coverage Strikes and lockout excluding strikes that last less than 1 day Workers involved includes workers directly and indirectly involved
0
50
100
150
200
250
2000
2001
2002
2003
2004
2005
2006
2007
2008
2009
2010
2011
2012
2013
days not worked (per 1000 employees)
0
10
20
30
40
50
2000
2001
2002
2003
2004
2005
2006
2007
2008
2009
2010
2011
2012
2013
workers involved in industrial action (per 1000 employees)
Norway
source Statistics Norway Statistics Labour market and earnings Strikes and lockouts
multi-employer bargaining system
Mainly regulated by collective agreements between the social partners
nearly two yearly peaks Negotiations about renewal of collective agreements in the economic sectors
right to strike private sector public sector
data coverage Only strikes excluding strikes that last less than 1 day workers involved excludes workers indirectly involved
0
5
10
15
20
25
2000
2001
2002
2003
2004
2005
2006
2007
2008
2009
2010
2011
2012
2013
days not worked (per 1000 employees)
0
5
10
15
20
2000
2001
2002
2003
2004
2005
2006
2007
2008
2009
2010
2011
2012
2013
workers involved in industrial action (per 1000 employees)
Poland
source ILOSTAT
single-employer bargaining system
Guaranteed by the Constitution and regulated by law
peak 2008 Various teachersrsquo strikes over a pay increase and other demands and other strikes in the public sector
right to strike private sector public sector
data coverage Only strikes excluding public administration workers involved excludes workers indirectly involved
0
10
20
30
2000
2001
2002
2003
2004
2005
2006
2007
2008
2009
2010
2011
2012
2013
days not worked (per 1000 employees)
0
5
10
15
20
25
2000
2001
2002
2003
2004
2005
2006
2007
2008
2009
2010
2011
2012
2013
workers involved in industrial action (per 1000 employees)
Portugal
source Gabinete de Estrateacutegia e Planeamento Estatiacutestica Greves Official strike data is not available after 2007
multi-employer bargaining system
Guaranteed by the Constitution and regulated by law
peak 2002 Several strike actions particularly in the public sector against changes in the Labour Code
right to strike private sector public sector
data coverage Only strikes Workers involved excludes workers indirectly involved
0
50
100
2000
2001
2002
2003
2004
2005
2006
2007
2008
2009
2010
2011
2012
2013
days not worked (per 1000 employees)
0
2
4
6
8
10
2000
2001
2002
2003
2004
2005
2006
2007
2008
2009
2010
2011
2012
2013
workers involved in industrial action (per 1000 employees)
Romania
source ILOSTAT Official data is very partial in 2009 and not available after 2010
single-employer bargaining system
Guaranteed by the Constitution and regulated by law
peaks 2000 and 2007 Several strike actions in particularly the manufacturing industry
right to strike private sector public sector
data coverage Only strikes workers involved excludes workers indirectly involved
0
10
20
30
40
2000
2001
2002
2003
2004
2005
2006
2007
2008
2009
2010
2011
2012
2013
days not worked (per 1000 employees)
0
2
4
6
8
10
2000
2001
2002
2003
2004
2005
2006
2007
2008
2009
2010
2011
2012
2013
workers involved in industrial action (per 1000 employees)
Slovakia
source 2000-2002 ILOSTAT 2003-2009 Carley (2004) Carley (2008) and Carley (2010) Since 2010 Statistical Office of the Slovak Republic (on demand)
mixed bargaining system
Guaranteed by the Constitution and regulated by law
peak 2003 Limited number of strike actions in railways and the public sector
right to strike private sector public sector
0
10
20
30
40
50
2000
2001
2002
2003
2004
2005
2006
2007
2008
2009
2010
2011
2012
2013
days not worked (per 1000 employees)
0
2
4
6
2000
2001
2002
2003
2004
2005
2006
2007
2008
2009
2010
2011
2012
2013
workers involved in industrial action (per 1000 employees)
Slovenia
source Carley (2004) Carley (2008) and Carley (2010) Trade union data (ZSSS) Official data is not available
multi-employer bargaining system
Guaranteed by the Constitution and regulated by law
peak 2005 Union mobilisation against labour market reforms
right to strike private sector public sector
data coverage Strikes and lockouts excluding strikes that last less than 1 hour workers involved excludes workers indirectly involved The 2012 data excludes the general strikes of the 29th of March and the 14th of November and the nation-wide strike in the education sector of 22nd of May In 2013 several strikes in the education sector are excluded
050
100150200250300350
2000
2001
2002
2003
2004
2005
2006
2007
2008
2009
2010
2011
2012
2013
days not worked (per 1000 employees)
050
100150200250300350
2000
2001
2002
2003
2004
2005
2006
2007
2008
2009
2010
2011
2012
2013
workers involved in industrial action (per 1000 employees)
Spain
source ILOSTAT Ministry of Employment and Social Security Statistics Condiciones de trabajo y relaciones laborales Huelgas y Cierres Patronales
multi-employer bargaining system
Guaranteed by the Constitution and regulated by law
peak 2004 Strike action in shipyards over renewal of collective agreements and against relocation decisions in mainly the manufacturing industry
underestimated peak in 2012 and 2013 General strikes in 2012 and various strikes in the public sector
right to strike private sector public sector
data coverage Strikes and lockouts Workers involved excludes workers indirectly involved
0
50
100
150
200
2000
2001
2002
2003
2004
2005
2006
2007
2008
2009
2010
2011
2012
2013
days not worked (per 1000 employees)
0
5
10
15
20
25
2000
2001
2002
2003
2004
2005
2006
2007
2008
2009
2010
2011
2012
2013
workers involved in industrial action (per 1000 employees)
Sweden
source Sweden National Mediation Office Melding amp konflikt Konfliktstatistik
multi-employer bargaining system
Guaranteed by the Constitution and regulated by law and in the 1938 collective agreement between the social partners
peak 2003 Large strike of blue-collar workers in the municipal and city council sector over a new pay agreement
right to strike private sector public sector
data coverage Strikes and lockouts Excluding strikes that last less than 1 day Workers involved includes workers directly and indirectly involved
0
5
10
15
2000
2001
2002
2003
2004
2005
2006
2007
2008
2009
2010
2011
2012
2013
days not worked (per 1000 employees)
0
2
4
6
8
10
2000
2001
2002
2003
2004
2005
2006
2007
2008
2009
2010
2011
2012
2013
workers involved in industrial action (per 1000 employees)
Switzerland
source Office feacutedeacuteral de la statistique Thegravemes Organisation du marcheacute du travail conventions collectives de travail Donneacutees deacutetailleacutees Gregraveves et lock-out
multi-employer bargaining system
Guaranteed by the Constitution and regulated by law and in the 1938 collective agreement between the social partners
peak 2004 Difficult to attribute to a specific large strike
right to strike private sector public sector
data coverage 2000-2008 Excluding political strikes Since 2009 Strikes and lockouts Excluding strikes that last less than 1 day Workers involved includes workers directly and indirectly involved
0
20
40
60
2000
2001
2002
2003
2004
2005
2006
2007
2008
2009
2010
2011
2012
2013
days not worked (per 1000 employees)
0
20
40
60
2000
2001
2002
2003
2004
2005
2006
2007
2008
2009
2010
2011
2012
2013
workers involved in industrial action (per 1000 employees)
United Kingdom
source Office for National Statistics Browse by Theme Labour Market Labour Disputes Days Lost due to Industrial Action
single-employer bargaining system
Regulated by law
peak 2004 One-day strike by civil servants to protest against governments plans to cut a large number of civil service posts peak 2007 One-day strike by postal workers in protest over pay and modernisation plans and one-day strike by prison officers
against the governmentrsquos decision to introduce a pay award in stages peak 2011 Union mobilisation against public service pension reforms in June and November
Right to strike legend
yes with minor restrictions (eg recognized union balloting proportionality respect of peace obligation)
yes with major restrictions (eg monopoly union compulsory arbitration or conciliation restrictions on issues or content major groups excluded
no
yes
private sector
yes with minor restrictions (eg recognized union balloting proportionality respect of peace obligation only military judiciary or police excluded ndash as per ILO convention)
yes with major restrictions (eg monopoly union compulsory arbitration or conciliation restrictions on issues or content major groups excluded
no
yes
public sector
source J Visser Database on Institutional Characteristics of Trade Unions Wage Setting State Intervention and Social Pacts (ICTWSS) database version 4 2013 The indicators reflect the situation in 2011
Prevelant bargaining regime legend
Single-employer bargaining system the establishment or company level is predominant
Multi-employer bargaining system sector andor the cross-sector level is predominant
Mixed bargaining system an intermediate situation where sector and company negotiations each respectively account for at least one-third of those covered by collective wage-setting arrangements
source P Marginson and C Welz (2014) Changes to wage-setting mechanisms in the context of the crisis and the EUrsquos new economic governance regime Dublin Eurofound
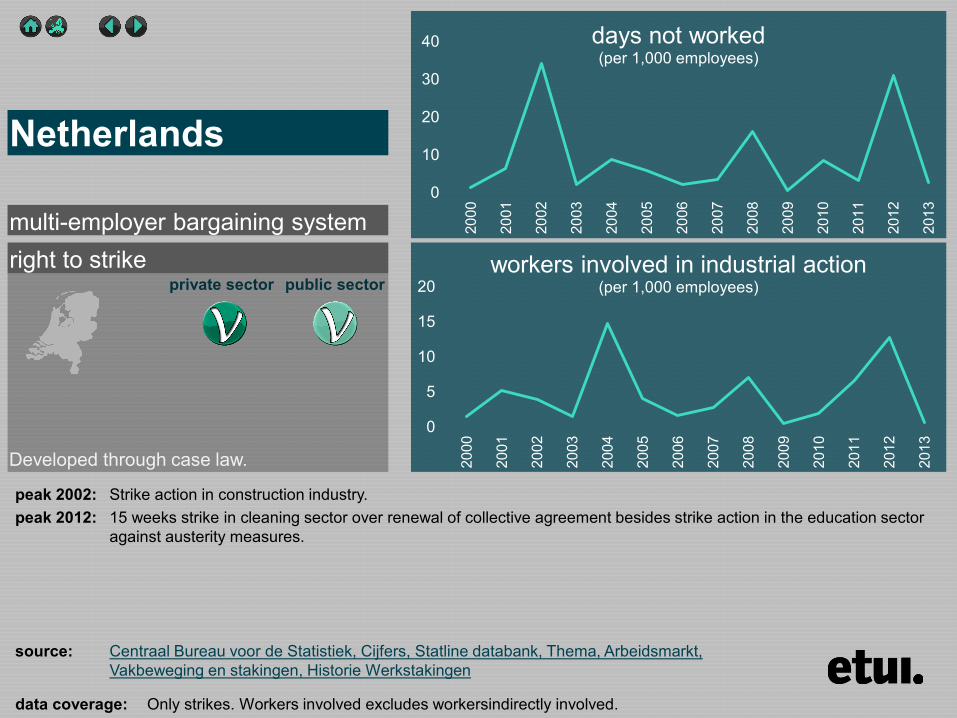
right to strike private sector public sector
data coverage Strikes and lockout excluding strikes that last less than 1 day Workers involved includes workers directly and indirectly involved
0
50
100
150
200
250
2000
2001
2002
2003
2004
2005
2006
2007
2008
2009
2010
2011
2012
2013
days not worked (per 1000 employees)
0
10
20
30
40
50
2000
2001
2002
2003
2004
2005
2006
2007
2008
2009
2010
2011
2012
2013
workers involved in industrial action (per 1000 employees)
Norway
source Statistics Norway Statistics Labour market and earnings Strikes and lockouts
multi-employer bargaining system
Mainly regulated by collective agreements between the social partners
nearly two yearly peaks Negotiations about renewal of collective agreements in the economic sectors
right to strike private sector public sector
data coverage Only strikes excluding strikes that last less than 1 day workers involved excludes workers indirectly involved
0
5
10
15
20
25
2000
2001
2002
2003
2004
2005
2006
2007
2008
2009
2010
2011
2012
2013
days not worked (per 1000 employees)
0
5
10
15
20
2000
2001
2002
2003
2004
2005
2006
2007
2008
2009
2010
2011
2012
2013
workers involved in industrial action (per 1000 employees)
Poland
source ILOSTAT
single-employer bargaining system
Guaranteed by the Constitution and regulated by law
peak 2008 Various teachersrsquo strikes over a pay increase and other demands and other strikes in the public sector
right to strike private sector public sector
data coverage Only strikes excluding public administration workers involved excludes workers indirectly involved
0
10
20
30
2000
2001
2002
2003
2004
2005
2006
2007
2008
2009
2010
2011
2012
2013
days not worked (per 1000 employees)
0
5
10
15
20
25
2000
2001
2002
2003
2004
2005
2006
2007
2008
2009
2010
2011
2012
2013
workers involved in industrial action (per 1000 employees)
Portugal
source Gabinete de Estrateacutegia e Planeamento Estatiacutestica Greves Official strike data is not available after 2007
multi-employer bargaining system
Guaranteed by the Constitution and regulated by law
peak 2002 Several strike actions particularly in the public sector against changes in the Labour Code
right to strike private sector public sector
data coverage Only strikes Workers involved excludes workers indirectly involved
0
50
100
2000
2001
2002
2003
2004
2005
2006
2007
2008
2009
2010
2011
2012
2013
days not worked (per 1000 employees)
0
2
4
6
8
10
2000
2001
2002
2003
2004
2005
2006
2007
2008
2009
2010
2011
2012
2013
workers involved in industrial action (per 1000 employees)
Romania
source ILOSTAT Official data is very partial in 2009 and not available after 2010
single-employer bargaining system
Guaranteed by the Constitution and regulated by law
peaks 2000 and 2007 Several strike actions in particularly the manufacturing industry
right to strike private sector public sector
data coverage Only strikes workers involved excludes workers indirectly involved
0
10
20
30
40
2000
2001
2002
2003
2004
2005
2006
2007
2008
2009
2010
2011
2012
2013
days not worked (per 1000 employees)
0
2
4
6
8
10
2000
2001
2002
2003
2004
2005
2006
2007
2008
2009
2010
2011
2012
2013
workers involved in industrial action (per 1000 employees)
Slovakia
source 2000-2002 ILOSTAT 2003-2009 Carley (2004) Carley (2008) and Carley (2010) Since 2010 Statistical Office of the Slovak Republic (on demand)
mixed bargaining system
Guaranteed by the Constitution and regulated by law
peak 2003 Limited number of strike actions in railways and the public sector
right to strike private sector public sector
0
10
20
30
40
50
2000
2001
2002
2003
2004
2005
2006
2007
2008
2009
2010
2011
2012
2013
days not worked (per 1000 employees)
0
2
4
6
2000
2001
2002
2003
2004
2005
2006
2007
2008
2009
2010
2011
2012
2013
workers involved in industrial action (per 1000 employees)
Slovenia
source Carley (2004) Carley (2008) and Carley (2010) Trade union data (ZSSS) Official data is not available
multi-employer bargaining system
Guaranteed by the Constitution and regulated by law
peak 2005 Union mobilisation against labour market reforms
right to strike private sector public sector
data coverage Strikes and lockouts excluding strikes that last less than 1 hour workers involved excludes workers indirectly involved The 2012 data excludes the general strikes of the 29th of March and the 14th of November and the nation-wide strike in the education sector of 22nd of May In 2013 several strikes in the education sector are excluded
050
100150200250300350
2000
2001
2002
2003
2004
2005
2006
2007
2008
2009
2010
2011
2012
2013
days not worked (per 1000 employees)
050
100150200250300350
2000
2001
2002
2003
2004
2005
2006
2007
2008
2009
2010
2011
2012
2013
workers involved in industrial action (per 1000 employees)
Spain
source ILOSTAT Ministry of Employment and Social Security Statistics Condiciones de trabajo y relaciones laborales Huelgas y Cierres Patronales
multi-employer bargaining system
Guaranteed by the Constitution and regulated by law
peak 2004 Strike action in shipyards over renewal of collective agreements and against relocation decisions in mainly the manufacturing industry
underestimated peak in 2012 and 2013 General strikes in 2012 and various strikes in the public sector
right to strike private sector public sector
data coverage Strikes and lockouts Workers involved excludes workers indirectly involved
0
50
100
150
200
2000
2001
2002
2003
2004
2005
2006
2007
2008
2009
2010
2011
2012
2013
days not worked (per 1000 employees)
0
5
10
15
20
25
2000
2001
2002
2003
2004
2005
2006
2007
2008
2009
2010
2011
2012
2013
workers involved in industrial action (per 1000 employees)
Sweden
source Sweden National Mediation Office Melding amp konflikt Konfliktstatistik
multi-employer bargaining system
Guaranteed by the Constitution and regulated by law and in the 1938 collective agreement between the social partners
peak 2003 Large strike of blue-collar workers in the municipal and city council sector over a new pay agreement
right to strike private sector public sector
data coverage Strikes and lockouts Excluding strikes that last less than 1 day Workers involved includes workers directly and indirectly involved
0
5
10
15
2000
2001
2002
2003
2004
2005
2006
2007
2008
2009
2010
2011
2012
2013
days not worked (per 1000 employees)
0
2
4
6
8
10
2000
2001
2002
2003
2004
2005
2006
2007
2008
2009
2010
2011
2012
2013
workers involved in industrial action (per 1000 employees)
Switzerland
source Office feacutedeacuteral de la statistique Thegravemes Organisation du marcheacute du travail conventions collectives de travail Donneacutees deacutetailleacutees Gregraveves et lock-out
multi-employer bargaining system
Guaranteed by the Constitution and regulated by law and in the 1938 collective agreement between the social partners
peak 2004 Difficult to attribute to a specific large strike
right to strike private sector public sector
data coverage 2000-2008 Excluding political strikes Since 2009 Strikes and lockouts Excluding strikes that last less than 1 day Workers involved includes workers directly and indirectly involved
0
20
40
60
2000
2001
2002
2003
2004
2005
2006
2007
2008
2009
2010
2011
2012
2013
days not worked (per 1000 employees)
0
20
40
60
2000
2001
2002
2003
2004
2005
2006
2007
2008
2009
2010
2011
2012
2013
workers involved in industrial action (per 1000 employees)
United Kingdom
source Office for National Statistics Browse by Theme Labour Market Labour Disputes Days Lost due to Industrial Action
single-employer bargaining system
Regulated by law
peak 2004 One-day strike by civil servants to protest against governments plans to cut a large number of civil service posts peak 2007 One-day strike by postal workers in protest over pay and modernisation plans and one-day strike by prison officers
against the governmentrsquos decision to introduce a pay award in stages peak 2011 Union mobilisation against public service pension reforms in June and November
Right to strike legend
yes with minor restrictions (eg recognized union balloting proportionality respect of peace obligation)
yes with major restrictions (eg monopoly union compulsory arbitration or conciliation restrictions on issues or content major groups excluded
no
yes
private sector
yes with minor restrictions (eg recognized union balloting proportionality respect of peace obligation only military judiciary or police excluded ndash as per ILO convention)
yes with major restrictions (eg monopoly union compulsory arbitration or conciliation restrictions on issues or content major groups excluded
no
yes
public sector
source J Visser Database on Institutional Characteristics of Trade Unions Wage Setting State Intervention and Social Pacts (ICTWSS) database version 4 2013 The indicators reflect the situation in 2011
Prevelant bargaining regime legend
Single-employer bargaining system the establishment or company level is predominant
Multi-employer bargaining system sector andor the cross-sector level is predominant
Mixed bargaining system an intermediate situation where sector and company negotiations each respectively account for at least one-third of those covered by collective wage-setting arrangements
source P Marginson and C Welz (2014) Changes to wage-setting mechanisms in the context of the crisis and the EUrsquos new economic governance regime Dublin Eurofound
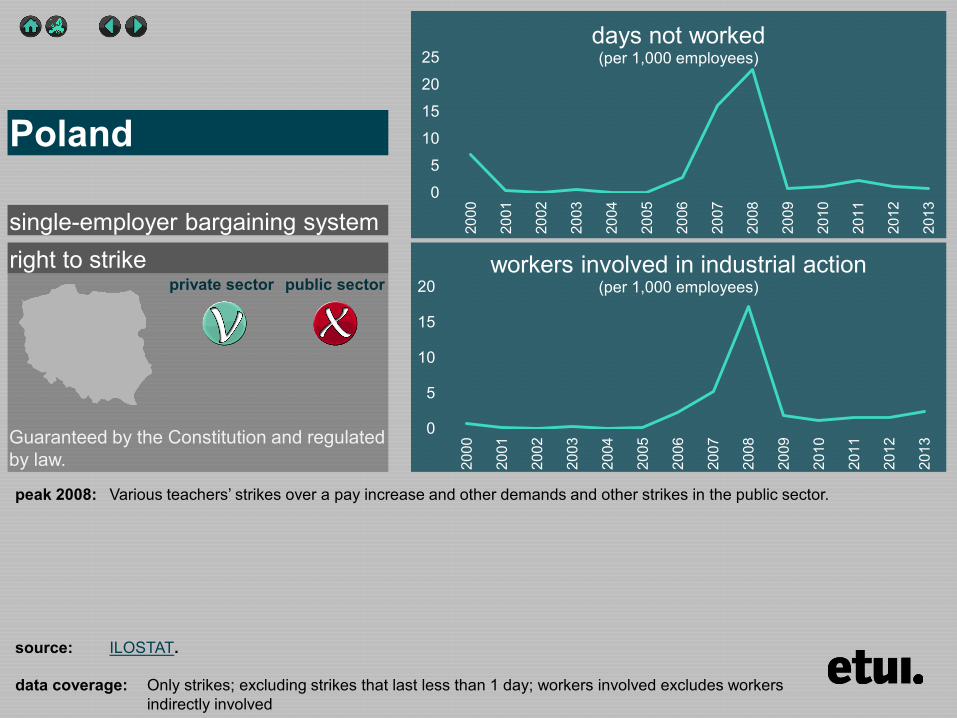
right to strike private sector public sector
data coverage Only strikes excluding strikes that last less than 1 day workers involved excludes workers indirectly involved
0
5
10
15
20
25
2000
2001
2002
2003
2004
2005
2006
2007
2008
2009
2010
2011
2012
2013
days not worked (per 1000 employees)
0
5
10
15
20
2000
2001
2002
2003
2004
2005
2006
2007
2008
2009
2010
2011
2012
2013
workers involved in industrial action (per 1000 employees)
Poland
source ILOSTAT
single-employer bargaining system
Guaranteed by the Constitution and regulated by law
peak 2008 Various teachersrsquo strikes over a pay increase and other demands and other strikes in the public sector
right to strike private sector public sector
data coverage Only strikes excluding public administration workers involved excludes workers indirectly involved
0
10
20
30
2000
2001
2002
2003
2004
2005
2006
2007
2008
2009
2010
2011
2012
2013
days not worked (per 1000 employees)
0
5
10
15
20
25
2000
2001
2002
2003
2004
2005
2006
2007
2008
2009
2010
2011
2012
2013
workers involved in industrial action (per 1000 employees)
Portugal
source Gabinete de Estrateacutegia e Planeamento Estatiacutestica Greves Official strike data is not available after 2007
multi-employer bargaining system
Guaranteed by the Constitution and regulated by law
peak 2002 Several strike actions particularly in the public sector against changes in the Labour Code
right to strike private sector public sector
data coverage Only strikes Workers involved excludes workers indirectly involved
0
50
100
2000
2001
2002
2003
2004
2005
2006
2007
2008
2009
2010
2011
2012
2013
days not worked (per 1000 employees)
0
2
4
6
8
10
2000
2001
2002
2003
2004
2005
2006
2007
2008
2009
2010
2011
2012
2013
workers involved in industrial action (per 1000 employees)
Romania
source ILOSTAT Official data is very partial in 2009 and not available after 2010
single-employer bargaining system
Guaranteed by the Constitution and regulated by law
peaks 2000 and 2007 Several strike actions in particularly the manufacturing industry
right to strike private sector public sector
data coverage Only strikes workers involved excludes workers indirectly involved
0
10
20
30
40
2000
2001
2002
2003
2004
2005
2006
2007
2008
2009
2010
2011
2012
2013
days not worked (per 1000 employees)
0
2
4
6
8
10
2000
2001
2002
2003
2004
2005
2006
2007
2008
2009
2010
2011
2012
2013
workers involved in industrial action (per 1000 employees)
Slovakia
source 2000-2002 ILOSTAT 2003-2009 Carley (2004) Carley (2008) and Carley (2010) Since 2010 Statistical Office of the Slovak Republic (on demand)
mixed bargaining system
Guaranteed by the Constitution and regulated by law
peak 2003 Limited number of strike actions in railways and the public sector
right to strike private sector public sector
0
10
20
30
40
50
2000
2001
2002
2003
2004
2005
2006
2007
2008
2009
2010
2011
2012
2013
days not worked (per 1000 employees)
0
2
4
6
2000
2001
2002
2003
2004
2005
2006
2007
2008
2009
2010
2011
2012
2013
workers involved in industrial action (per 1000 employees)
Slovenia
source Carley (2004) Carley (2008) and Carley (2010) Trade union data (ZSSS) Official data is not available
multi-employer bargaining system
Guaranteed by the Constitution and regulated by law
peak 2005 Union mobilisation against labour market reforms
right to strike private sector public sector
data coverage Strikes and lockouts excluding strikes that last less than 1 hour workers involved excludes workers indirectly involved The 2012 data excludes the general strikes of the 29th of March and the 14th of November and the nation-wide strike in the education sector of 22nd of May In 2013 several strikes in the education sector are excluded
050
100150200250300350
2000
2001
2002
2003
2004
2005
2006
2007
2008
2009
2010
2011
2012
2013
days not worked (per 1000 employees)
050
100150200250300350
2000
2001
2002
2003
2004
2005
2006
2007
2008
2009
2010
2011
2012
2013
workers involved in industrial action (per 1000 employees)
Spain
source ILOSTAT Ministry of Employment and Social Security Statistics Condiciones de trabajo y relaciones laborales Huelgas y Cierres Patronales
multi-employer bargaining system
Guaranteed by the Constitution and regulated by law
peak 2004 Strike action in shipyards over renewal of collective agreements and against relocation decisions in mainly the manufacturing industry
underestimated peak in 2012 and 2013 General strikes in 2012 and various strikes in the public sector
right to strike private sector public sector
data coverage Strikes and lockouts Workers involved excludes workers indirectly involved
0
50
100
150
200
2000
2001
2002
2003
2004
2005
2006
2007
2008
2009
2010
2011
2012
2013
days not worked (per 1000 employees)
0
5
10
15
20
25
2000
2001
2002
2003
2004
2005
2006
2007
2008
2009
2010
2011
2012
2013
workers involved in industrial action (per 1000 employees)
Sweden
source Sweden National Mediation Office Melding amp konflikt Konfliktstatistik
multi-employer bargaining system
Guaranteed by the Constitution and regulated by law and in the 1938 collective agreement between the social partners
peak 2003 Large strike of blue-collar workers in the municipal and city council sector over a new pay agreement
right to strike private sector public sector
data coverage Strikes and lockouts Excluding strikes that last less than 1 day Workers involved includes workers directly and indirectly involved
0
5
10
15
2000
2001
2002
2003
2004
2005
2006
2007
2008
2009
2010
2011
2012
2013
days not worked (per 1000 employees)
0
2
4
6
8
10
2000
2001
2002
2003
2004
2005
2006
2007
2008
2009
2010
2011
2012
2013
workers involved in industrial action (per 1000 employees)
Switzerland
source Office feacutedeacuteral de la statistique Thegravemes Organisation du marcheacute du travail conventions collectives de travail Donneacutees deacutetailleacutees Gregraveves et lock-out
multi-employer bargaining system
Guaranteed by the Constitution and regulated by law and in the 1938 collective agreement between the social partners
peak 2004 Difficult to attribute to a specific large strike
right to strike private sector public sector
data coverage 2000-2008 Excluding political strikes Since 2009 Strikes and lockouts Excluding strikes that last less than 1 day Workers involved includes workers directly and indirectly involved
0
20
40
60
2000
2001
2002
2003
2004
2005
2006
2007
2008
2009
2010
2011
2012
2013
days not worked (per 1000 employees)
0
20
40
60
2000
2001
2002
2003
2004
2005
2006
2007
2008
2009
2010
2011
2012
2013
workers involved in industrial action (per 1000 employees)
United Kingdom
source Office for National Statistics Browse by Theme Labour Market Labour Disputes Days Lost due to Industrial Action
single-employer bargaining system
Regulated by law
peak 2004 One-day strike by civil servants to protest against governments plans to cut a large number of civil service posts peak 2007 One-day strike by postal workers in protest over pay and modernisation plans and one-day strike by prison officers
against the governmentrsquos decision to introduce a pay award in stages peak 2011 Union mobilisation against public service pension reforms in June and November
Right to strike legend
yes with minor restrictions (eg recognized union balloting proportionality respect of peace obligation)
yes with major restrictions (eg monopoly union compulsory arbitration or conciliation restrictions on issues or content major groups excluded
no
yes
private sector
yes with minor restrictions (eg recognized union balloting proportionality respect of peace obligation only military judiciary or police excluded ndash as per ILO convention)
yes with major restrictions (eg monopoly union compulsory arbitration or conciliation restrictions on issues or content major groups excluded
no
yes
public sector
source J Visser Database on Institutional Characteristics of Trade Unions Wage Setting State Intervention and Social Pacts (ICTWSS) database version 4 2013 The indicators reflect the situation in 2011
Prevelant bargaining regime legend
Single-employer bargaining system the establishment or company level is predominant
Multi-employer bargaining system sector andor the cross-sector level is predominant
Mixed bargaining system an intermediate situation where sector and company negotiations each respectively account for at least one-third of those covered by collective wage-setting arrangements
source P Marginson and C Welz (2014) Changes to wage-setting mechanisms in the context of the crisis and the EUrsquos new economic governance regime Dublin Eurofound
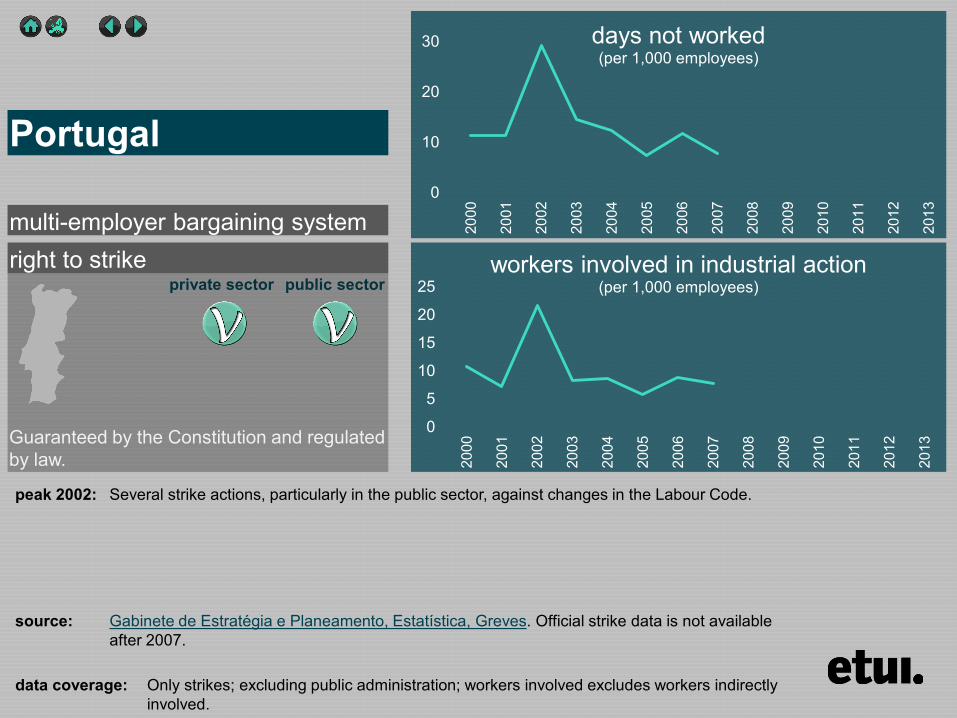
right to strike private sector public sector
data coverage Only strikes workers involved excludes workers indirectly involved
0
10
20
30
40
2000
2001
2002
2003
2004
2005
2006
2007
2008
2009
2010
2011
2012
2013
days not worked (per 1000 employees)
0
2
4
6
8
10
2000
2001
2002
2003
2004
2005
2006
2007
2008
2009
2010
2011
2012
2013
workers involved in industrial action (per 1000 employees)
Slovakia
source 2000-2002 ILOSTAT 2003-2009 Carley (2004) Carley (2008) and Carley (2010) Since 2010 Statistical Office of the Slovak Republic (on demand)
mixed bargaining system
Guaranteed by the Constitution and regulated by law
peak 2003 Limited number of strike actions in railways and the public sector
right to strike private sector public sector
0
10
20
30
40
50
2000
2001
2002
2003
2004
2005
2006
2007
2008
2009
2010
2011
2012
2013
days not worked (per 1000 employees)
0
2
4
6
2000
2001
2002
2003
2004
2005
2006
2007
2008
2009
2010
2011
2012
2013
workers involved in industrial action (per 1000 employees)
Slovenia
source Carley (2004) Carley (2008) and Carley (2010) Trade union data (ZSSS) Official data is not available
multi-employer bargaining system
Guaranteed by the Constitution and regulated by law
peak 2005 Union mobilisation against labour market reforms
right to strike private sector public sector
data coverage Strikes and lockouts excluding strikes that last less than 1 hour workers involved excludes workers indirectly involved The 2012 data excludes the general strikes of the 29th of March and the 14th of November and the nation-wide strike in the education sector of 22nd of May In 2013 several strikes in the education sector are excluded
050
100150200250300350
2000
2001
2002
2003
2004
2005
2006
2007
2008
2009
2010
2011
2012
2013
days not worked (per 1000 employees)
050
100150200250300350
2000
2001
2002
2003
2004
2005
2006
2007
2008
2009
2010
2011
2012
2013
workers involved in industrial action (per 1000 employees)
Spain
source ILOSTAT Ministry of Employment and Social Security Statistics Condiciones de trabajo y relaciones laborales Huelgas y Cierres Patronales
multi-employer bargaining system
Guaranteed by the Constitution and regulated by law
peak 2004 Strike action in shipyards over renewal of collective agreements and against relocation decisions in mainly the manufacturing industry
underestimated peak in 2012 and 2013 General strikes in 2012 and various strikes in the public sector
right to strike private sector public sector
data coverage Strikes and lockouts Workers involved excludes workers indirectly involved
0
50
100
150
200
2000
2001
2002
2003
2004
2005
2006
2007
2008
2009
2010
2011
2012
2013
days not worked (per 1000 employees)
0
5
10
15
20
25
2000
2001
2002
2003
2004
2005
2006
2007
2008
2009
2010
2011
2012
2013
workers involved in industrial action (per 1000 employees)
Sweden
source Sweden National Mediation Office Melding amp konflikt Konfliktstatistik
multi-employer bargaining system
Guaranteed by the Constitution and regulated by law and in the 1938 collective agreement between the social partners
peak 2003 Large strike of blue-collar workers in the municipal and city council sector over a new pay agreement
right to strike private sector public sector
data coverage Strikes and lockouts Excluding strikes that last less than 1 day Workers involved includes workers directly and indirectly involved
0
5
10
15
2000
2001
2002
2003
2004
2005
2006
2007
2008
2009
2010
2011
2012
2013
days not worked (per 1000 employees)
0
2
4
6
8
10
2000
2001
2002
2003
2004
2005
2006
2007
2008
2009
2010
2011
2012
2013
workers involved in industrial action (per 1000 employees)
Switzerland
source Office feacutedeacuteral de la statistique Thegravemes Organisation du marcheacute du travail conventions collectives de travail Donneacutees deacutetailleacutees Gregraveves et lock-out
multi-employer bargaining system
Guaranteed by the Constitution and regulated by law and in the 1938 collective agreement between the social partners
peak 2004 Difficult to attribute to a specific large strike
right to strike private sector public sector
data coverage 2000-2008 Excluding political strikes Since 2009 Strikes and lockouts Excluding strikes that last less than 1 day Workers involved includes workers directly and indirectly involved
0
20
40
60
2000
2001
2002
2003
2004
2005
2006
2007
2008
2009
2010
2011
2012
2013
days not worked (per 1000 employees)
0
20
40
60
2000
2001
2002
2003
2004
2005
2006
2007
2008
2009
2010
2011
2012
2013
workers involved in industrial action (per 1000 employees)
United Kingdom
source Office for National Statistics Browse by Theme Labour Market Labour Disputes Days Lost due to Industrial Action
single-employer bargaining system
Regulated by law
peak 2004 One-day strike by civil servants to protest against governments plans to cut a large number of civil service posts peak 2007 One-day strike by postal workers in protest over pay and modernisation plans and one-day strike by prison officers
against the governmentrsquos decision to introduce a pay award in stages peak 2011 Union mobilisation against public service pension reforms in June and November
Right to strike legend
yes with minor restrictions (eg recognized union balloting proportionality respect of peace obligation)
yes with major restrictions (eg monopoly union compulsory arbitration or conciliation restrictions on issues or content major groups excluded
no
yes
private sector
yes with minor restrictions (eg recognized union balloting proportionality respect of peace obligation only military judiciary or police excluded ndash as per ILO convention)
yes with major restrictions (eg monopoly union compulsory arbitration or conciliation restrictions on issues or content major groups excluded
no
yes
public sector
source J Visser Database on Institutional Characteristics of Trade Unions Wage Setting State Intervention and Social Pacts (ICTWSS) database version 4 2013 The indicators reflect the situation in 2011
Prevelant bargaining regime legend
Single-employer bargaining system the establishment or company level is predominant
Multi-employer bargaining system sector andor the cross-sector level is predominant
Mixed bargaining system an intermediate situation where sector and company negotiations each respectively account for at least one-third of those covered by collective wage-setting arrangements
source P Marginson and C Welz (2014) Changes to wage-setting mechanisms in the context of the crisis and the EUrsquos new economic governance regime Dublin Eurofound
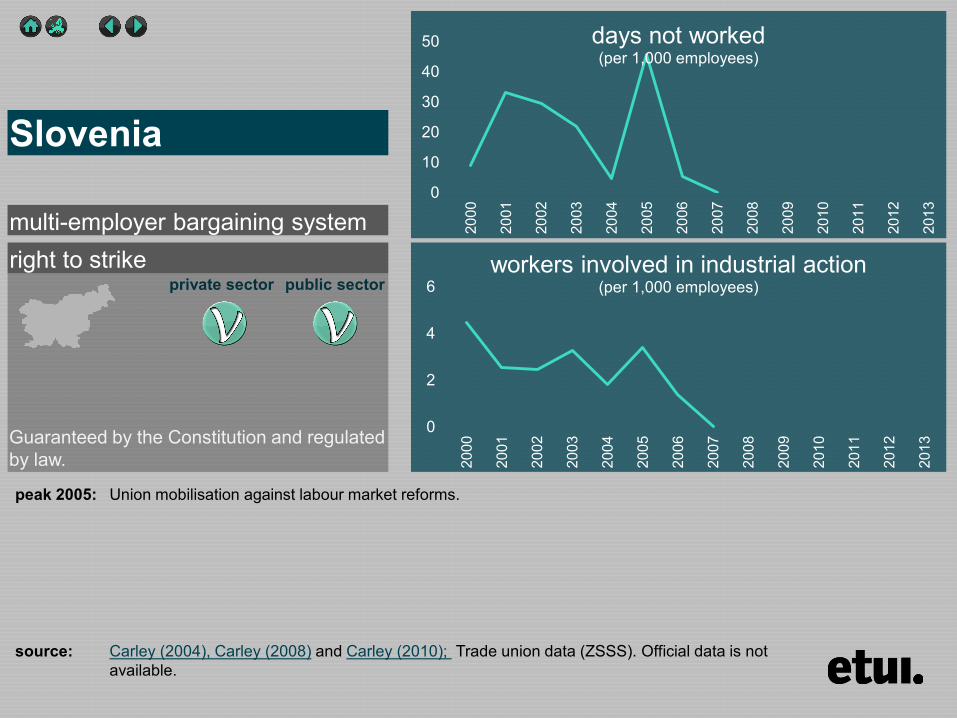
right to strike private sector public sector
0
10
20
30
40
50
2000
2001
2002
2003
2004
2005
2006
2007
2008
2009
2010
2011
2012
2013
days not worked (per 1000 employees)
0
2
4
6
2000
2001
2002
2003
2004
2005
2006
2007
2008
2009
2010
2011
2012
2013
workers involved in industrial action (per 1000 employees)
Slovenia
source Carley (2004) Carley (2008) and Carley (2010) Trade union data (ZSSS) Official data is not available
multi-employer bargaining system
Guaranteed by the Constitution and regulated by law
peak 2005 Union mobilisation against labour market reforms
right to strike private sector public sector
data coverage Strikes and lockouts excluding strikes that last less than 1 hour workers involved excludes workers indirectly involved The 2012 data excludes the general strikes of the 29th of March and the 14th of November and the nation-wide strike in the education sector of 22nd of May In 2013 several strikes in the education sector are excluded
050
100150200250300350
2000
2001
2002
2003
2004
2005
2006
2007
2008
2009
2010
2011
2012
2013
days not worked (per 1000 employees)
050
100150200250300350
2000
2001
2002
2003
2004
2005
2006
2007
2008
2009
2010
2011
2012
2013
workers involved in industrial action (per 1000 employees)
Spain
source ILOSTAT Ministry of Employment and Social Security Statistics Condiciones de trabajo y relaciones laborales Huelgas y Cierres Patronales
multi-employer bargaining system
Guaranteed by the Constitution and regulated by law
peak 2004 Strike action in shipyards over renewal of collective agreements and against relocation decisions in mainly the manufacturing industry
underestimated peak in 2012 and 2013 General strikes in 2012 and various strikes in the public sector
right to strike private sector public sector
data coverage Strikes and lockouts Workers involved excludes workers indirectly involved
0
50
100
150
200
2000
2001
2002
2003
2004
2005
2006
2007
2008
2009
2010
2011
2012
2013
days not worked (per 1000 employees)
0
5
10
15
20
25
2000
2001
2002
2003
2004
2005
2006
2007
2008
2009
2010
2011
2012
2013
workers involved in industrial action (per 1000 employees)
Sweden
source Sweden National Mediation Office Melding amp konflikt Konfliktstatistik
multi-employer bargaining system
Guaranteed by the Constitution and regulated by law and in the 1938 collective agreement between the social partners
peak 2003 Large strike of blue-collar workers in the municipal and city council sector over a new pay agreement
right to strike private sector public sector
data coverage Strikes and lockouts Excluding strikes that last less than 1 day Workers involved includes workers directly and indirectly involved
0
5
10
15
2000
2001
2002
2003
2004
2005
2006
2007
2008
2009
2010
2011
2012
2013
days not worked (per 1000 employees)
0
2
4
6
8
10
2000
2001
2002
2003
2004
2005
2006
2007
2008
2009
2010
2011
2012
2013
workers involved in industrial action (per 1000 employees)
Switzerland
source Office feacutedeacuteral de la statistique Thegravemes Organisation du marcheacute du travail conventions collectives de travail Donneacutees deacutetailleacutees Gregraveves et lock-out
multi-employer bargaining system
Guaranteed by the Constitution and regulated by law and in the 1938 collective agreement between the social partners
peak 2004 Difficult to attribute to a specific large strike
right to strike private sector public sector
data coverage 2000-2008 Excluding political strikes Since 2009 Strikes and lockouts Excluding strikes that last less than 1 day Workers involved includes workers directly and indirectly involved
0
20
40
60
2000
2001
2002
2003
2004
2005
2006
2007
2008
2009
2010
2011
2012
2013
days not worked (per 1000 employees)
0
20
40
60
2000
2001
2002
2003
2004
2005
2006
2007
2008
2009
2010
2011
2012
2013
workers involved in industrial action (per 1000 employees)
United Kingdom
source Office for National Statistics Browse by Theme Labour Market Labour Disputes Days Lost due to Industrial Action
single-employer bargaining system
Regulated by law
peak 2004 One-day strike by civil servants to protest against governments plans to cut a large number of civil service posts peak 2007 One-day strike by postal workers in protest over pay and modernisation plans and one-day strike by prison officers
against the governmentrsquos decision to introduce a pay award in stages peak 2011 Union mobilisation against public service pension reforms in June and November
Right to strike legend
yes with minor restrictions (eg recognized union balloting proportionality respect of peace obligation)
yes with major restrictions (eg monopoly union compulsory arbitration or conciliation restrictions on issues or content major groups excluded
no
yes
private sector
yes with minor restrictions (eg recognized union balloting proportionality respect of peace obligation only military judiciary or police excluded ndash as per ILO convention)
yes with major restrictions (eg monopoly union compulsory arbitration or conciliation restrictions on issues or content major groups excluded
no
yes
public sector
source J Visser Database on Institutional Characteristics of Trade Unions Wage Setting State Intervention and Social Pacts (ICTWSS) database version 4 2013 The indicators reflect the situation in 2011
Prevelant bargaining regime legend
Single-employer bargaining system the establishment or company level is predominant
Multi-employer bargaining system sector andor the cross-sector level is predominant
Mixed bargaining system an intermediate situation where sector and company negotiations each respectively account for at least one-third of those covered by collective wage-setting arrangements
source P Marginson and C Welz (2014) Changes to wage-setting mechanisms in the context of the crisis and the EUrsquos new economic governance regime Dublin Eurofound
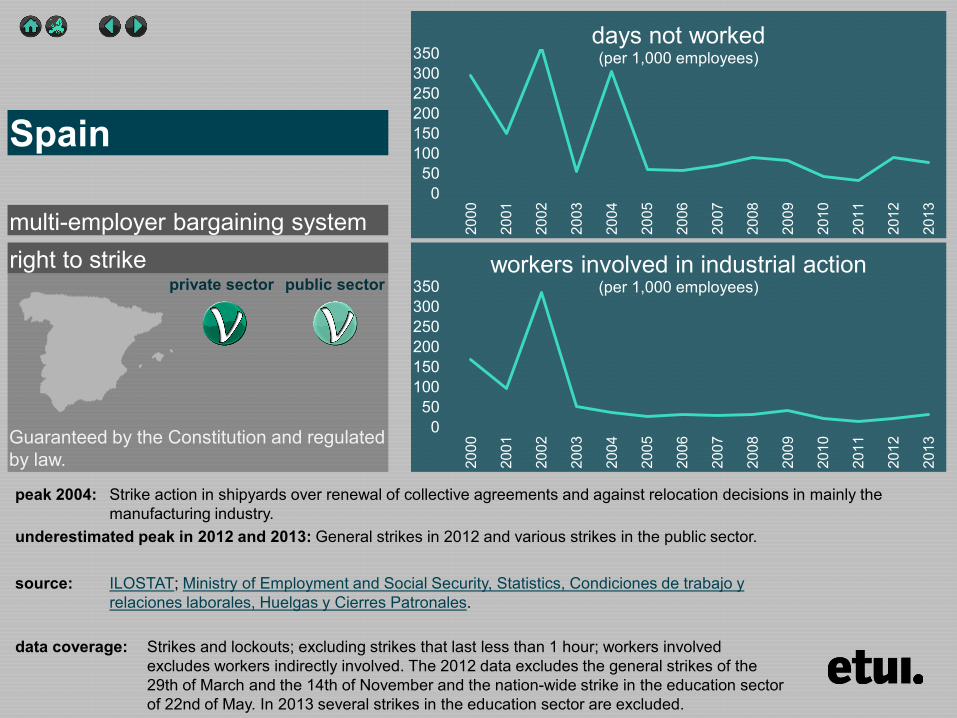
right to strike private sector public sector
data coverage Strikes and lockouts excluding strikes that last less than 1 hour workers involved excludes workers indirectly involved The 2012 data excludes the general strikes of the 29th of March and the 14th of November and the nation-wide strike in the education sector of 22nd of May In 2013 several strikes in the education sector are excluded
050
100150200250300350
2000
2001
2002
2003
2004
2005
2006
2007
2008
2009
2010
2011
2012
2013
days not worked (per 1000 employees)
050
100150200250300350
2000
2001
2002
2003
2004
2005
2006
2007
2008
2009
2010
2011
2012
2013
workers involved in industrial action (per 1000 employees)
Spain
source ILOSTAT Ministry of Employment and Social Security Statistics Condiciones de trabajo y relaciones laborales Huelgas y Cierres Patronales
multi-employer bargaining system
Guaranteed by the Constitution and regulated by law
peak 2004 Strike action in shipyards over renewal of collective agreements and against relocation decisions in mainly the manufacturing industry
underestimated peak in 2012 and 2013 General strikes in 2012 and various strikes in the public sector
right to strike private sector public sector
data coverage Strikes and lockouts Workers involved excludes workers indirectly involved
0
50
100
150
200
2000
2001
2002
2003
2004
2005
2006
2007
2008
2009
2010
2011
2012
2013
days not worked (per 1000 employees)
0
5
10
15
20
25
2000
2001
2002
2003
2004
2005
2006
2007
2008
2009
2010
2011
2012
2013
workers involved in industrial action (per 1000 employees)
Sweden
source Sweden National Mediation Office Melding amp konflikt Konfliktstatistik
multi-employer bargaining system
Guaranteed by the Constitution and regulated by law and in the 1938 collective agreement between the social partners
peak 2003 Large strike of blue-collar workers in the municipal and city council sector over a new pay agreement
right to strike private sector public sector
data coverage Strikes and lockouts Excluding strikes that last less than 1 day Workers involved includes workers directly and indirectly involved
0
5
10
15
2000
2001
2002
2003
2004
2005
2006
2007
2008
2009
2010
2011
2012
2013
days not worked (per 1000 employees)
0
2
4
6
8
10
2000
2001
2002
2003
2004
2005
2006
2007
2008
2009
2010
2011
2012
2013
workers involved in industrial action (per 1000 employees)
Switzerland
source Office feacutedeacuteral de la statistique Thegravemes Organisation du marcheacute du travail conventions collectives de travail Donneacutees deacutetailleacutees Gregraveves et lock-out
multi-employer bargaining system
Guaranteed by the Constitution and regulated by law and in the 1938 collective agreement between the social partners
peak 2004 Difficult to attribute to a specific large strike
right to strike private sector public sector
data coverage 2000-2008 Excluding political strikes Since 2009 Strikes and lockouts Excluding strikes that last less than 1 day Workers involved includes workers directly and indirectly involved
0
20
40
60
2000
2001
2002
2003
2004
2005
2006
2007
2008
2009
2010
2011
2012
2013
days not worked (per 1000 employees)
0
20
40
60
2000
2001
2002
2003
2004
2005
2006
2007
2008
2009
2010
2011
2012
2013
workers involved in industrial action (per 1000 employees)
United Kingdom
source Office for National Statistics Browse by Theme Labour Market Labour Disputes Days Lost due to Industrial Action
single-employer bargaining system
Regulated by law
peak 2004 One-day strike by civil servants to protest against governments plans to cut a large number of civil service posts peak 2007 One-day strike by postal workers in protest over pay and modernisation plans and one-day strike by prison officers
against the governmentrsquos decision to introduce a pay award in stages peak 2011 Union mobilisation against public service pension reforms in June and November
Right to strike legend
yes with minor restrictions (eg recognized union balloting proportionality respect of peace obligation)
yes with major restrictions (eg monopoly union compulsory arbitration or conciliation restrictions on issues or content major groups excluded
no
yes
private sector
yes with minor restrictions (eg recognized union balloting proportionality respect of peace obligation only military judiciary or police excluded ndash as per ILO convention)
yes with major restrictions (eg monopoly union compulsory arbitration or conciliation restrictions on issues or content major groups excluded
no
yes
public sector
source J Visser Database on Institutional Characteristics of Trade Unions Wage Setting State Intervention and Social Pacts (ICTWSS) database version 4 2013 The indicators reflect the situation in 2011
Prevelant bargaining regime legend
Single-employer bargaining system the establishment or company level is predominant
Multi-employer bargaining system sector andor the cross-sector level is predominant
Mixed bargaining system an intermediate situation where sector and company negotiations each respectively account for at least one-third of those covered by collective wage-setting arrangements
source P Marginson and C Welz (2014) Changes to wage-setting mechanisms in the context of the crisis and the EUrsquos new economic governance regime Dublin Eurofound
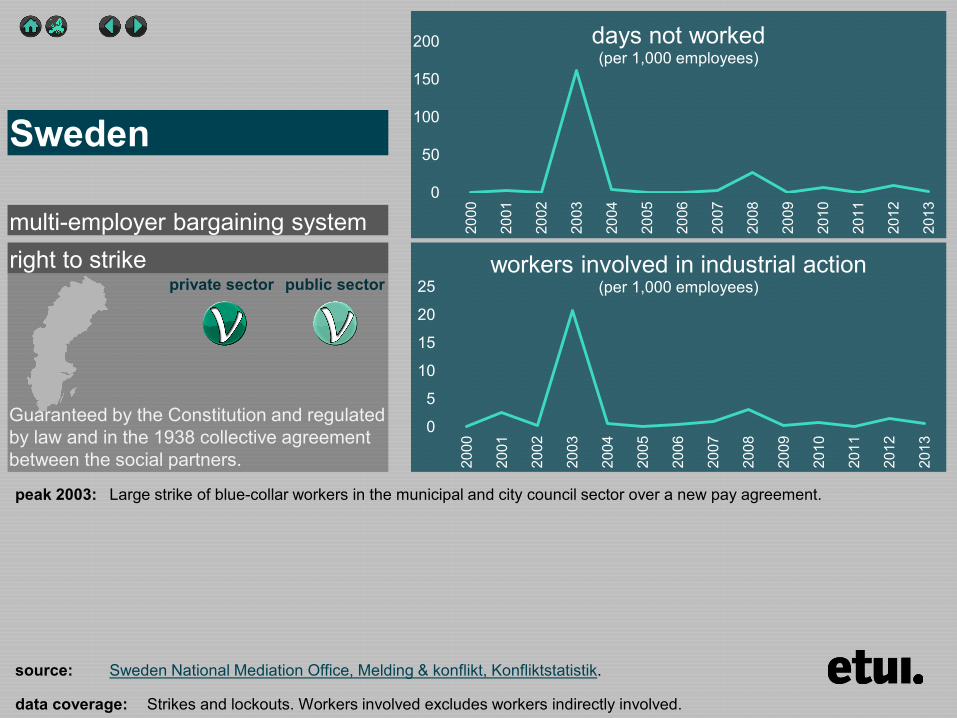
right to strike private sector public sector
data coverage Strikes and lockouts Workers involved excludes workers indirectly involved
0
50
100
150
200
2000
2001
2002
2003
2004
2005
2006
2007
2008
2009
2010
2011
2012
2013
days not worked (per 1000 employees)
0
5
10
15
20
25
2000
2001
2002
2003
2004
2005
2006
2007
2008
2009
2010
2011
2012
2013
workers involved in industrial action (per 1000 employees)
Sweden
source Sweden National Mediation Office Melding amp konflikt Konfliktstatistik
multi-employer bargaining system
Guaranteed by the Constitution and regulated by law and in the 1938 collective agreement between the social partners
peak 2003 Large strike of blue-collar workers in the municipal and city council sector over a new pay agreement
right to strike private sector public sector
data coverage Strikes and lockouts Excluding strikes that last less than 1 day Workers involved includes workers directly and indirectly involved
0
5
10
15
2000
2001
2002
2003
2004
2005
2006
2007
2008
2009
2010
2011
2012
2013
days not worked (per 1000 employees)
0
2
4
6
8
10
2000
2001
2002
2003
2004
2005
2006
2007
2008
2009
2010
2011
2012
2013
workers involved in industrial action (per 1000 employees)
Switzerland
source Office feacutedeacuteral de la statistique Thegravemes Organisation du marcheacute du travail conventions collectives de travail Donneacutees deacutetailleacutees Gregraveves et lock-out
multi-employer bargaining system
Guaranteed by the Constitution and regulated by law and in the 1938 collective agreement between the social partners
peak 2004 Difficult to attribute to a specific large strike
right to strike private sector public sector
data coverage 2000-2008 Excluding political strikes Since 2009 Strikes and lockouts Excluding strikes that last less than 1 day Workers involved includes workers directly and indirectly involved
0
20
40
60
2000
2001
2002
2003
2004
2005
2006
2007
2008
2009
2010
2011
2012
2013
days not worked (per 1000 employees)
0
20
40
60
2000
2001
2002
2003
2004
2005
2006
2007
2008
2009
2010
2011
2012
2013
workers involved in industrial action (per 1000 employees)
United Kingdom
source Office for National Statistics Browse by Theme Labour Market Labour Disputes Days Lost due to Industrial Action
single-employer bargaining system
Regulated by law
peak 2004 One-day strike by civil servants to protest against governments plans to cut a large number of civil service posts peak 2007 One-day strike by postal workers in protest over pay and modernisation plans and one-day strike by prison officers
against the governmentrsquos decision to introduce a pay award in stages peak 2011 Union mobilisation against public service pension reforms in June and November
Right to strike legend
yes with minor restrictions (eg recognized union balloting proportionality respect of peace obligation)
yes with major restrictions (eg monopoly union compulsory arbitration or conciliation restrictions on issues or content major groups excluded
no
yes
private sector
yes with minor restrictions (eg recognized union balloting proportionality respect of peace obligation only military judiciary or police excluded ndash as per ILO convention)
yes with major restrictions (eg monopoly union compulsory arbitration or conciliation restrictions on issues or content major groups excluded
no
yes
public sector
source J Visser Database on Institutional Characteristics of Trade Unions Wage Setting State Intervention and Social Pacts (ICTWSS) database version 4 2013 The indicators reflect the situation in 2011
Prevelant bargaining regime legend
Single-employer bargaining system the establishment or company level is predominant
Multi-employer bargaining system sector andor the cross-sector level is predominant
Mixed bargaining system an intermediate situation where sector and company negotiations each respectively account for at least one-third of those covered by collective wage-setting arrangements
source P Marginson and C Welz (2014) Changes to wage-setting mechanisms in the context of the crisis and the EUrsquos new economic governance regime Dublin Eurofound
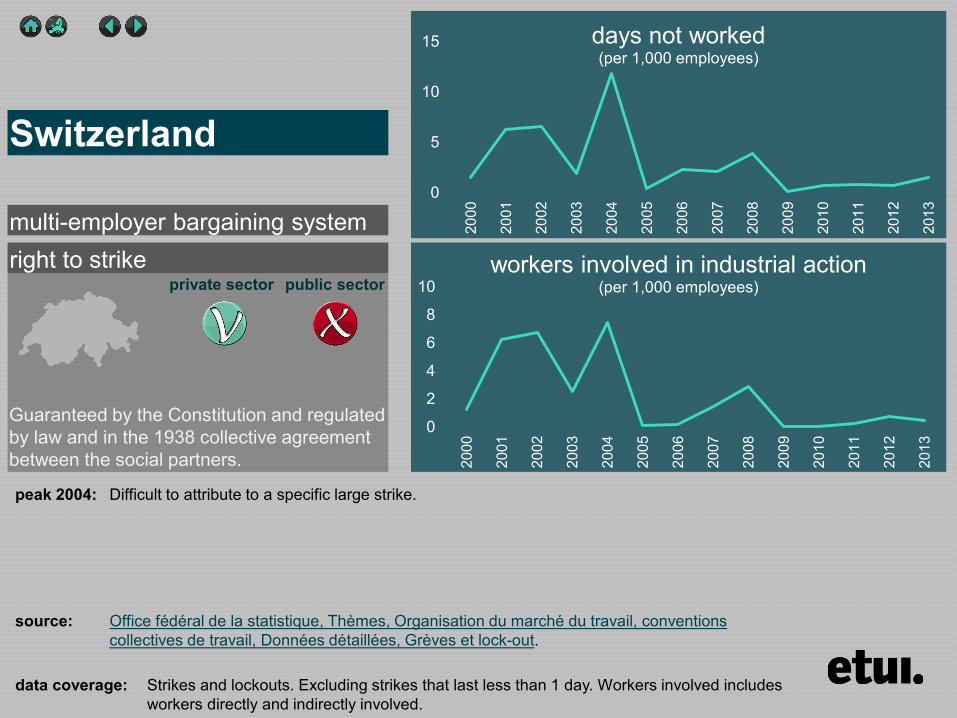
right to strike private sector public sector
data coverage Strikes and lockouts Excluding strikes that last less than 1 day Workers involved includes workers directly and indirectly involved
0
5
10
15
2000
2001
2002
2003
2004
2005
2006
2007
2008
2009
2010
2011
2012
2013
days not worked (per 1000 employees)
0
2
4
6
8
10
2000
2001
2002
2003
2004
2005
2006
2007
2008
2009
2010
2011
2012
2013
workers involved in industrial action (per 1000 employees)
Switzerland
source Office feacutedeacuteral de la statistique Thegravemes Organisation du marcheacute du travail conventions collectives de travail Donneacutees deacutetailleacutees Gregraveves et lock-out
multi-employer bargaining system
Guaranteed by the Constitution and regulated by law and in the 1938 collective agreement between the social partners
peak 2004 Difficult to attribute to a specific large strike
right to strike private sector public sector
data coverage 2000-2008 Excluding political strikes Since 2009 Strikes and lockouts Excluding strikes that last less than 1 day Workers involved includes workers directly and indirectly involved
0
20
40
60
2000
2001
2002
2003
2004
2005
2006
2007
2008
2009
2010
2011
2012
2013
days not worked (per 1000 employees)
0
20
40
60
2000
2001
2002
2003
2004
2005
2006
2007
2008
2009
2010
2011
2012
2013
workers involved in industrial action (per 1000 employees)
United Kingdom
source Office for National Statistics Browse by Theme Labour Market Labour Disputes Days Lost due to Industrial Action
single-employer bargaining system
Regulated by law
peak 2004 One-day strike by civil servants to protest against governments plans to cut a large number of civil service posts peak 2007 One-day strike by postal workers in protest over pay and modernisation plans and one-day strike by prison officers
against the governmentrsquos decision to introduce a pay award in stages peak 2011 Union mobilisation against public service pension reforms in June and November
Right to strike legend
yes with minor restrictions (eg recognized union balloting proportionality respect of peace obligation)
yes with major restrictions (eg monopoly union compulsory arbitration or conciliation restrictions on issues or content major groups excluded
no
yes
private sector
yes with minor restrictions (eg recognized union balloting proportionality respect of peace obligation only military judiciary or police excluded ndash as per ILO convention)
yes with major restrictions (eg monopoly union compulsory arbitration or conciliation restrictions on issues or content major groups excluded
no
yes
public sector
source J Visser Database on Institutional Characteristics of Trade Unions Wage Setting State Intervention and Social Pacts (ICTWSS) database version 4 2013 The indicators reflect the situation in 2011
Prevelant bargaining regime legend
Single-employer bargaining system the establishment or company level is predominant
Multi-employer bargaining system sector andor the cross-sector level is predominant
Mixed bargaining system an intermediate situation where sector and company negotiations each respectively account for at least one-third of those covered by collective wage-setting arrangements
source P Marginson and C Welz (2014) Changes to wage-setting mechanisms in the context of the crisis and the EUrsquos new economic governance regime Dublin Eurofound
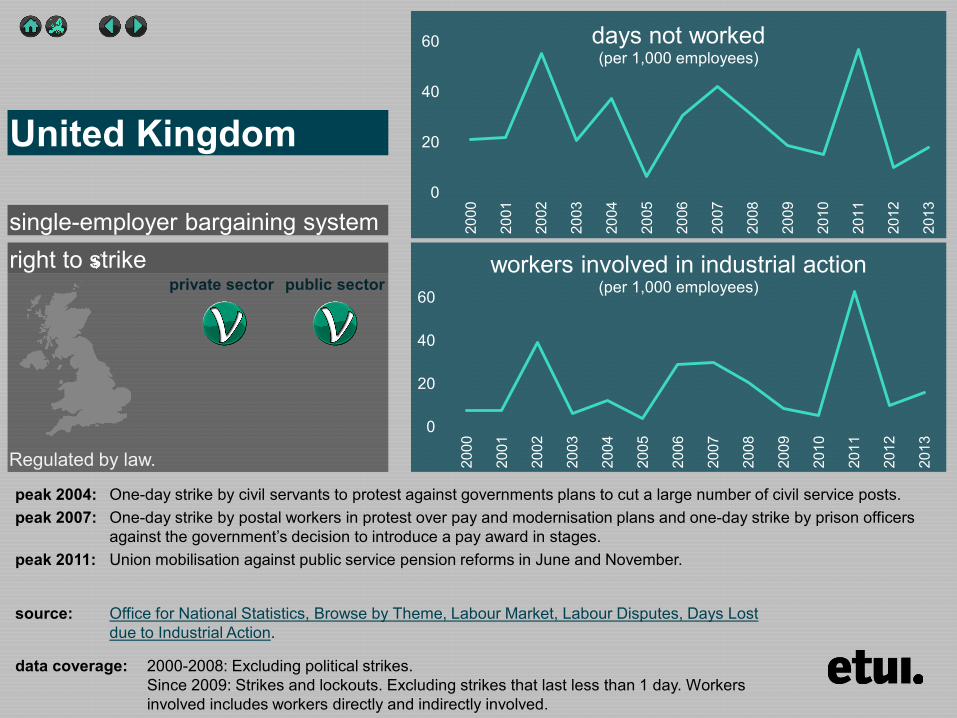
right to strike private sector public sector
data coverage 2000-2008 Excluding political strikes Since 2009 Strikes and lockouts Excluding strikes that last less than 1 day Workers involved includes workers directly and indirectly involved
0
20
40
60
2000
2001
2002
2003
2004
2005
2006
2007
2008
2009
2010
2011
2012
2013
days not worked (per 1000 employees)
0
20
40
60
2000
2001
2002
2003
2004
2005
2006
2007
2008
2009
2010
2011
2012
2013
workers involved in industrial action (per 1000 employees)
United Kingdom
source Office for National Statistics Browse by Theme Labour Market Labour Disputes Days Lost due to Industrial Action
single-employer bargaining system
Regulated by law
peak 2004 One-day strike by civil servants to protest against governments plans to cut a large number of civil service posts peak 2007 One-day strike by postal workers in protest over pay and modernisation plans and one-day strike by prison officers
against the governmentrsquos decision to introduce a pay award in stages peak 2011 Union mobilisation against public service pension reforms in June and November
Right to strike legend
yes with minor restrictions (eg recognized union balloting proportionality respect of peace obligation)
yes with major restrictions (eg monopoly union compulsory arbitration or conciliation restrictions on issues or content major groups excluded
no
yes
private sector
yes with minor restrictions (eg recognized union balloting proportionality respect of peace obligation only military judiciary or police excluded ndash as per ILO convention)
yes with major restrictions (eg monopoly union compulsory arbitration or conciliation restrictions on issues or content major groups excluded
no
yes
public sector
source J Visser Database on Institutional Characteristics of Trade Unions Wage Setting State Intervention and Social Pacts (ICTWSS) database version 4 2013 The indicators reflect the situation in 2011
Prevelant bargaining regime legend
Single-employer bargaining system the establishment or company level is predominant
Multi-employer bargaining system sector andor the cross-sector level is predominant
Mixed bargaining system an intermediate situation where sector and company negotiations each respectively account for at least one-third of those covered by collective wage-setting arrangements
source P Marginson and C Welz (2014) Changes to wage-setting mechanisms in the context of the crisis and the EUrsquos new economic governance regime Dublin Eurofound
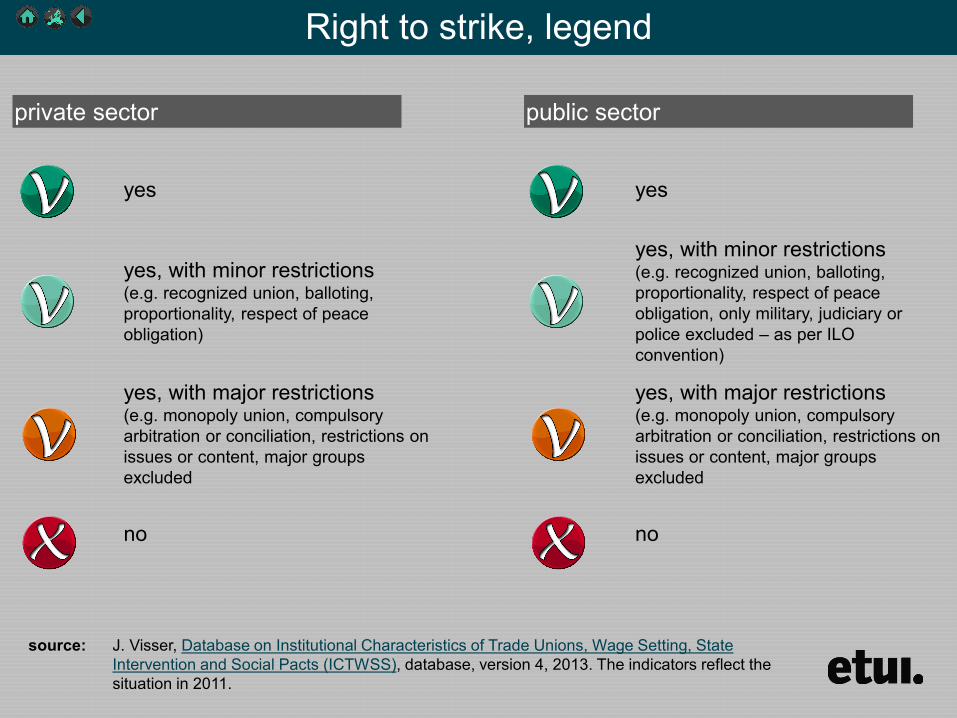
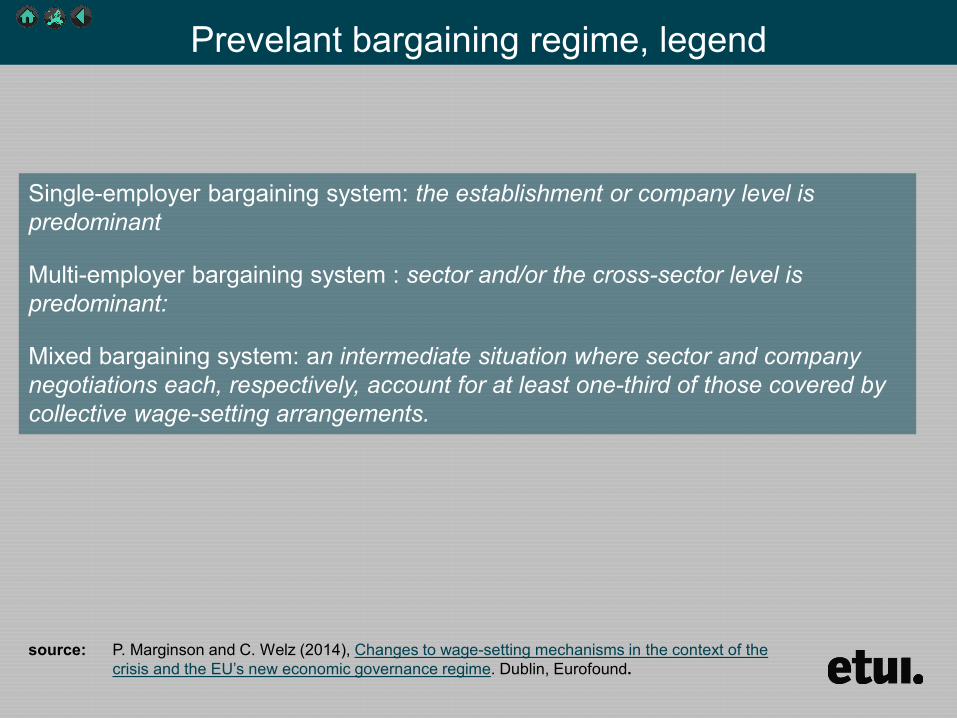