Embed Size (px)
Citation preview
VOL 37, NOS. 1 2 SEPTEMBER 1999 ISSN 0341--8162
AN INTERDISCIPLINARY JOURNAL OF
SOIL SCIENCE · HYOROLOGY · GEOMORPHOLOGY
FOCUSING ON
GEOECOLOGY ANO LANOSCAPE EVOLUTION
founded by H. Rohdenburg
-. -~~~..- A Cooperating Joumal of the lntemational Society of Soil Science
IUSS-UISS-IBU
Special lssue
The Signlflcance of Soll, Water and Landscape Processes in Banded Vegetatlon Patternlng
C. Valentln and J. Poesen (Editora)
JOINT EDITORS
J.A. Catt, Harpenden J.Poesen, Leuven O. Slaymaker, Vancouver
M.F. Thomas, Stirling S. W. Trimble, Los Angeles M.J. Singar, California

CATENAMF Thomas, Stirllf1gSW, Trimble, Los AngelesMJ, Singer, California
Joint EditorsJA Cart, HarpendenJ, Poesen, Leuveno Slaymakcr, Vancouver
Honorary EditorD,H, Yaalon, Jerusalem
Editorial BoardRW. Arnold, Washington, DCK. Auerswald, Freising-
WeihenstephanG Benito. MadridPW. Birkeland, Boulder, COH.-P. Blume, KielJ. Bouma, WagenlngenRB Bryan, TorontoPA Burrough, UtrechtB. DiekkrOger, BonnI. Douglas, ManchesterAR. Eschner, Syracuse, NYN. Fedoro!!, Thiverval-GrignonL.A Follrner, Champaign, ILF. Gallart, BarcelonaJB.J, Harrison, Socorro. NMM. lcole. Aix-en-Provence
Ac. Imeson, AmsterdamS Iwata, IbarakiA. Kerenvi, DebrecenG.J Kukla, Palisades, NYH. Lavee, Ramat-GanPJ Loveland, SilsoeL.D McFadden, Albuquerque, NMME Meadows, RondeboschMA Nearing, Wesl-Lafayette, INM.D. Newson, Newcastle upon TyneW.G, Nickling, GuelphD_A. Nielsen, Davis, CAT. Oguchi, TokyoCG_ Otson. Lincoln, NEYA Pachepsky, Beltsville, MDB. Pillans, Canberrao Righl, Poitiers
A Ruellan, MontpellierA P Schick, JerusalemU Schwertmann. Freismq-
WelhenstephanK, Stahr, StuttgartL, Starkel, KrakowG Stoops, GentJ. Thomes, LondonD. Torri. FirenzeC Valentin, PansDE. Walling, ExeterR. Webster, HarpendenM. Williams, AdelaideD.H. Yaaton. JerusalemA Yair, .IerusalernD,H, Yaalon, Jerusalem
Scope of the JournalGalena publishes papers describing onginal field and laboratory investigations and reviews on geo ecology andlandscape evolution with emphasis on interdisciplinary aspects of soil, hydrology and geomorphology. It aims to disseminate new knowledge and foster better understanding of the physical environment, of evolutionary sequencesthat have resulted in past and current landscapes, and of the natural processes that are likely 10 determine the fateof our terrestrial environment.Papers within anyone of the above tOPiCS are welcome provided they are of sufficiently Wide Interest and relevance.
Publication information: Cetene (ISSN 0341-8162). For 1999, volumes 35-37 are scheduled for publication. Subscription prices are available upon request from the Publisher or from the Regional Sales Office nearest you or fromthis Journal's websue (http://v.ww.elsevier.nl/locateicatena). Further information is available on this journal and otherElsevier Science products through Etseviers website: (http://www.elsevier.nl). Subscriptions are accepted on a prepaid basis only and are entered on a calendar year basis, Jssues are sent by standard mail (surface within Europe,air delivery outside Europe) Priority rates are available upon request. Claims for missing issues should be madewithin six months of the date of dispatch.
Orders, claims, and product enquiries: please contact the Customer Support Department at the Regional SalesOffice nearest you:
New York: Elsev,er SCIence, PO Box 945, New York, NY 10159-0945, USA; phone: (+1) (212) 633 3730, [loll freenumber for North American customers: 1-888-4ES-INFO (437-4636)]: fax (+1) (212) 633 3680; e-rnail usinloI@elseviercomAmsterdam: Elsevier Science, PO Box 211, 1000 AE Amsterdam, The Netherlands; phone: (+31) 204853757; tax:(+31) 20 4853432; e-mail: [email protected]: Elsevier Science, 9-15 Hiqashi-Azabu t-chorne, Minato-ku, Tokyo 106, Japan; phone (+81) (3) 5561 5033;fax: (+81) (3) 5561 5047; e-mail: info@elsevier,co.jpSingapore: Elsevier Science, No. 1 Temasek Avenue, #17-01 Millenia Tower, Slrlgapore 039192; phone (+65) 4343727; tax: (+65) 3372230; e-rnatl: asiainfo@elsevier,corn.sgRio de Janeiro: Elsevier Science, Rua Sete de Setembro 111/16 Andar, 20050-002 Centra, Rio de Janeiro - RJ,Brazil; phone: (+55) (21) 509 5340; fax (+55) (21) 507 1991; e-mai! [email protected],br [Note (LatinAmerica) for orders, claims and help desk information, please contact the Regional Sales Office in New York aslisted above]
Advertising information, Advertising orders and enquiries may be sent to: Europe and ROW: Rachel GresleFarthing, Elsevier Science Ltd., Advertising Department, The Boulevard, Lanqtord Lane, Kidlington, Oxiord OX51GB, UK; phone (+44) (1865) 843565; fax: (+44) (1865) 843976: e-mail: r.gresle-farth,[email protected],uk. USAand Canada: Elsevier Science lnc., Mr Tino DeCarlo, 655 Avenue of the Americas, New York, NY 10010-5107,USA; phone (+1) (212) 633 3815, fax: (+1) (212) 633 3820; e-rnait: [email protected] Japan: ElsevierScience Japan, Advertising Department, 9- t5 Higashi-Azabu t-cnorna, Minato-ku, Tokyo 106, Japan; phone (+81)(3) 5561-5033; fax: (+81) (3) 55615047.
<9 The paper used In trils publication meets the requirements of ANSliNISO Z39,48,1992 (Permanence of Paper),

ELSEVIER
CATENA
VOL. 37 (1999)
Amsterdam - Lausanne - New York - Oxford - Shannon - Tokyo

Why publish in this journal?
Publishing in this Elsevier Journal has the following advantages for authors:
Unique current awareness service Increases visibility of your article - Catena is covered by twonewspapers, SedAbstracts published br-montly and Soil SCience Alert published quarterly, whichare distributed free of charge to thousands of active researchers. SedAbstracts covers the fieldsof sedimentology, stratigraphy and palaeontology, and SOIl Science Alert covers the broad area ofsoil science. By publishing In these journals you can be sure that your colleagues worldwide willbe quickly aware of your article
No page charges - we believe that this is the fairest policy and results in truly International communication of science. After all, many authors do not have access to grants for publication of theirwork.
30% discount on all books published by the Elsevler Science group of companies.
Skilled desk editing of your electronic or paper manuscript.
Manuscripts on floppy disk are highly recommended - all major word processinq programsare accepted for processing manuscripts electronically.
Fifty free reprints of each article.
International distribution of the journal.
International marketing of the journal.
Wide coverage in appropriate indexing and abstracting services to help other scientistsaccess your work.
Abstracts and/or contents lists of this Journal are published in: Chemical Abstracts Service; CurrentContents/Agriculture, Biology & Envtronmenisl Sciences; Current Geographical Publications;Dokumentation Wasser;' Elsevier BIQBASE/Current Awareness In Biological Sciences; Focus on:Global Change; Geo Abstracts; Research Alert Direct; SCience Citation Index; SciSearch).
A detailed GUide for Authors IS available upon request. The guide can also be foundon the Wond WideWeb: access under http.//www.elsevier.nl or http://www.elseVler.com.A summary is given at the back ofthis issue.

CATENAJoint EditorsJ.A. Catt, HarpendenJ. Poesen, LeuvenO. Slaymaker, Vancouver
M.F. Thomas, StirlingS.w. Trimble, Los AngelesM.J. Singer, California
Editorial BoardR W. Arnold, Washington, DCK Auerswald, Frelslng-
WeihenstephanG. Benito, Madridp.w Birkeland, Boulder, COH -P. Blume, KielJ. Bouma, WageningenR B Bryan, TorontoPA Burrough, UtrechtLA. Campbell, EdmontonB. Dlekkruger, Bonn1. Douglas, ManchesterA A. Eschner, Syracuse, NYN. Fedoroff, Thlverval-GngnonL.A. Follmer, Champalgn, ILF Gallart, BarcelonaJ.B J. Harnson, Socorro, NMM Icole, Aix-en-Provence
A.C Imeson, AmsterdamS. Iwata, IbaraklA. Kerényi, DebrecenG.J Kukla, Pallsades, NYH Lavee, Ramat-GanPJ. Loveland, SllsoeL.D McFadden, Albuquerque, NMM.E Meadows, RondeboschM.A Neanng, West Lafayette, INM.D Newson, Newcastle upon Tynew'G. Nlckhng, GuelphD.R Nielsen, DavIs, CAT Oguchi, TokyoC. Oison, Lincoln, NEYA Pachepsky, Beltsville, MDB Pillans, CanberraD. Righi, POitiers
A Ruellan, MontpellierA P SChlCk, JerusalemU Schwertmann, Frelslng-
WeihenstephanK. Stahr, StuttgartL Starkel, KrakowG. Stoops, GentU Strelt, MunsterJ. Thornes, LondonD Torn, FirenzeC. Valentin, PansD.E. Walling, ExeterR Webster, HarpendenM. Williams, AdelaideA. Yalr, JerusalemD.H. Yaalon, Jerusalem
VOLUME 37 (1999)
ELSEVIER Amsterdam - Lausanne - New York - Oxford - Shannon - Tokyo

© 1999 Elsevier Science B.Y. Ali nghts reserved.
This Journal and the individual contributions contained in il are protected under copyright by Elsevier ScienceB.Y., and the fo11owing terms and conditions apply to their use:
PhotocopyingSingle photocopies of single articles may be made for personal use as allowed by national copyright laws.Permission of the publisher and payment of a fee is required for a11 other photocopying, includmg multiple orsystematic copying, copymg for advertismg or promotional purposes, resale, and a11 forms of document dehvery. Special rates are available for educational institutions that wish to make photocopies for non-profit educational classroom use.PermissIOns may be sought directly from Elsevier Science Rights & Permissions Department, PO Box 800,Oxford OX5 IDX, UK; phone: (+44) 1865 843830, fax: (+44) 1865 853333, e-mail:[email protected]. You may also contact Rights & Permissions directly through Elsevier's home page(http://www.elsevier.nlJ.se1ectmg first 'Customer Support', then 'General Information', then 'PermissionsQuery Form'.ln the USA, users may clear permissions and make payments through the Copyright Clearance Center, Inc., 222Rosewood Dnve, Danvers, MA 0 1923, USA; phone: (978) 7508400, fax: (978) 7504744, and in the UK throughthe Copyright Licensing Agency Rapid Clearance Service (CLARCS), 90 Tottenham Court Road, London WIPOLP, UK; phone: (+44) l71 4365931; fax: (+44) 1714363986. Other countries may have a local reprographIC nghts agency for payments.
Derivative WorksSubscribers may reproduce tables of contents or prepare hsts of articles mcluding abstracts for mternal circulation wilhin their institutIOns. Permission of the publisher is required for resale or distribution outslde the institution.Penrussion of the publisher IS required for all other derivative works, mcluding compilations and translations.
Electronic Storage or UsagePenrussion of the pubhsher is required to store or use electronica11y any matenal contained in this Journal,including any article or part of an article. Contact the publisher at the address indicated.Except as outlined above, no part of this publication may he reproduced, stored in a retrieval system or transmitted in any form or by any means, electronic, mechamcal, photocopying, recordmg or otherwise, without priorwritten permission of the publisher.Address permissions requests to: Elsevier Science Rights & Permissions Department, at the mail, fax and e-mailaddresses noted above.
NoticeNo responsibility is assumed by the Publisher for any injury and/or damage to persons or property as a matterof products liability, negligence or otherwise, or from any use or operation of any methods, products, instructions or ideas contamed in the material herein. Because of rapid advances in the medical sciences, in particular,independent verification of diagnoses and drug dosages should be made.Although al! advertising material is expected to conform to ethical (medical) standards, inclusion in this pubhcation does not constitute a guarantee or endorsement of the qualily or value of such product or of the claimsmade of it by ilS manufacturer.
El The paper used in this publication meets the requirements of ANSI/NISO Z39.48-1992(Permanence of Paper).
Printed in The Netherlands
CATE NA ELSEVIER
VOLUME 37 NOS. 1-2 SPECIAL ISSUE
THE SIGNIFICANCE OF SOIL, WATER ANO LANDSCAPE PROCESSES IN BANDEO VEGETATION PATTERNING
Edited by
C. Valentin and J. Poesen
CONTENTS
Soil and water components of banded vegetation patterns C. Valentin, J.M. d'Herbes and J. Poesen ............................. .
The influences of ecological factors on tiger bush and dotted bush patterns along a gradient from Mali to northern Burkina Faso J.C. Leprun .............................................. .
A geomorphological based banded {'t1ger') vegetation pattern related to former dune fields in Sokoto {Northern Nigeria) l.S. Zonneveld .................................. .
Vegetation ares and litter dams: similarities and differences J. Eddy, G.S. Humphreys, D.M. Hart, P.B. Mitchell and P.C. Fanning. . . . ....... .
Banded vegetation near Broken Hill, Australia: significance of surface roughness and soil physical properties D.L. Dunkerley and K.J. Brown .......... • ......................... .
The distribulion of soluble cations within chenopod-patterned ground, arid western New South Wales, Australia B.C.T. Macdonald, M.O. Melville and l. White ........................... .
The evolution and significance of soil-vegetation patterns following land abandonment and fire in Spain L.H. Cammeraat and A.C. lmeson ................................ .
Magnitude-frequency analysis of water redistribution along a climate gradient in Spain G. Bergkamp, A. Cerda and A.C. lmeson ............................ .
Laboratory experiments on sequential scour/deposition and their application to !he development of banded vegetation R.B. Bryan and S.E. Brun ...................................... .
The soil surface characteristics of vegetation stnpes in Northern Mexico and their influences on the system hydrodynamics. An experimental approach J.L. Janeau, A. Mauchamp and G. Tarin ............................. .
Morphology and microstructure of microbiotic soil crusts on a tiger bush sequence {Niger, Sahel) O. Malam lssa, J. Trichet, C. Défarge, A. Couté and C. Valenlin ................ .
Water balance in a banded vegetalion pattern. A case study of tiger bush in western Níger S. Galle, M. Ehrmann and C. Peugeot ............................... .
1esting the validity of upslope migrat1on in banded vegetation from south-west Níger A. Chappell, C. Valentin, A. Warren, P. Noon, M. Charllon and J.M. d'Herbes ........ .
Níger tiger bush as a natural water harvesting system C. Valentin and J.M. d'Herbes ................................... .
Stripes, strands or st1pples: modelling the influence of three landscape banding patterns on resource capture and productivity in semi-arid woodlands, Australia J.A. Ludwig, D.J. Tongway and S.G. Marsden .......................... .
25
45
57
75
89
107
129
147
165
175
197
217
231
257

ELSEVIER Catena 37 (I999) 1-24
CATENA
Soil and water components of banded vegetationpatterns
C. Valentin a. * , J.M. d'Herbès b, J. Poesen c
a IRD, 210, rue La Favette, 75480 Paris cedex JO, Franceh IRD, B P. 5045, 34032 Montpe/her, France
C Frmd for Scientrfic Researclr Fhlllders, Laboratory for E.tperimenfll/ Geoll1orph%gy, Katllolieke Universrteltuur'en, Redilrgenstraat 16, B-3000 Leuven, Be/glUm
Received 4 November 1998; accepted 1 April 1999
Abstract
Banded landscapes are comprised of alternating bands of vegetation and bare ground alignedalong the contours in arid and semi-arid regions (50-750 mm rainfalO, on very gentle and uniformslopes (0.2-2%). Vegetated bands can be perpendicular to the direction of the dominant wind, ormore frequently of the slope. Under given climatic conditions, slope gradient is the controllingfactor of the type of pattern ('spotted', 'broadly' or 'typically' banded). For a given slopegradient, mean annual rainfall determines the contrast between the vegetated and bare phase, asweil as the band length and the interband width:band width ratio. A typical transect through suchtwo-phase mosaic includes a dynamic succession of surface crusts which generates a mn-off-runon system. This favours the capture of limited water resources and thus a biomass productiongreater for banded patterns than spotted patterns or uniformly scattered vegetation. Moreover,vegetated bands act as natural bench structures that greatly limit soil erosion. As suggested bymodelling, banded vegetation patterns can equally be derived from nearly bare areas or from densevegetation patterns. Because banded vegetation patterns have often been considered as a form ofdegradation of previous continuous vegetation cover, many attempts have been made by forestersto restore this initial cover by reforestation of the bare interbands. However the numerous failuresof reforestation of the bare interbands illustrate the key role of these mosaic components in themaintenance of the tiger bush ecosystem. Banded vegetation patterns are more resilient to climatechange than to human disturbances. The 10ss of landscape patchiness due to the clearing of thebands either for fuelwood or for ephemeral cropping induces a rapid decline in soil fertility andwater infiltration potential. Long-term monitoring shows that the interband width:band width ratioadapts to rainfall variations that are intrinsic of semi-arid zones. Moreover, climatic changes might
• Corresponding author.
0341-8162/99/$ - see front matter © 1999 Elsevier Science B.V. Ali rights reserved.PlI: S0341-8162(99)00053-3
2 C. Valelltll1 et al. / Carella 37 (1999) 1-24
also mduce a change in the type of patterning, suggesting that banded vegetation patterns arehighly self-sustainable. The ecological differences between the pioneer and the decaying edges ofthe vegetated bands. the temporal/spatial succession of SOli crusts, as weil as other indices such asthe spatial distribution of soil orgamc matter and termite nests suggest the upslope migration ofthe bands. Nevertheless field evidence of such a shift remains scarce. Profound lessons can belearnt from the study of banded landscapes in terms of ecosystems functions. When deslgningwater-harvesting systems, or restoring degraded arid and semi-arid land, banded vegetatIOnpatterns should be imitated to optimize biomass production and limit land degradatlOn. © 1999Elsevier Science B.V. Ali rights reserved.
KeYl1'ords: Landscape patchine,s; Banded vegetatIOn pattern: SOlI crustmg: Water-harvestmg. Seml-and zone
1. Introduction
Studies of soil erosion, both theoretical and field oriented, have usually focused onagricultural plots. Much research has been therefore experimental and small scale incharacter. Integrating it into larger-scale models requires substantial progress in accounting for processes in real landscapes at the appropriate spatial and temporal sc,lles. Thisraises questions about major controls on erosional process variations within a landscape(e.g.. soil, topography, and land use). However. important effects of landscapes onmn-off production and erosion also depend on the ways in which different sites interactwith one another. Moreover, the effects of erosional processes across an entire landscapeare often different from their effects within a small area (e.g., Poesen et al., 1996). Inrecent years, erosion modellers have become increasingly aware of the need to incorporate landscape patchiness and interactions.
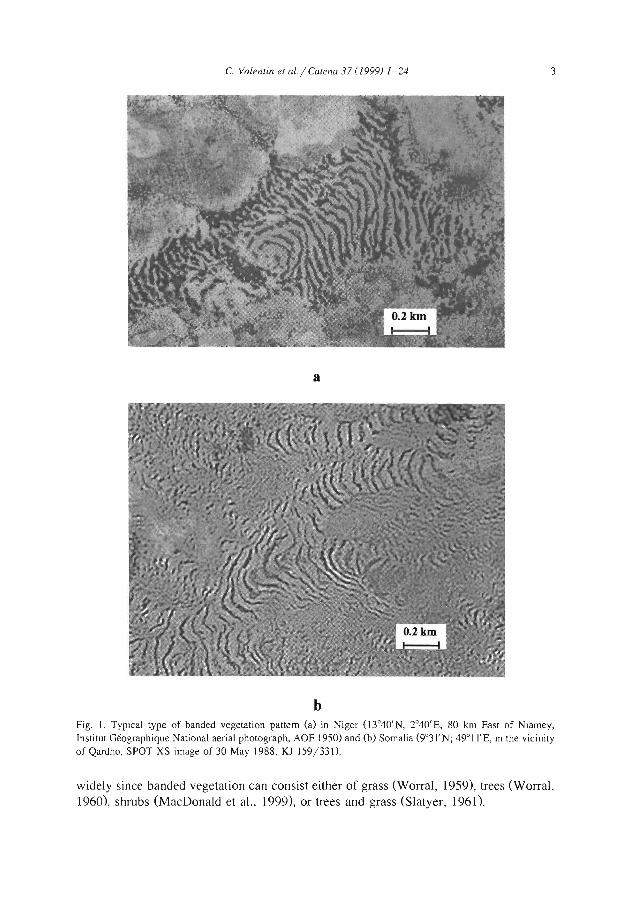
This special issue of Catena does not claim to address ail these complex issues. Itaims to provide insights on the interactions between soiL water and vegetation in apeculiar type of ecosystem that occurs in arid and semi-arid zones. In these regionslandscapes are commonly organized in a two-phase mosaic including vegetated and barecomponents. Among these communities, two main types have been often distinguished.The most common consists of spotted patches more or less circular (e.g., Puigdefabregasand Sanchez, 1996; Lavee et al., 1998), the second of banded patches (Fig. 1). Thispaper, as weil as the series of papers of this special issue will refer to this latter type.
Banded vegetation patterns encompass densely vegetated stripes (bands) alternatingregularly with bare areas of soil (interbands). Such patterns have drawn a growingattention among the scientific community over the last decades not only because theypose intriguing questions on (i) their forming processes (e.g., Thiéry et al., 1995), (iD theinteractions between patterns and functions kg., Boaler and Hodge, 1964; Noy-Meir,1973; Ludwig and Tongway, 1995), (iiD their sensibility to climatic changes (e.g.,Boudet, 1972; Couteron, 1997), but also (iv) because of their economical importance interms of fuel and fodder production (e.g., d'Herbès et al., 1997a,b).
The most characteristic form of banded vegetation has been first recognized fromaerial photographs and called 'tiger bush' in Niger (Clos-Arceduc, 1956) and the Sudan(Worral. 1960). Among clearly banded patterns, great similarities can be observedbetween aerial-photos from many parts of the world. However, ground tmth may differ
C. Valentin et al./Catena 37 (1999) 1-24
a
b
3
Fig. 1. Typical type of banded vegetal ion paltern (a) in Niger ()3°40' N, 2°40' E, 80 km East of Niamey,Institut Géographique National aerial phOlograph, AOF 1950) and (b) Somalia (9°3 l' N; 49°1 l'E, in the vicinityof Qardho, SPOT XS image of 30 May 1988, KJ 159/331).
widely since banded vegetation can consist either of grass (Worral, 1959), trees (Worral,1960), shrubs (MacDonald et al., 1999), or trees and grass (Slatyer, 1961).
4 C. Valentin et ul.jeatenu 37 (199'}) 1~24
altitude (m)5
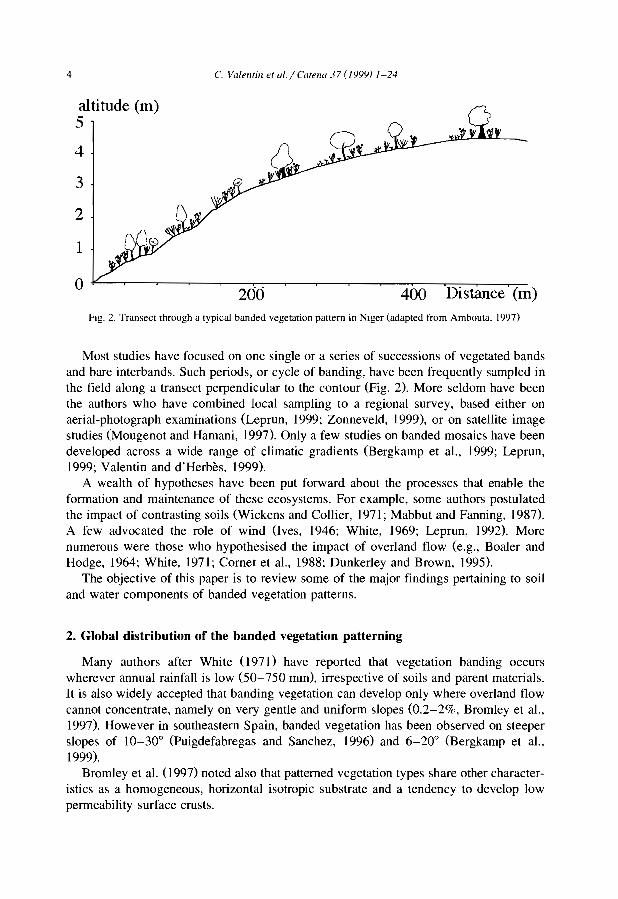
Fig. 2. Transect through a typical banded vegetation pattern in Niger (adapted t'rom Ambouta, 1997)
Most studies have focused on one single or a series of successions of vegetated bandsand bare interbands. Such periods, or cycle of banding, have been frequently sampled inthe field along a transect perpendicular to the contour (Fig. 2). More seldom have beenthe authors who have combined local sampling to a regional survey, based either onaerial-photograph examinations (Lepmn, 1999; Zonneveld, 1999), or on satellite imagestudies (Mougenot and Hamani, 1997). Only a few studies on banded mosaics have beendeveloped across a wide range of climatic gradients (Bergkamp et al., 1999; Lepmn,1999; Valentin and d'Herbès, 1999).
A wealth of hypotheses have been put forward about the processes that enable theformation and maintenance of these ecosystems. For example, sorne authors postulatedthe impact of contrasting soils (Wickens and Collier, 1971; Mabbut and Fanning, 1987).A few advocated the role of wind Oves, 1946; White, 1969; Lepmn, 1992). Morenumerous were those who hypothesised the impact of overland flow (e,g., Boaler andHodge, 1964; White, 1971; Cornet et al., 1988; Dunkerley and Brown, 1995).
The objective of this paper is to review sorne of the major findings pertaining to soiland water components of banded vegetation patterns.
2. Global distribution of the banded vegetation patterning
Many authors after White (971) have reported that vegetation banding occurswherever annual rainfall is low (50-750 mm), irrespective of soils and parent materials,It is also widely accepted that banding vegetation can develop only where overland flowcannot concentrate, namely on very gentle and uniform slopes (0.2-2%, Bromley et al.,1997), However in southeastern Spain, banded vegetation has been observed on steeperslopes of 10-30° (Puigdefabregas and Sanchez, 1996) and 6-20° (Bergkamp et al.,1999),
Bromley et al. (I997) noted also that patterned vegetation types share other characteristics as a homogeneous, horizontal isotropie substrate and a tendency to develop lowpermeability surface crusts.

C. Valentin et al. / Catena 37 (1999) 1-24 5
Table 1Main reference, on banded vegetation patterns
Ref. Region Authors and date Ref. RegIOn Authors and date
A Australia Dunkerley and Brown, 1995 Me MexIco Janeau et al .. 1999A Austraha Dunkerley and Brown, 1999 Me MexIco Mauchamp, 1992A Australia Greene, 1992 Me Mexico Mauchamp et aL 1994A Australia Greene et al., 1994 Me MexIco Mauchamp and Janeau, 1993A Australia Grelg-Smllh, 1979 Me MexIco Montana, 1992A Australia Litchtïeld and Mabbut, 1962 Me Mexico Montana et aL 1990A Au,tralia Ludwig and Tongway, 1995 N Niger Ambouta, 1984A Australia Ludwig et al., 1994 N Niger Ambouta, 1997A Austraha Ludwig et al .. 1999 N Niger Chappel et al., 1999A Australia Mabbut and Fanning, 1987 N Niger Chase and Boudouresque,
1987A Australia MacDonald et al., 1999 N Niger Bromley et al., 1997A Austraha Slatyer, 1961 N Niger d'Herbès et al., 1997bA Australia Tongway and Ludwig, 1989 N Niger d'Herbès et al., 1997aA Australla Tongway and Ludwig, 1990 N Niger Galle et al., 1997A Austraha Tongway and Ludwig, 1994 N Niger Galle et al., 1999Ar Saudi Arabia Vesey-Fitzgerald, 1957 N Niger GUillaume et al., in press aAf South Aftlca MacDonald, 1978 N Niger Guillaume et al., ln press bAf South Africa Van der Meulen and N Niger Ichaou and d'Herbès, 1997
Morris, 1979B Burkina Faso CoUleron, 1997 N Niger Malam Issa et al., 1999B Burlana Faso Couteron and Kokou, 1997 N Niger Mougenot and Hamani,
1997B Burkma Faso Couteron et al., 1996 N Niger Orr,1995B Burkma Faso Ouédraogo and Lepage, 1997 N Niger Peltier et al., 1994a,bB Burkina Faso Serpantié et al., 1992 N Niger Seghleri et al., 1996E East Africa Belskl, 1990 N Niger Vandervaere et al., 1997E East Africa Boaler and Hodge, 1962 N Niger Wallace and Holwill, 1997E East Aftlca Gllhland, 1952 N Niger White, 1970E East Africa Greenwood, 1957 N Niger White, 1971E East Africa Hemming, 1965 N Niger/ Thiéry et al., 1995
globalE East Africa MacFayden, 1950 N Nlger/ Thiéry et al., 1996
globalE/J/S East Africa/ Boaler and Hodge, 1964 N Niger/ Valentin and d'Herbès,
Jordan/Syria global 1999J Jordan White, 1969 Ni Nigeria Clayton, 1966M Mali Boudet, 1972 Ni Nigeria Grove, 1957M Mah Hiernaux and Gérard, in press Ni Nigeria Zonneveld, 1999M/B Mali/ Lepron, 1992 Su Sudan Morrison et al., 1948
Burkina FasoM/B Malij Lepron, 1999 Su Sudan Ruxton and Berry, 1960
Burkina FasoM/N MalijNlger Clos-Arceduc, 1956 Su Sudan Warren, 1973Ma Mauritania Audry and Rossetti, 1962 Su Sudan Wickens and Collier, 1971Me Mexico Cornet, 1992 Su Sudan Worral,1959Me Mexico Cornet et al., 1988 Su Sudan Worral, 1960Me Mexico Cornet et al., 1992 (U) USA Ives, 1946Me Mexico Delhoume, 1995 (U) USA MacMahon and Shimpf, 1981
Arid zone
D Seml Arid zoneo cl
0-..
n~'"~5'~
!'?-""-~~
i5w
".....~~.....1
N....
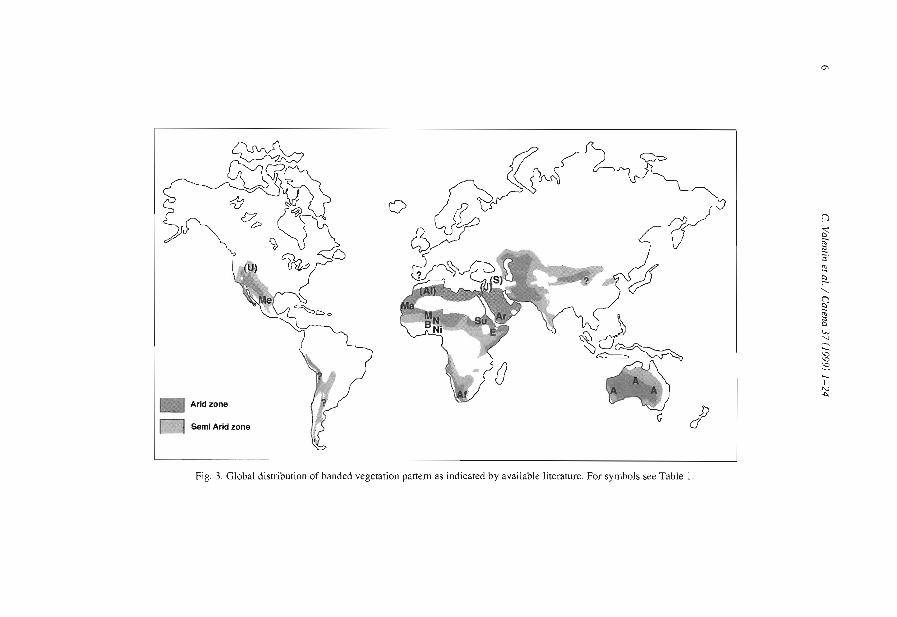
Fig. 3. Global distribution of banded vegetation panem as indicated by available IiteralUre. For symbols see Table 1.
C. Valentin et al. / Catena 371/999) /-24 7
The domain of occurrence of the banded vegetation patterns as indicated by availableliterature (Table 1, Fig. 3) has certainly been biased by the number of studies conductedin Africa and in Australia compared to other continents. Banded vegetation is thus likelyto cover larger areas in South America and in Asia but systematic surveys still have tobe conducted at the global scale.
3. Types of banded vegetation patterns and associated factors
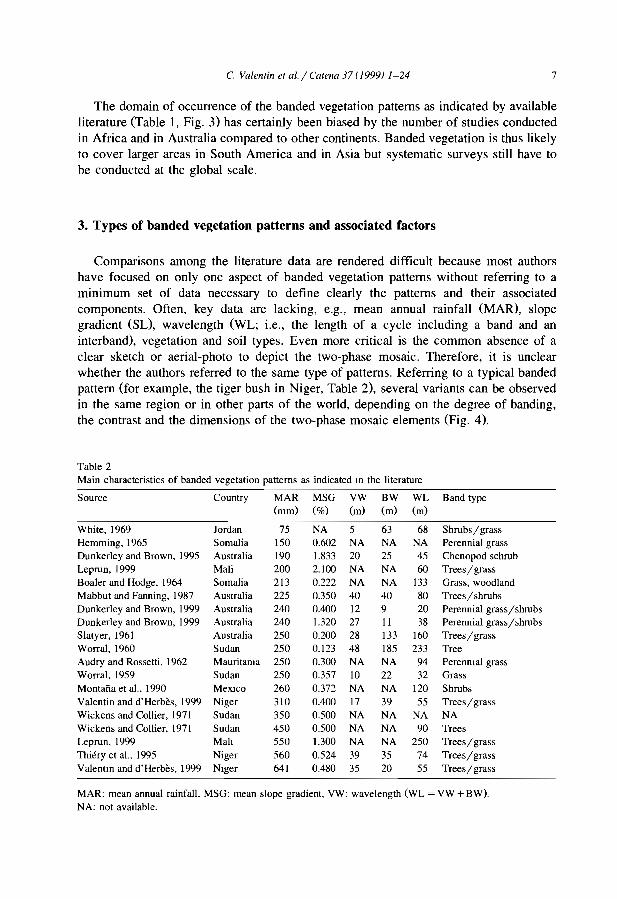
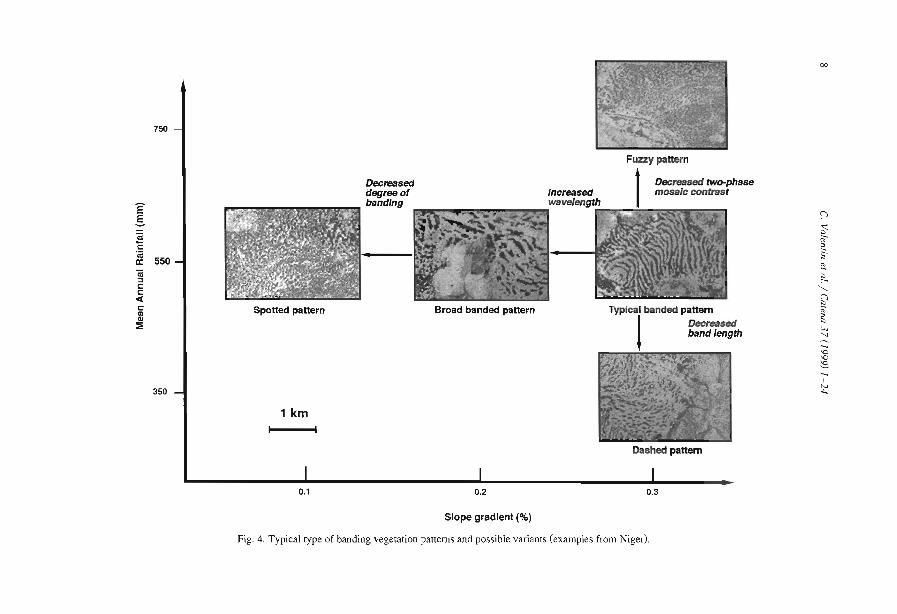
Comparisons among the literature data are rendered difficult because most authorshave focused on only one aspect of banded vegetation patterns without referring to aminimum set of data necessary to define c1early the patterns and their associatedcomponents. Often, key data are lacking, e.g., mean annual rainfall (MAR), slopegradient (SL), wavelength (WL; i.e., the length of a cycle including a band and aninterband), vegetation and soil types. Even more critical is the common absence of ac1ear sketch or aerial-photo to depict the two-phase mosaic. Therefore, it is unclearwhether the authors referred to the same type of patterns. Referring to a typical bandedpattern (for example, the tiger bush in Niger, Table 2), several variants can be observedin the same region or in other parts of the world, depending on the degree of banding,the contrast and the dimensions of the two-phase mosaic elements (Fig. 4).
Table 2Main characteristics of banded vegetation patterns as indicated m the literature
Source Country MAR MSG VW BW WL Band type(mm) (%) (m) (m) (m)
White, 1969 Jordan 75 NA 5 63 68 Shrubs / grassHemming, 1965 Somalia 150 0.602 NA NA NA Perennial grassDunkerley and Brown, 1995 Australia 190 1.833 20 25 45 Chenopod schrubLeprun, 1999 Mali 200 2.100 NA NA 60 Trees/ grassBoaler and Hodge, 1964 Somalia 213 0.222 NA NA 133 Grass, woodlandMabbut and Fanning. 1987 Australia 225 0.350 40 40 80 Trees/ shrubsDunkerley and Brown, 1999 Australia 240 0.400 12 9 20 Perennial grass/ shrubsDunkerley and Brown, 1999 Australia 240 1.320 27 II 38 Perennial grass/ shrubsSlatyer, 1961 Australia 250 0.200 28 133 160 Trees/ grassWorral,1960 Sudan 250 0.123 48 185 233 TreeAudry and Rossetti, 1962 Mauritama 250 0.300 NA NA 94 Perenmal grassWorral, 1959 Sudan 250 0.357 10 22 32 GrassMontana et al.. 1990 MeXICO 260 0.372 NA NA 120 ShrubsValentin and d'Herbès, 1999 Niger 310 0.400 17 39 55 Trees/ grassWickens and Collier, 1971 Sudan 350 0.500 NA NA NA NAWickens and Collier, 1971 Sudan 450 0.500 NA NA 90 TreesLeprun, 1999 Mah 550 1.300 NA NA 250 Trees/ grassThiéry et al.. 1995 Niger 560 0.524 39 35 74 Trees/ grassValentm and d' Herbès, 1999 NIger 641 0.480 35 20 55 Trees/ grass
MAR: mean annual rainfall, MSG: mean sIope gradient, VW: wavelength (WL = VW +BW).NA: not available.
750
Ê.sQi....c'(ij
550a:Qi::1CCc:(Cca<Il::!;
350
Spetted pattern
1 km
0.1
Bread banded pattern
0.2
Siope gradient (%)
Decreased two-phasemosale eontrast
Typlcal banded pattem
1Decreasedbandlength
.J 1 $l'.
Dashed pattern
0.3
00
()
~"::.::;'~
'":-"-~~'"<...>
"~.....~.....1
N...
Fig. 4. Typical type of banding vegetation patterns and possible variants (examples from Niger).
3.1. Degree of banding
C. Valentin el al. / Catena 37 (J 999) 1-24 9
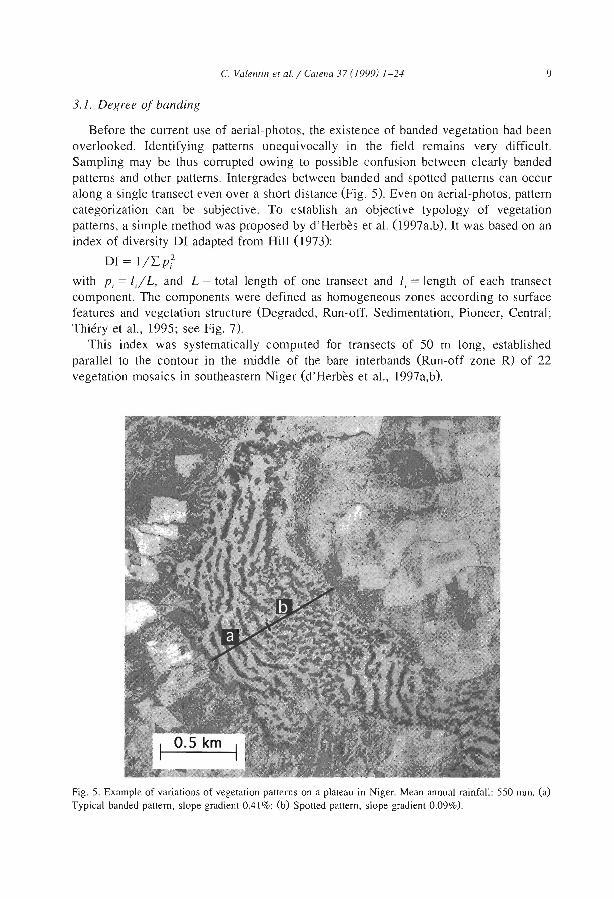
Before the CUITent use of aerial-photos, the existence of banded vegetation had beenoverlooked. Identifying patterns unequivocally in the field remains very difficult.Sampling may be thus corrupted owing to possible confusion between clearly bandedpatterns and other patterns. Intergrades between banded and spotted patterns can occuralong a single transect even over a short distance (Fig. 5). Even on aerial-photos, patterncategorization can be subjective. To establish an objective typology of vegetationpatterns, a simple method was proposed by d'Herbès et al. (l997a,b). It was based on anindex of diversity DI adapted from Hill (L 973):
DI = l/f..p;with Pi = ljL, and L = total length of one transect and l; = Jength of each transectcomponent. The components were defined as homogeneous zones according to surfacefeatures and vegetation structure (Degraded, Run-off, Sedimentation, Pioneer, Central;Thiéry et al., 1995; see Fig. 7).
This index was systematically computed for transects of 50 m long, establishedparallel to the contour in the middle of the bare interbands (Run-off zone R) of 22vegetation mosaics in southeastern Niger (d'Herbès et al., 1997a,b).
Fig. 5. Example of varjations of vegetation patterns on a plateau in Niger. Mean annual rainfall: 550 mm. (a)Typical banded pattern, slope gradient 0.41 %; (b) Spotted pattern, slope gradient 0.09%).
10 C Va/en/Ill e/a/. / Ca/el/a 37 (1999) / -24
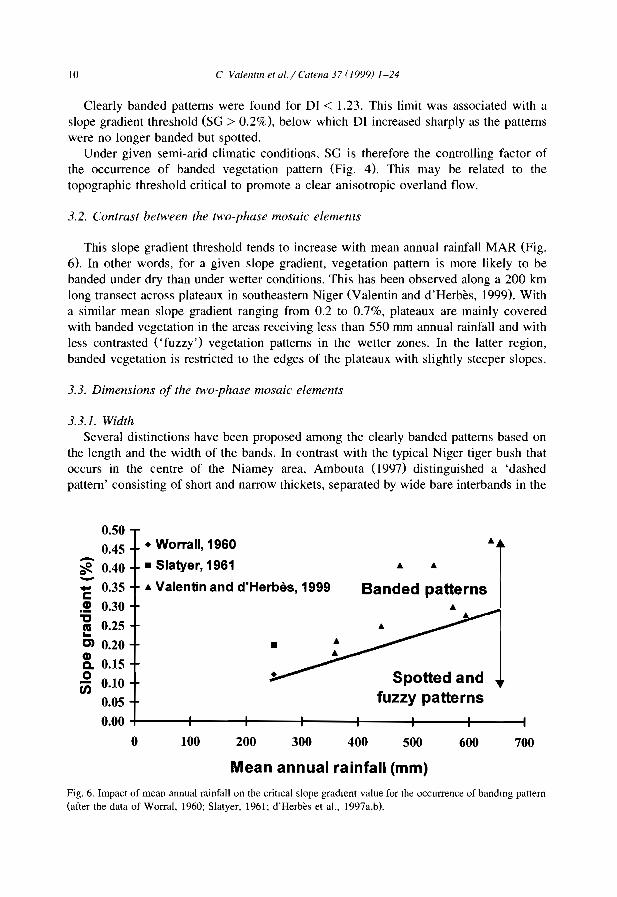
Clearly banded patterns were found for DI < 1.23. This limit was associated with aslope gradient threshold (SG > 0.2%), below which DI increased sharply as the patternswere no longer banded but spotted.
Under given semi-arid climatic conditions, SG is therefore the controlling factor ofthe occurrence of banded vegetation pattern (Fig. 4). This may be related to thetopographie threshold critical to promote a clear anisotropie overland flow.
3.2. Contrast bet.veen the m'a-phase mosaic elements
This slope gradient threshold tends to increase with mean annual rainfall MAR (Fig.6). In other words, for a given slope gradient, vegetation pattern is more likely to bebanded under dry than under wetter conditions. This has been observed along a 200 kmlong transect across plateaux in southeastern Niger (Valentin and d'Herbès, 1999). Witha similar mean slope gradient ranging from 0.2 to 0.7%, plateaux are mainly coveredwith banded vegetation in the areas receiving less than 550 mm annual rainfall and withless contrasted ('fuzzy') vegetation patterns in the wetter zones. In the latter region,banded vegetation is restricted to the edges of the plateaux with slightly steeper slopes.
3.3. Dimensions of the two-phase mosaic elements
3.3.1. WidthSeveral distinctions have been proposed among the clearly banded patterns based on
the length and the width of the bands. In contrast with the typical Niger tiger bush thatoccurs in the centre of the Niamey area, Ambouta (1997) distinguished a 'dashedpattern' consisting of short and narrow thickets, separated by wide bare interbands in the
Spotted andfuzzy patterns
•
• Worrall, 1960
• 51atyer, 1961
• Valentin and d'Herbès, 1999
0.50
0.45-';ft 0.40-- 0.35c.! 0.30
'i 0.25...C) 0.20
8. 0.15oen 0.10
0.05
0.00 ;----+----+----+---+----+-----1----1o 100 200 300 400 500 600 700
Mean annual rainfall (mm)
Fig. 6. Impact of mean annual rainfall on the crilIcal slope gradient value for the occurrence of bandmg pattern(after the data of Worral, 1960; Slatyer, 1961; d'Herbès et al., 1997a,bl.
C. Valentin et a!./ Catena 37 (1999) 1-24 Il
drier zone. Similarly, Ludwig et al. (1999) distinguished in Australia stripes (short bandssimilar to the above 'dashes') and strands (long bands, analogous to the typical tigerbush).
3.3.2. WauelengthEither in Niger (Ambouta, 1984; d'Herbès et al., 1997a,b), or in Australia (Mabbut
and Fanning, 1987; Dunkerley and Brown, 1995) distinctive banded patterns have beenrecognized consisting of broad bands of thickets alternating with broad and bareinterbands. They are usually referred to as 'broad-banded patterns'. The occurrence oftypical- and broad-banded patterns nearly on the same locations have been explained byslight difference in slope gradient values. Several authors (d'Herbès et al., 1997a,b;Eddy et al., 1999) have reported that WL increases when SG decreases. However, asmentioned earlier there is a minimum value of SG below which vegetation is no longerbanded but spotted. Near this critical limit of SG (0.2% in Niger), bands and interbandstend to reach a maximum width just before being disorganized. Typical-banded,broad-banded and no banded vegetation can therefore be adjacent as a result of slightdifferences in SG (0.25%, 0.20%, 0.15% respectively; d'Herbès et al., 1997a,b).
4. Soil components of banded patterns
4.1. Soil properties
One of the most crucial conditions to the development of banded vegetation patternsis the low infiltrability of soils and thus their ability to produce overland flow. Forexample, where aeolian sands cover the soil uniformly, no vegetation banding occurs onthe Niger plateaux (d'Herbès and Valentin, 1997).
Although the greater depth of interband soils is reported from banding of Terminaliabrownii savannah in the Sudan (Wickens and Collier, 1971), most observers (e.g.,Ambouta, 1984; Bromley et al., 1997) agree that there is little difference between thesoils of band and interband, besides the one directly induced by positive feedbacks fromvegetation, faunal and hydrological differences. For example, MacDonald et al. (I 999)reported that the cations were concentrated within the bare areas of a chenopodshrubland in South East Australia. The sodium concentration decreased towards thecentre of the vegetation arcs. The authors observed that such distribution is notresponsible for banding pattern but conversely is chiefly influenced by differences insoil moisture resulting from the accumulation of run-on vegetation depression andrun-off from bare and impermeable gilgài mounds.
The contrast in the soils which support banded vegetation patterns is thus mainly inthe surface and subsoil features.
4.2. Suiface features
Most authors have noted the very smooth surface of interbands, which efficientlygenerates run-off generation, compared to the rougher surfaces of the band more
12 C. Valentin et al. / Catena 37 (1999) 1~2"
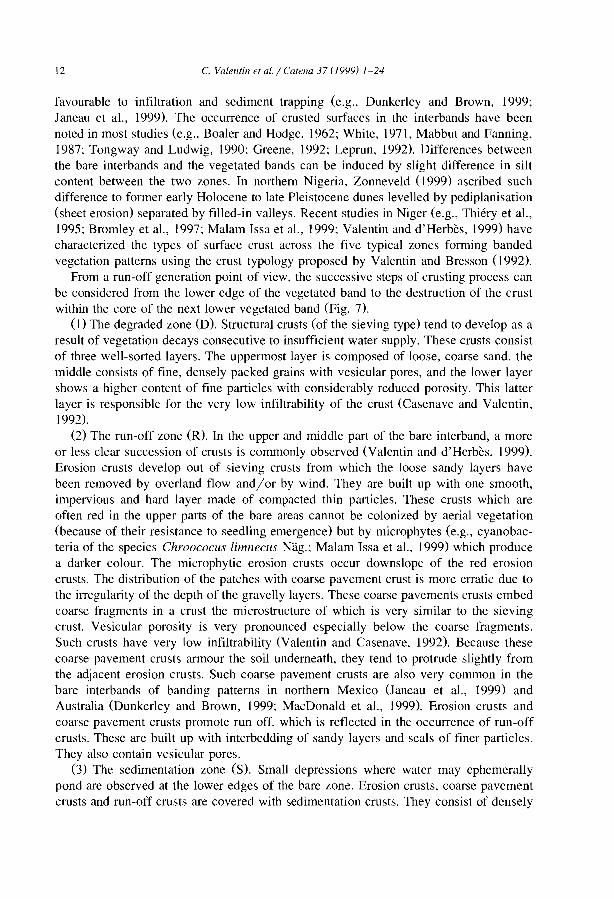
favourable to infiltration and sediment trapping (e.g., Dunkerley and Brown, 1999;Janeau et al., 1999). The occurrence of crusted surfaces in the interbands have beennoted in most studies kg., Boaler and Hodge, 1962; White, 1971, Mabbut and Fanning,1987; Tongway and Ludwig, 1990; Greene, 1992; Leprun, 1992). Differences betweenthe bare interbands and the vegetated bands can be induced by slight difference in siltcontent between the two zones. In northem Nigeria, Zonneveld (1999) ascribed suchdifference to former early Holocene to late Pleistocene dunes levelled by pediplanisation(sheet erosion) separated by filled-in valleys. Recent studies in Niger (e.g., Thiéry et al.,1995; Bromleyet al., 1997; Malam Issa et al., 1999; Valentin and d'Herbès, 1999) havecharacterized the types of surface crust across the five typical zones fonning bandedvegetation patterns using the crust typology proposed by Valentin and Bresson (1992).
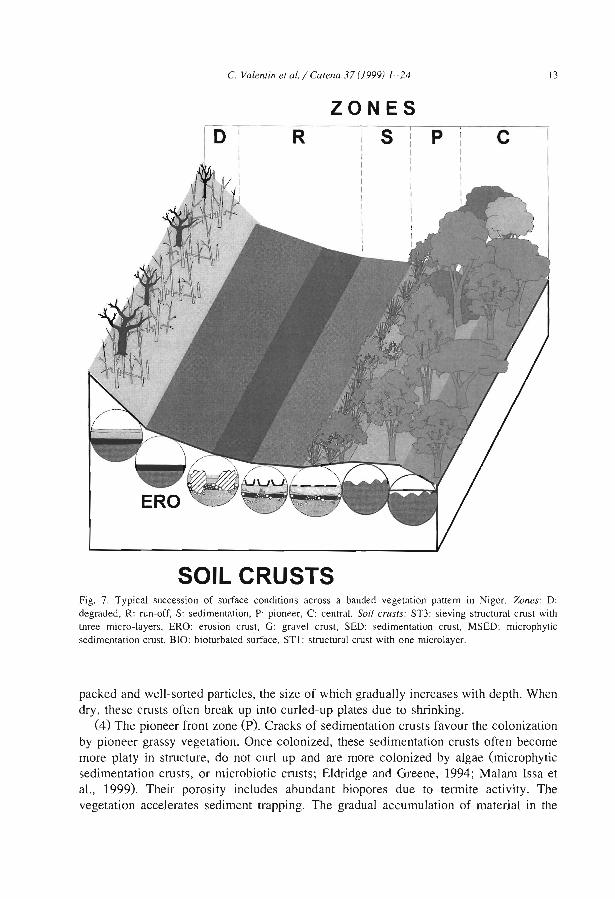
From a run-off generation point of view, the successive steps of crusting process canbe considered from the 10wer edge of the vegetated band to the destruction of the crustwithin the core of the next 10wer vegetated band (Fig. 7).
(l) The degraded zone (D). Structural crusts (of the sieving type) tend to develop as aresult of vegetation decays consecutive to insufficient water supply. These crusts consistof three well-sorted layers. The uppermost layer is composed of 100se, coarse sand. themiddle consists of fine, densely packed grains with vesicular pores, and the lower layershows a higher content of fine particles with considerably reduccd porosity. This latterlayer is responsible for the very low infiltrability of the crust (Casenave and Valentin.1992).
(2) The run-off zone (R). In the upper and middle part of the bare interband, a moreor less clear succession of crusts is commonly observed (Valentin and d'Herbès, 1999).Erosion crusts develop out of sieving crusts from which the loose sandy layers havebeen removed by overland flow and/or by wind. They are built up with one smooth,impervious and hard layer made of compacted thin particles. These crusts which areoften red in the upper parts of the bare areas cannot be colonized by aerial vegetation(because of their resistance to seedling emergence) but by microphytes (e.g., cyanobacteria of the species Chroococus /imneclls Nag.; Malam Issa et al., 1999) which producea darker colour. The microphytic erosion crusts occur downslope of the red erosioncrusts. The distribution of the patches with coarse pavement crust is more erratic due tothe irregularity of the depth of the gravelly layers. These coarse pavements crusts embedcoarse fragments in a crust the microstructure of which is very similar to the sievingcrust. Vesicular porosity is very pronounced especially below the coarse fragments.Such crusts have very low infiltrability (Valentin and Casenave, 1992). Because thesecoarse pavement crusts armour the soil underneath, they tend to protrude slightly fromthe adjacent erosion crusts. Such coarse pavement crusts are also very common in thebare interbands of banding patterns in northern Mexico (Janeau et al., 1999) andAustralia (Dunkerley and Brown, 1999; MacDonald et al., 1999). Erosion crusts andcoarse pavement crusts promote run-off, which is reflected in the occurrence of run-offcrusts. These are built up with interbedding of sandy layers and seals of finer particles.They also contain vesicular pores.
(3) The sedimentation zone (S). Small depressions where water may ephemerallypond are observed at the 10wer edges of the bare zone. Erosion crusts, coarse pavementcrusts and run-off crusts are covered with sedimentation crusts. They consist of densely
C. Valentin et al. / Catena 37 (J999) /-24 13
D R
ZONESS p c
SOll CRUSTSFig, 7, Typical succession of surface conditions across a banded vegetation pattern in Niger. Zones: D:degraded, R: run-off, S: sediment<t!ion, P: pioneer, C: central. Soil crusts: ST3: sieving structural cruS! withthree micro-Iayers, ERO: erosion crust, G: gravel crust, SED: sediment<ttion cruS!, MSED: microphyticsedimentation cruS!, BIO: bioturbated surface, ST]: structural cruS! with one microlayer.
packed and well-sorted particles, the size of which gradually increases with depth, Whendry, these crusts often break up into curled-up plates due to shrinking.
(4) The pioneer front zone (p). Cracks of sedimentation crusts favour the colonizationby pioneer grassy vegetation. Once colonized, these sedimentation crusts often becomemore platy in structure, do not curl up and are more colonized by algae (microphyticsedimentation crusts, or microbiotic crusts; Eldridge and Greene, 1994; Malam Issa etal., 1999). Theil' porosity includes abundant biopores due to termüe activity, Thevegetation accelerates sediment trapping, The graduaI accumulation of material in the
C. Valentin et al. / Catena 37 (/999) J-24
Siope direction
20 30 40
1 Sare ground
o 10
Tree zone
-20 -10
Grassy 1zone
14
100
N
E 80IJ')
N
0....8.60CIlCL!....0
8-40il-0V20.0E::JZ
0-40 -30
SareGround
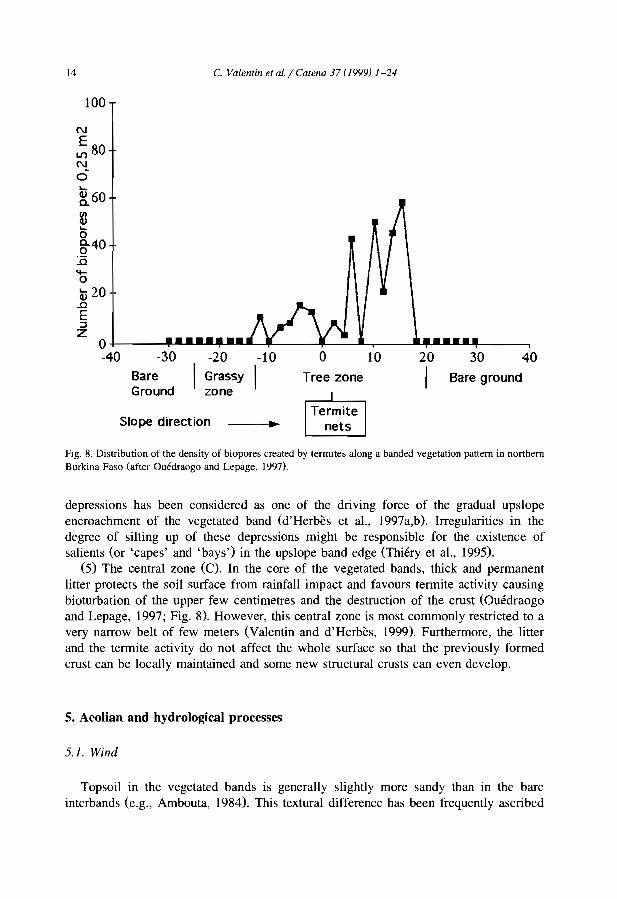
Fig. 8. Distribution of the density of biopores created by termItes a10ng a banded vegetation pattern in northernBurkina Faso (after üuédraogo and Lepage, 1997).
depressions has been considered as one of the driving force of the graduai upslopeencroachment of the vegetated band (d'Herbès et al., 1997a,b). Irregularities in thedegree of silting up of these depressions might be responsible for the existence ofsalients (or 'capes' and 'bays') in the upslope band edge (Thiéry et al., 1995).
(5) The central zone (C). In the core of the vegetated bands, thick and permanentlitter protects the soil surface from rainfall impact and favours termite activity causingbioturbation of the upper few centimetres and the destruction of the crust (Ouédraogoand Lepage, 1997; Fig. 8). However, this central zone is most commonly restricted to avery narrow belt of few meters (Valentin and d'Herbès, 1999). Furthermore, the litterand the termite activity do not affect the whole surface so that the previously formedcrust can be locally maintained and sorne new structural crusts can even develop.
5. Aeolian and hydrological processes
5.J. Wind
Topsoil in the vegetated bands is generally slightly more sandy than in the bareinterbands (e.g., Ambouta, 1984). This texturai difference has been frequently ascribed
C. Valentin et al. / Catena 37 (J999) 1-24 15
to sand trapping by the vegetation (e.g., White, 1971). ln Mali, Lepmn (I992, 1999)observed micro-dunes upslope of the bare interbands and vegetated bands perpendicularto the direction of the dominant wind. White (I969, 1971) suggested that in Jordan windmight be the initiating factor of banded patterns. The accumulation of wind-blownmaterial around isolated plants might act as a nucleus for the development of vegetationarcs. In northern Nigeria, banded vegetation patterns associated with former levelleddunes are also orientated perpendicular to the prevailing wind direction during theperiod of dune formation (Clayton, 1966, 1969; Zonneveld, 1999).
5.2. Ouer/and flow
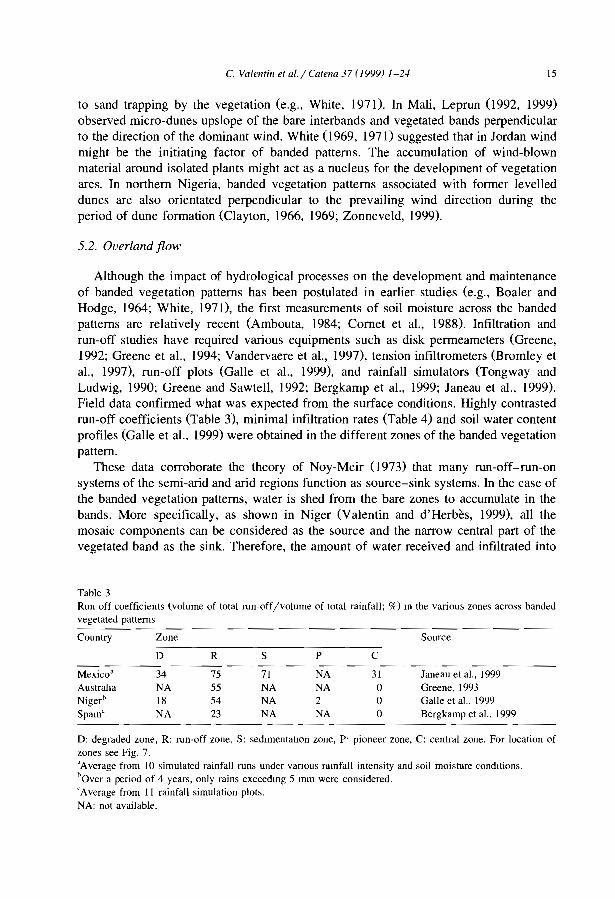
Although the impact of hydrological processes on the development and maintenanceof banded vegetation patterns has been postulated in earlier studies (e.g., Boaler andHodge, 1964; White, 1971), the first measurements of soil moisture across the bandedpatterns are relatively recent (Ambouta, 1984; Cornet et al., 1988). Infiltration andmn-off studies have required various equipments such as disk permeameters (Greene,1992; Greene et al., 1994; Vandervaere et al., 1997), tension infiltrometers (Bromley etal., 1997), mn-off plots (Galle et al., 1999), and rainfall simulators (Tongway andLudwig, 1990; Greene and Sawtell, 1992; Bergkamp et al., 1999; Janeau et al., 1999).Field data confirmed what was expected from the surface conditions. Highly contrastedmn-off coefficients (Table 3), minimal infiltration rates (Table 4) and soil water contentprofiles (Galle et al., 1999) were obtained in the different zones of the banded vegetationpattern.
These data corroborate the theory of Noy-Meir CI 973) that many run-off-run-onsystems of the semi-arid and arid regions function as source-sink systems. ln the case ofthe banded vegetation patterns, water is shed from the bare zones to accumulate in thebands. More specifically, as shown in Niger (Valentin and d'Herbès, 1999), aIl themosaic components can be considered as the source and the narrow central part of thevegetated band as the sink. Therefore, the amount of water received and infiltrated into
Table 3Run-off coefficients (volume of total mn-off/volume of total rainfall; %) m the various zones across bandedvegetated patterns
Country Zone Source
D R S P C
Mexico' 34 75 71 NA 31 Janeau et al.. 1999Austraha NA 55 NA NA 0 Greene, 1993Nigerh 18 54 NA 2 0 Galle et al., 1999Spam' NA 23 NA NA 0 Bergkamp et al.. 1999
D: degraded zone, R: mn-off zone. S: sedImentatIOn zone, p. pioneer zone, C: central zone. For location ofzones see Fig. 7.'Average from 10 simulated rainfall mns under vanous ramfall intensity and soil moisture conditions.haVer a period of 4 years. only rains exceedmg 5 mm were considered.'Average from II rainfall simulation plots.NA: not available.
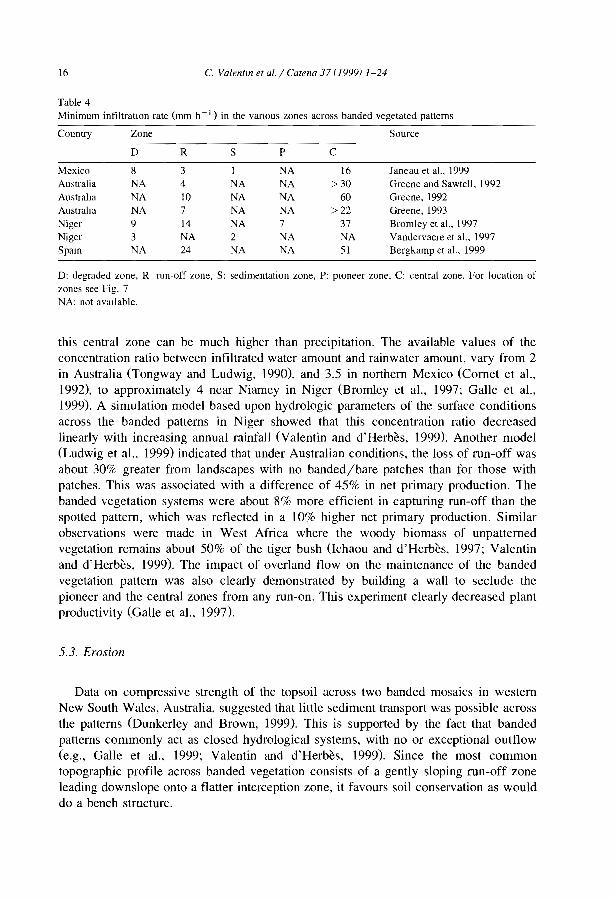
16 C. Valenlln et al./ Catena 37 (1999) 1-24
Table 4Minimum infiltration rate (mm h- J ) in the vanous zones across banded vegetated patterns
Country Zone Source
D R S P C
Mexico 8 3 1 NA 16 Janeau et al., 1999Australia NA 4 NA NA >30 Greene and Sawtell, 1992Austraha NA 10 NA NA 60 Greene, 1992Australla NA 7 NA NA >22 Greene, 1993Niger 9 14 NA 7 37 Bromley et al., 1997Niger 3 NA 2 NA NA Vandervaere et al., 1997Spam NA 24 NA NA 51 Bergkamp et al., 1999
D: degraded zone, R mn-off zone, S: sedimentation zone, P: pIoneer zone, C: central zone. For location ofzones see Fig. 7NA: not avmlable.
this central zone can be much higher than preCIpItation. The available values of theconcentration ratio between infiltrated water amount and rainwater amount, vary from 2in Australia (Tongway and Ludwig, 1990), and 3.5 in northern Mexico (Cornet et al.,1992), to approximately 4 near Niamey in Niger (Bromley et al., 1997; Galle et al.,1999). A simulation model based upon hydrologic parameters of the surface conditionsacross the banded patterns in Niger showed that this concentration ratio decreasedlinearly with increasing annual rainfall (Valentin and d'Herbès, 1999). Another model(Ludwig et al.. 1999) indicated that under Australian conditions, the loss of run-off wasabout 30% greater from landscapes with no banded/bare patches than for those withpatches. This was associated with a difference of 45% in net primary production. Thebanded vegetation systems were about 8% more efficient in capturing run-off than thespotted pattern, which was ref1ected in a 10% higher net primary production. Similarobservations were made in West Africa where the woody biomass of unpatternedvegetation remains about 50% of the tiger bush CIchaou and d' Herbès, 1997; Valentinand d'Herbès, 1999). The impact of overland f10w on the maintenance of the bandedvegetation pattern was also clearly demonstrated by building a wall to seclude thepioneer and the central zones from any run-on. This experiment clearly decreased plantproductivity (Galle et al.. 1997).
5.3. Erosion
Data on compressive strength of the topsoil across two banded mosaics in westernNew South Wales, Australia, suggested that iittle sediment transport was possible acrossthe patterns (Dunkerley and Brown, 1999). This is supported by the fact that bandedpatterns commonly act as closed hydrological systems, with no or exceptional outf1ow(e.g., Galle et al.. 1999; Valentin and d'Herbès, 1999). Since the most commontopographic profile across banded vegetation consists of a gently sloping run-off zoneleading downslope onto a flatter interception zone, it favours soil conservation as wouIddo a bench structure.
C. Valentin et al. / Catena 37 (191.)1)) 1-2-1 17
Recent laboratory rainfall and run-on experiments suggested that sequentialscour/ deposition features could favour the development of small-scale vegetation bandsas observed in the field in semi-arid northern Kenya (Bryan and Brun, 1999).
Using m Cs techniques to measure erosion and deposition rates in Niger tiger bush,Chappell (I995) found a net soil loss of 3 t ha -1 yr- 1 in the interbands and a net soilgain of 4 t ha -1 yr- I in the bands. These results suggest that soil gain is not only due tothe accumulation of sediment redistributed by surface wash but also by wind deposition.In the region, Orees et al. (1993) monitored a mean dust deposition rate of 2 t ha -1 yr- 1
over 8 years.
6. Genesis and dynarnics
6.1. Genesis
The intriguing question of how banded vegetation patterns originate has not yet beenelucidated. In particular, the possible temporal succession between unpatterned andpatterned vegetation have not been c1early documented. Two main alternative hypotheses have been advocated, either the graduaI degradation of an originally uniform plantcoyer due to climatic or human disturbances (White, 1971), or conversely the colonization of previously degraded bare areas under improving climatic or land use conditions(Boudet, 1972; Bryan and Brun, 1999). Banded patterns were observed for examplewhere vegetation recovered from wildfire in Spain (Cammeraat and Imeson, 1999).
To compensate the absence oflong-term monitoring experiments, Thiéry et al. (I995)elaborated a simple model to simulate the development of banded vegetation patterns.This landscape model was based on cellular automata, i.e., fixed arrays in which eachcell represents an area of the land surface. Only two hypotheses were required: theestablishment, growth and survival of a given plant is (I) negatively affected by theinfluence of plants situated upslope (competition) and (2) positiveJy by lateral anddownslope plants (synergy). To represent time, the model updated the state of ail ceUs inthe grid iteratively. On a practical level, it was compatible with aerial photos so thatresults could be compared with real patterns as observed on the Niger plateaux. Byvarying only the two parameters a (upslope resource competition) and b (Jateralsynergies) and the number of iterations, the model could generate almost aIl the patternsobserved on aerial photos. Because these results were independent of the initial treedensity, they suggest that banded vegetation patterns could equaUy be derived fromnearly bare areas or from dense vegetation patterns. Current studies aim at providingecological meaning to the coefficients a and band to specify time spans.
A similar model was developed by Puigdefabregas et al. (in press) to elucidate thedevelopment of banded patterns in a primevaJ forest of Tierra deI Fuego island(Argentina), with tree stripes perpendicular to the prevailing wind direction. The climatewas cold oceanic, with 5°C annual temperature and 600 mm annual rainfall. Older anddying trees occurred in the windward edge of each band and seedling regrowth in the leeside. The authors hypothesised that (1) vulnerability of trees to wind damage increasedwith age, (2) c1usters of older trees produced cone-shaped wind shadows that protected
18 C. Valelltill et al / Catella 37 (1999) 1-24
larger clusters of younger trees leeward. Based on these hypotheses, banded patternswere simulated, the initial state being a heterogeneous forest with randomly distributedtree ages. The model showed that increasing tree growth rates led to longer wavelengthsand higher wave propagation rates, while increasing wind killing capacity led to shorterwavelengths and lower propagation rates. Similar wind-induced and moving cyclicwaves of death, regeneration and maturation have also been observed in other 'waveregenerating forests' in the northeastern United States (Sprugel, 1976; Sprugel andBormann, 1981) and in central Japan (Kohyama, 1988; Sato and Iwasa, 1993).
6.2. Respanses ta human disturbances
Because banded vegetation patterns have often been considered as a form ofdegradation of previous continuous vegetation cover, many attempts have been made byforesters to restore this initial cover by reforestation of the bare interbands. Adaptingtheir model (Thiéry et aL 1995) to such tree planting, Thiéry et al. (1996) showed thatplanted trees disappear after only two iterations, suggesting a rapid failure of theseplantations. Even more important to note was the resulting thinning of the downslopenatural vegetation band. The model results were corroborated by the numerous failuresof reforestation of the bare interbands in the tiger bush region (d'Herbès et al., 1997a,b).This illustrates the key role of these mosaic components in the maintenance of the tigerbush ecosystem.
The loss of landscape patchiness is associated with a rapid decline in soil fertility andwater infiltration potential (Ludwig et al., 1999). The most serious degradation of thesystem results from the clearing of the bands either for fuel wood or for ephemeralcropping of sorghum and millet. This leads to degraded landscapes that are extremelycostly and hazardous to reclaim (Torrekens et al., 1997).
6.3. Respanses ta climate change
Measuring the interband width:band width ratio (IRB) on sequential aerial photosfrom 1950 to 1992 along a 200 km transect in Niger, Valentin and d'Herbès (1999)established a clear correlation between this ratio and the mean annual rainfall averagedover the last 15 years (MAR 15)' IRB increased dramatically from l.l to 2.3 whenrainfall decreased from 426 mm to 315 mm in 1992. Such results ilIustrate the greatadaptability of the banded vegetation pattern to rainfall variations that are intrinsic toarid and semi-arid zones.
Fig. 6 suggests that climatic changes might also induce a change in the type ofpatterning, especially between typical banded and fuzzy patterns. Such transition hasbeen reported in northern Burkina Faso comparing aerial photos taken in 1952 and 1984(Serpantié et al., 1992). Fuzzy patterns evolved into a typical banded pattern most likelyas a response to the very severe droughts of 1971-1974 and 1983-1984. This increasedcontrast is related to a reduction of the vegetation cover from 50 to 33%. The fuzzycharacter of the oIder pattern in the 1950s was due to isolated shrubs and trees in theinterbands which did resist the droughts of the 1970s and the 1980s (Couteron, 1997).
Nevertheless, evidences of transformation of vegetation patterns remain very rarebecause they can occur only when, for a given slope gradient, the mean annual rainfall
C Valentin et al. / Catella 37 (1999) 1-24 19
reaches a critical limit as illustrated in Fig. 6. This restricts the possible use of thebanded patterns as indicators of climatic changes.
These ecosystems can clearly adapt to altering climatic inputs and can be thusconsidered as highly resilient.
6.4. Upslope migration of the ['egetation bands
Many authors have inferred from their observations that the banded patterns shouldmigrate upslope (e.g., Boudet, 1972; Cornet et al., 1988). The upslope edge consists ofyoung and pioneer vegetation, the downslope edge of decayed plants. This hypothesiswas supported by the model of Thiéry et al. (1995) which showed that competition forupslope resources implies upslope migration. Remnants of termite mounds of Macrotermes slIbhyalilJlIs Rambur were commonly observed within the bare interbands (e.g., 18.3nests ha -) , in northern Burkina Faso) whereas habited nests occurred only in the bands(22.3 nests ha - 1; Ouédraogo and Lepage, 1997). Irrespective of biological considerations, uniform subsoil characteristics also tend to substantiate such shift. Stable bandsshould be associated with more contrasted subsoils between bands and interbands. At thesoil surface, the spatial succession of genetically linked surface crusts suggests also atemporal succession. In particular, the distribution of erosion and sedimentation crustsreflects an upslope shift of the erosional and depositional fronts.
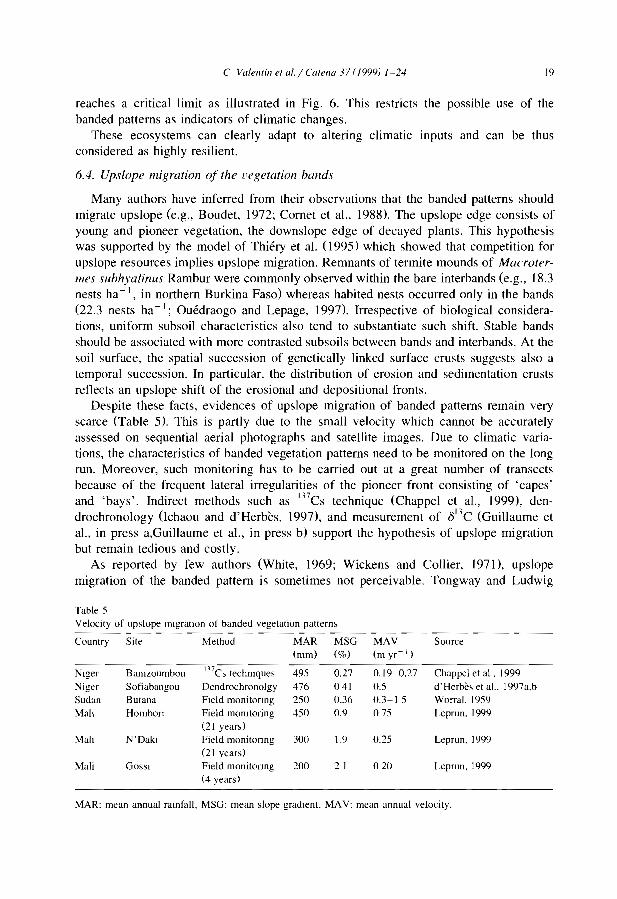
Despite these facts, evidences of upslope migration of banded patterns remain veryscarce (Table 5). This is partly due to the small velocity which cannot be accuratelyassessed on sequential aerial photographs and satellite images. Due to climatic variations, the characteristics of banded vegetation patterns need to be monitored on the longrun. Moreover, such monitoring has to be carried out at a great number of transectsbecause of the frequent lateral irregularities of the pioneer front consisting of 'capes'and 'bays'. Indirect methods such as InCs technique (Chappel et aL, 1999), dendrochronology Ochaou and d'Herbès, 1997), and measurement of Ol3C (Guillaume etal., in press a,Guillaume et al., in press b) support the hypothesis of upslope migrationbut remain tedious and costly.
As reported by few authors (White, 1969; Wickens and Collier, 1971), upslopemigration of the banded pattern is sometimes not perceivable. Tongway and Ludwig
Table 5Velocity of upslope ImgratlOn of banded vegetation patterns
Country Site Method MAR MSG MAV Source(mm) ('le) (01 yr- 1 )
Niger BaOlLoumbou 1) 7Cs techOlques 495 0.27 0.19-0.27 Chappel et al . 1999Niger Sofiabangou Dendrochronolgy 476 041 0.5 d'Herbh et al., 1997a.bSudan Butana Field monitonng 250 0.36 0.3-15 Worral. 1959Mali Hombon Field mOOltoring 450 0.9 0.75 Leprun, 1999
(21 years)Mali N'Dakl Field monitonng 300 1.9 0.25 Leprun. 1999
(21 years)Mali GOSSI Field monitonng 200 21 020 Leprun, 1999
(4 years)
MAR: mean annual ramfall, MSG: mean slope gradient, MAV: mean annual velocity.
20 C. Va/entm et al. 1 Catena 37 (1999) 1-24
(1990) anticipated upslope movement of the vegetation bands, but were unable tomeasure any change over 10 years (Tongway, personal communication). Mabbut andFanning (1987) considered that upslope migration does not occur in the systems becauseof the hardpan location which was much deeper under the vegetation band than on theinterband zone.
These results suggest that upslope migration cannot be therefore considered asinvariable for ail banded vegetation patterns. Further research is needed to document thefactors controlling migration velocity.
7. Conclusions
Over the last years, a number of essential questions related to banded vegetationpatterns have been unravelled at least partly. The types of patterns and of components,as the interband width:band width ratio, are controlled by topographie and to a lesserextent by climatic factors. Hydrological processes have also been substantially documented. Other issues such as the temporal dynamics of these ecosystems in terms ofgenesis and upslope migration should still be cleared up.
Among the most interesting results are the close relationships that have beenestablished between patterns, ecological processes including hydrological and erosionprocesses and biomass production.
Profound lessons can be learnt from the study of banded landscapes in terms ofecosystems functions. A better understanding of these functions has influenced changesin management practices in Niger and Australia. In particular, decision-makers are nowmore aware of the invaluable raie of banded vegetation patterns in terms of soil, waterand nutrients conservation.
Robust and resilient to climatic change, and to moderate land use, this type oflandscape patchiness offers a remarkable example of capture, concentration and storageof resources in dry and poor environments. Land managers should attempt to mimicsuch banded vegetation patterns when restoring degraded arid or semi-arid land andwhen designing water-harvesting systems.
References
Ambouta, KJ.-M., 1984. Contribution à l'édaphologie de la brousse tIgrée de l'Oue,t nigénen Doctor-Englneer the'ls. Umversity of Nancy. 116 pp.
Ambouta, K J.-M. 1997. DéfinitIon et caractérisation au sol des dIfférents types de végétation contractée auNiger. In d·Herbès. J.-M.. Ambouta, J.-M.K.. Peltier, R. (Eds.), FonctIOnnement et Gestion desÉcosystèmes Forestiers Contractés Sahéliens. John Libbey Eurotext, Paris, pp. 41-57.
Audry. P.. Ro,setti. c., 1962. ObservatIon sur les sols et la végétation en Mauntanie du ,ud-est et sur labordure adjacente du MalI (J959 et 1961). ProspectIon Ecologique en Afnque Occidentale. FAO. Rome,pp. 53-71.
Belskl, AJ.. 1990 Tree/grass ratIOS in east Afncan savannas: a comparison of eXlstlllg models Journal ofBiogeography 17. 483-489.
Bergkamp. G.. Cerda. A., Imeson. A.C.. 1999. Magmtude-frequency analy,is of water redistributIOn along aclimate gradient in Spain. Catena. this i'5ue.
Boaler. S.B., Hodge, C.A.H., 1962. Vegetation bands III Somaliland. Journal of Ecology 50, 465-524.
C. ValelllUl et al. j Cafena 37 (1999) 1-24 21
Boaler, S.B , Hodge, C.A.H., 1964. ObservatIOns on vegetation arcs ln the northern reglon, Somalia Republic.Journal of Ecology 52, 511-544.
Boudet, G., 1972 DésertIfication de l'Afrique tropicale sèche. Adansonia 12 (4), 505-524, ,éne 2.Bromley, J., Brouwer, 1., Barker, T., Gaze, S., Valentin, C., 1997. The role of surface water redlstnbution ln
an area of patterned vegetation in south west Niger. Journal of Hydrology 198, 1-29.Bryan, R.B., Brun. S.E, 1999. Laboratory expenments on sequential scourjdeposltion and their application to
the development of banded vegetation Catena, thls issue.Cammeraat, L.H., Imeson, A.C., 1999. The evolution and sigmficance of SOlI-vegetation pattern, followlng
land abandonment and fire in Spain. Catena 37, 107-127.Casenave, A., Valentin. C., 1992. A runoff capability classification system based on surface features cntena ln
semi-arid areas of Afnca. Journal of Hydrology 130, 231-249.Chappell, A., 1995. Geostatlstlcal mapping and ordInation analysed of IJ7Cs_derived net SOli tlux ln southwest
Niger. Unpublished doctoral thesls, University of London.Chappel, A., Valentin, c., Warren, A., Noon, P., Charlton, M., d'Herbès, J.M., 1999. Testlng the validity of
upslope migration ln banded vegetation from southwest Niger. Catena 37, 217-229.Chase, R.G., Boudouresque, E., 1987. Methods to stimulate plant regrowth on bare sahelian forest soils In the
region of Niamey, Niger Agriculture. Ecosystems and Environment 18, 211 -22 1.Clayton, W,D" 1966, Vegetation ripples near Gumml, Nigeria, Journal of Ecology 54. 415-417.Clayton, W,D" 1969. The vegetation of Katsina province, Nigeria, Journal of Ecology 57, 445-451.Clos-Arceduc, M" 1956, Etude sur photographies aériennes d'une formation végétale sahélienne: la brousse
tigrée. BulletIn de l'IFAN 7 (3). 677-684, série A,Cornet, A., 1992, Relation entre la structure spatiale des peuplements végétaux et le bilan hydnque des sols de
quelques phytocénoses en zone aride, In: Le Floc'h, E,. Grouzis, M., Cornet, A., Bille, J.C. (Eds,),L'Aridité, une Contrainte au Développement. Editions de l'ORSTOM, Pans, pp. 245-265.
Cornet, A.F., Delhoume, J.P., Montana, c., 1988 Dynamics of stnped vegetation patterns and water balancein the Chihuahuan desert. In: During, H.J., Wergner. M.J.A., Willems, J.H. (Eds,), Diversity and Pattern inLand Communities SPB Academlc Publishing, The Hague, Netherlands, pp. 221-231
Cornet, A.F , Montana, c., Delhoume, 1.P., Lopez-Portillo. J., 1992. Water tlows and the dynamics of desertvegetation stnpes. In: Hansen, A.J., Di Castri, F. (Eds.), Landscape Boundaries. Consequences for BioticDiverslty and Ecological F1ows, Chap. 16. Ecological Studles 92, Springer-Verlag, New York, pp.327-345.
Couteron, P" 1997. Sécheresse et hétérogénéité spatiale de paysages végétaux soudano-sahéliens: exemple aunord-ouest du Burkina Faso, In: d'Herbès, 1.-M., Ambouta, J.-M.K., Peltier, R. (Eds.), Fonctionnement etGestion des Écosystèmes Forestiers Contractés Sahéliens. John Libbey Eurotext, Paris, pp. 69-79,
Couteron, P., Kokou, K., 1997. Woody vegetatIOn spatial patterns in a seml-and savanna of Burkina Faso,west Africa. Plant Ecology 132, 21 J-227.
Couteron. P., Mahamane, A., Ouedraogo, P., 1996. Analyse de la structure de peuplements lIgneux dans un'fourré tigré' au nord Yatenga (BurkIna Faso). Etat actuel et conséquences évolutives. Annales desSCiences Forestières 53, 867 -884,
Delhoume, J.P, 1995. Fonctionnement hydro-pédologique d'une toposéquence de sols en milieu aride(Réserve de la Biosphère de Mapimi, Nord-Mexique). PhD Thesis, Université de Poitiers, France.
d'Herbès, J,M" Valentin, C" 1997. Land surface conditions of the Niamey region, Niger: ecological andhydrological Implications. Journal of Hydrology 188 to 189, 18-42.
d'Herbès. J.M., Ambouta, J.M.K" Peltier, R. (Eds.). 1997. Fonctionnement et Gestion des ÉcosystèmesForestiers Contractés Sahéliens. John Llbbey Eurotext, Paris, 274 pp.
d'Herbès, J.M" Valentin, C., Thiéry, J., 1997, La brousse tigrée au Niger: synthèse des connaissancesacquises. Hypothèses sur la genèse et les facteurs détermInant les différentes structures contractées. In:d'Herbès, J.M., Ambouta, J.M.K" Peltier, R. (Eds,), Fonctionnement et Gestion des Écosystèmes ForestiersContractés Sahéliens. John Libbey Eurotext. Paris, pp. 120-131.
Drees, L.R., Manu, A., Wilding. L.P" 1993. Characteristlcs of aeolian dusts in Niger. West Africa. Geoderma59.213-233.
Dunkerley, D.L., Brown, K.J., 1995. Runoff and runon areas in a patterned chenopod shrubland. arid westernNew South Wales, AustralIa: characteristics and origin. Journal of And Environments 30. 41-55.
22 C. Valentin et al./ Catena 37 (I999) 1-24
Dunkerley, D., Brown, K., 1999. Banded vegetation near Broken Hill, Australia: slgmficance of surfaceroughness and soil physical properties. Catena 37, 75-88.
Eddy, J., Humphreys, G.S., Hart, D.M., Mitchell, P.B.. Fanmng, P.c., 1999. Vegetation arcs and litter dams:similarities and dlfferences. Catena 37, 57-73.
Eldndge, 0.1., Greene, R.S.B., 1994. Microbiotic SOli crusts: a review of their roles in soil and ecologicalprocesses m the rangelands of Australia. Australian Journal of Soil.
Galle, S.. Seghieri, J., Mounka:ila, H., 1997. Fonctionnement hydrique et biologique de la brousse tigréenigérienne à l'échelle locale. In. d'Herbès, J.-M., Ambouta, J.-M.K, Peltier, R. (Eds.l, Fonctionnement etGestion des Écosystèmes Forestiers Contractés Sahéhens. John Libbey Eurotext, Paris. pp. 131-152.
Galle. S., Ehrmann. M., Peugeot, 1999. Water balance on a banded vegetation pattern. The case of the tigerbush in western Niger. Catena 37, 197-216.
Gilliland, H.B., 1952. The vegetation of eastern British Somahland. Journal of Ecology 40. 91-124.Greene, R S.B., 1992. SOli physlcal properties of three geomorphic zones m a semi-arid mulga woodland.
Australian Journal of Soil Research 30 (J). 55-69.Greene, R.S.B., 1993. Infiltration measurements in the semi-arid woodland of eastern Australia-a cornpari
son of methods. Proceedings of the XVII Internallonal Grassland Congress. Palmerston North, NewZealand, pp. 79-80.
Greene. R.S.B., Sawtell. G.R., 1992. A collectIOn system for measuring runoff and soil erosion with a mobileramfall simulator on crusted and stony red earth soils. Australian Journal of SOli Research 30, 457-463.
Greene. R.S.B.. Kinnell, P.LA., Wood, J.T., 1994. Role of plant cover and stock trampling on runoff and soileroslOn from semi-arid wooded rangelands. Australian Journal of Soil Research 32, 953, 973.
Greenwood, J.E.G.W., 1957 The development of vegetation patterns m Somaliland Protectorate. GeographicJournal 123, 465-473.
Grelg-Smith, P., 1979. Patterns in vegetation. Journal of Ecology 67. 755-779.Grove, AF., 1957. Patterned ground in northern Nigeria. Geographie Journal 123,271-274.Guillaume, K. Huard, M., Mariotti. A. Abbadie, L., in press a. I3 C natural abundance m plant and soil
orgamc matter in tiger bush, Niamey, Niger. Ecology.Guillaume, K, Abbadle. L., Mariotti, A, Nacro, H , in press b. Soil organic matter dynamlcs in tiger bush,
Niamey. Niger Acta Oecologica.Hemming, c.F., 1965. Vegetation arcs m Somaliland. Journal of Ecology 53, 57-67.Hiernaux, P. Gérard, B., in press. Does patchmess increase vegetation productivity, biodiversity and stability?
The case of 'Brousse Tigrée' in the Sahel. Acta Oecologica.Hill, M.O.. 1973. Diversily and evenness: a umfying notation and ItS consequences. Ecology 54 (2), 427-432.Ichaou, A, d'Herbès, J.-M., 1997. Productivité comparée des formations structurées et non structurées dans le
Sahel nigérien: conséquences pour la gestion forestière. In: d'Herbès, J.-M., Ambouta, J.-M.K., Peltier, R.(Eds.l, Fonctionnement et Gestion des Écosystèmes Forestiers Contractés Sahéliens. John Libbey Eurotext,Paris, pp. 119-130.
Ives. R., 1946 Desert riples. Amencan Journal of Science 244, 492-50\.Janeau, J.L.. Mauchamp, A. Tarin, G.. 1999. The soit surface characteristics of vegetation stripes in Northern
Mexico and their influences on the system hydrodynamlcs. Catena 37. 165-173.Kohyama, T., 1988. Etiology of 'Shigamare' dieback and regeneration in subalpine Abies forests of Japan.
GeoJournal 17.201-209.Lavee, H., Imeson, A.C., Sarah, P., 1998. The impact of climate change on geomorphology and desertlfication
along a Medilerranean-arid transect. Land Degradation and Development 9, 407-422.Leprun, J.-C. 1992. Etude de quelques brousses ligrées sahéliennes: structure, dynamique, Ecologie. In: Le
Floc'h. E.. Grouzis, M., Cornet, A.. Bille, J,c. (Eds.l, L'Aridité, une Contramte au Développement.Edillons de l'ORSTOM, Paris, pp. 221-244.
Leprun, J,-c.. 1999. The influences of ecological factors on liger bush and dotted bush patterns along agradient from Mali to northern Burkina Faso. Catena 37. 25-44.
Litchfield, W.H., Mabbul. J A., 1962. Hardpan in soils of semi-and western Austraha. Journal of Soil SCience13, 148-159.
Ludwig. J.A. Tongway, 0.1., 1995. Spatial organisation of landscapes and its funclion m semi-aridwood lands, Australia. Landscape Ecology 1.209-215.
LudWig. J.A. Tongway, 0.1 , Marsden, S.G.. 1994. A flow-filter model for simulatmg the conservation of
C. Valetztin etal.jCatena 37 (t999) 1-24 23
limited resources In spatially heterogeneous semi-and landscapes. Paclfic Conservation Biology 1.209-213.
Ludwig, J.A" Tongway, D.J .. Mardsen, S.G., 1999. Stripes, strands or stipples: modelling the influence ofthree landscape banding patterns on resource capture and productivity ln semi-and woodlands. Australia.Catena 37, 257-273.
Mabbut, J.A., Fanning, P.c., 1987. Vegetation banding in arid western Australia. Journal of Arid Environments 12,41-59.
Mac Donald, l.A.W., 1978. Pattern and process in semi-arid grassveld in Rhodesia. Proc. Grassland Soc. SouthAfrica 13, 103-109.
MacDonald, RC.T., Melville, M.D., White, 1., 1999. The distribution of soluble catIOns withIn a patternedground gIigai complex, western New South Wales. Australia. Catena 37,89-105.
MacFayden, W.A., 1950. Vegetation patterns In British Somalilands. Nature 165. 121.MacMahon, J.A., Shimpf, DJ, 1981. Water as a factor in the biology of North Amencan desert plants. In:
Evans, D.D" Thames, J.L. (Eds.), Water in Desert Ecosystems. IBP, Il. pp. 114-171.Malam Issa, O., Trichet, J., Defarge, c., Couté, A., ValentIn, c., 1999. Morphology and microstructure of soil
microbiotic crusts on a tiger bush sequence Niger, Sahel. Catena 37, 175-196.Mauchamp, A., 1992. L'hétérogénéité spatiale, sa dynamique et ses implications dans une mosaïque de
végétation en zone aride. PhD Thesis, Univ. de Montpelher II, France.Mauchamp, A., Janeau, J.L., 1993. Water funneling by the crown of Flourensia cemua, a Chihuahuan Desert
shrub. Journal of Arid Environments 25. 299-306.Mauchamp, A., Rambal, S., Lepart, 1., 1994. Simulating the dynamlcs of a vegetation mosaic: a spatialized
functional mode!. Ecologtcal Modelhng 71, 107- J30.Montana, C" 1992. The colonizatlOn of bare areas in two-phase mosaics of an arid ecosystem. Journal of
Ecology 80, 315-327.Montana, c., Lopez-Portillo, J., Mauchamp, A., 1990. The response of two woody species to the conditions
created by a shifting ecotone in an arid ecosystem. Journal of Ecology 78, 789-798.Morrison, c.G.T., Hoyle, A.C., Hope-Simpson, J.F., 1948. Tropical soil-vegetation catenas and mosaics: a
study in the south western part of the Anglo-Egyptian Sudan. Journal of Ecology 36, 1-84.Mougenot, B., Hamani, S., 1997. Les possibilités de classification des formations contractées à partir de la
télédétection aérienne et satelhtaire. Exemple dans l'ouest nigérien. In: d'Herbès, J.M., Ambouta, J.M.K.,Peltier, R. (Bds,), Fonctionnement et Gestion des Écosystèmes Forestiers Contractés Sahéliens. JohnLibbey Eurotext, Paris, pp. 59-68.
Noy-Meir, 1., 1973. Desert ecosystems: environment and producers. Annual Review of Ecology and SystematICS 4, 25-51.
Orr, B" 1995. Natural forest management in Sahelian ecosystems of southern Niger. Journal of AridEnvironments 30, 129-142.
Ouédraogo, P., Lepage, M., 1997. Rôle des termltlères de Macrotermes subhyalinus Rambur dans une broussetigrée (Yatenga, Burkina Faso). In: d'Herbès, J.-M., Ambouta, J.-M.K., Peltier, R. (Bds.), Fonctionnementet Gestion des Écosystèmes Forestiers Contractés Sahéliens. John Libbey Eurotext, Paris, pp. 81-94.
Peltier, R., Lawali, A.M., Montagne, P., 1994a. Aménagement villageois des brousses tachetées au Niger. Boiset Forêts des Tropiques 242, 59-76.
Peltier, R" Lawali, A.M" Montagne, P., 1994b. Aménagement villageois des brousses tachetées au Niger. Boiset Forêts des Tropiques 243, 5-24.
Poesen, J., Boardman, J., Wilcox, B., Valentin, c., 1996. Soil erosion momtoring and experimentation forglobal change studies. Journal of Soil and Water Conservation 51 (5), 386-390.
Puigdefabregas, 1., Sanchez, G., 1996. Geomorphological implications of vegetation patchiness on senti-andslopes. In: Anderson, M.G., Brooks, S.M. (Bds.), Advance in Hillslope Processes, Vo!. 2 Wiley,Chichester, pp. 1027-1060.
Puigdefabregas, J., Gallart, P., Bianclotto, O., Allogia, M., dei Bamo, G., in press. Banded vegetationpatternIng in a sub-Antarctic forest of Tierra dei Fuego. as an outcome of Ihe interaction between wind andtree growth. Acta Oecologica.
Ruxton, B.P., Berry, L., 1960. The Butana grass patterns. Journal of SOli Science Il, 61-62.Sato, K., Iwasa, Y., 1993. Modeling of wave regeneralion in subalpine AbleS forests: population dynamics
with spatial structure. Ecology 74 (5), 1538-1550.

24 C. Valentll1 etal./Catena 37 (I999) 1-24
Seghieri, J., Galle, S., Rajot, J.-L., Ehrmann. M., 1996. Relationships between the soil mOlsture regime and thegrowth of the herbaceous plants in a natural vegetation mosaic in Niger. Journal of And Environment 36,87-102.
SerpantIé, G.. Tezenas du Montcel, L., Valentin, C, 1992. La dynamIque des états de surface d'un territOIreagro-pastoral soudano-sahéllen. Conséquences et propositions. In: Le Floc'h, E., Grouzis, M., Cornet, A..Bille, J.C. (Eds,), L'Andité, une Contramte au Développement. Editions de l'ORSTOM. Paris, pp.419-447.
Slatyer, R O., 1961. Methodology of a water balance study conducted on a desert woodland (AcaclQ aneLII'(J F.Muell,) commumty m central Austraha. In Plant-Water Relationships m Arid and Seml-Arid ConditIons.Proc. of the Madrid symposium, UNESCO Arid Zone Research. Vol. 16. pp. 15-25.
Sprugel. D.G., 1976. Dynamic structure of wave regenerated Abie.l' bal.l'alllea forests m the northeasternUmted States. Journal of Ecology 64, 889-911.
Sprugel. D.G, Bonnann, F.H., 1981. Natural disturbance and the steady state III high altItude babam firforests. SCIence 211, 390-393.
Thiéry, J., d'Herbès, J.-M., Valentin. C, 1995. A model for sllnulating the genesis of banded patterns m Niger.Journal of Ecology 83, 497-507.
Thiéry, J.-M., d'Herbès. J,-M., Valentin. C., 1996. Un modèle simphfié de gestIon des écosystèmes forestierscontractés sahéliens. In: Blasco, F. (Ed), Tendances Nouvelles en Modéhsation pour l'EnvIronnement.ElsevIer, Paris, pp, 111-116.
Tongway, D.1., Ludwig, J.A., 1989. Mulga log mounds: fertile patches m the seml-arid woodlands of easternAustraha. Austrahan Journal of Ecology 14, 263-268.
Tongway, D.1., LudwIg. J.A., 1990, VegetatIon and sOli patternmg in seml-arid mulga lands of easternAustraha, Australlan Journal of EcoIogy 15. 23-24.
Tongway, D.1., LudwIg. J.A., 1994. Small-scale resource heterogenelty in seml-arid landscapes. PacificConservation Biology l, 201-208.
Torrekens, P. J. Brouwer. Hiernaux, P., 1997. Evolution de la végétation spontanée sur plateaux latéritiquestraités par des travaux anti-érosifs dans le departement de Dosso, NIger. In: d'Herbès, J.-M., Ambouta,J.-M K.. PeltIer, R. (Eds.). Fonctionnement et Gestion des Écosystèmes Forestiers Contractés SahéliensJohn Libbey Eurotext, Paris, pp. 235-246.
Valentin. C., Bresson, L.M., 1992. Morphology. genesis and classification of soil crusts III loamy and sandysoils. Geoderma 55, 225-245.
Valentm, C., Casenave. A., 1992. InfIltration IlltO sealed soils as mfluenced by gravel cover. Soil ScienceSociety of Amenca Journal 56. 1167-1673.
Valentin. C. d'Herbès. J.M., 1999 Niger tiger bush as a natural water harvesting system. Catena 37, 231-256Van der Meulen, F., Morris. J.W., 1979. Striped vegetation patterns in a transvaal savanna. Geo-Eco-Trop 3
(4). 253-266.Vandervaere, J.-P., Peugeot, C., Angulo Jaramlllo. R., Vauclin, M., Lebel, T., 1997, Estimatmg hydrauhc
condUCtIVlty of crusted soils by using disc infiltrometers and micro-tenslOmeters. Journal of Hydrology 188to 189 Cl to 4), 203-223.
Vesey-FitLgerald, D.F, 1957, The vegetatIon of the Red Sea coast north of Jedda. Saudl Arabia. Journal ofEcology 45, 547-562
Wallace, J.S., Holwill, C.J . 1997. Sot! evaporatlOn from tiger-bush III southwest NIger. Journal of Hydrology188 to 189.43-73
Warren. A., 1973. Sorne vegetallon patterns m the Republic of the Sudan-a discussion. Geoderma 9, 75-78.White, L.P.. 1969. Vegetation arcs in Jordan. Journal of Ecology 57, 461-464.White, L.P., 1970. Brousse tigrée patterns in southern Niger Journal of Ecology 58, 549-553.WhIte. L.P., 1971. VegetatIon stnpes on sheet wash surfaces. Journal of Ecology 59 (2), 615-622.Wickens, G.E., Collier, F.W., 1971. Some vegetation patterns in the Republic of the Sudan. Geoderrna 6.
43-59,Worral, G,A., 1959. The Butana grass patterns. Journal of Sot! Science 10,34-53.Worral. G.A., 1960. Patchiness in vegetation in the northern Sudan. Journal of Ecology 48. 107-117.Zonneveld, I.. 1999. A geomorphologicaI based banded ('tiger') pattern related to former dune fields III
Sokoto, northern Nigeria Catena 37. 45-56.
ELSEVIER Catena 37 (J 999) 25-44
CATENA
The influences of ecological factors on tiger bushand dotted bush patterns along a gradient from Mali
to northern Burkina Faso
Jean Claude Lepron *
ORSTOM. BP 5045. 34032 Monrpelher Cedex. France
Recelved 5 June 1996; received ln revlsed fOTIn 18 December 1997; accepted 10 February 1998
Abstract
Seven catenas across contracted vegetation patterns, including tiger bush and dotted bush. werestudied in the Gourma region in Mali and in northern Burkina Faso (mean annual rainfall 200-550mm). The tiger bush encompasses an alternate succession of bands oriented nearly perpendicularlyto the wind direction NE-SW; sandy grassy microdune, sloped band of bare crusted ground andwoody depressive band. A similar succession, without wind orientation. is found for the dottedbush. In this region, tiger bush develops under specifie conditions; (J) same orientation butopposite direction of wind and slope, (2) sedimentary and metamorphic rocks (sandstone andschist ironcrust), (3) shallow « 1 m) and Impervious soils. Under such circumstances, thedynamics of banded patterns result from alternate and successive action of water and winderosion. Field evidences showed that vegetation bands migrate upwards with a velocity of 0.2-0.7m yr- I . © 1999 Elsevier Science B.Y. Ail rights reserved.
Keywords: Vegetation pattern; Catena; Mali; Burkina Faso
1. Introduction
Clos-Arceduc CI 956) called 'brousse tigrée' (in English-tiger bush) the bandedvegetation patterns he observed in Sahelian areas because the alternation of dark woodedbands and bare light bands was similar on aerial photographs to the fur of atiger. Sincethen, many other studies have been devoted to the tiger bush in AfTica, includingClos-Arceduc (1956), Audry and Rosseti (1962), Boaler and Hodge (1962), Gallais
• Corresponding autbor.
0341-8162/99/$ - see front matter © 1999 ElseVIer SCIence B.V Ail rights reserved.PlI: S0341-8162(98)00054-X
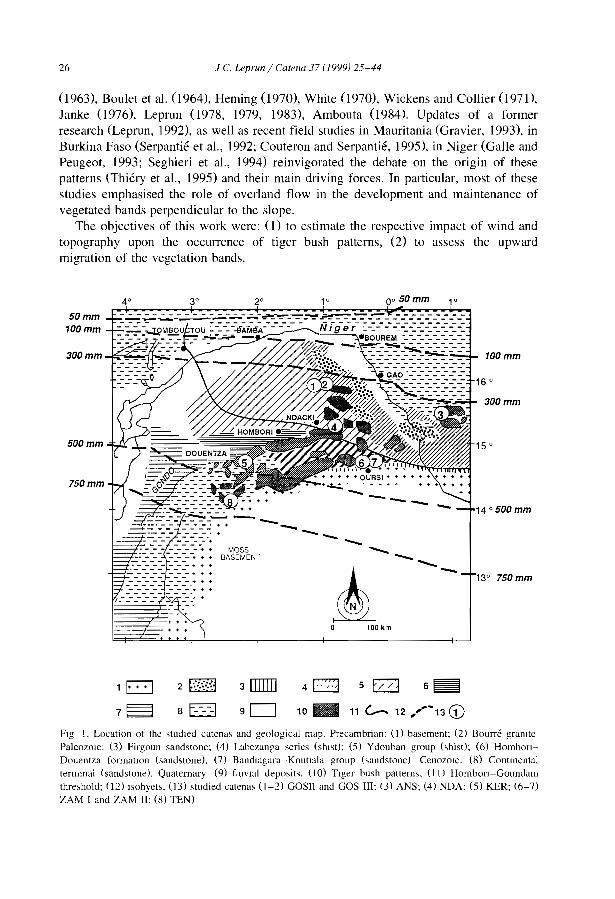
26 J C. Leprllll / Catma 37 (1999) 25-44
(1963), Boulet et al. (1964), Heming (1970), White (1970), Wickens and Collier (1971),Janke (1976), Leprun (1978, 1979, 1983), Ambouta (1984). Updates of a formerresearch (Leprun, 1992), as well as recent field studies in Mauritania (Gravier. 1993), inBurkina Faso (Serpantié et al., 1992; Couteron and Serpantié. 1995), in Niger (Galle andPeugeot, 1993; Seghieri et al., 1994) reinvigorated the debate on the origin of thesepatterns (Thiéry et al., 1995) and their main driving forces. In particular, most of thesestudies emphasised the role of overland flow in the development and maintenance ofvegetated bands perpendicular to the slope.
The objectives of this work were: (1) to estimate the respective impact of wind andtopography upon the occurrence of tiger bush patterns, (2) to assess the upwardmigration of the vegetation bands.
4° 3° 2° 1° 00 50 mm 1°
50 mm100 mm
300 mm 100 mm
16 °
300 mm
500 mm 15 °
750 mm --- 14 °500 mm---- -MOSSI -....BASEMENT
~13° 750mm
0 100 km
1G7~
2~ 3 ITIIJJ] 4D8 0 90 10. 5 L:'2J 6~
Fig 1. Location of the ,tudled catenas and geological map. Precambrian: (j) basement; (2) Bourré granItePaleozOlC: (3) Firgoun sandstone: (4) Labezanga series (Shlst); (5) Ydouban group (,.hist): (6) HombonDouentza formatIon (sand,tone). (7) Bandtagara-Knutlala group bandstone) CenozOlc: (8) ContInentaltermInai (sandstone). Quaternary (9) flUVIal deposits. (J 0) TLger bush patterns. (J Il Hombon-Goundamthre,hold: (\2) lsohyet'. (l3) studied catenas (1-2) GOSII and GOS III: (3) ANS; (4) NDA: (5) KER: (6-7)ZAM land ZAM II: (8) TEN)
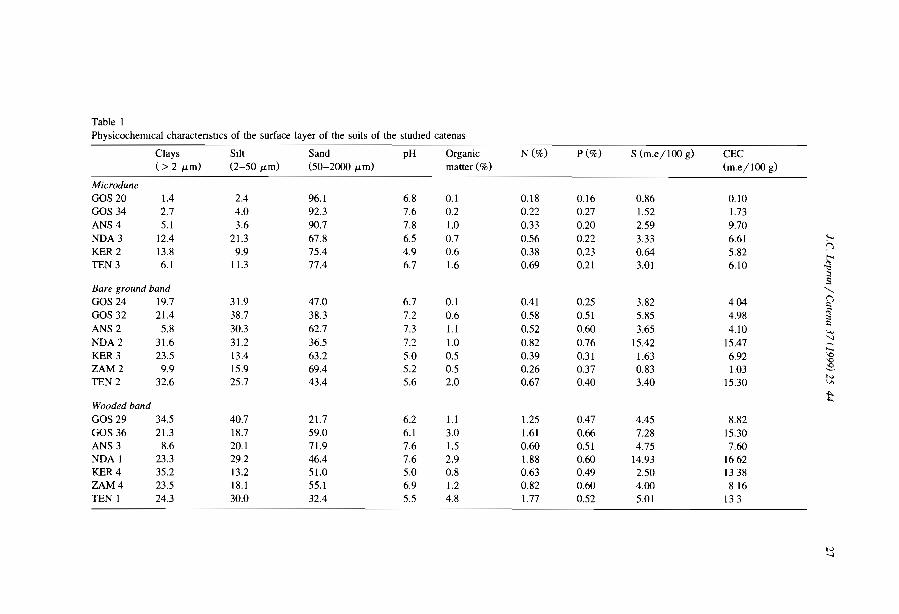
Table 1Physicochemlcal charactenstlcs of the surface layer of the soils of the studled catenas
Clays Sllt Sand pH Organic N (%) P(%} S (m.e/lOO g) CEC(> 2 JLm) (2-50 JLm) (50-2000 JLm) matter (%) (m.e/lOO g)
MicroduneGOS 20 1.4 2.4 96.1 6.8 0.1 0.18 0.16 0.86 0.10GOS 34 2.7 4.0 92.3 7.6 0.2 0.22 0.27 1.52 1.73ANS4 5.1 3.6 90.7 7.8 1.0 0.33 0.20 2.59 9.70NDA3 12.4 21.3 67.8 6.5 0.7 0.56 0.22 3.33 6.61 ~
KER 2 13.8 9.9 75.4 4.9 0.6 0.38 0.23 0.64 5.82 !"l
TEN 3 6.1 lU 77.4 6.7 1.6 0.69 0.21 3.01 6.10 ~...§
Bare ground band '-..
GOS 24 19.7 31.9 47.0 6.7 0.1 0.41 0.25 3.82 404 ~GOS 32 21.4 38.7 38.3 7.2 0.6 0.58 0.51 5.85 4.98 rt
;:,
ANS 2 5.8 30.3 62.7 7.3 l.l 0.52 0.60 3.65:;,
4.10 <...,
NDA2 31.6 31.2 36.5 7.2 1.0 0.82 0.76 15.42 15.47'l~......
KER 3 23.5 13.4 63.2 5.0 0.5 0.39 0.31 1.63 6.92 '0'0
ZAM2 9.9 15.9 69.4 5.2 0.5 0.26 0.37 0.83 1.03 ~
TEN2 32.6 25.7 43.4 5.6 2.0 0.67 0.40 3.40w
15.30 v,1~~
Wooded bandGOS 29 34.5 40.7 21.7 6.2 l.l 1.25 0.47 4.45 8.82GOS 36 21.3 18.7 59.0 6.1 3.0 1.61 0.66 7.28 15.30ANS3 8.6 20.1 71.9 7.6 1.5 0.60 0.51 4.75 7.60NDA 1 23.3 29.2 46.4 7.6 2.9 1.88 0.60 14.93 1662KER 4 35.2 13.2 51.0 5.0 0.8 0.63 0.49 2.50 1338ZAM4 23.5 18.1 55.1 6.9 1.2 0.82 0.60 4.00 816TEN 1 24.3 30.0 32.4 5.5 4.8 1.77 0.52 5.01 133
hl.....
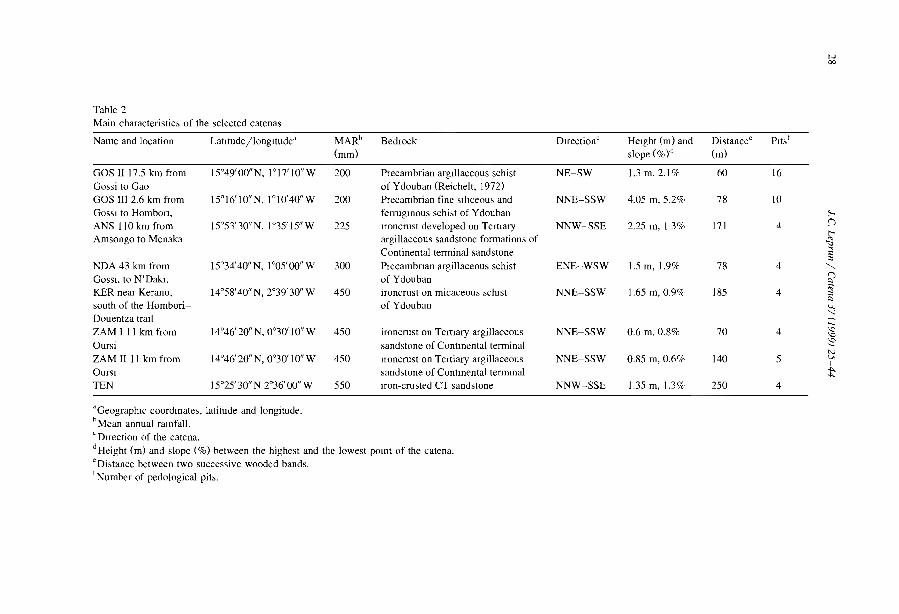
1"00
Table 2Main characteristic, of the selected catenas
Name and location Lalltudejlongllude" MARb Bedrock DIrection' Helght (m) and Distancee Plt,f(mm) slope (%)Ù (m)
GOS II 17 ,5 km from 15°49'00"N, 1°17' 10"W 200 Precambrian argI1laceous schist NE-SW 1.3 m, 2.1 '7e 60 16Gossi to Gao of Ydouban (Reichelt, 1972)GOS III 2.6 km from 15°16'10"N.l o I0'40"W 200 Precambrian fine slhceous and NNE-SSW 4.05 m, 5.2% 78 10GOSSI to Hombon, ferrugInous schi,t of Ydouban
"'"ANS 110 km from 15°53'30"N,1 0 35'15"W 225 lroncrust developed on Tertlary NNW-SSE 2.25 m, 1 3% 171 4 0
Amsongo to Menaka argillaceous sandstone fonnations of ~Continental tenninal sandstone
..,§
NDA 43 km from 15°34'40" N, 1°05' 00" W 300 Precambnan argillaceous schist ENE-WSW 1.5 m, 1.90/0 78 4 "-GOSSI. to N' Dakl. of Ydouban n
"KER near Kerano, 14°58'40"N,2°39'30"W 450 ironcrust on micaceous schlst NNE-SSW 1.65 m, 0.9'7c 185 4 ~"south of the Hombori- of Ydouban lA;
Douentza trail'J~
'-ZAM 1 II km from 14°46'20"N,0030'10"W 450 ironcrust on TertIary argillaceous NNE-SSW 0.6 m, 0.8% 70 4 'C
'C
Oursi sandstone of Continental tenninal ~N
ZAM II II km from 14°46'20"N,0030'10"W 450 lroncrust on Tertiary argillaceous NNE-SSW 0.85 m, 0.6'70 140 5 v,1
OurSI sandstone of ContInental termInaI 4:<4:<
TEN 15°25' 30" N 2°36' 00" W 550 lron-crusted CT sandstone NNW-SSE 1.35 m, 1.3% 250 4
'Geographlc coordinates, latitude and longitude.b Mean annual raInfal1.c Dlfection of the catena.dHeight (m) and slope (%) between the highest and the lowest pomt of the catena.c Di,tance between two successive wooded bands.t Number of pedological pits.
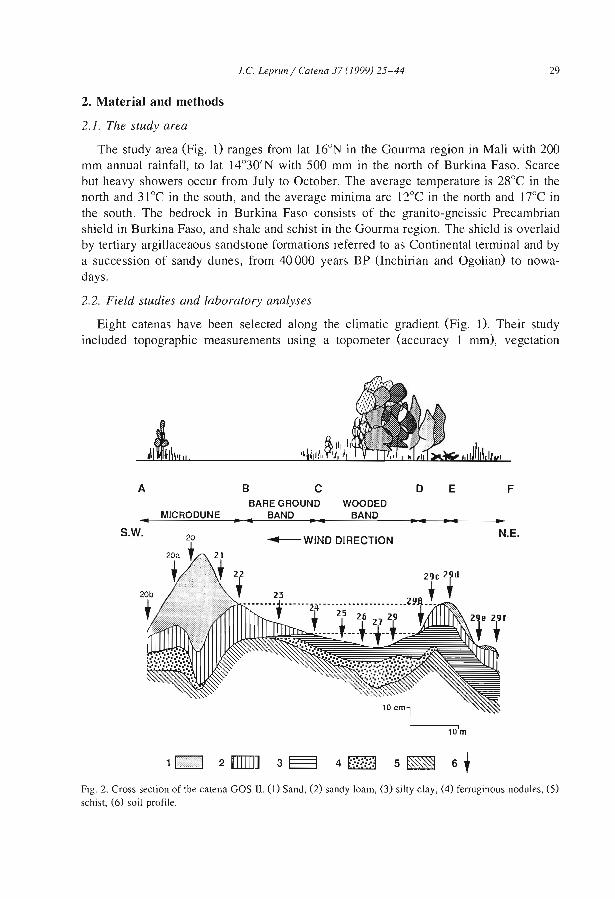
i.e. Leprun / Carena 37 (1999) 25-44 29
2. Material and methods
2.1. The study area
The study area (Fig. l) ranges from lat 16°N in the Gourma region in Mali with 200mm annual rainfal1, to Jat 14°30'N with 500 mm in the north of Burkina Faso. Scarcebut heavy showers occur from July to October. The average temperature is 28°C in thenorth and 31°C in the south, and the average minima are 12°C in the north and l7°C inthe south. The bedrock in Burkina Faso consists of the granito-gneissic Precambriansh.ield in Burkina Faso, and shale and schist in the Gourma region. The shield is overlaidby tertiary argillaceaous sandstone formations referred to as Continental terminal and bya succession of sandy dunes, from 40000 years BP (Inchirian and Ogolian) to nowadays.
2.2. Field studies and laboratory analyses
Eight catenas have been selected along the c1imatic gradient (Fig. l). Their studyincluded topographie measurements using a topometer (aeeuraey 1 mm), vegetation
A • ,
ABCBAREGROUND WOODED
MICRODUNE BAND BAND... .. .. .. ..
D E
.... .. ..F
S.W."'-WIND DIRECTION
10'm
N.E.
4 [ill].... ~ ... . .Fig. 2. Cross section of tbe catena GOS II. (1) Sand, (2) sandy loam, (3) silty clay, (4) ferruginous nodules, (5)schist, (6) soil profile.
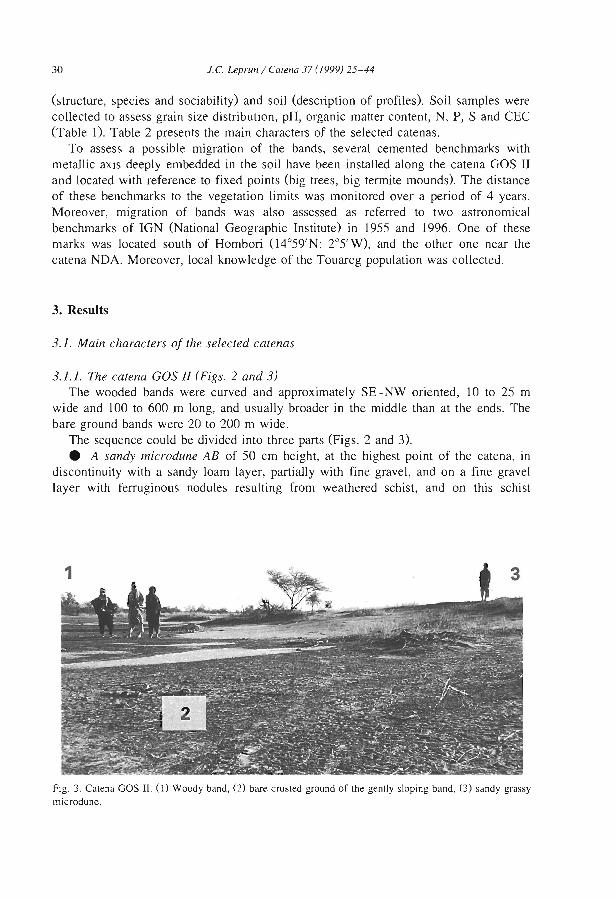
30 i.e. Leprun/ Carena 37 (1999) 25-44
(structure, species and sociability) and soil (description of profiles). Soil samples werecoJlected to assess grain size distribution, pH, organic matter content, N, P, S and CEe(Table 1). Table 2 presents the main characters of the selected catenas.
To assess a possible migration of the bands, several cemented benchmarks withmetaJlic axis deeply embedded in the soil have been installed along the catena GOS IIand located with reference to fixed points (big trees, big tennite mounds). The distanceof these benchmarks to the vegetation limits was monitored over a period of 4 years.Moreover, migration of bands was a1so assessed as referred to two astronomicalbenchmarks of IGN (National Geographie Institute) in 1955 and 1996. One of thesemarks was located south of Hombori (14°59' N; 2°S' W), and the other one near thecatena NDA. Moreover, local knowledge of the Touareg population was collected.
3. Results
3. J. Main characters of the selected catenas
3. J. J. The catena GOS JJ (Figs. 2 and 3)The wooded bands were curved and approximately SE-NW oriented, 10 to 25 m
wide and 100 to 600 m long, and usuaJly broader in the middle than at the ends. Thebare ground bands were 20 to 200 m wide.
The sequence couId be divided into three parts (Figs. 2 and 3).• A sandy microdune AB of 50 cm height, at the highest point of the catena, 10
discontinuity with a sandy 10am layer, partially with fine gravel, and on a fine gravellayer with ferruginous nodules resulting from weathered schist, and on this schist
Fig. 3. Catena GOS II. Cl) Woody band, (2) bare crusted ground of the gently sloping band, 0) sandy grassymicrodune.
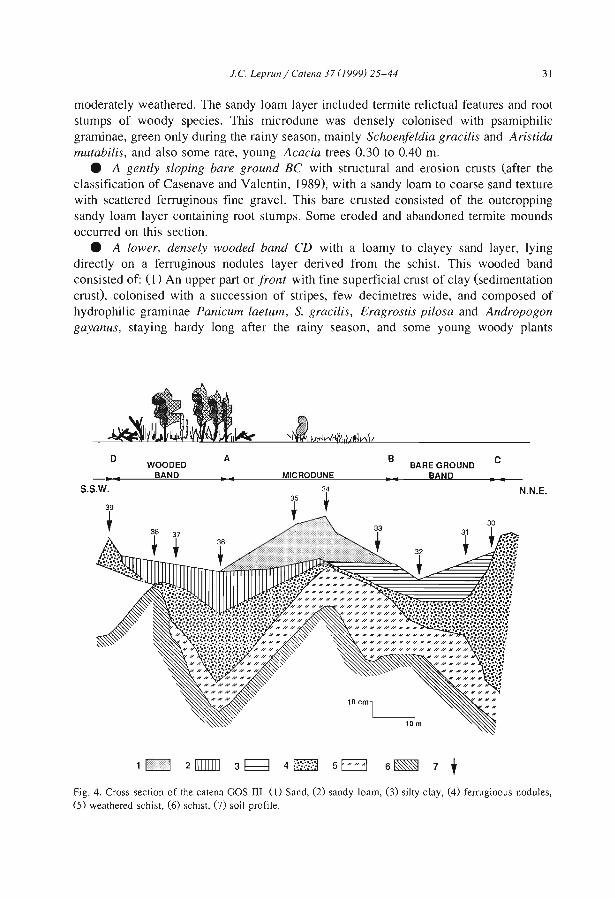
j,e. Leprun / Calena 37 (1999) 25-44 31
moderately weathered, The sandy loam layer included termite relictual features and rootstumps of woody species. This microdune was densely colonised with psamiphilicgraminae, green only during the rainy season, mainly Schoenfeldia gracilis and Aristidamutabilis, and also sorne rare, young Acacia trees 0.30 to 0.40 m.
• A gently sloping bare ground BC with structural and erosion crusts (after theclassification of Casenave and Valentin, 1989), with a sandy loam to coarse sand texturewith scattered ferruginous fine grave!. This bare crusted consisted of the outcroppingsandy loam layer containing root stumps. Sorne eroded and abandoned termite moundsoccurred on this section.
• A lower, densely wooded band CD with a loamy to clayey sand layer, lyingdirectly on a ferruginous nodules layer derived from the schist. This wooded bandconsisted of: (J) An upper part or front with fine superficial crust of clay (sedimentationcrust), colonised with a succession of stripes, few decimetres wide, and composed ofhydrophilic graminae Panicum laetum, S. gracilis, Eragrostis pilosa and Andropogongayanus, staying hardy long after the rainy season, and sorne young woody plants
D A B CWOODED BARE GROUND
• '1 BAND ... MICRODUNE .. Il BAND . ..S.S.W. 34 N.N.E.
t
Fig, 4. Cwss section of the catena GOS TIL (1) Sand, (2) sandy loarn, (3) silly clay, (4) ferruginous nodules,(5) weathe,ed schist, (6) schist, (7) soil profile,
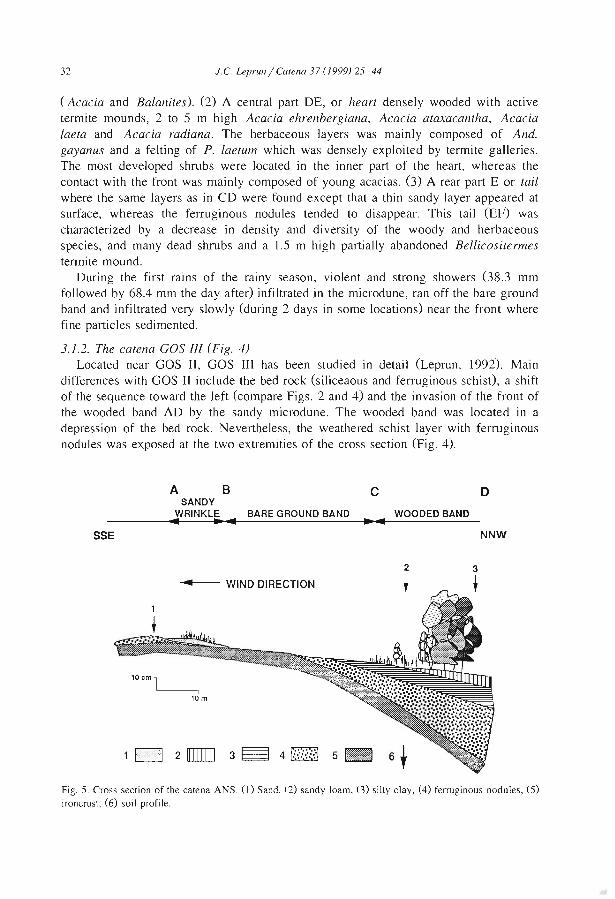
32 J.e. Leprun/ Catena 37 (1999) 25-44
(Acacia and Balanites). (2) A central part DE, or heart densely wooded with activetermite mounds, 2 to 5 m high Acacia ehrenbergiana, Acacia ataxacantha, Acacialaeta and Acacia radiana. The herbaceous layers was mainly composed of And.gayanus and a felting of P. laetum which was densely exploited by termite galleries.The most developed shrubs were located in the inner part of the heart, whereas thecontact with the front was mainly composed of young acacias. (3) A rear part E or tailwhere the same layers as in CD were found except that a thin sandy layer appeared atsurface, whereas the ferruginous nodules tended to disappear. This tail (EF) wascharacterized by a decrease in density and diversity of the woody and herbaceousspecies, and many dead shrubs and a 1.5 m high partially abandoned Bellicositermestermite mound.
During the first rains of the rainy season, violent and strong showers (38.3 mmfollowed by 68.4 mm the day after) infiltrated in the microdune, ran off the bare groundband and infiltrated very slowly (during 2 days in some locations) near the front wherefine particles sedimented.
3.1.2. The catena GOS [j[ (Fig. 4)Located near GOS 11, GOS III has been studied in detail (Leprun, 1992). Main
differences with GOS 11 include the bed rock (siliceaous and ferruginous schist), a shiftof the sequence toward the left (compare Figs. 2 and 4) and the invasion of the front ofthe wooded band AD by the sandy microdune. The wooded band was located in adepression of the bed rock. Nevertheless, the weathered schist layer with ferruginousnodules was exposed at the two extremities of the cross section (Fig. 4).
ABC 0SANDY
WRINKLE BARE GROUND BAND WOODED BAND4 • .. • ..
SSE
..-- WIND DIRECTION
1
•....... . "
locmlL 1
10 m
2
•
NNW
Fig. 5. Cross section of the catena ANS. (l) Sand, (2) sandy loam, (3) silty clay, (4) ferruginous nodules, (5)ironcrust, (6) soil profile.
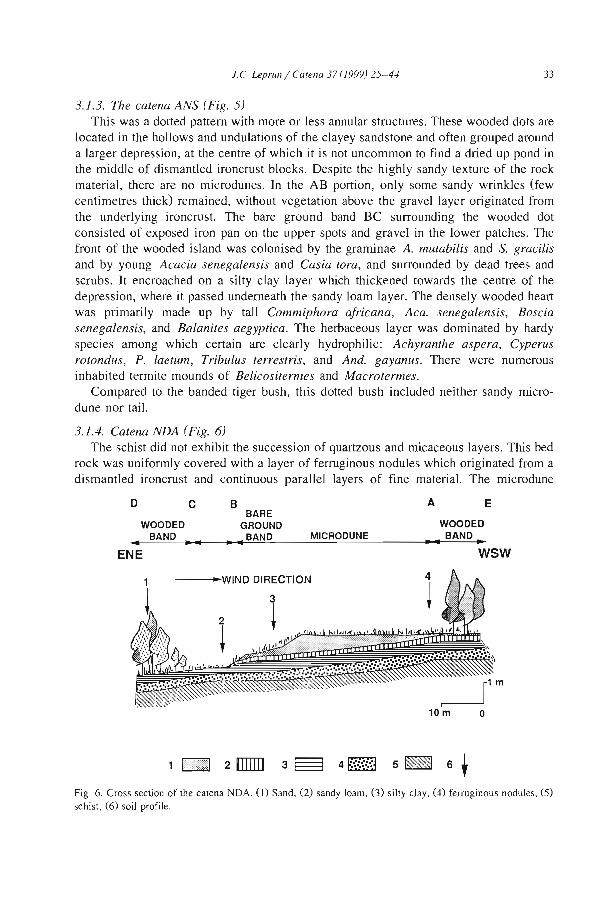
i.e. Leprun / Catetw 37 (1999) 25-44 33
3.1.3. The catena ANS (Fig. 5)This was a dotted pattern with more or less annular structures. These wooded dots are
located in the hollows and undulations of the clayey sandstone and often grouped arounda larger depression, at the centre of which it is not uncommon to find a dried up pond inthe middle of dismantled ironcrust blocks. Despite the highly sandy texture of the rockmaterial, there are no microdunes. In the AB portion, only some sandy wrink1es (fewcentimetres thick) remained, without vegetation above the gravel layer originated fromthe underlying ironcrust. The bare ground band BC surrounding the wooded dotconsisted of exposed iron pan on the upper spots and graveI in the lower patches. Thefront of the wooded island was colonised by the graminae A. mutabilis and S. gracilisand by young Acacia senegalensis and Casia tora, and surrounded by dead trees andscrubs. It encroached on a silty clay layer which thickened towards the centre of thedepression, where il passed undemeath the sandy loam layer. The densely wooded heartwas primarily made up by taH Commiphora africana, Aca. senegalensis, Bosciasenegalensis, and Balanites aegyptica. The herbaceous layer was dominated by hardyspecies among which certain are clearly hydrophilic: Achyranthe aspera, Cyperusrotondus, P. laetum, Tribulus terrestris, and And. gayanus. There were numerousinhabited termite mounds of Belicositermes and Macrotermes.
Compared to the banded tiger bush, this dotted bush included neither sandy microdune nor tail.
3.1.4. Catena NDA (Fig. 6)The schist did not exhibit the succession of quartzous and micaceous layers. This bed
rock was uniformly covered with a layer of ferruginous nodules which originated from adismantled ironcrust and continuous parallel layers of fine material. The microdune
D C B A E
WOODEDBAND.. ., ..
ENE
BAREGROUND
.... BAND MICRODUNEWOODED
BAND.,.. ..wsw
--_.. WIND DIRECTION 4
~
o
1 Innni 2 mlm 3~ 4 V~·~·~Jt:::::=:j •••••••• 5~ 6.Fig. 6. Cross section of the catena NDA. (1) Sand, (2) sandy loam, (3) silty clay, (4) ferruginous nodules, (5)schisl, (6) soi! profile.
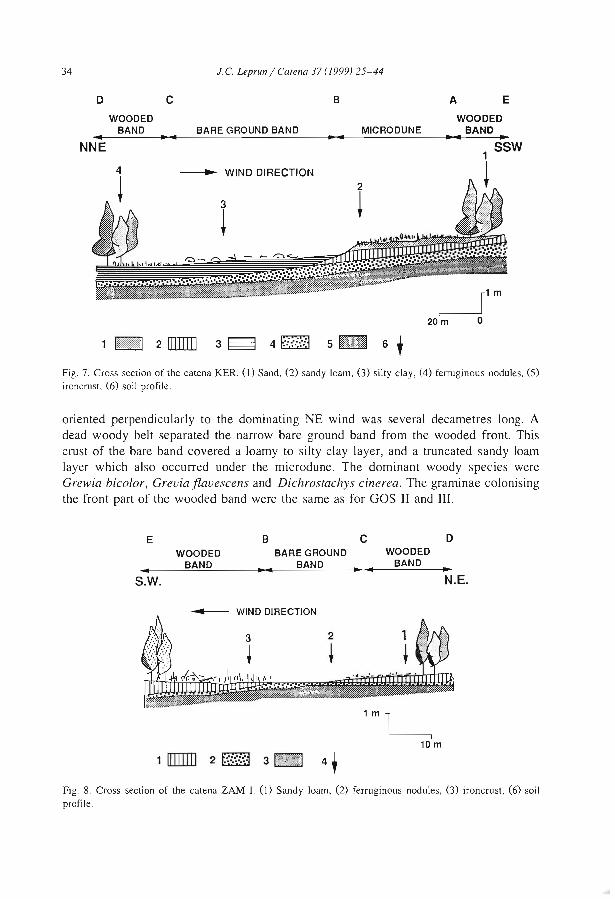
34
D C
i.e. Leprun / Calena 37 (1999) 25-44
B A E
..WOODED
BAND BARE GROUND BAND• • • •MICRODUNE
WOODEDBAND ..
NNE
--.- WIND DIRECTION
3 t~
1 SSW
~
~__11 m
20 m 0
1 1:1 2 IIIIIIIJ 4 ~~:\\l......
Fig. 7. Cross section of the catena KER. (1) Sand, (2) sandy loam, (3) silly clay, (4) ferruginous nodules, (5)ironcrust, (6) soil profile.
oriented perpendicularly to the dominating NE wind was several decametres long. Adead woody belt separated the narrow bare ground band from the wooded front. Thiscrust of the bare band covered a loamy ta silty clay layer, and a truncated sandy loamlayer which also occurred under the microdune. The dominant woody species wereGrewia bicolor, Greuia flauescens and Dichrostachys cinerea. The graminae colonisingthe front part of the wooded band were the same as for GOS II and III.
E B C DWOODED BAREGROUND WOODED
BAND BAND BAND~.. • II: .. ..
S.W. N.E.
~ WIND DIRECTION
1 ITIIIIIJ 2 ~~
Fig. 8. Cross section of the catena ZAM 1. (1) Sandy loam, (2) ferruginous nodules, (3) ironcrust, (6) soilprofile.
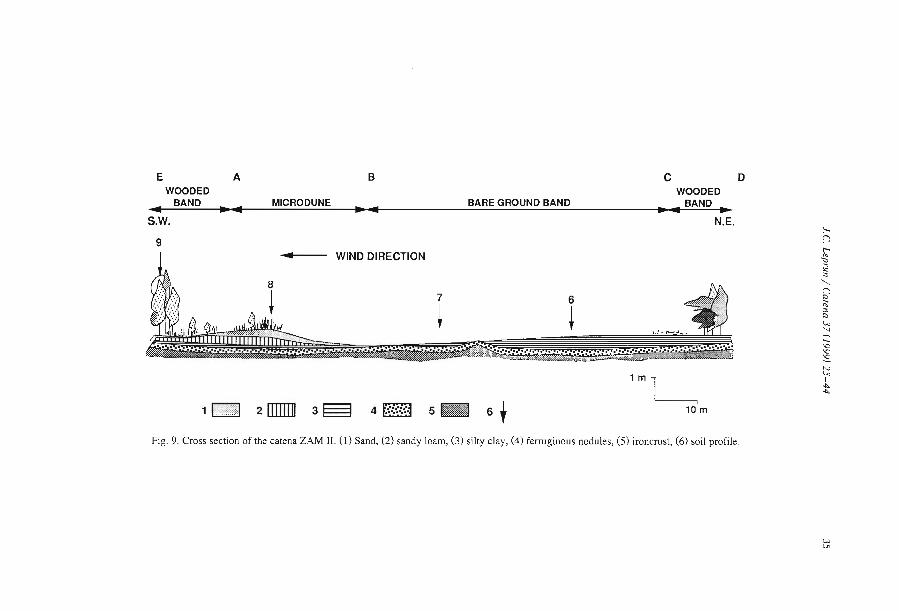
E ABC DWOODED WOODED
BAND MICRODUNE BARE GROUND BAND BAND...~..~... ~... .
S.W. N.E.
9WIND DIRECTION
1 11t;11 2 mmn 3 §
7
+
4 f.··:":··4 5 W'llTf1 6 1........ :*~..--=::: ,
6
+
1 ml10 m
'<)
.g2'"'--kJ(i;"
'"'"'-"'-l
'\Cl\Cl~
'"V,1........
Fig. 9. Cross section of the catena ZAM II. (1) Sand, (2) sandy loam, (3) silty clay, (4) ferruginous nodules, (5) ironcrust, (6) soif profile.
W!.Jo
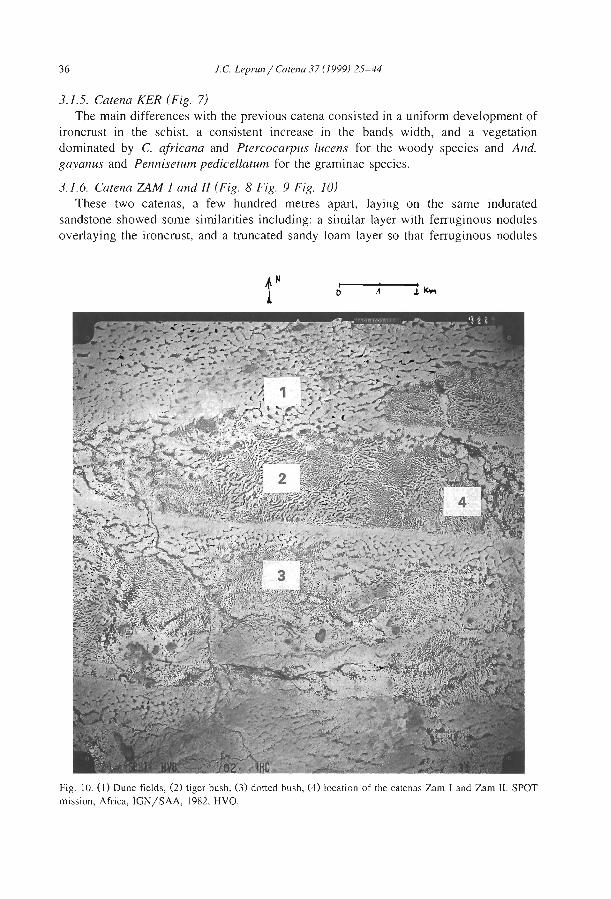
36 i.e. LeprUJ1 / Calena 37 (1999) 25-44
3.1.5. Catena KER (Fig. 7)The main differences with the previous catena consisted in a uniform development of
ironcrust in the schist, a consistent increase in the bands width, and a vegetationdominated by C. africana and Ptercocarpus lucens for the woody species and And.gayanus and Pennisetum pedicellatum for the graminae species.
3.1.6. Catena ZAM 1 and Il (Fig. 8 Fig. 9 Fig. 10)These two catenas, a few hundred metres apart, laying on the same indurated
sandstone showed sorne similarities including: a similar layer with ferruginous nodulesoverlaying the ironcrust, and a truncated sandy loam layer so that ferruginous nodules
Fig. 10. (1) Dune fields, (2) tiger bush, (3) dotted bush, (4) location of the catenas Zam 1 and Zam II. SPOTmission, Africa, IGN/SAA, 1982, HYO.
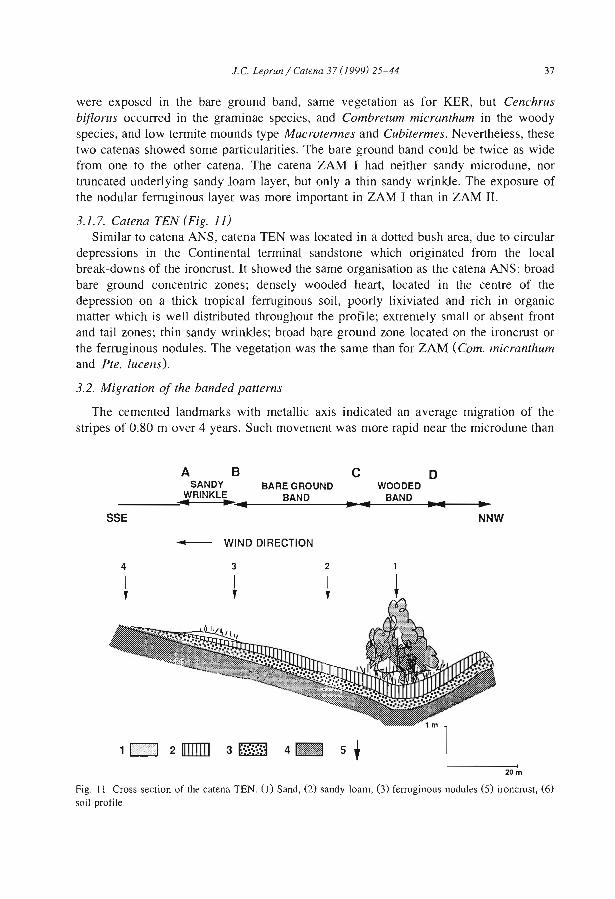
1. C. Leprun / Calena 37 (1999) 25-44 37
were exposed in the bare ground band, same vegetation as for KER, but Cenchrusbiflortls occurred in the graminae species, and Combretum micranthum in the woodyspecies, and low termite mounds type Macrotermes and Cubitermes. Nevertheless, thesetwo catenas showed sorne particularities. The bare ground band could be twice as widefrom one to the other catena. The catena ZAM 1 had neither sandy microdune, nortruncated underlying sandy Joam layer, but only a thin sandy wrinkJe. The exposure ofthe nodular ferruginous layer was more important in ZAM 1 than in ZAM II.
3.1.7. Catena TEN (Fig. 1 j)Similar to catena ANS, catena TEN was located in a dotted bush area, due to circular
depressions in the Continental terminal sandstone which originated from the localbreak-downs of the ironcrust. It showed the same organisation as the catena ANS: broadbare ground concentric zones; densely wooded heart, located in the centre of thedepression on a thick tropical ferruginous soil, pooriy lixiviated and rich in organicmatter which is weil distributed throughout the profile; extremely small or absent frontand tail zones; thin sandy wrinkJes; broad bare ground zone located on the ironcrust orthe ferruginous nodules. The vegetation was the same than for ZAM (Cam. micranthumand Pte. lucens).
3.2. Migration of the banded patterns
The cemented landmarks with metallic axis indicated an average migration of thestripes of 0.80 m over 4 years. Such movement was more rapid near the microdune than
SSE
A BSANDY
WRINKLE.. .. ...BARE GROUND
BAND
c
~ .. WOODEDBAND
D
NNW
4
-- WIND DIRECTION
3 2
L20 m
Fig. Il. Cross section of the catena TEN. (l) Sand, (2) sandy loam, (3) ferruginous nodules (5) ironcrust, (6)soil profile.
38 J.e. Leprull / Catella 37 (1999) 25-44
near the wooded front. It also varied with years, the average migration during a rainyyear being two-fold than the one observed during dryer years.
Over a period of 21 years, the mean annual shift as referred to the geographicalbenchmarks was 0.75 m in the south of Hombori (Tega), and 0.25 m yr- 1 have beenmeasured near the catena NDA.
The enquiry among the Touareg population confirmed such shifts. Remnants of anancient pastoral settlement near a termite mound in a wooded band 20 years ago, werenow found in the middle of a bare stripe.
4. Discussion
4.1. Comparison of the different ecological factors and components of the contractedformations
4.1.1. ClimateThe studied tiger bush, showed more or less the same succession of bare and wooded
bands, oriented NE-SW, with annual rainfall ranging from 200 to 550 mm. The twoexamples of very similar dotted bush formation were located under very differentrainfall conditions (ANS under 225 mm and TEN under 550 mm). The dominating windfrom the NE was more constant and stronger in the North near Gao, than in the Southnear Oursi.
4.1.2. Bed-rocksln most cases, they were more or less iron-crusted sedimentary or metamorphic rocks
such as sandstones or schists. The lateritic ironcrust increased and generalised fromnorth to south, as the relief became more tabular (sandstone of the Continental terminalor margin sandstone) or monoclinal (Precambrian schists). The same bed rocks, locatedunder different rainfall conditions exhibited identical sequences of tiger bush (GaS IIIand KER on schist) or dotted bush (ANS and TEN on iron-crusted sandstone).
4.1.3. Slope gradientLithology controlled low slope gradient which decreased from north to south, from
5% on the schist to 0.6% on the iron-crusted sandstone in the case of banded tiger bush(Table 2). On a given bedrock (Continental terminaI), higher slope gradient (1.3%, ANSand TEN) was found for dotted bush than for tiger bush (0.6 and 0.8% for Zam II andZam 1, respectively).
4.1.4. HydrologyAlI the studied formations were located in endoreic zones where runoff water
concentrated in the depressions or the lower points of the topography.
4.1.5. SoilBecause the layers, distinguishable mainly by their texture, were made of different
deposited materials, most of the soils were thin, young and poorly differentiated. Thesoil was thicker only in the depressions (dotted bush ANS and TEN) where it exhibited
J C. Leprun / Catena 37 (1999) 25-44 39
a slightly differentiated ferruginous facies or a sub-arid soil facies with graduaitransition among sorne more pedologically differentiated layers. The layers of ferruginous nodules were ubiquitous. They originated from the dismantled ironcrust and wereexposed where the overlying fine layers had been removed by erosion. The sandymicrodune, always present at the north and the centre of the zone, decreased in thesouth. It overlaid invariably a sandy loam layer, truncated near the bare ground band orzone and changing to a more silty clay layer downwards. These layers often includeddecomposed woody roots and remnants of termite nests.
4.1.6. Floristic compositionAlthough many species were common to sorne formations, none of the studied
formations had strictly the same floristic composition. Acacia woody species, A.mutabilis and S. graciUs dominated in the north, Com. micranthum, Pte. lucens, And.gayanus, Pen. pedicellatum and Cen. biflorus in the south. Many of the Sahelianspecies usually common under SOO-6OÜ mm rainfall, were found in the contractedformations under 200-300 mm rainfall, near their northem limit.
Interpretation of the catena GOS II.The evidences of biological activity (termites, root stumps) under the microdune AB
indicate that this depleted part of the bed rock had been occupied by a wooded band,probably similar to the one, now located in the CD depression.
This was similar to the mesofauna distribution: the active termite mounds weresituated only in the centre of the wooded bands, whereas the big abandoned anddismantling terrnitarias were in the tail and in sorne of the widest bare ground bands.
4.2. Dynamic of the studied contracted patterns
The dynamic of the northem tiger bush is suggested by the detailed study of thecatena GOS II. During the rainy season, the sheet water erosion which is the mostefficient on the BC slope (Fig. 2), removes the superficial material and truncates thesandy loam and partially, the nodular underlying layers. The raindrop impact sorts outthe texturai fractions of this layer. While the coarser fraction (gravel and coarse sand)stay in place. the finer elements (clay and silt) are removed, transported by the overlandflow and accumulated in CD, near the wooded band front. Water penetrates slowlytowards the centre of the wooded stripe. During the dry season, the wind from NEremoves the sand splashed by the water drops in the bare ground band (structural crust).This sand accumulates in AB, forming a sandy ridge or microdune. During the rainyseason, the seeds trapped in the microdune germinate because of the readily infiltratedwater into the sand. The graminae and woody seeds, stocked in the finer sediments, nearthe wooded front, emerge also during the rainy season. Because such processes arerepeated every year, more or less intensively, the erosive truncation of the bare groundband moves in the SW direction, following the progression of the microdune. Thismicrodune then invades the tail of the next wooded zone, covering and destroying thewoody species (GOS II, in EF Fig. 2 and GOS III in A Fig. 4). The finer elementsaccumulated downslope of BC fill partially the depression CD. Benefiting from sediments and run-on, the colonisation of the wooded band near the CD front by graminae
40 f.C. LeprWl/ Carena 37 (I999) 25-44
and woody seeds, leads to a general shift of the wooded band in the SW direction. As aresult of the graduai decrease of the water intake in the centre and peculiarly near thetail, the most hydrophilic species die. This hydrological dynamic explains, thus, thetypical dissymmetrical pattern of the tiger bush: including young woody and hydrophilicgraminae in the front, mature woody adult plants in the centre and decaying plants in thetai!. Such simultaneous migration of the soils due to both water and wind erosion resultsin a lateral sorting of the texturai fractions with sand accumulation in SW andsedimentation of the finer fraction in NE. Ferruginous nodules are not removed andaccumulate in the hollows of the bed rock. This may explain why the partially nodular,sandy loam layer that outcrops in CD (upper dotted line from profile 22 to profile 29c,and lower dotted line from profile 24 to profile 29b Fig. 2) is changed into a nodule-freefine silty loam layer. This layer is also partially eroded (partial incisions between profile24 and 29b IG. 2). As the wooded band migrates, the root stumps of the dead woody andthe termite mounds DE are left behind, and gradually invaded by the sand EF of the nextadvancing bush. The lack of soil moisture, nutrients and shade of the wooded stripe,causes the abandonment of the nest and its graduai collapse due to erosion. Its materials,mainly clay and loam, slakes and forms bare and crusted concentric circles, before beingstructured again during the next cycle.
In GOS II, the erosion does not reach the nodular layer and the underlying schist,whereas in GOS III the erosion removed this layer in CE and gets near it in BC (profile32, Fig. 4).
Where the bedrock is the iron-crusted sandstone of Continental terminal (like in ANSor TEN), the nodular layer and ironcrust are often exposed due to water erosion. Thefiner fraction originated from the dismantled ironcrust sediments in circular lower zones(CD). However, this process is lirnited due to the low quantity of silt and clay in Be.Similarly, the supply of sand from BC is not sufficient for the microdune to be formed.Because of the predominance of nodules and ironpan, and the subsequent lack of clay,silt and loam which are the agents of the migration, the motor being the water and thewind. the dynamic of the system is stopped. The woody and herbaceous vegetation, andthe termite mounds stay in the centre of the depression, and develop in equilibrium. Thesurrounding front of this vegetation remains steady and exhibits a combination ofsprouting, growing plants and decaying plants. The tiger bush with bands submitted to acontinuous migration of the soil-vegetation couple is then tumed into a tïxed dottedbush.
On the iron-crusted schist, under 250 to 450 mm annual rainfall (NDA and KER).similar organisation to the tiger bush in GOS II and III was observed. The layers abovethe nodular ferruginous layer and the ironcrust are thick enough to prevent the exposureof these lower layers.
Further south. under 450 to 500 mm rainfall, on the iron-crusted sandstone ofContinental terminal, the tiger bush still evolves as a result of the progression of themicrodune and regression of fine materials where superficial layers are thick enough(ZAM 11), but tends to stop where the ironcrust is exposed in the bare ground band Be.Nevertheless, erosion is already reaching the highest points of the bed rock, bringing theferruginous nodule to out crop in BC (ZAM 1). In this case, the sandy microdune isreplaced by a sandy film, only colonised by graminae.
f.C. Leprull / Catena 37 (1999) 25-·U 41
The evolution is completely stopped in ANS (Fig. 5) and in TEN (Fig. II). Theiron-crusted sandstone of Continental terminal formation is undulating and dotted withcircular depressions, denoting the presence of weak zones where the ironcrust has beendismantled into big blocks, and where water accumulates. Water erosion is limited to thebanks of the depressions where sediments accumulate, resulting in a fixed dotted bush.
4.3. Evidences and assessment of the migration of the tiger bush
Two observations suggest the migration bands in the tiger bush.(I) The occurrence of poody decomposed plant residues, root stumps and termite
nests under the present bare ground bands, where neither living vegetation nor inhabitedtermite mounds were found. Under Saharo-Sahelian conditions (annuai rainfall 200-300mm), the occurrence of high inhabited termite mounds (Bellicotermes) which arecommon in the southern Sahelian and Sudanian zones, is restricted to the centre of thewooded bands of the tiger bush or in the dotted where sufficient water, shade and foodare available for their development and survival. The abandoned and collapsed termitemound of the bare stripes can be therefore considered as remnants of ancient woodedstripes. In the catena GaS II (DE, Fig. 2), one of the termite mounds has beenabandoned and eroded owing to the migration of wooded bands to SW and the sandyinvasion from the NE.
(2) The absence in the soils of the tiger bush of any typical layers of the adjacentSahelian soils. The succession of parallel layers made of recent deposits are verydifferent from those of soils formed over long periods. The only pedogenically evolvedlayers with a vertical and isohumic distribution of soil organic matter occurred in thedotted bush where the absence of migration enabled pedogenic processes (Table 1, ANSand TEN,).
The presumed shi ft was substantiated by field assessment using landmarks, with avelocity ranging from 0.20 to 0.70 m yr- 1
• The rate of migration seems to depend moreon edaphic conditions than on rainfall since tiger bush patterns occur between 200 and550 mm in the studied area, and up to 750 mm in Niger. Velocity is reduced in thesouthern tiger bush to zero where the topography and the exposed nodular layer and theironpan favour dotted bush.
4.4. Hypothesis on the formation of the tiger bush
Many authors have proposed hypotheses on the formation of the contracted Sahelianformations. Various factors have been put forward including termite activity (ClosArceduc, 1956), overgrazing (Boudet, 1972), or a combination of edaphic and climaticfactors (Janke, 1976). This last hypothesis, established from observations near Niameyin Niger. is the most complete, and in closest agreement with ours.
A long drought period. as the Sahel suffered in the 70s, may have destroyed most ofthe vegetation. On the sandy loam substrata, originated from more or less iron-crustedsedimentary or schistose rocks, with a gentle slope due to the monoclinal structureoriented NE-SW Oike many geological formations in this area), the thin soils are veryprone to erosion. Water erosion affects the bare crusted slopes and sorts out the eroded
42 f.C Leprun / Catena 37 (1999) 25-44
particles into texturaI fractions. The sandy sediments are removed by the wind from NEduring the dry season (harmattan) and deposited upslope. A part of the finer particlesclogs the pores, seals the surface and hence, decreases infiltration, whilst the other partis removed downslope by overland flow until it reaches a depression, due to the ripplesrelated to the schistosity or the stratification of the bed rock. The accumulation of fineparticles and water, in this succession of depressions foster their subsequent colonisationby the vegetation and the soil fauna, especially the termites, and promotes the formationof parallel wooded and bare ground bands. An annual cycle includes a phase ofregressive water erosion and downslope sedimentation during the rainy season and aphases of deflation and upslope aeolian deposits during the dry season. This repeatedcycle results in an upslope migration of the sandy materials along the slope and favour aconstant progress of associated vegetation and fauna. Such dynamic is stopped where thebed rock or the topography of the ironcrust changes (fiat thick ergs-sandy surfaces-orregs-pebbly surfaces-in the north, and granitic shield with chaotic relief, and circulardepressions in the iron-crusted sandstone of the Continental terminal, in the South), orwhere the fine overlying materials have been completely eroded leading to the exposureof the ironcrust. The tiger bush is first changed into dotted bush and further into a poorsteppic formation, typical of this area.
5. Conclusions
(I) Contracted vegetation patterns in the Sahel, tiger bush and dotted bush, studiedalong eight detailed catenas are made of the cyclic successions of bands goingdownslope: (a) a sandy grassy microdune; (b) a bare ground sandy loam crusted gentlysloping surface; (c) a densely wooded loam clay sand depression. These bands aresubmitted to a rapid and continuous shifting dynamic from NE to SW. This is thedirection of the dominant wind (harmattan), the orientation of the sandstone, the schistand of the steepest slope.
(2) On the bare ground crusted band, the eroded and sorted out soil particlesexperience two different processes. The finer, clay and loam, are removed downslope bythe overland flow and accumulate in the depressions to form the wooded band wherevegetation and fauna subsequently concentrate. The sandy particles are shifted byaeolian deflation and deposited upslope forming a microdune.
(3) The migration velocity varies from 0.20 to 0.75 m yr- l. Further south (annual
rainfall > 500 mm), the change in lithology and in surface runoff patteros (from sheet tolinear flow) tend to stop the migration of the tiger bush, and to alter it into a dotted bush.
(4) The observations suggest that the formation, development and evolution of theseformations result from an the combination of an array of factors: (a) an aggressivecontrasted tropical climate, semi-arid Sahelian type, with a permanent wind blowingfrom NE (harmattan), and an average annual rainfall ranging from 200 to 500 mm, andmore (750 mm in Niger); (b) a rocky substratum with a sedimentary or metamorphicpetrography (more or less iron-crusted sandstone and clayey schist), with a monoclinallithology, oriented NE-SW, giving to the bed rock a low and constant slope < 5%; (c)the presence of thin « 1 ml, continuous and fragile soil layers without or with poorpedogenic features; (d) local and regional endoreism.
J.c. Leprrm / Catena 37 (1999) 25-44 43
(5) Petrography seems to be the main limiting factor (Fig. 1) due to: (a) a gentlysloping monoclinal lithology oriented NE-SW; (b) to the stratification and the smaltundulation of the bed rock, that enable water to accumulate in the depressions. Thesedimentary origin of the bed rock controls the sandy loamy clay texture of the originalweathered materials. In particular, the stratification, oriented perpendicularly to thedominant wind direction and its sIope facing the wind control, the process and thedirection of the stripe migration.
(6) Under 200 mm, water erosion and runoff are insufficient for the processes tooccur. Over 800 mm, the upper limit of the Sahelian climate, superficial flow tends tobecome linear, hence suppressing the hydrodynamic influence of the bands. AIso,despite not being necessary to the formation of the contracted bush, the action of thewind is necessary for its migration.
(7) Even though the tiger bush patterns are natural formations corresponding toSahelian ecological niches, with bioceonosis of a more humid environment, in asemi-arid environment, they are very fragile ecosystems and their survival dependsclosely on climatic crises, and on their human corollaries of over-use and destruction.
Acknowledgements
1 would like to express thanks to Dr. Claude Hammecker, soil scientist at ORSTOM,Dakar, for the translation and to Dr. Christian Valentin for substantial improvements tothe manuscript.
References
Ambouta, K., 1984. Contribullon à l'édaphologie de la brousse tigrée de l'ouest Nigérien. Thèse docteuringénieur, Umv. Nancy I, 116 pp.
Audry, P., Rosseti, Ch., 1962. Observations sur les sols et la végétallon en Mauritanie du sud-est et dur labordure adjancente du Mali, 1959-1961. FAO, 24067/F/I, Rome.
Boaler, S.Boo Hodge, C.A.H., 1962. VegetatIOn stnpes in Somaliland. J. Ecol. 50, 465-474.Boudet, G., 1972. Désertification de l'Afnque tropicale sèche. Adansonia, sér. 2 12,505-524.Boulet, R., Gavaud, Moo Bocquier, G., 1964. Etude pédologique du Niger Central. ORSTOM, Dakar, 211 ppCasenave, A., Valentin, Coo 1989. Les états de surface de la zone sahélienne. Influence sur l'mfiltration
Didacllques ORSTOM, 229 pp.Clos-Arceduc, Moo 1956. Etude sur photographies aériennes d'une fonnallon végétale Sahélienne: la brousse
tigrée. Bull IFAN, sér. A 7 (3), 677-684.Couteron, Poo Serpantié, G, 1995. CartographIe d'un couvert végétal Soudano-Sahélien à partir d'Images Spot
XS. Exemple du Nord-Yatenga (Burkma Faso). Photo-Interprétation l, 19-24.Gallais, J., 1963. Pasteurs et paysans du Gounna. La condition Sahélienne. Mém. Centre Et. Géogr. Trop.
CNRS, Paris, 239 pp.Galle, S., Peugeot, c., 1993. SoIl water spatial dIstributIOn of tiger bush m NIger. AGU meeting, San
Fanclsco, USA, 6-10 Dec. 1993.GraVIer, M., 1993. Le Tagant entre Sahel et Sahara (Mauritanie). Thèse géographie, Univ. Aix-Marseille, 304
pp.Heming, C.F., 1970. Vegetation arcs in Somaliland. J. Ecol. 53, 57-67.Janke, B., 1976. Zum problem der vegetationstreifen (Brousse llgrée) lm semiariden Afnka. Geokologlsche
untersuchungen in West-Niger. Die Erde 107,31-46.

44 J.e. Leprun / Cafen" 37 (1999) 25--44
Leprun. J.C, 1978 Etude de l'évolution d'un système d'exploitatIOn sahélien au Mali. Compte rendu de fmd'études sur les sols et leur susceptlbilité à l'érosion. les terres de cures salées, les fonnatlOns de 'broussetigrée' dans le Gourma üRSTüM-DGRST, Dakar, 51 pp.
Leprun, J.e., 1979. Rapport scientifique complémentaire de l' A.C C LAT Etude de J'évolution d'un systèmed'exploitatton sahélien au Mali. Volet pédologLe. üRSTüM-DGRST, Dakar, '27 pp.
Leprun. J.e., 1983. Les sols. Les relations sols-végétation. In. Etude des potentialités pastorales et de leurévolution en milieu sahélien au Mali. A.e.e.-G.R I.Z.A.-L A.T.. Groupe de Recherches InterdiscIplinairesen zones arides et Minist. Déve!. Rural. Rép. du Mali pp. 19-30,43-56.
Leprun. J.C, ]992. Les brousses tlgrées: structure, dynamique, écologie (MalI et Burkina Faso). In: L'aridIté'une contrainte au développement. Caractérisation-réponses biolog.lques-stratégies des sociétés. DidactiquesüRSTüM, Paris, pp. '221-'244.
Reichelt, R., 1972. Géologie du Gounna {Afnque occidentale!. Un seuil et bassin du précambrien supérieur, ]map 1:500000. Mém. BRGM, 53, '2]3 pp.
Seghien. J.. Galle, S , RaJot. J L., 1994 La brousse tigrée dans la Sahel NIgérien: étude de la confluctuatIondu stock hydrique et de la végétatlon annuelle. Journées hydrologLques de J'üRSTüM, 13-14 Sept. 1994.in press.
Serpantié. G., Tezenas De Montcel, L., Valentin, C.. 199'2. La dynamIque des états de surface d'un territoireagro-pastoral soudano-,ahélien In: L' aridité, une contrainte au développement. DIdactIques. üRSTüM.pp. 419-447.
Thiéry, J.M., D'Herbès, J.-M.. Valentm. e., 1995. Amadei slmu]atmg the genesis of banded vegetationpatterns in NIger. J. Eco!. 83.497-507.
White. H.. 1970. Brousse tigrée patterns in Southern Niger. J. Sail SCI. 58, 549-553.Wickens. C.E., Collier. F.W.. 1971. Sorne vegetatlon patterns in the Republie of Sudan Geoderma 6. 43-59.
ELSEVIER Catena 37 (1999) 45-56
CATENA
A geomorphological based banded ('tiger')vegetation pattern related to former dune fields in
Sokoto (Northern Nigeria)
Isaak S. Zonneveld a,b, *
• Agricultural Unil'erstity Wagenmgen, Wageningen, Netherlandsb Intemationallnstitute for Aerospace SUrL'eys and Earth Sciences, ITC, P.o. Box 6, Enschede 7500 AA.
Netherlands
Received 10 May 1995: recelved in revised form 24 April 1998; accepted 15 May 1998
Abstract
A banded vegetation pattern has been observed on aerial photographs of Sokoto province inNorthern Nigeria. It was successfully used as a land mapping characteristic in the soil andvegetation (land unit) reconnaissance survey see FAO (1969) [FAO, 1969. Soils Survey and LandClassitication, Soils and Water Resources Survey of the Sokoto Valley (Nigeria). Final report Vol.V, FAOjSF:67jNr3.], Zonneveld et al. (1971) [Zonneveld, I.S., de Leeuw, P.N., Sombroek,W.G., 1971. An ecological interpretation of aerial photographs in a savanna region in northernNigeria. Publication of the International Institute for Aerial Survey and Earth Sciences OTC)Enschede, The Netherlands, 41 pp.]. The banded pattern is visible through vegetation densityrelated to differences in surface hydrology. The latter are caused by variation in soil sealing that isconnected with a by sheet erosion (pediplanisation) levelled former early Holocene to latePleistocene dune landscape (Sangiwa coversand landscape), The difference in sealing is related toa (very small) difference in silt content between the levelled former dunes and the filled in valleysin combination with extreme low organic matter content. The lower silt content in the valleyfilling is connected with the re-sedimentation process, a feature well known in coversandformation. The sealing is a present day process. Fresh loosened soil material (by ploughing andsoil pit digging) is after one rain shower already covered with a sealed crust of several millimetresthrough which no water penetrates. The orientation of the bands (about NNW-SSE) is perpendicular to the prevailing wind direction (ENE-WSW) during the period of formation of the formerdunes. The genesis of this pattern of regional scale appears to be quite different from local scalebanded patterns known to us in dry zones in Africa and Asia and described, in the same period of
• Corresponding author. Vaarwerkhorst 63, 7531 HL Enschede, Netherlands. Tel.: +31-53-4353-890
0341-8162/99/$ - see front matter © 1999 Elsevier Science B.V Ali rights reservedPll S0341-8162(98)00073-3
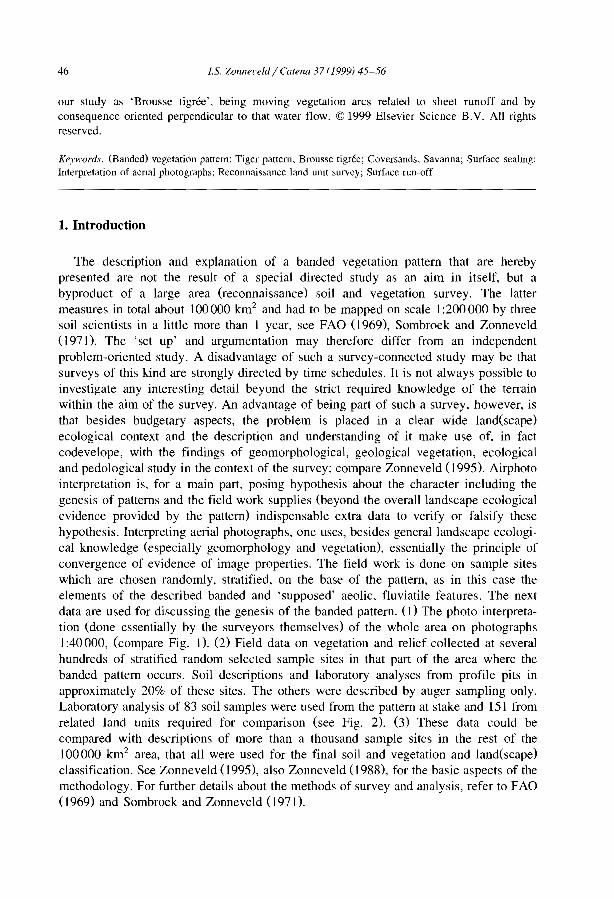
46 /.S. Zonneceld / Calena 37 (1999) 45-56
our study as 'Brousse tigrée'. being moving vegetation arcs related ta sheet runoff and byconsequence oriented perpendicular ta that water flow. © 1999 Elsevier Science B.V. Ali rightsreserved.
Keywords. (Banded) vegetation pattern: Tiger pattern, Brousse tigrée: Coversands. Savanna; Surface seahng:Interpretation of aenal photographs: Reconnaissance land umt survey; Surface ron-off
1. Introduction
The description and explanation of a banded vegetation pattern that are herebypresented are not the result of a special directed study as an aim in itself, but abyproduct of a large area (reconnaissance) soil and vegetation survey, The lattermeasures in total about 100 000 km2 and had to be mapped on scale 1:200 000 by threesoil scientists in a little more than 1 year, see FAü (1969), Sombroek and Zonneveld(971). The 'set up' and argumentation may therefore differ from an independentproblem-oriented study. A disadvantage of such a survey-connected study may be thatsurveys of this kind are strongly directed by time schedules. It is not always possible toinvestigate any interesting detail beyond the strict required knowledge of the terrainwithin the aim of the survey. An advantage of being part of such a survey, however. isthat besides budgetary aspects, the problem is placed in a clear wide land(scape)ecological context and the description and understanding of it make use of. in factcodevelope, with the findings of geomorphological, geological vegetation, ecologicaland pedological study in the context of the survey: compare Zonneveld (1995), Airphotointerpretation is. for a main part, posing hypothesis about the character including thegenesis of patterns and the field work supplies (beyond the overall landscape ecologicalevidence provided by the pattern) indispensable extra data to verify or falsify thesehypothesis, Interpreting aerial photographs, one uses, besides general landscape ecological knowledge (especially geomorphology and vegetation), essentially the principle ofconvergence of evidence of image properties. The field work is done on sample siteswhich are chosen randomly, stratified. on the base of the pattern, as in this case theelements of the described banded and 'supposed' aeolic. fluviatile features. The nextdata are used for discussing the genesis of the banded pattern, (1) The photo interpretation (done essentially by the surveyors themselves) of the whole area on photographs1:40 000, (compare Fig. 1). (2) Field data on vegetation and relief collected at severalhundreds of stratified random selected sample sites in that part of the area where thebanded pattern occurs. Soil descriptions and laboratory analyses from profile pits inapproximately 20% of these sites. The others were described by auger sampling only.Laboratory analysis of 83 soil samples were used from the pattern at stake and 151 fromrelated land units required for comparison (see Fig. 2). (3) These data could becompared with descriptions of more than a thousand sample sites in the rest of the100 000 km2 area, that ail were used for the final soil and vegetation and land(scape)classification. See Zonneveld (995), also Zonneveld (1988), for the basic aspects of themethodology. For further details about the methods of survey and analysis, refer to FAü(969) and Sombroek and Zonneveld (971).
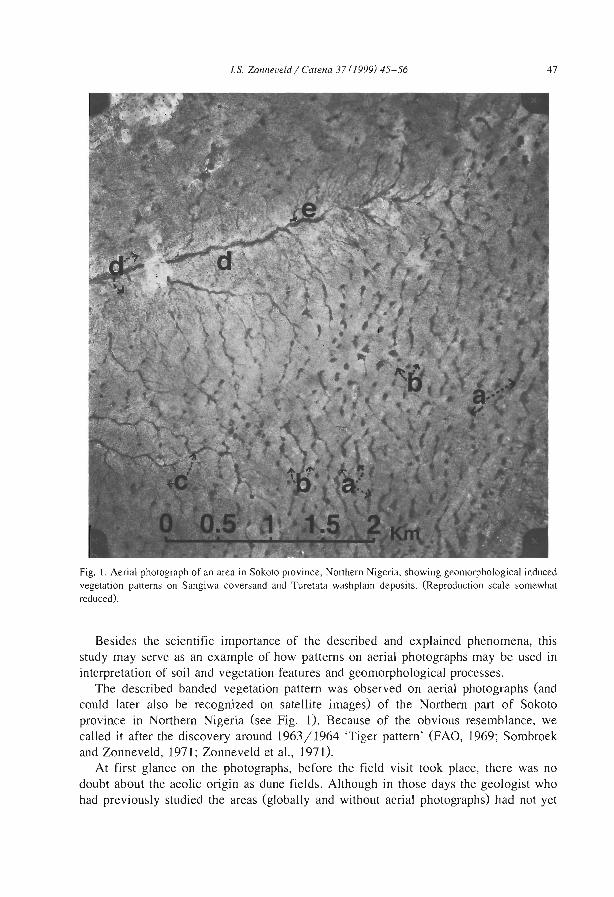
1.5. Zonneveld / Ca/enD 37 (1999) 45-56 47
Fig. 1. Aerial photograph of an area in Sokoto province, Northern Nigeria, showing geomorphological inducedvegetation patterns on Sangiwa coversand and Thretata washplain deposits. (Reproduction scale somewhatreduced).
Besides the scientific importance of the described and explained phenomena, thisstudy may serve as an example of how patterns on aerial photographs may be used ininterpretation of soil and vegetation features and geomorphological processes.
The described banded vegetation pattern was observed on aerial photographs (andcould later also be recognized on satellite images) of the Northern part of Sokotoprovince in Northern Nigeria (see Fig. 1). Because of the obvious resemblance, wecalled it after the discovery around 1963/1964 'Tiger pattern' (FAO, 1969; Sombroekand Zonneveld, 1971; Zonneveld et aL, 1971).
At first glance on the photographs, before the field visit took place, there was nodoubt about the ae01ic Oligin as dune fields. Although in those days the geologist whohad previously studied the areas (globally and without aerial photographs) had not yet
48 I.S. Zonne"eld / Carena 37 (1999) 45-56
COMPARISON OF GRAINSIZE DISTRIBUTION
%50
;;' "'1 ,, 1 /
.' 1 ",: l ":y "
'/ ,"'1 /, ,
'/:/:/
/"Ç/' ,~
-'..."..,,;.,,:".. -
02000 1000 500 250 100 5'0 MICRONS
010Songlwo cO\lersond 13a ( 50 Sampi•• )
l Turelo wosh deposllS 14 e 33 Sampi•• )
Sokoto cO\ll'rsond 15 b (130 Sampi")
YOUNGlilelo coversond 21 (21 Sampi•• )
10
20
30
40
Fig. 2. Grain size distribution of Sangiwa cover,and, Tureta wash, Sokoto coversand and IIIela coversanddeposits.
recognized these sandy formation as (aeolic) coversands. However, the lack of stereodepth later confirmed lack of considerable (even absence of) relief in the field anddemanded for more explanation and more close observation.
2. The area
The location of the area is the Sokoto-Rima basin in Northern Nigeria between 4° and8°E and 11° and 14°N and is land(scape) ecologically, usually indicated as 'Sudan zone.'
The climate is characterized by a severe dry season with dry eastern winds ('Harmattan') from October to May and an intensive wet season from May to September, with anaverage rainfall of about 400 mm in the North to 600 in the southern part. Thevegetation has been described as a grazed and periodically burned Combrefllm nigricans'Sudan' savanna, see FAO (1969), Sombroek and Zonneveld (1971).
The geological formation at the place of the banded pattern are described as aeolic'Sangiwa' coversands of several metres (up to 15 m) over late Cretaceous kaolinitic'Gundumi' or Tertiary 'Gwandu' deposits, usually bordering 'Rima' sandstone of
1.5. ZOIlIleL'eld / Calma 37 (1999) 45-56 49
Cretaceous age (Sombroek and Zonneveld, 1971). The coversands are most probablyformed in the late Pleistocene as the first of a series of aeolic desert deposits laterfollowed by somewhat better sorted 'Sokoto' coversands locally reworked to stillcoarser 'Illela' coversands. The texture can be described as poorly to relativelywell-sorted fine sand (see Fig. 2 for details). The mineralogical composition is mainlyquartz, locally with considerable additions of epidote, hornblende and andalusite. Thesoils are classified as 'Red Acid Sands' or Quarzipsamment (see USDA, 1960; Dudal,1968; FAO, 1969; Sombroek and Zonneveld, 1971). Sorne transitions may occur to Redor yellowish broWI1 leached kaolinitic soifs (Normustult) where the coversand is veryshallow.
3. The pattern
3.1. Shape and size of pattern elements
The configuration of the pattern elements as reflected in the grey tone on thephotographs (see Fig. 1) equals in form and scale mainly a ripple mark feature clearlysuggesting an aeolic genesis. So this became the leading hypothesis of the photointerpretation and hence for the explanation of the pattern. Towards the sides where thecoversand is thinner and overlying kaolinitic late Cretaceous 'Gundumi' deposits, alsomore dendritic figures exist pointing to sorne fluviatile influences (see Fig. 1). Neitherthe 'dune' shape nor the 'river' landform are however within the study area, reflected inthe vertical dimension. Between the two elements of the ripple figures, in the largest partof the survey area, differences in height exist of hardly 1 m and usually even less, withslope of approximately 1% or slightly more, just enough to encourage surface flow(sheet erosion) towards the dark coloured 'depression '(the supposed former duneslacks). Towards the North (North of 13°30'N), a very graduai transition to a real in thefield recognizable dune landscape is apparent with, outside the survey area, differencesbetween dune slacks and ridges up to about 10 m. This fact, together with the size, shapeand arrangements of the pattern elements is a strong argument for the hypothesis of theaeolic character of the deposit.
A similar sheet erosion process may have reduced the relief in the fluviatile forms,even the larger 'river' elements, except sometime for the most 'down stream' 'gully'that indeed may show a slight lower, even discontinuously bordered 'bed'. The largerareas belonging to this fluviatile patters are indicated as (Tureta) 'Sandy washplain'(Sombroek and Zonneveld, 1971). From geomorphological evidence, it is however clearthat the 'fill' of the dune valleys is identical to the washplain sediment, so consequentlyhave similar properties in relation to soil formation and ecologicaJ processes.
4. The vegetation
(The names of the mentioned species are in accordance with Blair Rains, 1968 andGeerling, 1982).
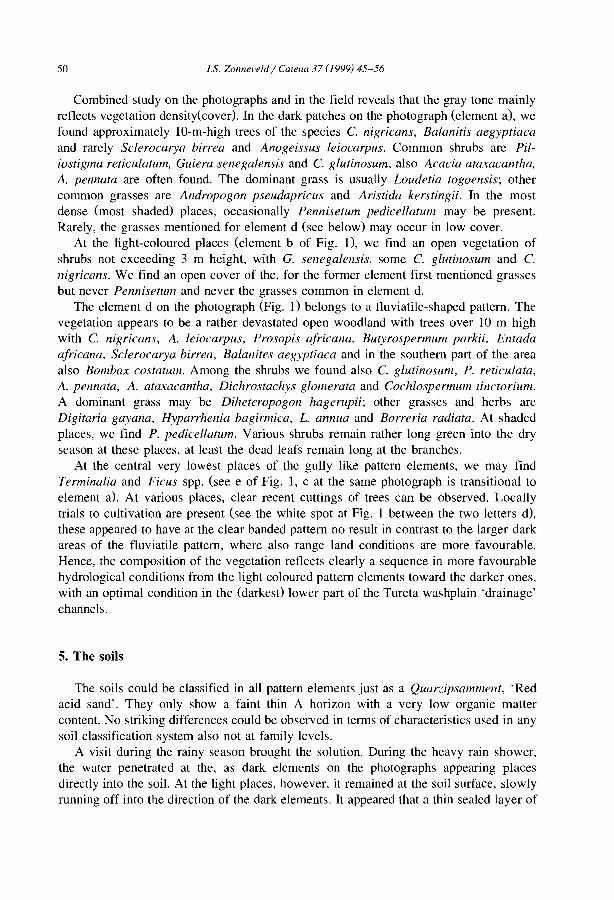
50 I.S. ZOl1nel'eld / Calma 37 (1999) 45-56
Combined study on the photographs and in the field reveals that the gray tone mainlyreflects vegetation density(cover). In the dark patches on the photograph (element a), wefound approximately IO-m-high trees of the species C. nigricans, Balanitis aegyptiacaand rarely Sc/erocarya birrea and Anogeissus leiocarpus. Common shrubs are Piliostigma reticulatum, Guiera senegalensis and C. glutinosum, also Acacia ataxacantha,A. pennata are often found. The dominant grass is usually Loudetia togoensis; othercommon grasses are Andropogon pseudapricus and Aristida kerstingii. In the mostdense (most shaded) places, occasionally Pennisetul1l pedicellatum may be present.Rarely, the grasses mentioned for element d (see below) may occur in low coyer.
At the light-coloured places (element b of Fig. n, we find an open vegetation ofshrubs not exceeding 3 m height, with G. senegalensis, sorne C. glutinosum and C.nigricans. We find an open coyer of the, for the former element first mentioned grassesbut never Pennisetull1 and never the grasses common in element d.
The element d on the photograph (Fig. 1) belongs to a fluviatile-shaped pattern. Thevegetation appears to be a rather devastated open woodland with trees over 10 m highwith C. nigricans, A. leiocarpus, Prosopis a.fricana, Butyrosperll1um pm·kii. Entadaa.fricana, Sc/erocarya birrea, Balanites aegyptiaca and in the southern part of the areaalso BOl1lbax costatUI1l. Among the shrubs we found also C. glutinosul1l, P. reticulata,A. pennata, A. ataxacantha, Dichrostachys glomerata and Cochlospennul1l tinctorium.A dominant grass may be Diheteropogon hagerupii; other grasses and herbs areDigitaria gayana, Hyparrhenia bagirmica, L. annua and Borreria radiata. At shadedplaces, we find P. pedicellatum. Various shrubs remain rather long green into the dryseason at these places, at least the dead leafs remain long at the branches.
At the central very lowest places of the gully like pattern elements, we may findTerminalia and Ficus spp. (see e of Fig. l, c at the same photograph is transitional toelement a). At various places, clear recent cuttings of trees can be observed. Locallytrials to cultivation are present (see the white spot at Fig. 1 between the two letters d),these appeared to have at the clear banded pattern no result in contrast to the larger darkareas of the fluviatile pattern, where also range land conditions are more favourable.Hence, the composition of the vegetation reflects clearly a sequence in more favourablehydrological conditions from the light coloured pattern elements toward the darker ones,with an optimal condition in the (darkest) lower part of the Tureta washplain 'drainage'channels.
5. The soUs
The soils could be classified in ail pattern elements just as a Quarzipsamment, 'Redacid sand'. They only show a faint thin A horizon with a very low organic mattercontent. No striking differences could be observed in terms of characteristics used in anysoil classification system also not at family levels.
A visit during the rainy season brought the solution. During the heavy rain shower,the water penetrated at the, as dark elements on the photographs appearing placesdirectly into the soil. At the light places, however, it remained at the soi! surface, slowlyrunning off into the direction of the dark elements. It appeared that a thin sealed layer of
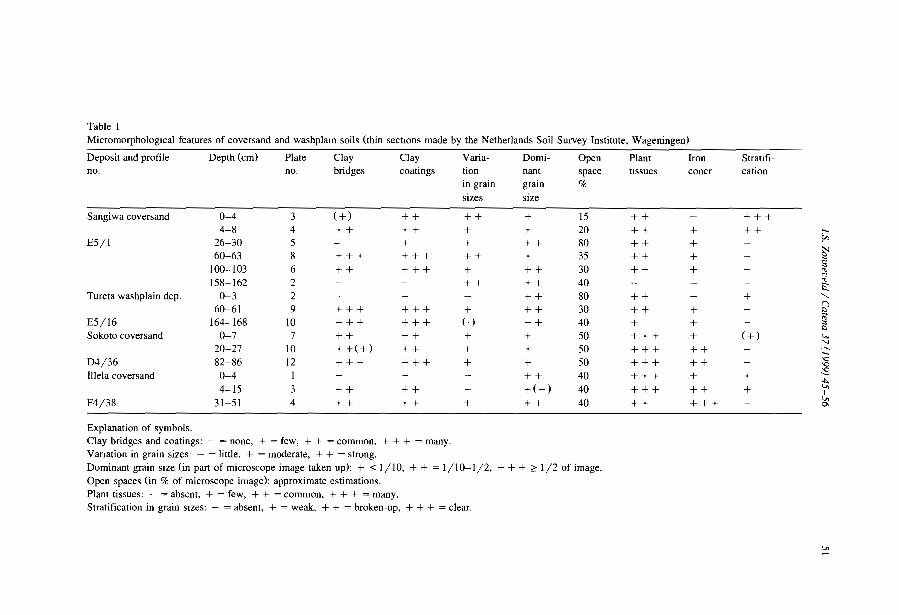
Table 1Micromorphologlcal features of coversand and washplam soils (thin sectIOns made by the Netherlands Soil Survey Institute, Wageningen)
Deposit and profile Depth (cm) PlaIe Clay Clay Varia- Domi- Open PianI Iron Stra\lfi-no. no. bridges coatings tion nant space \Issues concr cation
in grain grain %
sizes size
Sangiwa coversand 0-4 3 (+) ++ ++ + 15 ++ +++4-8 4 ++ ++ + + 20 ++ + ++ .....
E5/1 26-30 5 + + ++ 80 ++ + - 060-63 8 +++ +++ ++ + 35 ++ + ~
lOO-lm 6 ++ +++ + ++ 30 ++ + '"~158-162 2 ++ ++ 40 - "s::
Tureta washplain dep. 0-3 2 - ++ 80 ++ + "-60-61 9 +++ +++ + ++ 30 ++ + ~
E5/16 164-168 JO +++ +++ ( .) ++ 40 + "+ '"l:lSokoto coversand 0-7 7 ++ ++ + + 50 +++ + (+ ) '--
+ +(+)'1
20-27 JO ++ + + 50 +++ ++ - ~.....D4/36 82-86 12 +++ +++ + + 50 +++ ++ '0
'0
IlIela coversand 0-4 1 - - - ++ 40 +++ + + ~.c..
4-15 3 ++ ++ - +(+) 40 +++ ++ + v,1
F4/38 31-51 4 ++ ++ + ++ 40 ++ +++ v,0>
Explanation of symbols.Clay bridges and coatings: - = none, + = few, + + = cornrnon. + + + = many.VarIation in grain sizes' - = little. + = moderate, + + = strong.Dominant grain Slze (in part of microscope image taken up): + ,.; 1/ JO. + + = 1/10-1/2, + + + ~ 1/2 of image.Open spaces (in % of microscope image): approximate estimations.Plant tissues: - = absent, + = few, + + = common. + + + = many.Stratification in grain slzes: - = absent, + = weak. + + = broken-up, + + + = clear.
lJ>
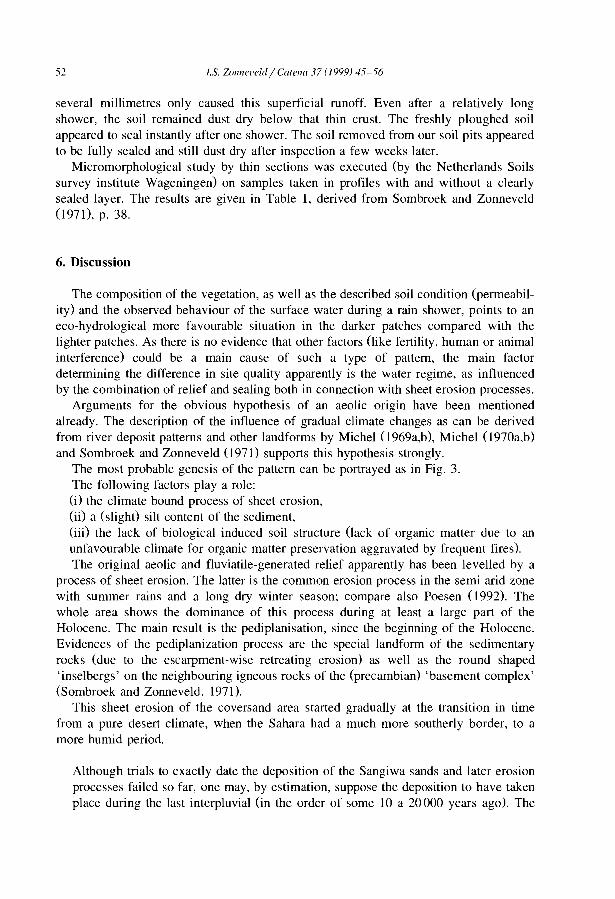
52 I.S. ZOllllel'eld/ Calena 37 (1999) 45-56
several millimetres only caused this superficial runoff. Even after a relatively longshower, the soil remained dust dry below that thin crust. The freshly ploughed soilappeared to seal instantly after one shower. The soil removed from our soil pits appearedto be fully sealed and still dust dry after inspection a few weeks later.
Micromorphological study by thin sections was executed (by the Netherlands Soilssurvey institute Wageningen) on samples taken in profiles with and without a clearlysealed layer. The results are given in Table l, derived from Sombroek and Zonneveld(197 I), p. 38.
6. Discussion
The composition of the vegetation, as weil as the described soil condition (permeability) and the observed behaviour of the surface water during a rain shower, points to aneco-hydrological more favourable situation in the darker patches compared with theIighter patches. As there is no evidence that other factors Oike fertility, human or animalinterference) could be a main cause of such a type of pattern, the main factordetermining the difference in site quality apparently is the water regime, as influencedby the combination of relief and sealing both in connection with sheet erosion processes.
Arguments for the obvious hypothesis of an aeolic origin have been mentionedalready. The description of the influence of graduaI climate changes as can be derivedfrom river deposit patterns and other landforms by Michel (1969a,b), Michel (1970a.b)and Sombroek and Zonneveld (1971) supports this hypothesis strongly.
The most probable genesis of the pattern can be portrayed as in Fig. 3.The following factors play a raIe:(i) the climate bound process of sheet erosion,(ii) a (slight) siIt content of the sediment,(iii) the lack of biological induced soil structure Oack of organic matter due to anunfavourable climate for organic matter preservation aggravated by frequent fires).The original aeolic and fluviatile-generated relief apparently has been levelled by a
process of sheet erasion. The latter is the common erasion process in the semi arid zonewith summer rains and a long dry winter season; compare also Poesen (1992). Thewhole area shows the dominance of this process during at least a large part of theHolocene. The main result is the pediplanisation, since the beginning of the Holocene.Evidences of the pediplanization process are the special landform of the sedimentaryrocks (due to the escarprnent-wise retreating erasion) as weil as the round shaped'inselbergs' on the neighbouring igneous rocks of the (precambian) 'basement complex'(Sombroek and Zonneveld. 1971).
This sheet erosion of the coversand area started gradually at the transition in timefrom a pure desert climate, when the Sahara had a much more southerly border, to amore humid period.
Although trials to exactly date the deposition of the Sangiwa sands and later erosionprocesses failed so far, one may, by estimation, suppose the deposition to have takenplace during the last interpluvial (in the order of sorne 10 a 20000 years ago). The
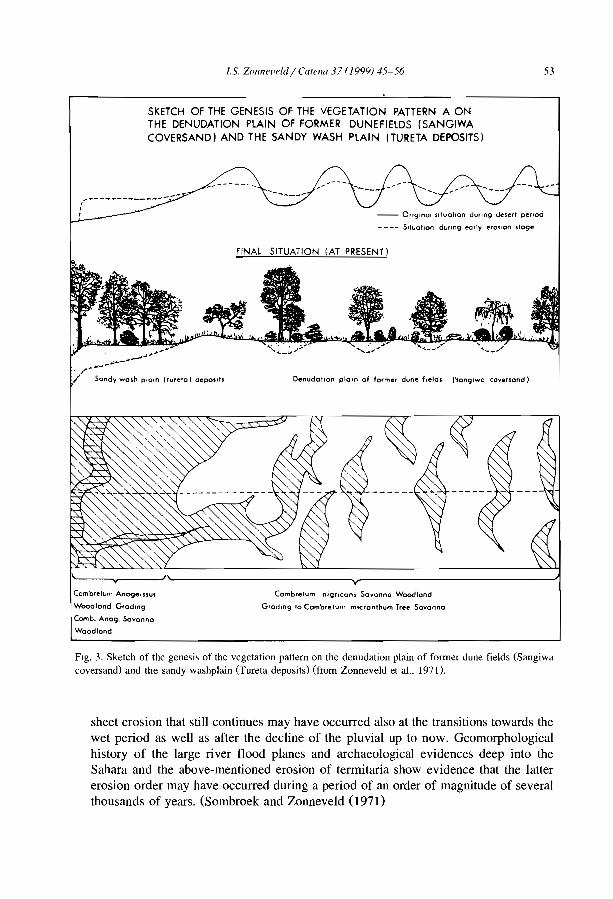
1.5. ZOllnel'eld / CalellQ 37 (1999) 45-56
SKETCH Of THE GENESIS OF THE VEGETATION PATTERN A ONTHE DENUDATION PLAIN OF fORMER DUNE fiELDS (SANGIWACOVERSAND) AND THE SANDY WASH PLAIN (TURETA DEPOSITSJ
53
-- ..._--
-- Onglnal situation dUflng desert penoci
- --- Sttuatlon dUring eorly erOSlon stoge
Combretum Anoge.ssus
Wood land GrodJng
Comb. Anog. Savonna
Woodlond
Combretum nlgneons Savonna Woodlond
Gradlng 10 Combretum mlcronthum Tree Savonna
Fig. 3. Sketch of the genesis of the vegetation pattern on the denudation plain of former dune fields (Sangiwacoversand) and the sandy washplain (Tureta depositsl (from Zonneveld et al., 1971).
sheet erosion that still continues may have occurred also at the transitions towards thewet period as weil as after the decline of the pluvial up to now. Geomorphologicalhistory of the large river flood planes and archaeological evidences deep into theSahara and the above-mentioned erosion of terrnitaria show evidence that the lattererosion order may have occurred during a period of an order of magnitude of severalthousands of years. (Sombroek and Zonneveld (1971)
54 /.S. Zonnet'eld / Cafena 37 (J999) 45-56
The transition from dry to humid can also be observed spatially as the relief decreasesfrom north to south where the erosion process started earlier. Sheet erosion requireshowever a nonpermeable surface in order to maintain an overland flow. At first glance,'psamments' may not be the most likely base for surface sealing. However, Fig. 2 showsthe differences in texture between the various patches of the pattern. The originalSangiwa sands appears to have just enough silt to form a crust (see Fig. 2).
The silt content in the less or not sealed sediments appear to be lower. The reason ofthis can be found in the resedimentation process which often results in a loss of thefinest fractions either by fluviatile or aeolic processes. For example, the Pleistocene colddesert fringe coversands from the last glaciation in the Netherlands show also a similardecrease in fine fraction after resedimentation. The dune valleys, in contrast to thewashplain. have no outlet. So even in case of sorne sealing, the water eventually hasmore time to penetrate the top layer.
The dominant role of sheet erosion, as main geomorphological process in (sub) recentperiods, is also reflected in the interesting dotted pattern caused by levelling of former(fossil) termitaria at more loamy deposits in the neighbourhood of the banded pattern asdescribed by Sombroek and Zonneveld (1971) and Zonneveld et al. (1971).
Sealing couId be counteracted by soil structure formation under biological influence(fresh organic matter). The extremely long dry periods in combination with anthropogenic generated fires, counteract this certainly on those places were the vegetation isless dense. So one can expect a tendency, as an example of a negative feedback systemincreasing stability, that once the vegetation has reacted on a slightly more favourablehydrological situation, the organic matter production of the vegetation it self helps inmaintaining the favourable permeability. Under these circumstances, rain-fed agricultureappears to be disastrous and therefore virtually impossible, as the first shower afterploughing causes sealing. Theoretically, the creation of more permanent humidity thatallows sorne formation of stabile structure improving humus is a prerequisite foragriculture at these soils. Under the present conditions, any form of irrigation seems,however, in the study area to be excluded.
The banded Sangiwa pattern so serves as a clear indication of a special landscapeecological situation connected with a special geomorphological history. resulting in aspecial texture which still indirectly is related to climatic factors.
It is an example how vegetation features instead of actual physical landform like thiscould be used as land unit mapping characteristics, compare Zonneveld (1995). But theimage as shown by the vegetation as such could be recognized because its geomorphological (aeolic and fluviatile) shape features.
7. Comparison with other banded patterns
So far, we found in literature only one description of similar banded patterns like oursconducted by Clayton (1966, 1969). It refers apparently also to Sangiwa sands in theneighbouring areas in Nigeria.
Not any dune pattern needs to be banded. One can well imagine that a certain notbanded relief in sandy deposits after levelling by sheet erosion may result in a dot
1.5. Zonnel'eldj Calma 37 (1999) 45-56 55
pattern with similar properties of the elements in relation to surface hydrology. Aiso atFig. 3, one may observe transitions from bands to dots. So Sombroek et al. (1976, andoral communication) described in local soil survey reports in Kenya similar, be it more'panther'- than 'tiger'-like, patterns related to the more static Sangiwa fossil dunepattern.
Most publications, from the same period as our study and later, about bandedpatterns, deal with quite deviating phenomena, be it under a similar name: 'Broussetigrée'. So did White (1969, 1970, 1971) for Republique Nigère. Greenwood (1957)described similar features as 'Vegetation arcs' in Somalia. Thiéry et al. (1995) summarize the genesis as moving vegetation arcs under influence of sheet-run-off. See, e.g.,Bergkamp et al. (1996), Chappel et al. (I996), Galle et al. (I996) and others in thisissue. These patterns have a very much different genesis. Aiso here runoff water is acause but they have a much more dynamic character. The orientation of the bandsirrespective the compass direction is determined by the terrain slope and are perpendicular to the water flow (not the wind). These vegetated arcs are not necessarily the lowestparts, provided they receive and hold surface water. It are the places were sediment (andorganic matter) accumulate, in contrast with the strongly sealed parts of the surfacemosaic, that serves as runoff bed. Stronger then in our static bands, here a clear dynamicequilibrium exist between mutual influence of vegetation, sedimentation, structurebuilding (by organic matter).
We observed similar 'brouse tigrée' patterns at different scales in the field and by airin wadies in the Syrian and other deserts. These arcs may generate, collapse and move intime and space, depending on the balance between runoff and intrinsic vegetationgrowth factors.
For more details, especially also about the termite related dot patterns mentionedearlier, may be referred to Sombroek and Zonneveld (1971), Zonneveld et al. (197]),Zonneveld (1975).
References
Blair Rains, A., 1968. A field key to the commoner genera of Nlgenan grasses. Samaru Miscellaneous PaperNo. 7. Inst. for Agncultural Research, Amadu Bello University, Samaru, Zaria, Nigeria.
Bergkamp, G., Cerda, A.. Imeson, A., Jongejans, J., 1996. The importance of surface water redl,tnbution forthe ware budget of banded vegetation structures. This publication.
Chappe!. A., Valentin, c., Peugeot, C.. Warren, A., 1996. Impact of water harvestmg variations along aclimactic transect in Niger upon productlvity and pattern in Niger. This publication.
Clayton, W.D., 1966. Vegetation ripples near Gummi, Nigeria. J. Eco!. 54,415-417.Clayton, W.D., 1969. The vegetation of Katsma province, Nigeria. J. Eco!. 57.445-451.Duda!. R., 1968. Definition of soil umts for the soil map of the world. FAOjUNESCO World SOli Resources
Report 33, Rome.FAO, 1969. Soils Survey and Land Classification, Soils and Water resources Survey of the Sokoto Valley
(Nigeria) Final report Vo!. V FAOjSF:67 jNr3.Galle, Ehrrnann. M., Peugeot, c.. 1996. Water balance in banded vegetatIOn pattern: the case of the Tiger bush
in West Niger. This publication.Geerling, Ch., 1982. GUide de terram des ligneux Sahéliens et Soudano-Guinéens. Mededelingen Land-
56 I.S. ZOllne1"eld / Catena 37 (1999) 45-56
bouwhogeschool Wageningen. Nederland 82-3, 340 pp.( See also Flora of West Tropical Africa. 2nd edn.MIllbank London)
Greenwood. J.E.G.. 1957 The development of vegetation patterns III Somaltland protectorate. The Geograph.J 123. 465-473.
Michel, P.. 1969a. Les Grandes étappes de la morphogénèse dans les bassin des fleuve Senegal en Gambiependant le Quaternaire. Bul!. Inst. Afr. Noir A. 31 (2), 293-324.
Michel. P., 1969b. Les depôts du Quaternair de la vallée inteneur du Niger. d'après H. Busier. Bull. ASEQUA21, 55-57.
Michel. P., 1970a. Chronologie du Quaternalf des basslll des fleuves Sénégal et Gambie, ESSai de synthès.Bull. ASEQUA 25. 53-64.
MIchel. P. 1970b. Chronologie du Quaternair des bassin des fleuves Sénégal et GambIe. ESSai de synthès.Bull ASEQUA 26.
Poesen, J.A W., 1992. Mechanisms of overland-flow generation and sediment production on loamy and sandysoils with and without rock fragments. In: Parsons. AJ.. Abrams. A.D. (Eds.). Overland Flow. Hydraulicsand Erosion Mechanics. UCL Press. London. pp. 275-305.
Sombroek. W.G. Zonneveld, I.S., 1971 Anclent dune fields and flUVIatile deposits in the Rima-Sokoto Riverbasin (N.W. Nigeria) SOlI Survey Papers No. 5. Netherlands Soils Survey Institute. Wagenmgen. Colourpnnted map, 107 pp
Sombroek. W.G.. MbuvI, J.P .. Okwaro. H.W.. 1976. Sods of the semi-arid Savanna zone of North-EasternKenya. Kenya Soils Survey. Miscellaneous Soil Paper M2. 14 pp.
Thiéry. J.M .. d·Herbès. J M., Valentin, c., 1995. A model simulatlllg the genesls of banded vegetatIOn paternsIII Niger. J. Ecol. 83.497-507.
USDA. 1960. Soil survcy staff. Soil classIfication. a comprehensIve system.White. L.P.. 1969. Vegetallon arcs III Jordan. J. Eco!. 57.5461-5464.White, L.P., 1970. 'Brousse tigrée' patterns III souther NIger 54. J. Eco!. 58. 549-553White, L.P. 1971. Vegetation stnpes on sheet wash surfaces. J. Eco!. 59. 615-622.Zonneveld. I.S, 1975. Der Zusammenhang zwischen dem Honzontal-gefùge der Vegetation und dem
Edaphischen Zustand III einem Savannegeblet Nord-Nlgerias VegetatIOn und Substrat. Benchte der Int5ymp. der Internat. Verein. f. Vegetationskunde. (Rinteln 1969). Cramer III A R. Gantner Verlag, FI 9094VADUZ, 1975. pp. 511-527
Zonneveld, 1.S. 1988. Vegetation mapping. In: Küchler, Zonneveld CEds.l, Handbook of Vegetation Science10. Chaps. 4. lIa. 17.20. and especlally 29. Kluwer Ac. Pub. Dordrecht. Boston, London, 635 pp.
Zonneveld. I.S .. 1995. Land Ecology. an Introducllon to Landscape Ecology as a Base for Land Evaluallon.Land Management and ConservatIOn 5PB Acad. Pub!., Amsterdam. 199 pp.
Zonneveld, 1.5 , de Leeuw. P.N.. Sombroek, W.G. 1971. An ecological interpretation of Aenal photographs ma savanna regIOn in northern Nlgena. PubltcatlOn of the International Institute for Aenal 5urvey and EarthsCIences OTe) Enschede. The Netherlands. 41 pp.
ELSEVIER Catena 37 (1999) 57-73
CATENA
Vegetation arcs and litter dams: similarities anddifferences
J. Eddy a, G.S. Humphreys a,*, D.M. Hart a, P.B. Mitchell a,
P.e. Fanning b
a School of Earth Sciences, Ml1cquarie University, Macqul/rie 2109, Australll1b Gradul1te Sc/zool of the En['ironmellt, Macquane Unù'ersity, Macquarie 2109, Australil1
Received 30 June 1996; received in revl,ed fonn 19 November 1997; accepted ]() February 1998
Abstract
Vegetation arcs are near parallel bands of denser vegetation aligned perpendicular to slope andseparated by barer inter-arc zones. These patterns occur in arid and semi-arid areas of gentle tovery gentle gradient. Similar, but much smaller scale patterns, here referred to as 'litter dams andmicroterraces' , occur in a variety of climatic regions, from tropical to temperate to arid, on steeperslopes, as weil as on very gentle slopes. We describe similarities between arcs and dams inattributes such as shape, orientation, cross-sectional profile, spatial organisation, and surfacefeatures (arrangement of plants, surface crusts). Differences are in spatIal and temporal scale.Range of wavelengths, or spacing between bands, is 25-300 m for arcs and 0.1-2 m for dams.With regard to time, arcs may be stable for tens to a hundred or more years while dams may beephemeral or remain stable for more than a decade. Overland flow involving the transport oforganic material (ieaves, charcoal, faecal pellets) as floating load over comparatively bare surfacesis an important factor in the maintenance of vegetation arcs and formation of and maintenance oflitter dams. Recognising the importance of gradient to transport by overland flow a preliminarylllvestigation of the relationship between wavelength and gradient was conducted. A combinedanalysis of a limited set of arc and dam data describes parallel lines which may indicate thatsimilar processes are operating at the two scales. This would allow the convenience of processstudies on dams as an aid in understanding the origin of arcs. However, the difference in the
• Corre&ponding author
0341-8162/99/$ - see front matter © 1999 ElseVier Science B.V. Ali rights re,ervedPli: S0341-8162(98)O0055-1
58 J Eddy et al. / Catena 37 (1999) 57-73
intercept of the two lines with the In(wavelength) axis may indicate changes in process thatpreclude extrapolations from one spatio-temporal scale to the other. © 1999 Elsevier Science B.V.AU rights reserved.
Keywords: Vegetation arcs; Litter dams; Vegetation patterns; Sheetf100d bedforms; Overland f1ow; Ramwash
1. Introduction
Several types of banded vegetation patterns are described in the literature. Thosereferred to in this paper as 'vegetation arcs' are near parallel bands (spacing 25-300 m)of denser vegetation aligned approximately perpendicular to slope and are known in aridand semi-arid areas on gentle slopes in Africa (e.g., Macfadyen, 1950a,b; Boaler andHodge, 1964; Greenwood, 1957; White, 1970; Worrall, 1959, 1960), Australia (e.g.,Mabbutt and Fanning, 1987; Greene, 1992; Ludwig et al., 1994; Dunkerley and Brown,1995), Mexico, (Montana et al., 1990) and the Middle East (White, 1969, 1971). Despitea low and erratic rainfall, mostly between 150-450 mm, the arcs support distinctivecommunities of grasses, shrubs and trees.
Litter dams and microterraces are similar to vegetation arcs in shape and orientationbut they are considerab1y smaller (spacing 0.1-2 m). They are common in sub-humid tohumid bushfire prone parts of Australia on gent1e hillslopes subject to rainwash(Mitchell and Humphreys, 1987). The convex downs10pe dams consist of floating 10admaterial: ash, fragments of charcoal and acicular debris. Trailing edges of litter damsoften merge with others forming an interconnected network over the hillslope in asimilar way to vegetation arcs. The litter dam is the site of regeneration of fire-tolerantspecies, perennial grasses, stoloniferous rushes and sedges, seedlings of herbs and firedependent obligate seeding shrubs. Downslope of the dam is a steeper scarp or erosionzone. Upslope of the dam a microterrace forms as bedload mineraI material, composedmainly of sand-sized quartz grains, is deposited in the ponded zone created by the litterdam. Within the microterrace a variety of crusts form during the post-fire period as themicroterrace is stabilised by algal and root mats, but it remains largely devoid of higherplants. In this sense microterraces resemble the vegetation deficient intergrove ofvegetation arcs. The pattern of these microrelief fonns has been observed to persist forlonger than a decade between major fires. Similar features have been described in othersettings (Paton et al., 1995) and under a variety of names, such as debris bars, floatingloadjbedload dams, barrier dams, listed in Mitchell and Humphreys (1987) who chosethe term 'litter dam and microterrace' to describe both the material and the microreliefform.
The origin of vegetation arcs has not been fully established. Mechanisms that maycontribute to their formation include the effect of prevailing winds (White, 1971) andentrapment of wind-blown sand behind barriers (Worrall, 1959), though it is apparent tomany authors that sheetwash is an important contributing factor. With the much smallerlitter dams rainwash, i.e., a combination of rainsplash, slopewash and sediment rafting(cf. Paton et al., 1995; van Zon, 1980) remain the most important factors providing thata suitable supply of organic debris is available. In both situations a fonn of overlandflow is implicated. Il is possible that a better understanding of litter dams may assist in
J. Eddy et al. / Catena 37 (1999) 57-73 59
determining the origin of vegetation arcs. However, this approach by analogy works bestonly if similarities can be demonstrated. As a contribution towards this objective it isnecessary to evaluate the similarities and differences between vegetation arcs and litterdams, and this is the purpose of the paper.
2. Materials and methods
Apart from observations at Fowlers Gap in serni-arid Australia we have relied onpublished accounts for information on vegetation arcs. In contrast, details on litter damsare largely from our own observations. Accordingly, the description of field sites andmethods refers to litter dams only.
2.1. Field sites
Detailed observations of litter dams and related features have been made at twolocations in eastern Australia: the Sydney Basin and the Pilliga State Forests (Fig. 0.Unqualified observations have extended from semi-arid New South Wales to thewetjdry tropics of the Northern Territory and the wet tropics of Papua New Guinea.
2.1.1. Sydney BasinThe study plots in the Sydney Basin (at Cherrybrook, Ku-ring-gai and Oxford Falls)
were in natural bushland reserves on 2°_10° slopes on which 1-2 m high benches ofquartzose Hawkesbury Sandstone outcrop. Texture contrast soils (Haplohumults, SoilSurvey Staff, 1992; Yellow Podzolics, Stace et al., 1968) and shallow earthy sands(Quartzipsamments, Soil Survey Staff, 1992; Earthy sandsjLithosols, Stace et al., 1968)comprise an apedal loamy sand to fine sandy loam topsoil overlying clayey or loamysubsoils respectively. The vegetation is a woodland or open forest (after Specht, 1970)dorninated by Eucalyptus spp. A shrub understorey is dominated by species of Banksia,Hakea, Casuarina and Grevillea. Patchy groundcover consists of perennial tussockgrasses and stoloniferous rushes such as Lomandra spp. Average yearly rainfall is about1200 mm falling to less than 1000 mm in drier years and exceeding 1900 mm in wetteryears. Most rainfall occurs in storm events in autumn and summer.
2.1.2. PilligaIn the Pilliga State Forests a mosaic of vegetation is supported on a variety of soils
formed mainly from sediments derived from Jurassic Pilliga Sandstone. The vegetationcommunities referred to in this study occur on slopes up to 2°-4° and consist of an openwoodland of Eucalyptus viridis growing in multi-stemmed habit referred to as 'mallee'and a forest of Allocasuarina cristata or 'belah'. The mallee-soils are texture contrastsoils comprising sandy loam to sandy clay loam over a sandy clay with columnarstructure (Natrustalf, Soil Survey Staff, 1992; Solodized Solonetz, Stace et al., 1968).The belah soil is a Vertisol (Soil Survey Staff, 1992); gilgaied Grey Clay (Stace et al.,1968). Average annual rainfall is about 600 mm, much of which falls during summerstorms, though extremes of both drought and wet periods are common. The last majorfire in the area was 45 years ago, with patchy minor fires occurring 30 years ago.
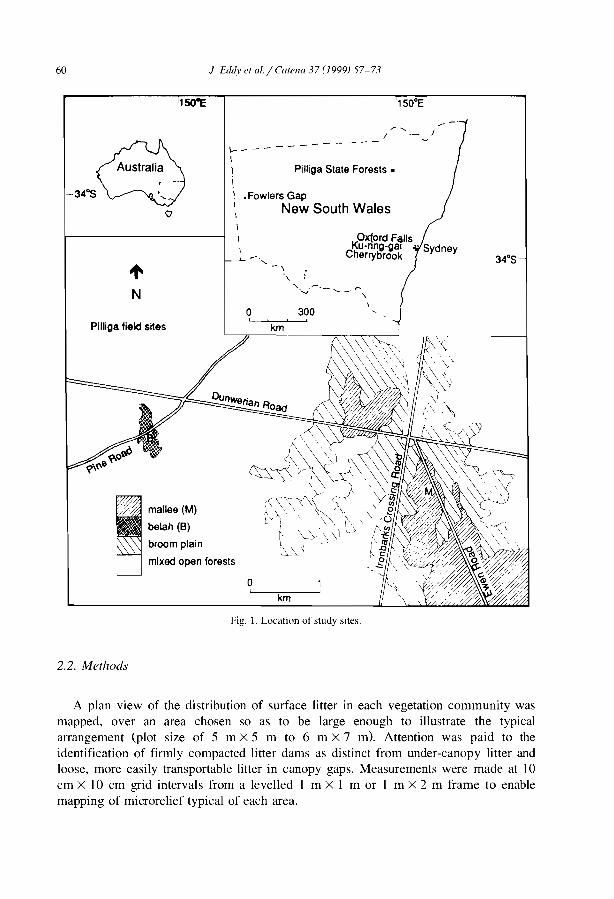
60 J Edd.l' el al. / Calma 37 (1999) 57-73
150"E 1500 E
34°5K0xford Fallsu-nng-gal Sydney
Cherrytlrook
300
Pilliga State Forests •
km
km
o!
o
...... -.,-\
.~
' ........-.- ........ _-,
J
1-----1
11
1 • Fowlers Gap
1 New South Wales\
11
mallee (M)
belah (B)
broom plain
mixed open forests
Pilliga field sites
Fig. 1. Location of stndy sites.
2.2. Met/lOds
A plan view of the distribution of surface litter in each vegetation community wasmapped, over an area chosen so as to be large enough to illustrate the typicalarrangement (plot size of 5 m X 5 m to 6 m X 7 m). Attention was paid to theidentification of firmly compacted litter dams as distinct from under-canopy litter and100se, more easily transportable Iitter in canopy gaps. Measurements were made at 10cm X 10 cm grid intervals from a levelled 1 m X 1 m or 1 m X 2 m frame to enablemapping of microrelief typical of each area.
J. Eddy el al. / Calella 37 (1999) 57-73 61
Surface features (e.g., microbiotic or mineraI crusts, presence and arrangement ofherbs, forbs or cryptogams, type and compactness of litter) characteristic of eachmicrotopographical zone were noted. Undisturbed soil samples, 0-5 cm depth, werecollected from each zone for preparation of thin sections for micromorphologicalexamination.
In the mallee cornmunity the vegetation was recorded along two intersecting transects; one along the maximum gradient (a gradsect, cf. Gillison and Brewer, 1985) and atransect along the contour, each 50 m long and one metre wide. These patterns werechecked against aerial photographs of the site.
3. Results
3.1. Ares and dams in plan
From aerial photographs in arid areas vegetation arcs appear as regularly spacedbands which, together with intervening bare or less densely vegetated areas, form adistinctive pattern (Fig. 2a) often covering many square kilometres. Bands on low slopesare typically convex downslope, orthogonal to the direction of sheet f10w though convexupslope patterns have been observed along shallow water ways and on the side slopes ofspurs (Mabbutt and Fanning, 1987). The plan view map of litter dams in the Pilliga StateForests also shows a pattern of convex downslope arcuate bands, parallel to contours(Fig. 2b) that is very similar to vegetation arcs. Furthermore, the trailing edges of damsmerge with others to form an interconnected network over the hillslope, similar to thereticulate patterning of 'master groves' and 'minor groves' reported by Mabbutt andFanning (1987).
3.2. Topographie profile
Although the earliest investigations did not elaborate on a topographie vanatlonacross vegetation bands/interbands it nevertheless became apparent that differencesexisted. For example Worrall (1960) reported that tree bands formed gentle risers andWhite (1969) noted that a slight rise was created by sand blown against the bases ofshrubs in the vegetation band. Terminology used for different topographical zones variesfrom author to author. Sorne refer to the difference in vegetation cover (vegetationband/bare area), others to hydrologieal processes or resource availability (runoff/interception zones, fertile patch) and still others to ecological succession (pioneer zone).Taken together these illustrate the growing understanding of interactions of process andfunction in banded landscapes. In this section and in Fig. 3, referred to in (a) and (b)below, the original terminology of authors whose diagrams have been used is thereforeretained, while sorne attempt has been made to integrate concepts by doubling up onlabels for particular parts of the one diagram.
From published information, two types of topographie profile are distinguishable.(a) The vegetated arc is supported on the 'riser' (Fig. 3a).Slatyer (1960 noted from observations of water movement that the intergrove area
was flatter just upslope of the tree band. About two-thirds of the vegetated band and theadjacent downslope intergrove area were on a greater than average slope forming a
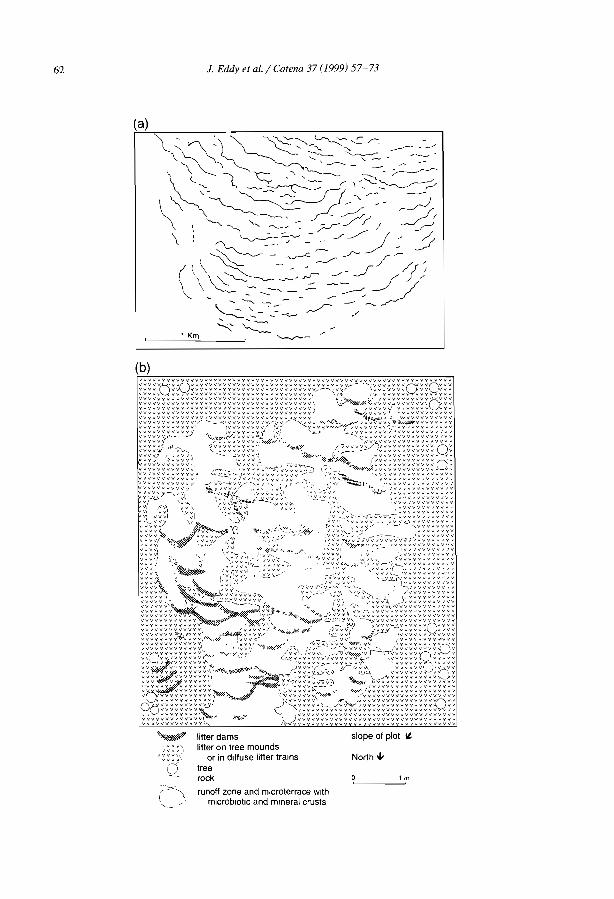
62 J. Eddy et al. / Carena 37 (1999) 57-73
(a)
(b)"" VV "" YVV Il Il "" Il VV Il Il YVV Il VV Il Il Il Il Il Il vv Il Il V V Il V Il \IV V Il Il VVY Il Il VV Il vv" Il VVVV Il YVV Il ""
~~~~~d~~~~~~~~~~~~~~~~~~~~~~~~~~~~~;;f.~~\~t;r--'j~~~2~~~q~~ÇS~~Il Il Il vv Il Il Il Il Il Il YVY Il Il Il YVY Il Il VV V Il Il V V "" Il V v v v ,,( ~ '>~ .~' 1 Il Il Il Il Il Il Il VV Il R Il Il
~~~~~~~ ~ ~ ~ ~~ ~ ~~~~ ~~~~ ~~~ ~ ~ ~~ ~ ~ ~~ ~~ ~ ~ ~) ~ ~j'~~~ ~)I~~~~~ ~~~~~~~~VIII/VIIVVVVV"","" 'VIII/VIIVVVVV"Y ..IYVVV':'-.::{ ""V '\1t"'n~': 1.: WVVVVVV>lYVV
~ ~~ ~ ~ ~ ~ ~ ~ ~ ~ ~/- -- - '-\~ ~ ~~~ ~ ~ ~ ''/7~'Y/ "<~ ~ v';~~:~'»~: ~ ~ ~ ~ ~: ~~:.~~~ ~ ~ ~ ~ ~ ~ ~VIII/VIIVVVVVY,) IVVVVII""! Iyf .....:LJ-/ '-"-L.::!"vv.Jv"::;·vvvvvvvv" ,,,"
~ ~ ~~ ~ }"-- --'" ~..~:r~~<:~ ~~ ~ ~~~:'~~<'.. !::,~ ~ ~ ~ 0~ ~ ~ 0000~ 0~ 0~ 00vvvvv~ ,,1-... aVVIIVVVVV"'1 .~~~....... j'7!VYVv y /,VVVVVVV V o,/VV 0"
....,-,.. :.:-:. ··.':·:6-'II" " 1';/
'" \ c.~,r... '" 1
I ~~~~~~~~V ~,,' • __ J'~vv' ,"vv~vvv~~~vv>v~~~~~n~~~~~~~~~~~~Vl v\. ,~.~'~~~~ ~-"-~~~~~~~~~~~~~~~0
~~§,~~~1i~~~~:~~::·:*~~:J~.~'~::~~~:::~;:~~~~1~t~~C(;~~~~R~~3~~}__./~V.I~~~0~~~ c 0.':t.~~00~~~~00000Y \~0000~~ ~::~0\IV "VVVVVY ~,. ~\\'>-';.\ )V"V'C "y--,vv,!\ 'YVVVVV\ l'VI\/\/>.IV vvvvvv'\·""\;1'\\\\~.. -\>;-~ __r"yVV,!-i50'.."") ~0~vvvvvvv:;,-/"Ov
~~~v v~~~~~~~ ~~~~'~-~~~~~~~0 ~I /~~00~~~~~~~~~~~0~~v~~ yvvvvV,v\.... ":..-vvvvv~ " ~.., Ivv"vv"""""""""v""v,,"IV vvvvvvvvvvf~ '~'vvvvvv,:,\~.w>" ,-'YVVYVV"VV"""""vv""""
o~~ ~ ~ ~ ~ ~~~~0YI 0~~:~ ~ ~Vv~~t~:\~ ~ ~~~~~~~~~ ~~~ ~ ~ Q~~~ ~~0 00 ~ 000 0~~... ,~s '\ 000~0~0 00 000 0~0 000 000 000 000 ~ ~ 000 0~YVVVVVyy>.;y""".,- '1 \IV V \IV 'vvvvvv""" IYVYVV,,""y
liner damsliner on tree mounds
or in diffuse liner trainsIreerock
runoff zone and mlcroterrace wlthmlcroblotlc and minerai crusts
slope of plot "
North.
lm
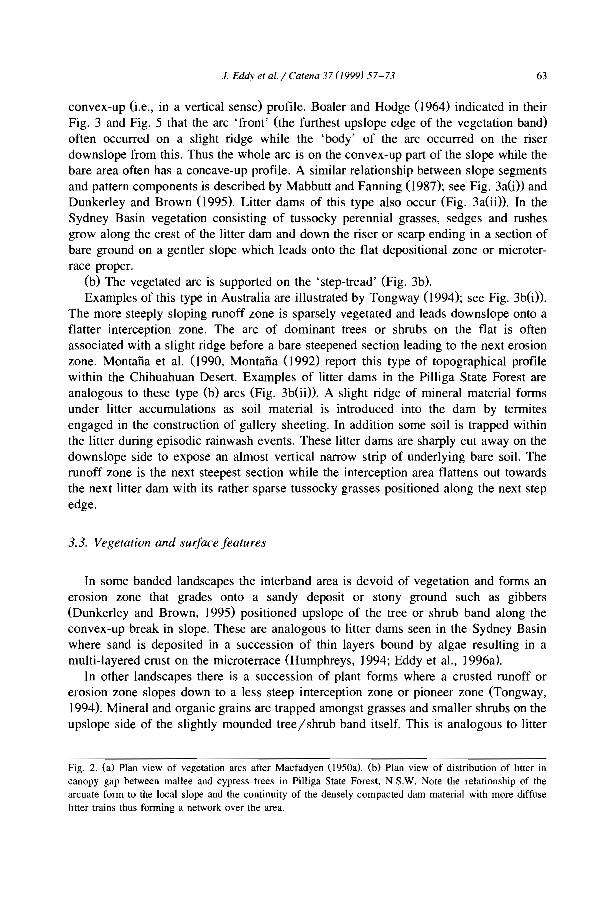
J. Eddy el al./ Calena 37 (1999) 57-73 63
convex-up (i.e., in a vertical sense) profile. Boaler and Hodge (J 964) indicated in theirFig. 3 and Fig. 5 that the arc 'front' (the furthest upslope edge of the vegetation band)often occurred on a slight ridge while the 'body' of the arc occurred on the riserdownslope from this. Thus the whole arc is on the convex-up part of the slope while thebare area often has a concave-up profile. A similar relationship between slope segmentsand pattern components is described by Mabbutt and Fanning (I987); see Fig. 3a(j)) andDunkerley and Brown (1995). Litter dams of this type also occur (Fig. 3a(ii)). In theSydney Basin vegetation consisting of tussocky perennial grasses, sedges and rushesgrow along the crest of the litter dam and down the riser or scarp ending in a section ofbare ground on a gentler slope which leads onto the fiat depositional zone or microterrace proper.
(b) The vegetated arc is supported on the 'step-tread' (Fig. 3b).Examples of this type in Australia are illustrated by Tongway (I994); see Fig. 3b(j)).
The more steeply sloping runoff zone is sparsely vegetated and leads downslope onto aflatter interception zone. The arc of dominant trees or shrubs on the fiat is oftenassociated with a slight ridge before a bare steepened section leading to the next erosionzone. Montana et al. (I990, Montana (I992) report this type of topographical profilewithin the Chihuahuan Desert. Examples of litter dams in the Pilliga State Forest areanalogous to these type (b) arcs (Fig. 3b(ii». A slight ridge of minerai material formsunder litter accumulations as soil material is introduced into the dam by termitesengaged in the construction of gallery sheeting. In addition sorne soil is trapped withinthe litter during episodic rainwash events. These litter dams are sharply cut away on thedownslope side to expose an almost vertical narrow strip of underlying bare soil. Therunoff zone is the next steepest section while the interception area flattens out towardsthe next litter dam with its rather sparse tussocky grasses positioned along the next stepedge.
3.3. Vegetation and surface features
In sorne banded landscapes the interband area is devoid of vegetation and forms anerosion zone that grades onto a sandy deposit or stony ground such as gibbers(Dunkerley and Brown, 1995) positioned upslope of the tree or shrub band along theconvex-up break in slope. These are analogous to litter dams seen in the Sydney Basinwhere sand is deposited in a succession of thin layers bound by algae resulting in amulti-Iayered crust on the microterrace (Humphreys, 1994; Eddy et al., 1996a).
In other landscapes there is a succession of plant forms where a crusted runoff orerosion zone slopes down to a less steep interception zone or pioneer zone (Tongway,1994). Mineral and organic grains are trapped amongst grasses and smaller shrubs on theupslope side of the slightly mounded tree/ shrub band itself. This is analogous to litter
Fig. 2. (a) Plan view of vegetation arcs after Macfadyen (l950a). (b) Plan view of distribution of hller incanopy gap between mallee and cypress trees in Pilliga State Forest, N S.W. Note the relationship of thearcuate form ta the local slope and the continuity of the densely compacted dam material with more diffuselitter trains thus forming a network over the area.
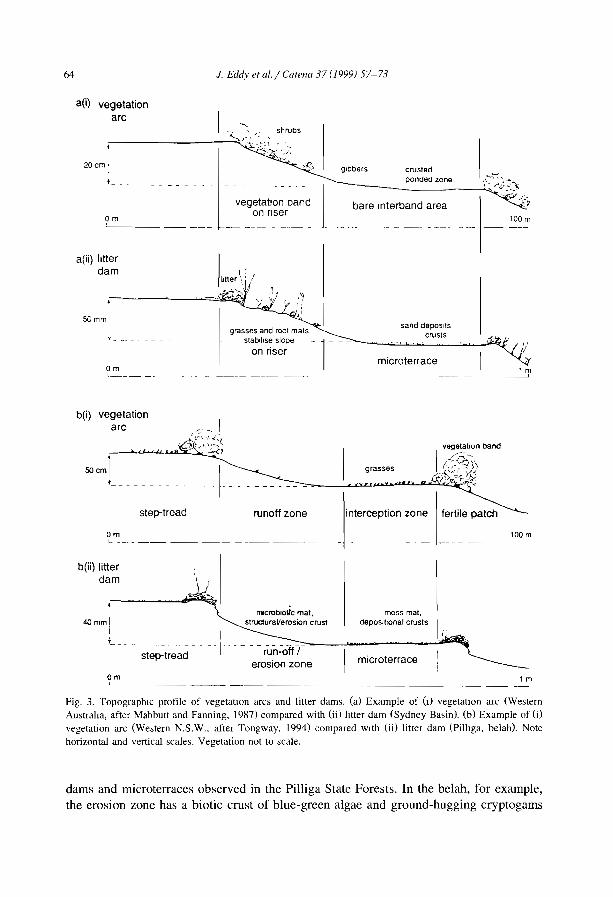
64 J. Eddy el al. / Catella 37 (/999) 57-73
a(i) vegetationarc
bare Interband area
20cm'
Om
a(ii) htterdam
SCmm,
Oml~ _
b(i) vegetationarc
,socml
"- - - - - - - -
OmL.
b(ii) \itterdam
shrubs
vegetation bandon nser
grasses and root matsstabtllse slope
on riser
crustad 1ponded zone .è'--~' -
~--__~~__-----l'~~"'~:";J.~-:::.'t:1 ,.~
'':,
100 m
sand deposltscrusts
microterrace, m
__~~__--.J
grasses
rT'IcrobloJc mat,40 mm 1 strucluraUerosion crust
i 1
'- - - - -ste~t~e~d - - - -1- -- - - - rün:offT1 erosion zone
mass mat,deposItIonal crusts
microterrace
Om~------- -- --------- --- ------ --
lm-~
Fig. 3. TopographlC profile of vegetatlon arcs and litter dams. (a) Example of (il vegetatIOn arc (WesternAustraha, after Mabbutt and Fanning. 1987) eompared with (ii)litter dam (Sydney Basin). (b) Example of (i)vegetation arc (We,tern N.S.W.. after Tongway. 1994) eompared wlth (ii) litter dam (Pilhga, belah). Notehorizontal and vertical seales. Vegetation not to seale.
dams and microterraces observed in the Pilliga State Forests. In the belah. for example,the erosion zone has a biotic crust of blue-green algae and ground-hugging cryptogams
J. Eddy el al. / Calma 37 (1999) 57-73 65
dominated by the liverwort Riccia limbata. On the microterrace a dense mat of moss,dominated by Barbula calycina, acts as an interception zone that traps sand and siltparticles. Sparse perennial grasses occur usually in the litter dam.
3.4. SU/face condition
Micromorphological examination of surface soil in banded mulga vegetation (Greene,1992) showed that porosity differs between three geomorphic zones (cf. runoff andinterception zones and fertile patch (Tongway, 1994; Fig. 3b(j)). In the runoff zone asmooth discontinuous surface seal overlay dense soil consisting of tightly packed sandand silt grains. Large pores were absent as was organic debris and the surface soil wasdevoid of biological activity. The surface of the interception zone was smooth but moreporous, with sorne aggregation of particles of sand, silt and clay. Rootlets and organicdebris were present in the topsoil and cracks, 1-2 mm wide, extended into the subsoiI.The soil adjacent to the cracks was highly bioturbated. The soil of the grove zonecontained abundant organic matter and was much more bioturbated. Bioturbationcontinued along the cracks, similar in size and penetration depth to those in theinterception zone, but the biopores were much larger (up to 10 mm). Another example,from West Africa, describing this type of variation in the surface condition is providedby Thiéry et al. (1995).
Preliminary micromorphological studies of soil sampled from the three zones of litterdams and microterraces from the Sydney Basin and the Pilliga State Forests illustrate asimilar regular succession of porosity and crusts (Eddy et al., 1996a,b). On the runoffzone, often underlying a micobiotic mat consisting mainly of blue-green and greenalgae, structural slaking crusts, sometimes modified to erosion crusts, overlie a densefabric with minimal bioturbation. In the interception zone, where ponding and depositionoccur, complex multi-generational sedimentation crusts are found. Here bioturbationbecomes evident and in c1ayey soils cracks extend to the subsoil. Within and under thelitter dam bioturbation is at a maximum and this activity disrupts a multi-Iayered fabricsimilar to that in the interception zone.
3.5. Infiltration
Both arcs and dams act as efficient natural water harvesting systems. Worrall (1959)observed ponding upslope of grass arcs as did Boaler and Hodge (1964), who attributedrunoff collection to 'the effect of the grass plants and their associated debris on watermovement' (Boaler and Hodge, 1964, p. 535). Litter dams serve the same purpose assurface water detention occurs on microterraces. Under these conditions it might beexpected that infiltration is greatest where ponding occurs. Indeed, in the case of litterdams we have observed a higher rate of infiltration into the soil in the ponded area thaninto soil beneath vegetated dams. This is particularly noticeable in the Sydney Basin,where slow wetting under the dam correlates with a higher degree of water repellence inthe localised patch of underlying soil (Eddy et al., 1996b). The situation appears to bemore complicated for vegetation arc complexes as Slatyer (1961) and Boaler and Hodge(1964) report greater depth of infiltration within the arcs than in the ponded zone. This
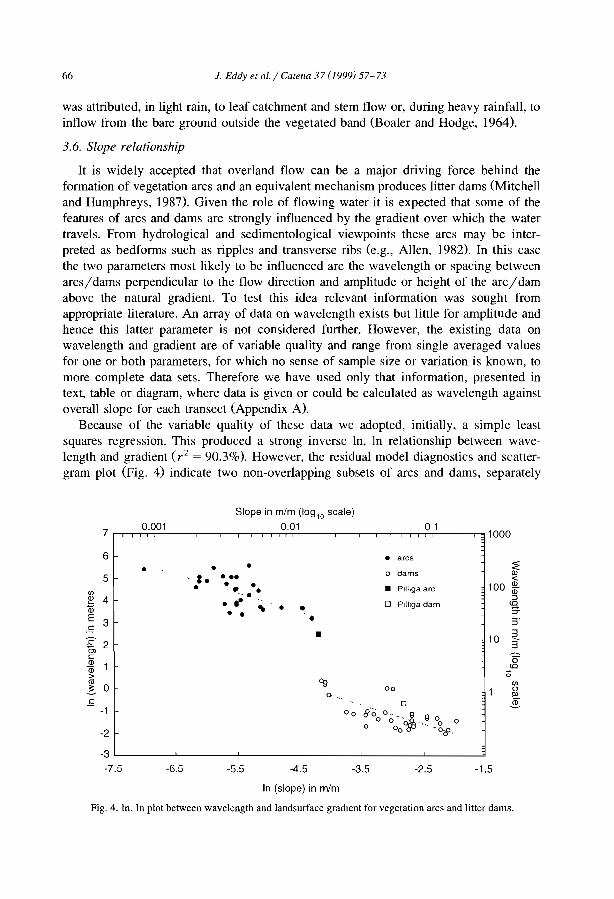
66 J. Eddy et al./ Catella 37 (1999) 57-73
was attributed, in light rain, to leaf catchment and stem flow or, during heavy rainfall, toinflow from the bare ground outside the vegetated band (Boaler and Hodge, 1964).
3.6. Slope relationship
It is widely accepted that overland flow can be a major driving force behind theformation of vegetation arcs and an equivalent mechanism produces litter dams (Mitchelland Humphreys, 1987). Given the role of flowing water it is expected that sorne of thefeatures of arcs and dams are strongly influenced by the gradient over which the watertravels. From hydrological and sedimentological viewpoints these arcs may be interpreted as bedforms such as ripples and transverse ribs (e.g., Allen, 1982). In this casethe two parameters most likely to be influenced are the wavelength or spacing betweenarcs / dams perpendicular to the flow direction and amplitude or height of the arc / damabove the natural gradient. To test this idea relevant information was sought fromappropriate literature. An array of data on wavelength exists but little for amplitude andhence this latter parameter is not considered further. However, the existing data onwavelength and gradient are of variable quality and range from single averaged valuesfor one or both parameters, for which no sense of sample size or variation is known, tomore complete data sets. Therefore we have used only that information, presented intext, table or diagram, where data is given or could be ca1culated as wavelength againstoverall slope for each transect (Appendix A).
Because of the variable quality of these data we adopted, initially, a simple leastsquares regression. This produced a strong inverse ln, ln relationship between wavelength and gradient (r 2
= 90.3%). However, the residual model diagnostics and scattergram plot (Fig. 4) indicate two non-overlapping subsets of arcs and dams, separately
Siope in m/m (log 10 scale)
70.001 0.01 01
1000
6 • arcs
• • • ::ê:0 dams Il>
5 '- -,. ••• <• • • Pllllga arc 100 (1)
-. . • roen -..~ 4 1·
::J
• 0 Plihga dam lOQi , • • SC• •E 3 • ci".S • 3:;::- 2 10 3'Œc: 0Q)
ID lO
> 0
'" cg li>
~ 0 00 0o. Il>
E 0 ~-1 00 1/0 o.... g go 0 .Of/J .... °0 0
-2 o 00 . "o<§'.
-3-7.5 -6.5 -5.5 -4.5 -3.5 -2.5 -1.5
ln (slope) in m/m
Fig. 4. ln. ln plot between wavelength and landsurface gradient for vegetation arcs and !itter dams.

J Eddv et al./Catena 37 (I999) 57-73 67
plotting on near parallellines. We therefore sought to test whether or not the relationshipbetween wavelength and gradient is different between the subsets using the followingmodel: In(wavelength) = /30+ f31 In(gradient) + f3 zS + /33S' ln(gradient) + E: where ln= natural logarithm S = an indicator variable (S = 0 for arcs, S = 1 for dams) E: (')
N(0,a 2 )
This showed that the /33 coefficient was not statistically different from zero (p-value0.542). Letting f33 = 0 simplifies the model and yielded a least-squares multipleregression equation of In(wavelength) = - 0.351-0.855 In(gradient) - 3.325 (F =
905.83, dj(2,60), p < 0.0001, r Z = 96.8%)-reasonable residual model diagnostics.From this the estimated equation for arcs is In(wavelength) = - 0.35-0.855 In(gradient)and for dams is ln(wavelength) = - 3.67-0.855 ln(gradient).
We conclude from this that the two data sets, arcs and dams, fit parallel lines (withslope of - 0.855) but with different intercepts on the ln(wavelength) axis.
4. Discussion
The comparison of vegetation arcs and litter dams describes many similarities. Inareal plan arcuate bands of arcs and dams are arranged orthogonal to slope, often withtrailing edges that interconnect to form a network. Two types of topographic profile aredefined by the positioning of the vegetation on riser or step-tread. Runoff zones,interception zones and fertile patches exhibit a distinct sequence of vegetation andsurface features, e.g., biotic and minerai crusts. Micromorphological examination showsa similar spatial arrangement of dense crusted and porous bioturbated near-surface soilmaterials. Both arcs and dams function as water harvesting systems and as traps forwater- and wind-transported organic matter, thus concentrating resources in the landscape.
The main differences are in the spatial and temporal scales of the features and theslopes on which they occur. Wavelengths of arcs, which occur on very gentle slopes, aretwo to three orders of magnitude greater than wavelengths of dams, which occur onsteeper slopes. The life-span of arcs may be over a hundred years, while dams may beephemeral or persist for over a decade.
The statistical analysis also suggests that arcs and dams have a similar In,lnrelationship of wavelength to gradient indicated by their same slope value, although theintercepts with the In(wavelength) axis for the two data sets are different (Fig. 4). Fromthese results it appears that gradient is a major determinant in controlling spacingbetween both arcs and dams. However, the role of gradient in explaining spacingbetween arcs or dams as shown in this paper requires further comment.
First the data set is of limited quality and unevenly weighted with varying numbers ofobservations per study site. There is no overlap in values between the two sets forwavelength nor gradient, and, with the exception of one arc and dam data pair (Pilliga),there is no overlap in location, either. Additionally, only two sites provide htter damdata and one of these (Allen, 1982) is consistently underestimated by the fitted mode!.Although the present data set suggests parallel lines, it remains possible that futureresearch may reveal other relationships.
68 J Eddv el al. / Catena 37 (J999) 57-73
Second, it is known that various banding patterns can be generated in simulationmodels in which other parameters are used (e.g., Thiéry et al., 1995; Lefever andLejeune, 1997). Nevertheless, it remains true that whenever a gradient parameter isincluded (e.g., Gallart et al., 1993; Lefever and Lejeune, 1997) a banding patternemerges that conforms to the vegetation arcs and litter dams described. Furthermore,two types of topographic profile occur in both vegetation arcs and litter dams, and itremains uncertain how these differences develop. Other parameters that could beimportant include the type of vegetation, the particle size of the soil over which runoffoccurs, soil type and its possible effects on seepage into the riser, as weil as the balanceof processes leading to the maintenance or degradation of the arcs and dams. Regardlessof morphological type, however, the relationship between wavelength and gradientremains.
Third, the range of slopes considered in our data is from 0.0009 to 0.142 rn/m, withno overlap of the two data sub-sets. Several authors have noted that vegetation arcsrarely occur on gradients < 0.001 presumably because the flow is poorly organisedgiven the surface roughness conditions on very low slopes. Vegetation arc wavelengthwould necessarily have a lower limit dependent on the canopy size of trees or shrubs.We do not know the minimum spacing of litter dams but note that on steeper slopes(gradient approx. 0.5 m/m) microterracettes (2-5 mm high, 2-3 cm spacing) occur inwhich the feature has a lobate form composed of mineraI material and organics.Similarly we are uncertain as to the maximum spacing of litter dams and/or theminimum slopes on which they occur. Our measurements to date, however, conformwith the general limits indicated in Fig. 4. In the Pilliga mallee, for example, both arcsand dams occur. The dominant mallee vegetation is organised into bands with anaverage wavelength of 12 m with interconnecting narrower bands, about 8 m apart,aligned parallel to the slope so that a lattice pattern occurs. Within the canopy gaps ofthis lattice litter dams occur. This juxtaposition may be explained by the relationshipsportrayed in Fig. 4, as the smaller scale dams are found on a slope segment which has asteeper gradient than the overall gradient encompassing the larger scale arc pattern.However. we have observed, on quite gentle slopes litter dams of greater wavelengthand Ludwig and Tongway (I995) have noted fertile patches at a variety of scales,including litter trains (i.e., litter dams), that occur within vegetation arc complexes. Itremains to be tested, whether these widely spaced litter dams conform to the relationshipwith gradient presented here.
Fourth, the disjunction between the two parallel lines in Fig. 4 requires an explanation. We remain unsure as to the real meaning of this but note that the type and size ofparticles transported during arc/dam initiation may be important. For example, intransverse ribs (i.e.. regularly spaced gravel bands aligned normal to flow), wavelengthis inversely proportional to gradient but proportional to maximum grain size (grave])transported (Koster, 1978; Allen, 1982). Any sheetflood event producing vegetation arcsmight be expected to be capable of transporting gravel bedload as weil as litter (tloatingload). Wells and Dohrenwend (I985) report on arcuate sheetflood bedforms on unchannelied alluvial fan surfaces that contain fine gravel. Thus particle size and particledensity Oower density litter compared to higher density mineraI and rock fragments)may also prove to be important parameters in predicting wavelength.
J. Eddy et al./ Carena 37 (1999) 57-73 69
The development of litter dams occurs during runoff events of small to moderatemagnitude (Mitchell and Humphreys, 1987) and this development can be observed inreal time. It has been suggested that sheet wash is also important in the development ofvegetation arcs (Boaler and Hodge, 1964; White, 197 I). However, the arid to semi-aridenvironments where vegetation arcs are commonly found are affected also by highmagnitude runoff events. Do vegetation arcs form by graduai accumulation or are they aproduct of rare but large magnitude sheet flood events? Patton et al. (I993) describevegetation arc-like features along the Ross River in Central Australia as large, low-relieftransverse bedforms. They interpret these bedforms as products of a high magnitudepaleo-flood event. However, the organic debris that contributes to these bedformspresumably was transported as floating load. Consequently, their bedforms may havedeveloped gradually. The graduai accumulation of material is not unexpected as theorganic debris provides seeds and added nutrients, and the resulting vegetation improvessediment trapping efficiency whether or not subsequent transport is via fluvial or aeolianprocesses. Nevertheless, this does not negate the possibility of an extreme eventestablishing an initial pattern that is subsequently modified over time via geomorphicprocesses in conjunction with ecological mechanisms.
5. Conclusion
This paper seeks to assess the appropriateness of using litter dams as an analogy tovegetation arcs. Vegetation arcs, although two to three orders of magnitude larger inwavelength, are similar to much smaller litter dams in terms of shape, orientation,cross-sectional profiles and in the types of surface features encountered. Analysis ofwavelength and slope data for arcs and dams shows that spacing between arcs and damsis strongly associated with slope of the land-surface, possibly reflecting the relativeimportance of runoff as a major factor in determining wavelength of both arcs and damsFurthermore, both data sets have regression equations with the same slope value of-0.855. We suggest that this reflects similarities in mechanisms of formation of arcsand dams. However, arcs and dams plot as separate populations and this implies animportant difference between them. Whether the difference in intercepts with theIn(wavelength) axis is merely a reflection of the difference in scale, with or withoutchangees) in operation of a similar slope-related mechanism, or, alternatively, indicatesthat a quite separate set of mechanisms is involved, awaits future research.
The formation of litter dams is readily observable and appears to be dependententire1y on rainwash moving particles downslope during a single rainfall event. Thequestion of origin of arcs, however, may be difficult to resolve. We have seen at FowlersGap that vegetation arcs are a focal point of re1ative1y intense bioturbation. If this is alsotrue of other locations, the evidence needed to evaluate their origin may have beenseverely disturbed. We suggest that future research incorporate detailed stratigraphic,sedimentological, pedological and chronological based studies with an evaluation of pastand present geomorphic and ecological processes if the question of origin is to beresolved. An essential part of this will be to seek an explanation of mechanisms whichmay operate at different spatial and temporal scales from the patterns themselves, either
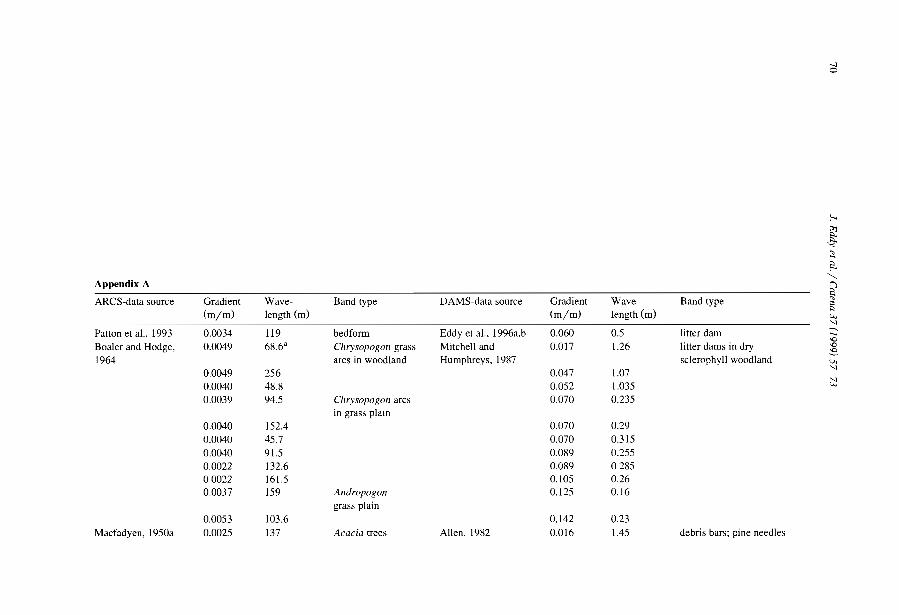
--Jo
~
g;.~
~::l,..."-Appendix A f?
ARCS-data source Gradient Wave- Band type DAMS-data source Gradient Wave- Band type ~(m/m) length (m) (m/m) length (m)
::lu.,'-l
Patton et al.. 1993 0.0034 119 bedform Eddy et al.. 1996a.b 0.060 0.5 litter dam ~......'0
Boaler and Hodge. 0.0049 68.6' Chrysopogon grass Mitchell and 0.017 1.26 liller dams in dry '0~
1964 arcs in woodland Humphreys. 1987 sclerophyll woodland v,'-l
0.0049 256 0.047 1.07 1
0.0040 48.8 0.052 1.035 ~
0.0039 94.5 Chrysopogoll arcs 0.070 0.235in grass plalO
0.0040 152.4 0.070 0.290.0040 45.7 0.070 0.3150.0040 91.5 0.089 0.2550.0022 132.6 0.089 02850.0022 161.5 0.105 0.260.0037 159 Andropogon 0.125 0.16
grass plain0.0053 103.6 0.142 0.23
Macfadyen. 1950a 0.0025 137 Acacia trees Allen. 1982 0.016 1.45 debris bars; pine needles

Worrall, 1959
Worrall, 1960
Mabbutt andFanmng, 1987
Dunkerley andBrown, 1995
Ludwig andTongway, 1995Eddy et al., 1996a,b
0.0036 320.0083 380.0044 280.0043 540.0059 400.0062 350.0028 2490.0021 1010.0009 2330.0119 37
0.0033 480.0058 83.50.0117 37.5
00137 240.0032 167
0.015 12
BUlana grass
tree bands
mulga trees
saltbush
mulga trees
mallee
0017 1.380.018 0.780.024 0.350.027 0.330033 0.190.033 0.320.034 0.370.038 0.340.041 0.260.046 0.35
0.050 0.250.054 0.18
,...
0.058 0.15 ~.~
~0.063 0.21 ",.....0.066 0.16 "-
Q0.068 0.19 """0.072 0.20 "'""0.072 0.18 ~.....0.110 0.21 \Q
\Q
0.110 0.16 ~v,
0.120 0.13 "1;::;::
aMeasurements (Boaler and Hodge, 1964) to first decimal place result from conversion from feet to metres, rather than a hlgher degree of accuracy than otherdata.
-.J

72 J Eddy et al. / Catena 37 (1999) 57-73
as broader scale constraints or as the combined effect of smaller components of thesystem (Levin, 1992). Certainly temporal scale variations need to be considered. Arcsmay persist for tens to a hundreds of years, while dams, though often ephemeral mayremain stable for a few years (observed up to 14 years; Paton et al., 1995). Individualplant and plant community life cycles need to be considered in this context as weil asspatial variation that these cycles may impose.
Acknowledgements
We are grateful for the generous assistance of Dr Ann Eyland in carrying out thestatistical analysis. We thank Merrin Tozer for her assistance in identifying cryptogamsand Dr Michel Esteves and an anonymous reviewer for valuable comments thatcontributed to the clarity of the paper.
References
Allen. J.RL., 1982, Sedlmentary Structures, Thelr Character and Physical BaSlS, Vol. II. ElsevIer, Amsterdam,663 pp.
Boaler, S B., Hodge, C.A.H., 1964. Observations on vegetation arcs in the northern region, Somah Republic.J. Ecol. 52, 511-544.
Dunkerley, D.L., Brown, K.1., 1995. Runoff and runon areas 10 a patterned chenopod shrubland, and westernNew South Wales, Australia. characteristtcs and origm. J. Arid Environ. 30,41-55.
Eddy, J., Hart, D.M., Humphreys, G.S., 1996a. Spatial sequence of soil crusts withm litter dams andmicroterraces in the Pilliga State Forests, N.S.W. Australian and New Zealand National Soils Conference1996, Vol. 3: pp. 67-68.
Eddy, J. Humphreys, G.S., Mitchell, P.B , 1996b. Lltter dams and microterraces-an overview. Australian andNew Zealand National SOlls Conference 1996, Vol 2: pp 67-68.
Gallart, F., Puigdefâbregas, J., dei Barrio, G., 1993. Computer simulation of high mountam terracettes asinteraction between vegetation growth and sediment movement. Catena 20, 529-542.
Gillison, A.N., Brewer, K.RW.. 1985 The use of gradient directed transects or gradsects 10 natural resourcesurveys. J. Environ. Manage. 20, 103-127.
Greene, RS.B., 1992. Soil physical propertles of three geomorphic zones in a seml-arid mulga woodlandAust. J. Soil Res. 30, 55-69.
Greenwood. J.E G W., 1957. The development of vegetatton patterns 10 Somahland Protectorate. Geograph. 1.123, 465-473.
Humphreys, G.S., 1994. Bowl structures: a composite depositional crust. In: Rmgrose-Voase, A 1., HumphreysG.S. (Eds.), SOli MlCromorphology: Studies 10 Management and Genesis. Proc. IX Int. Workmg Meetingon SOli Micromorphology, Townsville, Austraha, July, 1992 Developments ln SOli Science 22, Elsevier,Amsterdam, pp 787-798.
Koster, E.H., 1978. Transverse nbs: their characteristics. ongin and paleohydraulic significance. In: Miall,AD (Ed.), flUVIal Sedlmentology Can Soc Petrol. Geol. MemOlr No. 5, pp 161-186.
Lefever, R., Lejeune, O., 1997. On the origin of TIger Bush. Bull. Math. BIOl. 59 (2). 263-294Levin, S.A., 1992 The problem of pattern and scale in ecology. Ecology 73 (6), 1943-1967.LudWIg, J.A., Tongway. D.1 . Marsden, S.G., 1994. A tlow-filter model for slmulating the conservation of
hmited resources 10 spaually heterogeneous, semi-arid landscapes PacifIc ConservatIOn BIOl. 1, 209-213Ludwig, J A.. Tongway. D.1., 1995. Spaual organisatIOn of landscapes and its function ln semi-and
woodlands, Australia. Landscape Ecol 10, 51-63.Mabbutt. J.A.. Fanning, P.c.. 1987. VegetatIOn banding in and Western Australia. J. Arid Environ. 12,41-59.

J. Eddy ct al. / Catclla 37 (1999) 57-73 73
Macfadyen. W.A., 1950a SOlI and vegetation in British Somaliland. Nature 165, 121.Macfadyen, W.A.. 1950b. VegetatIOn patterns in the semi-desert plains of British Somali land. Geograph. J.
116,199-211Mitchell, P.B .. Humphreys, G.S .. 1987. Lllter dams and microterraees formed on hillslopes subJect to ramwash
in the Sydney Basin, Australia. Geoderma 39. 331-357.Montana. C., Lopez-Portillo, J., Mauchamp. A.. 1990. The response of two woody speCles ta the conditIOns
created by a shIttmg ecotone ln an and ecosystem J. Eco!. 78, 789-798.Montana, c.. 1992. The colonizalJon of bare areas m two-phase mosmcs of an arid system J. Eco!. 80.
315-327.Paton, T.R.. Humphreys, G.S.. Mitchell. P.B., 1995. SOlls: a new global view. UCL Press, London, 213 pp.Patton. P.C.. Pickup, G., Priee. D.M.. 1993. Holoeene paleofloods of the Ross River. Central Australia.
Quaternary Res. 40, 1-11.Slatyer. R.O., 1961. Methodology of a water balance study conducted on a desert woodland (Acaclll allcura F
MuelU commumty m Central Austraha. Arid Zone Res. 16, 15-26.Specht. R.L, 1970. Vegetation. In: Leeper, G.W. (Ed.). The Austrahan Environment, 4th ed.. CSIRO and
Melbourne Umv. Press. pp. 44-67.Stace. H.C.T.. Hubble, G.D.. Brewer. R.. Northcote, K.H., Sieeman, J.R., Mulcahy. M.J .. Hallsworth, E.G.,
1968. A Handbook of Australian Soils. Rellim. Adelaide, Austraha.Soil Survey Staff, 1992. Keys to Soil Taxonomy. 5th edn.. SMSS Technical Monograph No. 19.Thiéry, J.M., D' Herbès, J.-M., Valentin. C.. 1995. A model simulating the genesis of banded vegetatIOn
patterns in Niger. J. Ecol. 83,497-507.Tongway, D., 1994. Rangeland SOli Condition Assessment Manua!. DIviSIOn of Wildlife and Ecology, CSIRO,
Australia.van Zon, H.J M., 1980 The transport of Ieaves and sediment over a forest floor. A case study m the Grand
Duchy of Luxembourg. Catena 7, 97-110.Wells, S.G., Dohrenwend, J C., 1985. Relict sheetflood bed forms on late Quaternary alluvial-fan surfaces in
the southwestern Umted States. Geology 13,512-516.White, L.P.. 1969. Vegetation arcs in Jordan. J. Ecol 57, 461-464.White, L.P., 1970. Brousse Tigree patterns m southern Niger. J. Eco!. 58, 549-553.White. L.P.. 1971. VegetatIOn stripes on sheet wash surfaces. J. Eco!. 59, 615-622.Worra Il , G.A., 1959. The Butana grass patterns. J. SOli Sci. 10 (1),34-53.Worrall, GA, 1960 Tree patterns in the Sudan. J. Soil Sci. II (I), 63-67.

ELSEVIER Catena 37 (1999) 75-88
CATENA
Banded vegetation near Broken Hill, Australia:significance of surface roughness and soil physical
properties
D.L. Dunkerley *, K.J. BrownDepartment ofCeography and EllL'lrollmental SCIence. MOllash UniversIty, Claytoll. Victoria. Altstralia
Received 26 May 1996; received in revised fonn 7 March 1997; accepted 10 February 1998
Abstract
Selected physical properties of the soils developed within a strongly-banded grassland in aridNew South Wales were investigated to reveal their possible significance for the hydrologie anderosional behaviour of the mosaie landscape. Detmled surface mierotopography, surface roughness, soil bulk density and the unconfined compressive strength of the soils were determined usinglinear transects across the banded mosaic. The landscape is shown to consist of a tier ofconcave-upward microtopographie elements. Results indicate that the cross-pattern (downslope)variation in the soil parameters is systematieally related to position within a particular component(grove, intergrove, etc.) of the mosaic. Compressive strength and bulk density increase downslopeacross intergroves, peaking at very high levels within the zone of forbs, while groves displaylower but more uniform values. Surface roughness increases downslope through the intergrove andthe zone of forbs at the upslope margin of a grove, reaching its maximum within the grove.Mosaic components thus cannot be treated as uniform in their soil properties, and single samplesfrom within a component are shown in general to be inadequate. The mapped pattern of soilproperties implies a very stable configuration for banded mosaics. Surface runoff is increasinglyhindered during flow from the intergrove onto the grove. At the same time, sOlI resistance toentrainment increases in opposition to the shear forces generated by the runoff. In concert, thesetendencies imply that little sediment transport is possible across the mosaic. The resultinglandscape stability appears to confer robustness to the mosaic in the face of stresses such asdrought and pastoralism, when plant cover may be temporarily thinned or absent. Nter drought,for example. water ponding would again begin at the downslope margin of the concave
• Corresponding author
0341-8162/99/$ - see front matter © 1999 Elsevier Science B.V. ALI right" reserved.PlI: S0341-8162(98)00056-3
76 DL. Dlinkerley, K.J. Brown / Carena 37 (1999) 75-88
topographie elements, fostering re-establishment of the graves. © 1999 Elsevier Science B.Y. Alirights reserved.
Keywords: Concave-upward elernent; Runon/runoff patterns; Mosalc landscape
1. Introduction
Relatively !ittle is known about the extent of pattern-related variation in the physicalproperties of soils within the banded mosaic landscapes of dry regions. Most publisheddata (e.g., Cornet et al., 1988) deal with distributions of moisture and plant nutrients.However, the most fundamental property of banded mosaics is the pattern of runoff andrunon that sustains them. This is dominated by differences in the physical properties ofthe soils among mosaic components. notably their infiltration properties and theirerosional behaviour. Many authors (e.g., Mabbutt and Fanning, 1987; Tongway andLudwig, 1990) have drawn attention to the subdued microtopography associated withvegetation banding. This is evidently the result of differential erosion and deposition,together with shrink-swell phenomena. Given that surface sediment transport processesare size-selective, it seems reasonable to suppose that the microtopography, and thechanging surface gradient associated with it, is associated with physical differences inthe near-surface rego!ith. Sorne parameters, such as soil strength, are clearly relevant tothe detachment of grains by splash or surface runoff. Others, including primarily thesurface roughness, are important in the behaviour of the runoff that carries sedimentfollowing detachment. On a given gradient, flow speeds and shear stresses are inverselyproportional to the roughness. The opportunity time for infiltration is promoted bysurface roughness acting to retard flow, and at the same time, since flow speeds arelowered, surface scour must be restricted. Two simple parameters, unconfined compressive strength (DCS) and bulk density ( Pb)' were adopted in the present work as two soilproperties relevant to these various processes.
The goal of the work was to investigate the variation in these soil properties and insoil surface roughness within a strongly-banded vegetation community. Data on thevariation in these properties allows the development of hypotheses about the processesthat take place during the infrequent episodes of smface runoff that are more difficult toobserve directly.
Most field observations were replicated at two adjacent sites, less than 0.5 km apart,that display clear contrasts in band width. The goal of examining these two sites was toevaluate the possible role of soil factors in influencing the contrasting mosaic geometries. Since the sites were adjacent, other potentially influential factors such as rainfallenvironment, evaporative water losses and grazing pressure, could be excluded fromconsideration.
2. The field study area
The study site was located within a broad area of banded shrublands and grasslandsin the Broken Hill region of western New South Wales. Mosaic landscapes also extend
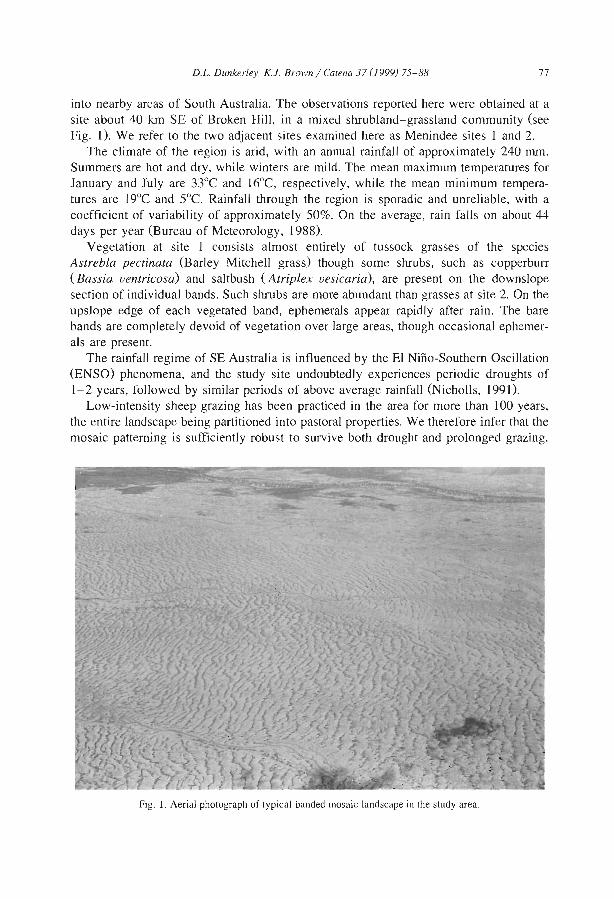
DL Dunkerley, K.i. Brown / Cateno]7 (1999) 75-88 77
into nearby areas of South Australia. The observations reported here were obtained at asite about 40 km SE of Broken Hill, in a mixed shrubland-grassland community (seeFig. O. We refer to the two adjacent sites examined here as Menindee sites 1 and 2.
The c1imate of the region is arid, with an annual rainfall of approximately 240 mm.Summers are hot and dry, while winters are mild. The mean maximum temperatures forJanuary and July are 33°C and 16°C, respectively, while the mean minimum temperatures are 19°C and 5°C. Rainfall through the region is sporadic and unreliable, with acoefficient of variability of approximately 50%. On the average, rain faIls on about 44days per year (Bureau of Meteorology, 1988).
Vegetation at site 1 consists almost entirely of tussock grasses of the speciesAstrebla pectinata (Barley Mitchell grass) though sorne shrubs, such as copperbulT(Bassia uentricosa) and saltbush (Atriplex uesicaria), are present on the downslopesection of individual bands. Such shrubs are more abundant than grasses at site 2. On theupslope edge of each vegetated band, ephemerals appear rapidly after rain. The barebands are completely devoid of vegetation over large areas, though occasional ephemeraIs are present.
The rainfall regime of SE Australia is influenced by the El Nino-Southem Oscillation(ENSO) phenomena, and the study site undoubtedly experiences periodic droughts of1-2 years, followed by similar periods of above average rainfall (Nicholls, 1991).
Low-intensity sheep grazing has been practiced in the area for more than 100 years,the entire landscape being partitioned into pastoral properties. We therefore infer that themosaic patterning is sufficiently robust to survive both drought and prolonged grazing.
Fig. J. AeriaJ photograph of typical banded mosaic landscape in the study area.
78 DL. Dunkerley. K.i. Brown / Carena 37 (1999) 75-88
Undoubtedly, however, variations in landscape condition do occur. A 1995 fieldinspection of a South Australian site that displayed strikingly regular banding on aerialphotographs taken in 1968 revealed only a rather diffuse vegetation zonation. However,the site did display very strongly-developed microrelief associated with the banding,similar to but considerably more pronounced than that revealed in the detailed surveysmade at the Menindee sites. We are as yet unable to place the Menindee sites in thecontinuum of site condition, though certainly the vegetation banding in 1995, when ourfieldwork was conducted, was strikingly regular and sharply defined, and though dry,vegetation coyer in the groves was extensive.
3. Field methods
Transects spanning multiple wavelengths of the banded grassland were set out withmarkers. Detailed topographic profiles along these transects were derived from carefulsurvey with a digital electronic distance measuring theodolite. Surveys of band marginswere also made to assess the degree of contour-parallelism of the banding. Thetheodolite target, equipped with a broad supportive baseplate, was positioned gently toavoid disturbing the soil surface elevation across soils of varying mechanical properties.
Unconfined compressive strength of the uppermost 1-3 cm of regolith was measuredat I-m intervals along the transects with a hand-operated penetrometer equipped withinterchangeable domed tips. Bulk density was evaluated from small cores extracted atpoints adjacent to the strength measurement sites. Since the site was under intensesummer sun, with strong hot winds, no air drying of samples was performed. A 54-mmi.d. corer yielding 100-cm3 samples was pushed into the soil and carefully removed byexcavating around il. The samples were weighed in the field on a battery-poweredbalance accurate to 1%. To yield a larger sample volume, at each meter along thetransects two cores were extracted and the mean value of Pb recorded.
Surface roughness was assessed in two ways. Within intergroves and the zone ofsmall forbs which lies just upslope of groves, an x-y profilemeter was used. Thisconsisted of a 1 m X 1 m frame set on short legs. A travelling gantry mounted on thisframe carried a rod which could be lowered vertically to touch the surface. The standarddeviation of 100 point elevations measured to the nearest 1 mm on a lO-cm grid wasused to quantify surface roughness. Within groves, measurements of this kind were notpossible because of the dense tussocks and the greater surface roughness arising fromcrabhole collapse pipes. A survey of 60 points on a I-m grid was therefore carried outfor each grave with the digital theodolite. Elevations were again recorded with aprecision of 1 mm and the standard deviation of the elevations caIculated.
Plant canopy coyer and surface stone coyer were estimated from vertically-orientedphotographs taken with a remotely-triggered camera held 2.5 m above the ground on aboom. Coloured slides were later projected onto a grid having 100 nodes and coyerfraction estimated by counting occurrences on this grid. Photographs were taken atroughly the mid-point of each grove and intergrove along the study transects. The datafrom a transect were pooled and mean values for grove and intergrove sites along thattransect recorded.
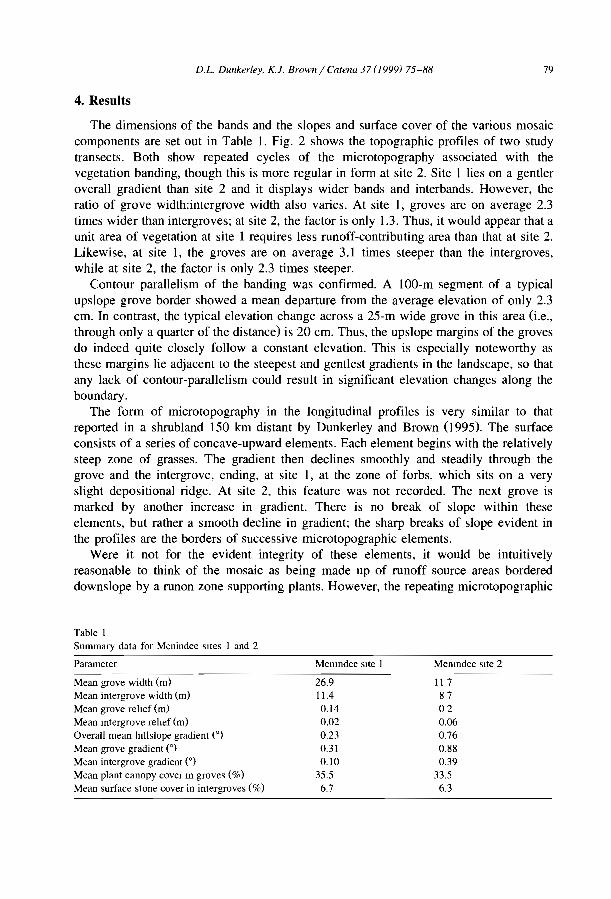
4. Results
DL Dtmkerley. K.i. Browll / Carellll 37 (1999) 75-88 79
The dimensions of the bands and the slopes and surface cover of the various mosaiccomponents are set out in Table 1. Fig. 2 shows the topographie profiles of two studytransects. Both show repeated cycles of the microtopography associated with thevegetation banding, though this is more regular in form at site 2. Site 1 lies on a gentleroverall gradient than site 2 and it displays wider bands and interbands. However, theratio of grove width:intergrove width also varies. At site l, groves are on average 2.3times wider than intergroves; at site 2, the factor is only 1.3. Thus, it would appear that aunit area of vegetation at site 1 requires less runoff-contributing area than that at site 2.Likewise, at site l, the groves are on average 3.1 times steeper than the intergroves,while at site 2, the factor is only 2.3 times steeper.
Contour parallelism of the banding was confirmed. A lOO-m segment of a typicalupslope grove border showed a mean departure from the average elevation of only 2.3cm. In contrast, the typical elevation change across a 25-m wide grove in this area (i.e.,through only a quarter of the distance) is 20 cm. Thus, the upslope margins of the grovesdo indeed quite closely follow a constant elevation. This is especially noteworthy asthese margins lie adjacent to the steepest and gentlest gradients in the landscape, so thatany lack of contour-parallelism could result in significant elevation changes along theboundary.
The form of microtopography in the longitudinal profiles is very similar to thatreported in a shrubland 150 km distant by Dunkerley and Brown (I995). The surfaceconsists of a series of concave-upward elements. Each element begins with the relativelysteep zone of grasses. The gradient then declines smoothly and steadily through thegrove and the intergrove, ending, at site 1, at the zone of forbs, which sits on a veryslight depositional ridge. At site 2, this feature was not recorded. The next grove ismarked by another increase in gradient. There is no break of slope within theseelements, but rather a smooth decline in gradient; the sharp breaks of slope evident inthe profiles are the borders of successive microtopographic elements.
Were it not for the evident integrity of these elements, it wouId be intuitivelyreasonable to think of the mosaic as being made up of runoff source areas bordereddownslope by a runon zone supporting plants. However, the repeating microtopographic
Table 1Summary data for Menindee sites 1 and 2
Parameter
Mean grave width (m)Mean intergrave width (m)Mean grave relIef (m)Mean mtergrove rehef (m)Overall mean hlllslope gradient (0)
Mean grave gradient 0Mean intergrave gradient nMean plant canopy caver m graves (%)Mean surface stone caver in intergraves (%)
Memndee site 1
26.911.40.140.020.230.310.10
35.56.7
Menmdee sile 2
II 787020.060.760.880.39
33.56.3
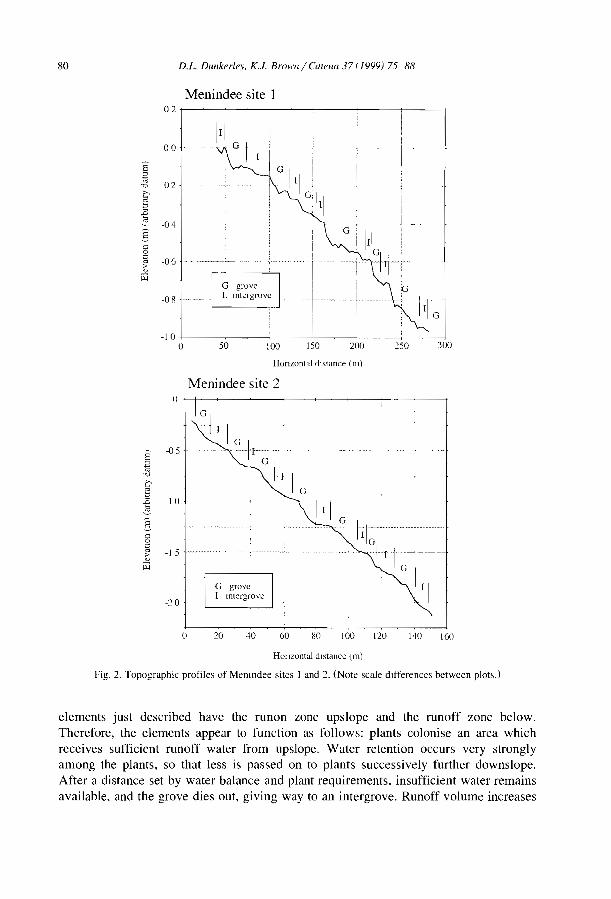
80 DL DWlker/ev, K.J. Brown/ Calena 37 (1999) 75-88
Menindee site 1o2 r---~---r-----t-------->-----j-------+
00 .-
30025020015010050-1 0 +-- -----:--_----I ~-_ ___+
oHonzonta1 dIstance (m)
Menindee site 2Or---1f---~---------------~-__t
-05
-10
·15
·20
G
··11 1
... -..~+t;;_·/1 1 G
o 20 40 60 80 100 120 140 160
HOllzontal dtstanœ lm)
Fig. 2. Topographie profiles of Memndee sites 1 and 2. (Note scale differenees between plots,)
elements just described have the runon zone upslope and the runoff zone below.Therefore, the elements appear to function as follows: plants colonise an area whichreceives sufficient runoff water from upslope. Water retention occurs very stronglyamong the plants, so that less is passed on to plants successively further downslope.After a distance set by water balance and plant requirements, insufficient water remainsavailable. and the grove dies out, giving way to an intergrove. Runoff volume increases
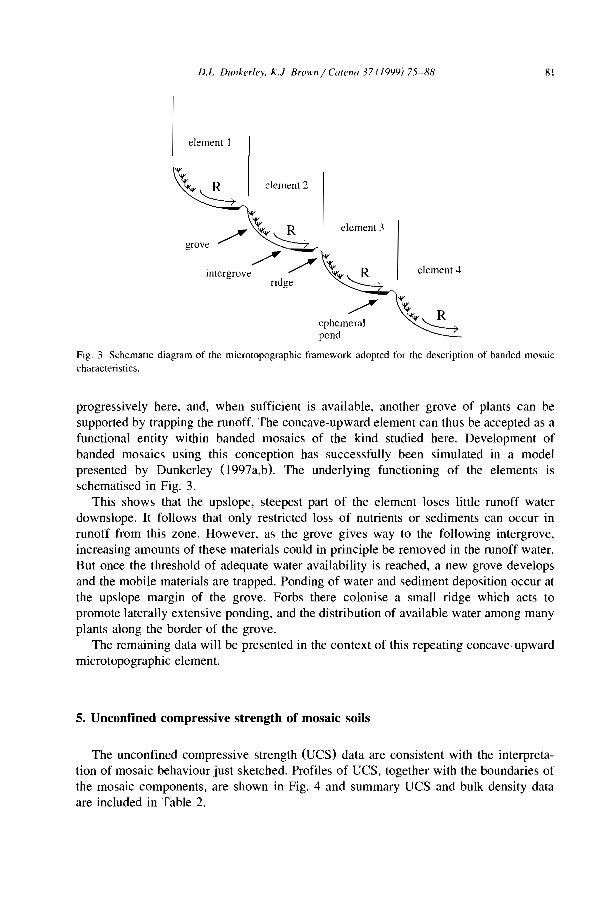
D.L DUllkerley. K.J Browll / Carella 37 (19'J9) 75-88
element 1
RI
~ donrem2
~'"~'" Rgrove / S-7
/intergrove /
ndge
e\ement 3
ephemeralpond
element"
FIg. 3 Schematlc diagrarn of the microtopographic framework adopted for the description of banded rnosaiccharacteristics.
progressively here, and, when sufficient is available, another grove of plants can besupported by trapping the runoff. The concave-upward element can thus be accepted as afunctional entity within banded mosaics of the kind studied here. Development ofbanded mosaics using this conception has successfully been simulated in a modelpresented by Dunkerley (l997a,b). The underlying functioning of the elements isschematised in Fig. 3.
This shows that the upslope, steepest part of the element loses Iittle runoff waterdownslope. It follows that only restricted loss of nutrients or sediments can occur inrunoff from this zone. However, as the grove gives way to the following intergrove,increasing amounts of these materials couId in principle be removed in the runoff water.But once the threshold of adequate water availability is reached, a new grove developsand the mobile materials are trapped. Ponding of water and sediment deposition occur atthe upslope margin of the grove. Forbs there colonise a small ridge which acts topromote laterally extensive ponding, and the distribution of available water among manyplants along the border of the grove.
The remaining data will be presented in the context of this repeating concave-upwardmicrotopographic element.
5. Unconfined compressive strength of mosaic soils
The unconfined compressive strength (UeS) data are consistent with the interpretation of mosaic behaviour just sketched. Profiles of ues, together with the boundaries ofthe mosaic components, are shown in Fig. 4 and summary ues and bulk density dataare incIuded in Table 2.
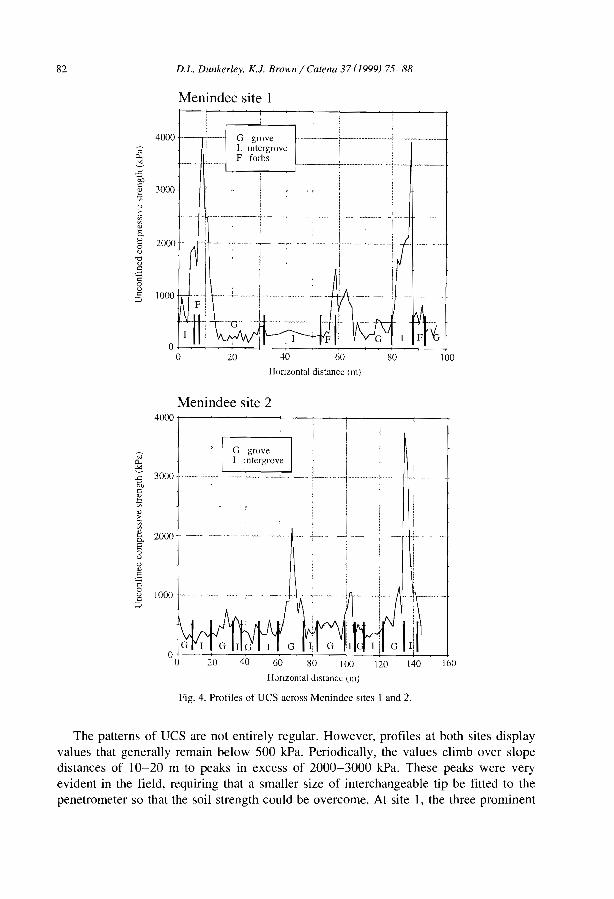
82 DL Dunkerley, K.i. Brown / Catena 37 (1999) 75-88
Menindee site 1
4000 +----.-'--- G' grove1. mtergroveF forbs
3000
"~~p..Eo<.J
"0
"c::<.:::c::o<.Jc::
:::>
2000 .. -
1000
f-i
0+---1--..-..;---+.:.....~-_.:....--'-I--__~.......:......:.....-4
o 20 40 60 ~O 100
Honzontui distunce (In)
Menindee site 24000 t-------~--t__-.....,....--t_-.....,....-__+
160140120
~0..~ 3000- L- ...J
bÎ;c::
~";-~13.. 2000 _.- ----.-Eo<.J
"0
"c::<.:::
c::og 1000 .... ._._- -.
:::>
100
Honzontal dIstance (m)
Fig. 4. Profiles of UCS across Menindee sites 1 and 2.
The patterns of DeS are not entirely regular. However, profiles at both sites displayvalues that generally remain below 500 kPa. Periodically, the values c1imb over slopedistances of JO-20 m to peaks in excess of 2000-3000 kPa. These peaks were veryevident in the field, requiring that a smaller size of interchangeable tip be fitted to thepenetrometer so that the soil strength could be overcome. At site 1. the three prominent
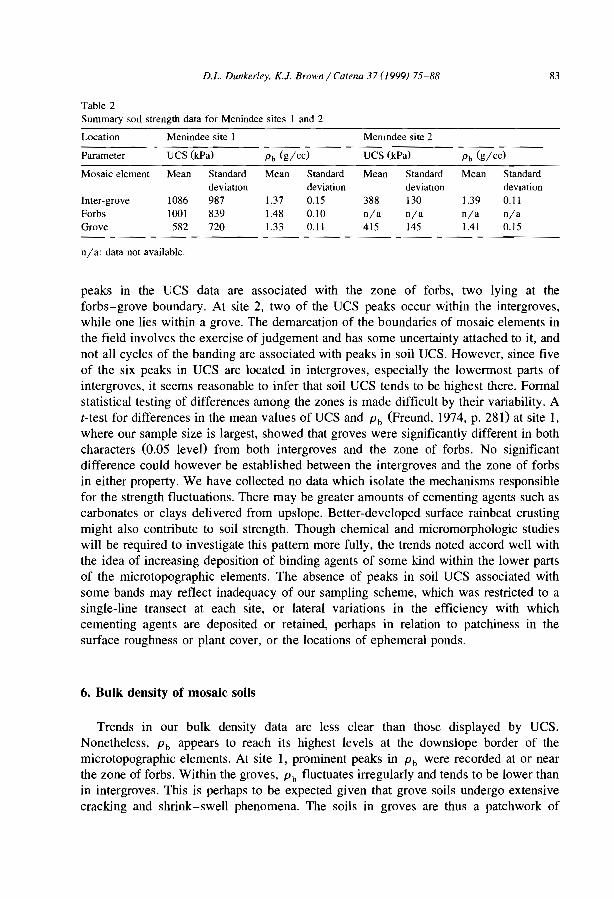
D.L. Dunkerley. K.i. Brown / Catena 37 (1999) 75-88
Table 2Summary sOli strength data for Menindee sites 1 and 2
Location Menindee site 1 Memndee site 2
Parameter DeS (lcPa) Pb (g/cc) Des (kPa) Pb (g/cc)
Mosaic element Mean Standard Mean Standard Mean Standard Mean Standarddeviatlon deviation deviatlOn devIation
Inter-grave 1086 987 1.37 0.15 388 130 1.39 0.11Forbs IODI 839 1.48 0.\0 nia nia nia niaGrave 582 720 1.33 0.11 415 145 lAI 0.15
nia: data not available.
83
peaks in the ues data are associated with the zone of forbs, two Iying at theforbs-grove boundary. At site 2, two of the ues peaks occur within the intergroves,while one lies within a grave. The dernarcation of the boundaries of mosaic elements inthe field involves the exercise of judgement and has sorne uncertainty attached to it, andnot ail cycles of the banding are associated with peaks in soil ues. However, since fiveof the six peaks in ues are located in intergroves, especially the lowermost parts ofintergroves, it seems reasonable to infer that soil ues tends to be highest there. Formaistatistical testing of differences among the zones is made difficult by their variability. At-test for differences in the mean values ofUeS and Pb (Freund, 1974, p. 281) at site l,where our sample size is largest, showed that graves were significantly different in bothcharacters (0.05 levei) from both intergroves and the zone of forbs. No significantdifference could however be established between the intergroves and the zone of forbsin either property. We have collected no data which isolate the mechanisms responsiblefor the strength fluctuations. There rnay be greater amounts of cementing agents such ascarbonates or clays delivered from upslope. Better-developed surface rainbeat crustingmight also contribute to soil strength. Though chemical and micromorphologic studieswill be required to investigate this pattern more fully, the trends noted accord weil withthe idea of increasing deposition of binding agents of sorne kind within the lower partsof the micratopographic elements. The absence of peaks in soil ues associated withsorne bands may reflect inadequacy of our sampling scherne, which was restricted to asingle-line transect at each site, or lateral variations in the efficiency with whichcementing agents are deposited or retained, perhaps in relation to patchiness in thesurface roughness or plant coyer, or the locations of ephemeral ponds.
6. Bulk density of mosaic soUs
Trends in our bulk density data are less clear than those displayed by ues.Nonetheless, Pb appears to reach its highest levels at the downslope border of themicrotopographic elements. At site 1, prominent peaks in Pb were recorded at or nearthe zone of forbs. Within the graves, Pb fluctuates irregularly and tends to be lower thanin intergroves. This is perhaps to be expected given that grove soils undergo extensivecracking and shrink-swell phenornena. The soils in groves are thus a patchwork of
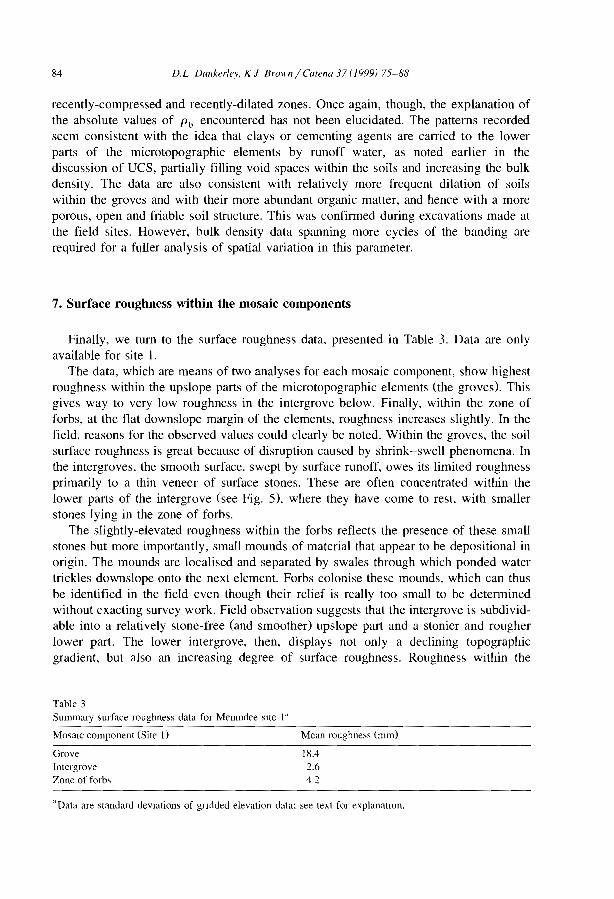
84 D.L Dlmkerlev. K.i Br<JIt'Il / Catena 37 (1999) 75-88
recently-compressed and recently-dilated zones. Once again, though, the explanation ofthe absolute values of Pb encountered has not been elucidated. The patterns recordedseem consistent with the idea that clays or cementing agents are carried to the lowerparts of the microtopographic elements by runoff water, as noted earlier in thediscussion of DeS, partially filling void spaces within the soils and increasing the bulkdensity. The data are also consistent with relatively more frequent dilation of soilswithin the graves and with their more abundant organic matter, and hence with a moreporous, open and friable soil structure. This was confirmed during excavations made atthe field sites. However, bulk density data spanning more cycles of the banding arerequired for a fuller analysis of spatial variation in this parameter.
7. Surface roughness within the mosaic components
Finally, we turn to the surface roughness data. presented in Table 3. Data are onlyavailable for site 1.
The data, which are means of two analyses for each mosaic component, show highestroughness within the upslope parts of the micratopographic elements (the graves). Thisgives way to very low raughness in the intergrove below. Finally, within the zone offorbs, at the flat downslope margin of the elements, roughness increases slightly. In thefield, reasons for the observed values could clearly be noted. Within the graves, the soilsurface raughness is great because of disruption caused by shrink-swell phenomena. Inthe intergroves, the smooth surface, swept by surface runoff, owes its limited roughnessprimarily to a thin veneer of surface stones. These are often concentrated within thelower parts of the intergrove (see Fig. 5), where they have come to rest. with smallerstones lying in the zone of forbs.
The slightly-elevated raughness within the forbs reflects the presence of these smallstones but more importantly, small mounds of material that appear to be depositional inorigin. The mounds are localised and separated by swales thraugh which ponded watertrickles downslope onto the next element. Forbs colonise these mounds. which can thusbe identified in the field even though their relief is really too smail to be deterrninedwithout exacting survey work. Field observation suggests that the intergrove is subdividable into a relatively stone-free (and smoother) upslope part and a stonier and raugherlower part. The lower intergrove, then, displays not only a declining topographiegradient, but also an increasing degree of surface roughness. Roughness within the
Table 3Summary ;,urface raughness data for Memndee site 1"
MosalC component (Site 1)
GraveIntergroveZone of forbs
Mean roughness (mm)
18.42.642
'Data are standard devlations of gndded elevation data; see text for explanatlOn.
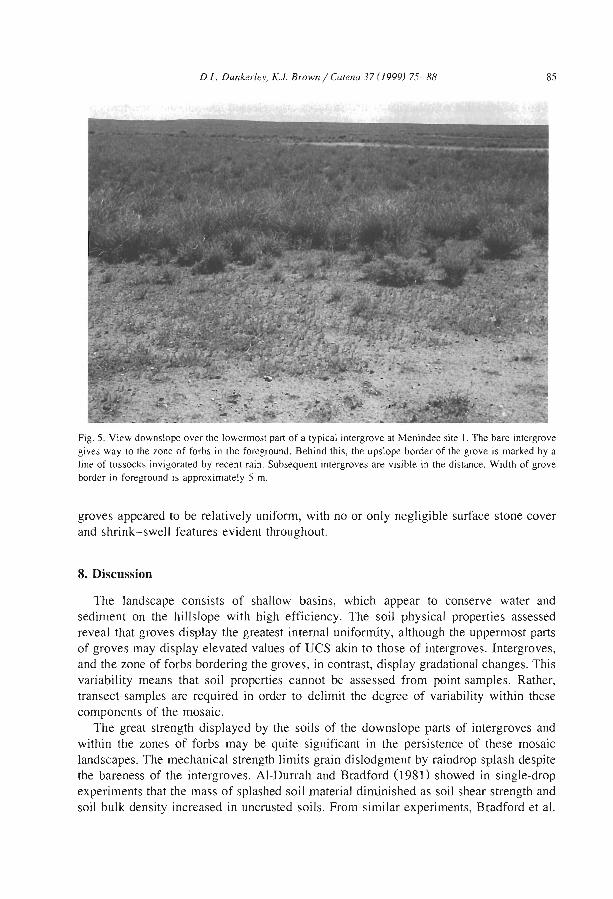
DL Dunkerley, KI Brown / Carena 37 (1999) 75-88 85
Fig. 5. View downslope over the lowermost part of a typical intergrove at Menindee site 1. The bare intergrovegives way to the zone of forbs in the foreground. Behind this, the upslope border of the grove is marked by aline of tussocks invigorated by recent rain. Subsequent intergroves are visible in the distance. Width of groveborder in foreground is approximately 5 m.
graves appeared to be relatively uniform, with no or only negligible surface stone coyerand shrink-swell features evident throughout.
8. Discussion
The Jandscape consists of shallow basins, which appear to conserve water andsediment on the hillslope with high efficiency. The soil physical praperties assessedreveal that graves display the greatest internai uniformity, although the uppermost partsof graves may display elevated values of ues akin to those of intergroves. Intergroves,and the zone of forbs bordering the groves, in contrast, display gradational changes. Thisvariability means that soil propel1ies cannot be assessed from point-samples. Rather,transect-samples are required in order to delimit the degree of variability within thesecomponents of the mosaic.
The great strength displayed by the soils of the downslope parts of intergroves andwithin the zones of forbs may be quite significant in the persistence of these mosaiclandscapes. The mechanical strength limits grain dislodgment by raindrop splash despitethe bareness of the intergroves. AI-Durrah and Bradford (I98l) showed in single-dropexperiments that the mass of splashed sail material diminished as soil shear strength andsoil bulk density increased in uncrusted soils. Fram similar experiments, Bradford et al.
86 DL DWlkerley. K.I. Brown / Catena 37 (1999) 75-88
(1986) showed that soils having sealed surfaces also released less splashed soil mass perdrop than did unsealed soils. In the study area, intergrove soils display high strength andbulk density and are also sealed, so that splash detachment must thus be restricted by ailthree characteristics. Though weaker, of lower bulk density and uncrusted, the soils ofthe groves are partially protected by the much more extensive plant canopy coyer andleaf litter, so that there, too, splash detachment and transport is likely to be restricted.The same kinds of limitations apply to the entrainment of regolith particles by the shearforces developed in surface runoff. Within the groves, runoff must be extremely rare, sothat little entrainment can occur there, while in the intergroves where runoff does occur,the soil surface displays very high strength. Thus, in the face of shear forces as weil asraindrop impact, the surface appears to be extremely stable. The DeS data analysed herewere derived under dry conditions, whereas the character of wet soils may be moreimportant. Though we would expect the absolute values to change, the general trends instrength appear likely to persist.
Given its robustness, the microtopography created by erosion and deposition, as weilas by shrink-swell, appears capable of enduring within the landscape even when theplant coyer is altered by drought or grazing pressure. The microtopography may thusform a better framework for studying landscape hydrology and erosion than does thezonation of plants, which may be labile.
9. Grove and intergrove dimensions
Neither the plant canopy coyer fraction within the groves nor the surface stone coyerwithin the intergroves were significantly different between the two study sites. Nor werethe soil properties examined able to distinguish between the sites. However, the groveand intergrove widths were significantly different (see Table 0, as were the grovewidth:intergrove width ratios. We conclude that the soil physical properties examinedhere, though clearly important in mosaic behaviour, are not those that control mosaicdimensions such as these.
Since the groves at site 1 were supported by a smaller area of intergrove but liewithin the same external climatic environment, then either more runoff is generated froma unit area of intergrove at site 1 or the efficiency with which groves trap and hold waterOncluding rain falling directly onto the grove) is greater there, or both.
Since the steeper intergroves at site 2 promote runoff, stronger grove water retentionis required at site 1. The abundant leaf litter from the grasses at site 1 would provideadditional protection of the soil surface against raindrop splash, as weil as contributingto ephemerallitter barriers. These are associated with enhanced trapping of sediment andorganic detritus and may trigger the accumulation of the low sediment ridge. During afield visit a few weeks after sorne rain had fallen, we observed abundant green leaves inthe uppermost parts of the groves at site l, but no such effect among the shrubs at site 2.Thus, rapidly-increased density of plant growth along the upslope grove border dynamically increases water trapping efficiency among the grasses, especially in sequences ofrain events occurring over several weeks. The significance of the time sequence of rainevents for grove hydrologie behaviour seems thus to be an important topic that we hopeto address in later work.
10. Conclusions
DL Dunkerley, K.I. Brown / Catena 37 (1999) 75-88 87
There is clearly much to be leamed about the study sites. However, severalconclusions can be drawn from the work reported above.
(1) The stability and longevity of banded mosaic landscapes is enhanced by patternsof soil differentiation that evolve within the mosaic. In particular, the microtopographicelements that compose the mosaic are associated with spatial variations in soil strengthand bulk density, as weil as surface roughness, that oppose entrainment of materials bysplash and surface runoff.
(2) The roughness data derived from site 1 show clearly that there are very significantvariations in surface roughness among mosaic components. The great roughness of thegroves reflects many small depressions where water may pond and slowly infiltrate. Thevery smooth intergroves, with hard rainbeat crusts, partially-swept free of stones,provide an efficient surface for runoff generation.
(3) Deposition at the gentle base of each concave element has resulted in theformation of a small ridge. This physical feature probably acts as a barrier to runoff andencourages laterally extensive water ponds. Since this behaviour would occur even inthe absence of the plant cover, it provides a mechanism by which the water partitioningcan persist in the face of drought or other pressure and the mosaic rapidly recover, uponthe retum of more favourable conditions. The extremely high soil strength displayedwithin the lowermost parts of the microtopographic elements would add to the robustness of the surface form even when unvegetated.
(4) The dimensions of mosaic elements are controlled by a complex set of influences.Water shedding and trapping efficiencies may vary with site characteristics such as theslope steepness, the abundance of litter and litter dams and the density and dimensionsof plant stems or surface stones acting as surface roughness elements. Finally, it is clearthat the rapidity of plant response to rain and the temporal distributions of rain events,may both be involved in a quite dynamic process of adjustment in grove water trappingefficiency. This is an important conclusion, since it suggests that in situ infiltrationcapacity data, taken under a limited set of field conditions, may not be sufficient tocharacterise site behaviour.
Acknowledgements
Fieldwork was supported by a grant from the Faculty of Arts at Monash University.
References
AI-Durrah, Bradford, 1981. New methods of studying SOlI detachment due 10 waterdrop impact. SOli Sci. Soc.Am. J. 45. 949-953.
Bradford. J.M.• Remley, P.A., Ferris, J.E., Santini, J.B., 1986. Effect of soil surface sealing on splash from asingle waterdrop. Soil Sci. Soc. Am. J. 50, 1547-1552.
Bureau of Meteorology, 1988. Climatic averages, Australia. Australian Govemment Publishmg SerVIce,Canberra, 532 pp.

88 D.L. DUllkerley, K.i. Browll j Carella 37 (1999) 75-88
Cornet A.F.. Delhoume. J.P.. Montana, c., 1988. Dynamlcs of ,tnped vegetation patterns and water balance inthe Chihuahuan Desert, pp 221-231. In: During, H.J.. Werger, M.J.A., Willems, J.H (Eds,), Diversity andPattern 10 Plant Commumtles. SPB Publishing, The Hague, 278 pp.
Dunkerley, D.L., 1997a. Banded vegetation. development under uniform ramfall from a simple cellularautomaton mode\. Plant Ecology 129, 103-111.
Dunkerley, D.L., 1997b. Banded vegetation: survlval under drought and grazing pressure from a sImplecellular automaton mode\. J. Arid Envlfon. 35,419-428.
Dunkerley, D.L., Brown, K.J., 1995. Runoff and runon areas ln a patterned chenopod ,hrubland, arid westernNew South Wales, Australia. charactenstics and ongin. J. Arid Environ. 30, 41-55.
Freund, J.E., 1974. Modern Elementary Statlstics, 4th edn. Prentice-HaIJ, London, 532 pp.Mabbutt, J.A., Fanning, pc., 1987. Vegetation bandmg in arid Western Aw,tralia. J. Arid Environ. 12, 41-59.Nlcholls, N., 1991. The El NinojSouthern Oscillation and Austrahan vegetation. VegetatlO 91, 23-36.Tongway, D J.. Ludwig, J.A, 1990. Vegetation and sOlI patterning 10 .,emi-and mulga lands of Eastern
Australia. Aus!. J. Ecol 15, 23-34.
ELSEVIER Catena 37 <1999) 89-105
CATENA
The distribution of soluble cations withinchenopod-patterned ground, arid western New
South Wales, Australia
RC.T. Macdonald a, * , M.D. Melville a, 1. White b
3 School of Geography. Ullll'ersity ofNew South Wales, Sydney, NSW, 2052. Al/stralwh Centre for Resource and EIll'ironmental Stl/dies. AustrallOn NatIOnal Unil'erslty. Canberra, ACT, 0200,
Australia
Received 5 June 1996: recelved 10 revised form 12 September 1997: accepted 10 February 1998
Abstract
The soluble cation (Na, Mg, K, Ca) concentrations of the soils underlying differentvegetated/soil surface units were measured within a chenopod-pattemed ground complex. It wasfound that distribution of soil cations within the chenopod-pattemed ground is not uniform acrossthe landscape. The data shows that there are at least three chemically distinct zones: the bare,mtermedlate, and vegetated areas, within chenopod-pattemed ground. The bare areas, which areconsidered salt dumps, are dominated by sodium and its concentration decreases towards thecentre of the vegetated arcs. The magneslUm and calcium ions have a similar pattern ofdistribution across vegetated-bare ground transects, but in the vegetated arcs they are relativelymore concentrated than the sodium ions. The potassium ions are concentrated in the vegetated arcsand decrease in the bare ground. A model is proposed to explain how the spatial distribution of thesoluble soil cations is maintained. © 1999 Elsevier Science B.V. Ali rights reserved.
Keywords: Soluble cation: Chenopod-pattemed ground complex: Vegetated areas. Salt dumps: Gilgal phenomena
1. Introduction
1.1. Worldwide occurrence ofpatterned ground
Pattemed ground is a landscape feature where the spatial variation of vegetated andbare areas are rhythmically repeated. The vegetation usually appears as arcs, stripes, or
• Corre,ponding author.
0341-8162/99/$ - see front matter © 1999 Elsevier SCience B.V. Ail rights reserved.PlI: S0341-8162(98)(lOO57-5
90 B.CT. Macdonald et al. / Catena 37 (J999) 89-105
whorls (Wickens and Collier, 1971), with the main axis paralle1 to the contour(Montana, 1992) and separated by bare areas. The vegetated arcs may fonn approximate1y continuous lines over a kilometre or more, and from the air, patterned groundlooks like the stripes on atiger skin (Macfayden, 1950) and is known as 'brousse tigrée'(White, 1970). Patterned ground has been reported in many 10ca1ities around the worldincluding Jordan (White, 1969), North America (White, 1971; Montana, 1992), TheSomali Repub1ic (Macfayden, 1950; Greenwood, 1957; Boa1er and Hodge, 1964;Hemming, 1965), and The Sudan (Worrall, 1959, 1960). In these areas it is usuallydeve10ped in arid grass1and and wood1and.
Patterned ground a1so occurs in many parts of arid Australia which are dominated bymu1ga (Acacia aneura): in Western Austra1ia (Litchfie1d and Mabbutt, 1962; Mabbuttand Fanning, 1987; Mott and McComb, 1979) and New South Wa1es (Tongway andLudwig, 1990; Greene et al., 1992). Simi1ar patterns are reported in Western Queensland(Boy1and, 1973; Dawson and Ahern, 1973). Patterning has a1so been described inchenopod shrub1ands around the Barrier Ranges north of Broken Hill in semi-arid NewSouth Wa1es (Mabbutt, 1973). Patterned ground as seen from the worldwide perspectiveoccurs in many arid zone 10ca1ities and is a response of the aridity (Goodspeed andWinkworth, 1978).
1.2. Chenopod-pattenzed ground
Chenopod-patterned ground of the Barrier Range is generally confined to foot-s10pes,which are 1ess than 5%. The microtopography of these slopes redistributes run-offthrough sheet flow, concentrating it in the vegetated arcs rather than it being unifonn1ydistributed across the 1andscape (Dunkerly and Brown, 1995).
Mabbutt (1973) made the connection that microtopography of chenopod-patternedground of the Barrier Range is generated by the 'gi1gai phenomena' as a resu1t of thedifferentia1 wetting and swelling of the clayey subsoi1 of the vegetated arcs. Washburn(1956) describes a simi1ar process occurring within polar, subpo1ar and alpine patternedground which is caused by the freezing and thawing of the subsoi1 soil. The bare areaswere considered the 'mounds', the vegetated areas the 'depressions' and the intennediate areas 'she1ves' according to the gi1gai descriptions of Hallsworth et al. (1955). Themound soi1s appear to be better structured than those of the she1f (Hallsworth et al.,1955). Despite the apparently more favourab1e soi1 physica1 properties of the mound,and the possibility of higher avai1ab1e soi1 water in the depressions or she1f, thedifferences in the vegetation between the areas are a1so due to different nutrient 1eve1s inthe soi1s (Butler and Hubble, 1977).
The bare mounds and semi-bare she1ves are considered run-off zones, whi1e vegetated depressions are run-on zones. This hydro10gica1 system is common to aIl aridfonns of patterned ground. The vegetated areas can receive in excess of 100% of totalrainfall due to inputs of water from bare areas (Greene, 1992). Run-off water carriesnutrients, sediments and seed, further benefiting the vegetated areas. 'Crabho1es', whichare small depressions averaging 50 cm in diameter and 30 cm in depth CUpton, 1983),are usually associated with the vegetated areas. Boa1er and Hodge (1964) recognised that
Re. T. Macdonald el al./ Calena 37 (1999) 89-105 91
holes, which are similar to crabholes, within vegetated areas promoted infiltration andacted as a sediment and seed trap. At a smaller scale the distribution of vegetation andsoil surface (crusts, etc.) units are controlled by water redistribution within the vegetatedarea (Bromley et al., in press).
The soils of the bare and vegetated areas have different properties (Wilson and Liegh,1964) and many writers (e.g., Greig-Smith, 1979; Charley, 1959) have attributed thedifferences to the presence of vegetation and differential penetration of water. However,the study of patterned ground has generally been confined to the relationship betweenthe hydrological regime and its control and distribution of plant growth and soil crusts.Usually, only a secondary consideration has been given to the soil's chemical andphysical properties and subsequently there is a failure to emphasise the spatial variationof soil properties in patterned ground. Studies do exist that have established patterns ofassociation between vegetation distribution and soil properties that range in scale fromthat of the broad geological province (Noy-Meir, 1974) to that of soil changes aroundindividual shrubs (Charley, 1972). However, there is a lack of data on the chernicalproperties at a scale underlying different vegetation/soil surface units within thepatterned ground complex.
The aim of this paper is to investigate spatial variation of soil chernical properties atan intermediate scale between that Noy-Meir (1974) and that of Charley (1972). It isproposed that there is an association between the different vegetation and soil surface(soil and biotic crusts) units and the underlying soil chemical properties; that bare areashave a relatively larger soluble salt concentration compared to the vegetated areas. Amodel that explains this distribution, and incorporates vegetation, microtopographic andinfiltration differences of a chenopod-patterned ground system will be discussed.
2. The study area
2.1. Environmental characteristics
The study site is located on the University of New South Wales Fowlers Gap AridZone Field Station, located approximately 110 km north of Broken Hill in westernNSW, (Fig. 0. The stony chenopod-patterned ground site for detailed study is anenclosure, located in Airstrip Paddock, on the rolling stone country to the east of theCoko Ridge, in Nutherungie Landsystem, Unit 1 (Mabbutt et al., 1973).
2.2. The climate
The distribution of annual and seasonal rainfall is very variable for the region in bothspace and time. Most rainfall is probably delivered in 'wet spells' (Dunkerly and Brown,1995) and when it does fall it tends to "consist of short bursts of high intensity rainlasting from a few minutes up to an hour" (Bell, 1973). Comparison of the meanpotential evaporation (3613 mm Bell, 1973) and rainfall (237 mm Zhou, 1989) throughout the year at Fowlers Gap shows that monthly rainfall is never likely to exceedmonthly evaporation. A complete c1imatic description can be found in Bell (1973).
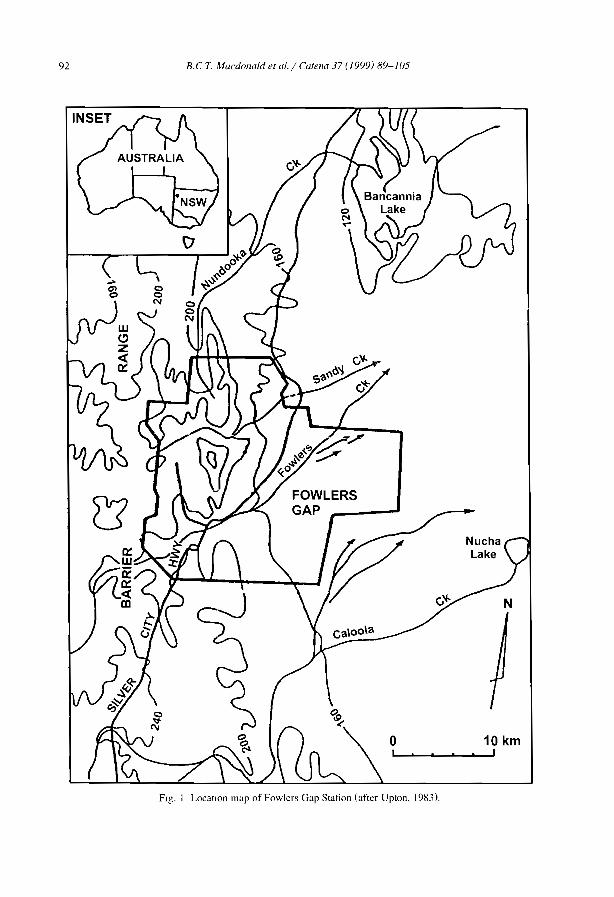
92 RC T. Macdonald et al. / Catena 37 (1999) 89-105
o1
FIg. 1 LocatIon map of Fowlers Gap Station (after Upton, 1983).
10 km,

2.3. The soils
B.C T. Macdonald et al. / Catena 37 (1999) 89-105 93
The soils of the hilly areas of Fowlers Gap, shown by Chartres (I982, 1983a,b) andCharley (I 959), are morphologically similar, being three separated layers of aeolian andin situ weathered material. Each of these layers are best developed at a particulartopographie position where they are not buried (Charley, 1959). This is similar to theevolutionary history of the rest of the south-eastem portion of the Australian arid zoneas described by Jessup (I960a,b,c,d, 1961 a,b,c),
2.4. The vegetation
High evaporation and low rainfall have resulted in low and open communities and ina perennial vegetation that is floristically poor (Burrell, 1973). Despite being protectedby the enclosure (since 1968), the vegetation of the study site will not be trulyrepresentative of the original vegetation because the grazing which has occurred at thestation has caused the replacement of the long-lived perennial chenopods by thesemi-perennial chenopods or ephemeral species (Burrell, 1973).
3. Experimental procedures
3.1. Vegetation and soil surface analysis
Species distribution within the enclosure was mapped using the line-intercept method(Canfield, 194\). Transects were aligned downslope, spaced at 5 m intervals, and amarker was placed at each discemible change in the vegetation/soil surface on the basisof species coyer and distribution. A vegetation/soil surface map was produced by visualinterpolation between adjacent marking pins.
3.2. Topographie analysis
The elevations at 1 m intervals and each marking pin along the transects weresurveyed using standard automatic levelling techniques to give 0.1 m contours reducedto an arbitrary local benchmark.
3.3. Soil sampling
Soil samples were taken at fixed depths (0-10, 10-50, 80-100, 150-200, 300-350mm) from triplicate soil profiles from the approximate centre of representative sites ofeach unit in the enclosure. It is recognised that within the vegetated areas the saltdistribution is at finer scale than that sampled. There will be differences in the saltconcentration between Atriplex uesicaria and under A. vesiearia (Charley, 1959;Sharma and Tongway, 1973). However, the difference of the salt concentrations in thiscase is at a scale considerably less than between a bare area and a vegetated area within
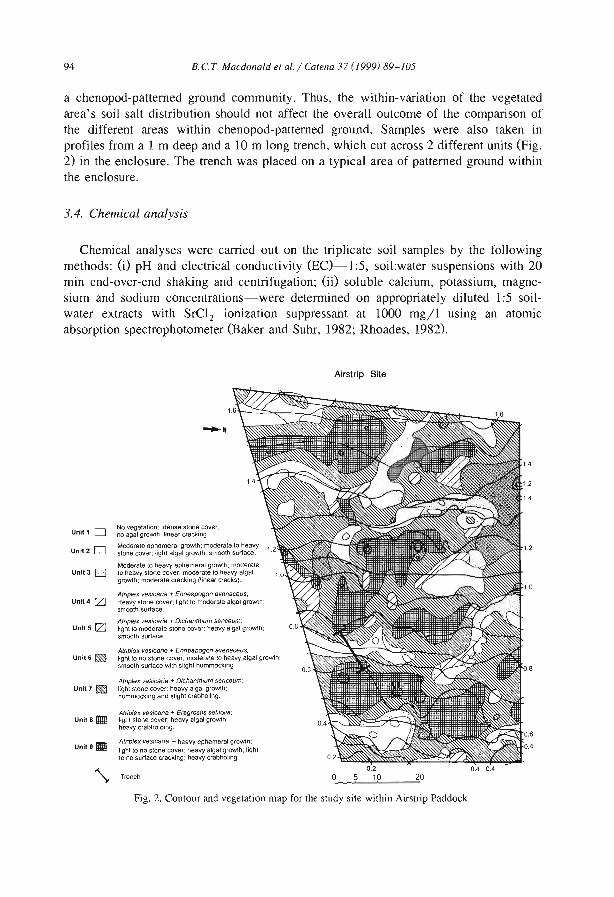
94 B.e T MacdonaLd el aL / Catena 37 (/999) 89-/05
a chenopod-patterned ground community. Thus, the within-variation of the vegetatedarea's soil salt distribution should not affect the overall outcome of the comparison ofthe different areas within chenopod-patterned ground. Samples were also taken inprofiles from a 1 m deep and a 10 m long trench, wh.ich eut across 2 different units (Fig.2) in the enclosure. The trench was placed on a typical area of patterned ground withinthe enclosure.
3.4. Chemical analysis
Chemical analyses were carried out on the triplicate soil samples by the followingmethods: (i) pH and electrical conductivity (EC)-l :5, soil:water suspensions with 20min end-over-end shaking and centrifugation; (ii) soluble calcium, potassium, magnesium and sodium concentrations-were deterrnined on appropriately diluted 1:5 soilwater extracts with SrCl 2 ionization suppressant at 1000 mg/l using an atomicabsorption spectrophotometer (Baker and Suhr, 1982; Rhoades, 1982).
Airslrip Sile
.8
0.4 0.420
0.2
5 10
__ N
Alnp/ex vesiC8na + Enne8pogon evenaceus;light la no stone oover; maclerale 10 heavy algal gra'N1h;smooth surface with slighl hummocklng
A/np/ex vesicaria .. Dlchanthium senC8um;I1ghllo moderale stone caver; heavy 81gel gro'N'Ù'l;smooth surface.
Afripfex vesicaria + D/chanth/um senc&um;lighl stone cover: heavy algal graw1.h;hummocklng and sllght crabholing.
No vegetation: dense stone cover;no agal growth; Ilnear cracking.
Moderate ephemeral growth: mOderale 10 heavystone cover; light algal growth; smooth surface.
Moderale 10 heavy ephemeral growth; moderale10 heavy stone coyer; moderale 10 heavy elgalgrow1h; moderale cracking (Iinear cracks).
Alriplex vaS/C8ria + Enneapogon 8venaceus;Heavy stone cover; light 10 moderate slgal growth:smootn surface.
Atripfex vesicaria + Er8groslls setifo/i8;Iighl stone cover; heavy algal grOw1.h;heavy crabhaloing.
Atriplex vesicaria + heavy ephemeral grOw1.h;Iight ta no stone cover; heavy algal growlh; Iightto no surface cracking; heavy crabhOling.
~ Trench
Unit sllll!l
Unit B l!lIIl
Unit 6 ~
Unlt7 ~
Unl15 fZJ
Unlt4 rzJ
Unlt3 D
Unit2D
Unit 1 0
Fig. 2. Contour and vegetation map for the study site within Airstrip Paddock.
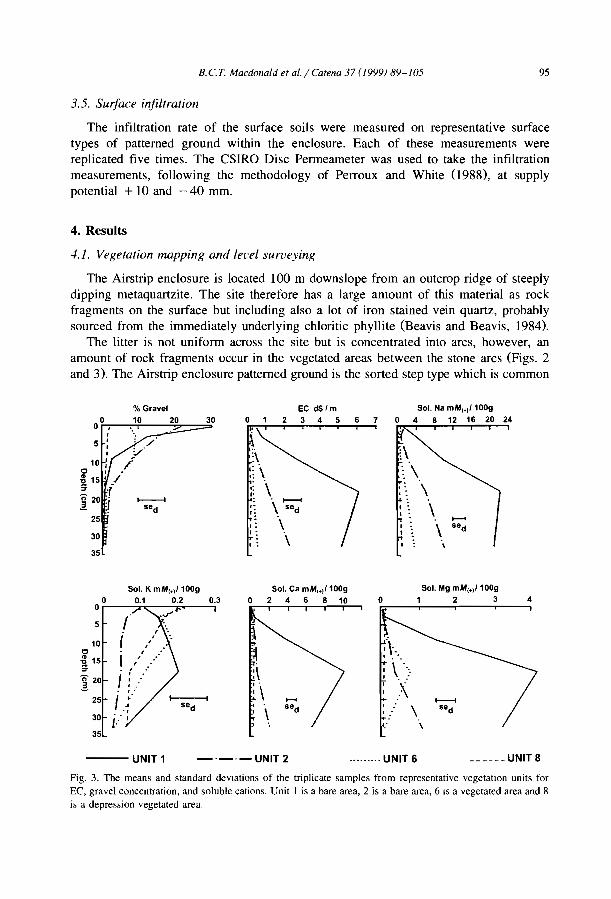
B.CT. Macdonald e' al. / Ca'ena 37 (J999) 89-105 95
3.5. Surface infiltration
The infiltration rate of the surface soils were measured on representative surfacetypes of pattemed ground within the enclosure. Each of these measurements werereplicated five times. The CSIRü Dise Permeameter was used to take the infiltrationmeasurements, following the methodology of Perroux and White (988), at supplypotential + JO and - 40 mm.
4. Results
4.1. Vegetation mapping and level surveying
The Airstrip enclosure is located 100 m downslope from an outcrop ridge of steeplydipping metaquartzite. The site therefore has a large amount of this material as rockfragments on the surface but including also a lot of iron stained vein quartz, probablysourced from the immediately underlying chloritic phyllite (Beavis and Beavis, 1984).
The htter is not uniform across the site but is concentrated into arcs, however, anamount of rock fragments occur in the vegetated areas between the stone arcs (Figs. 2and 3). The Airstrip enclosure pattemed ground is the sorted step type which is common
% Gravel EC d5'm 501. Na mM,.)' 100g0 2 3 4 5 6 7 4 8 12 16 20 24
0
,.. ;\:\~~ \ ~\.: \ .. \': .:
~ ...........sed " \ sed 1 \1 : ,
\..........,:
\ sed30 ' : \, :35
30 (" 1
35
4
\
501. Mg mM,.)' 100g1 2 3
.:
o501. Ca mM,.)/100g
2 4 6 8 10
\
( , "
( ,~, ..,
1 '
"
r' ,.'.., .-
i/
o 0.3o'---?",""-""ï'---'
5
25
10o! 15:T
n 202.
---UNIT1 -·_·-UNIT2 ......... UNIT 6 ______ UNIT 8
Fig. 3. The means and standard devlations of the triplicate samples from representative vegetahon units forEC, gravel concentration, and soluble cations. Unit 1 is a bare area, 2 is a bare area, 6 IS a vegetated area and 8is a depression vegetated area.

96 S.CT. Macdonald et al / Catena 37 (I999) 89-105
on the Barrier Range foot-slopes (Mabbutt, 1979) and is characterised by discontinuousstony arcs. The vegetation analysis Gncluding in-season ephemeral vegetation) and soilsurface mapping determined nine different vegetation units ranging from completelybare stony ground to that dominated by A. vesicaria plus heavy ephemeral growth (Fig.2). The contour map (Fig. 2) shows that the landscape has a weakly developed gilgaiform, with crabholes concentrated in the vegetated depressions.
4.2. Soil chemical analysis
The results from the triplicate samples for EC and the soluble soil cation data (Fig. 3)for representative vegetation units show that the soils of the bare area (Unit I) aresignificantly different from the rest of the intermediate and vegetated areas (Units 2, 6and 8). The differences between the vegetated units (6 and 8) are not significant and onthe basis of soil analysis, separation of those areas into discrete units is not possible. Thedistinction between Unit 1 and Unit 2 is possible on the basis of their soil properties.The terms bare areas (mounds) and vegetated (depressions) areas subsequently will beapplied to Units 1 and 4-9, respectively, Units 2 and 3 being intermediate (shelves)between the two groups. The relative distribution of the soluble soil cations (Figs. 4 and5) within the trench transect profiles can be assumed to be representative of chenopodpatterned ground at a similar topographie position.
The water soluble cation concentrations of the trench are illustrated in Figs. 4 and 5by fitting isopleths to the concentrations in the measured soil profiles. These isoplethmaps are representative of soluble cation distribution between vegetated and bare areasin the upper metre of soil profile within the enclosure site. The soils of both areas aredominated by soluble sodium throughout the majority of the profile. The largestconcentrations of sodium were found in the top 70 cm of the bare area soils and theydecreased rapidly from the centre of these arcs towards the vegetated areas (Fig. 4). Thepattern of distribution for the soluble magnesium and calcium is similar to solublesodium (Fig. 3). Figs. 3 and 4 show that there are great differences in the concentrationsand the distribution of the soluble cations between the vegetated and bare areas.
The potassium distribution is concentrated towards the centre of the vegetated areasand decreases towards the centre of the bare areas (Fig. 5) because of this ion's role asan important plant nutrient that is relatively rapidly cycled by vegetation. Tt appears thatthe bare areas are salt dumps and the concentrations of the salts decline into the centreof the vegetation arcs.
4.3. Infiltration measurements
The surface soils of the bare stony ground have very small hydraulic conductivityvalues (Fig. 6) for both supply potentials. Infiltration measured with a positive supplypotential (+ 10 mm) represents the contribution to flow from ail pore sizes; thatmeasured with a negative potential ( - 40 mm) excludes flow from the larger pores. Theinfiltration rate for the surface soils of the vegetated areas (Fig. 6) are greater whencompared to the stony ground with Unit 8 having the greatest proportion of infiltration
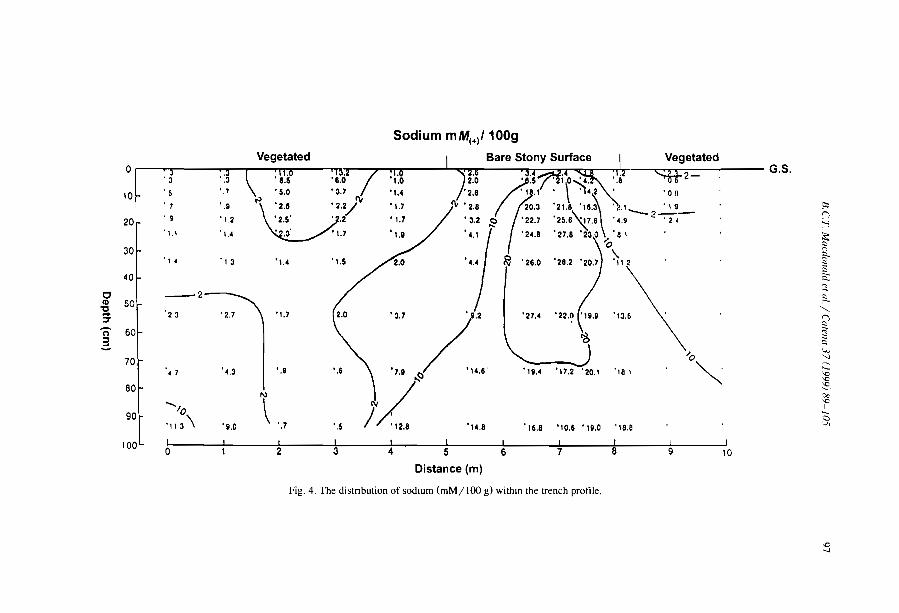
~
-\0\0~00\01--s:
I:ll
"~?::::
'"~'":;::~
'":-""Cl
~/o~',a 1
~
"6.a '10.6' 19.0 'le.e
'27.' '22.0 "19.9 "3,6
'''.a
Sodium mM(+/ 1009
Bare Stony Surface
'U /'
~ '7"/"<:i "U'
//'2,8
, .6
'.5
, .9
'1.7
~ ',7
'1.4 ' 1.5
. '5.0 '6.0\.) '37
V'U. '2:2/r\i2.5 ' /
, . ,2.3 ' 1.7
'9.0
, 4.3
'. '
23
, .9
'1.2
1.\ '1.4
\ 1 1 1 1 1 1 1 1 1 1
o 1 2 3 4 5 6 7 6 9 laDistance (m)
'. 7
........'0
'113 \
-2
. \( '1.3
1 i, . 'il i litA 1 Pi " 7 liA 1 <'ijA '42 __ 'J] <C b ili] C''5"5 _ G.S.0
'0
20
30
40
0CP 50
"-~ô 60
2-70
60
90
100
Fig. 4. The distnbution of sodIUm (mM/1OO g) withln the trench profIle.
'0-J
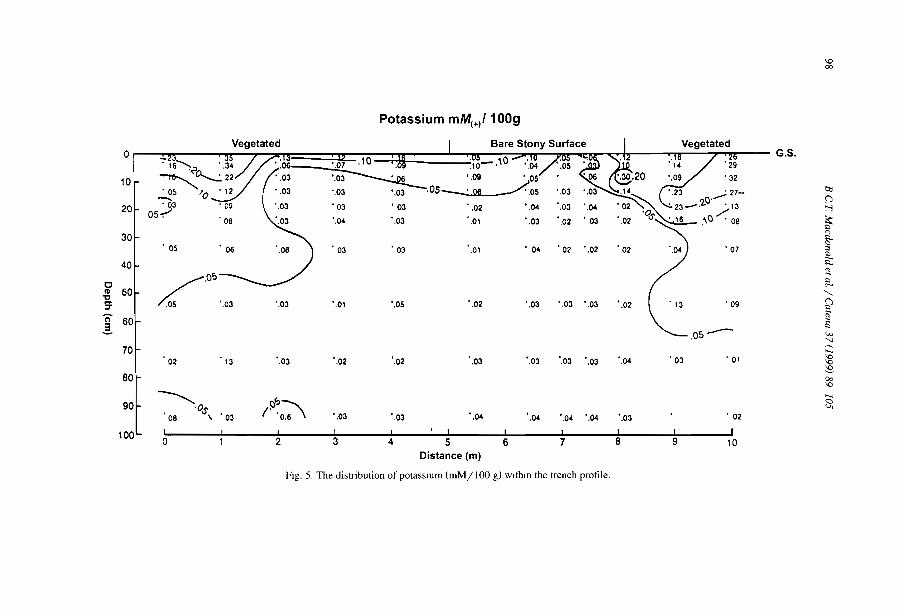
'000
Potassium mM(+)/1 OOg
'-'V
".....~f:g1.....s:
tl:ln~
~
~'"~~
'",.....'-..
~~'"
G.S,
, 07',04',02
',04
, 03
',03
',03
',02
'04 ' 02 ',02',01',03, 03
.,~ "'""=-- 10 '!~' ',u~·O - ,>06 ',07' ',0 ,10-. 1 ',04
"03~ '.09 'os',03 ',03 ',03 .OS~05',03 '03 '03 ',02 ',04
',03 ',04 ',03 01 ' ,03
Vegetated 1 Bare Stony Surface
, 05
',03 ',01 ',os ' ,02 ',03 ',03 ',03 ',02\. "3
' 09
05-
02 13 ',03 ',02 ',02 ',03 '.03 ',03 ',03 ',04 ' 03 ' 01
--...... 0':1:\' 'Os, (' '0.6 ',03 ',03 '.04 '.04 ',04 ',04 ',03 . 0208 \ .03
! ! ! ! , 1 1 1 1 1 10 1 2 3 4 5 6 7 8 9 10
Distance (m)
Fig. 5, The distribution of potassIUm (mM/ 100 g) wJthm the trench profile.
0
10
20
30
40
0.g 50~
ri' 60È..
70
80
90
100
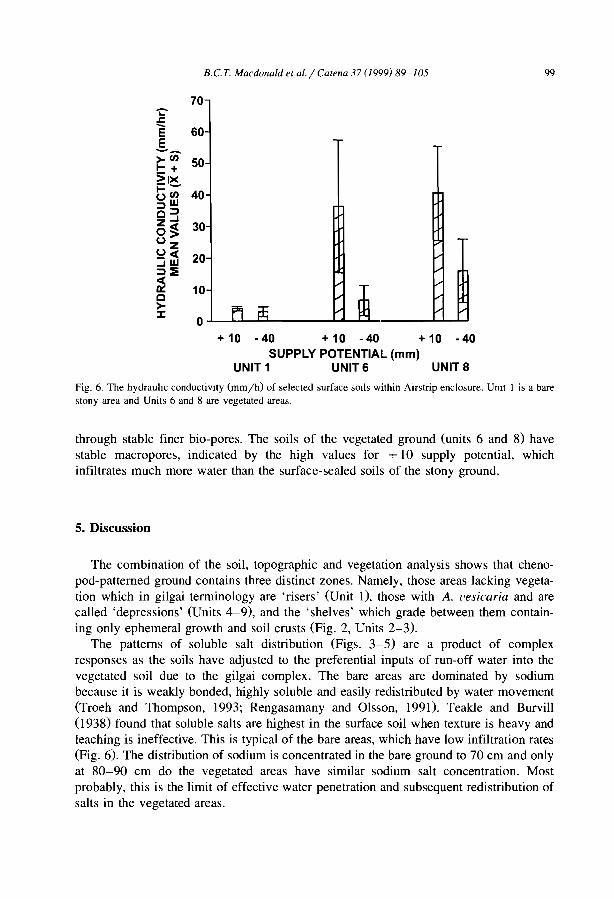
B.CT. Macdonald et al. / Catena 37 (1999) 89-105
70
o-'-----'-..L..-"""'"- ...........-.L...&. ...........L-.......
+10 -40 +10 -40 +10 -40SUPPLY POTENTIAL (mm)
UNIT 1 UNIT 6 UNIT 8
99
Fig. 6. The hydrauhc conductivIly (mm/h) of selected surface sOils within Airstrip enclosure. Umt 1 is a barestony area and Units 6 and 8 are vegetated areas.
through stable finer bio-pores. The soils of the vegetated ground (units 6 and 8) havestable macropores, indicated by the high values for + JO supply potential, whichinfiltrates much more water than the surface-sealed soils of the stony ground.
5. Discussion
The combination of the soil, topographie and vegetation analysis shows that chenopod-patterned ground contains three distinct zones. Namely, those areas lacking vegetation which in gilgai terminology are 'risers' (Unit 1), those with A. uesicaria and arecalled 'depressions' (Units 4-9), and the 'shelves' which grade between them containing only ephemeral growth and soil crusts (Fig. 2, Units 2-3).
The patterns of soluble salt distribution (Figs. 3-5) are a product of complexresponses as the soils have adjusted to the preferential inputs of run-off water into thevegetated soil due to the gilgai complex. The bare areas are dominated by sodiumbecause it is weakly bonded, highly soluble and easily redistributed by water movement(Troeh and Thompson, 1993; Rengasamany and Olsson, 1991). Teakle and Burvill(I938) found that soluble salts are highest in the surface soil when texture is heavy andleaching is ineffective. This is typical of the bare areas, which have low infiltration rates(Fig. 6). The distribution of sodium is concentrated in the bare ground to 70 cm and onlyat 80-90 cm do the vegetated areas have similar sodium salt concentration. Mostprobably, this is the limit of effective water penetration and subsequent redistribution ofsalts in the vegetated areas.

100 B.CT. Macdonald et al. / Carena 37 (/999) 89-/05
Fairly similar patterns occur for magnesium and calcium but they contain relativelyhigher concentrations than sodium in the vegetated areas due their greater bondingstrengths with clays. The distribution of potassium within the whole system is controlledby vegetation-induced turnover. The vegetated areas have a greater absolute amount ofpotassium in the topsoil compared to the adjacent bare areas. The presence of potassiumwithin the topsoil of the bare areas is probably due to the decomposition of organicmatter present on the sUlface and the presence of microbiotic crusts.
There is a relatively slight increase in the concentration of sodium, calcium andmagnesium within the topsoil of the vegetated areas. The increase of these soluble saltsis because of the A. vesicaria salt cycling (Sharma and Tongway, 1973). Prior tograzing-induced land degradation the vegetation-induced salt turnover by the saltbushes(Charley and West, 1975) ensured that rainfall did not leach the depression sufficientlyto allow competition by salt-intolerant species. The increase in soluble salts in thetopsoil would lower the permanent wilting point (Charley, 1977), which would inhibitperennial establishment and growth. The saltbushes were, and in sorne cases still are,maintaining their own ecological niche within the system.
The present soluble salt distribution within the vegetated area is certainly influencedby A. vesicaria. However, it is unlikely that the redistribution of soluble salts from thevegetated soils was caused solely by Atriplex spp. salt cycling. The relative differencesof the soluble salt concentrations between the soils of the vegetated and bare areas aretoo great.
5.1. Model of soluble salt distribution mailltenance
The data supports the hypothesis that bare areas are salt dumps where salt is movedlaterally from the vegetated areas over time. There is much evidence that the lateralmovement of salts is possible provided the right conditions are established (Russell,1966; Teakle and Burvill, 1938; Lawrie, 1978; Whittig and Janitzky, 1963). Theestablishment of the gilgai complex started the process by initialising the appropriatemoisture gradients (Charley, 1959), which then would favour the movement of water,collected by the depressed vegetated areas, through the soil and under the bare areas(Fig. 7). This soil water would carry soluble salts, thus increasing salt concentrationthrough time. The establishment of a favourable osmotic gradient would have takenplace during this time due to inputs of soluble salts from the adjacent vegetation areasand from subsoil migration within the bare ground. This would further promote themovement of water in the soil, from the vegetated to the bare areas.
Daubenmire (1957) states that temperature gradients are important with plant ecology. Temperature of the soil affects soil water as it increases, by increasing the rate ofmoisture movement and the amount available to plants. Tongway and Ludwig (1996)found that within a degraded semi-arid Aca. aneura woodland, soil surfaces which weredevoid of vegetation htter were be relatively warmer during the daytime than the soilswhose surface was covered with litter and branches. A similar temperature gradient mustoccur between the bare and vegetated areas within chenopod-patterned ground. Atnighttime, the bare soil surface cools more than that beneath the vegetated areas. Thissets up a greater moisture potential gradient between the moister subsoil and the bare
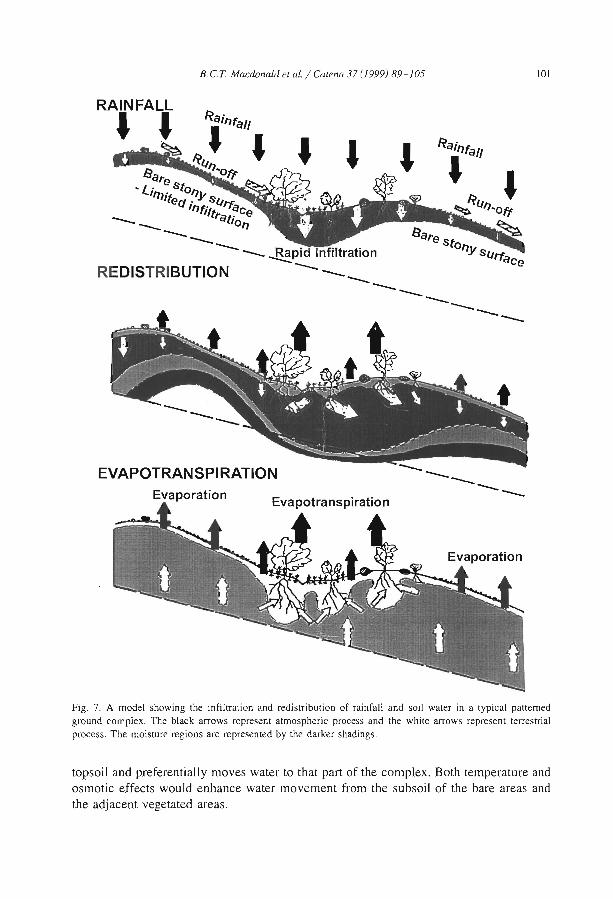
B.C T. Macdonald el al. / Calena 37 (/999) 89-/05 101
----------Evaporation
EVAPOTRANSPIRATION
RAINFALLJ , Rainfa/l
"e·~~l?q!OFF •are. '-i .StOl]tnlteeJ . :Y SiJ .
ln"" l'fac__ 1 trati e__ On----
---- -8!pid InfiltrationREDISTRIBUTION ----__------------
Fig. 7. A model showing the infiltration and redistributioo of rainfall and soil water in a typical pattemedground complex. The black arrows represenl atmospheric process and the white arrows represent terrestrialprocess. The moisture regions are represented by the darker shadings.
topsoil and preferentially moyes water to that part of the complex. Both temperature andosmotic effects would enhance water moyement from the subsoil of the bare areas andthe adjacent yegetated areas.
102 B.e. T. Macdonald el al. / Calena 37 (1999189-105
It is hypothesised that the majority of the soil water in the bare ground is beingevaporated from the soil's immediate subsurface. This would cause the migration ofsalts from the subsoil to the topsoil of the bare ground. Within the vegetated soils, saltsare drawn from throughout the soil profile into the roots and through the transpirationstream. They are stored temporarily in/on the vegetation for re-cycling in litter fall tothe soil surface and returned to the soil profile depth with infiltrating water (Sharma andTongway, 1973). The gilgai complex has probably established a system where soilmoisture and osmotic gradients ail favour the flow of soil water (Fig. 7) carrying solublesalts from the vegetated areas and the bare area's subsoil, concentrating them into thebare area's upper subsoil.
The processes described in the above model would require long periods of soilstability. The soils present at the site have not been dated; however, a nearby area ofpatterned ground is Holocene in age (Dunkerly and Brown, 1995) and soil of the MundiMundi plain have been dated to 16,000 BP (Wasson, 1979). Thus, it is assumed that thesoils of study area are sirnilar in age and stability. There would of course have beenadditions and erosion of soil materials since this time. However, the landscape stabilitywould have perrnitted the processes described in the model, suffIcient time to modify thesoil chemical landscape.
6. Conclusions
The vegetation pattern of the chenopod shrobland patterned ground described here, ischiefly due to differences in soil moisture, which arises largely through the ron-off ofrainwater from bare, impermeable gilgai mound to the vegetated depression. Thehydrological and vegetational patterns in turn control the distribution of soil cationswithin patterned ground, but the large salt concentrations beneath the bare soil areasprovide a feed-back mechanism to inhibit plant growth there. The pattern of saltredistribution is strengthened through time by positive feedback effects. The chemicaland vegetational differences influence the soil' s physical properties increasing thestrength of the gilgai complex that further promotes the redistribution of ron-off. This inturn would favour more salt transportation out of the vegetated areas because of theincreased flow potential. At sorne point, the gilgai and patterned ground complexreaches a balance with the prevailing climatic conditions and the system would bemaintained in a dynamic equilibrium. Mabbutt (I 973) envisaged this dynarnic equilibrium as the process, which controls the maintenance of the whole system. It representsthe end point in the evolution of the landscape to the prevailing conditions such that thephysical and chernical properties of the soil, and the amount and type of vegetation,remains relatively constant.
References
Baker. D.E.. Suhr, N.H., 1982 Atomic absorption and t1ame emlssion spectrometry. In: Page, AL., Miller.R.H., Keeney, D.R. (Eùs.), Methods of Soil Analysls, Part 2; Chemical and Microbiological Propertles.2nd eùn. American Society of Agronomy and Soil Science Society of Amenca. Madison. WI, USA, pp.13-28.

B.e. T. Macdonald et al. / Catena 37 (1999) 89-105 103
Bell, FC., 1973. Climate of the Fowlers Gap Station. In: Mabbutt, J.A. (Ed.), Lands of the Fowlers GapStation, New South Wales Fowlers Gap Arid Zone Research Station, Research Series No. 3. UNSW, pp.123-149.
Beavis, F.G., Beavls, J.c., 1984. Geology, engineering geology and hydro-geology of Fowler, Gap Station.Fowlers Gap Arid Zone Research StatIOn Senes No. 6, UNSW.
Boaler, S.B., Hodge, C.A.H., 1964. Observation on vegetation arcs in the northern reglOn, Somali Republic. J.Eco!. 52, 511-544
Boyland, E.E., 1973. Vegetation of the mulga lands with special reference to South Western Queensland.Trop. Grasslands 7, 23-34.
Bromley, J., Brouwer, J., Barker, A.P., Gaze, S.R, Valentin, c., in press. The role of surface waterredlstnbution in an area of patterned vegetation in a semi-arid environment, south west Niger.
Burrel!. 1.P., 1973. Vegetation of the Fowlers Gap Station. In: Mabbutt, J.A. (Ed.), Lands of the Fowlers GapStation, New South Wales. Fowlers Gap Arid Zone Research Station, Research Series No. 3., pp.175-194.
Butler, RE., Hubble, G.D., 1977. Morphologic properties. In: Russell, J.S., Greacen. EL (Eds.), Soil Factorsin Crop Production in a Senti-arid Environment. Univ. Qld Press. St Lucia, pp. 9-33.
Canfield, RH., 1941. Application of the Ime interceptIOn method in sampling range vegetation. J. For. 39,388-394.
Charley, J.L., 1959. Soil salinity vegetation patterns in western New South Wales. PhD TheSlS, University ofNew England, p. 274
Charley, J.L., 1972. The role of shrubs in nutrient cyc1ing. In: Mckell, C.M., Blaisdell, J.P., Goodin, J.R(Eds.), Wildland Shrubs-Thelr Biology and Utilisation. An International SymposIUm. Utah State Univ.,Logan, UT, July 1971. USDA, pp. 182-204
Charley, J.L., 1977. Mineral cycling in rangeland ecosystems. In: Sosebee, RE. (Ed.), Rangeland PlantPhysiology. Rangeland Sci. Series, pp. 215-256.
Charley, J.L., West, N.E., 1975. Plant induced patterns in sorne shrub dominated seml-desert ecosystems ofUtah. J. Eco!. 63, 945-964
Chartres, C J., 1982. The pedogenesls of the desert loam soils in the Barner Range, Western New SouthWales: 1. SOli parent materials. Aust. J. Soil Res. 20, 269-281.
Chartres, C.J., 1983a. The pedogenesis of the desert loam soils in the Barner Range, Western New SouthWales: II. Weathering and soit fonnation. Aust. J. Soil Res. 21, 1-13.
Chartres, C.J., 1983b. The micromorphology of desert loam soils and implications for quaternary studies inwestern New South Wales. In: Bullock, P., Murphy, c.P. (Eds.), SOli Micromorphology, Vol. l,Techmques and ApplicatIOns. Academic Publishers, Berkhamsted, pp. 273-279.
Daubenmire, R, 1957. Influence of temperature upon soil moisture contents and ItS possible ecologicalsigmficance. Ecology 38, 320-324.
Dawson, N.M., Ahern, C.R, 1973. Soils and landscapes of mulgalands with special reference to south westernQueensland. Trop. Grasslands 7, 23-34.
Dunkerly, D.L., Brown, K.J., 1995. Runoff and runon areas in patterned chenopod shrubland, and westernNew South Wales, Australia: characteristics and origins. J. Arid Environ. 30,41-45.
Goodspeed, M.J., Wmkworth, R.E., 1978. Fate and effect of runoff-with speCial reference to arid andsemi-arid plain lands. In: Howes, K.M.W. (Ed.), Studies of the Australian Arid Zone: III. Water inRangelands. Proceedings of the Symposium held at the Rangelands Research Umt, Alice Springs FieldCentre, 15-18 October 1974, Melbourne. CSIRO Division of Land Resources Management, pp. 53-60.4
Greene, R.S.B., 1992. Soil physical properties of three geomorphlc zones in senti-arid mulga woodland. Aust.J. Soil Res. 9, 157-164.
Greene, RS.B., Kinnell, PIA., Wood, J.T., 1992. Role of plant cover in runoff and soil eroslOn fromsemi-and wooded rangeland. Aust. J. Soil Res. 32 (5), 953-973.
Greenwood, J.E.G.W., 1957. The development of vegetation patterns in the Somaliland Protectorate. Geogr. J.123, 465-473.
Greig-Smlth, P, 1979. Pattern in vegetation. J. Eco!. 67, 755-779.Hallsworth, E.G., Robertson, G.K., Gibbons, F.R, 1955. Studies in pedogenesis III New South Wales: VII.
The gilgm soils. J. Soil Sei. 6 (J), 1-31.Hemming, C.F., 1965. Vegetation arcs in Somaliland. J. Eco!. 53, 57-63

104 B.CT. Macdonald el al. / Carena 37 (/999) 89-105
Je,sup, R.W., 1960a. An introduction to the sOlls of the south-eastern portion of the Austrahan arid zone. J.Soil Sci. 11, 92-105
Jessup, R.W., 1960b. The Iateritic sOlls of the south-eastern portion of the Australian arid zone. J. Soil SCI. Il(l), 106-113.
Jessup, R.W., 1960c. The stony tabldand soils of the ,outh-eastern portIOn of the Australian and zone. J. SOlI.SCI. II (2), 188-197
Jessup, R.W., 1960d. Idenllfication and signitïcance of buried soils of quaternary age in the south-easternportIOn of the Australian and zone. J. SOlI SCI. II (2), 197-205.
Je"up, R.W., 1961a. EvolutIOn of the two youngest (Quaternary) sOli layers on the south-eastem portIOn ofthe Australian arid zone: 1. The paraklia layer. J. SOlI Sci 12 (J), 52-63.
Je"up, R.W., 1961b. EvolutIOn of the two youngest (Quaternary) sOlllayers on the south-ea,tern portion ofthe Au,trahan and zone: II. The bookaloo layer. J. Soil Sci. 12 (J), 64-72.
Jessup, R.W., 1961c. A Tertiary-Quaternary pedological chronology for the south-eastern portion of theAustrahan and zone. J. Soil SCI 12 (2), 199-213.
Lawrie, J.W., 1978. Hardpans In western New South Wales. Proceedings of the First InternatIonal RangelandCongress, pp. 303-306.
Lltchfield, W.H., Mabbutt, J.A, 1962. Hardpan in sOlls of the semi-arid Western Australia. J. Soil Sci. 13 (2),149-159.
Mabbutt, J.A, 1973 Geomorphology of the Fowlers Gap Station. ln: Mabbutt, 1.A ŒdJ, Lands of theFowlers Gap Station, New South Wales. Fowlers Gap And Zone Research Station, Research Series No. 3,pp. 67-83.
Mabbutt, J.A., 1979. Pavements and patterned ground in the Australian stony deserts. Stuttgartert Geogr.Studlen 93, 107-123.
Mabbutt, J.A., Fanning, P.c., 1987. VegetatIOn banding In and Western Australia. 1. Arid Environ 12,41-59.Mabbutt. J.A., BurrelL 1.P., Corbett, 1.R., Sullivan, M.E., 1973. Landsystems of Fowlers Gap Station ln:
Mabbutt, J A. (Ed.). Land, of the Fowlers Gap StatIOn, New South Wales. Fowlers Gap And ZoneResearch StatIOn, Research Serie, No. 3, pp. 25-49.
Macfayden, W A., 1950. VegetatIOn patterns in the seml-desert plains of British Somahland. Geogr. 1. 116.199-210.
Montana, c., 1992. The colomsatlOn of bare areas In two phase mosaics of an arid ecosy,tem. J. Ecol 80,315-327.
Mott, J.A, McComb, AJ., 1979 Patterns in annual vegetation and soil mlcrorelief in arid reglon of WesternAustralia. J. Ecol. 62, 115-126.
Noy-Melr, L 1974. Multivariate analysis of the semiarid vegetation In ,outh eastern Australia, Part Il.Vegetallon catenae and envlronment. Au,t. J. Bot. 22, 154-155
Perroux, K.M., White, 1., 1988 Designs for disc permeameters. Soil Sci. Soc. Am. J 52 (5), 1205-1215Rengasamany, P., Olsson. K.A., 1991. Sodicitiy and soil structure. Aust. J. Soil. Res. 29, 935-952.Rhoades. 1.D., 1982. Soluble salt,. ln: Page, AL., Miller, R.H., Keeney, D.R. (EdsJ, Methods of Soil
Analysis, Part 2; Chemlcal and MicroblOloglcal Propertles, 2nd edn. American SocIety of Agronomy andSot! Science SocIety of Amenca, Madison, WI, USA, pp. 167-180.
Russell, J.S., 1966. Changes In the properties of a deep gilgaied clay soil associated with the replacement ofbrigalow (Acacia hmpophylla F. Mue]]) forest with grassland. Aust SOlI. Conf., May, pp. 5-11.
Sharma, ML., Tongway, DJ., 1973. Plant induced soil salinity patterns in two saltbush (Arnplex spp.)communities. Range Man. 26 (2), 121-125.
Teakle. LJ.H., Burvlll, G.H., 1938. The movement of soluble salts In soils under light raInfall conditions. 1.Dept. Agric. W. Aust. 15, 218-245.
Tongway, DJ., LudWIg, J.M., 1990. Vegetation and soil pattermng in semi-arid mulga lands of easternAustralia. Aust. 1. Ecol 15, 23-34.
Tongway, DJ., Ludwig, lM., 1996. Rehablhtation of semiarid landscapes in Austraha: 1. Restonng productivesoil patchcs. Restoration Ecol. 4 (4), 388-397.
Troeh, F.R., Thompson, LM., 1993. Soils and SOlI Fertility, 4th edn. Oxford Univ. Press, Melbourne.Upton, E., 1983. Genesis of crabhole microrelief at Fowlers Gap western New South Wale,. Catena 10,
383-392.

RCT Macdonald el al. / Calena 37 (J999) 89-105 105
Washburn, AL.. 1956 A clasSificatIon of patterned ground and review of suggested ongIns Bull Geo!. Soc.Am 67. 823-866.
Wasson, R.J., 1979 SedImentation hlstory of the Mundi Mundi alluvIal fans. Western NSW. Sed Geo!. 22.22-51
WhIte. L.P. 1969. Vegetation arcs In Jordan. J. Eco!. 57,461-464.WhIte, L.P.. 1970. Brou'>se TIgrée patterns in southern Niger J. Eco!. 58. 549-553WhIte, L.P., 1971. VegetatIOn stripes on sheet wash surfaces. J. Eco!. 59,615-622.WhlttIg, L.D., JanItzky, P.. 1963. Mechamsms of formatIon sodium carbonate in soils: 1. ManifestatIons of
blOlogical conversions. J. Soil Sci. 14 (2), 322-333.Wickens, G.E., Collier, F.W., 1971. Sorne vegetation patterns in the Republic of the Sudan. Geoderma 6,
43-59.Wilson. J.W., Llegh. J.H.. 1964. Vegetation patterns on an unusual gilgai sOlI in New South Wales. J Ecol
52, 379-389.Worrall, G.A.. 1959. The Butana grass patterns. J. Soil Sci. JO, 34-53.Worrall, G.A.. 1960. Tree patterns in The Sudan. J. Soil Sei. II. 63-67.Zhou, Q., 1989 The integratIon of remote sensing and geographlCal informatIOn systems for land resource
management In the Australian and zone. PhD Thesls, UnIversity of New South Wales.

ELSEVIER Catena 37 (1999) 107-127
CATENA
The evolution and significance of soil-vegetationpatterns following land abandonment and fire in
Spain
L.H. Cammeraat *, A.C. ImesonLandscape and EnL'lronmental Research Group, UnÎl'ersity ofAmsterdam, Nieuwe Pinsengracht /30, /0/8 VZ
Amsterdam, Netherlands
Received 18 February 1998; accepted 27 May 1998
Abstract
Examples are presented from two locations in SE and NE Spain where patterned or bandedvegetation are found on semi-natural and abandoned land or where vegetation is recovering fromwildfire. In both cases patterns are being investigated as process-pattern phenomena with the aimof understanding how different kinds of environmental gradients influence pattern evolution. Onabandoned land, patterns occur at different scales. At the patch scale there are areas wherePlantago albicans germinates in cracks and influences the accumulation of silty material. At theslope scale these form elongated steps that create a characteristic micro-topography. At the patchand sIope scale Stipa tenacissima tussocks form an hexagonal pattern on level areas where waterinfiltrates in and around the tussocks. On sloping areas the S. tenacissima tussocks form parallelovoid bands. They intercept fine and coarse material being eroded on the slopes by both overlandflow and the hooves of sheep and goats. This also creates a distinctive micro-topography. Rainfallsimulation experiments were undertaken in combination with monitoring activities in order toinvestigate the effects that key-processes of sediment and water movement have on the patterns.Other methods include controlled experiments and modelling. Biologically driven erosion processes are very important as key processes. Positive feedback mechanisms are important at variousstages in the evolution of the pattern. The patterns studied play an important role in creating morefavourable micro-environments where vegetation recovers first after disturbances. This is particularly the case following wildfire. The first post-fire rain produces patterns in ash and litter aroundsites, concentrating these at locations where shrubby vegetation subsequently resprouts or becomes
• Corresponding author
0341-8162/99/$ - see front matter © 1999 Elsevier Science B.Y. Ali rights reserved.PlI: S0341-8162(98)00072-1
108 L.H. Cammeraat. A.c. /Illeson / Catena 37 (1999) /07-/27
seeded. On abandoned land, the evolution of patterns reflects the parent material, grazing and theclimate. © 1999 Elsevier Science B.Y. Ali rights reserved.
KeYll'ord.\: Vegetation patterns; Runoff; Upscaling; Land degradation; Water repellency
1. Introduction
In Mediterranean areas semi-natural vegetation is often structured in a spotted orbanded spatial configuration and these patterns are of importance for understandingrunoff and erosion processes. The interaction between vegetation development, soilsurface properties and water movement must be responsible for the patterns observed.The patterns found resemble features described for semi-arid regions such as inAustralia (Tongway and Hindley, 1995), the Sahel zone of Africa (Thiéry et al., 1995),and the western USA (Pierson et al., 1994). Most of such patterns indicate a verysensitive relationship between the amount of available water and the vegetation. Thisinvariably reflects positive feedback mechanisms between water movement and thevegetation (Imeson et al., 1995; Tongway and Hindley, 1995). The spatial patterning ofthe vegetation can used as an expression of soil properties important for waterreallocation in and over the soil.
Under the plants often higher organic matter contents are found. favouring soilaggregation and soil faunal activity, both increasing macroporosity. A special microclimate is present under plants and vegetated zones, with much smaller temperatureamplitudes, more shading and often better soil moisture conditions than for bare soilconditions. This results in higher infiltration rates under the plants (runoff absorption)and lower infiltration rates on bare crusted soil surface (runoff generating areas). Inwater limited geo-ecological zones, such as the sub-humid and semi-arid Mediterraneanareas, the spatial configuration of vegetated and bare areas is therefore very importantand often indicates the spatial distribution of higher infiltration rates (Morin andKosovsky, 1995).
Understanding the positive feed-back mechanisms that link water and vegetation hasbeen an aim of recent research in Central and SE Spain undertaken on the context landdegradation research (Imeson et al., 1995, 1996a; Bergkamp, 1996). This research hasemphasised the importance of scale dependent linkages and has followed an hierarchicalapproach whereby processes at the fine scale are seen as important driving forces at thenext hillslope level. Processes at this level operate under the constraints of the nexthigher level of scale (O'Neill et al., 1986). This means that the upscaling of small plotsresults, using for instance infiltration rates, cannot be done unless the spatial configuringof soil-plant phenomena is incorporated.
Land degradation and erosion processes are perceived to be important problems inmany Mediterranean and semi-arid areas (Fantechi and Margaris. 1986; Thornes, 1995).In the northern Mediterranean much effort has been made to understand the effects ofland use change and practices, fire and climatic change on land degradation. One of themost important aspects of this problem concerns the resilience of perturbed systems. Theobjective of this paper is to illustrate the potential significance of patterns in promoting
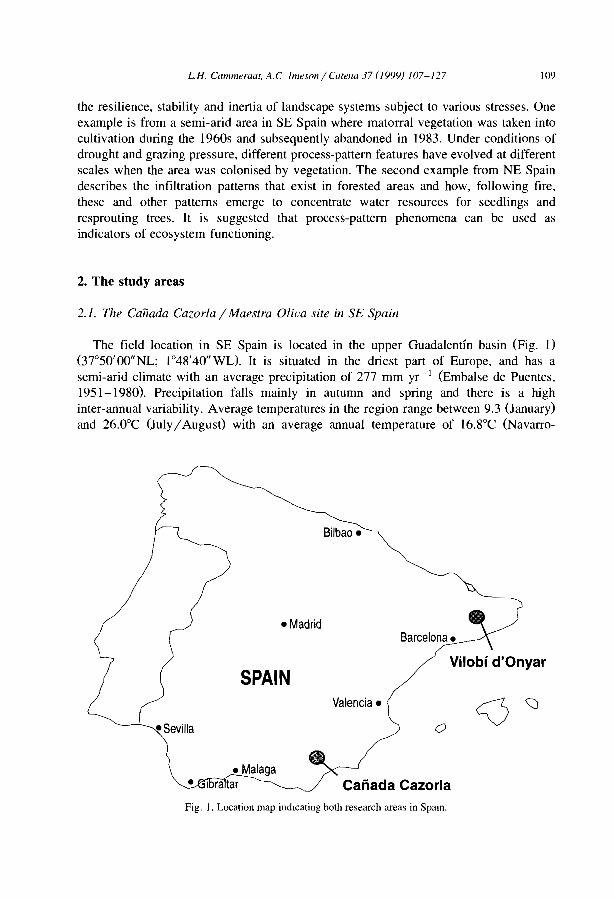
L.H. Cl/mmeral/t. A.C lmesolljCatelll/ 37 (1999) 107-127 J09
the resilience, stability and inertia of landscape systems subject to various stresses. Oneexample is from a semi-arid area in SE Spain where matorral vegetation was taken intocultivation during the 1960s and subsequently abandoned in 1983. Under conditions ofdrought and grazing pressure, different process-pattern features have evolved at differentscales when the area was colonised by vegetation. The second example from NE Spaindescribes the infiltration patterns that exist in forested areas and how, following fire,these and other patterns emerge to concentrate water resources for seedlings andresprouting trees. It is suggested that process-pattern phenomena can be used asindicators of ecosystem functioning.
2. The study areas
2.1. The Canada Cazorla / Maestra Oliva site in SE Spain
The field location in SE Spain is located in the upper Guadalentin basin (Fig. I)(37°50'OO"NL; I048'40"WL). It is situated in the driest part of Europe, and has asemi-arid climate with an average precipitation of 277 mm yr- 1 (Embalse de Puentes,1951-1980). Precipitation falls mainly in autumn and spring and there is a highinter-annual variability. Average temperatures in the region range between 9.3 Oanuary)and 26.0°C (July/ August) with an average annual temperature of 16.8°C (Navarro-
·Sevilla
• Madrid
SPAIN
Bilbao •
Vilobi d'Onyar
Valencia.
o
Canada CazorlaFig. J. Location rnap indlcating both research areas in Spain.
\\0 L.H. Cammeraat, A.C. 1meson / Catella 37 (1999) 107-127
Hervas, 1991). The investigated site constitutes one of seven reference locations of theMEDALUS Project in the Upper Guadalentin region (MEDALUS, 1996; Imeson et al.,1996b). The field area has a flat to gentle roUing topography and is part of an almost flatplanation surface, developed in horizontally bedded Pliocene marIs, conglomerates andlimestones. It consists of a plateau bounded in aU directions by concave slopes on whicherosion processes are active. On the lower gently sloping areas calcareous marIs ofUpper Cretaceous-Lower Tertiary age (LG.M.E., 1981) are found. The large variationin soil types reflects a combination of lithological differences, topographie position andaspect. Sorne characteristics of the most frequently occurring soils are shown in Table 1.
The soils, with a silt loam texture, are shallow and highly calcareous with low to verylow organic matter contents, depending on the vegetation coyer. Under the plants, insemi-natural conditions, organic carbon levels are higher and soil aggregation is better.The bare areas between the plants are crusted and the soil aggregation is very weak.Both structural and depositional crusts are found (Valentin and Bresson, 1992), whereasunder the plants the soil surface is more open due to soil aggregation and soil animalactivity, permitting higher infiltration rates. Sorne aspects of microbial biomass andaggregate stability in relation to surface coyer type or land use are discussed in Cerdà etal. 0994, 1995) and in Cammeraat and Imeson (1998).
Land use varies throughout the area and has changed considerably over the last 40years. Only 37% of the land use is the same today (1995) as in 1957, as interpreted fromaerial photography analysis. On the plateau, open semi-natural Stipa tenacissima L.(Esparto grass) matorral occurs as well as fallow agricultural lands, the latter being usedfor rain-fed cereal production. The steep upper and middle hillslopes are covered withopen S. tenacissima matorral. The lower hillslope was abandoned in 1983 and showsbare and strongly crusted soils altemating with bands of Plantago albicans. However,one small area under S. tenacissima still remains on the foot slope. The valley bottomitself is still under cultivation, for growing rain fed cereals, and was tilled just beforesampling. The talweg is terraced to reduce gully development and for water harvesting.
2.2. The Vi/obi d'Onyar site in NE Spain
The field area is located in the Selva region near the village of Vilobi d'Onyar in thesouth of the Gerona Province, Catalonia (41 0 53'02"NL; 2°44' 30" EL), which has asub-humid Mediterranean climate receiving between 700 and 800 mm of rainfall andwhich is covered by extensive Mediterranean oak forests. It is located on sandy andgravely Pleistocene and Pliocene fan deposits that occupy a large roughly north-southrunning graben that separates two major parallel mountain ranges, with mainly acidigneous and metamorphic rocks. The mean summer and winter temperatures range fromabout 24°C in the summer to 8°C in the winter. Most of the precipitation falls in thespring and autumn. The research site forms one of the reference locations established toinvestigate relationships between soil characteristics, hydrology and forest fires (Sevinket al., 1989; Imeson et al., 1992). The morphology of the field site, located on a fanwhich slopes gent1y eastward, is rather simple reflecting the incision by shallow butrather steep sided valleys that also drain eastward. The maximum altitude difference isabout 15 m. Basic information on soi1s and land use is given in Table 2. The soils at non
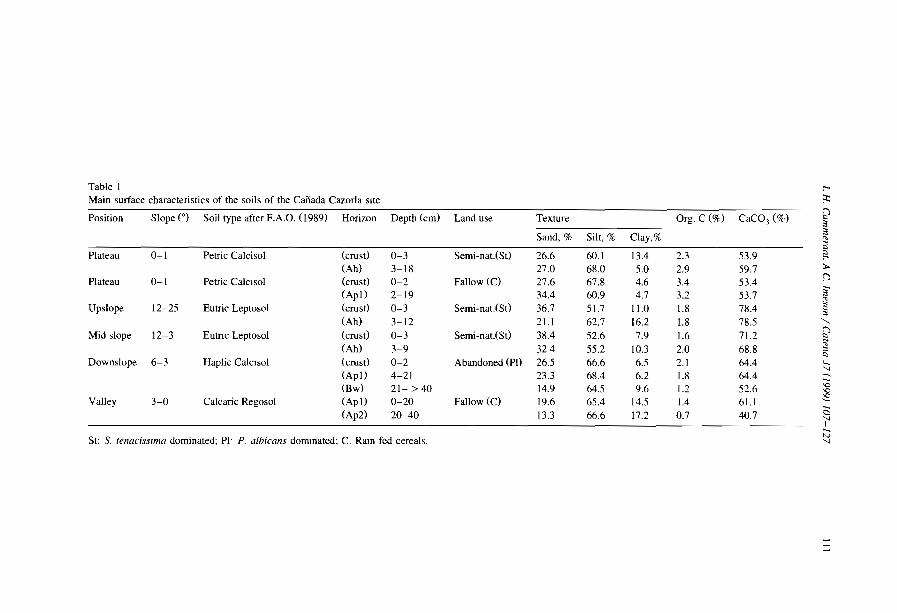
Table 1 t-<Main surface eharaeteristies of the soils of the Canada Cazorla site ;x:
Position Slope (0) Soil type after F.A.O. (J 989) Horizon Depth (cm) Land use Texture Org. C (%) CaCO} (%) 9'"Sand, % Silt, % Clay,% '"'":::
Plateau 0-1 Petrie Calcisol (crust) 0-3 Semi-nat.(St) 26.6 60.1 13.4 2.3 53.9 !'-(Ah) 3-18 27.0 68.0 5.0 2.9 59.7 ;,..
Plateau 0-1 Petrie Calclsol (crust) 0-2 Fallow (C) 27.6 67.8 4.6 3.4 53.4 n.....
(Apl) 2-19 34.4 60.9 4.7 3.2 53.7 '"'"Upslope 12-25 Eutrie Leptosol (crust) 0-3 Semi-nat.(St} 36.7 51.7 11.0 1.8 78.4 '""'"(Ah) 3-12 21.1 62.7 16.2 1.8 78.5 "'-Mid slope 12-3 Eutne Leptosol (crust) 0-3 Semi-nat.{St) 38.4 52.6 7.9 1.6 71.2 9
(Ah) 3-9 324 55.2 10.3 2.0 68.8 "'"'"Downslope 6-3 Haplie Calclsol (erust) 0-2 Abandoned (PI) 26.5 66.6 6.5 2.1 64.4 '--"(Apl) 4-21 23.3 68.4 6.2 1.8 64.4 ;::;
(Hw) 21- > 40 14.9 64.5 9.6 1.2 52.6 'C'C
(Apl) Fallow (C)'C
Valley 3-0 Calcarie Regosol 0-20 19.6 65.4 14.5 1.4 61.1 ~
.....(Ap2) 20-40 13.3 66.6 17.2 0.7 40.7 a
"1.....St: S. tenaciSSlma dominated: PI' P. albicans dommated: C. Ram fed eereals. N
"
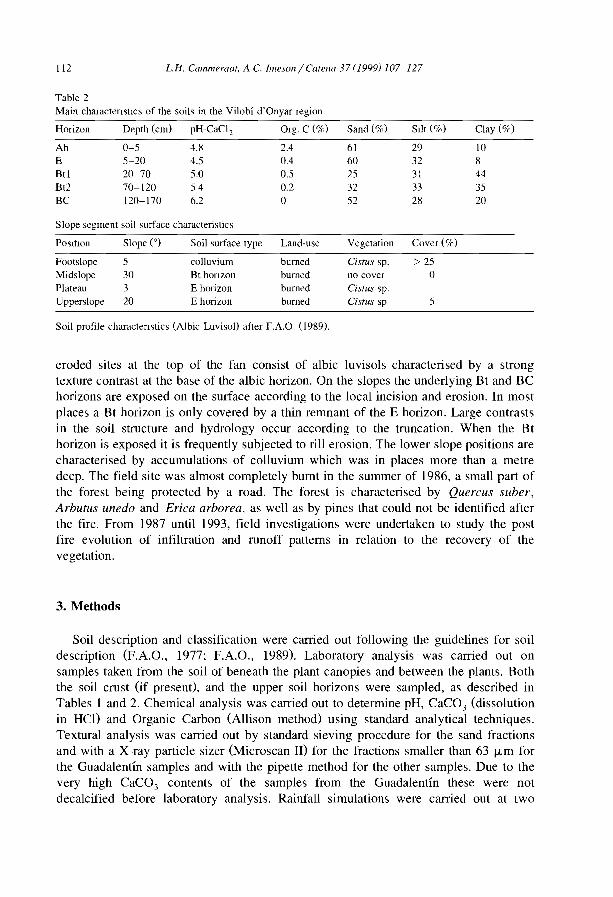
112 LB. Cammeraaf, A C. lmeson / Cafella 37 (J999) 107-127
Table 2Main charactensllcs of the soils in the Vilobi d'Onyar region
Horizon Depth (cm) pH-CaCI 2 Org. C (%) Sand (%) SJIt (%) Clay (%)
Ah 0-5 4.8 2.4 61 29 JOE 5-20 4.5 0.4 60 32 8Btl 20-70 5.0 0.5 25 31 44Bt2 70-120 54 0.2 32 33 35BC 120-\70 6.2 0 52 28 20
Siope segment soil surface characteristics
PosJllon Slope (0) Soil surface type Land-use Vegetation Cover ('!c)
Footslope 5 colluvium burned Cisflls sp. > 25Midslope 30 Bt honzon burned no cover 0Plateau 3 E horizon burned CiSfUS sp.Upperslope 20 E horizon burned Cisfus sp 5
Soil profile charactemtics (Albic Luvisoll after F.A.O. (1989).
eroded sites at the top of the fan consist of albic luvisols characterised by a strongtexture contrast at the base of the albic horizon. On the slopes the underlying Bt and BChorizons are exposed on the surface according to the local incision and erosion. In mostplaces a Bt horizon is only covered by a thin remnant of the E horizon. Large contrastsin the soil structure and hydrology occur according to the truncation. When the Bthorizon is exposed it is frequently subjected to rill erosion. The lower slope positions arecharacterised by accumulations of colluvium which was in places more than a metredeep. The field site was almost completely bumt in the summer of 1986, a small part ofthe forest being protected by a road. The forest is characterised by Quercus suber,Arbutus unedo and Erica arborea, as well as by pines that could not be identified afterthe fire. From 1987 until 1993, field investigations were undertaken to study the postfire evolution of infiltration and runoff patterns in relation to the recovery of thevegetation.
3. Methods
Soil description and classification were carried out following the guidelines for soildescription (F.A.O., 1977; F.A.O., 1989). Laboratory analysis was carried out onsamples taken from the soil of beneath the plant canopies and between the plants. Boththe soil crust (if present), and the upper soil horizons were sampled, as described inTables 1 and 2. Chemical analysis was carried out to determine pH, CaC03 (dissolutionin HCl) and Organic Carbon (Allison method) using standard analytical techniques.Texturai analysis was carried out by standard sieving procedure for the sand fractionsand with a X-ray particle sizer (Microscan II) for the fractions smaller than 63 !Lm forthe Guadalentîn samples and with the pipette method for the other samples. Due to thevery high CaC03 contents of the samples from the Guadalentîn these were notdecalcified before laboratory analysis. Rainfall simulations were carried out at two
L.H Ca/llmeraal, A.C ImelOl/ / Calena 37 (1999) 107-127 113
scales: At the 0.5 m2 plot scale, a portable dripping plate simulator (Bowyer-Bower andBurt, 1989) was used to apply three rainfall intensities. At the intermediate scale a largesprinkling rainfall simulator was used, covering 5 X 2,5 m2 (SE Spain) or 10 X 2.5 m2
(NE Spain), The experiments in SE Spain were designed in the following way: a rainfallintensity of 40 mm h - 1 was applied for ail experiments. An experiment of 2 daysconsisted of 5 consecutive storms, the first three of 10 min evenly spread over the firstday of the experiment, and on the second day a storm of 10 min, after 1 h followed by afinal storm of 30 min duration. In ail cases demineralised water was used to preventproblems related to flocculation of suspended material and swelling of the topsoil, asthese soils are very susceptible to dispersion, Time to ponding and overland flow wasvisually determined. Runoff was sampled at regular intervals and sediment load wasdeterrnined by drying the runoff samples. The wetting front was studied by excavating asoil profile over 2 m width, after the experiments, The depth and lateral extension of thewetting front was recorded with measurement tapes and plotted on paper. Vegetationcoyer and structure were mapped in the field by using a grid counting method for smallareas « 1 m2
). Vegetation patterns on the hillslope scale were mapped at a scale of1:100 or 1:50 using a grid system over 30 m length, Mapping also allowed for theidentification of runoff, erosion, and deposition areas and patterns at the hillslope scale,
4. Results and analysis
4.1. Patterned phenomena in SE Spain
The plateau soil surface is fiat and soil depth is delimited by a massive layeredpetrocalcic horizon to 18 cm depth. The soil surface under the S, tenacissima tussocks isslightly higher than the surrounding bare places and the soil surfaces can be distinguished into three main zones. The central zone of the living S. tenacissima tussock, hashigh porosity, high biological activity and an active root system. This part of the planttransmitted large amounts of rainfall directly to the soil via stem flow and root fiow,After 10 min of rain at 40 mm h -1 (6.8 mm of rainfall) the wetting front protrudedabout 5-8 cm around the central rooting system into the soil matrix, The plant tussock issurrounded by a zone with sorne plant debris water repellent in nature, cryptogamiccrusts and worm casts which are often colonised with lichen. This zone is overshadowedby dead standing litter at the sides of the S. tenacissima tussock with very highinterception and storage capacities. Around this zone, a bare strongly crusted area withsmall embedded rock fragments is found. The 0,5-1 cm thick crust is underlain by apowdery layer, about 3 cm thick, with no soil structure at ail. During rainfall simulationsGntensity 40 mm h- 1) it was observed that the bare central areas were completelyponded and no overland flow occurred over the fiat surfaces,
Rainfall simulations carried out on S. tenacissima tussocks clearly demonstrated thefast transmittance of soil water under living plants and the intercepting effect of the deadcanopy, The wetting front under the plants showed clear quickly extending wet pocketsaround the central root system under the living central part of the plant. Under the deadstanding part of the canopy no infiltration was observed, whereas in the surrounding
114 L.H. Camllleraat. A.c. Imeson / Cafena 37 (1999) 107-127
bare areas the wetting front moved more slowly but regularly with increasing rainfalldepth. This can be explained by the following mechanisms: water intercepted in theliving part of the canopy is partly transmitted as stemflow directly to the rooting zone,where water is transported by rootflow and along other preferential flowpaths of waterin the partly water repellent subsoil. Sorne rain, falling through the canopy on the litterfloor is also reallocated to the central part of the S. tenacissima tussock due to the waterrepellency of the litter material at the soil surface. Most water falling on the deadstanding canopy is stored in the dead canopy or falls on the water repellent surface andis also redirected to the plant centre. After five successive short showers the importanceof the stem-rootflow mechanism became clear, even under low amounts of precipitation.
The slopes have an open S. tenacissima vegetation coyer (Fig. 2). The S. tenacissimaplants are more widely distributed on the upper part of the slope, compared to the lowerpart of the slope, and also other species occur on the upper part of the slope such asrosemary bushes (Rosmarinus officinalis) and isolated pine trees (Pinus halepensis).Often the micro-topography of the slope surface shows miniature terracing, as a result ofthe accumulation of coarse and fine material in front of the S. tenacissima tussocks.
On the steeper parts of the slopes rock fragments are very common. They are derivedfrom either limestone outcrops at the plateau rim, or are transported petrocalcicfragments. Most of them are not embedded in the soil crust and the amount of rockfragments decreases down slope as the gradient decreases.
During rainfall events which generate overland flow the water is transportingconsiderable amounts of sediment as could be derived from many traces on the soilsurface. Fig. 2 illustrates the presence of overland flow pathways, visible as narrowchannels of clean crusted surfaces, ending in sedimentation lobes, of gravel sizedmaterial near S. tenocissima tussocks. Sorne larger channels continue over much longerdistances in between the widely distributed S. tenacissima tussocks, with deposition ofgravel sized material along the channel sides as small natural levees of 5-10 cm widthand 3-4 cm height. In larger complexes of S. tenacissillla tussocks, complete infiltrationmay occur and no trace of overland flow was observed below these complex tussocks. Ingeneral the density and width of overland flow channels increases down slope, notwithstanding slope angle decrease.
In Fig. 3 the runoff characteristics are displayed obtained from experiments with thelarge sprinkler rainfall simulator. The sprinkled zone covered several connected openareas around isolated S. tenacissima tussocks. The experiment consisted of four 10-minand one 30-min shower carried out on two days. On a wetted surface and with rainfalldurations longer than 10 min at an intensity of 40 mm h - 1 runoff percentages reachover 60% at the plot scale. The soil moisture content at 5 cm depth under bare surfacerose from an initial level of 0.06 cm' cm - 3 to 0.17, 0.25 and 0.28 cm .1 cm-, at theonset of the 2nd, 3rd, and 4th. event. The fifth event started with a level of 0.37 cm'cm- .1 •
Fig. 2. Sketch map of the upper hillslope (22° to 12°) indicatmg relative dense arrangement of S. fenacissimatussocks and indlcating the traces of overland flow as weil as the places where sediment was deposiled. Top offigure is the top of the hillslope.
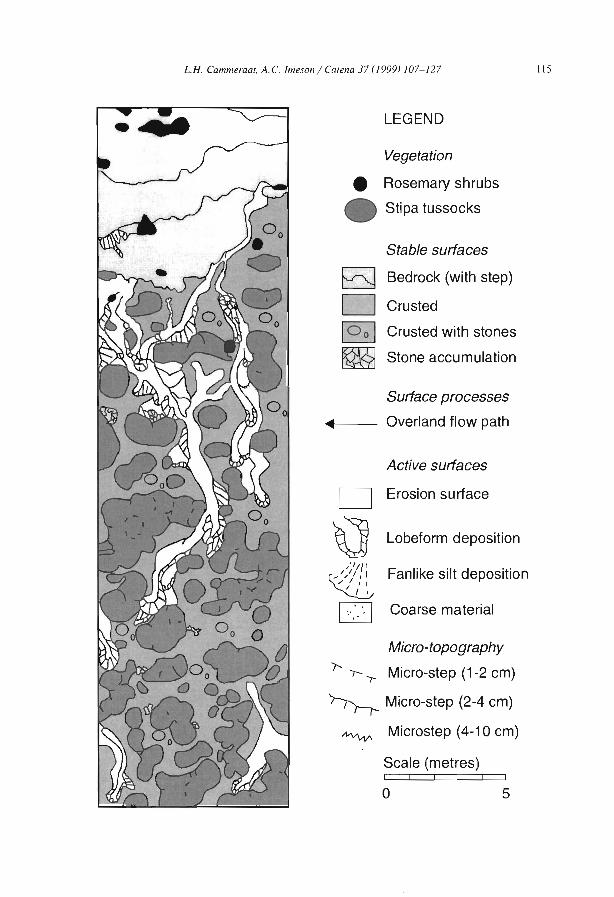
L.H. Cammeraa/, A.c. Imeson / Ca/ena 37 (1999) 107-/27 115
Micro-topography
r- ...,...,... Micro-step (1-2 cm)
~ Micro-step (2-4 cm)
~ Microstep (4-10 cm)
Scale (metres)1 1 1 1
LEGEND
Vegetation
• Rosemary shrubs
• Stipa tussocks
Stable surfaces
a Bedrock (with step)
D Crusted
10 01 Crusted with stones
~ Stone accumulation
Surface processes
• Overland flow path
Active surfaces
D Erosion surface
Û Lobeform deposition
/1//,Fanlike silt deposition",,/~/I, 1
..... 1 J 11 l ,
CJ Coarse material, -
o 5
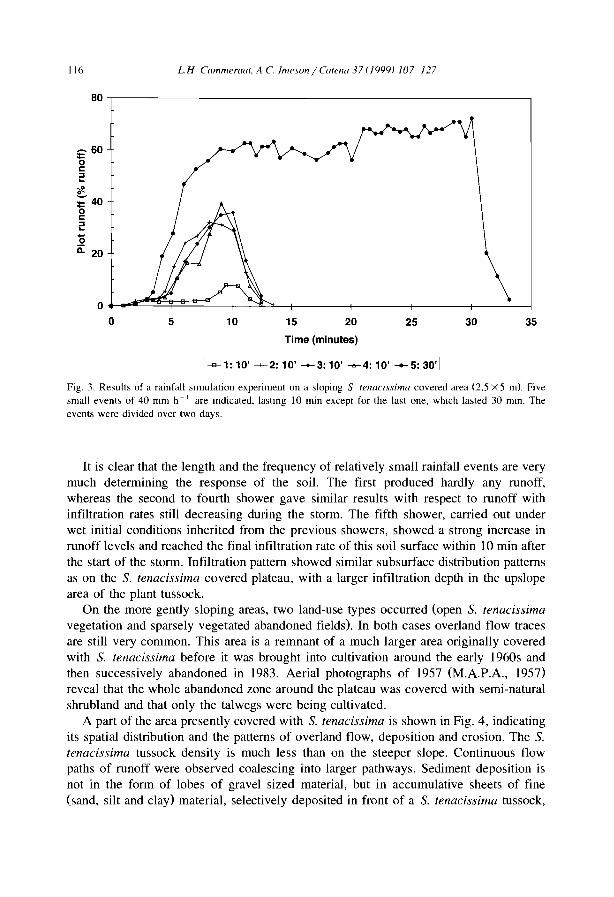
116 L.H Call1meraa/. A C. 1me501l / Ca/el/a 37 (1999) 107-127
80,-------------------------------,
:g 60
c:::::l"-
<ft=- 40oc::2'0ii: 20
3530252015105
O.t-~~~~~__+----':'::~'_____!---+__--_+_--_+_-~_____.j
oTime (minutes)
'-i3-1: 10' ---+--2: 10' -+-3: 10' .......... 4: 10' -+-5: 30'1
Fig. 3. Results of a rainfall sImulation experiment on a sloping S /ellaCl.l'.I'Îma covered area (2.5 X5 ml. Fivesmalt events of 40 mm h- 1 are mdicated. lastmg 10 min except for the last one, WhlCh Im,ted 30 mm. Theevents were divided over two days.
It is clear that the length and the frequency of relatively small rainfall events are verymuch determining the response of the soil. The first produced hardly any runoff,whereas the second to fourth shower gave similar results with respect to runoff withinfiltration rates still decreasing during the storm. The fifth shower, carried out underwet initial conditions inherited from the previous showers, showed a strong increase inrunoff levels and reached the final infiltration rate of this soil surface within 10 min afterthe start of the storm. Infiltration pattern showed similar subsurface distribution patternsas on the S. tenacissima covered plateau, with a larger infiltration depth in the upslopearea of the plant tussock.
On the more gently sloping areas, two land-use types occurred (open S. tenacissimavegetation and sparsely vegetated abandoned fields). In both cases overland flow tracesare still very common. This area is a remnant of a much larger area originally coveredwith S. tenacissima before it was brought into cultivation around the early 1960s andthen successively abandoned in 1983. Aerial photographs of 1957 (M.AP.A, 1957)reveal that the whole abandoned zone around the plateau was covered with semi-naturalshrubland and that only the talwegs were being cultivated.
A part of the area presently covered with S. tenacissima is shown in Fig. 4, indicatingits spatial distribution and the patterns of overland flow, deposition and erosion. The S.tenacissima tussock density is much less than on the steeper slope. Continuous flowpaths of runoff were observed coalescing into larger pathways. Sediment deposition isnot in the form of lobes of grave! sized material, but in accumulative sheets of fine(sand, silt and clay) material, selectively deposited in front of a S. tenacissima tussock,
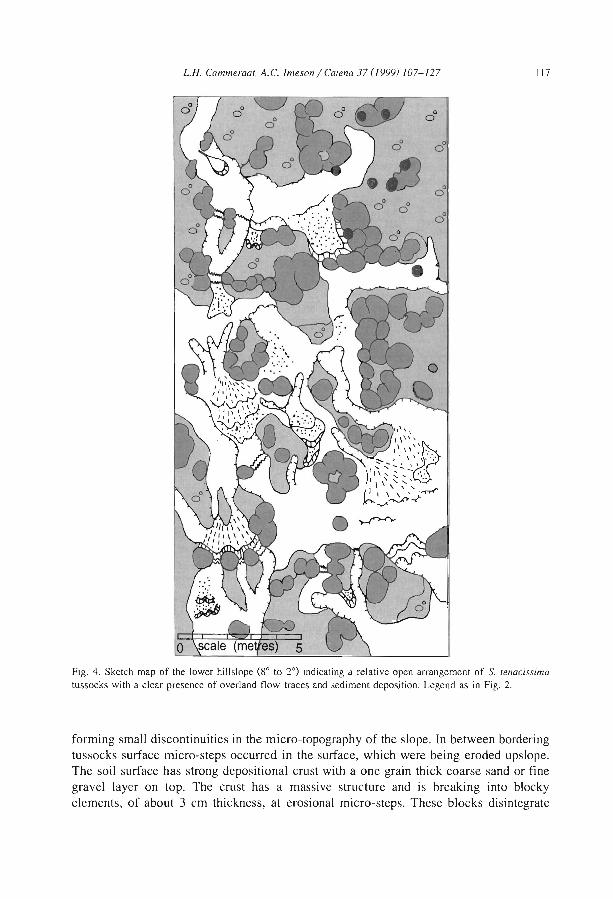
L.H. Cammeraal, A.C. 1meson / Ca/ena 37 (/999) 107-/27
00
0 00 0
lJ 00
00 0
0
117
Fig. 4. Sketch map of the lower hillslope (80 to 2°) indicating a relative open arrangement of S. lenacissima
tussocks with a clear presence of overland f10w traces and sediment deposition. Legend as in Fig. 2.
forming small discontinuities in the micro-topography of the slope. In between borderingtussocks surface micro-steps occurred in the surface, which were being eroded upslope.The soil surface has strong depositionaI crust with a one grain thick coarse sand or finegravel layer on top. The Crust has a massive structure and is breaking into bJockyelements, of about 3 cm thickness, at erosional micro-steps. These blocks disintegrate
118 L.H. Cammeraar, A.C. Imeson / Carena 37 (1999) 107-127
into smaller parts, rrticro-aggregates and primary particles which are deposited lower onthe slope.
The area where the S. tenacissima has been cleared for agricultural use, and whichhas been abandoned in 1983, a massive continuous bright crust is present, most probablyformed by slaking and/or depositional processes. The silt loam material at the surfacewas found to be very sensitive to dispersion in relation to the electrical conductivity ofthe water. At very low electrolyte contents (EC 25 = 25 IJ-S cm -1) material readilydispersed whereas at CaC03 domjnated water (EC 25 = 800 IJ-S cm - 1) flocculationoccurred much faster. Small desiccation cracks were found on the surface, rapidlydisappearing upon wetting.
On this surface hardly any plants were present. This can be explained by acombination of several factors such as a hindered germination of seeds and very lirrtitedinfiltration in the dense crust, the very low amounts of precipitation during recent years,the mariy character of the soil with lower water retention capacities, and also grazing.
One of the dominant vegetation species is P. albicans, which is very small andadapted to trampling, and occurs in serrti-linear bands or lines, developed in a directionparallel to the contours, at a more or less regular intervaJ. Directly downslope of theseplants micro-steps of a few 0-4) centimetres height have developed in the soil surface,due to the accumulation of mainly fine soil material and sorne organic debris.
It was also observed that at zones where more runoff is produced, especially inshallow depressions in the plateau slope, small rills and gullies have developed on theslope. They end shortly downslope of the break in the slope or piedmont junction in thefootslope (Kirkby and Kirkby, 1974; Abrahams et al., 1994). Here they becometransformed into blankets of silty sediments spreading out just below the slope transition, indicating a threshold in hydraulic conditions from sediment carrying overland flowand rill-flow towards a sedimentation dorrtinated regime. This is also reflected by theeffects of two short convective storms (approximately 30 mm within 30 min) in Mayand September, that produced overland flow in considerable amounts, resulting in theburying of the P. albicans plants under a silt blanket.
4.2. Pattemed phenomena in bumt oak forests NE Spain
This section summarises the results of more than one hundred rainfall simulationexperiments made on burnt areas in the vicinity of Vilobi and from studying runoff innatural storms. Measurements were first made at Vilobi one year after the fire. At othersites nearby, infiltration rates were measured directly following a fire and found to berelatively high. Due to wind, very intense thunderstorms and disturbance, the ash andburnt topsoil is redistributed and the surface attains patterned properties relativelyquickly. In some cases this is enhanced by dead needles that drop from the trees killedby the fire.
At Vilobi, after one year micro steps, strips and polygonal patterns characterised theupper parts of the slope and the local terrace plateau. The polygons were formed byCistus species. and other seedlings, and fine accumulating organic debris. About 80% ofthe area appeared as a bare sandy surface and the remainder appeared as vegetationcovered areas. The vegetation covered areas consisted of the resprouting stems of plants
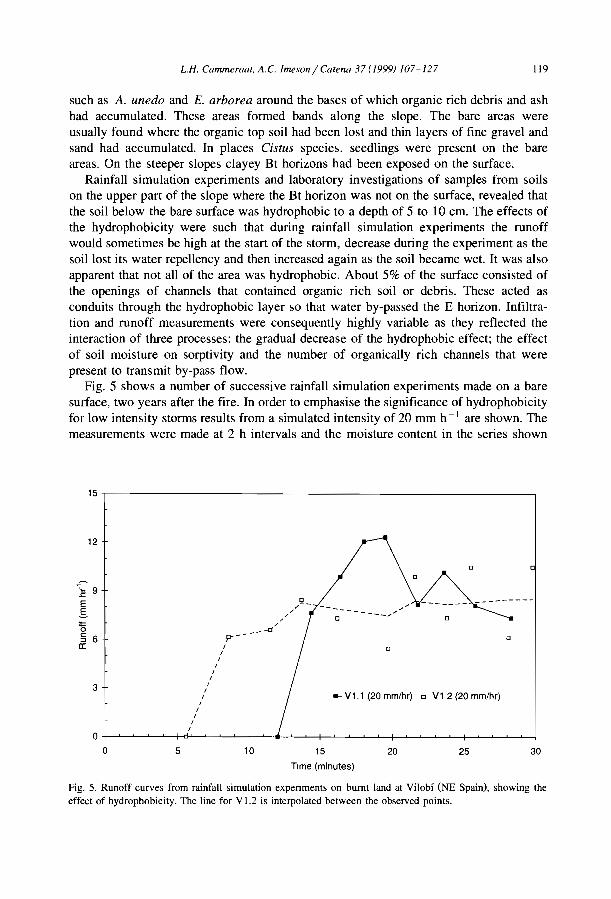
L.H. Cammeraat. A.C./meson/Catena 37([999) 107-/27 119
such as A. unedo and E. arborea around the bases of which organic rich debris and ashhad accumulated. These areas formed bands along the slope. The bare areas wereusually found where the organic top soil had been lost and thin layers of fine gravel andsand had accumulated. In places Cistus species. seedlings were present on the bareareas. On the steeper slopes clayey Ht horizons had been exposed on the surface.
Rainfall simulation experiments and laboratory investigations of samples from soilson the upper part of the slope where the Ht horizon was not on the surface, revealed thatthe soil below the bare surface was hydrophobic to a depth of 5 to 10 cm. The effects ofthe hydrophobicity were such that during rainfall simulation experiments the runoffwould sometimes be high at the start of the storm, decrease during the experiment as thesoil lost its water repellency and then increased again as the soil became wet. It was alsoapparent that not ail of the area was hydrophobic. About 5% of the surface consisted ofthe openings of channels that contained organic rich soil or debris. These acted asconduits through the hydrophobie layer so that water by-passed the E horizon. Infiltration and runoff measurements were consequently highly variable as they reflected theinteraction of three processes: the graduaI decrease of the hydrophobic effect; the effectof soil moisture on sorptivity and the number of organically rich channels that werepresent to transmit by-pass flow.
Fig. 5 shows a number of successive rainfall simulation experiments made on a baresurface, two years after the fire. In order to emphasise the significance of hydrophobicityfor low intensity storms results from a simulated intensity of 20 mm h -1 are shown. Themeasurements were made at 2 h intervals and the moisture content in the series shown
15,----------------------------------,
12
-:c 9
E..s:g§ 6cr:
3
[],--,,,p-_----c'
11
11
[]
-+- VU (20 mm/hr) [] Vl 2 (20 mm/hr)
[]
302520105
O+--'---'---'---'--+-D~~~'--t__'--l~-----'__t~~~~___I_---'----'----'----'-_+-'--'--'--'---i
o 15
Tlme (minutes)
Fig. 5. Runoff curves from rainfall simulation expenments on bumt land at Vilobî (NE Spain), showing theeffect of hydrophobicity. The line for V 1.2 is înterpolated between the observed points.
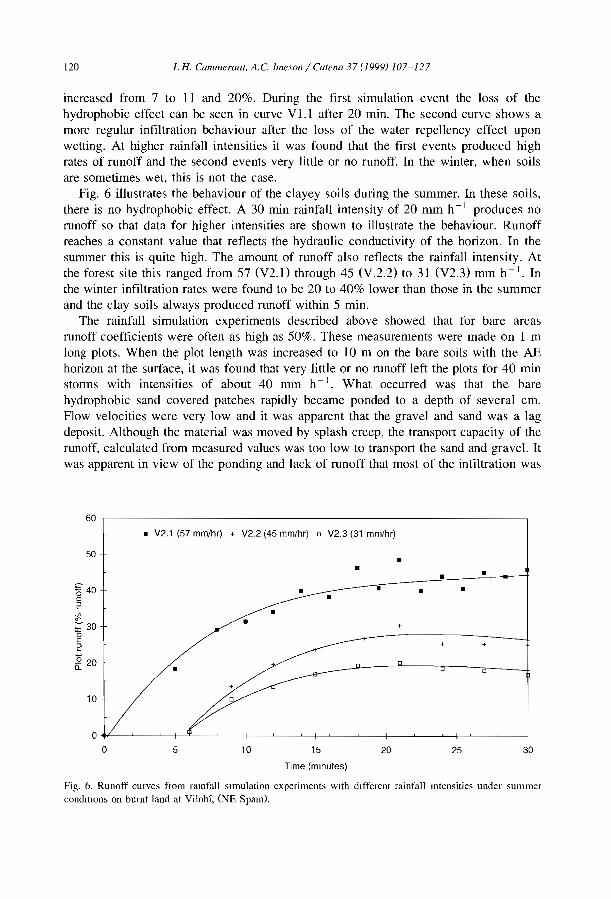
120 L H. Cammeraat. A.C. /mesol/ / Catena 37 (/999) 107-/27
increased from 7 to II and 20%. During the first simulation event the loss of thehydrophobie effect can be seen in curve V1.1 after 20 min. The second curve shows amore regular infiltration behaviour after the loss of the water repellency effect uponwetting. At higher rainfall intensities it was found that the first events produced highrates of runoff and the second events very little or no runoff. In the winter, when soilsare sometimes wet, this is not the case.
Fig. 6 illustrates the behaviour of the clayey soils during the summer. In these soils.there is no hydrophobie effect. A 30 min rainfall intensity of 20 mm h-) produces norunoff so that data for higher intensities are shown to illustrate the behaviour. Runoffreaches a constant value that reflects the hydraulic conductivity of the horizon. In thesummer this is quite high. The amount of runoff also reflects the rainfall intensity. Atthe forest site this ranged from 57 (V2.)) through 45 (V.2.2) to 31 (V2.3) mm h -). Inthe winter infiltration rates were found to be 20 to 40% lower than those in the summerand the clay soils always produced nmoff within 5 min.
The rainfall simulation experiments described above showed that for bare areasrunoff coefficients were often as high as 50%. These measurements were made on 1 mlong plots. When the plot length was increased to 10 m on the bare soils with the AEhorizon at the surface, it was found that very little or no nmoff left the plots for 40 minstorms with intensities of about 40 mm h -1. What occurred was that the barehydrophobie sand covered patches rapidly became ponded to a depth of several cm.Flow velocities were very low and it was apparent that the gravel and sand was a lagdeposit. Although the material was moved by splash creep, the transport capacity of therunoff, calculated from measured values was too low to transport the sand and gravel. Itwas apparent in view of the ponding and lack of runoff that most of the infiltration was
60 ~---------------------------------,
• V2.1 (57 mm/hr) + V2.2 (45 mm/hr) 0 V2.3 (31 mm/hr)
50 •
:§ 200..
10
•
o
•
•
•
•
+
••
+
••
+
o
10 15
Tlme (minutes)
20 25 30
Fig. 6. Runaff curves from ramfall sImulation experiments wlth dlfferent rainfall mtensities under summercandltIam, an burnt land at Vilobî. (NE Spam).
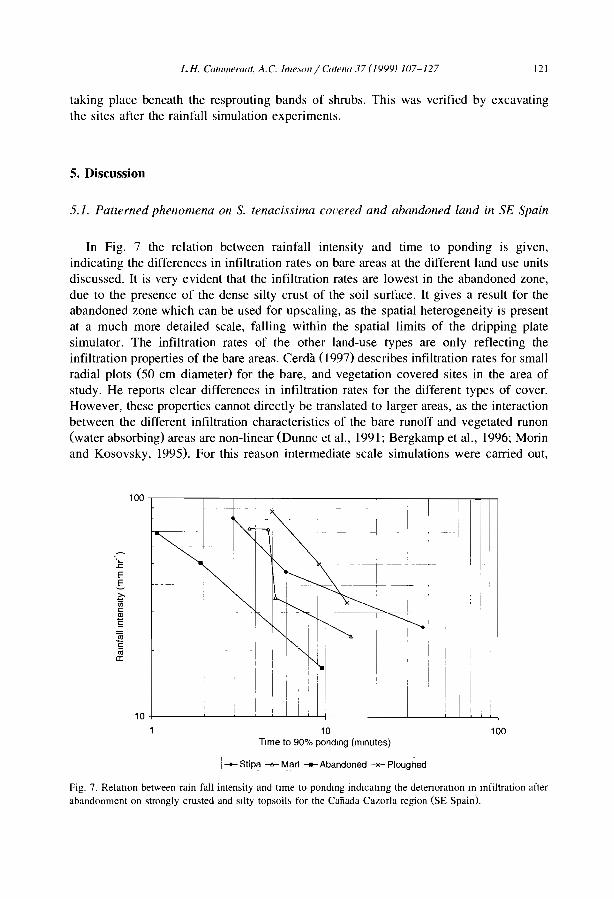
L.H. Call1llleraal, A.C. Ime.\ol/ / Calel/a 37 (1999) 107-127 121
taking place beneath the resprouting bands of shrubs. This was verified by excavatingthe sites after the rainfall simulation experiments.
5. Discussion
5.1. Patterned phenomena on S. tenacissima couered and abandoned land in SE Spain
In Fig. 7 the relation between rainfall intensity and time to ponding is given,indicating the differences in infiltration rates on bare areas at the different land use unitsdiscussed. It is very evident that the infiltration rates are lowest in the abandoned zone,due to the presence of the dense silty crust of the soil surface. It gives a result for theabandoned zone which can be used for upscaling, as the spatial heterogeneity is presentat a much more detailed scale, falling within the spatial limits of the dripping platesimulator. The infiltration rates of the other land-use types are only reflecting theinfiltration properties of the bare areas. Cerdà (1997) describes infiltration rates for smallradial plots (50 cm diameter) for the bare, and vegetation covered sites in the area ofstudy. He reports clear differences in infiltration rates for the different types of coyer.However, these properties cannot directly be translated to larger areas, as the interactionbetween the different infiltration characteristics of the bare runoff and vegetated runon(water absorbing) areas are non-linear (Dunne et al., 1991; Bergkamp et al., 1996; Morinand Kosovsky, 1995). For this reason intermediate scale simulations were carried out,
100 ,-----,----,------,-..,-,--;-,--.,------------r-,--r-,---,-,
..cE.s,::.üicQ)
OS
~1
c(ijcr:
-=r ---+--T-----~--
- i
10010Tlme to 90% pondlng (minutes)
r --+- Stipa~Mari ~ Abandoned -x- Ploughed 1
10 +------'~-.i...----'----'--l--L--'---4---_...l__ __L___.J_ _'__L.....--L...J....\
1
Fig. 7. Relalion between rain fall intensity and lime to pondIng indlcatmg the detenoralion In Infiltration afterabandonment on strongly crusted and stlty topsoils for the Canada CazorJa region (SE Spain).
122 L.H. Cammeraat, A.c. /meson / Catena 37 (1999) 107-127
containing both vegetated, and bare areas to incorporate their mutual effect on infiltration and runoff production which were described before.
Under S. tenacissima tussocks infiltration was found to be greatly enhanced by anactive stem-root flow system. This resulted in a deeper penetration of the wetting frontunder the living plant. It was not clear how much water was totally absorbed by the deadstanding biomass and how much water was diverted towards the plant root system overthe water repellent material on the soil surface. The bare area showed a slow regularincrease in infiltration depth, and it might be suggested that two different rootingsystems are active, one dealing with diverting water efficiently directly to the rootsunder small rainfall amounts and a second system, which is active under more wetconditions, when the wetting front under bare soil surfaces reaches deep enough to passthe surface crust and the dusty layer.
On the hillslope the S. tenacissima tussocks are situated at the downslope rim ofsmall terracettes, built of accumulated sediment at the upslope side of the tussocks. Thisprocess of accumulation is described for mountain slopes in the Pyrenees (Gallart et al.,1993) and on metamorphic rocks (Sanchez and Puigdefabregas, 1994). Processesresponsible for movement of slope material are wash and deposition by overland flowand rock fragments displaced by trampling, grazing animais. The downslope splash ofsoil material may also play a role.
On sloping areas the lateral redistribution of water over the surface becomesimportant and plant patterns develop over the slope. These become significant indetermining whether overland flow is generated over longer distances or not. On morebare areas with less tussocks, more traces of overland flow and sediment depositionwere found. The density of the S. tenacissima tussocks on the slopes studied showed adecrease with lower slope angles at lower slope position. On these slopes a decrease inrock fragment coyer at the soil surface and a decreasing surface roughness are found in adownslope direction. Apparently, on these slopes so much water is produced that, withdecreasing slope angles, more and more water is concentrated downslope. This conformwith the results of the rainfall simulations, which indicate very high runoff figures forslopes with an open plant coyer and for heavily crusted areas. Deposition of materialincreases with lower slope angles and the material is preferably deposited directlyupslope of the S. tenacissima tussocks (see also Fig. 4). Puigdefabregas and Sanchez(1996) found that the sedimentation rate is a very important factor in the openness of thevegetation. It must be said, however, that the amount of rock fragments, which decreasesdownslope, certainly will influence infiltration properties and therefor also the transportcapacity of overland flow (Poesen and Lavee, 1994). In other nearby areas where thebanded nature of vegetation layout becomes prominent, virtually ail water is absorbed inthe plant tussocks and infiltrates into the soil. This was also found on thyme androsemary type of matorral growing on an arch-form terracette micro-topography onlimestone slopes in other areas in SE and Central Spain (Bergkamp et al., 1996). It issuggested that vegetation structure ranging from banded via arch formed and openpolygon-like S. tenacissima structure towards a more spotted vegetation structure isleading towards an increasing amount of runoff concentration and sediment transport.This phenomenon is also described for semi-arid regions in Australia (Tongway andHindley, 1995). Local factors related to this are also gradient and aspect, sail roughness
L.H. Cammeraat, A.C. 1meson / Catena 37 (1999) 107-127 123
(rock fragment cover), soil surface conditions (crusting and infiltration capacity),sediment de!ivery, and cover percentages of vegetation. More regional factors affectingthese processes are climatological conditions as weIl as geological properties.
The tussocks of the S. tenacissima plants act as important sinks for water, sedimentsand nutrients. The more continuous the vegetation structure is, the more effective it willbe in capturing these important resources. The tussocks themselves also act as fertileislands on the slope, where organic matter and other nutrients are retained. They giveshade and shelter to many soil animaIs which play an active role in bioturbation. This inturn positively affects infiltration and incorporation of organic matter in the soil whichpositively influences soil structure (Cammeraat and Imeson, 1998). This will favour thehealth of the plant and this whole cycle could be seen as a positive feed-backmechanism. In fact the presence of a (banded) vegetation structure could be used as anindicator of health of the ecosystem as also is proposed by Tongway and Hindley (1995)in Austra!ian areas, The processes of sedimentation, erosion and water reallocation showa very dynamic interaction with vegetation. Sanchez and Puigdefabregas (I994) showedthat the S. tenacissima tussocks have a radial growth pattern. Once the tussock becomestoo large, it falls apart into a polygon of clumps of plants, each evolving into a separatenew plant. This growth pattern is strongly influenced by gradient, sediment flux andwater reallocation, The development of these vegetation structures is highly dynamicand different from the patterns as observed by Dunkerley and Brown (1995), whodescribe a type of vegetation banding as old stable features.
At much lower slope positions, at the sIope break, deposition clearly becomes moreand more important, and blankets of silt sized material are deposited, both in open S.tenacissima matorral and on abandoned fields. On this latter zone a thick silty crust ispresent, which micro-topographical steps are coinciding with bands of P. albicans, Thevegetation bands have a wavelength with an average of 1,2 m. The general percentagecover of vegetation is very low, and this is apparently related to persistence of drought,presence of a heavy crust and grazing, although no actual traces of grazing were found.The small bands of plants act as a sediment trap during the scarce periods of overlandflow, when silty sediments are transported downslope. Directly under the small stepserosion takes places during overland flow, creating small steep cuts in the surface with aheight of about 2 cm, exposing coherent layered silts, Vegetation banding and theresultant stepped topography, are probably related to the dynamics of the erosion andsedimentation. A process is supposed where sediment is deposited in small lobes fromconcentrated flow !ines. The sediments form a dense crust where germination is difficultand infiltration is reduced, Just downslope the micro-steps the new silt deposit and crustis less dense and infiltration and germination are expected to be favoured in thisposition. Hence the upslope part of the sedimentation lobe acts as a runoff producingarea, whereas the lower rim of the sedimentation lobe acts as a water absorbing area(runon area). When several lobes of sediment grow laterally together over a longerperiod, and plants have established along its rim, this could result in a alternatingbanding of relative broad strongly crusted areas, and a narrow zone with plants.However, several other processes could also play a role, of which the formation oftracks by passing grazing flocks is one, as weIl as inheritance of micro-topographyresulting from parallel contour ploughing.
124 LB. Call1llleraat. A C. /lIleSOIl / Catena 37 (/999) /07-/27
5.2. The sigll(ficance of patterned phenomena following fire (VitoM area, NE Spain)
The results from Vilobi d'Onyar in NE Spain show that soil hydrophobicity plays animportant role in concentrating infiltration beneath vegetation. The hydrophobic layerhas a very positive effect as a rainwater harvesting mechanism. It does not seem to beproduced as a result of the fire. Rainfall simulation experiments in undisturbed forestsshowed that as on the burnt land, the AE horizons were hydrophobic. except for bothareas around the roots and in old root channels filled with organic matter. Low tomoderate intensity summer rainfall is trapped by this mechanism and conserved in theBC horizons for use by shrubs and trees. It is a coincidence that just as is the case withthe S. tenacissima. roots are concentrated probably in relation to different types ofhydrological event and runoff generating mechanism. They are located both beneath theshrubs where runon water accumulates during periods that are antecedently dry but alsoin the BC horizon beneath the hydrophobic AE horizon. This area receives waterthrough the by-pass channels during minor events that do not produce runon. In thewinter during wet weather. completely different mechanisms sometimes exist whensubsurface saturation overland flow can occur above the Bt horizon.
An important research question concerns the degree to which the resilience of thebumt area is affected by the runoff and infiltration patterns that are present prior to thefire. Patterns in soil structure and infiltration rates that have evolved under the forestover perhaps hundreds of years ensure that after a fire water is trapped and protectedfrom evaporation by the hydrophobic effects. Observations and data suggest that soilerosion seldom occurs following a fire if the soil surface is left undisturbed. Management practices such as ploughing and terracing and post fire tree extraction destroy thenatural runoff trapping mechanisms that are present. Perhaps a reason why post fire soilerosion is so high on plantations of exotic and other vegetation is that these do not havethe facility to generate soil water harvesting strategies or that they cannot do so becauseof a lack of synergetic relationships with other ecosystem components.
6. Conclusions
From the study in SE Spain it is concluded that patterned phenomena are of greatsignificance in explaining hillslope hydrology and patterns in soil erosion. Thesepatterns form a potential key to understanding an important component of the resilienceof the systems studied. The results also demonstrate that the non-random distributions ofpattemed phenomena on hillslopes need to be considered in up-scaling. The individualresponses of bare and vegetated area to infiltration and overland flow cannot beunderstood without studying their spatial configuration. At the hillslope or basin scale,the spatial patterning of vegetation determines the flow concentration of overland flowas different bare areas may become connected if the infiltration rates of bares areas areexceeded by rainfall intensities and the absorption of water in the vegetated structures.The larger the upslope perimeter and perimeter/ surface area ratio, and the larger thevegetation coyer, the larger the capacity of infiltration will be. The semi-naturalvegetation therefore is an important factor in reducing overland flow and land degrada-
L H. Cammeraat. A.C. Ime.\'(J/1 / Catena 37 (1999) 107-127 125
tion. The disturbance of these areas by drought or overgrazing, or by removal of thevegetation will therefor decrease the ability to absorb the water at a local scale andincrease the generation of runoff over larger areas. The natural revegetation was foundto be very low indicating that these areas are vulnerable to land degradation after thedestruction of the semi-natural S. tenacissima vegetation. Under these degraded circumstances the development of fine scale banded vegetation structures, dominated by P.afbicans was observed, indicating a strong interrelationship with plant development,sedimentation and soil surface crusting.
Two conclusions from the study in NE Spain are emphasised. The first concerns theconclusion that hydrophobie effects are positive and not negative. There are two possibleexplanations. The first is that conditions in NE Spain are different from elsewhere. Thesecond is that previous studies have considered infiltration and runoff rates measuredfrom small scale experiments and scaled up to a hillslope or catchments scale usingstatistics. When larger scale measurements are used to establish how large scale slopesections generate runoff, it is c1ear that the system is behaving differently at this higherhierarchical level of scale. In other words when a hierarchical systems concept is appliedto the interpretation of the data, it is evident that the small scale structures that haveevolved create positive feedbacks at a higher scale that enable the vegetation to trap andconserve water and also to recover efficiently following a disturbance.
The second conclusion, which also applies to SE Spain is that patterns that takedecades or hundreds of years to evolve are stabilising properties of ecosystems that helpthem to recover from disturbance or to resist stressors. Management should take this intoaccount and follow strategies that enable these to be promoted or conserved. It seemsthat many attempts to restore land that has been burnt or abandoned are doomed to failbecause they not only neglect the importance of water redistribution phenomenon, butactually promote their destruction.
Acknowledgements
Part of the research for this paper was carried out as a part of the MEDALUSresearch project. MEDALUS is funded by the EU under the European Programme onClimate and Natural Hazards (BPOCH) contract number EV5V-CT92-0128. The research was also supported by the project 'Hierarchy in patterns and processes in theMediterranean ecosystems', funded by NWO-GOA, under number 750-29-403, thesupport greatly being acknowledged. Artemmi Cerdà, Ellen van Mulligen, Ruud andArjen are thanked for helping in the field during the rainfall simulations.
References
Abrahams. A.D., Howard, A.D., Parsons, AJ., 1994. Rock-mantled slopes. ln: Abrahams, A.D., Parsons, A.I.(Eds.), Geomorphology of Desert Envlronments. Chapman and Hall, London, pp. 173-212.
Bergkamp, G., 1996 Mediterranean geoecosystems: hierarchical organIsation and degradation. PhD TheslsUniversity of Amsterdam, 238 pp.
126 LB. Cammeraat, A.c. Imeson / Catena 37 (1999) 107-127
Bergkamp. G., Cammeraat. L.H.. Martmez-Fernandez. J.• 1996. Water movement and vegetation patterns onshrubland and an abandoned field in two desertification threatened areas in Spam. Earth Surface Processesand Landforrns 21, 1073-1090.
Bowyer-Bower, TA.S., Burt. T P.• 1989. Rainfall simulators for investigating sOli response to ramfall. SoilTechnology 2,1-16.
Cammeraat. L.H., Imeson. A.C., 1998. Deriving indicators of soil degradation from soil aggregation studies inSE Spain and S France. Geomorphology 23,307-321.
Cerdà, A.. Garda-Alvarez, A.. Cammeraat. L.H., Imeson, A.C.. 1994. In: Garda-Ruiz, J.H., Lasanta, T(EdsJ. Agregacion dei suelo en una catena afectada por el abandono dei cultivo en la cuenca deiGuadalentin (Murcia): 1. Estabilidad y distribucion de los agregados dei suelo. Efectos Geomorfologicosdei Abandono de Tierras. Sociedad Espaiiola de Geomorfologia, Zaragoza, pp. 9-19.
Cerdà, A.. Garda-Alvarez, A.. Cammeraat, L.H., Imeson. AC., 1995. Fluctuation estacional y dinamicamicrobiana en una catena afectada por el abandono dei cultiva en la cuenca dei Guadalentin (Murcia).Pirineos 145/146,3-11.
Cerdà, A., 1997. The effect of patchy distributIOn of Stipa tenacIssima L. on runoff and erosion. Journal ofArid Envlronments 36,37-51.
Dunkerley, D.L., Brown, K.J., 1995. Runoff and runon areas in a patterned chenopod shrubland, arid westernNew South Wales, Australia: characteristIcs and origin. Journal of Arid Environments 30, 41-55.
Dunne, T., Zhang, W., Aubry. B.F.. 1991. Effects of rainfall. vegetation, and lllicrotopography on infiltrationand mnoff. Water Resources Research 27. 2271-2285.
F.AO.. 1977. Guidelines for sOli profile description. Soil Survey and Fertility Branch. Land and WaterDevelopment Division. FAO, Roma. 150 pp.
F.A.O., 1989. FAO/Unesco Soil Map of the World. Revised Legend, World Resources Report 60, FAO,Rome. Reprinted as Technical Paper 20, ISRIC, Wageningen, 138 pp.
Fantechi, R., Margaris, N.S., 1986. Desertification in Europe. Reidel, Dordrecht, 229 pp.Gallart, F., Puigdefabregas, 1.. Bamo, G.D., 1993. Computer simulation of high mountain terracettes as
interaction between vegetation growth and sediment movement. Catena 20, 529-542.I.G.M.E. (Instituto Geologico y Minero de E~paiia), 1981. Mapa Geologico de Espaiia, 1:50.000. Sheet Lorca
(no. 953), Sery. Publ. Min. Industria, Madrid. 43 pp.Imeson. A.C., Verstraten, J.M., Van Mulligen, E.J., Sevink, 1.. 1992. The effects of fire and water repellency
on infiltratIOn and runoff under Mediterranean type forest. Catena 19, 345-361.Imeson, A.C., Cammeraat, L.H., Perez-Trejo, F., 1995. Desertification response units. In: Fantechl, R, Peter,
D., Balabanis. p.. Rubio, J.L. (Eds.), DesertIfication in a European Context: Physlcal and Socio-EconomicAspects. Office for Official Publications of the European Communities. Luxembourg. pp. 263-277.
Imeson, A.C., Perez-Trejo. F., Cammeraat. L.H., 1996a. The response of landscape-units to desertification. In:Brandt, J., Thornes, J B (Eds.). Medtterranean DesertIfication and Land-Use. Wiley. Chichester. pp.447-469.
Imeson. A.C.. Cammeraat, L.H., Pnnsen, H.AM., Cerdà, A, 1996b. Field site integratlOn, data basemanagement. desertlfication response units. In: MEDALUS II, Final Report Basic Field Programme.King's College, London, pp. 1-37.
Kirkby, A., Kirkby, M.J .. 1974. Surface wash at the semi-arid break in slope. Z. Geomorph. N. F. Suppl. Bd.21,151-176.
M.A.P.A., 1957. Aerial photographs, Mmisterio Agricultura Pesca y Alimentacion, Madrid.MEDALUS. 1996. Research and policy mterfacing in selected regions. MEDALUS II Final Report. Kings's
College. London, 715 pp.Morin. J., Kosovsky, A.. 1995. The surface infiltratIOn model. J. of Soil and Water Conservation 50, 470-476.Navarro-Hervas. F., 1991. El sistema hidrogrâfico dei Guadalentin. Consejeria de Politica Temtorial. Obras
Publicas y Medio Amblente. Murcia. 256 pp.O'Neill. R.V., DeAngelis, D.L.. Walde, J.B., Allen, TF.H.. 1986. A Hierarchical Concept of Ecosystems.
Princeton UniverSIty Press, NJ, 253 pp.Pierson, F.B., Van Vactor, S.S.. Blackburn. W.H., Wood, J.c., 1994. IncorporatlOg smail scale spatIal
variablhty lOto predictions of hydrologic response on sagebrush rangelands. In: Blackburn. W.H.,Schuman. G.E.. Plerson. F B. (Eds.), Variability in Rangeland Water EroSion Processes. SSSA SpecialPubhcatIon 38. Soil SCIence Soc. of America, Madison, pp. 23-34.

L H. Cammeraal, A.c. /mesan / Calena 37 (/999) /07-/27 127
Poesen, J., Lavee, H., 1994. Rock fragments ln top sOlls: significance and processes. Catena 23, 1-28.Puigdefabregas, J., Sanchez, G. 1996. Geomorphological Implications of vegetation patchiness on seml-and
slopes. In: Anderson, M.G., Brooks, S.M. (Eds,), Advances in HIlIslope Processes. Wiley, London, pp.1027-1060.
SancheL, G., Puigdefabregas, J., 1994. Interactions of plant growth and sediment on slopes in a seml-andenvironment. Geomorphology 9, 243-260.
Sevink, J., Imeson, A.C.. Verstraten, J.M" 1989. Humus form development and hillslope runoff. and the effectof fire and management under Mediterranean forest in NE-Spain. Catena 16,461-475.
Thléry, J.M., D'Herbes, J.-H., Valentin, c., 1995. A model simulating the genesis of banded vegetationpatterns in Niger. Journal of Ecology 83, 497-507.
Thornes, J.B., 1995. Mediterranean desertification and the vegetation cover. In: Fantechi, R" Peter, D.,Balabanis, P., Rubio, J.L. (Eds.), DesertIfication in a European Context: Physlcal and Socio-EconomicAspects. Office for Official Publications of the European Communities, Luxembourg, pp. 169-194.
Tongway, D., Hindley, N., 1995. Manual for assessment of sOli condiuon tropical grassland. CSIRO, Divisionof Wildlife and Ecology, Canberra, 60 pp.
Valentin, c., Bresson, L.-M" 1992. Morphology, genesis and classification of surface crusts in loamy andsandy soils. Geoderrna 55, 225-245.

ELSEVIER Catena 37 (J999) 129-146
CATENA
Magnitude-frequency analysis of waterredistribution along a climate gradient in Spain
G. Bergkamp a.*, A. Cerdà b, A.C. Imeson a
d Ecosystem Management Group, [UCN. The World COllserl'ation Union, Rue Mmll'emey 28, Il'J6 GlandSWÎtzerland
h Departamellto de Geogrqfia Fisica. UfIll'ersllat de ValèllcLQ, 22060-46020, Valencia, Spmll
Reeelved 3 July 1997; recelved ln revlsed form 21 Oetober 1997; aecepted 10 February 1998
Abstract
Banded patterns in soils and vegetation form part of important discontinuities on semi-aridslopes m Spain. At fine scales ( < 1 m) vegetation and well-structured soils are often located at theouter rim of smail terracettes. Together they form banded patterns, distributed in a scattered wayalong contour Hnes. The objective of this study is to quantify the amuunt of surface waterredistribution at fine spatial seales for three areas in Spain, having different rainfall regimes (290,394 and 688 mm annual ramfalI). Rainfall simulations experiments were carried out to determinerunoff and infiltration characteristics of the bare and vegetated zones. The results of theseexperiments are combined with an analysis of the rainfall magnitude-frequency characteristics ofthe three area's. The combination of these two type of data has resulted in the calculations of aRedistribution Index (RI). The results showed a high variability in surface water redistributionfrom bare areas to banded vegetated zones. The combmation of the infiltration characteristics atthe different sites with the magnitude-frequency data of rainfall shows that most of the surfacewater redistribution originates from short storms with a duration of 10 min. The largest amount ofredistribution during these events is found for areas having an intermediate rainfall reglme with anannual rainfall of 394 mm. The Redistribution Index developed dunng this study provides a rapidmethodology that can be used to evaluate differences in the importance of surface waterredistribution in different banded vegetation structures at a reglOnal scale. © 1999 Published byElsevier Science B.V. AIl rights reserved.
Keywords: Water redistribution; Vegetalion patterns; Chmate gradient; Matorral; Runoff; Mediterranean
• Corresponding author. E-mail: [email protected]
0341-8162/99/$ - see front matter © 1999 Pubhshed by ElseVier Science B.V. Ali nghts reserved.PlI: S0341-ln 62( 98 )0005 8- 7
130
1. Introduction
G. Bergkamp et al. / Catena 37 (1999) 129-146
In many semi-arid environments, vegetation occurs in banded structures. Well knownexamples of banding at scales of hundreds of metres are described for the 'tiger bush' inthe Sahel zone (Casenave and Valentine, 1989), banded patterns in the Mulga woodlands in Australia (Ludwig and Tongway, 1995) and 'two-phase mosaics' in theChihuahua Desert in Mexico (Montana, 1992). In these environments, the movement ofsurface water from the less well vegetated bands forms an important input of water andnutrients into the vegetated bands. This redistribution of water affects dramatically thefunctioning of these ecosystems through, amongst other things, an increase in biomassproduction (Valentin and d'Herbes, this issue) and an increase in soil biological activitywithin the vegetated zones.
During investigations at several sites in Spain, it was observed that a banding of thesemi-natural vegetation is present at a scale of metres. This banding is present in ascattered way along the contour lines and consists of small discontinuous stripes ofvegetation located at the outer rims of small, stony terracettes, behind which mostly bareand often crusted surfaces are found. On the basis of these first observations, it washypothesized that the hydrological functioning of these vegetated structures is stronglyaffected by surface water redistribution from the bare areas to the vegetated rims. Thislead to the formulation of three main questions: (a) How much of the water input belowthe fine scale vegetation structures originates from surface water redistribution? (b) Howdoes this amount of redistribution change with rainfall regime? and (c) How does therelative importance of redistribution depend on the time scale considered?
The amount of surface water redistribution, occurring under natural conditions,depends both on the infiltration characteristics of the bare and vegetated surfaces as wellas the rainfall intensity, the storm duration and the recurrence intervals of specificevents. For different locations within Spain these properties will be different. As boththe infiltration characteristics and the rainfall intensity-retum period relationships arehighly non-linear, a comparison of the amount of surface water redistribution fordifferent sites located in areas with different rainfall regimes will not be straightforward.
The objective of this paper is to quantify the amount of surface water redistribution inthree areas in Spain having different climatological characteristics, for a fine spatialscale and temporal scales of 1 yr and 10 yr. The following approach focuses on: (a) thedetermination of runoff and infiltration characteristics by means of rainfall simulationexperiments at a fine scale, (b) the analysis of meteorological data of the stations nearestto the field sites, and (c) the calculation of the amounts of surface water redistribution onthe basis of the results of (a) and (b).
2. Research areas and sites
2.1. Research sites
The research was carried out in three areas in Spain, located along a climatologicalgradient. The first field site, Murcia, is located at 'El Ardal', in south east Spain nearMurcia. The second site, Albacete, is located in central Spain in a less dryer area closeto the city of Albacete. The third site is located near Valencia, near the Mediterranean
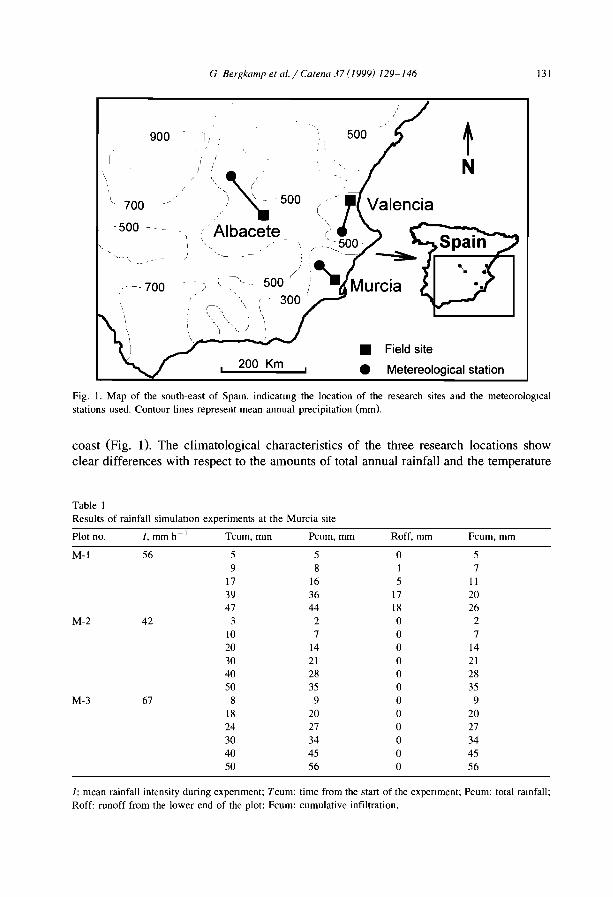
G Bergkaml' et al. / Catena 37 (/999) 129-/46 131
500900 -
(
\\
1,__ 700
- 500---\
)
!~-700
/
/ /.1 :\ \./.
.) \1 500
,.. Albacete\
200 Km
tN
• Field site
• Metereological station
Fig. L Map of the south-east of Spam, indicatmg the location of the research sites and the meteorologlcalstations used. Contour lines represent mean annual precipitation (mm).
coast (Fig. 1). The climatological characteristics of the three research locations showclear differences with respect to the amounts of total annual rainfall and the temperature
Table 1Results of rainfall simulatIOn experiments at the Murcia site
Plot no. l, mmh 1 Tcum, mm Pcum, mm Roff, mm Fcum, mm
M-I 56 5 5 0 59 8 1 7
17 16 5 II39 36 17 2047 44 18 26
M-2 42 3 2 0 2JO 7 0 720 14 0 1430 21 0 2140 28 0 2850 35 0 35
M-3 67 8 9 0 918 20 0 2024 27 0 2730 34 0 3440 45 0 4550 56 0 56
/: mean rainfall intensity during expenment: Tcum: time from the star! of the expenment: Pcum: total ramfall:Roff: runoff from the lower end of the plot: Fcum: cumulative infiltration.
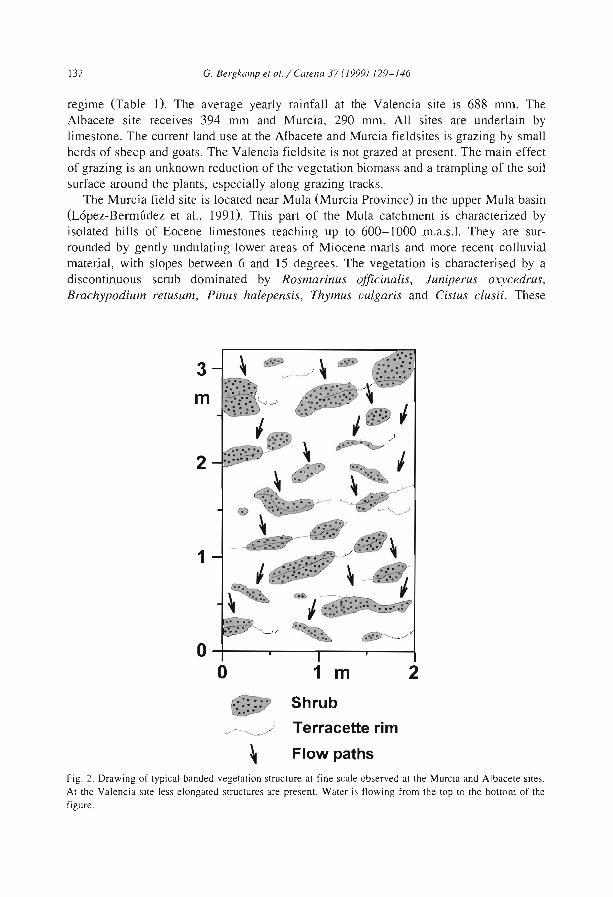
132 G. Bergkamp el al. / Catena 37 (1999) 129-146
regime (Table 1). The average yearly rainfall at the Valencia site is 688 mm. TheAlbacete site receives 394 mm and Murcia, 290 mm. Ali sites are underlain bylimestone. The CUITent land use at the Albacete and Murcia fieldsites is grazing by smallherds of sheep and goats. The Valencia fieldsite is not grazed at present. The main effectof grazing is an unknown reduction of the vegetation biomass and a trampling of the soilsurface around the plants, especially along grazing tracks.
The Murcia field site is located near Mula (Murcia Province) in the upper Mula basin(Lopez-Bermudez et al., 1991). This part of the Mula catchment is characteJized byisolated hills of Eocene limestones reaching up to 600-1000 m.a.s.l. They are surrounded by gently unduJating lower areas of Miocene maris and more recent colluvia1material, with slopes between 6 and 15 degrees. The vegetation is characterised by adiscontinuous scrub dominated by Rosmarinus officinalis, Juniperus oxycedrus,Brachypodium retusum, Pinus halepensis, Thymus uulgaris and Cistus clusii. These
m
2
1
O~----r--.-----r----1
o 1 m.". '" Shrub.. ::.e.
2
~/ Terracette rim
~ Flow paths
Fig. 2. Drawing of lypical banded vegetation structure at fine scale observed at the Murcia and Albacete sites.At the Valencia sile Jess elongated structures are present. Water is flowing from the top 10 the bOllom of thefigure.
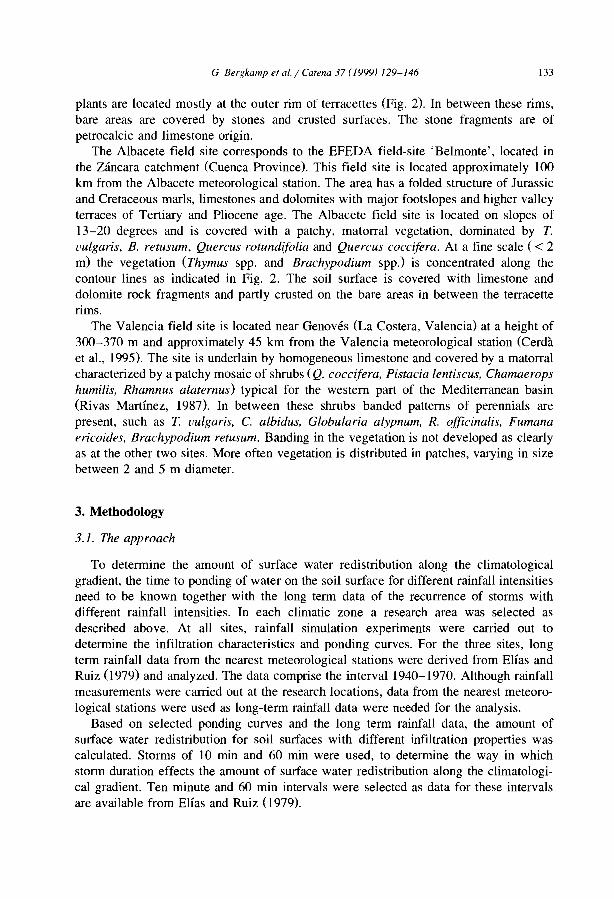
G Bergkamp et al. / Catena 37 (1999) 129-146 133
plants are located mostly at the outer rim of terracettes (Fig. 2). In between these rims,bare areas are covered by stones and crusted surfaces. The stone fragments are ofpetrocalcic and limestone origin.
The Albacete field site corresponds to the EFEDA field-site 'Belmonte', located inthe Zancara catchment (Cuenca Province). This field site is located approximately 100km from the Albacete meteorological station. The area has a folded structure of Jurassicand Cretaceous marIs, limestones and dolomites with major footslopes and higher valleyterraces of Tertiary and Pliocene age. The Albacete field site is located on slopes of13-20 degrees and is covered with a patchy, matorral vegetation, dominated by T.L'ulgaris, B. retusum, Quercus rotundifolia and Quercus coccifera. At a fine scale ( < 2m) the vegetation (Thymus spp. and Brachypodium spp.) is concentrated along thecontour lines as indicated in Fig. 2. The soil surface is covered with limestone anddolomite rock fragments and partly crusted on the bare areas in between the terracetterims.
The Valencia field site is located near Genovés (La Costera, Valencia) at a height of300-370 m and approximately 45 km from the Valencia meteorological station (Cerdàet al., 1995). The site is underlain by homogeneous limestone and covered by a matorralcharacterized by a patchy mosaic of shrubs (Q. coccifera, Pistacia lentiscus, Chamaeropshumilis, Rhamnus alaternus) typical for the western part of the Mediterranean basin(Rivas Martfnez, 1987). In between these shrubs banded patterns of perennials arepresent, such as T. vulgaris. C. albidus, Globularia alypnum. R. officinalis, Fumanaericoides. Brachypodium retusum. Banding in the vegetation is not developed as clearlyas at the other two sites. More often vegetation is distributed in patches, varying in sizebetween 2 and 5 m diameter.
3. Methodology
3.1. The approach
To determine the amount of surface water redistribution along the climatologicalgradient, the time to ponding of water on the soil surface for different rainfall intensitiesneed to be known together with the long term data of the recurrence of storms withdifferent rainfall intensities. In each climatic zone a research area was selected asdescribed above. At aIl sites, rainfall simulation experiments were carried out todetermine the infiltration characteristics and ponding curves. For the three sites, longterm rainfall data from the nearest meteorological stations were derived from Elfas andRuiz (1979) and analyzed. The data comprise the interval 1940-1970. Although rainfallmeasurements were carried out at the research locations, data from the nearest meteorological stations were used as long-term rainfall data were needed for the analysis.
Based on selected ponding curves and the long term rainfall data, the amount ofsurface water redistribution for soil surfaces with different infiltration properties wascalculated. Storms of 10 min and 60 min were used, to determine the way in whichstorm duration effects the amount of surface water redistribution along the climatological gradient. Ten minute and 60 min intervals were selected as data for these intervalsare available from Eifas and Ruiz (1979).
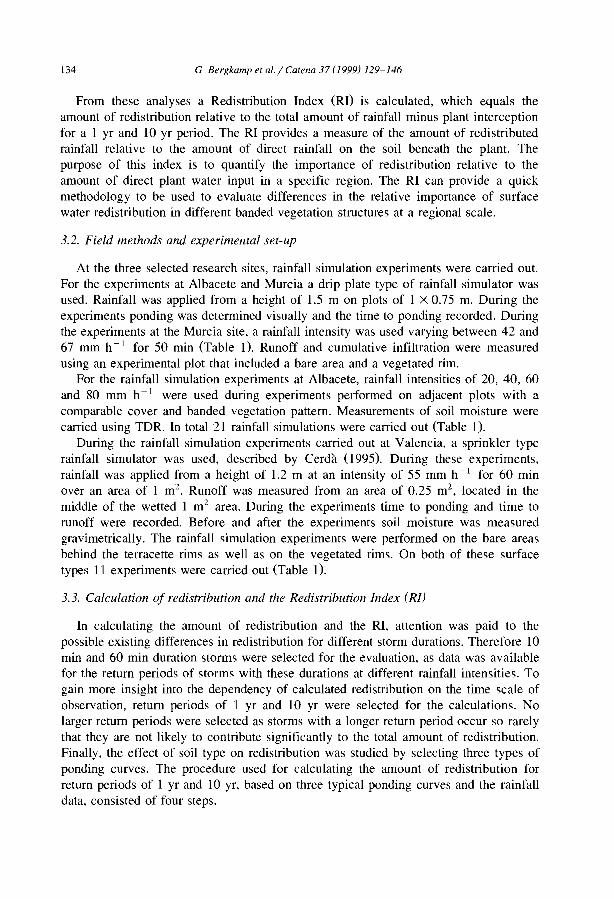
134 G Bergkamp et al. / Catena 37 (1999) 129-146
From these analyses a Redistribution Index (RI) is calculated, which equals theamount of redistribution relative to the total amount of rainfall minus plant interceptionfor a 1 yr and 10 yr period. The RI provides a measure of the amount of redistributedrainfall relative to the amount of direct rainfall on the soil beneath the plant. Thepurpose of this index is to quantify the importance of redistribution relative to theamount of direct plant water input in a specifie region. The RI can provide a quickmethodology to be used to evaluate differences in the relative importance of surfacewater redistribution in different banded vegetation structures at a regional scale.
3.2. Field methods and experimental set-up
At the three selected research sites, rainfall simulation experiments were carried out.For the experiments at Albacete and Murcia a drip plate type of rainfall simulator wasused. Rainfall was applied from a height of 1.5 m on plots of 1 X 0.75 m. During theexperiments ponding was determined visually and the time to ponding recorded. Duringthe experiments at the Murcia site, a rainfall intensity was used varying between 42 and67 mm h-) for 50 min (Table 1). Runoff and cumulative infiltration were measuredusing an experimental plot that included a bare area and a vegetated rim.
For the rainfall simulation experiments at Albacete, rainfall intensities of 20, 40, 60and 80 mm h-) were used during experiments performed on adjacent plots with acomparable coyer and banded vegetation pattern. Measurements of soil moisture werecarried using TDR. In total 21 rainfall simulations were carried out (Table O.
During the rainfall simulation experiments carried out at Valencia, a sprinkler typerainfall simulator was used, described by Cerdà (1995). During these experiments,rainfall was applied from a height of 1.2 m at an intensity of 55 mm h-\ for 60 minover an area of 1 ml. Runoff was measured from an area of 0.25 ml, located in themiddle of the wetted 1 m2 area. During the experiments time to ponding and time torunoff were recorded. Before and after the experiments soil moisture was measuredgravimetrically. The rainfall simulation experiments were performed on the bare areasbehind the terracette rims as well as on the vegetated rims. On both of these surfacetypes 11 experiments were carried out (Table O.
3.3. Calculation of redistribution and tlze Redistribution Index (RI)
In calculating the amount of redistribution and the RI, attention was paid to thepossible existing differences in redistribution for different storm durations. Therefore 10min and 60 min duration storms were selected for the evaluation, as data was availablefor the return periods of storms with these durations at different rainfall intensities. Togain more insight into the dependency of calculated redistribution on the time scale ofobservation, return periods of 1 yr and 10 yr were selected for the calculations. Nolarger return periods were selected as storms with a longer return period occur so rarelythat they are not likely to contribute significantly to the total amount of redistribution.Finally, the effect of soil type on redistribution was studied by selecting three types ofponding curves. The procedure used for calculating the amount of redistribution forreturn periods of 1 yr and 10 yr, based on three typical ponding curves and the rainfalldata. consisted of four steps.

G. Bergkamp et al. / Catena 37 (J999) 129-146 135
3.3./. Step /- Calculating of the number of euents per intensity classFirstly, the rainfall intensity data is grouped into classes of 10 mm h - 1. For each
intensity class, the retum periods are derived based on the medium value of each class.From these, the number of events during l yr and during 10 yr are calculated using,respectively:
N1(I) = 365/RT(I)
NID(I) = 3650/RT(I)
(1)
(2)
where NI (I): number of events with rainfall intensity (I) during l yr (365 days); NID(1): number of events with rainfall intensity (I) during 10 yr (3650 days); /: rainfallintensity (mm h-[); RT: retum period of events with different rainfall intensities with 10min or 60 min duration (days).
3.3.2. Step 2- Calculation of the duration of redistributionBased on the field data three characteristic ponding curves are selected for the
redistribution calculations. The three selected curves include: (l) a rapid ponding curve,(2) a moderate ponding curve, and (3) a slow ponding curve (see Section 4). For each ofthese ponding curves, the duration of redistribution at a given rainfall intensity andstonn duration is calculated by subtracting the time to ponding for a given intensity fromthe duration of the storm event:
(3)
where DL!: duration of redistribution during storm with duration x and intensity 1(min); x: duration of stonn (lo or 60) (min); TI: time to ponding (minutes) for rainfallintensity /.
3.3.3. Step 3-Calculation of the amount of redistributionThe total redistribution is calculated by multiplying the number of events during l or
10 yr with the duration of redistribution and the intensity per minute. Furthennore, theratio of the surface of the contributing area relative to the surface of the vegetated area(5: 1) is taken into account by multiplying the calculated amount of redistribution by 5.The ratio contributing receiving area is an average number derived from field observations. The amounts of redistribution per rainfall intensity interval are then summed (cf.Eqs. (4) and (5)). The rainfall intensity interval over which the summation is carried outequals the maximum range over which redistribution is important (see Section 4).
I~ 165
L Rd = NI (I) . Dt 1 • //60 . 51=0
I~ 165
L R t 1= NID(I) . Dt 1.//60 . 51=0
for: x = l
for: x = 10
(4)
(5)
where R: surface water redistribution of bare area to vegetated area (mm).

136 G. Bergkalllp et al. / Catena 37 (1999) 129-146
3.3.4. Step 4- Calculation of RIFrom the above calculated amount of redistribution and the data of mean annual
rainfall and interception, RI is calculated (Eq. (6)). This index can be used as anindicator of the relative importance of the contribution of surface water redistribution forvegetated zones at fine scales. The index provides information on the amount of waterinput near plants derived from surface water redistribution relative to the amount ofwater input derived from rainfall reduced with the interception by the plant. The meanfraction of intercepted rain (0.28) was derived from Bergkamp (1996).
RI=R/(P- (p. C)) (6)
where RI: redistribution index; P: mean annual rainfa11 or 10 yr rainfa11; C: meanannual interception fraction (0.28).
4. ResuUs and discussion
4. I. Field lIleasurements of runoff and infiltration
During the experiments carried out at the Murcia site, no runoff was measured at thelower side of the experimental plot (0.75 m2
), although ponding occurred rapidly on thebare areas in between the banded vegetation (Table l). The water was observed to flowto these structures and to infiltrate there. During other experiments at the same site, withan intensity of 70 mm h -1, this behaviour was also observed (Bergkamp et al., 1996).
At the Albacete site, ponding and movement of water over the soil surface in betweenthe vegetated rims was observed to occur rapidly during the rainfa11 simulation experiments on a11 slope sections (Fig. 3). Despite this observed surface water movement norunoff was obtained at the lower edge of the plots. Water was observed to infiltraterapidly near the vegetated rims as indicated by the arrows in Fig. 4. The variability ofwater movement on the surface and infiltration was however observed to be very high.Detailed TDR-measurements of changes in soil moisture contents at different depthsduring experiments showed these to change much more rapidly under the vegetatedzones than under the bare areas (Bergkamp et al., 1996). Observation made by using dyetracers indicated that no exfiltration at the lower site of the vegetated rims occurredduring the experiments.
The observation made during the experiments performed at the Valencia site, showedwater to pond at the bare surface between 1 min, 37" and 5 min, 30" after the start of theexperiments (Table 2). During 7 experiments located on vegetated zones no pondingoccurred. Runoff coefficients for the bare surfaces varied between 9.5 to 47% while forthe vegetated zones these were close to zero. The calculated averaged infiltration ratesvaried between 23 and 47 mm h -1 for the bare zones and were above 55 mm h- 1 formost vegetated zones. Excavations carried out after each experiment showed that belowthe vegetation the soil was wetted in pockets, indicating that water had infiltratednon-uniformly along roots and macropores. This rapid infiltration caused the runoff fromthe bare zones to move only over sma11 distances.
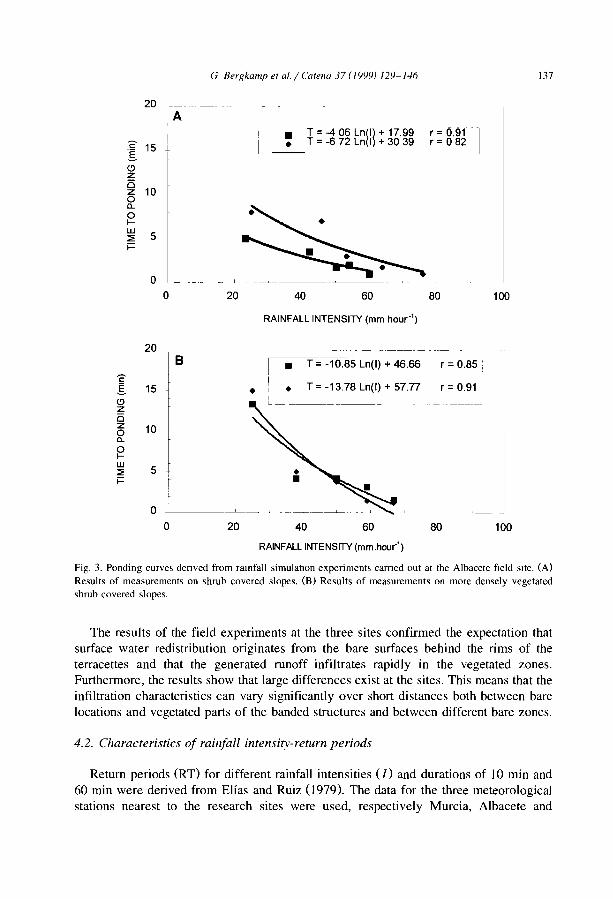
G Bergkamp et al. / CatellG 37 (J999i 129-].16 137
20A
• T = -4 06 Ln!ll + 17.99 r = 0.91ê 15 • T = -6 72 Ln 1 + 30 39 r = 082
lClz15z 100c..0 •1-W
5::i;
~ï=
0 j---------'-------~-
0 20 40 60 80 100
RAINFALL INTENSITY (mm heur-')
20 --------
B • T - -10.85 Ln(l) + 46.66 r = 0.85êl 15 • • T= -13.78 Ln(l) + 57.77 r = 0.91Cl 1L _______________
z15z 100c..01-W
5::i;ï=
0 ____-----.L-____ -------l.-- __
0 20 40 60 80 100
RAINFALL INTENSfTY (mm.heur')
Fig. 3. Ponding curves denved from ramfall simulatlon experiments carned out at the Albacete field sile. (A)Resu1ts of measurements on shrub covered slopes. (B) Resu1ts of measurements on more densely vegetatedshrub covered slopes.
The results of the field experiments at the three sites confirmed the expectation thatsurface water redistribution originates from the bare surfaces behind the rims of theterracettes and that the generated mnoff infiltrates rapidly in the vegetated zones.Furthermore, the results show that large differences exist at the sites. This means that theinfiltration characteristics can vary significantly over short distances both between barelocations and vegetated parts of the banded structures and between different bare zones.
4.2. Characteristics of rain/all intensity-return periods
Retum periods (RT) for different rainfall intensities (j) and durations of 10 min and60 min were derived from Elfas and Ruiz (I 979). The data for the three meteorologicalstations nearest to the research sites were used, respectively Murcia, Albacete and
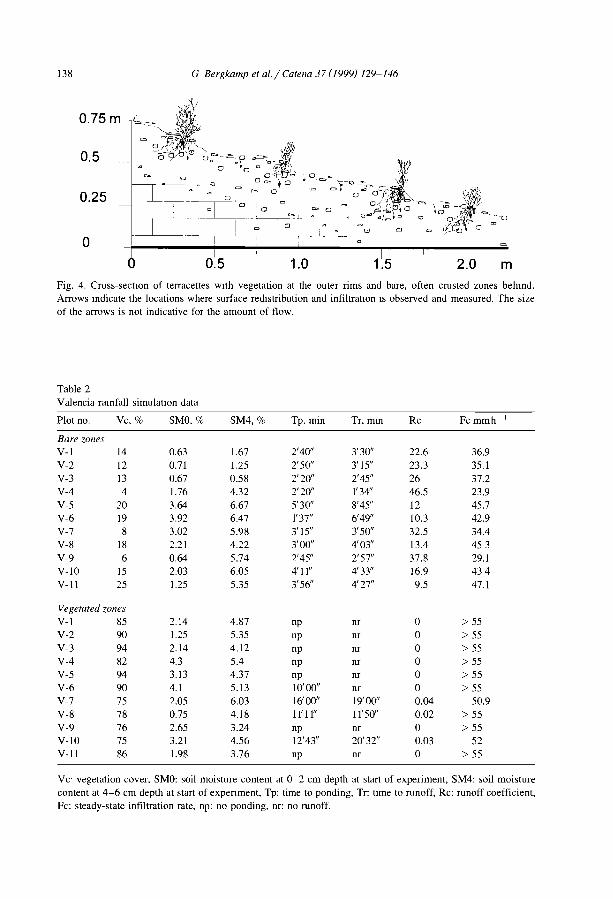
138 G Bergkamp et al. / Catella 37 (J999) 129-146
0.5
0.25
o
Fig. 4. Cross-secllon of terracettes wlth vegetation at the outer rims and bare, often crusted zones behmd.Arrows mdicate the locations where surface redistribution and infiltratIOn IS observed and measured. The sizeof the arrows is not indicative for the amount of flow.
Table 2Valencia ramfall simulallon data
Plot no. Vc, % SMO,% SM4,% Tp, min Tr,mm Re Fcmmh 1
Bare zonesV-l 14 0.63 1.67 2'40" 3'30" 22.6 36.9V-2 12 0.71 1.25 2'50" 3' 15" 23.3 35.1V-3 13 0.67 0.58 2'20" 2'45" 26 37.2V-4 4 1.76 4.32 2'20" 1'34" 46.5 23.9V-5 20 3.64 6.67 5'30" 8'45" 12 45.7V-6 19 3.92 6.47 1'37" 6'49" 10.3 42.9V-7 8 3.02 5.98 3'15" 3'50" 32.5 34.4V-8 18 2.21 4.22 3'00" 4'03" 13.4 453V-9 6 0.64 5.74 2'45" 2'57" 37.8 29.1V-IO 15 2.03 6.05 4' II" 4'33" 16.9 434V-II 25 1.25 5.35 3'56" 4'27" 9.5 47.1
Vegetated zonesV-l 85 2.14 4.87 np nr 0 > 55V-2 90 1.25 5.35 np nr 0 > 55V-3 94 2.14 4.12 np nr 0 > 55V-4 82 4.3 5.4 np nr 0 > 55V-5 94 3.13 4.37 np nr 0 > 55V-6 90 4.1 5.13 10'00" nr 0 > 55V-7 75 2.05 6.03 16'00" 19'00" 0.04 50.9V-8 78 0.75 4.18 11' 11" 11'50" 0.02 > 55V-9 76 2.65 3.24 np or 0 > 55V-IO 75 3.21 4.56 12'43" 20'32" 0.03 52V-Il 86 1.98 3.76 np or 0 > 55
Vc vegetation cover. SMO: soil moisture content at 0-2 cm depth at start of experiment, SM4: soil moisturecontent at 4-6 cm depth at start of expenment, Tp: time to ponding. Tr: time to runoff, Re: runoff coefficient,Fe: steady-state infiltration rate. np: no ponding, or: no runoff.
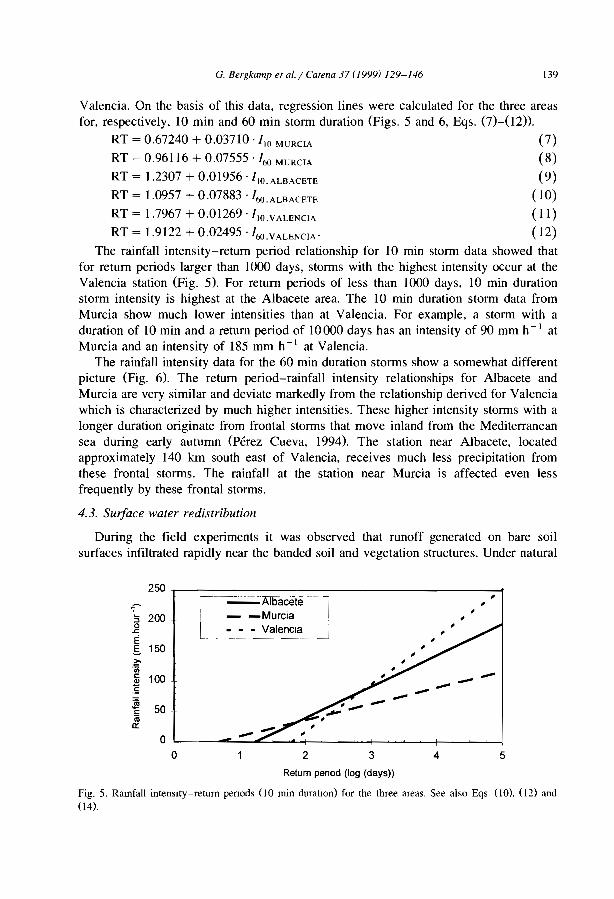
G. Bergkamp et al. / Catena 37 (/999) 129-146 139
Valencia. On the basis of this data, regression lines were calculated for the three areasfor, respectively, 10 min and 60 min storm duration (Figs. 5 and 6, Eqs. (7)-(12)).
RT = 0.67240 + 0.03710 ./10 MURClA (7)
RT = 0.96116 + 0.07555 '/60 MURCIA (8)
RT = 1.2307 + 0.01956 ·/IO.ALBACETE (9)
RT = 1.0957 + 0.07883 ·/60.ALBACETE (10)
RT = 1.7967 + 0.01269 ·/1O.VALENCIA (11)
RT = 1.9122 + 0.02495 ·/60.VALENCIA' (12)The rainfall intensity-retum period relationship for 10 min storm data showed that
for retum periods larger than 1000 days, storms with the highest intensity occur at theValencia station (Fig. 5). For retum periods of less than 1000 days, 10 min durationstorm intensity is highest at the Albacete area. The 10 min duration storm data fromMurcia show much lower intensities than at Valencia. For example, a storm with aduration of 10 min and a retum period of 10 000 days has an intensity of 90 mm h- 1 atMurcia and an intensity of 185 mm h - 1 at Valencia.
The rainfall intensity data for the 60 min duration storms show a somewhat differentpicture (Fig. 6). The retum period-rainfall intensity relationships for Albacete andMurcia are very sirnilar and deviate markedly from the relationship derived for Valenciawhich is characterized by much higher intensities. These higher intensity storms with alonger duration originate from frontal storms that move inland from the Mediterraneansea during early autumn (Pérez Cueva, 1994). The station near Albacete, locatedapproximately 140 km south east of Valencia, receives much less precipitation fromthese frontal storms. The rainfall at the station near Murcia is affected even lessfrequently by these frontal storms.
4.3. Surface water redistribution
During the field experiments it was observed that runoff generated on bare soilsurfaces infiltrated rapidly near the banded soil and vegetation structures. Under natural
250 .
1
~Albacete-- l
l -Murcia 1
5 200 - - ! ,0 - ValenCia.<: ,E -------- ---------
.s 150~<Il -c: 100Q) -:s --~ 50 -c:a;
0::
0 -0 2 3 4 5
Return penod {log (days»
Fig. 5. Ramfall intenslty-return penods (JO min duratlOn) for the three areas. See also Eqs. (IO). (I2) and(I4).
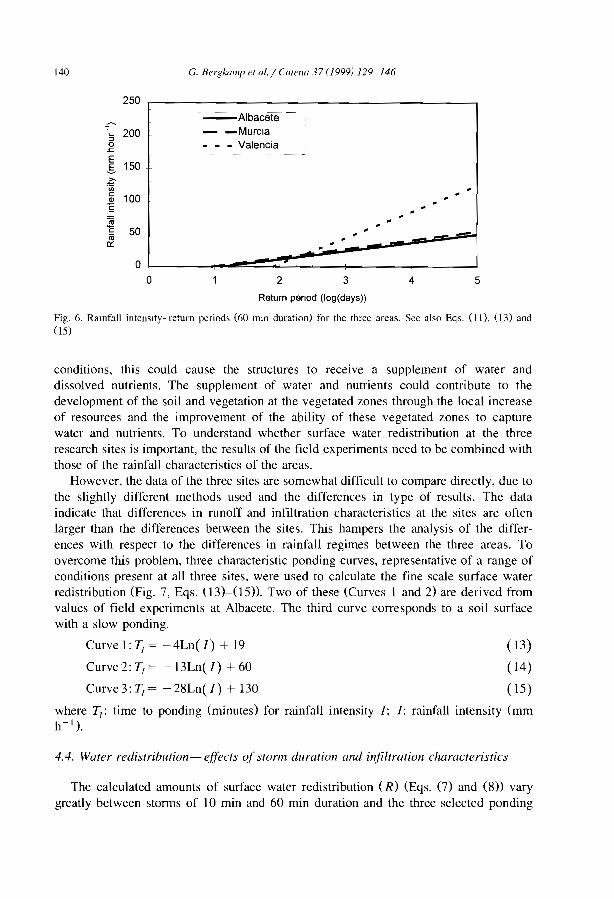
G. BergkamjJ et al. / Carena 37 (J999) 129-146140
250
:; 2000.<:
E150S
~"iiic 100al
"êJi!
50c(ij0::
aa
~Albacete -
- -MurclaValencia
2 3 4 5
( 13)
(14)
(15)
Return penod (Iog(days»
Fig. 6. Ramfall intenslty-return period, (60 mm duration) for the three areas. See also Eqs. (11), (13) andOS)
conditions, this could cause the structures ta receive a supplement of water anddissolved nutrients, The supplement of water and nutrients could contribute ta thedevelopment of the sail and vegetation at the vegetated zones through the local increaseof resources and the improvement of the ability of these vegetated zones ta capturewater and nutrients, Ta understand whether surface water redistribution at the threeresearch sites is important, the results of the field experiments need ta be combined withthose of the rainfall characteristics of the areas,
However, the data of the three sites are somewhat difficult ta compare directly, due tathe slightly different methods used and the differences in type of results, The dataindicate that differences in runoff and infiltration characteristics at the sites are oftenlarger than the differences between the sites. This hampers the analysis of the differences with respect ta the differences in rainfall regimes between the three areas, Taovercome this problem, three characteristic ponding curves, representative of a range ofconditions present at ail three sites, were used ta calculate the fine scale surface waterredistribution (Fig, 7, Eqs. (13)-(15)), Two of these (Curves 1 and 2) are derived fromvalues of field experiments at Albacete, The third curve corresponds ta a sail surfacewith a slow ponding,
Curve 1: Tl = -4Ln(I) + 19
Curve 2: Tl = - 13Ln( l) + 60
Curve 3: Tl = - 28Ln( l) + 130
where Tl: time ta ponding (minutes) for rainfall intensity 1: 1: rainfall intensity (mmh- l ).
4.4. Water redistribution- effects of storm duration and infiLtration characteristics
The calculated amounts of surface water redistribution (R) (Eqs, (7) and (8)) varygreatly between storms of 10 min and 60 min duration and the three selected ponding
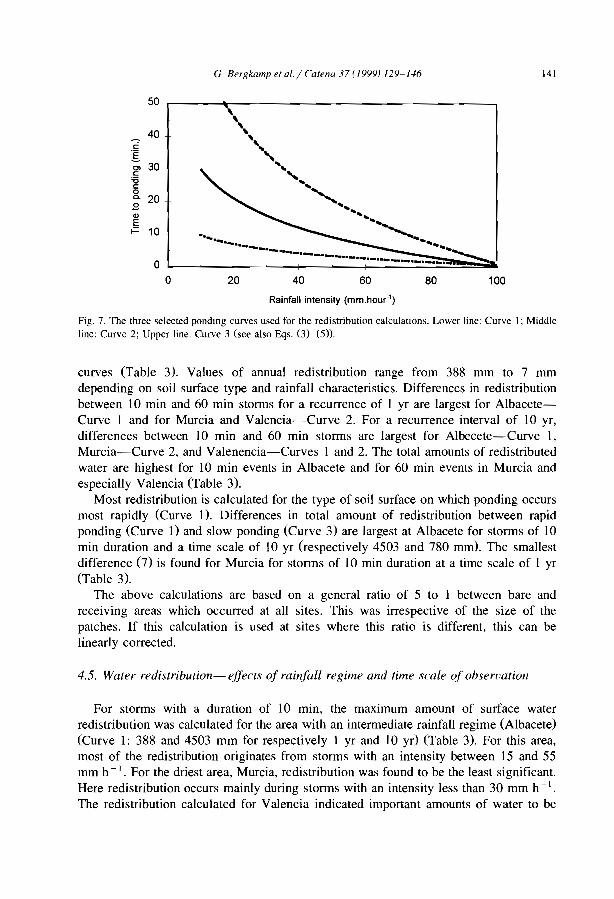
G Bergkamp et al. j Catena 37 (J999) 129-J.l6 141
10080604020
",
'''"'.......................................
..~....... ......~.........-....._.- ----....-.__.._._._._._...._._._._._. ~
50
40'""c
lC> 30c'0c0a. 20.8Q)
Et= 10
00
Rainfall intensity (mm.hour"')
Fig. 7. The three selected pondmg curves used for the redistribution calculatlOns. Lower line: Curve 1; Middleline: Curve 2; Upper line: Curve 3 (see also Eqs. (3)-(5»).
curves (Table 3). Values of annual redistribution range from 388 mm ta 7 mmdepending on sail surface type and rainfall characteristics. Differences in redistributionbetween 10 min and 60 min storms for a recurrence of 1 yr are largest for AlbaceteCurve 1 and for Murcia and Valencia-Curve 2. For a recurrence interval of 10 yr,differences between 10 min and 60 min storms are largest for Albecete-Curve 1,Murcia-Curve 2, and Valenencia-Curves 1 and 2. The total amounts of redistributedwater are highest for 10 min events in Albacete and for 60 min events in Murcia andespecially Valencia (Table 3).
Most redistribution is calculated for the type of sail surface on which ponding occursmost rapidly (Curve 1). Differences in total amount of redistribution between rapidponding (Curve 1) and slow ponding (Curve 3) are largest at Albacete for storms of 10min duration and a time scale of 10 yr Üespectively 4503 and 780 mm). The smallestdifference (7) is found for Murcia for storms of 10 min duration at a time scale of 1 yr(Table 3).
The above calculations are based on a general ratio of 5 ta 1 between bare andreceiving areas which occurred at aIl sites. This was irrespective of the size of thepatches. If this calculation is used at sites where this ratio is different, this can belinearly corrected.
4.5. Water redistribution- effects of rainfaIl regime and time scale of observation
For storms with a duration of 10 min, the maximum amount of surface waterredistribution was calculated for the area with an intermediate rainfall regime (Albacete)(Curve 1: 388 and 4503 mm for respectively 1 yr and 10 yr) (Table 3). For this area,most of the redistribution originates from storms with an intensity between 15 and 55mm h-\. For the driest area, Murcia, redistribution was found ta be the least significant.Here redistribution occurs mainiy during storms with an intensity less than 30 mm h- 1•
The redistribution calculated for Valencia indicated important amounts of water ta be
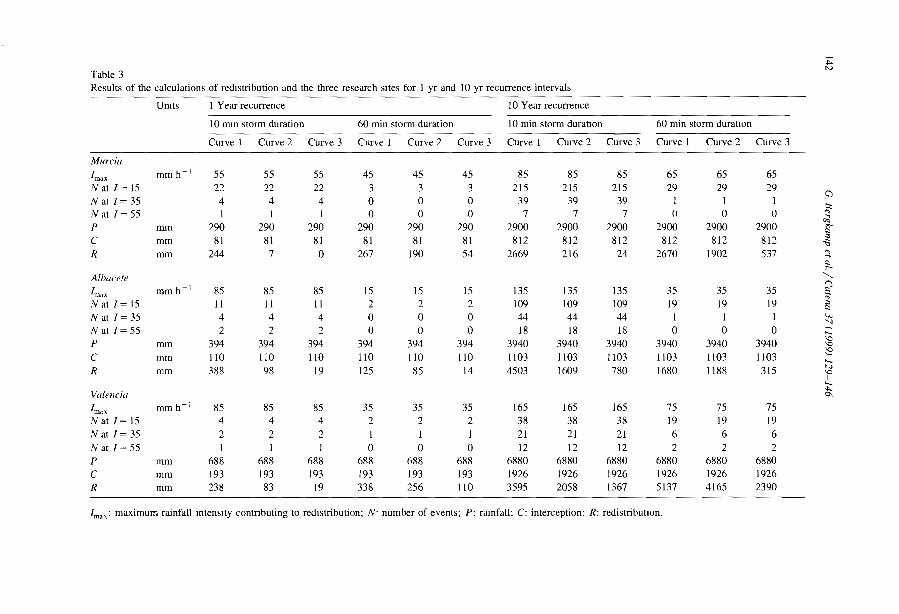
:ï=N
Table 3Results of the calculations of redIstribution and the three research sItes for 1 yr and 10 yr recurrence intervals
VOlts 1 Year recurrence 10 Year recurrence
10 mm storm duration 60 min storm duration 10 min storm durallon 60 min storm duratIOn
Curve 1 Curve 2 Curve 3 Curve 1 Curve 2 Curve 3 Curve 1 Curve 2 Curve 3 Curve 1 Curve 2 Curve 3
Murcin
lmax mmh- l 55 55 55 45 45 45 85 85 85 65 65 65Nat 1 = 15 22 22 22 3 3 3 215 215 215 29 29 29
1;')Nat 1 = 35 4 4 4 0 0 0 39 39 39 1 1 1
t:J:lNat 1 = 55 1 1 1 0 0 0 7 7 7 0 0 0 "~P mm 290 290 290 290 290 290 2900 2900 2900 2900 2900 2900 ,.,.
I:l
C mm 81 81 81 81 81 81 812 812 812 812 812 812 ~R mm 244 7 0 267 190 54 2669 216 24 2670 1902 537 ~
I:l:-
Albacete "-[mH mmh- I 85 85 85 15 15 15 135 135 135 35 35 35 ~
~Nat 1= 15 II II II 2 2 2 109 109 109 19 19 19 ;:,
I:l
N al 1= 35 4 4 4 0 0 0 44 44 44 1 1 1 v"
"N aIl = 55 2 2 2 0 0 0 18 18 18 0 0 0 ---.....P 394 394 394 394 394 394 3940 3940 3940 3940 3940 3940
IQmm IQ
C 110 110 110 110 110 110 1103 1103 1103 1103 1103 1103 ~mm .....
R 388 98 19 125 85 14 4503 1609 780 1680 1188 315 Nmm IQ
1.....Valencia "'"0\
I rnd ,\ mmh- I 85 85 85 35 35 35 165 165 165 75 75 75Nat 1= 15 4 4 4 2 2 2 38 38 38 19 19 19Nat 1= 35 2 2 2 1 1 1 21 21 21 6 6 6N al 1= 55 1 1 1 0 0 0 12 12 12 2 2 2P mm 688 688 688 688 688 688 6880 6880 6880 6880 6880 6880C mm 193 193 193 193 193 193 1926 1926 1926 1926 1926 1926R mm 238 83 19 338 256 110 3595 2058 1367 5137 4165 2390
lm,,: maximum rainfal1 intenslty contributing to redIstribution; N· number of events; P: ralOfal1; C: interception: R: redistributIOn.
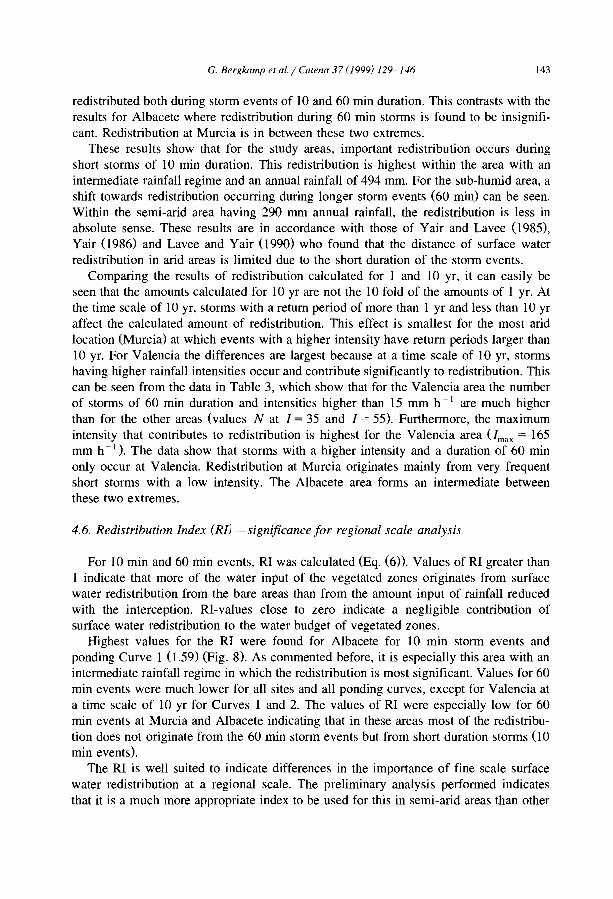
G. BerRkamp et al. / Catena 37 (1999) 129-146 143
redistributed both during storm events of 10 and 60 min duration. This contrasts with theresults for Albacete where redistribution during 60 min storms is found to be insignificant. Redistribution at Murcia is in between these two extremes.
These results show that for the study areas, important redistribution occurs duringshort storms of 10 min duration. This redistribution is highest within the area with anintermediate rainfall regime and an annual rainfall of 494 mm. For the sub-humid area, ashift towards redistribution occurring during longer storm events (60 min) can be seen.Within the semi-arid area having 290 mm annual rainfall, the redistribution is less inabsolute sense. These results are in accordance with those of Yair and Lavee (1985),Yair (1986) and Lavee and Yair (1990) who found that the distance of surface waterredistribution in arid areas is limited due to the short duration of the storm events.
Comparing the results of redistribution calculated for 1 and 10 yr, it can easily beseen that the amounts calculated for 10 yr are not the 10 fold of the amounts of 1 yr. Atthe time scale of 10 yr, storms with a retum period of more than 1 yr and less than 10 yraffect the calculated amount of redistribution. This effect is smaBest for the most aridlocation (Murcia) at which events with a higher intensity have retum periods larger than10 yr. For Valencia the differences are largest because at a time scale of 10 yr, stormshaving higher rainfall intensities occur and contribute significantly to redistribution. Thiscan be seen from the data in Table 3, which show that for the Valencia area the numberof storms of 60 min duration and intensities higher than 15 mm h -1 are much higherthan for the other areas (values N at 1 = 35 and 1 = 55). Furthermore, the maximumintensity that contributes to redistribution is highest for the Valencia area (lmax = 165mm h- 1 ). The data show that storms with a higher intensity and a duration of 60 minonly occur at Valencia. Redistribution at Murcia originates mainly from very frequentshort storms with a low intensity. The Albacete area forms an intermediate betweenthese two extremes.
4.6. Redistribution Index (RIJ-significance for regional scale analysis
For 10 min and 60 min events, RI was calculated (Eq. (6)). Values of RI greater than1 indicate that more of the water input of the vegetated zones originates from surfacewater redistribution from the bare areas than from the amount input of rainfaB reducedwith the interception. RI-values close to zero indicate a negligible contribution ofsurface water redistribution to the water budget of vegetated zones.
Highest values for the RI were found for Albacete for 10 min storm events andponding Curve 1 (1.59) (Fig. 8). As commented before, it is especiaBy this area with anintermediate rainfaH regime in which the redistribution is most significant. Values for 60min events were much lower for aH sites and aH ponding curves, except for Valencia ata time scale of 10 yr for Curves 1 and 2. The values of RI were especially low for 60min events at Murcia and Albacete indicating that in these areas most of the redistribution does not originate from the 60 min storm events but from short duration storms (10min events).
The RI is weB suited to indicate differences in the importance of fine scale surfacewater redistribution at a regional scale. The preliminary analysis performed indicatesthat it is a much more appropriate index to be used for this in semi-arid areas than other
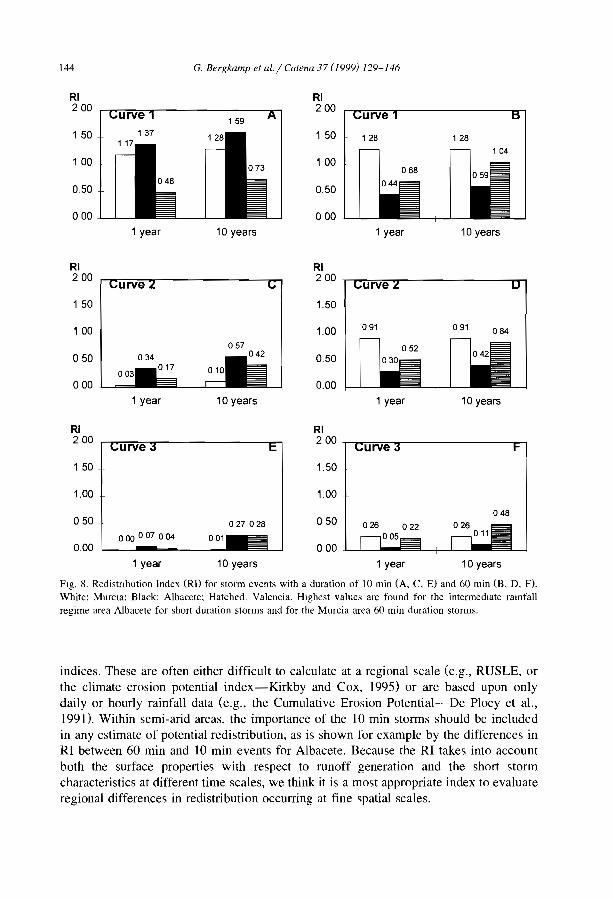
144 G. Bergkamp et al./ Catena 37 (1999) 129-146
RI200 r"7..-;-;;=,...,.---------....,
159
1 50
1 00
0.50
000
RI200
1 50
100
0.50
000
128 128
1 year 10 years 1 year 10 years
RI2 00 ,....,~=,....,...-------.........n
RI200
150
1 00
050
000
1.50
1.00
0.50
0.00
091 091 084
1 year 10 years 1 year 10 years
RI200r-ror:-:-:==........-------..........,
1 50 .
1.00
RI200 ...-r..-;-;;=........-------..,....,
1.50
1.00
050
0.00000 007 004
027 028
001
048050
o00 l-L-J""""IIIIE3--+-..l- _
1 year 10 years 1 year 10 years
Fig. 8. Redistnbution Index (RD for storm events with a duration of 10 min (A, C E) and 60 min (8, D, F).White: MurCla: Black: Albacete: Hatched: Valencia. Hlghest values are found for the intennedJate ramfallregime area Albacete for short duration storms and for the Murcia area 60 min duration stonns.
indices. These are often either difficult to calculate at a regional scale (e.g" RUSLE, orthe climate erosion potential index-Kirkby and Cox, 1995) or are based upon onlydaily or hourly rainfall data (e,g., the Cumulative Erosion Potential-De Ploey et al.,1991). Within semi-arid areas, the importance of the 10 min storms should be includedin any estimate of potential redistribution, as is shown for example by the differences inRI between 60 min and 10 min events for Albacete. Because the RI takes into accountboth the surface properties with respect to runoff generation and the short stormcharacteristics at different time scales, we think it is a most appropriate index to evaluateregional differences in redistribution occurring at fine spatial scales,
5. Conclusions
G. Bergkamp et al. / Catena 37 (1999) 129-146 145
0) At the investigated sites a high variability at fine scales in the contribution ofsurface water redistribution from bare areas to banded vegetated zones at scales of 1 m2
were found. Differences in amount of redistribution between the ponding curves werelargest for the intermediate rainfall regime.
(2) Within the semi-arid areas studied, the surface water redistribution originatesmostly from short storms with a duration of 10 min. The largest amount of redistributionduring these events for ail ponding curves were found for the intermediate rainfallregime with an annual rainfall of 394 mm.
(3) Surface water redistribution was found to become more important at larger timescales as more extreme events are included in the observation series. This wil1 especiallybe so on slowly ponding surfaces and areas with a rainfall regime as in Valencia.
(4) The relationship between redistribution and vegetation banding is most apparentfor the semi-arid zone. Although redistribution is occurring at the sub-humid site. thebanding at this site is much less clear. Probably vegetation at this site receives asufficiently large water input from rainfall to maintain biomass production.
(5) The Redistribution Index developed during this study provides a quick methodology that can be used to evaluate differences in the importance of surface waterredistribution in different banded vegetation structures at a regional scale.
Acknowledgements
The research for this paper was carried out as a part of the MEDALUS and EFEDAcol1aborative research projects. MEDALUS 1, EFEDA 1 and ERMES 1 were funded bythe CEC under their respective European Programme on Climate and Natural Hazards(EPOCH) contract numbers EPOC-CT90-0014-(SMA). EPOC-CT90-0030 and EPOCCT92-0000, the support being greatly acknowledged. E.C. Cammeraat, M. Boer andL.K. Karssies are acknowledged for their field assistance. C. Valentin, D. Dunkeriey andan unknown reviewer are acknowledged for their useful comments for improvement ofthe manuscript.
References
Bergkamp. G., 1996. Mediterranean geoecosystems. Hlerarchical organisation and degradation. PhD thesis.University of Amsterdam. 238 pp
Bergkamp. G., Cammeraat, L.H., Martinez Femandez. J.. 1996. Water movement and vegetation patterns onshrubland and an abandoned fIeld JO two desertification threatened areas JO Spain. Earth Surf Proc.Landforms 21. 1073-1090.
Casenave, A. Valentine. c.. 1989. Les états de surface de la zone sahélienne: influence sur l'JOfiltratlOn.üRSTüM, Pans.
Cerdà, A.. 1995. Factores y vanaciones espaclO-temporales de la JOfiltraclon en los ecoslstemas mediterraneos.Geoforma Edlciones, Logrono, p. 151.
Cerdà. A., Imeson, A.C., Calvo, A., 1995. Fire and aspect induced differences on the erodlbility and hydrologyof soils at La Costera, Valencia, southeast SpaJO. Catena 24. 289-304.

146 G. Berg"amp el al./ Calena 37 (1999) 129-146
De Ploey, J., Klrkby, M.J., Ahnert, F., 1991. Hlllsiope erosion by rainstonns-A magnitude-frequencyanalysis. Earth Surf. Proc. Landfonns 16. 399-409.
Elîas. J., Ruiz, J.. 1979. Preclpitaciones maxlmas en Espana. Ministerio de Agricultura, Madrid, 545 pp.Kirkby, M.J .. Cox, N.J., 1995. A c1imatlc index for soil erosion potential (CSEP) inc1uding seasonal and
vegetation factors. Catena 25, 333-352.Lavee, H., Yair, A., 1990, Spatial variabihty of overland flow in a small arid basin. Int. Assoc. Hydra!. Sci.
Pub\' 189. 105-120.L6pez-Bennûdez, F.. Roméro-Diaz, M.A.. Martinez-Femandez, J., 1991. Soil erosion in a semi-arid mediter
ranean environment. El Ardal Experimental field (Murcia. Spain). In: Sala, M.. RubiO. J.L., Garcia-Ruiz,lM <Bds.), Soil ErosIOn Studies in Spain. Geofonna Ediciones, Longrono. Spain, pp. 137-152.
Ludwig, J.A., Tongway, D.. 1995. Spatial organisation of landscapes and ItS function in semi-arid woodlands.Australia. Landscape Eco!. 10 (1), 51-63.
Montana. C.. 1992. The colonizallon of bare areas 10 two-phase mosaics of an arid ecosystem. J. Eco!. 80,315-327.
Pérez Cueva. A. 1994. Atlas climatlCo de la comunldad Valenciana. Comunidad Valenciana. Valencia, 205pp
Rivas Martinez. S., 1987. Memona dei mapa de series de vegetacion de Espana, ICONA. Madrid, 357 pp.Yalf, A. Lavee. H., 1985. Runoff generation in and and semi-and zones. In: Anderson. M.G., Burt, T.P.
<Bds.). Hydralogical Forecasting, Wiley. Chichester, pp. 183-220.Yalr, 1986.
ELSEVIER Catena 37 (1999) 147-163
CATENA
Laboratory experiments on sequentialscour/ deposition and their application to the
development of banded vegetation
R.B. Bryan *, S.E. BrunSOli EroslOn Laboratory, UllIl'ersity of Toronto, Scarborough, Canada
Received 13 January 1998; accepted 18 February 1999
Abstract
Altemating bands of vegetation and bare soil, reported from many dryland regions, have beenidentified as indicators of rangeland deterioration triggered by overgrazing, cattle trampling orclimatic change. Banded vegetation occurs at a range of scales and although it has been reportedfrom a number of different environments, it is not characteristic of ail degraded rangelands. Il doesappear particularly frequently on low angle, smooth slopes over soils of high erodibility but lowpermeability, where scant rainfall is sporadic or highly seasonal. It has been attributed both towind and to water erosion, but few data on the processes active or their specific response tolimiting environmental variables are available. Small-scale banded vegetation associated withsmall scour steps occurs on low angle alluvio-lacustrine flats sUITounding Lake Baringo insemi-and northem Kenya. In this area of strong moisture deficit, the dominant factor controllingthe incidence of ground vegetation is variation in near-surface moisture storage. The regularspacing of the small-scale vegetation bands reflects preferential moisture storage in regularlyspaced sediment deposits. Field and laboratory runon and rainfall simulation experiments,previously reported, provided sorne data on the processes and conditions involved in formation ofthese deposits. This paper describes more closely-controlled laboratory rainfall simulation andrunon experiments, carried out to identify the sequential scour and deposition processes involved,which are ultimately responsible for the regular variations in moisture storage capacity. Theseexperiments, carried out in an 8.5 m long flume, show critical stream power (il) conditions insheetwash and rain-impacted sheetflow required for sequential scourjdeposition as 0.020-0.025W m- 2 and between 0.043 and 0.055 W m- 2, respectively. Experimental results indicate thatvegetation bands at the scale observed at Baringo are consistent with development by sequentialscour and deposition. caused by sorne combination of sheetwash, rainsplash and rainflow. Thevegetation bands are composed primarily of unpalatable low herbaceous plants, dominated by
• Corresponding author. Tel.: + 1-416-978-5480; Fax: + 1-416-978-3834; E-mail: [email protected]
0341-8162/99/$ - see front matter © 1999 ElseVIer Science B.V. Ali rights reservedPlI: S0341-8162(99)00042-9
148 R.B. Brytln. SE Bnll1 / Carena 37 (1999) 147-163
Trianthellla triqUl'tra. These plants colonize or survive better on depositlOn zones because ofbetter soil moisture status. The vegetation bands can therefore indicate an initial stage invegetation recovery rather than continuing rangeland deterioration, but at Baringo further development of vegetation appears to be restricted by high grazing intensities or by allelopathy. © 1999Elsevier Science B.V. Ali rights reserved.
Keywol'ds. MOlsture detïclt: Land degradation; Scour and deposltion. Hydraulic condItIOns: Vegetationculonlzation
1. Introduction
Vegetation patterns in which more or less regularly spaced bands of vegetationalternate with zones of bare soil have been reported from many dryland regions (e.g ..Litchfield and Mabbutt 1962; Hemming, 1965; White, 1969, White, 1970, White, 1971;Mabbutt and Fanning, 1987; Cornet et al.. 1988, Cornet et al., 1992; Thiery et al., 1995).These features, referred to as banded vegetation, vegetation arcs, vegetation stripes orbrousse tigree, share superficial similarities, though there are considerable variations indetailed characteristics and relations to environmental controls. Ali reported occurrencesare from dry regions, but these cover a range of annual precipitation conditions from50-750 mm. The most critical feature appears to be sporadic or highly seasonalprecipitation, so that vegetation is moisture-limited for ail or pm1 of the year.
Vegetation bands occur on smooth, gentle slopes between 0.13° and 1.2°. and areusually, though not invariably, perpendicular to the slope direction. Related soils varybut are typically shallow, rich in fine particles, highly erodible. and often haveimpermeable layers close to the surface. Detailed characteristics are extremely varied,with reported band spacing ranging from 3 to 300 m, band width from 1 to 70 m, andband length from 5 to 800 m. Vegetation is also diverse; bands are usually dominated byannual and perennial herbs and grasses, but large scale features can include low shrubsand trees as weil. Good descriptions of the typical structure of larger bands from Mexico(Cornet et al.. 1988) and Niger (Thiery et al., 1995) show a degraded downslope zone, acentral closed bush/tree zone. and an upper pioneer zone. This structure markedlyinfluences moisture fluxes (Cornet et al., 1992: Holwill, 1997); bare soil areas concentrate runoff which infiltrates in the adjacent downslope vegetated band. As the vegetation develops, progressively less water reaches the downslope edge of the band, whichbecomes desiccated and degraded. At the upper edge, pioneer plants slowly invade thebare soil zone, so that the vegetation bands tend to migrate slowly upslope (Worrall,1959: Boaler and Hodge. 1964; Leprun, 1992).
Despite numerous good descriptions of the features, and several detailed studies ofmoisture dynamics, the processes involved in initiation of vegetation bands are stilluncertain. Ives (1946) in the western United States. and Audrey and Rossetti (1962) inMauretania attributed them to aeolian deposition, while Clos-Arceduc (1956) linkedtheir formation in Niger to decay of termite mounds with increasing aridity. Mostauthors (e.g., White, 1971; Rapp, 1974), however. have linked vegetation bands torangeland deterioration resulting from localized degradation of a vegetation cover byovergrazing, trampling or precipitation decline. Exposed or eroded soil, often crusted
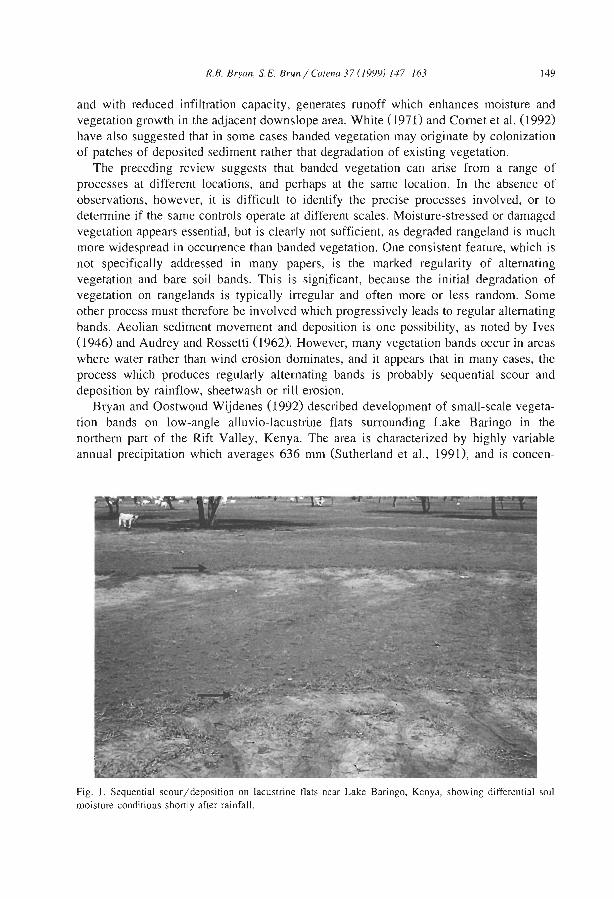
R.B. Bryan, SE Brun / Calena 37 (J9YY) /47-/63 149
and with reduced infiltration capacity, generates ronoff which enhances moisture andvegetation growth in the adjacent downslope area. White CI 971) and Cornet et al. CI 992)have also suggested that in sorne cases banded vegetation may originate by colonizationof patches of deposited sediment rather that degradation of existing vegetation.
The preceding review suggests that banded vegetation can arise from a range ofprocesses at different locations, and perhaps at the same location. In the absence ofobservations, however, it is difficult to identify the precise processes involved, or todetermine if the same controls operate at different scales. Moisture-stressed or damagedvegetation appears essential, but is clearly not sufficient, as degraded rangeland is muchmore widespread in occurrence than banded vegetation. One consistent feature, which isnot specifically addressed in many papers, is the marked regularity of alternatingvegetation and bare sail bands. This is significant, because the initial degradation ofvegetation on rangelands is typica1Jy irregular and often more or less random. Someother process must therefore be involved which progressively leads to regular alternatingbands. Aeolian sediment movement and deposition is one possibility, as noted by Ives(1946) and Audrey and Rossetti (1962). However, many vegetation bands occur in areaswhere water rather than wind erosion dominates, and it appears that in many cases, theprocess which produces regularly altemating bands is probably sequential scour anddeposition by rainflow, sheetwash or rill erosion.
Bryan and Oostwoud Wijdenes (1992) described development of small-scale vegetation bands on low-angle alluvio-Iacustrine flats surrounding Lake Baringo in thenorthem part of the Rift Valley, Kenya. The area is characterized by highly variableannual precipitation which averages 636 mm (Sutherland et al., 1991), and is concen-
Fig. 1. Sequential scour/deposition on lacustrine flats near Lake Baringo, Kenya, showing differential soil
moisture conditions shonly after rainfall.
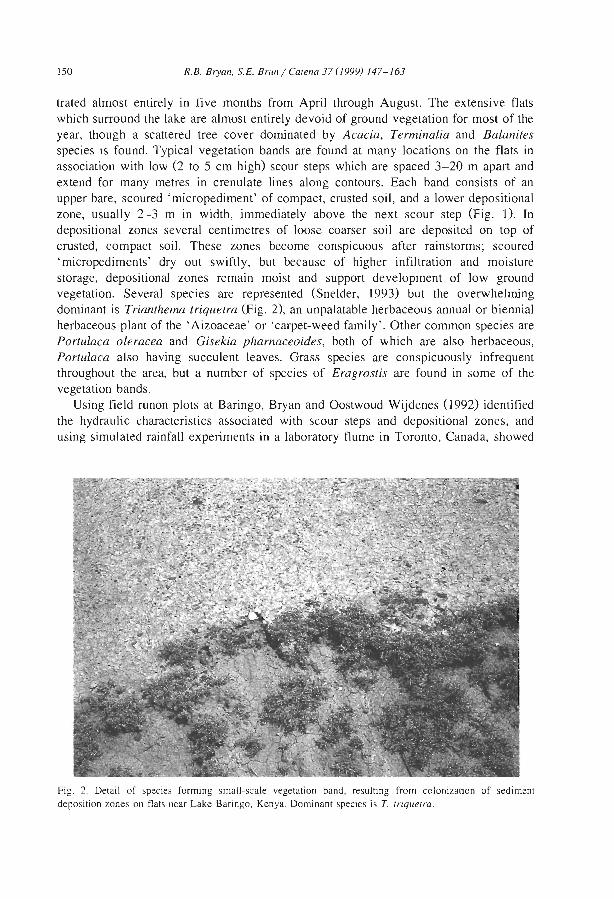
150 R.B. Bryan, S.E. Brun / Carena 37 (J999) 147-163
trated almost entirely in five months from April through August. The extensive flatswhich surround the lake are almost entirely de void of ground vegetation for most of theyear, though a scattered tree cover dominated by Acacia, Terminalia and Balanitesspecies is found. Typical vegetation bands are found at many locations on the flats inassociation with low (2 to 5 cm high) scour steps which are spaced 3-20 m apart andextend for many metres in crenulate !ines along contours. Each band consists of anupper bare, scoured 'micropediment' of compact, crusted soil, and a lower depositionalzone, usually 2-3 m in width, immediately above the next scour step (Fig. 1). Indepositional zones several centimetres of loose coarser soil are deposited on top ofcrusted, compact soil. These zones become conspicuous after rainstorms; scoured'micropediments' dry out swiftly, but because of higher infiltration and moisturestorage, depositionaJ zones remain moist and support development of low groundvegetation. Several species are represented (Snelder, 1993) but the overwhelmingdominant is Trianlhema triquetra (Fig. 2), an unpalatable herbaceous annual or biennialherbaceous plant of the' Aizoaceae' or 'carpet-weed family'. Other common species arePortulaca oleracea and Gisekia pharnaceoides, both of which are also herbaceous,Ponulaca also having succulent leaves. Grass species are conspicuously infrequentthroughout the area, but a number of species of Eragrostis are found in sorne of thevegetation bands.
Using field runon plots at Baringo, Bryan and Oostwoud Wijdenes (I992) identifiedthe hydraulic characteristics associated with scour steps and depositional zones, andusing simulated rainfall experiments in a laboratory flume in Toronto, Canada, showed
Fig. 2. Detail of species forming small-scale vegetation band, resulting from colonization of sedimentdeposition zones on fiats near Lake Baringo, Kenya. Dominant species is T. rriqllelra.
R.B. Bryan. s.E. Brun / Catena 37 (/999) 147-163 151
that scour steps very similar in size to those at Baringo can form due to hydraulicconditions in sheetflow. On the 1.5° flume slope, critical threshold conditions for scourinitiation were reached after flow lengths of approximately 10 m. Initial scour wasfollowed sequentially by alternating zones of deposition and renewed scour. Althoughthese experiments indicated linkage of sequential scour and deposition to hydraulicconditions, experimental controls were not sufficiently precise to permit clear definitionof linkages between scour step spacing and local hydraulic conditions. The experimentsdescribed in the present paper were carried out under more closely controlled conditionsto clarify these linkages and to provide a more precise understanding of the processeswhich control sequential scour and deposition and development of the small-scalevegetation bands at Baringo.
2. Experimental design
Experiments were carried out in the same 0.8 m wide laboratory flume used in theexperiments of Bryan and Oostwoud Wijdenes (1992), but in this case length wasrestricted to 8.5 m, and the f1ume was set at a range of angles from 0.026 (1.5°) to 0.087(5°). The initial intention was to generate mnoff by simulated rainfall, as in the previousexperiments. Three preliminary experiments with simulated rainfall did provide usefulresults, discussed below, but sorne difficulty was encountered in producing spatiallyhomogeneous rainfall, and therefore in ensuring that scour location was not an artifact ofrainfall patterns. Accordingly, it was decided to base subsequent experiments on mnongenerated by a constant head tank at the top of the flume. This produced controlleddischarges from 1.0 to 3.0 1 min-\ .
The soil used in the experiments was an artificial mixture of two natural soils fromthe vicinity of Toronto, the Pontypool fine loamy sand and the Peel clay, in a 4: 1 ratio.This mixture was originally used by Bryan and Poesen (1989) in experiments on mnoffand rill generation because of its sensitivity to surface sealing, and was also used for theoriginal experiments by Bryan and Oostwoud Wijdenes (1992). The basic properties ofthe mixture are shown in Table l, together with those of typical soils of the NjempsFlats at Baringo. The dispersed mixture is a fine sandy loam with 98% finer than 0.05mm, but as used in the flume, it includes sorne stable aggregates, and has a bimodal
Table 1Basic properties of artificial mixture of Ontario sOlls used in experiments compared with surface soil fromNJemps Flats. Baringo, Kenya
Pontypoolloamy sand: peel clay mixture Lameluk silt loam
Texture (USDA)Sand (%)Silt (%)Clay (%)WSA > 0.5 (%)Liquid limit (%)pH
Sandy loam49.432.518.134.017.18.1
Silt loam17.466.1
4.21.4
35.068
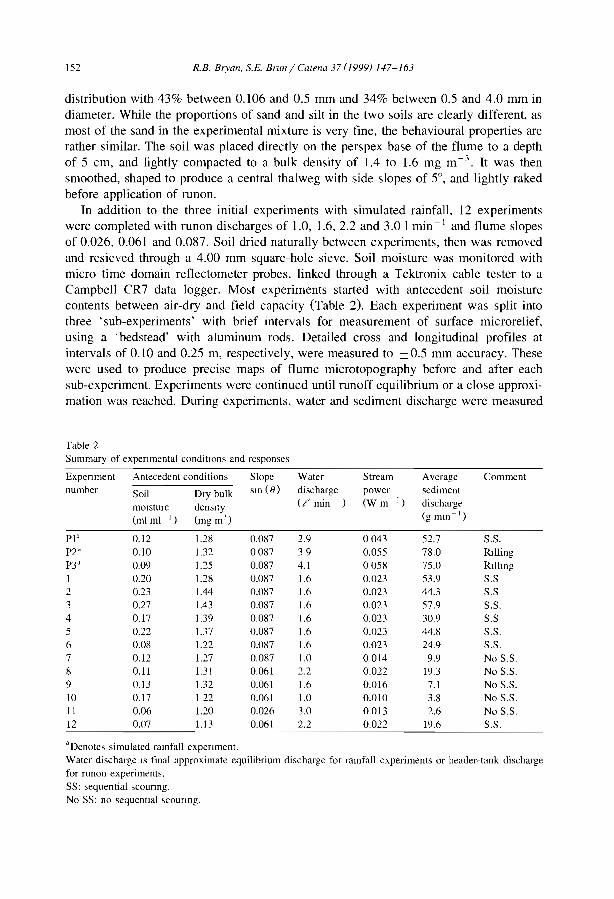
152 R.B. Brvan, s.E. Bnm / Calena 37 (/999) /47-/63
distribution with 43% between 0.106 and 0.5 mm and 34% between 0.5 and 4.0 mm indiameter. While the proportions of sand and silt in the two soils are clearly different, asmost of the sand in the experimental mixture is very fine, the behavioural properties arerather similar. The soil was placed directly on the perspex base of the flume to a depthof 5 cm, and lightly compacted to a bulk density of lA to 1.6 mg m - 3. It was thensmoothed, shaped to produce a central thalweg with side slopes of 5°, and lightly rakedbefore application of runon.
In addition to the three initial experiments with simulated rainfall, 12 experimentswere completed with runon discharges of 1.0, 1.6,2.2 and 3.0 1 min- I and flume slopesof 0.026,0.061 and 0.087. Soil dried naturally between experiments, then was removedand resieved through a 4.00 mm square-hole sieve. Soil moisture was monitored withmicro time domain reflectometer probes, linked through a Tektronix cable tester to aCampbell CR7 data logger. Most experiments started with antecedent soil moisturecontents between air-dry and field capacity (Table 2). Each experiment was split intothree 'sub-experiments' with brief intervals for measurement of surface microrelief.using a .bedstead' with aluminum rods. Detailed cross and longitudinal profiles atintervals of 0.10 and 0.25 m, respectively, were measured to ±0.5 mm accuracy. Thesewere used to produce precise maps of flume microtopography before and after eachsub-experiment. Experiments were continued until runoff equilibrium or a close approximation was reached. During experiments, water and sediment discharge were measured
Table 2Summary of expenmental conditIOns and responses
Expenment Antecedent conditions Slope Water Stream Average Commentnumber Soil Dry bulk sm (e) discharge power sediment
mOIsture denwy (1' min -[) (W m- è ) discharge
(ml ml- I ) (mg mJ)
(g nlLn - [)
PI' 0.12 1.28 0.087 2.9 0043 52.7 S.S.P2" 0.10 1.32 0087 39 0.055 78.0 RlllingP3" 0.09 l.25 0.087 4.1 0058 75.0 Rllhng1 0.20 l.28 0.087 1.6 0.023 53.9 S.S2 0.23 1.44 0.087 1.6 0.023 44.3 S.S3 0.27 1.43 0.087 1.6 0.023 57.9 S.S.4 0.17 1.39 0.087 1.6 0.023 30.9 S.S5 0.22 1.37 0.087 1.6 0.023 44.8 S.S.6 0.08 l.22 0.087 1.6 0.023 24.9 S.S.7 0.12 1.27 0.087 1.0 0.014 9.9 No S.S.8 0.11 1.3! 0.061 2.2 0.022 19.3 No S.S.9 0.13 1.32 0.061 1.6 0.016 7.1 No S.S.10 0.17 122 0.061 1.0 0.010 3.8 No S.S.11 0.06 1.20 0.026 3.0 0.013 2.6 No S.S.12 0.07 1.13 0.061 2.2 0.022 19.6 S.S.
"Denotes simulated ramfall expenment.Water discharge IS final approximate equilibrium discharge for ramfall experiments or header-tank dischargefor runon experiments.SS: ;equential ;counng.No SS: no sequenual scounng.
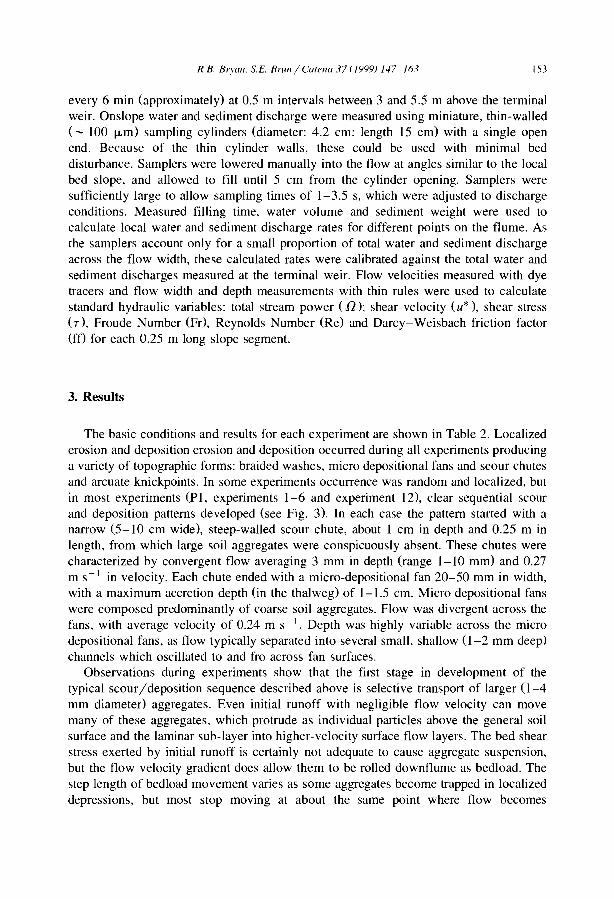
RB. Brya/l, SE Brull/Catena37(J')99) ].1.7-/63 153
every 6 min (approximately) at 0.5 m intervals between 3 and 5.5 m above the terminalweir. Onslope water and sediment discharge were measured using miniature, thin-walled(- 100 fLm) sampling cylinders (diameter: 4.2 cm: length 15 cm) with a single openend. Because of the thin cylinder walls, these could be used with minimal beddisturbance. Samplers were lowered manua11y into the flow at angles similar to the localbed slope, and a110wed to fill until 5 cm from the cylinder opening. Samplers weresufficiently large to a110w sampling times of 1-3.5 s, which were adjusted to dischargeconditions. Measured fïlling time, water volume and sediment weight were used tocalculate local water and sediment discharge rates for different points on the flume. Asthe sampIers account only for a sma11 proportion of total water and sediment dischargeacross the flow width, these calculated rates were calibrated against the total water andsediment discharges measured at the terminal weir. Flow velocities measured with dyetracers and flow width and depth measurements with thin rules were used to calculatestandard hydraulic variables: total stream power (il); shear velocity (u*), shear stress(d, Froude Number (Fr), Reynolds Number (Re) and Darcy-Weisbach friction factor(ff) for each 0.25 m long slope segment.
3. ResuUs
The basic conditions and results for each experiment are shown in Table 2. Localizederosion and deposition erosion and deposition occurred during a11 experiments producinga variety of topographie forms: braided washes, micro depositional fans and scour chutesand arcuate knickpoints. In sorne experiments occurrence was random and localized, butin most experiments (p l, experiments 1-6 and experiment 12), clear sequential SCOUT
and deposition patterns developed (see Fig. 3). In each case the pattern started with anarrow (5-10 cm wide), steep-wa11ed scour chute, about l cm in depth and 0.25 m inlength, from which large soil aggregates were conspicuously absent. These chutes werecharacterized by convergent flow averaging 3 mm in depth (range 1-10 mm) and 0.27m s- 1 in velocity. Each chute ended with a micro-depositional fan 20-50 mm in width,with a maximum accretion depth (in the thalweg) of 1-1.5 cm. Micro depositional fanswere composed predominantly of coarse soil aggregates. Flow was divergent across thefans, with average velocity of 0.24 m s- 1. Depth was highly variable across the microdepositional fans, as flow typica11y separated into several sma11, sha110w (1-2 mm deep)channels which osci11ated to and fro across fan surfaces.
Observations during experiments show that the first stage in development of thetypical scour/ deposition sequence described above is selective transport of larger (1-4mm diameter) aggregates. Even initial runoff with negligible flow velocity can movemany of these aggregates. which protrude as individual particles above the general soilsurface and the laminar sub-Iayer into higher-velocity surface flow layers. The bed shearstress exerted by initial runoff is certainly not adequate to cause aggregate suspension,but the flow velocity gradient does a110w them to be rolled downflume as bedload. Thestep length of bedload movement varies as sorne aggregates becorne trapped in localizeddepressions, but most stop moving at about the same point where flow becomes
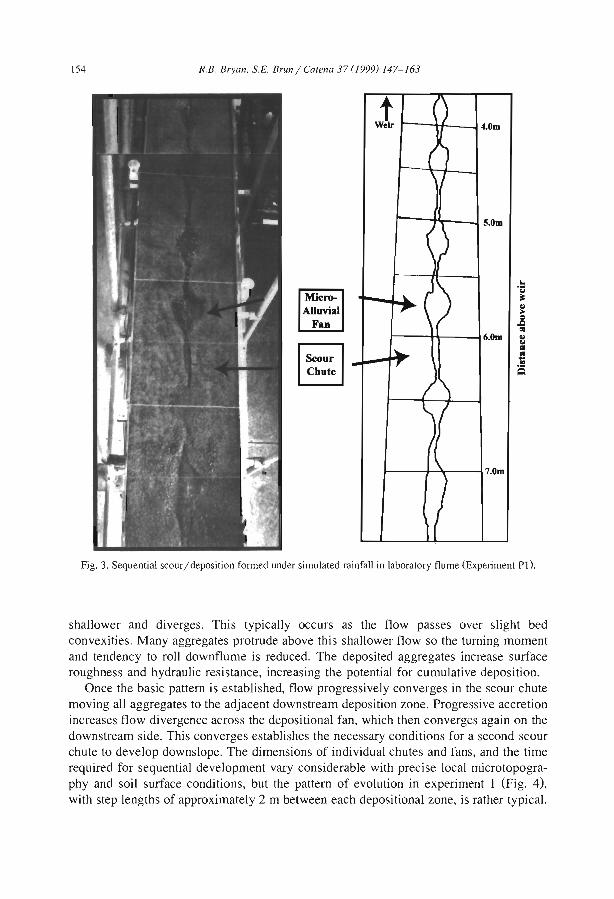
154 R,B, Bryan, S.E. Bruni Carena 37 (1999) 147-163
'--;-I---I4.0m
r---1~--J !'i.Om
1-----I-:lr-----I7.0m
tWelr
.!::IMicro-
..it
Alluvial ..~
Fan oB..6.Om .....
§ J.:l
Chute Cl
Fig. }, Sequential scour/deposition formed under simulated rainfall in laboratory flume (Experiment pl).
shallower and diverges. This typically occurs as the flow passes over slight bedconvexities. Many aggregates protrude above this shallower flow so the turning momentand tendency to roll downflume is reduced. The deposited aggregates increase surfaceroughness and hydraulic resistance, increasing the potential for cumulative deposition.
Once the basic pattern is established, flow progressively converges in the scour chutemoving ail aggregates to the adjacent downstream deposition zone. Progressive accretionincreases flow divergence across the depositional fan, which then converges again on thedownstream side. Tlùs converges establishes the necessary conditions for a second scourchute to develop downslope. The dimensions of individual chutes and fans, and the timerequired for sequential development vary considerable with precise local microtopography and soil surface conditions, but the pattern of evolution in experiment 1 (Fig. 4),with step lengths of approximately 2 m between each depositional zone, is rather typical.
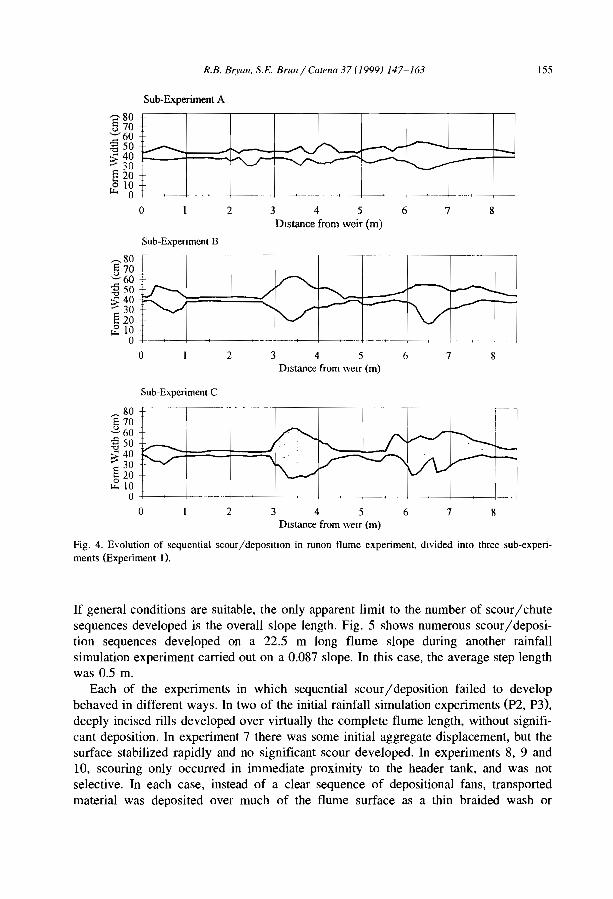
R.B. Bryull. S.E. B'lm j Catena 37 (1999) 147-163 155
Sub-Experimenl A
873 4 5 6Distance from weir (m)
2
~80
§ 70:;;- 60
-0 50 >-::::=.......::::::j:==:::::::::~~-;::+=:~;; 401"-.... 30§ 20o 10
p;.. 0 -+-~--I
o
Sub-Expenmcnt B
2
~80
570~60
-5 'i0-g 40
iîL ~_~--+_~o 1 345
Distance from welr (m)6 7 8
Sub-Expcriment C
8762
Ê~~ 1-- --~60-5 50-g 40~ 30§ 20~10
o -+--~-+----~- ----+-------+-~--+-~--+--
o 345Distance from welr (m)
Fig. 4. Evolution of sequential scourjdeposition in runon flume experiment, dlvided into three sub-experiments (Experiment I).
If general conditions are suitable, the only apparent limit to the number of scour/ chutesequences developed is the overall slope length. Fig. 5 shows numerous scour/deposition sequences developed on a 22.5 m long flume slope during another rainfallsimulation experiment carried out on a 0.087 slope. In this case, the average step lengthwas 0.5 m.
Each of the experiments in which sequential scour/ deposition failed to developbehaved in different ways. In two of the initial rainfall simulation experiments (P2, P3),deeply incised rills developed over virtually the complete flume length, without significant deposition. In experiment 7 there was sorne initial aggregate displacement, but thesurface stabilized rapidly and no significant scour developed. In experiments 8, 9 and10, scouring only occurred in immediate proximity to the header tank, and was notselective. In each case, instead of a clear sequence of depositional fans, transportedmaterial was deposited over much of the flume surface as a thin braided wash or
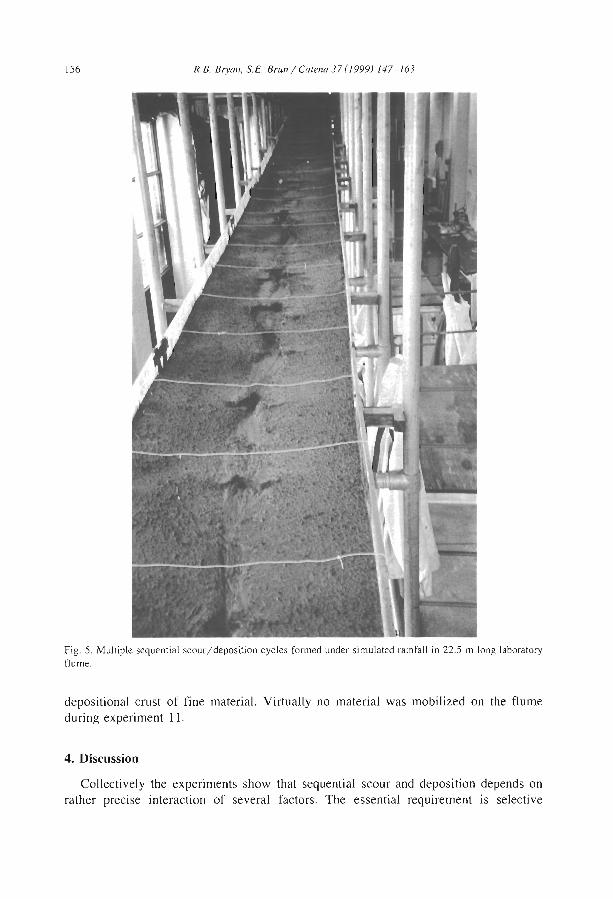
156 R.B. Bryan, s.E. Brun j CG/enG 37 (/999) /47-/63
Fig. 5. Multiple sequential scourjdeposition cycles formed under simulated rainfall in 22.5 m long laboratoryfJume.
depositional crust of fine materiaJ. Virtually no material was mobilized on the flumeduring experiment 11.
4. Discussion
Collectively the experiments show that sequential scour and deposition depends onrather precise interaction of several factors. The essential requirement is selective
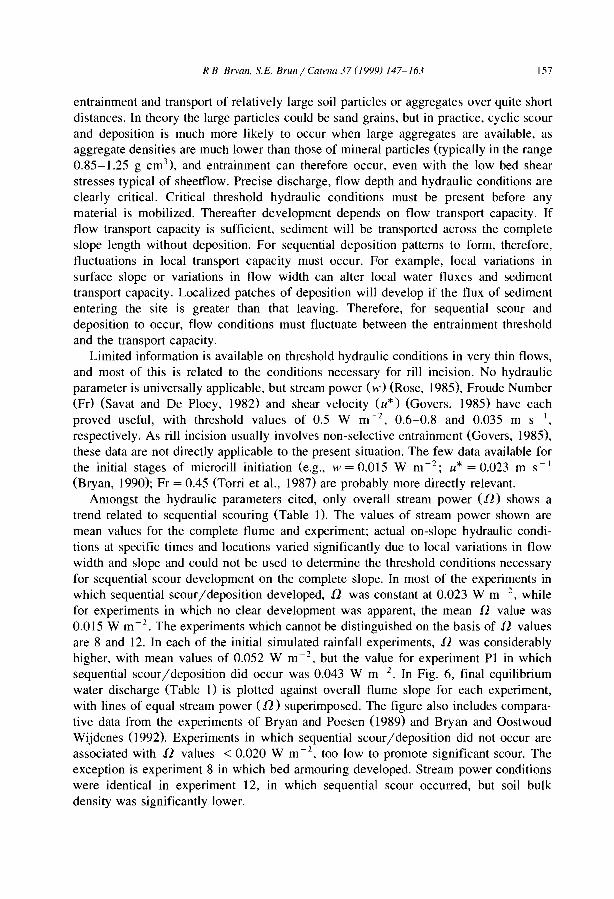
RB Brvan, S.E. BrUil/Catel1l137(I999) 147-163 157
entrainment and transport of relatively large soil particles or aggregates over quite shortdistances. In theory the large particles could be sand grains, but in practice, cyclic scourand deposition is much more likely to occur when large aggregates are available, asaggregate densities are much lower than those of minerai particles (typically in the range0.85-1.25 g cm'), and entrainment can therefore occur, even with the low bed shearstresses typical of sheetflow. Precise discharge, flow depth and hydraulic conditions areclearly critical. Critical threshold hydraulic conditions must be present before anymaterial is mobilized. Thereafter development depends on flow transport capacity. Ifflow transport capacity is sufficient, sediment will be transported across the completeslope length without deposition. For sequential deposition patterns to form, therefore,fluctuations in local transport capacity must occur. For example, local variations insurface slope or variations in flow width can alter local water fluxes and sedimenttransport capacity. Localized patches of deposition will develop if the flux of sedimententering the site is greater than that leaving, Therefore, for sequential scour anddeposition to occur, flow conditions must fluctuate between the entrainment thresholdand the transport capacity.
Limited information is available on threshold hydraulic conditions in very thin flows,and most of this is related to the conditions necessary for rill incision. No hydraulicparameter is universally applicable, but stream power (w) (Rose, 1985), Froude Number(Fr) (Savat and De Ploey, 1982) and shear velocity (u*) (Govers, 1985) have eachproved useful, with threshold values of 0.5 W m - 2, 0.6-0.8 and 0.035 m s- 1,
respectively. As ril1 incision usually involves non-selective entrainment (Govers, 1985),these data are not directly applicable to the present situation. The few data available forthe initial stages of microril1 initiation (e.g., w = 0.015 W m-2; u* = 0.023 m s - 1
(Bryan, 1990); Fr = 0.45 (Torri et al., 1987) are probably more directly relevant.Amongst the hydraulic parameters cited, only overal1 stream power (n) shows a
trend related to sequential scouring (Table 1). The values of stream power shown aremean values for the complete flume and experiment; actual on-slope hydraulic conditions at specific times and locations varied significantly due to local variations in flowwidth and slope and could not be used to determine the threshold conditions necessaryfor sequential scour development on the complete slope. In most of the experiments inwhich sequential scour/deposition developed, n was constant at 0.023 W m- 2
, whilefor experiments in which no clear development was apparent, the mean n value was0.015 W m- 2
• The experiments which cannot be distinguished on the basis of n valuesare 8 and 12. In each of the initial simulated rainfal1 experiments, n was considerablyhigher, with mean values of 0.052 W m-2, but the value for experiment PI in whichsequential scour/ deposition did occur was 0.043 W m- 2. In Fig. 6, final equilibriumwater discharge (Table 1) is plotted against overal1 flume slope for each experiment,with lines of equal stream power (n) superimposed. The figure also inc1udes comparative data from the experiments of Bryan and Poesen (1989) and Bryan and OostwoudWijdenes (J 992). Experiments in which sequential scour/ deposition did not occur areassociated with n values < 0.020 W m -2, too low to promote significant scour. Theexception is experiment 8 in which bed annouring developed. Stream power conditionswere identical in experiment 12, in which sequential scour occurred, but soil bulkdensity was significantly lower.
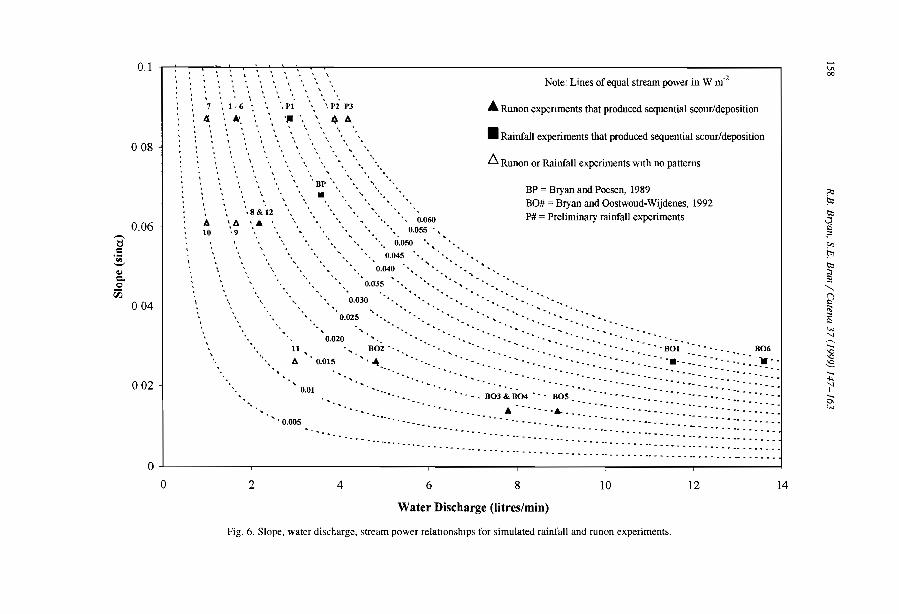
0.1Note: Unes of equal stream power in W m
o2VI00
008
7 : 1 - 6
il A',
',Pl
'II "'.P2 P3
* A"
""
"
• Runon expenments that produced sequential scour/deposition
• Rainfall experiments that produced sequential scour/deposition
!':,. Runon or Rainfall experiments wlth no patterns
. 0.005
0.01
0.025"
?:J~
tll
j'"~tll~::
........
o§l:lV,'ol~......~~......-l:<j'J......0V,
............ .. -- .......... - ........ .. - .... .... - ........ - ... oo .. - ........ __
BP = Bryan and Poesen, 1989BO# = Bryan and Oostwoud-Wijdenes, 1992P# = Preliminary rainfall experiments
• ' 'BOl '--. _ B06
, -. '- , - -::: .. :.- -~: :::: :- :: :::~ :-.......
"
- .. .. - .........
, .. " BO;';''iÎ04 '. - BOS
A - - - - ••. A. __ :: : : :: : : •
"
'.•••• 0,060
", 0.055',
" 0.050 ",
0.045 , ,0.040 "
0.035
'."
"
"
'.
"
'.
0.030
" .
"
'.
'.
,0.020
-.- ..
BOl'· .
0.015 ' , -4
, , ,
'.'.
"'.
BP ,. .
'.
'.
"
11
tJ.
'."
"
"
'.8& 12
'&
..
, ,
'tJ."9
"
002
- -- -- _ - - ..
o 1 1
o 2 4 6 8 10 12 14
Water Discharge (litres/min)
Fig. 6. Slope, water discharge, stream power relatlonshlps for simulated rainfall and runan experiments.

R.B. Bryan, SE Brun / Carena 37 (J999) 147-163 159
In addition to the mean data for each experiment shown in Table 2, the hydraulicconditions at the precise location and time at which initial scour developed during themost of the runon experiments have been isolated. The mean values for u*, T, Fr, and w(unit stream power) for experiments 1-6 (scouring) are 0.48 m s-1, 2.35 Pa, 1.34 and0.52 W m- 2
, compared with values for experiments 7-10 (non-scouring) of 0.039 mS-I, 1.53 Pa, 1.47 and 0.34 W m- 2
, respectively. Values for u* and w for scour anddeposition agree closely with the values for riH initiation cited by Rose (1985) andSlattery and Bryan (1992).
Stream power is an index of the conditions necessary for initial selective transport, inthis case flow with a strong velocity gradient, just sufficiently deep to immerse anddestabilize protruding particles. The precise threshold value should reflect soil surfaceconditions and the height to which individual large particles protrude above the generalsurface. Clearly a sufficient proportion of particles must protrude, become destabilizedand move, to produce a significant deposition zone, with associated feedback effects onsurface roughness and hydraulic roughness. From this, it would appear that soils withstrongly bimodal particle size distribution would be particularly suitable, though notnecessarily essential, for sequential scour and deposition. The process will be enhancedif the large particles are aggregates with low particulate density and resistance to rolling.
Data from the runon experiments of Bryan and Oostwoud Wijdenes (1992) atBaringo plot (Fig. 6; B02-B05) almost exactly on the same threshold il value as theexperiments in which sequential scouring developed in this project. It should be noted,however, that sequential scour steps already existed before the Baringo runon experiments. These were presumably formed by rain-impacted sheetflow or rainflow during aseries of rainstorms. The laboratory simulated rainfall experiments (P1) show thatsequential scour and deposition can form in such conditions, if the stream power is nottoo high. In these experiments, the upper threshold stream power (il) value whichseparates sequential scour from continuous riH incision appears to be about 0.05 W m- 2 •
In Bryan and Oostwoud Wijdenes' comparable laboratory experiments, sequentialscouring developed with il values of 0.05 and 0.058 W m- 2. The difference betweenthese results probably reflects the fact that in the latter experiment, the flume bed wasnot shaped to form a central thalweg, and so higher threshold stream power values wererequired before continuous rill development could occur.
The data from ail these simulated rainfaH experiments, together with those of Bryanand Poesen (1989) (Fig. 6) indicate that raindrop impact increases the threshold streampower necessary for selective transport. One effect of rainsplash is to disrupt the laminarsub-Iayer in sheetwash, reducing the flow velocity gradient, and limiting the tendencyfor protruding aggregates to roll. Sorne of the aggregates will breakdown under raindropimpact, so the net effect will be reduced selective transport of aggregates. Large sandgrains will become more significant in selective transport, which because of higherdensity will require higher threshold stream power. Rainsplash is selective in bothentrainment and transportation (Savat and Poesen, 1981), but is strongly affected by therunoff depth, diminishing swiftly once depth exceeds the median drop diameter. Splashintensity also generally diminishes rapidly after the first 10 min of rainfall, particularlyon soils sensitive to sealing (Slattery and Bryan, 1992). It seems likely that the dominantprocess in both the initial laboratory experiments (PI-P3) and in the field at Baringo,
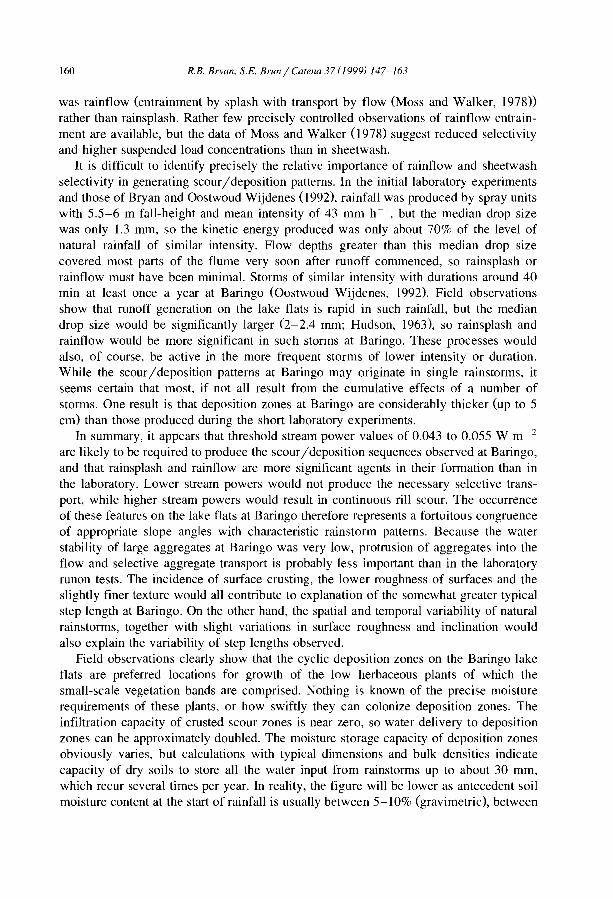
160 R.B. Bryan. S.E. Brun / Cafella 37 (1999) 147-163
was rainfiow (entrainment by splash with transport by fiow (Moss and Walker, 1978))rather than rainsplash. Rather few precisely controlled observations of rainfiow entrainment are available, but the data of Moss and Walker (I978) suggest reduced selectivityand higher suspended load concentrations than in sheetwash.
It is difficult to identify precisely the relative importance of rainfiow and sheetwashselectivity in generating scour j deposition patterns. In the initial laboratory experimentsand those of Bryan and Oostwoud Wijdenes (1992), rainfall was produced by spray unitswith 5.5-6 m fall-height and mean intensity of 43 mm h- 1, but the median drop sizewas only 1.3 mm, so the kinetic energy produced was only about 70% of the level ofnatural rainfall of similar intensity. Flow depths greater than this median drop sizecovered most parts of the fiume very soon after runoff commenced, so rainsplash orrainfiow must have been minimal. Storms of similar intensity with durations around 40min at least once a year at Baringo (Oostwoud Wijdenes, 1992). Field observationsshow that runoff generation on the lake fiats is rapid in such rainfall, but the mediandrop size would be significantly larger (2-2.4 mm; Hudson, 1963), so rainsplash andrainfiow would be more significant in such storms at Baringo. These processes wouldalso, of course, be active in the more frequent storms of lower intensity or duration.While the scour j deposition patterns at Baringo may originate in single rainstorms, itseems certain that most, if not ail result from the cumulative effects of a number ofstorms. One result is that deposition zones at Baringo are considerably thicker (up to 5cm) than those produced during the short laboratory experiments.
In summary, it appears that threshold stream power values of 0.043 to 0.055 W m - 2
are likely to be required to produce the scourjdeposition sequences observed at Baringo,and that rainsplash and rainfiow are more significant agents in their formation than inthe laboratory. Lower stream powers would not produce the necessary selective transport, while higher stream powers would result in continuous rill scour. The occurrenceof these features on the lake fiats at Baringo therefore represents a fortuitous congruenceof appropriate slope angles with characteristic rainstorm patterns. Because the waterstability of large aggregates at Baringo was very low, protrusion of aggregates into theflow and selective aggregate transport is probably less important than in the laboratoryrunon tests. The incidence of surface crusting, the lower roughness of surfaces and theslightly finer texture would ail contribute to explanation of the somewhat greater typicalstep length at Baringo. On the other hand, the spatial and temporal variability of naturalrainstorms, together with slight variations in surface roughness and inclination wouldalso explain the variability of step lengths observed.
Field observations clearly show that the cyclic deposition zones on the Baringo lakefiats are preferred locations for growth of the low herbaceous plants of which thesmall-scale vegetation bands are comprised. Nothing is known of the precise moisturerequirements of these plants, or how swiftly they can colonize deposition zones. Theinfiltration capacity of crusted scour zones is near zero, so water delivery to depositionzones can be approximately doubled. The moisture storage capacity of deposition zonesobviously varies, but calculations with typical dimensions and bulk densities indicatecapacity of dry soils to store ail the water input from rainstorms up to about 30 mm,which recur several times per year. In reality, the figure will be lower as antecedent soilmoisture content at the star! of rainfall is usually between 5-10% (gravimetric), between
R,B, BrWIIl, S.E. Bnlll/Catella37(J999J J.l7-J63 161
field capacity and wilting point, but this is counterbalanced by the effect of rootdeveloprnent and enhanced activity of rnicroorganisrns on percolation into underlyingsoil. Although the vegetation bands wither during dry weather, the rapidity of responseafter rainfall suggests that rnany plants remain viable for prolonged periods. In theory,prolonged proliferation of these low herbaceous plants in should provide a preferredlocation for colonization by grasses and higher plants. There is, in fact, little evidence offurther developrnent, suggesting that grazing pressures on the Baringo lake flats are toohigh to allow colonization by anything other than unpalatable plants, or perhaps that theherbaceous plants are allelopathic.
5. Conclusion
Most banded vegetation is attributed in literature reports to vegetation degradation byovergrazing, trarnpling and drought. While such degradation certainly causes plant stressand can produce patches of bare soil, typically these are initially rather randorn inorganization. Sorne further process is necessary to organize these patches into theregular alternating bands typically described in the literature. In rnost cases this processis probably selective soil erosion and deposition, supported by feedback effects on waterinfiltration and plant growth, Most reported occurrences of banded vegetation are atquite large scales, but srnall scale examples also occur on lake flats in northern Kenya,where low herbaceous plants preferentially colonize, or survive on, srnall alluvialdeposits which provide enhanced moisture storage capacity, In sorne cases these srnallvegetation bands rnay represent a first stage in the recolonization of severely degradedsurfaces, rather than a late stage in vegetation deterioration.
Laboratory experiments show that regular sequential seour/ deposition patterns candevelop on bare, homogeneous soil surfaces at scales similar to those in the field inKenya, The key process in laboratory runon experiments is selective rolling of largeaggregates which protrude across a steep velocity gradient in sheetflow. These aretransported for varied step lengths, but are soon deposited as small alluvial fans indiverging shallower flow. The critical environmental condition is irregular shallow flowwith a combination of slope inclination and runoff discharge which causes stream powerto fluctuate above and below values of about 0.020-0.025 W m- ~. Flows of higherstream power prevent significant deposition and lead to continuous rill scour.
Most of the laboratory features are produced by runon while those in the field inKenya develop in rain-impacted flow, and are probably in part due to rainsplash andrainflow erosion. Sirnulated rainfall experiments in this project and previous studiesshow that the critical stream power values for formation of scour/ deposition features inrain-impacted flow vary between about 0,043 and 0,055 W rn -2, depending on thedegree of flow concentration caused by surface microtopography. It appears that thesignificance of aggregate selective transport is reduced under rainfall. Because of verylow water-stable aggregation, finer soil textures and srnoother slopes, step lengthsbetween successive deposition zones are typically longer in the field at Baringo than inthe laboratory.
162 R.B. Bryan. S.E. Brun / Catena 37 (1999) 147-163
The laboratory conditions clearly differed from those in the field, with somewhatsteeper slopes and clearly defined thalwegs with relatively steep 'interrilI' slopes.Nevertheless the experiments show that transverse deposition zones can evolve fromprimarily linear flow patterns. This evolution will be more pronounced in the field inBaringo, where 'interrill' slopes approach zero, and will probably also be enhanced bythe surface roughness of colonizing vegetation.
The study shows that vegetation bands at this scale can develop as a result ofsequential scourjdeposition processes in runon and rain-impacted sheetflow, wheredeposit zones establish suitable conditions for colonization by sorne plants. These smallscale vegetation bands may evolve into large-scale features with shrub and treecomponents, though this is apparently currently precluded at Baringo by intense grazingpressures or allelopathy. Nevertheless it does appear that these small scale vegetationbands can represent a stage in recovery of degraded surfaces rather that unequivocalevidence of advancing degradation.
Acknowledgements
This study was supported by research grants to R.B. Bryan from the Natural Sciencesand Engineering Research Council, Canada, and the International Development Research Centre, Ottawa, which are gratefully acknowledged. The experimental work wasassisted by Neely Law, Niklaus Kuhn, Martin Gleixner and Ali Basiji. An earlier versionof the paper was improved by valuable comments from Mike Kirkby, Ian Prosser and ananonymous reviewer. This assistance is greatly appreciated.
References
Audrey, P.. Rossetti, Ch.. 1962. Observations sur les Sols et la Vegetation en Mauntanie du Sud-Est et sur laBordure adjacent du Mali, FAO, Rome.
Boaler, S.B .. Hodge, CA.H .. 1964. Observations on vegetation arcs In the northern region, Somali Republic.J. Ecol. 52, 511-544.
Bryan, RB., 1990. KnickpOlnt evolution In nllwash. In: Bryan, RB. (Ed.), Soil ErosIOn: Experiments andModeb, Catena, Supp. Bd., 17. pp. 111-132.
Bryan, RB., Oostwoud Wijdenes, D., 1992. Field and laboratory experiments on the evolutlOn of microstepsand scour channels on low-angle slopes. In: Schmidt, K.H., De Ploey, J. (Eds.). FunctlOnal Geomorphology: Landfonn Analysis and Models, Catena, Supp. Bd., 23, pp. 1-29.
Bryan, R.B .. Poesen. J.W.A.. 1989 Laboratory experiments on the influence of slope length on runoff.percolation. and nl! development. Earth Surface Processes and Landforms 12,211-231.
Clos-Arceduc, M., 1956 Etude sur photographhies aeriennes d'une formation vegetale sahelienne: la broussetigree. Bull. de l'IFAN, Ser A 7 (3). 677-684, Clted by Thiery et al., 1995.
Cornet, A.. Delhoume, J.P , Montana, C, 1988. Dynaffilcs of striped vegetatIon patterns and water balance In
the Chihuahuan Desert. In. During, H.J., Werger, M.J.A., WIllems, J.B. (Eds.), Diversity and Pattern inPlant Communities, SPB Acadeffilc Publishing, The Hague, The Netherlands, pp. 221-231.
Cornet, A., Montana, C, Delhoume, J P, Lopez-Portillo, J.. 1992. Water flows and the dynamics of desertvegetation stripes. In: Hansen, A J .. De Castri, F. (Eds.), Landscape Boundaries Consequences for BioticDiversity and Ecological Flows, EcologlCal Studies. 92, Spnnger Verlag. New York, pp. 327-345.
Govers, G.. 1985. Selectivity and transport capacity of thin flows in relatIOn to rill eroslOn. Catena 12,35-50.

R.B. Bryall. SE Brull / Catellll 37 (1999) 147-163 163
Hemming. C.F.. 1965. Vegetation arcs In Somaliland. J. Eco!. 53, 57-68.Holwtll. C J , 1997. SOli evaporatlon from llger-brush in south-west Niger. J. Hydrol 189,426-442.Hudson, N.W., 1963. RaIndrop 'I,(e d"tnbution In hlgh Inten"ty ,torms. Rhode'lan J. Agnc. Re~. 1. 6-11Ives, R.. 1946. Desert ripples. Am. J. SCI. 244,492-501.Leprun, J.c., 1992. Etude de quelques brousses tigrees saheliennes:structure, dynamique, ecologle ln: Le
Floc'h, E., GrouZIS, M., Cornet, A., BJ1le, J.c. Œds.l, L'Andite, Une Contrainte au Developpement,ORSTOM Coll. Didactiques, Paris, pp. 221-244.
Lltchfield, W.D., Mabbutt, J.A., 1962. Hardpan soil of semiarid southwestern Austraha. J. SOli SCI. 13,148-159.
Mabbutt, J.A.. Fanning, P.C.. 1987. VegetatIOn bandIng In arid western Australia. J. And Environ. 12,41-59.Moss, AJ., Walker, PH, 1978. Particle transport by continental water tlows in relation to erosion, deposltion,
soils and human actlVlties. Sedlmentary Geol. 20, 81-139.Oostwoud Wijdenes, DJ.. 1992. The dynamics of gully-head erosion on a semi-arid piedmont plain, Baringo
District, Kenya. Unpublished PhD thesis, University of Toronto, 212 ppRapp, A, 1974. A review of desertization In Afnca. Water, vegetation and man SIES Report, l, Secretanat
for International Ecology, Stockholm, 77 pp.Rose, C.W., 1985. Developments in soil erosional and depositional models. Adv. Soil Sci. 2, 1-63Savat, J., De Ploey, 1.. 1982. Sheetwash and nll development by surface tlow. In: Bryan, RB., Yalr, A (Eùs.),
Badland Geomorphology and Piping, Geobooks, Norwich, pp. 113-126.Savat, J., Poesen, J W A.. 1981 Detachment and transportatIOn of loose sediments by rainùrop splash: I. The
calculation of absolute data on detachablhty and transportabllity. Catena 8, 1-\7.Slattery, M.C., Bryan, RB., 1992. Hydrauhc condItions for rill inCISiOn under slmulated raInfall: a laboratory
experiment Earth Surface Processes and Landfonns \7, 127-146Snelder, DJ.R.M., 1993. Methods of rangeland improvement anù revegetatlOn for denuùeù, ,eml-and ,avanna
areas in the Baringo District, Kenya. Unpublished PhD thesis, University of Toronto, 208 pp.Sutherland, R.A, Bryan, RB., Oostwoud Wljdenes, D., 1991. Analysis of the monthly and annuai raInfali
c1imate In a seml-and environment, Kenya. J. And EnViron. 20, 257-275.Thiery, J.M., D'Herbes, J.-M.. Valentin, c., 1995. A model slmulating the genesis of banded vegetallon
patterns in Niger. J. Eco!. 83, 497-507.Torn, D., Sfalanga.. ChiscI, G.. 1987. Threshold condIlions for Incipient rilhng. In: Bryan, R.B. (Ed.), Rtll
Erosion: Processes and Slgnificance, Catena, Supp Bù., 8, pp. 97-105White, L P.. 1969. Vegetation arcs In Jordan. J. Ecol 57,461-464.White, L.P.. 1970. 'Brousse tigree' patterns In southern Niger. J. Ecol. 58, 549-553.White, L.P., 1971 Vegetation stripes on sheet wash surface. J. Eco\. 59, 615-622Worrall, G.A., 1959. The BUlana grass patterns. J. Soil SCI. 10,34-53.

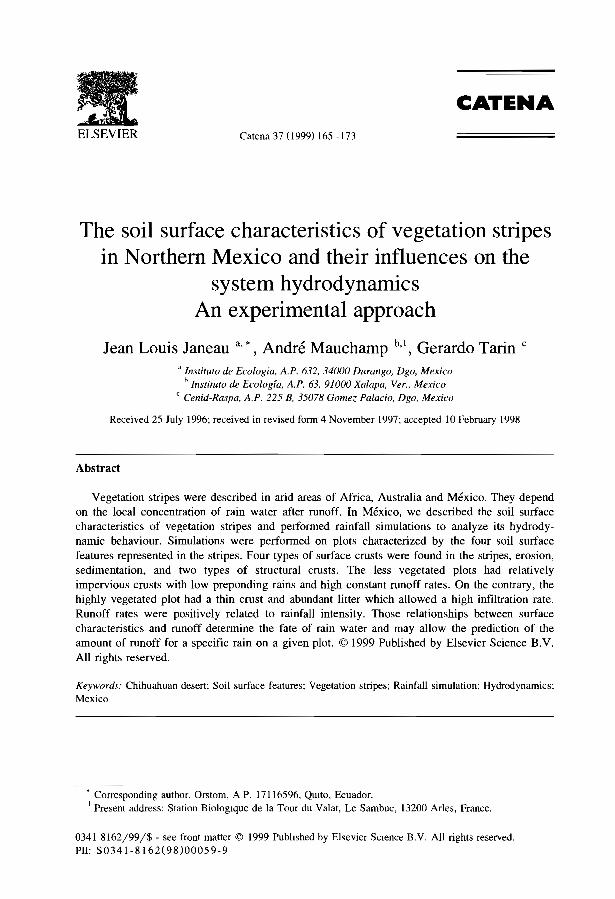
ELSEVIER Catena 37 (J 999) 165-173
CATENA
The soil surface characteristics of vegetation stripesin Northem Mexico and their influences on the
system hydrodynamicsAn experimental approach
Jean Louis Janeau a, *, André Mauchamp b,l, Gerardo Tarin c
d lnstituto de Ecologia, AP. 632, 34000 Durango, Dgo, Mexicob lnstituto de Ecologfa, AP. 63, 91000 Xalapa, Ver., Mexico
C Cenid-Raspa, AP. 225 B, 35078 Gomez Palacio, Dgo, Mexico
Received 25 July 1996; received in revised form 4 November 1997; accepted Lü February 1998
Abstract
Vegetation stripes were described in arid areas of Africa, Australia and México. They dependon the local concentration of rain water after runoff. In México, we described the soil surfacecharacteristics of vegetation stripes and performed rainfall simulations to analyze its hydrodynamic behaviour. Simulations were performed on plots characterized by the four soil surfacefeatures represented in the stripes, Four types of surface crusts were found in the stripes, erosion,sedimentation, and two types of structural crusts. The less vegetated plots had relativelyimpervious crusts with low preponding rains and high constant runoff rates. On the contrary, thehighly vegetated plot had a thin crust and abundant litter which allowed a high infiltration rate.Runoff rates were positively related to rainfall intensity. Those relationships between surfacecharacteristics and runoff determine the fate of rain water and may allow the prediction of theamount of runoff for a specifie rain on a given plot. © 1999 Published by Elsevier Science B.V.Ali rights reserved.
Keywords: Chihuahuan desert; Soil surface features; Vegetation stripes; Rainfall simulation; Hydrodynamics;Mexico
• Corresponding author. Orstom, A P. 17116596, QUito, Ecuador.1 Present address: Station Biologique de la Tour du Valat, Le Sambuc, 13200 Arles, France.
0341-8162/99/$ - see front matter © 1999 Publlshed by Elsevier SCience B.V. Ali rights reserved.PlI: S0341-8162(98)00059-9
166
1. Introduction
J.L. Janeall et al. / Catella 37 (J999J 165-173
The vegetation stripes, called 'mogotes' in Northern México, correspond to a verysimilar formation known as the 'brousse tigrée' described in Sahelian Africa (ClosArceduc, 1956; Hemming, 1965; White, 197 I) or the 'mulga groves' in Australia(Litchfield and Mabbut, 1962; Tongway and Ludwig, 1990). In Northern México, it isan important source of forage for the cattle and a source of fire wood. It is a successionof densely vegetated stripes and bare soil areas (Cornet et al., 1988; Montana andBreimer, 1988; Delhoume, 1988). The vegetation stripes are approximately 50 m wideper 200 to 300 m long and are separated by bare soil stripes of about 250 m wide. Theyare found on slopes less than 1% and are parallel to the contour lines. The c1imatic andtopographic conditions in which such striped patterns are found in Africa are similar tothose of Northern México (Gallais, 1967; in Mauritania, Audry and Rossetti, 1962; inMali, Leprun, unpublished; 2 in Niger, Ambouta, 1984; in Burkina Faso, Serpantie etal., 1992). In Mapimi, average annual rainfall is 264 mm and slope 0.9 to l.l %. A verygentle upslope movement of the stripes is evidenced by the structure of the vegetationand the presence of remnants of trees and shrubs in the bare zone just downslope of astripe (Mauchamp et al., 1993). This dynamics is due to a preferential establishment ofseedlings at the upper edge which receives more water from runoff, and on the contrary,an increased mortality at the lower edge (Cornet et al., 1988; Montana, 1992; Mauchampet al., 1993). Several authors suggested that a progressive modification of the Il soilsurface features was responsible for the dynamics. These modifications would lead tochanges in the infiltration rates and the water storage capacity of the soil, and wouldfurther affect the vegetation dynamics (Boaler and Hodge, 1964; White, 1971; Yeaton etal., 1977; Cornet et al., 1988; Montana, 1992; Mauchamp, 1992). Soil surface featuresare characterised by the vegetation itself, the superficial pedological structure and resultfrom complex interactions between flora, fauna, meteorological and possibly anthropological factors (Casenave and Valentin, 1992).
To characterise the spatial variability of the soil surface features and their role in thehydrodynamics of the vegetation stripes, we first described them along a transectperpendicular to the main axis of a stripe together with the detailed topography. Thetransect (Fig. I) crossed a bare zone (Plot I) and the pioneer (Plot 2), central (Plot 3)and senescence (Plot 4 in limir) zones of a stripe. Rainfall simulations were then used toanalyse the relationship between these soil surface features and infiltration and runoff.
2. Site description and methods
The study was conducted in the Mapimi Biosphere Reserve (Chihuahuan desert,México, 26°N, 103°W). Mean annual rainfall is 264 mm (Standard deviation 65 mm,from 12 yr observation at the Reserve Station) and mean annual temperature is 20.8°C
2 Leprun, J.c., 1978. Etude de l'évolution d'un ,ystème d'exploitatIOn Sahélien au Mali. Unpub. report,Or,tom, D.G.R.S.T., Paris, France.
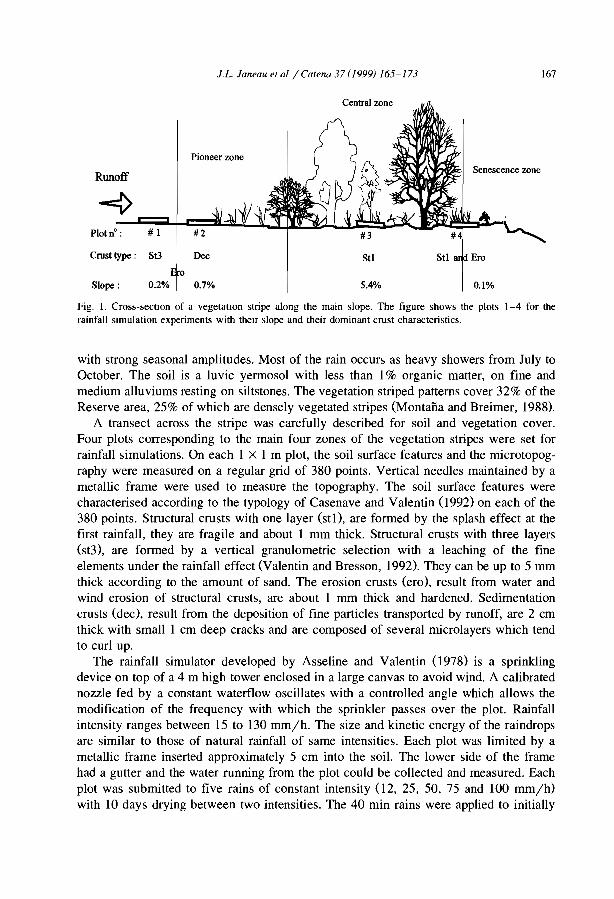
iL ianeau et al / Catena 37 (1999) 165-173 167
Pioneer zone
Runoff
~Plot n' : #1
Crusttype : St] Dec
0
Siope : 0.2% 0.7%
Central zone
St!
5.4%
Senescence zone
0.1%
Fig. l. Cross-sectIOn of a vegetatIOn stripe along the main slope. The figure shows the plots 1-4 for therainfall simulation experiments with theu slope and their dominant crust characteristics.
with strong seasonal amplitudes. Most of the rain occurs as heavy showers from July toOctober. The soil is a luvic yermosol with less than 1% organic matter, on fine andmedium alluviums resting on siltstones. The vegetation striped patterns coyer 32% of theReserve area, 25% of which are densely vegetated stripes (Montana and Breimer, 1988).
A transect across the stripe was carefully described for soil and vegetation coyer.Four plots corresponding to the main four zones of the vegetation stripes were set forrainfall simulations. On each 1 X 1 m plot, the soil surface features and the microtopography were measured on a regular grid of 380 points. Vertical needles maintained by ametallic frame were used to measure the topography. The soil surface features werecharacterised according to the typology of Casenave and Valentin (1992) on each of the380 points. Structural crusts with one layer (stI), are formed by the splash effect at thefirst rainfall, they are fragile and about 1 mm thick. Structural crusts with three layers(st3), are formed by a vertical granulometric selection with a leaching of the fineelements under the rainfall effect (Valentin and Bresson, 1992). They can be up to 5 mmthick according to the amount of sand. The erosion crusts (ero), result from water andwind erosion of structural crusts, are about 1 mm thick and hardened. Sedimentationcrusts (dec), result from the deposition of fine particles transported by runoff, are 2 cmthick with small 1 cm deep cracks and are composed of several microlayers which tendto curl up.
The rainfall simulator developed by Asseline and Valentin (1978) is a sprinklingdevice on top of a 4 m high tower enclosed in a large canvas to avoid wind. A calibratednozzle fed by a constant waterflow oscillates with a controlled angle which allows themodification of the frequency with which the sprinkler passes over the plot. Rainfallintensity ranges between 15 to 130 mm/ho The size and kinetic energy of the raindropsare similar to those of natural rainfall of same intensities. Each plot was limited by ametallic frame inserted approximately 5 cm into the soil. The lower side of the framehad a gutter and the water running from the plot could be collected and measured. Eachplot was submitted to five rains of constant intensity 02, 25, 50, 75 and 100 mm/h)with 10 days drying between two intensities. The 40 min rains were applied to initially
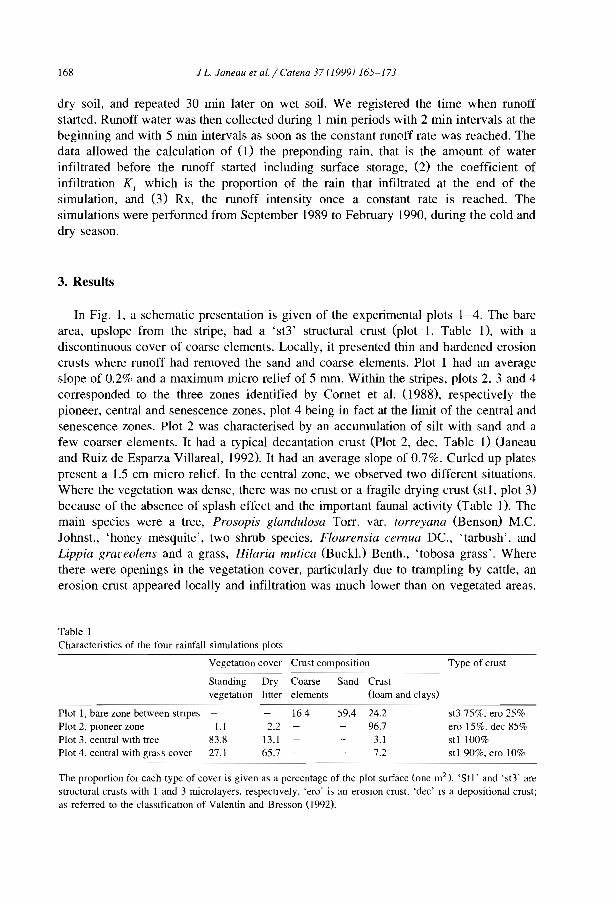
168 J L. Janeau et al. / Carena 37 (1999) 165-173
dry soil, and repeated 30 min later on wet soil. We registered the time when runoffstarted. Runoff water was then collected during 1 min periods with 2 min intervals at thebeginning and with 5 min intervals as soon as the constant runoff rate was reached. Thedata allowed the calculation of (1) the preponding rain, that is the amount of waterinfiltrated before the runoff started including surface storage, (2) the coefficient ofinfiltration KI which is the proportion of the rain that infiltrated at the end of thesimulation, and (3) Rx, the runoff intensity once a constant rate is reached. Thesimulations were performed from September 1989 to February 1990, during the coId anddry season.
3. Results
In Fig. l, a schematic presentation is given of the experimental plots 1-4. The barearea, upslope from the stripe, had a 'st3' structural crust (plot l, Table I), with adiscontinuous cover of coarse elements. Locally, it presented thin and hardened erosioncrusts where runoff had removed the sand and coarse elements. Plot 1 had an averageslope of 0.2% and a maximum micro relief of 5 mm. Within the stripes, plots 2. 3 and 4corresponded to the three zones identified by Cornet et al. (1988), respectively thepioneer, central and senescence zones, plot 4 being in fact at the limit of the central andsenescence zones. Plot 2 was characterised by an accumulation of silt with sand and afew coarser elements. It had a typical decantation crust (Plot 2. dec. Table 1) (Janeauand Ruiz de Esparza Villareal, 1992). It had an average slope of 0.7%. Curled up platespresent a 1.5 cm micro relief. In the central zone, we observed two different situations.Where the vegetation was dense, there was no crust or a fragile drying crust (st!. plot 3)because of the absence of splash effect and the important faunal activity (Table 1). Themain species were a tree, Prosopis glandulosa Torr. var. torreyana (Benson) M.e.Johnst., 'honey mesquite', two shrub species. Flourensia cernua De., 'tarbush', andLippia gral'eolens and a grass, Hilaria mutica (BuckI.) Benth., 'tobosa grass'. Wherethere were openings in the vegetation cover, particularly due to trampling by cattle, anerosion crust appeared locally and infiltration was much lower than on vegetated areas.
Table 1Characteristics of the four rainfall simulations plots
VegetatIOn caver Crust composition
Standing Dry CoarsevegetatIOn htter elements
Type of crust
Plot 1, bare zone between stnpes -Plot 2, pIOneer zone 1.1Plot 3, central wlth tree 83.8Plot 4. central with gra,s caver 27.1
16.42.2
13.165.7
59.4 24.296.7
3.17.2
st3 75%. ero 25%ero 15%. dec 85%st! 100%st! 90%, ero 10%
The proportion for each type of caver is given as a percentage of the plot surface (one m2). 'Stl' and 'st3' are
structural crusts with 1 and 3 microlayers, respecltve1y, 'ero' is an eroslOn crus!, 'dec' IS a depositional crust;as referred ta the clasSificatIOn of Valentin and Bresson (J 992).
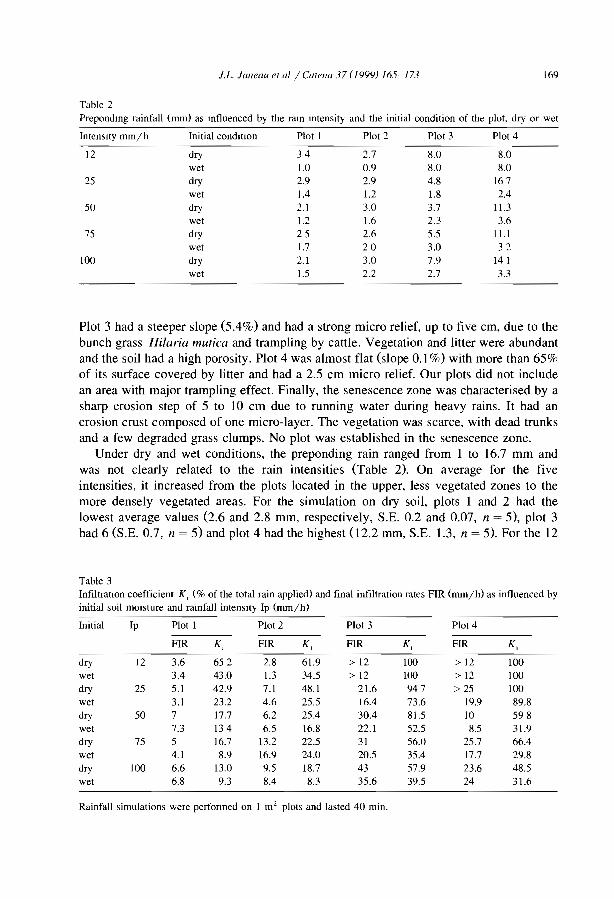
JL Jmleall el a/ / Calenll 37 (1999) 165-173 169
Table 2Prepondmg rainfall (mm) as mfluenced by the ram mtensity and the initial condition of the plot dry or wet
Inten51ly mm/h Initial condition Plot 1 Plot 2 Plot 3 Plot 4
12 dry 34 2.7 8.0 8.0wet 1.0 0.9 8.0 8.0
25 dry 2.9 2.9 4.8 167wet 1.4 1.2 1.8 2.4
50 dry 2.1 3.0 3.7 1l.3wet 1.2 1.6 2.3 3.6
75 dry 25 2.6 5.5 ILlwet 1.7 20 3.0 32
100 dry 2.1 3.0 7.9 14]wet 1.5 2.2 2.7 3.3
Plot 3 had a steeper siope (5.4%) and had a strong micro relief, up to five cm, due to thebunch grass Hilaria mutica and trampling by cattle. Vegetation and litter were abundantand the soil had a high porosity. Plot 4 was almost fiat (slope 0.1 %) with more than 65%of its surface covered by litter and had a 2.5 cm micro relief. Our plots did not includean area with major trampling effect. Finally, the senescence zone was characterised by asharp erosion step of 5 to 10 cm due to running water during heavy rains. It had anerosion crust composed of one micro-layer. The vegetation was scarce, with dead trunksand a few degraded grass clumps. No plot was established in the senescence zone.
Under dry and wet conditions, the preponding rain ranged from 1 to 16.7 mm andwas not c1early related to the rain intensities (Table 2). On average for the fiveintensities, it increased from the plots located in the upper, less vegetated zones to themore densely vegetated areas. For the simulation on dry soil, plots 1 and 2 had thelowest average values (2.6 and 2.8 mm, respectively, S.E. 0.2 and 0.07, n = 5), plot 3had 6 (S.E. 0.7, n = 5) and plot 4 had the highest 02.2 mm, S.E. 1.3, n = 5). For the 12
Table 3InfiltratIOn coetlïcient K, (% of the total rain applied) and final inftitration rates FIR (mm/h) as influenced byinitial soil mOlsture and rainfall intenslty Ip (mm/h)
Initial Ip Plot 1 Plot 2 Plot 3 Plot 4
FIR K, FIR K, FIR K, FIR K,
dry 12 3.6 652 2.8 61.9 > 12 100 >12 100wet 3.4 43.0 l.3 34.5 > 12 100 > 12 100dry 25 5.1 42.9 7.1 48.1 21.6 947 > 25 100wet 3.] 23.2 4.6 25.5 ]6.4 73.6 ]9.9 89.8dry 50 7 17.7 6.2 25.4 30.4 81.5 10 598wet 7.3 134 6.5 16.8 22.1 52.5 8.5 31.9dry 75 5 ]6.7 13.2 22.5 3] 56.0 25.7 66.4wet 4.] 8.9 16.9 24.0 20.5 35.4 17.7 29.8dry 100 6.6 13.0 9.5 18.7 43 57.9 23.6 48.5wet 6.8 9.3 8.4 8.3 35.6 39.5 24 31.6
Rainfall simulations were performed on 1 m2 plots and lasted 40 min.
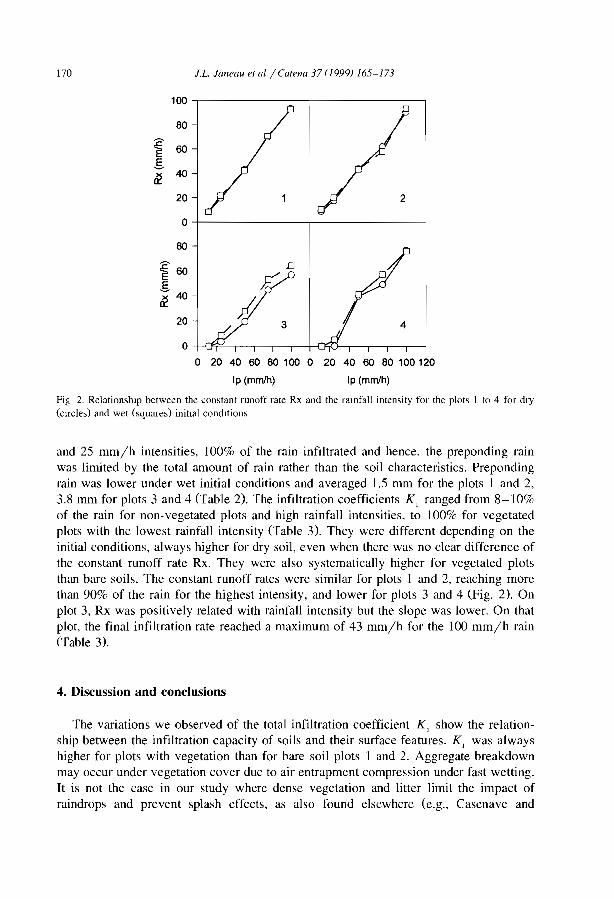
170 IL. Jalleau et al / Catella 37 (1999) 165-173
100
80
'E60Ê.s
~40
20
0
80
'E60
IJÊ z::.s~
40
~20 3
0
0 20 40 60 80 100 0 20 40 60 80 100120
Ip (mm/h) Ip (mm/h)
Fig 2. Relationshlp between the constant runoff rate Rx and the ratnfall intensity for the plots 1 ta 4 for dry(clrcle,) and wet (squares) inilial conditions
and 25 mm/h intensities, 100% of the rain infiltrated and hence, the preponding rainwas limited by the total amount of rain rather than the soil characteristics. Prepondingrain was lower under wet initial conditions and averaged 1.5 mm for the plots 1 and 2,3.8 mm for plots 3 and 4 (Table 2). The infiltration coefficients KI ranged from 8-10%of the rain for non-vegetated plots and high rainfall intensities, to 100% for vegetatedplots with the lowest rainfall intensity (Table 3). They were different depending on theinitial conditions, always higher for dry soil, even when there was no c1ear difference ofthe constant mnoff rate Rx. They were also systematically higher for vegetated plotsthan bare soils. The constant mnoff rates were similar for plots 1 and 2, reaching morethan 90% of the rain for the highest intensity, and lower for plots 3 and 4 (Fig. 2). Onplot 3, Rx was positively related with rainfall intensity but the slope was lower. On thatplot, the final infiltration rate reached a maximum of 43 mm/h for the 100 mm/h rain(Table 3).
4. Discussion and conclusions
The variations we observed of the total infiltration coefficient KI show the relationship between the infiltration capacity of soils and their surface features. KI was alwayshigher for plots with vegetation than for bare soil plots 1 and 2. Aggregate breakdownmay occur under vegetation coyer due to air entrapment compression under fast wetting.It is not the case in our study where dense vegetation and litter limit the impact ofraindrops and prevent splash effects. as also found elsewhere (e.g., Casenave and
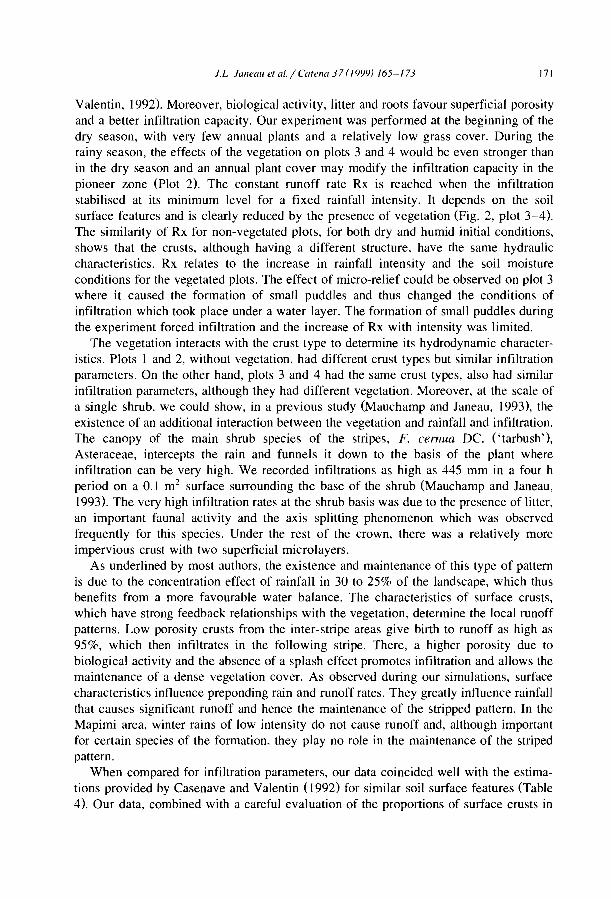
1.L JOlleau et al. / Cafella 37 (/999) /65-/73 171
Valentin, 1992). Moreover, biological activity, litter and roots favour superficial porosityand a better infiltration capacity. Our experiment was performed at the beginning of thedry season, with very few annual plants and a relatively low grass coyer. During therainy season, the effects of the vegetation on plots 3 and 4 would be even stronger thanin the dry season and an annual plant coyer may modify the infiltration capacity in thepioneer zone (Plot 2). The constant runoff rate Rx is reached when the infiltrationstabilised at its minimum level for a fixed rainfall intensity. It depends on the soilsurface features and is c1early reduced by the presence of vegetation (Fig. 2, plot 3-4).The similarity of Rx for non-vegetated plots, for both dry and humid initial conditions,shows that the crusts, although having a different structure, have the same hydrauliccharacteristics. Rx relates to the increase in rainfall intensity and the soil moistureconditions for the vegetated plots. The effect of micro-relief could be observed on plot 3where it caused the formation of smal1 puddles and thus changed the conditions ofinfiltration which took place under a water layer. The formation of small puddles duringthe experiment forced infiltration and the increase of Rx with intensity was limited.
The vegetation interacts with the crust type to determine its hydrodynamic characteristics. Plots 1 and 2, without vegetation, had different crust types but similar infiltrationparameters. On the other hand, plots 3 and 4 had the same crust types, also had similarinfiltration parameters, although they had different vegetation. Moreover, at the scale ofa single shrub, we could show, in a previous study (Mauchamp and Janeau, 1993), theexistence of an additional interaction between the vegetation and rainfall and infiltration.The canopy of the main shrub species of the stripes, F. cernua De. ('tarbush'),Asteraceae, intercepts the rain and funnels it down to the basis of the plant whereinfiltration can be very high. We recorded infiltrations as high as 445 mm in a four hperiod on a 0.1 m2 surface surrounding the base of the shrub (Mauchamp and Janeau,1993). The very high infiltration rates at the shrub basis was due to the presence of litter,an important faunal activity and the axis splitting phenomenon which was observedfrequently for this species. Under the rest of the crown, there was a relatively moreimpervious crust with two superficial microlayers.
As underlined by most authors, the existence and maintenance of this type of patternis due to the concentration effect of rainfall in 30 to 25% of the landscape, which thusbenefits from a more favourable water balance. The characteristics of surface crusts,which have strong feedback relationships with the vegetation, determine the local runoffpatterns. Low porosity crusts from the inter-stripe areas give birth to runoff as high as95%, which then infiltrates in the fol1owing stripe. There, a higher porosity due tobiological activity and the absence of a splash effect promotes infiltration and al10ws themaintenance of a dense vegetation coyer. As observed during our simulations, surfacecharacteristics influence preponding rain and runoff rates. They greatly influence rainfallthat causes significant runoff and hence the maintenance of the stripped pattern. In theMapimi area, winter rains of low intensity do not cause runoff and, although importantfor certain species of the formation, they play no role in the maintenance of the stripedpattern.
When compared for infiltration parameters, our data coincided weil with the estimations provided by Casenave and Valentin (I992) for similar soil surface features (Table4). Our data, combined with a careful evaluation of the proportions of surface crusts in
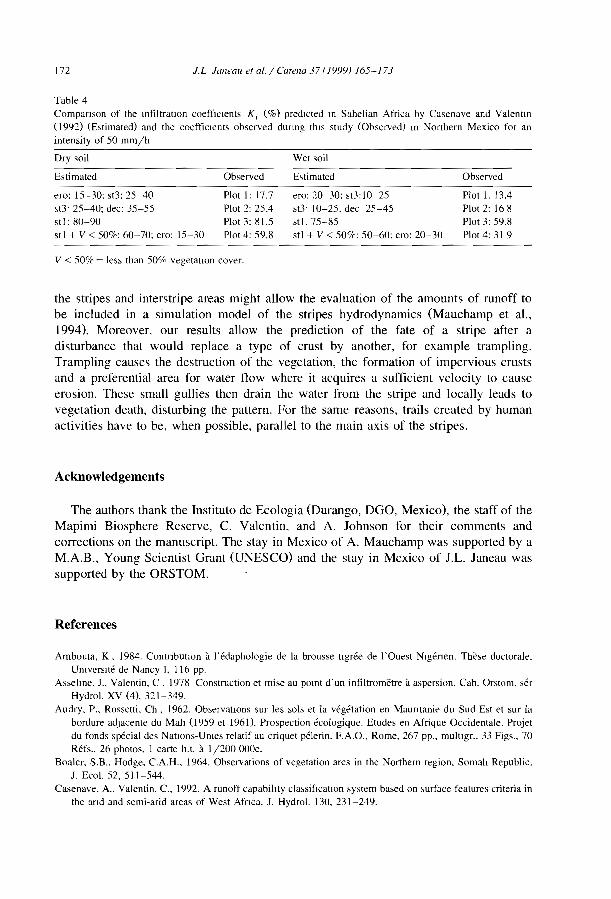
172 J.L J<1llealll!fa/./Cafl!lla37!1999! 165-173
Table 4Companson of the infiltratIOn coeffIcIents K, (%) predlcted ln Sahelian Africa by Casenave and Valentin(l992) (E,timated) and the coeffiCIents observed dunng thls study (Observed) in Northern Mexico for anintensity of 50 mm/h
Dry soil Wet soil-----------------
Estimated
ero: 15-30: st3: 25-40st3' 25-40: dec: 35-55stl: 80-90stl + V < 50'k: 60-70: ero: 15-30
Observed
Plot 1: 17.7Plot 2: 25.4Plot 3: 81.5Plot 4: 59.8
E,timated
ero: 20-30: st3:10-25,t3' 10-25. dec 25-45st 1. 75-85stl + V < 50%: 50-60: ero: 20-30
Observed
Plot 1. 13.4Plot 2: 168Plot 3: 59.8Plot 4: 31 9
V < 50% = less than 50% vegetatIon cover.
the stripes and interstripe areas might allow the evaluation of the amounts of runoff tobe included in a simulation model of the stripes hydrodynamics (Mauchamp et al.,1994). Moreover. our results allow the prediction of the fate of a stripe after adisturbance that would replace a type of crust by another, for example trampling.Trampling causes the destruction of the vegetation, the formation of impervious crustsand a preferential area for water flow where it acquires a sufficient velocity to causeerosion. These small gullies then drain the water from the stripe and locally leads tovegetation death, disturbing the pattern. For the same reasons, trails created by humanactivities have to be, when possible, parallel to the main axis of the stripes.
Acknowledgements
The authors thank the Instituto de Ecologia (Durango, DGO, Mexico), the staff of theMapimi Biosphere Reserve, C. Valentin. and A. Johnson for their comments andcorrections on the manuscript. The stay in Mexico of A. Mauchamp was supported by aM.A.B., Young Scientist Grant (UNESCO) and the stay in Mexico of J.L. Janeau wassupported by the ORSTOM.
References
Ambouta, K. 1984. ContributIOn à l'édaphologie de la brousse tIgrée de l'Ouest NIgérien. Thèse doctorale.Umversllé de Nancy l, 116 pp.
Assehne. J., Valentin. C . 1978 Construction et mise au pOInt d'un infiltromëtre à aspersion. Cah. Orstom. sérHydro!. XV (4). 321-349.
Audry, P., Rossetti. Ch. 1962. ObservatIons sur les sols et la végétation en MaUritanie du Sud-Est et sur labordure adjacente du MalI (J 959 et 1961). Prospection écologique. Etudes en Afrique Occidentale. Projetdu fonds spécial des NatlOns-Umes relatif au criquet pélerin. F.A.O., Rome, 267 pp., multlgr., 33 Figs., 70Réfs., 26 photos, 1 carte h.t. à 1/200 OOOe.
Boaler, S.B., Hodge, C.A.H., 1964. Observations of vegetation arcs in the Northern region. Somah Republic.J. Eco!. 52, 511-544.
Casenave. A.. Valentin. c.. 1992. A runoff capabihty classifIcatIOn system based on surface features criteria inthe and and semi-arid areas of West Afnca. J. Hydro!. 130, 231-249.

J.L Jal1eml et al. / Catel10 37 (1999) 165-173 173
Clos Arceduc. M, 1956. Etude ,ur photographies aériennes d'une formation végétale ,ahélienne: la broussellgrée Bulletin de l'Institut Francais d'Afrique NOIre A-18, 677-684.
Cornet, A., Delhoume. J.P.. Montana, C.. 1988. Dynamics of striped vegetatIOn patterns and water balance lnthe Chihuahuan Desert ln. During, H,J .. Werger, M J.A, Willems. J.H (Edd, Dlverslly and Pattern lnPlant Commumtles pp. 221-231 The Hague SPB Academlc Publishlng, 278 pp.
Delhoume, J.P, J988 Dlstnbution spatiale de, sols le long d'une toposéquence représentative ln: Montana,C. (Ed.), EstudlO integrado de los recurso, vegetaeiôn, suelo y agua en la reserva de la biosfera de MaplmiAmbiente natural y humano Inslltuto de Ecologia. México, Pub!. 23, pp 135~165.
Gallais. 1.. 1967 Le delta inténeur du Niger et ses bordures. Etude morphologiques. CNRS. Centre deRecherche, et Documentation CartographIques et Géographiques. Mém. et Doc.. Nouvelle série, Vol 3.153 pp , 30 Figs., 16 pl photos, + 1 carte h.t. à 1/2000 DODe
Hemming, C.F., 1965. Vegetation arcs in Somaliland. J. Eco!. 53. 57-68.Janeau. J.L, Ruiz de Esparza Villareal. R. 1992, Cartographie des états de surface d'une toposéquence
représentative du bassin versant de San Ignacio In: Actas deI seminano de Mapimi. Instlluto de ecologia,MéxIco, pp. 161-175.
Litchfield. W.H., Mabbut. J.A.. 1962. Hardpan ln soils of semi arid Western Austraha. J. Soil Sei 13,148-159.
Mauchamp, A.. 1992, L'hétérogénité spatiale, sa dynamique et ses implications dans une mosàique devégétation en zone aride. Thèse de doctorat, Université de Montpellier II, France.
Mauchamp, A, Janeau. J.L., 1993. Water funneling by the crown of Flourer/slU cl'mua, a Chihuahuan Desertshrub. J. Arid Environ. 25, 299-306.
Mauchamp, A.. Montana, c., Lepart, J., Ramba), S., 1993. Ecotone dependent recruitment of a desert shrub(Flourl'llsia cl'mua) in vegetatIOn stnpes. Oikos 68. 107-116.
Mauchamp. A., Rambal, S., Lepart, J., 1994. Simulating the dynamics of a vegetation mosalc: a spatiahzedfunctional mode!. Ecol Modelling 71,107-130.
Montana, C. 1992. The colonization of bare areas in two phase mosaics of an and ecosystem. J. Eco!. 80,315-327
Montana, C., Brelmer, RF, 1988 Major vegetatIOn and environment untts. In: Montana, C. (Ed.), Estudiointegrado de los recursos vegetaciôn. suelo y agua en la reserva de la biôsfera de Mapimi. Ambientenatural y humano. Instituto de ecologia, México. Pub!. 23, pp. 99-114.
Serpantie. G.. Tezenas du Moncel, L., Valentin. C., 1992. La dynamique des états de surface d'un territOIreagropastoral soudano-sahéhen sous aridificallon chmatique: conséquences et propositions. In: L'andité:une contrainte pour le dévelopement. Orstom, collectIOn DIdactiques, pp. 419-447.
Tongway, DJ, Ludwig, J.A" 1990. Vegetation and soil patternlng in semi arid mulga lands of EasternAustralia. Aust. J. Eco!. 15, 23-34.
Valentin, C., Bresson, L.M., 1992. Morphology, genesis and classification of sOlls crusts in loamy and sandysOlls. Geoderrna 55. 225-245.
White, L.P.. 1971. Vegetation stripes on sheet wash surfaces. J. Eco!. 57. 549-553,Yeaton, RI, Travis. J.. Gilinsky. E, 1977. Competition and spaeing in plant communitles: the Arizona upland
association. J. Eco!. 65, 587-595.

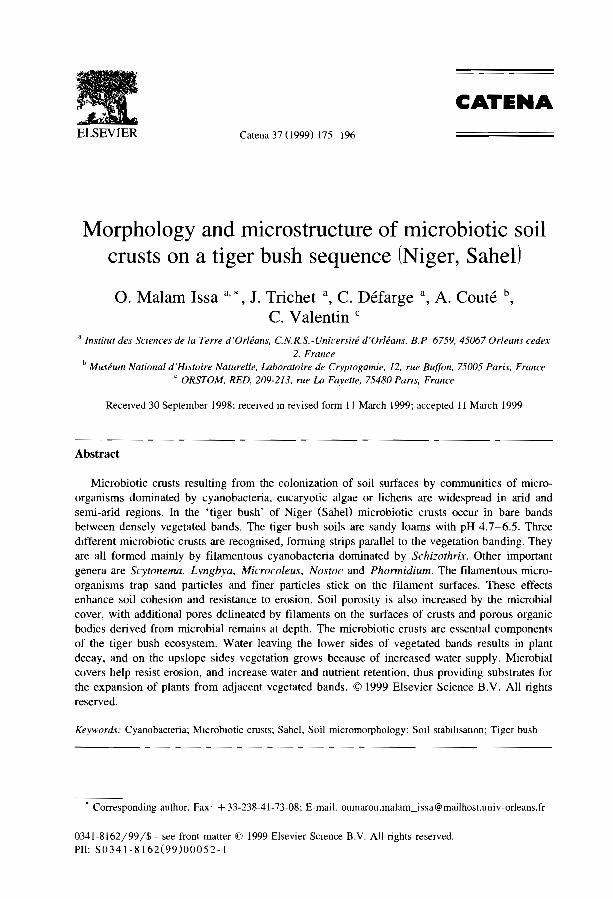
ELSEVIER Catena 37 (1999) 175-196
CATENA
Morphology and nlÎcrostructure of microbiotic soilcrusts on a tiger bush sequence (Niger, Sahel)
O. Malam Issa a,' , J. Trichet a, C. Défarge a, A. Couté b
C. Valentin C
a Institut des SClence,l' de la Terre d'Orléans, C.N.R.S.-Unil'ersité d'Or/éans, B.P 6759,45067 Orleans cedex2, France
b Muséum National d'Hl.'toire Naturelle, Laboratoire de Cryptogamie, 12, rue Buffon, 75005 Paris, Francec ORSTOM, RED, 209-213, rue La Fayette, 75480 Pans, France
Recelved 30 September 1998; recelved 10 revised form II March 1999; accepted II March 1999
Abstract
Microbiotic crusts resulting from the colonization of soil surfaces by communities of microorganisms dominated by cyanobacteria. eucaryotic algae or lichens are widespread in arid andsemi-arid regions. In the 'tiger bush' of Niger (Sahel) microbiotic crusts accur in bare bandsbetween densely vegetated bands. The tiger bush soils are sandy loams with pH 4.7-6.5. Threedlfferent microbiotic crusts are recognised, forming strips paraUel to the vegetation banding. Theyare aU formed mainly by filamentous cyanobacteria dominated by Schizothrix. Other importantgenera are Scyt01zema, Lyngbya, Microcoleus, Nostoc and Phormidium. The filamentous microorganisms trap sand particles and tiner particles stick on the filament surfaces. These effectsenhance soil cohesion and resistance to erosion. Soil porosity is also increased by the microbialcoyer, with additional pores delineated by filaments on the surfaces of crusts and porous organicbodies derived from microbial remains at depth. The microbiotic crusts are essential componentsof the tiger bush ecosystem. Water leaving the lower sides of vegetated bands results in plantdecay, and on the upslope sides vegetation grows because of increased water supply. Microbialcovers help resist erosion, and increase water and nutrient retention. thus providing substrates forthe expansion of plants from adjacent vegetated bands. © 1999 Elsevier Science B.V. Ali rightsreserved.
Keywords: Cyanobacteria; MICroblOtic crusts; Sahel, Soil micromorphology; SOlI stabIlIsatIOn; Tiger bush
• Corresponding author. Fax' + 33-238-41-73-08; E-mail. [email protected]
0341-8162/99/$ - see front matter © 1999 Elsevier SCIence B.Y. Ali rights reserved.PlI: S0341-8162(99)00052-1
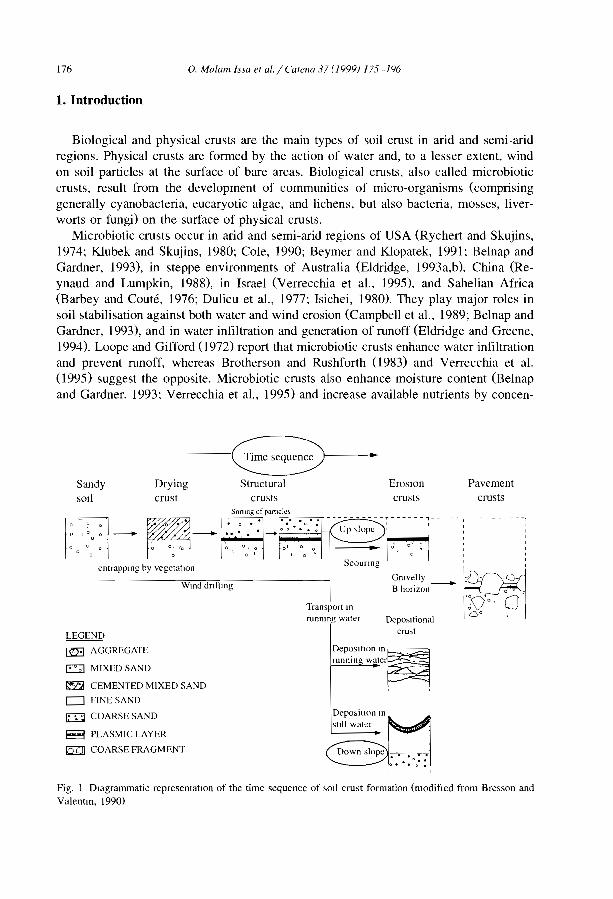
176 O. Malam Issa et al. / Catel/a 37 (]999) 175-l'i6
1. Introduction
Biological and physical crusts are the main types of soil crust in arid and semi-aridregions. Physical crusts are formed by the action of water and, to a lesser extent, windon soil particles at the surface of bare areas. Biological crusts, also called microbioticcrusts. result from the development of communities of micra-organisms (comprisinggenerally cyanobacteria, eucaryotic algae, and lichens, but also bacteria, mosses, liverworts or fungj) on the surface of physical crusts.
Microbiotic crusts occur in arid and semi-arid regions of USA (Rychert and Skujins,1974; Klubek and Skujins, 1980; Cole, 1990; Beymer and Klopatek, 1991; Belnap andGardner, 1993), in steppe environments of Australia (Eldridge, 1993a,b). China (Reynaud and Lumpkin, 1988), in Israel (Verrecchia et al.. 1995). and Sahelian Africa(Barbey and Couté, 1976; Dulieu et al., 1977; Isichei, 1980). They play major raies insoil stabilisation against both water and wind erosion (Campbell et al.. 1989; Belnap andGardner, 1993), and in water infiltration and generation of runoff (Eldridge and Greene,1994). Loope and Gifford (1972) report that micrabiotic crusts enhance water infïltrationand prevent runoff, whereas Brotherson and Rushforth (1983) and Verrecchia et al.(I995) suggest the opposite. Microbiotic crusts also enhance moisture content (Belnapand Gardner. 1993; Verrecchia et al., 1995) and increase available nutrients by concen-
Pavementcrusts
EroSIOncrusts
----E;>-Structural
crustsDryingcrust
SandySOli
Dcpo"tiona!cru~t
Down slnpc .' • "<) • •• 0,: :
DepOSition ln~runmng water~
, ,
Dcpos.itlon ln
std' water
Transport lnrunmng water
LEGEND
I:S:E AGGREGATE
~ MIXEDSAND
~ CEMENTED MIXED SAND
o FINESAND
m COARSE SAND
E3 PLASMIC LAYER
00 COARSE FRAGMENT
~l;' i i 1~ ~~li7~:F~:C.-:..~:-".~,;'"" ---------:------~----T---------i0
00
0
0 ~ O. 10 0, 0, 0 0 1 01 0 ---1,,- ~o\Q : :o a 0) la"\. 1-/0'<1 1 1
1
Scouflng 1 1
1 entrapplng by vegetation l "Gravelly ___
Wlnd dnlüng B honzon
Fig. 1 Dlagrammatic representalion of the time sequence of SOlI crust formation (modifled from Bresson andValentm, 1990)
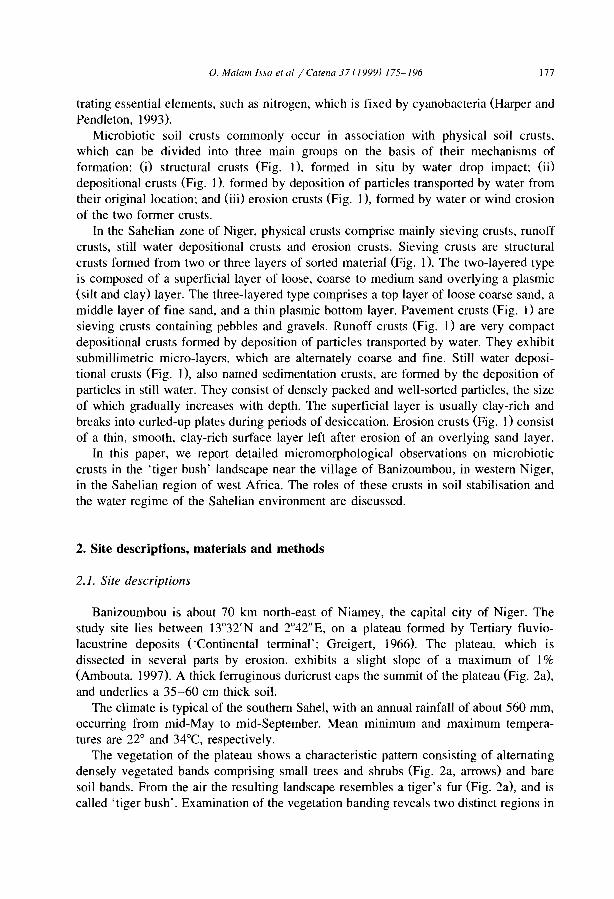
o. Malam /I.\{/ et al / Catena 37 (1999) 175-196 177
trating essential elements, such as nitrogen, which is fixed by cyanobacteria (Harper andPendleton, 1993).
Microbiotic soil crusts commonly occur in association with physical soil crusts,which can be divided into three main groups on the basis of their mechanisms offormation: (i) structural crusts (Fig. 1), formed in situ by water drop impact; (ii)depositional crusts (Fig. 1), formed by deposition of particles transported by water fromtheir original location; and (iii) erosion crusts (Fig. 1), formed by water or wind erosionof the two former crusts.
In the Sahelian zone of Niger, physical crusts comprise mainly sieving crusts, runoffcrusts, still water depositional crusts and erosion crusts. Sieving crusts are structuralcrusts formed from two or three layers of sorted material (Fig. 1). The two-Iayered typeis composed of a superficial layer of 100se, coarse to medium sand overlying a plasmic(silt and clay) layer. The three-Iayered type comprises a top layer of loose coarse sand, amiddle layer of fine sand, and a thin plasmic bottom layer. Pavement crusts (Fig. 1) aresieving crusts containing pebbles and gravels. Runoff crusts (Fig. 1) are very compactdepositional crusts formed by deposition of particles transported by water. They exhibitsubmillimetric micro-Iayers, which are altemately coarse and fine. Still water depositional crusts (Fig. 1), also named sedimentation crusts, are formed by the deposition ofparticles in still water. They consist of densely packed and well-sorted particles, the sizeof which gradually increases with depth. The superficial layer is usually clay-rich andbreaks into curled-up plates during periods of desiccation. Erosion crusts (Fig. 1) consistof a thin, smooth, clay-rich surface layer left after erosion of an overlying sand layer.
In this paper, we report detailed micromorphological observations on microbioticcrusts in the 'tiger bush' landscape near the village of Banizoumbou, in western Niger,in the Sahelian region of west Africa. The roles of these crusts in soil stabilisation andthe water regime of the Sahelian environment are discussed.
2. Site descriptions, materials and methods
2.1. Site descriptions
Banizoumbou is about 70 km north-east of Niamey, the capital city of Niger. Thestudy site lies between 13°32'N and 2°42"E, on a plateau formed by Tertiary fluviolacustrine deposits ('Continental terminal'; Greigert, 1966). The plateau, which isdissected in several parts by erosion, exhibits a slight slope of a maximum of 1%(Ambouta, 1997). A thick ferruginous duricrust caps the summit of the plateau (Fig. 2a),and underlies a 35-60 cm thick soil.
The climate is typical of the southern Sahel, with an annual rainfall of about 560 mm,occurring from mid-May to mid-September. Mean minimum and maximum temperatures are 22° and 34°C, respectively.
The vegetation of the plateau shows a characteristic pattern consisting of alternatingdensely vegetated bands comprising small trees and shrubs (Fig. 2a, arrows) and baresoil bands. From the air the resulting landscape resembles a tiger's fur (Fig. 2a), and iscalled 'tiger bush'. Examination of the vegetation banding reveals two distinct regions in
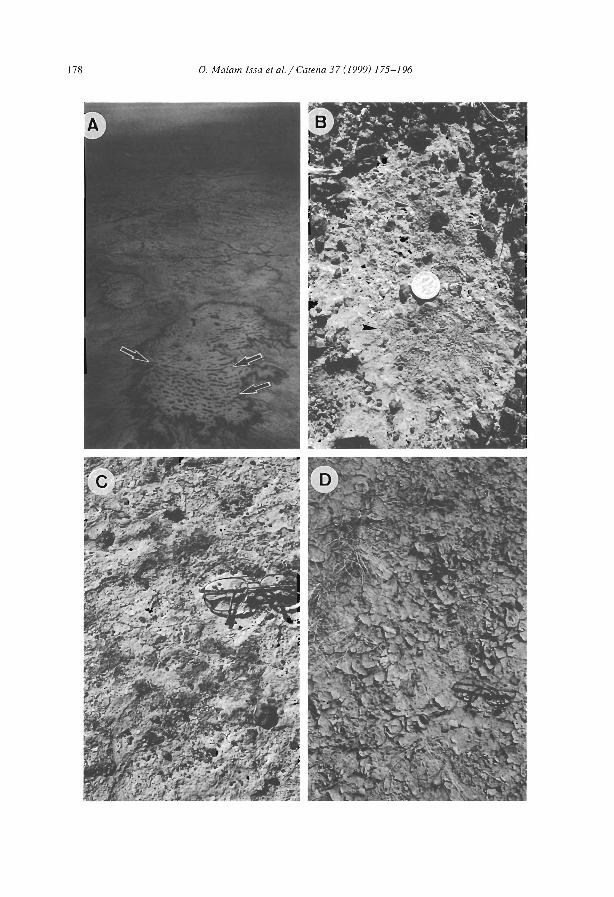
178 o. Ma/am Issa et al. / Carena 37 (1999) 175-196
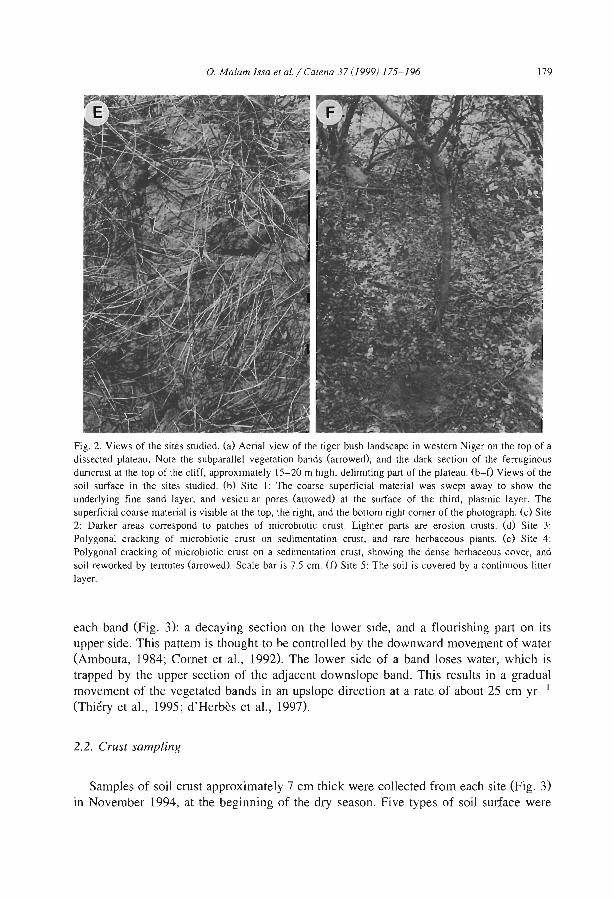
O. Malam Issa el al.1 COlena 37 (1999) 175-196 179
Fig. 2. Views of the sites studied. (a) Aerial view of the tiger bush landscape in western Niger on the top of adissected plateau. Note the subparallel vegetation bands (arrowed), and the dark section of the ferruginousduricrust at the top of the cliff, approximately l5-20 m high, delimiting part of the plateau. (b-f) Views of thesoil surface in the sites studied. (b) Site 1: The coarse superficial material was swept away to show theunderlying fine sand layer, and vesicular pores (arrowed) at the surface of the third, plasmic layer. ThesuperficiaJ coarse material is visible at the top, the right, and the botlom right corner of the photograph. (c) Site2: Darker areas correspond to patches of microbiotic crus!. Lighter parts are erosion crusts. (d) Site 3:Polygonal cracking of microbiolic crusl on sedimentation crust, and rare herbaceous plants. (e) Site 4:Polygonal cracking of microbiotic crust on a sedimentation crust, showing the dense herbaceous cover, andsoil reworked by termites (arrowed). Scale bar is 7.5 cm. (f) Site 5: The soil is covered by a continuous linerlayer.
each band (Fig. 3): a decaying section on the lower side, and a flourishing part on itsupper side. This pattern is thought to be controlled by the downward movement of water(Ambouta, 1984; Cornet et al., 1992). The lower side of a band Joses water, which istrapped by the upper section of the adjacent downsJope band. This results in a graduaimovement of the vegetated bands in an upslope direction at a rate of about 25 cm yr- I
(Thiéry et al., 1995; d'Herbès et al., 1997).
2.2. Crus! sampling
Samples of soil crust approximately 7 cm thick were collected from each site (Fig. 3)in November 1994, at the beginning of the dry season. Five types of soil surface were
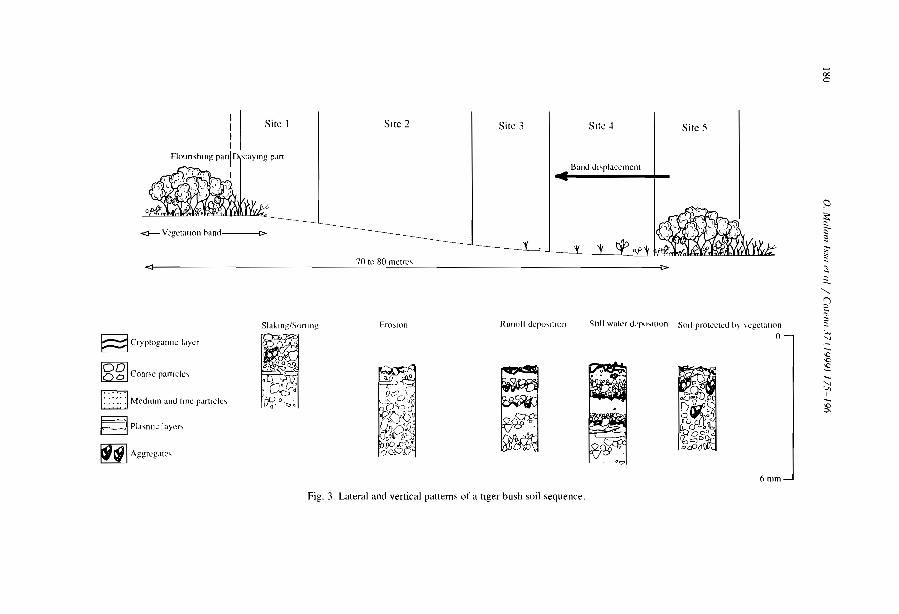
00o
<J 70 ln 80 mctre... [>
Sitc 1
<J-- Vegetation hanu-----t>
Site :2 Site 3 Site -1
DamJ ul'..pl.:tcemenL
Site :;
~
~:;:;;:;-""~2..
>C>C
~....'J'.J11....'00-
'...
6l~'....'J
'ry'
Sull wali:r lh:po"'JlIOn Sod protL'L'h:u hy \cgctatlon
oRUllo11 UC'po"'ltlOnEro'>lonSla"'Jllg/S()rtJJ1g
§ CryplOgamlc I.lycr
r:::: :1 MediUm and IJIlL' pMtlcle ...
~ Pla'illlll: layer...
~ Aggreg.ltc,
18~1 Coa,," pantele'
omm
Fig. 3. Lateral and vertical pattern, of a tlger bush soil sequence.
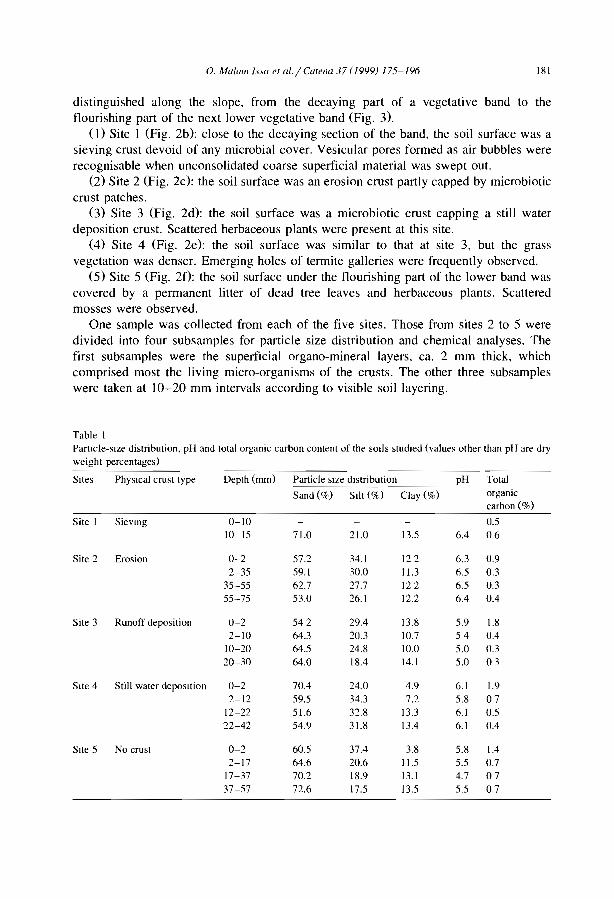
O. Ma/am/s.lu el (l/./Carel/a 37 (/9Y9) /75-/Y6 181
distinguished along the slope, from the decaying part of a vegetative band to theflourishing part of the next lower vegetative band (Fig. 3).
(1) Site 1 (Fig. 2b): close to the decaying section of the band, the soil surface was asieving crust devoid of any microbial cover. Vesicular pores formed as air bubbles wererecognisable when unconsolidated coarse superficial material was swept out.
(2) Site 2 (Fig. 2c): the soil surface was an erosion crust partly capped by microbioticcrust patches.
(3) Site 3 (Fig. 2d): the soil surface was a microbiotic crust capping a still waterdeposition crust. Scattered herbaceous plants were present at this site.
(4) Site 4 (Fig. 2e): the soil surface was similar to that at site 3, but the grassvegetation was denser. Emerging holes of termite galleries were frequently observed.
(5) Site 5 (Fig. 2f): the soil surface under the flourishing part of the lower band wascovered by a permanent litter of dead tree leaves and herbaceous plants. Scatteredmasses were observed.
One sample was callected from each of the five sites. Those from sites 2 to 5 weredivided into four subsamples for particle size distribution and chemical analyses. Thefirst subsamples were the superficial organo-mineral layers, ca. 2 mm thick, whichcomprised most the living micro-organisms of the crusts. The other three subsampleswere taken at 10-20 mm intervals according ta visible soil layering.
Table 1Partll:le-Slze distribution. pH and total organic carbon content of the sOils studled (values other than pH are dryweight percentages)
Sites Physlcal crust type Depth (mm) Particle slze distribution pH Total
Sand (%) Sllt (%) Clay (%) organiccarbon (%)
Site 1 SievlOg 0-10 0.510-15 71.0 21.0 13.5 6.4 06
Site 2 Erosion 0-2 57.2 34.1 122 6.3 0.92-35 59.1 30.0 Il.3 6.5 0.3
35-55 62.7 27.7 122 6.5 0.355-75 53.0 26.1 12.2 6.4 0.4
Site 3 Runoff deposition 0-2 542 29.4 13.8 5.9 1.82-10 64.3 20.3 JO.7 54 0.4
10-20 64.5 24.8 10.0 5.0 0.320-30 64.0 18.4 14.1 5.0 03
Site 4 Still water deposltion 0-2 70.4 24.0 4.9 6.1 1.92-12 59.5 34.3 7.2 5.8 0.7
12-22 51.6 32.8 13.3 6.1 0.522-42 54.9 31.8 13.4 6.1 0.4
Site 5 No crust 0-2 60.5 37.4 3.8 5.8 1.42-17 64.6 20.6 11.5 5.5 0.7
17-37 70.2 18.9 13.1 4.7 0737-57 72.6 17.5 13.5 5.5 0.7
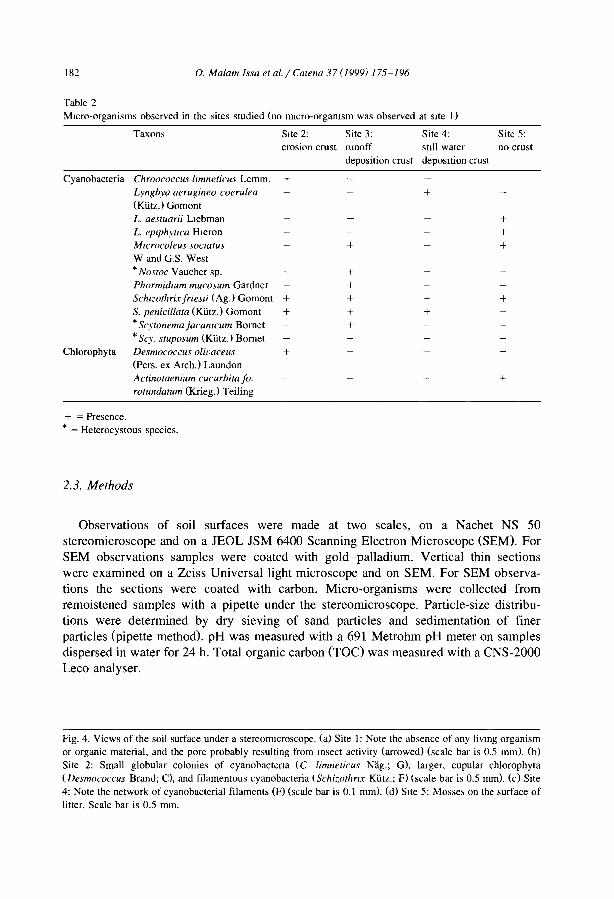
JIl2 O. Malam Issa et al./ Catena 37 (1999) 175-196
Table 2Mlcro-organisms observed in the sites studied (no mlcro-orgamsm was observed at site 1)
Taxons Sile 2: Site 3: Site 4: Site 5:erosion crust runoff sull water no crust
deposition crust deposilion crust
Cyanobacteria Chrooeoeeus ilmnetieus Lemm. +Lyngbya aerugineo-coerulea(Kütz,) GomontL. aestuarii LlebmanL. eplphyllca HleronMl(Toeoleus sociatusW and G.S. West*Nostoc Vaucher sp.PhormidlUm mueosum GardnerSehlzothrix friesli (Ag.) Gomont +S. penieillata (Kütz,) Gomont +*Seytonema jm'ameum Bornet*Scy. stuposum (Kütz.) Bornet
Chlorophyta Desmoeoeeus o/il'aeells +(Pers. ex Arch.) LaundonAetinotaenium eueurbita fo.rotundatum (Krieg,) Teiling
+ = Presence.* = Heterocystous species,
2.3. Methods
+
++++++
+
++
+++
+
+
Observations of soil surfaces were made at two scales, on a Nachet NS 50stereomicroscope and on a JEOL JSM 6400 Scanning Electron Microscope (SEM). ForSEM observations samples were coated with gold-palladium. Vertical thin sectionswere examined on a Zeiss Universal light microscope and on SEM. For SEM observations the sections were coated with carbon. Micro-organisms were collected fromremoistened samples with a pipette under the stereomicroscope. Particle-size distributions were determined by dry sieving of sand particles and sedimentation of finerparticles (pipette method). pH was measured with a 691 Metrohm pH meter on samplesdispersed in water for 24 h. Total organic carbon (TOC) was measured with a CNS-2000Leco analyser.
Fig. 4. Views of the soil surface under a stereomlcroscope. (a) Site 1: Note the absence of any livmg organismor organic material. and the pore probably resulting from msect activity (arrowed) (scale bar is 0.5 mm). (b)Site 2: Small globular colonies of cyanobactena (C limnetieus Nag.; G). larger. cupular chlorophyta(Desmoeoeells Brand; Cl, and filamentous cyanobacteria (Sehizotlmx Kütz.; F) (scale bar is 0.5 mm). (cl Site4: Note the network of cyanobacterial filaments (F) (scale bar is 0.1 mm). (d) Site 5: Masse, on the surface ofliner. Scale bar is 0.5 mm.
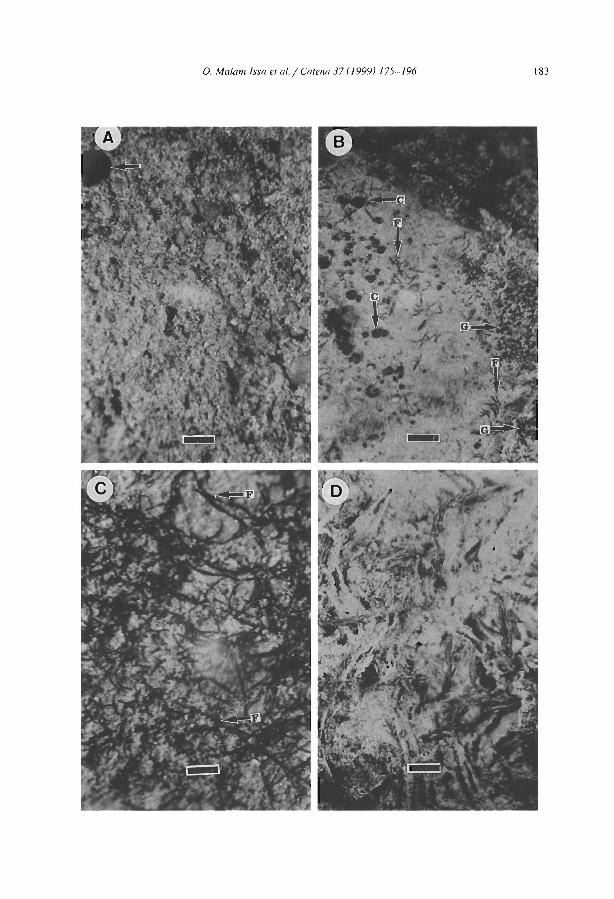
O. Malnm Issa el al. / Calena 37 (1999) 175-196 L8J
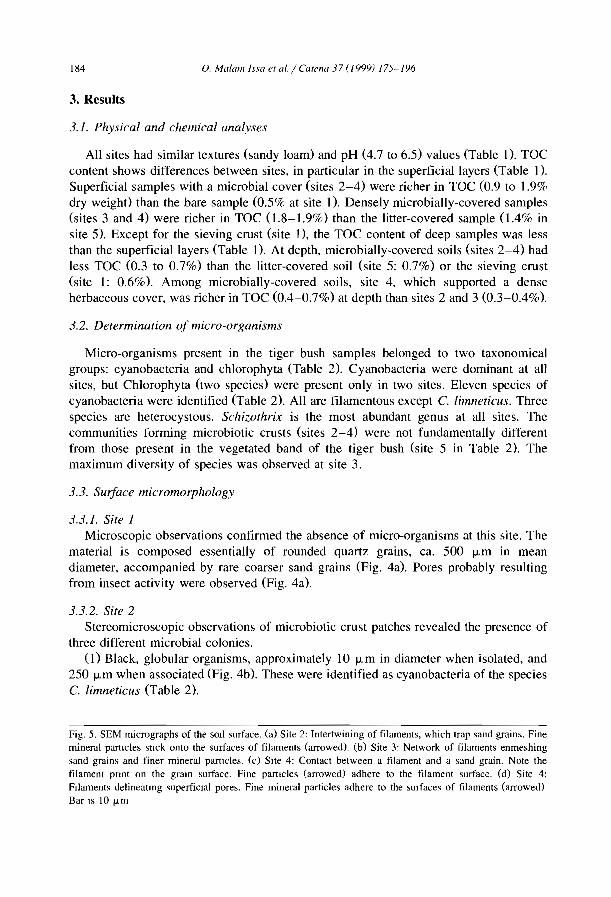
184
3. Results
O. Malam Issa el al. / Carena 37 (1999) 175-[1)6
3.1. Physical and chemical analyses
Ail sites had similar textures (sandy loam) and pH (4.7 to 6.5) values (Table 1). TOCcontent shows differences between sites, in particular in the superficial layers (Table 1).Superficial samples with a microbial coyer (sites 2-4) were richer in TOC (0.9 to 1.9%dry weighÜ than the bare sample (0.5% at site 1). Densely microbially-covered samples(sites 3 and 4) were richer in TOC (1.8-1.9%) than the litter-covered sample (1.4% insite 5). Except for the sieving crust (site 1), the TOC content of deep samples was lessthan the superficial layers (Table 1). At depth, microbially-covered soils (sites 2-4) hadless TOC (0.3 to 0.7%) than the litter-covered soil (site 5: 0.7%) or the sieving crust(site 1: 0.6%). Among microbially-covered soils, site 4, which supported a denseherbaceous coyer, was richer in TOC (0.4-0.7%) at depth than sites 2 and 3 (0.3-0.49'0).
3.2. Determination of micro-organisms
Micro-organisms present in the tiger bush samples belonged to two taxonomicalgroups: cyanobacteria and chlorophyta (Table 2). Cyanobacteria were dominant at ailsites, but Chlorophyta (two species) were present only in two sites. Eleven species ofcyanobacteria were identified (Table 2). Ail are filamentous except C. limneticus. Threespecies are heterocystous. Schizothrix is the most abundant genus at ail sites. Thecommunities forming microbiotic crusts (sites 2-4) were not fundamentally differentfrom those present in the vegetated band of the tiger bush (site 5 in Table 2). Themaximum diversity of species was observed at site 3.
3.3. Surface micromorphology
3.3.1. Site 1Microscopic observations confirmed the absence of micro-organisms at this site. The
material is composed essentially of rounded quartz grains, ca. 500 J.Lm in meandiameter, accompanied by rare coarser sand grains (Fig. 4a). Pores probably resultingfrom insect activity were observed (Fig. 4a).
3.3.2. Site 2Stereomicroscopic observations of microbiotic crust patches revealed the presence of
three different microbial colonies.(1) Black, globular organisms, approximately 10 J.Lm in diameter when isolated, and
250 J.Lm when associated (Fig. 4b). These were identified as cyanobacteria of the speciesC. limneticus (Table 2).
Fig. 5. SEM micrographs of the SOlI surface. (a) Site 2: Intertwining of filaments, which trap sand grains. FinemineraI partlcles stick onto the surfaces of filaments (arrowed). (b) Site 3: Network of filaments enmeshingsand grains and finer minerai partlcles. (c) Sile 4: Contact between a filament and a sand grain. Note thefilament pnnt on the gram surface. Fine partlcles (arrowed) adhere ta the filament surface. (d) Site 4:Fdaments delineatmg superficlal pores. Fine minerai particles adhere ta the surfaces of filaments (arrowed)Bar 1S Lü flm
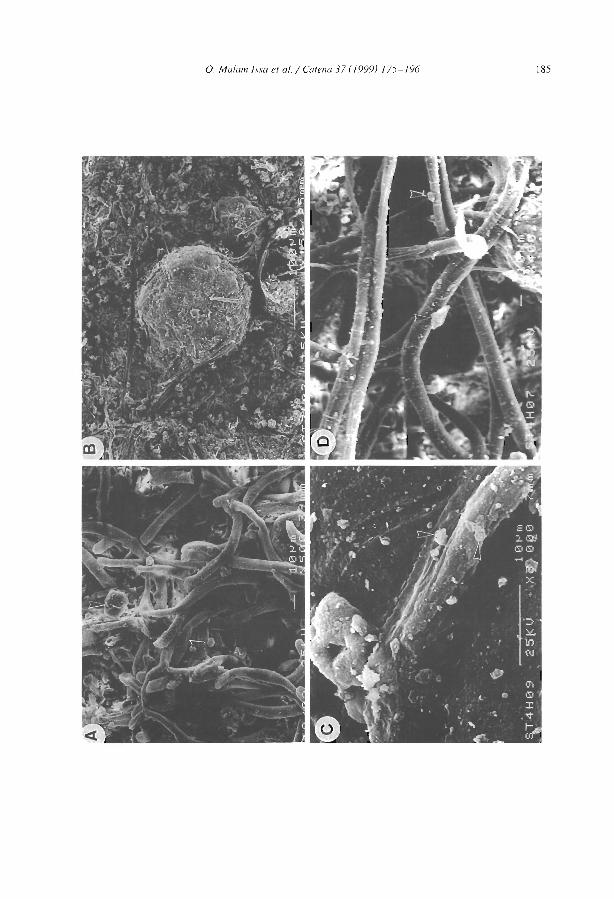
o. Ma/am /.Isa el al. / Calena 37 (/999) /75-/96 185
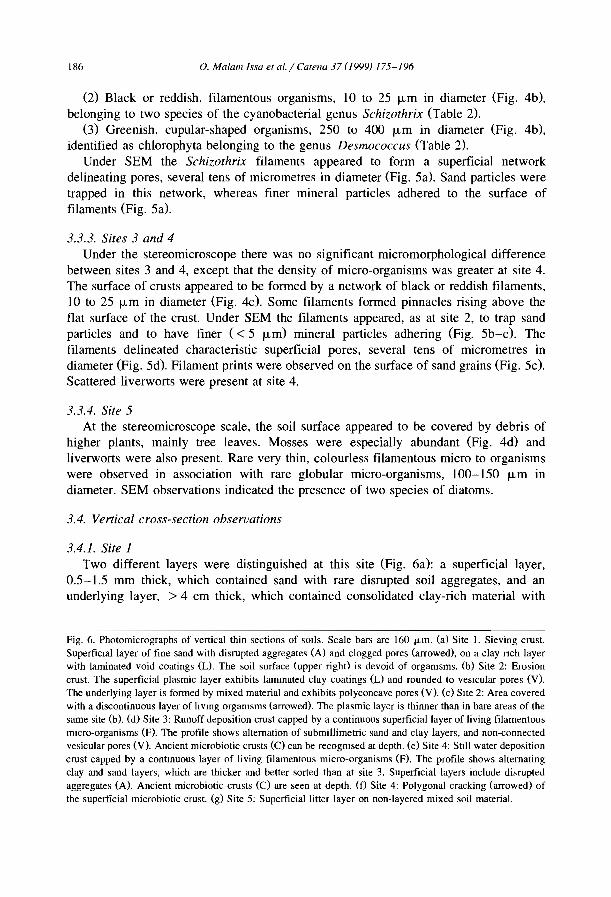
186 O. Malafll Issa etal.jCatella 37([999) /75-/96
(2) Black or reddish, filamentous organisms, 10 to 25 !-Lm in diameter (Fig. 4b),belonging to two species of the cyanobacterial genus Schizothrix (Table 2).
(3) Greenish, cupular-shaped organisms, 250 to 400 !-Lm in diameter (Fig. 4b),identified as chlorophyta belonging to the genus Desmococcus (Table 2).
Under SEM the Schizothrix filaments appeared to form a superficial networkdelineating pores, several tens of rnicrometres in diameter (Fig. Sa). Sand particles weretrapped in this network, whereas finer mineraI particles adhered to the surface offilaments (Fig. Sa).
3.3.3. Sites 3 and 4Under the stereomicroscope there was no significant micromorphological difference
between sites 3 and 4, except that the density of micro-organisms was greater at site 4.The surface of crusts appeared to be formed by a network of black or reddish filaments,10 to 25 !-Lm in diameter (Fig. 4c). Sorne filaments formed pinnacles rising above thefiat surface of the crust. Under SEM the filaments appeared, as at site 2, to trap sandparticles and to have finer « 5 !-Lm) mineraI particles adhering (Fig. 5b-c). Thefilaments delineated characteristic superficial pores, several tens of micrometres indiameter (Fig. 5d). Filament prints were observed on the surface of sand grains (Fig. 5c).Scattered liverworts were present at site 4.
3.3.4. Site 5At the stereomicroscope scale, the soil surface appeared to be covered by debris of
higher plants, mainly tree leaves. Mosses were especially abundant (Fig. 4d) andliverworts were also present. Rare very thin, colourless filamentous micro to organismswere observed in association with rare globular micro-organisms, 100-150 !-Lm indiameter. SEM observations indicated the presence of two species of diatoms.
3.4. Vertical cross-section observations
3.4.1. Site 1Two different layers were distinguished at this site (Fig. 6a): a superficial layer,
0.5-1.5 mm thick, which contained sand with rare disrupted soi! aggregates, and anunderlying layer, > 4 cm thick, which contained consolidated clay-rich material with
Fig. 6. Photomicrographs of vertical thin sections of sOlls. Scale bars are 160 I-Lm. (a) Site 1. Sieving crus!.Superficlallayer of fine sand with disrupted aggregates (A) and clogged pores (arrowed), on a clay nch layerwith laminated void coatings (L). The soil surface (upper right) is devoid of orgamsms. (b) Site 2: Erosioncrus!. The superficial plasmic layer exhibits larrunated clay coatings (L) and rounded to veslcular pores (V).The underlying layer is formed by mixed material and exhibits polyconcave pores (V). (c) Site 2: Area coveredwith a discontinuous layer of hvmg orgamsms (arrowed). The plasmic layer is thinner than in bare areas of thesame site (b). (d) Site 3: Runoff deposition crust capped by a continuous superficiallayer of living filamentousmlcro-organisms (F). The profile shows altemation of submillimetric sand and clay layers, and non-connectedvesicular pores (V). Ancient microbiotic crusts (C) can be recogmsed at depth. (e) Site 4: Sttll water depositioncrust capped by a contmuous layer of living filamentous micro-organisms (F). The profile shows altematingclay and sand layers, which are thicker and better sorted than at site 3. Superflcial layers include disruptedaggregates (A). Ancient microbiotic crusts (C) are seen at depth. (f) Site 4: Polygonal cracking (arrowed) ofthe superficial microbiotic crus!. (g) Site 5: Superficiallitter layer on non-Iayered mixed soil material.
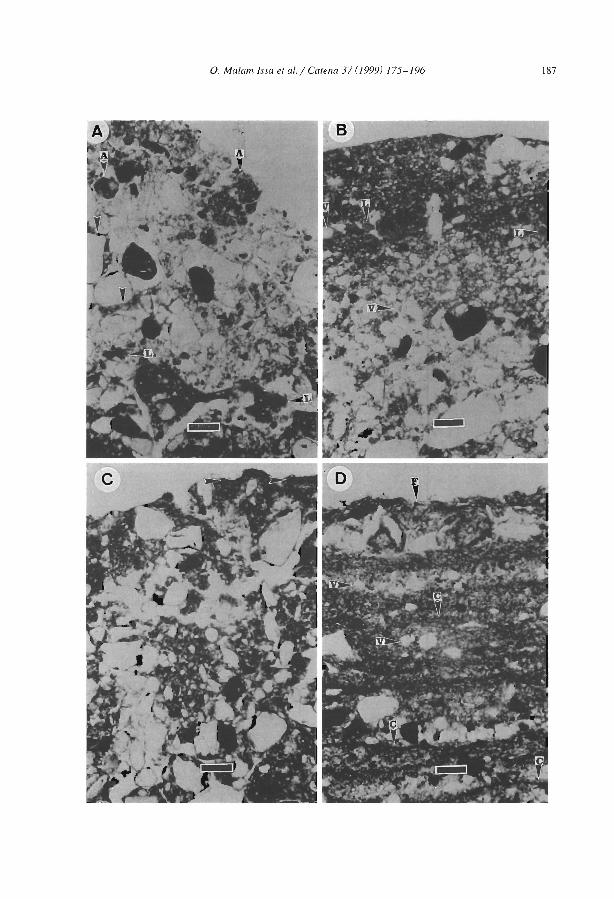
O. Ma/am Issa el al. / Calena 37 (999) 175-196 187
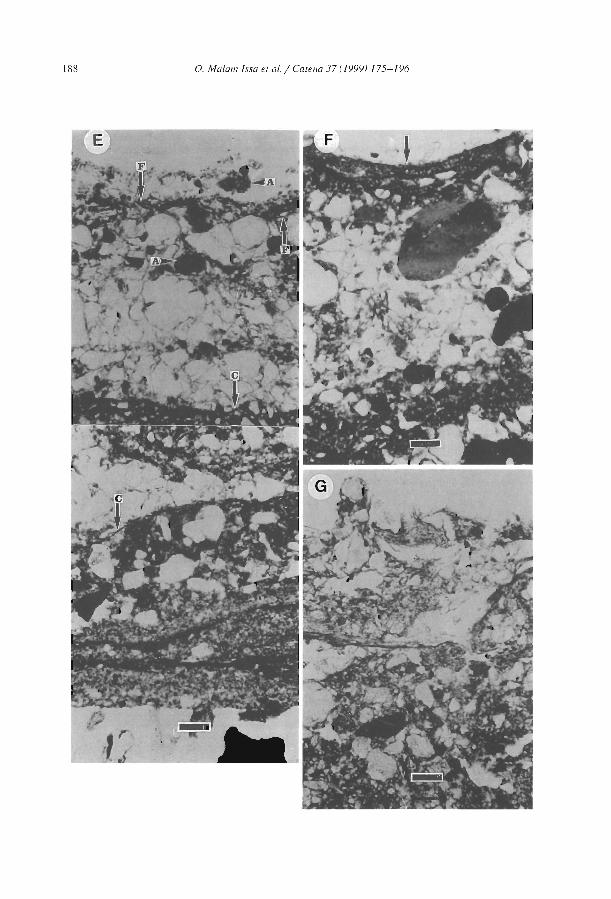
188 o. MaLam Issa el al. / Calena 37 (1999) 175-196
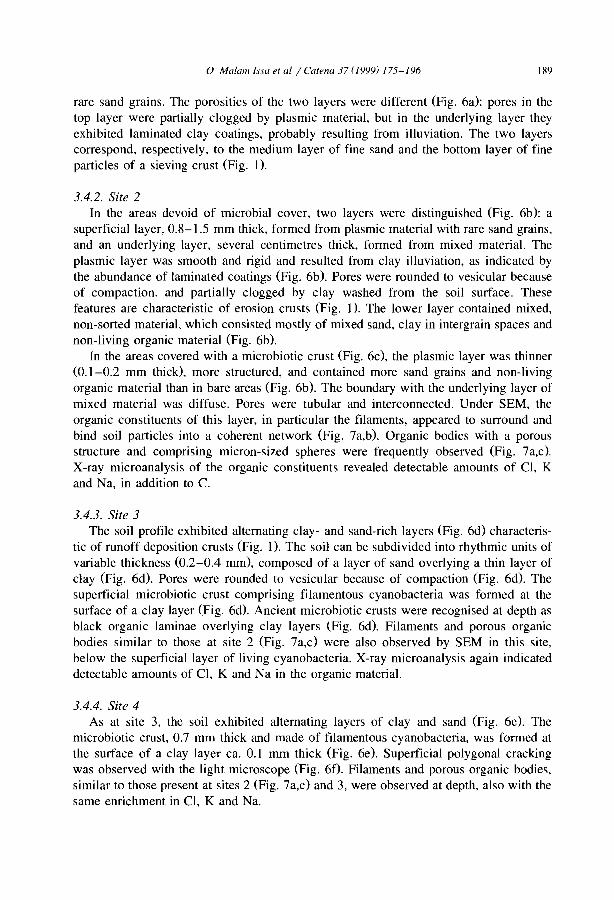
o Malam Issa el al / Calena 37 (1999) 175-196 IX,}
rare sand grains. The porosities of the two layers were different (Fig. 6a): pores in thetop layer were partially clogged by plasmic material, but in the underlying layer theyexhibited laminated clay coatings. probably resulting from illuviation. The two layerscorrespond. respectively. to the medium layer of fine sand and the bottom layer of fineparticles of a sieving crust (Fig. 1).
3.4.2. Site 2In the areas devoid of rnicrobial cover, two layers were distinguished (Fig. 6b): a
superficial layer, 0.8-1.5 mm thick, formed from plasmic material with rare sand grains.and an underlying layer, severa! centimetres thick, formed from mixed material. Theplasmic layer was smooth and rigid and resulted from clay illuviation, as indicated bythe abundance of laminated coatings (Fig. 6b). Pores were rounded to vesicular becauseof compaction. and partially clogged by clay washed from the soil surface. Thesefeatures are characteristic of erosion crusts (Fig. 1). The lower layer contained mixed,non-sorted material, which consisted mostly of mixed sand, clay in intergrain spaces andnon-living organic material (Fig. 6b).
In the areas covered with a microbiotic crust (Fig. 6c), the plasmic layer was thinner(0.1-0.2 mm thick), more structured, and contained more sand grains and non-livingorganic material than in bare areas (Fig. 6b). The boundary with the underlying layer ofrnixed material was diffuse. Pores were tubular and interconnected. Under SEM, theorganic constituents of this layer, in particular the filaments, appeared to surround andbind soil particles into a coherent network (Fig. 7a,b). Organic bodies with a porousstructure and comprising micron-sized spheres were frequently observed (Fig. 7a,c).X-ray microana!ysis of the organic constituents revealed detectable amounts of Cl, Kand Na, in addition to C.
3.4.3. Site 3The soil profile exhibited altemating clay- and sand-rich layers (Fig. 6d) characteris
tic of runoff deposition crusts (Fig. 1). The soil can be subdivided into rhythmic units ofvariable thickness (0.2-0.4 mm), composed of a layer of sand overlying a thin layer ofclay (Fig. 6d). Pores were rounded to vesicular because of compaction (Fig. 6d). Thesuperficial microbiotic crust comprising filamentous cyanobacteria was forrned at thesurface of a clay layer (Fig. 6d). Ancient microbiotic crusts were recognised at depth asblack organic laminae overlying clay layers (Fig. 6d). Filaments and porous organicbodies similar to those at site 2 (Fig. 7a,c) were also observed by SEM in this site,below the superficial layer of living cyanobacteria. X-ray microanalysis again indicateddetectable amounts of Cl, K and Na in the organic material.
3.4.4. Site 4As at site 3, the soil exhibited alternating layers of clay and sand (Fig. 6e). The
microbiotic crust, 0.7 mm thick and made of filamentous cyanobacteria, was forrned atthe surface of a clay layer ca. 0.1 mm thick (Fig. 6e). Superficial polygonal crackingwas observed with the light microscope (Fig. 6f). Filaments and porous organic bodies,similar to those present at sites 2 (Fig. 7a,c) and 3, were observed at depth, also with thesame enrichment in CI, K and Na.
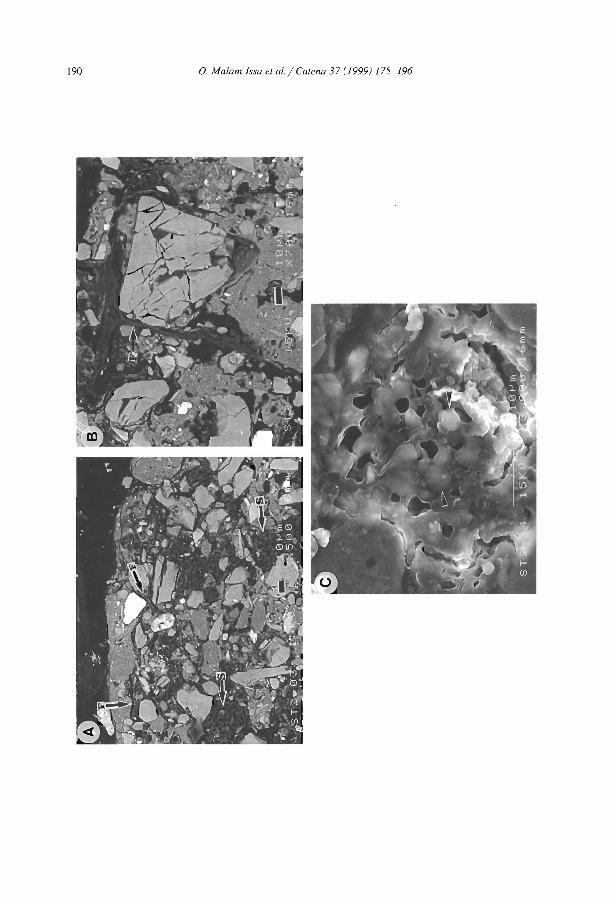
190 o. Malam Issa et al. / Catena 37 (1999) 175-196
o Malam Issa et al. / Catena 37 (1999) 175-196 191
Below the microbiotic crust, the soil profile was composed of two successive units(Fig. 6e): in the upper unit ca. 3 mm thick, the clay and sand layers were thicker (0.6-1mm) and better sorted than at site 3. whereas the microstructure of the lower unit wascloser to that at site 3. In the clay layers of the upper unit the clay was usually associatedwith non-living organic matter at the top, but was mixed with silt and sand particles atthe bottom (Fig. 6e). The features of the upper unit are characteristic of a still waterdeposition crust. As at site 3, ancient microbiotic crusts were recognised at depth (Fig.6e).
3.4.5. Site 5Two different layers were distinguished at this site (Fig. 6g); a superficial, discontinu
ous layer, ca. 1 mm thick consisting of mixed higher plant debris, sand grains, and finermineraI particles and an underlying layer consisting of material of various sizesdisturbed by vegetation growth.
4. Discussion
4.1. Biological composition
As observed by others. the microbiotic crusts we studied were fonned by microbialcommunities dominated by cyanobacteria. However, they differed from most othercrusts in that the prevalent genus was Schizothrix (Table 2). Other microbiotic crusts aredominated by Scytonema sp. in the N'Djamena region, Tchad (Dulieu et al., 1977) andin savanna zones of Nigeria (Isichei, 1980), by M. sociatus in the western Negev Desert,Israel (Lange et al., 1992) and by Microcoleus spp. in desert soil crusts in Idaho, Utahand Colorado (Brock, 1975; Campbell, 1979). In semi-arid and arid lands of NorthAmerica, the most widespread species of cyanobacteria is M. uaginatus. (Vauch.) Gom.Only in hot desert regions have microbiotic crusts been hitherto reported to consistmainly of Schizothrix Oohansen, 1993). Chlorophyta and liverworts are also commoncomponents of the microbiotic crusts in the tiger bush.
4.2. Soil stabilisation
Micro-organisms and mineraI grains are closely associated at the surface of the tigerbush microbiotic crusts. The network of filamentous cyanobacteria traps sand grains,and clay and silt sized particles adhere to the surfaces of filaments (Figs. 4c and 5a,b,d).This has already been noted in other microbiotic crusts by Cameron and Devaney (J 970)and Belnap and Gardner (1993). The ability of cyanobacterial filaments to cement
Fig. 7. SEM micrographs (backscattered electron mode) of a vertical thm section at site 2. (a) Cyanobacterialfilaments (F) and dark organic bodies enrnesh mmeral grams. Sorne organic bodies appear to be micron-sizedspheres (S). (b) Enlarged view of an area m (a). showlng cyanobacterial filaments (F) surrounding mineraIgrams. (c) Enlarged view of a dark organic body ln (a). Note the porous structure of the orgamc matter and thepresence of rnlcrospheres (arrowed).
192 O. Ma/am Issa eT al.! Catena 37 ([999) 175-196
minerai particles to the surface of their polysaccharide envelopes is weil known(Pentecost and Riding, 1986). Filament prints on the surface of minerai grains (Fig. Sc)suggest slight dissolution of the minerai at the contact with the filament.
Below the superficial layer of living cyanobacteria intermingled with mineraI grains,filaments and organic bodies also appear to enmesh soil mineraI particles (Figs. 6d,e and7a,b). The porous organic bodies presumably derive from extracellular polymer secretions (EPS) of micro-organisms. Cyanobacteria and other bacteria commonly producepolysaccharide EPS which reorganize into three-dimensional networks (Défarge et al.,1996). The role of EPS in soil aggregate stabilisation has already been mentioned byTisdall and Gades (1982). In the tiger bush soils this organic matter could be producedby the filamentous cyanobacteria or the microspheres (bacteria?) associated with theporous bodies (Fig. 7a,c).
The micro-organisms which form tiger bush microbiotic crusts thus provide cohesionto the soil through the trapping and binding effects of superficial living filaments and ofmicrobial organic material present at depth. This cohesion enhances soil stabilisationagainst water and wind erosion, as was confirmed by placing bare soil samples from site1 in water; they were completely dispersed after two days, whereas microbiotic crustsamples from sites 2 to 4 remained intact after several months of immersion. In situmeasurements made at other sites near Banizoumbou have shown that fewer mineraIparticles are removed from microbially-covered soils compared with bare soils (MalamIssa et al., 1998). These results agree with other studies, which have shown less erosionof soils covered by microbiotic crusts (Eldridge and Greene, 1994; McKenna Neuman etal., 1996; Eldridge and Kinnell, 1997).
At sites 3 and 4, the depositional crusts were interlayered at depth with ancientmicrobiotic crusts (Fig. 6d,e). In addition to their role in stabilisation of underlying soil,microbiotic crusts are thus probably involved in mineraI particle retention and depositionon their surface, and therefore in soil accretion. Cyanobacterial mats, includingSchizothrix-dominated mats, have been shown to control underwater particle sedimentation in shallow subtidal and intertidal marine areas (Neumann et al., 1970). In thedepositional sites of the tiger bush, soil accretion occurs through a rhythmic aggradationof layers, altemately organic and mineraI. The resulting structure is sedimentary ratherthan pedogenetic, and may be considered as a terrestriai stromatolite. Similaritiesbetween certain microbiotic soil crusts and stromatolites were noted by Campbell(1979).
4.3. Soil-wate,. interactions
Microscopic observations of tiger bush samples revealed two features which mayinfluence the water regime of the soil: (1) intertwining of the filamentous organisms atthe soil surface delineates pores of significant sizes (Fig. Sa,d), which could favourwater infiltration; (2) the presence of porous organic bodies at depth (Fig. 7a,c), whichenhances the water retention capacity of the soil.
When wetted, two possible kinds of behaviour can be expected from the polysaccharide constituents of cyanobacterial envelopes and of spongy organic bodies: (t) swellingresulting from absorption of water by the polysaccharide constituents is limited and the

O. Malam 1.1.\(/ el al. / Catet/a 37 (1999) 175-196 193
pore field allows water circulation, or (2) swelling reduces the pore size and enhanceswater retention by capillary forces. According to Verrecchia et al. (1995), the absorptionof water by biological material and the retention of water by strong capillary forces arethe ways in which microbiotic crusts limit water infiltration and promote runoff whenrain starts.
The int1uence on the water regime of other organisms such as termites, which wereconspicuous at site 4 (Fig. 2e), should also be considered. The foraging activity of theseorganisms has been shown to enhance water infiltration (Ouedraogo, 1997).
Further studies are necessary to determine the interactions of tiger bush microbioticcrusts and water. Laboratory measurements have indicated that microbial crusts enhancethe water retention capacity of Sahelian soils similar to those of the tiger bush. At pF2.5, water retention was 6.8-36% for microbially-covered samples but only 2.1-3.8%for bare samples (Malam Issa, unpubl. data).
4.4. Chemical composition
The presence of photosynthetic micro-organisms may account for the organic Cenrichment of the surface layer of microbiotic crusts compared with bare and littercovered soils <Table 1). The phototrophs fix atmospheric CO2 at rates estimated byBeymer and Klopatek (I 99]) for microbiotic crusts in Pinyon-Juniper woodlands(Northem Arizona, USA) to range from 43 (grazed soi]) to 350 kg C ha - 1 yr - 1
(ungrazed soi]). A sample from site 4 of Banizoumbou tiger bush has been shown to fix4.3-5.3 mg C m-2 mn - 1 under laboratory conditions (Malam Issa, unpubl. data).
The supply of nitrogen in microbiotic crusts is mainly from cyanobacteria and lichens(Mayland et al., 1966: Jeffries et al., 1992). Nitrogen fixation in crusts can vary from 1to 100 kg N2 ha- 1 yr- I (Jeffries et aL 1992). In the tiger bush soils, which do notsupport lichens, nitrogen should be fixed mainly by the heterocystous cyanobacterialspecies Nostoc sp., Scy. jauanicum and Scy. stuposum (Table 2). Sorne other species ofcyanobacteria devoid of heterocysts are also able to fix nitrogen (Stal, 1995; Bergman etal., 1997).
4.5. Microbiotic crusts in tiger bush dynamics
The microscopie features of the tiger bush sequence revealed a specifie organizationof the soil between successive vegetated bands (Fig. 3). From the decaying part of theupper band down to the flourishing part of the lower band, the soil surface consistssuccessively of a sieving crust (site 1), an erosion crust (site 2), a runoff sedimentationcrust (site 3) and a still water deposition crust (site 4). In site 4, the still water depositioncrust caps an ancient runoff deposition crust analogous to that at site 3 (Fig. 3). Thesuperficial layer of the crust at site 2 corresponds to the lower, plasmic layer of thesieving crust at site 1 (compare Fig. 6a and b). The erosion crust at site 2 probablyresults from the evolution of a sieving crust (Fig. 3). Deposition of particles translocatedfrom sites 1 and 2 induces the formation of depositional crusts at sites 3 and 4 (Fig. 3).These observations confirm the dynamic model of Bresson and Valentin (1990). The
194 O. Malam Issa et al. / Catena 37 (1999) 175-196
downward movement of water which controls the formation of the tiger bush landscapeis also responsible for the organisation of soil between the vegetated bands.
The cyclic evolution which results from the upslope migration of vegetated bandsalso affects the soil crusts. Vegetation decay at site 5 creates a bare soil which willevolve into a structural crust (site 1 type). The structural crust will be replaced by anerosion crust (site 2 type), then by a depositional crust (site 3 and site 4 types) suppliedby particles translocated from structural and erosion crusts formed above. The depositional crust will be progressively invaded by the upslope migrating vegetation and thusbecome a site 5 type soil.
The microbiotic crusts are essential components of the tiger bush ecosystem. Thezonation of microbiotic crusts is parallel to the tiger bush banding (Fig. 3). Site 1 isdevoid of any microbial coyer. The density of microbial coyer increases from site 2 tosite 4, and the microbial communities present at site 5 are close to those formingmicrobiotic crusts at sites 2 to 4 (Table 2). The most extensive development ofmicrobiotic crusts is associated with temporary accumulations of water at site 4. Themicrobial coyer enhances stabilisation of depositional crusts and promotes retention ofsand and clay particles on their surface. The continuous aggradation of minerai layers,whose surface is recolonised by micro-organisms after deposition, results in soilaccretion at this site. The resulting soil provides a stabilised, well-moistened andnutrient-enriched substrate for the upslope migration of plants from the adjacentvegetated band (site 5). The microbiotic crusts are then destroyed by root and faunalbioturbation which follows the establishment of higher plants.
5. Conclusions
This study has documented further occurrences of microbiotic crusts formed bycyanobacteria, chlorophyta and liverworts on the surface of soils in semi-arid tiger bushwoodlands. The results confirm the role of a microbial coyer and derived organic matterin microstructure development and stabilisation of the soils.
The microbiotic crusts are essential components of the tiger bush ecosystem. Thedownward movement of water, which controis the dynamics of the tiger bush landscape,also controls the lateral and vertical successions of crusts in the tiger bush sequencestudied. The formation of microbiotic crusts in the lower parts of bare bands helps retainwater, resist erosion and accumulate soil. Microbial activity also results in C and Nenrichment of superficial soil. The upslope development of trees and shrubs of thevegetated bands takes place on this substrate. The development of microbiotic crustsbetween the zones with higher plants appears to be a biological adaptation favourable tothe preservation of the structure and nutrient level of the soil during periods ofdenudation.
Microbiotic crusts may thus play a specifie role in the conservation and improvementof soil properties in Sahelian regions. Through increase of resistance to erosion,enrichment in essential nutrients, and control on water uptake, they can favour theestablishment of farm crops.

Acknowledgements
O. Ma/am Issa et al. / Catena 37 (/999) 175-196 195
This project was supported by ORSTOM and the paper is a contribution to the IGCPProject 380 'Biosedimentology of microbial buildups'. l.L. Rajot helped with fieldwork. Thin sections were made in the Institut National Agronomique de Paris-Grignonby L.M. Bresson. A. Genty and C. Lelay helped with microscopie observations, and B.Guillet with particle size analyses. Reviews by DJ. Eldridge and A. Yair significantlyimproved the paper.
References
Ambouta, K., 1984. Contribution à l'édaphologie de la brousse tigrée de l'Ouest nlgénen. Thèse deDocteur-Ingénieur. Université Nancy 1. France, 116 pp.
Ambouta, J.M.K. 1997. Définition et caracténsatlon des structures de végétation contractée au Sahel: cas de labrousse tigrée de l'ouest nigénen. In: d'Herbès. J.M .. Ambouta, J.M.K.. Peltier, R. (Eds.), Fonctionnementet Gestion des Écosystèmes Forestiers Contractés Sahéhens. John Libbey Eurotext, Paris, pp. 41-57.
Barbey, C.. Couté, A. 1976. Croûtes à cyanophycées sur les dunes du Sahel mauritanien. Bulletin del'I.F.A.N. 38, sér. A, 732-736.
Belnap. J.. Gardner. J.S., 1993. SOli microstructure ln sOlls of the Colorado Plateau: the role of thecyanobacterium Microco/eus l'agillatus. Great BaSin Naturalist 53. 40-47.
Bergman. B., Gallon, J.R., Rai. A.N., Stal, LJ.. 1997. N2 fixation by non-heterocystous cyanobacteria. FEMSMicrobiol. Rev. 19, 139-185.
Beymer, RJ., Klopatek. J.M., 1991. Potential contributIOn of carbon by microphytic crusts in Pinyon-Jumperwoodlands. And SOli Res. Rehab. 5, 187-198.
Bresson, L.M., Valentin, C, 1990. Comparative micromorphologlCal study of soil crusting in temperate andarid environments. Trans. 14th Int. Congr. Soil Sci.. Kyoto, Japan. VII. pp. 238-243.
Brock, T D., 1975. Effect of water potential on a Microcoleus (Cyanophycead from a desert crust. J. Phycol.11,316-320.
Brotherson, J.D., Rushforth, S.R., 1983. Influence of cryptogamic crusts on mOlsture relationships of soils ln
Navajo National Monument, Anzona. Great Basin Naturalist 43, 73-78.Cameron, R.E.. Devaney, J.R., 1970. Antarctic sOli algal crusts: scanning electron and optical microscope
study. Trans. Am. Microsc. Soc. 89, 264-273.Campbell, S.E., 1979. Soil stabilisation by a prokaryotic desert crust: implications for Precambrian land blOta.
Ongins of Life 9, 335~348.
Campbell, S.E.. Seeler, J.S., Golubic, S., 1989. Desert crust formation and SOli stabilisation. Arid SOli Res.Rehab 3,217-228.
Cole, D.N., 1990. Tramphng disturbance and recovery of cryptogamlc SOli crusts in Grand Canyon NationalPark. Great BaSin Naturalist 50,321-325.
Cornet, A.F., Montana, C.. Delhoume, J P, Lopez-Portillo. J., 1992. Water flows and the dynamics of desertvegetation stripes. In: Hansen, AJ., Di Castri, F. (Eds.l, Landscape Boundaries. Consequences for BiollcDiversity and Ecological Flows Spnnger-VerIag, New York. pp. 327-345.
d'Herbès, J.M.• Valentin, C. Thléry, J.M.. 1997. Synthèse des connaissances acquises sur la brousse tigréenigénenne: hypothèse sur la genèse et les facteurs déterminant les différentes structures contractées. In:d'Herbès, J.M., Ambouta. J.M.K.. Peltier, R. (Eds,). Fonctionnement et Gestion des Écosystèmes ForestiersContractés Sahéliens. John Libbey Eurotext, Pans, pp. 131-152.
Défarge, C, Tnchet. J.. Jaunet, A.Mo, Robert, M.. Tnbble, J.. Sansone, FJ.• 1996. Texture of microbialsediments revealed by cryo-scanning electron microscopy. J. Sedlmentary Res. 66, 935-947.
Dulieu, D.. Gaston, A.. DarIey, 1.. 1977. La dégradation des pâturages de la région de N'Djamena (Rép. duTchad) en relation avec la présence de cyanophycées psammophiles: étude préliminaire Revue d'Elevageet de Médécine Vétérinaire des Pays Tropicaux 30, 181-190.
1'.16 O. Malam Issa el al. / Calella 37 ([999) 175-196
Eldndge, D.J., 1993a. Cryptogams, vascular plants, and soIl hydrological relations: sorne preliminary resultsfrom the semlarid wood lands of eastern Australia. Great Basin Naturalist 53, 48-58.
Eldridge, D.J., 1993b. Cryptogam coyer and soil surface condition: effects on hydrology on a semiaridwoodland sOlI. And Soil Res. Rehab. 7, 207-217.
Eldridge, D.J., Greene, R.S.B., 1994. Assessment of sediment yield by splash eroslOn on a seml-arid soil withvarying cryptogam coyer. J. Arid Environ. 26, 221-232.
Eldridge, D.J., Kmnell, P.I.A.. 1997. Assessment of eroslOn rates from microphyte-dominated calcareous soilsunder ram-Impacted flow. Aust. J. Soli Res. 35,475-489.
Grelgert, J., 1966 Descnptlon des fonnations crétacés et tertiaires du bassm des Iullemmeden (AfriqueOCCidentale) Publicalions de la Direction Mmes et Géologie, Niger, 2. Bureau de Recherches Géologiqueset Mmlères. Niamey. Niger. 234 pp
Harper. K.T., Pendleton, R, 1993. Cyanobacteria and cyanohchens: Can they enhance availabliity of essentialmmerals for higher plants? Great Basin Naturalist 53. 59-72.
ISlchei, A.O., 1980. Nllrogen fixation by blue-green algal soil crusts m Nigerian savannah. In: Rosswall, T.(EdJ, Nitrogen Cychng m West African Ecosystems. SCOPE-UNEP International Nitrogen Umt, RoyalSwedish Academy of SCIences, Stockholm, pp. 191-198.
Jeffries, D.L., Klopatek, J M., Link. S.O., Bolton, H Jr., 1992. Acetylene reduction by cryptogamlc crustsfrom a blackbrush commumty as related to resalUration and dehydralion. Soil Biol. BlOchem. 24,1101-1105.
Johansen, J.R., 1993. Cryptogamlc crusts of semlarid and and lands of North Amenca. J. Phycol. 29,140-147.
Klubek, B.. SkuJins, J., 1980. Heterotrophlc N,-fixalion m and soil crusts. SOlI BIOl. Biochem 12,229-236.Lange, OL, Kidron, G.I., Büdel, B., Meyer. A., Kihan. E, Abeliovich, A, 1992. Taxonomlc composition and
photosynthetic charactenstlcs of the 'biological SOlI crusts' covenng sand dunes in the western NegevDesert. FunctIonal Ecology 6, 519-527.
Loope, W.L. Gifford, G.F., 1972. Intluence of a soil mlcrotloral crust on select properties of soils underPinyon-Juniper m southeastern Utah. J. Soil Water Conserv. 27, 164-167.
Malam Issa, 0, Trichet, 1., Défarge, c., Valentm, C.. Rajot, J.L, 1998. Mlcromorphology of microblOticcrusts from Niger soils. Influence on soil-water dynamlcs. Trans 16th Int. Congr. SOlI SCI., Montpellier,France, Symp. 30, 961, 7 pp.
Mayland, H.F., McIntosh, H.T., Fuller, W.H, 1966. FixatIOn of lSotopic nitrogen on a semiarid soil by algalcrust organisms. SOlI Sci Soc. Am. Proc 30, 56-60.
McKenna Neuman, C.M., Maxwell, C., Boulton, J W, 1996. Wmd transport of sand surfaces crusted wlthphotoautotrophic mlcroorganisms. Catena 27, 229-247
Neumann, A.C.. Gebelem, C.D., Scoffm, T.P, 1970. The compositIon, structure and erodabLlIty of sublidalmats, Abaco, Bahamas. J. Sedimentary Petrol. 40, 274-297.
Ouedraogo, P., 1997. Rôle des termites dans la structure et la dynamique d'une brousse tigrée soudanosahélienne. Thèse de doctorat, UniversIté Paris VI, France, 282 pp.
Pentecost, A., Rldmg, R., 1986. CalcificatIOn in cyanobacteria. In: Leadbeater. B.S.C., Rlding, R. ŒdsJ.Biomineralization in Lower Plants and AnimaIs. Clarendon Press, Oxford, pp. 73-90.
Reynaud, P.A., Lumpkm, TA, 1988. Mlcroalgae of the Lanzhou (China) cryptogamic crus!. Arid Soil Res.Rehab. 2.145-155.
Rychert, R.C., Skujms, J . 1974 Nllrogen fixation by blue-green algae-lichen crusts in the Great Basin Desert.Soil Sci. Soc. Am. Proc. 38, 768-771.
Stal, L J . 1995. Physiologlcal ecology of cyanobacteria in microbial mats and other communilies. New Phytol.131, 1-32.
Thiéry, J.M., d'Herbès, J M., Valentin, C., 1995. A model simulatmg the genesis of banded patterns in Niger.J. Ecology 83, 497-507.
Tisdall, J.M.. Oades, J.M , 1982. Orgamc maner and water-stable aggregates in soils. J Soil SCI. 33, 141-163.Verrecchia, E., Yair, A. Kidron, G.I., Verrecchia. K., 1995. Physical properlies of the psammophlle
cryptogamlc crust and thelr consequences of the water regime of sandy soils, North-western Negev Desert,Israel. J. And EnViron. 29,427-437.
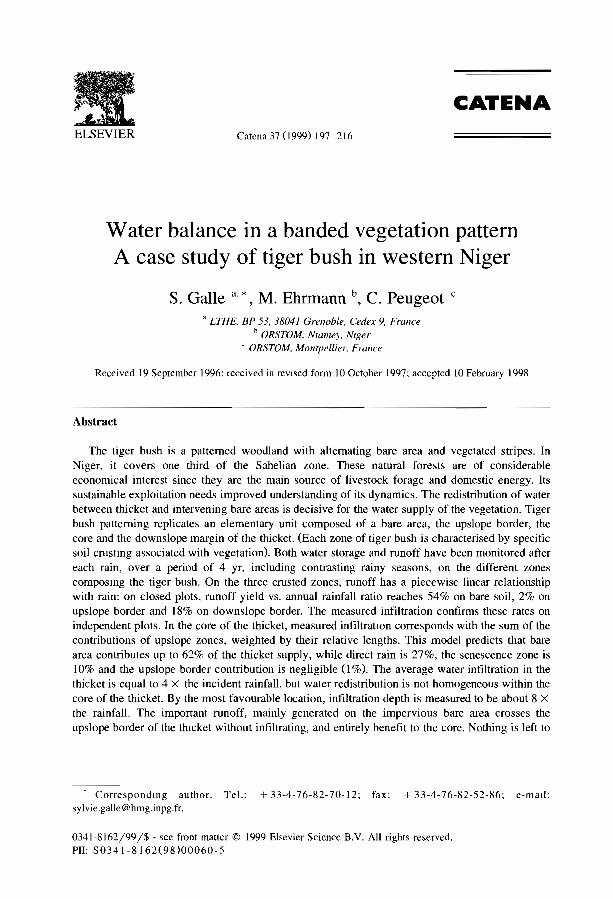
ELSEVIER Catena 37 (1999) 197-216
CATENA
Water balance in a banded vegetation patternA case study of tiger bush in western Niger
S. Galle a, * , M. Ehrmann b, C. Peugeot C
" LTHE. BP 53.38041 Grenoble. Cedex 9. Franceh OR5TOM. Nrumey. Niger
c OR5TOM, Montpellier. France
Received 19 September 1996; received in revlsed fonn JO October 1997; accepted 10 February 1998
Abstract
The tiger bush is a patterned woodland with alternating bare area and vegetated stripes. InNiger, it covers one third of the Sahelian zone. These natural forests are of considerableeconomical interest since they are the main source of livestock forage and domestic energy. Ilssustainable exploitation needs improved understanding of its dynamics. The redistribution of waterbetween thicket and intervening bare areas is decisive for the water supply of the vegetation. Tigerbush patterning replicates an elementary unit composed of a bare area, the upslope border, thecore and the downslope margin of the thicket. (Each zone of tiger bush is characterised by specificsoil crusting associated with vegetation). Both water storage and runoff have been monitored aftereach rain, over a period of 4 yr, including contrasting rainy seasons, on the different zonescomposing the tiger bush. On the three crusted zones, runoff has a piecewise linear relationshipwith rain; on closed plots. runoff yield vs. annual rainfall ratio reaches 54% on bare soil, 2% onupslope border and 18% on downslope border. The measured infiltration confirms these rates onindependent plots. In the core of the thicket, measured infiltratIOn corresponds with the sum of thecontributions of upslope zones, weighted by their relative lengths. This model predicts that barearea contributes up to 62% of the thicket supply, while direct rain is 27%, the senescence zone is10% and the upslope border contribution is negligible (I%). The average water infiltration in thethicket is equal to 4 X the incident rainfall, but water redistribution is not homogeneous within thecore of the thicket. By the rnost favourable location, infiltration depth is measured to be about 8 Xthe rainfall. The important runoff, mainly generated on the impervious bare area crosses theupslope border of the thlcket without infiltrating, and entirely benefit to the core. Nothing is left to
• Correspondmg author. Tel.: + 33-4-76-82-70-12; fax; + 33-4-76-82-52-86; e-maIl:[email protected].
0341-8162/99/$ - see front matter © 1999 Elsevier Science B.V. Ali rights reserved.PlI; S0341-8162(98)00060-5
198 S. Galle et al. / Catena 37 (J999) 197-216
the downslope border, only rainfed. The upslope border, often described as favourable location foryoung plants is only rainfed most part of the year. By the end of the season, its increasingporosity, due to vegetation and termite activity let it benefit of the last rains. The simple waterbalance madel based on mnatl measurement is satisfactorily validated by independent abservedinfiltration. © 1999 Elsevier Science B.Y. AU rights reserved.
Keywords' Water balance; Tiger bush; Sahel; Soil moisture storage; Runoff Yleld
1. Introduction
In Niger, tiger bush woodlands supply the major part of domestic energy (Peltier etal., 1995) and contribute to livestock forage. As the anthropogen pressure increases, sotoo does the risk of damage to the ecosystem. The need for sustainable exploitationimplies an understanding of tiger bush dynamics. Tiger bush is a pattemed woodlandmade up of altemating bare areas and vegetated stripes. It occurs in arid or semi-aridclimates, where water availability is limited, relative to vegetation needs. Similarpattemed vegetation has been reported in many parts of the world: in Sahelian Africa(from Mauritania to Somali), in Australia, Mexico, and in the USA. Since the firstdescription in Niger by Clos-Arceduc (1956), Boaler and Hodges (1964) postulated theimportance of the superficial water dynamics in the maintenance of the spatial structure:sheet runoff is generated on the bare ground area which benefits the downslopevegetation stripe. Although numerous studies have been undertaken describing similarecosystems ail over the world, very few of them have actually measured runoff or soilmoisture distribution over bare and vegetated areas to validate water dynamics hypotheses. Moreover, these studies concem different continents: Slatyer (196 I) and Greene(1992) worked in Australia; Cornet et al. (1992) and Mauchamp et al. (1994) in Mexico.Since 1992, hydrologieal and ecological studies related to tiger bush functioning havebeen undertaken in Niger as part of two international experiments HAPEX-Sahel 1
(Goutorbe et al., 1994) and GCTE-SALT 2 (Menaut et al., 1993).Peugeot et al. (1997) measured high runoff generation on tiger bush bare surface. But
at the plateau scale, the contribution to the foothill runoff is limited to the bare border ofthe plateau. This difference must be due to the sink role of the vegetated stripes.Seghieri et al. (1997) studied the relationship between surface soil water dynamics andherbaceous plant development on the upslope part of the thicket. The present paper aimsto calculate water balance of an entire tiger bush unit, including bare and vegetatedareas, to validate a rain redistribution hypothesis. We monitored measurements of runoffand soit moisture content in each zone composing a tiger bush unit in Niger during aperiod of 4 yr, including contrasting rainy seasons. The data were monitored at a raindependent time step.
1 HAPEX-Sahel: Hydrologlcal and Atmosphenc Pilot Experiment III the Sahel.l GCTE-SALT: Global Change Terrestnal Eco,ystem,-Savane à Long Terme core proJect.
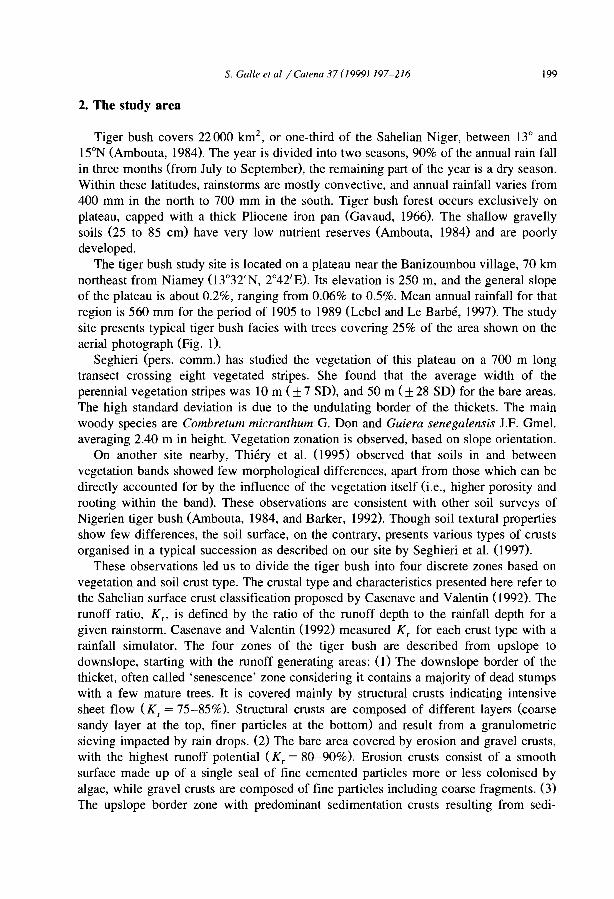
2. The study area
S. Galle et al / Catena 37 (J999) 197-216 199
Tiger bush covers 22000 km2, or one-third of the Sahelian Niger, between 13° and
15°N (Ambouta, 1984). The year is divided into two seasons, 90% of the annual rain fallin three months (from July to September), the remaining part of the year is a dry season.Within these latitudes, rainstorms are mostly convective, and annual rainfall varies from400 mm in the north to 700 mm in the south. Tiger bush forest occurs exclusively onplateau, capped with a thick Pliocene iron pan (Gavaud, 1966). The shallow gravellysoils (25 to 85 cm) have very low nutrient reserves (Ambouta, 1984) and are poorlydeveloped.
The tiger bush study site is located on a plateau near the Banizoumbou village, 70 kmnortheast from Niamey 03°32'N, 2°42'E). Its elevation is 250 m, and the general slopeof the plateau is about 0.2%, ranging from 0.06% to 0.5%. Mean annual rainfall for thatregion is 560 mm for the period of 1905 to 1989 (Lebel and Le Barbé, 1997). The studysite presents typical tiger bush facies with trees covering 25% of the area shown on theaerial photograph (Fig. 1).
Seghieri (pers. comm.) has studied the vegetation of this plateau on a 700 m longtransect crossing eight vegetated stripes. She found that the average width of theperennial vegetation stripes was 10 m ( ± 7 SD), and 50 m (± 28 SD) for the bare areas.The high standard deviation is due to the undulating border of the thickets. The mainwoody species are Combretum micranthum G. Don and Guiera senegalensis J.F. Gme!.averaging 2.40 m in height. Vegetation zonation is observed, based on slope orientation.
On another site nearby, Thiéry et al. (995) observed that soils in and betweenvegetation bands showed few morphological differences, apart from those which can bedirectly accounted for by the influence of the vegetation itself (i.e., higher porosity androoting within the band). These observations are consistent with other soil surveys ofNigerien tiger bush (Ambouta, 1984, and Barker, 1992). Though soil texturai propertiesshow few differences, the soil surface, on the contrary, presents various types of crustsorganised in a typical succession as described on our site by Seghieri et al. (997).
These observations led us to divide the tiger bush into four discrete zones based onvegetation and soil crust type. The crustal type and characteristics presented here refer tothe Sahelian surface crust classification proposed by Casenave and Valentin (992). Therunoff ratio, Kr' is defined by the ratio of the runoff depth to the rainfall depth for agiven rainstorm. Casenave and Valentin (992) measured Kr for each crust type with arainfall simulator. The four zones of the tiger bush are described from upslope todownslope, starting with the runoff generating areas: (1) The downslope border of thethicket, often called 'senescence' zone considering it contains a majority of dead stumpswith a few mature trees. It is covered mainly by structural crusts indicating intensivesheet flow (Kr = 75-85%). Structural crusts are composed of different layers (coarsesandy layer at the top, tiner particles at the bottom) and result from a granulometricsieving impacted by rain drops. (2) The bare area covered by erosion and gravel crusts,with the highest runoff potential (Kr = 80-90%). Erosion crusts consist of a smoothsurface made up of a single seal of tine cemented particles more or less colonised byalgae, while gravel crusts are composed of fine particles including coarse fragments. (3)The upslope border zone with predominant sedimentation crusts resulting from sedi-
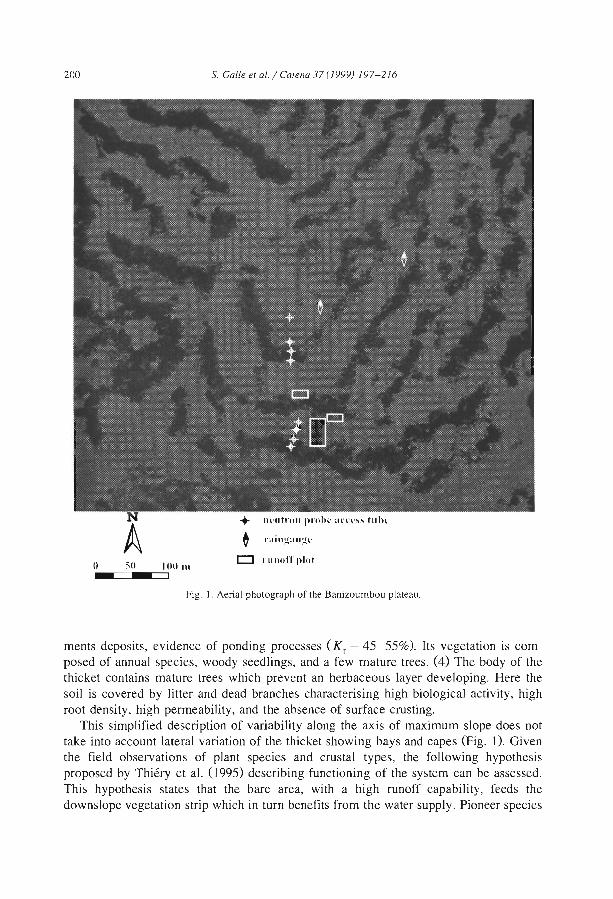
200 S. Galle el al. / Calena 37 (1999) 197-216
N
Ao ~O 100 III
- - 1
... Ill'Iltron pI'OIH' "l'l'l'.'.' tnlH'
~ ,.aill~~tll;!\·
o l'IlnOnl)lot
Fig. 1. Aerial photog(aph of the Banizoumbou plateau.
ments deposits, evidence of ponding processes (Kr = 45-55%). Its vegetation is composed of annual species, woody seedlings, and a few mature trees. (4) The body of thethicket con tains mature trees which prevent an herbaceous layer developing. Here thesoil is covered by litter and dead branches characterising high biological activity, highroot density, high permeability, and the absence of surface crusting.
This simplified description of variability along the axis of maximum slope does nottake into account lateral variation of the thicket showing bays and capes (Fig. 1). Giventhe field observations of plant species and crustal types, the following hypothesisproposed by Thiéry et al. (J 995) describing functioning of the system can be assessed.This hypothesis states that the bare area, with a high runoff capability, feeds thedownslope vegetation strip which in turn benefits from the water supply. Pioneer species
S. Glilleefll[.jCl1fe,/{/37(J999) 197-216 20)
at the front and dead trees at the rear of the thicket suggest that the pioneer front isalways favoured with respect to water feeding.
3. Methods
The study area, including three vegetation arcs, covers an area of 200 X 200 m2 andis shown in Fig. 1. The hydrological fieldwork was carried out from January, 1992 toDecember, 1995 including four rainy seasons and three dry seasons. Rainfall amountand intensity were measured at the event time step using raingauge recorders formingpart of the EPSAT-Niger 3 rainfall monitoring network described in Lebel et al. (1992).
3.1. Runoff
Three runoff plots were set up to provide discharge measurements on bare zone,upslope border and downslope border. As it is closed, a runoff plot is designed tomeasure runoff generated on a selected area. The total runoff crossing an open area willbe higher if it receives water from the upward zone. This plot arrangement did notmeasure runoff generated on the body of the thicket, as il is assumed to be nuIl. Thisassumption is based on observation of both absence of soil crusting and high macroporosity due to termite activity.
A runoff plot consists of a rectangular area of natural soil surrounded by an ironborder driven 10 cm into the soil and equipped downstream with a collector feeding a1 m3 tank for water volume measurements. A by-ten divider is mounted on the barezone plot to supply excess volume to a second tank. Water volume in the tanks weremeasured after each rainstorm. Each plot is assumed to be representative of thehydrologic behaviour of the surface crust enclosed. The three plots have the same width,but their length varies to include the total length of each zone of tiger bush. The plotareas are 26 X 5 m2
, 13 X 5 m2, and 12.4 X 5 m2
, for bare, pioneer and downslopeborders, respectively. The bare soil plot has been monitored from early July, 1992 to theend of the 1993 rainy season, whereas only the 1995 rainy season data set is availablefor the two other plots.
3.2. Soil water content
Soil moisture profiles were measured in two lines of neutron probe access tubes.Each line, installed perpendicularly to a different vegetation strip, included at least oneaccess tube in each of the four zones of the tiger bush. On this lateritic plateau, theaccess tubes were installed using a motorised hammer drill. The drilling rod and theaccess tubes had the same diameter to ensure tight contact with the surrounding soil. Anarrow 5-cm diameter seal of cement was settled around the tube on the soil surface, toprevent downward leakage of water. On the first line, four access tubes were placed to a
3 EPSAT: Estimatmg Precipitation usmg SATellite.
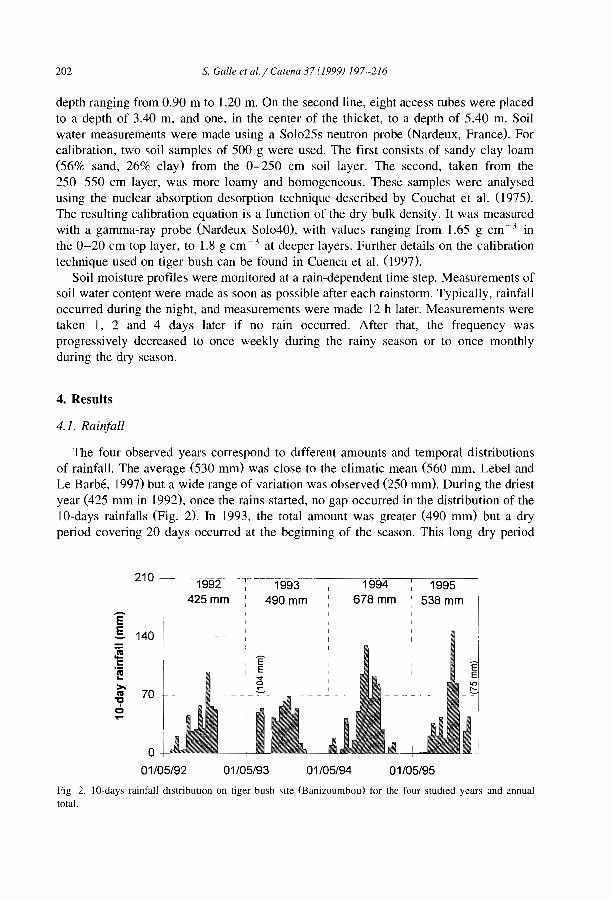
202 S. Galle et al. / Catena 37 (J999) 197-216
depth ranging from 0.90 m to 1.20 m. On the second line, eight access tubes were placedto a depth of 3.40 m, and one, in the center of the thicket, to a depth of 5.40 m. Soilwater measurements were made using a Sol025s neutron probe (Nardeux, France). Forcalibration, two soil samples of 500 g were used. The first consists of sandy clay loam(56% sand, 26% clay) from the 0-250 cm soil layer. The second, taken from the250-550 cm layer, was more loamy and homogeneous. These samples were analysedusing the nuclear absorption desorption technique described by Couchat et al. (1975).The resulting calibration equation is a function of the dry bulk density. It was measuredwith a gamma-ray probe (Nardeux Sol040), with values ranging from 1.65 g cm- 3 inthe 0-20 cm top layer, to 1.8 g cm- 3 at deeper layers. Further details on the calibrationtechnique used on tiger bush can be found in Cuenca et al. (1997).
Soil moisture profiles were monitored at a rain-dependent time step. Measurements ofsoil water content were made as soon as possible after each rainstorm. Typically, rainfalloccurred during the night, and measurements were made 12 h later. Measurements weretaken l, 2 and 4 days later if no rain occurred. After that, the frequency wasprogressively decreased to once weekly during the rainy season or to once monthlyduring the dry season.
4. Results
4.1. Rainfall
The four observed years correspond to different amounts and temporal distributionsof rainfall. The average (530 mm) was close to the climatic mean (560 mm, Lebel andLe Barbé, 1997) but a wide range of variation was observed (250 mm). During the driestyear (425 mm in 1992), once the rains started, no gap occurred in the distribution of the10-days rainfalls (Fig. 2). In 1993, the total amount was greater (490 mm) but a dryperiod covering 20 days occurred at the beginning of the season. This long dry period
01/05/9401/05/93
-~ -_u-Tè93 199~ 1995 1
: 490 mm 678 mm '538 mm l'
, 1
1 1
1 Iii-- - - - - -1- - - - - - - -- - 1 - - - - -- - - - - 1 - -
:l ' ~----:-~-------~- -·~·-9
,1 -J ~ ~I01/05/95
1992425 mm
210
o01/05/92
Ê.§. 140
j!c::.~
>.III 70
"o....
Fig 2. lO-days rainfall dIstributIOn on tiger bush ,He (Banizoumbou) for the four studied years and allnualtotal.
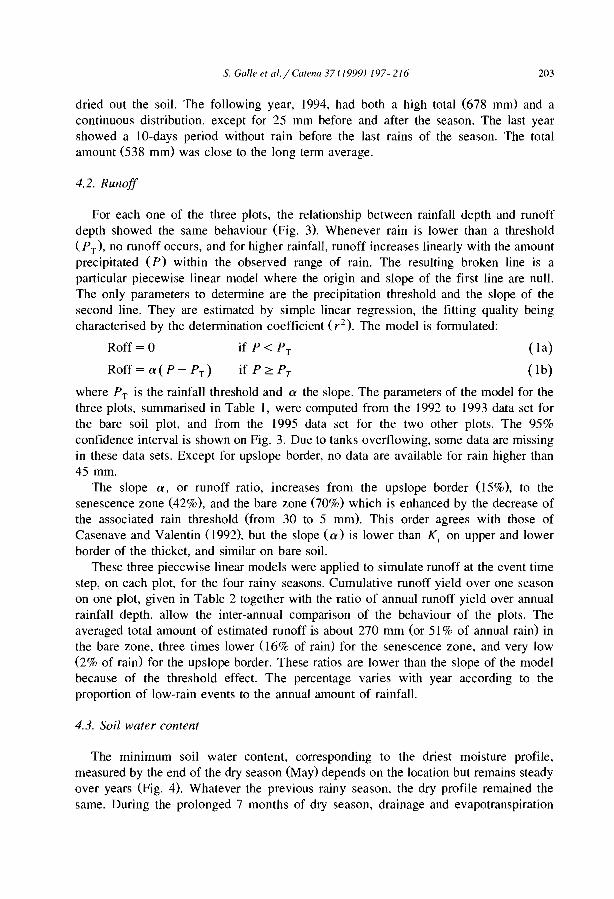
S. Galle et al. / Catena 37 (1999) 197-216 203
dried out the soil. The following year, 1994, had both a high total (678 mm) and acontinuous distribution, except for 25 mm before and after the season. The last yearshowed a 10-days period without rain before the last rains of the season. The totalamount (538 mm) was close to the long term average.
4.2. Runoff
For each one of the three plots, the relationship between rainfall depth and runoffdepth showed the same behaviour (Fig. 3). Whenever rain is lower than a threshold( PT)' no runoff occurs, and for higher rainfall, runoff increases linearly with the amountprecipitated (p) within the observed range of rain. The resulting broken line is aparticular piecewise linear model where the origin and sIope of the first line are null.The only parameters to determine are the precipitation threshold and the sIope of thesecond line. They are estimated by simple Iinear regression, the fitting quality beingcharacterised by the determination coefficient (r 2
). The model is formulated:
Roff = 0 if P < PT ( 1a)
Roff = ex ( P - PT) if P ~ PT ( 1b)
where PT is the rainfall threshold and ex the slope. The parameters of the model for thethree plots, summarised in Table l, were computed from the 1992 to 1993 data set forthe bare soil plot, and from the 1995 data set for the two other plots. The 95%confidence interval is shown on Fig. 3. Due to tanks overf1owing, sorne data are missingin these data sets. Except for upslope border, no data are available for rain higher than45 mm.
The slope ex, or runoff ratio, increases from the upslope border (15%), to thesenescence zone (42%), and the bare zone (70%) which is enhanced by the decrease ofthe associated rain threshold (from 30 to 5 mm). This order agrees with those ofCasenave and Valentin (1992). but the slope (ex) is lower than Kr on upper and lowerborder of the thicket, and similar on bare sail.
These three piecewise linear models were applied ta simulate runoff at the event timestep, on each plot. for the four rainy seasons. Cumulative runoff yield over one seasonon one plot, given in Table 2 together with the ratio of annual runoff yield over annualrainfall depth, allow the inter-annual comparison of the behaviour of the plots. Theaveraged total amount of estimated runoff is about 270 mm (or 51 % of annual rain) inthe bare zone, three times lower (16% of rain) for the senescence zone, and very low(2% of rain) for the upslope border. These ratios are lower than the slope of the modelbecause of the threshold effect. The percentage varies with year according to theproportion of low-rain events to the annual amount of rainfall.
4.3. Soil water content
The minimum soil water content. corresponding to the driest moisture profile,measured by the end of the dry season (May) depends on the location but remains steadyover years (Fig. 4). Whatever the previous rainy season, the dry profile remained thesame. During the prolonged 7 months of dry season, drainage and evapotranspiration
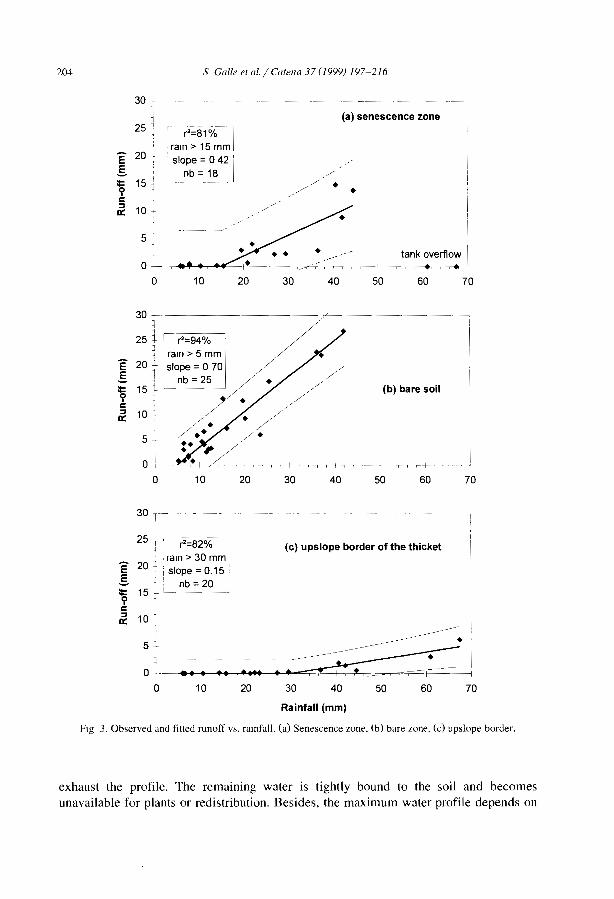
204 S Galle el al. / Calella 37 (1999) 197-216
30 r----- -- - ~~-- - --(a) senescence zone
•
706050
•
403020
r'=81% 1
raln> 15 mm
1 slope = 0 42 '1
1 nb = 18--- - -----_.
10
,
25,
Ê 20
.§.15 ~:1:
9 l
C::1 10ca:
5-:-j
0-
0
7060
,-+--,-
(b) bare sail
/~ -- --~--~---~I
il
,-,- l ,-, .-~-+
40 50
~~+-,~, I~-,
20 30
oa
5
30 ~~l
"25 l :- r2 =94% '
l 1 1
~ ,raln > 5 mm 1
Ê 20 l slope =a 70 1
.§. L nb = 25 J /~ 15 -- /
C y •~ 10 ~ /
./.// ..
25
10 ~
- r';szo/;-l,raln > 30 mm 1
Ê 20 ~ slope = a 15 i
.§. nb = 20 1
~ 15 - - J
c::1a:
(c) upslope border of the thicket
5~
aa 10 20 30 40 50 60 70
Rainfall (mm)
FIg. 3. Observed and fitted runoff vs. rainfall. (a) Senescence zone, (b) bare zone. <c) upslope border.
exhaust the profile. The remammg water is tightly bound to the soil and becomesunavailable for plants or redistribution. Besides, the maximum water profile depends on
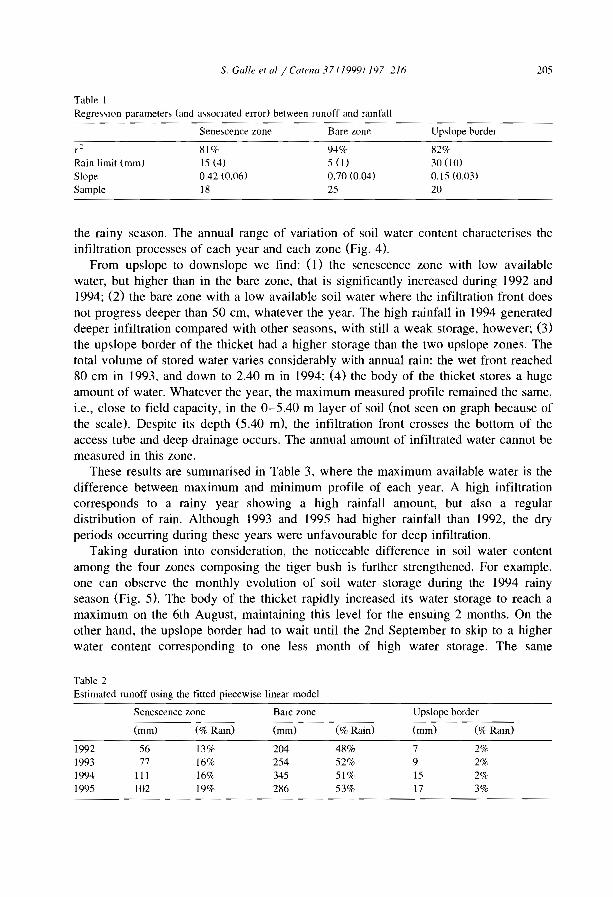
S. Galle el al / Calena 37 (1999) 197-216
Table 1Regre"lOn parameter; (and a,socIated erro,) between runoff and ralnfall
205
r-
Rain limit (mm)SiopeSample
Seneocence zone
81%15 (4)
0.42 (O.()6)18
Bare zone
94%5(1)0.70 (0.04)
25
Upslope bonler
82o/c30 (10)0.15 (003)20
the rainy season. The annual range of variation of soil water content characterises theinfiltration processes of each year and each zone (Fig. 4).
From upslope to downslope we find: (1) the senescence zone with low availablewater, but higher than in the bare zone, that is significantly increased during 1992 and1994; (2) the bare zone with a low available soil water where the infiltration front doesnot progress deeper than 50 cm, whatever the year. The high rainfall in 1994 generateddeeper infiltration compared with other seasons, with still a weak storage, however; (3)the upslope border of the thicket had a higher storage than the two upslope zones. Thetotal volume of stored water varies considerably with annual rain: the wet front reached80 cm in 1993, and down to 2.40 m in 1994; (4) the body of the thicket stores a hugeamount of water. Whatever the year, the maximum measured profile remained the same,i.e., close to field capacity, in the 0-5.40 m layer of soil (not seen on graph because ofthe scale). Despite its depth (5.40 m), the infiltration front crosses the bottom of theaccess tube and deep drainage occurs. The annual amount of infiltrated water cannot bemeasured in this zone.
These results are summarised in Table 3, where the maximum available water is thedifference between maximum and minimum profile of each year. A high infiltrationcorresponds to a rainy year showing a high rainfall amount, but also a regulardistribution of rain. Although 1993 and 1995 had higher rainfall than 1992, the dryperiods occurring during these years were unfavourable for deep infiltration.
Taking duration into consideration, the noticeable difference in soil water contentamong the four zones composing the tiger bush is further strengthened. For example,one can observe the monthly evolution of soil water storage during the 1994 rainyseason (Fig. 5). The body of the thicket rapidly increased its water storage to reach amaximum on the 6th August, maintaining this level for the ensuing 2 months. On theother hand, the upslope border had to wait until the 2nd September to skip to a higherwater content corresponding to one less month of high water storage. The same
Table 2Estimated runoff using the fitted piecewise linear model
Senescence zone Bare zone Upsiope border
(mm) (% Rain) (mm) (% Rain) (mm) (% Rain)
1992 56 13% 204 48% 7 2%1993 77 16% 254 52% 9 2%1994 III 16% 345 51% 15 2%1995 102 19% 286 53% 17 3%
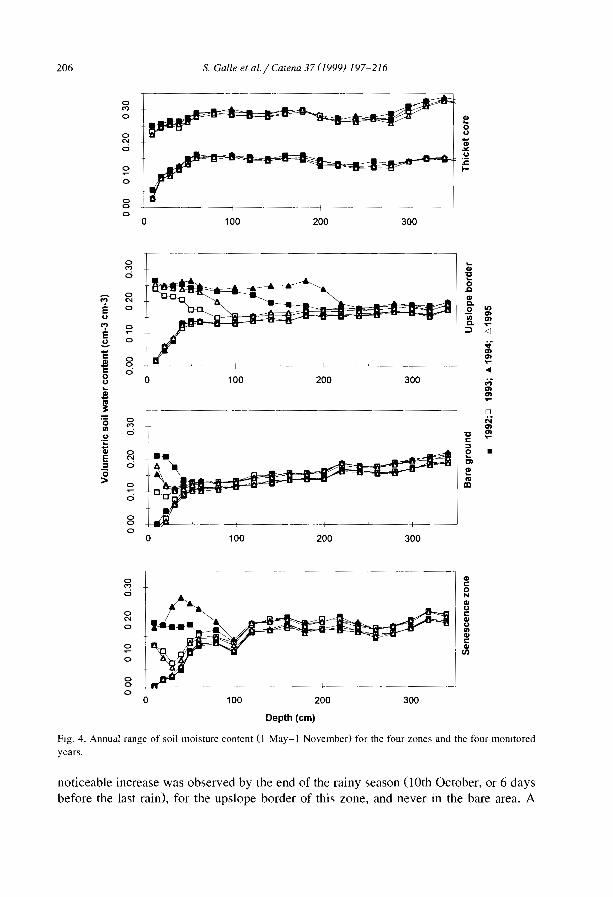
206 S. Galle et al. / Catena 37 (J999) 197-216
o 100 200 300
'?E...'?E.!:!.1:.$1:o...
1'Ci...~âiE:::lë>
•
200
Oepth (cm)
100
----- - ------- ---~---~
1 ~'[1I~
- _--+ ~ - __ +- 1
300o
Fig. 4. Annual range of sail moisture content (J May-l Novemberl for the four zones and the four momtoredyears.
noticeable increase was observed by the end of the rainy season (lOth October, or 6 daysbefore the last rain), for the upslope border of this zone, and never in the bare area. A
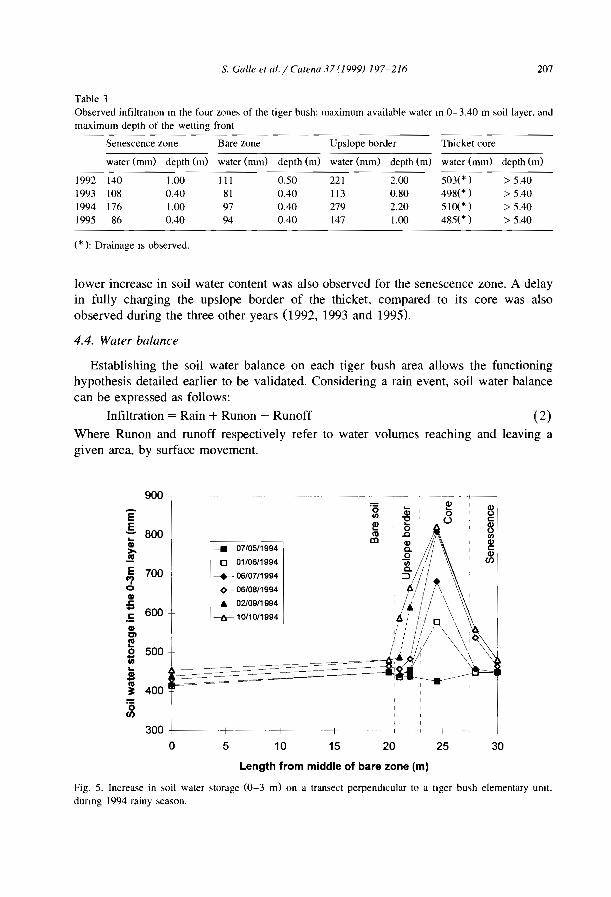
S. Galle et a/. / Carena 37 (J999) 197-216 207
Table 3Observed infiltration In the four zones of the tiger bush: maximum available water ln 0-3.40 m sail layer. andmaximum depth of the wetting front
Senescence zone Bare zone UpsIope border Thicket core
water (mm) depth (m) water(mm) depth (m) water(mm) depth (m) water (mm) depth (m)
1992 140 1.00 III 0.50 221 2.00 503(* ) > 5.401993 108 0.40 81 0.40 113 0.80 498(* ) > 5.401994 176 1.00 97 0.40 279 2.20 510(* ) > 5.401995 86 0.40 94 0.40 147 1.00 485(* ) > 5.40
(*): Drainage IS observed.
lower increase in soil water content was also observed for the senescence zone. A delayin fully charging the upslope border of the thicket, compared to its core was alsoobserved during the three other years 0992, 1993 and 1995).
4.4. Water balance
Establishing the soil water balance on each tiger bush area allows the functioninghypothesis detailed earlier to be validated. Considering a rain event, soil water balancecan be expressed as follows:
Infiltration = Rain + Runon - Runoff (2)Where Runon and runoff respectively refer to water volumes reaching and leaving agiven area, by surface movement.
900 -~------_. - ---+--
'01 ~
~Ê !II1 Qi 01 'E , ü c
.§. ~ 1 0 ~800 cu 1 .0 !II...1---- 07105/1994
ID 1 <Il <IlQI>- 1 c. 1
C
.!! 1 .Q 1 1 1<Il
--0- 01/06/1994
~1!~ \(J)
E 700 ---+- 06/07/1994...,CI -<>- 06/06/1994QI~ ! --.- 02/09/1994 :;. ~ 1/ \ 1
.. 600 ~- 10/10/1994.5QI
---
Cl1III...
500 t0..CIl
~~----------~....e ------- 1
; =---- 1
400 1
(),1
li) 1
3001
- -+--- --- --+----- - 1 ------t+-- --+--
0 5 10 15 20 25 30
Length from middle of bare zone (m)
Fig. 5. Increase in sail water storage (0-3 m) on a transect perpendlcular to a tlger bush elementary umt.dunng 1994 rainy season.

208 S. Galle etal.jeate/Ill 37(1999) 197-216
Two elements of the soil water balance equation (Eq. (2)) were directly measured onthe site (rain and runoff). The infiltration occurring during a rain event equals the changein soil water storage before and after the event plus deep drainage and evapotranspiration Œq. (3)).
Infiltration = ...lS + D + ETR (3)
where b.S is the change in soil water storage in the monitored soil layer. D is the deepdrainage beyond this level, ETR is the real evapotranspiration.
The change in soil water storage is measured using neutron probe. As soil physicalproperties of the soil are not known, drainage flux cannot be assessed. So we consideronly those events when no deep drainage occurs (D = 0), i.e., the wetting front has notcrossed the bottom of the tube, This limit does not affect bare soil, upslope anddownslope border of the thicket as seen on Fig. 4. Furthermore. infiltration in the thicketcore is only accessible during the beginning of the season. As soil water measurementsare not exactly synchronised with rain. evapotranspiration occurring in the meantime hasto be assessed and added to the measured change in water storage to obtain the actualamount infiltrated during a rainstorm.
Evapotranspiration is estimated using methodology developed by Monteny et al.(1997). They worked on the evaporation of a savannah located nearby (1 km), mainlycovered by the same woody species G. senegalensis. They showed that soil moisturedepletion affects the evapotranspiration rate through an increase in the local large-scalesurface resistance. When nearly 40% of the total soil water is depleted in the root zone,soil water content controls the evaporative regime of the Sahelian land surface. Thisrelation can be expressed as follows:
ETR/ETP = (1/0.6) * S/Sma,
ETR/ETP = 1
if 0 < S/Sma, ~ 0.6
if 0.6 <S/Sma, ~ 1
(4)
where ETR is the real evapotranspiration. ET? is the potential evapotranspiration.S/ Smax is the fraction of available water in the considered depth of soil.
Potential evapotranspiration was measured at the Banizoumbou weather stationsituated 2 km from our plateau. Estimated evaporation agreed with that recorded by Culfet al. (1993), and also by Wallace and Holwill (1997) on another tiger bush site in Niger.They found evaporation from bare areas decreased from 4 mm day-Ion the dayfoBowing a rainstorrn to 0.5 mm day -[ 3 days later.
The remaining unknown in Eq. (2) was runon. Three assumptions were made fromour understanding of the water dynamics suggested by experimental data: (j) ailgenerated runoff is transmitted to the downward zone, i.e., no lateral flux of waterexists; (ii) runoff from the thicket body is negligible; and (iii) ail generated runoffbenefits the core of the thicket. The third assumption is the strongest but it highlysimplifies the functioning by considering that upslope generated runon simply crossesbare soil and upslope border of the thicket without infiltration benefit. Given the amountof runoff generated on upslope zones, a particular attention must be given to the waterbalance of the upslope border of the thicket. AB assumptions were tested by comparingestimated and actual infiltration.
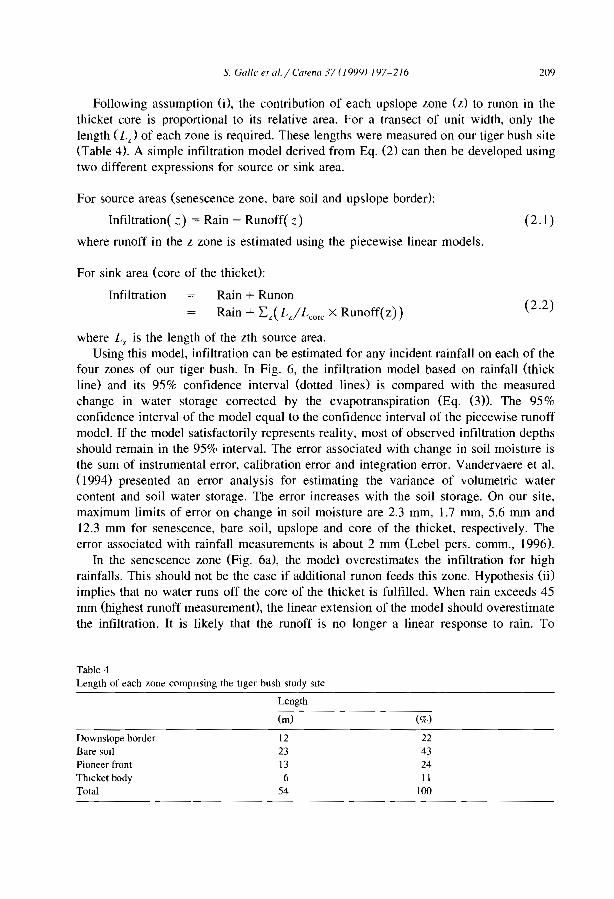
s. Galle el al./ Calella 37 (199<j) 197-216 209
Following assumption (i), the contribution of each upslope zone (z) to runon in thethicket core is proportional to its relative area. For a transect of unit width, only thelength (L,) of each zone is required. These lengths were measured on our tiger bush site(Table 4). A simple infiltration model derived from Eq. (2) can then be developed usingtwo different expressions for source or sink area.
For source areas (senescence zone, bare soil and upslope border):
Infiltration( ::.) = Rain - Runoff( ::.)
where runoff in the z zone is estimated using the piecewise linear models.
For sink area (core of the thicket):
(2.1 )
Infiltration Rain + RunonRain + L,( Lz / Lcore X Runoff( z) )
(2.2)
where L z is the length of the zth source area.Using this model, infiltration can be estimated for any incident rainfall on each of the
four zones of our tiger bush. In Fig. 6, the infiltration model based on rainfall Cthickline) and its 95% confidence interval (dotted lines) is compared with the measuredchange in water storage corrected by the evapotranspiration (Eq. (3». The 95%confidence interval of the model equal to the confidence interval of the piecewise runoffmode!. If the model satisfactorily represents reality, most of observed infiltration depthsshould remain in the 95% interva!. The error associated with change in soil moisture isthe sum of instrumental error, calibration error and integration error. Vandervaere et al.(I 994) presented an error analysis for estimating the variance of volumetric watercontent and soil water storage. The error increases with the soil storage. On our site,maximum limits of error on change in soil moisture are 2.3 mm, 1.7 mm, 5.6 mm and12.3 mm for senescence, bare soil, upslope and core of the thicket. respectively. Theerror associated with rainfall measurements is about 2 mm (Lebel pers. comm., 1996).
In the senescence zone (Fig. 6a), the model overestimates the infiltration for highrainfalls. This should not be the case if additional runon feeds this zone. Hypothesis (ij)implies that no water runs off the core of the thicket is fulfilled. When rain exceeds 45mm (highest runoff measurement), the linear extension of the model should overestimatethe infiltration. It is likely that the runoff is no longer a linear response to rain. To
Table 4Length of each zone compnsing the tlger bush study sile
Length
Downslope borderBare SOlI
Pioneer frontThlcket bodyTotal
(m)
1223136
54
(%)
224324li
100
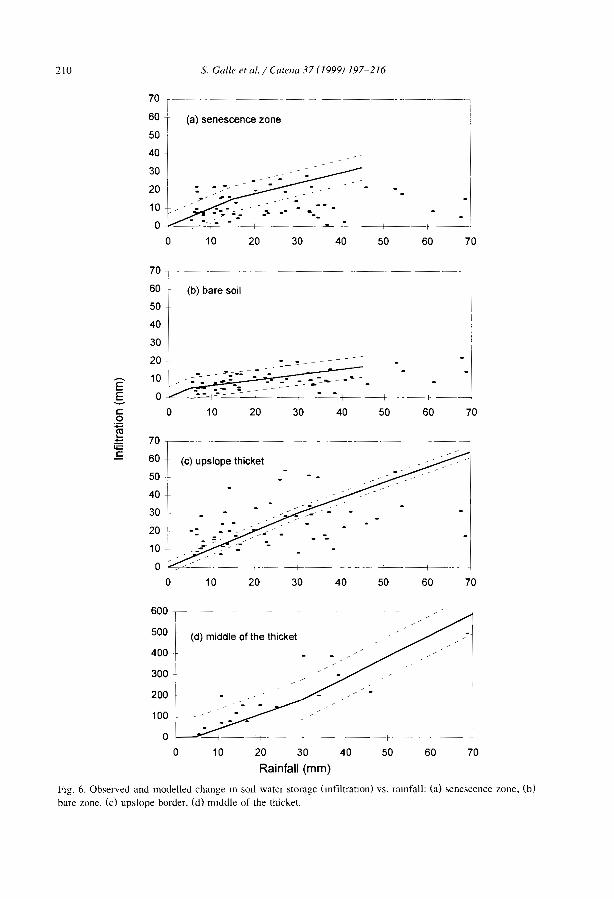
210 S. Galle et al. / Catena 37 (1999) 197-216
706050
------+---~
4030
.-. -. ------_. ---_._._--,
2010
70 r---1
60 T' (a) senescence zone
50 +
:~ i20 r :10 t - --o
o
1---- .-+--- f----.-_. ~'-'--f--"
70
70
60
60
-----1-
5040
."----. +-- ---+40 50
-- ----30
30
--+-
20
20
10
10
(c) upslope thicket
70
60
50
40
30
20
10
oo
:~ f' ~b'are soil50
40
~~r10 -
oo
7060
\-----f·
40 5020 30
Rainfall (mm)10
6001
----.500 1r (d) middle of the thicket
400 +300)
200
100
oo
Fig. 6. Observed and moùe\leù change m sOlI water storage (tnfiltratlOn) vs. ramfa\l: (a) senescence zone. (b)bare zone. (e) upslope border. (d) mlùùle of the thicket.
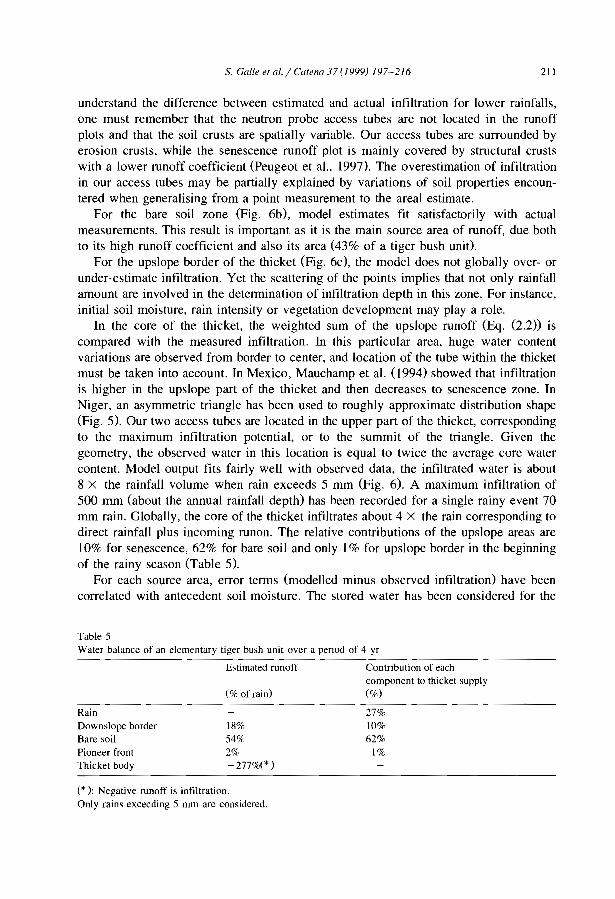
S. Galle et al. / Catena 37 (1999) 197-216 211
understand the difference between estimated and actual infiltration for lower rainfalls,one must remember that the neutron probe access tubes are not located in the runoffplots and that the soil crusts are spatially variable. Our access tubes are surrounded byerosion crusts, while the senescence runoff plot is mainly covered by structural crustswith a lower runoff coefficient (Peugeot et al., 1997). The overestimation of infiltrationin our access tubes may be partially explained by variations of soil properties encountered when generalising from a point measurement to the areal estimate.
For the bare soil zone (Fig. 6b), model estimates fit satisfactorily with actualmeasurements. This result is important as it is the main source area of runoff, due bothto its high runoff coefficient and also its area (43% of a tiger bush unit).
For the upslope border of the thicket (Fig. 6c), the model does not globally over- orunder-estimate infiltration. Yet the scattering of the points implies that not only rainfallamount are involved in the determination of infiltration depth in this zone. For instance,initial soil moisture, rain intensity or vegetation development may play a role.
In the core of the thicket, the weighted sum of the upslope runoff (Eq. (2.2» iscompared with the measured infiltration. In this particular area, huge water contentvariations are observed from border to center, and location of the tube within the thicketmust be taken into account. In Mexico, Mauchamp et al. (1994) showed that infiltrationis higher in the upslope part of the thicket and then decreases to senescence zone. InNiger, an asymmetric triangle has been used to roughly approximate distribution shape(Fig. 5). Our two access tubes are located in the upper part of the thicket, correspondingto the maximum infiltration potential, or to the summit of the triangle. Given thegeometry, the observed water in this location is equal to twice the average core watercontent. Model output fits fairly weil with observed data, the infiltrated water is about8 X the rainfall volume when rain exceeds 5 mm (Fig. 6). A maximum infiltration of500 mm (about the annual rainfall depth) has been recorded for a single rainy event 70mm rain. Globally, the core of the thicket infiltrates about 4 X the rain corresponding todirect rainfall plus incoming runon. The relative contributions of the upslope areas are10% for senescence, 62% for bare soil and only 1% for upslope border in the beginningof the rainy season (Table 5).
For each source area, error terms (modelled minus observed infiltration) have beencorrelated with antecedent soil moisture. The stored water has been considered for the
Table 5Water balance of an elementary tiger bush unit over a penod of 4 yr
Estimated runoff Contribution of eachcomponent to thicket supplY
(% of rain) (%)
RainDownslope borderSare soilPioneer frontThicket body
18%
54%2%-277%(* )
27%10%
62%1%
(*): Negative runoff is infiltration.Only rains exceeding 5 mm are considered.
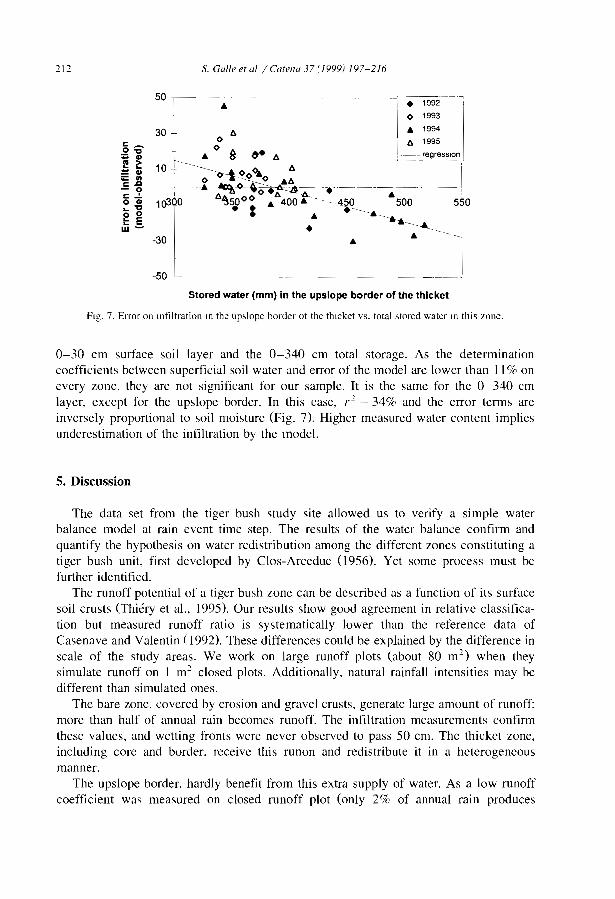
112 S. Galle eT a[ / Carena 37 (1999) 197-216
c_o'g.. CI)
~ ~~ CIl
'e!.- 0c":'o CIl.. 'go 0:: Ew-
-103QO
t-:L__
;-1ge2--'
o 1993
• 1994
l> 1995
-~-- regresslon
.• -+-- __.--+-_- _1-~O____ 500 5.10. ..~. .-._--.
•1
Stored water (mm) in the upslope border of the thicket
Fig. 7. Error on Infiltration III the up,lope border ot the thlcket vs. total stored water III this mne.
0-30 cm surface sail layer and the 0-340 cm total storage. As the determinationcoefficients between superficial sail water and error of the model are lower than II % onevery zone, they are not significant for our sample. It is the same for the 0-340 cmlayer, except for the upslope border. In this case, ,." = 34% and the error terms areinversely proportional ta sail moisture (Fig. 7). Higher measured water content impliesunderestimation of the infiltration by the mode!.
S. Discussion
The data set from the tiger bush study site allowed us ta vcrify a simple waterbalance model at rain event time step. The results of the water balance confirm andquantify the hypothesis on water redistribution among the different zones constituting atiger bush unit, first developed by Clos-Arceduc (1956). Yet sorne process must befurther identified.
The runoff potential of a tiger bush zone can be described as a function of its surfacesail crusts (Thiéry et al., 1995). Our results show good agreement in relative classification but measured runoff ratio is systematically lower than the reference data ofCasenave and Valentin (1992). These differences could be explained by the difference inscale of the study areas. We work on large runoff plots (about 80 m") when theysimulate runoff on 1 m" closed plots. Additionally, natural rainfall intensities may bedifferent than simulated ones.
The bare zone, covered by erosion and gravel crusts, generate large amount of runoff:more than half of annual rain becomes runoff. The infiltration mcasurements confirmthese values, and wetting fronts were never observed ta pass 50 cm. The thicket zone,including core and border. receive this runon and redistribute it in a heterogeneousmanner.
The upslope border, hardly benefit from this extra supply of water. As a low runoffcoefficient was measured on closed runoff plot (only 2% of annual rain produces
S. Galle el al. / Calena 37 (1999) 197-216 213
runoff), a good infiltration potential should be expected. Measured infiltration on openarea where ail upslope runon arrives is not higher than min height. The model expressesit by considering runon equal to zero. This result may seem paradoxical, it is due toinfiltration dynamics. Vandervaere et al. (I997) measured a saturated hydraulic conductivity of 5.2 E-04 mm s- 1 for sedimentation crusts of the upslope border, lower than forstructural crusts covering downslope border (8.3 E-04 mm s- 1), yet the latter producehigher runoff. The low runoff height measured in the upslope border of the thicket is notdue to high hydraulic conductivity but to the microtopography. The natural obstacles(roots, leaves) create local zones where water is temporarily stored (up to 30 mm)allowing longer time for surface storage infiltration. However, the major part goesthrough and reaches the body of the thicket. There, the macroporosity (due to microfauna) allows rapid infiltration under the ponded conditions found after rain. Chase andBoudouresque (1989) have shown that a single 0.8 cm diameter termite channel hadsufficient capacity to drain 0.6 1 min -1 during a 30 min test. Therefore, despitereceiving important runon, only water stored in the ripples appears to infiltrate in theupslope thicket.
In the upslope border of the thicket, the mean infiltration rate is reproduced, however,our simple piecewise linear model shows a wide scattering when compared with actualmeasurements. Error analysis shows a correlation between total stored water and error.Whether this relation was due to hydrodynamic properties, i.e., an increase in infiltrationcapacity with soil water content, the correlation should also be significant with surfacesoil water. As stored water increase with time, the measured correlation may be due tothe joint progress of the rainy season and annual plant development. Moreover, thecorrelation with stored water is not significant on the other tiger bush zones where verylittle annual vegetation develops. By the end of the season, annual plants have fini shedtheir growth and coyer upslope zone of tiger bush (Seghieri et al., 1997). The stems slowdown the runon from upslope areas, and the roots brake surface soil crusts. Saturatedhydraulic conductivity increases in the subsoil 6-fold compared with the sedimentationcrust (Vandervaere et al., 1997). Thus, the plant roots reduce the impeding effect of thesedimentation crusts, allowing more infiltration in the upslope zone compared with thebeginning of the season. Termite activity linked to vegetation development shouldreinforce this trend, as they generate macropores for their harvesting activity. As seen inFig. 7, the highest values of sail water storage, implying noticeable correction of themodelled infiltration (up to 30 mm) is mainly observed by the end of two long rainyyears (1992 and 1994). In 1995, when the model is calibrated with the runoff data, therainy season did not last long enough for water storage to reach high values. Because ofthe high variability of Sahelian rainy season (total amount and temporal distribution), asingle year monitoring may lead to miss sorne behaviour pattern. Although limited, thisseasonal increase in infiltration potential may be important for vegetation dynamics(wetting front progress from 80 cm to 2 m deep).
The core of the vegetation receives ail upslope generated runon, except by the veryend of rainy season as discussed above. Our mode! has not been tested during the end ofthe season due to lack of measurements. However by this time, infiltration in the coreshould be reduced due to higher infiltration in the upslope border. Since the observedmaximum increase during the four monitored years is about 30 mm in the upslope
214 S. Galle et al. / Catena 37 (1999) 197-216
border, the relative length of the two zones implies a maximum 70 mm decrease ofinfiltration in the thicket core. This correction is low compared with measured amounts,and close to the model confidence interval (100 mm) at this location. During the firstpart of the rainy season, the measured infiltration height is indeed striking, reaching 8 X
the incident rain recorded in the most favoured location of the thicket and an average of4 X the rain received over its total length. These significant amounts of available waterin the thicket core explain why two Sudanian woody species (Gardenia sokotensis andCombretum nigricans: Seghieri et al., 1997) are observed there, beyond their climaticoptimum. The concentration ratio is high compared to other studied sites: Cornet et al.(I992) measured a concentration ratio of 3.5 at Mapimi (Mexico) and Tongway andLudwig (1990) report a ratio of 2 for one rain event at Lake Mere (Australia). Theconcentration ratio varies with surface ratio (bare plus thicket area divided by thicketarea) equal to 5 in our site, 4.5 in Mapimi and 2 in Lake Mere. In Niger, surface ratio isshown to be also related to annuai rain (Valentin and d'Herbes, 1998).
Macroporosity is a key factor regulating rainfall redistribution among tiger bush. Therapidity of water infiltration in the core of the thicket explains the significant gradientbetween the core and its borders. Ali incoming runon is infiltrated in the core, leavingnothing for the downslope border. The downstream zone has an infiltration ratio muchlower than one, equal or slightly lower than the modelled infiltration considering runonequal to zero. This observation confirms the conclusion of Galle et al. (1997) whichcompared two thickets with and without runon contribution. They found that the barezone contributed mainly to total infiltration in the core, a lesser extent to the upslopeborder, and a negligible amount in the downslope area. The water deficit in that area,strengthened when annual rainfall is low, explains why most trees are dead in this«senescence» zone. However, water can cross the thicket on special occasions or bysorne temporary gullies created by human or animal paths. Though rare, these occasionsmay be important for Sahelian vegetation which is able to benefit from episodic watersupply.
6. Conclusion
Tiger bush patterning replicates an elementary unit composed of a bare area, theupslope border of a thicket, the body or core of the thicket and its downslope margin orsenescence zone. These terms refer to vegetation dynamics, and they reflect differentwater storage capacities induced by rain redistribution. By measuring both runoff andinfiltration, hypotheses on water redistribution can be validated by comparing modelestimates with actual measurements. Water balance determined at rain time stepsconfinns the generally supposed redistribution of rain: three zones generate runoff, withrunon benefiting the thicket. However, the results show that despite its favourablelocation, the crusted upslope part of the thicket does not benefit much from additionalwater supply. The thicket comprises three zones possessing large differences in availablewater over a short distance (about 10 m). This sharp gradient is due mainly to changes inmacroporosity that allow for extremely rapid infiltration in sorne zones under pondedconditions. The core of the thicket acts as a sink.
S. Galle et al. / Catena 37 (J999) 197-216 215
Locally, a tiger bush unit act as source-sink system (Ludwig et al., 1998) but at theplateau scale, the connections of intervening bare areas allow runoff circulation.Numerous gullies rise in the plateau covered by tiger bush, and Peugeot et al. (1997)show that the plateau contributes runoff to the foothills. Obviously, total wood exploitation would lead to very high runoff generation (70% of rain exceeding 5 mm), throughdestruction of the sink areas leading in term to disastrous erosion in the foothills, as seenon the Filingué region where road allows easy access for wood exploitation. Conversely,sorne intervening bare areas are essential to the development of the woody vegetation asthey bring 62% of the thicket water supply. Planting them with trees must be avoided.
Acknowledgements
The rain measurements were kindly provided by the EPSAT team. The authors arealso grateful to Eric Eiguero for his help in the statistical analysis of the data, and toProfesseur Baxter Vieux for his advice and help with English. This research waspartially supported by Savannah on the Long Term (SALT), core project of the GlobalChange Terrestrial Ecosystems project and the Hydrological and Atmospheric pilotExperiment in the Sahel (HAPEX-SaheD.
References
Ambouta. K.. 1984. Contribution à l'édaphologle de la brousse tigrée de l'Ouest NIgérien. Thèse DocteurIngénieur. Univ. Nancy 1. 1-116 pp.
Barker T., 1992. Vegetation pattern in the Nigerien lIger bush. Mémoire. Bachelor of Science Dept.Geography, Coventry Polytechnic. 91 pp.
Boaler. S.B., Hodges, C.A.H., 1964. ObservatIOns on vegetation arcs )fi the northern region Somali Republic.J. EcoL 52. 511-544.
Casenave. A.. Valentin, c.. 1992. A runoff capability classification system based on surface features cnteria insemi-arid areas of West Africa. J. HydroL 130,231-249.
Chase, R.G., Boudouresque, E., 1989. A study of method for revegetation of barren crusted SahelIan forestsoils. ICRISAT proceeding of workshop. pp. 125-135.
Clos-Arceduc, M.. 1956. Etude sur photographIes aénennes d'une formation végétale sahélIenne: la broussetigrée. Bull IFAN. XVlIl, Sér. A (3), 677-684.
Cornet. A., Montana. c.. Delhoume, J.-P., Lopez-PortIllo, J., 1992. Water tlows and the dynamics of desertvegetatIOn stripes. In Hansen. A.J., dl Castri. F. (Eds.), Springer-Verlag, ColL Ecological studies, pp.327-345.
Couchat. P., Carre, c.. Marcesse. 1.. Ho, J., 1975. The measurement of thermal neutron constants of the soli:application to the calIbration of neutron moi sture gauges and to the pedologlcal study of the soilo. In:Schrack, R.A.. Bowman, C.D. (Eds.l, Nuclear cross sectIOns and technology. US Dept. of Congress, pp.516-579.
Cuenca, R.H., Brouwer, J., Chanzy, A., Droogers, P., Galle, S.. Gaze. S.R.. SlcOt. M.. Stricker, H..Angulo-Jaramillo. R., Boyle, S.A., Bromley, J., Chebhouni, A.G.. Cooper, J.O., Dixon. A.J., Fies, J.-c.,Gandah. M., Gaudu, J.-c., Laguerre, L., Soet, M., Steward, H.J., Vandervaere, J.-P.. VauclIn, M., 1997.Variability of profile and surface SOlI moisture content and physical property measurement duringHAPEX-Sahel intenSIve observation penod. J. Hydro!. HAPEX-Sahel SpecIal Issue 188-189, 226-268.
Culf, A.D., Allen, S.J.. Gash. J.H.C , Lloyd, C.R.. Wallace. J.S., 1993. Energy and water budgets of an area ofpatterned woodland in the SaheL Agric For. MeteoroL 66. 65-80.
216 S. Galle el al. / Calena 37 ( 1999) 197-216
Galle, S.. Seghieri. J.. Mounkaila. H.. 1997. FonctIonnement hydrologique et biologique à l'échelle locale. Ca,d'une brousse tIgrée au Niger. In: d·Herbès. J.-M .. Ambouta. 1.M K.. PeltIer. R. (Eds.), Fonctionnement etge,tion des écosystèmes forestIer, contractés Sahéliens. Ed. John Llbbey, Paris, pp. 105-118
Gavaud. M..l966. Etude pédologique du Niger occIdental ORSTOM ed. Pans, pp. 109-116.Goutorbe, J.-P., Lebel. T, Tinga, A., Be,semoulin. P., Brouwer. 1., Dolman. A.J .. Engman, E.T., Gash,
1.H.C., Hoepffner. M., Kabat, P.. Kerr, Y.H., Monteny, B.A.. Pnnce. S.. Said, F.. Sellers. P., Wallace, 1.S ,1994. HAPEX-Sahel: a large scale study of land-atmosphere mteractions in the seml-and tropics. Ann.Geophys. 12,53-64.
Greene, R.S.B., 1992. Soil physlcal properties of three geomorphologic zones in a seml-and mulga woodland.Aust. J. Soil Res. 30. 55-69.
Lebel. T .. Le Barbé, L, 1997. Ramfall chmatology of the central Sahel during the years 1950-1990. 1.Hydrol HAPEX-Sahel SpeCIal Issue 188-189. 44- 74.
Lebel. T., Sauvageot, H, Hoepffner. M.. De,bois. M.. Guillot, M., Hubert. P., 1992. Ramfall estImation m theSahel: the EPSAT-Niger experiment. HydroL Sci. J. 37 (3).201-215
LudWig, J . Tongway. DE.. 1998. Mardsen S. Stripes. strands or stripples: modellmg the mtluence of threeland,cape bandmg patterns on re,ource capture and productIvity in se ml-and woodlands. Austraha. Catena.this issue.
Mauchamp. A., RambaL S.. Lepart. 1.. 1994 Simulatmg the dynamics of a vegetation mosaic a spatiallsedfunctIonal modeL Ecol Modelling 71. 107-130.
Menaut. J.-C .. Saint. G.. Valentin. C. 1993. SALT. les Savanes à Long Terme. Analyse de la dynamIque dessavanes d'Afrique de l'Ouest: mécanismes sous-jacents et spatIalisation des processu.,. Lettre du Programme EnVIronnement, CNRS 10, 34-36.
Monteny. B.A .. Lhomme. J.-P.. Chehbouni, A., Troutleau. D . Amadou. M.. Sicot. M, Verhoef. A.. Galle, S..SaId. F.. Lloyd. CR.. 1997. The role of the Sahelian bIOsphere on the water and the CO 2 cycle during theHAPEX-Sahel Experiment J. Hydro!. HAPEX-Sahel Special Issue 188-189.507-525.
PeltIer. R., Bertrand, A., Lawah, M., Madon, G.. Montagne. P. 1995. Marché, ruraux de bOI'..-énergie auSahel BOIS forêts tropiques 245, 75-89.
Peugeot. C.. Esteves. M.. Rajot, J.-L., Vandervaere. J -P.. Galle. S, 1997 Runoff generatIOn processes: resultsand analysis of field data collected at the East Central Superslrte of the HAPEX-Sahel experiment. J.Hydro!. HAPEX-Sahel Special Issue 188-189, 181-204
Seghieri.l.. Galle. S.. Rajot, J.-L., Ehrmann, M . 1997 RelatIonshlp" between the soil moi,ture regime and thegrowth of the herbaceous plants in a natural vegetatIOn mosaic in NIger. J. And Environ. 36, 87-102.
Slatyer. R.O .. 1961. Methodology of a water balance study conducted on a desert woodland ( Acacia at/euro F.MuelU community in central Australia. UNESCO, Pans. Coll. Arid Zone Research. pp 15-25.
Thiéry. J M., Valentm, C, d'Herbès. J.M.. 1995. A model slmulatmg the genesis of banding pattern, in Niger.J. Eco!. 83, 497-507.
Tongway. DJ .. LudWig. J.A., 1990. Vegetation and SOli pattermng in semi-and mulga lands of EasternAustraha Aust J. Eco!. 15. 23-34.
Valentm, C., d'Herbes. J.M.. 1998 The Nigenen tIger bush as a natural water harvesting system. Catena. thisissue.
Vandervaere. J.-P.. VauclIn, M.. Haverkamp, R.. Cuenca, R.H .. 1994. Error analysls m estImatmg the SOli
water balance of lITigated fIeld, dunng the EFEDA experiment: 1. Local standpoint J HydroL 156.351-370.
Vandervaere. J.-P. Peugeot, C., Vauclm, M., Angulo-JaramIllo, R.. Lebel, T .. 1997. Estlmatmg hydrauhcconductivity of crusted sOlIs using disc mfiltrometers and minitenslOmeters J. Hydro!. Hapex-SahelSpeCial Issue 188-189,205-225.
Wallace. J.S. Holwill, Cl.. 1997. Soil evaporation from tiger bush m southwest Niger. J. Hydrol 188-189,415-431.
ELSEVIER Catena 37 (1999) 217-229
CATENA
Testing the validity of upslope migration in bandedvegetation from south-west Niger
A. Chappell a.b. * , C. Valentin c, A. Warren b, P. Noon b
M. Charlton d, J.M. d'Herbes c
.• Departlllellt of Phv.lical Geography, VII/l'ersity ofLund, Box 1185-22100 LUlld, SH'edell
b Departlllellt of Geogral'hv, VIII/'ers/tv College LOlldon, 26 Bedford Wav, LOlldoll WCI H OAP. VK
c ORSTOM. B P 11416. Niallle.", NIger
ct Departlllellt of Phy.l/cs alld AStroIlOIllV. VIIIl'ersity College Londoll. GOH'er Street, LOlldoll WC1E 6BT. UK
Recelved 5 June 1996: received in reviseù form 21 June 1998: accepted 21 June 1998
Abstract
Recent studies of banded vegetation have suggested a successional model, in which bare bandsare colonised in a pioneer front on the upslope side of a vegetation band. Vegetation patterns insouth-west Niger have been interpreted to suggest that spatial transitions reflect this form oftemporal succession, and in these patterns there IS corroborating evidence for slow up-slopemigration. However, given the Inherent ditIiculties of long-term field experiments there are fewdata to judge the validlty of this mode!. The use of the artificial radionuclide caesium-137 (l37es)to provide information on net soil flux over the past ca. 30 years offers potential in this regard.Furthermore, the identification of vanous types of soil crust, which can induce different types ofhydrological behaviour, provides valuable information for predicting soil evolUlion. To test thehypothesis that banded vegetation migrates upslope, a 70-m transect encompassing two vegetationbands and a single bare lane was sampled in south-west Niger. The transect was ahgnedorthogonal to the bands and approximately parallel to the direction of water, SOli and nutrientflow. Soil samples for gamma-ray spectrometry and particle-size analysis were collected along thetransect al 21 locations wilh I-m Intervals in the lower part and three samples were obtained onthe upper part. Prior to collection, the soil surface characteristics were examined to distinguishbetween crust types and to identify the presence of tennite activity. The results demonstrate theutility of these techniques for examining the net redistribution of soil over a period of threedecades and ils relations to vegetation succession. The amount of soil eroded was found generallyto decrease downslope. whilst the proportIOn of fine silt in the soil generally increased downslope.These patterns correspond with the lœation of the erosion and sedImentation crusts identified
• Corresponding author
0341-8162/99/$ - see front matter © 1999 Ebevler Science B.Y. Ali nghts reservedPD S0341-8162(98)00074-S
218 A. Chappell et al. / Catena 37 (1999) 217-229
using a standardised classification. The relations between microtopography and net soil flux mayalso explain sorne of the spatial variation in sOli redistribution processes. The intensity of crust andl37es measurements on the upslope edge of the lower vegetation band enabled the calculation ofthe upslope migration rate (ca. 0.19-0.27 m yr- I
) which coincided with independent studies inthe same region. However, because considerable spatial variations in topography and soil fluxwere found to occur over very small distances, further detailed studies over larger areas will beneeded. © 1999 Elsevier Science B.Y. Ali rights reserved.
Keywords: Banded vegetation; South-west Niger: Caesium-137 e37C,); Sail ero'lOn
1. Introduction
Stripes of vegetation and bare ground have been noted on aerial photographs at manyplaces worldwide and several hypotheses have been proposed to explain their origin.The perpendicular alignment of vegetation arcs in Jordan and in Mali to the dominantwind has been interpreted as evidence for their association with aeolian transpOlt (White,1969; Leprun, 1992). However, detailed studies of the dynamics of vegetation bands innorthern Mexico (Cornet et al., 1992; Montana, 1992) were taken to suggest that theirformation was related to surface wash. The second hypothesis is now widely acceptedwhere low-frequency, high magnitude rainfall events produce runoff on slightly inclinedslopes on which the soils have low permeability resulting from an abundance of finepatticles (Cornet et al., 1992). In this environment, surface wash is generated in the barepatches between the bands but accumulates and infiltrates at their upslope edges, wherethe resulting soil moisture promotes plant colonisation. Furthermore, it is hypothesisedthat when plants colonise this zone, they gradually eut off the supply of water andnutrients to the rest of the band. Consequently, the whole band should move upslope(Thiery et al., 1995).
The runoff hypothesis is now also generally accepted as an explanation for the'brousse tigrée' banded vegetation patterns of south-west Niger. Support for thehypothesis in this area has been provided by Thiery et al. (1995), who also showed atemporal succession of different crusts across the band and interband. These authorsdeveloped a model to simulate formation of the bands, which could generate a variety ofpatterns depending on varying rainfall and surface wash conditions. However, thedynamic operation of this model cannot be verified without difficult long-term studies.Early field evidence of band shifts mainly due to aeolian activity has been provided byLeprun (I992), working in Mali, where a bench-mark in 1955 was located within a bandand 21 years later was found to be in a barren lane. The migration distance wasapparently 15.8 m, resulting in a mean annual velocity of 0.75 m yr- 1
• Otherbench-marks in the same region indicated annual velocities ranging between 0.20 myr- I and 0.25 m yr- 1 (Leprun, 1992).
Since soil redistribution is essential for the operation of the plant successional mode!,it is reasonable to assume that long-term monitoring of soil erosion would provide anindicator of band migration. UnfOltunately, studies of contemporary soil erosion cannotgive accurate estimates for periods long enough to coyer the rate of band migration(Higgitt, 199 I) especially in semi-arid environments with high spatial and temporal
A. Chappell et al. / Catena 37 (1999) 217-229 219
variability in rainfall. However, many of the problems with long-term monitoring of soilredistribution can be overcome by using the artificial radionuclide caesium-137 C37Cs)to trace soil movement (Sutherland and de Jong, 1990). The I37Cs technique providesaccurate net soil flux measurements aggregated over the last ca. 30 years (Martz and deJong, 199)) and has been used successfully in many environments throughout the world(Walling and Quine, 1992).
Thus, the aim here is to measure net soil flux in south-west Niger using I37Cs and torelate it to surface features and transitions in the structure of the brousse tigrée in anattempt to validate the model and quantify the rate of upslope band migration.
2. Materials and methods
2.1. Study area
The study area is 70 km east of Niamey in south-west Niger. The climate is semi-aridwith a monomodal rainfall distribution. The average rainfall at Niamey for the period1905-1989 was about 560 mm (Lebel et al., 1992), but for the past 25 years the rainfallhas been persistently below-average with a mean of about 495 mm. Potential evapotranspiration is approximately 2000 mm (Sivakumar, 1989).
During the summer, south-westerly winds are replaced periodically by easterlysqualls with short-duration, high-intensity rainfall. The intense rainfall can cause crusting, clay eluviation and rapid removal of unconsolidated material from the surface(Casenave and Valentin, 1989). Strong winds precede many of the squalls, and theseraise large quantities of dust. During the dry winter months, north-easterly winds of theHarmattan dominate, bringing dust from southem Sahara (McTainsh and Walker, 1982).Drees et al. (I993) reported a highly seasonal occurrence of dust deposition in Niger.They suggested that the frontal storms were responsible for more dust infall than was theHarmattan.
2.2. Banded vegetation structure, soi! and hydrological processes
The brousse tigrée in this region occurs only on broad ironstone-capped plateaux withslopes generally lower than 0.3°. The parent material of soil on the plateaux is highlyweathered, humus-poor and sesquioxide-rich. Clays are mostly kaolinitic. The soil isgravely loam over cemented ironstone gravel (Manu et al., 199 J). It is acid (pH < 5), oflow nutrient status and has little water storage capacity because of its shallow depth andlarge content of coarse fragments. The surface has bare patches interspersed with bandsof vegetation of varying sizes, oriented with their long axis parallei to the contour(Thiery et al., 1995). The soil within the vegetation bands is different from that betweenthe bands; pH is 5 to 6 and it is humus-rich, and approximately 20 cm thick above theferricrete cobbles.
The brousse tigrée (band and interband) has been divided into five typical zones(Thiery et al., 1995), shown in Fig. 1. The central zone (C) in the figure has a dense(60-100%) canopy, small shrubs in the understorey and sparse grass coyer. The soil has
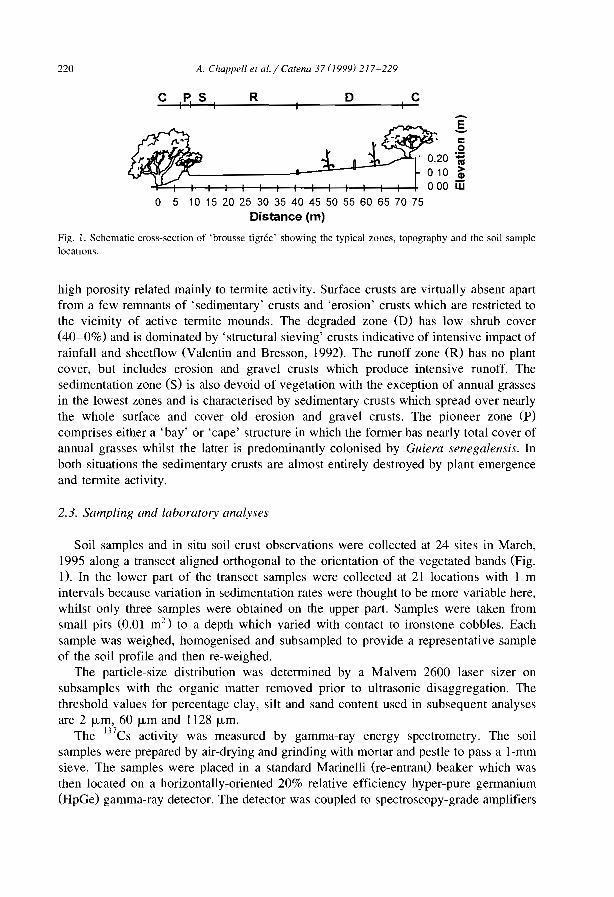
220 A. ChappeIl et al. / Catena 37 (]999) 217-229
cDR
l
~.,. . o~o l5
:ha ~1 1 1 1 : 1=: 1 1 ~ ~~ W
10 15 20 25 30 35 40 45 50 55 60 65 70 75Distance (m)
C I~ 5 1
o 5
Fig. 1. Schematic cross-section of 'brousse tigrée' showing the typical zones, topography and the soil samplelocatIOns.
high porosity related mainly to termite activity. Surface crusts are virtually absent apartfrom a few remnants of 'sedimentary' crusts and 'erosion' crusts which are restricted tothe vicinity of active tennite mounds. The degraded zone (D) has low shrub cover(40-0%) and is dominated by 'structural sieving' crusts indicative of intensive impact ofrainfall and sheetflow (Valentin and Bresson, 1992). The runoff zone (R) has no plantcover, but includes erosion and gravel crusts which produce intensive runoff. Thesedimentation zone (S) is also devoid of vegetation with the exception of annual grassesin the lowest zones and is characterised by sedimentary crusts which spread over nearlythe whole surface and cover old erosion and gravel crusts. The pioneer zone (P)comprises either a 'bay' or 'cape' structure in which the former has nearly total cover ofannual grasses whilst the latter is predominantly colonised by Guiera senegalensis. Inboth situations the sedimentary crusts are almost entirely destroyed by plant emergenceand termite activity.
2.3. Smnpling and laboratory analyses
Soil samples and in situ soil crust observations were collected at 24 sites in March,1995 along a transect aligned orthogonal to the orientation of the vegetated bands (Fig.n. In the lower part of the transect samples were collected at 21 locations with 1 mintervals because variation in sedimentation rates were thought to be more variable here,whilst only three samples were obtained on the upper part. Samples were taken fromsmall pits (0.01 m2
) to a depth which varied with contact to ironstone cobbles. Eachsample was weighed, homogenised and subsampled to provide a representative sampleof the soil profile and then re-weighed.
The particle-size distribution was determined by a Malvem 2600 laser sizer onsubsamples with the organic matter removed prior to ultrasonic disaggregation. Thethreshold values for percentage clay, silt and sand content used in subsequent analysesare 2 f-lm, 60 f-lm and 1128 f-lm.
The l37es activity was measured by gamma-ray energy spectrometry. The soilsamples were prepared by air-drying and grinding with mortar and pestle to pass al-mmsieve. The samples were placed in a standard Marinelli (re-entrant) beaker which wasthen located on a horizontally-oriented 20% relative efficiency hyper-pure germanium(HpGe) gamma-ray detector. The detector was coupIed to spectroscopy-grade amplifiers

A. Chappell et al / Catena 37 (1999) 217-229 221
(2)
and a PC-based data collection system. Calibration sampIes were used to derive theb 1 137C .... h 1a so ute s actlvItIeS III eac samp e.
2.4. Calcularion of net sail flux fram 137CS
The l37Cs concentration in the soil of the plateau is ten times greater than at otherlocations in this region (ChappelI, 1995). It is thought that the preferential accumulationof 137Cs-enriched dust beneath vegetation on the plateau is responsible, thus making itdifficult to identify a 'stable' l37Cs reference site (ChappelI, 1995). Because of this thesite chosen as the reference was devoid of vegetation except for a layer of annuaigrasses, close to the study area, where there has been no cultivation or wood cutting forat least ca. 30 years, and where only limited erosion is likely to have taken place. Amass-specific exponential model was fitted to the l37Cs profile for the soil at this site(r 2 = 0.97). The model is:
10g10C, = 0.933 - 0.034D, (1)
where C is the mass specifie I37Cs concentration (Bq kg- I), D is the soil depth (cm)
and i is the sample depth increment. The values of 0.034 and 0.933 represent the termsSand E in Eq. (2) below but are not appropriate for the Plateau region. The I37Csinventory predicted by the model for this site (2066 ± 125 Bq m- 2) is the bestapproximation of the reference I37Cs inventory for an 'undisturbed' site in the study area(ChappelL 1995). It is acknowledged that a more precise estimate of the falloutinventory would require many samples (Sutherland. 1994), but these are unavailable inthe present case.
To calculate the net soil flux a relation between the movement of l37Cs and theredistribution of soil must be established (Walling and Quine, 1990). The modeldeveloped by Zhang et al. (1990) for rangeland areas was used here to estimate surfacelowering at erosional sites, although it cannot be used for depositional sites. It utilisesthe widely reported exponential depth distribution of l37Cs in rangeland areas to estimatethe depth of soil removed from a site from the difference between the l37Cs remaining inthe profile and the l37Cs reference level:
y= 100ln(1-XI)/-SPE
XI=(R-A)/R
where Y is mean annual soil loss Ct ha -) yr - )), S is the depth distribution shapecoefficient, P is the number of years since 1963 and Xl is the reduction ratio of thetotal l37Cs activity per unit area (A), at each site, relative to the reference inventory (R)in the same units (Bq m - 2). A value of 0.144 was used for S to represent the shapecoefficient of l37Cs profile on the Plateau soils. Since the thin soil on the Plateau wasknown to be approximately 20 cm in depth before the soil matrix was dominated byferricrete cobbles, an additional term (E) with a value of 1.5 was used in the net soilflux model (2) to offset the total depth of soil removed. It was derived from empiricalmodel fitting using existing soil I37Cs profiles in this region (ChappelI, 1995).
An additional model is needed to define the relation between I37Cs and net soil gain.It is reasonable to assume that sites of accumulation are the result of deposition either
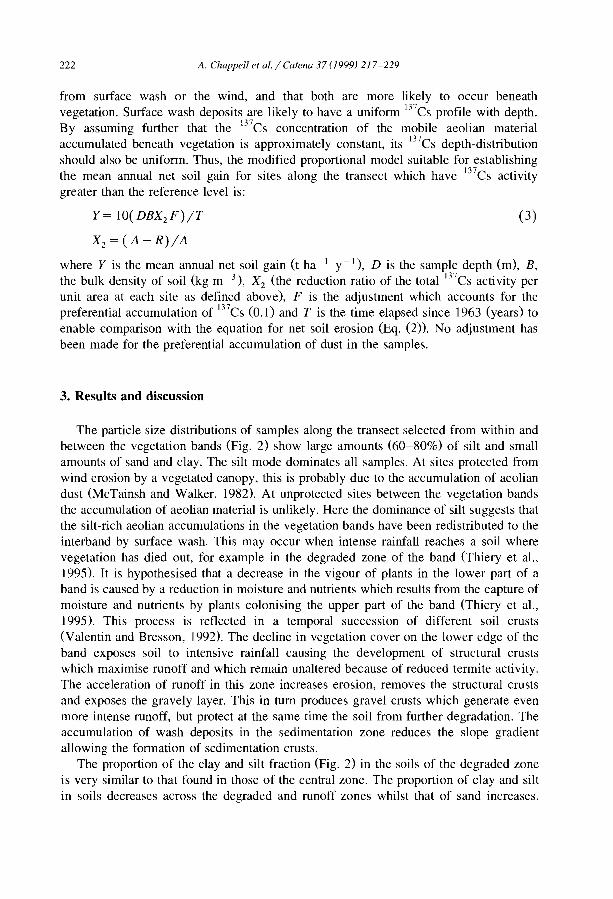
222 A. Chappell et al. / Catena 37 (1999) 217-229
(3)
from surface wash or the wind, and that both are more likely to occur beneathvegetation. Surface wash deposits are likely to have a uniform 137CS profile with depth.By assuming further that the 137CS concentration of the mobile aeolian materialaccumulated beneath vegetation is approximately constant, its 137CS depth-distributionshould also be uniform. Thus, the modified proportional model suitable for establishingthe mean annual net soil gain for sites along the transect which have 137Cs activitygreater than the reference level is:
y= 10(DBX2 F)/T
X2 = (A -R)/A
where Y is the mean annual net soil gain Ct ha -1 y- 1), D is the sample depth (m), B,the bulk density of soil (kg m- 3), X2 Cthe reduction ratio of the total 137Cs activitY perunit area at each site as defined above), F is the adjustment which accounts for thepreferential accumulation of 137CS (0.1) and T is the time elapsed since 1963 (years) toenable comparison with the equation for net soil erosion (Eq. (2)). No adjustment hasbeen made for the preferential accumulation of dust in the samples.
3. Results and discussion
The particle size distributions of samples along the transect selected from within andbetween the vegetation bands (Fig. 2) show large amounts (60-80%) of silt and smallamounts of sand and clay. The silt mode dominates all samples. At sites protected fromwind erosion by a vegetated canopy. this is probably due to the accumulation of aeoliandust (McTainsh and Walker, 1982). At unprotected sites between the vegetation bandsthe accumulation of aeolian material is unlikely. Here the dominance of silt suggests thatthe silt-rich aeolian accumulations in the vegetation bands have been redistributed to theinterband by surface wash. This may occur when intense rainfall reaches a soil wherevegetation has died out, for example in the degraded zone of the band (Thiery et al.,1995). It is hypothesised that a decrease in the vigour of plants in the lower part of aband is caused by a reduction in moisture and nutrients which results from the capture ofmoisture and nutrients by plants colonising the upper part of the band (Thiery et al.,1995). This process is reflected in a temporal succession of different soil crusts(Valentin and Bresson, 1992). The decline in vegetation cover on the lower edge of theband exposes soil to intensive rainfall causing the development of structural crustswhich maximise runoff and which remain unaltered because of reduced termite activity.The acceleration of runoff in this zone increases erosion. removes the structural crustsand exposes the gravely layer. This in tum produces gravel crusts which generate evenmore intense runoff, but protect at the same time the soil from further degradation. Theaccumulation of wash deposits in the sedimentation zone reduces the slope gradientallowing the formation of sedimentation crusts.
The proportion of the clay and silt fraction (Fig. 2) in the soils of the degraded zoneis very similar to that found in those of the central zone. The proportion of clay and siltin soils decreases across the degraded and runoff zones whilst that of sand increases.
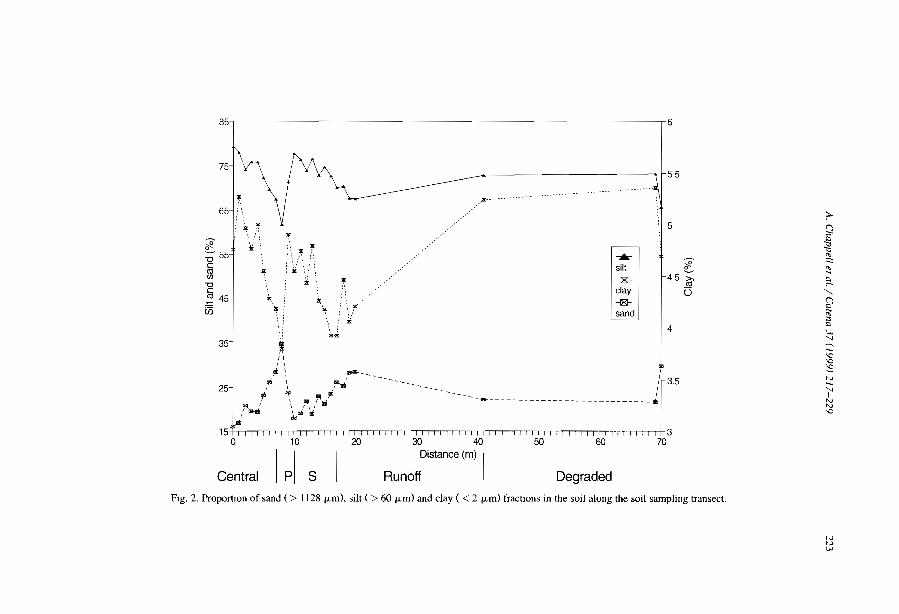
85-,---- fi
1\, ,cO \ ..... __
~' \ !"'ri" ..
'" ": '" ~./l!Bl.. f \ f \ 1
l ""' , .. ", '"
~
/1-351,
---------------s
?>9~~~
",....
'....."~.....1010~l'V.....l'~10
"-~~5
55
5
4
~~
45 ~
<3
-.silt'Z'clay-®sand
~
~ x~ \:
'":à:É
i
:'. if'!
:'i" :'
~
~.~
'!
i
~ ~
75
65
25
35
~~ 55""0C
œ""0c~ 45US
Degraded
15T 1 1 Iii 1 i 1 Iii 1 Iii 1 Iii i \ i Iii 1) 1 Iii i 1 i 1 1 1 1 1 Iii i 1 i 1 1 Il J 1 Iii i i i 1 1 Il 1 i 1 1 1 1 1 3o 10 20 30 40 50 60 70
1 1 1
Distance (m)
P S RunoffCentral
FIg. 2. Proporlion of sand (> 1128 f-Lm). silt (> 60 f-Lm) and clay ( < 2 f-Lm) fractions in the soil along the soil sampling transect.
N
'"w
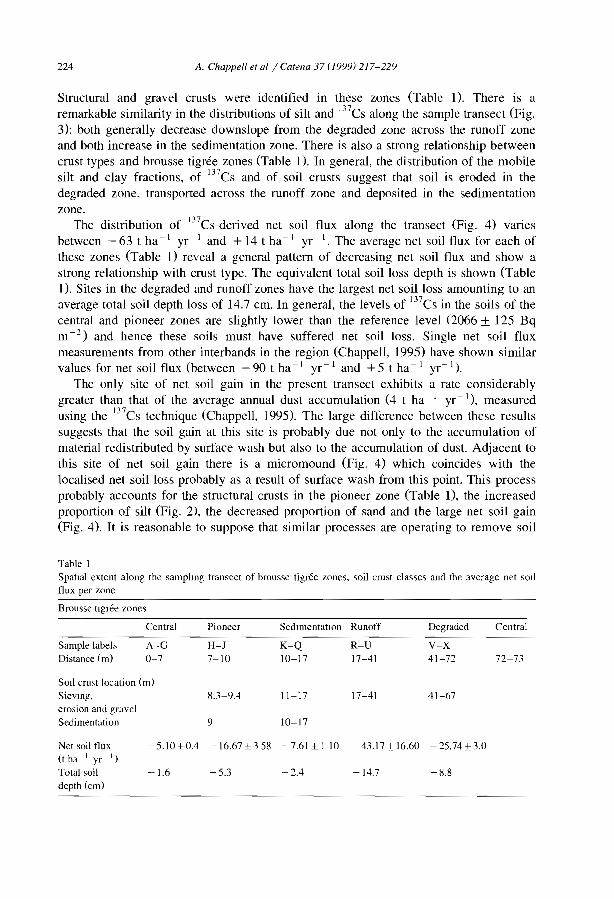
224 A. Chappell et al / Calena 37 (J999) 217-229
Structural and gravel crusts were identified in these zones (Table 1). There is aremarkable similarity in the distributions of silt and lJ7Cs along the sample transect (Fig.3): both general!y decrease downslope from the degraded zone across the runoff zoneand both increase in the sedimentation zone. There is also a strong relationship betweencrust types and brousse tigrée zones (Table 1). In general, the distribution of the mobilesilt and clay fractions, of lJ7Cs and of soil crusts suggest that soil is eroded in thedegraded zone, transported across the runoff zone and deposited in the sedimentationzone.
The distribution of lJ7Cs-derived net soil flux along the transect (Fig. 4) variesbetween -63 t ha- 1 yr-' and + 14 t ha- I yr-'. The average net soit flux for each ofthese zones (Table 1) reveal a general pattern of decreasing net soil flux and show astrong relationship with crust type. The equivalent total soil loss depth is shown (Table1). Sites in the degraded and runoff zones have the largest net soil loss amounting to anaverage total soil depth loss of 14.7 cm. In general, the levels of lJ7Cs in the soils of thecentral and pioneer zones are slightly lower than the reference level (2066 ± 125 Bqm-2) and hence these soils must have suffered net soil loss. Single net soil fluxmeasurements from other interbands in the region (Chappel!, 1995) have shown similarvalues for net soit flux (between - 90 t ha - J yr- J and +5 t ha - 1 yr- 1).
The only site of net soil gain in the present transect exhibits a rate considerablygreater than that of the average annual dust accumulation (4 t ha -1 yr-'), measuredusing the lJ7Cs technique (Chappel!, 1995). The large difference between these resultssuggests that the soil gain at this site is probably due not only to the accumulation ofmaterial redistributed by surface wash but also to the accumulation of dust. Adjacent tothis site of net soil gain there is a micromound (Fig. 4) which coincides with thelocalised net soil loss probably as a result of surface wash from this point. This processprobably accounts for the structural crusts in the pioneer zone (Table l), the increasedproportion of silt (Fig. 2), the decreased proportion of sand and the large net soil gain(Fig. 4). It is reasonable to suppose that similar processes are operating to remove soil
Table 1Spatial extent along the samphng transect of brousse tigrée zones. ,;oil crust classes and the average net sOliflux per zone
Brous,e tigrée zones
Central Pioneer Sed1mentatlOn Runoff Degraded Central
Sample labels A-G H-J K-Q R-U V-XDistance (m) 0-7 7-10 10-17 17-41 41-72 72-73
SOli crust location (m)Sievmg, 8.3-9.4 11-17 17-41 41-67erosion and gravelSedimentation 9 10-17
Net soil flux -5.1O±0.4 -16.67±358 -7.61±110 -43.17± 16.60 -25.74±3.0(t ha- 1 yr - 1)
Total soil -1.6 -5.3 -2.4 -14.7 -8.8depth (cm)
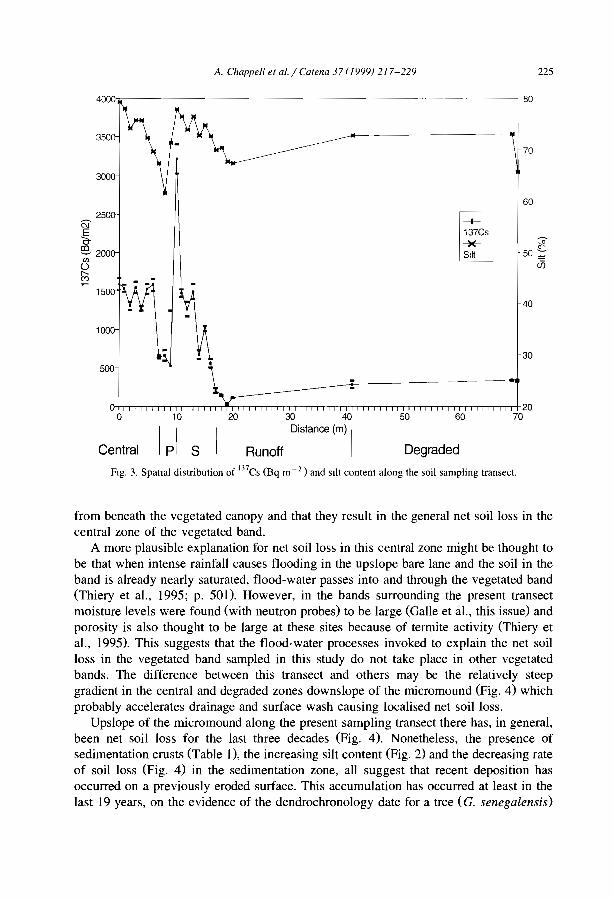
A. Chappell et al. / Catena 37 (1999) 217-229 225
---~80
70
60
500
-+137Cs
-*Sllt
~50 ~
c7.i
40
30
Degraded
50 6020 30 40
Distance (m) 1
Runoffs
10oo--h-rTTT""CrrTTTrrrTTTTT+r-rrrTTrrrTTTTTTTTTT-rTTTl--rTTT""TTTTTlrTTTrrTTTT""rTT-rr-rr+20
70
Central
Fig. 3. SpatIal distribution of l37es (Bq m -2) and silt content along the soil sampling transecl.
from beneath the vegetated canopy and that they result in the general net soil loss in thecentral zone of the vegetated band.
A more plausible explanation for net soil loss in this central zone might be thought tobe that when intense rainfall causes flooding in the upslope bare lane and the soil in theband is already nearly saturated, flood-water passes into and through the vegetated band(Thiery et al., 1995; p. SOI). However, in the bands surrounding the present transectmoisture levels were found (with neutron probes) to be large (Galle et al., this issue) andporosity is also thought to be large at these sites because of termite activity (Thiery etal., 1995). This suggests that the flood-water processes invoked to explain the net soilloss in the vegetated band sampled in this study do not take place in other vegetatedbands. The difference between this transect and others may be the relatively steepgradient in the central and degraded zones downslope of the micromound (Fig. 4) whichprobably accelerates drainage and surface wash causing localised net soilloss.
Upslope of the micromound along the present sampling transect there has, in general,been net soil loss for the last three decades (Fig. 4). Nonetheless, the presence ofsedimentation crusts (Table 1), the increasing silt content (Fig. 2) and the decreasing rateof soil loss (Fig. 4) in the sedimentation zone, aIl suggest that recent deposition hasoccurred on a previously eroded surface. This accumulation has occurred at least in thelast 19 years, on the evidence of the dendrochronology date for a tree (G. senegalensis)
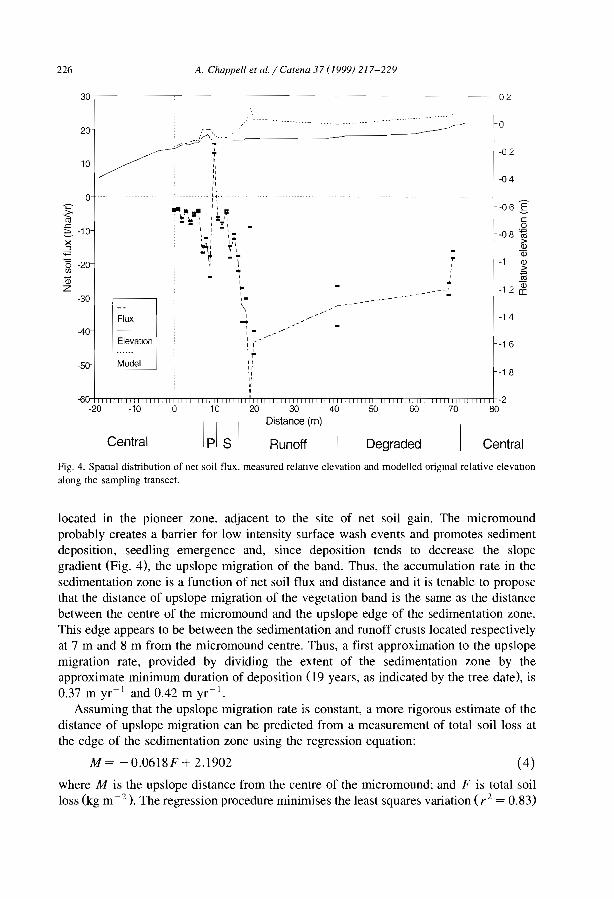
226 A. Chappel! et al. / Catena 37 (1999) 217-229
-16
-14
-18
1
-061-08 co
IiiQi
-1 QJ2co
-1 2 ~
...,1,..
1
\ ,-1,., ,/
Il:f-
""""",
Flux
Elevation
Model
30 -----~-----,--l---.-.-..-:.---f-.---..-~----------~------f:o',
~ : ~: :: -04
".. [4··_
". "r..",~ ,,:;:, _ == \ : :1:,,'11
\ 1 - 1\_1 \:
~: ~\-~ . ~
1 \..,,~,,-
20
10
0'2
~L
-102:-x::J
'i=
ô -20C/)
Q)Z
-30
-40
-50
-60-mTTTTTTITTlTTTrrn-rnTrTrTTITITTTT'rrrfTTTlrTTTTTTTTTITTTTITTTT'ITTTTTTrTTTITTTTTrITTTTTTnTlTITTTTrn+-2-20 -10 0 10 20 30 40 50 60 70 80
Distance (ml
Central Runoff Oegraded Central
Fig. 4. SpatIal distribution of net soil flux, measured relative elevation and modelled origmal relative elevatlOnalong the sampling transect.
located in the pioneer zone, adjacent to the site of net soil gain. The micromoundprobably creates a barrier for low intensity surface wash events and promotes sedimentdeposition, seedling emergence and, since deposition tends to decrease the slopegradient (Fig. 4), the upslope migration of the band. Thus, the accumulation rate in thesedimentation zone is a function of net soil flux and distance and it is tenable to proposethat the distance of upslope migration of the vegetation band is the same as the distancebetween the centre of the micromound and the upslope edge of the sedimentation zone.This edge appears to be between the sedimentation and runoff crusts located respectivelyat 7 m and 8 m from the micromound centre. Thus, a first approximation to the upslopemigration rate, provided by dividing the extent of the sedimentation zone by theapproximate minimum duration of deposition (I9 years, as indicated by the tree date), is0.37 m yr- 1 and 0.42 m yr- 1•
Assuming that the upslope migration rate is constant, a more rigorous estimate of thedistance of upslope migration can be predicted from a measurement of total soil loss atthe edge of the sedimentation zone using the regression equation:
M = -0.0618F + 2.1902 (4)
where M is the upslope distance from the centre of the micromound: and F is total soilloss (kg m -2), The regression procedure minimises the least squares variation (r 2 = 0.83)
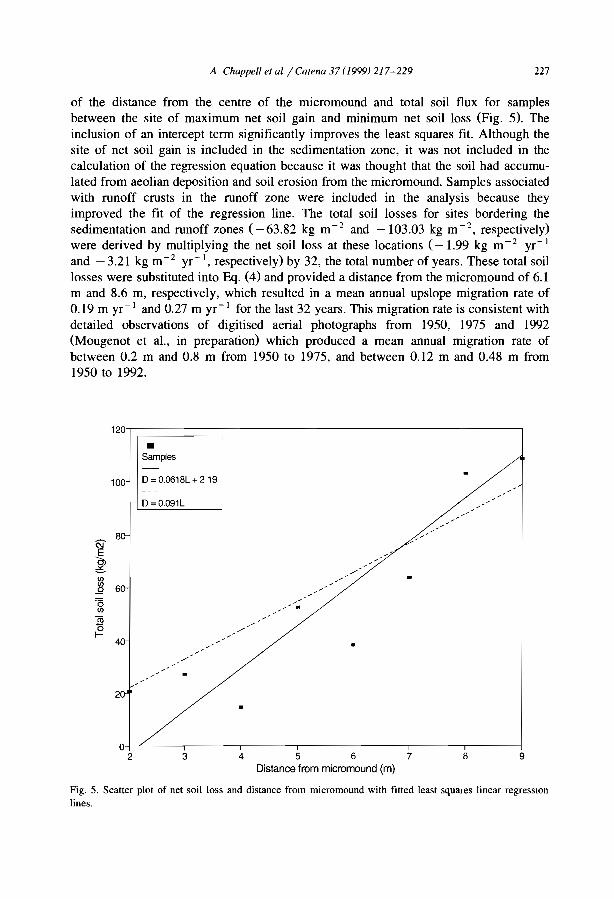
A Chappell el al./Calella 37 (J999) 217-229 227
of the distance from the centre of the micromound and total soil flux for samplesbetween the site of maximum net soil gain and minimum net soil loss (Fig. 5). Theinclusion of an intercept term significantly improves the least squares fit. Although thesite of net soil gain is included in the sedimentation zone, it was not included in thecalculation of the regression equation because it was thought that the soil had accumulated from aeolian deposition and soil erosion from the micromound. Samples associatedwith runoff crusts in the runoff zone were included in the analysis because theyimproved the fit of the regression line. The total soil losses for sites bordering thesedimentation and runoff zones (-63.82 kg m- 2 and -103.03 kg m- 2 , respectively)were derived by multiplying the net soil loss at these locations (-1.99 kg m- 2 yr- I
and - 3.21 kg m- 2 yr- 1, respectively) by 32, the total number of years. These total soil
losses were substituted into Eq. (4) and provided a distance from the micromound of 6.1m and 8.6 m, respectively, which resulted in a mean annual upslope migration rate of0.19 m yr- 1 and 0.27 m yr- 1 for the last 32 years. This migration rate is consistent withdetailed observations of digitised aerial photographs from 1950, 1975 and 1992(Mougenot et al., in preparation) which produced a mean annual migration rate ofbetween 0.2 m and 0.8 m from 1950 to 1975, and between 0.12 m and 0.48 m from1950 to 1992.
1201--;::=====;-----------------1
•Samples
100 D = 0.0618L + 2 19
D = 0.091L
//.
20
O+-L..---,------,------,-------,-------TI----,-,----2 3 4 5 6 7 8 9
Distance trom micromound (m)
Fig. 5. Scalter plot of net soil loss and distance from micromound with filted least squares linear regresslOnlines.
228 A. Chappell et al. / Catena 37 (1999) 217-229
4. Summary and conclusions
The l37Cs technique for measuring net soil flux identified the vegetation band and theinterband as zones of net soil loss. However, the soil texture, crust type and the l37Cscontent of samples obtained along the transect show that there is a decrease in net soilloss, resulting from recent accumulation, in the sedimentation zone of the downslopevegetation band. These apparently contradictory results are probably due to the particular band of this sample having a relatively steep topographie gradient that produces gooddrainage, which in turn results in localised surface wash and erosion processes beneaththe vegetation. The accumulation on the upslope side of the vegetation band is probablycaused by the presence of a micromound, which has reduced surface wash and enhanceddeposition. There is corroboration of such accumulation in the evidence of the sedimentation crusts and in the model predictions for the upslope migration of the vegetationband (Thiery et al., 1995). The rate of accumulation in the sedimentation zone wasconsidered to be representative of the upslope migration rate which was calculated to beapproximately 0.19-0.27 m yr- l
.
These results show that the average annual migration rate of the banded vegetationcan be calculated from accurate measurement of net soil flux for the last 32 years usingthe l37Cs technique. The spatial variability along the transect (across the band) wasanticipated but the variation along the vegetation band was not. It is necessary to ensurethat a single transect is representative of the pattern of soil redistribution. This should bedone either by detailed topographie sampling prior to soil sampling or by improved soilsampling which encompasses the spatial variation across and along the vegetation bands.Both approaches must account for the observed occurrence of the bay and headlandpattern in the pioneer zone of the vegetation bands as this may be caused by differencesin micro-topography and lateral flow between the vegetation bands.
In order to develop the l37Cs technique for measuring soil redistribution in thisenvironment many samples would be required which would be very time-consuming. Aviable alternative might be to develop the relationship established here between differenttypes of crust and their l37Cs content to produce a calibration curve for rapid calculationof net soil flux from different crust types.
Acknowledgements
We wouId like to thank J. Bromley and S. Batterbury for asslstmg with fieldsampling. We are also grateful to A. Ichaou for the dendrochronology date. A.c. isgrateful to the European Union Human Capital and Mobility research project onRegional Ecosystem Models and Climate Interaction for providing funding to presentthis work.
References
Casenave. A.. Valentin. C.. 1989. Les Etats De Surface De La Zone Sahehenne: Influence sur 1" infiltratiOn.EditiOns de l'ûRSTûM, Pam,.

A. Chappe" et al j Catetla 37 (1999) 217-229 229
Chappell, A. 1995. Geostatlstical mapping and ordmation analyses of 117Cs-denved net SOlI flux in south-westNiger. Unpubhshed doctoral thesis, Umversity of London.
Cornet. A, Montana, c., Delhoume, J.P.. Lopez-Portlllo, J.. 1992. Water flows and the dynamics of desertvegetatIOn stripes In: Hansen, A.J., di Casln, F. (Eds.), Landscape Boundaries Consequences for BiotlcDiversity and EcologlCal Flows. Ecological Studies, 92. Springer Verlag, New York, pp. 327-345.
Drees, L.R . Manu, A., Wilding, L.P.. 1993. Charactenslics of aeolian dusts in NIger, West Africa. Geoderma59, 213-233
Higgltt, D.L., 1991. Soil erosion and soil problems. Prog. 10 Phys Geog. 15 (l), 91-100.Lebel, T., Sauvegeot, H., Koepffner, M.. Desbois, M., Guillot, 8., Hubert, P., 1992. Rainfall estImation in the
Sahel: the EPSAT-Niger experiment. Hydrol. Sci. J. 37, 201-215.Leprun, J.c., 1992. Etude de quelques brousses tigrées sahéhennes: structure, dynamique, écologie. L'andilé,
une contrainte au devéloppement. In: Le Floc'h, E., Grouzis, M., Cornet. A., BIllie, J.c. (Eds,), ORSTOM,Coll. Didactiques, Paris, pp. 221-244.
Manu, A., Geiger, S.c., Pfordresher, A., Taylor-Powell, E., Mahamane, S., Ouattara, M., Isaaka. M.. Salou,M.. Juo, A.S.R., Puentes, R.. Wilding, L.P., 1991. Integrated management of agricultural watersheds(IMAW): CharacterisatlOn of a research site near Hamdallaye, Niger. TropSoils Bulletin No. 91-03. SOliManagement CRSP North Carohna State University, USAjS and CSD Texas A&M University, USAjINRAN Niamey, NigerjUSAID Niamey, Niger.
Martz, L.W., de Jong, E., 1991. Using caesmm-137 and landform classification to develop a net soil eroslOnbudget for a small Canadian Prairie watershed. Catena 18, 289- 308.
Montana, C.. 1992. The colomzation of bare areas in two-phase mosaics of an and ecosystem. J. Eco!. 78,789-798,
Mougenot, B., d'Herbes, J.M., Ichaou, A.. in preparation. How do vegetated arcs move upwards in Niger.Submitted to Acta Oecologica.
McTainsh, G.H., Walker, P.H.. 1982. Nature and distributIOn of Harmattan dust. Z Geomorph., N.F. 26,417-435.
Sivakumar, M.V.K., 1989. Agroclimatic aspects of rainfed agriculture in the SSZ. In: Soil Crop and WaterManagement Systems for Rainfed Agriculture in the SSZ. Proceedings of an International Workshop, Jan.1987, [CRISAT Sahelian Centre, Niamey, NIger, 17-38 [CRISAT, Patancheru, AP 502 234, India.
Sutherland, R.A., 1994. Spatial variability of l37Cs and the influence of sampling on estimates of sedimentredistribution. Catena 21,57-71.
Sutherland, R.A., de Jong, E., 1990. EstImation of sediment redistribution within agricultural fields usingcaesmm-137 Crystal Springs, Saskatchewan, Canada. Applied Geography 10, 205-221.
Thiery, J., d'Herbes, J.M., Valentin, c., 1995. A model simulatmg the genesls of banded vegetation pattern 10
Niger. J. Ecology 83, 497-507.Valentm, c.. Bresson, L.M., 1992. Morphology, genesis and classification of surface crusts 10 loamy and
sandy sOlls. Geoderma 55, 225-245.Walling, D.E., Quine, T.A., 1990. Cahbralion of caesium-137 measurements to provlde quantitative erosion
rate data. Land Degradation and Rehablhtation 2, 161-175.Walling, D.E., Quine, T.A., 1992. The use of caesmm-137 measurements in SOlI erosion surveys. Proc. IAHS
Symposium on Erosion and Sediment Transport Measurement Programs in River Basins, Oslo, August,1992.
White, L.P.. 1969. Vegetation arcs in Jordan. J. Ecol. 57,461-464.Zhang, X., Higgitt, DL, Walling, D.E., 1990. A preliminary assessment of the potential for using caesmm-137
to estimate rates of SOlI eroslon in the Loess Plateau of China. Hydro\. Sci. 1. 35, 267-276.

ELSEVIER Calena 37 (I999) 231-256
CATENA
Niger tiger bush as a natural water harvestingsystem
C. Valentin a,*, J.M. d'Herbès b
a ORSrOM, 213, rue La Fayette, 75480 Paris Cedex JO, Franceb ORSrOM, B.P. 5045, 34032, Montpellier Cedex 1, France
Received 16 September 1996; received in revised form 5 December 1996; accepted 10 February 1998
Abstract
Tiger bush in Niger has been often hypothesised to act as a natural water-harvesting system,The interband:band ratio (IBR) and the related efficiency of the system in terms of waterconcentration and woody biomass production appeared as crucial questions to be addressed anddocumented. This study focused on the role of annual rainfall upon the structure and thefunctioning of the tiger bush system. A regional transect, totalling approximately 200 km in lengthwas established north/south across the rainfall gradient. It included JO local transects eachspanning five interbands and bands. Along the local transects, surface features were carefullyrecorded as weil as woody biovolume. One of these local transects was completely harvested sothat biovolume could be related to biomass. Annual woodcutting was estimated after a detailedregional study. In addition to field measurements performed in 1995, the IBR was measured onsequential aerial photographs 0950, 1955, 1962, 1975, 1992), using a 16 X binocular magnifiercombined with a stage rnicrometer with 0.1 mm division. A simple model of rainwater redistribution was designed based on surface conditions properties. The best correlation of IBR wasobtained with annual rainfall averaged over the last 15 yr (Ra 15 ). This ratio was dramaticallyincreased where Ra 15 declined below a threshold of approximately 350 mm. The ratio between thewater shedding zone (RZ) and the infiltration zone OZ), RZ:IZ, based on field crust type survey,was a better predictor for the water-harvesting efficiency of the system than was IBR. The waterharvesting model could be used as a satisfactory predictor for woody biomass (R 2 = 0.83). Bestsimulations were obtained when wood cutting during the last 8 yr was accounted for. The waterharvesting and concentration enables wood production which equals that of the forest in muchmore humid southem zones. The thicket production in the banded patterned systems succeeds inover-compensating the barrenness of the interbands, even exceeding woody biomass of industrialplantations in the same region. Due to the graduai thickening of the infiltration zone, thewater-harvesting system becomes no longer effective at the wetter southern end of the tiger bush
• Corresponding author.
0341-8162/99/$ - ,ee front malter © 1999 Elsevier Science B V. Ali righlS reserved.PlI: S0341-8162(98)00061-7
232 C. Valentin. J.M. d'Herbès / Catena 37 (1999) 231-256
domain (Ra 15 = 685 mm). Conversely, the decreasing favourable conditions ta infiltration shouldlead to a dry limit of (Ra t5 = 155 mm). Therefore, woody biomass production of the tiger bush iscontrolled by two opposing trends linked to mean rainfall. The result is that the production ofthese structures reaches a maximum at 550 mm mean annual rainfall. The sustainable use of tigerbush in the longer term requires the careful maintenance of this natural water harvesting system.with no attempts of afforestation in the interbands, no agriculture, and only moderate woodharvesting in the vegetatIon bands. Rehabilitation strategies which mimic the natural tiger bushecosystem are the most appropriate under these climatic circumstances. © 1999 Elsevier ScienceB.V. Ali rights reserved.
Keywords: Surface condItions; Surface crusting; Runoff: Water harvestmg; Banded vegetation patterns:Drought
1. Introduction
Under arid and semi-arid conditions, the concentration of resources into patchesresults in a higher plant productivity (Noy-Meir, 1973). Such patches occur frequently inthe form of dense vegetation bands a1igned perpendicu1ar to slope, interspersed withbare soil. These banded vegetation patterns, which support distinctive communities ofgrasses, shrubs and trees, have been reported throughout the Sahelian zone fromMauritania (Audry and Rossetti, 1962) to Soma1ia (MacFayden, 1950), in East African(Be1sky, 1989) and South African semi-arid regions (Van der Meulen and Morris, 1979)as weIl as in the Middle East (Vezey-FitzGera1d, 1957; White, 1969); Mexico (Cornet etal., 1988) and Australia (Slatyer, 1961). Many authors considered overland flow as anessentia1 factor in the formation and the maintenance of these banded systems (e.g.,Ambouta, 1984; Mabbut and Fanning, 1987; Tongway and Ludwig, 1990; Greene, 1992;Dunkerley and Brown, 1995; Thiéry et al., 1995).
In these environments, often referred to as 'tiger bush' in West Africa (in French'brousse tigrée', C10s-Arceduc, 1956), the capture and storage of limited water resourceappeared to be optimized through a spatial partitioning between run-off, run-on andinfiltration, the bare interband acting as a source, and the vegetation band as a sink(Noy-Meir, 1973; Ludwig et al., 1998). In support of this natural water harvestingtheory, infiltration input in the bands was found to exceed 1.5-2.5 times the localprecipitation (Hemming, 1965; Cornet et al., 1988; Brom1ey et al., 1997).
In a given site, the amount of run-on to the vegetation bands is generally assumed tobe controlled by the surface conditions of the interband. Hydrologie characters of thetwo main system components, often broken into subzones, have been assessed usingrings method (Slatyer, 1961; Ambouta, 1984), rainfall simulation tests (Tongway andLudwig, 1990; De1houme, 1996) and disk infi1trometers (Greene, 1992; Vandervaere etal., 1997; Brom1ey et al., 1997). However, re1ative1y 1itt1e is known about factorscontrolling water shedding and trapping efficiencies and run-off mode1s are still neededto predict redistribution within the system.
If the vegetated mn-on band requires a certain area of interband to shed run-offwater, the relative dimensions of these two components must be an essentia1 factor to themaintenance of the system. Il has been thus postu1ated that the width of the interbands
C. Valentin, j,M. d'Herbès / Calena 37 (1999) 2]1-256 233
should increase relative to that of the bands as rainfall decreases. (Gavaud and Boulet,1967; Ambouta, 1984). The interband intervals can range from one to four times as wideas the bands (Gavaud and Boulet, 1967; Mabbut and Fanning, 1987). However, nofactor has been clearly shown to influence the width of the vegetation area as comparedto the ron-off contributing area (Ounkerley and Brown, 1998).
Even less documented is the plant biomass production within the band, Becausewater inflow is the first critical factor for production under these climatic conditions(Noy-Meir, 1973), it seems reasonable to speculate that productivity should be affectedby the factors controlling ron-off from the bare band and infiltration into the vegetationband,
The objectives of this study were (1) to investigate the factors influencing theinterband width:band width ratio, (2) to design a simple predictive model of rainwaterredistribution based upon surface conditions, (3) to relate woody phytomass to theefficiency of the tiger bush regarded as a water-harvesting system.
2. Methods
2.1. The tiger bush domain in Niger
In south western Niger, the plateaux where tiger bush patterns may occur covers anarea estimated at 22000 km2 (Ambouta, 1984) and located between l3°N and 15°N(Gavaud and Boulet, 1967). This region shares many characteristics of sites wherevegetation banding has been reported. The annual rainfall is characterized by a strongtemporal and spatial variability. This is due to periodic regional droughts and therandomness of local convective storms. However, in the long-term, annual rainfallclearly decreases from approximately 750 mm in the south to 400 mm in the north(Gavaud and Boulet, 1967). Rainfall distribution is monomodal, starting usually in Juneand lasting until mid-September. Intensive dry spells occur from late September until thesubsequent rainy season in June. In Niamey, most rainfall occurs in storm events. Themedian rainfall intensity being 35 mm h-[ and 35% of the total rainfall falling with anintensity exceeding 50 mm h -1 (Lebel et al., 1997). Mean monthly maximum andminimum air temperatures are 36.0°C and 22.2°C, respectively with the maximum inApril (40.9°C) and the minimum in January 05.9°C). Mean annual potential evapotranspiration is 2294 mm (Sivakumar et al., 1993).
The region is underlain by the Birrimian crystalline basement complex, part of thePrecambrian pan-African shield. The overlying rocks consist of a complex formation ofloamy sandstone of Miocene deposits called the Continental Terminal. These highlyweathered materials are covered with sand deposits of late Quaternary age which tend toplug the dry valley systems and in the north form dunes oriented ENE-WSW (Gavaudand Boulet, 1967; Wilding and Oaniels, 1989; d'Herbès and Valentin, 1997). The gentleundulating landscape is disropted by broad, nearly flat-topped, ironstone-capped plateauxof the Continental Terminal. The tiger bush patterns occur only on these plateaux.However, where thin, discontinuous aeolian sands survive on the plateaux, there istypically no vegetation banding probably due to an insufficient surface for production of
234 C. Va/en/i,l, J.M. d'Herbès / Catella 37 (1999) 231-256
run-off. In the tiger bush systems, the bare interbands are generally steeper (slopegradient = 1.3%) than the vegetated bands (0.8%; Ambouta, 1984).
In this region, the differences in the topsoils of the interbands and bands have beenascribed to the influence of the vegetation itself through accumulation of litter androoting (White, 1971; Ambouta, 1984; Barker, 1992). In general, these soils exhibitbetween 0.1 and 0.9 m of gravely loam (35-60% silt and clay) over ubiquitous ironstonegravel and more or less cemented sesquioxyde sheets. Mineral reserves in these acidicsoils (pH < 5.0) are low. Due to the iron pan and the gravel, these soils offer a lowwater-holding capacity. According to the reference base of the International Society ofSoil Science et al. (1994), most of these soils have been classified as Skeletic Leptosols(d'Herbès and Valentin, 1997). Detailed physical and pedologic descriptions have beengiven by Ambouta (1984), Wilding and Daniels (1989), Barker (1992) and Legger andvan der Aa (1994).
TypicaIly, the thickets of the Nigerien tiger bush are contour-aligned and arranged inmore or less concentric rings surrounding the slightly convex tops of the plateaux,forrning more parallel arcs than straight bands. The downslope distance between arcsranges from 35 to 150 m, and the width of the thickets from 10 m to 40 m (Gavaud andBoulet, 1967; White, 1970; Bromley et al., 1997). These arcs may extend up to 100-300m. The wavelength, i.e., interband width plus band width, is mainly controlled by slope(d'Herbès and Valentin, 1998; Eddy et al., 1998).
The interbands are completely devoid of vegetation. Starting from the bare area, asequence of three zones is more or less systematically encountered in a downslopedirection through the arc (Ambouta, 1984; Thiéry et al., 1995; Bromley et al., 1997): (1)a grassy open bush consisting of a nearly total grass cover of annual plants, such asMicrochloa indica (Linn. f.) (Seghieri et al., in press), associated with the shrub Guierasenegalensis lF. Gmel; (2) a closed bush with a canopy cover between 60 and 100% oftall shrubs and trees, up to 8 m, dominated by Combretum spp., with an understorey ofsmall shrubs, such as Gardenia sokotoensis Stapf et Hutch, and a very sparse grasscover ( < 5%); (3) a bare open bush with a cover declining from 40 to 0% contributedmainly by Combretum micranthum and small shrubs as Boscia angustifolia A. Rich.and B. senegalensis (Pers.) Lam.
2.2. Regional transect and field measurements
To investigate the effect of rainfall upon the geometry and the woody biomassproduction of the tiger bush pattern, a regional transect, was established north/southacross the rainfall gradient (Fig. 1). Nearly 200 km long, it included nine study sites atintervals as regular as possible depending on tiger bush occurrence and accessibility fora four-wheel drive vehicle. Zoukouara was the southernmost plateau with tiger bush thatcould be recognized on the panchromatic SPOT images of February 1991 (fieldresolution 10 m). Only one selected site, located north of Farantara. our northernmostsite, was not sampled due to safety reasons, the region north of the 14° parallel being outof governmental control. Each site consisted of a local line transect spanning fivewavelengths of the banding. One site, Dingazi, encompassed two transects, one withtypically patterned and one with large bands and interbands.
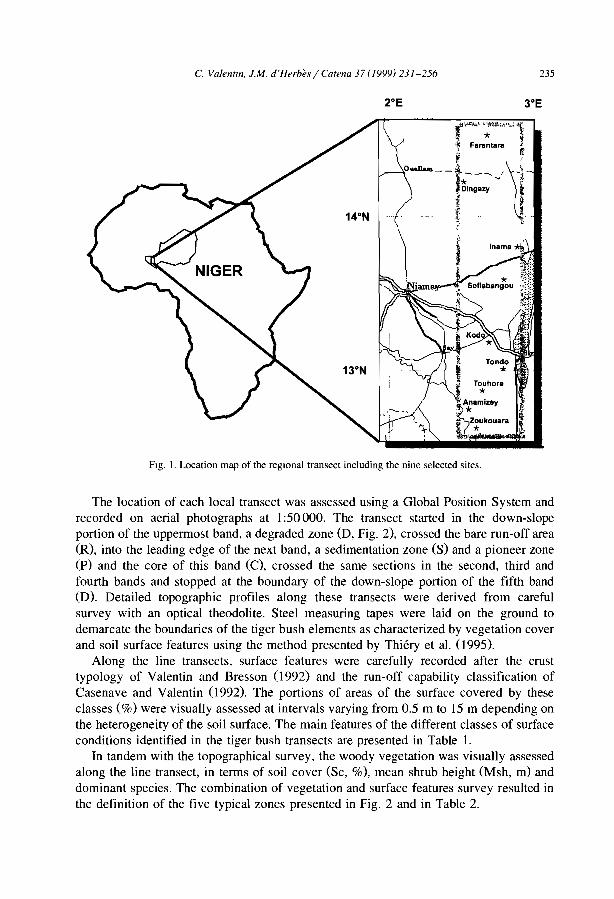
C. Va/entln, J.M. d'Herbès / Catena 37 (/999) 23/-256
2°E
235
3°E
FIg. 1. Location map of the reglOnal transect including the nine selected sites.
The location of each local transect was assessed using a Global Position System andrecorded on aerial photographs at 1:50 000, The transect started in the down-slopeportion of the uppermost band, a degraded zone (D, Fig, 2), crossed the bare run-off area(R), into the leading edge of the next band, a sedimentation zone (S) and a pioneer zone(p) and the core of this band (C), crossed the same sections in the second, third andfourth bands and stopped at the boundary of the down-slope portion of the fifth band(D). Detailed topographie profiles along these transects were derived from carefulsurvey with an optical theodolite. Steel measuring tapes were laid on the ground todemarcate the boundaries of the tiger bush elements as characterized by vegetation coyerand soil surface features using the method presented by Thiéry et al. (1995).
Along the line transects, surface features were carefully recorded after the crusttypology of Valentin and Bresson (1992) and the run-off capability classification ofCasenave and Valentin (1992). The portions of areas of the surface covered by theseclasses (%) were visually assessed at intervals varying from 0.5 m to 15 m depending onthe heterogeneity of the soil surface, The main features of the different classes of surfaceconditions identified in the tiger bush transects are presented in Table l.
In tandem with the topographieal survey, the woody vegetation was visually assessedalong the line transect, in terms of soil coyer (Sc, %), mean shrub height (Msh, m) anddominant species, The combination of vegetation and surface features survey resulted inthe definition of the five typical zones presented in Fig. 2 and in Table 2.
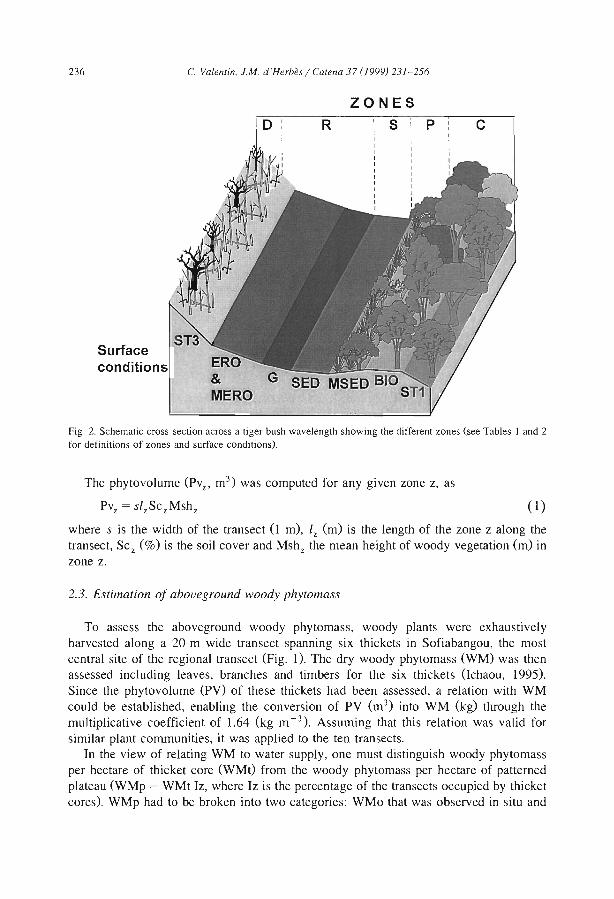
236 C. Valentin, J.M. d'Herbès / Catena 37 (1999) 231-256
ZONES
Surfaceconditions
D R S P c
Fig. 2. Schematic cross-section across a tiger bush wavelength showing the different zones (see Tables 1 and 2for definitions of zones and surface conditions).
The phytovolume (Pvz, m3) was computed for any given zone z, as
PVz = slzSczMsh z (1)
where s is the width of the transect (I m), Iz (m) is the length of the zone z along thetransect, SC z (%) is the soil coyer and Mshz the mean height of woody vegetation (m) inzone z.
2.3, Estimation of aboveground woody phytomass
To assess the aboveground woody phytomass, woody plants were exhaustivelyharvested along a 2ü-m wide transect spanning six thickets in Sofiabangou, the mostcentral site of the regional transect (Fig. 1). The dry woody phytomass (WM) was thenassessed including leaves, branches and timbers for the six thickets (Ichaou, 1995),Since the phytovolume (PV) of these thickets had been assessed, a relation with WMcould be established, enabling the conversion of PV (m3
) into WM (kg) through themultiplicative coefficient of 1.64 (kg m- 3
). Assuming that this relation was valid forsimilar plant communities, it was applied to the ten transects.
In the view of relating WM to water supply, one must distinguish woody phytomassper hectare of thicket core (WMt) from the woody phytomass per hectare of patternedplateau (WMp = WMt Iz, where Iz is the percentage of the transects occupied by thicketcores). WMp had to be broken into two categories: WMo that was observed in situ and

Table 1Main features and properties of the different surface conditions in the Nigerien tlger bush (adapted from Valentm and Bresson, 1992; Casenave and Valentin, 1992)
Type Structure Thickness Infiltrabi1ity Mean run-off Zoneh
(mm) (mm ha -1) coefficient' (Rc, %)
1-3 5-8
2-10 0-5
2-30 0-2
<1 0-2
<1 0-2
Structural crustsSlaking (ST!)
Sleving (ST3)
Coarse pavement (G)
EroSIOn crusts (ERO)
Microphytic erosion (MERO)
Depositional crustsRun-off (ROF)
Sedimentary (SED)
Microphytlc sedimentary (MSED)
No crust (BIO)
rough surface, weak textura] differentlation,weak void interconnectioncoarse sandy layer at the top, vesicu1ar finesandy layer, seal of fine partic1es at the bottomsimilar to the sieving crust mc1uding coarsefragments and much pronounced vesicular porositysmooth exposed sea1 made of fine cementedpartic1es, possible vesic1essimilar to ERO but colonised by microphytesas a1gae
interbeddmg of sandy layers and seals of finerpartic1es, possible vesic1eslarger partic1es at the top, finer partic1es at thebottom, possible vesic1es, frequent curled-up platessimilar to S but more platy m structure andcolonised by microphytes as algae and mossescontinuous and evolved forest litter, hlghtermItic porosity
2-20
2-50
2-50
1-5
0-2
4-7
25-40
35
50
90
85
85
50
72.5
50
75
C
R
R
R
R
R
S
P
C
o;:;;;:
~.
....~c..~<;.""'"'----(")
'"";:'"'"~~....\0\0~N
~1
N
~
'Re: mean cumulatIve run-offjrainfall ratio, as assessed through rainfall simulation tests.hMam zone of occurrence, D: degraded, R. run-off, S: sedimentation, P: pioneer, C: central (after Thiéry et al., 1995).
'"'...,-.J
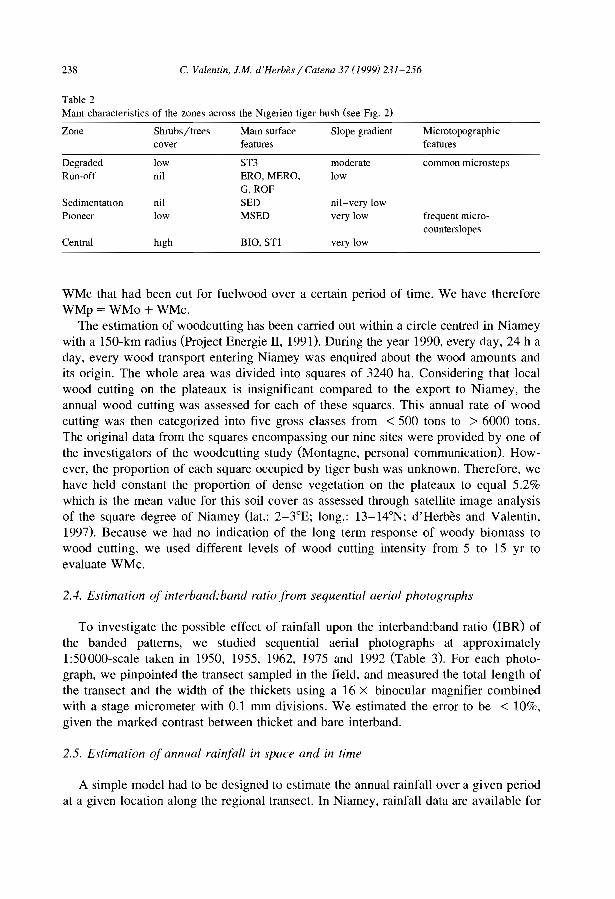
238 C. Valentin, J.M. d'Herbès / Catefla 37 (1999) 231-256
Table 2Mam characteristics of the zones across the Nigerien tiger bush (see Fig. 2)
Zone Shrubs/trees Mam surface Slope gradientcover features
Degraded low ST3 moderateRun-off nil ERO,MERO, low
G,ROFSedimentatIOn nil SED nil-very lowPIOneer low MSED very Iow
Central hlgh BIO, ST! very Iow
Microtopographicfeatures
common microsteps
frequent microcounterslopes
WMc that had been cut for fuelwood over a certain period of time. We have thereforeWMp = WMo + WMc.
The estimation of woodcutting has been carried out within a circle centred in Niameywith a ISO-km radius (Project Energie II, 1991), During the year 1990, every day, 24 h aday, every wood transport entering Niamey was enquired about the wood amounts andits origin. The whole area was divided into squares of 3240 ha. Considering that localwood cutting on the plateaux is insignificant compared to the export to Niamey, theannual wood cutting was assessed for each of these squares, This annual rate of woodcutting was then categorized into five gross classes from < 500 tons to > 6000 tons.The original data from the squares encompassing our nine sites were provided by one ofthe investigators of the woodcutting study (Montagne, personal communication). However, the proportion of each square occupied by tiger bush was unknown. Therefore, wehave heId constant the proportion of dense vegetation on the plateaux to equal 5.2%which is the mean value for this soil coyer as assessed through satellite image analysisof the square degree of Niamey (lat.: 2-3°E; long.: 13-14°N; d'Herbès and Valentin,1997). Because we had no indication of the long term response of woody biomass towood cutting, we used different levels of wood cutting intensity from 5 to 15 yr toevaluate WMc.
2.4. Estimation of interband:band ratio fram sequential aerial photographs
To investigate the possible effect of rainfall upon the interband:band ratio (IBR) ofthe banded patterns, we studied sequential aerial photographs at approximately1:50000-scale taken in 1950, 1955, 1962, 1975 and 1992 (Table 3). For each photograph, we pinpointed the transect sampled in the field, and measured the total length ofthe transect and the width of the thickets using a 16 X binocular magnifier combinedwith a stage micrometer with 0.1 mm divisions. We estimated the error to be < 10%,given the marked contrast between thicket and bare interband.
2.5. Estimation of annual rainfall in space and in time
A simple model had to be designed to estimate the annuaI rainfall over a given periodat a given location along the regional transect. In Niamey, rainfall data are available for

Table 3Aerial photography specifications (see Fig. 1 for site locatIon)
Date Nov. 1950 Nov.-Dec. 1955 Sept.-Nov. 1962Mission IGN-AOF IGN-ND-31-II IGN, ND, 31-XVApprox. sca1e 1:50000 1:50000 1:50000
Farantara 011-318 230Dmgazi 011-153 352Inama 016-163 255Banizoumbou 016-338 337Kodo 016-596 603Tondo 016-723 506 698Touhore 485Anamizey 416Zoukouara 353
Jan-Apr. 1975IGN, 75 NIG 40/6001:50000
329731432635276729613090484648924943
Sept. 1992NASA. Hapex-Sahel1:50000
88
Oct.-Nov.1992DG-DA/IGNN-JICA1:60000
1-214-199-21
o;f~;:,
~0-.~~
~;;."','""-.[;l
";:,.,c...'1
--......
~~......1
NV,01
NVol'0
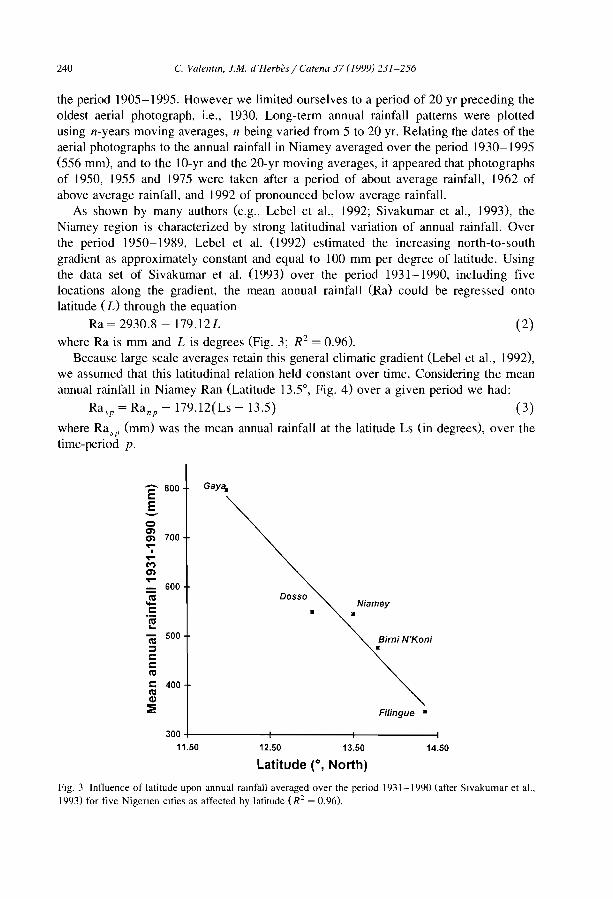
240 C. Valentin. J.M. d'Herbès / Catena 37 (1999) 231-256
the period 1905-1995. However we limited ourselves to a period of 20 yr preceding theoldest aerial photograph, i.e., 1930. Long-term annual rainfall patterns were plottedusing n-years moving averages, n being varied from 5 to 20 yr. Relating the dates of theaerial photographs to the annual rainfall in Niamey averaged over the period 1930-1995(556 mm), and to the 10-yr and the 20-yr moving averages, it appeared that photographsof 1950, 1955 and 1975 were taken after a period of about average rainfal1, 1962 ofabove average rainfall, and 1992 of pronounced below average rainfall.
As shown by many authors (e.g., Lebel et a1., 1992; Sivakumar et al., 1993), theNiamey region is characterized by strong latitudinal variation of annual rainfall. Overthe period 1950-1989, Lebel et al. (1992) estimated the increasing north-to-southgradient as approximately constant and equal to 100 mm per degree of latitude. Usingthe data set of Sivakumar et al. (1993) over the period 1931-1990, including fivelocations along the gradient, the mean annual rainfall (Ra) could be regressed ontolatitude (L) through the equation
Ra = 2930.8 - 179.l2L (2)
where Ra is mm and L is degrees (Fig. 3; R 2 = 0.96).Because large scale averages retain this general climatic gradient (Lebel et al., 1992),
we assumed that this latitudinal relation held constant over time. Considering the meanannual rainfall in Niamey Ran (Latitude 13.5°, Fig. 4) over a given period we had:
Ra,p = Ra llp - 179.12(Ls - 13.5) (3)
where Ra,p (mm) was the mean annual rainfall at the latitude Ls (in degrees), over thetime-period p.
- 800 Gay'\,EE-0."." 700....
1....M."....= 600
~Dosso
Niameyl: •1tI...1tI
500 Bimi N'Koni:::::l •l:l:1tI
l: 4001tIG.l:!: Filingue .
30011.50 12.50 13.50 14.50
Latitude (0, North)
FIg. 3 Int1uence of latitude upon annual ramfall averaged over the period 1931-1990 (after Slvakumar et al.,1993) for five NigerIen clties as affected by latitude (R" = 0.96).
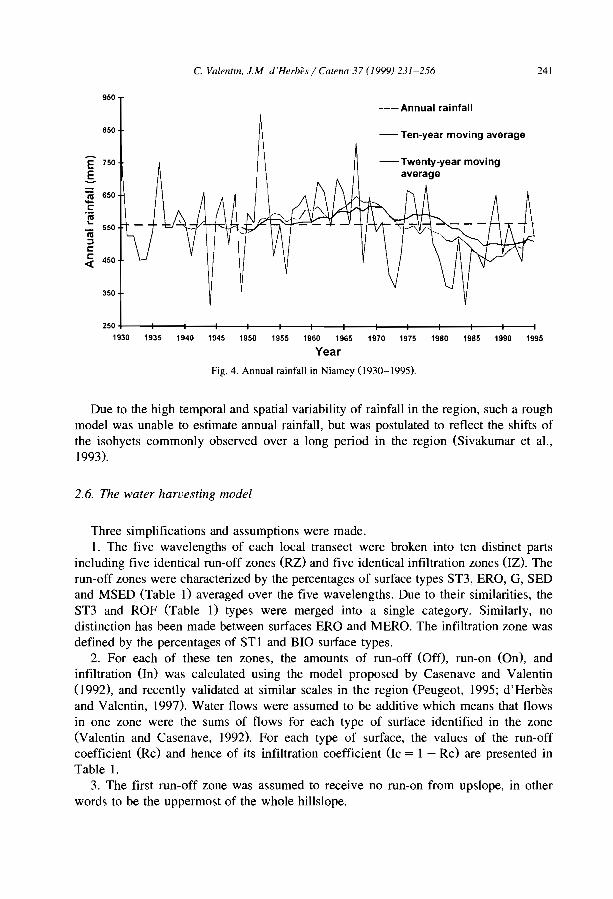
950
850
Ê 750
.s~ 650C.~
ïii 550
:JC
~ 450
350
C. Vaientltl, J.M d'Herhè.l' / Catena 37 (/999) 231-256
--Annual rainfall
- Ten-year moving average
241
250 +---+---+-----If---+---+---+--t----+---+---+--+---+----i1930 1935 1940 1945 1950 1955 1960 1965 1970 1975 1980 1985 1990 1995
Year
Fig. 4. Annual rainfall in Niamey (1930-1995).
Due to the high temporal and spatial variability of rainfall in the region, such a roughmodel was unable to estimate annual rainfall, but was postulated to ref1ect the shifts ofthe isohyets commonly observed over a long period in the region (Sivakumar et al.,1993).
2.6. The water harvesting model
Three simplifications and assumptions were made.1. The five wavelengths of each local transect were broken into ten distinct parts
including five identical mn-off zones (RZ) and five identical infiltration zones OZ). Themn-off zones were characterized by the percentages of surface types ST3, ERO, G, SEDand MSED (Table I) averaged over the five wavelengths. Due to their similarities, theST3 and ROF (Table I) types were merged into a single category. Similarly, nodistinction has been made between surfaces ERO and MERO. The infiltration zone wasdefined by the percentages of STI and BIO surface types.
2. For each of these ten zones, the amounts of mn-off (Off), mn-on (On), andinfiltration On) was calculated using the model proposed by Casenave and Valentin(1992), and recently validated at similar scales in the region (Peugeot, 1995; d'Herbèsand Valentin, 1997). Water f10ws were assumed to be additive which means that f10wsin one zone were the sums of f10ws for each type of surface identified in the zone(Valentin and Casenave, 1992). For each type of surface, the values of the mn-offcoefficient (Rc) and hence of its infiltration coefficient Oc = 1 - Rc) are presented inTable 1.
3. The first mn-off zone was assumed to receive no mn-on from upslope, in otherwords to be the uppermost of the whole hillslope.
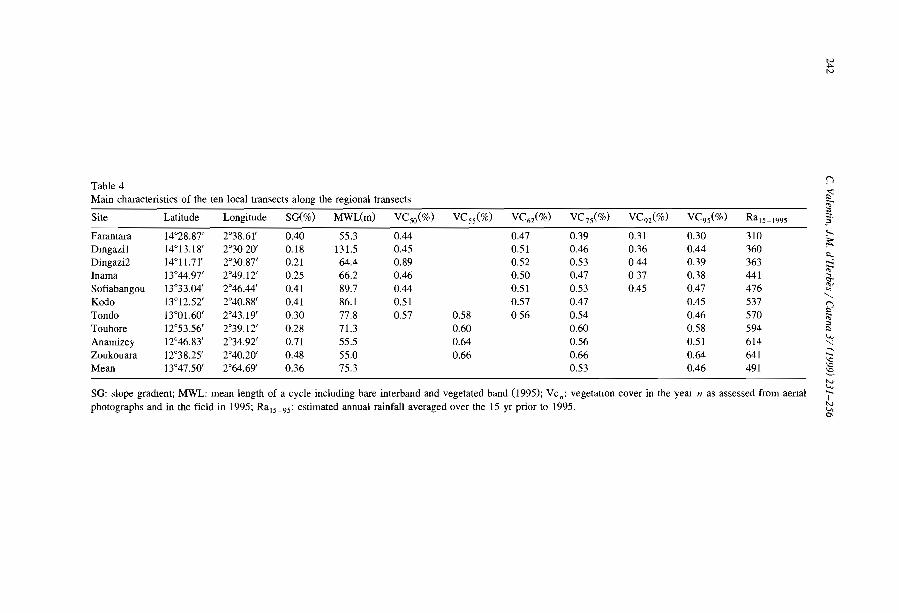
~
Table 4 0
Main characteristics of the ten local transects along the regional transects ;;:~
Site Latitude Longitude SG(%) MWL(m) VC so(%) VC ss (%) VC 6Z(%) VC 7S(%) VC 92 (%) VC 9S(%) Ra ls_ 199S ~.
Farantara 14°28.87' 2°38.61' 0.40 55.3 0.44 0.47 0.39 0.31 0.30 310"""DmgaziJ 14°13.18' 2°30.20' 0.18 131.5 0.45 0.51 0.46 0.36 0.44 360 ~"-
Dingazi2 [4011.71' 2°30.87' 0.21 64.4 0.89 0.52 0.53 044 0.39 363~
Inama 13°44.97' 2°49.12' 0.25 66.2 0.46 0.50 0.47 037 0.38 441 &Sofiabangou 13°33.04' 2°46.44' 0.41 89.7 0.44 0.51 0.53 0.45 0.47 476 "',
'"........Kodo 13°12.52' 2°40.88' 0.41 86.1 0.51 0.57 0.47 0.45 537
~Tondo ]3°01.60' 2°43.19' 0.30 77.8 0.57 0.58 0.56 0.54 0.46 570 "Touhore 12°53.56' 2°39.12' 0.28 71.3 0.60 0.60 0.58 594
;:,l:l
Anamizey 12°46.83' 2°34.92' 0.71 55.5 0.64 0.56 0.51 614v"'J~
Zoukouara 12°38.25' 2°40.20' 0.48 55.0 0.66 0.66 0.64 641 .....'0
Mean ]3°47.50' 2°64.69' 0.36 75.3 0.53 0.46 491 '0~w
SG: slope gradient; MWL: mean length of a cycle including bare interband and vegetated band (1995); Ven: vegetatIOn cover in the year Il as assessed from aenalv".....1
photographs and in the field in 1995: Ra ls_9S: estimated annual rainfall averaged over the 15 yr prior to 1995. wv,0\
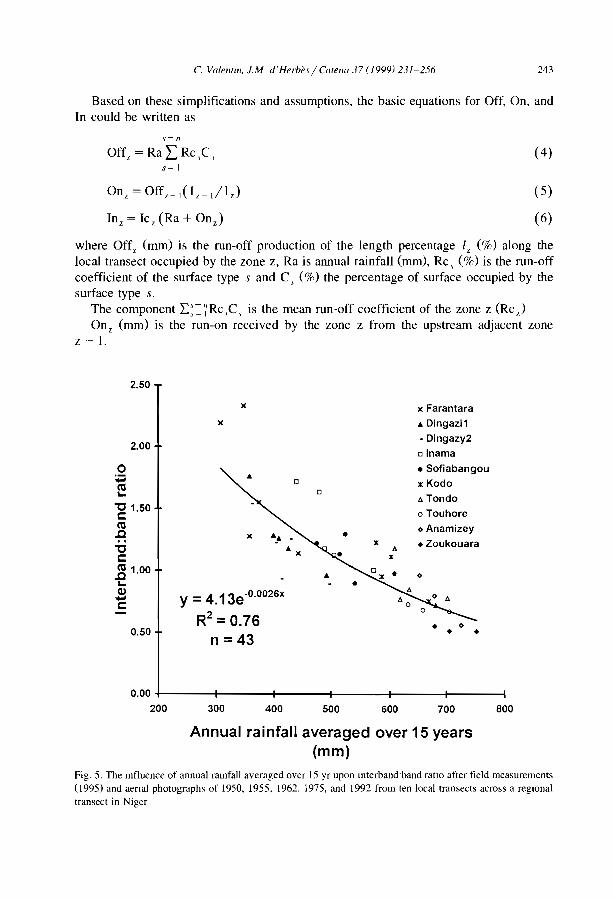
C. Va/el/lm, J.M d'Herbè.l'j Calel/a 37 (1999) 231-256 243
Based on these simplifications and assumptions, the basic equations for Off, On, andIn could be written as
f= n
Of( = RaLRc,C,s~ 1
(4)
(5)
(6)
where Offz (mm) is the mn-off production of the Iength percentage lz (%) along thelocal transect occupied by the zone z, Ra is annuai rainfall (mm), Rc, (%) is the mn-offcoefficient of the surface type sand C, (%) the percentage of surface occupied by thesurface type s.
The component L::: '; Rc ,C, is the mean mn-off coefficient of the zone Z (Rc)On z (mm) is the mn-on received by the zone z from the upstream adjacent zone
z - 1.
2.50
2.00
o;cu~
"C 1.50c:CU.c"Cc:~ 1.00~
$c:
0.50
x
x
oo
x •
y =4.13e -0.002Gx
R2 =0.76n =43
x
x Farantara
.. Dingazi1
·Dingazy2
o Inama
• Sofiabangou
x Kodo
l>. Tondo
o Touhore
o Anamizey
• Zoukouara
o
• 0• •
800700GOO500400300
0.00 i------lf----+----t-----t------lf-----l200
Annual rainfall averaged over 15 years(mm)
Fig. 5. The mfluence of annual ramfall averaged over 15 yr upon mterband'band ratio after field measurements(1995) and aenal photographs of 1950, 1955, 1962. 1975. and 1992 from ten local transects acro;s a reglOnaltransect in Niger
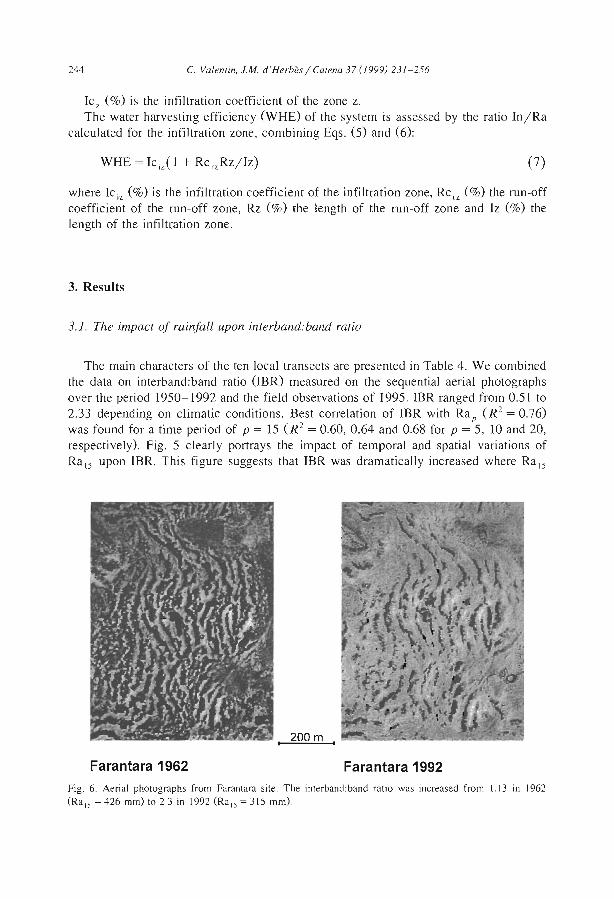
244 C. Valentin, J.M. d'Herbès / C(f/ena 37 (1999) 23J-256
lez (0/0) is the infiltration coefficient of the zone z.The water harvesting efficiency (WHE) of the system is assessed by the ratio In/Ra
calculated for the infiltration zone, combining Eqs. (5) and (6):
(7)
where Ic iz (0/0) is the infiltration coefficient of the infiltration zone, Rc rz (0/0) the run-offcoefficient of the run-off zone, Rz (0/0) the length of the run-off zone and Iz (0/0) theJength of the infiltration zone.
3. ResuIts
3.1. The impact of rainfall upon ùzterband:band ratio
The main characters of the ten local transects are presented in Table 4. We combinedthe data on interband:band ratio (IBR) measured on the sequential aerial photographsover the period 1950-1992 and the field observations of 1995. !BR ranged from 0.51 to2.33 depending on climatic conditions. Best correlation of !BR with Ra t' (R 2
= 0.76)was found for a time period of p = 15 (R 2 = 0.60,0.64 and 0.68 for p = 5, 10 and 20,respectively). Fig. 5 c1early portrays the impact of temporal and spatial variations ofRa 15 upon IBR. This figure suggests that IBR was dramatically increased where Ra 15
Farantara 1962
200m
Farantara 1992Fig. 6. Aerial photographs from Farantara site. The interband:band ratio was increased from 1.13 in 1962
(Rais = 426 mm) to 2.3 in 1992 (Rais = 315 mm).
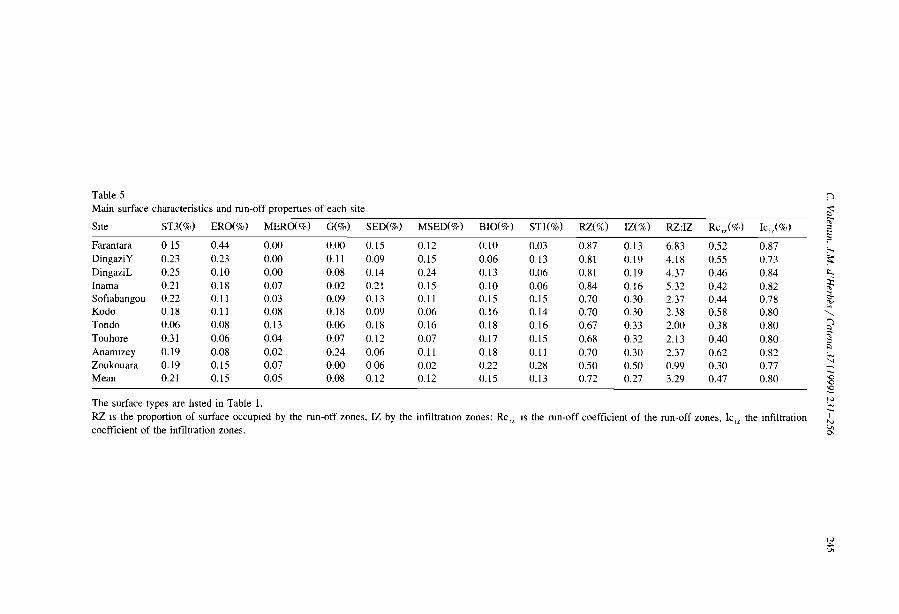
Table 5 nMain surface characteristics and mn-off properlies of each site 2fSite ST3(%) ERO(%) MERO(%) G(%) SED(%) MSED(%) BIO(%) STl(%) RZ(%) IZ(%) RZ:IZ Rc r/%) le,,(%) "5
0.00 0.12 0.10 0.03 0.87 0.13 6.83 0.52 0.87i"
Farantara 015 0.44 0.00 0.15 ,....DingaziY 0.23 0.23 0.00 0.11 0.09 0.15 0.06 0.13 0.81 0.19 4.18 0.55 0.73 :::DingaziL 0.25 0.10 0.00 0.08 0.14 0.24 0.13 0.06 0.81 0.19 4.37 0.46 0.84 "-Inama 0.21 0.18 0.07 0.02 0.21 0.15 0.10 0.06 0.84 0.16 5.32 0.42 0.82 ;F..,Sofiabangou 0.22 0.11 0.03 0.09 0.13 0.11 0.15 0.15 0.70 0.30 2.37 0.44 0.78 """,'"'Kodo 0.18 0.11 0.08 0.18 0.09 0.06 0.16 0.14 0.70 0.30 2.38 0.58 0.80 '-...
Tondo 0.06 0.08 0.13 0.06 0.18 0.16 0.18 0.16 0.67 0.33 2.00 0.38 0.80 9Touhore 0.31 0.06 0.04 0.07 0.12 0.07 0.17 0.15 0.68 0.32 2.13 0.40 0.80 ~
5Ananuzey 0.19 0.08 0.02 0.24 0.06 0.11 0.18 0.11 0.70 0.30 2.37 0.62 0.82 v.,
Zoukouara 0.19 0.15 0.07 0.00 006 0.02 0.22 0.28 0.50 0.50 0.99 0.30 0.77 "-Mean 0.21 0.15 0.05 0.08 0.12 0.12 0.15 0.13 0.72 0.27 3.29 0.47 0.80 '0'0~
The surface types are hsted in Table 1.N'~-RZ IS the proportion of surface occupled by the mn-off zones, IZ by the infiltratIOn zones; Rc rz IS the mn-off coefficient of the mn-off zones, le rz the infiltration 1N
coefficient of the infiltration zones. '"0-
,..)...'Jr
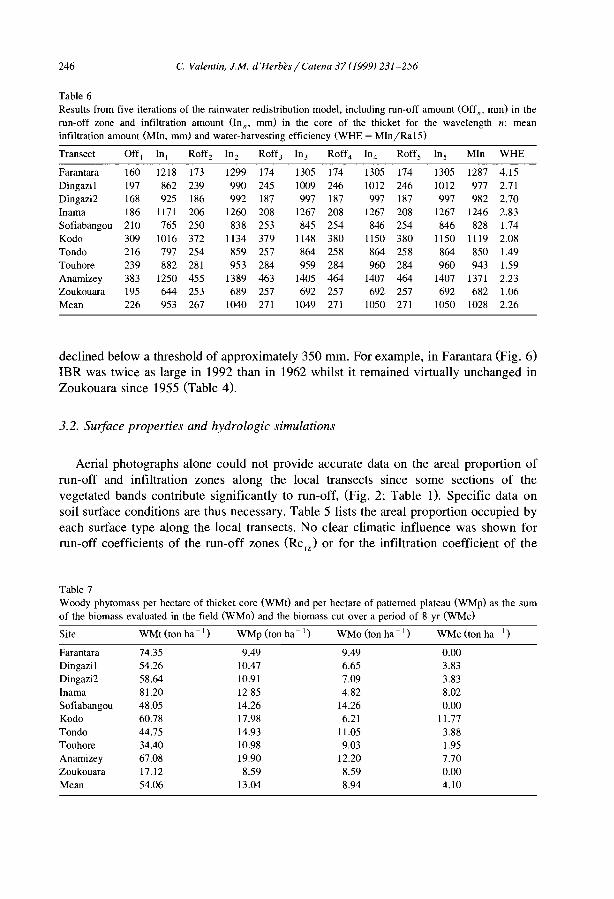
246 C. Valentin, J.M. d'Herbès / Carena 37 (I999) 231-256
Table 6Results from five iterations of the rainwater redistribution mode!, inc1uding run-off amount (Off", mm) in therun-off zone and infiltration amount (In", mm) in the core of the thicket for the wavelength n; meaninfiltration amount (MIn, mm) and water-harvesting efficiency (WHE = MIn/RaI5)
Transect Off 1 ln) Roffz In z Roff} ln} Roff, ln, Roffs Ins Min WHE
Farantara 160 1218 173 1299 174 1305 174 1305 174 1305 1287 4.15Dingazli 197 862 239 990 245 1009 246 1012 246 1012 977 2.71Dingazi2 168 925 186 992 187 997 187 997 187 997 982 2.70Inama 186 1171 206 1260 208 1267 208 1267 208 1267 1246 2.83Sofiabangou 210 765 250 838 253 845 254 846 254 846 828 1.74Kodo 309 1016 372 1134 379 1148 380 1150 380 1150 1119 2.08Tondo 216 797 254 859 257 864 258 864 258 864 850 1.49Touhore 239 882 281 953 284 959 284 960 284 960 943 1.59Anamizey 383 1250 455 1389 463 1405 464 1407 464 1407 1371 2.23Zoukouara 195 644 253 689 257 692 257 692 257 692 682 1.06Mean 226 953 267 1040 271 1049 271 1050 271 1050 1028 2.26
declined below a threshold of approximately 350 mm. For example, in Farantara (Fig. 6)IBR was twice as large in 1992 than in 1962 whilst it rernained virtually unchanged inZoukouara since 1955 (Table 4).
3.2. Suifaee properties and hydrologie simulations
Aerial photographs alone could not provide accurate data on the areal proportion ofrun-off and infiltration zones along the local transects since sorne sections of thevegetated bands contribute significantly to run-off, (Fig. 2; Table O. Specific data onsoil surface conditions are thus necessary. Table 5 lists the areal proportion occupied byeach surface type along the local transects. No clear clirnatic influence was shown forrun-off coefficients of the run-off zones (Rc r) or for the infiltration coefficient of the
Table 7Woody phytomass per hectare of thicket core (WMt) and per hectare of patterned plateau (WMp) as the sumof the biomass evaluated in the fie!d (WMo) and the biomass eut over a period of 8 yr (WMc)
Site WMt (ton ha- 1) WMp (ton ha - 1) WMo (ton ha- 1) WMc (ton ha- 1)
Farantara 74.35 9.49 9.49 0.00Dingazil 54.26 10.47 6.65 3.83Dingazi2 58.64 10.91 7.09 3.83Inama 81.20 12.85 4.82 8.02Sofiabangou 48.05 14.26 14.26 0.00Kodo 60.78 17.98 6.21 11.77Tondo 44.75 14.93 11.05 3.88Touhore 34.40 10.98 9.03 1.95Anamizey 67.08 19.90 12.20 7.70Zoukouara 17.12 8.59 8.59 0.00Mean 54.06 13.04 8.94 4.10
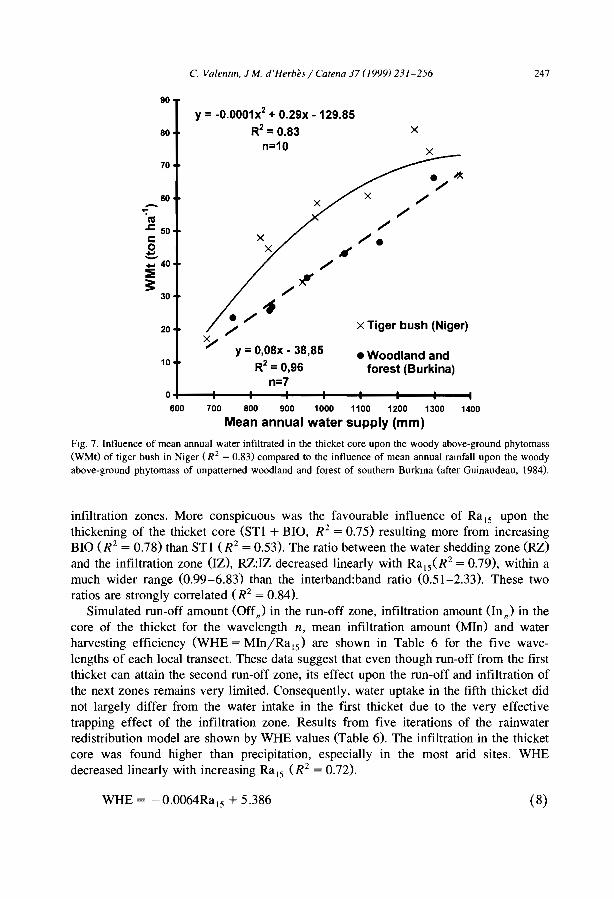
C. Valentm, J M. d'Herbè.l' / Catena 37 (1999) 231~256 247
x Tiger bush (Niger)
. ~
//
/
x
• Woodland andforest (Burkina)
//.
~
/
/~
./4/
y = 0,08x • 38,85R2 = 0,96
n=7
y = -0.0001x2 + 0.29x -129.85R2 = 0.83
n=1080
70
90
60-~ca
.s::. 501:0....-.... 40
:::E3:
30
20
Y10
0+---+--1---1---+--+---+--1--004600 700 800 900 1000 1100 1200 1300 1400
Mean annual water supply (mm)
Fig. 7. Intluence of mean annual water infiltrated in the thicket core upon the woody above-ground phytomass(WMt) of tiger bush in Niger (R 2 = 0.83) compared to the intluence of mean annual ramfall upon the woodyabove-ground phytomass of unpattemed woodland and forest of southem Burkma (after Guinaudeau, 1984).
infiltration zones. More conspicuous was the favourable influence of RaIs upon thethickening of the thicket core (STI + BIO, R 2 = 0.75) resulting more from increasingBIO (R 2 = 0.78) than sn (R 2 = 0.53). The ratio between the water shedding zone (RZ)and the infiltration zone OZ), RZ:IZ decreased linearly with Ra LS (R 2 = 0.79), within amuch wider range (0.99-6.83) than the interband:band ratio (0.51-2.33). These tworatios are strongly correlated (R 2 = 0.84).
Simulated mn-off amount (Off) in the mn-off zone, infiltration amount (Inn) in thecore of the thicket for the wavelength n, mean infiltration amount (MIn) and waterharvesting efficiency (WHE = MIn/RaIs) are shown in Table 6 for the five wavelengths of each local transect. These data suggest that even though mn-off from the firstthicket can attain the second mn-off zone, its effect upon the mn-off and infiltration ofthe next zones remains very limited. Consequently, water uptake in the fifth thicket didnot largely differ from the water intake in the first thicket due to the very effectivetrapping effect of the infiltration zone. Results from five iterations of the rainwaterredistribution model are shown by WHE values (Table 6). The infiltration in the thicketcore was found higher than precipitation, especially in the most arid sites. WHEdecreased linearly with increasing RaIS (R 2 = 0.72).
WHE = -0.0064Ra I5 + 5.386 (8)
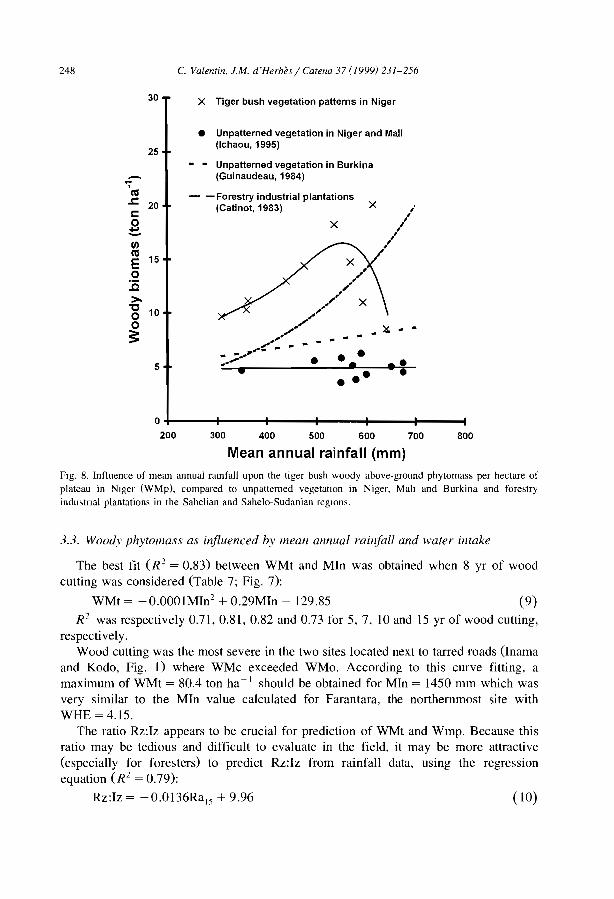
248 C. Valentin, J.M. d'Herbès / Catena 37 (1999) 231-256
30 X Tiger bush vegetation patterns in Niger
• Unpatterned vegetation in Niger and Mali(Ichaou, 1995)
Unpatterned vegetation in Burkina(Guinaudeau, 1984)
• •• •••
.. ~ ....
x
. .• •••
- - Forestry industrial plantations(Catinot, 1983)
x
25
-...CI:l.l: 20c:0--1IlCI:l
15E0:0>.'t:l 10003=
5
800700600500400300O+----+---+--~I_--+_--_+_--_t
200
Mean annual rainfall (mm)
Fig. 8. Influence of mean annual ramfall upon the tiger bush woody above-ground phytomass per hectare ofplateau in Niger (WMp), compared to unpattemed vegetation in Niger, Malt and Burkina and forestryindu,tnal plantations in the Sahelian and Sahelo-Sudanian reglOns.
3.3. Woody phyfomass as influenced by mean al/nua! rainfal! and wafer infake
( Lü)
(9)Lü and 15 yr of wood cutting,
The best fit (R 2 = 0.83) between WMt and MIn was obtained when 8 yr of woodcutting was considered (Table 7; Fig. 7):
WMt = -0.000IMIn2 + 0.29MIn - 129.85
R 2 was respectively 0.71, 0.81, 0.82 and 0.73 for 5,7,respectively.
Wood cutting was the most severe in the two sites located next to tarred roads (Inamaand Kodo, Fig. 1) where WMc exceeded WMo. According to this curve fitting, amaximum of WMt = 80.4 ton ha- I should be obtained for MIn = 1450 mm which wasvery similar to the MIn value calculated for Farantara, the northernmost site withWHE=4.15.
The ratio Rz:Iz appears to be crucial for prediction of WMt and Wmp. Because thisratio may be tedious and difficult to evaluate in the field, it may be more attractive(especially for foresters) to predict Rz:lz from rainfall data, using the regressionequation (R 2 = 0.79):
Rz:Iz = -0.0136Ra I5 + 9.96
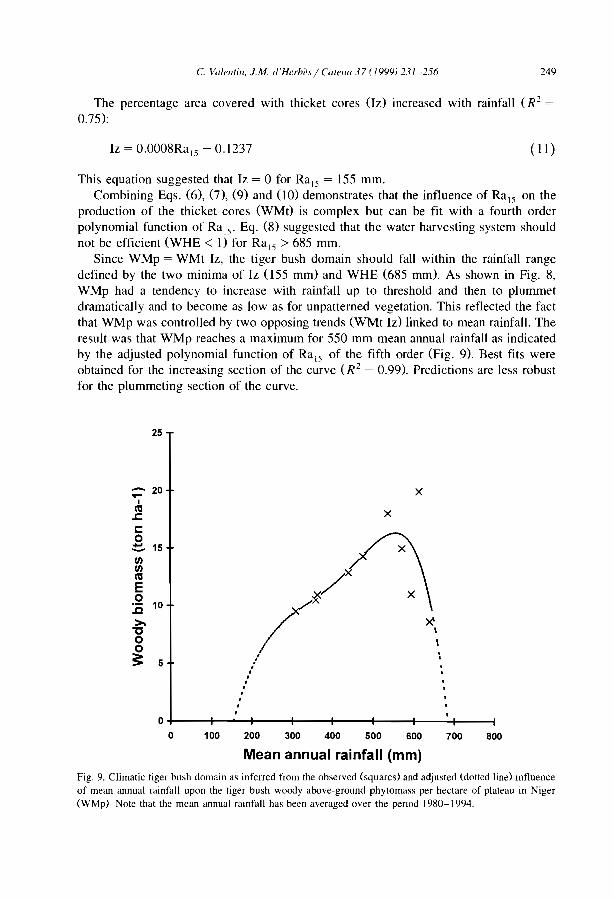
C. Vllientin. J.M. d'Herh".' / Clltellll 37 (1999) 231-256 249
The percentage area covered with thicket cores (Iz) increased with rainfall (R 2=
0.75);
Iz = 0.0008Ra 15 - 0.1237 ( Il)
This eguation suggested that Iz = 0 for Ra l5 = 155 mm.Combining Egs. (6), (7), (9) and (JO) demonstrates that the influence of Rais on the
production of the thicket cores (WMt) is complex but can be fit with a fourth orderpolynomial function of Ra 15 • Eg. (8) suggested that the water harvesting system shouldnot be efficient (WHE < 1) for Ra 15 > 685 mm.
Since WMp = WMt Iz, the tiger bush domain should fall within the rainfall rangedefined by the two minima of Iz (155 mm) and WHE (685 mm). As shown in Fig. 8,WMp had a tendency to increase with rainfall up to threshold and then to plummetdramatically and to become as low as for unpatterned vegetation. This reflected the factthat WMp was controlled by two opposing trends (WMt Iz) linked to mean rainfall. Theresult was that WMp reaches a maximum for 550 mm mean annual rainfall as indicatedby the adjusted polynomial function of Ra l5 of the fifth order (Fig. 9). Best fits wereobtained for the increasing section of the curve (R 2
= 0.99). Predictions are less robustfor the plummeting section of the curve.
25
x
x- 20....
1
l'll.J:c:0::t:. 15fi)fi)l'llE0:0 10
>.'000~ 5
/\/ X"
........800700600500400300200100
0+---+-.........-t----11---+---+---+---1------jo
Mean annual rainfall (mm)
Fig. 9. Climatic tiger bush domain as inferred from the observed (squares) and adjusted (dotted line) mfluenceof mean annual rainfall upon the tiger bush woody above-ground phytomass per hectare of plateau in Niger(WMp) Note that the mean annual ramfall has been averaged over the penod 1980-1994.

250
4. Discussion
C. Valentin. J.M. d'Herbès / Catena 37 (1999) 231-256
4.1. The efficienc.v of the natural water haruesting system for woody biomass production
As might intuitively be anticipated, vegetated bands in more humid regions requiresmaller catchment areas to shed run-off water, hence a marked decline of theinterband:band ratio with increasing rainfall. Our results are consistent with the observations of Ambouta (1984) in the same region (IBR = 2.1 for 400-450 mm, 1.2 for450-600 mm and 0.9 for 600-800 mm). IBR values as high as 5 to 20 have beenreported by White (1969) in the very arid region of Jordan (Ra = 50-100 mm). In fact,comparisons with other regions are made difficult due to the different nature of theinterband areas. For example, under an annual rainfall of 250 mm in Australia, IBR wasfound to range from 3 to 5 (Slatyer, 1961) but the water-shedding efficiency of theinterbands was presumably hampered by the presence of perennial grass, annual forbsand even isolated trees. In our case, the clearness of the relationship between IBR andRa 15 was favoured by the fact that the bare interband zones exhibited invariably thesame succession of crust types associated with a high run-off coefficients.
Our results suggest that the run-off zone:infiltration zone ratio based on field crusttype survey was a better predictor for the water-harvesting efficiency (WHE) of thesystem than was IBR. A part of the vegetated surface, especially in the most arid region,generates significant run-off. Only the thicket core can therefore be considered as a sinkfor overland flow. As a result WHE showed a wider range than IBR and a morepronounced decline with rainfall increase. The simulated values of WHE are consistentwith the few data available in the literature (1.5-2.5 in northern Mexico, Cornet et al.,1988; 1.38 in eastern Australia, Greene, 1992). In Niger these simulated values of WHEagree well with the data obtained from field measurements which fall in the range 1-2for the thicket core in a region south of Niamey (Bromley et al., 1997). However. thisredistribution model of rainwater along the transects across the banded patterns maysuffer sorne exception due to local heterogeneity. This variability can be associated withlocal landscape concavities and salients of the pioneer zone (Thiéry et al., 1995). Slightcounterslopes may force run-off to accumulate and to preferably infiltrate in these zones.This may explain why a higher water storage (WHE = 3.2, compared ta 1.6 in thethicket core) could be locally simulated and corroborated by field measurements in thispioneer zone (Bromley et al.. 1997). Heterogeneity in local microroughness may alsoresult in higher run-off concentration into the thicket core (Peugeot, 1995; Galle et al.,1998).
Due to the prevailing role of crusts in hampering infiltration, field survey of surfacecrusts appears to be a useful tool for predicting the spatial variation in soil moisture asshown by the consistency between simulations and field measurements. The very simplemodel derived from the hydrological characters of these crusts (Casenave and Valentin,1992) has proven to also be efficient to predict water redistribution along cultivatedhillslope in the region (Rockstrom and Valentin, 1997),
As pointed by our many authors (e.g., Noy-Meir. 1973; Schreiber et al.. 1995),understanding mn-off offers a key to biotic processes in arid and semi-arid regions. Asatisfactory relation could be obtained between the simulated water intake in the thicket
C. Va/err/Ill, J.M d'Herhè.\ / Ca/ena 37 (/99Y) 23/-256 251
core and woody biomass despite the numerous coarse simplifications and assumptionson the amount of eut wood, The very high values of simulated WMt (17-81 ton ha - 1 )
were consistent with field data from tiger bush in West Africa (21-88 ton ha-l,Hiernaux and Gérard, submitted). As illustrated in Fig. 7, the mean annual waterinfiltrating into the thicket cores to produce such biomass under Sahelian conditions arevery similar to the mean annuai rainfall required to support woodland and forest in theSudanian zone. Thus this water concentration enables wood production which equalsthat of a forest in much more humid southern zones. This implies that local highproduction is made possible but not that the tiger bush system would be invariably moreeffective that vegetation with no tiger bush patterns under the same climatic conditions.To tackle this issue, we need to compare woody biomass per hectare not of thicket butof plateau (WMp) with unpatterned vegetation in the same region. WMp of the patternedplateau was found three times higher than plateau in Niger and Mali with no tiger bushpatterns (Fig. 8: Ichaou, 1995). However these latter values have not been corrected bythe amount of eut wood (WMc), Even though the mean value of WMc considered forthe tiger bush (5.1 ton ha -1) is systematically added to WMp, the woody biomass ofunpatterned vegetation remains approximately half of that of the tiger bush. The thicketproduction in the banded patterned systems succeeds therefore in overcompensating thebarrenness of the interbands, as much as even exceeding woody biomass of industrialplantations in the same region (Fig. 8). This is corroborated by the WMp valuesavailable for Burkina Faso (Fig. 8). Similarly, banded vegetation systems in Australiahave a net primary production about double that of landscape systems with no patterns(Ludwig et al., 1998).
4.2. The climatic domain of the tiger bush
This regional transect also gives sorne insight on the climatic domain of tiger bush. Inaddition to slope conditions (d'Herbès and Valentin, 1998), this domain appears to belimited in the south by the water-harvesting efficiency of the system (WHE = 1 forRa 15 = 685 mm). In the most arid zone, the decline in rainfall is over-compensated byan increase of the ron-off zone:infiltration zone ratio. However, such a system requiresthe existence of an infiltration zone Iz which tends to disappear below Ra 15 = 155 mm(Eq. (II)). This may explain why similar formations may occur under 200-250 mm inMali, north of the 15°N parallel (Leprun, 1998; Hiernaux and Gérard, submitted) andunder 150-200 mm north of the l7°N parallel in Mauritania (Audry and Rossetti, 1962).The disappearance of tiger bush in Niger, north of the 15°N parallel seems thereforemore related to a change in geomorphic than to rainfall conditions. No lateritic plateauxcovered with shallow gravely soils occur north of this limit. The climatic optimum(Ra 15 = 550 mm) for woody biomass production from banded vegetation patterns iscomparable to the rainfall optimum for run-off production under natural conditions atthe scale of West Africa (Valentin, 1996). Along a regional transect from the Sahara tothe tropical forest, ron-off coefficient was found to decline regularly whilst rainfallincreases. The result of these two opposed trends is a maximum of mean annual run-offamount for an annual rainfall of approximately 600 mm. Such a consistency among the
252 C. Valenfin. J.M d'Herbès / Cafena 37 (1999) 231-256
two optima tend to confirm the strong relation between the tiger bush patterns andrun-off. Because of the frequent shift of the isohyets in the region, the rainfall figures(Rais) should be taken for their relative and not absolute values. In particular, RaIs mayoveremphasize the drought of the 198ü's.
4.3. Maintenance and rehabilitation of the tiger bush system
Lack of understanding of this system has led to poor management in the pastoForesters considered the bare interbands to be a sign of degradation, and reafforestationattempts were initiated. In Niger, the main technology was the construction of half-moonshaped furrows in the interbands. The reafforestation attempts were spectacular failures.Not only did the seedlings in the interbands receive insufficient rainfall to survive, thefurrows and seedlings trapped overland flow necessary for the maintenance of thedownslope vegetation, which consequently began to decay. With further disturbance,such as intensive fuel wood harvesting or ephemeral cropping of sorghum or millet, thespatial pattern of water redistribution was altered, run-off increased, and serious gullyerosion resulted (Hiernaux and Gérard, submitted). Our simulations suggest that the tigerbush is a nearly hydrological1y closed system, acting as a very effective buffer; overlandflow was only very slightly incremented from the first to the fifth wavelength (Table 6).Moreover, the vegetated bands form natural benches which enhance soil conservation(d'Herbès and Valentin, 1998). Therefore breakdown of the banded patterns of woodyvegetation caused a marked degradation of the landscape.
As emphasized by many authors (Thiéry et al., 1995; Orr, 1995; Ludwig et al., 1998),rehabilitation strategies which mimic the natural tiger bush ecosystem are the bestappropriate. Tree planting alone is not expected to be sufficient without restoring surfaceconditions. As suggested by our results, the restoration of the BIO surface type isessential for improving infiltration, and thus the chance of success for vegetationregrowth. BIO is characterized by decomposed litter and intensive bioturbation, i.e., bythe absence of crusts and of crusting hazards. Therefore branch mulching, whichprotects soil surface from erosion and attract termites, has great promise in terms ofacceptance and cost effectiveness as shown in the Nigerien tiger bush by Chase andBoudouresque (1987).
4.4. Climatic variations
As shown in Fig. 5, the synchronie study of a regional transect provides informationon diachronie evolution. Our observations indicated that shifts in rainfall isohyets havebeen associated with a shift in the interband:band ratio. Better correlations were foundfor a rainfall averaging period of 15 yr, suggesting that such a period was necessary forthe vegetation to response to rainfall changes. It is noteworthy that a 10 to 15-yr cycle isused by foresters in the region to enable woody plant regrowth between two successiveharvests (Orr, 1995).
Ambouta (1984) described the process of thinning of bands subjected to drought. Adrought period should accelerate the decay of the downslope edge of the band, while the
C. Va/enfin. J.M. d'Herbèl / Cafe/la 37 (1999) 231-256 253
pioneering process of the upslope edge should be seriously reduced if not stopped. As aresult the IBR increases, still enabling sufficient water to be shed from the bareinterband and trapped into the thicket core. The contrast between band and interband isenhanced resulting in a thinned thicket, and an even thinner thicket core. In years ofreturn to normal, or above average, the bottom edge of the band should receive enoughwater from the overland flow to develop again whilst the pioneer zone should extend.However this process is limited by the water-harvesting efficiency of the system whichtends to decrease with the IBR.
As simulated by Thiéry et al. (I995), these altemating periods should result in a netmigration of the vegetation bands. After caesium-137 measurements (Chappell et al.,1998) this upslope migration rate should be of few 0.1 m per year. These results havebeen obtained near the Sofiabangou site, i.e., in the central part of the regional transect.Because rainfall and associated IBR are subject to more pronounced variations in thenorthem part of the transect, slightly higher rates are speculated in the most arid zone.However, even on scanned and enlarged aerial photographs, such migrations are verydifficult to perceive (Fig. 6).
Despite major rainfall variations, especially in the north, no transformation of patterntype was observed on the aerial photographs. This suggests that the limits between thebanded vegetation pattern (tiger bush) and other patterns in the region (spotted, diffuse,etc., Ambouta, 1984) are mainly topographic in nature (d'Herbès and Valentin, 1998).
5. Conclusion
Based on a detailed survey of surface conditions on ten sites along a regionaltransect, simulation modelling indicated that the tiger bush in Niger functions as anatural water-harvesting system. The major critical factor for the efficiency of thissystem is the ratio between the mn-off zone, which includes a part of the vegetatedband, and the infiltration zone, limited to the thicket core. The soil surface acts as aregulator controlling the partitioning of rainwater between mn-off, mn-on, infiltrationand runout. Due to the very effective buffering effect of the bands for the overland flow,the banded systems on the plateaux, albeit not utterly hydrologically closed, limitsconsiderably the risks of degradation of the adjoining hillslopes and valleys. The tigerbush system has a very effective buffer for overland flow not only at the interband-bandscale but also at the landscape scale. Although this natural water-harvesting system hasproved to be robust and productive, its sustainable management requires sorne care. Inparticular it is essential to maintain high mn-off production in the mn-off zone(afforestation of the bare interbands are meaningless) and high infiltration rate in theinfiltration zone (no-cultivation, no complete clearing, but perhaps sorne selectivewood-cutting).
The observation of sequential aerial photographs from 1950 to 1992 highlighted thegreat plasticity of the tiger bush system which adjusted its geometry (IBR) to thefluctuating mean annual rainfall averaged over the last 15 yr. In the face of droughtconditions, IBR was dramatically increased, enlarging therefore the catchment area to
254 C. Vaientlll, J.M. d'Herbès / Catena 37 (J999) 231-256
shed mn-off to maintain the remaining vegetation. Upon the return of more favourableconditions, the initial geometry recovered. Such variations in time were validated inspace along the regional transect. The possible adjustment of geometry to rainfallconditions confer a great robustness to the system even under arid conditions.
The concentration of mn-on into thicket cores favours high local woody biomassproduction (20-80 tons ha-) ) similar to that of woodland and forest in the wet savannahzone, reflecting the infiltration depth in the thicket (as high as 1450 mm in thenorthemmost site). Even converted into value per hectare of plateau, namely accountingfor the mn-off zone, the woody biomass production was found to exceed that of forestryindustrial plantations under the same climatic conditions.
References
Ambouta, KJ.M., 1984. Contribution à l'édaphologie de la brous,e tigrée de l'Ouest mgérien. Doctor-Engineer the'ls. Umversity of Nancy, 116 pp
Audry, P., Rossetti. C, 1962. Observations sur les sols et la végétatIon en Mauritame du Sud-Est et sur labordure adjacente du Mali (1959 et 1961). ProspectIon écologique. Etudes en Afrique Occidentale. Projetdu fonds spéc131 des Nations-Unies relatif au criquet pélerin. F.A.O. Rome, 267 pp
Barker, T., 1992. VegetatIOn pattern in the Nlgenen tiger bu,h. Department of Geography, CoventryPolytehnic, B.S. dl!oSertation, 92 pp.
Belsky, AJ., 1989. Landscape patterns in a semi-and ecosystem in East Afnca. J. And Envlfon. 17, 265-270.Bromley, J., Brouwer. 1., Barker, A P., Gaze, S.R., Valentin, C, 1997. The role of surface water redistnbutlOn
in an area of patterned vegetation In Southwest NIger. J. Hydro!. 198, 1-29.Casenave, A.. ValentIn, C.. 1992. A run-off capability c!a"Ifïcation system ba,ed on surface features cnteria
in semi-and areas of West Africa. J. Hydro!. 130,231-249.Chappell, A., Valentin, c., Warre. A.. Charlton, M.. d'Herbès, 1.M.. 1998 Testing the validity of up,lope
migration In banded vegetation from southwest NIger. Catena, thi, I"ue.Chase, R., Boudouresque. E.. 1987. Methods to stImulated plant regrowth on bare Sahehan forest soib in the
region of Niamey, Niger. Agric. Ecosyst. EnvIron. 18, 211-221.C!o,-Arceduc, M., 1956. Etude sur photographies aérienne, d'une formation végétale sahélienne: la brousse
tigrée. BulletIn de l'IFAN. série A 7, 677-684.Cornet, A.F.. Delhoume, J.P., Montana, C, 1988. Dynarnics of ,triped vegetation patterns and water balance
in the Chlhuahuan desert. In: Dunng, HJ., Wergner, MJ.A.. Willems, J.H. (Eds.), Dlver,ity and Pattern inLand Communitie,. SPB Academic, The Hague, Netherland,. pp. 221-231.
d'Herbès, J.-M .. ValentIn, C.. 1997 Land surface conditions of the Niamey region: ecological and hydrological implicatIOns. J. Hydro!. 188-189, 18-42.
d'Herbès, J.-M.. Valentin, C, 1998. Siope gradIent control of banded woodland patterns In Niger. Catena, thlsIssue.
Delhoume, J.P.. 1996 FonctIonnement hydro-pédologique d'une toposéquence de ,ols en milieu ande(Réserve de la Biosphère de Mapimi, Nord-MeXIque). PhD. Umversity of POItIers, 295 pp.
Dunkerley, D.L.. Brown, KJ.. 1995. Run-off and run-on area, In a patterned chenopod shrubland, arid westernNew South Wales, Austraha: characteristics and origIn. J. Arid EnvIron. 30,41-55.
Dunkerley. D.L., Brown, KJ.. 1998. Banded vegetation near Broken Hill, Australia: Significance of surfaceroughness and soil physical propertles. Catena. thl' i!oSue.
Eddy. 1.. Humphreys, G S., Hart. D.M.. Mllchell, P.B., Fanmng, P.C.. 1998 VegetatIOn arcs and litter dams:simllantIes and differences. Catena, thls iS!oue.
Galle, S.. Ehnnann, M., Peugeot. c., 1998. Water balance on a banded vegetation pattern. The ca,e of the tigerbush in western Niger. Catena, this i5'ue.
Gavaud, M.. Boulet. R" 1967 Carte pédologique de reconnaissance de la RépublIque du NIger. FeUille deNiamey à 1/500000, ORSTOM, Dakar. Vo!. 3, 1120 pp
C. ValenTin. J M. d'Herbès / CaTena 37 (1999) 231-256 255
Greene, RS.B., 1992. SOli physical properties of three geomorphic zones in a seml-arid mulga woodland.Aust. J. Soil Res. 30, 55-69.
Guinaudeau. F . 1984. Estimation des volumes et de la productivilé des formations forestières sèches. Revuedes méthodes et des résultats. E.N.I.T.E.F.. Nogent sur Vernbson, 83 pp
Hemming, C.F., 1965. Vegetallon arcs in Somahland. J. Ecol. 53,157-167.Hiernaux. P, Gérard. B.. submitted. Does patchiness mcrease vegetallon productivity. diversity and stability'l
The case of .brousse llgrée' in the Sahel. Acta Oecologica.Ichaou. B., 1995. Etude de la produclivité des formations forestières de brousse llgrée et de brousse diffuse:
conséquences pour la gestion et la régénération de ces formations. LP.R de Katibougou, Mali, 161 pp.International Society of Soil Science (ISSS), International Soil Reference and Information Centre (ISRIC),
Food and Agnculture OrganizatlOn of the United Nations (FAO), 1994. World Reference Base for SoilResources. Wageningen/Rome, 161 pp.
Lebel. T., Sauvageot. R, Hoepffner, M., Desbois, M., Guillot, B., Hubert, P.. 1992. Rainfall estimation in theSahel: The EPSAT-Niger experiment. Hydrol. Sci. J. 37 (3).201-215.
Lebel, T., Taupin. J.-D., d'Amato. N.. 1997. Rainfall monitoring dunng Hapex-Sahel: L General rainfallconditions and c1imatology. J. Hydrol. 188-189 (74), 96.
Legger, D., van der Aa, M., 1994. Soils of the 'West central sile' Niger, Hapex-Sahel 1992. Department ofSoil Science and Geology, Wageningen Agricultural University, 31 pp.
Leprun, J.c., 1998. The influences of ecologlcal factors on the tiger bush along a gradient from Mali tonorthern Burkina Faso. Catena, this issue.
Ludwig, J.A., Tongway, DJ., Marsden, S.G., 1998. Stripes, strands or stipples: Modelling the int1uences ofthree landscape banding patterns on resource capture and productivity in semi-arid woodlands, Australia.Catena, this issue.
Mabbut, J.A., Fanning, P.C.. 1987. Vegetalion banding in and Western Australia. J. And Environ. 12,41-59.MacFayden, W.A., 1950. Vegetalion patterns in the semi-desert plains of British Somaliland. Geog. J. 115,
199-211.Noy-Melr, I., 1973. Desert ecosystems: environment and producers. Annu. Rev. Eco!. Systematics 4, 25-51.Orr, B., 1995. Natural forest management in Sahelian ecosystem of southern Niger. J. Arid Environ. 30.
129-142.Peugeot, c., 1995. Influence de l'encroûtement superficiel du sol sur le fonctionnement hydrologique d'un
versant sahélien (Niger). ExpérimentatIOns in situ et modélisation. PhD, University of Grenoble, 356 pp.ProJect Energie II, 1991. Schéma directeur d'approvisionnement en bois-énergie de Niamey. Répubhque du
Niger/Seed/CTFT, Niamey, 128 pp.Rockstrom, M., Valentin, c., 1997. HIllslope dynamics of on-farm generation of surface water flows: the case
of rainfed cultivation of pearl millet on sandy soil in the Sahel Agnc. Water Manage. 33, 183-210.Schreiber, K.F., Yair, A., Schachak, M., 1995. Ecological gradients along slopes of the northern Negev
highlands, Israel. Adv. GeoEcol. 28, 209-229.Seghleri, J., Galle. S , Rajot, J .L., Ehrmann, M.. m press. RelatlOnshlps between the soil mOisture regime and
the growth of the herbaceous plants in a natural vegetation mosaic in Niger. J. And Environ.Sivakumar, M.V.K.. Maidoukia, A., Stem, R.D., 1993. Agroclimatology of West Africa: Niger. ICRISAT,
Patancheru, Andra Pradesh, Indla, Informallon Bulletin no. 5, 2nd edn.. 48 pp. +append.Slatyer, RO.. 1961 Methodology of a water balance study conducted on a desert woodland (AcaCia alleura F.
Muell) community in central Australia. Plant-water relationships in arid and semi-arid condllions.UNESCO Arid Zone Research, 16. Proceeding of Madrid Symposium, pp. 15-26.
Thléry. J., d'Herbès, J.-M., Valentin, c., 1995. A model for simulatmg the genesis of banded patterns in Niger.J. Ecol. 83,497-507.
Tongway, DJ., LudWig, J A., 1990. Vegetation and soil patterning in semi-arid mulga lands of EasternAustraha. Aust J. Ecol. 15, 23-34.
Valentin, c., 1996. Soil erosion under global change. In. Walker, B.H., Steffen, W.L. (Eds.), Global Changeand Terrestrial Ecosystems, Cambridge Univ. Press, IGBP Book Series, no. 2
Valentin. c., Bresson, L.-M., 1992. Morphology, genesis and classificatIOn of SOli crusts in loamy and sandysoils Geoderma 55. 225-245.
Valentin, c.. Casenave, A, 1992. Infiltrallon into sealed soils as influenced by grave! coyer. Soil Sci. Soc.Am. J. 56, 1167-1673.

256 C. Va!el/llIl, j,M. d'Herbès / Calel/a 37 (1999) 231-256
Van der Meulen, F., Morris, J.W., 1979, Striped vegetation patterns in a transvaal savanna (South Africa),Geo-Eco-Trop 3, 253-266,
Vandervaere, J,-P, Peugeot, C, Angulo Jaramillo, R., Vaudin, M, Lebel, T" 1997, Esumating hydraulicconductivity of crusted soils by usmg disc mtiltrometers and micro-tenslometers. J Hydro!. 188-11\9,203-223.
Vezey-FitzGerald, D.F." 1957. The vegetatIOn of the Red Sea coast north of Jedda, Saudi Arabia, J, Eco!. 45,547-562,
White, L.P, 1969, Vegetation arcs 10 Jordan. J. Eco!. 57, 461-464,White, L.P" 1970. Brousse tigrée patterns in southern Niger. J. Eco!. 58, 549-553,White, L.P., 1971. VegetatIon stnpes on sheet wash surfaces. J. Ecol 59,612-615.Wilding, L.P., Daniels, R" 1989 SOiI-geomorphlc relationships 10 the vicmity of Niamey, Niger. Tropsoils
Bull" pp. 89-1O\.
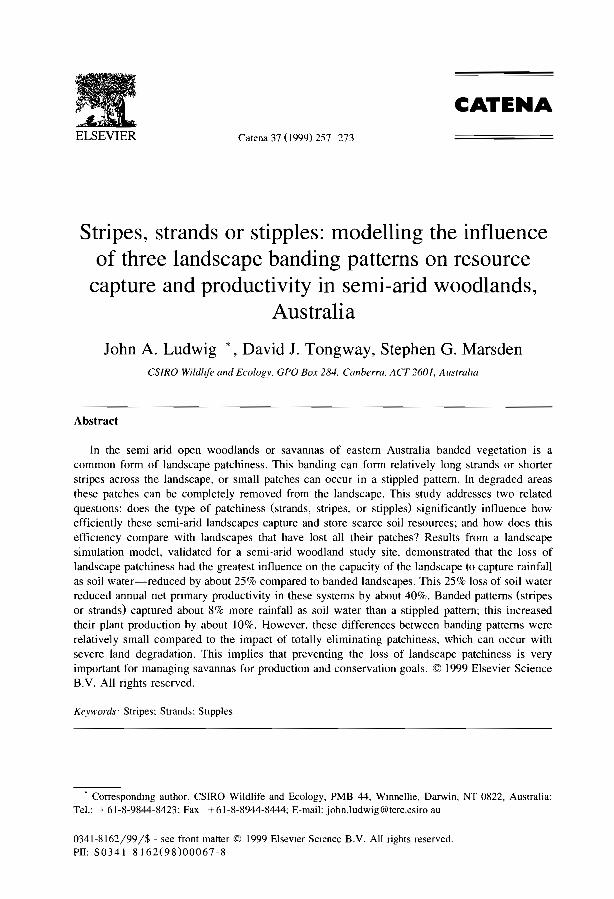
ELSEVIER Catena 37 (1999) 257-273
CATENA
Stripes, strands or stipples: modelling the influenceof three landscape banding patterns on resource
capture and productivity in sen1i-arid woodlands,Australia
John A. Ludwig *, David 1. Tongway, Stephen G. MarsdenCS/RO Wl/d/ife and Ec%gy, GPO Box 284. Canberra, ACT 260/, Austra/w
Abstract
ln the semi-arid open woodlands or savannas of eastern Australia banded vegetation is acommon form of landscape patchiness, This banding can form relatively long strands or shorterstripes across the landscape, or sma11 patches can occur in a stippled pattern, In degraded areasthese patches can be completely removed from the landscape. This study addresses two relatedquestIOns: does the type of patchiness (strands, stripes, or stipples) significantly influence howefficiently these semi-arid landscapes capture and store scarce soil resources; and how does thiseffiCiency compare with landscapes that have lost a11 their patches? Results from a landscapesimulation modeL validated for a semi-arid woodland study site, demonstrated that the loss oflandscape patchiness had the greatest influence on the capacity of the landscape to capture rainfa11as soil water-reduced by about 25% compared to banded landscapes. This 25% loss of soil waterreduced annual net pnmary productivity in these systems by about 40%. Banded patterns (stripesor strands) captured about 8% more rainfa11 as soil water than a stippled pattern; this increasedtheir plant production by about 10%, However, these differences between banding patterns wererelatively sma11 compared to the impact of totally eliminating patchiness, which can occur withsevere land degradation. This implies that preveming the loss of landscape patchiness is veryimportant for managing savannas for production and conservation goals. © 1999 Elsevier ScienceB.V, A11 rights reserved.
Keyword.\" Stripes; Strands; Sllpples
• Correspondmg author. CSIRO Wildlife and Ecology. PMB 44, Wmnellie, Darwin, NT 0822, Australia;Tel.: +61-8-9844-8423: Fax +61-8-8944-8444; E-mail: [email protected] au
0341-8162/99/$ - see front matter © 1999 Elsevier SCience B.V. Ail rights reserved.PlI: S0341-8162(98)00067-8
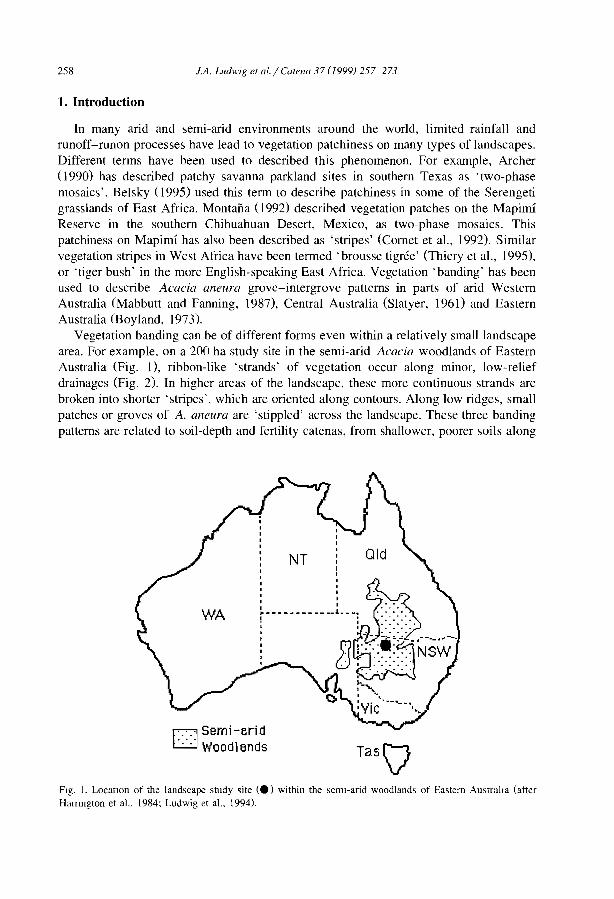
258
1. Introduction
J.A. Ludwig et al. / Catena 37 (1999) 257-273
In many arid and semi-arid environments around the world, limited rainfall andrunoff-runon processes have lead to vegetation patchiness on many types of landscapes.Different terms have been used to described this phenomenon. For example, Archer(1990) has described patchy savanna parkland sites in southern Texas as 'two-phasemosaics'. Belsky (J 995) used this term to describe patchiness in sorne of the Serengetigrasslands of East Africa. Montana (1992) described vegetation patches on the MapimiReserve in the southern Chihuahuan Desert, Mexico, as two-phase mosaics. Thispatchiness on Mapimi has also been described as 'stripes' (Cornet et al., 1992). Similarvegetation stripes in West Africa have been termed 'brousse tigrée' (Thiery et al., 1995),or 'tiger bush' in the more English-speaking East Africa. Vegetation 'banding' has beenused to describe Acacia aneura grove-intergrove patterns in parts of arid WesternAustralia (Mabbutt and Fanning, 1987), Central Australia (Slatyer, 196I) and EasternAustralia (Boyland, 1973).
Vegetation banding can be of different forms even within a relatively small landscapearea. For example, on a 200 ha study site in the semi-arid Acacia woodlands of EasternAustralia (Fig. 1), ribbon-like 'strands' of vegetation occur along minor, low-reliefdrainages (Fig. 2). In higher areas of the landscape, these more continuous strands arebroken into shorter 'stripes', which are oriented along contours. Along low ridges, smallpatches or groves of A. aneura are 'stippled' across the landscape. These three bandingpatterns are related to soil-depth and fertility catenas, from shallower, poorer soils along
D.':-: Semi -eri d.. Woodlends TasQ
FIg. 1. Location of the landscape study site (e) within the seml-arid woodlands of Eastern AustralIa (alterHamngton et al., 1984; Ludwig et al.. 1994).
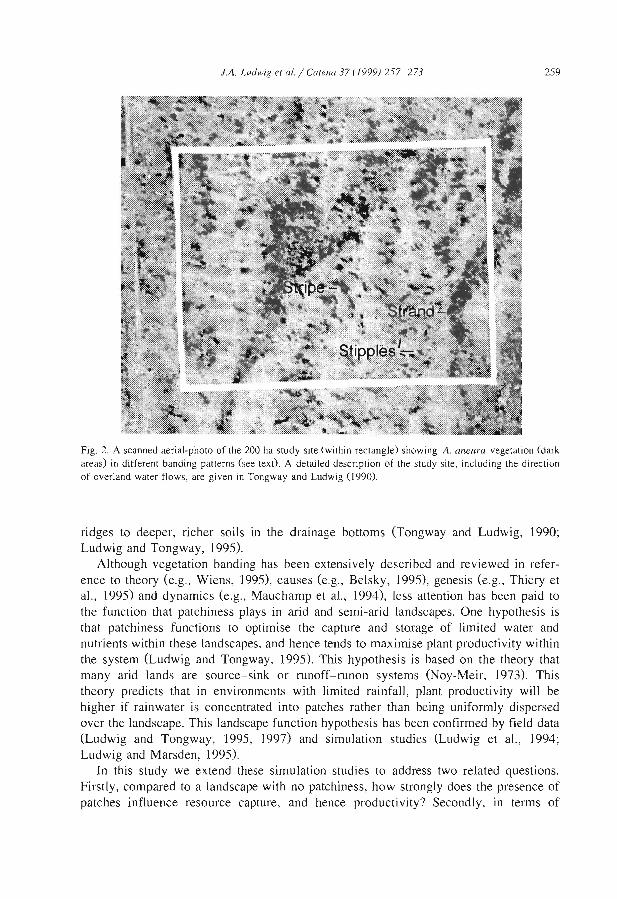
J.A. Ludwig el al. / Calella 37 (1999) 257-273 259
Fig. 2. A scanned aerial-photo of the 200 ha study site (wilhin recl1lngle) showing A. aneura vegetation (darkareas) in different banding patterns (see text). A detailed description of the study site, including the directionof overland water fJows, are given in Tongway and Ludwig ([990).
ridges to deeper, ri cher soiis in the drainage bottoms (Tongway and Ludwig, 1990;Ludwig and Tongway, 1995).
Although vegetation banding has been extensive1y described and reviewed in reference to theory (e.g., Wiens, 1995), causes (e.g., Belsky, 1995), genesis (e.g., Thiery etal., 1995) and dynamics (e.g., Mauchamp et al., 1994), less attention has been paid tothe function that patchiness plays in arid and semi-arid landscapes. One hypothesis isthat patchiness functions to optimise the capture and storage of limited water andnutrients within these landscapes, and hence tends to maximise plant productivity withinthe system (Ludwig and Tongway, 1995). This hypothesis is based on the theory thatmany arid lands are source-sink or runoff-runon systems (Noy-Meir, 1973). Thistheory predicts that in environments with limited rainfall, plant productivity will behigher if rainwater is concentrated into patches rather than being uniformly dispersedover the landscape. This landscape function hypothesis has been confirmed by field data(Ludwig and Tongway, 1995, 1997) and simulation studies (Ludwig et al., 1994;Ludwig and Marsden, 1995).
In this study we extend these simulation studies to address two related questions.Firstly, compared to a landscape with no patchiness, how strongly does the presence ofpatches influence resource capture, and hence productivity? Secondly, in terms of
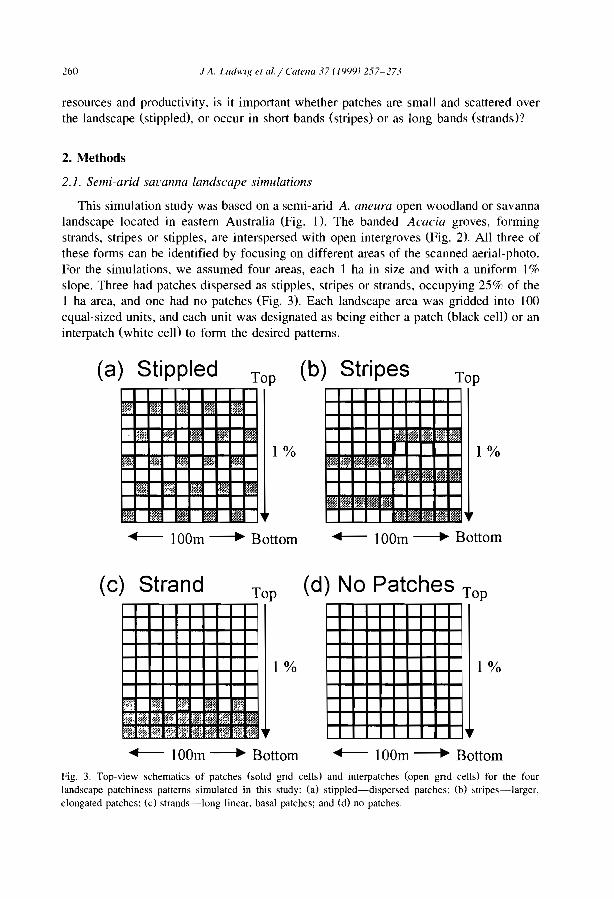
260 j A. LIIl/H'lg et a/./ Catella 37 (/<)99) 257-273
resources and productivity. is it important whether patches are small and scattered overthe landscape (stippled), or occur in short bands (stripes) or as long bands (strands)?
2. Methods
2.1. Semi-arid sm'al/na landscape simulations
This simulation study was based on a semi-arid A. aneura open woodland or savannalandscape located in eastem Australia (Fig. 1). The banded Acacia graves, formingstrands, stripes or stipples, are interspersed with open intergroves (Fig. 2). Ail three ofthese forms can be identified by focusing on different areas of the scanned aerial-photo.For the simulations. we assumed four areas, each 1 ha in size and with a uniform 1%slope. Three had patches dispersed as stipples, stripes or strands, occupying 25% of the1 ha area, and one had no patches (Fig. 3). Each landscape area was gridded into 100equal-sized units, and each unit was designated as being either a patch (black cell) or aninterpatch (white cell) to form the desired patterns.
Top(a) Stippled
mm' mm jlll! 1!iWi ;]11·
fiill1 l~ 100f !lm !iiffi
'llli filfu IllllII- 100;, !@l'.
1iliil ;~ lililil fili3 •1 1 WJ,~ liffii Il I!WI,
1%
(b) Stripes
1%
+-- 100m --. Bottom +-- 100m --. Bottom
(d) No Patches Top(c) Strand
1%
';;',' r.ljl ;JjWfil!!, W',;,,: '~JI' mi, il"'. 'l"" illli 4i1i [il;;! iil;' ll!iill#w, ·t~, liil '3" Ihi? @i· '!lll' ~im iljjll HM 1,
1%
+-- 100m --. Bottom +-- 100m -----. BottomFig. 3. Top-view schematics of patches (sohd gnd cells) and interpatches (open gnd cells) for the fourlandscape patchiness patterns simulated in this study: (a) stippled-disper5ed patches; (b) 5tripes-larger.elongated patches; (cl strands-long linear. basal patches; and (d) no patches.
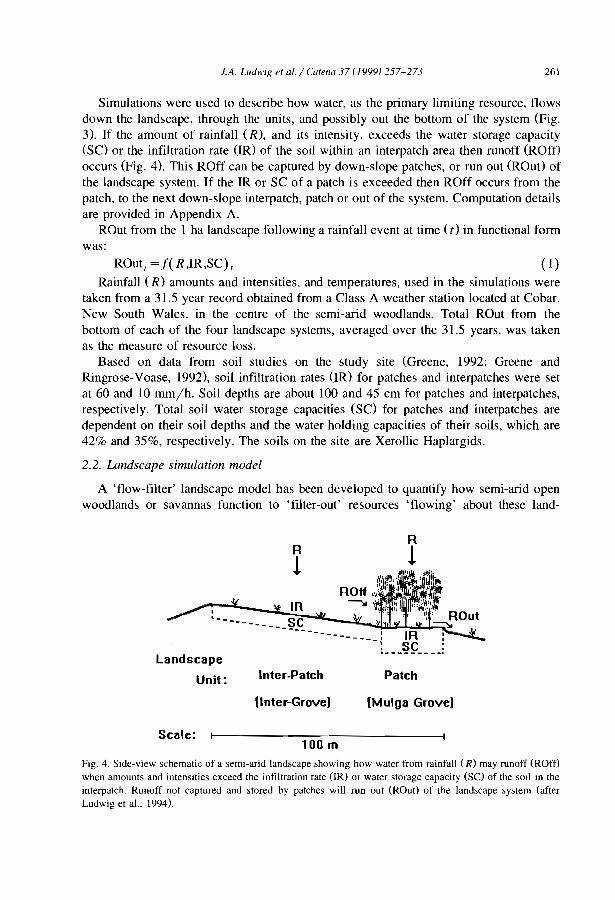
lA LlIdl1'IR et al. / Cl1tena 37 (1999) 257-273 261
Simulations were used to describe how water, as the primary limiting resource, flowsdown the landscape, through the units, and possibly out the bottom of the system (Fig.3). If the amount of rainfall (R), and its intensity, exceeds the water storage capacity(SC) or the infiltration rate (IR) of the soil within an interpatch area then runoff (ROU)occurs (Fig. 4). This ROff can be captured by down-slope patches, or run out (Raut) ofthe landscape system. If the IR or SC of a patch is exceeded then ROff occurs from thepatch, to the next down-slope interpatch, patch or out of the system. Computation detailsare provided in Appendix A.
Raut from the 1 ha landscape following a rainfall event at time (r) in functional formwas:
ROut l = J( R ,IR ,SC) 1 (l)Rainfall (R) amounts and intensities, and temperatures, used in the simulations were
taken from a 31.5 year record obtained from a Class A weather station located at Cobar,New South Wales, in the centre of the semi-arid woodlands. Total Raut from thebottom of each of the four landscape systems, averaged over the 31.5 years, was takenas the measure of resource loss.
Based on data from soil studies on the study site (Greene, 1992: Greene andRingrose-Voase, 1992), soil infiltration rates (IR) for patches and interpatches were setat 60 and JO mm/ho Soil depths are about 100 and 45 cm for patches and interpatches,respectively. Total soil water storage capacities (SC) for patches and interpatches aredependent on their soil depths and the water holding capacities of their soils, which are42% and 35%, respectively. The soils on the site are Xerollic Haplargids.
2.2. Landscape simulation mode!
A 'flow-filter' landscape model has been developed to quantify how semi-arid openwoodlands or savannas function tD 'filter-out' resources 'flowing' about these land-
Landscape
Unit:
Scale:
R
!IR
---- ~C
Inter-Patch
[Inter-Grave)
100 m
R
!
Patch
[Mulga Grave)
Fig. 4. Slde-view schematic of a seml-arid landscape showing how water from rainfal! (R) may runoff (ROff)when amounts and intenslties exceed the infiltration rate (IR) or water storage capacity (SC) of the sOli In theinterpatch. Runoff not captured and stored by patches will run out (Raut) of the landscape sy,tem (afterLudwig et al., 1994).
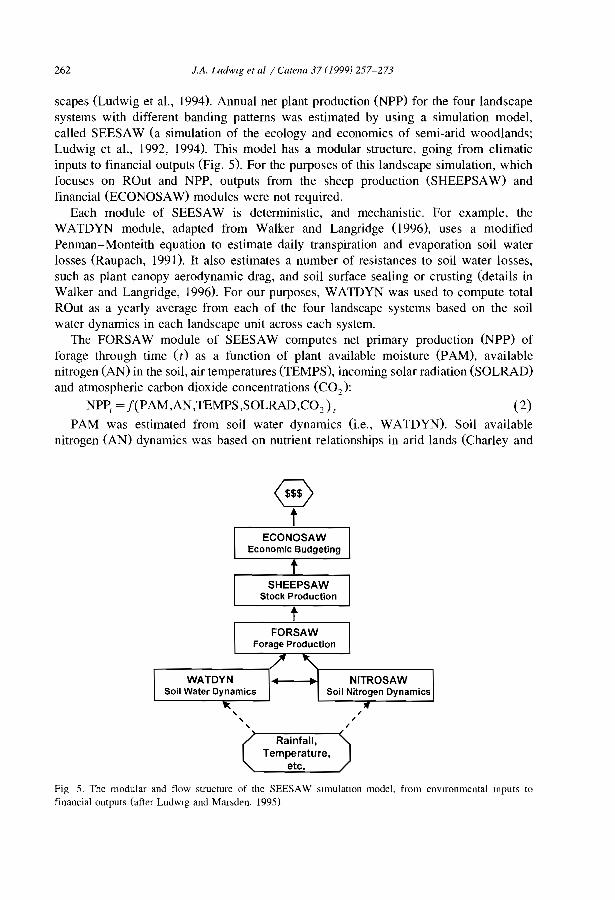
262 J.A. LudwIg et al / Catena 37 (1999) 257-273
scapes (Ludwig et al., 1994). Annual net plant production (NPP) for the four landscapesystems with different banding patterns was estimated by using a simulation model,called SEESAW (a simulation of the ecology and economics of semi-arid woodlands;Ludwig et al., 1992, 1994). This model has a modular structure, going from climaticinputs to financial outputs (Fig. 5). For the purposes of this landscape simulation, whichfocuses on ROut and NPP, outputs from the sheep production (SHEEPSAW) andfinancial (ECONOSAW) modules were not required.
Each module of SEESAW is deterministic, and mechanistic. For example, theWATDYN module, adapted from Walker and Langridge (1996), uses a modifiedPenman-Monteith equation to estimate daily transpiration and evaporation soil waterlosses (Raupach, 1991). It also estimates a number of resistances to soil water losses,such as plant canopy aerodynamic drag, and soil surface sealing or crusting (details inWalker and Langridge, 1996). For our purposes, WATDYN was used to compute totalROut as a yearly average from each of the four landscape systems based on the soilwater dynamics in each landscape unit across each system.
The FORSAW module of SEESAW computes net primary production (NPP) offorage through time (r) as a function of plant available moisture (pAM), availablenitrogen (AN) in the soil, air temperatures (TEMPS), incoming solar radiation (SOLRAD)and atmospheric carbon dioxide concentrations (C02):
NPPt = f(PAM,AN,TEMPS,SOLRAD,C0 2 ) t (2)
PAM was estimated from soil water dynamics (i.e., WATDYN). Soil availablenitrogen (AN) dynamics was based on nutrient re1ationships in arid lands (Charley and
@t
,,,Rainfall,
Temperature,etc.
//
/
Fig 5. The modular and flow structure of the SEESAW simulatlon mode!. from envlronmenlal Inputs totïnancial outputs (after LudwIg and Man,den, 1995).
J.A. LudWI[? et a/./ Catena 37 (jY99) 257-273 263
Cowling, 1968), where pools of mineralizable nitrogen tend to build-up during droughts,then produce 'flushes' of available nitrogen with drought-breaking rains.
Forage production by seven plant gui Ids (ephemeral forbs, perennial forbs, ephemeralgrasses, palatable C3 perennial grasses, palatable C4 perennial grasses, fibrous C4perennial grasses and palatable shrubs) was simulated. Given initial biomass of leaves,stems and roots for each guild, the daily rate of fixation of new photosynthetic biomasswas calculated using a scheme in wide usage by plant growth modellers (e.g., Hanson etal., 1988). First a maximum photosynthetic fixation rate per day (dependent on thegenetic potential of the plants in each guild) is computed based on available radiantenergy (SOLRAD). Then this maximum rate is adjusted by rate enhancing or limitingfactors (pAM, AN, TEMPS and CO2 ), resulting in a daily rate. The impact of thesefactors differs between the guilds.
The concentration of CO2 has been increasing at a rate of about 1.5 ppmv (0.4%) peryear (Pearrnan, 1988). Increased cal is known to enhance the yield of C3 crops due toincreased net photosynthesis, but not in C4 crops (Gifford, 1988). This productionenhancement due to increasing cal appears to be linear up to about 700 ppmv. InFORSAW, maximum photosynthetic rates for each guild were adjusted by increasingCO2 concentration changes over the 31.5 year simulated, the C3 plant guilds beingenhanced while C4s were unaffected.
For each plant guiId, maximum photosynthetic rate occurs at a temperature optimum,with 'bell-shaped' functions limiting this rate at temperatures lower or higher than thisoptimum. The minimum and maximum temperatures at which net photosynthesisbecomes negative (i.e., daily respiration losses exceed photosynthetic gains) also differsamong plant guilds kg., C4s have higher optimums, minimums and maximums thanC3s).
Plant available moisture (PAM) is that factor that most strongly limits the maximumphotosynthetic rate. For example, under the warm and windy conditions of spring andsummer, soil water in soil surface layers can quickly becorne limiting, particularly tothose plant guilds with shallow roots systems (e.g., ephemeral forbs and grasses). Assoils dry, PAM can quickly drop below a threshold, below which soil water is limiting.The function relating the limitation of maximum photosynthetic rate to PAM, expressedas volumetric soil water contents (e.g., cm3 H l O/cm3 soil) can be taken as sigmoidal,with asymptotes at zero when contents are low and at one when contents are high. Asimilar function can be used for the rate limitation due to available nitrogen (AN) in thesoil, as derived from the NITROSAW module, but the threshold below which the ratedrops off is generally quite low. In other words, the plant guilds in these semi-aridwoodlands are weIl adapted to growing under conditions of low soil nutrients (Charleyand Cowling, 1968).
In simulating the production of new plant biomass, or its decline, the FORSAWmodule of SEESAW estimates a number of other growth processes. The translocationand assimilation of new photosynthate to new leaf, stem and root biomass depends onthe 'internal' demands for maintaining a 'balance' between these plant organs (i.e., ashoot to root ratio). It assumes that these ratios remain relatively constant within a plantguild, but differ between guilds, depending on the life form of the guild (i.e., forb, grass,shrub, tree). For example, if the shoot to root ratio increases (i.e., above the constant),
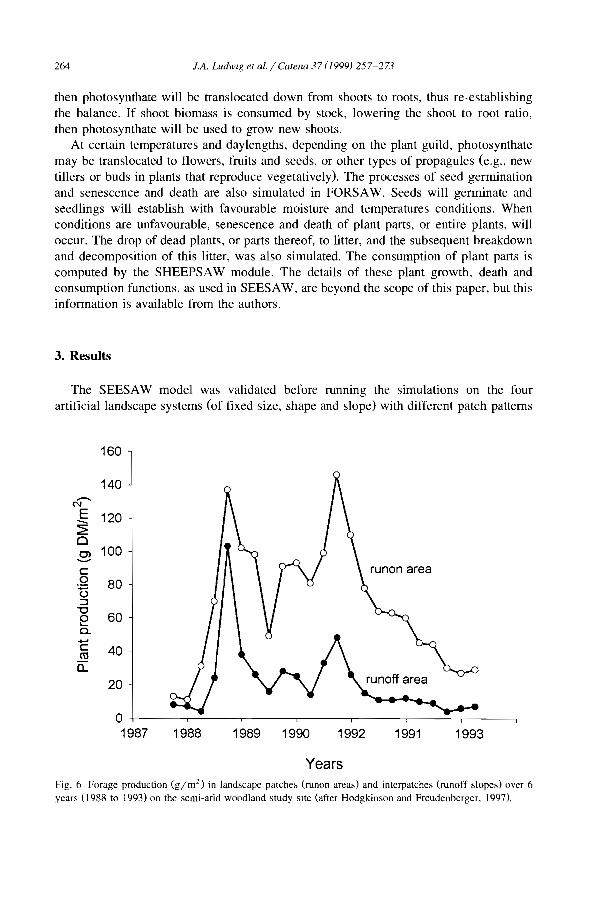
264 J.A. Ludwig et al. / Catena 37 (1999) 257-273
then photosynthate will be translocated down from shoots to roots, thus re-establishingthe balance. If shoot biomass is consumed by stock, lowering the shoot to root ratio,then photosynthate will be used to grow new shoots.
At certain temperatures and daylengths, depending on the plant guild, photosynthatemay be translocated to flowers, fruits and seeds, or other types of propagules (e.g., newtillers or buds in plants that reproduce vegetatively). The processes of seed germinationand senescence and death are also simulated in FüRSAW. Seeds will germinate andseedlings will establish with favourable moisture and temperatures conditions. Whenconditions are unfavourable, senescence and death of plant parts, or entire plants, willoccur. The drop of dead plants, or parts thereof, to litter, and the subsequent breakdownand decomposition of this liUer, was also simulated. The consumption of plant parts iscomputed by the SHEEPSAW module. The details of these plant growth, death andconsumption functions, as used in SEESAW, are beyond the scope of this paper, but thisinformation is available from the authors.
3. Resolts
The SEESAW model was validated before running the simulations on the fourartificiallandscape systems (of fixed size, shape and slope) with different patch paUerns
160
140.........
C\I
E 120--~Cl0> 100........c0 80:p<.>:::J"0
60ea.-c 40ma..
20
01987 1988 1989 1990 1992
runon area
1991 1993
YearsFig. 6 Forage production (g/m2
) in landscape patche, (runon areas) and interpatches (runoff slopes) over 6years (J 988 ta 1993) on the semi-arid woodland study sIte (after Hodgkinson and Freudenberger, 1997).
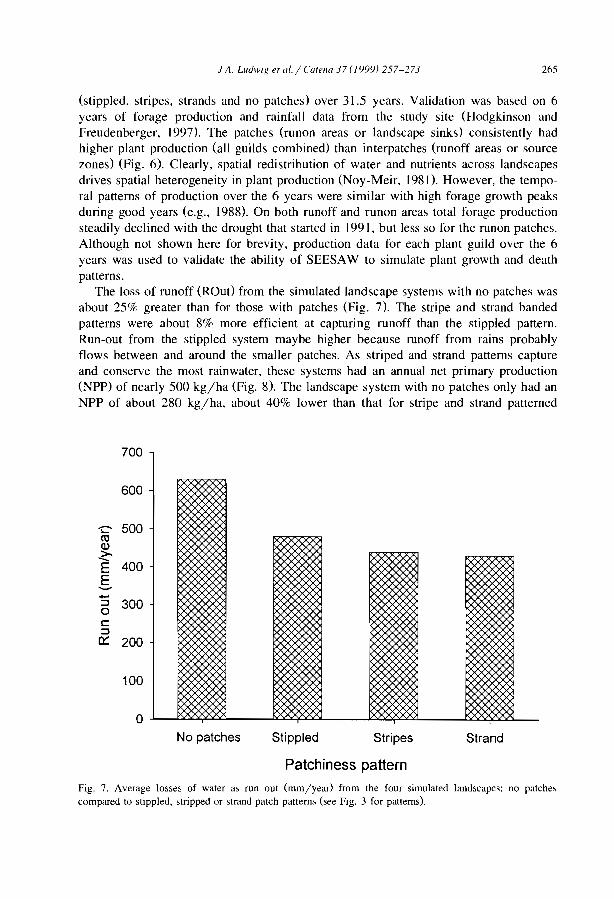
J A. LudwIg et al. j Catella 37/1999) 257-273 265
(stippled, stripes. strands and no patches) over 31.5 years. Validation was based on 6years of forage production and rainfall data from the study site (Hodgkinson andFreudenberger, 1997). The patches (runon areas or landscape sinks) consistently hadhigher plant production (ail gui Ids combined) than interpatches (runoff areas or sourcezones) (Fig. 6). Clearly, spatial redistribution of water and nutrients across landscapesdrives spatial heterogeneity in plant production (Noy-Meir, 198 O. However, the temporal patterns of production over the 6 years were similar with high forage growth peaksduring good years (e.g., 1988). On both runoff and runon areas total forage productionsteadily declined with the drought that started in 1991, but less so for the runon patches.Although not shown here for brevity, production data for each plant guild over the 6years was used to validate the ability of SEESAW to simulate plant growth and deathpatterns.
The loss of runoff (ROut) from the simulated landscape systems with no patches wasabout 25% greater than for those with patches (Fig. 7). The stripe and strand bandedpatterns were about 8% more efficient at capturing runoff than the stippled pattern.Run-out from the stippled system maybe higher because runoff from rains probablyflows between and around the smaller patches. As striped and strand patterns captureand conserve the most rainwater, these systems had an annual net primary production(NPP) of nearly 500 kg/ha (Fig. 8). The landscape system with no patches only had anNPP of about 280 kg/ha, about 40% lower than that for stripe and strand patterned
700
600
c 500COID~E 400E-.....:::J 3000c::::J0:: 200
100
0
><
No patches Stippled Stripes Strand
Patchiness patternFig. 7. Average lasses of water as run out (mmjyearl from the four simulated landscapes: no patchescompared ta stlppled, stripped or strand patch patterns (see FIg. 3 for patterns).
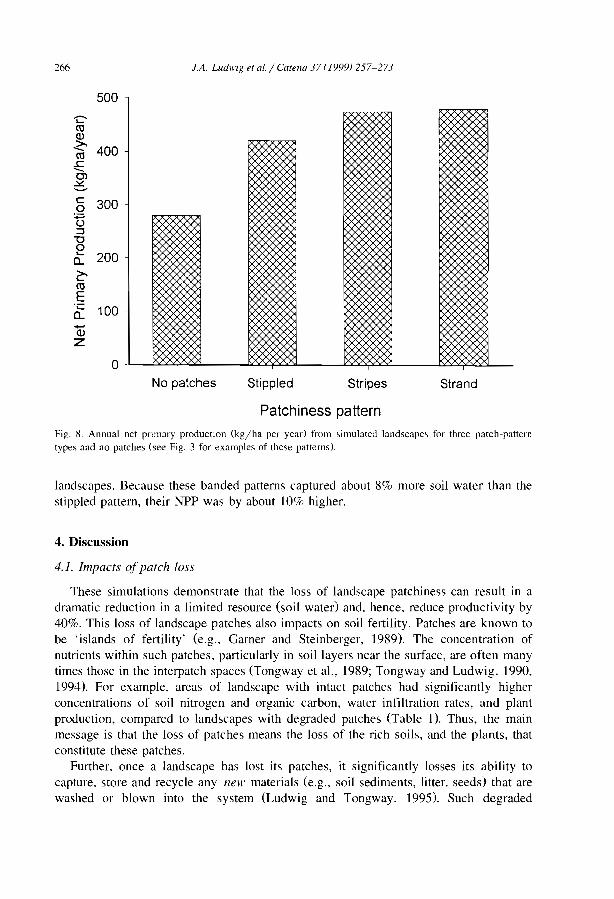
266
500.-~
coQ.)
~ 400co..c.......0>~--c 3000+JU:::l"'00~ 200a.~coEï:: 100a.-Q.)
Z
0
J.A. LudwIg et al. / Catella 37 (1999) 257-273
V<..
..J<...
X
>(
X :><
No patches Stippled Stripes Strand
Patchiness patternFig. 8. Annual net pnmary producllon (kg/ha per year) l'rom simulated landscapes for three patch-patterntypes and no patches (see Fig. 3 for examples of these patterns).
Jandscapes. Because these banded patterns captured about 8% more soil water than thestippled pattern, their NPP was by about 10% higher.
4. Discussion
4.1. Impacts of patch loss
These simulations demonstrate that the Joss of landscape patchiness can result in adramatic reduction in a limited resource (soil water) and, hence. reduce productivity by40%. This loss of landscape patches also impacts on soil fertility. Patches are known tobe 'islands of fertility' (e.g .. Garner and Steinberger, 1989). The concentration ofnutrients within such patches. particularly in soillayers near the surface, are often manytimes those in the interpatch spaces (Tongway et al., 1989; Tongway and Ludwig. 1990,1994). For example. areas of landscape with intact patches had significantly higherconcentrations of soil nitrogen and organic carbon, water infiltration rates, and plantproduction. compared to landscapes with degraded patches (Table 1). Thus, the mainmessage is that the loss of patches means the loss of the rich soils, and the plants, thatconstitute these patches.
Further. once a landscape has lost its patches, it significantly losses its ability tocapture. store and recycle any new materials kg., soil sediments, litter. seeds) that arewashed or blown into the system (Ludwig and Tongway. 1995). Such degraded
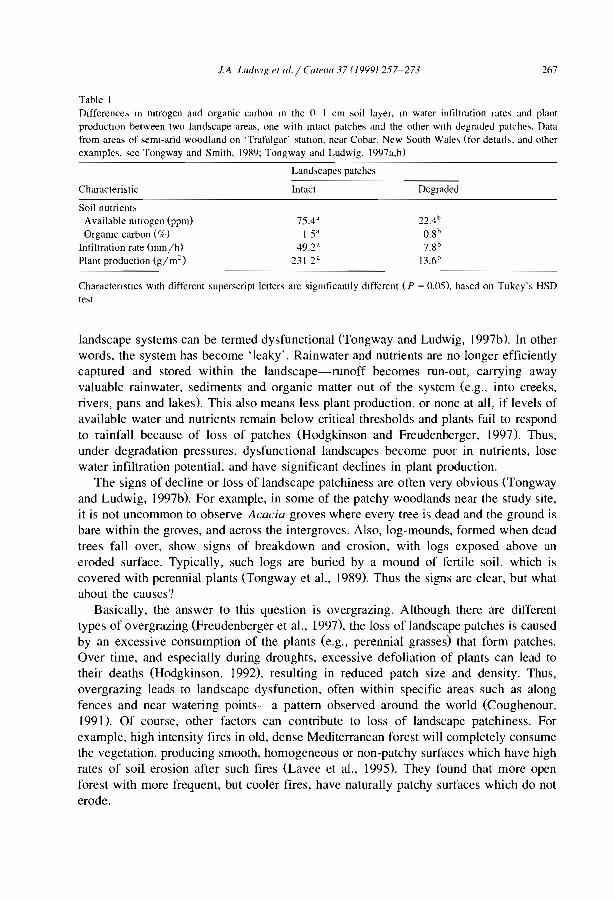
J.A Ludwig ef al. / Cafena 37 (1999) 257-273 267
Table 1Differences ln rntrogen and organic carbon ln the 0-1 cm sail layer, ln water infiltration rates and plantproductIOn between two lambcape areas, one with Intact patches and the other wllh ùegradeù patches. Datal'rom areas of seml-ariù woodland on 'Trafalgar' stallon. near Cobar, New South Wales (for detatls. anù otherexamples, see Tongway and Smith, J989; Tongway anù Ludwig. 1997a,b)
Lanùscapes patches
Characteristic
Sail nutrientsAvailable rntrogen (ppm)Orgarnc carbon (%)
Infiltration rate (mm/hlPlant production (g/m2
)
Intact
75.4"1 5'
49.2"2312'
Degraùeù
22.4b
0.8h
7.8 h
l3.6h
Charactensllcs wlth different superscript letters are sigrnficantly dlfferent (P = 0.05l. based on Tukey's HSDtest
landscape systems can be termed dysfunctional (Tongway and Ludwig, 1997b). In otherwords, the system has become 'leaky'. Rainwater and nutrients are no longer efficientlycaptured and stored within the landscape-runoff becomes mn-out, carrying awayvaluable rainwater, sediments and organic matter out of the system (e.g., into creeks,rivers, pans and lakeÙ This also means less plant production, or none at al!, if levels ofavailable water and nutrients remain below critical thresholds and plants l'ail to respondto rainfall because of loss of patches (Hodgkinson and Freudenberger, 1997). Thus,under degradation pressures, dysfunctional landscapes becorne poor in nutrients, losewater infiltration potential, and have significant declines in plant production.
The signs of decline or loss of landscape patchiness are often very obvious (Tongwayand Ludwig, 1997b). For example, in sorne of the patchy woodlands near the study site,it is not uncommon to observe Acacia groves where every tree is dead and the ground isbare within the groves, and across the intergroves. Also, log-mounds, formed when deadtrees l'ail over, show signs of breakdown and erosion, with logs exposed above aneroded surface. Typical!y, such logs are buried by a mound of fertile soil, which iscovered with perennial plants (Tongway et al., 1989). Thus the signs are clear, but whatabout the causes?
Basical!y, the answer to this question is overgrazing. Although there are differenttypes of overgrazing (Freudenberger et al., 1997), the loss of landscape patches is causedby an excessive consumption of the plants (e.g., perennial grasses) that form patches.Over time, and especially during droughts, excessive defoliation of plants can lead totheir deaths (Hodgkinson, 1992), resulting in reduced patch size and density. Thus,overgrazing leads to landscape dysfunction, often within specific areas such as alongfences and near watering points-a pattern observed around the world (Coughenour,1991). Of course, other factors can contribute to loss of landscape patchiness. Forexample, high intensity l'ires in old, dense Mediterranean forest will completely consumethe vegetation, producing smooth, homogeneous or non-patchy surfaces which have highrates of soi1 erosion after such fires (Lavee et al., 1995). They found that more openforest with more frequent, but cooler l'ires, have naturally patchy surfaces which do noterode.
268 J.A. Ludwig el al. / Calena 37 (1999) 257-273
Another question is why has overgrazing only occurred since pastoral settlement? InAustralia's rangelands this was about 150 years ago (Noble and Tongway, 1986). Thelikely answer is that pastoralism brought more consumers, e.g., domestic sheep andcattle, and feraI camels, horses, donkeys, rabbits, goats and pigs. Ail of these have beenintroduced to landscapes that since ancient time had only been grazed by macropodidmarsupials (Freudenberger et al., 1997). Stock watering points were extensively developed, with the effect that kangaroo populations have greatly increased, especially inplaces where its natural predator, the dingo, has been controlled to protect stock. The netresult is a 'total grazing pressure' that eventually destroys landscape patchiness. Howcan such degraded landscapes be fixed?
4.2. Landscape rehahilitation
The rehabilitation of dysfunctional landscapes can be achieved only by restoringlandscape patches, that is, by rebuilding the structures that trap and store limited soilresources (Tongway and Ludwig, 1993). Experimental work has demonstrated that newpatches can be restored on bare slopes by simply building piles of brush of about la m2
(Tongway and Ludwig, 1996). It was found that these brush piles functioned to traprunoff, sediments and litter flowing or blowing around the landscape. After only 3 years,soil sediments and litter had significantly accumulated within the brush piles. Comparedto controls, nitrogen and carbon levels were 30% higher, water infiltration ratesincreased JO-fold and the abundance of soil invertebrates increased four-fold. Perennialgrasses and forbs re-established within the brush piles, but not in the controls, eventhough the experimental plots were being subject to moderately high grazing pressuresby sheep and kangaroos (Ludwig and Tongway. 1996). The 'spiky' branches of thebrush pile protected new plants from grazing.
Some rangeland managers in the semi-arid Acacia woodlands of eastern Australiaalready make brush piles when they eut branches from Acacia during droughts to'emergency' feed their sheep (Harrington et al., 1984). However, rather than leavingbranches next to the trees they are eut from, managers should be encouraged ta buildbrush piles in places where rehabilitation is most needed, and with piles orientated alongcontours to increase their efficiency for trapping runoff.
Larger brush piles can be built by using bulldozers to 'thin' shrubs, where a chain ispulied between two bulldozers working parallel to the contours (Noble et al.. 1997). Atan appropriate spacing between strips, chaining creates large piles of uprooted trees (i.e.,large patches) that are very efficient at trapping soil and litter. These strips or piles ofbrush and trees also provide refuge sites for fauna such as small mammals and lizards.Of course, landscape restoration using the chaining method must be very carefullyplanned (i.e., no chaining on steep landscapes).
4.3. Soil condition and biodiL'ersitv
Semi-arid landscapes used for grazing must be managed wisely to avoid the loss ofpatches. Land managers need to acknowledge the significance of patches and incorpo-
J.A. Ludwig el al. / Carena 37 (1999) 257-273 269
rate this knowledge into property management plans. This includes having an understanding of why overgrazing reduces patchiness, soil surface condition and productivity,thus leading to landscape dysfunction, desertification, and losses of biodiversity.
Maintaining landscape patchiness is vital for maintaining biodiversity, and vice versa,as the two are closely linked. For example, if biologically derived soil pores (i.e., those> 0.75 mm) are closed, then the infiltration of water virtually stops (Greene, 1992).These biopores are formed by soil fauna such as ants and termites burrowing withinfavourable patchy habitats (Noble and Tongway, 1988; Whitford et al., 1992; Eldridge,1993a; Greenslade and Smith, 1994). The coyer of plants and cryptogams on alandscape are also important for slowing mnoff and erosion (Eldridge, 1993b; Greene etal., 1994); this coyer also protects biopores from raindrop impacts that tends to collapsethem (see Greene, 1992, for details). The type and nature of soil surface stone and rockcoyer can also greatly influence mnoff (Lavee and Poesen, 1991). For example, theyfound that landscapes with small (3 cm) stones resting on top of the soil surfaceconsistently produced less mnoff than bare soil at stone covers ranging from 30 to 88%.
Thus, the management of soil surfaces and patches is of critical importance inmaintaining landscape function; that is, the capturing and storing of limited soilresources and producing good plant growth (Tongway and Ludwig, 1997a,b), andtherefore conserving soil biotic diversity. Grazing land management must integrate bothproduction and conservation goals (Foran et al., 1990). Morton et al. (I995) and StaffordSmith (I994) provide sorne guidelines for assessing whether a pastoral property is beingmanaged sustainably. Ludwig and Freudenberger (I 997) provide a landscape perspectiveon semi-arid grazing land sustainability, which is not achieved by managing only forlandscape patchiness, but involves responding to many social, economic, ecological andpolitical factors. Therefore, a knowledge of how landscapes function, and the importanceof patches in this function, whether in stripes, strands or stipples, can contribute to theformation of policies and programs to achieve a goal of sustainable integration ofproduction and conservation activities and values in rangelands.
Acknowledgements
We thank David Freudenberger for conceptual developments on this landscapesimulation study, for providing us model validation data, and for advice and commentson a draft manuscript. We also thank Prof. Hanoch Lavee and an anonymous reviewerfor comments which significantly improved the manuscript.
Appendix A. Algorithm for the computation of runoff (ROff) between landscapeunits and run out (ROut) of the landscape system
The aim of this landscape simulation study was to investigate how three patchpatterns, stipples, stripes and strands, influence the amount of water flowing out of a

270 l.A. Ludwig et a/./ Catena 37 (1999) 257-273
hypothetical landscape system and, hence, its potential productivity. Therefore, anumber of other factors which could influence run out and productivity were heldconstant, and a number of simplifying assumptions were made. For this study of patchpattern slope, patch area and interpatch area were held constant at 1%, 25% and 75%,respectively. Patch size was set at 100 X 100 m, and stripe and strand patches wereconsistentJy located towards the bottom of the simulated hillslope (Fig. 3). For simplicity, it was assumed that lateral or reticulate flows were not significant in our simulationsbecause the landscape was assumed to be a flat planar surface of uniform 1% slope.
Computations were spatial and temporal. Runoff and run out were computed temporally for each rainfall event over a 31.5 year record from Cobar, New South Wales,Australia. given:1. If no rain occurs (the usual case), soil water balance for each landscape patch
pattern unit (see Fig. 3) was computed using the WATDYN model (Walker andLangridge, 1996).
2. If rain occurs and if the amount of rainfall (R), and its intensity, exceeds the waterinfiltration rate (IR) or the water storage capacity (SC) of the soil within alandscapeunit, then runoff (Rom occurred from that unit (see Fig. 4).
The spatial computations were as follows:1. Runoff, ROffz ' was first computed for each landscape unit (z) in the row at the
top of the landscape (Fig. 3) as:
ROff lz =R Jz - IR lz '
that is, rainfall inputs, (RI)' Jess infiltration, IR lz , in mm/h, summed over the 24h/day. Soil water storage for each unit was then computed given the amount ofwater infiltrated into the soil, balanced against other relationships within WATDYN.
2. Second, ROff2z was computed for the second row of landscape units, that is thoseimmediately downslope of the first row. For the second row of landscape units,runoff was computed as:
ROff2? = SR 2z - IR 2z
where SR 2z = R 2z + ROn 2z ' that is, the supply rate ofwater to unit z in row 2 is thesum of rainfall inputs and runon, ROn 2z ' which equals the runoff from the unitabove (ROn 2z = ROff l ). Note that these calculations do not apply to the first rowsince it is at the top of the landscape and does not receive runon.
3. Third, the above computations were repeated for each of the rows in the landscapesystem-lO in our four different simulated landscape systems (Fig. 3).
4. Last, run out (Raut) from the landscape system was equal to the sum of theamount of runoff computed for the last row of landscape units (i.e.,ROut z = ROff lO)·
Finally, note that as computations proceed down the rows of landscape units, thatsorne units are designated as 'runon patches' (Fig. 3), which have significantly higherinfiltration rates than runoff units (3 vs. 25 mm/h). It is the effect of patterning of thesepatches that was investigated in this simulation study.
References
J.A. Lud.....lg et al. / Catena 37 (J999) 257~273 271
Archer, S.. 1990. Development and stability of grass-woody mosalCS in a subtropical savanna parkland.Texas. V.S.A Journal of Biogeography 17.453-462.
Belsky, A.1.. 1995. Spatial and temporal landscape patterns in and and seml-arid African savannas. InHansson, L., Fahrig, L., Meeriam, G. (Eds.), Mosaic Landscapes and Ecological Processes. Chapman andHall, London, pp. 31-56.
Boyland, E.E., 1973. Vegetation of the mulga lands with special reference to south-western Queensland.Tropical Grasslands 7, 35-42.
Charley, J.L., Cowling, S.W., 1968 Changes in soil nutrient status resulting from overgrazing and theirconsequences in plant communities of seml-arid areas. Proceedings of the Ecologlcal Society of Australia3,28-38.
Cornet. A.F., Montana, c., Delhoume, J.P., Lopez-Portillo, J., 1992. Water flows and dynamics of desertvegetation stripes. In: Hansen, AJ., di Castri, F. (Eds.). Landscape Boundaries-Consequences for BiollcDiversity and Ecological Flows. Springer-Verlag, New York, pp. 327-345
Coughenour, M.B., 1991. Spatial components of plant-herbivore interactions in pastoral. ranching, and nativeungulate ecosystems. Journal of Range Management 44, 530-542.
Eldridge, D.1., 1993a. Effects of ants on sandy soils in semi-arid eastern Australia: local distribution of nestentrances and their effect on infiltratIOn of water. Australian Journal of Soil Research 31. 509-518.
Eldridge. D.1., 1993b. Cryptogam cover and soil surface condition: effects on hydrology on a semi-aridwoodland soi!. Arid Soil Research and Rehabilitation 7,203-217.
Foran, B.D., Friedel, M., MacLeod, N.D., Stafford Smith, D.M., Wilson, AD., 1990. The Future ofAustralia's Rangelands. Australian Government Publishing Service, Canberra.
Freudenberger, D.O., Hodgkinson, K.C.. Noble, J.c., 1997. Causes and consequences of landscape dysfunction in Australian rangelands. In: Ludwig, J., Tongway, D., Freudenberger, D.. Noble. J., Hodgkmson, K.(Eds.), Landscape Ecology, Function and Management: Princlples from Austraha's Rangelands, Chap. 6,CSIRO Publishing, Melbourne, pp. 63-77.
Gamer, W., Steinberger, Y., 1989. A proposed mechamsm for the fonnation of 'fertile islands' in the desertecosystem. Journal of Arid Environments 16, 257-262.
Gifford, R.M., 1988. Direct effects of hlgher carbon dlOxide concentratIOns on vegetation. In: Pearman, G.L(Ed,), Greenhouse: Planning for Climate Change. E.1. Brill Pub!., New York, pp. 506-519.
Greene, R.S.B .. 1992. Soil physical properties of three geomorphic zones in a semi-arid mulga woodland.Australian Journal of Soil Research 30, 55-69.
Greene. RS.B., Ringrose-Voase, Al.. 1992. Micromorphology and hydraulic properlIes of surface crustsfonned on a red earth sOli m the semi-arid rangelands of eastern Australia. In: Ringrose-Voase, AJ.,Humphreys, G.S. (Eds.), Soil Micromorphology: Studies m Management and Genesis. Proc. IX Int.Working Meeting of Soil Micromorphology, Townsville, Australia, July 1992. Developments m SOliScience 22, Elsevier. Amsterdam, pp. 763-776.
Greene, RS.B., Kinnell. P.LA., Wood, J.T., 1994. Role of plant cover and stock trampling on runoff and soileroslOn from semi-and wooded rangelands. Australian Journal of SOli Research 32, 953-973.
Greenslade, P.. Smith, D., 1994. Soil faunal responses to restoration by mulching of degraded semi-arid soilsat Lake Mere, New South Wales. In: Pankhurst. C.E. (Ed.), Soil Biota: Management in SustainableFanning Systems. CSIRO Pubhshmg, Melbourne, pp. 67-69.
Hanson. J.D., Skiles, J.W., Parton, W.1. 1988. A multi-species model for rangeland plant communities.Ecologlcal Modelling 44, 89-123.
Harrington, G.N., Mills, D.M.D., Pressland. A.1., Hodgkinson. K.C., 1984. Semi-arid woodlands. In: Harnngton, G.N., Wilson A.D., Young, M.D. (Eds.), Management of Australia's Rangelands. CSIRO Publishing,Melbourne, pp. 189-207.
Hodgkinson, K.C., 1992. Elements of grazing strategies for perennial grass management m rangelands. In:Chapman, G.P. (Ed.), Desertified Grasslands: Their Biology and Management. Academic Press, London,pp. 77-94.
Hodgkinson. K.C., Freudenberger, D.O., 1997. Production pulses and flow-ons in rangeland landscapes. In:Ludwig, J., Tongway, D., Freudenberger, D., Noble, J., Hodgkinson, K. (Eds.), Landscape Ecology,
272 J.A. Ludwig et al. / Catella 37 (1999) 257-273
Function and Management: Principles from Australia's Rangelands, Chap. 3. CSIRO Publishing, Melbourne, pp. 23-34.
Lavee, H., Poesen, J.W.A., 1991. Overland flow generation and continuity on stone-covered soil surfaces.Hydrologlcal Processes 5, 345-360.
Lavee, H., Kutie!, P., Sagev, M., Benyamini. Y , 1995. Effect of surface roughness on runoff and eroslOn in aMediterranean ecosystem: the role of fJre. Geomorphology 1L 227-234.
Ludwig, J.A., Freudenberger, D.O, 1997. Towards a sustainable future for rangelands In: Ludwig, J..Tongway, D., Freudenberger, D, Noble, J , Hodgkmson, K. (Eds), Landscape Ecology, FunctlOn andManagement: Princlples from Austraha's Rangelands, Chap. 10. CSIRO Pubhshing, Melbourne, pp.121-131.
Ludwig, J.A., Marsden, S.G., 1995. A simulation of resource dynamics wllhin degraded seml-arid landscapes.Mathemalics and Computers III Simulalion 39, 219-224.
Ludwig, J.A., Tongway, DJ., 1995. Spatial organIsatIOn of landscapes and lis functlOn III seml-aridwoodlands, Australia Landscape Ecology 10,51-63.
Ludwig, J.A., Tongway, DJ., 1996. RehabihtatlOn of semlarid landscapes III Australia: II. RestonngvegetatIOn patches. Restoralion Ecology 4, 398-406.
Ludwig, J.A., Tongway, D.J , 1997. A landscape approach to rangeland ecology In. Ludwig, J., Tongway, D.,Freudenberger, D., Noble, J., Hodgkinson, K. (Eds,), Landscape Ecology, FunctlOn and Management:Principles from Australia's Rangelands, Chap. 1, CSIRO Publishing, Melbourne, pp. 1-12.
LudWIg, J.A., Sinclair, R.E., Noble, LR., 1992. Embeddlllg a rangeland simulation model within a decislOnsupport system, Mathematics and Computers in Simulation 33, 373-378.
Ludwig, J.A., Tongway, DJ., Marsden, S.G., 1994. A flow-filler model for simulating the conservation oflimited resources in spalially heterogeneous, seml-and landscapes. Paclfic Conservation BlOlogy 1,209-215.
Mabbutt, J A, Fanning, PC., 1987. Vegetation banding in and Western Australia. Journal of Arid Environments 12,41-59.
Mauchamp, A., Rambal, S., Lepart, J., 1994 Simulating the dynamics of a vegetation mosaic: a spatializedfunctional model. Ecological Modelhng 71. 107-130.
Montana, C., 1992. The colonization of bare areas in two-phase mosaics of an and ecosystem. Journal ofEcology 80, 315-327.
Morton, S.R., Stafford Smith, D.M., Friedel. M H., Griftin, G.F, Pickup, G., 1995 The stewardship of aridAustralia: ecology and landscape management. Journal of Envlfonmental Management 43, 195-217
Noble, J.c., Tongway, D J , 1986. Pastoral settlement in arid and semi-arid rangelands. In: Russell, J.S., Isbell,R.E (Eds,), Austrahan Soils: The Human Impact. Univef',lty of Queensland Press, St. Lucia, pp. 217-242.
Noble, J.C., Tongway, D.J, 1988 Termite feeding sites and their influence on soil fertility and herbageproductivlty in seml-and AcaclO alleura communilies. In: Stehle, P.P Œd,), Proceedings of 5th Australasian Conference on Grassland Invertebrate Ecology. D&D Pnntmg, Melbourne, pp. 236-242.
Noble, J.C., MacLeod, N.D., Griffm, G.F., 1997. The rehabtlitatlOn of landscape function in rangelands. In:Ludwig, J., Tongway, D., Freudenberger, D., Noble, J., Hodgkinson, K. Œds.), Landscape Ecology,Function and Management: Prmciples from Austraha's Rangelands, Chap. 9, CSIRO Pubhshmg, Melbourne, pp 107-120.
Noy-Meir, L 1973. Desert ecosystems: environment and producers. Annual Revlew of Ecology and SystematICS 4, 25-51.
Noy-Meir, L, 1981. Spatial effects in modellmg and ecosystems. In: Goodall, D.W., Perry, R.A. Œds,),Arid-Iand Ecosystems: Structure, Functioning and Management, Vol. 2, Cambridge University Press,Sydney, pp. 411-432.
Pearman, G.L, 1988 Greenhouse gases: evidence for atmospheric changes and anthropogenic causes. In:Pearman, G.L Œd,), Greenhouse: Planning for Climate Change. EJ. Brill Publ., New York, pp. 3-21.
Raupach, M.R., 1991. Vegetatlon-atmosphere mteraction in homogeneous terrain: sorne imphcations ofmixed-Iayer dynamlcs. Vegetatio 91, 105-120.
Slatyer, R 0, 1961. Methodology of a water balance study conducted on a desert woodland (Acacia alleura)
communIty. Arid Zone Research 16, 15-26.Stafford Smith, M., 1994 Sustainable production systems and natural resource management III the rangelands.
J.A. LudwlK el al. / Calena 37 (1999) 257-273 273
ProceedIngs. Outlook 94. Vol. 2, Natural Resources. Aw,tralian Bureau of Agncultural and ResourceEconormcs. Canberra. pp 148-159.
Thiery, J,M., D'Herbes, J -M, ValentIn, C, 1995. Journal of Ecology 83, 497-507.Tongway. D 1.. LudWIg, J.A., 1990. VegetatIon and soil patterntng In sentI-and ntulga lands of eastern
AustralIa AustralIan Journal of Ecology 15, 23-34.Tongway. D.1., LudWig, J.A., 1993 Rehabilitation of Imneslte and pastoral land. the ecosystem functIon
approach. In di Rw,so, M. (Ed J. Proceedrngs. Goldtïelds InternatIonal Conference on And LandcareMilena di Ru ..so Pub!., HamIlton HIll. Western Australia, pp. 51-57
Tongway. D.1., Ludwig. J A., 1994. Small-scale resource heterogenerty In seml-and landscapes. PaCIfieConservatIon Biology l, 201-208
Tongway. D.1, LudWIg, J A, 1996 RehabIlitation of semlarid landscapes In Australia II. RestonngproduetIve SOli patches. Restoratron Ecology 4, 388-397.
Tongway. D.1.. LudWIg. J.A, 1997a. The conservatIon of water and nutnents within landscapes. In: LudWIg,J, Tongway, D., Freudenberger, D., Noble. 1.. Hodgkinson. K. (Eds J. Landscape Eeology, FunctlOn andManagement· Principles l'rom Australia's Rangelands, Chap. 2. CSIRO Publishing. Melbourne, pp 13-22.
Tongway. D.1., Ludwig, J A., 1997b. The nature of landseape dysfunctron In rangelands. In: LudWIg, J.Tongway, D. Freudenberger, D., Noble, 1.. HodgkInson, K. (Eds J, Landscape Ecology, Functron andManagement: Pnnclples l'rom Australia's Rangelands, Chap. 5. CSIRO Publishrng, Melbourne, pp. 49-61
Tongway, D.1., SmIth, E.L, 1989. Soil surface features as rndicators of rangeland site productivity. AustralranRangeland Journal lI. 15-20.
Tongway. D J., Ludwig, J.A., Whitford, W.G., 1989. Mulga log mounds: fertIle patches in the semi-andwoodlands of eastern Australia. Australian Journal of Ecology 14, 263-268.
Walker. B.H., Langndge, J.L., 1996. ModellIng plant and soil water dynamics In seml-and ecosystem.. wlthIrmited site data. Ecological ModellIng 87, 153-167.
Whitford, W.G., LudWIg, J.A., Noble, J.C., 1992. The importance of subterranean termites In seml-andecosystems of south-eastern Australra. Journal of Arid Environments 22, 87-'Il.
Wiens, J.A, 1995. Landscape mosaics and ecologlCal theory. In' Hansson, L , Fahng, L., Meenam, G. (Eds.),Mosaic Landscapes and EeologlCal Processes. Chapman and Hall, London, pp. 1-26