Embed Size (px)
Citation preview

FOREST INSECT AND DISEASE
CONDITIONS IN VERMONT 2017
AGENCY OF NATURAL RESOURCES
DEPARTMENT OF FORESTS, PARKS & RECREATION
MONTPELIER - VERMONT 05620-3801

STATE OF VERMONT
PHIL SCOTT, GOVERNOR
AGENCY OF NATURAL RESOURCES
JULIE MOORE, SECRETARY
PETER WALKE, DEPUTY SECRETARY
DEPARTMENT OF FORESTS, PARKS & RECREATION Michael C. Snyder, Commissioner
Sam Lincoln, Deputy Commissioner
Steven J. Sinclair, Director of Forests
http://www.vtfpr.org/
We gratefully acknowledge the financial and technical support provided by the USDA Forest Service, Northeastern Area State and Private Forestry that enables us to conduct the surveys and publish the results in this report. This document serves as the final report for fulfillment of the Cooperative Lands – Survey and Technical Assistance and Forest Health Monitoring programs.
In accordance with federal law and U.S. Department of Agriculture policy, this institution is prohibited from discrimination on the basis of race, color, national origin, sex, age, or disability.
This document is available upon request in large print, Braille or audio cassette.

FOREST INSECT AND DISEASE
CONDITIONS IN VERMONT
CALENDAR YEAR 2017
PREPARED BY:
Barbara Schultz, Trish Hanson, Sandra Wilmot,
Joshua Halman, Elizabeth Spinney, Tess Greaves
AGENCY OF NATURAL RESOURCES
DEPARTMENT OF FORESTS, PARKS & RECREATION

STATE OF VERMONT – DEPARTMENT OF FORESTS, PARKS & RECREATION FOREST RESOURCE PROTECTION PERSONNEL
Barbara Schultz Forest Health Program Manager Dept. of Forests, Parks & Recreation 100 Mineral Street, Suite 304 Springfield, VT 05156-3168 Cell Phone: 802-777-2082 [email protected]
Joshua Halman Forest Health Specialist Dept. of Forests, Parks & Recreation 111 West St. Essex Junction, VT 05452 Work Phone: 802-279-9999 [email protected]
Elizabeth Spinney Invasive Plant Coordinator 111 West Street Essex Junction, VT 05452-4695 Work Phone: 802-477-2134 [email protected]
Trish Hanson Forest Protection Entomologist Dept. of Forests, Parks & Recreation 111 West St. Essex Junction, VT 05452 Work Phone: 802-879-5687 [email protected]
Mary Burnham Environmental Scientist II Dept. of Forests, Parks & Recreation 111 West St. Essex Junction, VT 05452 Work Phone: 802-871-3389 [email protected]
Sandra Wilmot Forest Health Specialist/Climate Change Program Coordinator Dept. of Forests, Parks & Recreation 111 West St. Essex Junction, VT 05452-4695 Work Phone: 802-879-5691 Cell Phone: 802-777-5295 [email protected]
DISTRICT FORESTRY PROTECTION SPECIALISTS
District 1: Jim Esden 100 Mineral St., Suite 304 Springfield, VT 05156 802-777-1591 (cell) [email protected]
District 2: Lars Lund 271 North Main Street, Suite 215 Rutland, VT 05701 802-777-4188 (cell) [email protected]
District 3: Dan Dillner 111 West St. Essex Junction, VT 05452 802-777-3079 (cell) [email protected]
District 4: Neil Monteith 5 Perry St., Suite 20 Barre, VT 05641-4265 802-476-0178 (office); 802-535-8482 (cell) [email protected]
District 5: Tess Greaves 374 Emerson Falls Rd., Suite 4 St. Johnsbury, VT 05819 802-535-5727 (cell) [email protected]

i
INTRODUCTION
The report of Forest Insect and Disease Conditions in Vermont documents survey results and
observations by Vermont Department of Forests, Parks and Recreation (FPR) staff in the calendar year.
Activities were conducted in partnership with the US Forest Service, Vermont Agency of Agriculture,
Food and Markets, USDA-APHIS, the University of Vermont, the National Weather Service, cooperat-
ing landowners, resource managers, and citizen volunteers.
These reports have been produced annually since 1967. In prior years, observations were summarized
in the Vermont Department of Forests and Parks Biennial Reports.
The year’s most significant observations and activities are summarized at the front of the report in the
stand-alone Forest Health Highlights. Details follow about weather and phenology, forest insects, for-
est diseases, animal damage, invasive plants, and trends in forest health.
Results are summarized from aerial surveys to detect forest damage. On June 21, the US Forest Service
conducted an aerial survey over the Green Mountain National Forest. An FPR survey covering the rest
of the state, to map forest tent caterpillar defoliation and general forest conditions, was flown between
June 30 and July 21 (6/30, 7/5, 7/10, 7/12, 7/19, 7/20, 7/21). The range of dates flown in 2016 and
2017 is about a month earlier than the survey has been flown in recent years. As a consequence, chang-
es in acres mapped from previous years are sometimes due to the survey timing rather than a change in
damage incidence.
Ground data include tree health and pest population survey results. Additional data and metadata are
available through the Forest Ecosystem Monitoring Cooperative Database website or by request. Also
reported are insects and diseases of trees that were incidentally observed by our staff, the public and
others. Except where indicated, the lack of an observation does not mean that the insect or disease was
absent.
This report is available on-line at http://fpr.vermont.gov/forest/forest_health/current_health, or in hard-
copy format. For additional information, including defoliation maps, management recommendations,
and other literature, assistance in identifying pests, diagnosing forest health problems, on-site evalua-
tions, and insect population sampling, or to participate in invasive pest citizen monitoring, contact
Forest Resource Protection Personnel or your County Forester.

ii
ACKNOWLEDGEMENTS
The Forest Pest First Detector Program is in its fifth year. In 2017, 33 new volunteers attended
Vermont’s Forest Pest First Detector Program training, bringing the statewide total of trained volunteers
to 199. We thank the many continuing First Detectors, and welcome new volunteers: Sandra Andreas-
son, Farrah Ashe, John Barnes, Barb Blauvelt, Wendelyn Bolles, Fran Cohen, Rosemarie Conn, Steven
Farnham, Donna Fialkoff, Jennifer Goyne, Rachel Grigorian, Jessica Halterman, Alice Haskins, Eddie
Haynes, Sarah Holland, Maria Javanainen, Roy Karros, Charls Kletcka, Katie Kull, Carl LaShomb,
Jennifer Many, Darsey Moon, Tammy Morissette, Andrew Morrison, David Palumbo, Kate Reeves,
Rebecca Roman, Hannah Senecal, Kathy Swigon, Chad Ummel, Claire Whittaker, Brendan Whittaker,
and Chris Young.
Welcomed assistance with hemlock woolly adelgid surveys came from Ellen Allman, Alma Beals,
Kathleen Hacker, Helen Hamman, Candi Hess, Peter Isakson, Frankie Knibb, Irwin Kuperberg, Lynn
Morgan, Nick Potter, Kathie Stone, and staff and students from Burr and Burton’s Mountain Campus.
Julia Lund assisted with aerial survey ground checking.
Many thanks to all the invasive plant survey participants who helped continue the Mapping for Healthy
Forests citizen science project on iNaturalist.org, and helped the project reach over 3,000 observations.
Many groups, towns, and organizations took part in invasive plant management and outreach across
the state. Huge thanks to VT Coverts, Winooski Valley Park District, Birds of Vermont Museum, New
Hampshire Vermont Christmas Tree Association, Green Works, Vermont Nursery & Landscape Associ-
ation, Society of American Foresters Green Mountain Division, the Friends of the Hort Farm, Vermont
Woodlands Association, the Green Mountain Club, Conservation Commissions and other municipal and
private organizations across Vermont and many others.
The Forest Biology Lab received taxonomic and other assistance from Don Chandler, Rod Crawford,
Kevin Dodds, Charley Eiseman, Aaron Ellison, Nick Gotelli, Alan Graham, Ann Hazelrigg, Rick
Hoebeke, Ron Kelley, Warren Kiel, Gabriella Maya, Isabel Munck, Michael Sabourin, Scott Schneider,
Nate Siegert, and Dave Wagner. Warren Kiel continued to contribute Lepidoptera specimens for our in-
sect reference collection. Thanks to Warren, we have been able to rebuild our post-Irene collection and
to add new species records.
Support in many program areas was provided by staff of the US Forest Service Forest Health Protection,
the Vermont Agency of Agriculture, Food, and Markets, University of Vermont, USDA APHIS, the US
Forest Service Northern Research Station, and Vermont State Parks, as well as many others in the
Vermont Agency of Natural Resources.

iii
TABLE OF CONTENTS
Vermont 2017 Forest Health Highlights .......................................................................................... 1
Figures and Tables ........................................................................................................................................ 13
2017 Publications and Outreach. ................................................................................................... 17
Weather and Phenology ................................................................................................................ 19
Forest Insects ................................................................................................................................ 36
Hardwood Defoliators ........................................................................................................ 36
Forest Tent Caterpillar ........................................................................................................ 36 Gypsy Moth .......................................................................................................................... 42 Saddled Prominent ............................................................................................................... 44 Other Hardwood Defoliators ............................................................................................... 46
Softwood Defoliators ......................................................................................................... 50
Spruce Budworm ................................................................................................................. 50 Other Softwood Defoliators ................................................................................................ 53
Sapsucking Insects, Midges and Mites ................................................................................. 54
Balsam Woolly Adelgid ........................................................................................................ 54 Elongate Hemlock Scale ....................................................................................................... 56 Hemlock Woolly Adelgid ..................................................................................................... 56 Pear Thrips ........................................................................................................................... 59 Red Pine Scale ...................................................................................................................... 60 Other Sapsucking Insects, Midges and Mites ...................................................................... 62
Bud and Shoot Insects ........................................................................................................ 64
Root Insects ....................................................................................................................... 65
Bark and Wood Insects ..................................................................................................... 66
Asian Longhorned Beetle ..................................................................................................... 66 Emerald Ash Borer ............................................................................................................... 66 Firewood Program ................................................................................................................ 66 Exotic Wood Borer/Bark Beetle National Survey .............................................................. 68 Other Bark and Wood Insects ............................................................................................. 69
Fruit, Nut and Flower Insects ............................................................................................. 72
Forest Diseases .............................................................................................................................. 73
Stem Diseases ..................................................................................................................... 73
Beech Bark Disease............................................................................................................... 73 Other Stem Diseases ............................................................................................................ 75
iv
Foliage Diseases .................................................................................................................. 77
Hardwood Foliage Diseases ................................................................................................. 77 Needle Diseases of White Pine ............................................................................................ 77 Other Foliage Diseases ......................................................................................................... 82
Root Diseases ..................................................................................................................... 83
Diebacks, Declines, and Environmental Diseases ................................................................. 84
Drought ............................................................................................................................... 84 Frost Damage ........................................................................................................................ 86 Logging-Related Decline ...................................................................................................... 86 Ozone Injury ......................................................................................................................... 88 Rainfall-Induced Chlorosis .................................................................................................. 88 Red Pine Decline .................................................................................................................. 90 Damage from Unknown Causes .......................................................................................... 90 Extreme Weather Events ...................................................................................................... 92 Wet or Flooded Sites ............................................................................................................ 93 Wind Damage ...................................................................................................................... 95 Other Diebacks, Declines, and Environmental Diseases .................................................... 96
Animal Damage ................................................................................................................. 98
Invasive Plants .............................................................................................................................. 99
Early Detection Species ........................................................................................................ 99 Regional Grant-Funded Activities ....................................................................................... 99 Other Activities .................................................................................................................. 100
Trends in Forest Health .............................................................................................................. 104
Sugar Maple Health in 2017 .............................................................................................. 104 FEMC - Trends in Forest Health at Mt. Mansfield and Lye Brook in 2017 .................... 106

These Forest Health Highlights summarize information from the annual report on Forest Insect and Disease Conditions in Vermont. This summary provides an overview of the forest resource in Vermont, forest health program highlights, a weather summary, sections on hardwood and softwood insects and diseases which are native or well-established in the state, a section on exotic forest pests which are not known to occur in the state, a summary of activities related to non-native invasive plants, and forest health monitoring results.
Vermont forest health information is on-line at http://fpr.vermont.gov/forest/forest_health, or you can contact us:
• for assistance in identifying pests or diagnosing forest health problems
• to request on-site evaluations or management recommendations
• to obtain defoliation maps and hard-copy publications
• to participate in invasive pest citizen monitoring.
Forest Resource Summary
Vermont’s forests cover about three-quarters of the state, and include billions of trees. Eighty percent of the State’s forest land is privately owned with 11% under Federal management in the Green Mountain National Forest and 8% managed by the State of Vermont. Sugar and red maple and eastern hemlock are the most common species by number and volume. More information on Vermont’s forest inventory is at http://fpr.vermont.gov/forest/forest_business/forest_statistics/fia.
Forest Health Program Highlights
The Vermont Department of Forests, Parks and Recreation (FPR) conducts aerial and ground surveys to detect forest damage. In addition, long-term monitoring plots are inspected to evaluate forest health.
In 2017, 98,555 acres of forest damage were sketchmapped during statewide Aerial Detection Surveys. This represents just over 2% of Vermont’s forestland, and is similar to the area mapped in 2016. Defoliation by forest tent caterpillar and white pine needle damage accounted for 61% and 17%, respectively, of the area mapped.
highlights
2017
1
Data are from US Forest Service Forest Inventory and Analysis (FIA) plots. Estimates were calculated from FIA
DataMart (FIADB_1.6.0.02), November 2017 https://apps.fs.usda.gov/fia/datamart/datamart_excel.html.
Healthy forests are ecologically functional and resilient to disturbance. They are valued by commu-
nities and have the capacity to produce economic benefits. The mission of the Vermont Division of
Forests is to manage for and protect healthy forests. We work with Vermont citizens to promote
forest health, supporting best management practices, sustainable use, and respect for the land.

2
At the Forest Biology Lab, we continue to provide invertebrate identifications, tree disease diagnoses and pest management recommendations, and support environmental education and outreach. In 2017, 38% of our inquiries came directly from the public; 30% from forest and tree care professionals; questions from other labs, researchers and commissions made up 17% of our inquiries; 9% came from other state or federal agencies; and 6% involved education and outreach. Forest health inquiries came from all 14 Vermont counties. Six percent of our inquiries were from out-of-state. Planning efforts continue for eventual relocation of the Vermont Agriculture and Environmental Laboratory to a new facility in Randolph.
Climate Change remained a focus in 2017. Recommendations have been drafted on assisted migration for use on ANR lands, and State Park Interpretive Naturalists have begun including climate change information in their educational programming. In 2017, the Vermont Urban & Community Forestry Program partnered with the Vermont Climate & Health Program and the Arbor Day Foundation to provide 200 trees to residents in urbanized areas of Bennington and Newport. These communities were selected based on their relatively high risk for heat illnesses, in part due to lack of tree cover. For more information, visit our website on Climate Change and Forests.
The Vermont Monitoring Cooperative completed its 27th year of monitoring forest ecosystem health by broadening its focus to include neighboring states. Now called the Forest Ecosystem Monitoring Cooperative, survey and monitoring results are available at the new FEMC website.
FPR and the Agency of Agriculture, Food and Markets (AAFM) collaborate with USDA agencies to survey and manage Non-Native Forest Pests, and with University of Vermont (UVM) Extension on
education and outreach. UVM Extension led an effort this year focusing on private campgrounds. Host tree maps were created and pest surveys were conducted for participating campgrounds, and they received educational materials to share with campers.
To maintain our ability to respond to Invasive Pests, an Interagency ICS exercise was held in June. The tabletop exercise was facilitated by USDA APHIS, and included four other agencies, in a run-though of a simulated Asian longhorned beetle detection. Vermont continues to participate in the Northeastern Forest Fire Compact’s Forest Health Working Team, which streamlines resource sharing among northeastern states and provinces in response to forest pest incidents. Vermont participated in a Compact mobilization to assist with brown spruce longhorned beetle detection in New Brunswick. An update to Vermont’s Invasive Forest Pest Response plan is under review.
Two Forest Pest First Detector trainings were held in 2017 with 33 arborists, tree wardens, and concerned citizens attending. Volunteers assisted in detection surveys and community outreach.
The website vtinvasives.org has been re-launched with a new look. The expanded site continues to offer information on terrestrial plants, forest pests, and aquatics. To publicize the availability of this information, posters were distributed to 186 libraries in the state. On average, the website has approximately 400 online users per week.
Vermont’s Firewood Quarantine, the Rule Governing the Importation of Untreated Firewood into the State of Vermont, went into effect in 2016. Untreated firewood, less than 48 inches in length, cannot be brought into Vermont, unless a waiver has been granted to the person moving the firewood. Several waivers have been approved for wood from adjacent counties in New Hampshire that are not under quarantine for emerald ash borer.
The vtinvasives.org website was up-dated. Posters announcing the web-site were distributed to 186 libraries.
The Forest Biology Lab responded to inquiries
from throughout
the state.
The Forest Pest Outreach program included host tree surveys on private campgrounds.
Photo: UVM Extension

3
2017 Weather Influences on Forest Health
The winter of 2016-2017 lacked extremes, though it was somewhat warmer and drier than normal through February, and colder and wetter in March. Going into the winter, however, the entire state was abnormally dry or in moderate to severe drought. Dryness tapered off through the winter, finally ending by early May in eastern Windsor and Orange Counties.
Late spring and early summer 2017 were a different story, with May, most of June, and early July being cooler and wetter than normal. Cold temperatures May 8 and 9 resulted in snow at higher elevations and scattered frost damage.
By mid-July, weather conditions changed again, with generally drier than normal weather through September. That period remained cooler than normal in most of the state through mid-September, when warmer temperatures arrived. There were record-breaking high temperatures in late September, frequently reaching the mid-80s and sometimes exceeding 90°, and October was the warmest on record. By late October, most of the state was abnormally dry or in moderate drought.
Severe tree-damaging storms punctuated the growing season. A partial list includes gravity wave storms on May 5th, microburst storms on May 18th, storms including hail on May 31st, July 18th, and August 12th, and multiple days of torrential rain June 29 through July 2 and October 24 to 30th.
With the see-saw between wet and dry, unusual cool and warm periods, and severe storms, weather conditions, as always, were a major driver of tree health. In addition to direct hail injury, tree breakage, or windthrow from severe storms, these included the following:
The drought of 2016 continued to affect tree health long after moisture conditions improved, including the following conditions observed in 2017:
• This was a heavy seed year for many tree species: notably maple, beech, oak, basswood, apple, and hop hornbeam (but not white ash) among hardwoods, and among conifers including white pine, balsam fir, red, white, and Norway spruce and northern white cedar. Heavy seed
production, sometimes referred to as a “distress crop”, is common following drought conditions. When trees put lots of resources into seed production, they may look sparser than normal. We should also expect an uptick in squirrel damage in the near future, with exploding populations from the recent glut of food.
• New ash mortality and maple dieback was noticeable by mid-June in multiple locations in eastern Vermont where drought conditions had persisted into early spring. Ash trees are particularly sensitive to fluctuating water conditions. Affected maples often had foliage of good size and color on living branches, suggesting that plentiful moisture later in the spring is allowing trees to recover.
Dry conditions from the 2016 drought persisted through early spring. Rainfall was plentiful in late spring and early summer. However, by late October most of the state was abnormally dry or in drought.
Map Authors: Anthony Artusa and Eric Luebehusen NOAA/USDA/NDMC http://droughtmonitor.unl.edu/
Severe tree-damaging storms included a gravity wave storm that hit Rutland County on May 5th. (left).
Drought conditions in 2016 contributed to heavy seed pro-duction on multiple species, including white pine (center). It also led to dieback on maple (right) and ash, especially in eastern Vermont.

4
• Heavy production of Armillaria “honey mushrooms” suggests that this fungus successfully invaded drought-stressed roots.
• More attacks by hemlock borer were reported on wounded hemlocks.
Cool, wet weather in May and June slowed leaf development, saturated soil, and promoted the spread of fungi, resulting in the following conditions observed in 2017:
• Light frost damage to sugar maple and beech was observed in widely scattered locations, including northeastern and southwestern Vermont, and the central mountains.
• Conditions were ideal for leaf infection by fungal pathogens, and for caterpillar infection by fungal and viral diseases.
• Delayed leaf development led to increased damage by pear thrips on sugar maple.
• Stands of chlorotic sugar maples, were observed in scattered locations statewide, with 6,494 acres mapped from the air. This is frequently observed in unusually rainy summers.
• Saturated soil made trees more vulnerable to windthrow in stormy weather.
Warm dry conditions in late summer into fall led to:
• Refoliation failures from forest tent caterpillar and other defoliators, along with infection by leaf fungi and other factors.
• A general delay in fall foliage, with the exception of swamps and other stressed areas that start to turn color early.
• Early leaf drop of sugar maple and ash, especially on roadsides, openings, river corridors, and edges. Once leaves are compromised by disease infection they are more likely to brown and drop early under dry conditions.
2016 drought conditions likely led to a heavy crop of honey mushrooms (left) and more frequent hem-lock borer at-tacks (right).
Photos: K. Jones, R. Freeberg
Cool wet spring conditions resulted in scattered frost damage to sugar maple and beech (bottom left), stands of chlorotic sugar maple (top left) and made trees more vulnerable to windthrow in stormy weather (top center). Warm dry late summer and early fall con-tributed to early leaf drop of ash (right) and refoliation failures (bottom center).
Frost Photo: E. Crumley

5
We continue to monitor phenology for the timing of budbreak, leaf out, and fall leaf color and drop. Sugar maple budbreak on April 29th was 4 days earlier than the long-term average, but the timing of full leaf-out was nearly indistinguishable from the long-term average. In general, peak color was later than usual in 2017. Double-peaks in sugar maple color were likely due to initial color change that stalled, followed by some leaf drop due to dry conditions of early fall. Growing season length in 2017 was the longest since 2012, and exceeded the long-term average by 12 days.
Hardwood Insects and Diseases
Forest Tent Caterpillar (FTC) populations increased statewide in 2017, with 60,588 acres of defoliation mapped during statewide aerial surveys. This accounts for roughly 2% of the northern hardwood forest in Vermont. Defoliation was mapped in every county and total acres more than doubled compared to 2016. Defoliation data are available on the ANR Natural Resources Atlas.
In the spring, leaf development, caterpillar hatch, and defoliation were monitored at four sites. Hatching was first observed during the last week of April. By the last week of May, some trees were 90% defoliated.
In late 2016 and early 2017, FPR staff assisted landowners with FTC egg mass surveys to determine the likelihood of defoliation on their property. Of the 64 sugarbushes surveyed, 32 were identified as at risk of defoliation. Eighteen landowners made arrangements with an aerial applicator to have their sugarbushes treated with Foray 48B, a Btk product that is registered for use in certified organic production. In total, these accounted for 3,434 acres. At the time of treatment, defoliation averaged
18%. This increased to just 24% after FTC feeding had ended, suggesting that treatment was highly effective. Several additional landowners also had their forestland treated.
Based on sugar maple phenology moni-toring, the 2017 growing season was the longest since 2012, and exceeded the long-term average by 12 days.
Forest tent caterpillar (left) populations increased statewide in 2017. Hatching began in April (above right). By late May, some trees were completely de-foliated (below right). Defoliation was mapped in every county.

6
FTC parasitoids known as friendly flies were reported throughout the defoliated areas, and there was some early caterpillar mortality likely due to viral and/or fungal infection. However, moth capture in pheromone traps increased from 2016 levels, suggesting that we can expect more defoliation from FTC in 2018. By request, FPR is conducting egg mass surveys in late 2017 and early 2018 for landowners who might use the results to adjust management practices.
Trees typically respond to the relatively early-season feeding by FTC by sending out a new flush of leaves. However, in both 2016 and 2017, some defoliated areas remained noticeable all summer because of a lack of refoliation. Factors that may have contributed to this include the lingering effects of 2016 drought, heavy seed, a late start of feeding in 2017, infection by leaf fungi and dry mid-summer conditions. In late October, after a burst of rainfall and continued warm temperatures, some defoliated sugar maples attempted another refoliation.
Dieback and off-color leaves have been observed in some locations where defoliation was heavy in 2016 and trees were under stress from other factors. The second year of defoliation, and lack of refoliation, will almost certainly affect wood production, the amount of foliage and shoot growth next year.
More details on FTC biology and management are in the most recent Forest Tent Caterpillar Update.
Pear thrips damage was noticeable, and numbers in our only monitoring plot are up compared to the last 2 years. Damage was still mostly light, and mixed with frost, fungus disease and other defoliators. Pollen increases thrips fecundity, so the heavy flower production may produce a lot more thrips next spring.
Other maple insects observed in 2017, included persistent populations of maple webworm, maple leafcutter and maple trumpet skeletonizer. New this year were frequent observations of orange humped mapleworm.
The number of FTC moths trapped in 2017 increased from 2016, indicating that the outbreak will continue next year.
Parasitic friend-ly flies were common.
Photo: R. Kelley
Some FTC mortality occurred which was likely due to fungal or viral disease.
Some defoliated trees failed to refoliate all summer (top right) while others attempted to refoliate in late October (left). Dieback has been observed in some locations where defoliation was heavy in 2016 (below right).
Pear thrips damage may be more com-mon next spring, since pollen in-creases thrips fecundity.
Photo: R. Kelley

7
Vermont continued to dodge the gypsy moth outbreak occurring elsewhere in New England, with no significant defoliation, and infrequent caterpillar reports. Egg mass monitoring plots indicate populations will remain low in 2018.
Beech bark disease remains a chronic cause of dieback and mortality, with damage mapped on 2,807 acres.
Other hardwood insects observed in 2017 included birch leaf folder which increased noticeably statewide, although no significant defoliation was observed. Poplar and willow defoliation by non-native satin moth caterpillars was more widespread than in 2017. Locust leafminer damage was particularly heavy on many roadside locusts. A large variety of tussock moth caterpillar species were reported from throughout the state, but only light feeding was observed. New this year were noticeable feeding by the red humped oakworm and scattered observations of oystershell scale, which can cause dieback when populations are heavy.
Certain foliage diseases were common due to the wet weather in late spring. Sycamore anthracnose kept sycamores bare into early June, wherever they grow, but foliage emerging later was unaffected, and trees were green all summer. Apple scab was heavy throughout the state, and cedar apple rust was also common. Giant tarspot caused substantial early leaf drop of Norway maple in southwestern Vermont.
There’s no simple answer to the early leaf drop of sugar maple and white ash, but a number of fungi appear to have contributed. The UVM Plant Diagnostic Lab identified the Anthracnose fungi Discula and Aureobasidium and the leafspot fungi Phyllosticta and Septoria on symptomatic sugar maple leaves, and the Anthracnose fungi Gloeosporium and Aureobasidium and the leafspot fungi Mycosphaerella, Marssonina, Cercospora, and Phyllosticta on symptomatic white ash leaves.
Hardwood insects which were more common in 2017 included (clockwise from top left): orange-humped mapleworm, birch leaf fold-er, locust leafminer, and oystershell scale.
Photos: R. Kelley
Egg mass survey plots indicate gypsy moth populations will remain low in 2018.
Common foliage diseases included sycamore anthracnose (left) and giant tar spot on Norway maple (right).
Tar spot photo: R. Kelley
A variety of anthracnose and leafspot fungi have been identified on sugar ma-ple leaves that dropped in late summer.

8
Softwood Insects and Diseases
Vermont’s hemlock woolly adelgid (HWA) infestation remains centered primarily in Windham County, with small spots in Springfield and Pownal. In 2017, hemlock woolly adelgid was detected just south of Lake George in New York, posing an additional threat to western Vermont.
Thirty sites were surveyed in 2017, with significant assistance from volunteers, to delineate Vermont’s HWA infestation. No newly infested towns were reported. This limited spread is due in large part to three successive years with high winter mortality. However, the mortality rate for winter 2016-2017 was approximately 65%, well below the threshold that seems to slow new invasions. Consequently, we expect to see more HWA over the coming winter. Spread is most likely to occur into warmer regions of the state.
In spite of high adelgid mortality rates, some stands of hemlock are in noticeable decline. Compounding the situation are the spread of elongate hemlock scale into Windham County and the 2016 drought.
No predatory beetles, Laricobius nigrinus, were recovered during fall sampling of the three sites where they had been released in 2009 and 2012, so the status of this introduction remains unknown. To augment the population at the Brattleboro site, 468 beetle adults that had been field collected in North Carolina were released in late November.
Fir mortality caused by balsam woolly adelgid is continuing but only 1,641 acres were mapped compared to 5,616 acres in 2016. Active populations are widely scattered, and the infestation has collapsed in some areas.
Fir mortality is continuing, although, in some areas, the balsam woolly adelgid infesta-tion has collapsed.
Hemlock woolly adelgid spread has
been limited, due to three succes-
sive years with high overwintering
mortality. No newly infested towns
were detected in 2017. Spread is
most likely within zones 5a and 5b.
HWA mortality in winter 2016-17 was well below the threshold that seems to slow new invasions.
Laricobius nigrinus beetles from North Carolina were re-leased to augment a biocontrol site in Brattleboro.

9
Although white pine needle damage was widespread again this year, with 16,413 acres mapped, this was about half of the acreage mapped in 2016. This likely underestimates the area affected since damage is mapped from above, while much of the damage is in lower crowns. This damage has been attributed to a complex of fungal pathogens. Since symptoms appear the year following infection, the dry conditions in spring 2016 may have reduced disease severity in 2017. Symptoms didn’t develop until the second week of June, and with heavy winds and rains, many brown needles were already cast by late June.
The damage has been widespread since 2010, and the current epidemic has been building at least since 2005. Needle damage continues to affect the same trees each year, and some are now exceedingly thin. Decline and mortality of white pine have been observed where other stress factors are also present.
Reports of red pine mortality continued in 2016, with 516 acres mapped, scattered in seven counties. The exotic insect, red pine scale, detected in 2015 in Rutland and Orange Counties, continues to be a suspect, although it remains premature to say that red pine scale is the sole “cause” of this red pine mortality. In 2017, we were not able to detect scale insects in any stands that were visited. It’s possible that cold winters have knocked populations back. It’s also possible that the decline in these stands is not
related to red pine scale. Pests that were observed included Diplodia shoot blight and pine gall weevil.
While spruce budworm continues to cause widespread defoliation in eastern Canada, the number of moths captured in our Vermont pheromone traps this summer remains low.
White pine needle damage has been widespread since 2010. The disease was less severe in 2017, with only half as many acres mapped com-pared to 2016.
In 2017 we did not detect red pine scale in stands with shoot dieback. Diplodia shoot blight and pine gall weevil were commonly observed.
The number of spruce budworm moths caught in our traps remains low.
10
Exotic Forest Pests Threatening Vermont
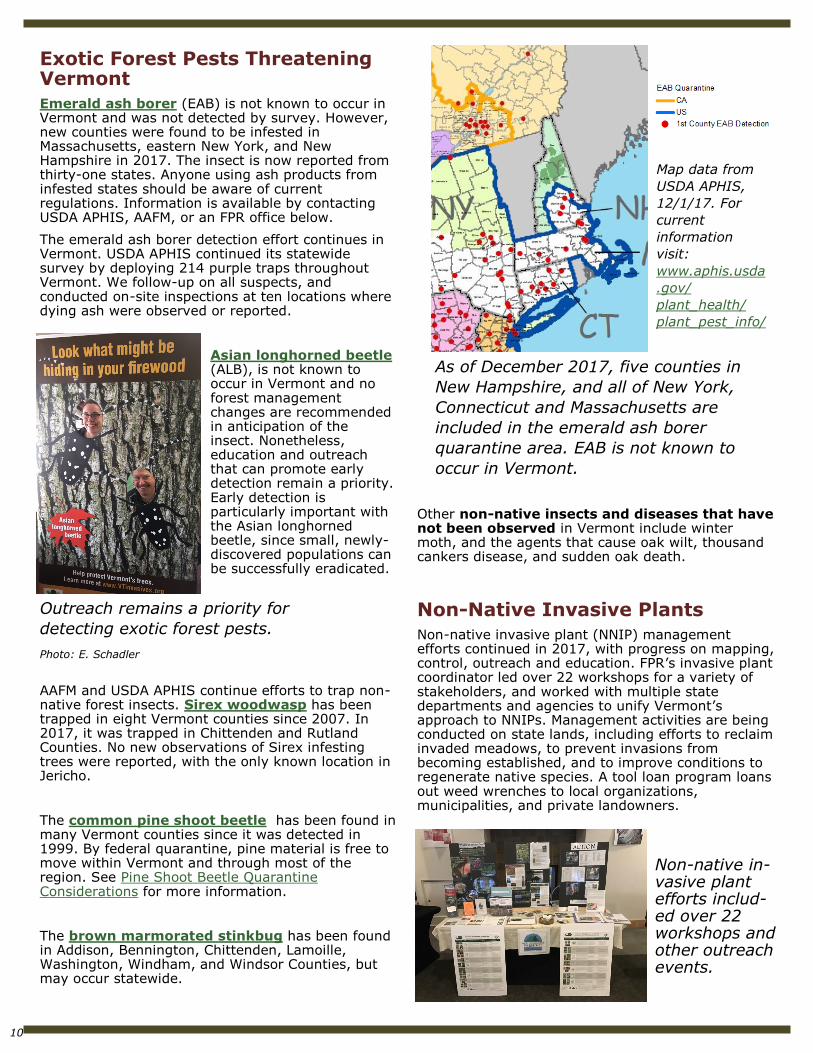
Emerald ash borer (EAB) is not known to occur in Vermont and was not detected by survey. However, new counties were found to be infested in Massachusetts, eastern New York, and New Hampshire in 2017. The insect is now reported from thirty-one states. Anyone using ash products from infested states should be aware of current regulations. Information is available by contacting USDA APHIS, AAFM, or an FPR office below.
The emerald ash borer detection effort continues in Vermont. USDA APHIS continued its statewide survey by deploying 214 purple traps throughout Vermont. We follow-up on all suspects, and conducted on-site inspections at ten locations where dying ash were observed or reported.
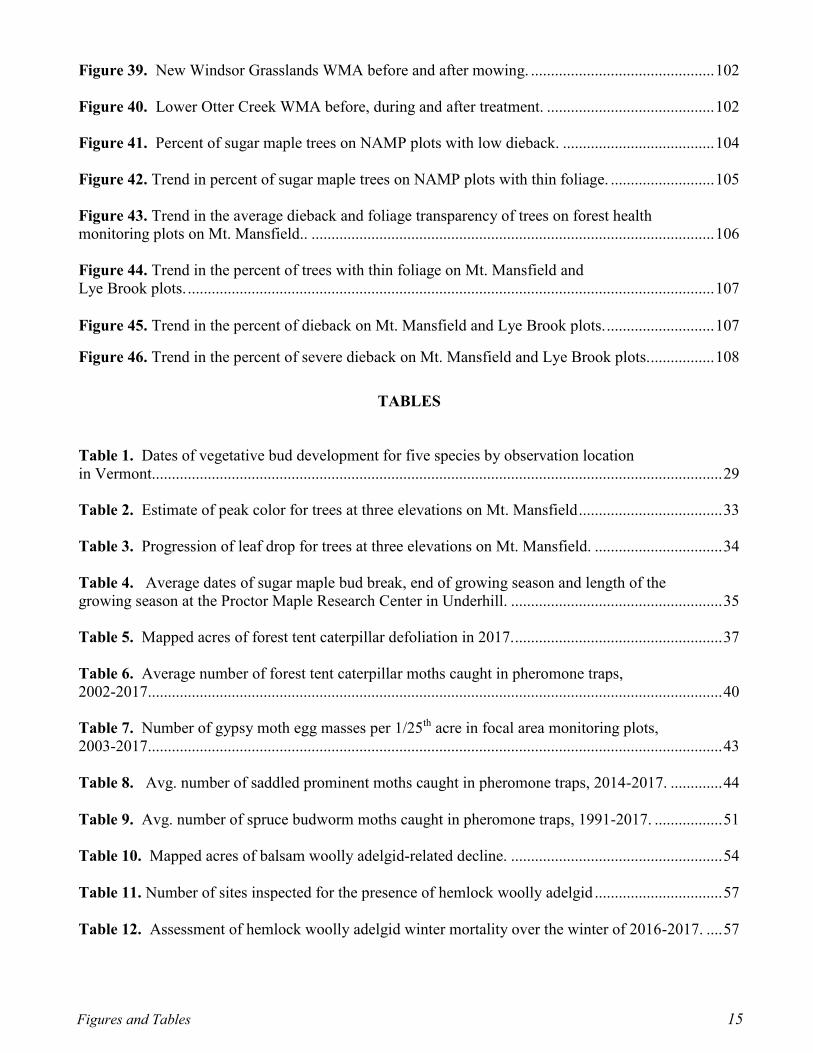
Asian longhorned beetle (ALB), is not known to occur in Vermont and no forest management changes are recommended in anticipation of the insect. Nonetheless, education and outreach that can promote early detection remain a priority. Early detection is particularly important with the Asian longhorned beetle, since small, newly-discovered populations can be successfully eradicated.
AAFM and USDA APHIS continue efforts to trap non-native forest insects. Sirex woodwasp has been trapped in eight Vermont counties since 2007. In 2017, it was trapped in Chittenden and Rutland Counties. No new observations of Sirex infesting trees were reported, with the only known location in Jericho.
The common pine shoot beetle has been found in many Vermont counties since it was detected in 1999. By federal quarantine, pine material is free to move within Vermont and through most of the region. See Pine Shoot Beetle Quarantine Considerations for more information.
The brown marmorated stinkbug has been found in Addison, Bennington, Chittenden, Lamoille, Washington, Windham, and Windsor Counties, but may occur statewide.
Other non-native insects and diseases that have not been observed in Vermont include winter moth, and the agents that cause oak wilt, thousand cankers disease, and sudden oak death.
Non-Native Invasive Plants
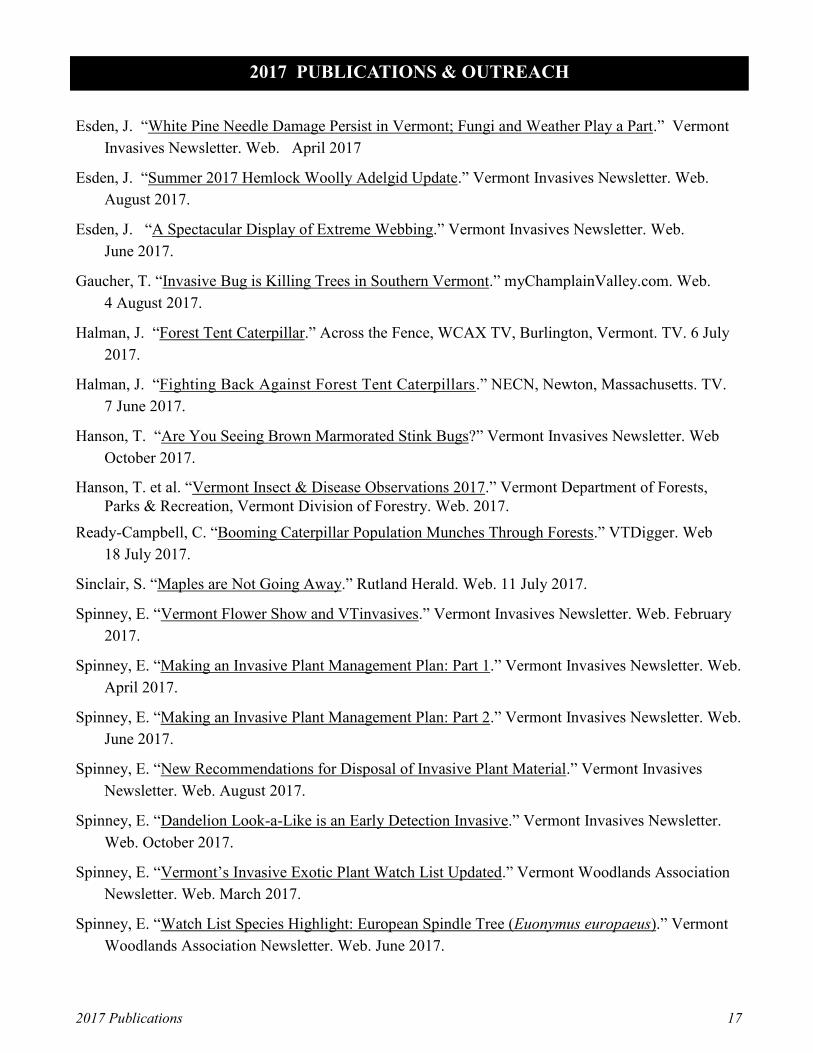
Non-native invasive plant (NNIP) management efforts continued in 2017, with progress on mapping, control, outreach and education. FPR’s invasive plant coordinator led over 22 workshops for a variety of stakeholders, and worked with multiple state departments and agencies to unify Vermont’s approach to NNIPs. Management activities are being conducted on state lands, including efforts to reclaim invaded meadows, to prevent invasions from becoming established, and to improve conditions to regenerate native species. A tool loan program loans out weed wrenches to local organizations, municipalities, and private landowners.
As of December 2017, five counties in
New Hampshire, and all of New York,
Connecticut and Massachusetts are
included in the emerald ash borer
quarantine area. EAB is not known to
occur in Vermont.
Map data from
USDA APHIS,
12/1/17. For
current
information
visit:
www.aphis.usda
.gov/
plant_health/
plant_pest_info/
Outreach remains a priority for
detecting exotic forest pests.
Photo: E. Schadler
Non-native in-vasive plant efforts includ-ed over 22 workshops and other outreach events.

11
The Vermont Invasive Exotic Plant Committee updated its Watch List of NNIP. Two early detection species of recent concern are species of Petasites, butterbur sweet coltsfoot (first documented in Vermont 2009) and Japanese sweet coltsfoot (first documented in 2016). Populations have been detected in 18 towns scattered throughout the state, and appear to be increasing rapidly.
Several targeted NNIP efforts are made possible through US Forest Service grant funding:
• The Mapping for Healthy Forests project continued efforts to provide a resource for tracking NNIP, with a focus on private and municipal lands. This citizen science project trains volunteers to conduct assessments and prioritize treatment areas. The information from this project is stored on the iNaturalist website; by mid-October the project exceeded 3,000 observations.
• A Habitat Restoration Crew was hired to lead a project focused on Education, Volunteer Outreach, & Capacity Building in southwestern Vermont. Management activities were conducted on over 20 state-owned properties. One example of the benefit of early detection and response was the crew’s effort to control a population of Phragmites australis threatening 300 acres of wetland in the Coolidge Management Unit. In 2016, the crew conducted drip application of herbicide to 1,000 Phragmites stems. By 2017, only five stems survived, which were treated. Elsewhere, management efforts included volunteers, with 348 assisting in 2017. Since 2014, this program has worked with 1,791 volunteers contributing 7,408 volunteer hours. Additionally, the crew worked on curriculum development for schools and creating interpretive materials for State Parks.
Local efforts contribute significantly to NNIP management. Highlights in 2017 included projects like South Burlington’s Weed Warriors, the Great Richmond Root-Out!, and NNIP management work completed by the Battenkill Watershed Comprehensive Invasive Species Management Association, Moving Towards Sustainability students at CCV-Winooski, and the Winooski Valley Park District.
Monitoring Forest Health
UrbanFIA work continued for the second year in Vermont. This US Forest Service program parallels traditional Forest Inventory and Analysis (FIA), measuring changes to forest demography and health through a network of long-term plots. Vermont was the first state to commit to a full UrbanFIA program, targeting urban areas statewide rather than focusing on a single metropolitan area. In 2017, all plots were completed by the end of June through the combined efforts of the USDA Forest Service, Vermont Department of Forests, Parks and Recreation, and the Forest Ecosystem Monitoring Cooperative. Data are collected on a seven year cycle, after which a statewide report will be published.
A Habitat Restoration Crew conducted NNIP management activities on over 20 state-owned properties (above). In the Plymsbury Basin, 1000 Phragmites stems were treated in 2016 (below left). Only five had survived when the site was re-visited in 2017 (below right).
The Mapping for Healthy Forests project trains vol-unteers to con-duct assessments. The website con-tains over 3,000 observations.
Local volun-teer efforts contribute significantly to NNIP manage-ment.

12
Vermont has continued to monitor sugar maple health in sugarbushes and in maple stands since 1988. In these North American Maple Project (NAMP) plots, 90% of trees were rated as having low dieback (less than 15%), compared to 95% in 2016. Dry conditions in 2016 may have been a factor in reduced tree health in 2017.
Thin foliage due to forest tent caterpillar defoliation was measured 9 of the 36 monitoring plots (25%). Seven had moderate-heavy defoliation (20%) and 2 had light defoliation (6%). Tree recovery through refoliation was minimal at most sites. Two additional sites were affected by pear thrips and frost. Statewide, there was an increase in trees with thin foliage from 7% in 2016 to 14% in 2017. Foliage transparency is sensitive to current stress factors. Other spikes in transparency were due to frost injury (2010, 2012, 2015), forest tent caterpillar defoliation (2004-2007, 2016), and pear thrips (1988-1989).
In addition, 48 forest health monitoring plots were sampled across Vermont in 2017 as part of the Forest Ecosystem Monitoring Cooperative (FEMC). Results from the original 23 sites on Mount Mansfield and Lye Brook Wilderness Area showed a decrease in both average dieback and foliage transparency, indicators of tree stress. An improvement in tree health in 2017 at these sites follows dry summer conditions in 2016.
2017-12
Fewer sugar maples had low dieback in
2017 than in 2016 in the North American
Maple Project plots (above). Dry conditions
and defoliation in 2016 may have been a
factor. Thin foliage in 2017 was mostly
due to forest tent caterpillar defoliation.
For more information,
contact the Forest
Biology Laboratory
at 802-879-5687 or:
Windsor & Windham Counties……………………………………………
Bennington & Rutland Counties…………………………………………
Addison, Chittenden, Franklin & Grand Isle Counties………
Lamoille, Orange & Washington Counties…………………………
Caledonia, Orleans & Essex Counties…………………………………
Springfield (802) 289-0613
Rutland (802) 786-0060
Essex Junction (802) 879-6565
Barre (802) 476-0170
St. Johnsbury (802) 751-0110
Forest health programs in the Vermont Department of Forests, Parks and Recreation (FPR) are supported, in part, by the US Forest Service, State and Private
Forestry. FPR works in partnership with the US Forest Service to monitor forest conditions and trends in Vermont and respond to pest outbreaks to protect the
forest resource. Jointly operated pest survey, detection, and management projects are conducted in cooperation with the Vermont Agency of Agriculture, Food
and Markets. We gratefully acknowledge additional contributions by the University of Vermont, USDA-APHIS, cooperating landowners, resource managers, and
citizen volunteers. In accordance with Federal law and US Department of Agriculture policy, this institution is prohibited from discrimination on the basis of
race, color, national origin, sex, age, or disability. Where not otherwise noted, photo credits are VT Department of Forests, Parks and Recreation.
FEMC monitoring sites include Mount
Mansfield (right) and Lye Brook Wilder-
ness Area. Tree health generally im-
proved in these sites in 2017.

Figures and Tables 13
FIGURES AND TABLES
Figure 1. Vermont drought maps, March 7 to May 2, 2017. ................................................................ 20
Figure 2. State of drought in Vermont as of October 24, 2017. ............................................................ 22
Figure 3. Monthly average temperature and total monthly precipitation in 2017, compared to
normal for Burlington, Vermont. ............................................................................................................ 24
Figure 4. Monthly rainfall amounts (in inches) at Vermont fire weather observation stations
through fire season, March – October, 2017. .......................................................................................... 25
Figure 5. Monthly rainfall amounts (in inches) at the Nulhegan fire weather observation
station in Brunswick, Vermont compared to normal through fire season, April-October, 2017. ........... 25
Figure 6. Monthly rainfall amounts (in inches) at the fire weather observation station in Elmore,
Vermont compared to normal through fire season, April-October, 2017. .............................................. 26
Figure 7. Monthly rainfall amounts (in inches) at the fire weather observation station in Essex,
Vermont compared to normal through fire season, April-October, 2017. .............................................. 26
Figure 8. Monthly rainfall amounts (in inches) at the fire weather observation station in Danby,
Vermont compared to normal through fire season, April-October, 2017. .............................................. 27
Figure 9. Monthly rainfall amounts (in inches) at the fire weather observation station in
Woodford, Vermont through fire season, April– October, 2017. ........................................................... 27
Figure 10. Sugar maple bud break and leafout at Proctor Maple Research Center, Underhill,
Vermont. ................................................................................................................................................. 28
Figure 11. Difference from long-term average of sugar maple bud break and leaf out at Proctor
Maple Research Center, Underhill, Vermont. ........................................................................................ 29
Figure 12. Timing of fall color of 5 tree species at 3 elevations on Mt. Mansfield. ............................. 30
Figure 12a. All species color at 1400 feet ................................................................................. 30
Figure 12b. All species color at 2200 feet ................................................................................. 31 Figure 12c. All species color at 2600 feet .................................................................................. 31
Figure 12d. Sugar maple color at 1400 and 2200 feet ............................................................... 32
Figure 12e. Red maple color - female and male, 1400 feet ....................................................... 32
Figure 12f. Yellow birch color at 1400, 2200, and 2600 feet .................................................... 33
Figure 13. Forest tent caterpillar defoliation mapped in 2017. ............................................................. 38
Figure 14. Predicted vs. mapped defoliation from forest tent caterpillar based on egg mass
surveys.. .................................................................................................................................................. 39
Figure 15. Average number of forest tent caterpillar moths caught in pheromone traps,
1989-2017. .............................................................................................................................................. 41
FIGURES

Figures and Tables 14
Figure 16. Number of gypsy moth egg masses per 1/25th acre in focal area monitoring
plots, 1987-2017. .................................................................................................................................... 42
Figure 17. Saddled prominent traps locations in 2017. ......................................................................... 45
Figure 18. Avg. number of spruce budworm moths caught in pheromone traps,
1983-2017. .............................................................................................................................................. 50
Figure 19. Locations of spruce budworm pheromone traps in 2017. .................................................. 52
Figure 20. Balsam woolly adelgid related decline mapped in 2017. .................................................... 55
Figure 21. Overwintering mortality of hemlock woolly adelgid in Windham County, 2010-2017. .... 58
Figure 22. Total number of thrips collected at Proctor Maple Research Center in Underhill, VT, 1993-2017. ...................................................................................................................... 59
Figure 23. Red pine decline mapped in 2017. ....................................................................................... 61
Figure 24. Acres of beech bark disease mapped in Vermont during aerial surveys,
1990 to 2017. .......................................................................................................................................... 73
Figure 25. Beech bark disease related decline and mortality mapped in 2017. .................................... 74
Figure 26. White pine needle damage mapped in 2017. ....................................................................... 79
Figure 27. Chlorosis severity of white pines surveyed between 2012-2017 in Vermont. .................... 80
Figure 28. Defoliation severity of white pines surveyed between 2012-2017 in Vermont. ................. 80
Figure 29. Average trends in yellowing severity and defoliation of white pines sampled in
Vermont between 2012-2017. ................................................................................................................. 81
Figure 30. Symptoms of drought damage mapped in 2017. ................................................................. 85
Figure 31. Symptoms of logging-related damage mapped in 2017. ..................................................... 87
Figure 32. Symptoms of rainfall-induced chlorosis damage mapped in 2017. ..................................... 89
Figure 33. Symptoms of damage from unknown causal agent mapped in 2017. ................................. 91
Figure 34. Trend in acres of forest decline related to wet or flooded sites. ........................................... 93
Figure 35. Wet or flooded site related decline mapped in 2017. ........................................................... 94
Figure 36. Trend in wind and storm damage mapped during aerial surveys. ........................................ 95
Figure 37. Plymsbury WMA Beaver Meadow phragmites control. ................................................... 100
Figure 38. There’s more than invasive plants to remove from the floodplain forest in
Richmond, Vermont. . ........................................................................................................................... 101
Figures and Tables 15
Figure 39. New Windsor Grasslands WMA before and after mowing. .............................................. 102
Figure 40. Lower Otter Creek WMA before, during and after treatment. .......................................... 102
Figure 41. Percent of sugar maple trees on NAMP plots with low dieback. ...................................... 104
Figure 42. Trend in percent of sugar maple trees on NAMP plots with thin foliage. .......................... 105
Figure 43. Trend in the average dieback and foliage transparency of trees on forest health monitoring plots on Mt. Mansfield.. ..................................................................................................... 106
Figure 44. Trend in the percent of trees with thin foliage on Mt. Mansfield and
Lye Brook plots. .................................................................................................................................... 107
Figure 45. Trend in the percent of dieback on Mt. Mansfield and Lye Brook plots. ........................... 107
Figure 46. Trend in the percent of severe dieback on Mt. Mansfield and Lye Brook plots................. 108
Table 1. Dates of vegetative bud development for five species by observation location
in Vermont............................................................................................................................................... 29
Table 2. Estimate of peak color for trees at three elevations on Mt. Mansfield .................................... 33
Table 3. Progression of leaf drop for trees at three elevations on Mt. Mansfield. ................................ 34
Table 4. Average dates of sugar maple bud break, end of growing season and length of the
growing season at the Proctor Maple Research Center in Underhill. ..................................................... 35
Table 5. Mapped acres of forest tent caterpillar defoliation in 2017. .................................................... 37
Table 6. Average number of forest tent caterpillar moths caught in pheromone traps,
2002-2017................................................................................................................................................ 40
Table 7. Number of gypsy moth egg masses per 1/25th acre in focal area monitoring plots,
2003-2017................................................................................................................................................ 43
Table 8. Avg. number of saddled prominent moths caught in pheromone traps, 2014-2017. ............. 44
Table 9. Avg. number of spruce budworm moths caught in pheromone traps, 1991-2017. ................. 51
Table 10. Mapped acres of balsam woolly adelgid-related decline. ..................................................... 54
Table 11. Number of sites inspected for the presence of hemlock woolly adelgid ................................ 57
Table 12. Assessment of hemlock woolly adelgid winter mortality over the winter of 2016-2017. .... 57
TABLES

Figures and Tables 16
Table 13. Pear thrips counts on yellow sticky traps at Proctor Maple Research Center in
Underhill, Vermont in 2017. ................................................................................................................... 59
Table 14. Mapped acres of red pine decline in 2017. ........................................................................... 60
Table 15. Numbers of bags of firewood brought into Vermont State Parks during the
2009-2017 camping seasons. .................................................................................................................. 67
Table 16. Target insects collected in Vermont as part of the Exotic Wood Borer/Bark Beetle
National Survey. ..................................................................................................................................... 68
Table 17. Mapped acres of beech bark disease in 2017. ....................................................................... 73
Table 18. Mapped acres of white pine needle damage in 2017. ........................................................... 78
Table 19. Mapped acres of drought symptoms in 2017. ....................................................................... 84
Table 20. Mapped acres of frost damage in 2017. ................................................................................. 86
Table 21. Mapped acres of logging-related damage in 2017. ................................................................ 86
Table 22. Ozone bioindicator sites visited in 2017 and observed ozone injury ..................................... 88
Table 23. Mapped acres of rainfall-induced chlorosis damage in 2017. ................................................ 88
Table 24. Mapped acres of damage from unknown causes in 2017. ..................................................... 90
Table 25. Trend in acres of forest damage from weather events. .......................................................... 92
Table 26. Mapped acres of forest decline associated with flooded or otherwise wet sites. ................... 93
Table 27. Mapped acres of wind damage in 2017 .................................................................................. 95
Table 28. Percent of NAMP sites reporting various damages in 2017. ............................................... 105
Table 29. New dead overstory trees on Mt. Mansfield and Lye Brook monitoring plots. ................... 108
Table 30. Percent of total number of damaged trees recorded by special damage type on
Mt. Mansfield and Lye Brook monitoring plots. .................................................................................. 109
2017 Publications 17
Esden, J. “White Pine Needle Damage Persist in Vermont; Fungi and Weather Play a Part.” Vermont
Invasives Newsletter. Web. April 2017
Esden, J. “Summer 2017 Hemlock Woolly Adelgid Update.” Vermont Invasives Newsletter. Web.
August 2017.
Esden, J. “A Spectacular Display of Extreme Webbing.” Vermont Invasives Newsletter. Web.
June 2017.
Gaucher, T. “Invasive Bug is Killing Trees in Southern Vermont.” myChamplainValley.com. Web.
4 August 2017.
Halman, J. “Forest Tent Caterpillar.” Across the Fence, WCAX TV, Burlington, Vermont. TV. 6 July
2017.
Halman, J. “Fighting Back Against Forest Tent Caterpillars.” NECN, Newton, Massachusetts. TV.
7 June 2017.
Hanson, T. “Are You Seeing Brown Marmorated Stink Bugs?” Vermont Invasives Newsletter. Web
October 2017.
Hanson, T. et al. “Vermont Insect & Disease Observations 2017.” Vermont Department of Forests,
Parks & Recreation, Vermont Division of Forestry. Web. 2017.
Ready-Campbell, C. “Booming Caterpillar Population Munches Through Forests.” VTDigger. Web
18 July 2017.
Sinclair, S. “Maples are Not Going Away.” Rutland Herald. Web. 11 July 2017.
Spinney, E. “Vermont Flower Show and VTinvasives.” Vermont Invasives Newsletter. Web. February
2017.
Spinney, E. “Making an Invasive Plant Management Plan: Part 1.” Vermont Invasives Newsletter. Web.
April 2017.
Spinney, E. “Making an Invasive Plant Management Plan: Part 2.” Vermont Invasives Newsletter. Web.
June 2017.
Spinney, E. “New Recommendations for Disposal of Invasive Plant Material.” Vermont Invasives
Newsletter. Web. August 2017.
Spinney, E. “Dandelion Look-a-Like is an Early Detection Invasive.” Vermont Invasives Newsletter.
Web. October 2017.
Spinney, E. “Vermont’s Invasive Exotic Plant Watch List Updated.” Vermont Woodlands Association
Newsletter. Web. March 2017.
Spinney, E. “Watch List Species Highlight: European Spindle Tree (Euonymus europaeus).” Vermont
Woodlands Association Newsletter. Web. June 2017.
2017 PUBLICATIONS & OUTREACH

2017 Publications 18
Spinney, E. “New Recommendations for Disposal of Invasive Plant Material.” Vermont Woodlands
Association Newsletter. Web. September 2017.
Spinney, E. “Watch List Species Highlight: Autumn Olive and Russian Olive.” Vermont Woodlands
Association Newsletter. Web. December 2017.
Vermont Department of Forests, Parks & Recreation. 2017. “Forest Tent Caterpillar Update.” Vermont
Forest Health Leaflet 2017-08. 4pp. Web. September 2017.

Weather and Phenology 19
WEATHER AND PHENOLOGY
2017 Weather Summary
2017 was the 3rd warmest average temperature on record in Burlington dating back to 1892 (2016 was
the 2nd warmest year). However, the year ended with a dramatic cold snap reminiscent of an old-
fashioned Vermont winter. High temps the week after Christmas in the single digits either side of zero
were felt across the state. Low temps bottomed out in the negative single digits in typically warmer
locations to the negative twenties in cold pockets. This bone chilling cold continued into 2018.
Winter 2016-2017
Winter 2016-2017 was the 2nd warmest on record in Burlington, the 3rd warmest in Montpelier (2015-
2016 the warmest) and the 5th warmest in St. Johnsbury (2015-2016 the warmest). This is the second year
in a row that warm winters were observed at the National Weather Service in Burlington, Vermont.
From December 2016 through February 2017, temperatures were 3° to 7° above normal across the state
and snowfall was near normal to below normal through most of the period. Some Vermont maple pro-
ducers took advantage of the warmer weather, got trees tapped early and even made some syrup starting
in January.
A series of snow storms through mid-February blanketed the state in snow with amounts ranging from 12
to 50 inches in the mid and upper elevations and a trace to 8 inches in the Champlain valley. The snow-
pack took a hit, however, from February 23-26, when record breaking high temperatures were recorded.
Temperatures reached the upper 50’s, the low, mid and upper 60’s and even 72° in Burlington. No snow
remained in the Champlain valley east to the base of the Green Mountains and a trace to 16 inches re-
mained across the rest of the state except for the highest elevations and Essex County.
The snow returned in March along with intense cold. By March 4, temps plunged into the single digits
and low teens breaking lowest maximum high temperature records across the state. The cold continued
through much of the month averaging 4 to 8 degrees below normal. Along with the cold came snow.
March averaged above normal snowfall statewide with the most snow falling in the northern part of the
state. A single 2-day storm on March 14-15, known as the “Pi Day” nor’easter, brought snow, wind and
headaches from Virginia to Maine. Between 1 and 3 feet of snow fell across the state. Schools, business-
es and state offices closed, and flights were cancelled across the country. Blowing and drifting snow
made road clearing difficult. The storm ranked number 2 for Burlington’s all time snowiest storms with
30.4 inches.
Spring, 2017
Snow melted rapidly during a warm and dry period the week of April 9. By April 15, only small patches
of snow remained on north facing, shaded and wooded areas of the northeast and in high elevations. This
dry period was enough to elevate fire danger. From April 9 to 15, thirteen fires were reported with 8 re-
ported on April 15. This was the most active period for fires all year.
May averaged cooler and wetter than normal. The 2016 drought hung on in parts of Vermont despite a
snowy winter and damp April. The last abnormally dry area along the Connecticut River Valley in Wind-
sor County finally received enough rain to take it out of drought on May 2 (Figure 1).

Weather and Phenology 20
The rest of the month was chilly and gloomy with
frequent light rain amounting to less than a tenth
of an inch on most rainy days. However, there
were a few severe storms as well. A severe wind-
storm knocked down trees and powerlines in Rut-
land County on May 5. On May 18 and again on
May 31, strong storms with torrential rain, gusty
winds and hail caused damage in Rutland, Addi-
son, Chittenden, Lamoille, Washington, Orange
Counties and northeastern Vermont. (See the May,
2017 Forest Health Insect & Disease Observations
report for more storm details.)
The lack of sunshine during the month kept tem-
peratures below normal for all but the northwest corner of the state. On May 8 and 9, one to two inches
of snow was recorded at the higher elevations of the Green Mountains, the NEK and Orange County.
Scattered frost damage resulted in some areas where temperatures were well below normal.
The month wasn’t without warmth. The week of May 14, had the greatest temperature swings. High
temperatures in Burlington fluctuated from 54° on May 14 to record breaking 90’s on the 17th and 18th
and back into the low 60’s by the end of the week. Elsewhere in the state saw similar variations except
that temps were cooler on the 14th in higher elevations and warmer on the 20th in lower Connecticut
River valley.
Summer, 2017
Meteorological summer - June, July and August, was cooler and wetter than normal. After a similar
trend in May, it seemed that summer would never come. Despite the chilly, gloomy weather, high tem-
perature records were broken in June with 88° in Montpelier on June 11 and 12 and in Burlington on
June 11 with a high of 95° and June 12 with a high of 94°. A heat wave occurred in Springfield on June
11, 12, and 13 with 90°, 94°, and 90° respectively. Temps in the 90° range were reported in several lo-
cations around the state. It would be September before 90° temps were recorded again in 2017.
In fact, lowest maximum temperature records were recorded in July with temps in the upper 50’s to up-
per 60’s on July 14-15 and again on July 24-25. South Lincoln set the lowest minimum temperature rec-
ord of 34° on July 29.
A dry stretch of weather accompanied the warm temps…a welcome and noticeable break after a soggy
May, but by mid-June, the rain and chill returned. A series of severe storms occurred during the latter
part of the month. Damage was generally minimal and localized. The last week of June was unsettled
with bouts of rain, severe weather including strong winds and hail and even some breaks of sun. Soils
were saturated, especially in northern Vermont. A long duration storm, from June 29 through July 1,
brought more rain and flooding. Total rain amounts from 0.10 to over 4 inches were recorded statewide.
Several roads were closed or were down to a single lane and the Vermonter Amtrak rail service was in-
terrupted. Homes and businesses, hayfields and corn crops were affected as well. Damage was wide-
spread affecting Addison, Bennington, Caledonia, Lamoille, Orange, Rutland, Washington and Windsor
Counties. By mid-July, 6.5 million dollars in damage to roads, culverts, bridges and municipal buildings
was assessed in preparation for a FEMA declaration. (See the July, 2017 Forest Health Insect & Disease
Observations report for more details.)
Figure 1. Vermont drought maps, March 7 to May 2, 2017.
Source: U.S. Drought Monitor

Weather and Phenology 21
Rainfall was below normal from mid-July through August, and like May, frequent cloudy and rainy
days with hit or miss storms were the common weather pattern that caused localized damage. On Au-
gust 21, sunny skies in Vermont allowed an unobstructed view of a partial solar eclipse. A full solar
eclipse was visible across the country with the path of totality stretching from Oregon to South Caroli-
na. Eclipse fever was short-lived, however, when category 4-Hurricane Harvey made landfall in Texas
on August 25.
While rain dumped on Texas and the southern U.S., a blocking high pressure system over the northeast-
ern U.S. brought dry weather to Vermont and the northeast. Temperatures felt more like fall with over-
night temps in the 40’s, even 30’s in the cold spots and daytime highs only reaching the 60’s.
Fall, 2017
September got off to a normal start. Temps were actually below normal early in the month with some
localized frosts in the colder pockets of the northeast and sheltered valleys. Fall color brightened under
sunny skies and shorter days and then the pattern reversed. A huge ridge of high pressure, a northward
bulge in the jet stream, stalled in place due to lack of strong winds. Tropical warm air moved north.
Temperatures soared and records were shattered. Summer had finally arrived.
On September 24, Burlington recorded 91° breaking the record of 84° set in 1961. This was the latest
occurrence of 90° or warmer on record going back to September 15, 1939. This record was broken
again on the September 25, 26 and 27, 2017. It was also the latest heat wave on record with the previ-
ous occurring September 8-10, 2002 and tied the record for most 90° or warmer days in September.
That record had only been reached once before in 1945.
Well above normal temperatures were recorded statewide from mid-September through the end of the
month. Heat waves were also recorded in Springfield, Essex, Danby and even at the Nulhegan fire
weather station in Brunswick.
The ridge of high pressure that brought the heat also blocked remnants of Hurricane Irma and the north-
ern progress of Hurricanes Jose and Maria. As a result, September was drier than normal after a wide-
spread rainfall on September 3 and scattered storms on September 5. By September 28, the U.S.
Drought Monitor listed most of Rutland County into Windsor County as abnormally dry.
Burlington recorded a streak of 20 dry days. This tied the 7th longest stretch of dry weather on record
dating back to January 1884. The streak ended on September 30 with .01 inch of rain. The same weath-
er system brought light rain to other parts of the state. The highest amounts were just over 0.3 inches. A
trace of snow was recorded on the top of Mt. Mansfield.
With the onset of the hot and dry weather pattern, fall color change stalled. Except for an occasional
pop of bright color here and there, lots of green persisted into October. A short return to cooler, damper
weather sparked the color change just in time for Columbus Day weekend. Color was brilliant along
roadways and villages and where leaves remained on the hillsides. Color remained in the Champlain
valley and southern Vermont through the end of the month. A quote from a FPR report describing the
1999 foliage season said, “Depending on where you looked, the foliage season was everything from
spectacular to disappointing. The distant panoramas in the high country were muted by the dry summer,
but the closeup views along the roadways and in the villages were as gorgeous as ever.” Except for the
dry summer reference, that sums up the 2017 season quite well.
The warm, dry weather pattern brought an elevated risk for wildfires by mid-October. With an abun-
dance of cured vegetation and newly fallen leaves, fire danger increased but only 10 small fires were

Weather and Phenology 22
reported. By October 24, moderate drought was in place in parts of Rut-
land, Windsor, Orange and Washington Counties. Most of the rest of the
state was abnormally dry (Figure 2). Despite heavy rains late in the
month, abnormally dry conditions persisted through November in parts of
Rutland, Windsor, Orange and Washington Counties.
A summerlike storm with warm temps and high humidities brought some
much needed rain on October 25. A record 78° in Burlington was 24 de-
grees above normal. Rainfall amounts from 0.25 to 0.75 of an inch were
recorded in western Vermont and from 1 to 3 inches in eastern Vermont.
Strong, gusty winds accompanied this storm as well with gusts 30 to 40
mph especially in western Vermont.
An even more powerful and destructive storm arrived a few days later, on
October 29-30. Rain and winds were forecast days in advance. The storm
was part of a larger east coast system that drew winds from the east and
pulled in the remnants of Tropical Storm Philippe similar to what hap-
pened with Superstorm Sandy. Downed trees and powerlines caused
power outages to over 1 million people across New England. Flooding was reported in parts of the re-
gion as well. In Vermont, rainfall amounts varied from 0.25 of an inch in northwestern Vermont to over
4 inches in southeastern Vermont.
The destructive winds, though, were the most significant part of this storm. Tree damage occurs when
wind speeds exceed 40 mph. Very few parts of the state saw wind gusts less than that. These strong
winds brought down trees and powerlines overnight on October 29. Wind gusts in the upper 30 and 40
mph range were common with gusts over 60 mph in the Champlain valley and western slopes of the
Green Mountains. The National Weather Service reported wind speeds on Mt. Mansfield of 115 mph.
By the morning of October 30, power outages to nearly 70,000 Vermont homes and businesses were
reported across the state. Some outages involved broken poles and damage to substations requiring spe-
cialized crews to restore. A limited number of out-of-state crews were available to help with restoration
as the storm affected an area from Virginia to Maine. For many utilities in Vermont and northern New
England, damage from this storm was worse than each utility’s most historic storm. It would be a week
or more before power was restored to everyone.
Damage was widespread. Roads were blocked from downed trees, debris and powerlines. Over 200
schools were closed across the state and travel was difficult. In Stowe, 13 roads were closed and 60% of
the town was without power. State land in central Vermont received significant blowdowns. The Cady
Hill Town Forest and the Cotton Brook/Nebraska Valley areas of Mt. Mansfield State Forest were hard
hit. Also affected by the storm was the trail to Spruce Mountain in Plainfield (LR Jones State Forest).
The month of October finished with above normal temperatures. It was the warmest on record at the
National Weather Service in Burlington, more than 10° warmer than normal. October was also the
warmest for Montpelier, almost 8° above normal. The month was wetter than normal in eastern Ver-
mont and drier than normal on the western side.
October warmth lingered into the first week of November, but normal chilly temps arrived by Novem-
ber 8. On the 7th, drizzle turned to snow in southern Vermont and New England late in the afternoon
with a dusting of snow overnight. Ski areas across the region cranked up the snow guns in anticipation
of a Veteran’s Day weekend opening. Natural snow was harder to come by through the month. On
November 20, lake effect snow from Lakes Superior, Huron, Ontario and Erie made it to Vermont. The
U.S. Drought Monitor
October 24, 2017
Figure 2. State of drought in
Vermont as of October 24, 2017.
Weather and Phenology 23
western slopes of the Green Mountains received the most with reports of 6 inches in Jericho Center and
5 inches in Jonesville but by the end of the month, very little remained.
December snow lagged as well until mid-month. A substantial snowstorm started on December 12 and
continued through the afternoon of December 13. Up to 18 inches of snow fell in the southern Green
Mountains, 8 to 12 inches from the western slopes of the Greens east and 4 to 8 inches in western Ver-
mont. Another light, fluffy 2 to 12 inches fell on December 22, just in time for Christmas. However,
rain on December 23 turned frozen surfaces to ice and washed the snow from trees. Slick roads impact-
ed travel and made for many accidents as rain hit below freezing surfaces across the state. The Con-
necticut River valley was hit the hardest from just south of St. Johnsbury down to Brattleboro. More
than 5,000 homes and businesses lost power. Weather improved for Christmas Eve, but snow returned
again on Christmas morning with an additional 2 to 12 inches statewide. Eastern and southern Vermont
received the most, but a White Christmas was had by all.
Along with the snow came colder than normal temperatures. By mid-month, temperatures were colder
than normal by 4 to 8 degrees due in part to the wave of arctic air from Canada the last week of the
year. This cold wave settled in across much of the eastern two-thirds of the U.S. late in the month.
Vermont felt the blast of cold temperatures and wind chills after Christmas that lingered into the new
year. You know it’s cold when Jay Peak Resort shuts down lifts to the upper mountain. On December
28, the temperature above 2,500 feet on Jay was -31 not counting the wind.
Figures 3-12 and Tables 1-4 provide details on 2017 temperatures, precipitation and phenological
observations.

Weather and Phenology 24
Figure 3. Monthly average temperature and total monthly precipitation in 2017, compared to normal
for Burlington, Vermont. (Normals are for years 1981-2010.) Source: National Weather Service,
Burlington, Vermont.

Weather and Phenology 25
Figure 4. Monthly rainfall amounts (in inches) at Vermont fire weather observation stations through
fire season, March-October, 2017.
Figure 5. Monthly rainfall amounts (in inches) at the Nulhegan fire weather observation station in
Brunswick, Vermont compared to normal through fire season, April-October, 2017. Normal is based on
15 years of data.

Weather and Phenology 26
Figure 6. Monthly rainfall amounts (in inches) at the fire weather observation station in Elmore,
Vermont compared to normal through fire season, April-October, 2017. Normal is based on 23 years
of data.
Figure 7. Monthly rainfall amounts (in inches) at the fire weather observation station in Essex,
Vermont compared to normal through fire season, April-October, 2017. Normal is based on 24 years
of data.
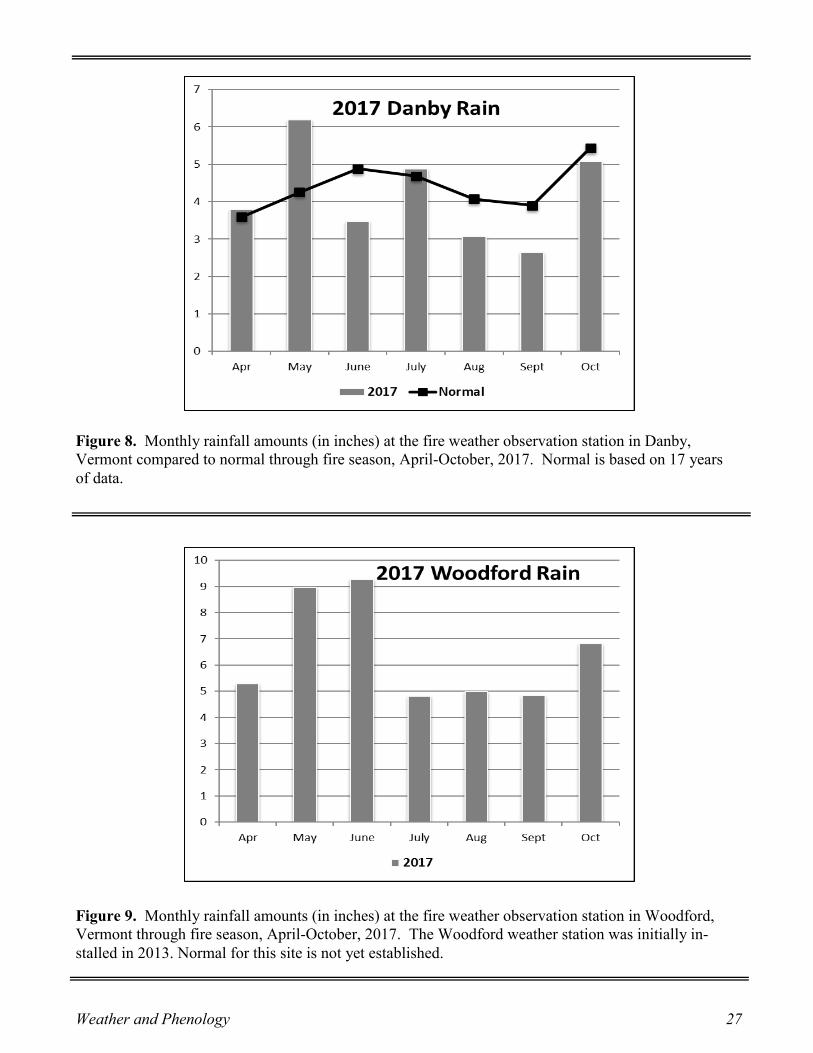
Weather and Phenology 27
Figure 8. Monthly rainfall amounts (in inches) at the fire weather observation station in Danby,
Vermont compared to normal through fire season, April-October, 2017. Normal is based on 17 years
of data.
Figure 9. Monthly rainfall amounts (in inches) at the fire weather observation station in Woodford,
Vermont through fire season, April-October, 2017. The Woodford weather station was initially in-
stalled in 2013. Normal for this site is not yet established.

Weather and Phenology 28
Spring Bud Break and Leaf Out at Mount Mansfield
Sugar maple trees were monitored for the timing of budbreak and leaf out in the spring at the Proctor
Maple Research Center in Underhill as part of the Forest Ecosystem Monitoring Cooperative. Sugar
maple leaf bud expansion was slightly earlier than normal in 2017. Budbreak on April 29th was 4 days
earlier than the long-term average. Full leaf-out was nearly indistinguishable from the long-term aver-
age (Figure 10), but was two days earlier than in 2016.
Figure 10. Sugar maple bud break (Bud Stage 4) and leaf-out (Bud Stage 8) at Proctor Maple Research
Center, Underhill, Vermont.

Weather and Phenology 29
Figure 11. Difference from long-term average of sugar maple bud break and leaf-out at Proctor Maple
Research Center, Underhill, VT.
Table 1. Dates of vegetative bud development for five species by observation location in Vermont.
Species Location Bud swell Bud break Leaf-out
Sugar maple Underhill 4/20 4/29 5/19
Red maple Underhill 4/12 5/4 5/22
White ash Underhill 5/4 5/11 5/30
Yellow birch Underhill 4/26 5/6 5/22
Eastern hemlock Springfield 5/9 5/18 5/26

Weather and Phenology 30
Fall Color Monitoring at Mount Mansfield
A total of 45 trees (5 trees per elevation per species) at three elevations in Underhill were monitored for
the timing of peak fall color and leaf drop (Figure 12). Five trees from each of the following species
were monitored per elevation:
At 1400 feet: Red maple (male), Red maple (female), Sugar maple, White ash, Yellow Birch
At 2200 feet: Sugar maple, Yellow Birch
At 2600 feet: Paper birch, Yellow Birch
In general, peak color was later than usual in 2017, with low elevation sugar maple, and high elevation
paper birch being the exceptions (Table 2). Some aberrations were noted in the progression of color
with double-peaks presenting themselves in the data (Figure 12 b). This was likely due to initial color
change that stalled, followed by some leaf drop due to dry conditions of early fall. Color development
subsequently continued, leading to peak color after this early period. Growing season length in 2017
was the longest since 2012, and exceeded the long-term average by 12 days (Table 4).
Figure 12. Timing of fall color (Figure 12 a-f) and leaf drop were monitored at three elevations on
Mount Mansfield in 2017: 1400 feet at the Proctor Maple Research Center, and 2200 and 2600 feet near
Underhill State Park. Five species are monitored: sugar maple, red maple (male and female trees), white
ash, paper birch and yellow birch.
Figure 12 a.
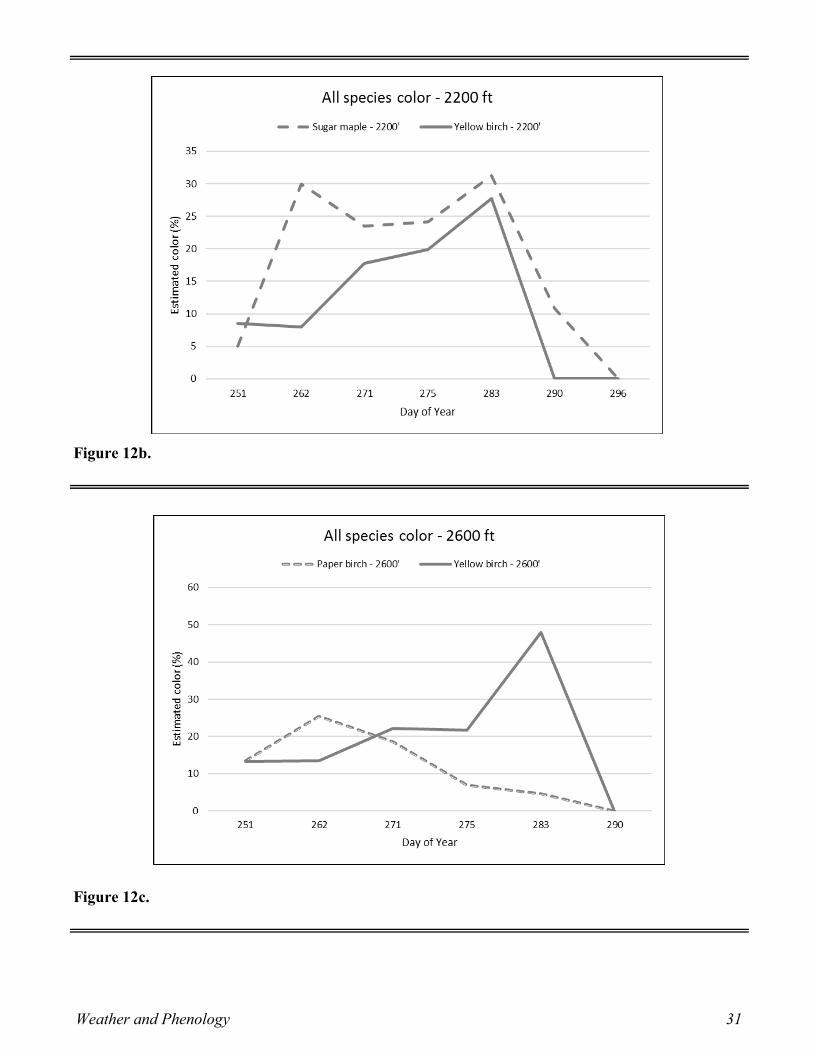
Weather and Phenology 31
Figure 12b.
Figure 12c.

Weather and Phenology 32
Figure 12 e.
Figure 12 d.

Weather and Phenology 33
Figure 12 f.
Table 2. Estimates of peak color based on percent color and percent of foliage present for trees at
three elevations on Mt. Mansfield. Lengths of long-term averages differ by species, with trees at 2600
feet having a 19-year record, red maple and white ash a 23-year record, sugar maple at 1400 feet a 27-
year record, and all other trees a 26-year record. Color was considered “peak” when the highest inte-
grated value of color and leaf presence occurred.
Peak Color
Long-term average
(Day of year) 2017 data
(Day of year)
Elevation 1400'
Red maple (Female) 281 283
Red maple (Male) 284 290 Sugar maple 287 283 Yellow birch 285 290 White ash 279 290
Elevation 2200'
Sugar maple 278 283
Yellow birch 276 283
Elevation 2600'
Yellow birch 276 283
Paper birch 269 262

Weather and Phenology 34
Leaf Drop
50% leaf drop > 95% leaf drop
Long-term
average
(Day of
year)
2017 data
(Day of
year)
Long-term
average
(Day of
year)
2017 data
(Day of
year)
Elevation 1400'
Red maple (Female) 289 291 300 301
Red maple (Male) 291 295 300 302
Sugar maple 290 291 303 302
Yellow birch 288 293 298 302
White ash 285 292 297 301
Elevation 2200' Sugar maple 282 282 295 294
Yellow birch 279 280 292 289
Elevation 2600' Yellow birch 278 282 290 290
Paper birch 272 262 287 283
Table 3. Progression of leaf drop for trees at three elevations on Mt. Mansfield. Day of year when ei-
ther 50% of foliage had dropped or more than 95% of foliage had dropped are included for both this
year, and for the long-term average.

Weather and Phenology 35
Table 4. Average dates of sugar maple bud break, end of growing season (leaf drop) and length of the
growing season at the Proctor Maple Research Center in Underhill.
Year Date of Bud
break
Date of End of
Growing Season
Length of growing
season (days)
1991 4/28 10/15 171
1992 5/7 10/13 159
1993 5/4 10/18 167
1994 5/6 10/14 161
1995 5/13 10/19 159
1996 5/14 10/22 161
1997 5/16 10/14 151
1998 4/17 10/15 181
1999 5/5 10/19 167
2000 5/9 10/17 161
2001 5/4 10/15 164
2002 4/18 11/5 201
2003 5/9 10/28 172
2004 5/4 10/27 175
2005 5/2 10/27 178
2006 5/2 10/16 167
2007 5/7 10/22 168
2008 4/22 10/15 175
2009 4/30 10/29 182
2010 4/22 10/26 187
2011 5/7 10/19 163
2012 4/16 10/16 186
2013 5/3 10/15 165
2014 5/12 10/20 161
2015 5/6 10/30 177
2016 5/9 10/31 175
2017 4/29 10/29 183
Long term Average
(1991-2017) 5/4 10/21 171

Hardwood Defoliators 36
HARDWOOD DEFOLIATORS
FOREST INSECTS
Forest Tent Caterpillar (FTC), Malacosoma disstria, populations increased statewide in 2017, with
60,588 acres of defoliation mapped during aerial surveys. This accounts for roughly 2% of the northern
hardwood forest in Vermont. Acres of defoliation more than doubled this year compared to 2016, when
24,278 acres were defoliated. The footprint also expanded considerably. Although over half of the
acreage was in Essex, Lamoille, and Orleans Counties, defoliation was mapped in all counties of the
state in 2017 (Table 5 and Figure 13). Defoliation data are available on the ANR Natural Resources
Atlas.
In late 2016 and early 2017, FPR staff assisted landowners with FTC egg mass surveys to determine the
likelihood of defoliation on their property. Of the 64 sugarbushes surveyed, 32 locations were identified
as at risk of defoliation.
In the spring, FPR monitored leaf development, caterpillar hatch, and defoliation at four sites in north-
ern Vermont. Weekly data from these sites were posted on the FPR website. Hatching was first ob-
served during the last week of April and continued into early May. Cold weather slowed hatch and leaf
development, but not for long. The week of May 14th, warm temperatures made a huge difference over
a three day period, and then cool weather slowed everything down again. By the last week of May,
some trees were 80 - 90% defoliated, although there was substantial variability from tree to tree. By the
end of the month, defoliated areas could be detected on the landscape, and caterpillars in some of these
areas were observed feeding on understory beech, ferns, and hobblebush.
During aerial surveys, locations where egg mass surveys had been done over the winter were observed
to determine if defoliation was easily visible. Based on these rapid evaluations, there was no significant
defoliation in 87% of the sugarbushes where defoliation was not expected based on egg mass surveys.
Defoliation was observed in, or close to, 62% of the unsprayed sugarbushes where defoliation was pre-
dicted (Figure 14).
Eighteen landowners made arrangements with an aerial applicator to have their sugarbushes treated
with Foray 48B, a Btk product that is registered for use in certified organic production. In total, these
accounted for 3,434 acres. Several additional forest landowners also had their forestland treated. Treat-
ments were conducted on May 21, 27 and 28.
Landowners were surveyed following treatment, and of those respondents, 18% reported seeing more
dead trees on their property since the beginning of the outbreak, 45% have made changes to their sugar-
ing operation to alleviate stress on their trees, and 100% would treat again if defoliation is predicted and
valued FPR involvement. As such, Forestry staff are again conducting FTC egg mass surveys in late
2017 and early 2018 in preparation for defoliation again in 2018.
FTC parasitoids known as friendly flies (Sarcophaga aldrichi) were reported throughout the state in
areas that had experienced FTC defoliation last year. Mortality of caterpillars was also noted in early
summer, likely due to viral and/or fungal infection associated with the wet weather we experienced in
May and June. Pheromone traps for FTC were again deployed throughout the state in 2017, and moth
capture increased from 2016 levels (Figure 15) despite the presence of natural predators. This suggests
that we can expect more defoliation from FTC in Vermont in 2018.

Hardwood Defoliators 37
Trees typically respond to the relatively early-season feeding by FTC by sending out a new flush of
leaves. However, in both 2016 and 2017, some defoliated areas remained noticeable all summer because
of a lack of refoliation. On some sites, the only visible refoliation was on ash. On sugar maple, refoliat-
ed leaves were small. The exact mechanism by which trees did not refoliate is unclear, but factors that
may have contributed to this include the lingering effects of 2016 drought, heavy seed on sugar maple in
2017, and a late start of feeding this year due to wet weather. Infection by leaf fungi and dry mid-
summer conditions may also have played a role. With a burst of rainfall, and continued warm tempera-
tures, some defoliated sugar maples attempted another refoliation in late October.
Dieback and off-color leaves were observed in some locations where defoliation was heavy last year
and trees were under stress from other factors. The second year of defoliation, and lack of refoliation
will almost certainly affect wood production, the amount of foliage and shoot growth next year.
For more details on FTC biology and management, refer to the most recent Forest Tent Caterpillar
Update.
County Acres
Addison 4,872
Bennington 3,724
Caledonia 3,927
Chittenden 11
Essex 12,088
Franklin 3,070
Grand Isle 173
Lamoille 10,154
Orange 696
Orleans 10,370
Rutland 3,537
Washington 7,111
Windham 853
Windsor 2
Total 60,588
Table 5. Mapped acres of forest tent caterpillar defoliation in 2017.
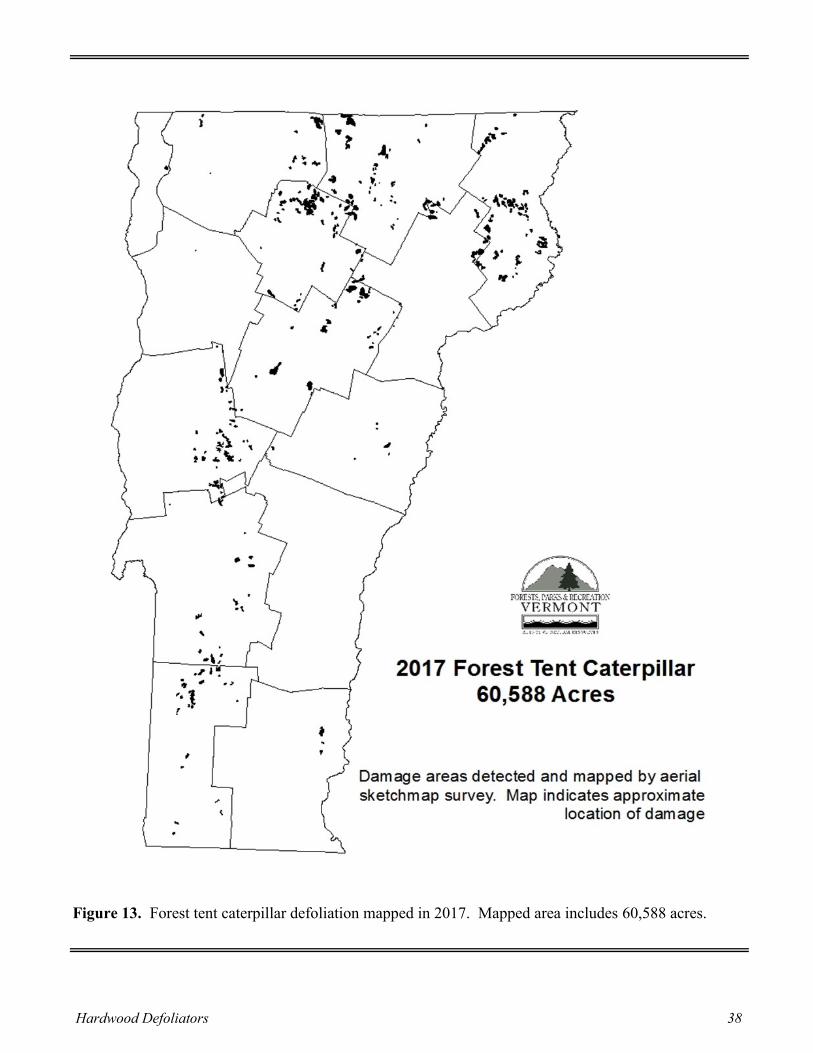
Hardwood Defoliators 38
Figure 13. Forest tent caterpillar defoliation mapped in 2017. Mapped area includes 60,588 acres.

Hardwood Defoliators 39
Figure 14. Predicted versus mapped defoliation by forest tent caterpillar based on egg mass surveys.
Data are from 39 sugarbush locations.

Hardwood Defoliators 40
Sit
e Y
ear
2
00
2
20
03
20
04
20
05
20
06
20
07
20
08
20
09
20
10
20
11
20
12
20
13
20
14
20
15
20
16
20
17
Cas
tlet
on
--
--
----
--
--
17
17
.3
8
1
4.7
1
1
.7
0.3
2
.3
1.7
1
.7
14
.0
13
.3
Fai
rfie
ld (
NA
MP
29
) --
--
1.3
1
.7
----
4
.3
4.7
4
1
0.3
2
.0
6
4
1.7
3
.3
1.3
1
.3
8.0
Hu
nti
ngto
n (
NA
MP
02
7)
9.2
6
.7
10
15
.7
16
6.3
4
.3
4.3
2
.7
6.3
6
1
.7
2.7
0
.0
10
.3
11
.0
Kil
lin
gto
n/S
her
burn
e
(Gif
ford
Wo
od
s)
6.9
9
.7
20
15
.3
21
17
.3
7.3
8
2
.7
0
1.0
0
.7
6.0
5
.3
8.3
1
8.7
Man
chest
er
----
--
--
----
--
--
----
--
--
0
5.7
3
1
0
.7
0.3
1
.3
10
.3
12
.0
19
.3
Ro
ches
ter
(Ro
ches
ter
Mo
unta
in)
5.0
4
.7
9
4.7
2
9
10
.3
0.7
--
--
0.3
0
0
0
3
.5
2.3
9
.0
7.3
Ro
xb
ury
(R
oxb
ury
SF
) 1
6
14
.7
13
.3
7.3
2
2
22
.7
8.0
2
.7
7.0
2
1
.5
1.7
6
.3
5.7
2
9.0
1
5.0
SB
22
00
(S
teven
svil
le
Bro
ok)
3.8
1
1.7
1
8.3
2
3.3
3
5.3
6
.3
5.7
1
0
2.7
6
.3
8
0.3
5
.3
2.7
7
.3
29
.0
Und
erhil
l (V
MC
14
00
) 3
.6
3
0.3
7
.3
9.3
2
.7
1.3
8
.3
5.7
8
.3
7.7
0
.3
5.7
0
.7
14
.3
11
.3
Und
erhil
l (V
MC
22
00
) 3
7
6
.3
11
.7
6.3
4
.7
1.3
4
.3
2
2.7
4
.7
0.3
2
.5
1.3
3
.7
9.0
Sto
we
(VM
C 3
80
0)
1
2.7
1
0.3
2
6
5.7
5
1
.3
1.7
0
.7
2
2
1.3
1
.7
----
--
--
Wat
erb
ury
(C
ott
on
Bro
ok)
2
0.7
1
.3
41
22
.3
0.3
1
5
3
.3
4.3
7
0
.3
9.3
5
.7
36
.3
15
.7
Wat
ervil
le (
Co
dd
ing
Ho
llo
w/L
ock
e)
0
2
1.3
1
7.7
2
4.7
2
.7
2.3
1
.3
3.0
4
.3
3
1
12
.5
3.3
1
3.3
2
8.3
Dil
lner
Far
m
Mo
ntg
om
ery
----
--
--
----
--
--
----
--
--
----
--
--
----
--
--
----
--
--
----
1
.0
4.3
1
8.0
Av
era
ge
5.1
5
.8
8.3
1
7
17
.8
7.6
2
.9
5.5
2
.8
3.5
3
.5
0.9
4
.8
3.2
1
2.5
1
5.7
Tab
le 6
. A
ver
age
num
ber
of
fore
st t
ent
cate
rpil
lar
moth
s ca
ught
in p
her
om
one
trap
s, 2
002
-2017. T
hre
e m
ult
i-pher
pher
om
one
trap
s bai
ted
wit
h P
her
oT
ech f
ore
st t
ent
cate
rpil
lar
lure
s w
ere
dep
loyed
at
each
surv
ey l
oca
tion i
n 2
017.

Hardwood Defoliators 41
Figure 15. Average number of forest tent caterpillar moths caught in pheromone traps 1989-2017.
Three multi-pher pheromone traps per site, with PheroTech forest tent caterpillar lures, were used in
2017.
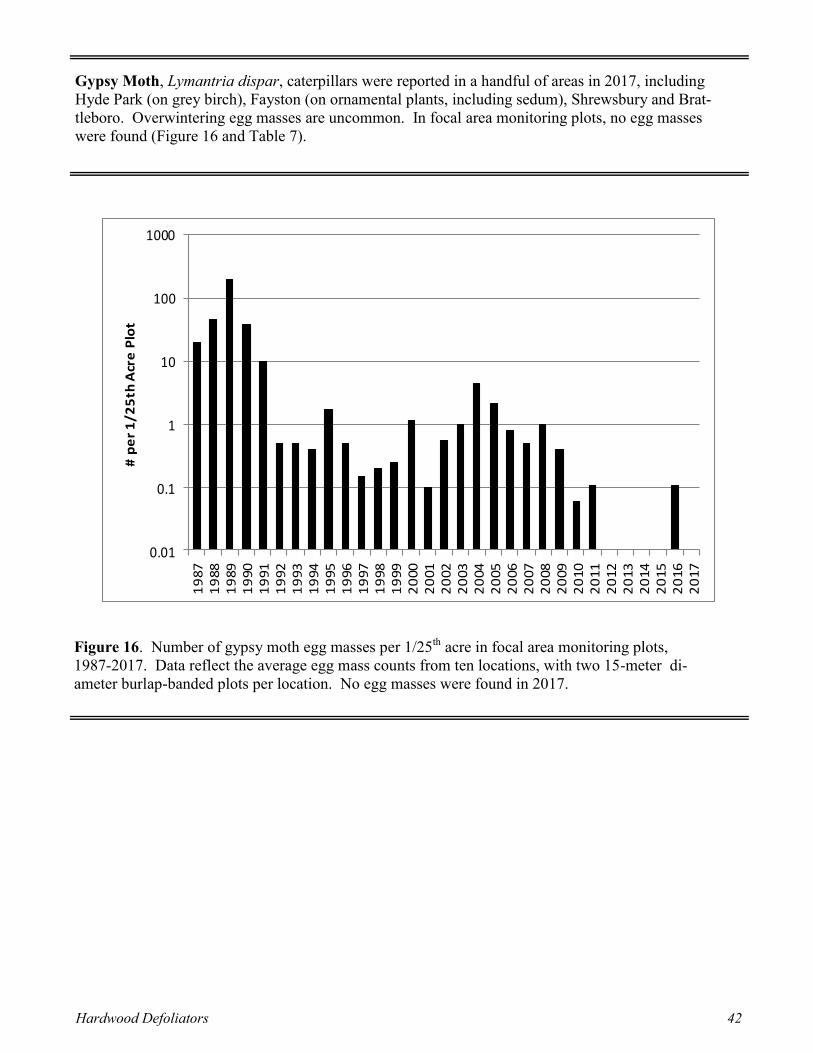
Hardwood Defoliators 42
Gypsy Moth, Lymantria dispar, caterpillars were reported in a handful of areas in 2017, including
Hyde Park (on grey birch), Fayston (on ornamental plants, including sedum), Shrewsbury and Brat-
tleboro. Overwintering egg masses are uncommon. In focal area monitoring plots, no egg masses
were found (Figure 16 and Table 7).
Figure 16. Number of gypsy moth egg masses per 1/25th acre in focal area monitoring plots,
1987-2017. Data reflect the average egg mass counts from ten locations, with two 15-meter di-
ameter burlap-banded plots per location. No egg masses were found in 2017.
0.01
0.1
1
10
100
1000
19
87
19
88
19
89
19
90
19
91
19
92
19
93
19
94
19
95
19
96
19
97
19
98
19
99
20
00
20
01
20
02
20
03
20
04
20
05
20
06
20
07
20
08
20
09
20
10
20
11
20
12
20
13
20
14
20
15
20
16
20
17
# p
er
1/
25
th A
cre
Plo
t

Hardwood Defoliators 43
Sit
e T
ow
n
Yea
r
20
03
20
04
20
05
20
06
20
07
20
08
20
09
20
10
20
11
20
12
20
13
20
14
20
15
20
16
20
17
Arr
ow
hea
d
Mil
ton
1.5
2
.5
0
0
0
2.5
0
0
0
.5
0
0
0
0
0
0
Bri
gham
Hil
l E
ssex
2
.5
2
1.5
0
0
0
0
0
0
0
0
0
0
0
0
Ft.
Dum
mer
G
uil
ford
0
—
—
0
0
0
0
0
0
0.5
0
0
0
0
0
0
Min
ard’s
Pond
R
ock
ingham
0
.5
2
0
0
0
0
0.5
0
0
0
0
0
0
0
0
Mo
unt
Anth
on
y
Ben
nin
gto
n
1.5
0
0
0
0
0
0
0
0
0
0
0
0
0
0
Per
ch P
ond
B
enso
n
0
0
0.5
1
0
0
.5
0
0.5
0
0
0
0
0
0
0
Rock
y P
ond
R
utl
and
0
0
0
.5
3
3
0.5
0
0
0
0
0
0
0
0
0
San
dbar
C
olc
hes
ter
3
1.5
0
0
0
2
.5
0.5
0
0
0
0
0
0
0
0
Tat
e H
ill
San
dgat
e 0
3
0
18
3
0
1.5
0
.5
0
0
0
0
0
0
1
0
Aver
age
1
4.4
2.3
0.8
0.3
0.8
0.2
0.0
6
0.1
1
0
0
0
0
0.1
1
0
Tab
le 7
. N
um
ber
of
gyp
sy m
oth
egg m
asse
s p
er 1
/25th
acr
e in
fo
cal
area
monit
ori
ng p
lots
, 2003
-2017. C
ounts
are
the
aver
age
of
two 15
-
met
er b
url
ap-b
anded
plo
ts p
er l
oca
tion.
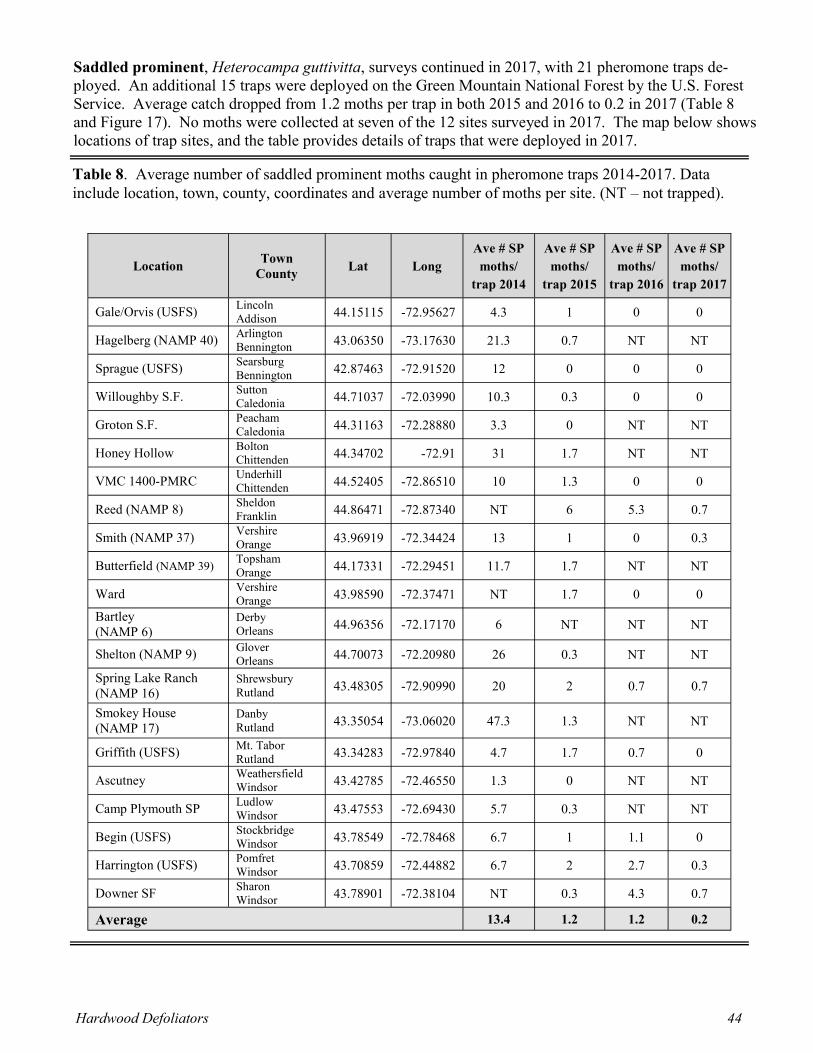
Hardwood Defoliators 44
Saddled prominent, Heterocampa guttivitta, surveys continued in 2017, with 21 pheromone traps de-
ployed. An additional 15 traps were deployed on the Green Mountain National Forest by the U.S. Forest
Service. Average catch dropped from 1.2 moths per trap in both 2015 and 2016 to 0.2 in 2017 (Table 8
and Figure 17). No moths were collected at seven of the 12 sites surveyed in 2017. The map below shows
locations of trap sites, and the table provides details of traps that were deployed in 2017.
Table 8. Average number of saddled prominent moths caught in pheromone traps 2014-2017. Data
include location, town, county, coordinates and average number of moths per site. (NT – not trapped).
Location Town
County Lat Long Ave # SP
moths/
trap 2014
Ave # SP
moths/
trap 2015
Ave # SP
moths/
trap 2016
Ave # SP
moths/
trap 2017
Gale/Orvis (USFS) Lincoln
Addison 44.15115 -72.95627 4.3 1 0 0
Hagelberg (NAMP 40) Arlington
Bennington 43.06350 -73.17630 21.3 0.7 NT NT
Sprague (USFS) Searsburg
Bennington 42.87463 -72.91520 12 0 0 0
Willoughby S.F. Sutton
Caledonia 44.71037 -72.03990 10.3 0.3 0 0
Groton S.F. Peacham
Caledonia 44.31163 -72.28880 3.3 0 NT NT
Honey Hollow Bolton
Chittenden 44.34702 -72.91 31 1.7 NT NT
VMC 1400-PMRC Underhill
Chittenden 44.52405 -72.86510 10 1.3 0 0
Reed (NAMP 8) Sheldon
Franklin 44.86471 -72.87340 NT 6 5.3 0.7
Smith (NAMP 37) Vershire
Orange 43.96919 -72.34424 13 1 0 0.3
Butterfield (NAMP 39) Topsham
Orange 44.17331 -72.29451 11.7 1.7 NT NT
Ward Vershire
Orange 43.98590 -72.37471 NT 1.7 0 0
Bartley (NAMP 6)
Derby
Orleans 44.96356 -72.17170 6 NT NT NT
Shelton (NAMP 9) Glover
Orleans 44.70073 -72.20980 26 0.3 NT NT
Spring Lake Ranch (NAMP 16)
Shrewsbury
Rutland 43.48305 -72.90990 20 2 0.7 0.7
Smokey House
(NAMP 17) Danby
Rutland 43.35054 -73.06020 47.3 1.3 NT NT
Griffith (USFS) Mt. Tabor
Rutland 43.34283 -72.97840 4.7 1.7 0.7 0
Ascutney Weathersfield
Windsor 43.42785 -72.46550 1.3 0 NT NT
Camp Plymouth SP Ludlow
Windsor 43.47553 -72.69430 5.7 0.3 NT NT
Begin (USFS) Stockbridge
Windsor 43.78549 -72.78468 6.7 1 1.1 0
Harrington (USFS) Pomfret
Windsor 43.70859 -72.44882 6.7 2 2.7 0.3
Downer SF Sharon
Windsor 43.78901 -72.38104 NT 0.3 4.3 0.7
Average 13.4 1.2 1.2 0.2

Hardwood Defoliators 45
Figure 17. Location of saddled prominent pheromone traps set in Vermont in 2017 by VT FPR and
the US Forest Service.

INSECT LATIN NAME HOST LOCALITY REMARKS
Beech Leaftier Psilocorsis sp. Beech Statewide Common, but less
noticeable than 2016.
Birch Leaf
Folder
Ancylis discigerana Yellow Birch Statewide Much more noticeable
throughout than 2016,
although no significant
defoliation observed.
Birch
Skeletonizer
Bucculatrix
canadensisella
Birch Hyde Park Light population reported.
Browntail Moth Euproctis
chrysorrhoea
Hardwoods Not observed or known to
occur in Vermont. Last
serious infestation in
Vermont was reported in
1917.
Bruce Spanworm Operophtera
bruceata
Sugar maple,
aspen, beech
and other
hardwoods
Statewide No feeding reported and
few moths observed.
Cherry Scallop
Shell Moth
Hydria prunivorata Cherry Statewide Individual nests observed in
widely scattered locations.
Dogwood Sawfly Macremphytus
tarsatus
Dogwood Swanton Observed on ornamental.
Eastern Tent
Caterpillar
Malacosoma
americanum
Cherry and
apple
Statewide Variable reports; fewer
nests observed in Addison,
Chittenden, Franklin,
Windham and Windsor
Counties, more in
Caledonia and Orleans
Counties, and stable
populations elsewhere.
Euonymus
Caterpillar
Yponomeuta
cagnagella
Euonymus Bethel Extensive defoliation on
specific trees.
European Snout
Beetle
Phyllobius oblongus Sugar Maple Bridgewater,
Hartland
Light feeding.
Fall Webworm Hyphantria cunea Hardwoods Statewide Only light damage, similar
to 2016.
OTHER HARDWOOD DEFOLIATORS
Hardwood Defoliators 46
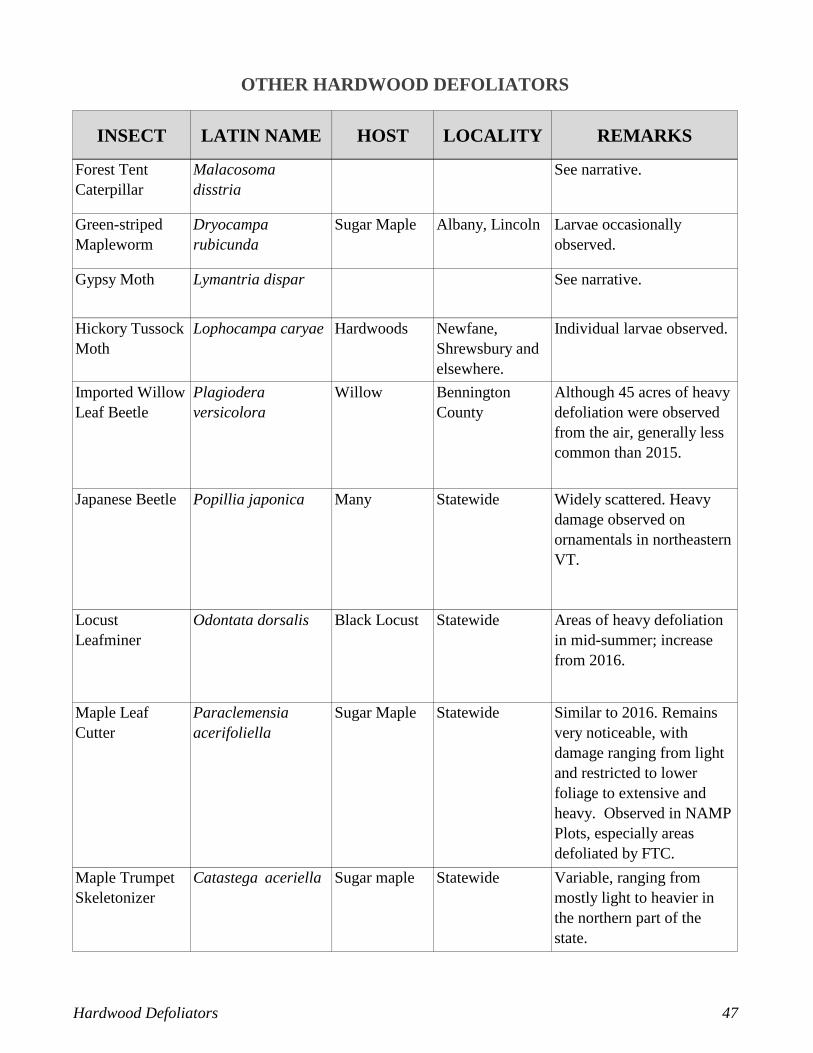
INSECT LATIN NAME HOST LOCALITY REMARKS
OTHER HARDWOOD DEFOLIATORS
Forest Tent
Caterpillar
Malacosoma
disstria
See narrative.
Green-striped
Mapleworm
Dryocampa
rubicunda
Sugar Maple Albany, Lincoln Larvae occasionally
observed.
Gypsy Moth Lymantria dispar See narrative.
Hickory Tussock
Moth
Lophocampa caryae Hardwoods Newfane,
Shrewsbury and
elsewhere.
Individual larvae observed.
Imported Willow
Leaf Beetle
Plagiodera
versicolora
Willow Bennington
County
Although 45 acres of heavy
defoliation were observed
from the air, generally less
common than 2015.
Japanese Beetle Popillia japonica Many Statewide Widely scattered. Heavy
damage observed on
ornamentals in northeastern
VT.
Locust
Leafminer
Odontata dorsalis Black Locust Statewide Areas of heavy defoliation
in mid-summer; increase
from 2016.
Maple Leaf
Cutter
Paraclemensia
acerifoliella
Sugar Maple Statewide Similar to 2016. Remains
very noticeable, with
damage ranging from light
and restricted to lower
foliage to extensive and
heavy. Observed in NAMP
Plots, especially areas
defoliated by FTC.
Maple Trumpet
Skeletonizer
Catastega aceriella Sugar maple Statewide Variable, ranging from
mostly light to heavier in
the northern part of the
state.
Hardwood Defoliators 47

INSECT LATIN NAME HOST LOCALITY REMARKS
OTHER HARDWOOD DEFOLIATORS
Maple Webworm Pococera
asperatella
Sugar Maple Statewide Very noticeable, although
feeding still classified as
light (<30% defoliation).
Noted in stands defoliated
by FTC.
Mountain Ash
Sawfly
Pristiphora
geniculata
Mountain Ash Barre City On ornamental.
Oak Slug Sawfly Caliroa
quercuscoccineae
Red oak Rutland Light feeding in upper to
mid canopy of small
ornamental.
Orange-humped
Mapleworm
Symmerista leucitys Maples Elmore,
Northfield
Rupert,
Springfield
In some locations, observed
in FTC outbreak areas.
Red-headed Flea
Beetle
Systena frontalis Ornamentals Colchester Numerous on ornamentals.
Red-humped
Caterpillar
Schizura concinna Apple Huntington Minor feeding.
Red-humped
Oakworm
Symmerista
canicosta
Oak Brattleboro,
Rockingham,
Springfield,
Westminster
Numerous larvae observed
in September associated
with light defoliation and
noticeable leaf fragments
on the ground.
Saddled
Prominent
Heterocampa
guttivata
Sugar maple See narrative.
Satin Moth Leucoma salicis Poplar Statewide Defoliation in widely
scattered locations.
Heaviest damage observed
along roadsides and from
the air in central Vermont.
Variable Oakleaf
Caterpillar
Lochmaeus manteo Oak Brattleboro Individual larva.
Hardwood Defoliators 48

INSECT LATIN NAME HOST LOCALITY REMARKS
OTHER HARDWOOD DEFOLIATORS
White-marked
Tussock Moth
Orgyia leucostigma Various Scattered Individual larvae reported
from a number of locations.
Winter Moth Operophtera
brumata
Hardwoods Not known to occur in
Vermont.
Hardwood defoliators not reported in 2017 include Apple and Thorn Skeletonizer, Choreutis pariana;
Elm Sawfly, Cimbex americana ; Large Aspen Tortrix, Choristoneura conflictana ; Mimosa webworm,
Homadaula anisocentra ; Oak Shothole Leafminer, Japanagromyza viridula ; Oak Skeletonizer,
Bucculatrix ainsliella ; Oak Slug Sawfly, Caliroa quercuscoccineae ; Rose Chafer, Macrodactylus
subspinosa ; Spiny Oak Sawfly, Periclista sp.; Uglynest Caterpillar, Archips cerasivorana, Viburnum
Leaf Beetle, Pyrrhalta viburni.
Hardwood Defoliators 49

Softwood Defoliators 50
SOFTWOOD DEFOLIATORS
Spruce Budworm, Choristoneura fumiferana, moth trap catches in Vermont remain low. Traps were
deployed in Caledonia, Chittenden, Essex and Orleans Counties in 2010-2017. A total of five moths
was collected in 2017, three in traps in Underhill and one each from Norton and Holland (Figures 18
and 19, Table 9). We do not anticipate defoliation by the spruce budworm in 2018.
Figure 18. Average number of spruce budworm moths caught in pheromone traps 1983-2017. Trapping
was discontinued, 2004-2009. Average of six locations in 2017.
0
10
20
30
40
50
60
70
Ave
rag
e N
umb
er
pe
r Tr
ap

Softwood Defoliators 51
Tab
le 9. A
ver
age
num
ber
of
spru
ce b
udw
orm
moth
s ca
ught
in p
her
om
on
e tr
aps,
1991
-2017. T
rap
pin
g h
ad b
een d
isco
nti
nu
ed 2
004
-2009. T
her
e
wer
e 3 t
raps
per
lo
cati
on,
one
loca
tion p
er t
ow
n i
n 2
017.
Co
un
ty
an
d T
ow
n
19
91
19
92
19
93
19
94
19
95
19
96
19
97
19
98
19
99
20
00
20
01
20
02
20
03
20
10
20
11
20
12
20
13
20
14
20
15
20
16
20
17
Ess
ex
No
rto
n
3
10
.7
5.7
2
.3
1
1
1.3
2
6
34
.7
29
.7
17
.7
1.3
2
5.3
1
1.3
0
.7
0
0.3
0
.3
0.3
Orl
eans
Ho
llan
d
3.3
1
1
2.3
1
.3
0
1.7
1
.3
5
4.7
2
9.3
5
5.7
3
.7
6
8.0
1
0.7
1
.7
1.3
0
0.3
Cal
edo
nia
W
ald
en
17
.7
17
.7
13
14
.3
3
6.3
2
4.3
5
85
16
.7
9.7
3
.7
6.7
1
0.7
0
0.3
1
.0
0
0
Ess
ex
Lew
is
2.0
2
.7
0.6
7
2
0
0.6
7
0
8
4.3
1
4
6.7
1
.3
1.7
5
.7
0.3
0
0
0
0.0
0
0
Chit
tend
en
Und
erhil
l 3
1.7
2
9
16
53
11
.7
30
.3
3.7
6
13
.3
24
.7
11
.3
14
.7
3.7
1
9
11
.3
8
1.3
3
.7
1.7
0
1
Cal
edo
nia
B
urk
e
3.5
2
.3
6
3
0
2
3.7
7
.3
6
30
15
3
1.7
4
1.7
0
0.3
0
.3
0.3
0
0
Aver
age
10
.2
12
.2
7.3
1
2.7
2
.6
7.0
2
.0
9.4
1
1.3
3
5.5
1
2.1
6
.0
2.8
7
.8
3.9
1
.8
0.5
1
.0
0.8
0
.1
0.3

Softwood Defoliators 52
Figure 19. Locations of spruce budworm pheromone traps in 2017. Coordinates are NAD83.
Spruce Budworm Trap Locations
Trap # Trap Location Town Latitude Longitude
SBW-18 Steam Mill Brook WMA Walden 44.48385 -72.25364
SBW-22 Willoughby S.F. Burke 44.69555 -72.03616
SBW-23 Tin Shack/Silvio Conte Lewis 44.85915 -71.74222
SBW-24 Black Turn Brook S. F. Norton 44.99521 -71.81300
SBW-25 Holland Pond WMA Holland 44.97610 -71.93103
SBW-27 VMC 1400 Underhill 44.52570 -72.86477

INSECT LATIN NAME HOST LOCALITY REMARKS
Arborvitae
Bagworm
Thyridopteryx
ephemeraeformis
Arborvitae Grand Isle Observed this fall in 3
locations on Grand Isle on
trees imported from out-of-
state. The bagworms had
successfully overwintered
in one site, but do not
appear to be established on
local native trees.
Bagworms are not thought
to be able to successfully
overwinter in northern
climes but with milder
winters this insect may
become more of a pest.
Eastern Spruce
Budworm
Choristoneura
fumiferana
Balsam fir and
spruce
Statewide See narrative.
Fall Hemlock
Looper
Lambdina
fiscellaria
Hemlock Woodstock
Underhill
Plainfield
Moths reported as common
in some locations.
Imperial Moth Eacles imperialis
pini
Bristol Observed in a driveway
August 22, just after the
partial solar eclipse.
OTHER SOFTWOOD DEFOLIATORS
Softwood defoliators not reported in 2017 included Arborvitae Leafminer, Argyresthia thuiella ;
Balsam Fir Sawfly, Neodiprion abietus ; European Pine Sawfly, Neodiprion sertifer, Larch
Casebearer, Coleophora laricella , Introduced Pine Sawfly, Diprion similis; Spruce Needleminer,
Taniva albolineana ; Yellow-headed Spruce Sawfly, Pikonema alaskensis ; White Pine Sawfly,
Neodiprion pinetum.
Softwood Defoliators 53

Sapsucking Insects, Midges and Mites 54
SAPSUCKING INSECTS, MIDGES, AND MITES
Balsam Woolly Adelgid (BWA), Adelges piceae, infestations have collapsed in some areas, but new fir
mortality is continuing, mostly where decline has been observed previously, and there are some pockets
of heavy mortality. BWA is still noticeable in occasional ornamental plantings (southern Vermont) and
Christmas tree plantations (Canaan). Populations are less noticeable in native stands.
During 2017 aerial surveys, 1,641 acres of fir dieback and mortality attributed to BWA were mapped as
compared to 5,615 in 2016 (Table 10 and Figure 20).
For more information, a leaflet entitled “Balsam Woolly Adelgid” can be found on the Vermont Forest
Health website.
Table 10. Mapped acres of balsam woolly adelgid-related decline in 2017.
County Acres
Caledonia 412
Essex 20
Lamoille 13
Orange 320
Orleans 399
Rutland 122
Washington 279
Windham 4
Windsor 72
Total 1,641

Sapsucking Insects, Midges and Mites 55
Figure 20. Balsam wooly adelgid related decline mapped in 2017. Mapped area includes 1,641 acres.

Sapsucking Insects, Midges and Mites 56
Elongate Hemlock Scale (EHS), Fiorinia externa, has been noticed in Windham County with increas-
ing frequency. The combination of EHS, which was not known to be established in Vermont prior to
2014, hemlock woolly adelgid, and the 2016 drought has resulted in tree decline in a few locations.
Hemlock Woolly Adelgid (HWA), Adelges tsugae, continues to be a threat to hemlocks in Southern
Vermont. The infestation remains centered primarily in Windham County, with small spots in Spring-
field and Pownal. The detection of HWA just south of Lake George in New York in 2017 poses an ad-
ditional threat to western Vermont.
During the winter of 2016-2017, 30 sites in 10 high risk towns were surveyed. No spread of the infesta-
tion to new towns was observed. Six survey sites were positive for HWA. Eleven volunteers logged 78
hours and did a significant portion of the survey work (Table 11).
Towns currently known to be infested include: Brattleboro, Brookline, Dummerson, Grafton, Guilford,
Halifax, Jamaica, Marlboro, Newfane, Putney, Rockingham, Townshend, Vernon, Wardsboro, West-
minster, and Whitingham in Windham County; Pownal in Bennington County and Springfield in Wind-
sor County.
HWA winter mortality study is evaluated towards the end of March at four sites. Enough branches are
collected to yield well over 200 adelgids. They are inspected in the lab to determine if alive, recently
dead or long dead. The mortality rate for the winter of 2016-2017 was 66%. This is well below the
threshold of 91 or 92 percent that seems to limit spread. The three previous winters had rates of 97 to 99
percent and there was no noticeable spread of the infestation boundary (Table 12 and Figure 21).
Volunteers assisted with the winter mortality study and also helped to mark study branches, do field
counts and then collect samples for the sisten/progredien density study. Field work was done at the
Townshend site in February and June 2017 and sent to Virginia Tech for inclusion with similar data
from other eastern states.
In 2017, we received multiple calls about sick or suddenly dying hemlocks in Windham and Windsor
Counties. In many cases, drought response was the most likely explanation for the decline.

Sapsucking Insects, Midges and Mites 57
Table 12. Assessment of hemlock woolly adelgid winter mortality over the winter of 2016-2017. Data
from four assessment sites include location, date hemlock wooly adelgid samples were collected, num-
ber of dead and live adelgids, and percent mortality.
Site Date No. alive No. dead Percent Mortality
Vernon 3/20/17 233 562 71
Cersosimo 3/20/17 40 779 95
Townshend 3/20/17 671 747 53
Jamaica 3/20/17 472 390 45
Table 11. Number of sites inspected for the presence of hemlock woolly adelgid (HWA) by visual sur-
vey, winter 2016-2017, including number of sites where HWA was detected.
County Town Number of sites
inspected
Number of sites
positive for HWA
Windham Grafton 1 0
Rockingham 6 3
Westminster 2 1
Londonderry 3 0
Windsor Springfield 8 2
Weathersfield 3 0
Chester 2 0
Bennington Woodford 1 0
Stamford 2 0
Bennington 2 0
30 6 TOTAL

Sapsucking Insects, Midges and Mites 58
Maintenance work was conducted on all five HWA impact plots. Monitoring on these plots will be done
every other year and staggered. This year, two plots were done; three will be undertaken next year. On
the plots at Roaring Brook Wildlife Management Area and the Guilford Visitor Center, DBH was re-
measured and crowns were reassessed for live crown ratio, crown density and crown transparency. Re-
production was also tallied.
Monitoring for Laricobius nigrinus (Ln) adult beetles is done on mild winter days in November and De-
cember. No Ln were found in 2017 in any of the release sites: Pownal, Vernon and Brattleboro. To
augment the population at the Brattleboro site, 468 Ln beetle adults that had been field collected in
North Carolina were released in late November. Monitoring efforts will be expanded this coming spring
to look for Ln larvae.
Numerous outreach activities were conducted, many through volunteers and Forest Pest First Detectors,
in the form of articles, public presentations, displays at town meeting, parades, county fairs, etc. A new
discovery of HWA in NY’s Adirondack State Park stimulated a wave of new interest. FPR staff were
interviewed for newspaper articles and television coverage.
Early surveys for the 2017-2018 season revealed settled sistens that were alive, but still aestivating.
Consequently, it is likely that reports of spread are expected in 2018.
Figure 21. Average overwintering mortality of hemlock woolly adelgid at four sites in Windham
County 2010-2017.

Sapsucking Insects, Midges and Mites 59
Pear Thrips, Taeniothrips inconsequens, damage was noticeable, and numbers in our only monitoring
plot are up compared to the last 2 years. Damage was still mostly light, and mixed with frost, fungus
disease and other defoliators. Pollen increases thrips fecundity, so the heavy flower production may pro-
duce a lot more thrips next spring.
This year, pear thrips emergence began April 17, as indicated on yellow sticky traps at our long-term
monitoring site at Proctor Maple Research Center in Underhill. Counts totaled 334 in 2017. The highest
numbers were present the first week of May, averaging just over 23 insects per trap. Emergence was
complete by June 12 (Table 13 and Figure 22).
Figure 22. Total number of thrips collected at Proctor Maple Research Center in Underhill, VT on sets
of four sticky traps, 1993-2017.
0
500
1000
1500
2000
2500
1994
1995
1996
1997
1998
1999
2000
2001
2002
2003
2004
2005
2006
2007
2008
2009
2010
2011
2012
2013
2014
2015
2016
2017
Thri
ps
Co
un
ts
Year
Table 13. Pear thrips counts on yellow sticky traps at Proctor Maple Research Center in Underhill, VT
in 2017. Sticky traps are deployed in sets of four. Traps are evaluated and replaced each week and
monitored throughout pear thrips emergence.
Sample dates Counts
4/10-4/17 49
4/17-4/21 12
4/21-5/4 91
5/4-5/12 94
5/12-5/19 56
5/19-5/26 25
5/26-6/12 7
Total 334

Sapsucking Insects, Midges and Mites 60
Red Pine Scale, Matsucoccus resinosae, was not detected in any stands visited in 2017, but reports of
red pine mortality continued in 2017, with 516 acres mapped, scattered in seven counties. (Table 14 and
Figure 23). Red pine scale, detected in 2015 in Rutland and Orange Counties, continues to be a suspect,
although it remains premature to say that it is the sole cause of this red pine mortality. It’s possible that
cold winters have knocked scale populations back. It’s also possible that the decline in these stands is
not related to red pine scale. Pests that were observed included Diplodia shoot blight and pine gall wee-
vil.
Table 14. Mapped acres of red pine decline in 2017. Red pine scale continues to be a suspect, but the
causal agent and/or contributing factors of the mortality remain under investigation.
County Acres
Caledonia 99
Franklin 47
Lamoille 17
Orange 154
Washington 101
Windham 27
Windsor 71
Total 516

Sapsucking Insects, Midges and Mites 61
Figure 23. Red pine decline mapped in 2017. Mapped area includes 516 acres.

INSECT LATIN NAME HOST LOCALITY REMARKS
Ash Flowergall
Mite
Aceria fraxiniflora Ash West Haven Light, scattered damage.
Balsam Woolly
Adelgid
Adelges piceae Balsam fir and
Fraser fir
Statewide See narrative.
Beech Scale Cryptococcus
fagisuga
Beech Statewide See Beech Bark Disease
narrative.
Boxelder Bug Leptocoris
trivittatus
Boxelder Scattered Usual number of reports of
"nuisance" bugs in and
around homes; no damage
to trees reported.
Brown
Marmorated
Stink Bug
Halyomorpha halys Wide variety
of hosts,
including
apples
Burlington,
Vergennes
No damage observed.
Records from past years
include Bennington,
Chittenden, Lamoille,
Washington, Windham and
Windsor Counties.
Eastern Spruce
Gall Adelgid
Adelges abietis Spruce Scattered reports,
including Bristol,
Shelburne and
Wilmington
More obvious than in recent
past.
Elongate
Hemlock Scale
Fiorinia externa Hemlock,
Korean fir
Windham
County;
ornamental
Korean fir in
Charlotte
See narrative.
Hemlock Woolly
Adelgid
Adelges tsugae Hemlock Windham,
Bennington and
Windsor
Counties
See narrative.
Magnolia Scale Neolecanium
cornuparvum
Magnolia Williston Light infestation.
Oystershell Scale Lepidosaphes ulmi Beech Rupert Heavy populations on
individual understory twigs.
No dieback observed.
OTHER SAPSUCKING INSECTS, MIDGES, AND MITES
Sapsucking Insects, Midges Mites 62

INSECT LATIN NAME HOST LOCALITY REMARKS
OTHER SAPSUCKING INSECTS, MIDGES, AND MITES
Pear Thrips Taeniothrips
inconsequens
Hardwoods Statewide See narrative.
Pine Bark
Adelgid
Pineus strobi White pine Milton Light populations.
Red Pine Scale Matsucoccus
resinosae
See narrative. Also see Red
Pine Decline.
Woolly Alder
Aphid
Paraprociphilus
tessellatus
Alder Morgan Lakeside trees.
Sapsucking Insects, Midges and Mites that were not reported in 2017 include Balsam Gall Midge,
Paradiplosis tumifex ; Balsam Twig Aphid, Mindarus abietinus ; Cinara Aphids, Cinara sp.; Conifer
Root Aphid, Prociphilus americanus ; Gouty Vein Midge, Dasineura communis ; Grape Phylloxera,
Daktulosphaira vitifoliae; Green Stink Bug, Chinavia hilaris; Pine Leaf Adelgid; Pineus pinifoliae;
Pine Needle Scale, Chionapsis pinifoliae ; Pine Spittlebug, Aphrophora parallela ; Spruce Spider Mite;
Oligonychus ununguis ; Woolly Elm Aphid, Eriosoma americanum.
Sapsucking Insects, Midges Mites 63

INSECT LATIN NAME HOST LOCALITY REMARKS
Common Pine
Shoot Beetle
Tomicus piniperda Pines Barre and Island
Pond
Trapped by APHIS. Since
first detected in 1999, has
been found in many
counties. Under federal
quarantine, but pine is free
to move through most of
the northeast.
Oak Twig Pruner Anelaphus
parallelus
Red oak Statewide Similar to 2016, except less
noticeable in Southern
Vermont.
Pine Gall Weevil Podapion gallicola Red pine Rutland and
Orange Counties
Found in declining trees
that were surveyed for the
presence of red pine scale.
White Pine
Weevil
Pissodes strobi White pine
and Colorado
blue spruce
Statewide Damage to young conifers
remains low.
BUD AND SHOOT INSECTS
Bud and Shoot Insects not reported in 2017 included Balsam Shootboring Sawfly, Pleroneura
brunneicornis.
Bud and Shoot Insects 64

INSECT LATIN NAME HOST LOCALITY REMARKS
Broadnecked
Root Borer
Prionus laticollis Various Brattleboro and
elsewhere
Specimen found in
swimming pool; most
inquiries about these insects
result from the appearance
of the large adult beetles.
Dog day cicada Neotibicen
canicularis
Soil Burlington Surprise for a homeowner.
Japanese Beetle Popillia japonica Many Scattered
throughout
Heavy in scattered
locations, but generally few
reports than in the recent
past.
June Beetle Phyllophaga spp. Many Scattered Few reports were received
in 2017.
ROOT INSECTS
Root Insects not reported in 2017 included Conifer Root Aphid, Prociphilus americanus ; Conifer
Swift Moth, Korsheltellus gracillis .
Root Insects 65

Bark and Wood Insects 66
BARK AND WOOD INSECTS
Asian Longhorned Beetle (ALB), Anoplophora glabripennis, was not observed and is not known to
occur in Vermont and no forest management changes are recommended in anticipation of the insect.
Nonetheless, education and outreach that can promote early detection remain a priority. Early detection is
particularly important with the Asian longhorned beetle, since small, newly-discovered populations can
be successfully eradicated.
As part of our invasive pest preparedness, an interagency ICS exercise was held in June to help prepare
for future invasive pest invasions. The tabletop exercise was facilitated by USDA APHIS, and included
four other agencies, in a run-though of a simulated Asian longhorned beetle detection. An update to
Vermont’s Invasive Pest Response plan is under review.
Emerald Ash Borer (EAB), Agrilus planipennis, is not known to occur in Vermont and was not detected
by survey. However, new counties were found to be infested in Massachusetts, eastern New York, and
New Hampshire in 2017. The insect is now reported from thirty-one states. Anyone using ash products
from infested states should be aware of current regulations. Information is available by contacting USDA
APHIS, AAFM, or an FPR office. As of December 2017, five counties in New Hampshire, and all of
New York, Connecticut and Massachusetts are included in the emerald ash borer quarantine area.
The emerald ash borer detection effort continues in Vermont. USDA APHIS continued its statewide sur-
vey by deploying 214 purple traps throughout Vermont. We follow-up on all suspects, and conducted on-
site inspections at ten locations where dying ash were observed or reported.
Firewood Program: Invasive insects, like the emerald ash borer and Asian longhorned beetle, can live
inside firewood and are unknowingly transported to new locations where they will emerge as adults and
start new infestations. The impacts from such infestations are devastating to the environment, economy,
and society.
State Parks Firewood Exchange Project: The 2017 camping season was the 9th year that Vermont
State Parks exchanged firewood. This year the total number of firewood bags collected from campers
who brought firewood in from out-of-state was 27. This number of bags is slightly less than one half the
amount collected last year (Table 15.)
The State Parks that collected firewood this year include: Elmore (12 bags), Little River (4 bags), Smug-
glers Notch (2 bags), Townshend (7 bags) and 1 bag each from Branbury and Jamaica. Firewood brought
into Vermont State Parks this year came from: New York, Massachusetts, Connecticut, New Hampshire,
Maine, and Quebec. Forest Protection staff opened and examined all the bags of firewood collected. No
evidence of invasive pests were found.

Bark and Wood Insects 67
Table 15. Numbers of bags of firewood brought into Vermont State Parks during the 2009-2017 camp-
ing seasons. From 2009-2012, firewood from over 50 miles away was exchanged. Since 2013, wood
has been exchanged if it was brought in from out of state.
Year
Number of
Bundles of
Firewood
2009 212
2010 379
2011 158
2012 136
2013 148
2014 51
2015 46
2016 64
2017 27
The Rule Governing the Importation of Untreated Firewood into the State of Vermont has been in effect
since May 2016. We continue to focus on outreach, so firewood users are aware of this rule. UVM Ex-
tension has been a partner in this effort along with Vermont Agency of Agriculture, Food, and Markets,
Animal and Plant Health Inspection Service (APHIS), and the National Don’t Move Firewood. A focus
in 2017 was a campaign to support private campground owners, supplying educational materials and
suggested best management practices for preventing the movement of firewood. Don’t Move Firewood
information is also available through the vtinvasives website.
Currently six waivers are in effect allowing importation of untreated firewood from adjacent counties in
New Hampshire. One additional waiver allows importation of firewood from an adjacent county in NY,
provided the firewood complies with the emerald ash borer quarantine. Three additional requests were
received from New York, but the requester chose not to follow through, given the EAB quarantine re-
strictions.
One enforcement action was taken by DEC. Untreated firewood imported from Massachusetts was con-
fiscated and destroyed off-site.

Bark and Wood Insects 68
Exotic Wood Borer/Bark Beetle National Survey: In 2017, staff with the USDA APHIS Plant Pro-
tection and Quarantine (PPQ) and the Vermont Agency of Agriculture, Food and Markets (VAAFM)
deployed traps for exotic woodboring beetles. Trap catches were submitted to the Carnegie Museum
for identification. Sirex woodwasp (Sirex noctilio) was the only targeted insect collected, and it was
found in four traps (Table 16).
Target County Collection Dates Trap Type Lure Combo Agency
Sirex noctilio Chittenden 8/17/16-8/31/2016 Lindgren
Alpha-pinene,
UHR Ethanol,
Monochamol VAAFM
Sirex noctilio Chittenden 8/31/2017-9/14/2017 Lindgren Alpha-pinene,
Ethanol UHR VAAFM
Sirex noctilio Chittenden 8/31/2017-9/14/2017 Lindgren Alpha-pinene,
Ethanol UHR VAAFM
Sirex noctilio Rutland 8/31/2017-9/13/2017 Lindgren Alpha-pinene,
Ethanol UHR VAAFM
Table 16. Target insects collected by USDA APHIS and VAAFM in Vermont as part of the Exotic
Wood Borer/Bark Beetle National Survey.

INSECT LATIN NAME HOST LOCALITY REMARKS
Asian
Longhorned
Beetle
Anoplophora
glabripennis
Various
hardwoods
Not observed or known to
occur in Vermont. See
narrative.
Black and Red
Horntail
Urocerus cressoni Firewood Wolcott Encountered while splitting
firewood.
Black Spruce
Beetle
Tetropium
castaneum
Spruce, pine,
fir and larch
Not observed or known to
occur in Vermont.
Bronze Birch
Borer
Argrilus anxius Birch Scattered
throughout
Sometimes observed on
stressed ornamentals.
Brown Prionid Orthosoma
brunneum
Conifers and
hardwoods
Calais, Underhill Sightings of adults.
Brown Spruce
Longhorned
Beetle
Tetropium fuscum Spruce, pine
and fir
Not observed or known to
occur in Vermont. As part
of the Northeastern Forest
Fire Compact’s Forest
Health Working Teams
resource sharing among
northeastern states and
provinces, two Vermonters
travelled to New Brunswick
to assist in surveys for this
insect. Other Tetropium
species that were captured
in traps deployed by
VAAFM in Vermont
included T. cinnamopterum
(11 specimens) and T.
schwarzianum (26
specimens).
Carpenter Ant Camponotus sp. Wood
products
Scattered Usual number of
homeowner inquiries.
Eastern Ash Bark
Beetle
Hylesinus aculeatus Ash Scattered reports Beetles encountered in
homes as they emerged
from firewood and logs.
Deathwatch
Beetle
Ptilinus ruficornis Firewood Norwich Encountered while splitting
firewood.
OTHER BARK AND WOOD INSECTS
Bark and Wood Insects 69

INSECT LATIN NAME HOST LOCALITY REMARKS
OTHER BARK AND WOOD INSECTS
Eastern
Carpenter Bee
Xylocopa virginica Wood product Weybridge Nesting in wood framing of
home.
Elderberry Borer Desmocerus
palliatus
Elderberry Essex Junction Showy adult observed.
Emerald Ash
Borer
Agrilus planipennis Ash Not observed or known to
occur in Vermont. See
narrative.
European
Woodwasp
Sirex noctilio Red and Scots
pine
Trapped in eight counties
since 2007. In 2017, AAFM
and USDA APHIS trapped
it in Chittenden and
Rutland Counties. No new
observations of Sirex
infesting trees were
reported, with the only
known location in Jericho.
Hemlock Borer Phaenops
fulvoguttata
Hemlock and
occasionally
other conifers
Statewide Increase in hemlock borer
following dry year in 2016.
Associated with widely
scattered hemlock mortality
on compromised sites.
Japanese Cedar
Longhorned
Beetle
Callidiellum
rufipenne
Arborvitae,
eastern
redcedar,
juniper and
others
Not observed or known to
occur in Vermont.
Northeastern
Sawyer
Monochamus
notatus
Conifers Scattered Occasional reports during
adult flight period.
Pigeon Tremex Tremex columba Sugar maple Scattered
throughout
Commonly observed in
declining trees or turning up
while splitting firewood.
Russian leather
beetle
Osmoderma
eremicola
Sugar maple Charlotte
Bark and Wood Insects 70

INSECT LATIN NAME HOST LOCALITY REMARKS
OTHER BARK AND WOOD INSECTS
Southern Pine
Beetle
Dendroctonus
frontalis
Pine Not observed or known to
occur in Vermont.
Sugar Maple
Borer
Glycobius speciosus Sugar maple Scattered
throughout
Stable populations.
Turpentine
Beetles
Dendroctonus spp. White pine Scattered
throughout
Observed in stands stressed
by white pine needle
diseases.
Whitespotted
Sawyer
Monochamus
scutellatus
White pine
and other
conifers
Throughout Adults commonly observed.
Other Bark and Wood Insects not reported in 2017 included Allegheny Mound Ant, Formica
exsectoides; Carpenterworm, Prionoxystus robiniae ; Eastern Larch Beetle, Dendroctonus
simplex; Elm Bark Beetles, Hylurgopinus rufipes and Scolytus multistriatus ; Red-headed Ash Borer,
Neoclytus acuminatus ; Round-headed Apple Tree Borer, Saperda candida; Spruce Beetle,
Dendroctonus rufipennis; Tanbark Borer, Phymatodes testaceus.
Bark and Wood Insects 71

INSECT LATIN NAME HOST LOCALITY REMARKS
Asiatic Garden
Beetle
Autoserica castanea Vershire Ornamentals.
Autographa
californica - a
plusiinae moth
Autographa
californica
Vineyards Chittenden and
Grand Isle
Counties
Found outside of its
described western North
America range during Farm
Bill-funded grape
commodity survey for
federal target pest
Autographa gamma . GBIF
and iDigBio databases
indicate that a specimen
was found in Maine (date
unknown) and southern
Connecticut (1973), plus
two locations in Michigan
(1992 and 2003).
Otherwise, documented
only in the west.
Rose Chafer Macrodactylus
subspinosus
Many Statewide Few reports in 2017.
Western Conifer
Seed Bug
Leptoglossus
occidentalis
Conifers Statewide A common household
invader, with a significant
increase in some areas.
Damage to Vermont
conifers has not been
recorded.
FRUIT, NUT AND FLOWER INSECTS
Fruit, Nut and Flower Insects not reported in 2017 included Butternut Curculio, Conotrachelus
juglandis; Fir Coneworm, Dioryctria abietivorella; Pine Coneworm, Dioryctria reniculelloides; Plum
Curculio, Conotrachelus nenuphar.
Fruit, Nut and Flower Insects 72

Stem Diseases 73
FOREST DISEASES
STEM DISEASES
Dieback from Beech Bark Disease was mapped on 2,807 acres, a decrease from the 7,278 acres
mapped in 2016 (Table 17 and Figure 25).
While bark symptoms remain common, crown symptoms from beech bark disease have been generally
less noticeable over the past decade, following a period when symptoms were more widespread (Figure
24). Weather contributing to the survival of beech scale crawlers or the susceptibility of beech bark are
likely to have contributed to the severity of the disease in the early 2000’s. The more recent drop in
acreage mapped may also be due to the mid-summer timing of the aerial survey in 2016 and 2017 com-
pared to the late summer surveys in other recent years. The bright yellow crowns of symptomatic trees
develop over the growing season, and would be less noticeable in mid-summer than in late summer.
County Acres
Addison 327
Bennington 212
Caledonia 44
Chittenden 412
Essex 726
Franklin 94
Orange 89
Orleans 55
Rutland 414
Washington 254
Windham 74
Windsor 106
Total 2,807
Table 17. Mapped acres of beech bark disease in 2017.
Figure 24. Acres of beech bark disease mapped in Vermont during statewide aerial surveys, 1990 – 2017.

Stem Diseases 74
Figure 25. Beech bark disease related decline and mortality mapped in 2017. Mapped area includes
2,807 acres.

DISEASE LATIN NAME HOST LOCALITY REMARKS
Ash Yellows Candidatus
phytoplasma fraxini
White ash Southern and
Northwestern
Vermont
Remains heavy in scattered
locations. See Ash Dieback
(page 95).
Beech Bark
Disease
Cryptococcus
fagisuga and Nectria
coccinea var.
faginata
See narrative.
Black Knot Dibotryon morbosum Cherry Scattered
throughout
Common at normal levels.
Most severe where cherry is
near edge of range.
Butternut Canker Sirococcus
clavigignenta-
juglandacearum
Widespread Remains stable, with most
butternuts showing signs of
the disease.
Caliciopsis
Canker
Caliciopsis pinea White pine Widely scattered Associated with decline
where trees are stressed by
recurrent needle diseases.
Heavy damage in a
deteriorating stand in South
Royalton.
Chestnut Blight Cryphonectria
parasitica
American
chestnut
Southern
Vermont,
Champlain
Valley
Observed on sprouts. The
American Chestnut
Foundation remains active
in establishing seed
orchards in Vermont.
Cytospora
Canker
Leucostoma kunzei Blue spruce Widely scattered Damage levels remain low.
Diplodia Shoot
Blight
Sphaeropsis sapinea Red pine Widespread Role in red pine decline is
unclear. Confirmed by the
USFS FHP in a historically
declining stand in Reading.
Dutch Elm
Disease
Ophiostoma novo-
ulmi
Elm Throughout Flagging and mortality
continued to be more
noticeable than normal by
mid-summer.
Fireblight Erwinia amylovora Apple Woodstock Submitted to the lab.
OTHER STEM DISEASES
Stem Diseases 75

DISEASE LATIN NAME HOST LOCALITY REMARKS
OTHER STEM DISEASES
Hypoxylon
Canker
Hypoxylon
pruinatum
Poplar Widely scattered Damage levels low.
Nectria Canker Nectria galligena Hardwoods Scattered
throughout
Oak Wilt Ceratocystis
fagacearum
Not observed or known to
occur in Vermont.
Red Ring Rot Phellinus pini White pine Scattered
throughout
Common in unthrifty,
heavily wounded, or
overstocked stands.
Thousand
Cankers Disease
Geosmithia morbida
and Pityophthorus
juglandis
Walnut Not observed or known to
occur in Vermont.
Verticillium Wilt Verticillium albo-
atrum
Sugar maple Woodstock Ornamental.
White Pine
Blister Rust
Cronartium ribicola White pine Scattered
throughout
Incidence remains higher
than normal with 197 acres
of scattered mortality
mapped during aerial
surveys.
Woodgate Gall
Rust
Endocronartium
harknessii
Scots pine Northern
Vermont
Present in pockets of
unthrifty roadside Scots
pine.
Yellow Witches
Broom Rust
Melampsorella
caryophyllacearum
Balsam fir Widely scattered Continues to be very
noticeable, especially in
northern Vermont.
Observed on Christmas
trees in Springfield.
Other Stem Diseases not reported in 2017 included Cedar Apple Rust, Gymnosporangium juniperi-
virginianae ; Delphinella Tip Blight of Fir, Delphinella balsamae ; Eastern Dwarf Mistletoe,
Arceuthobium pusillum ; Sapstreak, Ceratocystis coerulescens ; Scleroderris Canker, Ascocalyx
abietina; Verticillium Wilt, Verticillium albo-atrum.
Stem Diseases 76

Foliage Diseases 77
FOLIAGE DISEASES
Hardwood Foliage Diseases – Wet conditions early in the growing season led to an increase in some
foliage diseases this year. Foliage compromised by fungal infection was more susceptible to the dry con-
ditions present late in the growing season and dropped as early as mid-September.
• Defoliation of apple species was widespread, with an increase from 2016 levels in both apple scab
(Venturia inaequalis) and cedar-apple rust (Gymnosporangium juniperi-virginianae).
• Sycamore anthracnose (Apiognomonia veneta) was severe wherever sycamore occurs naturally. De-
foliated trees refoliated by early summer.
• Excessive moisture also produced signs of anthracnose (including genera listed below) on other
hardwood species. Misshapen and discolored leaves associated with the disease were visible on oaks,
maples and ash species through May and June.
• The impact of anthracnose and other fungi on foliage extended beyond spring, and contributed to ear-
ly leaf drop for some species, particularly maple and ash. The UVM Plant Diagnostic Lab identified
Discula sp., Aureobasidium sp., Alternaria sp. and an abundance of Phyllosticta sp on fallen sugar
maple leaves, and Gloeosporium sp., Marssonina sp., Phyllosticta sp., Mycosphaerella sp., Alternaria
sp., Powdery mildew (unidentified; chasmothecia), Alternaria sp., and Botryosphaeria-like fungi on
fallen white ash leaves. Symptoms resembling Septoria Leafspot were also reported, especially in
northeastern Vermont. Other players in the early leaf drop of 2017 included the legacy of the 2016
drought, and heavy seed by some species.
Needle Diseases of White Pines – White pine needles were affected once again this year by a complex
of fungal species including Brown Spot Needle Blight (Mycosphaerella dearnessii), and two needlecast
fungi (Lophophacidium dooksii and Bifusella linearis). During aerial surveys over 16,000 acres were
mapped, which is a reduction from 2016 (Table 18 and Figure 26). This likely underestimates the area
affected since damage is mapped from above the trees, while much of the damage is observed within, and
in lower portions of tree crowns.
These diseases are most severe in the lower crown where fungi have been thriving due to multiple wet
springs. The damage has been widespread since 2010, and the current epidemic has been building at least
since 2005. Decline and mortality of white pine have been observed in stands which have had multiple
years of needle damage where other stress factors are also present such as wet site conditions, wind im-
pact, or wounding. Weak pests and pathogens, such as turpentine beetles, Caliciopsis canker, and Armil-
laria root rot have been observed in some stressed stands.
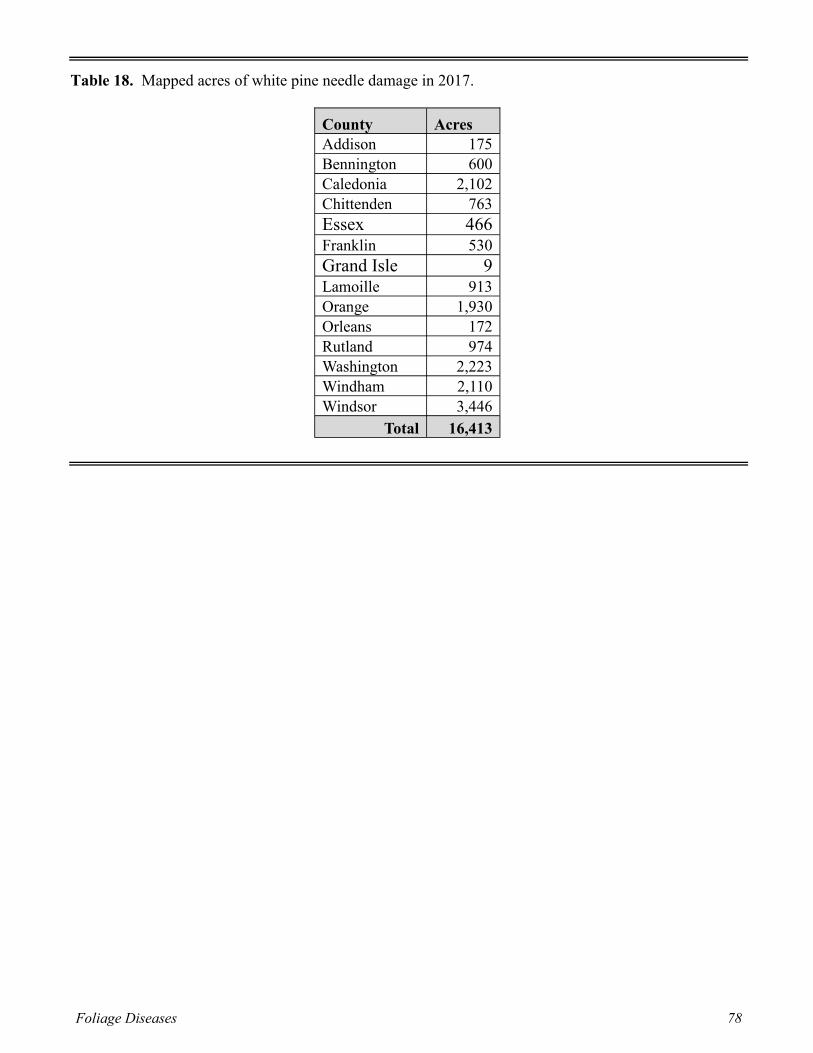
Foliage Diseases 78
County Acres Addison 175 Bennington 600 Caledonia 2,102 Chittenden 763
Essex 466 Franklin 530
Grand Isle 9 Lamoille 913 Orange 1,930 Orleans 172 Rutland 974 Washington 2,223 Windham 2,110 Windsor 3,446
Total 16,413
Table 18. Mapped acres of white pine needle damage in 2017.

Foliage Diseases 79
Figure 26. White pine needle damage mapped in 2017. Mapped area includes 16,413 acres.
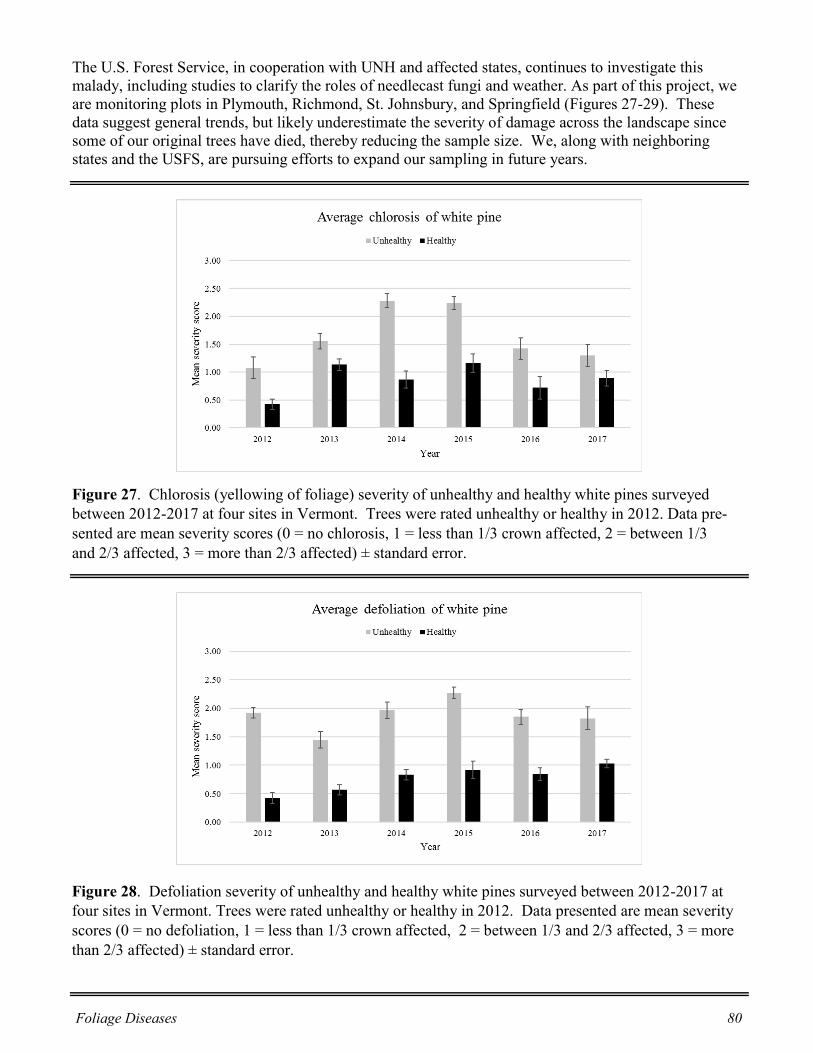
Foliage Diseases 80
The U.S. Forest Service, in cooperation with UNH and affected states, continues to investigate this
malady, including studies to clarify the roles of needlecast fungi and weather. As part of this project, we
are monitoring plots in Plymouth, Richmond, St. Johnsbury, and Springfield (Figures 27-29). These
data suggest general trends, but likely underestimate the severity of damage across the landscape since
some of our original trees have died, thereby reducing the sample size. We, along with neighboring
states and the USFS, are pursuing efforts to expand our sampling in future years.
Figure 27. Chlorosis (yellowing of foliage) severity of unhealthy and healthy white pines surveyed
between 2012-2017 at four sites in Vermont. Trees were rated unhealthy or healthy in 2012. Data pre-
sented are mean severity scores (0 = no chlorosis, 1 = less than 1/3 crown affected, 2 = between 1/3
and 2/3 affected, 3 = more than 2/3 affected) ± standard error.
Figure 28. Defoliation severity of unhealthy and healthy white pines surveyed between 2012-2017 at
four sites in Vermont. Trees were rated unhealthy or healthy in 2012. Data presented are mean severity
scores (0 = no defoliation, 1 = less than 1/3 crown affected, 2 = between 1/3 and 2/3 affected, 3 = more
than 2/3 affected) ± standard error.

Foliage Diseases 81
Figure 29. Average trends in yellowing severity and defoliation for all trees sampled at four sites in
Vermont between 2012-2017. Data presented are mean severity scores (0 = no chlorosis/defoliation, 1 =
less than 1/3 crown affected, 2 = between 1/3 and 2/3 affected, 3 = more than 2/3 affected) ± standard
error.

DISEASE LATIN NAME HOST LOCALITY REMARKS
Anthracnose Glomerella spp.;
Apiognomonia
Maples, Oaks,
Ash,
Sycamore
Statewide See narrative.
Apple Scab Venturia inaequalis Apple Statewide See narrative.
Brown Spot
Needle Blight
Scirrhia acicola Pines Northeastern
Vermont
Thin crowns, some decline
and mortality.
Cedar-Apple
Rust
Gymnosporangium
juniperi-virginianae
Apple Southern
Vermont
See narrative.
Fir-Fern Rust Uredinopsis
mirabilis
Balsam Fir Southeastern
Vermont
Incidental observation.
Giant Tar Spot Phytisma acerinum Norway Maple Statewide Increase from 2016 levels;
Bennington county had
early defoliation as a result.
Phyllosticta
leafspot
Phyllosticta spp. Sugar Maple Windham
County
See narrative.
Poplar Leaf
Blight
Marssonina spp. Balsam Poplar Statewide Similar to 2016 damage.
Powdery Mildew Eryiphaceae Lilac, Norway
Maple,
Honeysuckle
Statewide Increase in damage from
2016.
Rhizosphaera
Needlecast
Rhizosphaera
kalkhoffi
Spruce Statewide Mortality of ornamental
blue spruce continues due
to heavy defoliation in the
past.
Septoria Leaf
Spot
Septoria aceris Hardwoods Statewide See narrative.
OTHER FOLIAGE DISEASES
Foliage Diseases not reported in 2017 included Birch Leaf Fungus, Septoria betulae ; Dogwood
Anthracnose, Discula destructiva ; Lirula Needlcast, Lirula sp. ; Rhizosphaera Needle Blight,
Rhizosphaera pini .
Foliage Diseases 82

DISEASE LATIN NAME HOST LOCALITY REMARKS
Annosus Root
Rot
Heterobasidion
annosum
Red Pine Brattleboro Although no conks were
found, confirmed to be
present by spore trapping in
a stand where infection
centers had occurred in the
past.
Armillaria Root
Rot
Armillaria spp. Balsam Fir Northeastern
Vermont
Contributing to mortality
associated with balsam
woolly adelgid.
Armillaria Root
Rot
Armillaria spp. Many Statewide Heavy sporophore
production statewide
indicates the drought in
2016 has increased root
infection levels.
ROOT DISEASES
Root Diseases 83

Diebacks, Declines, and Environmental Diseases 84
DIEBACKS, DECLINES, AND ENVIRONMENTAL DISEASES
Drought conditions have affected forests at several times during the past year. Going into the winter of
2016-2017, the entire state was abnormally dry or in moderate to severe drought. Dryness tapered off
through the winter, finally ending by early May in eastern Windsor and Orange Counties. Then in
September 2017, dry conditions returned and were coupled with record-breaking high temperatures, at
times reaching 900F. By late-October abnormally dry conditions, and at times moderate drought condi-
tions, affected forest health.
Evidence of drought damage was recorded from aerial surveys affecting 1,601 acres (Figure 30). Symp-
toms of drought varied depending on which drought episode affected tree health.
Heavy seed production, sometimes referred to as a “distress crop”, is common following drought condi-
tions. When trees put lots of resources into seed production, they may look sparser than normal. Drought
symptoms included heavy seed on a variety of species: hardwood species notably maple, beech, oak,
basswood, apple, and hop hornbeam, and among conifers, white pine, balsam fir, red, white and Norway
spruce, and northern white cedar. An increase in squirrel damage is likely in the near future, as popula-
tions benefit from the recent glut of food.
New ash mortality and maple dieback were noticeable by mid-June in multiple locations in eastern
Vermont where drought conditions had persisted into early spring. Ash trees are particularly sensitive to
fluctuating water conditions. Affected maples often had foliage of good size and color on living branch-
es, suggesting that plentiful moisture later in the spring allowed trees to recover.
Other symptoms of drought effects on forest health included: heavy production of Armillaria “honey
mushrooms” suggesting that this fungus successfully invaded drought-stressed roots; more attacks by
hemlock borer were reported on wounded hemlocks.
Warm dry conditions in late summer into fall led to: refoliation failures from forest tent caterpillar and
other defoliators, along with infection by leaf fungi and other foliage injury factors; a general delay in
fall foliage, with the exception of swamps and other stressed areas that start to turn color early; and early
leaf drop of sugar maple and ash, especially on roadsides, openings, river corridors, and edges. Once
leaves are compromised by disease infection they are more likely to brown and drop early under dry
conditions.
Table 19. Mapped acres of drought symptoms in 2017. Drought symptoms were more visible late in
the summer, so some areas mapped early in the summer may not be well-represented in these data.
County Acres
Addison 28
Caledonia 176
Chittenden 56
Essex 1,114
Orange 25
Orleans 1
Rutland 13
Washington 109
Windsor 79
Total 1,601

Diebacks, Declines, and Environmental Diseases 85
Figure 30. Symptoms of drought damage mapped in 2017. Mapped area includes 1,601 acres.

Diebacks, Declines, and Environmental Diseases 86
Frost Damage resulting from stalled leaf development in the spring followed by a cold snap in early
May affected scattered locations in Caledonia and Windham Counties, and other locations statewide
(Table 20). Acres affected were much less than in 2015 when frost damage affected over 24,000 acres.
County Acres Caledonia 3 Windham 94
Total 97
Table 20. Mapped acres of frost damage in 2017.
Tree stress related to recent logging-related decline increased in 2017 to 629 acres, spread across 5
counties (Table 21). The majority of the areas mapped during aerial survey, 439 acres, occurred in Es-
sex County. Drought conditions in late summer 2016 likely affected trees already stressed following
harvesting.
County Acres
Addison 52
Bennington 42
Caledonia 19
Essex 439
Washington 77 Total 629
Table 21. Mapped acres of logging-related damage in 2017.

Diebacks, Declines, and Environmental Diseases 87
Figure 31. Symptoms of logging-related damage mapped in 2017. Mapped area includes 629 acres.

Diebacks, Declines, and Environmental Diseases 88
Ozone injury on sensitive plants was evaluated at 6 monitoring locations in August (Table 22). Of the
592 plants examined, symptoms of ozone injury (stippling on upper leaf surface) were recorded at 2 of
the locations, Orange and Rupert. Injury at the Orange site was on blackberry affecting 10 plants with
moderate severity. Injury at the Rupert site was on milkweed affecting 5 plants with light severity. No
ozone damaged forests were mapped during aerial survey.
Table 22. Ozone bioindicator sites visited in 2017 and observed ozone injury.
Town Ozone injury
Clarendon None
Dover None
Groton None
Orange Moderate
Rupert Light
Sudbury None
Woodstock No data
Rainfall caused a variety of symptoms due to due to excessive precipitation in late spring and early
summer, with May, most of June, and early July being cooler and wetter than normal. The cool, wet
weather slowed leaf development, saturated soil, and promoted the spread of fungi, resulting in the fol-
lowing conditions observed in 2017: Stands of chlorotic sugar maples, were observed in scattered
locations statewide, with 6,494 acres mapped from the air. This is frequently observed in unusually
rainy summers. Conditions were ideal for leaf infection by fungal pathogens, and for caterpillar infec-
tion by fungal and viral diseases. Wet spring weather led to sycamore anthracnose, which kept syca-
mores bare into early June (see Disease Section). Saturated soil made trees more vulnerable to wind-
throw in stormy weather.
Table 23. Mapped acres of rainfall-induced chlorosis in 2017.
County Acres
Addison 608
Bennington 716
Caledonia 504
Chittenden 591
Essex 275
Franklin 341
Grand Isle 107
Orange 574
Orleans 371
Rutland 1,781
Washington 87
Windham 232
Windsor 307
Total 6,494

Diebacks, Declines, and Environmental Diseases 89
Figure 32. Symptoms of rainfall-induced chlorosis mapped in 2017. Mapped area includes 6,494
acres.

Diebacks, Declines, and Environmental Diseases 90
Red Pine Decline in plantations statewide has been mapped on 516 acres. Several new locations were
observed, such as in Goshen. This decline is believed to be associated with red pine scale, Matsucoc-
cus resinosae, although identification of causal agents has been challenging (see Red Pine Scale in sec-
tion on Sapsucking Insects, page 60).
Damage from Unknown Causes
In 2017 there were 1,298 acres of forests with significant damage that could not be associated with any
specific cause (Table 24). A variety of species and locations, especially in the northeastern counties,
were mapped during aerial survey and ascribed as unknown causes.
Table 24. Mapped acres of damage from unknown causes in 2017.
County Acres
Addison 10
Caledonia 241
Chittenden 15
Essex 657
Orange 195
Orleans 97
Rutland 21
Washington 4
Windham 16
Windsor 42
Total 1,298

Diebacks, Declines, and Environmental Diseases 91
Figure 33. Symptoms of damage from unknown causal agent mapped in 2017. Mapped area includes
1,298 acres.

Diebacks, Declines, and Environmental Diseases 92
Year Total Acres from
Weather Damage Extensive Damage Factors Other Damage Factors
1991 64,529 Drought
1992 17,790 Flooded sites, drought, frost
1993 54,067 Spruce winter injury Flooded sites
1994 10,780 Flooded sites
1995 17,365 Flooded sites, drought
1996 19,324 Spruce winter injury, wet sites
1997 10,557 Flooded sites
1998 1,031,716 Ice storm, flooded sites
1999 122,024 Drought Ice, flooded sites, wind
2000 10,634 Flooded sites
2001 180,494 Drought Flooded sites
2002 210,534 Drought Flooded sites
2003 106,238 Spruce winter injury, flooded sites Wind, drought
2004 19,877 Flooded sites
2005 11,078 Flooded sites
2006 6,786 Flooded sites
2007 21,656 Drought, flooded sites, wind
2008 2,401 Flooded sites
2009 15,315 Winter injury, flooded sites
2010 417,180 Frost
2011 10,029 Flooded sites
2012 55,872 Frost Flooded sites
2013 15,332* Frost, ice* Flooded sites, wind
2014 4,848 Flooded sites, wind, ice storm, hail
damage
2015 35,898 Frost, drought Flooded sites, wind, ice/snow
breakage
2016 9,320 Drought Flooded sites, frost, wind
2017 11,915 Excessive Rain Flooded sites, drought, wind, frost
Table 25. Trend in acres of forest damage from weather events and major factors involved mapped dur-
ing aerial surveys.
*A December 2013 ice storm was not mapped during aerial survey but affected large areas in northern Vermont.
Extreme weather events consist of storms or abnormal weather patterns that result in impacts to tree
health. With the see-saw between wet and dry, unusual cool and warm periods, and severe storms,
weather conditions were a major driver of tree health. In addition to direct hail damage, trees suffered
breakage and windthrow in severe storms.
Aerial survey mapping of weather-related damages totaled 11,915 acres in 2017. These estimates of
weather-related damage likely under represent actual impacts since some of the damages are not visible
during aerial survey. In 2017, drought was the most significant and extensive weather damage (Table
25), although a late fall wind storm affected forests statewide and was not included in these data. Other
weather-related tree damage mapped during aerial survey was caused by late spring frost, inundated
sites, and from spring wind events.

Diebacks, Declines, and Environmental Diseases 93
Wet or Flooded Site Declines were mapped on 3,647 acres in 2017, an increase from 1,183 acres rec-
orded in 2016. Some of these sites may have been a result of past year’s flooding.
County Acres Addison 780
Bennington 23
Caledonia 47
Chittenden 350
Essex 438
Franklin 729
Grand Isle 534
Orange 66
Orleans 154
Rutland 503
Washington 23
Total 3,647
Figure 34. Trend in acres of forest decline related to wet or flooded sites mapped during aerial sur-
veys. In 2017, the mapped area included 3,647 acres, a increase from 1,183 in 2016.
Table 26. Mapped acres of forest decline associated with flooded or otherwise wet sites.

Diebacks, Declines, and Environmental Diseases 94
Figure 35. Wet or flooded site related decline mapped in 2017. Mapped area includes 3,647 acres.

Diebacks, Declines, and Environmental Diseases 95
Wind Damage from a variety of storms affected forests statewide: a gravity wave storm on May 5,
microburst storms on May 18, and storms including hail on May 31, July 18, and August 12. A wind
storm on October 29 affected forests statewide but damage will not be mapped until next field season.
A total of 76 acres were mapped in Caledonia County during aerial surveys (Table 27).
Table 27. Mapped acres of wind damage in 2017.
County Acres Caledonia 76
Total 76
Figure 36. Trend in wind and storm damage mapped during aerial surveys. Mapped area includes 76
acres in 2017.

CONDITION HOST LOCALITY REMARKS
Air Pollution Injury Milkweed,
dogbane,
blackberry
Groton, Orange See Ozone Injury.
Ash Dieback White ash Scattered Statewide Remains heavy in scattered
locations, perhaps compounded by
2016 drought.
Chlorosis Hardwoods,
especially sugar
maple
Statewide Similar symptoms also mapped in
2008 (among other years) when
"All this rain produced one of the
greenest summers in recent
memory."
Drought Damage Hardwoods Statewide Dry conditions in late September
2016 led to browning and early leaf
drop of white ash and sugar maple.
Spring 2017 fungal diseases
exacerbated damage.
Frost Damage Hardwoods Scattered statewide Especially at higher elevations.
Girdling roots Hardwoods Colchester
Hail Sugar maple,
ornamental hosta
Northeastern towns Noticeable damage to understory.
Heavy Seed Select species of
hardwoods and
softwoods
Statewide Especially sugar maple, red maple,
beech, oaks, pines, fir and spruce.
Logging-related
Decline
See narrative.
Salt damage Conifers Statewide Damage noticeable in the spring on
roadside pines and other conifers.
Red Pine Decline Red pine Statewide Plantations, both in previously
known and new locations (e.g.
Goshen).
Spruce Dieback and
Mortality
Blue spruce Statewide Mortality of ornamental blue spruce
is still noticeable and is due to
previous defoliation by
Rhizosphaera.
OTHER DIEBACKS, DECLINES, AND ENVIRONMENTAL DISEASES
Diebacks, Declines, and Environmental Diseases 96

CONDITION HOST LOCALITY REMARKS
OTHER DIEBACKS, DECLINES, AND ENVIRONMENTAL DISEASES
Wet Site See narrative.
White Pine Decline White pine Royalton Significant mortality of sawtimber
size trees. Cause unknown, but
thought to be initiated by wind or
another abiotic factor.
White Pine Needle
Damage
See Foliage Diseases.
White Spruce Decline White spruce Northeast and north
central Vermont
White spruce mortality continues to
be noticeable in scattered locations
in NE and NC VT likely from
needlecast, although the causative
organisms are unknown. Mortality
levels in young white spruce stands
were reported to be as high as 90%.
Wind Damage Varied, especially
white pine, sugar
maple, poplars
Statewide May 5th windstorm in Rutland
County resulted in breakage and
blowdown; an October 29-30
windstorm affected forests and
infrastructure statewide.
Other Diebacks, Declines, and Environmental Diseases not reported in 2017 included birch decline,
fire damage, hardwood decline and mortality, ice damage, interior needle drop, larch decline, lightning
damage, snow damage, winter injury.
Diebacks, Declines, and Environmental Diseases 97

ANIMAL SPECIES
DAMAGEDLOCALITY REMARKS
Squirrel Oaks, Norway
spruce
Statewide Noticeable late season clipping
Woodpecker Wood products;
Balsam fir
Statewide
ANIMAL DAMAGE
Animal Damage 98

Invasive Plants 99
INVASIVE PLANTS
2017 saw the continued growth of non-native invasive plant (NNIP) early detection and management
efforts statewide. Progress with mapping, control, outreach and education have been made possible
through several grant-funded opportunities, and varied strategies within local communities. The
statewide invasive plant coordinator within FPR led over 23 workshops for a variety of stakeholders
(state parks, conservation commissions, non-profits, community groups, others), focusing on NNIP in-
formation, management, and prioritization. Department staff continue to provide outreach and infor-
mation about NNIP to the public and professionals, and are building the capacity to continue to identify
and manage NNIP on state lands across Vermont.
Populations of early detection species, Petasites hybridus and Petasites japonicus, have been identified
in Vermont. P. hybridus was first documented in 2009, and P. japonicus was first documented in 2016.
Additional populations of petasites have been noted in: Barton, Warren, Waitsfield, Woodbury, Burling-
ton, Readsboro, Barnet, Plainfield, East Montpelier, Sharon/Hartford (one population on the town line),
South Pomfret, Dorset, Wallingford, Canaan, Weathersfield, Springfield, and Guilford.
All known populations appear to be increasing rapidly. Some are reportedly small and contained at
first, for as much as 10 years, before aggressively spreading. Populations of both species are known to
propagate extensively by rhizome fragments, which can break away in floods and be carried long dis-
tances downstream, and regrow. Both species need soil that is permanently moist, which would poten-
tially make the species more invasive in northern and higher elevations of Vermont. The species report-
edly prefers fertile sites, so some of the acid sites on granitic bedrock in the Northeast Kingdom may be
less suitable. Elsewhere in the country, these species have been reported to be aggressive to at least har-
diness zone 3 in Minnesota, where winter temperatures reach -40oF.
The Vermont Invasive Exotic Plant Committee updated the unofficial watch list of NNIP. The complete
list can be found at: http://fpr.vermont.gov/forest/forest_health/invasive_plants
Regional Grant-Funded Activities
Education, Outreach, Capacity Building & Treatment in Vermont’s Forest Priority Areas: Efforts
continued to train volunteers to take part in a citizen science project to assess and prioritize treatment
areas for NNIP management (NNIPM) on town or private land. Observations made by volunteers are
linked to spatial location, photos, information on seed production, and level of infestation of the specific
observation. This information is stored on the iNaturalist website and is accessible through this link:
https://www.inaturalist.org/projects/mapping-for-healthy-forests-vermont. On October 12, 2017, the
project exceeded 3,000 observations, and is continuing to grow.
Invasive Plant Mitigation on State Land in Vermont: Education Volunteer Outreach & Capacity
Building: Two seasonal staff were hired onto the Habitat Restoration Crew in District 2 (southwest),
running volunteer days and conducting NNIPM in state forests and state parks throughout the district.
The Crew worked with 348 volunteers in 2017, with 1,282 volunteer hours. This program has worked
with 1,791 volunteers (7,408 volunteer hours) from 2014-2017. Additionally, this year the Crew worked
on mapping, curriculum development for programs with schools, and creating interpretive panels about
demonstration sites for NNIPM for state parks.
Early Detection Species

Invasive Plants 100
One example of NNIPM conducted by the
Crew includes a small population of Phrag-
mites australis in the Plymsbury beaver
meadow in Coolidge State Forest. In late
2014, this site was brought to FPR staff’s
attention by local residents who had partici-
pated in a volunteer day that summer. And in
2016 the Crew conducted drip application of
herbicide to the 1,000 phragmites stems. A
return visit in 2017 revealed that the treat-
ment was successful, with only 5 stems sur-
viving. This precision, strike team effort
ended up protecting 300 acres of wetlands
from further spread of phragmites.
Invasive Terrestrial Plant Treatment on Working Forests and Conserved Natural Areas in Ver-
mont’s Forest Priority Areas: The Nature Conservancy (TNC) completed a variety of NNIPM work
across VT. Volunteers removed garlic mustard and wall lettuce in the spring, and woody NNIP in the
fall, at Williams Woods in Charlotte. These efforts were part of a follow-up of the long-term control
there that was funded through WHIP. Volunteers removed NNIP along the LaPlatte River, and TNC
contracted with Redstart Forestry to do a large NNIP control project on 50 acres along the east side of
the river. This contract work included brush-hogging extensive honeysuckle populations in the spring,
and fall herbicide follow-up. The contractors will return next year to treat anything that was missed.
Volunteers pulled wall lettuce at Chickering Bog this spring. Garlic mustard and wall lettuce were con-
trolled on the Raven Ridge property in Monkton in the spring, and woody NNIP were removed along
the edge of the old field and around the beaver pond in the fall. Volunteers helped control woody NNIP
this fall at Wilmarth Woods in Addison. Wall lettuce was controlled at Eshqua Bog this spring.
Other Activities
The growing season for 2017 saw many projects across the state on NNIPM. Below are highlights of
some of these local efforts.
Tool Loan Pilot Program: In an effort to increase access to NNIPM tools, the District 3 (Northwest)
office started a pilot program, loaning out weed wrenches to local organizations, municipalities, and
private landowners. FPR’s Invasive Plant Coordinator communicated with participants, and organized
pick up and return dates. The wrenches were successfully borrowed and returned 8 times throughout
2017. The Coordinator shared information about the program at speaking engagements throughout the
year, and the tools are stored and available for pick up at FPR’s main office in District 3.
South Burlington, VT: The City of South Burlington completed its first Weed Warrior season in Sep-
tember of 2017. The goal of the program is to create a corps of trained volunteers focused on removing
NNIP in City parks. 2017 efforts were focused on City Center Park. Each of two trainings were fol-
lowed up by a separate Invasive Plant Removal Day (May, September). These trainings and workdays
were assisted by a professional NNIP expert, and weed wrenches were loaned by VT Forests, Parks &
Recreation. Species of concern included: glossy and common buckthorn, multiflora rose, and bush hon-
eysuckles.
Volunteers at the park this summer included members of the community, Vermont Youth Conservation
Corps, students from the Frederick H. Tuttle Middle School, and employees from Stantec Consulting
Figure 37. Plymsbury Beaver Meadow WMA; before
(2016) with 1,000 stems, after (2017) with only 5 stems.

Invasive Plants 101
Services. In total, 33 volunteers participated in the Weed Warrior Program and 47 additional volunteers
helped out via the other events. Approximately 50,000 individual buckthorn (or other plant) were physi-
cally removed.
The City will be monitoring the regrowth of all NNIP in the park in 2018, and plan on holding more
events next year to assist the City in managing these plants in the years to come. Additionally, the City
is hoping to expand the program and begin it at a different park to attract a new community of volun-
teers. These efforts were made possible by the following community organizations: City of South Bur-
lington; Vermont Forests, Parks & Recreation; Starbucks Coffee; The Mill Market & Deli; and Gar-
dener’s Supply Company.
Richmond, VT: Since 2009, the Great Richmond Root-Out! has worked to control invasive plants on
120 acres of state-significant silver maple-ostrich fern floodplain forest—the largest remaining example
of this now rare natural community on the upper Winooski River. In addition to its ecological im-
portance, this area is also prized by the people of Richmond who use it extensively for hiking, biking,
bird-watching, fishing, boating, and nature exploration. Partici-
pating lands are owned by the Town of Richmond, the Richmond
Land Trust, The Nature Conservancy and private landowners.
Many volunteers have helped the Root-Out! over the years, in-
cluding community members, middle and high school science
classes, UVM, land trust members and more. This past year both
5th and 7th grade science classes from Camel’s Hump Middle
School got very connected. They spent class and field time learn-
ing about floodplain ecology and they helped remove invasive
plants. Thanks to their help and that of all Root-Out! volunteers,
knotweed, barberry, honeysuckles and phragmites infestations
have all been shrunk by 95-99% since the program’s inception.
Bennington County, VT: The Battenkill Watershed Comprehensive Invasive Species Management
Association, along with the Bennington County Conservation District, spent 54 hours this field season
mapping Japanese knotweed in the Green River subwatershed of the Batten Kill (digitally and on the
ground). These groups also reached out to and met with 37 landowners along Tidd Brook and the Green
River in the watershed in efforts to build a landowners’ Japanese knotweed management association.
The new habitat steward for the BK CISMA has hand-pulled 2.3 acres for over 10 hours, with the help
of Equinox Preservation Trust (caretaker Rick LaDue), removing honeysuckle, common buckthorn,
glossy buckthorn, bittersweet, burning bush, goutweed, barberry, and wall lettuce. The habitat steward
also co-hosted a workshop with VT Fish and Wildlife on October 21, with 11 individuals in attendance.
Burlington, VT: With the help of a Community Colleges for Environmental Sustainability grant,
Heather Fitzgerald's Moving Towards Sustainability students at CCV-Winooski organized a restoration
effort on impaired Englesby Brook where it runs next to Champlain Elementary School. They worked
with Roger Klinger and Betsy Patrick's 3rd grade classes to uproot buckthorn and plant 60 bare root
dogwoods from Intervale Conservation Nursery in place of the buckthorn. They also planted 15 dog-
woods in an area of bare, compacted soil and 30 live stakes in riprap. The 3rd graders also collected
garlic mustard and made pesto with Champlain school chef Kaye Douglas. Heather's Landscape Natural
History students from the University of Vermont took the 3rd graders on a tour of Burlington Urban
Wild Crescent Woods, just upstream from the school, so they could see what an older, more intact for-
est looks like and imagine what their efforts might help lead to.
Figure 38. There’s more than
invasive plants to remove from the
Floodplain forest in Richmond, VT.

Invasive Plants 102
Burlington, VT: The Winooski Valley Park District (WVPD) works with and relies on local schools,
youth groups and other volunteer groups to manage NNIP across their parklands. This year they contin-
ued mapping NNIP at the Ethan Allen Homestead property in Burlington and also at Derway Island in
Burlington. This mapping work has helped to focus their efforts on higher priority areas. Recent re-
moval days targeted these high priority areas and involved a removal day at the Ethan Allen Homestead
with a Boy Scout Troop and a staff training/removal day at Derway Island. They plan to continue map-
ping and targeting future removal and mitigation efforts at all of their parklands.
County foresters continue to work with land owners and consulting foresters on addressing NNIP in
forest management plans and forest management activities on private lands. Other department staff con-
tinue to identify NNIP on state lands.
Numerous NNIPM activities took place on State Lands.
District 1 (southeast): Numerous NNIPM projects were completed,
including follow up on a multi-year approach to managing woody
NNIP at the New Windsor Grasslands WMA in Windsor. 2017’s
work was a follow-up from last years chemical control of knotweed/
multiflora rose/honeysuckle in adjacent areas.
This project involved a tracked Kubota skid steer with a Fecon mow-
er attachment. The contractor mowed down the field in the project
area, excluding apples. These fields had been abandoned, and con-
sisted of mostly multiflora rose and honeysuckle species. After mow-
ing, the area was overseeded with a rye grass mixture. The current
plan is to return in the spring and chemically treat the stump sprouts,
and continue a regime of mowing the area annually. If this project is
successful, this methodology will be expanded to other abandoned
fields.
District 2 (southwest): See Invasive Plant Mitigation on State Land
in Vermont: Education, Volunteer Outreach, & Capacity Building
(page 99).
District 3 (northwest): The seasonal Forestry technician revisited
areas treated in 2016 and found that for the most part, initial treat-
ment was highly successful. Some areas did require follow-up treat-
ment. One particularly challenging project was the treatment of a
widespread multiflora rose and barberry infestation located on Hon-
ey Hollow road. This site was treated using a foliar application of
herbicide, and was done in advance of an apple tree release project
which would have given the invasive plants lots of light to thrive
and expand.
Work has also been completed at Lower Otter Creek WMA, in Fer-
risburgh. In the fall of 2016 approximately 20 acres received a com-
mercial herbicide treatment to control NNIP. The project area was
overwhelmed and infested with large, established honeysuckles,
buckthorns, and barberries. The forest floor below the NNIP was
Figure 39. New Windsor Grass-
lands WMA before (left) and af-
ter (right) mowing, field to the
north.
Figure 40. Before, during and after treatment for honeysuckles,
buckthorns and barberries. Lower Otter Creek WMA in Ferrisburgh.

Invasive Plants 103
nearly bare, and practically void of any native vegetation. The target NNIP received foliar and basal
bark treatments. The initial herbicide treatment was highly effective, achieving nearly 90% efficacy. In
the fall of 2017, the project area received a follow-up brontosaurus treatment. The goal of the bronto-
saurus treatment was to grind up the standing dead NNIP material, thereby returning woody organic
materials, nutrients, and minerals to the soils. In doing so, this work improved light conditions on the
forest floor, and soil scarification resulted, aiding in preparing a seed bed for native species to become
established. All red oak, swamp white oak, black cherry, and shagbark hickory were retained in the pro-
ject area for their mast and as future seed sources. Sparse grey birch, mature cottonwoods, and white
pine were also retained for seed. A follow-up foliar herbicide treatment has been started to address re-
sidual NNIP, and is planned to be completed in the spring/summer 2018. The project area will be moni-
tored annually, and NNIP will be controlled as needed through employing this Integrated Pest Manage-
ment program.
District 4 (central): A variety of NNIPM control projects were done this year. Staff treated a number
of areas in Cotton Brook that had extensive populations of honeysuckle species. This work was com-
pleted before the area was mowed.
Staff also participated in two District work days this year, focused on NNIPM. On May 19, 7 people
worked at Pine Mountain WMA for 6 hours, hand-pulling smaller stems of honeysuckle, buckthorn,
burning bush, false spiraea and barberry, and doing cut stump treatment on all of these species. A larger
area of false spiraea was also treated with a backpack sprayer. On June 9, 7 people worked at Clover
Hill WMA for 8 hours, covering a 2-acre area, hand-pulling smaller stems of buckthorn and cut stump
treating honeysuckle, buckthorn, barberry, and autumn olive. This site will require continued monitor-
ing and treatment. The staff also came away with over 100 ticks. Most were dog ticks found on cloth-
ing, and 2 deer ticks were identified. Three people had 4 attached dog ticks.
District 5 (northeast): Much of the NNIPM occurred on a variety of WMAs, by F&W staff with assis-
tance by FPR staff. Phragmites was treated by over a dozen people at West Mountain WMA; honey-
suckle was removed prior to brushmowing in a field at Calendar Brook WMA; Japanese knotweed was
removed from a cellarhole at Calendar Brook WMA; Phragmites was treated along roadsides, and hon-
eysuckles species were treated in the woods at Eagle Point WMA; and a number of new sites of honey-
suckle and Japanese knotweed were mapped at Victory Basin WMA, and new sites of honeysuckle
were mapped at West Mountain WMA.
VTinvasives.org website: The VTinvasives.org website has been re-launched. On average, there are
approximately 400 online users per week to the website. Content now includes information on terrestri-
al and aquatic invasive plants and animals, insects, and diseases. The website continues to provide a
wide range of information to a variety of user groups from landowners to professional foresters to mu-
nicipalities, including educational resources and Best Management Practices.

Trends in Forest Health 104
TRENDS IN FOREST HEALTH
Sugar Maple Health in 2017 Vermont has continued to monitor sugar maple health in sugarbushes and in maple stands since 1988,
and currently measures health annually in 36 North American Maple Project (NAMP) plots. In 2017,
90% of trees on these plots were rated as having low dieback (less than 15% dieback) (Figure 41).
Thin foliage due to forest tent caterpillar defoliation was measured on nine of the 36 monitoring plots
(25%). Seven had moderate-heavy defoliation (20%) and two had light defoliation (6%). Tree recovery
through refoliation was minimal at most sites. Two additional sites were affected by pear thrips and frost
damage. There was an increase in the average number of trees with thin foliage over last year, from 7%
in 2016 to 14% in 2017 (Figure 42). Foliage transparency is sensitive to current stress factors. Past
spikes in transparency were due to frost injury (2010, 2012, 2015), forest tent caterpillar defoliation
(2004-2007, 2016), and pear thrips (1988-1989). Dry conditions in 2016 may have been a factor in re-
duced tree health in 2017. There were only five new dead overstory sugar maple trees on plots in 2017
(0.4%).
Of the 1,659 live sugar maple trees (all crown classes) surveyed in 2017, 247 (14.8%) had damages from
a variety of damage agents. The most common damage type was bole injury from sugar maple borer,
which made up nearly a third of damages (Table 28).
Figure 41. Percent of overstory sugar maple trees on NAMP plots with low dieback (0-15%). N=1,142
trees at 36 sites.

Trends in Forest Health 105
Figure 42. Trend in the percent of overstory sugar maple trees on NAMP plots with thin foliage
(>25% foliage transparency). N=1,142 trees at 36 sites.
Table 28. Percent of damage types observed on NAMP sites in 2017.
Damage Agent Percent of sites
Sugar maple borer 33.1
Cracks/seams 19.2
Other conks 12.8
Eutypella canker 10.9
Other weather damage 8.6
Other canker 7.1
Logging wounds (>20% of circumference) 2.6
Sapsucker damage 2.3
Other animal damage 0.8
Wind thrown/uprooted 0.8
Broken bole 0.4
Nectria canker 0.4
Other borers 0.4
Porcupine damage 0.4

Trends in Forest Health 106
Forest Ecosystem Monitoring Cooperative
Trends in Forest Health at Mt. Mansfield and Lye Brook in 2017
Vermont forest health monitoring plots were sampled at 48 sites across the state in 2017 as part of the
Forest Ecosystem Monitoring Cooperative (formerly the Vermont Monitoring Cooperative). Results
from the original 23 sites on Mt. Mansfield and Lye Brook Wilderness Area showed a decrease in both
average dieback and foliage transparency (Figure 43). An improvement in tree health is also reflected in
a reduced number of trees with thin foliage (Figure 44), which reflects current year stress. However,
there was an increase in the number of trees with high dieback in 2017 (Figure 45 and 46). Trees show-
ing moderate dieback in 2016 may have been further stressed by the late season drought, leading to fur-
ther decline.
Figure 43. Trend in the average dieback and foliage transparency of overstory trees on 14 monitoring
plots on Mt. Mansfield.

Trends in Forest Health 107
Figure 44. Trend in the percent of overstory trees with thin foliage (>25% foliage transparency) on
Mt. Mansfield and Lye Brook plots.
Figure 45. Trend in the percent of overstory trees with low (0-15%), moderate (16-40%) or severe
(>40%) dieback on Mt. Mansfield and Lye Brook plots.

Trends in Forest Health 108
Figure 46. Trend in overstory trees with severe (>40%) dieback on Mt. Mansfield and Lye Brook plots.
Mortality of overstory trees in 2017 was 0.71% at Lye Brook and 2.44% at Mt. Mansfield (Table 29).
Mansfield mortality was higher on the west slope plots and on the high elevation plots (>=3000 ft).
New dead over-
story trees (%) Lye Brook 0.71
Mansfield 2.44
Mansfield west 3.24
Mansfield east 1.23
Mansfield low 1.81
Mansfield high 3.30
Table 29. New dead overstory trees on monitoring plots at Mt. Mansfield and Lye Brook.

Trends in Forest Health 109
Significant tree damages were recorded. Beech bark disease was the most common damage, accounting
for 64% of damaged trees (Table 30). Other damages recorded included: cracks or seams (24%), dwarf
mistletoe on balsam fir at upper elevations (4%), and sugar maple borer, eutypella canker, sapsucker
damage and logging damage (2% each).
Table 30. Percent of total number of damaged trees recorded by special damage types in 2017 on plots at
Mt. Mansfield and Lye Brook.
Tree Damage Percent of
damaged trees Beech bark disease 64
Cracks or seams 24
Dwarf mistletoe 4
Sugar maple borer 2
Eutypella canker 2
Sapsucker damage 2
Logging damage 2