Embed Size (px)
Citation preview

Energies 2014, 7, 7434-7453; doi:10.3390/en7117434
energies ISSN 1996-1073
www.mdpi.com/journal/energies
Article
3D Geothermal Modelling of the Mount Amiata Hydrothermal
System in Italy
Paolo Fulignati 1,†,*, Paola Marianelli 1,†, Alessandro Sbrana 1,† and Valentina Ciani 2,†
1 Dipartimento di Scienze della Terra, University of Pisa, Via S. Maria 53, 56126 Pisa, Italy;
E-Mails: [email protected] (P.M.); [email protected] (A.S.) 2 Terra Energy Srl, Spin-off of the University of Pisa, Via S. Maria 53, 56126 Pisa, Italy;
E-Mail: [email protected]
† These authors contributed equally to this work.
* Author to whom correspondence should be addressed; E-Mail: [email protected];
Tel.: +39-050-221-5756; Fax: +39-050-221-5800.
External Editor: Paul Younger
Received: 29 May 2014; in revised form: 6 October 2014 / Accepted: 6 November 2014 /
Published: 17 November 2014
Abstract: In this paper we build a subsurface model that helps in visualizing and
understanding the structural framework, geology and their interactions with the Mt. Amiata
geothermal system. Modelling in 3D provides the possibility to interpolate the geometry of
structures and is an effective way of understanding geological features. The 3D modelling
approach appears to be crucial for further progress in the reconstruction of the assessment
of the geothermal model of Mt. Amiata. Furthermore, this model is used as the basis of a
3D numerical thermo-fluid-dynamic model of the existing reservoir(s). The integration
between borehole data and numerical modelling results allows reconstructing the
temperature distribution in the subsoil of the Mt. Amiata area.
Keywords: Mt. Amiata; 3D geological modelling; numerical modelling; geothermics
1. Introduction
The Mt. Amiata volcano-geothermal area, located in Southern Tuscany (Figure 1), is characterized
by very high heat flux (up to 600 mW/m2) and hosts two high-temperature geothermal fields
OPEN ACCESS
Energies 2014, 7 7435
(Bagnore and Piancastagnaio) that, together with Larderello-Travale, are the only economically
exploited fields in Italy for power production.
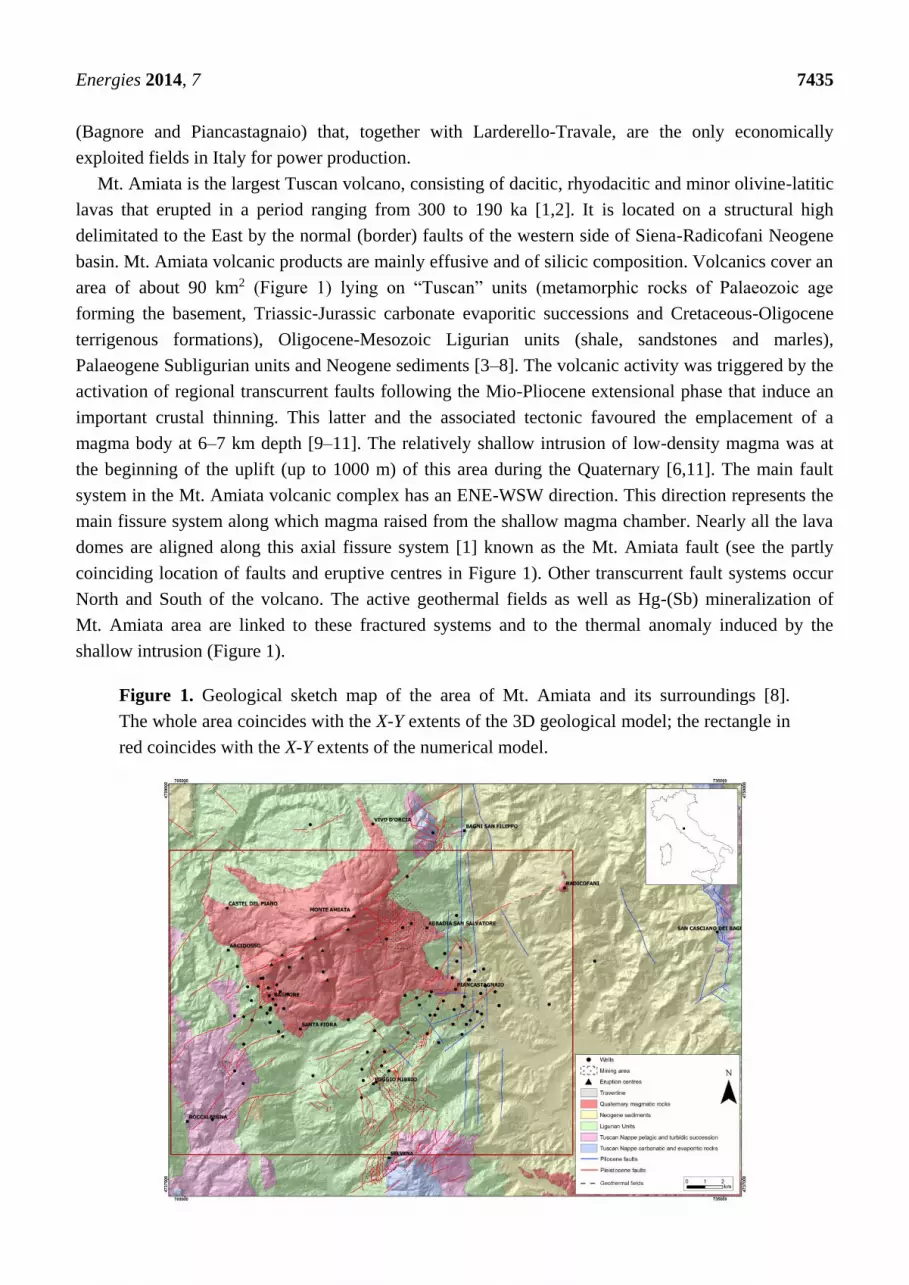
Mt. Amiata is the largest Tuscan volcano, consisting of dacitic, rhyodacitic and minor olivine-latitic
lavas that erupted in a period ranging from 300 to 190 ka [1,2]. It is located on a structural high
delimitated to the East by the normal (border) faults of the western side of Siena-Radicofani Neogene
basin. Mt. Amiata volcanic products are mainly effusive and of silicic composition. Volcanics cover an
area of about 90 km2 (Figure 1) lying on “Tuscan” units (metamorphic rocks of Palaeozoic age
forming the basement, Triassic-Jurassic carbonate evaporitic successions and Cretaceous-Oligocene
terrigenous formations), Oligocene-Mesozoic Ligurian units (shale, sandstones and marles),
Palaeogene Subligurian units and Neogene sediments [3–8]. The volcanic activity was triggered by the
activation of regional transcurrent faults following the Mio-Pliocene extensional phase that induce an
important crustal thinning. This latter and the associated tectonic favoured the emplacement of a
magma body at 6–7 km depth [9–11]. The relatively shallow intrusion of low-density magma was at
the beginning of the uplift (up to 1000 m) of this area during the Quaternary [6,11]. The main fault
system in the Mt. Amiata volcanic complex has an ENE-WSW direction. This direction represents the
main fissure system along which magma raised from the shallow magma chamber. Nearly all the lava
domes are aligned along this axial fissure system [1] known as the Mt. Amiata fault (see the partly
coinciding location of faults and eruptive centres in Figure 1). Other transcurrent fault systems occur
North and South of the volcano. The active geothermal fields as well as Hg-(Sb) mineralization of
Mt. Amiata area are linked to these fractured systems and to the thermal anomaly induced by the
shallow intrusion (Figure 1).
Figure 1. Geological sketch map of the area of Mt. Amiata and its surroundings [8].
The whole area coincides with the X-Y extents of the 3D geological model; the rectangle in
red coincides with the X-Y extents of the numerical model.
Energies 2014, 7 7436
Geothermal exploration of the Mt. Amiata area started at the beginning of the 50s, and the first
overview of the geothermal system was carried out in 1970 [3]. Previous studies were developed for
mining activities linked to cinnabar production [12]. All available data (more than 100 drillings from
500 to about 4000 m depth, as well as many geophysical, geological, structural, geochemical and
hydrogeological studies), derived from the exploration and exploitation activities mainly carried out
for geothermal purposes, allow developing a well-constrained geothermal model.
The goal of this paper is to build a fit-for-purpose 3D geological model of Mt. Amiata geothermal
system. Modelling in 3D provides the possibility to interpolate the geometry of geological structures
and is an effective way of understanding the subsoil geology. As a consequence, a 3D modelling approach
appears to be crucial to make further progress in the understanding of the geothermal-geological
system of Mt. Amiata. Furthermore, this geological model is used as the basis of a 3D numerical
thermo-fluid-dynamic simulation of the volcanic geothermal system that led to an integrated
geothermal model of the area.
2. Mt. Amiata Geothermal System
Mt. Amiata is a classic volcanic-intrusive geothermal system. This is characterized by clay-rich
sedimentary units (Ligurian alloctonous nappes and Neogene units) that represent a very efficient
impermeable cover. Two confined water-dominated geothermal reservoirs occur. The shallower one
(500–1500 m of depth) is hosted in carbonate-evaporitic rocks belonging to the Tuscan Nappe,
in particular in the “Calcare Cavernoso” formation and locally in fractured carbonate units. Calcare
Cavernoso is a vacuolar carbonate breccia characterized by dolostone porphyroclasts (often dissolved)
cemented by carbonate cement resulting from alteration of gypsum evaporite layers. This formation is
often very permeable due to fracturing and porosity. The mean temperatures found in this reservoir
range from 150 to 220 °C. The reservoir hosts a two-phase water dominated aquifer. In correspondence
of structural highs (traps) this reservoir presents pressurized gaseous caps in which gas and steam
accumulate [13]. The gaseous phase is mainly constituted by CO2, in accordance with the very high
CO2 degassing that characterizes the whole Mt. Amiata area [14,15]. Shallow reservoir outcrops in two
different areas (North East and South of Mt. Amiata). These probably represent the main recharge
areas of the geothermal fields.
The deeper reservoir (below 2500–3000 m of depth) is hosted in thermometamorphic fractured
phyllites and metasandstones of the Tuscan Metamorphic Complex, modified by thermometamorphic
processes [16]. These belong to the termometamorphic aureole of the recent silicic intrusion. In the
deeper reservoir temperatures up to 300–350 °C are actually measured. The fluid in this reservoir is a
two-phase too [3,10]. This represents the main reservoir industrially exploited at present [13] with a
total power production of 88 MWe.
Below the deeper reservoir, reflection seismic profiles reveal the occurrence of a geopressurized
system evidenced by discontinuous “bright spot”-type reflections, named K-horizon [17–21], at depth
between 4 and 7 km. This is assumed to be the root of the hydrothermal systems in the Mt. Amiata
area. The temperatures estimated for the K-horizon are considered to be above 400 °C [17,22]. This
horizon is present also outside the geothermal region but at much greater depth [18]. The interpretation
of K horizon is still debated: some authors [18,21] suggested, basing on the earthquake hypocentres

Energies 2014, 7 7437
distribution, that the K-horizon corresponds to a ductile-brittle boundary; others [22] suggested that
this ductile-brittle transition occurs in coincidence with high fluid pressure; others [23] explain the
K-horizon as the roof of over-pressurized reservoirs on the basis of the interpretation of deep crustal
seismic lines.
The Mt. Amiata intrusion, present at about 6 km of depth, represents the heat source of the
hydrothermal system described above.
3. 3D Geological and Geothermal Model
3.1. Available Data
Geological models in three dimensions integrate different kinds of data (i.e., geological maps,
cross-sections, seismic profiles, gravity profiles, logs of deep wells etc.) much more easily than
traditional techniques and allow the three-dimensional (3D) structure to be represented more
coherently and exhaustively [24–26]. The available data implemented in this work are reported
as follow:
- Geological maps and cross-sections
- Data from boreholes
- Data from geophysical investigation
The geological maps used in this work derive from the recent 1:10,000 maps of the CARG
(CARtografia Geologica) project [27]. The cross sections are taken from CARG project and from
literature [3,4,6,8,27–29].
More than 100 deep geothermal boreholes (from 153 to 4836 m of depth) occur (UNMIG, Ufficio
Nazionale Minerario per gli Idrocarburi e le Georisorse geothermal database) in the Mt. Amiata area.
Geothermal wells (Figures 1 and 2) are mostly located in correspondence with the active geothermal
fields of Bagnore and Piancastagnaio. Well data concern stratigraphy, temperatures, pressure of the
fluid phase, flow rates, technical drilling profiles, depth of the water table. Unfortunately no
geophysical borehole logs are available, with exception of temperature logs, because in some cases
they were not carried out and in others the data were not published by the owner companies.
Many other shallower wells (from 100 to 750 m of depth) were drilled in the past for mining activities.
All data concerning these wells were also used in this work.
Data from geophysical investigation, derived from past geothermal and hydrocarbon (this latter in
the Radicofani graben) exploration, are available (Figure 3). The geophysical data used in this work
are: the map of the resistive substratum [3] and seismic profiles [4,20,29,30]. Regional gravity data
were also incorporated in the study [31–33].
3.2. Data Integration Toward a 3D Geological Model
All data were implemented in the 3D modelling Petrel 2011 platform (Schlumberger Limited,
Houston, TX, USA). Data include both hard copies (digitalized and georeferenced) and GIS
(geographical information system) format data. Geological data were elaborated in the geodatabase.

Energies 2014, 7 7438
Geological units were grouped on the basis of their “geothermal” characteristics, essentially in terms of
cover type and reservoir type formations, taking into account their permeability (Figure 4).
Figure 2. 3D view of geological map spread on DEM (digital elevation model) of the
Mt. Amiata area (vertical dimension is exaggerated by factor of 2). Z-axis in meters,
X-axis and Y-axis: the coordinate system used is WGS 84/UTM zone 32N (EPSG: 32632).
Arrow points to the North. Legend as reported in Figure 1.
Figure 3. Map of the Mt. Amiata area with the location of the deep boreholes and the
traces of geological, seismic and gravimetric sections.

Energies 2014, 7 7439
Figure 4. Sketch of the geological units used in this work (right) and the complete
geological succession taken from literature. Stratigraphic succession in the Monte Amiata
area (modified after [34,35]: see the references for further information). Ligurian and
Subligurian Units; Ophiolitic Unit; APA: “Argille a Palombini” Fm.; CCL: “Calcari a
calpionelle” Fm.; DSA: “Diaspri” Fm.; PRN, GBB, BRG: Ophiolites (serpentinites,
gabbros, basalts); “S. Fiora” Unit; MLL: “Monte Morello” Fm.; AVR: “Santa Fiora” Fm.;
PTF: “Pietraforte” Fm.; Subligurian Unit; ACC: “Canetolo” Fm.; Tuscan Nappe: MAC:
“Macigno” Fm.; STO: “Scaglia Toscana” Fm.; MAI: “Maiolica” Fm.; DSD: “Diaspri”
Fm.; POD: “Marne a Posidonia” Fm.; LIM: “Calcare Selcifero” Fm.; RSA: “Calcare Rosso
Ammonitico” Fm.; MAS: “Calcare Massiccio” Fm.; RET: “Calcare a Rhaetavicula
contorta” Fm.; CCA: “Burano and Calcare cavernoso” Fm.; Tuscan metamorphic units;
“Monticiano-Roccastrada” Unit (MRU); MRU3: “Verrucano” Group; MRU2: Palaeozoic
Phyllite-Quartzite Group.
Six units were derived as follow: (1) the volcanic complex: fractured and permeable lavas; (2) the
Neogene and Quaternary mainly impermeable sedimentary deposits: clay, sands and minor
conglomerate; (3) the Ligurian units mainly impermeable: shale, sandstones and marls; (4–5) the
Tuscan Nappe, subdivided into two sub-units: (4) an upper sub-unit denoted as TN 2, represented by
the mainly impermeable terrigenous successions and (5) a lower sub-unit that is denoted as TN 1 and
represented by the fractured and permeable carbonate-evaporitic successions (shallow geothermal
reservoir); (6) the Palaeozoic basement, formed by the Tuscan Metamorphic Complex constituted by
low permeability phyllites and permeable thermometamorphosed fractured phyllites (this latter is the
deep geothermal reservoir). The geological map of the area (Figures 1 and 2) and the geological cross
sections (Figure 5) [3,4] were elaborated on the basis of the above reported criteria, digitalized and
uploaded in the model.

Energies 2014, 7 7440
Figure 5. Fence diagram built from geological cross sections (vertical dimension is
exaggerated by factor of 2). Z-axis in meters; X-axis and Y-axis: the coordinate system used
is WGS 84/UTM zone 32N (EPSG: 32632). Arrow points to the North.
Also the well stratigraphy was generalized on the basis of the simplified stratigraphy described
above (see Figure 4 right). As regard the data from geophysical investigations, they were implemented
in the geodatabase as follows:
Interpreted 2D reflection seismic data were added to geodatabase and used for constraining
geometries and characteristics of the subsoil units. In Figure 3 traces of interpreted seismic lines,
derived from [4–6,10,13,19–22,29,30], are reported. In particular, seismic lines define the structural
setting of the main geological units, evidencing reverse faults (main thrusts) involved in Miocene
compressive phase of North Apennine chain formation, normal faults formed during the successive
Pliocene-Pleistocene tensional phase.
Geoelectrical data, covering wide areas of the volcano and carried out during the early exploration
phase of the Mt Amiata geothermal fields [3], are used to define geometries and thickness of resistive
substratum, coinciding with carbonate and evaporite formations (shallow geothermal reservoir).
Gravity data reported in the Bouger anomaly map were elaborated through 2.5 D numerical
modelling and implemented in geodatabase to constrain geometries and thickness of subsoil
formations, including deep intrusive low-density bodies and thickness of Neogene sedimentary basin.
All geophysical interpretations and modelling were carefully calibrated using deep and shallow wells,
previously implemented in our geodatabase.
The 3D geological model is 28 km × 20 km wide, with its longer wide oriented EW, and has a
vertical extension of approximately 4 km. A 3D grid, which forms the skeleton of the geological

Energies 2014, 7 7441
model, was then generated and used for the property modelling stage, in which 3D surface (such as
lithology, resistivity and temperature) were created.
The main horizons, corresponding to the top of the simplified geological units discussed above,
were obtained by using the “convergent interpolation algorithm” built in Petrel platform (i.e., see
Figure 6).
Figure 6. 3D view of geological map spread on DEM and of the horizon corresponding to
the top of the first geothermal reservoir in the Mt Amiata area (vertical dimension is
exaggerated by factor of 2). Z-axis in meters; X-axis and Y-axis: the coordinate system used
is WGS 84/UTM zone 32N (EPSG: 32632). Arrow points to the North. Legend as reported
in Figures 1 and 4.
Shallower horizons are more accurately located and modelled because more wells encounter them.
The reconstruction of deeper horizons is more problematic because there are fewer data; obviously, the
horizons are more accurately modelled in the areas of Bagnore and Piancastagnaio active geothermal
fields where density of deep wells and geophysical data is considerably higher compared to other areas
(Figures 1, 2 and 6). The outputs of the 3D model contain information about depths of stratigraphic
units and other geological information about faults, erosive surfaces and geothermal information such
as reservoir volumes, used for geothermal potential assessment, and to constrain the conceptual model
of the geothermal system. In correspondence of the Mt. Amiata volcano, geoelectric survey data were
used to reconstruct surfaces between cover and reservoir units. Seismic reflection lines and gravimetric
modelling are used to constrain the surface shapes where deep wells are not present. The top surface of
Ligurian cover unit is well constrained in correspondence of geothermal fields (Figure 7) where
stratigraphy of deep boreholes occurs. Particular attention was also dedicated to the reconstruction of
surfaces delimitating the shallow reservoir and the metamorphic basement (Figure 7). The abrupt
deepening of all surfaces toward East reflects the occurrence of the normal master fault, delimitating
the Western side of Radicofani Pliocene sedimentary basin (Figures 1, 6 and 7). In this particular

Energies 2014, 7 7442
situation low angle normal fault offset reaches 200–400 m. Radicofani basin (eastward) have about
2400 m of sediments in its depocentre, as indicates by deep wells.
Figure 7. 3D subsurface horizons of the study area that are incorporated in the model,
as reconstructed from available surface and subsurface data (vertical dimension is
exaggerated by factor of 2). In figure three of these modelled horizons are shown:
(a) green = top of cover formations (Ligurian units); (b) Blue = top of shallow geothermal
reservoir; (c) Purple = top of metamorphic basement (see Figure 4 for details).

Energies 2014, 7 7443
Figure 7. Cont.
4. Numerical Modelling
The output of the 3D geological modelling was used as input data for the numerical simulation of
Mt. Amiata hydrothermal system. The geometry of the top of deeper geothermal reservoir, which is
hosted within the Palaeozoic phylladic basement (unit 6 of Figure 4), was defined on the basis of the
boreholes that encountered it. No data constrain the base of this reservoir; therefore in the numerical
model we assumed a thickness of 500 m.
The Mt. Amiata hydrothermal system was simulated using the numerical simulator TOUGH2
(Lawrence Livermore Laboratories, Berkeley, CA, USA), a general-purpose code for modelling
multi-dimensional, multiphase/multi-component flow and heat transport in porous and fractured
media [36]. The modelling was performed using the “equation of state” module (EOS1) for pure water.
Corey curves were adopted for the relative permeability. Capillarity, adsorption, and double porosity
were not considered. The simulation domain has an area of 23 km × 17 km (391 km2, Figure 1) and a
depth of 5500 m below sea level (i.e., the model height ranges from 7160 to 5750 m, considering local
topographic relief). The model is centred on the active geothermal fields where available data allow
constraining a reliable physical model. The numerical grid is subdivided into 22 layers and consists of
8228 cells (Figure 8); each horizontal layer consists of 374 (22 × 17) cells with variable sizes. A cell
size of 1 km × 1 km is used. Along the domain boundary, where great detail is not necessary, cell size
of 2 km × 2 km has been adopted. The layer thickness varies from a maximum of a few thousand
meters to only 60 m as a function of the horizons derived from 3D geological modelling.
The physical parameters used in the model (permeability, porosity, density, thermal conductivity
under saturated condition, specific heat) are listed in Table 1 and based on literature values [37–40].

Energies 2014, 7 7444
Figure 8. 3D simulation grid. Cap rock corresponds to units 2, 3, 4 of Figure 4; Shallow
reservoir corresponds to unit 5 of Figure 4; Phylladic basement, Deep reservoir and
Basement rock correspond to unit 6 of Figure 4.
Table 1. Petrophysical parameters of main rock types.
Rock types Density
(Kg/m3) Porosity
Permeability
(Darcy)
Thermal Cond.
(W/m * K)
Specific Heat
(J/kg * K)
Cap rock 2400 0.0055 0.00001 2.4 883
Shallower reservoir
(carbonates) 2660 0.02 0.1 2.4 836
Phylladic basement 2570 0.01 0.00005 4.0 1000
Deeper reservoir (basement) 2570 0.013 0.05 4.0 1000
Basement 2570 0.013 0.005 4.0 1000
Temperature and pressure are considered time invariant in the cells at the top and bottom of the
simulation grid. A fixed temperature of 10 °C and atmospheric pressure were set for cells along the
upper boundary. A variable temperature between 400 and 500 °C was assumed for the cells in the
bottom layer, in accordance with the temperatures assumed for K-horizon. The lateral boundaries are
considered no-flow insulating boundaries. The simulation of the natural state of the geothermal system
(steady state) covers a period of 200,000 years but in some simulations the steady state was reached
before. During the simulation some parameters (mainly permeability and temperatures at the bottom
layer) were tuned to match the temperature distribution at depth. To verify the reliability of the
simulated values of temperatures, simulated well temperature profiles were compared with temperature
profiles of wells drilled in the area. A good match between simulated and measured temperature in
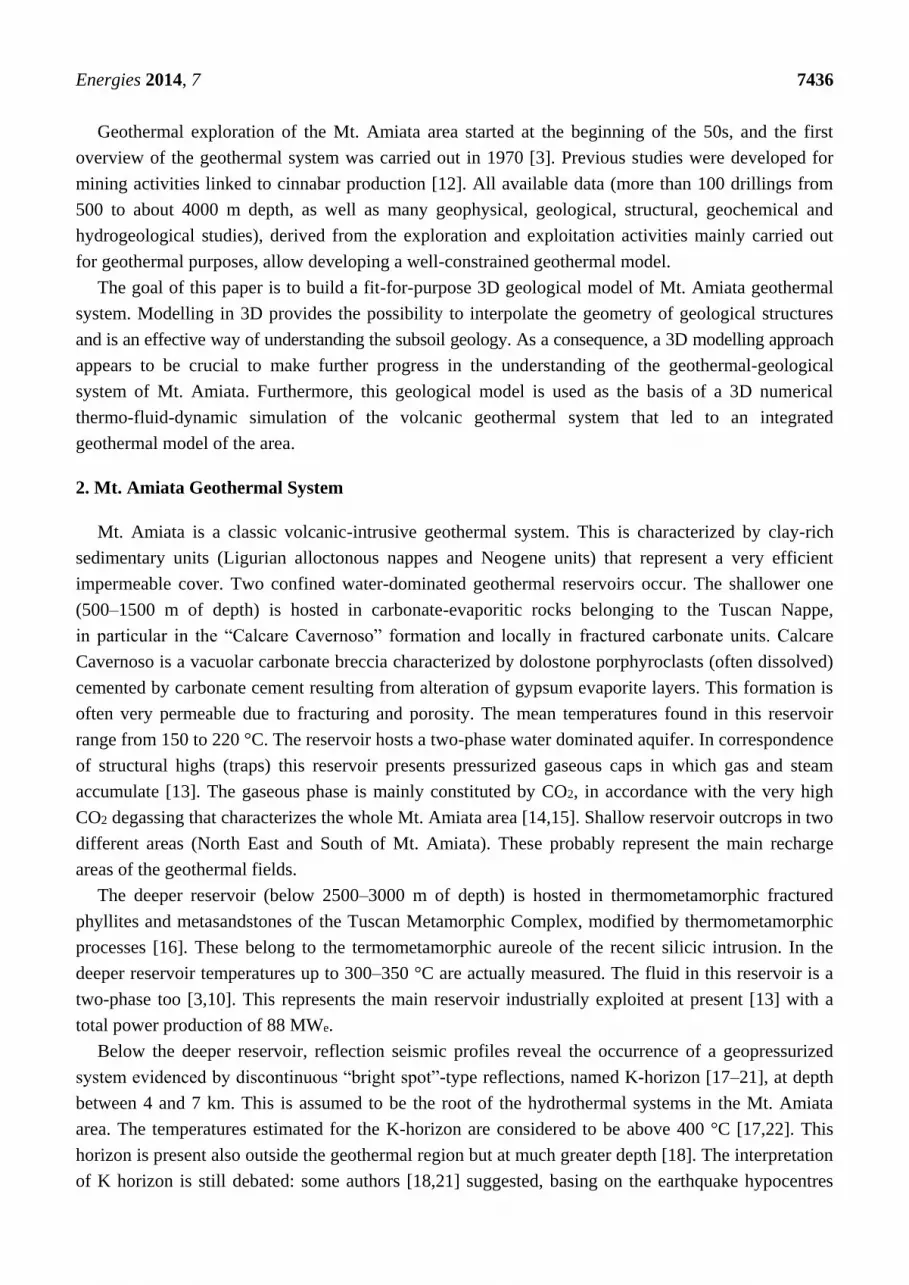
deep wells was obtained (Figure 9), suggesting that a satisfactory simulation was achieved. The shape
of the profiles from temperature modelling is linear or stepped. A vertical shape of the profiles
indicates the occurrence of a convective heat transfer (reservoir zones), whereas an oblique shape is
suggestive of a mainly conductive heat transfer (cover and impermeable units). The simulated
temperature profiles of PC 30, BAGN 13 bis and BAGN 3 bis deep boreholes are indicative on the
occurrence of both geothermal reservoirs of Mt. Amiata area (deep and shallow) and this is in
agreement with the well logs. The simulated temperature profile of Nibbio 8 borehole is in good
agreement with the measured temperatures at the level of the deeper reservoir whereas it does not
Energies 2014, 7 7445
agree at the level of the shallower one. The simulated profile suggests a convective heat transfer
whereas the measured temperatures indicate a mainly conductive heat transfer. This disagreement is
probably due to scarce permeability of the carbonate units of the Tuscan Nappe in the area of
Nibbio 8 well; this would locally prevent the efficient hydrothermal fluid circulation and the
consequent convective heat transfer. Capannacce 1 and PC 24 boreholes reach only the shallower
geothermal reservoir.
Figure 9. Simulated and observed temperature vertical profiles along hole for selected
deep geothermal wells in Bagnore and Piancastagnaio active geothermal fields of the
Mt. Amiata area. On the left of each temperature profile the simplify stratigraphy
(see Figure 4) of the well is reported.

Energies 2014, 7 7446
The main results of numerical modelling are shown in Figure 10. At the level of first geothermal
reservoir (0 m sea level), numerical modelling results evidence the occurrence of three high
temperature zones centred in the Piancastagnaio (East), Bagnore (West) and Nibbio (South-East)
geothermal areas. The higher temperatures observed in the Piancastagnaio area (East) are due to the
normal fault system that characterizes the Eastern sector of Mt. Amiata. On the other hand, the highest
temperature and highest productivity of the deep boreholes recorded in the area are found in the
Piancastagnaio geothermal field. At level of the second and deeper geothermal reservoir (−2000,
−3000 m sea level) the only two significant high temperature zones occur in correspondence of the
Piancastagnaio and Bagnore geothermal fields (Figure 10). This agrees with the temperature measured
in deep geothermal boreholes.
Figure 10. Thermal state of Mt. Amiata area at 0 m sea level (sl) (a), −1000 m sl (b),
−2000 m sl (c), −3000 m sl (d) respectively, as deduced from numerical modelling. Dotted
circles indicates the two active industrially exploited geothermal fields of Bagnore (left)
and Piancastagnaio (right).

Energies 2014, 7 7447
Figure 10. Cont.
5. Discussion and Conclusions
The use of a 3D subsurface modelling represents an effective aid to better comprehend the geologic
framework of the Mt. Amiata geothermal system. After combining the information, we received a 3D
geological/stratigraphic model and outlined a conceptual model of the geothermal system of
Mt. Amiata area.
The Mt. Amiata geothermal system is formed by two distinct water dominated reservoirs [3,13,41].
The shallower one is hosted in the Mesozoic, carbonate-evaporitic formations of the Tuscan Nappe at
depths ranging between 500–1500 m, the second, and deeper one in the Palaeozoic, metamorphic
basement at depths below 2500–3000 m. These two reservoirs are characterized by different
temperatures (150–220 °C for the shallower one, 300–350 °C for the deeper one) and, although they
are in hydrostatic equilibrium, they are separated by a low permeable layer as evidenced by the
temperature profiles of deep wells (Figure 9).
3D integrated modelling allows the reconstruction of the shallow geothermal reservoir geometries
(Figure 7). Figure 7a evidences the irregular shape of the top surface of Ligurian cover units and
highlights the sharp deepening of this surface that occurs in correspondence of the western master fault
of the Radicofani basin. In Figure 7b the top surface of carbonate fractured shallow reservoir is shown.
This has a complex geometry due to the tectonic framework of the area, particularly characterized by
an important uplift caused by the emplacement (between 130 and 300 ka) of the low-density intrusion
that constituted the volcano feeding system. In the northern side of Mt Amiata, the reservoir outcrops
in Bagni S. Filippo area (Figure 1), this represents one of the recharge zones of the geothermal fields.
The carbonate units deepen abruptly (more than 30° dip westward) reaching about 1000 m of
deepening westward (Figure 11). Shallow reservoir outcrops also in Selvena-Castell’Azzara hills and
deep northward toward the volcano edifice (Figures 7b and 11). This represents another probable
recharge area of the geothermal systems. The top surface of the reservoir shows structural highs in
correspondence with the Piancastagnaio, Bagnore and Poggio Nibbio geothermal fields and Bagni S.
Filippo low-temperature hydrothermal system, where thermal and gas pools are widespread. These
highs correspond to highs either in the Palaeozoic basement and intrusive body and K-horizon. The 3D
geological model takes in evidence that the thickness of the shallow geothermal reservoir is strongly
variable (150–1000 m) with the thinner portions that often correspond to the structural highs
(Figure 7b). In Figure 7c the top surface of the metamorphic basement is represented. The dome shape
of the metamorphic basement influences the thickness of the carbonate-evaporitic shallow reservoir

Energies 2014, 7 7448
that is laminated in correspondence of the metamorphic basement highs. This is due to the
displacement of the ductile carbonate-evaporitic units of the Tuscan Nappe as a consequence of the
emplacement and uplift of the low-density intrusion below Mt. Amiata volcano.
Figure 11. Isobaths (m sl) of the top of the shallow geothermal reservoir in the Mt. Amiata area.
It is impossible to reconstruct with the same accuracy the top of the deeper geothermal reservoir.
This is due not only to the paucity of borehole data that encountered this horizon but also because the
top of the deeper reservoir does not correspond with a specific geologic unit but it depends on the
occurrence of thermometamorphic and metasomatic processes that affected the phylladic basement in
the past, modifying its rheology. This is analogous to what observed in the similar Larderello-Travale
geothermal system [16].
The occurrence of the active geothermal systems in the south-central portion of the Mt. Amiata may
suggest that the intrusion (the heat source of the geothermal systems) is probably asymmetric with
respect to the Mt. Amiata volcano. Further evidence supporting this is represented by the occurrence of
considerable mercury mineralization [12,42] that is linked to the hydrothermal activity of the area and
mainly distributed in the central-southern part of Mt. Amiata (Figure 1).
The subsequent combination of borehole data and numerical modelling results (in the areas where
borehole data of temperature are not present), implemented in the Petrel geological model platform,
allows reconstructing the temperature behaviour at the top of the shallower geothermal reservoir that is
an industrial target for geothermoelectric power production (Figure 12). This is an important issue
accomplished thank to this approach. In previous studies on Mt. Amiata geothermal system [13],
numerical modelling experiments reconstructed the isotherms along horizontal slices in the subsoil of
the geothermal system, as we also carried out in Figure 10. This of course does not take into account

Energies 2014, 7 7449
the 3D behaviour of geological units that are cut by horizontal slices (Figure 10). The isotherms
reported in Figure 12 show the highest values in correspondence of Piancastagnaio area, where they
reach temperatures in excess of 230 °C, and Bagnore area where temperatures up to 180 °C are shown.
These very high temperatures could be related to highs of the intrusive body and, particularly in the
Piancastagnaio area, to the fractured gauge zone of the normal master fault delimiting the western side
of the Radicofani basin, which favours the rise of hot fluids from depth toward the shallow
geothermal system.
Figure 12 shows that, in the northern and southern portion of the area, the temperatures sharply
decrease. This occurs in correspondence with the outcropping of the evaporite-carbonatic units of the
Tuscan Nappe (Figures 1 and 11) that form the shallow geothermal reservoir. This is in agreement with
the fact that these outcrops are assumed as the main hydrogeological recharge areas of the Mt. Amiata
geothermal system.
Figure 12. Map of the isotherms at the top of the shallower geothermal reservoir as
elaborated by the combining of 3D geological and numerical modelling (up). Map
of the isobaths of the top of the shallower geothermal reservoir from 3D geological
model (down).
The obtained 3D geothermal model of Mt. Amiata area can be used for a first theoretical evaluation
of the geothermal potential of the shallow reservoir (where we have more data for constraining its
volume) [43]. As an output of the 3D model, a volume of 293 km3 has been estimated for the shallow
geothermal reservoir, considering the area of the numerical modelling simulation (23 km × 17 km),

Energies 2014, 7 7450
and an average temperature of the reservoir of 148 °C. The estimate of geothermal energy stored
underground above the mean annual temperature (15 °C), obtained by the volume method [43],
is 2840 GWy (thermal). Assuming a mean value of the recovery factor of 10%, the exploitable energy
of the first reservoir can be quantified in 284 GWy.
The quality of the elaborated model and the possibility of using it for prediction purposes will be
improved when data from new deep wells will be available. An integrated approach with 3D tools
makes geologic information more accessible to a wider audience of non-geologic specialists and
decision-makers. The model is also suitable for the planning of new boreholes and further exploration
and exploitation steps to proceeds with the usage of geothermal energy in Mt. Amiata area.
Acknowledgments
We thank SORGENIA GEOTHERMAL Srl (Milan, Italy) for access to the data and for permission
to publish them and Matteo Ceroti and Sefano Scazzola for encouraging this work. We are in debt with
two anonymous referees whose comments and suggestions significantly contribute to improve the
quality of this work.
Author Contributions
Alessandro Sbrana had the original idea for the study and, with all co-authors contributed to the
conceptualization and writing of the paper.
Conflicts of Interest
The authors declare no conflict of interest.
References
1. Ferrari, L.; Conticelli, S.; Burlamacchi, L.; Manetti, P. Volcanological evolution of the Monte
Amiata, Southern Tuscany: New geological and petrochemical data. Acta Vulcanol. 1996, 8,
41–56.
2. Conticelli, S.; D’Antonio, M.; Pinarelli, L.; Civetta, L. Source contamination and mantle
heterogeneity in the genesis of Italian potassic and ultrapotassic volcanic rocks: Sr-Nd-Pb isotope
data from Roman Province and Southern Tuscany. Mineral. Petrol. 2002, 74, 189–222.
3. Calamai, A.; Cataldi, R.; Squarci, P.; Taffi, L. Geology, geophysics and hydrogeology of the
Monte Amiata geothermal field. Geothermics 1970, 1, 1–9.
4. Brogi, A. Seismic reflection and boreholes logs as tools for tectonic and stratigraphical
investigations: New geological data for the Tuscan Nappe exposed in the northeastern Mt. Amiata
area (Northern Apennines, Italy). Boll. Soc. Geol. Ital. 2004, 123, 189–199.
5. Brogi, A. Neogene extension in the Northern Apennines (Italy): Insights from the southern part of
the Mt. Amiata geothermal area. Geodin. Acta 2006, 19, 33–50.
6. Brogi, A. The structure of the Monte Amiata volcano-geothermal area (Northern Apennines, Italy):
Neogene-Quaternary compression versus extension. Int. J. Earth Sci. 2008, 97, 677–703.
Energies 2014, 7 7451
7. Cadoux, A.; Pinti, D.L. Hybrid character and pre-eruptive events of Mt Amiata volcano (Italy)
inferred from geochronological, petro-geochemical and isotopic data. J. Volcanol. Geotherm. Res.
2009, 179, 169–190.
8. Brogi, A.; Fabbrini, L.; Liotta, D. Sb-Hg ore deposit distribution controlled by brittle structures:
The case of the Selvena mining district (Monte Amiata, Tuscany, Italy). Ore Geol. Rev. 2011, 41,
35–48.
9. Marinelli, G. Genèse des magmas du volcanisme Plio-Quaternaire des Apennins. Geol. Rundsch.
1967, 57, 127–141. (In French)
10. Gianelli, G.; Puxeddu, M.; Batini, F.; Bertini, G.; Dini, I.; Pandeli, E.; Nicolich, R.
Geological model of a young volcano-plutonic system: The geothermal region of Monte Amiata
(Tuscany, Italy). Geothermics 1988, 17, 719–734.
11. Marinelli, G.; Barberi, F.; Cioni, R. Sollevamenti neogenici e intrusioni acide della Toscana e del
Lazio settentrionale. Mem. Soc. Geol. Ital. 1993, 49, 279–288. (In Italian)
12. Arisi Rota, F.; Brondi, A.; Dessau, G.; Franzini, M. Monte Amiata SPA Stab. Minerario del Siele,
Stea, B., Vighi, L. I Giacimenti minerari della Toscana meridionale. Rend. Soc. It. Miner. Petr.
1971, 27, 357–544. (In Italian)
13. Barelli, A.; Ceccarelli, A.; Dini, I.; Fiordelisi, A.; Giorgi, N.; Lovari, F.; Romagnoli, P. A review
of the Mt. Amiata geothermal system (Italy). In Proceedings of the World Geothermal Congress,
Bali, Indonesia, 25–29 April 2010; pp. 1–6.
14. Frondini, F.; Caliro, S.; Cardellini, C.; Chiodini, G.; Morgantini, N. Carbon dioxide degassing and
thermal energy release in the Monte Amiata volcanic-geothermal area (Italy). Appl. Geochem.
2009, 24, 860–875.
15. Ceroti, M.; Fulignati, P.; Marianelli, P.; Sbrana, A.; Scazzola, S. Integrated exploration of
geothermal systems in Southern Tuscany for medium enthalpy resources detecting and possible
exploiting through very low impact power plants. In Proceedings of the European Geothermal
Congress, Pisa, Italy, 6 June 2013; pp. 1–4.
16. Carella, M.; Fulignati, P.; Musumeci, G.; Sbrana, A. Metamorphic consequences of Neogene thermal
anomaly in northern Apennines (Radicondoli-Travale area, Larderello geothermal field—Italy).
Geodin. Acta 2000, 13, 345–366.
17. Gianelli, G.; Manzella, A.; Puxeddu, M. Crustal models of the geothermal areas of southern
Tuscany (Italy). Tectonophysics 1997, 281, 221–239.
18. Decandia, F.A.; Lazzarotto, A.; Liotta, D.; Cernobori, L.; Nicolich, R. The Crop 03 traverse:
Insights on post-collisional evolution of Northern Apennines. Mem. Soc. Geol. Ital. 1998, 52,
427–439.
19. Barchi, M.; Minelli, G.; Pialli, G. The CROP 03 profile: A synthesis of results on deep structures
of the Nothern Appennines. Mem. Soc. Geol. Ital. 1998, 52, 383–400.
20. Brogi, A.; Lazzarotto, A.; Liotta, D.; Ranalli, G.; CROP 18 Working Group. Crustal structures in
the geothermal areas of southern Tuscany (Italy): Insights from the CROP 18 deep seismic
reflection lines. J. Volcanol. Geotherm. Res. 2005, 148, 60–80.
21. Cameli, G.M.; Dini, I.; Liotta, D. Brittle/ductile boundary from seismic reflection lines of
southern Tuscany (Northern Apennines, Italy). Mem. Soc. Geol. Ital. 1998, 52, 153–163.

Energies 2014, 7 7452
22. Liotta, D.; Ranalli, G. Correlation between seismic reflectivity and rheology in extended
lithosphere: Southern Tuscany, inner Northern Apennines, Italy. Tectonophysics 1999, 315, 109–122.
23. Accaino, F.; Tinivella, U.; Rossi, G.; Nicolich, R. Geofluid evidence from analysis of deep crustal
seismic data (Southern Tuscany, Italy). J. Volcanol. Geotherm. Res. 2005, 148, 46–59.
24. Caumon, G.; Collon-Drouaillet, P.; le Carlier de Veslund, C.; Viseur, S.; Sausse, J. Surface-based
3D modelling of geological structures. Math. Geosci. 2009, 41, 927–945.
25. Holden, L.; Mostad, P.F.; Nielsen, B.F.; Gjerde, J.; Townsend, C.; Ottesen, S. Stochastic
structural modelling. Math. Geosci. 2003, 35, 899–914.
26. Kaufman, O.; Martin, T. 3D geological modelling from boreholes, cross-sections and geological
maps, applicationsover former natural gas storages in coal mines. Comput. Geosci. 2008, 34,
278–290.
27. Regione Toscana, Cartografia Geologica Regionale 1:10.000. Available online:
http://www.regione.toscana.it/-/carta-geologica (accessed on 6 November 2014).
28. Pandeli, E.; Bertini, G.; Castellucci, P.; Morelli, M.; Monechi, S. The sub-Ligurian units of
Mt. Amiata geothermal Region (south-eastern Tuscany): New stratigraphic and tectonic data and
insight into their relationships with the Tucsan Nappe. Boll. Soc. Geol. Ital. 2005, 3, 55–71.
29. Liotta, D. Structural features of the Radicofani basin along the Piancastagnaio (Mt. Amiata)–S.
Casciano dei Bagni (Mt. Cetona) cross section. Mem. Soc. Geol. Ital. 1994, 48, 401–408.
30. Brogi, A.; Lazzarotto, A.; Liotta, D.; CROP 18 Working Group. Structural features of southern
Tuscany and geological interpretation of the CROP 18 seismic reflection survey (Italy). Boll. Soc.
Geol. Ital. 2005, 3, 213–236.
31. ISPRA Gravimetric Map of Italy. Available online: http://www.isprambiente.gov.it/it/progetti/
cartografia-gravimetrica-digitale/index (accessed on 6 November 2014).
32. Bernabini, M.; Bertini, G.; Cameli, G.M.; Dini, I.; Orlando, L. Gravity interpretation of
Mt. Amiata geothermal area (Central Italy). In Proceedings of the World Geothermal Congress,
Florence, Italy, 18–31 May 1995; pp. 859–862.
33. Orlando, L.; Bernabini, M.; Cameli, G.M.; Dini, I.; Bertini, G. Interpretazione preliminare del
minimo gravimetrico del Monte Amiata. Stud. Geol. Camerti Spec. 1994, 1, 175–181. (In Italian)
34. Elter, F.M.; Pandeli, E. Structural features of the metamorphic Paleozoic-Triassic sequences in
deep geothermal drillings of the Mt. Amiata area (SE Tuscany, Italy). Boll. Soc. Geol. Ital. 1991,
110, 511–522.
35. Batini, F.; Brogi, A.; Lazzarotto, A.; Liotta, D.; Pandeli, E. Geological features of Larderello-Travale
and Mt. Amiata geothermal areas (southern Tuscany, Italy). Episodes 2003, 26, 239–244.
36. Pruess, K.; Oldenburg, C.; Moridis, G. TOUGH2-User’s Guide, Version 2.0; Report LBNL-43134;
Lawrence Livermore Laboratory: Berkeley, CA, USA, 1999; p. 198.
37. Della Vedova, B.; Bellani, S.; Pellis, G.; Squarci, P. Deep temperature and surface heat flow
distribution. In Anatomy of an Orogen: The Apennines and Adjacent Mediterranean Basins;
Vai, G.B., Martini, L.P., Eds.; Springer: Berlin, Germany, 2001.
38. Viganò, A.; Della Vedova, B.; Ranalli, G.; Martin, S.; Scafidi, D. Geothermal and rheological
regime in the Po plain sector of Adria (Northern Italy). Int. J. Geosci. 2011, 131, 228–240.
39. Gualteri, L.; Zappone, A. Hypothesis of ensialic subduction in the Northern Apennines:
A petrophysical contribution. Mem. Soc. Geol. Ital. 1998, 52, 205–214.

Energies 2014, 7 7453
40. Trippetta, F.; Collettini, C.; Vinciguerra, S.; Meredith, P.G. Laboratory measurements of the
physical properties of Triassic Evaporites from Central Italy and correlation with geophysical data.
Tectonophysics 2010, 492, 121–132.
41. Bertini, G.; Cappetti, G.; Dini, I.; Lovari, F. Deep drilling results and updating of geothermal
knowledge on the Monte Amiata area. In Proceedings of the World Geothermal Congress,
Florence, Italy, 18–31 May 1995; pp. 1283–1286.
42. Marinelli, G. II magmatismo recente in Toscana e le sue implicazioni minerogenetiche. Mem. Soc.
Geol. Ital. 1983, 25, 111–124. (In Italian)
43. Muffler, P.; Cataldi, R. Methods for regional assessment of geothermal resources. Geothermics
1978, 7, 53–89.
© 2014 by the authors; licensee MDPI, Basel, Switzerland. This article is an open access article
distributed under the terms and conditions of the Creative Commons Attribution license
(http://creativecommons.org/licenses/by/4.0/).