Embed Size (px)
Citation preview
Applied Geochemistry 24 (2009) 860–875
Contents lists available at ScienceDirect
Applied Geochemistry
journal homepage: www.elsevier .com/locate /apgeochem
Carbon dioxide degassing and thermal energy release in the Monte Amiatavolcanic-geothermal area (Italy)
Francesco Frondini a,*, Stefano Caliro b, Carlo Cardellini a, Giovanni Chiodini b, Nicola Morgantini c
a Dipartimento di Scienze della Terra, Università di Perugia, Piazza dell’Università, I-06123 Perugia, Italyb INGV Sezione di Napoli, Osservatorio Vesuviano, Via Diocleziano 328, I-80124 Napoli, Italyc ARPA Umbria, Via Pievaiola, San Sisto, I-06132 Perugia, Italy
a r t i c l e i n f o a b s t r a c t
Article history:Received 9 July 2008Accepted 22 January 2009Available online 3 February 2009
Editorial handling by R. Fuge
0883-2927/$ - see front matter � 2009 Elsevier Ltd. Adoi:10.1016/j.apgeochem.2009.01.010
* Corresponding author. Fax: +39 75 5852603.E-mail address: [email protected] (F. Frondini).
The quaternary volcanic complex of Mount Amiata is located in southern Tuscany (Italy) and representsthe most recent manifestation of the Tuscan Magmatic Province. The region is characterised by a largethermal anomaly and by the presence of numerous CO2-rich gas emissions and geothermal features,mainly located at the periphery of the volcanic complex. Two geothermal systems are located, at increas-ing depths, in the carbonate and metamorphic formations beneath the volcanic complex. The shallowvolcanic aquifer is separated from the deep geothermal systems by a low permeability unit (LigurianUnit). A measured CO2 discharge through soils of 1.8 � 109 mol a�1 shows that large amounts of CO2
move from the deep reservoir to the surface. A large range in d13CTDIC (�21.07 to +3.65) characterisesthe waters circulating in the aquifers of the region and the mass and isotopic balance of TDIC allows dis-tinguishing a discharge of 0.3 � 109 mol a�1 of deeply sourced CO2 in spring waters. The total natural CO2
discharge (2.1 � 109 mol a�1) is slightly less than minimum CO2 output estimated by an indirect method(2.8 � 109 mol a�1), but present-day release of 5.8 � 109 mol a�1 CO2 from deep geothermal wells mayhave reduced natural CO2 discharge. The heat transported by groundwater, computed considering theincrease in temperature from the infiltration area to the discharge from springs, is of the same orderof magnitude, or higher, than the regional conductive heat flow (>200 mW m�2) and reaches extremelyhigh values (up to 2700 mW m�2) in the north-eastern part of the study area. Heat transfer occurs mainlyby conductive heating in the volcanic aquifer and by uprising gas and vapor along fault zones and in thoseareas where low permeability cover is lacking. The comparison of CO2 flux, heat flow and geological set-ting shows that near surface geology and hydrogeological setting play a central role in determining CO2
degassing and heat transfer patterns.� 2009 Elsevier Ltd. All rights reserved.
1. Introduction
The Tyrrhenian side of central-southern Italy, characterised bythinned crust (20–25 km), positive magnetic anomalies (Arisi Rotaand Fichera, 1985), shallow earthquakes, positive gravity anomalyand high heat flow (Della Vedova et al., 1984), is affected by a glob-ally significant CO2 degassing process (Chiodini et al., 1999, 2000,2004; Chiodini and Frondini, 2001; Gambardella et al., 2004;Frondini et al., 2008). This process, probably due to migration intothe upper crust of deep mantle fluids, is responsible for the transferof large amounts of energy and matter toward the surface and pro-duces strong CO2 emissions at the surface and chemical modifica-tion of the shallow groundwater. Degassing occurs from two largesectors of central-southern Italy (Chiodini et al., 2004). The north-ern area (TRDS, Tuscan Roman degassing structure) partially over-laps Tuscany and the Roman magmatic province and releases
ll rights reserved.
about 1.4 � 1011 mol a�1 of CO2, while the southern area (CDS,Campanian degassing structure) is related to the Campanian volca-nism and discharges about 0.7 � 1011 mol a�1 of CO2 (Chiodiniet al., 2004).
The Mount Amiata volcanic-geothermal area (AVGA), located insouthern Tuscany (Fig. 1) within the TRDS, is characterised by thepresence of numerous CO2-rich gas emissions and geothermal fea-tures (Fig. 2) and is one of the Italian areas where the effects of theCO2 degassing process are more evident. Some estimations of theCO2 degassing process have been recently carried out in selectedsectors of the AVGA (Rogie et al., 2000; Gambardella et al., 2004;Donnini et al., 2007), but at the present there is no estimation ofthe CO2 flux from the whole AVGA and more data are needed in or-der to give a reasonable value (or range of values) for the total CO2
efflux.Another issue that is worthy of more investigation is the rela-
tionship of heat flow with the degassing process. Chiodini et al.(1988), through the enthalpy balance of the cold springs of theMt. Amiata volcanic aquifer, showed that the effect of regional
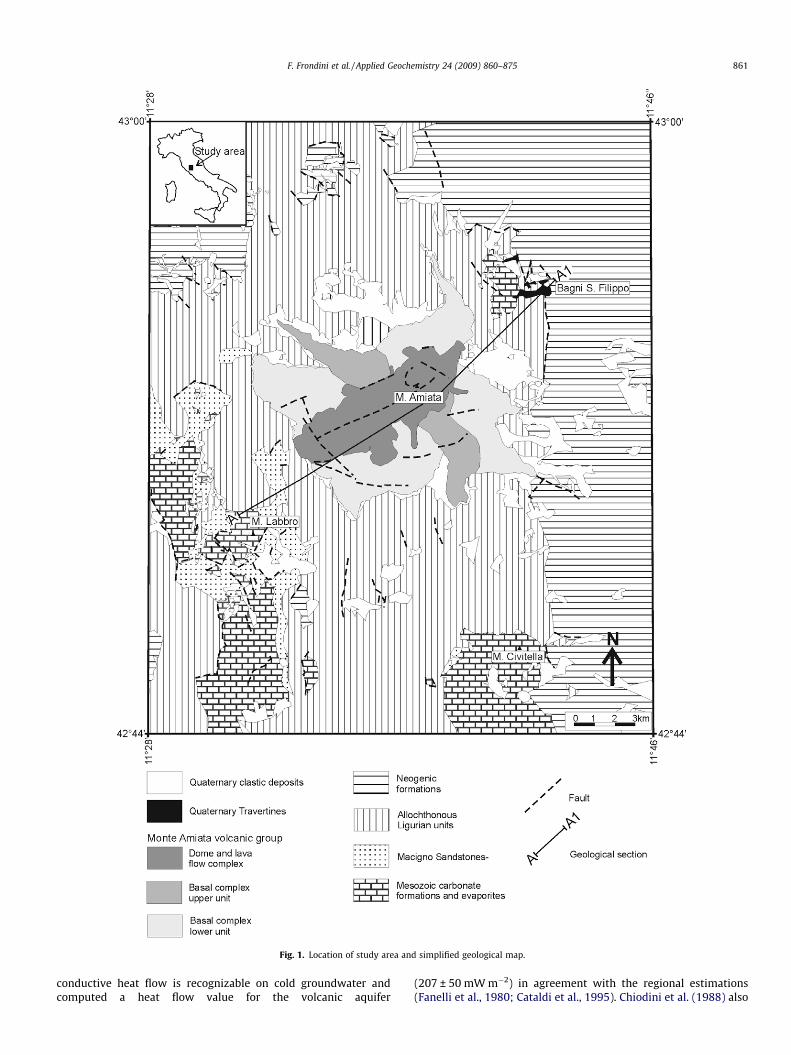
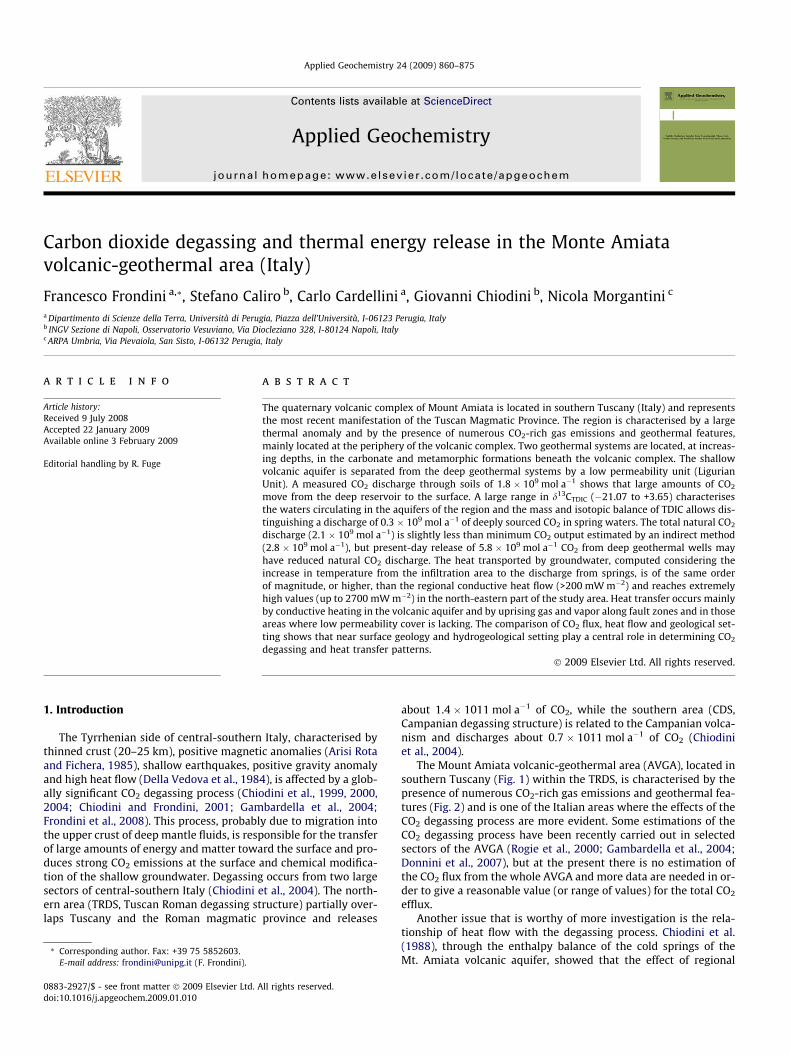
Fig. 1. Location of study area and simplified geological map.
F. Frondini et al. / Applied Geochemistry 24 (2009) 860–875 861
conductive heat flow is recognizable on cold groundwater andcomputed a heat flow value for the volcanic aquifer
(207 ± 50 mW m�2) in agreement with the regional estimations(Fanelli et al., 1980; Cataldi et al., 1995). Chiodini et al. (1988) also
Fig. 2. Location of the sampling points, gas emissions and geothermal wells; drainage network and piezometric map (simplified from Calamai et al. (1970)).
862 F. Frondini et al. / Applied Geochemistry 24 (2009) 860–875
used groundwater chemistry to show isolation of the volcanicaquifer from deep thermal waters, but they did not consider thepossibility that heat transfer might occur through uprising gasand vapor. Given that the area is characterised by numerous CO2
emissions, this is quite possible. Furthermore they limited theirstudy to the volcanic aquifer and did not consider the springs ofthe sedimentary aquifers surrounding the volcano, even thoughsome of them are characterised by temperatures appreciably high-er than infiltration temperature.
The purposes of this work are the study of CO2 discharge andDIC source in both the volcanic and surrounding areas in order tocomplete the job of quantifying CO2 efflux begun by Rogie et al.(2000), Gambardella et al. (2004) and Donnini et al. (2007), and
to assess if deep fluids can transfer significant amounts of heat toshallow groundwater. The specific objectives are: (1) to constrainthe groundwater evolution and mixing processes, (2) to give a rea-sonable estimation of the total CO2 emission from the AVGA, and(3) to expand the heat flow estimations to the areas surroundingthe volcanic aquifer.
In order to achieve the objectives, the following are considered:(i) the unpublished chemical and isotopic data of 48 groundwatersamples collected during the summer 2003, (ii) the chemical andisotopic composition of three gas emissions (Selvena, Banditellaand Zancona) sampled in 2006, (iii) the results of the CO2 flux sur-vey carried out in the Selvena and Banditella sites in 2005–2006and (iiii) the chemical and isotopic data of some selected gas
F. Frondini et al. / Applied Geochemistry 24 (2009) 860–875 863
emissions, geothermal brines and thermal springs deriving fromprevious works (Collettini et al., 2008; Frondini et al., 2008; Minis-sale et al., 1997; D’Amore et al., 1987).
2. Geological, geophysical and hydrogeological setting
The study area is located in southern Tuscany and is character-ised by the presence of the Quaternary volcanic complex of MountAmiata (Fig. 1). The summit has an altitude of 1738 m a.s.l. and thevolcanic products cover a surface area of about 90 km2. The build-ing of the volcanic edifice occurred through two different phases(Ferrari et al., 1996). The first phase (about 300 ka) produced theemplacement of a Basal Trachydacitic Complex (BTC) consistingof two units: the lower unit, made up of massive rocks related toan explosive eruption, and the upper unit consisting of blocky la-vas. The second phase (about 200 ka) mainly produced massivelava flows and domes of trachyte to trachydacite compositionand ended with the eruption of small domes and lava flows of latiteto olivine latite composition (domes and lava flows complex –DLC).
The study area also includes the Neoautochton sedimentarycomplex, the Ligurian and the Tuscan stratigraphic-structural units.The Neoautocthon complex consists of marine and continentalpostorogenic deposits (clay, sands and conglomerates filling theNeogene basins), Quaternary travertines and clastic deposits. TheLigurian unit is an allochthonous unit extending eastwards overthe Tuscan Nappe and includes ophiolites associated with a pelagicsequence (Jurassic-Lower Cretaceous) and calcareous turbidites(Cretaceous-Neogene). The Tuscan nappe unit consists of a meta-morphic basement (Carboniferous-Lower Triassic), a Mesozoiccarbonate-evaporite sequence (Tuscan sequence) and Oligocene-Middle Miocene sandstones (Macigno formation). The basal meta-morphic formations, made up of graphitic phyllites, meta-sand-stones, siltites, meta-carbonates and graphite-rich metasediments(Elter and Pandeli, 1991), are not exposed at the surface but havebeen drilled in the Piancastagnaio area (Chiodini et al., 1988).
The faults involving the sedimentary units generally haveNNW–SSE and N–S directions, corresponding to the directions ofthe main regional geological structures, such as the Siena-Radico-fani graben (east of Mt. Amiata). The fracture pattern in the Mt.Amiata volcanic complex is different and derives from the super-imposition of the volcanic collapse structures over a ENE–WSWfracture system. This direction probably represents the main fis-sure system along which effusion occurred. In fact, the flow direc-tions of the BTC are symmetrical with respect to the ENE–WSWaxis and nearly all the domes of the DLC are aligned along the sameaxial fissure system (Ferrari et al., 1996).
The AVGA is characterised by two water-dominated geothermalreservoirs sited in the southern part of the Amiata volcano andtapped by the wells of three geothermal fields (Piancastagnaio,Bagnore and Poggio Nibbio). In these areas there are five produc-tion units with a total capacity of 88 MW (Cappetti and Ceppatelli,2005). The shallower geothermal system is hosted by the carbon-ate-evaporite formations at depths of 500–1000 m and produces200–240 �C fluids whereas the deeper one is localized in the meta-morphic basal complex at depths of 2000–4500 m and tempera-tures between 300 and 350 �C (Calamai et al., 1970; Bertini et al.,1995). North-east of the volcanic structure is the relatively shallowhydrothermal system of Bagni San Filippo, hosted by Mesozoic car-bonates and characterised by equilibrium temperature of 60 �C andPCO2 of 10 bar (Donnini et al., 2007).
The geothermal gradient is generally between 80 and150 �C km�1 with local peaks up to 300 �C km�1 in the Bagnoreand Piancastagnaio areas (Baldi et al., 1994). The heat flow reflectsthe geothermal gradient and reaches values of about 600 mW m�2
in corresponding with the geothermal fields (Brogi et al., 2005).The thermal anomaly is strictly related to the presence at relativelyshallow depth of intrusive magmatic bodies and metasomatic flu-ids as suggested by the seismic data showing the presence at depthbetween 4 and 7 km of a discontinuous reflector, named the K-horizon, (Mongelli et al.,1991; Gianelli et al., 1996, 1997; Decandiaet al., 1998; Barchi et al., 1998; Brogi et al., 2005). This horizon ispresent also outside the geothermal region but at much greaterdepth (Decandia et al., 1998; Liotta and Ranalli, 1999). Cameliet al. (1998) and Decandia et al. (1998) suggested, based on theearthquake hypocentres distribution, that the K-horizon corre-sponds to a ductile-brittle boundary; Liotta and Ranalli (1999) sug-gested that this ductile-brittle transition occurs in coincidencewith high fluid pressure; Gianelli (1994) proposed that this horizoncorresponds to a fractured zone above the top of an intrusive bodycharacterised by hydrothermal fluids and thermo-metamorphicreactions; Accaino et al. (2005) explain, based on the interpretationof deep crustal seismic lines, the K-horizon as the roof of over pres-surized reservoirs. The temperatures estimated for the K-horizonrange between 400 and 450 �C (Gianelli et al., 1997; Liotta andRanalli, 1999).
The hydrogeological setting of the area is characterised by aregional aquifer sited in the Mesozoic carbonate-evaporite for-mations of the Tuscan sequence and by a shallower aquiferhosted by fractured volcanic rocks (Boni et al., 1986; Chiodiniet al., 1988). The deep aquifer is partly buried under a low per-meability cover (clays, shales and marls of the ‘‘Ligurian” unitsand ‘‘Neoautochton” complex) and is characterised by discontin-uous recharge areas corresponding to the outcrops of the carbon-ate-evaporite formations. However, according to Celati et al.(1990) and Minissale et al. (2002), it is possible to suppose a lat-eral continuity of the buried Mesozoic sequences under the covercomplex that permits the circulation of groundwater over a largearea. On the southern and western side of Mt. Amiata the car-bonate-evaporite structures represent the main geothermalreservoir.
3. Chemical and isotopic composition of groundwater
3.1. Materials and methods
Forty-eight springs and wells of thermal and cold water weresampled and analysed during 2003, for chemical compositionand C isotopic composition of total dissolved inorganic C (TDIC).
Water temperature, pH, Eh, conductivity, silica concentrationand total alkalinity were determined in the field. Total silica wasdetermined using a colorimetric kit and alkalinity by titration withHCl (0.01 N). Water samples for chemical analyses were collectedin 100 mL and 50 mL HDPE (high-density polyethylene) bottles.The 50 mL aliquot was filtered upon sampling through 0.45 lmmembrane filters and then acidified with 1% HCl. Calcium andMg concentrations were determined by atomic absorption (AA)flame spectroscopy on the acidified sample while Na, K were deter-mined by atomic emission (AE) flame spectroscopy. Cl, SO4, F andNO3 were determined by ion chromatography.
Water samples for isotopic composition of dissolved inorganic Cwere collected in 1000 mL glass bottles and saturated with SrCl2
and NaOH, directly in the field, to precipitate dissolved C as SrCO3.Isotopic analyses were performed by mass spectrometry on theCO2 gas liberated from the precipitate by reaction with 100%H3PO4 under vacuum.
The locations of the sampling points are shown in Fig. 2 and theresults of the chemical analyses are listed in Table 1. The data havebeen integrated with the published chemical compositions of eightsprings and wells (Frondini et al., 2008; Minissale et al., 1997).
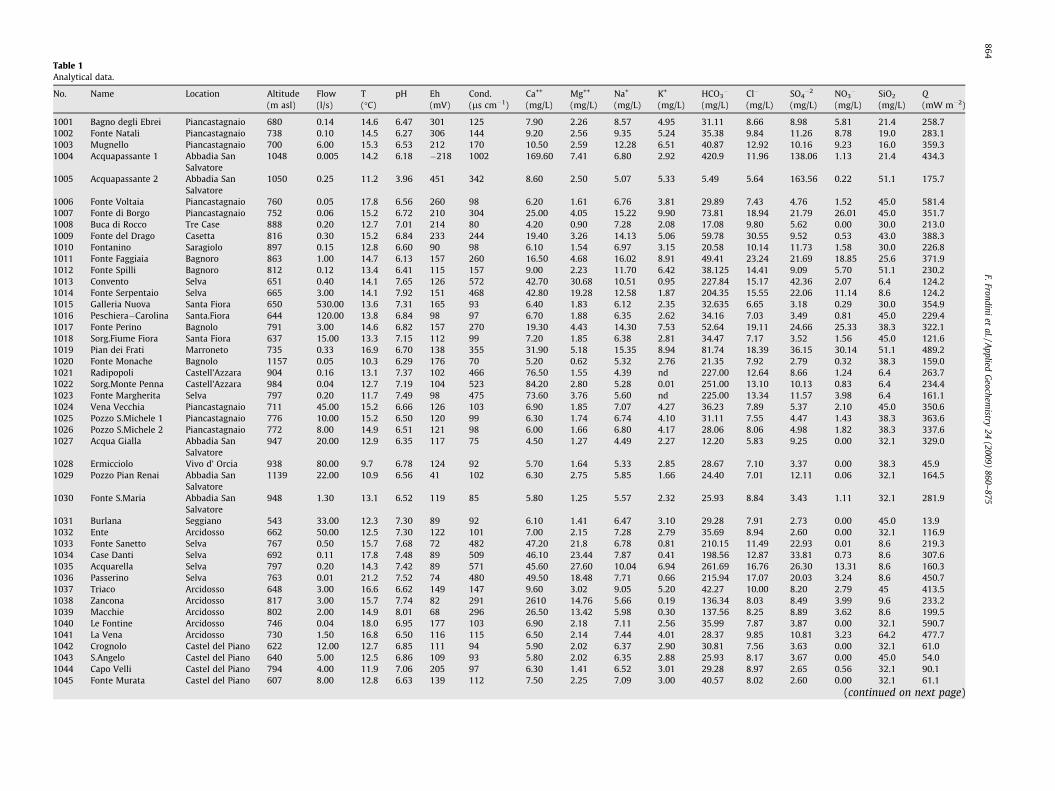
Table 1Analytical data.
No. Name Location Altitude(m asl)
Flow(l/s)
T(�C)
pH Eh(mV)
Cond.(ls cm�1)
Ca++
(mg/L)Mg++
(mg/L)Na+
(mg/L)K+
(mg/L)HCO3
�
(mg/L)Cl�
(mg/L)SO4
�2
(mg/L)NO3
�
(mg/L)SiO2
(mg/L)Q(mW m�2)
1001 Bagno degli Ebrei Piancastagnaio 680 0.14 14.6 6.47 301 125 7.90 2.26 8.57 4.95 31.11 8.66 8.98 5.81 21.4 258.71002 Fonte Natali Piancastagnaio 738 0.10 14.5 6.27 306 144 9.20 2.56 9.35 5.24 35.38 9.84 11.26 8.78 19.0 283.11003 Mugnello Piancastagnaio 700 6.00 15.3 6.53 212 170 10.50 2.59 12.28 6.51 40.87 12.92 10.16 9.23 16.0 359.31004 Acquapassante 1 Abbadia San
Salvatore1048 0.005 14.2 6.18 �218 1002 169.60 7.41 6.80 2.92 420.9 11.96 138.06 1.13 21.4 434.3
1005 Acquapassante 2 Abbadia SanSalvatore
1050 0.25 11.2 3.96 451 342 8.60 2.50 5.07 5.33 5.49 5.64 163.56 0.22 51.1 175.7
1006 Fonte Voltaia Piancastagnaio 760 0.05 17.8 6.56 260 98 6.20 1.61 6.76 3.81 29.89 7.43 4.76 1.52 45.0 581.41007 Fonte di Borgo Piancastagnaio 752 0.06 15.2 6.72 210 304 25.00 4.05 15.22 9.90 73.81 18.94 21.79 26.01 45.0 351.71008 Buca di Rocco Tre Case 888 0.20 12.7 7.01 214 80 4.20 0.90 7.28 2.08 17.08 9.80 5.62 0.00 30.0 213.01009 Fonte del Drago Casetta 816 0.30 15.2 6.84 233 244 19.40 3.26 14.13 5.06 59.78 30.55 9.52 0.53 43.0 388.31010 Fontanino Saragiolo 897 0.15 12.8 6.60 90 98 6.10 1.54 6.97 3.15 20.58 10.14 11.73 1.58 30.0 226.81011 Fonte Faggiaia Bagnoro 863 1.00 14.7 6.13 157 260 16.50 4.68 16.02 8.91 49.41 23.24 21.69 18.85 25.6 371.91012 Fonte Spilli Bagnoro 812 0.12 13.4 6.41 115 157 9.00 2.23 11.70 6.42 38.125 14.41 9.09 5.70 51.1 230.21013 Convento Selva 651 0.40 14.1 7.65 126 572 42.70 30.68 10.51 0.95 227.84 15.17 42.36 2.07 6.4 124.21014 Fonte Serpentaio Selva 665 3.00 14.1 7.92 151 468 42.80 19.28 12.58 1.87 204.35 15.55 22.06 11.14 8.6 124.21015 Galleria Nuova Santa Fiora 650 530.00 13.6 7.31 165 93 6.40 1.83 6.12 2.35 32.635 6.65 3.18 0.29 30.0 354.91016 Peschiera�Carolina Santa.Fiora 644 120.00 13.8 6.84 98 97 6.70 1.88 6.35 2.62 34.16 7.03 3.49 0.81 45.0 229.41017 Fonte Perino Bagnolo 791 3.00 14.6 6.82 157 270 19.30 4.43 14.30 7.53 52.64 19.11 24.66 25.33 38.3 322.11018 Sorg.Fiume Fiora Santa Fiora 637 15.00 13.3 7.15 112 99 7.20 1.85 6.38 2.81 34.47 7.17 3.52 1.56 45.0 121.61019 Pian dei Frati Marroneto 735 0.33 16.9 6.70 138 355 31.90 5.18 15.35 8.94 81.74 18.39 36.15 30.14 51.1 489.21020 Fonte Monache Bagnolo 1157 0.05 10.3 6.29 176 70 5.20 0.62 5.32 2.76 21.35 7.92 2.79 0.32 38.3 159.01021 Radipopoli Castell’Azzara 904 0.16 13.1 7.37 102 466 76.50 1.55 4.39 nd 227.00 12.64 8.66 1.24 6.4 263.71022 Sorg.Monte Penna Castell’Azzara 984 0.04 12.7 7.19 104 523 84.20 2.80 5.28 0.01 251.00 13.10 10.13 0.83 6.4 234.41023 Fonte Margherita Selva 797 0.20 11.7 7.49 98 475 73.60 3.76 5.60 nd 225.00 13.34 11.57 3.98 6.4 161.11024 Vena Vecchia Piancastagnaio 711 45.00 15.2 6.66 126 103 6.90 1.85 7.07 4.27 36.23 7.89 5.37 2.10 45.0 350.61025 Pozzo S.Michele 1 Piancastagnaio 776 10.00 15.2 6.50 120 99 6.30 1.74 6.74 4.10 31.11 7.55 4.47 1.43 38.3 363.61026 Pozzo S.Michele 2 Piancastagnaio 772 8.00 14.9 6.51 121 98 6.00 1.66 6.80 4.17 28.06 8.06 4.98 1.82 38.3 337.61027 Acqua Gialla Abbadia San
Salvatore947 20.00 12.9 6.35 117 75 4.50 1.27 4.49 2.27 12.20 5.83 9.25 0.00 32.1 329.0
1028 Ermicciolo Vivo d’ Orcia 938 80.00 9.7 6.78 124 92 5.70 1.64 5.33 2.85 28.67 7.10 3.37 0.00 38.3 45.91029 Pozzo Pian Renai Abbadia San
Salvatore1139 22.00 10.9 6.56 41 102 6.30 2.75 5.85 1.66 24.40 7.01 12.11 0.06 32.1 164.5
1030 Fonte S.Maria Abbadia SanSalvatore
948 1.30 13.1 6.52 119 85 5.80 1.25 5.57 2.32 25.93 8.84 3.43 1.11 32.1 281.9
1031 Burlana Seggiano 543 33.00 12.3 7.30 89 92 6.10 1.41 6.47 3.10 29.28 7.91 2.73 0.00 45.0 13.91032 Ente Arcidosso 662 50.00 12.5 7.30 122 101 7.00 2.15 7.28 2.79 35.69 8.94 2.60 0.00 32.1 116.91033 Fonte Sanetto Selva 767 0.50 15.7 7.68 72 482 47.20 21.8 6.78 0.81 210.15 11.49 22.93 0.01 8.6 219.31034 Case Danti Selva 692 0.11 17.8 7.48 89 509 46.10 23.44 7.87 0.41 198.56 12.87 33.81 0.73 8.6 307.61035 Acquarella Selva 797 0.20 14.3 7.42 89 571 45.60 27.60 10.04 6.94 261.69 16.76 26.30 13.31 8.6 160.31036 Passerino Selva 763 0.01 21.2 7.52 74 480 49.50 18.48 7.71 0.66 215.94 17.07 20.03 3.24 8.6 450.71037 Triaco Arcidosso 648 3.00 16.6 6.62 149 147 9.60 3.02 9.05 5.20 42.27 10.00 8.20 2.79 45 413.51038 Zancona Arcidosso 817 3.00 15.7 7.74 82 291 2610 14.76 5.66 0.19 136.34 8.03 8.49 3.99 9.6 233.21039 Macchie Arcidosso 802 2.00 14.9 8.01 68 296 26.50 13.42 5.98 0.30 137.56 8.25 8.89 3.62 8.6 199.51040 Le Fontine Arcidosso 746 0.04 18.0 6.95 177 103 6.90 2.18 7.11 2.56 35.99 7.87 3.87 0.00 32.1 590.71041 La Vena Arcidosso 730 1.50 16.8 6.50 116 115 6.50 2.14 7.44 4.01 28.37 9.85 10.81 3.23 64.2 477.71042 Crognolo Castel del Piano 622 12.00 12.7 6.85 111 94 5.90 2.02 6.37 2.90 30.81 7.56 3.63 0.00 32.1 61.01043 S.Angelo Castel del Piano 640 5.00 12.5 6.86 109 93 5.80 2.02 6.35 2.88 25.93 8.17 3.67 0.00 45.0 54.01044 Capo Velli Castel del Piano 794 4.00 11.9 7.06 205 97 6.30 1.41 6.52 3.01 29.28 8.97 2.65 0.56 32.1 90.11045 Fonte Murata Castel del Piano 607 8.00 12.8 6.63 139 112 7.50 2.25 7.09 3.00 40.57 8.02 2.60 0.00 32.1 61.1
(continued on next page)
864F.Frondini
etal./A
ppliedG
eochemistry
24(2009)
860–875
Tabl
e1(c
onti
nued
)
No.
Nam
eLo
cati
onA
ltit
ude
(mas
l)Fl
ow(l
/s)
T (�C
)pH
Eh (mV
)C
ond.
(ls
cm�
1)
Ca+
+
(mg/
L)M
g++
(mg/
L)N
a+
(mg/
L)K
+
(mg/
L)H
CO
3�
(mg/
L)C
l�
(mg/
L)SO
4�
2
(mg/
L)N
O3�
(mg/
L)Si
O2
(mg/
L)Q (m
Wm�
2)
1046
Fon
tede
lD
azio
Cas
tel
del
Pian
o60
74.
0012
.16.
7048
710
77.
201.
947.
452.
6036
.60
8.60
2.69
0.49
45.0
0.5
1047
Fon
tede
lR
eC
aste
lde
lPi
ano
758
4.00
11.4
7.12
200
875.
001.
275.
883.
3028
.98
7.31
2.00
0.38
64.2
26.2
1048
Cam
pole
Cap
ann
eV
ivo
d’O
rcia
775
0.07
16.3
7.61
115
642
91.1
08.
868.
080.
4922
5.40
27.4
327
.51
17.4
37.
281
.833
(a)
Term
eB
agn
iSa
n.F
ilip
po52
924
.00
48.7
6.43
�25
310
568
4.00
184.
0030
.19
9.56
1610
.40
16.0
412
86.5
00.
1517
.027
74.7
34a
Foss
oB
ian
coB
agn
iSa
n.F
ilip
po53
23.
0042
.26.
35�
167
8653
8.00
166.
0029
.07
9.08
1124
.84
17.3
511
87.0
00.
1213
.022
98.6
35a
Bol
lore
Bag
ni
San
.Fil
ippo
600
0.10
48.5
6.28
�28
811
073
2.00
187.
0030
.21
9.60
1744
.60
16.0
313
07.0
00.
1120
.027
60.0
43a
Acq
uap
assa
nte
Bag
ni
San
.Fil
ippo
480
0.50
21.2
6.50
139
2120
372.
0010
7.80
20.5
25.
5278
4.46
16.1
567
9.00
2.16
21.4
760.
316
bA
cqu
apas
san
te2
Abb
adia
San
Salv
ator
e10
500.
0311
.04.
1564
314
15.
401.
304.
605.
000.
005.
0080
.00
nd
54.6
158.
417
bA
cqu
apas
san
te1
Abb
adia
San
Salv
ator
e10
480.
0612
.06.
15�
4549
521
5.00
7.50
4.30
3.10
536
5.60
114.
00n
d30
.024
3.8
22b
Gal
.Nu
ova
Ital
iaB
agn
iSa
n.F
ilip
po78
025
.00
16.0
4.45
506
790
98.1
019
.80
10.2
09.
600.
006.
1063
4.00
nd
52.0
477.
623
bR
ondi
nai
aA
bbad
iaSa
nSa
lvat
ore
660
0.01
18.0
4.18
8154
016
7.00
13.3
07.
102.
000.
007.
8039
6.00
nd
36.9
427.
8
nd
=n
otde
tect
ed.
aD
ata
from
Fron
din
iet
al.(
2008
).b
Dat
afr
omM
inis
sale
etal
.(19
97).
F. Frondini et al. / Applied Geochemistry 24 (2009) 860–875 865
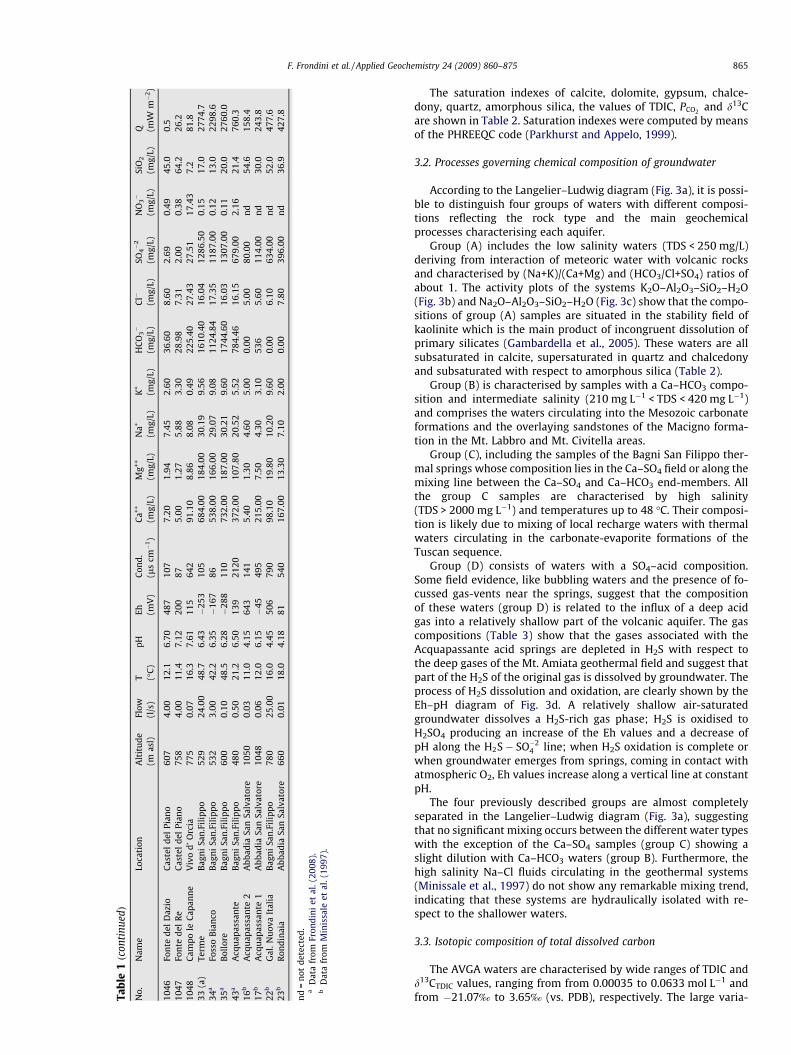
The saturation indexes of calcite, dolomite, gypsum, chalce-dony, quartz, amorphous silica, the values of TDIC, PCO2 and d13Care shown in Table 2. Saturation indexes were computed by meansof the PHREEQC code (Parkhurst and Appelo, 1999).
3.2. Processes governing chemical composition of groundwater
According to the Langelier–Ludwig diagram (Fig. 3a), it is possi-ble to distinguish four groups of waters with different composi-tions reflecting the rock type and the main geochemicalprocesses characterising each aquifer.
Group (A) includes the low salinity waters (TDS < 250 mg/L)deriving from interaction of meteoric water with volcanic rocksand characterised by (Na+K)/(Ca+Mg) and (HCO3/Cl+SO4) ratios ofabout 1. The activity plots of the systems K2O–Al2O3–SiO2–H2O(Fig. 3b) and Na2O–Al2O3–SiO2–H2O (Fig. 3c) show that the compo-sitions of group (A) samples are situated in the stability field ofkaolinite which is the main product of incongruent dissolution ofprimary silicates (Gambardella et al., 2005). These waters are allsubsaturated in calcite, supersaturated in quartz and chalcedonyand subsaturated with respect to amorphous silica (Table 2).
Group (B) is characterised by samples with a Ca–HCO3 compo-sition and intermediate salinity (210 mg L�1 < TDS < 420 mg L�1)and comprises the waters circulating into the Mesozoic carbonateformations and the overlaying sandstones of the Macigno forma-tion in the Mt. Labbro and Mt. Civitella areas.
Group (C), including the samples of the Bagni San Filippo ther-mal springs whose composition lies in the Ca–SO4 field or along themixing line between the Ca–SO4 and Ca–HCO3 end-members. Allthe group C samples are characterised by high salinity(TDS > 2000 mg L�1) and temperatures up to 48 �C. Their composi-tion is likely due to mixing of local recharge waters with thermalwaters circulating in the carbonate-evaporite formations of theTuscan sequence.
Group (D) consists of waters with a SO4–acid composition.Some field evidence, like bubbling waters and the presence of fo-cussed gas-vents near the springs, suggest that the compositionof these waters (group D) is related to the influx of a deep acidgas into a relatively shallow part of the volcanic aquifer. The gascompositions (Table 3) show that the gases associated with theAcquapassante acid springs are depleted in H2S with respect tothe deep gases of the Mt. Amiata geothermal field and suggest thatpart of the H2S of the original gas is dissolved by groundwater. Theprocess of H2S dissolution and oxidation, are clearly shown by theEh–pH diagram of Fig. 3d. A relatively shallow air-saturatedgroundwater dissolves a H2S-rich gas phase; H2S is oxidised toH2SO4 producing an increase of the Eh values and a decrease ofpH along the H2S� SO�2
4 line; when H2S oxidation is complete orwhen groundwater emerges from springs, coming in contact withatmospheric O2, Eh values increase along a vertical line at constantpH.
The four previously described groups are almost completelyseparated in the Langelier–Ludwig diagram (Fig. 3a), suggestingthat no significant mixing occurs between the different water typeswith the exception of the Ca–SO4 samples (group C) showing aslight dilution with Ca–HCO3 waters (group B). Furthermore, thehigh salinity Na–Cl fluids circulating in the geothermal systems(Minissale et al., 1997) do not show any remarkable mixing trend,indicating that these systems are hydraulically isolated with re-spect to the shallower waters.
3.3. Isotopic composition of total dissolved carbon
The AVGA waters are characterised by wide ranges of TDIC andd13CTDIC values, ranging from from 0.00035 to 0.0633 mol L�1 andfrom �21.07‰ to 3.65‰ (vs. PDB), respectively. The large varia-
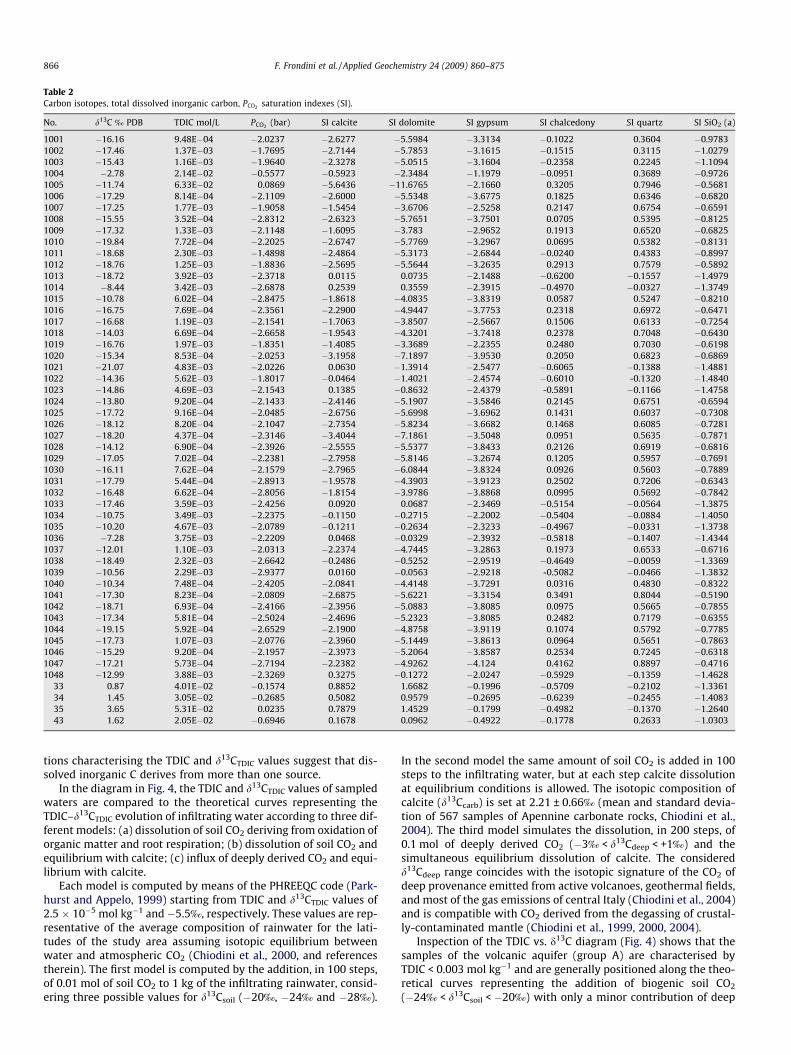
Table 2Carbon isotopes, total dissolved inorganic carbon, PCO2 saturation indexes (SI).
No. d13C ‰ PDB TDIC mol/L PCO2 (bar) SI calcite SI dolomite SI gypsum SI chalcedony SI quartz SI SiO2 (a)
1001 �16.16 9.48E�04 �2.0237 �2.6277 �5.5984 �3.3134 �0.1022 0.3604 �0.97831002 �17.46 1.37E�03 �1.7695 �2.7144 �5.7853 �3.1615 �0.1515 0.3115 �1.02791003 �15.43 1.16E�03 �1.9640 �2.3278 �5.0515 �3.1604 �0.2358 0.2245 �1.10941004 �2.78 2.14E�02 �0.5577 �0.5923 �2.3484 �1.1979 �0.0951 0.3689 �0.97261005 �11.74 6.33E�02 0.0869 �5.6436 �11.6765 �2.1660 0.3205 0.7946 �0.56811006 �17.29 8.14E�04 �2.1109 �2.6000 �5.5348 �3.6775 0.1825 0.6346 �0.68201007 �17.25 1.77E�03 �1.9058 �1.5454 �3.6706 �2.5258 0.2147 0.6754 �0.65911008 �15.55 3.52E�04 �2.8312 �2.6323 �5.7651 �3.7501 0.0705 0.5395 �0.81251009 �17.32 1.33E�03 �2.1148 �1.6095 �3.783 �2.9652 0.1913 0.6520 �0.68251010 �19.84 7.72E�04 �2.2025 �2.6747 �5.7769 �3.2967 0.0695 0.5382 �0.81311011 �18.68 2.30E�03 �1.4898 �2.4864 �5.3173 �2.6844 �0.0240 0.4383 �0.89971012 �18.76 1.25E�03 �1.8836 �2.5695 �5.5644 �3.2635 0.2913 0.7579 �0.58921013 �18.72 3.92E�03 �2.3718 0.0115 0.0735 �2.1488 �0.6200 �0.1557 �1.49791014 �8.44 3.42E�03 �2.6878 0.2539 0.3559 �2.3915 �0.4970 �0.0327 �1.37491015 �10.78 6.02E�04 �2.8475 �1.8618 �4.0835 �3.8319 0.0587 0.5247 �0.82101016 �16.75 7.69E�04 �2.3561 �2.2900 �4.9447 �3.7753 0.2318 0.6972 �0.64711017 �16.68 1.19E�03 �2.1541 �1.7063 �3.8507 �2.5667 0.1506 0.6133 �0.72541018 �14.03 6.69E�04 �2.6658 �1.9543 �4.3201 �3.7418 0.2378 0.7048 �0.64301019 �16.76 1.97E�03 �1.8351 �1.4085 �3.3689 �2.2355 0.2480 0.7030 �0.61981020 �15.34 8.53E�04 �2.0253 �3.1958 �7.1897 �3.9530 0.2050 0.6823 �0.68691021 �21.07 4.83E�03 �2.0226 0.0630 �1.3914 �2.5477 �0.6065 �0.1388 �1.48811022 �14.36 5.62E�03 �1.8017 �0.0464 �1.4021 �2.4574 �0.6010 -0.1320 �1.48401023 �14.86 4.69E�03 �2.1543 0.1385 �0.8632 �2.4379 -0.5891 �0.1166 �1.47581024 �13.80 9.20E�04 �2.1433 �2.4146 �5.1907 �3.5846 0.2145 0.6751 -0.65941025 �17.72 9.16E�04 �2.0485 �2.6756 �5.6998 �3.6962 0.1431 0.6037 �0.73081026 �18.12 8.20E�04 �2.1047 �2.7354 �5.8234 �3.6682 0.1468 0.6085 �0.72811027 �18.20 4.37E�04 �2.3146 �3.4044 �7.1861 �3.5048 0.0951 0.5635 �0.78711028 �14.12 6.90E�04 �2.3926 �2.5555 �5.5377 �3.8433 0.2126 0.6919 �0.68161029 �17.05 7.02E�04 �2.2381 �2.7958 �5.8146 �3.2674 0.1205 0.5957 �0.76911030 �16.11 7.62E�04 �2.1579 �2.7965 �6.0844 �3.8324 0.0926 0.5603 �0.78891031 �17.79 5.44E�04 �2.8913 �1.9578 �4.3903 �3.9123 0.2502 0.7206 �0.63431032 �16.48 6.62E�04 �2.8056 �1.8154 �3.9786 �3.8868 0.0995 0.5692 �0.78421033 �17.46 3.59E�03 �2.4256 0.0920 0.0687 �2.3469 �0.5154 �0.0564 �1.38751034 �10.75 3.49E�03 �2.2375 �0.1150 �0.2715 �2.2002 �0.5404 �0.0884 �1.40501035 �10.20 4.67E�03 �2.0789 �0.1211 �0.2634 �2.3233 �0.4967 �0.0331 �1.37381036 �7.28 3.75E�03 �2.2209 0.0468 �0.0329 �2.3932 �0.5818 �0.1407 �1.43441037 �12.01 1.10E�03 �2.0313 �2.2374 �4.7445 �3.2863 0.1973 0.6533 �0.67161038 �18.49 2.32E�03 �2.6642 �0.2486 �0.5252 �2.9519 �0.4649 �0.0059 �1.33691039 �10.56 2.29E�03 �2.9377 0.0160 �0.0563 �2.9218 -0.5082 �0.0466 �1.38321040 �10.34 7.48E�04 �2.4205 �2.0841 �4.4148 �3.7291 0.0316 0.4830 �0.83221041 �17.30 8.23E�04 �2.0809 �2.6875 �5.6221 �3.3154 0.3491 0.8044 �0.51901042 �18.71 6.93E�04 �2.4166 �2.3956 �5.0883 �3.8085 0.0975 0.5665 �0.78551043 �17.34 5.81E�04 �2.5024 �2.4696 �5.2323 �3.8085 0.2482 0.7179 �0.63551044 �19.15 5.92E�04 �2.6529 �2.1900 �4.8758 �3.9119 0.1074 0.5792 �0.77851045 �17.73 1.07E�03 �2.0776 �2.3960 �5.1449 �3.8613 0.0964 0.5651 �0.78631046 �15.29 9.20E�04 �2.1957 �2.3973 �5.2064 �3.8587 0.2534 0.7245 �0.63181047 �17.21 5.73E�04 �2.7194 �2.2382 �4.9262 �4.124 0.4162 0.8897 �0.47161048 �12.99 3.88E�03 �2.3269 0.3275 �0.1272 �2.0247 �0.5929 �0.1359 �1.4628
33 0.87 4.01E�02 �0.1574 0.8852 1.6682 �0.1996 �0.5709 �0.2102 �1.336134 1.45 3.05E�02 �0.2685 0.5082 0.9579 �0.2695 �0.6239 �0.2455 �1.408335 3.65 5.31E�02 0.0235 0.7879 1.4529 �0.1799 �0.4982 �0.1370 �1.264043 1.62 2.05E�02 �0.6946 0.1678 0.0962 �0.4922 �0.1778 0.2633 �1.0303
866 F. Frondini et al. / Applied Geochemistry 24 (2009) 860–875
tions characterising the TDIC and d13CTDIC values suggest that dis-solved inorganic C derives from more than one source.
In the diagram in Fig. 4, the TDIC and d13CTDIC values of sampledwaters are compared to the theoretical curves representing theTDIC–d13CTDIC evolution of infiltrating water according to three dif-ferent models: (a) dissolution of soil CO2 deriving from oxidation oforganic matter and root respiration; (b) dissolution of soil CO2 andequilibrium with calcite; (c) influx of deeply derived CO2 and equi-librium with calcite.
Each model is computed by means of the PHREEQC code (Park-hurst and Appelo, 1999) starting from TDIC and d13CTDIC values of2.5 � 10�5 mol kg�1 and �5.5‰, respectively. These values are rep-resentative of the average composition of rainwater for the lati-tudes of the study area assuming isotopic equilibrium betweenwater and atmospheric CO2 (Chiodini et al., 2000, and referencestherein). The first model is computed by the addition, in 100 steps,of 0.01 mol of soil CO2 to 1 kg of the infiltrating rainwater, consid-ering three possible values for d13Csoil (�20‰, �24‰ and �28‰).
In the second model the same amount of soil CO2 is added in 100steps to the infiltrating water, but at each step calcite dissolutionat equilibrium conditions is allowed. The isotopic composition ofcalcite (d13Ccarb) is set at 2.21 ± 0.66‰ (mean and standard devia-tion of 567 samples of Apennine carbonate rocks, Chiodini et al.,2004). The third model simulates the dissolution, in 200 steps, of0.1 mol of deeply derived CO2 (�3‰ < d13Cdeep < +1‰) and thesimultaneous equilibrium dissolution of calcite. The consideredd13Cdeep range coincides with the isotopic signature of the CO2 ofdeep provenance emitted from active volcanoes, geothermal fields,and most of the gas emissions of central Italy (Chiodini et al., 2004)and is compatible with CO2 derived from the degassing of crustal-ly-contaminated mantle (Chiodini et al., 1999, 2000, 2004).
Inspection of the TDIC vs. d13C diagram (Fig. 4) shows that thesamples of the volcanic aquifer (group A) are characterised byTDIC < 0.003 mol kg�1 and are generally positioned along the theo-retical curves representing the addition of biogenic soil CO2
(�24‰ < d13Csoil < �20‰) with only a minor contribution of deep
Fig. 3. (a) Langelier–Ludwig diagram; (b) activity plot for the system K–Si–O–H, showing the samples of the volcanic aquifer; (c) activity plot for the system Na–Si–O–H,showing the samples of the volcanic aquifer; (d) Eh–pH diagram for the system S–O–H at P = 1 bar and T = 25 �C, showing the samples with SO4–acid composition.
F. Frondini et al. / Applied Geochemistry 24 (2009) 860–875 867
CO2, probably connected to the rise of hydrothermal gases alongthe ENE–WSW eruptive fracture system.
The waters of peripheral carbonate aquifers (group B) are gen-erally compatible with closed-system equilibration between car-bonate minerals and water with TDIC 6 0.004 mol kg�1. Only fora few samples, with d13CTDIC > �10‰, is it possible to hypothesizethe dissolution of deeply derived CO2 and equilibrium with calcite.
The Ca–SO4 waters of Bagni San Filippo (Group C) are character-ised by extremely high TDIC values and d13C close to 0‰ and areclearly related to the input into the aquifer of large amounts of dee-ply derived C. Furthermore the positive shift of d13CTDIC suggeststhat the Bagni San Filippo hydrothermal system is affected by anongoing degassing process. This hypothesis is confirmed by thepresence of large degassing zones and by the PCO2 values estimatedat reservoir conditions (about 10 bar at 60 �C, Donnini et al., 2007),which are much higher than PCO2 computed at sampling conditions.
4. Carbon dioxide degassing
4.1. Origin of the gases
The high PCO2 of Bagni San Filippo groundwater and the pres-ence of the numerous diffuse and focussed gas emissions in the
whole AVGA, suggest the occurrence of a large degassing processin the study area. This process is probably related to the regionaldegassing affecting Tyrrhenian Central Italy, generated by themigration into the upper crust of deep fluids derived from a con-taminated mantle (Chiodini et al., 2004; Frondini et al., 2008).Degassing mainly occurs outside the volcanic complex due to thepresence of low permeability flysch formation at the base of thecomplex. Only minor features are located within the volcanic com-plex and are probably connected to the old ENE–WSW magmaticfissure system. The larger gas emissions are located in the BagniSan Filippo zone or SW of the volcano (Selvena, Banditella, Anteie,Zancona), as shown in Fig. 2.
The analyses of the AVGA gases (Table 3) show that CO2 is themain component followed by N2, H2S, CH4, Ar, H2, He and CO. In or-der to characterise the origin of gases in relation to the tectonicsetting Giggenbach (1987), Giggenbach and Goguel (1989) andGiggenbach and Poreda (1993) proposed the use of the relativeconcentrations of the inert gas constituents He, Ar and N2. Fig. 5plots the relative N2, He and Ar contents of AVGA gases togetherwith those of the other gas emissions of TRDS, of the active quies-cent volcanoes of the Italian Peninsula (i.e., Vesuvius, PhlegreanFields and Ischia) and of the potential end member components(Chiodini et al., 2007). All the samples fall in the field of TRDS
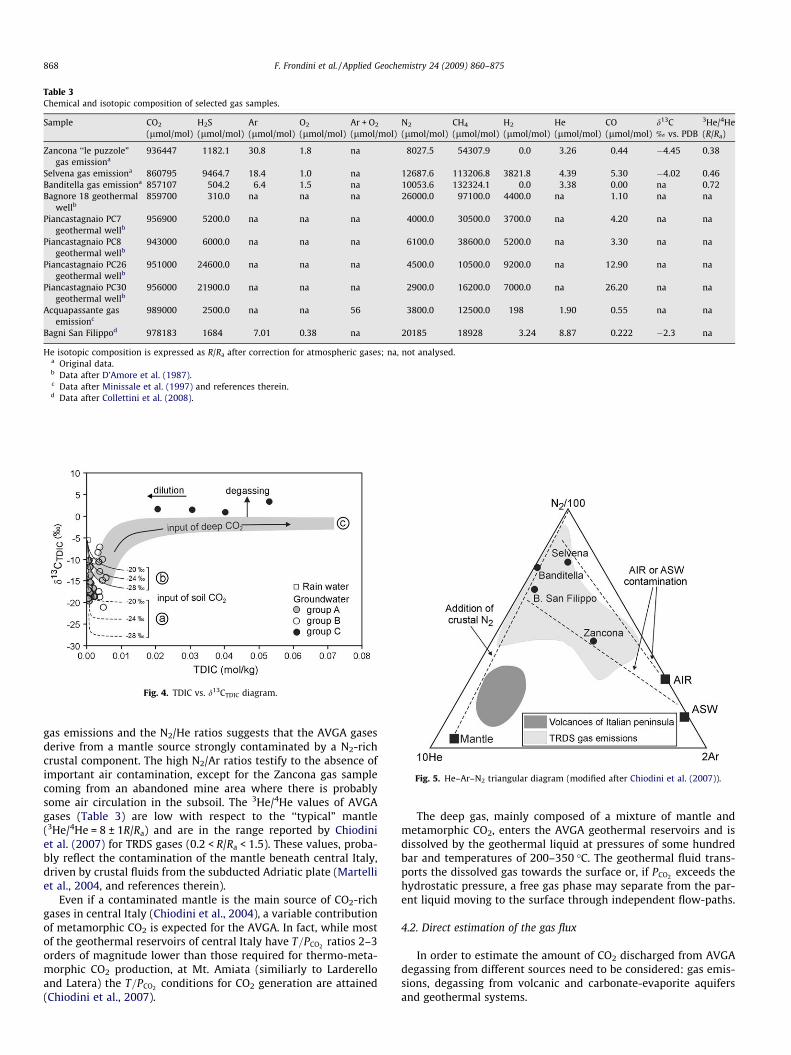
Fig. 4. TDIC vs. d13CTDIC diagram.
Fig. 5. He–Ar–N2 triangular diagram (modified after Chiodini et al. (2007)).
Table 3Chemical and isotopic composition of selected gas samples.
Sample CO2
(lmol/mol)H2S(lmol/mol)
Ar(lmol/mol)
O2
(lmol/mol)Ar + O2
(lmol/mol)N2
(lmol/mol)CH4
(lmol/mol)H2
(lmol/mol)He(lmol/mol)
CO(lmol/mol)
d13C‰ vs. PDB
3He/4He(R/Ra)
Zancona ‘‘le puzzole”gas emissiona
936447 1182.1 30.8 1.8 na 8027.5 54307.9 0.0 3.26 0.44 �4.45 0.38
Selvena gas emissiona 860795 9464.7 18.4 1.0 na 12687.6 113206.8 3821.8 4.39 5.30 �4.02 0.46Banditella gas emissiona 857107 504.2 6.4 1.5 na 10053.6 132324.1 0.0 3.38 0.00 na 0.72Bagnore 18 geothermal
wellb859700 310.0 na na na 26000.0 97100.0 4400.0 na 1.10 na na
Piancastagnaio PC7geothermal wellb
956900 5200.0 na na na 4000.0 30500.0 3700.0 na 4.20 na na
Piancastagnaio PC8geothermal wellb
943000 6000.0 na na na 6100.0 38600.0 5200.0 na 3.30 na na
Piancastagnaio PC26geothermal wellb
951000 24600.0 na na na 4500.0 10500.0 9200.0 na 12.90 na na
Piancastagnaio PC30geothermal wellb
956000 21900.0 na na na 2900.0 16200.0 7000.0 na 26.20 na na
Acquapassante gasemissionc
989000 2500.0 na na 56 3800.0 12500.0 198 1.90 0.55 na na
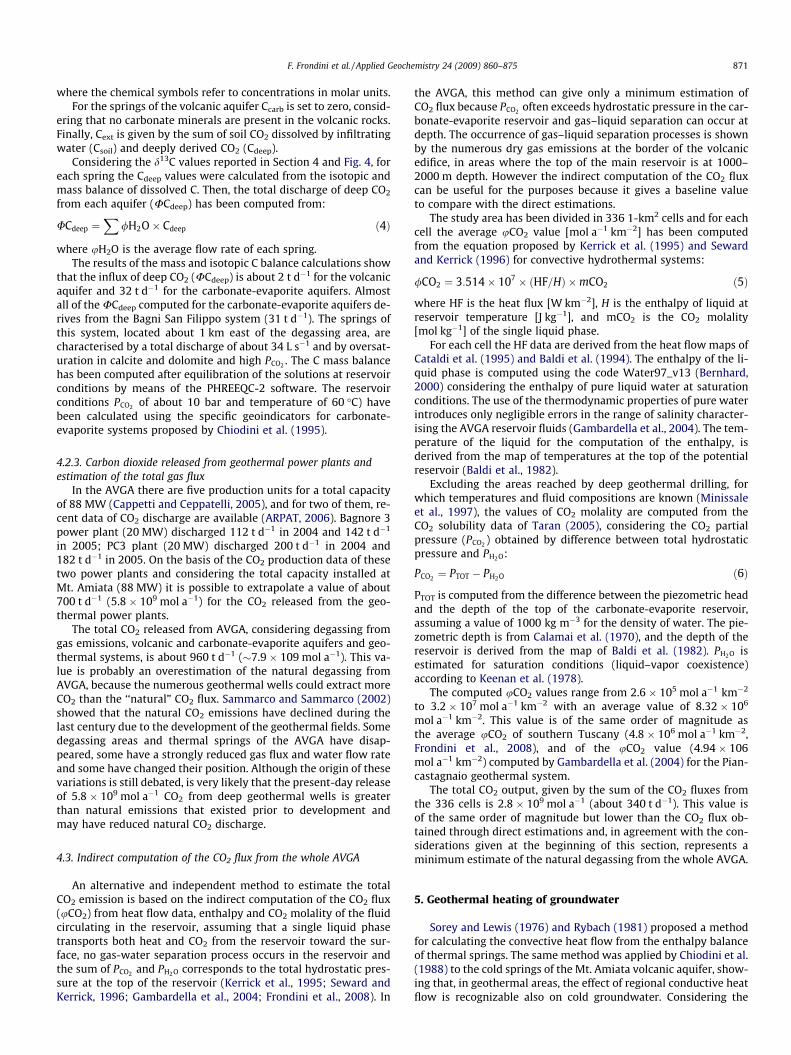
Bagni San Filippod 978183 1684 7.01 0.38 na 20185 18928 3.24 8.87 0.222 �2.3 na
He isotopic composition is expressed as R/Ra after correction for atmospheric gases; na, not analysed.a Original data.b Data after D’Amore et al. (1987).c Data after Minissale et al. (1997) and references therein.d Data after Collettini et al. (2008).
868 F. Frondini et al. / Applied Geochemistry 24 (2009) 860–875
gas emissions and the N2/He ratios suggests that the AVGA gasesderive from a mantle source strongly contaminated by a N2-richcrustal component. The high N2/Ar ratios testify to the absence ofimportant air contamination, except for the Zancona gas samplecoming from an abandoned mine area where there is probablysome air circulation in the subsoil. The 3He/4He values of AVGAgases (Table 3) are low with respect to the ‘‘typical” mantle(3He/4He = 8 ± 1R/Ra) and are in the range reported by Chiodiniet al. (2007) for TRDS gases (0.2 < R/Ra < 1.5). These values, proba-bly reflect the contamination of the mantle beneath central Italy,driven by crustal fluids from the subducted Adriatic plate (Martelliet al., 2004, and references therein).
Even if a contaminated mantle is the main source of CO2-richgases in central Italy (Chiodini et al., 2004), a variable contributionof metamorphic CO2 is expected for the AVGA. In fact, while mostof the geothermal reservoirs of central Italy have T=PCO2 ratios 2–3orders of magnitude lower than those required for thermo-meta-morphic CO2 production, at Mt. Amiata (similiarly to Larderelloand Latera) the T=PCO2 conditions for CO2 generation are attained(Chiodini et al., 2007).
The deep gas, mainly composed of a mixture of mantle andmetamorphic CO2, enters the AVGA geothermal reservoirs and isdissolved by the geothermal liquid at pressures of some hundredbar and temperatures of 200–350 �C. The geothermal fluid trans-ports the dissolved gas towards the surface or, if PCO2 exceeds thehydrostatic pressure, a free gas phase may separate from the par-ent liquid moving to the surface through independent flow-paths.
4.2. Direct estimation of the gas flux
In order to estimate the amount of CO2 discharged from AVGAdegassing from different sources need to be considered: gas emis-sions, degassing from volcanic and carbonate-evaporite aquifersand geothermal systems.
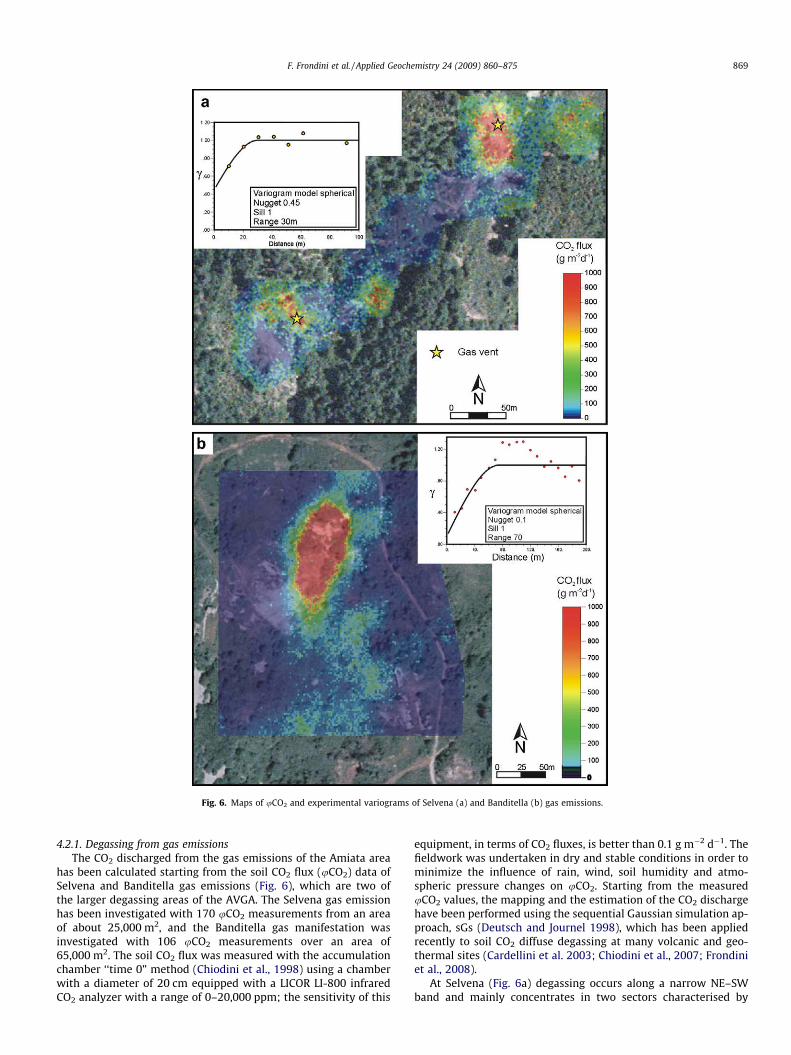
Fig. 6. Maps of uCO2 and experimental variograms of Selvena (a) and Banditella (b) gas emissions.
F. Frondini et al. / Applied Geochemistry 24 (2009) 860–875 869
4.2.1. Degassing from gas emissionsThe CO2 discharged from the gas emissions of the Amiata area
has been calculated starting from the soil CO2 flux (uCO2) data ofSelvena and Banditella gas emissions (Fig. 6), which are two ofthe larger degassing areas of the AVGA. The Selvena gas emissionhas been investigated with 170 uCO2 measurements from an areaof about 25,000 m2, and the Banditella gas manifestation wasinvestigated with 106 uCO2 measurements over an area of65,000 m2. The soil CO2 flux was measured with the accumulationchamber ‘‘time 0” method (Chiodini et al., 1998) using a chamberwith a diameter of 20 cm equipped with a LICOR LI-800 infraredCO2 analyzer with a range of 0–20,000 ppm; the sensitivity of this
equipment, in terms of CO2 fluxes, is better than 0.1 g m�2 d�1. Thefieldwork was undertaken in dry and stable conditions in order tominimize the influence of rain, wind, soil humidity and atmo-spheric pressure changes on uCO2. Starting from the measureduCO2 values, the mapping and the estimation of the CO2 dischargehave been performed using the sequential Gaussian simulation ap-proach, sGs (Deutsch and Journel 1998), which has been appliedrecently to soil CO2 diffuse degassing at many volcanic and geo-thermal sites (Cardellini et al. 2003; Chiodini et al., 2007; Frondiniet al., 2008).
At Selvena (Fig. 6a) degassing occurs along a narrow NE–SWband and mainly concentrates in two sectors characterised by
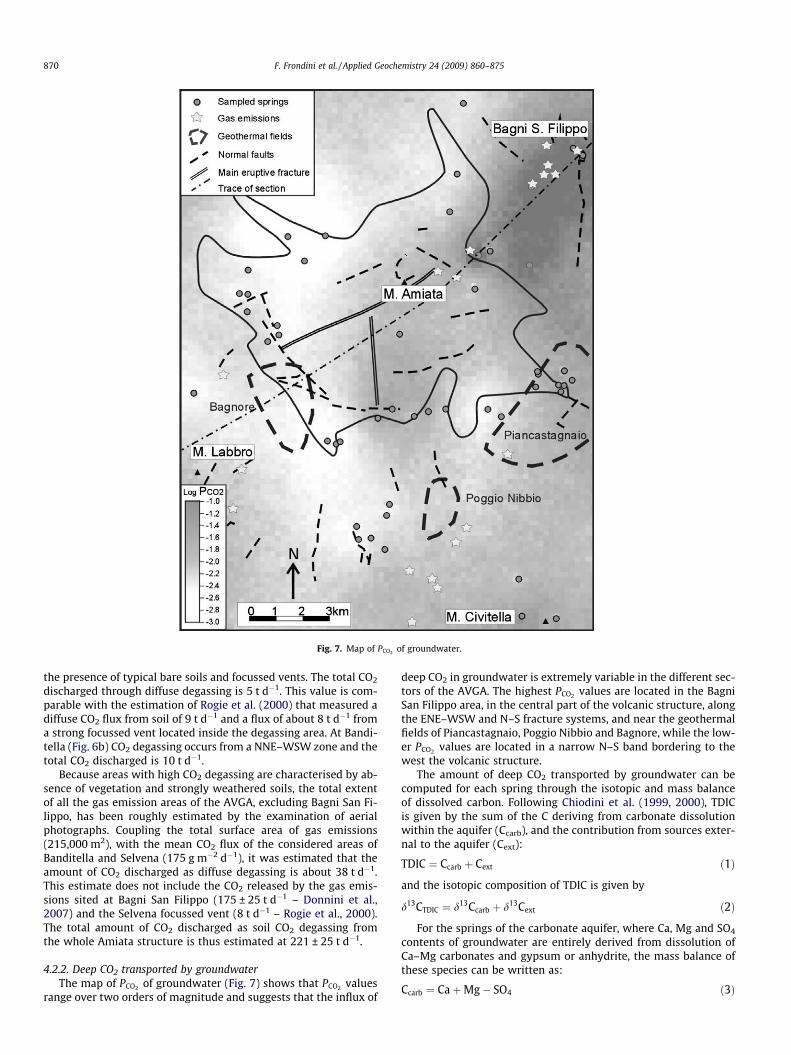
Fig. 7. Map of PCO2 of groundwater.
870 F. Frondini et al. / Applied Geochemistry 24 (2009) 860–875
the presence of typical bare soils and focussed vents. The total CO2
discharged through diffuse degassing is 5 t d�1. This value is com-parable with the estimation of Rogie et al. (2000) that measured adiffuse CO2 flux from soil of 9 t d�1 and a flux of about 8 t d�1 froma strong focussed vent located inside the degassing area. At Bandi-tella (Fig. 6b) CO2 degassing occurs from a NNE–WSW zone and thetotal CO2 discharged is 10 t d�1.
Because areas with high CO2 degassing are characterised by ab-sence of vegetation and strongly weathered soils, the total extentof all the gas emission areas of the AVGA, excluding Bagni San Fi-lippo, has been roughly estimated by the examination of aerialphotographs. Coupling the total surface area of gas emissions(215,000 m2), with the mean CO2 flux of the considered areas ofBanditella and Selvena (175 g m�2 d�1), it was estimated that theamount of CO2 discharged as diffuse degassing is about 38 t d�1.This estimate does not include the CO2 released by the gas emis-sions sited at Bagni San Filippo (175 ± 25 t d�1 – Donnini et al.,2007) and the Selvena focussed vent (8 t d�1 – Rogie et al., 2000).The total amount of CO2 discharged as soil CO2 degassing fromthe whole Amiata structure is thus estimated at 221 ± 25 t d�1.
4.2.2. Deep CO2 transported by groundwaterThe map of PCO2 of groundwater (Fig. 7) shows that PCO2 values
range over two orders of magnitude and suggests that the influx of
deep CO2 in groundwater is extremely variable in the different sec-tors of the AVGA. The highest PCO2 values are located in the BagniSan Filippo area, in the central part of the volcanic structure, alongthe ENE–WSW and N–S fracture systems, and near the geothermalfields of Piancastagnaio, Poggio Nibbio and Bagnore, while the low-er PCO2 values are located in a narrow N–S band bordering to thewest the volcanic structure.
The amount of deep CO2 transported by groundwater can becomputed for each spring through the isotopic and mass balanceof dissolved carbon. Following Chiodini et al. (1999, 2000), TDICis given by the sum of the C deriving from carbonate dissolutionwithin the aquifer (Ccarb), and the contribution from sources exter-nal to the aquifer (Cext):
TDIC ¼ Ccarb þ Cext ð1Þ
and the isotopic composition of TDIC is given by
d13CTDIC ¼ d13Ccarb þ d13Cext ð2Þ
For the springs of the carbonate aquifer, where Ca, Mg and SO4
contents of groundwater are entirely derived from dissolution ofCa–Mg carbonates and gypsum or anhydrite, the mass balance ofthese species can be written as:
Ccarb ¼ CaþMg� SO4 ð3Þ
F. Frondini et al. / Applied Geochemistry 24 (2009) 860–875 871
where the chemical symbols refer to concentrations in molar units.For the springs of the volcanic aquifer Ccarb is set to zero, consid-
ering that no carbonate minerals are present in the volcanic rocks.Finally, Cext is given by the sum of soil CO2 dissolved by infiltratingwater (Csoil) and deeply derived CO2 (Cdeep).
Considering the d13C values reported in Section 4 and Fig. 4, foreach spring the Cdeep values were calculated from the isotopic andmass balance of dissolved C. Then, the total discharge of deep CO2
from each aquifer (UCdeep) has been computed from:
UCdeep ¼X
/H2O� Cdeep ð4Þ
where uH2O is the average flow rate of each spring.The results of the mass and isotopic C balance calculations show
that the influx of deep CO2 (UCdeep) is about 2 t d�1 for the volcanicaquifer and 32 t d�1 for the carbonate-evaporite aquifers. Almostall of the UCdeep computed for the carbonate-evaporite aquifers de-rives from the Bagni San Filippo system (31 t d�1). The springs ofthis system, located about 1 km east of the degassing area, arecharacterised by a total discharge of about 34 L s�1 and by oversat-uration in calcite and dolomite and high PCO2 . The C mass balancehas been computed after equilibration of the solutions at reservoirconditions by means of the PHREEQC-2 software. The reservoirconditions PCO2 of about 10 bar and temperature of 60 �C) havebeen calculated using the specific geoindicators for carbonate-evaporite systems proposed by Chiodini et al. (1995).
4.2.3. Carbon dioxide released from geothermal power plants andestimation of the total gas flux
In the AVGA there are five production units for a total capacityof 88 MW (Cappetti and Ceppatelli, 2005), and for two of them, re-cent data of CO2 discharge are available (ARPAT, 2006). Bagnore 3power plant (20 MW) discharged 112 t d�1 in 2004 and 142 t d�1
in 2005; PC3 plant (20 MW) discharged 200 t d�1 in 2004 and182 t d�1 in 2005. On the basis of the CO2 production data of thesetwo power plants and considering the total capacity installed atMt. Amiata (88 MW) it is possible to extrapolate a value of about700 t d�1 (5.8 � 109 mol a�1) for the CO2 released from the geo-thermal power plants.
The total CO2 released from AVGA, considering degassing fromgas emissions, volcanic and carbonate-evaporite aquifers and geo-thermal systems, is about 960 t d�1 (�7.9 � 109 mol a�1). This va-lue is probably an overestimation of the natural degassing fromAVGA, because the numerous geothermal wells could extract moreCO2 than the ‘‘natural” CO2 flux. Sammarco and Sammarco (2002)showed that the natural CO2 emissions have declined during thelast century due to the development of the geothermal fields. Somedegassing areas and thermal springs of the AVGA have disap-peared, some have a strongly reduced gas flux and water flow rateand some have changed their position. Although the origin of thesevariations is still debated, is very likely that the present-day releaseof 5.8 � 109 mol a�1 CO2 from deep geothermal wells is greaterthan natural emissions that existed prior to development andmay have reduced natural CO2 discharge.
4.3. Indirect computation of the CO2 flux from the whole AVGA
An alternative and independent method to estimate the totalCO2 emission is based on the indirect computation of the CO2 flux(uCO2) from heat flow data, enthalpy and CO2 molality of the fluidcirculating in the reservoir, assuming that a single liquid phasetransports both heat and CO2 from the reservoir toward the sur-face, no gas-water separation process occurs in the reservoir andthe sum of PCO2 and PH2O corresponds to the total hydrostatic pres-sure at the top of the reservoir (Kerrick et al., 1995; Seward andKerrick, 1996; Gambardella et al., 2004; Frondini et al., 2008). In
the AVGA, this method can give only a minimum estimation ofCO2 flux because PCO2 often exceeds hydrostatic pressure in the car-bonate-evaporite reservoir and gas–liquid separation can occur atdepth. The occurrence of gas–liquid separation processes is shownby the numerous dry gas emissions at the border of the volcanicedifice, in areas where the top of the main reservoir is at 1000–2000 m depth. However the indirect computation of the CO2 fluxcan be useful for the purposes because it gives a baseline valueto compare with the direct estimations.
The study area has been divided in 336 1-km2 cells and for eachcell the average uCO2 value [mol a�1 km�2] has been computedfrom the equation proposed by Kerrick et al. (1995) and Sewardand Kerrick (1996) for convective hydrothermal systems:
/CO2 ¼ 3:514� 107 � ðHF=HÞ �mCO2 ð5Þ
where HF is the heat flux [W km�2], H is the enthalpy of liquid atreservoir temperature [J kg�1], and mCO2 is the CO2 molality[mol kg�1] of the single liquid phase.
For each cell the HF data are derived from the heat flow maps ofCataldi et al. (1995) and Baldi et al. (1994). The enthalpy of the li-quid phase is computed using the code Water97_v13 (Bernhard,2000) considering the enthalpy of pure liquid water at saturationconditions. The use of the thermodynamic properties of pure waterintroduces only negligible errors in the range of salinity character-ising the AVGA reservoir fluids (Gambardella et al., 2004). The tem-perature of the liquid for the computation of the enthalpy, isderived from the map of temperatures at the top of the potentialreservoir (Baldi et al., 1982).
Excluding the areas reached by deep geothermal drilling, forwhich temperatures and fluid compositions are known (Minissaleet al., 1997), the values of CO2 molality are computed from theCO2 solubility data of Taran (2005), considering the CO2 partialpressure (PCO2 ) obtained by difference between total hydrostaticpressure and PH2O:
PCO2 ¼ PTOT � PH2O ð6Þ
PTOT is computed from the difference between the piezometric headand the depth of the top of the carbonate-evaporite reservoir,assuming a value of 1000 kg m�3 for the density of water. The pie-zometric depth is from Calamai et al. (1970), and the depth of thereservoir is derived from the map of Baldi et al. (1982). PH2O isestimated for saturation conditions (liquid–vapor coexistence)according to Keenan et al. (1978).
The computed uCO2 values range from 2.6 � 105 mol a�1 km�2
to 3.2 � 107 mol a�1 km�2 with an average value of 8.32 � 106
mol a�1 km�2. This value is of the same order of magnitude asthe average uCO2 of southern Tuscany (4.8 � 106 mol a�1 km�2,Frondini et al., 2008), and of the uCO2 value (4.94 � 106mol a�1 km�2) computed by Gambardella et al. (2004) for the Pian-castagnaio geothermal system.
The total CO2 output, given by the sum of the CO2 fluxes fromthe 336 cells is 2.8 � 109 mol a�1 (about 340 t d�1). This value isof the same order of magnitude but lower than the CO2 flux ob-tained through direct estimations and, in agreement with the con-siderations given at the beginning of this section, represents aminimum estimate of the natural degassing from the whole AVGA.
5. Geothermal heating of groundwater
Sorey and Lewis (1976) and Rybach (1981) proposed a methodfor calculating the convective heat flow from the enthalpy balanceof thermal springs. The same method was applied by Chiodini et al.(1988) to the cold springs of the Mt. Amiata volcanic aquifer, show-ing that, in geothermal areas, the effect of regional conductive heatflow is recognizable also on cold groundwater. Considering the
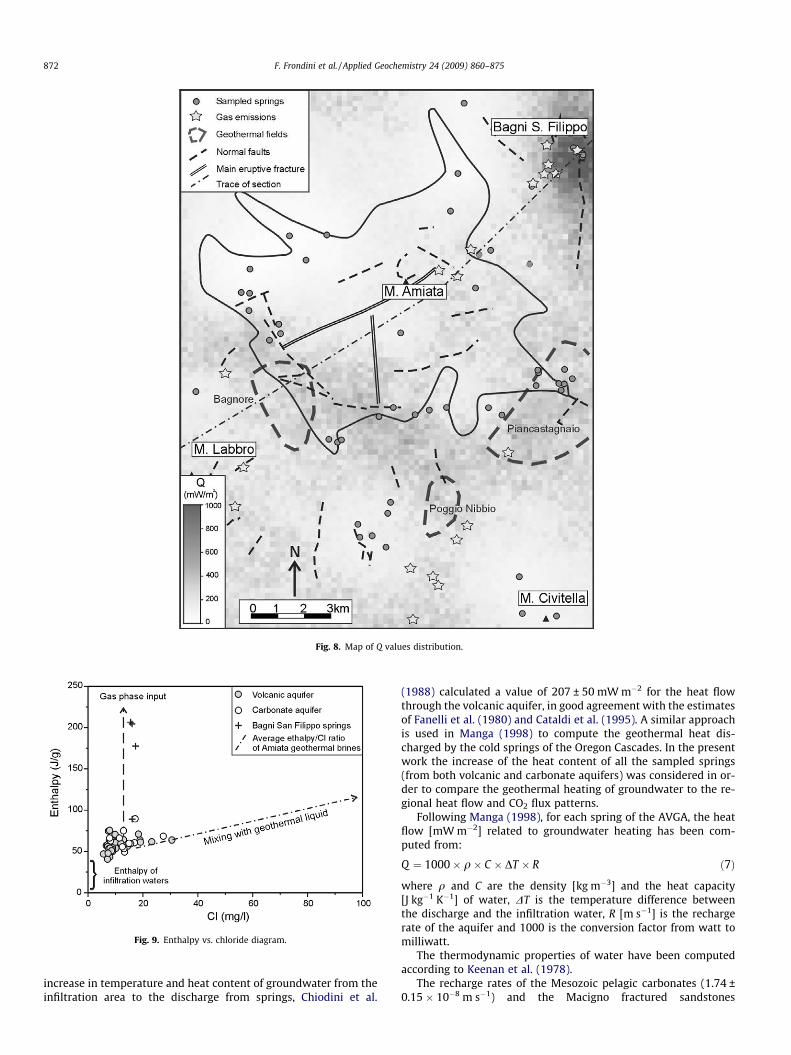
Fig. 8. Map of Q values distribution.
Fig. 9. Enthalpy vs. chloride diagram.
872 F. Frondini et al. / Applied Geochemistry 24 (2009) 860–875
increase in temperature and heat content of groundwater from theinfiltration area to the discharge from springs, Chiodini et al.
(1988) calculated a value of 207 ± 50 mW m�2 for the heat flowthrough the volcanic aquifer, in good agreement with the estimatesof Fanelli et al. (1980) and Cataldi et al. (1995). A similar approachis used in Manga (1998) to compute the geothermal heat dis-charged by the cold springs of the Oregon Cascades. In the presentwork the increase of the heat content of all the sampled springs(from both volcanic and carbonate aquifers) was considered in or-der to compare the geothermal heating of groundwater to the re-gional heat flow and CO2 flux patterns.
Following Manga (1998), for each spring of the AVGA, the heatflow [mW m�2] related to groundwater heating has been com-puted from:
Q ¼ 1000� q� C � DT � R ð7Þ
where q and C are the density [kg m�3] and the heat capacity[J kg�1 K�1] of water, DT is the temperature difference betweenthe discharge and the infiltration water, R [m s�1] is the rechargerate of the aquifer and 1000 is the conversion factor from watt tomilliwatt.
The thermodynamic properties of water have been computedaccording to Keenan et al. (1978).
The recharge rates of the Mesozoic pelagic carbonates (1.74 ±0.15 � 10�8 m s�1) and the Macigno fractured sandstones
F. Frondini et al. / Applied Geochemistry 24 (2009) 860–875 873
(0.32 ± 0.10 � 10�8 m s�1) are taken from Boni et al. (1986), the re-charge rates of the fractured lavas (1.90 ± 0.45 � 10�8 m s�1) arefrom Barazzuoli and Solleolini (1994). The appropriate rechargerate values have been assigned to each spring on the basis of waterchemistry, as discussed in Section 3.2, strictly reflects the rock typeof the aquifer. The recharge area of each spring has been computeddividing the measured flow rate by the recharge rate.
The discharge temperatures have been measured during sam-pling and the average temperatures of the recharge areas havebeen calculated from the linear regression of temperature [�C] vs.altitude [m] proposed by Chiodini et al. (1988) for the AVGA:
T ¼ 16:1� 0:0066� Z ð8Þ
The resulting values of Q vary in a wide interval, from 0 to about2700 mW m�2. Starting from the Q values of each spring, theweighted mean values of Q were computed for each aquifer(weighting Q on recharge areas). The resulting values are:240 ± 57 mW m�2 for the volcanic aquifer; 328 ± 30 mW m�2 forthe sedimentary aquifers; 2686 ± 242 mW m�2 for the carbonate-evaporite thermal aquifer of Bagni San Filippo. It is worth pointingout that the heat flow values of the volcanic aquifer, calculatedfrom recharge data, are in good agreement with the estimationof Chiodini et al. (1988) calculated on the basis of discharge data(207 ± 50 mW m�2).
Starting from the Q values of each spring, the mapping of theheat flow has been performed using a sequential Gaussian simula-tion procedure (Deutsch and Journel, 1998) over a simulation gridof 840 (200 m � 200 m) cells, giving each spring a weight propor-tional to its recharge area.
The map of Q values (Fig. 8), obtained by linear averaging of 100simulations, shows a relative minimum in the northern part of thevolcanic structure, where the heat flow related to spring discharge
Fig. 10. Geological NE–SW section compared to conductive heat flow (HF), heat flow reCalamai et al. (1970), Batini et al. (2003), Brogi et al. (2005). Temperature and conductiveGianelli et al. (1997), Cameli et al. (1998).
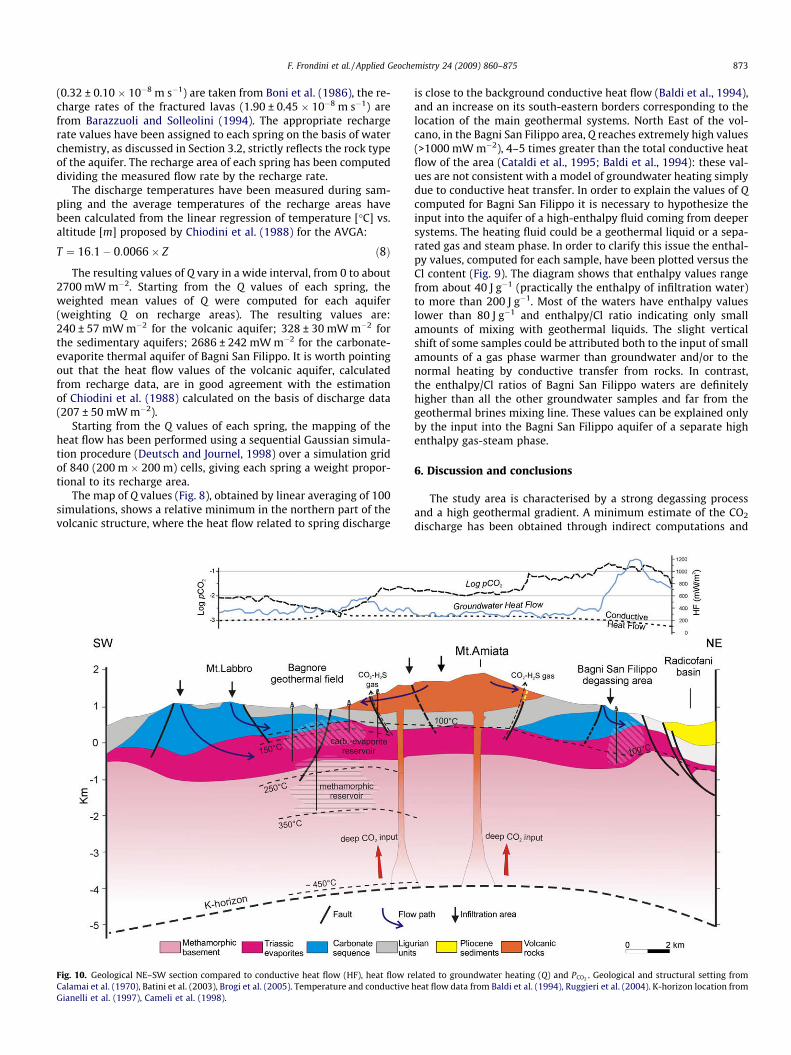
is close to the background conductive heat flow (Baldi et al., 1994),and an increase on its south-eastern borders corresponding to thelocation of the main geothermal systems. North East of the vol-cano, in the Bagni San Filippo area, Q reaches extremely high values(>1000 mW m�2), 4–5 times greater than the total conductive heatflow of the area (Cataldi et al., 1995; Baldi et al., 1994): these val-ues are not consistent with a model of groundwater heating simplydue to conductive heat transfer. In order to explain the values of Qcomputed for Bagni San Filippo it is necessary to hypothesize theinput into the aquifer of a high-enthalpy fluid coming from deepersystems. The heating fluid could be a geothermal liquid or a sepa-rated gas and steam phase. In order to clarify this issue the enthal-py values, computed for each sample, have been plotted versus theCl content (Fig. 9). The diagram shows that enthalpy values rangefrom about 40 J g�1 (practically the enthalpy of infiltration water)to more than 200 J g�1. Most of the waters have enthalpy valueslower than 80 J g�1 and enthalpy/Cl ratio indicating only smallamounts of mixing with geothermal liquids. The slight verticalshift of some samples could be attributed both to the input of smallamounts of a gas phase warmer than groundwater and/or to thenormal heating by conductive transfer from rocks. In contrast,the enthalpy/Cl ratios of Bagni San Filippo waters are definitelyhigher than all the other groundwater samples and far from thegeothermal brines mixing line. These values can be explained onlyby the input into the Bagni San Filippo aquifer of a separate highenthalpy gas-steam phase.
6. Discussion and conclusions
The study area is characterised by a strong degassing processand a high geothermal gradient. A minimum estimate of the CO2
discharge has been obtained through indirect computations and
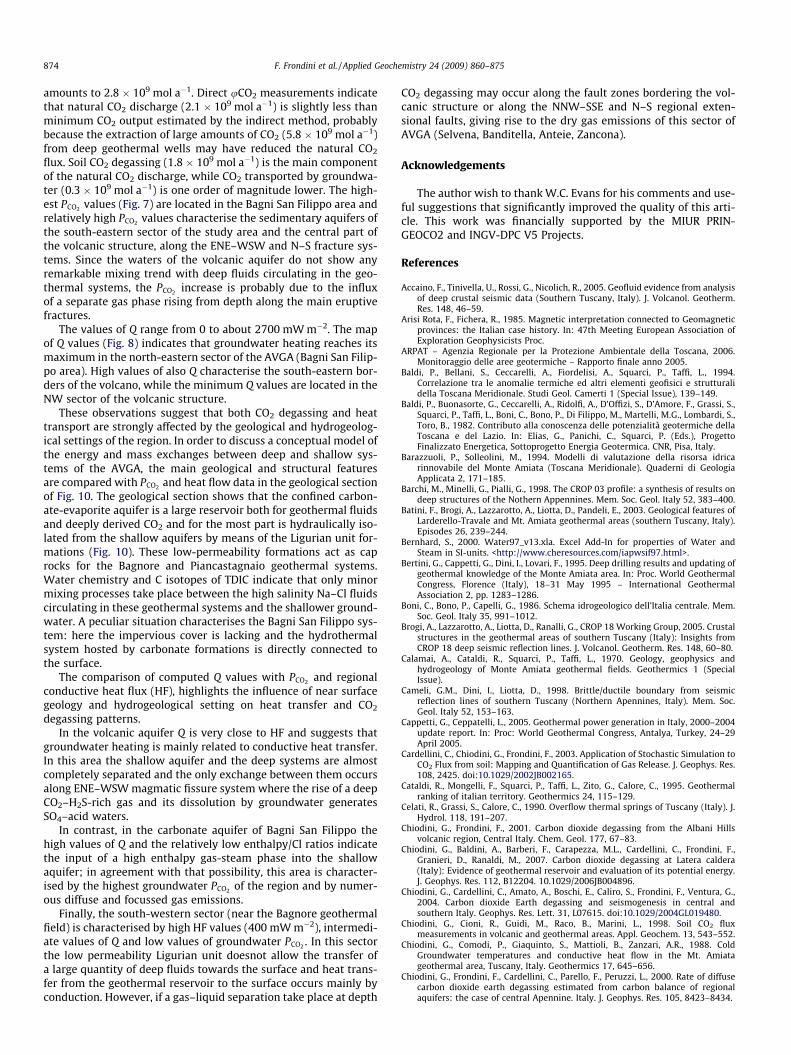
lated to groundwater heating (Q) and PCO2 . Geological and structural setting fromheat flow data from Baldi et al. (1994), Ruggieri et al. (2004). K-horizon location from
874 F. Frondini et al. / Applied Geochemistry 24 (2009) 860–875
amounts to 2.8 � 109 mol a�1. Direct uCO2 measurements indicatethat natural CO2 discharge (2.1 � 109 mol a�1) is slightly less thanminimum CO2 output estimated by the indirect method, probablybecause the extraction of large amounts of CO2 (5.8 � 109 mol a�1)from deep geothermal wells may have reduced the natural CO2
flux. Soil CO2 degassing (1.8 � 109 mol a�1) is the main componentof the natural CO2 discharge, while CO2 transported by groundwa-ter (0.3 � 109 mol a�1) is one order of magnitude lower. The high-est PCO2 values (Fig. 7) are located in the Bagni San Filippo area andrelatively high PCO2 values characterise the sedimentary aquifers ofthe south-eastern sector of the study area and the central part ofthe volcanic structure, along the ENE–WSW and N–S fracture sys-tems. Since the waters of the volcanic aquifer do not show anyremarkable mixing trend with deep fluids circulating in the geo-thermal systems, the PCO2 increase is probably due to the influxof a separate gas phase rising from depth along the main eruptivefractures.
The values of Q range from 0 to about 2700 mW m�2. The mapof Q values (Fig. 8) indicates that groundwater heating reaches itsmaximum in the north-eastern sector of the AVGA (Bagni San Filip-po area). High values of also Q characterise the south-eastern bor-ders of the volcano, while the minimum Q values are located in theNW sector of the volcanic structure.
These observations suggest that both CO2 degassing and heattransport are strongly affected by the geological and hydrogeolog-ical settings of the region. In order to discuss a conceptual model ofthe energy and mass exchanges between deep and shallow sys-tems of the AVGA, the main geological and structural featuresare compared with PCO2 and heat flow data in the geological sectionof Fig. 10. The geological section shows that the confined carbon-ate-evaporite aquifer is a large reservoir both for geothermal fluidsand deeply derived CO2 and for the most part is hydraulically iso-lated from the shallow aquifers by means of the Ligurian unit for-mations (Fig. 10). These low-permeability formations act as caprocks for the Bagnore and Piancastagnaio geothermal systems.Water chemistry and C isotopes of TDIC indicate that only minormixing processes take place between the high salinity Na–Cl fluidscirculating in these geothermal systems and the shallower ground-water. A peculiar situation characterises the Bagni San Filippo sys-tem: here the impervious cover is lacking and the hydrothermalsystem hosted by carbonate formations is directly connected tothe surface.
The comparison of computed Q values with PCO2 and regionalconductive heat flux (HF), highlights the influence of near surfacegeology and hydrogeological setting on heat transfer and CO2
degassing patterns.In the volcanic aquifer Q is very close to HF and suggests that
groundwater heating is mainly related to conductive heat transfer.In this area the shallow aquifer and the deep systems are almostcompletely separated and the only exchange between them occursalong ENE–WSW magmatic fissure system where the rise of a deepCO2–H2S-rich gas and its dissolution by groundwater generatesSO4–acid waters.
In contrast, in the carbonate aquifer of Bagni San Filippo thehigh values of Q and the relatively low enthalpy/Cl ratios indicatethe input of a high enthalpy gas-steam phase into the shallowaquifer; in agreement with that possibility, this area is character-ised by the highest groundwater PCO2 of the region and by numer-ous diffuse and focussed gas emissions.
Finally, the south-western sector (near the Bagnore geothermalfield) is characterised by high HF values (400 mW m�2), intermedi-ate values of Q and low values of groundwater PCO2 . In this sectorthe low permeability Ligurian unit doesnot allow the transfer ofa large quantity of deep fluids towards the surface and heat trans-fer from the geothermal reservoir to the surface occurs mainly byconduction. However, if a gas–liquid separation take place at depth
CO2 degassing may occur along the fault zones bordering the vol-canic structure or along the NNW–SSE and N–S regional exten-sional faults, giving rise to the dry gas emissions of this sector ofAVGA (Selvena, Banditella, Anteie, Zancona).
Acknowledgements
The author wish to thank W.C. Evans for his comments and use-ful suggestions that significantly improved the quality of this arti-cle. This work was financially supported by the MIUR PRIN-GEOCO2 and INGV-DPC V5 Projects.
References
Accaino, F., Tinivella, U., Rossi, G., Nicolich, R., 2005. Geofluid evidence from analysisof deep crustal seismic data (Southern Tuscany, Italy). J. Volcanol. Geotherm.Res. 148, 46–59.
Arisi Rota, F., Fichera, R., 1985. Magnetic interpretation connected to Geomagneticprovinces: the Italian case history. In: 47th Meeting European Association ofExploration Geophysicists Proc.
ARPAT – Agenzia Regionale per la Protezione Ambientale della Toscana, 2006.Monitoraggio delle aree geotermiche – Rapporto finale anno 2005.
Baldi, P., Bellani, S., Ceccarelli, A., Fiordelisi, A., Squarci, P., Taffi, L., 1994.Correlazione tra le anomalie termiche ed altri elementi geofisici e strutturalidella Toscana Meridionale. Studi Geol. Camerti 1 (Special Issue), 139–149.
Baldi, P., Buonasorte, G., Ceccarelli, A., Ridolfi, A., D’Offizi, S., D’Amore, F., Grassi, S.,Squarci, P., Taffi, L., Boni, C., Bono, P., Di Filippo, M., Martelli, M.G., Lombardi, S.,Toro, B., 1982. Contributo alla conoscenza delle potenzialità geotermiche dellaToscana e del Lazio. In: Elias, G., Panichi, C., Squarci, P. (Eds.), ProgettoFinalizzato Energetica, Sottoprogetto Energia Geotermica. CNR, Pisa, Italy.
Barazzuoli, P., Solleolini, M., 1994. Modelli di valutazione della risorsa idricarinnovabile del Monte Amiata (Toscana Meridionale). Quaderni di GeologiaApplicata 2, 171–185.
Barchi, M., Minelli, G., Pialli, G., 1998. The CROP 03 profile: a synthesis of results ondeep structures of the Nothern Appennines. Mem. Soc. Geol. Italy 52, 383–400.
Batini, F., Brogi, A., Lazzarotto, A., Liotta, D., Pandeli, E., 2003. Geological features ofLarderello-Travale and Mt. Amiata geothermal areas (southern Tuscany, Italy).Episodes 26, 239–244.
Bernhard, S., 2000. Water97_v13.xla. Excel Add-In for properties of Water andSteam in SI-units. <http://www.cheresources.com/iapwsif97.html>.
Bertini, G., Cappetti, G., Dini, I., Lovari, F., 1995. Deep drilling results and updating ofgeothermal knowledge of the Monte Amiata area. In: Proc. World GeothermalCongress, Florence (Italy), 18–31 May 1995 – International GeothermalAssociation 2, pp. 1283–1286.
Boni, C., Bono, P., Capelli, G., 1986. Schema idrogeologico dell’Italia centrale. Mem.Soc. Geol. Italy 35, 991–1012.
Brogi, A., Lazzarotto, A., Liotta, D., Ranalli, G., CROP 18 Working Group, 2005. Crustalstructures in the geothermal areas of southern Tuscany (Italy): Insights fromCROP 18 deep seismic reflection lines. J. Volcanol. Geotherm. Res. 148, 60–80.
Calamai, A., Cataldi, R., Squarci, P., Taffi, L., 1970. Geology, geophysics andhydrogeology of Monte Amiata geothermal fields. Geothermics 1 (SpecialIssue).
Cameli, G.M., Dini, I., Liotta, D., 1998. Brittle/ductile boundary from seismicreflection lines of southern Tuscany (Northern Apennines, Italy). Mem. Soc.Geol. Italy 52, 153–163.
Cappetti, G., Ceppatelli, L., 2005. Geothermal power generation in Italy, 2000–2004update report. In: Proc: World Geothermal Congress, Antalya, Turkey, 24–29April 2005.
Cardellini, C., Chiodini, G., Frondini, F., 2003. Application of Stochastic Simulation toCO2 Flux from soil: Mapping and Quantification of Gas Release. J. Geophys. Res.108, 2425. doi:10.1029/2002JB002165.
Cataldi, R., Mongelli, F., Squarci, P., Taffi, L., Zito, G., Calore, C., 1995. Geothermalranking of italian territory. Geothermics 24, 115–129.
Celati, R., Grassi, S., Calore, C., 1990. Overflow thermal springs of Tuscany (Italy). J.Hydrol. 118, 191–207.
Chiodini, G., Frondini, F., 2001. Carbon dioxide degassing from the Albani Hillsvolcanic region, Central Italy. Chem. Geol. 177, 67–83.
Chiodini, G., Baldini, A., Barberi, F., Carapezza, M.L., Cardellini, C., Frondini, F.,Granieri, D., Ranaldi, M., 2007. Carbon dioxide degassing at Latera caldera(Italy): Evidence of geothermal reservoir and evaluation of its potential energy.J. Geophys. Res. 112, B12204. 10.1029/2006JB004896.
Chiodini, G., Cardellini, C., Amato, A., Boschi, E., Caliro, S., Frondini, F., Ventura, G.,2004. Carbon dioxide Earth degassing and seismogenesis in central andsouthern Italy. Geophys. Res. Lett. 31, L07615. doi:10.1029/2004GL019480.
Chiodini, G., Cioni, R., Guidi, M., Raco, B., Marini, L., 1998. Soil CO2 fluxmeasurements in volcanic and geothermal areas. Appl. Geochem. 13, 543–552.
Chiodini, G., Comodi, P., Giaquinto, S., Mattioli, B., Zanzari, A.R., 1988. ColdGroundwater temperatures and conductive heat flow in the Mt. Amiatageothermal area, Tuscany, Italy. Geothermics 17, 645–656.
Chiodini, G., Frondini, F., Cardellini, C., Parello, F., Peruzzi, L., 2000. Rate of diffusecarbon dioxide earth degassing estimated from carbon balance of regionalaquifers: the case of central Apennine. Italy. J. Geophys. Res. 105, 8423–8434.
F. Frondini et al. / Applied Geochemistry 24 (2009) 860–875 875
Chiodini, G., Frondini, F., Kerrick, D.M., Rogie, J.D., Parello, F., Peruzzi, L., Zanzari, A.R.,1999. Quantification of deep CO2 fluxes from Central Italy. Examples of carbonbalance for regional aquifers and of soil diffuse degassing. Chem. Geol. 159,205–222.
Chiodini, G., Frondini, F., Marini, L., 1995. Theoretical geothermometers and PCO2
indicators for aqueous solutions coming from hydrothermal systems ofmedium-low temperature hosted in carbonate-evaporite rocks. Application tothe thermal springs of the Etruscan Swell. Italy. Appl. Geochem. 10, 337–346.
Collettini, C., Cardellini, C., Chiodini, G., De Paola, N., Holdsworth, R.E., Smith, S.A.F.,2008. Fault weakening due to CO2 involvement in the extension of the NorthernApennines: short- and long-term processes. Geological Society of London,Special Publication, 299, 151–173.
D’Amore, F., Fancelli, R., Saracco, L., Truesdell, A., 1987. Gas geothermometry basedon CO content: application to Italian geothermal fields. In: Proc. 12th Workshopon Geothermal Reservoir Engineering, 20–22 January 1987, Stanford, California.SGP-TR-109, pp. 247–252.
Decandia, F.A., Lazzarotto, A., Liotta, D., Cernobori, L., Nicolich, R., 1998. The Crop 03traverse: insights on post-collisional evolution of Northern Apennines. Mem.Soc. Geol. Ital 52, 427–439.
Della Vedova, B., Pellis, G., Foucher, J.P., Rehault, J.P., 1984. Geothermal structure ofTyrrhenian Sea. Mar. Geol. 55, 271–289.
Deutsch, C.V., Journel, A.G., 1998. GSLIB: Geostatistical Software Library and UsersGuide. Oxford Univ Press, New York.
Donnini, M., Chiodini, G., Avino, R., Baldini, A., Cardellini, C., Caliro, S., Frondini, F.,Granieri, D., Morgantini, N., 2007. Carbon dioxide degassing at Bagni San Filippo(Tuscany, Italy): Quantification and modeling of gas release. Geophys. Res.Abstr. 9, 02954. SRef-ID: 1607-7962/gra/EGU2007-A-02954.
Elter, F.M., Pandeli, E., 1991. Structural features of the metamorphic Paleozoic-Triassic sequences in deep geothermal drillings of the Monte Amiata area (SETuscany, Italy). Boll. Soc. Geol. Italy 110, 511–522.
Fanelli, M., Rossi, A., Salomone, M., Taffi, L., 1980. Temperature and heat flowpatterns of Italy. In: Proc. 2nd Internat. Sem. Results EC Geothermal EnergyResearch. Strasbourg, France, pp. 506–515.
Ferrari, L., Conticelli, S., Burlamacchi, L., Manetti, P., 1996. Volcanological evolutionof the Monte Amiata, Southern Tuscany: new geological and petrochemicaldata. Acta Vulcanol. 8, 41–56.
Frondini, F., Caliro, S., Cardellini, C., Chiodini, G., Morgantini, N., Parello, F., 2008.Carbon dioxide degassing from Tuscany and Northern Latium (Italy). GlobalPlanet. Change 61, 89–102. doi:10.1016/j.gloplacha.2007.08.009.
Gambardella, B., Cardellini, C., Chiodini, G., Frondini, F., Marini, L., Ottonello, G.,Vetuschi Zuccolini, M., 2004. Fluxes of deep CO2 in the volcanic areas of central-southern Italy. J. Volcanol. Geotherm. Res. 136, 31–52. doi:10.1016/j.jvolgeores.2004.03.018.
Gambardella, B., Marini, L., Baneschi, I., 2005. Dissolved potassium in the shallowgroundwaters circulating in the volcanic rocks of central-southern Italy. Appl.Geochem. 20, 875–897.
Gianelli, G., 1994. Ipotesi di un mantello di crosta superiore per le aree geotermicheToscane. Studi Geol. Camerti 1994, 195–200.
Gianelli, G., Manzella, A., Puxeddu, M., 1997. Crustal models of the geothermal areasof southern Tuscany, Italy. Tectonophysics 281, 221–239.
Gianelli, G., Manzella, A., Puxeddu, M., 1996. Crustal models of the geothermal areasof Larderello and Mt. Amiata, Italy. Geotherm. Res. Council. Trans. 20, 287–293.
Giggenbach, W.F., 1987. Redox processes governing the chemistry of fumarolic gasdischarges from White Island, New Zealand. Appl. Geochem. 2, 143–161.
Giggenbach, W.F., Goguel, R.L., 1989. Collection and analysis of geothermal andvolcanic water and gas discharges. Report, Department of Science and IndustrialResearch, Chem. Div., Petone, New Zealand.
Giggenbach, W.F., Poreda, R.J., 1993. Helium isotopic and chemical composition ofgases from volcanic-hydrothermal systems in the Philippines. Geothermics 22,369–380.
Keenan, J.H., Keyes, F.G., Hill, P.G., Moore, J.G., 1978. Steam tables. ThermodynamicProperties of Waters Including Vapor, Liquid and Solid Phases (InternationalSystem of Units-S.I. units). Wiley, New York.
Kerrick, D.M., McKibben, M.A., Seward, T.M., Caldeira, K., 1995. Convectivehydrothermal CO2 emission from high heat flow regions. Chem. Geol. 121,285–293.
Liotta, D., Ranalli, G., 1999. Correlation between seismic reflectivity and rheology inextended lithosphere: southern Tuscany, inner Northern Apennines, Italy.Tectonophysics 315, 109–122.
Manga, M., 1998. Advective heat transport by low-temperature discharge in theOregon cascades. Geology 26, 799–802.
Martelli, M.P., Nuccio, M., Stuart, F.M., Burgess, R., Ellam, RM., Italiano, F., 2004.Helium-strontium isotope constraints on mantle evolution beneath the Romancomagmatic province, Italy. Earth. Planet. Sci. Lett. 224, 295–308.
Minissale, A., Magro, G., Vaselli, O., Verrucchi, C., Perticone, I., 1997. Geochemistry ofwater and discharges from Mt. Amiata silicic complex and surrounding areas(central Italy). J. Volcanol. Geotherm. Res. 79, 223–251.
Minissale, A., Vaselli, O., Tassi, F., Magro, G., Grechi, G.P., 2002. Fluid mixing incarbonate acquifers near Rapolano (central Italy): chemical and isotopicconstraints. Appl. Geochem. 17, 1329–1342.
Mongelli, F., Puxeddu, M., Squarci, P., Taffi, L., Zito, G., 1991. Il flusso di calore el’anomalia geotermica nell’area Tosco-Laziale: implicazioni profonde. StudiGeol. Camerti 1991/1 (Special Issue), 399–402.
Parkhurst, D.L., Appelo, C.A.J., 1999. User Guide to PHREEQC (Version 2) – AComputer Program for Speciation, Batch-reaction, One-dimensional Transport,and Inverse Geochemical Calculations. US Geol. Surv. Water-Resour. Invest. Rep.99-4259.
Rogie, J.D., Kerrik, D.M., Chiodini, G., Frondini, F., 2000. Flux measurements ofnonvolcanic CO2 emission from some vents in Central Italy. J. Geophys. Res. 105,8435–8445.
Ruggieri, G., Giolito, C., Gianelli, G., Manzella, A., Boiron, M.C., 2004. Application offluid inclusion to the study of Bagnore geothermal field (Tuscany, Italy).Geothermics 33, 675–692.
Rybach, L., 1981. Geothermal systems, conductive heat flow, geothermal anomalies.In: Rybach, L., Muffler, L.J.P. (Eds.), Geothermal Systems: Principles and CaseHistories. John Wiley, New York, pp. 3–35.
Sammarco, G., Sammarco, O., 2002. Gas da acque termo-minerali: modalità diliberazione, rischi e cautele. Acque Sotterranee 78, 35–46.
Seward, T.M., Kerrick, D.M., 1996. Hydrothermal CO2 emission from the TaupoVolcanic zone, New Zealand. Earth Planet. Sci. Lett. 139, 105–113.
Sorey, M.L., Lewis, R.E., 1976. Convective heat flow from hot springs in the LongValley Caldera, Mono County. California. J. Geophys. Res. 81, 785–791.
Taran, Y.A., 2005. A method for determination of the gas–water ratio in bubblingsprings. Geophys. Res. Lett. 32, L23403. doi:10.1029/2005GL24547.


