Embed Size (px)
Citation preview

4 Harmonics
4.1 DEFINITION OF HARMONICS
Webster’s New World Dictionary defines harmonics as pure tones making up acomposite tone in music. A pure tone is a musical sound of a single frequency, anda combination of many pure tones makes up a composite sound. Sound waves areelectromagnetic waves traveling through space as a periodic function of time. Canthe principle behind pure music tones apply to other functions or quantities that aretime dependent? In the early 1800s, French mathematician, Jean Baptiste Fourierformulated that a periodic nonsinusoidal function of a fundamental frequency f maybe expressed as the sum of sinusoidal functions of frequencies which are multiplesof the fundamental frequency. In our discussions here, we are mainly concernedwith periodic functions of voltage and current due to their importance in the fieldof power quality. In other applications, the periodic function might refer to radiof-requency transmission, heat flow through a medium, vibrations of a mechanicalstructure, or the motions of a pendulum in a clock.
A sinusoidal voltage or current function that is dependent on time t may berepresented by the following expressions:
Voltage function, v(t) = V sin(ωt) (4.1)
Current function, i(t) = I sin(ωt ± Ø) (4.2)
where ω = 2 × π × f is known as the angular velocity of the periodic waveform andØ is the difference in phase angle between the voltage and the current waveformsreferred to as a common axis. The sign of phase angle Ø is positive if the currentleads the voltage and negative if the current lags the voltage. Figure 4.1 containsvoltage and current waveforms expressed by Eqs. (4.1) and (4.2) and which bydefinition are pure sinusoids.
For the periodic nonsinusoidal waveform shown in Figure 4.2, the simplifiedFourier expression states:
v(t) = V0 + V1 sin(ωt) + V2 sin(2ωt) + V3 sin(3ωt) + … + Vn sin(nωt) +
Vn+1 sin ((n+1)ωt) + … (4.3)
The Fourier expression is an infinite series. In this equation, V0 represents theconstant or the DC component of the waveform. V1, V2, V3, …, Vn are the peak valuesof the successive terms of the expression. The terms are known as the harmonics ofthe periodic waveform. The fundamental (or first harmonic) frequency has a
© 2002 by CRC Press LLC

frequency of f, the second harmonic has a frequency of 2 × f, the third harmonichas a frequency of 3 × f, and the nth harmonic has a frequency of n × f. If thefundamental frequency is 60 Hz (as in the U.S.), the second harmonic frequency is120 Hz, and the third harmonic frequency is 180 Hz.
The significance of harmonic frequencies can be seen in Figure 4.3. The secondharmonic undergoes two complete cycles during one cycle of the fundamental fre-quency, and the third harmonic traverses three complete cycles during one cycle ofthe fundamental frequency. V1, V2, and V3 are the peak values of the harmoniccomponents that comprise the composite waveform, which also has a frequency of f.
FIGURE 4.1 Sinusoidal voltage and current functions of time (t). Lagging functions areindicated by negative phase angle and leading functions by positive phase angle.
FIGURE 4.2 Nonsinusoidal voltage waveform Fourier series. The Fourier series allowsexpression of nonsinusoidal periodic waveforms in terms of sinusoidal harmonic frequencycomponents.
v(t)=Vsin(wt)
w = Angular velocity
= 2 f
T
Period T = 1/f
= 2 w
current lags voltage
V
I
i(t)=Isin(wt- )
v(t)
t
© 2002 by CRC Press LLC

The ability to express a nonsinusoidal waveform as a sum of sinusoidal waves allowsus to use the more common mathematical expressions and formulas to solve powersystem problems. In order to find the effect of a nonsinusoidal voltage or current ona piece of equipment, we only need to determine the effect of the individual harmonicsand then vectorially sum the results to derive the net effect. Figure 4.4 illustrates howindividual harmonics that are sinusoidal can be added to form a nonsinusoidal wave-form.
The Fourier expression in Eq. (4.3) has been simplified to clarify the conceptbehind harmonic frequency components in a nonlinear periodic function. For thepurist, the following more precise expression is offered. For a periodic voltage wavewith fundamental frequency of ω = 2πf,
v(t) = V0 + ∑ (ak cos kωt + bk sin kωt) (for k = 1 to ∞) (4.4)
FIGURE 4.3 Fundamental, second, and third harmonics.
V1
V2
V3
FUNDAMENTAL
SECOND HARMONIC
THIRD HARMONIC
1 CYCLE
1 CYCLE
1CYCLE
V1 sin wt
V2 sin 2wt
V3 sin 3wt
© 2002 by CRC Press LLC

where ak and bk are the coefficients of the individual harmonic terms or components.Under certain conditions, the cosine or sine terms can vanish, giving us a simplerexpression. If the function is an even function, meaning f(–t) = f(t), then the sineterms vanish from the expression. If the function is odd, with f(–t) = –f(t), thenthe cosine terms disappear. For our analysis, we will use the simplified expressioninvolving sine terms only. It should be noted that having both sine and cosineterms affects only the displacement angle of the harmonic components and theshape of the nonlinear wave and does not alter the principle behind application ofthe Fourier series.
The coefficients of the harmonic terms of a function f(t) contained in Eq. (4.4)are determined by:
ak = f(t).coskt.dt, (k = 1,2,3, …, n) (4.5)
bk = f(t).sinkt.dt, (k = 1,2,3, …, n) (4.6)
The coefficients represent the peak values of the individual harmonic frequency termsof the nonlinear periodic function represented by f(t). It is not the intent of this bookto explore the intricacies of the Fourier series. Several books in mathematics areavailable for the reader who wants to develop a deeper understanding of this veryessential tool for solving power quality problems related to harmonics.
FIGURE 4.4 Creation of nonlinear waveform by adding the fundamental and third harmonicfrequency waveforms.
FUNDAMENTAL
THIRD HARMONIC
FUNDAMENTAL + THIRDHARMONIC
1π---
–π
+π
∫
1π---
–π
+π
∫
© 2002 by CRC Press LLC

4.2 HARMONIC NUMBER (h)
Harmonic number (h) refers to the individual frequency elements that comprise acomposite waveform. For example, h = 5 refers to the fifth harmonic componentwith a frequency equal to five times the fundamental frequency. If the fundamentalfrequency is 60 Hz, then the fifth harmonic frequency is 5 × 60, or 300 Hz. Theharmonic number 6 is a component with a frequency of 360 Hz. Dealing withharmonic numbers and not with harmonic frequencies is done for two reasons. Thefundamental frequency varies among individual countries and applications. Thefundamental frequency in the U.S. is 60 Hz, whereas in Europe and many Asiancountries it is 50 Hz. Also, some applications use frequencies other than 50 or60 Hz; for example, 400 Hz is a common frequency in the aerospace industry, whilesome AC systems for electric traction use 25 Hz as the frequency. The inverter partof an AC adjustable speed drive can operate at any frequency between zero and itsfull rated maximum frequency, and the fundamental frequency then becomes thefrequency at which the motor is operating. The use of harmonic numbers allows usto simplify how we express harmonics. The second reason for using harmonicnumbers is the simplification realized in performing mathematical operations involv-ing harmonics.
4.3 ODD AND EVEN ORDER HARMONICS
As their names imply, odd harmonics have odd numbers (e.g., 3, 5, 7, 9, 11), andeven harmonics have even numbers (e.g., 2, 4, 6, 8, 10). Harmonic number 1 isassigned to the fundamental frequency component of the periodic wave. Harmonicnumber 0 represents the constant or DC component of the waveform. The DCcomponent is the net difference between the positive and negative halves of onecomplete waveform cycle. Figure 4.5 shows a periodic waveform with net DCcontent. The DC component of a waveform has undesirable effects, particularly ontransformers, due to the phenomenon of core saturation. Saturation of the core iscaused by operating the core at magnetic field levels above the knee of the magne-tization curve. Transformers are designed to operate below the knee portion of thecurve. When DC voltages or currents are applied to the transformer winding, largeDC magnetic fields are set up in the transformer core. The sum of the AC and theDC magnetic fields can shift the transformer operation into regions past the knee ofthe saturation curve. Operation in the saturation region places large excitation powerrequirements on the power system. The transformer losses are substantiallyincreased, causing excessive temperature rise. Core vibration becomes more pro-nounced as a result of operation in the saturation region.
We usually look at harmonics as integers, but some applications produce har-monic voltages and currents that are not integers. Electric arc furnaces are examplesof loads that generate non-integer harmonics. Arc welders can also generate non-integer harmonics. In both cases, once the arc stabilizes, the non-integer harmonicsmostly disappear, leaving only the integer harmonics.
The majority of nonlinear loads produce harmonics that are odd multiples ofthe fundamental frequency. Certain conditions need to exist for production of even
© 2002 by CRC Press LLC

harmonics. Uneven current draw between the positive and negative halves of onecycle of operation can generate even harmonics. The uneven operation may be dueto the nature of the application or could indicate problems with the load circuitry.Transformer magnetizing currents contain appreciable levels of even harmonic com-ponents and so do arc furnaces during startup.
Subharmonics have frequencies below the fundamental frequency and are rarein power systems. When subharmonics are present, the underlying cause is resonancebetween the harmonic currents or voltages with the power system capacitance andinductance. Subharmonics may be generated when a system is highly inductive (suchas an arc furnace during startup) or if the power system also contains large capacitorbanks for power factor correction or filtering. Such conditions produce slow oscil-lations that are relatively undamped, resulting in voltage sags and light flicker.
4.4 HARMONIC PHASE ROTATION AND PHASE ANGLE RELATIONSHIP
So far we have treated harmonics as stand-alone entities working to produce wave-form distortion in AC voltages and currents. This approach is valid if we are lookingat single-phase voltages or currents; however, in a three-phase power system, theharmonics of one phase have a rotational and phase angle relationship with the
FIGURE 4.5 Current waveform with DC component (scale, 1 A = 200 A). This waveformhas a net negative DC component as indicated by the larger area of the negative half comparedto the positive half of each cycle.
© 2002 by CRC Press LLC

harmonics of the other phases. In power system studies involving harmonics, thisrelationship is important.
In a balanced three-phase electrical system, the voltages and currents have apositional relationship as shown in Figure 4.6. The three voltages are 120˚ apart andso are the three currents. The normal phase rotation or sequence is a–b–c, which iscounterclockwise and designated as the positive-phase sequence in this book. Forharmonic analyses, these relationships are still applicable, but the fundamentalcomponents of voltages and currents are used as reference. All other harmonics usethe fundamental frequency as the reference. The fundamental frequencies have apositive-phase sequence. The angle between the fundamental voltage and the fun-damental current is the displacement power factor angle, as defined in Chapter 1.
So how do the harmonics fit into this space–time picture? For a clearerunderstanding, let us look only at the current harmonic phasors. We can furthersimplify the picture by limiting the discussion to odd harmonics only, whichunder normal and balanced conditions are the most prevalent. The followingrelationships are true for the fundamental frequency current components in athree-phase power system:
ia1 = Ia1 sin ωt (4.7)
ib1 = Ib1 sin (ωt-120°) (4.8)
ic1 = Ic1 sin (ωt-240°) (4.9)
FIGURE 4.6 Balanced three-phase power system. Phase sequence refers to the order in whichphasors move past a reference axis. The positive phase sequence is assigned a counterclock-wise rotation.
REFERENCE AXISVa
Ia
Ic
Ib
Vc
Vb
COUNTERCLOCKWISEPHASE SEQUENCE
120 DEG.
© 2002 by CRC Press LLC

The negative displacement angles indicate that the fundamental phasors ib1 and ic1
trail the ia1 phasor by the indicated angle. Figure 4.7a shows the fundamentalcurrent phasors.
The expressions for the third harmonic currents are:
ia3 = Ia3 sin 3ωt (4.10)
ib3 = Ib3 sin 3(ωt-120°) = Ib3 sin (3ωt-360°) = Ib3 sin 3ωt (4.11)
ic3 = Ic3 sin 3(ωt-240°) = Ic3 sin (3ωt-720°) = Ic3 sin 3ωt (4.12)
The expressions for the third harmonics show that they are in phase and have zerodisplacement angle between them. Figure 4.7b shows the third harmonic phasors.The third harmonic currents are known as zero sequence harmonics due to the zerodisplacement angle between the three phasors.
FIGURE 4.7 (a) Fundamental phasors. (b) Third harmonic phasors. (c) Fifth harmonic pha-sors. (d) Seventh harmonic phasors.
I a1
I b1
I c1 POSITIVE PHASE SEQUENCE
I a3, I b3, I c3
I
I
I
a5
b5
c5
NEGATIVE PHASE SEQUENCE
I
I
I
a7
c7
b7
POSITIVE PHASE SEQUENCE
ZERO PHASE SEQUENCE
(a) (c)
(b) (d)
© 2002 by CRC Press LLC
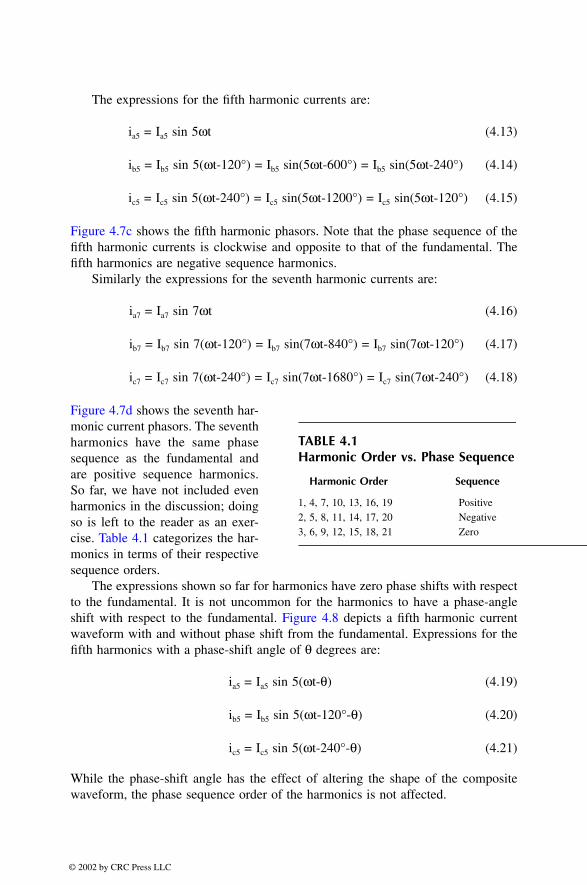
The expressions for the fifth harmonic currents are:
ia5 = Ia5 sin 5ωt (4.13)
ib5 = Ib5 sin 5(ωt-120°) = Ib5 sin(5ωt-600°) = Ib5 sin(5ωt-240°) (4.14)
ic5 = Ic5 sin 5(ωt-240°) = Ic5 sin(5ωt-1200°) = Ic5 sin(5ωt-120°) (4.15)
Figure 4.7c shows the fifth harmonic phasors. Note that the phase sequence of thefifth harmonic currents is clockwise and opposite to that of the fundamental. Thefifth harmonics are negative sequence harmonics.
Similarly the expressions for the seventh harmonic currents are:
ia7 = Ia7 sin 7ωt (4.16)
ib7 = Ib7 sin 7(ωt-120°) = Ib7 sin(7ωt-840°) = Ib7 sin(7ωt-120°) (4.17)
ic7 = Ic7 sin 7(ωt-240°) = Ic7 sin(7ωt-1680°) = Ic7 sin(7ωt-240°) (4.18)
Figure 4.7d shows the seventh har-monic current phasors. The seventhharmonics have the same phasesequence as the fundamental andare positive sequence harmonics.So far, we have not included evenharmonics in the discussion; doingso is left to the reader as an exer-cise. Table 4.1 categorizes the har-monics in terms of their respectivesequence orders.
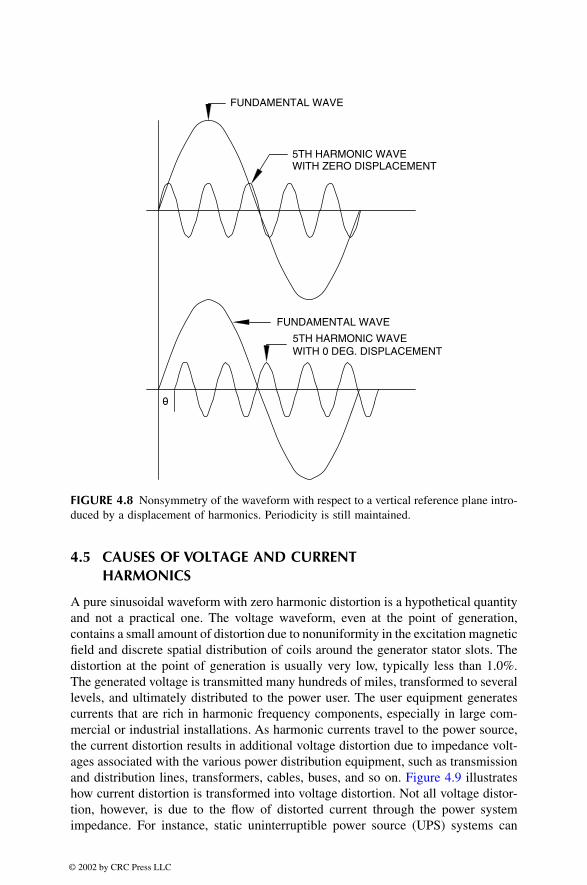
The expressions shown so far for harmonics have zero phase shifts with respectto the fundamental. It is not uncommon for the harmonics to have a phase-angleshift with respect to the fundamental. Figure 4.8 depicts a fifth harmonic currentwaveform with and without phase shift from the fundamental. Expressions for thefifth harmonics with a phase-shift angle of θ degrees are:
ia5 = Ia5 sin 5(ωt-θ) (4.19)
ib5 = Ib5 sin 5(ωt-120°-θ) (4.20)
ic5 = Ic5 sin 5(ωt-240°-θ) (4.21)
While the phase-shift angle has the effect of altering the shape of the compositewaveform, the phase sequence order of the harmonics is not affected.
TABLE 4.1Harmonic Order vs. Phase Sequence
Harmonic Order Sequence
1, 4, 7, 10, 13, 16, 19 Positive2, 5, 8, 11, 14, 17, 20 Negative3, 6, 9, 12, 15, 18, 21 Zero
© 2002 by CRC Press LLC
4.5 CAUSES OF VOLTAGE AND CURRENT HARMONICS
A pure sinusoidal waveform with zero harmonic distortion is a hypothetical quantityand not a practical one. The voltage waveform, even at the point of generation,contains a small amount of distortion due to nonuniformity in the excitation magneticfield and discrete spatial distribution of coils around the generator stator slots. Thedistortion at the point of generation is usually very low, typically less than 1.0%.The generated voltage is transmitted many hundreds of miles, transformed to severallevels, and ultimately distributed to the power user. The user equipment generatescurrents that are rich in harmonic frequency components, especially in large com-mercial or industrial installations. As harmonic currents travel to the power source,the current distortion results in additional voltage distortion due to impedance volt-ages associated with the various power distribution equipment, such as transmissionand distribution lines, transformers, cables, buses, and so on. Figure 4.9 illustrateshow current distortion is transformed into voltage distortion. Not all voltage distor-tion, however, is due to the flow of distorted current through the power systemimpedance. For instance, static uninterruptible power source (UPS) systems can
FIGURE 4.8 Nonsymmetry of the waveform with respect to a vertical reference plane intro-duced by a displacement of harmonics. Periodicity is still maintained.
0
FUNDAMENTAL WAVE
5TH HARMONIC WAVE
FUNDAMENTAL WAVE
5TH HARMONIC WAVEWITH ZERO DISPLACEMENT
WITH 0 DEG. DISPLACEMENT
© 2002 by CRC Press LLC

generate appreciable voltage distortion due to the nature of their operation. NormalAC voltage is converted to DC and then reconverted to AC in the inverter sectionof the UPS. Unless waveform shaping circuitry is provided, the voltage waveformsgenerated in UPS units tend to be distorted.
As nonlinear loads are propagated into the power system, voltage distortions areintroduced which become greater moving from the source to the load because ofthe circuit impedances. Current distortions for the most part are caused by loads.Even loads that are linear will generate nonlinear currents if the supply voltagewaveform is significantly distorted. When several power users share a commonpower line, the voltage distortion produced by harmonic current injection of oneuser can affect the other users. This is why standards are being issued that will limitthe amount of harmonic currents that individual power users can feed into the source(an issue that we will examine later in this chapter). The major causes of currentdistortion are nonlinear loads due to adjustable speed drives, fluorescent lighting,rectifier banks, computer and data-processing loads, arc furnaces, and so on. Onecan easily visualize an environment where a wide spectrum of harmonic frequenciesare generated and transmitted to other loads or other power users, thereby producingundesirable results throughout the system.
4.6 INDIVIDUAL AND TOTAL HARMONIC DISTORTION
Individual harmonic distortion (IHD) is the ratio between the root mean square(RMS) value of the individual harmonic and the RMS value of the fundamental
IHDn = In/I1 (4.22)
FIGURE 4.9 Voltage distortion due to current distortion. The gradient graph indicates howdistortion changes from source to load.
I h
HARMONIC CURRENT
Z T
SOURCE
VOLTAGE DISTORTIONLOW
VOLTAGE DISTORTIONHIGH
Z Z(SOURCE) (LOAD)
GENERATOR
SO
UR
CE
LOA
D
VOLTAGE DISTORTION GRADIENT
© 2002 by CRC Press LLC

For example, assume that the RMS value of the third harmonic current in anonlinear load is 20 A, the RMS value of the fifth harmonic current is 15 A, andthe RMS value of the fundamental is 60 A. Then, the individual third harmonicdistortion is:
IHD3 = 20/60 = 0.333, or 33.3%
and the individual fifth harmonic distortion is:
IHD5 = 15/60 = 0.25, or 25.0%
Under this definition, the value of IHD1 is always 100%. This method of quantifyingthe harmonics is known as harmonic distortion based on the fundamental. This isthe convention used by the Institute of Electrical and Electronic Engineers (IEEE)in the U.S. The European International Electrotechnical Commission (IEC) quanti-fies harmonics based on the total RMS value of the waveform. Using the sameexample shown above, the RMS value of the waveform is:
Irms = = 65 A
Based on the IEC convention,
IHD1 = 60/65 = 0.923, or 92.3%
IHD3 = 20/65 = 0.308, or 30.8%
IHD5 = 15/65 = 0.231, or 23.1%
The examples illustrate that even though the magnitudes of the harmonic currentsare the same, the distortion percentages are different because of a change in thedefinition. It should be pointed out that it really does not matter what convention isused as long as the same one is maintained throughout the harmonic analysis. Inthis book, the IEEE convention will be followed, and all harmonic distortion calcu-lations will be based on the fundamental.
Total harmonic distortion (THD) is a term used to describe the net deviation ofa nonlinear waveform from ideal sine waveform characteristics. Total harmonicdistortion is the ratio between the RMS value of the harmonics and the RMS valueof the fundamental. For example, if a nonlinear current has a fundamental componentof I1 and harmonic components of I2, I3, I4, I5, I6, I7, …, then the RMS value of theharmonics is:
IH = (4.23)
THD = (IH/I1) × 100% (4.24)
602 202 152+ +( )
I22 I3
2 I42 I5
2 I62 I7
2 …+ + + + + +( )
© 2002 by CRC Press LLC
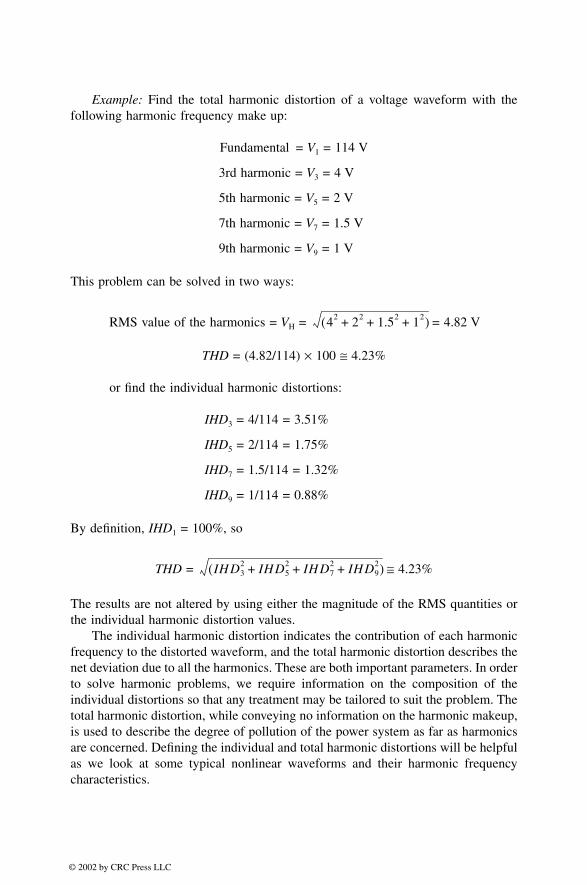
Example: Find the total harmonic distortion of a voltage waveform with thefollowing harmonic frequency make up:
Fundamental = V1 = 114 V
3rd harmonic = V3 = 4 V
5th harmonic = V5 = 2 V
7th harmonic = V7 = 1.5 V
9th harmonic = V9 = 1 V
This problem can be solved in two ways:
RMS value of the harmonics = VH = = 4.82 V
THD = (4.82/114) × 100 ≅ 4.23%
or find the individual harmonic distortions:
IHD3 = 4/114 = 3.51%
IHD5 = 2/114 = 1.75%
IHD7 = 1.5/114 = 1.32%
IHD9 = 1/114 = 0.88%
By definition, IHD1 = 100%, so
THD = ≅ 4.23%
The results are not altered by using either the magnitude of the RMS quantities orthe individual harmonic distortion values.
The individual harmonic distortion indicates the contribution of each harmonicfrequency to the distorted waveform, and the total harmonic distortion describes thenet deviation due to all the harmonics. These are both important parameters. In orderto solve harmonic problems, we require information on the composition of theindividual distortions so that any treatment may be tailored to suit the problem. Thetotal harmonic distortion, while conveying no information on the harmonic makeup,is used to describe the degree of pollution of the power system as far as harmonicsare concerned. Defining the individual and total harmonic distortions will be helpfulas we look at some typical nonlinear waveforms and their harmonic frequencycharacteristics.
42 22 1.52 12+ + +( )
IHD32 IHD5
2 IHD72 IHD9
2+ + +( )
© 2002 by CRC Press LLC

4.7 HARMONIC SIGNATURES
Many of the loads installed in present-day power systems are harmonic currentgenerators. Combined with the impedance of the electrical system, the loads alsoproduce harmonic voltages. The nonlinear loads may therefore be viewed as bothharmonic current generators and harmonic voltage generators. Prior to the 1970s,speed control of AC motors was primarily achieved using belts and pulleys. Now,adjustable speed drives (ASDs) perform speed control functions very efficiently.ASDs are generators of large harmonic currents. Fluorescent lights use less electricalenergy for the same light output as incandescent lighting but produce substantialharmonic currents in the process. The explosion of personal computer use hasresulted in harmonic current proliferation in commercial buildings. This section isdevoted to describing, in no particular order, a few of the more common nonlinearloads that surround us in our everyday life.
4.7.1 FLUORESCENT LIGHTING
Figure 4.10 shows a current waveform at a distribution panel supplying exclusivelyfluorescent lights. The waveform is primarily comprised of the third and the fifthharmonic frequencies. The individual current harmonic distortion makeup is pro-vided in Table 4.2. The waveform also contains slight traces of even harmonics,especially of the higher frequency order. The current waveform is flat topped dueto initiation of arc within the gas tube, which causes the voltage across the tube andthe current to become essentially unchanged for a portion of each half of a cycle.
4.7.2 ADJUSTABLE SPEED DRIVES
While several technologies exist for creating a variable voltage and variable fre-quency power source for the speed control of AC motors, the pulse-width modulation(PWM) drive technology is currently the most widely used. Figures 4.11 and 4.12show current graphs at the ASD input lines with a motor operating at 60 and 45 Hz,respectively. Tables 4.3 and 4.4 show the harmonic current distortion spectrum forthe two respective frequencies. The characteristic double hump for each half cycleof the AC waveform is due to conduction of the input rectifier modules for a durationof two 60˚ periods for each half cycle. As the operating frequency is reduced, thehumps become pronounced with a large increase in the total harmonic distortion.The THD of 74.2% for 45-Hz operation is excessive and can produce many delete-rious effects, as will be shown in later sections of this chapter.
Figure 4.13 is the waveform of the voltage at the ASD input power lines. It wasstated earlier that large current distortions can produce significant voltage distortions.In this particular case, the voltage THD is 8.3%, which is higher than levels typicallyfound in most industrial installations. High levels of voltage THD also produceunwanted results. Table 4.5 provides the voltage harmonic distortion distribution.
Figure 4.14 is the current waveform of an ASD of smaller horsepower. Thisdrive contains line side inductors which, along with the higher inductance of themotor, produce a current waveform with less distortion. Table 4.6 provides theharmonic frequency distribution for this ASD.
© 2002 by CRC Press LLC

FIGURE 4.10 Nonlinear current drawn by fluorescent lighting.
TABLE 4.2Harmonic Number h(n) vs. Individual Harmonic Distortion (IHD) for a Fluorescent Lighting Load
Harmonic Distortion Spectrum
h(n) IHD (%) h(n) IHD (%) h(n) IHD (%)
0 — 11 2.2 22 0.61 100 12 0.3 23 0.62 0.3 13 1.7 24 0.73 13.9 14 0.3 25 1.44 0.3 15 1.9 26 1.15 9 16 0.3 27 0.36 0.2 17 0.8 28 0.97 3.3 18 0.5 29 1.58 0 19 1.4 30 19 3.2 20 0.4 31 0.3
10 0.1 21 1.2
Note: Total harmonic distortion = 18.0%.
© 2002 by CRC Press LLC

FIGURE 4.11 Adjustable speed drive input current with motor operating at 60 Hz.
FIGURE 4.12 Adjustable speed drive input current with motor operating at 45 Hz.
© 2002 by CRC Press LLC

TABLE 4.3Harmonic Number h(n) vs. Individual Harmonic Distortion for an Adjustable Speed Drive Input Current with Motor Running at 60 Hz
Harmonic Distortion Spectrum
h(n) IHD (%) h(n) IHD (%) h(n) IHD (%)
0 0.15 11 9.99 22 0.391 100 12 0.03 23 2.952 4.12 13 0.19 24 0.023 0.78 14 0.48 25 0.664 1.79 15 0.07 26 0.155 35.01 16 0.52 27 0.056 0.215 17 4.85 28 0.227 2.62 18 0.03 29 1.798 1 19 0.67 30 0.039 0.06 20 0.31 31 0.64
10 0.73 21 0.04
Note: Total harmonic distortion = 37.3%.
TABLE 4.4Harmonic Number h(n) vs. Individual Harmonic Distortion for an Adjustable Speed Drive Input Current with Motor Running at 45 Hz
Harmonic Distortion Spectrum
h(n) IHD (%) h(n) IHD (%) h(n) IHD (%)
0 2.23 11 6.36 22 0.161 100 12 0.03 23 3.752 4.56 13 9.99 24 0.123 2.44 14 0.11 25 1.734 3.29 15 0.62 26 0.425 62.9 16 0.35 27 0.336 1.4 17 5.22 28 0.227 36.1 18 0.35 29 1.688 0.43 19 1.96 30 0.269 0.73 20 0.64 31 1.36
10 0.58 21 0.22
Note: Total harmonic distortion = 74.2%.
© 2002 by CRC Press LLC

FIGURE 4.13 Adjustable speed drive input voltage with motor operating at 60 Hz.
TABLE 4.5Harmonic Number h(n) vs. Individual Harmonic Distortion for an Adjustable Speed Drive Input Voltage with Motor Running at 60 Hz
Harmonic Distortion Spectrum
h(n) IHD (%) h(n) IHD (%) h(n) IHD (%)
0 0.02 11 1.87 22 0.071 100 12 0.02 23 0.462 0.12 13 0.92 24 0.043 0.09 14 0.07 25 0.364 0.11 15 0.01 26 0.065 7.82 16 0.04 27 0.036 0.01 17 0.61 28 0.077 1.42 18 0.06 29 0.48 0.06 19 0.36 30 0.029 0.04 20 0.06 31 0.34
10 0.03 21 0.12
Note: Total harmonic distortion = 8.3%.
© 2002 by CRC Press LLC

FIGURE 4.14 Adjustable speed drive input current for a smaller motor operating at 50 Hz(ASD with input line inductors).
TABLE 4.6Harmonic Number h(n) vs. Individual Harmonic Distortion for an Adjustable Speed Drive Input Voltage with Line Inductor and Motor Running at 50 Hz
Harmonic Distortion Spectrum
h(n) IHD (%) h(n) IHD (%) h(n) IHD (%)
0 1.27 11 0.93 22 0.431 100 12 0.44 23 0.422 1.76 13 1.01 24 0.293 35.5 14 0.35 25 0.514 1.91 15 0.96 26 0.245 3.83 16 0.53 27 0.586 1.62 17 0.23 28 0.157 3.42 18 0.64 29 0.28 0.93 19 0.82 30 0.139 3.22 20 0.44 31 0.21
10 0.54 21 0.75
Note: Total harmonic distortion = 36.3%.
© 2002 by CRC Press LLC

4.7.3 PERSONAL COMPUTER AND MONITOR
Figures 4.15 and 4.16 show the nonlinear current characteristics of a personalcomputer and a computer monitor, respectively. Tables 4.7 and 4.8 provide theharmonic content of the currents for the two devices. The predominance of the thirdand fifth harmonics is evident. The current THD for both devices exceeds 100%, asthe result of high levels of individual distortions introduced by the third and fifthharmonics. The total current drawn by a personal computer and its monitor is lessthan 2 A, but a typical high-rise building can contain several hundred computersand monitors. The net effect of this on the total current harmonic distortion of afacility is not difficult to visualize.
So far we have examined some of the more common harmonic current genera-tors. The examples illustrate that a wide spectrum of harmonic currents is generated.Depending on the size of the power source and the harmonic current makeup, thecomposite harmonic picture will be different from facility to facility.
4.8 EFFECT OF HARMONICS ON POWER SYSTEM DEVICES
We are interested in the subject of harmonics because of the harmful effects theyhave on power system devices. What makes harmonics so insidious is that very often
FIGURE 4.15 Nonlinear current drawn by single personal computer.
FIGURE 4.16 Nonlinear current drawn by single computer video monitor.
© 2002 by CRC Press LLC

the effects of harmonics are not known until failure occurs. Insight into how har-monics can interact within a power system and how they can affect power systemcomponents is important for preventing failures. In this section, we will look at theeffect of harmonics on some common power system devices.
TABLE 4.7Harmonic Number h(n) vs. Individual Harmonic Distortion for a Personal Computer
Harmonic Distortion Spectrum
h(n) IHD (%) h(n) IHD (%) h(n) IHD (%)
0 12.8 11 10.3 22 2.11 100 12 1.2 23 02 3.3 13 10.3 24 03 87.2 14 0 25 04 5.1 15 10.3 26 05 64.1 16 0 27 06 1.6 17 5.1 28 07 41.1 18 0 29 08 0 19 2.4 30 09 17.9 20 0 31 0
10 1.1 21 2.1
Note: Total harmonic distortion = 118.3%.
TABLE 4.8Harmonic Frequency h(n) vs. Individual Harmonic Distortion for Computer Monitor Current
Harmonic Distortion Spectrum
h(n) IHD (%) h(n) IHD (%) h(n) IHD (%)
0 0 11 10 22 01 100 12 2.5 23 52 5 13 10 24 03 90 14 2.5 25 04 5 15 10 26 05 62.5 16 0 27 06 5 17 2.5 28 07 32.5 18 0 29 08 0 19 0 30 09 12.5 20 0 31 0
10 2.5 21 5
Note: Total harmonic distortion = 116.3%.
© 2002 by CRC Press LLC

4.8.1 TRANSFORMERS
Harmonics can affect transformers primarily in two ways. Voltage harmonics pro-duce additional losses in the transformer core as the higher frequency harmonicvoltages set up hysteresis loops, which superimpose on the fundamental loop. Eachloop represents higher magnetization power requirements and higher core losses. Asecond and a more serious effect of harmonics is due to harmonic frequency currentsin the transformer windings. The harmonic currents increase the net RMS currentflowing in the transformer windings which results in additional I2R losses. Windingeddy current losses are also increased. Winding eddy currents are circulating currentsinduced in the conductors by the leakage magnetic flux. Eddy current concentrationsare higher at the ends of the windings due to the crowding effect of the leakagemagnetic field at the coil extremities. The winding eddy current losses increase asthe square of the harmonic current and the square of the frequency of the current.Thus, the eddy loss (EC) is proportional to Ih
2 × h2, where Ih is the RMS value ofthe harmonic current of order h, and h is the harmonic frequency order or number.Eddy currents due to harmonics can significantly increase the transformer windingtemperature. Transformers that are required to supply large nonlinear loads must bederated to handle the harmonics. This derating factor is based on the percentage ofthe harmonic currents in the load and the rated winding eddy current losses.
One method by which transformers may be rated for suitability to handle har-monic loads is by k factor ratings. The k factor is equal to the sum of the square ofthe harmonic frequency currents (expressed as a ratio of the total RMS current)multiplied by the square of the harmonic frequency numbers:
(4.25)
where
I1 is the ratio between the fundamental current and the total RMS current.I2 is the ratio between the second harmonic current and the total RMS current.I3 is the ratio between the third harmonic current and the total RMS current.
Equation (4.25) can be rewritten as:
(4.26)
Example: Determine the k rating of a transformer required to carry a loadconsisting of 500 A of fundamental, 200 A of third harmonics, 120 A of fifthharmonics, and 90 A of seventh harmonics:
Total RMS current (I) = = 559 A
I1 = 500/559 = 0.894
k I12 1( )2 I2
2 2( )2 I32 3( )2 I4
2 4( )2 … In2 n( )2+ + + + +=
k Σ In2h2 h = 1 2 3 … n, , , ,( )=
5002 2002 1202 902+ + +( )
© 2002 by CRC Press LLC

I3 = 200/559 = 0.358
I5 = 120/559 = 0.215
I7 = 90/559 = 0.161
k = (0.894)212 + (0.358)232 + (0.215)252 + (0.161)272 = 4.378
The transformer specified should be capable of handling 559 A of total RMS currentwith a k factor of not less than 4.378. Typically, transformers are marked with kratings of 4, 9, 13, 20, 30, 40, and 50, so a transformer with a k rating of 9 shouldbe chosen. Such a transformer would have the capability to carry the full RMS loadcurrent and handle winding eddy current losses equal to k times the normal ratededdy current losses.
The k factor concept is derived from the ANSI/IEEE C57.110 standard, Recom-mended Practices for Establishing Transformer Capability When Supplying Non-Sinusoidal Load Currents, which provides the following expression for derating atransformer when supplying harmonic loads:
I max.(pu) = [PLL–R(pu)/1 + (Σfh2 h2/Σf h
2 )PEC–R(pu)]1/2 (4.27)
where
I max.(pu) = ratio of the maximum nonlinear current of a specified harmonicmakeup that the transformer can handle to the transformer rated current.
PLL–R(pu) = load loss density under rated conditions (per unit of rated load I2Rloss density.
PEC–R(pu) = winding eddy current loss under rated conditions (per unit of ratedI2R loss).
fh = harmonic current distribution factor for harmonic h (equal to harmonic hcurrent divided by the fundamental frequency current for any given loadlevel).
h = harmonic number or order.
As difficult as this formula might seem, the underlying principle is to account forthe increased winding eddy current losses due to the harmonics. The followingexample might help clarify the IEEE expression for derating a transformer.
Example: A transformer with a full load current rating of 1000 A is subjectedto a load with the following nonlinear characteristics. The transformer has a ratedwinding eddy current loss density of 10.0% (0.10 pu). Find the transformerderating factor.
Harmonic number (h) fh (pu)
1 13 0.355 0.177 0.09
© 2002 by CRC Press LLC

Maximum load loss density, PLL–R(pu) = 1 + 0.1 = 1.1
Maximum rated eddy current loss density, PEC–R(pu) = 0.1
Σfh2h2 = 12 + (0.35)232 + (0.17)252 + (0.09)272 = 3.22
Σfh2 = 12 + 0.352 + 0.172 + 0.092 = 1.16
I max.(pu) = [1.1/1 + (3.22 × 0.1/1.16)]1/2 = 0.928
The transformer derating factor is 0.928; that is, the maximum nonlinear current ofthe specified harmonic makeup that the transformer can handle is 928 A.
The ANSI/IEEE derating method is very useful when it is necessary to calculatethe allowable maximum currents when the harmonic makeup of the load is known.For example, the load harmonic conditions might change on an existing transformerdepending on the characteristics of new or replacement equipment. In such cases,the transformer may require derating. Also, transformers that supply large thirdharmonic generating loads should have the neutrals oversized. This is because, aswe saw earlier, the third harmonic currents of the three phases are in phase andtherefore tend to add in the neutral circuit. In theory, the neutral current can be ashigh as 173% of the phase currents. Transformers for such applications should havea neutral bus that is twice as large as the phase bus.
4.8.2 AC MOTORS
Application of distorted voltage to a motor results in additional losses in the magneticcore of the motor. Hysteresis and eddy current losses in the core increase as higherfrequency harmonic voltages are impressed on the motor windings. Hysteresis lossesincrease with frequency and eddy current losses increase as the square of thefrequency. Also, harmonic currents produce additional I2R losses in the motor wind-ings which must be accounted for.
Another effect, and perhaps a more serious one, is torsional oscillations due toharmonics. Table 4.1 classified harmonics into one of three categories. Two of themore prominent harmonics found in a typical power system are the fifth and seventhharmonics. The fifth harmonic is a negative sequence harmonic, and the resultingmagnetic field revolves in a direction opposite to that of the fundamental field at aspeed five times the fundamental. The seventh harmonic is a positive sequenceharmonic with a resulting magnetic field revolving in the same direction as thefundamental field at a speed seven times the fundamental. The net effect is a magneticfield that revolves at a relative speed of six times the speed of the rotor. This inducescurrents in the rotor bars at a frequency of six times the fundamental frequency. Theresulting interaction between the magnetic fields and the rotor-induced currentsproduces torsional oscillations of the motor shaft. If the frequency of the oscillationcoincides with the natural frequency of the motor rotating members, severe damageto the motor can result. Excessive vibration and noise in a motor operating in aharmonic environment should be investigated to prevent failures.
© 2002 by CRC Press LLC

Motors intended for operation in a severe harmonic environment must be spe-cially designed for the application. Motor manufacturers provide motors for opera-tion with ASD units. If the harmonic levels become excessive, filters may be appliedat the motor terminals to keep the harmonic currents from the motor windings. Largemotors supplied from ASDs are usually provided with harmonic filters to preventmotor damage due to harmonics.
4.8.3 CAPACITOR BANKS
Capacitor banks are commonly found in commercial and industrial power systemsto correct for low power factor conditions. Capacitor banks are designed to operateat a maximum voltage of 110% of their rated voltages and at 135% of their ratedkVARS. When large levels of voltage and current harmonics are present, the ratingsare quite often exceeded, resulting in failures. Because the reactance of a capacitorbank is inversely proportional to frequency, harmonic currents can find their wayinto a capacitor bank. The capacitor bank acts as a sink, absorbing stray harmoniccurrents and causing overloads and subsequent failure of the bank.
A more serious condition with potential for substantial damage occurs due to aphenomenon called harmonic resonance. Resonance conditions are created whenthe inductive and capacitive reactances become equal at one of the harmonic fre-quencies. The two types of resonances are series and parallel. In general, seriesresonance produces voltage amplification and parallel resonance results in currentmultiplication. Resonance will not be analyzed in this book, but many textbooks onelectrical circuit theory are available that can be consulted for further explanation.In a harmonic-rich environment, both series and parallel resonance may be present.If a high level of harmonic voltage or current corresponding to the resonancefrequency exists in a power system, considerable damage to the capacitor bank aswell as other power system devices can result. The following example might helpto illustrate power system resonance due to capacitor banks.
Example: Figure 4.17 shows a 2000-kVA, 13.8-kV to 480/277-V transformerwith a leakage reactance of 6.0% feeding a bus containing two 500-hp adjustablespeed drives. A 750-kVAR Y-connected capacitor bank is installed on the 480-V busfor power factor correction. Perform an analysis to determine the conditions forresonance (consult Figure 4.18 for the transformer and capacitor connections andtheir respective voltages and currents):
Transformer secondary current (I) = 2000 × 103/ = 2406 A
Transformer secondary volts = (V) = 277
Transformer reactance = I × XL × 100/V = 6.0
Transformer leakage reactance (XL) = 0.06 × 277/2406 = 0.0069 Ω
XL = 2πfL, where L = 0.0069/377 = 0.183 × 10⁻⁴ H
3 480×
© 2002 by CRC Press LLC

FIGURE 4.17 Schematic representation of an adjustable speed drive and a capacitor banksupplied from a 2000-kVA power transformer.
FIGURE 4.18 Transformer and capacitor bank configuration.
2000 KVA, 13.8 KV-480/2776% REACTANCE
TRANSFORMER
750 KVARCAPACITOR BANK
500 HP, ASD500 HP, ASD
I H
C
13.8 KV SOURCE
480 V
277
VOLT
S
2406 A
480 VOLTS
277
VOLT
S
902 A
TRANSFORMER CAPACITOR BANK
L=0.
0000
183
H
C=0
.008
6 F
© 2002 by CRC Press LLC

For the capacitor bank,
× IC = 750 × 103, where IC = 902 A
Capacitive reactance (XC) = V/IC = 277/902 = 0.307 Ω
XC = 1/2πfC, where C = 1/(377 × 0.307) = 86 × 10–4 F
For resonance, XL = XC; therefore,
2πfRL = 1/2πfRC
where fR is the resonance frequency
fR = 1/2π ≅ 401 Hz
The resonance frequency is 401 Hz or the 6.7th (401/60) harmonic frequency. Theresonance frequency is close to the seventh harmonic frequency, which is one of themore common harmonic frequency components found in power systems. This con-dition can have very serious effects.
The following expression presents a different way to find the harmonic resonancefrequency:
Resonance frequency order = Rn = (4.28)
where MVASC is the available symmetrical fault MVA at the point of connection ofthe capacitor in the power system, and MVARC is the rating of the capacitor bankin MVAR. In the above example, neglecting the source impedance, the available faultcurrent = 2406 ÷ 0.06 ≅ 40,100 A.
Available fault MVA = = 33.34
Capacitor MVAR = 0.75
Therefore, the resonance frequency number = = 6.67, and the har-monic frequency = 6.67 × 60 = 400.2. This proves that similar results are obtainedby using Eq. (4.28). The expression in Eq. (4.28) is derived as follows: The availablethree-phase fault current at the common bus is given by ISC = V ÷ X, where V is thephase voltage in kilovolts and X is the total reactance of the power system at thebus. ISC is in units of kiloamperes.
ISC = V ÷ 2πf1L, where f1 is the fundamental frequency
Short circuit MVA = MVASC = 3 × V × ISC = 3V2 ÷ 2πf1L
3 480×
LC
MV ASC ÷ MVARC( )
3 480× 40 100 10 6–×,×
33.34 ÷ 0.75
© 2002 by CRC Press LLC

From this,
L = 3V2 ÷ 2πf1(MVASC)
At resonance,
XLR = 2πfRL = 3V2fR ÷ f1(MVASC)
Because fR ÷ f1 = resonance frequency order, Rn, then
XLR = 3V2Rn ÷ (MVASC)
For the capacitor bank, IC = V ÷ XC, and capacitor reactive power MVARC =3 × V × IC = 3V2(2πf1C). We can derive an expression for the capacitive reactanceat resonance XCR = 3V2 ÷ Rn(MVARC). Equating XLR and XCR, the harmonic order atresonance is the expression given by Eq. (4.28).
The capacitor bank and the transformer form a parallel resonant circuit with theseventh harmonic current from the ASDs acting as the harmonic source. This con-dition is represented in Figure 4.19. Two adjustable speed drives typically draw acurrent of 550 A each, for a total load of 1100 A. If the seventh harmonic currentis 5.0% of the fundamental (which is typical in drive applications), the seventhharmonic current seen by the parallel resonant circuit is 55 A = I7.
If the resistance of the transformer and the associated cable, bus, etc. is 1.0%,then R ≅ 0.0012 Ω.
The quality factor, Q, of an electrical system is a measure of the energy storedin the inductance and the capacitance of the system. The current amplification factor(CAF) of a parallel resonance circuit is approximately equal to the Q of the circuit:
Q = 2π(maximum energy stored)/ energy dissipated per cycle
Q = (2π)(1/2)LIm2 ÷ (I2R)/f, where Im =
Q = X/R
FIGURE 4.19 Parallel resonance circuit formed by transformer inductance and capacitorbank capacitance at harmonic frequency fH.
2I
I
(CAF)I
H
H
C L
I H=HARMONIC CURRENT FROM ASD(S)
© 2002 by CRC Press LLC

For the seventh harmonic frequency, CAF = X7/R = 7 × 0.0069/0.0012 = 40.25.Therefore, current IR = 40.25 × 55 = 2214 A. The net current through the capacitorbank = = 2390 A. It is easy to see that the capacitor bank is severelyoverloaded. If the capacitor protective device does not operate to isolate the bank,the capacitor bank will be damaged.
In the above example, by changing the capacitor bank to a 500-kVAR unit, theresonance frequency is increased to 490 Hz, or the 8.2 harmonic. This frequency ispotentially less troublesome. (The reader is encouraged to work out the calculations.)In addition, the transformer and the capacitor bank may also form a series resonancecircuit as viewed from the power source. This condition can cause a large voltagerise on the 480-V bus with unwanted results. Prior to installing a capacitor bank, itis important to perform a harmonic analysis to ensure that resonance frequencies donot coincide with any of the characteristic harmonic frequencies of the power system.
4.8.4 CABLES
Current flowing in a cable produces I2R losses. When the load current containsharmonic content, additional losses are introduced. To compound the problem, theeffective resistance of the cable increases with frequency because of the phenomenonknown as skin effect. Skin effect is due to unequal flux linkage across the crosssection of the conductor which causes AC currents to flow only on the outer peripheryof the conductor. This has the effect of increasing the resistance of the conductorfor AC currents. The higher the frequency of the current, the greater the tendencyof the current to crowd at the outer periphery of the conductor and the greater theeffective resistance for that frequency.
The capacity of a cable to carry nonlinear loads may be determined as follows.The skin effect factor is calculated first. The skin effect factor depends on the skindepth, which is an indicator of the penetration of the current in a conductor. Skindepth (δ) is inversely proportional to the square root of the frequency:
δ = S ÷
where S is a proportionality constant based on the physical characteristics of thecable and its magnetic permeability and f is the frequency of the current.
If Rdc is the DC resistance of the cable, then the AC resistance at frequency f,(Rf) = K × Rdc. The value of K is determined from Table 4.9 according to the valueof X, which is calculated as:
X = 0.0636 (4.29)
where 0.0636 is a constant for copper conductors, f is the frequency, µ is the magneticpermeability of the conductor material, and Rdc is the DC resistance per mile of theconductor. The magnetic permeability of a nonmagnetic material such as copper isapproximately equal to 1.0. Tables or graphs containing values of X and K areavailable from cable manufacturers.
IC2 IR
2+( )
f
fµ ÷ Rdc
© 2002 by CRC Press LLC

Example: Find the 60-Hz and 420-Hz resistance of a 4/0 copper cable with aDC resistance of 0.276 Ω per mile. Using Eq. (4.29),
X60 = 0.0636 = 0.938
From Table 4.2, K ≅ 1.004, and R60 = 1.004 × 0.276 = 0.277 Ω per mile. Also,
X420 = 0.0636 = 2.48
From Table 4.2, K ≅ 1.154, and R420 = 1.154 × 0.276 = 0.319 Ω per mile.The ratio of the resistance of the cable at a given frequency to its resistance at
60 Hz is defined as the skin effect ratio, E. According to this definition,
E2 = resistance at second harmonic frequency ÷ resistance at the fundamentalfrequency = R120 ÷ R60
E3 = resistance at third harmonic frequency ÷ resistance at the fundamentalfrequency = R180 ÷ R60
Also, remember that the general form expression for the individual harmonicdistortions states that In is equal to the RMS value of the nth harmonic currentdivided by the RMS value of the fundamental current, thus an expression for thecurrent rating factor for cables can be formulated. The current rating factor (q) isthe equivalent fundamental frequency current at which the cable should be rated forcarrying nonlinear loads containing harmonic frequency components:
(4.30)
TABLE 4.9Cable Skin Effect Factor
X K X K X K
0 1 1.4 1.01969 2.7 1.227530.1 1 1.5 1.02558 2.8 1.26620.2 1 1.6 1.03323 2.9 1.286440.3 1.00004 1.7 1.04205 3.0 1.318090.5 1.00032 1.8 1.0524 3.1 1.351020.6 1.00067 1.9 1.0644 3.1 1.385040.7 1.00124 2.0 1.07816 3.3 1.419990.8 1.00212 2.1 1.09375 3.4 1.45770.9 1.0034 2.1 1.11126 3.5 1.492021.0 1.00519 2.3 1.13069 3.6 1.528791.1 1.00758 2.4 1.15207 3.7 1.565871.2 1.01071 2.5 1.17538 3.8 1.603121.3 1.0147 2.6 1.20056 3.9 1.64051
60 1 ÷ 0.276×( )
420 1÷ 0.276×( )
q I12E1 I2
2E2 I32E3 … In
2En+ + + +=
© 2002 by CRC Press LLC

where I1, I2, I3 are the ratios of the harmonic frequency currents to the fundamentalcurrent, and E1, E2, E3 are the skin effect ratios.
Example: Determine the current rating factor for a 300-kcmil copper conductorrequired to carry a nonlinear load with the following harmonic frequency content:
Fundamental = 250 A
3rd harmonic = 25 A
5th harmonic = 60 A
7th harmonic = 45 A
11th harmonic = 20 A
The DC resistance of 300-kcmil cable = 0.17 Ω per mile. Using Eq. (4.29),
X60 = 0.0636 = 1.195, K ≅ 1.0106
X180 = 0.0636 = 2.069, K ≅ 1.089
X300 = 0.0636 = 2.672, K ≅ 1.220
X420 = 0.0636 = 3.161, K ≅ 1.372
X660 = 0,0636 = 3.963, K ≅ 1.664
R60 = 1.0106 × 0.17 = 0.1718 Ω/mile
R180 = 1.089 × 0.17 = 0.1851 Ω/mile
R300 = 1.220 × 0.17 = 0.2074 Ω/mile
R420 = 1.372 × 0.17 = 0.2332 Ω/mile
R660 = 1.664 × 0.17 = 0.2829 Ω/mile
Skin effect ratios are:
E1 = 1, E3 = 1.077, E5 = 1.207, E7 = 1.357, E11 = 1.647
The individual harmonic distortion factors are:
I1 = 1.0, I3 = 25/250 = 0.1, I5 = 60/250 = 0.24, I7 = 0.18, I11 = 20/250 = 0.08
The current rating factor from Eq. (4.30) is given by:
q = 1 + (0.1)2(1.077) + (0.24)2(1.207) + (0.18)2(1.357) + (0.08)2(1.647) = 1.135
60 1 ÷ 0.17×( )
180 1 ÷ 0.17×( )
300 1 ÷ 0.17×( )
420 1 ÷ 0.17×( )
660 1 ÷ 0.17×( )
© 2002 by CRC Press LLC

The cable should be capable of handling a 60-Hz equivalent current of 1.135 × 250≅ 284 A.
4.8.5 BUSWAYS
Most commercial multistory installations contain busways that serve as the primarysource of electrical power to various floors. Busways that incorporate sandwichedbusbars are susceptible to nonlinear loading, especially if the neutral bus carrieslarge levels of triplen harmonic currents (third, ninth, etc.). Under the worst possibleconditions, the neutral bus may be forced to carry a current equal to 173% of thephase currents. In cases where substantial neutral currents are expected, the buswaysmust be suitably derated. Table 4.10 indicates the amount of nonlinear loads thatmay be allowed to flow in the phase busbars for different neutral currents. The dataare shown for busways with neutral busbars that are 100 and 200% in size.
4.8.6 PROTECTIVE DEVICES
Harmonic currents influence the operation of protective devices. Fuses and motorthermal overload devices are prone to nuisance operation when subjected to nonlin-ear currents. This factor should be given due consideration when sizing protectivedevices for use in a harmonic environment. Electromechanical relays are alsoaffected by harmonics. Depending on the design, an electromechanical relay mayoperate faster or slower than the expected times for operation at the fundamentalfrequency alone. Such factors should be carefully considered prior to placing therelays in service.
TABLE 4.10Bus Duct Derating Factor for Harmonic Loading
IN/I∅HI∅H/I∅
100% N 200% N
0 1.000 1.0000.25 0.99 0.9950.50 0.961 0.980.75 0.918 0.9561.00 0.866 0.9261.25 0.811 0.8911.50 0.756 0.8531.75 0.703 0.8142.00 0.655 0.775
Note: IN is the neutral current, I∅H is the harmoniccurrent component in each phase, and I∅ is thetotal phase current. N = size of neutral bus bar inrelation to phase bus bar.
© 2002 by CRC Press LLC

4.9 GUIDELINES FOR HARMONIC VOLTAGE AND CURRENT LIMITATION
So far we have discussed the adverse effects of harmonics on power system opera-tion. It is important, therefore, that attempts be made to limit the harmonic distortionthat a facility might produce. There are two reasons for this. First, the lower theharmonic currents produced in an electrical system, the better the equipment withinthe confinement of the system will perform. Also, lower harmonic currents produceless of an impact on other power users sharing the same power lines of the harmonicgenerating power system. The IEEE 519 standard provides guidelines for harmoniccurrent limits at the point of common coupling (PCC) between the facility and theutility. The rationale behind the use of the PCC as the reference location is simple.It is a given fact that within a particular power use environment, harmonic currentswill be generated and propagated. Harmonic current injection at the PCC determineshow one facility might affect other power users and the utility that supplies thepower. Table 4.11 (per IEEE 519) lists harmonic current limits based on the size ofthe power user. As the ratio between the maximum available short circuit current atthe PCC and the maximum demand load current increases, the percentage of theharmonic currents that are allowed also increases. This means that larger powerusers are allowed to inject into the system only a minimal amount of harmoniccurrent (as a percentage of the fundamental current). Such a scheme tends to equalizethe amounts of harmonic currents that large and small users of power are allowedto inject into the power system at the PCC.
IEEE 519 also provides guidelines for maximum voltage distortion at the PCC(see Table 4.12). Limiting the voltage distortion at the PCC is the concern of theutility. It can be expected that as long as a facility’s harmonic current contributionis within the IEEE 519 limits the voltage distortion at the PCC will also be withinthe specified limits.
TABLE 4.11Harmonic Current Limits for General Distribution Systems (120–69,000 V)
ISC/IL h < 11 11 ≤ h < 17 17 ≤ h < 23 23 ≤ h < 35 35 ≤ h THD
<20 4.0 2.0 1.5 0.6 0.3 5.020–50 7.0 3.5 2.5 1.0 0.5 8.050–100 10.0 4.5 4.0 1.5 0.7 12.0100–1000 12.0 5.5 5.0 2.0 1.0 15.0>1000 15.0 7.0 6.0 2.5 1.4 20.0
Note: ISC = maximum short-circuit current at PCC; IL = maximum fundamental frequency demandload current at PCC (average current of the maximum demand for the preceding 12 months); h =individual harmonic order; THD = total harmonic distortion. based on the maximum demand loadcurrent. The table applies to odd harmonics; even harmonics are limited to 25% of the odd harmoniclimits shown above.
© 2002 by CRC Press LLC

When the IEEE 519 harmonic limits are used as guidelines within a facility, thePCC is the common junction between the harmonic generating loads and otherelectrical equipment in the power system. It is expected that applying IEEE guide-lines renders power system operation more reliable. In the future, more and moreutilities might require facilities to limit their harmonic current injection to levelsstipulated by IEEE 519. The following section contains information on how har-monic mitigation might be achieved.
4.10 HARMONIC CURRENT MITIGATION
4.10.1 EQUIPMENT DESIGN
The use of electronic power devices is steadily increasing. It is estimated that morethan 70% of the loading of a facility by year 2010 will be due to nonlinear loads,thus demand is increasing for product manufacturers to produce devices that generatelower distortion. The importance of equipment design in minimizing harmoniccurrent production has taken on greater importance, as reflected by technologicalimprovements in fluorescent lamp ballasts, adjustable speed drives, battery chargers,and uninterruptible power source (UPS) units. Computers and similar data-process-ing devices contain switching mode power supplies that generate a substantialamount of harmonic currents, as seen earlier. Designing power supplies for electronicequipment adds considerably to the cost of the units and can also make the equipmentheavier. At this time, when computer prices are extremely competitive, attempts toengineer power supplies that draw low harmonic currents are not a priority.
Adjustable speed drive (ASD) technology is evolving steadily, with greateremphasis being placed on a reduction in harmonic currents. Older generation ASDsusing current source inverter (CSI) and voltage source inverter (VSI) technologiesproduced considerable harmonic frequency currents. The significant harmonic fre-quency currents generated in power conversion equipment can be stated as:
n = kq ± 1
where n is the significant harmonic frequency, k is any positive integer (1, 2, 3, etc.),and q is the pulse number of the power conversion equipment which is the number
TABLE 4.12Voltage Harmonic Distortion Limits
Bus Voltage at PCCIndividual Voltage
Distortion (%)Total Voltage
Distortion THD (%)
69 kV and below 3.0 5.069.001 kV through 161 kV 1.5 2.5161.001 kV and above 1.0 1.5
Note: PCC = point of common coupling; THD = total harmonic distortion.
© 2002 by CRC Press LLC

of power pulses that are in one complete sequence of power conversion. For example,a three-phase full wave bridge rectifier has six power pulses and therefore has apulse number of 6. With six-pulse-power conversion equipment, the following sig-nificant harmonics may be generated:
For k =1, n = (1 × 6) ± 1 = 5th and 7th harmonics.For k =2, n = (2 × 6) ± 1 = 11th and 13th harmonics.
With six-pulse-power conversion equipment, harmonics below the 5th harmonic areinsignificant. Also, as the harmonic number increases, the individual harmonicdistortions become lower due to increasing impedance presented to higher frequencycomponents by the power system inductive reactance. So, typically, for six-pulse-power conversion equipment, the 5th harmonic current would be the highest, the7th would be lower than the 5th, the 11th would be lower than the 7th, and so on,as shown below:
I13 < I11< I7< I5
We can deduce that, when using 12-pulse-power conversion equipment, harmon-ics below the 11th harmonic can be made insignificant. The total harmonic distortionis also considerably reduced. Twelve-pulse-power conversion equipment costs morethan six-pulse-power equipment. Where harmonic currents are the primary concern,24-pulse-power conversion equipment may be considered.
4.10.2 HARMONIC CURRENT CANCELLATION
Transformer connections employing phase shift are sometimes used to effect can-cellation of harmonic currents in a power system. Triplen harmonic (3rd, 9th, 15th,etc.) currents are a set of currents that can be effectively trapped using a specialtransformer configuration called the zigzag connection. In power systems, triplenharmonics add in the neutral circuit, as these currents are in phase. Using a zigzagconnection, the triplens can be effectively kept away from the source. Figure 4.20illustrates how this is accomplished.
The transformer phase-shifting principle is also used to achieve cancellation ofthe 5th and the 7th harmonic currents. Using a ∆–∆ and a ∆–Y transformer to supplyharmonic producing loads in parallel as shown in Figure 4.21, the 5th and the 7thharmonics are canceled at the point of common connection. This is due to the 30˚phase shift between the two transformer connections. As the result of this, the sourcedoes not see any significant amount of the 5th and 7th harmonics. If the nonlinearloads supplied by the two transformers are identical, then maximum harmoniccurrent cancellation takes place; otherwise, some 5th and 7th harmonic currentswould still be present. Other phase-shifting methods may be used to cancel higherharmonics if they are found to be a problem. Some transformer manufacturers offermultiple phase-shifting connections in a single package which saves cost and spacecompared to using individual transformers.
© 2002 by CRC Press LLC

FIGURE 4.20 Zig-zag transformer application as third harmonic filter.
FIGURE 4.21 Cancellation of fifth and seventh harmonic currents by using 30° phase-shiftedtransformer connections.
A
B
C
N
SO
UR
CE
LOA
D
I 3
I I I3 3 3
3 3 3
M M
5TH AND 7TH
HARMONICS
FLOW IN THE
BRANCHES
5TH AND 7TH HARMONICS
CANCEL OUT AT THE COMMON BUS
© 2002 by CRC Press LLC

4.10.3 HARMONIC FILTERS
Nonlinear loads produce harmonic currents that can travel to other locations in thepower system and eventually back to the source. As we saw earlier, harmonic currentscan produce a variety of effects that are harmful to the power system. Harmoniccurrents are a result of the characteristics of particular loads. As long as we chooseto employ those loads, we must deal with the reality that harmonic currents willexist to a degree dependent upon the loads. One means of ensuring that harmoniccurrents produced by a nonlinear current source will not unduly interfere with therest of the power system is to filter out the harmonics. Application of harmonicfilters helps to accomplish this.
Harmonic filters are broadly classified into passive and active filters. Passivefilters, as the name implies, use passive components such as resistors, inductors, andcapacitors. A combination of passive components is tuned to the harmonic frequencythat is to be filtered. Figure 4.22 is a typical series-tuned filter. Here the values ofthe inductor and the capacitor are chosen to present a low impedance to the harmonicfrequency that is to be filtered out. Due to the lower impedance of the filter incomparison to the impedance of the source, the harmonic frequency current willcirculate between the load and the filter. This keeps the harmonic current of thedesired frequency away from the source and other loads in the power system. Ifother harmonic frequencies are to be filtered out, additional tuned filters are appliedin parallel. Applications such as arc furnaces require multiple harmonic filters, asthey generate large quantities of harmonic currents at several frequencies.
Applying harmonic filters requires careful consideration. Series-tuned filtersappear to be of low impedance to harmonic currents but they also form a parallelresonance circuit with the source impedance. In some instances, a situation can becreated that is worse than the condition being corrected. It is imperative that computersimulations of the entire power system be performed prior to applying harmonicfilters. As a first step in the computer simulation, the power system is modeled toindicate the locations of the harmonic sources, then hypothetical harmonic filtersare placed in the model and the response of the power system to the filter is examined.If unacceptable results are obtained, the location and values of the filter parametersare changed until the results are satisfactory. When applying harmonic filters, theunits are almost never tuned to the exact harmonic frequency. For example, the 5thharmonic frequency may be designed for resonance at the 4.7th harmonic frequency.
FIGURE 4.22 Series-tuned filter and filter frequency response.
L
C
HARMONICCURRENTSOURCE
POWERSOURCE
Z(S)
Z
FREQUENCY
Z
f R
I H
© 2002 by CRC Press LLC

By not creating a resonance circuit at precisely the 5th harmonic frequency, we canminimize the possibility of the filter resonating with other loads or the source, thusforming a parallel resonance circuit at the 5th harmonic. The 4.7th harmonic filterwould still be effective in filtering out the 5th harmonic currents. This is evidentfrom the series-tuned frequency vs. impedance curve shown in Figure 4.22.
Sometimes, tuned filters are configured to provide power factor correction fora facility as well as harmonic current filtering. In such cases the filter would bedesigned to carry the resonant harmonic frequency current and also the normalfrequency current at the fundamental frequency. In either case, a power systemharmonic study is paramount to ensure that no ill effects would be produced by theapplication of the power factor correction/filter circuit.
Active filters use active conditioning to compensate for harmonic currents in apower system. Figure 4.23 shows an active filter applied in a harmonic environment.The filter samples the distorted current and, using power electronic switchingdevices, draws a current from the source of such magnitude, frequency composition,and phase shift to cancel the harmonics in the load. The result is that the currentdrawn from the source is free of harmonics. An advantage of active filters overpassive filters is that the active filters can respond to changing load and harmonicconditions, whereas passive filters are fixed in their harmonic response. As we sawearlier, application of passive filters requires careful analysis. Active filters have noserious ill effects associated with them. However, active filters are expensive andnot suited for application in small facilities.
4.11 CONCLUSIONS
The term harmonics is becoming very common in power systems, small, medium,or large. As the use of power electronic devices grows, so will the need to understandthe effects of harmonics and the application of mitigation methods. Fortunately,
FIGURE 4.23 Active filter to cancel harmonic currents.
M
ACTIVE
FILTER
COMPUTER
LOADS
ASD
POWER SOURCE I(LOAD)I(SOURCE)
I(C
OM
P)
© 2002 by CRC Press LLC

harmonics in a strict sense are not transient phenomena. Their presence can be easilymeasured and identified. In some cases, harmonics can be lived with indefinitely,but in other cases they should be minimized or eliminated. Either of these approachesrequires a clear understanding of the theory behind harmonics.
© 2002 by CRC Press LLC


