Embed Size (px)
Citation preview

lable at ScienceDirect
ARTICLE IN PRESS
Quaternary Science Reviews xxx (2008) 1–10
Contents lists avai
Quaternary Science Reviews
journal homepage: www.elsevier .com/locate/quascirev
A 10Be chronology of lateglacial and Holocene mountain glaciationin the Scoresby Sund region, east Greenland: implicationsfor seasonality during lateglacial time
Meredith A. Kelly a,*, Thomas V. Lowell b, Brenda L. Hall c, Joerg M. Schaefer a, Robert C. Finkel d,Brent M. Goehring e, Richard B. Alley f, George H. Denton c
a Geochemistry Division, Lamont-Doherty Earth Observatory, Palisades, NY 10964, United Statesb Department of Geology, University of Cincinnati, Cincinnati, OH 45221, United Statesc Department of Earth Sciences and Climate Change Institute, University of Maine, Orono, ME 04469, United Statesd Center for Accelerator Mass Spectrometry, Lawrence Livermore National Laboratory, Livermore, CA 94550, United Statese Department of Earth and Environmental Sciences, Columbia University, New York, NY 10027, United Statesf Department of Geosciences and Earth and Environmental Systems Institute, Pennsylvania State University, University Park, PA 16802, United States
a r t i c l e i n f o
Article history:Received 21 September 2007Received in revised form 31 July 2008Accepted 1 August 2008Available online xxx
* Corresponding author. Tel.: þ1 845 365 8675; faxE-mail address: [email protected] (M.A
0277-3791/$ – see front matter � 2008 Elsevier Ltd.doi:10.1016/j.quascirev.2008.08.004
Please cite this article in press as: MeredithSund region, east Greenland:..., Quaternary
a b s t r a c t
Thirty-eight new cosmogenic (10Be) exposure ages from the Scoresby Sund region of east Greenlandindicate that prominent moraine sets deposited by mountain glaciers date from 780 to 310 yr, approx-imately during the Little Ice Age, from 11660 to 10 630 yr, at the end of the Younger Dryas cold interval orduring Preboreal time, and from 13 010 to 11630 yr, during lateglacial time. Equilibrium line altitudes(ELAs) interpreted from lateglacial to Early Holocene moraines indicate summertime cooling betweenw3.9 and 6.6 �C relative to today’s value, much less than the extreme Younger Dryas cooling registeredby Greenland ice cores (mean-annual temperatures of w15 �C colder than today’s value). This apparentdiscrepancy between paleotemperature records supports the contention that Younger Dryas cooling wasprimarily a wintertime phenomenon. 10Be ages of lateglacial and Holocene moraines show that mountainglaciers during the Little Ice Age were more extensive than at any other time since the Early HoloceneEpoch. In addition, 10Be ages of lateglacial moraines show extensive reworking of boulders withcosmogenic nuclides inherited from prior periods of exposure, consistent with our geomorphic obser-vations and cosmogenic-exposure dating studies in other Arctic regions.
� 2008 Elsevier Ltd. All rights reserved.
1. Introduction
Many climate records, as typified by Greenland ice cores, revealnotable abrupt climate changes during the last glacial period and theEarly Holocene Epoch (e.g., Johnsen et al., 1992, 2001; Alley et al.,1997; Severinghaus et al., 1998; Stuiver and Grootes, 2000; Kobashiet al., 2007; Thomas et al., 2007). These climate changes include the‘‘8.2 kyr’’ cold event about 8200 yr BP (Alley et al., 1997), the Pre-boreal Oscillation (w11400–11 200 yr BP; Bjorck et al., 1997), theYounger Dryas cold interval (w12 800–11500 yr BP; Alley et al.,1993) and the millennial-scale events during the last glacial periodknown as Dansgaard–Oeschger events (w60 000–26 000 yr BP;Dansgaard et al.,1993). The large amplitude (as much as w10 �C) andrapid onset or termination of these events (order of 10 years in manycases; e.g., Alley et al., 1993; Severinghaus et al., 1998) have
: þ1 845 365 8155.. Kelly).
All rights reserved.
A. Kelly et al., A 10Be chronoScience Reviews (2008), doi:
generated intense interest. Developing a more complete under-standing of these abrupt climate changes is essential for advancingour knowledge of the mechanisms that cause climate change and forevaluating the potential for future changes.
Recent research suggests that the Younger Dryas cold intervaland possibly other millennial-scale events were characterized byenhanced seasonality marked by extremely cold winter tempera-tures and only moderately cold summer temperatures (e.g., Bjorcket al., 2002; Denton et al., 2005). Ice-core data from central Green-land (GISP2, GRIP and North-GRIP) register temperatures during theYounger Dryas of w15 �C colder than today’s value, close to LastGlacial Maximum (LGM) values (w21–23 �C peak and w15 �Caverage cooling between w25 000 and 19 000 yr BP) (Cuffey et al.,1995; Cuffey and Clow, 1997; Dahl-Jensen et al., 1998; Severinghauset al., 1998; Grachev and Severinghaus, 2005). In contrast, YoungerDryas-age extents of mountain glaciers were much smaller thanduring the LGM and indicate temperatures only w3–6 �C colderthan today’s value (Porter,1975; Maisch,1982,1987; Dahl and Nesje,1992; Denton et al.,1999). Denton et al. (2005) suggested that, while
logy of lateglacial and Holocene mountain glaciation in the Scoresby10.1016/j.quascirev.2008.08.004

M.A. Kelly et al. / Quaternary Science Reviews xxx (2008) 1–102
ARTICLE IN PRESS
Greenland ice cores register mean-annual temperatures dominatedby extremely cold winter temperatures, mountain glacier extentsindicate primarily ablation season (summer) temperatures. Deter-mining whether seasonality, characterized by extremely cold wintertemperatures, was a factor would shed new light on the abruptclimate changes that influenced much of the Northern Hemispherefrom the North Atlantic region to east Asia (Denton et al., 2005).
The Scoresby Sund region of east Greenland is an ideal locationfor testing the ‘‘seasonality’’ hypothesis (Fig. 1). In this region,a record of past mountain glacier extents is located less than500 km from the GISP2 and GRIP ice core sites and less than 100 kmfrom the Renland ice core site (Fig. 1). Although borehole- andthermal-diffusion paleothermometry are not available for theRenland core, the very strong similarity of stable-isotopic-basedtemperature histories from Renland and from central Greenland(Johnsen et al., 2001) argues that the Scoresby Sund region expe-rienced the same pattern of mean-annual temperature changes asdid central Greenland. Well-preserved moraines in the ScoresbySund region, which indicate past mountain glacier extents, allowa determination of ELA lowering and thus summer temperatures(Denton et al., 2005; Lie and Paasche, 2006). However, until now,mountain glacier moraines in the Scoresby Sund region have notbeen dated directly.
We report new cosmogenic (10Be) exposure ages of lateglacial toEarly Holocene age moraines in the Scoresby Sund region, and ina companion paper (Hall et al., in this volume), we report newradiocarbon ages of raised marine sediments associated with thesemoraines. In addition, we present 10Be ages of historical moraineswhich provide insights into the climate during the Holocene Epoch,
Fig. 1. (Upper inset) Map of Greenland showing the locations of GISP2 and GRIP ice cores atScoresby Sund region showing locations of off-shore cores reported in Funder et al. (1998). (Milne Land stade and LGM ice extents as interpreted by Funder (1978) and Denton et al. (20as Milne Land, Renland, the location of Renland ice core, the Stauning Alper, Schuchert Dal,
Please cite this article in press as: Meredith A. Kelly et al., A 10Be chronoSund region, east Greenland:..., Quaternary Science Reviews (2008), doi:
including the Little Ice Age (w1290–1850 AD; Grove, 2001, 2004).10Be ages from numerous moraines demonstrate the prevalence ofboulders with cosmogenic nuclides accumulated during priorperiods of exposure that are recycled into younger moraines.
2. Background
The Scoresby Sund region (w70–72�N, 22–28�W) is the largestembayment on the east coast of Greenland (Fig 1). Although outletglaciers of the Greenland Ice Sheet drain into the sea through thefjord system, much of the region is characterized by local ice capsand mountain glaciation. Based on the existence of ice in the icecore from Renland ice cap that is interpreted to have formed locallyduring the last glacial period and the latter part of the precedingEemian interglacial period, it is assumed that the Scoresby Sundregion was not overrun by the Greenland Ice Sheet during the lastglacial period (Johnsen et al., 1992). Johnsen et al. (1992) suggestedthat the Renland ice cap was isolated from the main ice sheet due tobeing surrounded by the deep fjords feeding Scoresby Sund, whicheffectively drained inland ice. Sets of moraines and other ice-marginal features formed during the last glacial period andHolocene Epoch are well preserved in the Scoresby Sund region.
2.1. The LGM ice extent in the Scoresby Sund region
During the LGM, Scoresby Sund was filled with a grounded icetongue that reached at least to the fjord mouth. The Kap Brewstersubmarine moraine is interpreted to mark the calving terminus ofthe LGM ice tongue (Dowdeswell et al., 1994; Mangerud and
the Summit site and the Scoresby Sund region in east Greenland. (Lower inset) Map ofMain panel) Detailed map of the Scoresby Sund region showing approximate historical,05) (modified from Denton et al., 2005). Shown are locations discussed in the text, suchJameson Land and Liverpool Land. Black rectangle indicates the region shown in Fig. 2.
logy of lateglacial and Holocene mountain glaciation in the Scoresby10.1016/j.quascirev.2008.08.004

M.A. Kelly et al. / Quaternary Science Reviews xxx (2008) 1–10 3
ARTICLE IN PRESS
Funder, 1994), although the terminus may have extended past thislocation (Funder et al., 1998) (Fig. 1). Marine sediment cores east ofthe mouth of Scoresby Sund (Fig. 1) register high concentrations ofice-rafted debris at 29 000–26 000 14C yr BP and 21000–13 000 14Cyr BP, indicating the presence of ice in the fjord during these times(Funder et al., 1998 and references therein).
The extent of LGM ice on interfjord uplands in the ScoresbySund region is less well understood. Based on weathered bedrocksurfaces and a lack of deposits dating to the last glacial period, someprevious research has reconstructed LGM ice as largely restricted tothe fjords, with extensive ice-free areas remaining in regions suchas Jameson Land (e.g., Funder and Hjort, 1973; Moller et al., 1994;Funder et al. 1998) (Fig. 1). However, more recent research suggestsa substantial LGM ice cover in the Scoresby Sund region. Radio-carbon-dated marine sediments document isostatic uplift(including modern elevation plus sea-level rise during uplift) ofalmost 200 m since Younger Dryas time in the Schuchert Dal regionat the edge of Jameson Land (Hall et al., in this volume). Prior workalso shows similar amounts of isostatic uplift in nearby regionssince approximately Younger Dryas time (Washburn and Stuiver,1962; Lasca, 1969; Funder, 1978). Geodynamic modeling to inter-pret the isostatic uplift curves indicates extensive ice cover duringthe LGM, with hundreds of meters of ice over Jameson Land andmore than a kilometer of ice just inland of our study area (Flemingand Lambeck, 2004). In addition, new cosmogenic-exposure ages oferratic boulders on Kap Brewster (Fig. 1) indicate that the LGM icecover reached at least 250 m asl at the mouth of Scoresby Sund(Hakansson et al., 2007). Thus, recent data confirm the hypothesisthat LGM ice margins extended to or beyond the current coastlineand that low-elevation regions were likely covered with ice.Evidence for substantial LGM ice thickness in the Scoresby Sundregion is described further in the companion paper (Hall et al., inthis volume).
2.2. Lateglacial and Holocene ice extents in the ScoresbySund region
The Scoresby Sund region exhibits numerous moraine sets.Fresh moraines, typically within 1–2 km of modern ice margins andassociated with fresh trimlines, are ubiquitous (Funder, 1990).These historical moraines are dated in many parts of Greenland tothe middle-1800s or slightly more recently (Ahlmann, 1941; Wei-dick, 1963, 1968).
Occurring beyond the historical moraines are the Milne Landstade moraines (Funder, 1970) (Fig. 1). These prominent moraines,with associated kame terraces and outwash deposits, extendapproximately 9–15 km down valley from historical glacial deposits(Funder, 1970, 1971). In most valleys, terminal moraines are lacking,likely because Milne Land stade glacier tongues were in contactwith the sea. Due to post-glacial isostatic uplift, the outer MilneLand stade moraines in some locations are truncated by shorelinesat w120 m asl and are associated with a marine cliff at w134 m asl(Sugden and John, 1965; Funder, 1978; Hall et al., in this volume).The inner Milne Land stade moraines in some locations grade intoraised marine sediments at w90–101 m asl (Funder, 1978; Hallet al., in this volume). To constrain the age of the Milne Land stadeglaciation, Funder (1978) used radiocarbon dates of shells in raisedmarine sediments associated with Milne Land stade moraines todevelop an uplift (emergence) curve for western Scoresby Sund andHall Bredning. By extrapolating this curve, Funder (1978) inter-preted the age of the ice retreat from the outer Milne Land stademoraines as w10 400–10 100 14C yr BP (w12 230–11720 cal. yr BP),during Younger Dryas time, and the age of ice retreat from the innerMilne Land stade moraines as w9400 14C yr BP (w10 630 cal. yr BP),during Preboreal time. However, more recent work (e.g., Funderand Hansen,1996; Bjorck et al., 1997) suggested that the Milne Land
Please cite this article in press as: Meredith A. Kelly et al., A 10Be chronoSund region, east Greenland:..., Quaternary Science Reviews (2008), doi:
stade glaciation occurred during Preboreal time (w11500–10 400cal. yr BP), possibly associated with the Preboreal Oscillation.
2.3. Gurreholm Dal
For this paper, we focus on past mountain glacier extents inGurreholm Dal, located in the Stauning Alper (Fig. 2). GurreholmDal presently is influenced by valley glaciers and outlet glaciersfrom small ice caps. The valley trends northwest to southeast and isapproximately 20 km long. The head of Gurreholm Dal is underlainby Middle Proterozoic to Caledonian granites and gneisses and ischaracterized by high relief and classic alpine glacial features(Funder, 1990). Jagged peaks above the present-day (modern)valley-glacier terminus (w700 m asl) are w1500–2000 m asl.A north–south trending fault occurs about 3 km southeast of thepresent-day valley-glacier terminus. Southeast of this fault, thevalley is underlain by Devonian to Lower Permian sedimentarybedrock (Funder, 1990).
3. Methods
We have conducted a coordinated, multi-year campaign ofreconnaissance field mapping, radiocarbon dating of shells inraised marine features (Hall et al., in this volume) and cosmogenic-exposure dating of glacial features. Mapping was conducted using1:50,000 aerial photographs, satellite images and field observa-tions. Samples for cosmogenic-exposure dating were obtained fromcrystalline (garnetiferous granite and migmatic gneiss) boulders onmoraine crests or associated with moraine sets. In general,approximately 0.5–1.0 kg of rock was removed from bouldersurfaces (upper 5 cm) using a hammer and chisel or a hammer drilland small explosives following Kelly (2003).
10Be samples were prepared in the Cosmogenic Nuclide Labo-ratory at Lamont-Doherty Earth Observatory (L-DEO) usingmethods developed after those described by Rinterknecht (2003),Licciardi (2000) and Stone (2001). Five samples of clean (>99%)quartz were spiked with SPEX CertiPrep Reference Standard 9Becarrier solution containing 1.000 mg g�1 9Be and yielding a 10Be/9Beratio of w1�10�14 (Table 1). All other samples of clean quartz werespiked with one of two different 9Be carrier solutions prepared atL-DEO containing 0.996 and 0.986 mg g�1 9Be, respectively, andyielding 10Be/9Be ratios at least one order of magnitude less thanthe SPEX 9Be carrier (Table 1). Samples from lateglacial agemoraines were processed using w20–30 g quartz and w0.00025 g9Be carrier. Samples from Late Holocene age moraines were pro-cessed using w70–100 g quartz and w0.00020 g 9Be carrier. All10Be/9Be ratios were measured at Lawrence Livermore NationalLaboratory (LLNL) Center for Accelerator Mass Spectrometry(CAMS). Typical measured 10Be/9Be ratios of lateglacial age sampleswere between 4�10�14 and 1�10�13 and those of Late Holoceneage samples were between 1�10�14 and 4�10�14. Measured10Be/9Be ratios of laboratory process blanks accounted for back-ground corrections of generally less than 3%.
10Be ages were calculated using a modified form of the CRONUS-Earth online calculator version 2.1 (Balco et al., 2008) and scalingfactors given by Desilets et al. (2006). 10Be ages calculated using theCRONUS-Earth online calculator show good agreement amongvarious scaling methods due to the relatively small differences ingeomagnetic field corrections at high latitudes. Based on relativesea level curves for the Scoresby Sund region (Funder, 1978; Hallet al., in this volume), samples older than w5000 yr underwentpost-glacial isostatic uplift of w134 m between w5000 and 12 000cal. yr BP. Using the new relative sea level curve described in Hallet al. (in this volume), the CRONUS-Earth calculator was modifiedto calculate time-dependent scaling factors and production rates,and thus to calculate isostatically corrected exposure ages. This
logy of lateglacial and Holocene mountain glaciation in the Scoresby10.1016/j.quascirev.2008.08.004

Fig. 2. Glacial extents G-I, G-II, G-III and G-IV and associated ELAs, as well as 10Be sample locations, are shown on an aerial photograph. Also shown are raised marine sediments inthe mouth of Gurreholm Dal further discussed in the companion paper, Hall et al. (in this volume). Sample location numbers are the same as those in Table 1 but the ‘‘MKG-’’ samplelabel is not shown on the map.
M.A. Kelly et al. / Quaternary Science Reviews xxx (2008) 1–104
ARTICLE IN PRESS
uplift correction increases 10Be ages by w2–3% for Early Holoceneto lateglacial age samples and w5–7% for LGM age samples.Uncertainties associated with the uplift correction are estimated tobe �10% resulting in additional age uncertainties of less than 1%.
10Be ages of Early Holocene and older samples also were cor-rected for weathering and erosion on boulder surfaces using anerosion rate of 0.0002 cm yr�1. This erosion rate was estimatedbased on boulder surface characteristics observed in the field and issupported by a study of weathering and erosion in Scandinavia(at w68�N latitude) that indicates erosion rates of 0.0001–0.0003 cm yr�1 on granitic surfaces (Andre, 2002). The correctionfor erosion increases 10Be ages by w1–2% for Early Holocene tolateglacial age samples and w3–4% for LGM age samples.
Uncertainties in 10Be production rates based on the global cali-bration data set are estimated at �10% (e.g., Gosse and Phillips,2001). Recent research (Balco et al., in press) shows that a regional10Be production rate in locations greater than 40�N latitude ineastern North America is w7% lower than the global 10Be produc-tion rate (using scaling factors given by Desilets et al., 2006) andthat uncertainties related to the regional production rate areconsiderably smaller than those associated with the globalproduction rate. If a similar regional 10Be production rate isdemonstrated for east Greenland, the 10Be ages presented herewould increase by w7% and systematic uncertainties would beconsiderably lower.
Please cite this article in press as: Meredith A. Kelly et al., A 10Be chronoSund region, east Greenland:..., Quaternary Science Reviews (2008), doi:
4. Results and interpretations
4.1. Past mountain glacier extents in Gurreholm Dal
Mapping on remote images and in the field identified four setsof moraines in Gurreholm Dal (Fig. 2). For convenience, we termthese glacial extents G-I, G-II, G-III and G-IV, from youngest tooldest based on their stratigraphic position in the landscape andgeomorphic character.
The youngest, G-I, is marked by a drift sheet that terminates2–5 km down valley from modern ice margins. The edge of thisdrift sheet and moraine ridges within the drift are outlined in red inFig. 2 and shown in Fig. 3. This drift sheet is characterized by thicktill with a high boulder concentration relative to older glacialdeposits. Boulders and cobbles in the drift sheet are not notablyweathered and, in some cases, preserve striae and polishedsurfaces. There is little to no vegetation on the drift sheet and thereis evidence for buried ice. The upper trimline of this drift is at1100 m asl. The characteristics of this drift sheet are similar to thosethat mark historical glacial extents throughout Greenland (Ahl-mann, 1941; Weidick, 1963, 1968).
The next glacier extent (G-II), located down valley from thehistorical (G-I) drift sheet, is marked by prominent lateralmoraines, which are outlined in light blue in Fig. 2 and shown inFig. 3. G-II lateral moraines are sharp-crested ridges and exhibit
logy of lateglacial and Holocene mountain glaciation in the Scoresby10.1016/j.quascirev.2008.08.004

Table 110Be ages and relevant data for all samples from Gurreholm Dal
Samplenumber
Lat.(�N)
Long.(�W)
Elev.(m asl)
Factorsshieldingtopo./thick.
10Bea
(atoms g�1)1s
(�atoms g�1)Age (yr)and 1s
uncertainty
Age (yr) (upliftand erosion)and1s uncertainty
G-I moraines – interpreted age (780–310 yr)MKG-93 71.5096 �24.9449 790 0.989/0.9850 8.190� 103 4.080� 102 780� 40 –MKG-94c 71.5099 �24.9443 780 0.984/0.9828 4.190� 103 7.320� 102 410� 70 –MKG-95c 71.5103 �24.9434 780 0.989/0.9843 7.050� 103 4.790� 102 680� 50 –MKG-97 71.5106 �24.9433 778 0.983/0.9727 3.180� 103 2.310� 102 310� 20 –
G-II moraines – interpreted age (11660–10 630 yr)MKG-32b 71.5536 �24.9044 709 0.997/0.9670 1.030� 105 2.600� 103 10 690� 270 11120� 280MKG-33 71.5531 �24.9050 684 0.998/0.9590 1.150� 105 2.650� 103 12 290� 280 12 960� 300MKG-35b 71.5397 �24.8892 610 0.977/0.9670 1.180� 105 2.530� 103 13 770� 290 14 590� 310MKG-36 71.5431 �24.8872 626 0.998/0.9590 1.020� 104 3.410� 103 11520� 390 12 060� 400MKG-89 71.4824 �24.8142 375 0.998/0.9759 7.680� 104 2.230� 103 10 820� 310 11 240� 330MKG-90 71.4811 �24.8114 365 0.996/0.9833 9.460� 104 2.370� 103 13 390� 340 14 220� 360MKG-91 71.4795 �24.8079 348 0.997/0.9874 1.170� 105 2.840� 103 16 830� 410 18 220� 440MKG-92 71.4783 �24.8063 330 0.991/0.9899 7.610� 104 2.050� 103 11120� 300 11590� 310MKG-98 71.5118 �24.8114 500 0.994/0.9784 9.410� 104 3.140� 103 11800� 390 12 360� 410MKG-99 71.5154 �24.8212 515 0.998/0.9614 3.510� 105 6.080� 103 44 310� 770 53 390� 930MKG-100c 71.5130 �24.9358 720 0.948/0.9699 1.080� 105 4.770� 103 11670� 510 12 170� 540MKG-101 71.5130 �24.9358 720 0.996/0.9638 1.000� 105 4.100� 103 10 370� 420 10 700� 440MKG-102 71.5123 �24.9381 740 0.994/0.9735 1.180� 105 2.830� 103 11840� 290 12 450� 300MKG-103 71.5112 �24.9389 750 0.992/0.9841 1.070� 105 2.640� 103 10 580� 260 10 970� 270MKG-104c 71.5107 �24.9070 603 0.996/0.9618 8.900� 105 2.180� 103 10 280� 250 10 630� 260
G-III moraines – interpreted age (13 010–11630 yr)MKG-11 71.4231 �24.7697 345 0.977/0.9670 8.510� 104 2.890� 103 12 720� 430 13 420� 460MKG-12 71.4186 �24.7728 360 0.977/0.9670 2.350� 105 5.420� 103 34 810� 800 40 800� 940MKG-13 71.4025 �24.7153 129 0.994/0.9751 9.410� 104 2.810� 103 16 920� 500 18 420� 550MKG-14 71.4211 �24.7103 134 0.999/0.9796 1.010� 105 2.340� 103 17 970� 420 19 610� 450MKG-15 71.4081 �24.7067 134 1.000/0.9590 6.180� 104 1.440� 103 11150� 260 11630� 270MKG-20b 71.4306 �24.6725 215 0.994/0.9751 7.550� 104 1.940� 103 12 470� 320 13140� 340MKG-21 71.4319 �24.6700 230 0.998/0.9630 1.330� 105 5.550� 103 21830� 910 24 460� 1020MKG-22 71.4436 �24.6672 317 1.000/0.9670 8.710� 104 2.020� 103 13 070� 300 13 830� 320MKG-24 71.4428 �24.6836 372 0.982/0.9630 1.380� 105 4.730� 103 20 150� 690 22 260� 760MKG-25 71.4500 �24.6842 385 1.000/0.9590 3.880� 105 9.140� 103 55 470� 1310 68 940� 1630MKG-26b 71.4503 �24.6844 385 0.999/0.9510 1.580� 105 3.030� 103 22 640� 430 25 390� 490MKG-30 71.4178 �24.6778 124 0.996/0.9710 7.910� 104 1.840� 103 14 310� 330 15 310� 360
G-IV morainesMKG-07 71.4183 �24.7669 360 1.000/0.9670 1.700� 105 3.910� 103 24 510� 560 27 750� 650MKG-08 71.4181 �24.7678 360 1.000/0.9710 2.510� 105 5.910� 103 36 240� 850 42 650� 1430MKG-09 71.4378 �24.7764 380 1.000/0.9670 1.680� 105 5.640� 103 23 860� 800 26 810� 620MKG-16 71.4575 �24.6811 478 1.000/0.9630 6.390� 105 1.370� 104 83 890� 1800 112 880� 2430MKG-19b 71.4422 �24.6511 333 0.998/0.9590 2.790� 105 4.660� 103 41960� 700 50 260� 840MKG-27 71.4450 �24.6714 375 1.000/0.9670 1.720� 105 6.300� 103 24 520� 900 27 660� 1010MKG-28 71.4422 �24.6642 338 1.000/0.9670 2.350� 105 5.390� 103 34710� 800 40 740� 940
Shown are sample locations (latitude, longitude and elevation) and factors for shielding due to sample geometry and local topography (topo.) and sample thickness (thick.).10Be concentrations in (column six) are shown with�1s uncertainties (column seven) that indicate AMS measurement uncertainties not those associated with 10Be productionrates or scaling. 10Be ages in column eight are calculated using the CRONUS-Earth online calculator version 2.1 (Balco et al., 2008) with scaling of Desilets et al. (2006) and arenot corrected for uplift or boulder surface erosion. 10Be ages in column nine are calculated using a modified form of the CRONUS-Earth online calculator version 2.1 (Balco et al.,2008) with scaling of Desilets et al. (2006) that corrects for a change in sample elevation due to post-glacial isostatic uplift. These 10Be ages are also corrected for bouldersurface erosion (0.0002 cm yr�1). Except for samples from G-I moraines, 10Be ages discussed in the text are those corrected for uplift and erosion shown in column nine. It isunnecessary to correct samples from G-I moraines for uplift or erosion. Boulder sample data are provided as an input file for the CRONUS-Earth online calculator (Supple-mentary data).
a All samples were measured relative to LLNL internal standards and normalized to the standard KNST3110 except for MKG-104, which was normalized to the standard07KNST3110 (see Nishiizumi et al., 2007). The standard KNST3110 is based on a 10Be half-life of 1.5�106 yr and the 07KNST3110 is based on a 10Be half-life of 1.36�106 yr(Nishiizumi et al., 2007).
b Samples processed using the SPEX CertiPrep Reference Standard 9Be carrier containing 1.000 mg g�1 9Be.c Samples processed using the 9Be carrier prepared at L-DEO containing 0.996 mg g�1 9Be. All other samples were processed using the 9Be carrier prepared at L-DEO
containing 0.986 mg g�1 9Be.
M.A. Kelly et al. / Quaternary Science Reviews xxx (2008) 1–10 5
ARTICLE IN PRESS
fewer boulders on their surfaces than does the G-I drift. G-II lateralmoraines are vegetated. They are best preserved on the northeastwall of Gurreholm Dal, where individual ridges are traceable forw12 km. The uppermost elevation of G-II lateral moraines isw825 m asl.
The G-III glacier extent, shown in dark blue in Fig. 2, is markedby left- and right-lateral moraine ridges at the southeastern end ofGurreholm Dal, between w400 and 200 m asl. This glacier reachedthe valley confluence with the adjacent Schuchert Dal. Truncationof the moraines at that location and a lack of distinct terminalmoraines suggest that the G-III ice ended in the sea. Consistent with
Please cite this article in press as: Meredith A. Kelly et al., A 10Be chronoSund region, east Greenland:..., Quaternary Science Reviews (2008), doi:
this, a small ridge on the valley floor at w130–134 m asl is coveredwith moderately sorted gravel; we interpret it as a moraine bank.The G-III lateral moraines have a somewhat rounded appearanceand boulders on the surface are about as abundant as for G-IImoraines. The uppermost elevation of G-III lateral moraines isw400 m asl.
The final set of moraines in Gurreholm Dal marks a glacierextent (G-IV) that terminated in the valley mouth. This moraine setcomprises 2–3 subdued lateral ridges located w500–600 m asl,only slightly higher than G-III lateral moraines; however, surfacecharacteristics of G-IV moraines are notably different from those of
logy of lateglacial and Holocene mountain glaciation in the Scoresby10.1016/j.quascirev.2008.08.004
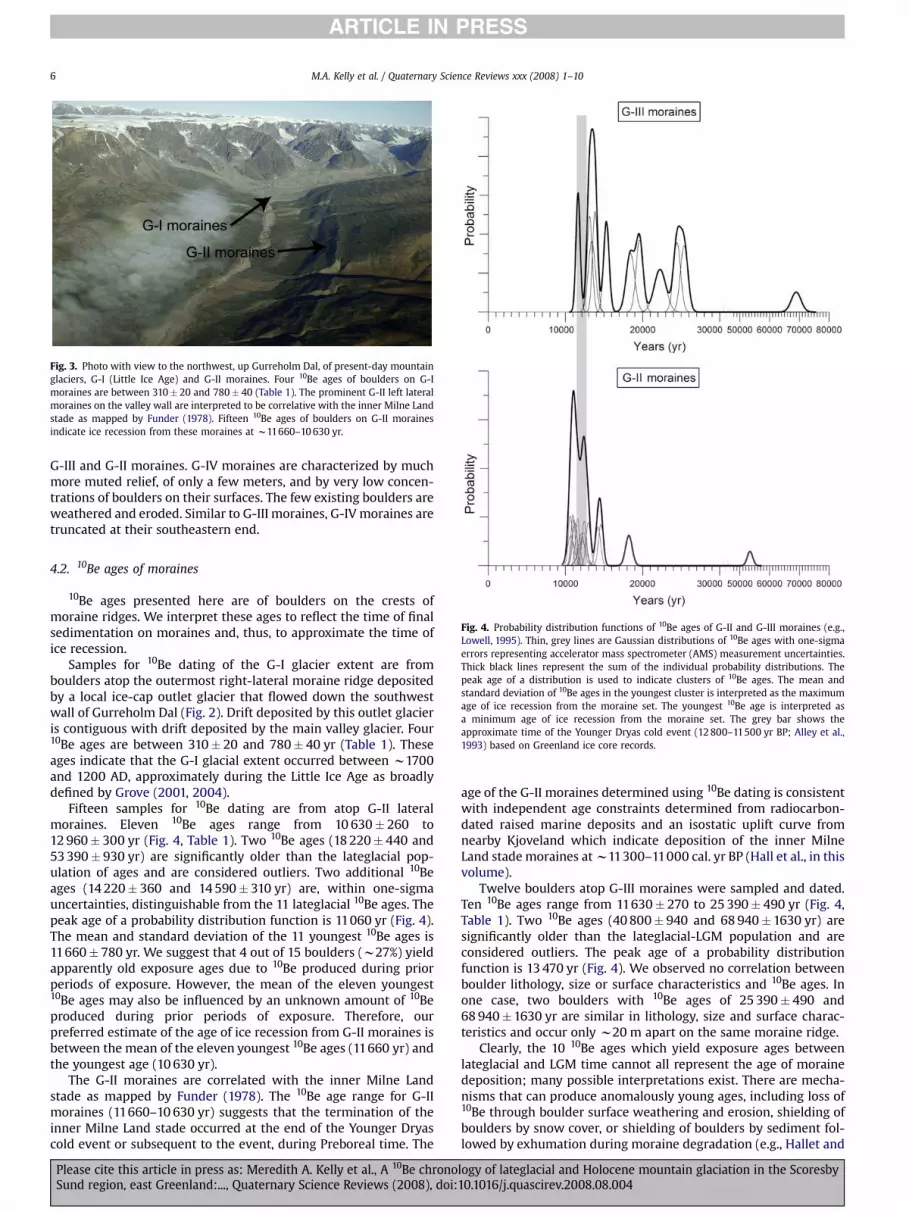
Fig. 3. Photo with view to the northwest, up Gurreholm Dal, of present-day mountainglaciers, G-I (Little Ice Age) and G-II moraines. Four 10Be ages of boulders on G-Imoraines are between 310� 20 and 780� 40 (Table 1). The prominent G-II left lateralmoraines on the valley wall are interpreted to be correlative with the inner Milne Landstade as mapped by Funder (1978). Fifteen 10Be ages of boulders on G-II morainesindicate ice recession from these moraines at w11660–10 630 yr.
M.A. Kelly et al. / Quaternary Science Reviews xxx (2008) 1–106
ARTICLE IN PRESS
G-III and G-II moraines. G-IV moraines are characterized by muchmore muted relief, of only a few meters, and by very low concen-trations of boulders on their surfaces. The few existing boulders areweathered and eroded. Similar to G-III moraines, G-IV moraines aretruncated at their southeastern end.
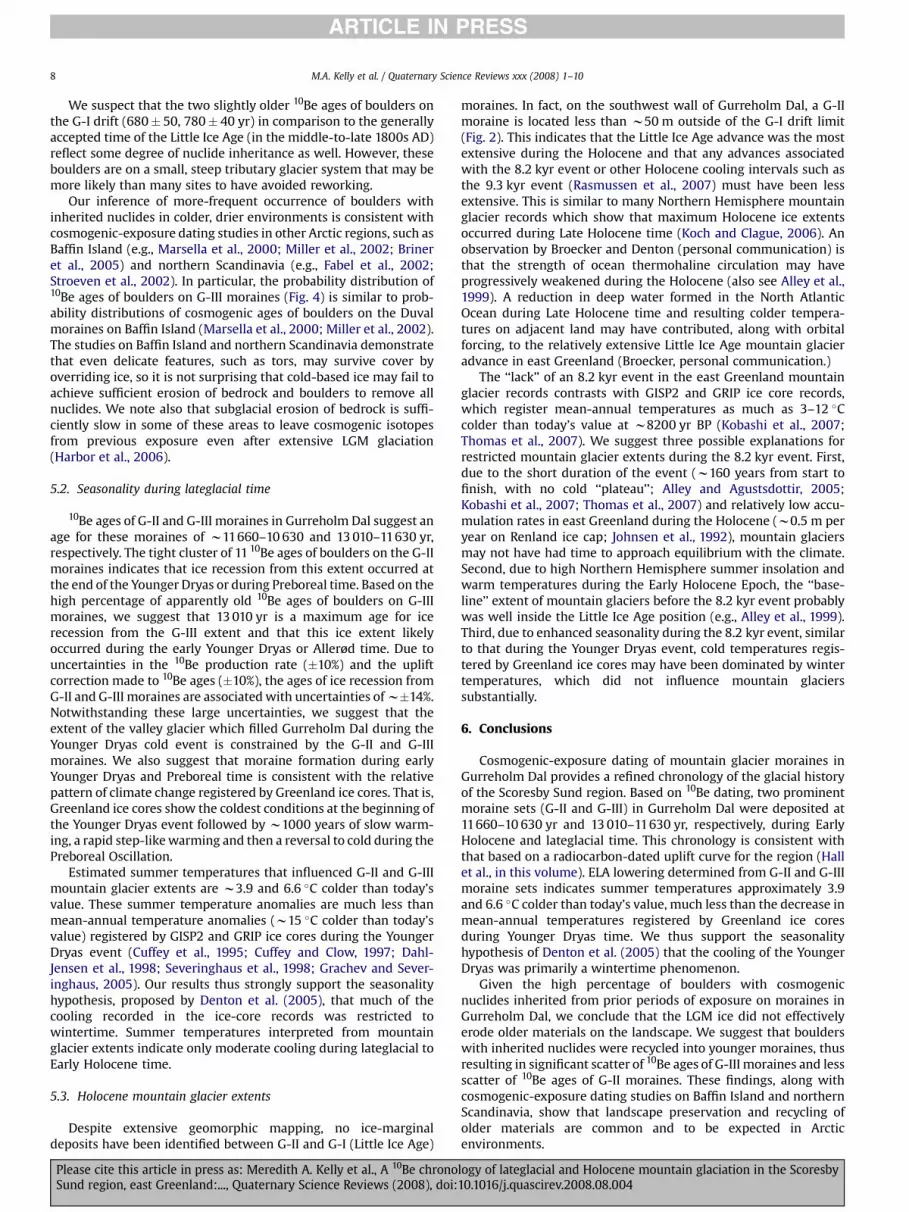
Fig. 4. Probability distribution functions of 10Be ages of G-II and G-III moraines (e.g.,Lowell, 1995). Thin, grey lines are Gaussian distributions of 10Be ages with one-sigmaerrors representing accelerator mass spectrometer (AMS) measurement uncertainties.Thick black lines represent the sum of the individual probability distributions. Thepeak age of a distribution is used to indicate clusters of 10Be ages. The mean andstandard deviation of 10Be ages in the youngest cluster is interpreted as the maximumage of ice recession from the moraine set. The youngest 10Be age is interpreted asa minimum age of ice recession from the moraine set. The grey bar shows theapproximate time of the Younger Dryas cold event (12 800–11500 yr BP; Alley et al.,1993) based on Greenland ice core records.
4.2. 10Be ages of moraines
10Be ages presented here are of boulders on the crests ofmoraine ridges. We interpret these ages to reflect the time of finalsedimentation on moraines and, thus, to approximate the time ofice recession.
Samples for 10Be dating of the G-I glacier extent are fromboulders atop the outermost right-lateral moraine ridge depositedby a local ice-cap outlet glacier that flowed down the southwestwall of Gurreholm Dal (Fig. 2). Drift deposited by this outlet glacieris contiguous with drift deposited by the main valley glacier. Four10Be ages are between 310� 20 and 780� 40 yr (Table 1). Theseages indicate that the G-I glacial extent occurred between w1700and 1200 AD, approximately during the Little Ice Age as broadlydefined by Grove (2001, 2004).
Fifteen samples for 10Be dating are from atop G-II lateralmoraines. Eleven 10Be ages range from 10 630� 260 to12 960� 300 yr (Fig. 4, Table 1). Two 10Be ages (18 220� 440 and53 390� 930 yr) are significantly older than the lateglacial pop-ulation of ages and are considered outliers. Two additional 10Beages (14 220� 360 and 14 590� 310 yr) are, within one-sigmauncertainties, distinguishable from the 11 lateglacial 10Be ages. Thepeak age of a probability distribution function is 11060 yr (Fig. 4).The mean and standard deviation of the 11 youngest 10Be ages is11660� 780 yr. We suggest that 4 out of 15 boulders (w27%) yieldapparently old exposure ages due to 10Be produced during priorperiods of exposure. However, the mean of the eleven youngest10Be ages may also be influenced by an unknown amount of 10Beproduced during prior periods of exposure. Therefore, ourpreferred estimate of the age of ice recession from G-II moraines isbetween the mean of the eleven youngest 10Be ages (11660 yr) andthe youngest age (10 630 yr).
The G-II moraines are correlated with the inner Milne Landstade as mapped by Funder (1978). The 10Be age range for G-IImoraines (11660–10 630 yr) suggests that the termination of theinner Milne Land stade occurred at the end of the Younger Dryascold event or subsequent to the event, during Preboreal time. The
Please cite this article in press as: Meredith A. Kelly et al., A 10Be chronoSund region, east Greenland:..., Quaternary Science Reviews (2008), doi:
age of the G-II moraines determined using 10Be dating is consistentwith independent age constraints determined from radiocarbon-dated raised marine deposits and an isostatic uplift curve fromnearby Kjoveland which indicate deposition of the inner MilneLand stade moraines at w11300–11000 cal. yr BP (Hall et al., in thisvolume).
Twelve boulders atop G-III moraines were sampled and dated.Ten 10Be ages range from 11630� 270 to 25 390� 490 yr (Fig. 4,Table 1). Two 10Be ages (40 800� 940 and 68 940�1630 yr) aresignificantly older than the lateglacial-LGM population and areconsidered outliers. The peak age of a probability distributionfunction is 13 470 yr (Fig. 4). We observed no correlation betweenboulder lithology, size or surface characteristics and 10Be ages. Inone case, two boulders with 10Be ages of 25 390� 490 and68 940�1630 yr are similar in lithology, size and surface charac-teristics and occur only w20 m apart on the same moraine ridge.
Clearly, the 10 10Be ages which yield exposure ages betweenlateglacial and LGM time cannot all represent the age of morainedeposition; many possible interpretations exist. There are mecha-nisms that can produce anomalously young ages, including loss of10Be through boulder surface weathering and erosion, shielding ofboulders by snow cover, or shielding of boulders by sediment fol-lowed by exhumation during moraine degradation (e.g., Hallet and
logy of lateglacial and Holocene mountain glaciation in the Scoresby10.1016/j.quascirev.2008.08.004

M.A. Kelly et al. / Quaternary Science Reviews xxx (2008) 1–10 7
ARTICLE IN PRESS
Putkonen, 1994). However, the relatively sharp-crested appearanceof G-III moraines is not consistent with the diffusive broadeningthat is expected to affect sufficiently old moraines, leading toboulder exhumation (Hallet and Putkonen, 1994). We do not seehigher concentrations of boulders on older moraines, as mightoccur if fines were removed to reveal buried boulders, and therelatively fresh appearance of all boulders observed eliminates thepossibility that exhumation is being balanced by boulder disinte-gration. Cover by snow may have influenced the 10Be ages, butconsidering the low precipitation rate of the region (w0.15 m yr�1,Yang et al., 1999; Lie and Paasche, 2006; and 0.5 m yr�1 atop Ren-land, Johnsen et al., 1992) and the likelihood that wind scouringwould have quickly removed snow from the large boulders (0.7–2 m high) sampled, we argue that the snow-shielding effect hasbeen small.
We suggest that 8 of 12 boulders dated (w67%) on G-IIImoraines yield apparently old exposure ages due to 10Be producedduring prior periods of exposure. The mean and standard deviationof the four youngest 10Be ages are 13 010� 960 yr. However, themean of the four youngest 10Be ages may also be influenced by anunknown amount of 10Be produced during prior periods of expo-sure. Therefore, our preferred estimate of the age of ice recessionfrom G-III moraines is between the mean of the four youngest ages(13 010 yr) and the youngest age (11630 yr).
The G-III moraines are tentatively correlated with the outerMilne Land stade defined by Funder (1978). The 10Be age range of13 010–11630 yr indicates that the outer Milne Land stade occurredduring or prior to the Younger Dryas cold event, possibly duringAllerød time. The age of the G-III moraines determined using 10Bedating is broadly consistent with an independent age constraintdetermined from the radiocarbon-dated isostatic uplift curve fromnearby Kjoveland which indicates deposition of outer Milne Landstade moraines prior to w12 400 cal. yr BP (Hall et al., in thisvolume).
Seven boulders atop G-IV moraines were sampled and dated. Allseven 10Be ages are older than the LGM and must be consideredminimum ages due to weathering and erosion apparent on bouldersurfaces (Table 1). Based on the lack of 10Be ages that are lateglacialin age and the extremely old appearance of the moraines, wesuggest that either 1) all 10Be ages from these moraines are influ-enced by inherited nuclides or 2) that these moraines pre-date theLGM and may have been covered by non-erosive ice during the lastglacial cycle. We do not correlate G-IV moraines with morainesmapped by Funder (1978), but note the possibility that the formerinterpretation is correct and these moraines may be associatedwith the outer Milne Land stade.
4.3. Paleoclimate information from lateglacial and Holoceneice extents
Paleoclimatic conditions are interpreted from past glacialextents by determining ELAs associated with each extent. Themethod relying on maximum elevation of lateral moraines (MELM)(e.g., Andersen, 1954, 1968; Dahl and Nesje, 1992) is used todetermine past ELAs from certain moraine sets. It is assumed thatmountain glacier extents are influenced primarily by ablationseason (summer) temperature and duration and, to a lesser extent,winter precipitation (Ahlmann, 1924; Liestøl, 1967; Oerlemans,2001, 2005). In addition, it is assumed that these relatively smallmountain glaciers respond rapidly to climate change (Koch andClague, 2006).
ELAs associated with G-II and G-III glacial extents in GurreholmDal are w825 m asl and w400 m asl, respectively (Fig. 2). TheseELAs must be adjusted to account for 101 and 134 m of isostaticuplift since w11000 and 12 000 cal. yr BP, respectively (Hall et al., inthis volume). ELAs associated with the G-I and present-day
Please cite this article in press as: Meredith A. Kelly et al., A 10Be chronoSund region, east Greenland:..., Quaternary Science Reviews (2008), doi:
(modern) glacier extents in Gurreholm Dal are w1100 and 1200 masl, respectively (Fig. 2) (Denton et al., 2005). The differencebetween the G-II ELA and the present-day ELA is w476 m and thatbetween the G-III ELA and the present-day ELA is w934 m. Thedifference between the G-I ELA and the present-day ELA is w100 m.
A determination of past summer temperatures based on thedifferences between past ELAs and the present-day ELA is madefollowing procedures described by Dahl and Nesje (1992). Weassume that the adiabatic lapse rate during lateglacial time in eastGreenland was similar to that determined for western Norwayduring Younger Dryas time (6 �C km�1; Dahl and Nesje, 1992).Accumulation records from GISP2 and Renland ice cores are used toinfer a decrease in precipitation during lateglacial time of w50%relative to present (Johnsen et al., 1992; Kapsner et al., 1995). It hasbeen demonstrated that the effect on a mountain glacier of a 40–50% change in precipitation may be offset by an w1 �C temperaturechange or slightly more (Oerlemans, 2001; Alley, 2003). Based onthese parameters, G-II and G-III ELA depressions relative to present(476 and 934 m) suggest decreases in summer temperatures ofw3.9 and 6.6 �C, respectively, relative to present. The accumulationrecord from GISP2 shows little change for the Little Ice Age versusconditions before or after (Kapsner et al., 1995), so adjustment forchanging precipitation is not required. Assuming the same adia-batic lapse rate during lateglacial and Little Ice Age time, an ELAdepression of 100 m during the Little Ice Age suggests an w0.5–0.6 �C decrease in summer temperature relative to present.
5. Discussion
5.1. Cosmogenic-exposure dating in Arctic regions
Based on the 10Be ages of moraines in Gurreholm Dal, we inferthat mountain glaciers in the Scoresby Sund region frequentlyincorporate boulders with so called ‘‘inherited’’ nuclides, cosmo-genic nuclides produced during prior periods of exposure and notfully removed by erosion during glacial transport. Boulders withinherited nuclides are common on moraines in Gurreholm Dal(w67% of boulders dated on G-III moraines, w27% on G-II moraines,based on our interpretation), much higher percentages than anaverage (<3%) determined from a review of numerous cosmogenic-exposure dating studies elsewhere (Putkonen and Swanson, 2003).However, the high percentages of apparently old 10Be ages areconsistent with our expectations that the cold, slow-weathering,low glacier mass-flux environment in Scoresby Sund favorsreworking of boulders with inherited nuclides.
Our working hypothesis is that the LGM advance involved cold-based ice in many low-elevation interfjord regions (although thethicker, faster-moving ice that occupied what are now the mainfjords was warm-based), and that this cold-based ice was nothighly erosive, leaving boulders with inherited nuclides on thelandscape. Retreat after the LGM (e.g., Evans et al., 2002) proceededto a position probably well within the G-III moraines during theBølling warm interval, which reached near-Holocene values basedon the Greenland ice-core records. The next advance, whichoccurred during lateglacial time and formed the G-III moraines,incorporated boulders already on the landscape or within olderdrifts and containing inherited nuclides into the moraines. Expo-sure to produce these inherited nuclides may have occurred duringthe brief time between the post-LGM ice recession and the G-IIIadvance, or prior to the LGM. The G-III glacial advance likelyremoved many of the inherited-nuclide-bearing boulders from thelandscape, so that less pre-exposed material remained to berecycled into the G-II moraines. Boulders containing inheritednuclides from older drift sheets on valley walls may also have beenrecycled into younger deposits by slope processes and tributarystreams.
logy of lateglacial and Holocene mountain glaciation in the Scoresby10.1016/j.quascirev.2008.08.004
M.A. Kelly et al. / Quaternary Science Reviews xxx (2008) 1–108
ARTICLE IN PRESS
We suspect that the two slightly older 10Be ages of boulders onthe G-I drift (680� 50, 780� 40 yr) in comparison to the generallyaccepted time of the Little Ice Age (in the middle-to-late 1800s AD)reflect some degree of nuclide inheritance as well. However, theseboulders are on a small, steep tributary glacier system that may bemore likely than many sites to have avoided reworking.
Our inference of more-frequent occurrence of boulders withinherited nuclides in colder, drier environments is consistent withcosmogenic-exposure dating studies in other Arctic regions, such asBaffin Island (e.g., Marsella et al., 2000; Miller et al., 2002; Brineret al., 2005) and northern Scandinavia (e.g., Fabel et al., 2002;Stroeven et al., 2002). In particular, the probability distribution of10Be ages of boulders on G-III moraines (Fig. 4) is similar to prob-ability distributions of cosmogenic ages of boulders on the Duvalmoraines on Baffin Island (Marsella et al., 2000; Miller et al., 2002).The studies on Baffin Island and northern Scandinavia demonstratethat even delicate features, such as tors, may survive cover byoverriding ice, so it is not surprising that cold-based ice may fail toachieve sufficient erosion of bedrock and boulders to remove allnuclides. We note also that subglacial erosion of bedrock is suffi-ciently slow in some of these areas to leave cosmogenic isotopesfrom previous exposure even after extensive LGM glaciation(Harbor et al., 2006).
5.2. Seasonality during lateglacial time
10Be ages of G-II and G-III moraines in Gurreholm Dal suggest anage for these moraines of w11660–10 630 and 13 010–11630 yr,respectively. The tight cluster of 11 10Be ages of boulders on the G-IImoraines indicates that ice recession from this extent occurred atthe end of the Younger Dryas or during Preboreal time. Based on thehigh percentage of apparently old 10Be ages of boulders on G-IIImoraines, we suggest that 13 010 yr is a maximum age for icerecession from the G-III extent and that this ice extent likelyoccurred during the early Younger Dryas or Allerød time. Due touncertainties in the 10Be production rate (�10%) and the upliftcorrection made to 10Be ages (�10%), the ages of ice recession fromG-II and G-III moraines are associated with uncertainties of w�14%.Notwithstanding these large uncertainties, we suggest that theextent of the valley glacier which filled Gurreholm Dal during theYounger Dryas cold event is constrained by the G-II and G-IIImoraines. We also suggest that moraine formation during earlyYounger Dryas and Preboreal time is consistent with the relativepattern of climate change registered by Greenland ice cores. That is,Greenland ice cores show the coldest conditions at the beginning ofthe Younger Dryas event followed by w1000 years of slow warm-ing, a rapid step-like warming and then a reversal to cold during thePreboreal Oscillation.
Estimated summer temperatures that influenced G-II and G-IIImountain glacier extents are w3.9 and 6.6 �C colder than today’svalue. These summer temperature anomalies are much less thanmean-annual temperature anomalies (w15 �C colder than today’svalue) registered by GISP2 and GRIP ice cores during the YoungerDryas event (Cuffey et al., 1995; Cuffey and Clow, 1997; Dahl-Jensen et al., 1998; Severinghaus et al., 1998; Grachev and Sever-inghaus, 2005). Our results thus strongly support the seasonalityhypothesis, proposed by Denton et al. (2005), that much of thecooling recorded in the ice-core records was restricted towintertime. Summer temperatures interpreted from mountainglacier extents indicate only moderate cooling during lateglacial toEarly Holocene time.
5.3. Holocene mountain glacier extents
Despite extensive geomorphic mapping, no ice-marginaldeposits have been identified between G-II and G-I (Little Ice Age)
Please cite this article in press as: Meredith A. Kelly et al., A 10Be chronoSund region, east Greenland:..., Quaternary Science Reviews (2008), doi:
moraines. In fact, on the southwest wall of Gurreholm Dal, a G-IImoraine is located less than w50 m outside of the G-I drift limit(Fig. 2). This indicates that the Little Ice Age advance was the mostextensive during the Holocene and that any advances associatedwith the 8.2 kyr event or other Holocene cooling intervals such asthe 9.3 kyr event (Rasmussen et al., 2007) must have been lessextensive. This is similar to many Northern Hemisphere mountainglacier records which show that maximum Holocene ice extentsoccurred during Late Holocene time (Koch and Clague, 2006). Anobservation by Broecker and Denton (personal communication) isthat the strength of ocean thermohaline circulation may haveprogressively weakened during the Holocene (also see Alley et al.,1999). A reduction in deep water formed in the North AtlanticOcean during Late Holocene time and resulting colder tempera-tures on adjacent land may have contributed, along with orbitalforcing, to the relatively extensive Little Ice Age mountain glacieradvance in east Greenland (Broecker, personal communication.)
The ‘‘lack’’ of an 8.2 kyr event in the east Greenland mountainglacier records contrasts with GISP2 and GRIP ice core records,which register mean-annual temperatures as much as 3–12 �Ccolder than today’s value at w8200 yr BP (Kobashi et al., 2007;Thomas et al., 2007). We suggest three possible explanations forrestricted mountain glacier extents during the 8.2 kyr event. First,due to the short duration of the event (w160 years from start tofinish, with no cold ‘‘plateau’’; Alley and Agustsdottir, 2005;Kobashi et al., 2007; Thomas et al., 2007) and relatively low accu-mulation rates in east Greenland during the Holocene (w0.5 m peryear on Renland ice cap; Johnsen et al., 1992), mountain glaciersmay not have had time to approach equilibrium with the climate.Second, due to high Northern Hemisphere summer insolation andwarm temperatures during the Early Holocene Epoch, the ‘‘base-line’’ extent of mountain glaciers before the 8.2 kyr event probablywas well inside the Little Ice Age position (e.g., Alley et al., 1999).Third, due to enhanced seasonality during the 8.2 kyr event, similarto that during the Younger Dryas event, cold temperatures regis-tered by Greenland ice cores may have been dominated by wintertemperatures, which did not influence mountain glacierssubstantially.
6. Conclusions
Cosmogenic-exposure dating of mountain glacier moraines inGurreholm Dal provides a refined chronology of the glacial historyof the Scoresby Sund region. Based on 10Be dating, two prominentmoraine sets (G-II and G-III) in Gurreholm Dal were deposited at11660–10 630 yr and 13 010–11630 yr, respectively, during EarlyHolocene and lateglacial time. This chronology is consistent withthat based on a radiocarbon-dated uplift curve for the region (Hallet al., in this volume). ELA lowering determined from G-II and G-IIImoraine sets indicates summer temperatures approximately 3.9and 6.6 �C colder than today’s value, much less than the decrease inmean-annual temperatures registered by Greenland ice coresduring Younger Dryas time. We thus support the seasonalityhypothesis of Denton et al. (2005) that the cooling of the YoungerDryas was primarily a wintertime phenomenon.
Given the high percentage of boulders with cosmogenicnuclides inherited from prior periods of exposure on moraines inGurreholm Dal, we conclude that the LGM ice did not effectivelyerode older materials on the landscape. We suggest that boulderswith inherited nuclides were recycled into younger moraines, thusresulting in significant scatter of 10Be ages of G-III moraines and lessscatter of 10Be ages of G-II moraines. These findings, along withcosmogenic-exposure dating studies on Baffin Island and northernScandinavia, show that landscape preservation and recycling ofolder materials are common and to be expected in Arcticenvironments.
logy of lateglacial and Holocene mountain glaciation in the Scoresby10.1016/j.quascirev.2008.08.004

M.A. Kelly et al. / Quaternary Science Reviews xxx (2008) 1–10 9
ARTICLE IN PRESS
Mountain glaciers in Gurreholm Dal reached their maximumHolocene extents approximately during the Little Ice Age. Nomoraines are observed from intervening Holocene cold intervalsincluding the 8.2 kyr and 9.3 kyr events. The short duration of the8.2 kyr event, its probable wintertime bias, and the orbitally warmconditions preceding and following the short-lived cold intervallikely contributed to the lack of an extensive mountain glacieradvance.
Acknowledgements
This research was made possible by the generous contributionsof the Comer Science and Education Foundation, which provideda Postdoctoral Fellowship for M. Kelly as well as funding andlogistical support for field work. This research also was supportedby an NSF Polar Postdoctoral Fellowship to M. Kelly (ANT-0527946).R. Finkel was supported by the U.S. Department of Energy undercontract number DE-AC52-07NA27344. R. Alley acknowledgespartial support from NSF grants OPP-0531211 and OPP-0424589.We are grateful for the kind and helpful assistance of the captainand crew on the Turmoil, including P. Walsh, B. Walsh and P. Migro.T. Allen and various pilots with Air Greenland provided safetransport to and from field sites. We are indebted to R. Schwartz,manager of the Cosmogenic Nuclide Laboratory at L-DEO. Wethank E. Brook, M. Bentley and an anonymous reviewer forconstructive comments.
Appendix. Supplementary data
Supplementary data associated with this article can be found, inthe online version, at doi:doi:10.1016/j.quascirev.2008.08.004.
References
Ahlmann, H.W., 1924. Le niveau de glaciation comme fonction de l’accumulationd’humidite sous forme solide. Geografiska Annaler 3, 223–272.
Ahlmann, H.W., 1941. Studies in North-East Greenland 1939–1940, Part I, The mainmorphological features of north-east Greenland. Geografiska Annaler 23,148–183.
Alley, R.B., 2003. Comment on When the Earth’s freezer door is left ajar. EOS 84, 315.Alley, R.B., Agustsdottir, A.M., 2005. The 8k event: cause and consequences of
a major Holocene abrupt climate change. Quaternary Science Reviews 24,1123–1149.
Alley, R.B., Agustsdottir, A.M., Fawcett, P.J., 1999. Ice-core evidence of Late-Holocenereduction in north Atlantic ocean heat transport. In: Clark, P.U., Webb, R.S.,Keigwin, L.D. (Eds.), Mechanisms of Global Climate Change at Millennial TimeScales. Geophysical Monograph 112. American Geophysical Union, Washington,DC, pp. 301–312.
Alley, R.B., Mayewski, P.A., Sowers, T., Stuiver, M., Taylor, K.C., Clark, P.U., 1997.Holocene climatic instability: A prominent, widespread event at 8200 yr ago.Geology 6, 483–486.
Alley, R.B., Meese, D.A., Shuman, C.A., Gow, A.J., Taylor, K.C., Grootes, P.M.,White, J.W.C., Ram, M., Waddington, E.D., Mayewski, P.A., Zielinski, G.A., 1993.Abrupt increase in snow accumulation at the end of the Younger Dryas event.Nature 362, 527–529.
Andersen, B.G., 1954. Randmorener, Sørvest-Norge. Norsk Geographisk Tidsskrift14, 274–342.
Andersen, B.G., 1968. Glacial geology of Troms, north Norway. Norges GeologiskeUndersøkelse 265, 160.
Andre, M.F.-., 2002. Rates of postglacial rock weathering on glacially scouredoutcrops (Abisko-Riksgransen area, 68�N). Geografiska Annaler 84A, 139–150.
Balco G., Briner, J., Rayburn, J., Ridge, J.C., Schaefer, J.M. Regional beryllium-10production rate calibration for northeastern North America. QuaternaryGeochronology, in press.
Balco, G., Stone, J.O., Lifton, N.A., Dunai, T.J., 2008. A complete and easily accessiblemeans of calculating surface exposure ages or erosion rates from 10Be and 26Almeasurements. Quaternary Geochronology.
Bjorck, S., Bennike, O., Rosen, P., Andresen, C.S., Bohncke, S., Kaas, E., Conley, D.,2002. Anomalously mild Younger Dryas summer conditions in southernGreenland. Geology 30, 427–430.
Bjorck, S., Rundgren, M., Ingolfsson, O., Funder, S., 1997. The Preboreal oscillationaround the Nordic Seas: terrestrial and lacustrine reponses. Journal of Quater-nary Science 12, 455–465.
Briner, J.P., Miller, G.H., Davis, T.R., Finkel, R., 2005. Cosmogenic exposure dating inarctic glacial landscapes: implications for the glacial history of northeasternBaffin Island, Arctic Canada. Canadian Journal of Earth Sciences 42, 67–84.
Please cite this article in press as: Meredith A. Kelly et al., A 10Be chronoSund region, east Greenland:..., Quaternary Science Reviews (2008), doi:
Cuffey, K.M., Clow, G.D., Alley, R.B., Stuiver, M., Waddington, E.D., Saltus, R.W., 1995.Large temperature change at the Wisconsin-Holocene glacial transition. Science270, 455–458.
Cuffey, K.M., Clow, G.D., 1997. Temperature, accumulation, and ice sheet elevation incentral Greenland through the last deglacial transition. Journal of GeophysicalResearch 102, 26383–26396.
Dahl, S.O., Nesje, A., 1992. Paleoclimatic implications based on equilibrium-linealtitude depressions of reconstructed Younger Dryas and Holocene cirqueglaciers in inner Nordfjord, western Norway. Palaeogeography, Paleoclima-tology, Paleoecology 94, 87–97.
Dahl-Jensen, D., Mosegaard, K., Gundestrup, N., Clow, G.D., Johnsen, S.J.,Hansen, A.W., Balling, N., 1998. Past temperatures directly from the GreenlandIce Sheet. Science 282, 268–271.
Dansgaard, W., Johnsen, S.J., Clausen, H.B., Dahl-Jensen, D., Gundestrup, N.S.,Hammer, C.U., Hvidberg, C.S., Steffensen, J.P., Sveinbjonsdottir, A.E., Jouzel, J.,Bond, G., 1993. Evidence for general instability of past climate from a 250-kyrice-core record. Nature 364, 218–220.
Denton, G.H., Alley, R.B., Comer, G.C., Broecker, W.S., 2005. The role of seasonality inabrupt climate change. Quaternary Science Reviews 24, 1159–1182.
Denton, G.H., Heusser, C.J., Lowell, T., Moreno, I., Andersen, B.P.G., Heusser, L.E.,Schl}uchter, C., Marchant, D.R., 1999. Interhemispheric linkage of paleoclimateduring the last glaciation. Geografiska Annaler 81A, 107–153.
Desilets, D., Zreda, M., Prabu, T., 2006. Extended scaling factors for in situ cosmo-genic nuclides: New measurements at low latitude. Earth and Planetary ScienceLetters 246, 265–276.
Dowdeswell, J.A., Uenzelmann-Neben, G., Whittington, R.J., Marienfield, P., 1994.The Late Quaternary sedimentary record in Scoresby Sund, East Greenland.Boreas 23, 294–310.
Evans, J., Dowdeswell, J.A., Grobe, H., Niessen, F., Stein, R., Hubberten, H.-W.,Whittington, R.J., 2002. Late Quaternary sedimentation in Kejser Franz JosephFjord and the continental margin of East Greenland. In: Dowdeswell, J.A.,Cofaigh, C. (Eds.), Glacier-Influenced Sedimentation on High-Latitude ContinentalMargins. Geological Society of London Special Publication, vol. 203, pp. 149–179.
Fabel, D., Stroeven, A.P., Harbour, J., Kleman, J., Elmore, D., Fink, D., 2002. Landscapepreservation under Fennoscandian ice sheets determined from in situ produced10Be and 26Al. Earth and Planetary Science Letters 201, 397–406.
Fleming, K., Lambeck, K., 2004. Constraints on the Greenland Ice Sheet since theLast Glacial Maximum from sea-level observations and glacial-rebound models.Quaternary Science Reviews 23, 1053–1077.
Funder, S., 1990. Descriptive text to Quaternary map of Greenland 1:500,000,Scoresby Sund, sheet 12. Grønlands Geologiske Undersøgelse, 24.
Funder, S., 1978. Holocene stratigraphy and vegetation history in the Scoresby Sundarea, East Greenland. Grønlands Undersøgels Bulletin 129, 66.
Funder, S., 1971. Observations on the Quaternary geology of the Rødefjord region,Scoresby Sund, East Greenland. Rapport Grønlands Geologiska Undersøgels 37,51–55.
Funder, S., 1970. Notes on the glacial geology of eastern Milne Land, Scoresby Sund,East Greenland. Rapport Grønlands Geologiska Undersøgels 30, 37–42.
Funder, S., Hjort, C., Landvik, J., Nam, S.I., Reeh, N., Stein, R., 1998. History of a stableice margin – East Greenland during the middle and upper Pleistocene.Quaternary Science Reviews 17, 77–123.
Funder, S., Hansen, L., 1996. The Greenland Ice Sheet – a model for its culminationand decay during and after the last glacial maximum. Bulletin of the GeologicalSociety of Denmark 42, 137–152.
Funder, S., Hjort, C., 1973. Aspects of the Weichselian chronology in central EastGreenland. Boreas 2, 69–84.
Gosse, J.C., Phillips, F.M., 2001. Terrestrial in situ cosmogenic nuclides: theory andapplication. Quaternary Science Reviews 20, 1475–1560.
Grachev, A.M., Severinghaus, J.P., 2005. A revised þ10 � 4 degrees C magnitude ofthe abrupt change in Greenland temperature at the Younger Dryas terminationusing published GISP2 gas isotope data and air thermal diffusion constants.Quaternary Science Reviews 24, 513–519.
Grove, J.M., 2004. Little ice ages: ancient and modern. In: Routledge Studies inPhyiscal Geography and Environment, vol. 5. Routledge, London 718pp.
Grove, J.M., 2001. The initiation of the ‘‘Little Ice Age’’ in regions round the NorthAtlantic. Climatic Change 48, 53–82.
Hakansson, L., Briner, J., Alexanderson, H., Aldahan, A., Possnert, P., 2007. 10Beages from central east Greenland constrain the extent of the Greenland IceSheet during the Last Glacial Maximum. Quaternary Science Reviews 26,2316–2321.
Hall, B.L., Baroni, C., Denton, G.H., Kelly, M.A., Lowell, T.V., in this volume. Relativesea-level change, Kjove Land, Scoresby Sund, East Greenland: implications forseasonality in Younger Dryas time. Quaternary Science Reviews.
Hallet, B., Putkonen, J., 1994. Surface dating of dynamic landforms: young Boulderson aging moraines. Science 265, 937–940.
Harbor, J., Stroeven, A.P., Fabel, D., Clarhall, A., Kleman, J., Li, Y.K., Elmore, D., Fink, D.,2006. Cosmogenic nuclide evidence for minimal erosion across two subglacialsliding boundaries of the late glacial Fennoscandian ice sheet. Geomorphology75, 90–99.
Johnsen, S.J., Dahl-Jensen, D., Gundestrup, N., Steffensen, J.P., Clausen, H.B., 2001.Oxygen isotope and palaeotemperature records from six Greenland ice-corestations: Camp Century, Dye-3, GRIP, GISP2, Renland and NorthGRIP. Journal ofQuaternary Science 16, 299–307.
Johnsen, S.J., Clausen, H.B., Dansgaard, W., Gundestrup, N.S., Hansson, M.,Jonsson, P., Steffensen, J.P., Sveinbjørnsdottir, A.E., 1992. A ‘‘deep’’ ice core fromEast Greenland. Meddelelser om Grønland. Geoscience 29, 3–22.
logy of lateglacial and Holocene mountain glaciation in the Scoresby10.1016/j.quascirev.2008.08.004

M.A. Kelly et al. / Quaternary Science Reviews xxx (2008) 1–1010
ARTICLE IN PRESS
Kapsner, W.R., Alley, R.B., Shuman, C.A., Anandakrishnan, S., Grootes, P.M., 1995.Dominant control of atmospheric circulation on snow accumulation in centralGreenland. Nature 373, 52–54.
Kelly, M.A., 2003. The late Wurmian Age in the western Swiss Alps – last glacialmaximum (LGM) ice-surface reconstruction and 10Be dating of late-glacialfeatures. Ph.D. dissertation, University of Bern, 105pp.
Kobashi, T., Severinghaus, J.P., Brook, E.J., Barnola, J.-M., Grachev, A.M., 2007. Precisetiming and characterization of abrupt climate change 8200 years ago from airtrapped in polar ice. Quaternary Science Reviews 26, 1212–1222.
Koch, J., Clague, J.J., 2006. Are insolation and sunspot activity the primary drivers ofglobal Holocene glacier fluctuations? PAGES Newsletter, 20–21.
Lasca, N., 1969. The surficial geology of Skeldal, Mesters Vig, northeast Greenland.Meddelelser om Grønland 176 (3), 111. and 3 plates.
Licciardi, J.M., 2000. Alpine glacier and pluvial lake records of late Pleistoceneclimate variability in the western United States. Ph.D. dissertation, Oregon StateUniversity, 155 pp.
Lie, Ø., Paasche, Ø., 2006. How extreme was northern hemisphere seasonalityduring the Younger Dryas? Quaternary Science Reviews 25, 404–407.
Liestøl, O., 1967. Storbreen glacier in Jotunheimen, Norway. Norsk PolarinstituttSkrifter 141, 63.
Lowell, T.V., 1995. The application of radiocarbon age estimates to the dating ofglacial sequences: an example from the Miami sublobe, Ohio. QuaternaryScience Reviews 14, 85–94.
Maisch, M., 1982. Zur Gletscher-und Klimageschichte des alpinen Spatglazials.Geographica Helvetica 37, 93–104.
Maisch, M., 1987. Zur Gletschergeschichte des alpinen Spatglazials: Analyse undInterpretation von Schneegrenzdaten. Geographica Helvetica 42, 63–71.
Mangerud, J., Funder, S., 1994. The interglacial–glacial record at the mouth ofScoresby Sund, East Greenland. Boreas 23, 349–358.
Marsella, K.A., Bierman, P., Davis, P.T., Caffee, M.W., 2000. Cosmogenic 10Be and 26Aldates for the Last Glacial Maximum on Eastern Baffin Island, Arctic Canada.Geological Society of America Bulletin 112, 1296–1312.
Miller, G.H., Wolfe, A.P., Steig, E.J., Sauer, P.E., Kaplan, M.R., Briner, J.P., 2002. TheGoldilocks dilemma: big ice, little ice, or ‘‘just-right’’ ice in the Eastern CanadianArctic. Quaternary Science Reviews 21, 33–48.
Moller, P., Hjort, C., Adrielsson, L., Salvigsen, O., 1994. Glacial history of interiorJameson Land, East Greenland. Boreas 23, 320–348.
Nishiizumi, K., Imamura, M., Caffee, M.W., Southon, J.R., Finkel, R.C., McAninch, J.,2007. Absolute calibration of 10Be AMS standards. Nuclear Instruments andMethods in Physics Research B 258, 403–413.
Please cite this article in press as: Meredith A. Kelly et al., A 10Be chronoSund region, east Greenland:..., Quaternary Science Reviews (2008), doi:
Oerlemans, J., 2005. Extracting a Climate Signal from 169 Glacier Records. Science308, 675–677.
Oerlemans, J., 2001. Glaciers and Climate Change. A.A. Balkema Publishers,Lisse. 148p.
Porter, S.C., 1975. Equilibrium-line altitudes of late Quaternary glaciers in theSouthern Alps, New Zealand. Quaternary Research 5, 27–47.
Putkonen, J., Swanson, T., 2003. Accuracy of cosmogenic ages for moraines.Quaternary Science Reviews 59, 225–261.
Rasmussen, S.O., Vinther, B.M., Clausen, H.B., Andersen, K.K., 2007. Early Holoceneclimate oscillations recorded in three Greenland ice cores. Quaternary ScienceReviews 26, 1907–1914.
Rinterknecht, V.R., 2003. Cosmogenic 10Be chronology for the last deglaciation ofthe southern Scandinavian Ice Sheet. Unpublished Ph.D. dissertation, OregonState University.
Severinghaus, J., Sowers, T., Brook, E.J., Alley, R.B.P., Bender, M.L., 1998. Timing ofabrupt climate change at the end of the Younger Dryas interval from thermallyfractionated gases in polar ice. Nature 391, 141–146.
Stone, J.O., 2001. Extraction of Al & Be from quartz for isotopic analysis. University ofWashington Cosmogenic Isotope Laboratory website. http://depts.washington.edu/cosmolab/chem/Al-26_Be-10.pdf.
Stroeven, A.P., Fabel, D., Hattestrand, C., Harbor, J., 2002. A relict landscape inthe centre of Fennoscandian glaciation: cosmogenic radionuclide evidenceof tors preserved through multiple glacial cycles. Geomorphology 44,145–154.
Stuiver, M., Grootes, M., 2000. GISP2 oxygen-isotope ratios. Quaternary Research 53,277–284.
Sugden, D.E., John, B., 1965. The raised marine features of Kjove Land. East Green-land: Geographical Journal 131, 235–248.
Thomas, E.R., Wolff, E.W., Mulvaney, R., Steffensen, J.P., Johnsen, S.J., Arrowsmith, C.,White, J.W.C., Vaughn, B., Popp, T., 2007. The 8.2 ka event from Greenland icecores. Quaternary Science Reviews 26, 70–81.
Washburn, A.L., Stuiver, M., 1962. Radiocarbon-dated postglacial delevelling inArctic north-east Greenland and its implications. Arctic 15, 66–74.
Weidick, A., 1968. Observations on some Holocene glacier fluctuations in WestGreenland. Meddelelser om Grønland 165 (6), 202.
Weidick, A., 1963. Ice margin features in the Julianhåb District, South Greenland.Meddelelser om Grønland 165 (3), 133.
Yang, D.Q., Ishida, S., Goodison, B.E., Gunther, T., 1999. Bias correction of dailyprecipitation measurements for Greenland. Journal of Geophysical Research –Atmospheres 104, 6171–6181.
logy of lateglacial and Holocene mountain glaciation in the Scoresby10.1016/j.quascirev.2008.08.004


