Embed Size (px)
Citation preview

Critical Reviews in Toxicology, 36:727–776, 2006Copyright c© Informa HealthcareISSN: 1040-8444 print / 1547-6898 onlineDOI: 10.1080/10408440600908821
A Critical Assessment of Studies on the CarcinogenicPotential of Diesel Exhaust
Thomas W. Hesterberg and William B. Bunn IIIInternational Truck and Engine Corporation, Warrenville, Illinois, USA
Gerald R. ChaseConsultant in Statistics and Epidemiology, Larkspur, Colorado, USA
Peter A. ValbergGradient Corporation, Cambridge, Massachusetts, USA
Thomas J. SlavinInternational Truck and Engine Company, Warrenville, Illinois, USA
Charles A. LapinLapin and Associates, Glendale, California, USA
Georgia A. HartToxicology Consultant, Englewood, Colorado, USA
After decades of research involving numerous epidemiologic studies and extensive investigationsin laboratory animals, a causal relationship between diesel exhaust (DE) exposure and lungcancer has not been conclusively demonstrated. Epidemiologic studies of the transportationindustry (trucking, busing, and railroad) show a small elevation in lung cancer incidence(relative risks [RRs] generally below 1.5), but a dose response for DE is lacking. The studiesare also limited by a lack of quantitative concurrent exposure data and inadequate or lackof controls for potential confounders, particularly tobacco smoking. Furthermore, prior todieselization, similar elevations in lung cancer incidence have been reported for truck drivers,and in-cab diesel particulate matter (DPM) exposures of truck drivers were comparableto ambient highway exposures. Taken together, these findings suggest that an unidentifiedoccupational agent or lifestyle factor might be responsible for the low elevations in lungcancer reported in the transportation studies. In contrast, underground miners, many of whomexperience the highest occupational DPM exposures, generally do not show elevations in lungcancer. Laboratory studies must be interpreted with caution with respect to predicting thecarcinogenic potential of DE in humans. Tumors observed in rats following lifetime chronicinhalation of very high levels of DPM may be attributed to species-specific overload mechanismsthat lack relevance to humans. Increased tumor incidence was not observed in other species(hamsters or mice) exposed to DPM at very high levels or in rats exposed at lower levels (≤2000µg/m3). Although DPM contains mutagens, mutagenicity studies in which cells were exposed toconcentrated extracts of DPM also have limited application to human risk assessment, becausesuch extracts can be obtained from DPM only by using strong organic solvents, agitation, andheat. Most studies have shown that whole DPM itself is not mutagenic because the adsorbedorganic compounds are minimally bioavailable in aqueous-based fluids. In the past two decades,dramatic changes in diesel engine technology (e.g., low-sulfur fuel and exhaust after-treatment)have resulted in >99% reduction in DPM and other quantitative and qualitative changes inthe chemical and physical characteristics of diesel exhaust. Thus, the current database, whichis focused almost entirely on the potential health effects of traditional diesel exhaust (TDE),has only limited utility in assessing the potential health risks of new-technology diesel exhaust
Accepted 1 July 2006.Address correspondence to Thomas W. Hesterberg, International Truck and Engine Corporation, 4201 Winfield Road, P.O. Box 1488,
Warrenville, IL 60555, USA. E-mail: [email protected]
727

728 T. W. HESTERBERG ET AL.
(NTDE). To overcome some of the limitations of the historical epidemiologic database on TDEand to gain further insights into the potential health effects of NTDE, new studies are underwayand more studies are planned.
Keywords: Diesel, Engine Exhaust, Epidemiology, Lung Cancer, Risk Assessment
Internal combustion engines were developed just over acentury ago. The gasoline-fueled engine, invented in the 1870s,uses a spark ignition system, while the diesel engine, invented inthe 1890s, uses high compression instead of a spark to ignite thefuel. After World War II, gasoline fueled-engines were usedextensively to power passenger vehicles, and diesel enginessoon became the power source of choice for heavy-duty trucks,railroad locomotives, and heavy off-road applications such asagricultural and construction activities. Today, diesel enginesplay a prominent vital role in the world economy, especiallyin transportation. Compared to gasoline engines, diesel enginesmay last longer, have lower maintenance, and have better fueleconomy, but in the past have had higher emission levels (U.S.EPA, 2002 chap. 2). However, as discussed later in this review,new technologies have dramatically reduced emissions fromdiesel engines.
CHARACTERISTICS OF DIESEL ENGINE EXHAUSTSDiesel engine emissions (referred to here as diesel exhaust
or DE) are highly complex mixtures that vary widely dependingupon engine type, fuel type, and operating conditions. Tradi-tional diesel exhaust (TDE), the primary focus of this review, iscomposed of gaseous and vapor phases of numerous chemicalsand of particles (the latter are termed diesel particulate matter,DPM). As used in this review, TDE refers to the exhaustfrom diesel technology typical of the engines, fuel injectionsystems, fuels, and lubricants in use prior to 1988, when exhaustemissions from diesel were not regulated in the United States.By far, the vast majority of the total mass of TDE is composedof gas and vapor phases, which are typically composed ofup to 98% carbon dioxide and also include nitrogen oxides,sulfur dioxide, carbon monoxide, methane, and nonmethanevolatile organic carbon compounds. The DPM emitted from atraditional diesel engine running on high sulfur fuel is typicallyless than 1% of the total DE mass (McDonald et al., 2004b).This DPM will be essentially completely eliminated fromnew-technology diesel exhaust (NTDE) starting in 2007. In thisreview, the term NTDE refers to the diesel exhaust from newintegrated systems (engines, fuel injection systems, ultra-low-sulfur fuels, lubricants, and exhaust after-treatment) intended forintroduction in 2007 to meet stringent new U.S. EnvironmentalProtection Agency (EPA) standards for particulate matter andnitrogen oxides (NOx), which go into effect beginning in2007 (U.S. EPA, 2002). In addition to an almost completeelimination of DPM, as discussed later in this review, thechemical composition of the gases released from NTDE isqualitatively and quantitatively different from TDE.
Most of the DPM emitted in TDE develops during thecombustion process, with a smaller portion resulting fromcondensation of semivolatile gases in the exhaust. During fuelcombustion, ultrafine particles of elemental carbon (EC) formand combine or agglomerate into larger particles; as the particlesgrow in size, they adsorb organic carbon (OC) compounds. Thiscombustion DPM from TDE consists of a solid core of EC(approximately 65–70%), with adsorbed OC (approximately30–35%) and sulfate/nitrate (4–5%) (McDonald et al., 2004a,2004b). Ninety-five percent of the particles are submicron in di-ameter. The aerodynamic diameter of combustion DPM (some-times referred to as diesel exhaust soot) is typically 50 nm to1000 nm. Condensation particles are <50 nm in aerodynamic di-ameter (in the nanoparticle range), and are actually more numer-ous in DPM than the larger EC carbonaceous particles, but area much smaller mass fraction; these particles are composed pri-marily of hydrocarbons or sulfate and form by nucleation in DEduring cooling and dilution (Kittelson, 1998). This nanoparticlePM (particulate matter) will be virtually eliminated by the 2007technology diesel systems and thus will not be found in NTDE.
Because the particles in DPM released in TDE are highlyrespirable, and because extraction processes using heat andorganic solvents can yield mutagenic compounds from DPMparticles, concerns have been raised regarding the cancer-causing potential of DE exposure, and, in particular, of DPM.In 1954, Kotin published the first cell culture studies testingthe toxicity of DE (Kotin et al., 1954, 1955); in the 1980s thetoxicity and carcinogenicity of DE were tested in a number ofstudies using laboratory animals (reviewed in Hesterberg et al.,2005); during the last two decades, epidemiology studies haveinvestigated the association between occupational exposureto DE and health effects. Various agencies have evaluatedthis research, one of which is IARC (International Agencyfor Research on Cancer, an agency of the World HealthOrganization).
ASSESSMENTS OF THE POSSIBLE CARCINOGENICITYOF DIESEL EXHAUST
Over the years, a number of authors as well as someregulatory agencies have concluded that the weight of theevidence supports a causal role for DE in the risk of lung cancer(Wichmann, 2006; U.S. EPA, 2002; Lloyd and Cackette, 2001;IARC, 1989). However, other assessments of the DE epidemio-logic database have concluded that the existing epidemiologicalstudies are unable to predict potential human health effects fromexposure to DE or to link DE to increases in lung cancer (Muscatand Wynder, 1995; Stober and Abel, 1996; Cox, 1997; Morgan

ASSESSMENT OF DIESEL EXHAUST CARCINOGENESIS STUDIES 729
et al., 1997; Bunn et al., 2004). This conclusion was related tothe finding of various limitations in the epidemiology database,such as the lack of good historical exposure estimates andpossible confounding factors. In a recent study, which found nosignificant association between occupational exposure to dieselexhaust and lung cancer, the authors provided a detailed discus-sion of the potential limitations of earlier studies, including thefailure to adequately estimate exposure and adjust for potentialconfounders (Richiardi, L., Mirabelli, D., et al., 2006). One ob-jective of the present critical assessment is to discuss and clarifysome of those limitations. Even though parts of previous DEcancer assessments are discussed here, readers are encouragedto refer to the cited documents for the complete discussions.
In 1989, IARC listed traditional diesel engine exhaust (TDE)as a probable human carcinogen (group 2A) (IARC, 1989).The 2A classification was based on the findings of a panelof expert scientists that the evidence for the carcinogenicityof DE was limited in humans but sufficient in animals. Thepanel arrived at these conclusions following a review of thepublished peer-reviewed literature that was available at thattime, which included epidemiologic studies of people whoworked in occupations that have a potential for higher thanambient exposure to DE (e.g., railroad workers, professionaldrivers, and dock workers), as well as laboratory studies ofanimals and cells grown in culture.
The finding of limited evidence from studies of humansfor carcinogenicity of DE rested primarily on studies ofrailroad workers, especially those reported by Garshick et al.
(1987, 1988), in part because these studies had some quan-titative exposure data available from which they attemptedretrospectively to estimate historical worker exposures (Woskieet al., 1988a, 1988b). The IARC panel reserved judgment onpreliminary studies of Teamsters (International Brotherhood ofTeamsters; mostly truck drivers), because data were not yetcompletely reported. The panel noted in the monograph thatin the epidemiologic studies it reviewed, there were no directdata for the workers’ DE exposures; historical exposures wereeither assumed based on job title or were estimated from morerecent exposure assessments (IARC, 1989, Vol. 46, p. 132). Theunderground mining industry also included many workers thatwere (and are) exposed to above-ambient levels of DE. However,the IARC panel, for the most part, considered studies of theseworkers to be unsuitable for evaluating the health effects of DEbecause underground mining includes multiple exposures thatcould not be distinguished from DE.
The IARC finding of sufficient evidence from animal studiesfor carcinogenicity of DE was based primarily on studies inwhich rats (but not mice or hamsters) developed tumors afterlifetime inhalation of very high concentrations of DE (≥2200µg/m3 DE particulate). At the time of the IARC review,strong evidence had not yet been developed regarding therole of a rat-specific lung clearance overload mechanism inthe association between high exposure rates to DE and lungcancer in the rat and thus this could not be considered bythe IARC panel. This evidence is briefly reviewed later in thisarticle. Any future updated review by IARC of the carcinogenic
FIG. 1. Reductions in diesel particulate matter emissions in the United States. U.S. EPA standards for particulate emissions fromheavy-duty diesel trucks (t) or urban buses (ub), calculated as grams particulate matter emitted per brake-horsepower-hour (g/bhp-hr) and adjusted relative to pre-1988 unregulated engine emissions. From U.S. EPA Health Assessment Document for DieselEngine Exhaust (2002, Tables 2–4, p. 2–16).

730 T. W. HESTERBERG ET AL.
potential of TDE should evaluate these mechanistic findings inmaking a decision on the weight of the evidence from laboratoryanimal studies. Furthermore, as recommended by the U.S. EPA(2002), new-technology diesel emissions (NTDE) should beevaluated independently of TDE. In that document, the U.S.EPA emphasized that the 2002 health assessment applied onlyto engines that were manufactured before 1995, and that newertechnology engines would require a reevaluation with regard topotential health impacts (U.S. EPA, 2002).
CHANGES IN DIESEL TECHNOLOGIES HAVE RESULTEDIN DRAMATIC REDUCTIONS IN EMISSIONS
In a review of research on the carcinogenicity of DE, it isimportant to recognize that past research has been conductedalmost entirely on TDE, and that NTDE is quantitatively andqualitatively very different from TDE. Advances in dieseltechnology, starting 18 years ago, have resulted in progressivereductions in diesel engine emissions (U.S. EPA, 2002) (Figs. 1and 2). Diesel engines built in 1988 showed a 40% reduction inparticulate matter (PM) mass emissions compared to emissionsfrom unregulated, pre-1988 diesel engines (TDE). A “transi-tional diesel” phase, 1988–2006, showed further reductions inparticle emissions. In 1994, advances in diesel technology (e.g.,electronic engine controls) resulted in a 90% reduction in PMmass emissions compared with pre-1988 engines. In the presentarticle, the terms “traditional” (pre-1988) and “transitional”(1988–2006), like the term “NTD” (post-2006), are used toroughly categorize engines that comply with various emissions
FIG. 2. Reductions in diesel nitrogen oxide (NOx) emissions inthe United States. U.S. EPA standards for NOx emissions fromheavy-duty diesel engines, calculated as grams NOx emittedper brake-horsepower-hour (g/b hp-hr). From U.S. EPA HealthAssessment Document for Diesel Engine Exhaust (2002, Tables2–4, p. 2–16).
standards; in actuality, each term encompasses a variety of dieselengine technologies and fuel types.
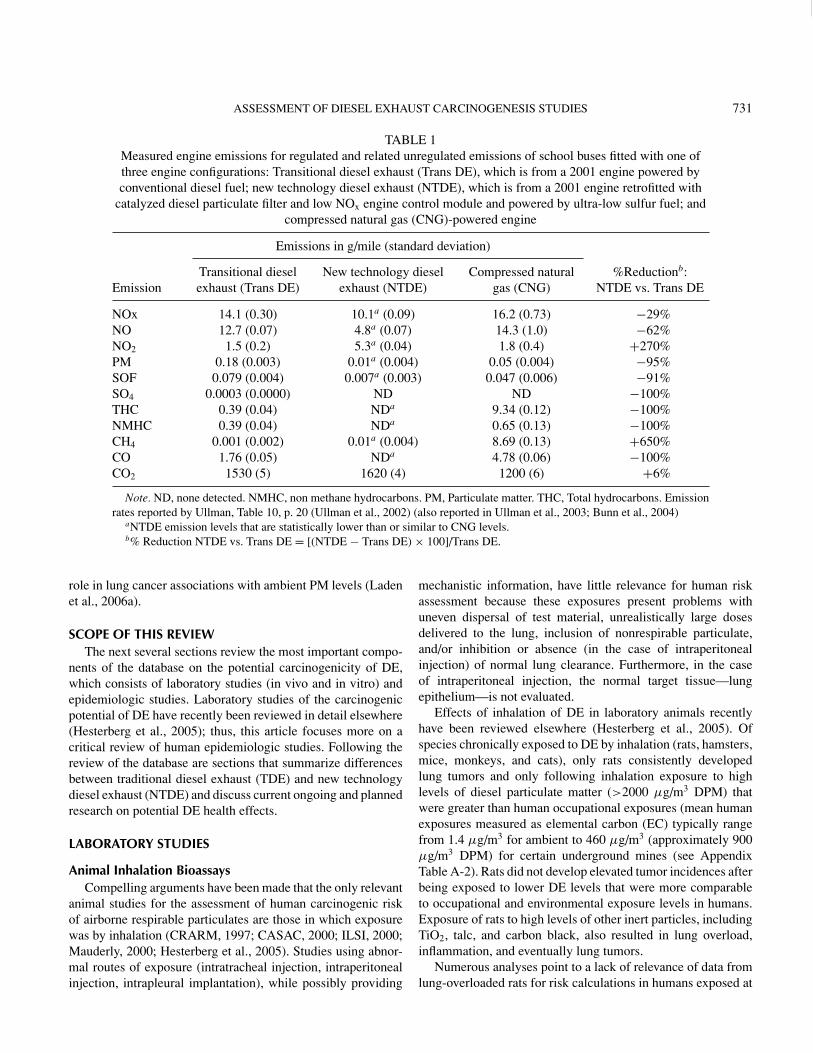
Diesel engines have undergone similar reductions in nitrogenoxide (NOx) emissions (U.S. EPA, 2002) (Fig. 2). In 2007 muchmore stringent engine emissions standards promulgated by theU.S. EPA and the California Air Resources Board (CARB)will go into effect, which will require reductions in PM andNOx emissions by approximately 99% from the pre-1988 levels(Table 1) (CalEPA, 1998; U.S. EPA, 2002). Also in 2007, theU.S. EPA and CARB standards will result in further reductionsin CARB-listed TACs (toxic air contaminants, see Table 2).Tables 1 and 2 demonstrate that not only the regulated but alsomany related nonregulated emission levels are much lower inNTDE than in transitional DE and are comparable to or lowerthan levels in exhaust from compressed natural gas (CNG),which is generally considered to be “clean.” The exhaust fromengines that comply with the 2007 emissions standards (NTDE)is not only quantitatively very different from traditional DE, butit is also qualitatively very different (Figs. 3 and 4) (Ullmanet al., 2003).
AMBIENT PARTICULATE MATTERSome epidemiologic studies correlating levels of ambient
airborne fine particulate matter (PM10 and PM2.5, with aero-dynamic diameter <10 µm and <2.5 µm, respectively) withdisease statistics have reported associations between ambientPM concentrations and lung cancer risk. There are manyuncertainties in these associations, and their causal basis isunknown, but some may wonder whether DPM plays a rolein correlations between ambient-PM and lung cancer risk. It isbeyond the scope of this article to review the lengthy healthliterature on airborne respirable PM, either PM10 or PM2.5; anin-depth and current review of this topic has been providedelsewhere (Pope and Dockery, 2006). However, three factsshould be noted on this topic: (1) DPM constitutes about 1%to 2% of ambient PM, even in urban air (Kleeman et al., 2000;Kim and Hopke, 2006); (2) dieselization of heavy-duty vehicles(class 8) in the United States is estimated to have occurredbetween 1965 and 1970 and of medium-duty engines (class5–7) in the late 1970s; and (3) the minimum latency (i.e.,time between exposure and cancer diagnosis) is estimated to be15–20 years for lung cancer. Hence, the potential magnitude forDPM’s role in any ambient-PM associations with lung cancer ismarginal. Moreover, studies of population lung cancer statisticsfor the 1980s and 1990s would have inadequate latency toexhibit DPM effects, if any. Furthermore, DPM is similar tothe PM from numerous other combustion sources, and accurateseparation and measurement of the DPM portion of ambientcombustion PM is not possible at this time (Schauer, 2003);therefore, when PM levels increase, it is not known whether theDPM level is also increased. Thus, exposure to DPM in ambientPM has been quite low and not far enough in the past to play a
ASSESSMENT OF DIESEL EXHAUST CARCINOGENESIS STUDIES 731
TABLE 1Measured engine emissions for regulated and related unregulated emissions of school buses fitted with one ofthree engine configurations: Transitional diesel exhaust (Trans DE), which is from a 2001 engine powered byconventional diesel fuel; new technology diesel exhaust (NTDE), which is from a 2001 engine retrofitted with
catalyzed diesel particulate filter and low NOx engine control module and powered by ultra-low sulfur fuel; andcompressed natural gas (CNG)-powered engine
Emissions in g/mile (standard deviation)
EmissionTransitional dieselexhaust (Trans DE)
New technology dieselexhaust (NTDE)
Compressed naturalgas (CNG)
%Reductionb:NTDE vs. Trans DE
NOx 14.1 (0.30) 10.1a (0.09) 16.2 (0.73) −29%NO 12.7 (0.07) 4.8a (0.07) 14.3 (1.0) −62%NO2 1.5 (0.2) 5.3a (0.04) 1.8 (0.4) +270%PM 0.18 (0.003) 0.01a (0.004) 0.05 (0.004) −95%SOF 0.079 (0.004) 0.007a (0.003) 0.047 (0.006) −91%SO4 0.0003 (0.0000) ND ND −100%THC 0.39 (0.04) NDa 9.34 (0.12) −100%NMHC 0.39 (0.04) NDa 0.65 (0.13) −100%CH4 0.001 (0.002) 0.01a (0.004) 8.69 (0.13) +650%CO 1.76 (0.05) NDa 4.78 (0.06) −100%CO2 1530 (5) 1620 (4) 1200 (6) +6%
Note. ND, none detected. NMHC, non methane hydrocarbons. PM, Particulate matter. THC, Total hydrocarbons. Emissionrates reported by Ullman, Table 10, p. 20 (Ullman et al., 2002) (also reported in Ullman et al., 2003; Bunn et al., 2004)
aNTDE emission levels that are statistically lower than or similar to CNG levels.b% Reduction NTDE vs. Trans DE = [(NTDE − Trans DE) × 100]/Trans DE.
role in lung cancer associations with ambient PM levels (Ladenet al., 2006a).
SCOPE OF THIS REVIEWThe next several sections review the most important compo-
nents of the database on the potential carcinogenicity of DE,which consists of laboratory studies (in vivo and in vitro) andepidemiologic studies. Laboratory studies of the carcinogenicpotential of DE have recently been reviewed in detail elsewhere(Hesterberg et al., 2005); thus, this article focuses more on acritical review of human epidemiologic studies. Following thereview of the database are sections that summarize differencesbetween traditional diesel exhaust (TDE) and new technologydiesel exhaust (NTDE) and discuss current ongoing and plannedresearch on potential DE health effects.
LABORATORY STUDIES
Animal Inhalation BioassaysCompelling arguments have been made that the only relevant
animal studies for the assessment of human carcinogenic riskof airborne respirable particulates are those in which exposurewas by inhalation (CRARM, 1997; CASAC, 2000; ILSI, 2000;Mauderly, 2000; Hesterberg et al., 2005). Studies using abnor-mal routes of exposure (intratracheal injection, intraperitonealinjection, intrapleural implantation), while possibly providing
mechanistic information, have little relevance for human riskassessment because these exposures present problems withuneven dispersal of test material, unrealistically large dosesdelivered to the lung, inclusion of nonrespirable particulate,and/or inhibition or absence (in the case of intraperitonealinjection) of normal lung clearance. Furthermore, in the caseof intraperitoneal injection, the normal target tissue—lungepithelium—is not evaluated.
Effects of inhalation of DE in laboratory animals recentlyhave been reviewed elsewhere (Hesterberg et al., 2005). Ofspecies chronically exposed to DE by inhalation (rats, hamsters,mice, monkeys, and cats), only rats consistently developedlung tumors and only following inhalation exposure to highlevels of diesel particulate matter (>2000 µg/m3 DPM) thatwere greater than human occupational exposures (mean humanexposures measured as elemental carbon (EC) typically rangefrom 1.4 µg/m3 for ambient to 460 µg/m3 (approximately 900µg/m3 DPM) for certain underground mines (see AppendixTable A-2). Rats did not develop elevated tumor incidences afterbeing exposed to lower DE levels that were more comparableto occupational and environmental exposure levels in humans.Exposure of rats to high levels of other inert particles, includingTiO2, talc, and carbon black, also resulted in lung overload,inflammation, and eventually lung tumors.
Numerous analyses point to a lack of relevance of data fromlung-overloaded rats for risk calculations in humans exposed at

732 T. W. HESTERBERG ET AL.
TABLE 2Measured engine emissions for CARB-listed toxic air contaminants (TACs) (as for Table 1)
Emissions in mg/mile (standard deviation)
Toxic air contaminantaTransitional dieselexhaust (Trans DE)
New technology dieselexhaustb (NTDE)
Compressed naturalgas (CNG)
%ReductionNTDE vs. Trans DEc
Acetaldehyde 9.5 (0.82) 2.7 (0.18) 24 (2.5) −72%Acrolein 3.3 (0.65) 0.45 (0.33) 4.9 (0.59) −86%Benzene 4.7 (0.36) ND 4.3 (0.31) −100%Biphenyl 0.410 (0.021) 0.004 (0.001) 0.005 (0.005) −99%Bis[2-ethylhexyl]phthalate 0.0017 (0.0029) 0.0010 (0.0017) 0.0016 (0.0028) −41%Butadiene, 1,3- ND 1.3 (2.3) 4.5 (1.8) NCCresol isomers 0.190 (0.022) 0.049 0.004) 0.073 (0.053) −74%Cyanide compounds 0.33 (0.27) 0.11 (0.20) 0.29 (0.50) −67%Di-n-butylphthalate 0 0.007 (0.002) 0.005 (0.006) NCDioxins & furans × 10−6 0.26 (0.07) 0.26 (0.17) 0.25 (0.14) 0%Formaldehyde 27 (1.7) 5.2 (2.1) 500 (25) −81%Hexane ND 0.39 (0.67) ND NCMethanol 10 (10) 23 (29) 30 (8) 130%Methyl ethyl ketone 0.51 (0.11) 0.02 (0.03) 0.28 (0.06) −99%Naphthalene 0.73 (0.04) 0.07 (0.04) 0.07 (0.08) −90%Phenol 0.65 (0.05) 0.15 (0.02) 0.17 (0.15) −77%Phosphorus 0.13 (0.23) ND 0.30 (0.26) −100%POM (PAHs+derivatives) 2.8 (0.21) 0.076 (0.027) 0.16 (0.13) −97%Propionaldehyde 3.0 (0.06) 0.35 (0.26) 6.9 (0.85) −88%Toluene 4.3 (0.2) 2.0 (0.92) 3.2 (2.1) −53%
Note. CARB, California Air Resources Board. NTDE, new-technology diesel exhaust, which is from a 2001 engine retrofitted with catalyzeddiesel particulate filter and low NOx engine control module and powered by ultra-low sulfur fuel. Trans DE, transitional diesel exhaust, which isfrom a 2001 engine powered by conventional diesel fuel. NC; not calculable, division by zero is undefined. ND. none detected. Emission ratesreported by Ullman et al. (2002, Table 13, p. 26; also reported in Ullman et al., 2003; Bunn et al., 2004).
aOf the 41 TACs listed by CARB, only the 20 herein listed were detected in any of the three engine emissions.bAll data in this column are NTD emission levels that are statistically lower than or similar to CNG levels.c%Reduction NTD vs. TD = [(NTD−TD) × 100]/TD.
environmental or ambient levels of DE (e.g., HEI, 1999; U.S.EPA, 2002; Greim et al., 2001; ILSI, 2000). At realistic humanlevels of exposure to DE, no lung cancer hazard is anticipatedbased on these rat data (ILSI, 2000). The general consensus isnow that the tumorigenic effects observed in the high-DE-doserat studies were primarily due to a rat-specific lung clearanceoverload mechanism that is not applicable to humans (Heinrichet al., 1986; Lewis et al., 1986; Stober, 1986; Heinrich et al.,1989, 1995; Mauderly et al., 1996; McClellan, 1996; Mauderly,2000).
Moreover, a review of responses to inhaled DE particles atthe cellular level in the rat lung suggests that the mechanisticseries of steps related to tumorigenesis in rats is not likely to berelevant to humans (Watson and Valberg, 1996). These authorsconcluded that the unique sensitivity of the rat to particle-induced tumorigenesis relates to a rat-specific exaggeratedinflux of leukocytes, which produce oxygen free radicals.They further concluded that rat tissues are not able to protectthemselves adequately against oxidative damage. Thus, the free
radicals stimulate epithelial cell proliferation and contributeto DNA damage. In the rat, DNA repair mechanisms areapparently unable to keep up with the chronic damage to thegenome. The authors suggest that “Even though differencesin dosimetry may contribute some to species differences inresponse, the available evidence indicates that species-specific(i.e., rat-specific) reactions dominate.”
A recent study provided further evidence that the mechanismof tumor development in rats following inhalation of DEwas lung particle overload. Rats were exposed by nose-onlyinhalation to DE at particulate concentrations of 3,000 or 10,000µg/m3 for 6 h/d, 7 d/w, for 2 yr. and were maintained foran additional 6 months without exposure (Stinn et al., 2005).DE exposure was associated with dose-related pulmonaryinflammation, fibrosis, and an elevated incidence of lungtumors. However, the incidence of bulky DNA adducts wasnot significantly increased by exposure to either of these DElevels. Lung tumor incidences were 23% in rats exposed at3000 µg/m3, 46% in rats exposed at 10,000 µg/m3, and 2% in

ASSESSMENT OF DIESEL EXHAUST CARCINOGENESIS STUDIES 733
FIG. 3. Low-molecular weight (“light”) PAH emissions from transitional diesel exhaust (1988–2006) vs. new-technology dieselexhaust (NTDE): quantitative and qualitative differences. “Transitional diesel” emissions were from a 2001 diesel engine poweredby high-sulfur fuel. NTDE was from an engine with a particle trap and was powered by ultra-low-sulfur fuel. Adapted from Ullmanet al. (2003).
air control rats. The authors concluded that chronic exposureto high levels of DE resulted in the following series of events:particle deposition in lungs → lung “overload” → pulmonaryinflammation → tumorigenesis. The lung tumor incidence
of 46% in rats chronically exposed to 10,000 µg/m3 wascomparable to those reported previously for similar exposuresto 7000 µg/m3: 12.8% (Mauderly et al., 1987) and 38.5%(Brightwell et al., 1989). Interestingly, there was no increase
FIG. 4. High-molecular-weight (“heavy”) PAH emissions from transitional diesel exhaust (1988–2006) vs. new-technology dieselexhaust (NTDE): quantitative and qualitative difference. “Transitional diesel” emissions were from a 2001 diesel engine poweredby high-sulfur fuel. NTDE was from an engine with a particle trap and was powered by ultra-low-sulfur fuel. Adapted from Ullmanet al. (2003).

734 T. W. HESTERBERG ET AL.
in lung cancer in rats exposed to similar levels of sidestreamenvironmental tobacco smoke (ETS). This is not unexpectedsince DPM contains 50% insoluble elemental carbon (EC) byweight, while ETS contains negligible amounts of this insolublematerial. Thus, in ETS-exposed lungs, there is no opportunityfor the progressive buildup of insoluble particles, which hasbeen related to lung overload and tumorigenesis in rats exposedto very high levels of insoluble particles such as TiO2, talc,carbon black, and DE.
In 1999, Valberg and Crouch combined tumor data from eightchronic inhalation studies in rats (Valberg and Crouch, 1999).Exposure-response analysis of rats showed no tumorigeniceffect for exposures less than 600 µg/m3 average continuouslifetime concentration. In fact, the maximum likelihood estimateof the cancer slope factor at low DE concentrations was negative(but not statistically different from zero). This meta-analysis ofstudies exposing rats to DE gave no evidence that DE exertsa tumorigenic effect at low exposures even in rats. The ratdata predict that ambient and modest levels of occupationalexposures to diesel exhaust are consistent with no increases inlung tumor risk.
Mutagenicity of DPM-Associated Organic CompoundsOrganic carbon compounds (OC) can be extracted and
concentrated from DPM using strong, nonaqueous solvents,such as dichloromethane (DCM), in combination with agitation,heat, and ultrasonic energy. Among the OC that can be isolated inthis manner are several known mutagens, including polycyclicaromatic hydrocarbons (PAHs). Differences in the extractionconditions can result in differences in the mutagenic activityof the concentrated extract (Claxton et al., 1992). Considerableattention has focused on whether the presence of mutagenicOC extractable from DPM may be the basis for the lungtumors observed in rats exposed for a lifetime to high levelsof traditional DE. Three mechanistic hypotheses have beenconsidered as a basis for rat lung tumors: (1) The OC compoundsadsorbed onto DPM dissolve in lung fluids and interact directlywith lung-cell DNA to initiate adduct formation, leading tomutations and tumorigenesis; (2) long-term inhalation of allpoorly soluble particles at high concentrations (including DPM)causes (in rats) chronic inflammation and formation of freeradicals that can lead to DNA adducts, along with tissue injurythat increases cell proliferation, with both actions promotingtumorigenesis; and (3) the combination of both (1) and (2)(dissolved OC compounds and promoting action of particle-induced inflammation) leads to rat lung tumorigenesis.
Reviews of in vitro mutagenicity studies of DPM extracts areavailable elsewhere (Vostal, 1983; IARC, 1989; Rosenkranz,1993, 1996; Valberg and Watson, 1999; ACGIH, 2000;Mauderly, 2000). In brief, these reviews report on in vitro studiesshowing that concentrated organic-solvent extracts of DPM caninduce gene mutations in Salmonella bacteria and in mammaliancells. Also, OC extracts of DPM, applied topically to the skinof mice, induced DNA adducts and tumorigenesis in the skin
(Schoket et al., 1989; Nesnow, 1990). A recent study showed thatthe OC extracted from DPM and the OC extracted from gasoline-engine exhaust particulate matter (GPM) were comparablepositive mutagens in a bacterial assay (Liu et al., 2005). GPMOC was somewhat more active on per unit mass basis, andDPM OC was somewhat more active on a mass-per-mile basis.In terms of a chromosomal-damage (micronucleus) assay, DPMOC were about one-tenth as active as GPM OC on a mass basis,but comparable on a per-mile basis. The investigators also testedvapor-phase semivolatile organic compounds (SVOC) from DEand GE. Diesel SVOC was inactive, but gasoline SVOC wasactive and had much higher toxicity. That is, some degree ofpositive in vitro genotoxicity, as estimated by standard assaysystems, is not unique to diesel exhaust.
Levels of lung-cell DNA adducts in laboratory animalsfollowing inhalation of DE or other particles have been used toestimate in vivo DNA toxicity. It has been reported (Shirname-More, 1995) that chronic inhalation of high levels of DE causesincreases in the numbers of DNA adducts in the lung cells ofrodents. However, inhalation exposure to high levels of manydifferent types of particles increases the frequency of lung DNAadducts, and the types of adducts formed are not the same as themutations induced by PAH. This suggests that adduct formationfollowing particle inhalation may be a nonspecific PM response,rather than a specific chemical effect of DE PAHs. In one groupof studies, rats exposed by inhalation to DE for 12 weeks (Bondet al., 1990a, 1990b, 1990c) or chronically (Randerath et al.,1995) showed an approximately 2- to 4-fold elevation in lungcell total DNA adducts (compared to air controls); however,carbon black (CB)-exposed rats showed similar elevations inadducts. Although the DPM and CB in these experiments hadsimilar EC cores, the DPM contained up to 30% adsorbed OC byweight, while the CB contained only 0.04% adsorbed OC. Thefact that both of these particle types induced similar lung DNAadduct levels suggests that the adduct effect was associated withthe particles per se, and not with the adsorbed OC. The adductfrequency in DE- and CB-exposed rats was not dose dependentand declined rapidly after cessation of the 12-week exposure. Incontrast to the Bond et al. results, a study reported by Gallagheret al. (1994) found no significant increases in the numbers ofPAH-associated DNA adducts or in total DNA adducts in lungcells (relative to air controls) of rats that had been exposedto DE (7,500 µg/m3), CB (11,300 µg/m3), or TiO2 (10,400µg/m3) for up to 2 years. Notably, these researchers reporteda unique “nuclease-sensitive” adduct in DE-exposed rats, butnot in controls. They speculated that this adduct might havebeen caused by nitro-PAHs. However, a key study by Areyet al. provides insight on the bacterial mutagenicity of DPMextracts possibly being artifactual (Arey et al., 1988). That is, themutagenicity of DPM that has been attributed to nitro-aromaticsmay arise artificially from the passing of NOx gasses overthe aromatic hydrocarbons deposited on the filter during thecollection of DPM, and these nitrocompounds are not presentin ambient particulate prior to collection.

ASSESSMENT OF DIESEL EXHAUST CARCINOGENESIS STUDIES 735
Working with the Health Effects Institute (HEI), Randerathet al. (1995) reviewed the findings of lung cell DNA adductsin rats following inhalation of particles and concluded that“endogenous precursors rather than inhalation of exogenouschemicals gave rise to the observed adducts.” The authors stated,“These results imply that, although the organic compounds indiesel exhaust are capable of damaging cellular DNA, suchdamage did not occur under the conditions of the inhalationbioassay.” HEI concluded that although diesel extracts havebeen shown to cause genetic mutations in vitro, the majorityof experiments using whole DPM have shown no such in vitromutagenic activity, again suggesting that potentially mutagenicOC on DPM are poorly bioavailable (HEI, 1995). Furthermore,the fact that lung tumors can be induced in rats exposed byinhalation to >2000 µg/m3 ultrafine particles with virtually noadsorbed OC (e.g., TiO2) supports the idea that PM per se, andnot the OC bound to DPM, is responsible for lung tumors in ratsexposed to overloading levels of DE.
Bioavailability of DPM-Associated Organic CompoundsAs already noted, OC on DPM can be extracted efficiently
(close to 100%) with organic solvents such as DCM, andthese organic-solvent derived extracts have been found to bemutagenic. However, bioavailability of these OCs in biologicalfluids in the respiratory tract appears to be minimal. Indeed,studies of 14C-labeled DPM incubated in DCM, blood, serum,or saline showed almost 100% OC extraction in DCM, whileonly 50% in serum, and less than 5% in saline (King et al.,1981; McClellan et al., 1982; Brooks et al., 1984). Moreover,in contrast to DCM extracts of DPM, extracts of DPM obtainedin serum, lavage fluid, or saline had very low levels ofmutagenicity (i.e., comparable to background) (Brooks et al.,1980). One hypothesis is that the OC extracted using serumor other biological fluids become inactivated. This theory issupported by an in vitro test in which a DCM extract aloneshowed high mutagenicity and toxicity, but when serum or lungcytosol was added to the extracted material, the effects weresignificantly reduced (McClellan et al., 1982). The potentiallylow bioavailability of OC adsorbed on the surface of DPM isconsistent with the pharmacologic principle that the activityof any drug or compound introduced into the body dependson the solubility of the administered compound in biologicalfluids (Vostal, 1983). When a compound is administered in aninsoluble form, the chemical will not reach the target organ,and the response seen for a soluble form cannot be expected tooccur.
The bioavailability of PAHs on the surface of DPM wasrecently studied by Borm et al. (2005). They assessed therelease and bioavailability of PAHs from CB (containingbenzo[a]pyrene levels of 0 to 6.8 mg/kg) as well as froma DPM NIST standard (SRM 2975) containing 0.052 mg/kgbenzo[a]pyrene. The NIST DPM standard has low levels of OC,and may not be representative of typical DPM. No leaching of
PAHs was detectable in saline or surfactant-containing salinefrom either CB or the NIST DPM. DPM and three differenttypes of CBs did not induce formation of DNA-adducts in theA549 human lung cell line in vitro. A solvent extract fromone of the CB types that contained the highest amount ofbenzo[a]pyrene (BaP) (6.8 mg/kg) did induce DNA adductsin vitro in A549 cell cultures. Borm et al. concluded. “However,the in vitro conditions showing this effect [of the CB extract]will not be encountered in vivo and renders this mechanismin particle-induced lung cancer at in vivo exposures highlyunlikely.” Moreover, lung DNA from rats exposed by inhalationfor 13 weeks to high levels of the same CB type did not showelevated adducts. That is, rats exposed to filtered air had thesame types and incidences of adducts as rats exposed to CB atexposure levels up to 50,000 µg/m3. The Borm et al. resultssuggest that DPM and CB PAHs are very tightly bound tothe particles, and only by using organic solvent extraction andconcentration do the PAHs become available at high enoughconcentrations to form PAH–DNA adducts.
Most bioavailability studies test the mutagenicity of thefluid phase of organic-solvent or biological-fluid extracts, andnot DPM per se. There is less evidence that whole DPM (asopposed to solvent extracts of DPM) is mutagenic in vitro,indicating that the OCs (and associated PAHs) extracted fromDPM are poorly bioavailable in lung fluids (Randerath et al.,1995). Some studies have focused on the particle phasewhen combined with surfactant-like substances (Wallaceet al., 1987; Keane et al., 1991; Gu et al., 1992, 2005), andhave reported in vitro mutagenic activity for DPM suspended ina phospholipid emulsion that simulates pulmonary surfactants.In one study, diesel soot scrapings from the inside of an exhaustpipe were either extracted with DCM, dispersed in saline, oremulsified in dipalmitoyl lecithin (DPL), an artificial pulmonarysurfactant (Wallace et al., 1987). The emulsification requiredultrasonic agitation, a nonphysiological treatment. The dieselsoot gave mutagenic results in bacteria both for DCM extractsand the DPL emulsion, and the response was dose dependent.However, when the supernatants versus the sediments of thesetest systems were separately assayed for mutagenic activity, theactivity was found exclusively in the supernatant for the DCMextracts and exclusively in the sediment for the DPL emulsions.Similar results have been found using other genotoxicity testssuch as the sister chromatid exchange assay (Keane et al.,1991), the micronucleus induction assay (Gu et al., 1992), andother assay systems (Gu et al., 2005). The results suggest thatthe in vitro mutagenic activity of DPM may be increased bythe particles being dispersed in a lung-surfactant-like medium,and that the particles themselves, rather than any extractedfraction, are responsible for this mutagenic response. Threecaveats of interpretation for these studies are that (1) the DPMevaluated was derived from diesel engines of the 1980s era,(2) preparing the DPM–surfactant emulsion required dispersionwith ultrasonic vibration energy, and (3) the authors did notverify that application of their test system to control particles

736 T. W. HESTERBERG ET AL.
(e.g., carbon black or titanium dioxide without OC) yielded anull result.
Assuming that all of the DCM-extractable mutagenic ac-tivity of DPM is bioavailable, one can compare DE-deliveredmutagenic activity with that of other sources of mutagens.Valberg and Watson used a comparative potency approach torank the mutagenicity of DPM extracts relative to cigarettesmoke condensate (CSC) (Valberg and Watson, 1999). Theydetermined that the quantity of DPM, the extract from whichhad the same mutagenicity as CSC from one cigarette, rangesfrom 63 to 181 mg, depending on the source of CSC and theDPM. This suggests that, at ambient urban levels of DPM (∼2µg/m3) and assuming complete bioavailability of DPM OC, aperson would have to breathe DPM in ambient air (∼20 m3/day)for 4 to 12 years to reach the mutagenic level equivalent to CSCfrom smoking 1 cigarette. At 5% bioavailability, it would take80–240 years of ambient DPM inhalation.
Another quantitative comparison of this kind relates to theamount of the mutagen 1-nitropyrene (1-NP) in DPM versusthe diet. Of the mutagens present in organic solvent extracts ofDPM, 1-NP is a major contributor, accounting for about 10%of the mutagenic activity (Pederson and Siak, 1981; Nakagawaet al., 1983). The content of 1-NP in DPM is such that ambientlevels (∼2 µg/m3) would be expected to have about 0.30 pg/m3
of 1-NP (Scheepers et al., 2003). By comparison, the contentof 1-NP in grilled chicken is about 20 ng/g (Kinouchi et al.,1986). Hence, ingesting a single serving of grilled chicken (3.5oz) would deliver about 2000 ng 1-NP. A person would have tobreathe ambient levels of DPM for 1000 years to receive thatamount of 1-NP. Although this is a comparison across differentroutes of entry, 1-NP has been shown to be rapidly absorbedfrom the gut (van Bekkum et al., 1999). This calculation againsuggests that mutagens in DPM, even if completely bioavailable,are markedly lower in quantity that what is received from othersources.
Interestingly, in one of the very few studies of dieseloccupations in which a range of DPM exposures in a groupof 87 railroad workers was compared to mutagenic activity intheir urine, no association was found between personal DPMexposure and urinary mutagenicity (Schenker et al., 1992).
In summary: (1) Biological fluids are far less efficient atextracting potentially mutagenic OC from DPM than organicsolvents, (2) mutagenic chemicals tightly adherent to DPMare not likely to be bioactive in vivo, and (3) biologic fluids(e.g., serum, surfactants) may mitigate the mutagenic activity ofextracted OC such as PAHs, but (4) some evidence suggests thatDPM coated with surfactant may have mutagenic activity. Quan-titatively considering the organic-solvent-extracted mutagenicpotential of OC from DPM shows that continuous exposure toDPM at ambient concentrations delivers a far lower dose ofmutagenicity than that received from other common sources ofhuman exposure to mutagens. Thus, even for traditional DE, itappears that genotoxicity of DPM is unlikely to increase lungcancer risk.
Summary of Laboratory StudiesIn summary, the apparent mechanism whereby lifetime in-
halation of very high concentrations of DE leads to lung tumorsin rats is: Deposition of high levels of particles in the lungsoverloads clearance mechanisms and initiates an inflammatoryresponse to which rats are particularly vulnerable; chronicinflammation, with ongoing release of oxygen free radicalsfrom pulmonary macrophages and neutrophils, damages lungtissues and stimulates tissue repair, increasing the chances ofDNA mistakes and failure of DNA repair mechanisms; at thesame time, oxygen free radicals act as direct mutagens. Thespecies-specific carcinogenic process appears to occur onlyat very high doses and to be a particle and not a chemicaleffect. Neither the animal nor the cell culture studies of DEprovide convincing evidence of a mechanism involving a directexogenous mutagen.
Mutations have been demonstrated in cells that have beendirectly treated (in vitro or ex vivo from rodents intratracheallyinstilled) with OC extracted from DPM by organic solvents.However, these results are not likely relevant to DE tumori-genicity observed in rats, because DPM mutagens are relativelynon-bioavailable and low in quantitative activity compared toother sources. Mutagenic OC can be extracted from DPMonly by the use of heat, ultrasonication, and organic solvents,processes that do not occur in a living organism. Althoughsome evidence exists that DPM coated with surfactant may havemutagenic activity, the interpretation of these results is unclear.In summary, both the animal and the in vitro laboratory studiesof DPM are not adequate for predicting that inhalation of DEleads to an increased risk of lung cancer in humans.
EPIDEMIOLOGIC STUDIES
Introduction to Epidemiologic StudiesWhile there have been numerous epidemiologic studies of
occupational groups with potential or known exposure to DE,only some of them have been undertaken with the investigationof DE as an a priori objective. Among those studies with such anobjective, many have concluded that DE exposure is or may bea factor in the risk of lung cancer. Similarly, among authors orpanels that have reviewed studies of such occupational groups,whether or not the investigation of DE was an original studyobjective, many have concluded that there is at least a weakassociation between long-term occupational exposure to DEand the risk of lung cancer. The objective of this section is tosummarize and critically assess the assumptions and conclu-sions of the topics considered most relevant: studies of railroadworkers, on-road transportation workers, and undergroundminers; associated exposure information; and selected reviews.
Assessment of Exposure to Diesel Engine ExhaustBefore reviewing the epidemiologic studies, some back-
ground information on the assessment of diesel exposure willbe helpful.

ASSESSMENT OF DIESEL EXHAUST CARCINOGENESIS STUDIES 737
A major problem in estimating DE exposure is that most DE-exposed work areas also include airborne particles from manyother sources, including carbon compounds from nondieselsources (e.g., tobacco smoke, gasoline engine exhaust, othersources of combustion, solvents, pollen, paper, dust, etc.).The exhausts of engines (both gasoline- and diesel-powered)share similar physical and chemical characteristics with eachother and with airborne materials from many other combustionsources. There is no known marker for distinguishing DPM fromother types of carbon-based dust. Thus, it has been difficult,if not impossible, to quantify the portion of an individual’stotal airborne particulate exposure that derives from engineexhaust, and even more difficult to quantify the portion thatis specifically related to diesel exhaust. Indeed, the followingsections of this work describe research that suggests that DE andgasoline engine exhaust exposures are present together and areinseparable in the trucking industry, but not in the undergroundmining industry.
As discussed in the introduction, DPM develops during thecombustion process; ultrafine particles of EC form, agglomerateinto larger particles, and adsorb OC compounds as they grow insize. Typically, high levels of airborne OC particulate indicateone or more non-DE sources. For example, the total carbon(TC = EC + OC) in cigarette smoke is >98% OC and <2% EC.In contrast, the TC in DPM is only 15–65% OC (35%–85% EC),depending on fuel type, engine type, and operating conditions(Zaebst et al., 1991; Sirianni et al., 2003). There are also manyother sources of EC and OC, such as gasoline engines, cooking,industrial boilers and manufacturing processes (Rogge et al.,1991, 1993a, 1993b, 1993c, 1993d, 1994, 1997a, 1997b, 1998).
Because DE is a complex mixture, it cannot be measureddirectly. Markers, or surrogates, that have been measured in thefield in order to estimate DE exposure in occupational settingsinclude the following:
• Carbon monoxide.• Nitrogen dioxide.• Coal tar pitch volatile organic compounds.• Respirable particulate matter (RPM; particles with
median aerodynamic diameter 3.5 µm).• Respirable combustible dust (RCD, i.e., RPM that is
pyrolized to obtain the organic fraction).• Adjusted respirable particulate matter (ARPM, i.e.,
RPM minus the estimated tobacco-related component).• Submicrometer particulate matter (also referred to as
DPM; aerodynamic diameter <1 µm, or in some cases<0.8 µm).
• Total carbon (TC).• More recently, elemental carbon (EC).
Of the identified surrogates, the EC exposure measurementprovides the most specific representation of historic DEexposure. EC is a relatively good surrogate for traditionalDPM, because DPM has a relatively high fraction of EC formany occupational environments. However, as discussed in the
introduction of this article, DPM is typically less than 1% ofthe mass of total DE; thus, EC, although the best of the knownsurrogates for DE, is still not ideal. Moreover, newer engines(that comply with 2007 emissions regulations) have particulatetraps that virtually eliminate all EC from the exhaust and alterthe emission profile in other ways, thus further limiting theutility of EC as an effective surrogate for DE in the future.
For EC analysis, NIOSH method 5040 uses a thermal processto separately measure the EC and OC components of air samplescollected in DE-exposed workplaces (Birch and Cary, 1996;Birch and Noll, 2004). Current assessments of DE exposurecommonly measure EC as a marker to help distinguish dieselexhaust from other types of airborne particles (especially fromtobacco smoke). Even this approach, however, cannot fullydifferentiate DE exposure from exposure to other combustionsources. For example, gasoline exhaust typically consists of20–35% or more (in late-model vehicles) EC (Norbeck et al.,1998). EC is commonly present in many different combustionproducts (though at lower concentrations than in DE) and isalso produced by some other sources such as iron foundries,cooking, and agricultural burning.
In 2003, HEI convened a panel of world experts to identifya marker for diesel. The panel concluded: “Better measuresof exposure to constituents of diesel emissions, with carefulattention to selection of the sample studies, are needed. Ofparticular importance are the selection and validation of achemical marker of exposure to the complex mix of dieselexhaust emission” (HEI, 2003).
In the epidemiologic studies discussed next, various markersand methodologies have been used to estimate DE exposure.Table A-2 lists DE exposure studies for various occupationalgroups and compares results of different DPM measurementtechniques. The accuracy and appropriateness of the DE-exposure assessments in each study have a major impact on thevalidity of the findings with regard to associating DE-exposureto lung cancer mortality.
Railroad WorkersRelevant studies of U.S. railroad workers that bear on DE
exposure and its possible relationship to lung cancer risk includecase-control and retrospective cohort mortality studies reportedby Garshick et al. (1987, 1988, 2004, 2006b); an industrialhygiene survey of DE exposures in railroad jobs (Woskieet al., 1988a, 1988b); a reanalysis of the epidemiologic databy Crump (1999); and later assessments of DE-exposures ofU.S. train crews by Liukonen et al., Seshagiri, and Verma(Liukonen et al., 2002; Seshagiri and Burton, 2003; Vermaet al., 2003). The railroad epidemiologic studies were based oncomputerized work records maintained since 1959 by the U.SRailroad Retirement Board (RRB). By 1959, the transition fromcoal-powered to diesel-powered locomotives was 95% completein the United States.

738 T. W. HESTERBERG ET AL.
FIG. 5. Railroad worker exposure to respirable particulate matter, elemental carbon, and environmental tobacco smoke.Comparison of railroad worker exposure measurements of Woskie (1988a) and Verma et al. (1999). Height of bar representsrespirable particulate matter (RPM). The five bars on the left show the relative proportion of environmental tobacco smoke (ETS)and other (adjusted) respirable particulate matter (ARPM) estimated by Woskie et al. The four bars on the right show the proportionof elemental carbon (EC) and other respirable particulate matter measured by Verma et al.
Woskie et al. Assessment of DE Exposure of Railroad WorkersThe Garshick epidemiologic studies classified various rail-
road job categories as either DE-exposed or nonexposed basedon an industrial hygiene survey conducted during 1981–1983to evaluate the then-current exposure of railroad workers toDE (Woskie et al., 1988a, 1988b). The survey measuredconcentrations of airborne respirable particulate matter (RPM;3.5 µm mass median aerodynamic diameter), adjusted forcigarette smoke, as a marker of DE exposure in four smallnortheastern U.S. railroads, for more than 530 workers in 39common jobs, over a period of 3 years. (It may be noteworthythat the DE exposure period in the Garshick epidemiologicstudy was 1959–1980, whereas the DE exposure assessmentperiod in the Woskie study was 1981–1983. Furthermore,the epidemiologic study population worked throughout theUnited States, whereas the Woskie study was conducted in thenortheastern United States.) In many of the exposure samplesthe investigators estimated that 20–90% of the RPM wasderived from cigarette smoke (Fig. 5); thus they subtractedfrom the RPM measurements the estimated fraction due tocigarette smoke to obtain an adjusted respirable particulatematter (ARPM) value. The ARPM levels for the job categoriesfell into three exposure groups: clerks and signalmen, lowexposure; train crews, medium exposure; shop workers, highexposure. The adjusted ARPM exposures ranged as follows(geometric means, µg/m3): “Unexposed” jobs were 17 for clerksand 49 for signalmen; “DE-exposed” jobs were 39–92 for train
crew other than hostler; 191 for hostlers (highest exposure); and114–134 for shop workers (Table 3). The Woskie et al. studyfound notable variations in exposure results between differentrailroads and with weather changes. Based on limited historicalexposure data, Woskie et al. assumed that DE exposure wasapproximately constant from 1959 to 1983.
Garshick Case-Control Study, 1981–1982The initial study published by Garshick and his investigative
team was a case-control study in which the cases were lungcancer deaths of railroad workers who were born during or after1900, had at least 10 years railroad service, and died betweenMarch 1981 and February 1982 (Garshick et al., 1987). Deathcertificates were located for about 13,000 deaths during this 1year, including 1256 lung cancer deaths (cases). The controlswere randomly selected from the remaining RR worker non-lung-cancer deaths, subject to eligibility criteria, and matched tothe cases for age at death and date of death. Exposure to DE wasmeasured in years of working in DE-exposed jobs (Woskie et al.,1988b) since 1959. Multiple conditional logistic regressionmodels, with adjustments for smoking (including pack-years,categories of pack-years, cigarettes per day, years of smoking,and years of smoking and years since stopped) and asbestosexposure (including yes/no, estimated years of exposure, andcategories or regular, intermittent and none), were used for theanalyses. The authors reported the following: (a) Workers who

ASSESSMENT OF DIESEL EXHAUST CARCINOGENESIS STUDIES 739
TABLE 3Railroad industry: Personal exposures to adjusted respirable particulate matter by job
group and lung cancer mortality based on U.S. rates
Exposure Lung cancer mortality
Job category n
Adjusteda respirableparticulate matterb
(µg/m3, geometric mean) n Relative riskd
UnexposedClerks 59 17 315e 0.98e
Signal Men 13 49Exposed
Engineers/firemen 128 39–73c 298 1.23Conductors/brakemen 158 52–92c 437f 1.20f
Hostlers 8 191Shop workers 174 114–134c 318 1.08
aFor each air sample, estimated fraction of cigarette smoke was subtracted from total respirableparticulate matter; adjusted data are presumed to reflect the concentration of airborne DE particulate(Woskie et al., 1988b).
bRPM median aerodynamic diameter 3.5 µm.cRanges for various subcategories within this job category.dBased on U.S. lung cancer mortality rates (Crump, 1999).eClerks and signal men combined.fConductors/brakemen and hostlers combined.
were less than 65 years of age at time of death and had workedin a DE-exposed job for 20 years had a statistically significantincreased odds ratio for lung cancer, which was calculated tobe 1.40. (b) Risk for lung cancer was not elevated in workerswho were 65 years of age or older at time of death (the oddsratio was calculated to be 0.91 for 20 years of service), because(the authors concluded) “many of these men retired soon afterthe 1959 transition to diesel locomotives.” The investigatorsconcluded, “The relative risk obtained in this current studyis low. Some believe that at relative risks of this magnitude,epidemiologic methods cannot be used to establish risk.” Theyalso concluded, “Our findings suggest that other groups withoccupational exposures (underground workers exposed to dieselexhaust) may be at excess risk of lung cancer.”
Garshick Retrospective Cohort Study Through 1980One year after publishing their case-control study, Garshick
et al. reported on their retrospective cohort mortality study forthe follow-up period of 1959 through 1980 (Garshick et al.,1988). The cohort consisted of approximately 55,000 Whitemale railroad workers 40 to 64 years of age in 1959, with 10 to20 years of service by 1959. As in the case-control study alreadydescribed, jobs were again classified as either “DE-exposed”or “nonexposed” according to yearly job records from 1959 todeath or retirement. No adjustments for smoking were made, andthe authors cited data on a subset that indicated no differencein smoking prevalence between workers with and without DE
exposure. The cohort was selected to minimize possible asbestosexposure. Directly standardized rates and a proportional hazardsmodel were used to calculate the relative risk of lung cancerbased on work in a job with DE exposure beginning in 1959.DE exposure was considered to be a dichotomous (yes/no)variable. Death certificates were obtained for 88% of 19,396deaths, including 1694 lung cancer deaths.
The authors reported the following results: (a) The relativerisk of lung cancer was progressively higher among workers whowere younger in 1959 and who thus had potentially longer DEexposures or at least longest elapsed time since first exposure.For workers aged 40–44 years in 1959, the relative risk was 1.45(Table 4); for the workers aged 60–64 in 1959, the relative riskwas 0.99. Garshick et al., concluded, “Workers with 20 years ormore elapsed since 1959, the effective start of diesel exposurefor the cohort, had the highest relative risk.” (b) The authorsalso reported that the relative risk of lung cancer increased withincreasing cumulative years of DE exposure from 1959 on. Theauthors concluded that these results “support the hypothesis thatoccupational exposure to DE results in a small but significantlyelevated risk for lung cancer.”
Crump Analysis of Garshick StudiesIn response to a request from the U.S. EPA, Crump conducted
a quantitative risk assessment for DE based on the data from theGarshick 1988 cohort study and pointed out several importantfindings (Crump et al., 1991; Crump, 1999, 2001). (a) First,

740 T. W. HESTERBERG ET AL.
TABLE 4Railroad industry: Relative risk for lung cancer mortality,
1959–1980
Relative risk for lung cancer mortality
Worker age(yr) in 1959
Exposed vs.unexposeda
Exposed vs.U.S. ratesb
Unexposed vs.U.S. ratesb
40–44 1.45 0.66 1.0345–49 1.33 0.84 1.0850–54 1.12 0.96 1.1755–59 1.18 1.23 1.3960–64 0.99 1.25 1.23
Note. Diesel exposure, yes or no, based on job classification in 1959.aGarshick et al. (1988).bCrump (1999).
Crump reported evidence that follow-up was incomplete for thestudy; that is, “a sizable fraction of deaths during the last fouryears of follow-up evidently were not identified” (apparentlydue to incomplete transmittal of data from the RRB). Theshortfall of data effectively ended the follow-up at 1976, insteadof 1980 as originally intended. (b) In contrast to the Garshicket al. (1988), finding that relative risk for lung cancer increasedwith duration of exposure, Crump did not find a plausibledose-response for DE. Crump concluded that, “A positive,monotone dose-response trend in lung cancer mortality withincreasing duration of exposure . . . was not present when agewas controlled more carefully and years of exposure quantifiedmore accurately. Instead, a negative dose-response trend forlung cancer was seen among exposed workers based on eitherduration of exposure or quantitative measures of cumulativeexposure.” (c) In contrast to the Garshick 1988 finding of adecreased lung cancer risk with increasing age at 1959, Crumpreported opposite trends when U.S. rates were used as the basisof comparison; lung cancer mortality was higher among workerswho were older in 1959 (and therefore had less DE exposure)(Table 4). (d) Crump reported that although the engineers andconductors had similar DE exposures (based on airborne RPMlevels adjusted for tobacco smoke), convincing evidence existsthat shop workers had higher DE exposures (perhaps twicethat of the train crews). Crump pointed out that although traincrews (exposed) had significantly elevated lung cancer mortalityrelative to clerks and signalmen (assumed to be unexposed),shop workers (the most highly DE-exposed group) did not havean elevated risk (Table 3). Crump noted that shop workersalso were exposed to other industrial lung carcinogens suchas asbestos and welding fumes, and the fact that lung cancermortality in these workers was no different from that of clerksand signalmen argues against a causal effect of diesel exposurein this cohort. Based on their findings, Crump and colleaguesrecommended to the U.S. EPA that the railroad study reported
by Garshick et al. (1988) did not constitute an appropriate basisfor a risk assessment of DE (Crump, 2001).
Garshick Cohort Study Update Through 1996In 2004, Garshick and colleagues updated the cohort mortal-
ity experience to cover the 37 years from 1959 through 1996,during which time there were nearly 44,000 deaths with knowncause of death, including 4351 lung cancer deaths (Garshicket al., 2004). The update confirmed and corrected theirincomplete follow-up through 1980, which Crump had reported(Crump et al., 1991; Crump 1999), adding several thousand pre-1981 deaths that inadvertently had been excluded in the original1959–1980 cohort study. In their 2004 paper, after “adjustingfor a healthy worker survivor effect and age,” Garshick et al. re-ported an elevated lung cancer relative risk of 1.40 for train crews(engineers, firemen, conductors, and brakemen; jobs identifiedas DE exposed) compared with railroad workers in unexposedjobs (clerks and station agents). Indirect adjustment for smokingusing Schlesselman and Axelson methods (Schlesselman, 1978;Axelson and Steenland, 1988; Larkin et al., 2000) attenuated therelative risk to between 1.17 and 1.27. The job-specific smokinghabits were estimated from the case-control study and a surveyof 514 white male workers at a small railroad in 1982. Shopworkers, who reportedly were exposed to the highest levels ofARPM but did not show elevated lung tumor incidence, wereomitted from this comparison. The reasons given were that “thejob codes of shop workers were not specific to work in areas withlocomotive exhaust, so diesel exposures of these job codes couldnot be specified,” and “in addition, it was possible that some ofthese workers had previous asbestos exposure in steam enginerepair shops.” Garshick et al. further reported that “lung cancermortality did not increase with increasing years of work in thesejobs,” which confirmed the Crump (1999) finding and reversedtheir own 1988 reported finding. They concluded “Although acontribution from exposure to coal combustion products priorto 1959 cannot be excluded, these results suggest that exposureto diesel exhaust contributed to lung cancer mortality in thiscohort.”
Using a different approach to estimate smoking patterns intheir cohort, Garshick and his team recently published (Garshicket al., 2006b) an analysis of a subset of the full cohort reportedin Garshick et al. (2004). The subset is made up of 39,388railroad workers who died from 1959 to 1996. Using smokinginformation from their case-control study, they “imputed”smoking histories (i.e., estimated by randomly selecting fromthe case-control workers for whom smoking information wasavailable) for the 39,388 who died. They reported, “The smokingadjusted relative risk of lung cancer in railroad workers exposedto diesel exhaust compared to unexposed workers was 1.22(95% CI = 1.12–1.32), and unadjusted for smoking the relativerisk was 1.35 (95% CI = 1.24–1.46).” It was concluded that“In this cohort, small differences in smoking behavior betweendiesel exposed and unexposed workers did not explain the

ASSESSMENT OF DIESEL EXHAUST CARCINOGENESIS STUDIES 741
elevated lung cancer risk.” Their innovative approach illustrateshow smoking adjustments can lower relative risks. However,estimates based on case-control data are not unbiased, leavingthe possibility for uncontrolled confounding. As Marsh et al.(2001) noted in their study of man-made vitreous fiberproduction workers, “Because the case-control studies were notbased on random samples of cohort members, however, theycould not provide unbiased estimates of smoking rates in thetotal cohort” (Marsh et al., 2001).
Laden et al., 2006b, recently published a report using aninnovative exposure intensity characterization by using histor-ical data on dieselization of individual railroads and emissionfactors and constants suggested by the US EPA (1996b). WhileRRs for lung cancer remained elevated, as expected, there wasno evidence of an exposure-response relationship using themeasures of exposure based on the intensity measure. They alsoreported on measures of duration of exposure going back to1945. (Earlier reports started in 1959.) They reported evidenceof an exposure-response for workers first hired from 1945–1949using years of exposure. However, there was no evidence of sucha response for the full cohort or the much larger group of workersfirst hired from 1939–1944.
Critique of DE Exposure AssessmentsIn commenting on the railroad worker cohort investigation
reported by Garshick in 1988, Crump (1999) noted that “evenif the problem of incomplete follow-up was corrected, and evenif follow-up was extended to additional years, this would notaddress the limitations of the exposure data for this cohort.” TheGarshick 2004 update did just that: the incomplete follow-upfor 1959–1980 was corrected and the follow-up was extendedthrough 1996, but the limitations of the exposure data for thecohort were not addressed.
Garshick excluded shop workers from the “exposed group”of conductors and engineers. However, Crump concluded that“based on all the available evidence, it appears highly likelythat the shop workers (90% of whom were machinists andelectricians) had the highest DPM exposures of any group ofworkers in the Garshick et al. cohort.” Garshick does not refutethat conclusion. Crump’s important observation is ignored inspite of his warning that the fact that “lung cancer mortalityin these workers was no different from that of clerks andsignalmen argues against a causal effect of diesel exposure inthis cohort.” Given that there was essentially no increase in lungcancer risk among shop workers, potential asbestos exposuredoes not justify considering that group separately. Furthermore,the EC levels provided in subsequent manuscripts by Vermaet al. (1999, 2003), Liukonen et al. (2002), Seshagiri (2003),and Seshagiri and Burton (2003), collectively, suggest that theshop worker (machinists and electricians) exposures to DE wereat least comparable to that of conductors and engineers, andmay well have been substantially greater (thus corroboratingCrump’s discussion and conclusion) (Fig. 6). The 2004 Garshick
follow-up shows essentially the same results for shop workers,with an average RR of about 1.04.
More recent industrial hygiene studies of exposure to dieselexhaust in the Canadian railroad work environment (Vermaet al., 1999, 2003; Seshagiri 2003; Seshagiri and Burton, 2003)found total respirable particulate matter (RPM) concentrationsin the same range as those reported by Woskie et al. (1988a,1988b). However, as shown in Fig. 5, the Canadian studyobserved low EC levels for the DE-exposed job groups (onboard, turnaround, and repair). Importantly, the Canadian studyshowed that EC constituted only a minor part (2–16%) of totalrailroad worker RPM exposures. In contrast, Woskie et al.using ARPM as their estimate of DPM, concluded that DPMconstituted 73–84% of total RPM. The exposure findings of themore recent Canadian studies, and the lack of a more specificindicator of DPM exposure (like EC) in the earlier Woskiestudies, suggest that the Woskie studies overestimated the DPMcontent of the RPM exposure. The EC content of DPM varieswith engine age, condition, fuel, etc. (as discussed earlier).However, in the Verma study, even if the DPM mass in thesamples were equal to twice that measured for EC, DPM wouldstill be a small fraction of the RPM exposure. The Canadianstudies show that the RR worker RPM contained much non-DEmaterial, and this likely would be true also for the Woskie U.S.studies, even after adjustment for environmental tobacco smoke(ETS).
The more recent railroad worker exposure studies (Liukonenet al., 2002; Seshagiri, 2003; Seshagiri and Burton, 2003;Verma et al., 2003) use NIOSH Method 5040 (developedsubsequent to the Woskie studies) to measure airborne EClevels (Fig. 6). For engineer and conductor exposures, resultsdepend on season and location in the train. For workers in thelead locomotive, Liukonen found train crew exposure to DEcomparable to background urban exposures. Geometric meanexposure levels were 3.7 µg/m3 for EC inside the operatinglocomotives compared to a background range of up to 8 µg/m3
for EC. For trailing locomotives, Seshagiri found that higherlevels of EC were also associated with open windows duringthe summer and proximity of exhaust stack. These more recentstudies using EC as the comparison metric indicate that levels ofDE for train crews are not much different from, and on averagemay be less than, exposures for mechanics and repair operations.These data appear to further weaken the Garshick finding of anassociation between DE and lung cancer risk among train crews,which was based on a presumed higher DE exposure of traincrews.
Healthy Worker EffectIn 2004, Garshick et al. acknowledged that their original
1988 conclusion, stating that “lung cancer risk increased withincreasing years of work in diesel-exposed jobs,” was in errorand that “subsequent re-analyses of these data, with adjustmentfor attained age, indicated decreased risk with more years

742 T. W. HESTERBERG ET AL.
FIG. 6. Airborne diesel exhaust levels in railroad work environments measured as elemental carbon. Elemental carbon (EC)sampling results (arithmetic means) for various job categories and locations. First letter indicates reference: A, Verma et al. (2003);B, Liukonen et al. (2002); C, Seshagiri (2003); D, Seshagiri and Burton (2003). Area = area sample; pers. = personal sample.(References A, B, and C noted that on-board area samples were considered equivalent to personal samples if crew members werepresent.) [n] = sample size. Some values were calculated from data in the articles (e.g., mean was estimated using geometric meanand geometric standard deviation).
worked,” agreeing with Crump (1999). Garshick et al. (2004)further reported, “Analysis in this updated cohort with longerfollow-up also indicates that lung cancer mortality is inverselyrelated to total years worked.” Garshick et al., suggested that thisinverse association between lung cancer and exposure durationmight be explained by a healthy worker survivor effect.
Some comments on the “healthy worker effect” are in orderhere to clarify how this effect might impact evaluations ofthe potential risks arising from employment. The “healthyworker effect” is comprised of several factors, including: (1)those who are hired tend to be healthier, the healthy hireeffect; and (2) healthier individuals tend to remain employed,the healthy worker survivor effect (Checkoway et al., 1989;Arrighi and Hertz-Picciotto, 1994). Garcia and Checkowayexplained the “healthy worker survivor” as the effect that “refersto the selection process by which workers affected by theiroccupational exposure terminate prematurely their working lifeor transfer from higher to lesser exposure jobs, generally leading
to under-estimation of risks and dose-response estimation”(Garcia and Checkoway, 2003). In such a scenario, job statusmay be viewed as an “intermediate variable” or a “mediatorvariable” that is influenced by the occupational exposure andmay be associated with the health outcome of interest. They alsonoted that the healthy worker survivor effect “is most prominentin cross sectional studies of disease prevalence and exposure.”The Garshick et al. railroad worker study is not a cross sectionalstudy, it is a cohort study with both retrospective and prospectivecomponents. Last, in part, defined the “healthy worker effect”by noting that “Workers usually exhibit lower overall death ratesthan the general population, due to the fact that the severely illand disabled are ordinarily excluded from employment” (Last,1988).
Monson suggested that the “healthy worker effect” is“somewhat of a misnomer, since similar deficits are foundwhen other non-hospitalized groups are followed, e.g., religiousgroups” (Monson, 1990). Monson suggested a more general

ASSESSMENT OF DIESEL EXHAUST CARCINOGENESIS STUDIES 743
term, “healthy person effect.” As Monson explained, “Generalpopulations are made up of two groups: the healthy and the ill.Those who are healthy tend to be employed and those who are illtend to be hospitalized. Each, however, contributes to the overallmortality rate of the general population.” It is perhaps intuitivelyunderstandable that if a cohort of active workers is identified andfollowed from January 1, 1959, forward (the Garshick cohortwas identified as workers who were active in 1959 with 10 to20 years of experience), it would not include former workerswho had stopped work in 1957 or 1958 because they were toosick to work (e.g., disabling respiratory or heart disease, orterminal cancer). As a result, the mortality in the cohort fromthose diseases would likely have been initially lower than in thegeneral population. Conversely, some causes of death, such asaccidents, may be seen in greater numbers than in the generalpopulation. The combined effect of healthier persons making upthe cohort often results in lower overall death rates, hence the“healthy worker effect.” In fact, Garshick et al., reported justthat: The SMR for all observed deaths in the cohort was 0.81in 1959, consistent with a healthy worker effect, and by 1967the yearly overall SMR in the cohort had risen to 1.01. Thisincrease in overall SMR in the cohort for 1959–1967 is alsoshown in Fig. 1 of Crump (1999) (“Observed deaths dividedby expected deaths based on U.S. Rates”). The “healthy workersurvivor effect” can be subtler than the generally recognizedfact that workers tend to have better health than the generalpopulation because better health enhances employment. For thehealthy worker effect to have an impact on the disease outcomeof interest, the risk of the disease must be different for thosewho have ceased employment than for those who continueemployment. If such is the case, an adverse risk of exposure maybe attenuated.
How does the healthy worker effect manifest with lungcancer? Howe et al. found that “the healthy worker effect isless for lung cancer than for other cancers, and, in turn, this isless than for all causes of death” (Howe et al., 1988). Arrighiand Hertz-Picciotto remarked, “A common belief is that thehealthy worker effect is small for cancer, especially lung cancer”(Arrighi and Hertz-Picciotto, 1994). They went on to note thatalthough smaller than for cardiovascular mortality, particularlyin the period shortly after hire, some empirical results consistentwith the effect have been reported for cancers. If the Garshicket al. cohort had been initially made up of workers who werecancer-free (or who had not yet been diagnosed), the numberof deaths from lung cancer would be expected to be less in thecohort than in the general population. That is because only afraction of those that were diagnosed in 1959 would have diedin 1959 (some would have died in 1960, etc., and some wouldhave died from other causes). However, because survival forlung cancer victims is low, most probably in only a few yearsthere would be little or no effect from the initial cancer-freestatus of the cohort. The formulas given by Sasieni can be usedto illustrate that any healthy person effect for lung cancer shouldbe essentially gone within 5 to 7 years, definitely before 10 years
(Sasieni, 2003). Such calculations illustrate that from that pointforward, the number of expected lung cancer deaths for thecohort is essentially that of the general population, even thoughthe cohort was cancer-free initially.
Garshick et al. (2004) offered no explanation as to howsuch an effect could produce an inverse relationship in therailroad worker study for a follow-up period of 38 years. Aplausible healthy worker explanation for the consistent inverserelationship between duration of employment and lung cancermortality found in this cohort of 55,000 men over a period of38 years is deemed extremely unlikely.
Health Effects Institute Review of Railroad StudiesThe HEI Diesel Epidemiology Expert Panel (HEI, 1999)
conducted a detailed review of the raw Garshick data and variousanalyses of those data, including the Crump assessment. Thispanel was assisted by leading investigators who had conductedepidemiologic research on diesel exhaust, and by expert analystswho had conducted critical reviews of that research. Thepanel reviewed data on the three broad categories of railroadworkers—train workers (engineers, conductors), shop workers(machinists, electricians), and clerks and signalmen—and con-cluded that lung cancer risks for train workers were higher thanfor clerks/signalmen (unexposed), with shop workers exhibitingintermediate risks. However, the panel’s analysis also found thatwithin each category of worker, the risk of lung cancer decreasedwith increasing duration of employment, and, further, that thedecrease was statistically significant for clerks/signalmen andtrain workers. The HEI report therefore concludes:
These findings are not consistent with a steadily increasingassociation between cumulative diesel exposure and lung cancerrisk. Furthermore, if the difference in risk between train workersand clerks/signalmen was due primarily to differences in exposureto diesel emissions, one would expect the relative risk for trainworkers compared with that for clerks and signalmen to be reducedor even eliminated after adjusting for exposure. In fact, adjustmentfor exposure increased this relative risk. Such a systematic patternof decreasing risk with increasing exposure suggests that some formof bias is present in the data.
The report notes that the negative exposure-response relation-ship could be due to a number of possible reasons, includingunmeasured confounding variables and/or “other sources ofpollution” that could have been responsible for the observedeffect.
The HEI Panel noted that the conclusions initially reachedby Garshick (i.e., a positive exposure–response relationship)resulted entirely from the baseline differences in risk betweenthe two job categories (train workers and clerks/signalmen). ThePanel concluded:
These patterns are not consistent with a monotonically increasingassociation between cumulative exposure to diesel exhaust and lungcancer risk. If risk increased consistently with increasing exposure,a positive trend with duration of employment would be expected

744 T. W. HESTERBERG ET AL.
for the exposed groups (including train workers), even if exposuremagnitudes were incorrect.
In short, the current weight of evidence suggests that in theGarshick study, any occupational increase in lung cancer amongtrain riders was not due to diesel exposures.
The phrase “confounding variable” and associated termsare found throughout this assessment and the various citationsherein. A brief discussion of a selection of those concepts isoffered here for interested readers who do not customarily inter-pret epidemiologic literature. The lay definition of confoundingas “confusing” is helpful in understanding the scientific usesof the term; a confounding factor may complicate or mix upthe interpretation of the data. Monson (1990) used the term“confounding bias” to refer to a confounding factor as “one thatis associated with the exposure and independently is a causeof the disease.” Last (1988) defined a confounding variable as“a factor that distorts the apparent magnitude of the effect of astudy factor on risk; such a factor is a determinant of the outcomeof interest and is unequally distributed among the exposed andthe unexposed.” Smoking is a prominent potential confounder,particularly when the main health outcome of interest is lungcancer. If smoking histories of exposed workers differ fromthe comparison group, whether that is unexposed workers orthe general population, it is likely to be intuitively apparentthat there is an inherent bias, depending on how the smokingpatterns differ. There are various methods intended to adjust forthe differences, depending on the type of study, available detailsof the smoking histories, and analytical techniques.
A related concept is when the risk of disease depends not onlyon the exposure of interest, but the presence of another factor.For example, for workers with a history of both occupationalexposure to asbestos and cigarette smoking, the risk of lungcancer is far greater than would be explained by the risk of lungcancer among workers with a history of one or the other factors,but not both. Such an effect of another factor may be referred toas “effect modification,” “synergism,” or “interaction.”
On-Road Transportation Workers (TeamstersUnion Studies)
The most relevant published investigation of lung cancerdeaths among on-road transportation workers was conductedusing information obtained from the Central States Conferenceof the International Brotherhood of Teamsters. The investigationincluded: a case-control study of lung cancer deaths amongteamsters during 1982–1983 (Steenland et al., 1990, 1992);an assessment of DPM exposure for selected Teamster jobcategories during 1990 (Zaebst et al., 1991); and finally anexposure-response analysis and risk assessment of the case-control population based on the exposure data (Steenland et al.,1998). The paragraphs that follow present brief summaries ofthese three studies followed by a critique.
Steenland et al. Case-Control StudyTo investigate the hypothesis that truck drivers have an excess
risk of lung cancer, Steenland et al. conducted a case-controlstudy in which they compared the work histories of maleTeamster Union members who died of lung cancer during1982–1983 with those of controls selected from Teamsterswho died of other causes (excluding deaths associated withbladder cancer or motor vehicle accident) during the same period(1288 cases and 1452 controls) (Steenland et al., 1990). Foreach case and control subject, DE exposure was consideredto be a yes/no (ever/never) variable based on the job categoryin which the subject had worked the longest. Four Teamsterjob categories were assumed to be DE-exposed: long-haultruck drivers, short-haul truck drivers, mechanics, and dockworkers (loading dock and warehouse workers). Subjects whohad worked in office jobs were considered to be unexposed.Work histories before and after dieselization of trucks (estimatedto have taken place between 1960 and 1965) were based onTeamster records and next-of-kin recollections. Teamster Uniondata did not state whether the drivers were driving truckspowered by gasoline or by diesel; this information was obtainedfrom next-of-kin recollections. Information on smoking habitsand asbestos exposure was also obtained from next of kin. Theresearchers considered a number of possible confounders andeffect modifiers. The only factors included in the final modelwere age (five categories), smoking (six categories), asbestos(yes/no), and a dichotomous variable for having held other jobswith potential diesel exposure.
Using unconditional logistic regression analyses, lung cancerodds ratios were estimated for the four presumed DE-exposedoccupations using the non-exposed Teamsters members (officeworkers, etc.) as the reference group. The odds ratios for lungcancer were elevated (but not statistically significantly) fordrivers and mechanics but not for dock workers using propane-powered forklifts. (Dock workers primarily used propane-powered forklifts until the early 1980s, when diesel-poweredforklifts were introduced.) The lung cancer odds ratios, adjustedfor tobacco smoking, were as follows: dock workers (propane),0.92; long-haul drivers, 1.27; short-haul drivers, 1.31; andmechanics, 1.69 (Table 5).
Duration of employment in a presumed DE-exposed occupa-tion was used as a surrogate for cumulative DE exposure. Whenboth pre- and postdieselization employment was considered,no significant trend of increased lung cancer with increasedduration of employment was observed in any of the jobcategories. In contrast, when only employment after 1959was considered (Table 6), both long- and short-haul driversshowed increased odds ratios related to duration of employment;however, mechanics (also presumed to be DE-exposed) didnot show this trend. When only employment after 1964 wasconsidered, results were similar; lung cancer odds ratios were1.55 for long-term, long-haul truckers, and 1.89 for long-termdrivers of primarily diesel trucks (per next of kin).
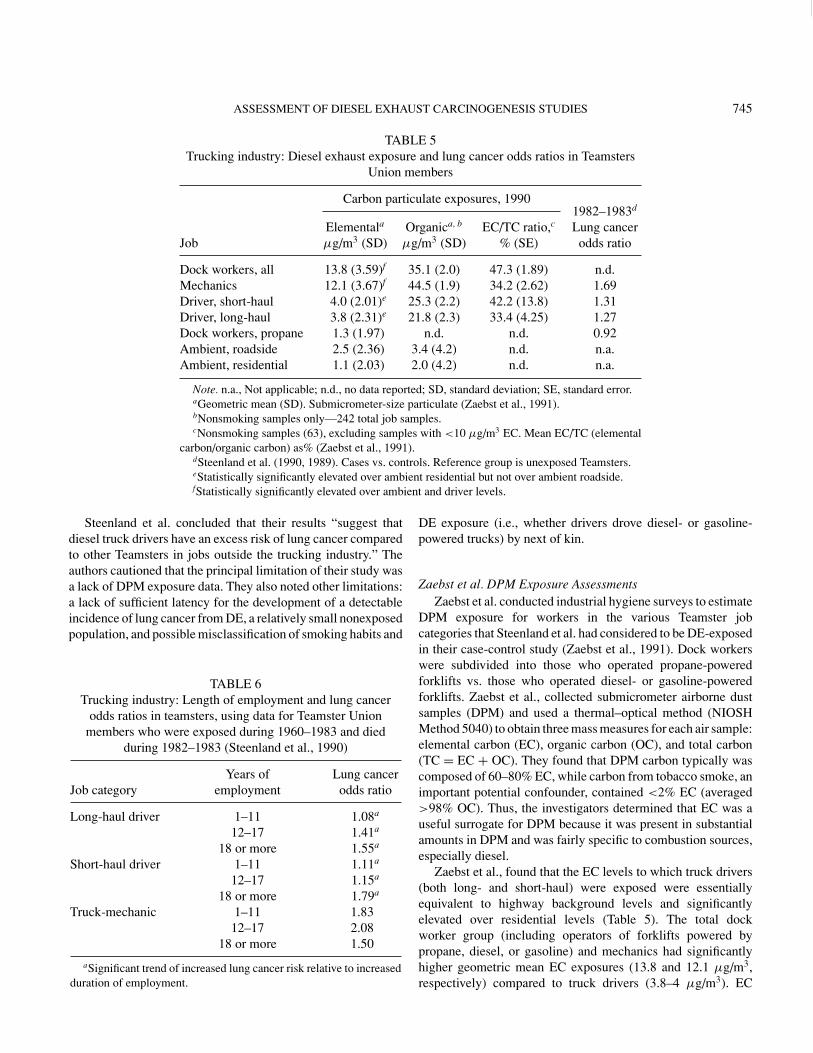
ASSESSMENT OF DIESEL EXHAUST CARCINOGENESIS STUDIES 745
TABLE 5Trucking industry: Diesel exhaust exposure and lung cancer odds ratios in Teamsters
Union members
Carbon particulate exposures, 1990
JobElementala
µg/m3 (SD)Organica, b
µg/m3 (SD)EC/TC ratio,c
% (SE)
1982–1983d
Lung cancerodds ratio
Dock workers, all 13.8 (3.59)f 35.1 (2.0) 47.3 (1.89) n.d.Mechanics 12.1 (3.67)f 44.5 (1.9) 34.2 (2.62) 1.69Driver, short-haul 4.0 (2.01)e 25.3 (2.2) 42.2 (13.8) 1.31Driver, long-haul 3.8 (2.31)e 21.8 (2.3) 33.4 (4.25) 1.27Dock workers, propane 1.3 (1.97) n.d. n.d. 0.92Ambient, roadside 2.5 (2.36) 3.4 (4.2) n.d. n.a.Ambient, residential 1.1 (2.03) 2.0 (4.2) n.d. n.a.
Note. n.a., Not applicable; n.d., no data reported; SD, standard deviation; SE, standard error.aGeometric mean (SD). Submicrometer-size particulate (Zaebst et al., 1991).bNonsmoking samples only—242 total job samples.cNonsmoking samples (63), excluding samples with <10 µg/m3 EC. Mean EC/TC (elemental
carbon/organic carbon) as% (Zaebst et al., 1991).dSteenland et al. (1990, 1989). Cases vs. controls. Reference group is unexposed Teamsters.eStatistically significantly elevated over ambient residential but not over ambient roadside.fStatistically significantly elevated over ambient and driver levels.
Steenland et al. concluded that their results “suggest thatdiesel truck drivers have an excess risk of lung cancer comparedto other Teamsters in jobs outside the trucking industry.” Theauthors cautioned that the principal limitation of their study wasa lack of DPM exposure data. They also noted other limitations:a lack of sufficient latency for the development of a detectableincidence of lung cancer from DE, a relatively small nonexposedpopulation, and possible misclassification of smoking habits and
TABLE 6Trucking industry: Length of employment and lung cancer
odds ratios in teamsters, using data for Teamster Unionmembers who were exposed during 1960–1983 and died
during 1982–1983 (Steenland et al., 1990)
Job categoryYears of
employmentLung cancerodds ratio
Long-haul driver 1–11 1.08a
12–17 1.41a
18 or more 1.55a
Short-haul driver 1–11 1.11a
12–17 1.15a
18 or more 1.79a
Truck-mechanic 1–11 1.8312–17 2.08
18 or more 1.50
aSignificant trend of increased lung cancer risk relative to increasedduration of employment.
DE exposure (i.e., whether drivers drove diesel- or gasoline-powered trucks) by next of kin.
Zaebst et al. DPM Exposure AssessmentsZaebst et al. conducted industrial hygiene surveys to estimate
DPM exposure for workers in the various Teamster jobcategories that Steenland et al. had considered to be DE-exposedin their case-control study (Zaebst et al., 1991). Dock workerswere subdivided into those who operated propane-poweredforklifts vs. those who operated diesel- or gasoline-poweredforklifts. Zaebst et al., collected submicrometer airborne dustsamples (DPM) and used a thermal–optical method (NIOSHMethod 5040) to obtain three mass measures for each air sample:elemental carbon (EC), organic carbon (OC), and total carbon(TC = EC + OC). They found that DPM carbon typically wascomposed of 60–80% EC, while carbon from tobacco smoke, animportant potential confounder, contained <2% EC (averaged>98% OC). Thus, the investigators determined that EC was auseful surrogate for DPM because it was present in substantialamounts in DPM and was fairly specific to combustion sources,especially diesel.
Zaebst et al., found that the EC levels to which truck drivers(both long- and short-haul) were exposed were essentiallyequivalent to highway background levels and significantlyelevated over residential levels (Table 5). The total dockworker group (including operators of forklifts powered bypropane, diesel, or gasoline) and mechanics had significantlyhigher geometric mean EC exposures (13.8 and 12.1 µg/m3,respectively) compared to truck drivers (3.8–4 µg/m3). EC
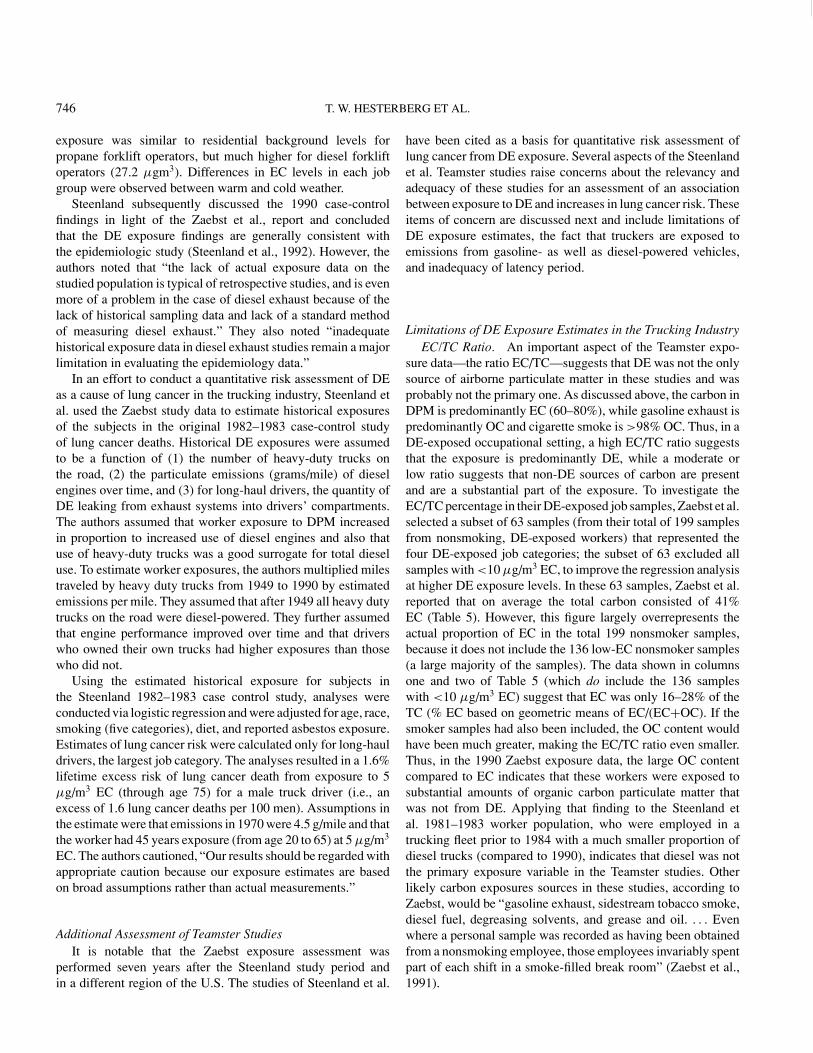
746 T. W. HESTERBERG ET AL.
exposure was similar to residential background levels forpropane forklift operators, but much higher for diesel forkliftoperators (27.2 µgm3). Differences in EC levels in each jobgroup were observed between warm and cold weather.
Steenland subsequently discussed the 1990 case-controlfindings in light of the Zaebst et al., report and concludedthat the DE exposure findings are generally consistent withthe epidemiologic study (Steenland et al., 1992). However, theauthors noted that “the lack of actual exposure data on thestudied population is typical of retrospective studies, and is evenmore of a problem in the case of diesel exhaust because of thelack of historical sampling data and lack of a standard methodof measuring diesel exhaust.” They also noted “inadequatehistorical exposure data in diesel exhaust studies remain a majorlimitation in evaluating the epidemiology data.”
In an effort to conduct a quantitative risk assessment of DEas a cause of lung cancer in the trucking industry, Steenland etal. used the Zaebst study data to estimate historical exposuresof the subjects in the original 1982–1983 case-control studyof lung cancer deaths. Historical DE exposures were assumedto be a function of (1) the number of heavy-duty trucks onthe road, (2) the particulate emissions (grams/mile) of dieselengines over time, and (3) for long-haul drivers, the quantity ofDE leaking from exhaust systems into drivers’ compartments.The authors assumed that worker exposure to DPM increasedin proportion to increased use of diesel engines and also thatuse of heavy-duty trucks was a good surrogate for total dieseluse. To estimate worker exposures, the authors multiplied milestraveled by heavy duty trucks from 1949 to 1990 by estimatedemissions per mile. They assumed that after 1949 all heavy dutytrucks on the road were diesel-powered. They further assumedthat engine performance improved over time and that driverswho owned their own trucks had higher exposures than thosewho did not.
Using the estimated historical exposure for subjects inthe Steenland 1982–1983 case control study, analyses wereconducted via logistic regression and were adjusted for age, race,smoking (five categories), diet, and reported asbestos exposure.Estimates of lung cancer risk were calculated only for long-hauldrivers, the largest job category. The analyses resulted in a 1.6%lifetime excess risk of lung cancer death from exposure to 5µg/m3 EC (through age 75) for a male truck driver (i.e., anexcess of 1.6 lung cancer deaths per 100 men). Assumptions inthe estimate were that emissions in 1970 were 4.5 g/mile and thatthe worker had 45 years exposure (from age 20 to 65) at 5 µg/m3
EC. The authors cautioned, “Our results should be regarded withappropriate caution because our exposure estimates are basedon broad assumptions rather than actual measurements.”
Additional Assessment of Teamster StudiesIt is notable that the Zaebst exposure assessment was
performed seven years after the Steenland study period andin a different region of the U.S. The studies of Steenland et al.
have been cited as a basis for quantitative risk assessment oflung cancer from DE exposure. Several aspects of the Steenlandet al. Teamster studies raise concerns about the relevancy andadequacy of these studies for an assessment of an associationbetween exposure to DE and increases in lung cancer risk. Theseitems of concern are discussed next and include limitations ofDE exposure estimates, the fact that truckers are exposed toemissions from gasoline- as well as diesel-powered vehicles,and inadequacy of latency period.
Limitations of DE Exposure Estimates in the Trucking IndustryEC/TC Ratio. An important aspect of the Teamster expo-
sure data—the ratio EC/TC—suggests that DE was not the onlysource of airborne particulate matter in these studies and wasprobably not the primary one. As discussed above, the carbon inDPM is predominantly EC (60–80%), while gasoline exhaust ispredominantly OC and cigarette smoke is >98% OC. Thus, in aDE-exposed occupational setting, a high EC/TC ratio suggeststhat the exposure is predominantly DE, while a moderate orlow ratio suggests that non-DE sources of carbon are presentand are a substantial part of the exposure. To investigate theEC/TC percentage in their DE-exposed job samples, Zaebst et al.selected a subset of 63 samples (from their total of 199 samplesfrom nonsmoking, DE-exposed workers) that represented thefour DE-exposed job categories; the subset of 63 excluded allsamples with <10 µg/m3 EC, to improve the regression analysisat higher DE exposure levels. In these 63 samples, Zaebst et al.reported that on average the total carbon consisted of 41%EC (Table 5). However, this figure largely overrepresents theactual proportion of EC in the total 199 nonsmoker samples,because it does not include the 136 low-EC nonsmoker samples(a large majority of the samples). The data shown in columnsone and two of Table 5 (which do include the 136 sampleswith <10 µg/m3 EC) suggest that EC was only 16–28% of theTC (% EC based on geometric means of EC/(EC+OC). If thesmoker samples had also been included, the OC content wouldhave been much greater, making the EC/TC ratio even smaller.Thus, in the 1990 Zaebst exposure data, the large OC contentcompared to EC indicates that these workers were exposed tosubstantial amounts of organic carbon particulate matter thatwas not from DE. Applying that finding to the Steenland etal. 1981–1983 worker population, who were employed in atrucking fleet prior to 1984 with a much smaller proportion ofdiesel trucks (compared to 1990), indicates that diesel was notthe primary exposure variable in the Teamster studies. Otherlikely carbon exposures sources in these studies, according toZaebst, would be “gasoline exhaust, sidestream tobacco smoke,diesel fuel, degreasing solvents, and grease and oil. . . . Evenwhere a personal sample was recorded as having been obtainedfrom a nonsmoking employee, those employees invariably spentpart of each shift in a smoke-filled break room” (Zaebst et al.,1991).

ASSESSMENT OF DIESEL EXHAUST CARCINOGENESIS STUDIES 747
TABLE 7Airborne concentrations of elemental carbon (EC) and organic
carbon (OC) in work areas of a trucking terminal in Detroit,MI, winter 2003 (Lee et al., 2005)
Airborne concentrations, µg/m3
Area (job) EC OC EC/TC% PM2.5
Shop (mechanic) 17.4 55 23 83Short-haul (truck driver) 1.8 27 7 42Dock (forklift driver) 1.1 13 7.5 35Long-haul (truck driver) 0.6 17 4 28Yard (hostler) 0.6 8 6 19Office 0.3 15 2 13
Note. Long- and short-haul drivers’ area samples were collectedinside the cab, near the drivers’ breathing zone.
EC, elemental carbon; OC, organic carbon; TC, total carbon (EC +OC).
Findings from a recent study of airborne particulate levels inthe trucking industry parallel the Zaebst et al. DE-exposure dataand confirm the very low EC/TC ratios in this industry, againsuggesting that non-DE particulates dominated the exposures(Lee et al., 2005). Airborne levels of EC, OC, and PM2.5 (fineparticulate matter less than 2.5 µm aerodynamic diameter)were investigated in two Detroit, MI, trucking terminals for5 consecutive days during February 2003. Personal and areasamples were collected for 6 job categories (Table 7). The EClevels for the job categories fell into three groups (arithmeticmeans): Highest level was 17.4 µg/m3 for shop mechanic;intermediate level was 2 µg/m3 for short haul truck driver;low exposures were 0.3–1.1 µg/m3 for dock worker (forkliftoperator), long haul truck driver, yard worker (hostler), andoffice worker. Correlations were observed between levels of OCand PM2.5, but—notably—not between EC and either of the
other two parameters. Smokers’ levels compared to those ofnon-smokers were significantly higher for OC and PM2.5, butnot for EC. The EC concentrations reported by Lee et al. for2003 parallel those reported by Zaebst et al. for 1990, in thatairborne levels of EC for truckers were low and similar to orslightly elevated over background (or office) levels, while EClevels for shop mechanics were significantly elevated over thoseof truckers. Findings from the two studies differed somewhat, inthat mean EC levels in the Lee study were lower for drivers (<2µg/m3) and higher for mechanics (17 µg/m3) compared to theZaebst study (drivers ∼4 µg/m3, mechanics ∼12 µg/m3). TheLee study, like the Zaebst study, found very low EC/TC ratiosof 2% to 23% for these job categories (Table 7).
An exposure assessment at a diesel truck and enginemanufacturing facility illustrates how a small ratio of EC:OCcan indicate that carbon particle exposures are predominantlyof non-DE origin—even in a work area in which one mighteasily presume that the predominant exposure would be DE(Sirianni et al., 2003). Sirianni et al. used NIOSH Method5040 to analyze the carbon content of airborne RPM in twomachining work areas without known diesel exposure (one withhigh oil mist levels and one without oil mist) and one workarea with DE exposure (test cell area; some oil-mist present)(Table 8). All three work areas had very low EC levels. Themachining/oil mist and test cell areas had high OC levels, butthe non-oil-mist area had very low OC. The high OC in the testcell area was presumably a result of the oil mist that was noted inthis area. Sirianni et al. concluded, “These findings demonstratethe capacity for non-diesel organics to overwhelm and obscurethe [relatively low] levels of OC expected from diesel engines.. . . [The] use of OC or TC levels as DPM surrogates is likely tolead to erroneous conclusions about diesel exposure levels.” Inother words, the high levels of OC from non-DE environmentalsources can and often does overwhelm the low levels of OC indiesel. Even though DE does contain OC, there are too many
TABLE 8Trucking industry: Airborne respirable carbon particles in a diesel engine and truck assembly plant, using
data from area air samples collected and analyzed using NIOSH Method 5040 (Sirianni et al., 2003)
Respirable carbon particles, range ofairborne concentrations, µg/m3 Percent of Samples with
Location n Elemental carbon Organic carbon TCa >50 µg/m3 ECb >20 µg/m3
No DEOil mist areac 66 0.05–5.70 10.0–1600 71% 0Non-oil mistc 27 0.38–0.70 14.0–940 63% 0
High DETest cellsd 10 0.50–6.30 55.0–226 100% 0
aTC, total carbon. 50 µg/m3 TC was proposed by ACGIH as the TLV (threshold limit value) in 2000 (ACGIH, 2000).bEC, elemental carbon.cMachining work areas, no diesel equipment; presumed DE-free.dEngine testing area; substantial diesel engine use; presumed DE exposure. Oil mist present.

748 T. W. HESTERBERG ET AL.
other sources of OC for the DE-derived OC to be meaningful.Sirianni et al. suggest that the EC:TC ratio for DPM should berelatively high, 35–85%; a lower ratio indicates confounding bynon-DE carbon sources. In the diesel truck plant, the EC/TCratio in each of the three work areas was less than 1%.
Diesel Exhaust Is Not the Only Source of Elemental Carbon.The Steenland studies and risk assessment reflect the underlyingassumption that DE, as measured by EC, represents the greaterpart of PM exposure for truckers. There is substantial evidence,however, that such an assumption is not valid. Other sourcesof EC include gasoline engines, tire and brake wear, stationarycombustion sources, and industrial processes (HEI, 1999). Thecarbonaceous component from gasoline engine exhaust hasbeen reported to contain 20–35% EC (Norbeck et al., 1998).Recently, while investigating the uncertainties in the historicalDE exposure estimates used in the Teamster mortality studies,Bailey et al. also concluded that the proportion of DE relative toother emissions was much lower in these studies than originallyestimated (Bailey et al., 2003). Bailey et al., noted numerousunderlying assumptions in both their own exposure predictionmodel and the model used by Steenland et al. (1998). Two oftheir major assumptions were: (1) EC was used as a markerfor DE exposure based on studies indicating that DPM isprimarily composed of EC and is the primary source of EC; and(2) DPM exposures were assumed to be proportional to dieseltruck emission rates (i.e., the proportion of EC in DPMemissions was assumed to be constant over time) and to thedieselization of the truck fleet. Bailey et al. further suggestedthat gasoline may make a greater contribution to airborne ECthan has been assumed.
Truck Drivers Are Exposed to Both Gasoline and DieselEngine Emissions
In most, if not all, of the epidemiologic studies of trans-portation workers that associate DE with lung cancer, theworkers were exposed to mixed (and inseparable) gasoline anddiesel exhausts, which, evidence suggests, were predominantlygasoline. The truckers drove on highways where most vehicleswere gasoline-fueled. Truck drivers, particularly on highways,are not likely to be exposed to own-truck exhaust emissions,because the exhaust pipe on a diesel truck is above and behindthe driver. Indeed, Zaebst et al. found that EC levels inside thetruck were not significantly elevated over ambient roadside EClevels, but the in-cab OC levels (nonsmokers) were about 8-foldelevated over outdoor levels (Table 5) (Zaebst et al., 1991). Theyconcluded that if truck drivers experience an increased incidenceof cancer as a consequence of diesel exhaust, “It may be becausethey spend more time on the highway and not because the truckthey are driving is exposing them to diesel exhaust.”
In another more recent study, nondetectable to very low levelsof EC were measured inside a diesel-powered school bus testedon an automotive test track (Borak et al., 2003). These findingssuggest that truckers are not likely to be primarily exposed to
emissions from their own vehicles, but are instead exposed toemissions from other on-road vehicles. Since the other onroadvehicles during the Steenland et al. study period (1960–1983)were predominantly gasoline, the truckers were likely exposedpredominantly to gasoline exhaust. Indeed, during the 1960s (thecritical years of the Steenland study from a latency perspective),diesel fuel represented only 4–7% of the total fuel sales (carsand trucks) (HEI, 1999). Moreover, in the 1960s, gasoline-fueledvehicles had no exhaust after-treatment, and quite likely wouldhave contributed as much or more to mobile source air pollutionas diesel vehicles. Accordingly, HEI has cautioned that “the lackof data to reconstruct gasoline exhaust emissions, particularlyfor years earlier than 1990, will significantly limit attempts tocalculate risks from diesel as opposed to other sources, as wellas any epidemiologic study of DE” (HEI, 2000).
In another recent study, Ireson et al., recognizing the lowspecificity of EC for identifying the source of EC-containingparticulate matter, used a fuel-borne tracer (iridium) to estimatethe DPM inside a school bus during normal operation (Iresonet al. 2004). The bus was fueled with iridium-tagged dieselfuel. The mass ratio of DPM:iridium in the bus exhaust wasestablished from emissions tests. Iridium levels were measuredinside the bus during normal operations to estimate the levelsof in-bus DPM that was derived from the bus exhaust. Ireson etal. noted that some previous studies attributed in-bus airbornefine particle concentrations of over 30 µg/m3 to the same bus’sexhaust. In contrast, the Ireson et al., study, using the iridiumtracer (high sensitivity), reported an average DPM concentrationof 0.22 µg/m3 from the same bus’s exhaust, which is about 1%of the previous estimates.
One more observation should be noted in regard to exposuresfrom emissions from diesel versus gasoline engines. Table 6demonstrates that, after 18 or more years of service, short-hauldrivers (i.e., deliveries within a city) had a higher apparentincrease in lung cancer risk than did long-haul drivers (oddsratio of 1.79 versus 1.55, respectively). These smaller trucks,however, were not dieselized until the late 1970s and 1980s(Bunn and Slavin, 2001).
In conclusion, the findings summarized in this section callinto question the categorization of the health effects of dieselexposure based on assessments of the transportation industry,because diesel exposure is likely to be a small part of the overallexposure within this industry.
Inadequate Latency PeriodHEI concluded that the Steenland study quite likely suffers
from an inadequate latency period, making it unsuitable forreaching any qualitative or quantitative conclusions about anassociation between DE exposure and lung cancer (HEI, 1999).Specifically, the Steenland researchers assumed that trucks weredieselized by 1960; the case-control study analyzed lung cancermortality in 1982–1983. However, data submitted to the U.S.EPA suggested that a more accurate date of dieselization is

ASSESSMENT OF DIESEL EXHAUST CARCINOGENESIS STUDIES 749
between 1965 and 1970 for heavy-duty (class 8) trucks andafter 1980 for medium-duty (class 5–7) trucks (Bunn and Slavin,2001). The U.S. EPA, in a reanalysis, then picked 1963 as thedate when 50% of vehicle miles traveled (by commercial trucks)were in diesel vehicles (U.S. EPA, 2002). Given that the latencyperiod for lung cancer is estimated to be at least 15+ years(Peto et al., 1977), the Steenland study (1981–1983 mortalityperiod) did not allow a sufficient latency period if the date ofdieselization was 1970; latency would still be inadequate ifthe dieselization occurred in 1963. The HEI recognized thisproblem, stating that “the latency period may not be sufficientto demonstrate an excess of lung cancer due to diesel exposurefor all workers” (HEI, 1995).
Associations of Gasoline Exhaust Exposure With LungCancer Risk
Crump and coworkers (2000) reanalyzed the data utilizedby Steenland et al. (1998) in their epidemiologic studies oftransportation workers and found a statistically significantrelationship with cumulative gasoline exposure. Crump con-ducted statistical analyses of the long-haul trucker data fromthe Steenland studies to investigate a possible relationshipbetween exposure to gasoline engine exhaust and increasedincidence of lung cancer in this data set (International, 2000;Bunn and Slavin, 2001). Exposures from DE and from gasolineemissions were estimated from 1949 forward, lagged 5 years.For DE exposures, Crump used the original Steenland exposureestimates (Steenland et al., 1998) as well as the U.S. EPAreconstruction of those exposure estimates (U.S. EPA, 2000).For gasoline exposures, Crump used estimates of carbonaceousPM10 emitted from gasoline vehicles in tons per year. Theanalysis then evaluated lung cancer incidence for long-haultruckers against cumulative exposure, while controlling forsmoking, age and asbestos exposure. Cumulative gasolineexhaust exposure, like cumulative DE exposure, showed astatistically significant relationship to increased lung cancerincidence.
Preliminary results from a recently initiated trucking studyshowed that PM exposures were from mobile sources, includinggasoline exhaust, and not diesel exhaust alone (Garshick et al.,2006a). The cohort included 769 lung cancer deaths. Lungcancer standardized mortality ratio (SMR) (95%CI) for long-haul drivers was 1.09 (0.97–1.22), for local drivers was 1.17(1.01–1.37), and for dock workers was 1.11 (0.95–1.31). Theabstract stated: “Cox regression models suggested an increasinglung cancer risk with greater years of employment in workerswith mobile source exposures. Local sources significantlycontributed to terminal exposures, and EC values were similar inlocal and long haul drivers. Lung cancer mortality was elevatedin trucking company workers with regular exposures to PM onloading docks, local roads, and highways and was not relatedto historical differences in operating diesel equipment. Thissuggests that a mix of mobile-source PM from a variety of
sources [including gasoline-powered vehicles] may result in anelevated lung cancer risk.”
In addition, there are a number of older studies in which theincreased lung cancer incidence was confined to populationswho had had, at most, a few years of diesel exposure atthe very end of their professional driving careers. In thesepre-diesel era drivers, it appears that something other thandiesel exhaust in their work or lifestyle was increasing theirlung cancer risk (Table 9). There are seven studies datingback to 1947 that showed a statistically significant increasein lung cancer risk among truckers prior to dieselization ofthe U.S. trucking fleet. Importantly, the U.S. EPA incorrectlyclaimed that a sufficient latency period existed by comparingthe follow-up periods for cancer ascertainment with the dateof dieselization (International, 2000). The workers themselvesneed to be employed during the diesel era for a sufficient latencyperiod to exist. CASAC specifically urged the U.S. EPA to reviseits latency analyses accordingly (CASAC, 2000).
A few of these trucker studies with critical exposure periodsoccurring prior to dieselization are particularly illustrative andwarrant a more in-depth discussion. The Damber and Larssonstudy was a case-referent study of 600 cases of male lung cancerin northern Sweden with a focus on the risk of lung cancer inprofessional drivers (Damber and Larsson, 1985). The studysubjects drove in the most northern part of Sweden, where,according to the study researchers, the air in vehicle cabins islikely to contain unusually high concentrations of combustionproducts. The study showed that drivers over the age of 70 had asignificantly increased risk of lung cancer, but drivers under 70,with similar average duration of employment, had no increasedrisk of lung cancer. The subjects of the Damber study wereall registered as suffering from lung cancer between 1972 and1977. Given that the increased risk of lung cancer was onlyamong those drivers aged 70 and older, the youngest possiblesubject was 63 in 1970. By that point, the majority of driversin the “at-risk” population had either retired or were on theverge of retiring. They did the bulk of their driving well before1970. The critical exposure period for these drivers (≥20 yrprior to lung cancer diagnosis) was, at the latest, 1937–1957,which was well before the advent of dieselization in the truckingindustry. In fact, the critical exposure period might have beenmuch earlier—the subjects were registered between 1972 and1977 and thus might have been diagnosed several years before.Nonetheless, Damber’s subjects who were 70 or older were fivetimes more likely to suffer from lung cancer than the referentsample. A risk ratio of 5.0 is very high in comparison to therisk ratios found in other studies. However, this risk ratio wasobserved exclusively among older drivers while other studies’risk ratios were observed among a combination of older andyounger drivers. Damber’s study found no increased risk oflung cancer among drivers under the age of 70. Therefore, anassessment of Damber’s older and younger drivers would leadto a risk ratio much lower than 5.0 and much closer to the riskratios (1.2–1.6) found in other studies.

750 T. W. HESTERBERG ET AL.
TABLE 9Lung cancer in truck drivers prior to dieselization
Risk ratio Risk ratio typeDate of diagnosis
(or death)Critical exposure
perioda Reference
1.49b 1921–1938 1898–1918 (Kennaway and Kennaway, 1947)6.0b,c 1955 1915–1935 (Mills, 1960)1.08 1950 1910–1930 (Enterline and Mckiever, 1963)2.16 SMRb 1966 1926–1946 (Hueper, 1966)1.2 SMRb 1961 1921–1941 (Registrar-General, 1971)1.34 1977 1937–1957 (Williams et al., 1977)1.65 1970–1973 1933–1953 (Menck, 1976)1.21 SMR 1976 1936–1956 (Leupker, 1978)1.29 PMR 1959–1961 1921–1941 (Petersen and Milham, 1980)1.3–1.6 Case-control ratio 1958–1962 1922–1942 (Milne et al., 1983)1.25 RR 1977 1937–1957 (Dubrow and Wegman, 1983)1.18 1950–1979 1939–1959 (Milham, 1983)1.4 RR 1980–1982 1942–1962 (Hall and Wynder, 1984)1.65–1.78 1971–1973 1933–1953 (Dubrow and Wegman, 1984)1.49–1.53 SMR 1954–1974 1934–1954 (Walrath et al., 1985)5.0 RR 1972–1977 1937–1957 (Damber and Larsson, 1987)1.5 OR 1976–1983 1943–1963 (Hayes et al., 1989)
aPeriod during which there must have been DE exposure (or other pollutant exposure) for a sufficient latency period toexist
bStudy subjects were motor vehicle drivers, but not necessarily truck drivers.cStudy compared urban drivers, who drove more than 12,000 miles, to urban drivers, who drove less than 12,000 miles.
Menck relied on death certificates from 1968 to 1970 andincident cases from 1970 to 1973 to assess the relative risk oftruck drivers contracting lung cancer (Menck, 1976). Althoughdata regarding the incident cases were collected in the 1970s,the drivers drove for at most 3 years post-1970. Even for thesedrivers, the critical exposure period was 1933–1953 at the latest.The drivers were 65% more likely to contract lung cancer thanthe general population.
Dubrow and Wegman aggregated the data from 9 surveillancestudies, conducted in Britain and in the United States, todetermine the relative risk of truck drivers contracting lungcancer (Dubrow and Wegman, 1983). The latest data used in thestudy was from 1977. The critical exposure period, therefore,was 1937–1957 at the latest—again, prior to dieselization of thetrucking industry. Upon aggregating the data from the studies,Dubrow found a 25% greater incidence of lung cancer amongtruck drivers than expected in the population at large.
Milham assessed the relative risk of truck drivers contractinglung cancer based on death certificates from between 1950 and1979 (Milham, 1983). Thus, in this study, the critical exposureperiod was 1939–1959 at the latest. The drivers were 18%more likely than the population at large to suffer from lungcancer (proportionate mortality ratio of 1.18). Drivers who diedbetween 1950 and 1959, and for whom the critical exposureperiod was between 1919 and 1939 at the latest, were 52%
more likely than the population at large to suffer from lungcancer (proportionate mortality ratio 1.52).
Hayes assessed the risk of New Jersey, Florida, and Louisianatruck drivers contracting lung cancer (Hayes et al., 1989). Thedrivers were interviewed between 1976 and 1983. Although thedrivers were studied after 1970, the critical exposure period forthem was 1943–1963. Hayes determined that drivers with 10 ormore years of experience were 50% more likely to contract lungcancer than the population at large (odds ratio 1.5).
Summary of On-Road Transportation StudiesIn summary, EC/TC mass ratios suggest that, in addition to
DE, a variety of other agents contribute to exposures in thetrucking industry, including tobacco smoke, gasoline exhaust,solvents and fuel. There is no way to separate the DE exposurefrom other particulate exposures, especially gasoline exposures.Data on dieselization indicate that the truckers studied mayhave been exposed to more gasoline exhaust than dieselexhaust. In addition, at least 17 epidemiologic studies showan increased risk of lung cancer among truck drivers for whomthe critical exposure period occurred before the trucking fleetwas dieselized. These data suggest a significant likelihood thatany increased lung cancer risk in the trucking industry couldbe due to an etiology other than DE. Indeed, unless and until

ASSESSMENT OF DIESEL EXHAUST CARCINOGENESIS STUDIES 751
the factor that caused an increased lung cancer incidence priorto dieselization is identified and controlled for, one cannotproperly conclude that exposure to DE is causally related toan increased incidence of lung cancer in the trucking industry.Moreover, as is apparent from comparing the relative risksfrom the prediesel trucking studies with the postdiesel truckingstudies, there was no increase in relative risk following theadvent of dieselization. There is no plausible explanation forhow DE can be a carcinogen in the trucking population when itdid not increase the risk of cancer after the onset of the dieselera.
Mining Industry Worker EpidemiologyMining Industry and Diesel Exhaust Exposures
If there is an empirical basis for associating DE withlung cancer in humans, this association should appear mostclearly in the underground mining industry, which includesoccupations that undoubtedly have the highest potential for DEexposure. However, while not definitive, underground miningepidemiology studies are generally negative for lung cancer,despite potential confounding in some underground mines byother factors such as radon and silica that would tend to increaselung cancer incidence in the study populations.
There are several reasons why underground mining studiesshould be included in an assessment of the potential lung cancerhazard of DE. First, historical airborne levels of DPM in someunderground mines are quite high compared with airborne levelsfound in other occupational studies of DE-exposed workers,ranging up to two orders of magnitude higher than exposuresreported for truckers and railroad workers (Appendix, TableA-2). Using EC as the indicator of DE exposure, mean or medianairborne levels of 81 to 420 µg/m3 EC have been reportedin underground coal mines. In contrast, mean airborne levelsof approximately 0.4 to 25 µg/m3 EC have been reported fortruckers and railroad workers (MSHA, 2001a). Undergroundcoal mining studies are particularly useful in the DE-versus-lung cancer assessment, in that IARC has evaluated coal miningfor cancer risk (IARC, 1997). However, metal and nonmetalunderground mines have airborne levels of DPM comparable tothe underground coal mines and provide further opportunity forinvestigating DE (MSHA, 2001b).
Second, some nonmetal underground mining operations(e.g., potash mining), like underground coal mining, arerelatively free of potential confounders such as arsenic andradiation, which are more common in underground metal mines.
Third, unlike many of the studies of other DE-associatedoccupations, a number of published and ongoing mining studiesprovide latency periods that are quite sufficient for excess risksfor lung cancer to become detectable, if such risks do indeedexist. To illustrate, some coal mines of Europe and the UnitedKingdom were dieselized more than 60 years ago (Rice andHarris, 1936). Australian coal mines have been dieselized formore than 50 years, providing latency periods that clearly are
also sufficient (Pratt et al., 1997). Underground coal minesin the United States were more recently—and only in someregions—dieselized (MSHA, 1998a, 2001a). In contrast to thelong history of diesel use in underground mining in variousregions of the world, the U.S. railroad and trucking industrieswere gradually dieselized beginning in approximately 1960 and1970, respectively.
Fourth, unlike the railroad and trucking industries in par-ticular, workplace exhaust exposures for miners in Europe andAustralia were basically limited to DE, since very few gasolineengines were used in these mines due to concerns about firesand carbon monoxide emissions. Further, particularly for coalminers, the assortment of DE-exposed and nonexposed the rangeof latencies offer the opportunity for comparisons between thosestudies (i.e., comparisons of DE-exposed miners vs. miners notexposed to DE) as well as with the general populations. For thesecompelling reasons, underground mining studies are much moreuseful than studies of other occupational groups for investigatingthe potential carcinogenic effects of DE.
Overview of Diesel Use in MiningAs noted earlier, the United States lagged behind Europe
and Australia in the introduction of diesel technology in itsunderground mining industry. The European mining communitybegan using diesel engines in significant numbers by the 1930s,and various reports on the subject were published during thatdecade. According to a 1936 summary of these reports (Riceand Harris, 1936), the diesel engine had been introducedinto German mines by 1927. By 1936, diesel engines wereused extensively in coal mines in Germany, France, Belgium,and Great Britain. Diesel engines were also used in potash,iron and other mines in Europe. Their primary use was inlocomotives for hauling material (MSHA, 1998a). The situationwas apparently quite different in the United States: A 1935U.S. Bureau of Mines report on ventilation in metal mines didnot even mention ventilation requirements for diesel-poweredequipment, suggesting that diesel use was so low or nonexistentin the United States that it was not yet of concern. Approximately1300 diesel mine locomotives were reported to be in use inEuropean underground mines as of January 1, 1947 (Harringtonand East, 1947). (For more details on diesel use in the UnitedStates, Europe, and Australia, see Appendix 1.)
IARC Review of Coal Miner Cancer RiskEight years after the publication of their monograph on
diesel exhaust, IARC issued a monograph on the cancer riskfor coal miners (IARC, 1989, 1997). In the 1997 monograph,IARC reviewed studies of coal miners and determined thatevidence was inadequate for the carcinogenicity of coal dust;IARC classified coal dust as Group 3, “cannot be classified asto its carcinogenicity to humans.” This conclusion is deemedimportant in this discussion of diesel for two reasons: (1) Thestudies in the IARC review included coal miner cohorts

752 T. W. HESTERBERG ET AL.
of workers who historically inhaled some of the highestoccupational concentrations of total airborne particulates amongall working environments, and (2) as noted earlier, hundredsof underground coal mines, particularly outside the UnitedStates, have used diesel equipment for many decades, exposingthose coal miners to DPM as well as to coal dust. As theU.S. EPA concluded in its Health Assessment Document fordiesel exhaust, “The highest occupational exposures to DPMare for workers in coal and non-coal mines using diesel-poweredequipment” ((U.S. EPA, 2002, p. 2-107).
Because coal miners’ lungs are known to show evidence ofheavy loads of inhaled particulate (leading to noncancer disease,primarily coal miners’ pneumoconiosis, or “black lung”), the1997 IARC analysis of coal miner populations offers theopportunity to evaluate in a human population the combinedeffect of possible “lung overloading” (with coal dust) plusexposure to the highest occupational levels of DPM. Like DPM,the primary constituent of coal dust is carbon. Like DPM, coaldust contains organic carbons, some of which are PAHs. Yet forcoal miners, the occupational group exposed to elevated concen-trations of both coal dust and DPM, the 1997 IARC monographconcluded there was “inadequate evidence” for carcinogenicity.It reasonably follows that the IARC conclusion on coal minersis consistent with a lack of carcinogenicity for DPM.
Strengths and Weaknesses of Underground Mining Studiesfor DE Evaluation
In reviewing underground mining studies, it should be keptin mind that they are not definitive, either collectively orindividually, for an assessment of possible lung cancer risk fromDE exposure. The strengths and weaknesses of epidemiologicstudies depend on a number of factors. For example, most ofthe studies of interest here were not undertaken to investigatepossible associations between DE exposures and lung cancer.Therefore, a study that might be considered very informative forrisks associated with coal dust may provide more limited insightfor DE. Unlike controlled laboratory experiments, epidemiologyis an observational science; researchers can only observe whatis happening or has happened—they cannot control or alter therelevant factors. For example, it is well known that blue-collarworkers, as a group, tend to smoke cigarettes more than thegeneral population (i.e., a greater percentage of blue-collarworkers smoke and often start younger). If such is the casewith a particular cohort, the workers would likely have anelevated lung cancer risk, and the associated risk would havenothing to do with their working environment. Alternatively,if for some reason, perhaps simply by chance, one part of aworkforce smokes less than another part, by comparing thetwo groups it would be more difficult to detect an excessrisk of lung cancer among the lesser smoking group merelybecause the underlying lung cancer risks in the two groups arenot similar. Such “confounding” can result in seeming risksthat are superficial or mask risks that are real. Particularly in
investigating lung cancer, smoking patterns can be extremelyimportant. There is reliable evidence that underground miners insome studies do, in fact, smoke more than the general population(Goldman, 1965; Waxweiler et al., 1973; Morfeld et al., 1997).
In commenting on the ability of epidemiologic studies todetect risks, Monson concluded that at one extreme, “if thetrue association between exposure and disease is very weak,the detection of such an association by non-experimental datais unlikely” and at the other, “if the true association betweenexposure and disease is very strong, no epidemiologic expertiseis necessary to detect it” (Monson, 1990). Monson’s guidelinesfor strength of positive association, that he described as “totallyempiric and based on experience,” ranged: 1.0 to 1.2 (i.e., up toa 20 percent increase in risk), “none”; 1.2 to 1.5, “weak”; 1.5 to3.0, “moderate”, 3.0 to 10.0, “strong”; and >10.0, “infinite.”While such subjective guidelines predictably differ betweenresearchers, they are given here to caution interpretation of weakassociations, even if statistically significant, or, conversely, sug-gested strong associations, even if not statistically significant.
What is a pragmatic minimum latency for epidemiologicstudies of lung cancer (period of time from first exposure to thecarcinogen until detection of lung cancer)? Depending on thecarcinogen and the levels of exposure, a few cases may developas soon as 10 years, with the excess risk of developing the diseasecontinuing to increase for a further 20 years and possibly longer(Doll and Peto, 1981; HEI, 1999). However, for the excess lungcancer risk to reach a level that can be effectively detectedusing epidemiologic techniques, at least 15 years should beconsidered a minimum latency period, with perhaps 20 yearsfulfilling the criteria best. With the power of studies dependenton such factors as the intensity of exposure(s), the duration ofexposure(s), the size of the cohort, etc., no one latency period isapplicable in all situations, but 15 is considered here to be at thelow end for a pragmatic minimum latency, with 20 years betteryet. Another important consideration in evaluating studies is thedetail of the characterization of DE exposures. It can range fromthe minimum of just knowing who worked in the mine to fullknowledge of dates, individual job assignments, and estimatesof actual airborne levels, enabling estimates of exposure for allindividuals. The likelihood that a study will actually find a risk,if in fact it exists, is referred to as the power of a study. Thepower is influenced by many factors, including the number ofworkers being studied, the magnitude of the risk, availabilityof work histories, exposure estimates, potential confounders,detailed knowledge of potential confounders, possible healthyworker effects, use of personal protective equipment, and others.With regard to DE, essentially all of the studies cited here haveweaknesses related to these factors.
A Look at Several Underground Mining Studies With LikelyDE Exposure
Atuhaire et al., reported a study of coal miners in the RhondaFach valley in South Wales; this study was included in the

ASSESSMENT OF DIESEL EXHAUST CARCINOGENESIS STUDIES 753
IARC review of coal mining (Atuhaire et al., 1985). The cohortwas originally defined in 1950–1951 to study an entire miningcommunity (2139 nonminers and 6387 miners and ex-miners)regarding progressive massive fibrosis (PMF) as it relates topneumoconiosis and tuberculosis, so it is an example of agroup of workers originally identified to look at morbidity,not mortality. Subsequently the records were used to trace themortality of those miners as it relates to their work in the coalmines. We are now trying to glean something from this studyrelating to possible DE associations with lung cancer, becauseof the possibility or likelihood that some of the miners wereexposed to DE. Several mines in the valley operated duringthe period of rapid dieselization after 1947, but no specificinformation on DE exposure has been found on those mines.DE exposure is believed likely for at least some of the cohort,and the latency period could have been over 30 years, from thelate 1940s to 1980. For the period 1950–1980 the SMR for lungcancer deaths was 70.0 for nonminers (43 deaths) and 77.6 forminers and ex-miners (191 deaths). The SMR for all deaths was99.0 for nonminers and 128 for miners and ex-miners. Thus,while information specific to DE is lacking, the study does notsuggest an increased risk of lung cancer.
An earlier study by Goldman, also in the IARC review,reported on the lung cancer deaths among miners and ex-minersemployed by the National Coal Board (England and Wales)in 1955 (Goldman, 1965). It is considered unlikely that manyof the miners and ex-miners would have had sufficient latencyfrom DE exposure, since rapid dieselization took place after1947. Regarding smoking, it was reported that there was “muchevidence that the cigarette consumption of miners at least equalsthat of men in other occupations.” The SMR for lung cancer was70.1 for underground miners (216 lung cancer deaths) and 91.5for surface miners (54 lung cancer deaths). The lung cancer risksfor miners in the studies of Atuhaire et al., (1985) and Goldman(1965) appear similar.
Consider another study of coal miners, this one in theNetherlands, reported by Swaen et al. (1995). As with theAtuhaire et al. cohort, this cohort was originally identifiedduring surveys of respiratory health during the 1950s. All 3790in the cohort were identified as having radiological signs ofrespiratory disease. All workers in the study were followed formortality through 1991. All members of the cohort had at least10 years underground (90.5% had 20 or more years) at thetime of their survey in the 1950s. Coal production remainedhigh in the Netherlands through the late 1960s and stopped by1975. DE exposure is judged likely for at least many in thecohort because: By 1936 diesel engines were used extensivelyin coal mines in Germany and Belgium; the coal mining regionin the Netherlands was near Germany and Belgium; and thereare pictures of diesel engines underground in the Netherlandsfrom the 1940s. Here again the latency for those exposed toDE is certainly sufficient, even though details on the exposureare lacking. The SMR for all causes is 127 (2941 deaths), withthe excess essentially due to nonmalignant respiratory disease
(NMRD). The SMR for lung cancer is 102, based on 272 lungcancer deaths.
Morfeld et al., reported on the mortality of German coalminers; this study was reported after the IARC review (Morfeldet al., 1997). The cohort of 4628 was originally recruited for apneumoconiosis study. All worked at least 5 years undergroundduring 1963–1977 and the cohort was followed for 12 years from1980 through 1991. DE exposure is considered very likely; theminers had an average of 29 years underground. The minimumlatency would have been 19 years at the end of the 1991 andranged from 5 to 59 during follow-up. Smoking was reported tobe higher among miners (50%) than the general male population(33%) in the Saar area. The SMR for all deaths was 63 (317deaths) and the SMR for lung cancer was 70 (41 deaths). Theauthors concluded there was “no indication of an increasedcancer or lung cancer risk in coal miners.” The power in thisstudy is modest and the authors noted the need for additionalfollow-up and analysis. Once again, the intent of the researcherswas to investigate the risk of lung cancer and coal mine dust, notDE. However, with the likelihood of DE exposure, the findingsare consistent with no increase in risk because of DE exposure.
Waxweiler et al. reported on a study of underground potashminers from 8 New Mexico mines (Waxweiler et al., 1973). Thecohort consisted of 2,743 men with 1 year or more undergroundand less than 1 year at surface between 1940 and 1967, and1143 men with 1 year or more at surface and less than 1year underground. There was dieselization in some mines inthe early 1950s, so for miners from those mines latency wouldrange from none to 17 years. Lung cancer SMRs were 112(10 deaths) and 108 (12 deaths) for surface and undergroundworkers, respectively. In this study the power is, of course, low.Also, there is a possibility of a healthy worker effect, since newminers were added to the cohort as they reached the threshold forinclusion. Nevertheless, with smoking rates among the minersreported to have been higher than for all U.S. males, the findingsare consistent with no increased risk.
The Institute of Occupational Medicine (IOM) conductedan evaluation of a cohort of 18,166 colliers (coal miners) whowere employed in British underground coal mines between theearly 1950s to the mid-1980s (Johnston et al., 1997). Acrossall collieries (coal mines), a weak association between DEexposure and lung cancer risk was found (relative risk [RR] =1.23, 95% confidence interval [CI] 1.00–1.50), but aftercorrection for overall differences in the collieries, the associationdiminished (RR = 1.16, 95% CI 0.90–1.49), and no associationwas found among men with different DE exposures working inthe same colliery. In other words, groups of workers withinthe same colliery that had different levels of DE exposurehad the same relative risks for lung cancer. Moreover, thecolliery with the highest lung-cancer mortality rate also hadhigher exposures to respirable quartz and low-level radiation.The authors concluded: (a) “It is entirely plausible that anysuggestion of a relationship between cancer death and dieselexhaust exposure can be explained by different practices and/or

754 T. W. HESTERBERG ET AL.
environmental conditions among the ten collieries in this study”and (b) “The findings of the current study suggest that currenturban exposure concentrations for diesel exhaust particulate areunlikely to result in significantly elevated risks of lung cancer.”
These examples of studies of underground miners illustratethe broad range of factors such as likelihood of DE exposure,latency periods, study sizes, and smoking history that makea review of mining experience important to the investigationof DE health effects. The discussion here is not intended tobe complete, but simply to illustrate that underground miningstudies are potentially much more useful for risk assessmentof DE than studies of other occupational groups. Furthermore,while certainly not definitive, they provide no convincingevidence of a risk of lung cancer associated with DE, andgenerally are consistent with no risk. The studies discussedabove are included, along with a number of other studies, manyfrom the IARC review, in the Appendix, Tables A-2 and A-3.
Perusal of Table A-3 shows that almost all of the studiesreported empirical measures of lung cancer risk (e.g., SMRsand ORs) within or below the ranges of “none” and “weak”noted earlier. The only exception is the study by Saverin et al.,(1999). While other elevated RRs were given, the RR of 1.7was considered the principal finding by the authors. However,the numbers in this study are modest, and the broad range forthe confidence interval clearly shows the statistical uncertainty.As Saverin et al., cautioned, “the observed elevation is non-significant even at a 90% level.” Thus, as with the examplesdiscussed in more detail here, even with DE exposures that werean order of magnitude higher than those in either the truckingor railroad industries studies, the mining studies summarized inTable A-3 are, on balance, consistent with no detectable increasein risk.
Meta-Analyses of the Diesel Exhaust EpidemiologicDatabase
The epidemiologic database for DE has undergone two majormeta-analyses that were conducted to evaluate the relationshipbetween occupational exposure to DE and lung cancer incidence(Bhatia et al., 1998; Lipsett and Campleman, 1999). Bhatiaet al. (1998) evaluated 29 DE epidemiologic studies and selected23 that complied with their criteria for inclusion in theirmeta-analysis. They defined exposure to DE as work in anindustry in which diesel engines (vehicles or equipment) wereused. They included studies of truckers, railroad workers, busdrivers, other professional drivers, equipment operators, andmechanics. However, they excluded from their analysis studiesof miners, due to the potential for exposure to multiple airbornesubstances in this industry. Ten of the 23 studies controlledfor smoking, and 13 did not. The investigators chose 10 yearsas a minimum latency interval from first exposure to end offollow-up; if at least some of the workers in the study hadexperienced their first exposure 10 years or more prior tofollow-up, then the study was included. Bhatia et al. reporteda lung cancer relative risk of about 1.33 for all 29 studies
combined and for several subcategories of studies (e.g., studieswith adjustments for smoking vs. studies without adjustmentsfor smoking, case-control vs. cohort, internal referent groupvs. external referent group). Relative risks for individual jobcategories ranged from a low of 1.11 for equipment operatorsto a high of 1.49 for truck drivers. The investigators concludedthat their meta-analysis “supports a causal association betweenincreased risks for lung cancer and exposure to diesel exhaust.”
Lipsett and Campleman (1999) also conducted a meta-analysis of epidemiologic studies to investigate associationsbetween occupational DE exposure and lung cancer incidence.Their analysis included many of the same studies as thoseincluded in the Bhatia et al. analysis, and, like Bhatia et al.they excluded studies of miners. Lipsett and Campleman alsoreported increased relative risks for lung cancer of about 1.33when data for all studies were pooled or were grouped intovarious subcategories.
Both Bhatia et al. (1998) and Lipsett and Campleman (1999)concluded that their meta-analyses of the epidemiologic studiessupported a causal relationship between occupational exposureto DE and increased incidence in lung cancer. However, ameta-analysis is only as strong as the data on which it isbased. In the case of DE, the existing epidemiological databasehas important limitations, among which can be inadequate orabsent controls for tobacco smoking, inadequate latency forthe development of lung cancer among some or all of thestudy subjects, lack of direct quantitative data to confirm DEexposure, and lack of consistent evidence of a dose-responserelationship. Silverman (1998) notes three main concerns aboutthe epidemiologic evidence: The magnitude of effect in moststudies is low (reported RRs were generally under 1.5); of the30 studies that investigated associations between DE and lungcancer, only two (truckers and railroad workers) (Steenlandet al., 1998; Garshick et al., 2004) had quantitative data onwhich to base their estimates of historical exposure (Silverman,1998; and. In these studies, exposures for past time periods wereestimated from more contemporary data collected well after thestudy time periods.
Given the strong association between smoking and lungcancer, failure to control adequately for smoking can causesignificant confounding of the results in the DE epidemiologicstudies. For example, Stober et al. (1998) found that of the sevenepidemiologic studies of truckers cited in Bhatia et al. (1998);four made no adjustment for smoking, even though 78% of truckdrivers in the United States reportedly smoke (Stober and Abel,1996). Of the 29 studies included in the Bhatia analysis, theinvestigators listed 16 as having no adjustments for smoking.Of the 35 studies cited in the Bhatia paper (including 6 thatwere excluded from their meta-analysis), 17 did not control forsmoking (Silverman, 1998). Similarly, in the analysis by Lipsettand Campleman (1999); 19 of the 30 studies were listed as notcontrolling for smoking. Further, both of these meta-analysesrelied predominantly on studies in the trucking industry, inwhich latency periods were inadequate, that is, many or all

ASSESSMENT OF DIESEL EXHAUST CARCINOGENESIS STUDIES 755
of the study subjects’ initial exposure to DE was less than 20years prior to the follow-up date (Raffle, 1957; Menck, 1976;Williams et al., 1977; Ahlberg et al., 1981; Howe et al., 1983;Rushton et al., 1983; Coggon et al., 1984; Buiatti et al., 1985;Gustafsson et al., 1986; Damber and Larsson 1987; Siemiatyckiet al., 1988; Swanson et al., 1993).
Another important item to note is the fact that 17 of the studiescited by Bhatia and 19 of the studies cited by Lipsett/Camplemaninvolved transportation workers (truck and bus drivers andmechanics). However, as discussed earlier in the present review,there was an increased relative risk of lung cancer among truckdrivers before there were diesel trucks (Table 9). A reanalysisof the Teamster studies data also demonstrated increased lungcancer incidence in truckers prior to dieselization (Crump, 2000)(see earlier discussion of Steenland et al., 1998). The cause ofthat pre-dieselization elevation in risk has never been identified;consequently, investigators have not been able to install controlsin the DE epidemiologic for this unidentified cause.
The lack of dose-response findings in the DE epidemiologicdatabase further suggests that the lung cancer relative risksderived by the Bhatia et al. and Lipsett/Campleman analysescould be related to lifestyle or other exposures of theseoccupational populations rather than to DE. Once again, it isimportant to return to the fact that all of the existing positiveepidemiological studies show a consistent, relatively weakincreased risk, while the estimated exposure levels of DE in thesestudies vary substantially for the different worker categories.There is a lack of dose-response even within occupations.Valberg and Watson compared reported lung cancer risks withestimated DPM exposures for a number of epidemiologicstudies, some of which were included in the Bhatia et al.(1998) meta-analyses (Valberg and Watson 2000). They foundthat estimates of exposures for these occupations fell into threeoverlapping groups:
Truck drivers, dock workers, train crews, 5–100 µg/m3.Bus garage workers, railroad shop workers, and railroad
hostlers, 50–700 µg/m3.Underground miners, 500–2000 µg/m3.
In their meta-analysis, Bhatia et al. (1998) found an overallrelative risk value of 1.33, with a range from 1.11 to 1.49 inthe subanalysis by occupation. Valberg and Watson pointedout that, if DE were causally increasing lung-cancer risk by50% for low-exposure occupations (e.g., truck drivers, RR =1.49), then the lung-cancer risk in a more heavily exposedpopulation (e.g., railroad shop workers) should be much higher.However, the shop workers experienced an RR of around 1.0(Crump, 1999; HEI, 1999). Similarly, the added lung-cancerrisk for bus garage workers (RR = 1.24) was half that of truckdrivers, but DPM concentrations were considerably higher forgarage workers (ACGIH, 2000). The occupations in the studiesanalyzed by Bhatia et al. (1998) encompassed approximatelytwo orders of magnitude difference in potential diesel-exhaustexposure, yet, the epidemiologic relative risks clustered in a
narrow range. Valberg and Watson concluded that such a lack ofconcordance between reported lung-cancer risk and estimatedexposure argues against a causal role for diesel exhaust in theepidemiologic associations; the interpretation of this lack ofconcordance remains uncertain because of the epidemiologicstudies lacked concurrent exposure data.
In regard to the epidemiologic studies on DE, Silvermanconcluded, “The repeated finding of small effects, coupledwith the absence of quantitative data on historical exposure,precludes a causal interpretation. To establish causality willrequire well designed epidemiologic studies that do not sufferfrom the weaknesses of previous studies.” Specifically, sherecommended large cohorts of heavily exposed workers withadequate latency for lung cancer and quantitative exposure data.She further concluded, “Underground miners may, in fact, be themost attractive group for study because their exposure to dieselexhaust is at least five times greater than that of previouslystudied occupational groups.”
Indeed, if the increased relative risks of lung cancer reportedfor truck drivers and train crews were caused by DE exposure,then the highest incidence of lung cancer should appear in anoccupation that has the potential for even higher DE exposures,that is, underground mining, which has not been demonstratedby the data to date. As discussed earlier, even though miners’estimated exposures can be as much as two orders of magnitudehigher than truck drivers or railroad workers, miners haveactually shown slightly lower lung cancer risks than these otheroccupations (Table A-3) (Valberg and Watson, 2000).
Notably, the meta-analyses do not take into account the factthat lung cancer rates are elevated in a number of non-DE-exposed occupations. For example, the analysis by Bruske-Hohlfeld et al. (2000) demonstrated that, even after adjustmentfor smoking and potential asbestos exposure, an elevatedodds ratio for lung cancer excess was statistically significantin a wide variety of occupations: farmers; forestry workers,fishermen, and livestock workers; miners and quarrymen;chemical processors; cabinetmakers and related woodworkers;metal producers and processors; bricklayers and carpenters;road construction workers, pipe layers, and well diggers;plasterers, insulators, and upholsterers; painters and lacquerers;stationary engine and heavy equipment operators; transportworkers and freight handlers; and service workers. Althoughsome of these occupations have the potential for DE exposure,the fact that a lung cancer elevation was found in such abroad range of occupations suggests that a common failing ofoccupational studies is incomplete adjustment for confoundingby cigarette smoking, as well as insufficient latency periods.As Bruske-Hohlfeld et al. point out, “Cohort studies usuallydo not provide information on smoking detailed enough toallow for accurate adjustment in the analysis.” This finding isvery similar to the HEI conclusion that confounding factors(e.g., lifestyle) are more likely responsible for the elevatedlung cancer odds ratios reported in the railroad worker studies,rather than DE exposure (HEI, 1999). In an earlier publication

756 T. W. HESTERBERG ET AL.
(accepted for publication a month earlier, but published a yearearlier), Bruske-Hohlfeld et al. (1999) used the same pooledcase-control study to investigate only workers exposed to dieselmotor emissions. The odds ratio for workers exposed to DE,adjusted for smoking and asbestos exposure, was reported as1.43 in both papers. However, the earlier publication went intomore detail on occupations with exposure to DE. The authorsnoted “a weakness of the study lies in the limited exposureassessment available.”
In sum, meta-analyses are only as strong as the studies onwhich they are based. In the DE epidemiologic database, thecurrently available data do not constitute an adequate basis formeta-analyses in lieu of a detailed and critical review of theindividual studies on DE versus lung cancer incidence.
Evaluation of the Epidemiological Database Usingthe Hill Criteria
The Hill criteria constitute a systematic approach forevaluating causality when an association has been observed inepidemiologic studies. These criteria were originally identifiedby the noted British medical statistician, Austin Bradford Hill,in his landmark 1965 paper (Hill, 1965), and have since becomea basic tool of epidemiological research. The nine Hill Criteriaare listed and defined in Appendix 2 of this work.
In his comments on the U.S. EPA draft HAD for DE, Dr.Sverre Vedal (a member of the Clean Air Scientific AdvisoryCommittee, CASAC) found that the DE database satisfied fewof the Hill criteria (CASAC, 1999). A closer look at the firstsix of the criteria with regard to the DE database supports thisfinding.
1. The “temporality” criterion appears to be satisfied in theDE epidemiologic studies because DE exposures occurredprior to the onset of lung cancer. In most of the DE studies,the latency period is barely adequate or of questionableadequacy for the reliable detection of an increased risk,if such a risk exists. The latency period in the Teamsterstudies, for example, would be about 22 years if the date ofdieselization of the trucking fleet had been 1959 as assumedby the researchers; if the more likely date for dieselization of1970 is used, the latency period in this study would be only11 years, which is clearly insufficient.
2. The “strength of association” between diesel and lung canceris weak, given that the magnitude of the observed lung cancerincrease is relatively small. In the DE database, the relativerisks have been generally 1.2–1.4 with a few instances of2.0 (see tables in IARC, 1997, and U.S. EPA 2002). Theweak statistical associations, combined with the existenceof several negative as well as statistically nonsignificantstudies, and the potential for residual confounding fromcigarette smoking and other exposures, all undermine theoverall strength of the association.
3. The DE epidemiologic studies do not show a “dose-responserelationship” or “biological gradient,” in that similar lung
cancer increases were seen across many different populationswith a wide range of exposure levels. The estimated levelsto which the different types of workers were exposedvaried dramatically (Table A-3). For example, the estimatedexposures of truck drivers were an order of magnitude lowerthan those of railroad repair workers and train crews, and twoorders of magnitude lower than exposures of mine workers,yet similar relative lung cancer risk estimates have beenreported for all of these workers. Actually, miners haveshown slightly lower risks than truck drivers or railroadworkers. The fact that risk levels are not substantially higheramong miners, whose estimated exposures are more thantwo orders of magnitude higher than the truckers,’ does notsupport a finding of a biological gradient. Commenting on thenearly 100-fold range of DPM exposures among the variousoccupational categories, Valberg and Watson noted that “theepidemiologic relative risks cluster in a narrow range,” which“argues against a cause and effect relationship” (Valberg andWatson, 2000).
4. “Consistency”: In the DE epidemiologic database, studiesconducted in several industries and occupations have con-sistently reported the same effect, that is, a small elevationin lung cancer risk for those working in occupations withpotential DE exposure. However, in its Proposed Guidelinesfor Carcinogenic Risk Assessment, the U.S. EPA notes thatconsistency across study results is strong evidence for acausal interpretation “when the same bias or confoundingis not also duplicated across studies” (U.S. EPA 1996).As pointed out in previous sections of this article, residualconfounding from smoking very likely exists in many of theDE epidemiologic studies. Stober and Abel (1996) noted,“Occupations with a high exposure to diesel exhaust aremainly manual ones where smoking is highly prevalentamong the workers.” They reported that 78% of truckdrivers smoked, which was much higher than the rate in thegeneral population. Likewise, railroad workers have beenreported to have one of the highest rates of smoking ofany occupation, slightly over 80% (Morgan et al., 1997).Thus, the consistency among the studies is not strong (aweak or modest association reported only for some butnot all DE-exposed occupations), and possible residualconfounding from tobacco smoking further weakens the casefor consistency.
5. The case for the “biological plausibility” of a causalrelationship between DE exposure and lung cancer hasincluded the following: DE caused lung tumors in rats; DEcontains mutagenic compounds; and DE contains particulatematter consisting of a carbon core with surface layers oforganic compounds that include known mutagens. At thistime, the lung cancer in rats is viewed with caution, becausethis effect was observed consistently only in rats (not in miceor hamsters) and only with chronic exposure to extremelyhigh DE doses (orders of magnitude greater than humanexposures). The rat lung tumors are now generally accepted

ASSESSMENT OF DIESEL EXHAUST CARCINOGENESIS STUDIES 757
to be a result of lung overload and a nonspecific inflammatoryparticle effect unique to rats and not relevant to humans.While diesel exhaust does contain compounds known tobe mutagenic and potentially carcinogenic (e.g., PAHs), itappears that those compounds are tightly adsorbed to thecarbon core. Negative mutagenicity data on whole diesel ex-haust particulate suggest that these compounds are not likelyto be bioavailable. (For more details on studies of animalsand cells, see previous sections in this article.) Moreover,the large body of negative animal studies (with the exceptionof rat data that involve a rat-specific threshold mechanism)undermines arguments for the biological plausibility of anassociation between DE and lung cancer.
6. The “specificity” of the cancers seen in these studies isnot a persuasive factor since no other outcomes (i.e., typesof cancers) were systematically evaluated. Lung cancer isa relatively common disease that can be caused by manypossible agents (not the least of which is smoking), makingit one of the least specific tumors in terms of attributingcausality. Thus, in the case of the DE database, the specificitycriterion does not provide any particular support for causality.
Overall, a hypothesis for a cause-and-effect relationshipbetween DE and lung cancer does not gain much support fromthe Hill criteria. The only Hill criterion that clearly is met by thediesel epidemiologic database is temporality, in that some, butnot all, of the positive studies include an adequate latency period.Evidence in support of biological plausibility and consistency isat best equivocal; only small risk ratios have been reported, andthus the current data suggest only a modest or weak association;no biological gradient has been demonstrated; and specificity isof little relevance in this case in that the effect (lung cancer) canresult from a number of different agents.
Conclusions on Epidemiologic StudiesA number of recent reevaluations of the DE epidemiologic
data have concluded that existing epidemiological studies areunable to predict potential human health effects from exposureto DE or to link DE to increases in lung cancer (Muscat andWynder, 1995; Stober and Abel, 1996; Cox, 1997; Morgan et al.,1997). There are several factors that lead to this conclusion:(1) Many, if not most, of the DE epidemiologic studies sufferfrom inadequate latency periods; (2) of the positive studies,only weak associations are seen and those could be attributableto residual confounding (particularly by smoking); (3) theepidemiologic database is inconsistent and inconclusive, witha few studies showing a weak association between DE exposureand lung cancer and other studies showing no association;(4) there is no exposure-response relationship in most studies,with some studies even showing negative dose response;(5) given the negative mutagenicity data on whole DE anda negative animal database for carcinogenicity, biologicalplausibility is questionable; and (6) the epidemiological studies
lack adequate exposure information regarding DE particulate,without which the relevance of the human studies is unknown.
CHANGES IN DIESEL EXHAUST COMPOSITIONThe existing epidemiologic and toxicologic databases on DE
address predominantly or only pre-1988 TDE. Over the past18 years, major changes have occurred in diesel technologywhich have resulted in very significant quantitative and qual-itative changes in engine emissions, noteworthy of which aremajor reductions in emitted DPM, nitrogen oxides, and othercomponents (Fig. 1–4). Thus, past research does not provideaccurate information for assessments of human health effectsthat might be associated with current and future exposures todiesel exhaust. The paragraphs that follow summarize the majoradvances in diesel technology over the past 18 years and theresultant dramatic changes in diesel exhaust composition. Asdiscussed next; the physical and chemical characteristics ofNTDE are closer to those of compressed natural gas (CNG)emissions than to TDE. Thus, NTDE should be evaluated forhuman health effects independently from TDE.
To comply with the 2007 emissions standards, the dieselindustry has developed NTD engines, which consist of an inte-grated system of advanced engine design, ultra-low-sulfur (<15ppm) fuel, specialized lubricants, and a catalyzed particulatetrap filter (International, 2002). New technology diesel has beensummarized elsewhere (Hesterberg et al., 2005). NTD engineshave been developed to be introduced into the marketplace by2007. Emissions from current diesel engines manufactured after1994 can be dramatically reduced by retrofitting the engineswith the new catalyzed particulate filters and running them onultra-low-sulfur fuel. Other than higher NOx levels, emissionsfrom these retrofitted engines are very close to NTDE. Severalthousand retrofitted diesel engines (e.g., school buses) have beenintroduced into limited markets where the fleets operate closeto a common fueling point and ultra-low-sulfur diesel fuel isavailable.
Advances in diesel technology by 2007 are far-reaching, tothe extent that NTDE does not resemble TDE, which werethe emissions evaluated in all published chronic inhalation andepidemiologic studies of DE. In fact, emissions from NTD are asclean as or cleaner than emissions from engines fueled by eithergasoline (Ahlvik, 2002) or CNG (Ullman et al., 2003) (Tables1 and 2). By 2010, U.S. heavy-duty diesel engine emissionstandards (on a per-mile basis) will have dropped 99% for bothoxides of nitrogen and particulate matter (Figs. 1 and 2) (U.S.EPA, 2002).
Changes in fuel composition and the introduction of exhaustafter-treatment filters have led to qualitative and quantitativechanges in the composition of diesel exhaust, as seen inFigs. 3 and 4. Compared to the emissions from a 2001transitional diesel engine, NTDE shows a large drop in thetotal quantity of both low and high molecular weight PAHs,as well as large differences in the proportions of each ofthe different PAHs—many of them are no longer detectable.

758 T. W. HESTERBERG ET AL.
Mandated changes in California diesel fuel produced largedrops in the emissions of total polycyclic aromatic hy-drocarbons (PAH) as well as specific compounds, such asphenanthrene, methylphenanthrenes, methylanthracenes, and2,3,5-trimethylnaphthalene (Norbeck et al., 1998). Furthermore,ultra-low-sulfur (<15 ppm) and low-aromatic (4%) diesel fuelproduced additional decreases in PAHs (Lev-On et al., 2002a).These quantitative and qualitative changes in emissions wouldbe even greater if NTDE were compared with TDE.
Examples of qualitative and quantitative differences betweenNTDE and transitional diesel engine exhaust (from engines builtbetween 1988 and 2006) are striking, as seen here (see also Figs.3 and 4):
Low molecular weight (MW) PAHs in diesel exhaustNaphthalene
NTDE69 µg/mile
(∼ 90% of the low-MW PAHs)
Transitional DE730 µg/mile
(∼25% of the low-MW PAHs)
2-MethylnaphthaleneNTDE
3.1 µg/mile(4% of the low-MW PAHs)
Transitional DE1200 µg/mile
(43% of the low-MW PAHs)
High-molecular-weight (MW) PAHs in diesel exhaustBenzo[a]anthracene
NTDE0.08 µg/mile
(> 50% of high-MW PAHs)
Transitional DE1.1 µg/mile
(∼10% of high-MW PAHs)
ChryseneNTDE
0.00003 µg/mile(0.02% of high-MW PAHs)
Transitional DE2.4 µg/mile
(29% of high-MW PAHs)
Studies have shown that the combination of ultra-low-sulfurfuels with the new after treatment (used in NTD-type engines)systems produce diesel emissions that are much lower thantransitional diesel (1988–2006) and that compare very favorablywith emissions from CNG, typically considered to be “cleanburning” (Gragg, 1995b; Ayala et al., 2002; Lev-On et al., 2002a,2002b; Lanni et al., 2003; Ullman et al., 2003). Continuouslyregenerating traps with oxidation catalysts significantly reduceor eliminate particulate matter, carbon monoxide and volatilehydrocarbons to levels that are lower than those found with CNG(Table 1). Also total PAH and semivolatile PAH levels weremuch lower in diesels with traps (particulate-filtered diesel)compared to diesels without traps or to CNG emissions (Gragg,1995a, 1995b, 2001; Lev-On et al., 2002a; Okamoto et al., 2002,2006; Lanni et al., 2003; Ullman et al., 2003; Kado et al., 2005).
In fact, the PAH composition of particulate-filtered diesel ismore similar to CNG emissions than pre-1994 diesel emissions.Further, a study comparing the emissions of diesel-fueled schoolbuses to those fueled by CNG found that CNG exhaust hadhigher levels of six toxic air contaminants (TACs) listed by theCalifornia Air Resources Board than particulate-filtered diesel,and CNG did not have lower levels of any TAC (Table 2) (Ullmanet al., 2003).
A recent short-term inhalation study in mice illustratesthe differences between standard diesel technology and newdiesel emissions reduction technology (McDonald et al., 2004c).Although this study does not address carcinogenicity, it isincluded in this review because it demonstrates importantdifferences between the respective emissions of old and newdiesel technologies. McDonald et al. compared lung toxicityof emissions from two diesel engine configurations: (1) adiesel engine powered by standard diesel fuel and lackingafter treatment, and (2) the same diesel engine running onultra-low-sulfur fuel and fitted with a catalyzed particle trap.The studies were conducted serially using a small (0.65-L)diesel-powered generator (5500-W single cylinder). The enginewas operated identically in both cases, and the inhalationexposures were diluted at the same ratio of 1:620 exhaustto air. Particulate concentration in standard engine emissionswas 200 µg/m3. However, when the engine was fitted with atrap filter and run on ultra-low-sulfur fuel, particulate matteras well as most other emissions components (except nitrogenoxides, NOx) were near background levels. Mice (C57Bl/6)were exposed to emissions by inhalation for 6 h/d for 1week and then assessed for resistance to respiratory viralinfection, lung inflammation, and oxidative stress. Comparedto air controls, DE without emissions reduction technologyproduced statistically significant elevations in all three toxicityparameters in the mice. However, the use of ultra-low-sulfurfuel and a catalyzed particle trap either completely or nearlyeliminated the three effects. Thus, in this short-term inhalationstudy, diesel emissions reduction technology (ultra-low-sulfurfuel and catalyzed particle trap) was effective in mitigatingthese noncarcinogenic pulmonary effects in mice. This studydemonstrates the significant differences in biological impactbetween emissions from uncontrolled diesel engines versusdiesel engines with emissions reduction technology.
In summary, over the past several years, the compositionof DE has changed both quantitatively and qualitatively to theextent that NTDE hardly resembles TDE. NTDE is now morecomparable to CNG exhaust than to TDE. Given the dramaticchanges in diesel emissions composition, new toxicologic andepidemiologic research should focus more on NTDE exposures,to begin developing a health effects database upon which thisnew technology can be evaluated. Clearly, when evaluatingpossible health effects of engine emissions, it is importantto make a clear distinction between NTDE and TDE. In1989, IARC evaluated the evidence for the carcinogenicity ofTDE. The numerous studies conducted on this topic since that

ASSESSMENT OF DIESEL EXHAUST CARCINOGENESIS STUDIES 759
evaluation suggest that it would be appropriate for IARCto consider reevaluating TDE. Furthermore, the dramaticdifferences in the physical/chemical composition of NTDEcompared to TDE, suggest that IARC should evaluate theemissions of this new technology independently from TDE.To apply the findings of the health studies conducted over thelast 30 years on TDE to NTDE would make as much senseas applying those health study results to gasoline or CNGexhaust, which are much closer in composition to NTDE than toTDE.
STUDIES UNDERWAY OR PLANNEDSeveral DE studies are either underway or planned that
will significantly improve our understanding of the effects ofpast, current and future exposures to DE. When evaluatingDE, it is important to account for the marked reductions inemissions from diesel engines over the last two decades and theadditional advances that will be made in order to meet upcomingemission regulatory requirements. New epidemiologic studiesare underway that address many of the shortcomings of earlierstudies, which are discussed throughout this article. These newstudies are designed to provide a better understanding of thepotential biological effects of exposure to TDE as well asNTDE. Further, there are recent toxicity studies that providea context for comparing current diesel emissions with othertypes of engine exhausts (summarized elsewhere; Hesterberget al., 2005).
A major research effort is underway in the United States tocharacterize the composition and potential toxicity of emissionsof diesel engines equipped with the latest emissions controltechnology. This 5-year, multi-million-dollar research programwill receive funding from the U.S. Environmental ProtectionAgency, the Engine Manufacturers Association, the U.S. De-partment of Energy, the California Air Resources Board, and theAmerican Petroleum Institute. Initially, the testing program willchemically and physically characterize the emissions of dieselengines that are equipped with NTD (i.e., engines that meet the2007 U.S. EPA emissions standards). The centerpiece of theprogram will be a chronic inhalation toxicity study of multipleexposure levels of NTDE in two species of animals, using theNational Toxicology Program protocol as a guideline. This studywill provide a safety assessment of NTDE to determine whetherthere are any unintended health risks associated with exposureto this new low-emitting technology.
Preliminary data provide important insights on the impact ofnew diesel technologies on the chemical and physical charac-teristics of NTDE. Elements of NTD (e.g., ultra-low-sulfur fuelwith catalyzed particulate filters) have already been studied.By itself, ultra-low-sulfur fuel with lower aromatic contentprovides a 10–30% reduction in particulate and polycyclicaromatic hydrocarbon (PAH) emissions (Ball et al., 2001;LeTavec et al., 2002). Moreover, the ultra-low sulfur enablesthe use of catalyzed particulate filters, which provide substantial
reductions (80–100%) in particulate mass and number (in all sizeranges), volatile hydrocarbons (including benzene, butadiene,and formaldehyde), and carbon monoxide and PAHs (Ayalaet al., 2002; Lev-On et al., 2002a, 2002b; Lanni et al., 2003;Ullman et al., 2003). Testing of engines that will be usedto meet the U.S. 2007–2010 emission requirements is in theplanning stages in the United States. Japan has also begun testingprototype engines that meet the new requirements (Shibataet al., 2003). Recent results from studies of ultra-low-sulfurfuel and catalyzed particulate filters clearly demonstrate thatemissions from diesels in the future will be quite different (bothquantitatively and qualitatively) from TDE.
There are three large epidemiologic studies underway thataddress many of the shortcomings of earlier studies. Findingsfrom these studies are expected within the next 3 to 5 years, andshould provide a better understanding of the effects of exposureto historical diesel.
Harvard University researchers are conducting an epidemio-logic study of particle exposures in the trucking industry, whichis being funded by the National Cancer Institute (Garshick et al.,2003). This large cohort, 54,319 unionized workers employedin 1985, included drivers, dock workers, hostlers, mechanics,and clerks from four large shipping companies in the UnitedStates. The study will assess lung cancer risk over a longperiod (through 2000, covering >20–30 years), will includelarge numbers of subjects with relevant exposure, and willaccurately characterize exposure by an extensive assessmentof representative samples. Preliminary results from this studyshowed that PM exposures were from mobile sources, includinggasoline exhaust, and not diesel exhaust alone (Garshick et al.,2006a).
Researchers at the National Institute of Occupational Safetyand Health (NIOSH) and the National Cancer Institute (NCI) areevaluating mortality from lung cancer and other diseases amongnonmetal miners in relation to quantitatively measured exposureto diesel exhaust, using a cohort and nested case-control study(Attfield, 2003). NIOSH researchers will characterize currentand past levels of surrogates of diesel exhaust with the aimof developing reliable estimates of cumulative exposure andassociated indices. These exposures will be used to investigatepotential exposure-response relationships in the two studies.NIOSH is expected to issue a final report on this study inapproximately 2 years.
Finally, in Australia, the Cancer Surveillance Project ismonitoring the rate of cancer in 24,139 New South Walesblack-coal miners (Kirby et al., 2000). As mentioned earlier,miners have the highest occupational exposure to diesel exhaust.This study, with results expected in about 5 years, will providefurther insight into the potential health effects of traditionaldiesel exhaust.
These extensive new data should prove invaluable to a con-temporary, comprehensive assessment of DE exposures—bothpast, present, and future—and any association withcarcinogenicity.

760 T. W. HESTERBERG ET AL.
CONCLUSIONSA critical assessment of the currently available laboratory and
epidemiological data has not provided a convincing argumentfor a causal relationship between exposure to TDE and anincreased incidence of lung cancer. This historical databaseapplies primarily to TDE and has only limited relevance to ahealth assessment of NTDE. The data from laboratory studiesof TDE, both in vivo and in vitro, have only limited relevancein assessing the carcinogenic potential of TDE in humans.Laboratory rats exposed to very high levels of TDE (>2200µg/m3) developed an excess of lung tumors; however, the tumorincidence was consistent with that observed in rats exposed tothe same overload levels of other types of fine particles (TiO2,talc, and carbon black). Other species (mice and hamsters)exposed at similar, high DE levels did not show an excessof lung tumors, nor did rats exposed at lower DE levels. Inrats, high exposures to a variety of different particulates (DPMas well as inert TiO2, talc, and carbon black) resulted in lungoverload, lung inflammation, cell proliferation, and eventuallytumors. This mechanism is not DE specific and did not occur inthe rats at DPM exposure concentrations below 2000 µg/m3, aconcentration level that is 100-fold greater than DPM levels towhich railroad and trucking industry workers might be exposed.Thus, the tumorigenic effect of high levels of TDE PM in rats isnow considered to be a nonspecific particle effect that resultedfrom a species-specific overload mechanism. Such a mechanismhas little or no relevance to humans exposed either to lowlevels in occupational environments or to even lower ambientlevels.
Furthermore, mutagenicity studies in which cultures ofmammalian or bacterial cells were exposed to organic solventextracts of DPM are of limited utility for understanding thepotential carcinogenicity of whole DPM. Although organiccompounds can be extracted from DPM, and some of thesecompounds have been shown to cause mutations in vitro, suchmutagens become effectively available only after particles havebeen treated with organic solvents, agitation, and heat. WholeDPM itself has not been found to be mutagenic in most studies.The mutagens extractable from DPM dissolve either minimallyor not at all in aqueous based fluids, such as body fluids or cellculture medium. Thus, these adsorbed mutagens are generallynot considered to be bioavailable, which could explain why moststudies have not shown DPM to be a direct-acting mutagen.
The epidemiologic database for DE is comprised of studiesof the transportation industry and of the underground miningindustry. Epidemiologic studies of the transportation industry(trucking, busing, and railroad) generally show a low elevationin lung cancer incidence (RRs generally below 1.5), but doseresponse for DE exposure is lacking, and the studies are limitedby minimal or inadequate latency periods, a lack of quantitativeconcurrent exposure data, and inadequate or lack of controls fortobacco smoking. Furthermore, there were similar elevationsin lung cancer incidence in truck drivers prior to dieselization.And finally, in-cab PM exposures of truck drivers have been
shown to be comparable to ambient highway exposures; thus,at least on the road, long-haul truckers are not exposed to anyhigher DPM than the rest of the driving or highway-situatedpopulation. Taken together, these findings suggest that lifestyleor an unidentified occupational agent other than DE mightbe responsible for the low elevations in lung cancer reportedin the transportation studies. In contrast to the transporta-tion industries studies, epidemiologic studies of undergroundminers, many of whom are exposed to perhaps the highestknown human DPM exposures, are generally negative for lungcancer.
The existing epidemiologic studies were of occupational pop-ulations that were exposed to TDE. However, diesel technologyhas undergone significant changes over the past two decades,resulting in dramatic changes in exhaust emissions. Furthermarked reductions in diesel engine emissions will occur in 2007,as the new-technology diesel (NTD) engines enter the market.NTDE differs, both quantitatively and qualitatively, from TDE.In fact, the physical/chemical characteristics of NTDE aremore similar to compressed natural gas (CNG) emissions thanto TDE. Thus IARC and other regulatory agencies shouldevaluate the potential carcinogenicity of NTDE independentlyof TDE, just as CNG and gasoline exhaust are independentlyevaluated.
Understanding the potential health effects of DE is important,not only for the large populations that are occupationallyexposed but also for the general public, which is exposed atlower ambient levels. New studies are underway and othersare proposed that will investigate possible associations betweenexposure to DE and increases in lung cancer incidence (as wellas other possible health effects). These new studies will striveto eliminate the weaknesses and limitations of the past studies.Specifically, the new epidemiologic studies will measure healtheffects in a large cohort of heavily exposed miners with anadequate latency period for lung cancer and with quantitativehistorical exposure data. Furthermore, additional new laboratorystudies will evaluate the potential health effects of NTDEindependently from those studies that have historically focusedon TDE.
ACKNOWLEDGMENTSThis review was prepared by T.W. Hesterberg and W.B. Bunn
in the course of their employment by the International Truckand Engine Corporation and Gerald R. Chase, Peter A. Valberg,Thomas J. Slavin, Charles A. Lapin, and Georgia A. Hart asconsultants to International Truck and Engine Corporation.The proposed studies of the new-technology diesel exhaustemissions are part of a proposed program being developed bythe Health Effects Institute (HEI) and its stakeholders. Theproposed program outlined here represents the independentviews of the authors and does not necessarily imply acceptanceor endorsement by the HEI and its stakeholders.

ASSESSMENT OF DIESEL EXHAUST CARCINOGENESIS STUDIES 761
REFERENCESACGIH. (2000). American Conference of Governmental Industrial
Hygienists: Draft recommended TLV documentations for dieselexhaust particulate (aerodynamic diameter <1 micron).. Cincinnati,OH: American Conference of Governmental Industrial Hygienists.
Ahlberg, J., Ahlbom, A., et al. (1981). [Cancer in profes-sional drivers—Problem-orientated registry study]. Lakartidningen78(15):1545–1546.
Ahlvik, P. (2002). Environmental and health impact from moderncars. A comparison between two petrol and two diesel carswith varying emission control technology. A report for theSwedish National Road Administration, Vehicle Standards Division.Borlange, Sweden, Ecotraffic R&D 3 AB, Vagverket http://www.vv.se/publ blank/bokhylla/miljo/lista.htm.
Ames, R.G., and Gamble, J.F. (1983). Lung cancer, stomach cancer,and smoking status among coal miners. A preliminary test of ahypothesis. Scand. J. Work. Environ. Health 9(5):443–448.
Ames, R.G., Amandus, H., et al. (1983). Does coal mine dust present arisk for lung cancer? A case-control study of U.S. coal miners. Arch.Environ. Health. 38(6):331–333.
Arey, J., Zielinska, B., et al. (1998). Formation of nitroarenesduring ambient high-volume sampling. Environ. Sci. Technol.22(4):457–462.
Armstrong, B.K., McNulty, J.C., et al. (1979). Mortality in gold andcoal miners in Western Australia with special reference to lungcancer. Br. J. Ind. Med. 36(3):199–205.
Arrighi, H.M., and Hertz-Picciotto, I. (1994). The evolving concept ofthe healthy worker survivor effect. Epidemiology 5(2):189–196.
Attfield, M. (2003). A cohort mortality study with a nested casecontrol study of lung cancer and diesel exhaust among non-metal miners. (Accessed on November 14, 2003. http://www.cdc.gov/niosh/mining/projects/cmswn.html). Division of Respira-tory Disease Studies, National Institute for Occupational Safety andHealth.
Atuhaire, L.K., Campbell, M.J., et al. (1985). Mortality of men in theRhondda Fach 1950–80. Br. J. Ind. Med. 42(11):741–745.
Axelson, O., and Steenland, K. (1988). Indirect methods of assessingthe effects of tobacco use in occupational studies. Am. J. Ind. Med.13(1):105–118.
Ayala, A., Kado, N.Y., et al. (2002). Diesel and CNG heavy-duty transitbus emissions over multiple driving schedules; regulated pollutantsand project overview. 2003-01-0300.. Warrendale, PA: SAE.
Bailey, C.R., Somers, J.H., et al. (2003). Exposures to diesel exhaustin the International Brotherhood of Teamsters, 1950–1990. AIHA J.64(4):472–479.
Ball, J. C., Lapin, C. A. et al. (2001). Dimethoxy methane in dieselfuel: Part 2. The effect of fuels on emissions of toxic air pollutantsand gas/solid phase PAH using a composite of engine operatingmodes. Society of Automotive Engineers Technical Paper Series,2001, 2001-01-3628. Warrendale, PA: SAE.
Barrett, R.E. (1982). The Federal Viewpoint (MESA). Proceedings of aworkshop on the use of diesel equipment in underground coal mines.NIOSH pub 82–122:6–12.
Bhatia, R., and Lopipero, P. (1998). Diesel exhaust exposure and lungcancer. Epidemiology 9(1):84–91.
Birch, M.E., and Cary, R.A. (1996). Elemental carbon-based methodfor occupational monitoring of particulate diesel exhaust: method-ology and exposure issues. Analyst. 121(9):1183–1190.
Birch, M.E., and Noll, J.D. (2004). Submicrometer elemental carbonas a selective measure of diesel particulate matter in coal mines. J.Environ. Monit. 6(10):799–806.
Bond, J.A., Harkema, J.R., et al. (1990a). The role of DNA adducts indiesel exhaust-induced pulmonary carcinogenesis. Prog. Clin. Biol.Res. 340C:259–269.
Bond, J.A., Johnson, N.F., et al. (1990b). DNA adduct formation inrat alveolar type II cells: cells potentially at risk for inhaled dieselexhaust. Environ. Mol. Mutagen. 16(2):64–69.
Bond, J.A., Mauderly, J.L., et al. (1990c). Concentration- and time-dependent formation of DNA adducts in lungs of rats exposed todiesel exhaust. Toxicology. 60(1–2):127–135.
Borak, J., and Sirianni, G. (2003). Comparison of NIOSH 5040 methodversus Aethalometer to monitor diesel particulate in school buses andat work sites. AIHA. J. 64(2):260–268.
Borm, P., and Cakmak, G. (2005). Formation of PAH–DNA adductsafter in vivo and vitro exposure of rats and lung cells to differentcommercial carbon blacks. Toxicol. Appl. Pharmacol. 205:157–167.
Boyd, J.T., and Doll, R. (1970). Cancer of the lung in iron ore(haematite) miners. Br. J. Ind. Med. 27(2):97–105.
Brightwell, J., and Fouillet, X. (1989). Tumours of the respiratory tractin rats and hamsters following chronic inhalation of engine exhaustemissions. J. Appl. Toxicol. 9(1):23–31.
Brooks, A.L., Li, A.P., et al. (1984). A comparison of genotoxicityof automotive exhaust particles from laboratory and environmentalsources. Environ. Mutagen. 6(5):651–668.
Brooks, A. L., Wolff, R. K., et al. (1980). Health effects of dieselengine emissions: Proceedings of an international symposium heldat Cincinnati, OHIO on December 3–5, 1979. Volume I. Reportto U.S. EPA, PB81-173809 ; PB81 173817; EPA-600/9-80/057a,b;pp. 345–358. Health Effects Research Laboratory (Cincinnati, OH)and National Technical Information Service (NTIS) (Springfield,VA).
Bruske-Hohlfeld, I., and Mohner, M. (2000). Occupational lung cancerrisk for men in Germany: Results from a pooled case-control study.Am. J. Epidemiol. 151(4):384–395.
Buiatti, E., and Kriebel, D. (1985). A case control study of lungcancer in Florence, Italy. I. Occupational risk factors. J. Epidemiol.Community Health. 39(3):244–250.
Bunn, W. B. and T. J. Slavin (2001). “Analysis of the suitability ofdiesel-exhaust particulates in the trucking industry for conductingqualitative risk assessment.” The OEM Report 15:67–75.
Bunn, W.B., Hesterberg, W.T., et al. (2004). A reevaluatioin of theliterature regarding the health assessment of diesel engine exhaust.Inhalation. Toxicology. 16:889–900.
CalEPA. (1998). Report to the Air Resources Board on the proposedidentification of diesel exhaust as a toxic air contaminant. Part B.Health risk assessment for diesel exhaust. Office of EnvironmentalHealth Hazard Assessment, California Environmental ProtectionAgency, Sacramento.
Cantrell, B.K., and Watts, W.F. (1997). Diesel exhaust aerosol: Reviewof occupational exposure. Appl. Occup. Environ. Hyg. 12(12):1019–1027.
CASAC. (1999). Condensed Transcript of Diesel Review Panel, PublicMeeting, Washington, DC, December 1, 1999. Clean Air ScienceAdvisory Committee, U.S. Environmental Protection Agency.
CASAC. (2000). Review of EPA’s health assessment document fordiesel exhaust. EPA SAB-CASAC-01-003. Washington, DC: Clean

762 T. W. HESTERBERG ET AL.
Air Scientific Advisory Committee, U.S. Environmental ProtectionAgency.
Checkoway, H., Pearce, N., et al. (1989). Research methods inoccupational epidemiology. Monographs in Epidemiology andBiostatistics. New York: Oxford University Press.
Clark, T. M. (1982). Experience in the use of diesel equipment inNew South Wales coal mines. Proceedings of a workshop on theuse of diesel equipment in underground coal mines. NIOSH pub.82–122:33–54.
Claxton, L.D., Creason, J., et al. (1992). Results of the IPCS colla-borative study on complex mixtures. Mutat. Res. 276(1–2):23–32.
Cochrane, A.L., Haley, T.J., et al. (1979). The mortality of men in theRhondda Fach, 1950–1970. Br. J. Ind. Med. 36(1):15–22.
Coggon, D., Pannett, B., et al. (1984). Use of job-exposure matrix inan occupational analysis of lung and bladder cancers on the basis ofdeath certificates. J. Natl. Cancer Inst. 72(1):61–65.
Cohen, H.J., Borak, J., et al. (2002). Exposure of miners to dieselexhaust particulates in underground nonmetal mines. Am. Indus.Hyg. Assoc. J. 63(5):651–658.
Costello, J., Ortmeyer, C.E., et al. (1974). Mortality from lung cancerin U.S. coal miners. Am. J. Public Health 64(3):222–224.
Cox, L.A. (1997). Does diesel exhaust cause human lung cancer?. RiskAnal 17(6):807–829.
CRARM. (1997). Risk assessment and risk management in reg-ulatory decision-making. Final report. Washington, DC, Presi-dential/Congressional Commission on Risk Assessment and RiskManagement.
Crump, K.S. (1999). Lung cancer mortality and diesel exhaust:reanalysis of a retrospective cohort study of U.S. railroad workers.Inhal. Toxicol. 11(1):1–17.
Crump, K. (2000). Re-analysis of Steenland data. Report 2. T.W.Hesterberg. Chicago.
Crump, K. (2001). Modeling lung cancer risk from diesel exhaust:suitability of the railroad worker cohort for quantitative riskassessment. Risk Anal 21(1):19–23.
Crump, K., Lambert. T., et al. (1991). Assessment of risk fromexposure to diesel engine emissions. U.S. EPA Contract 68-02-4601;Appendix B. Health. Assessment Document for Diesel Emissions.Washington, DC: U.S. EPA. 2, EPA-600/8-90/057Bb.
Dahmann, D., and Bauer, H.D. (1997). Diesel particulate matter inworkplaces in Germany. Appl. Occup. Environ. Hyg. 12(12):1028–1031.
Dahmann, D., Fricke, H.H., et al. (1996). Diesel engine emissions inworkplace atmospheres in Germany. Occup. Hyg. 3:255–262.
Damber, L., and Larsson, L.G. (1985). Underground mining, smoking,and lung cancer: a case-control study in the iron ore municipalitiesin northern Sweden. J. Natl. Cancer Inst. 74(6):1207–1213.
Damber, L.A., and Larsson, L.G. (1987). Occupation and male lungcancer: a case-control study in northern Sweden. Br. J. Ind. Med.44(7):446–453.
Doll, R., and Peto, R. (1981). The causes of cancer: Quantitativeestimates of avoidable risks of cancer in the U.S. today. New York:Oxford University Press.
Dubrow, R., and Wegman, D.H. (1983). Setting priorities for oc-cupational cancer research and control: synthesis of the resultsof occupational disease surveillance studies. J. Natl. Cancer Inst.71(6):1123–1142.
Dubrow, R., and Wegman, D.H. (1984). Cancer and occupation inMassachusetts: a death certificate study. Am. J. Ind. Med. 6(3):207–230.
East, J.H. Jr. (1946). Operating diesel locomotives underground inEuropean mines. U.S. Bureau of Mines Information Circular 7378.September.
Enterline, P.E. (1972). A review of mortality data for American coalminers. Ann. NY Acad. Sci. 200:260–272.
Enterline, P.E., and Mckiever, M. (1963). Differential mortality fromlung cancer by occupation. J. Occup. Med. 5:283–290.
Gallagher, J., and Heinrich, U. (1994). Formation of DNA adducts inrat lung following chronic inhalation of diesel emissions, carbonblack and titanium dioxide particles. Carcinogenesis 15(7):1291–1299.
Garcia, M.L., and Checkoway, H. (2003). A glossary for research inoccupational health. J. Epidemiol. Community Health 57:7–10.
Garshick, E., Laden, F., et al. (2004). Lung cancer in railroad workersexposed to diesel exhaust. Environ. Health Perspect. 112(15):1539–1543.
Garshick, E., Laden, F., et al. (2006a). Update of trucking industryparticulate matter exposures and lung cancer 1985–2000. Proc. Am.Thoracic Soc. 3(Abstr. vol.):A251.
Garshick, E., Laden, F., et al. (2006b). Smoking imputation and lungcancer in railroad workers exposed to diesel exhaust. Am. J. Ind.Med. 49(9):709–718.
Garshick, E., Schenker, M.B., et al. (1987). A case-control study oflung cancer and diesel exhaust exposure in railroad workers. Am.Rev. Respir. Dis. 135(6):1242–1248.
Garshick, E., Schenker, M.B., et al. (1988). A retrospective cohort studyof lung cancer and diesel exhaust exposure in railroad workers. Am.Rev. Respir. Dis. 137(4):820–825.
Garshick, E., Smith, T., et al. (2003). Update: The trucking industryparticle study. Fourth World Truck Conference, March 2-4, 2003.Monterey, CA.
Goldman, K.P. (1965). Mortality of coal-miners from carcinoma of thelung. Br. J. Ind. Med. 22:72–77.
Gragg, K. (1995a). Chemical characterization and biological testing ofexhaust from a truck fueled with EC1 and EPEFE reference fuel.Report no. MTC 9510. Haninge, Sweden: ASB Motortestcenter.
Gragg, K. (1995b). Emissions from two CNG-fueled buses. Haninge,Sweden: ASB Motortestcenter. Report no. MTC 9450B.
Gragg, K. (2001). Efficiency of a catalytic muffler and crt systems forheavy duty vehicles. Haninge, Sweden: ASB Motortestcenter.
Greim, H., Borm, P., et al. (2001). Toxicity of fibers and particles.Report of the workshop held in Munich, Germany, 26–27 October2000. Inhal. Toxicol 13(9):737–754.
Gu, Z.W., Zhong, B.Z., et al. (1992). Micronucleus induction andphagocytosis in mammalian cells treated with diesel emissionparticles. Mutat. Res. 68(6):431–444.
Gu, Z.W., Keane, M.J., et al. (2005). Diesel exhaust particulatematter dispersed in a phospholipid surfactant induces chromosomalaberrations and micronuclei but not 6-thioguanine-resistant genemutation in V79 cells. J. Toxicol. Environ Health A 68(6):431–444.
Gustafsson, L., Wall, S., et al. (1986). Mortality and cancer incidenceamong Swedish dock workers—A retrospective cohort study. ScandJ Work Environ Health 12(1):22–26.
Hall, N.E., and Wynder, E.L. (1984). Diesel exhaust exposure and lungcancer: a case–control study. Environ. Res. 34(1):77–86.

ASSESSMENT OF DIESEL EXHAUST CARCINOGENESIS STUDIES 763
Hammond, S.K., Smith, T.J., et al. (1988). Markers of exposure todiesel exhaust and cigarette smoke in railroad workers. Am. Indus.Hyg. Assoc. J. 49(10):516–522.
Haney, R.A., and Fields, K.G. (1996). In mine comparison of dieselparticulate sampling methods. Appl. Occup. Environ. Hyg. 11:717–720.
Harrington, D., and J.H. East, Jr. (1947). Diesel equipment inunderground mining. U.S. Bureau of Mines Information Circular7406. April.
Hayes, R.B., Thomas, T., et al. (1989). Lung cancer in motor exhaust-related occupations. Am. J. Ind. Med. 16(6):685–695.
HEI. (1995). Diesel exhaust: A critical analysis of emissions, exposure,and health effects. A special report of the Diesel Working Group ofthe Health Effects Institute. Boston: Health Effects Institute.
HEI. (1999). Diesel emissions and lung cancer: Epidemiology andquantitative risk assessment. Special report. Boston: Health EffectsInstitute, Diesel Epidemiology Expert Panel.
HEI. (2000). Health Effects Institute review of draft EPA document:Reconstruction of Teamsters union exposures 1950–1999. Boston:Health Effects Institute.
HEI. (2003). Improving estimates of diesel and other emissions forepidemiologic studies, Baltimore, MD, Dec. 2002. Bston: HealthEffects Institute.
Heinrich, U., Muhle, H., et al. (1986). Chronic effects on the respiratorytract of hamsters, mice and rats after long-term inhalation of highconcentrations of filtered and unfiltered diesel engine emissions. JAppl Toxicol 6(6):383–395.
Heinrich, U., Fuhst, R., et al. (1995). Chronic inhalation exposure ofWistar rats and two different strains of mice to diesel engine exhaust,carbon black, and titanium dioxide. Inhal. Toxicol. 7:533–556.
Heinrich, U., Mohr, U., et al. (1989). Investigation of a potentialcotumorigenic effect of the dioxides of nitrogen and sulfur, andof diesel-engine exhaust, on the respiratory tract of Syrian goldenhamsters. Res. Rep. Health Effects Inst. 26:1–27.
Hesterberg, T.W., Bunn, W.B., et al. (2005). Carcinogenicity studiesof diesel engine exhausts in laboratory animals: a review of paststudies and a discussion of future research needs. Crit. Rev. Toxicol.35:379–411.
Higginson, N. (1975). Use of diesel engines underground in Britishcoal mines. Bureau of Mines Information Circular 8666:276–316.
Hill, A.B. (1965). The environment and disease: Association orcausation?. Proc. R. Soc. Med. 58:295–300.
Holtz, J.C., (1962). Safety with mobile diesel-powered equipmentunderground. Bureau of Mines report of investigations 5616.
Howe, G.R., Chiarelli, A.M., et al. (1988). Components and modifiersof the healthy worker effect: Evidence from three occupationalcohorts and implications for industrial compensation. Am. J.Epidemiol. 128(6):1364–1375.
Howe, G.R., Fraser, D., et al. (1983). Cancer mortality (1965–77) inrelation to diesel fume and coal exposure in a cohort of retired railwayworkers. J. Natl. Cancer Inst. 70(6):1015–1019.
Hueper, W. (1966). Occupational and environmental cancers of therespiratory system. New York: Springer-Verlag.
IARC. (1989). Diesel and gasoline engine exhausts and somenitroarenes. Lyon, France: World Health Organization, InternationalAgency for Research on Cancer.
IARC. (1997). Silica, some silicates, coal dust and para-aramid fibrils.Lyon, France: World Health Organization, International Agency forResearch on Cancer.
ILSI. (2000). The relevance of the rat lung response to particle overloadfor human risk assessment: a workshop consensus report. ILSI RiskScience Institute Workshop Participants. Inhal. Toxicol. 12(1–2):1–17.
International. (2002). The diesel advantage. Warrenville, IL: Interna-tional Truck and Engine Corporation.
International, Truck and Engine Corp. (2000). Supplemental commentson the Clean Air Science Advisory Committee Review Draft ofthe July 2000 Revised Health Assessment Document for DieselEmissions submitted to USEPA and CASAC. Chicago: InternationalTruck and Engine Corp.
Ireson, R., M.D. Easter, et al. (2004). Estimation of diesel particulatematter concentrations in a school bus using a fuel-based tracer–Asensitive and specific method for quantifying vehicle contributions.Transportation Research Record No. 1880. Energy and Environmen-tal Concerns 2004. pp. 21–28. Washington, DC: U.S. Government.
Johnston, A., Buchanan. D., et al. (1997). Investigation of the possibleassociation between exposure to diesel exhaust particulates inBritish coal mines and lung cancer. Rept. no. TM/97/08. Edinburgh,Scotland: Institute of Occupational Medicine (IOM).
Jorgensen, H.S. (1982). The Swedish experience with diesel engines inunderground mining. Proceedings of a workshop on the use of dieselequipment in underground coal mines. NIOSH pub 82–122:109–119.
Kado, N.Y., Okamoto, R.A., et al. (2005). Emissions of toxic pollutantsfrom compressed natural gas and low sulfur diesel-fueled heavy-duty transit buses tested over multiple driving cycles. Environ. Sci.Technol. 39(19):7638–7649.
Keane, M.J., Xing, S.G., et al. (1991). Genotoxicity of diesel-exhaustparticles dispersed in simulated pulmonary surfactant. Mutat. Res.260(3):233–238.
Kennaway, E., and Kennaway, N. (1947). A further study of theinfluence of cancer of the lung and larynx. Br. J. Ind. Med. 1:260–298.
Kibble, J.D. (1982). Mobile power in British Coal Mines. Proceedingsof a workshop on the use of diesel equipment in underground coalmines. NIOSH pub 82–122:55–75.
Kim, E., and Hopke, P.K. (2006). Characterization of fine particlesources in the Great Smoky Mountains area. Sci. Total. Environ.368:781–794.
King, L.C., Kohan, M.J., et al. (1981). Evaluation of the release ofmutagens from diesel particles in the presence of physiologicalfluids. Environ. Mutagen. 3(2):109–121.
Kinouchi, T., Tsutsui, H., et al. (1986). Detection of 1-nitropyrene inyakitori (grilled chicken). Mutat Res 171(2–3):105–113.
Kirby, W., Berry, G., et al. (2000). New South Wales coal mining cancersurveillance program. Fourth International Scientific Conferenceof the International Occupational Hygiene Association, Australia,July 10–14, 2000, International Occupational Hygiene Association,Derby, UK.
Kittelson, D.B. (1998). Engines and nanoparticles—a review. J.Aerosol. Sci. 29(5):575–588.
Kleeman, M.J., Schauer, J.J., et al. (2000). Size and compositiondistribution of fine particulate matter emitted from motor vehicles.Environ. Sci. Technol. 34:1132–1142.
Kotin, P., Falk, H., et al. (1954a). Aromatic hydrocarbons II.Presence in the particulate phase of diesel-engine exhausts and thecarcinogenicity of exhaust extracts. Arch. Ind. Hyg. Occup. Med.9:164–177.
Kotin, P., and Falk, H. (1954b). Aromatic hydrocarbons I. Pres-ence in the Los Angeles atmosphere and the carcinogenicity

764 T. W. HESTERBERG ET AL.
of atmospheric extracts. Arch. Ind. Hyg. Occup. Med. 9:153–163.
Kotin, P., Falk, H., et al. (1955). Aromatic hydrocarbons III. Presencein the particulate phase of diesel-engine exhausts and the carcino-genicity of exhaust extracts. Arch. Ind. Health 11:113–120.
Kuempel, E.D., Stayner, L.T., et al. (1995). Exposure-response analysisof mortality among coal miners in the United States. Am. J. Ind. Med.28(2):167–184.
Laden, F., Schwartz, J., et al. (2006a). Reduction in fine particulateair pollution and mortality: Extended follow-up of the Harvard SixCities study. Am. J. Respir. Crit. Care Med. 173(6):667–672.
Laden, F., Hart, J.E., et al. (2006b). Historical estimation of dieselexhaust exposure in a cohort study of U.S. railroad workers and lungcancer. Cancer Causes Control 17:911–919.
Lanni, T., Frank, B.P., et al. (2003). Performance and emissionsevaluation of compressed natural gas and clean diesel buses at NewYork City’s Metropolitan Transit Authority. Society of AutomotiveEngineers Technical Paper Series. Paper No. 2003–01–0300. War-rendale, PA: SAE.
Larkin, E.K., Smith, T.J., et al. (2000). Diesel exhaust exposure andlung cancer: adjustment for the effect of smoking in a retrospectivecohort study. Am. J. Ind. Med. 38(4):399–409.
Last, J.M. (1988). A dictionary of epidemiology.. New York: OxfordUniversity Press.
Lee, B.K., and Smith, T. (2005). “Exposure of trucking companyworkers to particulate matter during the winter”. Chemosphere
LeTavec, C., Uihlein, J., et al. (2002). Year-long evaluation of trucksand buses equipped with passive diesel particulate filters. Society ofAutomotive Engineers Technical Paper Series, 2002, 2002–01–0433.Warrendale, PA: SAE.
Leupker, R. (1978). Mortality in unionized truck drivers. J. Occup.Med. 20:677–682.
Lev-On, M., LeTavec, C., et al. (2002a). Speciation of organiccompounds from the exhaust of trucks and buses: Effect of fueland after-treatment on vehicle emission profiles. Society of Auto-motive Engineers Technical Paper Series. Paper no. 2002–01–2873.Warrendale, PA: SAE.
Lev-On, M., LeTavec, C., et al. (2002b). Chemical speciation of exhaustemissions from trucks and buses fueled on ultra-low sulfur dieseland CNG. Society. of Automotive Engineers Technical Paper Series,2002, 2002–01–0432. Warrendale, PA: SAE.
Lewis, T.R., Green, F.H., et al. (1986). A chronic inhalation toxicitystudy of diesel engine emissions and coal dust, alone and combined.Dev. Toxicol. Environ. Sci. 13:361–380.
Li, N., and Nel, A.E. (2006). The cellular impacts of diesel exhaustparticles: beyond inflammation and death. Eur. Respir. J. 27(4):667–668.
Liu, Y.Q., Keane, M., et al. In vitro genotoxicity of exhaust emissionsof diesel and gasoline engine vehicles operated on a unified drivingcycle. J. Environ. Monit. 7(1):60–66.
Liddell, F.D. (1973). Morbidity of British coal miners in 1961–1962.Br. J. Ind. Med. 30(1):1–14.
Lipsett, M., and Campleman, S. (1999). Occupational exposure todiesel exhaust and lung cancer: A meta-analysis”. Am. J. PublicHealth 89(7):1009–1017.
Liukonen, L.R., Grogan, J.L., et al. (2002). Diesel particulate matterexposure to railroad train crews. Am. Indus. Hyg. Assoc. J.63(5):610–616.
Lloyd, A.C., and Cackette, T.A. (2001). Diesel engines: environmentalimpact and control. J. Air Waste Manag. Assoc. 51(6):809–847.
Marsh, G.M., Buchanich, J.M., et al. (2001). Historical cohortstudy of US man-made vitreous fiber production workers: VI.Respiratory system cancer standardized mortality ratios adjustedfor the confounding effect of cigarette smoking. J. Occup. Environ.Med. 43(9):803–808.
Mauderly, J.L. (2000). Diesel exhaust. In Environmental toxicants:human exposures and their health effects, ed. M. Lippman, pp. 193–241. New York: Wiley-Interscience.
Mauderly, J.L., Banas, D.A., et al. (1996). Diesel exhaust is not apulmonary carcinogen in CD-1 mice exposed under conditionscarcinogenic to F344 rats. Fundam. Appl. Toxicol. 30(2):233–242.
Mauderly, J.L., Jones, R.K., et al. (1987). Diesel exhaust is a pulmonarycarcinogen in rats exposed chronically by inhalation. Fundam. Appl.Toxicol. 9(2):208–221.
McClellan, R.O. (1996). Lung cancer in rats from prolonged ex-posure to high concentrations of carbonaceous particles: Impli-cations for human risk assessment. Inhal. Toxicol. 8(suppl.):193–226.
McClellan, R.O., Brooks, A.L., et al. (1982). Inhalation toxicologyof diesel exhaust particles. In Toxicological effects of emissionsfrom diesel engines, ed. J. Lewtas, pp. 99–120. New York: ElsevierBiomedical.
McDonald, J.D., Zielinska, B., et al. (2003). Source apportionment ofairborne fine particulate matter in an underground mine. J. Air WasteManag. Assoc. 53(4):386–395.
McDonald, J.D., Barr, E.B., et al. (2004a). Design, characterization, andevaluation of a small-scale diesel exhaust exposure system. Aerosol.Sci. Technol. 38(1):62–78.
McDonald, J.D., Barr, E.B., et al. (2004b). Generation and character-ization of four dilutions of diesel engine exhaust for a subchronicinhalation study. Environ. Sci. Technol. 38(9):2513–2522.
McDonald, J.D., Harrod, K.S., et al. (2004c). Effects of low sulfur fueland a catalyzed particle trap on the composition and toxicity of dieselemissions. Environ. Health Perspect. 112(13):1307–1312.
Meijers, J.M., Swaen, G.M., et al. (1991). Long-term mortality inminers with coal workers’ pneumoconiosis in The Netherlands: Apilot study. Am. J. Ind. Med. 19(1):43–50.
Menck, H. (1976). Occupational differences in rates of lung cancer. J.Occup. Med. 18:797–801.
Milham, S., (1983). Occupational Mortality in Washington State1950–1979. NIOSH Publ. no. 83–116. Cincinnati, OH: U.S. Dept. ofHealth, Education and Welfare, National Institute for OccupationalSafety and Health.
Mills, C.A. (1960). Motor exhaust gases and lung cancer in Cincinnati.Am. J. Med. Sci. 239:316–319.
Milne, K.L., Sandler, D.P., et al. (1983). Lung cancer and occupationin Alameda County: A death certificate case-control study. Am. J.Ind. Med. 4(4):565–575.
Monson, R.R. (1990). Occupational epidemiology, 2nd ed. Boca Raton,FL: CRC Press.
Morfeld, P., Lampert, K., et al. (1997). Coal mine dust exposure andcancer mortality in German coal miners. Appl. Occup. Environ. Hyg.12:909–914.
Morgan, W.K., Reger, R.B., et al. (1997). Health effects of dieselemissions. Ann. Occup. Hyg. 41(6):643–658.

ASSESSMENT OF DIESEL EXHAUST CARCINOGENESIS STUDIES 765
MSHA. (1998a). Mine Safety and Health Administration: Proposedrule on diesel particulate matter exposure of underground coalminers. Fed. Reg. 63:17491–1749.
MSHA. (1998b). Mine Safety and Health Administration: Proposedrule on diesel particulate matter exposure of underground metal andnonmetal miners. Fed. Reg. 63:58103–58270.
MSHA. (2001a). Mine Safety and Health Administration: DieselParticulate Matter Exposure of Underground Coal Miners; FinalRule. Fed. Reg. 30 CFR Part 72:5526–5706.
MSHA. (2001b). Mine Safety and Health Administration: Dieselparticulate matter exposure of underground metal and nonmetalminers; Final rule.” Fed. Reg. 30 CFR Part 72:5706–5912.
MSHA. (2005). Mine Safety and Health Administration: Dieselparticulate matter exposure of underground metal and nonmetalminers; Final rule.” Fed. Reg. 70:32867–32968.
Muscat, J.E., and Wynder, E.L. (1995). Diesel engine exhaust andlung cancer: an unproven association. Environ Health Perspect103(9):812–818.
Nakagawa, R., Kitamori, S., et al. (1983). Identification of dinitropy-renes in diesel-exhaust particles. Their probable presence as themajor mutagens. Mutat. Res 124(3–4):201–211.
Nesnow, S. (1990). Mouse skin tumours and human lung cancer:relationships with complex environmental emissions. IARC Sci.Publ. 104:44–54.
Norbeck, J., and Smith, M. (1998). Evaluation of factors that affectdiesel exhaust toxicity. Sacramento: California Air Resources Board.
Okamoto, R.A., Kado, N.Y., et al. (2002). Chemical and bioassay analy-ses of emissions from two CNG buses with oxidation catalyst. Draft.December. Davis: California Environmental Protection Agency,Air Resources Board, Department of Environmental ToxicologyUniversity of California, Davis.
Okamoto, R.A., Kado, N.Y., et al. (2006). Unregulated emissionsfrom compressed natural gas (CNG) transit buses configured withand without oxidation catalyst. Environ. Sci. Technol. 40:332–341.
Pederson, T.C., and Siak, J.S. (1981). The role of nitroaromaticcompounds in the direct-acting mutagenicity of diesel particleextracts. J. Appl. Toxicol. 1(2):54–60.
Petersen, G., and Milham, S., (1980). Occupational mortality in theState of California 1959–1961. Publ. No. 80–104. Cincinnati, OH,National Institute for Occupational Safety and Health, U.S., Dept.of Health Education and Welfare.
Peto, J., Doll, R., et al. (1977). A mortality study among workers in anEnglish asbestos factory. Br. J. Ind. Med. 34(3):169–173.
Pope, A.C., Dockery, D.W., et al. (2006). Health effects of finepartiuclate air pollution: Lines that connect. Air Waste Manage.Assoc. 56:709–742.
Pratt, S., Grainger, A., et al. (1997). Evaluation and control of employeeexposure to diesel particulate at several Australian coal mines. Appl.Occup. Environ. Hyg. 12:1032–1037.
Raffle, P.A. (1957). The health of the worker. Br. J. Ind. Med. 14(2):73–80.
Ramachandran, G., and Watts, W.F. (2003). Statistical comparison ofdiesel particulate matter measurement methods. Am. Indus. Hyg.Assoc. J 64:329–337.
Ramachandran, G., Paulsen, D., et al. (2005). Mass, surface areaand number metrics in diesel occupational exposure assessment.J. Environ. Monit. 7(7):728–735.
Randerath, K., Putman, K.L., et al. (1995). Pulmonary toxicity ofinhaled diesel exhaust and carbon black in chronically exposed rats.Cambridge, MA: Health Effects Research Institute.
Reger, R., Hancock, J., et al. (1982). Coal miners exposed to dieselexhaust emissions. Ann. Occup. Hyg 26(1–4):799–815.
Registrar-General. (1971). Dicennial Supplement: England and Wales1961. London: Her Majesty’s Stationery Office.
Rice, G.S., and Harris, F.E., (1936). Diesel minelocomotives—Development and use in European coal mines.U.S. Bureau of Mines Report of Investigations 3320. November1936.
Richiardi, L., Mirabelli, D., et al. (2006). Occupational ex-posure to diesel exhausts and risk for lung cancer in apopulation-based case-control study in Italy. Annals of Oncol-ogy. Advance Access published online September 13, 2006.(http://annonc.oxfordjournals.org/cgi/reprint/mdl307v1)
Rockette, H.E. (1977). Cause specific mortality of coal miners. J.Occup. Med. 19(12):795–801.
Rogge, W.F., Hildemann, L.M., et al. (1991). Sources of fine organicaerosol. 1. Charbroilers and meat cooking operations. Environ. Sci.Technol. 25(6):1112–1125.
Rogge, W.F., Hildemann, L.M., et al. (1993a). Sources of fineorganic aerosol. 2. Noncatalyst and catalyst-equipped automobilesand heavy-duty diesel trucks. Environ. Sci. Technol. 27(4):636–651.
Rogge, W.F., Hildemann, L.M., et al. (1993b). Sources of fine organicaerosol. 3. Road dust, tire debris, and organometallic brake liningdust: roads as sources and sinks. Environ. Sci. Technol. 27(9):1892–1904.
Rogge, W.F., Hildemann, L.M., et al. (1993c). Sources of fine organicaerosol. 4. Particulate abrasion products from leaf surfaces of urbanplants. Environ. Sci. Technol. 27(13):2700–2711.
Rogge, W.F., Hildemann, L.M., et al. (1993d). Sources of fine organicaerosol. 5. Natural gas home appliances. Environ. Sci. Technol.27(13):2736–2744.
Rogge, W.F., Hildemann, L.M., et al. (1994). Sources of fine organicaerosol. 6. Cigaret smoke in the urban atmosphere. Environ. Sci.Technol. 28(7):1375–1388.
Rogge, W.F., Hildemann, L.M., et al. (1997a). Sources of fine organicaerosol. 7. Hot asphalt roofing tar pot fumes. Environ. Sci. Technol.31(10):2726–2730.
Rogge, W.F., Hildemann, L.M., et al. (1997b). Sources of fine organicaerosol. 8. Boilers burning no. 2 distillate fuel oil. Environ. Sci.Technol. 31(10):2731–2737.
Rogge, W.F., Hildemann, L.M., et al. (1998). Sources of fine organicaerosol. 9. Pine, oak, and synthetic log combustion in residentialfireplaces. Environ. Sci. Technol. 32(1):13–22.
Rooke, G., and Ward, F. (1979). Carcinoma of the lung in Lancashirecoal miners. Thorax 34:229–233.
Rosenkranz, H.S. (1993). Revisiting the role of mutagenesis in theinduction of lung cancers in rats by diesel emissions. Mutat. Res.303(2):91–95.
Rosenkranz, H.S. (1996). Mutagenic nitroarenes, diesel emissions,particulate-induced mutations and cancer: an essay on cancer-causation by a moving target. Mutat. Res. 367(2):65–72.
Rushton, L., Alderson, M.R., et al. (1983). Epidemiological survey ofmaintenance workers in London Transport Executive bus garagesand Chiswick Works. Br. J. Ind. Med. 40(3):340–345.

766 T. W. HESTERBERG ET AL.
Sasieni, P. (2003). On the expected number of cancer deathsduring follow-up of an initially cancer-free cohort. Epidemiology14(1):108–110.
Saverin, R., Braunlich, A., et al. (1999). Diesel exhaust and lung cancermortality in potash mining. Am. J. Ind. Med. 36(4):415–422.
Schauer, J.J. (2003). Evaluation of elemental carbon as a markerfor diesel particulate matter”. J. Expos. Anal. Environ. Epidemiol13(6):443–453.
Scheepers, P.T., Micka, V., et al. (2003). Exposure to dust and particle-associated 1-nitropyrene of drivers of diesel-powered equipment inunderground mining. Ann. Occup. Hyg. 47(5):379–388.
Schenker, M.B., Kado, N.Y., et al. (1992). Urinary mutagenic activityin workers exposed to diesel exhaust. Environ. Res. 57(2):133–148.
Schlesselman, J.J. (1978). Assessing effects of confounding variables.Am. J. Epidemiol. 108(1):3–8.
Schoket, B., Hewer, A., et al. (1989). 32P-postlabelling analysis ofDNA adducts in the skin of mice treated with petrol and dieselengine lubricating oils and exhaust condensates. Carcinogenesis10(8):1485–1490.
Seshagiri, B. (2003). Exposure to diesel exhaust emissions on boardlocomotives. AIHA J 64(5):678–683.
Seshagiri, B., and Burton, S. (2003). Occupational exposure to dieselexhaust in the Canadian federal jurisdiction. AIHA J. 64(3):338–345.
Shibata, Y., and Omata, T. (2003). Results of JCAP I studies and outlineof JCAP II program. Society of Automotive Engineers TechnicalPaper Series, 2003, 2003–01–1902. Warrendale, PA: SAE.
Shirname-More, L. (1995). Genotoxicity of diesel emissions. Part I:Mutagenicity and other genetic effects. Diesel exhaust: A criticalanalysis of emissions, exposure, and health effects. A special reportof the Institute’s Diesel Working Group, pp. 222–242. Cambridge,MA, Health Effects Institute.
Siemiatycki, J. (1991). Risk factors for cancer in the workplace. BocaRaton, FL: CRC Press.
Siemiatycki, J., and Gerin, M. (1988). Associations between severalsites of cancer and ten types of exhaust and combustion products.Results from a case-referent study in Montreal. Scand. J. WorkEnviron. Health 14(2):79–90.
Silverman, D.T. (1998). Is diesel exhaust a human lung carcinogen?Epidemiology 9(1):4–6.
Sirianni, G., Chemerynski, S., et al. (2003). Sources of interference infield studies of diesel exhaust emissions. Appl. Occup. Environ. Hyg.18(8):591–596.
Stanevich, R.S., Hintz, P., et al. (1997). Elemental carbon levels at apotash mine. Appl. Occup. Environ. Hyg. 12(12):1009–1012.
Starzynski, Z., Marek, K., et al. (1996). Mortality among differentoccupational groups of workers with pneumoconiosis: results froma register-based cohort study. Am. J. Ind. Med 30(6):718–725.
Steenland, K., Silverman, D., et al. (1992). Exposure to diesel exhaustin the trucking industry and possible relationships with lung cancer.Am. J. Ind. Med. 21(6):887–890.
Steenland, K., Deddens, J., et al. (1998). Diesel exhaust and lungcancer in the trucking industry: exposure-response analyses and riskassessment. Am. J. Ind. Med. 34(3):220–228.
Steenland, N.K., Silverman, D.T., et al. (1990). Case-control study oflung cancer and truck driving in the Teamsters Union. Am. J. PublicHealth 80(6):670–674.
Stewart, D.B., Mogan, J.P., et al. (1982). Canadian Diesel Experience.Proceedings of a workshop on the use of diesel equipment inunderground coal mines. NIOSH pub 82–122:76–90.
Stinn, W., Teredesai, A., et al. (2005). Chronic nose-only inhala-tion study in rats, comparing room-aged sidestream cigarettesmoke and diesel engine exhaust. Inhal. Toxicol. 17(11):549–576.
Stober, W. (1986). Experimental induction of tumors in hamsters,mice and rats after long-term inhalation of filtered and unfil-tered diesel engine exhaust. Dev. Toxicol. Environ. Sci. 13:421–439.
Stober, W., and Abel, U.R. (1996). Lung cancer due to diesel sootparticles in ambient air? A critical appraisal of epidemiologicalstudies addressing this question. Int. Arch. Occup. Environ. Health68(Suppl.):S3–61.
Stober, W., Abel, U.R., et al. (1998). Revisiting epidemiological keystudies on occupational diesel exhaust exposure and lung cancer intruck drivers. Inhal. Toxicol. 10:1045–1078.
Swaen, G.M., Meijers, J.M., et al. (1995). Risk of gastric cancer inpneumoconiotic coal miners and the effect of respiratory impairment.Occup. Environ. Med. 52(9):606–610.
Swanson, G.M., Lin, C.S., et al. (1993). Diversity in the associationbetween occupation and lung cancer among black and white men.Cancer Epidemiol. Biomarkers Prev. 2(4):313–320.
Tomb, T.F., and Raney, R.A. (1995). Results of underground miningstudies to assess particulate exposures and control technologies.Mining Eng. (March) 276–279.
Ullman, T.L., Smith, L.R., et al. (2002). Exhaust emissions fromschool buses in compressed natural gas, low emitting diesel, andconventional diesel engine configurations. Southwest ResearchInstitute Report 08.05303, October 2002. Report available fromInternational Truck and Engine Corporation, Chicago, upon request.
Ullman, T.L., Smith, L.R., et al. (2003). Comparison of exhaustemissions, including toxic air contaminants, from school buses incompressed natural gas, low emitting diesel, and conventional dieselengine configurations. Society of Automotive Engineers TechnicalPaper Series (Paper No. 2003–01–1381).
U.S. EPA. (1996). Proposed guidelines for carcinogenic risk assess-ment. Fed. Reg. 61(79):17959–18011.
U.S., EPA. (2000). Reconstruction of Teamsters Union exposure,1950–1990 (Draft).. Washington, DC: U.S. Environmental Protec-tion Agency.
U.S., EPA. (2002). Health Assessment Document for Diesel Engine Ex-haust. EPA/600/8–90/057F.. Washington, DC: U.S. EnvironmentalProtection Agency, Office of Research and Development, NationalCenter for Environmental Assessment.
Valberg, P.A., and Crouch, E.A. (1999). Meta-analysis of rat lungtumors from lifetime inhalation of diesel exhaust. Environ. HealthPerspect. 107(9):693–699.
Valberg, P.A., and Watson, A.Y. (1999). Comparative mutagenicdose of ambient diesel engine exhaust. Inhal. Toxicol. 11(3):215–228.
Valberg, P.A., and Watson, A.Y. (2000). Lack of concordance betweenreported lung-cancer risk levels and occupation-specific diesel-exhaust exposure. Inhal. Toxicol. 12(suppl. 1):199–208.
van Bekkum, Y.M., van den Broek, P.H., et al. (1999). Biological fateof [14C]-1-nitropyrene in rats following intragastric administration.Chem. Biol. Interact. 117(1):15–33.
Verma, D.K., and Shaw, L. (1999). A comparison of sampling andanalytical methods for assessing occupational exposure to dieselexhaust in a railroad work environment. Appl. Occup. Environ. Hyg.14(10):701–714.

ASSESSMENT OF DIESEL EXHAUST CARCINOGENESIS STUDIES 767
Verma, D.K., Finkelstein, M.M., et al. (2003). Diesel exhaust exposurein the Canadian railroad work environment. Appl. Occup. Environ.Hyg. 18(1):25–34.
Vostal, J.J. (1983). Bioavailability and biotransformation of themutagenic component of particulate emissions present in motorexhaust samples. Environ. Health Perspect. 47:269–281.
Wallace, W.E., Keane, M.J., et al. (1987). Mutagenicity of dieselexhaust particles and oil shale particles dispersed in lecithinsurfactant. J. Toxicol. Environ. Health. 21(1–2):163–171.
Walrath, J., Rogot, E., et al. (1985). Mortality patterns among U.S.veterans by occupations and smoking status. Publ. no. 85–2756.Cincinnati, OH: U.S. Dept. of Health, Education, and Welfare.National Institute for Occupational Safety and Health.
Watson, A.Y., and Valberg, P.A. (1996). Particle-induced lung tumors inrats: evidence for species specificity in mechanisms. Inhal. Toxicol.8(suppl.):227–257.
Watts, W. F., B. K. Cantrell, et al. (1992). Diesel exhaust aerosollevels in underground coal mines. Diesels in underground mines:management and control of particulate emissions. Proceedings:Bureau of Mines Information and Technology Transfer Seminar,Minneapolis, MN, September 29–30, 1992. Bureau of MinesInformation Circular 9324:31–39.
Waxweiler, R.J., Wagoner, J.K., et al. (1973). Mortality of potashworkers. J. Occup. Med. 15(6):486–489.
Whittaker, L.S., MacIntosh, D.L., et al. (1999). Employee exposure todiesel exhaust in the electric utility industry. Am. Indus. Hyg. Assoc.J. 60:635–640.
Wichmann, H.-E. (2006). Environmental pollutants: Diesel exhaustparticles. In Encyclopedia of respiratory medicine, ed. L. Shapiro,pp. 96–100. Oxford: Elsevier.
Williams, R.R., Stegens, N.L., et al. (1977). Associations of cancersite and type with occupation and industry from the Third NationalCancer Survey Interview. J. Natl. Cancer Inst. 59(4):1147–1185.
Woskie, S.R., Smith, T.J., et al. (1988a). Estimation of the dieselexhaust exposures of railroad workers: I. Current exposures. Am.J. Ind. Med. 13(3):381–394.
Woskie, S.R., Smith, T.J., et al. (1988b). Estimation of the dieselexhaust exposures of railroad workers: II. National and historicalexposures. Am. J. Ind. Med. 13(3):395–404.
Zaebst, D.D., Clapp, D.E., et al. (1991). Quantitative determination oftrucking industry workers’ exposures to diesel exhaust particles. Am.Ind. Hyg. Assoc. J. 52(12):529–541.
Zorychta, H. (1975). Canadian experience using diesels in undergroundcoal mines. Bureau of Mines Information Circular 8666:317.
APPENDIX 1. DIESEL USE IN UNDERGROUND MININGIN THE UNITED STATES, CANADA, EUROPE, ANDAUSTRALIA
The United StatesAt the beginning of 1947 only four diesel mine locomotives
were used in underground mines in the United States, twoin metal mines and two in nonmetal mines. Adverse mininglaws and safety concerns prevented their widespread adoption.However, a 1947 Bureau of Mines report noted that othertypes of diesel-powered equipment in underground mineswere “somewhat common in the Central States: Diesel trucks,
shovels, Caterpillar tractors and loaders, and diesel-poweredportable compressors are used successfully in undergroundlimestone, clay, and lead-zinc mines of that area.” (Harringtonand East, 1947).
In the United States, diesel engines currently power a fullrange of mining equipment on the surface and underground.As shown in Table A-1, nearly all U.S. underground metal andnonmetal mines use diesel powered equipment. This is not truein underground coal mines in the United States, due in part tothe fact that several key underground coal states have for manyyears banned the use of diesel-powered equipment (MSHA,1998a). When the U.S. Bureau of Mines was established in1910, gasoline engines were being used in mines and tunnels,sometimes with fatal consequences. As a result, most statesdeveloped laws that prohibited use of gasoline or other volatilefuels in mines except in very limited and controlled quantities.After review by the Bureau of Mines in the 1940s, many statesbegan to permit diesel use in underground mines by specialexemption (Holtz, 1962).
Diesel equipment used in underground coal mines in theUnited States has been as follows: in 1976, 114 pieces in 22mines located in three districts, with a majority located inDistrict 9 (Colorado, Wyoming and Utah); in 1977, 162 piecesin 28 mines, with all of the increase in District 9 (Barrett, 1982);in 1987, 1100 pieces in 110 mines; in 1992, 1951 pieces in 152mines. Approximately 33% of the diesel engines were used tohaul coal, 45% were used to haul personnel and materials, and22% performed other duties, such as roof bolting, rock dusting,and road maintenance. Most mines using diesel equipment werelocated in Kentucky, Utah, Virginia, and Colorado (Watts et al.,1992).
Continental EuropeMines employ locomotives to haul coal or ore out of the mines
and typically also to transport personnel to the work area. Diesellocomotives were introduced into German underground coalmines in 1927, and by 1938 there were 602 diesel locomotivesused accounting for 16% of the mine locomotives in use. Thenational policy of not using imported materials, such as fuel oil,prevented a more rapid increase. (East, 1946)
Diesel engines are in widespread use throughout the miningindustry in Germany. In salt and potash mining they have beenthe most important production factor since their introductionin the early 1960s (Dahmann and Bauer, 1997). During 1969to 1970 the potash mines in the South Harz Mountains areaof Germany changed technology to the use of mobile diesel-powered vehicles. From that time until the mines were closed in1991 the underground workforce was exposed to diesel exhaust.The potash mines used the room and pillar method allowingspacious rooms for production and transportation. The mainsources of diesel exhaust were huge front-end loaders used toscoop and carry material after blasting. Drill carriages were asecondary source. The mining technology and type of machinery

768 T. W. HESTERBERG ET AL.
TABLE A1Diesel equipment in U.S. mines in 1996
Mine typeNumber of
minesNumber of mines
with dieselPercent mines
with dieselNumber of
enginesNumber of
miners
Underground coal 971 173 18% 2950 50,577Small 426 15 4% 50 4371Large 545 158 29% 2900 46,206
Underground M/NM 261 203 78% 4100 17,786Small 130 82 63% 625 1103Large 131 121 92% 3475 16,683
Surface Coal 1673 1673 100% 22,000 40,567Small 1175 1175 100% 7000 7243Large 498 498 100% 15,000 33,324
Surface M/NM 10,474 10,474 100% 97,000 129,400
Note. Small = a mine with less than 20 miners. M/NM, metal/nonmetal. Source: MSHA (1998a, 1998b).
used did not change between 1970 and 1991 (Saverin et al.,1999).
The coal beds of Belgium are thinner and more broken byfaults than other European countries. They are also gassier,which limits the use of electric locomotives. After the successfulintroduction of diesel locomotives in German mines, theadoption in Belgium was rapid. By 1939, 114 diesel locomotiveswere in use in Belgian underground coal mines, accounting for62% of the locomotives used (East, 1946).
In 1935 the number of diesel locomotives used in under-ground French coal mines was 357, representing 49% of thetotal locomotives used in that country. By 1937 the number ofdiesel locomotives had grown to 380, with no increase for othertypes (electric or compressed air). Diesel locomotive use was58% in the top four producing districts, which accounted for81% of the coal (East, 1946).
A 1946 review of European underground diesel use foundthat while the coal deposits of Italy and Sardinia were relativelyunimportant, diesel locomotives were used exclusively for alltypes of underground service. Diesels were also used extensivelyin mercury and pyrite mines (East, 1946).
In 1977 there were about 1500 diesels in use in undergroundSwedish mines, more than half of which were in use by the ironore company LKAB in northern Sweden. Until 1959 the minewas mainly an open-pit mine, but in the late 1950s undergroundmining began and used diesels for subterranean transportation(Jorgensen, 1982).
Great BritainIn a May 1935 communication, Sir Henry Walker, H.M.
Chief Inspector of Mines of Great Britain, stated: “At thepresent time Diesel engines are in use successfully in onecoal mine and in about half a dozen metalliferous mines inGreat Britain” (Rice and Harris, 1936). In April 1946, 40flame-proof diesel locomotives were in service in mines in theBritish Isles (Harrington and East, 1947). The conversion to
diesel power was limited until nationalization of coal mining in1947. The use of diesel locomotives in Great Britain increasedrapidly from 37 pieces in 1945 to a peak of 874 in 1965 whenproduction efficiencies reduced the number of coal faces inuse, and improved belt conveyors replaced some diesel uses(Higginson, 1975).
During 1976–1977 the Great Britain National Coal Boardproduced 106 million tons of coal from 236 underground mineswith a payroll of 242,000 people. Use of diesel equipment islimited by the layouts of some mines, many over 100 yearsold, which do not make it easy for diesel use. Even in newermines, the coal formations do not allow large or wide openings.A typical 9-foot-high, 12-foot-wide roadway precludes the useof large vehicles. Ninety-five percent of underground coal ismined by longwall faces, with only two or three mines beingon stall-and-pillar methods that involve more extensive use ofdiesel equipment (Higginson, 1975).
About 17% of the payroll in underground mines are employedon transport duties. In addition, those at the coal face or intunneling work, some 50% of the total, spend on average 1.5hours out of a 7.25-hour shift traveling to and from their workassignment. Some travel is done on conveyor belt, but the mostcommon method is by rope haulage of vehicles on rails. In1976 there were 617 diesel locomotives in use and 337 electriclocomotives (Kibble, 1982).
AustraliaTechnical literature as far back as 1912 contains references
to the use of 7 diesel engines in Australian mines to drivepumps underground. In 1926 legislation was introduced in NewSouth Wales prohibiting the use of diesel engines underground.However, this rule was amended in 1941 to allow only dieselengines. At the same time, another rule was introduced requiringthe provision of underground human transport (Clark, 1982).The first diesel engine in this era, a 10-ton locomotive, wasintroduced into an Australian coal mine shortly after the rule

ASSESSMENT OF DIESEL EXHAUST CARCINOGENESIS STUDIES 769
was amended. “The design largely followed the British practicewhere diesel locomotives had been in use for some years. Forpractical purposes Australian experience with diesel engines inunderground coal mines can therefore be regarded as from 1941.Diesel equipment in underground coal mines consisted only ofrail mounted locomotives ranging in sizes up to 25 tons and 204bhp, and were used for coal haulage as well as men and materialstransport” (Clark, 1982). Diesel locomotives were confined tomain intake roads where ventilation was provided. In 1966, inaddition to locomotives, diesel shuttle cars were introduced intoface areas, followed by other diesel equipment used for facehaulage, transport, roof drills, rock dusters, tractors and frontend loaders. As of December 1976 there were 599 pieces ofdiesel equipment used in underground coal mines in Australia(Clark, 1982).
CanadaIn Canada, diesel engines have been used in coal mines
since 1949 (Zorychta, 1975), but they have not been as popularin coal mines as they have in metal and non-metal mines.A 1975 survey indicated that 75% of underground mineralproduction was conducted by trackless methods, which, inCanada, is synonymous with diesel power. While the worldwidepopulation of diesels underground was estimated at 10,000 in1976, there were 3151 diesel units underground in Canada in1977, including 40 units in Canadian underground coal mines(Stewart et al., 1982).
APPENDIX 2. THE HILL CRITERIA (HILL, 1965)The nine Hill Criteria proposed by Hill, 1965, for evaluating
causality when an association has been observed in epidemio-logic studies are:
1. Temporality: Exposure to the suspected causative agent mustprecede the onset of the adverse effect. This is the only one ofthe Hill criteria that is absolutely essential; all others simplycontribute to the weight of the evidence.
2. Strength of the association: This criterion evaluates themagnitude of the association as measured using statisticaltests. The stronger the association, the more likely that
the relationship is causal. According to Morgan et al.(1997), when evaluating the strength of the association, an“association of greater than 3 is likely to be causal, while arisk of 1.5 to 3 is suggestive, [and] associations below 1.5are often weak and explicable by bias and other confoundingfactors.”
3. Dose-response relationship (biological gradient): Exposureto increasing amounts of the suspected causative agentcorresponds with increasing risk of the adverse effect.Presence of a dose-response relationship provides strongevidence of causality, but absence of a dose-responserelationship may not rule out causality, as there may be athreshold below which the suspected agent does not causethe adverse effect. Some epidemiologists have suggested a“supralinear” dose response, where the slope is steeper atlow exposures than at high exposures.
4. Consistency: The association between the suspected agentand presence of the adverse effect is consistent in a varietyof studies in a variety of locations, and using differentmethods.
5. Biological plausibility: The association can be explainedbased on current understanding of pathological processes.
6. Specificity: Considered by some to be the weakest ofthe criteria, specificity refers to a single suspected causeleading to a single suspected effect. With a disease suchas angiosarcoma, which is both rare and has few causalagents, the concurrent presence of the disease and the agentcontributes strongly to a finding of causality, but this criterionmay not be helpful with more commonly occurring diseases.
7. Consideration of alternate explanations: Has the researchertaken into account—and effectively ruled out—other possi-ble explanations?
8. Experiment: Can an experimental regime be devised wherebythe outcome is prevented (or lessened) by eliminating thepresence of the suspected causative agent?
9. Coherence: This criterion is related to biological plausibilityand refers to whether the association is consistent withexisting theory and knowledge (e.g., do we need to rejectwhat we currently believe to be true in order to accept thisassociation as true?).

TAB
LE
A2
Exp
osur
esto
dies
elex
haus
tin
vari
ous
occu
patio
ns
DPM
surr
ogat
e(µ
g/m
3)
Exp
osur
ety
pePa
ram
eter
EC
aT
Cb
DPM
cA
RPM
dR
CD
eR
PMf
Ref
eren
ce
Am
bien
tR
esid
entia
ln=
23M
ean
1.4
(Zae
bste
tal.,
1991
)H
ighw
aybk
dn
=21
Mea
n3.
4(Z
aebs
teta
l.,19
91)
Bac
kgro
und
atel
ectr
icut
ility
wor
ksi
tes
(U.S
.)n
=18
Mea
n2
18(W
hitta
ker
etal
.,19
99)
28U
.S.n
onra
ilroa
dlo
catio
nsM
ean
2.6
29.5
(Liu
kone
net
al.,
2002
)T
ruck
ers
Ele
ctri
cut
ility
wor
kers
(US)
(Whi
ttake
ret
al.,
1999
)T
ruck
bay
n=
64M
ean
611
5L
inem
ann
=90
Mea
n3
61W
inch
truc
kop
er.n
=30
Mea
n4
69T
ruck
repa
ir(C
anad
a)n
=40
Mea
n9.
9(S
esha
giri
and
Bur
ton,
2003
)D
ock
wor
kers
and
mec
hani
cs(U
.S.)
n=
155
Mea
n25
(Zae
bste
tal.,
1991
)D
rive
rs(U
.S.)
n=
128
Mea
n5.
2(Z
aebs
teta
l.,19
91)
Det
roit
inw
inte
rn
=10
3M
ean
2.2
21.9
32.6
h(L
eeet
al.,
2005
)Sh
op17
.472
84Pi
ckup
and
deliv
ery
1.8
3041
Lon
g-ha
ul0.
619
27Y
ard
and
dock
0.4–
1.1
6–13
19–3
7O
ffice
0.3
1515
Min
neso
tatr
ansp
orta
tion
(Ram
acha
ndra
net
al.,
2005
)B
usdr
iver
sn
=39
Mea
n2.
0R
amp
atte
ndan
tsn
=34
Mea
n1.
1G
arag
em
echa
nics
n=
35M
ean
3.9
Rai
lroa
dw
orke
rsFo
urra
ilroa
ds(U
S)N
=399
Mea
n10
314
3(H
amm
ond
etal
.,19
88)
Can
ada
(N=1
77A
)R
ange
<0.
9–60
.1(V
erm
aet
al.,
2003
)M
edia
n3.
6L
ead
loco
mot
ive
Mea
nl2.
9T
raili
nglo
com
otiv
eM
eanl
7.9
Bot
hle
adan
dtr
ailin
gM
eanl
2.5
Cab
oose
Mea
nl3.
6T
urna
roun
d/fu
elpl
ant
Mea
nl4.
9H
eavy
repa
ir/b
acks
hop
Mea
nl3.
6O
ffice
sM
eanl
<2.
2T
rack
equi
pmen
teng
inee
ring
Mea
nl2.
7
770

Can
ada
(n=
101
P)R
ange
<0.
9–18
.8(V
erm
aet
al.,
2003
)M
edia
n4.
0E
ngin
eers
Mea
nl2.
9C
ondu
ctor
sM
eanl
3.5
Mac
hini
sts/
mec
hani
csM
eanl
4.6
Lab
orer
s/en
gine
atte
ndan
tsM
eanl
4.3
Hos
tlers
/labo
rers
mov
ing
units
Mea
nl3.
5E
lect
rici
ans
Mea
nl7.
2Pi
pefit
ters
Mea
nl<
2.7
Stor
ecl
erks
Mea
nl<
1.6
Supe
rvis
ors
Mea
nl4.
0E
ngin
eers
/equ
ipm
ento
pera
tors
Mea
nl7.
3C
anad
an
=57
Mea
n8
(Ver
ma
etal
.,19
99)
Can
ada
n=
62M
ean
157
166
Can
ada
n=
40M
ean
3.7
(Ses
hagi
rian
dB
urto
n,20
03)
Can
ada
(Ses
hagi
ri,2
003)
On
boar
dle
adlo
com
otiv
esn
=23
1M
ean
<2
On
boar
dtr
ailin
glo
com
otiv
esn
=47
Mea
n10
.1R
ailr
oad
trai
ncr
ews
(U.S
.)n
=49
GM
3.7
40(L
iuko
nen
etal
.,20
02)
Min
ing—
Uni
ted
Stat
es11
U.S
.sur
face
min
esn
=45
Mea
n88
(MSH
A,1
998a
)12
US
Und
ergr
ound
coal
min
esn
=22
6M
ean
640
(MSH
A,1
998a
)25
US
Und
ergr
ound
met
al/m
iner
alm
ines
n=
331
Mea
n83
0g(M
SHA
,199
8a)
31U
.S.u
nder
grou
ndm
etal
and
nonm
etal
min
esn
=11
94M
ean
i196
j29
3k 366
(MSH
A,2
005)
Met
aln
=28
4M
ean
274
370
463
Ston
en
=68
9M
ean
182
282
353
Oth
erno
nmet
aln
=19
6M
ean
149
238
298
Tro
nan
=25
Mea
n81
140
175
Seve
nno
n-m
etal
min
es(U
.S.)
(Coh
enet
al.,
2002
)U
nder
grou
ndw
orke
rsn
=61
2M
ean
177
290
Surf
ace
wor
kers
n=
164
Mea
n13
80Z
inc
Min
e(U
.S.)
n=
19R
ange
140–
260
(Han
eyan
dFi
elds
,199
6)M
edia
n20
0Po
tash
min
e(U
.S.)
n=
30R
ange
150–
450
(Han
eyan
dFi
elds
,199
6)M
edia
n42
0(C
onti
nued
onne
xtpa
ge)
771

TAB
LE
A2
Exp
osur
esto
dies
elex
haus
tin
vari
ous
occu
patio
ns(C
onti
nued
)
DPM
surr
ogat
e(µ
g/m
3)
Exp
osur
ety
pePa
ram
eter
EC
aT
Cb
DPM
cA
RPM
dR
CD
eR
PMf
Ref
eren
ce
Pota
shm
ine—
surf
ace
(U.S
.)n
=25
Mea
n24
(Sta
nevi
chet
al.,
1997
)Po
tash
min
e-un
derg
roun
d(U
.S.)
n=
43M
ean
190
(Sta
nevi
chet
al.,
1997
)U
nder
grou
ndm
inin
g(U
.S.)
n=
193
Mea
n11
12(C
antr
ella
ndW
atts
,19
97)
Four
unde
rgro
und
coal
min
es(T
omb
and
Ran
ey,1
995)
No
afte
rtre
atm
ent
Mea
ns90
0–12
00W
ithdi
esel
exha
ustfi
lter
Mea
ns10
0–20
0W
ithw
ire
mes
hfil
ter
(U.S
.)M
ean
1200
Ten
met
al/n
onm
etal
unde
rgro
und
min
es(U
.S.)
Mea
n70
0(T
omb
and
Ran
ey,1
995)
Six
unde
rgro
und
coal
min
es(U
S)n
=78
Mea
n14
83(R
eger
etal
.,19
82)
Und
ergr
ound
gold
min
e(U
.S.)
374
496
656h
(McD
onal
det
al.,
2003
)M
inin
g—ou
tsid
eU
nite
dSt
ates
Und
ergr
ound
salt
and
pota
shm
ines
(Ger
man
y)n
=28
5M
edia
ndi
stri
butio
n10
0–15
0(D
ahm
ann
and
Bau
er,
1997
)U
nder
grou
ndsa
lt,po
tash
and
met
alm
ines
(Ger
man
y)n
=62
2M
edia
ndi
stri
butio
n30
0–40
0(D
ahm
ann
etal
.,19
96)
Und
ergr
ound
min
ing
(Aus
tral
ia)
n=
134
Ran
ge30
–165
0(P
ratt
etal
.,19
97)
Und
ergr
ound
pota
shm
inin
g(G
erm
any)
(Sav
erin
etal
.,19
99)
Wor
ksho
pn
=37
Mea
n12
0M
aint
enan
cen
=18
Mea
n23
0Pr
oduc
tion
n=
200
Mea
n39
0U
nder
grou
ndm
inin
g(C
anad
a)n
=90
Mea
n14
826
4(R
amac
hand
ran
and
Wat
ts,2
003)
n=
79M
ean
421
n=
73M
ean
398
aE
C,e
lem
enta
lcar
bon.
bT
C,t
otal
carb
on.
cD
PM,d
iese
lpar
ticul
ate
mat
ter,
allp
artic
ulat
em
atte
r<
0.8
µm
diam
eter
.MSH
A(1
998)
estim
ates
that
400
µg/
m3
tota
lcar
bon
corr
espo
nds
to∼5
00µ
g/m
3D
PM.
dA
RPM
,adj
uste
dre
spir
able
part
icul
ate
mat
ter=
resp
irab
lepa
rtic
ulat
em
inus
aver
age
estim
ated
cont
ribu
tion
ofto
bacc
osm
oke
for
this
job
cate
gory
.e
RC
D,r
espi
rabl
eco
mbu
stib
ledu
st.
fR
PM,r
espi
rabl
epa
rtic
ulat
em
atte
r.g
Sam
ples
attw
oof
the
25m
etal
/min
eral
min
esw
ere
colle
cted
usin
gth
esu
bmic
rom
eter
impa
ctor
.h
Part
icul
ate
mat
ter<
2.5
µm
.iB
ack
calc
ulat
edfr
omso
urce
tabl
e.jT
C=
EC
+OC
(org
anic
carb
on).
kM
SHA
calc
ulat
esth
atD
PM=
TC
×1.
3(M
SHA
2005
).lno
n-de
tect
able
valu
esca
lcul
ated
usin
gde
tect
ion
limit.
772

TAB
LE
A3
Stud
ies
oflu
ngca
ncer
inm
iner
sgr
oupe
dby
coun
try
and
conf
ound
ers
Cou
ntry
(ref
eren
ce)
Stud
yba
se/f
ollo
w-u
pFo
llow
-up
Subg
roup
Lun
gca
ncer
risk
Cas
es95
%C
ID
Eex
posu
reL
aten
cyd
Coa
lMin
ers
W.V
irgi
nia,
USA
(Ent
erlin
e,19
72)
553
WV
mal
eco
alm
iner
sin
1937
1938
–66
Res
pira
tory
canc
erSM
R1.
114
0.3–
2.85
Unl
ikel
yN
/A
USA
(Cos
tello
etal
.,19
74)
2549
empl
oyed
min
ers,
1962
–63,
1177
ex-m
iner
sfr
omA
ppal
achi
a.U
.S.P
HS
stud
y.
1962
–63
to19
72V
olun
teer
sam
ong
4134
rand
omly
sele
cted
SMR
0.67
240.
43–0
.99
Unl
ikel
yN
/A
USA
(Roc
kette
,19
77)
23,2
32co
alm
iner
sco
vere
dby
the
Uni
ted
Min
eW
orke
rsH
ealth
and
Ret
irem
entF
unds
in19
59
1959
–71
Lun
gca
ncer
SMR
1.13
352
1.02
–1.2
6L
imite
dto
afe
wN
/A
USA
(Am
eset
al.,
1983
)Tw
oca
se-c
ontr
olst
udie
sba
sed
onlu
ngca
ncer
deat
hsam
ong
coal
min
ers
from
4N
IOSH
coho
rts;
mat
ched
for
age;
with
and
with
outs
mok
ing
stat
us;d
ecea
sed
and
livin
gco
ntro
ls(O
Rfo
r25
+vs
<25
yrun
derg
roun
d)
1959
–75
Dec
ease
dco
ntro
ls1:
1w
/osm
okin
g2:
1w
ithsm
okin
gL
ivin
gco
ntro
ls1:
1w
/osm
okin
g2:
1w
ithsm
okin
g
OR
1.18
0.89
0.87
0.80
317
137
0.86
–1.6
20.
66–1
.20
0.52
–1.4
50.
48–1
.32L
imite
dto
afe
wU
nlik
ely
>20
yr
USA
(Am
esan
dG
ambl
e,19
83)
Four
coho
rts
com
pose
dof
appr
oxim
atel
y20
,000
coal
min
ers
prov
ided
case
sof
lung
and
stom
ach
canc
er
Not
give
nL
ung
canc
er(u
nder
grou
nd>
25yr
)an
dde
ceas
edco
ntro
ls.
OR
1.42
460.
70–2
.89
Unl
ikel
yfo
rm
any
Unl
ikel
y>
15yr
USA
(Kue
mpe
let
al.,
1995
)88
78co
alm
iner
sm
edic
ally
exam
ined
1969
–71
from
31m
ines
(Pen
nsyl
vani
a,E
.A
ppal
achi
a,W
.App
alac
hia,
Mid
wes
t,W
est)
1969
–71
thro
ugh
1979
SMR
RSM
R0.
770.
9165
0.60
–0.9
Lim
ited
toa
few
(Wes
tan
dM
idw
est)
>10
yr.
Lik
ely
for
som
e
Can
ada
(Sie
mia
tyck
i,19
91)
3,73
0m
ale
canc
erpa
tient
sre
side
ntin
Mon
trea
l,ag
ed35
–70;
6%ex
pose
dto
coal
dust
Any
expo
sure
Subs
tant
ial
expo
sure
OR
1.3
1.1
63 271.
0–1.
90.
7–1.
7L
ikel
yfo
rso
me
Lik
ely
>20
yr
Uni
ted
Kin
gdom
(Gol
dman
,196
5)M
iner
sem
ploy
edby
Nat
iona
lCoa
lB
oard
,age
d20
–65
in19
5550
96m
ale
coal
min
ers≥
35ye
ars
inG
lam
orga
n
1955
1955
1951
–56
Und
ergr
ound
wor
kers
Surf
ace
wor
kers
Min
ers
and
ex-m
iner
s
SMR
0.70
0.92
0.81
216
54 30
0.61
–0.8
00.
69–1
.19
0.55
–1.1
6Lik
ely
for
man
yL
imite
d
Uni
ted
Kin
gdom
(Boy
det
al.,
1970
)
Coa
lmin
ers
inC
umbe
rlan
d,E
ngla
nd,a
ged
≥15
.19
48–6
7U
nder
grou
ndw
orke
rsSu
rfac
ew
orke
rs
PMR
0.79
0.99
28 110.
53–1
.15
0.49
–1.7
7Lik
ely
for
man
yL
imite
d
Uni
ted
Kin
gdom
(Roo
keet
al.,
1979
)
1003
deat
hsin
coal
min
ers
inN
WE
ngla
nd;i
nclu
des
lung
canc
ers
diag
nose
dat
auto
psy
1974
–76
Onl
yth
ose
repo
rted
toth
eco
rone
ror
pneu
moc
onio
sis
pane
l
PMR
1.17
114
0.96
–1.4
1L
ikel
yfo
rm
any
Lik
ely
>20
yrfo
rm
any
(Con
tinu
edon
next
page
)
773

TAB
LE
A3
Stud
ies
oflu
ngca
ncer
inm
iner
sgr
oupe
dby
coun
try
and
Foun
ders
(Con
tinu
ed)
Cou
ntry
(ref
eren
ce)
Stud
yba
se/f
ollo
w-u
pFo
llow
-up
Subg
roup
Lun
gca
ncer
risk
Cas
es95
%C
ID
Eex
posu
reL
aten
cyd
Uni
ted
Kin
gdom
(Lid
dell,
1973
)32
39de
aths
amon
gco
alm
iner
sag
ed20
–64
iden
tified
byth
eN
atio
nalC
oalB
oard
1961
Face
wor
kers
Und
ergr
ound
wor
kers
Surf
ace
wor
kers
SMR
0.49
0.53
0.82
n.d.
n.d.
Lik
ely
for
man
yL
imite
d
Wal
es,U
K(C
ochr
ane
etal
.,19
79)
6212
min
ers
and
ex-m
iner
s,ex
amin
edfo
rpn
eum
ocon
iosi
sin
1950
–51.
2138
nonm
iner
sag
ed≥2
0ye
ars
1950
–70
Non
min
ers
Min
ers—
all
radi
ogra
phic
cate
gori
es
SMR
0.66
0.70
21 570.
41–1
.00
0.53
–0.9
1L
ikel
yfo
rm
any
Unl
ikel
y>
20yr
for
mos
t
Uni
ted
Kin
gdom
(Joh
nsto
net
al.,
1997
)
18,1
66un
derg
roun
dco
alm
iner
sfr
om10
unde
rgro
und
coal
min
es(6
used
dies
ello
com
otiv
es
1958
–78
thro
ugh
1992
Cox
regr
essi
onw
ithou
gpi
tadj
.Cox
reg.
with
pita
dj.
RR
1.23
c
1.16
c63
263
21.
00–1
.50
0.90
–1.4
9Y
esfo
rm
iner
sfr
om6
min
es.
>20
yrfo
rm
any
UK
,Wal
es(A
tuha
ire
etal
.198
5)E
xten
ded
follo
w-u
pof
Coc
hran
eet
al.(
1979
).19
50–1
980
Non
-min
ers
Min
ers
SMR
0.70
0.77
43 100
0.51
–0.9
40.
63–0
.94
Lik
ely
for
man
y>
20yr
for
som
e
W.A
ustr
alia
(Arm
stro
nget
al.,
1979
)
213
mal
eco
alm
iner
s(2
05un
derg
roun
d)19
61–7
5R
espi
rato
ryca
ncer
SMR
0.2
10.
01–1
.1L
ikel
yfo
ral
lL
ikel
y>
20yr
.fo
rso
me
Aus
tral
ia∗
(Kir
byet
al.,
2000
)24
,139
min
ers
join
ed1/
1/73
–12/
31/9
719
73–9
7SI
R0.
6549
0.48
–0.8
6L
ikel
yfo
ral
lL
ikel
y>
20yr
for
som
eT
heN
ethe
rlan
ds(M
eije
rset
al.,
1991
)
334
unde
rgro
und
coal
min
ers
with
pneu
moc
onio
sis
diag
nose
dbe
twee
n19
56an
d19
60.
1956
–60
thro
ugh
1983
Und
ergr
ound
SMR
1.31
190.
79–2
.05
Lik
ely
for
mos
t>
15yr
?
The
Net
herl
ands
(Sw
aen
etal
.,19
95)
3790
coal
min
ers
with
abno
rmal
ches
tx-r
ays
in19
50s
1950
s–19
91un
derg
roun
dSM
R1.
0227
20.
90–1
.15
Lik
ely
for
mos
tL
ikel
y>
20yr
for
man
y
Ger
man
y(M
orfe
ldet
al.1
997)
∗45
78m
iner
sw
how
orke
dat
leas
t5yr
.196
3–79
(ave
rage
time
sinc
e1s
texp
osur
e36
.3yr
)
1980
–91
Und
ergr
ound
min
ers
SMR
RS
0.70
a
1.11
a41
410.
50–0
.95
0.80
–1.5
1L
ikel
yfo
rm
ost
Lik
ely
>20
yrfo
rm
any
Pola
nd∗(
Star
zyns
kiet
al.,
1996
)70
65m
iner
sdi
agno
sed
with
coal
-wor
ker
pneu
moc
onio
sis
1970
–85.
1970
–91
SMR
1.04
b15
30.
88–1
.22
Lik
ely
for
mos
tsa
me
Pota
shM
iner
sG
erm
any
(Sav
erin
etal
.,19
99)
5536
min
ers
follo
wed
from
1970
–94;
Cox
regr
essi
on(c
onsi
dere
dth
epr
inci
palfi
ndin
gby
the
auth
ors)
base
don
subc
ohor
t.
1970
–94
SMR
Eas
tGer
man
y20
yrD
Eex
p.(C
oxre
gres
sion
)
SMR
RR
0.78
1.7
380.
55–1
.07
0.5–
5.8
120–
390
µg/
m3
TC
>20
yrfo
rso
me
US
(Wax
wei
ler
etal
.,19
73)
1143
surf
ace
wor
kers
(>1
yrbe
twee
n19
40–6
7)19
40–6
7Su
rfac
em
iner
sSM
R1.
1210
0.41
–1.8
3L
ikel
yfo
rm
any
Unk
now
n
2743
unde
rgro
und
wor
kers
(>1
yr.
betw
een
1940
–67)
,9m
ines
;2w
ithdi
esel
1940
–67
Und
ergr
ound
min
ers
SMR
1.08
120.
46–1
.72
of9
min
es:1
sinc
e19
49;1
sinc
e19
57
<20
yr.f
oral
l
774

TAB
LE
A3
Stud
ies
oflu
ngca
ncer
inm
iner
sgr
oupe
dby
coun
try
and
Foun
ders
(Con
tinu
ed)
Cou
ntry
(ref
eren
ce)
Smok
ing
disc
usse
d/m
entio
ned
rest
udy
Det
aile
din
form
atio
nav
aila
ble
for
stud
yA
djus
tmen
tsin
anal
yses
Oth
erco
nfou
nder
se
Coa
lMin
ers
WV
irgi
nia,
USA
(Ent
erlin
e,19
72)
No
Non
eN
one
Non
eU
SA(C
oste
lloet
al.1
974)
Yes
Pack
year
san
dsm
okin
gst
atus
atst
arto
ffo
llow
-up
Non
eN
one
USA
(Roc
kette
,197
7)C
omm
ento
nly
Non
eN
one
Non
eU
SA(A
mes
etal
.,19
83)
Yes
Smok
ing
hist
orie
sC
ase-
cont
rols
:mat
ched
and
unm
atec
hed
for
smok
ing
Non
e
USA
(Am
eset
al.,
1983
)Y
esSm
okin
ghi
stor
ies
Smok
ing
incl
uded
inan
alys
esN
one
USA
(Kue
mpe
leta
l.,19
95)
Yes
Pack
year
san
dsm
okin
gst
atus
atst
arto
ffo
llow
upY
es,i
nclu
ded
inpr
opor
tiona
lha
zard
sm
odel
Non
e
Can
ada
(Sie
mia
tyck
i,19
91)
Yes
Smok
ing
stat
usY
es,i
nM
ante
l-H
anze
land
logi
stic
anal
yses
Yes
,inc
ludi
ngas
best
osan
dot
hers
Uni
ted
Kin
gdom
(Gol
dman
,196
5)Y
esSm
okin
ghi
stor
ies
amon
gm
iner
san
dge
nera
lpo
pula
tion
Dis
cuss
ion
ofpo
tent
ial
impa
ctU
rban
diff
eren
ces
disc
usse
d
Uni
ted
Kin
gdom
(Boy
det
al.,
1970
)Y
esN
one
Non
eR
adon
men
tione
dre
iron
ore
min
ing,
butn
otfo
rco
alU
nite
dK
ingd
om(R
ooke
etal
.,19
79)
Yes
His
tori
esav
aila
ble
for
som
eD
iscu
ssio
nof
pote
ntia
lim
pact
Non
e
Uni
ted
Kin
gdom
(Lid
dell,
1973
)N
oN
one
Non
eN
one
Wal
es,U
K(C
ochr
ane
etal
.,19
79)
No
Non
eN
one
Non
eU
nite
dK
ingd
om(J
ohns
ton
etal
.,19
97)
Yes
Stat
usan
dam
ount
smok
edat
time
ofen
try
into
stud
yY
es,C
oxre
gres
sion
mod
els
Non
e
UK
,Wal
es(A
tuha
ire
etal
.,19
85)
No
Non
eN
one
Non
eW
.Aus
tral
ia(A
rmst
rong
etal
.,19
79)
Yes
Smok
ing
hist
orie
sam
ong
attim
eof
orig
inal
surv
eyN
one
Non
e
Aus
tral
ia(K
irby
etal
.,20
00)
No
Non
eN
one
Non
eT
heN
ethe
rlan
ds(M
eije
rset
al.,
1991
)Y
esR
ates
inpo
pula
tion
atst
arto
fst
udy
Non
e,bu
tpot
entia
lim
pact
disc
usse
dA
lcoh
olm
entio
ned
(Con
tinu
edon
next
page
)
775

TAB
LE
A3
Stud
ies
oflu
ngca
ncer
inm
iner
sgr
oupe
dby
coun
try
and
Foun
ders
(Con
tinu
ed)
Cou
ntry
(ref
eren
ce)
Smok
ing
disc
usse
d/m
entio
ned
rest
udy
Det
aile
din
form
atio
nav
aila
ble
for
stud
yA
djus
tmen
tsin
anal
yses
Oth
erco
nfou
nder
se
The
Net
herl
ands
(Sw
aen
etal
.,19
95)
No
Non
eN
one
Som
e(e
.g.,
silic
a,tr
ace
met
als)
men
tione
dG
erm
any
(Mor
feld
etal
.,19
97)
Yes
Rat
esam
ong
unde
rgro
und
coal
min
ers
and
gene
ral
popu
latio
n
Axe
lson
met
hod
Qua
rtz
men
tione
d
Pola
nd(S
tarz
ynsk
ieta
l.,19
96)
Yes
Smok
ing
stat
usan
dhi
stor
yfr
oma
sam
ple
surv
eyof
coho
rt;p
opul
atio
nra
tes
(sta
tus)
avai
labl
e
Axe
lson
met
hod
for
nonm
inin
gsu
bcoh
ort
Rad
onm
entio
ned
Pota
shM
iner
sG
erm
any
(Sav
erin
etal
.,19
99)
Yes
His
tori
es(f
orm
ost)
from
med
ical
reco
rds
&vo
lunt
eer
subg
roup
Con
clud
edsm
okin
gno
taco
nfou
nder
Asb
esto
sm
entio
ned
for
subc
ohor
t
U.S
.(W
axw
eile
ret
al.,
1973
)Y
esR
ates
avai
labl
efr
omsa
mpl
eof
wor
kers
;U.S
.rat
esal
soci
ted
Pote
ntia
lim
pact
disc
usse
dR
adon
men
tione
das
abse
ntor
only
trac
eam
ount
s
Not
e.A
dapt
edfr
omIA
RC
Mon
ogra
phV
ol.4
6(1
997)
and
upda
ted
with
seve
rala
dditi
onal
stud
ies.
Add
ition
alre
fere
nces
notc
ited
inIA
RC
1997
have
been
adde
dto
this
tabl
ean
dar
ein
dica
ted
with
anas
teri
sk.
PMR
,pro
port
iona
tem
orta
lity
ratio
;SM
R,s
tand
ardi
zed
mor
talit
yra
tio;O
R,o
dds
ratio
;CI,
confi
denc
ein
terv
al;R
SMR
,rel
ativ
eSM
R;S
IR,s
tand
ardi
zed
inci
denc
era
tio.
USP
HS;
U.S
.Pub
licH
ealth
Serv
ices
.aU
nadj
uste
dfo
rsm
okin
g.W
hen
adju
sted
for
smok
ing
(Axe
lson
tech
niqu
e),R
SMR
<1.
bD
idno
tinc
lude
deat
hsov
er80
.Una
djus
ted
for
smok
ing
(85%
ever
smok
ers)
.c T
heun
itcu
mul
ativ
eex
posu
reof
1g-
hour
s-m
−3fo
rth
eR
Rw
asgr
eate
rth
anth
em
ean
and
med
ian
cum
ulat
ive
expo
sure
for
the
coho
rtan
dw
asex
ceed
edby
only
asm
all
perc
enta
geof
the
coho
rtdB
estj
udgm
ento
fth
epr
esen
taut
hors
,bas
edon
the
info
rmat
ion
inth
eci
ted
stud
ies.
e Som
eau
thor
s(e
.g.,
John
ston
etal
.,19
97)
use
the
term
“con
foun
der”
tode
scri
befa
ctor
sth
atot
hers
refe
rto
as“e
ffec
tmod
ifier
”(e
.g.,
age)
.Mos
tsuc
h“c
onfo
unde
rs”
are
notl
iste
dhe
re.
776