Embed Size (px)
Citation preview

Aa
YF
a
ARA
KRAEIT
1
atwcapcr
tsmNv
0h
Aquacultural Engineering 52 (2013) 27– 38
Contents lists available at SciVerse ScienceDirect
Aquacultural Engineering
journa l h omepa g e: www .e lsev ier .com/ locate /aqua-onl ine
novel approach for ammonia removal from fresh-water recirculatedquaculture systems, comprising ion exchange and electrochemical regeneration
ouri Gendel, Ori Lahav ∗
aculty of Civil and Environmental Engineering, Technion, Haifa 32000, Israel
r t i c l e i n f o
rticle history:eceived 10 April 2012ccepted 29 July 2012
eywords:ASmmonia removallectrooxidationon-exchangeilapia
a b s t r a c t
A new physico-chemical process for ammonia removal from fresh-water recirculated aquaculture sys-tems (RASs) is introduced. The method is based on separating NH4
+ from RAS water through anion-exchange resin, which is subsequently regenerated by simultaneous chemical desorption and indirectelectrochemical ammonia oxidation. Approach advantages include (1) only slight temperature depend-ence and no dependence on bacterial predators and chemical toxins; (2) no startup period is required andthe system can be switched on and off at will; and (3) the fish are grown in much lower bacterial concen-tration, making the potential for both disease and off-flavor, lower. A small pilot scale RAS was operatedfor 51 d for proving the concept. The system was stocked by 105 tilapia fish (initial weight 35.8 g). Thefish, which were maintained at high TAN (total ammonia nitrogen) concentrations (10–23 mgN L−1) andfish density of up to 20 kg m−3, grew at a rate identical to their established growth potential. NH3(aq) con-centrations in the fish tank were maintained lower than the assumed toxicity threshold (0.1 mgN L−1) byoperating the pond water at low pH (6.5–6.7). The low pH resulted in efficient CO2 air stripping, and lowresultant CO2(aq) concentrations (<7 mg L−1). Due to efficient solids removal, no nitrification was observed
in the fish tank and measured nitrite and nitrate concentrations were very low. The system was operatedsuccessfully, first at 10% and then at 5% daily makeup water exchange rate. The normalized operationalcosts, calculated based on data derived from the pilot operation, amounted to 28.7 $ cent per kg fish feed.The volume of the proposed process was calculated to be ∼13 times smaller than that of a typical RASbiofilter. The results show the process to be highly feasible from both the operational and economicalstandpoints.. Introduction
Recirculated Aquaculture Systems (RASs) are the future of thequaculture industry. Despite being more capital-intensive thanraditional approaches, RAS has major advantages such as lowerater and area requirements, year-round production, temperature
ontrol and mitigation of environmental effects. RAS is species-daptable, allowing operators to follow market trends for seafoodreference. RAS is also a “point” pollution source, enabling effi-ient solids waste treatment and nutrients removal, which allowseducing the impact on the environment at a reasonable cost.
The high fish densities practiced in RAS require efficient gas-ransfer systems to dissolve oxygen into the culture water andtrip carbon dioxide out of it. Additionally, since NH3 is toxic to
ost fish species it has to be constantly removed. A maximumH3(aq) concentration of 21 �gN L−1 was proposed as a thresholdalue for most marine and fresh water aquaculture species (Eddy,∗ Corresponding author. Tel.: +972 4 8292191; fax: +972 4 8228898.E-mail address: [email protected] (O. Lahav).
144-8609/$ – see front matter © 2012 Elsevier B.V. All rights reserved.ttp://dx.doi.org/10.1016/j.aquaeng.2012.07.005
© 2012 Elsevier B.V. All rights reserved.
2005). In order to avoid NH3(aq) accumulation, a nitrification unit isinvariably employed in RAS to reduce the total ammonia nitrogen(TAN) to concentrations typically below 2–3 mg L−1 (warm-waterfish). Most RAS configurations do not include a nitrate removal unit(denitrification), and hence, typically, the nitrate concentration inthe system and effluents is set only by the make-up water exchangerate (except for minor uncontrolled denitrification, which invari-ably occurs in the system). Intensive nitrate removal is feasible onlyif a dedicated denitrification reactor is operated, as is the case incertain low discharge systems (Singer et al., 2008) and where strictenvironmental regulations are enforced (Klas et al., 2006). Never-theless, the increasing demand for releasing aquaculture effluentsto receiving waters with low total dissolved nitrogen concentra-tions, will, in all likelihood, lead to a need for the inclusion of nitrateremoval systems in RAS in the near future.
The reliance of RAS on conventional biological processes fornitrogen species removal, despite being an established procedure,
has disadvantages: nitrifying bacteria are autotrophic organismswith long doubling times and a low biomass yield. As such they aresensitive to low temperatures (especially relevant in the growthof cold water fish, e.g. juvenile salmonids), their start-up periods
2 tural E
arstda
taitppi
1a
i(eircrfi
N
cpFrul
tetu1raNtpvpcwteW
pttmsrtttdt
8 Y. Gendel, O. Lahav / Aquacul
re long, and when system failure occurs the bacterial populationequires a long period to recover. Moreover, when a denitrificationystem is employed and its effluent is recycled back into the system,urbidity, caused by both organic matter and bacteria loads mayevelop in the pond, increasing the potential for disease outbreaknd the development of off-flavor in the fish.
The incentive for the development of a new, physico-chemicalechnology for RAS water treatment stems from the drawbacksssociated with the biological treatment sequence, in particularn cold places and where the excreted ammonia is required to beransformed all the way to benign N2(g). The goal of the currentaper is to introduce a reliable and cost effective physico-chemicalrocess, which has the potential to replace the widespread biolog-
cal nitrogen-species removal techniques.
.1. Description of the proposed physico-chemical operationalpproach
Ammonia in aqueous solution acts as a weak-acid, compris-ng ionic (NH4
+) and non-ionic (NH3(aq)) species. According to Eq.1), reduction in pH shifts TAN toward NH4
+ and vice versa. Fishxcrete NH3 from the gills as part of their metabolism. At the typ-cal RAS operational pH values, NH3 is largely converted to theelatively non-toxic NH4
+ species. In typical RAS practice TAN con-entrations are controlled such that NH3(aq) concentration is in theange 0.05–0.27 mgN L−1 (Eshchar et al., 2006) depending on thesh species grown.
H3 + H2O ↔ NH4+ + OH− pKa = 9.24 (1)
Based on Eq. (1), one can readily calculate the maximal TANoncentrations that can be maintained in RAS as a function ofH, assuming a given, fish-specific NH3 threshold concentration.rom the practical standpoint, Eshchar et al. (2006) showed thatelatively sensitive fish fingerlings (Sparus aurata) can be grownnharmed at high TAN concentrations (20 mgN L−1) and a relatively
ow pH (pH 6.8).Shifting to the ammonia removal angle, it is well known
hat NH4+ can be effectively separated from fresh water by ion-
xchange (IX). For example, natural zeolites, having a high affinityoward a wide range of cations (Na+, K+, Ca2+, Mg2+), are oftensed for separating NH4
+ from wastewater (e.g. Lahav and Green,998). With regard to aquaculture, Dryden and Weatherley (1989)eported that clinoptilolite (a common natural zeolite) can bepplied for continuously removing TAN from RAS. Working withH4
+ concentrations in the range 1–5 mgN L−1 they showed thathe practical capacity of clinoptilolite for NH4
+ increased almostroportionally with the ammonium ion concentration. This obser-ation means that, for given concentrations of competing cations, aroportionally lower zeolite mass is required when the NH4
+ con-entration is higher. The new approach presented in this work,hich is shown schematically in Fig. 1, relies (with respect to
he TAN removal component) on the observations of Eshchart al. (2006), coupled with the method proposed by Dryden andeatherley (1989).Referring to Fig. 1: In order to remove NH4
+ effectively, it isroposed to operate the pond at a relatively high TAN concentra-ion (i.e. TAN >5 mg N L−1). In order to not exceed the NH3 designhreshold concentration, the pH value in the fishpond should be
aintained at a relatively low value by controlled addition oftrong acid (either HCl or H2SO4). Since at the close-to-neutral pHange each mole of NH3 excreted by the fish is converted to NH4
+
hereby consuming one equivalent of acidity, the acid consump-
ion rate (in equivalent units) is expected to be almost equal tohe NH3 flux (acid consumption is also affected, to a much lesseregree, by the makeup water alkalinity influx). The TAN concen-ration in the fishpond water is maintained constant by continuousngineering 52 (2013) 27– 38
removal of NH4+ from the water, carried out by passing the water
through an ammonium-specific ion-exchange resin (from the zeo-lite group). Once the ion-exchange capacity of the operative columnis exhausted, it should undergo regeneration, and the flow from thefishpond is transferred to another, fresh column, i.e. the fish aregrown at pseudo steady state conditions with respect to both theTAN concentration and pH.
The typical regeneration sequence of cation exchange resinsis performed by passing through it water with high countercation concentration (typically Na+, less often Ca2+). In the currentapproach, in order to use the regeneration solution for multi-ple regeneration cycles and at the same time convert NH4
+ tobenign N2(g), we propose to oxidize the ammonia electrochemi-cally, using the indirect ammonia electro-oxidation approach (e.g.Vanlangendonck et al., 2005; Szpyrkowicz et al., 2005; Gendel andLahav, 2012). This complex process can be described in a somewhatsimple fashion by the following stoichiometric equations (Gendeland Lahav, 2012), dominant in Cl−-rich solutions:
At the anode
2Cl− → Cl2 + 2e− (2)
At the cathode
2H+ + 2e− → H2 (3)
In the electrolyte solution
3Cl2 + 2NH4+ → N2(g) + 6Cl− + 8H+ (4)
Overall (dominant) reaction
2NH4+ → N2(g) + 3H2 + 2H+ (5)
The rate of ammonia electro-oxidation has been reported to bepseudo-zero order and first order with respect to the TAN and chlo-ride ions concentrations, respectively (Liu et al., 2009). In spite ofthe similarity in the overall stoichiometric reaction (Eq. (4)) themechanism of the electrochemical ammonia oxidation process iscompletely different from that observed in classic breakpoint chlo-rination (Gendel and Lahav, 2012). The conversion of NH4
+ to N2(g)in the latter process (at the range 7 < pH < 8) when HOCl/OCl− is theactive chlorine source, proceeds almost completely via the conver-sion of TAN into chloramines species, and N2(g) formation occursonly when the Cl2/TAN molar ratio exceeds unity. In contrast, inthe indirect ammonia electro-oxidation process carried out at batchmode, very low concentrations of chloramine species are observed,and N2 formation occurs from the very beginning of the oxidation.The difference between the two processes has been attributed tothe particular conditions prevailing in the near anode (i.e. pH < 2,high [Cl−]) and near cathode (pH > 12) zones (Gendel and Lahav,2012). In this study the primary oxidizing agent in the near anodezone was found to be Cl2(aq). Cl2(aq) reacts with ammonium ions toform trichloramine (NCl3) as a primary product. This is in contrastwith the known chloramination process, where the dominant oxi-dizing agent is HOCl (or OCl−) and monochloramine (NH2Cl) is theprimary product of ammonia oxidation at 7 < pH < 8. A portion ofCl2(aq) which did not react in the near anode area reaches the bulkelectrolyte solution where it undergoes hydrolysis to HOCl. Subse-quently, monochloramine or/and dichloramine (NHCl2) are formedby the reaction of HOCl with ammonia. NCl3 decomposes to N2 bothin the bulk electrolyte solution and in the near cathode area via areaction with hydroxide ions and ammonia. In batch mode electro-oxidation mono- and dichloramine are converted to trichloramineupon their return to the near anode area. For elaboration on the
mechanism the reader is referred to Gendel and Lahav (2012).As shown in Fig. 1, during the regeneration step, both theextraction of the NH4
+ ion from the zeolite (i.e. the chemicalregeneration step) and the ammonia electro-oxidation step are

Y. Gendel, O. Lahav / Aquacultural Engineering 52 (2013) 27– 38 29
Make up water
Discharge water IX NH4
+
separation
Fish pond
…
Fishpond water tr eatment
Solid
s
separa
tion
Electrolysis Tan k
NH4+ N→ 2(g)
Ele
ctro
lyzer
Electrochemical IX regeneration
ropos
psapsrabvcu
eitNfv
abfsOttfdwCst
1
pfiatafiapbaaa
Fig. 1. Schematic of the p
erformed simultaneously. Such simultaneous operation neces-itates low regenerant volume, as NH4
+ does not accumulatend its concentration remains low throughout the regenerationeriod. Conversely, the two regeneration steps can be carried outeparately. Under such operation the column is first chemicallyegenerated by the brine that is passed trough the column. There-fter, the desorbed NH4
+ is oxidized electrochemically to N2(g) inatch mode. This alternative requires relatively large regenerantolume, but it allows performing the electrolysis step at the low-ost electricity hours. The decision on which regeneration mode tose should be made based on local economic optimization.
According to Eq. (5) one equivalent of alkalinity is destroyed forach mole of exchanged, and subsequently oxidized, ammoniumon. To make up for both alkalinity and counter cation loss duringhe regeneration step, a stoichiometric mass of strong base (e.g.aOH) should be added continuously during the electrolysis step,
or maintaining the pH of the electrolyzed solution at a constantalue.
Another pollutant that is excreted by the fish and is toxic toquatic organisms is CO2(aq). Threshold CO2 concentrations haveeen reported to be 10–20 mg L−1 for Salmonids and 30–50 mg L−1
or Tilapia and Catfish (Eshchar et al., 2006). In aerated systems, CO2tripping from the water is a byproduct of the intensive air supply.n the one hand the proposed pH reduction in the fishpond shifts
he carbonate system to result in higher CO2(aq) concentrations inhe pond but on the other these conditions lead to a higher drivingorce for CO2 stripping. The net result, as shown in this work for fishensities of up to 20 kg m−3, is that the acidification of the fishpondater to pH 6.5–6.8 results in low carbonate alkalinity and thus lowO2 concentrations can be readily achieved. Note that this conclu-ion is restricted to aerated aquaculture systems and does not applyo systems relying on pure O2 supply.
.2. Process limitations
Three operational limitations are associated with the describedrocess: the first limitation is that the low pH maintained in theshpond water requires intensive removal of CO2 that can bechieved only when air is applied for oxygen supply. It is notedhat modern aeration technologies make it possible to grow fisht very high densities of up to the 100 kg fish m−3 without needor pure oxygen supply (Mozes et al., 2005). The second limitations associated with the IX component, which becomes inefficientt high counter cations concentrations. Accordingly, the proposedrocess is feasible only for fresh water RAS applications and cannot
e applied in saline or seawater-fed RAS. The third limitation: sincemmonium ions in the fishpond water are replaced in the proposedpproach with other cations (mainly Na+), the method cannot bepplied in very low discharge (so called “zero-discharge”) systemsed TAN removal process.
because as counter cations accumulate in the pond water, NH4+
separation through IX becomes inefficient. However, as shown inthis paper, the system operated efficiently at 5% water replacement(fish density 20 kg m−3), and can be theoretically shown to workalso at lower exchange rates (and much higher densities).
This paper presents the results obtained when the describedapproach was tested at the small pilot scale, for growing tilapiafor a period of 51 days. This initial work is intended to serve asproof-of-concept for the described approach, and by no means as adescription of a fully developed technology. However, both the fishperformance and cost estimations derived from the pilot operationshowed the approach to be very promising.
2. Materials and methods
In order to prove the feasibility of the proposed approach, a pilotscale system was constructed and operated for 64 days. Tilapia waschosen as the proof-of-concept fish species both due to its relativetolerance to NH3 and CO2 concentrations and the large experienceaccumulated with this fish in Israel. 105 fish, with an initial averageweight of 35.8 g, were grown for 51 days in a 500 L fresh-water fedcontainer. Before stocking the fish the system was first operated for13 days in simulation mode. A schematic of the pilot scale systemis shown in Fig. 2. Technical details of all the equipment are listedin Table A.1 (Appendix A). Preliminary ion-exchange breakthroughexperiments were performed in order to estimate the amount ofchabazite–zeolite required for the pilot operation. The results ofthis step are reported in Appendix B.
2.1. Fishpond operation
The fish were grown in a 700 L tank, filled up with 500 L freshwater (T1 in Fig. 2). During the first 36 days the system was oper-ated with 10% daily make up water exchange; in the last 15 daysmake up water supply was reduced to 5%. The make up (tap) waterwas added via a level sensor (V0 in Fig. 2) and activated carbonfilters were used to remove residual chlorine from it (F1 and F2in Fig. 2). Make up water characterization is shown in Table 1.Oxygen was supplied (also causing CO2 stripping) by three air dif-fusers. Suspended solids separation was performed by continuousrecirculation of the fishpond water (∼12 L min−1) through a 12 Lcoarse filter (F2 in Fig. 2), using a magnetic pump (M5 in Fig. 2).The pH value of the fishpond water was controlled at pH 6.5–6.7by H2SO4 (2.35 M) dosage. The pH electrode in the fishpond was
calibrated daily. Water temperature was maintained at 28 ◦C by a1.2 kW heating element.105 Tilapia fish with an average weight of 35.8(±6.6%) g werestocked in the container, making for an initial fish density of
30 Y. Gendel, O. Lahav / Aquacultural Engineering 52 (2013) 27– 38
ental
7aipcNeawIe
2
pww
TCs
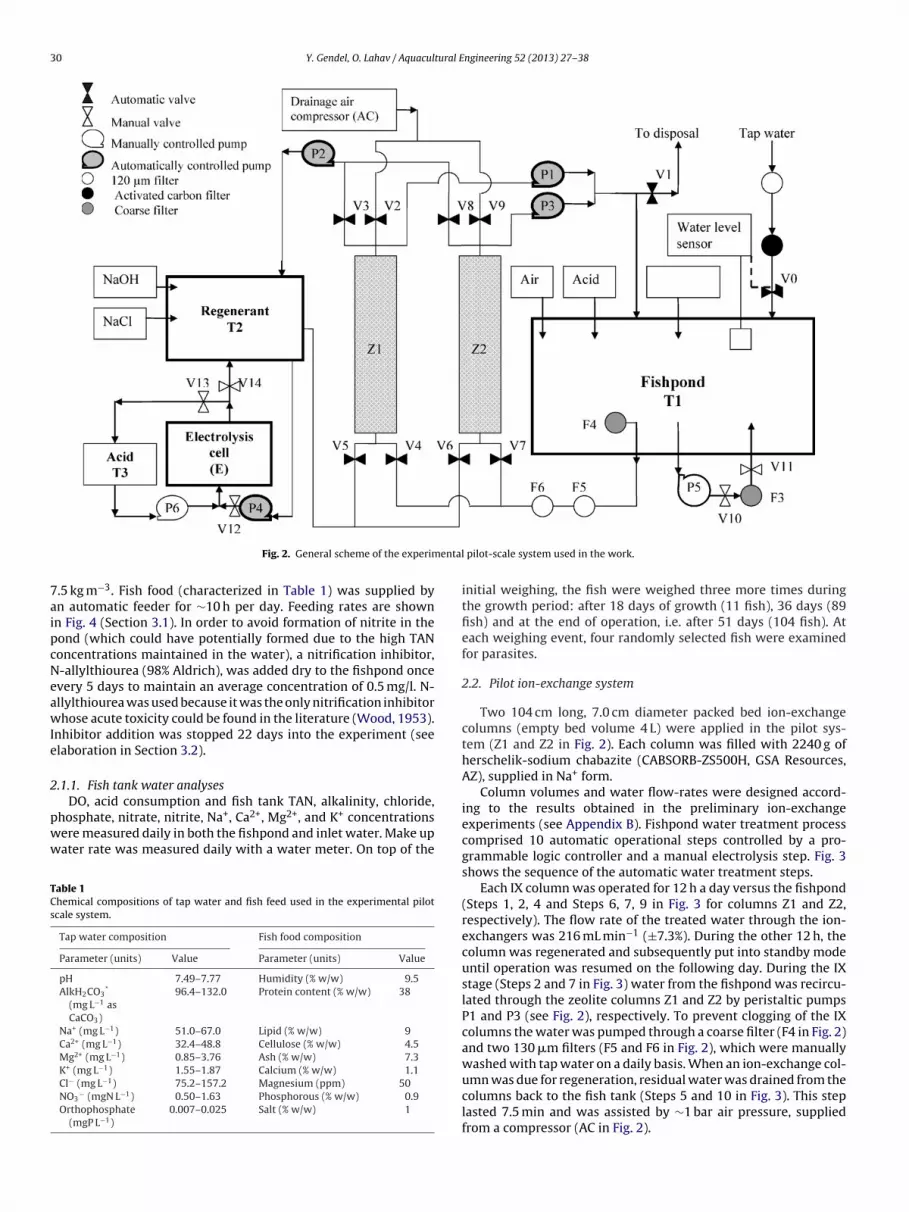
Fig. 2. General scheme of the experim
.5 kg m−3. Fish food (characterized in Table 1) was supplied byn automatic feeder for ∼10 h per day. Feeding rates are shownn Fig. 4 (Section 3.1). In order to avoid formation of nitrite in theond (which could have potentially formed due to the high TANoncentrations maintained in the water), a nitrification inhibitor,-allylthiourea (98% Aldrich), was added dry to the fishpond oncevery 5 days to maintain an average concentration of 0.5 mg/l. N-llylthiourea was used because it was the only nitrification inhibitorhose acute toxicity could be found in the literature (Wood, 1953).
nhibitor addition was stopped 22 days into the experiment (seelaboration in Section 3.2).
.1.1. Fish tank water analyses
DO, acid consumption and fish tank TAN, alkalinity, chloride,hosphate, nitrate, nitrite, Na+, Ca2+, Mg2+, and K+ concentrationsere measured daily in both the fishpond and inlet water. Make upater rate was measured daily with a water meter. On top of the
able 1hemical compositions of tap water and fish feed used in the experimental pilotcale system.
Tap water composition Fish food composition
Parameter (units) Value Parameter (units) Value
pH 7.49–7.77 Humidity (% w/w) 9.5AlkH2CO3
*
(mg L−1 asCaCO3)
96.4–132.0 Protein content (% w/w) 38
Na+ (mg L−1) 51.0–67.0 Lipid (% w/w) 9Ca2+ (mg L−1) 32.4–48.8 Cellulose (% w/w) 4.5Mg2+ (mg L−1) 0.85–3.76 Ash (% w/w) 7.3K+ (mg L−1) 1.55–1.87 Calcium (% w/w) 1.1Cl− (mg L−1) 75.2–157.2 Magnesium (ppm) 50NO3
− (mgN L−1) 0.50–1.63 Phosphorous (% w/w) 0.9Orthophosphate
(mgP L−1)0.007–0.025 Salt (% w/w) 1
pilot-scale system used in the work.
initial weighing, the fish were weighed three more times duringthe growth period: after 18 days of growth (11 fish), 36 days (89fish) and at the end of operation, i.e. after 51 days (104 fish). Ateach weighing event, four randomly selected fish were examinedfor parasites.
2.2. Pilot ion-exchange system
Two 104 cm long, 7.0 cm diameter packed bed ion-exchangecolumns (empty bed volume 4 L) were applied in the pilot sys-tem (Z1 and Z2 in Fig. 2). Each column was filled with 2240 g ofherschelik-sodium chabazite (CABSORB-ZS500H, GSA Resources,AZ), supplied in Na+ form.
Column volumes and water flow-rates were designed accord-ing to the results obtained in the preliminary ion-exchangeexperiments (see Appendix B). Fishpond water treatment processcomprised 10 automatic operational steps controlled by a pro-grammable logic controller and a manual electrolysis step. Fig. 3shows the sequence of the automatic water treatment steps.
Each IX column was operated for 12 h a day versus the fishpond(Steps 1, 2, 4 and Steps 6, 7, 9 in Fig. 3 for columns Z1 and Z2,respectively). The flow rate of the treated water through the ion-exchangers was 216 mL min−1 (±7.3%). During the other 12 h, thecolumn was regenerated and subsequently put into standby modeuntil operation was resumed on the following day. During the IXstage (Steps 2 and 7 in Fig. 3) water from the fishpond was recircu-lated through the zeolite columns Z1 and Z2 by peristaltic pumpsP1 and P3 (see Fig. 2), respectively. To prevent clogging of the IXcolumns the water was pumped through a coarse filter (F4 in Fig. 2)and two 130 �m filters (F5 and F6 in Fig. 2), which were manuallywashed with tap water on a daily basis. When an ion-exchange col-
umn was due for regeneration, residual water was drained from thecolumns back to the fish tank (Steps 5 and 10 in Fig. 3). This steplasted 7.5 min and was assisted by ∼1 bar air pressure, suppliedfrom a compressor (AC in Fig. 2).
Y. Gendel, O. Lahav / Aquacultural Engineering 52 (2013) 27– 38 31
Step 6Step 7Step 8Step 9
Washing of Column 1
with fish tank water
On-V1, V4, P1
Treatment of fish tank
water by Column 1
On-V4, P1
Column 2 regene ration
On-V6, V8, P2, P4, E
Draina ge of Col umn2 t o
brine vessel
On-V2, V6, V8, AC
Treatment of fish tank
water by Column 1
On-V4, P1
Draina ge of Col umn 1 to
fish tank
On-V2, V4, AC
Washing of Column 2
with fish tank water
On-V1, V7, P3
Treatment of fish tank
water by Column 2
On-V7, P3
Column 1 regene ration
On-V3, V5, P2, P4, E
Draina ge of Col umn 1 to
brine vessel
On-V2, V3, V5
AC
Treatment of fish tank
water by Column 2
On-V7, P3
Draina ge of Col umn 2 to
fish tank
On-V7, V9, AC 24 h
Step 1 Step 2 Step 3 Step 4
Step 5Step 10
12 h
12 h
24 h
nd an
irn1rrw
2
ooFwsspseoica
aepTto
Fig. 3. Time sequence of fishpo
A 56 L NaCl (food grade, 99.5%) solution (T2 in Fig. 2), with annitial chloride concentration of 50 gCl L−1, was used to chemicallyegenerate the zeolite columns (Steps 2 and 7 in Fig. 3). A mag-etic pump (P2 in Fig. 2) was used to recycle water (flow rate.72 L min−1) between the zeolite column (Z1 or Z2 in Fig. 2) and theegenerant holding vessel. Ammonia electrooxidation and columnegeneration were stopped automatically once all the ammoniaas removed from the regenerant solution (Section 2.4).
.3. Indirect ammonia electro-oxidation unit
Desorbed ammonia was oxidized into N2(g) by indirect electro-xidation. Both the chemical regeneration and the ammoniaxidation steps were performed simultaneously (Steps 2 and 7 inig. 3). A flow-through, monopolar parallel plate electrolysis cellas used for electrochemical ammonia oxidation. The electrolyte
olution (IX regenerant) was recirculated between the holding ves-el (T2 in Fig. 2) and the electrolysis cell (EC in Fig. 2) by a magneticump (P4) at a flow rate of approximately 12 L min−1, which alsoerved for stirring the electrolyte solution during operation. Thelectrolysis cell was operated at 5 A, resulting in current densityf 0.333 kA/m2. The corresponding (measured) cell potential wasn the range 3.1–3.2 V. The pH of the regenerant solution wasontrolled automatically at pH 6.5 during the electrolysis step byutomatic NaOH (2.14 M) dosage.
Vanlangendonck et al. (2005) reported that at the final stage ofmmonia indirect electro-oxidation, i.e. when all ammonia in thelectrolyte solution had oxidized into N2, the oxidation reduction
otential (ORP) of the electrolyte solution increased immediately.his occurs due to the rapid development of free chlorine concen-ration in the electrolyte solution, in the absence of ammonia. Thisbservation was used in this work for automatic control of thed water treatment operations.
electrolysis step. An ORP electrode was connected to the analoginput of a controller through the voltage, followed by operationalamplifier with a voltage gain of 9.2 (both elements were based ona TL08 operational amplifier). A Schmidt trigger was applied foron–off operation of the electrolysis step. Based on to the results ofthe simulation experiments the low trigger limit was set at 600 mVand the upper limit at 700 mV. On top of the ORP control theelectrolysis step was programmed to proceed for at least one hour.This was done because a sharp increase of ORP beyond 700 mV wasobserved also at the very beginning of some electrochemical oxida-tion steps, even when a high initial TAN concentration was presentin the electrolyte. Overall electrolysis duration was limited to 6 h.After the completion of the regeneration step brine was drainedfrom the column (air-pressure assisted drainage) for 7.5 min to theregenerant tank (Steps 3 and 8 in Fig. 3). Before the regeneratedcolumn was reconnected to the fishpond in the following NH4
+
adsorption cycle, residual regenerating solution had to be washedout of the column because even trace concentrations of activechlorine could be detrimental to the fish. To this end fish tank waterwas pumped through the IX column at the beginning of the watertreatment step and was not returned to the fishpond but ratherdisposed of to the sewage (Steps 1 and 6 in Fig. 3). The volume ofthe disposed water applied for washing both columns constitutedthe daily make up water volume of the fishpond minus the 12 L thatwere used for washing the coarse filter F3 (Fig. 2). For example, dur-ing the 10% water exchange operation (i.e. 50 L of water replaceddaily) each column was washed with 19 L of fish-tank water.
During the simulation stage, solid precipitates were observed
on the cathode surface area. This phenomenon resulted in dete-rioration of the observed current efficiency. To avoid this, anadditional unit, aimed at acidic dissolution of the cathodic precipi-tates, was operated. Precipitate removal was performed manually
3 tural E
e(3tr
2
ttogwcp
trcimw
2
b
ooSmromtdMfiim(c
A H3]
[0−3pH
Kc11
w
1
3
3
g2
W
wi
2 Y. Gendel, O. Lahav / Aquacul
very other day, by recycling (∼500 mL min−1) 0.25 M HCl solution10 L) between the electrolyzer and the acid tank T3 (Fig. 2) for0 min using a peristaltic pump P6 (Fig. 2). It is noted that in indus-rial applications this acid rinsing would be minimized by periodiceversal of the electrodes’ polarities.
.3.1. Electrolysis stepThe duration of the electrolysis step, the rate of base consump-
ion and concentrations of Cl−, NO3−, K+, Na+, Ca2+ and Mg2+ in
he regenerant solution were recorded daily. Detailed performancef the electrochemical stage was recorded six times during therowth period. In these experiments the following parametersere recorded as a function of time: power demand, TAN con-
entration, active and available chlorine concentrations, ORP andH.
The TAN concentrations in the effluent of the IX columns athe end of the column treatment cycle were measured daily. Dataegarding long term stability of the chabazite material in activehlorine solutions could not found in the literature. In order to mon-tor possible zeolite breakdown, aluminum concentrations were
easured (ICP) in the regenerant solution after one week, twoeeks, one month and two months of process operation.
.4. Analytical techniques
TAN concentrations were determined by the method proposedy Willis et al. (1996).
Nitrite concentration was measured using the 4500-NO2− B col-
rimetric method (Clesceri et al., 1998). Metal cations and totalrthophosphate were determined by ICP (1CAP6300 Duo, Thermocientific). Chloride ion and nitrate concentrations were deter-ined by the argentometric and cadmium reduction methods,
espectively (Clesceri et al., 1998). Free chlorine and concentrationf chloramines were determined by the DPD spectrophotometricethod (Clesceri et al., 1998). Alkalinity was measured by the Gran
itration method (Gran, 1952). pH in the fishpond was measuredaily by Titrino 718 equipped with a glass electrode (6.0228.010,etrohm, Switzerland). The alkalinity term representative of the
shpond water is described by Eq. (6). The CO2(aq) concentrationn the pond was calculated from Eq. (7) from the knowledge of the
easured alkalinity value, the total orthophosphate concentrationPT), and pH. The minute NH3 concentrations were ignored in thisalculation.
lk(H2CO∗3,NH3,H2PO−
4) = [HCO−
3 ] + 2[CO2+3 ] + [HPO2−
4 ] + 2[PO3−4 ] + [N
H2CO∗3] = 10−2pH · Alk − PT (Kp110−2pH + 2Kp1Kp2Kp3 − 10−3pH/1
here:Kp1 = 7.1 × 10⁻³ M, Kp2 = 6.3 × 10⁻⁸ M, Kp3 = 4.5 ×
0−13 M, Kc1 = 4.5 × 10⁻⁷ M, Kc2 = 4.7 × 10⁻¹¹ M.
. Results and discussion
.1. Fish performance
Fig. 4 shows average weights (and STDEV) of the fish during therowth period, as compared with the growth potential of Tilapia at8 ◦C, determined using Eq. (8) (Lupatsch, 2008):
t = [W0.4530 + 0.00512 × e0.09 Temp(28◦C) × days]
2.207(8)
here Wt (g) is the fish weight after t days of growth and W0 is thenitial fish weight (g).
ngineering 52 (2013) 27– 38
− [H3PO4] + [OH−] − [H+] (6)
+ Kp110−2pH + Kp1Kp210−pH + Kp1Kp2Kp3) − 1014−pH + 10−pH
0−pH + 2Kc1Kc2(7)
Fig. 4 shows that the fish grew from an average 35.8 g to 107.7 gin 51 days at a rate similar to the theoretical potential growthrate. The observed FCR value was 1.2 (w/w). Periodical observa-tions proved the fish to be in excellent condition throughout thegrowth period. One fish out of the initial 105 died after 20 days butno other infected fish were observed during the entire experimentperiod. Despite not being a very long growth period, it can be statedwith reasonable certainty that tilapia fish (strictly speaking, withinthe size range grown) were comfortable in the conditions appliedin the experiment (i.e. 10 < TAN < 23 mgN L−1 and pH 6.5–6.7).
3.2. Chemical characterization of fish pond water
Fig. 5 shows the concentrations of dissolved nitrogen com-pounds and orthophosphate that developed in the fishpond as afunction of time, during the growth experiment.
The actual pH values measured in the pond during the exper-iment fluctuated in the range pH 6.5–6.74. Dissolved oxygenconcentration was between 5.1 and 5.48 mgO2 L−1. The nitrite con-centration increased to a maximum value of 0.095 mgN L−1 tendays into the experiment, dropped afterwards to almost zero andremained very low thereafter, in spite of the fact that additionof the nitrification inhibitor was stopped after 22 days. The lownitrite and nitrate concentrations were attributed to the very shortsludge age periods of the bacteria in the tank, caused by the efficientsolids filtration, which apparently caused the slow growing nitri-fying bacteria to be washed out of the tank. The orthophosphateconcentration increased continuously in the fish tank, reaching avalue of 20.3 mgP L−1 after 50 days of growth. Note that phosphateremoval can be, theoretically, also attained in the proposed method,via the precipitation of hydroxyapatite (Ca10(PO4)6(OH)2) in thefishpond, if Ca2+, rather than Na+, is applied as the predominantcation exchanged for NH4
+ in the IX step. To attain such conditionsCa(OH)2 should be used instead of NaOH for alkalinity compensa-tion in the ammonia electrooxidation step, and as a result the Ca2+
concentration in the pond would increase significantly, promotinghydroxyapetite precipitation, despite the relatively low pH (as canbe shown from computer simulations – results not shown). In anyevent, phosphate removal was not attempted in the current workas NaOH was used as the strong base.
Fig. 6 depicts the change in time in the concentrations of themain cations in the fish tank: while the concentrations of Ca2+,K+ and Mg2+ remained very low throughout the growth period,
the Na+ concentration went up steadily as the fish density in thepond increased, and more Na+ was exchanged with NH4
+ on a givenday. Naturally, the slope of the Na+ concentration increase becamesteeper when the make up water exchange was reduced to 5%.At the end of the experiment [Na+] in the fishpond amounted toapproximately 500 mg L−1. Since the system was not maintained atsteady state with respect to feed addition and fish density, the Na+
concentration had not leveled off, and would have increased, had
the experiment been continued. The concentration of the countercation that develops in the fishpond water under steady state condi-tions is a main design parameter for the IX step. For example, underthe assumption of operation with fish density of 60 kg m−3 and 5%
Y. Gendel, O. Lahav / Aquacultural E
0
20
40
60
80
100
120
140
0 10 20 30 40 50
Fish growth pe riod (d)
Fis
h w
eig
ht (g
)
0.0
0.5
1.0
1.5
2.0
2.5
Fe
ed
ing
ra
te (
g fis
h-1
d-1
)
Feed ing rate
0
20
40
60
80
100
120
140
0 10 20 30 40 50
Fish growth pe riod (d)
Fis
h w
eig
ht (g
)
0.0
0.5
1.0
1.5
2.0
2.5
Fe
ed
ing
ra
te (
g fis
h-1
d-1
)
Feed ing rate
Fig. 4. Tilapia average weights (and feed addition) as a function of time duringthe experiment as compared with potential tilapia weights (g) calculated using thegrowth term suggested by Lupatsch (2008).
0
5
10
15
20
25
0 10 20 30 40 50
Fish growth duration (d)
[TA
N] (m
gN
L-1
), [P
T] (m
g L
-1)
0
0.2
0.4
0.6
0.8
1
1.2
1.4
1.6
[NO
3- ],
[N
O 2
- ] m
gN
L-1
[NO3-]
[TAN]
[NO2-]
10 % da ily water exchange 5 % dail y water exchang e
[PT]
Fig. 5. Change in nitrogen species and orthophosphate (PT) concentrations in thefi
wtt(ca
cws2t(le
Fg
tained in the electrolyte during the electrolysis step, lays within theoptimal pH range (pH 5–7) for chemical chlorate formation accord-
sh tank during the growth experiment.
ater exchange, the Na+ concentration can be logically expected toriple, i.e. to arrive at ∼1500 mg L−1. Under such conditions, sincehe affinity of NH4
+ to chabazite is much higher than that of Na+
Lahav and Green, 1998), the IX concept is still expected to be effi-ient, although IX breakthrough curves would logically be shorternd required chabazite volume, higher.
Despite the low pH maintained in the pond, the highest CO2(aq)oncentration recorded in the fish tank water was 7.2 mg L−1,hich is bellow the reported toxicity threshold of most aquaculture
pecies (Eshchar et al., 2006). Overall acid consumption rate was.89 eq H+ (kg feed)−1, as calculated by linearization of the cumula-ive acid consumption curve obtained throughout the experimentR2 > 0.999). The apparent NH3 mass excreted by the fish was calcu-ated backwards from the feed specific acid consumption rate (2.42q H+ per kg feed−1) to be 0.034 (kg kg−1).
0
5
10
15
20
25
0 10 20 30 40 50
Fish growth duration (d)
[Ca
2+],
[K
+],
[M
g2+]
(mg L
-1)
0
100
200
300
400
500
600
[Na
+], (
mg
L-1
)
[Na+]
10 % water exchag e 5 % water exchag e
[Ca2+
]
[K+]
[Mg2+
]
ig. 6. Concentrations of metal ions in fishpond water as a function of time and fishrowth stages. � [Na+]; � [K+]; � [Ca2+]; � [Mg2+]; all concentrations in mg L−1.
ngineering 52 (2013) 27– 38 33
3.3. Performance of the water treatment component
No. ion exchange NH4+ breakthrough was observed during the
entire experiment. In fact, the TAN concentration in the water com-ing out of the columns tended toward zero during the entire period.Aluminum concentrations measured in the regenerant solutionwere nil, indicating that the chabazite was stable in (at least) thediluted active chlorine concentrations to which it was exposed inthis work.
As described in Section 2.3, the electrolysis step was ORPcontrolled. Fig. 7 shows a typical regeneration/ammonia elec-trooxidation step. In preliminary lab-scale indirect ammoniaelectro-oxidation experiments (results not shown) a sharp ORPincrease was observed immediately once the ammonia oxidationhad been completed. In the pilot scale process the picture wasdifferent, probably due to a certain organic matter concentrationentrapped in the zeolite column during the adsorption step andreleased to the electrolyte solution in the regeneration step: a sharpORP increase occurred only when the concentration of the free chlo-rine reached became higher than between 30 and 55 mgCl2 L−1.However, since the reproducibility of the results was good, it wasdecided to continue controlling the electrolysis step by ORP, despitethe high final Cl2 concentration, because it was observed that mostof the superfluous active chlorine produced during a given regener-ation step remained almost unaffected during the delay period andwas consumed for ammonia oxidation in the next electrooxidationcycle.
The consumption rates of the acid and base and the electricalpower demand were averaged from linearization of the cumu-lative curves obtained during the whole experiment (R2 > 0.995).Power and base demand measured during the electrochemicalregeneration of the IX columns were 0.95 kWh (kg feed)−1 and2.38 eq OH− (kg feed)−1, respectively. As expected from the massbalance standpoint, the actual acid mass required in the fish tank forcompensating for the alkalinity increase due to ammonia excretion(2.42 eq H+ (kg feed)−1), was almost identical to the base consump-tion rate observed in the electrooxidation step.
The current efficiency recorded in the ammonia oxidation stepwas merely 66%, as calculated from the 3.4% (w/w) value takenin the experiment as the representative digestible nitrogen con-tent in the fish feed. This observed efficiency is much lower thanthe typical current efficiencies of >85% which observed in prelimi-nary lab-scale batch electrolysis experiments (results not shown).The reason for this low current efficiency could stem from somechlorine consumption by organic matter, as explained before andprobably also by conversion of active chlorine to chlorate (ClO3
−)in the regenerant solution. The pH value of 6.5, which was main-
ing to Eq. (9) (Tilak et al., 1981). It is thus possible that some of the
0
100
200
300
400
500
600
700
800
900
1000
1100
0 20 40 60 80 10 0 12 0 14 0 16 0
Electrolysis duration (min)
OR
P (
mV
)
0
10
20
30
40
50
60
[C
l 2] (m
gC
l 2 L
-1),
[T
AN
] (m
g L
-1)
ORP controlled electrolysis
Free chlorine
ORP
TAN
Fig. 7. Results of a typical indirect ammonia electro-oxidation step. �Free chlorine(mgCl2 L−1); � [TAN] (mgN L−1); � ORP (mV).

3 tural E
rdno
2
s((e1noafacd
teerttases
ctwatCfira
3
3
dpiAspfpveCatwt
oatAw
4 Y. Gendel, O. Lahav / Aquacul
esidual active chlorine, which was produced but not consumeduring the electrolysis step, was converted to chlorate, which doesot oxidize NH4
+. This issue was not explored further in the coursef the current work.
HOCl + OCl− → ClO3− + 2HCl (9)
Another reason for the relatively low current efficiency mea-ured could have stemmed from nitrate and nitrite formationand destruction) during the ammonia electro-oxidation stepVanlangendonck et al., 2005). [NO3
−] accumulated in the brinelectrolyte solution during the last 17 days of growth, reaching1.75 mgN/L. Note that this value reflects net accumulation, i.e.itrate formation at the anode minus nitrate reduction at the cath-de. However, loss of current efficiency for ammonia oxidationssociated with nitrate formation could not be calculated directlyrom the collected data due to possible back reduction of nitrate tommonia at the cathode (Vanlangendonck et al., 2005). The nitriteoncentration in the electrolyte solution was at all times below theetection limit, obviously due to its oxidation by active chlorine.
Drainage of the brine from the IX columns after each regenera-ion step, as done in this work, can minimize, but not completelyliminate, the loss of sodium and chloride ions from the regen-rant solution, due to the field capacity of the zeolite bed. As aesult of this phenomenon, after 28 days of operation the concen-rations of Na+ and Cl− in the electrolyte solution decreased fromhe initial concentration of 29.9 g L−1 and 44.1 g L−1 to 7.14 g L−1
nd 13.42 g L−1, respectively. From this point further 184.6 g of dryodium chloride were added manually to the regenerant solutionvery other day to maintain the Na+ and Cl− concentrations con-tant at ∼10.93 and ∼18.32 g L−1, respectively.
Removal of available chlorine residuals, which remain in the IXolumns after regeneration and subsequent brine drainage opera-ions, was essential in order to prevent contact of chlorine and tankater. Fig. 8 represents the composition of the column effluents as
function of the applied volume of the fishpond water (BV), duringhe rinse procedure. According to Fig. 8 more than 98% of the Na+,l− and available chlorine were removed from the column with therst BV of tank water applied. The concentration of available chlo-ine in the column effluent was lower than 0.1 mgCl2 L−1 following
rinse with two bed volumes of water.
.4. Cost estimation
.4.1. Operational expenses (OPEX)Table 2 lists the operational costs assessment, which was
erived directly from the data collected during the operation of theilot plant. The main operational expenses stemmed from chem-
cals (acid and base) consumption and electrical power demand.s shown in Table 2, the overall OPEX of the pilot treatmentystem was fairly low, i.e. 28.7 $ cent per kg feed or 34 $ center kg fish assuming FCR of 1.2 kg feed kg fish−1 (a common valueor tilapia growth in Israel and also the value recorded in theresent, limited, growth experiment). Assuming a higher FCRalue of 1.8 kg feed kg fish−1 (more appropriate for Bass growth, forxample) the operational costs would become $0.52 per kg fish.onsidering that this figure included an excessive cost for NaClddition and that it was calculated based on a relatively low elec-rooxidation efficiency, which could almost certainly be improvedhen the technology progresses to the next level, it appears that
he proposed process is feasible, cost wise.The very high NaCl consumption (0.49 kg NaCl kg feed−1)
bserved in the pilot operation can be significantly decreased by
ppropriate system design that will minimize loss of salt whenhe column shifts between regeneration and adsorption cycles.lternatively, cheap seawater (or another source of cheap Cl−-richater) may also be used, if available, as the regenerant solutionngineering 52 (2013) 27– 38
in the proposed process, thereby reducing the operational costsconsiderably. When a restriction exists on the discharge of Na+ toa receiving water body, operation should be performed with Ca2+
as the NH4+ counter cation, rather than Na+.
Optimizing the electro-oxidation process was not attemptedin this study. However it can be safely stated that the electricalpower demand can be significantly reduced, as current efficien-cies higher than 66% have been often reported in similar situations(Vanlangendonck et al., 2005; Gendel and Lahav, 2012). In addition,hydrogen gas, which is a valuable byproduct of the indirect ammo-nia electro-oxidation process, can be collected in large full-scaleoperations. Such practice would reduce the overall operational cost.
3.4.2. Estimation of capital expenses (CAPEX)Estimation of the required capital investment could not be
done with reasonable accuracy on the basis of the results obtainedfrom the operation of a small pilot scale unit, such as the oneoperated in this study. However, a rough estimation of capitalinvestment is presented here to show that the proposed technol-ogy is economically feasible. The two major components affectingthe capital investment are the electrochemical device and the ionexchanging material and reactor. For a fish growing plant producing100 × 103 kg fish y−1 and assuming FCR (food conversion ratio) of1.8 kg feed kg fish−1 a feeding rate of 1.8 × 10⁵ kg feed y−1 would berequired. Assuming the application of food with 4% digestible nitro-gen, 7200 kg N would be released to the pond annually, i.e. 0.89 kg Nwould have to be removed hourly from the fishpond water (assum-ing a treatment system that is operated 22 h a day). Assuming thatthe TAN concentration in the fishpond is maintained at 15 mgN L−1,1315 m3 of fishpond water would have to be treated daily.
Further assuming that the two IX columns are operated in asequence of 2 h for IX treatment and 2 h for regeneration, the result-ing volume of treated water per cycle would be 120 m3. Since an IXcolumn can treat 40 BV of water until NH4
+ breakthrough occurs,the volume of each column should be 3 m3. The overall volume ofthe zeolite columns will thus be 6 m3 and assuming a package den-sity of 560 g L−1 of chabazite, annual replacement of 10% (weight)and 15 years of operation, an overall 40 tons of zeolite would berequired for 15 operation years. At an estimated 500 $ per ton ofchabazite zeolite, the capital investment on the IX component willamount to $20,000.
The electrochemical unit should be capable of oxidizing0.89 kgN h−1 which equals an active chlorine production of11.27 kgCl2 h−1 at 60% current efficiency. The estimated cost of theelectrolysis unit is $110,000 (Online electrolyzer).
The combined CAPEX of the electrolysis unit and IX materialis thus $130,000. Assuming a high safety factor of 2 (to accountfor peripheral equipment and unknowns), an interest of 5% and aserviceable life of 15 years the annual return on the capital wouldbe ∼$25,000, i.e. ∼$3 per kg TAN removed and $0.25 per kg fishproduced.
The overall fish production cost (CAPEX and OPEX) in thenew approach is estimated at $0.8 per kg fish (assuming FCR of1.8 kg feed kg fish−1).
3.5. Comparison of volumes and recirculation flow rates requiredin the proposed physico-chemical technology with conventionalnitrification biofilters
One noticeable advantage of the proposed technology is its smallvolume relative to the biological systems and also the much lower
recirculation flow rate required for its operation, as compared withconventional nitrifying biofilters. Table 3 lists the assumptionsmade for estimating the volumes and recirculation flow rates forboth the proposed technology and biofiltration.
Y. Gendel, O. Lahav / Aquacultural Engineering 52 (2013) 27– 38 35
0
2
4
6
8
10
12
14
16
18
20
0 0.5 1 1.5 2
BV
[Na
+] a
nd
[C
l- ], (
g L
-1)
0
10
20
30
40
50
60
[Cl 2
] (m
gC
l 2 L
-1)
Na+
Cl-
Free chlorine
Fig. 8. Species concentrations measured in water leaving IX column during a typical rinse operation. � Chloride ions (g L−1); � sodium ions (g L−1); �total available chlorine(mgCl2 L−1).
Table 2Actual operational costs, as determined from the pilot operation.
Parameter Demand Price tag Cost
Electrolysis power demand 0.95 kWh kg feed−1 16.4 cent kWh−1 15.6 cent kg feed−1
Strong acid (H2SO4 98%) 118.6 g kg feed−1 200 $ t−1 2.4 cent kg feed−1
Strong base (NaOH) 95.29 g kg feed−1 400 $ t−1 3.8 cent kg feed−1
NaCl 0.49 kg kg feed−1 150 $ t−1 6.9 cent kg feed−1
nfl
r2ivrytsb
TRi
Total cost per kg feed
Total cost per kg fish (FCR = 1.2)
A detailed comparison between the proposed technology andormal RAS biofiltration with respect to volume and recirculationow rates is presented in Appendix C.
In biofilters, the highest zero-order (diffusion controlled) TANemoval rate was reported to be 0.71 (g m−2 d−1) (Eding et al.,006). Plugging this value and the parameters listed in Table 3
nto Eq. (C.8) (see Appendix C for elaboration) indicates that theolume required for the biofilter is 13 times higher than thatequired for the proposed technology (ion exchangers and electrol-sis unit, combined). Additionally, Eq. (C.9) (Appendix C) reveals
hat the recirculation flow rate through the proposed treatmentcheme is at least seven times smaller than that required for typicaliofiltration practice. Moreover, TAN oxidation rate in biofilters isable 3AS parameters applied for the comparison of the design parameters of the biolog-
cal and proposed physico-chemical RAS water treatment technologies.
Parameter Value
Fishpond volume (m3) 500Fish density (kg fish m−3) 10–100Feeding rate (g feed kg fish−1) 10TAN load (kgN d−1) 2–20Excreted TAN (g N kg feed−1) 40Biological removal rate of TAN per biofilter surface area(g m−2 d−1) (after Eding et al., 2006)
0.36–0.71
[TAN] in the biofilter effluent (g m−3) 0.5[TAN] in biologically treated RAS (mg L−1) 2.2Specific surface area of the biofilter (m2 m−3) (Eding et al., 2006) 200–230Fishpond water exchange rate (d−1) 0.05Number of IX columns 2[TAN] in physico-chemically treated RAS (mg L−1) 20Retention time of IX treatment (min) 3Number of BV treated by column per operation 40
28.7 cent kg feed−1
34.5 cent kg fish−1
temperature dependent. Boller and Gudjer (1986) proposed theterm R(10◦C) = R(T◦C)
.e[K(10−T)] for linking nitrification rates with tem-perature in tertiary trickling filters (K = 0.044 ◦C−1 and T in ◦C).Accordingly, TAN oxidation rates in RAS operated at 10 ◦C will beas low as 0.36 (g m−2 d−1). At such conditions the volume ratiobetween typical biofilters and the proposed system will jump to26.
As opposed to biological processes, indirect ammoniaelectro-oxidation and removal of NH4
+ by IX processes areboth only slightly dependent on temperature. Khelifa et al.(2004) reported that electrochemical formation of active chlo-rine is almost similar at the range 10–40 ◦C. McLaren andFarquhar (1973) studied the performance of clinoptilolite (aspecific type of zeolite) at different operational conditionsand reported no temperature dependency of NH4
+ removalat the range between 2 and 12 ◦C. Leyva-Ramos et al. (2010)reported an increase and decrease of only 13% in the maximalammonia exchange capacity of chabazite when the temper-ature was increased and decreased by 10 ◦C from an initial25 ◦C.
4. Conclusions
• A new ion exchange/electrochemical regeneration process wasintroduced and successfully applied at the pilot scale for con-tinuous oxidation of ammonia from RAS water to N2(g) in one
oxidation step.• The suggested process has low sensitivity to temperature, doesnot require long startup and recovery periods, and can beswitched on and off at will.

3 tural Engineering 52 (2013) 27– 38
•
•
•
•
•
•
•
A
T
ti
A
A
Bp
ppfitrw([Tawctcc
cw3iBb
t
••
Table A.1List and parameters of the equipment used in the pilot scale studies.
Equipment description (in Fig. 2) Parameters/model/manufacturer
Fishpond (T1) 700l. Box pallet type 1120 solid,Dolev Plastic Products
Regenerant holding vessel (T2) 60 l, Plastic drum HDPE, PachmasPackaging Ltd.
Acid tank for electrodes treatment(T3)
16 l, Plastic Jerrycan HDPE, S 18L,Pachmas Packaging Ltd.
Automatic ball valve(V0) 1/2′′ , 24VAC. Sagiv Ltd.Automatic ball valves (V1–V9) PVC, OM-1,24 VAC coil, 1/2′′ , Sun
Yeh Electrical Ind. Co. Ltd.Manual ball valves (V10–V14) PVC, 1/2′′ 11151005, Plasson Ltd.Peristaltic pump (P1, P2, P3) Drive: 6–600 rpm, 7553-75,
Cole-ParmerHead: 77200-62, Cole-ParmerTubing: 06404-24 Norprene,Masterflex
Magnetic pump (P6, P5) NH-50PX-Z, Pan World Co.Ltd.130 �m filter (F1, F5, F6) 3/4′′ Tagline plastic filter, Amiad
Water SystemsActivated carbon filter (F2) 5′′ , Granular activated carbon, Noga
WaterCareCoarse filter (F3, F4) 1.5l and 12 l, Two layers of plastic
screen ∼0.5 mm mesh, Self madeDrainage air compressor (AC) 250 PSI portable 12VDC. Unknown
manufacturer.Ion-exchange columns (Z1, Z2) PVC, length-105 cm
Internal diameter: 7.04 cm,Unknown manufacturer. Self madeassembly
Electrolysis cell (EC) Klorogen M10, Monopolar, parralelplate.5 electrodes, 15.2.5.0.5 cm.cm.cmAnode: Ti/precious metal oxidecoatingCathode: Ti/precious metal oxidecoatingTitanium Tantalum Products Ltd.
DC power supply HCS-3402. 1–30 VDC, 20 A.Manson.
Base addition pump (Regenerant) Dosing pump, Gala1000, ProMinentpH sensor (Regenerant) Glass electrode. ECFC7252101B,
Eutech InstrumentspH controller
(Fishpond/regenerant)Alpha pH190, Thermo Scientific.
Fishpond pH sensor Style B, 3/4′′ , Van London PhoenixCo.
Acid addition pump (Fishpond) Dosing pump. Pulsatron C-plus.Pulsafeeder Inc.
Fishpond water level sensor DNR2. SyrelecTemperature controller (Fishpond) NA6810, Suzhou Newasia
Technologies Inc.Heating element (Fishpond) 1.2 kW. Titanium body. Unknown
manufacturer.ORP sensor (regenerant) 6.045.100, MetrohmProgrammable logic controller Millenium 3 custom, XD26, 24VDC,
Crouzet.
0
0.5
1
1.5
2
2.5
0 10 20 30 40 50 60 70 80 90 10 0 11 0
Cu
mu
lative
[T
AN
], (
mg
N L
-1)
6 Y. Gendel, O. Lahav / Aquacul
Tilapia fish grew from 35.8 g to 107.1 g at a rate similar to theirpotential growth rate under conditions of TAN concentration ofup to 23 mgN L−1 and pH 6.5–6.7.Nitrite and nitrate concentrations recorded in the pond waterwere very low (<0.1 mgN L−1), with and without addition of anitrification inhibitor.The volume of the required ammonia oxidation reactors (ionexchange and electrolysis reactors, combined) is at least 13 timeslower than the volume of typical RAS nitrification biofilters.The required recirculation flow rate through the ion exchangereactors is 7 times lower than the equivalent recirculation ratetypically applied for typical RAS biofilter operation.The system converts ammonia directly to the benign N2(g) in oneoxidation step.The low biomass concentration maintained in the pond in theproposed process has the potential to reduce fish disease andoff-flavor development.The process was shown feasible from both the operational andeconomic standpoints.
cknowledgement
The authors thank the Mitchell Entrepreneurial Program at theechnion for the financial support.
The authors wish to thank Noam Mozes and Ayana Perlberg fromhe Ministry of Agriculture and Rural Development in Israel for theirndispensable contribution in executing this research.
ppendix A.
See Table A.1.
ppendix B.
.1. Preliminary ion-exchange experiments used for IX columnsilot design
NH4+ breakthrough curves were obtained using a 300 mL
acked-bed ion-exchange column made of a transparent PVCipe (length 33 cm; internal diameter 3.4 cm). The column waslled with 180 g (dried at 100 ◦C) of chabazite. Three break-hrough curves (applied hydraulic retention time = 6 min) wereecorded: two curves using RAS water as background and oneith tap water. Cationic composition of RAS and tap water were
mg L−1): [Ca2+] = 112; [Mg2+] = 51.7; [Na+] = 194.4, [K+] = 20.45 andCa2+] = 82.6; [Mg2+] = 36.2; [Na+] = 101.8; [K+] = 4.9, respectively.AN concentrations in RAS water breakthrough curves weredjusted to 15 and 30 mgN L−1 by addition of (NH4)2SO4; pH valuesere adjusted to 7.2 and 6.8, respectively, with H2SO4 (1.8 M). TAN
oncentration and pH in the tap water experiment were adjustedo 29.7 mgN L−1 and pH 6.8. The water leaving the ion-exchangeolumn was collected in a stirred vessel and the (cumulative) TANoncentration measured throughout each experiment.
NH4+ breakthrough curves are shown in Fig. B.1. Arbitrary
umulative ammonia breakthrough concentration of 2 mgN L−1
as chosen. This value was attained (for water containing 15 and0 mgN L−1) after 93 and 60 BV, respectively. In the tap water exper-
ment (29.7 mgN L−1) 2 mg L−1 in the effluent were attained after 98V. The pilot scale fishpond water treatment system was designedased on these results.
The following assumptions were applied for the design of the
reatment process:Maximal fish density: 22 kg m−3.Maximal feed load: 2.3 g fish−1 d−1.
BV
Fig. B.1. NH4+ breakthrough curves: � Fishpond water: pH 6.8 and 30 mgN L−1; �
Fishpond water: pH 7.2 and 15 mgN L−1; tap water: pH 6.8 and 29.7 mgN L−1.

tural E
aouotbtptept
A
t“e
a
Q
L
r(
V
Q
w–crcfi–r
mBdnttt
Q
Fflg
Y. Gendel, O. Lahav / Aquacul
The design TAN load on the water treatment system wasssumed to be 9.7 gN d−1. In order to achieve a TAN concentrationf 30 mgN L−1 in the fishpond at the highest TAN load, each col-mn was designed to treat ∼160 L of fish tank water during 12 h ofperation, assuming 100% TAN removal efficiency. Consequently,he flow rate of the water through the column was calculated toe 220 mL min−1. The cationic composition that would develop inhe fish tank water in the fish growth experiment could not beredicted a priori with reasonable accuracy. Therefore, it was arbi-rarily decided that within the 12 h of the water treatment stageach column would accept a maximum volume of 40 BV of fish-ond water. These considerations ultimately led to the design ofwo IX columns, each with a volume of 4 L.
ppendix C.
Fig. C.1 shows the general schematic of the RAS operated withhe biological/ion-exchange water treatment methods. The termFilter unit” in Fig. C.1 stands for either the biofilter or the ion-xchangers, respectively.
Eqs. (C.1) and (C.2) are mass balances of TAN round the biofilternd the fishpond, respectively.
T-BIO · CTAN-BIO = CEFF-BIO · QT-BIO + R · VBIO · S (C.1)
TAN = QT-BIO · CTAN-BIO − CEFF-BIO · QR (C.2)
The volume of the biofilter (Eq. (C.3)) and the recirculation flowate thereof (Eq. (C.4)) can be calculated from the combining Eqs.C.1) and (C.2):
BIO =(
V
RS
)(LTAN − CEFF-BIO · WER) (C.3)
T-BIO = V · (LTAN − CEFF-BIO · WER)(CTAN-BIO − CEFF-BIO)
(C.4)
here QT-BIO – flow rate of the filter influent (m3 d−1); CTAN-BIOTAN concentration in the fishpond (g m−3 as N); CEFF-BIO – TAN
oncentration in the biofilter effluent (g m−3 as N); R – biologicalemoval rate of TAN relative to filter surface (g m−2 d−1); S – spe-ific surface area of the biofilter (m2 m−3); LTAN – TAN load on theshpond (g d−1 as N); V – volume of the fishpond water (m3); VBIO
volume of the biofilter (m3); and WER – fishpond water exchangeate (1 d−1).
At least two IX columns have to be operated (in series) in order toaintain the TAN concentration in the fish tank roughly constant.
esides the number of IX columns the volume of proposed methodepends on the TAN concentration maintained in the fishpond, theumber of tank water BV passed through a single IX column, andhe retention time of the water in the IX column. If the TAN concen-ration in the IX effluent is neglected, the water flow rate through
he IX column becomes (QT-PC):T-PC = LTAN · V
CTAN-PC(C.5)
Qin
QT ,
Qout=Qin, CEFFQR, CEFF
Fishpond
Fil
ter
Feed
ig. C.1. Schematic RAS process applied for the comparison of volumes and waterow rates required for biological and physicochemical water treatment technolo-ies.
ngineering 52 (2013) 27– 38 37
Consequently, the volume of a single IX column is:
VIX = RT · LTAN · V
CTAN-PC(C.6)
where VIX, RT and CTAN-PC stand for empty bed volume of a singleIX column (m3), water retention time in the IX column (d) and TANconcentration maintained in the fishpond (g m−3), respectively.
For a process operated with two IX columns, the overall volumeof the system (VPC) comprises the volume of the columns and thevolume of the regenerating solution that can be assumed to be equalto three empty bed volumes of a single column. Thus, the overallvolume of the IX treatment system becomes:
VPC = 5VIX = 5 · RT · V · LTAN
CTAN-PC(C.7)
Finally, Eq. (C.8) describes the maximal ratio between the vol-ume of a bio-trickling filter (VBIO) and the volume of the proposedphysico-chemical process (VPC):
VBIO
VPC=
(CTAN-PC
R · S
)· (LTAN − CEFF-BIO · WER)
(5 · RT · LTAN)(C.8)
The ratio of the flow rates applied in biologically treated RAS vs.the proposed method was derived from combining Eqs. (C.4) and(C.5):
QT-BIO
QT-PC= CTAN-PC · (LTAN − CEFF-BIO · WER)
(CTAN-BIO − CEFF-BIO)(C.9)
References
Boller, M., Gudjer, L., 1986. Nitrification in tertiary trickling filters followed by deepbed filters. Water Research 20, 1363–1373.
Clesceri, L.S., Greenberg, A.E., Eaton, A.D., 1998. Standard Methods for the Examina-tion of Water and Wastewater, 20th ed. American Public Health Association,American Water Works Association and Water Environmental Federation,Washington, DC, USA.
Dryden, H.T., Weatherley, L.R., 1989. Aquaculture water treatment by ion exchange:continuous ammonium ion removal with clinoptilolite. Aquacultural Engineer-ing 8, 109–126.
Eddy, F.B., 2005. Ammonia in estuaries and effects on fish. Journal of Fish Biology 67(6), 1495–1513.
Eding, E.H., Kamstra, A., Verreth, J.A.J., Huisman, E.A., 2006. Design and operationof nitrifying trickling filters in recirculating aquaculture: a review. AquaculturalEngineering 34, 234–260.
Eshchar, M., Lahav, O., Mozes, N., Peduel, A., Ron, B., 2006. Intensive fish culture athigh ammonium and low pH. Aquaculture 255, 301–313.
Gendel, Y., Lahav, O., 2012. Revealing the mechanism of indirect ammonia electroox-idation. Electrochimica Acta 63, 209–219.
Gran, G., 1952. Determination of the equivalence point in potentiometric titrations.Part II. Analyst 77, 661–671.
Khelifa, A., Moulay, S., Hannane, F., Benslimene, S., Hecini, M., 2004. Application ofan experimental design method to study the performance of electrochlorinationcells. Desalination 160, 91–98.
Klas, S., Mozes, N., Lahav, O., 2006. Development of a single-sludge denitrificationmethod for nitrate removal from RAS effluents: lab-scale results vs. model pre-diction. Aquaculture 259, 342–353.
Lahav, O., Green, M., 1998. Ammonium removal using ion exchange and biologicalregeneration. Water Research 32 (7), 2019–2028.
Leyva-Ramos, R., Monsivais-Rocha, J.E., Aragon-Pina, A., Berber-Mendoza,M.S., Guerrero-Corondo, R.M., Alonso-Davila, P., Mendoza-Barron, J., 2010.Removal of ammonium from aqueous solution by ion-exchange on nat-ural and modified chabazite. Journal of Environment Management 91,2662–2668.
Liu, Y., Li, L., Goel, R., 2009. Kinetic study of electrolytic ammonia removal usingTi/IrO2 as anode under different experimental conditions. Journal of HazardousMaterials 167, 959–965.
Lupatsch, I., 2008. Predicting growth, feed intake and waste production of intensivelyreared tilapia based on nutritional bioenergetics. In: Proceedings of the SeventhInternational Conference on Recirculating Aquaculture, Roanoke, Virginia, pp.306–314.
McLaren, J.R., Farquhar, G.J., 1973. Factors affecting ammonia removal by clinoptilo-lite. Journal of Environmental Engineering Division ASCE 99 (4), 429–446.
Mozes, N., Alfiya, Y., Conijeski, D., Ezer, T., Yiger, A., Haddas, I., 2005. Intensive cultureof Tilapia in a mega-flow system. Fisheries and Fishbreeding in Israel 36 (2),818–828 (in Hebrew).
Online electrolyzer store, 2010. EU-CHLOR Ltd. http://www.eu-chlor.eu/parallel%20plate%20el-ectrolyzers.html.

3 tural E
S
S
T
8 Y. Gendel, O. Lahav / Aquacul
inger, A., Parnes, S., Gross, A., Sagi, A., Brenner, A., 2008. A novel approach to denitri-fication processes in a zero-discharge recirculating system for small-scale urbanaquaculture. Aquacultural Engineering 39 (2-3), 72–77.
zpyrkowicz, L., Kaul, S.N., Neti, R.N., Satyanarayan, S., 2005. Influence of anodematerial on electrochemical oxidation for the treatment of tannery wastewater.Water Research 39, 1601–1613.
ilak, B.V., Viswanathan, K., Rader, C.G., 1981. On the mechanism of sodium chlorateformation. Journal of Electrochemical Society 128 (6), 1228–1981.
ngineering 52 (2013) 27– 38
Vanlangendonck, Y., Corbisier, D., Van Lierde, A., 2005. Influence of operating condi-tions on the ammonia electro-oxidation rate in wastewater from power plants(ELONITATM technique). Water Research 39, 3028–3034.
Willis, R.B., Montgomery, M.E., Allen, P.R., 1996. Improved method for manual,calorimetric determination of total Kjeldahl nitrogen using salicylate. Journalof Agriculture and Food Chemistry 44, 1804–1807.
Wood, E.M., 1953. The Toxicity of 3400 Chemicals to Fish. U.S. Fish and WildlifeService, Kearneysville, West Virginia.


