Embed Size (px)
Citation preview

DOCUMENT RESUME
ED 416 723 FL 801 215
AUTHOR Binkley, Marilyn; Matheson, Nancy; Williams, TrevorTITLE Adult Literacy: An International Perspective. Working Paper
Series.INSTITUTION American Institutes for Research, Washington, DC.; Westat,
Inc., Rockville, MD.SPONS AGENCY National Center for Education Statistics (ED), Washington,
DC.
REPORT NO NCES-WP-97-33PUB DATE 1997-00-00NOTE 59p.
PUB TYPE Numerical/Quantitative Data (110) Reports - Research(143)
EDRS PRICE MF01/PC03 Plus Postage.DESCRIPTORS *Adult Literacy; Comparative Analysis; Comparative
Education; Definitions; Difficulty Level; EducationalAttitudes; *Employment Patterns; Foreign Countries; Income;International Education; Interviews; Language Skills;*Literacy Education; *Occupations; Surveys
ABSTRACTThe comparison of adult literacy in the United States and in
other countries is based on data gathered in interviews with a sample ofindividuals representative of the population aged 16-65 in twelve countries:Sweden, the Netherlands, Canada, Germany, New Zealand, Australia, the UnitedStates, Belgium, the United Kingdom, Ireland, Switzerland, and Poland.Respondents' literacy was measured using 114 literacy tasks found to be validacross cultures and reflecting three domains of literacy: prose, document,and quantitative. An introductory section gives background information on thestudy, definition of literacy, and methodology used in the survey. Subsequentsections contain the findings, in tables and narrative, concerning: nationalliteracy averages and distribution of literacy skills at five levels; therelationship of literacy to employment status (unemployed, employed, out ofworkforce, student), occupational status (professionals, managers,technicians, clerical, sales/service, skilled craft, machine operators,agricultural/primary), and income, and the importance of literacy toindividuals. Contains three references. (MSE) (Adjunct ERIC Clearinghouse on
Literacy Education)
********************************************************************************* Reproductions supplied by EDRS are the best that can be made *
* from the original document. *
********************************************************************************

NATIONAL CENTER FOR EDUCATION STATISTICS
Working Paper Series
Adult Literacy:
An International Perspective
Working Paper No. 97-33October 1997
"PERMISSION TO REPRODUCE THISMATERIAL HAS BEEN GRANTED BY
TO THE EDUCATIOINFORMATION CE
NAL RESOURCESNTER (ERIC)."
U.S. Department of EducationOffice of Educational Research and improvement
BEST COPY AVAILABLE 02,
U.S. DEPARTMENT OF EDLCATICNIOffice of Eoucahonai Research eon -soroveent
E UCATIONAL RESOURCES INFORMATICP,CENTER (ERIC)
his document has been reprpcluce= asreceived from the person or ohganizationoriginating it.
ID Minor changes have been ma-3e toimprove reproduction quality.
Points of view or opinions stated in thisdocument do not necessarily epresentofficial OERI position or odic,

Adult Literacy:
An International Perspective
Working Paper No. 97-33 October 1997
Contact: Marilyn BinkleyData Development and Longitudinal Studies Group(202) 219-2195
3

U.S. Department of EducationRichard W. RileySecretary
Office of Educational Research and ImprovementRicky T. TakaiActing Assistant Secretary
National Center for Education StatisticsPascal D. Forgione, Jr.Commissioner
Data Development and Longitudinal Studies GroupMartin OrlandAssociate Commissioner
The National Center for Education Statistics (NCES) is the primary federal entity for collecting, analyzing,and reporting data related to education in the United States and other nations. It fulfills a congressionalmandate to collect, collate, analyze, and report full and complete statistics on the condition of educationin the United States; conduct and publish reports and specialized analyses of the meaning and significanceof such statistics; assist state and local education agencies in improving their statistical systems; and reviewand report on education activities in foreign countries.
NCES activities are designed to address high priority education data needs; provide consistent, reliable,complete, and accurate indicators of education status and trends; and report timely, useful, and high qualitydata to the U.S. Department of Education, the Congress, the states, other education policymakers,practitioners, data users, and the general public.
We strive to make our products available in a variety of formats and in language that is appropriate to avariety of audiences. You, as our customer, are the best judge of our success in communicatinginformation effectively. If you have any comments or suggestions about this or any other NCES productor report, we would like to hear from you. Please direct your comments to:
National Center for Education StatisticsOffice of Educational Research and ImprovementU.S. Department of Education555 New Jersey Avenue, NWWashington, DC 20208
Suggested Citation
U.S. Department of Education. National Center for Education Statistics. Adult Literacy:An International Perspective,Working Paper No. 97-33, by Marilyn Binkley, Nancy Matheson, and Trevor Williams. Project officer: Marilyn Binkley.Washington, D.C.: 1997.
October 1997
4

Foreword
Each year a large number of written documents are generated by NCES staff andindividuals commissioned by NCES which provide preliminary analyses of survey results andaddress technical, methodological, and evaluation issues. Even though they are not formallypublished, these documents reflect a tremendous amount of unique expertise, knowledge, andexperience.
The Working Paper Series was created in order to preserve the information containedin these documents and to promote the sharing of valuable work experience and knowledge.However, these documents were prepared under different formats and did not undergovigorous NCES publication review and editing prior to their inclusion in the series.Consequently, we encourage users of the series to consult the individual authors for citations.
To receive information about submitting manuscripts or obtaining copies of the series,please contact Ruth R. Harris at (202) 219-1831 or U.S. Department of Education, Office ofEducational Research and Improvement, National Center for Education Statistics, 555 NewJersey Ave., N.W., Room 400, Washington, D.C. 20208-5654.
Samuel S. PengActing DirectorStatistical Standards and Services Group
...5111

Adult Literacy:
An International Perspective
Prepared by:
Marilyn BinkleyNational Center for Education Statistics
I
Nancy MathesonAmerican Institutes for Research
Trevor WilliamsWestat, Inc.
Contributors:
Julie IssacsAmerican Institutes for Research
Irwin KirschEducational Testing Services
Prepared for:
U.S. Department of EducationOffice of Educational Research and Development
National Center for Education Statistics
October 1997

Preface
This report is a working paper produced as part of a forthcoming larger report on adultliteracy in the United States. In fact, this working paper presents, in draft form, the analysesand text of the first two chapters of the larger report to come. The first of the two chaptersin question provides a comparison of the literacy levels of adults in 12 nations -- Canada,Germany, the Netherlands, Poland, Sweden, Switzerland, the United States, Australia,Flemish-speaking Belgium, Ireland, New Zealand, and the United Kingdom. The second ofthe two chapters takes this same comparative view of the relationship between literacy levelsand, respectively, employment, occupational status and income, across all but one of thesenations. (At this time the appropriate data for Australia are not available for publication.)
The full report will be released later this year and will contain, in addition to the chaptersnoted above, a discussion of the variation in literacy levels across across different industry -defined sectors of the labor force, and an extended discussion of the relationship betweenliteracy and education.
7vi
a

Table of Contents
Chapter Page
Foreward III
Preface VI
Introduction 1
Arriving at an international definition of literacy 2
Measuring literacy in the International Adult Literacy Survey 3
Conducting the survey 4
1. COMPARING LITERACY ACROSS NATIONS
National averages 8
The national distribution of literacy skills 10
Literacy level 1 12
Literacy level 2 14
Literacy level 3 16
Literacy levels 4 and 5 18
2. LITERACY, EMPLOYMENT, OCCUPATION, AND INCOME
Literacy and employment status in the United States 24Literacy and employment status across nations 27
Literacy and occupational status in the United States 30Literacy and occupational status across nations 34Literacy and income in the United States 35
Literacy and income across nations 40
The importance of literacy to individuals 41
8

List of Exhibits,Figures, and Tables
Figure Page
1.1 Multiple comparisons of the mean literacy performance byscale, all nations: 1994, 1996. 9
Panel a: prose scale
Panel b: document scale
Panel c: quantitative scale
1.2 National literacy levels, percentage of adult population age16 to 65, all nations: 1994, 1996.
Figure 1.1a: prose scale
Figure 1.1b: document scale
Figure 1.1c: quantitative scale
11
1.3 National literacy level 5, all scales, percentage of adultpopulation age 16 to 65, all nations: 1994-1996 21
2.1 Percentage of U.S. adults, age 16 to 65 in each laborforce status by document literacy level: 1994 25
2.2 Percentage of adults age 16 to 65 in each labor forcestatus, by document literacy level, by nations: 1994. 28-29
Figure 2.2a: literacy level 1
Figure 2.2b: literacy level 2
Figure 2.2c: literacy level 3
Figure 2.2d: literacy level 4/5
2.3 Percentage of U.S. adults age 16 to 65 in each occu-pational status group by document literacy level: 1994 31

List of Exhibits,Figures, and Tables
Figure Page
2.4 Percentage of adults age 16 to 65 in each occupational
status group, by document literacy level, by nations: 1994. 32-33
Figure 2.4a: literacy level 1
Figure 2.4b: literacy level 2
Figure 2.4c: literacy level 3
Figure 2.4d: literacy level 4/5
2.5 Mean annual income quintile of U.S. adults age 16 to 65by document literacy level by age: 1994 37
2.6 Mean annual income quintile of adults age 16 to 65 bydocument literacy level by age and nation: 1994.
Figure 2.6a: 25- to 34-year-olds
Figure 2.6b: 35- to 44-year-olds
Figure 2.6c: 45- to 54-year-olds
Figure 2.6d: 55- to 65-year-olds
38-39
Exhibit Page
1.1 An example - Level 1 prose literacy 13
1.2 An example - Level 2 quantitative literacy 15
1.3 An example - Level 3 document literacy 17
1.4 An example - Level 4 quantitative literacy 19
1.5 An example - Level 5 prose literacy 19
I
Introduction
0 n December 6, 1995, the Organization for Economic Cooperation
and Development (OECD) and Statistics Canada released a report
called Literacy, Economy, and Society, which compares literacy
rates, the relationship between literacy and income, immigration, partic-
ipation in the labor force, education, and literacy practices across seven
countries. The report was based on the first international household study
that included an actual assessment of the literacy skills of adults. The study
was designed and implemented through a cooperative effort on the part
of government agencies in each of the participating countries. Scientific
breakthroughs in assessment design and psychometrics made it possible
to compare, in the first instance, the distribution of literacy within Canada,
Germany, the Netherlands, Poland, Sweden, Switzerland, and the United
States. Subsequently, five additional countries Australia, Flemish-speak-
ing Belgium, Ireland, New Zealand, and the United Kingdom replicated
the International Adult Literacy Survey and so provided for additional com-
parisons. During November of 1997, the OECD and Statistics Canada released
a second report including further analyses of the expanded set of data.
The data included in these reports illustrate that the overall literacy
skills of Americans are similar to those of people from the other major
industrial societies participating in the study. Sweden outperforms every
other country and Poland does less well than every other country on each
of the three scales. After that, clear rankings that have statistical signifi-
cance become more difficult to describe. However, Americans, in all their
diversity, achieve somewhere in the middle on each of the literacy scales.
The Americans achieve at the same level as the Canadians, Germans,
Australians, Flemish speaking Belgians, English, Irish, and the French and
German speaking Swiss on the prose scale. And, on the document and
quantitative scales the United States does as well as Canada, Flemish-speak-
ing Belgium, French-speaking Switzerland, Australia, German-speaking
Switzerland, New Zealand, the United Kingdom, and Ireland.
Despite similarities in mean literacy scores among subsets of partici-
pating countries, the distribution of literacy skills within all countries var-
11Introduction
1

ied considerably. In addition to providing scale scores, the International
Adult Literacy Survey (IALS) literacy data is divided into five levels.' It is
easiest to look at the distribution of literacy in terms of these five levels.
The United States was most similar to Canada, New Zealand, and the United
Kingdom in this respect. These three countries had close to 20 percentof their adult population at both the high and low ends of the literacy
scale (levels 1, 4, and 5). In contrast, the performance of their Europeancounterparts was concentrated in the middle literacy levels at least two-
thirds of the adult population in the Netherlands, Switzerland (both Frenchand German speaking), and Germany were at literacy levels 2 or 3. While
Sweden tended to have the greatest concentration at the higher end of
the scale, Poland's adults were concentrated at the lower end.
Although the U.S. findings were similar to what Americans had learned
from our own National Adult Literacy Survey (September 1993), the addi-
tion of the comparative data sheds further light on the competitive statusof the U.S. population. These comparative data heighten our understand-ing of the importance of literacy skills to our population at work, in school,and at home.
Arriving at an international definition of literacy
Believing that literacy has become one of the fundamental tools nec-
essary for successful economic performance in industrialized societies, and
consistent with North American and Australian frameworks for literacy,ii
countries participating in the IALS agreed to no longer define literacy as
a dichotomy separating those who are literate from those who are not.
Rather, literacy could more effectively be described in terms of a contin-uum related to "...how adults use written information to function in soci-
ety."' This broader definition would be useful to governments and policy-
makers, because it would provide more information about the level and
distribution of literacy across populations and could thus help shape appro-priate literacy programs.
A complete description of each literacy level is provided in Chapter 1 of this report.
Within the United States, the view of literacy as a continuum of multiple skills can be clearly tracedto the Young Adult Literacy Study (YALS) conducted in 1986, followed by a U.S. Department of Laborstudy in 1992, and the National Adult Literacy Study (NALS) done i n 1993. Both Canada andAustralia also have defined literacy in this manner (The Creative Research Group 1987, andStatistics Canada 1991 in Canada, The Commonwealth Department of Employment, Education andTraining 1989 in Australia.
Introduction
2
12
a

The literacy assessment work within the United States, Canada, and
Australia had demonstrated the possibility of developing wide-ranging scales
of literacy performance within any one country. IALS extended that work
by testing whether one could successfully describe and compare the lit-
eracy skills of adults from different countries. The challenge rested in deter-
mining whether there was something fundamental about literacy skills
that transcended culture and language.
Originally national research teams from seven countries and three inter-
national organizationsiii joined together under the leadership of Statistics
Canada and the Educational Testing Service to develop a survey instru-
ment that consisted of a background questionnaire and a set of more than
100 new literacy tasks. Empirical evidence revealed that the survey was a
success and that countries could be compared with respect to their liter-
acy skills. An independent quality review team recommended publication
of these data." Later, 5 additional countries collected data that are now
included in this report. Currently another 10 countries are collecting data."
Measuring literacy in the International Adult Literacy Survey
IALS did not set a single international literacy standard, but rather fol-
lowed the example set in the United States, Canada, and Australia of defin-
ing literacy in terms of a mode of adult behavior:
...Using printed and written information to functionin society, to achieve one's goals, and to develop one'sknowledge and potential.
This definition allowed the inclusion of a broad set of information-pro-
cessing skills used in performing many different tasks. IALS defined liter-
acy in terms of three domains, each encompassing a common set of skills
relevant for diverse tasks:
iii The participating international organizations were: the Organization for Economic Cooperation andDevelopment through the Directorate for Education, Employment, Labor and Social Affairs; theEuropean Union through the Task Force for Human Resources, Education, Training and Youth,Commission of the European Union; and UNESCO through the Institute for Education.
iv The independent quality review team consisted of Graham Kalton, Westat; Lars Lyberg, StatisticsSweden; and Jean Michel Rempp, National Institute of Economic and Statistical Studies. While itsreview indicated that there were a number of areas of weakness in the study, and it cautionedagainst possible areas where there might be bias, the team concluded that overall the study didmaintain reasonable standards for an international comparative study and that the findings couldand should be made public with the appropriate caveats indicated.
v The 10 additional countries are Chile, Czech Republic, Denmark, Finland, Hungary, Italy, Malaysia,Norway, Slovenia, and Italian- speaking Switzerland.
13 Introduction
3

Prose literacy the knowledge and skill needed to understandand to use information from texts, including editorials, news sto-ries, poems, and fiction.
Document literacy the knowledge and skill required to locateand to use information contained in various formats, includingjob applications, payroll forms, transportation schedules, maps, tables,and graphics.
Quantitative literacy the knowledge and skill required to applyarithmetic operations, either alone or sequentially, to numbersembedded in printed materials, such as balancing a checkbook,figuring out a tip, completing an order form, or determining theamount of interest on a loan.
In each of the three domains, a scale from 0 to 500 was constructed,
with tasks of varying difficulty placed along the scale. A person's literacy
ability in each domain could be expressed by a score. In addition, because
the scale scores were then grouped into five empirically determined liter-
acy levels, with each level implying an ability to deal with a particular sub-
set of reading tasks, a person's literacy ability can be described in terms
of the reading tasks they can do.
Conducting the survey
To conduct this study, interviewers went into people's homes to speak
with them and to administer the IALS literacy test. The interview was
designed and conducted to obtain detailed demographic information relat-
ed to literacy in addition to the test.
Each country drew a probability sample from which results represen-
tative of the civilian, noninstitutionalized population aged 16 to 65 could
be derived. In 10 of the countries whose data is included in this report,
the survey was carried out in the national language; in Canada, respon-
dents were given a choice of English or French; in Switzerland, samples
drawn from French-speaking and German-speaking cantons responded in
those respective languages (all other regions were excluded). In all coun-
tries, if respondents did not speak the designated language, attempts were
made to complete the background questionnaire so that more accurate
national estimates of literacy levels could be made.
To design a culturally unbiased test, each participating country was asked
to submit appropriate materials. From those submissions, 175 literacy tasks
Introduction
414

were constructed; of those, 114 tasks proved valid across cultures and,
therefore, were selected for inclusion. Because no one individual could be
expected to respond to so many test items, each participant was given a
subset of tasks carefully selected from the total pool in a way that would
generate a reasonable mix of topics, types, and difficulties and that could
be completed in approximately a 45-minute session.
The following report is a comparison of literacy across nations, with a
focus on how the United States compares to other countries. Although 12
countries have completed data collection, not all have released data tapes.
Consequently at this time the United States may only be compared to Australia,
Flemish-speaking Belgium, Canada, Germany, Ireland, the Netherlands, New
Zealand, Poland, Sweden, German and French speaking Switzerland, and
the United Kingdom. In addition, in some cases comparisons are only pos-
sible with national statistics already appearing in published reports.
Consequently, fewer countries are represented in these analyses.
15Introduction
5

Chapter 1
Comparing LiteracyAcross Nations

Ranking nations according to the achievement levels of their citi-
zens always attracts attention because it touches on matters of
national pride and raises concerns about the human capital avail-
able in each nation. Because issues related to human capital and the com-petitiveness of the labor force are at the heart of the International Adult
Literacy Survey (IALS), this chapter provides a snapshot of how the United
States compares to other developed countries on literacy.
There are at least three ways to compare the literacy of nations. First,
it is possible to compare national averages. Second, one can look at thedistribution of each national population across literacy levels. And, third
comparisons of the proportion of the population across nations at eachlevel can also be informative. Each is discussed in this chapter. In addi-
tion, descriptions of what adults at each literacy level on each of the scalescan do are provided.
National averages
Figures 1.1a, b, and c list the national averages and standard errors foreach country in descending order on separate measures of prose, docu-ment, and quantitative literacy.' More importantly, the figures also display
differences that are statistically significant by indicating which countries
have scores that exceed, are the same as, or are less than each referencecountry.
Based upon the comparisons in the figures, two findings are clear. Sweden
outperforms every other country on each of the three scales and Poland
does less well than every other country on each of the three scales. After
that, clear rankings that have statistical significance become more diffi-cult to describe.
Americans achieve somewhere in the middle on each of the literacy
scales. When statistical significance is considered, Sweden, the Netherlands,
and New Zealand do better than the United States on the prose scale. The
Americans achieve at the same level as the Canadians, Germans,
The notion that countries can be ranked in this way based solely on their national means is dubiousat best. National means are based on samples, not whole populations, and have a degree ofsam-pling variation associated with them. When we consider the effect of such sampling variation (asmeasured by the standard error) on national averages, as well as the very small differences betweencountries, the ranked differences could be due to sampling variability, rather than to real differencesin the achievement of national populations. Consequently, these potential sampling errors must betaken into account before drawing conclusions about the relative performance of nations.
Comparing Literacy Across Nations
817

1111
1111
1111
1: 1
1111
1111
1111
1111
1:
1111
1111
1111
1
.-. I
MM
III
i
Ing1
1111
1160
011
1111
1111
1111
1 lLI-
1111
11M
O.A
(//4
0rt
:
11P
41
'/'"
FA 'f
r:4
4,7,
p;'',
MV
,P,
,,,, A
0,,4
1,: 4
C.4
V J
0 ,K(x
.3:,4
"i. '
NW
/an
w, ,
' %/,
?;',/
zAfr
4o/
Axd
id.,
,,x),
#' '
''',
:3 r
,v;A
,,A
,e
1111
1111
1111
Pr' 4,1
5
rAv3
ww
"ff's
,,,m
,r
114
F,r
ni,a
, 0;,
;' A' .,.
..,
ywr
ArI
T r
*/'
/41
!ri%
IrA
r 0M
rAw
/717
4%/i
g/g%

Australians, Flemish speaking Belgians, English, Irish, and the French-
speaking Swiss. The Americans do better than the German-speaking Swiss
and the Polish.
On the document scale, Sweden, the Netherlands, and Germany do bet-
ter than the United States. The United States does as well as Canada, Flemish-
speaking Belgium, French-speaking Switzerland, Australia, German-speak-
ing Switzerland, New Zealand, the United Kingdom, and Ireland. The United
States does better than Poland.
U.S. comparative performance on the quantitative scale is similar to its
performance on the document scale Sweden, Germany, and the Netherlands
do better, Poland does less well, and all other participating countries per-
form at roughly the same level.
But, this comparative ranking is at best a crude description of adult lit-
eracy within and among countries. More complete information can be gar-
nered from a look at how literacy skills are distributed across the popu-lations of each country.
The national distribution of literacy skills
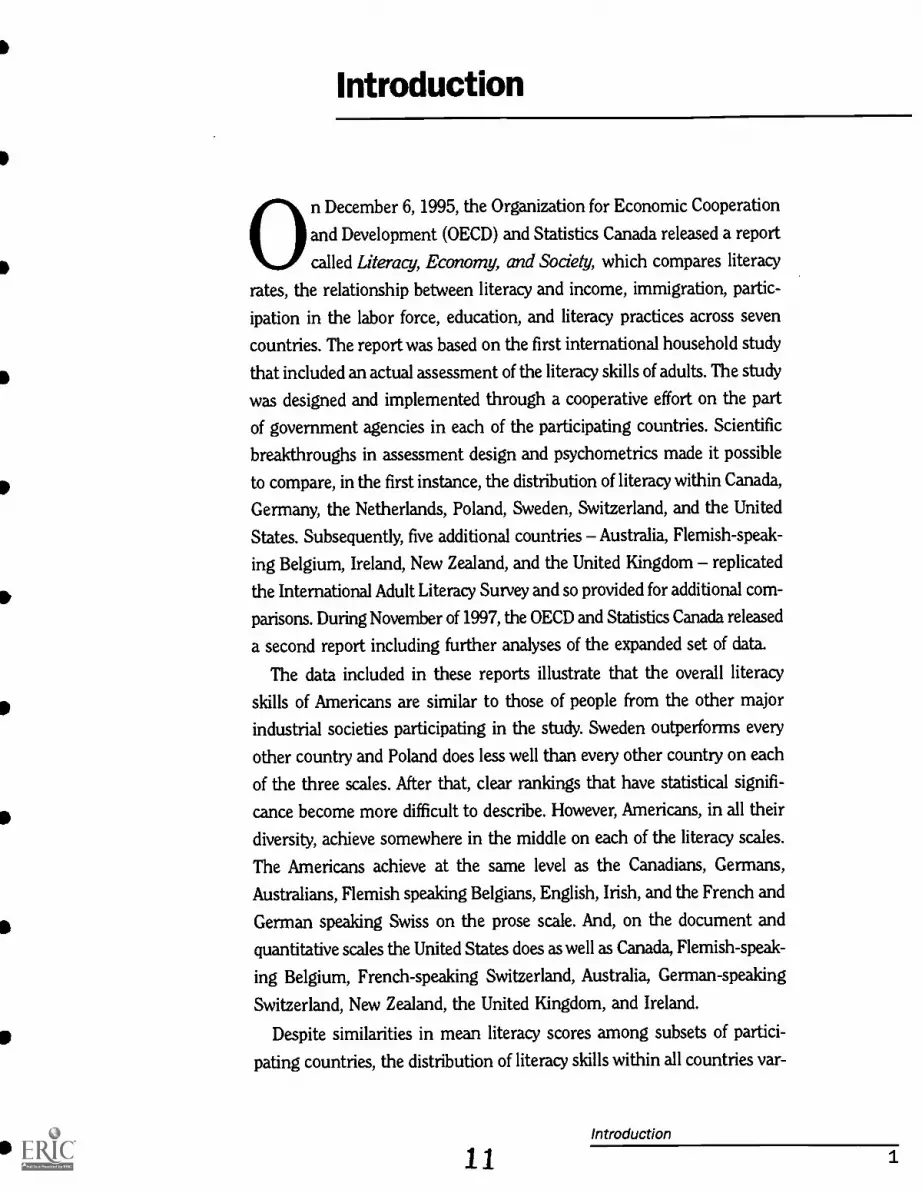
Differences in the distribution of literacy skills across countries are rep-
resented in Figures 1.2 a, b, and c. These figures present the estimated
proportion of each country's population in each literacy level by literacy
scale." Levels 1 and 2 are shown below the axis, while levels 3, and 4/5 areshown above the axis.
As was seen in the comparison of national means, two countries are
distinctly different from all the others with regard to the distribution of
literacy skills. Sweden consistently has the smallest proportion of is adult
population in the lower levels (levels 1 and 2) and roughly three-fourths
of their population in the upper levels (levels 3 and 4/5) (72% on prose,
75% on document and quantitative). In Poland, on the other hand, most
of the population has lower literacy levels. Roughly seventy to 80 percent
are grouped in the lower two levels (78% on prose, 76% on document,
and 69% on quantitative).
The United States, Canada, New Zealand, and the United Kingdom are
similar with regard to the distribution of literacy skills across their pop-
ii Levels 4 and 5 have been combined in these tables, because, in most countries, the proportion ofthe population at level 5 is under 5 percent.
Comparing Literacy Across Nations
10
19
111111111111111111111 1111111111
'11211.11s11 11.124123121 I III 451
111111111111111111111111111113°131111121-112121-11 26 I2,12,1212sl 28 IA
7 7170177 771741771171121 I 23, 25, I
7
490

ulations. There is no statistically significant difference between the pro-
portions of people at each level in the United States and each of these
other countries except that each has a slightly larger proportion of peo-
ple at level 4/5 on one of the three scales.
In all other cases, the comparisons between the United States and each
other country vary based on the literacy scale under consideration.
What impact does the distribution of literacy skills on each of the scales
within the United States have on our national well being and on our com-
petitive position? To answer this question many factors including anunderstanding of the skills people have, the market value of those skills,
and whether there is a good match between those skills and the demands
of the local workplace must be considered. To begin to answer this ques-
tion, it helps to understand the range of skills people at each level pos-
sess and to consider how the United States compares.
Literacy level 1
Literacy level 1 is the lowest level on the IALS literacy scales. In gen-
eral, people who have attained no more than level 1 literacy skills can read
relatively short pieces of text to find a single piece of information. They
are often able to enter personal information on forms or to locate specif-
ic information in a table. In addition, they are frequently able to perform
simple arithmetic operations, such as adding numbers on a bank deposit
form. At best these can be considered basic skills.
Although all of the people in this group are not equally adept, there are
two related conclusions to be drawn. First, a large proportion of individ-
uals with level 1 literacy skills are not illiterate. They do, in fact, have
many basic literacy skills. They can read the words on the page. They can
understand and use information that appears in simple formats. Secondly,
the skills associated with this level may not be sufficient for individuals to
successfully participate in their communities. Level 1 literacy skills are
often not sufficient for the reader to independently learn from text. People
at this level can only find what is there when they already know what they
are looking for. For an example of this level, see Exhibit 1.1.
Depending upon which scale is considered, between 21 and 24 percent
of U.S. adults (roughly 37 million)2 demonstrate the skills associated with
Comparing Literacy Across Nations
1221

I
I
I
1
I
I
S
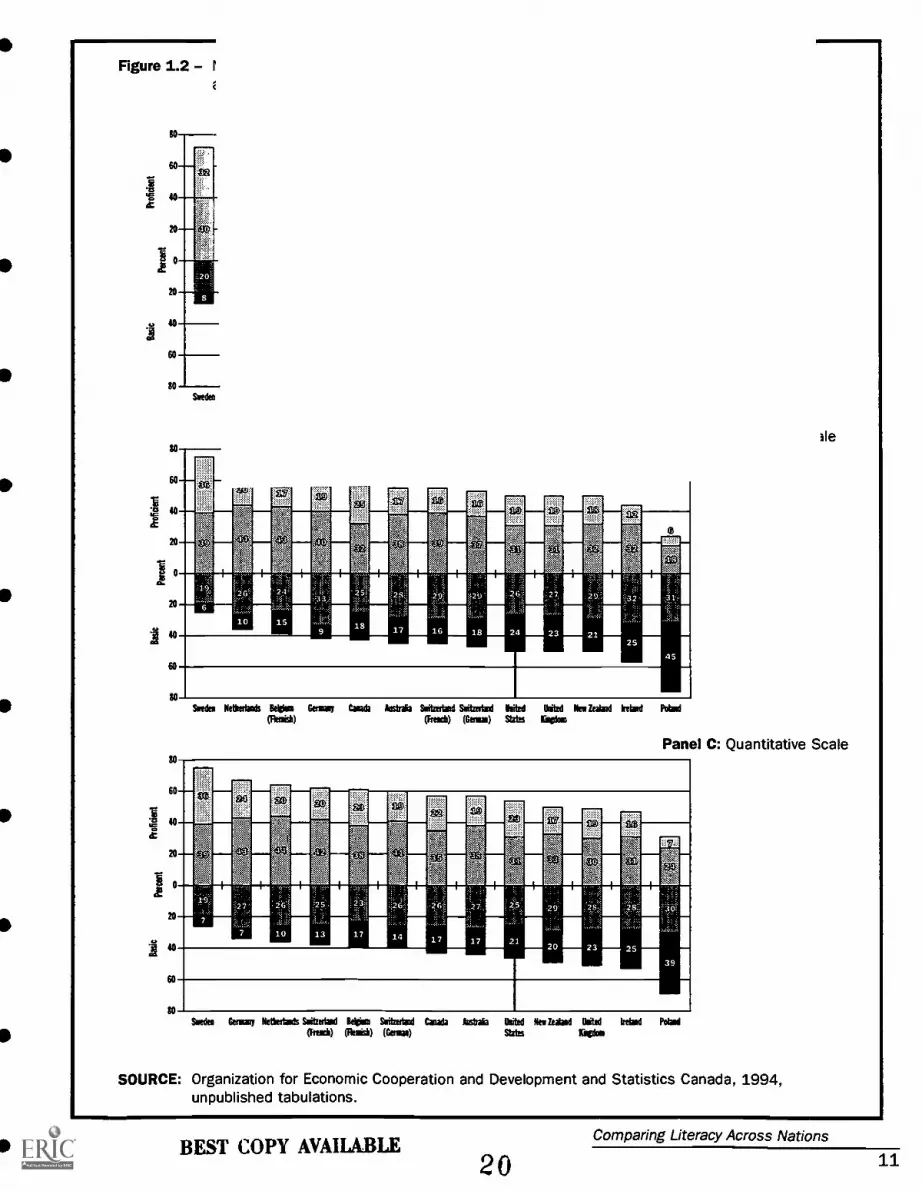
Exhibit 1.1 An example Level 1 prose literacy
MEDCO ASPIRIN 500
INDICATIONS: Headaches, muscle pains, rheumatic pains, toothaches, earaches. RELIEVES
COMMON COLD SYMPTOMS.
DOSAGE: ORAL. 1 or 2 tablets every 6 hours, preferably accompanied by food, for not longer
than 7 days. Store in a cool, dry place.
CAUTION: Do not use for gastritis or peptic ulcer. Do not use if taking anticoagulant drugs. Donot use for serious liver illness or bronchial asthma. If taken in large doses and for an extendedperiod, may cause harm to kidneys. Before using this medication for chicken pox or influenzain children, consult with a doctor about Reyes Syndrome, a rare but serious illness. Duringlactation and pregnancy, consult with a doctor before using this product, especially in the lasttrimester of pregnancy. If symptoms persist, or in case of an accidental overdose, consult adoctor. Keep out of reach of children.
INGREDIENTS: Each tablet contains
500 mg acetylsalicicylic acid.Excipient c.b.p. 1 tablet. 0Reg. No. 88246
Made in Canada by STERLING PRODUCTS, INC.1600 Industrial Blvd., Montreal, Quebec H9J 3P1
Reprinted by permission
SOURCE: Organization for Economic Cooperation and Development and Statistics Canada,Literacy, economy, and society, Ottawa, Canada: Statistics Canada, 1995.
the lowest level of literacy. As seen in Figures 1.2 a, b and c, most English-
speaking countries,tm have similar proportions of their populations at level
1. In contrast, Poland has a larger proportion of their population with
these minimal skills. On the other hand, Sweden, Germany, the Netherlands
and Australia consistently have a smaller proportion of their populations
at this level. On two of the scales, quantitative and document, both French-
and German-speaking Switzerland have a smaller proportion of their pop-
ulations at this level.
From a competitive standpoint, if literacy skills are truly crucial to nation-
al economic well being, then the United States may be at a disadvantage
as compared to a number of our European counterparts. However, other
contextual factors play an important role as well.
iii Canada, Ireland, New Zealand, and the United Kingdom
BEST COPY AVAILABLE 22 Comparing Literacy Across Nations
13

Literacy level 2
Although individuals with level 2 literacy skills can do somewhat more
than those with level 1 literacy skills, their repertoire is still limited. In
addition to having the skills associated with level 1 literacy, adults with
Level 2 literacy skills can make low-level inferences based upon what they
read; they can compare and contrast information that is easily found in
text; they can discriminate between correct and incorrect plausible infor-
mation in documents; and they can do single arithmetic operations after
locating easily identified numbers that appear in printed materials. For an
example of this level, see Exhibit 1.2.
Approximately one-fourth of all adults in the United States have attained
level 2 literacy skills (roughly 39 million adults)"' As seen in Figures 1.2 a,
b, and c, Sweden has a smaller proportion of its population at literacy level
2 on all three literacy scales than the United States and most of the other
countries. Given the somewhat limited range of skills associated with this
level, Sweden is in a comparatively favorable competitive position not only
with regard to the United States, but also to most of the other countries.
On the prose scale, Australia, Belgium, Canada, Ireland, New Zealand,
and the United Kingdom have about the same proportion of their popu-
lations as the United States at level 2. Germany, the Netherlands, Poland,
and both French- and German-speaking Switzerland have a larger pro-portion of their populations at this level than the United States.
On the document scale, the United States, Australia, Belgium, Canada,
the Netherlands, New Zealand, both French- and German-speaking
Switzerland and the United Kingdom statistically are no different. While
the United States has a smaller percentage of its population at this level
than Germany, Ireland, and Poland.
Finally, on the quantitative scale, a smaller proportion of adults in the
United States perform at level 2 than in Poland and a larger proportion
than in Sweden. Otherwise, there is no statistical difference between the
United States and any of the other countries, all of whom have roughly
the same percentage of their populations at this level.
iv This is true for all three domains of literacy.
23Comparing Literacy Across Nations
14
41

Exhibit 1.2 An example Level 2 quantitative literacy
The reader is directed to use the accompanying weather chart in a news-paper to determine how many degrees warmer today's high temperatureis expected to be in Bangkok than in Seoul.
Literacy, Economy and Society
Europe
TodayHigh Low
TomorrowW High Low
C CAlgarve 19 7 21 9
Amsterdam 11 6 PC 12 7Ankara 17 7 pc 19 8
Athens 22 15 pc 23 14Barcelona 16 6 s 14 9
Belgrade 14 6 pc 10 1
Berlin 8 2 C 6 1
Brussels 11 6 pc 14 7
Budapest 9 1 pc 9 2Copenhagen 7 1 r 6 2
Costa del Sol 21 8 s 21 10Dublin 10 6 pc 13 8Edinburgh 10 6 c 10 6Florence 11 5 s 14 6Frarildurt 12 6 pc 13 4Geneva 9 2 s 12 4
Helsinff -1 -7 sf -3 -10Istanbul 17 10 pc 15 9Las Palmas 26 18 pc 27 18Lisbon 19 9 s 19 10London 12 5 per 13 7Madrid 17 3 5 18 4Milan 9 3 5 13 6Moscow 1 -3 r -3 -11Munich 11 3 per 12 6Nice 14 7 s 15 8Oslo 4 -4 c 5 -2Paris 12 6 per 13 6Prague 11 1 pc 8 2Reykjavik 4 2 r 6 -1
Rome 20 12 5 20 10St Petersburg -1 -7 of -4 -12Stockholm 1 -5 an -2 -7Strasbourg 12 5 per 15 7Tallinn -1 -7 sf -4 -10Venice 10 3 $ 11 4Vienna 9 -1 pc 10 2Warsaw 8 2 sh 6 1
Zurich 8 0 5 9 1
Oceania
Auckland 20 14 17 11
Sydney 27 17 Pc 25 16
W
Pcpcpc5cc
pcce
spcc5
pcs
pcohgos
per
sssf
per
sc
per
ccs
pcc
pcpcscc
pc
sh
Pc
WEATHERForecast tor Friday through Sunday
,,,,
erg ....
nn,," ,,-"es:,
'", ,"-<",=t
.,. ; ^
, e
tri,,,,
, -"1111.1111A,
_
' *","
11111
,
;t ".1'-,,,,,,,
4.:vi?..,......
:,
',-
4%.,0-4P F/7", Onlasons*Mgr= Cold
UnteesnattfHat
Wavy!bin
HumMow
North AmericaCold weatherwitl enguff the Midwest-ern and Northeastern United StatesFriday and over the weekend. Al-though it will be cold in Chicago, To-ronto and NevrYork City, the weatheris expected to be dry. Los Angeleswill have some sunshine and season-able temperatures each day.
EuropeWestern and central Europe wit havea spell of mild weather Friday into theweekend. London and Paris will havedry weather with some sunshine Fri-day into Sunday. Rain will continueto soak southwestern Norway. Snowwill blanket the area from Minsk toMoscow.Asia
Middle East
BeirutCairoDamascusJerusalemRiyadh
TodayHigh Low
C C28 1929 2024 1227 1534 13
TomorrowW High Low w
C Cper 29 20 sper 28 19 pc
26 14s 26 14 5s 32 13 s
Typhoon Elsie will probably stay to theeast of the Philippines and south ofJapan Friday and the weekend. Somerain is apt to tall in Seoul and therecould even be a little ice or snow. Coldair will pour into Beijing and snow is aposskirrty. Hong Kong will start theweekend warm.
Latin America
TodayHigh Low
C CBuenos Aires 23 11
Caracas 29 20Lima 23 17Mexico City 23 11
Rio de Janiero 32 22Santiago 24 4
TomorrowW High Low W
C C26Pc
sha
1331 1823 1623 1228 2122 6
Legend: s-sunny, pc-partly cloudy, coloudy. sh-showers, I-thunders:toms, r-rain, of -snow flurries, snonow, i-ice,Weather. All maps, forecasts and data provided by Aeon-Weather, Inc. 0 1992
C
PcshPc
Asia
TodayHigh Low
C CBangkok 32 22Beijing 11 0Hong Kong 30 23Manila 31 25New Delhi 31 13Seoul 14 6Shanghai 22 10Singapore 31 24Taipei 26 2tTokyo 18 9
TomorrowW High Low W
C C30 23
8 229 2231 2532 1614 424 1228 2326 1917 7
Africa
AlgiersCape TownCasablancaHarareLagosNairobiTunis
1411
1417241217
shC
PcPc
Pc
26 1318 11
21 11
32 1829 2426 1317 14
North
AnchorageAtlantaBostonChicagoDenverDetroitHonoluluHoustonLos AngelesMiamiMinneapoisMontrealNassauNew YorkPhoenixSan Fran.SeattleTorontoWashington
0 -244
14 Pc15
2 -5 c8 -3 pc4 -2 c
31 20 s15 3 pc28 14 s30 22 pc-1 -8 C
7 -2 sf31 22 pc14 4 r23 11 pc20 11 pc
3 08 28 -1
-2 -84 -64 -5
31 2112 624 1329 21
1 -74 -3
28 2110 222 821 8
11 6 pc 13 76 -3 c 3 -3
14 6 r 11 4
SOURCE: Organization for Economic Cooperation and Development and Statistics Canada,Literacy, economy, and society, Ottawa, Canada: Statistics Canada, 1995.
sh
Pc
Pc
Pcon
PcPcPc
PcPc
shPca
Pc
BEST COPY AVAILABLE
24 Comparing Literacy Across Nations
15

Literacy level 3
Nearly one-third or about 50 million adults in the United States demon-
strate performance that can be defined as level 3 on each of the literacy
scales. In addition to the skills associated with levels 1 and 2, people who
have level 3 literacy skills also demonstrate the ability to match pieces of
information by making low-level inferences, and to integrate information
from relatively long or dense text. They can integrate multiple pieces of
information located in documents and can perform arithmetic operations
by using one or more numbers located in printed material, and by inter-
preting arithmetic terms included in the question. For an example of this
level, see Exhibit 1.3.
On all three scales, Australia, Germany, the Netherlands, Sweden, and
French-speaking Switzerland consistently have a larger proportion of their
populations at this level than the United States, as does German-speaking
Switzerland on two of the three scalesdocument and quantitative liter-
acy. Belgium exceeds the United States in the proportion of its population
performing at this level on the quantitative scale.
Except for the Australians, the other English-speaking countries all have
approximately the same proportion (roughly one-third) of their popula-
tions performing at level 3 on all three scales as the United States. Only
Poland, with one-fourth of its population at this level, has a smaller pro-
portion than the United States.
It may be argued that level 3 skills mark the transition to the ability to
learn and generate new concepts or ideas from text, a skill deemed nec-
essary in an information-processing environment. But, roughly one-half
of the American population have not attained this level of literacy com-
petence. While the same can be said about many of America's interna-
tional competitors, that does not allay concerns about the potential inabil-
ity of the American labor force to adapt to major changes in workplace
demands that accompany the shift from an industrial to an information-
processing society. Clearly, a number of America's European counterparts
may be better positioned to meet the projected challenges.
25
Comparing Literacy Across Nations
16

Exhibit 1.3 An example Level 3 document literacyThe task directs the reader to write a brief description between sales andinjuries based on the information shown in the two graphs.
Fireworks inin millions of Can
20
'/1986
22
1987
- A!
SOURCE: Organization for Economic Cooperation and Development and Statistics Canada,Literacy, economy, and society, Ottawa, Canada: Statistics Canada, 1995.
BEST COPY AVAILABLE
26Comparing Literacy Across Nations
17
Literacy levels 4 and 5
As noted in Figure 1.2, roughly one-fifth of the American population
perform at literacy levels 4 and 5 (21% prose, 19% document, 23% quan-
titative). On all three scales, only Sweden has a larger proportion of their
population at these levels (32% prose, 36% document, 36% quantitative).
On the prose scale Australia, Canada, and New Zealand are statistically
similar to the United States, while Belgium, Germany, Ireland, theNetherlands, Poland and both French and German-speaking Switzerland
have less of their populations achieving at these levels.
On the document scale, while Sweden and Canada have larger propor-
tions of their populations at these levels, and Ireland and Poland have
smaller proportions of their populations, all other participating countries
are statistically no different from the United States.
On the quantitative scale, Belgium, Canada, Germany, the Netherlands,
both French- and German-speaking Switzerland and the United Kingdom
look no different from the United States. Australia, Ireland, New Zealand
and Poland have smaller proportions of their populations at these levels.
In each of the international reports presenting IALS data, levels 4 and 5
have been grouped together for analytic purposes. This report has followed
that position when talking about national averages and the pattern of dis-
tribution of the populations across literacy levels. However, when examin-
ing what people can do at these levels, there are differences worth noting.
Individuals with level 4 literacy skills can synthesize information from
lengthy or complex passages and can make inferences based on informa-tion in texts and documents. They successfully perform sequential arith-
metic operations based on numbers they have located in different types
of displays. These readers often make high-level inferences and draw ontheir background knowledge. See Exhibit 1.4.
Individuals who consistently function at level 5 can do quite a lot with
written material (see Exhibit 1.5). These readers can contrast complex infor-
mation from multiple sources, make high-level inferences and search for
information in dense text. They can regularly use specialized knowledge
and search through complex displays for pertinent information. They can
determine the features of arithmetic problems by examining text (or based
on their background knowledge) and then can perform the arithmetic oper-
Comparing Literacy Across Nations
1827
4

Exhibit 1.4'An example Level 4 quantitative literacyReaders were asked to calculate the total number of kilometers traveledin a trip from Guadalajara to Tecoman and then to Zamora.
TABLE OF APPROXIMATE DISTANCES (in kilometres)
371
45
340
269
273
62 330
244 171 342 515 289
orsTe
Exhibit 1.5 An example Level 5 prose literacyThe reader is to look at an announcement from a personnel departmentand list two ways in which CIEM helps people who will lose their jobs becauseof departmental reorganization.
CANCO
What is CIEM?
CANCO Manufacturing CompanyPasonnel Deputmcm
Centre on Internal and External Mobility
CIEM stands for Centre on Internal and&tonal Mobility. an inithuiveof the posonneldepartment. A number of workers of thisdepartment work in CIEM, together withmembers from other departments and outsidecanxrconsultants.
CIEM is available to help employees in theirsearch for anotherjob inside or outside theC.arsco Manufacturing Company.
What does CIEM do?
CIEM supports employees who are seriouslyconsidering other work through the followingaaivines:
Job Data BankAfter an interview with theemployee.information is entered into a data bank that tracksjob seekers and job openings at Canco and atothermanufaconngcompanks.
GuidanceThe employee's potential is explored throughcareer counsellingdiscussions.
CoursesCoumesarebeing organized (in collaborationwith the department forinfonnationand training)that will deal with jobsearch and career planning.
Career Change ProjectsCIEM supports and coordinates projects to helpemployees prepare for new careers and new
PersPectivm.Mediation
CIEM acts as a mediator for employees who areencatened withdisrnissal resulting fromreorganization, and assistswithfindingnewpositionswhennecessary.
How much does CIEM cost?
Payment is determined in consultation with thedepartment where you work.A number ofservices of CLEM are free. You may also beasked to pay, either in money or in time.
How does CIEM work?
CIEMassistsemployees who are seriouslyconsidering another job within or outside thecompany.
Than process begins by submitting anapplication.A discussion with a personnelcounsellor can also be usefuL It is obvious thatyou should talk with the counsellor fast aboutyour wishes and the internal possibilitiesregarding your career. The counter Voris familiarwith you abilities and with developments withinyourunit.
Contact with CIEM in any case is made via thepersonnel counsellor. He or she handles theapplication for you, after which you are invitedto a discussion with aCIF-M mpresentative.
For more information
Thepersoluteldeparonentcan give you moreinformation
SOURCE: Organization for Economic Cooperation and Development and Statistics Canada,Literacy, economy, and society, Ottawa, Canada: Statistics Canada, 1995.
BEST COPY AVAILABLE 28Comparing Literacy Across Nations
19

ations required to complete the problem. It is believed that these readers
regularly think beyond the text and bring information from many sources
to bear on what they are reading. Additionally, they consistently take infor-
mation, ideas and concepts from what they read and apply these ideas tonew problems.
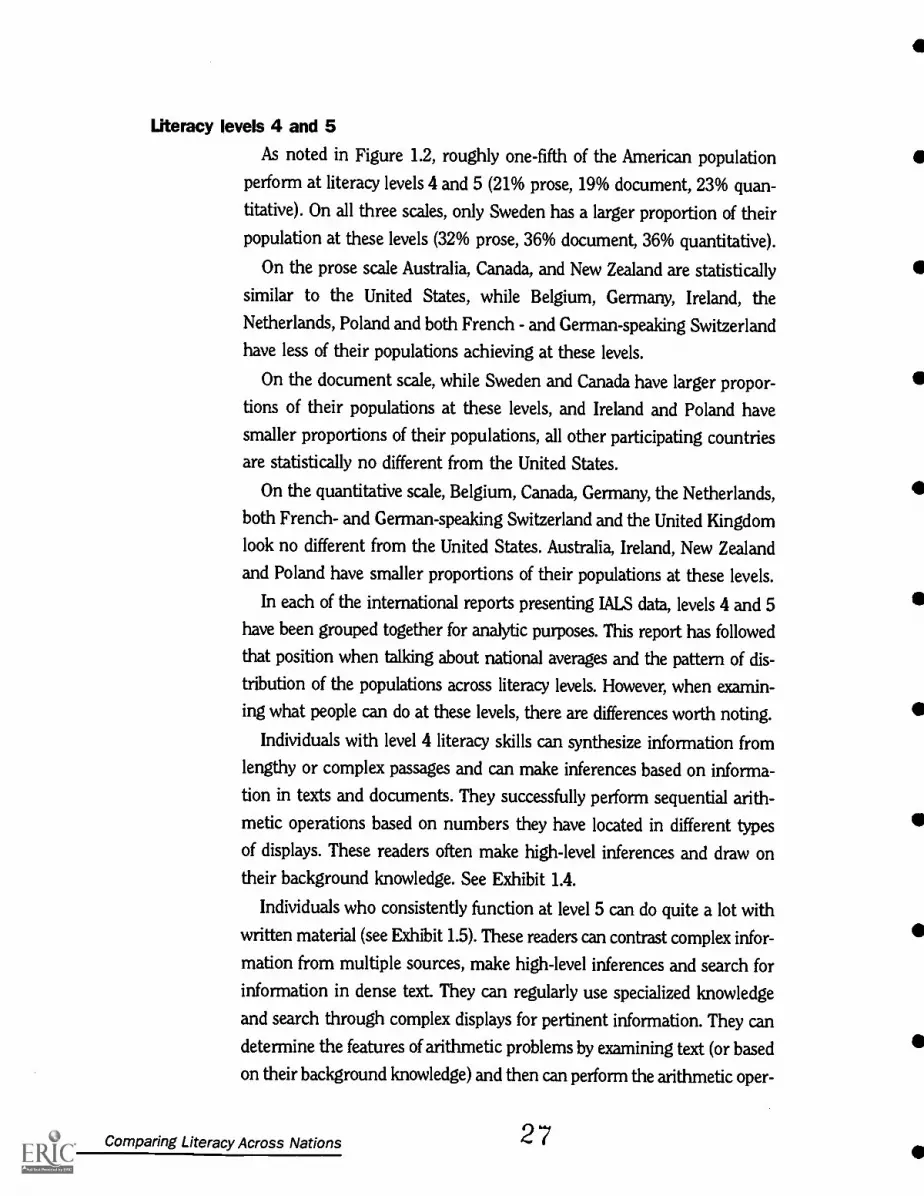
As seen in Figure 1.3, internationally people who consistently perform
at level 5 represent a small proportion of the overall population in all coun-
tries (never greater than 8 percent). As compared with other countries,
the United States has a relatively high concentration of adults at literacy
level 5. Only Sweden has a larger proportion of their population at this
level on just one scale, the document scale. However, only between 4 and
5 percent of U.S. adults or roughly 5.7 million individuals reach this level.
Because it is this group of people who most frequently create new knowl-
edge, bring about innovations, and generate new ways of thinking, hav-
ing even the slightly larger proportion of people at this level might beconsidered the source of a competitive advantage.
While this chapter has provided descriptions of the range of literacy
abilities within nations, interpreting the meaning of these distributions
and the impact of varying literacy abilities depends on what skills and abil-
ities are necessary within the immediate environment. In an environment
where books were not readily available, high-level literacy skills would be
of no importance. On the other hand, where economic success and par-ticipation in the community were dependent on text materials, literacy
skills become crucial. The following chapters examine how literacy relates
to economic success and to labor force needs.
29Comparing Literacy Across Nations
20
41

Figure 1.3 National literacy level 5, all scales, percentage of adult population age 16 to 65,all nations: 1994-1996
10
9
8
r
6
zE 5at
4
3
2
1
0
Sweden USA Canada New Zealand Australia Bdgium Irdand Crated Gummy Netherlands Switzerland Switzerland Poland
(Flemish) Kingdom (French) (German)
10
9
8
7
6
5
4
3
2
1
0
111 Quadftative
Document
Prose
SOURCE: Organization for Economic Cooperation and Development and Statistics Canada, 1994,unpublished tabulations.
30 Comparing Literacy Across Nations
21

Chapter 2
Literacy, Employment,Occupation, and Income

It is commonly believed that literacy skills' have a direct impact on a
person's ability to participate successfully in the workforce and in soci-
ety in general. Many even argue that the literacy skills of a nation'sworkforce have a great deal to do with the economic productivity and
world market competitiveness of the nation now, and in the future. If these
beliefs are true, as the United States evolves further into an information-
processing society, literacy skills will increase in importance playing a
crucial role in the economic success of both individuals and the nation as
a whole. Increasingly occupational and economic rewards during the life
cycle, and quality of life in general, will come to depend on access to tech-
nology and information and the ability to manipulate both.
While this report cannot establish whether these beliefs about future
economic viability will come to pass, the International Adult Literacy Study
(IALS) data does demonstrate how literacy levels relate to occupational
and economic attainments within the United States and across all seven
participating nations.'' There are three sets of comparisons that shed light
on the relationships between literacy skills and economic viability. The
data allow comparisons between literacy levels and
Employment status in terms of an adult's relationship to thelabor force;
Occupational status in terms of the prestige rankings" assignedto occupational groups; and,
Economic attainments - as reflected in the reported annual incomeof the individuals in question.
Literacy and employment status in the United States
The relationship between document literacy levels and the employment
status of U.S. adults 16 to 65 years of age is shown in Figure 2-1.iv Figure
i In this context literacy skills include not only the capability to decode the written word but also theability to interpret, synthesize, and act upon information gathered from multiple sources.
ii Although five additional nations joined IALS subsequent to the original surveys of seven nations, atthe time of writing, data on the matters examined in this chapter were available only for the origi-nal seven nations. Subsequent analyses will extend the findings reported here to include all par-ticipating nations.
iii Occupations and groups of occupations can be assigned prestige rankings that represent publicperceptions of the general social standing, or desirability, of occupations. Typically, medical practi-tioners, independent lawyers, judges and the like top the list while occupations at the other end ofthe scale tend to be varieties of unskilled labor.
iv Here, as elsewhere, literacy levels are defined with level 1 the lowest and level 4/5 the highest.Detailed descriptions of the skills defining each level are to be found in Chapter 1 of this report.
Literacy, Employment, Occupation, and Income
24

Figure 2.1 Percentage of U.S. adults, age 16 to 65 in each labor force status by documentliteracy level : 1994
100
so
60
40
0.
3
20
1N1
mm,iGrmar ,witzaw4wzo,
20
40
60
1528
12
Leven Level 2 Level 3 leve14/5
mooted
Unenloyed
IIOut of workforce
111 Student
SOURCE: Organization for Economic Cooperation and Development and Statistics Canada, 1994,unpublished tabulations.
2.1 displays for each literacy level, the percentage of adults in each of four
labor force statuses:
Employed.
Unemployed the respondent was currently out of a job but wasactively looking for a new one;
Out of the workforce the respondent was not currently work-ing, was not looking for another job, and was not a student; and
Student.
No things stand out at first glance. First, the percentage of people out
of the workforce at level 1 (28 percent) is greater than the percentages at
levels 3 and 4. The percentages of levels 2, 3, and 4/5 people out of the work-
force are not significantly different from each other. (The differences between
group's unemploymentv rates are small and not statistically significant)
Second, this pattern is reflected in the proportions of employed adults
at each literacy level. At level 1 the percentage is 59 percent, a proportion
significantly lower than those at levels 3 and 4/5 but not different from
v Unemployment is distinguished from out of the workforce" by the additional criterion that theunemployed are looking for work whereas the out of the workforce" group are not looking for work.
33 Literacy, Employment, Occupation, and Income
25

that at level 2. Moving up the levels, the proportions at levels 2 and 3 are
not different from each other, but the 71 percent at level 2 is significant-
ly less than the 82 percent at level 4/5.
Figure 2.1 displays, for each literacy level, the percentage of adults in
each of four labor force statuses employed, unemployed, out of the work-
force, and student. The two former groups are usually counted as part ofthe labor force, and the latter two groups are considered "not in the labor
force." Figure 2.1 shows this distinction by placing employed and unem-ployed adults above the axis, and the remaining two groups below the axis.
In the figure the bar representing each literacy level has four segments
corresponding to these four labor force status groups, and the percentage
of persons in each segment is indicated.
This means that adults at the lowest literacy level are less likely to be
employed than those who demonstrate more complex skills and are morelikely to be out of the labor force altogether rather than unemployed. About
one-fourth (27 percent) of adults whose literacy skills are limited to those
defined as level 1 are not working and are not looking for work. Some of
these will be retired, or engaged in home duties, or in similar activities.Others may be what are sometimes called "discouraged workers," people
who were classified as unemployed at one stage but who gave up looking
for work. Therefore, it appears that there is a higher probability that peo-ple in the United States who have the lowest literacy skills will be out ofthe workforce altogether. Whether this is true for other nations is con-sidered next.
34Literacy, Employment, Occupation, and Income
26
a
I
a
a
a
a
a
41
41
a

Literacy and employment status across nations
Figure 2.2 represents the relationship between document literacy lev-
els and the employment status of adults 16 to 65 years of age in each of
the seven original participating nations. Generally speaking, as one com-
pares panel a to b to c to d, two trends stand out. First, within each nation
as literacy levels increase there appears to be a decrease in the proportion
of adults who are out of the workforce. As described in the case of the
United States where the percentages are 27 percent at level 1, 18 percent
at level 2, 15 percent at level 3 and 12 percent at level 4/5, the same trend
appears within the data from other countries. For example, in the case of
the Netherlands while 49 percent of those with level 1 skills are out of the
workforce, the proportion decreases to 36 percent at level 2, 20 percent
at level 3, and 12 percent at level 4/5.
Similarly, as was the case in the United States, this trend is mirrored by
an increase across literacy levels in the proportion of adults who are work-
ing. Where as in the United States 59 percent of those at level 1 are employed
as compared to 82 percent of those at level 4/5, in the Netherlands 38 per-
cent of those at level 1 are employed as compared to 73 percent at level 4/5.
Although the trends are similar across nations, the proportions vary,
especially at literacy level 1. For example, close to one-half of all adults in
the Netherlands at literacy level 1 are out of the workforce relative to a
little more than a quarter of the least literate adults in the United States
or Switzerland. Statistically, these differences from the United States are
only significant in the case of Germany and the Netherlands. At literacy
levels 1 and 2 the percentages of adults in these two countries classified
as out of the workforce are higher than the United States. In the case of
Germany this is also true for level 3, which shows a significantly higher
proportion of adults out of the workforce relative to their counterparts in
the United States. The United States, on the other hand, has significant-
ly higher percentages of the adult population at each literacy level employed
relative to Germany and at each level except level 4/5 in the case of the
Netherlands vii
vii With only one exception the unemployment levels of other nations do not differ significantly fromthose of the United States across comparable literacy levels; that is, comparing level 1. with level1 and so on. Only Poland has a higher unemployment rate at level 2 than in the United States.
Literacy, Employment, Occupation, and Income

Figure 2.2a Percentage of adults age 16 to 65 in each labor force status, by document literacy level,by nations: 1994; level 1
ts
A
lop
so
so
48
20
1211Allall:zo
40
so
wrn;aes>zz
III 26 26 III
Soeden Netherlands Camda United States Getaway Saitzerland
Om*babertaxl
(G
Polaid
Figure 2.2b Percentage of adults age 16 to 65 in each labor force status, by document literacy level,by nations: 1994; level 2
1oo
so
60
is 40
20
$ 20
60
go
PAM 111;:rTIMaI 18. 111 36 1111 .
20 w 18
10
11..11133
111 20 III 18 III 21
Sseden Nebniands Linda baled States Genial hibestand(Frondi)
biberLed(Gomm)
Maid
SOURCE: Organization for Economic Cooperation and Development and Statistics Canada, 1994,unpublished tabulations.
Literacy, Employment, Occupation, and Income
28
36

1
Figure 2.2c - Percentage of adults age 16 to 65 in each labor force status, by document literacy level,by nations: 1994; level 3
Li-80 - -_-
I
T I!SIIINeth C tedStes C -....
(frth) (cm)
Figure 2.2d - Percentage of adults age 16 to 65 in each labor force status, by document literacy level,by nations: 1994; level 4/5
100
80 Li-60
I Li iU
40
I HI I
U1 1
0 I I I I
40
60
Sudei Ca IkitSTh Ceru Sui.fl (iiet (Gi) P
SOURCE: Organization for Economic Cooperation and Development and Statistics Canada, 1994,unpublished tabulations.
Note: Figures 2-2a,b,c, and d show analogous information for all nations separately by literacy level. That is, Figure 2-2a displaysthe proportion of level 1 adults in each labor force status for all seven countries. Figure 2-2b displays analogous informationfor adults at literacy level 2 in each of the nations, and so on. As before those categories classified as part of the labor forceare shown above the axis, and the two groups not regarded as part of the labor force are pictured below the axis.
BEST COPY AVA1B-
Utera, &pIoent, Occupation, and Income
29

Literacy and occupational status in the United States
In addition to being related to whether one is in or out of the laborforce, literacy skills may play a part in determining what occupation a per-
son is likely to pursue as well as how successful they might be in that job.
Using IALS data it is possible to examine the relationship between litera-
cy skill levels and occupation. For the purposes of the IALS survey,
occupations were classified as professional, managerial, technician, cleri-
cal, sales and service, skilled craft workers, machine operators, and, agri-
cultural and primary occupations. In addition to following the International
Standard Classification of Occupations,' grouping occupations in this way
resembles occupational prestige orderings of occupations arrived at from
public perceptions of the general social standing, or desirability, of occu-pations?
For each of the four literacy levels the percentages of adults within each
occupational group is indicated in the segment of the bar referring to that
literacy level. For example, 37 percent of U.S. adults performing at the
lowest of the four literacy levels are in sales/service-related occupations; 2
percent report being in professional occupations; 20 percent are skilledcraft workers; and so on. In this display the occupations are also grouped
into broader "blue-collar" and "white-collar" groups. Skilled craft work-
ers, machine operators and agricultural/primary industry workers, con-
sidered the blue-collar categories, are displayed below the horizontal axis,
while all other classifications, considered the white-collar categories, areabove the horizontal axis.
Figure 2.3 shows the distribution of adults within the United States
across the eight occupational status groups within each literacy level. This
display makes it clear that as one moves from literacy level 1 through to
level 4/5 the proportion of adults in blue-collar occupations decreases sub-
stantially from close to 50 percent of all adults at literacy level 1 down
to a total of 8 percent of those adults at level 4/5.
Craft workers and machine operators make up the greater proportions
of the blue-collar group and their relative proportions within each litera-
cy level generally decrease as one moves from the lowest to the highest
literacy levels. The same trend exists among the sales/service group of white-
collar occupations. Where nearly 40 percent of level 1 adults are in sales/ser-
Literacy, Employment, Occupation, and Income
3038

Figure 2.3 Percentage of U.S. adults age 16 to 65 in each occupational status group bydocument literacy level: 1994
100
80
60
aA 40
20
0
20
40
g 60
80Ind 2 level 3 level 4/5
El Professionals
Managers
Technicians
Clerical
Sales/Service
SkMed Craft
Machine operators
lkgrienthual/Primary
SOURCE: Organization for Economic Cooperation and Development and Statistics Canada, 1994,unpublished tabulations.
vice related occupations this drops to 22 percent at level 3 and to 18 per-
cent among those at literacy level 4/5.
In contrast, the proportion of adults in the managerial and profession-
al occupations increases in parallel with increasing literacy levels. While
adults in managerial occupations make up 6 percent of the literacy level
1 group, they are 18 percent of those at level 3 and 20 percent of those at
level 4/5. The proportion of adults in professional occupations also grows
from 2 percent at level 1 to 17 percent at level 3 to 33 percent at level 4/5.
This American data might be taken to indicate the importance of liter-
acy skills for managerial/professional occupations, and a somewhat lesser
degree of importance for sales/service and clerical occupations, consistent
with the general notion that occupations vary in their demands on liter-
acy just as they vary in their demands for fine-motor skills, physical strength,
or interpersonal skills. It might also reflect the underlying notion behind
a more recent view for categorizing of occupations in terms of data/peo-
ple/things.viii This categorization scheme stresses the different types of skills
viii These characterizations are developed in the Dictionary of Occupational Titles (U.S. Department ofLabor, 1965) and in the related characterization developed by Osberg et al. (1989).
Literacy, Employment, Occupation, and Income
31

Figure 2.4a Percentage of adults age 16 to 65 in each occupational status group, by document literacylevel, by nations: 1994; level 1
a
loo
so
so
40
20
20
40
60
ND
"r
matt
5
i2
I 35 E 25 III 1.11 24
a
29 II 20
2428
6
23
20
7
U 30
8
U
ow
1.0
'61,8,W
. .
35 III 30
16 I2G
18
7
Sweden Nethatards Canada Switzerlaxl
(french)
Sutherland
(G)Poland
Figure 2.4b Percentage of adults age 16 to 65 in each occupational status group, by document literacylevel, by nations: 1994; level 2
too
so
so
40
20
o
20
so
80
Sweden Netbertands Canada OiledStates
man Sintrataid Switzerlaid
(French) (Cam*Poland
Literacy, Employment, Occupation, and Income
32
BEST COPY AVAILABLE
40

Figure 2.4c Percentage of adults age 16 to 65 in each occupational status group, by document literacylevel, by nations: 1994; level 3
100
80
so
40
20
0
20
3 90
2
80
Sweden Netherlands Canada United
States
Winne Wantland(French)
Switzerland
(German)
Poland
Prefessireis
Idanagas
Technicians
Clerical
Salami=
Crafts eaters
Nadineopentors
Agricattranimary
Figure 2.4d Percentage of adults age 16 to 65 in each occupational status group, by document literacylevel, by nations: 1994; level 4/5
100
so
so
40
20
I o
a
20
40
so
soSweden Netherbods Canada !kited
States
Camaro Switzahnd
(French)
&Oberland
(German)
Poland
SOURCE: Organization for Economic Cooperation and Development and Statistics Canada, 1994,unpublished tabulations.
Note: Figures 2.4 a, b, c, and d show analogous information for all nations separately by literacy level. That is, Figure 2.4 a dis-plays the proportion of literacy level 2. adults in each occupational status group for all seven countries. Figure 2.4b displaysanalogous information for adults at literacy level 2 in each of the nations, and so on. As in the case of Figure 2.3, occupa-tions are identified broadly as blue-collar and white-collar, these groups being distinguished by being respectively below andabove the horizontal axis.
BEST COPY AVAILABLE
41Literacy, Employment, Occupation, and Income
33

needed for particular occupations. However, this would be better studied
in relation to the distribution of workers within an industrial sector. This
idea is explored in the next chapter.
Literacy and occupational status across nations
Figures 2.4 a, b, c, and d demonstrate that although countries may dif-
fer quite substantially in terms of the distribution of occupational status
within any one literacy level, the general decrease in the proportion of
adults in blue-collar occupations associated with an increase in literacy
level is evident for all countries. For example, in the case of Poland, while
72 percent of those adults with literacy level 1 skills would be considered
blue-collar workers, that proportion drops to 17 percent among those who
have literacy level 4/5 skills.
At literacy level 1 perhaps the most notable finding is that the United
States has a significantly greater proportion of sales/service workers than
any of the other nations except the French-speaking community ofSwitzerland. Perhaps this reflects the growth of the personal service indus-
try in the United States along with a decline in demand for relatively unskilled
labor from traditional blue-collar occupations in manufacturing, such that
the least skilled of adults are finding employment in relatively unskilled
personal service occupations. Alternatively, the demand for personal ser-
vice and the supply that meets that demand may simply be higher in the
United States than in other nations.
As a general trend, at literacy level 2 the proportion of blue-collar work-
ers substantially decreases for all nations other than Germany. In this case
the percentage of blue-collar workers is only six points below what it is
at literacy level 1. Some 45 percent of German adults at literacy level 2
are working in blue-collar occupations. Other differences between nations
show no obvious pattern though, as expected, the proportion of adults in
white-collar occupations grows further at the expense of blue-collar occu-
pations. Most notably, and not unexpectedly, this increase occurs at the
upper end of the status scale, in professional occupations.
At literacy level 4/5 only 9 percent of U.S. adults are in blue-collar occu-
pations, a decrease from the 48 percent apparent at level 1. The same
marked decrease is apparent in Sweden where 49 percent of adults with
Literacy, Employment, Occupation, and Income
34

level 1 literacy skills are in blue-collar occupations as compared to just 16
percent at level 4/5. This consistent evidence for the relationship between
literacy and occupational status is reinforced by the observation that between
one-third and one-half of adults in all participating countries able to per-
form at level 4/5 are in professional or managerial occupations.
Overall then the distribution of occupations across countries within lit-
eracy levels follow a broadly similar pattern, a pattern that demonstrates
the relationship between literacy skills and occupational status in all
nations, adults with high levels of literacy are to be found disproportion-
ately in high status occupations.
Literacy and income in the United States
Literacy skills are part of the qualifications a potential employee brings
to the labor force. The importance of literacy skills in the workforce depends
on the particular occupation. For example, people who regularly deal with
data are more likely to need literacy skills than people who work on a fac-
tory production line. Given the relationship between literacy level and occu-
pation, where those who have higher literacy skills are more likely to be
a professional or manager, it is reasonable to believe that literacy skills
may also account for some part of the differences in individuals' incomes.
Experience is also likely to be an important determiner of income. People
who have been in a particular job for a number of years will have gained
experience and developed skills directly related to the particular job that
would be rewarded by greater compensation. Consequently when looking
at the relationship between income and literacy, it is important to also
consider the potential growth in income over an individual's career. Generally
adults between the ages of 16 and 25 who are just starting their careers
do not earn as much as adults who have been in the workforce for a num-
ber of years. In addition, there is a high probability that the best and bright-
est in this age group are enrolled in school. Consequently those in the
labor force are likely to be atypical. To take this into account, we exam-
ined the relationship of literacy to income across five age groups 16- to
24-year-olds, 25- to 34-year-olds, 35- to 44-year-olds, 45- to 54-year-olds,
and 55- to 65-year-olds.
4';3:Literacy, Employment, Occupation, and Income
35

Figure 2.5 illustrates the relationship between literacy and earnings among
American adults aged 16 to 65 who are in the labor force. The IALS sur-
vey reported income in quintiles based on the earnings of the entire pop-
ulation.ix This form of reporting income was chosen so that comparisons
across countries might be made, not on the basis of the absolute mone-
tary value of the income, but rather as it relates to relative economic suc-cess within each nation.
Figure 2.5 illustrates the relationship between literacy and earnings
among U.S. adults aged 16 to 65 years of age who are classified as being
in the labor force. The relationship between literacy and income is shown
separately for each of five age groups: adults who are, respectively, 16-24,
25-34, 35-44, 45-54, and 55-65 years of age. Within each of the five age
groups the average income for each of the four literacy levels is indicat-
ed on the vertical line shown. Each point on the line represents the aver-
age income of adults at the literacy level as indicated in the legend. With
the exception of the 16-24-year-old group, the lowest point on each ver-tical line tends to be the average income of literacy level 1 adults, and the
highest point tends to the average income of literacy level 4/5 adults. The
average income of adults at literacy levels 2 and 3 tend to lie betweenthese two points and in the order one would expect.
The measure of income available is a grouped measure, showing onlythe income quintile in which each person's income falls, not the actual
income in dollars. Thus, the means displayed in Figure 2-5 are the meansof the quintile scores. Using the 25-34-year-old group as an example, the
data displayed in Figure 2-5 can be read as follows: adults at literacy level
1 have a mean income quintile of 2.4, those at literacy level 2 have a mean
income quintile of 3.2, at literacy level 3 the mean income quintile is also
3.2, and at literacy level 4 the mean income quintile is 3.6.
As seen in Figure 2.5, there is consistency in the relationship of aver-
age income quintile to literacy level for each age group except the 16- to
ix The term quintile means the separation of a given population into fifths. Within each country, anestimate of the earnings of the entire population was used to locate the income ranges in whichexactly 20 percent of the population resides. The values for each country were then applied to thatcountry's 1ALS sample.
Literacy, Employment, Occupation, and Income
36

S$
Figure 2.5: Mean annual income quintile of U.S. adults age 16 to 65 by documentliteracy level by age: 1994
4.5
44.1 A
as33 32
3.5
3.2 323.1
3
2.7
232A
2122L9
1.5
16-24 25-34
Age
3544 45.54
SOURCE: Organization for Economic Cooperation and Development and Statistics Canada, 1994,unpublished tabulations.
level 4/5
Ind 3
level 2
level 1
24-year-olds. In all cases, other than 16- to 24-year-olds, the average income
quintile rises as literacy level rises; people at literacy level 1 always appear
as the lowest point on each line, and people at literacy level 4/5 always
appear as the highest point.
In the case of the youngest adults, people at literacy level 4/5 are at the
second lowest level for income rather than at the top. This is a common
finding for this age group and the usual explanation given is that these
young adults are at the beginning of their occupational careers, a time of
considerable instability, such that the relationships between individual attrib-
utes and income depart from the main trends observed for the population
as a whole. Jobs, labor market status, and income levels all change in the
short term in ways not characteristics of the adult population as a whole.
In the present instance this fact is reflected in the lack of relationship
between literacy and income for this age group. With the exception of the
difference between the level 1 and level 3 means, none of the averages in
question are significantly different from each other, in short, there is almost
no relationship between literacy and income for the 16- to 24-age group.
45Literacy, Employment, Occupation, and Income
37
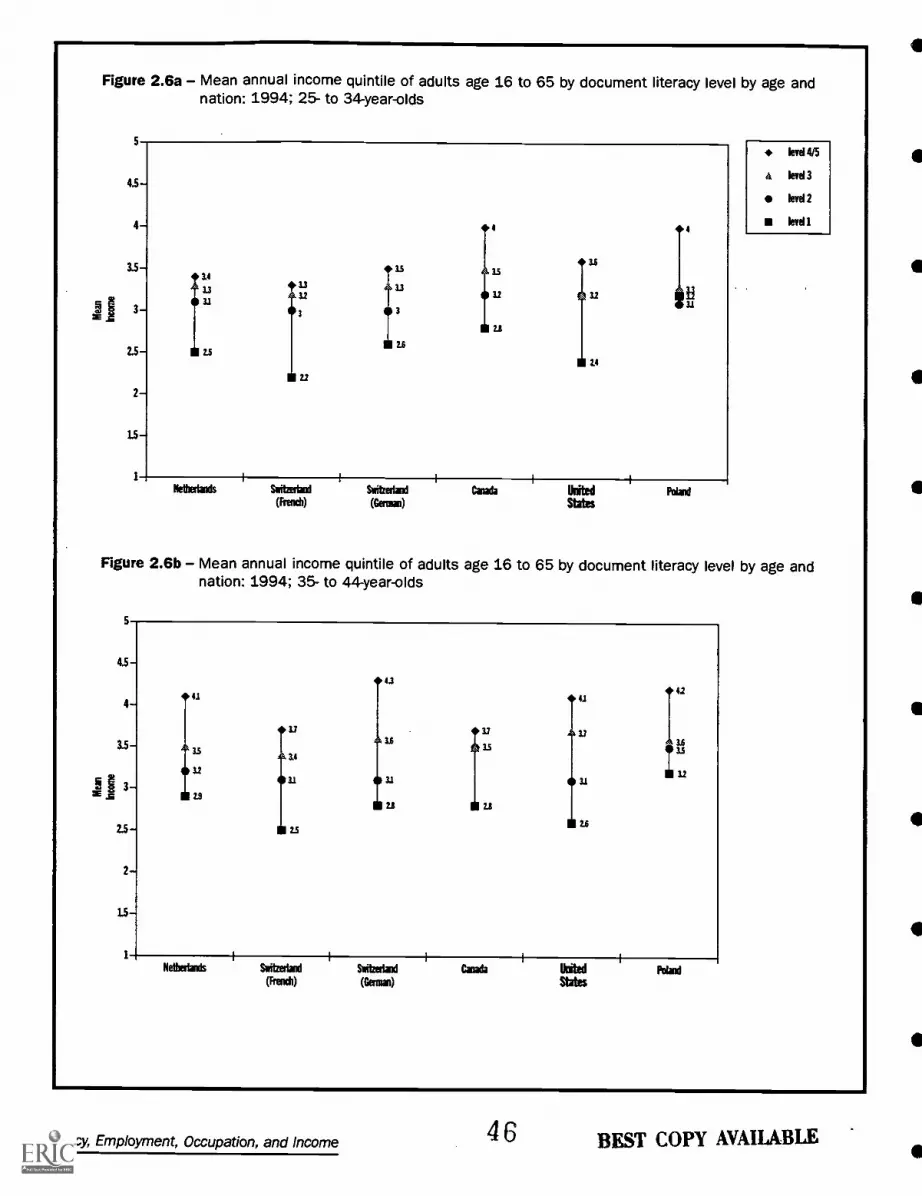
Figure 2.6a Mean annual income quintile of adults age 16 to 65 by document literacy level by age andnation: 1994; 25- to 34-year-olds
5
4.5
3.5
2.5
2
4
1S
1
4
34
1.3
31
23
121
3
1311
3
ea 3.5
32
21
3:22.4
H31
Netherlands Switzerland
(French)
Switzerland
(German)
Cala& UnitedStates
Poland
Wei 4/5
A level 3
level 2
level 1
Figure 2.6b Mean annual income quintile of adults age 16 to 65 by document literacy level by age andnation: 1994; 35- to 44-year-olds
5
4.54.3
4 41 41
1:su
33
3335
:14
3131 31 31
19
2.5- as2$
2
13
1
kennings Sutherland
(French)
Switzerland
(German)
Canada tkitedStites
42
1 1.6
1352
Mad
Literacy, Employment, Occupation, and Income
3846 BEST COPY AVAILABLE

Figure 2.6c Mean annual income quintile of adults age 16 to 65 by document literacy level by age andnation: 1994; 45- to 54year-olds
Netherlands Switzetall(French)
Switzerland
(German)
Canada UnitedStates
Poland
level 4/5
A level 3
level 2
level 1
Figure 2.6d Mean annual income quintile of adults age 16 to 65 by document literacy level by age andnation: 1994; 55- to 65-year-olds
5
4.5-
42
4- 41 t
u2
35
3-
33
2.5
2
15
1
Netherlands Sititzstaid(French)
Saitzerhnd
(Germ)
3.4
2.4
Cala&
42
1.9
2.9
UnitedStates
42
42
22
Poland
SOURCE: Organization for Economic Cooperation and Development and Statistics Canada, 1994,unpublished tabulations.
BEST COPY AVAILABLE47 Literacy, Employment, Occupation, and Income
39

On the other hand, the remaining four age groups demonstrate a clear
and consistent positive relationship between literacy level and income
as literacy increases, so does income.x For the 25- to 34-year-old group
the average income for level 1 adults is significantly lower than that for
adults at each of the other literacy levels. Differences between levels 2, 3,
and 4/5 fail to reach statistical significance. The same pattern holds for
the 35-44 and 45- to 54-year-old groups with two exceptions. For both age
groups level 4/5 adults have a higher average income quintile than level
2 adults and the difference between mean income quintiles at levels 1 and
2 is not significant. For the oldest age group, 55- to 65-year-olds, the only
difference between average income quintile that is statistically significant
is that between the extremes levels 1 and 4/5.
The data seem to demonstrate a clear pattern between literacy and income
among U.S. adults even though only the differences involving the average
income of level 1 adults reach statistical significance and show that, for
the most part, the average income quintile of this group is lower thaneach of adults at each of the other literacy levels across all age groups.xi
Given this demonstration of the apparent importance of literacy for income
in the United States, the next step is to place this relationship in a per-
spective provided by the other IALS countries, with the view to exploring
the generality of this finding.
Literacy and income across nations
Following the same pattern as in the preceding sections the relation-
ship between literacy and income is portrayed for each participating nation.
For reasons already noted, the data for the 16- to 24-year-old group are
excluded from these presentations. Each of Figures 2.6a through 2.6d focus
on a single age group and provide evidence of the relationship between
literacy and income for five of the seven nations.x1i
It is important to keep in mind that the income quintiles are nation-
specific and thus the means as shown do not have the same monetary
x Joining the means by literacy level across the age groups would convert the present display into aform similar to the familiar age-income curves and makes obvious that the income levels of litera-cy level 1 adults show relatively little growth over the working life of those concerned.
xi Subsetting the sample into age groups increases the size of the sampling error for these groupsand, as a result, makes only the largest differences statistically significant.
xii Sweden and Germany are not included because they did not provide this data.
Literacy, Employment, Occupation, and Income
4048

value across nations. That is, in the case of Figure 2-6a, for example, the
monetary value of an average income quintile of 4 for Canadian adults at
literacy level 4/5 is not equivalent to an average income quintile of 4 for
literacy level 4/5 Polish adults. Similarly, it is not legitimate to infer that
French-speaking Swiss adults at level 415 earn as much on average as German-
speaking Swiss adults at level 3. However, the comparisons imply equiv-
alent status within each nation's hierarchy.
The information displayed is remarkable for its consistency. Within each
country and across all four age groups the relationship between literacy
and income is one that shows a rise in income as level of literacy increas-
es from level 1 to level 4/5. In most countries and age groups (except for
the case of German-speaking Switzerland) levels 3 and/or 4/5 are higher
than level 1.
Another way of looking at these data displays is to consider the length
of the line as a measure of the strength of the relationship between liter-
acy and income the difference between the average level of income for
level 1 adults and that for level 4/5 adults. The longer the line the greater
the difference and the greater the income gap between the least and most
literate citizens in each country. In most countries and most age groups
the differences in average income quintiles between adults at level 1 and
4/5 is nearly an entire quintile or more. The only exception is in the 55-
to 65-year-olds in French-speaking Switzerland. Since these are all work-
ing adults these most likely reflect differences in wage rates by literacy
levels and not so much the effects of compensatory social welfare pro-
grams designed to redistribute income, though the latter cannot be ruled
out. Irrespective, the general consistency of the relationship between lit-
eracy and income throughout the course of an individual's working life
in each of the several countries examined here makes clear the benefits
of both individual and national literacy capabilities.
The importance of literacy to individuals
The data on employment status, occupational status, and annual income
as related to literacy level all indicate that a consistent relationship exists
across countries. Within each nation there is a general trend indicating
that as literacy levels increase:
49 Literacy, Employment, Occupation, and Income
41

There is a decrease in the proportion of adults whoare out of the workforce and an increase in the pro-portion who are working.
The proportion of adults in blue-collar occupationsdecreases dramatically while the proportion of adultsin managerial and professional occupations increases.
Income also increases.
These relationships support the belief that literacy skills are directly relat-
ed to a person's ability to participate successfully in the workforce. This
will become even more evident as economies continue their evolution from
an agrarian to an industrial to an information base. While occupations
associated with preceding economic configurations will continue to exist,
both the number of jobs in particular sectors and the form that work will
take are likely to evolve in ways that will depend on increasingly complexliteracy skills.
50
Literacy, Employment, Occupation, and Income
42
I
References
1 Organization for Economic Cooperation and Development and
Statistics Canada. (1995). Literacy, economy and society.
Ottawa, Canada: Statistics Canada.
2 Organisation for Economic Cooperation and Development. (1988).
International standard classification of occupations. Paris: OECD.,
3 Treiman, D. (1977). Occupational prestige in comparative per-
spective. New York: Academic Press
51
43

Number
94-01 (July)
94-02 (July)
94-03 (July)
94-04 (July)
94-05 (July)
94-06 (July)
94-07 (Nov.)
95-01 (Jan.)
95-02 (Jan.)
95-03 (Jan.)
95-04 (Jan.)
95-05 (Jan.)
Listing of NCES Working Papers to Date
Please contact Ruth R. Harris at (202) 219-1831if you are interested in any of the following papers
Title
Schools and Staffmg Survey (SASS) Papers Presentedat Meetings of the American Statistical Association
Generalized Variance Estimate for Schools andStaffing Survey (SASS)
1991 Schools and Staffmg Survey (SASS) ReinterviewResponse Variance Report
The Accuracy of Teachers' Self-reports on theirPostsecondary Education: Teacher Transcript Study,Schools and Staffing Survey
Cost-of-Education Differentials Across the States
Six Papers on Teachers from the 1990-91 Schools andStaffing Survey and Other Related Surveys
Data Comparability and Public Policy: New Interest inPublic Library Data Papers Presented at Meetings ofthe American Statistical Association
Schools and Staffing Survey: 1994 Papers Presented atthe 1994 Meeting of the American StatisticalAssociation
QED Estimates of the 1990-91 Schools and StaffingSurvey: Deriving and Comparing QED SchoolEstimates with CCD Estimates
Schools and Staffing Survey: 1990-91 SASS Cross-Questionnaire Analysis
National Education Longitudinal Study of 1988:Second Follow-up Questionnaire Content Areas andResearch Issues
National Education Longitudinal Study of 1988:Conducting Trend Analyses of NLS-72, HS&B, andNEL S : 88 Seniors
Contact
Dan Kasprzyk
Dan Kasprzyk
Dan Kasprzyk
Dan Kasprzyk
William Fowler
Dan Kasprzyk
Carrol Kindel
Dan Kasprzyk
Dan Kasprzyk
Dan Kasprzyk
Jeffrey Owings
Jeffrey Owings

Number
95-06 (Jan.)
95-07 (Jan.)
95-08 (Feb.)
95-09 (Feb.)
95-10 (Feb.)
95-11 (Mar.)
95-12 (Mar.)
95-13 (Mar.)
95-14 (Mar.)
95-15 (Apr.)
95-16 (Apr.)
95-17 (May)
95-18 (Nov.)
96-01 (Jan.)
Listing of NCES Working Papers to DateContinued
Title
National Education Longitudinal Study of 1988:Conducting Cross-Cohort Comparisons Using HS&B,NAEP, and NELS:88 Academic Transcript Data
National Education Longitudinal Study of 1988:Conducting Trend Analyses HS&B and NELS:88Sophomore Cohort Dropouts
CCD Adjustment to the 1990-91 SASS: A Comparisonof Estimates
The Results of the 1993 Teacher List Validation Study(TLVS)
The Results of the 1991-92 Teacher Follow-up Survey(TFS) Reinterview and Extensive Reconciliation
Measuring Instruction, Curriculum Content, andInstructional Resources: The Status of Recent Work
Rural Education Data User's Guide
Assessing Students with Disabilities and LimitedEnglish Proficiency
Empirical Evaluation of Social, Psychological, &Educational Construct Variables Used in NCESSurveys
Classroom Instructional Processes: A Review ofExisting Measurement Approaches and TheirApplicability for the Teacher Follow-up Survey
Intersurvey Consistency in NCES Private SchoolSurveys
Estimates of Expenditures for Private K-12 Schools
An Agenda for Research on Teachers and Schools:Revisiting NCES' Schools and Staffing Survey
Methodological Issues in the Study of Teachers'Careers: Critical Features of a Truly LongitudinalStudy
53
Contact
Jeffrey Owings
Jeffrey Owings
Dan Kasprzyk
Dan Kasprzyk
Dan Kasprzyk
Sharon Bobbitt &John Ralph
Samuel Peng
James Houser
Samuel Peng
Sharon Bobbitt
Steven Kaufman
StephenBroughman
Dan Kasprzyk
Dan Kasprzyk

Number
96-02 (Feb.)
96-03 (Feb.)
96-04 (Feb.)
96-05 (Feb.)
96-06 (Mar.)
96-07 (Mar.)
96-08 (Apr.)
96-09 (Apr.)
96-10 (Apr.)
96-11 (June)
96-12 (June)
96-13 (June)
96-14 (June)
Listing of NCES Working Papers to DateContinued
Title
Schools and Staffing Survey (SASS): 1995 Selectedpapers presented at the 1995 Meeting of the AmericanStatistical Association
National Education Longitudinal Study of 1988(NELS:88) Research Framework and Issues
Census Mapping Project/School District Data Book
Cognitive Research on the Teacher Listing Form forthe Schools and Staffing Survey
The Schools and Staffing Survey (SASS) for 1998-99:Design Recommendations to Inform Broad EducationPolicy
Should SASS Measure Instructional Processes andTeacher Effectiveness?
How Accurate are Teacher Judgments of Students'Academic Performance?
Making Data Relevant for Policy Discussions:Redesigning the School Administrator Questionnairefor the 1998-99 SASS
1998-99 Schools and Staffing Survey: Issues Related toSurvey Depth
Towards an Organizational Database on America'sSchools: A Proposal for the Future of SASS, withcomments on School Reform, Governance, and Finance
Predictors of Retention, Transfer, and Attrition ofSpecial and General Education Teachers: Data from the1989 Teacher Followup Survey
Estimation of Response Bias in the NHES:95 AdultEducation Survey
The 1995 National Household Education Survey:Reinterview Results for the Adult EducationComponent
54
Contact
Dan Kasprzyk
Jeffrey Owings
Tai Phan
Dan Kasprzyk
Dan Kasprzyk
Dan Kasprzyk
Jerry West
Dan Kasprzyk
Dan Kasprzyk
Dan Kasprzyk
Dan Kasprzyk
Steven Kaufman
Steven Kaufman

Number
96-15 (June)
96-16 (June)
96-17 (July)
96-18 (Aug.)
96-19 (Oct.)
96-20 (Oct.)
96-21 (Oct.)
96-22 (Oct.)
96-23 (Oct.)
96-24 (Oct.)
96-25 (Oct.)
96-26 (Nov.)
96-27 (Nov.)
Listing of NCES Working Papers to DateContinued
Title
Nested Structures: District-Level Data in the Schoolsand Staffing Survey
Strategies for Collecting Finance Data from PrivateSchools
National Postsecondary Student Aid Study: 1996 FieldTest Methodology Report
Assessment of Social Competence, AdaptiveBehaviors, and Approaches to Learning with YoungChildren
Assessment and Analysis of School-LevelExpenditures
1991 National Household Education Survey(NHES:91) Questionnaires: Screener, Early ChildhoodEducation, and Adult Education
1993 National Household Education Survey(NHES:93) Questionnaires: Screener, SchoolReadiness, and School Safety and Discipline
1995 National Household Education Survey(NHES:95) Questionnaires: Screener, Early ChildhoodProgram Participation, and Adult Education
Linking Student Data to SASS: Why, When, How
National Assessments of Teacher Quality
Measures of Inservice Professional Development:Suggested Items for the 1998-1999 Schools andStaffing Survey
Improving the Coverage of Private Elementary-Secondary Schools
Intersurvey Consistency in NCES Private SchoolSurveys for 1993-94
55
Contact
Dan Kasprzyk
StephenBroughman
Andrew G.Malizio
Jerry West
William Fowler
Kathryn Chandler
Kathryn Chandler
Kathryn Chandler
Dan Kasprzyk
Dan Kasprzyk
Dan Kasprzyk
Steven Kaufman
Steven Kaufman
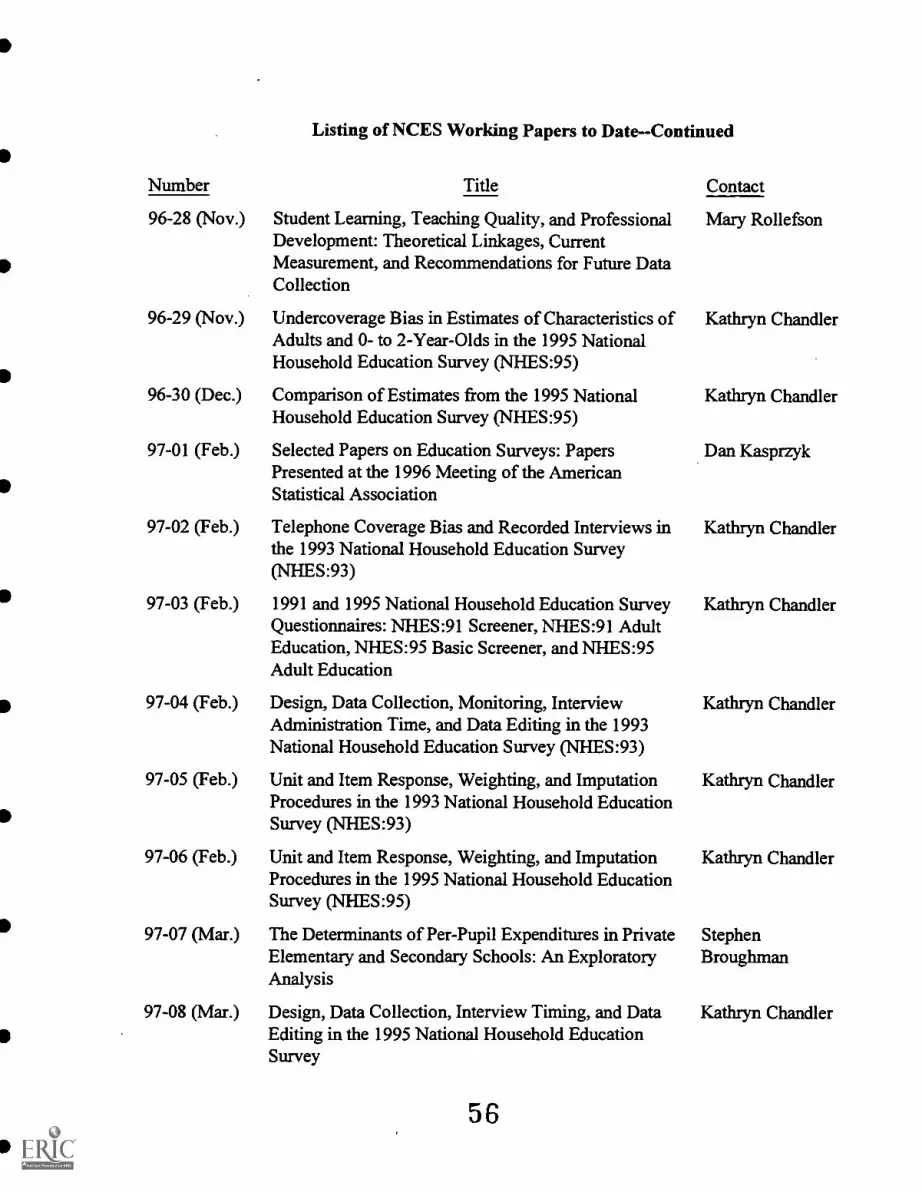
Number
96-28 (Nov.)
96-29 (Nov.)
96-30 (Dec.)
97-01 (Feb.)
97-02 (Feb.)
97-03 (Feb.)
97-04 (Feb.)
97-05 (Feb.)
97-06 (Feb.)
97-07 (Mar.)
97-08 (Mar.)
Listing of NCES Working Papers to DateContinued
Title
Student Learning, Teaching Quality, and ProfessionalDevelopment: Theoretical Linkages, CurrentMeasurement, and Recommendations for Future DataCollection
Undercoverage Bias in Estimates of Characteristics ofAdults and 0- to 2-Year-Olds in the 1995 NationalHousehold Education Survey (NHES:95)
Comparison of Estimates from the 1995 NationalHousehold Education Survey (NHES:95)
Selected Papers on Education Surveys: PapersPresented at the 1996 Meeting of the AmericanStatistical Association
Telephone Coverage Bias and Recorded Interviews inthe 1993 National Household Education Survey(NHES:93)
1991 and 1995 National Household Education SurveyQuestionnaires: NHES:91 Screener, NHES:91 AdultEducation, NHES:95 Basic Screener, and NHES:95Adult Education
Design, Data Collection, Monitoring, InterviewAdministration Time, and Data Editing in the 1993National Household Education Survey (NHES:93)
Unit and Item Response, Weighting, and ImputationProcedures in the 1993 National Household EducationSurvey (NHES:93)
Unit and Item Response, Weighting, and ImputationProcedures in the 1995 National Household EducationSurvey (NHES:95)
The Determinants of Per-Pupil Expenditures in PrivateElementary and Secondary Schools: An ExploratoryAnalysis
Design, Data Collection, Interview Timing, and DataEditing in the 1995 National Household EducationSurvey
56
Contact
Mary Rollefson
Kathryn Chandler
Kathryn Chandler
Dan Kasprzyk
Kathryn Chandler
Kathryn Chandler
Kathryn Chandler
Kathryn Chandler
Kathryn Chandler
StephenBroughman
Kathryn Chandler

Number
97-09 (Apr.)
97-10 (Apr.)
97-11 (Apr.)
97-12 (Apr.)
97-13 (Apr.)
97-14 (Apr.)
97-15 (May)
97-16 (May)
97-17 (May)
97-18 (June)
97-19 (June)
97-20 (June)
97-21 (June)
97-22 (July)
Listing of NCES Working Papers to DateContinued
Title
Status of Data on Crime and Violence in Schools: FinalReport
Report of Cognitive Research on the Public and PrivateSchool Teacher Questionnaires for the Schools andStaffing Survey 1993-94 School Year
International Comparisons of Inservice ProfessionalDevelopment
Measuring School Reform: Recommendations forFuture SASS Data Collection
Improving Data Quality in NCES: Database-to-ReportProcess
Optimal Choice of Periodicities for the Schools andStaffing Survey: Modeling and Analysis
Customer Service Survey: Common Core of DataCoordinators
International Education Expenditure ComparabilityStudy: Final Report, Volume I
International Education Expenditure ComparabilityStudy: Final Report, Volume II, Quantitative Analysisof Expenditure Comparability
Improving the Mail Return Rates of SASS Surveys: AReview of the Literature
National Household Education Survey of 1995: AdultEducation Course Coding Manual
National Household Education Survey of 1995: AdultEducation Course Code Merge Files User's Guide
Statistics for Policymakers or Everything You Wantedto Know About Statistics But Thought You CouldNever Understand
Collection of Private School Finance Data:Development of a Questionnaire
Contact
Lee Hoffman
Dan Kasprzyk
Dan Kasprzyk
Mary Rollefson
Susan Ahmed
Steven Kaufman
Lee Hoffman
Shelley Burns
Shelley Burns
Steven Kaufman
Peter Stowe
Peter Stowe
Susan Ahmed
StephenBroughman

Number
97-23 (July)
97-24 (Aug.)
97-25 (Aug.)
97-26 (Oct.)
97-27 (Oct.)
97-28 (Oct.)
97-29 (Oct.)
97-30 (Oct.)
97-31 (Oct.)
97-32 (Oct.)
97-33 (Oct.)
Listing of NCES Working Papers to DateContinued
Title
Further Cognitive Research on the Schools and StaffingSurvey (SASS) Teacher Listing Form
Formulating a Design for the ECLS: A Review ofLongitudinal Studies
1996 National Household Education Survey(NHES:96) Questionnaires: Screener/Household andLibrary, Parent and Family Involvement in Educationand Civic Involvement, Youth Civic Involvement, andAdult Civic Involvement
Strategies for Improving Accuracy of PostsecondaryFaculty Lists
Pilot Test of IPEDS Finance Survey
Comparison of Estimates in the 1996 NationalHousehold Education Survey
Can State Assessment Data be Used to Reduce StateNAEP Sample Sizes?
ACT's NAEP Redesign Project: Assessment Design isthe Key to Useful and Stable Assessment Results
NAEP Reconfigured: An Integrated Redesign of theNational Assessment of Educational Progress
Innovative Solutions to Intractable Large ScaleAssessment (Problem 2: Background Questionnaires)
Adult Literacy: An International Perspective
58
Contact
Dan Kasprzyk
Jerry West
Kathryn Chandler
Linda Zimbler
Peter Stowe
Kathryn Chandler
Steven Gorman
Steven Gorman
Steven Gorman
Steven Gorman
Marilyn Binkley


U.S. DEPARTMENT OF EDUCATIONOffice of Educational Research and Improvement (OEM)
Educational Resources Information Center (ERIC)
NOTICE
REPRODUCTION BASIS
e
ERIC
This document is covered by a signed "Reproduction Release(Blanket)" form (on file within the ERIC system), encompassing all
or classes of documents from its source organization and, therefore,does not require a "Specific Document" Release form.
This document is Federally-funded, or carries its own permission toreproduce, or is otherwise in the public domain and, therefore, may
be reproduced by ERIC without a signed Reproduction Releaseform (either "Specific Document" or "Blanket").