Embed Size (px)
Citation preview
ORIGINAL RESEARCH
Advanced microscale bioreactor system: a representativescale-down model for bench-top bioreactors
Wei-Ting Hsu • Rigzen P. S. Aulakh •
Donald L. Traul • Inn H. Yuk
Received: 11 November 2011 / Accepted: 27 February 2012
� Springer Science+Business Media B.V. 2012
Abstract In recent years, several automated scale-
down bioreactor systems have been developed to
increase efficiency in cell culture process develop-
ment. ambrTM is an automated workstation that
provides individual monitoring and control of culture
dissolved oxygen and pH in single-use, stirred-tank
bioreactors at a working volume of 10–15 mL. To
evaluate the ambrTM system, we compared the perfor-
mance of four recombinant Chinese hamster ovary cell
lines in a fed-batch process in parallel ambrTM, 2-L
bench-top bioreactors, and shake flasks. Cultures in
ambrTM matched 2-L bioreactors in controlling the
environment (temperature, dissolved oxygen, and pH)
and in culture performance (growth, viability, glucose,
lactate, Na?, osmolality, titer, and product quality).
However, cultures in shake flasks did not show
comparable performance to the ambrTM and 2-L
bioreactors.
Keywords Scale-down system � Chinese hamster
ovary � Cell culture automation � ambrTM �Single-use bioreactor
Introduction
Several scale-down cell culture systems have been
developed in recent years to reduce the timelines and
costs associated with cell culture process development
(Bareither and Pollard 2011; Betts and Baganz 2006;
Kondragunta et al. 2010; Kumar et al. 2004; Lewis
et al. 2010). Scale-down systems such as shake flasks
and bench-top bioreactors are typically used to
develop cell culture processes for clinical and com-
mercial manufacturing. Although shake flasks provide
higher throughput than bench-top bioreactors, they do
not offer the environmental control capabilities of a
bench-top bioreactor. The newly developed advanced
microscale bioreactor (ambrTM) system uses 24 or 48
single-use, pre-sterilized, stirred-tank bioreactors on
an automated workstation that enables pH and
dissolved oxygen (DO) control for each individual
vessel (Bareither and Pollard 2011). In a recent trial
run for the ambrTM system, Lewis et al. (2010)
observed reproducible growth profiles for a Chinese
hamster ovary (CHO) cell line cultured simulta-
neously in all 24 vessels under identical process
conditions. When they cultured three CHO cell lines in
fed-batch mode in the ambrTM system and compared
W.-T. Hsu (&) � R. P. S. Aulakh � I. H. Yuk
Early Stage Cell Culture, Genentech, Inc., 1 DNA Way,
South San Francisco, CA 94080, USA
e-mail: [email protected]
R. P. S. Aulakh
e-mail: [email protected]
I. H. Yuk
e-mail: [email protected]
D. L. Traul
TAP Biosystems, York Way, Royston,
Hertfordshire SG8 5WY, UK
e-mail: [email protected]
123
Cytotechnology
DOI 10.1007/s10616-012-9446-1

the performance to historic data from 7-L bioreactors,
they observed comparable viability and antibody
production profiles (Lewis et al. 2010).
Here we conducted a more extensive evaluation of
the ambrTM system to determine its ability to support
cell culture process development. We simultaneously
cultured four representative CHO cell lines in the
ambrTM system, 2-L bioreactors, and shake flasks, and
we assessed (1) online controls (temperature, DO, and
pH) provided by the ambrTM and 2-L bioreactor
systems; (2) off-line pO2, pH and pCO2 profiles; and
(3) culture performance (growth, metabolism, pro-
ductivity, and product quality) in the three culture
systems. We also cultured two additional CHO cell
lines in parallel ambrTM and 2-L bioreactors to
compare different DO control strategies.
Materials and methods
ambrTM system
The ambrTM system (TAP Biosystems) used in this
study consisted of 24 single-use bioreactors that are
arranged in two sets of 12. Each set is supplied with a
temperature sensor and a heating fan for temperature
control, and a stirring plate for agitation control. Each
bioreactor is equipped with an agitator with a pitched-
blade impeller (11 mm diameter, impeller power
number 0.6), a pH sensor spot, and a DO sensor spot.
The ambrTM system was programmed to take pH and
DO readings every 90 s, and to use these readings to
control pH and DO via PID feedback loops. Gases for
pH and DO control were mixed prior to entering each
bioreactor via a sparge tube. A liquid handler was used
to extract culture samples and to perform liquid
additions using disposable pipette tips. To maintain
aseptic operations, the system was placed inside a
biological safety cabinet.
Cell lines
Cell lines 1 and 2 are different clones that secrete
recombinant monoclonal antibody A, and were
derived from a CHO dihydrofolate reductase-deficient
(DHFR-) host as described previously (Guo et al.
2010). Cell lines 3 and 4 are different clones that
secrete recombinant monoclonal antibody B, and were
derived from a CHO-K1 host that utilizes the
glutamine synthetase selection marker. Cell lines 5
and 6 are different clones that secrete recombinant
monoclonal antibody C, and were also derived from a
CHO-K1 host that utilizes the glutamine synthetase
selection marker. To generate these cell lines, the host
cells (CHO DHFR- or CHO-K1) were transfected with
a DNA plasmid encoding genes for the appropriate
selection marker, light chain, and heavy chain. The
transfected cells were passaged every 3–4 days in
proprietary chemically-defined media (derived from
Ham’s F12/Dulbecco’s Modified Eagle’s Medium)
containing selective pressure (methotrexate for cell
lines 1 and 2, and methionine sulfoximine for cell lines
3, 4, 5, and 6).
2-L bioreactor production cultures
For each cell line tested, two glass stirred-tank
bioreactors (Applikon, Foster City, CA) were seeded
at *1.7 9 106 cells/mL in a proprietary, chemically-
defined medium. One culture was inoculated at 1.5 L.
The other culture was inoculated at 2.0 L, from which
0.5 L was removed to seed the parallel ambrTM and
shake flasks cultures after inoculating the 2-L biore-
actor. Each identically-configured stirred-tank biore-
actors had a maximum working volume of 2 L, a
vessel diameter of 0.13 m, and vessel height of
0.25 m. The bioreactor process setpoints were con-
trolled by DCUs (B. Braun Biotech, Allentown, PA).
The cultures were maintained with setpoints for pH at
7.0, dissolved oxygen at 30 % of air saturation, and
agitation (via single pitched-blade impeller with
45 mm diameter and impeller power number 1.5) at
350 rpm. Culture pH was maintained by addition of
1 M Na2CO3 to increase pH, or by sparging of CO2 gas
to decrease pH. At the time of inoculation, each
bioreactor culture started with a constant 10 mL/min
air sparge, corresponding to 0.0067 vvm of air flow.
Separate mass flow controllers were used for air and
oxygen, and DO was controlled in cascade mode by
sparging with air and then with the required amount of
supplemental oxygen. Culture temperature was main-
tained at 37 �C initially for all cell lines from days 0–3.
On day 3, the culture temperature was shifted to 35 �C
for cell lines 1 and 2, and to 33 �C for cell lines 3 and 4.
On day 3, a single nutrient feed consisting of a
proprietary blend of chemically-defined ingredients
was added to all cultures, increasing the culture
volumes by 20 %. When glucose dropped below
Cytotechnology
123

4 g/L, the culture received a concentrated glucose feed
consisting of a 500 g/L glucose stock solution to
increase culture glucose by 12 g/L.
ambrTM production cultures
The culture material taken from the newly inoculated
2-L bioreactors for each cell line was used to seed six
ambrTM vessels at 14 mL working volume. The
ambrTM system, with vessel dimensions of
28 mm 9 16 mm 9 58 mm, maintained the culture
temperature at 37 �C, agitation at 1,400 rpm, and DO
at 30 % of air saturation. The air sparge rate was set at
a constant 0.15 mL/min. Oxygen was sparged as
needed to maintain the DO at setpoint. When pH
dropped below 6.97, 0.5 M Na2CO3 was added to
increase pH to the target of 7.0. When pH rose above
7.05, sparging of CO2 was triggered to decrease pH.
Over the course of the 14-day fed-batch process,
ambrTM cultures received the same temperature shift,
nutrient feed, and glucose feeds as the parallel 2-L
bioreactors for each cell line. On days 0, 2, 3, 5, and 7,
60 lL of antifoam (Dow Corning) was added to each
ambrTM culture. From each replicate, 200–350 lL
was taken for each cell count, and 900 lL was taken
for each off-line pH, pCO2, and metabolite analysis.
For titer and product quality analyses, a 1.4-mL
sample was taken from three of the six replicates for
each cell line on day 10, and a 1.4-mL sample was
taken from the other three replicates on day 12.
Shake flask production cultures
The culture material taken from the newly inoculated
2-L bioreactors for each cell line was also used to seed
two 125-mL shake flasks at 40 mL each. The shake
flasks were agitated on an orbital shaker (150 rpm
with 25 mm throw), and maintained in a humidified
incubator at 37 �C with 5 % CO2 overlay. Over the
course of the 14-day process, shake flask cultures
received the same temperature shift, nutrient feed, and
glucose feed criteria as the parallel 2-L bioreactors and
ambrTM vesssels for each cell line.
Off-line sample analyses
Samples were analyzed for viable cell concentration
(VCC) and viability using the Vi-Cell XR (Beckman
Coulter), and for pO2, pH, pCO2, Na?, glucose, and
lactate using the Bioprofile 400 (Nova Biomedical).
All samples from 2-L and ambrTM bioreactors were
analyzed on BioProfile 400 within a few minutes
after sampling to minimize off-gassing. The same
Vi-Cell XR, BioProfile 400, and osmometer (Model
2020, Advanced Instruments) were used for all
samples to eliminate instrument-to-instrument vari-
ability. Antibody titer was measured using high-
pressure liquid chromatography (HPLC) with a
protein A column. Antibody product quality assays
were conducted using cell culture supernatant sam-
ples purified by PhyTip protein A column. Antibody
glycan distribution was analyzed by capillary elec-
trophoresis (CE) with fluorescence detection (Gen-
naro and Salas-Solano 2008) while molecular size
distribution was analyzed by size-exclusion chroma-
tography (SEC). Protein charge heterogeneity was
measured using imaged capillary isoelectric focusing
(icIEF); all charge heterogeneity samples were pre-
treated with carboxypeptidase B. All protein product
quality assays were developed in-house, and detailed
protocols have been published (Hopp et al. 2009).
Amino acid concentrations in the cultures at time of
harvest were quantified by ultra-performance liquid
chromatography (Waters AcQuity UPLC, Waters,
Milford, MA) after the free amino acids in the cell
culture supernatant samples were derivatized with
6-aminoquinolyl-N-hydroxysuccinimidyl carbamate
(AQC) to generate highly-fluorescent derivatives
(Cohen and Michaud 1993).
Calculations
The growth rate between any two time points was
calculated by taking the natural log of the ratio of VCC
at the later time point to the VCC at the earlier time
point, and dividing this number by the time interval.
The average cell-specific productivity, qp, was calcu-
lated as the final antibody titer divided by the integral
of VCC over the culture duration. The tip speed of
impellers was calculated as pDiN, where Di represents
the impeller diameter, and N represents the agitation
rate. The impeller power was calculated as PNoN3Di5q,
where PNo represents the impeller power number, N
represents the agitation rate, Di represents the impeller
diameter, and q represents the liquid density (which is
assumed to be 1 g/mL).
Cytotechnology
123

Experiment testing agitation rate and air flow rate
using cell lines 5 and 6
In this experiment, the 2-L bioreactors were operated
as described earlier in the ‘‘2-L bioreactor production
cultures’’ section. The process setpoints were con-
trolled by TruBio (Finesse Solutions, San Jose, CA).
Culture temperature for both cell lines 5 and 6 was
shifted on day 3 to 33 �C. The culture material taken
from the newly inoculated 2-L bioreactors for each
cell line was used to seed six ambrTM vessels at the
14 mL working volume. The ambrTM system main-
tained the agitation rate at 1,400 rpm and the air flow
rate at a constant 0.15 mL/min for 3 replicates. For the
other 3 replicates, the ambrTM system maintained the
agitation rate at 1,000 rpm and the air flow rate at a
constant 0.09 mL/min. All other conditions for the
ambrTM cultures were as described earlier in the
‘‘ambrTM production cultures’’ section.
Results and discussion
ambrTM system: evaluation of environmental
controls
Temperature
For the first three culture days, both 12-vessel blocks
on the ambrTM system maintained temperature within
±0.1 �C of the 37.0 �C setpoint. Upon shifting to a
lower temperature setpoint on day 3, the temperature
stabilized after 2 h. Thereafter, the first block main-
tained temperature within ±0.1 �C of the 35.0 �C
setpoint, while the second block maintained temper-
ature between 33.18 and 33.22 �C, slightly higher than
the 33.0 �C setpoint. The precision of temperature
control and the time to stabilize at setpoint will be
affected by environmental temperature because the
ambrTM system controls temperature for each 12-ves-
sel block by heating the air within the block, or by
drawing in ambient air (for cooling).
DO
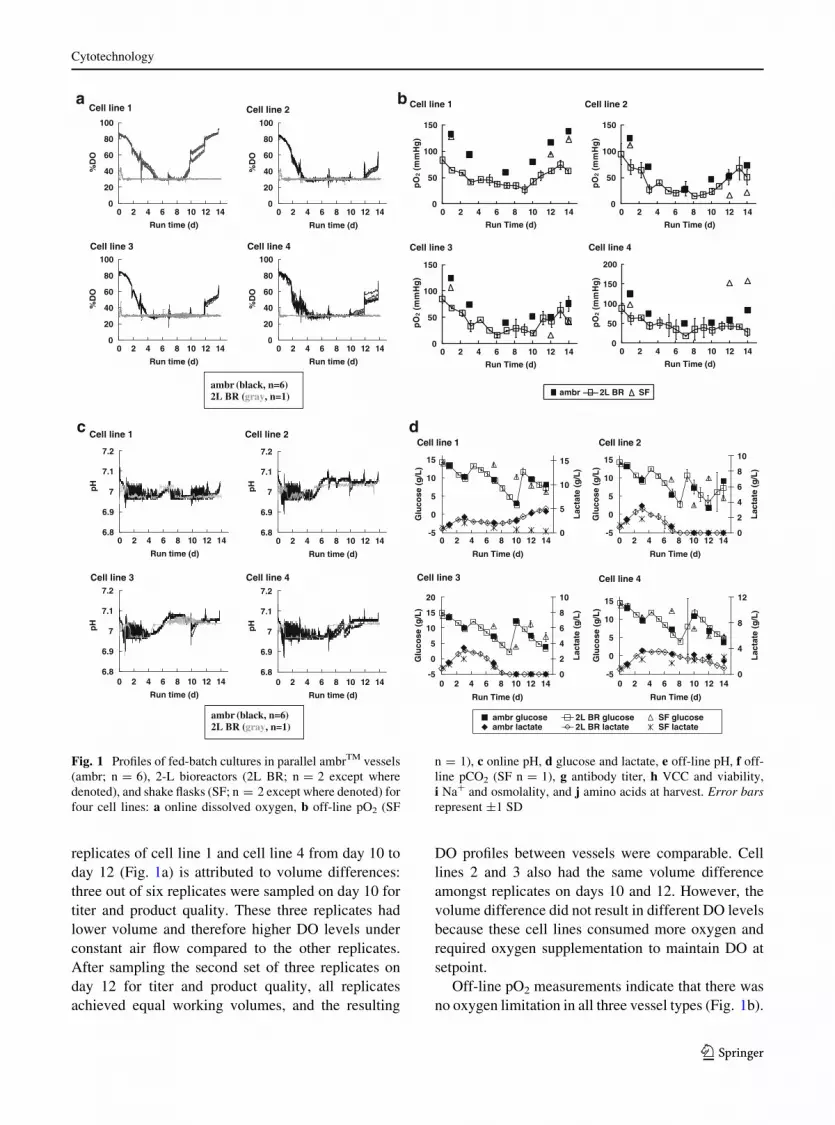
The ambrTM system generated comparable DO pro-
files amongst the replicates, and maintained DO at or
above 30 % of air saturation throughout the run for all
vessels (Fig. 1a). When DO dipped below the setpoint,
supplemental oxygen kicked in to maintain DO within
5 % of the setpoint. The agitation rate for the 2-L
bioreactors was chosen based on our experience with
in-house CHO cell lines: it provides sufficient kLa to
meet the oxygen requirements while avoiding cell
damage. In selecting agitation rates for the ambrTM to
scale from the 2-L bioreactors, we applied the same
considerations towards oxygen transfer and shear
sensitivity. Typical scale-up/down strategies include
matching the power input per volume (P/V) or the
maximum shear (as represented by impeller tip speed)
across scales (Chisti 1993; Varley and Birch 1999).
Based on the power numbers and the dimensions of the
impellers, an agitation rate of 1,000 rpm in ambrTM
would generate equivalent P/V as the 2-L bioreactors
at the typical working volume, while an agitation rate
of 1,400 rpm in ambrTM would generate equivalent tip
speed as the 2-L bioreactors. For this first experiment,
we chose 1,400 rpm to maximize oxygen transfer, to
avoid vortex and bubble entrainment, and to ensure
that the maximum amount of shear would be compa-
rable to the 2-L bioreactor. At this selected condition
for the ambrTM cultures, DO remained above 30 % of
air saturation for the first 3–5 days of culture as well as
towards the end of the culture. In the 2-L bioreactors,
DO dropped to 30 % of air saturation within an hour of
inoculation. However, we did not adjust the sparge
strategy during this experiment when DO exceeded
30 % because CHO cell cultures are typically insen-
sitive to DO at levels between 10 and 80 % of air
saturation (Restelli et al. 2006; Trummer et al. 2006).
In a subsequent experiment, by lowering the agitation
and air flow rates for the ambrTM system, we observed
an improved match in the DO profiles between the
ambrTM and 2-L bioreactor cultures (Fig. 2). The
culture performance was similar between the different
agitation and aeration cases within the range studied
(data not shown).
The spikes in the DO profiles before DO dropped to
setpoint corresponded to antifoam and batch feed
additions. The spikes in the DO profiles after trigger-
ing oxygen supplementation corresponded to bioreac-
tor sampling. Liquid additions and sampling are
expected to cause DO spikes because they disturb
the headspace and alter the working volume. The time
for the DO traces to equilibrate to setpoint after such
manipulations would depend on the controller setup,
the cell metabolism and its associated sparge require-
ment. The slight difference in DO amongst the
Cytotechnology
123
replicates of cell line 1 and cell line 4 from day 10 to
day 12 (Fig. 1a) is attributed to volume differences:
three out of six replicates were sampled on day 10 for
titer and product quality. These three replicates had
lower volume and therefore higher DO levels under
constant air flow compared to the other replicates.
After sampling the second set of three replicates on
day 12 for titer and product quality, all replicates
achieved equal working volumes, and the resulting
DO profiles between vessels were comparable. Cell
lines 2 and 3 also had the same volume difference
amongst replicates on days 10 and 12. However, the
volume difference did not result in different DO levels
because these cell lines consumed more oxygen and
required oxygen supplementation to maintain DO at
setpoint.
Off-line pO2 measurements indicate that there was
no oxygen limitation in all three vessel types (Fig. 1b).
2enillleC1enillleC
4enillleC3enillleC
0
20
40
60
80
100
Run time (d)
%D
O
0
20
40
60
80
100
Run time (d)
%D
O
0
20
40
60
80
100
Run time (d)
%D
O
0
20
40
60
80
100
0 2 4 6 8 10 12 14 0 2 4 6 8 10 12 14
0 2 4 6 8 10 12 14 0 2 4 6 8 10 12 14
Run time (d)
%D
O
ambr (black, n=6) 2L BR (gray, n=1)
2enillleC1enillleC
4enillleC3enillleC
ambr 2L BR SF
0
50
100
150
Run Time (d)
pO
2 (m
mH
g)
0
50
100
150
Run Time (d)
pO
2 (m
mH
g)
0
50
100
150
Run Time (d)
pO
2 (m
mH
g)
0
50
100
150
200
0 2 4 6 8 10 12 14 0 2 4 6 8 10 12 14
0 2 4 6 8 10 12 14 0 2 4 6 8 10 12 14
Run Time (d)
pO
2 (m
mH
g)
6.8
6.9
7
7.1
7.2
Run time (d)
pH
6.8
6.9
7
7.1
7.2
Run time (d)
pH
6.8
6.9
7
7.1
7.2
Run time (d)
pH
6.8
6.9
7
7.1
7.2
0 2 4 6 8 10 12 14 0 2 4 6 8 10 12 14
0 2 4 6 8 10 12 14 0 2 4 6 8 10 12 14
Run time (d)
pH
2enillleC1enillleC
4enillleC3enillleC
ambr (black, n=6) 2L BR (gray, n=1)
2enillleC1enillleC
Cell line 3 Cell line 4
-5
0
5
10
15
0 2 4 6 8 10 12 14
Run Time (d)
Glu
cose
(g
/L)
0
2
4
6
8
10
Lac
tate
(g
/L)
-5
0
5
10
15
20
0 2 4 6 8 10 12 14
Run Time (d)
Glu
cose
(g
/L)
0
2
4
6
8
10
Lac
tate
(g
/L)
-5
0
5
10
15
0 2 4 6 8 10 12 14
Run Time (d)
Glu
cose
(g
/L)
0
5
10
15
Lac
tate
(g
/L)
-5
0
5
10
15
0 2 4 6 8 10 12 14
Run Time (d)
Glu
cose
(g
/L)
0
4
8
12
Lac
tate
(g
/L)
ambr glucose 2L BR glucose SF glucoseambr lactate 2L BR lactate SF lactate
a
c d
b
Fig. 1 Profiles of fed-batch cultures in parallel ambrTM vessels
(ambr; n = 6), 2-L bioreactors (2L BR; n = 2 except where
denoted), and shake flasks (SF; n = 2 except where denoted) for
four cell lines: a online dissolved oxygen, b off-line pO2 (SF
n = 1), c online pH, d glucose and lactate, e off-line pH, f off-
line pCO2 (SF n = 1), g antibody titer, h VCC and viability,
i Na? and osmolality, and j amino acids at harvest. Error barsrepresent ±1 SD
Cytotechnology
123

The off-line pO2 profile for the ambrTM cultures
trended with the online DO profile (Fig. 1a). If DO in
all the cultures was maintained at 30 % of air saturation
throughout the off-line sampling process, we would
expect the off-line pO2 readings to approximate
50 mmHg. We attribute the off-line pO2 readings that
were lower than 50 mmHg to the drop in DO between
the time of culture sampling and the time of assay by
the Bioprofile 400 for high cell density cultures. Using
oxygen uptake rates of 0.6–1.5 9 10-13 mol O2
cell-1 h-1 measured for CHO cells (Keane et al.
2003; Lin et al. 1993), pO2 levels would decrease at
15–40 mmHg per minute for non-agitated culture
samples at high cell densities (*20 9 106 cells/mL).
In this experiment, the sampling-to-assay time ranged
from one minute for ambrTM cultures to several minutes
for 2-L bioreactor and shake flask cultures. Therefore,
the off-line pO2 readings may provide DO trends over
time in the cultures, but they would not accurately reflect
actual DO levels in the cultures.
pH
We configured the pH control strategy in the ambrTM
system to maintain pH around 7.0 and to match that of
the 2-L bioreactor. The ambrTM replicates showed
similar online pH profiles, with pH readings between
6.96 and 7.07 (Fig. 1c). All four cell lines required
ambr 2L BR SF
2enillleC1enillleC
Cell line 3 Cell line 4
6.6
6.8
7.0
7.2
7.4
Off
-lin
e p
H
6.6
6.8
7.0
7.2
7.4
Run Time (d)
Off
-lin
e p
H
5.6
6.0
6.4
6.8
7.2
Run Time (d)
Off
-lin
e p
H
6.4
6.6
6.8
7.0
7.2
7.4
Run Time (d)
0 2 4 6 8 10 12 14
0 2 4 6 8 10 12 14 0 2 4 6 8 10 12 14
0 2 4 6 8 10 12 14
Run Time (d)
Off
-lin
e p
H
2enillleC1enillleC
4enillleC3enillleC
ambr 2L BR SF
0
20
40
60
80
0 2 4 6 8 10 12 14
Run Time (d)
pC
O2
(mm
Hg
)
0
50
100
150
200
0 2 4 6 8 10 12 14
Run Time (d)
pC
O2
(mm
Hg
)
0
50
100
150
200
250
0 2 4 6 8 10 12 14
Run Time (d)
pC
O2
(mm
Hg
)
0
40
80
120
160
0 2 4 6 8 10 12 14
Run Time (d)
pC
O2
(mm
Hg
)
ambr 2L BR SF
2enillleC1enillleC
Cell line 3 Cell line 4
0.0
0.5
1.0
1.5
2.0
Run Time (d)
Tit
er (
g/L
)
0.0
0.5
1.0
1.5
2.0
2.5
Run Time (d)
Tit
er (
g/L
)
0.0
1.0
2.0
3.0
4.0
Run Time (d)
Tit
er (
g/L
)
0.0
1.0
2.0
3.0
4.0
0 2 4 6 8 10 12 14 0 2 4 6 8 10 12 14
0 2 4 6 8 10 12 14 0 2 4 6 8 10 12 14
Run Time (d)
Tit
er (
g/L
)
Cell line 1 Cell line 2
Cell line 3 Cell line 4
ambr VCC 2L BR VCC SF VCC
ambr Viability 2L BR Viability SF Viability
0
10
20
30
40
Run Time (d)
VC
C (
106 c
/mL
)
0
20
40
60
80
100
Via
bili
ty (
%)
0
10
20
30
40
Run Time (d)
VC
C (
106 c
/mL
)
0
20
40
60
80
100
Via
bili
ty (
%)
0
10
20
30
40
Run Time (d)
VC
C (
106 c
/mL
)
0
20
40
60
80
100
Via
bili
ty (
%)
0
10
20
30
40
0 2 4 6 8 10 12 14 0 2 4 6 8 10 12 14
0 2 4 6 8 10 12 14 0 2 4 6 8 10 12 14Run Time (d)
VC
C (
106 c
/mL
)
0
20
40
60
80
100
Via
bili
ty (
%)
e f
g h
Fig. 1 continued
Cytotechnology
123

2enillleC1enillleC
Cell line 3 Cell line 4
0
20
40
60
80
100
0 2 4 6 8 10 12 14
Run Time (d)N
a+ (m
M)
250
350
450
550
Osm
ola
lity
(mO
smo
/kg
)
0
20
40
60
80
100
0 2 4 6 8 10 12 14
Run Time (d)
Na+ (
mM
)
200
300
400
500
600
Osm
ola
lity
(mO
smo
/kg
)
0
20
40
60
80
100
0 2 4 6 8 10 12 14
Run Time (d)
Na+ (
mM
)
200
300
400
500
Osm
ola
lity
(mO
smo
/kg
)
0
20
40
60
80
100
0 2 4 6 8 10 12 14
Run Time (d)
Na+ (
mM
)
250
350
450
550
Osm
ola
lity
(mO
smo
/kg
)
ambr Na+ 2L BR Na+ SF Na+ambr osmolality 2L BR osmolality SF osmolality
05
101520
Amino Acid
Co
nc.
(m
M)
01234
Amino Acid
Co
nc.
(m
M)
01234
Amino Acid
Co
nc.
(m
M)
02468
1 2 3 4 5 6 7 8 9 10 11 12 13 14 15 16 17 18 19
1 2 3 4 5 6 7 8 9 10 11 12 13 14 15 16 17 18 19
1 2 3 4 5 6 7 8 9 10 11 12 13 14 15 16 17 18 19
1 2 3 4 5 6 7 8 9 10 11 12 13 14 15 16 17 18 19
Amino Acid
Co
nc.
(m
M)
Cell line 1
Cell line 2
Cell line 3
Cell line 4
ambr 2L BR SF
i
j
Fig. 1 continued
Cytotechnology
123

base addition approximately every 1–2 h during the
first 4 days of culture. By testing the pH increase per
unit volume of base added to our culture media, we
empirically determined the volume of base to add
upon each base trigger. Taking into consideration the
narrow pH range between the base trigger pH (6.97)
and target pH (7.0), as well as the minimum volume
for liquid addition (10 lL), we selected a diluted base
(0.5 M Na2CO3) for pH adjustment. This approach
enabled us to limit any pH overshoot during base
addition by the ambrTM to *0.03–0.04 units.
Although we could further lower the base concentra-
tion to reduce the pH overshoot, this would increase
the frequency of base addition. To avoid triggering
CO2 sparge from the *0.03–0.04 overshoot in pH, we
set the CO2 trigger at pH 7.05.
All cell lines required CO2 to maintain pH when
lactate was consumed (Fig. 1d). The timing of
switches between base and CO2 addition was similar
in ambrTM and 2-L bioreactors for all four cell lines.
For example, in both ambrTM and 2-L bioreactors, cell
line 1 required base addition from the initial part of the
culture until day 5. Between day 5 and day 7, cultures
in both types of bioreactor systems required CO2
addition to maintain pH because of lactate consump-
tion. After day 7, cultures in both bioreactor systems
required base because of lactate production. In line
with the spikes in the online DO profiles, the spikes in
the online pH profiles corresponded to headspace and
volume disturbances during additions and sampling.
Based on off-line pH measurements, both the
ambrTM and 2-L bioreactor cultures successfully
maintained pH around 7.0 (Fig. 1e). The average
offset between online and off-line pH values over all
measurements was 0.05 units for both bioreactor
systems. Off-line pH measurements also indicated that
culture pH in shake flasks drifted downward for all cell
lines, to as low as 5.8 for cell line 4. The pCO2 profiles
in the ambrTM cultures were more similar to those of
the corresponding 2-L bioreactor cultures than to the
parallel shake flask cultures (Fig. 1f). Because we
used shake flasks with vented caps and maintained the
agitated shake flask cultures in incubators with 5 %
CO2 overlay, we expected the pCO2 levels measured
in these bicarbonate-buffered cultures to be in equi-
librium with the CO2 levels of their environment. Our
off-line pCO2 measurements for the shake flask
cultures—showing that pCO2 levels remained rela-
tively constant at approximately 40 mmHg throughout
the duration of the shake flask culture—are consistent
with this expectation.
Cell culture performance comparison
The ambrTM and 2-L bioreactor cultures trended
similarly in titer, growth, and metabolites, whereas
the shake flask cultures showed greater deviation from
the bioreactor cultures (Fig. 1d, g–j).
Titer and growth
The four recombinant CHO cell lines used in this study
were chosen to span a range of titers in 2-L bioreactors
(Fig. 1g). Day 14 titers (Table 1) in ambrTM cultures
deviated from the 2-L bioreactor cultures by an
average of 8 % (5, 5, 5, and 17 %, respectively, for
cell lines 1, 2, 3, and 4), which is close to the 5 %
coefficient of variation typically expected for the titer
Fig. 2 Online DO profiles
of fed-batch cultures in
parallel 2-L bioreactors (2L
BR) and ambrTM vessels
(ambr) with different
agitation rates and air flow
rates
Cytotechnology
123
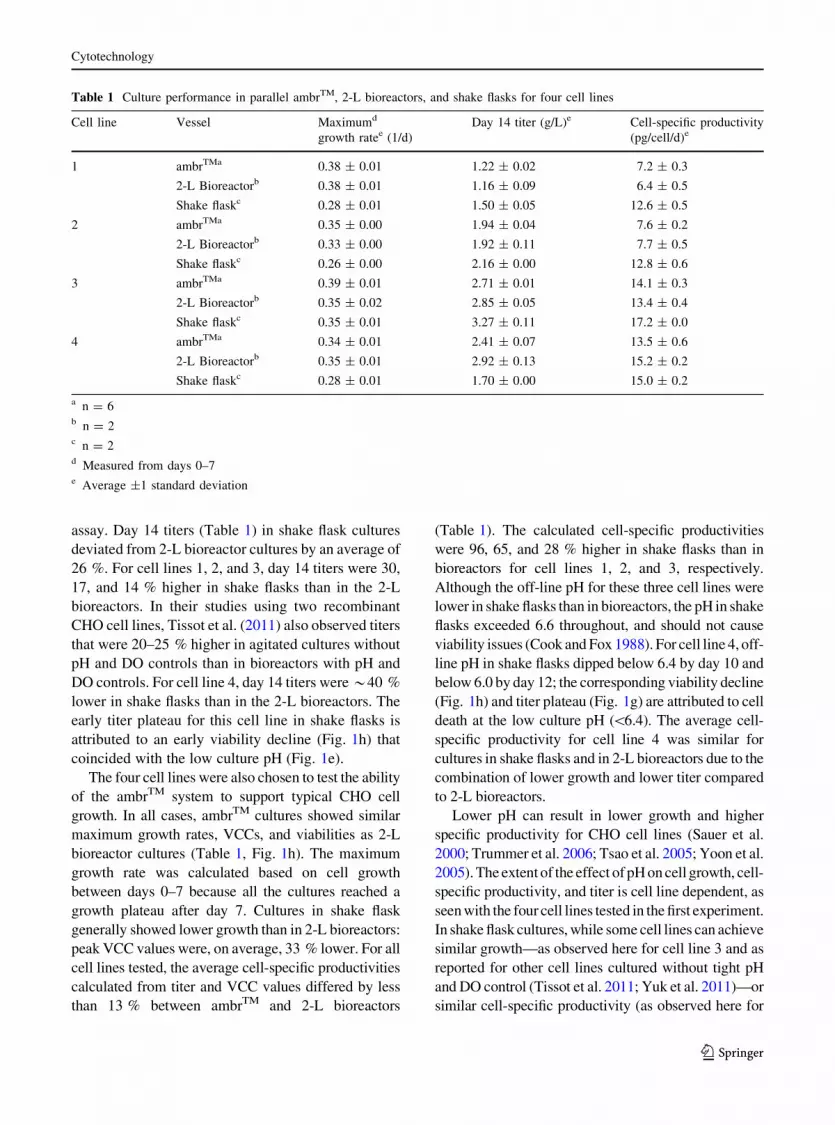
assay. Day 14 titers (Table 1) in shake flask cultures
deviated from 2-L bioreactor cultures by an average of
26 %. For cell lines 1, 2, and 3, day 14 titers were 30,
17, and 14 % higher in shake flasks than in the 2-L
bioreactors. In their studies using two recombinant
CHO cell lines, Tissot et al. (2011) also observed titers
that were 20–25 % higher in agitated cultures without
pH and DO controls than in bioreactors with pH and
DO controls. For cell line 4, day 14 titers were *40 %
lower in shake flasks than in the 2-L bioreactors. The
early titer plateau for this cell line in shake flasks is
attributed to an early viability decline (Fig. 1h) that
coincided with the low culture pH (Fig. 1e).
The four cell lines were also chosen to test the ability
of the ambrTM system to support typical CHO cell
growth. In all cases, ambrTM cultures showed similar
maximum growth rates, VCCs, and viabilities as 2-L
bioreactor cultures (Table 1, Fig. 1h). The maximum
growth rate was calculated based on cell growth
between days 0–7 because all the cultures reached a
growth plateau after day 7. Cultures in shake flask
generally showed lower growth than in 2-L bioreactors:
peak VCC values were, on average, 33 % lower. For all
cell lines tested, the average cell-specific productivities
calculated from titer and VCC values differed by less
than 13 % between ambrTM and 2-L bioreactors
(Table 1). The calculated cell-specific productivities
were 96, 65, and 28 % higher in shake flasks than in
bioreactors for cell lines 1, 2, and 3, respectively.
Although the off-line pH for these three cell lines were
lower in shake flasks than in bioreactors, the pH in shake
flasks exceeded 6.6 throughout, and should not cause
viability issues (Cook and Fox 1988). For cell line 4, off-
line pH in shake flasks dipped below 6.4 by day 10 and
below 6.0 by day 12; the corresponding viability decline
(Fig. 1h) and titer plateau (Fig. 1g) are attributed to cell
death at the low culture pH (\6.4). The average cell-
specific productivity for cell line 4 was similar for
cultures in shake flasks and in 2-L bioreactors due to the
combination of lower growth and lower titer compared
to 2-L bioreactors.
Lower pH can result in lower growth and higher
specific productivity for CHO cell lines (Sauer et al.
2000; Trummer et al. 2006; Tsao et al. 2005; Yoon et al.
2005). The extent of the effect of pH on cell growth, cell-
specific productivity, and titer is cell line dependent, as
seen with the four cell lines tested in the first experiment.
In shake flask cultures, while some cell lines can achieve
similar growth—as observed here for cell line 3 and as
reported for other cell lines cultured without tight pH
and DO control (Tissot et al. 2011; Yuk et al. 2011)—or
similar cell-specific productivity (as observed here for
Table 1 Culture performance in parallel ambrTM, 2-L bioreactors, and shake flasks for four cell lines
Cell line Vessel Maximumd
growth ratee (1/d)
Day 14 titer (g/L)e Cell-specific productivity
(pg/cell/d)e
1 ambrTMa 0.38 ± 0.01 1.22 ± 0.02 7.2 ± 0.3
2-L Bioreactorb 0.38 ± 0.01 1.16 ± 0.09 6.4 ± 0.5
Shake flaskc 0.28 ± 0.01 1.50 ± 0.05 12.6 ± 0.5
2 ambrTMa 0.35 ± 0.00 1.94 ± 0.04 7.6 ± 0.2
2-L Bioreactorb 0.33 ± 0.00 1.92 ± 0.11 7.7 ± 0.5
Shake flaskc 0.26 ± 0.00 2.16 ± 0.00 12.8 ± 0.6
3 ambrTMa 0.39 ± 0.01 2.71 ± 0.01 14.1 ± 0.3
2-L Bioreactorb 0.35 ± 0.02 2.85 ± 0.05 13.4 ± 0.4
Shake flaskc 0.35 ± 0.01 3.27 ± 0.11 17.2 ± 0.0
4 ambrTMa 0.34 ± 0.01 2.41 ± 0.07 13.5 ± 0.6
2-L Bioreactorb 0.35 ± 0.01 2.92 ± 0.13 15.2 ± 0.2
Shake flaskc 0.28 ± 0.01 1.70 ± 0.00 15.0 ± 0.2
a n = 6b n = 2c n = 2d Measured from days 0–7e Average ±1 standard deviation
Cytotechnology
123

cell line 4), other cell lines may show lower growth (as
observed here for cell lines 1, 2, and 4) or higher cell-
specific productivity (as observed here for cell lines 1
and 2). The resulting effect on titer would reflect the net
effect on both growth and cell-specific productivity.
Glucose and lactate
The ambrTM cultures showed similar glucose profiles
and required glucose feeds at the same time as 2-L
bioreactor cultures (Fig. 1d). By contrast, all the
corresponding shake flask cultures consumed less
glucose, similar to observations by Tissot et al. (2011)
with CHO cells cultured in orbitally-shaken vessels
without pH and DO control. The four cell lines also
exhibited a range of lactate production and consump-
tion behaviors. For all these cell lines, ambrTM cultures
exhibited similar lactate profiles as 2-L bioreactor
cultures (Fig. 1d). By contrast, shake flask cultures
exhibited peak lactate levels that were 20–25 % lower
than 2-L bioreactor cultures, also similar to observa-
tions by Tissot et al. (2011). The higher glucose levels
and lower lactate profiles observed in the shake flasks
(as compared to the ambrTM and 2-L bioreactor
cultures) are consistent with the expected decrease in
glucose consumption and lactate production when
CHO cells are cultured at lower pH (Trummer et al.
2006; Tsao et al. 2005; Yoon et al. 2005).
Na?, osmolality, and amino acids
Since the four cell lines showed different lactate
profiles (Fig. 1d), they are also expected to differ in
their Na? and osmolality profiles (Fig. 1i) when
cultured using Na2CO3 addition for pH control. In
the shake flask cultures, Na? profiles are identical for
all four cell lines, consistent with the lack of pH
adjustment. For each cell line, both the ambrTM and
2-L bioreactors maintained pH at *7.0 (Fig. 1c), and
showed similar Na? profiles. Because the Na? con-
tribution from the production media and nutrient feeds
should be identical, and evaporation rates are compa-
rably low in both systems (\2 %), similar Na? profiles
indicate similar base usage throughout the culture
duration. The increase in Na? concentration can be
used to estimate the base requirement, and thus a
predictor for basic titrant needed during process scale-
up. Consistent with the similar Na? (Fig. 1i), growth
(Fig. 1h), glucose and lactate (Fig. 1d) profiles, the
osmolality profiles were also similar between the
ambrTM and 2-L bioreactor cultures (Fig. 1i).
Analysis of the spent media at the end of the culture
showed similar amino acid concentrations between the
ambrTM and the 2-L bioreactor cultures for all four cell
lines (Fig. 1j). The shake flask cultures showed higher
amino acid concentrations in the spent media than the
ambrTM and 2-L bioreactor cultures for cell line 4; the
decline in viability during the last few days of the shake
flask cultures for cell line 4 should lower nutrient
consumption. Although the amino acid assay can
measure 21 amino acids, two amino acids were below
the level of detection in all the cultures; therefore the data
here show the concentrations for only 19 amino acids.
Product quality
Samples were taken from the three culture systems on
days 10, 12 and 14 and analyzed for key product quality
attributes: glycan distribution, molecular size distribu-
tion, and charge heterogeneity. For each cell line tested,
all product quality attributes analyzed were comparable
in the three culture systems in general (Table 2). The
glycan distribution quantifies the three main species of
N-linked glycans in the Fc domain of IgG with zero
(G0), or one (G1) terminal galactose residue, or with
terminal mannose residues (Man 5), as detailed by
Gennaro and Salas-Solano (2008). The molecular size
distribution quantifies the high molecular weight spe-
cies (HMWS), monomer (main), and low molecular
weight species (LMWS). The charge heterogeneity
distribution quantifies the acidic, main, and basic
species captured by icIEF (Zhang et al. 2011).
Automation and other capabilities
In this evaluation, the ambrTM system successfully
maintained sterility and executed all automated steps.
The ambrTM workstation also reduced manual oper-
ations by automating liquid additions such as bolus
nutrient feeds and glucose feeds, and sampling for off-
line analyses. For example, the workstation transferred
samples from the culture vessels into Vi-Cell cups, and
diluted the samples prior to cell counting by the Vi-
Cell XR system. By automating routine operations, the
ambrTM system increased throughput and operational
ease over the 2-L bioreactors. The single-use feature
of the ambrTM vessels also provided additional time
savings over the 2-L bioreactors.
Cytotechnology
123

Table 2 Day 14 product quality (glycan distribution, molecular size distribution, and charge heterogeneity) for samples from
ambrTM, 2-L bioreactor, and shake flask cultures
Cell Line Vessel % G0d % G1d % Man5d
Glycan distribution
1 ambrTMa 81.3 ± 0.4 14.8 ± 0.3 0.6 ± 0.0
2-L Bioreactorb 82.7 ± 0.1 12.2 ± 1.9 0.5 ± 0.0
Shake flaskc 84.4 ± 0.1 10.5 ± 0.1 0.5 ± 0.1
2 ambrTMa 89.5 ± 0.2 6.0 ± 0.2 0.5 ± 0.0
2-L Bioreactorb 89.9 ± 0.3 5.2 ± 0.1 0.5 ± 0.0
Shake flaskc 89.4 ± 0.3 5.1 ± 0.1 0.7 ± 0.0
3 ambrTMa 88.0 ± 0.3 5.9 ± 0.2 0.6 ± 0.1
2-L Bioreactorb 84.3 ± 3.2 9.0 ± 2.2 0.6 ± 0.2
Shake flaskc 88.4 ± 0.3 3.9 ± 0.0 1.0 ± 0.0
4 ambrTMa 88.6 ± 0.2 5.9 ± 0.1 0.5 ± 0.1
2-L Bioreactorb 87.6 ± 0.3 6.4 ± 0.3 0.5 ± 0.0
Shake flaskc 87.3 ± 0.1 4.9 ± 0.1 1.2 ± 0.1
Cell Line Vessel %HMWSd %Maind %LMWSd
Molecular size distribution
1 ambrTMa 2.0 ± 0.1 97.8 ± 0.1 0.2 ± 0.1
2-L Bioreactorb 2.0 ± 0.0 97.8 ± 0.0 0.3 ± 0.0
Shake flaskc 1.8 ± 0.1 97.9 ± 0.0 0.3 ± 0.0
2 ambrTMa 2.9 ± 0.2 96.4 ± 0.1 0.8 ± 0.1
2-L Bioreactorb 1.6 ± 0.6 97.1 ± 0.6 1.3 ± 0.0
Shake flaskc 2.3 ± 0.0 96.7 ± 0.0 1.0 ± 0.1
3 ambrTMa 1.6 ± 0.1 98.2 ± 0.0 0.2 ± 0.0
2-L Bioreactorb 1.5 ± 0.2 98.3 ± 0.1 0.3 ± 0.1
Shake flaskc 1.5 ± 0.0 98.0 ± 0.4 0.5 ± 0.4
4 ambrTMa 1.8 ± 0.1 98.0 ± 0.0 0.2 ± 0.1
2-L Bioreactorb 1.2 ± 0.1 98.5 ± 0.1 0.3 ± 0.0
Shake flaskc 2.3 ± 0.1 97.5 ± 0.0 0.3 ± 0.0
Cell Line Vessel %Acidicd %Maind %Basicd
Charge heterogeneity
1 ambrTMa 22.9 ± 0.1 69.9 ± 0.2 7.2 ± 0.1
2-L Bioreactorb 25.7 ± 1.1 68.3 ± 1.5 6.1 ± 0.4
Shake flaskc 22.7 ± 0.2 71.9 ± 0.2 5.4 ± 0.4
2 ambrTMa 25.9 ± 0.3 69.5 ± 0.6 4.6 ± 0.4
2-L Bioreactorb 26.6 ± 1.4 69.2 ± 2.5 4.3 ± 1.0
Shake flaskc 25.4 ± 1.1 71.0 ± 1.2 3.6 ± 0.1
3 ambrTMa 24.0 ± 0.3 60.3 ± 0.7 15.7 ± 0.5
2-L Bioreactorb 26.9 ± 1.6 60.1 ± 0.4 13.0 ± 1.1
Shake flaskc 25.7 ± 0.3 64.3 ± 1.6 10.0 ± 1.2
4 ambrTMa 24.9 ± 1.2 56.1 ± 1.2 19.0 ± 0.2
2-L Bioreactorb 27.7 ± 0.4 56.3 ± 1.8 16.0 ± 2.2
Shake flaskc 33.4 ± 0.2 56.0 ± 0.3 10.6 ± 0.5
a n = 4b n = 2c n = 2d Average ±1 standard deviation
Cytotechnology
123

Conclusions
For the four CHO cell lines chosen to represent the
range of growth, metabolism, and productivities
typically observed in our fed-batch cultures, we
observed consistent performance among replicates in
ambrTM bioreactors, and similar performance between
the ambrTM and 2-L bioreactor cultures. However, the
performance in shake flask cultures—in terms of
growth, viability, metabolism, titer, and cell-specific
productivity—was generally not representative of the
performance in the bioreactor cultures. By providing
pH and DO control and an automated liquid handling
system, the ambrTM system overcomes some of the
limitations of conventional small-scale cultures ves-
sels such as shake flasks. By supplying single-use, pre-
calibrated, and instrumented vessels, the ambrTM
system provides a higher throughput platform for cell
culture process development in a stirred-tank biore-
actor environment.
Acknowledgments The authors thank cell line development
groups for generating the CHO cell lines evaluated; B6 media
preparation group for supplying all the media and solutions
used; cell banking group for supplying ampoules; Peter Harms
and Louis Cheung for discussions on methods of higher
throughput for off-line analysis; Analytical Operations group,
especially Yun Tang, Kevin Lin, and Renee Yang, for providing
analytical support for titer, product quality and amino acid
assays; Andy Lin and John Joly for guidance and support.
References
Bareither R, Pollard D (2011) A review of advanced small-scale
parallel bioreactor technology for accelerated process
development: current state and future need. Biotechnol
Prog 27:2–14
Betts JI, Baganz F (2006) Miniature bioreactors: current prac-
tices and future opportunities. Microb Cell Fact 5:21
Chisti Y (1993) Animal cell culture in stirred bioreactors:
observations on scale-up. Process Biochem 28:511–517
Cohen SA, Michaud DP (1993) Synthesis of a fluorescent
derivatizing reagent, 6-aminoquinolyl-N-hydroxysuccinimidyl
carbamate, and its application for the analysis of hydrolysate
aminoacidsviahigh-performance liquidchromatography.Anal
Biochem 211:279–287
Cook JA, Fox MH (1988) Effects of chronic pH 6.6 on growth,
intracellular pH, and response to 42.0 �C hyperthermia of
Chinese Hamster Ovary cells. Cancer Res 48:2417–2420
Gennaro LA, Salas-Solano O (2008) On-line CE-LIF-MS tech-
nology for the direct characterization of N-linked glycans
from therapeutic antibodies. Anal Chem 80:3838–3845
Guo D, Gao A, Michels DA, Feeney L, Eng M, Chan B, Laird
MW, Zhang B, Yu XC, Joly J, Snedecor B, Shen A (2010)
Mechanisms of unintended amino acid sequence changes in
recombinant monoclonal antibodies expressed in Chinese
hamster ovary (CHO) cells. Biotechnol Bioeng 107:163–171
Hopp J, Pritchett R, Darlucio M, Ma J, Chou JH (2009)
Development of a high throughput protein a well-plate
purification method for monoclonal antibodies. Biotechnol
Prog 25:1427–1432
Keane JT, Ryan D, Gray PP (2003) Effect of shear stress on
expression of a recombinant protein by Chinese Hamster
Ovary cells. Biotechnol Bioeng 81:211–220
Kondragunta B, Drew JL, Brorson KA, Moreira AR, Rao G
(2010) Advances in clone selection using high-throughput
bioreactors. Biotechnol Prog 26:1095–1103
Kumar S, Wittmann C, Heinzle E (2004) Minibioreactors.
Biotechnol Lett 26:1–10
Lewis G, Lugg R, Lee K, Wales R (2010) Novel automated micro-
scale bioreactor technology: a qualitative and quantitative
mimic for early process development. Bioprocess J 9:22–25
Lin AA, Kimura R, Miller WM (1993) Production of tPA in
recombinant CHO cells under oxygen-limited conditions.
Biotechnol Bioeng 42:339–350
Restelli V, Wang MD, Huzel N, Ethier M, Perreault H, Butler M
(2006) The effect of dissolved oxygen on the production and
the glycosylation profile of recombinant human erythropoie-
tin produced from CHO cells. Biotechnol Bioeng 94:481–494
Sauer PW, Burky JE, Wesson MC, Sternard HD, Qu L (2000) A
high-yielding, generic fed-batch cell culture process for
production of recombinant antibodies. Biotechnol Bioeng
67:585–597
Tissot S, Oberbek A, Reclari M, Dreyer M, Hacker DL, Baldi L,
Farhat M, Wurm FM (2011) Efficient and reproducible
mammalian cell culture bioprocesses without probes and
controllers? N Biotechnol 28:382–390
Trummer E, Fauland K, Seidinger S, Schriebl K, Lattenmayer C,
Kunert R, Vorauer-Uhl K, Weik R, Borth N, Katinger H,
Muller D (2006) Process parameter shifting: part I. Effect
of DOT, pH, and temperature on the performance of Epo-
Fc expressing CHO cells cultivated in controlled batch
bioreactors. Biotechnol Bioeng 94:1033–1044
Tsao Y-S, Cardoso AG, Condon RGG, Voloch M, Lio P, Lagos
JC, Kearns BG, Liu Z (2005) Monitoring Chinese hamster
ovary cell culture by the analysis of glucose and lactate
metabolism. J Biotechnol 118:316–327
Varley J, Birch J (1999) Reactor design for large scale suspen-
sion animal cell culture. Cytotechnology 29:177–205
Yoon SK, Choi SL, Song JY, Lee GM (2005) Effect of culture
pH on Erythropoietin production by Chinese Hamster
Ovary cells grown in suspension at 32.5 and 37.0 �C.
Biotechnol Bioeng 89:345–356
Yuk IH, Baskar D, Duffy PH, Hsiung J, Leung S, Lin AA (2011)
Overcoming challenges in WAVE bioreactors without
feedback controls for pH and dissolved oxygen. Biotechnol
Prog 27:1397–1406
Zhang L, Lilyestrom W, Li C, Scherer T, van Reis R, Zhang B
(2011) Revealing a positive charge patch on a recombinant
monoclonal antibody by chemical labeling and mass
spectrometry. Anal Chem 83:8501–8508
Cytotechnology
123