Embed Size (px)
Citation preview
African Journal of
Agricultural Research Volume 11 Number 21 26 May 2016
ISSN 1991-637X

ABOUT AJAR The African Journal of Agricultural Research (AJAR) is published weekly (one volume per year) by Academic Journals.
African Journal of Agricultural Research (AJAR) is an open access journal that publishes high-quality solicited and unsolicited articles, in English, in all areas of agriculture including arid soil research and rehabilitation, agricultural genomics, stored products research, tree fruit production, pesticide science, postharvest biology and technology, seed science research, irrigation, agricultural engineering, water resources management, marine sciences, agronomy, animal science, physiology and morphology, aquaculture, crop science, dairy science, entomology, fish and fisheries, forestry, freshwater science, horticulture, poultry science, soil science, systematic biology, veterinary, virology, viticulture, weed biology, agricultural economics and agribusiness. All articles published in AJAR are peer- reviewed.
Contact Us
Editorial Office: [email protected]
Help Desk: [email protected]
Website: http://www.academicjournals.org/journal/AJAR
Submit manuscript online http://ms.academicjournals.me/

. Editors
Prof. N.A. Amusa
Editor, African Journal of Agricultural Research Academic Journals.
Dr. Panagiota Florou-Paneri Laboratory of Nutrition, Faculty of Veterinary Medicine, Aristotle University of Thessaloniki, Greece.
Prof. Dr. Abdul Majeed Department of Botany, University of Gujrat,India, Director Horticulture, and landscaping. India.
Prof. Suleyman TABAN Department of Soil Science and Plant Nutrition, Faculty of Agriculture, Ankara University, 06100 Ankara-TURKEY.
Prof.Hyo Choi
Graduate School Gangneung-Wonju National University Gangneung, Gangwondo 210-
702, Korea.
Dr. MATIYAR RAHAMAN KHAN
AICRP (Nematode), Directorate of Research, Bidhan Chandra Krishi
Viswavidyalaya, P.O. Kalyani, Nadia, PIN-741235, West Bengal. India.
Prof. Hamid AIT-AMAR University of Science and Technology, Houari Bouemdiene, B.P. 32, 16111 EL-Alia, Algiers, Algeria.
Prof. Sheikh Raisuddin Department of Medical Elementology and
Toxicology,Jamia Hamdard (Hamdard University) New Delhi, India.
Prof. Ahmad Arzani Department of Agronomy and Plant Breeding College of Agriculture Isfahan University of Technology
Isfahan-84156, Iran.
Dr. Bampidis Vasileios
National Agricultural Research Foundation (NAGREF), Animal Research Institute 58100 Giannitsa, Greece.
Dr. Zhang Yuanzhi Laboratory of Space Technology, University of Technology (HUT) Kilonkallio Espoo, Finland. Dr. Mboya E. Burudi International Livestock Research Institute (ILRI) P.O. Box 30709 Nairobi 00100, Kenya. Dr. Andres Cibils Assistant Professor of Rangeland Science
Dept. of Animal and Range Sciences Box 30003, MSC 3-I New Mexico State University Las Cruces, NM 88003 (USA). Dr. MAJID Sattari
Rice Research Institute of Iran, Amol-Iran. Dr. Agricola Odoi University of Tennessee, TN., USA.
Prof. Horst Kaiser Department of Ichthyology and Fisheries Science Rhodes University, PO Box 94, South Africa.
Prof. Xingkai Xu Institute of Atmospheric Physics, Chinese Academy of Sciences, Beijing 100029,
China.
Dr. Agele, Samuel Ohikhena Department of Crop, Soil and Pest Management, Federal University of Technology
PMB 704, Akure, Nigeria. Dr. E.M. Aregheore The University of the South Pacific, School of Agriculture and Food Technology Alafua Campus, Apia, SAMOA

Editorial Board
Dr. Bradley G Fritz Research Scientist, Environmental Technology Division, Battelle, Pacific Northwest National Laboratory, 902 Battelle Blvd., Richland, Washington, USA.
Dr. Almut Gerhardt LimCo International, University of Tuebingen, Germany.
Dr. Celin Acharya Dr. K.S.Krishnan Research Associate (KSKRA), Molecular Biology Division, Bhabha Atomic Research Centre (BARC), Trombay, Mumbai-85, India.
Dr. Daizy R. Batish Department of Botany, Panjab University, Chandigarh, India.
Dr. Seyed Mohammad Ali Razavi University of Ferdowsi, Department of Food Science and Technology, Mashhad, Iran.
Dr. Yasemin Kavdir
Canakkale Onsekiz Mart University, Department of Soil Sciences, Terzioglu Campus 17100 Canakkale Turkey.
Prof. Giovanni Dinelli Department of Agroenvironmental Science and Technology Viale Fanin 44 40100, Bologna
Italy.
Prof. Huanmin Zhou College of Biotechnology at Inner Mongolia Agricultural University, Inner Mongolia Agricultural University, No. 306# Zhao Wu Da Street, Hohhot 010018, P. R. China, China.
Dr. Mohamed A. Dawoud Water Resources Department, Terrestrial Environment Research Centre, Environmental Research and Wildlife Development Agency (ERWDA), P. O. Box 45553, Abu Dhabi, United Arab Emirates.
Dr. Phillip Retief Celliers
Dept. Agriculture and Game Management, PO BOX 77000, NMMU, PE, 6031, South Africa.
Dr. Rodolfo Ungerfeld Departamento de Fisiología, Facultad de Veterinaria, Lasplaces 1550, Montevideo 11600, Uruguay. Dr. Timothy Smith Stable Cottage, Cuttle Lane, Biddestone, Chippenham, Wiltshire, SN14 7DF. UK. Dr. E. Nicholas Odongo,
27 Cole Road, Guelph, Ontario. N1G 4S3 Canada. Dr. D. K. Singh Scientist Irrigation and Drainage Engineering Division, Central Institute of Agricultural Engineeinrg Bhopal- 462038, M.P. India.
Prof. Hezhong Dong Professor of Agronomy, Cotton Research Center, Shandong Academy of Agricultural Sciences, Jinan 250100 China.
Dr. Ousmane Youm Assistant Director of Research & Leader, Integrated Rice Productions Systems Program Africa Rice Center (WARDA) 01BP 2031, Cotonou, Benin.

Table of Contents: Volume 11 Number 21, 2 6 May, 2016
ARTICLES
Evaluation of physiological quality of lettuce and rocket salad seeds in the presence of purple nuts edget extract 1887 Ivana da Silva Gomes, Cleiton da Silva Oliveira, Ana Paula Pelosi, Lara Cristina Pereira da Silva Pacheco, Cleiton Gredson Sabin Benett and Katiane Santiago Silva Benett
Performance of SMA-C model on crop evapotranspiration estimation 1894 Bruno Patias Lena, Rogério Teixeira de Faria, Alexandre Barcellos Dalri, Luiz Fabiano Palaretti, and Miquéias Gomes dos Santos
A meta-analysis of in situ degradability of corn grains and non-starch energy sources found in Brazil 1902 Marcos Busanello, João Pedro Velho, Antônio Augusto Cortiana Tambara, Dileta Regina Moro Alessio, Ione Maria Pereira Haygert-Velho and André Thaler Neto
Co-inoculation with rhizobacteria in association with humic acid and nitrogen on common bean development 1908 Érica de Oliveira Araújo, Juliana Guimarães Gerola, Juan Ricardo Rocha and Leandro Cecílio Matte
Artificial intelligence tools in predicting the volume of trees within a forest stand 1914 Eder Pereira Miguel, Fabrícia Conceição Menez Mota, Saulo Jorge Téo, Rodrigo Geroni Mendes Nascimento, Fabrício Assis Leal, Reginaldo Sérgio Pereira and Alba Valéria Rezende
Effects of water deficit on morphophysiology, productivity and chemical composition of Ocimum africanum Lour (Lamiaceae) 1924 Martielly Santana dos Santos, Lucinéia dos Santos Souza, Carlos Augusto Souza Costa, Fabio Pinto Gomes, Larissa Corrêa do Bomfim Costa, Rosilene Aparecida de Oliveira and Delmira da Costa Silva
The management of sowing density on yield and lodging in the main oat biotype grown in Brazil 1935
Marcos Vinicios Romitti, José Antonio Gonzalez da Silva, Anderson Marolli, Emilio Ghisleni Arenhardt, Ângela Teresinha Woschinski de Mamann, Osmar Bruneslau Scremin, Osório Antonio Lucchese, Cleusa Adriane Menegassi Bianchi Krüger, Lorenzo Ghisleni Arenhardt and Luis Michel Bandeira
African Journal of Agricultural Research

Table of Contents: Volume 11 Number 21, 26 M a y , 2016
African Journal of Agricultural Research
ARTICLES
Hoof trimming for effective health management: What cattle farmers need to know 1945 Ifeanyieze F. O., Ogunbosoye D. O. and Ikehi M. E. Lignification of the plant and related aspects of soaking seeds and soybean pod of RR and conventional cultivars 1952 Cristiane Fortes Gris, Edila Vilela de Resende Von Pinho, Francisco Carlos Krzyzanowski, José Renato Emiliorelli Evangelista, Willian César Freiria and Alexana Baldoni

Vol. 11(21), pp. 1887-1893, 26 May, 2016
DOI: 10.5897/AJAR2016.10956
Article Number: 565905758701
ISSN 1991-637X
Copyright ©2016
Author(s) retain the copyright of this article
http://www.academicjournals.org/AJAR
African Journal of Agricultural Research
Full Length Research Paper
Evaluation of physiological quality of lettuce and rocket salad seeds in the presence of purple nuts
edget extract
Ivana da Silva Gomes1, Cleiton da Silva Oliveira1, Ana Paula Pelosi2, Lara Cristina Pereira da Silva Pacheco1, Cleiton Gredson Sabin Benett2* and Katiane Santiago Silva Benett1
1State University of Goiás (UEG), Campus Ipameri, Ipameri, Goiás, Brazil.
2Federal Institute of Goiás (Instituto Federal Goiano), Campus Urutaí, Urutaí, Goiás, Brazil.
Received 2 March, 2016; Accepted 19 April, 2016
Purple nuts edge (Cyperus rotundus L.) is responsible for great losses in crop production areas. Purple nuts edge tubers possess substances with allelopathic effects on certain crops. The aim of this study was to evaluate the physiological quality of lettuce and rocket salad seeds grown on different substrates in the presence of purple nuts edge extract. A completely randomized experimental design was used with a 3×5 factorial scheme (three substrates × five doses of purple nuts edge extract) and four replicates of 50 seeds. The extract was diluted to four different concentrations (25, 50, 75 and 100%), and distilled water was used as a control treatment (0%). Seeds were sown in three different substrates: Germitest paper, sand or soil. The first and second germination count, the total germination and the germination speed index were evaluated. Lettuce germination was affected by the application of purple nuts edge extract to the tested substrates. Lower germination percentages were observed for sand than for the remaining tested substrates. The application of purple nuts edge extract did not affect the evaluated germination parameters for rocket salad seeds. The germination of lettuce and rocket salad seeds was higher with soil as substrate. Key words: Lactuca sativa L., Eruca sativa L., Cyperus rotundus L.
INTRODUCTION Olericulture plays an important role in Brazilian agriculture and the economy. One of the main obstacles to achieving high productivity in vegetable production is the high incidence of weeds, especially those that are
difficult to control. Searching for new management alternatives and for plants with allelopathic effects on other crops is important for producers to develop strategies that may increase production.
*Corresponding author. E-mail: [email protected]
Author(s) agree that this article remain permanently open access under the terms of the Creative Commons Attribution
License 4.0 International License

1888 Afr. J. Agric. Res.
Purple nuts edge (Cyperus rotundus L.) is an herbaceous perennial weed that reproduces both through seeds and vegetatively through bulbs, tubers and subterranean rhizomes and is considered one of the most important invasive plants in the world (Francineuma et al., 2005). It is responsible for extensive damage in production areas, especially due to its high photosynthetic efficiency and capacity to directly compete with crops for water, light and nutrients (Catunda et al., 2006).
Purple nuts edge can emerge and develop intensively at the beginning of the crop cycle. Although it is considered a small plant, it can substantially decrease the production of several crops due to the detrimental effects of its extensive subterranean structure and release of allelopathic substances (Novo et al., 2006; Durigan, 1991). Purple nuts edge is present in half of the agricultural soils in Brazil, regardless of the type of soil, climate and crops (Durigan et al., 2005).
Several plants possess allelopathic compounds. These chemical substances can interfere with seed germination and the development of other plants and can distinguish plants from the organisms that are beneficial or harmful to them (Mairesse et al., 2007). Purple nuts edge tubers possess substances with allelopathic effects on some crop species as well as insecticidal and repellent effects on arthropods. Furthermore, these substances act in synergy with indole acetic acid (IAA) and may be used to induce rooting on cuttings (Durigan et al., 2005; Quayyum et al., 2000; Costa, 1994).
Purple nuts edge presents high levels of indolebutyric acid (IBA), a plant hormone used in root formation and the improvement of bud formation on cuttings (Lorenzi, 2000). Exogenous application of IBA has been used to stimulate rooting of billets in several species (Alves Neto and Cruz-Silva, 2008). Purple nuts edge aqueous extracts have also been used to induce rooting and growth of Manihot esculenta cuttings (Mahmoud et al., 2009). However, purple nuts edge extracts have been observed to interfere with seed germination in some species (Muniz et al., 2007).
Bolzan (2003) evaluated the germination of corn, bean and lettuce seeds and bud germination of sugarcane billets in the presence of purple nuts edge leaf and bulb extracts, and they observed decreased germination in lettuce seeds treated with leaf or bulb extract.
Studying the influence of different substrates on the germination of species of interest is advisable because the physiological response of seeds varies with different substrates (Stockman et al., 2007). Factors such as the water holding capacity, degree of pathogen infestation and aeration may vary between different substrates and directly influence seed germination. The main function of the substrate is to supply support and maintain adequate conditions for germination and seedling development (Moraes et al., 2007; Cunha et al., 2006).
It is therefore important to evaluate the allelopathic
potential of purple nuts edge (Cyperus rotundus L.) extracts on seed germination. The aim of this study was to evaluate the physiological quality of lettuce and rocket salad seeds sown on different substrates in the presence of purple nuts edge extract. MATERIALS AND METHODS The experiment was performed at the Federal Institute of Goiás (Instituto Federal Goiano- IF Goiano), Campus Urutaí, located at Highway Geraldo Silva Nascimento, km 2.5, Rural Zone of the municipality of Urutaí, Goiás (GO), latitude 17° 27’ 49’’ S and longitude 48° 12’ 06’’ W, with an average altitude of 744 m.
A completely randomized experimental design was used for both experiments with a 3×5 factorial scheme. The factors tested included three substrates (germitest paper, soil and sand) and five doses of purple nuts edge extract (0, 25, 50, 75 and 100%). Four replicates of 100 seeds of each species (curly lettuce and rocket salad) were used. The extract was diluted to four different concentrations, where the 100% concentration consisted of sieved crude extract and distilled water was used for the control treatment (0%).
Lettuce and rocket salad seeds sold for commercial vegetable production were used. The germination tests were performed in BOD germinators at 25°C with a constant photoperiod. Purple nuts edge (C. rotundus) tubers were obtained from plants collected from a homogeneous area of the Institute and used for the preparation of an aqueous extract.
The extract was prepared using purple nuts edge tubers at a concentration of 100% according to the method of Bolzan (2003). A pure extract stock solution was obtained using 100 g of tubers per litre of distilled water, and this solution was then diluted to the different tested extract concentrations. The tubers were washed in running water and homogenized in distilled water using a liquefier, and the resulting solution was filtered.
The substrates were placed in gerbox-type acrylic boxes and moistened with purple nuts edge extract at the different tested concentrations. The field capacity of sand and soil was measured to determine the amount of water required to moisten the substrate. The germitest paper was moistened with 2.5 times the weight of the paper. Evaluations were performed 4 and 7 days after the beginning of the experiment according to the Rules for Seed Analysis (Seed Analysis Rule - SAR) (Brazil, 2009) for the tested species. Germination was quantified by measuring the formation of normal seedlings, radicle and shoot.
The first and second counts of germination were performed four and seven days following germination, respectively, and expressed as the percentage germination according to the method of Brazil (2009). Total germination was determined by adding the values for the first and second counts of germination. The speed of germination index was determined by daily counting of germinated seeds according to Maguire (1962). The data for the different substrates were subjected to a variance analysis (F test) followed by Tukey’s test at p<0.05. Regression analyses were performed for the data for the extract doses. All statistical analyses were performed using Sanest software.
RESULTS AND DISCUSSION
Lettuce experiment
A significant interaction between the type of substrate and dose of purple nuts edge extract was observed for all
Gomes et al. 1889
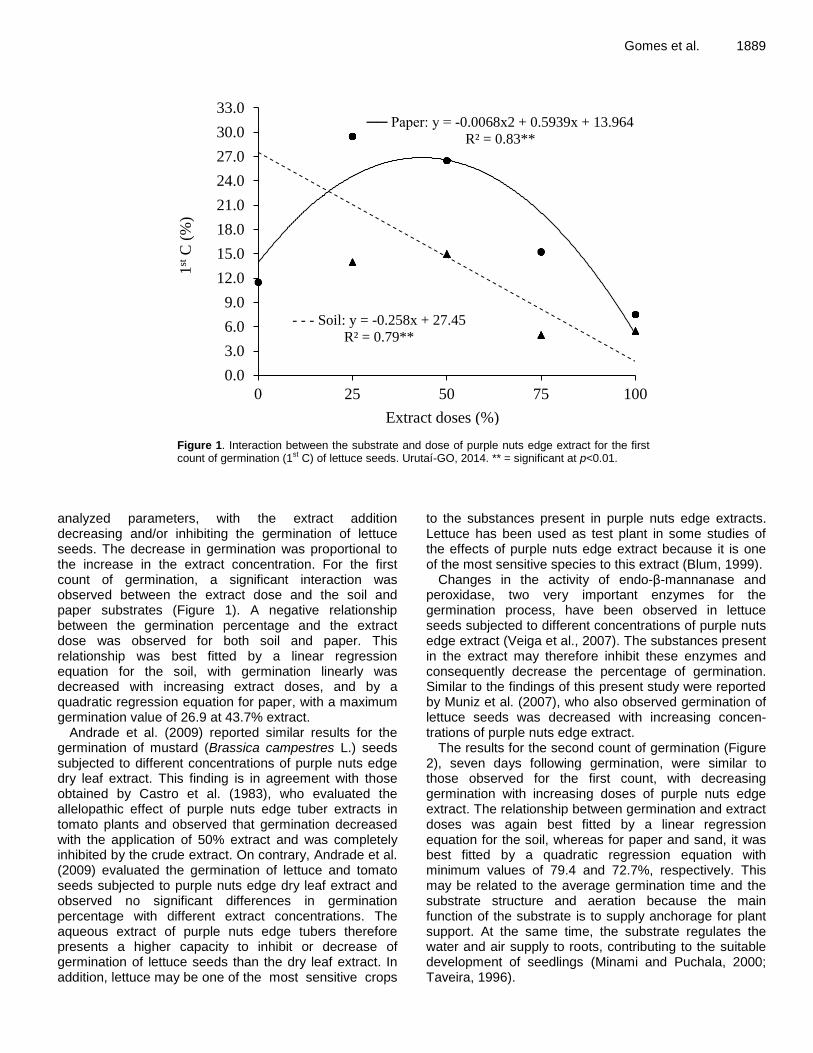
Figure 1. Interaction between the substrate and dose of purple nuts edge extract for the first count of germination (1st C) of lettuce seeds. Urutaí-GO, 2014. ** = significant at p<0.01.
analyzed parameters, with the extract addition decreasing and/or inhibiting the germination of lettuce seeds. The decrease in germination was proportional to the increase in the extract concentration. For the first count of germination, a significant interaction was observed between the extract dose and the soil and paper substrates (Figure 1). A negative relationship between the germination percentage and the extract dose was observed for both soil and paper. This relationship was best fitted by a linear regression equation for the soil, with germination linearly was decreased with increasing extract doses, and by a quadratic regression equation for paper, with a maximum germination value of 26.9 at 43.7% extract.
Andrade et al. (2009) reported similar results for the germination of mustard (Brassica campestres L.) seeds subjected to different concentrations of purple nuts edge dry leaf extract. This finding is in agreement with those obtained by Castro et al. (1983), who evaluated the allelopathic effect of purple nuts edge tuber extracts in tomato plants and observed that germination decreased with the application of 50% extract and was completely inhibited by the crude extract. On contrary, Andrade et al. (2009) evaluated the germination of lettuce and tomato seeds subjected to purple nuts edge dry leaf extract and observed no significant differences in germination percentage with different extract concentrations. The aqueous extract of purple nuts edge tubers therefore presents a higher capacity to inhibit or decrease of germination of lettuce seeds than the dry leaf extract. In addition, lettuce may be one of the most sensitive crops
to the substances present in purple nuts edge extracts. Lettuce has been used as test plant in some studies of the effects of purple nuts edge extract because it is one of the most sensitive species to this extract (Blum, 1999).
Changes in the activity of endo-β-mannanase and peroxidase, two very important enzymes for the germination process, have been observed in lettuce seeds subjected to different concentrations of purple nuts edge extract (Veiga et al., 2007). The substances present in the extract may therefore inhibit these enzymes and consequently decrease the percentage of germination. Similar to the findings of this present study were reported by Muniz et al. (2007), who also observed germination of lettuce seeds was decreased with increasing concen-trations of purple nuts edge extract.
The results for the second count of germination (Figure 2), seven days following germination, were similar to those observed for the first count, with decreasing germination with increasing doses of purple nuts edge extract. The relationship between germination and extract doses was again best fitted by a linear regression equation for the soil, whereas for paper and sand, it was best fitted by a quadratic regression equation with minimum values of 79.4 and 72.7%, respectively. This may be related to the average germination time and the substrate structure and aeration because the main function of the substrate is to supply anchorage for plant support. At the same time, the substrate regulates the water and air supply to roots, contributing to the suitable development of seedlings (Minami and Puchala, 2000; Taveira, 1996).
── Paper: y = -0.0068x2 + 0.5939x + 13.964
R² = 0.83**
- - - Soil: y = -0.258x + 27.45
R² = 0.79**
0.0
3.0
6.0
9.0
12.0
15.0
18.0
21.0
24.0
27.0
30.0
33.0
0 25 50 75 100
1
st C
(%
)
Extract doses (%)

1890 Afr. J. Agric. Res.
Figure 2. Interaction between the substrate and the purple nuts edge extract dose for the second count of germination (2nd C) of lettuce seeds.. * = p<0.01 (Urutaí-GO, 2014).
Figure 3. Interaction between the substrate and the purple nuts edge extract dose for the total germination (TG %) of lettuce seeds. ** = p<0.01 (Urutaí-GO, 2014).
A significant interaction between the substrate type and the purple nuts edge extract dose was observed for the total germination of lettuce (Figure 3). A negative relationship between the total germination and dose of
extract was observed for all tested substrates. This relationship was best fitted by a quadratic regression equation for sand, with minimum germination values at 72.9% extract, and by a linear regression equation for soil
— Paper: y = 0.0116x2 - 1.8419x + 77.536
R² = 0.93**
- -Sand: y = 0.0153x2 - 2.2234x + 76.943
R² = 0.90**
— - —Soil: y = -0.53x + 57.75
R² = 0.91**
0.0
10.0
20.0
30.0
40.0
50.0
60.0
70.0
80.0
90.0
0 25 50 75 100
2n
d C
(%
)
Extract doses (%)
---- Paper: y = -0.768x + 85.5
R² = 0.94** — Sand: y = 0.0158x2 - 2.3049x + 84.686
R² = 0.89**
— · — Soil: y = -0.788x + 85.2
R² = 0.88**
0.0
10.0
20.0
30.0
40.0
50.0
60.0
70.0
80.0
90.0
100.0
0 25 50 75 100
TG
(%
)
Extract doses (%)

Gomes et al. 1891
Figure 4. Effect of the substrate and purple nuts edge extract dose on the speed of germination index (SGI %) of lettuce seeds. ** = p<0.01. (Urutaí-GO, 2014).
and paper. This result shows the potential of purple nuts edge extract to decrease seed germination, especially for
lettuce. Gusman et al. (2012) evaluated the allelopathic effect of certain pharmaceutically important plant species
on several different crops, including lettuce, and observed a decrease in lettuce germination proportional to increasing extract concentrations, similar to the effect observed in this present study.
Periotto et al. (2004) observed the sensitivity of lettuce and radish germination to different concentrations of aqueous extracts of Andira humilis Mart. ex Benth. Aqueous, methanol and hexanol extracts of neem (Azadirachta indica A. Juss.) decreased the percentage germination of lettuce seeds (França et al., 2008). However, Pinus elliottii ethanol extracts had no allelopathic effect on lettuce, whereas Eucalyptus citriodora ethanol extracts significantly decreased its speed of germination (Ferreira et al., 2007).
The speed of germination index for lettuce seeds was negatively affected by the purple nuts edge aqueous extract, decreasing as increasing extract concentrations were applied to the substrate (Figure 4). This relationship was best fitted by linear regression equations for soil and paper and by a quadratic regression equation for sand, with a minimum speed of germination at 73% extract. This result is in accordance with the results of Gusman et al. (2012), who tested purple nuts edge aqueous extracts on tomato and rocket salad seeds and observed a decreased speed of germination index starting at 30% extract concentration when compared to the control treatment.
Rocket salad experiment No significant interactions between the extract dose and type of substrate were observed for any of the parameters evaluated for rocket salad seeds.
The average values for the first and second counts of germination, the total germination, and the speed of germination index for rocket salad seeds are presented in Table 1. A significant difference between the first and second counts of germination was observed with paper and soil as substrates (Table 1). Paper allowed the germination of rocket salad seeds but did not provide conditions that supplied vigour to the resulting seedlings. However, a significant positive effect of soil on the germination of rocket salad seeds was observed at the second count of germination.
No significant differences in the total germination and the speed of germination index were observed between treatments (Table 1). This result indicated that the purple nuts edge aqueous extract and the tested substrates did not affect seedling development, indicating a possible higher tolerance of rocket salad to purple nuts edge.
Gusman et al. (2012) tested the allelopathic effect of several different extracts on certain crops and observed that although purple nuts edge was the only species
__ __ Paper: y = -0,1096x + 12.206
R² = 0.94**
__ Sand: y = 0.0023x2 - 0.3295x + 12.097
R² = 0.89**
_._ Soil: y = -0.1128x + 12.194
R² = 0.88**
0.0
2.0
4.0
6.0
8.0
10.0
12.0
14.0
16.0
0 25 50 75 100
SG
I (%
)
Extract doses (%)
1892 Afr. J. Agric. Res.
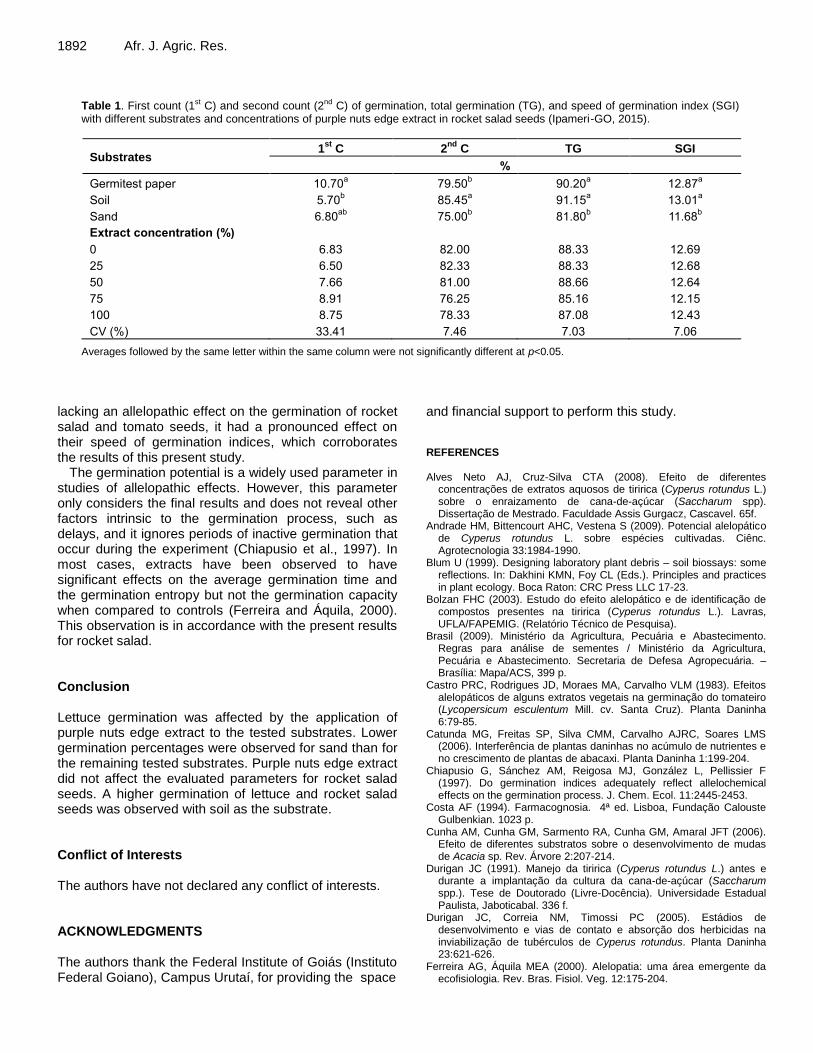
Table 1. First count (1st C) and second count (2nd C) of germination, total germination (TG), and speed of germination index (SGI) with different substrates and concentrations of purple nuts edge extract in rocket salad seeds (Ipameri-GO, 2015).
Substrates 1
st C 2
nd C TG SGI
%
Germitest paper 10.70a 79.50
b 90.20
a 12.87
a
Soil 5.70b 85.45
a 91.15
a 13.01
a
Sand 6.80ab
75.00b 81.80
b 11.68
b
Extract concentration (%)
0 6.83 82.00 88.33 12.69
25 6.50 82.33 88.33 12.68
50 7.66 81.00 88.66 12.64
75 8.91 76.25 85.16 12.15
100 8.75 78.33 87.08 12.43
CV (%) 33.41 7.46 7.03 7.06
Averages followed by the same letter within the same column were not significantly different at p<0.05.
lacking an allelopathic effect on the germination of rocket salad and tomato seeds, it had a pronounced effect on their speed of germination indices, which corroborates the results of this present study.
The germination potential is a widely used parameter in studies of allelopathic effects. However, this parameter only considers the final results and does not reveal other factors intrinsic to the germination process, such as delays, and it ignores periods of inactive germination that occur during the experiment (Chiapusio et al., 1997). In most cases, extracts have been observed to have significant effects on the average germination time and the germination entropy but not the germination capacity when compared to controls (Ferreira and Áquila, 2000). This observation is in accordance with the present results for rocket salad. Conclusion Lettuce germination was affected by the application of purple nuts edge extract to the tested substrates. Lower germination percentages were observed for sand than for the remaining tested substrates. Purple nuts edge extract did not affect the evaluated parameters for rocket salad seeds. A higher germination of lettuce and rocket salad seeds was observed with soil as the substrate. Conflict of Interests The authors have not declared any conflict of interests. ACKNOWLEDGMENTS The authors thank the Federal Institute of Goiás (Instituto Federal Goiano), Campus Urutaí, for providing the space
and financial support to perform this study. REFERENCES Alves Neto AJ, Cruz-Silva CTA (2008). Efeito de diferentes
concentrações de extratos aquosos de tiririca (Cyperus rotundus L.) sobre o enraizamento de cana-de-açúcar (Saccharum spp). Dissertação de Mestrado. Faculdade Assis Gurgacz, Cascavel. 65f.
Andrade HM, Bittencourt AHC, Vestena S (2009). Potencial alelopático de Cyperus rotundus L. sobre espécies cultivadas. Ciênc. Agrotecnologia 33:1984-1990.
Blum U (1999). Designing laboratory plant debris – soil biossays: some reflections. In: Dakhini KMN, Foy CL (Eds.). Principles and practices in plant ecology. Boca Raton: CRC Press LLC 17-23.
Bolzan FHC (2003). Estudo do efeito alelopático e de identificação de compostos presentes na tiririca (Cyperus rotundus L.). Lavras, UFLA/FAPEMIG. (Relatório Técnico de Pesquisa).
Brasil (2009). Ministério da Agricultura, Pecuária e Abastecimento. Regras para análise de sementes / Ministério da Agricultura, Pecuária e Abastecimento. Secretaria de Defesa Agropecuária. – Brasília: Mapa/ACS, 399 p.
Castro PRC, Rodrigues JD, Moraes MA, Carvalho VLM (1983). Efeitos alelopáticos de alguns extratos vegetais na germinação do tomateiro (Lycopersicum esculentum Mill. cv. Santa Cruz). Planta Daninha 6:79-85.
Catunda MG, Freitas SP, Silva CMM, Carvalho AJRC, Soares LMS (2006). Interferência de plantas daninhas no acúmulo de nutrientes e no crescimento de plantas de abacaxi. Planta Daninha 1:199-204.
Chiapusio G, Sánchez AM, Reigosa MJ, González L, Pellissier F (1997). Do germination indices adequately reflect allelochemical effects on the germination process. J. Chem. Ecol. 11:2445-2453.
Costa AF (1994). Farmacognosia. 4ª ed. Lisboa, Fundação Calouste Gulbenkian. 1023 p.
Cunha AM, Cunha GM, Sarmento RA, Cunha GM, Amaral JFT (2006). Efeito de diferentes substratos sobre o desenvolvimento de mudas de Acacia sp. Rev. Árvore 2:207-214.
Durigan JC (1991). Manejo da tiririca (Cyperus rotundus L.) antes e durante a implantação da cultura da cana-de-açúcar (Saccharum spp.). Tese de Doutorado (Livre-Docência). Universidade Estadual Paulista, Jaboticabal. 336 f.
Durigan JC, Correia NM, Timossi PC (2005). Estádios de desenvolvimento e vias de contato e absorção dos herbicidas na inviabilização de tubérculos de Cyperus rotundus. Planta Daninha 23:621-626.
Ferreira AG, Áquila MEA (2000). Alelopatia: uma área emergente da ecofisiologia. Rev. Bras. Fisiol. Veg. 12:175-204.

Ferreira MC, Souza JRP de, Faria T de J (2007). Potenciação
alelopática de extratos vegetais na germinação e no crescimento inicial de picão-preto e alface. Ciênc. Agrotecnologia 31:1054-1060.
Francineuma PA, Francineuma PA, Alberício PA, Napoleão BEM, Walter EP, João RFL (2005). Viabilidade econômica de sistemas de preparo do solo e métodos de controle de tiririca em algodoeiro. Rev. Bras. Engenharia Agríc. Ambient. 4:481-488.
Gusman GS, Vieira LR, Vestena S (2012). Alelopatia de espécies vegetais com importância farmacêutica para espécies cultivadas. Biotemas 25:37-48.
Lorenzi H (2000). Plantas daninhas do Brasil: terrestres, aquáticas, parasitas e tóxicas. 3ºed. São Paulo, Instituto Plantarum. 90 p.
Maguire JD (1962). Speed of germination-aid selection and evaluation for seedling emergence and vigor. Crop Sci. 2:176-177.
Mahmoud TS, Santos AH, Schuroff IA, Santos HCXM (2009). Avaliação do efeito de hormônio natural, sintético e indutor no desenvolvimento da primeira fase de brotação das estacas de Manihot esculenta Crantz. In: XIII Congresso Brasileiro de Mandioca, Botucatu. RAT - Revista Raízes e Amidos Tropicais. pp. 621-625.
Mairesse SLA, Costa EC, Farias JR, Fiorin RA (2007). Bioatividade de extratos vegetais sobre alface (Lactuca sativa L.). Rev. FZVA 2:1-12.
Minami K, Puchala B (2000). Produção de mudas de hortaliças de alta qualidade. Hortic. Bras. 18:162-163.
Moraes LCA, Garcia TB, Sousa NR, Moreira A (2007). Indução de brotação apical em mudas provenientes de sementes e do enraizamento de estacas de mangostãozeiro. Acta Sci. Agron. 1:665-669.
Muniz FR, Cardoso M, Von Pinho EVR, Vilela M (2007). Qualidade de sementes na presença de extrato de tiririca. Rev. Bras. Sementes 2:195-204.
Novo MCSS, Filho RV, Langbeck, FM, Lago AA (2006). Efeito da palha de cana-de-açúcar e do tamanho do tubérculo na brotação e no desenvolvimento da parte aérea de tiririca. Bragantia 65(1):97-107.
Periotto F, Perez SCJGA, Lima MIS (2004). Efeito alelopático de Andira humilis Mart. ex Benth na germinação e no crescimento de Lactuca sativa L. e Raphanus sativus L. Acta Botanica Bras. 3:425-430.
Quayyum HA, Mallik AU, Leach DM, Gottardo C (2000). Growth inhibitory effects of nutgrass (Cyperus rotundus L.) on rice (Oryza sativa) seedlings. J. Chem. Ecol. 26:2221-2231.
Gomes et al. 1893 Stockman AL, Brancalion PHS, Novembre ADLC, Chamma HMCP
(2007). Sementes de ipê-branco (Tabebuia roseo-alba (Ridl.) Sand-Bignoniaceae): temperatura e substrato para o teste de germinação. Rev. Bras. Sementes 29:139-143.
Taveira JAM (1996). Produção de mudas: substratos. Serviço Nacional de Aprendizagem Rural. Curitiba: SENAR. (Manual do instrutor). 88 p.
Veiga AD, Guimarães RM, Rosa SDVF, Pinho EVRV, Silva LHC (2007). Armazenabilidade de sementes de cafeeiro colhidas em diferentes estádios de maturação e submetidas a diferentes métodos de secagem. Rev. Bras. Sementes 29:83-91.

Vol. 11(21), pp. 1894-1901, 26 May, 2016
DOI: 10.5897/AJAR2016.10968
Article Number: 5A9AFF358703
ISSN 1991-637X
Copyright ©2016
Author(s) retain the copyright of this article
http://www.academicjournals.org/AJAR
African Journal of Agricultural Research
Full Length Research Paper
Performance of SMA-C model on crop evapotranspiration estimation
Bruno Patias Lena1, Rogério Teixeira de Faria2*, Alexandre Barcellos Dalri2, Luiz Fabiano Palaretti2, and Miquéias Gomes dos Santos2
1Universidade de Sao Paulo, Piracicaba-SP, Brazil
2Universidade Estadual Paulista, Jaboticabal-SP, Brazil
Received 7 March, 2016; Accepted 23 April, 2016
Many simulation models found in the literature integrates data on climate and crop characteristics to provide great information on the season for different crops. The objectives of this study were: a) to measure soil water balance components of a wheat crop to determine its evapotranspiration (ETc) and crop coefficients (Kc) during the growing season; b) to use experimental data to evaluate the performance of SMA-C in estimating evapotranspiration for a wheat in Paraná State, Brazil; and c) to make adjustments to improve model estimates. Two weighing lysimeters cultivated with a wheat crop were used to measure soil water storage and ETc during the growing season of a wheat crop. Reference evapotranspiration (ETo) was determined by FAO 56 method using data from a local weather station. Wheat crop coefficients were calculated by the ratio ETc/ETo, were 0.7, 1.5 and 0.6, for initial, mid and late season, respectively. The comparison of SMA-C simulations with the observed data showed inaccuracies in estimation of soil water storage due to model underestimation for ETc. Estimates were improved by adjusting the model to consider Kc measured in the field.
Key words: Models, lysimeters, decision-making support.
INTRODUCTION The economic viability of an agricultural business is associated with high quality and quantity of data collection during all seasons of a crop production. Utilizing information such as local climate variable and crop characteristics is very important to improve the decision-making by farmers.
Many simulation models found in the literature integrates data on climate and crop characteristics to provide great information during the season for different
crops. Examples such as DSSAT (Jones et al., 2003), APSIM (Holzworth et al., 2014), AquaCrop (Steduto et al., 2009), CERES (Ritchie et al., 1998), STICS (Brisson et al., 2003), VegSyst (Giménez et al., 2013) and CropSyst (Stöckle et al., 2003) use mainly data on climate and crop characteristics to estimate crop development in different conditions, with the aim of improving decision- making by the user. In Brazil, MCID (Borges et al., 2008) provides data to help develop irrigation and drainage
*Corresponding author. E-mail: [email protected].
Author(s) agree that this article remain permanently open access under the terms of the Creative Commons Attribution
License 4.0 International License
Lena et al. 1895
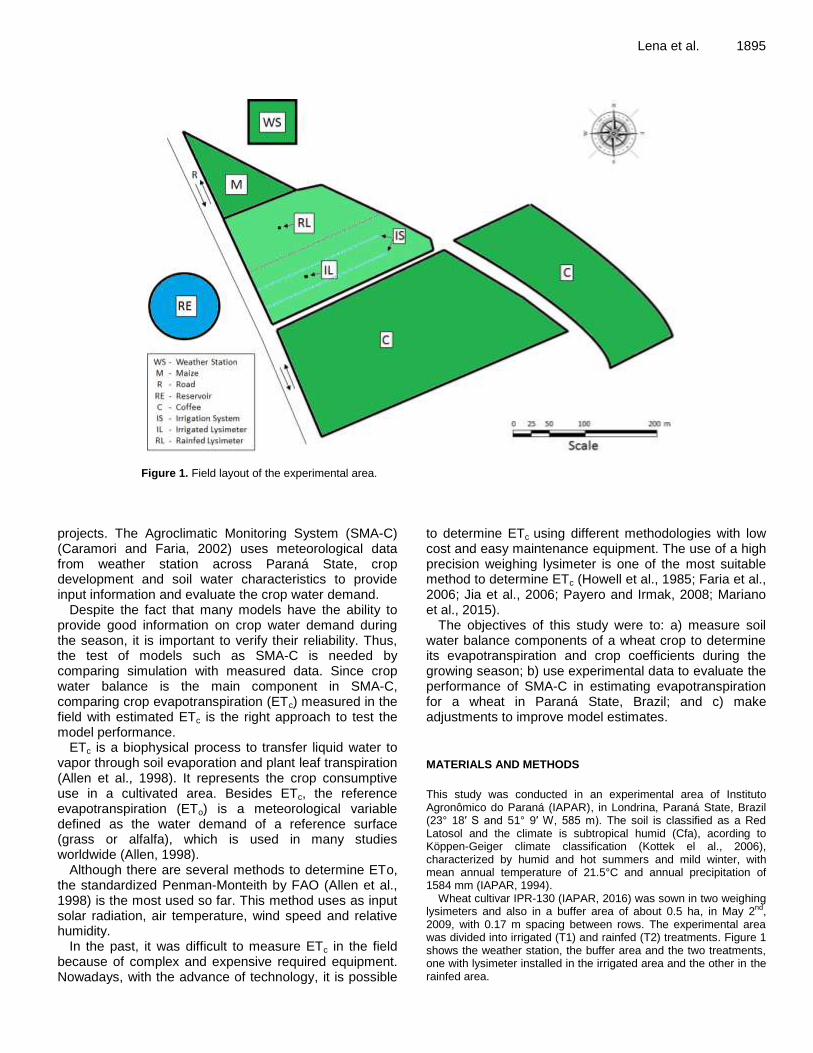
Figure 1. Field layout of the experimental area.
projects. The Agroclimatic Monitoring System (SMA-C) (Caramori and Faria, 2002) uses meteorological data from weather station across Paraná State, crop development and soil water characteristics to provide input information and evaluate the crop water demand.
Despite the fact that many models have the ability to provide good information on crop water demand during the season, it is important to verify their reliability. Thus, the test of models such as SMA-C is needed by comparing simulation with measured data. Since crop water balance is the main component in SMA-C, comparing crop evapotranspiration (ETc) measured in the field with estimated ETc is the right approach to test the model performance.
ETc is a biophysical process to transfer liquid water to vapor through soil evaporation and plant leaf transpiration (Allen et al., 1998). It represents the crop consumptive use in a cultivated area. Besides ETc, the reference evapotranspiration (ETo) is a meteorological variable defined as the water demand of a reference surface (grass or alfalfa), which is used in many studies worldwide (Allen, 1998).
Although there are several methods to determine ETo, the standardized Penman-Monteith by FAO (Allen et al., 1998) is the most used so far. This method uses as input solar radiation, air temperature, wind speed and relative humidity.
In the past, it was difficult to measure ETc in the field because of complex and expensive required equipment. Nowadays, with the advance of technology, it is possible
to determine ETc using different methodologies with low cost and easy maintenance equipment. The use of a high precision weighing lysimeter is one of the most suitable method to determine ETc (Howell et al., 1985; Faria et al., 2006; Jia et al., 2006; Payero and Irmak, 2008; Mariano et al., 2015).
The objectives of this study were to: a) measure soil water balance components of a wheat crop to determine its evapotranspiration and crop coefficients during the growing season; b) use experimental data to evaluate the performance of SMA-C in estimating evapotranspiration for a wheat in Paraná State, Brazil; and c) make adjustments to improve model estimates.
MATERIALS AND METHODS
This study was conducted in an experimental area of Instituto Agronômico do Paraná (IAPAR), in Londrina, Paraná State, Brazil (23° 18′ S and 51° 9′ W, 585 m). The soil is classified as a Red Latosol and the climate is subtropical humid (Cfa), acording to Köppen-Geiger climate classification (Kottek el al., 2006), characterized by humid and hot summers and mild winter, with mean annual temperature of 21.5°C and annual precipitation of 1584 mm (IAPAR, 1994).
Wheat cultivar IPR-130 (IAPAR, 2016) was sown in two weighing lysimeters and also in a buffer area of about 0.5 ha, in May 2nd, 2009, with 0.17 m spacing between rows. The experimental area was divided into irrigated (T1) and rainfed (T2) treatments. Figure 1 shows the weather station, the buffer area and the two treatments, one with lysimeter installed in the irrigated area and the other in the rainfed area.

1896 Afr. J. Agric. Res.
Figure 2. Cross section view of a lysimeter and its components.
Figure 3. Soil water storage and precipitation during the growing season. FC is field capacity and PWP is permanent wilting point.
Figure 2 shows the cross section of the lysimeter system, with internal and external tanks, concrete pillars, steel frames and load cells. The lysimeter tank was made of fiber glass in a square format of 0.95 x 0.95 m and 1.3 m depth. An external fiber glass tank of 1 x 1 m surface and 1.5 m depth was installed to isolate the smaller lysimeter tank from the surrounding soil. Four load cells were placed between the concrete pillar and the steel frame.
Lysimeter mass was measured every 3 s by four load cells Model-I, ALFA Instruments (ALFA, 2016). The electric signals measured by each load cell were averaged every 10 min (200 readings) and then storage in a datalogger model CR10x (Campbel Scientific) was powered by a 12 V battery. The measured data by each load cell was sent to a union box through a coaxial cable and then to the datalogger. The data, in mV, were input in the calibration equation to calculate mass, in kg, using the procedure described by Faria et al. (2006) and Mariano et al. (2015). Soil water storage, in mm equivalent, was then calculated from lysimeter mass, in kg, by dividing by mass by lysimeter area (0.9 m2).
Irrigation management of treatment T1 was preconized to maintain soil water storage higher than 70% of the soil available
water, by application of water to replace the soil at field capacity twice a week. Soil available water, as given by difference between field capacity and permanent wilting point for the experimental area, was determined by Faria and Caramori (1986) as 10% in a volumetric basis. Thus, the soil available water in 1.3 m depth in the lysimeter profile varied from zero, at permanent wilting point, to 130 mm, at field capacity. To represent graphically lysimeter mass variation in the range of soil available water (Figure 3), the lysimeter mass (converted to mm equivalent) at field capacity was assigned to 130 mm and the remaining measurements were calculated proportionally. The lysimeter was considered to be at field capacity at 4 days of drainage after occurrence of a precipitation sufficient to reach soil saturation (Faria and Caramori, 1986). Crop evapotranspiration and soil water storage in each lysimeter were determined according to the following equation:
(1)
where ETc is crop evapotranspiration, P is precipitation, I is
0
20
40
60
80
100
120
140
160
180
0
20
40
60
80
100
120
140
160
180
0 10 20 30 40 50 60 70 80 90 100 110 120
Pre
cip
itat
ion
(m
m)
So
il w
ater
sto
rag
e (m
m)
DAP (days)
Precipitation
Soil water storage
FC
PWP

Lena et al. 1897
Figure 4. a) Crop evapotranspiration (ETc) and reference evapotranspiration (ETo), and b) crop coefficient (Kc) during the growing season. EM: emergence, TI: tillering, SE: stem elongation, FL: flowering, MI: milk stage and RI: ripening.
irrigation, D is drainage, R is runoff (considered zero because the elevated edge of the lysimeter tank) and ∆S is variation soil water storage variation, all in mm d-1.
Crop coefficient was determined by Equation 2 (Allen et al., 1998):
(2)
Where Kc is crop coefficient (dimensionless), ETc is crop evapotranspiration and ETo is grass reference evapotranspiration, both in mm d-1. Daily ETo was computed by CLIMA software (Faria et al., 2002), using the standardized Penman-Monteith equation (Allen et al., 1998) with daily data from an automatic weather station installed in the IAPAR Experimental Station, at 150 m from the lysimeter (Figure 1).
SMA-C uses a soil moisture module described in detail by Faria and Madramootoo (1996). The inputs are plant characteristics such as rooting depth and leaf area index (LAI), soil water retention data and meteorological data to calculate soil water balance components of a specific crop. In this study, wheat LAI data was determined five times during the experimental period by a leaf area integrator (LI-COR, 1996), and soil water retention characteristics for the experimental area were taken from data collected by Faria and Madramootoo (1996). Wheat phenological stages were evaluated every week to characterize crop development. Daily simulated ETc and water storage data were compared with measured data, using
linear regression and the t-test (p = 1%).
RESULTS AND DISCUSSION
This research reported on two treatments of water management, irrigated and rainfed. However, due to the high precipitation during the growing season (Figure 3), it was not necessary to irrigate and, thus, soil water storage was similar in both treatments. Instead of the two treatments, the measurements of the two lysimeters were averaged to perform the test of the model. The results show that precipitation was sufficient to supply crop requirements and soil water storage was close to the field capacity during the whole growing season (Figure 3).
Daily ETc varied from 1 to 5 mm d-1
during the growing season. It was higher during milk stage and lower from emergence to the end of flowering and during ripening (Figure 4a). In addition, ETc was low during some periods (45, 70 DAP and 100 DAP) due to decrease in ETo, caused by low temperature, as a result of rainy periods. Average seasonal ETo was equal to 2.4 mm d
-1, which
was about 10 and 20% less than seasonal ETc. Kc
a)
b)

1898 Afr. J. Agric. Res.
Figure 5. Leaf area index during the growing season.
Figure 6. Precipitation and observed and simulated soil water storage during the growing season.
increased from emergence to reach higher values during the mid-crop stages, and then decreased during the later stages (Figure 4b). Variations in Kc were mostly related to LAI variation during the growing season (Figure 5). LAI was higher than 5 during flowering (60 DAP). At that time, transpiration was the main component of ETc because of full soil cover by the canopy. After the reproductive period, the plant initiated the senesce, decreasing the LAI and also ETc.
The comparison between simulated and observed soil water storage showed that model followed the same trend with the observed data, decreasing when ETc was high and increasing during precipitation events (Figure 6). Simulations agreed with the observed data from
emergence to 55 DAP. After that, simulated soil water storage was always higher than observed data. The analysis by t-test showed significant difference (p = 1%) between the two data sets. Therefore, SMA-C over-estimates soil water retention, indicating that the model needs corrections in its calculation method.
Simulated ETc overestimated observed data, as given by statistical difference at 1% probability by t-test using data for the whole growing season (Figure 7). While observed ETc was 270 mm, the model simulated 220 mm during the growing season, was an underestimation of 18.5%. The difference between model estimates and field data was more evident for the period from 60 to 128 DAP. This finding confirms the need to correct the method
0
1
2
3
4
5
6
7
0 10 20 30 40 50 60 70 80 90 100 110 120
Leaf
are
a i
nd
ex
DAP (days)
0
60
120
180
240
0
60
120
180
240
0 10 20 30 40 50 60 70 80 90 100 110 120P
recip
itati
on
(m
m)
So
il w
ate
r st
ora
ge (m
m)
DAP (days)
Precipitation
Observed
Simulated
ts (p= 0.01)

Lena et al. 1899
Figure 7. Observed and simulated accumulated crop evapotranspiration for the growing season.
Figure 8. Accumulated crop evapotranspiration for the growing season, observed and simulated by adjusted SMA-C.
of calculating ETc in SMA-C. In that model, Kc is equal to 1 by assuming ETc equal to ETo in conditions of no water stress. However, this was not correct because the values of Kc estimated using field data measured in this study varied according to crop development, as given in Figure 4b.
In order to improve SMA-C estimates, the model was modified to consider Kc measured in the field. That coefficient was used into the model to multiply ETo and then to calculate ETc, following the approach described by Allen et al. (1998). Therefore, the crop season was divided into three phases in which Kc was assumed to be
0.7, 1.5 and 0.6 for initial, mid and late seasons, respectively. The results in Figure 8 show that simulations are in close agreement with observed data.
In addition, to demonstrate the improvement in model estimates, a regression analysis was performed on daily and accumulated ETc estimated by the original and adjusted model against observed data (Figure 9). The scatter of data around 1:1 curve decreased considerably for both, daily and accumulated ETc data using the adjusted model. The linear regression for simulated vs. observed data gave a slope coefficient significantly different from 1 for the original SMA-C and not different
t2 (p = 0.01)

1900 Afr. J. Agric. Res.
Figure 9. Regression of observed and simulated daily (a) and accumulated (b) crop evapotranspiration (ETc) for the original and adjusted SMA-C.
from 1 for the adjusted model. Moreover, the comparison between simulated and observed ETc for the adjusted model did not differ statistically. The coefficient of determination increased from 0.753 for daily and 0.808 for accumulated ETc as calculated by the original model to 0.967 and 0.998, respectively, for adjusted SMA-C. Conclusions
1. Soil water storage and ETc were measured by lisimetry and ETo were calculated from meteorological data during a wheat growing season. 2. Estimated Kc by the ratio between ETc and ETo
followed the course of LAI during the growing season. The test of SMA-C against experimental data showed low
performance of the model to simulate soil water storage, as a result of inaccuracies in the method of calculating ETc; 3. SMA-C estimates were improved by adjustment of the model to consider Kc measured in the field. The coefficient varied during the growing season was used into the model to multiply ETo and then to calculate ETc.
Conflict of interest The authors have not declared any conflict of interest. REFERENCES ALFA (2016). ALFA Instrumentos. Lead Cell model I. Available at:
a) b)
c) d)
y = 0.9674x R
2 =0.5225
p = 0.138ns
y = 0.7253x R
2 =0.509
p = 0.008s
y = 1.8083x R
2 =0.9648
p = 0.000s
y = 1.0239x R
2 =0.9981
p = 0.000s

http://www.alfainstrumentos.com.br/I-Shear-Beam.html. Allen RG, Pereira LS, Raes D, Smith M (1998). Crop evapotranspiration:
guidelines for computing crop water requirements. Rome: FAO. Irrigation and Drainage Paper 56.
Borges JCF, Ferreira PA, Hedden-Dunkhorst B, Andrade CLT (2008). Modelo computacional para suporte à decisão em áreas irrigadas. Parte I: Desenvolvimento e análise de sensibilidade. Rev. Bras. Eng. Agríc. Ambient. 12(1):3-11.
Brisson N, Gary C, Justes E, Roche R, Mary B, Ripoche D, Zimmer D, Sierra J, Bertuzzi P, Burger P, Bussière F, Cabidoche TM, Cellier P, Debaeke P, Gaudillère JP, Hénault C, Maraux F, Seguin B, Sinoquet H (2003). An overview of the crop model STICS. Eur. J. Agron. 18:309-332.
Caramori PH, Faria RT (2002). SMA - Sistema de Monitoramento Agroclimático para o Estado do Paraná. IAPAR, Agrometeorologia, Monitoramento Agroclimático, Mapas Climáticos. Available at: http://www.iapar.br/modules/conteudo/conteudo.php?conteudo=983.
Faria RT, Caramori, PH (1986). Physical-Hydrical characterization in a Dystrophic dusky-latosol of Londrina, PR, Brazil. Pesqui. Agropecu.
Bras. 21(12):1303‑1311.
Faria RT, Campeche FSM, Chibana EY (2006). Construção e calibração de lisímetros de alta precisão. Rev. Bras. Eng. Agríc. Ambient. 10(1):237-242.
Faria RT, Caramori PH, Chibana EY, Brito LRS, Nakamura AK, Ferreira AR (2002). CLIMA - programa computacional para organização e análise de dados meteorológicos. Bol. Técnico 56:1-23.
Faria RT, Madramootoo CA (1996). Simulation of soil moisture profiles for wheat in Brazil. Agric. Water Manage. 31(1-2)35-49.
Giménez C, Gallardo M, Martínez-Gaitán C, Stockle CO, Thompson RB, Granados MR (2013). Veg Syst, a simulation model of daily crop growth, nitrogen uptake and evapotranspiration for pepper crops for use in an on-farm decision support system. Irrig. Sci. 31(3):465-477.
Holzworth DP, Huth NI, Voil PG, Zurcher EJ, Herrmann NI, McLean G, Chenu K, Oosterom EJO, Snow V, Murphy C, Moore AD, Brown H, Whish JPM, Verrall S, Fainges J, Bell LW, Peake AS, Poulton PL, Hochman Z, Thorburn PJ, Gaydon DS, Dalgliesh NP, Rodriguez D, Cox H, Chapman S, Doherty A, Teixeira E, Sharp J, Cichota R, Vogeler I, Li FY, Wang E, Hammer GL, Robertson MJ, Dimes JP, Whitbread AM, Hunt J, Rees HV, McClelland T, Carberry PS, Hargreaves JNG, MacLeod N, McDonald C, Harsdorf J, Wedgwood S, Keating BA (2014). APSIM. Evolution towards a new generation of agricultural system simulation. Environ. Modell. Software. 62:327-350.
Lena et al. 1901 Howell TA, McCormick RL, Phene CJ (1985). Design and installation of
large weighing lysimeters. Trans. ASAE 35:106-117. IAPAR, Instituto Agronômico do Paraná (1994). Cartas Climáticas do
Estado do Paraná. IAPAR, Londrina. 49 p (Documento 18) IAPAR, Instituto Agronômico do Paraná Agrometeorologia (2016).
Catálago de cultivar. Available at: http://www.iapar.br/arquivos/File/folhetos/trigo/ipr130.html.
Jia X, Dukes MD, Jacobs JM, Irmak S (2006). Weighing lysimeter for evapotranspiration research in a humid environment. Trans. ASABE 42(2):401-412.
Jones JW, Hoogenboom G, Porter CH, Boote KJ, Batchelor WD, Hunt LA, Wilkens PW, Singh U, Giksman AJ, Richie JT (2003). The DSSAT cropping system model. Eur. J. Agron. 18(3-4):235-265.
Kottek M, Grieser J, Beck C, Rudolf B, Rubel F (2006). World map of the Köppen-Geiger climate classification updated. Meteorol. Z. 15(3):259-263.
LI-COR (1996). LI 3100 area meter instruction manual. Lincoln, 1996. 34 p.
Mariano DC, Faria RT, Freitas PSL, Lena BP, Johann AL (2015). Construction and calibration of a bar weighing lysimeter. Acta. Sci. Agron. 37(3):271-278.
Payero JO, Irmak S (2008). Construction, installation, and performance of two repacked weighing lysimeter. Irrigation Sci. 26(2):191-202.
Steduto P, Hsiao TC, Raes D, Fereres E (2009). Aqua Crop – the FAO crop model to simulate yield response to water: I. Concepts and underlying principles. Agron. J. 101(3):426-437.
Stöckle CO, Donatelli M, Nelson R (2003). CropSyst, a cropping systems simulation model. Eur. J. Agron. 18(3-4):289-307.

Vol. 11(21), pp. 1902-1907, 26 May, 2016
DOI: 10.5897/AJAR2016.10983
Article Number: A574A2258707
ISSN 1991-637X
Copyright ©2016
Author(s) retain the copyright of this article
http://www.academicjournals.org/AJAR
African Journal of Agricultural Research
Full Length Research Paper
A meta-analysis of in situ degradability of corn grains and non-starch energy sources found in Brazil
Marcos Busanello1, João Pedro Velho2*, Antônio Augusto Cortiana Tambara3, Dileta Regina Moro Alessio4, Ione Maria Pereira Haygert-Velho2 and André Thaler Neto5
1Post Graduate Program in Animal Science and Pastures of the University of São Paulo – College of Agriculture “Luiz de
Queiroz” (ESALQ), Piracicaba – SP, Brazil. 2Department of Animal Science and Biological Sciences, Federal University of Santa Maria (UFSM) – Campus Palmeira
das Missões, 98300-000, Palmeira das Missões, RS, Brazil. 3Federal Institute Farroupilha, Campus São Vicente do Sul, São Vicente do Sul, RS, Brazil.
4Post Graduate Program in Animal Science, University of the State of Santa Catarina (UDESC), Lages SC, Brazil.
5Department of Animal and Food Production, University of the State of Santa Catarina (UDESC), Lages - SC. Brazil.
Received 11 March, 2016; Accepted 23 April, 2016
Owing to the magnitude and importance of the production of citrus fruits pulp, soybeans and corn in Brazil, considerable research has focused on the main feedstuffs, co-products, and/or byproducts of these crops. The present study is aimed at comparing the ruminal degradability parameters of corn and non-starchy energy sources with high pectin content, including soybean hulls and citrus pulp, through meta-analysis. The experiments were designed to include parameters related to potential and effective degradability of the concentrates of these energy feeds. The database (DB) was composed of 62 treatments obtained from 20 papers. No difference (P>0.05) was observed in any of the ruminal degradability parameters of the dry matter (DM) or crude protein (CP), demonstrating that the total replacement of corn grain by non-starch feed is possible. The degradation rates of DM were 6.78 and 6.14%.h
-1 and those of CP were 5.97 and 5.93%.h
-1, for corn and non-starch feeds, respectively.
Therefore, depending on the cost, corn grain could be substituted by soybean hulls or citrus pulps, which reduce the possibility of the occurrence of metabolic disorders, such as subclinical and/or clinical acidosis, without affecting ruminal fermentation. Key words: Starch, citrus pulps, soybean hulls, energy, pectin, degradability, non-starch feed, acidosis.
INTRODUCTION According to official information from the Companhia Nacional de Abastecimento, 32 million hectares of land were cultivated for soybeans and 15.6 million hectares for
maize in the 2014/2015 harvest in Brazil (CONAB, 2015). The same agency also reported that the yield of oilseed in the harvest was three tons/hectare and that of cereal
*Corresponding author. E-mail: [email protected]
Author(s) agree that this article remain permanently open access under the terms of the Creative Commons Attribution
License 4.0 International License

was 5.3 tons/hectare, generating 96.2 and 84.6 million tons of soybean and corn, respectively. According to Costa and Santana (2015), the soybean production chain is one of the most important industries for Brazilian agribusiness.
Another productive enterprise of great importance in national and international market is of citrus fruits production chain, especially oranges. According to the Ministério da Agricultura, Pecuária e Abastecimento (MAPA, 2015), Brazil annually harvests more than 18 million tons of orange or about 30% of world fruit crop. According to Neves et al. (2014), the country produces more than 50% of the orange juice produced in the world, with more than 90% of the production destined for foreign markets.
Corn grain is usually processed (ground or flaked) for human and/or animal intake, generating few byproducts to be used in animal feed. In contrast, the orange juice production generates citrus fruit pulp, which can be used in ruminant feed. According to Neves et al. (2010), in 2010 the marketing and export of citrus pulp in Brazil, reached the figure of US$ 178.8 million. Although, the industrial extraction of soybean oil enables the production of various byproducts, the most important energy source for ruminant nutrition is soybean hulls. Both citrus fruit pulp and soybean hulls are rich in pectin, a structural carbohydrate that can be used as energy source in ruminant feeds.
Corn kernel is used worldwide as a major feed ingredient, in the form of starch, in feed concentrates for ruminants, and is an energy source. However, excess degradable feed starch in the rumen can negatively affect ruminal microbiota by decreasing ruminal pH (Russell and Rychlik, 2001; Wang et al., 2009).
Starch is degraded quickly by amylolytic bacteria, leading to an increase in the production of volatile fatty acids affecting the acetate: propionate ratio, which causes the ruminal pH to decrease (Berchielli et al., 1996; Nagaraja and Titgemeyer, 2007). Thereafter, increased lactic acid formed in the rumen minimizes or paralyzes the growth of fibrolytic bacteria, causing antagonism between the amylolytic and fibrolytic bacterial strains (Kamra, 2005). Thus, variation in dietary intake affects the productivity of the animal (Bevans et al., 2005; Plaizier et al., 2009), which, in turn influences the planning of rural enterprise systemically.
One way to minimize such harmful effects on rumen health is to replace the corn grains partially or totally with soybean hulls (SBH) and citrus fruit pulps, which are generated almost constantly throughout the year as byproducts from processing by two of the largest agricultural production chains in Brazil. The pectin present in these products makes them good energy sources. Pectin produces the bulky base, which is essential in ruminant feeds, as it is part of the cell wall neutral detergent fiber (NDF), unlike starch, which is part of cell content. However, unlike fiber, pectin has a high
Busanello et al. 1903 rate of degradation in the rumen (Jung et al., 2012). Based on dry matter, soybean hulls have 60.74% of NDF and 0.14% of starch, whereas corn has 12.34% of NDF and 77.11% of starch (Alcalde et al., 2009). However, based on DM, Tambara et al. (1995) reported 33.82% of crude fiber, 50.86% of acid detergent fiber (ADF) and 1.81% of acid detergent lignin (ADL), as well as 65.49% apparent digestibility of dry matter, 69.27% in vitro digestibility of dry matter, and 67.05% total digestible nutrients (TDN) for SBH. These authors also reported that SBH is classified as roughage energy-concentrate because even with short fiber, it showed effectiveness in stimulation of rumination/salivation in sheep.
Although, having similar NDF content, based on DM, SBH showed less effectiveness in stimulating rumination and chewing in lactating goats than did chopped-off hay coast cross grass. According to Gentil et al. (2011), the ingredient composition in SBH was 70.3% of NDF and 17.9% of peNDF, whereas that in chopped-off hay is 67.6% of NDF and 51.1% of peNDF. A linear reduction in ruminal pH was detected with the increase in SBH content. However, the opposite is true when replacing concentrated ingredients with bulky ones. Because of high biodegradability of its fiber and its increased buffering capacity of saliva due to the presence of sodium bicarbonate, the use of soybean hulls in place of corn can increase rumen pH, reducing the ruminal-acidosis risk associated with diets having high share of feed concentrates. Pectin is a carbohydrate that is highly degradable in rumen, and, unlike starch, produces less lactate, thus causing minor decreases in ruminal pH (Bampidis and Robinson, 2006).
On the other hand, citrus fruit pulp has lower NDF content and protein when compared with SBH. Based on DM, Santos et al. (2007) recorded 9.17, 6.90 and 11.96% CP; 6.12, 23.41 and 63.79% NDF; 1.22, 15.76 and 46.27% ADF; and 73.39, 0.5 and 3.6% starch, for corn, citrus fruit pulp and soybean hulls, respectively. Rodrigues et al. (2008a) found that the substitution of one third of the maize by citrus fruit pulp improved the dry matter intake and performance of lambs fed with this concentrate. The low protein content of dehydrated citrus fruit pulp, as well as its limited digestibility, is the biggest nutritional limitation of this ingredient, because according to the NRC (2007), it contains less digestible protein than corn (3.3 versus 5.1%, based on DM).
Owing to the magnitude and importance of the production chains of citrus, soybean, and corn in Brazil, many studies have been conducted using the main raw material and/or their byproducts. Therefore, a meta-analysis is possible for identifying and/or solving the gaps in the production systems, which have passed unnoticed in the assessed works conducted independent of each other. The objective of the present study was to perform a meta-analysis to assess the differences, if any, in the in situ degradability of maize grain and non-starch feeds with high pectin content, from Brazil.
1904 Afr. J. Agric. Res. MATERIALS AND METHODS The overall database (ODB) was constructed by including scientific works available in the public domain, in journals published in Brazil. The data were collected from experiments published between January 1998 and December 2013. After the collection of data, analysis of all the work was performed in its entirety for subsequent tabulation of the information contained in the methodology and results, using an Excel® spreadsheet, following the criteria proposed by Lovatto et al. (2007).
Estimations were performed using parameters related to potential degradability of dry matter (DM) and crude protein (CP) according to the methods described by Ørskov and McDonald (1979) as obtained by: p = a + b (1 - e-ct), where "p" = potential degradability in time "t"; "a" = water soluble fraction; "b" = insoluble, but potentially degradable fraction; "c" = degradation rate of the fraction "b", and "e" = natural logarithm. The effective ruminal degradability of dry matter (EDDM) and crude protein (EDCP) was calculated by the formula EDDM and EDCP = a + [(b * c) / (c + k)], where "k" = passage rate of particles in the rumen.
The passage rates used for experiments in Brazil have been recommended by the AFRC (1993): 2%.h-1 for animals with low level of feed intake, that is, once in a given maintenance time; 5%.h-
1 for calves and cows producing less than 15 kg of milk per day, beef cattle, and sheep with intake lower than twice of that necessary for maintenance; and 8%.h-1 for dairy cows with a milk yield above 15 kg per day, with intake of more than twice that necessary for maintenance.
The feeds were classified into energy source concentrates according to the chemical composition guidelines enforced in Brazil, according to Ministério da Agricultura, Pecuária e Abastecimento (MAPA, 2013). The data were processed and a partial database constructed to compare corn grain with non-starchy feeds (BDPMi) such as citrus fruit pulp and soybean hulls; which constituted 62 treatments obtained from 20 papers, namely Beran et al. (2005), Fernandes et al. (2002), Fortaleza et al. (2009), Franzolin Neto et al. (2000), Garcia et al. (2003), Goes et al. (2004, 2011), Marcondes et al. (2009), Martins et al. (1999), Mizubuti et al. (2007), Moreira et al. (2009), Mouro et al. (2002), Nussio et al. (2002), Oliveira et al. (2003), Porcionato et al. (2004), Prado et al. (2000), Santos et al. (2012), Silva et al. (1999), Simas et al. (2008) and Zeoula et al. (1999). The analysis of variance was performed using the statistical software SAS ® (SAS Institute, 2002), employing the mixed model procedure (PROC MIXED), with the dataset considered as a random variable.
RESULTS AND DISCUSSION
Ideal feed with carbohydrates as the main energy source should be assessed by the fractionation of the constituents into fibrous carbohydrates (cellulose, hemicellulose and lignin) and non-fibrous carbohydrates (starch, soluble sugars and fructose) (Lanzas et al., 2007). However, besides this being a laborious and expensive technique, the value of non-fibrous carbohydrates is estimated by the difference and tends to accumulate mistakes made in the calculations of other parameters (crude protein, mineral matter, ether extract and neutral detergent fiber) (Detmann and Filho, 2010). Therefore, most of the studies conducted in Brazil focus on the evaluation of DM and CP.
The values for DM (Table 1) of both starch and non-starch ingredients in pectin are adequate for its use in
animal feed. Unlike soybean hulls, citrus fruit pulp can be used fresh, dried, or pressed in pelletized form (Rodrigues et al., 2011; Santos et al., 2014.). Therefore, it is important to note that there are farms that use fresh citrus pulp and pressed citrus fruit pulp as they are cheaper than the pelleted pulp (Pereira et al., 2008). However, fresh and pressed citrus fruit pulps have high moisture content, they must be used quickly so that the quality of the feed is maintained (Macedo et al., 2007). An alternative to the use of fresh citrus fruit pulp would be the ensilage with feed or forages with high DM (Chaudhry and Naseer, 2006; Volanis et al., 2006; Tanaka et al., 2010; Lashkari et al., 2014).
There was no difference (P>0.05) in any of the evaluated parameters of DM and CP of corn when compared with those of the non-starchy energy sources (Tables 1 and 2). The results obtained from the meta-analysis are extremely important, because the studies were carried out in different conditions and show synchrony in the degradation of carbohydrates and nitrogenous constituents of these feeds. According to Tylutki et al. (2008), the fermentative bacteria use non-fibrous carbohydrates starch, pectin and soluble sugars; they grow faster than fibrolytic bacteria and can use ammonia or amino acids as nitrogen sources. However, we must be mindful of pectin being part of the cell wall (NDF), although it is degraded in a differentiated manner of other fibrous components (hemicellulose and cellulose) (Bampidis and Robinson, 2006). The growth rates of the different bacterial strains mentioned are established by the quantity of carbohydrates degraded in the rumen and by the degradation rate, subject to the availability of nitrogen in the rumen ecosystem in time and amount required (Chumpawadee et al., 2006).
The Cornell Net Carbohydrate and Protein System (CNCPS) assumes that the bacterial growth rate is proportional to the rate of degradation of starch, considering the hypothesis that the rumen experiences substrate (carbohydrates) limitation owing to excess enzymes derived from the rumen microflora (Fox et al., 2004; Tylutki et al., 2008). Therefore, the DM and CP degradation rates indicate that both corn grain and non-starch feeds, when used in the right physiological proportions in the rumen, stimulate greater intake of DM throughout the day (Franco et al., 2010).
Considering that pectin fermentation does not involve lactic acid formation, it might be better for replacing starch, which when fermented results in the decrease in ruminal pH, causing the occurrence of metabolic disorders, such as subclinical and/or clinical acidosis (Cañizares et al., 2009; Plaizier et al., 2009). Therefore, the use of pectin should be recommended for animals that consume feeds in the order of two to three times more than the requirements for maintenance.
On the other hand, the diets with high proportion of citrus fruit pulp can cause parakeratosis, especially when the level of fiber in the diet is low (Arthington et al., 2002;

Busanello et al. 1905
Table 1. Adjusted average dry matter (DM), water-soluble fraction (a) of the DM, potentially degradable fraction (b) of the DM, degradation rate (c) of the DM, and effective degradability at 2%.h-1, 5%.h-1, and 8%.h-1 of the DM of corn grain and non-starchy ingredients.
Parameters Ingredients
E P Corn Non-starchy
Dry matter (% of natural matter) 90.66 89.28 2.26 0.5535
Water-soluble fraction (a)* 33.12 24.97 5.58 0.1632
Potentially degradable fraction (b)* 66.70 65.72 5.74 0.8659
Degradation rate (c)* 6.78 6.14 1.17 0.5941
Effective degradability 2%.h-1
*† 72.70 74.31 7.91 0.8430
Effective degradability 5%.h-1
*† 63.12 52.56 6.35 0.1138
Effective degradability 8%.h-1
*† 56.37 54.40 6.99 0.7831
*Values determined using the model of Ørskov and McDonald (1979);†Values determined considering passage rates indicated by the AFRC (1993).
Table 2. Adjusted average crude protein (CP), water-soluble fraction (a), potentially degradable fraction (b), degradation rate (c) and effective degradability at 2, 5 and 8%.h-1 passage rates of the CP of corn grain and non-starchy ingredients.
Parameters Ingredients
E P Corn Non-starchy
Crude Protein (% DM) 9.25 10.33 1.23 0.3947
Water-soluble fraction (a)* 24.87 15.93 8.20 0.2930
Potentially degradable fraction (b)* 56.49 52.85 7.43 0.6307
Degradation rate (c)* 5.97 5.93 1.14 0.9703
Effective degradability 2%.h-1
*† 49.20 49.00 13.18 0.9890
Effective degradability 5%.h-1
*† 42.29 35.88 7.58 0.4099
Effective degradability 8%.h-1
*† 22.86 25.61 9.07 0.7688
*Values determined using the model of Ørskov and McDonald (1979); †Values determined considering passage rates indicated by the AFRC (1993).
Bampidis and Robinson, 2006). In addition, the citrus fruit pulp and soybean hulls expand when in contact with rumen fluid; a diet with a high proportion of carbohydrates in the form of pectin might limit consumption (Wing, 1982).
Briefly, in case of ruminants used as beef cattle, the use of these pectin sources as substitutes for corn in diets with high share of concentrates generally increases DM intake and nutrient digestibility and maintains similar carcass traits, but reduces feed efficiency (Pinheiro et al., 2000; Caparra et al., 2007; Rodrigues et al., 2008b). On the other hand, in studies with animals bred for milk production, an increase in milk production and changes in milk composition as well as ingestion behavior are observed (Belibasakis and Tsirgogianni, 1996; Miron et al., 2002; Mendes Neto et al., 2007; Pedroso et al., 2007).
Therefore, in addition to the afore-mentioned biological advantages, the use of these two byproducts, instead of corn, in feeding and ruminant nutrition is also justified by the cost. This is because when the main soybean products, such as soybean oil and citrus fruit product,
that is, orange juice are extracted, soybean hulls and citrus fruit pulp, respectively, are generated from the raw materials as byproducts of the process, and therefore, can be sold for the cost below that of the corn grain.
Conclusion Corn grains can be replaced with soybean hulls or citrus pulps in the feed of ruminants, which reduces the possibility of the occurrence of metabolic disorders, such as subclinical and/or clinical acidosis, without damaging ruminal fermentation. Conflict of Interests
The authors have not declared any conflict of interest.
ACKNOWLEDGEMENT This study was supported by the Financiadora de

1906 Afr. J. Agric. Res. Estudos e Projetos (FINEP) of the Ministério da Ciência e Tecnologia (MCT) through the Public Call MCT/FINEP/CT-INFRA-CAMPI REGIONAL-01/2010. REFERENCES Agricultural and Food Research Council – AFRC (1993). Energy and
protein requirements of ruminants. Wallingford, UK: CAB international. 159 p.
Alcalde CR, Zambom MA, Passianoto GO, Lima LS, Zeoula LM, Hashimoto JH (2009). Valor nutritivo de rações contendo casca do grão de soja em substituição ao milho moído para cabritos Saanen. R. Bras. Zootec. 38(11):2198-2203.
Arthington JD, Kunkle WE, Martin AM (2002). Citrus pulp for cattle. Vet. Clin. N. Am. Food A. 18(2):317-326.
Bampidis VA, Robinson PH (2006). Citrus by-products as ruminant feeds: A review. Anim. Feed Sci. Technol. 128(3-4):175-217.
Belibasakis NG, Tsirgogianni D (1996). Effects of dried citrus pulp on milk yield, milk composition and blood components of dairy cows. Anim. Feed Sci. Technol. 60(1-2):87-92.
Beran FHB, Silva LDF, Ribeiro ELA, Castro VS, Correa RA, Kagueyama ÊO, Rocha MA (2005). Degradabilidade ruminal “in situ” da matéria seca, matéria orgânica e proteína bruta de alguns suplementos concentrados usados na alimentação de bovinos. Semin. Ciênc. Agrár. 26(3):405-418.
Berchielli TT, Rodriguez NM, Andrade P (1996). Concentração, proporção molar e taxa de produção de ácidos graxos voláteis (AGV) no rúmen de bovinos alimentados com diferentes níveis de concentrado na dieta. R. Bras. Zootec. 25(3):511-521.
Bevans DW, Beauchemin KA, Schwartzkopf-Genswein KS, McKinnon JJ, McAllister TA (2005). Effect of rapid or gradual grain adaptation on subacute acidosis and feed intake by feedlot cattle. J. Anim. Sci. 83(5):1116-1132.
Cañizares GIL, Rodrigues L, Cañizares MC (2009). Metabolismo de carboidratos não-estruturais em ruminantes. Arch. Vet. Sci. 14(1):63-73.
Caparra P, Foti F, Scerra M, Sinatra M C, Scerra V (2007). Solar-dried citrus pulp as an alternative energy source in lamb diets: Effects on growth and carcass and meat quality. Small Rumin. Res. 68(3):303-311.
Chaudhry SM, Naseer Z (2006). Silages of citrus pulp-poultry litter-corn forage for sheep. Pak. J. Agric. Sci. 43(3-4):173-179.
Chumpawadee S, Sommart K, Vongpralub T, Pattarajinda V (2006). Effects of synchronizing the rate of dietary energy and nitrogen release on ruminal fermentation, microbial protein synthesis, blood urea nitrogen and nutrient digestibility in beef cattle. Asian Aust. J. Anim. 19(2):181-188.
CONAB – Companhia Nacional de Abastecimento (2015). Séries Históricas. Available at: http://www.conab.gov.br/conteudos.php?a=1252&ordem=produto&Pagina_objcmsconteudos=3#A_objcmsconteudos
Costa NL, Santana AC (2015). Exports and market power of the soybean processing industry in Brazil between 1980 and 2010. Afr. J. Agric. Res. 10(26):2590-2600.
Detmann E, Valadares Filho SC (2010). On the estimation of non-fibrous carbohydrates in feeds and diets. Arq. Bras. Med. Vet. Zool. 62(4):980-984.
Fernandes JJR, Pires AV, Santos FAP, Susin I, Simas JMC (2002). Teores de caroço de algodão em dietas contendo silagem de milho para vacas em lactação. Acta Sci. Anim. Sci. 24(4):1071-1077.
Fortaleza APS, Silva LDF, Ribeiro ELA, Barbero RP, Massaro Júnior FL, Santos AX, Castro VS, Castro FAB (2009). Degradabilidade ruminal In Situ dos componentes nutritivos de alguns suplementos concentrados usados na alimentação de bovinos. Semin. Ciênc. Agrár. 30(2):481-496.
Fox DG, Tedeschi LO, Tylutki TP, Russell JB, Van Amburgh ME, Chase LE, Pell AN, Overton TR (2004). The Cornell Net Carbohydrate and Protein System model for evaluating herd nutrition and nutrient excretion. Anim. Feed Sci. Technol. 112(1-4):29-78.
Franco GL, Barros LF, Rocha MST, Madeiros LQ, D’Oliveira MC, Diogo
JMS, Ramos AKB (2010). Suplementação proteico-energética sobre o consumo voluntário e parâmetros ruminais em novilhos. Rev. Bras. Saúde Prod. Anim. 11(2):371-385.
Franzolin Neto R, Franzolin MHT, Gomide CA, Schalch E, Silva JR (2000). Efeitos de dietas com polpa cítrica em substituição ao milho em grãos no concentrado sobre a degradabilidade e a fauna ruminal em bubalinos. R. Bras. Zootec. 29(6):2109-2118.
Garcia J, Alcalde CR, Jobim CC, Zambom MA, Damasceno JC, Santos VC (2003). Degradabilidade in situ de alimentos concentrados e do capim Brachiaria decumbens Stapf. em diferentes crescimentos vegetativos. Acta Scie. Anim. Sci. 25(2):387-395.
Gentil RS, Susin I, Pires AV, Ferreira EM, Mendes CQ, Almeida OC, Queiroz MAA (2011). Metabolismo de nutrientes em ovinos alimentados com casca de soja em substituição ao feno de coastcross. R. Bras. Zootec. 40(12):2835-2843.
Goes RHTB, Mancio AB, Valadares Filho SC, Lana RP (2004). Degradação ruminal da matéria seca e proteína bruta, de alimentos concentrados utilizados como suplementos para novilhos. Ciênc. Agrotec. 28(1):167-173.
Goes RHTB, Souza KA, Nogueira KAG, Pereira DF, Oliveira ER, Brabes KCS (2011). Degradabilidade ruminal da matéria seca e proteína bruta, e tempo de colonização microbiana de oleaginosas, utilizadas na alimentação de ovinos. Acta Sci. Anim. Sci. 33(4):373-378.
Jung HJG, Samac DA, Sarath G (2012). Modifying crops to increase cell wall digestibility. Plant Sci. 185-186:65-77.
Kamra DN (2005). Rumen microbial ecosystem. Curr. Sci. 89(1):124-135.
Lanzas C, Sniffen CJ, Seo S, Tedeschi LO, Fox DG (2007). A revised CNCPS feed carbohydrate fractionation scheme for formulating rations for ruminants. Anim. Feed. Technol. 136(3-4):167-190.
Lashkari S, Taghizadeh A, Seifdavati J, Salem AZM (2014). Qualitative characteristics, microbial populations and nutritive values of orange pulp ensiled with nitrogen supplementation. Slovak J. Anim. Sci. 47(2):90-99.
Lovatto PA, Lehnen CR, Andretta I, Carvalho AD, Hauschild L (2007). Meta-análise em pesquisas científicas - enfoque em metodologias. R. B. Zootec. 36:285-294.
Macedo CAB, Mizubuti IY, Pereira ES, Ribeiro ELA, Ramos BMO, Mori RM, Pinto AP, Moreira FB, Bonin MN (2007). Apparent digestibility and nitrogen use of diets with different levels of fresh orange pulp. Arch. Zootec. 56(216):907-917.
Marcondes MI, Valadares Filho SC, Detmann E, Valadares RFD, Silva LFC, Fonseca MA (2009). Degradação ruminal e digestibilidade intestinal da proteína bruta de alimentos para bovinos. R. Bras. Zootec. 38(11):2247-2257.
Martins AS, Zeoula LM, Prado IN, Martins EM, Loyola VR (1999). Degradabilidade ruminal in situ da matéria seca e proteína bruta das silagens de milho e sorgo e de alguns alimentos concentrados. R. Bras. Zootec. 28(5):1109-1117.
Mendes Neto J, Campos JMS, Valadares Filho SC, Lana RP, Queiroz AC, Euclydes RF (2007). Comportamento ingestivo de novilhas leiteiras alimentadas com polpa cítrica em substituição ao feno de capim-tifton 85. R. Bras. Zootec. 36(3):618-625.
MAPA (2013). Ministério da Agricultura, Pecuária e Abastecimento – MAPA. Brasil.
MAPA (2015). Ministério da Agricultura, Pecuária e Abastecimento – MAPA. Brasil. Available at: http://www.agricultura.gov.br/vegetal/culturas/citrus
Miron J, Yosef E, Ben-Ghedalia D, Chase LE, Bauman DE, Solomon R (2002). Digestibility by dairy cows of monosaccharide constituents in total mixed rations containing citrus pulp. J. Dairy Sci. 85(1):89-94.
Mizubuti IY, Moreira FB, Ribeiro ELA, Pereira ES, Rocha MA, Silva Filho MF (2007). Degradabilidade in situ da matéria seca e da proteína bruta do farelo de arroz, farelo de trigo, grão de milho e grão de aveia. Acta Sci. Anim. Sci. 29(2):187-193.
Moreira PC, Reis RB, Wascheck RC, Rezende PLP, Mendonça AC, Rassi LF (2009). Degradabilidade in situ das rações de vacas da raça holandês em lactação com substituição do milho por polpa cítrica. Ci. Anim. Bras. 10(2):406-412.
Mouro GF, Branco AF, Macedo FAF, Guimarães KC, Alcalde CR, Ferreira RA, Prohmann PEF (2002). Substituição do milho pela

farinha de mandioca de varredura em dietas de cabras em lactação: fermentação ruminal e concentrações de ureia plasmática e no leite. R. Bras. Zootec. 31(4):1840-1848.
Nagaraja TG, Titgemeyer EC (2007). Ruminal acidosis in beef cattle: The current microbiological and nutritional outlook. J. Dairy Sci. 90(1):17-38.
National Research Council – NRC (2007). Nutrient requirements of small ruminants: sheep, goats, cervids, and New World camelids. Washington: National Academic Press. 292 p.
Neves MF, Trombin VG, Kalaki RB (2014). Mercado Brasileiro de Suco de Laranja: uma alternativa para mitigar os efeitos do declínio do consumo no mundo. Citrus Res. Technol. 35(2):61-71.
Neves MF, Trombin VG, Milan P, Lopes FF, Cressoni F, Kalaki R (2010). O retrato da citricultura brasileira. 1. Ed. Riberão Preto: Markestrat Centro de pesquisa e projetos em marketing e estratégia 137 p.
Nussio CMB, Santos, FAP, Pires, AV, Simas JMC, Zopollatto M (2002). Fontes de amido de diferentes degradabilidades e sua substituição parcial por polpa de citrus em dietas para vacas leiteiras. Acta Sci. Anim. Sci. 24(4):1079-1086.
Oliveira MVM, Vargas Junior FM, Sanchez LMB, Paris W, Frizzo A, Haygert IP, Montagner D, Weber A, Cerdótes L (2003). Degradabilidade ruminal e digestibilidade intestinal de alimentos por intermédio da técnica in situ associada à do saco de náilon móvel. R. Bras. Zootec. 32(6):2023-2031.
Ørskov ER, McDonald I (1979). The estimation of protein degradability in the rumen from incubation measurements weighted according to rate of passage. J. Agri. Sci. 92(2):499-503.
Pedroso AM, Santos FAP, Bittar CMM, Pires AV, Martinez JC (2007). Substituição do milho moído por casca de soja na ração de vacas leiteiras em confinamento. R. Bras. Zootec. 36(5):1651-1657.
Pereira MS, Ribeiro ELA, Mizubuti IY, Rocha MA, Kuraoka JT, Nakaghi EYO (2008). Consumo de nutrientes e desempenho de cordeiros em confinamento alimentados com dietas com polpa cítrica úmida prensada em substituição à silagem de milho. R. B. Zootec. 37(1):134-139.
Pinheiro AD, Prado IN, Alcalde CR, Zeoula LM, Nascimento WG, Torii MS (2000). Efeitos dos níveis de substituição do milho pela polpa de citrus peletizada sobre a digestibilidade aparente em bovinos mestiços confinados. Acta Sci. Anim. Sci. 22(3):793-799.
Plaizier JC, Krause DO, Gozho GN, McBride BW (2009). Subacute ruminal acidosis in dairy cows: The physiological causes, incidence and consequences. Vet. J. 176(1):21-31.
Porcionato MAF, Berchielli TT, Franco GL, Andrade P, Silveira RN, Soares WVB (2004). Digestibilidade, degradabilidade e concentração amoniacal no rúmen de bovinos alimentados com polpa cítrica peletizada normal ou queimada. R. Bras. Zootec. 33(1):258-266.
Prado IN, Medroni S, Damasceno JC, Zeoula LM, Vinocur K, Nascimento WG (2000). Degradabilidade ruminal in situ de dietas contendo milho ou triticale e farelo de soja ou levedura. Acta Sci.. Anim. Sci. 22(3):755-759.
Rodrigues GH, Susin I, Pires AV, Mendes CQ, Araujo RC, Packer IU, Ribeiro MF, Gerage LV (2008a). Substituição do milho por polpa cítrica em rações com alta proporção de concentrado para cordeiros confinados. Ciênc. Rural 38(3):789-794.
Rodrigues GH, Susin I, Pires AV, Mendes CQ, Urano FS, Castillo CJC (2008b). Polpa cítrica em rações para cordeiros em confinamento: Características da carcaça e qualidade da carne. R. Bras. Zootec. 37(10):1869-1875.
Rodrigues GH, Susin I, Pires AV, Nussio LG, Gentil RS, Ferreira EM, Biehl MV, Ribeiro MF (2011). Desempenho, características da carcaça, digestibilidade aparente dos nutrientes, metabolismo de nitrogênio e parâmetros ruminais de cordeiros alimentados com rações contendo polpa cítrica úmida semidespectinada e/ou polpa cítrica desidratada. R. Bras. Zootec. 40(10):2252-2261.
Russell JB, Rychlik JL (2001). Factors that alter rumen microbial ecology. Science 292(5519):1119-1122.
Santos FAP, Carmo CA, Bittar CMM, Pires AV, Pedroso AM, Pereira EM (2007). Milho com diferentes graus de moagem em combinação com polpa cítrica peletizada ou casca de soja para vacas leiteiras no terço médio da lactação. R. Bras. Zootec. 36(4):1183-1191.
Busanello et al. 1907 Santos GT, Lima LS, Schogor ALB, Romero JV, Marchi FE, Grande PA,
Santos NW, Santos FS, Kazama R (2014). Citrus pulp as a dietary source of antioxidants for lactating Holstein cows fed highly polyunsaturated fatty acid diets. Asian Austral. J. Anim. Sci. 27(8):1104-1113.
Santos VC, Ezequiel JMB, Morgado ES, Homem Júnior AC, Fávaro VR, D’Aurea AP, Souza SF, Barbosa JC (2012). Influência de subprodutos de oleaginosas sobre parâmetros ruminais e a degradação da matéria seca e da proteína bruta. Arq. Bras. Med. Vet. Zootec. 64(5):1284-1291.
SAS Institute (2002). SAS/STAT. Guide for personal computers. Cary P 1.
Silva LDF, Ezequiel JMB, Azevedo PS, Barbosa JC, Cattelan JW, Resende FD, Seixas JRC, Carmo FRG (1999). Degradabilidade ruminal in situ da matéria seca, matéria orgânica e da proteína bruta de alguns alimentos em novilhos. Semin. Ciênc. Agrár. 20(1):25-30.
Simas JMC, Pires AV, Susin I, Santos FAP, Mendes CQ, Oliveira Jr RC, Fernandes JJR (2008). Efeitos de fontes e formas de processamento do amido na utilização de nutrientes e parâmetros ruminais de vacas em lactação. Arq. Bras. Med. Vet. Zootec. 60(5):1128-1134.
Tambara AAC, Olivo CJ, Pires MBG, Sanchez LMB (1995). Avaliação in vivo da digestibilidade da casca do grão de soja moída com ovinos. Ciênc. Rural, 25(2):283-287.
Tanaka M, Kamiya Y, Suzuki T, Nakai Y (2010). Effect of citrus pulp silage feeding on concentration of beta-cryptoxanthin in plasma and milk of dairy cows. Anim. Sci. J. 81(5):569-573.
Tylutki TP, Fox DG, Durbal VM, Tedeschi LO, Russell JB, Van Amburgh ME, Overton TR, Chase LE, Pell AN (2008). Cornell Net Carbohydrate and Protein System: A model for precision feeding of dairy cattle. Anim. Feed Sci. Technol. 143(1-4):174-202.
Volanis M, Zoiopoulos P, Panagou E, Tzerakis C (2006). Utilization of an ensiled citrus pulp mixture in the feeding of lactating dairy ewes. Small Ruminant Res. 64(1-2):190-195.
Wang YH, Xu M, Wang FN, Yu ZP, Yao JH, Zan LS, Yang FX (2009). Effect of dietary starch on rumen and small intestine morphology and digesta pH in goats. Livest. Sci. 122(1):48-52.
Wing JM (1982). Citrus feedstuffs for dairy cattle. Florida Agricultural Experiment Station Bulletin 829. University of Florida, Gainsville (FL) 1982.
Zeoula LM, Martins AS, Prado IN, Alcalde CR, Branco AF, Santos GT (1999). Solubilidade e degradabilidade ruminal do amido de diferentes alimentos. R. Bras. Zootec. 28(5):898-905.

Vol. 11(21), pp. 1908-1913, 26 May, 2016
DOI: 10.5897/AJAR2016.10824
Article Number: 14AC98058711
ISSN 1991-637X
Copyright ©2016
Author(s) retain the copyright of this article
http://www.academicjournals.org/AJAR
African Journal of Agricultural Research
Full Length Research Paper
Co-inoculation with rhizobacteria in association with humic acid and nitrogen on common bean development
Érica de Oliveira Araújo*, Juliana Guimarães Gerola, Juan Ricardo Rocha and Leandro Cecílio Matte
Institute of Education, Science and Technology of Rondônia, BR 434 km 63, CEP 76993-000, Colorado do Oeste -RO,
Brazil.
Received 20 January, 2016; Accepted 17 March, 2016
Studies on co-inoculation of strains with high symbiotic potential, as well as the use of humic substances are of great importance for obtaining increases in nodulation, biological nitrogen fixation and yield of the bean crop. Thus, this study aimed to evaluate the effects of the co-inoculation of Rhizobium tropici and Azospirillum brasilense in association with humic acids and nitrogen (N) on the behavior of different bean genotypes, cultivated in a protected environment. The experiment was carried out at the Federal Institute of Education, Science and Technology of Rondônia, Campus of Colorado do Oeste-RO, Brazil, from February to April 2015. The experimental design was completely randomized, with four replicates. Common bean seeds of the cultivars ‘Pérola’ and ‘BRS Esplendor’ were previously co-inoculated with Azospirillum brasilense and Rizhobium tropici. Shoot dry matter production in the cultivar ‘Pérola’ increased by 76.12% when co-inoculated with rhizobacteria. N use efficiency in the bean cultivar ‘Pérola’ is higher when co-inoculated with Azospirillum brasilense and Rizhobium tropici, confirming that co-inoculation alone is sufficient to provide the N necessary for plant development. Key words: Phaseolus vulgaris L., Rhizobium tropici, Azospirillum brasilense, biological N fixation (BNF).
INTRODUCTION The common bean (Phaseolus vulgaris L.) constitutes the staple food of many developing countries and is considered as one of the most important constituents in the diet of the Brazilian population, for being recognizably an excellent source of protein, carbohydrates and iron. Global bean production has progressively increased since the 1960s. Brazil is the world‟s largest producer and consumer of this leguminous plant, with production of about 3.39 million tons. However, the mean yield of bean in the country is relatively low, only 1071 kg ha
-1 in the
2014/2015 season, considering 1º, 2º and 3º crops (Conab, 2015). These low crop yields reflect the low technological level employed by farmers, as well as the cultivation of bean in soils with low fertility, especially poor in nitrogen (N) (Pelegrin et al., 2009). Among the factors that most contribute to the increase in production costs of bean crops, the use of mineral fertilizers, especially with N, stands out, because they are required in larger amounts by plants. However, although N fertilizers are the fastest form of absorption by plants,
*Corresponding author. E-mail: [email protected], [email protected]
Author(s) agree that this article remain permanently open access under the terms of the Creative Commons Attribution
License 4.0 International License

they have high costs, high expenditure of energy sources in their manufacturing, low efficiency of use by plants, rarely exceeding 50%, besides being closely related to environmental pollution (Hungria et al., 2013). Thus, alternatives aiming to reduce input application in agricultural production areas, capable of promoting high yields and maintaining environmental sustainability, with focus on food safety, are of great interest. One alternative for the reduction in the necessity of N fertilizers is the biological N fixation (BNF), which is performed by a restrict group of bacteria, referred to as diazotrophic (Reis, 2007).
Currently, the commercial inoculant for bean in Brazil is produced with a species of rhizobium adapted to tropical soils, Rhizobium tropici, which is able to fix 20 to 30% of the N required by the plant through BNF and can provide 20 to 40 kg ha
-1 of N (Fancelli and Dourado Neto, 2007).
Besides rhizobia that are specific for leguminous plants, other microorganisms can bring great benefits to crops. One of the most promising groups is represented by associative bacteria, which are capable of promoting plant growth through various processes, such as the production of growth hormones, capacity to perform BNF, etc. Among these bacteria, those belonging to the genus Azospirillum stand out.
In this context, an alternative co-inoculation technique, also referred to as mixed inoculation, with symbiotic and non-symbiotic bacteria, has been studied in leguminous plants. This technique consists in the use of combinations of different microorganisms, which produce a synergetic effect, surpassing the production results obtained when they are used in separate (Bárbaro et al., 2011). In the cases in which Azospirillum brasilense has been used in leguminous plants, the beneficial effect of the association with rhizobium is mostly due to the capacity of the bacteria to produce phytohormones, which results in higher root system development and, therefore, the possibility to explore a greater soil volume (Bárbaro et al., 2008). In the bean crop, studies have shown that the combined inoculation of Rhizobium and Azospirillum can increase the amount of N fixed and grain yield (Yadegari, 2010).
The interaction between the bean crop and atmospheric N-fixing bacteria has shown the capacity to substitute N fertilization, at least partially, for obtaining high yields (Pelegrin et al., 2009). However, although the number of researches involving these bacteria has increased in the last years in Brazil, little is known about the effects of using these microorganisms together with humic substances (HS).
Substance humic, the main component of soil organic matter (85 to 90%), can promote effects on plants that are related to the increase in nutrient absorption, due to the influence in cell membrane permeability and to the chelating power, as well as to photosynthesis and the formation of ATP, amino acids and proteins. In addition, HS directly alter plant biochemical metabolism and,
Araújo et al. 1909 consequently, can influence growth and development, as well as promote increase in the population of endophytic bacteria, stimulating the increase in the establishment of the bacterial inoculum inside the plant. This can be hypothetically explained as part of the effects of HS on the increase in the number of lateral roots, which constitute the major site of infection of the host plant by endophytic bacteria (Marques Júnior et al., 2008).
Therefore, studies on the association of rhizobium strains with high symbiotic potential and rhizobacteria, as well as the use of HS, become of great importance for obtaining increases in nodulation, biological N fixation and bean yield, under tropical conditions.
Given the above, this study aimed to evaluate the effects of co-inoculation of R. tropici and A. brasilense in association with humic acids and N on the behavior of different bean genotypes, cultivated in a protected environment.
MATERIALS AND METHODS
The experiment was carried out from February to April 2015, at the Plant Production Sector of the Federal Institute of Education, Science and Technology of Rondônia, Campus of Colorado do Oeste-RO, Brazil (13° 06' S; 60° 29' W; 407 m). According to Köppen‟s classification, the climate in the region is Awa, hot and humid tropical, with two well-defined seasons. The soil used in the study, classified as Red Yellow Argisol of very clayey texture (Embrapa, 2013), was collected in the layer of 0 to 20 cm. The soil chemical analysis before the experiment showed the following results: O.M. - 10.00 g dm-3; pH (CaCl2) - 5.30; P - 1.10 mg dm-3; K - 0.14 cmolc dm-3; Ca - 5.56 cmolc dm-3; Mg - 1.15 cmolc dm-3; Al - 0.0 cmmolc dm-3; H+Al - 2.25 cmolc dm-3; SB - 6.90 cmolc dm-3; CEC - 9.10 cmolc dm-3 and base saturation - 75.30%. Granulometric analysis showed 199 g kg-1 of sand, 166 g kg-1 of silt and 635 g kg-1 of clay.
The experiment was set in a completely randomized design, with four replicates, and the treatments were: 1) Control; 2) Co-inoculation with R. tropici and A. brasilense ; 3) 30 kg ha-1 of N; 4) Co-inoculation with R. tropici and A. brasilense + Humic acid; 5) Co-inoculation with R. tropici and A. brasilense + 30 kg ha-1 of N and 6) Co-inoculation with R. tropici and A. brasilense + 30 kg ha-1 of N + Humic acid, totaling 24 experimental units for each bean genotype evaluated.
Based on the results of soil chemical analysis, basal fertilization was performed in order to guarantee the establishment of the crop, by mixing the soil with 110 kg ha-1 of P2O5 and 60 kg ha-1 of K2O, as single superphosphate (18% P2O5) and potassium chloride (60% K2O), respectively. Micronutrients were applied based on crop requirements, in the form of a solution, using deionized water and salts (A.R.), according to Epstein and Bloom (2006). N fertilization was performed at sowing, using the dose of 30 kg ha-1, as urea (45%).
The experimental units consisted of plastic pots with capacity for 8 dm-3, filled with air-dried soil, sieved through a 4-mm mesh. The moisture in the pots was daily controlled through weighing, in order to maintain the soil at 60% of field capacity. Irrigation was performed using distilled water.
Seeding was performed using common bean seeds, cultivars “Pérola” („Carioca‟ group) and “BRS Esplendor” („Preto‟ group), which were previously inoculated with a product containing a combination of two strains of A. brasilense (Ab-V5 and Ab-V6), in

1910 Afr. J. Agric. Res. Table 1. Plant height (PH), stem diameter (SD), root length (RL), root volume (RV), shoot dry matter (SDM) and root dry matter (RDM) of bean plants, cv. „Pérola‟, in response to co-inoculation of Azospirillum brasilense and Rizhobium tropici and application of humic substances and nitrogen. Colorado do Oeste-RO, Brazil (2015).
Treatments PH (cm) SD (mm) RL (cm) RV (cm3/plant) SDM (g) RDM (g)
1. Control 22.00b 2.71
b 19.00
b 6.66
b 1.55
b 0.28
2. Co-inoculation 42.00a 4.10
a 29.50
a 9.00
a 2.73
a 0.32
3. 30 kg ha-1
N 34.16ab
3.75ab
27.50ab
8.33ab
2.06ab
0.38
4. Co-inoculation + Humic acid 36.76ab
3.34ab
20.76b 7.99
ab 1.48
b 0.29
5. Co-inoculation + 30 kg ha-1
N 40.23a 3.37
ab 23.33
ab 8.66
ab 1.31
b 0.23
6. Co-inoculation + 30 kg ha-1
N + Humic acid 41.26a 3.20
ab 23.00
ab 8.00
ab 1.31
b 0.25
Medium 36.06 3.41 23.84 8.10 1.74 0.29
Test F 0.00* 0.01* 0.03* 0.03* 0.04* 0.05NS
CV (%) 18.47 13.85 10.82 38.82 61.08 69.00
* and NS
- significant 5% probability and not significant, respectively. Medium followed by the same letter in the columns, do not differ statistically between themselves by Tukey test, the 5% probability. CV: coefficient of variation. inoculant with liquid formulation, and an inoculant containing the strain R. tropici, in peat-based formulation, produced by the company Total Biotecnologia. The applied dose was 150 mL for each 50 kg of bean seeds, for the inoculant with liquid formulation, and 250 g for each 10 kg of bean seeds, for the inoculant with peat-based formulation. For the inoculation with R. tropici, 60 mL of a sugar solution at 10% (m/v) were added to each 10 kg of seeds, in order to increase the adhesion of the inoculant to the seeds. Thus, co-inoculation corresponded to the mixed inoculation of the two inoculants, according to the recommendations for the crop.
Humic acids were extracted and provided by the Biotechnology Laboratory of the Norte Fluminense State University – UENF, Campus of Goytacazes-RJ, and were isolated from vermicompost, according to Canellas et al. (2005). The material was previously dissolved in water, in the proportion of 50 mg L-1. HS was directly applied on the seeds, inside plastic bags, with a volumetric pipette. After application, the plastic bags were closed and vigorously agitated for two minutes, for a homogeneous distribution of the product on the seeds. The seeds were placed to germinate directly in the pots and, 8 days after emergence (DAE), thinning was performed, leaving only one plant in each experimental unit.
At 35 DAE, plant height and stem diameter were determined. Plant height was measured from the basis to the apical meristem of the plants, using a ruler. Stem diameter was determined using a digital caliper, at the height of 2 cm from the soil surface. Then, plants were collected and divided into roots and shoots. After that, all the collected plant material was washed in running water, HCl solution at 0.1 mol L-1 and deionized water, respectively. Root length was determined using a ruler and root volume through the graduated cylinder method, in which roots are submerged in a graduated cylinder containing a known volume of water and their volume is determined by the difference between the initial and final volumes of the container. Then, the samples were placed in paper bags and dried in a forced-air oven at temperature of 65ºC for 72 h. After drying the plant material, its dry matter was weighed and ground in a Wiley-type mill and the samples were subjected to sulfuric digestion, for the determination of N contents in the different plant parts (roots and shoots), according to the methodology described in Embrapa (2009).
N absorption efficiency, ratio between total N content in the plant and root dry matter, was calculated according to Swiader et al. (1994). N transport efficiency, ratio between shoot N content and total N content in the plant, and N use efficiency, ratio between the total dry matter production and total N accumulation in the plant, were calculated according to Siddiqi and Glass (1981).
Nitrogen absorption efficiency, ratio between the total N content in the plant and root dry matter, was calculated according to Swiader et al. (1994), while N use efficiency, ratio between total dry matter production and total N accumulation in the plant, was calculated according to Siddiqi and Glass (1981).
The results were subjected to analysis of variance and the means were compared by Tukey test at 0.05 probability level, using the statistical program Sisvar.
RESULTS AND DISCUSSION
There was significant difference (p≤0.05) for plant height, stem diameter, root length, root volume, shoot dry matter, root dry matter and N use efficiency in response to the co-inoculation of A. brasilense and R. tropici and application of humic substances and N in bean plants, cv. „Pérola‟, from the „Carioca‟ group (Tables 1 and 2).
On the other hand, the cultivar „BRS Esplendor‟, from the „Preto‟ group, showed significant response (p≤0.05) only for plant height, and no significant effects of treatments for the other studied variables (Tables 3 and 4).
The lack of response to the application of A. brasilense and R. tropici can be related to the period of evaluation of the experiment (V4 stage), when BNF activity is still low. Brito et al. (2009), evaluating the uptake rate of N derived from BNF, N fertilizers and from the soil for bean growth, observed that the highest N fixation rates occur from the pre-flowering (R5 stage) on. These results corroborate those of Souza (2014), who observed no effect of R. tropici, isolated or combined with A. brasilense, on shoot, root and total dry matter production of bean plants, cv. „Pérola‟.
Plant height for the cultivar „Pérola‟ showed the highest values in the treatment corresponding to co-inoculation of A. brasilense and R. tropici, co-inoculation + 30 kg ha
-1 of
N and co-inoculation + 30 kg ha-1
of N + humic acid, being superior to the control (without co-inoculation and without N) and similar to the other treatments. The values

Araújo et al. 1911
Table 2. Shoot nitrogen content (SNC), root nitrogen content (RNC), total nitrogen content (TNC), nitrogen absorption efficiency (NAE), nitrogen transport efficiency (NTE) and nitrogen use efficiency (NUE) of bean plants, cv. „Pérola‟, in response to co-inoculation of A. brasilense and R. tropici and application of humic substances and nitrogen. Colorado do Oeste-RO, Brazil (2015).
Treatments SNC (g kg-1) RNC (g kg-1) TNC (g kg-1) NAE (mg g-1) NTE (%) NUE (mg g-1)
1. Control 41.60 24.22 65.82 309.17 73.89 0.02b
2. Co-inoculation 45.25 24.62 79.70 627.27 85.58 0.07a
3. 30 kg ha-1 N 44.20 26.80 69.87 621.92 86.60 0.05ab
4. Co-inoculation + Humic acid 48.46 26.63 75.10 346.49 91.07 0.03ab
5. Co-inoculation + 30 kg ha-1 N 45.73 27.35 73.08 484.54 91.08 0.03ab
6. Co-inoculation + 30 kg ha-1 N + Humic acid 43.56 26.16 69.72 514.14 94.31 0.03ab
Medium 44.80 25.96 72.21 483.92 87.08 0.04
Test F 0.11NS 0.21NS 0.08NS 0.57NS 0.48NS 0.04*
CV (%) 7.05 7.63 5.79 61.80 17.09 20.01
* and NS
- significant 5% probability and not significant, respectively. Medium followed by the same letter in the columns, do not differ statistically between themselves by Tukey test, the 5% probability. CV: coefficient of variation.
Table 3. Plant height (PH), stem diameter (SD), root length (RL), root volume (RV), shoot dry matter (SDM) and root dry matter (RDM) of bean plants, cv. „BRS Esplendor‟, in response to co-inoculation of Azospirillum brasilense and Rizhobium tropici and application of humic substances and nitrogen. Colorado do Oeste-RO, Brazil (2015).
Treatments PH (cm) SD (mm) RL (cm) RV (cm3/planta) SDM (g) RDM (g)
1. Control 35.05b 3.56 31.00 12.00 1.01 0.28
2. Co-inoculation 50.75a 3.61 32.33 12.25 1.28 0.43
3. 30 kg ha-1
N 37.80b 4.15 29.95 15.50 2.50 0.68
4. Co-inoculation + Humic acid 45.40ab
3.82 27.62 11.75 1.85 0.42
5. Co-inoculation + 30 kg ha-1
N 50.17a 3.90 26.55 14.50 2.58 0.52
6. Co-inoculation + 30 kg ha-1
N + Humic acid 44.20ab
3.66 28.72 12.25 1.82 0.35
Medium 43.89 3.78 29.36 13.04 1.67 0.45
Test F 0.01* 0.19NS
0.61NS
0.53NS
0.08NS
0.15NS
CV (%) 19.51 9.02 17.14 26.05 57.56 45.37
* and NS
- significant 5% probability and not significant, respectively. Medium followed by the same letter in the columns, do not differ statistically between themselves by Tukey test, the 5% probability. CV: coefficient of variation. ranged from 22 cm (control) to a mean of 41.16 cm (co-inoculation, co-inoculation + 30 kg ha
-1 of N and co-
inoculation + 30 kg ha-1
of N + humic acid), with increment of 87.09% in relation to the control (Table 1). On the other hand, the cultivar „BRS Esplendor‟ showed greater height in the treatment with co-inoculation of A. brasilense and R. tropici and co-inoculation + 30 kg ha
-1
of N, statistically differing from the control. A mean increment of 43.96% was observed in plant height, in comparison to the control (Table 3).
This increase in plant height is associated with the stem elongation promoted by N associated with co-inoculation. According to Marschener (1995), the application of N doses in the initial development stage of plants causes increments in the production of growth-promoting phytohormones (auxins, gibberellins and cytokines), which are responsible for processes of cell division and expansion. It is important to point out that, even with rhizobium inoculation, many studies (Pelegrin
et al., 2009; Brito et al., 2011) suggest the need for the application of an initial N dose in the bean crop.
As to the stem diameter of the cultivar „Pérola‟, the treatment with co-inoculation of A. brasilense and R. tropici was superior, statistically differing (p≤0.05) only from the control (Table 1). Higher stem diameter is directly related to the increase in production, since it acts in the storage of soluble solids that will be used later for grain formation (Fancelli and Dourado Neto, 2008).
Co-inoculation of A. brasilense and R. tropici influenced root length and volume of bean plants cv. „Pérola‟ (Table 1). Co-inoculated plants showed increment of about 55.26% in root length and 35.13% in root volume, compared with the control (not inoculated), but did not differ statistically from the treatment with co-inoculation + 30 kg ha
-1 of N and co-inoculation + 30 kg ha
-1 of N +
humic acid. This effect of increase in root length and volume is due to the production of auxins by the bacteria, which stimulates the growth of secondary roots, thus

1912 Afr. J. Agric. Res. Table 4. Shoot nitrogen content (SNC), root nitrogen content (RNC), total nitrogen content (TNC), nitrogen absorption efficiency (NAE), nitrogen transport efficiency (NTE) and nitrogen use efficiency (NUE) of bean plants, cv. „BRS Esplendor‟, in response to co-inoculation of Azospirillum brasilense and Rizhobium tropici and application of humic substances and nitrogen. Colorado do Oeste-RO, Brazil (2015).
Treatments SNC (g kg-1) RNC (g kg-1) TNC (g kg-1) NAE (mg g-1) NTE (%) NUE (mg g-1)
1. Control 44.75 23.00 67.75 149.83 84.18 0.04
2. Co-inoculation 43.90 22.57 66.47 190.42 87.27 0.03
3. 30 kg ha-1 N 44.32 23.85 68.17 189.22 87.24 0.08
4. Co-inoculation + Humic acid 43.40 22.75 66.15 205.52 86.93 0.05
5. Co-inoculation + 30 kg ha-1 N 43.97 23.25 67.22 255.25 90.55 0.07
6. Co-inoculation + 30 kg ha-1 N + Humic acid 43.90 22.90 66.80 123.45 76.47 0.03
Medium 44.04 23.05 67.09 185.61 85.44 0.05
Test F 0.98NS 0.92NS 0.95NS 0.10NS 0.12NS 0.98NS
CV (%) 6.18 7.54 5.01 32.86 7.82 41.44
* and NS
- significant 5% probability and not significant, respectively. Medium followed by the same letter in the columns, do not differ statistically between themselves by Tukey test, the 5% probability. CV: coefficient of variation. increasing the specific area of absorption of water and nutrients by plants (Radwan et al., 2004).
Similar results were obtained by Burdman et al. (1997), who claim that the inoculation with Azospirillum ssp. increases the number of root hairs and, since there is an increment in the root system, the combined inoculation with Rhizobium contributes to colonizing a greater number of roots, increasing the number of atmospheric N-fixing nodules. Canellas et al. (2013) observed increase in root area of corn plants when inoculated with Herbaspirillum seropedicae in combination with humic substances. Gitti et al. (2012) observed increase in root system and higher number atmospheric N-fixing nodules in common bean when co-inoculated with A. brasilense and a strain of Rhizobium.
Shoot dry matter production increased by approximately 76.12% in the treatment with co-inoculation of A. brasilense and Rhizobium in relation to the control (without co-inoculation and without N), evidencing the beneficial effects of co-inoculation with symbiotic and associative bacteria in N assimilation by bean plants. In agreement with the obtained results, Oliveira (2011) observed increase in shoot dry matter production of common bean with co-inoculation of CIAT 899 and UFLA 04-155. In addition, Peres (2014) reported that co-inoculation allowed higher production of shoot dry matter and that did not differ from A. brasilense. On the other hand, Veronezi et al. (2012) observed no differences in shoot dry matter between the treatments with inoculation of bean seeds with R. tropici, co-inoculation with R. tropici and A. brasilense and without inoculation added or not to mineral N.
It is important to point out that, based on the previously discussed results, most treatments with co-inoculation of A. brasilense and R. tropici showed results similar to those of treatments with co-inoculation + humic acids and co-inoculation + 30 kg ha
-1 of N for plant height, stem
diameter and root volume (Tables 1 and 2). This allows
suggesting that co-inoculation of bean plants alone is able to supply the N necessary for crop growth and development, which can lead to a reduction in the use of synthetic N fertilizers and, consequently, reduce production costs.
There was no significant effect (p>0.05) of the treatments for shoot N content, root N content, total N content and N absorption and transport efficiencies in bean plants, cv. „Pérola‟ (Table 3). Only N use efficiency showed significant response (p>0.05) to the treatments. Co-inoculation with R. tropici and A. brasilense promoted significant increase in N use efficiency, in relation to the control, indicating synergism of the bacteria inoculated in the seeds, which increases the efficiency of initial BNF in the plants (Table 3). This shows that the N use efficiency obtained through the interaction of these microorganisms is equivalent to or higher than that observed with only mineral fertilization (30 kg ha
-1 of N). Hungria et al.
(2013a) observed positive effects on plant total mass, leaf N and nodulation characteristics of bean with co-inoculation. However, there are still doubts about the origin of the benefits of Azospirillum in this interaction, whether from the hormonal effects that they cause on plants or from the improvements in nodulation caused by the rhizobia. Darnadelli et al. (2008) associated the positive effect of co-inoculation to root expansion and reduction in acetylene activity. However, Cássan et al. (2009) related the benefits of this interaction to the release of growth-regulating compounds, which besides promoting increase in root development rate, favors the capacity of plants to absorb water and nutrients, making them more tolerant to possible environmental stresses. Conclusions (1) Co-inoculation of A. brasilense and R. tropici allows obtaining higher initial growth in bean plants, cv. „Pérola‟.

(2) Shoot dry matter production of bean plants, cv. „Pérola‟, increased by approximately 76.12% when co-inoculated with rhizobacteria. (3) N use efficiency of bean plants, cv. „Pérola‟, is superior when co-inoculated with A. brasilense and R. tropici, confirming that co-inoculation alone is sufficient to provide the N necessary for plant development. (4) Co-inoculation of A. brasilense and R. tropici did not interfere with growth and initial development of bean plants, cv. „BRS Esplendor‟, confirming the different responses of bean genotypes regarding the co-inoculation with rhizobacteria. Conflict of Interests The authors have not declared any conflict of interests.
ACKNOWLEDGMENTS
The authors thank the Federal Institute of Rondônia (IFRO), the National Council for Scientific and Technological Development (CNPq) and the PhD researcher Fábio Lopes Olivares, from the Norte Fluminense State University, for providing resources, the scholarship to the second author and humic substances to this research. REFERENCES Bárbaro IM, Barbaro júnior LS, Ticelli M, Machado PC, Miguel FB
(2011). Preliminary results of Azospirillum brasilense along with coinoculação of Bradyrhizobium in soybeans. Pesq. Tec. 8(12):15-21.
Bárbaro IM, Brancalião SR, Ticelli M, Miguel FB, Silva JAA (2008). Alternative technique: coinoculação with Azospirillum and Bradyrhizobium aiming to increase productivity. Pesq. Tec. 9(12):15-25.
Burdman S, Kigel J, Okon Y (1997). Effects of Azospirillum brasilense on nodulation and growth of common bean (Phaseolus vulgaris L.). Soil Biol. Biochem. 29(5/6):923-929.
Brazilian Agricultural Research Corporation – Embrapa (2009). Manual of chemical analysis of soils, plants and fertilizers.-2. Ed, Brazília., Embrapa Inf. Technol. P 627.
Brazilian Agricultural Research Corporation – Embrapa. National center for soil research. (2013). Brazilian soil classification system. 3 ed. Rev. Exp. - brasília, df: Embrapa soils P 353.
Brito MMP, Muraoka T, Silva EC (2009). Marcha de absorção do nitrogênio do solo, do fertilizante e da fixação simbiótica em feijão-caupi (Vigna unguiculata (L.) Walp.) e feijão-comum (Phaseolus vulgaris L.) determinada com uso de 15N. J. Br. Sci. Soil. 33(4):895-905.
Brito MMP, Muraoka T, Silva EC (2011). Contribution of biological fixation of nitrogen, nitrogen fertilizer and soil nitrogen on the development of bean and Cowpea. Bragantia 70(1):206-215.
Canellas LP, Zandonadi DB, Medici LO, Peres LEP, Olivares FL, Facanha AR (2005). Bioactivity of humic substances – action on development and metabolism of plants. In: Canellas LP, Santos GA. Preliminary treaty about the chemistry of humic substances. Campos dos Goytacazes – RJ, pp. 224-243.
Canellas LP, Balmori DM, Medici LO, Aguiar NO, Capostrini E, Rosa RCC, Façanha AR, Olivares FLA (2013). The combination of humic substances and Herbaspirillum seropedicae inoculation enhances the growth of maize (Zea mays L.). Plant Soil 366:119-132.
Araújo et al. 1913 Cássan F, Perrig D, Sgroy V, Masciarelli O, Penna C, Luna V (2009).
Azospirillun brasilense AZ 39 and Bradyrhizobium japonicum E119, inoculated singly ou in combination, promoted seed germination and early seedling growth in corn (Zea mays L.) and soybean (Glicine max L.). Eur. J. Soil Biol. 45(1):28-35.
Conab (2015). Monitoring of the Brazilian Harvest of Grains 2014/2015: Seventh Survey, Apr/2015, National Supply Company. Brasília, CONAB, 105 p.
Darnadelli MS, Cordoba FJF, Espuny MR, Carvajal MAR, Diaz MÊS, Serrano AMG, Okon Y, Megas M (2008). Effect of Azospirillum brasilense coinoculated with Rhizobium on Phaseolus vulgaris flavonoids and nos-factor production under salt stress. Soil Biol. Biochem. 40(11):2713-2914.
Embrapa (2009). Manual of chemical analysis of soils, plants and fertilizers. Brasília: Embrapa Inf. Technol. P 627.
Epstein E, Bloom AJ (2006). Mineral nutrition of plants: Principles and perspectives. London: Editora Plant. P 403.
Gitti DC, Arf O, Kaneko FH, Rodrigues FRA, Buzetti S, Portugal JR, Corsini DCDC (2012). Azospirillum brasilense inoculation in beans grown cultivars in winter. J. Agrarian 5(15):36-45.
Hungria M, Nogueira MA, Araujo RS (2013a). Coinoculation of soybeans and common beans with Rhizobium and Azospirillun: strategies to improve sustainability. Biol. Fertil. Soils 49(7):791-801.
Hungria M, Mendes IC, Mercante FM (2013). Biological nitrogen fixation technology with bean: Feasibility in small family properties and experiments properties. London: Embrapa Soy. 32 p.
Marques Júnior RB, Canellas LP, Silva LG, Olivares FL (2008). Promoting rooting of microtoletes of sugar cane by using set of humic substances and bacteria diazotrophic endofitic. J. Braz. Sci. Soil. 32:1121-1128.
Marschener H (1995). Mineral nutrition of higher plants. San Diego: Academic Press. 889 p.
Oliveira SM (2011). Rhizobacteria promote the growth of common fejoeiro and maize by different processes. Lavras: Federal University of Lavras, 103 f. Doctoral thesis.
Pelegrin R (2009). Reply of the culture of the bean to nitrogen fertilization and inoculation with Rhizobium. J. Braz. Soil Sci. 33(1):219-229.
Peres AR (2014). Rhizobium tropici and Coinoculation Azospirillum brasilense in bean grown under two irrigation blades: Production and physiological quality of seeds. Ilha Solteira: University State Paulista, 71 f. dissertation.
Radwan T, Mohamed ZK, Reis VM (2004). Effect of inoculation of Azospirillum and Herbaspirillum in the production of indole compounds in seedlings of corn and rice. Pesq. Agrop. Braz. 39(10):987-994.
Reis VM (2007). Use of nitrogen-fixing bacteria as inoculant for grass. Seropédica: Embrapa Agrobiologia. 22 p. (documents, 232).
Siddiqi MY, Glass ADM (1981). Utilisation index: A modified approach to the estimation and comparison of nutrient utilization efficiency in plants. J. Plant Nutr. 4(3):289-302.
Souza KG (2014). Growth and nodulation of common bean in response to coinoculação of seeds with Rhizobium tropici and Azospirillum brasilense and. Rio Branco: University State of Acre. 45 p. dissertation.
Swiader JM, Chyan Y, Freiji FG (1994). Genotypic differences in nitrate uptake and utilization efficiency in pumpkin hybrids. J. Plant Nutr. 17(10):1687-1699.
Veronezi SDF, Costa MR, Silva AT, Mercante FM (2012). Co-inoculation of Azospirillum brasilense and Rhizobium in bean (Phaseolus vulgaris L.) In: Seminar of Agroecology of Mato Grosso do Sul, 4.; Ecological Producers Meeting of MS, 3., 2012, Anais. Brasilia, DF: Embrapa, 2012. 1 CD-ROM.
Yadegari M (2010). Plant growth promoting rhizobacteria increase growth, yield and nitrogen fixation in Phaseolus vulgaris. J. Plant Nutr. 33(12):1733-1743.

Vol. 11(21), pp. 1914-1923, 26 May, 2016
DOI: 10.5897/AJAR2016.11015
Article Number: A2EFD2958715
ISSN 1991-637X
Copyright ©2016
Author(s) retain the copyright of this article
http://www.academicjournals.org/AJAR
African Journal of Agricultural Research
Full Length Research Paper
Artificial intelligence tools in predicting the volume of trees within a forest stand
Eder Pereira Miguel1*, Fabrícia Conceição Menez Mota1, Saulo Jorge Téo2, Rodrigo Geroni Mendes Nascimento2, Fabrício Assis Leal1, Reginaldo Sérgio Pereira1 and Alba Valéria
Rezende1
1Department of Forest Engineering, University of Brasília, Brasília, DF, 70910-900, Brazil.
2Department of Forest Engineering, Federal University of Parana, Curitiba, PR, 80210-170, Brazil.
Received 18 March, 2016; Accepted 23 April, 2016
The goal of this study was to train, validate, select and evaluate artificial neural networks (ANN) to predict the individual volume of wood in eucalyptus stand, based on the diameter at breast height (DBH) and DBH with the total height (Ht). Data was obtained from a plantation of Eucalyptus urophylla ST Blake of seven years of age, located in the state of Goiás, Brazil. Sixteen plots were randomly set in this area, from which the variables diameter, total height and volume were accounted. The volume of all the trees in each plot was measured by the Smalian method; afterwards, the data were checked for normality using the Shapiro-Wilk test. Sequentially, perceptron network settings (ANN1 = DBH and Ht; and ANN2 = DBH) were trained using sigmoid activation functions and resilient propagation (Rprop) algorithm. In addition, a root-mean-square error (RMSE) of less than 1% was adopted as stopping criterion or when this rose again. The selected ANNs presented low variation among the task-specific
training indices, selection and evaluation, showing correlation ( ̂) between predicted and observed volume (0.9945 and 0.9898), and RMSE from 1.75 and 2.22%, respectively. The Shapiro-Wilk test highlighted non-normality of data distribution; hence, various selected ANNs were subjected to the
Kruskal-Wallis test for validation, as well as for comparison with each other and sequentially
submitted to the overall group difference test. The test demonstrated that both ANNs were able to
predict tree volume; leading to the conclusion that multilayer perceptron neural networks (MLPNNs), using just one neuron input- the diameter, are as precise and accurate as networks using two neurons- the diameter and height, in order to predict individual volume of E. urophylla. Key words: Eucalyptus, Brazil, volumetry, forest inventory, neural networks.
INTRODUCTION Planted forests cover about 264 million hectares, comprising nearly 7% of total forest area, with the largest part located in China, India and the United States (61%).
Brazil has 7.6 million hectares of planted forest (3%) and contributes to 17% of all wood harvested each year. This contribution arises from the high productivity of
*Corresponding author. E-mail: [email protected].
Author(s) agree that this article remain permanently open access under the terms of the Creative Commons Attribution
License 4.0 International License

plantations, mainly of Eucalyptus trees, which represent 72% of the planted forest area planted in the country (IBÁ, 2014).
It is estimated that among all planted trees in the world, Eucalyptus makes up nearly 38% of that (Pérez-Cruzado et al., 2011). From that, India has the highest planted area, with 22% of this tree genus. However, Brazil is the second place (21%); and new plantations have been growing in the country due to wood demands from the industries that use it as raw material. This growth comes also from the need for restoration of native areas, which minimizes environmental impacts.
Besides being the main tree genus grown in Brazil, Eucalyptus is the most planted tree in the tropics (Epron et al., 2013) because of its rapid growth, yield, easy adaptability, species diversity and wide range of wood use. However, before being marketed, plantation production measurements have to be held, particularly the wood volume (Miguel et al., 2014).
Estimating the volume of forest stands derives from quantitative inventories. This operation consists of measuring representative samples that are called plots (Binoti et al., 2013). Subsequently, this volume is rigorously correlated with easy-to-measure variables, such as diameter at 1.30 m above soil (diameter at breast height - DBH) and total height (Ht). Then, regression techniques and adjustments of volumetric equations are adopted as a routine procedure.
Several volumetric models can be applied to these measures, which are adjusted linearly or non-linearly, being divided into single input models (DBH) and dual input (DBH and Ht) besides their multiple combinations. Nevertheless, regarding statistic methods used to measure the quality and accuracy of the adjustment, the dual-input models are preferred because they are more accurate, as stated by Thomas et al. (2006), Azevedo et al. (2011) and Miguel et al. (2014). In addition, this type of modeling requires statistical assumptions such as data normality or linearity (Egrioglu et al., 2014).
One option for exempting these statistical assumptions to represent nonlinear relationships between predictor and predicted variables is the use of artificial intelligence (AI) techniques and resources. The use of these tools in growth and production modeling is still new and unexplored. However, efforts have been made and with promising results (Diamantopoulou, 2005; Gorgens et al., 2009; Castro et al., 2013). Among these techniques, artificial neural networks (ANN) has gained prominent position (Silva et al., 2009; Binoti et al., 2013; Miguel et al., 2015). Forest stand modeling through ANNs allows greater accuracy in production estimates, as well as being a good aid at making decisions (Castellanos et al., 2007).
ANNs are modern data processing systems whose design, structure and operating principles are based on biological neural system, interconnected to perform a particular task. It has as fundamental element an artificial
Miguel et al. 1915 neuron, which receives as input operating parameter values and returns an expected result as output.
According to Wang et al. (2010), artificial neuron is a simplified model and related real neuron, whose basic properties are the suitability and reproduction of information based on connections, which is the information processing unit of a neural network. The networks has as basic characteristics adaptive learning, self-organizing capacity, robust structure distributed in parallel (layers), efficiency in learning and generalization, besides being tolerant to outliers, are able to model different variables and their nonlinear relationships, as well as enabling quantitative and qualitative variable modeling (Haykin, 2001; Kuvendziev et al., 2014).
This work aimed to train, validate, select and evaluate artificial neural networks (ANN) to predict individual wood volume in a Eucalyptus stand, using diameter at breast height with total height (RNA1) and only diameter at breast height (RNA2). MATERIALS AND METHODS
Data were collected from a plantation of Eucalyptus urophylla S. T. Blake of seven years old, planted at spacing of 3 x 3 m (1,111 trees per hectare). The area has 110 hectares and belongs to the Cooperativa Agroindustrial dos Produtores Rurais do Sudoeste Goiano (COMIGO) (cooperative society), in the city of Rio Verde, southwest of the state of Goiás, Brazil. The area lies at an average altitude of 700 m, limited between 18° 00’ 45’’ to 18° 01’ 45’’ south latitude and from 50° 52’ 45’’ to 50° 53’ 15’’ west longitude (Figure 1). According to Köppen, local climate is humid tropical (Aw type) with two distinct seasons: a dry one (fall and winter) and another wet with pouring rains (spring and summer). Each year, rainfall ranges from 1,200 to 1,500 mm, averaging around 1,300 mm, and average temperatures between 20 and 25°C (Siqueira-Neto et al., 2011).
Sampling, variables and data analysis The authors carried out a pre-exploratory forest inventory within the study area. Fifteen 400 m2 plots were delimited with the aid of a measuring tape. For evaluations, a fixed area method with a simple random sampling process was adopted (Husch et al., 1993).
After the plots were set, diameter, total height (Ht) and volume were measured. For diameter, a diameter tape performing measurements at 1.3 m above the ground, which is called diameter at breast height (DBH) was used. Then, all standing living timbers within the 15 plots (605 trees) were cut, the total heights were obtained directly and their wood volume was strictly measured.
Next, the distribution of trees was assessed by diameter class within a range of 2.5 cm each class. Scolforo and Thiersch (2004) mentioned that forest stands should be evaluated at a class range between 2 and 5 cm. Such evaluation is intended to represent a horizontal stand structure, while ensuring that all trees are sampled by their diameter class during the process of wood volume measurement, increasing the prediction consistency and accuracy.
Subsequently, wood volumes were measured by the analytical method of Smalian. According to Machado and Filho (2006), this method is widely used in Brazil, mainly due to its practical advantage and precision. Diameter was measured throughout the entire timber at spots previously set, disregarding the height of stumps with 0.1 m. At stem basal portion, section lengths were 0.2
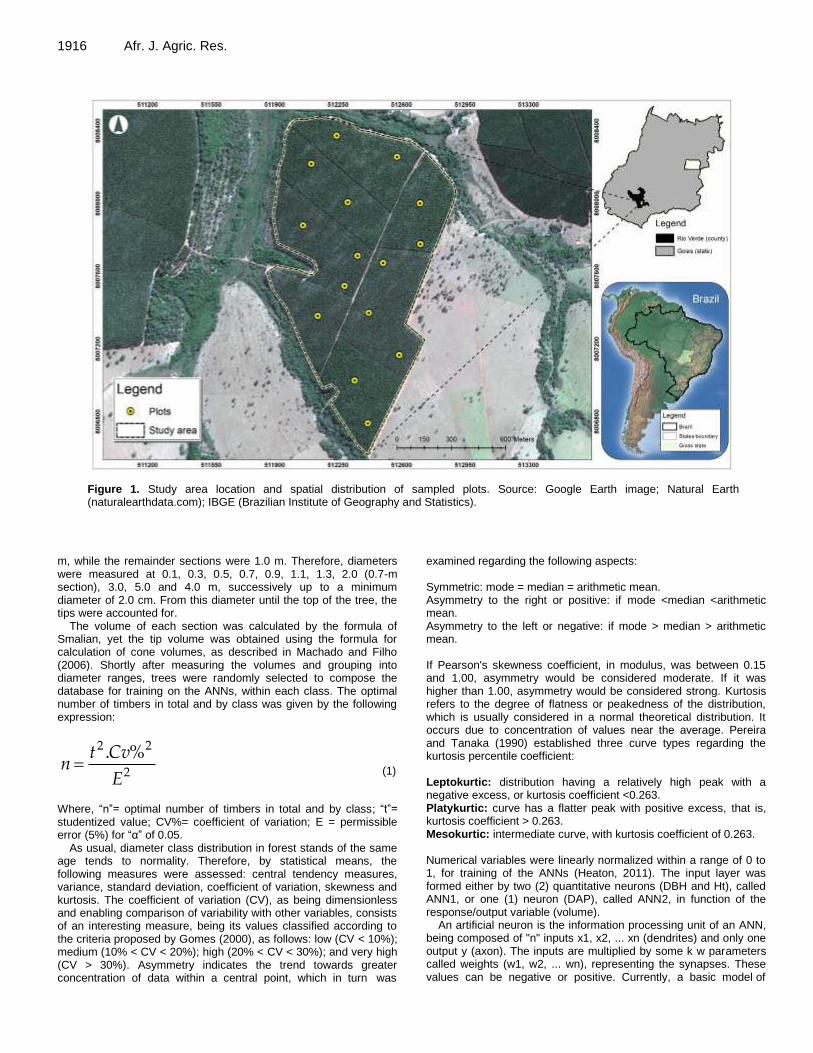
1916 Afr. J. Agric. Res.
Figure 1. Study area location and spatial distribution of sampled plots. Source: Google Earth image; Natural Earth (naturalearthdata.com); IBGE (Brazilian Institute of Geography and Statistics).
m, while the remainder sections were 1.0 m. Therefore, diameters were measured at 0.1, 0.3, 0.5, 0.7, 0.9, 1.1, 1.3, 2.0 (0.7-m section), 3.0, 5.0 and 4.0 m, successively up to a minimum diameter of 2.0 cm. From this diameter until the top of the tree, the tips were accounted for.
The volume of each section was calculated by the formula of Smalian, yet the tip volume was obtained using the formula for calculation of cone volumes, as described in Machado and Filho (2006). Shortly after measuring the volumes and grouping into diameter ranges, trees were randomly selected to compose the database for training on the ANNs, within each class. The optimal number of timbers in total and by class was given by the following expression:
2
22 %.
E
Cvtn (1)
Where, “n”= optimal number of timbers in total and by class; “t”= studentized value; CV%= coefficient of variation; E = permissible error (5%) for “α” of 0.05.
As usual, diameter class distribution in forest stands of the same age tends to normality. Therefore, by statistical means, the following measures were assessed: central tendency measures, variance, standard deviation, coefficient of variation, skewness and kurtosis. The coefficient of variation (CV), as being dimensionless and enabling comparison of variability with other variables, consists of an interesting measure, being its values classified according to the criteria proposed by Gomes (2000), as follows: low (CV < 10%); medium (10% < CV < 20%); high (20% < CV < 30%); and very high (CV > 30%). Asymmetry indicates the trend towards greater concentration of data within a central point, which in turn was
examined regarding the following aspects: Symmetric: mode = median = arithmetic mean. Asymmetry to the right or positive: if mode <median <arithmetic mean. Asymmetry to the left or negative: if mode > median > arithmetic mean. If Pearson's skewness coefficient, in modulus, was between 0.15 and 1.00, asymmetry would be considered moderate. If it was higher than 1.00, asymmetry would be considered strong. Kurtosis refers to the degree of flatness or peakedness of the distribution, which is usually considered in a normal theoretical distribution. It occurs due to concentration of values near the average. Pereira and Tanaka (1990) established three curve types regarding the kurtosis percentile coefficient: Leptokurtic: distribution having a relatively high peak with a negative excess, or kurtosis coefficient <0.263. Platykurtic: curve has a flatter peak with positive excess, that is, kurtosis coefficient > 0.263. Mesokurtic: intermediate curve, with kurtosis coefficient of 0.263. Numerical variables were linearly normalized within a range of 0 to 1, for training of the ANNs (Heaton, 2011). The input layer was formed either by two (2) quantitative neurons (DBH and Ht), called ANN1, or one (1) neuron (DAP), called ANN2, in function of the response/output variable (volume).
An artificial neuron is the information processing unit of an ANN, being composed of "n" inputs x1, x2, ... xn (dendrites) and only one output y (axon). The inputs are multiplied by some k w parameters called weights (w1, w2, ... wn), representing the synapses. These values can be negative or positive. Currently, a basic model of

artificial neuron can be represented mathematically as:
)( kk VY (2)
Where, Yk = output of the artificial neuron; = Activation function;
Vk = result of the linear combiner, that is:
m
o
nnk wxV . (3)
The networks were also comprised of a single hidden layer architecture. According to Esquerre (2002), most of the time, the networks require a single hidden layer to solve nonlinearly separable problems. The number of neurons in this layer has been optimized by the Intelligent Problem Solver (IPS) tool of the Statistica 7 software (Statsoft, 2007); and as activation function, the sigmoidal was used.
Sigmoid activation function is quite common in developing artificial neural networks, and in addition to a well-built network architecture, it can bring closer any continuous function with great precision (Ismailov, 2014); this function is mathematically expressed by:
uv
exp1
1)(
(4)
Where, = sigmoid activation function; β = parameter determining
the sigmoidal function slope; u = function activation potential. The resilient propagation was used as training algorithm
(Riedmiller and Braun,1993), and the training parameters were learning rate (μ) of 0.2 and momentum (η) of 0.9 (Gorgens et al., 2009).
First, all network weights were randomly generated (Heaton, 2011). Then, individual update value evolved during the learning process, based on the error function. Network training continued until error rate was reduced to an acceptable margin between the predicted and actual values, known as delta rule, or until a maximum number of times or cycles (Shiblee et al., 2010).
To estimate the individual total volume, 100-perceptron multilayer networks were trained, which are commonly known as multilayer perceptron (MLP). One hundred networks were trained using diameter and total height in the input layer, and other 100 networks using only diameter, totaling 200-trained networks. Trainings were carried by a supervised method, in which input and output variables were indicated for the networks. This feedforward type method uses unidirectional data flow algorithm without cycles (Haykin, 2001).
Several methods determine the time at which the training of a neural network should be terminated. According to Chen et al. (2014), excessive number of cycles can lead to a network overfitting; on the other hand, it is underfitted when it has few cycles, what impairs a maximum performance. However, to eliminate these problems, the mean square error less than 1% was used, or when the root mean square error (RMSE) increased again as a stopping criterion, as suggested by Chen et al. (2014). Thus, training was terminated when one of the criteria was reached.
Based on the correlation between the volumes observed and the
estimated networks ( ̂), the best two ANNs were selected. The authors also took as a basis stability of the training indexes of the networks that were provided by the software during training, selection and evaluation phases. In these phases, these indexes
Miguel et al. 1917 should be stable, that is, there must be variation among such indexes, the root mean square error (RMSE) in percentage and the graphical analysis of residues.
The root-mean-square error evaluates the mean square difference between observed and estimated values. The lower the RMSE, the better the average accuracy of estimates, being optimal when it is equal to zero (Mehtätalo et al., 2006).
n
vv
vRMSE
n
i 1
2ˆ100(%) (5)
Where, ̅ is the average of total volumes originating from wood volume measuring; ̂ is the individual total volume estimated by the ANN; is the individual total volume from the wood measuring, and "n" is the total number of observations.
Once the two best ANNs are defined, if non-used sampled timbers presented regular destruction in accordance with the Shapiro-Wilk test (1965), they would undergo variance analysis (ANOVA); if not, they would undergo the Kruskal-Wallis' test (1952). Sequentially, they would undergo the aggregate difference test (Da%) for training validation, as well as comparison between the ANNs with one (1) or with two (2) neurons in the input layer (DBH and DBH/ Ht, respectively).
The software used were SISVAR and Action 2.7, which performed descriptive statistics and normality test. Yet the graphics were made through Microsoft Office Excel 2013, and neural networks were trained in Statistica 7 (Statsoft, 2007).
RESULTS AND DISCUSSION The structure of a forest is mostly defined by size and distribution of trees per area unit. In this aspect, the diameter is the most important variable, being used for modeling, volume measurement and in the understanding of the forest stand growth.
Diameters ranged from a minimum of 5 cm to and maximum of 21.75 cm, and mean, median and mode of 15.47, 15.05 and 15.73, respectively. These values indicate that the diameters presented a negative moderate asymmetric distribution, as mean <median <fashion, the negative skewness is also justified by the asymmetry coefficient of -0.233.
The Shapiro-Wilk (1965) normality test presented p-value of 1.97e
-12, indicating a non-normal distribution, as
shown in Figure 2A, since data are not distributed on the line. Diameter distribution had class range of 2.5 cm, platykurtic type (Figure 2B) with kurtosis of 0.280 and variation coefficient of 19.37%, ensuring a mean variability (Gomes, 2000) and standard deviation of 2.92 cm.
In studies in Brazilian, forest stands as Eucalyptus urograndis (Miguel et al., 2014), Acacia mearnsii (Sanquetta et al., 2014) and Pinus taeda (Téo et al., 2012) were found to have descriptive characteristics similar to this study. This behavior is expected in stands of the same age in Brazil; however, it may differ according to species genetic improvement degree, silvicultural treatment and such a way as to raise or lower the frequency of trees management type adopted, in

1918 Afr. J. Agric. Res.
Figure 2. Normal distribution probability (A) and diameter distribution in a stand of E. urophylla S. T. Blake sampled in the state of Goiás, Brazil (B).
Table 1. Frequency distribution of the optimal number (α = 0.05; 5%) of measured tree for training of the ANNs, by diameter and height classes for Eucalyptus urophylla in the state of Goiás, Brazil.
Class center
Ht (m)
Class center DBH (cm) Total
6.25 8.75 11.25 13.75 16.25 18.75 21.25
12.5 2 1 - - - - - 3
15.5 3 2 3 2 2 - - 12
18.5 3 3 5 4 4 5 - 24
21.5 2 4 5 5 5 6 2 30
24.5 - 4 4 8 7 5 3 31
27.5 - - 3 6 5 5 3 22
30.5 - - - - 2 4 3 9
Total 10 14 20 25 25 25 12 131
DBH = diameter at 1.3 m above ground, Ht = total height.
with larger diameters, shifting the mode to the right or left of the average.
Of the sampled and measured trees in the field (605), sampling intensity by diameter class (α = 0.05; 5%) had a total optimal number of 131 trees (28%) for training the ANNs. These trees were distributed into the different classes of diameter and height, as shown in Table 1. The remaining 471 trees composed of another independent database used for validation.
Afterwards, based the 131 sampled trees for training, two networks were selected. Both with an input layer, a hidden layer and an output layer. The input layer differed in the number of neurons, sometimes two (2), the diameter and height (ANN1), other times one (1) and only the diameter (ANN2). The use of a single hidden layer is
supported by the "universal approximation theorem", which states that only one hidden layer is enough for a MLP network to do the approximation of any continuous function (Cybenko, 1989). Yet, the number of neurons was determined by the Intelligent Problem Solver tool (IPS) (STATSOFT, 2007), and presented different numbers according to the amount of neurons in the input layer. Therefore, in total volume estimate by DBH and Ht (ANN1), the hidden layer had five neurons (Figure 3A), but when it was estimated based on DBH only (ANN2), the number of neurons increased to seven in this layer (Figure 3B). This difference is attributed to a greater or lesser difficulty of the network in predicting the volume using one neuron (DBH) or two (DBH and Ht) in the input layer.

Miguel et al. 1919
Figure 3. Architecture of artificial neural networks (ANN) for prediction of individual total wood volume of forest stands of E. urophylla, in function of the DBH and Ht (ANN1) and DBH (ANN2), in the state of Goiás, Brazil.
Table 2. Characteristics and performance statistics of the artificial neural networks (ANN) selected to estimate the volume of E. urophylla trees in the city of Rio Verde, state of Goiás, Brazil.
Network Predicting
variables
Neurons by layer Adjustment
Input hidden output LT LS LA ̂ RMSE (%)
ANN1 Diameter and height
Diameter
2 5 1 0.08 0.08 0.08 0.994 1.75
ANN2 1 7 1 0.10 0.12 0.11 0.989 2.22
IT = Levels of training (network acquisition), IS = levels of stop selection (training stop), IA = levels of assessment
(trained network quality), ̂ = correlation between observed and predicted volume, RMSE% = root-mean-square error in percentage.
Within this structure, the input layer is where the standards are displayed to the network (DBH and Ht); the intermediate layers (also called hidden or secret layer) are responsible for much of the processing, which may be considered as extractors of characteristics; and the output layer is one where the result is displayed (volume). ANN training Adjustment and accuracy statistics of both selected networks to predict individual wood volume of E. urophylla trees were satisfactory. The selected ANNs showed low variation between the levels of training, selection and evaluation, which consist of ideal results that show training stability (Binoti et al., 2013). The correlation between observed and predict volumes ( ̂) was 0.9945 and 0.9898, with root-mean-square error in percentage (RMSE%) between 1.75 and 2.22%, respectively (Table 2). Thus, the use of the ANNs has
effectively estimated tree volume and at the same time exempts from basic assumptions of the standard mathematical modelling, such as normality and linearity of the forest attributes (Egrioglu et al., 2014). These attributes often undergo different mathematical transformations to be modeled in a traditional way, which may cause losses in quality and selection of models.
Artificial intelligence has great potential in diverse applications, especially in the areas of engineering and agriculture. However, for its application feasibility, Cartwright (2008) stated that there should be a direct relationship between the input parameters and the target responses. Overall, the networks are developed for non-linear mapping from a set of inputs and outputs that are interrelated. In such cases, the ANNs are developed aiming to achieve a typical performance of a biological system, based on the interconnections of the elements, similarly to what occurs with biological neurons (Gürüler et al., 2015). In addition to these characteristics, ANNs had some advantages over the conventional techniques,
ANN 1 ANN 2

1920 Afr. J. Agric. Res.
Figure 4. Behavior in the training of ANN1 (DBH and Ht) and ANN2 (DBH) in predicting individual wood volume (A), residual distribution (B) and the error frequency histogram (C) for stands of E. urophylla in the city of Rio Verde, state of Goiás, Brazil.
such as the ability to generalize, parallelism and the possibility of learning, generating accurate values as the ones presented in this study.
Nevertheless, even if the presented statistical criteria of adjustment quality are good indicators for the selection of any type of model, the graphical analysis of residues is a key role to support them or not (Draper and Smith, 1981), since trend errors may occur in a given range of the response variable class, and not detected by the statistics that assess accuracy.
Hence, Figure 4 shows the graphs of network model behavior (ANN1 and ANN2) for individual wood volume estimate of eucalyptus and the real values (A), residue distribution in percentage (B) and the error frequency histogram for the two distinct settings of trained networks (C). Both networks were similar (Figure 4) having adequate predictive behavior; however, ANN1 (DAP and Ht) was superior, being more flexible in gathering data (A). Residual graph showed adequate distribution of errors with no trends in all the different classes of diameter with maximum errors within ±30%, but ANN1 presents a slightly more compact and homogeneous residue distribution (B). According to Campos and Leite (2013), the assessment of residues through histograms (C) is an interesting type of analysis, since when there are large numbers of observations, only the scatter plots may lead to a risk of misinterpreting because there are many overlapping points within the graph. In this regard, both trained networks (ANN1 and ANN2) had adequate frequency errors, with the vast majority in classes ranging between -10 and 10% error; however, it was evident that ANN1 had no error greater than ± 20%.
Based on statistics indicating accuracy shown in Table 2, the compliance between the residual distribution and histograms errors can be highlighted (Figure 4).
Therefore, ANNs were able to predict accurately the individual wood volume of E. urophylla trees, using diameter and height attributes. Neural network validation The trained networks (ANN1 and ANN2) validation statistically proves the viability of using artificial intelligence (IA) tools to predict individual wood volume of E. urophylla (Table 3). For analysis of these statistics, 474 trees (72%) from experimental data which were not used for network trainings were used. It is therefore in accordance with Zucchini (2000), who reported that the validation sample must be independent. Additionally, meeting the modeling principles recommended by Gujarati and Poter (2011), set that at least 20% of samples that integrates the database, should be left to validate the models.
As the Shapiro-Wilk (1965) normality test presented a p-value of 1.97e
-12, which denotes non-normality of data
distribution, both ANNs were submitted to the Kruskal-Wallis’ test (1952) for validation, besides comparisons with each other and, in sequence subjected to the aggregated difference test in percentage (Table 3). Both ANN1 as ANN2 obtained individual wood volume values near each other, as well as close to the real values. Such proximity is detected by the Kruskal-Wallis analysis. This fact indicates that both ANNs are valid and reliable in estimating this variable (volume) using as predictors, attributes such as diameter and height. It is mentioned also that ANN1 (DBH and Ht) and ANN2 (DBH) did not differ (p> 0.05), so both can be used.
The aggregate difference (AD), which is the difference between the sums of the observed values with estimated
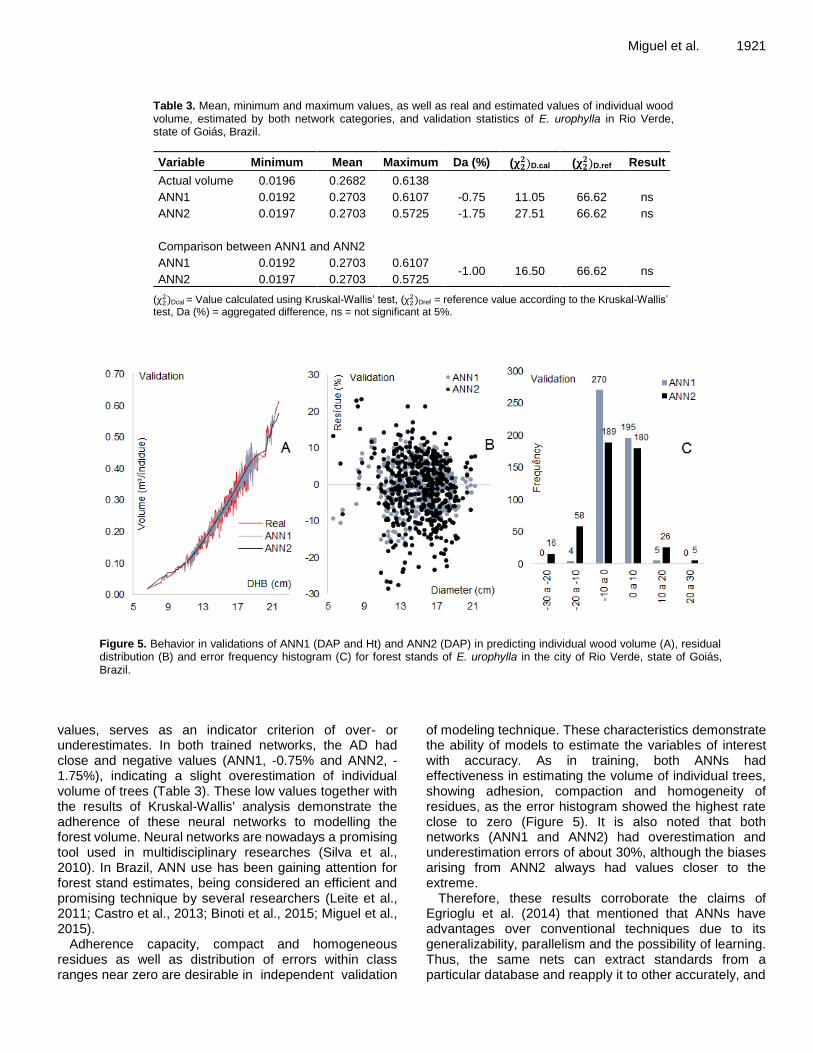
Miguel et al. 1921
Table 3. Mean, minimum and maximum values, as well as real and estimated values of individual wood volume, estimated by both network categories, and validation statistics of E. urophylla in Rio Verde, state of Goiás, Brazil.
Variable Minimum Mean Maximum Da (%) ( D.cal (
D.ref Result
Actual volume 0.0196 0.2682 0.6138
ANN1 0.0192 0.2703 0.6107 -0.75 11.05 66.62 ns
ANN2 0.0197 0.2703 0.5725 -1.75 27.51 66.62 ns
Comparison between ANN1 and ANN2
ANN1 0.0192 0.2703 0.6107 -1.00 16.50 66.62 ns
ANN2 0.0197 0.2703 0.5725
( Dcal = Value calculated using Kruskal-Wallis’ test, (
Dref = reference value according to the Kruskal-Wallis’ test, Da (%) = aggregated difference, ns = not significant at 5%.
Figure 5. Behavior in validations of ANN1 (DAP and Ht) and ANN2 (DAP) in predicting individual wood volume (A), residual distribution (B) and error frequency histogram (C) for forest stands of E. urophylla in the city of Rio Verde, state of Goiás, Brazil.
values, serves as an indicator criterion of over- or underestimates. In both trained networks, the AD had close and negative values (ANN1, -0.75% and ANN2, -1.75%), indicating a slight overestimation of individual volume of trees (Table 3). These low values together with the results of Kruskal-Wallis' analysis demonstrate the adherence of these neural networks to modelling the forest volume. Neural networks are nowadays a promising tool used in multidisciplinary researches (Silva et al., 2010). In Brazil, ANN use has been gaining attention for forest stand estimates, being considered an efficient and promising technique by several researchers (Leite et al., 2011; Castro et al., 2013; Binoti et al., 2015; Miguel et al., 2015).
Adherence capacity, compact and homogeneous residues as well as distribution of errors within class ranges near zero are desirable in independent validation
of modeling technique. These characteristics demonstrate the ability of models to estimate the variables of interest with accuracy. As in training, both ANNs had effectiveness in estimating the volume of individual trees, showing adhesion, compaction and homogeneity of residues, as the error histogram showed the highest rate close to zero (Figure 5). It is also noted that both networks (ANN1 and ANN2) had overestimation and underestimation errors of about 30%, although the biases arising from ANN2 always had values closer to the extreme.
Therefore, these results corroborate the claims of Egrioglu et al. (2014) that mentioned that ANNs have advantages over conventional techniques due to its generalizability, parallelism and the possibility of learning. Thus, the same nets can extract standards from a particular database and reapply it to other accurately, and

1922 Afr. J. Agric. Res. then its use recommended.
Traditionally, in the routine of Brazilian forest inventories to measure tree volumes, it is very common to use volumetric equations of double entry, whose volume is estimated by relating the diameter at breast height (DBH) and height (Ht) of the trees. However, measuring the height of trees in forest stands is a costly activity as compared to the diameter measurement. Furthermore, the difficulty to obtain it makes impracticable the process, as some problems may occur as a lack of top of the tree visibility in dense stands, as well as the occurrence of winds, especially in eucalyptus plantations (Binoti et al., 2013).
As the Kruskal-Wallis’ test showed adherence for
both ANNs in predictions of individual tree volume, the performance of ANN2, which is formed by a single neuron in the input layer (diameter) is noteworthy. Therefore, this result is of great value, as it affects positively by reducing the time and cost of forest inventories, allowing accurate indirect estimates of the volume of trees in the forest, using only the diameter as a predictor variable.
However, it is emphasized that the results obtained in this study are specific to the species E. urophylla, at the same age. Thus, further studies must be carried using other species at different ages, as consequence, different neural network settings and architectures should be trained. As a suggestion, the variables "species" and "age" could be used as categorical variables in the input layer, which may result in a single ANN that will be able to accurately predict the individual volume range of different species and ages of the genus Eucalyptus. Conclusions Artificial neural networks of the type multilayer perceptron using the diameter and the total tree height as predictor variables are accurate in the estimate of individual wood volume of E. urophylla trees and are not statistically different from the true wood volume derived from rigorous tree scaling process. Settings of multilayer perceptron networks with a single neuron in the input layer, the diameter, are as precise and accurate as networks using two neurons in the same layer, the diameter and height. Conflict of Interests The authors have not declared any conflict of interests. REFERENCES Azevedo TL, Mello AA, Ferreira RA, Sanquetta CR, Nakajima NY
(2011). Equações hipsométricas e volumétricas para um povoamento de Eucalyptus sp. localizado na FLONA do Ibura, Sergipe. Rev. Bras. Cienc. Agrárias 6(1):105-112.
Binoti MLMS, Binoti DHB, Leite HG (2013). Aplicação de redes neurais
artificiais para estimação da altura de povoamentos equiâneos de eucalipto. Rev. Arvore 37(4):639-645.
Binoti MLMS, Leite HG, Binoti DHB, Gleriani JM (2015). Prognose em nível de povoamento de clones de eucalipto empregando redes neurais artificiais. Cerne 21(1):97-105.
Cartwright H (2008). Using artificial intelligence in chemistry and biology: a practical guide. Boca Raton: CRC Press 360 p.
Castellanos A, Blanco AM, Palencia V (2007). Applications of radial basis neural networks for area forest. Int. J. Inf. Theor. Appl. 14(3):218-222.
Castro RVO, Soares CPB, Leite HG, Souza AL, Nogueira GS, Martins FB (2013). Individual Growth Model for Eucalyptus Stands in Brazil Using Artificial Neural Network. ISRN For. 2:1-12.
Chen WC, Tseng LY, Wu CS (2014). A unified evolutionary training scheme for single and ensemble of feedforward neural network. Neurocomputing 143(11):347-361.
Cybenko GV (1989). Approximation by superpositions of a sigmoidal function. Math. Control Sig. Syst. 2(4):303-314.
Diamantopoulou MJ (2005). Artificial neural networks as an alternative tool in pine bark volume estimation. Comput. Electron. Agric. 10(3):235-244.
Draper NR, Smith H (1981). Applied regression analysis. New York: Jonh Willey & Sons 407 p.
Egrioglu EA, Ufuk YB, Cagdas HA, Eren B (2014). Recurrent Multiplicative Neuron Model Artificial Neural Network for Non-Linear Time Series Forecasting. Proc. Soc. Behav. Sci. 109(2):1094-1100.
Epron D, Nouvellon Y, Mareschal L, Moreira RME, Koutika LS, Geneste B, Delgado-Rojas JS, Laclau JP, Sola G, Gonçalves JLDM, Bouillet JP (2013). Partitioning of net primary production in Eucalyptus and Acacia stands and in mixed-species plantations: Two case-studies in contrasting tropical environments. For. Ecol. Manage. 301(8):102-111.
Esquerre KPO, Mori M, Bruns RE (2002). Simulation of an industrial wastewater treatment plant using artificial neural networks and principal components analysis. Braz. J. Chem. Eng. 19(4):365-370.
Gomes FP (2000). Curso de estatística experimental. 14ª ed. Piracicaba, Degaspari 477 p.
Gorgens EB, Leite HG, Santos HN, Gleriani JM (2009). Estimação do volume de árvores utilizando redes neurais artificiais. Rev. Arvore 33(6):1141-1147.
Gujarati DN, Porter DC (2011). Econometria Básica. 5. ed. Porto Alegre: AMGH 924 p.
Gürüler H, Balli S, Yeniocak M, Göktaş, O (2015). Estimation the properties of particleboards manufactured from vine prunings stalks using artificial neural networks. Mugla J. Sci. Technol. 1(1):24-33.
Haykin S (2001). Redes neurais: princípios e prática. Porto Alegre: Bookman 900 p.
Heaton J (2011). Programming Neural Networks with Encog3 in Java. 2ed. Heat Research, Incorporated 240 p.
Husch B, Miller CL, Beers TW (1993). Forest mensuration. 3.ed. Malabar: Krieger Publishing Comp. 402 p.
IBÁ (2014). Industria brasileira de árvores, Disponível em: http://www.iba.org/images/shared/iba_2014_pt.pdf. Acesso em: 01 set. 2015.
Ismailov VE (2014). On the approximation by neural networks with bounded number of neurons in hidden layers. J. Math. Anal. Appl. 417(2):963-969.
Kruskal WH, Wallis W (1952). Use of ranks in one-criterion variance analysis. J. Am. Stat. Assoc. 47(260):583-621.
Kuvendziev AS, Lisichkova K, Zekovic Z, Marinkovski M (2014). Artificial neural network modelling of supercritical fluid CO2 extraction of polyunsaturated fatty acids from common carp (Cyprinus carpio L.) viscera. J. Supercrit. Fluids 92(6):242-248.
Leite HG, Silva MLM, Binoti DHB, Fardin L, Takizawa FH (2011). Estimation of inside-bark diameter and heartwood diameter for Tectona grandis Linn. Trees using artificial neural networks. Eur. J. For. Res. 130(2):263-269.
Machado SA, Figueiredo-Filho A (2006). Dendrometria. 2. ed. Guarapuava: Unicentro 316 p.
Mehtätalo L, Maltamo M, Kangas A (2006). The use of quantile trees in the prediction of the diameter distribution of a stand. Silva Fenn. 40(3):501-516.

Miguel EP, Leal FA, Ono HA, Leal UAS (2014). Modelagem na predição
do volume individual em plantio de Eucalyptus urograndis. Rev. Bras. Biometria 32(4):584-598.
Miguel EP, Rezende AV, Leal FA, Matricardi, EAT, Vale Miguel EP, Rezende AV, Leal FA, Matricardi EAT, do Vale AT, Pereira RS (2015). Redes neurais artificiais para a modelagem do volume de madeira e biomassa do cerradão com dados de satélite.Pesqui. Agropecu. Bras. 50(9):829-839.
Pereira W, Tanaka OK (1990). Estatística: Conceitos básicos. 2. ed. São Paulo: Makron Books 371 p.
Pérez-Cruzado C, Merino A, Rodríguez-Soalleiro R (2011). A management tool for estimating bioenergy production and carbon sequestration in Eucalyptus globulus and Eucalyptus nitens grown as short rotation woody crops in north-west Spain. Biomass Bioenergy 35(7):2839-2851.
Riedmiller M, Braun H (1993). A direct adaptive method for faster backpropagation learning: Therporp algorithm. Int. Join. Conf. Neural Netw. 1(7):586-591.
Sanquetta CR, Behling A, Dala Corte AP, Ruza MS, Simon A, São José JFB (2014). Relação hipsométrica em inventários pré-corte em povoamentos de Acacia mearnsii De Wild. Científica 42(1):80-90.
Scolforo JRS, Thiersch CR (2004). Biometria florestal: Medição, volumetria e gravimetria. Lavras: UFLA/FAEPE 285 p.
Shapiro SS, Wilk MB (1965). An analysis of variance test for normality (complete sample). Biometrika 52(3):591-611.
Shiblee MD, Chandra B, Kalra PK (2010). Learning of geometric mean neuron model using resilient propagation algorithm. Expert Syst. Appl. 37(12):7449-7455.
Silva IN, Spatti DH, Flauzino RA (2010). Redes Neurais Artificiais para engenharia e ciências aplicadas. Artliber. 397 p.
Silva MLM, Binoti DHB, Gleriani JM, Leite HG (2009). Ajuste do modelo de Schumacher e Hall e aplicação de redes neurais artificiais para estimar volume de árvores de eucalipto. Rev. Arvore 33(6):1133-1139.
Miguel et al. 1923 Siqueira Neto M, Piccolo MC, Costa Junior C, Cerri CC, Bernoux M
(2011). Emissão de gases do efeito estufa em diferentes usos da terra no bioma Cerrado. Rev. Bras. Cienc. Solo 35(1):63-76.
Statsoft INC (2007). Statistica (data analysis software system), version 7. Disponível em: http://www.statsoft.com
Téo SJ, Bianchi JC, Peloso A, Nava PR, Marcon A, Ehlers T, Costa RH (2012). Desempenho de funções de densidade probabilísticas para descrever a distribuição diamétrica de Pinus taeda, na região de Caçador, SC. Floresta 42(4):741-754.
Thomas C, Andrade CM, Schneider PR, Finger CAG (2006). Comparação de equações volumétricas ajustadas com dados de cubagem e análise de tronco. Cienc. Florest. 16(3):319-327.
Wang G, Hao J, Ma J, Huang L (2010). A new approach to intrusion detection using Artificial Neural Networks and fuzzy clustering. Expert Syst. Appl. 37(9):6225-6232.
Zucchini W (2000). An introduction to model selection. J. Math. Psychol. 44(1):41-61.

Vol. 11(21), pp. 1924-1934, 26 May, 2016
DOI: 10.5897/AJAR2015.10248
Article Number: AFD5A3458717
ISSN 1991-637X
Copyright ©2016
Author(s) retain the copyright of this article
http://www.academicjournals.org/AJAR
African Journal of Agricultural Research
Full Length Research Paper
Effects of water deficit on morphophysiology, productivity and chemical composition of Ocimum
africanum Lour (Lamiaceae)
Martielly Santana dos Santos1, Lucinéia dos Santos Souza2, Carlos Augusto Souza Costa2, Fabio Pinto Gomes2, Larissa Corrêa do Bomfim Costa2, Rosilene Aparecida de
Oliveira3 and Delmira da Costa Silva2*
1Programa de Pós-graduação em Produção Vegetal, Universidade Estadual de Santa Cruz, Ilhéus, Bahia, Brazil.
2Departamento de Ciências Biológica, Universidade Estadual de Santa Cruz, Ilhéus, Bahia, Brazil.
3Departamento de Ciências Exatas e Tecnológicas, Universidade Estadual de Santa Cruz, Ilhéus, Bahia, Brazil.
Received 5 August, 2015; Accepted 17 February, 2016
Mechanisms by which plants acclimatize to water deficit conditions can affect development and, especially in aromatic plants, the essential oil synthesis. To evaluate the effects of water deficit on Ocimum africanum, seedlings were exposed to water levels corresponding to 100, 80, 70 and 60% of the substrate field capacity. The different watering regimes corresponded to predawn water potentials of –0.5, –0.9, –1.6 and –1.9 MPa, respectively. Decreased stomatal conductance and increased glandular and tector trichome density were observed under water deficit. In addition, reductions in leaf gas exchange and water consumption under water deficit led to decreased plant height, numbers of leaves and inflorescences, and total biomass production. As a result, lower essential oil yield and water use efficiency for biomass production occurred in the -1.9 MPa treatment. The content and production efficiency of essential oil (quantity of oil produced per unit water consumed) were higher in the –0.9 and –1.6 MPa treatments. There were no significant differences among treatments in the chemical composition of essential oil, and the major component of essential oil in leaves and inflorescences was isoeugenol in all treatments. The 80% field capacity watering regime (branch water potential of –0.9 MPa) was best for the growth and production of essential oil in O. africanum, for the cultivation of aromatic plant under drought economically viable in the semi-arid climatic regions. Key words: Drought adaptation, essential oil, irrigation, water use efficiency.
INTRODUCTION The production and composition of secondary metabolites in plants is affected by environmental
conditions, physiological characteristics, genetics and evolutionary factors (Selmar and Kleinwächter, 2013).
*Corresponding author. E-mail: [email protected]. Tel: + 55 73 3680 5191.
Author(s) agree that this article remain permanently open access under the terms of the Creative Commons Attribution
License 4.0 International License

For essential oil-producing aromatic species, the quantity and chemical composition of secondary metabolites varies according to the cultivation conditions (Marchese et al., 2010; Saeidnejad et al., 2013), among which water availability is a major factor influencing oil yield and quality (Baghalian et al., 2011; Bahreininejad et al., 2013).
Water is a critical factor for the maintenance of primary and secondary metabolism in plants. Drought conditions are normally associated with low precipitation, high evaporative demand, and high temperatures and irradiation, which makes the water deficit a multidimensional stress (Larcher, 2000). Under water deficit conditions, plant growth and development are affected by changes in turgor pressure, cell wall elasticity, carbon assimilation and opening and closing of stomata (Akinci and Lösel, 2012; Wang et al., 2012). In addition, metabolic changes can occur, including increased photorespiration (Lambers et al., 2008), antioxidant enzyme activity (Reddy et al., 2004) and production of secondary metabolites (Saeidnejad et al., 2013; Selmar and Kleinwächter, 2013). In many species, stomatal and biochemical adjustments occur to maintain photosynthesis under moderate water deficits. Partial stomatal closure early after the onset of drought is essential for the control of transpiration rate and may be an important biological strategy for increasing water use efficiency (WUE) by enabling more CO2 to be absorbed per unit of transpired water. Irrigation techniques designed to examine plant responses to water stress and to improve WUE have been developed; these techniques include partial root zone drying and regulated water deficit (Kriedemann and Goodwin, 2003) and cutback (Valipour, 2013). The water deficit approach has been used with aromatic species including Matricaria recutita L. (Baghalian et al., 2011), Thymus daenensis (Bahreininejad et al., 2013), Catharanthus roseus (Jaleel et al., 2008), Ocimum basilicum and Ocimum americanum L. (Khalid, 2006), with the goal of increasing essential oil production.
Species of the genus Ocimum (Lamiaceae) stand out for the quality, quantity and chemical diversity of the essential oils they produce. These oils have been used in applications in the pharmaceutical, cosmetic and food industries (Vani et al., 2009). The main components of essential oils in Ocimum species are estragol, eugenol, methyl eugenol, citral, linalool, geraniol and thymol (Blank et al., 2004; Khalid, 2006; Vani et al., 2009). Some of these compounds have antibacterial (Stefan et al., 2013; Sneha and Sastry, 2011), insecticidal (De Paula et al., 2004) and antioxidant properties (Kaurinovic et al., 2011). According to Blank et al. (2004), the price of Ocimum basilicum essential oil reached US$110,000/L in the international market because of demand from the fine perfumery industry for its main component, linalool, which is used as a fixative. However, despite the economic importance of Ocimum species, its botanical and
dos Santos et al. 1925 agricultural studies are scarce.
An understanding of plant drought tolerance is necessary to determine cultivation conditions that optimize harvest time and essential oil yield and will contribute to improved oil production and quality to meet market standards. This study aimed to investigate the effects of water deficit on gas exchange and biomass partitioning and accumulation. The authors examined plant water use efficiency based on biomass and essential oil production, content, yield and chemical composition in leaves and inflorescences of O. africanum under controlled experimental conditions. MATERIALS AND METHODS Plant and growing conditions The experiment was conducted in a greenhouse in the Campus of Universidade Estadual de Santa Cruz (UESC), Ilhéus, Bahia, Brazil (14°47′00″S, 39°02′00″W), from January 07 to April 17, 2012. Voucher materials are deposited at the herbarium of the UESC (number VIC 16.344). Seedlings of Ocimum africanum Lour. were grown from seed and transferred to 10-L pots containing a mixture of soil and sand (3:1) as substrate. After potting, the seedlings were irrigated to field capacity, and the weight of the pots was measured gravimetrically until constant weight was obtained. After acclimatization for 20 days, irrigation was stopped and the pots were covered to control evaporative losses. The evaluations began 5 days after irrigation was stopped. Irrigation was controlled by weighing the pots on alternate days, and the amount of water to be replaced was determined by the difference between the current weight and the corresponding water holding capacity. Four treatments were applied: T1, 100% of field capacity (the control); T2, 80%; T3, 70%; and T4, 60% of field capacity.
During the experiment, photosynthetically active radiation (PAR) in the greenhouse was monitored using S-LIA-M003 light radiation sensors coupled to a Hobo Micro Station data logger (Onset Computer Corp., Bourne, MA). The mean daily PAR measured in the greenhouse was between 8.6 and 23.2 mol photons m–2 d–1; temperature ranged from 24 to 30.7°C; and relative humidity (RH) was between 64 and 94%. Water potential (Ψw) Water potential (Ψw) was measured in branches at predawn using a pressure chamber 1000 (PMS Instrument Company, Corvallis, OR) according to Scholander et al. (1965). The measurements were performed every 8 days in 60 plants for the entire experimental period. Leaf gas exchange Measurements of leaf gas exchange were performed in mature and completely expanded leaves localized in the third or fourth node from the apex at 20, 40, and 60 days from the start of treatment. The evaluations were performed between 08:30 and 12:00 h in 10 plants per treatment using a portable Li-6400 photosynthesis system (Li-Cor, Lincoln, NB). Net photosynthetic rate (A), stomatal conductance to water vapor (gs), transpiration (E) and the ratio between internal and external CO2 concentrations (Ci/Ca) were evaluated under an artificial saturating light of 1000 μmol photons m–2 s–1 and an atmospheric CO2 concentration (Ci/Ca) of 380 μmol
1926 Afr. J. Agric. Res. mol–1. Growth measurements The number of leaves and inflorescences per plant was manually counted on day 60. The dry biomass of roots (DBR), stems (DBS), leaves (DBL), inflorescences (DBI) and total biomass (TDB) were obtained by drying at 75°C in a circulating air oven until constant biomass was reached. Leaf area (LA) was estimated using an LI-3100 Area Meter (Li-Cor), and 30 millimeter ruler was used to determine the height of the plants (HP). The following variables were calculated from the dry biomass and leaf area: specific leaf mass (SLM) = DBL/LA; relative growth rate (RGR) = lnTDB2 – lnTDB1/(T2 – T1); and net assimilation rate (NAR) = [(lnTDB2 – lnTDB1/(T2 – T1) × (lnLA2 – lnLA1)/(LA2 – LA1)], according to Hunt (1990). Micromorphology For scanning electron microscopy (SEM), leaf fragments from each treatment were fixed at room temperature in 2.5% glutaraldehyde (v/v) prepared in 0.1 mol/L sodium cacodylate buffer (pH 6.9) for 48 h. The fragments were then dehydrated twice in an increasing ethanol series and brought to critical drying point using a CPD-030 (Bal-Tec, Balzers, Liechtenstein) with liquid carbon dioxide. The dried fragments were mounted on aluminum stubs, coated with gold, and examined under a JSM-6390 low-vacuum (LV) SEM (Jeol, Peabody, MA). Determination of stomata and glandular and tector trichome density was performed using electron micrographs of the same magnification. Water-use efficiency (WUE), production and chemical composition of essential oil Water use efficiency (WUE) was determined for biomass (total dry weight/water transpired) and essential oil production in leaves and inflorescences (total essential oil produced/water transpired) (g). Production and chemical composition of essential oil Leaves and inflorescences were dried in a circulating air oven at 75°C until constant dry biomass was reached. The essential oil was extracted from 100 g samples of dry biomass through hydrodistillation in 1500 mL distilled water for 90 min using a Clevenger apparatus; the extractions were performed in quadruplicate. The essential oil content was determined based on the volume extracted per 100 g dry biomass (% w/v); essential oil yield was determined by multiplying the content by the average value of leaf or inflorescence dry biomass (g plant–1).
The essential oil was analyzed by gas chromatography using a Varian Saturn 3800 (Varian, Palo Alto, CA) equipped with a flame ionization detector (GC-FID) and VF-5ms capillary column (30 mm × 0.25 mm × 0.25 μm film thickness), using helium as the carrier gas at a flow rate of 1.2 mL min–1. The injector and detector temperatures were 250 and 280°C, respectively. The column temperature program began at 70°C, increased by 8°C min–1 to 200°C and by 10°C min–1 to 260°C, and was held at 260°C for 5 min. One milliliter of a 10% solution of oil in chloroform was injected in the 1:10 split mode. The concentration of volatile constituents was calculated based on the full area of each peak in relation to the total area of all constituent peaks. Qualitative analysis of the essential oil was carried out using a Chromopack 2000 MS/MS mass spectrometer (Varian) with the same VF-5ms column and temperature program. The transfer line temperature was 250°C and
the trap temperature was 220°C. The chemical constituents were identified by computer comparison with the apparatus library and literature, and linear retention indices were calculated by injecting a series of n-alkanes (C8–C26) under the same chromatographic conditions as used for the samples (Adams, 1995).
Experimental design
The experiment was conducted following a completely randomized design, in a split-plot array with four water conditions: 100% (T1), 80% (T2), 70% (T3) and 60% (T4) of field capacity; four evaluation times (0, 20, 40 and 60 days); and 10 replications per treatment, (n = 160 plants). The data were examined by analysis of variance (ANOVA, F-test). For the treatment averages, polynomial regression models were adjusted using Sisvar 5.3 (Ferreira and Sisvar, 2010). Tukey tests were used to assess the average values within treatments for each evaluation time. Significance was defined as P ≤ 0.05. RESULTS Water relations and leaf gas exchange Water deficit treatments in O. africanum resulted in a significant decrease (P ≤ 0.001) in predawn branch water potential (Ψw) throughout the experimental period. Values ranging from –0.3 to –0.5 MPa and from –0.4 to –2.2 MPa were measured in the well watered and water deficit (more severe) treatments, respectively (Figure 1).
A significant (P < 0.01) interaction was observed between water deficit treatment and time of evaluation for leaf gas exchange variables: A, gs and E decreased linearly with increasing treatment time. Photosynthetic parameters decreased with increasing duration of drought stress (Figure 2A–C). A and gs were positively correlated in all treatments (R
2 ≥ 0.92) (Figure 2D); the
reduced transpiration rate indicated that stomatal limitation was an efficient mechanism for reducing water loss (Figure 2C). Morphological aspects of biomass partitioning O. africanum plants cultivated under the highest water deficit conditions showed reduced growth. Dry biomass of all plant parts (roots, stems, leaves and inflorescences) decreased linearly with increasing water deficit (Table 1). At Ψw of –1.9 MPa (severe deficit), biomass was reduced most in stems and inflorescences, with values that were 60 and 69% lower, respectively, than those of the control treatment (Ψw ~0.5 MPa) (Table 1). The allometric relationship observed in the ratio of roots to aerial parts (R/AP) showed a quadratic response with a maximum value of 0.106 g at Ψw = –1.04 MPa.
Plant height, leaf area, number of leaves and inflorescences, relative growth rate and net assimilation rate decreased linearly, with the lowest values in the plants subjected to the highest water stress (Table 1).

dos Santos et al. 1927
Figure 1. Predawn water potential (Ψw) measured in branches of O. africanum under different watering regimes. Points are means (n = 5) and bars represent standard error.
A B
C D
Figure 2. Net photosynthetic rate, A (A); stomatal conductance, gs (B); transpiration rate, E (C); and relationship between gs and A in leaves of O. africanum subjected to soil water deficit as indicated by the predawn water potential measured in branches ( W) (D). Points are means (n = 5); bars represent standard error.

1928 Afr. J. Agric. Res. Table 1. Plant growth variables in O. africanum after 60 days of water deficit treatments at different branch water potentials. Values are means (± s.e.) of five replicates.
Variable Predawn water potential (–MPa)
Equation R2
0.5 MPa 0.9 MPa 1.6 MPa 1.9 MPa
RDB 3.1 ± 0.5 1.9 ± 0.1 1.5 ± 0.2 1.2 ± 0.1 ŷ = - 1.278**x + 3.513** 0.90
SDB 11.7 ± 0.2 7.9 ± 0.9 5.3 ± 0.2 4.7 ± 0.3 ŷ = - 4.864**x + 13.423** 0.92
LDB 6.3 ± 0.6 4.8 ± 0.5 3.7 ± 0. 3.5 ± 0.3 ŷ = - 1.988**x + 7.003** 0.93
IDB 15.7 ± 0.6 9.5 ± 0.9 5.3 ± 0.5 4.8 ± 0.5 ŷ = - 7.522**x + 18.001** 0.91
TDB 36.9 ± 0.9 24.2 ± 2.3 15.7 ± 0.5 14.2 ± 1.0 ŷ = - 15.652**x + 41.941** 0.92
R:PA 0.09 ± 0.02 0.1 ± 0.02 0.1 ± 0.01 0.09 ± 0.01 ŷ= -0.069x2* + 0.142x** + 0.032* 0.63
HEI 63.2 ± 2.7 59.2 ± 1.1 52.6 ± 0.7 53.2 ± 0.9 ŷ = -7.678** x + 66.412** 0.94
SLM 42.8 ± 1.9 45.0 ± 2.0 50.1 ± 3.3 55.2 ± 3.3 ŷ = 8.478**x + 37.909** 0.95
NI 129.4 ±6.8 88.0 ± 9.1 62.2 ± 5.8 53.6 ± 6.8 ŷ = - 51.251**x + 146.08** 0.93
NL 1149 ± 96 853 ± 80 620 ± 30 558 ± 50 ŷ = - 407.87**x + 1294.4** 0.94
LA 1478 ± 110 1066 ± 90.3 734 ± 23.3 644 ± 86 ŷ = - 576.63**x + 1686.6** 0.95
RGR 33.7 ± 0.3 29.1 ± 1.1 24.7 ± 0.3 23.5 ± 0.8 ŷ = - 7.125**x + 36.488* 0.97
NAR 0.6 ± 0.02 0.5 ± 0.02 0.4 ± 0.01 0.4 ± 0.01 ŷ = - 0.165**x + 0.659** 0.90
RDB (root dry biomass, g); SDB (stem dry biomass, g); LDB (leaf dry biomass, g); IDB (inflorescence dry biomass, g); TDB (total dry biomass, g); HEI (height, cm); SLB (specific leaf biomass, g m
–2); NI (number of inflorescences); NL (number of leaves); LA (leaf area, cm
2 ); RGR (relative growth rate,
mg g–1
d–1
); NAR (net assimilation rate, mg cm–2
d–1
).
The most evident morphological differences between treatments were reduced height (16%), number of leaves (51%) and inflorescences (59%) at low Ψw (–1.9 MPa) as compared to Ψw = –0.5 MPa (Table 1). However, drought stress corresponded to a significant (29%) increase in specific leaf mass at Ψw = –1.9 MPa, which was related to the 56% reduction in foliage in this treatment.
Leaf micromorphology
O. africanum had stomata and glandular and tector trichomes on both epidermal faces. The trichomes were classified as peltate glandular, with four secretory cells in the head and protected by a cuticle; multicellular tector trichomes had cuticular ornaments (Figure 3A–C).
The density of capitate, peltate glandular and tector trichomes was influenced by water deficit. The density of glandular trichomes adjusted linearly on the adaxial surface of the epidermis; these trichomes showed a 9-mm
2 quadratic adjustment on the abaxial surface, with
maximum mean values of 10 trichomes mm–2
for Ψw of –1.5 MPa. At Ψw = –1.9 MPa, tector trichomes showed a quadratic adjustment with maximum mean value of 23 trichomes mm
–2 for the abaxial surface, and a linear
adjustment for the abaxial face with 31 trichomes mm–2
(Figure 4A and B).
Stomatal density showed quadratic adjustments with significant increases (P ˂ 0.01) in the number of stomata in the adaxial and abaxial surfaces at Ψw = –1.6 and –1.9 MPa. The maximum stomatal density occurred at Ψw = –1.6 MPa, with 10 and 12 stomata mm
–2 in the adaxial and
abaxial surfaces, respectively (Figure 4C).
Essential oil production and water use efficiency
The essential oil content in leaves and inflorescences was significantly affected by water deficit and was highest at the lowest water potentials in branches (Figure 5A). The essential oil yield of leaves and inflorescences decreased significantly with increasing severity of the water deficit (R
2 = 0.95) (Figure 5B).
The WUE based on the productivity of total biomass (WUE bm) and essential oil (WUE oil) showed quadratic responses, reaching a maximum of 5.54 g/L at Ψw = –1.1 MPa. In leaves and inflorescences, the maximum WUE was 0.75 and 2.7 g/L at Ψw = –1.24 and –1.15 MPa, respectively (Figure 6).
Water deficit had little effect on the chemical composition of the essential oil extracted from leaves and inflorescences of O. africanum (Tables 2 and 3). Nine chemical compounds were identified in the essential oil; the major component was isoeugenol. There were difference in the composition of the essential oil between leaves and inflorescences: linalool was present only in
the leaves; and -curcumen, caryophyllene oxide, fenchol and (endo)-fenchol only occurred in the inflorescences (Tables 2 and 3). Changes in the content, yield and WUE of essential oil production after 60 days of the treatments caused only small variations in the chemical composition of the oil (Tables 2 and 3). In leaves, the concentration of isoeugenol remained stable at the different water potentials, whereas in inflorescences, the relative

dos Santos et al. 1929
Figure 3. Scanning electron micrograph of leaf surface of O. africanum; (A) Overview of epidermis, abaxial surface; (B) Tector trichome; (C) Peltate glandular trichome. Scale bars = 100 μm (A and C), 20 μm (B).
concentration of isoeugenol varied among the treatments (Table 3). DISCUSSION Plants subjected to water deficit have mechanisms for acclimating to these environmental conditions, including high level of expression of many genes and transcription factors (Rehem et al., 2012; Osakabe et al., 2014), increase in absicisc acid biosynthesis, stomatal closure and intracellular somatically active solutes accumulation (Lisar et al., 2012; Osakabe et al., 2014). These biochemical and physiological adjustment helps maintain cellular turgor and metabolic homeostasis and can be indicator of capacity of plant respond to drought stress (Akinci and Losel, 2012). All changes can interfere with growth patterns and, in aromatic plants, with essential oil biosynthesis.
Water deficit caused reductions in net photosynthetic rate and stomatal conductance in O. africanum. This response pattern was attributed to partial stomatal closure, which affects photosynthesis (Akinci and Lösel, 2012; Lisar et al., 2012), showing that stomata in this species are strongly sensitive to drought. The decreases in stomatal conductance were accompanied by a drop in
water potential throughout the experimental period. The reduced conductance is thus related to a decrease in water lost to transpiration (Guha et al., 2010) and an increase in water use efficiency, which is an important protection mechanism against leaf dehydration and loss of enzyme activity, both of which affect carbon fixation (Parry et al., 2002; Saeidnejad et al., 2013).
Reduced growth in response to drought is common in plants and is one of the first responses to water limitation. Growth is affected by drought through decreased cell turgor pressure, which leads to inhibition of cell expansion (Cominelli et al., 2008; Harb et al., 2010). In the aromatic plants, Matricaria recutita L. (Baghalian et al., 2011), Thymus daenensis subsp daenensis (Bahreininejad et al., 2013), Artemisia annua L. (Marchese et al., 2010) and Salvia officinalis L. (Bettaieb et al., 2009), growth changes under water deficit included reductions in leaf area, pigment contents, and leaf, flower and stem biomass. In O. africanum, the reduction in biomass production under the most severe water deficit conditions was mainly related to the decreased stomatal conductance and photosynthetic rate. Water availability is essential for cell expansion and division, which are also important during the flowering stage. Water deficit reduced flower size and nectar volume in Epilobium angustifolium, although nectar concentration was

1930 Afr. J. Agric. Res.
Figure 4. Density of peltate glandular trichomes (A) and tector trichomes (B); and stomatal density on the adaxial (circles) and abaxial (squares) surfaces of Ocimum africanum at different water potentials (C). Values are means of five replicates; bars indicate standard error.
unchanged (Carroll et al., 2001).
The reduction in relative growth rate of O. africanum at lower water potential (Ψw = –1.6 and –1.9 MPa) suggested physiological changes, which were reflected in the reduced net assimilation rate. Relative growth rate is indicative of adaptations of plants to environmental conditions and is determined by changes in biomass (Hunt, 1990). The reduction in leaf number and area in O. africanum with increased water deficit (Table 1) showed strong plasticity to adapt to water availability. A decrease in photosynthetic area is an important mechanism under drought conditions, resulting in less light absorption and water loss by transpiration, and thus in higher water use efficiency (Bahreininejad et al., 2013; Shao et al., 2008).
The allometric relationship observed in the increased
ratio of roots to aerial parts in O. africanum reflected a complex system that involves nutrient uptake and vegetative growth to maximize water absorption and assimilate flow in roots, consistent with the functional balance theory (Poorter et al., 2012).
The increased density of stomata and glandular and tector trichomes in O. africanum was associated with decreased leaf area in treatments with lower water potential. The presence of tector trichomes on leaf surfaces may contribute to the formation of a humid microclimate that reduces transpiration and heating by helping to reflect solar radiation (Guerfel et al., 2009). This an important morphological characteristic for tolerance to water stress in leaves of amphistomatic species such as O. africanum.

dos Santos et al. 1931
A B
Figure 5. Essential oil contents in leaves (○) and inflorescences (Δ) (A); Essential oil yield in leaves (○) and inflorescences (Δ) of Ocimum africanum 60 days after water deficit was imposed (B). Values are means of five replicates; bars indicate standard error.
Figure 6. Water use efficiency of biomass production (A) and of essential oil production (B) by O. africanum leaves () and inflorescences (∆), 60 days after the start of the treatments. Values are means of five replicates; bars indicate standard error.
In some species in the Lamiacea family, synthesis and storage of essential oils occur in secretory structures in leaves and inflorescences (Bahreininejad et al., 2013;
Bettaieb et al., 2009; Khalid, 2006; Singh‐Sangwan et al., 1994). The effects of water deficit on biomass production and glandular trichome density may influence the content, yield (Baghalian et al., 2011) and chemical composition of essential oils (Saeidnejad et al., 2013). In qualitative and quantitative aspects, the essential oils are chemically unstable and may undergo changes
depending on the severity of stress (Sangwan et al., 2001). O. africanum under water deficit increased the glandular trichomes density and essential oil content. There were no significant changes in the relative percentage of the main constituents of the essential oil from the leaves and inflorescence.
An effect of drought on water use efficiency per liter of essential oil produced in aerial parts was observed in Thymus daenensis (Bahreiniejad et al., 2013), and here, flowers of O. africanum had higher essential oil yield and

1932 Afr. J. Agric. Res.
Table 2. Relative percentages of components in essential oil extracted from leaves of Ocimum africanum under water deficit treatments. KI: (Kovats indices).
Compound KI literature KI experiment
Predawn water potential (–MPa)
0.5 0.9 1.6 1.9
Relative percentage
Linalool 1098 1095 0.76 0.28 0.70 0.38
Methyl(Z)-cinnamate 1301 1302 4.95 4.51 5.09 5.19
(Z)-isoeugenol 1402 1396 92.00 94.24 92.89 93.54
(E)-caryophyllene 1418 1425 0.63 0.49 0.71 0.47
Cis-thujopsene 1429 1433 0.54 0.43 0 0.62 0.43
Oxygenated monoterpenes
5.71 4.79 5.79 5.57
Phenylpropanoids
92.00 94.24 92.89 93.54
Sesquiterpenes
1.17 0.92 1.33 0.90
Total identified (%)
99.88 99.94 100 100
Table 3. Relative percentages of components in essential oil extracted from inflorescences of Ocimum africanum under water deficit treatments.
Component KI literature KI experiment
Predawn water potential (–MPa)
0.5 0.9 1.6 1.9
Relative percentage
Fenchol 1087 1096 0.91 0.84 0.58 0.58
(Endo)-fenchyl acetate 1220 1218 0.11 0.20 - -
(Z)-methyl cinnamate 1301 1302 2.25 2.41 1.56 2.36
(Z) isoeugenol 1402 1400 89.27 88.70 92.59 90.50
(E)-caryophyllene 1418 1427 2.92 3.09 1.97 2.26
Cis-thujopsene 1429 1434 230 2.73 1.76 2.18
-Curcumene 1480 1484 1.56 - 1.54 1.32
Caryophyllene oxide 1581 1580 0.31 0.21 - 0.53
Oxygenated monoterpenes
3.27 3.45 2.14 2.93
Phenylpropanoids
89.27 88.70 92.59 90.50
Sesquiterpenes
6.77 5.83 5,27 5.77
Oxygenated Sesquiterpenes 0.31 0.21 - 0.53
Total identified (%) 99.62 98.19 100 99.2
KI: Kovats indices.
WUE at the lowest water potential.
These results suggest that the plants invested proportionally more photoassimilate in the production of essential oil per water unit consumed at Ψw of –0.9 MPa, primarily in flowers. Understanding the effects of drought on essential oil production in these organs will help to maximize the raw material obtained before and during harvest. In O. africanum, essential oil content was higher in leaves than in inflorescences, and the largest density of glandular trichomes was found in the leaves. In addition, the highest essential oil content occurred under the most severe water deficit conditions. Simon et al. (1992) observed an increase in essential oil content in O. basilicum from mild (–0.68 MPa) to moderate (–1.12 MPa) water deficit, from 3.1 to 6.2 µL g
–1.
Increased essential oil content under water stress has been attributed to the production of high concentrations of terpenes, isoprenoids and phenylpropanoids by plants (Delfine et al., 2005). In O. africanum, the essential oil yield of leaves and inflorescences was inversely proportional to the essential oil contents in those organs. Thus, this study verified that water deficiency promoted increased essential oil content but decreased essential oil yield in this species. This finding is attributed to reduced numbers of leaves and inflorescences under water deficit, which led to lower biomass.
Understanding the relationship between water use and essential oil production and quality is fundamental in order for the cultivation of aromatic plants under drought to be economically viable. Furthermore, the presence of

essential oil in leaves and inflorescences, and differential responses of essential oil content and yield as observed in this study, may reduce the cost of processing by the harvest of the organs and drying period. Here, for O. africanum, increased essential oil content and water use efficiency in the production of essential oil were demonstrated for both organs under moderate water deficit. Methyl (Z)-cinnamaldehyde, caryophyllene and tujupesno were observed in the essential oil of leaves and inflorescences. However, isoeugenol was the major component in both organs, while derivatives of fenchol were observed in the oil of inflorescences. Isoeugenol is a chemical isomer of eugenol, which is known for its antifungal, antibacterial and antioxidant properties (Dubey et al., 2000; Lemos et al., 2005; Pereira and Maia, 2007), and which is broadly used in the perfume, cosmetic and pharmaceutical industries (Oliveira et al., 2008; Costa et al., 2010). Furthermore, eugenol and isoeugenol obtained from essential oils are viable economical sources for the production of valine by bioconversion (Daugsch and Pastore, 2005; Zhao et al., 2006; Ashengroph et al., 2012). Thus, considering the elevated concentration of isoeugenol in leaves and inflorescences even under water deficit, O. africanum may hold potential as a source of eugenol and vanillin for industry. In addition, the cost of managing the harvest and post-harvest may be reduced because leaves and inflorescences do not need to be processed. Conclusion The results presented here showed that irrigation at 80% of the field capacity (water potential of –0.9 MPa) provides the best condition for the growth and production of essential oil in O. africanum. Under these conditions, the yield and quality of essential oil make cultivation of O. africanum economically viable. No change were observed in the chemical composition of the essential oil in leaves and inflorescences, and the essential oil content and the quantity of oil produced per unit water consumed increased under moderate water deficit. More detailed studies are necessary to support the development of appropriate field management conditions to achieve maximum essential oil yield while conserving water resources.
Conflict of Interests The authors have not declared any conflict of interests.
ACKNOWLEDGEMENTS The authors thank the Brazilian Higher Education Council (CAPES) and the Brazilian National Council for Scientific and Technological Development (CNPq) for financial
dos Santos et al. 1933 support and fellowships provided. REFERENCES Adams RP (1995). Identification of essential oil components by gas
chromatography/ mass spectroscopy. Illinois: Allured Publishing Corporation, 4
th Edition, P 804.
Akinci S, Lösel DM (2012). Plant water-stress response mechanisms. In Rahman IMM, Hasegawa H (Eds.). Water Stress. Croatia: In Tech. pp. 15-42.
Ashengroph M, Nahvi I, Zarkesh-Esfahami H, Momenbeik F (2012). Conversion of isoeugenol to vanillin by Pyschrobacter sp. Strain CSW4. Appl. Biochem. Biotechnol. 166:1-12.
Baghalian K, Abdoshah SH, Khalighi-Sigaroodi F, Paknejad F (2011). Physiological and phytochemical response to drought stress of German chamomile (Matricaria recutita L.). Plant Physiol. Biochem. 49:201-207.
Bahreininejad AB, Razmjoo J, Mirza M (2013). Influence of water stress on morpho-physiological and phytochemical traits in Thymus daenensis. Int. J. Plant Prod. 7:151-166.
Bettaieb I, Zakhama N, Aidi Wannes W, Kchouk ME, Marzouk B (2009). Water deficit effects on Salvia officinalis fatty acids and essential oils composition. Sci. Hortic. 120:271-275.
Blank AF, Carvalho Filho JLS, Santos-Neto AL, Alves PB, Arrigoni-Blank MF, Silva-Mann R, Mendonça MC (2004). Caracterização morfológica e agronômica de acessos de manjericão e alfavaca. Hortic. Bras. 22:113-116.
Carroll AB, Pallardy SG, Galen C (2001). Drought stress, plant water status, and floral trait expression in fireweed, Epilobium angustifolium (Onagraceae). Am. J. Bot. 88:438-446.
Cominelli E, Galbiati M, Tonelli C (2008). Integration of water stress response Cell expansion and cuticle deposition in Arabidopsis thaliana. Plant Sig. Behav. 8:556-557.
Costa LCB, Pinto JEBP, Bertolucci SKV, Guimarães RM (2010). Qualidade fisiológica de sementes de Ocimum selloi benth. sob condições de luz, temperatura e tempo de armazenamento. Ciênc. Agrotec. 34:675-680.
Daugsch A, Pastore G (2005). Obtenção de vanilina: Oportunidade biotecnológica. Quim. Nova 28:642-645.
De Paula JP, Farago PV, Checchia LEM, Hirose KM, Ribas JLC (2004). Atividade repelente do óleo essencial de Ocimum selloi Benth. (variedade eugenol) contra o Anopheles braziliensis Chagas. Acta Farm. Bonaer. 23:376-388.
Delfine S, Loreto F, Pinelli P, Tognetti R, Alvino A (2005). Isoprenoids content and photosynthetic limitations in rosemary and spearmint plants under water stress. Agric. Ecosyst. Environ. 106:243-252.
Dubey N, Tiwari TNA, Mandin D, Andriamboavonjy H, Chaumont JP (2000). Antifungal properties of Ocimum gratissimum essential oil (ethyl cinnamate chemotype). Fitoterapia 71(5):567-569.
Ferreira D, Sisvar F (2010). Sistema de análises estatísticas para dados balanceados. Versão 5.3. Lavras: UFLA/DEX.
Guerfel M, Baccouri O, Boujnah D, Chaibi W, Zarrouk M (2009). Impacts of water stress on gas exchange, water relations, chlorophyll content and leaf structure in the two main Tunisian olive (Olea europaea L.) cultivars. Sci. Hortic. 119:257-263.
Guha A, Sengupta D, Rasineni GK, Reddy AR (2010). An integrated diagnostic approach to understand drought tolerance in mulberry (Morus indica L.). Flora 205:144–151.
Harb A, Krishnan A, Madana MR, Ambavaram R, Pereira A (2010). Molecular and physiological analysis of drought stress in arabidopsis reveals early responses leading to acclimation in plant growth. Plant Physiol. 154:1254-1271.
Hunt R (1990). Basic growth analysis. London: Unwin Hyman Ltd. P 112.
Jaleel CA, Gopi R, Sankar B, Gomathinayagam M, Panneerselvam R (2008). Differential responses in water use efficiency in two varieties of Catharanthus roseus under drought stress. C. R. Biol. 331(1):42-47.
Kaurinovic B, Popovic M, Vlaisavljevic S, Trivic S (2011). Antioxidant capacity of Ocimum basilicum L. and Origanum vulgare L. Extract.
1934 Afr. J. Agric. Res.
Molecules 16:7401-7414. Khalid KHA (2006). Influence of water stress on growth, essential oil,
and chemical composition of herbs (Ocimum sp). Int. Agrophys. 20:289-296.
Kriedemann PE, Goodwin I (2003). Regulated deficit irrigation and partial rootzone drying. Canberra: Land & Water. Australia.
Lambers H, Chapim III FS, Pons TL (2008). Plant Physiological Ecology. Springer: New York (2a Ed.).
Larcher W (2000). Ecofisiologia Vegetal. Rima. São Carlos –São Paulo. Lemos JA, Passos XS, Fernandes OFL, De Paula JR, Ferri PH,
Hasimoto LK, Lemos AA, Silva MRR (2005). Antifungal activity from Ocimum gratissimum L. towards Cryptococcus neoformans. Memórias do Instituto Oswaldo Cruz 100(1):55-68.
Lisar SYS, Motafakkerazad R, Hossain MM, Rahman IMM (2012). Water stress in plants: causes, effects and responses, In: Rahman IMM, Hasegawa H (Eds.). Water Stress. Croatia: InTech. pp. 1-15
Marchese JA, Ferreira JFS, Rehder VLG, Rodrigues O (2010). Water deficit effect on the accumulation of biomass and artemisin in annual wormwood (Artemisia annua L., Asteraceae). Braz. Soc. Plant Physiol. 22:1-9.
Oliveira RA, Reis TV, Duarte LP, Sacramento CK, Oliveira FF (2008). Constituintes químicos voláteis de especiarias ricas em eugenol. Rev. Bras. Farmacogn. 19:771-775.
Osakabe Y, Osakabe K, Shinozaki K, Tran LS (2014). Response of plants to water stress. Front Plant Sci. 5:1-8.
Parry MAJ, Andralojc PJ, Khan S, Peter JL, Keys AJ (2002). Rubisco activity: effects of drought stress. Ann. Bot. 89:833-839.
Pereira CAM, Maia JF (2007). Estudo da atividade antioxidante do extrato e do óleo essencial obtidos das folhas de alfavaca (Ocimum gratissimum L.). Ciênc. Tecnol. Aliment. 27(3):624-632.
Poorter H, Niklas KJ, Reich PB, Oleksyn J, Poot P, Momme L (2012). Biomass allocation to leaves, stems and roots: Meta analyses of interspecific variation and environmental control. New Phytol. 193:30-50.
Rehem BC, Bertolde FZ, Almeida AAF (2012). Regulation of gene expression in response to abiotic stress in plants. In: P. Bubulya, (Ed.) Cell Metabolism - Cell Homeostasis and Stress Response. Biochem. Genet. Mol. Biol. pp. 15-38.
Reddy AR, Chaitanya KV, Vivekanandan M (2004). Drought-induced responses of photosynthesis and antioxidant metabolism in higher plants. J. Plant Physiol. 16:1189-1202.
Saeidnejad AH, Kafi M, Khazaei HR, Pessarakli M (2013). Effects of drought stress on quantitative and qualitative yield and antioxidative activity of Bunium persicum. Turk. J. Bot. 37:930-939.
Sangwan NS, Farooqi AHA, Shabih F, Sangwan RS ( 2001) . Regulation of essential oil production in plants. Plant Growth Regul. 34:3-21.
Scholander PF, Hammel HT, Bradstreet ED, Hemmingsen EA (1965). Sap pressure in vascular plants. Science 148:339-346.
Selmar D, Kleinwächter M (2013). Stress enhances the synthesis of secondary plant products: the impact of stress-related over-reduction on the accumulation of natural products. Plant Cell Physiol. 54:817-826.
Shao HB, Chu LY, Jaleel CA, Zhao CX (2008). Water-deficit stress-induced anatomical changes in higher plants. C.R. Biol. 331:215-225.
Simon JE, Reiss-Bubenheim D, Joly RJ, Charles DJ (1992). Water stress-induced alterations in essential oil content and composition of sweet basil. J. Essent. Oil Res. 128:173-175.
Singh‐Sangwan NEELAM, Abad Farooqi AH, Singh SR (1994). Effect of drought stress on growth and essential oil metabolism in lemongrasses. New Phytol. 128(1):173-179.
Sneha GMNJ, Sastry PJC (2011). Evaluation of antibacterial activity of Ocimum. Int. J. Pharmacogn. Phytochem. Res. 3:89-92.
Stefan M, Zamfirache MM, Padurariu C, Trută E, Gostin I (2013). The
composition and antibacterial activity of essential oils in three Ocimum species growing in Romania. Cent. Eur. J. Biol. 8:600-608.
Valipour M (2013). Increasing irrigation efficiency by management strategies: cutback and surge irrigation. J. Agric. Biol Sci. 8:35-42.
Vani SB, Cheng SF, Chuah CH (2009). Comparative study of volatile compounds from genus Ocimum. Am. J. Appl. Sci. 6:23-528.
Wang S, Liang D, Chao L, Hao Y, Fengwang MA, Shu H (2012). Influence of drought stress on the cellular ultrastructure and antioxidant system in leaves of drought-tolerant and drought-sensitive apple rootstocks. Plant Physiol. Biochem. 51:81-89.
Zhao LQ, Sun Z-H, Zheng P, He JY (2006). Biotransformation of isoeugenol to vanillin by Bacillus fusiformis CGMCC1347 with the addition of resin HD-8. Process Biochem. 41:1673-1676.

Vol. 11(21), pp. 1935-1944, 26 May, 2016
DOI: 10.5897/AJAR2016.10909
Article Number: F8D839858719
ISSN 1991-637X
Copyright ©2016
Author(s) retain the copyright of this article
http://www.academicjournals.org/AJAR
African Journal of Agricultural Research
Full Length Research Paper
The management of sowing density on yield and lodging in the main oat biotype grown in Brazil
Marcos Vinicios Romitti1, José Antonio Gonzalez da Silva2, Anderson Marolli1, Emilio Ghisleni Arenhardt3*, Ângela Teresinha Woschinski de Mamann1, Osmar Bruneslau
Scremin1, Osório Antonio Lucchese2, Cleusa Adriane Menegassi Bianchi Krüger2, Lorenzo Ghisleni Arenhardt2 and Luis Michel Bandeira2
1Department of Physical and Engineering Sciences, Regional University of the Northwest of Rio Grande do Sul, 480
Lulu Ingelfritz Street, Zip code: 98700-000, Ijuí, RS, Brazil. 2Department of Agrarian Studies, Regional University of the Northwest of Rio Grande do Sul, 3000 Comércio Street,
Zip code: 98700-000, Ijuí, RS, Brazil. 3Department of Crop Plants, Federal University of Rio Grande do Sul, 7712 Bento Gonçalves Avenue,
Zip code: 91540-000, Porto Alegre, RS, Brazil.
Received 15 February, 2016; Accepted 19 April, 2016
The sowing density management in the main oat biotype cultivated in Brazil can bring yield gains with reduced lodging. The aim of this study was to sow the density adjustment of early cycle oat cultivars and reduced stature to increase biomass and grain yield with reduced lodging, considering high and low N-residual release succession systems in different years. The study was carried out in 2011, 2012 and 2013 in randomized blocks experimental design with four replications in factorial scheme 4 × 2, for sowing density (100, 300, 600 and 900 seeds m
-2) and oat cultivars (Brisasul and URS Taura) in the
corn/oat and soybean/oat succession systems. In each succession system two experiments were conducted, one to quantify the biomass production rate, and the other, aimed at estimating the grain yield and lodging. Regardless of year and cultivar, the main oat biotype grown in Southern Brazil evidences optimal sowing density around 500 seeds m
-2 in the biomass and grain expression yield in
the corn/oat and soybean/oat succession systems. In the soybean/oat succession system, the use of optimal density can favor the plant lodging, especially in favorable cultivation years. The corn/oat succession system through lower release of N-residual proves to be efficient concerning the grain yield expression and reduced lodging in the use of adjusted density. Key words: Avena sativa L., succession systems, climate change, biomass, regression.
INTRODUCTION Oats (Avena sativa L.) is considered a multi-purpose cereal and its grains have excellent nutritional value for human and animal consumption (Hawerroth et al., 2013). The greatest expression of oat productivity is directly
associated with the management techniques, such as the nutrients availability, plant population, phytosanitary control, among others (Benin et al., 2005; Silva et al., 2015). The plant population is an important factor in the

1936 Afr. J. Agric. Res. potential expression of biomass and grains yield in cereals (Ceccon et al., 2004), its variation is associated with the genotype potential in producing fertile tillers, once the sowing density influences the number of spikes and/or panicles produced by area (Sparkes et al., 2006; Valério et al., 2009). The increase in the number of tillers and/or plants per area acts directly on the vegetal biomass, an important aspect to enhance biological productivity and the relationship between the straw and grain mass (Ozturk et al., 2006; Silveira et al., 2010). It is highlighted that the rapid coverage of vegetal biomass on the soil by the canopy adjustment may favor a better use of light and nutrients for grain yield and a more effective control in the weeds evolution (Fleck et al., 2009; Silva et al., 2012).
The technical specifications of the Brazilian Commission of Oat Research have suggested sowing density in 200 to 300 seeds m
-2, a condition adopted since that the
cultivation of this species began to have commercial importance in the 90s. However, the continuous oat breeding has modified the plant architecture, among other features, changing the high stature biotype, late cycle and high relation straw/grain, for genotypes with stature lower than one meter, reduced cycle and greater caryopsis volume in relation to husk (Hawerroth et al., 2015; Silva et al., 2015). Therefore, changes that may modify the response of cultivars to plant population, suggest the need for more adjusted recommendations to the actual biotype of white oats grown in the Southern Brazil.
In agricultural systems, the type of biomass on soil influences the dynamics of release and use of N-residual in the expression of the yield components (Mantai et al., 2015). The wheat and oat grown on the soybeans and corn residue show differences in the tillers and canopy development, reflecting directly on biomass and grain yield (Wendling et al., 2007; Mantai et al., 2015). Aside from this, the constant climate changes has also changed the vegetal productivity, demonstrating the necessity of more stressed tolerant plant varieties (Araus et al., 2008) and efficient in the use of light and nutrients (Oliveira et al., 2011; Costa et al., 2013). Therefore, the oat productivity is directly associated to the use of fertilizers, cultivation techniques and soil and edaphoclimatic conditions (Costa et al., 2013; Silva et al., 2015). Although the favorable cultivation conditions may increase vegetal productivity, they tend to promote increased vegetative vigor, making favorable the lodging occurrence, condition that brings serious losses in yield and grains quality (Silva et al., 2012).
The occurrence of rains, winds and soil condition with a
higher nitrogen content, may increase the occurrence of plant lodging, whose conditions are common variables along the crops cultivation (Berry et al., 2003). In this context, the use of sustainable technologies and low cost, such as vegetation cover management, the use of the N-residual and the density cultivation adjustment on the main oat biotype grown in the Southern Brazil, can bring benefits to maximize the biomass and grain yield with lodging reduction.
The aim of this study is the sowing density adjustment of early cycle’s oat cultivars and reduced stature to increase biomass and grain yield with reduced lodging, considering high and low N-residual release succession systems in different years. MATERIALS AND METHODS
The study was developed in the field during the years 2011, 2012 and 2013 in Augusto Pestana city, RS state, Brazil (28°26'30'' South latitude and 54°00'58'' West longitude). The soil of the experimental area is classified as Distrofic Red Latosol Typical, which its U.S. equivalent is Rhodic Hapludox (USDA, 2014), and the climate of the region, according to Köppen classification, is ‘Cfa type’, with hot summer without a dry season. In the study, ten days before sowing, soil analysis was performed and it was identified in the following chemical characteristics of the local: i) corn/oat system (pH = 6.5, P = 34.4 mg dm-3, K = 262 mg dm-3, Organic matter = 3.5%, Al = 0.0 cmolc dm-3, Ca = 6.6 cmolc dm-3 and Mg = 3.4 cmolc dm-3) and ii) soybean/oat system (pH = 6.2, P = 33.9 mg dm-3, K = 200 mg dm-3, Organic matter = 3.4%, Al = 0.0 cmolc dm-3, Ca = 6.5 cmolc dm-3 and Mg = 2.5 cmolc dm-3). During the three years, sowing was performed in the second fortnight of May with seeder-fertilizer for composition of 5 rows of 5 m in length and row spacing of 0.20 m, forming the experimental unit of 5 m2. During the study execution, tebuconazole fungicide applications were made at the dosage of 0.75 L ha-1. Moreover, the weeds control was carried out with metsulfuron-methyl herbicide at a dose of 4 g ha-1 and additional weeding whenever necessary. At the oats sowing time 80 and 60 kg ha-1 of P2O5 and K2O, were applied, respectively, based on levels of P and K in the soil and nitrogen base with 10 kg ha-1 and rest of N applied in topdressing on the phenological stage of fourth leaf expanded, expecting thus grain yield about 3 t ha-1. The studies were carried out considering the two main succession systems used in southern Brazil for oats, involving soil coverage with vegetable residue of high and reduced carbon/nitrogen ratio in the corn/oat and soybean/oat succession systems, respectively. In each succession system two experiments were conducted, one to quantify the biomass production rate by the cuts made every 30 days until the harvesting point, and the other, for analysis of plant lodging and grain harvest to estimate yield.
Therefore, in all four experiments, the experimental design was randomized blocks with four repetitions, following factorial scheme 4 × 2 to oat cultivars (Brisasul and URS Taura) and sowing density (100, 300, 600 and 900 seeds m-2), respectively. The oat
*Corresponding author. E-mail: [email protected].
Author(s) agree that this article remain permanently open access under the terms of the Creative Commons Attribution
License 4.0 International License

cultivars used represent current genotypes with biotype desired in southern Brazil, with similarity to the cycle (early), height (reduced) and lodging (moderately resistant), however, distinguished in production tillering capacity (Brisasul = high; URS Taura = reduced).
Grain yield was obtained by cutting three central rows of each plot in the moment defined as the last cut in the experiment directed to analysis of biomass production rate (120 days), stage near the harvesting point, with grain moisture around 15%. The plants were threshed with a stationary harvester and directed the laboratory to correct grain moisture to 13%, and weighing to estimate grain yield (GY, kg ha-1). In experiments aiming to quantify the biomass production rate in each succession system, the harvest of the plant material was held close to the ground at the 30, 60, 90 and 120 days after the emergency, totaling four cuts through collection of a linear meter of three central rows of each plot. The green biomass samples were directed to forced-air oven at a temperature 65°C, until it reached constant weight to estimation of total dry matter produced (TDM, kg ha-1).
The lodging index was estimated visually and expressed in percentage, having considered the angle formed in the vertical position of the plants culm in relation to the ground and the area of lodged plants. For this estimate it was used the methodology suggested by Moes and Stobbe (1991), modified, with the lodging index (LODG-I) defined by the equation: LODG-I% = I × LODG × 2; where (I) reflects the plants inclination degree, ranging from 0 to 5 (0, absence of inclination and 5, all plants completely lodged); LODG represents the area with lodged plants in the plot, which ranges from 0 to 10, where 0 corresponds to the absence of lodged plants in the plot and 10 to lodged plants over the whole plot, regardless of their inclination. Therefore, this equation considered the incidence and severity of plants lodging, for example, when there is I = 5 and LODG = 10, LODG-I%= 5×10×2 = 100%, which corresponds to the existence of lodged plants close to the ground in the total area of plot.
To meet the homogeneity and normality assumptions via Bartlett tests, analysis of variance were performed for the detection of the main effects and interaction. Based on this information, it was
proceeded the linear equation adjustment 0 1( b x)TDM b in
estimating the biomass production day-1 ha-1 rate and the averages comparison by Scott and Knott ( 1974) at the analysis of points of density considered on grain yield and lodging. Afterwards, with the
equation adjustment of degree two 20 1 2( b x b x )GY b for
grain yield (GY), it was obtained the optimal sowing density (X) by
the equation 1
2
b(X - )
2b . It was carried out regression equation
adjustment (linear or quadratic) that describes the behavior expression of percentage of oat plant lodging by increasing the cultivation density. In these equations, oat lodging estimate was performed in distinct cultivation conditions using optimal sowing density (X) at maximum grain yield. For all the determinations employed, computational program GENES (Cruz, 2013) was used. It is highlighted that the average grain yield values per crop year along with the temperature and rainfall information were used to classify the years as favorable and unfavorable.
RESULTS AND DISCUSSION In this study, significant differences were detected between the main effects and interaction between
Romitti et al. 1937 cultivars, years and sowing densities. Therefore, the results are presented in order to unfold the effects of this interaction. In Table 1, about the soybean/oat succession system, the highest rate of biomass production day
-1 was
obtained at a density of 900 seeds m-2
, regardless of the years and cultivars evaluated. The increase of sowing density in oat indicates the biomass rate fostering; however, the most expressive average values of grain yield were obtained at the points of 300 and/or 600 seed m
-2. In these two densities, the 600 seeds m
-2 provided in
most cases, greater plant lodging. However, the highest biomass day
-1 rate for rapid ground cover in the use of
light and weed control with grain yield, is more efficient at the point of 600 seeds m
-2. Although this density
facilitates greater plant lodging in this system in relation to 300 seeds m
-2, the tendency of increased lodging can
be circumvented by the use of growth reducers, strategy that has been adopted for oats and other cereals (Hawerroth et al., 2015).
In Table 1, the rapid N-residual release soybean/oat system, the biomass production day
-1 rate and grain yield
indicated in general terms, cultivar URS-Taura is larger than Brisasul and with greater stability of the grain yield and lodging in different densities tested, regardless of cultivation year. It is highlighted, in this condition, that the most favorable years to increase of grain yield were also those that provided greater plant lodging. The years 2011 and 2013 indicated the most expressive average values (Table 3) as a result of climate conditions temperature and more favorable rainfall for the cultivation, mainly in 2013, with mild temperatures and adequate rain distribution during the crop cycle (Figure 1). It is verified that in a condition that high biomass and grain yield are searched by means of combined use of N-fertilizer and N-residual, the possibility of plant lodging becomes stronger on condition of favorable cultivation year.
In Table 2, corn/oat system, the equations obtained also indicated higher biomass production day
-1 rate in
higher density, justifying the fact that they are positively related. In this condition, the highest yields were found at 300 and 600 seeds m
-2. In the analysis of the biomass
production day-1
rate with grain yield, regardless of year and cultivar, the point of 600 seeds m
-2 also appears as
more indicated. In this condition of high C/N ratio (corn/oat system), the low N-residual release rate seems to influence on sowing density when compared to soybean/oat system, because in most situations, the maximum grain yield was obtained at the point of 600 seeds m
-2. The year 2011 stands out when the cultivar
URS Taura also indicated maximum yields with 900 seeds m
-2. In this way, differences between cultivars were
detected, with cultivar URS Taura showing in 2011 and 2012 the greatest grain yield, but in 2013, the most expressive results were

1938 Afr. J. Agric. Res.
Table 1. Regression equation of total dry matter and grain yield averages and lodging oat cultivars in sowing densities on soybean/oat system.
Cultivar Density (seeds m-2
) Equation TDM=b0±b1x R² P (b1x) GY (kg ha-1
) LODG (%)
Year 2011
Brisasul
100 1142 + 59x 0.93 * 2672c 3.5
d
300 1762 + 71x 0.95 * 3142b 17.5
c
600 1773 + 78x 0.95 * 3627a 58.7
b
900 2656 + 98x 0.90 * 2887c 85.0
a
URS-Taura
100 1729 + 64x 0.94 * 2712c 4.7
c
300 1542 + 68x 0.98 * 3841a 8.7
c
600 1420 + 75x 0.89 * 3833a 30.0
b
900 1282 + 78x 0.90 * 3470b 52.5
a
Year 2012
Brisasul
100 2444 + 77x 0.98 * 2221b 1.2
b
300 2129 + 84x 0.95 * 2923a 6.2
b
600 2476 + 98x 0.97 * 2851a 10.0
b
900 2533 + 102x 0.99 * 2315b 45.0
a
URS-Taura
100 2680 + 88x 0.94 * 2463b 2.7
b
300 2334 + 92x 0.89 * 3101a 3.2
b
600 3052 + 104x 0.93 * 3326a 4.5
b
900 2796 + 108x 0.98 * 2473b 20.0
a
Year 2013
Brisasul
100 2975+86x 0.93 * 3629b 0.0
d
300 2519+96x 0.93 * 4100a 10.2
c
600 2855+108x 0.94 * 3790b 83.7
b
900 3106+112x 0.97 * 3191c 96.2
a
URS-Taura
100 3192+96x 0.86 * 3133a 6.7
c
300 3302+103x 0.88 * 3329a 11.7
c
600 3289+112x 0.90 * 3182a 56.7
b
900 3702+115x 0.95 * 2835b 80.0
a
TDM: Total dry matter (kg ha-1); GY: grain yield (kg ha-1); LODG: lodging (%); R²: determination coefficient; P (bix
n): equation
inclination parameter; *Significant at 5% error probability by the t test. Averages followed by different letters are statistically different group by Scott & Knott test at 5% error probability.
obtained with the cultivar Brisasul. A relevant fact was the reduced lodging observed in all conditions tested, reporting that the corn/oat system proves efficient in reducing plant lodging (Table 2). Although in this system, the N-residual rate release is reduced, benefits in the tissues structure was obtained, possibly by increasing
lignin content, generating greater culm resistance. Concerning the oats aimed at human food, this condition shows relevant, because the value of the product for the industry is reflected in high mass of grains and the hectoliter, strongly damaged traits in occurrence of lodging.
The determination of the biomass production rate is decisive in determining the sowing density adjustment, and it allows the establishment that will favor better use of light and nutrients in association with natural weeds control (Fleck et al., 2009; Silva et al., 2012). However, the use of very elevated densities may reduce the grain yield through strong intraspecific competition and encourage plant lodging (Krüger et al., 2011; Hawerroth et al., 2015). Pinthus (1973) defined the lodging as a permanent modification state of the culm position in relation to its original position, resulting in curved plants or broken culms. The breaking and/or lodging are

Romitti et al. 1939
Figure 1. Different years of study climatological data.
complex phenomena, and their expression depends on genetic factors interrelated with the climate, soil and management practices (Fontoura et al., 2006). Among
the main agents that promote the plant lodging, the wind and rain stand out (Easson et al., 1993; Silva et al., 2006). In favoring conditions to lodging, the use of plant

1940 Afr. J. Agric. Res.
Table 2. Regression equation of total dry matter and grain yield averages and lodging oat cultivars in sowing densities in corn/oat system.
Cultivar Density (seeds m-2
) Equation: TDM= b0±b1x R² P (b1x) GY (kg ha-1
) LODG (%)
Year 2011
Brisasul
100 1837 + 54x 0.95 * 1918c 1.0
c
300 1689 + 63x 0.91 * 2731b 4.0
c
600 2126 + 72x 0.98 * 3221a 6.7
b
900 3029 + 91x 0.97 * 2562b 15.0
a
URS-Taura
100 2158 + 68x 0.92 * 2045c 0.5
b
300 2422 + 71x 0.98 * 2836b 1.3
b
600 2772 + 98x 0.92 * 3111a 3.0
b
900 3533 + 102x 0.97 * 3127a 6.2
a
Year 2012
Brisasul
100 2966 + 84x 0.91 * 2427b 1.2
b
300 2881 + 90x 0.91 * 2816a 1.7
b
600 2703 + 93x 0.87 * 2938a 4.0
b
900 2742 + 110x 0.97 * 2489b 10.0
a
URS-Taura
100 2838 + 82x 0.95 * 2641b 1.2
c
300 2933 + 90x 0.94 * 3056a 1.7
c
600 2761 + 94x 0.97 * 2967a 3.7
b
900 3472 + 111x 0.93 * 2453b 6.2
a
Year 2013
Brisasul
100 1797 + 83x 0.94 * 3065c 1.0
a
300 2228 + 101x 0.92 * 3441b 1.5
a
600 3488 + 104x 0.93 * 3687a 1.7
a
900 4045 + 118x 0.91 * 3381b 2.7
a
URS-Taura
100 3649 + 105x 0.86 * 2748b 0.7
a
300 3862 + 111x 0.92 * 3231a 0.7
a
600 3812 + 112x 0.93 * 3157a 1.0
a
900 4055 + 122x 0.87 * 2833b 2.7
a
TDM: Total dry matter (kg ha-1); GY: grain yield (kg ha-1); LODG: lodging (%); R²: determination coefficient; P (bix
n): equation inclination
parameter; *Significant at 5% error probability by the t test. Averages followed by different letters are statistically different group by Scott & Knott test at 5% error probability.
growth regulator has been used as an efficient solution, including allowing the use of higher sowing densities and larger doses of nitrogen in increasing yield (Matysiak, 2006; Schwerz et al., 2015). Rademacher (2000) defines plant growth regulator as a synthetic compound capable of reducing undesirable longitudinal growth of the aerial part of plants, with no decrease in grain yield.
In the definition of the optimal sowing density in oats and their reflexes about the plant lodging, in Tables 3 and 4 equations presented that the grain yield behavior
and the lodging, validated by the analysis of variance of regression (not displayed) and test on the inclination parameter (bix
n) that were significant. In Table 3, in the
soybean/oat system, regardless of year and cultivar, the grain yield showed quadratic trend and the lodging linear adjustment at the sowing densities increase, except in 2012, because the cultivars showed quadratic behavior in plant lodging. In the years 2011 and 2012 in soybean/oat system Table 3), independent of the cultivars tested, the optimal density cultivation for grain yield was obtained

Romitti et al. 1941
Table 3. Regression equation to estimate the optimal density on grain yield and reflections on the plant lodging in soybean/oat system.
Cultivar Equation: y= a±b1x±b2
2x R2 P (bix
n) Density (seeds m
-2) YE
Year 2011
Brisasul GY= 2145 + 5.1881x - 4.81. 10
-3x
2 0.94 * 539 3543
LODG= - 9.34 + 0.1064x 0.98 * (539) 48
URS-Taura GY= 2243 + 6.2308x - 5.48. 10
-3x
2 0.89 * 568 4014
LODG= - 5.40 + 0.0619x 0.97 * (568) 30
Year 2012
Brisasul GY= 1874 + 4.4343x - 4.42. 10
-3x
2 0.93 * 502 3006
LODG= 7 - 0.04874x + 7.99. 10-5
x2 0.96 * (502) 3
URS-Taura GY= 1947 + 5.6068x - 5.57.10
-3x
2 0.99 * 503 3357
LODG= 6 - 0.03081x + 5.08. 10-5
x2 0.97 * (503) 5
Year 2013
Brisasul GY= 3431 + 2.8854x - 3.54. 10
-3x
2 0.93 * 408 4018
LODG = - 16.52 + 0.1336x 0.91 * (408) 38
URS-Taura GY= 3031 + 1.38642x - 1.65. 10
-3x
2 0.97 * 420 3322
LODG= - 8.37 + 0.0993x 0.95 * (420) 33
General model GY= 2445 + 4.28886x - 4.24. 10
-3x
2 - * 505 3529
LODG= - 9.91 + 0.1003x - * (505) 40
GY: Grain yield (kg ha-1); LODG: lodging (%); R²: determination coefficient; P (bix
n): equation inclination parameter; *Significant at 5% error
probability by the t test.
with values greater than 500 seeds m
-2. On the other
hand, in 2013, the adjusted density results indicated values below 500 seeds m
-2, but higher than the
recommendation of the species which is 200 to 300 seeds m
-2.
The equations obtained with the use of optimal sowing density indicated grain yield estimates of more than 3 t ha
-1 at the soybean/oat system, in some situations,
surpassing 4 t ha-1
(Table 3). In this way, the optimal sowing density for maximum grain yield to be included in the model that describes the lodging in oats, allowed estimation of lodged plants by using the optimal density. Therefore, in favorable cultivation years (2011 and 2013), the lodging was estimated between 30 and 48%, indicating that the adjusted density in soybean/oat system can bring losses by the plants falling and compromising the grain quality. It is highlighted that the genotypes tested besides showing cycle and reduced height are also described as moderately resistant to plant lodging (Silva et al., 2015). In unfavorable cultivation year (2012), the plant lodging was almost non-existent, however, with the lowest grain yield (Table 3).
The favorable cultivation conditions defined by temperature and rainfall (Figure 1) were decisive on the plant lodging. Therefore, the improvement of investments with fertilization in favorable years can step up lodging, especially with the use of higher sowing density seeking maximum yield. The general analysis (Table 3), regardless of the cultivars and cultivation years, the density adjusted to maximum yield in the soybean/oat system was around 500 seeds m
-2 (x = 506), with 40% of
lodging. In Table 4, corn/oats succession system, behavior
similar to soybean/oat system were observed, with adjustment of quadratic functions in the estimation of grain yield and linearity on the plant lodging in the increased density of sowing, regardless of year and cultivar. In this system, the adjusted densities for maximum grain yield was higher than 500 seeds m
-2,
however, situations such as in 2011, which showed optimal density around 600 seeds m
-2 (x = 618) on the
cultivar URS Taura. This condition reinforces the hypothesis of dependence of the sowing density adjustment by succession system and cultivar, mainly

1942 Afr. J. Agric. Res.
Table 4. Regression equation to estimate the optimal density on grain yield and reflections on the plant lodging in corn/oat system.
Cultivar Equation: y= a±b1x±b2
2x R2 P (bix
n) Density (seeds m
-2) YE
Year 2011
Brisasul GY= 1294 + 6.65352x - 5.82.10
-3x
2 0.99 * 573 3195
LODG= - 1.08 + 0.0174x 0.99 * (573) 5
URS-Taura GY= 1683 + 4.42860x - 3.58. 10
-3x
2 0.97 * 618 3053
LODG= - 0.64 + 0.0071x 0.96 * (618) 4
Year 2012
Brisasul GY= 2135 + 3.21667x - 3.14. 10
-3x
2 0.99 * 512 3000
LODG= - 0.88 + 0.0108x 0.99 * (512) 4
URS-Taura GY= 2402 + 2.96546x - 3.25. 10
-3x
2 0.97 * 456 3078
LODG= 0.21 + 0.0063x 0.97 * (456) 3 -
Year 2013
Brisasul GY= 2769 + 3.12254x - 2.71.10
-3x
2 0.99 * 576 3668
LODG= 0.78 + 0.0020x 0.94 * (576) 2
URS-Taura GY= 2529 + 2.89005x - 2.86.10
-3x
2 0.90 * 505 3259
LODG= 1 - 0.00588x + 7.89. 10-3
x2 0.97 * (505) 1
General model GY= 2135 + 3.8794x - 3.56. 10
-3x
2 - * 545 3191
LODG= 0.322 + 0.00872x - * (545) 5
GY: Grain yield (kg ha-1); LODG: lodging (%); R²: determination coefficient; P (bix
n): equation inclination parameter; *Significant at 5%
error probability by the t test.
influenced by genetic differences of the lowest production rate and development of tillers observed in cultivar URS Taura, and intensified on condition of lower N-residual availability. In this system, grain yield above 3 t ha
-1 were
also obtained, highlighting the cultivar Brisasul in more favorable cultivation year (2013) with 3.6 t ha
-1. In the
behavior linear equation of plant lodging, the inclusion of the optimal density for grain yield showed lodging estimates totally different from those obtained in the soybean/oat system. The use of optimal sowing density on this system, independent of favorable and unfavorable year of cultivation and genetic differences between cultivars, allowed efficient reduction in plant lodging. Therefore, management condition evidenced the increase in grain yield with the use of optimal density without lodging. This fact reports the possibility of greater ease of harvest and maintenance of the physical and chemical qualities of the grain, characteristic strongly required by industry.
Valério et al. (2008) observed that wheat genotypes with reduced tillering are more dependent on the sowing density increase. The genotypes of high tillering submitted
to high densities, suffer greater competition for water, light and nutrients, reducing the grain yield and favoring the plant lodging (Ozturk et al., 2006). Therefore, the identification of a stable sowing density and responsive to cultivation improvements can foster greater grain yield in the ideal balance of development of yield components and with less risk in the plants fall (Silva et al., 2012). In wheat, it was observed that the equidistant distribution of seeds at density of 350 to 500 seeds m
-2, promoted
greater grain yield in the cultivars evaluated (Silveira et al., 2010). They also observed that the sowing density adjustment was changed by genotype and cultivation year, with yield increase with stability in higher density. Mantai et al. (2015) observed that the type of vegetal residue by the succession system in oat significantly alters the expression of biomass and grain yield. According to these authors, the N-fertilizer, although being used in less proportion in the soybean/oat system, brings greater plant lodging risks, especially in favorable.
On the other hand, increased doses of N-fertilizer did not promote plant lodging in the corn/oat system, which cultivation conditions reinforces the results obtained in

this study, by the contribution of this system in reducing plants fall. Abreu et al. (2005) by studying delayed cycle oat genotypes observed linear increase in biomass and grain yield by increasing the population from 100 to 400 plants m
-2. Silva et al. (2015) highlight that the proposal of
recommendation of seeds higher than the techniques currently used in oats can increase grain yield provided that there is no lodging, and with benefits in the management of the crop by the greater vegetation cover, be through a more effective weeds control or through moisture maintenance and soil erosion control, qualifying the direct sowing system for the summer species. Conclusions Regardless of year and cultivar, the main oat biotype grown in Southern Brazil shows optimal sowing density around 500 seeds m
-2 in the biomass and grain yield
expression in the corn/oat and soybean/oat succession systems.
In the soybean/oat succession system, the use of optimal density can promote the plant lodging, mainly in favorable cultivation years.
The corn/oat succession system although be of lower N-residual release, proves efficient the grain yield expression and reduced lodging in the use of adjusted density.
Conflict of Interests The authors have not declared any conflict of interests.
ACKNOWLEDGEMENTS
To CNPq, FAPERGS, CAPES and UNIJUÍ for the contribution of resources for the development of this research and for the Scholarship for Scientific and Technological Initiation and Research Productivity. REFERENCES Abreu GT, Schuch LO, Maia MS, Rosenthal MS, Bacchi S, Pereira E,
Cantarelli LD (2005). Produção de biomassa em consórcio de aveia branca (Avena sativa L.) e leguminosas forrageiras. Rev. Bras. Agrociênc. 11(1):19-24.
Araus JL, Slafer GA, Royo C, Serret MD (2008). Breeding for yield potential and stress adaptation in cereals. Crit. Rev. Plant Sci. 27(1):377-412.
Benin G, Carvalho FIF, Oliveira AC, Lorencetti C, Vieira EA, Coimbra JLM, Valério IP, Floss EL, Bertan I, Silva GO (2005). Adaptabilidade e estabilidade em aveia em ambientes estratificados. Cienc. Rural 35(2):295-302.
Berry PM, Spink JH, Gay AP, Craigon J (2003). A comparison of root and stem lodging risks among winter wheat cultivars. J. Agric. Sci. 141:191-202.
Romitti et al. 1943 Ceccon G, Grassi Filho H, Bicudo SJ (2004). Rendimento de grãos de
aveia branca (Avena sativa L.) em densidades de plantas e doses de nitrogênio. Cienc. Rural 34(6):1723-1729.
Costa L, Zucareli C, Riede CR (2013). Parcelamento da adubação nitrogenada no desempenho produtivo de genótipos de trigo. Rev. Ciênc. Agron. 44(2):215-224.
Cruz CD (2013). GENES - a software package for analysis in experimental statistics and quantitative genetics. Acta sci. 35(3):271-276.
Easson DL, White EM, Pickles SJ (1993). The effects of weather, seed rate and cultivar on lodging and yield in winter wheat. J. Agric. Sci. 121:145-156.
Fleck NG, Schaedler CE, Agostinetto D, Rigoli RP, Dal Magro T, Tironi SP (2009). Associação de características de planta em cultivares de aveia com habilidade competitiva. Planta Daninha 27(2):211-220.
Fontoura D, Stangarlin JR, Trautmann RR, Sschirmer R, Schwantes DO, Andreotti M (2006). Influência da população de plantas na incidência de doenças de colmo em híbridos de milho na safrinha. Acta Sci. Agron. 28:545-551.
Hawerroth MC, Silva JAG, Souza CA, Oliveira AC, Luche HS, Zimmer CM, Hawerroth FJ, Schiavo J, Sponchiado JC (2015). Redução do
acamamento em aveia‑branca com uso do regulador de crescimento
etil‑trinexapac. Pesqui. Agropecu. Bras. 50(2):115-125.
Hawerroth MC, Carvalho FIF, Oliveira AC, Silva JAG, Gutkoski LC, Sartori JF, Woyann LG, Barbieri RL, Hawerroth FJ (2013). Adaptability and stability of white oat cultivars to chemical composition of the caryopsis. Pesqui. Agropecu. Bras. 48(1):42-50.
Krüger CAMB, Silva JAG, Medeiros SLP, Dalmago GA, Sartori CO, Schiavo J (2011). Arranjo de plantas na expressão dos componentes da produtividade de grãos de canola. Pesqui. Agropecu. Bras. 46(11):1448-1453.
Mantai RD, Silva JAG, Sausen ATZR, Costa JSP, Fernandes SBV, Ubessi CA (2015). A eficiência na produção de biomassa e grãos de aveia pelo uso do nitrogênio. Rev. Bras. Eng. Agric. Ambient. 19(4):343-349.
Matysiak K (2006). Influence of trinexapac-ethyl on growth and development of winter wheat. J. Plant Prot. Res. 46(2):133-143.
Moes J, Stobbe EH (1991). Barley treated with ethephon: I. yield components and net grain yield. Agron. J. 83(1):86-90.
Oliveira AC, Crestani M, Carvalho FIF, Silva JAG, Valério IP, Hartwig I, Benin G, Schmidt DAM, Bertan I (2011). Brisasul: a new high-yielding white oat cultivar with reduced lodging. Crop Breed. Appl. Biotechnol. 11:370-374.
Ozturk A, Caglar O, Bulut S (2006). Growth and yield response of facultative wheat to winter sowing, freezing sowing and spring sowing at different seeding rates. J. Agron. Crop Sci. 192(1):10-16.
Pinthus MJ (1973). Lodging in wheat, barley, and oats: the phenomenon, its causes, and preventive measures. Adv. Agron. 25(1):208-263.
Rademacher W (2000). Growth retardants: effects on gibberellin biosynthesis and other metabolic pathways. Ann. Rev. Plant Physiol. 51:501-531.
Scott AJ, Knott M (1974). A cluster analysis method for grouping means in the analysis of variance. Biometrics 30:507-512.
Schwerz F, Caron BO, Schimidt D, Oliveira DM, Elli EF, Eloy E, Rockenbach AP (2015). Growth retardant and nitrogen levels in wheat agronomic characteristics. Científica 43(2):93-100.
Silva EC, Muraoka T, Buzetti S, Trivelin PCO (2006). Manejo de nitrogênio no milho sob plantio direto com diferentes plantas de cobertura, em latossolo vermelho. Pesqui. Agropecu. Bras. 41:477-486.
Silva JAG, Fontaniva C, Costa JSP, Krüger CAMB, Ubessi C, Pinto FB, Arenhardt EG, Gewehr E (2012). Uma proposta na densidade de semeadura de um biotipo atual de cultivares de aveia. Rev. Bras. Agrociênc. 18(3):253-263.
Silva JAG, Mantai RD, Oliveira, AC, Fontaniva C, Arenhardt EG, Olegário MB, Sberse VL (2015) Sowing density on oat production physiological parameters. Científica 43(3):181-189.
1944 Afr. J. Agric. Res. Silveira G, Carvalho FIF, Oliveira AC, Valério IP, Benin G, Ribeiro G,
Crestani M, Luche HS, Silva JAG (2010). Efeito da densidade de semeadura e potencial de afilhamento sobre a adaptabilidade e estabilidade em trigo. Bragantia 69:63-70.
Spakes DL, Holme SJ, Gaju O (2006). Does light quality initiate tiller death in wheat? Eur. J. Agron. 24(3):212-217.
USDA (2014) Soil Survey Staff. 2014. Keys to Soil Taxonomy, 12th
ed. USDA-Natural Resources Conservation Service, Washington, DC.
Valério IP, Carvalho FIF, Oliveira AC, Machado AA, Benin G, Scheeren PL, Souza VQ, Hartwig I (2008). Desenvolvimento de afilhos e componentes do rendimento em genótipos de trigo sob diferentes densidades de semeadura. Pesqui. Agropecu. Bras. 43:319-326.
Valério IP, Carvalho FIF, Oliveira AC, Benin G, Maia LC, Silva JAG,
Schmidt DM, Silveira G (2009). Fatores relacionados à produção e desenvolvimento de afilhos em trigo. Semina: Cienc. Agron. 30(1):1207-1218.
Wendling A, Eltz FLF, Cubilla MM, Amado TJC, Mielniczuk J, Lovato T (2007) Recomendação de adubação nitrogenada para trigo em sucessão ao milho e soja sob sistema de plantio direto no Paraguai. Rev. Bras. Cienc. Solo 31:985-994.

Vol. 11(21), pp. 1945-1951, 26 May, 2016
DOI: 10.5897/AJAR2015.10772
Article Number: 3CB02BD58723
ISSN 1991-637X
Copyright ©2016
Author(s) retain the copyright of this article
http://www.academicjournals.org/AJAR
African Journal of Agricultural Research
Full Length Research Paper
Hoof trimming for effective health management: What cattle farmers need to know
Ifeanyieze F. O.1, Ogunbosoye D. O.2 and Ikehi M. E.1*
1Department of Agricultural Education, University of Nigeria, Nsukka, Enugu State, Nigeria.
2Department of Animal Production, Fisheries and Aquaculture, College of Agricultural Science, Kwara State University,
Malete, Kwara State, Nigeria.
Received 27 December, 2015; Accepted 19 April, 2016
Cattle is one of the animals raised by animal farmers for income generation from milk and meat. This study was carried out to identify the practices required by farmers in hoof trimming for effective health management of cattle. The objectives of the study were to identify the practises required by farmers in planning for, preventive, curative, and the materials for hoof trimming of cattle. The study adopted descriptive survey research design and was carried out in The Netherlands. The population for the study was 38 comprising of 13 lecturers of animal science, 11 veterinary doctors, 10 extension agents and 4 hoof trimmers. There was no sampling because of the manageable size of the population. The instrument for data collection was a 45 item structured questionnaire. The questionnaire was validated by three experts in the dairy training centre. Data were collected by the researchers and analysed using mean and standard deviation. Findings from the study showed that a balanced hoof and proper body posture are the primary desired results of hooves trimming, for both routine or preventive approach, using the right tools. Findings further revealed that effective hooves trimming requires such activity based skills which needs to be hought to cattle keepers for effective animal health management The study therefore recommended that the identified techniques should be utilized in training of extension agents through workshop, and the farmers in a town hall meeting to make them effective in hoof trimming of their cattle in Nigeria. Key words: Animal health, routine, training, preventive, cattle production, posture.
INTRODUCTION In most countries of the world, beef and milk from cattle farming provides the bulk of the meat and milk consumed. Cattle could be kept for beef or milk. Beef cattle are mainly bulls (males) primarily raised for meat
production while milk producing cattle are cows (females). To derive the benefits inherent in animal farming, most cattle farmers keep the stock together as a herd for easy management. Management in animal
*Corresponding author. E-mail: [email protected].
Author(s) agree that this article remain permanently open access under the terms of the Creative Commons Attribution
License 4.0 International License

1946 Afr. J. Agric. Res. production relates to decisions on how to raise and run the business operations to ensure maintenance of the health status of the animals. It entails setting a production standard and working towards achieving them based on appropriate housing, feeding, and general health care of animals including hoof condition.
Major health care maintenance of cattle through hoof management is hoof trimming. Hoof trimming refers to the activities carried out on the foot of the animal to achieve proper heel and toe length for better balancing (Leacha et al., 2005; Hepworth et al., 2004). Hoof trimming is the removal of overgrown appendages or part of the honey materials covering the feet of animal for better balance/posture and healthy living (Ovnicek et al., 2003; Kummer et al., 2004, 2006). Hoof trimming is an essential part of animal management for raising cattle. Hoof trimming is aimed at helping cows have equal weight distribution to maintain the health status for enhanced production. Cattles in a herd should be frequently examined for abnormal hoof growth as overgrown hooves may make walking painful, predispose the animal to other foot and leg problems, and makes competing for feed difficult (Vermun, 2005; eF, 2016). This may cause animals to stop eating and exercising, become susceptible to joint and tendon problems and arthritis. Also, breeding animals use their hind legs during mating; mating and reproductive performance of a herd may seriously be affected if hooves of breeding males are not trimmed. Herd owners must realize that for maximum cattle health and longevity, through hoof and leg soundness, regular hoof care is a must (McKendrick et al., 2010; Duberstein et al., 2013).
Depending on the environment hoofed animals live in and the diet they are fed, some animals require that their feet be trimmed every 6 weeks to 2 months (Chesterton, 2004; Kummer et al., 2006; Hampson, 2011a, 2011b; Malone and Davies, 2011; Duberstein et al., 2013). A minimum of 2 to 3 times a year is essential for almost all animals no matter their diet or environment (Leacha et al., 2005). Hoof trimming is needed more on the hind legs than on the front. Better (2011) explained that front hooves naturally tend to get worn out faster and so the hind hooves need to be trimmed regularly for better balance. The author further stated that as the hind hooves grow, they tend to turn under on the sides and protrude outwards to become elf shoes thereby requiring trimming very regularly. Special attention is needed in trimming hoof walls especially when it is overgrown (Mob et al., 2014). There are two types of hoof trimming which are preventive and curative. Preventive also called functional or routine hoof trimming is carried out to avoid occurrence of lameness and claw diseases while curative hoof trimming is carried out to address injury in the hooves as well as to control infectious diseases in the foot in cows (Cook, 2005; Hüppler et al., 2015; Ype, 2015). Whichever method is needed at the time of trimming, the skills are to be known and use of the
relevant tools mastered. Related studies on horse and goat keeping outlines the stepwise approaches and techniques for hoof trimming (Ovnicek et al., 2003; Better, 2011; Gordon et al., 2012; Elham and Faisal 2015). These techniques if applied in both preventive and curative hoof trimming increases the health status of the cow (McKinzie et al., 2006; Better, 2011; Hampson, 2011a, b) thereby helping farmers earn more income for sustainability of their families. A drive for this study is the prevalent poor hoof management among herds in cattle rearing countries in Africa, especially in Nigeria.
Nigeria is an equatorial and tropical country with average temperatures of 80 to 90° F (26.6 to 32.2°C) and rainfall that storms almost every day, especially in the rainy season (mainly April to August) ) (Ikehi et al., 2014; Ifeanyieze et al., 2016). During the rainy season cattle are left in open swampy places. Some farmers in the country adopt intensive system of cattle management while few others depend on extensive system-nomadic. Cattle rearing in Nigeria are predominantly in the northern part with few local breeds reared in the South. With the listed dangers resulting from poor hoof management in herds, it is likely that cattle farmers in most regions of the world particularly in Africa and mostly in Nigeria are not meeting the expected output in their farms when compared with informed farmers in other developing and developed nations. A clear case of the low production is in the Southern part of Nigeria, where the local breeds could be better managed for higher production but farmers lack the relevant skills and available material. Further, most researches on hoof management are on Equine (mainly horses) with very limited studies on cattle hoof management. Interactions with contact cattle farmers in Nigeria revealed that most of the farmers observe the hoof claws of their cattle growing outwardly, cracked hooves and other hoof problems among their herd but bother less about it or do not even know what to do. The consequence is low production of milk and/or meat. The study was thus conceived to present the hooves trimming activities, skills and how to go about cattle hoof trimming. Specifically, the objectives of this study were to identify the techniques required by farmers in (a) planning for hoof trimming of cattle (b) preventive hoof trimming of cattle (c) curative hoof trimming of cattle, as well as (d) the materials required for hoof trimming of cattle.
METHODS
The study was carried out to identify skills required by farmers in hoof trimming for effective health management of dairy cattle. The study adopted descriptive survey research design and was carried out in Onkerk-Friesland in The Netherlands. The study was carried out in The Netherlands where experts converged for training on hoof management. The population for the study was 38 comprised of 13 lecturers of animal science, 11 veterinary doctors, 10 extension agents and 4 hoof trimmers, and where from Ethiopia

Ifeanyieze et al. 1947
Table 1. Mean ratings of respondents on techniques required in planning for hoof trimming of cattle
Response option Value Real limit
Highly required (HR) 4 3.50 - 4.00
Averagely required 3 2.50 - 3.49
Slightly required 2 1.50 - 2.49
Not required 1 0.00 - 1.49
Table 2. Mean ratings of respondents on techniques required in planning for hoof trimming of cattle (N=38).
S/N Item statement on planning for hoof trimming of cows Mean SD Decision
1 Determine the objective of hoof trimming 3.70 1.12 HR
2 Identify hoof trimming tools and equipment 3.52 1.01 HR
3 Locate the market for purchasing the tools (if none is available) 3.13 0.82 AR
4 Budget for the purchase of the identified tools and equipment 3.13 0.81 AR
5 Identify source of fund for purchasing the tools and equipment 3.74 1.22 HR
6 Buy the tools and equipment based on budget and prices. 3.22 0.87 AR
7 Sharpen the trimming knives and others that require sharpening 3.39 0.90 AR
8 Locate the group of cows that need foot trimming within the herd 3.43 0.97 AR
9 Identify individual cows that require hoof trimming 3.57 1.05 HR
(11), Bhutan (6), Indonesia (5), Pakistan (4), Friesland, The Netherlands (4), Egypt (3), Nigeria (2), Ghana (1) and Tanzania (1). There was no sampling due to the manageable size of the population. The instrument for data collection was a questionnaire with 47 items developed from literature reviewed for the study and through functional industry approach (scheduled visits to various dairy farms in Friesland in The Netherlands to observe the skills displayed and materials used by experienced cattle farmers in hoof trimming. The materials and techniques were compiled in form of questionnaire for this study. The questionnaire was made up of two parts- 1 and 2. Part 1 with 2 items sought information on the background of the respondents like country and major occupation while part 2 comprised of 45 items grouped into techniques in (a) planning for hoof trimming with 9 items, (b) preventive hoof trimming with 15 items (c) curative hoof trimming with 9 items and (d) materials required in hoof trimming with 13 items. Each item in the questionnaire was assigned four response options of Highly Required (HR); Averagely Required (AR); Slightly Required (SR) and Not Required (NR) with means values of 4, 3, 2 and 1 respectively. Three experts from dairy training Centre Oenkerk in The Netherlands validated the questionnaire to make it suitable for data collection. Cronbach alpha reliability test for instrument had 0.87 coefficient value. Data collected were analysed using means to analyse response for the research objectives and standard deviation (SD) to validate the means. In taking decision on the required item, real limit of numbers were assigned to the response options as shown in Table 1. Therefore, the result in each table was interpreted in line with the real limit and the corresponding response option as highly required for items with mean values within the real limit of 3.50 - 4.00; averagely required for items with mean value within the real limit of 2.50 - 3.49; slightly required for items with mean value within the real limit of 1.50 - 2.49 and not required for items with mean value within the real limit of 0.00 - 1.50. Generally, any item with a mean value of 1.50 or above was regarded as required while any item with a mean value below 1.50 was not required. Standard deviation as a user statistic was used to validate the means and the closeness of the respondents to the means. So
any item with a standard deviation of 1.96 or below indicated that the respondents were close to the mean and to one another in their responses while any item with a standard deviation above 1.96 indicated that the respondents were far from the mean and from one another in their responses.
RESULTS Accomplishing any task begins with planning, same applies for hoof management as presented on Table 2. Data in Table 2 revealed that 4 out of 9 items had their mean values ranging from 3.52 to 3.74. These values were within the real limit of 3.50 to 4.00; indicating that the four items (S/N 1, 2, 5 and 9) were highly required in planning for hoof trimming. The remaining five items (S/N 3, 4, 6, 7 and 8) had their mean values ranging from 3.13 to 3.43 which were within the real limit of 2.50 to- 3.49; indicating that the five items were averagely required in planning for hoof trimming. The table also showed that the standard deviation (SD) of the 9 items ranged from 0.81 to 1.22; indicating that the respondents were close to the mean and to one another in their responses. Generally, all the nine items were required in planning for hoof trimming of cattle as their means were greater than 1.50.
Putting the plan into action means that the farmer is willing to through the processes of ensuring good health among the herd through hoof management, beginning with routine steps as presented in Table 3.
Data in Table 3 revealed that 7 out of 15 items had their mean values ranged from 3.57 to 3.94. These values
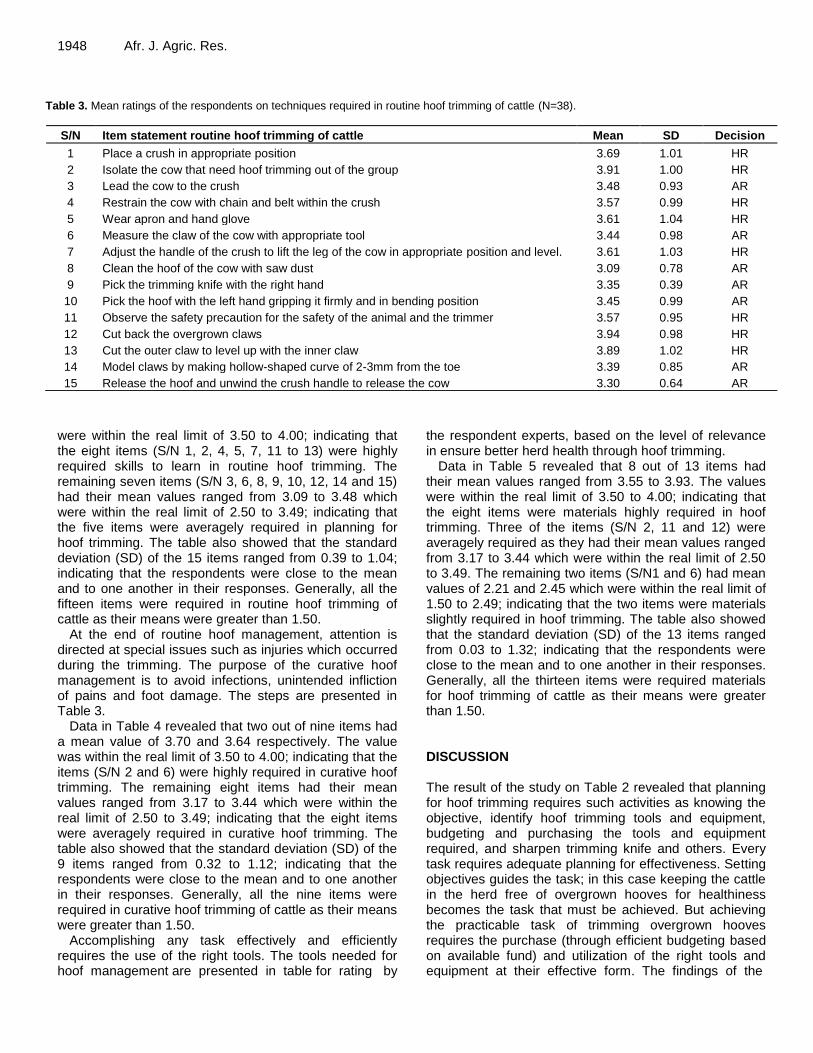
1948 Afr. J. Agric. Res.
Table 3. Mean ratings of the respondents on techniques required in routine hoof trimming of cattle (N=38).
S/N Item statement routine hoof trimming of cattle Mean SD Decision
1 Place a crush in appropriate position 3.69 1.01 HR
2 Isolate the cow that need hoof trimming out of the group 3.91 1.00 HR
3 Lead the cow to the crush 3.48 0.93 AR
4 Restrain the cow with chain and belt within the crush 3.57 0.99 HR
5 Wear apron and hand glove 3.61 1.04 HR
6 Measure the claw of the cow with appropriate tool 3.44 0.98 AR
7 Adjust the handle of the crush to lift the leg of the cow in appropriate position and level. 3.61 1.03 HR
8 Clean the hoof of the cow with saw dust 3.09 0.78 AR
9 Pick the trimming knife with the right hand 3.35 0.39 AR
10 Pick the hoof with the left hand gripping it firmly and in bending position 3.45 0.99 AR
11 Observe the safety precaution for the safety of the animal and the trimmer 3.57 0.95 HR
12 Cut back the overgrown claws 3.94 0.98 HR
13 Cut the outer claw to level up with the inner claw 3.89 1.02 HR
14 Model claws by making hollow-shaped curve of 2-3mm from the toe 3.39 0.85 AR
15 Release the hoof and unwind the crush handle to release the cow 3.30 0.64 AR
were within the real limit of 3.50 to 4.00; indicating that the eight items (S/N 1, 2, 4, 5, 7, 11 to 13) were highly required skills to learn in routine hoof trimming. The remaining seven items (S/N 3, 6, 8, 9, 10, 12, 14 and 15) had their mean values ranged from 3.09 to 3.48 which were within the real limit of 2.50 to 3.49; indicating that the five items were averagely required in planning for hoof trimming. The table also showed that the standard deviation (SD) of the 15 items ranged from 0.39 to 1.04; indicating that the respondents were close to the mean and to one another in their responses. Generally, all the fifteen items were required in routine hoof trimming of cattle as their means were greater than 1.50.
At the end of routine hoof management, attention is directed at special issues such as injuries which occurred during the trimming. The purpose of the curative hoof management is to avoid infections, unintended infliction of pains and foot damage. The steps are presented in Table 3.
Data in Table 4 revealed that two out of nine items had a mean value of 3.70 and 3.64 respectively. The value was within the real limit of 3.50 to 4.00; indicating that the items (S/N 2 and 6) were highly required in curative hoof trimming. The remaining eight items had their mean values ranged from 3.17 to 3.44 which were within the real limit of 2.50 to 3.49; indicating that the eight items were averagely required in curative hoof trimming. The table also showed that the standard deviation (SD) of the 9 items ranged from 0.32 to 1.12; indicating that the respondents were close to the mean and to one another in their responses. Generally, all the nine items were required in curative hoof trimming of cattle as their means were greater than 1.50.
Accomplishing any task effectively and efficiently requires the use of the right tools. The tools needed for hoof management are presented in table for rating by
the respondent experts, based on the level of relevance in ensure better herd health through hoof trimming.
Data in Table 5 revealed that 8 out of 13 items had their mean values ranged from 3.55 to 3.93. The values were within the real limit of 3.50 to 4.00; indicating that the eight items were materials highly required in hoof trimming. Three of the items (S/N 2, 11 and 12) were averagely required as they had their mean values ranged from 3.17 to 3.44 which were within the real limit of 2.50 to 3.49. The remaining two items (S/N1 and 6) had mean values of 2.21 and 2.45 which were within the real limit of 1.50 to 2.49; indicating that the two items were materials slightly required in hoof trimming. The table also showed that the standard deviation (SD) of the 13 items ranged from 0.03 to 1.32; indicating that the respondents were close to the mean and to one another in their responses. Generally, all the thirteen items were required materials for hoof trimming of cattle as their means were greater than 1.50. DISCUSSION The result of the study on Table 2 revealed that planning for hoof trimming requires such activities as knowing the objective, identify hoof trimming tools and equipment, budgeting and purchasing the tools and equipment required, and sharpen trimming knife and others. Every task requires adequate planning for effectiveness. Setting objectives guides the task; in this case keeping the cattle in the herd free of overgrown hooves for healthiness becomes the task that must be achieved. But achieving the practicable task of trimming overgrown hooves requires the purchase (through efficient budgeting based on available fund) and utilization of the right tools and equipment at their effective form. The findings of the

Ifeanyieze et al. 1949 Table 4. Mean ratings of the respondents on techniques required in curative hoof trimming of cattle (N=38).
S/N Item statement on curative hoof trimming Mean SD Decision
1 Carry out steps 1-14 of preventive hoof trimming 3.39 0.85 AR
2 Identify any wound and the typical spot by pressing to trimmed hoof while observing the reaction of the cattle
3.64 0.48 HR
3 Observe the reaction of the cow at each pressing of the quick 3.44 0.98 AR
4 Lower the outer claw to 2/3 towards the sole of the heel to transfer the weight of the wound to the healthy claw
3.44 0.98 AR
5 Apply block to the sound claw if the level of the inner and outer claws is not equal. 3.44 0.98 AR
6 Hold the block for 3minutes to gum firmly 3.70 1.12 HR
7 Release the hoof and unwind the crush to release the cow 3.44 0.97 AR
8 Relocate the cow to release the block after 5-6 weeks 3.39 0.85 AR
9 Remove hard ridges in the claw 3.17 0.32 AR
Table 5. Mean ratings of the respondents on materials required in hoof trimming of cattle (N=38).
S/N Item statement on the materials in hoof trimming Mean SD Decision
1 Tilt table 2.21 0.03 SR
2 Small board 3.12 0.68 AR
3 Hoof knife 3.93 1.09 HR
4 Gloves 3.86 1.27 HR
5 Apron 3.51 0.91 HR
6 Iodine 2.45 0.41 SR
7 Hoof pick 3.71 1.23 HR
8 Rasp 3.59 1.01 HR
9 Brush 3.55 1.06 HR
10 Nippers 3.72 1.21 HR
11 Wood block 2.55 1.10 AR
12 Boot 3.15 0.91 AR
13 Saw dust 3.75 1.32 HR
study pose the need to begin teaching cattle farmers in Nigeria how to plan for hooves trimming and maintain a regular cycle of activities while aiming to keep the herd healthy through hooves management. The planning activities identified here conform to planning activities in most tasks in other fields as presented by various authors (Drummond and Goodwin, 2011; Kent, 2011; Talathi et al., 2011; Ifeanyieze et al., 2014; Onu et al., 2014).
The findings of the study in Table 3 revealed that routine or preventive hoof requires such activity based skills like: Isolating and restrain the animal needing hooves trimming, measuring the claw to determine the excess growth and applying standard cutting procedure to remove the overgrowth. Isolating the animal needing hooves trimming had a high mean rating (after S/N 12; cutting back by the experts). Obviously, this should be the very important task, as the farmer should be able to differentiate an overgrown hoof from a normal hoof. Authors such as Leacha et al. (2005), McKendrick et al. (2010) and Joanne (2010) explained how to identify farm
animals with improper hooves from their body posture and limited functionality. Most of the items on Table 3 are easily performable tasks except for the actually hoof cutting, which is the main activity. In trimming off the excess, PTC (2015) explained that cutting back the inner claw to a length of 7.5 cm leaving 5 to 7 mm thickness in the tip of the toe would save the height of the heel. The author explained that the outer claw should be trimmed to be equal in length and height as the inner. Further, the author explained that the claw cutting should be modelled by cutting into a slightly hollow shape starting 2.5 to 3 cm from the toe. From Table 4, treatment of any observed wound helps to prevent infections. As indicated in the data on Table 4 as curative hoof trimming skills, PTC (2015) explained the corrective measure in the case of wounded sole to be to transfer the weight of the wounded sole to the sound claws by lowering 2/3 of the outer claw towards the sole of the heel. The attachment of the block covers the injured sole cushioning possible pains and walking difficulties for the animal, and can be removed

1950 Afr. J. Agric. Res. when the trimmed hoof is healed. While the identified steps or practices can easily be narrated, the practise would need more detailing and even one on one training for the less informed farmer. The findings of the study conform to that of other authors on basic techniques and practices in hoof trimming (Ovnicek et al., 2003; Kloosterman, 2004; Kummer et al., 2006; Joanne, 2010; Hüppler et al., 2015; Caldwell et al., 2016)
The experts identified the items enlisted on Table 5 as required tools/equipment for any cattle farmer aiming to trim overgrown hooves of any cattle in a herd. The respondents indicated that the tilt table and iodine solution are slightly required (SR) probably because a farmer with a need to trim overgrown hooves but lacks a table could improvise and iodine solution is needed only in the case of wounded sole. While the tilt table is slightly needed, a small board, wood block and boot are averagely required (AR) because the trimmed hoof needs to be placed on a platform separating it from dirt (if not suspended with a mechanical tool). Like the iodine, the Wood block is needed as corrective item in the case of a wounded sole. The Boot on the other hand is to be worn by the trimmer (farmer) as a safety kit. However, like the use of table, the farmer can improvise and any other foot cover. Other items like the hoof knife, hoof pick, rasp and nippers among others well indicated to be highly required (HR). It is obvious that the trimming activity will not be efficient without these tools as explained by Kloosterman (2004), Jan (2008), Malone and Davies (2011) and Ype (2015).
Balance is the primary concerns and objectives when trimming. A balanced hoof and proper body posture are the primary desired results of hooves trimming. This improves the health status of the animal and allow it to perform better like other normal hoofed cattle in the herd. Improving the healthiness of overgrown hooves through regular trimming improves the general health of the herd which directly improves economic returns of the farmers. However, contacting hoof trimmers on a regular base might be uneconomical for the already indigent cattle farmers in both the northern and southern region of Nigeria, and likely other rural African nationals. More so, finding a (professional) hoof trimmer to come down to the locations of the cattle keepers will always prove difficult as the farmers are scattered and the professional trimmers are very few. These techniques can be taught to the farmers, including the nomadic ones to help them improve in cattle management. The study therefore recommended that the identified techniques should be utilized in training of extension agents through workshop, and the farmers in a town hall meeting to make them effective in hoof trimming of their cattle in Nigeria. The trained extension agents could help the farmers perfect the skills by scheduling visits for a group of farmers to ascertain perfection level and further clarify any misunderstandings. The training for both the extension agents and the farmers could be organised by the
government through the ministry of Agriculture and/or by agro-allied Non-governmental Agencies (NGOs) who are interested in improving the economic welfare of cattle farmers and cattle production in Nigeria. Conflict of Interests The authors have not declared any conflict of interests. REFERENCES Better HG (2011). Goat hoof trimming. Available at:
http://articles.extension.org/pages/30650/goat-basic-hoof-care Caldwell MN, Allan LA, Pinchbeck GL, Clegg PD, Kissick KE, Milner PI
(2016). A test of the universal applicability of a commonly used principle of hoof balance. Vet. J. 207:169-176.
Chesterton RN (2004). Linking farm physical conditions, herd management and cow behaviour to the distribution of foot lesions causing lameness in pasture fed dairy cattle in New Zealand: Proceedings of the 13
th Symposium and 5
th Conference on Lameness
in Ruminants. Cook NB (2005). A guide to investigating a herd lameness problem.
InProc. American Association of Bovine Practitioners Annual Meeting, Salt Lake City, UT.
Drummond EH, Goodwin JW (2011). Agricultural economics. United States of America. Pearson Education, Inc.
Duberstein KJ, Johnson EL, Whitehead A (2013). Effects of Shortening Breakover at the Toe on Gait Kinematics at the Walk and Trot. J. Equine Vet. Sci. 33(11):930-936.
eF (2016). eXtension Foundation. Why is it so important to regularly trim the feet of sheep and goats? Available at: https://articles.extension.org/pages/67152/why-is-it-so-important-to-regularly-trim-the-feet-of-sheep-and-goats
Elham AH, Faisal AT (2015). Two-Dimensional and M-Mode Echocardiographic Measurements in the Healthy Donkey (Equus asinus). J. Equine Vet. Sci. 35(4):283-289.
Gordon S, Rogers C, Weston J, Bolwell C, Doloonjin O (2012). The Forelimb and Hoof Conformation in a Population of Mongolian Horses. J. Equine Vet. Sci. 33(2):90-94.
Hampson B (2011a). Foot types in feral horses and their relevance to foot care in domestic horses. J. Equine Vet. Sci. 31(10):571.
Hampson B (2011b). The effects of environment on the horse’s hoof. J. Equine Vet. Sci. 31(10):609.
Hepworth K, Neary M, Kenyon S (2004). Hoof anatomy, care and management in livestock. Purdue Extension ID-321-W, Purdue University Cooperative Extension Service, West Lafayette, IN, 47907.
Hüppler M, Häfner F, Geiger S, Mäder D, Hagen J (2015). Modifying the surface of horseshoes: effects of eggbar, heartbar, open toe, and wide toe shoes on the phalangeal alignment, pressure distribution, and the footing pattern. J. Equine Vet. Sci. 37:86-97.
Ifeanyieze FO, Ikehi ME, Isiwu E (2014). Techniques in utilizing remote sensor technology for precision crop production by farmers as climate change adaptation strategy in Nigeria. J. Agric. Sci. 5:1476-1482.
Jan H (2008). Cow signals: A practical guide for dairy farm management. The Netherlands. Roodbont Publishers.
Joanne D (2010). Efficient hoof management. Tumba, Sweden. DeLaval Publications. Available at: www.delaval.com/Global/PDF/Efficient-hoof-care.pdf
Kent DO (2011). Economics of farm management in a global setting. United States of America. John Wiley & Sons, Inc.
Kloosterman P (2004) Claw trimming techniques, research and practice: Proceedings of the 13th Symposium and 5th Conference on Lameness in Ruminants.
Kummer M, Geyer H, Imboden I, Auer J, Lischer C (2006). The effect of hoof trimming on radiographic measurements of the front feet of normal Warmblood horses. Vet. J. 172(1):58-66.
Kummer M, Lischer C, Vargas J, Hugelshofer J (2004). Evaluation of a

standardised radiographic technique of the equine hoof. Schweizer Archiv fu¨r Tierheilkunde 11:507-514.
Leacha KA, Offerb JE, Svobodac I, Logue DN (2005). Effects of type of forage fed to dairy heifers: Associations between claw characteristics, clinical lameness, environment and behaviour. Vet. J. 169(3):427-436.
Malone SR, Davies HMS (2011). The effects of hoof trimming and farrier on hoof shape. J. Equine Vet. Sci. 31(5-6):294-295.
McKendrick S, Evans P, Bagley DVM (2010). Proper Basic Hoof Care. Utah State University. ADVS Faculty Publications. Available at : http://digitalcommons.usu.edu/cgi/viewcontent.cgi?article=1120&context=extension_curall
McKinzie MD, Janowicz P, Hemling TC, Ehrman C, Harausz C (2006). Results from a 2005 Survey of Hoof Health on U.S. Dairy Farms. WBC, Nice, France.
Mob S, Seng M, Theng K, Chea B (2014). Cattle production system in NW Cambodia. Available at: http://lrrd.cipav.org.co/lrrd26/3/sere26042.htm
Onu FM, Ugwoke EO, Agboeze MU, Ikehi ME (2014). Cost effective mechanisms for mobilizing the youths for fish production and marketing in Niger Delta region of Nigeria. Afr. J. Soc. Sci. 4(1):36-42.
Ifeanyieze et al. 1951 Ovnicek G, Page B, Trotter GW (2003). Natural balance trimming and
shoeing: its theory and application. Vet. Clin. North Am. Equine Pract. 19:353-377.
PTC (2015). Practical Training Centre. Reproduction, health and breeding. Sanjestreed. Dairy Training Centre. Onkerk-Friesland in The Netherlands.
Talathi JM, Naik VG, Jalgaonkar VN (2011). Introduction to agricultural economics and agribusiness management. New Delhi, India. Ane books Pvt Ltd.
Vermun JJ (2005). The multifactorial nature of cattle lameness: A few more pieces of the jigsaw. Vet. J. 169(3):317-318.
Ype VWR (2015). Hoof care in cattle. Slide/Lecture Presentation. Dairy training Centre Oenkerk-The Netherlands. Unpublished.

Vol. 11(21), pp. 1952-1960, 26 May, 2016
DOI: 10.5897/AJAR2015.10271
Article Number: E43478C58727
ISSN 1991-637X
Copyright ©2016
Author(s) retain the copyright of this article
http://www.academicjournals.org/AJAR
African Journal of Agricultural Research
Full Length Research Paper
Lignification of the plant and related aspects of soaking seeds and soybean pod of RR and conventional
cultivars
Cristiane Fortes Gris1*, Edila Vilela de Resende Von Pinho2, Francisco Carlos Krzyzanowski3, José Renato Emiliorelli Evangelista2, Willian César Freiria1 and Alexana Baldoni2
1Instituto Federal do Sul de Minas Gerais, Campus Muzambinho, Muzambinho, Minas Gerais, Brazil.
2Universidade Federal de Lavras, Lavras, Minas Gerais, Brazil.
3Embrapa Soja, Londrina, Paraná, Brazil.
Received 11 August, 2015; Accepted 27 January, 2016
There has been great speculation about differential responses of transgenic and conventional cultivars of soybean lignin content in its stem, pod and seeds. Each characteristic is associated with the soaking of seeds and pods. Increase of weight of intact soybean seeds and pods at different soaking periods and their relation to the lignin contents in RR and conventional soybean plants was determined. Samples of 20 pods and 50 seeds from the conventional cultivars, Jataí, Celeste, and Conquista and their respective transgenic RR versions Silvânia, Baliza, and Valiosa were utilized. The pods were immersed into water for 1, 3, 6, 9, 12, 24, and 48 h, and the seeds were immersed into water for 1, 2, 3, 4, 5, 6, 7, 9, 12, 24, and 48 h. The intact pods showed some resistance against water in the first few hours of soaking, but the seeds possess greater absorption at the onset and later stabilization. There were no differences between RR transgenic and conventional cultivars for lignin content in stem, leaf, pod, and seed coat and the IVH of intact pods was found. It was difficult to establish an association between the soaking rate and transgenic characteristic in the evaluated soybean cultivars. Key words: Imbibition rate, lignin, water immersion.
INTRODUCTION The genetically modified soybean (RR), resistant to the herbicide glyphosate, has been in Brazilian market for about 21 years ago, and their launch revolutionized the soybean market in Brazil and worldwide. In 2014/2015, the cultivation of these varieties reached 93.2% of the
planted area; about 29.10 million hectares were planted with this crop in Brazil. Transgenic intact soybean RR2 IPRO, which has stacked traits, in the second year of commercial adoption reached 5.2 million hectares planted, or 16.5% of the total soybean sown in 2014/2015
*Corresponding author. E-mail: [email protected].
Author(s) agree that this article remain permanently open access under the terms of the Creative Commons Attribution
License 4.0 International License

(SNA, 2014).
Some writers have mentioned differential responses in lignin contents in RR and conventional cultivars due to excess lignification that occurs in RR transgenic cultivars (Coghlan, 1999; Kuiper et al., 2001; Edmisten et al., 2006; Nodari and Destro, 2006). However, research in this area is rather restricted, these claims being not based on comparative studies within the same genotype.
Lignin deposition gives strength and rigidity to plant tissues such as stems and leaves, especially soybean seed coat, which resists mechanical damage (Panobianco, 1997); it gives tissues strength and protection and also protects the cell wall from microorganisms’ infestation (Rijo and Vasconcelos, 1983; Tavares et al., 1987). In this context, possible differential responses may become relevant to physiological quality of seeds, considering the relationship between the permeability of soybean seeds and the physiological quality.
Large characteristics of seed coats are associated with specific problems presented in the seeds, such as the susceptibility of mechanical damage, longevity and potential to deterioration that may be associated with their lignin content and levels of permeability of the seed coat. These aspects are considered for seed coat and can also be applied to pod and therefore be associated with the quality of seeds. Yaklich and Cregan (1981) have observed that the differences between soybean cultivars cannot be attributed just to environmental factors, but mainly to genetic differences between cultivars, such as soaking pods. Tully (1982) also mentioned that the incorporation of water impermeability in the pod would be most appropriate alternative to the impermeability seeds, verifying this characteristic variability between different soybean cultivars.
A good relationship between permeability of pods and quality of soybean seeds was reported by Pereira et al. (1985), who evaluated methods for the identification of genotypes with high quality seed. Costa et al. (2002), contrasting two soybean cultivars to water absorption in laboratory and field conditions, determined that the lower water absorption would be the probable cause of tolerance deterioration of seed of the cultivars. Braccini (1993) noted that the pod dunk test correlated negatively with premature aging tests, emergence in sand and emergency speed index, indicating that with increased permeability of the same the quality of seeds decreases. Therefore, the aim of this work is to determine the increase of weight of intact soybean seeds and pods at different soaking periods and their relation with the lignin contents in RR and conventional soybean plants. MATERIALS AND METHODS
The experiment was conducted in Lavras, Minas Gerais, Brazil (21°14′S, 45°00′W, 918 m of altitude), an important region of coffee beans production. It was done in winter, in the agricultural year of 2007 (April - August). Soil in the experimental area is classified as
Gris et al. 1953 dystrophic red latosol. Climate in the region is type Cwa (wet moderate subtropical), according to the Köppen classification; it has mean annual temperature of 19.3°C and normal annual rainfall of 1530 mm (Dantas et al., 2007). The climatic data were collected in a meteorological station of the Instituto Nacional de Meteorologia (INMET) at the Universidade Federal de Lavras - UFLA (Figure 1).
The experimental design was a randomized complete block design (RBD) with four replications. The experimental unit consisted of four rows with 6.0 m, and 0.50 m space from each one. In this case, the relevant areas are composed of two central rows of 0.50 m (useful area of 3.2 m²).
Three conventional cultivars and their RR transgenic versions were evaluated: BRS MG 46 ‘Conquista’ versus BRS Valiosa RR, BRS MG 46 ‘Jataí’ versus BRS Silvânia RR e BRS ‘Celeste’ versus BRS Baliza RR. When seeding, the seeds were treated with the commercial product Vitavax Thiram 200 SC® in the concentration of 250 ml-1 100 kg-1 seed, and then inoculated with peat commercial product (minimum population of 1.200.000 cells/seed). The soybean seeding fertilization was performed according to the soil analysis and the second interpretations by Ribeiro et al. (1999). During thinning, there remained 16 plants/m linear density, and when required, cultural practices were performed according to recommendations for the crop. The average air temperature and precipitation in the region during the study period are given in Figure 1.
The lignin contents were determined in stem, leaf, vegetable and husk of soybean (Capeleti et al., 2005). The amounts of material to be analyzed, as well as electrical conductivity test (Vieira, 1994) and seed immersion test were done. For seed immersion test, the seeds from the electrical conductivity test were used, subjected to submersion in water for 24 h at 25°C. Later, germination test was done. The number of normal and abnormal plants was evaluated for four days.
The plant tissues for lignin analysis were collected when they were between R7 and R8 stages (Fehr and Caviness , 1977) by selecting (Figure 1). There was daily change in air temperature and average rainfall from March to August 2007) (Meteorological Station of the Instituto Nacional de Meteorologia (INMET) at the Universidade Federal de Lavras - UFLA, MG, Brazil).
For soaking tests, pods with 2 or 3 seed each were selected, without apparent damage. They were collected with the scissors. The pods were threshed manually and retained in circular sieve of 5.55 and 6.35 mm. two replicates of 20 units per field block were used for soaking intact pods and 4 replicates of 50 units per field block to soak seeds. The samples were initially weighed and then immersed completely in 250 ml plastic cups containing demineralized water at 25 ± 2°C, for 1, 3, 6, 9, 12, 24 and 48 h for intact pods, using the methodology proposed by Boldt (1984), and 1, 2, 3, 4, 5, 6, 7, 9, 12, 24 and 48 h for seed according to Rocha et al. (1990).
To avoid the fluctuation of pods other plastic cups of the same volume were overlapped. After the soaking period, the glass is drained from the water and excess water from pods or seeds were eliminated by drying blotting paper. It was then weighed and soaked for a further period. With the initial and final weight of each sample, percentage of seed imbibition and intact pods was determined, for each soaking time, and the extracted intact seeds of pods, according to the equation:
E (%) = [(PF – PI)] / PI × 100
where E (%) = soaking percentage relative to the initial weight of the sample; PI = initial weight of the sample (for each period); PF = final weight of the sample after 48 h of immersion in water.
At the end of the soaking tests, the samples were subjected to 105°C for 24 h in an oven for final moisture determination; intact pods were determined separately in the water content of seeds and pods. Nakagawa et al. (2007) method was used to determine the

1954 Afr. J. Agric. Res.
region during the study period are given by Figure 1.
Determinaram-se os teores de lignina em caule, folha, legume e tegumento de
sementes de soja (CAPELETI et al., 2005), modificando-se a quantidade de material a
ser analisado, assim como a condutividade elétrica de sementes (VIEIRA, 1994) e teste
de imersão de sementes em água. Para o teste de imersão de sementes em água
utilizaram-se as sementes oriundas do teste de condutividade elétrica, submetidas à
submersão em água por 24 horas a 25oC, sendo após, submetidas ao teste de
germinação, avaliando-se aos 4 dias o número de plantas normais e anormais. Os
tecidos vegetais para as análises de lignina na planta foram coletados quando as mesmas
se encontravam entre os estádios R7 e R8 (FEHR & CAVINESS, 1977), selecionando-
Figure 1. Daily change in air temperature and average rainfall from March to August
2007. Source: Meteorological Station of the Instituto Nacional de Meteorologia
(INMET) at the Universidade Federal de Lavras - UFLA, MG, Brazil.
0
10
20
30
40
50
60
70
80
90
100
Pre
cip
ita
tio
n (
mm
)
0
4
8
12
16
20
24
28
Av
era
ge
air
tem
per
atu
re (
oC
)
10 20 31 10 20 30 10 20 31 10 20 30 10 20 31 10 20 31
Mar Apr May Jun Jul Aug
Figure 1. Daily change in air temperature and average rainfall from March to August 2007. Source: Meteorological Station of the Instituto Nacional de Meteorologia (INMET) at the Universidade Federal de Lavras - UFLA, MG, Brazil.
hydration rate index (IVH), based on the equation of germination speed index (GSI) of Edmond and Drapala (1958); the replacement of germination was given by the percentage of soaking.
Evaluation results were submitted to analysis of variance by F test (Storck et al., 2000) and when there was significance, the means were compared by Schefeé test (5% significance), through computer statistical software R (2008), for each soaking period, in contrast to conventional cultivars and their RR transgenic versions. For the variable hours of soaking, regression analysis was performed using quadratic model response plateau, which is the amount of time in which there is a stabilization value (% final soaking), given by:
2
0 1 2 0
0
se X
se X
i i i i
i
i i
x x XyP X
RESULTS AND DISCUSSION There was a significant effect for the interaction between cultivars and percentage of seed soaking (Table 1). For the cultivars, Conquista and Valiosae RR were observed different rates of seed soaking for 4, 5 and 6 h and for Jataí and Silvânia RR cultivars, it was 1 and 2 h. There was no statistical difference for the percentage of seed soaking for Celeste and Baliza RR cultivars.
After 4 h of immersion in water, it was observed that the seeds of the cultivar RR Valiosa absolved 55.24% of its weight in water; its value is statistically less than that 72.07% absolved by conventional Conquista.
Considering these three periods in which both cultivars showed differences in average, conventional seeds absolved 23.61% more water than RR seeds. This indicates greater restriction on water intake in these seeds.
According to Calero et al. (1981) and McDonald et al. (1988), probably the restriction on water ingress is due to the permeability of the seed coat, which according to these authors, acts as regulator of seed soaking. McDougall et al. (1996) emphasized that the seed coat impermeability awarded by the lignin, has a significant effect on the ability and speed of water absorption through this. However, it was not possible to establish relationship between increased permeability of the seed coat and lower lignin content. So, in this work, the cultivars showed no differences for this trait (Table 4).
According to McDonald et al. (1988), soybean seeds absorb approximately 80% water for the first 3 h of soaking, seeds coats having a relevant role in this process. In Table 1, it was observed that within 3 h, only Conquista and Valiosa cultivars RR showed absorptions smaller than 70% water by weight, and the cultivars, Jatai and Silvânia RR absorbed more than 90%.
It is noteworthy that among the materials evaluated, the seeds of Jataí and Silvânia RR had the lowest percentages at final soaking. However, they have absorbed during the first 2 h, 73.58 and 90.68% water weight, respectively. This indicates increased permeability of the seed coat for these crops compared to

Gris et al. 1955
Table 1. Averages of contrasts obtained for soaking percentage of conventional soybean varieties of seeds and their transgenic versions RR. South of Minas, Brazil, 2007.
Time (h) Averages of contrasts
Conquista vs. Valiosa RR Celeste vs. Baliza RR Jataí vs. Silvânia RR
1 20.81ª 13.85a 23.12
a 35.21
a 45.22
b 63.68
a
2 37.92ª 27.77a 48.03
a 58.45
a 73.58
b 90.68
a
3 53.96ª 40.11a 72.43
a 76.91
a 96.34
a 106.91
a
4 72.07a 55.24
b 97.45
a 93.59
a 110.41
a 115.94
a
5 87.49a 70.91
b 113.62
a 107.13
a 117.77
a 120.44
a
6 99.25a 83.23
b 123.67
a 117.62
a 123.72
a 124.11
a
7 108.50a 94.16
a 129.90
a 124.67
a 126.70
a 126.15
a
9 120.08a 107.56
a 135.07
a 131.60
a 128.73
a 127.83
a
12 127.95a 118.56
a 137.86
a 135.65
a 129.70
a 128.21
a
24 131.75a 122.67
a 137.39
a 135.95
a 128.17
a 125.94
a
48 136.55a 136.73
a 140.18
a 135.51
a 127.85
a 125.29
a
*Means followed by the same letter in the line, between the contrasts, do not differ by Schefeé test at 5% probability.
Table 2. Averages values for the variables in which the contrasts between conventional soybean cultivars and their transgenic versions RR showed significance. South of Minas, Brazil, 2007.
Variable Averages
Jataí Silvânia RR
Water soaking (%) 59.00a 36.00
b
Electrical conductivity (µS/cm/g of seeds) 76.54b 100.25
a
*Means followed by the same letter in the line, between the contrasts, do not differ by Schefeé test at 5% probability.
others; faster stabilization occurred at 5.81 and 6.67 h, respectively, getting for these times some statistical differences.
Soaking differences occurred for both varieties with 1 and 2 h of soaking. Silvânia RR cultivar was more permeable to water with about 90% of after 2 h Rodrigues et al. (2006) studied preview hydration of soybean seeds, and found sharp increase in the water content within the first 3 h; there was 6 h of relative stabilization.
These results are against those obtained for physiological quality of seeds of the two cultivars (Table 2). Once, the cultivar Silvânia RR had smaller number of normal germinated seedlings after being immersed in water, and greater value electrical conductivity, possibly because of higher membrane permeability and damages caused by the rapid entry of water.
Figure 1 shows the regressions for hours within each cultivar, indicating the average stabilization values (Xo) and the percentage of soaking (P) at Xo time to seed. It can be inferred there are different periods of stabilization of soaking seeds of cultivars, Jataí/Silvânia RR, Celeste/Baliza RR e Conquista/Valiosa RR, which showed an average of 6.24, 9.10 and 13.53 h for
stabilization, respectively. However, the final imbibition values were not significantly different, and the average concentration was between 126.71 and 136.12% absorbed water (Figure 2).
According to Labouriau (1983), soaking speed is affected when environmental conditions vary, but the maximum amount of water absorbed at this stage does not change. This is because this maximum is a property of hydrophilic colloids seed, conditioned by maturity and/or the storage. In soybeans, proteins are primarily responsible for the soaking phenomenon, due to their hydrophilic nature (Rocha et al., 1990). However, the composition and protein in the seeds produced have not been determined in this work.
Costa et al. (2002) observed variations in water absorption speed among soybean cultivars, until the eighth hour absorption when the authors observed a quadratic response to this variable. These results contrary are to this work. The percentage of seed soaking is framed in quadratic model; indicating that the amount of absorbed water became lower, stabilizing at the last hour.
In contrast, Toledo (2008) observed linear response of soybean cultivars as the capacity of water absorption by

1956 Afr. J. Agric. Res.
Figure 2. Averages values (symbols) and estimated (lines), stabilization of average time (Xo) and average weight value in time Xo (P) obtained in the regression analysis for the percentage of seed soaking the conventional soybean cultivars and their transgenic versions RR. South of Minas, Brazil, 2007.

Gris et al. 1957
Table 3. Averages of contrasts obtained for soaking percentage of intact legumes of conventional soybean cultivars and their transgenic versions RR. South of Minas, Brazil, 2007.
Time (h) Means of contrasts
Conquista vs. Valiosa RR Celeste vs. Baliza RR Jataí vs. Silvânia RR
1 7.67a 7.64
a 10.30
a 7.12
a 4.46
a 4.23ª
3 13.12a 11.89
a 18.71
a 14.03
a 9.21
a 7.34ª
6 19.48a 16.21
a 25.98
a 22.17
a 10.49
a 9.54ª
9 26.78a 21.31
a 34.48
a 29.64
a 13.63
a 13.34
a
12 33.60a 24.83
a 42.64
a 37.80
a 16.74
a 17.09
a
24 51.75a 39.20
b 61.02
a 55.92
a 28.07
a 29.27
a
48 70.74a 56.79
b 80.81
a 74.43
a 43.49
a 43.78
a
*Means followed by the same letter in the line, between the contrasts, do not differ by Schefeé test at 5% probability.
the seeds as a function of time, indicating gradual increases in the amount of water absorbed within 8 h of imbibition. Santos et al. (2007) observed that seeds of cultivars Embrapa 48 and BRS 133, evaluated for 24 h of hydration, also showed linear adjustment of the data. However, it is noteworthy that Santos et al. (2007) and Toledo (2008) used the methodology of the humid atmosphere and moistened paper method, respectively, which provided slower seed absorption process.
Souza et al. (2004), evaluating the physiological quality of bean seeds by water absorption in different storage periods, observed genetic variability for both percentage of water absorption as for the germination and emergence speed. The difference was accentuated with the storage time of seed. These authors observed that the water absorption decreased during storage, as the emergence speed and germination rate increased; indicating that probably for bean seeds, water absorption does not seem to affect the seed vigor.
About the cumulative percentage of water gain by legumes (Table 3), it was observed that the cultivar Valiosa RR showed lower soaking rate than its conventional version, possibly indicating greater restriction on the water ingress through the walls of RR legumes. These results were similar with the seed soaking test (Table 1), where legumes of the cultivar Conquista had 32% more water absorption than the cultivar, Valiosa RR.
Regarding the evolution of the process of water absorption by intact pods (Table 3), there were observed differentiations in periods of 24 to 48 h between Conquista and Valiosa RR cultivars; there were no other differences between RR and conventional materials. It is noteworthy that when the Xo stabilization time is not among the periods when there was a statistical difference, do not consider different the Xo and P values between RR and conventional materials.
Contrasting Figures 2 and 3, in the process of seed soaking there are fast initial absorption of water, with subsequent stabilization, of at most 13.54 h; while in the intact pods, there was resistance to water ingress in the
first hours of soaking, taking stabilization time of the same, with the exception of Celeste and Baliza RR cultivars that exceeded 48 h. This shows that the period of performing the test was not sufficient for the stabilization of soaking pods.
Among the cultivars evaluated, as well as for soaking seeds, Jataí and Silvânia RR had lower percentage (52.25 and 42.26%), respectively, as well as smaller values of soaking in all periods when compared to other cultivars. As for seeds, it was not possible to establish an association between the soaking rate of pods and the transgenic characteristic of soybean cultivars evaluated. Table 4 shows the significant effect of the hydration rate index (IVH) on the seeds of the cultivars, Conquista and Valiosa RR; with no differences between RR and conventional cultivars for the other variables.
There was a higher rate of hydration of seeds to cultivate transgenic Valiosa RR (5.23 g/h) when compared to conventional Conquista (3.84 g/h). However, the results obtained are contrary to the soaking percentages for these cultivars, wherein the cultivar Conquista, in some periods, exceeded Valiosa cultivar. These results of IVH are justified since the weight increments are multiplied by soaking period. To cultivate Valiosa, there were additions of soaking in the last periods, 24 and 48 h, than those observed for the cultivar Conquista, which resulted in higher IVH for this cultivar.
The RR and conventional cultivars did not differ in the percentage of final soaking of seeds from the soaking test of pods which, absolved on average 70.69, 86.22 and 72.15% water by weight; this is contrasting with Conquista/Valiosa RR, Celeste/Baliza and Jataí RR/RR Silvânia, which were observed in the final water content of 41, 46 and 41%, respectively (Table 4). It is noteworthy that this final water content obtained at the end of the soaked seed test (64% for cultivars Conquista and Valiosa RR and 61% for other cultivars) demonstrate the important role of pod in the quality of soybean seeds, acting as a regulator of water absorption.
This regulatory function of pods can be better viewed for Jataí and Silvânia RR cultivars, when observing the

1958 Afr. J. Agric. Res.
Figure 3. Averages values (symbols) and estimated (lines), stabilization of average time (Xo) and average weight value in time Xo (P) obtained in the regression analysis for soaking percentage of intact pods, conventional soybean cultivars and their versions transgenic RR. South of Minas, Brazil, 2007.

Gris et al. 1959
Table 4. Averages of contrasts obtained for the variables studied (I to IX) of conventional soybean cultivars and their transgenic versions RR. South of Minas, 2007.
Variable Averages of contrasts
Conquista vs. Valiosa RR Celeste vs. Baliza RR Jataí vs. Silvânia RR
I 3.84b 5.23a 2.64
a 2.04
a 1.30
a 0.87
a
II 11.62ª 10.50a 10.38
a 10.10
a 6.98
a 7.57
a
III 64.47ª 76.92a 89.45
a 82.99
a 66.08
a 78.22
a
IV 0.26ª 0.25a 0.21
a 0.21
a 0.39
a 0.39
a
V 7.62ª 7.64a 7.92
a 7.77
a 7.85
a 7.51
a
VI 12.45a 12.43a 12.09
a 12.71
a 11.53
a 12.66
a
VII 6.62ª 7.19a 5.88
a 5.33
a 6.34
a 6.20
a
VIII* 39.07 43.27 45.19 47.01 39.68 43.60
IX* 64.11 63.24 62.95 58.35 61.66 60.95
(I) IVH of seeds (g/h), (II) IVH of intact pods (g/h), (III) Final percentage of seed soaking in soak test of intact pods (%), (IV) Lignin in seed coat (%), (V) Pod lignin (%), (VI) Lignin in stem (%), (VII) Lignin in leaf (%), (VIII) Final moisture of the seeds after pods soaking test (%), (IX) Final moisture of the seeds after seed soaking test (%). Means followed by the same letter in the line, between the contrasts, do not differ by Schefeé test at 5% probability. *No data analyzed statistically.
results of physiological quality (Table 2) and the data obtained from the soaking of seeds and intact pods. When the seeds were submitted for vigor tests characterized by immersion in water as seed soaking, germination after immersion in water and electrical conductivity, there were the highest percentages of soaking in the early hours of the test, in addition to the smaller number of normal seedlings after immersion and the highest electrical conductivity values.
However, when subjected to other vigor tests, which did not use direct immersion in water, the seeds of these cultivars showed high vigor. This allows one to infer that the seed coat of Jataí and Silvânia RR cultivars, despite having the highest values of lignin, is not the mainly responsible for maintaining the physiological quality of seeds, and possibly the pod is an important ally of the seed, in maintaining the physiological quality. It acts as a regulator of water absorption, especially during the final maturation process. These results are different from the work of Braccini (1993), which suggests that increased permeability of pods is correlated with the reduction of the quality of soybean seeds; which according to Pereira et al. (1985), it should be explored further improving the processes of high quality seeds. The results observed for the lignin content in stem, leaf and pods were similar among all materials tested (Table 4).
As for the lignin content in the seed coat, the greater values were observed for the Jataí and Silvânia RR cultivars, when compared with the other cultivars. However, from the results, it is inferred that the seed water absorption does not appear to be associated only with the lignin, since these cultivars had the highest percentages of soaking in the early hours of the test. According to Calero et al. (1981), soybean cultivars with slow absorption of water can have elongated pores and teguments with waxy material embedded in the
epidermis, one fact that makes the water imbibition process slower. However, these characteristics were not evaluated in this work. Conclusion
There were no differences in the lignin content of the stem, leaf, pod and seed coat between the transgenic and conventional soybean cultivars. It was not possible to establish an association between the soaking rate in seeds and pods, and evaluate the transgenic characteristic of the soybean cultivars. The pod soaking correlates with the physiological quality of soybean seeds. Conflict of interests
The authors have not declared any conflict interests. ACKNOWLEDGEMENTS
The authors are grateful to the CAPES (Higher Education Personnel Improvement Coordination), Universidade Federal de Lavras (UFLA) and Instituto Federal de Educação, Ciência e Tecnologia do Sul de Minas Gerais (IFSULDEMINAS) for scholarship granted and financial support. REFERENCES Boldt AF (1984). Relação entre os caracteres de qualidade da vagem e
da semente de soja (Glycine max (L.) Merrill). 70f. Dissertação (Mestrado em Fitotecnia)-Universidade Federal de Viçosa, Viçosa, MG.

1960 Afr. J. Agric. Res. Braccini ADL (1993). Avaliação da qualidade fisiológica da semente de
variedades e linhagens de soja (Glycine max (L.) Merrill) com diferentes graus de impermeabilidade do tegumento. 109 f. Tese (Doutorado em Fitotecnia)-Universidade Federal de Viçosa, Viçosa, MG.
Calero E, West SH, Hinson K (1981). Water absorption of soybean seeds and associated causal factors. Crop Sci. 21(6):926-933.
Capeleti I, Ferrarese MLL, Krzyzanowski FC, Ferrarese FO (2005). A new procedure for quantification of lignin in soybean (Glycine max (L.) Merrill) seed coat and their relationship with the resistance to mechanical damage. Seed Sci. Technol. 33(2):511-515.
Coghlan A (1999). Splitting headache: Monsanto’s modified soya beans are cracking up in the heat. Saint Louis: Monsanto. Available at: http://www.mindfully.org/GE/Monsanto-RR-Soy-Cracking.htm.
Costa JA, Pires JLF, Thomas AL, Alberton M (2002). Variedades de soja diferem na velocidade e capacidade de absorver água. Sci. Agraria 3(1/2):91-96.
Dantas AA, Carvalho LG, Ferreira E (2007). Classificação e tendências climáticas em Lavras, MG. Ciênc. Agrotecnologia 31(6):1862-1866.
Edmisten KL, Wells R, Wilcut JW (2006). Investigation of the cavitation and large boll shed in Roundup Ready cotton. Disponível: http://www.cottoninc.com/projectsummaries/2000projectsummaries/details.asp?projectid=119.
Edmond JB, Drapala WS (1958). The effects of temperature, sand and acetone on germination of okra seed. Proc. Am. Soc. Hortic. Sci. 71:428-434.
Fehr WR, Caviness CE (1977). Stage of soybean development. Ames, 11p.
Kuiper HA, Kleter GA, Noteborn HPJM, Kok EJ (2001). Assessment of the food safety issues related to genetically modified foods. Plant J. 27(6):503-528.
Labouriau LG (1983). A germinação das sementes. Washington: OEA, 174p.
Mcdonald MB, Vertucci CW, Roos EE (1988). Soybean seed imbibition: water absorption by seeds parts. Crop Sci. 28(6):993-997.
Mcdougall GJ, Morrison IM, Stewart D, Hillman JR (1996). Plant cell walls as dietary fibre: range, structure, processing and function. J. Sci. Food Agric. 70(2):133-150.
Nakagawa J, Cavariani C, Martins CC, Coimbra RDA (2007). Intensidade de dormência durante a maturação de sementes de mucuna preta. Rev. Bras. Sementes 29(1):165-170.
Nodari RO, Destro D (2006). Relatório sobre a situação de lavouras de soja da região de Palmeira das Missões, RS, safra 2001/2002, cultivadas com cultivares convencionais e com cultivares transgênicas. Available at: <http://www.agirazul.com.br/123/noticias/000000a3.htm>.
Panobianco M (1997). Variação na condutividade elétrica de sementes de diferentes genótipos de soja e relação com o conteúdo de lignina no tegumento. 59 p. Dissertação (Mestrado em Agronomia)-Universidade Estadual Paulista, Jaboticabal.
Pereira LAG, Henning AA, França NJB, Costa NP, Magalhães CV
(1985). Teste de metodologia para identificação de genótipos de alta qualidade fisiológica de sementes de soja. In: Empresa Brasileira De Pesquisa Agropecuária. Centro Nacional de Pesquisa de Soja. Resultados de pesquisa de soja 1984/85. Documentos 15. pp. 407-420.
R-Development Core Team (2008). R: a language and environment for statistical computing: reference index version 2.8.0. Available at: http://www.R-project.org.
Ribeiro AC, Guimarães PTG, Vicente VHA (1999). Recomendações para o uso de corretivos e fertilizantes em Minas Gerais: 5
a
aproximação. 359p. Rijo L, Vasconcelos I (1983). Formação de calose e de lignina em
combinações incompatíveis Coffea sp. H. vastatrix. In: Simpósio sobre ferrugens do cafeeiro. Oerias, Portugal pp. 269–281.
Rocha VS, Oliveira AB, Sediyama T, Gomes JLL, Sediyama CS, Pereira MG (1990). A qualidade da semente de soja. Viçosa, UFV. 76 p. Boletim, 188.
Rodrigues MBC, Villela FA, Tillmann MAA, Carvalho R (2006). Pré-hidratação em sementes de soja e eficiência do teste de condutividade elétrica. Rev. Bras. Sementes 28(2):168-181.
SNA (2014). Sociedade Nacional de Agricultura. Área com transgênicos crescerá 4% no Brasil, indica consultoria. Available at: http://sna.agr.br/area-com-transgenicos-crescera-4-no-brasil-indica-consultoria/.
Santos ELD , Póla JN, Barros ASDR, Prete CEC (2007). Qualidade fisiológica e composição química das sementes de soja com variação na cor do tegumento. Rev. Bras. Sementes 29(1):20-26.
Souza LV de, Ramalho MAP, Von Pinho EVDR (2004). Genetic parameters in relation to the physiological quality of common bean seeds. Crop Breed. Appl. Biotechnol. 4:43-47.
Storck L, Garcia DC, Lopes SJ, Estefanel V (2000). Experimentação vegetal. 198p.
Tavares DQ, Miranda MAC, Umino CY, Dias GM (1987). Características estruturais do tegumento de sementes permeáveis e impermeáveis de linhagens de soja Glycine max (L.) Merrill. Rev. Bras. Bot. 10(1):147-153.
Toledo MZ (2008). Dano por embebição em sementes de soja em função do teor de água inicial, cultivar e local de produção. 68 p. Dissertação (Mestrado em Agronomia)-Universidade Estadual Paulista, Botucatu.
Tully RE (1982). A new technique for measuring permeability of dry soybean pods to water. Crop Sci. 22(2):437-440.
Vieira RD (1994). Teste de condutividade elétrica. In: Vieira RD, Carvalho NM (Eds.). Testes de vigor em sementes. FUNEP. pp. 103-132.
Yaklich RW, Cregan PB (1981). Moisture migration into soybean pods. Crop Sci. 21(5):791-793.

African Journal of
Agricultural Research
Related Journals Published by Academic Journals
African Journal of Environmental Science & Technology
Biotechnology & Molecular Biology Reviews
African Journal of Biochemistry Research
African Journal of Microbiology Research
African Journal of Pure & Applied Chemistry
African Journal of Food Science
African Journal of Biotechnology
African Journal of Pharmacy & Pharmacology
African Journal of Plant Science
Journal of Medicinal Plant Research
International Journal of Physical Sciences
Scientific Research and Essays