Embed Size (px)
Citation preview
.~ I "'."'.''''"'';'''~ I ,':1< \\ i
. ';,l~ ''1 I
~"Jj J .~ ~ .
. :---1-, --'---'--." ---,--'
• • • - r, H , c. '. 'f'-. I •
S. DEPARTMENT OF JUSTICE
--------,-----~~..,
The E;~aHlination and Typing of Bloodstains
in the Crime Laboratory
-W ENFORCEMENT ASSISTANCE ADMINISTRATION
If you have issues viewing or accessing this file contact us at NCJRS.gov.
The Examination and Typing of Blc)odstains
in the Crime LeJboratory
By
BRYAN J. CULLIFORD Senior Principal Scientific Officer Metropolitan Police Forensic Laboratory London, England
The fact that the National Institute of Law Enforcement and Crirninal Justice furnished financial support to the activities described in this publication does not necessarily indicate the concurrence of the Institute in the statements or conclusions contained herein.
PR 71-7 DECEMBER 1971
NILE
~
U.S. DEPARTMENT OF JUSTICE
LAW ENFORCEMENT ASSISTANCE ADMINISTRATION
National Institute of Law Enforcement and Criminal Justice
For sale by the Superintendent oC Documents, U.S. Government Printlng Office Washington, D.C. 20102 - Price $2
Stock Number 2700-0083
ACKNOWLEDGEMENTS
But for a great deal of help, advice, and coercion, most of this volume would
not have been written. I am very grateful to Miss M. Pereira for undertaking
the whole Section 2 on serological techniques of grouping of bloodstains. I am
also grateful to B. Wraxall for his help in checking some of the manuscript; to
R. Stedman for his work on population data; to B. Parkin and Dr. C. Parr for
their advice; and to Professor A. Joseph for his unbounded enthusiasm that en
sured the materialization of this book.
2
PREFACE
This is not intended as a complete academic treatment of the subjects included,
but as a useful and practical basis from which a forensic scientist may make a
reasonable start. Work of collecting samples and the evaluations and distribu
tion of blood either at the scene of the crime or on items submitted for labora
tory examination have been deliberately excluded on the basis that this volume
will cover only scientific techniques used in the laboratory. Sample collection
and bloodstain distribution may be dealt with later in a different publication.
This document brings together relevant published information and considerable
work by the authors that has not been previously published.
The report has been organized into Section 1, prelimtnary techniques of exam
ination and an introduction to electrophoretic techniques in general; Section 2,
serological grouping techniques in the ABO, MN, and Rhesus systems; Section 3,
the polymorphic enzyme systems; Section 4, the polymorphic protein systems;
and Section 5, other group systems of all types that have been or are being in
vestigated for use in the forensic science field. Appendix A contains informa
tion about equipment and materials that could be of value to the sd,entist per
forming the type of work discussed in this document.
3
1
TABLE OF CONTENTS
Paragraph Title
SECTION 1-PRELIMINARY TECHNIQUES OF' EXAMINATION
1.1 INTRODUC TION 15
1.2 ELECTROPHORETIC TECHNIQUES 18
1. 2.1 GENERAL 18
1. 2. 2 BUFFERS 18
1.2.3 ELECTRO-ENDOSMOSIS 21
1. 2.4 HOMOGENEITY OF THE GEL 22
1. 2. 5 EQUIPMENT 22
1.2.6 TEMPERATURE 27
1. 2. 7 POWER PACKS 29
1. 2.8 MEDIA ON WHICH ELECTROPHORESIS IS PERFORMED 31
1. 2.9 PREPARATION OF STARCH GEL (THICK) 34
1. 2.10 THIN LAYER STARCH GEL TECHNIQUE 35
1. 2.11 TRANSFUSION PROBLEMS 38
1.3 BENZIDINE TEST 41
1. 3.1 HISTORICAL 41
1.3.2 METHOD AND REAGENTS 44
1.3.3 FALSE POSITIVE REACTIONS 47
1..3.4 BEHAVIOR OF PLANT PEROXIDASES 49
1. 3. 5 ELECTROPHORETIC METHOD 53
1. 3. 6 CONCLUSIONS 57
1.4 PRECIPITIN REACTIONS 59
1.4.1 INTRODUCTION 59
1.4.2 ANTISERA 59
1.4.3 SPECIFIC ANTISERA 60
1.4.4 METHODS 61
1.4.5 PROBLEMS 66
4
TABLE OF CONTENTS (Continued)
Paragraph Title
SECTION 2-RED CELL ANTIGEN SYSTEMS
2. 1 INTRODUC TION
2.2 ABO SYSTEM
2.2.1 METHODS
2.2.2 HOWARD AND MARTIN TECHNIQUE
2.2.3 SUBGROUPS OF A
2.3 MN SYSTEM
2.4 RHESUS SYSTEM
2.4.1
2.4.2
2.4.3
2.4.4
2.4.5
2.4.6
2.4.7
2.5
2.5.1
2.5.2
2.5.3
ADAPTION OF ABSORPTION-ELUTION
SELECTION OF ANTISERA
MANUAI:, TECHNIQUES
AUTO-ANALYZER
AUTO-ANALYZER USE FOR ABSORPTION-ELUTION
LESS COMMON Rh ANTIGENS
PROBLEMS ASSOCIATED WITH Rh GENOTYPING OF DRIED BLOODSTAINS
ABO IN SALIVA, SEMEN AND OTHER BODY FLUIDS
GENERAL
GROUPING TESTS ON FLUID SALIVA SAMPLES
GROUPING TESTS ON DRIED STAINS
2.6 OTHER GENOTYPING SYSTEMS
2.6.1 Gm AND Inv SERUM GROUPS
2.6.2 OTHER RED CELL ANTIGEN SYSTEMS
SECTION 3-POLYMORPHIC ENZYME SYSTEMS
3.1 PHOSPHOGLUCOMUTASE (PGM)
3.1.1 PHYSICAL DATA
3.1. 2 ACTIVATORS AND INHIBITORS
3.1. 3 COENZYMES
3.1.4 POL YMORPHISMS
5
67
70
70
71
77
79
81
81
82
83
85
88
93
96
98
98
100
102
105
105
105
106
106
108
109
109
TABLE OF CONTENTS (Continued)
ParaKEaph Title
3. 1. 5 PGM IN BLOOD AND OTHER TISSUES
3.1.6 EFFECTS OF AGE
3.1. 7 EFFECT OF THE STAIN SUBSTRATE
3.1. 8 EFFECTS OF VARIOUS CHEMICALS
3. 1. 9 METHOD
3.1.10 PROBLEMS
3.2 ADENYLA TE KINASE
J.2.1 PHYSICAL DATA
~.~.2 ACTIVATORS AND INHIBITORS
3.2.3 COENZYMES
3.2.4 POLYMORPHISM
3.2.5 AK IN BLOOD AND OTHER TISSUES
3.2.6 EFFECTS OF AGE
3.2.7 EFFECT OF THE BLOODSTAIN SUBSTRATE
3.2.8 EFFECT OF VARIOUS CHEMICALS
3.2.9 SAMPLE PREPARATION
3.2.10 PROBLEMS WITH THE AK SYSTEM
3.3 6-PHOSPHOGLUCONATE DEHYDROGENASE (PGD)
3.3.1 PHYSICAL DATA
3.3.2 ACTIVATORS AND INHIBITORS
3.3.3 COENZYMES
3.3.4 POLYMORPHISM
3.3. 5 PGD IN BLOOD AND OTHER TISSUES
3.3.6 EFFECTS OF AGE
3.3.7 DEFICIENCY
3.3.8 SPECTROPHOTOMETRIC METHODS
3.3.9 EFFECTS OF STROMA
3.3.10 STAIN SUBSTRATE
3.3.11 EFFECTS OF CHEMICALS
3.3.12 METHODS
3.3.13 PROBLEMS
6
114
117
120
120
122
125
129
129
130
130
132
135
136
136
136
137
142
146
146
146
147
147
149
149
152
153
154
155
155
155
157
TABLE OF CONTENTS (Continued)
Paragraph
3.4 GLUCOSE-6-PHOSPHATE DEHYDROGENASE (G6PD)
3.4.1 INTRODUCTION
3.4.2 PHYSICAL DATA
3.4.3 ACTIVATION AND INHIBITION
3.4.4 COENZYMES STNBILITY
POL YMORPHISM 3.4.5
3.4.6
3.4.7
3.4.8
f"CTIVITY OF THE ENZYME IN BLOOD
EFFECTS OF STORAGE
EFFECT OF CHEMICALS
3.4.9 BLOODSTAIN SUBSTRATE
3.4.10 SAMPLE PREPARATION
3.4.11 METHODS
3.4.12 G6PD AND PGI ON THE SAME GEL
3.4. 13 PROBLEMS
3.4.14 POPULATION DATA
3.5 ADENOSINE DEAMINASE (ADA)
3.5.1 PHYSICAL DATA
3.5.2 ACTIVA TORS AND INHIBITORS
3.5.3 COENZYMES
3.5. 4 POLYMORPHISM
3.5.5 ASSAY AND OCCURRENCE
3.5.6 EFFECTS OF AGE
3.5.7 SUBSTRATE
3.5.8 EFFECT OF CHEMICALS
3.5.9 PREPARATION OF SAMPLES
3.5.10 PROBLEMS
3.6 PSEUDOCHOLINESTERASE (PCE)
3.6.1 PHYSICAL DATA
3.6. 2 ACTIVATORS AND INHIBITORS
3.6.3 COENZYMES
7
161
161
162
162
163
163
166
167
167
167
168
168
171
172
172
173
173
173
173
174
174
174
176
177
177
178
182
182
182
183
TABLE OF CONTENTS (Continued)
Paragraph Title
3.6.4 POLYMORPHISMS
3.6.5 PCE IN BLOOD AND OTHER TISSUES
3.6.6 EFFECTS OF AGE
3.6.7 EFFECTS OF BLOODSTAIN SUBSTRATE
3.6.8 EFFECTS OF VARIOUS CHEMICALS
3.7 PSEUDOCHOLINESTERASE El LOCUS VARIANTS
3.7.1 SPECTROPHOTOMETRIC METHOD
3.7. 2 SCREENING TECHNIQUE FOR SERA
3.7.3 SCREENING OF BLOODSTAINS
3.7.4 ELECTROPHORETIC SCREENING METHOD
183
186
188
188
189
190
190
193
196
199
3.8 PSEUDOCHOLINESTERASE E2 LOCUS ELECTROPHORETIC VARIANTS 203
3.8.1 METHODS 203
3.8.2 MATERIALS 203
3,8.3 PROCEDURE 204
3.8.4 REACTION MIXTURE 206
3.8.5 C5 AND AK TYPES FROM SINGLE SAMPLES IN ONE GEL 207
SECTION 4--POLYMORPHIC PROTEIN SYSTEMS
4.1 HAPTOGLOBIN 211
4.1.1 INTRODUCTION 211
4.1. 2 POLYMORPHISM 211
4.1. 3 DETERMINATION OF Hp TYPES IN SERUM 214
4.1.4 HAPTOGLOBIN TYPES IN BLOODSTAINS 216
4.1. 5 PROBLEMS 225
4.2 HAEMOGLOBIN 229
4.2.1 INTRODUCTION 229
4.2.2 HAEMOGLOBINS A AND F 230
4.2.3 HAEMOGLOBIN S 230
4.2.4 HAEMOGLOBIN C 231
4.2.5 HAEMOGLOBINS D, E, AND OTHERS 232
8
---- - ------
TABLE OF CONTENTS (Continued)
Paragraph Title
4.2.6 METHODS AND SAMPLE PREPARATION
4.2.7 PROBLEMS
5.1
5.2
5.3
5.4
5.5
5.6
5.7
5.8
5.9
5.10
5.11
5.12
SECTION 5-FUTURE OF BLOODSTAIN GROUPING SYSTEMS
INTRODUC TION
RED CELL ACID PHOSPHATASE
PHOSPHO-GLUCOSE ISOMERASE
PEPTIDASES
SERUM AMYLASES
SERUM ALKALINE PHOSPHATASE
OTHER ENZYMES
Gc GROUPS
TRANSF ERRINS
OTHER POLYMORPHIC PROTEINS
Gm AND Inv SERUM GROUPS
OTHER RED CELL ANTIGEN SYSTEMS
SECTION 6-REFERENCES
APPENDIX A-SAMPLE EQUIPMENT AND LIST OF
233
242
247
247
247
248
248
248
249
249
249
249
249
250
251
CHEMICALS AND ANTISERA 264
9
Figure
1-1
1-2
1-3
1-4
1-5
1-6
1-7
1~8
1-9
1-10
1-11
1-12
1-13
1-14
1-15
2-1
2-2
2-3
2-4
2-5
2-6
3-1
3-2
3-3
3-4
LIST OF ILLUSTRATIONS
Sample Gel Faults
Completed Tank
Tank with Cooling Plate
Cooling Plate Construct:ion
Title
Simple Home-Made Power Pack (Upper and Lower Views)
Circuit Diagram of Home-Made Power Pack
PGM 1 Subject Transfused with PGM 2 Blood
PGM 2 Subject TransfusEld with PGM 1 Blood
Use of Small Folded Filter Paper on a Stain Suspected of Being Blood
The Electrophoresis of Various Peroxidases (Fresh)
Various Peroxidase Reactions From Stains 24 Hours Old
Drop in Reaction Intensity
The Mechanism of the Electrophoretic Method
Layout of Precipitin Plate (Actual Size)
Completed Precipitin PlatlB
Lay-out of Cellulose Acetmte Sheet for Howard ~nd Martin Technique
Technicon Antibody Screening Auto-Analyzer
G'lass Manifold
Washing Machine
Auto-Analyzer Results from Positive and Negative Control Bloodstains
Auto-Analyzer Result from a Stain of RU
1 r
Phosphoglucomutase Reactions
Action of PhoElphorylase on Glycogen
Bands of Isozymes After Electrophoresis by the Various PGM Alleles
Patterns of Various PGM TY,pes
10
23
26
28
29
30
30
39
40
46
55
56
57
62
64
65
74
86
87
89
94
95
107
108
111
111
3-5
3-6
3-7
3-8
3-9
3-10
3-11
3-12
3-13
3-14
3-15
3-16
3-17
3-18
3-19
3-20
3-21
3-22
3-23
3-24
3-25
3-26
3-27
3-28
3-29
3-30
3-31
3-32
LIST OF ILLUSTRATIONS (Continued)
Title
Three Common Variants at Locus PGM1 with Nomenclature Bands Marked
A PGM2
Locus Variant PGM1
1, PGM
22
-1
Numerous Homologous Blood and Semen Samples
PGM in Vaginal Secretion
Enhancement of Activity in Stored Blood Samples
Loss of Activity and Development of a Diffuse Band in Stored Blood Samples
Effect of Fluoride
Sample Mechanism for Determining PGM Types
Adenylate Kinase Reaction
Two AK Contributions to Glycolysis via ATP
Inhibition of AK with Increasing Molarity of Phosphate
AK Phenotypes in Histidine Buffer
AK Phenotypes AKI and AK3-1 in Phosphate Buffer
Separation of AK Types Using the Succinic Buffer System
Separation of AK Types using the Histidine Buffer System
Mechanism for Detecing AK
6-Phosphogluconate Dehydrogenase Reaction
Other Alleles
Table of Enzyme Activity
PGD After Storage
Diagrammatic Representation of the Mechanism for Detecting PGD
Glucose-6-Phosphate Dehydrogenase (G6PD) Reaction
G6PDA&B Blood Samples
Diagrammatic Representation of Various G6PD Phenotypes
Mechanism for Determining G6PD
G6PD and PGI Variants
ADA Reaction
Various Examples of Types ADA 1 and ADA 2-1
11
112
114
116
117
118
118
121
124
129
131
132
133
133
134
135
141
146
148
150
151
158
162
164
165
170
171
173
175
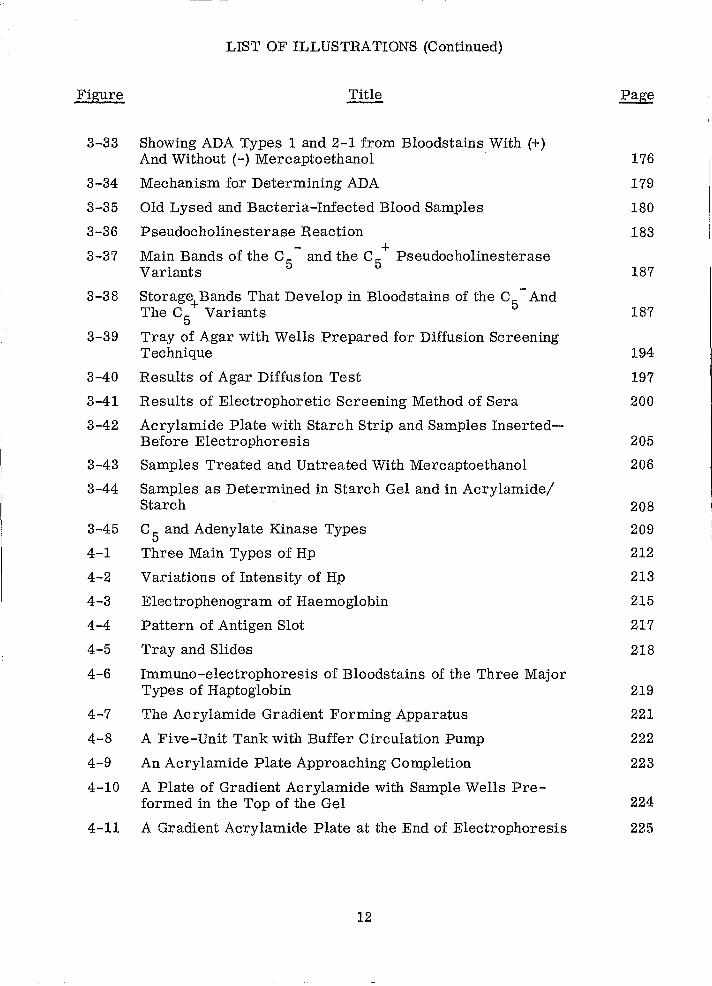
LIST OF ILLUSTRATIONS (Continued)
Figure Title Page
3-33 Showing ADA Types 1 and 2-1 from Bloodstains With (+) And Without (-) Mercaptoethanol 176
3-34 Mechanism for Determining ADA 179
3-35 Old Lysed and Bacteria-Infected Blood Samples 180
3-36 Pseudocholinesterase Reaction 183
3-37 Main Bands of the C 5 - and the C 5+ Pseudocholinesterase Variants 187
3-38 Storage+Bands That Develop in Bloodstains of the C5
- And The C5 Variants 187
3-39 Tray of Agar with Wells Prepared for Diffusion Screening Technique 194
3-40 Results of Agar Diffusion Test 197
3-41 Results of Electrophoretic Screening Method of Sera 200
3-42 Acrylamide Plate with Starch Strip and Samples Inserted-Before Electrophoresis 205
3-43 Samples Treated and Untreated With Mercaptoethanol 206
3-44 Samples as Determined in Starch Gel and in Acrylamide/ Starch 208
3-45 C5
and Adenylate Kinase Types 209
4-1 Three Main Types of Hp 212
4-2 Variations of Intensity of Hp 213
4-3 Electrophenogram of Haemoglobin 215
4-4 Pattern of Antigen Slot 217
4-5 Tray and Slides 218
4-6 Immuno-electrophoresis of Bloodstains of the Three Major Types of Haptoglobin 219
4-7 The Acrylamide Gradient Forming Apparatus 221
4-8 A Five-Unit Tank with Buffer Circulation Pump 222
4-9 An Acrylamide Plate Approaching Completion 223
4-10 A Plate of Gradient Acrylamide with Sample Wells Pre-formed in the Top of the Gel 224
4-11 A Gradient Acrylamide Plate at the End of Electrophoresis 225
12
Figure
4-12
4-13
4-14
4-15
4-16
4-17
4-18
A-1
A-2
A-3
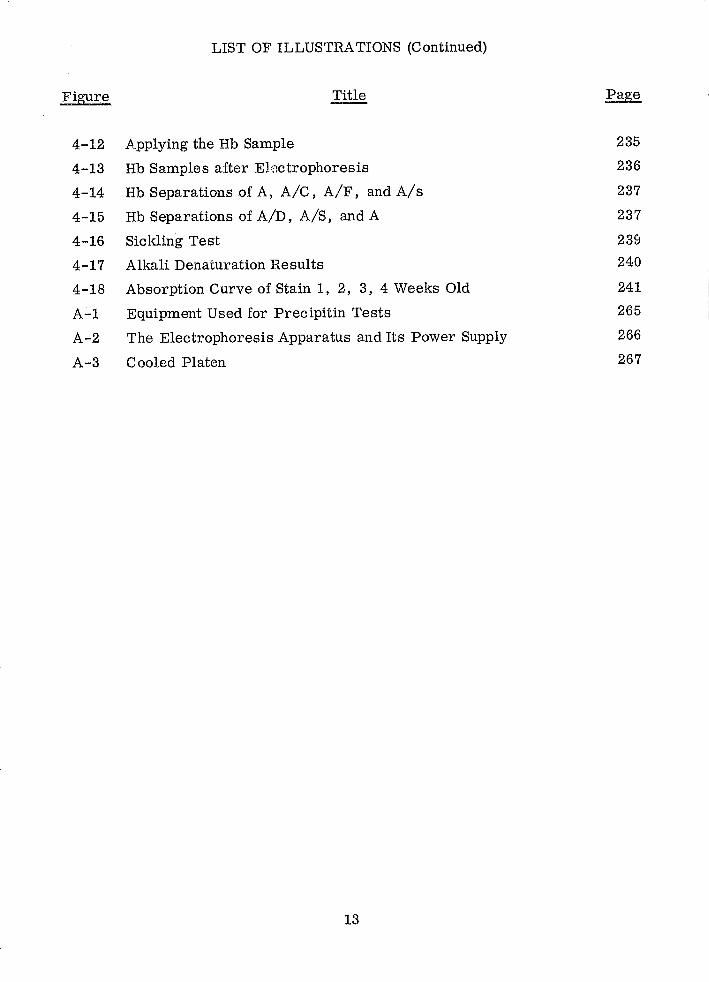
LIST OF ILLUSTRATIONS (Continued)
Title
Applying the Hb Sample
Hb Samples after EL1ctrophoresis
Hb Separations of A, AIC, AIF, and AI s
Hb Separations of AID, A/s, and A
Sickling Test
Alkali Denaturation Results
Absorption Curve of Stain 1, 2, 3, 4 Weeks Old
Equipment Used for Prec ipitin Tests
The Electrophoresis Apparatus and Its Power Supply
Cooled Platen
13
235
236
237
237
239
240
241
265
266
267
Table
1-1
2-1
3-1
3-2
3-3
3-4
3-5
3-6
3-7
3-8
3-9
3-10
3-11
3-12
3-13
4-1
4-2
4-3
4-4
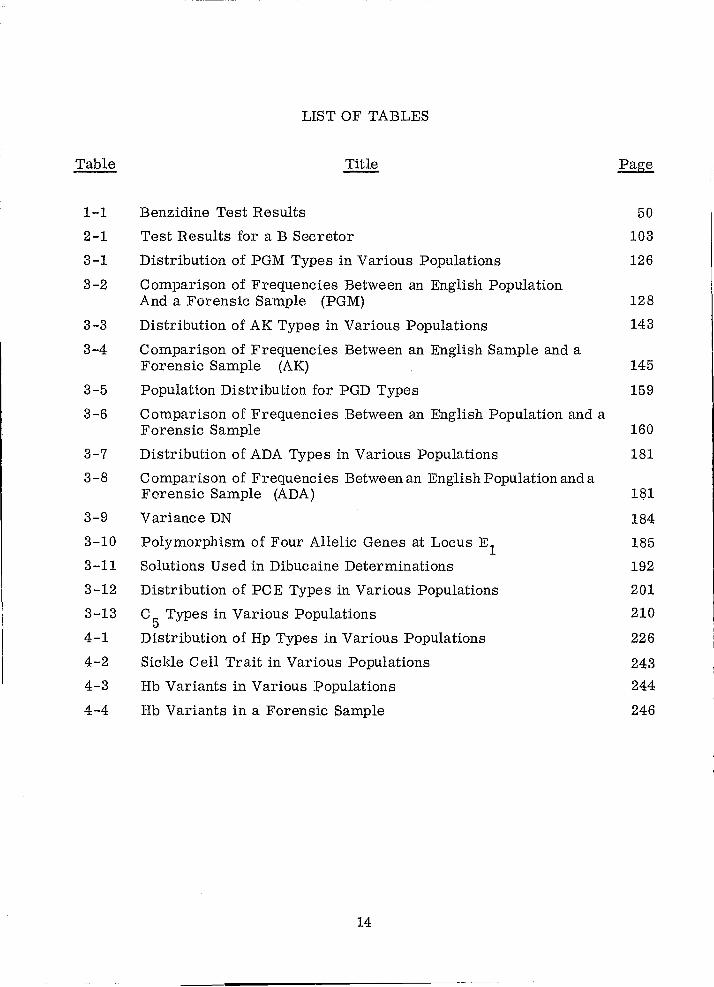
LIST OF TABLES
Title
Benzidine Test Results
Test Results for a B Secretor
Distribution of PGM Types in Various Populations
Comparison of Frequencies Between an English Population And a Forensic Sample (PGM)
Distribution of AK Types in Various Populations
Comparison of Frequencies Between an English Sample and a Forensic Sample (AK)
Population Distribution for PGD Types
Comparison of Frequencies Between an English Population and a Forensic Sample
Distribution of ADA Types in Various Populations
Comparison of Frequencies Between an English Population and a Forensic Sample (ADA)
Variance DN
Polymorphism of Four Allelic Genes at Locus E1
Solutions Used in Dibucaine Determinations
Distribution of PCE Types in Various Populations
C 5 Types in Various Populations
Distribution of Hp Types in Various Populations
Sickle Cell Trait in Various Populations
Hb Variants in Various Populations
Hb Variants in a Forensic Sample
14
50
103
126
128
143
145
159
160
181
1$1
184
185
192
201
210
226
243
244
246
SECTION 1
PRELIMINARY TECHNIQUES OF EXAMINATION
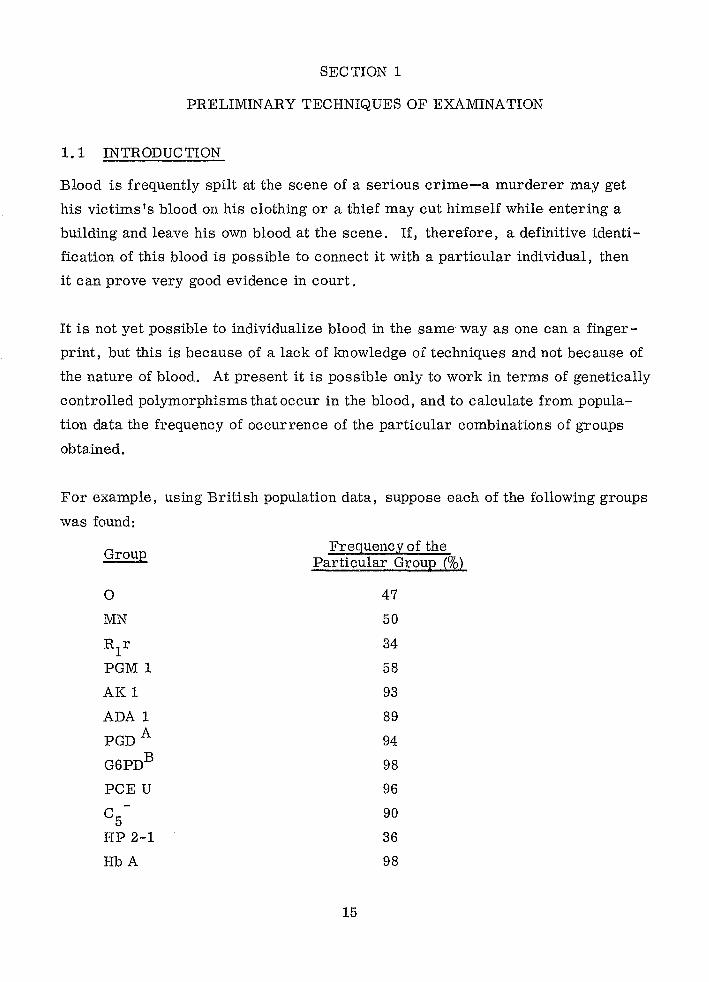
1.1 INTRODUCTION
Blood is frequently spilt at the scene of a serious crime-a murderer may get
his victims's blood on his clothing or a thief may cut himself while entering a
building and leave his own blood at the scene. If, therefore, a definitive identi
fication of this blood is possible to connect it with a particular individual, then
it can prove very good evidence in court.
It is not yet possible to individualize blood in the same way as one can a finger
print, but this is because of a lack of knowledge of techniques and not because of
the nature of blood. At present it is possible only to work in terms of genetically
controlled polymorphisms that occur in the blood, and to calculate from popula
tion data the frequency of occurrence of the particular combinations of groups
obtained.
For example, using British population data, suppose each of the following groups
was found:
Group
o MN
R1r
PGM 1
AK 1
ADA 1
PGD A
G6PDB
PCE U
C5
HP 2-1
HbA
Frequency of the Particular Group (0/0)
15
47
50
34
58
93
89
94
98
96
90
36
98
l
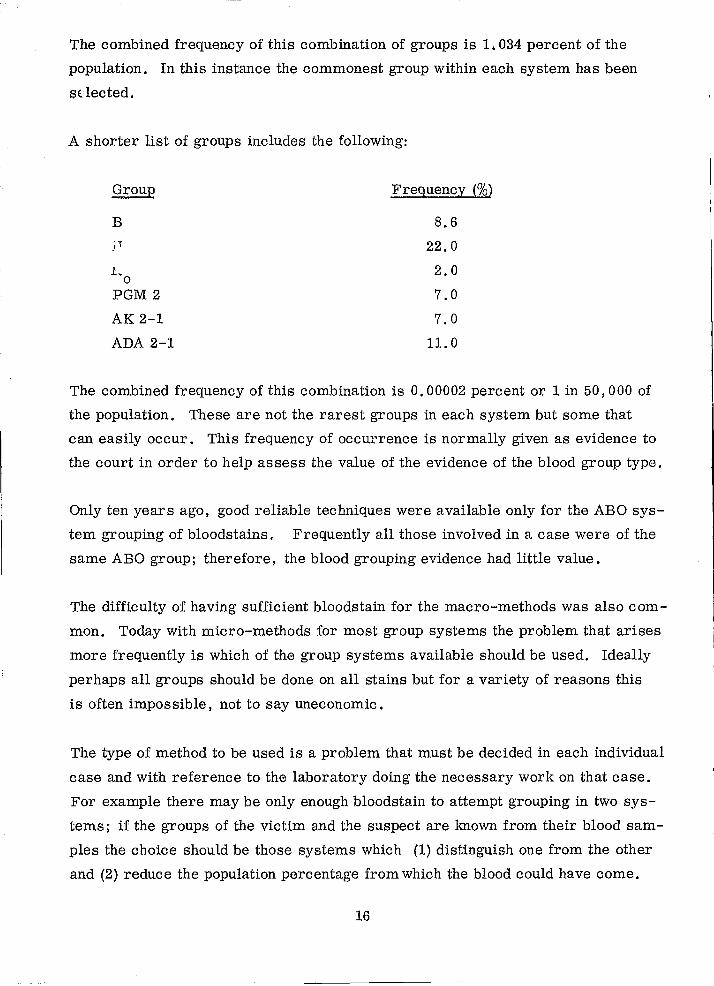
The combined frequency of this combination of groups is 1.034 percent of the
population. In this instance the commonest group within each system has been
sdected.
A shorter list of groups includes the following:
Group Frequency {%)
B 8.6 ;T 22.0
1-\0. 2.0 0
PGM2 7.0
AK 2-1 7.0
ADA 2-1 11. 0
The combined frequency of this combination is 0.00002 percent or 1 in 50,000 of
the population. These are not the rarest groups in each system but some that
can easily occur. This frequency of occurrence is normally given as evidence to
the court in order to help assess the value of the evidence of the blood group type.
Only ten years ago, good reliable techniques were available only for the ABO sys
tem grouping of bloodstains. Frequently all those involved in a case were of the
same ABO group; therefore, the blood grouping evidence had little value.
The difficulty of having sufficient bloodstain for the macro-methods was also com
mon. Today with micro-methods for most group systems the problem that arises
more frequently is which of the group systems available should be used. Ideally
perhaps all groups should be done on all stains but for a variety of reasons this
is often impossible, not to say uneconomic.
The type of method to be used is a problem that must be decided in each individual
case and with reference to the laboratory doing the necessary work on that case.
For example there may be only enough bloodstain to attempt grouping in two sys
tems; if the groups of the victim and the suspect are known from their blood sam
pIes the choice should be those systems which (1) distinguish one from the other
and (2) reduce the population percentage from which the blood could have come.
16
It is highly desirable, and this cannot be overstressed, that blood samples should
be obtained from all those who are or may be involved in the particular case.
These can be rapidly processed through all the groupinJ systems as a routine
and the results used in the manner indicated above to make the optimum selection
of the work to be done on the bloodstains.
By obtaining blood samples from a large number of possible suspects in a case
where the criminal has left his own blood at the scene of the crime, it is pos
sible to save a great deal of the police time by eliminating all those who could
not have shed blood. This is an aspect of the work which, in England, is increas
ing, and the saving in interrogation and checking time can be very great.
Accurate and detailed records of all the work done are absolutely essential, for
errors are much more likely to occur in a simple clerical transposition than in
the performance or interpretation of the experimental work. These recor~s also
build a local knowledge of population frequencies that may be of value in the future.
Methods and some background have been given to each of the blood group systems
dealt with in later paragraphs, si.nce it is usually not a matter of following a cook
book and reading answers. Experience and an understanding of the background
and the pa.rticular material being investigated are essential if the best results
are going to be obtained and presented in court.
Little is said here about court presentation because this will vary from place to
place according to the local laws of evidence and will have to be worked out by
those concerned.
As progress is made in this field, it is possible that convicted criminals will
have a complete blood typing on record as well as photographs, fingerprints, and
other data. In the future known criminals may be traced by the blood that they
leave at the scenes of their activities.
17
451-769 0 - 72 - 2
1. 2 ELECTROPHORET!Q TECHNIQUES
1.2.1 GENERAL
Since this document is intended to be a practical volume, the theoretical aspects
of electrophoresis are largely omitted. Many treatises on this subject have
been written and the reader is referred to these for such background. J., 2, 3, 4.
Only those factors that are readily modified in practice will be considered
briefly.
1.2.2 BUFFERS
Buffers should always be made from high grade chemicals, and made accurately.
Technical grade chemicals may contain impurities that will affect certain pro
teins, or adversely affect the activity of enzymes which it is desired to detect
subsequently. An example from experience was the use of TRIS (tris
hydroxymethyl-methylamine) technical grade which was not earmarked for
buffers. This gave extremely poor. separation of serum proteins; this fault was
immediately rectified by changing to TRIS produced specifically for buffers by
BDH Ltd.
Inaccurately made buffers will affect the pH and the mobility of the material
under investigation. Having weighed the necessary components they should be
made up to the required volume with distilled water and the pH should ALWAYS
be checked.
If a buffer is likely to be kept at room temperature for more than a few weeks it
is advisable to include a bacteriastat, such as Thiomersal (merthiolate) at 1
part in 10,000.
A buffer, such as the histidine one for adenylate kinase, is particularly prone to
bacterial growth which affects the quality of the separation achieved. The
bacteriastat used must not alter the pH or the ionic strength of the buffer.
It will seem that innumerable different buffer systems are used for the various
investigations, and attempts have been made to achieve a universal buffer system
18
applicable to all investigations. So far this has failed. The attempts that came
nearest to success still did not produce results of such reliably good quality as
those using the individual buffer systems.
It has been found that many of the buffers described later deteriorate and the
practice is to keep all buffers refrigerated at 0 to 2.0 C. At the first suspicion
of a poor separation the buffer is discarded and a new batch is made.
Buffers are normally made at room temperature (18 to 20°C), regardless of the
temperature they are going to be used at, and all the pH data given for buffers
is at that temperature.
The ionic strength of the buffer is the remaining consideration that will be dealt
with. If the ionic strength (J.L) of the gel buffer is too high, a high current for a
given voltage is produced that results in (1) the gel overheating and (2) poor
separation of the components. Overheating can disrupt the gel, precipitate
protein, cause loss of enzyme activity, and enhance diffusion.
The charges on the molecules under examination attract ions of the reverse
charge from the electrolyte forming a double layer that tends to obscure the
charge on the molecule. This layer can vary in thickness and this is dependent
on the ionic strength (J.L) of the electrolyte or buffer.
Thus, with an electrolyte of low J.L, the layer is thick but diffuse, but with high J.L,
the layer is thin but dense and the charge on the molecule is rapidly screened
giving no opportunity for an electric field to have its effect on the molecule.
With decreasing values of J.L, the thiclmess of the double layer increases. At low
J.L, which is often used in electrophoresis, variation in J.L can make a considerable
difference.
19
A definitlon of J.1. (ionic strength) is shown in the following equation.
J.1. = 1. L: Mv2 2
where:
M = Molar concentration
valency ~ of each ion or radical v =
)
L: - sum
Electrophoretic mobility, as a result of this double layer effect is inversely pro
portional to I' of /-L.
1 Mobility =
The order of ionic strengths that are used is between O. 1 and 0.01. The relative
mobilities of a protein due to changes in J.1. can be calculated, for example:
When
/-L = 0.01
1 = 10 ..; 0.01
When
J.1. = 0.1
1 3.162 = ..; 0.1
while at J.1. = 1 Mobility = 1
From this it appears that the lower the J.1. of the buffer the better. There are,
however, other factors involved, such as
a. Precipitation of proteins being run. Some proteins require higher
ionic strength in order to remain in a soluble or mobile state.
b. Immuno precipitation requires higher ionic strength for the aggre
gation of antigen/antibody complexes into a visible precipitate.
c. The lower the ionic strength the thicker the double layer, greater
distance of repulsion leading to a greater diffusion of the bands.
20
Thus i~ is clear that the choice of the ionic strength of the buffer is a compro
mise, and in spite of trying to calculate the effects of changing this it is best to
try a series of ionic strengths of each buffer to see which, for laboratory condi
tions, works best.
Later, where detailed methods are given, it is recommended, for example in the
6-phosphogluconate dehydrogenase system, to dilute the tank buffer 1: 15 for use
in the gel. This is the dilution that works best at Forensic Science Laboratory.
Other laboratories use 1: 10 or 1: 20 dilutions.
It is recommended that if the separations achieved are not as good as they should
be, a slight change of the ionic strength of the gel buffer should be tried and the
one most appropriate to your own conditions should be adopted.
1. 2. 3 ELECTRO-ENDOSMOSIS
Electro-endosmosis is a function of the particular substrate or medium being
used and it will vary from batch to batch of the same medium. It will also vary
with pH and ionic stren.gth of the electrolyte being used.
In a given electrolyte the support medium, such a.s agar, will itself carry some
charge on its molecules. Thus when the electric field is applied the agar will
attempt to move towards the anode. This is patently impossible, so a movement
of water in the reverse direction occurs. This flow of water is, at the slightly
alkaline pH occurring in most gels, in the reverse direction to all the proteins
and they have to battle their way against the tide. This slows down their apparent
mobility and in fact gives gamma-globulin a mobility towards the cathode instead
of its true mobility slightly towards the anode. But for thie phenomenon the pre
cipitin method described in paragraph 1.4 would not work.
It has, however, certain dangers in that if the supply of water and its intake in
to the gel at the anodic end is at all restricted, the gel will shrink at this end.
Shrinkage will not only mechanically distort the gel but will increase the ionic
strength in that area, increasing the conductivity and so on with all the conse
quent troubles this brings.
21
Normally electro-endosmosis is within tolerable limits and work is not only pos
sible with it present but also it can be used as a specific tool. If electro
endosmosis is excessive, then the whole system must be readjusted.
1.2.4 HOMOGENEITY OF THE GEL
The electric field in an electrophoresis plate is determined by the voltage across
its ends and the nature of the plate itself. This plate should be so constructed
that this field is homogeneous throughout the plate.
In discontinuous buffer systems there will, of course, be a heterogeneity at the
leading ion/trailing ion boundary. This sweeps through the gel and improves
separation. The heterogeneity to avoid is any minor one that does not affect the
whole gel but only part of it.
Discontinuities in conductivity seem to be the most common source of error. If
a sample is inserted into the gel on filter paper and the sides of the gel slot do
not close on the sample properly, then the results will be wrong. Use of a liquid
or gel sample insert in a large volume can cause gross change of the ionic
strength at this point and cause curvature effects on the sample running. The
field appears higher or lower each side of the sample than through its center.
If the concept of minimum alteration of the gel by sample insertion is followed,
then the heterogeneities introduced will be minimal and will be held within
tolerable limits.
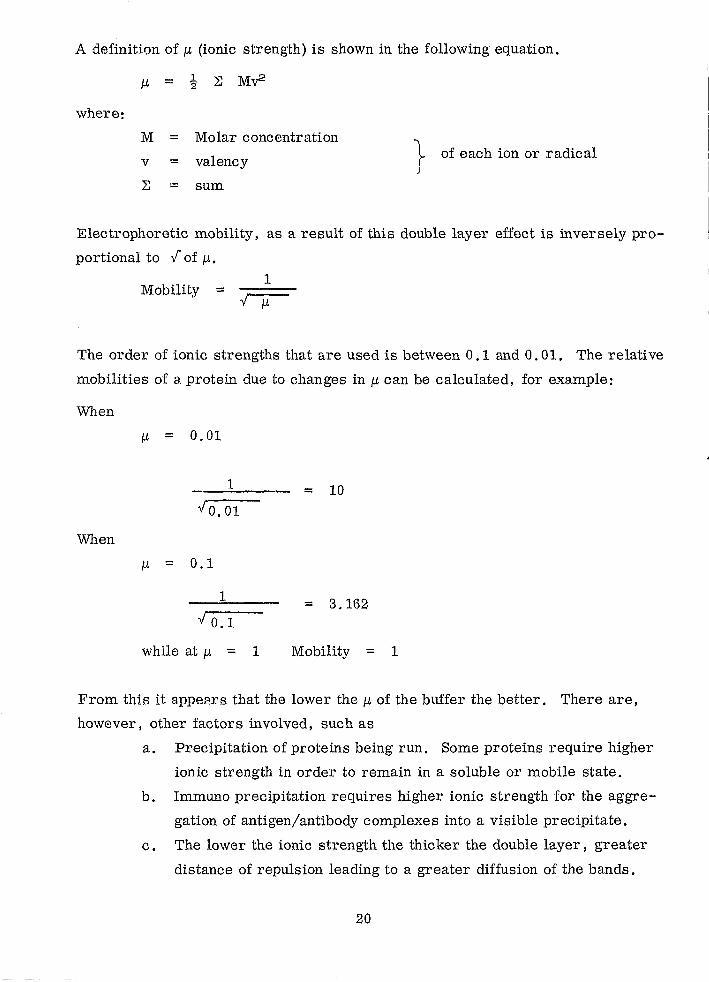
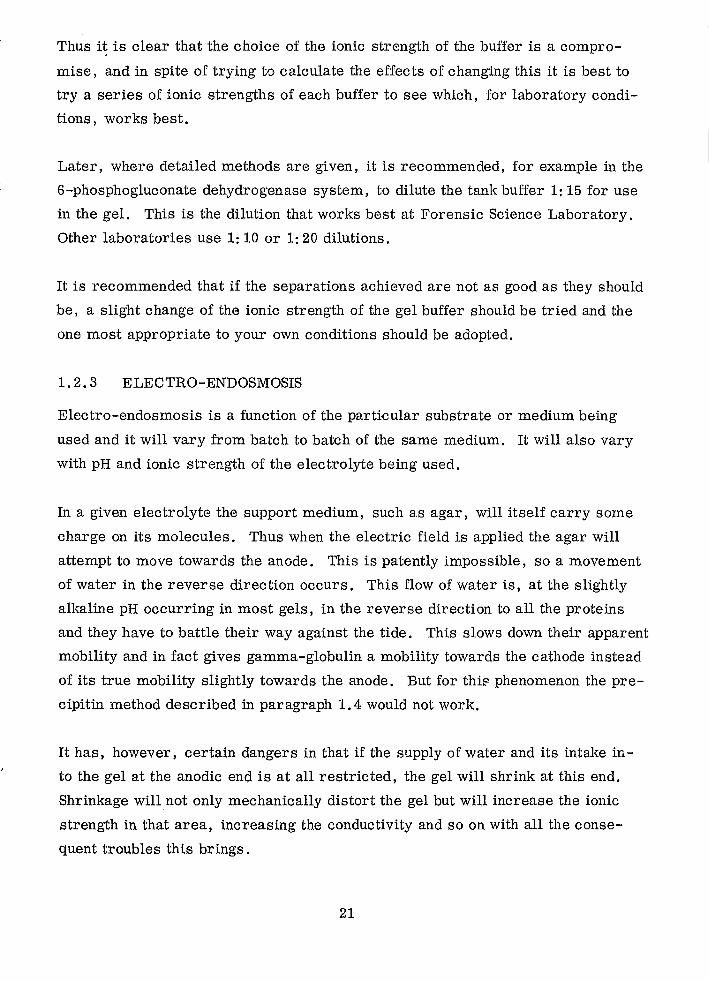
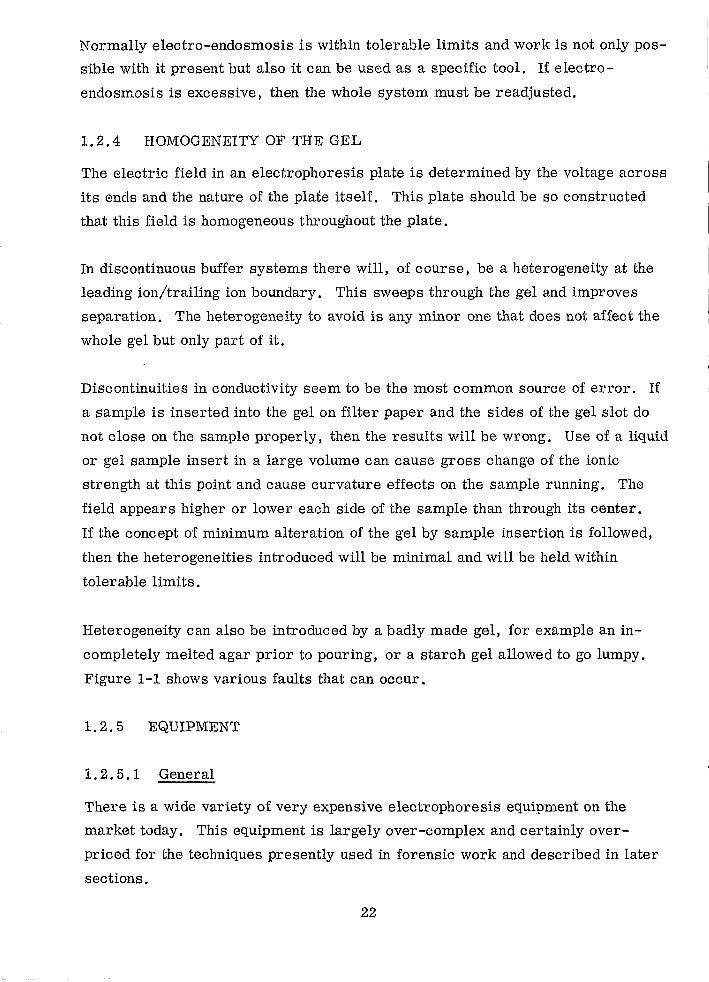
Heterogeneity can also be introduced by a badly made gel, for example an in
completely melted agar prior to pouring, or a starch gel allowed to go lumpy.
Figure 1-1 shows various faults that can occur.
1.2. 5 EQUIPMENT
1. 2.5.1 General
There is a wide variety of very expensive electrophoresis equipment on the
market today. This equipment is largely over-complex and certainly over
priced for the techniques presently used in forensic work and described in later
sections.
22
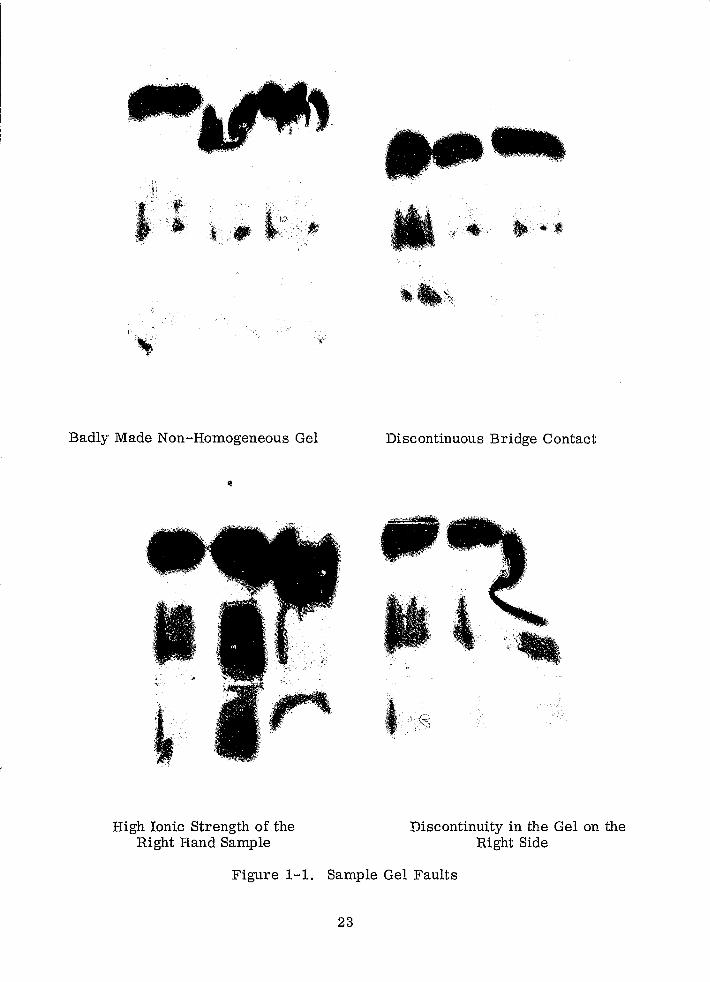
Badly Made Non-Homogeneous Gel
,,\,' ' '
, 4
High Ionic Strength of the Right Hand Sample
Discontinuous Bridge Contact
Discontinuity in the Gel on the Right Side
Figure 1-1. Sample Gel Faults
23
---- ---- -------------
If accurate quantitation is required of the components of an electrophoretogram,
then this type of equipment is necessa.ry. In forensic work this quantitation is
not required and simple but adaptablEI equipment has been found best.
1. 2. 5.2 Tanks
The most adaptable and useful tank on the market in England many years ago
when this work was started was thoul~ht to be the Kohn tank made by Shandon
Scientific Company prieed at about £25. This tank was capable, with the aid
of accessories, of dealing with paper, cellulose acetate, thin-layer silica gel or
alumina, agar, immuno-electro-phoresis, and starch gel.
Two problems arose, 1(1) the laboratory's usage of tanks increased to an extent
where £25 each meant a very large <capital outlay, and (2) with the introduction
of cooling plates below the gels, a tank designed for this purpose was needed;
therefore, the Shandon tank was unsuitable. (This firm now makes tanks with
suitable oooling plates that require only a small modificafion to the lid.)
The solution at the Forensic Science Laboratory was to design a tank that met
the laboratory's requi,rements. The parts, in 3/16-inch thick sheet Perspex,
were bought ready cut to size. All that was needed was to drill a few holes and
assemble the parts. A completed tank cost less than £2.50. These tanks proved
as good as any commercial tank that was tested.
For those with the same problems the parts required are listed below and the
diagrams show the method of assembly.
The following pieces of 3/16-inch Perspex are required:
a. Base:
• 1 at 10 1/2 inehes by 10 inches.
• 4 at 10 inches by 2 1/2 inches
• 3 at 10 inches~ by 1 inch, 2 with 1/4-inch holes for buffer
contact.
24
b. Lid:
• 1 at 10 1/2 inches by 11 inches.
• 4 at 10 1/2 inches by 1 inch.
Other parts also required include a handle for lid, two l-foot lengths of thin
stainless steel wire, two terminals, silicone rubber, two small pieces of Per
spex to hold wire, and Perspex glue.
Figure 1-2 shows a completed tank. Note the silicone rubber seals around the
ends of the center division to give improved insulation under conditions of high
voltage and condensation within the tank.
Various tank accessories are necessary and these can be either made or bought.
The tank described will accept the accessories made for the Shandon Kohn tank.
Most of the techniques described involve the use of starch or acrylamide gel.
Experience has shown that it is best to set up at least one tank for each type of
examination or group system that is going to be used. Bearing these facts in
mind, it is worth buying Shandon tanks with the appropriate accessories (or their
equivalent) for precipitins, immuno-electrophoresis and for cellulose acetate
membrane (CAM) electrophoresis, using the home-made tanks for everything
else. While this is not essential, it saves a lot of fine detail additional work on
the home-made tanks.
1. 2.5.3 Accessories
1. 2. 5. 3. 1 Extended Shoulder s
These hold paper or cellulose acetate strips in the tank and with the extended
shoulders narrow strips of cellulose acetate membrane (CAM) can be used as
described in the technique for detection of haemoglobin variants (paragraph 4.2).
They are needed also for the precipitin technique where a 3-inch microscope
slide, coated with agar, is inverted onto filter paper bridges supported by these
extended shoulders.
25
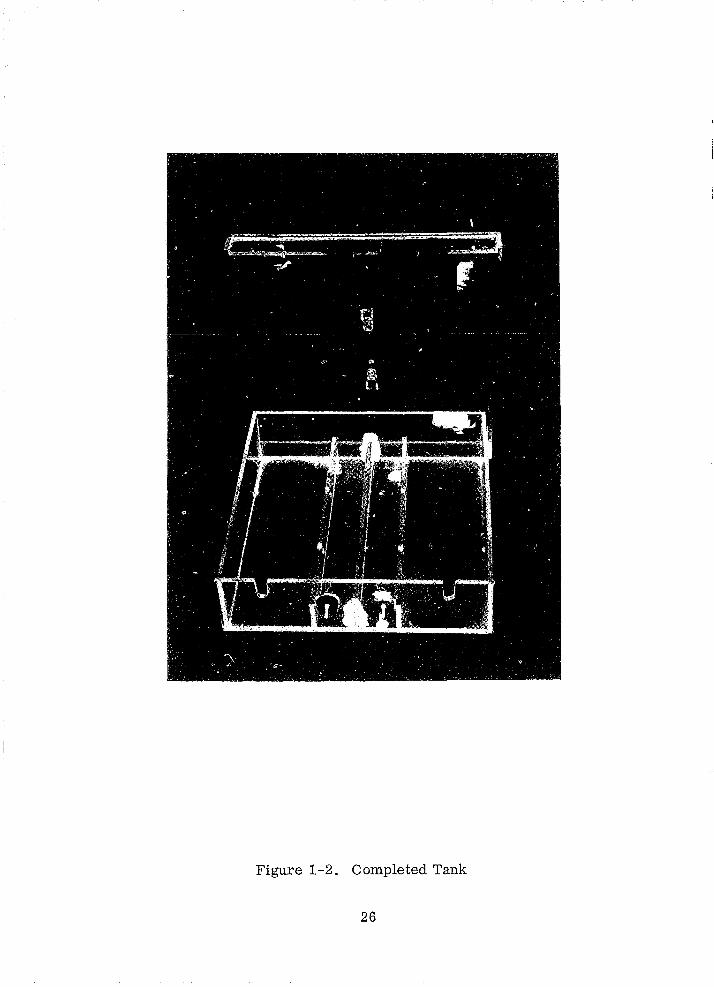
Figure 1-2. Completed Tank
26
1.2.5.3.2 Immuno-Electrophoresis Accessories
If immuno-electrophoresis is going to be undertaken, such as in Hp groups in
bloodstains or Gc groups (see paragraph 4.1 and Appendix A) then a tank or
accessories to a tank designed to simplify the procedures is desirable. These
accessories include, as a minimum, slide holders for the agar coated microscope
slides and a pattern cutter to mark the sample origins and the antiserum trough.
Accurate repeatability is more difficult without such a pattern cutter.
If the use of the Laurel! technique of two-way electrophoresis is contemplated
then suitable tank supports and, if necessary, narrow cooling plates may be
needed. (The new Shandon tank is well suited to this purpose. See Figure 1-3.)
1.2.6 TEMPERA TURE
Control of temperature during a run is of great importance in many cases. Run
ning at low temperature reduces diffusion and gives a greater clarity of separa
tion than is obtainable at higher temperatures. With some of the enzyme sys
terns, the maintenance of an even low temperature appears to be critical to good
quality work.
The removal of heat as it is formed by the current in the plate reduces the effects
of heterogeneities mentioned earlier. The most efficient temperature control
has been found to be by means of metal surfaced cooling plates that are in the
form of flat boxes through which water is pumped at the chosen temperature.
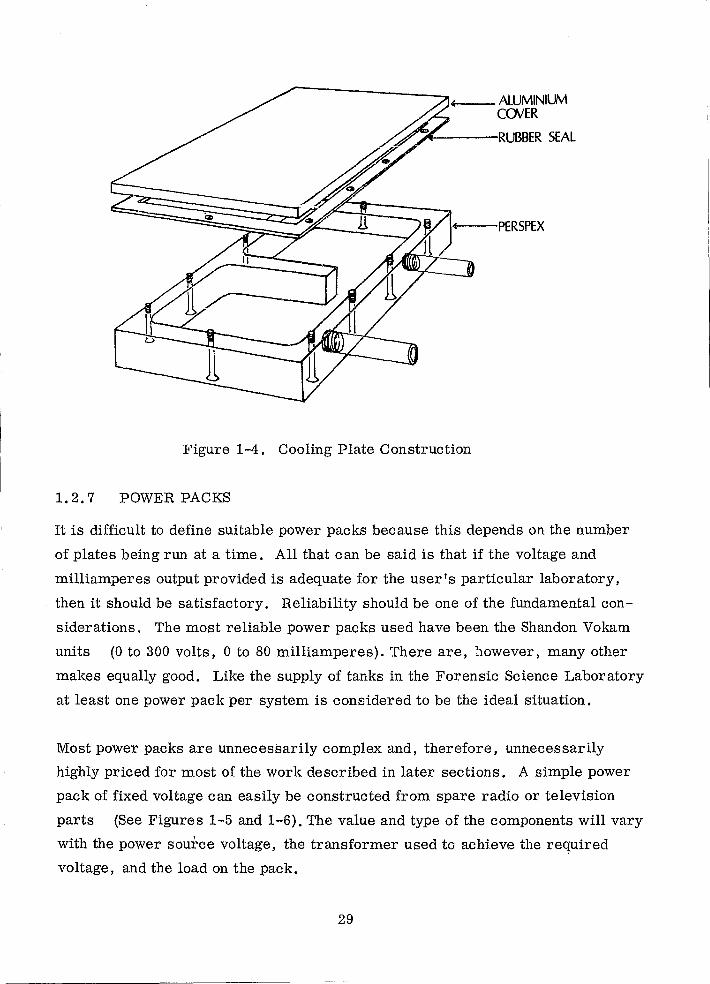
It is difficult to buy ready-made satisfactory cooling plates of the correct size
so a detailed description of these is given. (See Figure 1-4.) The sizes given
fit the tanks previously described and also fit the size of gel plates that were
adopted as a standard.
Aluminum
Perspex
Rubber gasket
8 1/2 inches by 6 1/2 inches by 1/4 inch
8 1/2 inches by 6 1/2 inches by 3/4 inch
27
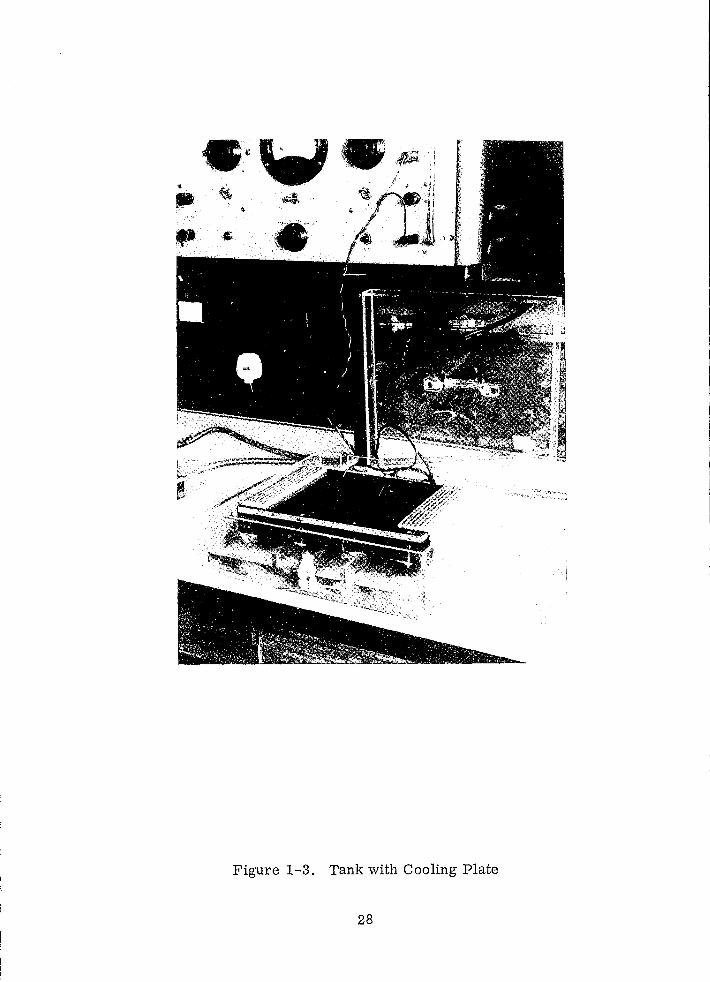
Figure 1-3. Tank with Cooling Plate
28
+--_ AlUMINILM COVER
..,...---RUBBER SEAL
I+---PERSPEX
Figure 1-4. Cooling Plate Construction
1.2.7 POWER PACKS
It is difficult to define suitable power packs because this depends on the number
of plates being run at a time. All that c an be said is that if the voltage and
milliamperes output provided is adequate for the user's particular laboratory,
then it should be satisfactory. Reliability should be one of the fundamental con
siderations. The most reliable power packs used have been the Shandon Vokam
units (0 to 300 volts, 0 to 80 milliamperes). There are, however, many other
makes equally good. Like the supply of tanks in the Forensic Science Laboratory
at least one power pack per system is considered to be the ideal situation.
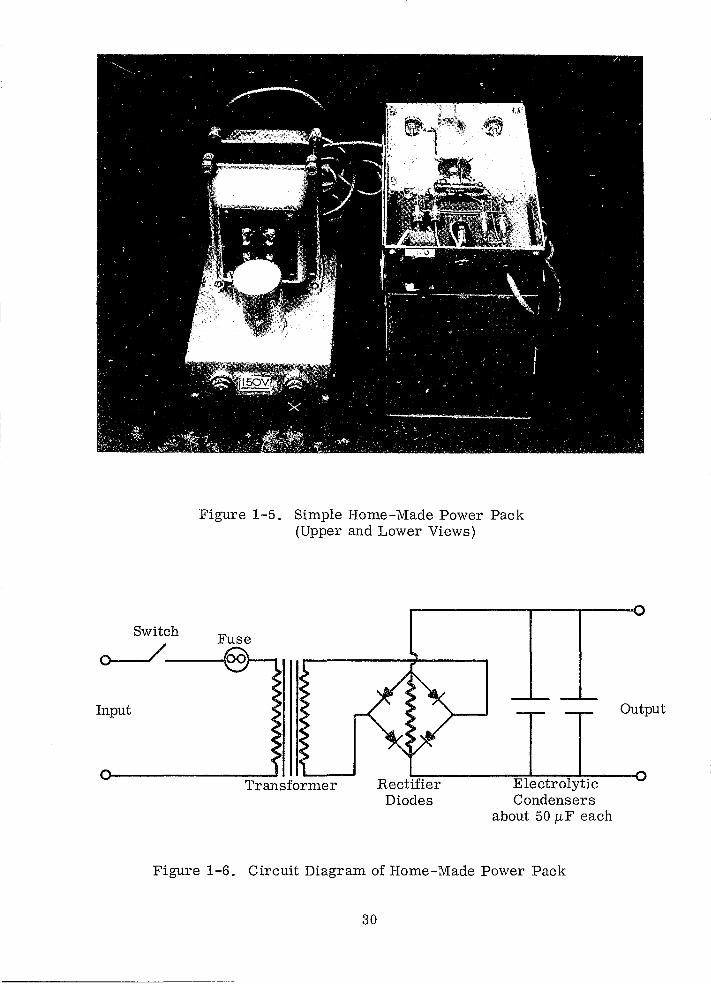
Most power packs are unnecessarily complex and, therefore, unnecessarily
highly priced for most of the work described in later sections. A simple power
pack of fixed voltage can easily be constructed from spare radio or television
parts (See Figures 1-5 and 1-6). The value and type of the components will vary
with the power source voltage, the transformer used to achleve the req.uired
voltage, and the load on the pack.
29
Input
Switch
Figure 1-5. Simple Home-Made Power Pack (Upper and Lower Views)
Transformer Rectifier Diodes
Electrolytic Condensers
about 50 p,F each
Figure 1-6. Circuit Diagram of Home-Made Power Pack
30
Output
1.2.8 MEDIA ON WHICH ELECTROPHORESIS IS PERFORMED
1. 2. 8. 1 Paper
This was one of the earliest bases used. The time taken in the run was long and
the resolution poor when compared to other quicker running media.
1.2. 8.2 CAM (Cellulose Acetate Membrane)
CAM looks like a thin fine paper. When dry it is very brittle and must be handled
with care. Wet or dry it fingermarks very easily and is best handled with for
ceps. The resolution obtainable on this medium is better than that of paper or
agar for protein stained material. Kohnl has used this medium for immuno
electrophoresis and several others have described its use for enzymograms .2, 3, 4
It was found that this medium is more difficult to handle for immuno
electrophoresis than agar and not as good on resolution as starch or acrylamide
gels. The amount of sample required is smaller than with most other methods.
The thin layer starch gel method requires slightly more but is of the same order
of sample size. The only variant system using CAM as the base medium in this
work is that of haemoglobin.
The dry CAM is floated on the surface of a dish of buffer until wetted through;
it is then submerged in the buffer and allowed to soak for a few minutes. If it is
immersed in buffer when it is dry, air is trapped in the CAM matrix and the
strip cannot be evenly soaked in buffer. After soaking it is removed, blotted
lightly with a smooth filter paper to remove excess buffer, and placed in position
in the tank. It is at this stage that the strip can dry out unduly and care must be
taken to ensure that this does not happen.
Some workers recommend either leaving the strip for one-half to one hour in the
tank or one-quarter to one-half hour with the current switched on before applica
tion of the sample. This is due to the difficulty of repeatability in the blotting
stage of excess buffer removal. Experience, practice, and good technique are
the best cure for lack of repeatability and neither of the former processes is
necessary.
31
Care must also be exercised in the application of the sample to the strip of CAM.
Many patent applicators have been marketed and many more home-made ones
tried but a drawn-out capillary tube still seems to be the easiest and most satis
factory applicator used in conjunction with a ruler to ensure a straight line of
sample on the CAM. It is yery easy to put too large a sample on the strip. It is
adequate to use 1 to 2 J.Ll of serum, for a protein separ ation, or O. 1 to O. 5 J.Ll
of haemolysate for haemoglobin separations, in a line about 1 cm. long.
1. 2.8.3 Agar
Agar is a biological product and, therefore, very variable from one manufacturer
to another and from one batch to another. The two most important factor s in the
choice of an agar for electrophoresis are the degree of endosmosis with the buf
fer system to be used and the clarity of the gel.
A number of agars are now produced specially for electrophoresis and some of
these are good quality products. Difco Agar Noble has excellent clarity and is
ideally suited to immuno-diffusion techniques but some batches used have all
shown a very strong endosmosis if used without a great deal of prior treatment.
Difao Bacto Agar has a much lower endosmosis but the clarity is very poor.
This latter point of poor clarity applies to almost all the agars produced for
bacteriological work. If the agar is as cloudy as most of these, faint precipitate
lines cannot be seen properly. Behringwerke agar is excellent but its price is
too high for routine use.
It was found that most batches of Oxoid Ionagar No.2 meet all requirements of
clarity, possess a low endosmosis, and are reasonably priced. Some endosmosis
is necessary for the precipitin reaction technique (described in paragraph 1.4).
When making agar gels, it is a great deal easier to make a bulk agar in distilled
water gel at 2 percent agar and then make each different buffer to be used at
double the normal strength. Then it is easy to melt equal quantities of buffer and
agar to obtain the final gel qUickly, easily, and when it is required. This applies
also to the agar gel overlays for the detection of enzymes after starch gel
electrophoresis.
32
1. 2. 8.4 Starch
There is only one supplier of hydrolysed starch for electrophoresis and that is
Connaught Laboratories Toronto. (There are agencies in most countries.)
Suitable starch can be obtained, hydrolysed, and then standardized in the labora
tory according to the method described by Smithies63 but this is uneconomic in:
terms of laboratory staff time.
Quoted on the label of each batch of starch is the quantity of that batch which will
give a standard separation. Starch percentages given later assume this concen
tration quoted on the jar to be 109 per 100 ml, If it is different from this, then
the concentration quoted under particular methods should be modified as follows:
concentration _ conc. quoted on jar X conc. quoted in method required - 10
Starch gels at the usual concentrations that are used form a molecular sieve so
that proteins and enzymes are separated according to molecular size as well as
charge. The gel should be carefully and properly made, it is easy to heat in
sufficiently and equally easy to burn the starch. Either circumstance will lead
to poor quality runs. A description of the method of making starch gels is given
later in this Section.
1.2.8.5 Acrylamide
This type of gel gives separations similar to those of starch. It is much easier
to control the pore size of the molecular sieve in this gel than in starch. It is an
extremely useful medium but experience has shown that it is not as easy to es
tablish as a routine method with this medium within a busy laboratory as it is
with starch. Hence, starch methods are used as routine in preference to acryla
mide. The exception to this is the cholinester ase C 5 system where the separa
tion is greatly superior using a mixed plate of acrylamide and starch. The
method is described in detail under that enzyme paragraph 3.7.
1.2. 8. 6 Techniques
With the exception of starch gel electrophoresis, all the methods described in
the ensuing paragraphs are individual ones restricted to a particular group system
or investigation.
33 451-769 0 - 72 - 3
Thick plate (or standard) and thin layer starch gels are used in many of the sys
tems so it is intended to describe each of these here rather than repeat the de
scription under each group system.
The thick starch gel plate is described as it refers to haptoglobin and the thin
layer starch gel as it applies to phosphoglucomutase. The necessary buffer and
starch concentration changes in order to use these techniques on other group
systems are given under the description of each system.
1. 2.9 PREPARATION OF STARCH GEL (THICK)
1.2. 9. 1 Preparation of Plate
An 8 1/2-inch by 6-inch glass plate is made into a mould by sticking two
layers of 1/4-inch wide glass strips 3-mm thick around the perimeter of the
upper surface with M. S. 4 silicone grease.
1.2.9.2 Buffer for Gel (pH 8.65)
The buffer for gel contains the following:
TRIS 9.196 gm
Citric acid
Distilled water
1. 2. 9. 3 Preparation of Gel
1.05gm
1 litre
Place 180 ml of gel buffer in a 1 litre conical flask and add 18 gm of hydrolysed
starch. This mixture is heated over a bunsen burner with continual shaking and
swirling. It will become thick and agitation is essential at this point. Subse
quently it will become clear and then thinner when boiling will commence. After
very brief boiling, a few seconds, remove from the heat and continue agitation
by shaking and swir ling.
De-gassing is effected by cor.necting the conical flask to a water pump until the
mixture boils and becomes quite clear and bubble-free. It is then poured into the
mould which has been made as described previously. The mould should be
placed on a level surface or a leveling table prior to pouring the starch gel into it.
34
The mixture is allowed to cool to room temperature and a cover of PVC sheet is
then put over it.
1. 2.9.4 Application of Samples
The PVC cover is removed from the gel and a straight edge, such as a ruler,
placed across the gel parallel to one of the short sides, 2 1/2 inches from the
cathode end. A 7 to 8 mm wide razor blade is then inserted vertically into the
gel towards the top of the plate. A piece of 3MM Whatman filter paper approxi
mately 5 by 8 mm is soaked in the serum sample. This is then inserted verti
cally down the side of the piece of razor blade so that it enters the gel. The
razor blade is withdrawn and a short distance away the next slot is made in the
gel and the next sample inserted. Using these sample sizes the gap between
samples should be about 1/2 cm or more. When the plate has been filled with
samples in this manner, it can be transferred to the appropriate tank.
1. 2.9.5 Connection in Tank
The gel is connected to the tanks, which have been filled with tank buffer, by
means of either pieces of Spontex sponge dishcloth material or 6 thicknesses of
3MM filter paper runnil1g the full width of the gel. These should over lap the
gel by approximately 1 cm. The PVC cover is replaced over the gel. The power
pack, connected to the tanks, is then switched on and adjusted to a constant
voltage of 100 volts. This is the correct voltage when running in a cold room at
4°C. If the run is being made at room temperature, the voltage should be ap
proximately 60 volts. The overnight run is 15 to 17 hours.
1.2.10 THIN LAYER STARCH GEL TECHNIQUE
Materials used for this technique include the following:
a. Two glass plates 22 cm by 15 cm by 3-6 mm thick.
b. Two glass strips 22 cm by 5 mm by 1 mm thick.
c. Two glass strips 14 cm by 5 mm by 1 mm thick.
d. Two glass strips 22 cm by 5 mm by 3 mm thick.
e. Four glass strips 14 cm by 5 mm by 3 mm thick.
f. Two foam plastio (Spontex) buffer bridges 14-cm wide to fit the
tank being used.
g. Starch, buffers, etc.
35
The glass strips b and c are lightly greased with M, S, 4 silicone grease and
stuck by means of the grease around the perimeter of one of the glass plates a
to form a shallow mould 1-mm deep, A permanent mould may be made using
Araldite instead of grease. U sing the phosphoglucomutase gel buffer 50 ml of
10 percent starch gel is made. (TRIS, 12.11 g; maleic acid, 11.62 g; EDTA,
2. 92 g; magnesium chloride, 2.03 g; water to one litre. This is the tank buffer.
Dilute 1: 15 for the gel.)
The starch gel is boiled and de-gassed as described earlier and poured into the
glass mould at one end. A bevelled Perspex starch gel scraper (Shandon Scien
tific) is drawn across the mould resting on the strips b, starting at the end con
taining the starch gel. The purpose of this operation is to produce an even layer
of starch gel 0.8- to 1-mm thick. There will be an excess of starch gel which
flows off the mould at the end of the scraping process.
Most of the failures when using this technique have been caused by either an un
even layer of starch gel or a layer that is too thick.
A check on the thiclmess of the gel can be made when electrophoresis is started.
At 4 volts/cm the current should not exceed 8 mao If the current is over 10 rna,
the plate is probably too thick for the best results.
Origin slots are made 7 to 8 cm from the cathode end of the plate; each slot is
8 to 10 mm long. The inserts used are 8 to 10 mm pieces of cotton thread soaked
in lysate or a similar amount of bloodstained thread, when dealing with dried
bloodstains. In the case of bloodstained clothing, a thread is carefully removed
and allowed to soak in gel buffer for about five minutes prior to insertion into
the gel. In the case of weak bloodstains or stains on thin material, several
threads should be used.
The Sponte x bridges, soaked in tank buffer, are positioned across the ends of the
plate overlapping the gel by about 2 cm and are held in contact with the gel by
placing the second glass plate over the first thus sandwiching the Spontex bridges
at each end.
36
Electrophoresis is carried out for 17 to 20 hours at 2 to 4 °0 with a voltage of
4 volts/cm. On completion of electrophoresis the two glass strips d and two of
the strips e are greased and stuck on top of the strips band c, respectively.
The two remaining glass strips are used to block off an area running from the
origin to 3 cm from the anode end of the plate.
The reaction mixture is made by dissolving the solid components in the buffer
(see paragraph 3.1) and warming to 37 °0 in an incubator (in the dark), mixed
with the melted agar, which has been cooled to 50 to 55 °0, and immediately
poured onto the appropriate area of the starch gel. There is no need to slice
the gel as in the thick gel technique. When the agar is set, it is covered with
the second glass plate and jncubated at 37 °0 in the dark for one to two hours,
after which the bands of enzyme activity will be seen.
The advantages of the thin gel technique are in the quantities of reagents, .ed,
the lack of any need to slice the gel, and in particular the small amount of
sample required. This is advantageous when dealing with bloodstains of limited
size.
When dealing with blood samples or lysates, the inserts used for most techniques
are lengths of cotton thread about 8 to 10 mm long taken from cotton sheeting
which has been well-washed. Standard sizes of sewing cotton are rather too
thin and two or three thicknesses of this would be required.
With the acrylamide/starch technique used for pseudocholinesterase 0 5 system,
slightly more material is used, so the insert used is a I-mm wide strip of
Whatman 3MM filter paper, or cotton inserts.
Bloodstained clothing is usually simple to deal with. A thread of bloodstained
cloth, approximately equivalent to the standard cotton thread, is removed and
used as the insert. In some systems short soaking of this thread in buffer is
all that is required; in other systems slightly more preparation is needed.
With bloodstains on carpet or non-spun textile materials, a small bunch of indi
vidual fibres is taken and treated similarly to a spun thread of fibres.
37
Bloodstai:ns often occur on hard porous or non-porous surfaces, such as bricks,
wood, knives, glass, etc. In these cases the bloodstain (or a portion of it) is
swabbed off using a standard cotton insert soaked in the appropriate gel buffer
for the system of grouping for which it is intended to use it.
If, as in adenosine deaminase, a bloodstain sample is normally soaked in buffer
containing mercaptoethanol, then the same mixture is used when swabbing a
bloodstain from a hard surface.
With some porous substrates it may be better to scrape the blood from the sur
face onto a glass slide before attempting to swab it onto a standard cotton insert.
This is because some very porous materials will absorb liquid from the swab
without allowing solution of the bloodstain onto the insert.
The usual practice is to hold the cotton thread inserts in fine watchmaker's for
ceps (a No.4 or 5) when swabbing a bloodstain from a hard surface or when put
ting the inserts into the thin starch gel.
Inserts for haptoglobin typing are larger than those used in any other system and
are considered in paragraph 4.1.
1.2.11 TRANSFUSION PROBLEMS
In serious assault cases, the victim often loses a lot of blood, so that on arrival
at hospital a blood transfusion is given at an early stage in the treatment. Trans
fusion services usually type the victims blood only in the ABO and Rhesus systems.
The typing tn the Rhesus system may not be a complete typing. The remainder
of the systems which are of use to the forensic scientist are not determined or
matched. Hence a person of type PGM 1 may well receive a transfusion of PGM 2
blood. This will not harm the patient but could make a blood sample taken as a
control from the victim unreliable for forensic purposes.
The recognition of transfusion effects is an important factor when typing blood
samples. Every effort should be made to ensure that the laboratory knows
whether or not a transfusion has occurred, and if possible a pre-transfusion
blood sample obtained. If this cannot be done then it may be better to use the
38
victim's bloodstained clothing as the source of the control blood sample. Other
wise a sample of blood taken 4 to 6 weeks after the transfusion will normally
give the victim's correct groups.
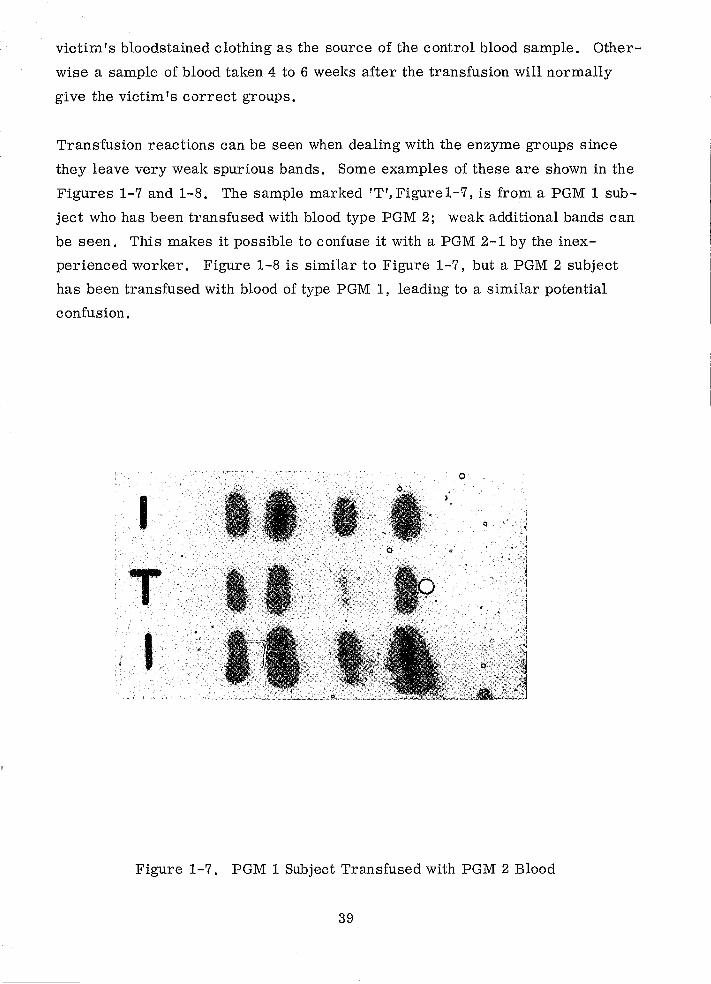
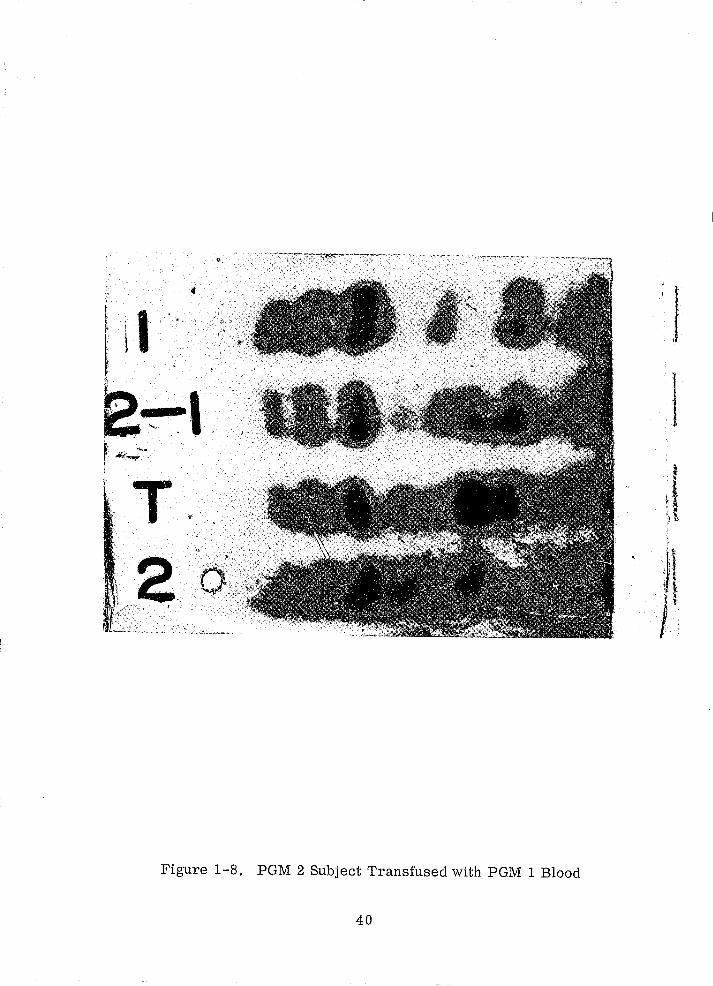
Transfusion reactions can be seen when dealing with the enzyme groups since
they leave very weak spurious bands. Some examples of these are shown in the
Figures 1-7 and 1-8. The sample marked 'T', Figure 1-7 , is from a PGM 1 sub
ject who has been transfused with blood type PGM 2; weak additional bands can
be seen. This makes it possible to confuse it with a PGM 2-1 by the inex
perienced worker. Figure 1-8 is similar to Figure 1-"1, but a PGM 2 subject
has been transfused with blood of type PGM 1, leading to a similar potential
confusion.
o
I
T
Figure 1-7. PGM 1 Subject Transfused with PGM 2 Blood
39
I I
2 1
Figure 1-8. PGM 2 Subject Transfused with PGM 1 Blood
40
---------------------
1. 3 BENZIDINE TEST
1. 3.1 HISTORICAL
For many years a search was made for a diagnostic test for blood. This was,
of course, of great importance in forensic investigation as well as in clinical
pathology.
The first test of any significance was the guaiacum test discovered in 18.61 5• Its
inconvenience and erratic nature led to the search for a better method which re
sulted in the pUblication of numerous tests including the benzidine test in 19046 •
This proved to be so delicate and positive in its reaction to blood that it was im
mediately adopted for clinical work while forensic workers sought to prove its
specificity so that its value as evidence in a Court of Law could be determined.
It was, of course, soon shown that the test was not specific, and a number of
variants were suggested, such as the leucomalachite green test, the phenolphthal
tin test and the luminol test. All these, however, are tests for peroxidase and,
therefore, suffer from the same drawbacks as the original test and are, in addi-
tion, much less convenient to use and in some cases, less certain in operation.
Later in 1968 the use of o-tolidine and o-dianisidine was dropped because they
also were reported as carcenogenic. The reagent that was substituted at this
time was a modified Kastle-Meyer, an alkaline leuco-phenolphthalein. The
modifications improved its sensitivity but it is not considered as good as benzi
dine and the search for a better replacement to benzidine is continuing.
The results obtained with all these reagents are similar and any reference to
benzidine should be regarded as including these other reagents. The benzidine
test has been retained as a generic term here, because of its long usage, to
describe a particular type of testing in forensic science and because many people
know the implications of this test under this name. Throughout this paragraph
benzidine test will be used in this broad sense.
The use of the benzidine test in practical forensic science is of great importance
and its interpretation and precise value should be clearly understood. Because
41
of its lack of specificity, the test has gone up and down in popularity over the
years. Originally it was accepted as being a specific test for blood. When the
lack of specificity of the test in the form in which it was then being used had been
conclusjvely proved, it fell out of favour to such an extent that Glaister in 1931 7
states:
While some employ this test it has the disadvantage that like the guaiacum test it can only be of value as a negative test. We do not put our trust in this test. We have abandoned completely the guaiac. and benzidine tests for the reason chiefly that the reaction obtained in the presence of minute amounts of Imown blood is uncertain and doubtful and also because a reaction may be produced by substances other than blood.
Because of the methods that were used in performing the benzidine test it would
appear that Glaister was misled into considering it useless. Further experience
in the Forensic Science Laboratories showed, however, that the test was certainly
much more valuable than Glaister stated.
In 1954 Gradwoh19 took an almost opposite view to that of Glaister.
Make a solution of the material suspected of being blood. Place a drop of solution of the suspected stain on the new clean glass slide and add a drop of the benzidine/glacial acetic acid/hydrogen peroxide mixture. A green or blue colour indicates the presence of blood.
Experience does not support this view of the simple benzidine test either.
The majority of workers in the medico-legal field writing in the period of 1920 to
1950 decided that the test was only of use when it was negative. This attitude is lO
summed up by Gonzales, Vance, Helpern and Umberger 1950 :
Valuable as a negative test and more sensitive than the guaiac te st.
Those who hold this view give considerable weight to the evidence of materials
other than blood which are said to give positive results.
42
The authors' own view of the simple benzidine test has been expressed by Sydney
Smithll and by Nickolls1.2 in a previous publication:
This is the best preliminary test for blood and by means of it a large number of possible stains may be examined and those that give a positive test marked out for further examination. (Smith)
The superiority of the benzidine reaction over the phenolphthalein and the leucomalachite green reaction lies in the cleanness of the negative test and the intensity and striking nature of the positive test. The benzidine test gives a colourless blank which only slowly discolours. The blanks from the other two tests are always quite strongly tinted, a fact which obscures the certainty of the test. As a result, it is safe to assume that the benzidine test is the most satisfactory presumptive test for blood notwithstanding the recent strong disparagement given to it by Kirk 1953. (Nickolls)
8 Nevertheless, as recently as 1960 Hunt et aI, in a survey of the testing of
bloodstains state that even less reliance should be placed in the benzidine test.
Referring to this test:
Occasions do occur when a garment which is expected to be contaminated with blood gives a positive presumptive test for blood, although the deposit ts insufficient or unsuitable for more specific tests. However tempting it may be to use this as evidence, it is scientific ally and morally incorrect to do so, for it is clearly recognized that such tests are not specific and their introduction into evidence may well mislead.
The concept implied here that the results of a scientific test should be deliberately
withheld from the court or that positive results should be denied is alarming,
since it usurps the function and power of the court. Indeed, having obtained a
positive benzidine reaction, it would be considered morally wrong to withhold
this information.
If a garment had been stained with blood and the quantity was minute (e. g., having
been subsequently washed) then one would expect to get a positive benzidine re
action. One would hope to get other reactions to further tests but one would not
necessarily get them. In these circumstances, it would be equally misleading to
43
report that a garment gave no reaction which could indicate the presence of
blood as to report emphatically that human blood was present on the garment.
The court should be told the facts of the testing and at the same time it should be
told the precise implications of this test.
In the Metropolitan Police Laboratory more than 10,000 articles are examined
each year by means of the benzidine test for the presence of bloodstaining and,
it has been found that a positive test is very rarely obtained in the absence of
blood and in these few cases the reason for the reaction could be easily demon
strated. The Forensic Science Laboratory has, therefore, a very considerable
faith in the test as being indicative of blood in the circumstances in which it is
performed. It was decided, therefore, that it was necessary to find out exactly
what could be said for and against the test apd what facts could be stated with
certainty. The results of the investigation were surprising.
1.3.2 METHOD AND REAGENTS
There have been innumerable variations of reagents and technique in the benzi
dine test, since its original description and it is more than possible that these
variations ac~ount for some of the varying results obtained and opinions formed.
It was originally performed on liquid extracts of bloodstains, a method which few
if any workers still use. Scrapings of bloodstains in tubes, wet filter paper
blottings (wetted with a variety of solvents), and dry filter paper rubbings have
all been used as methods of obtaining a minute sample for testing.
The reagents used have varied also from a weak alcoholic solution of benzidine
to a saturated solution of benzidine in glacial acetic acid.
Four samples of the differing peroxide substrates which have been used include
three vol. hydrogen peroxide, 100 vol. hydrogen peroxide, 20 percent sodium
perborate solution and ozonised turpentine
44
Usually the benzidine and the peroxide have been together in a single reagent
solution. This single solution benzidine reagent has led to the inclusion of chemi
cal oxidants in the list of materials giving a positive benzidine reaction.
The methods used in the Metropolitan Police Laboratory are as follows:
a. Solution of benzidine, o-tolidine or o-dianisidine (0.1 to 0.5percent)
in alcohol/acetic acid 50/50 or in glacial acetic acid.
b. 20 vol. hydrogen peroxide, or Kastle-Meyer reagent
Phenolphthalein 4 g
Sodium hydroxide 40 g
Zinc dust
Water
20 g
1000 ml
This mixture is refluxed until colorless, cooled, decanted and made
up to 1200 ml with ethyl alcohol.
Also required in this test are ethyl alcohol and 20 vol. hydrogen
peroxide.
The stain to be tested is lightly rubbed with the corner of a small (4 cm) dry filter
paper folded into four. It is not necessary to rub to such an extent that the stain
is visibly affected or that the filter paper is visibly discolored or abraded.
A single drop of bem;idine solution is applied to the corner of the filter paper.
After a brief interval to ensure no color develops, hydrogen peroxide is dropped
onto the same area of the filter paper. An immediate deep blue coloration indi
cates a positive reaction (see Figure 1-9).
If Kastle-Meyer reagent is used, then a drop of ethyl alcohol is put onto the cor
ner of the filter paper first, followed by the reagent and finally the hydrogen
peroxide. In this instance the color is deep pink for a positive reaction.
The filter paper is used in this manner to avoid undue damage to the stain and to
avoid using too much of the available material on a test used solely to sort out
potential bloodstains from stains of material other than blood.
45
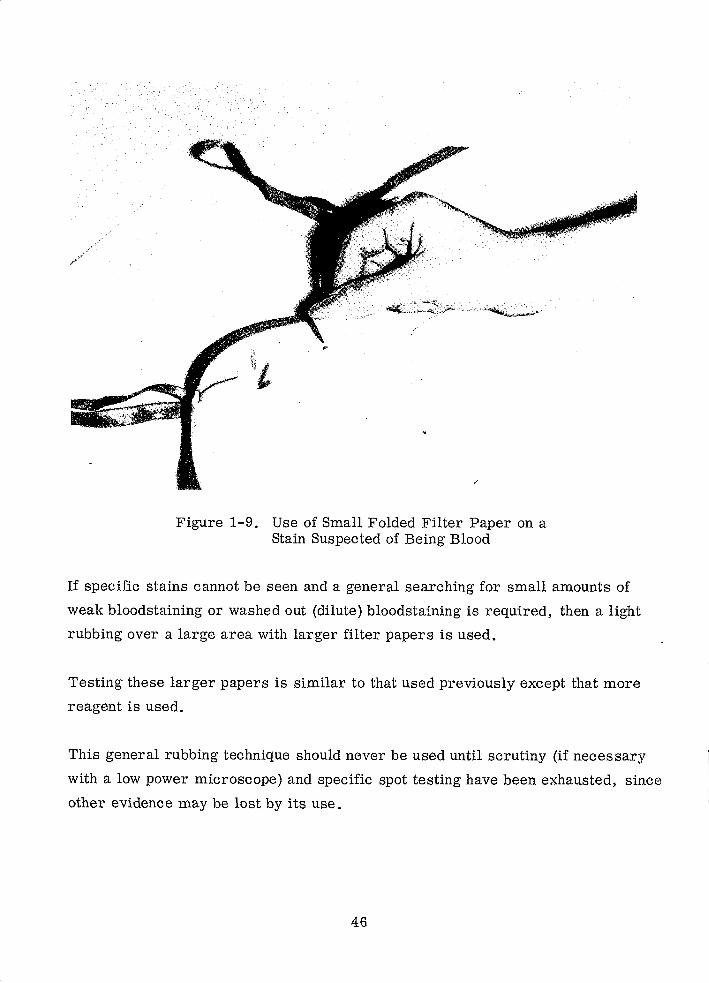
Figure 1-9. Use of Small Folded Filter Paper on a Stain Suspected of Being Blood
If specific stains cannot be seen and a general searching for small amounts of
weak bloodstaining or washed out (dilute) bloodstaining is required, then a light
rubbing over a large area with larger filter papers is used.
Testing these larger papers is similar to that used previously except that more
reagent is used.
This general rubbing technique should never be used until scrutiny (if necessary
with a low power microscope) and specific spot testing have been exhausted, since
other evidence may be lost by its use.
46
1.3.3 FALSE POSITIVE REACTIONS
In the particular circums~tances which are being considered here, a false positive
reaction may be defined as any positive reaction given by any substance other than
the bloodstaining being sought. These substances may be conveniently divided
into four groups.
a. Blood Contamination-The test is so sensitive that quantities of
blood far too small to see will give a strong positive reaction.
Scrupulous care must be exercised to see that the conditions under
which the test is carried out ensure that negative reactions are
given in all cases where they should be expected. If unexpected
positive reactions are found, a·search must be made for the source
of the contamination and, for example, the search bench cleansed,
blank reagent tests performed, etc., until 100 percent negatives
are obtained. A few sporadic false positives can easily produce a
feeling of uncertainty in the validity of the test.
b. Chemical Oxidants and Catalysts-The behavior of these chemicals
is, in general, different from that of blood. Although they give
strong colors, these colors often differ quite obviously from the
color given by blood. Nevertheless, it is not desirable that ad
ventitious colors should arise in practice. This, however, can be
avoided easily by use of the two-solution test. Chemical oxidants
will give a discoloration before the addition of the hydrogen peroxide
while blood does not. If a discoloration is obtained the chemical
should be sought and its effect eliminated if possible before further
tests are performed. If a negative test reaction is obtained, a few
drops of 20 volume H2
0 2 are dropped into the benzidine wetted
area. In the presence of blood or a vegetable peroxidase an immedi
ate blue color will develop, By the use of this two-solution test,
the effect of chemical oxidants can be eliminated.
Chemical catalysts, however, are not all eliminated by this means
and it is only on the addition of peroxide that color develops.
Those most often quoted are copper and nickel salts. These do, in
a strong solution only, give a positive reaction with the benzidine
47
reagents. The reaction when it does occur is different to that pro
duced by blood. A weak coloration is usually produced before the
addition of the hydrogen peroxide. When the peroxide is added there
is an immediate removal of the existing coloration and then very
slowly a deep blue coloration is produced. This starts as a ring
around the wet area on the filter paper and very gradually extends
inwards. The reaction is usually still incomplete after 15 to 20 min
utes. Thus, the reaction obtained is quite different in its form from
that obtained with blood or the chemical oxidants. But when dry
stains (or crystals of the chemical) are tested tn the manner de
scribed, no rea.Jtion is obtained.
The color of the stain tested must be considered and the evidence
of usual observation added to the intelligent use of this test. A
stain on cloth of these salts strong enough to give a positive re
action will (a) discolor the cloth (unless the cloth is of identical
color) and (b) show small crystals in the cloth where the salt
has dried. Its color will not be that of blood. Invisible traces of
blood can be detected. Invisible traces of these salts are not de
tected using the method described.
c. Other Substances of Animal Origin-l'he literature states that sub
stances other than those considered in a, b, d will give positive
reactions. Such substances mentioned are pus, some nasal secre
tions and faeces. These need cause no concern. It is impossible
to obtain pus completely free from blood. Traces of blood, not
obvious to the naked eye, are commonly present in nasal secretion
and faeces. The great sensitivity of the benzidine test is such that
these invisible traces are ample to give a strong positive reaction.
Microscopic examination of such substances will immediately dis
tinguish them.
d. Plant Peroxidases-The most important class of substances that is
liable to interfere with the benzidine test and that has always been
held to vitiate the specificity of the test is the vegetable peroxi
dases. There is no doubt that many plant tissues give intense re
actjons with the benzidine reagents which can be mistaken for blood.
48
The excellent work of Hunt et al,8 has confirmed this. Neverthe
less, certain facts do not appear to have been noticed or at any rate
recorded. The color of the stain must be observed before any tests
are done and in most cases this is not the color of bloodstaining.
Green and white are the commonest colors to find associated with
plant materials. The plant peroxidases appear to reside in the par
ticulate contents of the cells of the plant tissue. the juice of the
plant giving a negative or only a faint positive reaction. As was
pointed out by Nickolls12, a strong positive reaction is usually asso
ciated with tissue or tissue fragments to be present: such frag
ments are detectable and identifiable by microscopic examination.
A survey of the literature failed to show an adequate account of the
behavior of plant peroxidases. The papers suggested that all the
experimental work had been performed by smearing the suspect plant
material onto filter paper and testing the smears immediately, or
alternatively, testing the fresh plant directly. It would appear
profitable to discover whether plant peroxidases differ in their
properties from animal peroxidases.
1.3.4 BEHAVIOR OF PLANT PEROXIDASES
1. 3.4.1 Thermostability
It has been confirmed that all vegetable peroxidases become inactivated with heat.
At a temperature of 100°C the vegetable peroxidases are rapidly inactivated. At
the same temperature, the animal peroxidases are relatively stable. A short
period (five minutes) of heating to 100°C will, therefore, serve to differentiate
between them.
1.3.4.2 Time Factors
Animal haemoglobin peroxidases are very stable substances. Bloodstains many
months old give strong benzidine reactions. Stains years old will still give good
reactions. Stains received in a forensic science laboratory are usually at least
24 hours old and often older when the examination of the stains is completed.
49
451-769 0 - 72 - 4

This lapse of time in ne way invalidates the benzidine test on the stains. When
vegetable stains are treated in this manner, quite different results are obtained.
For example, fresh, uncooked vegetables have been pulped and stains have been
made from them. These were allowed to dry at room temperature and kept for
varying periods of time. The reactions to benzidine were observed at intervals.
The benzidine tests were performed on filter paper rubbings of the stains directly
on the stained cloth and on aqueous extracts of the stains. The results are set
out in Table 1-1.
Dilute blood 1: 100
Onion
Garlic
Beetroot
Cucumber
Horseradish
Horseradish sauce
Lettuce
Tomato
Potato
Cabbage
Bread
Milk
Gluten
Table 1-1
Benzidine Test Results
Rubbing Direct On Cloth
After After After After 1 Day 3 Days 1 Day 3 Days
++++ ++++ ++++ ++++ ± ± ± ±
± ± + ± ±
± ±
± ± ± ±
±
± ±
± + ± + + ±
± ±
± ±
50
Extract
After After 1 Day 3 Days
++++ +H-+
±
±
±
±
--------------------
After five days it was found that none of the plant material stains gave positive
reactions except when benzidine and hydrogen peroxide were applied directly to
the stain on cloth, and then weak reactions were obtained only when much cellular
material was present. In order to obtain these results undiluted crushed vege
tables had to be used and the color of these pulps showed strongly providing the
cloth was not of the same color.
If the vegetable extracts were finely sprayed or diluted to an extent where they
were almost invisible, no benzidine reaction could be obtained except by flooding
the cloth with reagent. In some cases even this did not reveal positive reaction
since the residual peroxidase activity of these pulps was so low compared to that
of blood.
1. 3 . 4 . 3 Effect of pH
Plant peroxidases react well in a strongly acid substrate. In general they do not,
however, react at a strongly alkaline pH. For this reason the Kastle-Meyer test
has been held by many to be much more specific (and even to be specific) for
blood. It is, however, an awkward reagent to make, keep, and use. At its most
sensitive composition the sensitivity is lower than that of benzidine. At this
stage, however, it will rapidly become oxidized and turn pink in air. To make
the reagent more reasonable to use one must either remove the air or appreciably
reduce the sensitivity to blood. This reagent is also much more fallible as re
gards chemical agents; more materials in this class produce the pink coloration
and they do so at lower concentrations than with benzidine. The standard method
of using this reagent is, in our opinion, cumbersome and quite unsuited to a busy
laboratory maki.ng thousands of tests.
1. 3 .4.4 Chromatogr aphy
The identification of bloodstains by means of paper chromatography was sug
gested by Fiori 13. Several methods have been proposed, all of them relying on
a specific RF value associated with detection of haemoglobin by means of
51
benzidine. Fiori, nevertheless, relies on heat to eliminate the plant peroxidases
by inactivation and the two-solution technique to eliminate the chemical oxidants.
Some of the chemical catalysts are quoted as having Rf values similar to that
of haemoglobin. It is, therefore, difficult to see much advantage in preparing the
chromatograms and then using other methods, equally applicable to a rubbing, to
.distinguish the blood from other peroxidases or oxidizing agents.
1. 3.4. 5 Electropgoresis
Electrophoresis of small amolmts of blood and other peroxidase active materials
has been performed and the subsequent detection was by means of the benzidine
reaction. The object of this was to try to typify blood in small dilute or dispersed
amounts.
It was found that under certain electrophoretic conditions blood from a stain
gave a pattern that was drop-shaped, the tail of which had moved towards the
anode, the main bulk of the ha:emoglobin remaining at the origin.
The majority of plant peroxidases moved towards the cathode. An exception
which was tomato pulp peroxidase, moved in a single, more or less circular,
area towards the anode and was, therefore, just as distinguishable from blood as
those which moved towards the cathode.
Chemical oxidants were not considered here since they are so easily detected
by the two-solution method. Chemical catalysts were run as a matter of thorough
ness and were found to have cathodic mobility. Disruption of the gel used as a
substrate also occurred with these when they were present in sufficient concen
tration to give a reaction. Excessive diffusion also occurred with these chemicals.
This method was found to distinguish bh/ch1stains from all other substances tried
which react to the benzidine test in any form, even when using the optimum con
ditions for these other substances, e. g., freshly pulped vegetables.
52
1. 3. 5 ELECTROPHORETIC METHOD
Electrophoresis was carried out in a 1 percent agar gel. The agar used was
Ionagar No.2. The buffer system used was the discontinuous one ofHirschfied14
for immuno-electrophoresis.
Barbituric acid
Sodium Barbitone
Calcium Lactate
Distilled water to
Gel. Buffer
1. 660 g
10.510 g
1. 536 g
1500 ml
To make the gel, equal volumes of buffer and a 2 percent ion agar gel in water
were heated, mixed and poured onto glass plates to a devth of approximately
2 mm. When the gel hs.d solidified, wells 1 to 1.5 mm in diameter were punched
in it using a suitable pB.steur pipette. These wells were 1.5 em apart at right
angles to the direction of travel and 7.5 cm apart along the direction of travel.
This plate was connected to the electrode tanks by three-layered bridges of
Whatman 3 MM filter paper.
The buffer used in the tanks and on the bridges is as follows:
Barbituri.c acid
Sodium Barbitone
Calcium Lactate
Distilled water to
1. 380 g.
8.760 g
0.384 g
1 1
The materials to be tested (bloodstain extracts, vegetable pulps, etc.) were
placed one in e?ch of the wells in the gel and electrophoresis was performed at
5 to 6 volts/cm for 30 minutes.
The gel was then stained by pouring a small quantity of benzidine solution in
glacial acetic acid onto it and smoothing this out into a film with a glass rod.
After 1 to 2 minutes, 10 to 20 volumes hydrogen peroxide is applied in a simi
lar manner.
53
After a few minutes, when the full color reactions had developed, the excess re
agent was washed off with tap water and the gel was placed in a dish of 50 percent
alcohol containing a few crystals of phenol. This phenol helps to preserve the
staining and to limit fungal growths. After two hours, the gel may be removed and
dried at room temperature or in an incubator.
Some examples of this method are illustrated in Figure 1-10. The vegetable ex
tracts were prepared by pounding the fresh material to a pulp in a pestle and
mortar and using the pulp undiluted. Gluten and bread were inserted into the
wells as moist pellets. Nasal mucus was used fresh.
The bloodstain extract was prepared by taking a stain made 24 hours previously
on cloth from a single drop of blood, extracting it with 100 drops of distilled
water, and inserting a small portion of this into the well. This was to obtain
the equivalent from the stain of 5 ml of a one percent solution of blood. The fresh
blood was prepared by diluting a standard haemoglobin A solution until the color
approximately matched that of the bloodstain extract.
The remainder of the vegetable pulps, gluten, blood, etc., was used to make
stains on cloth. These stains were allowed to dry under normal conditions at
room temperature. Extracts were made 24 hours after these stains were made
on the cloth. In the case of the bloodstain, the method used was that previously
described. In the case of all the other materials, a concentrated pulpy extract
was used. The result is shown in Figure 1-11.
In common with most of the vegetable pulps shown in Figure 1-11, none of the
remaining substances gave a positive reaction.
After three days those substances that had given a positive result after 24 hours
were subjected to electrophoresis again. The only substance other than blood to
give a positive reaction was the stain made from raw pulped beetroot (beta
vulgaris). Compared to Figure 1-11, Figure 1-12 shows that the intensity of the
reaction has dropped markedly between one day and three days.
54
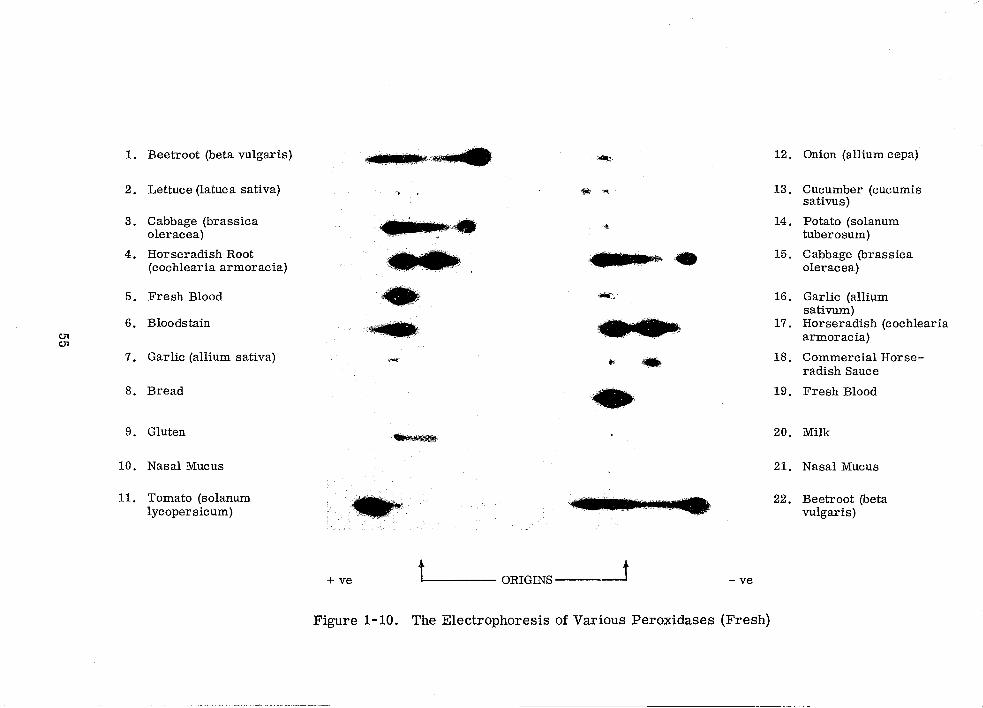
I. Beetroot (beta vulgaris) ~. 12. Onion (allium cepa)
2. Lettuce (latuca sativa) .> • "''I 13 . Cucumber (cucumis sativus)
3. Cabbage (bras sica oleracea)
• ·'rJ •.. · . J. .,. 14 . Potato (solanum tuberosum)
4. Horseradish Root (cochlearia armoracia) • '-~
15 . Cabbage (bras sica oleracea)
5. Fresh Blood ......... ,~'~ "\
. ' ... .. e 16 . Garlic (allium
sativum) 6. Bloodstain
c:n c:n
#1'":12" 17. Horseradish (cochlearia armoracia)
7. Garlic (allium sativa) """. ", ,. 18. Commercial Horse-radish Sauce
8. Bread • 19. Fresh Blood
9. Gluten ~,.,a 20. Milk
10. Nasal Mucus 2I. Nasal Mucus
II. Tomato (solanum lycopersicum)
~ .... " ~~--
d 22. Beetroot (beta vulgaris)
+ ve t ORIGINS--1 - ve
Figure 1-10. The Electrophoresis of Various Peroxidases (Fresh)
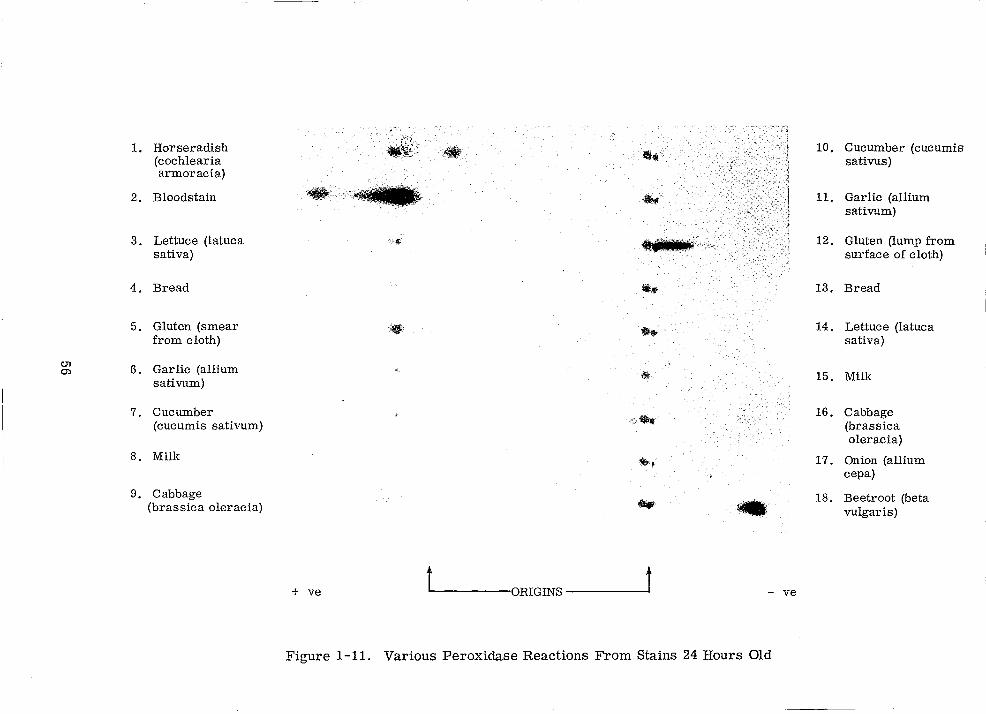
1. Horseradish ([~k. 'I 10. Cucumber (cucumis (cochlearia -~::..~' :. . ... 1 sativus) . , '1 armoracia)
2. Bloodstain .(~II if ~ '. I 11. Garlic (allium !
sativum)
3. Lettuce (latuca fI • .. 'It.'X· 12. Gluten (lump from sativa) surface of cloth)
4. Bread -. 13. Bread
5. Gluten (smear .~. ~ 14. Lettuce (latuca from cloth) sativa)
<:.TI 6. Garlic (allium (j) li!f 15. Milk sativum)
7. Cucumber ., .... 16. Cabbage
(cucumis sativum) (brassica oleracia)
8. Milk ., 17. Onion (allium cepa)
9. Cabbage 18. Beetroot (beta (brassica oleracia) - ~ vulgaris)
+ ve t ORIGINS t - ve
Figure 1-11. Various Peroxidase Reactions From Stains 24 Hours Old
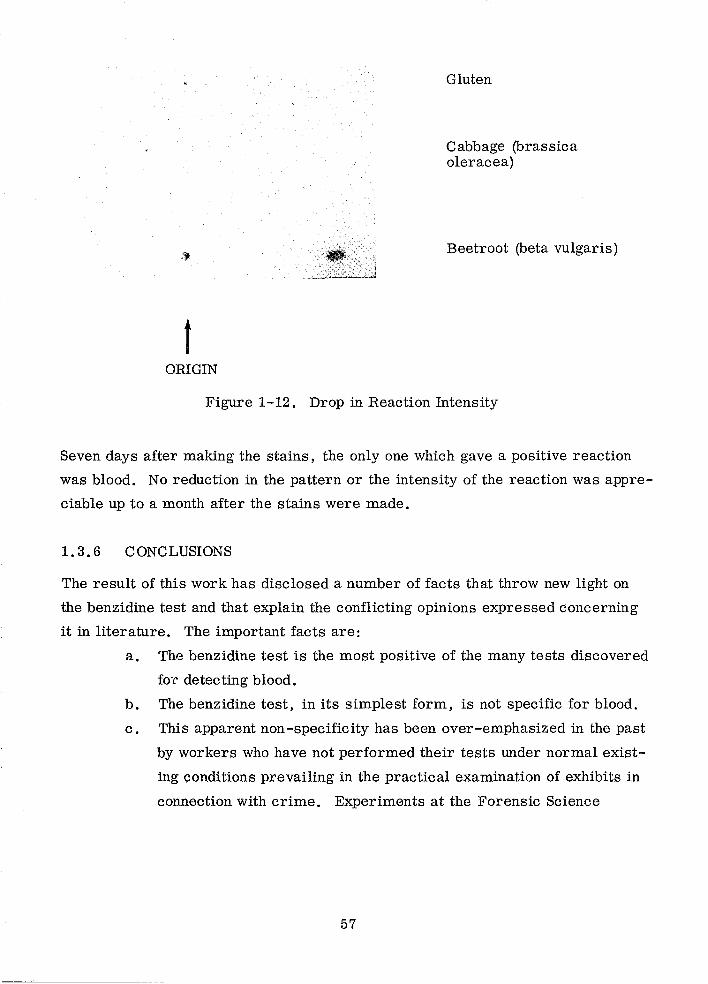
t ORIGIN
--------------------
Gluten
Cabbage (brassica oleracea)
Beetroot (beta vulgaris)
Figure 1-12. Drop in Reaction Intensity
Seven days after making the stains, the only one which gave a positive reaction
was blood. No reduction in the pattern or the intensity of the reaction was appre
ciable up to a month after the stains were made.
1.3.6 CONCLUSIONS
The result of this work has disclosed a number of facts that throw new light on
the benzidine test and that explain the conflicting opinions expressed concerning
it in literature. The important facts are:
a. The benzidine test is the most positive of the many tests discovered
for detecting blood.
b. The benzidine test, in its simplest form, is not specific for blood.
c. This apparent non-specificity has been over-emphasized in the past
by workers who have not performed their tests under normal exist
ing conditions prevailing in the practical examination of exhibits in
connection with crime. Experiments at the Forensic Science
57
Laboratory have shown that it is quite useless making desultory
spot-tests. The possible confusing substances are:
(1) Chemicals-These can be eliminated by inspection and by the
routine use of the two-solution test.
(2) Plant Peroxidases-These are essentially eliminated on stand
ing. Their elimination can be hastened by heating.
(3) Various Other Body Secretions-These cannot always be ob
tained completely free from blood and, therefore, there is no
evidence that the secretions themselves are responsible for the
test. (The nasal secretions that were tried at no time gave a
positive benzidine).
d. While the benzidine test in the hands of an experienced worker may
be regarded as being specific for blood, complete specificity is ob
tained by electrophoresis. As a result of the work on this subject,
much of the information published to date can be completely mis
leading, particularly if taken out of context.
58
1.4 PRECIPITIN REACTIONS
1.4.1 INTRODUCTION
Since early this century it has been !mown that it is possible to distinguish the
blood of different animals from one another by means of specific precipitating
antisera. Before proceeding to group bloodstains in forensic work it is essential
to !mow if the blood is of human origin. On some occasions blood of other animals
may be sought and reliable identification methods for this also are required.
The basic technique of bringing into close reacting contact an extract of a blood
stain and suitable antisera has remained the same since the test was originally
described. The means of accomplishing this has, over many years, had many
variations and only the major ones will be mentioned.
1. 4. 2 ANTISERA
Whichever method is being used, the whole technique relies on the quality of the
antisera used. An antiserum is a biological product and is, as a result, un
predictable in its manufacture. It may turn out to be univalent or polyvalent. If
polyvalent serum is required, the antibodies present in different preparations
will vary not only between different species but also from batch to batch. The
titre of a specific antibody will also vary from one batch of antiserum to another
even from the same animal.
There are two basic forms of precipitating antisera depending on the animal in
which they are prepared. Those antisera prepared in horses are Imown as H type
and those prepared in rabbits, sheep, goats, etc., are !mown as R type. Those
prepared in chickens are generally of the R type but have certain peculiarities of
their own, requiring higher salt concentrations to give good precipitates.
H type antisera produce a flocculent precipitate which is soluble in excess antigen
or antibody and, therefore, requires a narrow range of antigen/antibody concen
trations. The R type antiserum produces a much more stable precipitate which
is not soluble in excess antibody and only partially soluble in excess antigen.
59
Horses tend to produce more antibodies than rabbits and the antisera at equivalence
produce neater, clearer, cleaner lines than the R type antisera. If the maximum
number of antigen/antibody reactions is required, then, the H type is the bestM If,
however, the concentration and number of antigens is unlmown, the R type should
be used.
The shape and position of the precipitin band depends on the concentrations of
antibody and antigen and also their relative diffusion coefficients. Coefficients
of diffusion cannot be changed but antigen and antibody concentrations can be
changed to improve the shape of the arc obtained. This is a matter of trial and
experience.
The specificity of sera is a matter that must be of considerable concern. The
precise specificities of the antisera in the conditions in which they are used
must be known, Commercially available precipitin sera can be relied on to be
reasonably speCific. However, two problems occur here. First, these antisera
are not tissue specific and will give a reaction with most tissues from the animal
concerned as well as from the blood. Also they will react with blood and tissues
from closely related animals. Anticow for example reacts with deer blood. Anti
human serum reacts with certain anthropoid sera.
Secondly, there is the problem of nonspecific precipitation. This occurs when
the concentration of the blood extract is too high. For example, the Metropolitan
Police Laboratory has found that cow blood at a dilution of 1: 400 reacts with cer
tain batches of antisera against human and sheep. Obviously, when dealing with
stains, this problem is obviated by working at dilutions greater than 1:400.
1.4.3 SPECIFIC ANTISERA
Recently, antiserum of special interest to the forensic scientist has become avail
able. This is the anti-human semen serum. Unfortunately, several brands of
this antiserum that have been tried reacted with high concentrations of blood and
saliva and also with vaginal epithelium from some adult donors. It is, therefore,
not possible to determine by this method whether there is semen on a vaginal swab.
60
Most tissue and body fluids can be u~led to provide tissue specific antisera, such as
anti saliva , antiurine, antivaginal secretion, antiamniotic fluid, and antistomach
secretion (to identify vomit).
Until these antisera are available commercially, it is possible to tackle the prob
lem in two ways. The first is to use an immuno-electrophoretic technique using
the cross-reactivity of a non-specific, anti-blood serum to detect the common
proteins between two body fluids. The second method is to absorb the antiserum
with the unwanted antigens, for example absorb anti-human semen serum with
vaginal secretion, thus removing the cross-reactivity and making it specific for
semen. The tests are then made with the suspect material agai.nst the absorbed
antiserum.
Since the majority of problems are associated with blood rather than any other
body fluid or tissue, the routine laboratory procedure for bloodstains will be de
scribed and any other problem can be dealt with as a special project. In all nor
mal routine conditions, commercially available antisera are excellent. In some
countries, however, specific local problems may well arise where no suitable
antiserum is commercially available. In these circumstances some of the possible
solutions have been suggested; this does not invalidate the use of the technique but
makes all the more important the need to know well and accurately the attributes
of all the antisera that are being used.
1.4.4 METHODS
1.4.4. 1 Tube Technique
The original technique used in precipitin tests was the tube technique in which a
small quantity of the antiserum, centrifuged or filtered clear, is put into a small
glass tube about 2 inches by 1/4 inch. The dilute extract of the bloodstain, also
centrifuged or filtered clear, is carefully layered over the top of the antiserum
without disturbing the interface thus formed. If a reaction occurs, a white pre
cipitate forms at this interface within 20 to 30 minutes.
61
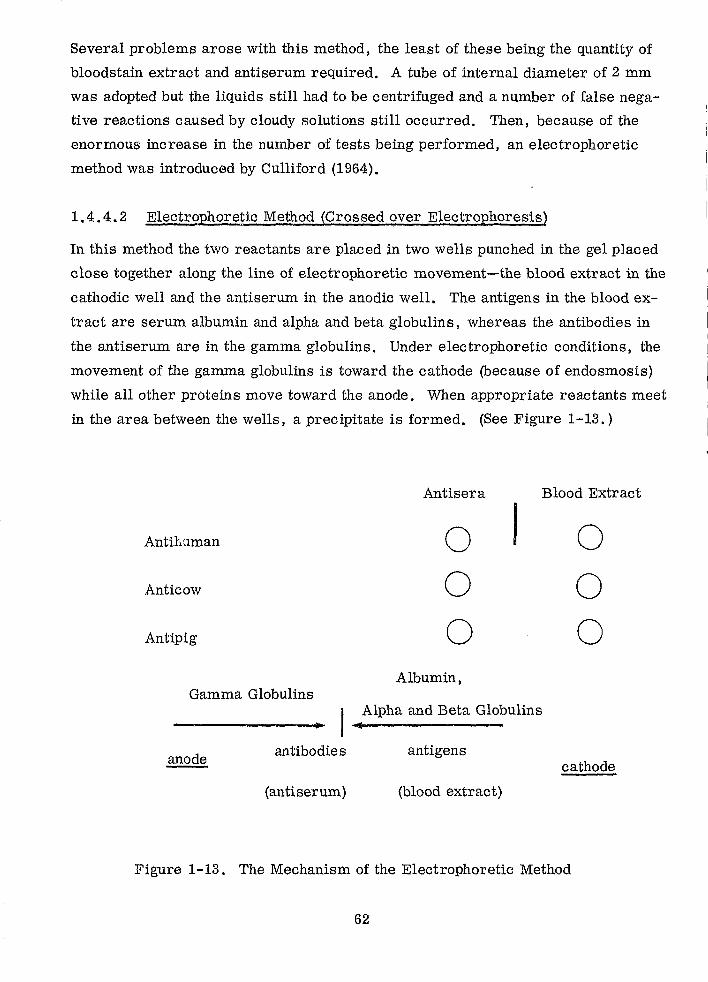
Several problems arose with this method, the least of these being the quantity of
bloodstain extract and antiserum required. A tube of internal diameter of 2 mm
was adopted but the liquids still had to be centrifuged and a number of false nega
tive reactions caused by cloudy solutions still occurred. Then, because of the
enormous increase in the number of tests being performed, an electrophoretic
method was introduced by Culliford (1964).
1.4.4.2 Electrophoretic Method (Crossed over Electrophoresis)
In this method the two reactants are placed in two wells punched in the gel placed
close together along the line of electrophoretic movement-the blood extract in the
cathodic well and the antiserum in the anodic well. The antigens in the blood ex
tract are serum albumin and alpha and beta globulins, whereas the antibodies in
the antiserum are in the gamma globulins. Under electrophoretic conditions, the
movemlent of the gamma globulins is toward the cathode (because of endosmosis)
while all other proteins move toward the anode. When appropriate reactants meet
in the area between the wells, a precipitate is formed. (See Figure 1-13.)
Antisera Blood Extract
Antihaman 0 I 0 Anticow 0 0 Antipig 0 0
Albumin, Gamma Globulins I .. AlPha and Beta Globulins
cathode anode antibodies antigens
(antiserum) (blood extract)
Figure 1-13. The Mechanism of the Electrophoretic Method
62
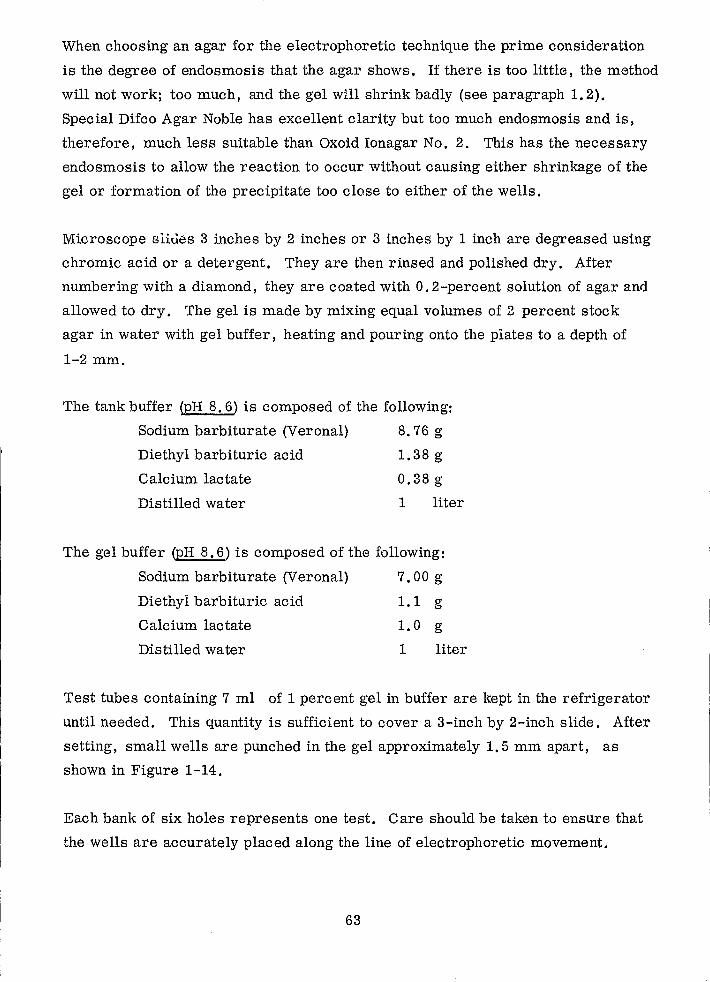
When choosing an agar for the electrophoretic technique the prime consideration
is the degree of endosmosis that the agar shows. If there is too little, the method
will not work; too much, and the gel will shrink badly (see paragraph 1. 2).
Special Difco Agar Noble has excellent clarity but too much endosmosis and is,
therefore, much less suitable than Oxoid Ionagar No.2. This has the necessary
endosmosis to allow the reaction to occur without causing either shrinkage of the
gel or formation of the precipitate too close to either of the wells.
Microscope slilies 3 inches by 2 inches or 3 inches by 1 inch are degreased using
chromic acid or a detergent. They are then rinsed and polished dry. After
numbering with a diamond, they are coated with O. 2-percent solution of agar and
allowed to dry. The gel is made by mixing equal volumes of 2 percent stock
agar in water with gel buffer, heating and pouring onto the plates to a depth of
1-2 mm.
The tank buffer (pH 8.6) is composed of the following:
Sodium barbiturate (Veronal) 8.76 g
Diethyl barbituric acid 1. 38 g
Calcium lactate
Distilled water
0.38 g
1 liter
The gel buffer (E!i.l.:.§) is composed of the following:
Sodium barbiturate (Veronal) 7.00 g
Diethyl barbituric acid 1. 1 g
Calcium lactate 1. 0 g
Distilled water 1 liter
Test tubes containing 7 ml of 1 percent gel in buffer are kept in the refrigerator
until needed. This quantity is sufficient to cover a 3-inch by 2-inch slide. After
setting, small wells are punched in the gel approximately 1. 5 mm apart, as
shown in Figure 1-14.
Each bank of six holes represents one test. Care should be taken to ensure that
the wells are accurately placed along the line of electrophoretic movement.
63
E/875 0 0 0 0 0 0 0 0
0 0 0 0 0 0 0 0
0 0 0 0 0 0 0 0
0 0 0 0 0 0 0 0
0 0 0 0 0 0 0 0
0 0 0 0 0 0 0 0
Figure 1-14. Layout of Precipitin Plate (Actual Size)
To produce the correct pattern, a ptmch obtainable from Shandon Scientific can
be used. This cuts the gel and the small plugs of gel are removed using a
Pasteur pipette attached to a vacuum. Alternatively, a template can be drawn
on a card and placed under the plate and the wells punched out using the pipette
and vacuum.
An extract of the bloodstained material is prepared by adding a drop of gel buffer
diluted with an equal volume of distilled water to a small quantity of the material
and allowing it to soak for 5 to 10 minutes. The ideal extract will appear as a
pale straw color. Too strong an extract will cause non-specific precipitation of
the control antisera, so it should be diluted with extracting buffer. By means of
a very fine Pasteur pipette, the three right hand wells of a bank of six are filled
with extract. The three left hand wells are filled with antisera. Normally, two
control antisera are used in each test to ensure that the bloodstain is not a mix
ture of two bloods and that no foreign substance in the material is causing non
specific precipitation. The selection of these two control antisera is largely
governed by the circumstances of the case. For exampl:e, if a butcher's knife
is a suspected murder weapon then th.e controls would be antic ow , antisheep,
and possibly antihen and antipig. Similarly in a road accident, the controls
should be anticat and antidog. Hence the choice of control antisera must be de
cided by the worker, taking into account the circumstances of the case and its
country of origin.
64
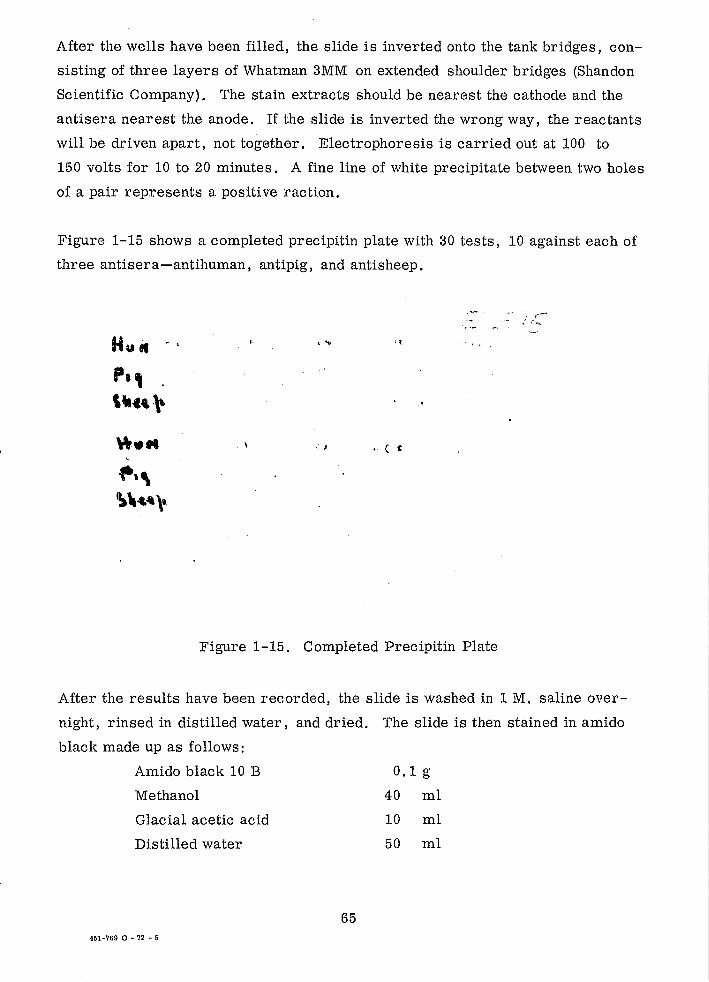
----~~~
After the wells have been filled, the slide is inverted onto the tank bridges, con
sisting of three layers of Whatman 3MM on extended shoulder bridges (Shandon
Scientific Company). The stain extracts should be nearest the cathode and the
antisera nearest the anode. If the slide is inverted the wrong way, the reactants
will be driven apart, not together. Electrophoresis is carried out at 100 to
150 volts for 10 to 20 minutes. A fine line of white precipitate between two holes
of a pair represents a positive raction.
Figure 1-15 shows a completed precipitin plate with 30 tests, 10 against each of
three antisera-antihuman, antipig, and antisheep.
, ,-HUll ' \ , '" ,t
PI, ,,, ... ,, " ... ~. , . ( , ~,\
\\,,"\t,
Figure 1-15. Completed Precipitin Plate
After the results have been recorded, the slide is washed in 1 M. saline over
night, rinsed in distilled water, and dried. The slide is then stained in amido
black made up as follows:
Amido black 10 B 0.1 g
Methanol
Glacial acetic acid
Dlstilled water
451-769 0 - 72 - 5
65
40 ml
10 ml
50 ml
After leaving the slid~ in the stain for 10 minutes, it is differentiated in a wash
soluHon consisting of four parts methanol, five parts distilled water, and one
part glacial acetic acid. The precipitates now appear as blue bands. After dry
ing, the slides can be stored as a permanent record.
1.4.5 PROBLEMS
The most frequently encountered problem is the extract being too strong and
causing non-specific precipitation. For example, human serum at a dilution
of 1: 400 will cause precipitation with antic ow serum.
Antihuman semen serum can be used when seminal stains are encountered, but it
haf::l been found that most of these antisera react with vaginal epithelium, so care
should be taken when dealing with this determination.
66
SECTION 2
RED CELL ANTIGEN SYSTEMS
2.1 INTRODUCTION
Many text books have been written on this subject and there is very ample cover
age of both the theoretical aspects and the practical applications in terms of
grouping fresh fluid blood samples. It would bt;l superfluous to deal with matters
so adequately documented elsewhere. It is therefore proposed to confine this
section to the particular problems facing the forensic serologist. For the most
part, this is a matter of detection of antigens in dried bloodstains, but it also
involves the grouping of lysed blood samples and human tissue (e.g., fragments
adhering to vehicles involved in fatal road accidents).
In fluid blood samples the presence or absence of an antigen is ascertained by
whether or not the red cells are agglutinated. In dried bloodstains, the cells
have ruptured and, therefore, direct agglutination tests are no longer feasible.
However, the antigens are not immediately denatured upon drying. Indeed, in
the ABO system they survive for many years and retain the capability of com
bining with specific antibodies. The formation of these antigen-antibody com
plexes is the basis of all methods employed in the detection of red cell antigens
in dried bloodstains. There are several methods of detecting this.
Absorption-inhibition is the classical method of detection of antigens in dried
bloodstains. This has been in use for several decades. Aliquots of antisera are
added to portions of stains or extracts thereof and, after a suitable period of ab
sorption, the residual sera are tested with red cell suspensions of appropriate
groups (e.g. , group A cells are added to anti-A serum) and the degree of aggluti
nation is compared. with that of controls tested in parallel from the unstained sub
strate. A substantial reduction in titre of serum added to stained material com
pared with that of serum in the control indicates the presence of an antigen. For
this test, the antisera are usually diluted, but nevertheless, it is necessary for a
very high proportion of the antibody content to be absorbed by the red cell antigens
in order to obtain a significant reduction in titre. This method is relatively
67
insensitive when compared with more recent techniques and, in practice, has
proved satisfactory only for grouping in the ABO system,
In recent years, methods have been evolved in which, instead of testing residual
serum, reactions are obtained directly from the absorbed antibody. Theoreti
cally, it is obvious that such an approach should lead to greater sensitivity and
this is born out in practice. To detect a positive reaction, it is only necessary
for a very small proportion of the antibody contellt of the serum to be absorbed,
and also it is unnecessary to obtain absorption of all of the antibody components.
One such method is mixed agglutination 15. A high proportion of bloodstains which
are grouped occur on textile fabrics and the corpuscular debris containing the
antigenic material adheres tenaciously to the fibres. By this method, finely
teased bloodstained fibres are submerged in antiserum and, after a period of
absorption, the unbound antibody is washed away leaVing only antibody which has
combined specifically with the antigens. The fibres are then suspended in indi
cator cell suspension of appropriate group and rotated. During this period, ag
glutination occurs between the absorbed antibody and the indicator cells so that,
in the presence of a specific antigen, the fibres, when viewed with a microscope,
are seen to be coated with a layer of red cells of the same specificity as the stain.
This method has proved very satisfactory for the ABO system and can be used on
extremely small stai.ns, but, for maximum sensitivity, it is necessary to use
specially selected high titre immune anti-A and anti-B sera and the group 0 in
dicator cells must be pretreated with enzyme (e. g. , papain) in order to detect
H antigen. The method has not been found suitable for Rh or MN typing.
Another means of dir(9ct testing for absorbed antibody is that of absorption
elution. After absorption and subsequent washing away of unbound serum, the
combined antibody is elnted, usually by raising the temperature to about 56°C.
The eluate is then tested with indicator cells of the appropriate group; agglutina
tion indicates the presence of an antigen of the same specificity as that of the
indicator cells. A variety of adaptations of this basic principle is in use and
some of these will be discussed later.
68
Absorption-elution has proved highly satisfactory for ABO grouping where it is
possible to group stains of I-mm diameter. It is also in routine use for MN and
Rh typing in dried bloodstains. Detection of the antigens K, k16
and S17 have
also been reported. This method is both more sensitive and more versatile than
mixed agglutination. One possible reason for the greater sensitivity is that in
mixed agglutination, reactions are only obtained from the antigenic sites exposed
on the surface whereas in absorption-elution the submerged sites are also in
cluded. It is also likely that red cells agglutinate more readily with each other
than. with dEibris adhering to fibres.
Another obvious approach in the grouping of dried bloodstains is the use of
labelled antibody. This can be achieved either by conjugation with a fluorescent
dye or with radioisotopes. Theoretically, these methods should be infinitely
more sensitive than those previously described. In practice it is difficult to ob
tain clear-cut negative reactions. For this' reason neither method is in routine
use for red cell antigen detection. However, it is likely that these techniques
may be improved.
69
2.2 ABO SYSTEM
2.2.1 METHODS
In 1960, S. S. Kind introduced absorption-elution for the detection of ABH anti
gens19 ,20. The original method was crude but modifications of this principle
have been described by a number of workers including Kind 18,21,23,24,25,29.
In the Metropolitan Police La.boratory, the method of Nickolls and Pereira 24 was
in use for many years. This facilitated the grouping of very small stains using
short pieces of bloodstained threads, the entire test being carried out on cavity
slides. To achieve satisfactory removal of unbound antibody, the threads were
teased into individual fibres and each tuft of fibre. was rinsed separately using
a wash bottle containing chilled saline and a pipette attached to a suction pump for
removal of the saline. It was a matter of some skill to ensure that the fibres
were adequately washed without being lost! When dealing with large numbers of
stains it was also very time consuming.
A modification by Howard and Martin.23
has provided a very satisfactory solution
to these problems. The tests are carried out on cellulose ac,etate sheet with the
pieces of thread being firmly secured to it with an adhesive of cellulose acetate
in acetone. The washing then can be achieved. by soaking the entire sheet in
chilled saline without fear of losing the threads. Furthermore, because it is
possible to allow prolonged soaking in chilled sa.line, it has been found unneces
sary to tease the fibres. Bulk handling of a fairly large number of stains is
possible by this method.
25 Another method which facilitates a batch procedure is that of Outteridge . He
recommends working on water extracts of stains that are fixed by immersing in
a buffer solution at 99° C. The use of an extract has the advantage of ensuring
that precisely the same quantity of material is tested against the various anti
sera. There is a serious disadvantage, however. A high proportion of the cor
puscular debris remains firmly attached to the fabric and cannot be utilized.
The use of 5 percent: ammonia solution for extracting stains 21 is far more ef
ficient for the purpose. It is argued by Kind that, with such an extraction me thod,
70
it is possible to expose a large surface area of antigenic material to antiserum
and because of this, greater sensitivity can be achieved. It is highly probable
that a more rapid antigen-antibody raction will occur, but Kind's argumen.t that
antigen-antibody reaction takes place only at the solid/liquid interface is probably
unfounded when dealing with undenatured stains. Unfixed protein will absorb
water and it is likely, therefore, that serum antibodies can penetrate to unex
posed sites given adequate time. Comparative studies on several series of
stains produced by double-diluting whole blood have shown that the Howard and
Martin method is more sensitive than the ammonia extraction method26• There
is a very marked decrease in sensitivity in reactions against anti-H, although
those for anti-A and anti-B are .less seriously affected.
Fior/8
recommended fixation of bloodstained fibres with methyl alcohol prior
to absorption-elution. He claims that weaker reactions are obtained from unfixed
material. Experience at the Forensic Science Laboratory is a complete contra
diction of this. All forms of fixation cause a reduction in antigenic sensitivity.
This may be because only surface antigens are involved in the reaction, but the
possibility of an adverse effect on the antigens cannot be excluded. The disad
vantages of fixation are even more apparent with the MN and Rh systems.
2.2.2 HOWARD AND MARTIN TECHNIQUE
2 . 2 .2 . 1 Materials
The materials used for this technique include the following:
a. Humid Chambers-Polystyrene sandwich boxes (obtained from
Woolworth's) used upside down are ideal for this. The tops are
lined with damp blotting paper.
b. Cellulose Acetate Sheets-The optimum thickness is 0.4 mm. They
are cut to fit the humid chambers and should be ruled out into a
grid of approximately 1. 5-cm squares using a wax pencil. Alter
natively, the sheets can be moulded into a series of cavities using
a suitably constructed press.
c. Cellulose Acetate Adhesive-The proportion of powdered cellulose
acetate to acetone is to some extent a matter of personal choice.
71
Respective proportions by volume of 1:2 are satisfactory. It is
essential that the adheEJive should be sufficiently viscous to avoid
absorption by the threads, since this results in a coating of cellu
lose acetate on the threads and negative reactions at the conclusion
of the test. On the other hand, if the adhesive is too viscous, handl
ing becomes very difficult. During use, there is evaporation of
acetone which can be replaced from time to time.
d. Serological Reagents
Anti-A (a)
Anti-B ({3)
Anti-·A + B (a (3)
Anti-A and Anti-B sera which are normally used for grouping
whole blood are satisfactory for this purpose. Selection of
anti-A + B serum is desirable. This is discussed later.
2.2.2.2 Anti-H Lectin
The anti-H lectin is an important ingredient in the Howard and Martin technique.
This is an extract of gorse seeds (ulex europaeus) in normal saline. The seeds
are ground in a pepper mill and 10 gill of crushed seed are added to 100 ml of
saline and left at 4 0 C for a few days. The extract is then passed through a mus
lin bag to remove gross particles and centrifuged. Following this, the super
natant is flocculated at 60 0 C for 30 minutes and re-centrifuged.
The supernatant is tested against AlB and 0 cells. A negative reaction should
be obtained from AlB cells and strong agglutination from the 0 cells. A prepara
tion having a titre of less than 1/32 is unlikely to be suitable for dried stain work.
By this method of extraction, providing the seeds are in good condition, it is
usually possible to obtain titres of 1/128 or. 1/64. In the experience of the Metro
politan Police Laboratory, a~ti-H prepared by this simple method is superior to
the purified commercial products.
Suitable seeds can be obtained from Thompson & Morgan Ltd., Ipswich, England.
It is advisable to check the preparation against some known stains before finally
accepting it as suitable. It should then be bottled and stored at _20 0 C.
72
2 .2.2 . 3 Indicator Cells
A1, Band 0 cells are thrice washed in normal saline and very weak suspensions,
pale pink in color, are prepared in 0.3 percent bovine albumin in saline (i. e. ,
1 percent of a 30 percent commercial preparation) . This diluent helps to avoid
lysis during the elution phase and also increases the sensitivity to a small degree.
It is advisable to select suitable donors of 0 cells since some show greater sensi
tivity to the lectin than others. This can be done by comparative titration against
anti-H, those producing the highest titres being most satisfactory. It is ideal to
take about 10 donors from which to make the selection. The A, B, and 0 cell
suspensions should be freshly prepared each day.
2.2.2.4 Method
The following method is used for the Howard and Ma.rtin technique:
1. Cellulose acetate sheet is ruled out and labelled as shown in
Figure 2-l.
2. Five pieces of bloodstained thread and five unstained threads are
secured to the sheet in the appropriate squares by inserting one
end into a spot of cellulose acetate adhesive. The optimum length
of thread protruding from the adhesive is about2 mm, except for
very fine fabrics when the length should be increased a little.
3. After the adhesive has hardened, which is .complete in 5 to 10 min
utes, a drop of the appropriate antiserum is added to each square,
making certain that each thread is submerged in serum.
4. The sheets are placed in humid chambers and left at 4 0 C for a
minimum period of 2 hours. For maximum sensitivity, overnight
absorption is preferable.
5. The serum is rinsed off the sheets by spraying from a wash bottle
of chi.lled saline. Each sheet is then blotted dry and immersed in
a. tank of saline at 4 () C and left 20 minutes. Preferably, there
should be constant agitation of the saline during this period but it
is adequate to agitatEl the sheets occasionally.
6. The sheets should then he removed from the saline and blotted dry.
A drop of appropdate indicator cells added to each square (i. e . ,
A1 cells to the threads treated with anti-A and one of each pair
73
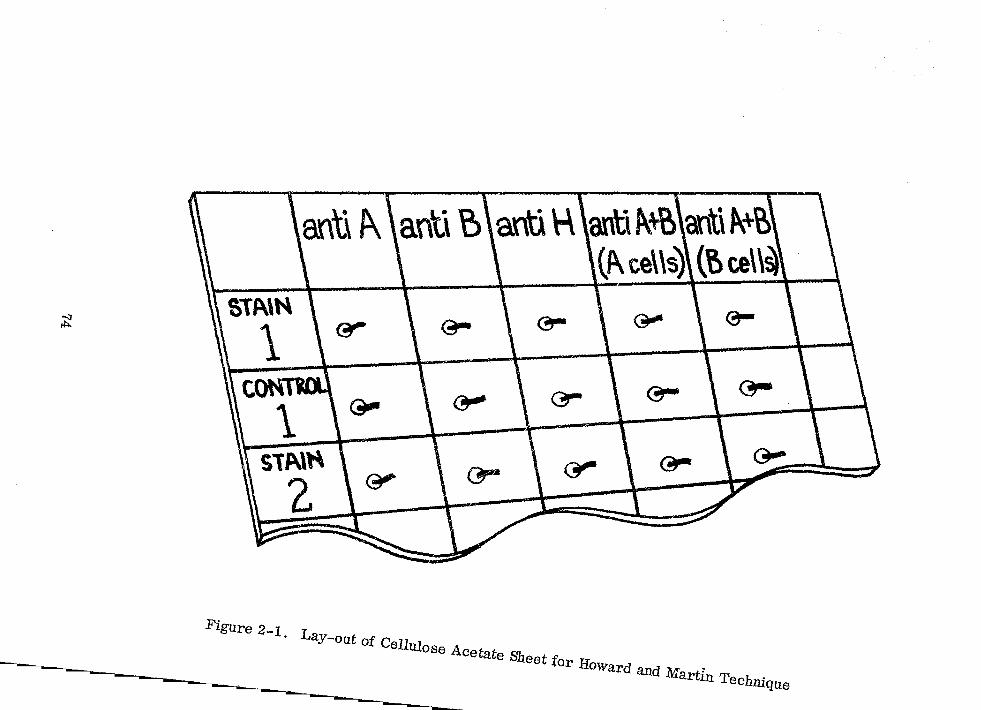
ant\ f:\ \anti ~\anti \i \ant\~~\ant\~+~ (1\ te\ \s)\ (f> ce\ \~
~ @r @- @- G-- (?J-
~ ~ (Jr @J- ~
@J- ~
Figure 2-1. Lay-out of Cellulose Acetate Sheet for Howard and Martin Technique
--..---.--------.-----.------~----
treated with anti-A + B, B to those treated with anti-B and the
second of each pair treated with anti-A + B, and 0 cells to those
treated with anti-H).
7. The sheets are replaced in humid chambers and left in an incu
bator at 50° C for 15 minutes. During this period absorbed anti
body is eluted.
8. The humid chambers should then be put on a low speed rotator and
left for 30 minutes at room temperature for the development of
agglutination.
9. The degree of agglutination is read using a microscope. With
heavy stains it is not uncommon to find large agglutinates and no
free cells. With weaker stains the agglutination is correspond
ingly less.
2 . 2 , 2 . 5 Grouping of Stains
In experienced hands, the grouping of dried bloodstains in this system presents
relatively few problems. The antigens are very stable and the concentration of
antigenic sites is high. With some stains it is also possible to confirm the anti
gen results by detection of serum antibodies. However, because these antigens
also occur in a water soluble form in other body fluids, there can be a problem
caused by reactions from the unstained substrate. For example, this may arise
when dealing with garments where sweat from the wearer gives specific reactions.
Because of this, the necessity for adequate controls from an unstained portion of
the item cannot be over-emphasized. These should be taken from as near as pos
sible to the bloodstain. Despite the greater sensitivity of absorption-elution over
absorption-inhibition, difficulties caused by control reactions are more common
with the latter. This may be because of the water soluble nature of the antigens
in sweat.
The possibility of obtaining false positive reactions caused by bacterial contami
nation cannot be ignored but, in practice, this is not a problem. However, in the
case of large stains that have dried slowly there can be a loss of antigenic activ
ity. It i~ advisable, therefore, to take the material for grouping from the edge
of such stains or, in some circumstances, it may be possible to group from a
discreet stain on the same item.
75
When bloodstains occur on non-absorbant surfaces, it is necessary to absorb
the dried blood onto a piece of cotton thread moistened with distilled water. It is
preferable to use threads of woven cloth from white cotton items which have been
laundered many times because the presence of dressings can give rise to weak
control reactions. It is obviously necessary to obtain an even distribution of
blood along the thread. A control should be taken from an unstained part of the
surface in the same manner. "The threads should. be dried as soon as possible
and moderate heat (i. e. , up to 50° C) is an advantage. It is also necessary to
adopt the same approach with waterproofed fabrics because the proofing material
prevents the normal degree of adhesion of corpuscular debris to the fabric.
2 .2 .2 . 6 Detection of A in Stains x
The use of anti-A + B serum is a refinement that is not absolutely necessary and
was not included in the original method. It has been incorporated for two reasons.
First, it is possible to detect A ; whereas, without its use, such stains would be x grouped as 0 because, as with whole blood samples, Ax is not detected by normal
anti-A. Since A is very rare this is not a serious problem. Second, it provides x confirmation of reactions obtained by the anti-A and anti-B sera. In this context
it is not entirely satisfactory because a high proportion of group 0 sera cross
react when used in an absorption test (i. e., a group A stain will absorb not only
the anti-A fraction of the serum but the anti-B fraction also). With a serum of a
cross reacting type, in addition to detection of Ax ' its use is limited to a con
firmation that anti-A and/or anti-B sera have not failed to react. It may there
fore be argued that testing stains with a cross-reacting serum and eluting into B
cell suspension is of little value. However, by careful selection, it is possible to
obtain anti-A + B sera which show little or no cross reaction. Some commercial
anti-A sera give weak positive reactions with A stains. This may be because of x the presence of immune anti-A.
Obviously, if bloodstains are very small it is possible to test using only anti-A,
anti-B, and anti-H sera. In these circumstances the bloodstained threads should
be secured by inserting 8]1 unstained portion into the adhesive.
76
-----~-------
2 .2 .2. 7 Diluted Bloodstains
Dilute bloodstains can present a problem. If they are diluted to a considerable
degree with water there is usually no difficulty in detecting the antigens present.
However, if they are diluted with saliva or semen there is a risk of wrong inter
pretation. This is only too obvious if the blood and saliva or semen originate
from different lndividuals but, there is also a danger of erroneous interpretation
if they originate from the same individual, due to the possible presence of excess
water soluble antigens. This problem will be discussed further when dealing with
saliva and semen grouping.
2.2.2.8 Grouping Fragments of Muscle, Skin, Tissue
Fragments of muscle, skin, etc., usually can be grouped using the Howard and
Martin method. These are commonly contaminated with grease or fat. A rapid
wash in methyl alcohol followed by a wash in ether is usually adequate to remove
this. The sample is then dried, cut into thin strips about 3 mm in length, and
secured to cellulose acetate sheet in the normal manner. After absorption, the
wash period is increased to one hour. Otherwise the procedure is exactly as
previously described.
2.2.2.9 Grouping of Lysed Blood Samples
Lysed blood samples can be tested by immersing pieces of cotton thread into them
and, after drying. the usual procedure can be followed. He sults obtained from
samples showing obvious signs of putrefaction must be viewed with circumspection.
2.2.3 SUBGROUPS OF A
Various methods have been described for distinction between Al and A2 stains. 28
Poon and Dodd reported the use of mixed agglutination in conjunction with 22
Dolichos biflorus lectin. Hayward has given an absorption-elution method also
using Dolichos biflorus. Experience at the Forensic Science Laboratory shows
that neither of these methods gives completely unequivocal results. The use of
anti-H lectin has also been advocated on the basis of the strong positive reactions
obtained from A2 stains compared with negative or weak reactions usually ob-26
tained from Al stains . Without doubt, anti-H reactions give a strong indication
77
of the sub-group, but it is unwise to form a definite opinion on this basis alone.
A potent human anti-AI is probably the most likely answer to this problem, but
such a serum is, to say the least, difficult to find. A completely reliable method
for AI/ A2 distinction in dried stains has yet to be developed.
78
2 0 3 MN SYSTEM
The use of absorption elution for the detection of MN antigens in dried blood-32 '18
stains was reported by Pereira and also by Fiori in 1963 0 The techniques
involved are similar to those used for ABO grouping and the Howard and Martin
modification23
provides the same advantage 0 Immune anti-M and anti-N produced
in rabbits are used together with MM and NN indicator cells.
In the detection of MN antigens in dried bloodstains, there are serious problems
that are not encountered in ABO grouping 0 These are inherent in the system and
a simple solution is unlikely. Without delving too deeply into theoretical con
cepts, it is well established that some N is normally present on cells of MM indi-°d 1 30, 3J., 33 d" 1 . h . VI ua s ,an It IS reasonab e to assume that N IS t e basIc substance and
the precursor of M. This is the fundamental cause of the difficulties encountered
in dried stain grouping in this system 0 It is also undoubtedly the cause of the
great difference in quality between the anti-M and anti-N sera produced in rabbits.
In practice. it is found absolutely essential to carefully select suitable antisera
for work on dried stains. The only satisfactory means of selection is to make
tests using a range of stains of known group and of various ages. The titre of the
serum is no guide as to suitability 0 Some of the best sera have been of relatively
low titre 0 Of those tested. approximately 50 percent of anti-M sera have been
found to be ideal, giving no indication of cross reaction, yet being highly sensi
tive. Of anti-N sera, less than 10 percent have been satisfactory. Reactions
obtained from some are very weak with a serious risk of failure to detect N,
particularly in MN stains. Others show cross reactions with MM stains to vary
ing degrees. In some this is only slight but with others. there is little distinc
tion between stains of MM and MN 0 It is also found that some MM individuals
show a higher level of cross reaction than the majority 0 Stains from a donor of
this type should always be included in tests for selection of antisera. Another
hazard involved in dried stain grouping in this system is that" because of the
greater potency of anti-M compared with that of anti-N, in an old MN stain it
might be possible to detect M but not No
79
In selecting sera it is also necessary to determine the optimum period for absorp
tion and also the optimum temperature. Some sera require overnight absorption,
while others are specific only when absorbed for a shorter period (i. e .. 3 hours).
Some sera are more specific when absorption is at room temperature and others
are lacking in sensitivity unless absorbed at 4 0 C.
With each batch of stains under test it is necessary to include controls of stains
of the three groups. including a stain from a cross-reacting type of M. Results
obtained from the unknown stains can only be regarded a.s significant if the reac
tions from the control stains are completely satisfactory. For the grouping of
fresh fluid blood samples, anti-N lectin obtained from the seeds of vicia gram
inae is highly potent and frequently used as a substitute for anti-N serum. It has
proved unsatisfactory for a.bsorption-elution techniques because of strong cross
reaction.
The problems outlined above are formidable but nevertheless, providing antisera
are carefully selected and rigid control tests are made, accurate grouping is
possible from recent stains (up to 4 to 6 weeks old) in good condition. On some
occasions. even though the group of a stain cannot be definitely established. one
can exclude the possibility that it has originated from a certain individual. For
example. if a stain gives strong positive reactions for M and weak positive reac
tions for N, the stain may have originated from a cross reacting MM individual
or it may be an MN stain in which. perhaps because of age, the N is only reacting
weakly. It is absolutely certain, however, that the person who produced that
stain was not of group NN. In Britain this means that more than one-fifth of the
population could be excluded.
In view of the problems in this system, interpretation of results should be made
with great caution. When weak reactions are obtained, no positive identification
of the group can be made. Dilute stains are likely to be unsatisfactory, particu
larly stains contaminated with saliva, semen, or other body fluids. Stains that
have dried slowly usually lose all detectable trace of M and N antigens. The ad
vantage of MN grouping of dried bloodstains compared with many other systems
is that first, only a small bloodstain is necessary and second, there is a favour
able distribution of the three major groups as compared with the Kell system, for
instance, where over 90 percent of individuals are of the same type.
80
2.4 RHESUS SYSTEM
2.4.1 ADAPTION OF ABSORPTION-ELUTION
Because of the complexity of the Rh system, it is potentially capable of providing
results of greater significance than any other single red cell antigen system or
indeed any other form of blood typing with the possibl~ \'Jxception of Gm. It has
therefore been the subject of research in forensic serology over many years.
With the advent of absorption-elution, the prospect of full Rh geno typing in dried
bloodstains became more feasible. In 1967, Bargagna and Pereira 34 published a
report on the use of absol:ption-elution for the detection of Rh antigens in dried
bloodstains. In the intervening period, improvements in technique have been
made and Rh geno typing of adequate stains is now a routine procedure in the
Metropolitan Police Laboratory.
The simple absorption-elution technique used for ABO and MN grouping is, for a
variety of reasons, unsuited to the Rh system althou;;h the general principle in
volved is precisely the same. The quantity of bloodstain required is very much
greater than with the ABO and MN systems. This is largely because of the lower
concentration of Rh antigenic sites on the cell membrane. The use of larger por
tions of bloodstain in turn necessitates a more prolonged washing procedure.
In grouping fluid blood samples in the Rh system, slide techniques are less satis
factory than grouping in tubes. For working on dried stains the use of tubes is
essential. Apart from the risk of loss of sensitivity because of the use of slides,
the evaporation problems during the absorption period would be enormous in view
of the optimum temperature of 37 0 C. Elution directly into indicator cell suspen
sions is impossible because, after such exposure to heat, cells are no longer
capable of being agglutinated by anti-Rh sera. It is therefore necessary to elute
into saline. The absence of cell$ during elution give s greater latitude regardlng
duration and temperature as there is no limitation imposed by red cell fragility .
An increase of both duration and tempe'rature produces more efficient elution.
~~_1 __ 76_9_0 __ 7_2 ___ 6 ____________ __
81
2.4.2 SELECTION OF ANTISERA
As with MN grouping of dried stains, selection of antisera is important, but there
is less difficulty in obtaining suitable sera. While it is possible to use complete
antisera, incomplete sera are more satisfactory. Sensitivity is generally
greater and specificity is more certain. Unlike anti·M and anti-N sera, those
of highest titre are usually most sensitive under absorption-elution conditions.
fucomplete sera (slide test) marketed by Hyland, Dade and Ortho have been found
very satisfactory. Ortho sera tend to be more viscous than others and therefore,
additional care is necessary in washing away unbound antibody. Because of the
sensitivity of absorption-elution and the fact anti-Rh sera may contain more than
one antibody, it is necessary to test each new batch of serum with stains from
a wide range of Rh groups before putting into routine use.
For full genotyping, the following sera are necessary: anti-C, -c, -D, -E, and
anti-e. Anti-Cw is also commercially available and capable of detecting the CW
antigen in dried bloodstains. Anti-c and anti-D are usually more potent than
anti-C, anti-E, and anti-e.
The quantity of bloodstain necessary is dependent upon the quality of the antisera
in use. This means that it is usuaJJy possible to detect c and D antigens from a
smaller quantity of stain compared with antigens C, E and e. For reasons of
economy of bloodstain and, more important, to avoid the risk of detecting some
of the antigens in a stain and miSSing others, it is necessary to attempt to re
store the balance between the degree of reaction of the five antigens by suitably
adjusting the relative proportion of stain tested with each antiserum. fu practice,
portions of stain 2 to 3 mm2 have been found suitable for testing against anti-c
and anti-D, The quantity required for c is usually a little less than for D. Stain
portions of 4 to 5 mm 2 are usually adequate for C, E and e. Obviously. this is
to some extent dependent on the nature of the bloodstain and the thicimess of the
fabric. As the quality of antisera varies so much, proportions must be read
justed to the serum in use and no hard and fast rules can be made. If certain
antisera are of low titre, the balance can also be adjusted by increasing the quan
tity of serum used. Because the quantity of bloodstained material is large, there
is difficulty in washing out unabsorbed serum. It is therefore preferable to work
82
with all sera diluted. With anti-C, -E and -e, dilutions of 1/2 are usually ade
quate but for some anti-a and anti-D sera it may be necessary to dilute as much
as 1/20.
When incomplete antisera are used, any of the established techniques recommended
for such sera can be employed for testing the eluates. The albumin addition
method is simple but less sensitive than enzyme techniques. The indirect Coomb IS
test can also be applied but this is time consuming and not well suited for testing
large numbers of stains. A highly satisfactory alternative to conventional meth
ods is the use of the Technicon Antibody Screening Auto-analyzer.
2.4.3 MANUAL TECHNIQUES27
There are two manual techniques in the rhesus system, (1) using bovine albumin,
and (2) using papain. The materials necessary include the following:
a. Tubes-Glass or plastic tubes approximately 8 mm in diameter are
suitable.
b. Anti-Rh Ser~-High titre incomplete anti-C, _·c, -D, -E, and anti-e
are used. These should be tested for suitability using stains of a
wide range of Rh genotypes.
c. Indicator Cells-Freshly prepared R1 R1 and R2 R2 are used.
d. Bovine Albumin-30 percent bovine albumin is recommended.
e. Papain3 'LA stock solution of papain is prepared as a I-percent
suspension in saline and is stored at _20 0 C. For use, the stock
solution is diluted 1/10 with M/15 Sorensen buffer of pH 7.3.
f. Racks-These should accommodate the tubes in rows of five so that
each row can be labelled for one of the antisera and rows at right
angles can be numbered.
The following is a deseription of the method.
1. Divide stains into flve suitable portions and place in tubes in the rack.
2 . Prepare controls from an unstained portion of the fabric.
3. For positive controls, take five portions of an R1 R2 stain and for
negative controls take portions of stains lacking the antigens cur
responding to each antiserum.
83
4. Record the sequence of stains and controls in the racks.
5. Add one drop of appropriate antiserum to each cup and dilute with
a suitable quantity of saline.
6. Ensure that all of the pieces of fabric are immersed in diluted anti
serum, cork the tubes, and leave overnight in a 37° C incubator.
7. After removal from the incubator, fill the tubes with saline, remove
the saline/serum mixture, and replenish with fresh saline. For
cotton, linen, woolen, and all heavy fabrics, exchange saline six
times during two hours. For delicate fabrics and lightweight syn
thetics, the duration of washing should be reduced. For very light
weight nylon fabric, half an hour is adequate.
8. Remove saline from all tubes and add two drops of fresh saline
to each.
9. Immerse tubes in a wat.3r bath at 60° C for 40 minutes and agitate
occasionally.
10. Take racks from the water bath, agitate vigorously and remove the
pieces of cloth from the eluate as quickly as possible using a fresh
piece of applicator (swab) stick for each tube.
Albumin Method
lOa. Prep!lre indicator cells as 3 to 5 percent suspensions. Add one drop
of R1 Iii cell suspension to each of the tubes originally treated with
anti-C and anti-e. Add one drop of R2 R2 cell suspension to each of
the remaining tubes. Place the tubes in a 37° C incubator for
1-1/2 hours.
lla. Remove the tubes from the incubator and run a little 30 percent
bovine albumin down the side of each tube taking care to avoid dis
turbing the button of cells at the bottom. The albumin should then
form a layer between the cells and the supernatant. Replace the
tubes in the 37° C incubator and leave for 1/2 hour.
12a. Remove the tubes from the incubator. Taking up the contents from
each tube in turn, streak out on a microscope slide and, in the ab
sence of strong positive macroscopic agglutination, e~amine under
a microscope. Record the results.
84
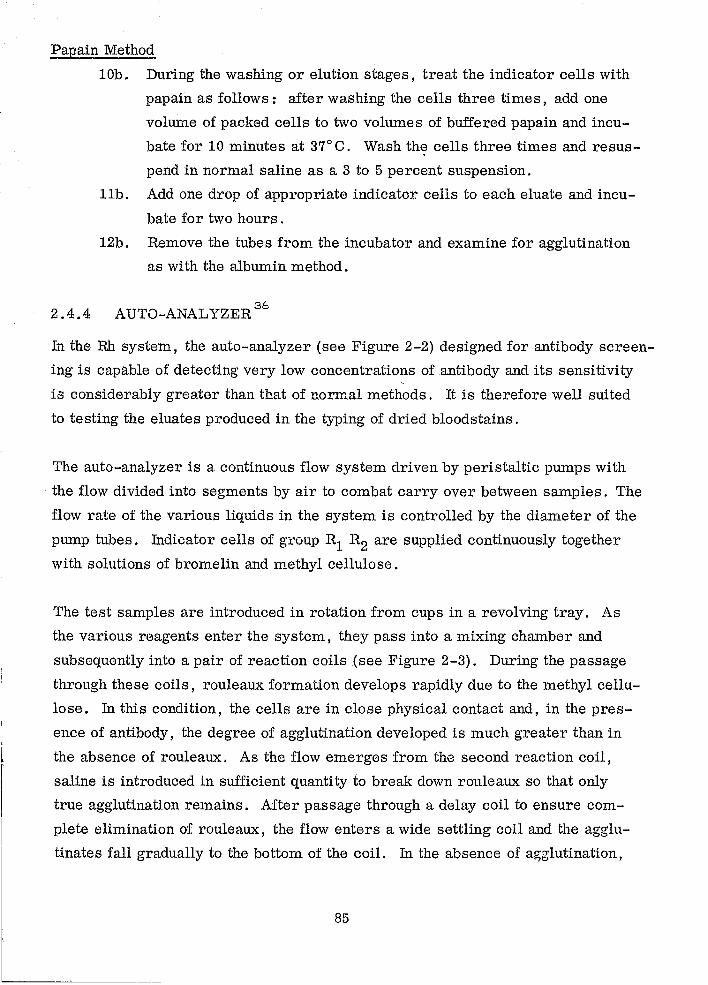
P~ain Method
lOb. During the washing or elution stages, treat the indicator cells with
papain as follows: after washing the cells three times, add one
volume of packed cells to two volumes of buffered papain and incu
bate for 10 minutes at 37° C. Wash the cells three times and resus
pend in normal saline as a 3 to 5 percent suspension.
llb. Add one drop of appropriate indicator cells to each eluate and incu
bate for two hours.
12b. Remove the tubes from the incubator and examine for agglutination
as with the albumin method.
2.4.4 AUTO-ANAL YZER 36
fu the Rh system, the auto-analyzer (see Figure 2-2) designed for antibody screen
ing is capable of detecting very low concentrations of antibody and its sensitivity
is considerably greater than that of normal methods. It is therefore well suited
to testing the eluates produced in the typing of dried bloodstains.
The auto-analyzer is a continuous flow system driven by peristaltic pumps with
the flow divided into segments by air to combat carryover between samples. The
flow rate of the various liquids in the system is controlled by the diameter of the
pump tubes. Indicator cells of group Rl R2 are supplied continuously together
with solutions of bromelin and methyl cellulose.
The test samples are introduced in rotation from cups in a revolving tray. As
the various reagents enter the system, they pass into a mixing chamber and
subsequently into a pair of reaction coils (see Figure 2-3). During the passage
through these coils, rouleaux formation develops rapidly due to the methyl cellu
lose. In this condition, the cells are in close physical contact and, in the pres
ence of antibody, the degree of agglutination developed is much greater than in
the absence of rouleaux. As the flow emerges from the second reaction coil,
saline is introduced in sufficient quantity to break down rouleaux so that only
true agglutination remains. After passage through a delay coil to ensure com
plete elimination of rouleaux, the flow enters a wide settling coil and the agglu
tinates fall gradually to the bottom of the coil. In the absence of a~glutination,
85
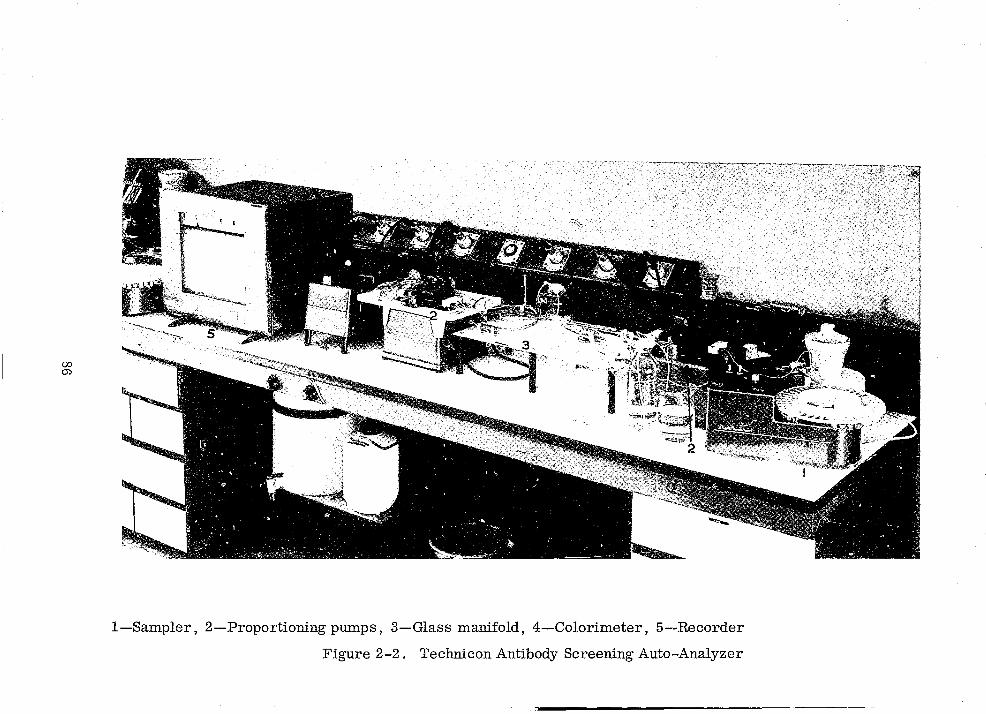
CIJ cr.>
I-Sampler, 2-Proportioning pumps, 3-Glass manifold, 4-Colorimeter, 5--Recorder
Figure 2-2. Technicon Antibody Screening Auto-Analyzer
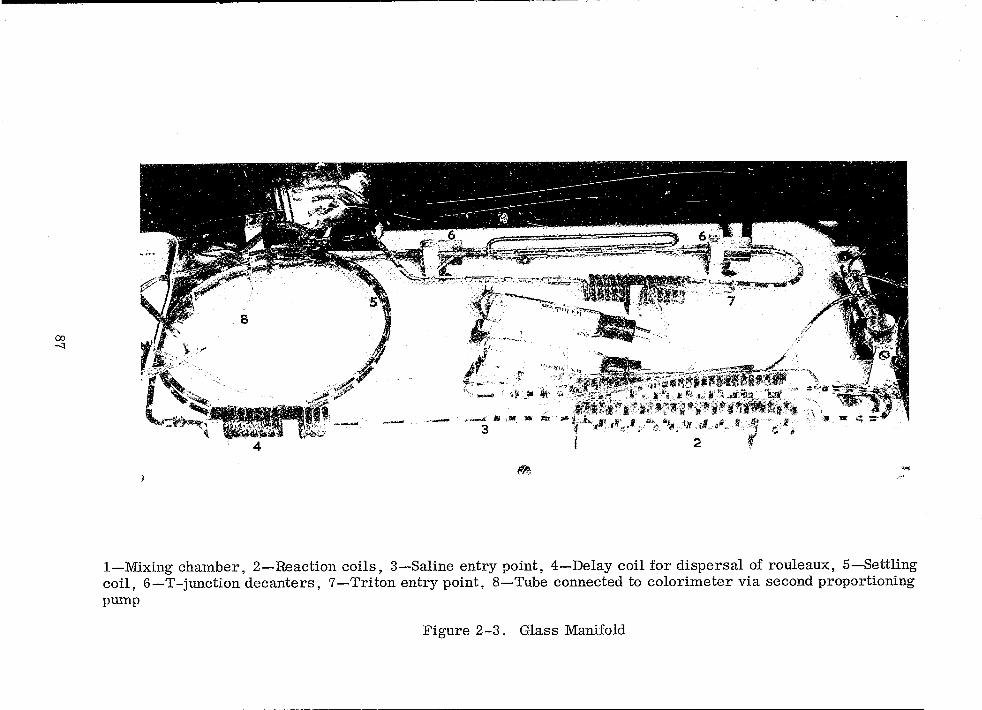
C1J ..;)
1~",~
"......-..' ,_,,,,,,,,,{ III ,Uir _ i'tt 3 '
4
\~;
:;":.~,~~~;~':: ;.;;jO'lI$~I't,'I'
'1/"", j'kiL Ai '" ,1': .'>lj ';-l!i """''';'''~'\'II!;''iF'ji\' ';j,
,""" to\"~ ", t r~i "'('l<! ~"J" 'J ' if'}
.... ~4...i..'Jt'~li:,.I ""JI/ ;'Nfl"a$. ~.~I I 2 r
....
I-Mixing chamber, 2-R.eaction coils, 3-Saline entry point, 4-Delay coil for dispersal of rouleaux, 5-Settling coil, 6-T-junction decanters, 7-Triton entry point, 8-Tube connected to colorimeter via second proportioning pump
Figure 2-3. Glass Manifold
the stream remains homogeneous. On leaving the settling coil, the flow passes
over a pair of T-junction decanters through which a constant volume of the flow
is removed. All agglutinates are thus removed so that the concentration of cells
present in the flow at this stage is inversely proportional to the degree of agglu
tination, and hence to the concentration of antibody present in the respective sam
pIes. A haemolytic reagent is then introduced and, after completion of lysis, a
sample of the flow passes through a colorimeter and the relative concentrations
of haemoglobin are charted by a recorder. In the absence of agglutination, the
haemoglobin concentration is constant and a relatively high optical density is
obtained. This forms the baseline on the recorder chart. Optical density is
reduced because of the loss of haemoglobin and thus, where reactions have oc
curred, peaks are formed in proportion to the degree of agglutination.
In addition to increased sensitivity, other advantages in the use of the auto
analyzer are the economy of labour and the fact that the assessment of the degree
of agglutination is truly objective. The apparatus is, however, very costly and
some experience is necessary before it can be run with efficiency.
2.4.5 AUTO-ANALYZER USE FOR ABSORPTION-ELUTION 27
2.4 . 5 .1 General
One of the most important and potentially time consuming operations in absorption
elution is the washing away of unbound antibody. By using auto-analyzer equip
ment, it is p ,sible to construct a washing machine for this purpose (Figure 2-4).
It consists of a peristaltic pump and a sampler fitted with a 120/hour adjustable
cam in which the wash phase spaces are reduced to a minimum. The 2-ml cups
containing pieces of fabric to be washed are placed in the circular sample tray in
sequence but alternating with 8-ml cups. All of the cups are filled with saline.
The sampler is equipped with a stirrer and two probes set up so that after each
cup is stirred, saline is drawn off through the first probe and fresh saline is
added by the second. The suction probe is coupled to a pump tube through which
the flow is 3.9 ml per minute and for the second probe, the flow rate is 2.9 ml
per minute. Each piece of cloth remains soaking in saline during the rotation of
the sample tray. The 8-ml cups are included to avoid the pieces of cloth being
88
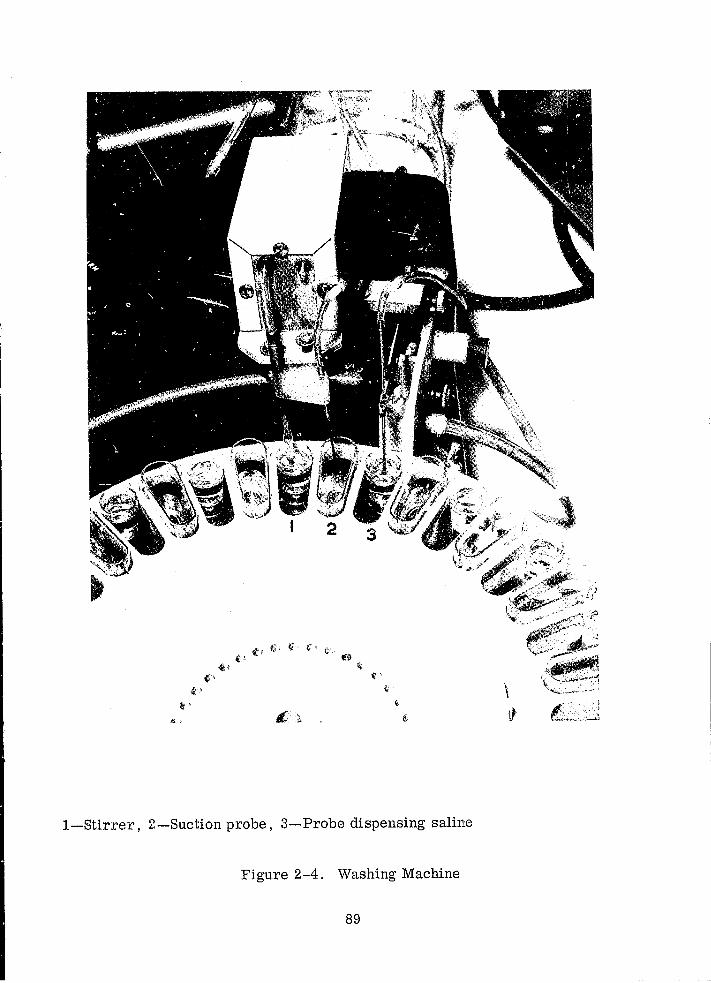
I-Stirrer, 2-Suction probe, 3-Probe dispensing saline
Figure 2-4. Washing Machine
89
carried over into the next sample. In the event of the suction probe carrying over
a piece of cloth, the latter is trapped by sinking to the bottom of the 8-ml cup and
can easily be restored to its correct position. The sample trays accommodate
40 cups and, with a 120/hour cam, it is possible to carry out three changes of
saline per hour. If required, two or three samplers can be operated by one pum.p.
This washing method is unsuitable for loosely woven fabrics or cotton wool. In
such cases, a manual method must be employed.
With an automated technique, it is obviously essential that each sample can be
accurately related to a particular part of the recorder chart. For this reason,
a regular routine should be developed and the sequence of samples recorded and
rigidly maintained. The absorption is set up in 2-ml auto-analyzer cups and
each piece of cloth remains in the same cup until after elution when the cloth is
removed but the corresponding eluate remains. Metal racks are available which
accommodate 2-ml auto-analyzer cups in rows of five and are ideal for use with
the five anti-Rh sera. Each row therefore can be used for either a complete test
on a bloodstain or its control and be labelled accordingly.
If washing is carried out by the automated method, it is necessary to transfer
the cups into sampler trays for this process and later to transfer them back into
the metal racks for elution. Finally, the cups are transferred to sampler trays
prior to testing the eluates. It is essential to maintain an exact sequence of the
cups at all stages. When using the auto-analyzer it is necessary to use markers
at regular intervals in order to precisely locate the reaction from each sample
on the recorder chart.
Anti-D diluted 1: 100 is usually suitable. At such a dilution very strong aggluti
nation is obtained but carry-over problems are avoided. The optimum dilution
for the marker is obviously dependent upon the quality of the serum. It is con
venient to put a marker between groups of five eluates corresponding to individual
stains or unstained cloth controls.
90
2.4.5.2 Reagents for Auto-Analyzer
2 .4 . 5 . 2 .1 Cell Suspension
Rl R.2 cells are freshly prepared and 20 ml of packed cells are suspended in
20 mm of 30 percent bovine albumin, 15 ml of AB serum, and 45 ml of normal
saline. During use, the container should stand in melting ice and the cells should
be mildly agitated by a magnetic stirrer.
2.4.5.2.2 Rouleaux Inducing Agent
Methyl cellulose is prepared as a O. 3 p(~rcent aqueous solution. Since this is
difficult to dissolve, it is best prepared on the previous day. The use of a mag
netic stirrer can expedite preparation. Before use, the preparation should be
centrifuged.
2.4.5.2.3 Enzyme
One gm of bromelin is added to 100-ml of saline. This is best prepared using a
homogeniser. If this is not possible, the preparation should be left to extract
overnight at 4 0 C. Before use, the preparation should be centrifuged and, during
use, the container should stand in melting ice.
2.4.5.2.4 Wash Solution
This is supplied to the wash trough of the sampler and is used for flushing through
the probe between samples. It consists of 15 ml of 30 percent bovine albumin in
885 ml of saline.
2.4.5.2.5 Haemolytic Reagent
This is a O. 5-percent aqueous solution of Triton X100 . It is best to prepare this
on a daily basis. For rapid dissolution a magnetic stirrer is useful.
2.4 . 5 . 2 . 6 Antisera
The following antisera should be used: anti-C, anti-c, anti-D, anti-E, and
anti-e. All should be of the incomplete type having an auto-analyzer titre of at
91
least 1/2000. They should be tested for specificity with stains of a wide range
of Rh groups before putting into routine use with unknown stains.
2 .4 . 5 . 3 Method
The following method is used with the auto-analyzer.
1. Divide bloodstains into five suitable portions as discussed in
paragraph 2.5.4.1 and place in 2 ml auto-analyzer cups arranged
in labelled metal racks.
2. Prepare similar controls of unstained fabric.
3. For positive controls, take five portions of an R1 R2 stain and for
negative controls take portions of stains of different groups that
lack antigens corresponding to each antiserum.
4. Record the sequence of stains and controls as they are arranged in
the racks.
5. Add one drop of appropriate antiserum to each cup and dilute with
a suitable quantity of saline.
6. Ensure that all of the pieces of fabric are immersed in diluted
antiserum, cap the cups and leave overnight in a 37° C incubator.
It is necessary to place another rack or suitable object on top of
the cups to prevent the caps from blowing off during incubation.
7. After removing from the incubator, either follow the washing pro
cedure recommended for the manual method or remove unabsorbed
serum using a washing machine. Load the cups in sequence into
sampler trays and wash to 1/2 to 2 hours according to the type of
fabric.
8. Replace the cups in the same sequence in the labelled racks. With
draw the saline from all of the cups and replenish with 0.3 ml of
fresh saline. Ascertain that every piece of fabric is immersed in
saline.
9. Immerse cups in a water bath at 60° C for 40 minutes and agitate
occasionally.
10. Take the racks from the water bath, agitate them vigorously and
remove the pieces of cloth from the eluate as quickly as possible
using a fresh piece of applicator stick for each cup.
92
11. During the washing process, the auto-analyzer should be set in
motion so that, by the time the eluates are prepared, a steady
baseline has been established and positive controls using the
marker ant.i-D have been made.
12. Cups containing saline are placed in the even numbered spaces in
the sampler tray. This is a further precaution against carryover.
The marker is placed in the first space and eluate from anti-C in
the third with the eluates from the remaining four antisera in the
uneven spaces up to No. 11. A second marker is placed in space
No. 13. This sequence is continueu until all of the eluates are
accommodated. The final cup should contain marker.
13. The sampler trays are run in sequence on the auto-analyzer.
Most satisfactory results are obtained when the sampler is fitted
with a 40/hour cam, 2:1 wash ratio.
14. After the final marker peak has appeared on the chart, the latt.er
should be removed from the recorder. The marker peaks should
be located and labelled and, from the record prepared of sequence
of tests in the racks, the results from each stain and control can
be identified and labelled,
2.4.5.4 Interpretation of Results
Before an interpretation can be made regarding the results from any parti.cular
stain, it is necessary that there should be large, well-defined peaks from the
Rl R2 positive control stain and no peaks from the negative control stains and
also from the cloth control from the individual item (see Figures 2-5 and 2-6).
With very strong positive reactions differences in optical density of 005 may be
obtained, but with small or poor quality stains differences of as little as 0.2
or even 0.15 are acceptable.
2.4.6 LESS COMMON Rh ANTIGENS
2.4.6.1 DU
This is fairly rare among caucasians but common in negroes. With whole blood
samples the cells usually fail to agglutip..ate with anti-D sera unless the indirect
93
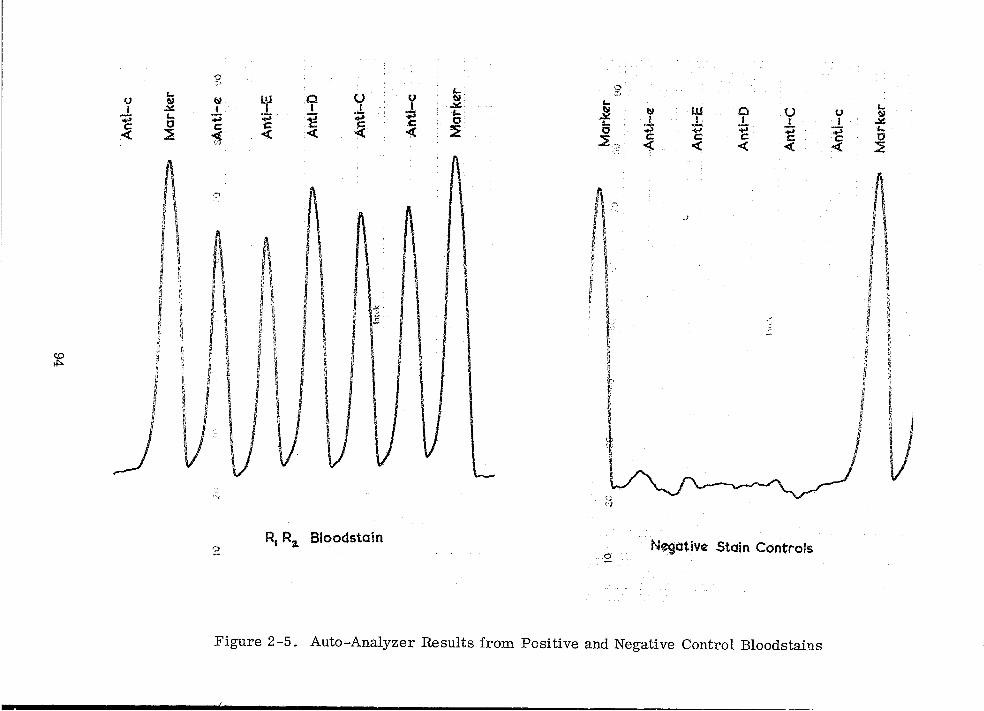
'0 Q
<j!
l- e:, I...
Lf CI () Y tI: I... I...
0 ~ til I :1 ,:"t;.
~ ~ lJ.l 0 U 0 ~ I ,:"t; I . ..... :;; '- I I I r I ~. :;::; I... :;::; :;:> ~ ~ t: 0 I... :;:; .- :;; :;; -;;:; t-O t:
~ 0 +" 0
C C « .« "':t c c c c c « ~ 1t < .2.~ « « <{ « :< ~
.'J
I \ '\ M
1\ A a .....
.J
~ n , , , I
~
I I I j . I .. . , . -
" I ~ I ~
to » ~." f tl , ; ~
H>- ' ~ ~ i"
t i ill II/ II j i I I I I
" (,,; ~'1
R, Ra Bloodstain .0
Negative Stain Controls 2
Figure 2-5. Auto-Analyzer Results from Positive and Negative Control Bloodstains
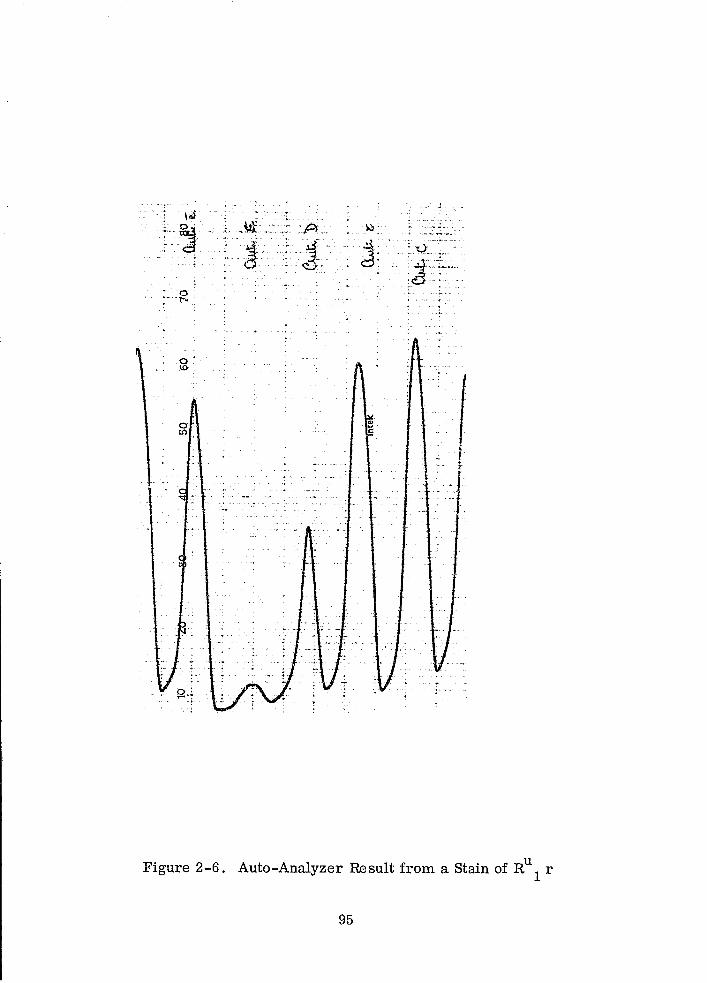
. o· '" i"< .
_wi .,' ~:: .,'Pi ..
' .. 'j. " ~iH ,j: . :V.
:~
Figure 2-6. Auto-Analyzer Result from a Stain of RU 1 r
95
Coombs test is used. When using the manual techniques, one would normally
obtain no agglutination from eluates of DU stains. It is possible to detect the
presence of DU in dried stains by incubating a second anti-D eluate with R2 R2
cells for two hours, washing the cells twice, and testing with antihuman globulin
serum. If the stain contained the DU antigen, the cells should be agglutinated.
It is possible, however, that some forms of DU may not be detected and, there
fore, with manual techniques there is always a small risk that a stain giving
negative reactions for D is in fact a DU• With the auto-analyzer, the situation
is much more satisfactory as eluates from stains of DU individuals produce well
defined peaks but of a reduced size compared with normal D. The peaks are
usually between 1/4 and 1/2 of the normal size.
2.4.6.2 CW
Good quality anti-Cw sera are available and can be used in exactly the same way
as other anti-Rh sera. For reasons of economy it is usually best to test for CW
only on stains that have previously given positive reactions for C. If anti-Cw is
only available as a complete antibody, it must be checked for the absence of in
complete antibodies of other specificity before it is used for any of the techniques
described on the foregoing pages. In the presence of other antibodies, the eJuates
can only be tested by a saline method. It is necessary to employ a manual tech
nique and, after elution, the indicator cells are left in the eluate at 37°C for two
hours and then examined for agglutination. Albumin and enzyme methods must
not be used. Obviously, the indicator cells must contain the antigen CW•
2.4.7 PROBLEMS ASSOCIATED WITH Rh GENOTYPING OF DRIED BLOODSTAINS
With adequate recent bloodstains that have dried quickly, Rh genotyping is highly
reliable. With old stains or those of inadequate quantity, it is only safe to draw
conclusions from positive reactions. In these circumstances, one cannot be
certain of the absence of an antigen when a negative reaction is obtained. Stains
that have dried slowly present the greatest danger of erroneous typing and it is
never safe to rely on results from those smelling of putrified blood. The appear
ance of the bloodstain to an experienced eye is a good guide to its suitability for
96
grouping. The behaviour of the stain when tested for other components is also
a useful guide to its quality for Rh typing. For example, those which have lost
PGM activity are likely to give negative reactions in the Rh system.
Problems arising from the DU antigen have been mentioned previously. In a
caucasian society the incidence of R is low and R u is extremely rare and, o 0
therefore, when reactions for rr are obtained, the chance that the stain is ac-
tually R u is remote. In a negro population or one with a high proportion of o
negroes, the possibility of the presence of DU is considerably greater.
In some cases a bloodstain might be too small for full Rh genotyping but it can
be profitable to test for certain antigens. For example, if a victim possessed
the antigen E and the suspect did not, useful information could be obtained by
t(~sting for E and e. If the presence of CW was suspected in a stain of inadequate
size for full genotyping, it would obviously be of great value if CW could be
detected.
When stains occur on non-absorbant surfaces, they can be absorbed onto small
pieces of white cotton fabric moistened with water and, after drying, the cloth
can be tested in the normal way. When stains occur on carpets it is best to
scrape the blood from the carpet and absorb this on cotton cloth. A serious
problem is encountered in grouping in the Rh system on denim material. It is
so closely woven that it is impossible to completely remove the unabsorbed
serum. If the bloodstains are in a crusty condition it is better to scrape off the
blood and treat as for carpets.
The detection of Rh antigens in dried bloodstains is exacting and time consuming
but, because of the variety of genotypes within the system, it can be highly re
warding. Despite the heavy financial outlay involved in the automated method it
has many advantages over manual techniques.
97 451-769 0 - 72 - 7
2.5 ABO IN SALIVA, SEMEN AND OTHER BODY FLUIDS
2.5.1 GENERA.L
Approximately 80 percent of individuals are secretors and produce ABH group
specific substances in high concentration in saliva, semen, vaginal secretion,
and gastric juice. In other body fluids, such as sweat, tears and urine, the con
centration is fairly low. These substances differ from those of blood in that they
are mucoids instead of glycolipids and are readily soluble in water. In fluids,
such as saliva and semen, the relative concentration of ABH antigens is much
greater than in blood. Because of this, absorption-inhibition is more reliable
for testing saliva etc., than it is for blood. In non-secretors there are low con
centrations of group substances in body fluids and these can be detected by
absorption-elution.
Classification into secretor and non-secretor is usually a very simple matter,
but occasionally it is difficult to assess. There is also evidence that some indi
viduals secrete in one body fluid and not in another. In forensic serology, the
grouping of seminal stains is a routine occurrence but, for the purpose of elicit
ing whether or not a person is a secretor, it is usual to test saliva and, in these
circumstances, a suspect can only be eliminated with certainty on the basis of
his ABO group and not by the secretor status indicated by his' saliva.
Despite the high concentration of group specific substances in the saliva and
semen di secretors, there are serious problems involved in group determination.
A small proportion of individuals of groups A and 0 exhibit B activity in body
fluids and some people of groups Band 0 show A activity. The latter is more
common. Most of the work on this subject has been carried out on saliva but
there is evidence of similar difficulties in semen and vaginal secretion. For
tunately, the levels of spurious A and B are much lower than those of genuine
group specific substances and, by adopting semi-quantitative methods and using
absorption-inhibition and absorption-elution in parallel, it is usually possible to
determine the group. However, in some cases the results are contradictory and
the group cannot be determined with certainty.
98
The cause of this spurious A and B activity has not been ascertained, but it is
likely to be caused by bacteria. Although cultures of bacteria from saliva sam
ples that gave spurious reactions were tested and failed to show the correspond
ing A or B reactions, it is possible that the problem arises because of the activity
of bacterial enzymes that may convert a small proportion of the terminal sugars
of the group subsi;~.nces.
As previously stated, the levels of spurious A and! B activity are much lower
than those of true group specific substances. With both absorption-inhibition
and absorption-elution techniques, it is normally possible to dilute saliva or
other body fluids to an extent where false activity is not detected but specific reactions are obtained. Because there is considerable variation in the reactions
of samples and stains from different individuals, it is preferable to carry out
tests on a series of dilutions rather than at.tempt to select an optimum workin~
dilution. When testing fluid saliva by absorption-inhibition, it is common to find
strong inhibition with saliva diluted 1/1000, whereas false positive A and B reac
tions are rarely detectea. in dilutions of 1/10. Because of the soluble nature of
blood group substances in body fluids, it might be expected that their detection
by absorption-elution without prior fixation would be impossible because of the
washing process involved, but this is not the case. Tests are carried out by im
mersing pieces of cotton in the successive dilutions and, after the cotton has
dried, a simple technique such as that of Howard and Martin 23 is followed. A
and B substances from secretors can be shown at dilutions of 1/4000 or more.
It is rare to detect spurious A and B activity at dilutions of more than 1/40.
With neat saliva from secretors, it is common to obtain negative or very weak
reactions for the appropriate A or B antigen buJ;, with successive dilutions, the
strength of agglutination increases progressively up to a maximum which is main
tained over many dilutions 37 • This prozone effect is undoubtedly caused by the
presence of an excess of water soluble antigens that dissolve in the grouping
serum and absorb a high proportion of the antibody content so that insufficient
remains to combine with the antigens absorbed onto the cotton fibres. III prac
tice, this prozone reaction is advantageous, since it provides very convincing
evidence of the presence of true group specific substance compared with the
reaction obtained from false A and B where there is a progressive diminution
in agglutination.
99
On account of difficulties arising from spurious reactions, the use of absorption
inhibition and absorption-elution in parallel is highly desirable for grouping both
fluid samples and dried stains. Of the two methods, because of the lower sensi
tivity, inhibition is less prone to the detection of false A and B and is therefore
more reliable. However, with some AB secretors, the level of A activity is
very low and can remain undetected by absorption-inhibition although clearly
demonstrated by absorption-elution. In grouping dried stains, the highly sensi
tive elution method can serve as a confirmation that negative reactions obtained
by inhibition are caused by absence of antigen and not by the presence of insuf
ficient material.
2.5.2 GROUPING TESTS ON FL DID SALIVA SAMPLES
2.5.2.1 Preliminary Treatment
On receipt in the laboratory, samples should be centrifuged to remove as much
cellular debris as possible. The supernatants are transferred to suitable tubes
and these are placed in a boiling water bath for ten minutes. After further centri
fugation, the supernatants are ready for serological testing but they may be
stored at _20 0 C and tested later if this is more convenient.
2.5.2.2 Absorption-Inhibition
2.5.2.2.1 Materials and Reagents
The tests may be carried out in tubes or welled tiles, etc., according to personal
preference. For absorption, tubes of 5 to 8 mm in diameter are suitable.
Anti-A, anti-B and anti-H are used in conjunction with A2
, B and a indicator
cells in 2 percent suspensions.
2.5.2.2.2 Method
The following method is used for absorption-inhibition testing:
1. By double dilution, select the optimum dilution of each anti
serum. This is the penultimate dilution capable of giving large
agglutinates without free cells.
100
2. Prepare saline dilutions of the saliva sf'tlnples as follows ~
1/10, 1/100, and 1/1000.
3. To aliquots of neat saliva and the thre~ dilutions add equal
quantities of diluted anti-A, anti-B, and anti-H.
4. To aliquots of saline add equal quantities of diluted anti-A,
anti-B, and anti-H to provide unabsorbed serum controls.
5. Cork the tubes and leave for 2 hours at 4 0 C.
6. To one drop of the contents of each tube add one drop of appro
priate indicator cells in well tiles or tubes.
7. Leave at room temperature to allow development of agglutina
tion-with welled tiles, 30 minutes is appropriate. The method
of testing should be precisely the same as that employed to
select the optimum dilutions of antisera.
8. Examine for agglutination and record the results.
2.5.2.3 Absorption-Elution
2.5.2.3.1 Technique
The Howard and Martin technique is employed using undiluted anti-A, anti-B,
and anti-H. Anti-A + B serum is not used.
2.5.2.3.2 Method
The following ml;lthod is used for the absorption-elution tests:
1. Prepare the following dilutions of saliva in water: 1/20,
1/40, 1/80, 1/160.
2 . Immerse short cotton threads in neat saliva and in the four
dilutions. Leave for a few minutes.
3. Thoroughly dry the threads. Secure short pieces to cellulose
acetate sheet with adhesive leaving 2 to 3 mm of cotton exposed
for subsequent treatment with antisera.
4. Proceed as for blood giving 2 hours absorption at 4°'C and
using A l' Band 0 indicator cells.
101
2.5.2.4 Interpretation of Results
The results obtained by the two methods must be assessed together. With the
majority of samples, little evidence of spurious activity is found, but occasion
ally it is more pronounced. The results given in Table 2-1 are fairly typical
of a B secretor showing spurious A activity. The quantity of detectable H sub
stance in A and B secretor saliva various greatly. Typically, it can easily be
detected by absorption-inhibition but, in some cases, it is only demonstrated by
absorption-elution. In such individuals, the relative concentration of A or B
group specific substance is very high and this would suggest that a high proportion
of H substance has been converted to A or B.
2 .5.3 GROUPING TESTS ON DRIED STAINS
2.5.3.1 General
The difficulties involved in grouping dried stains are greater than with fluid
saliva samples. Once the fluid has dried on an absorbent surface, the extent
to which the substances can be re-dissolved varies considerably. In some cases
it is easy to prepare an extract and results similar to those obtained with fluid
saliva are obtained. In others, the solubility is low and it is then impossible to
distinguish between reactions because of spurious A and B and true group specific
substances. In sexual crimes, semen is frequently mixed with vaginal secretion.
A critical microscopic examination is therefore necessary to form an opinion as
to whether or not a particular stain is neat semen. Grouping tests may also be
made on vaginal swabs, but these can only be of use if the group of the woman
concerned is known. If she is of group AB, such tests would be useless, but if
she is group 0, then there is a high probability of obtaining useful information.
2.5.3.2 Absorption-Inhibition
2.5.3.2.1 Materials and Reagents
These are exactly the same as for testing fluid saliva.
102
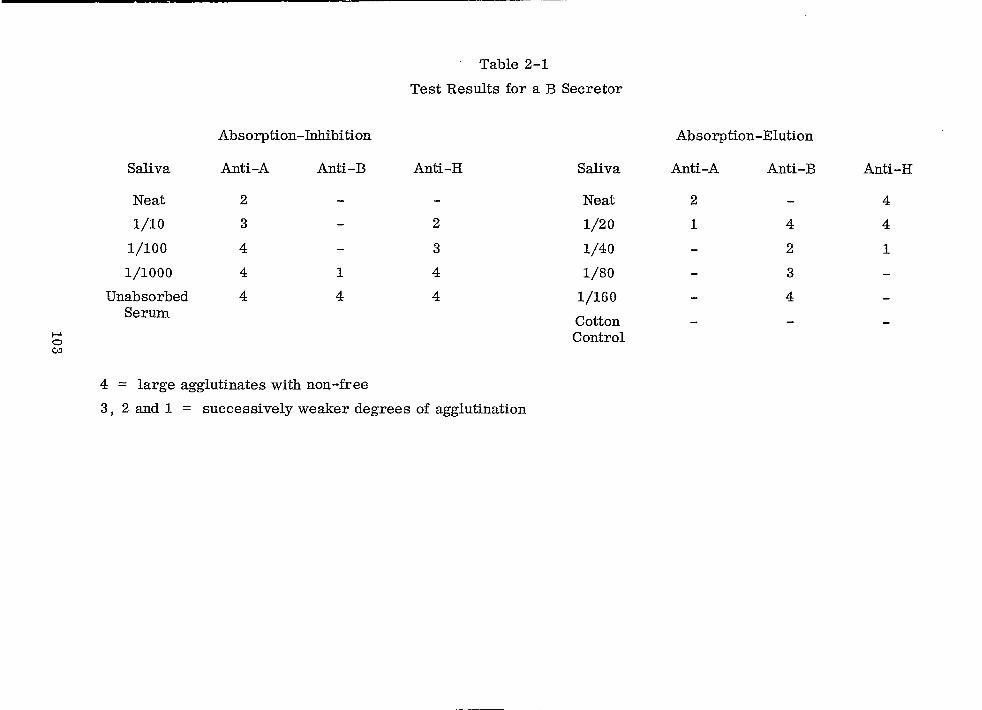
l-" 0 C.:J
Saliva
Neat
1/10
1/100
1/1000
Unabsorbed Serum
Absorption-Inhibition
Anti-A
2
3
4
4
4
Anti-B
1
4
4 = large agglutinates with non-free
Table 2-1
Test Results for a B Secretor
Anti-H
2
3
4
4
Saliva
Neat
1/20
1/40
1/80
1/160
Cotton Control
3, 2 and 1 = successively weaker degrees of agglutination
Absorption-Elution
Anti-A
2
1
Anti-B
4
2
3
4
Anti-H
4
4
1
~------------- --- ---
2.5.3.2.2 Method
The method for absorption-inhIbition testing of dried stains is as follows:
1. To 3 pieces of stained ~laterial 2 to 3 mm 2
, add one drop of
salin.e and one drop of anti-A, anti-B, and anti-H respectively.
2. Take controls of unstained material and treat in a similar
manner.
3. Prepare saline extracts of the stain using (j to 9 mm 2
of stain
and adding sufficient saline for the later recovery of six drops
of extract. Leave to soak at approximately 5\)° C for one hour
in corked tubes.
4. Prepare dilutions of the extract in saline of 1/5, 1/10,
and 1/20.
5. To aliquots of the neat extract and the three dilutions add equal
quantities of diluted anti-A, anti-B and anti-H.
6. Proceed thereafter as with fluid saliva testing.
Providing dilution tests are made in the elution technique, stages 3 to 5 are not
essential and may be omitted for routine work. However, if there is evi.dence
of spurious A or B activity, the inclusion of these stages can sometimes clarify
the situation. In practise, there is frequently insufficitmt material for the in
clusion of stages 3 to 5.
2.5.3.3 Absorption-Elution
2.5.3.3.1 Materials and Reagents
These are the same as for testing fluid saliva samples.
2.5.3.3.2 :Method
The method for absorption-elution of dried stains is as follows:
1. Take three short pieces of stained thread and secure to cellu
lose acetate sheet in the same way as for testing dried blood
stains. For cigarette ends, small strips of paper should be
used.
2. Take unstained controls in a similar manner.
104
3. Prepare an extract of the stain by adding two drops of water to
a piece of stained material approximately 3 mm 2 in size and
leaving to soak for 1 hour at approximately 50 0 C.
4. Prepare a control extract in a "3imilar manner.
5. Make dilutions of the extract in water of 1/5, 1/10, and 1/20.
6. Proceed as for fluid saliva samples testing the extracts to
gether with the neat stain.
2.5.3.4 Interpretation of Results
Obviously, this is exactly the same as for fluid saliva samples. Because of
difficulties encountered because of lack of solubility of stains and reactions
from unstained fabric, some results are equivocal and no positive interpretation
can be made.
2.6 OTHER GENOTYPING SYSTEMS
2.6.1 Gm AND Inv SERUM GROUPS
The complexity of the Gm system is such that, if it was possible to carry out full
genotyping on dried bloodstains, it would be more useful than any single system.
In practice, the quality of many of the antisera is inadequate for use in stain
grouping. Gm(l) and Gm(2) can be easily detected by absorption-inhibition and
this is routine in some European countries. Preliminary work in the Metro
politan Police Laboratory has shown that it is also possible to detect Inv types
in dried bloodstains.
2.6.2 OTHER RED CELL ANTIGEN SYSTEMS
It is highly likely that, in time, given adequate quantities of bloodstain and good
quality antisera, it will be possible to detect most, if not all of these in dried
bloodstains.
105
SECTION 3
POLYMORPHIC ENZYME SYSTEMS
3.1 PHOSPHOGLUCOMUTASE (PGM)
3.1.1 PHYSICAL DATA
Phosphoglucomutase tx-ansfers the position of the phosphate radical from the
1-position to the 6-position 011 the glucose molecule (see Figure 3-1). This is
one of the necessary stages early in glycolisis just prior to the dehydrogenation
steps of the pentose phosphate pathway or prior to the isomerase step of the con
version of glucose-6-phosphate to fructose-6-·phosphate in the Eniden-Meyerhof
pathway.
The glucose-1-phosphate substrate is formed by the action of phosphorylase on
glycogen (Figure 3-2).
The equilibrium of the phosphoglucomutase reaction is strongly towards the pro
duction of glucose-6-phosphate. At equilibrium 5.5 percent of the glucose-1-
phosphate remains unchanged, 94.5 percent having been converted to glucose-6-
phosphateS 9 • This equilibrium is only reached under laboratory conditions with
a purified enzyme, since within the red cell the product, glucose-6-phosphate,
will be utilized as a substrate by both glucose-6-phosphate dehydrogenase and
phosphoglucose isomerase.
The molecular weight of the enzyme (purified from rabbit muscle) is quoted as
74,000 by Bocchini et al. 38 and as 77,000 by Najjar et al. 56
Najjar gives an electrophoretic mobility for the rabbit muscle enzyme of
2.01 cm2 /volt/sec. at pH 5 in an acetate buffer of ionic strength 0 .154 ~ Phos
phoglucomutase is active over a pH range from 4" 5 to 8.5. Above and below
these limits it is rapidly inactivated54•
106
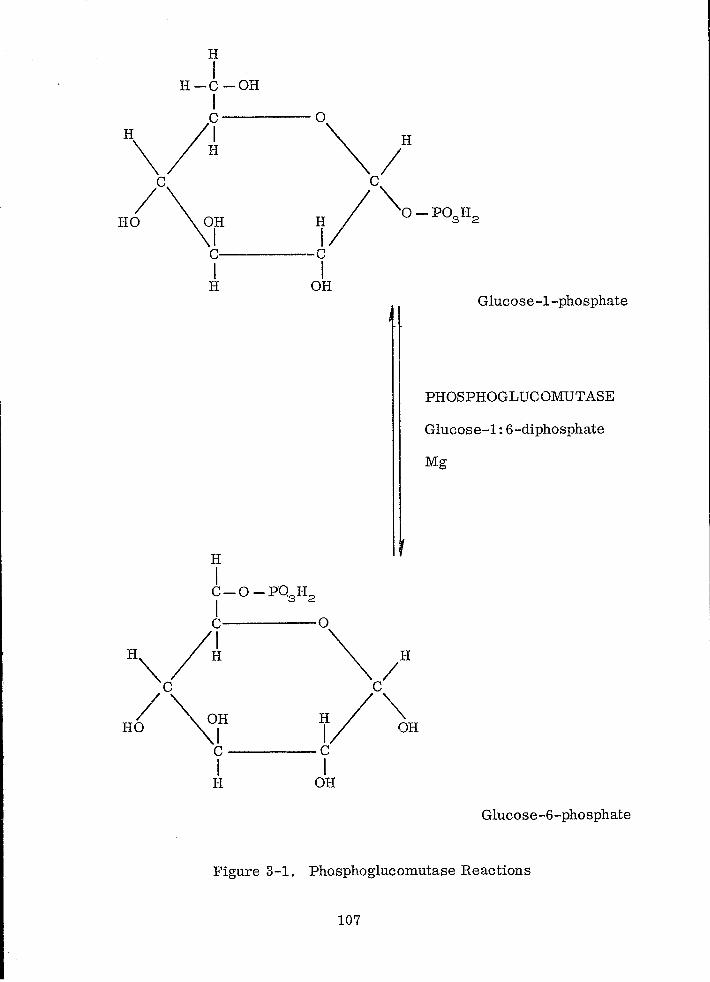
I Glucose-I-phosphate
PHOSPHOGLUCOMUTASE
Glucose-l: 6-diphosphate
Mg
Glucose-6-phosphate
Figure 3-1. Phosphoglucomutase Reactions
107
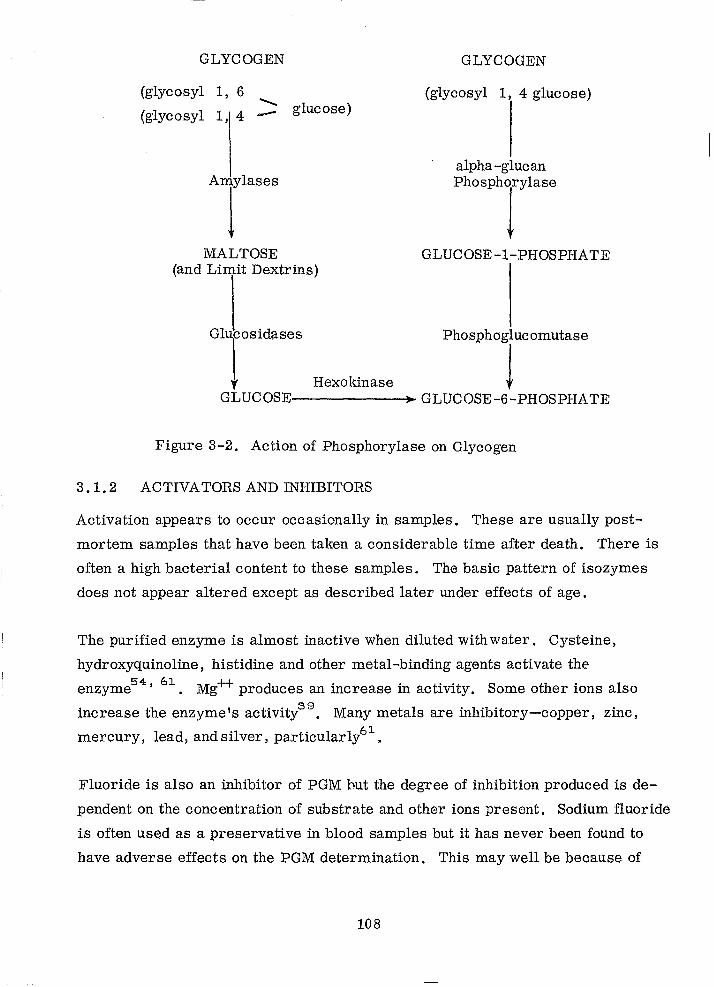
GLYCOGEN
(glycosyl 1, 6
(glycosyl 1, 4 ........ -
Am[laSeS
MALTOSE
glucose)
(and Limit Dextrins)
GLYCOGEN
('glycosyl 1, 4 glucose)
alpha-glucan
PhOSPhlYlase
GLUCOSE -1-PHOSPHATE
Gl10Sidases Hexokinase PhOSPhOgrComutase
GLUCOSE-----.....;)o-~ GLUCOSE -6-PHOSPHATE
Figure 3-2. Action of Phosphorylase on Glycogen
3.1.2 ACTIVATORS AND INHIBITORS
Activation appears to occur occasionally in samples. These are usually post
mortem samples that have been taken a considerable time after death. There is
often a high bacterial content to these samples. The basic pattern of isozymes
does not appear altered except as described later under effects of age.
The purified enzyme is almost inactive when diluted with water. Cysteine,
hydroxyquinoline, histidine and other metal-binding agents activate the
enzyme54, 61. Mg++ produces an increase in activity. Some other ions also
increase the enzyme's activity3 9 • Many metals are inhibitory-copper, zinc,
mercury, lead, and silver, particularly61,
Fluoride is also an inhibitor of PGM }:lut the degree of inhibition produced is de
pendent on the concentration of substrate and other ions present. Sodium fluoride
is often used as a preservative in blood samples but it has never been found to
have adverse effects on the PGM determination. This may well be because of
108
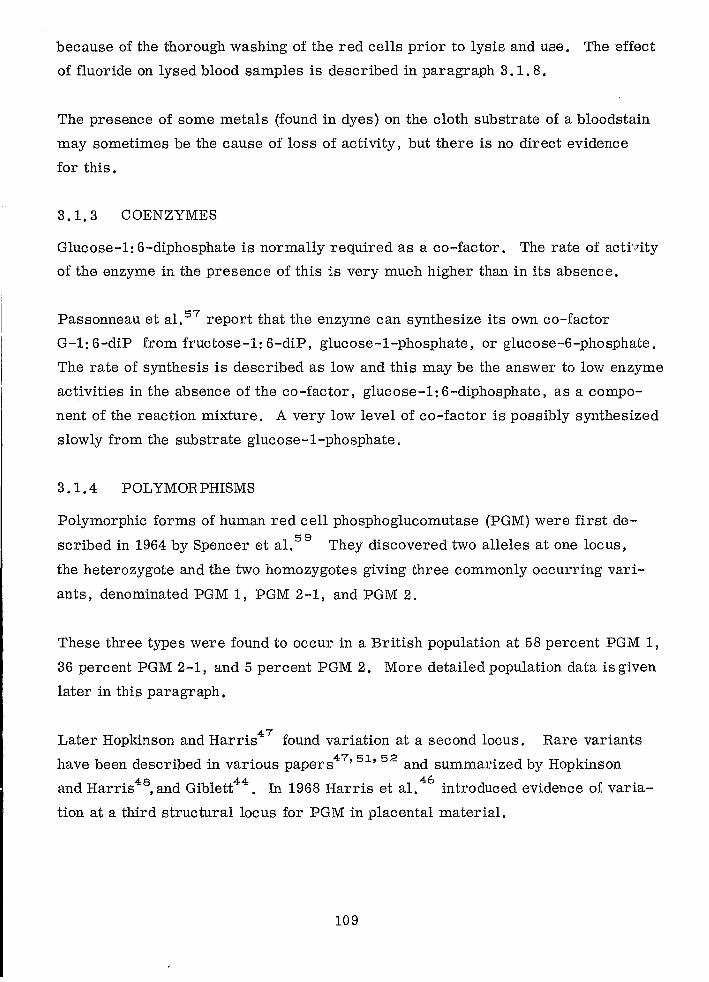
because of the thorough washing of the red cells prior to lysis and use. The effect
of fluoride on lysed blood samples is described in paragraph 3. 1. 8.
The presence of some metals (found in dyes) on the cloth substrate of a bloodstain
may sometimes be the cause of loss of activity, but there is no direct evidence
for this.
3.1.3 COENZYMES
Glucose-1: 6-diphosphate is normally required as a co-factor. The rate of acti':rity
of the enzyme in the presence of this is very much higher than in its absence.
Passonneau et al. 57 report that the enzyme can synthesize its own co-factor
G-1: 6-diP from fructose-1: 6-diP, glucose-1-phosphate, or glucose-6-phosphate.
The rate of synthesis is described as low and this may be the answer to low enzyme
activities in the absence of the co-factor, glucose-1: 6-diphosphate, as a compo
nent of the reaction mixture. A very low level of co-factor is possibly synthesized
slow ly from the substrate glucose-1-phosphate.
3.1.4 POL YMORPHISMS
Polymorphic forms of human red cell phosphoglucomutase (PGM) were first de
scribed in 1964 by Spencer et al. 58 They discovered two alleles at one locus,
the heterozygote and the two homozygotes giving three commonly occurring vari
ants, denominated PGM 1, PGM 2-1, and PGM 2.
These three types were found to occur in a British population at 58 percent PGM 1,
36 percent PGM 2-1, and 5 percent PGM 2. More detailed population data is given
later in this paragraph.
Later Hopkinson and Harris 47 found variation at a second locus. Rare variants
have been described in various papers47, 5l, 52 and summarized by Hopkinson
and Harris48, and Giblett44
• In 1968 Harris et al, 46 introduced evidence of varia
tion at a third structural locus for PGM in placental material.
109
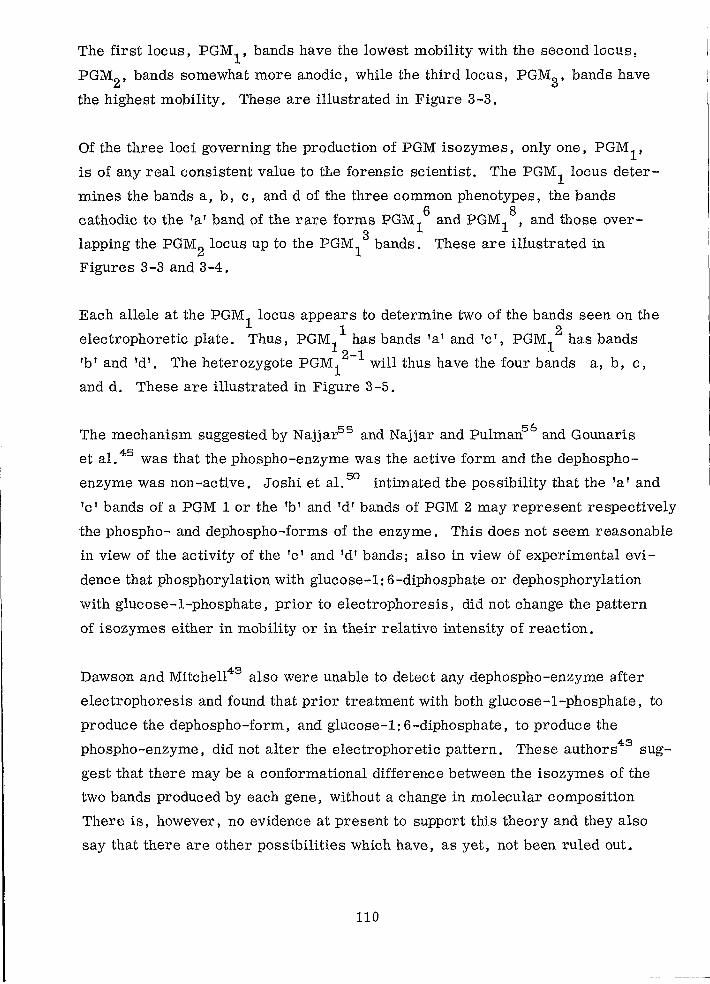
The first locus, PGM1
, bands have the lowest mobility with the second locus,
PGM2 , bands somewhat more anodic, while the third locus, PGM3 , bands have
the highest mobility. These are illustrated in Figure 3-3.
Of the three loci governing the production of PGM isozymes, only one, PGM1,
is of any real consistent value to Hie forensic scientist. The PGMI locus deter
mines the bands a, b, c, and d of the three common phenotypes, the bands
cathodic to the 'a' band of the rare forms PGM16
and PGM18
, and those over
lapping the PGM2 locus up to the PGM13 bands. These are illustrated in
Figures 3-3 and 3-4.
Each allele at the PGM1
locus appears to determine two of the bands seen on the
electrophoretic plate. Thus, PGMI1
has bands 'a' and 'c', PGM12 has bands
2-1 'b' and 'd'. The heterozygote PGMI will thus have the four bands a, b, c,
and d. These are illustrated in Figure 3-5.
The mechanism suggested by Najjar55 a.nd Najja.r and Pulman56 and Gounaris
et a1. 45 was that the phospho-enzyme was the active form and the dephospho
enzyme was non-active. Joshi et a1. 50 intimated the possibility that the 'a' and
'c' bands of a PGM lor the 'b' and 'd' bands of PGM 2 may represent respectively
the phospho- and dephospho-forms of the enzyme. This does not seem reasonable
in view of the activity of the 'c' and 'd' bands; also in view 6f experimental evi
dence that phosphorylation with glucose-I: 6-diphosphate or dephosphorylation
with glucose-1-phosphate, prior to electrophoresis, did not change the pattern
of isozymes either in mobility or in their relative intensity of reaction.
Dawson and MitcheU43 also were unable to detect any dephospho-enzyme after
electrophoresis and found that prior treatment with both glucose-I-phosphate, to
produce the dephospho-form, and glucose-I: 6-diphosphate, to produce the
phospho-enzyme, did not alter the electrophoretic pattern. These authors43 sug
gest that there may be a conformational difference between the isozymes of the
two bands produced by each gene, without a change in molecular composition
There is, however, no evidence at present to support this theory and they also
say that there are other possibilities which have, as yet, not been ruled out.
110
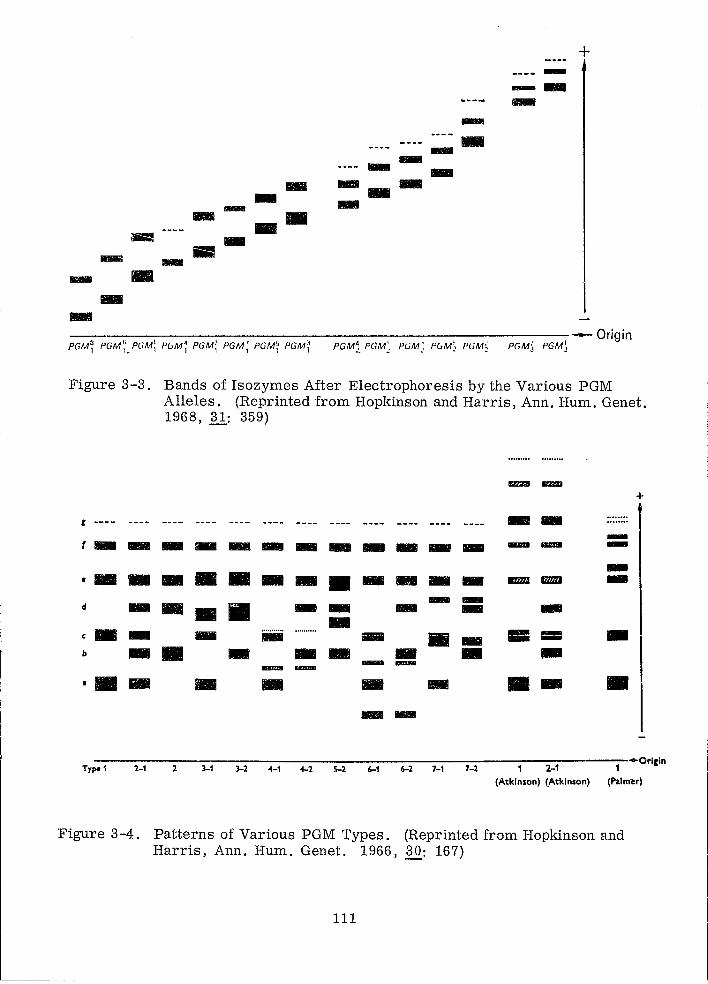
... --.. .--.-
-------... -
--.. +
---------------------------------- Origin PGM~ PGM~.PGM\ PGM~ PGM; PGM; PGMr PGM!' PGM1 PGM~ PuM; P('M~ PGM~ PGM) PGM~
Figure 3-3. Bands of Isozymes After Electrophoresis by the Various PGM Alleles. (Reprinted from Hopkinson and Harris, Ann. Hum. Genet. 1968, 31: 359)
- - +
r ---- -- -f .. .. -.. .. ---.. .. -.- -- -- --. ---• • --• ---- II'lllJJ flll11.I -- --d .. -• • -.. II1II - --c -- - - .. • - -== -b -• - -- - - -- -- ......... •• - - - - - • - • - IIIIIIIIIIII
Type 1 2-1 2 3-1 3-2 4-1 4-2 S-2 6-1 6-2 7-1 7-2 2-1 +Origin
(Atkinson) (Atkinson) (Palmer)
Figure 3-4. Patterns of Various PGM Types. (Reprinted from Hopkinson and Harris, Ann. Hum. Genet. 1966,~: 167)
111
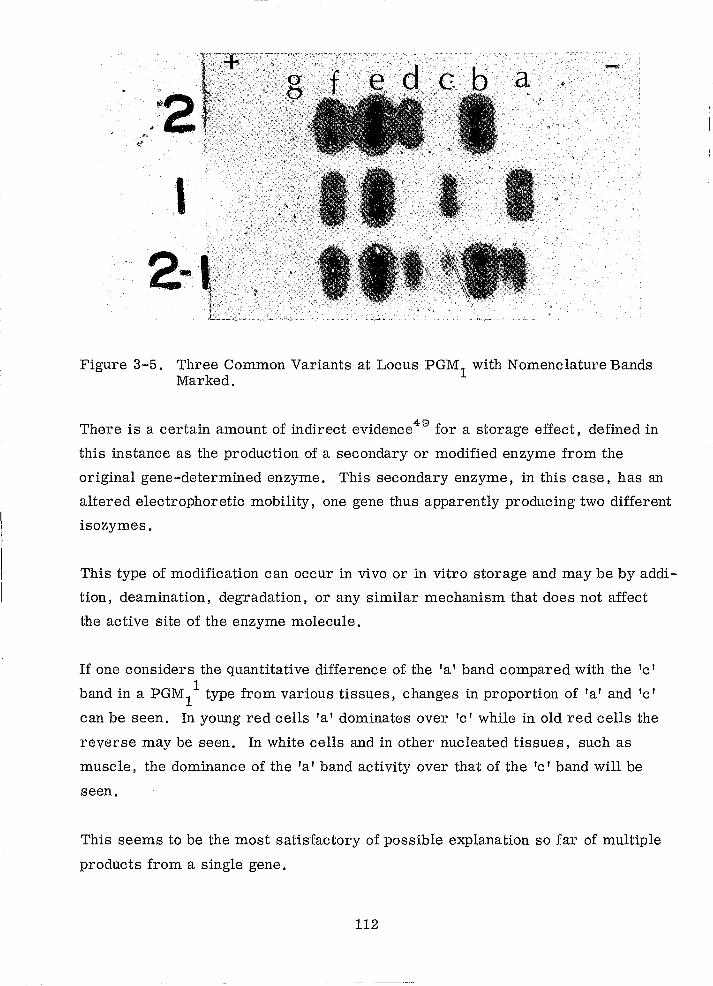
I
2. -,.,,'" ~' )
" I' !-~.-,
-,a. . "
Figure 3-5. Three Common Variants at Locus PGM1 with Nomenclature Bands Marked.
There is a certain amount of indirect eVidence49 for a storage effect, defined in
this instance as the production of a secondary or modified enzyme from the
original gene-determined enzyme. This secondary enzyme, in this case, has an
altered electrophoretic mobility, one gene thus apparently producing two different
isozymes.
This type of modification can occur in vivo or in vitro storage and may be by addi
tion, deamination, degradation, or any similar mechanism that does not affect
the active site of the enzyme molecule.
If one considers the quantitative difference of the 'a' band compared with the 'c'
band in a PGM11 type from various tissues, changes in proportion of 'a' and 'c'
can be seen. In young red cells 'a' dominates over 'c' while in old red cells the
reverse may be seen. In white cells and in other nucleated tissues, such as
muscle, the dominance of the 'a' band activity over that of the 'c' band will be
seen.
This seems to be the most satisfactory of possible explanation so far of multiple
products from a single gene.
112
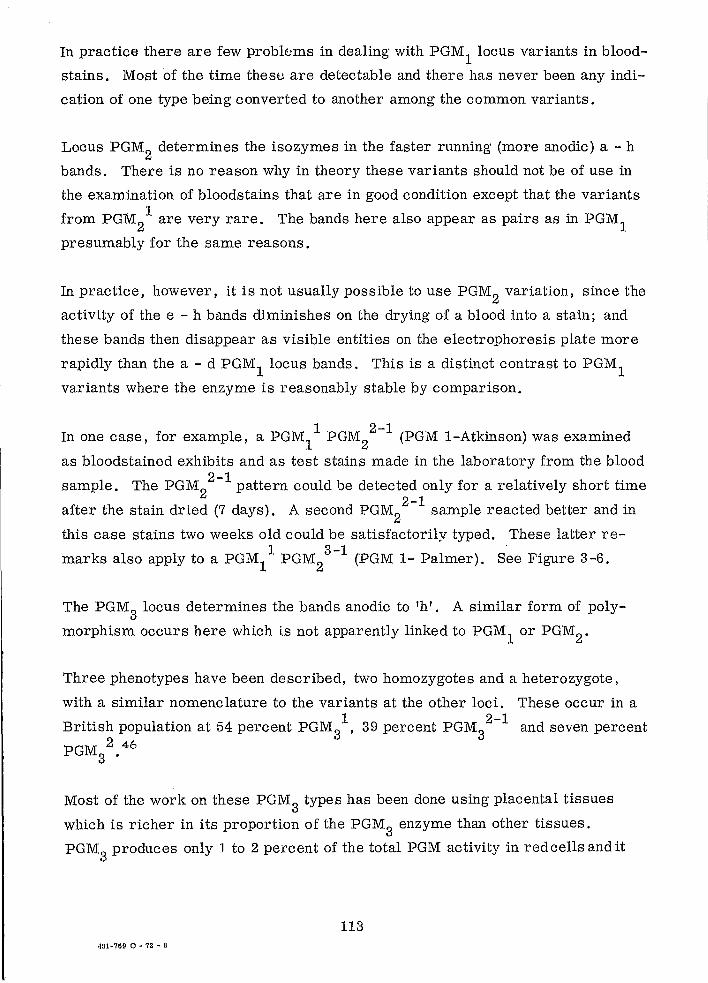
- -----------
In practice there are few probl0ms in dealing with PGM1 locus variants in blood
stains. Most of the time thesu are detectable and there has never been any indi
cation of one type being converted to another among the common variants.
Locus PGM2
determines the isozymes in the faster running (more anodic) a - h
bands. There is no reason why in theory these variants should not be of use in
the examination of bloodstains that are in good condition except that the variants 1 from PGM2 are very rare. The bands here also appear as pairs as in PGM1
presumably for the same reasons,
In practice, however, it is not usually possible to use PGM2 variation, since the
activity of the e - h bands diminishes on the drying of a blood into a stain; and
these bands then disappear as visible entities on the electrophoresis plate more
rapidly than the a - d PGM1 locus bands. This is a distinct contrast to PGM1 variants where the enzyme is reasonably stable by comparison,
1 2-1 In one case, for example, a PGM1 PGM2 (PGM I-Atkinson) was examined
as bloodstained exhibits and as test stains made in the laboratory from the blood
sample. The PGM22- 1 pattern could be detected only for a relatively short time
after the stain dried (7 days), A second PGM22- 1 sample reacted better and in
this case stains two weeks old could be satisfactorily typed, These latter re-I 3-1 .
marks also apply to a PGM1
PGM2
(PGM 1- Palmer), See Figure 3-6,
The PGM3 locus determines the bands anodic to 'h'. A similar form of poly
morphism occurs here which is not apparently linked to PGM1 or PGM2 ,
Three phenotypes have been described, two homozygotes and a heterozygote,
with a similar nomenclature to the variants at the other loci. These occur in a
British population at 54 percent PGM31, 39 percent PGM
32- 1 and seven percent
PGM3 2,46
Most of the work on these PGM3
types has been done using placental tissues
which is richer in its proportion of the PGM3 enzyme than other tissues,
PGM~ produces only 1 to 2 percent of the total PGM activity in red cells and it ....
113 451-769 0 - 72 - B
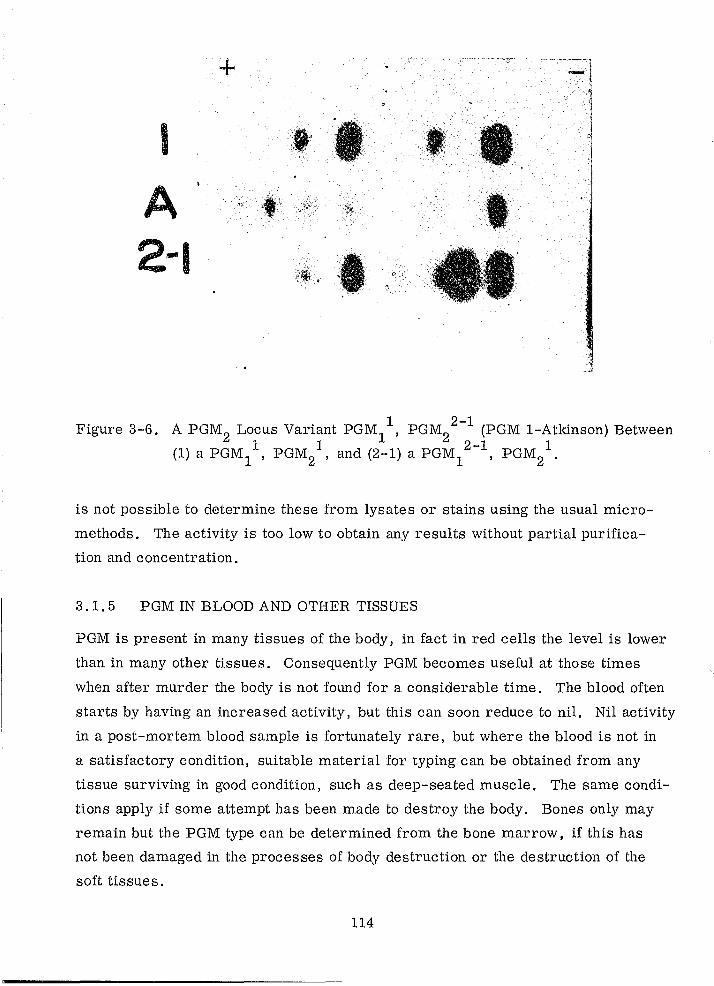
I
A 2-1
\ .
." ,\ "."" .. "
"
. "
',~ ,J'
o ,
Figure 3-6. A PGM2 Locus Variant PGM1
1, PGM2
2- 1 (PGM 1-Atkinson) Between 1 1 2-1 1
(1) a PGM 1 ' PGM2 ' and (2-1) a PGM1 ,PGM2
is not possible to determine these from lysates or stains using the usual micro
methods. The activity is too low to obtain any results without partial purifica
tion and concentration.
3.1. 5 PGM IN BLOOD AND OTHER TISSUES
PGM is present in many tissues of the body, in fact in red cells the level is lower
than in many other tissues. Consequently PGM becomes useful at those times
when after murder the body is not found for a considerable time. The blood often
starts by having an increased activity, but this can soon reduce to nil. Nil activity
in a post-mortem blood sample is fortunately rare, but where the blood is not in
a satisfactory condition, suitable material for typing can be obtained from any
tissue surviving in good condition, such as deep-seated muscle. The same condi
tions apply if some attempt has been made to destroy the body. Bones only may
remain but the PGM type can be determined from the bone marrow, if this has
not been damaged in the processes of body destruction or the destruction of the
soft tissues.
114
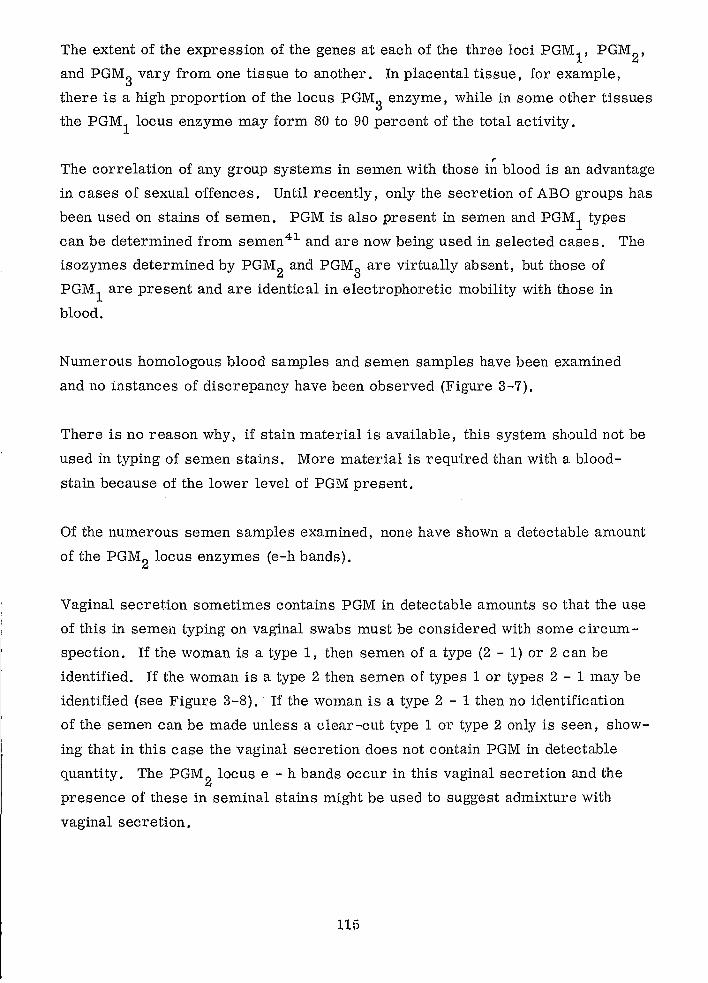
The extent of the expression of the genes at each of the three loci PGMl , PGM2,
and PGM3 vary from one tissue to another. In placental tissue, for example,
there is a high proportion of the locus PGM3 enzyme, while in some other tissues
the PGM1 locus enzyme may form 80 to 90 percent of the total activity .
.. The correlation of any group systems in semen with those in blood is an advantage
in cases of sexual offences. Until recently, only the secretion of ABO groups has
been used on stains of semen. PGM is also present in semen and PGM1 types
can be determined from semen41 and are now being used in selected cases. The
isozymes determined by PGM2 and PGM3
are virtually absent, but those of
PGM1 are present and are identical in electrophoretic mobility with those in
blood.
Numerous homologous blood samples and semen samples have been examined
and no instances of discrepancy have been observed (Figure 3-7).
There is no reason why, if stain material is available, this system should not be
used in typing of semen stains. More material is required than with a blood
stain because of the lower level of PGM present.
Of the numerous semen samples examined, none have shown a detectable amount
of the PGM2 locus enzymes (e-h bands).
Vaginal secretion sometimes contains PGM in detectable amounts so that the use
of this in semen typing on vaginal swabs must be considered with some circum
spection. If the woman is a type 1, then semen of a type (2 - 1) or 2 can be
identified. If the woman is a type 2 then semen of types 1 or types 2 - 1 may be
identified (see Figure 3-8). ' If the woman is a type 2 - 1 then no identification
of the semen can be made unless a clear-cut type 1 or type 2 only is seen, show
ing that in this case the vaginal secretion does not contain PGM in detectable
quantity. The PGM2
locus e - h bands occur in this vaginal secretion and the
presence of these in seminal stains might be used to suggest admixture with
vaginal secretion.
115
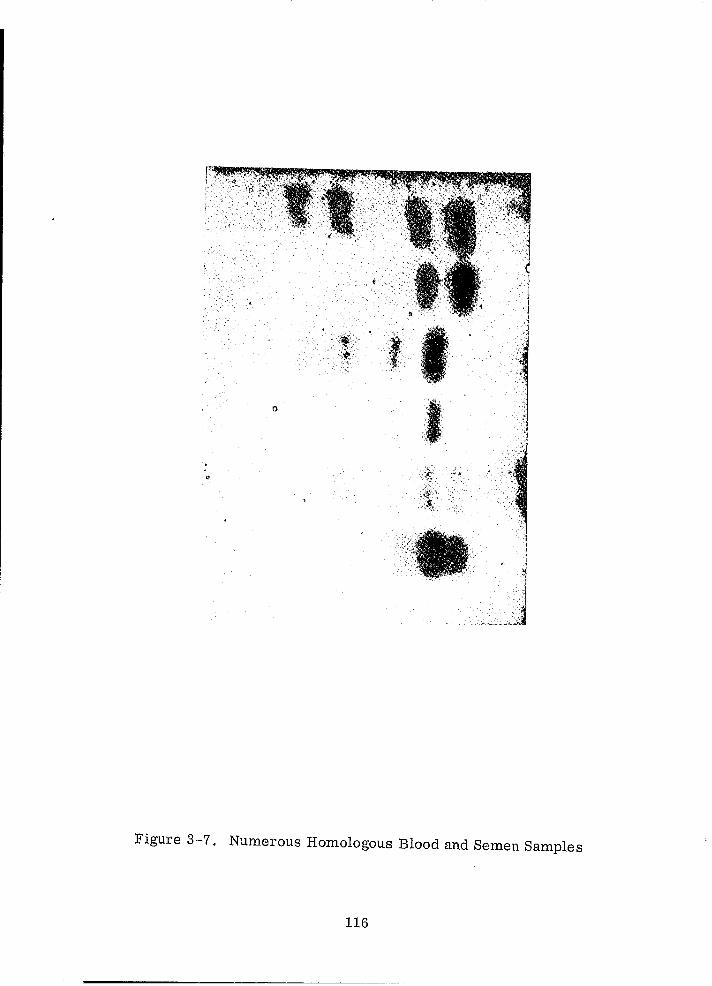
Figure 3-7. Numerous Homologous Blood and Semen Samples
116
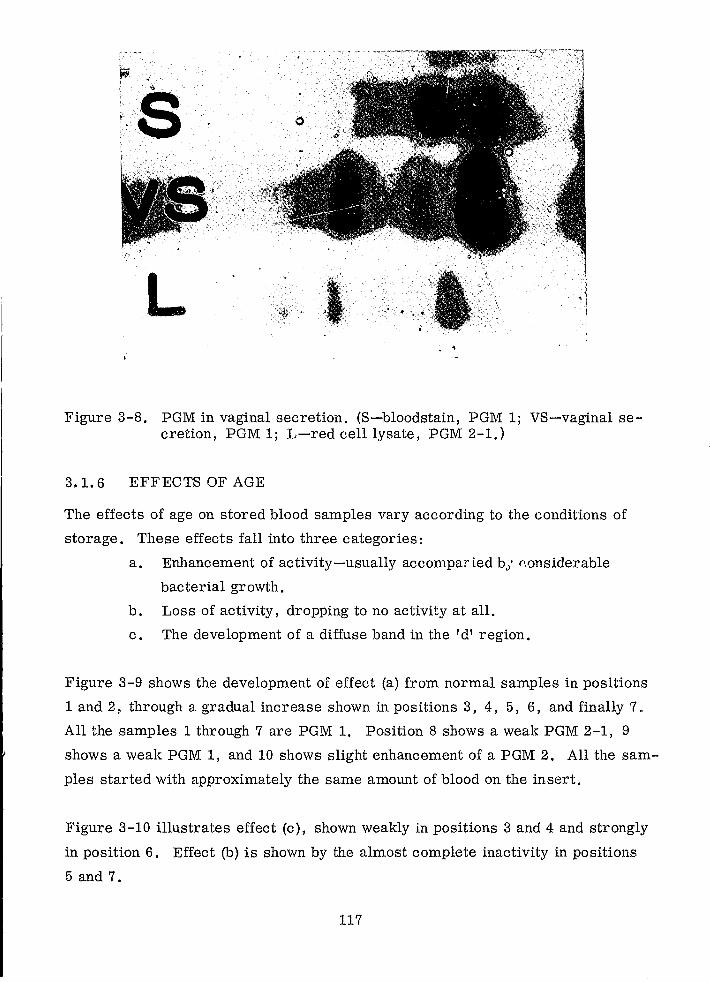
L .'
Figure 3-8. PGM in vaginal secretion. (S-bloodstain, PGM 1; VS-vaginal secretion, PGM 1; L-red cell lysate, PGM 2-1,)
3.1. 6 EFFECTS OF AGE
The effects of age on stored blood samples vary according to the conditions of
storage. These effects fall into three categories:
a. Enhancement of activity-usually accompar ied bj' nonsiderable
bacterial growth.
b. Loss of activity, dropping to no activity at all.
c. The development of a diffuse band in the 'd' region.
Figure 3-9 shows the development of effect (a) from normal samples in positions
1 and 2. through a gradual increase shown in positions 3, 4, 5, 6, and finally 7.
All the samples 1 through 7 are PGM 1. Position 8 shows a weak PGM 2-1, 9
shows a weak PGM 1, and 10 shows slight enhancement of a PGM 2. All the sam
ples started with approximately the same amOlmt of blood on the insert.
Figure 3-10 illustrates effect (c), shown weakly in positions 3 and 4 and strongly
in position 6. Effect (b) is shown by the almost complete inactivity in positions
5 and 7.
117
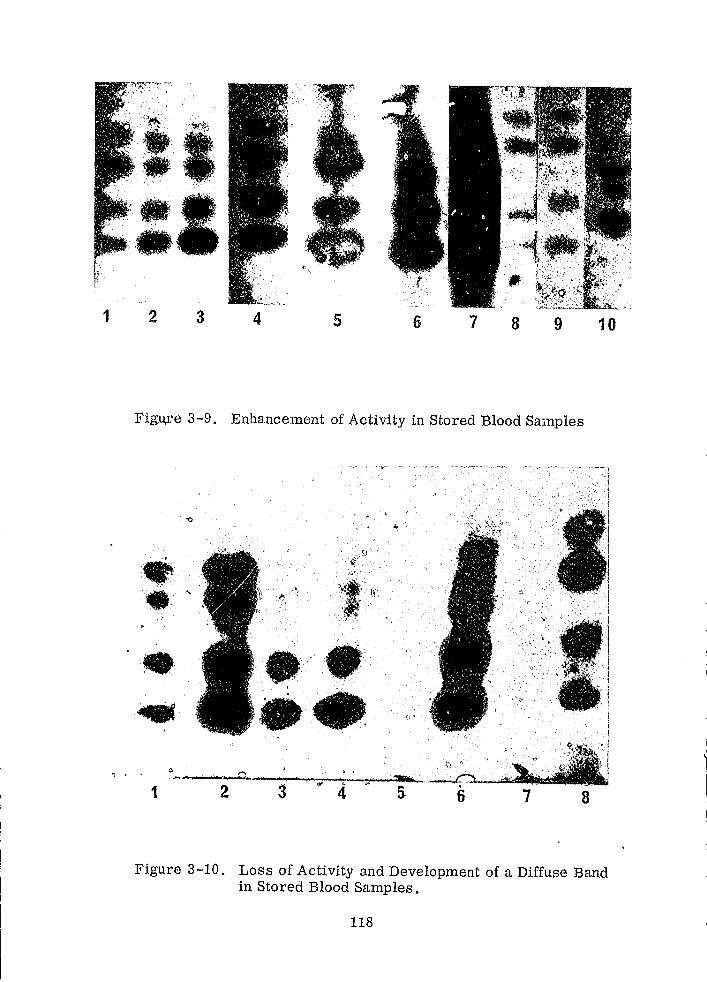
1 2 3 4 5 6 7 8 9 10
Fig,u,re 3-9. Enhancement of Activity in Stored Blood Samples
" . . ' '
• •• ,
• 1 2 5 6 7 8
Figure 3-10. Loss of Activity and Development of a Diffuse Band in Stored Blood Samples.
118
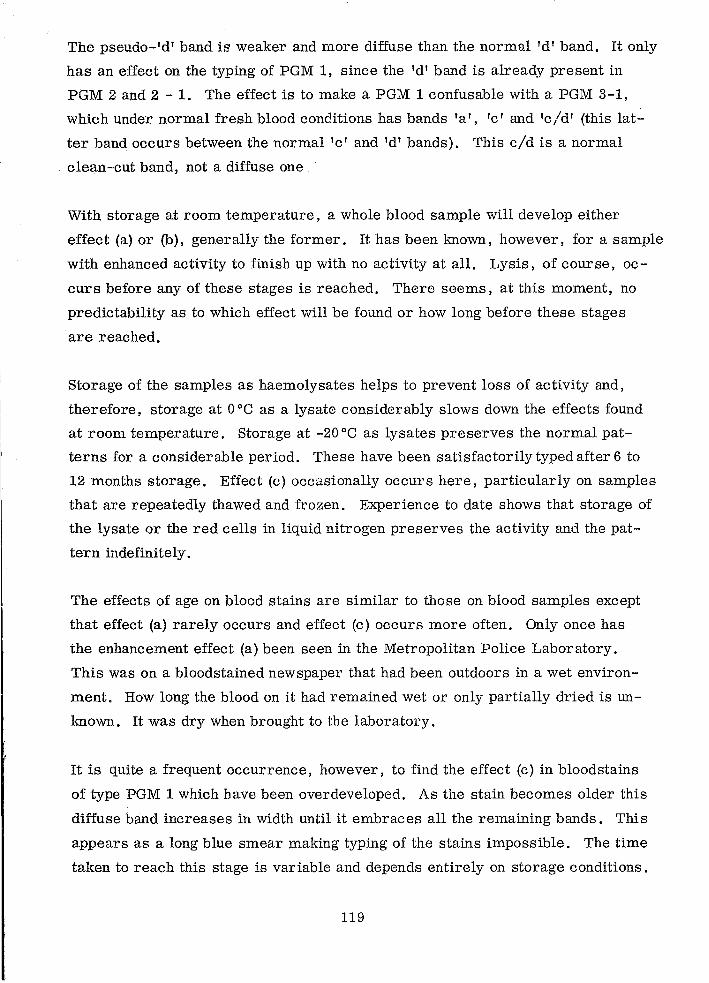
The pseudo-'d' band is weaker and more diffuse than the normal 'd' band. It only
has an effect on the typing of PGM 1, since the 'd' band is already present in
PGM 2 and 2 - 1. The effect is to make a PGM 1 confusable with a PGM 3-1,
which under normal fresh blood conditions has bands 'a', 'c' and 'cld' (this lat':'
ter band occurs between the normal 'c' and 'd' bands). This cld is a normal
clean -cut band, not a diffuse one
With storage at room temperature, a whole blood sample will develop either
effect (a) or (b), generally the former. It has been !mown, however, for a sample
with enhanced activity to finish up with no activity at all. Lysis, of course, oc
curs before any of these stages is reached. There seems, at this moment, no
predictability as to which effect will be found or how long before these stages
are reached.
Storage of the samples as haemolysates helps to prevent loss of activity and,
therefore, storage at O°C as a lysate considerably slows down the effects found
at room temperature. Storage at -20°C as lysates preserves the normal pat
terns for a considerable period. These have been satisfactorily typed after 6 to
12 months storage. Effect (c) occasionally occurs here, particularly on samples
that are repeatedly thawed and frozen. Experience to date shows that storage of
the lysate or the red cells in liquid nitrogen preserves the activity and the pat
tern indefinitely.
The effects of age on blood stains are similar to those on blood samples except
that effect (a) rarely occurs and effect (c) occurs more often. Only once has
the enhancement effect (a) been seen in the Metropolitan Police Laboratory.
This was on a bloodstained newspaper that had been outdoors in a wet environ
ment. How long the blood on it had remained wet or only partially dried is un
known. It was dry when brought to the laboratory.
It is quite a frequent occurrence, however, to find the effect (c) in bloodstains
of type PGM 1 which have been overdeveloped. As the stain becomes older this
diffuse band increases in width until it embraces all the remaining bands. This
appears as a long blue smear making typing of the stains impossible. The time
taken to reach this stage is variable and depends entirely on storage conditions.
119
Inactivity has been found in stains one week old; on the other hand bloodstains
over three months old have been typed quite satisfactorily.
Both these occurrences are rare and experience indicates that the probabilities
of being able to type bloodstains are favorable up to one month old and unfavor
able after two months.
As with all work on blood samples and bloodstains they should be typed as soon
as possible.
3.1. 7 EFFECT OF THE STAIN SUBSTRATE
Most clothing textiles have no effect on the ability to determine a PGM type.
Some, however, are more difficult to handle than others. Very light thin mate
rial, such as nylon stockings, does not easily yield a single thread containing enough
dried blood. It may be necessary, therefore, to make up several fine threads into
one insert for a standard thin gel. Other materials may be of coarse springy fibres
which are difficult to insert into the gel slot. These usually become manageable
if they are soaked in a minimum of gel buffer.
In the case of a non-spun material, coarse carpet or rope fibres for example,
sufficient fibres are removed and placed separately in the gel slot. With hard
substrates, such as glass or metal, the stain is swabbed from the article with a
standard cotton insert, which is then put in the gel as described under general
methods.
Stains have been typed satisfactorily from many clothing materials (wool, cotton,
fur, viscose acetate, nylon, acrylics, polyesters, PVC, leather, etc.) and from
iron, brass, galvanized iron, steel, copper, glass, painted surfaces, wood, hard
board, paper, tarmac, vegetation, bricks, and soil.
3.1. 8 EFFECTS OF VARIOUS CHEMICALS
Mercaptoethanol has no effect on the pattern of the enzyme. According to Dawson
and Mitchell 43 , iodine produces no change of total activity but increases the mo
bility of rabbit muscle enzyme. P-mercuribenzoate also produces an increase
120
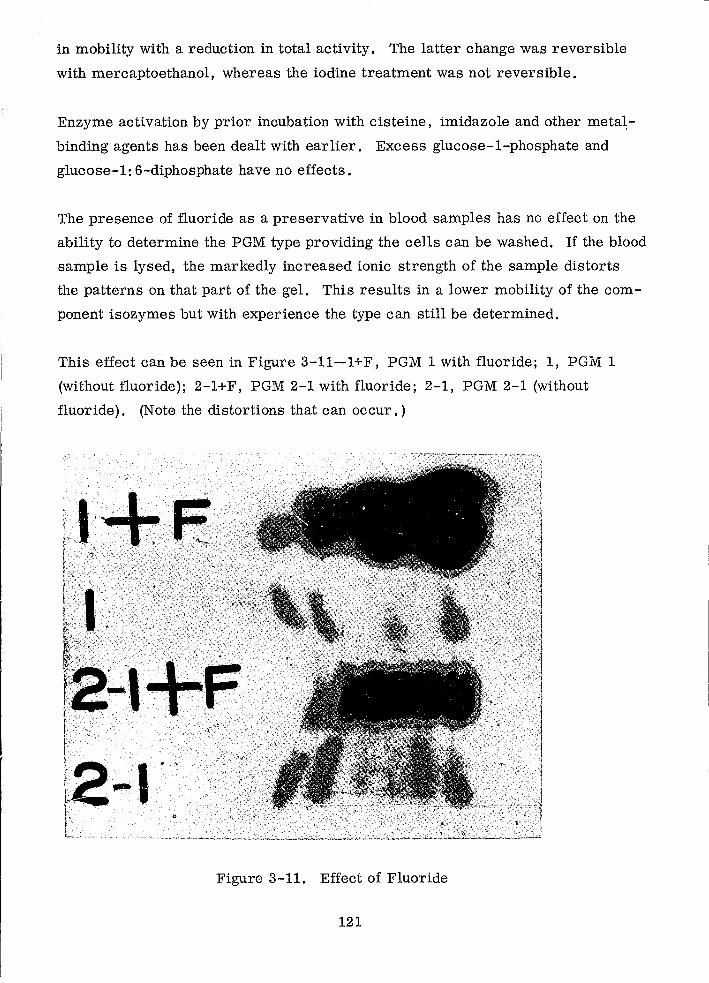
in mobility with a reduction in total activity. The latter change was reversible
with mercaptoethanol, whereas the iodine treatment was not reversible.
Enzyme activation by prior incubation with cisteine, imidazole and other meta~
binding agents has been dealt with earlier. Excess glucose-I-phosphate and
glucose-I: 6-diphosphate have no effects.
The presence of fluoride as a preservative in blood samples has no effect on the
ability to determine the PGM type providing the cells can be washed. If the blood
sample is lysed, the markedly increased ionic strength of the sample distorts
the patterns on that part of the gel. This results in a lower mobility of the com
ponent isozymes but with experience the type can still be determined.
This effect can be seen in Figure 3-11-1+F, PGM 1 with fluoride; 1, PGM 1
(without fluoride); 2-1+F, PGM 2-1 with fluoride; 2-1, PGM 2-1 (without
fluoride). (Note the distortions that can occur.)
2-1 F~ L ...
Figure 3-11. Effect of Fluoride
121
l
3.1. 9 METHOD
Several methodR have been described for the determination of PGM types 59, 53, 62.
Most workers use a thick starch gel such as that originally described by
Smithies 58 , used first for PGM by Spencer, Hopkinson and Harris 59 for lysates
and Culliford40
for bloodstains. Thin starch gel, Wraxall and Culliford 196862
;
Agar gel, Monn 1968 53; Acrylamide 42; and cellulose acetate have all been tried.
Wraxall and Culliford's method has proved most satisfactory for forensic use,
being specifically designed for work in this field. The sample preparation is
minimal. For blood samples a cotton thread soaked in lysate is used as the in,
sert. For bloodstains, a bloodstained thread is soaked in a minimum of gel
buffer for 5 to 10 minutes before it is inserted into the gel.
The thin layer technique should be used as described in paragraph 1.4, using
10 percent starch and the following buffers:
a. Tank Buffer (PH 7.4)
TRIS (Trishydroxymethy l-aminoethane)
Maleic acid
EDTA (Ethylene-diaminetetracetic acid)
Magnesium chloride
Water (distilled)
12.11 g
11. 62 g
2.92 g
2.03 g
to 1 litre
Adjust to pH 7.4 with 40 percent sodium hydroxide.
b. Gel Buffer
Tank buffer diluted 1: 15.
Electrophoresis is carried out at 0 to 4°C for 16 to 17 hours at
4 to 5 volts/cm.
The activity is developed using the agar overlay technique described
ear lie r in par agr aph 1. 2 .
c. Overlay
Glucose-I-phosphate containing 1 percent glucose-I: 6-diphosphate 35 mg
Magnesium chloride 20 mg
122
Glucose-6-phosphate dehydrogenase
NADP (nicotinamide adenine dinucleotide phosphate)
MTT (tetrazolium)
PMS (phenazine methosulphate)
Buffer TRIS O. 06 M
0.4 to 1. 0 units
1 mg
1 mg
1 mg
10 ml
(The buffer composition is TRIS 3 .. 64 gin 500 mlofwater adjusted
to pH 8.0 with Hel.)
This solution is brought to 37°C and mixed with 10 grams of 2 percent agar in
distilled water at 50 to 55°C and immediately poured onto the starch gel in a
position from the origin to 8 cm towards the anode. When the overlay is set, it
is covered with a glass plate and incubated in darlmess at 37°C. With this re
action mixture the glucose-6-phosphate produced by PGM activity is used as a
substrate for glucose-6-phosphate dehydrogenase; concomitant with the action
of this latter enzyme, NADP is reduced. Using phenazine methosulphatp- as a
transfer agent MTT tetrazolium is reduced to a blue colored formazan. This
mechanism is summarized and illustrated in Figure 3-12.
The areas of activity are seen as blue bands on a yellow background in about one
half to two hours, depending on the activity of the samples or stains used in the
starch plate.
After a little experience it is normally simple to interpret the results with re
spect to the usual variant types, so, unlike some other enzyme systems, no lmown
control sample is put on the plate. Some of the rarer forms could be difficult to
interpret in the absence of the correct reference sample. One or two lysates are
usually put in each plate of stains in case of total failure of the stain samples from
difficult case material.
The difficulties encountered with interpretation of stain material or old blood
samples are discussed in paragraph 3. 1. 6.
123
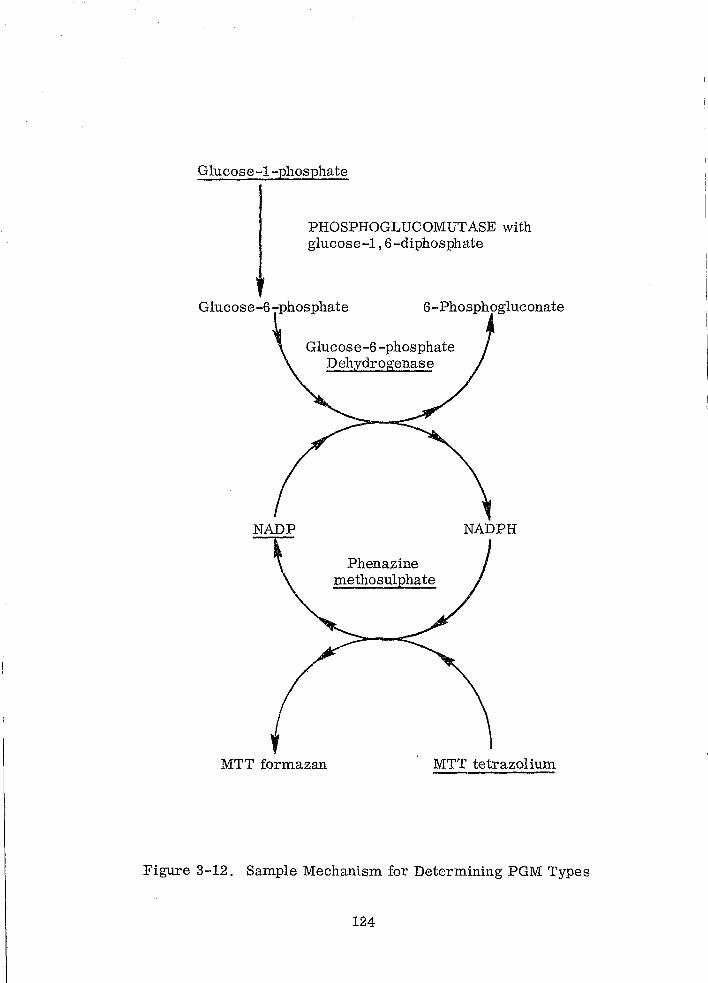
Glucose-I-phosphate
PHOSPHOGLUCOMUTASE with glucose-I, 6 -diphosphate
Glucose-6-phosphate 6-Phosphogluconate
Glucose-6 -phosphate Dehydrogenase
MTT formazan
Phenazine methosulphate
MTT tetrazolium
Figure 3-12. Sample Mechanism for Determining PGM Types
124
The assessment of the quality of the plate can be made by the appearance of the
bands, which should be clear, clean, and straight, and there should be clear
separation of the fbI and 'c' bands in a PGM 2-1.
3.1. 10 PROBLEMS
The 'd' band in stains has already been described. With fresh buffer, the haemo
globin moves slightly towards the cathode (about 1 to 2 cm from the origin). As
the gel buffer deteriorates, the haemoglobin remains at the origin or later be
gins to move toward the anode. Shortly after this, the separation of the 'aI_fbI
bands deteriorates.
The batch of buffer should be replaced before this latter effect occurs. It is
usually a gradual process, which may occur within a week, or on the other hand
a batch may last 2 to 3 months. If the buffer is replaced before the haemoglobin
moves towards the anode, unsatisfactory separations caused by buffer deteriora
tion may be avoided.
The use of disinfectants, such as Dettol, or strong soap solution either when
taking a blood sample or attempting to ~lean bloodstaining, causes severe inter
ference with PGM typing. The particular sample may give no reaction and the
presence of these materials in the gel may interfere with adjacent samples as
well.
The distribution of the various PGM types in the population is included in Table 3-1.
A comparison is shown in Table 3-2.
125
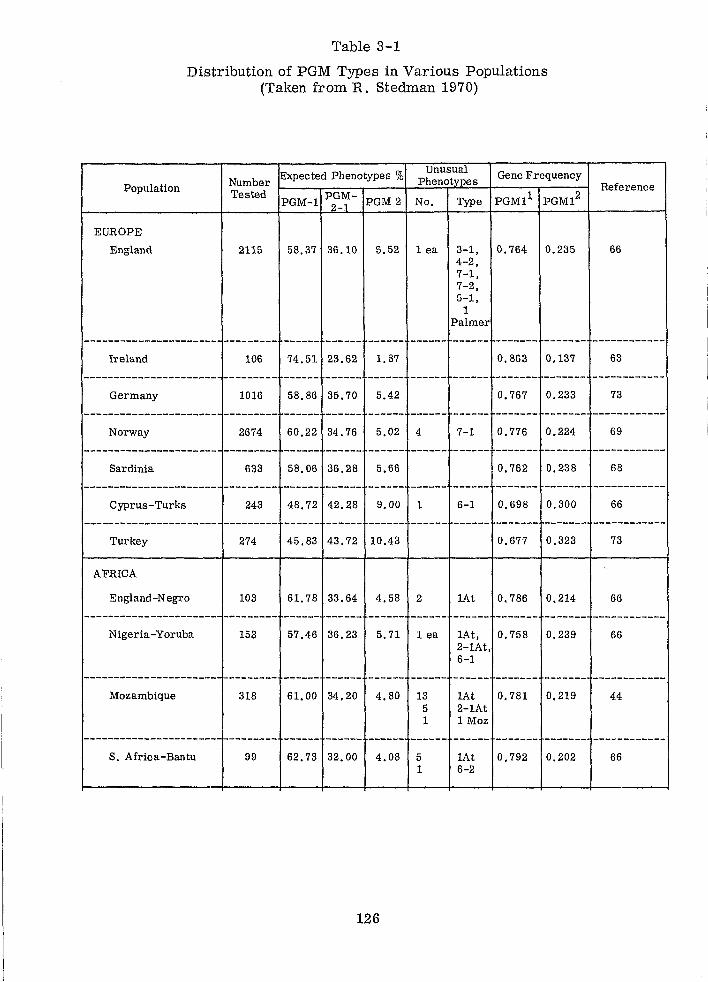
Table 3-1
Distribution of PGM Types in Various Populations (Taken from R. Stedman 1970)
Population
EUROPE
England
Ireland
Germany
Norway
Sardinia
Cyprus-Turks
Turkey
AFRICA
England-Negro
Nigeria-Yoruba
Mozambique
S. Africa-Bantu
Number Expected Phenotypes % Unusual
Phenotypes Gene Frequency
Tested PGM PGM-1 - PGM 2 No. Type PGM1
1 PGM12
2115
106
1016
2674
633
243
274
103
153
318
99
2-1
58.37 36.10 5.52 1 ea 3-1, 0.764 0.235 4-2,
74.51 23.62 1.87
58.86 35.70 5.42
60.22 34.76 5.02 4
58.06 36.28 5.66
48.72 42.28 9.00 1
45.83 43.72 10.43
61.78 33.64 4.58 2
7-1, 7-2, 5-1,
1 Palmer
7-1
6-1
lAt
0.863 0.137
0.767 0,233
0.776 0,224
0.762 0.238
0.698 0.300
0.677 0.323
0.786 0.214
57.46 36.23 5.71 1 ea lAt, 0.758 0.239
61.00 34,20 4.80 13
62.73 32.00 4.08 5 1
126
5 1
2-1At, 6-1
lAt 0.781 0.219 2-1At 1 Moz
1At 6-2
0.792 0.202
Reference
66
63
73
69
68
66
73
66
66
44
66
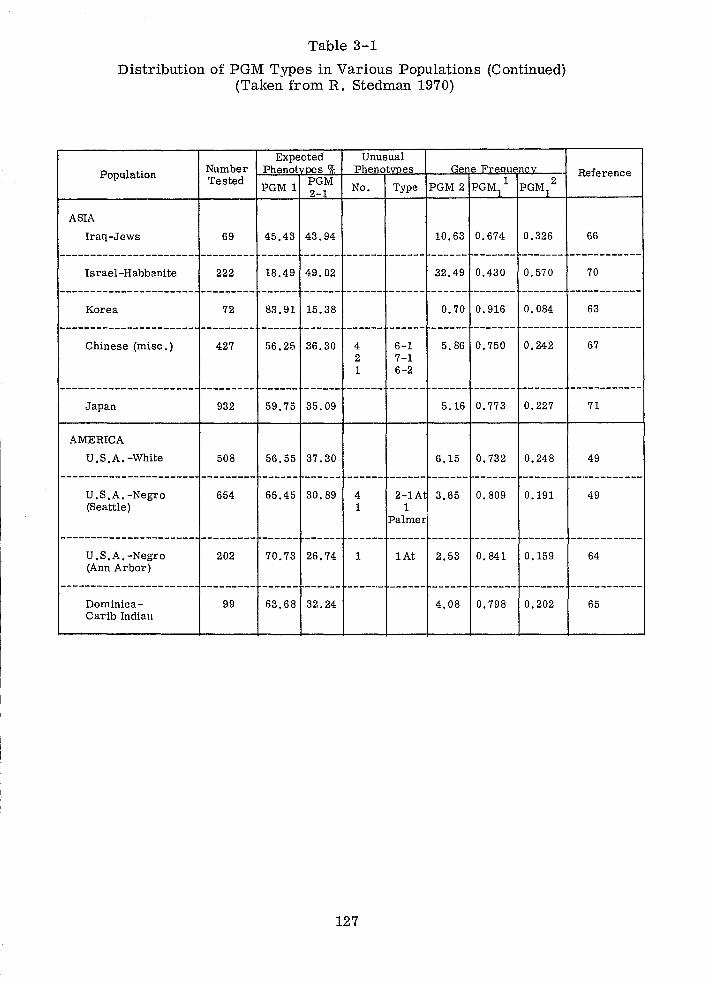
Table 3-1
Distribution of PGM Types in Various Populations (Continued) (Taken from R. Stedman 1970)
Population
ASIA
Iraq-Jews
Israel-Habbanite
Korea
Chinese (misc.)
Japan
AMERICA
U.S.A. -White
U.S.A.-Negro (Seattle)
U.S.A. -Negro (Ann Arbor)
DominicaCarib Indian
Unusual Expected Number Phenotypes % Tested PGM 1 PGM
2-1
Phenotypes Gene Freau ICV
69
222
72
427
932
508
654
202
99
No. Type PGM 2 PGM] 1 PGM] 2
45.43 43.94
18.49 49.02
83.9115.38
56.25 36.30 4
59.75 35.09
56.55 37.30
2 1
65.45 30.89 4 1
70.73 26.74 1
63.68 32.24
127
6-1 7-1 6-2
10.63 0.674 0.326
32.49 0.430 0.570
0.70 0.916 0.084
5.86 0.750 0.242
5.16 0.773 0.227
6.15 0.732 0.248
2-1A 3.65 0.809 0.191 1
Palmer
lAt 2.53 0.841 0.159
4.08 0.798 0.202
Reference
66
70
63
67
71
49
49
64
65
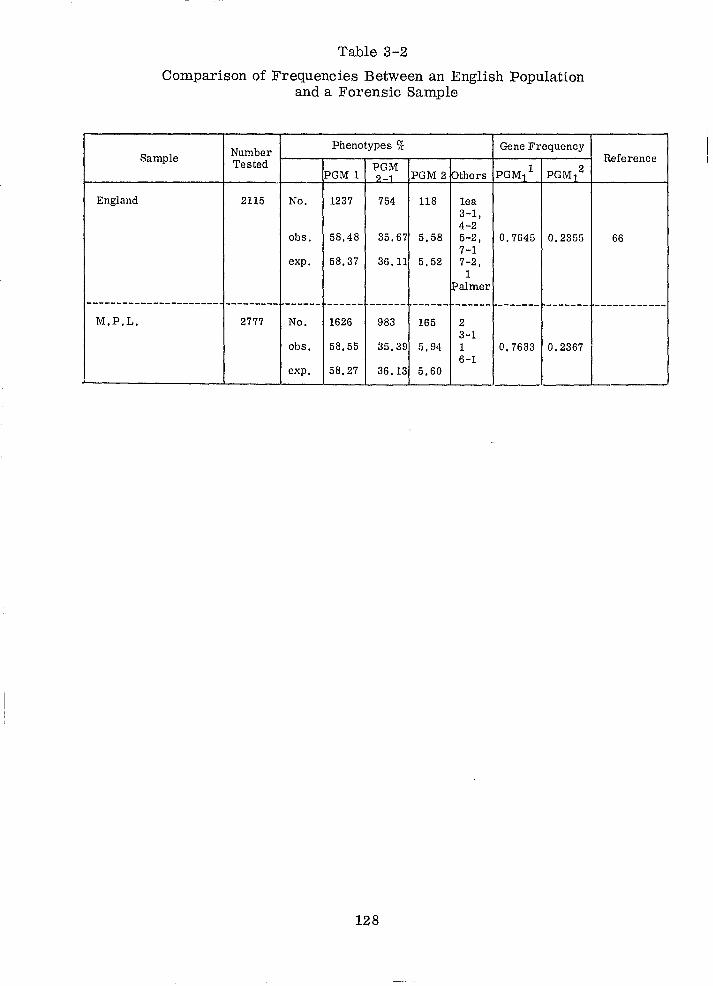
England
Table 3-2
Comparison of Frequencies Between an English Population and a Forensic Sample
Number Phenotypes % Gene Frequency
Sample Tested PGM PGM,l PGM12 PGM 1 9-1 PGM 2 Others
2115 No. 1237 754 118 lea 3-1, 4-2
obs. 58.48 35.67 5.58 5-2, 0.7645 0.2355 7-1
expo 58.37 36.11 5.52 7-2, 1
iJ?almer
---------------------- --------- ------ ------ ------ ------ ------ ------- -------M.P.L. 2777 No. 1626 983 165 2
3-1
Reference
66
------------
obs. 58.55 35.39 5.94 1 0.7633
:l 6-1 expo 58.27 36.13 5.60
128
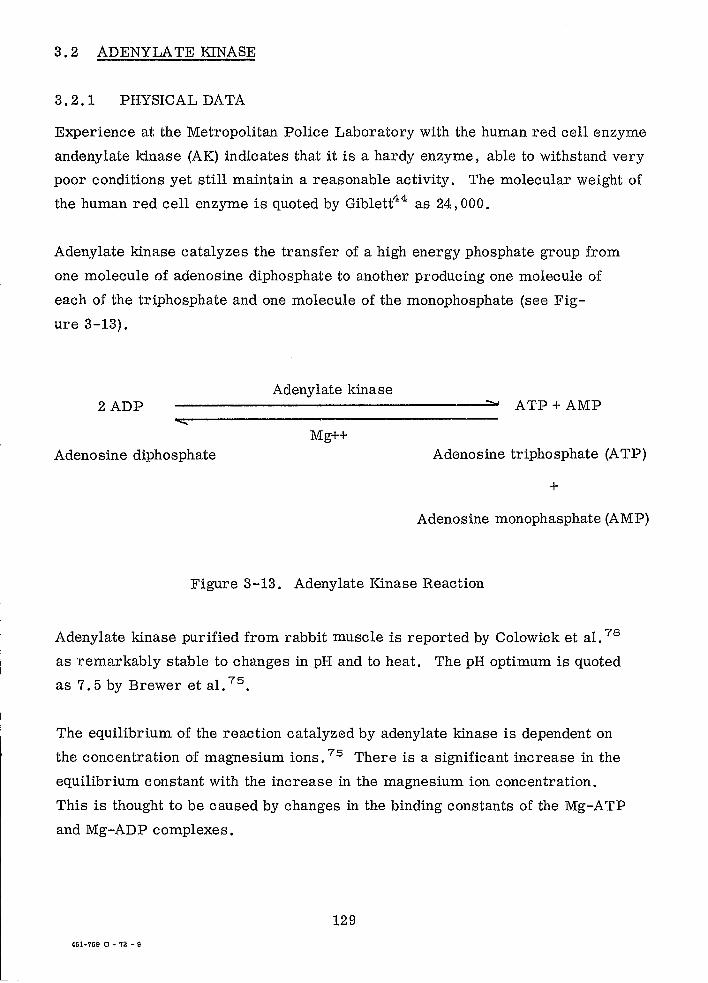
--------- -------------
3.2 ADENYLA TE KINASE
3.2. 1 PHYSICAL DATA
Experience at the Metropolitan Police Laboratory with the human red cell enzyme
andenylate kinase (AK) indicates that it is a hardy enzyme, able to withstand very
poor conditions yet still maintain a reasonable activity. The molecular weight of
the human red cell enzyme is quoted by Giblett44 as 24,000.
Adenylate kinase catalyzes the transfer of a high energy phosphate group from
one molecule of adenosine diphosphate to another producing one molecule of
each of the triphosphate and one molecule of the monophosphate (see Fig-
ure 3-13).
Adenylate kinase 2ADP -----------------..;;;::",...... ATP + AMP
..... Mg++
Adenosine diphosphate Adenosine triphosphate (A TP)
+
Adenosine monophasphate (AMP)
Figure 3-13. Adenylate Kinase Reaction
Adenylate kinase purified from rabbit muscle is reported by Colowick et al. 78
as remarkably stable to changes in pH and to heat. The pH optimum is quoted
as 7.5 by Brewer et al. 75.
The equ.ilibrium of the reaction catalyzed by adenylate kinase is dependent on
the concentration of magnesium ions. 75 There is a significant increase in the
equilibrium constant with the increase in the magnesium ion concentration.
This is thought to be caused by changes in the binding constants of the Mg-ATP
and Mg-ADP complexes.
129
451-769 0 - 72 - 9
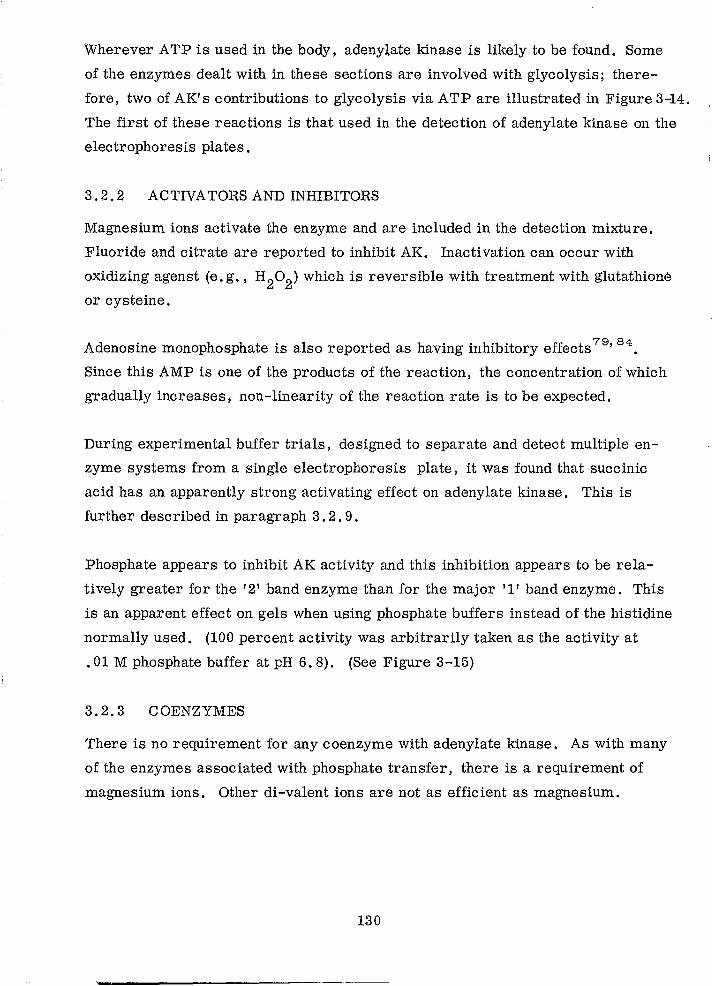
Wherever A TP is used in the body, adenylate kinase is likely to be found. Some
of the enzymes dealt with in these sections are involved with glycolysis; there
fore, two of AK's contributions to glycolysis via ATP are illustrated in Figure 3-14.
The first of these reactions is that used in the detection of adenyl ate kinase on the
electrophoresis plates.
3.2.2 ACTIVATORS AND INHIBITORS
Magnesium ions activate the enzyme and are included in the detection mixture.
Fluoride and citrate are reported to inhibit AK. Inactivation can occur with
oxidizing agenst (e.g., H20 2) which is reversible with treatment with glutathione
or cysteine.
Adenosine monophosphate is also reported as having inhibitory effects 79,84.
Since this AMP is one of the products of the reaction, the concentration of which
gradually increases, non-linearity of the reaction rate is to be expected.
During experimental buffer trials, designed to separate and detect multiple en
zyme systems from a single electrophoresis plate, it was found that succinic
acid has an apparently strong activating effect on adenylate kinase. This is
further described in paragraph 3.2. 9.
Phosphate appears to inhibit AK activity and this inhibition appears to be rela
tively greater for the '2' band enzyme than for the major '1' band enzyme. This
is an apparent effect on gels when using phosphate buffers instead of the histidine
normally used. (100 percent activity was arbitrarily taken as the activity at
.01 M phosphate buffer at pH 6.8). (See Figure 3-15)
3.2.3 COENZYMES
There is no requirement for any coenzyme with adenyl ate kinase. As with many
of the enzymes associated with phosphate transfer, there is a requirement of
magnesium ions. Other di-valent ions are not as efficient as magnesium.
130
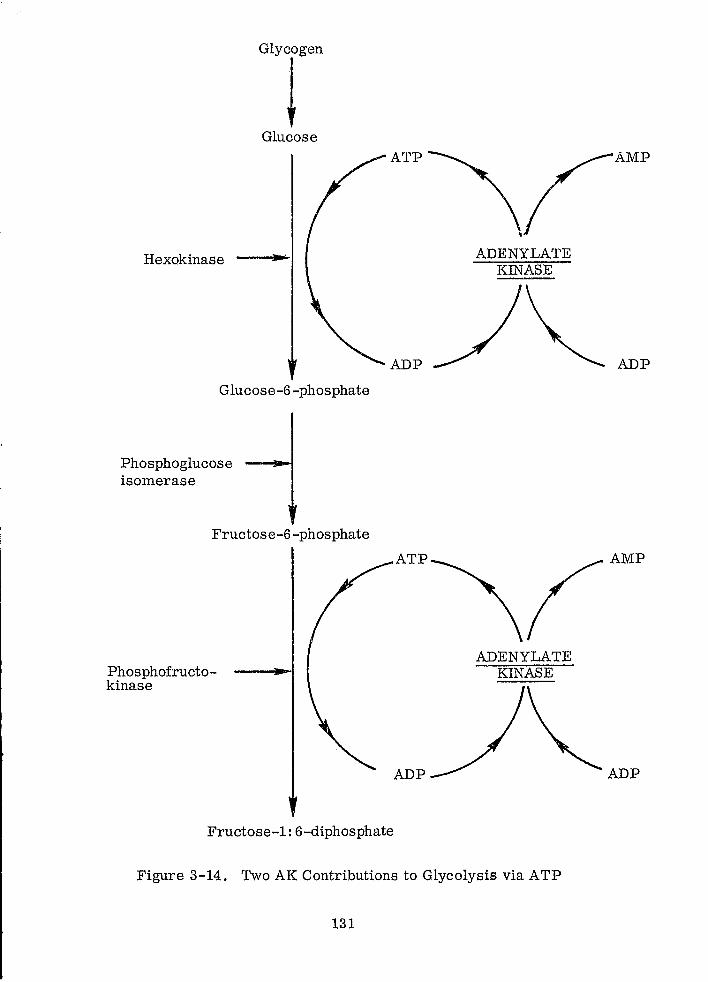
Glucose
Hexokinase
Glucose-6-phosphate
Phosphoglucose isomerase
Fructose-6 -phosphate
Phosphofructokinase
ATP
ADP
ATP
Fructose-1: 6-diphosphate
ADENYLATE KINASE
ADENYLATE KINASE
Figure 3-14. Two AK Contributions to Glycolysis via ATP
131
AMP
ADP
ADP
100
50
O~~~~~·-rf~~i~'~·-~l~'~i~'~'~I~·--'~i--'-rt-------
·05 .10 ·15 ·20
Molarity of Phosphate Buffer
Figure 3-15. Inhibition of AK with Increasing Molarity of Phosphate
3.2.4 POLYMORPHISM
The polymorphism in human red cell adenylate kinase was first described by
Fildes and Harris in 1966 8J-. The genetics of AK in human red cells is, to date,
a simple system of multiple alleles at a single locus. There are two common
forms of the enzyme, AK1 and the heterozygote AK 2-1. The homozygote
AK2 is rare, and even rarer are the other forms AK 3_1 76 and AK 4_183.
AK 3-1 has been described using a different buffer system (phosphate) from
that originally used by Fildes and Harris. Figure 3-16 is diagrammatic
representation of the AK phenotypes separated in histidine buffer. Fig-
ure 3-17 is diagrammatic representation of the AK phenotypes AKl andAK3-1
132
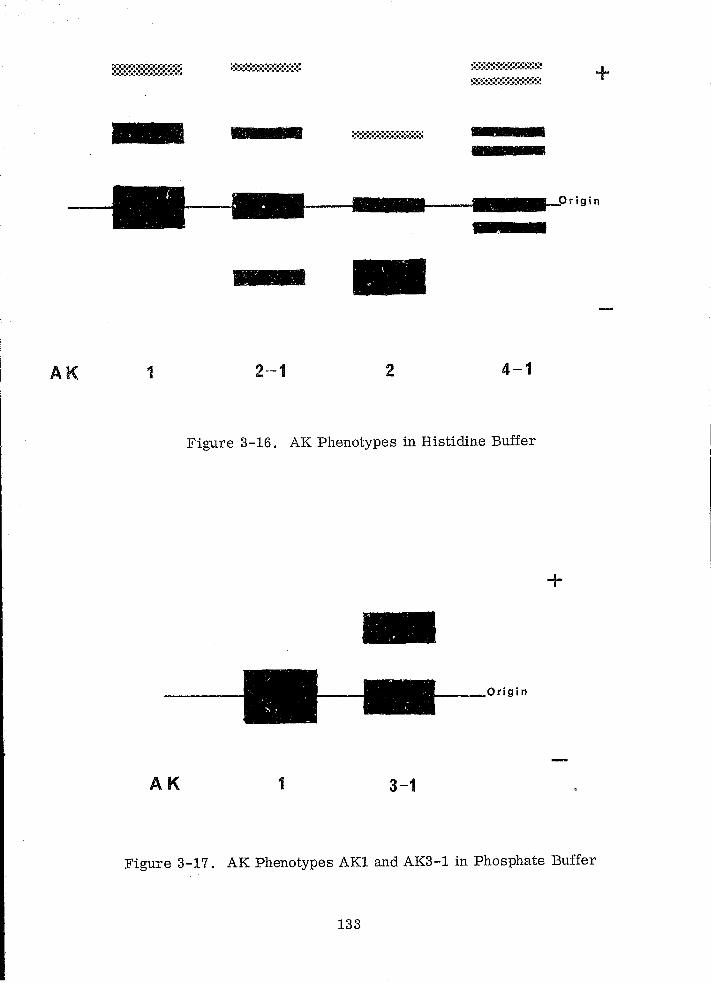
+
- I
~_-I ••• I-__ •••• !-Or igi n
E,
-AK 1 2-1 2 4-1
Figure 3-16. AK Phenotypes in Histidine Buffer
+
___ urigin
AK 1 3-1
Figure 3-17. AK Phenotypes AK1 and AK3-1 in Phosphate Buffer
133
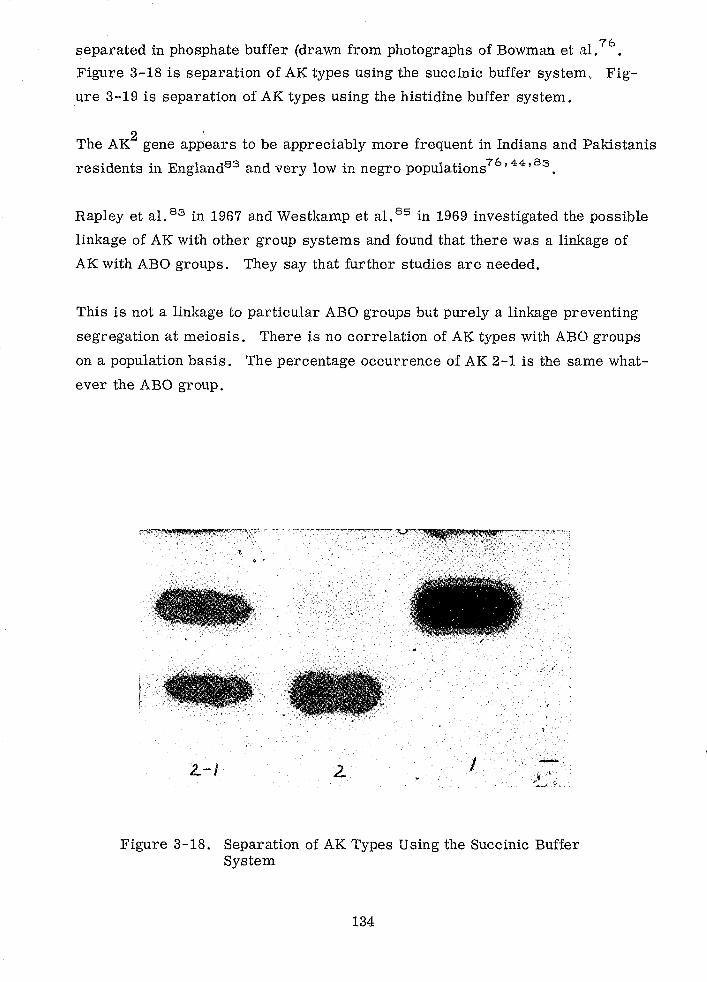
separated in phosphate buffer (drawn from photographs of Bowman et .11. 76.
Figure 3-18 is separation of AK types using the succinic buffer system, Fig
ure 3-19 is separation of AK types using the histidine buffer system.
The AK2 gene ap~ears to be appreciably more frequent in Indians and Pakistanis
residents in England83 and very low in negro populations76, 44,83 •
Rapley et al. 83 in 1967 and Westkamp et al. 85 in 1969 investigated the possible
linkage of AK with other group systems and found that there wa.s a linkage of
AK with ABO groups. They say that further studies are needed.
This is not a linkage to particular ABO groups but purely a linkage preventing
segregation at meiosis. There is no correlation of AK types with ABO groups
on a population basis. The percentage occurrence of AK 2-1 is the same what
ever the ABO group.
r~":~/;!k P?t44.s;4!:~, ~' . .. '::~\\:" .. \' ..
2.-1 2 I
Figure 3-18. Separation of AK Types Using the Succinic Buffer System
134
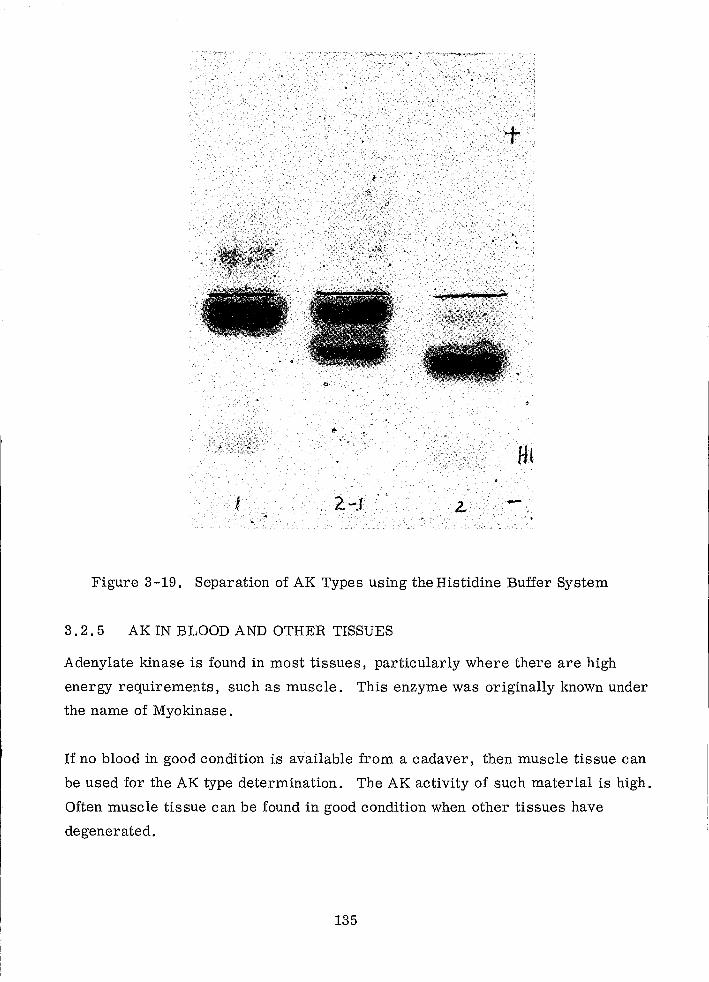
· ,
'+
Ht " -
Figure 3-19. Separation of AK Types using the Histidine Buffer System
3.2.5 AK IN BLOOD AND OTHER TISSUES
Adenylate kinase is found in most tissues, particularly where there are high
energy requirements, such as muscle. This enzyme was originally known under
the name of Myokinase.
If no blood in good condition is available from a cadaver, then muscle tissue can
be used for the AK type determination. The AK activity of such material is high.
Often muscle tissue can be found in good condition when other tissues have
degenerated.
135
The electrophoretic mobility of adenylate kinase varies slightly depending on
what tissue it is derived from74• This does not interfere with the ability to de
termine the AK type.
3.2.6 EFFECTS OF AGE
AK is a very stable enzyme and refrigeration of a blood sample or a lysate is all
that is required to keep good activity for several weeks. A lysate deep frozen
(-20°C) keeps its activity satisfactorily forperiods exceeding one year.
Dried bloodstains rarely give trouble from loss of activity up to one month old
and stains 3 to 6 months old have been satisfactorily typed. After 3 to 4 weeks,
the effects of loss of activity are seen and as time progresses this loss of activity
becomes more and more apparent until at three months some samples will retain
sufficient activity but many will not have sufficient residual activity to make
typing possible.
The t2' band seems more sensitive to aging than the major '1' band, particularly
if phosphate buffer is used for the investigation. If it is suspected that the sam
ple is old or in a condition in which low activities might be expected the use of
succinic buffers is recommended.
3.2.7 EFFECT OF THE BLOODSTAIN SUBSTRATE
The stain substrate appears to make no difference to the enzyme. Satisfactory
typing has been performed on all types of textile materials, carpets, metal,
glass, painted surfaces, and others. The usual techniques for dealing with
various substrates apply with no difficulty.
3.2.8 EFFECT OF VARIOUS CHEMICALS
Mercaptoethanol has no effect at dilutions up to 1 percent. The effects of other
chemicals have not been investigated in the Metropolitan Police Laboratory since
this enzyme has not given the problems that need to be solved by this type of
investigation.
136
3.2.9 SAMPLE PREPARATION
3.2.9.1 General
There is some disagreement on the nature of AK in the red cell. According to
Kashket and Denstedt82 , an appreciable proportion of AK activity is associated
with the red cell stroma. These authors82 say that the major part of the activity
is in the soluble fraction, but stroma prepared from the haemolysate and well
washed with distilled water and isotonic KCl showed, as a suspension in KC 1,
an activity amounting to about one quarter of the total activity.
Cerletti and De Ritis 77 disagree with this conclusion. These authors state that
freshly sedimented stroma from a haemolysate display AK activity. However,
as shown, when the stroma are washed the activity consistently decreases and
disappears after 5 to 6 washings and is found in the washing liquid.
This is not a point that is critical when examining forensic material which, as a
bloodstain, is going to contain a mixture of haemolysate and stroma. It does,
however, indicate that the presence of stroma will not ha.ve a deleterious effect
on the AK enzyme, as in the case with some other enzymes.
From the above, and from the information that AK is an enzyme stable to heat
and a wide range of pH, one can expect that minimum preparation of the sample
will be necessary, and this has been found to be the case.
Blood samples can be dealt with as a simple lysate-that is, packed cells with
a minimum of distilled water added. There is no need for further additions or
centrifugation unless the lysate is going to be used for other enzyme examina
tions, such as ADA or G6PD.
Likewise, the preparation of a bloodstain for examination for AK is minimal.
Soaking the bloodstained thread in a minimum of gel buffer for a few minutes
(5 to 10 minutes) prior to its insertion into the gel is all that is required.
137
--------------- ----
The activity of AK in bloodstains is reasonably high, and it is possible to over
load the gel with enzyme if the thread that is used is thick and heavily blood
stained. This does not prevent type classification but tends to make a plate have
a poor appearance; in addition the sample may spread and interfere slightly with
adjacent samples.
3.2.9.2 Methods
Usually starch gel has been used in investigations of AK polymorphism and the
original buffer system described by Fildes and Harris8~ is better than any other
published method that has been tried. The determination of AK types in blood
stains was reported by Oulliford and Wraxall80 in 1968. It has been found that
a succinic buffer is also excellent and both will be described in the following
paragraphs.
In an effort to reduce the amount of bloodstain r~quired for a completed enzyme
investigation, an attempt was made to combine AK with 6-phosphogluconate
dehydrogenase on a phosphate buffer gel, developing one part of the plate for
6-phosphogluconate dehydrogenase and the cathodal part for AK. The results
for lysates and strong fairly fresh bloodstains were satisfactory and correct
typing was obtained. It was found, however, that stains of low activity, either
bec ause of the age of the stain or bec ause of the small amount of blood in the
stain, gave weak AK 1 results when in fact they were AK 2-1. The '2' band did
not stain with the reaction mixture as it should have done.
When the same stains were run with histidine buffer, the '2' band showed clearly.
Therefore, the phosphate buffer was dropped and all AK work is now done using
the histidine buffer or the succinic buffer.
The thin layer starch gel technique is used and this can be done in a cold room
0°0 or using a cooling plate below the gel at 6 to 8 °0. At room temperature
too much diffusion occurs.
138
3 . 2. 9. 3 Histidine Buffer System
Starch gel at a concentration of 13 g percent is made in the gel buffer adjusted to
pH 7 with 2N sodium hydroxide and composed of:
Histidine (0.005 M) 0.79 g
Distilled water 1 litre
The tank buffer, adjusted to pH 7 with 2N sodium hydroxide, is composed of:
Citric acid (0.41M) 86.1 g
Distilled water to 1 litre
The inserts are put into the gel at the centre of the gel. Electrophoresis is per
formed for four hours at 10 to 12 volts/em or overnight (17 hours) at 3 volts
per cm at O°C.
After electrophoresis, a reaction mixture agar overlay is poured onto the starch
gel 5 cm towards both tI e anode and the cathode from the origin.
3.2. 9.4 .§uccinic Buffer System
Starch gel at a concentration of 13 g percent is made in the gel buffer, adjusted
to pH 5 with saturated succinic acid solution if necessary, and which is com
posed of:
Succinic acid 1. 84 g
TRIS (Tris-hydroxymethylamino-ethane) 2. 236 g
Distilled water to 1 litre
The tank buffer, adjusted to pH 5 with 40 percent sodium hydroxide and make up
to 1 litre, is composed of:
Citric acid
Distilled water
86.1 g
800 ml
The inserts are put into the gel towards the anode end of the plate, about one
third of the distance from the anode to the cathode. Electrophoresis is per
formed for 4 hours at 12 volts/ cm.
139
After electrophoresis, a reaction mixture agar overlay is poured onto the starch
gel from 2 cm on the anodic side of the origin to 7 to 8 cm to the cathodic side
of the origin.
3.2. 9.5 Development of the Gels
The AK detection is accomplished by using the A TP formed by AK from ADP to
phosphate glucose in the presence of hexokinase. The glucose-6-phosphate is
then ozidized by G-6-P dehydrogenase and NADP forming NADPH, which,
through the usual PMS and MTT system forms the blue bands at the positions
of AK activity. This mechanism is illustrated in Figure 3-20.
The reaction mixture is as follows:
Buffer 0.1 M TRIS (12.14 g TRIS in 500 ml distilled water adjusted
to pH 8 with HCI).
Buffer
Glucose
Magnesium chloride
Adenosine diphosphate
Nicotinamide adenine dinucleotide diphosphate
Phenazine methosulphate
MTT tetrazoleum
Hexokinase
G luc ose -6 -phosphate dehydr ogenase
10 ml
18 mg
40 mg
5 mg
3 mg
2 mg
2 mg
0.8 units
0.4 units
This mixture is brought to 37°C in the incubator and mixed with 10 g of 2 percent
agar in distilled water at 50 to 55°C and immediately poured onto the gel.
When set it is covered with a glass plate and incubated at 37 °C for one-half to
one hour; the bands of activity are seen, as illustrated in Figures 3-18 and
3-19.
3.2. 9.6 AK and Pseudocholinesterase C 5 from the Same Electrophoresis Plate
Using the acrylamide/starch method described under pseudocholinesterase C5 ,
AK and C5
typing can both be obtained from one plate and one insert. This system
140
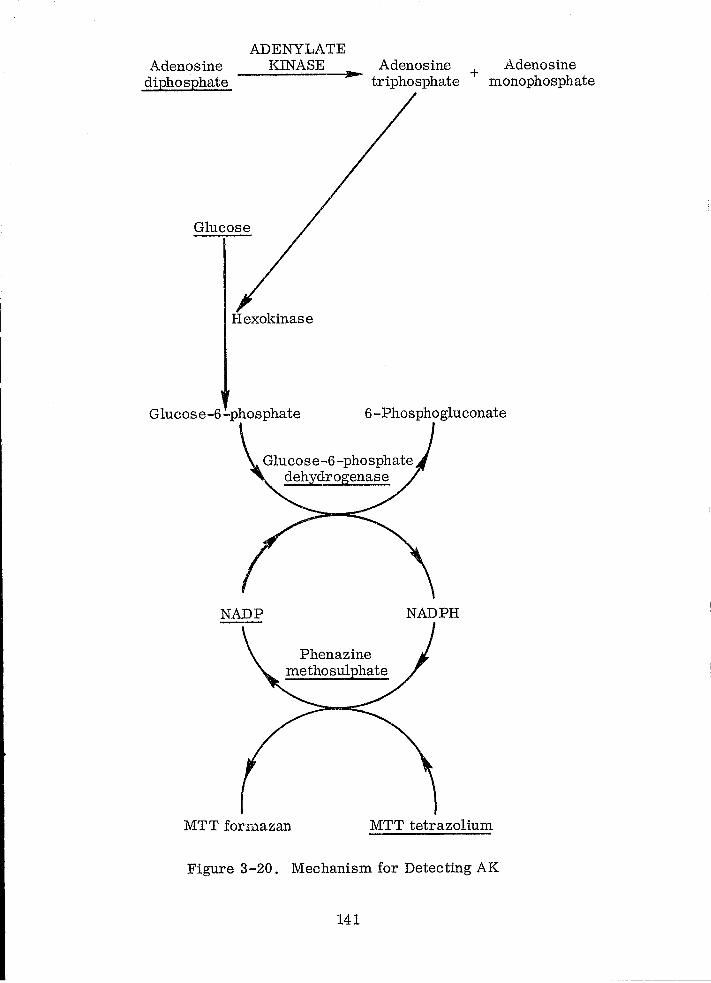
Adenosine diphosphate
ADENYLATE KINASE Adenosine + Adenosine ... triphosphate monophosphate
Glucose
Hexokinase
Glucose-6-phosphate 6 -Phosphogluconate
Glucose-6 -phosphate dehyd!ogenase
Phenazine methosulphate
MTT formazan MTT tetrazolium
Figure 3-20. Mechanism for Detecting AK
141
u.ses the clarity obtained with succinic buffers and the distinctness of acrylamide
in the banding. A photograph of AK types separated by this technique is also
illustrated in paragraph 3.6, Pseudocholinesterase.
3.2.10 PROBLEMS WITH THE AK SYSTEM
When the histidine buffer system is used, as bloodstains age, the AK2 band
weakens and the AK1 band tends to widen and become diffuse. These can
make interpretation difficult in old stains, particu.larly if the activity of the sam
ple is low.
In cases where only an indistinct pattern can be seen, no interpretation should
be given. There is considerable reduction of these aging effects if the succinic
buffer system is used.
Occasionally, with fresh blood samples, a weak sha.dow band between AKl and
AK2 bands can be seen. This appears to occur when the red cells are incom
pletely lysed. Care should be taken to ensure complete lysis of the sample.
In general, very few difficulties are encountered with this group system.
The population distribution of AK types is shown in Table 3-3. Comparison of
frequencies is given in Table 3-4.
142
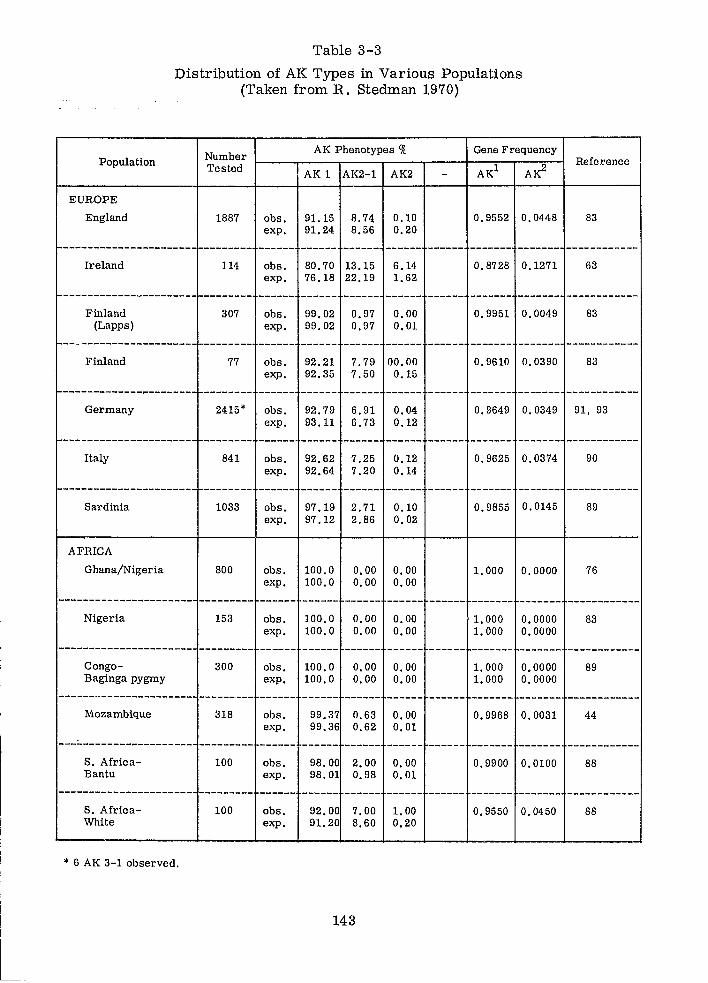
Population
EUROPE
England
Table 3-3
Distribution of AK Types in Various Populations (Taken from R, Stedman 1970)
Number AK Phenotypes Oft Gene Frequency
Tested AK 1 AK2-1 AK2 AK1 AK2
1887 obs. 91.15 8.74 0.10 0,9552 0.0448 expo 91.24 8.56 0.20
--------------------- -------- ------ ------ ------- -------
Ireland
Finland (Lapps)
Finland
114
307
--------
77
obs. 80.70 expo 76.18
obs. 99.02 expo 99.02
------ ------obs. 92.21 expo 92.35
13.15 6.14 0.8728 0.1271 22.19 1.62
0.97 0.00 0.9951 0.0049 0.97 0.01
7.79 00.00 0.9610 0.0390 7.50 0.15
Reference
83
------------63
83
83
Germany 2415* obs. 92.79 6.91 0.04 0.9649 0.0349 91, 93 expo 93.11 6.73 0.12
--------------------- -------- ------ ------Italy 841 obs. 92.62 7.25 0.12 0.9625 0.0374 90
Sardinia 1033
AFRICA
expo 92.64 7.20 0.14
obs. 97.19 2.71 0.10 expo 97.12 2.86 0.02
0.9855 0.0145
Ghana/Nigeria 800 obs. 100.0 0.000.00 1.0000.0000 expo 100.0 0.00 0.00
-------------------------------- ------ ------ ------ ------ ------ ------- -------Nigeria
CongoBaginga pygmy
Mozambique
S. AfricaBantu
S. AfricaWhite
* 6 AK 3-1 observed.
153
300
318
100
100
obs. 100.0 0.00 0.00 expo 100.0 0.00 0.00
obs. 100.0 0.00 0.00 expo 100.0 0.00 0.00
obs. expo
obs. expo
obs. expo
99.37 0.63 0.00 99.36 0.62 0.01
98.00 2.00 0.00 98.01 0.98 0.01
92.00 7.00 1.00 91.20 8.60 0.20
143
1.000 0,0000 1. 000 0.0000
1.000 0.0000 1. 000 0.0000
0.9968 0.0031
0.9900 0.0100
0.9550 0.0450
89
76
83
89
44
88
88
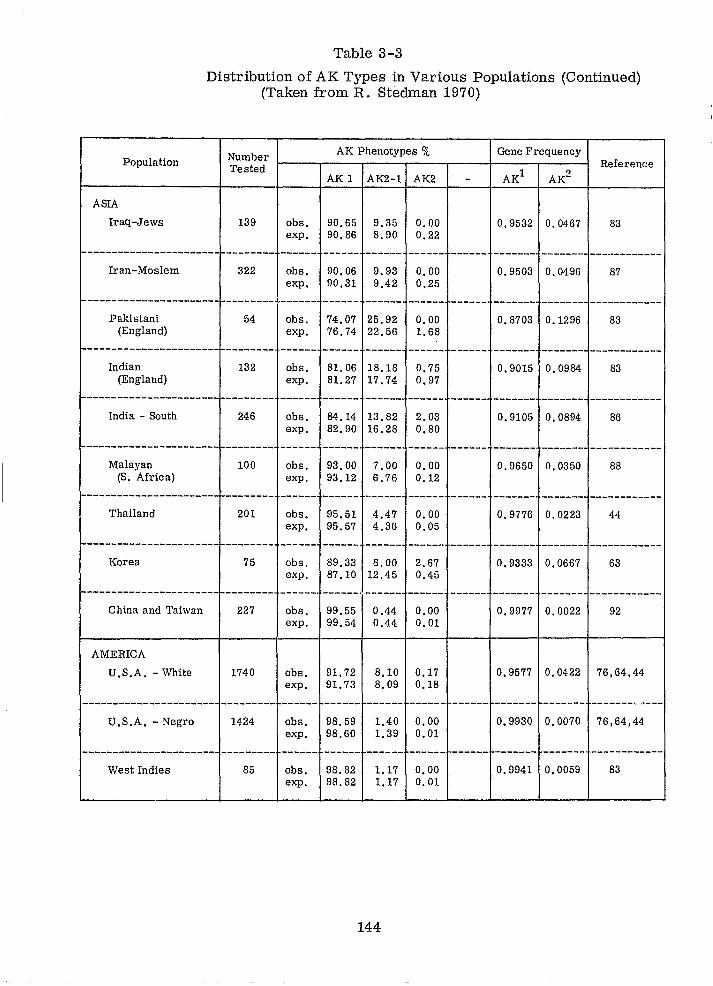
Table 3-3
Distribution of AI< Types in Various Populations (Continued) (Taken from R. Stedman 1970)
Population Number r-____ r-_A_K-,p_h_en_o_t_yp~e.-s-~-~--._----~Ge--ne--F,re-q-u-e-n-cy-; Tested Reference
ASIA
Iraq-Jews
Iran-Moslem
139
322
AK 1 AK2-1 AK2
obs. 90.65 9.35 0.00 expo 90.86 8.90 0.22
obs. 90.06 9.93 0.00 expo 90.31 9.42 0.25
--------------------- --------~------ ------Pakistani
(England)
Indian (England)
India - South
Malayan (S. Africa)
---------------------Thailand
Korea
-----------------------China and Taiwan
AMERICA
U.S.A. - White
U.S.A. - Negro
----------------------West Indies
54
--------
132
--------
246
100
--------201
75
--------
227
1740
1424
---------85
obs. 74.07 25.92 0.00 expo 76.74 22.56 1.68
------ ------obs. 81. 06 18.18 0.75 expo 81.27 17.74 0.97
------ ------obs. 84.14 13.82 2.03 expo 82.90 16.28 0.80
obs. 93.00 7.00 0.00 expo 93.12 6.76 0.12
------ ------obs. 95.51 4.4'1 0.00 expo 95.57 4.36 0.05
obs. 89.33 8.00 2.67 expo 87.10 12.45 0.45
------ ------obs. 99.55 0.44 0.00 expo 99.54 0.44 0.01
obs. 91.72 8.10 0.17 expo 91. 73 8.09 0.18
obs. 98.59 1.40 0.00 expo 98.60 1.39 0.01
------ ------obs. 98.82 1.17 0.00 expo 98.82 1.17 0.01
144
0.9532 0.0467 83
0.9503 0.0496 87
0.8703 0.1296 83
0.9015 0.0984 83
0.9105 0.0894 86
0.9650 0.0350 88
0.9776 0.0223 44
0.9333 0.0667 63
0.9977 0.0022 92
0.9577 0.0422 76,64,44
0.9930 0.0070 76,64,44
------ ------- ------- ------------0.9941 0.0059 83
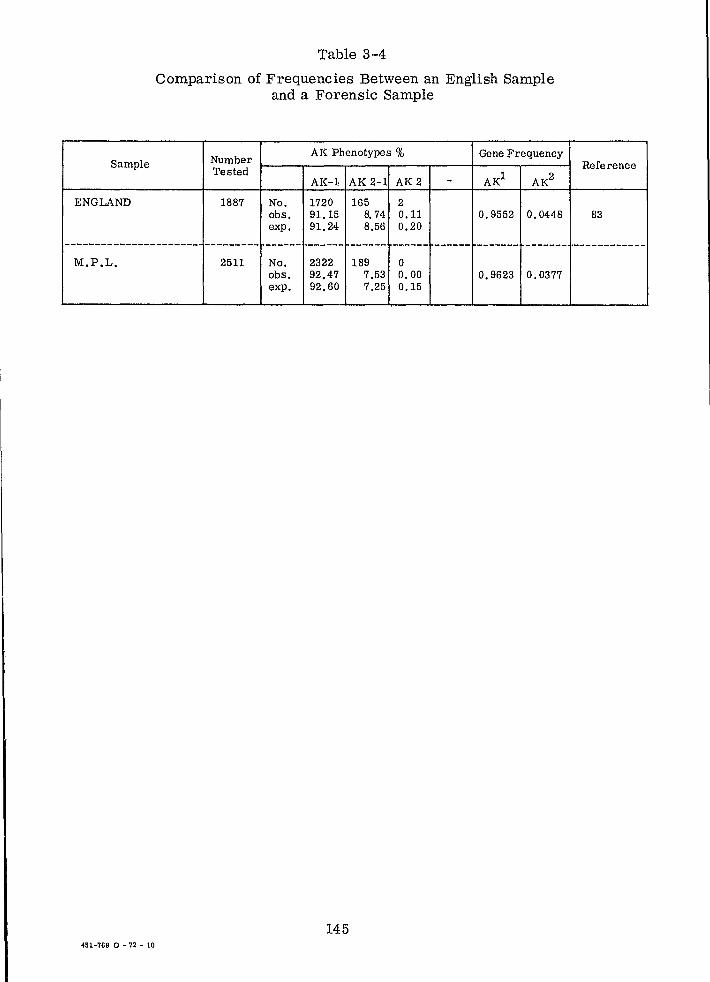
Sample
ENGLAND
Table 3-4
Comparison of Frequencies Between an English Sample and a Forensic Sample
Number AK Phenotypes % Gene Frequency
Tested AK1 AK2 AK-1 AK 2-1 AK 2 -
1887 No. 1720 165 2 obs. 91.15 8.74 0.11 0.9552 0.0448 expo 91.24 8.56 0.20
---------------------- --------- ------ ------ ------ ------ ------ ------- -------M.P.L. 2511 No. 2322 189 0
obs. 92.47 7.53 0.00 0.9623 0.0377 expo 92.60 7.25 0.15
145 451-769 0 - 72 - 10
Reference
83
------------
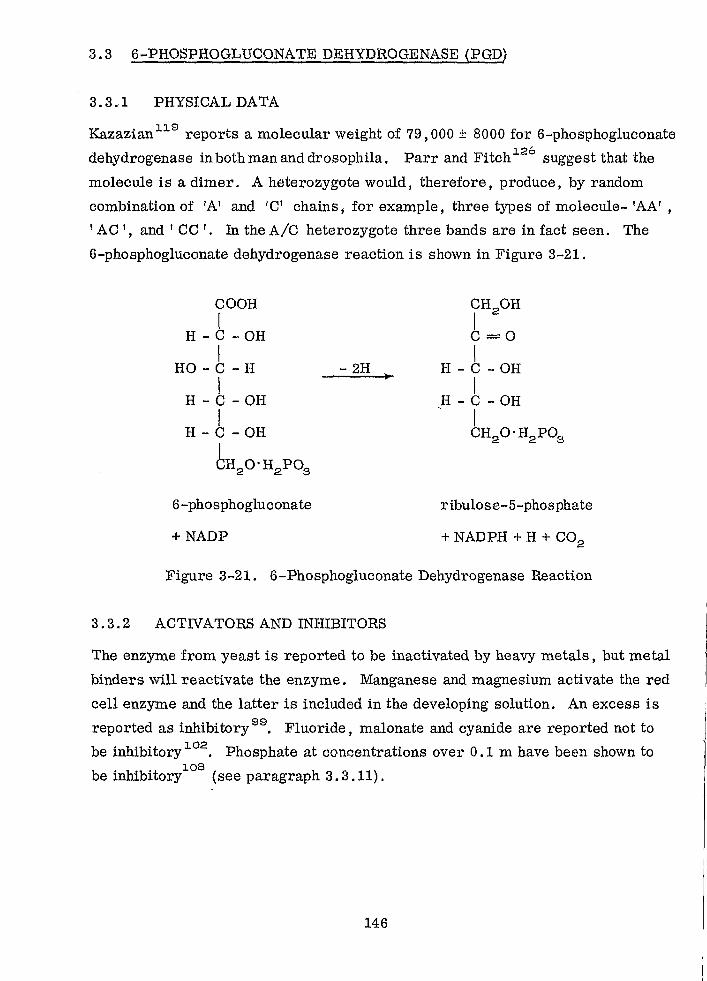
3.3 6-PH08PHOGLUCONATE DEHYDROGENASE (PGD)
3.3.1 PHYSICAL DATA
Kazazian lJ.9 reports a molecular weight of 79,000 ± 8000 for 6-phosphogluconate
dehydrogenase in both man and drosophila. Parr and Fitch ~26 suggest that the
molecule is a dimer. A heterozygote would, therefore, produce, by random
combination of IN and lC' chains, for example, three types of molecule- 'AA' ,
'AC', and ' CC'. In the Alc heterozygote three bands are in fact seen. The
6-phosphogluccillate dehydrogenase reaction is shown in Figure 3-21.
CH2 0H I C=O I
- 2H l'"
H - C - OH I
H - C - OH I CH
20'H2 PO
S
6-phosphogluconate ribulose-5-phosphate
+NADP + NADPH + H + CO2
Figure 3-21. 6-Phosphogluconate Dehydrogenase Reaction
3.3.2 ACTIVATORS AND INHIBITORS
The enzyme from yeast is reported to be inactivated by heavy metals, but metal
binders will reactivate the enzyme. Manganese and magnesium activate the red
cell enzyme and the latter is included in the developing solution. An excess is
reported as inhibitory 99. Fluoride, malonate and cyanide are reported not to
be inhibitory~02. Phosphate at concentrations over 0.1 m have been shown to
be inhibitory~08 (see paragraph 3.3.11).
146
The White chapel variant is reported as unstable in the absence of the usual
type PGDA. That is, the stability of the homozygous PGD W . PGD W is poor
but that of the Dalston variant PGD W . PGDA is satisfactory.
The heat stability of the enzyme at 37 0 C in human ly~ates is poor and variation
between the normal and the less stable variant types was described by Parr 114
and Parr .
3.3.3 COENZYMES
NADP is required as a coenzyme (hydrogen accepter) . There is an optimum
concentration since, as will be described later, NADP can have an apparently
inhibitory effect.
3.3.4 POLYMORPHISM
102,103,104 The polymorphism of PGD was attributed originally to two alleles,
alpha and beta, giving three possible variations, the homozygous types for alpha
and beta alleles and the heterozygous type, with one of each allele.
The symbols alpha and beta were later thought to be inappropriate, since they
are generally accepted as representing polypeptide chains that may be synthe
sized by genes at different loci (e. g., the alpha and beta chains of haemoglobin).
Since Arabic numbers had from the start been used to denote the phosphogluco
nate dehydrogenase electrophoretic components, it seemed quite appropriate to
use the same numbers (where applicable) for the genes responsible for these
components.
To avoid this confusion, the alleles were subsequently renamed PGDA and PGD G98,113
PGD , thus giving three (electrophoretic) phenotypes: the A (or usual)
type, with an 'a' electrophoretic band; the C (or canning) variant, with a domi
nant 'c' band; and the heterozygous CA type (the so-called common variant),
with both 'a' and 'c' electrophoretic bands and also a strong hybrid 'b' band.
147
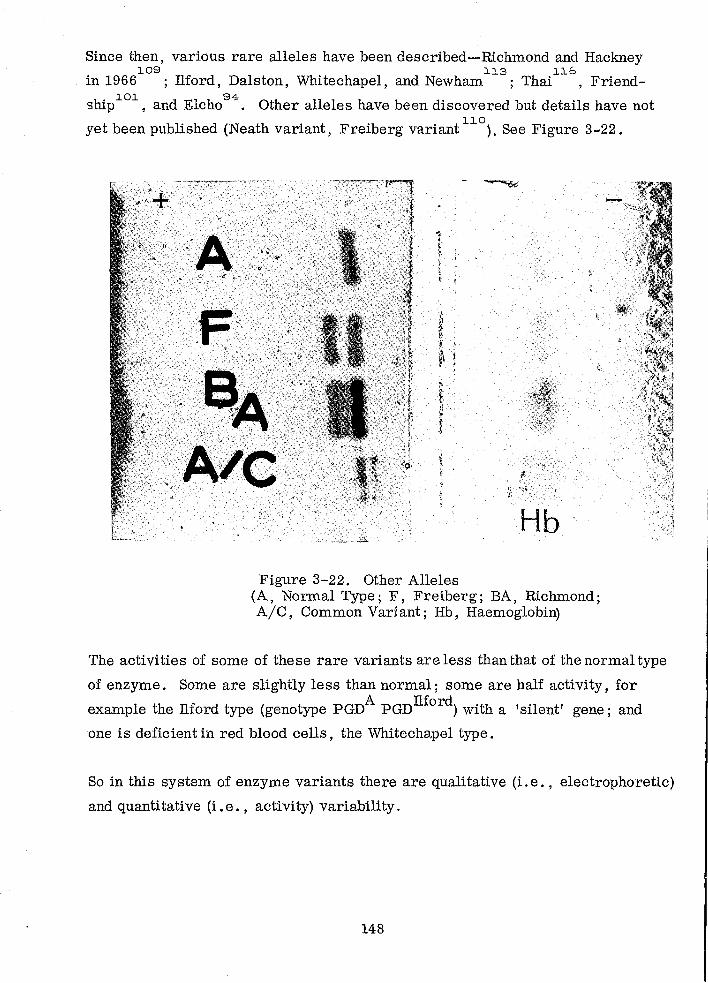
Since then, various rare alleles have been described-Richmond and Hackney 109 113 Ilb
in 1966 ; liford, Dalston, Whitechapel, and Newham ; Thai , Friend-
ship 101, and Elcho 94. Other alleles have been discovered but details have not
yet been published (Neath variant, Freiberg variant 110). See Figure 3-22.
Hb
Figure 3-22. Other Alleles (A, Normal Type; F, Freiberg; BA, Richmond; A/e, Common Variant; Hb, Haemoglobin)
The activities of some of these rare variants are less than that of the normal type
of enzyme. Some are slightly less than normal; some are half activity, for A TIford. example the TIford type (genotype PGD PGD ) WIth a 'silent' gene; and
one is deficient in red blood cells, the Whitechapel type.
So in this system of enzyme variants there are qualitative (i. e., electrophoretic)
and quantitative (i. e., activity) variability.
148
Parr, et al U4 have suggested that those half activity forms should be named
similarly to the electrophoretic variants to avoid any confusions that might arise
from the earlier half-activity nomenclature.
Throughout this paragraph Parr's recent nomenclature and notation have been
adopted, since this is clearly more satisfactory in use than the earlier systems.
It was reported99 that the drosophila enzyme of M. W. 80,000 was composed of
two sub-units each of about 40,000. Parr and Fitch us suggest a similar struc
ture to explain the triple-banding of the heterozygous common variant. For de
tails, refer to this and other papers by Parr. See Figure 3-23 for a table of
enzyme activity.
3.3.5 PGD IN BLOOD AND OTHER TISSUES
The assay of total activity in red cells is dependent on the PGD phenotype pres
ent. The average assay on the usual type is 136 ± 24~tMoles NADPH per gram,
haemoglobin per hour according to Brewer and Dern 96 or 3.08 ± 0.33 units
per gram Hb according to Parr and Fitch U2 (the .latter result is 185 ± 19.8
M Moles NADPH per gram haemoglobin per hour).
105 Gibbs reported the 6PGD activity in vaginal secretion. Unfortunately Gibbs
states that the first action is to make up the sample of vaginal secretion to 3 ml
from an unknown original amount. Therefore, the relationship of enzyme activ
ity to original secretion cannot be determined from the figures he quotes. No
PGD activity was found in human semen.
3.3.6 EFFECTS OF AGE
The effects of storage are connected with those of stability in the usual, common
variant, and canning type s .
The development of anodal bands, the so-called 'storage bands' or 'satellite
bands', occurs with the A or usual type associated with some loss of activity.
Anodal band formation also occurs with the CA and the C types but the storage
stability of these is lower than that of the A type and loss of activity is more
marked.
149
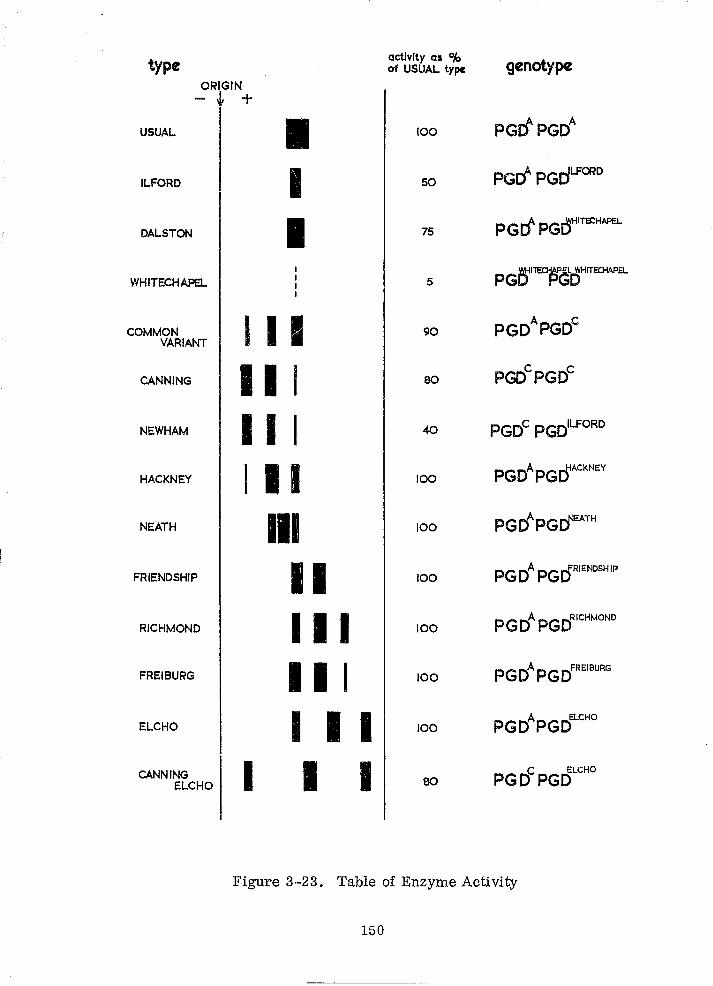
type activity 01 % genotype of USlJAL type
ORIGIN - ~ +
USUAL • 100 PG~PGDA
ILFORD I 50 PGd' PGdLFCRD
DALSTON I 75 PGrf PGtflTS:HAPEL
WHITECHAPEL 5 PG5PGLo
rrrow>a
COMMON I I I 90 PGOApGOC
VARIANT
CANNING II I 80 PGDCPGOC
NEWHAM I I I PGOC PGOILFORD
HACKNEY I II 100 PGOApGcrACKNEY
NEATH III 100 PGr/'PGrfEATH
FRIENDSHIP II 100 PGOA PGORIENDSHIP
RICHMOND I I I 100 PGDApGr1ICHMOND
FREIBURG III 100 PGOA PG OREIBURG
ELCHO I I I 100 PGDApGOELCHO
CANNING I I I 80 PG DC PGOLCHO
ELCHO
Figure 3·-23. Table of Enzyme Activity
150
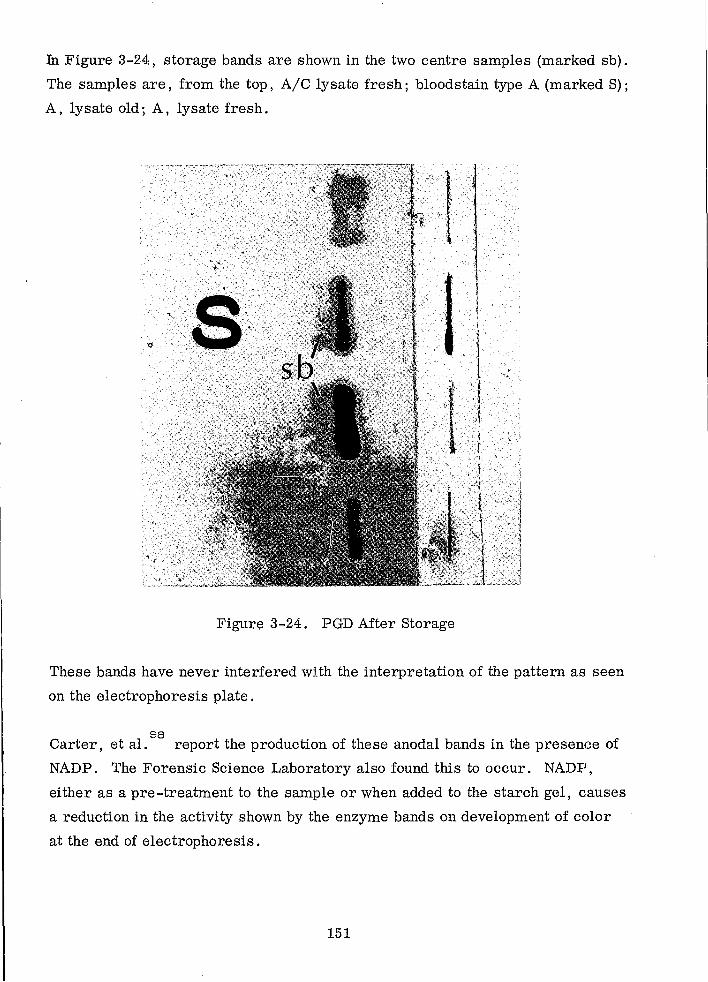
In Figure 3-24, storage bands are shown in the two centre samples (marked sb).
The samples are, from the top, A/C lysate fresh; bloodstain type A (marked S);
A, lysate old; A, lysate fresh.
Figure 3-24. PGD After Storage
These bands have never interfered with the interpretation of the pattern as seen
on the electrophoresis plate.
98 Carter, et al. report the production of these anodal bands in the presenee of
NADP. The Forensic Science Laboratory also found this to occur. NADP,
either as a pre-treatment to the sample or when added to the starch gel, causes
a reduction in the activity shown by the enzyme bands on development of color
at the end of electrophoresis.
151
Storage or incubation leads to loss of activity. Parr and Parrll.4 report a rapid
loss of activity dependent on enzyme type after 15 minutes incubation at 37°C.
Mean Loss of Activity ~%~
(AA) Usual 27
(CA) Common Variant 49
Newham 70
llford 35
(CC) Canning 62
Storage of blood samples at room temperature leads to loss of PGD activity at
a slower rate than this. Storage at O°C delays this but loss of activity is appar
ent in two to three weeks. Excellent preservation according to Azewedo and
Yoshida is obtained by storage at _70° C.
The Forensic Science laboratory found that at _20° C, unsatisfactory storage of
AIC is obtained beyond one week, if it is thawed and frozen each day, while
storage in liquid nitrogen has been found to be excellent. At present, no very
long terms of storage have been tried. To date, all samples stored in nitrogen
that have been tested have been satisfactory to periods of over one year.
The storage factor with bloodstains at normal temperatures is similar to that
of other enzymes. During a short period of storage-up to three weeks-satis
factory results can be obtained by electrophesis. The loss of activity is faster
than that of PGM, AK, or ADA, but sufficient activity persists for a time, which
makes this system useful in most instances of bloodstain examination.
3.3.7 DEFICIENCY
As has been mentioned, genetically controlled partial deficiency can also occur
associated with several forms of the enzyme, e.g., where a Isilent' gene
PGDllford is present. For example, PGDA PGDllford is a half activity usual
electrophoretic type (the llford type). The deficient types can be assayed read
ily in fresh samples of lysates and their activity expressed in units per gram Hb
or a.s a ratio of 6PGD to G6PD activities. G6PD can also be deficient and Brewer 96
and Dern showed that inaividuals can be deficient in both enzymes.
152
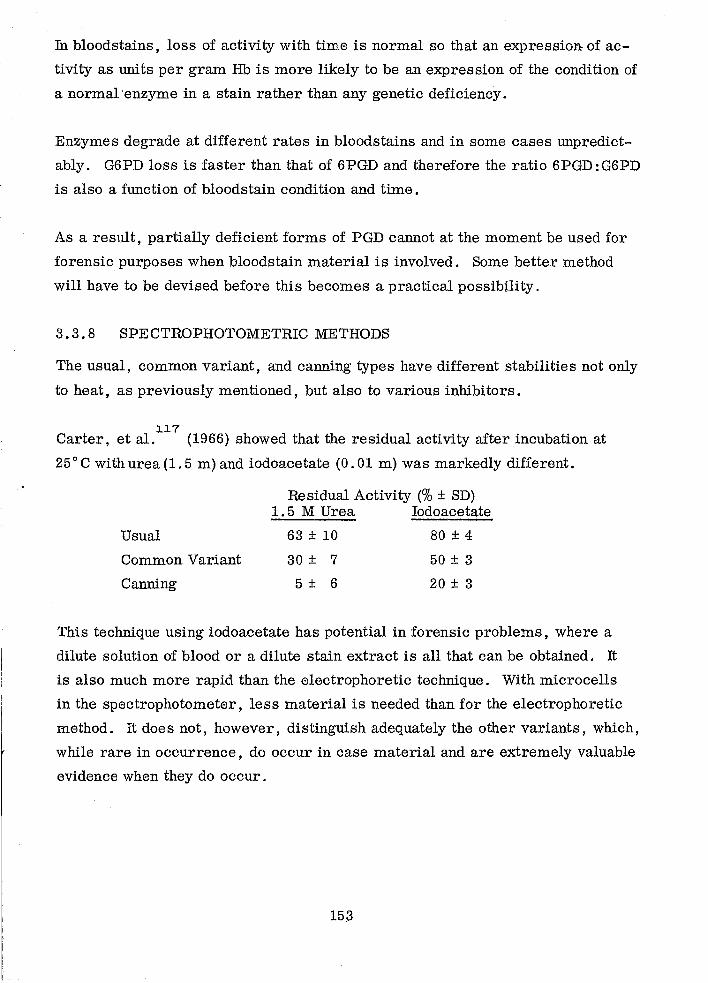
--------~~~--~-
In bloodstains, loss of activity with time is normal so that an expression. of ac
tivity as units per gram Hb is more likely to be an expression of the condition of
a normal 'enzyme in a stain rather than any genetic deficiency.
Enzymes degrade at different rates in bloodstains and in some cases unpredict
ably. G6PD loss is faster than that of 6PGD and therefore the ratio 6PGD :G6PD
is also a function of bloodstain condition and time.
As a result, partially deficient forms of PGD cannot at the moment be used for
forensic purposes when bloodstain material is involved. Some better method
will have to be devised before this becomes a practical possibility.
3.3.8 SPECTROPHOTOMETRIC METHODS
The usual, common variant, and canning types have different stabilities not only
to heat, as previously mentioned, but also to various inhibitors.
117 Carter, et al. (1966) showed that the residual activity after incubation at
25 0 C with urea (1. 5 m) and iodoacetate (0. 01 m) was markedly different.
Usual
Common Variant
Canning
Residual Activity (% ± SD) 1. 5 M Urea Iodoacetate
63 ± 10
30 ± 7
5 ± 6
80 ± 4
50 ± 3
20 ± 3
This technique using iodoacetate has potential in forensic problems, where a
dilute solution of blood or a dilute stain extract is all that can be obtained. It
is also much more rapid than the electrophoretic technique. With microcells
in the spectrophotometer, less material is needed than for the electrophoretic
method. It doe s not, however, distinguish adequately the other variants, which,
while rare in occurrence, do occur in case material and are extremely valuable
evidence when they do occur.
15;3
Teepol has also been used by ParrlH
as a selective inhibitor. In the Forensic
Science Laboratory, this technique was found to be difficult to work with satis
factorily. It does, however, point out the necessity of adequately cleaning glass
ware prior to its use in such assays and ensuring complete freedom from
de tergents .
3.3.9 EFFECTS OF STROMA 97
Carson, et al. reported the effects of stroma on the activity of G6PD, PGD,
and GR in lysates. The assay of the activity of PGD varies with (a) the presence
or absence of NADP, (b) the electrophoretic type of the enzyme, and (c) the
presence or absence of stroma in the lysate. These authors found that after
two hours' incubation at 45° C in the absence of stroma, the usual enzyme gave
a 97 percent residual activity without NADP and 96 percent residual activity
with 10-4 M. NADP.
In the presence of stroma and the absence of NADP, there was 82 percent resid-_4
ual activity, but in the presence of both stroma and 10 M. NADP only 55 per-
cent of the original activity remained after the incubation. This seems surpris
ingly high when compared with the results of incubation reported by Parr and ll4
Parr .
If the PGD type is other than the usual type, i. e., common variant or canning,
then there is a much lower residual activity after incubation, which agrees with
the relative stability findings of Parr and ParrH4
. These findings have rele
vance in the examination of bloodstains, for in these it is not possible to remove
stromal debris during the ageing of the stain and during the preparative stages
prior to electrophoresis. Upon electrophoresis, the enzyme is separated from
the stromal debris.
It is disadvantageous to have NADP in the gel or as a pre-treatment to the stain
prior to electrophoresis. NADP is, however, required as a coenzyme and ob
viously the concentration of this during the development stage after electro
phoresis should be kept to an amount that will give the optimum results, unlike
other enzymes where an excess is not deleterious.
154
Unfortunately, most of these findings with regard to PGD are reversed when
considering G6PD. This leads to some difficulty in getting good results for
both enzymes from one electrophoresis plate when dealing with the more critical
bloodstain material. Results can be obtained from 1ysates in this way, but they
are not the optimal, high-quality results obtainable by using separate gels for
each system.
3.3.10 STAIN SUBSTRATE
The substrate material that is bloodstained appears to have no effect on the
ability to determine the type of PGD. Cotton, wool, and synthetic fibres, glass,
metal, and other substrates have been investigated and found satisfactory.
3.3.11 EFFECTS OF CHEMICALS
Mercaptoethanol1eads to a diminution or loss of activity depending on the con
centration used. It is not, therefore, employed to remove storage bands as
with some other enzyme systems.
In lysed blood sa..mp1es, which have been preserved with fluoride, there is a
marked diminution or complete loss of activity. In normal blood samples, cells
preserved with fluoride should be well washed prirr to use.
3.3.12 METHODS
3.3.12.1 General
Numerous methods have been described for the determination of PGD types. 103
The method first described was by starch gel electrophoresis . Bowman, 95 ,107
et aI. used starch with a different buffer system. Khan and Rattazzl
described the use of cellulose acetate gel. Cellulose acetate membranes also 42 115
have been tried . Peebles et al. used acrylamide gel (for the drosophila
enzyme).
All of these techniques have been t.ded but the one found most satisfactory for 62
forensic work on bloodstains was based on the thin layer starch gel technique
155

with a single cooling plate underneath at 6 to 8° C. The following buifer system
is used:
Tank Buffer: 0 . 2 M phosphate
a.
b.
Disodium Hydrogen Phosphate (anhydrous)
Water to
Sodium Dihydrogen Phosphate (2H2 0)
Water to
b. is added to a. until pH 6.8 is reached.
Gel Buffer
1/15 dilution of tank buffer.
28.4 g
1 litre
31.2 g
1 litre
The bloodstained thread is soaked in a minimum of gel buffer for 15 to 30 min
utes prior to insertion into the gel. Only just sufficient buffer to moisten the
stained thread should be used without any excess. During this soaking period
the sampJ.es should be kept in a moist chamber.
A lysate or a stain eluate or a liquid sample of any sort may be used undiluted
or, if somewhat too concentrated (e.g., lysate), it can be diluted with gel buffer.
Clearer bands of activity are seen if the activity of the sample is not too high.
A standard control sample of the common variant (A/C) should always be in
cluded in the plate as a marker. The A/C control lysate should not be diluted.
Since there is loss of activity in storage, it has been found most satisfactory to
use a fresh lysate for this. Rather than store this as a lysate and have to con
tinually freeze and thaw (which also decreases activity), it has been found best
to store the control as a cell suspension at 0 to 4°C and lyse a small amount of
this immediately before use.
3.3.12.2 Electrophoresis
Electrophoresis is carried out at 9 volts/cm for 4 to 5 hours with a cooling plate
at 6 to 8° C. Overnight runs at reduced voltage give diffuse bands and poorer
separation.
156
3.3.12.3 Devalopment
After electrophoresis is completed, development of the PGD bands is accom
plished by the agar overlay technique. Fitch and Parr described a painting
technique for this, but this was found to be less satisfactory than the agar over
lay method when dealing with bloodstains.
The reaction buffer is 12.14 g TRIS dissolved in 450 ml of distilled water and
adjusted to pH 8 with 2N HCl. It is made up to 500 m!.
The reaction mixture includes:
Buffer
Magnesium chloride
6-Phosphogluconate (trisodium salt)
Phenazine methosulphate
MTT
NADP
10 ml
40 mg
3 mg
1 mg
2 mg
2 mg
The above mixture is brought to 37° C and mixed with 10 g 2 percent agar in
di stilled water and melted and cooled to 50 to 55° C and immediately poured onto
the starch plate from the origin to 7 cm towards the anode. When set, it is
covered with a glass plate supported on 3-mm thick glass edge stt'ips as de
scribed in paragraph 1.2. Incubation in the dark can be at room temperature,
but 37° C is preferable. The blue bands of PGD activity are seen 15 to 60 min
utes later. See Figure 3-25 of a diagrammatic representation of the detection
mechanism.
3.3.13 PROBLEMS
The only problem which has arisen, apart from loss of activity, is the appear
ance of a fast anodal band of activity in blood samples that are in bad condition
and in some old bloodstains. When this band occurs, it replaces the bands in
the normal positions and is non-specific with reference to the original type of
enzyme present, and the sample cannot be typed. Storage bands are present
normally with stains and this should not be confused with the Richmond type.
Table 3-5 shows the population distribution for PGD types. Table 3-6 is a
comparison of frequencies.
157
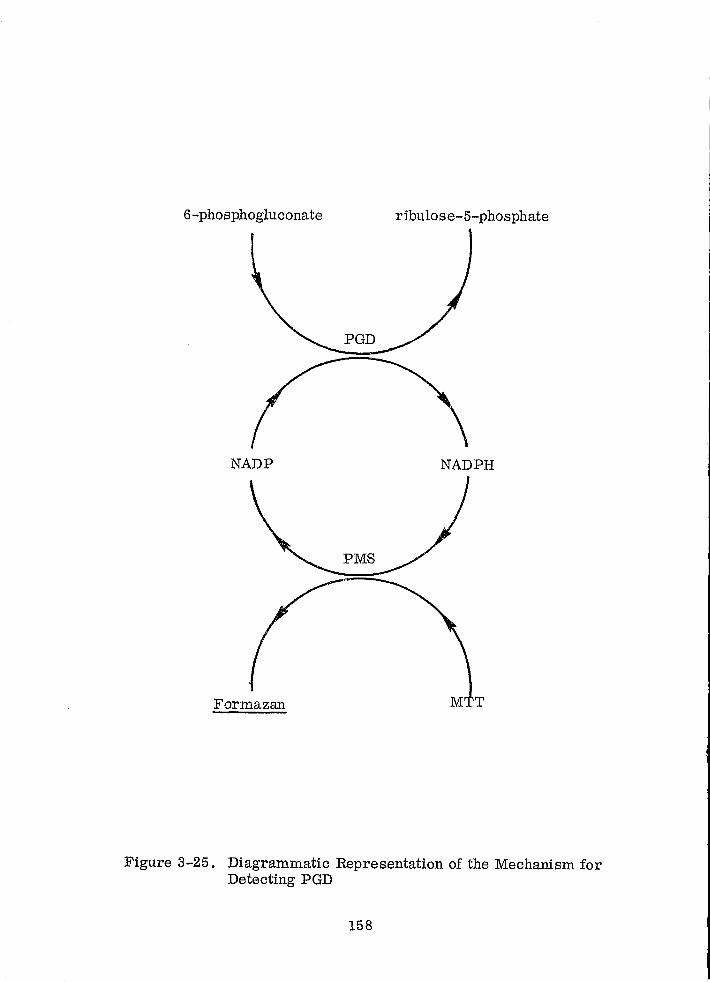
6 -phosphogluconate ribulose-5-phosphate
NADP NADPH
Formazan
Figure 3-25. Diagrammatic Representation of the Mechanism for Detecting PGD
158
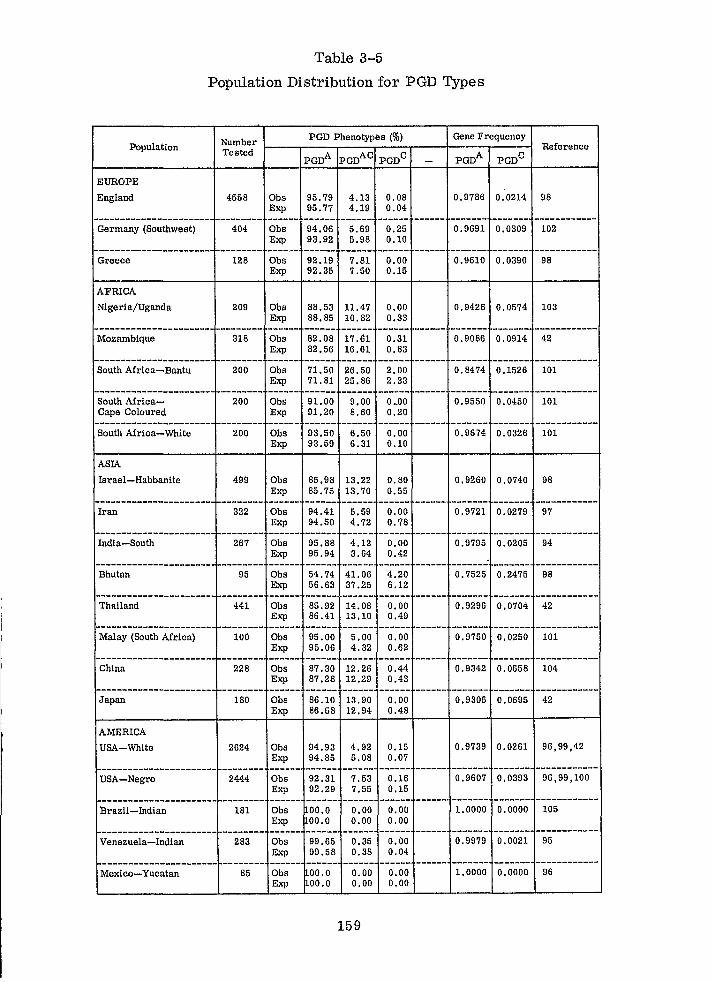
Population
EUROPE
England
Germany (Southwest)
Greece
AFRICA
Nigeria/Uganda
Mozambique
South Africa-Bantu
South AfricaCape Coloured
South Africa-White
ASIA
ISl."aeI-Habbanite
Iran
India-South
Bhutan
Thailand
Malay (South Africa)
China
Japan
AMERICA
USA-White
USA-Negro
:Brazil-Indian
Venezuela-Indian
Mexico-Yucatan
Table 3-5
Population Distribution for PGD Types
Nwmber ~ __ ~_P_G_D __ P~h_e_no_typ~e_s_(_%_)-. ____ +-Ge __ ne_F~re_q_U_el_lc._y~
Tested PGDA PGDAC PGDC Reference
4558
404
128
209
318
200
200
200
499
322
267
95
441
100
228
180
2624
2444
181
283
85
Obs Exp
Obs Exp
Obs Exp
Obs Exp
Obs Exp
Obs Exp
Obs Exp
Obs Exp
Obs Exp
Obs Exp
Obs Exp
Obs Exp
Obs Exp
Obs Exp
Obs Exp
Obs Exp
Obs Exp
Obs Exp
Obs Exp
Obs Exp
Obs Exp
95.79 4.13 0.08 95.77 4.19 0.04
94.06 5.69 0.25 93.92 5.98 0.10
92.19 7.81 0.00 92.35 7.50 0.15
88.53 11.47 0.00 88.85 10.82 0.33
82.08 17.61 0.31 82.56 16.61 0.83
71.50 26.50 2.00 71.81 25.86 2.33
91.00 9.00 0_00 91.20 8.60 0.20
93.50 6.50 0.00 93.59 6.31 0.10
85.98 13.22 0.80 85.75 13.70 0.55
94.41 5.59 O.OG 94.50 4.72 0.18
95.88 4.12 0.00 95.94 3.64 0.42
54.74 41.06 4.20 56.63 37.25 6.12
85.92 14.08 0.00 86.41 13.10 0.49
95.00 5.00 0.00 95.06 4.32 0.62
87.30 12.26 0.44 87.28 12.29 0.43
86.10 13.90 0.00 86.58 12.94 0.48
94.93 4.92 0.15 94.85 5.08 0.07
92.31 7.53 0.16 92.29 7.55 0.15
00.0 00.0
0.00 0.00 0.00 0.00
99.65 0.35 0.00 99.58 0.38 0.04
00.0 00.0
0.00 0.00 0.00 0.00
159
0.9786 0.0214 98
0.9691 0.0309 102
0.9610 0.0390 98
0.9426 0.0574 103
0.9086 0.0914 42
0.8474 0.1526 101
0.9550 0.0450 101
0.9674 0.0326 101
0.9260 0.0740 98
0.9721 0.0279 97
0.9795 0.0205 94
0.7525 0.2475 98
0.9296 0.0704 42
0.9750 0.0250 101
0.9342 0.0658 104
0.9305 0.0695 42
0.9739 0.0261 96,99,42
0.9607 0.0393 96,99,100
1.0000 0.0000 105
0.9979 0.0021 95
1.0000 0.0000 96
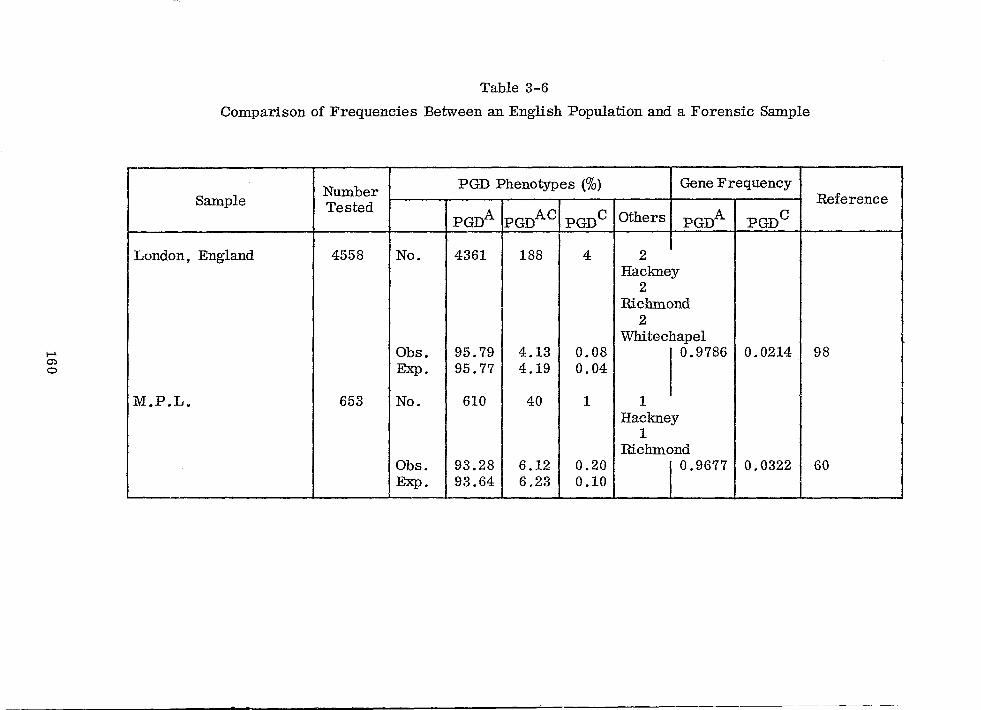
I-< 0)
o
Table 3-6
Comparison of Frequencies Between an English Population and a Forensic Sample
r PGD Phenotypes (%) Number
Gene Frequency Sample Tested
PGDA PGDAC
PGDC Others PGDA PGDC
London, England 4558 No. 4361 188 4 2 Haclmey
2 Richmond
2 Whitechapel
Obs. 95.79 4.13 0.08 0.9786 0.0214 Exp. 95.77 4.19 0.04 I
M.P.L. 653 No. 610 40 1 1 Haclmey
1 Richmond
Obs. 93.28 6.12 0.20 I 0.9677 0.0322 Exp. 93.64 6.23 0.10
Reference
98
60
3.4 GLUCOSE-6-PHOSPHATE DEHYDROGENASE (G6PD)
3.4.1 'INTRODUCTION
Since such a large number of papers have been written and such a large mass of
information has been accumulated about glucose-6-phosphate, this paragraph will
cover in detail only those aspects which, it is thought, can be of use in bloodstain
examination to the forensic scientist.
The WHO reportJ.18 in 1967 quoted five major parameters and some minor ones
desirable for the identification of G6PD variants from red cells. These were:
a. Activity.
b. Electrophoresis.
c. Michaelis constant for G6P.
d. Relative rate of utilization of 2 desoxy G6P.
e. Thermal stability.
The electrophoresis should be in two different buffers: TRIS chloride and EDTA
boric TRIS.
As minor parameters , activity/pH curves, activation energy, differential inhibi
tion, fingerprinting, column chromatography, immunological techniques, micro
purification,and hybridization are mentioned.
This Is obviously impractical for the forensic scientist dealing with bloodstain
material, so largely the concern must be with the major electrophoretic variants
only at the moment.
In view of this, the background to the subject will be markedly restricted, par
ticu.larly from any clinical point of view, so the reader is recommended to obtain
this background elsewhere. (WHO report no. 3661.29, Lehmann and Huntsman 1.25,
Giblett1.2J., Harris 1.22, and the bibliographies given in these. )
161
451-769 0 - 72 - 11
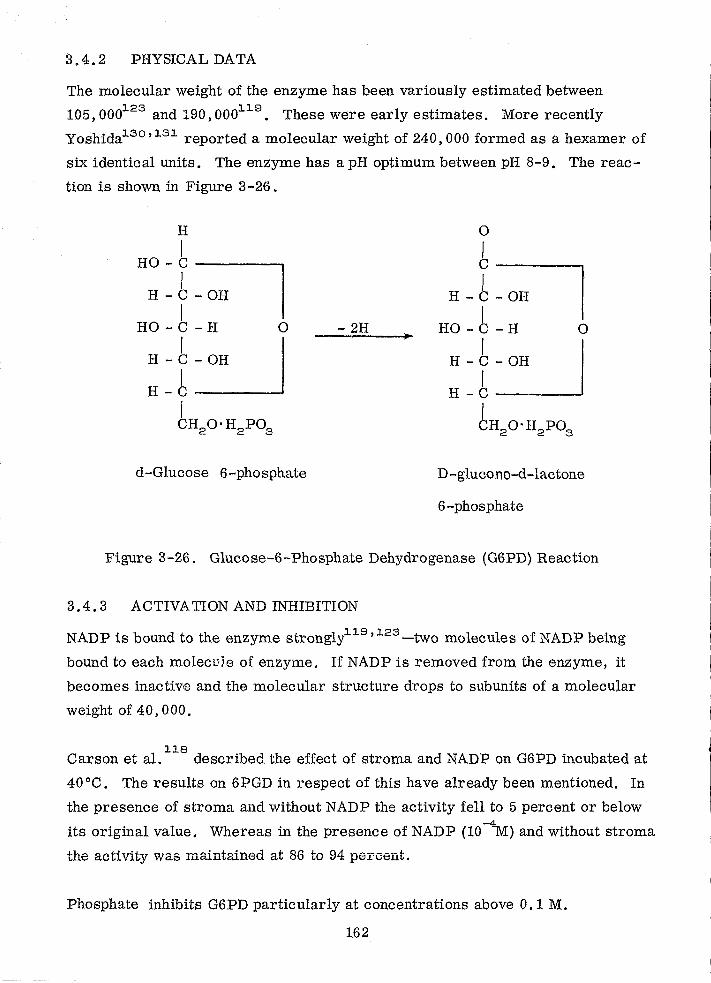
3.4.2 PHYSICAL DATA
The molecular weight of the enzyme has been variously estimated between ~23 ~19 . 105,000 and 190,000 . These were early estlmates. More recently
Yoshida130,131 reported a molecular weight of 240,000 formed as a hexamer of
six identical units. The enzyme has a pH optimum between pH 8-9. The reac
tion is shown in Figure 3-26.
H
I HO-C~
H - f -OH I HO - C - H °
H - f -OH I H-C~
I CH2 0'H
2P0
3
d-Glucose 6-phosphate
- 2H
° 6 HJ=i HO - 6 - H °
H - f -OH I H-C~
6H2 0'H2
POS
D-glucono-d-lactone
6-phosphate
Figure 3-26. Glucose-6-Phosphate Dehydrogenase (G6PD) Reaction
3.4.3 ACTIVATION AND INHIBITION
NADP is bound to the enzyme strongly119, 123 -two molecules of NADP being
bound to each molecule of enzyme. If NADP is removed from the enzyme, it
becomes inactiv\e and the molecular structure drops to subunits of a molecular
weight of 40,000.
118 Carson et al. described the effect of stroma and NADP on G6PD incubated at
40°C. The results on 6PGD in respect of this have already been mentioned. In
the presence of stroma and without NADP the activity fell to 5 percent or below
its original value. Whereas in the presence of NADP (10-M) and without stroma
the activity was maintained at 86 to 94 percent.
Phosphate inhibits G6PD particularly at concentrations above O.l M.
162
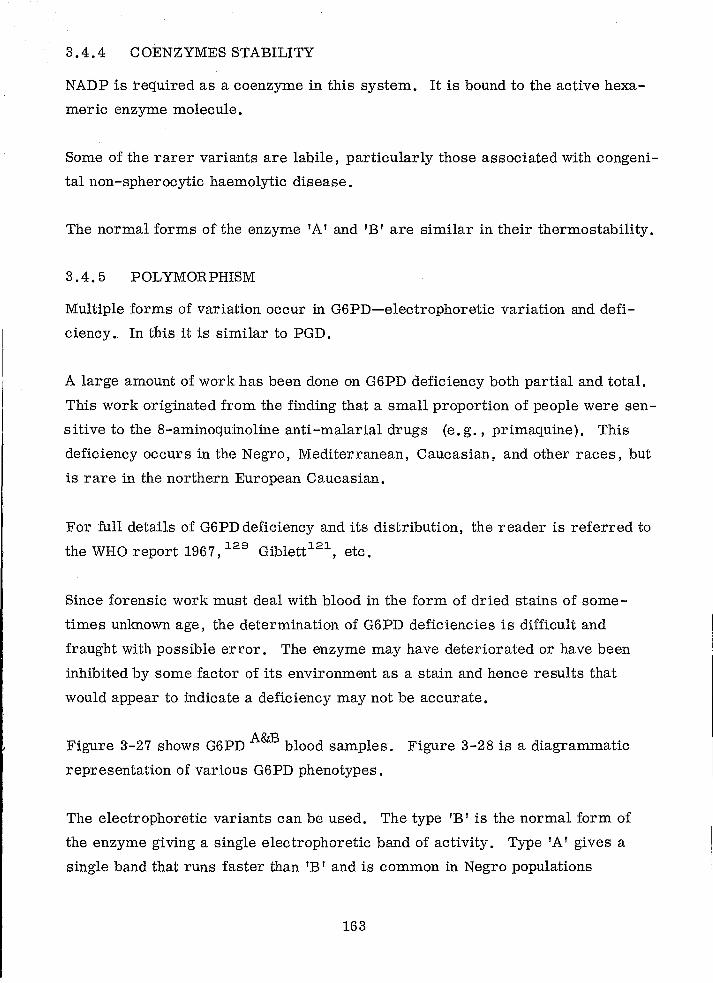
3.4.4 COENZYMES STABILITY
NADP is required as a coenzyme in this system. It is bound to the active hexa
meric enzyme molecule.
Some of the rarer variants are labile, particularly those associated with congeni
tal non -spherocytic haemolytic disease.
The normal forms of the enzym.e 'A' and 'B' are similar in their thermostability.
3.4.5 POLYMORPHISM
Multiple forms of variation occur in G6PD-electrophoretic variation and defi
c ienc y. In this it is similar to PG D .
A large amount of work has been done on G6PD deficiency both partial and total.
This work originated from the finding that a small proportion of people were sen
sitive to the 8-aminoqu:inoline anti-malarial drugs (e, g., primaquine). This
deficiency occurs in the Negro, Mediterranean, Caucasian, and other races, but
is rare in the northern European Caucasian.
For full details of G6PD deficiency and its distribution, the reader is referred to
the WHO report 1967, 129 Giblett121, etc.
Since forensic work must deal with blood in the form of dried stains of some
times unlmown age, the determination of G6PD deficiencies is difficu.lt and
fraught with possible error. The enzyme may have deteriorated or have been
inhibited by some factor of its environment as a stain and hence results that
would appear to indicate a deficiency may not be accurate.
Figure 3-27 shows G6PD A&B blood samples. Figure 3-28 is a diagrammatic
representation of various G6PD phenotypes.
The electrophoretic variants can be used. The type 'B' is the normal form of
the enzyme giving a single electrophoretic band of activity. Type 'A' gives a
single band that runs faster than 'B' and is common in Negro populations
163
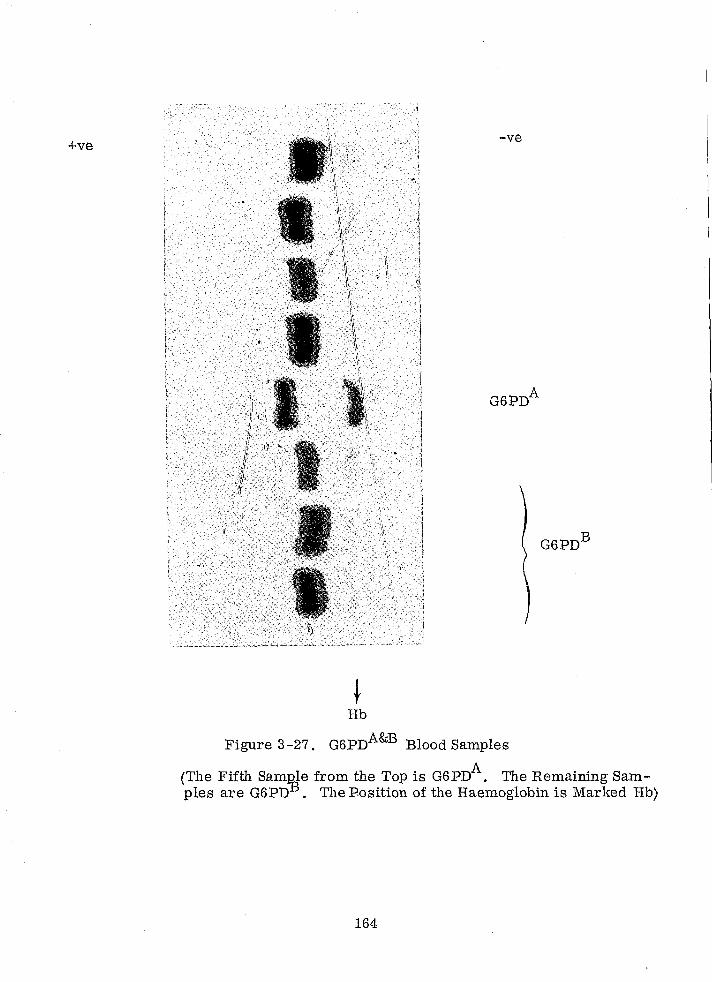
+ve
.1
-ve
t Hb
Figure 3 -27. G6PDA&B Blood Samples
(The Fifth samRJe from the Top is G6PDA
. The Remaining Samples are G6PD . The Bosition of the Haemoglobin is Marked Bb)
164
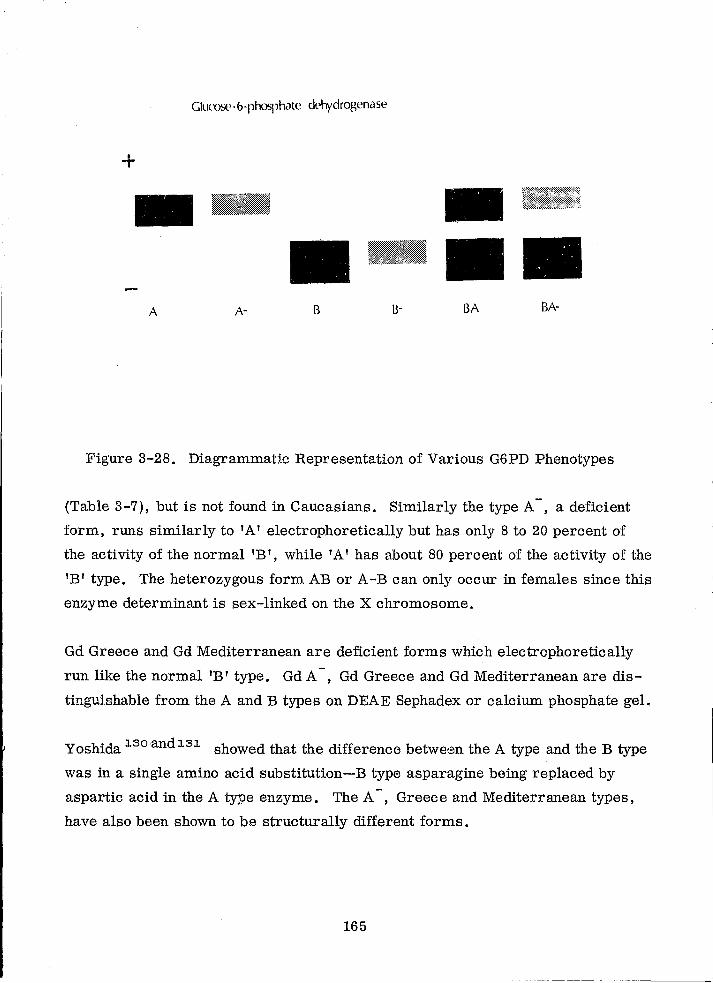
Glucos(' ·6·phosphllte c\phyclrogenase
+
A A- B B- BA BA-
Figure 3-28. Diagrammatic Representation of Various G6PD Phenotypes
(Table 3-7), but is not found in Caucasians. Similarly the type A -, a deficient
form, runs similarly to 'A' electrophoretic ally but has only 8 to 20 percent of
the activity of the normal 'B', while 'A' has about 80 percent of the activity of the
'B'type. The heterozygous form AB or A-B can only occur in females since this
enzyme determinant is sex-linked on the X chromosome.
Gd Greece and Gd Mediterranean are deficient forms which electrophoretic ally
run like the normal 'B' type. Gd A -, Gd Greece and Gd Mediterranean are dis ....
tinguishable from the A and B types on DEAE Sephadex or calcium phosphate gel.
Yoshida J.30 and J.3J. showed that the difference between the A type and the B type
was in a single amino acid SUbstitution - B type asparagine being replaced by
aspartic acid in the A type enzyme. The A -, Greece and Mediterranean types,
have also been shown to be structurally different forms.
165
- --- -------
In addition to those types already mentioned, there are over 30 other types ofthis
enzyme. These are of :r.are occurrence and in many cases require techniques
other than activity assay and electrophoresis to distinguish one from another.
In terms of the type of sample dealt with in forensic science, it is impractical
at present to consider variants other than electrophoretic ones.
3.4.6 ACTIVITY OF THE ENZYME IN BLOOD
The accurate determination of the activity i}f this enzyme in crude mixtures, such
as blood, can give rise to more problems than most enzyme assays.
The methods are based on the production of reduced coenzyme, NADPH. The
product of G6PD is gluconolactone which is converted to 6 -phosphogluconate,
the substrate for 6-phosphogluconate dehydrogenase, which is also NADP
coupled.
Temperature has the effect of increasing the activity but to a much less extent
than with other enzymes. The WHO bulletin~29 quotes an increase in activity
of 6 percent per 0 °C . In trials at Metropolitan Police Laboratory this figure
seemed to be rather high.
Tan and Whitehead~28 reported the activity of the enzyme in normal type B human
red cells as 62 to 102 j.J, Moles of NADPH generated per minute per 100 mls
packed cells. Zinkham et al.1.39
reported the activity as 4.5 to 6.5 units per
100 mls red blood cells where 1 unit equals an optical density change at 340 nm
of 2.07 absorbance units per minute per 3 ml of reaction mixture which con
tained 0.1 haemolysate (made from 0.2 ml packed red cells with 3.8 ml water)
at 26°C.
The WHO bulletin1.29 gives no absolute figures. It >-nay be that a comparative
ratio would be more useful for forensic purposes.
166
3.4.7 EFFECTS OF STORAGE
The effects of storage on G6PD are dependent upon the condition of the blood
stored. The effects are those which Carson described as caused by stromal
NADP-ase. If a lysate free from stroma or intact cells is stored, the loss or
activity is less than if a lysate with stroma present is stored.
The temperature of storage has the usual effect, in other words, the colder the -4
better. A lysate free from stroma with NADP added to about 10 M will keep its
activity for several months at -20 0 C. At room temperature there is rapid loss
of activity.
Storage of a bloodstain has similar but slower effects to storage of a blood sam
pIe. Since stroma are present in the stain, fairly rapid loss of activity can be
expected and is in fact found. Treatment of the stain or stain extract with 10mM
NADP improves the quality of the result. It is, however, much more difficult
to get satisfactory levels of activity of G6PD from bloodstains than most other
enzymes that have been tested.
3.4.8 EFFECT OF CHEMICALS
One of the major causes of the intense investigation of G6PD in recent years has
been the effects of a wide variety of drugs when abnormal G6PD is present. These
have been fully reported and it would serve no useful purpose to summarize these
here. (See the WHO bulletin and other papers and books already mentioned. )
Mercaptoethanol when in the presence of NADP appears to have desirable effects
in helping to prevent inactivation of this enzyme.
3.4.9 BLOODSTAIN SUBSTRATE
So far there has been inadequate experience of the variety of substrates but to
date nothing stands out as a distinctly poor or inhibitory substrate for G6PD
determination in a bloodstain.
167
3.4.10 SAMPLE PREPARATION
The WHO bulletin recommends the use of very dilute lysates, approximately
1: 100 dilution of packed red cells. Metropolitan Police Laboratory has found
stronger lysates to be better suited to its methods.
Lysis should be brought about using the recommended lysing solution, (NADP
10 f.lM, beta-mercaptoethanol 7 nm and sodium EDTA, pH7, 2.7 nm), then centri
fuged to remove stroma for assay work. For electrophoresis, cells freshly lysed
with a minimum of water and/or sonicated are quite satisfactory.
Bloodstained threads are soaked in a minimum of gel buffer for a few minutes im
mediately prior to insertion into the gel.
3.4.11 METHODS
Like 6PGD numerous methods for the electrophoresis and assay of G6PD have
been described. Cellogel was used by Rattazzi et al. in 1967J.26, cellulose ace
tate by Sparks et al. in 1969J.27, but starch gel is usually employed, with a
starch concentration increased above the usual 10 percent. The concentration
preferred for forensic work is 15 percent.
Various buffers have been suggested; the WHO report 1967 recommends two.
a. TRIS chloride buffer method (from Kirkman and Hendrickson)J.24
Gel buffer solution: 150 ml of 0.5 M TRIS chloride at pH 8.8 (25°C) and 15 ml of 0.27 M sodium EDTA at pH 7. 0 are added to
b.
1350 ml of H20~ ,
Reservoir solution: One litre of gel buffer solution plus 3 g sodium chloride.
Running time: 14 to 16 hours at 2°C.
Gradient: 4 volts per cm
EBT (EDTA, boric acid, TRIS system)
Stock buffer solution: EDTA (acid form) Boric acid TRIS
0.02 M 0.5 M 0.9 M
Gel buffer solution: Dilute stock buffer solution 1: 20
Heservoir solUtions:
For cathodic chamber: dilute stock buffer 1: 7 For anodic chamber: dilute stock buffer 1: 5
168
Running time: 12 hours at 2 to 4°C
Gradient: 4. 5 volts per cm
Parr, Giblett and others use a phosphate buffer of the same constitution as that
for 6PGD. This did not, when tried at the Metropolitan Police Laboratory,
give good results; the separation between the A and B bands were very small.
The EBT system of the WHO report is the one found most satisfactory.
The starch gel is made of 15 percent starch using the thin gel dystem, adding
2 mg of NADP per 40 ml of starch gel after boiling the starch and before de-gassing.
Electrophoresis is carried out for about 17 hours at 4 to 5 volts/cm at 0-2 °C.
The enzyme bands are detected with an agal' gel overlay, the reaction mixture
being:
Buffer (0.1 M TRIS/HC1, pH 8.0)
Magnesium chloride
Glucose-6-phosphate
MTT
PMS
NADP
10 ml
40 mg
10 mg
2 mg
1.5 mg
4 mg
This mixture is put in the incubator and brought to 37°C. It is then mixed with
10 ml of 2 percent agar in distilled water, melted and cooled to 50 to 55°C.
This agar mixture is immediately poured onto the starch gel surface from the po
sition of the haemoglobin to 6 cm towards the anode. After covering the agar
layer with a glass plate, it is incubated at 37°C for 30 to 60 minutes, after which
the results may be read. See Figure 3-29.
169
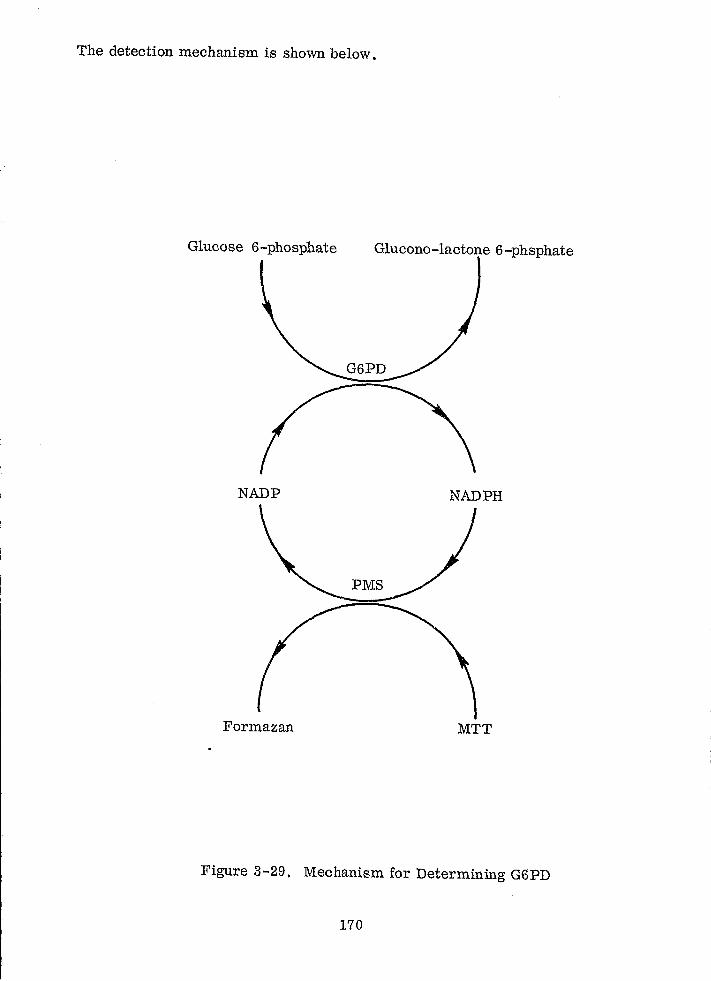
The detection mechanism is shown below.
Glucose 6-phosphate Glucono-lactone 6-phsphate
NADP NADPH
Formazan MTT
Figure 3-29. Mechanism for Determining G6PD
170
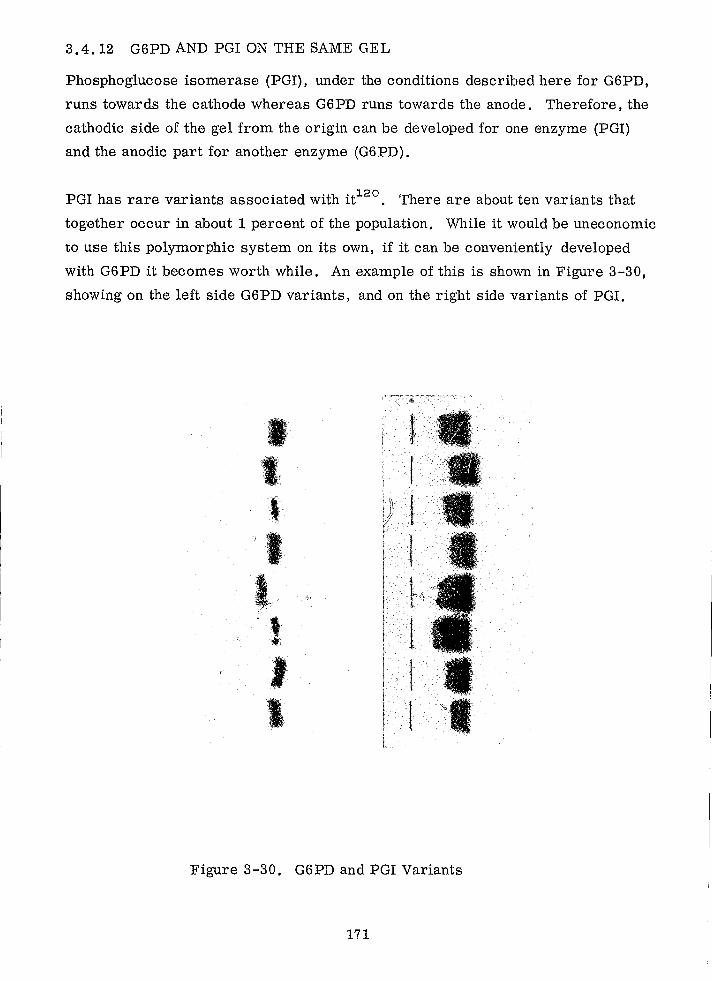
3.4.12 G6PD AND PGI ON THE SAME GEL
Phosphoglucose isomerase (PGI), under the conditions described here for G6PD,
runs towards the cathode whereas G6PD runs towards the anode. Therefore, the
cathodic side of the gel from the origin can be developed for one enzyme (PGI)
and the anodic part for another enzyme (G6 PD) .
PGI has rare variants associated with it120• There are about ten variants that
together occur in about 1 percent of the population. While it would be uneconomic
to use this polymorphic system on its own, if it can be conveniently developed
with G6PD it becomes worth while. An example of this is shown in Figure 3-30,
showing on the left side G6PD variants, and on the right side variants of PGI.
Figure 3-30. G6PD and PGI Variants
171
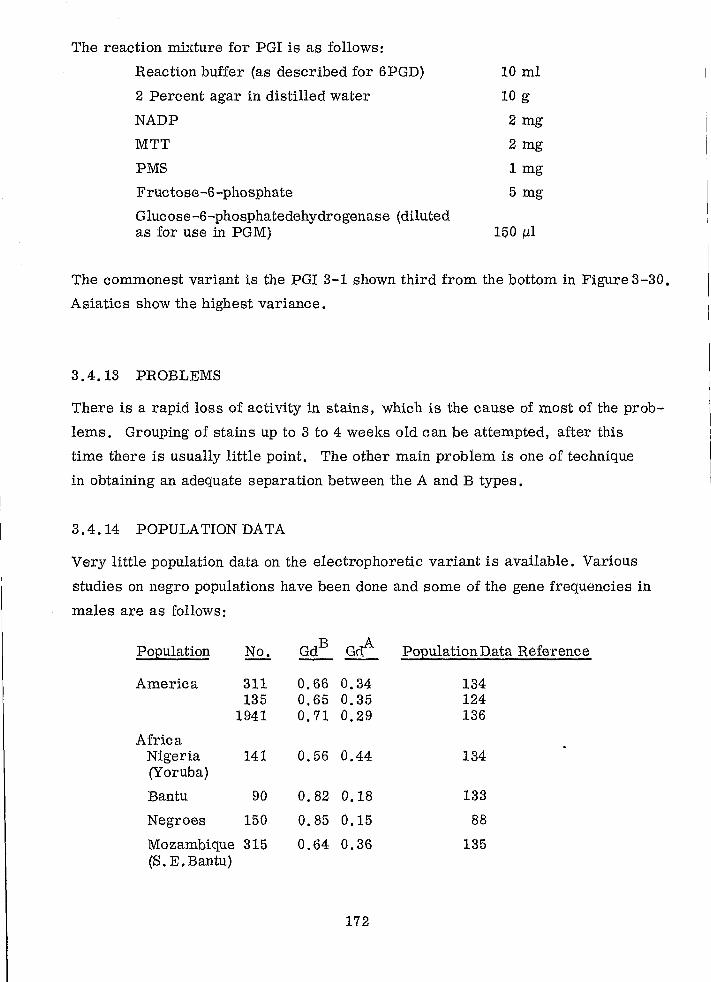
The reaction mixture for PGI is as follows:
Reaction buffer (as described for 6PGD)
2 Percent agar in distilled water
NADP
MTT
PMS
Fructose-6-phosphate
G luc ose-6-phosphatedehydrogenase (diluted as for use in PG M)
10 ml
10 g
2 mg
2 mg
1 mg
5 mg
150 f.ll
The commonest variant is the PGI 3-1 shown third from the bottom in Figure 3-30.
Asiatics show the highest variance.
3.4.13 PROBLEMS
There is a rapid loss of activity in stains, which is the cause of most of the prob
lems. Grouping of stains up to 3 to 4 weeks old can be attempted, after this
time there is usually little point. The other main problem is one of technique
in obtaining an adequate separation between the A and B types.
3.4.14 POPULATION DATA
Very little population data on the electrophoretic variant is available. Various
studies on negro populations have been done and some of the gene frequencies in
males are as follows:
Population No. GdB A Go. Population Data Refer~
America 311 0.66 0.34 134 135 0.65 0.35 124
1941 0.71 0.29 136
Africa Nigeria 141 0.56 0.44 134 (Yoruba)
Bantu 90 0.82 0.18 133
Negroes 150 0.85 0.15 88
Mozambique 315 0.64 0.36 135 (8. E.Bantu)
172
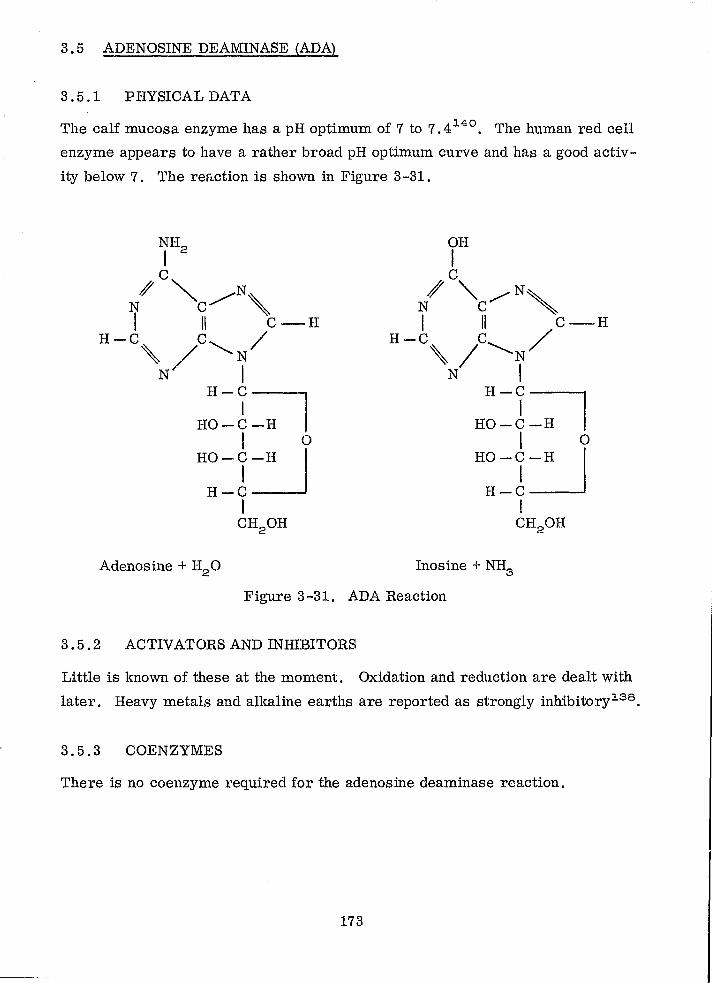
3.5 ADENOSINE DEAMINASE (ADA)
3.5.1 PHYSICAL DATA
The calf mucosa enzyme has a pH optimum of 7 to 7.4140. The human red cell
enzyme appears to have a rather broad pH optimum curve and has a good activ
tty below 7. The refLction is shown in Figure 3-31.
Adenosine + H2 0 Inosine + NH3
Figure 3-31. ADA Reaction
3.5.2 ACTIVATORS AND INHIBITORS
Little is known of these at the moment. Oxidation and reduction are dealt with
later. Heavy metals and alkaline earths are reported as strongly inhibitory 138 .
3.5.3 COENZYMES
There is no coenzyme required for the adenosine deaminase reaction.
173
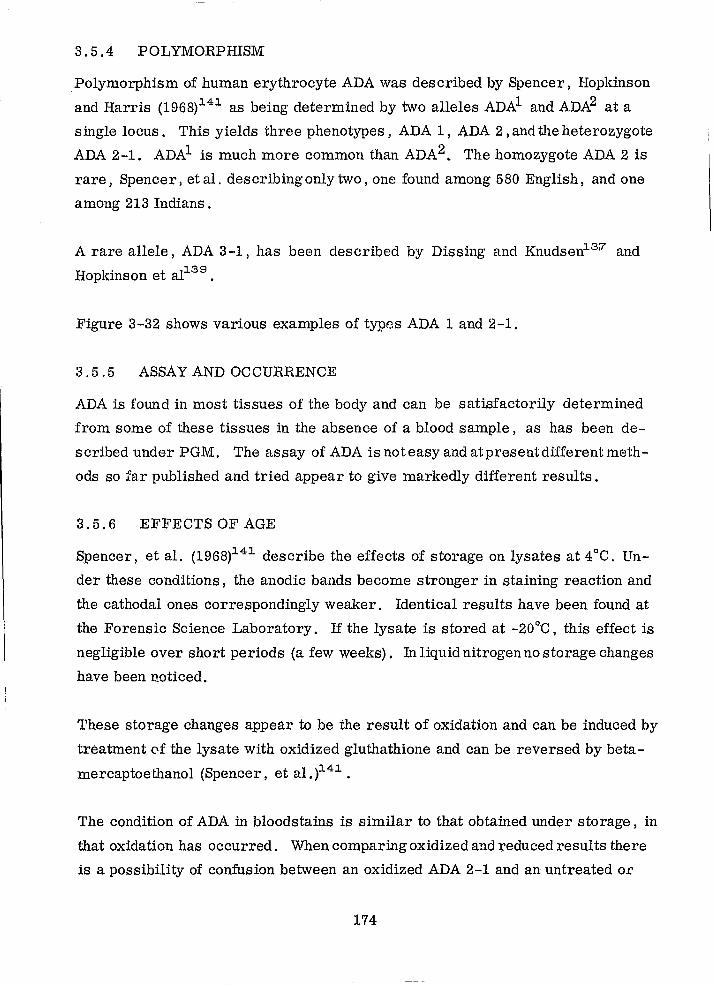
3.5.4 POLYMORPHISM
Polymorphism of human erythrocyte ADA was described by Spencer, Hopkinson
and Harris (1968)~41 as being determined by two alleles ADAl and ADA2 at a
single locus. This yields three phenotypes, ADA 1, ADA 2, and the heterozygote
ADA 2-1. ADA1 is much more common than ADA2. The homozygote ADA 2 is
rare, Spence r, et al. des cribing only two , one found among 580 English, and one
among 213 Indians.
A rare allele, ADA 3-1, has been described by Dissing and Knudsen13r7 and
Hopkinson et al~39 .
Figure 3-32 shows various examples of types ADA 1 and 2-1.
3.5.5 ASSAY AND OCCURRENCE
ADA is found in most tissues of the body and can be satisfactorily determined
from some of these tissues in the absence of a blood sample, as has been de
scribed under PGM. The assay of ADA is not easy and atpresentdifferentmeth
ods so far published and tried appear to give markedly different results.
3.5.6 EFFECTS OF AGE
Spencer, et al. (1968)~4~ describe the effects of storage on lysates at 4°C. Un
der these conditions, the anodic bauds become stronger in staining reaction and
the cathodal ones correspondingly weaker. Identical results have been found at
the Forensic Science Laboratory. If the lysate is stored at -20°-0, this effect is
negligible over short periods (a few weeks). In liquid nitrogen no storage changes
have been noticed.
These storage changes appear to be the result of oxidation and can be induced by
treatment 0f the lysate with oxidized gluthathione and can be reversed by beta
mercaptoethanol (Spencer, et al. )14~ .
The condition of ADA in bloodstains is similar to that obtained under storage, in
that oxidation has occurred. When comparing oxidized and reduced resul ts there
is a possibility of confusion between an oxidized ADA 2-1 and an untreated or
174
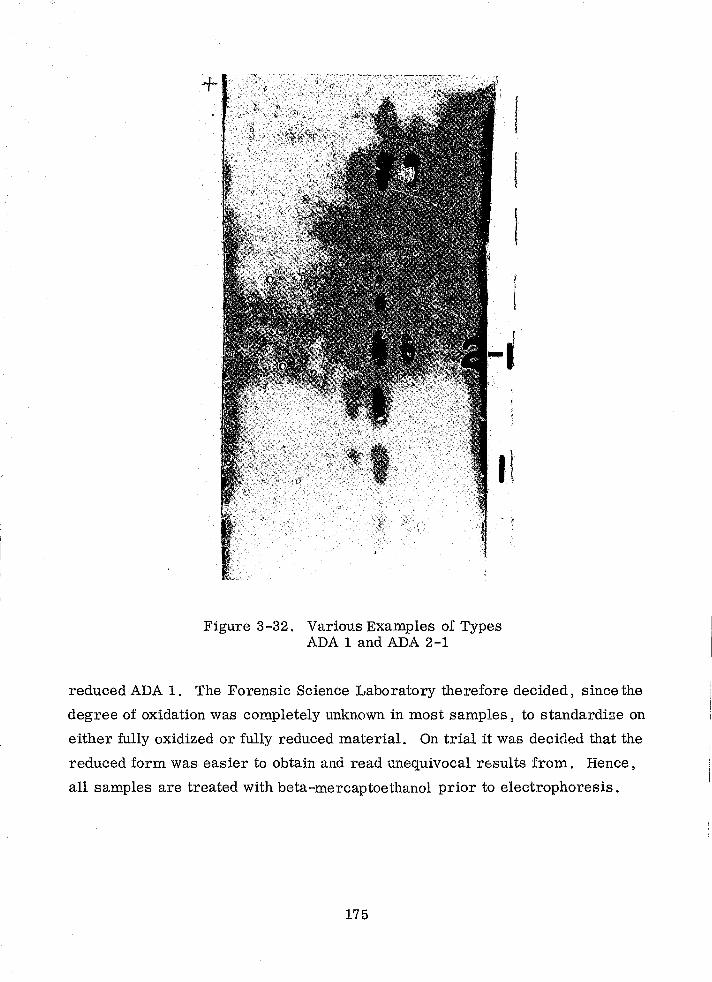
+
Figure 3 -32. Various Examples of Types ADA 1 and ADA 2-1
I
I
"
reduced ADA 1. The Forensic Science Laboratory therefore decided, since the
degree of oxidation was completely unknown in most samples, to standardize on
either fully oxidized or fully reduced material. On trial it was decided that the
reduced form was easier to obtain and read unequivocal results from. Hence,
all samples are treated with beta-mercaptoethanol prior to electrophoresis.
175
The activity of ADA remains high in stains up to three to four weeks old and has
been determined satisfactorily in stains up to three months old. At this age,
however, the activity has become low and larger inserts may be required.
ADA is reasonably resistant to change on drying into a stain and presents few
difficulties, adequate activity being found in most casework material.
Figure 3-33 shows ADA Types 1 and 2-1 stain with and without mercaptoethanol.
3.5.7
+
+ z-{
z-{
I
Figure 3 -33. Showing ADA Types 1 and 2 -1 From Bloodstains With (+) and Without (-) Mercaptoethanul
SUBSTRt~TE
So far no difficulties have been encountered with any particular stain substrate.
Textiles, metals, glass, etc. , have been tried without trouble.
176
3.5.8 EFFECT OF CHEMICALS
The effect of oxidizing and reducing agents have been described. The effects of
other chemicals, fluoride, etc., are similar to those obtained with some other
enzymes (e.g., PGM).
3.5.9 PREPARATION OF SAMPLES
If lysates are fresh, no preparation is needed. If they have been stored for
some time prior to electrophoresis, then in view of the decision to standardize
on the reduced form of the enzyme in work on stains, the same decision must
hold here. This is achieved by m:ixing four or five drops of lysate with one drop
of 10 percent beta-mercaptoethanol in gel buffer at least 15 minutes before use.
1'he trea.ted lysate is kept at room temperature during this time.
With bloodstains, the stained thread is soaked in a minimum of gel buffer con
taining 1 percent beta-mercaptoethanol solution for a similar time prior to its
insertion into the gel. The amount of solution used should be just sufficient to
make the thread wet without any excess and it should be placed in a moist cham
ber until required.
The starch gel technique described by Spencer, et al. (1968}~n is excellent,
but for forensic purposes takes too much material. The thin-layer starch gel
technique therefore is used with a cooling plate below the gel. Tap water can
be used through the cooling plate but water at 6-8°C is preferred.
Electrophoresis is carried out overnight for 16 to 18 hours at 3 to 3.5 volts/em
or for a shorter daytime run 4 hours at 8 to 9 volts/em.
The starch gel should be about 10 percent in 0.01 phosphate buffer pH 6.5.
a. NaH2 P04
Water
b. Na2 HP04
15.6('1 g
to 1 litre
14.196g
Water to 1 litre
a. is added to b. until pH is 6.5.
177
451-769 0 - 72 - 12
This is the 0.1 M tank buffer. The gel buffer in this tank buffer is diluted
1:10.
At the end of electrophoresis, an agar gel overlay containing the reactants is
poured over the surface of the starch gel from the origin to a line 10 cm towards
the anode. The reaction mixture is made up in phosphate buffer 0.025 MpH 7 . 5.
Using the previously described phosphate solutions, A is added to B until pH 7 . 5
is reached. The resulting solution is diluted 1 in 4. This forms the reaction
buffer.
Buffer
Adenosine
MTT
PMS
Xanthine Oxidase (Boehringer)
Nucleoside Phosphorylase [Boehringer diluted 1/10 with (NH4 b S0 4 J
10 ml
15 mg
2 mg
2 mg
10 f..I,l (= 0.03 units)
10 f..I,l (= 0.3 units)
This mixture is brought to 37°C and mixed with 10 g of 2 percent agar in dis
tilled water at 50 to 55°C and immediately poured on the starch gel. When set,
the agar is covered with a glass plate to prevent evaporation and incubated at
37°C for 30 to 60 minutes, at which time bands of activity will be seen. The de
tection mechanism for ADA is shown in Figure 3-3 t1.
3.5.10 PROBLEMS
Two problems may occur, the first of these in relation to the oxidized or the re
duced form of the enzyme. If insufficient beta-mercapto€::thanol is used then one
may get a mixture of reduced and oxidized enzyme, which gives a confusing pic
ture. If too much beta-mercaptoethanol is used, then partial destruction of the
enzyme may 00cur.
The second problem is in relation to old lysed and bacteria-infected blood sam
pIes. In some of these, instead of losing the enzyme completely, a single slow
178
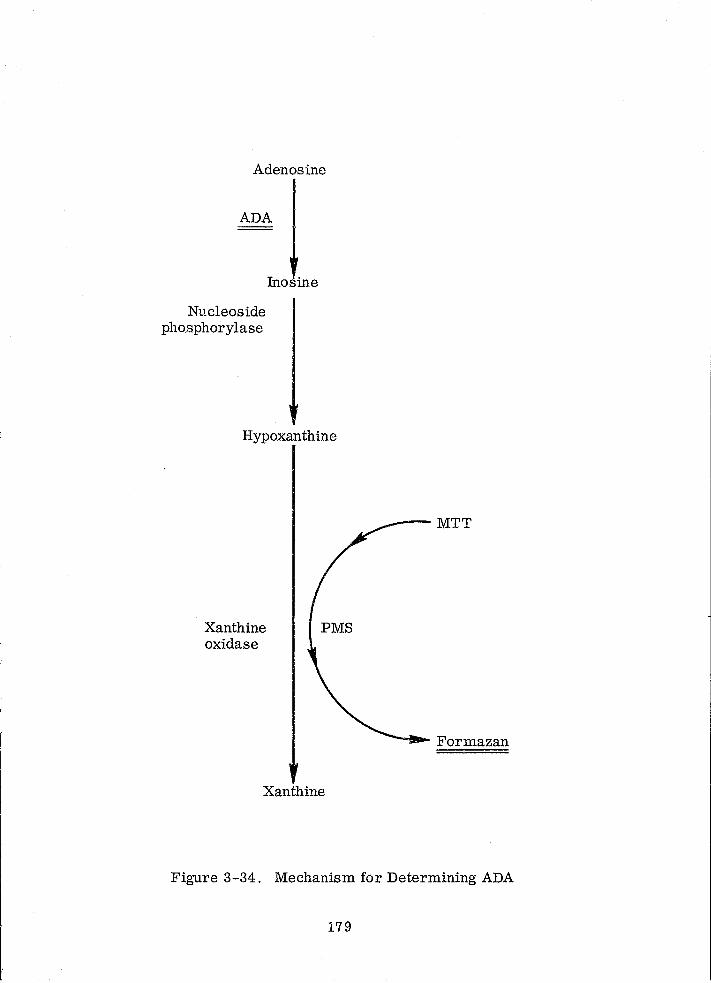
Adenosine
ADA
Nucleoside pho,sphorylase
Inosine
Hypoxanthine
Xanthine oxidase
Xanthine
------------------
----MTT
Formazan
Figure 3-34. Mechanism for Determining ADA
179
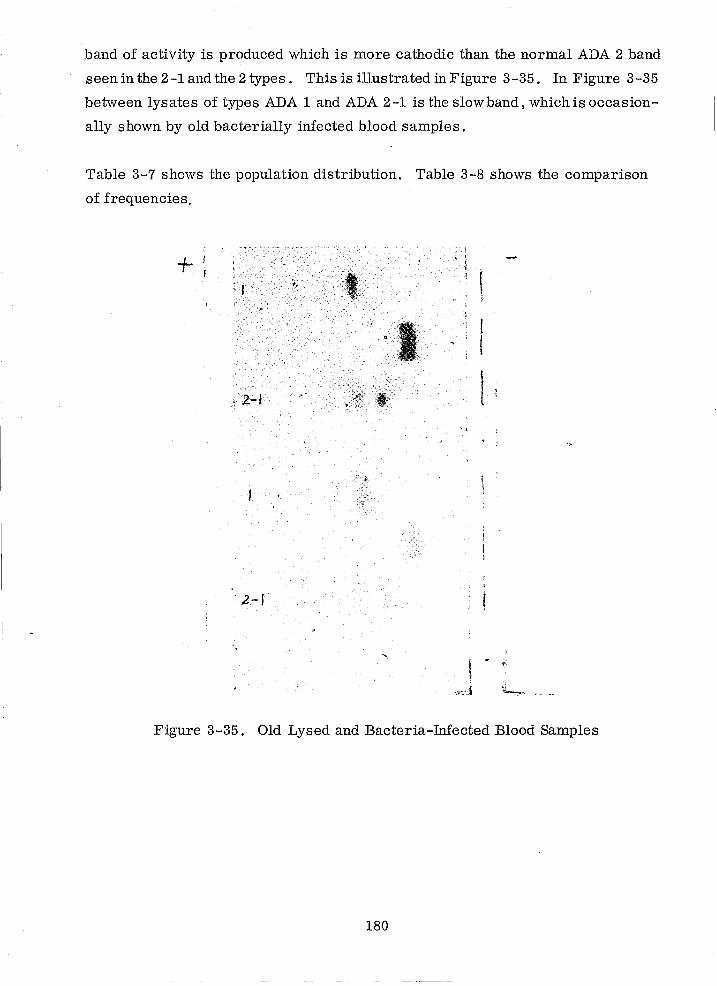
band of activity is produced which is more cathodic than the normal ADA 2 band
seen in the 2-1 and the 2 types. This is illustrated in Figure 3-35. In Figure 3-35
between lysates of types ADA 1 and ADA 2-1 is the slow band , which is occasion
ally shown by old bacterially infected blood samples.
Table 3-7 shows the population distribution. Table 3-8 shows the comparison
of frequencies.
+i
.2-1
• I
I 1
! I
1
[ -t
"",d .~ .. ,
Fjlgure 3-35. Old Lysed and Bacteria-Infected Blood Samples
180
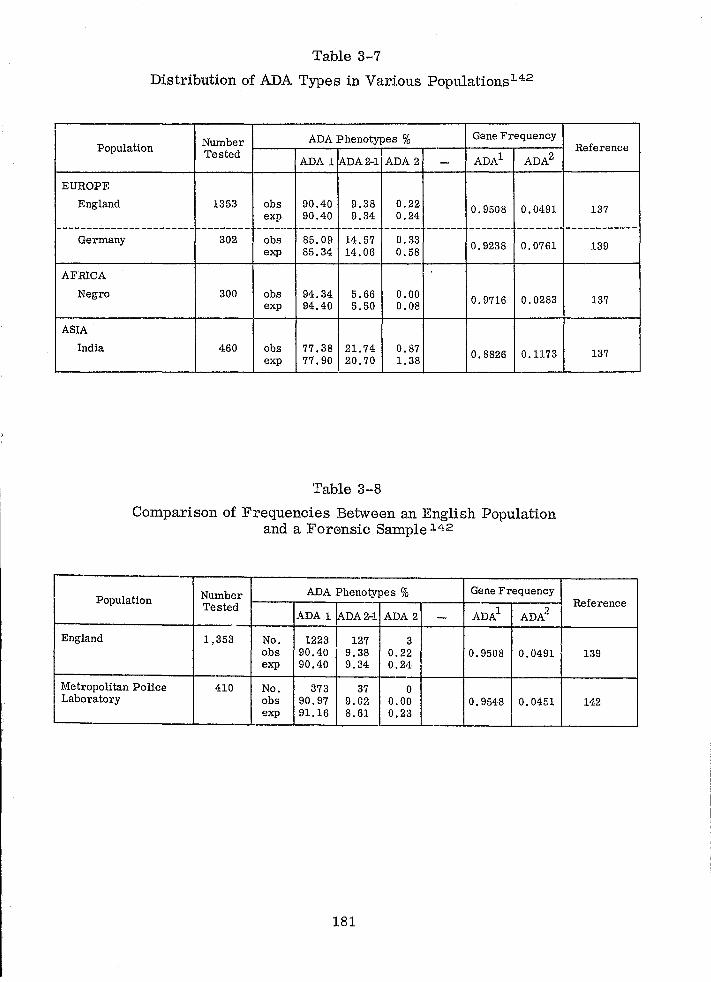
Table 3-7
Distribution of ADA Types in Various Populations142
Number ADA Phenotypes % Gene Frequency Population Tested
/ADA 2-1 ADA1 ADA2 ADA 1 ADA 2 -EUROPE
England 1353 obs 90.40 9.38 0.22 0.9508 0.0491 exp 90.40 9.34 0.24 -----------------------1--------- ------ ------ ------ ------ ------ ------- -------
Germany 302 obs 85.09 14.57 0.33 0.9238 0.0761 exp 85.34 14.06 0.58
AFRICA
Negro 300 obs 94.34 5.66 0.00 0.9716 0.0283 exp 94.40 5.50 0.08
ASIA
India 460 obs 77.38 21.74 0.87 0.8826 0.1173 exp 77.90 20.70 1.38
Table 3-8
Comparison of Frequencies Between an English Population and a Forensic Sample 142
Number ADA Phenotypes % Gene Frequency Population
Tested ADA 1 /ADA 2-1 ADA 2 - ADA1 ADp.:?
England 1,353 No. 1223 127 3 obs 90.40 9.38 0.22 0.9508 0.0491 exp 90.40 9.34 0.24
Metropolitan Police 410 No. 373 37 0 Laboratory obs 90.97 9.02 0.00 0.9548 0.045,1
exp 91.16 8.61 0.23
181
Reference
137
------------139
137
137
Reference
139
142
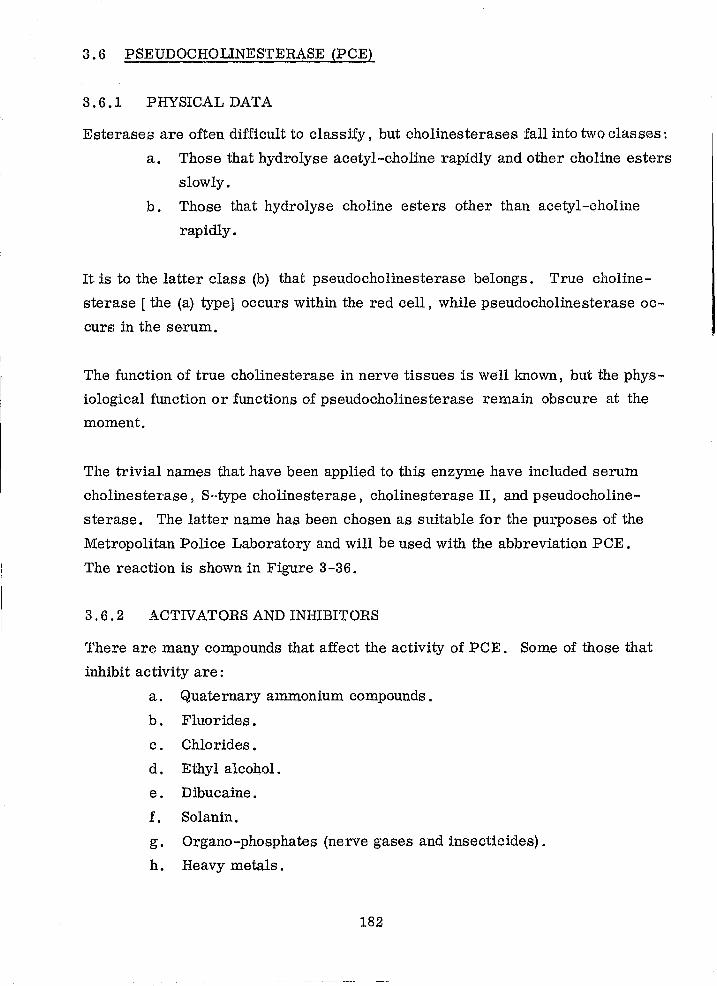
3.6 PSEUDOCHOLINESTERASE (PCE)
3.6.1 PHYSICAL DATA
Esterasea are often difficult to classjfy, but cholinesterases fall into two classes:
a. Those that hydrolyse acetyl-choline rapidly and other choline esters
slowly.
b. Those that hydrolyse choline esters other than acetyl-choline
rapidly.
It is to the latter class (b) that pseudocholinesterase belongs. True choline
sterase [ the (a) type] occurs within the red cell, while pseudocholinesterase oc
curEl in the serum.
The function of true cholinesterase in nerve tissues is well known, but the phys
iological function or functions of pseudocholinesterase remain obscure at the
moment.
The trivial names that have been applied to this enzyme have included serum
cholinester"ase, S .. type cholinesterase, cholinesterase II, and pseudocholine
sterase. The latter name has been chosen as suitable for the purposes of the
Metropolitan Police Laboratory and will be used with the abbreviation PCE .
The reaction is shown in Figure 3-36.
3.6.2 ACTIVATORS AND INHIBITORS
There are many compounds that affect the activity of PCE . Some of those that
inhibit activity are:
a. Quaternary ammonium compounds.
b. Fluorides.
c . Chlorides.
d. Ethyl alcohol.
e. Dibucaine.
f. Solanin.
g. Organo-phosphates (nerve gases and insecticides).
h. Heavy metals.
182
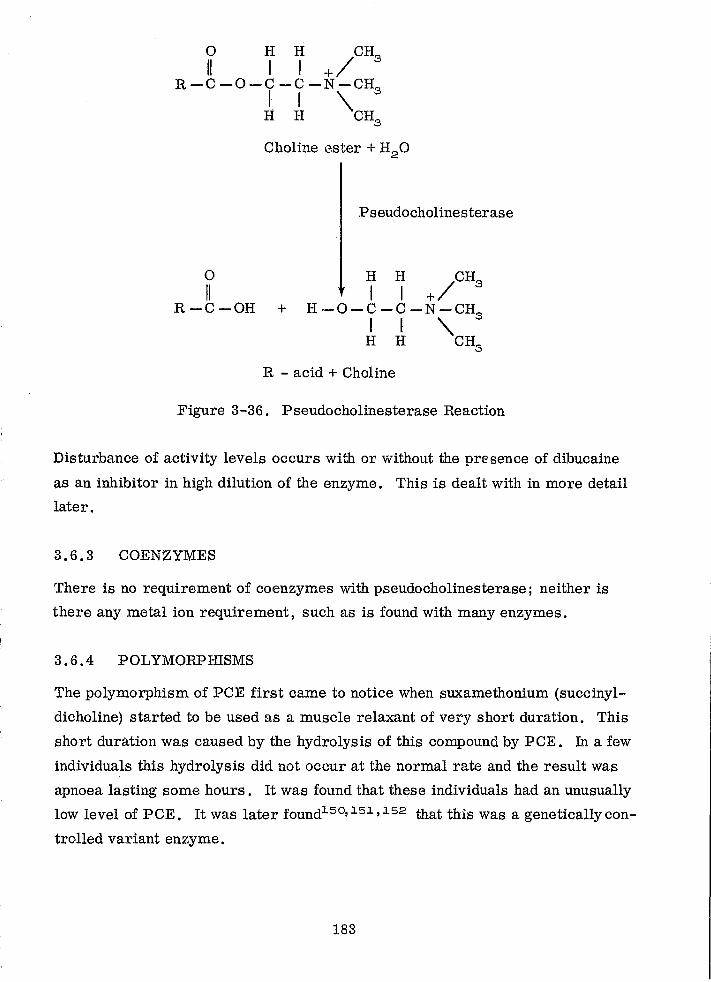
o H H CH II I I +/ 3
R-C-O-C-C-N-CH I I \ 3
o II
R-C-OH
H H CH3
Choline ~ster + H20
+
Pseudocholinesterase
H H /CH3 I I +
H-O-C-C-N-CH I ! '\ 3
H H CH3
R - acid + Choline
Figure 3-36. Pseudocholinesterase Reaction
Disturbance of activity levels occurs with or without the presence of dibucaine
as an inhibitor in high dilution of the enzyme. This is dealt with in more detail
later.
3.6.3 COENZYMES
There is no requirement of coenzymes with pseudocholinesterase; neither is
there any metal ion requirement, such as is found with many enzymes.
3.6.4 POLYMORPIllSMS
The polymorphism of PCE first came to notice when suxamethonium (succinyl
dicholine) started to be used as a muscle relaxant of very short duration. This
short duration was caused by the hydrolysis of this compound by PCE. In a few
individuals this hydrolysis did not occur at the normal rate and the result was
apnoea lasting some hours. It was found that these individuals had an unusually
low level of PCE. It was later found~50,~5~,~52 that this was a genetically con
trolled variant enzyme.
183
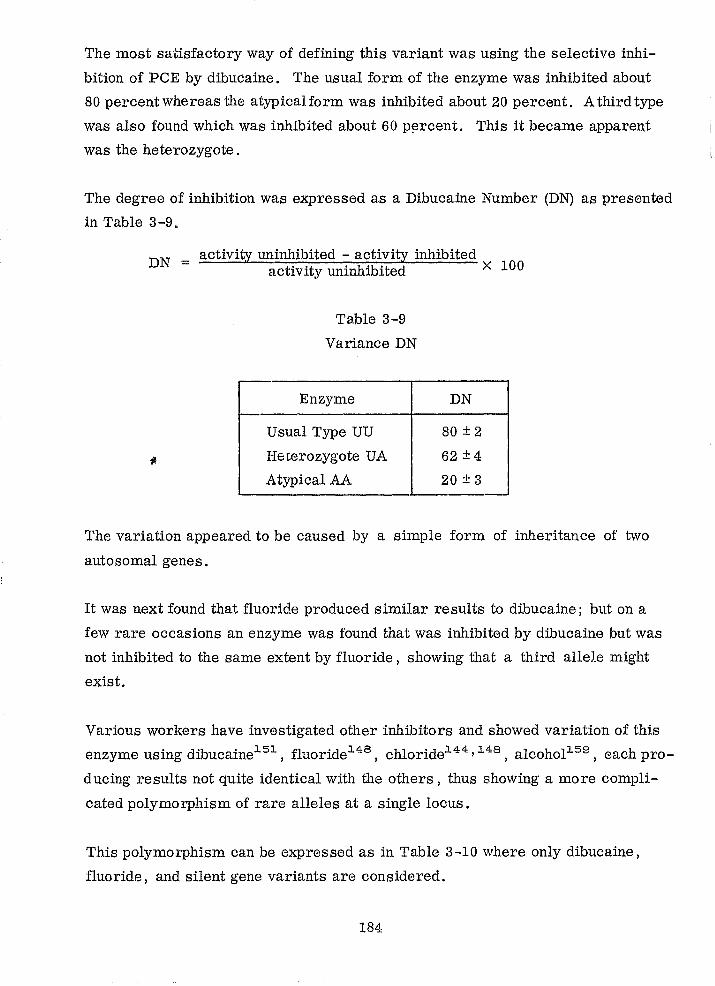
The most satisfactory way of defining this variant was using the selective inhi
bition of peE by dibucaine. The usual form of the enzyme was inhibited about
80 percent whereas the atypicalform was inhibited about 20 percent. A third type
was also found which was inhibited about 60 p~rcent. This it became apparent
was the heterozygote.
The degree of inhibition was expressed as a Dibucaine Number (DN) as presented
in Table 3-9.
DN = activity uninhibited - activity inhibited activity uninhibited X 100
Table 3-9
Variance DN
Enzyme
Usual Type UU
HE:terozygote UA
Atypical AA
DN
80 ± 2
62 ±4
20 ± 3 ~-------------------~.----.. ---
The variation appeared to be caused by a simple form of inheritance of two
autosomal genes.
It was next found that fluoride produced similar results to dibucaine; but on a
few rare occasions an enzyme was found that was inhibited by dibucaine but was
110t inhibited to the same extent by fluoride, showing that a third allele might
exist.
Various workers have investigated other inhibitors and showed variation of this
enzyme using dibucaineJ,5J" fluorideJ,48, chlorideJ,44, J,48, alcoholJ,59 , each pro-
ducing results not quite identical with the others, thus showing a more compli
cated polymorphism of rare alleles at a single locus.
This polymorphism can be expressed as in Table 3-10 where only dibucaine,
fluoride, and silent gene variants are considered.
184
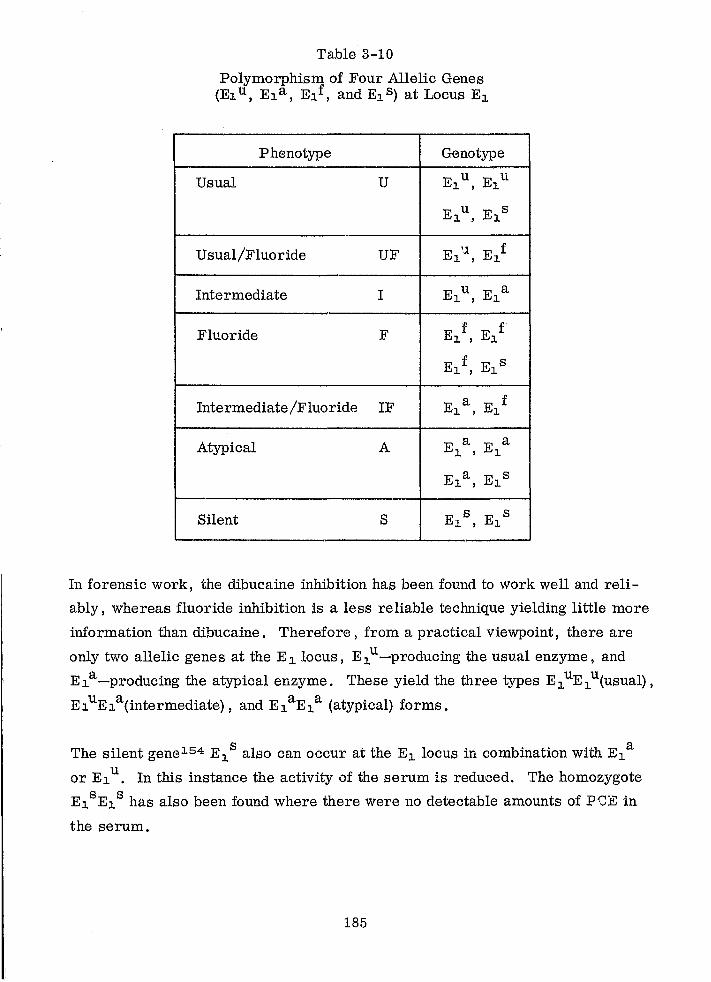
Table 3-10
Polymorphism of Four Allelic Genes (EJ. U, EJ. a, EJ. f, and EJ. S) at Locus EJ.
Phenotype Genotype
Usual U u EJ. , EJ.u
EJ.u , EJ. S
Usual/Fluoride UF E 'J. f J. , EJ.
Intermediate I u EJ. , EJ.a
Fluoride F f EJ. , EJ. f
f EJ. , EJ.s
Intermediate /F luo ride IF a EJ. , EJ. f
Atypical A E a J. , EJ.a
EJ. a, EJ. s
Silent S s EJ. , EJ.s
In forensic work, the dibucaine inhibition has been found to work well and reli
ably, whereas fluoride inhibition is a less reliable technique yielding little more
information than dibucaine. Therefore, from a practical viewpoint, there are
only two allelic genes at the EJ.locus, EJ.u-producing the usual enzyme, and
E J. a -producing the atypical enzyme. These yield the three types E J. uE J. u(usual) ,
EJ.uEJ.a(intermediate), and EJ.aEJ.a (atypical) forms.
The silent geneJ.54 E/ also can occur at the EJ. locus in combination with EJ.a
or EJ. u. In this instance the activity of the serum is reduced. The homozygote
EJ. sEJ. s has also been found where there were no detectable amounts of P(!E in
the serum.
185
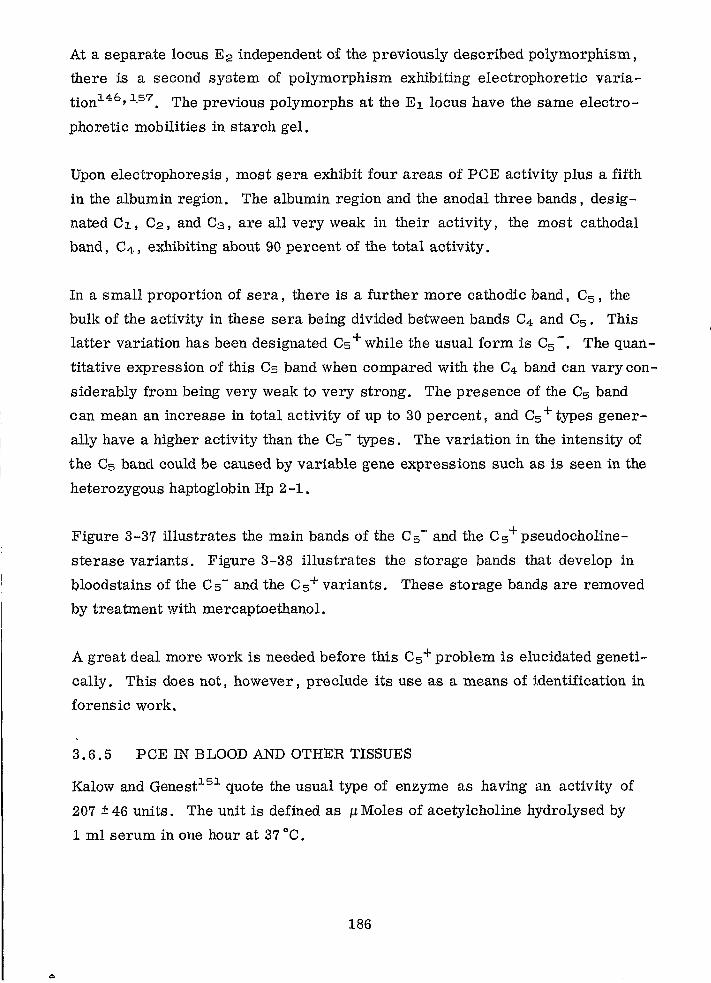
At a separate locus E2 independent of the previously described polymorphism,
there is a second system of polymorphism exhibiting electrophoretic varia
tionl46 , l.S7. The previous polymorphs at the El locus have the same electro
phoretic mobilities in starch gel.
Upon electrophoresis, most sera exhibit four areas of PCE activity plus a fifth
in the albumin region. The albumin region and the anodal three bands, desig
nated Cl, C2, and Cs , are all very weak in their activity, the most cathodal
band, C4, exhibiting about 90 percent of the total activity.
In a small proportion of sera, there is a further more cathodic band, Cs , the
bulk of the activity in these sera being divided bet'neen bands C4 and Cs . This
latter variation has been designated Cs + while the usual form is Cs -. The quan
titative expression of this Cs band when compared with the C4 band can vary con
siderably from being very weak to very strong. The presence of the Cs band
can mean an increase in total activity of up to 30 percent, and Cs + types gener
ally have a higher activity than the Cs - types. The variation in the intensity of
the Cs band could be caused by variable gene expressions such as is seen in the
heterozygous haptoglobin Hp 2 -1.
Figure 3-37 illustrates the main bands of the C s - and the C s + pseudocholine
sterase variants. Figure 3-38 illustrates the storage bands that develop in
bloodstains of the C s - and the C s + variants. These storage bands are removed
by treatment with mercaptoethanol.
A great deal more work is needed before this Cs+ problem is elucidated geneti·
cally. This does not, however, preclude its use as a means of jdentification in
forensic work.
3.6.5 PCE IN BLOOD AND OTHER TISSUES
Kalow and Genestl5l quote the usual type of enzyme as having an activity of
207 ± 46 units. The unit is defined as ~t Moles of acetylcholine hydrolysed by
1 ml serum in one hour at 37 DC.
186
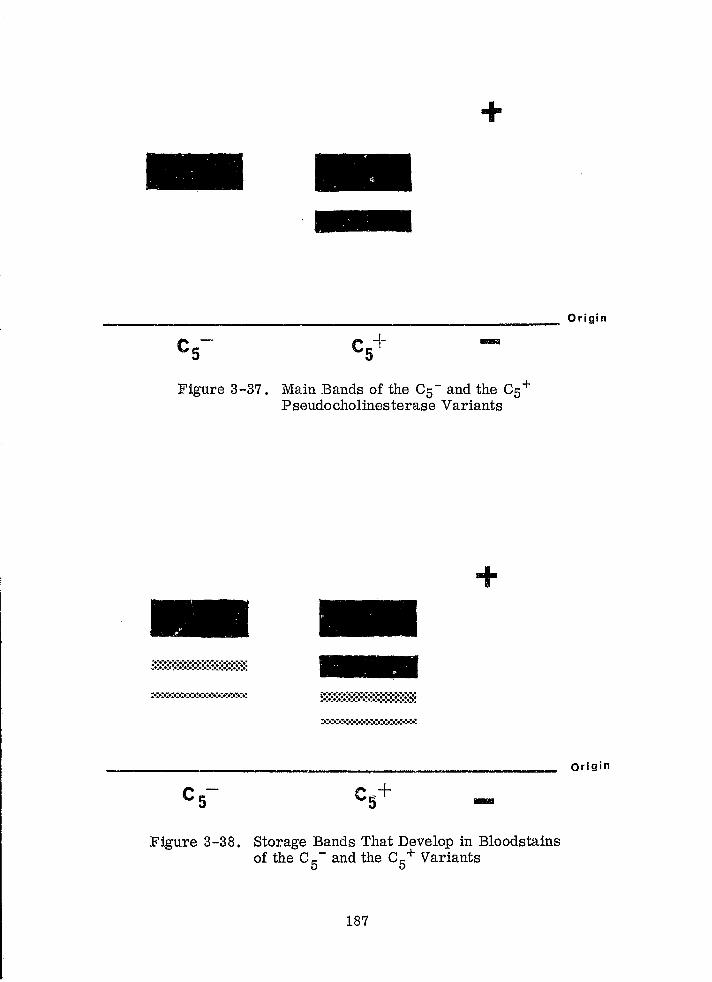
+
___________________________ Origin
c-5 c+ 5
Figure 3-37. Main Bands of the C5 - and the C5 + Pseudocholinesterase Variants
c-5
+
-Figure 3-38. Storage Bands That Develop in Bloodstains
of the C5 - and the C5 + Variants
187
Origin
In addition to its presence in serum, the enzyme has also been found in heart
muscle, skin, glia, intestines, and liver. There are no detectable amounts of
PCE in semen.
In the absence of a satisfactory blood sample from a cadaver, it is doubtful if a
satisfactory alternative tissue source could be found.
3.6.6 EFFECTS OF AGE
Up to 30 percent loss of activity on a single freezing and thawing has been re
ported. The experience vf the Metropolitan Police Laboratory has been that the
losses are much less than this.
Storage of serum samples of -20°C has yielded samples that are still satisfac
tory after repeated freezing and thawing for over three years, freezing and thaw
ing occurring at least once per week.
There is an appreciable loss of activity when a bloodstain dries, but good results
have been obtained from bloodstains up to three months old. After this the re
sults tend to become weak and indistinct, very little activity remaining after six
months for determining the inhibition variant.
Bloodstains and stored serum samples develop storage bands that can be quite
strong and, un]ess the correct techniques are used, they may be confused with
the C do band. C + sera also develop a storage band cathodal to the C band. !D 5 5
These storage effects are removed by treatment with mercaptoethanol.
The age of the person from whom the sample has come also appears to affect
thr activity. The older the donor, the lower the activity.
3.6.7 EFFECTS OF BLOODSTAIN SUBSTRATE
Bloodstains from numerous substrates, including most textiles, metals, glass,
etc. , have been examined and none has so far given any difficulties that were
directly attributable to the substrate.
188
3.6.8 EFFECTS OF VARIOUS CHEMICALS
Most of the effects have been dealt with under information on inhibitors. Mer
captoethanol has no effect on the enzyme except to remove storage band effects,
as previously described.
189
3.7 PSEUDOCHOLINESTERASE E1 LOCUS VARIANTS
3.7.1 SPECTROPHOTOMETRIC METHOD
3 . 7 . 1 . 1 General
Dibucaine number variants are practical determinations on bloodstains as has
been shown by Lehmann 153 and Parkin 155. The determination of fluoride or
alcohol variants is considered an uneconomic use of effort in a routine forensic
laboratory in view of their low occurrences and the amount of additional work
required to detect them. Hence, the only inhibition variants to be considered
here are the dibucaine ones.
The original method of determining dibucaine numbers, described by Kalow
and Genest151, is the most reliable method for work on bloodstains and is the
one which should be used to give final answers. There are, however, various
difficulties and a variety of ways of solving each. The first difficulty is that a
bloodstain extract in buffer or water contains a large amount of haemoglobin
which makes the extract optically very dense at 240 nm.
When determination of the dibucaine number of a fresh unhaemolysed serum is
performed, the serum is diluted approximately 1: 50 to 1: 100 with buffer. Hence,
a fairly dilute extract of a bloodstain approximately equivalent to a 1/50 dilution
of serum is required.
The density of the extract may still be too high for a programmed slit width, and
it is found with the Beckman DB-G that opening the slit width to 1-2mm improves
the signal-to-noise ratio to acceptable levels. Even so, some extracts of stains
are still optically dense producing an unacceptable signal-to-noise ratio which
'then gives poor or wrong results when determining inhibited activity. This diffi
culty has been overcome by visually monitoring the signal-to-noise ratio by con
necting an oscilloscope across the photomultiplier output. If an unsatisfactory
trace on the oscilloscope is seen, then the sample is diluted to give a satisfac
tory signal. This dilution must be done with oare since overdilution leads to
the other major problem.
190
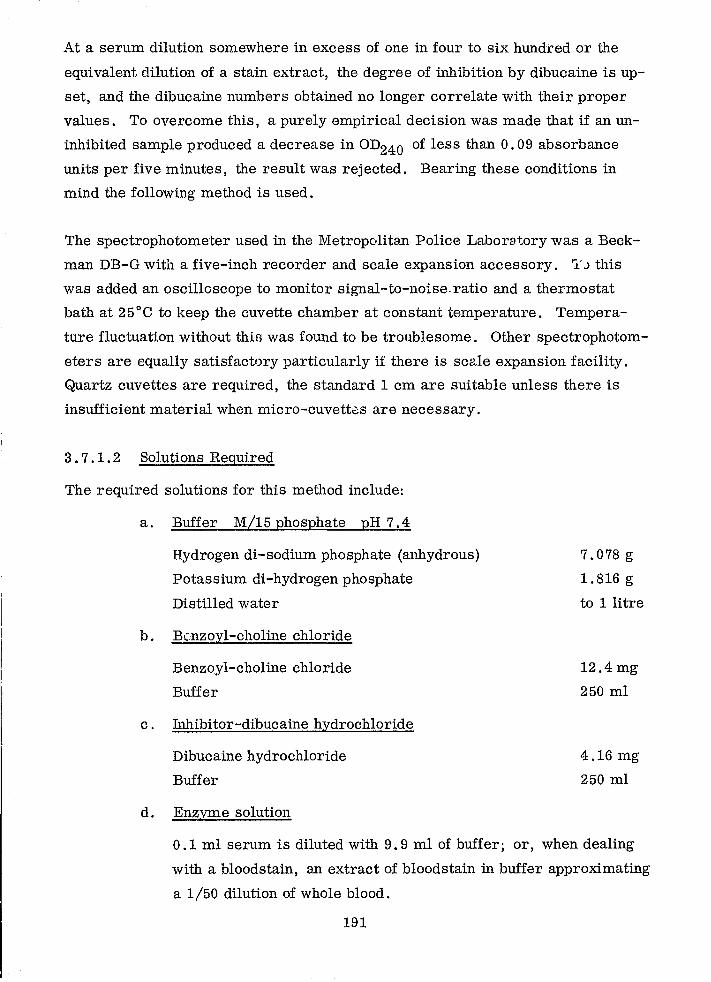
At a serum dilution somewhere in excess of one in four to six hundred or the
equivalent dilution of a stain extract, the degree of in...l-tibition by dibucaine is up
set, and the dibucaine numbers obtained no longer correlate with their proper
values. To overcome this, a purely empirical decision was made that if an un
inhibited sample produced a decrease in OD240 of less than 0.09 absorbance
units per five minutes, the result was rejected. Bearing these conditions in
mind the following method is used.
The spectrophotometer used in the Metropolitan Police Laboratory was a Beck
man DB-G with a five-inch recorder and scale expansion accessory. 'l' J this
was added an oscilloscope to monitor signal-to-noise.ratio and a thermostat
bath at 25°C to keep the cuvette chamber at constant temperature. Tempera
ture fluctuation without this was found to be troublesome. Other spectrophotom
eters are equally satisfactory particularly if there is scale expansion facility.
Quartz cuvettes are required, the standard 1 cm are suitable unless there is
insufficient material when micro-cuvettes are necessary.
3 . 7. 1 .2 Solutions Required
The required solutions for this method include:
a. Buffer M/15 phosphate pH 7.4
Hydrogen di-sodium phosphate (anhydrous)
Potassium di-hydrogen phosphate
Distilled water
b. Benzoyl-choline chloride
Benzoyl-choline chloride
Buffer
c. Inhibitor-dibucaine hydrochloride
Dibucaine hydrochloride
Buffer
d. Enzyme solution
7.078 g
1. 816 g
to 1 litre
12.4 mg
250 ml
4.16 mg
250 ml
0.1 ml serum is diluted with 9.9 ml of buffer i or, when dealing
with a bloodstain, an extract of bloodstain in buffer approximating
a 1/50 dilution of whole blood.
191
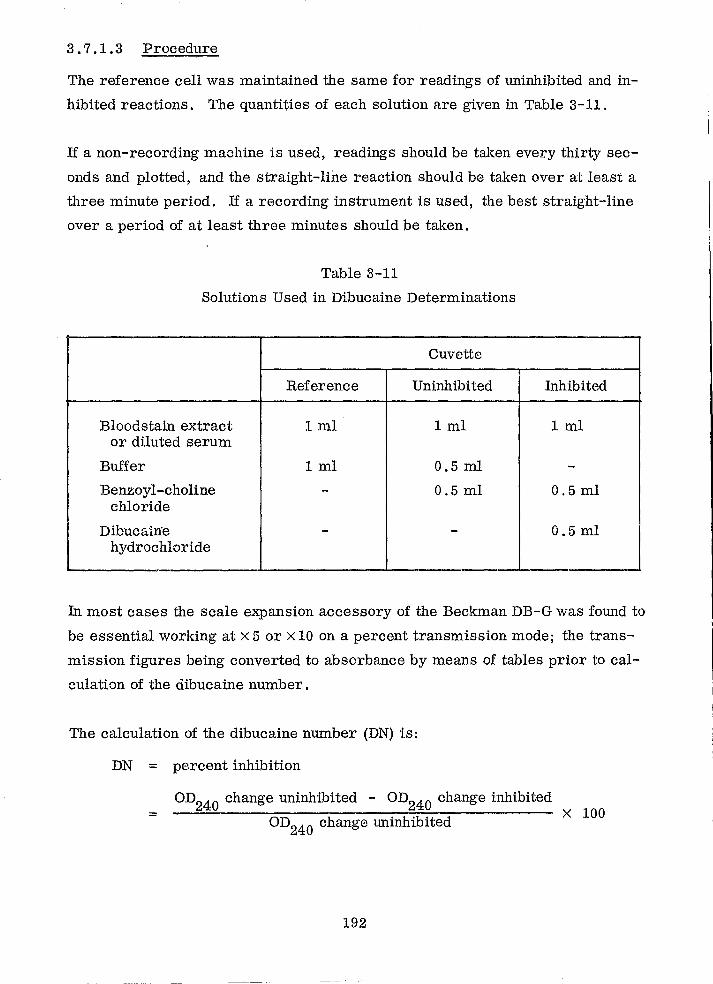
3.7.1.3 Procedure
The reference cell was maintained the same for readings of uninhibited and in
hibited reactions. The quantities of each solution are given in Table 3-11.
If a non-recording machine is used, readings should be taken every thirty sec
onds and plotted, and the straight-line reaction should be taken over at least a
three minute period. If a recording instrument is used, the best straight-'line
over a period of at least three minutes should be taken.
Table 3-11
Solutions Used in Dibucaine Determinations
Cuvette
Reference Uninhibited Inhibited
Bloodstain extract 1 ml 1 ml 1 ml or diluted serum
Buffer 1 ml 0.5 ml -Benzoyl-choline - 0.5 ml 0.5 ml
chloride
Dibucliirre - - 0.5 ml hydrochloride
In most cases the scale expansion accessory of the Beckman DB-G was found to
be essential working at x 5 or X 10 on a percent transmission mode; the trans
mission figures being converted to absorbance by means of tables prior to cal
culation of the dibucaine number.
The calculation of the dibucaine number (DN) is:
DN = percent inhibition
= OD
240 change uninhibited - OD240 change inhibited
x 100 OD240 change uninhibited
192
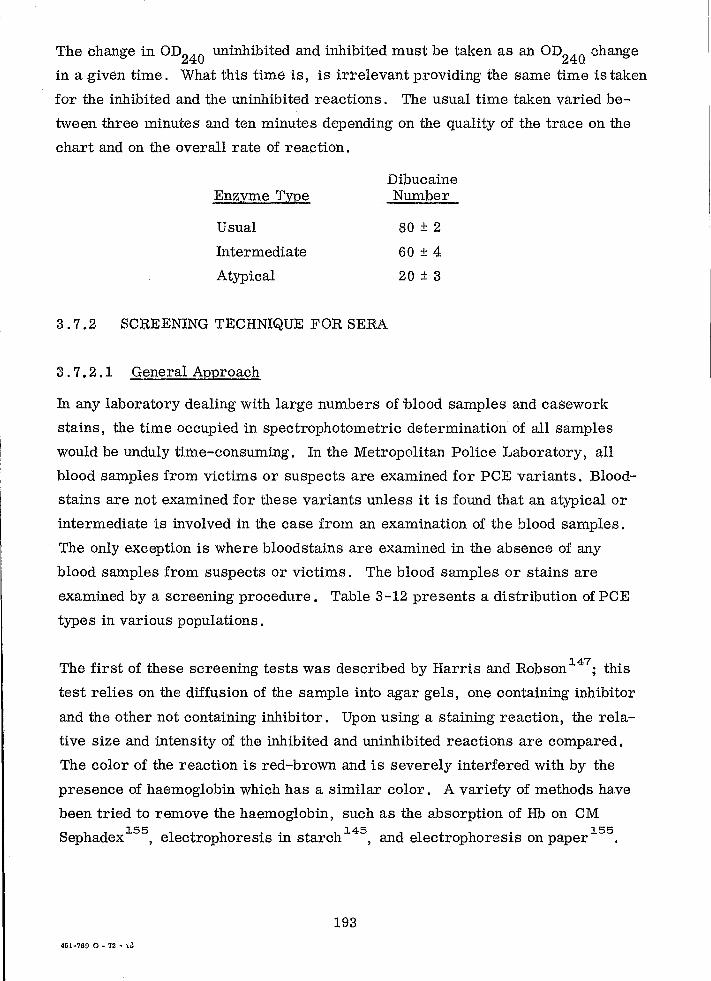
The change in OD240
uninhibited and inhibited must be taken as an OD240
change
in a given time. What this time is, is irrelevant providing the same time is taken
for the inhibited and the uninhibited reactions. The usual time taken varied be
tween three minutes and ten minutes depending on the quality of the trace on the
chart and on the overall rate of reaction.
Enzyme Type
Usual
Intermediate
Atypical
Dibucaine Number
80 ± 2
60 ± 4
20 ± 3
3.7.2 SCREENING TECHNIQUE FOR SERA
3 . 7.2.1 General Approach
In any laboratory dealing with large numbers of "blood samples and casework
stains, the time occupied in spectrophotometric determination of all samples
would be unduly time-consuming. In the Metropolitan Police Laboratory, all
blood samples from victims or suspects are examined for PCE variants. Blood
stains are not examined for these variants unless it is found that an atypical or
intermediate is involved in the case from an examination of the blood samples.
The only exception is where bloodstains are examined in the absence of any
blood samples from suspects or victims. The blood samples or stains are
examined by a screening procedure. Table 3-12 presents a distribution of PCE
types in various populations.
The first of these screening tests was described by Harris and Robson H7; this
test relies on the diffusion of the sample into agar gels, one containing inhibitor
and the other not containing inhibitor. Upon using a staining reaction, the rela
tive size and intensity of the inhibited and uninhibited reactions are compared.
The color of the reaction is red-brown and is severely interfered with by the
presence of haemoglobin which has a similar color. A variety of methods have
been tried to remove the haemoglobin, such as the absorption of Hb on CM
Sephadex 155, electrophoresis in starch 145, and electrophoresis on paper 155.
193 451-769 0 - 72 - iJ
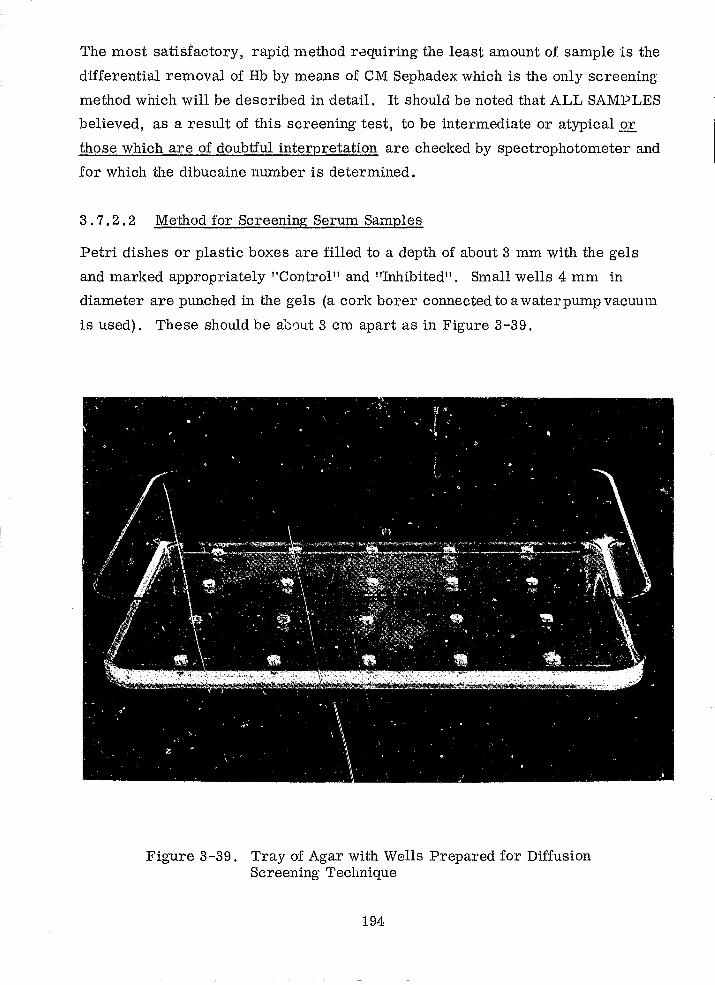
The most satisfactory, rapid method requiring the least amount of sample is the
differential removal of Hb by means of OM Sephadex which is the only screening
method which will be described in detail. It should be noted that ALL SAMPLES
believed, as a result of this screening test, to be intermediate or atypical.2!:,
those which are of doubtful interpretation are checked by spectrophotometer and
for which the dibucaine number is determined.
3 . 7 . 2 . 2 Method for Screening Serum Samples
Petri dishes or plastic boxes are filled to a depth of about 3 mm with the gels
and marked appropriately "Control" and "Inhibited". Small wells 4 mm in
diameter are punched in the gels (a cork borer connected to a water pump vacuum
is used). These should be a00ut 3 cm apart as in Figure 3-39.
Figure 3-39. Tray of Agar with Wells Prepared for Diffusion Screening Technique
194
The concentration of inhibitor was chosen to produce about 10 percent of the
activity of the atypical or intermediate f:Jrms in the control plate. Hence, by
making the sera in the inhibited plate four times as concentrated as that in the
control plate, the stained-up diffusion zones developed around the atypical or
intermediate types in the inhibited plate would be as great as, or even greater
than, t.he corresponding sera in the control plate. On comparison, the usual
type of sera at the same concentrations would have a far weaker zone of color
in the inhibited plate than in the control plate.
The serum dilutions actually chosen for the most convenient Tesults were 1 in
8 for the inhibited plate and 1 in 32 for the control plate. The dilutions were
carried out in a depression tile, using the TRIS/hydrochloric acid gel buffer, by
counting the drops from a Pasteur pipette. The diluted sera were pipetted into
the wells of the appropriate boxes, and their positions were noted. The lids
were replaced to prevent the gels from drying, and the boxes were left to diffuse
for 17 hours in an incubator at 37°C.
3 . 7.2 . 3 Reaction Mixture
The diffusion zones of each gel were developed by flooding with 50 ml of the
following reaction mixture:
20 mg fast red TR salt (5-chloro-o-tolidine).
2 ml 1 percent a -naphthyl acetate in 50 percent aqueous acetone.
100 ml O. 2M phosphate buffer, pH 7.1.
The buffer that was used was prepared as indicated below:
Disodium hydrogen phosphate
Distilled water
Sodium dihydrogen phosphate
Distilled water
107.4 g
1.5litres
31.2g
1.0 litre
The sodium dihydrogen phosphate solution was added to the disodium hydrogen
phosphate solution to give a pH of 7.1.
The a -naphthyl acetate was used as a substrate for the diffused enzyme, PCK,
since it was non-specific cholinesterase, it hydrolysed the a -naphthyl acetate
195
at pH 7.1, releasing naphthol. The naphthol reacted with the fast red TR salt,
a diazo reagent, yielding a red colored product.
The usual type of PCE was inhibited in the inhibited plate, generating a color
which was weak, pink, and diffuse due to a reduced amount of liberated naphthol;
but the atypical and intermediate types at this concentration were stained up
strongly with red, well-defined diffusion zones. The diffusion zones of the inter
mediate form were roughly the same size and concentration as the corresponding
control sample, but the atypical type produced a diffusion zone larger than the
control sample. However, the difference between the intermediate and atypical
forms was so slight that this could not be regarded as a reliable method of differ
entiating them.
Although the results could usually be read after one hour, the reaction was
allowed to continue for two hours for optimum color development and then
stopped by flooding with the alcohol/acetic acid "wash" solution. The usual
type could then be easily distinguished from the intermediate and atypical types.
When the results were read, the inhibited plate was always checked against the
corresponding sera in the control plate with special reference to the discreetly
stained light-red diffusion zone and the innermost fine dark-red circle which
marked the intermediate and atypical forms. The "usualll zone in the inhibited
plate was weakly stained and diffused as shown in Figure 3-40.
The strength of the color zones on the control plate also gave a rough guide to
the relative level of PCE activity in the various sera used.
3. 7.3 SCREENING OF BLOODSTAINS
3 . 7 . 3 . 1 General Application
Where there is plenty of bloodstain material, the screening technique just de
scribed can work well. More bloodstain is needed for this method than in deter
mining the dibucaine number.
196
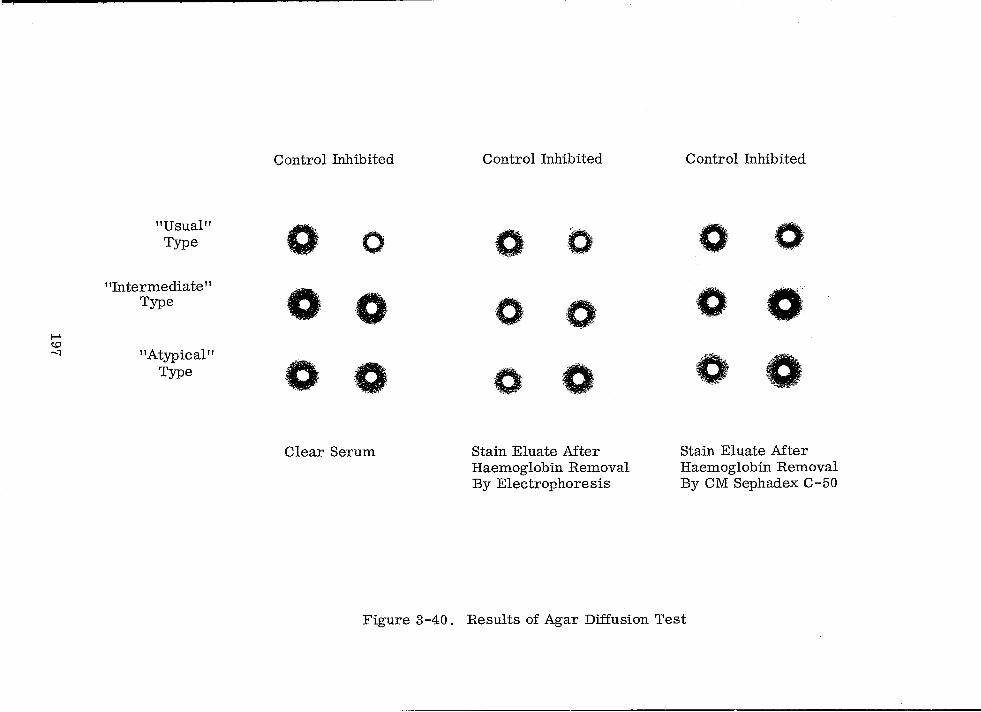
"Usual" Type
"Intermediate" Type
I-' to -1 "Atypical"
Type
Control Inhibited
0 0
0 '0
0 0
Clear Serum
Control Inhibited
0 0
0 ft
Stain Eluate After Haemoglobin Removal By Electrophoresis
Control Inhibited
0 0
0 ' , 0
Stain Eluate After Haemoglobin Removal By CM Sephadex C-50
Figure 3-40. Results of Agar Diffusion Test
The color developed in this test is red-brown and is markedly obscured by haemo
globin from a bloodstain extract. Haemoglobin must, therefore; be removed
prior to testing. The following techniques were developed by B. H. Parkin ~55 of the Metropolitan Police Laboratory.
3 . 7.3 .2 Method of Haemoglobin l:1emoval
A portion of bloodstain, about 1 cm square, is cut up into fragments in a small
test tube with about 1 ml of buffer. This buffer, with a pH of 6.5 is composed of:
Disodium hydrogen phosphate
Sodium dihydrogen phosphate
Water
0.8875 g
4.875 g
llitre
The stain is well soaked and mashed with a glass rod. The eluate is then pipetted
off into a small tube. A small quantity of dry CM Sephadex C-50 is added to the
eluate; it swells rapidly absorbing buffer. In its swollen state, it should occupy
about half to two-thirds of the volume of the eluate in the tube. This is allowed
to stand with occasional agitation for about thirty minutes. The slurry is centri
fuged' and the supernatant liquid is used as it is in the inhibited gel and is diluted
one in four for the uninhibited gel.
After Incubation for 17 hours at 37°C, it is stained and evaluated in exactly the
same manner as serum samples. The estimation of the quantity of stain required
may cause difficulty; about 1 em square of well stained cotton cloth is sufficient,
but weak blood smearing or thinner material will require a greater area of cloth.
An area of blood staining on an item of clothing may be eluted without cutting the
cloth but by moistening and squeezing out the extract. In this instance the eluate
may be greater in volume and of low concentration. If this is so, more dry
Sephadex is added to concentrate the eluatE'.
The problems which arose early in the trials of this method were associated with
impure distilled water which still contained sufficient contaminants to inhibit the
enzyme; and the use of certai.n plastic boxes which absorbed materials from the
gels, which resulted in eventual inhibition by their repeated use. Once these
initial difficulties had been overcome no further problems have been found.
198
3.7.4 ELECTROPHORETIC SCREENING METHOD
3 . 7 .4 . 1 General
Another screening technique has been developed recently in the Metropolitan 62
Police Laboratory by Wraxall . It is more rapid than others, but it requires
an accuracy of technique greater than the other methods, and it has not yet had
the long-term trials of other methods. In spite of this, it could become the
standard method for bloodstains or lysed blood samples because of the simplic
ity of the haemoglobin removal stage.
3.7.4.2 Method
Pour 7 ml of 1. 5 percent Difco Noble agar in the gel buffer (below) onto a
2 inch by 3 inch glass slide and allow to set. This will be the uninhibited plate.
A second plate is made with the addition of 0.2 ml of inhibitor RO.2-0683 per
50 ml of agar. The inhibitor solution contains:
TRIS
Water
12.1 g
800 ml
Gel and tank buffer are the same and [Ire adjut3ted to pH 7 .0 with RCl and made
up to one litre.
Small wells 1.5 to 2 mm diameter are punched in each plate in a regularly
spaced pattern.
The sera are diluted as before-I: 8 for the inhibited plate and 1: 32 for the un
inhibited plate and are put in the appropriate wells.
Using a precipitin type tank and set-up (see paragraph 1.4), electrophoresis is
performed at 50v for 45 minutes. The plates are then developed in the same
solution as for the previous screening test, and the results are interpreted in
the same way (Figure 3-41).
The advantages of this method are its speed and the fact that there is simulta
neous removal of the haemoglobin from the sample towards the cathode so that
it is outside the enzyme reaction area.
199
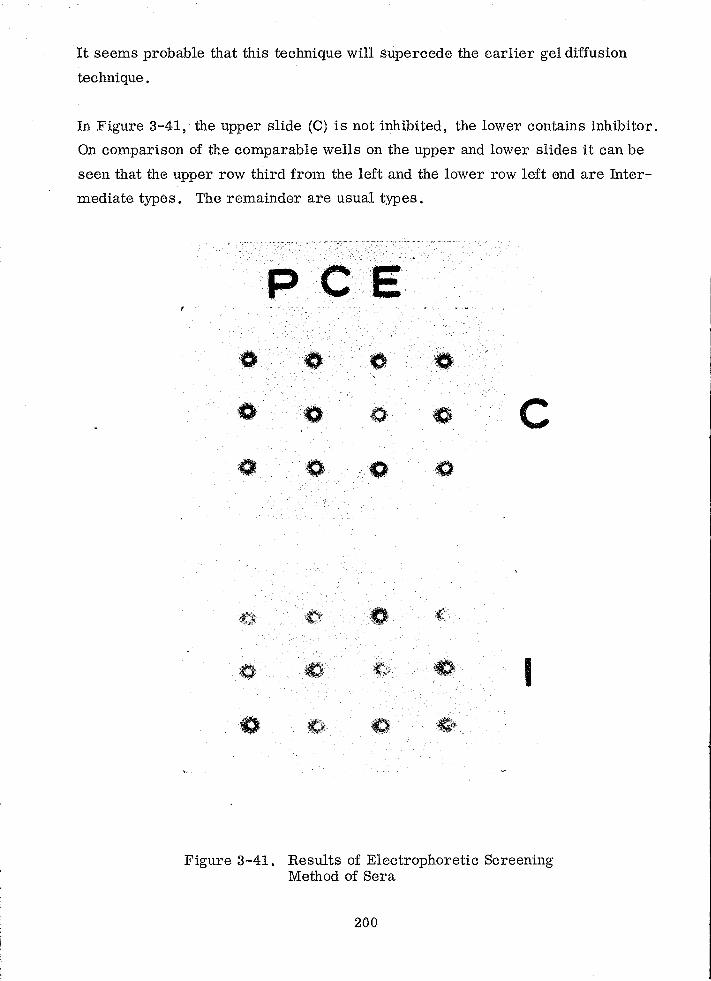
It seems probable that this technique will supercede the earlier gel diffusion
technique.
In Figure 3-41, the upper slide (C) is not inhibited, the lower contains inhibitor.
On comparison of the comparable wells on the upper and lower slides it can be
seen that the upper row third from the left and the lower row left end are Inter
mediate types. The remainder are usual types.
peE 0 0 " 0
'0 0 0 0 C 0 . . 0 0 0
0,
0 Cl ~' 0 I " . , ' 1"
0 0->"'" .' 0 ~'\
Figure 3-41. Results of Electrophoretic Screening Method of Sera
200
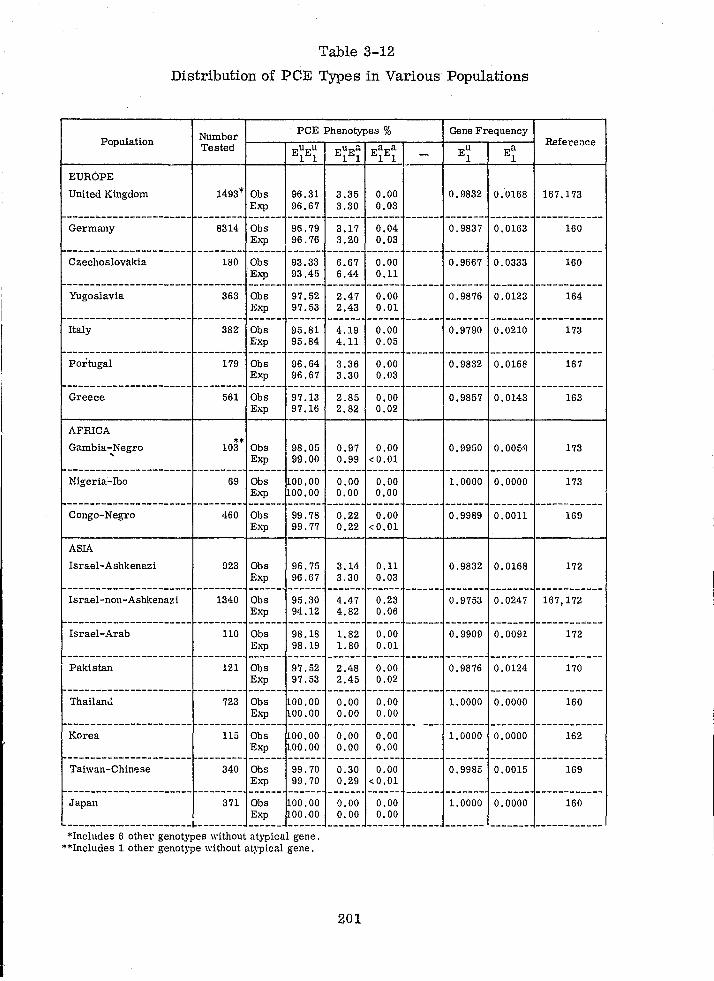
Table 3-12
Distribution of peE Types in Various Populations
Number PCE Phenotypes % Gene Frequency Population Tested EUEu EUEa EaEa EU Ea Reference
1 1 1 1 1 1 1 1
EUROPE
United Kingdom 1493* Obs 96.31 3.35 0.00 0.9832 0.0168 167.173 Exp 96.67 3.30 0.03
---------------------- -------- ------ ------ ------ ------ ------------Germany 8314 Obs 96.79 3.17 0.04 0.9837 0.0163 160
Exp 96.76 3.20 0.03 ---------------------- -------- ------------Czechoslovakia 180 Obs 93.33 6.67 0.00 0.9667 0.0333 160
Exp 93.45 6.44 0.11 ---------------------- -------- ------ ------ ------------Yugoslavia 363 Obs 97.52 2.47 0.00 0.9876 0.0123 164
Exp 97.53 2.43 0.01 ---------------------- -------- ------ ------- ------------Italy 382 Obs 95.81 4.19 0.00 0.9790 0.0210 173
Exp 95.84 4.11 0.05 ---------------------- -------- ------ ------ ------------Portugal 179 Obs 96.64 3.36 0.00 0.9832 0.0161! 167
Exp 96.67 3.30 0.03 ---------------------- -------- ------ ------ ------------Greece 561 Obs 97.13 2.85 0.00 0.9857 0.0143 163
El>.'P 97.16 2.82 0.02
AFRICA ** Gambia-..Negro 103 Obs 98.05 0.97 0.00 0.9950 0.005·t) 173
Exp 99.00 0.99 < 0.01 ---------------------- -------- ------------Nigeria-Ibo 69 Obs 00.00 0.00 0.00 1.0000 0.0000 173
Exp 00.00 0.00 0.00 ---------------------- -------- ------------Congo-Negro 460 Obs 99.78 0.22 0.00 0.9989 0.0011 169
Exp 99.77 0.22 <0.01
ASIA
Israel-Ashkenazi 923 Obs 96.75 3.14 0.11 0.9832 0.0168 172 Exp 96.67 3.30 0.03
---------------------- -------- ------------Israel-non-Ashkenaz i 1340 Obs 95.30 4.47 0.23 0.9753 0.0247 167,172
Exp 94.12 4.82 0.06 ---------------------- -------- ------------Israel-Arab llO Obs 98.18 1.82 0.00 0.9909 0.0091 172
Exp 98.19 1.80 0.01 ---------------------- -------- ------------Pakistan 121 Obs 97.52 2.48 0.00 0.9876 0.0124 170
Exp 97.53 2.45 0.02 ---------------------- -------- ------ ------------Thailand 723 Obs 00.00 0.00 0.00 1.0000 0.0000 160
Exp 00.00 0.00 0.00 ---------------------- -------- ------------KOrea 115 Obs 00.00 0.00 0.00 1.0000 0.0000 162
Exp 00.00 0.00 0.00 ---------------------- -------- ------------Taiwan-Chinese 340 Obs 99.70 0.30 0.00 0.9985 0.0015 169
Exp 99.70 0.29 < 0 .01 ---------------------- -------- ------------Japan 371 Obs 00.00 0.00 0.00 1.0000 0.0000 160
Exp 00.00 0.00 0.00 ----------------------~-------- ------------*Includes 6 other genotypes without atypical gene.
**Includes 1 other genotype without atypical gene.
201
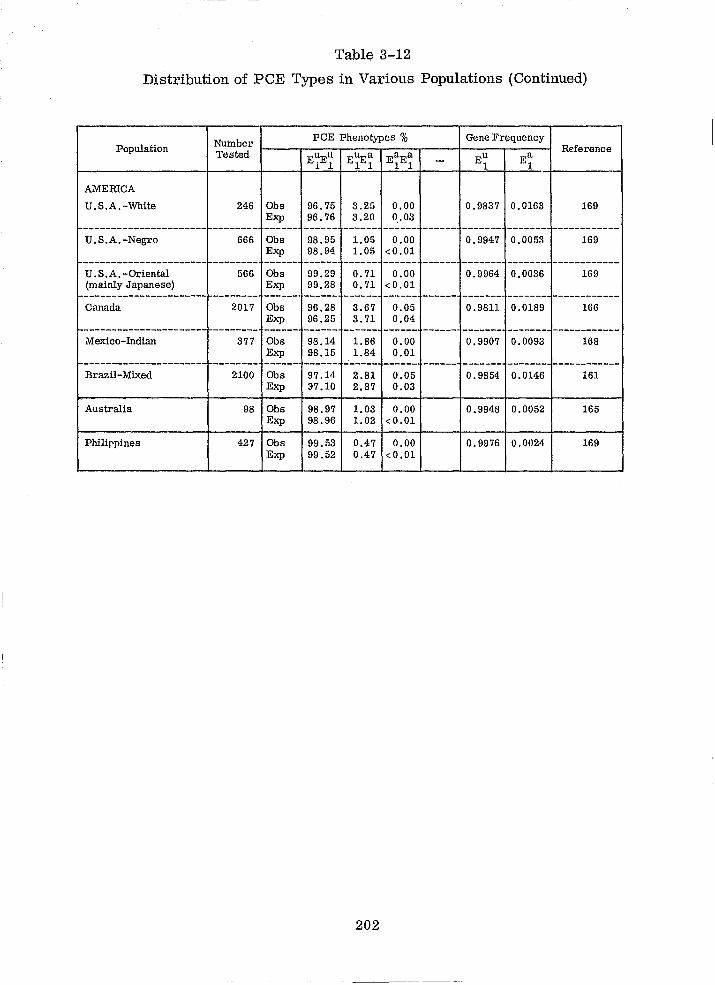
Table 3-12
Distribution of PCE Types in Various Populations (Continued)
Number PCE Phenotypes % Gene Frequency
Population Reference Tested EUEu EUEa EaEa EU Ea -1 1 1 1 1 1 1 1 --AMERICA
U.S.A.-White 246 Obs 96.75 3.25 0.00 0.9837 0.0163 169 Exp 96.76 3.20 0 .. 03
---------------------- -------- ------ ------ ------ ------ ------ ------- ------- ------------U.S.A.-Negro 666 Obs 98.95 1.05 0.00 0.9947 0.0053 169
Exp 98.94 1.05 <0.01 ---------------------- -------- ------ ------ ------ ------ ------ ------- ------- ------------U. S.A. -Oriental 566 Obs 99.29 0.71 0.00 0.9964 0.0036 169 (mainly Japanese) Exp 99.28 0.71 <0.01 ---------------------- -------- ------ ------ ------ ------ ------ ------- ------- ------------Canada 2017 Obs 96.28 3.67 0.05 0.9811 0.0189 166
Exp 96.25 3.71 0.04 ---------------------- -------- ------ ------ ------ ------ ------ ------- ------- ------------Mexico-Indian 377 Obs 98.14 1.86 0.00 0.9907 0.0093 168
Exp 98.15 1.84 0.01 ---------------------- -------- ------ ------ ------ ------ ------ ------- ------- ------------Brazil-Mixed 2100 Obs 97.14 2.81 0.05 0.9854 0.0146 161
Exp 37.10 2.87 0.03
Australia 98 Obs 98.97 1.03 0.00 0.9948 0.0052 165 Exp 98.96 1.02 <0.01
Philirpines 427 Obs 99.53 0.47 0.00 0.9976 0.0024 169 Exp 99.52 0.47 <0.01
202
3.8 PSEUDOCHOLlliESTERASE E2 LOCUS ELECTROPHORETIC VARIANTS
3.8.1 METHODS
. . . J.46 . . 158 The orlgmal method of Harns, et al ,Improved by Robson and Harns
used starch gels at acid pH's. The development of this method for use with
bloodstains was described by Parkin 155 and later adapted to the thin layer
technique 62 •
. 156 Subsequently Parkm developed a greatly improved technique involving starch
and acrylamide. The major part of the gel is 7 percent acrylamide with a strip
of 7 percent starch at the origin. In a thin layer technique, small pore acryla
mide is less simple to prepare at the origin, and agar is less satisfactory.
The acrylamide gel is made as a 1 mm thick flat plate using the same mould as
in the thin layer starch technique (paragraph 1.2).
3.8.2 MATERIALS
The materials and their preparations are:
a. Acrylamide Gel Buffer·
Succinic acid 0.0156 M
TRIS 0.0184 M
Water
1,84 g
2.23 g
125 ml
Adjuet to pH 4.8, if necessary, with saturated succinic acid
solution.
b. Starch Gel Buffe:r.,-Acrylamide gel buffer diluted 1/8 with distilled
water.
c . Tank Buffer Stock Solution
Citric acid 0.05 M
Water
86.16 g
800 ml
Adjusted to pH 4.8 with 40 percent sodium hydroxide and made up
to 1 litre.
This is diluted 1/8 for use.
203
3.8.3
d. Acrylamide Stock Solution
A ;}rylamide
Bis-acrylamide
Water
e . Activator
Ammonium per sulphate
Water
(this must be freshly prepared)
f. To Make the Gel
Acrylamide gel buffer
Acrylamide stock solution
Distilled water
Activator (ammonium persulphate)
PROCEDURE
28 g
0.735 g
to 100 ml
0.07 g
25 ml
6.5 ml
13 ml
6.5 ml
26 ml
The above solutions are mixed thoroughly and de-gassed with the aid of a water
pump. The mixture is then poured into a gel mould 1 mm thick by 22 cm by
15 cm. A glass plate 22 by 15 cm is carefully laid over the gel mould excluding
all air, anrl the whole is transferr8d to an incubator at 55 to 60°C for 30 minutes
in which time gelling will occur. If the de-gassing has been inadequate, numer
ous small air bubbles will appear at this stage, and the gel should be discarded.
The upper glass plate should be carefully removed. The origin slot is cut in
the center of the plate with a sharp blade; a slight sawing action of the blade is
helpful to get a clean cut edge. This slot should be made by removing a strip
of acrylamide gel about 5 to 7 mm wide and extending to about 5 mm from each
side of the plate. The slot thus formed is filled with 7 percent starch gel made
in the usual manner with the starch gel buffer.
The inserts are standard cotton threads about 1 cm long which are put into slots
made in the center of the starch gel strip. A plate prepared in this way is shown
in Figure 3-42.
204
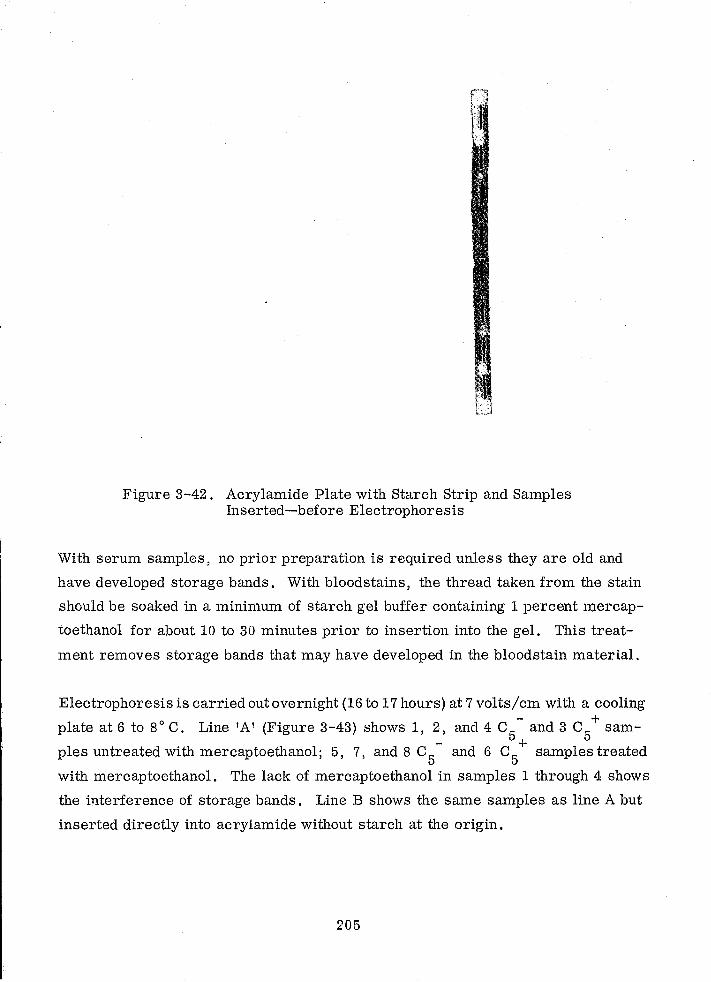
Figure 3-42. Acrylamide Plate with Starch Strip and Samples Inserted-before Electrophoresis
With serum samples, no prior preparation is required unless they are old and
have developed storage bands. With bloodstains, the thread taken from the stain
should be soaked in a minimum of starch gel buffer containing 1 percent mercap
toethanol for about 10 to 30 minutes prior to insertion into the gel. This treat
ment removes storage bands that may have developed in the bloodstain material.
Electrophoresis is carried out overnight (16 to 17 hours) at 7 volts/cm with a cooling
plate at 6 to 8° C. Line 'A' (Figure 3-43) shows 1, 2, and 4 C5
- and 3 C5 + sam-
- + pIes untreated with mercaptoethanol; 6, 7, and 8 C5
and 6 C5
samplestreated
with mercaptoethanol. The lack of mercaptoethanol in samples 1 through 4 shows
the illterference of storage bands. Line B shows the same samples as line A but
inserted directly into acrylamide without starch at the origin.
205
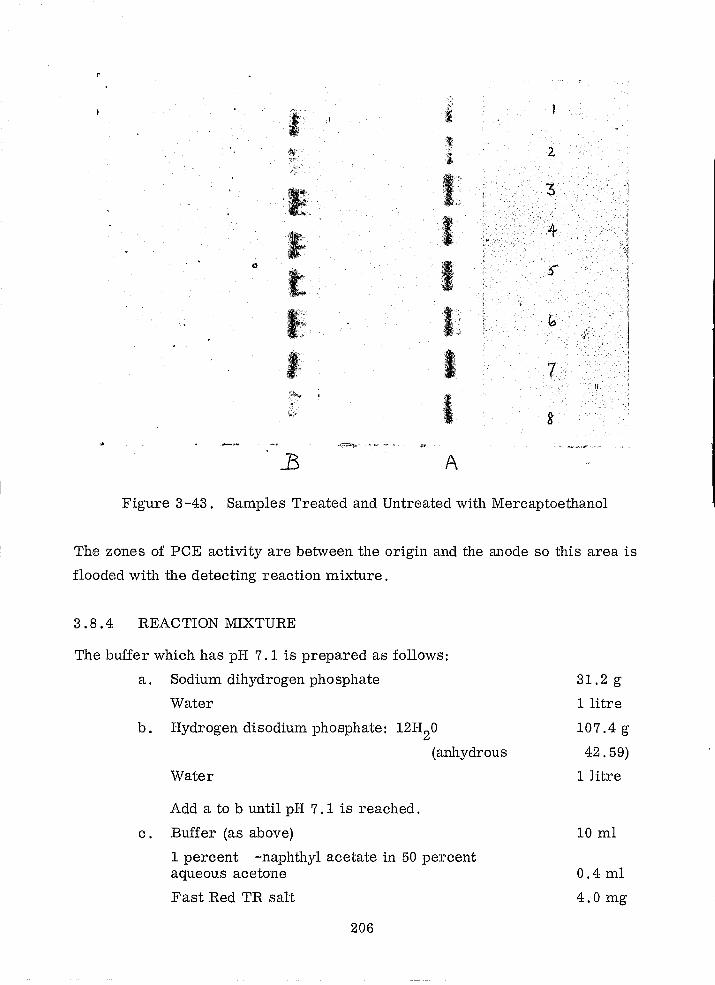
j' !I I ~ I'Jf 2 ,'I J
It' I;, '3 . ~ :
I 4-1~
, '
0 6" t I ? " ,
~i
I: Ij b ,~ t,~
I I , ' 7
!~?
, ~
.t~~ ,.. ~, ... ~ . .,. ~
.B A
Figure 3-43. Samples Treated and Untreated with Mercaptoethanol
The zones of PCE activity are between the origin and the anode so this area is
flooded with the detecting reaction mixture.
3.8.4 REACTION MIXTURE
The buffer which has pH 7.1 is prepared as follows:
a. Sodium dihydrogen phosphate
Water
b. Hydrogen disodium phosphate: 12H20
(anhydrous
Water
Add a to b until pH 7.1 is reached.
c. Buffer (as above)
1 percent -naphthyl acetate in 50 percent aqueous acetone
Fast Red TR salt
206
31.2g
1 litre
107.4 g
42.59)
1 litre
10 ml
0.4 ml
4.0 mg
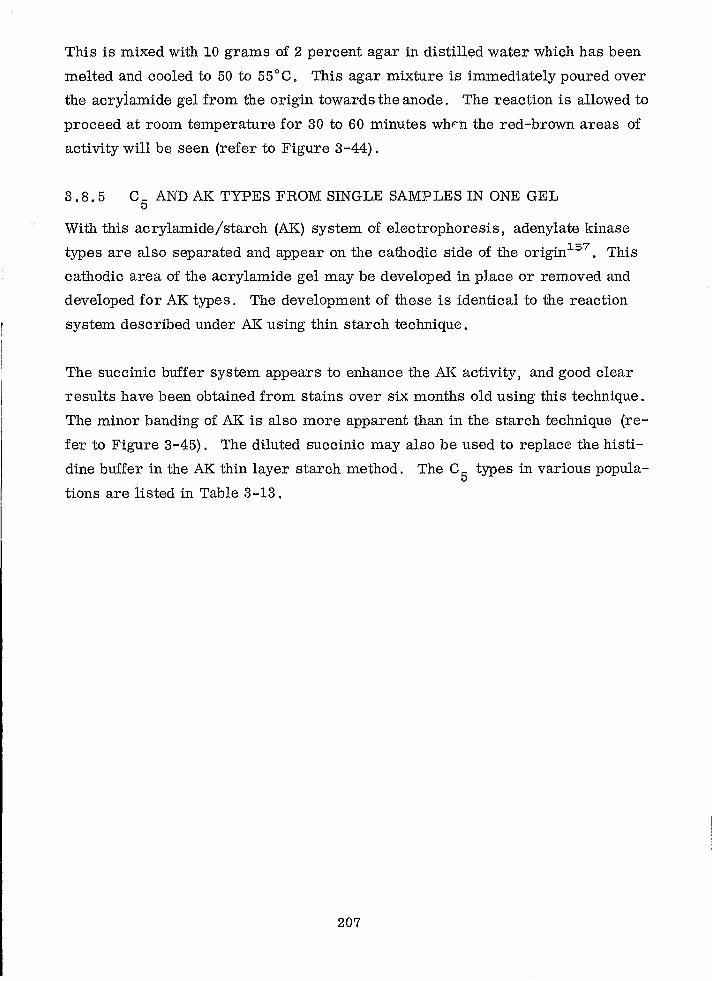
This is mixed with 10 grams of 2 percent agar in distilled water which has been
melted and cooled to 50 to 55°C. This agar mixture is immediately poured over
the acryiamide gel from the origin towards the anode. The reaction is allowed to
proceed at room temperature for 30 to 60 minutes whrn the red-brown areas of
activity will be seen (refer to Figure 3-44) .
3.8.5 C5
AND AK TYPES FROM SINGLE SAMPLES IN ONE GEL
With this acrylamide/starch (AK) system of electrophoresis, adenylate kinase
types are also separated and appear on the cathodic side of the origin1.57. This
cathodic area of the acrylamide gel may be developed in place or removed and
developed for AK types. The development of these is identical to the reaction
system described under AK using thin starch technique.
The succinic buffer system appears to enhance the AK activity, and good clear
results have been obtained from stains over six months old using this technique.
The minor banding of AK is also more apparent than in the starch technique (re
fer to Figure 3-45). The diluted succinic may also be used to replace the histi
dine buffer in the AK thin layer starch method. The C5
types in various popula
tions are listed in Table 3-13.
207
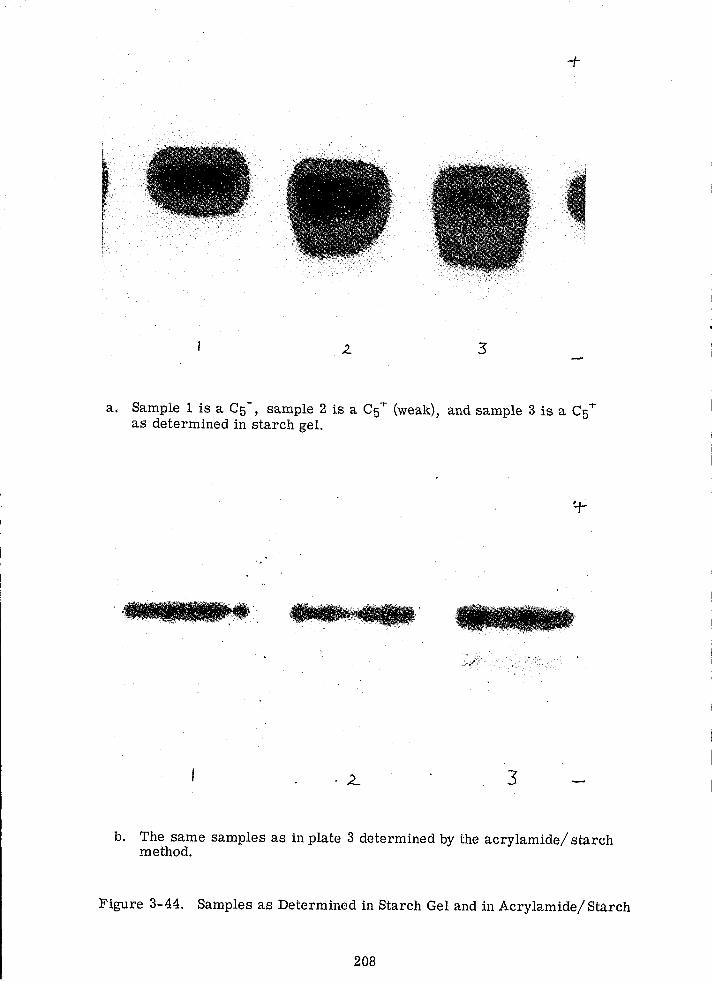
t I
3
a. Sample 1 is a C5 -, sample 2 is a C51"" (weak), and sample 3 is a C5-r as determined in starch gel.
.2.. 3
b. The same samples as in plate 3 determined by the acrylamide/ starch method.
Figure 3-44. Samples as Determined in Starch Gel and in Acrylamide/ Starch
208
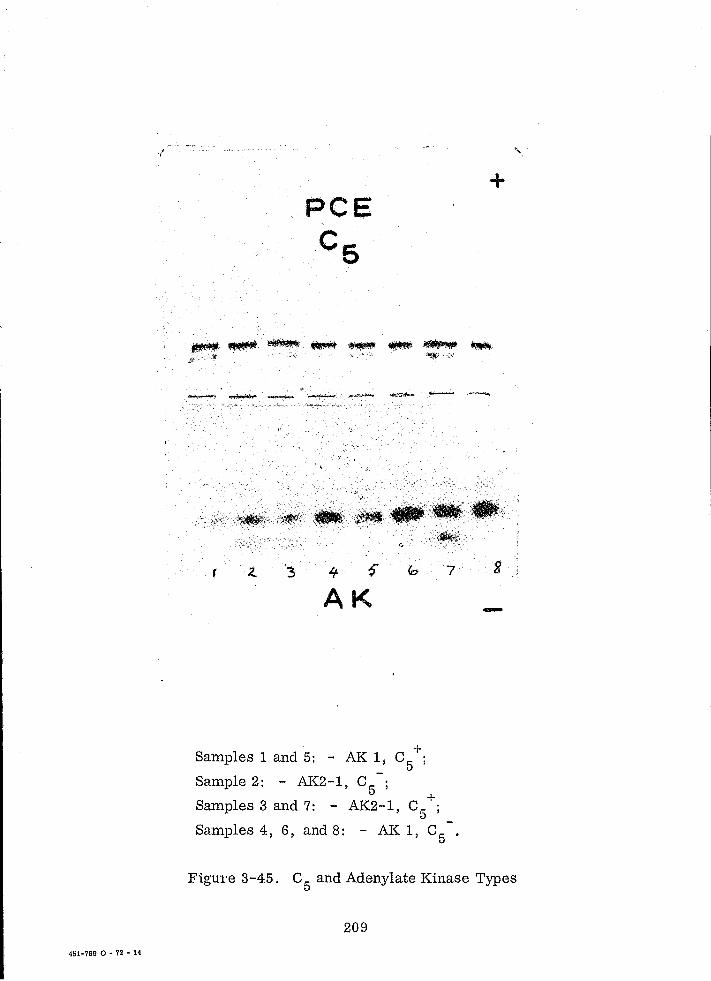
l
451-769 0 - 72 - 14
+
~ .... ~.--~~.~~ <$ .,. " - ;~
. + Samples 1 and 5: - AK 1 C . , 5' Sample 2· - AK2-1 C -. . , 5'
+ Samples 3 and 7: - AK2-1, Cr.:: ; ;)
7
Samples 4, 6, and 8: - AK 1, C5 -.
-
Figure 3-45. C5
and Adenylate Kinase Types
209
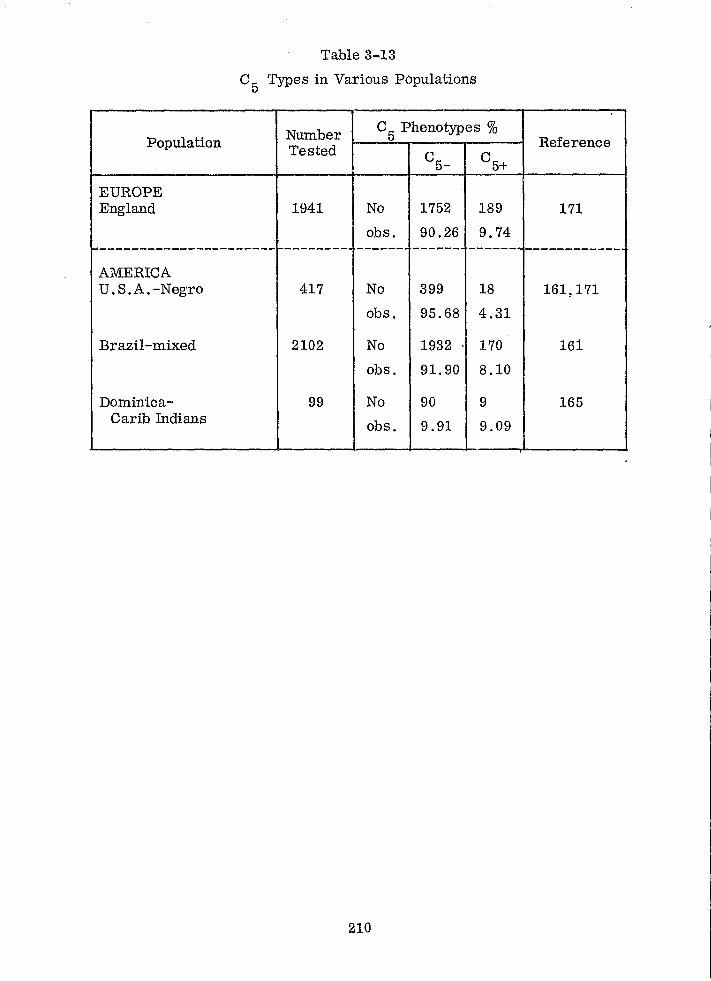
Table 3-13
C 5 Types in Various Populations
Population Number C 5 Phenotypes % Reference Tested C
5_ C5+
EUROPE England 1941 No 1752 189 171
obs. 90.26 9.74 ~---------------------- -------- ------ ------ ------~ ------------
AMERICA U.S.A.-Negro 417 No 399 18 161,171
obs. 95.68 4.31
Brazil-mixed 2102 No 1932 170 161
obs. 91.90 8.10
Dominica- 99 No 90 9 165 Carib Indians obs. 9.91 9.09
210
SECTION 4
POL YMORPHIC PROTEIN SYSTEMS
4.1 HAPTOGLOBIN
4.1.1 INTRODUCTION
Haptoglobin is an alpha globulin that binds free haemoglobin when it is released 2
into the serum by red cell breakdown. The haemoglobin is removed from the
serum after this transport as a haemoglobin/haptoglobin complex.
More has been written over the years about haptoglobin than any other single
serum protein and no attempt is made to summarize all the available information
here. The following references will provide an excellent background and detailed
information about haptoglobin: Kirk 177, Smithies 58, Allison 174
, and their bibliog
raphies. There are also many other treatises on haptoglobins.
4.1.2 POLYMORPHISM
Haptoglobin was the first of the serum proteins to be described as a polymorphic
system under genetic control. Smithies 180 , in 1955, described the electro
phoresis of serum proteins in hydrolysed starch gel and showed the three main
types of Hp. There are shown in Figure 4-1.
These threG Hp types were shown to be two alleles at a single locus. These
were denominated Hp 1 and Hp 2, giving the homozygotes Hp 1-1 and Hp 2-2 and
the heterozygote Hp 2-1. The quantitative expression of these genes also varies
markedly. The Hp 1-1 types have, on average, the highest concentration of
haptoglobin, and Hp 2-2 types the lowest. The number of multiple bands shown
by the types Hp 2-1 andHp 2-2 can vary considerably, particularly in the hetero
zygote. This has been described in detail as variable gene expression by Sutton
d K 181,199 an arp .
211
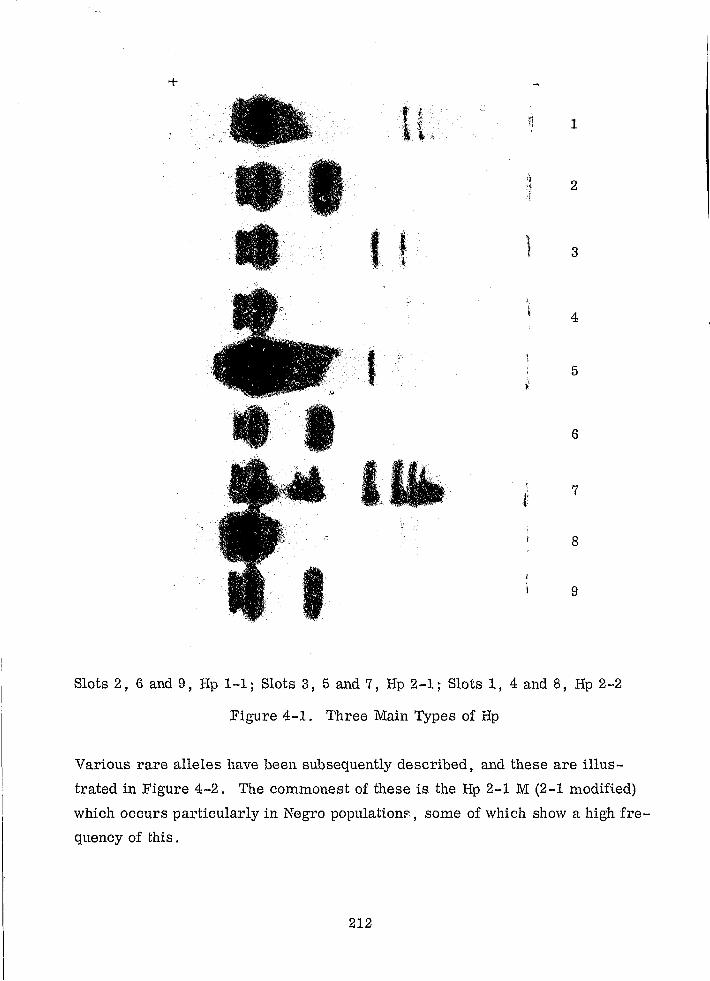
+ , . 1,. fl 1 I :~.
. ~ <
'I 2 ,'} ,1
, t $
3
l
I 4
I 5 ~:
6 , f
7 " ."
8
I H
Slots 2, 6 and 9, Hp 1-1; Slots 3, 5 and 7, Hp 2-1; Slots 1, 4 and 8, Hp 2-2
Figure 4-1. Three Main Types of Hp
Various rare alleles have been subsequently described, and these are illus
trated in Figure 4-2. The commonest of these is the Hp 2-1 M (2-1 modified)
which occurs particularly in Negro population~. some of which show a high fre
quency of this.
212
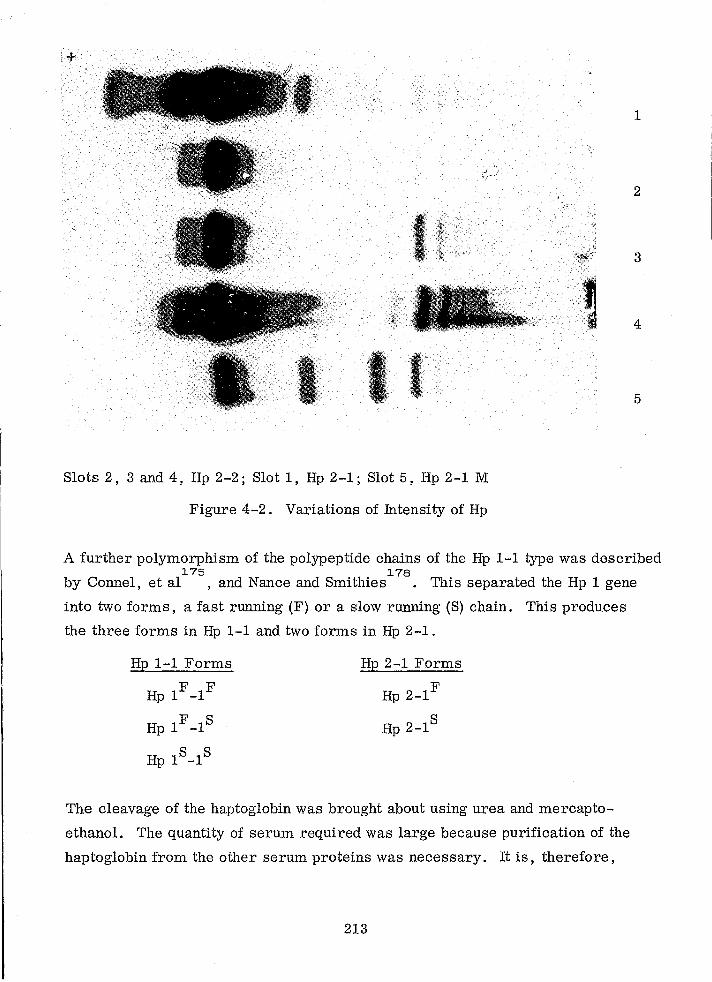
-- -------------
1
2
·1···
' .. '····.
' i:--
3
4
5
Slots 2, 3 and 4, Hp 2-2; Slot 1, Hp 2-1; Slot 5, Hp 2-1 M
Figure 4-2. Variations of Intensity of Hp
A further polymorphism of the polypeptide chains of the Hp 1-1 type was described 175 178
by Connel, et al ,and Nance and Smithies . This separated the Hp 1 gene
into two forms, a fast running (F) or a slow running (S) chain. This produces
the three forms in Hp 1-1 and two forms in Hp 2-1.
Hp 1-1 Forms
Hp IF _IF
H I F 1S P - ....
Hp IS _IS
Hp 2-1 Forms
F Hp 2-1
S Hp 2-1
The cleavage of the haptoglobin was brought about using urea and mercapto
ethanol. The quantity of serum required was large because purification of the
haptoglobin from the other serum proteins was necessary. It is, therefore,
213
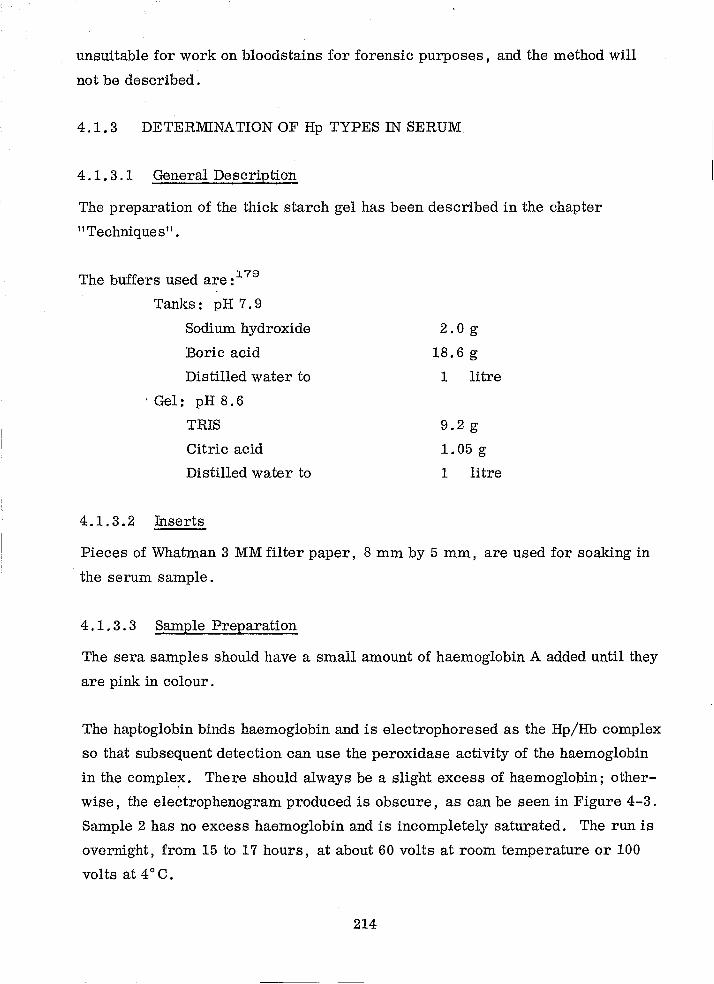
unsuitable for work on bloodstains for forensic purposes, and the method will
not be described.
4.1.3 DETERMINATION OF Hp TYPES IN SERUM,
4.1.3.1 General Descripti~
The preparation of the thick starch gel has been described in the chapter
"Techniques" .
The buffers used are: 179
Tanks: pH 7.9
Sodium hydroxide
Boric acid
Distilled water to
. Gel: pH 8.6
TRIS
Citric acid
Distilled water to
4.1. 3 . 2 Inserts
2.0 g
18.6 g
1 litre
9.2 g
1.05 g
1 litre
Pieces of Whatman 3 MM filter paper, 8 mm by 5 mm, are used for soalting in
the serum sample.
4. 1 .3. 3 Sample Preparation
The sera samples should have a small amount of haemoglobin A added until they
are pink in colour.
The haptoglobin binds haemoglobin and is electrophoresed as the Hp/Hb complex
so that subsequent detection can use the peroxidase activity of the haemoglobin
in the comple?C. There should always be a slight excess of haemoglobin; other
wise, the electrophenogram pr.oduced is obscure, as can be seen in Figure 4-3.
Sample 2 has no excess haemoglobin and is incompletely saturated. The run is
overnight, from 15 to 17 hours, at about 60 volts at room temperature or 100
volts at 4°C.
214
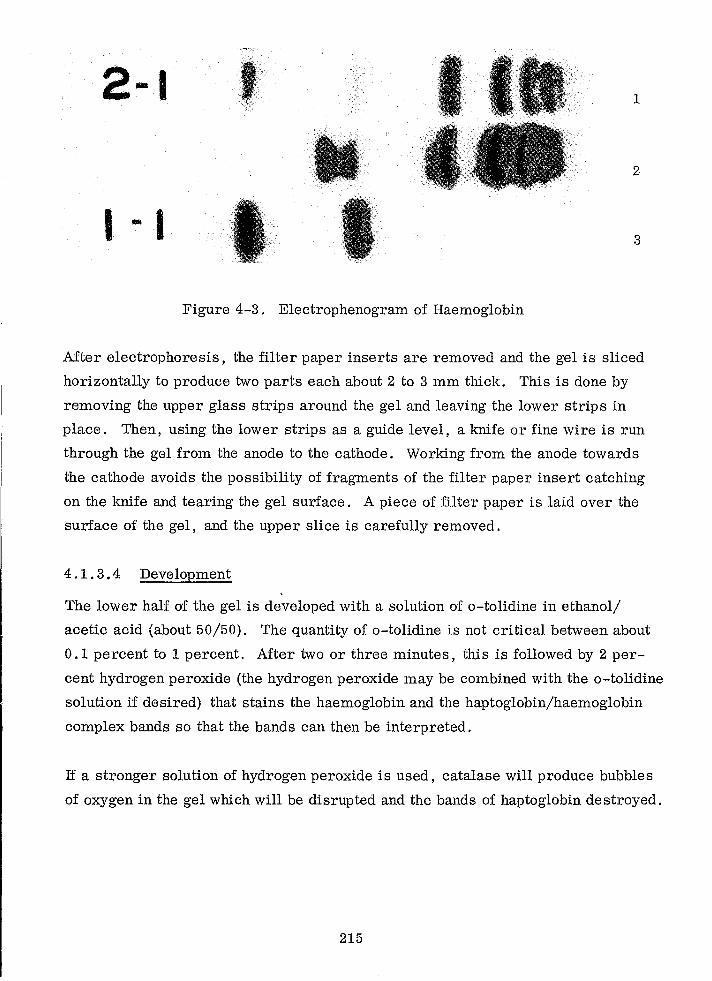
2-1 1
2
3
Figure 4-3. Electrophenograrn of Haemoglobin
After electrophoresis, the filter paper inserts are removed and the gel is sliced
horizontally to produce two parts each about 2 to 3 mm thick. This is done by
removing the upper glass strips around the gel and leaving the lower strips in
place. Then, using the lower strips as a guide level, a knife or fine wire is run
through the gel from the anode to the cathode. Working from the anode towards
the cathode avoids the possibility of fragments of the filter paper insert catching
on the knife and tearing the gel surface. A piece of filter paper is laid over the
surface of the gel, and the upper slice is carefully removed.
4. 1. 3.4 Development
The lower half of the gel is developed with a solution of o-tolidine in ethanol/
acetic acid (about 50/50). The quantity of o-tolidine is not critical between about
0.1 percent to 1 percent. After two or three minutes, this is followed by 2 per
cent hydrogen peroxide (the hydrogen peroxide may be combined with the o-tolidine
solution if desired) that stains the haemoglobin and the haptoglobin/haemoglobin
complex bands so that the bands can then be interpreted.
If a stronger solution of hydrogen peroxide is used, catalase will produce bubbles
of oxygen in the gel which will be disrupted and the bands of haptoglobin destroyed.
215
4.1.4 HAPTOGLOBIN TYPES IN BLOODSTAINS
4.1.4.1 General Description of Methods
The method used for serum samples has a very limited application to blood
stainsJ.45. Excess haemoglobin should be removed first, also the stain must be
very fresh, that is, less than three days old. The pattern obtained from sera is
lost when blood dries to a stain, but the relative mobility is retained for fast,
intermediate, and slow types of 1-1, 2-1, and 2-2, respectively; therefore, an
immuno-electrophoretic method was developed for their detection in stain ma
terial J. 76• Thi s method has been subsequently improved and is described below.
Very recently, 197042 , a different method has been developed which used the
same or slightly more material, but the results from stains are considerably
better than those using the immuno-electrophoretic technique. It is an expensive
technique requiring specialized equipment which may not be available; therefore,
both techniques are described.
4.1.4.2 hnmuno-electrophoretic Method
4. 1.4.2.1 Equipment and Buffers
Electrophoresis is performed on microscope slides using the Shandon immuno
electrophoresis equipment. Buffers as indicated below were used:
a. Tanks: pH 8.6
Sodium barbitone 8.76 g
Barbituric acid 1.38 g
Calcium lactate 0.38 g
Distilled water to 1 litre
b. Gel: pH 8.6
Sodium barbitone 7.00 g
Barbituric acid 1.10 g
Calcium lactate 1.00 g
Distilled water to 1 litre
216
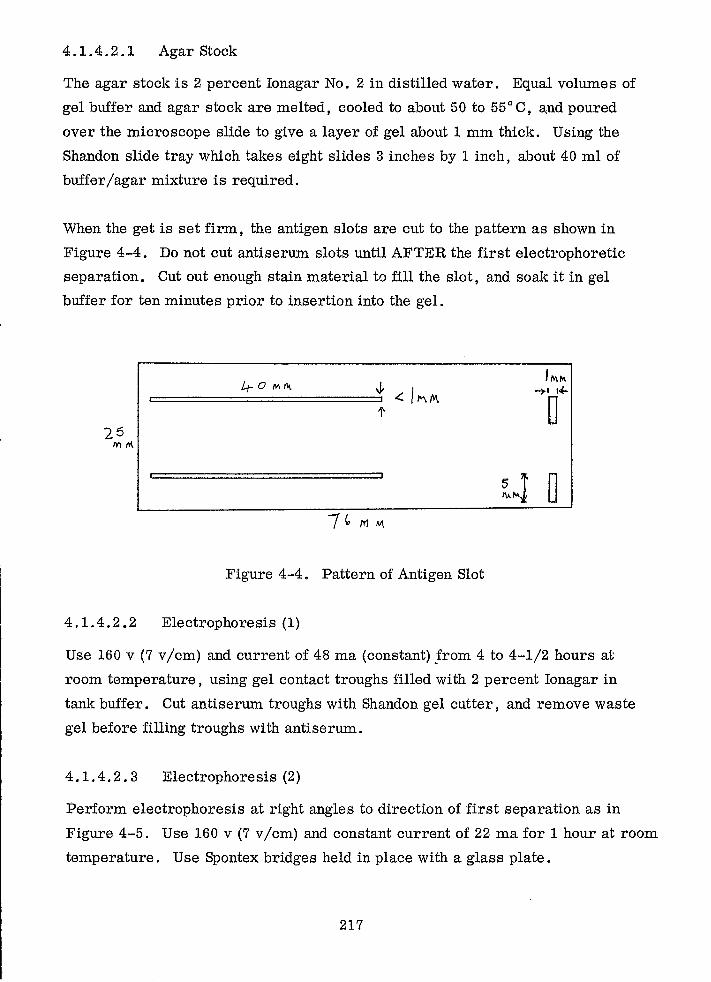
4 . 1. 4 . 2 . 1 Agar Stock
The agar stock is 2 percent Ionagar No.2 in distilled water. Equal volumes of
gel buffer and agar stock are melted, cooled to about 50 to 55 0 C, and poured
over the microscope slide to give a layer of gel about 1 mm thick. Using the
Shandon slide tray which takes eight slides 3 inches by 1 inch, about 40 ml of
buffer lagar mixture is required.
When the get is set firm, the antigen slots are cut to the pattern as shown in
Figure 4-4. Do not cut antiserum slots until AFTER the first electrophoretic
separation. Cut out enough stain material to fill the slot, and soak it in gel
buffer for ten minutes prior to insertion into the gel.
f-rOM!\ ~ ====================~I <IMM
t
Figure 4-4. Pattern of Antigen Slot
4.1.4.2.2 Electrophoresis (1)
Use 160 v (7 v Icm) and current of 48 ma (constant) .from 4 to 4-1/2 hours at
room temperature, using gel contact troughs filled with 2 percent Ionagar in
tank buffer. Cut antiserum troughs with Shandon gel cutter, and remove waste
gel before filling troughs with antiserum.
4. 1. 4 . 2 . 3 Electrophore sis (2)
Perform electrophoresis at right angles to direction of first separation as in
Figure 4-5. Use 160 v (7 v Icm) and constant current of 22 ma for 1 hour at room
temperature. Use Spontex bridge s held in place with a glass plate.
217
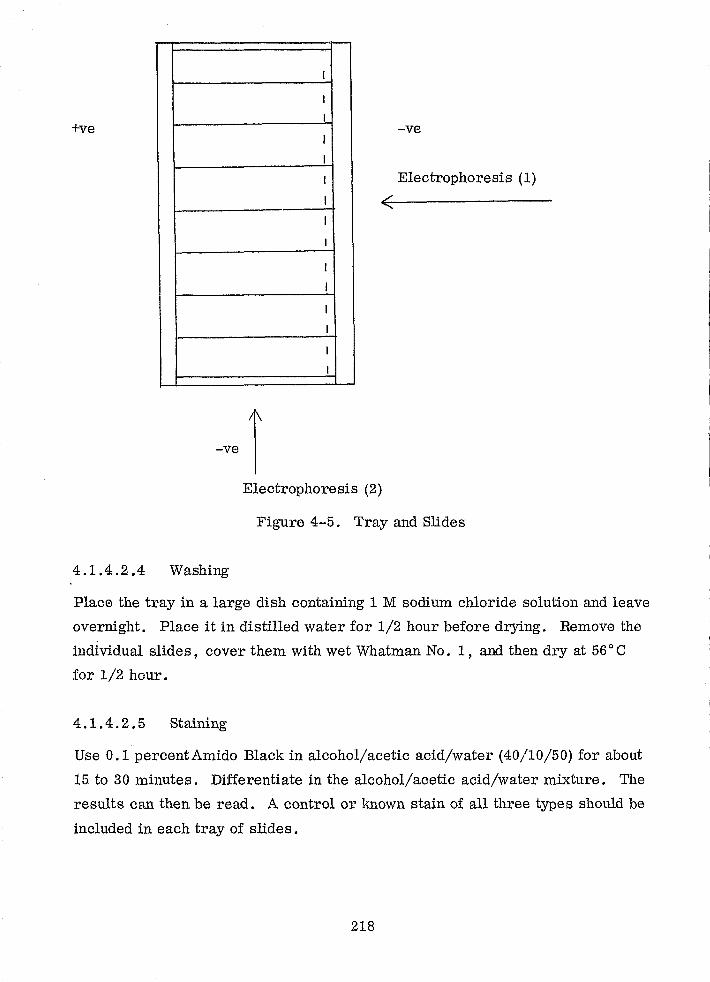
I
I
I +ve -ve
I
I
I Electrophoresis (1)
I < I
I
I
I
I
I
I
I
Electrophoresis (2)
Figure 4-5. Tray and Slides
4.1.4.2.4 VVashing
Place the tray in a large dish containing 1 M sodium chloride solution and leave
overnight. Place it in distilled water for 1/2 hour before drying. Remove the
individual slides, cover them with wet Whatman No.1, and then dry at 56°0
for 1/2 hour.
4 . 1. 4 . 2 . 5 Staining
Use 0.1 percentAmido Black in alcohol/acetic acid/water (40/10/50) for about
15 to 30 minutes. Differentiate in the alcohol/acetic acid/water mixture. The
results can then be read. A control or known stain of all three types should be
included in each tray of slides.
218
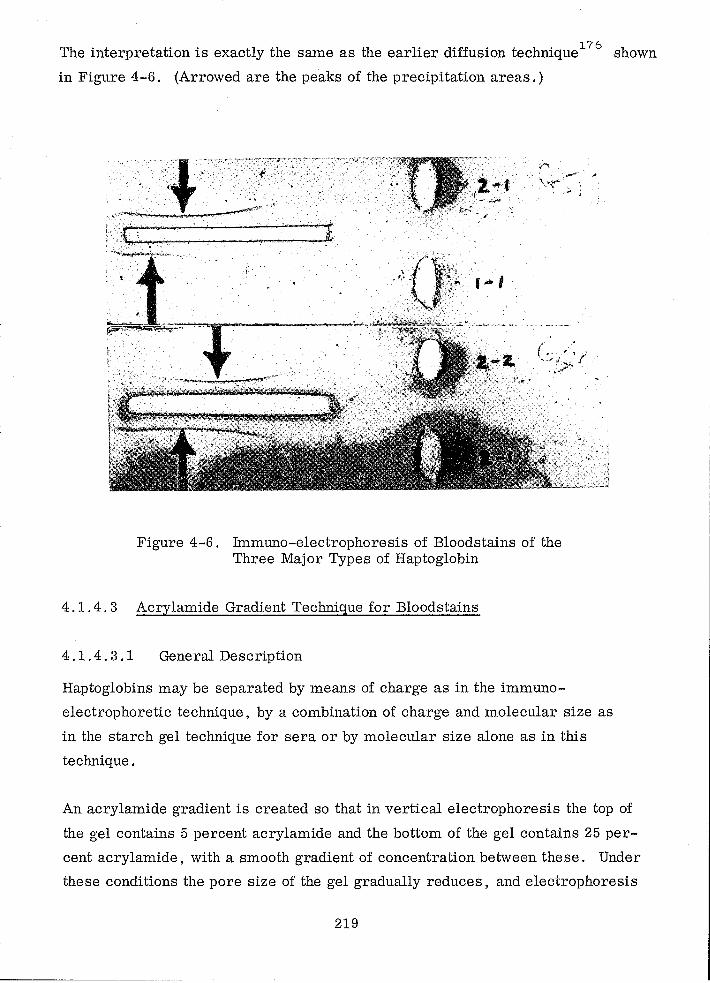
The interpretation is exactly the same as the earlier diffusion technique). 76 shown
in Figure 4-6. (Arrowed are the peaks of the precipitation areas. )
I" > , . "~-' .. , .... \ .~~ , .. 0,'.
n
\ • "~~_, ___ ;;;,..... __ t ..... .,..:~,~!I'If''?·:.·~'}~
Figure 4-6. Immuno-electrophoresis of Bloodstains of the Three Major Types of Haptoglobin
4. 1 .4. 3 Acry lamide Gradlent Technique for Bloodstains
4.1.4.3.1 General Description
-# ;
Haptoglobins may be separated by means of charge as in the immuno
electrophoretic technique, by a combination of charge and molecular size as
in the starch gel technique for sera or by molecular size alone as in this
technique.
An acrylamide gradient is created so that in vertical electrophoresis the top of
the gel contains 5 percent acrylamide and the bottom of the gel contains 25 per
cent acrylamide, with a smooth gradient of concentration between these. Under
these conditions the pore size of the gel gradually reduces, and electrophoresis
219
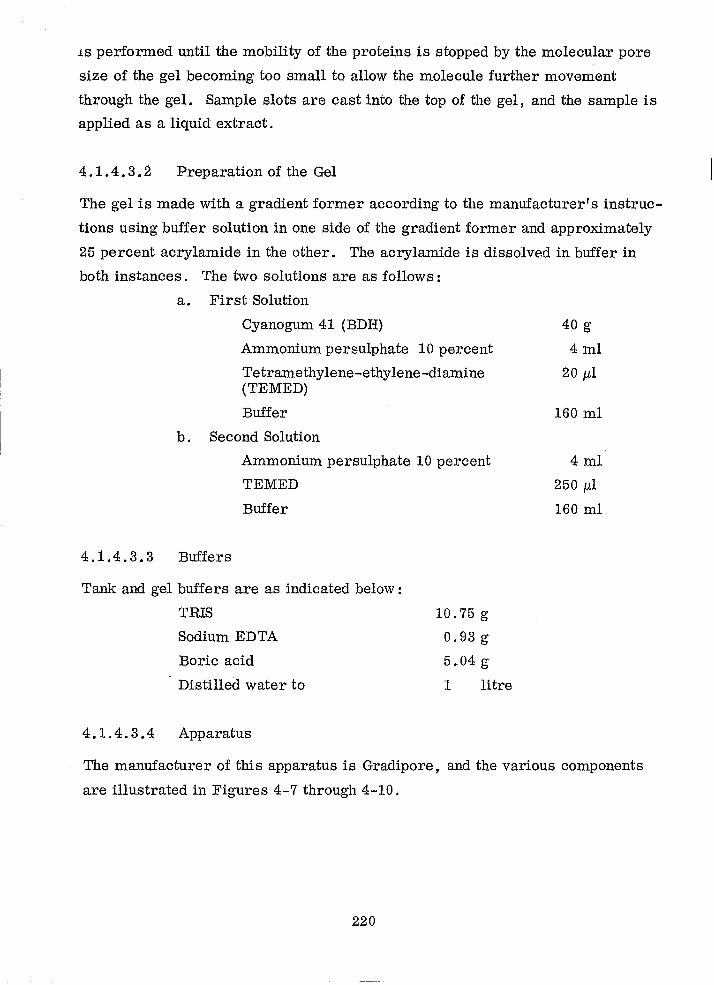
IS performed until the mobility of the proteins is stopped by the molecular pore
size of the gel becoming too small to allow the molecule further movement
through the gel. Sample slots are cast into the top of the gel, and the sample is
applied as a liquid extract.
4.1.4.3.2 Preparation of the Gel
The gel is made with a gradient former according to the manufacturer's instruc
tions using buffer solution in one side of the gradient former and approximately
25 percent acrylamide in the other. The acrylamide is dissolved in buffer in
both instances. The two solutions are as follows:
a. First Solution
Cyanogum 41 (BDH)
Ammonium persulphate 10 percent
Tetramethy lene-ethy lene -diamine (TEMED)
Buffer
b. Second Solution
Ammonium persulphate 10 percent
TEMED
Buffer
4.1. 4 • 3 . 3 Buffers
Tank and gel buffers are as indicated below:
TRIS
Sodium EDTA
Boric acid
Distilled water to
4.1.4.3.4 Apparatus
10.75 g
0.93 g
5.04 g
1 litre
40 g
4 ml
20 III
160 ml
4 ml
250 III
160 ml
The manufacturer of this apparatus is Gradipore, and the various components
are illustrated in Figures 4-7 through 4-10.
220
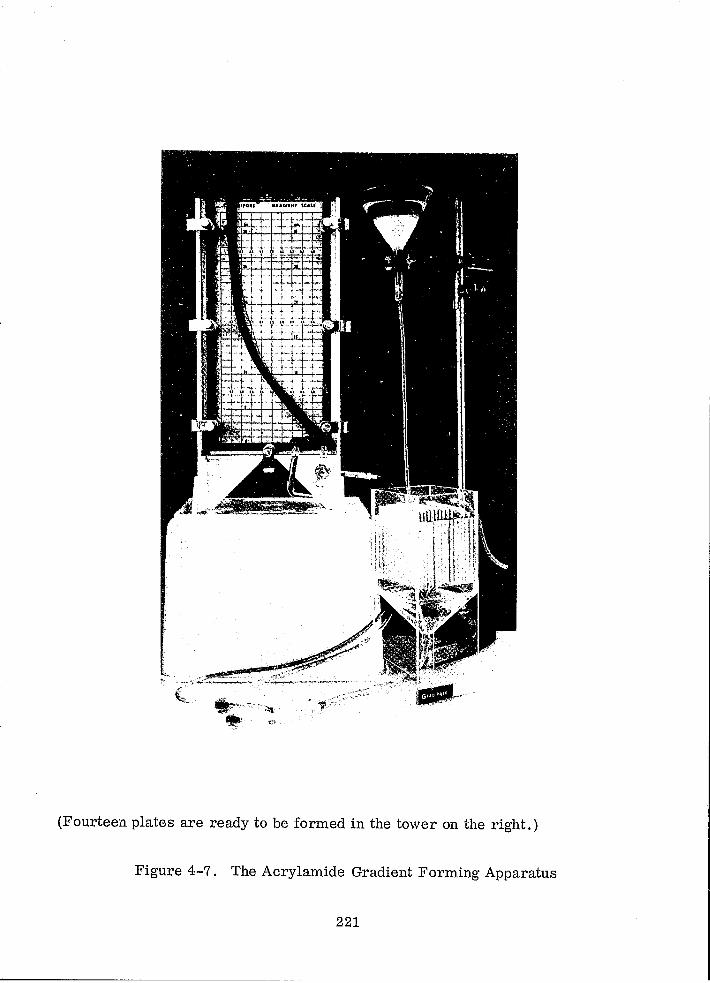
(Fourteen plates are ready to be formed in the tower on the right.)
Figure 4-7. The Acrylamide Gradient Forming Apparatus
221
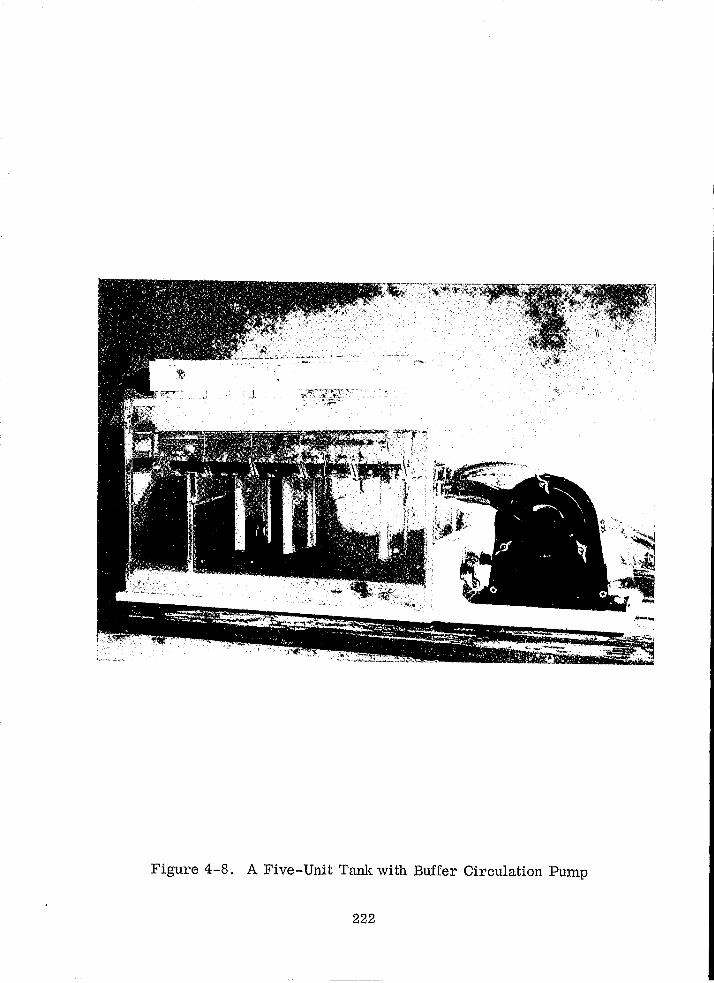
Figure 4-8. A Five-Unit Tank with Buffer Circulation Pump
222
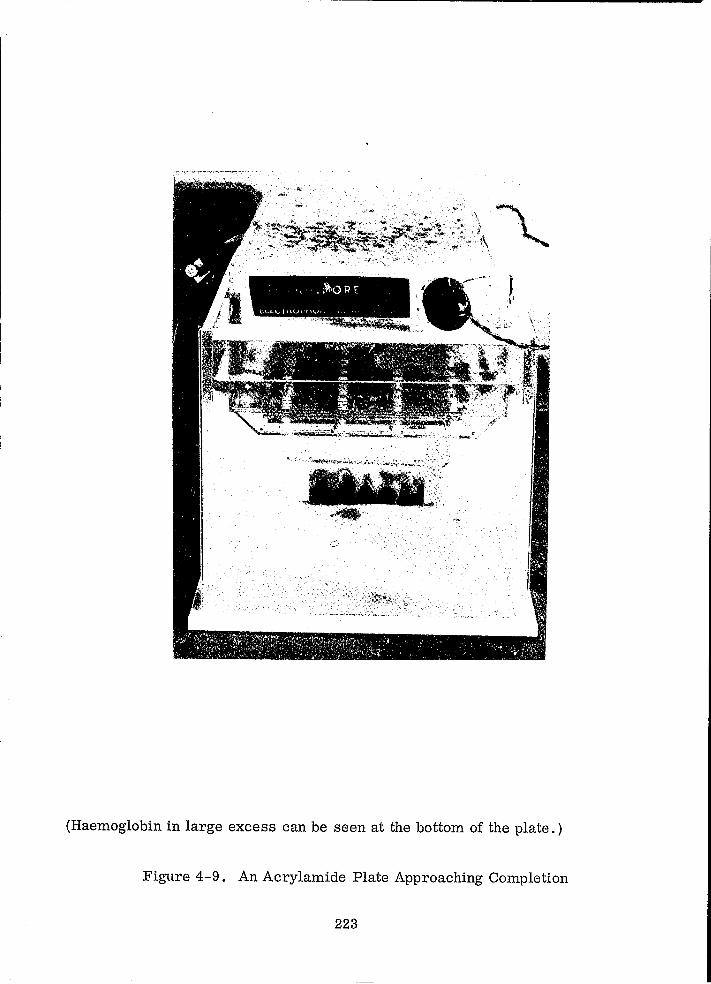
" .~~ORr
LL.L\;.., I '~Vt 'H...... ' ......
Ii I
\ \
(Haemoglobin in large excess can be seen at the bottom of the plate.)
Figure 4-9. An Acrylamide Plate Approaching Completion
223
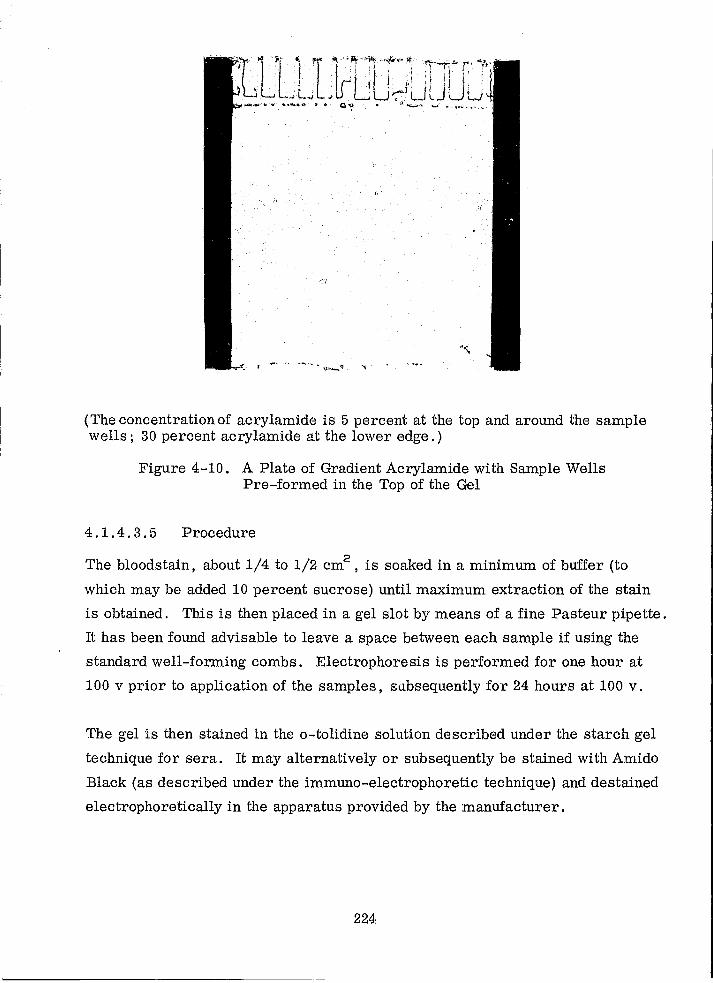
(The concentration of acry lamide is 5 percent at the top and around the sample wells; 30 percent acrylamide at the lower edge.)
Figure 4-10. A Plate of Gradient Acrylarnide with Sample Wells Pre-formed in the Top of the Gel
4.1.4.3.5 Procedure
The bloodstain, about 1/4 to 1/2 cm2, is soaked in a minimum of buffer (to
which may be added 10 percent sucrose) until ma.."dmum extraction of the stain
is obtained. This is then placed in a gel slot by means of a fine Pasteur pipette.
It has been found advisable to leave a space between each sample if using the
standard well-forming combs. Electrophoresis is performed for one hour at
100 v prior to application of the samples, subsequently for 24 hours at 100 v.
The gel is then stained in the o-tolidine solution described under the starch gel
technique for sera. It may alternatively or subsequently be stained with Amido
Black (as described under the immuno-electrophoretic technique) and de stained
electrophoretically in the apparatus provided by the manufacturer.
224
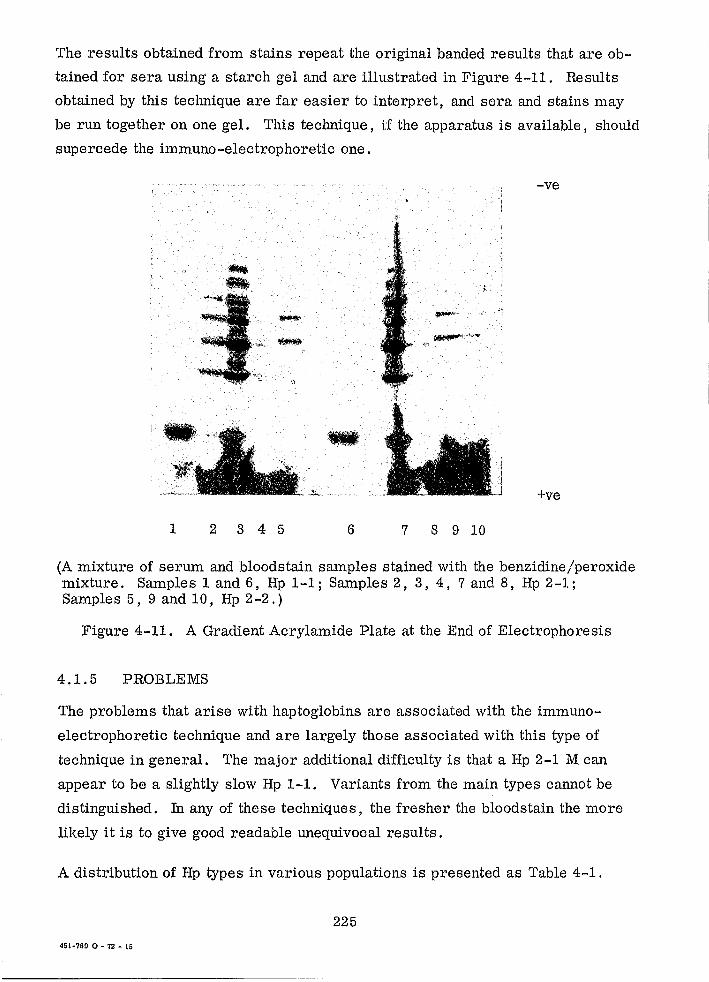
The results obtained from stains repeat the original banded results that are ob
tained for sera using a starch gel and are illustrated in Figure 4-11. Results
obtained by this technique are far easier to interpret, and sera and stains may
be run together on one gel. This technique, i.f the apparatus is available, should
supercede the immuno-electrophoretic one.
-ve
+ve
1 2 3 4 5 6 7 8 9 10
(A mixture of serum and bloodstain samples stained with the benzidine/peroxide mixture. Samples 1 and 6, Hp 1-1; Samples 2, 3, 4, 7 and 8, Hp 2-1; Samples 5, 9 and 10, Hp 2-2.)
Figure 4-11. A Gradient Acrylamide Plate at the End of Electrophoresis
4.1.5 PROBLEMS
The problems that arise with haptoglobins are associated with the immuno
electrophoretic technique and are largely those associated with this type of
technique in general. The major additional difficulty is that a Hp 2-1 M can
appear to be a slightly slow Hp 1-1. Variants from the main types cannot be
distinguished. In any of these techniques, the fresher the bloodstain the more
likely it is to give good readable unequivocal results.
A distribution of Hp types in various populations is presented as Table 4-1.
225
451-760 0 - 72 - 15
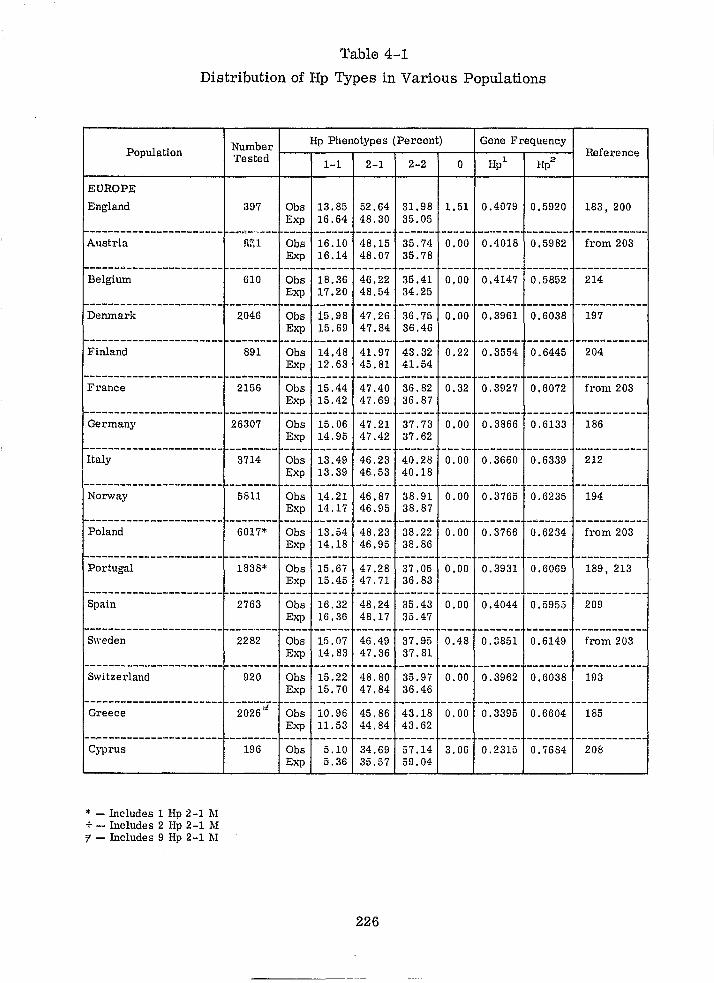
Table 4-1
Distribution of Hp Types in Various Populations
Population
EUROPE
England
----------------------Austria
----------------------Belgium
----------------------Denmark
-----------------------Finland
-----------------------France
-----~-----------------Germany
----------------------Italy
--------------_ .. _------Norway
----------------------Poland
----------------------Portugal
-----------------------Spain
-----------------------Sweden
---------- ... _-------_ .... _-Switzerland
-----------------------Greece
-~--------------------Cyprus
* - Includes 1 Hp 2-1 l\I + - Includes 2 Hp 2-1 M T - Includes 9 Hp 2-1 l\I
Number Tested
397 Obs Exp
-_ .. 1-·· .... -- ---_. 1l~1 Obs
Exp -------- ----
610 Obs Exp
-------- ----2046 Obs
Exp -------- ----
891 Obs Exp
-------- ----2156 Obs
Exp -------- ----26307 Obs
Exp -------- ----
3714 Obs Exp
-------- ----5811 Obs
Exp -------- ----
6017* Obs Exp
-------- ----1838* Obs
Exp -------- ----
2763 Obs Exp
---_ ... --- ----2282 Obs
Exp -------- ----
920 Obs Exp
-2'026-;;- ----Obs Exp
-------- ----196 Obs
Exp
Hp Phenotypes (Percent) Gene Frequency
1-1 2-1 2-2 0 Hpl Hp 2
13.85 52.64 31.98 1.51 0.4079 0.5920 16.64 48.30 35.05 ------ ------ ------ ----- .... - .... _--- -------16.10 48.15 35.74 0.00 0.4018 0.5982 16.14 48.07 35.78 ------ ------ ------ ----- ------- -------18.36 46.22 35.41 0.00 0.414,7 0.5852 17.20 48.54 34.25
- .. ---- ------ ------ ----- ------- -------15.98 47.26 36.75 0.00 0.3961 0.6038 15.69 47.84 36.46 ------ ------ ------ ----- ------- -------14.48 41. 97 43.32 0.22 0.3554 0,6445 12.63 45.81 41.54 ------ ------ ------ ----- ------- -------15.44 47.40 36.82 0.32 0.3927 0.6072 15.42 47.69 36.87 ------ ------ ------ ----- ------- -------15.06 47.21 37.73 0.00 0.3866 0.6133 14.95 47.42 37.62 ------ ------ ------ --- .. - ------- -------13.49 46.23 40.2B 0.00 0.3660 0.6339 13.39 46.53 40.18 ------ ------ ------ ----- ----_ ... - -------14.21 46.87 38.91 0.00 0.3765 0.6235 14.17 46.95 38.87 ------ ------ ------ ----- ------- -------13.54 48.23 38.22 0.00 0.3766 0.6234 14.18 46.95 38.86 ------ ------ ------ ----- ------- -------15.67 47.28 37.05 0.00 0.3931 0.6069 15.45 47.71 36.83 ------ ------ ------ ----- ------- -------16.32 48.24 35.43 0.00 0.4044 0.5955 16.36 48.17 35.47 ----_ ... ------ ------ ----- ------- -------15.07 46.49 37.95 0.48 0.0851 0.6149 14.83 47.36 37.81 ------ ------ ------ ----- ------- -------15.22 48.80 35.97 0.00 0.3962 0.6038 15.70 47.84 36.46 ------ -_ ... _-- ------ ----- ------- -------10.96 45.86 43.18 0.00 0.3395 0.6604 11.53 44.84 43.62 ------ ------ ------ ----- ------- -------
5.10 34.69 57.14 3.06 0.2315 0.7684 5.36 35.57 59.04
226
Reference
183, 200
------------from 203
------------214
------------197
------------204
-----------from 203
------------186
---------... _-212
------------194
------------from 203
------------189, 213
-----------209
-----------from 203
-----------193
-----------185
-----------208
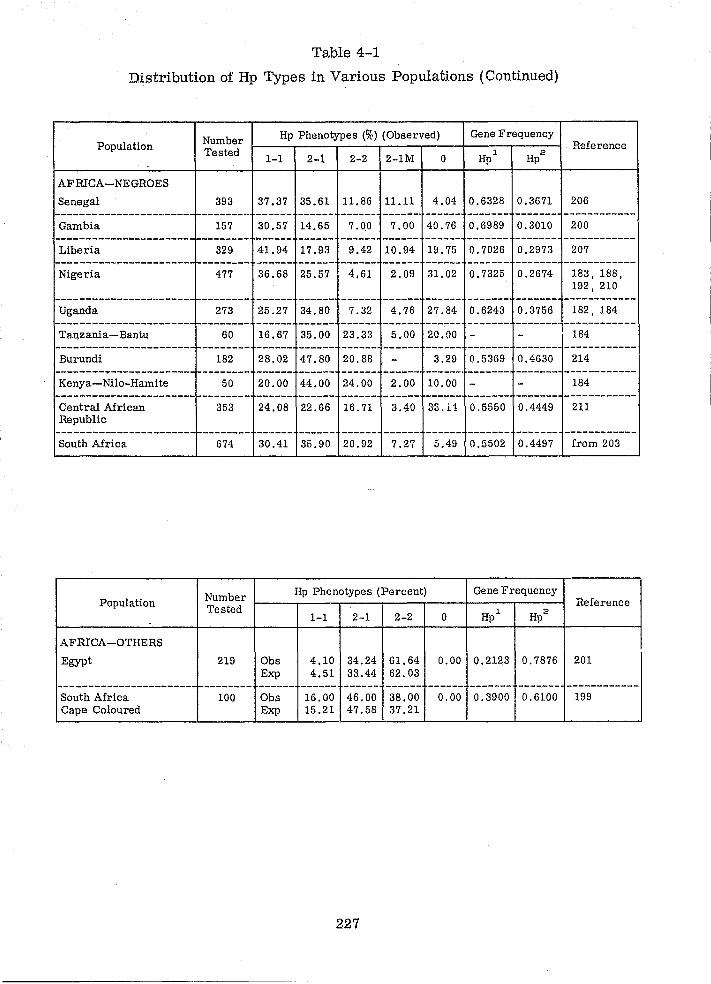
Table 4-1
Distribution of Hp Types in Various Populations (Continued)
Population
AFRICA-NEGROES
Senegal
Gambia
Liberia
Nigeria
Uganda
l'anzania-Bantu
Burundi
Kenya-Nilo-Hamite
Central African Republic
South Africa
Population
AFRICA-OTHERS
Egypt
----------------------South Africa Cape Coloured
Number ~ __ H~p~p_h_e_no_~~_es __ (%_c)~(_O_b_s_e_rVre_d_) __ ~Ge __ n_e_F_r~e_q_u_en_c_y~ Tested 1-1 2-1 2-2 2-1M 0 Hp 1 Hp 2 Reference
393
157
329
477
273
60
182
50
353
674
Number Tested
219
--------100
37.37 35.61 11.86 11.11 4.04 0.6328 0.3671 206
30.57 14.65 7.QO 7.00 40.76 0.6989 0.3010 200
41.94 17.93 9.42 10.94 19.75 0.7026 0.2973 207
36.68 25.57 4.61 2.09 31.02 0.7325 0.2674 183, 188, 192, 210
25.27 34.80 7.32 4.76 27.84 0.6243 0.3756 182,184
16.67 35.00 23.33 5.00 20.00 - 184
28.02 47.80 20.88 3.29 0.5369 0.4630 214
20.00 44.00 24.00 2.00 10.00 - 184
24.08 22.66 16.71 3.40 3S.i1 0.5550 0.4449 211
30.41 35.90 20.92 7.27 5.49 0.5502 0.4497 from 203
Hp Phenotypes (Percent) Gene Frequency Reference
1-1 2-1 2-2 0 Hpl Hp2
Obs 4.10 34.24 61.64 0.00 0.2123 0.7876 201 Exp 4.51 33.44 62.03 ------ ------ ------ ------ ------ ------- ----_._- ------------Obs 16.00 46.00 38.00 0.00 0.3900 0.6100 199 Exp 15.21 47.58 37.21
227
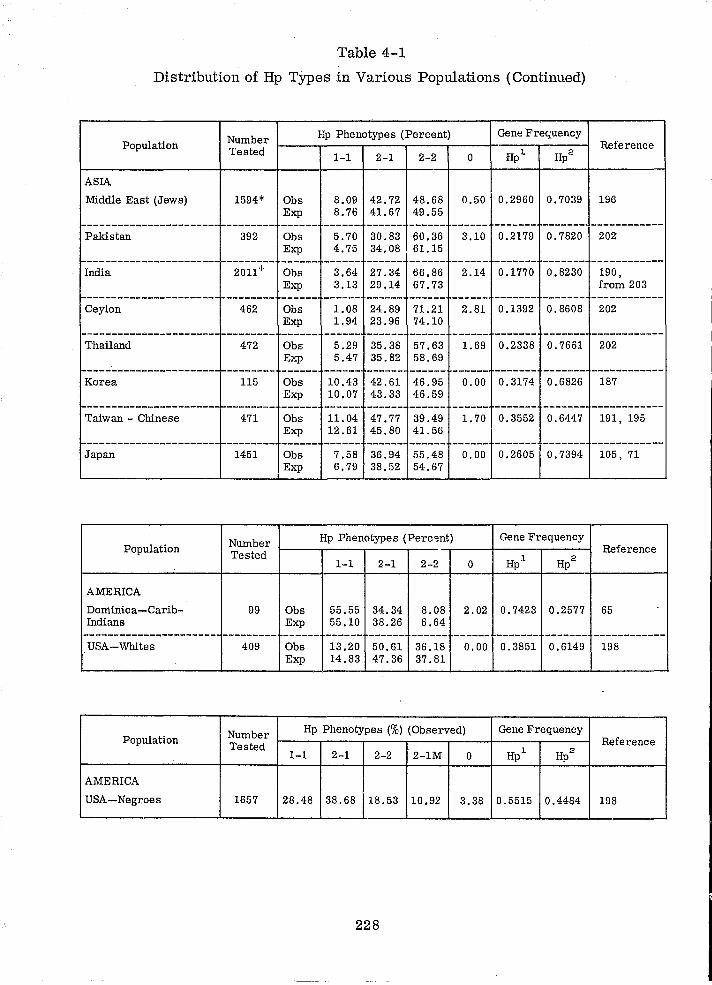
Table 4-1
Distribution of Hp Types in Various Populations (Continued)
Number rIp Phenotypes (Percent) Gene FreCiuency Population Tested Reference
1-1 2-1 2-2 0 Hp ~ Hp 2
ASIA
Middle East (Jews) 1594* Obs 8.09 42.72 48.68 0.50 0.2960 0.7039 196 Exp 8.76 41.67 49.55
---------------------- -------- ------ ------ ------ ------ ------ ------- ------- ------------Pakistan 392 Obs 5.70 30.83 60.36 3.10 0.2179 0.7820 202
Exp 4.75 34.08 61.15 ---------------------- -------- ------ ------ ------ ------ ------ ------- ------- ------------India 2011+ Obs 3.64 27.34 66.86 2.14 0.1770 0.8230 190,
Exp 3.13 29.14 67.73 from 203 ---------------------- -------- ------ ------ ------ ------ ------ ------- ------- ------------Ceylon 462 Obs 1.08 24.89 71.21 2.81 0.1392 0.8608 202
Exp 1.94 23.96 74.10 ---------------------- -------- ------ ------ ------ ------ ------ ------- ------- ------------Thailand 472 Obs 5.29 35.38 57.63 1.69 0.2338 0.7661 202
Exp 5.47 35.82 58.69 ---------------------- -------- ------ ------ ------ ------ ------ ------- ------- ------------Korea 115 Obs 10.43 42.61 46.95 0.00 0.3174 0.6826 187
Exp 10.07 43.33 46.59 ---------------------- -------- ------ ------ ------ ------ ------ ------- ------- ------- .... ----Taiwan - Chinese 471 Obs 11.04 47.77 39.49 1. 70 0.3552 0.6447 191, 195
Exp 12.61 45.80 41.56 ----------------------- -------- ------ ------ ------ ------ ------ ------- ------- ------------Japan 1451 Obs 7.58 36.94 55.48 0.00 0.2605 0.7394 105, 71
Exp 6.79 38.52 54.67
Number Hp Phenotypes (Perc<:lnt) Gene Frequency Population Tested Reference
1-1 2-1 2-2 0 Hp~ Hp2
AMERICA
Dominica-Carib- 99 Obs 55.55 34.34 8.08 2.02 0.7423 0.2577 65 Indians Exp 55.10 38.26 6.64 ---------------------- --------- ------ ------ ------ ------ ------ ------- ------- ------------USA-Whites 409 Obs 13.20 50.61 36.18 0.00 0.3851 0.6149 198
Exp 14.83 47.36 37.81
Number Hp Phenotypes (%) (Observed) Gene Frequency Population Tested Reference
1-1 2-1 2-2 2-1M 0 Hp~ Hp2
AMERICA
USA-Negroes 1657 28.48 38.68 18.53 10.92 3.38 0.5515 0.4484 198
228
4.2 HAEMOGLOBIN
4.2.1 INTRODUCTION
Variation in the human haemoglobin is generally known as a haemoglobinopathy
or Hb abnormality. There are, however, variants of adult haemoglobin which
are a normal part of development and, therefore, are not abnormali ties. These
are the embryonic and foetal haemoglobins. The foetal haemoglobin is more
likely to be encountered than the embryonic form and differs both in structure
and electrophoretic mobility from adult haemoglobin. Together with the other
variants of adult haemoglObin, these show that haemoglobin is polymorphic.
This fact enables us to differentiate not only between individuals but between
races.
Many treatises have been written on the structure of the haemoglobin molecule
by Perutz222 , Perutz and Lehmann223 and by other workers. No intent is made
to discuss this work here, but merely to provide a little background information.
For a full background on haemoglobin, suitable for the forensic scientist, the
reader is referred to "Man's Haemoglobins" by Lehmann and Huntsman22 0 .
Haemoglobin is synthesized in the protoplasm of the developing red cell and
consists of two pairs of polypeptide chains. These are known as alpha chains,
containing 141 amino acid residues and beta chains containing 146. The sequence
of these amino acid residues show mar!<:ed differences between the alpha and beta
chains, but their tertiary structure and the folding of the chains are very similar.
The histidine group of the chain is attached by a covalent bond to the iron atom,
and the haeme part of the molecule is between the loops of the polypeptide chain.
It has been reported by Lehmann and Huntsman220 that the dimensions of the
haemoglobin molecule are 64 by 55 by 50 angstrums and that the molecular
weight is about 67000. If one amino acid is replaced by another in either of the
alpha or beta chains this will give rise to a haemoglobin variant. Most variants
are extremely rare so it is proposed to consider only the more common variants
which are relevant to the forensic scientist.
229
4.2.2 HAEMOGLOBINS A AND F
There are at least three physiological haemoglobins of which adult haemoglobin
(HbA) and foetal haemoglobin (HbF) are the most important. The main adult
haemoglobin, HbAl.' consists of two alpha chains and two beta chains (Cl!2 (32)
and comprises 98 percent of normal blood. The other 2 percent is known as
HbA and consists of one pair of alpha chains and one pair of delta chains. These 2
differ from the beta chain amino acid sequence at 10 positions, HbA = Cl! O. 2 2 2
In very young embryos there are polypeptide chains called epsilon (E) chains, but
at approximately three months, this embryonic haemoglobin is replaced by foetal
haemoglobin which contains gamma chains. These differ from the normal alpha
chain at 39 positions, HbF = (l! 'Y • It is surprising that although HbA and HbF 2 2
differ so widely in structure, the functional differences are very small, and an
electrophoretic separation of the two is not easy. At birth, there is approximately
20 percent HbA present (although this is extremely variable) and this gradually
increases so that at six months, in most cases, all the foetal haemoglobin has
been replaced by adult. A decrease in the formation of the alpha and beta chains
causes thalassemia (discussed later).
4.2.3 HAEMOGLOBIN S
Sickle cell haemoglobin (HbS) is found in two forms; the "disease" or homozygous
form and the fltrait" or heterozygous form. In the homozygous state, nearly all
the haemoglobin is HbS, HbA being absent and the balance consisting of HbA l. 2
and HbF. As anaemia is often severe and the patient is normally subjected to
sickle cell crises, this type of individual usually does not occur in a forensic
sampling. The heterozygote individual, however, being quite healthy does occur
quite frequently, and here HbS accounts for approximately 45 percent of the total
haemoglobin. The rest consists of HbAl. and HbA2
• Sickling of the cells does not
normally occur in vivo but if the oxygen tension is lowered, e. g., at high alti
tudes, or if the individual undergoes violent exercise or receives an emotional
shock, then a sickle cell crisis can occur and can cause death.
There is no difference in the structure of the alpha chain between HbA and HbS
but in the beta chain valine replaces glutamic acid at the sixth position. It is not
230
fully understood why such a simple amino acid substitution should make such a
difference not only electrophoretic ally but in the solubility of deoxygenated HbS.
Haemoglobin S is also known to occur with other abnormal haemoglobins which
only occur quite rarely. The se are as follows:
a. Sickle Cell HbC Disease (SIC).
b. Sickle Cell HbD Disease (SID).
c. Sickle Cell HbE Disease (S/E).
d. Sickle Cell Thalassemia.
e. Sickle Cell Associated with Foetal Haemoglobin Other Than During
Infancy.
Carriers of the HbS gene are normally conf~ned to Negro populations or persons
of negroid ancestry. Being a carrier for the gene seems to afford the person
protection against malignant malaeria. As can be seen in the population data,
Table 4-2, the sickle cell gene has a wide geographical distribution, but all of
these are areas where malignant malaeris was indemic.
4.2.4 HAEMOGLOBIN C
Unlike haemoglobin S, both the homozygote and heterozygote of haemoglobin C
are found in healthy individuals. One homozygote C was found, during a survey231,
at a London railway station working as a porter. Although at Metropolitan Police
Laboratory a number of haemoglobin AIC individuals have been found, no homo
zygote form has been encountered in a criminal case.
The homozygous state is reported to produce a mild anaemia or jaundice, but
this is the exception rather than the rule. The heterozygote has not been re
ported as having produced any clinical symptoms. Similarly, those individuals
which have a combination of sickle cell and HbC disease (SIC) seem to be per
fectly healt'~y. These are even more rare than the homozygote C and have not
been encoUP.cered in our survey. Like haemoglobin S, there is only a single
amino acid substitution in the alpha chain, also occurring at the sixth position
where the glutamic acid of HbA is replaced by lysine. This produces an even
larger difference in the electrophoretic mobility.
231
The area of origin of HbO is confined to North and West Africa (Table 4-3) with
a very rare incidence found in Italy. Obviously any country with immigrants
from these areas will have individuals carrying the HbO gene. It is still sur
prising that it occurs in our forensic sampling as often as it does (Table 4-4).
4.2.5 HAEMOGLOBINS D, E, AND OTHERS
Both the homozygote and the heterozygote individuals for haemoglobins D and E
were first found during the course of a survey231, and so one can safely conclude
that they enjoy reasonable health. Obviously it is the HbA/E or AID forms which
are the most likely forms to be encountered.
In haemoglobin D, there is only one amino acid substitution, i. e. , glutamic acid
to glutamine at position 121 in the chain. In haemoglobin E, lysine replaces
glutamine at position 26. Unfortunately, although the substitutions are quite
different from those of HbS and HbO, it is quite difficult to separate electro
phoretically HbS from HbD and HbO from HbE at alkaline pH; however, this
problem can be resolved (see paragraph 4.2.6.3).
Other abnormalities which may be encountered are the thallasemias. These are
known as either alpha or beta thallasemia, depending on whether the alpha or
beta chain production is affected. The beta thallasemia is the more common of
the two. In the homozygote there is a complete absence of HbA , generally asso-1 .
ciated with high levels of HbA and HbF. The heterozygote is found in conjunc-2
tion with other abnormal haemoglobins.
The homozygote for alpha thallasemia shows a complete absence of HbA1 , HbA2 ,
and F and is, therefore, unable to sustain life. The heterozygote, however, ls
normally completely without symptoms and is very difficult to detect. Although
we have not encountered any thallasemias, we have found the abnormal haemo
globins J and M both in conjunction with HbA.
Oare must be exercised not to interpret a homozygote instead of a heterozygote
combined with a thallasemia gene. The latter is normally found with high levels
of HbA and HbF; nevertheless, homozygotes should not be confirmed without 2
family studies.
232
4.2.6 METHODS AND SAMPLE PREPARATION
4.2.6.1 General Description
Electrophoresis is the most useful method for differentiating between the haemo
globin variants in whole blood although the spectrophotometer, the sickling test,
and peptide mapping can also be used.
Numerous papers have been written on the identification of haemoglobin vari
ants in whole blood, but only three papers have been published on the determina
tion of variants in bloodstains. Each author seems to have a preference for one
particular buffer and media so it may be difficult to choose the best method.
Lehmann and Ager221 and Huntsman a'1d Lehmann218 used Whatman 3 MM paper
in a barbiturate buffer at pH 8.6. In 1964, Culliford216
, working on bloodstains,
recommended using cellulose acetate in the Poulik discontinuous buffer pH 8.6.
Breen, et al 215, suggested cellulose acetate in a Tris Glycine buffer pH 9.3.
All of these buffers are suitable for separating the common variants HbS and
HbC from HbA, but not the other variants. Grahrun and Grunbaun217 and Kohn219
suggested a discontinuous buffer for the separation of HbA from HbF. This
method was adapted for bloodstains by Wraxal1225
using the following buffers:
a. Tank Buffers
Anode: pH 9. 1
TRIS Tris (hydroxymethyl methylamine)
EDTA (ethylene diamine tetra acetic acid)
Boric Acid
Distilled water to
Cathode: pH 8.6
Sodium diethyl barbiturate
Diethyl barbituric acid
Distilled water to
b. Strip Buffer
Equal volumes of anodic and cathodic buffer.
233
25.2 g
2.5 g
1.9g
1 litre
5.15 g
0.92 g
1 litre
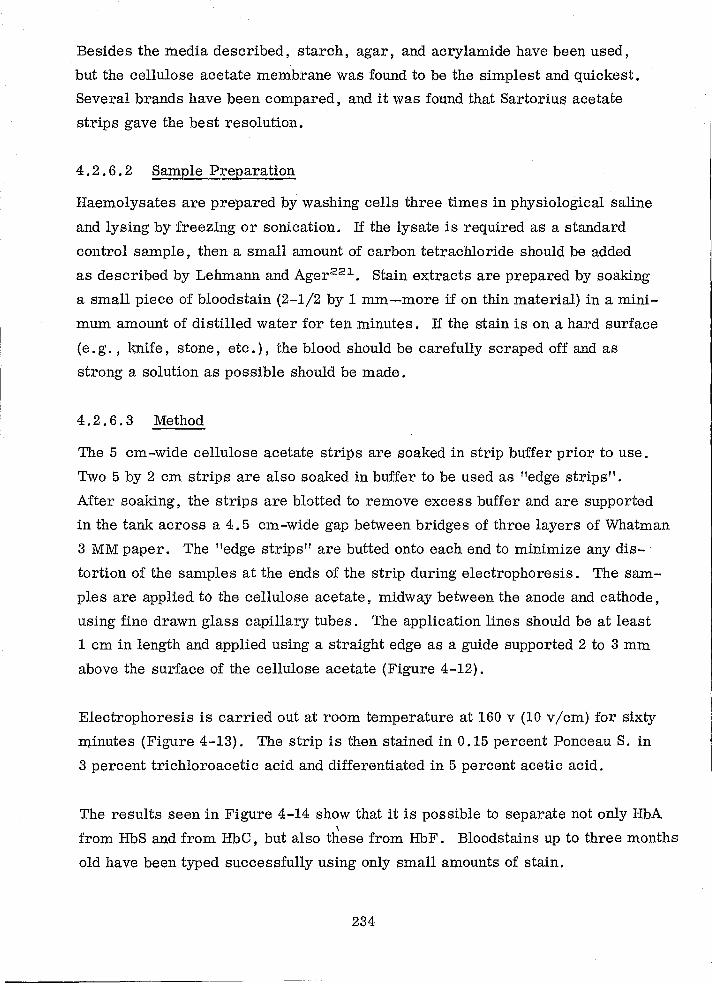
Besides the media described, starch, agar, and acrylamide have been used,
but the cellulose acetate membrane was found to be the simplest and quickest.
Several brands have been compared, and it was found that Sartorius acetate
strips gave the best resolution.
4.2. 6 . 2 Sample Preparation
Haemolysates are prepared by washing cells three times in physiological saline
and lysing by freezing or sonication. If the lysate is required as a standard
control sample, then a small amount of carbon tetrachloride should be added
as described by Lehmann and Ager22~. Stain extracts are prepared by soaking
a small piece of bloodstain (2-1/2 by 1 mm-more if on thin material) in a mini
mum amount of distilled water for ten minutes. If the stain is on a hard surface
(e. g. , knife, stone, etc.), the blood should be carefully scraped off and as
strong a solution as possible should be made.
4.2. 6 . 3 Method
The 5 cm-wide cellulose acetate strips are soaked in strip buffer prior to use.
Two 5 by 2 cm strips are also soaked in buffer to be used as "edge strips".
After soaking, the strips are blotted to remove excess buffer and are supported
in the tank across a 4.5 cm-wide gap between bridges of three layers of Whatman
3 MM paper. The "edge strips" are butted onto each end to minimize any dis
tortion of the samples at the ends of the strip during electrophoresis. The sam
ples are applied to the cellulose acetate, midway between the anode and cathode,
using fine drawn glass capillary tubes. The application lines should be at least
1 cm in length and applied using a straight edge as a guide supported 2 to 3 mm
above the surface of the cellulose acetate (Figure 4-12).
Electrophoresis is carried out at room temperature at 160 v (10 v Icm) for sixty
minutes (Figure 4-13). The strip is then stained in 0.15 percent Ponceau S. in
3 percent trichloroacetic acid and differentiated in 5 percent acetic acid.
The results seen in Figure 4-14 show that it is possible to separate not only HbA \
from HbS and from HbC, but also these from HbF. Bloodstains up to three months
old have been typed successfully using only small amounts of stain.
234
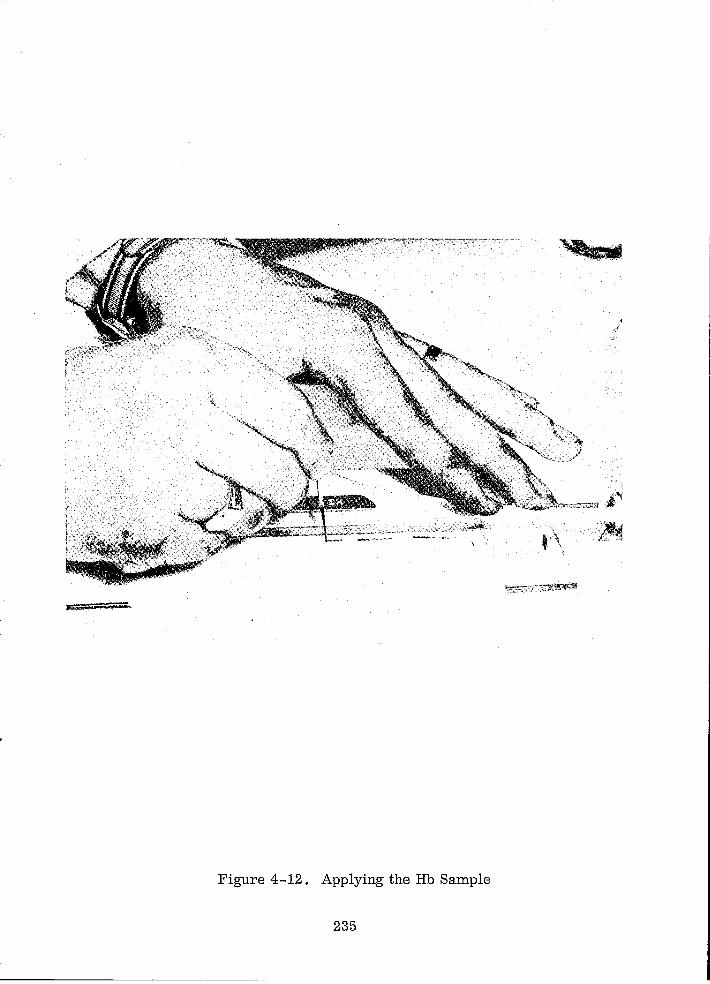
Figure 4-12. Applying the Hb Sample
235
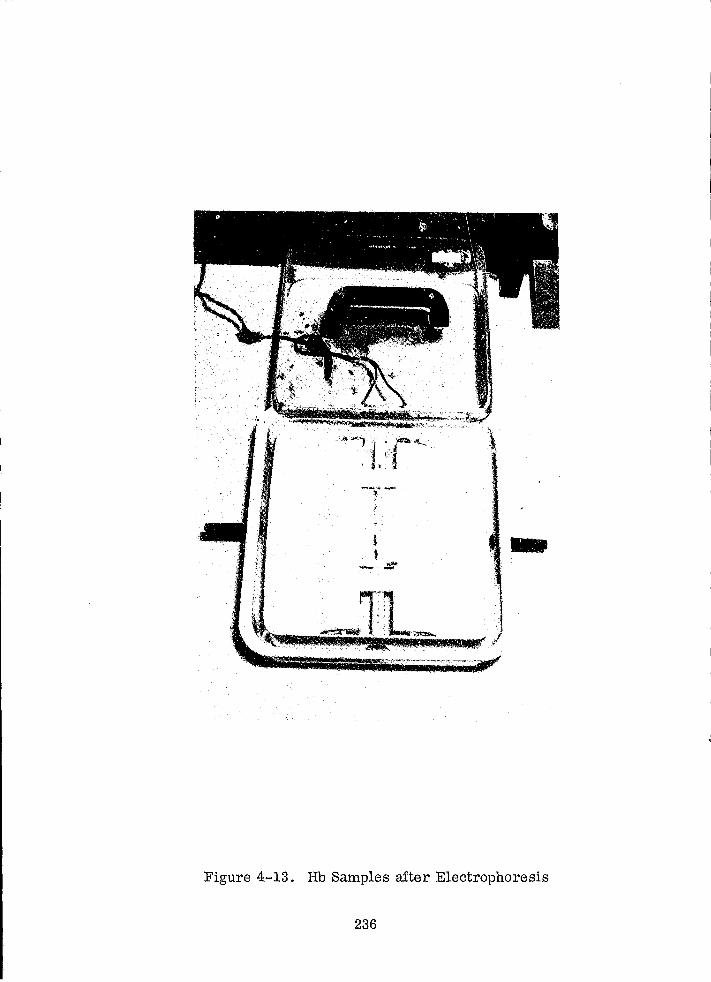
-~ .. -
...
Figure 4-13. lib Samples after Electrophoresis
236
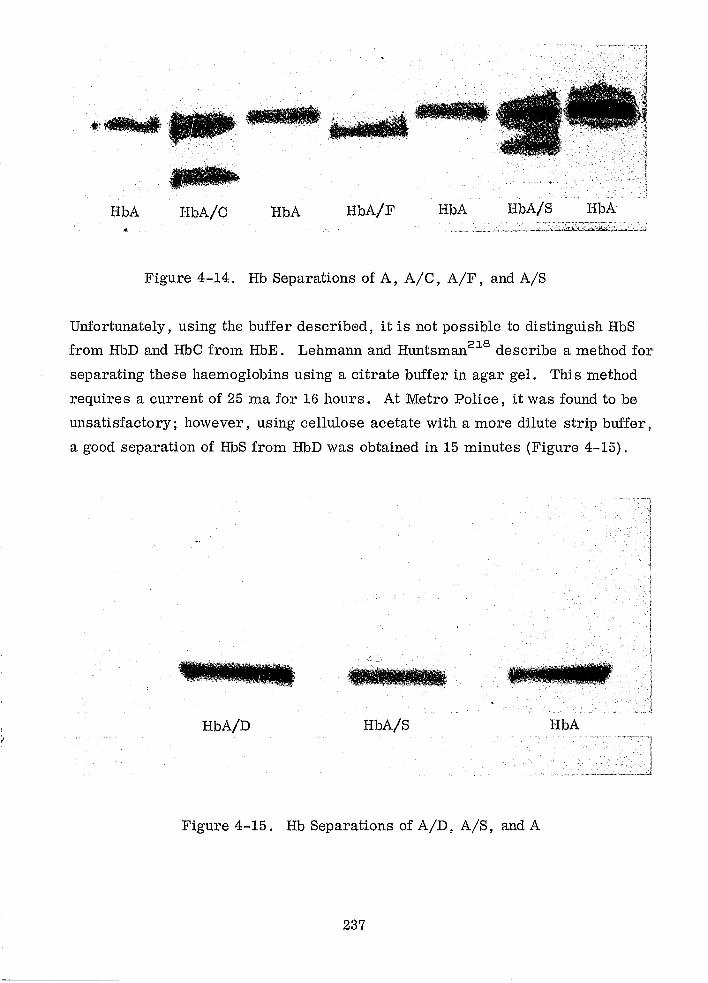
"
HbA HbA/O HbA HbA/F HbA HbA/S HbA
Figure 4-14. Hb Separations of A, A/O, A/F, and A/S
Unfortunately, using the buffer described, it is not possible to distinguish HbS
from HbD and HbO from HbE. Lehmann and Huntsman218 describe a method for
separating these haemoglobins using a citrate buffer in agar gel. This method
requires a current of 25 rna for 16 hours. At Metro Police, it was found to be
Qllsatisfactory; however, using cellulose acetate with a more dilute strip buffer,
a good separation of HbS from HbD was obtained in 15 minutes (Figure 4-15).
HbA/D HbA/S HbA
Figure 4-15. Hb Separations of A/D, A/S, and A
237
The buffers used are as follows:
a. Tank Buffer
Sodium citrate 73.5 g
Distilled water 500 ml
Add 34.0 ml of 0.5 M citric acid (10.5 g/100 ml) and make up to
1 litre with distilled water-pH 6.2.
b. Strip l~uffer
Tank buffer diluted 1 :20.
This buffer should also separate HbC from E.
Another method for separating HbS from D is by the sickling test although this
method cannot be used for bloodstains. All suspected HbS or A/S individuals
should be confirmed using this test.
4.2.6.4 Sickling Test
It is preferable to use clotted blood, a small drop of which is mixed with 2 to
3 drops of 2 percent sodium metabisulphite (Na2 S2 °5 ), It is essential that the
solution is freshly prepared and that the chemical has not become oxidized due
to long storage. The experiment is carried out on a microscope slide, covered
with a coverslip and incubated at 37° C in a moist chamber. After 20 minutes,
it is examined under low power for sickling (Figure 4-16); however, if the
blood sample is old, the sickling may not occur for at least three hours. Care
should be taken not to allow the cells to dry out as intracellular haemoglobin
crystaL: sation may be mistaken for sickling.
4. 2 . 6 . 5 Alkali Denaturation
Since von Korber in 1866 described lithe increased resistance of foetal haemo
globin to alkali", several different procedures have been described for the quanti
tative determination of haemoglobin F. Singer, et al224 , and Lehmann and
Ager221 have described methods for HbF identification in whole blood. Simi-218 . 216 . " .
larly, Huntsman and Lehmann and Culhford have descrIbed the Identlfl-
cation of foetal haemoglobin in bloodstains using this technique.
238
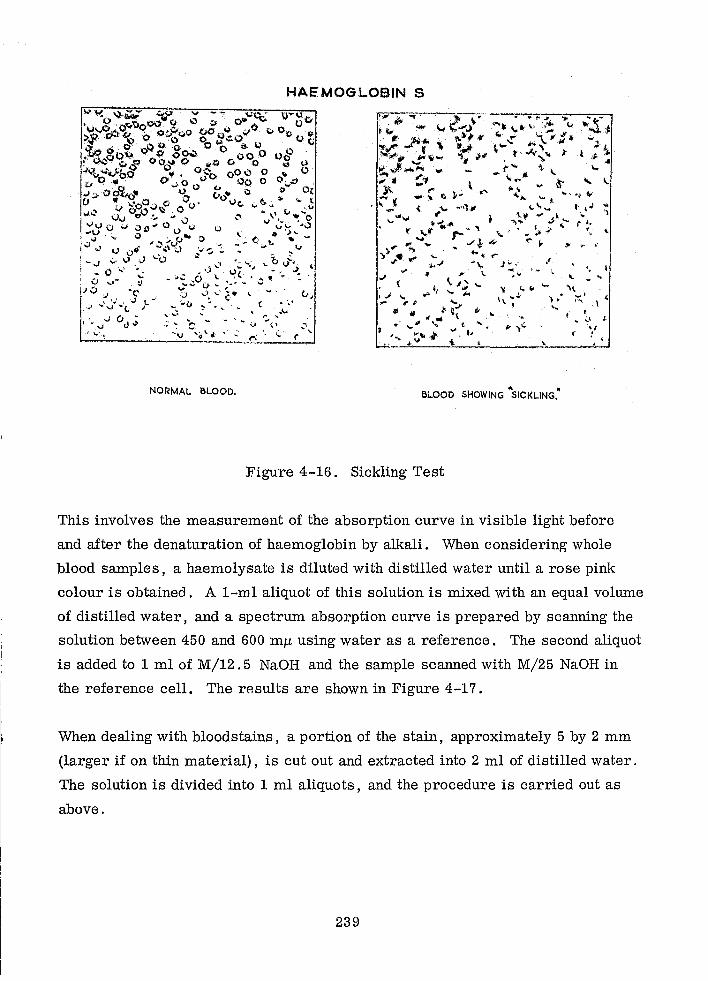
HAEMOGLOBIN S
... ~ .. ,~
).*;-;',' -.. '
NORMAL BLOOD. .. . BLOOD SHOWING SICKLING.
Figure 4-16. Sickling Test
This involves the measurement of the absorption curve in visible light before
and after the denaturation of haemoglobin by alkali. When considering whole
blood samples, a haemolysate is diluted with distilled water until a rose pink
colour is obtained. A 1-ml aliquot of this solution is mixed with an equal volume
of distilled water, and a spectrum absorption curve is prepared by scanning the
solution between 450 and 600 mfJ. using water as a reference. The second aliquot
is added to 1 ml of M/12 .5 NaOH and the sample scanned with M/25 NaOH in
the reference cell. The results are shown in Figure 4-17.
When dealing with bloodstains, a portion of the stain, approximately 5 by 2 mm
(larger if on thin material), is cut out and extracted into 2 ml of distilled water.
The solution is divided into 1 ml aliquots, and the procedure is carried out as
above.
239
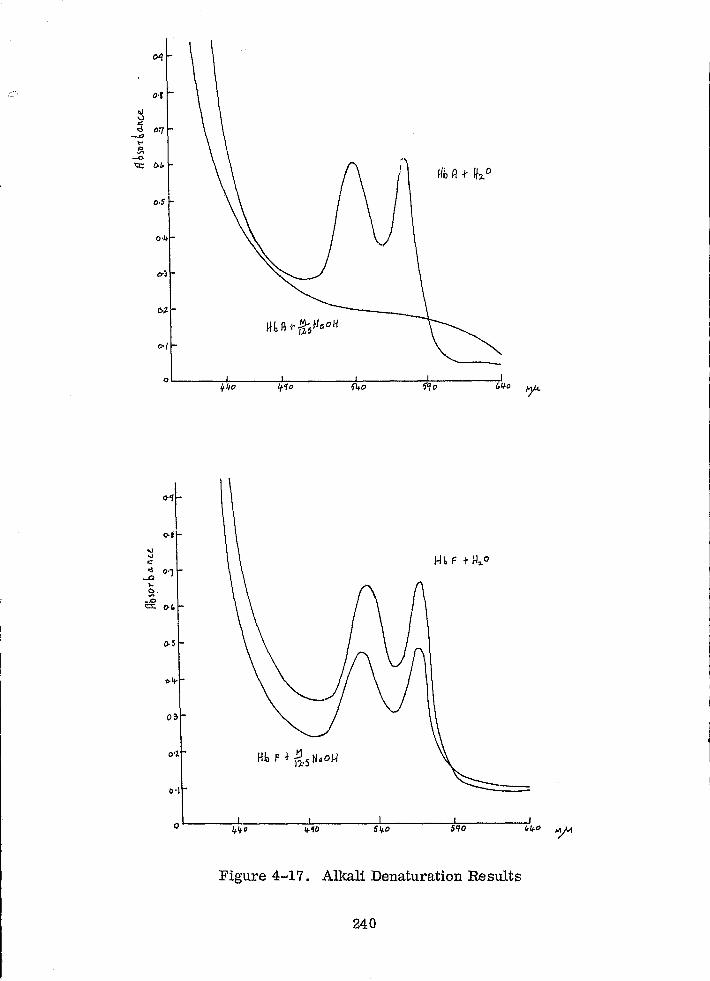
O"l
0"
\lJ
'" '" <l oq -c
"" !J!. --Q
rv 1:1:: o~
Ub R 1- ~,. 0
0·5
o·l/-
0'3
0.:;'
Ub fH"TttJa OH
0'/
0 Ho If '1 0 fifo ?'fo !.lIo
~
0''1
()ot
oJ ..., HbF + 1-1 .. 0 r:
<I 0', -.0 .. ~
...0 = ()o~
o.~
.,.4-
O~
0'1 Hb F + g'5 N.o/-l
0')
I I I I 0
I;. It ° Ij.'/o 5'1- 0 SqO ~",o -y"i
Figure 4-17. Alkali Denaturation Results
240
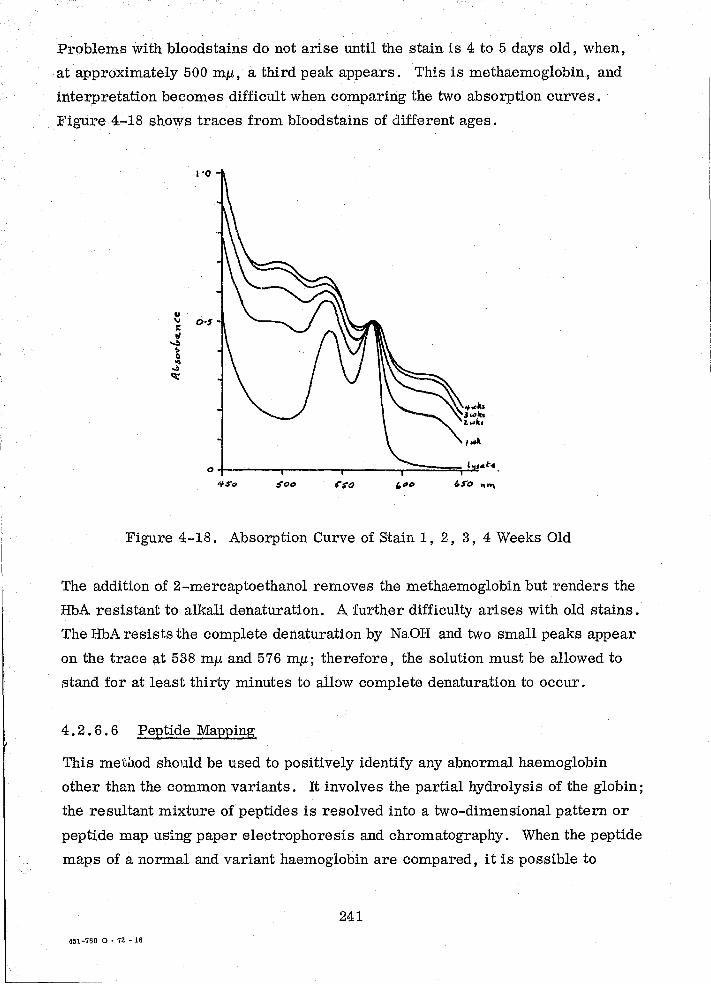
Problems with bloodstains do not arise until the stain is 4 to 5 days old, when,
at appro:Ximately 500 mM, a third peak appears. This is methaemoglobin, and
interpretation becomes difficult when comparing the two absorption curves.
Figure 4-18 shows traces from bloodstains of different ages.
1"0
,..".
o +-----.--,-.,----r=:===;_, !.:I.!",.tc, $00 'S'o .,..,
Figure 4-18. Absorption Curve of Stain 1, 2, 3, 4 Weeks Old
The addition of 2-mercaptoethanol removes the methaemoglobin but renders the
HbA resistant to alkali denaturation. A further difficulty arises with old stains.
The HbA resists the complete denaturation by NaOH and two small peaks appear
on the trace at 538 mM and 576 mM; therefore, the solution must be allowed to
stand for at least thirty minutes to allow complete denaturation to occur.
4. 2 • 6 . 6 Peptide Mapping
This metll.Od should be used to positively identify any abnormal haemoglobin
other than the common variants. It involves the partial hydrolysis of the globin;
the resultant mixtu,re of peptides is resolved into a two-dimensional pattern or
peptide map using paper electrophoresis and chromatography. When the peptide
maps of a normal and variant haemoglobin are compared, it is possible to
241
451-769 0 - 72 - 16
. (,
distinguish a difference in structure to one amino acid residue. Unfortunately,
the amount of sample required is quite large, and so far, no work has been
carried out on bloodstains .
4.2.7 PROBLEMS
All blood samples received in the laboratory are routinely screened for haemo
globin variants by the electrophoresis procedure described. Any variants found
are checked against known controls to positively identify the variant. These
controls, after prolonged freezing and thawing, tend to produce a brown pre
cipitate. This can be avoided by adding carbon tetrachloride as described.
Foetal haemoglobin can be confirmed using the spectrophotometer, but in blood
stains more than a week old caution should be exercised when using this technique.
Fluoride, as with other systems, tends to affect the electric field and therefore
should be avoided.
242
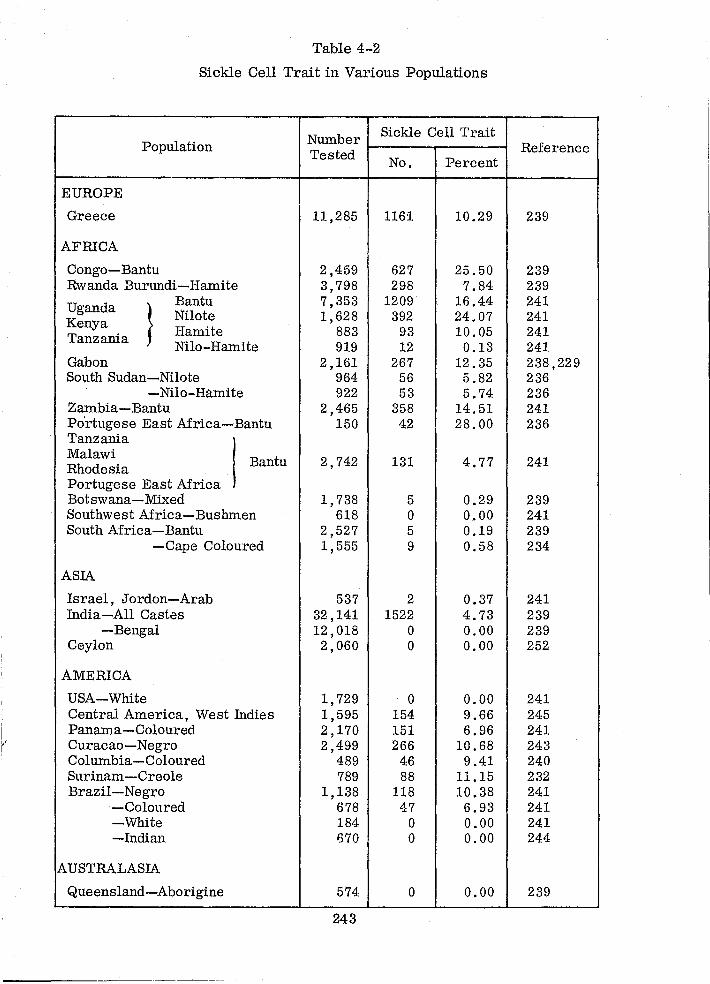
i r
Table 4-2
Sickle Cell Trait in Various Populations
Number Sickle Cell Trait Population
Tested No. Percent
EUROPE
Greece 11,285 1161 10.29
AFRICA
Congo-Bantu 2,459 627 25.50 Rwanda Burundi-Hamite 3,798 298 7.84
Uganda
} Bantu 7,353 1209 16.44
Kenya Nilote 1,628 392 24.07 Hamite 883 93 10.05 Tanzania Nilo-Hamite 919 12 0.13
Gabon 2,161 267 12.35 South Sudan-Nilote 964 56 5.82
-Nilo-Hamite 922 53 5.74 Zambia-Bantu 2,465 358 14.51 Po'rtugese East Africa-Bantu 150 42 28.00
Tanzania I Malawi Bantu 2,742 131 4.77 Rhodesia
Portugese East Africa Botswana-Mixed 1,738 5 0.29 Southwest Africa-Bushmen 618 0 0.00 South Africa-Bantu 2,527 5 0.19
-Cape Coloured 1,555 9 0.58
ASIA
Israel, Jordon-Arab 537 2 0.37 India-All Castes 32,141 1522 4.73
-Bengal 12,018 0 0.00 Ceylon 2,060 0 0.00
AMERICA
USA-White 1,729 0 0.00 Central America, West Indies 1,595 154 9.66 Panama-Coloured 2,170 151 6.96 Curacao-Negro 2,499 266 10.68 Columbia-Coloured 489 46 9.41 Surinam-Creole 789 88 11.15 Brazil-Negro 1,138 118 10.38
-Coloured 678 47 6.93 -White 184 0 0.00 -Indian 670 0 0.00
AUSTRALASIA
Queensland-Aborigine 574 0 0.00
243
Reference
239
239 239 241 241 241 241 238,229 236 236 241 236
241
239 241 239 234
241 239 239 252
241 245 241 243 240 232 241 241 241 244
239
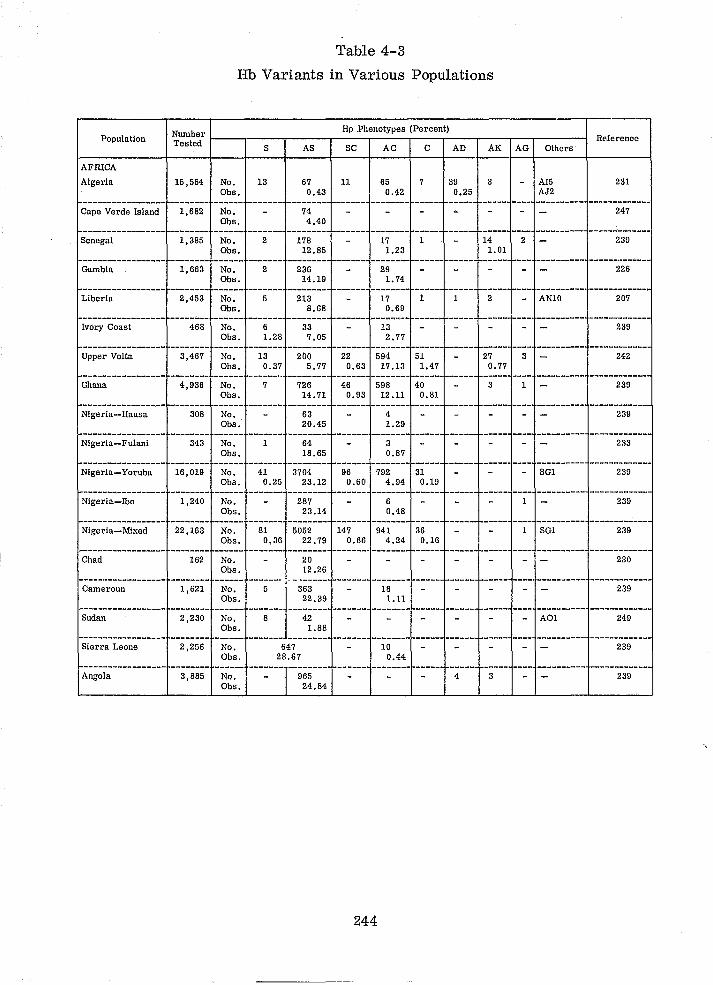
Table 4-3
Hb Variants in Various Populations
Number Hp 'phenotypes (Percent)
Population
AFRICA
Algeria
Cape Verde Island
Senegal
Gambia
Liberia
Ivory Coast
Upper Volta
Ghana
Nigeria-Hausa
Nigeria-Fulani
Nigeria-Yoruba
Nigeria-Tho
Tested
15,564
1,682
No. Obs.
No. Obs.
1,385 No. Obs.
1,663 No. Obs.
2,453 No. Obs.
468 No. Obs.
3,467 No. Obs.
4,936 No.
308
Obs.
No. Obs.
343 No. Obs.
16,019 No. Obs.
1,240 No. Obs.
S
13
2
2
5
6 1.28
AS
67 0.43
74 4.40
178 12.85
236 14.19
213 8.68
33 7.05
13 200 0.37 5.77
7
1
726 14.71
63 20.45
64 18 • .65
41 3704 0.25 23.12
287 23.14
SO AO C
11 65 7 0.42
-------- -----17 1
1.23 -------- ------
29 1. 74
17 1 0.69
... ---_ ... _ .... -----13 2.77
22 594 51 0.63 17.13 1.47
46 598 40 0.93 12.11 0.81
4 1.29
3 0.87
96 792 31 0.60 4.94 0.19
6 0.48
Nigeria-Mixed 22,163 No. 81 5052 147 941 36
Chad 162
Obs.
No. Obs.
0.36 22.79 0.66 4.24 0.16
20 12.26
------------------ -------- ------ ------~ !.~.-----Cameroun 1,621
Sudan 2,230
Sierra Leone 2 ,256
Angola 3,885
No. Obs. 22.39
------- --------5 j 363
No. 8 42 Obs. 1.88
------ ------- --------No. 647 Obs. 28.67
~~~. ---=---1--~~~~::
244
18 1.11
10 0.44
AD
39 0.25
4
Reference AK AG others
3 Al5 231 AJ2
247
14 2 239 1.01
226
2 ANI0 207
239
27 3 242 0.77
3 239
239
233
SGI 239
1 239
1 SGl 239
230
239
A01 249
239
3 239
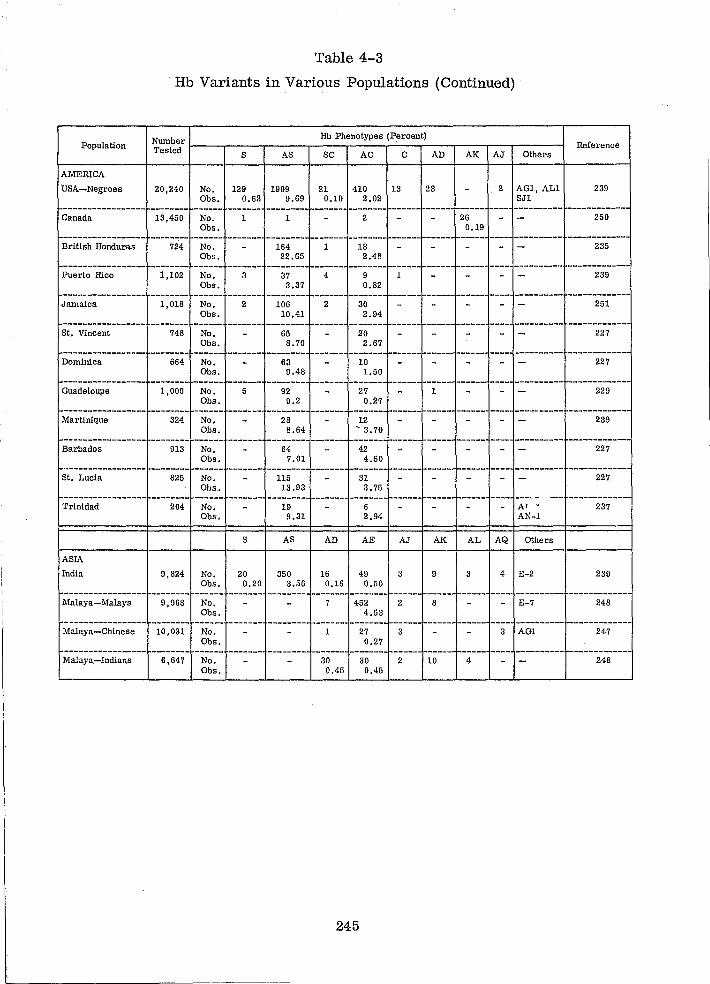
Population
AMERICA
USA-Negroes
Canada
------------.----British Honduras
-----------------Puerto Rico
-----------------Jamaica
-----------------St. Vincent
-----------------Dominica
-----------------Guadeloupe
Martinique
Barbados
St. Lucia
'rrinidad
Table 4-3
Hb Variants in Various Populations (Continued)
Number Hb Phenotypes (Percent) Tested ~---'---S---r---A-S--'---S-C--r--A-C--~~C--r--A-D-'--A-K--r-A-J-r--O-th-e-r-s~
20,240 No. 129 1969 21 410 13 Obs. 0.63 9.69 0.10 2.02
13,450 No. 1 2 Obs.
-------- ------ ------- --------724 No. 164 1 18
Obs. 22.65 2.48 ------ -----.-
1,102 No. 3 37 4 9 Obs. 3.37 0.82
1,018 No. 2 106 2 30 Obs. 10.41 2.94
748 No. 65 20 Obs. 8.70 2.67
-------- ------ -------664 No. 63 10
Obs. 9.48 1.50 .... ------ -----.
23
26 0.19
2 AGl, ALI SJ1
Reference
239
250
235
239
251
227
227
1,000 No. 92 27 1 229 Obs.
324 No.
913
Obs.
No. Obs.
825 No. Obs.
204 No. Obs.
9.2
28 8.64
64 7.01
115 13.93
19 9.31
0.27
A' • AN-1
239
227
227
237
F=========~====F===f===~====*===~==~==~F===F===F=~====~=====':== S AS AD AK AL AQ Others
ASIA
India. 9,824 No. 20 350 16 49 3 9 3 4 E-2 239 Obs. 0.20 3.56 0.16 0.50
----------------- .--------- ---------.--Malaya-Malays 9,968 No. 452 2 8 E-7 248
Obs. 4.53 ----------------. -------- ------ ------- -------- ------ ---- ---------- --.----------Malaya-Chinese 10,031 No. 27 3 3 AGl 247
Obs. 0.27 -----.----------- -------- ------ -----.- .--------- --.----------Mal aya-Indians 6,647 No. 30 30 2 10 4 248
Obs. 0.45 0.45
245
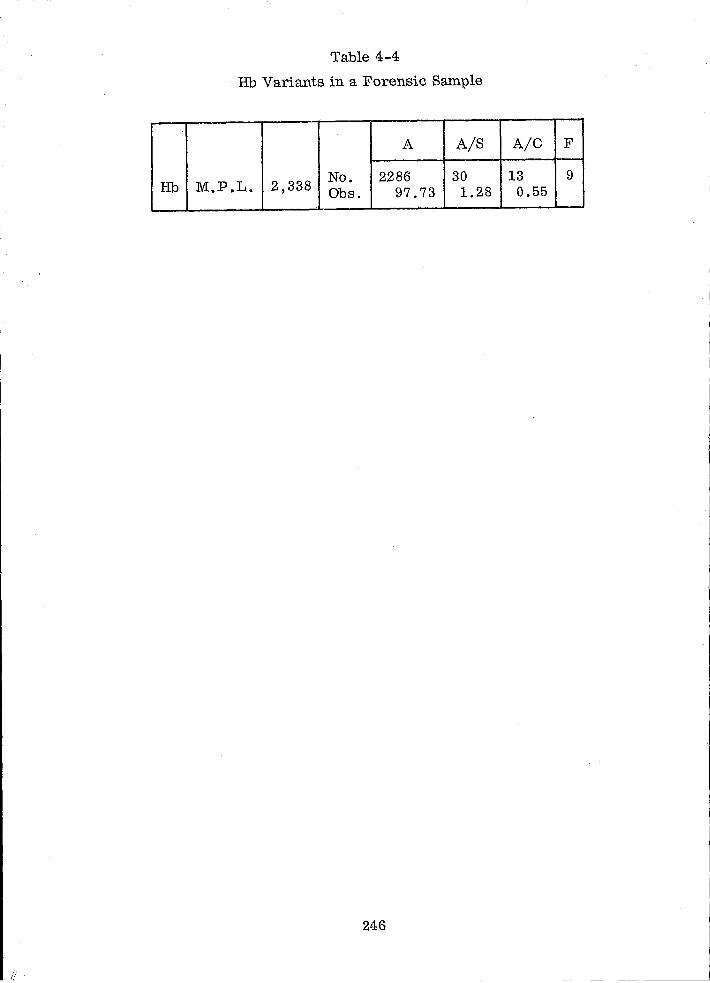
Table 4-4
Hb Variants in a Forensic Sample
A AIS Ale F
Hb M.P.L. 2,338 No. 2286 30 13 9 Obs. 97.73 1.28 0.55
246
,I // - ---~---
SECTION 5
FUTURE OF BLOODSTAIN GROUPING SYSTEMS
5.1 INTRODUCTION
There are many polymorphisms of human blood which have not been dealt with
in detail in the previous chapters. Only those which have been fully investigated
in bloodstains and are now in routine use have been considered in depth. Many,
however, have had some work done on them, and the results so far are listed
below. When these investigations are complete, the full results will be pub
lished in the journals.
5.2 RED CELL ACID PHOSPHATASE
This, at first glance, is an excellent polymorphic system for forensic work. It
was one of the first to be discovered and was the first to be investigated. It was
found that when blood dried into a stain, it very rapidly lost its activity to the
substrate, phenlophthalein phosphate. It was not until recently that it was de
cided to re-investigate this enzyme, when it was found that although phenol
phthalein diphosphate was useless as a substrate, the enzyme remained active
to other phosphate substrates after having dried into a bloodstain.
The most satisfactory of these substrates was 4-methyl-umbelliferyl-phosphate.
Using this, it has been found possible to type stains satisfactorily up to a few
weeks old. Based on present work, a confident prediction can be made that
within a year, it will be possible to use red cell acid phosphatase as a routine
enzyme typing method. Of the common phenotypes, the population is divided
as follows:
Phenotype
Percentage
A
11.2
BA
47.7
B
33.5
5.3 PHOSPHO-GL UCOSE ISOMERASE
CA
2.5
CB
5.2
This enzyme has been found to be very resistant to drying into a bloodstain, and
results are easy to obtain. The big disadvantage with this polymorphism is the
247
low frequenoy of the variants. About ten variants have been described which to
gether form only about 1 percent of the population. This enzyme if treated on its
own would head strongly towards uneconomic effort. It can, however, be com
bined with a number of other enzyme systems and be detected on the same starch
gel plate as these. The most satisfactory combination so far is with G6PD. The
development of PGl on G6PD plates is described in paragraph 3.4.
5.4 PEPTIDASES
There are four major peptidases in the red cell, denominated A, B, C, and D
according to their mobility and their substrate specificity. Each of these has
variant forms or polymorphism associated with it. So far, it has been shown
that the peptidases survive drying into a bloodstain and retain a good activity .
A great deal more work is required, and it would seem probable that 12 to
18 months will be required to develop better techniques before peptidase typing
can be routinely used. Some of the polypeptide substrates used are rather ex
pensive at present, and with a fairly low level of variants it may be thought
initially uneconomic of time and money-this remains to be seen.
5.5 SERUM AMYLASES
Work on these enzymes has proved to be very difficult, and erratic results at
present seem commonplace. This is a system where no two workers seem to
be in agreement, and at the present time with the difficulties which have been
found, it holds little hope of use in forensic work.
5.6 SERUM ALKALINE PHOSPHATASE
This is another rather difficult system with which to work. It is partly a quali
tative and partly a quantitative variation, dependent on factors other than genetic
in its quantitative aspect. The activity of the enzyme in bloodstains has been
found to be very low, and the results so far have been largely unsatisfactory.
It is not a system for which there can be much future in forensic work.
248
5.7 OTHER ENZYMES
Other enzyme polymorphisms are also being investigated such as glutathione
reductase, galactose-I-phosphate uridyl transferase, etc., but this work is at
an early stage, and it is not possible yet to predict its potential usefulness in
this field. Many other enzyme variations are known and documented, but the
rarity of the variant forms makes the screening for these very uneconomic
unless some blanket screening techniques can be developed.
5.8 Gc GROUPS
The polymorphic 0!2 protein Go has been investigated for use in bloodstain typing
in Denmark, Germany, and England. So far no satisfactory technique has been
developed for bloodstain work if the stains are more than a few days old. Stains
in good condition and fairly new state can be typed by the method described origi
nally by Hirschfeld or by the technique described in paragraph 4.1 on hapto
globins for typing by immuno-electrophoresis. Reliability for any but the best
of bloodstains is at present suspect.
5.9 TRANSFERRINS
Due to the low frequency of transferrin variants in European populations, no hard
effort has been put into this polymorphism. There should be no reason why this
should not be possible if the effort required is thought to be justified. Immune
techniques appear to be useless. Starch or acrylamide gel possibly using a
radioactive detection method seems theoretically the best chance.
5.10 OTHER POLYMORPHIC PROTEINS
Either rarity of variants or lack of work on some of the more recently discovered
polymorphisms has so far led to insufficient information to be able to judge the
value of these polymorphisms.
5.11 Gm AND Inv SERUM GROUPS
The complexity of the Gm system is such that, if it was possible to carry out
full genotyping on dried bloodstains, it would be more useful than any single sys
tem. In practise, the quality of many of the antisera is inadequate for use in
249

stain grouping. Gm(l) and Gm(2) can be easily detected by absorption-inhibition,
and this is routine in some European countries. Preliminary work in the Metro
politan Police Laboratory has shown that it is also possible to detect Illv types in
dried bloodstains.
5. 12 OTHER RED CELL ANTIGEN SYSTEMS
It is highly likely that, in time, given adequate quantities of bloodstain and good
quality antisera, it will be possible to detect most, if not all of these in dried
bloodstains.
250
SECTION 6
REFERENCES
1. Bier, M., Electrophoresis, Theory, Methods and Applications, Academic Press, Vol. 1, 1959, VoL 11, 1967.
2. Grabar, P. and Burtin, P., Immuno-electrophoretic Analysis, Applications to Human Biological yluids, Elesevier Publishing Co., 1964.
3. Gordon, A. H., Electrophoresis of Proteins in Polyacrylamide and Starch Gels, North Holland Publishing Co., 1969.
4. Nerenberg, S. T., Electrophoresis, A Practical Laboratory Manual, F. A. Davies Co., Philadelphia 1966.
5. Van Deen, "Tinctura guajaci und ein ozontrager, ais reagens aus sehr geringe blut mengen, II Arch. sur die Hollandische bei trage zur Nature. Herklunde (Utrecht) 1861, Vol. 3 p. 228 - 231.
6. Adler, O. and Adler, R., Zeitschr. F. Physill, ehimie, 1904,41: 59.
7. Glaister, J., A Textbook of Medical Jurisprudence and Toxicology ~ 5th ed. 1931.
8. Hunt, A. C., Corby, C., Dodd, B.C. and Camps, F., J. For. Med., 1960, 7: No.2.
9. Gradwohl, R.B.M. (Editor), Legal Medicine, 1954.
10. Gonzales, T. A. Vance, M., Helpern, M. and Umberger, C. J., Legal Medicine, Pathology and ToXicology, 2nd ed. 1954.
11. Smith, S., Taylors PrinciEles and Practice of Medical Jurisprudence, 10th ed., 1948.
12. Nickolls, L. C., Scientific Investigation of Crime, 1956.
13. Fiori, A., Minerva medicolegale e arch. antropol. criminale, 1957, 77: 84.
14. Hirschfield, J., Acta p. Patho!. Microbiol. Scand., 1959, 47: 160, (also in Science Tools, 1960, 7: No.2).
15. Coombs, R. R. A. and Dodd, Barbara E., Med. Sci. Law, 1961, 1: 357.
16. Douglas, R. and Stave ley , J. M., J. Forens. ScL, 1969, 14: 255.
17. Lincoln, P. J. and Dodd, Barbara E., Med. Sci. Law, 1968,4: 288.
251
18. Fiori, A., Marigo, M. and Benciolini, P., J. For. Sci., 1963, 8: 419.
19. Kind, S. S., Nature Lond., 1960, 185: 397.
20. Kind, S. c' l::l. , Nature Lond., 1960, 187: 789.
21. Kind, S. S. and Cleevely, Rosalyn H., J. For Sci. Soc., 1969, 9: 131.
22. Hayward, J. W., J. For Sci. Soc., 1969, 9: 147.
23. Howard, H. D. and Martin, P. D., J. For. Sci. Soc., 1969, 9: 28.
24. Niokolls, L. C. and Pereira, Margaret, Med. Sci. Law, 1962, 2: 172.
25. Outteridge, R. A., Nature Lond., 1962, 194: 385.
26. Outteridge, R. A., J. For Sci. Soc., 1965, 5: 22.
27. Pereira, M., to be published later.
28. Poon, W. L. and Dodd, Barbara, Med. Sci. Law, 1964, 4: 258.
29. Yada, S.,Japan J. Leg. Med., 1962, 16: 290.
30. Allen, F. H., Corcoran, P. A. and Ellis, F. R., Vox SangiriruE!, 1960, 5 : 224.
31. Hirsch, W., Moores, P .. , Sanger, R. and Race R. R., J. Haemet, 1957,3: 134.
32. Pereira, Margaret, Med. Sci. Law, 1963, 3: 268.
33. Uhlenbruk, G., Proc. 10th Congr. Int. Soc. Blood Transf., Stockholm, 476, 1965.
34. Bargagna M. and Pereira, Margaret, J. For. Sci., 1967, 7: 123.
35. Goldsmith, K., Lancet, 1955, 1: 76.
36. Marsh, W. L.,Automation in Analytical Chem. Technicon Symposium, 1967,2: 47.
37. Pereira, M., Dodd, B. E., and Marchant, J. V., Med. Sci. Law, 1969, 9: 116.
38. Bocchini, V., Ahoto, M. A., and Najjar, V., Biochemistry, 1967, 6: 313.
39. Cori, G. T., Colowick, S. P., and Cori, C. F., J. BioI. Chem., 1938, 123: 375.
252
40. Culliford, B. J., J. ForensicScienceSoe., 1967,7: 131.
41. Culliford, B. J., 5th Internation Meeting in Forensic Sciences, Toronto, 1969, (printed in International J. Legal Medictn~ Vol. 4).
42. Culliford, B. J., Unpublished Data.
43. Dawson, D. M., and Mitchell, A., Biochemistry, 1969, 8: 609.
44. Giblett, E. R., Genetic Markers in Human Blood, Blackwell Scientific Publishers, 1969.
45. Gounaris, A. D., Horton, H. R., and Koshland, D. E., Biochem. Biophys. Acta, 1967, 132: 41.
46. Harris, H., Hopkinson, D. A., Luffman, ,]. E., and Rapley, S., City f)f Hope Symposium Series, Vol. 1, Grune and Strutton, 1968.
47. Hopkinson, D. A., and Harris, H., Nature, 1965, 208: 410.
48. Hopkinson, D. A., and Harris, H., Ann. Hum. Genet, 1966, 30: 167.
49. Hopkinson? D. A. Personal Communication.
50. Joshi, J. G., Kuwaki, T., Swanson, J. R., Sukaradh, T., and Handler" P., Pr:oc. Natn. Acad. Sci., 1967, 57: 1482.
51. Lie-Injo Luan Eng, Nature, 1966, 210: 1183.
52. Monn, E., Acta. Genet., 1968.
53. Monn, E., Vox. Sang., 14: 70.
54. Najjar, V. A., in Methods in Enzymology, Vol. 1, Academic Press, 1955.
55. Najjar, V. A., in Mechanism of Enzyme Actiol!.z, 1954.
56. Najjar, V. A< and Pullman, M.E., Science, 1954, 119: 631.
57. Passoneau, J. V., Lowry, O. H., Schulz, D. W., and Brown, J. G., J. BioI. Chem., 1969, 244: 4, 902.
58. Smithies, 0., Biochem. J., 1955, 61: 629.
59. Spencer, N., Hopkinson, D. A., and HarriS, H., Nature, 1964, 204: 742.
60. Stedman, R., J. Forensic Science Soc., 1970,
61. Sutherland, E. W., J. BioI. Chem., 1949, 180: 1279.
253
62. Wraxall, B. and Culliford, B.J., J. Forensic Science Soc., 1968, 8: 81.
63, Bajatzadeh, M .• Walter, H., and Palsson, J., Humangenetik, 1969, 7: 353.
64. Brewer, G. J., Bowbeer, D. R., and Tashian, R. E., Acta Genet.) 1967, 17! 97.
65. Harvey, R. G., Godber, M. J., Kopec, A. C., Mourant, A. E., and Tills, D., Hum. BioI., 1969, 141: 342.
66. Hopkinson, D. A. and Harris, H., Ann. Hum. Genet., 1966 30: 167.
67, Lie-lnjo, L. E., Lopez, C. G., and Poey-Oey, H. G., Am. J. Hum. Genet., 1968, 20: 101.
68, Modiano, G., Scozzari, R., Gigliani, F., Filippi, G., and Latte, B., Rend. Ace. Nat. Lincei., 1967, 42: 906.
69, Monn, E., Hum. H~., 1969, 19: 274.
70. Mourant, A. E. and Tills, D., Nature, 1967, 214: 810.
71. Shinoda, T., Natn. lnst. Genet., Japan, Ann. Rpt., 1968, 19: 89.
72. Wille, B., Schmidt, E. and Ritter, H., Humangenetik, 1968, 5: 271.
73. Hummel, K., Pulverer, G., Schaal, K., and Weidtman, V., Humangenetik, 1970, 8: 330.
74. Bockelmann, W. and Ritter, H., Humangenetik, 1968, 6: 373.
75. Bowen, W. 1. and Kerwin, T. D., Arch. Biochem. Biophys., 1954, 49: 149.
76, Bowman, J. E., Frischer, H., Ajmar, F., Carson, P. E., and Gower, M. K., Nature, 1987, 214i 1156.
77. Cerletti, P. and De Ritis, G., Clin. Chim. Acta, 1962, 7: 402.
78. Colowick, S. P. and Kalclar, H. M., J. BioI. Chern., 1943, 148: 117.
a9. Colowick, S. P. and Kaplan, N. 0., in Methods in Enzymology, Vol. 11, 1955.
80. Culliford, B. J. and Wraxall, B. G. D., J. Forensic Science Soc. , 1968, 8: No.2.
81. Fildes, R. A. and Harris, H., Nature, 1966, 209: 261.
254
82. Kashket, S. and Densted.t, O. F., C anad. J. Biochem. Physiol., 1958, 36: 1057. '
83. Rapley, S., Robson., E. B., Harris, H., and Smith, S. M., Ann. Hum. Genet., 1967, 31: 237.
84. Slater, E. C., Nature~ 1950, 166: 982.
85. Westkamp, L. R., Sing, C. F. Schneffler, D. C., and Guttarmsen, S. A., Ann. Hum. Genet., 1969, 21: 600.
86. Ananthakrishnan, R. and Kirk, R. L., Ind. J. Med. Res., 1969, 57: 1011.
87. Bowman, J. E and Ronaghy, H., Am. J. Phys. Anthrop., 1967, 27: 119. , \
88. Gordon, H., Vooijs, M., and Keraan, M. M., S. Afr. M~d. J., 1966, 40: 1031.
89. Modiano, G., Scozzari, R., Gigliani, F., Filippi, G., and Latte, B., Rend. Acc. Naz. Lincei1 1967, 42: 906.
90. Modiano, G., Scozzari, R., Gigliani, F., andSantolamazza, C., Humangenetik, 1969, 8: 253.
91. Radam, G. and Strauch, H., Humangenetik, 1968, 6: 90.
92. Shih, Ling-Yu, Hsia, D., Bowman, J. E., Shih, Shu-Chuang, and Shih, Ping-Long., Am. J. Hum. Genet., 1968, 20: 474.
93. Willie, B. and Ritter, H., Humangenetik, 1968, 5: 278.
94. Blake, N. M. and Kirk, R. L., Nature, 1969, 221: 278.
95. Bowman, J. E., Carson, P. E., Frischer, H., and de Garay, A., Nature, 1966, 210: 811,
96. Brewer, G. J. and Dern, R. J., Am. J. Human Genet, 1964: 16: 472.
97. Carson, P. E., Ajmar, F., Hashimoto, F., and Bowman, J. E., . Nature, 1966, 210: 813.
98. Carter, N. D., Fildes, R. A., Fitch, L. I., and Parr, C. W., Acta. Genet. Basel, 1968, 18: 109.
99. Colowick and Kaplan, Methods in Enzymology.
100. Culliford, B. J., 5th International Conference in Forensic SCiE'illCe, Toronto, 1969.
255
------------ --
101. Davidson, R. G., Am. Human Genet, 1967, 30: 355.
102. Fildes, R. A. and Parr, C. W., R,roc. Sixth Int. Congo Biochem., New York, 229.
103. Fildes, R. A. and Parr, C. W., Nature, 1963, 200: 890.
104. Fitch, L. 1. and Parr, C. W., Biochem. J., 1966, 99: 20p.
105. Gibbs, D. F., J. Clin. Path., 1968, 21: 189.
106. Kazazia, H. H., Nature, 1966, 212: 197.
107. Khan, P. M. and Rattazzi, M. C., Biochem. Genetics, 1968, 2: 231.
108. Negelein, E. ~d Haas, E., Biochem. Z., 1935, 282: 206.
109. Parr, C. W., Natur~, 1966,210: 487.
110. Parr, C. W. Personal communication.
111. Parr, C. W., 1968, Personal communication. (Hanshaw, E. and Parr, C. W.), Trans. R. S. Trop. Med. Hyg., 1969, 63: 119.
112. Parr, C. W. and Fitch, L. 1., Biochem .. i[., 1964, 93: 28c.
113. Parr, C. W. and Fitch, L. 1., Ann. Hum. Genet., 1967, 30: 339.
114. Parr, C. W. and Parr, LB., Biochem. J., 1965, 95: 16p.
115. Peebles, E. E., Barnett, D. R., and Oliver, C. P., J. Heredity, 1967, 58: 243.
!l6. Tuchinda, S., Rucknagel, D. L., Na-Nakorn, S., and Wasi, P., Biochemical Genetics, 2: 253.
117. Carter, N. D., Gould, S. R., Parr, C. W., and Walter, P. H., Biochem J., 1966, 99: 17p-18p.
118. Carson, P. E., Ajmar, F., Ha.shiruoto, F., and Bowman, J. E., Nature, 1966, 210: 814.
119. Chung, A. E. and Langdon, R. G., J. BioI. Chemistry, 1963, 238: 2309.
120. Detter et al.,Ann. Hum. Genet., 1968, 31: p. 329.
121. Giblett, E. R., Genetic Markers in Human Blooe!; Blackwell Scientific Publications, 1969. .
122. Harris, H., The Principles of Human Biochemical Genetics, NorthHolland Publishing Co., 1970.
256
123. Kirkman, H. N. and Hendrikson, E. M., J. BioI. Chemistry, 1962, J. BioI. Chemistry, 237: 2371.
124. Kirkman, H. N. and Hendrikson, E. M., Amer. J. Hum. Genet., 1963, 15: 241.
125. Lehmann, H. and Huntsman, R. G., Man's Haemoglobins, NorthHolland Publishing Co., Amsterdam, 1966.
126. Rattazzi, M. C. Bernini, L. F., Fiorelli, G., and Manucci, P. M., Nature, 1969, 213: 79.
127. Sparks, R. S., Baluda, M. C., and Townsend, D. E., J. Lab. Clin. Med., 1969, 73: 531.
128. Tan, I. K. and Whitehead, T. P., Clinical Chemistry, 1969, 15: 467.
129. World Health Organization, Technical Report Series No. 366, Standardization of Procedures for the Study of Glucose-6-Phosphate Dehydrogenase, 1967.
130. Yoshida, A., J. BioI. Chem., 1966, 241: 4966.
131. Yoshida, A., Biochem. Genet., 1967, 1: 81.
132. Zinkham, W. H., Lenhard, R. E., and Childs, B., Bull. Johns Hopkins Hosp., 1958, 102: 169.
133. Balinsky, D., and Jenkins, T., S. Afr. J. Med. Sci., 1966, 31: 124.
134. Porter, J. H., Boyer, So' H., Watson-Williams, G. H., Adam, A., Szeinberg, A., and Siniscalo, M., Lancet, 1964, 1: 895.
135. Reys, L., Manso, C., and Stamatoyannopoulos, G., Amer. J. Hum. Genet. ,1970, 22: 203.
136. Yoshida, A., Stamatoyannopoulos, G., and Motulsky, A., Science, 1967, 155: 97.
137. Dissing, J. and Knudsen, J. B., Human Heredity, 1969, 19: 375.
138. Fielgelson, P. and Davidson, J., J. BioI. Chemistry, 1956, 223: 65.
139. Hopkinson, D. A., Cook, P. J. L., and Harris, H., Ann. Hum. Genet., 1969, 32: 361.
140. Kalckar, H. M., J. BioI. Chemistry, 1947, 167: 445.
141. Spencer, N., Hopkinson, D. A., and Harris, H. , Ann. Hum. Genet., 1968, 32: 9.
142. Stedman, R., J. Forensic Sci. Soc., 1971.
257
451-769 0 - 72 - 17
143. Tariwerdian, G. and Ritter, H., Humangenetik, 1969, 7: 176.
144. Callaghan and La Du, Fedn. Proe. Fedn. Am. Soes. Exp. BioI., 1965 24: 610.
145. Culliford, B. J., Nature, 1963, 198: 797.
146. Harris, H., Hopkinson, D. A., Robson, E., and Whittaker, M., Ann. Hum. Genet., 1963, 26: 359.
147. Harris, H. and Robson, E., Lancet,1963, (i): 218.
148. Harris, H. and Whittaker, M., Nature, 1961, 191: 496.
149. Harris, H. and Whittaker, M., Ann Hum. Genet., 1963, 27: 53.
150. Kalow, Lancet, 1956, (ii): 576.
151. Kalow and Genest, K., Can. J. Biochem. Physiol .. , 1957, 35: 339.
152. Kalow and Lindsay, Can. J. Biochem. Physiol., 1955, 33: 568.
153. Lehmann, H. and Davies, Med. Sc. and Law, 1962, 2: No.3.
154. Liddell, Lehmann, and Silk, Nature, 1962, 193: 561.
155. Parkin, B. H., M. Sc. Thesis, 1968.
156. Parkin, B. H., Biochem. J. to be published.
157. Parkin, B. H., Ph.D Thesi.s.
158. Robson, E. and Harris, H., Ann. Hum. Genet., 1966, 29: 403.
159. Whittaker, M., Acta Genet., 1968, 18: 325-340.
160. Altland, K., Epple, F., and Goedde, H. W. , llilman Genetik, 1967, 4: 127.
161. Ashton, C. C. and Simpson, N. E., Am. J. Hum. Genet., 1966, 18: 438.
162. Bajatzadeh, M., Neumann, S., and Walter, H., Eumangenetik, 1969 7: 91.
163. Fraser, G. R., Stamatoyannopoulos, G., and Kattamis, C., Ann. N. Y. Acad. Sci., 1964, 119: 415.
164. Fraser, G. R., Grunwald, P., Kitchin, F. D., and Steinberg, A. G., Hum. Hered., 1969, 19: 57.
258
165. Horsfall, W. R., Lehmann, H., and Davies, D., Nature, 1963, 199: 1115.
166. Kalow, W. and Gunn, Dr. R., Ann. Hum. Genet., 1959, 23: 239.
167. Kattamis, C., Zannos-Mariolea, L. Franco, A. P. Liddell, J., Lehmann, H., and Davies, D., Nature, 1962, 196: 599.
168. Lisker, R., Del Morel, C., and Loria, A., Nature, 1964, 202: 815.
169. Motulsky, A. G. and Morrow, A. C., Science,. 1968, 159: 202.
170. Neumann, S. and Walter H., Nature, 1968, 219: 950.
171. Robson, E. B. and Harris, H., Ann. Hum. Genet., 1966, 29: 403.
172. Szeinberg, A., Pipano, S., and Ostfeld, E., Acta Anaesth, Scand., Suppl., 1966,24: 199.
173. Whittaker, M., Acta Genet., Basel, 1968, 18: 567.
174. Allison, A. C., Develop. Med. Child. Neurol., 1963,5: 51.
175. Connell, G. E., Dixon, G. H., and Smithies, 0., Nature, 1962, 193: 505.
176. Culliford, B. J., Nature, 1966, 211: 872.
177. Kirk.
178. Nance, W. E., and Smithies, 0., Nature, 1963, 198: 869.
179. Poulik, M. D., Nature, 1957, 180: 1477.
180. Smithies,O., Nature, 1955, 175: 307.
181. Sutton, H. E. and Karp, G. W., Amer. J. Hum. Genet., 1964, 16: 419.
182. Allbrook, D., Barnicott, N.A., Dance, N., Lawler, S. D., Marshall, R., and Mungai, J., Hum. BioI,., 1965, 37: 217.
183. Allison, A. C., Blumberg, B. S., and Ap Rees, W., Nature, 1958, 181: 824.
184. Allison, A. C., and Barnicott, N. A., Acta Genet., Basel, 1960, 10: 17.
185. Angelopoulos, B., Tsoukantas, A., and Danopoulos, E., J. Med. Genet., 1966, 3: 276.
259
186. Baitsch H., Liebrich, K. G., Pinkerton, F. J., and Mermod, L. E., Acta. Genet. Med. Gemell, 11: 308.
187. Bajatzadeh, M. and Walter, H., Hum. Hered., 1969, 19: 514.
188. B arnic ott , N. A., Garlick, J. P., and Roberts, D. F., Ann. Hum. Genet, 1960, 24: 171. -
189. Barros, F., rxth Congr. Soc. Europ. Haematol.,Lisbon, 1963, 26.
190. Baxi, A. J .. and Cameons, H., Hum Hered., 1969, 19: 65.
191. Blackwell, R. Q., Lin, T-Y, and Shiao, D. D. F., Natu~~~l 1962, 193: 284.
192. Blumberg, B. S. and Gentile, Z., l':ature, 1961, 189: 897.
193. Butler, R., Metaxas-Buhler, M., Rosin, S., and Wandrey, R., Schweiz, Med. Wschr., 1959, 89: 1041.
194. Fleischer, E. A. and Mohr, J., Acta Genet., Basel1. 1962, 12: 281.
195. Fraser, G. R., Giblett, E. R., Lee, T-C, and Motulsky, A. G., J. Med. Genet., 1965, 2: 21.
196. Fried, K., Bloch, N., Sutton. E., Neel, J. V., Bayani-Sioson, P., Ramot, B., and Duvdevani, P., in Genetics of Migrant and Isolate Populations, 1963, edited by Goldschmidt, E., Williams and Wilkins, Baltimore, 266;
197. Galatius-Jensen, F., Acta Genet., Basel, 1958, 8: 232.
198. Giblett, E. R. and Brooks, L. e., Nature, 197: 576.
199. Gordon, H., Robertson, M., Blair, J. M., and Vooijs, M., S. Afr. Med. J., 1964, 38: 734.
200. Harris, H., Robson, E. B., and Siniscalco, M., in Biochemistry of Human Genetics, 1959, edited by Wolstenholme, G. E. W. and O'Connor, C. M., Churchill, London, 151.
201. Hashem, N., Kamel, K., and Hammond, E. I., J. Med. Genet., 1966, 3: 279.
202. Kirk, R. L. and Lai: Y. C", Acta Genet, Basel, 1961, 11: 97.
203. Kirk, R. L., The Haptoglobin Groups in Man, Karger, Basel, 1968.
204. Makela, 0., Eriksson, A. W., and Lehtovarra, R., Acta Genet., Basel, 1959, 9: 149.
2(W
205. Matsumoto, H., Jap. J. Leg. Med., 1964, 18: 380.
206. MouUec, J., Fine, J. M., and Linhard, J., Rev. Haemotol., 1960, 15: 174.
207. Neel, J. V., Robinson, A. R., Zuelzer, W. W., Livingston, F. B., and Sutton, H. E., Am. J. Hum. Genet., 1961, 13: 262.
208. Plato, C. C., Rucknagel, D. L., and Gershowitz, H., Am. J. Hum. Genet, 1964, 16: 267.
209. Planas, J., Fuste, M., Vinas, J., and Irizar, J. L., Acta Genet, Basel, 1966, 16: 371.
210. Shim, B-S. and Bearn, A. G., Am. J. Hum. Genet., 1964, 16: 477.
211. Spendini, G., Riv., 1961, 68: 145.
212. Spendini, G., Acta. Genet. Med. Gemell., 1964, 13: 388.
213. Torrinha, J. A. F., Acta Genet. ,Basel, 1967,17: 74.
214. Van Ros, C., Van Sande, M., and Druet, R., Ann. Soc. BeIge. Me<;!. Trop., 1963, 43: 511.
215. Breen, M., Weinstein, H. G., and Schap, F. D., Biochem. Med., 1968, 2: 35-40.
216. Culliford, B. J., J. For. Sci. Soc., 1964, Vol. 4, No.3.
217. Graham, J. L. and Grunbaum, B. W., Amer. J. Clin. Path., 1963 Vol. 39, No.6, 567-78.
218. Huntsman, R. G. and Lehmann, H., Med. Sci. and Law, 1963, 3: 59.
219. Kohn, J., J. Clin. Path., 1969, 22: 109-10.
220. Lehmann, H. and Huntsman, R. G., "Mans Haemoglobins", NorthHolland Publishing Company, Amsterdam, 1966.
221. Lehmann, H. andAger, J., Ass. of Clin. Path. Broadsheet No. 33, 1961.
2Z2. Perutz, M. F., Scientific American, Nov. 1964.
223. Perutz, M. F. and Lehmann H., Nature, 1968, 219: 902-9.
224. Singer, K., Chernoff, A.!., and Singer, L., Blood, 1951, 6: 413-428.
225. Wraxall, B. G. D., J. For. Sci. Soc., 1971, to be published.
261
----------------- -- --
226. Allison, A. C., Ann. Hum. Genet., 1956,21: 67.
227. AllWon, A. C., Cold Spring Harbor Symposia on Quantitatjve BioI, 1964, 29: 137.
228. Andre, L. and Andre-Gadras, E., Med. Trop:, 1957, 17: 596.
229. Bideau, J. and Courmes, E., J. Med. Bordeaux, 1965, 142: 961.
230. Cabannes, R. andRuffie, J., C. R. Soc. BioI., Paris, 1961, 155: 2449.
231. Cabannes, R., in Abnormal Haemoglobins in Africa, 1965, edited by Jonxis, J. H. P., Davis Philadelphia.
232. Collier, W. A. and Prarra, D. A. de la, Docum. Med. Geogr. Trop., 1952, 4: 221.
233. Edington, G. M., Ann. Rpt. Dept. of Path. Univ. ColI. Ibadan, 1959.
234. Esrachowitz, S. R., Friedlander, S., Radloff, G., and Saunders, S. , S. Afr. Med. J..:, 1952, 26: 239.
235. Firschen, I. L., Am. J. Hum. Genet., 1961, 13: 233.
236. Foy, H., Kondi, A., Timms, G. Lq Brass, G. W., and Bushra, F., Brit. Med. J., 1954, 1: 294.
237. Henry, M. U., Carib. Med. J., 1963, 25: 26.
238. Lalouel, J.F. B., Bull. Soc. Anthrop., Paris Ser. X t 1955,6: 129.
239. Livingstone, F. B., Abnormal Haemoglobins in Human Populations, Aldine, Chicago, 1967.
240, Mera t B.; Bo!. Ofic. Sanit. Pan-Amer., 1943, 22: 680.
241. Mourant, A. E., The Distribution of the Human Blood Groups, Blackwell, Oxford, 1954.
242. Sansarricq, H., Marill, H., Portier, A., and Cabannes, R., Sanlk 1959, 30: 503.
243. Sar, A. vander, Ned. Tijdschr. Geneesk., 194\1,93: 1867.
244. Silva, E. M. da, Mem. Inst. Osw. Cruz., 1948, 46: 125.
245. Tomlinson, W. J., Am. J. Med. Sci., 1945,209: 181.
246. Trincao, C. and Martini de meIo, J., Israel J. Med .. Sci., 1965, 1: 772.
262
-- -- ---------------'
247. Vella, F., Acta Haematol, 1960, 23: 393.
248. Vella, F., Oceania, 1962, 32: 219.
249. Vella, F., in Abnormal Haemoglobins in Africa, Edited by Jonxis, J. H. P., Davis, Philadelphia, 1965, 339.
250. Vella, F., cited by Livingstone, F. B., 1966, (14).
251. Went, L. N., Nature, 1957, 180: 1131.
252. Wickremasinghe, R. L. and Ponnuswamy, N'. E. L., Spol. Zeyland, 1963, 30: 149.
263
APPENDIX A
SAMPLE EQUIPMENT AND LIST OF CHEMICALS AND ANTISERA
After testing many makes of electrophoresis apparatus, the Shandon equipment
was selected because it provides an almost pure direct current output. Tests
on the output of almost all other power supplies measured on an oscilloscope
demonstrated that the output was not filtered as well as the output of the Shandon
power supply. If a person does not wish to employ cooling platens which must
be provided with a circulating water pump such as RTE 3 Circulator, manu
factured by N eslab Instruments Inc. J Portsmouth, N. H. or any other make, it
is possible to run the equipment where cooling is necessary inside a common
refrigerator. The power supply is kept on top of the refrigerator, the con
necting wires are thin enough to fit under the rubber seal of the refrigerator
without difficulty.
Figure A-l is used for precipitin tests. Figure A-2 illustrates the electrophore
sis apparatus and its power supply. Figure A-3 is the cooled platen. A pair
is required in each tank.
The complete Shandon apparatus, including power supply but not including cooled
platens, is under $600.00.
A list of chemicals and antisera and their sources beg; ns on page 268.
264
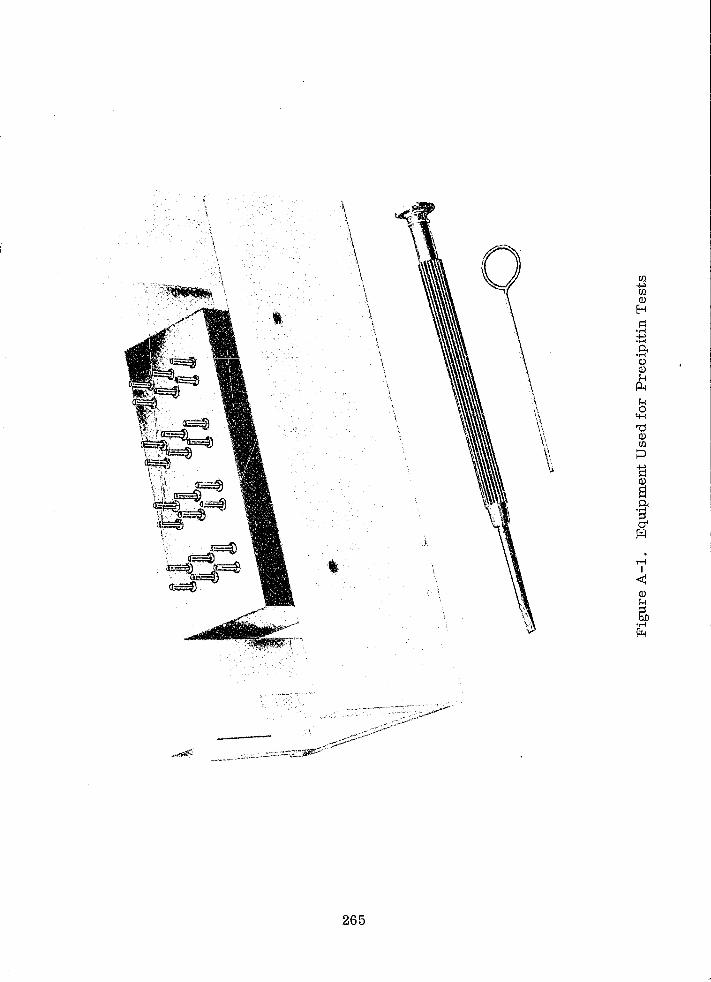
\
\ o
265
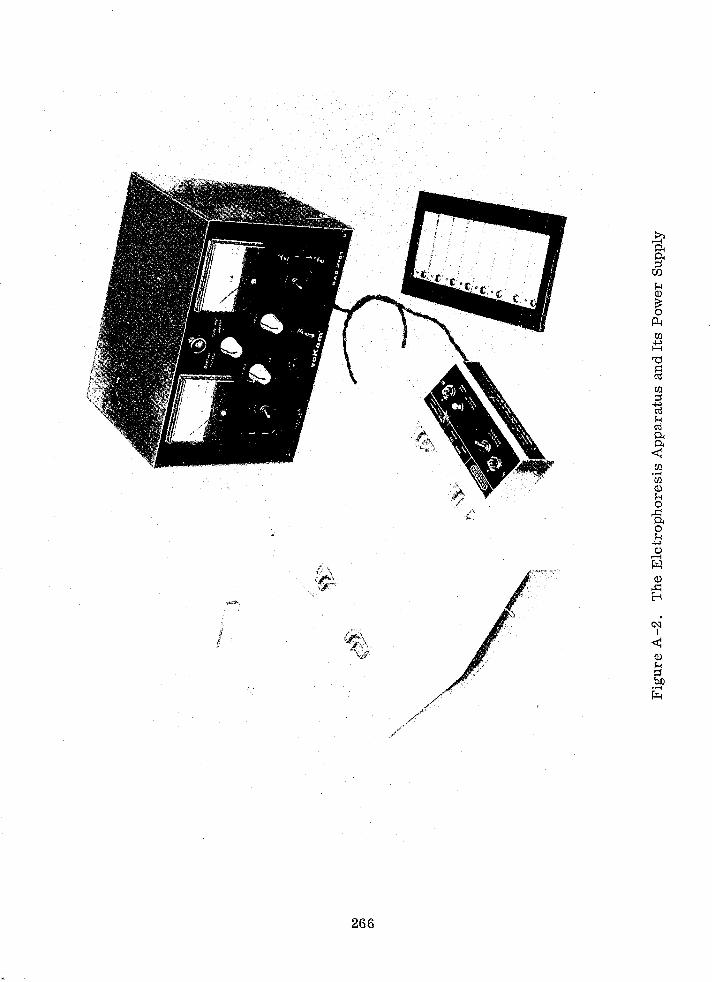
~ 0.. g. rn ~ OJ ~ 0
P-f 00 ...,
H
'0 § 00 ::J tl ~ cd 0. 0..
<t; 00 ...... 00 OJ ?-.. 0
,~ -a 0 ~ ..., C,)
...-t
~ OJ
..t:: ~
C'I I
<t; OJ
~ btl ...... r...t
/" ,/ ,/
266
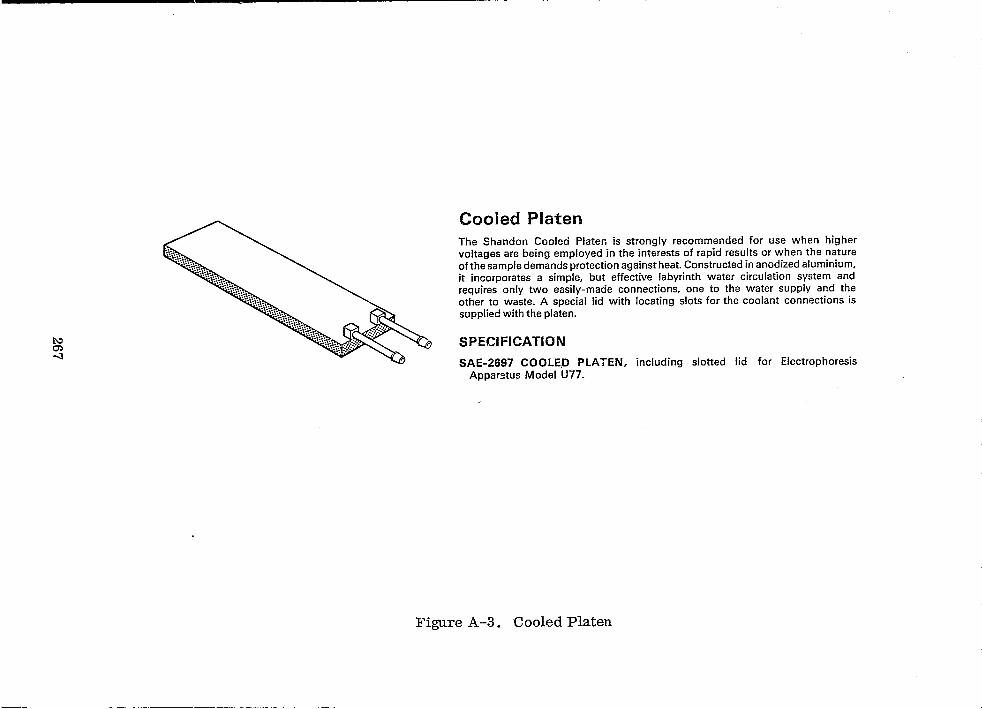
~ m -;J
Cooled Platen The Shandon Cooled Platen is strongly recommended for use when higher voltages are being employed in the interests of rapid results or when the nature ofthe sample demands protection against heat. Constructed in anodized aluminium. it incorporates a simple. but effective labyrinth water circulation system and requires only two easily-made connections. one to the water supply arid the other to waste. A special lid with locating slots for the coolant connections is supplied with the platen.
SPECIFICATION
SAE-2697 COOLE,D PLATEN, including slotted lid for Electrophoresis Apparetus Model U77.
Figure A -3. Cooled Platen
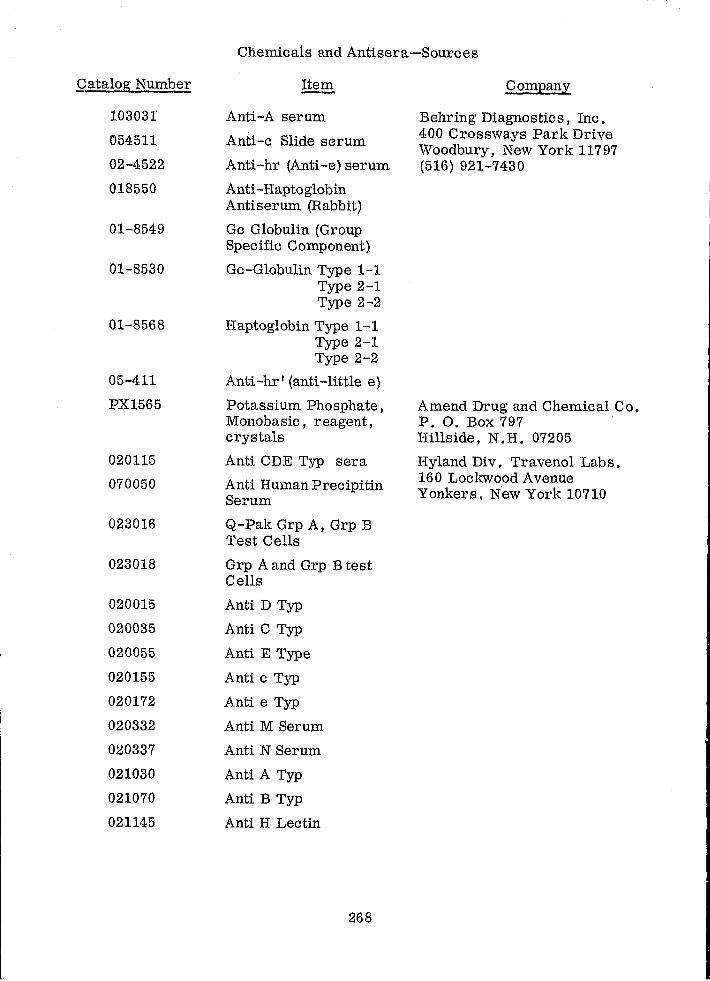
Catalog Number
103031
054511
02-4522
018550
01-8549
01-8530
01-8568
05-411
PX1565
020115
070050
023016
023018
020015
020035
020055
020155
020172
020332
020337
021030
021070
021145
Chemicals and Antisera-Sources
Anti-A serum
Anti -c Slide serum
Anti -hr (Anti -e) serum
Anti-Haptoglobin Antiserum (Rabbit)
Gc Globulin (Group Specific Component)
Gc-Globulin Type 1-1 Type 2-1 Type 2-2
Haptoglobin Type 1-1 Type 2-1 Type 2-2
Anti-hr' (anti-little e)
Potassium Phosphate, Monobasic, reagent, crystals
Anti CDE Typ sera
Anti Human Precipitin Serum
Q-Pak Grp A, Grp B Test Cells
Grp A and Grp B test Cells
Anti D Typ
Anti C Typ
Anti E Type
Anti c Typ
Anti e Typ
Anti M Serum
Anti N Serum
Anti A Typ
Anti B Typ
Anti H Lectin
268
Companl
Behring Diagnostics, Inc. 400 Crossways Park Drive Woodbury, New York 11797 (516) 921-7430
Amend Drug and Chemical Co. P. O. Box 797 Hillside, N.H. 07205
Hyland Div. Travenol Labs. 160 Lockwood Avenue Yonkers, New York 10710
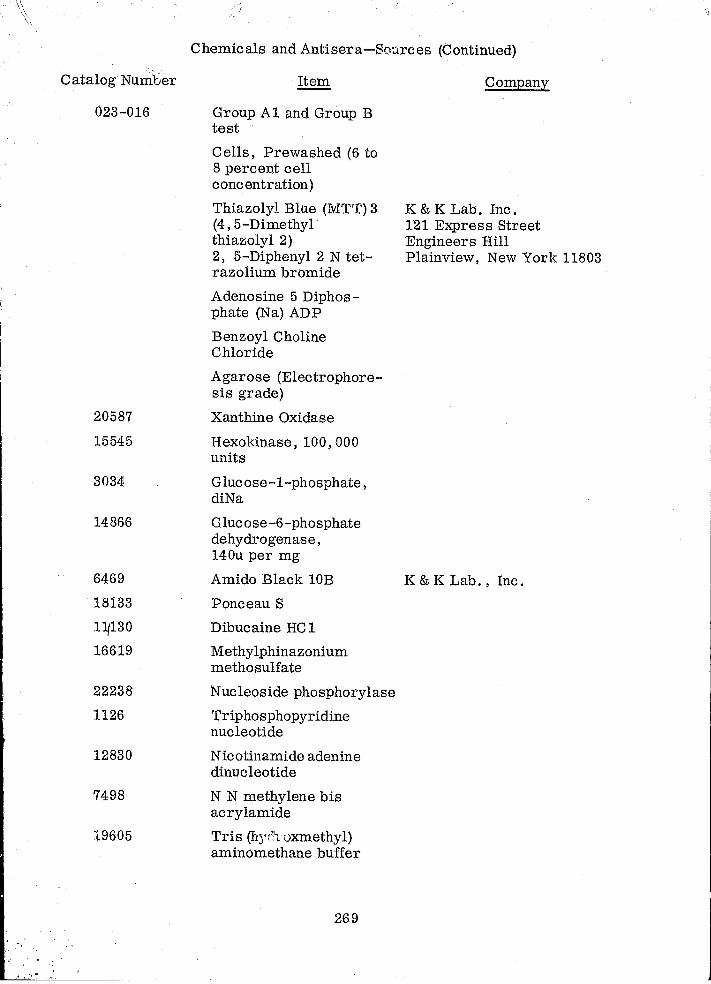
~ . ", ..
Catalog Number
023-016
20587
15545
3034
14866
6469
18133
111130
16619
22238
1126
12830
7498
19605
Chemicals and Antisera-Sources (Continued)
Item
Group A1 and Group B test
Cells, Prewashed (6 to 8 percent cell concentration)
Thiazolyl Blue (lvITT) 3 (4,5-Dimethyl thiazoly I 2) 2, 5-Diphenyl 2 N tetrazolium bromide
Adenosine 5 Diphosphate (Na) ADP
Benzoyl Choline Chloride
Agarose (Electrophoresis grade)
Xanthine Oxidase
Hexokinase, 100,000 units
G luc ose -l-phosphate , diNa
Glucose-6-phosphate dehydrogenase, 140u per mg
Amido Black lOB
Ponceau S
Dibucaine HC 1
Methy lphinazonium methosulfate
Nucleoside phosphorylase
Triphosphopyridine nucleotide
Nicotinamide adenine dinucleotide
N N methylene bis acrylamide
Tris (tlj"I''loxmethyl) aminomethane buffer
269
Company
K & K Lab. Inc. 121 Express Street Engineers Hill Plainview, New York 11803
K & K Lab., Inc.
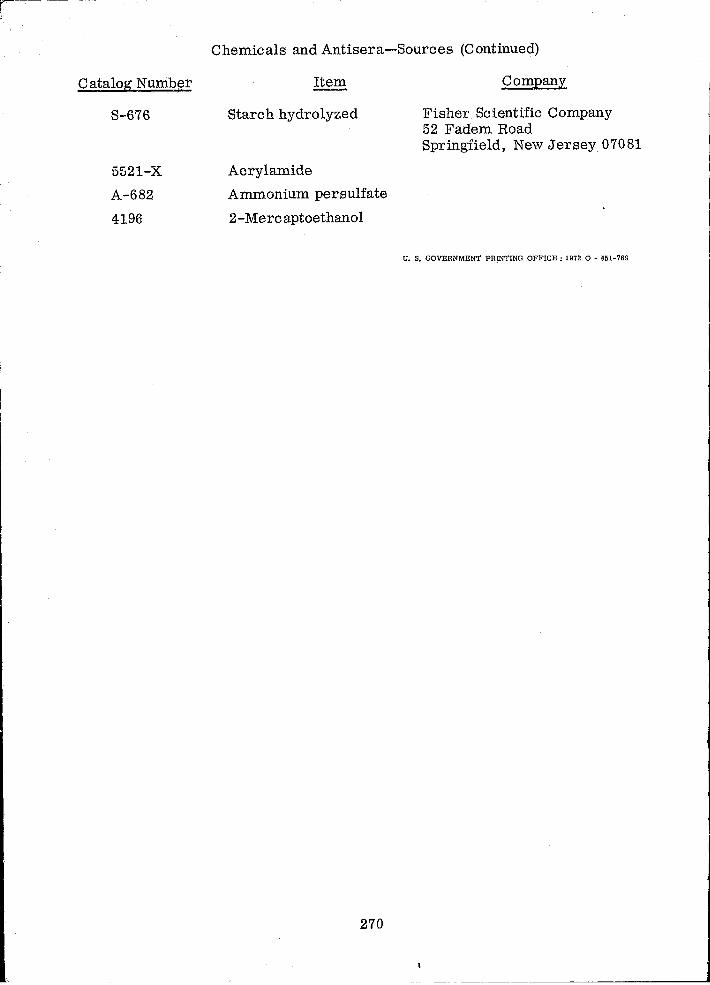
r il
Catalog Number
S-676
5521-X
A-682
4196
Chemicals and Antisera-Sources (Continued)
Item
Starch hydrolyzed
Acrylamide
Ammonium persulfate
2-~ercaptoethanol
270
Company
Fisher Scientific Company 52 Fadem Road Springfield, New Jersey 07081
U. S. GOVERNMENT PRINTING OFFICE! 1972 0 - 451-769