Embed Size (px)
Citation preview
ANAEROBIC DIGESTION APPLICATIONS IN THE TREATMENT
OF GELATIN-MANUFACTURING EFFLUENT
MAGARETHAHESTERLLOYD
Thesis approved in fulfilment of the requirements for the degree of
MASTER OF SCIENCE
in the Department of Food Science, Faculty of Agricultural Sciences
University of Stellenbosch
Study Leader: Dr. M. van der Merwe-Botha
Co-Study Leader: Prof. T.J. Britz
December 2000
ii
DECLARATION
I, the undersigned, hereby declare that the work contained in this thesis is my
own original work and that I have not previously submitted the thesis, in its
entirety or in part, at any university for a degree.
Magaretha Hester Lloyd Date
Stellenbosch University http://scholar.sun.ac.za
iii
ACKNOWLEDGEMENTS
I would like to express my gratitude and appreciation to the following persons
and institutions who formed an integral part of this research:
Dr. M. van der Merwe-Botha, Deputy Director Wastewater Engineering,
Krugersdorp Water Care Works, Krugersdorp Local Council, for her patience,
guidance and support throughout the duration of this study and most of all for
believing in me and giving me the chance to do this study;
Prof. T.J. Britz, Chairman of the Department of Food Science, University of
Stellenbosch, for his support, academic guidance and invaluable critique
throughout this study;
Dr. B. Cole and Mr. I. White from Leiner Davis Gelatin S.A. (Pty.) Limited, for
financial support and their interest, support, co-operation and enthusiasm
during the project;
Dr. A. van Niekerk, Mr. E. Joubert and Mr. T. Duminy from Wates, Meiring and
Barnard for the engineering assistance;
Krugersdorp Local Council for financial support towards my studies;
The process controllers and staff at the Percy Stewart Water Care Works for
assisting in the operation and cleaning of the pilot-scale system;
My fellow colleagues in the Water Laboratory - Flip Human Water Care Works,
for their endless patience and assistance with the analyses of the samples
throughout the study, as well as for their support and friendship;
The Water Institute of South Africa (Anaerobic Process Division), for
recognising my research and subsequently awarding me with the GG Cillié
award for the best contribution to anaerobic digestion research during 1999;
Stellenbosch University http://scholar.sun.ac.za
iv
My parents, for their encouragement and motivation throughout the study;
Mariana and Lizel, for their interest and moral support during this study;
Johan for his patience, endless love, dedication and encouragement through
out the study; and
Finally, the Creator of Life.
Stellenbosch University http://scholar.sun.ac.za
v
THIS THESIS IS DEDICATED TO MY PARENTS
" it is impossible to know the whole
without knowing its parts, as it is to know
the parts without knowing the whole."
B. Pascal, 1995
Stellenbosch University http://scholar.sun.ac.za
vi
ABSTRACT
A severely polluted industrial effluent is generated by the local gelatin-
manufacturing industry. Due to increasingly stringent restrictions on discharge
qualities enforced by the National Water Act of 1998 and National
Environmental Management Act of 1998, as well as increasing trade-effluent
charges implemented via the Local Municipal Bylaws, the industry is
compelled to consider a system to pre-treat the polluted effluent.
A study was undertaken to examine the viability of anaerobic treatment
of the gelatin-manufacturing effluent, since the anaerobic digestion technology
is well recognised for the high success rate in the treatment of high-strength,
complex wastewaters. Various laboratory and pilot-scale studies were done,
using different hybrid Upflow Anaerobic Sludge Blanket (UASB) and contact
designs.
Two mesophilic laboratory-scale hybrid UASB digester designs, fitted
with polyethylene (AD-1) and polyurethane (AD-2), performed well at a
hydraulic retention time (HRT) of 1.0 d. Chemical oxygen demand (COD)
removal efficiencies of up to 90% (avg. 53%) for AD-1 and 83% (avg. 60%) for
AD-2 at organic loading rates (OLR) of 9.56 and 4.62 kg COD.m-3.d-1,
respectively, were obtained. High sulphate (S04) removal efficiencies of up to
96% (avg. 86%) for AD-1 and 98% (avg. 82%) for AD-2 were also achieved,
respectively. A maximum total solid (TS) removal of 65% (avg. 25%) for AD-1
and 62% (avg. 28%) for AD-2 was reported. An average methane content of
80% (AD-1) and 79% (AD-2) with average methane yields per COD removed
of 2.19 and 1.86 m3. kg CODremoved.d-1for AD-1 and AD-2 were found,
respectively.
When the same digesters (AD-1 and AD-2) were combined in a muIti-
phase series configuration, a total COD removal efficiency of up to 97% (avg.
80%) at an OLR of 8.32 kg COD.m-3.d-1,was achieved. Excellent total S04
removals of 96% (avg. 69%) were accomplished. Up to 82% TS (avg. 29%)
was also removed during this study and the biogas consisted of 89% methane
(avg. 79%). For this multi-phase combination up to 92% volatile fatty acids
(VFA) (avg. 48%) were removed, indicating possible selective phase
separation of the respective fatty acid producing/utilising bacterial populations.
Stellenbosch University http://scholar.sun.ac.za
vii
The use of a laboratory-scale UASB bioreactor with recirculation,
resulted in COD removal efficiencies of up to 96% (avg. 51%) at an HRT of 3.0
d, and 95% (avg. 54%) at a HRT of 1.0 d. Low performances were generally
found, with average S04 and TS removals of 59% (max. 97%) and 26% (max.
67%), respectively at an HRT of 1.0 d. The biogas production was very low
throughout the study (0.05 - 0.63 I,d-1).
A pilot-scale UASB reactor (300 I) was constructed and performed
satisfactory with a 58% average COD removal and maximum of 96%. S04
and TS removals up to 96% (avg. 44%) and 93% (avg. 63%), respectively,
were obtained. The methane content of the biogas was 85%. The pilot-scale
studies were conducted under actual field conditions, where various shock and
organic loads had to be absorbed by the system.
The pilot-scale contact configuration (300 I) did not perform satisfactory
as a result of continuous blockages experienced in the feed and recirculation
lines. Maximum COD, S04, VFA and TS removal efficiencies of 41% (avg.
27%), 62% (avg. 41%), 64% (avg. 27%) and 39% (avg. 21%), respectively,
were obtained.
The results of all the studies indicated acceptable COD removals with
increasing OLR's. Indications of the presence of active methanogenic and
sulphate-reducing bacterial populations were apparent throughout the studies.
One possibility for the successful start-up and commissioning of the anaerobic
reactors was the use of a well-adjusted biomass, which consisted of highly
selected and adapted microbial consortium for the specific gelatin-
manufacturing effluent.
It was clear from this study that gelatin-manufacturing effluent can be
treated successfully, especially with the use of the UASB design. A well-
defined data base was constructed which could be of great value for further
upscaling to a full-scale digester.
Stellenbosch University http://scholar.sun.ac.za
viii
UITTREKSEL
'n Hoogs besoedelde industriele uitvloeisel word gegenereer deur die plaaslike
gelatien-vervaardigings industrie. As gevolg van toenemende streng
beperkings op die kwaliteit van uitvloeiselswat bepaal word deur die Nasionale
Water Wet van 1998 en Nasionale Omgewings Bestuurs Wet van 1998, asook
toenemende munisipale heffings wat geimplementeer word via Plaaslike
Munisipale Wette, word die industrie verplig om die uitvloeisel vooraf te
behandel.
'n Studie is onderneem om die lewensvatbaarheid van anaërobe
behandeling van gelatien-vervaardigings uitvloeisel te ondersoek, aangesien
anaërobe verterings tegnologie alombekend is vir die goeie sukses behaal in
die behandeling van hoë-sterkte, komplekse uitvloeisels. Verskeie
laboratorium- en loods-skaal studies is gedoen, met verskillende hibried
Opvloei Anaërobe Slykkombers (OAS) en kontak ontwerpe.
Goeie werksverrigting was verkry by 'n hidroliese retensie tyd (HRT) van
1.0 d met twee mesofiliese laboratorium-skaal hibried OAS verteerder
ontwerpe wat uitgevoer was met poli-etileen (AD-1) en poli-uretaan (AD-2)
materiaal. Chemiese suurstof behoefte (CSB) verwyderings van so hoog as
90% (gem. 53%) vir AD-1 en 83% (gem. 60%) vir AD-2 by organiese
ladingstempo's (OLT) van 9.56 en 4.62 kg CSB.m-3.d-1,was onderskeidelik
verkry. Hoë sulfaat (S04) verwyderings van tot 96% (gem. 86%) vir AD-1 en
98% (gem. 82%) vir AD-2 was ook onderskeidelik verkry. 'n Maksimum totale
vaste stof (TVS) verwydering van 65% (gem. 25%) vir AD-1 en 62% (gem.
28%) vir AD-2 is gerapporteer. 'n Gemiddelde metaan inhoud van 80% (AD-1)
en 79% (AD-2) met 'n gemiddelde metaan opbrengs per CSB verwyder van
2.19 en 1.86 m3.kg CSBverwyder.d-1vir AD-1 en AD-2, was onderskeidelik
gevind.
Met die aanwending van dieselfde twee verteerders (AD-1 en AD-2) in
'n series gekoppelde multi-fase konfigurasie, is 'n totale CSB verwydering so
hoog as 97% (gem. 80%) verkry by 'n OLT van 8.32 kg CSB.m-3.d-1.
Uitstekende totale S04 verwydering van 96% (gem. 69%) is behaal. Tot 82%
TVS (gem. 29%) was vewyder gedurende die studie en die biogas het uit 89%
metaan (gem. 79%) bestaan. Vir die multi-fase kombinasie is 'n maksimum
Stellenbosch University http://scholar.sun.ac.za
ix
van 92% vlugtige vetsure (WS) (gem. 48%) verwyder, wat dui op die
moontlike skeiding van selektiewe fases van die onderskeie vetsuur
produserende/verbruiker bakteriële populasies.
CSB verwydering van tot 96% (gem. 51%) by 'n HRT van 3.0 d en 95%
(gem. 54%) met 'n HRT van 1.0 d was verkry, tydens die gebruik van In
laboratorium-skaal OAS bioreaktor met hersirkulasie. Lae werksverrigting was
oor die algemeen waargeneem, met gemiddelde S04 en TVS verwyderings
van 59% (maks. 97%) en 26% (maks. 67%) by In HRT van 1.0 d. Die biogas
produksie was baie laag gedurende die studie (0.05 - 0.63 I,d-\
In Loods-skaal OAS verteerder was opgerig en bevredigende resultate
was verkry met In gemiddeld van 58% CSB verwydering en maksimum van
96%. S04 en TVS verwyderings so hoog as 96% (gem. 44%) en 93% (gem.
63%) is onderskeidelik verkry. Die metaan inhoud van die biogas was 85%.
Die loods-skaal studie was uitgevoer gedurende ware veld kondisies,
waartydens verskeie skok en organiese ladings deur die sisteem geabsorbeer
is.
Die loods-skaal kontak konfigurasie (300 I) het nie bevredigende
resultate getoon nie, as gevolg van voortdurende blokkasies wat ondervind is
in die toevoer en hersirkulasie pype. Maksimum CSB, S04, WS en TVS
verwyderings van 41% (gem. 27%), 62% (gem. 41%), 64% (gem. 27%) en
39% (gem. 21%) was onderskeidelik verkry.
Die resultate van al die studies het aanvaarbare CSB verwydering
aangedui by toenemende OLT's. Indikasies van aktiewe metanogene en
sulfaat-reduserende bakteriële populasies was ook teenwoordig gedurende die
studies. Die suksesvolle aansit-prosedure en begin van die anaërobe
verteerders kan toegeskryf word aan die gebruik van In goed aangepaste
biomassa, wat uit hoogs selektiewe en aangepaste mikrobiese populasies vir
die spesifieke uitvloeisel bestaan.
Hierdie studie het getoon dat gelatien-vervaardigings uitvloeisel
suksesvol met die OAS ontwerp behandel kan word. In Goed gedefinieerde
data basis kan voorsien word, wat van groot waarde sal wees vir verdere
opgradering na In volskaalse verteerder.
Stellenbosch University http://scholar.sun.ac.za
x
CONTENTS
Page
Acknowledgements iii
Abstract vi
Uittreksel viii
Chapter 1 Introd uction 1
Chapter 2 Literature review 7
Chapter 3 Treatment of gelatin-manufacturing effluent using 60
single-phase anaerobic hybrid digesters
Chapter 4 Treatment of gelatin-manufacturing effluent using multi- 95
phase anaerobic hybrid digesters
Chapter 5 Treatment of gelatin-manufacturing effluent using an 128
Upflow Anaerobic Sludge Blanket (UASB) bioreactor
Chapter 6 Pilot-scale anaerobic pre-treatment of undiluted gelatin- 145
manufacturing effluent using an UASB and a contact
configuration
Chapter 7 General discussion, conclusions and recommendations 169
Language and style used in this thesis are in accordance with the
requirements of the International Journal of Food Science and Technology.
This thesis represents a compilation of manuscripts where each chapter is an
individual entity and some repetition between chapters has, therefore, been
unavoidable.
Stellenbosch University http://scholar.sun.ac.za
1
CHAPTER 1
INTRODUCTION
The conservation of natural water resources enjoys a high priority listing in
both developing and first world countries. South Africa is a semi-arid region,
which makes it imperative that our water resources should be properly
protected, managed and treated, whether to produce water for general
consumption, for specific industrial uses, or to limit the discharge of pollution
into the environment.
Increasing problems experienced with the disposal of high-strength
industrial waste in an environmentally acceptable manner and compliance to
local water quality guidelines prompted research and investigations into
management strategies and treatment of wastewater (Laubscher et al., 1992;
Van Der Merwe & Britz, 1993). Different types of wastewaters are produced
daily which must then be accommodated by the wastewater purification
works. This may present a problem in itself to local authorities, as the
disposal of certain industrial effluents can inhibit the biological treatment
processes, such as anaerobic digestion and biological nutrient removal
plants, resulting in an inefficient and costly treatment process.
One of the most difficult wastewater types to treat is gelatin-
manufacturing effluent. Gelatin has a wide variety of uses, in food processing
from wine fining to confectionery, and in the manufacturing industry from
matches to photography. The problems associated with the disposal of
complex, high-strength wastewaters necessitate industries more and more to
consider suitable pre-treatment methods to minimise the detrimental effect of
the biological processes used in conventional treatment plants (Maree et al.,
1990). There are various treatment options to consider, ranging from physical
to chemical to biological methods.
Leiner Davis Gelatin S.A. (Pty.) Limited (LOG) is the only South African
manufacturing industry of edible and technical gelatin and is situated in West-
Krugersdorp, Gauteng Province. During April 1995, LOG changed their
gelatin-manufacturing process by substituting the lime (Ca(OH)2)process step
Stellenbosch University http://scholar.sun.ac.za
2
with a sodium hydroxide (NaOH) process step. This was done for economic
and product quality reasons. Following these changes, the local wastewater
purification works at Krugersdorp experienced numerous and complex
problems with the operational side of the plant. The LOG process produces
high effluent volumes, with distinctive peak and low periods in terms of
organic, hydraulic and toxic loads. These effluents are typically highly
alkaline with a high chemical oxygen demand (COD), suspended solid (SS),
sodium (Na), chloride (Cl), ammonia (NH3-N), electrical conductivity (EC) as
well as fats/oils contents (Table 1). High concentrations of sulphate (SO/-),
peroxide (H202) and hexavalent chromium (Cr6+) have also been detected.
Odours are also a major source of irritation and are associated with reduced
sulphur compounds, which are an environmental nuisance rather than a toxic
hazard (Lens et aI., 1998).
The modification of the gelatin-manufacturing process resulted in an
overall decrease in process efficiency and a subsequent increase in
operational costs of the local wastewater purification works. It was clear that
the 12% (v/v) gelatin-manufacturing effluent fraction of the total inflow volume
to the wastewater plant, could be correlated directly to the treatment plant
efficiency (Van Der Merwe-Botha, 1998, Personal communication). The
gelatin-manufacturing effluent contributes furthermore to 65% (m/m) of the
total organic load of the conventional plant. Problems experienced at the
local wastewater purification works included a loss in nitrification and
denitrification ability, reduced ortho-phosphate (P04-P) and COD removal, as
well as biosolids carry-over to the secondary clarifiers. The quality of the
anaerobic sludge also decreased, resulting in lower digester pH and alkalinity
values, decreased biogas production and volatile fatty acid (VFA) removal.
The salinity levels of the gelatin-manufacturing effluent discharged to
the local wastewater purification works has a high conductivity (800 - 1 500
rns.m'). This high electrical conductivity suggests the presence of high
concentrations of ions leading to high total dissolved solid (TOS)
concentrations (Department of Water Affairs and Forestry, 1996). This is
unacceptable to the local authorities as it contributes to the mineralisation of
the receiving water resources and it also has a definite toxic effect on
Stellenbosch University http://scholar.sun.ac.za
3
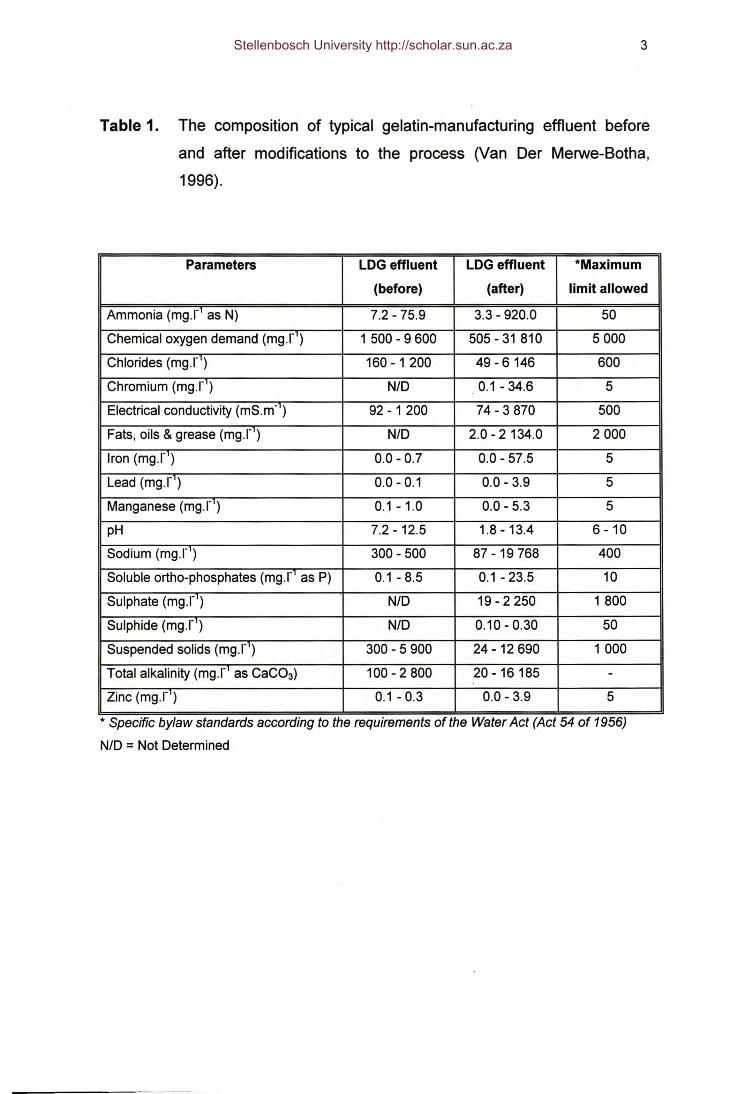
Table 1. The composition of typical gelatin-manufacturing effluent before
and after modifications to the process (Van Der Merwe-Botha,
1996).
Parameters LOG effluent LOG effluent *Maximum
(before) (after) limit allowed
Ammonia (rnq.l" as N) 7.2 - 75.9 3.3 - 920.0 50
Chemical oxygen demand (rnq.l") 1 500 - 9 600 505 - 31 810 5000
Chlorides (rnq.I") 160 - 1 200 49 - 6146 600
Chromium (rnq.I") NfD 0.1 - 34.6 5
Electrical conductivity (rns.m' ) 92 - 1 200 74 - 3 870 500
Fats, oils & grease (mg.r ) NfD 2.0 - 2134.0 2000
Iron (rnq.l") 0.0 - 0.7 0.0 - 57.5 5
Lead (rnq.I") 0.0 - 0.1 0.0 - 3.9 5
Manganese (mg.r ) 0.1-1.0 0.0 - 5.3 5
pH 7.2 - 12.5 1.8 -13.4 6 - 10
Sodium (mg.r ) 300 - 500 87 - 19 768 400
Soluble ortho-phosphates (mg.r as P) 0.1 - 8.5 0.1 - 23.5 10
Sulphate (rnq.l") NfD 19 - 2 250 1800
Sulphide (rnq.l") NfD 0.10 - 0.30 50
Suspended solids (rnq.I") 300 - 5 900 24 -12 690 1000
Total alkalinity (rnq.I as CaC03) 100 - 2800 20 -16185 -Zinc (rnq.l") 0.1 - 0.3 0.0 - 3.9 5
* Specific bylaw standards accordmg to the requirements of the Water Act (Act 54 of 1956)
NfD = Not Determined
Stellenbosch University http://scholar.sun.ac.za
4
microbial activity and nutrient removal. Both the high concentrations of Na
and Cl cause specific ion toxicity and osmotic stress to the microbial
populations of the purification works (Schoeman & Steyn, 1997). It was also
found that biomass disintegration of the natural-occurring algae on the
secondary clarifier walls occurred, again suggesting severe toxic effects
(Schoeman & Steyn, 1997).
It is generally recommended that chromium and sulphide concentration
levels in tannery effluents should be less than 40 and 5 rnq.l", respectively,
prior to discharge (Schoeman & Steyn, 1997). The presence of chromium
and/or heavy metals may possibly inhibit the acidogenic and methanogenic
bacteria as well as specific enzymatic processes of the anaerobic digestion
process. The high amounts of sulphur compounds in the gelatin-
manufacturing effluent also result in an increased growth of filamentous
organisms like Beggiatoa, Thiothrix and Type 021N (Eikelboom, 1975).
These organisms can grow on a number of organic compounds, but may also
gain energy for growth from the oxidation of reduced sulphur compounds, like
hydrogen sulphide (H2S) (Richard, 1989; Lens et al., 1998). Problems were
also experienced with Micothrix parvicella and Type 0092 filamentous
organisms due to high wastewater grease and fat contents. These filaments
result in a high sludge volume index (SVI), poor settling of sludge after the
activated sludge treatment process, sludge foaming and carry-over of the
biosolids during clarification (Jenkins et aI., 1986; Richard, 1989).
Furthermore, the presence of these filamentous organisms indicate the
conversion of sulphates to H2S, which then result in the corrosion of
equipment and inhibition of specific biological activities (Lens et aI., 1998).
It is therefore clear that efficient pre-treatment of this effluent is
extremely important to both the manufacturing/producing industry and the
receiving local authority. As the direct treatment seems to be a complex and
expensive option, the possibility of pre-treating this effluent might provide a
suitable option to increase the efficiency of the total process managed by the
wastewater purification works and ensure a continual disposal facility to the
effluent-producing industry. The idea of such a pre-treatment option has
been well received by the industry, which view this option as an attractive
Stellenbosch University http://scholar.sun.ac.za
5
alternative to promote their environmental policy, comply with the stricter
pollution control legislation and continue their core business in a suitable
manner.
Against this background, the objective of this study was to find a
suitable pre-treatment option for the biodegradation of the gelatin-
manufacturing effluent, so as to produce an acceptable effluent quality for
disposal to the local wastewater purification facilities.
References
Department of Water Affairs and Forestry (1996). South African Water Quality
Guidelines (second edition). Volume 4: Agricultural Use: Irrigation.
Published by the Department of Water Affairs and Forestry, Private
Bag X313, Pretoria, 0001, South Africa.
Eikelboom, D.H. (1975). Filamentous organisms observed in activated sludge.
Water Research, 9, 365-388.
Jenkins, D., Richard, M.G. & Daigger, G.T. (1986). Manual on the causes and
control of activated sludge bulking and foaming. Published by the
Water Research Commission, P.O. Box 824, Pretoria, 0001, South
Africa
Laubscher, S.J.A, Kenmuir, K., De Villiers, H.A, Messenger, J.R. & Ekama,
G.A (1992). Evaluation and optimization of dual digestion of sewage
sludge. WRC Report No 189/4/92. Published by the Water Research
Commission, P.O. Box 824, Pretoria, 0001, South Africa.
Lens, P.N.L., Visser, A, Janssen, AJ.H., Hulshoff Pol, L.W. & Lettinga, G.
(1998). Biotechnological treatment of sulfate-rich wastewaters. Critical
Reviews in Environmental Science and Technology, 28(1), 41-88.
Maree, J.P., Cole, C.G.B., Gerber, A & Barnard, J.L. (1990). Treatment of
gelatin factory effluent. Water SA, 16, 265-268.
Richard, M.G. (1989). Activated sludge microbiology. Published by the Water
Pollution Control Federation, Alexandra, Virginia.
Stellenbosch University http://scholar.sun.ac.za
6
Schoeman, J.J. & Steyn, A. (1997). Evaluation of membrane technology for
the treatment of industrial effluents. WRC Report No 590/1/97.
Published by the Water Research Commission, P.O. Box 824, Pretoria,
0001, South Africa.
Van Der Merwe- Botha, M. (1996). Performance of anaerobic hybrid digesters
treating different industrial wastewater treating types. In: Proceedings
of the Afriwater Conference, October 1996, Midrand, South Africa.
Van Der Merwe, M. & Britz, T.J. (1993). Anaerobic treatment of raw baker's
yeast effluent using an anaerobic filter and a hybrid digester.
Bioresource Technology, 43, 169-174.
Van Der Merwe-Botha, M. (1998). Personal communication, Local Council of
Krugersdorp, Krugersdorp, South Africa.
Stellenbosch University http://scholar.sun.ac.za
7
CHAPTER 2
LITERATURE REVIEW
A. Gelatin-manufacturing process
In South Africa the main source of gelatin is the bovine hide which is not
suitable for tanning purposes. The reject hides available to the gelatin
industry vary from green masks from local abattoirs through partly processed
or dehaired tannery waste (both wet and dry) to hides preserved by drying,
salting and treatment with sodium meta-bisulphite for short-term preservation
(Maree et aI., 1990). Besides the "non-chrome" waste hides (Fig. 1), by-
products from the leather tanning industries can also be used to produce
gelatin (Cot et al., 1985). These wet or dry by-products embody chrome-
tanned leather splits, trimmings, buffing dust and shavings, containing about
90% water-soluble protein and 5 - 6% Cr203 (chromium (III) oxide) (Cot et aI.,
1985).
The conversion of the insoluble hide collagen into water-soluble gelatin
involves several protein hydrolysis and denaturation processes. Additionally
to the "non-chrome" waste hides, the gelatin-manufacturing industry also uses
a small amount of chrome-tanned leather shavings for extraction of a good
edible food grade gelatin. The use of chrome-tanned leather is undesirable
because chromium strongly stabilises the leather structure and remains
unaffected by ordinary gelatin manufacturing processing conditions (Cot et
aI., 1985). The shavings are mixed with magnesium oxide (MgO) after which
the shavings undergo the same extraction and primary filtration process as
with the "non-chrome" wastes. Carbon treatment is thereafter used to remove
the residual amounts of inorganic compounds such as nitrogen, sulphides
and heavy metals, especially chromium.
The "non-chrome" waste hides are cut into smaller pieces, after
undergoing a mechanical desalting process. To remove all the hair and
epidermis, the hides are placed in processors with sodium sulphide (25 - 30
kg 60% Na2S) and sodium hydroxide (NaOH) at a pH of 12 for several hours.
Stellenbosch University http://scholar.sun.ac.za
8
HIDES"
RAW MATERIAl RECEIVING & STORAGE
I I TANNERY SHAVINGS I
+MIXING WITHMAGNESIUM OXIDE
+EXTRACTION"
~#
rHIDECUTTING
I--:J}---=JING
ALKALI PRIMARYFILTRATION
~
TREATMENT"
~#WASHING&ACIDULATION"
~#EXTRACTION"+ 5%
LIGHTLIQUORFILTRATION
~g~T;H -l ,~. .J
RESIDUECOOK
H.:~N_G_E_" _DISSOLVING OF "'~I-----,GELATIN
PRIMARY" 15% HEAVY LlQUOR --t•• STERILISATION *EVAPORATION~ FILTRATION .,.#
CARBONTREATMENT"
r---- DRYING" .....I-....:#:__- CHILL & ......I- __ _,3~O%!!!..... EXTRUDE" ....
SECONDARYEVAPORATION"1------------------------------- REPROCESSING ---+I:'
I.---I~ PRE-GRINDING"___' BATCH BLENDING -----I.. HOLD FORTESTING"rll-I------i.~ REPROCESSING ----I ••,"",G"'yBLENDING ~
~ REBLENDING
HOLD FOR I • REPROCESSING ---~ ....
rRE-SCREEN
TESTING *
BAG & .....1- FINAL .....I--------APPROVAL._JDESPATCH SIFTING"
(" QUALITY CONTROL PROCESS IN VOL VED)(# EFFLUENT DISCHARGE)
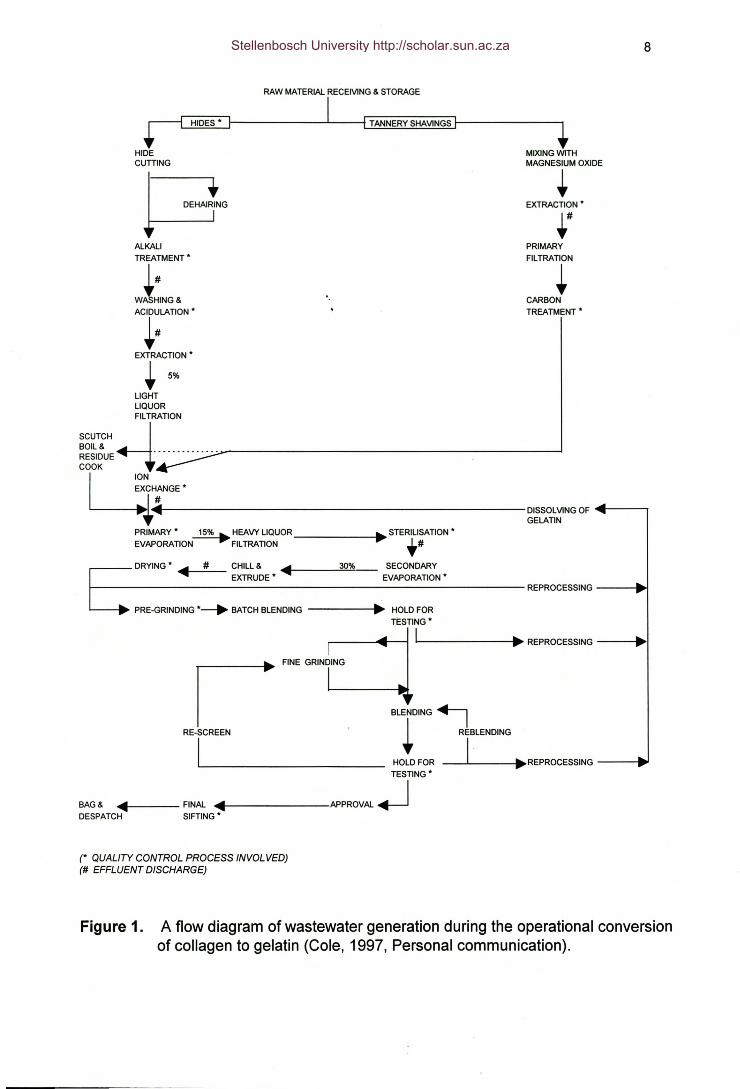
Figure 1. A flow diagram of wastewater generation during the operational conversionof collagen to gelatin (Cole, 1997, Personal communication).
Stellenbosch University http://scholar.sun.ac.za
9
The hides are then chemically conditioned in alkali pits at a pH of 11 - 12 for 9
- 18 days, depending on their condition. The alkali pits contain 1.1 - 1.8%
sodium hydroxide (44 kg NaOH.r\ of which 0.6% NaOH can be recovered.
During the alkali conditioning the swelling of the hides take place by
denaturation of the collagen peptide chains, thus opening the fibre structure.
The effluent discharge after the alkali conditioning has high pH, chemical
oxygen demand (COD), electrical conductivity (EC) and sodium (Na) values.
The hides are then transferred to washers with reclaimed water to remove
excess alkali, followed by bleaching with hydrogen peroxide (H202) for 8 h.
Bleaching eliminates the surplus sulphide (S2-) of the dehairing process. The
H202 is reduced with sulphur dioxide (S02-gas), since the H202 may cause
corrosion to the metal instruments of the process.
The next step is acidulation with 300 - 350 I sulphuric acid per washer
(22 kg H2S04.r1) for 6 - 8 h, resulting in a reduction of pH and inorganic
contamination. The hides are once again washed in reclaimed water to
change the pH from 1.5 - 3.0. After the acid wash the effluent has a low pH
and high EC and total dissolved solids (TOS) values. The water from the
alkali and acid-pits are disposed together in a sedimentation tank to neutralise
and prevent metal dissociation in the gelatin-manufacturing effluent. This
effluent is then discharged into the sewer system and has to comply with the
effluent discharge standards as specified by the local authorities.
The final denaturation of the collagen proteins (pH 3.0) is achieved by
gently heating (440 - 48°C) the product in fresh water to produce a diluted
solution of gelatin. By increasing the temperature (700- 80°C), more gelatin
can be extracted with a recovery rate of 4% gelatin. The undissolved
compounds such as fats, fine collagen and suspended solids, are eliminated
by primary (light liquor) filtration. The sodium and sulphate ions are removed
by adding hydrochloric acid (HCI) and NaOH, respectively. Hydrochloric acid
is used as a cation in the ion exchange process and NaOH is used as an
anion to remove the contaminating ions. After the extraction and primary
filtration process 5% of the gelatin can be recovered. The water used in the
ion exchange process is also disposed in the sedimentation tank. This
effluent usually has a high TOS concentration; a high pH and low COD
lj. s.
Stellenbosch University http://scholar.sun.ac.za
10
values. The gelatin and water (liquid) mixture is circulated in an evaporator to
remove most of the water from the gelatin. Low pressure and high
temperature (± 500G) is maintained in the evaporator to recover a higher
concentration of gelatin (15%).
The secondary (heavy liquor) filtration is a more specialised process
where cellulose filters and a higher temperature are used to remove
unwanted compounds like precipitated albumin. The gelatin is kept at 40° -
45°G at all times to prevent coagulation. The pH of the gelatin is adjusted to
5 or 6 with either ammonia or NaOH to prevent the protein concentrations
present in the gelatin to become unstable. Ultra-high temperature (UHT)
sterilisation takes place at 1400G for 8 sec to prevent any bacterial growth.
After the secondary evaporation, the gelatin is passed through a barrel
(scrape surface heat exchanger votator), with the outer pipe filled with calcium
chloride (GaGI) to cool and coagulate the gelatin in the inner pipe (-100G).
The gelatin is then passed through a noodle plater. The GaGI is retained and
recirculated continuously. In the final process the coagulated gelatin is
passed through a drying belt which is divided into eight compartments to
ensure proper drying of the gelatin. As the temperature increases in each
compartment from 28° - 600G, air is constantly blown into the drying belt. At
the end, 70% moisture is withdrawn and 30% gelatin powder can be
recovered. The dried gelatin then undergo a pre-grinding process and batch
blending. The gelatin must be tested for suitability before the final product
can be despatched.
The gelatin-manufacturing industry uses approximately 58 000 kl water
per month for a 6 day operational week. Up to ± 15% of the water is lost by
evaporation. The total volume of water used is between 1 500 - 2 500 kl.d".
The effluent discharge after certain processes, is shown in Fig. 1. The
quantity of effluent produced per day after the different processes are: alkali
conditioning (70 kLd-1 / 4.5%); ex-alkali washing (300 kLd-1 / 19.2%); acid
wash (540 kLd-1 / 34.6%); fluming of washers (160 kl.d' / 10.3%); ion
exchange (70 kLd-1 /4.5%); secondary filtration (40 kLd-1 / 2.6%); cooling (80
kLd-1 / 5.1%); cleaning of washers (250 kLd-1 / 16.0%) and for washing of
chrome shavings (50 kLd-1 /3.2%).
Stellenbosch University http://scholar.sun.ac.za
11
B. Treatment options
Industrial wastewater treatment requirements are becoming more stringent in
terms of limiting concentrations of organic and inorganic substances and
suspended solids (Metcalf & Eddy, 1991). Difficulties with the treatment of
gelatin-manufacturing effluent is related to the high organic and suspended
solid loads, as well as high sodium and chloride concentrations. This results
in a complex and highly variable mixture of soluble organic and inorganic
compounds, bacteriological constituents and suspended solids in an aqueous
medium and, thus, a difficult degradable effluent (Maree et al., 1990). The
implementation of effective pre-treatment methods (physical, chemical or
biological) in the South African market will lead to better point-source pollution
control, water savings, resource recovery and effluent volume reductions. By
using these methods to reduce the suspended solid and organic loads, a
facilitation of a reduced gelatin-manufacturing effluent strength may become
possible (Metcalf & Eddy, 1991). The gelatin-manufacturing industry
continuously experiments with different processes to extract the maximum
concentration of gelatin from the hides, hence the effluent quality and quantity
varies continuously. Subsequently, the local wastewater purification works
also have to change processes since the constituents of the gelatin-
manufacturing effluent varies periodically. The disposal of gelatin-
manufacturing effluent will remain a significant concern, if pre-treatment is not
considered. The necessity for pre-treatment and/or other disposal
alternatives for the gelatin-manufacturing effluent is therefore well-motivated.
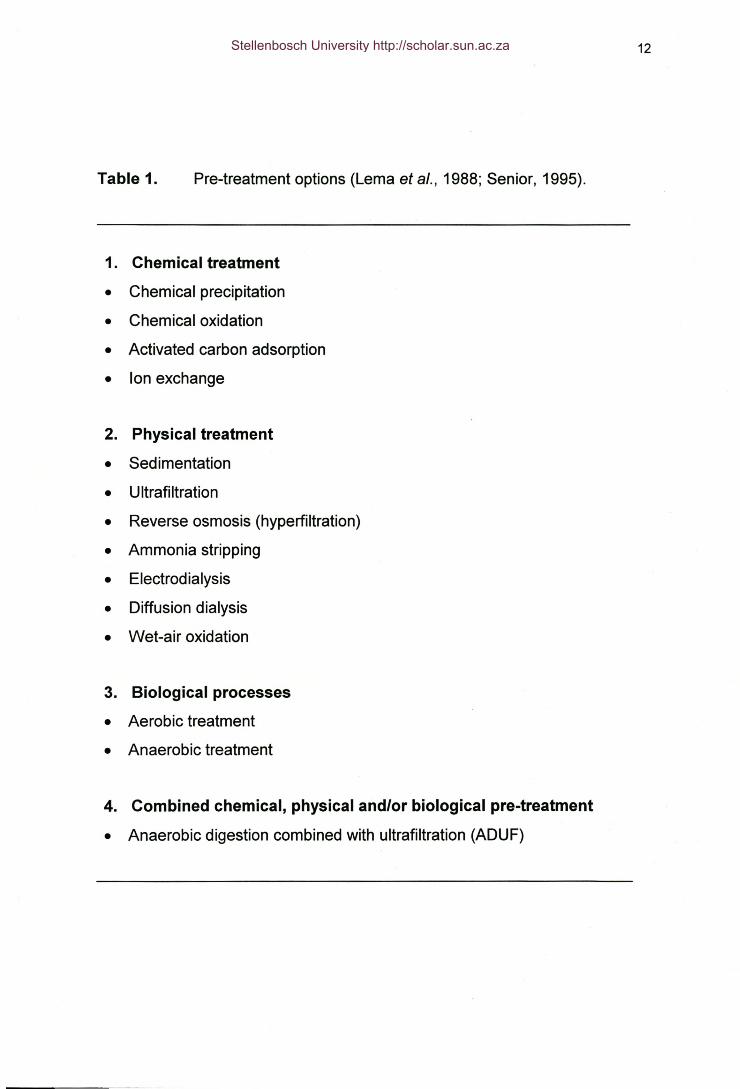
A variety of alternatives for the partial pre-treatment or total treatment
of gelatin-manufacturing effluent can be adopted in order to reach
environmental quality requirements (Table 1) (Lema et al., 1988; Senior,
1995).
Stellenbosch University http://scholar.sun.ac.za
12
Table 1. Pre-treatment options (Lema et al., 1988; Senior, 1995).
1. Chemical treatment
• Chemical precipitation
• Chemical oxidation
• Activated carbon adsorption
• Ion exchange
2. Physical treatment
• Sedimentation
• Ultrafiltration
• Reverse osmosis (hyperfiltration)
• Ammonia stripping
• Electrodialysis
• Diffusion dialysis
• Wet-air oxidation
3. Biological processes
• Aerobic treatment
• Anaerobic treatment
4. Combined chemical, physical and/or biological pre-treatment
• Anaerobic digestion combined with ultrafiltration (ADUF)
Stellenbosch University http://scholar.sun.ac.za
13
B.i. Chemical treatment
Chemical precipitation
This treatment involves the addition of chemicals to alter the physical
state of the dissolved and suspended solids and to facilitate their removal by
sedimentation, as well as the removal of heavy metals (Metcalf & Eddy,
1991). Lime (Ca(OH)2) and alum (AI2(S04)) are most commonly used,
although the addition of flocculants such as ferric chloride (FeCh), sodium
sulphide (Na2S) and ferrous sulphate (FeS04) have also been used
successfully (Chian & De Walle, 1976; Saint-Forte,1992). The addition of
flocculants will cause sludge and solids to settle faster. The removal of solids
will thus reduce the organic loading on a biological system. Due to the
reagents added a large quantity of sludge will be generated, which can be
potentially hazardous. Good improvements in colour, suspended solids, NH/
and heavy cation elimination are obtained, although the maximum reduction
of COD was only 30 - 60% (Harrington & Maris, 1986; Saint-Forte, 1992;
Gaydon & De Haas, 1998). High heavy metal concentrations can inhibit
biological activity (Senior, 1995). The addition of lime, for instance, results in
an increase in pH and this leads to coagulation and formation of insoluble
metal hydroxides and calcium carbonate. The resulting flocs then aid in the
settling of colloidal material (Kang et aI., 1990; Lugowski et aI., 1990; Duncan
et a/., 1995). This treatment option is often the most expensive due to high
operating costs and large amounts of sludge generated that have to be either
disposed of or further treated (Senior, 1995).
Chemical oxidation
Chemical oxidation can be used to either render several contaminants
insoluble, to gasify them or to stabilise them as relatively harmless
substances (Metcalf & Eddy, 1991; Saint-Forte, 1992). The effects of several
chemicals such as chlorine (CI2), ozone (03), calcium hypochlorite (Ca(CIO)2),
potassium permanganate (KMn04), hydrogen peroxide (H202), halogenated
oxidants, etc. have been evaluated (Kang et aI., 1990; Duncan et aI., 1995).
The reduction in COD by Clz, 03, Ca(CIO)2 and KMn04, even at high doses,
Stellenbosch University http://scholar.sun.ac.za
14
was insufficient « 48%) to give an acceptable treatment efficiency (Lema et
al., 1988).
Low COD removals were achieved with CI2 (between 20 - 30%)
(Loizidou et al., 1993). Chlorine (CI2) provides sufficient disinfection of the
effluent, but can also combine with organic compounds to form materials
which may present health hazards to humans and other life forms (Van Der
Walt, 1997). Excellent iron and colour removals were observed with
Ca(CIO)2, but it also increased the hardness concentrations of the final
effluent.
With H202, as another option, a 35% COD removal was achieved with
the treatment of leachate (Loizidou et al., 1993). However, Van Der Merwe
(1994) achieved a COD removal of 57 - 70% with varying H202
concentrations as post-treatment of baker's yeast effluent. A small
percentage of ammonia can also be oxidised with H202 (Loizidou et aI.,
1993). It can also be considered as a good option for taste and odour control
and treatment (Harrington & Maris, 1986). Chlorine (CI2) and H202 were both
however, not effective in the total removal of taste and odour (Van Der Walt,
1997).
Nickel (Ni) concentrations can be reduced (25 - 75%) by chemical
oxidation with KMn04 and H202. Problems with foaming may occur and this
is an unacceptable complication for a full-scale plant (Senior, 1995). In
addition to foaming, KMn04 treatment also generates 10 - 50% (w/v) more
sludge (Kang et aI., 1990), causing a further disposal problem.
The use of halogenated oxidants as a treatment option leads to the
formation of highly dangerous organic halides, which will upset the microbial
activity in the system (Senior, 1995).
Good colour removal was found with ozone (03) and CI2 (Van Der
Walt, 1997; Ramlall & Nozaic, 1998). Ozone (03) also kills bacteria more
rapidly than Cb (Bessarabov & Grimm, 1998). Ozone (03) is only applicable
to waste streams containing less than 1% oxidisable materials (Enzminger et
aI., 1987). Oxidation of iron (Fe), manganese (Mn) and organic compounds
can also be achieved with 03 (Bessarabov & Grimm, 1998; Ramlall & Nozaic,
1998). Hydrogen peroxide (H202) controls bulking during the initial stage of
Stellenbosch University http://scholar.sun.ac.za
15
treatment and 03 improves sludge settleability consistently and also stabilises
nutrient removal (Saayman et al., 1997). A combination, known as peroxone
(03 and H202), has a better oxidising capacity than the two separately, and
even more important, no harmful by-products are produced (Enzminger et al.,
1987; Saayman et ai., 1997). The oxidation of the taste and odour
compounds in effluents, were enhanced by the addition of peroxone.
Chemical oxidation is expensive and involves high treatment costs but
depends on the type of unit processes already installed in the treatment plant
(Senior, 1995).
Activated carbon adsorption
Carbon adsorption is the most extensively used physical-chemical
means of removal of refractory organic compounds, as well as residual
amounts of inorganic compounds such as nitrogen, sulphides and heavy
metals (Enzminger et aI., 1987; Metcalf & Eddy, 1991). This method entails
the collection of soluble substances that are in solution, on a suitable carbon
interface (Metcalf & Eddy, 1991). The best results reported were obtained
when combined with biological methods (Chain & De Walle, 1976; Ving et al.,
1987). Better reduction of organic levels (>85%) are achieved by the
adsorption of pollutants on activated carbon (Pohland & Kang, 1975). The
main disadvantage is the need for frequent regeneration of the carbon
columns or an equivalently high consumption of carbon powder (Lema et ai.,
1988; Senior, 1995). Handling and energy costs are high but this treatment
option can be cost effective for the removal of residual organics when the
total dissolved solids in solution are lower than 200 mq.l' (Senior, 1995).
Ion exchange
This is a process where the ions of an insoluble exchange material
(resin) are displaced by the ammonia (NH4+) ions in the effluent. It comprises
of three processes: sorption of heavy metals from the catching bath solution,
regeneration of the resin and electro-precipitation of heavy metals in the
electrolyser (Grebenyuk et aI., 1998). The process may be operated in a
batch or continuous mode. The ions which are displaced by NH4 + displaces,
Stellenbosch University http://scholar.sun.ac.za
16
vary with the nature of the solution used to regenerate the bed or packed
column. This process produces a relatively low TOS effluent and 80 - 90% of
the NH3/NH/ is removed to produce a reclaimable product (aqueous
ammonia). High concentrations of other cations will reduce the removal of
ammonia (Metcalf & Eddy, 1991).
It was also found that ion exchange is an effective method for the
removal of nickel, chromium and copper (Duncan et aI., 1995; Schoeman &
Steyn, 1995; Grebenyuk et aI., 1998). Filtration as pre-treatment option is,
however, required to prevent the accumulation of suspended solids. Other
problems found are the disposal of the regeneration products and the high
operational costs involved (Metcalf & Eddy, 1991).
B.2. Physical treatment
Sedimentation
Readily settleable solids with a higher gravity than the liquid tend to
settle when the effluent, which is often high in suspended solids, is placed in
a sedimentation tank (Van Der Walt, 1998). This is one of the most
commonly used methods in wastewater treatment. Solids with a lower gravity
(fats, oils and other floating material) will tend to rise. The aim of
sedimentation is thus to remove floating materials and settleable solids. The
solids are generally withdrawn from the bottom (Atlas & Bartha, 1993). These
solids can then be treated via anaerobic digestion and/or by composting prior
to final disposal in landfills or as a soil conditioner (Atlas & Bartha, 1993), thus
decreasing the SS and COD concentrations (Metcalf & Eddy, 1991). With the
use of a sedimentation tank, the load on biological treatment units can be
reduced and the removal of suspended solids is found to be between 50 -
70% (Metcalf & Eddy, 1991). However, initial capital investment and space
requirements are high.
Ultrafiltration
Different cross-flow pressure-driven membrane separation processes
fulfil different functions. These filtration membranes are mainly fabricated
Stellenbosch University http://scholar.sun.ac.za
17
from poly-ether sulphone or cellulose acetate (Sanderson & Hurndall, 1995;
Nell & Kafaar, 1996; Jacobs & Barnard, 1997). Microfiltration membranes
remove suspended solids and reduce bacteriological activity, but not the
colour and the dissolved organic content of the water. Ultrafiltration, in which
a finer membrane is used, does not affect most soluble cations and anions
such as alkalinity and hardness concentrations, but is capable of removing
medium molecular-mass dissolved organic material and reducing turbidity to
levels of 0.1 nephelometric turbidity units (NTU). Ultrafiltration is thus unable
to desalinate water (Jacobs et aI., 1998). Ultrafiltration can also be used to
remove up to 90% of the COD load in effluents (Swart et al., 1996).
Nanofiltration membranes, which are even finer, can partly desalinate water
(soften it) and can remove substantial quantities of low molecular-mass
organic material, as well as viruses (Buckley et al." 1992; Jacobs & Barnard,
1997). A typical nanofiltration membrane has a sodium chloride retention of
50% and a magnesium sulphate retention of 98% (Sanderson & Hurndall,
1995). The membrane technology also includes the removal of fats and oils,
chromium, iron and sulphate from tannery effluents, as well as the removal of
turbidity from colour colloids (Schoeman & Steyn, 1997). The pH of the
effluent must be more or less neutral, as it can cause hydrolysis of the
membrane over a period of time (Jacobs & Barnard, 1997). The membranes
have a finite life and also show a limited tolerance to the presence of chlorine
(Sanderson & Hurndall, 1995). Another major problem with this method is
membrane fouling, but this can be cleaned with the correct chemical and
enzyme combinations, depending on the type of effluent to be treated (Swart
et al., 1996; Maartens et al., 1998). Pressure-driven membrane processes
are an ideal treatment option to use together with reverse osmosis to produce
a higher quality effluent, but it requires very high running, capital and cleaning
costs (Swart et aI., 1996; Jacobs & Barnard, 1997). The selection of a
suitable filtration technique may pose specific problems due to the variability
of industrial effluents (Buckley et al., 1992).
Stellenbosch University http://scholar.sun.ac.za
18
Reverse osmosis (hyperfiltration)
Another pre-treatment possibility includes reverse osmosis, which
involves the separation of dissolved solids in a solution. This is a process
whereby water is forced, by pressure, through a semi-permeable membrane
at a pressure greater than the osmotic pressure caused by dissolved salts in
the wastewater (Krug & McDougall, 1988; Metcalf & Eddy, 1991; Sanderson
& Hurndall, 1995). The advantage of this process is almost complete
desalting or the removal of dissolved organic material, which can not be
removed by other demineralisation techniques (Buckley et al., 1992; Juby et
al., 1998). The prediction of the precipitation potential of effluents is difficult
because of the chemical complexity and variability. However, one major
disadvantage of ultrafiltration and reverse osmosis technologies is the
precipitation of trace substances and metals (Buckley et al., 1992). The
reverse osmosis membrane treatment is an effective physical method for
reducing the COD level (80 - 98%) (Chian & De Walle, 1976), the chromium
levels from 80% up to 94%, the cadmium levels up to 99%, the zinc
concentrations up to 94%, as well as for the recovery of 93 - 99% nickel
(Schoeman & Steyn, 1995). However, the zinc recovery in a reverse osmosis
plant is not as economical as for nickel recovery (Schoeman & Steyn, 1995).
With reverse osmosis it was shown that it is possible to reduce the
electrical conductivity in a heavy metal-rich effluent (Schoeman & Steyn,
1995). Reverse osmosis is usually very effective if it is combined with another
pre-treatment method, like ultrafiltration (Schoeman & Steyn, 1997). Due to
scale formation, the pH must be adjusted to a range of 4.0 - 7.5 and removal
of iron and manganese participates are recommended (Metcalf & Eddy,
1991). It is possible to control membrane fouling with regular chemical
cleaning (Schoeman & Steyn, 1995). Prolongation of membrane life
necessitates pre-treatment of the effluent to eliminate suspended solids and
colloidal material (Juby & Schutte, 2000). The type of membrane, pH,
pressure and pre-treatment are important factors in determining the
effectiveness of this process (Kettern, 1992). However, the cost of
purchasing, installing and cleaning the membranes, can be relatively high.
Stellenbosch University http://scholar.sun.ac.za
19
Ammonia stripping
Ammonia stripping is a possible option to remove excess
concentrations of ammonia (Henry, 1985; Prasad et aI., 1985; Lema et aI.,
1988; Smith & Arab, 1988; Kang et aI., 1990). The high concentrations of
ammonia-nitrogen can be removed from wastewater by increasing the pH, by
the addition of lime, to above 9 (Henry, 1985) or 11 (Lema et al., 1988),
followed by the formation of NH3-gas. By bubbling air through the system,
ammonia removal for atmospheric discharge can also be accomplished
(Smith & Arab, 1988.) Thus, when water contains a volatile gas such as NH3
in excess of its equilibrium level, the NH3 will move from the water into the air
until equilibrium is reached. Ammonia stripping allows the concentration of
NH3-N to be reduced by an overall removal of 60 - 95%, if it is used in
combination with chemical precipitation and biological activated sludge
treatment (Keenan et aI., 1984; Henry, 1985; Lema et aI., 1988). Due to the
high operating and maintenance costs, the application of ammonia air
stripping is limited (Metcalf & Eddy, 1991). The process is very sensitive to
temperature changes, wind speed, aeration rate, lagoon configuration, pH
control, surface area and the ammonia solubility increases with a decrease in
temperature (Smith & Arab, 1988; Saint-Forte, 1992). The disadvantage of
the pH increment, is that carbon dioxide (C02) is absorbed from the air and
the development of carbonate scaling will occur within towers, lagoons and
feed lines (Senior, 1995). Ammonia air stripping can be considered as a cost
effective and unsophisticated system, but stripping towers can be expensive
to build and operational problems include the formation of an adherent scale
in the tower (Smith & Arab, 1988). Lagoons can rather be seen as a lower
cost alternative. The high pH is also advantageous in removing heavy metals
by precipitation and then air stripping the ammonia from the wastewater, thus
minimising ammonia and metal inhibitory effects (Henry, 1985). Air pollution
is also a possibility, as a result of the reaction of ammonia with sulphur
dioxide (S02) (Metcalf & Eddy, 1991).
Stellenbosch University http://scholar.sun.ac.za
20
Electrodialysis
Electrically driven membrane separation processes are very promising
technologies in the reclamation of water and chemicals from industrial
effluents (Schoeman & Steyn, 1996). These include different methods like,
electrodialysis (ED), electrodialysis reversal (EDR), electro-electrodialysis
(EED) and bipolar electrodialysis (BED) (Schoeman & Steyn, 1996).
Electrodialysis can be effectively applied for the removal of dissolved organic
substances, desalination of brackish waters for potable use and for metal
recovery in the electroplating industry (Schoeman & Steyn, 1996). The
conventional ED also has the potential to be used for cost-effective treatment
of chromium (81% removal), cadmium, copper (92% removal), nickel (97%
removal), silver (95% removal) and zinc electroplating rinse waters for waste
and chemical recovery (Schoeman & Steyn, 1995; Schoeman & Steyn, 1996).
The EED process is also effective for the removal of chromium. The BED
process is effective for the recovery of acid and caustic soda (NaOH)
(Schoeman & Steyn, 1996). The ionic components of a solution are
separated through the semi-permeable ion-selective membranes (Metcalf &
Eddy, 1991).
Application of an electrical potential between the two electrodes
causes an electric current to pass through the solution and a migration of
anions to the positive electrode takes place. As a result of the alternate
spacing between the cation and anion-permeable membrane, precipitation of
salts with low solubility can occur on the membrane surface (Metcalf & Eddy,
1991). Depending on which variant of ED is chosen, the capital costs and
electrical energy usage are relatively high (Schoeman & Steyn, 1996).
Clogging of the membrane by residual colloidal organic matter and metals is
also one of the problems associated with the ED process (Metcalf & Eddy,
1991). To reduce membrane fouling, activated carbon pre-treatment
preceded by chemical precipitation, may be necessary. Regular chemical
cleaning should also be practised to clean fouled membranes (Schoeman &
Steyn, 1995). However, the above methods are expensive to implement and
to maintain.
Stellenbosch University http://scholar.sun.ac.za
21
Diffusion dialysis
The gelatin-manufacturing factory uses high volumes of acid (H2S04,
HCI) and alkali (NaOH) in the process (Cole, 1997, Personal communication).
Diffusion dialysis could effectively be used to recover acid from spent acid
(Schoeman & Steyn, 1995) produced during the gelatin-manufacturing
process. It was indicated by Schoeman & Steyn (1995), that 74 - 76% HCI
could be recovered using this method. Sulphuric acid (H2S04) recovery was
approximately 75%. Up to 95% iron, nickel and copper could also be
removed from the acid. However, zinc could not be removed effectively by
this method as when compared to other available methods (Schoeman &
Steyn, 1995). For better recovery of acids and caustic soda, the diffusion
dialysis can be combined with a BED process (Schoeman & Steyn, 1996).
The capital costs are also high for implementing this treatment option.
Wet-air oxidation
This technology is also suitable for the pre-treatment of high organic
and salinity wastewater (Neytzell-de Wilde, 1985). Aqueous wastes can be
oxidised into the liquid phase, by using a combination of elevated
temperatures and pressures (Neytzell-de Wilde, 1985). Wastewaters with
high organic or salinity content are quantitatively mixed with compressed air
(Metcalf & Eddy, 1991) and pumped through a heat exchanger where the
temperature is increased from 150° to 200°C (Neytzell-de Wilde, 1985).
About 5 - 10% of the COD may be oxidised at 150°C and at 320°C complete
oxidation would occur in a pressurised reactor (Neytzell-de Wilde, 1985).
After oxidation is initiated, the discontinuation of the steam heating occurs,
and the oxidation products leave the reactor at temperatures between 220°
and 330°C (Neytzell-de Wilde, 1985). These products are re-used to heat the
incoming organic liquor and air. Spent air, carbon dioxide and steam are
removed from the oxidised effluent in a separator. In wet-air oxidation
processes, the organic wastes are used as "free fuel" to heat the incoming
wastewater, but the air which must be supplied to the reactor under pressure,
can be very costly (Neytzell-de Wilde, 1985).
Stellenbosch University http://scholar.sun.ac.za
22
B.3. Biological processes
One of the most promising treatment options for the removal of organic
substances (colloidal or dissolved) in wastewater is biological degradation.
The objective of biological treatment is mainly to coagulate and remove the
non-settleable colloidal solids and to stabilise the organic matter (Metcalf &
Eddy, 1991). The substances can be converted into gas that can escape to
the atmosphere and be utilised as carbon in biological cell material that can
be removed by settling (Metcalf & Eddy, 1991). Other aims of biological
treatment methods are the nitrification, denitrification, phosphorus removal,
sulphate reduction and waste stabilisation, as well as the reduction in the
volume of biosolids.
Biological processes for treating wastewaters include aerobic, anoxic,
anaerobic, combined aerobic, anoxic and anaerobic methods and pond
(maturation, oxidation, stabilisation) processes. The biological treatment of
industrial wastewater holds several advantages, including: reduced pollution
load to the receiving waters; higher stability of the regional treatment plant;
lower impact of unexpected changes in industrial processes on discharging to
regional treatment plants; less probability of odour nuisance from the sewer
system in the drainage area; the microbial transformations of complex organic
material and possible adsorption of heavy metals by suitable microbes;
reduced overall costs; and better opportunities for the re-use of sludge
(Enzminger et al., 1987; Metcalf & Eddy, 1991; Nowak et a/., 1996).
Aerobic treatment
Aerobic treatment is one of severai alternative biological methods for
the treatment of domestic and industrial effluents (Atlas & Bartha, 1993; Lens
et aI., 1998). This method depends on micro-organisms growing in an
oxygen-rich environment, and their ability to oxidise soluble and colloidal
organic material to carbon dioxide (C02), water (H20), sludge (50 to 60%
biomass), ammonia (NH3) and other cellular materials as shown in the
following reactions (Gough et a/., 1987; Senior, 1995):
Stellenbosch University http://scholar.sun.ac.za
23
bacteria
COHNS + O2 + nutrients --~ C02 + NH3+ CSH903N + other end-products(organic matter) (biomass)
bacteria
CSH903N + 502 ---.> 5C02 + 2H20 + NH3 + energy(biomass)
The empirical formula CSH903N was chosen to represent an bacterial
biomass (Kalyuzhnyi, 1997). The micro-organisms use phosphates and
ammonia-nitrogen for cell maintenance (Knox, 1985; Metcalf & Eddy, 1991).
Only about 75 - 80% of the cell material can be oxidised, the remaining 20 -
25% is composed of inert components and organic compounds that are
generally not biodegradable. Aerobic treatment produces a high quality
effluent, but the start-up phase requires an acclimation period in order to
facilitate the development of a competitive microbial community (Senior,
1995). The disadvantages of this process are the occurrence of foaming,
poor solid-liquid separation, high volumes of sludge which may contain high
levels of heavy metals and thus need to be disposed off as hazardous waste
(Senior, 1995).
There are basically three different types of aerobic treatments (Atlas &
Bartha, 1993). A relatively inexpensive film-flow-type aerobic treatment
system is the trickling filter, where the wastewater percolates through a bed of
porous material covered with a bacterial community (rock or plastic packing).
Aeration is supplied by the porous nature of the bed (Atlas & Bartha, 1993).
The wastewater filter through the porous bed and the effluent and any
biological solids that have became detached from the media, are collected in
an underdrain unit (Metcalf & Eddy, 1991) at the bottom of the filter system
(Mack et aI., 1975). The bacterial community utilises the biodegradable
organic substances in the wastewater, thus reducing the COD and SS
concentrations of the effluent (Matasci et aI., 1986). A drawback of this
treatment system is that a nutrient overload can lead to excess microbial
slime, which subsequently influences the aeration and filtration rates of the
wastewater (Atlas & Bartha, 1993). A relative high incidence of clogging may
also occur (Senior, 1995; Van Niekerk & Rudert, 1998) and the efficiency is
often reduced by colder winter temperatures (Atlas & Bartha, 1993).
Stellenbosch University http://scholar.sun.ac.za
24
A more advanced aerobic film-flow-type treatment system is the
rotating biological contractor or biodisc system (Atlas & Bartha, 1993).
Closely spaced circular discs of polystyrene or polyvinyl chloride (Metcalf &
Eddy, 1991) are rotated slowly in a trough containing the wastewater. The
partially submerged discs become coated with the bacterial community (Atlas
& Bartha, 1993) as a slime layer over the wetted surface of the discs. The
continuous rotation insures constant aeration and contact with the nutrients in
the wastewater. These systems require less space than the trickling filters,
are efficient for the removal of heavy metals and NH3, are stable in operation,
no pumping, no aeration or recycling of solids are required and no aerosols
are produced (Lugowski et al., 1990; Spengel & Ozombak, 1992; Atlas &
Bartha, 1993), but they require a longer initial start-up.
The most popular aerobic treatment system, is the activated sludge
process. The wastewater containing the biodegradable organic substances is
contained in a mechanically stirred aeration tank (Atlas & Bartha, 1993). A
diverse non-pathogenic heterotrophic community of micro-organisms,
protozoa and filamentous organisms develop and are maintained in the
aerated tank. Well-managed systems are capable of effectively removing
phosphate, nitrogen and carbon, with resultant microbial biomass production
(Ubisi et al., 1997; Banister & Pretorius, 1998). The activated sludge
treatment process is efficient and flexible and can withstand variations in
wastewater flow rate and high organic loads (Atlas & Bartha, 1993). A high
quality effluent can be produced, with COD removals as high as 99% (Chian
& De Walle, 1976; Keenan et al., 1984; Lema et al., 1988; Zhi-rong Hu et al.,
2000). The start-up and operation is fairly quick and simple, with few odour
problems (Metcalf & Eddy, 1991).
The main disadvantages of the aerobic treatment are the high energy
requirements, sludge and foam production, nutrient requirements,
precipitation ability of sludge to adsorb specific organic compounds and toxic
heavy metals, sludge disposal and the large capital investment needed
(Blakey & Maris, 1990; Metcalf & Eddy, 1991; Senior, 1995).
Stellenbosch University http://scholar.sun.ac.za
25
Anaerobic treatment
One of the oldest forms of biological wastewater treatment is the
anaerobic digestion method (Metcalf & Eddy, 1991). The simplest anaerobic
treatment system is the septic tank, which is popular in rural areas lacking
formal sewer systems (Atlas & Bartha, 1993). These tanks serve as a
combined settling and skimming tank and as an unheated, mixed anaerobic
digester (Metcalf & Eddy, 1991). The residual biosolids settle in the tank,
while the clarified effluent can be distributed to a leaching field, where
dissolved organic material can undergo further treatment (Atlas & Bartha,
1993).
The first official tank was designed in the 1850's to separate and retain
solids and the wastewater plant in Baltimore, Maryland was one of the first to
install separate digestion tanks (Metcalf & Eddy, 1991). Thereafter,
anaerobic digestion was continuously studied and intensively evaluated,
resulting in heat application (Joubert & Britz, 1986; Van Der Merwe & Britz,
1994) and improvement in reactor design, as well as higher removal rates
(Britz et aI., 1990; Metcalf & Eddy, 1991; Guiot et al., 1997). Progress has
been made in understanding the mechanism control of the process, design
and size of the digesters (Metcalf & Eddy, 1991; Van Der Merwe & Britz,
1993). In modern practice, large-scale anaerobic reactors are constructed to
maintain strict anaerobic conditions, produce utilisable biogas and facilitate
the screening and settling of solids.
Anaerobic digestion depends on a microbial consortium for the
biological conversion of organic material in the absence of molecular oxygen
to a variety of end-products including methane (CH4), CO2 and other
metabolites, while less than 3% of the organic matter is transformed into
biomass (Metcalf & Eddy, 1991). The main disadvantages of anaerobic
digestion are: the complexity of the initial start-up process; the long start-up
time needed for biomass development; high ammonia concentrations are
needed for maximum biomass activity; the anaerobic system is sensitive to
heavy metals, solvents and detergents; a large capital lay-out is required; and
the need for strict control of many operational parameters is essential (Atlas &
Bartha, 1993; Backlund et aI., 1998). The pH has to be maintained within the
Stellenbosch University http://scholar.sun.ac.za
26
range of 6.5 - 7.5, with optimal performance at pH 7.0 and 35°C (Atlas &
Bartha, 1993; Van Der Merwe, 1994; Senior, 1995). pH extremes and the
influx of heavy metals, solvents or other toxic materials can easily upset the
anaerobic digestion process (Atlas & Bartha, 1993). Furthermore, heavy
metal removal in anaerobic processes are not as efficient as in aerobic
processes. Ammonia-nitrogen is not removed and will thus be discharged as
part of the digester effluent creating an oxygen demand in the receiving
waters (Senior, 1995). The sulphates present in the wastewaters are reduced
to hydrogen sulphide which can then result in corrosion, bad odours and the
inhibition of the microbial community in the digester. Hydrogen sulphide can
also be an efficient precipitant for most metals, which then precipitate and
accumulate as inert solids in the sludge blanket or on the filter media.
The main advantages of the anaerobic digestion process are: less
space is required than the aerobic process; there is no oxygen demand, thus
saving on energy costs since no mixing is required (Senior, 1995; Backlund et
a/., 1998); only 2 - 3% of the organic matter is transformed into biomass,
which is an indirect way to decrease the problem of sludge disposal as found
in aerobic processes (Backlund et al., 1998); lower nutrient requirements,
since substances like NH3-N are retained as food for the microbial population,
unlike in the aerobic treatment process; and pathogens and viruses are also
destroyed during the digestion process.
The anaerobic digestion process can handle high organic loads without
previous dilution, bad odours are mainly eliminated since the process takes
place in closed reactors (Backlund et al., 1998), the mineralised anaerobic
sludge can be used as a fertiliser if heavy metal concentrations are low and,
even more important, anaerobic sludge settles more easily than aerobic
sludge, which eliminates the use of flocculants (Lema et al., 1988). The most
important advantage of anaerobic digestion is the production of high-energy
volatile components (biogas) during the transformation of organic matter
(Backlund et al., 1998).
The anaerobic digestion of wastewater is an established technology
and has already been applied successfully at many municipal sewage works
(Augoustinos et a/., 1989). Recently, it has become very popular to use
Stellenbosch University http://scholar.sun.ac.za
27
anaerobic digestion for the treatment of high organic loads (Braun & Huss,
1982; Silverio et al., 1986; Augoustinos et al., 1989; Ross, 1989; Lin, 1991;
Britz et al., 1992; Ciftci & Ozturk, 1993; Keenan et ai., 1993; Backlund et ai.,
1998) and high salinity effluents (Shipin et al., 1994).
8.4. Combined chemical, physical and/or biological treatments
Combined processes or "hybrid systems" are becoming more popular for the
treatment of industrial wastewater (Dienemann et al., 1990; Abeling &
Seyfried, 1992). A small part of an organic load in wastewater can for
instance, be removed anaerobically, thereby producing methane. The
remaining pollution load can then be removed aerobically. This combined
technology is an efficient economical carbon removal solution
(Venkataramani et al., 1988; Dienemann et ai., 1990; Abeling & Seyfried,
1992).
Biological treatments have furthermore been combined successfully
with physical-chemical treatment methods (Ahiert & Kosson, 1990). Better
removal efficiencies have been found with combined treatments, than with
separate methods (Keenan et aI., 1984). Under normal conditions, physical-
chemical methods can be used to remove metals and hydrolyse part of the
organic material, while the biological methods can be employed to stabilise
the degradable organic matter. Reverse osmosis was reported to be a
popular and successful post-treatment physical-chemical method following a
combined aerobic-anaerobic process (Dienemann et al., 1990). Physical-
chemical processes are also ideal final or polishing treatment options, and
can remove ammonia-nitrogen successfully before biological treatment is
applied (Aynagiotou et al., 1993).
To simplify the presentation, the broad field of combined treatment
options is illustrated as one example that is currently successfully applied in
South Africa. This is the anaerobic digestion technology being combined with
ultrafiltration and generally known as the ADUF process (Ross et ai., 1990).
Stellenbosch University http://scholar.sun.ac.za
28
Anaerobic digestion combined with ultrafiltration (ADUF)
This treatment method is a recently developed membrane-assisted
process specifically for the treatment of industrial effluents, which, by means
of biomass separation, eliminates the sludge concentration and retention
problems associated with conventional systems (Ross et aI., 1990; Van Der
Merwe, 1994; Neil & Kafaar, 1996; Strohwald, 1996). Successful laboratory
and pilot-scale ADUF studies were done on wine distillery, malting, egg,
brewery, chemical, fruit and maize-processing effluents (Ross et al., 1994;
Nell & Kafaar, 1996; Strohwaid, 1996). Reduction of organic levels of up to
98% were achieved while operating under stable state conditions, and
producing a clear, colloid-free effluent (Sauvegrain et al., 1992; Ahmadun,
1994; Neil & Kafaar, 1996; Strohwaid, 1996).
Solvable problems experienced with some of the applications of the
ADUF technology were: blocking and deterioration of the ultrafiltration
membrane; generation of foam in the digester, which then restricted the
space and the organic loading rates which the digester could handle; clogging
of gas pipelines, water traps and meters; loss of solids from the ADUF
systems; lack of suitable nutrients and alkalinity, which resulted in poor
digester capacity and low organic loading rates; flux decline; and difficulty in
maintaining the desirable balance between substrate feed and permeate
production (Harada et aI., 1994; Van Der Merwe, 1994; Neil & Kafaar, 1996;
Strohwaid, 1996). In total this ADUF combination led to the production of a
fairly pure final effluent which could be either reused, recirculated or disposed
of into a water system.
c. Microbial populations in anaerobic digesters
The decomposition of organic matter to CH4 and CO2 by mixed anaerobic
microbial populations has received a great deal of attention and has provided
useful insights into anaerobic digester bioconversion technology (Zeikus,
1980; Lettinga et al., 1997). The bioconversion of the organic matter is a
stable process when performed under defined environmental conditions, and
is based on the catabolic activities of a diverse, yet substrate specific,
Stellenbosch University http://scholar.sun.ac.za
29
population of aerobic and anaerobic bacteria (Zeikus, 1980; Silvey et al.,
2000). Certain properties of the microbial populations responsible for the
anaerobic decomposition of the organic matter appears constant regardless
of whether this process is occurring in man-made digesters or in nature. The
properties include a specific population diversity, the effect of certain physical
and chemical conditions on species composition and the physiological
characteristics of the different active species (Zeikus, 1980). The alteration of
several physical and chemical environmental parameters in anaerobic
digesters can influence the microbial metabolism and thus also the digester
performance (Zeikus, 1980; Britz et al., 1997).
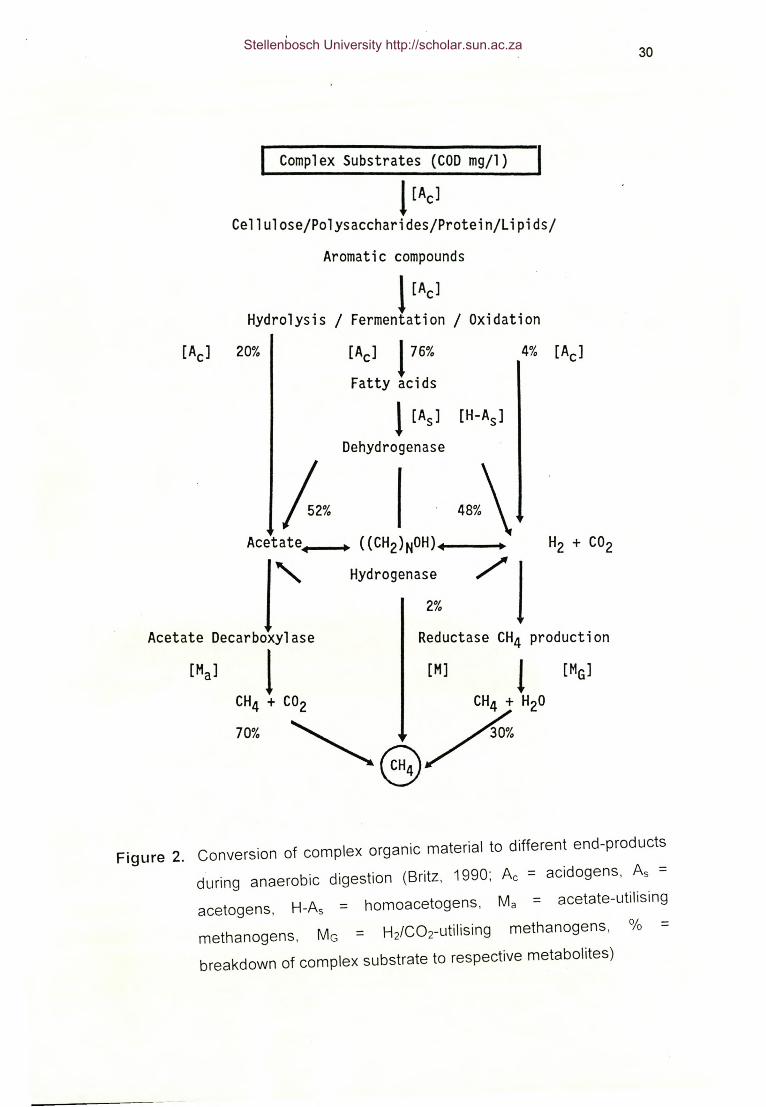
The complex organic material (Fig. 2), including the microbial biomass,
serves as a food source for the microbial consortium, and is depolymerised
and converted to easier degradable compounds, biomass, energy and other
gaseous end-products (Balch et al., 1979). Other end-products of the
digestion process include N2, H2S and H2 (Kasan, 1988). The current
biological model (Fig. 3) of a methanogenic mixed-culture digestion consists
of at least five major consecutive, but metabolic independent, trophic bacterial
groups (Gorris et aI., 1989; Tursman & Cork, 1989):
1. Hydrolysis of complex organic polymers, such as carbohydrates,
proteins, lipids, polysaccharides and aromatic 'compounds, into
smaller subunits for use as a source of energy and cell carbon,
which can be easily transported into the bacterial cell. Proteins are
then converted to amino acids, polysaccharides and carbohydrates
to sugar monomers and lipids to long chain fatty acids;
2. Fermentation (acidogenesis) of the smaller subunits resulting from
the hydrolysis process, to identifiable intermediate organic acids,
alcohol, H2 and CO2. These fermentation· products serve as a
source for the next trophic group of non-methanogenic bacteria;
3. ~-oxidation (acetogenesis) of intermediate and long chain fatty acids
(propionate, butyrate, benzoate) and ethanol to acetate, CO2 and
H2;
4. The homo-acetogenic bacteria can then catabolise one-carbon-
compound to acetate as main metabolic product; and
Stellenbosch University http://scholar.sun.ac.za
30
I Compl ex Substrates (COD mg/l) I1 [Ac]
Cellulose/Polysaccharides/Protein/Lipids/Aromatic compounds
1 [Ac]/ Fermentation / OxidationHydrolysis
[Ac] 176% 4% [Ac]Fatty acids
1 [As] [H-As]Dehydrogenase
IAcetate ....._ ..~ ((CH2)NOH)
l'Acetate Decarboxylase R de uctase CH4 production
1 [Ml 1CH4 + CO2 CH + H 070% <, ~ 2<,@/ 30%
Hydrogenase2%
Figure 2. Conversion of complex organic material to different end-products
during anaerobic digestion (Britz, 1990; Ac = acidogens, As =acetogens, H-As = homoacetogens, Ma = acetate-utilising
methanogens, MG = H2/C02-utilising methanogens, % =breakdown of complex substrate to respective metabolites)
Stellenbosch University http://scholar.sun.ac.za
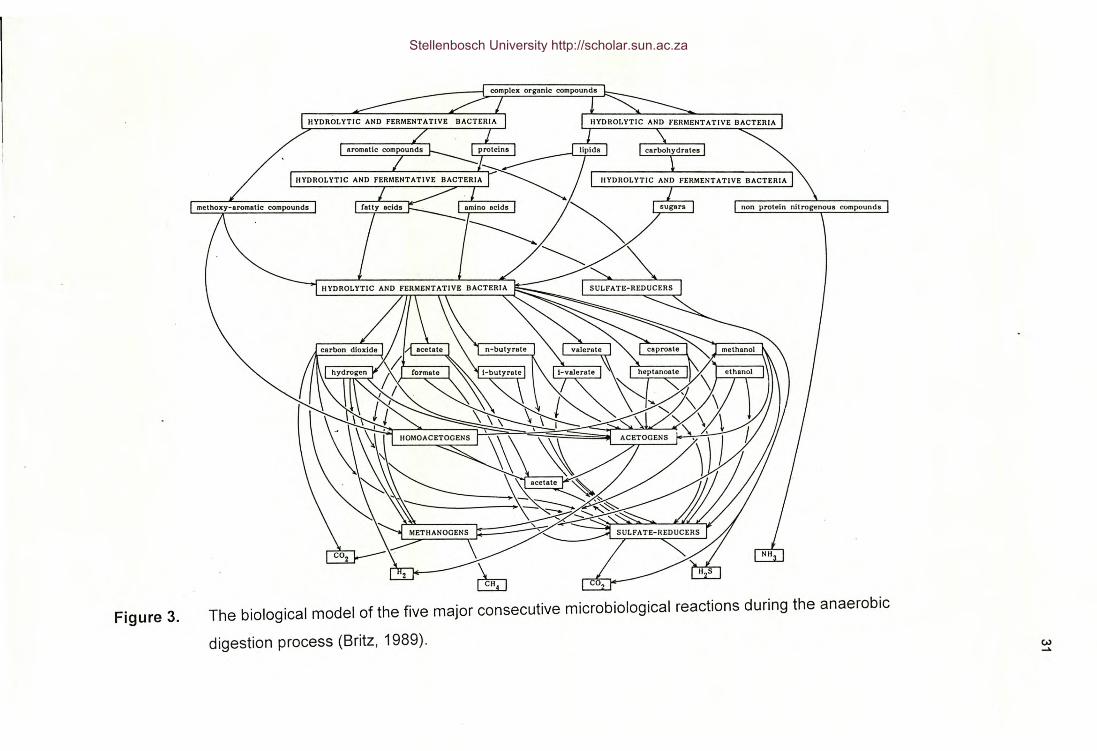
Figure 3. The biological model of the five major consecutive microbiological reactions during the anaerobic
digestion process (Britz, 1989). w.....
Stellenbosch University http://scholar.sun.ac.za
32
5. Methane formation is the final stage of anaerobic digestion. Two
types of metabolic pathways can be found: acetate is converted to
CH4 and CO2, and CO2 and H2 are converted to CH4 and H20. The
efficient metabolism of each trophic group is thus dependent on the
activity of the other trophic groups.
Hvdrolytic and Acidogenic Bacteria
To degrade complex organic substrates to methane by anaerobic
digestion, other organisms than the methanogenic bacteria are necessary
because of the limited number of substrates catabolised by the methanogens
(Klass, 1984; Pohland & Kim, 2000). The acidogenic population is thus by far
the largest of the trophic groups of bacteria (Forday & Greenfield, 1983).
Many of these bacteria have large substrate ranges, but their substrate
preferences and utilisation patterns are different (Mcinerney & Bryant, 1981).
The hydrolytic (acidogenic) bacteria depolymerise the complex organic
polymers and these products are then fermented to primary (volatile fatty)
acids, such as acetate, propionic and butyrate, with smaller quantities of
formic, valeric, iso-valeric and caproic acids which can also be produced
(Fang, 1997; Okamoto et aI., 2000). Ammonia, hydrogen gas (H2), C02, iso-
butyrate, iso-valerate, n-valerate, 2-methylbutyrate and certain aromatic
compounds are produced from amino acids which are of the smaller sub-units
formed after depolimerisation of the complex organic polymers (Bryant, 1976;
Salminen et al., 2000). Many aromatic compounds are also converted by
bacteria to benzoate (Knoll & Winter, 1989).
The concentration of H2 in the overall anaerobic digestion process
plays a central role as regulator in controlling the proportions of the products
produced by the bacteria (Bryant, 1979). In the presence of hydrogen-
consuming bacteria (methanogenic, homo-acetogenic and sulphate-reducing
bacteria), many bacteria will produce hydrogen for the disposal of excess
electrons generated during the energy yielding oxidations of organic materials
(Forday & Greenfield, 1983). When accumulation of hydrogen, due to the
inhibition of the hydrogen-consuming methanogens occurs, unfavourable
conditions for electron disposal will result (Forday & Greenfield, 1983). Under
Stellenbosch University http://scholar.sun.ac.za
33
stressed conditions, alternative electron sink products e.g. propionate,
butyrate, succinate and ethanol are formed, which can be an indication of
digester failure. Excessive activity of the acidogenic population can also
result in digester failure (Forday & Greenfield, 1983). Acidogenic bacteria are
tolerant to unionised organic acids, hydrogen ions and hydrogen, while these
compounds are inhibitory to the other trophic groups of bacteria (Forday &
Greenfield, 1983). The formation of acetate, CO2 and H2 are an indication of
efficiently operating metabolic interactions in the anaerobic digestion process.
The partial pressure of hydrogen must, however, be maintained at very low
levels, since the pressure may affect the metabolic pathway of the acidogenic
bacteria (Bryant, 1979; Okamoto et al., 2000).
Most of the acidogenic bacteria are obligate anaerobic, however some
are facultative and can also metabolise organic material via the oxidative
pathway. This is important in anaerobic sewage treatment, as dissolved
oxygen might become toxic to the obligate anaerobic organisms such as the
methanogens (Ueki et ai., 1978; Van Haandel & Lettinga, 1994). Depending
on the original complex organic substrate, the acidogens include members of
the genera Bacillus, Clostridium, Streptococcus, Micrococcus,
Staphylococcus, Pseudomonas, Lactobacillus, Eubacterium, Klebsiella,
Escherichia, Chryseomonas, Xanthomonas, Aerobacter, Acinetobacter,
Synergistis, Bacteroides, Butyrivibrio, Butyribacterium, Propionibacterium,
Acidaminobacter, Bifidobacterium and other Enterobacteriaceae. The
presence of Peptococcus, Peptostreptococcus, Ruminococcus, Caprococcus,
Acetivibrio and Sarcina have also been reported (Siebert & Toerien, 1969;
Scharer & Moo-Young, 1979; Mcinerney & Bryant, 1981; Klass, 1984;
Hakulinen et ai., 1985; De Haast & Britz, 1986; Heijthuijsen & Hansen, 1987;
Joubert & Britz, 1987; McSweeney et ai., 1993; Van Der Merwe, 1994;
Okamoto et ai., 2000).
Acetogenic Bacteria
Further degradation of acidogenic substrates are anaerobically
oxidised to acetate, formate, H2 and CO2 as main metabolic end-products
(Bryant, 1979; Mountford & Bryant, 1982; Klass, 1984; Henson & Smith,
Stellenbosch University http://scholar.sun.ac.za
34
1985; Hanaki et al., 1981; Fang, 1997; Salminen et al., 2000). Different from
the hydrogen-forming acidogenic bacteria, these bacteria do have an obligate
requirement for the disposal of electrons such as hydrogen (Forday &
Greenfield, 1983). The conversions are extremely sensitive to H2
concentration and the growth of these bacteria can only occur at partial
hydrogen pressures of less than 10-5 atmospheres (Forday & Greenfield,
1983). High hydrogen concentrations can inhibit acetogenesis which then
results in the formation of fermentation products other than acetate (linder,
1984; Labib et al., 1992). The conversion of these products (higher volatile
fatty acids, caproate, butyrate and propionate) to methanogenic substrates
(acetate, H2and C02) is an important step, as the unionised forms of these
acids are toxic to the methanogenic group. Inhibition of the acetogens will
result in a decrease in digester pH, which creates an unfavourable
environment for methanogenic bacteria (Van Haandel & Lettinga, 1994;
Broughton et al., 1998). Since the acetogenic bacteria are the slowest
growing of the trophic groups and hence represent a further rate-limiting step
in the degradation process, which can lead to subsequent digester failure.
The metabolic conversion of the acetogens are only possible if a low
hydrogen partial pressure is maintained (5.8 x 10⁻⁵ to 1.6 x 10⁻⁶atmospheres)
by the methanogens and sulphate-reducers (Boone & Bryant, 1980; Boone &
Mah,1989).
Due to their hydrogen sensitivity and strict anaerobic growth
requirements, the acetogens have generally not been well identified or
physiologically characterised. On the basis of experimental data collected
using co-cultures, the presence of these bacteria was first discovered in 1967
by Bryant and co-workers. It was found that the acetogens can only be
cultured in the presence of a methanogenic hydrogen-utilising bacterium
(leikus, 1980). A classic example of a hydrogen-producing acetogenic
bacterium is the "S" organism, which was isolated from a Methanobacillus
omelianskii mixed culture (Bryant et al., 1967). After the isolation of the "S"
organism, other strains of acetogens were also characterised. These bacteria
are mostly syntrophic and are also called "obligate proton-reducing bacteria".
These include members of the species of Syntrophomonas, Clostridium,
Stellenbosch University http://scholar.sun.ac.za
35
Syntrophococcus, Syntrophospora, Syntrophobacter, Syntrophus and
Acetomaculum (Boone & Bryant, 1980; Heyes & Hall, 1983; Diekert et ai.,
1984; Kellum & Drake, 1984; Mountford et ai., 1984; Stieb & Schink, 1985;
Krumholtz & Bryant, 1986; Roy et ai., 1986; Iannotti et ai., 1987; Lux et ai.,
1990; Zhao et al., 1990; Guangsheng et ai., 1992; Wu et ai., 1992; Guiot et
ai., 1997; Harper & Pohland, 1997; Zu et ai., 1997).
Homo-acetogenic Bacteria
The exact role of the homo-acetogenic bacteria in the anaerobic
digestion process is still not fully understood. The homo-acetogenic bacteria
display a mixotrophic metabolism and can utilise hydrogen and carbon
dioxide, as well as other one-carbon compounds, with acetate as a major
metabolic end-product (Britz, 1990). The homo-acetogenic bacteria can also
catabolise complex carbohydrates (Forday & Greenfield, 1983), aromatic
compounds, alcohol and fatty acids (Bache & Pfennig, 1981; Kellum & Drake,
1984; Schink, 1984). Other metabolites, such as acetate, CO2, ethanol,
propionate, butyrate and valerate may also be formed, depending on the
oxidation status of the available substrates (Eichler & Schink, 1984; Dehning
et ai., 1989; Scherer et ai., 2000).
The presence of homo-acetogens in digesters are very important as
they maintain the low hydrogen partial pressure required in an efficiently
operating anaerobic digester (Sam-Soon et ai., 1991). Homo-acetogens,
however, compete with the methanogens for substrates (Conrad & Wetter,
1990). They can also donate hydrogen to the methanogenic bacteria by the
"interspecies hydrogen transfer" phenomenon (Zeikus, 1980; Forday &
Greenfield, 1983). An advantage of the homo-acetogens over the other
bacteria, is their ability to use the bicarbonate (HC03-) ion as electron
acceptor (Balch et al., 1977). The reduction to acetate occurs through CO2
as an intermediate (Bryant, 1979; Diekert & Ritter, 1983; Diekert et ai., 1984).
There are very few easily recognised genera of this strict anaerobic,
hydrogen-oxidising homo-acetogenic trophic group. These include
Acetobacterium, Acetoanaerobium, Acetogenium, Selenomonas, Clostridium,
Eubacterium, Butyribacterium, Pelobacter and Sporomusa (Zeikus, 1980;
Stellenbosch University http://scholar.sun.ac.za
36
Bache & Pfennig, 1981; Diekert & Ritter, 1983; Forday & Greenfield, 1983;
Eichler & Schink, 1984; Zehnder et a/., 1982; Stieb & Schink, 1985; Dehning
et a/., 1989; Schuppert & Schink, 1990; Zhao et a/., 1990; Buschhorn et a/.,
1992; Guangsheng et a/., 1992; Van Der Merwe, 1994; Okamoto et a/., 2000).
Methanogenic Bacteria
The methanogens (MB) convert acetate, H2 and C02 to methane and
CO2 as metabolic end-products (Ahring & Schmidt, 1992). These
archaebacteria are a more diverse group of bacteria than the other three
trophic groups of the consortium associated with anaerobic digestion. The
methane-forming bacteria show considerable intra-species variations in cell
dimensions (Zeikus, 1980; Forday & Greenfield, 1983; Guiot et a/., 1992) and
are responsible for the terminal reactions in the anaerobic digestion process.
They can thus be seen as "key" organisms in the process.
All the methanogens are obligate anaerobes, requiring an oxidation-
reduction potential of less than -300 mV for growth (Bryant, 1976, Forday &
Greenfield, 1983). Inhibition of methanogenesis can also be caused by
organic overload when the rates of acetbgenesis will exceed
methanogenesis. Unionised volatile fatty acids will then start accumulating in
the bioreactor (Tracey et a/., 1989; NedweIl & Reynolds, 1996; Salminen et
a/., 2000) and thus, cause a decrease in pH as a result of the accumulation of
mainly acetate (NedweIl & Reynolds, 1996). Wide deviations in pH can thus
reduce the anaerobic microbial populations. The sensitivity of anaerobic
digestion to extreme pH is mainly due to the sensitivity of the methanogenic
populations to pH values above 7.8 and below 6.0 (Forday & Greenfield,
1983; Fang, 1997; Lens et a/., 1998). pH control at a neutral value facilitates
more rapid establishment of an active methanogenic population and
subsequent biogas production (Senior, 1995). If a neutral pH is not
maintained, this may lead to the souring of the digester (Forday & Greenfield,,
1983; Marchaim & Krause, 1993; NedweIl & Reynolds, 1996). The
methanogens are very sensitive organisms, even to the toxicity caused by
organic inhibitors such as toluene or chloroform and by accumulation of
metals present in the wastewater being treated. All this can contribute to the
Stellenbosch University http://scholar.sun.ac.za
37
loss of methanogenic activity of the sludge present inside the anaerobic
digester (Fang, 1997; Ruiz et al., 1998).
This unique group of anaerobic organisms oxidise H2, gaining energy
by reducing CO2 and acetate, as well as one of the methyl groups of either
methanol, methylamines, trimethylamines or formate to produce methane as
major end-product (Zehnder et al., 1980; Zeikus, 1980; Miller & Walin, 1985;
Reeve et al., 1997). The methanogens can grow either autotrophically,
heterotrophically and some even show an amixotrophic pattern (Zeikus,
1980), but they are only able to utilise a limited range of substrates (Zehnder
et al., 1982). Methanogens are thus dependent on the metabolic activities of
the other trophic groups in the anaerobic digestion process, as they do not
ferment carbohydrates directly.
Acetate is the main substrate for methanogenie bacteria, but is a
product of the acidogenic and acetogenic groups (Lens et al., 1998). It is one
of the most important substrates in the anaerobic degradation process
leading to the generation of methane (Weber et al., 1984). As much as 65 to
96% of the total methane produced can originate from acetate (Weber et al.,
1984). There is, however, another thermodynamically more favourable
conversion than the direct conversion of acetate, namely the reduction of
carbon dioxide to methane (Klass, 1984).
Methanogens include members of the genera Methanobacterium,
Methanobrevibacterium, Methanobacillus, Methanothermus, Methanococcus,
Methanosarcina, Methanothrix, Methanolobus, Methanococoides,
Methanomicrobium, Methanogenium, Methanospiri/lum, Methanoplanus,
Methanocorpusculum, Methanoculleus, Methanosaeta and Methanosphaera
(Mcinerney & Bryant, 1981; Henson & Smith, 1985; Krumholtz & Bryant,
1986; Holland et a/., 1987; Zellner & Winter, 1987; Conrad & Wetter, 1990;
Pauss et al., 1990; Winter & Zellner, 1990; Ahring & Schmidt, 1992; Guiot et
al., 1992; Heppner et al., 1992; Kitaura et al., 1992; Reeve, 1992; Wu et al.,
1992; Shin et al., 1996; Harper & Pohland, 1997; Reeve et al., 1997; Zu et al.,
1997).
Stellenbosch University http://scholar.sun.ac.za
38
Sulphate-Reducing Bacteria
Just as the methanogenic bacteria (MB) are known to be able to
couple the oxidation of molecular hydrogen (H2) with the reduction of CO2 to
yield CH4 as the electron sink product, the sulphate-reducing bacteria (SRB)
are known to couple the oxidation of H2with the reduction of sulphate to yield
hydrogen sulphide (H2S) as the electron sink product (Tursman & Cork,
1989). Thus, the SRB behave similarly to the hydrogenotrophic MB. The
electron donor in each case may be a dissolved gas from an exogenous
source, or through a syntrophic association with an obligate proton/hydrogen-
reducing acetogen. This interspecies hydrogen transfer mechanism can be
seen as a type of intimate association or mutualism.
SRB compete with MB for substrates as well as electron donors, such
as H2 and acetate and normally outcompete the MB when sufficient sulphate
is present in the environment (Fang, 1997; Lens et al., 1998). MB can only
utilise a restricted range of substrates (H2 and acetate), while SRB can utilise
a wider range of substrates (formate, acetate, methanol, pyruvate and H2)
(Fang, 1997) (Fig. 3). For this reason, the interactions between the SRB and
the rest of the microbial community cannot be ignored. The SRB also convert
sulphate into sulphide, which forms insoluble metal sulphides precipitating on
the surface of bacterial cells (Fang & Liu, 1995). SRB can therefore be seen
as more resilient to challenge by novel organic molecules than the MB, and
digestion based upon sulphate reduction can thus be more resilient than
methanogenic digestion (NedweIl & Reynolds, 1996).
In anaerobic digestion, sulphate reduction has generally been regarded
as undesirable due to the production of hydrogen sulphide. Reis et al. (1992)
reported that H2S may have a direct and reversible toxic effect on the
sulphate-reducing bacterial population. In terms of sulphide production,
cytotoxicity, reaction rate kinetics and thermodynamic analysis, sulphate-
reduction also result in the inhibition of acetoclastic methanogenesis, due to
the distribution of sulphide precipitates on biogranule formation (Tursman &
Cork, 1989; Reis et al., 1992; Fang, 1997; Lens et al., 1998).
The production of sulphide during anaerobic digestion also has
beneficial effects through the precipitation of heavy metals as their insoluble
Stellenbosch University http://scholar.sun.ac.za
39
sulphides thus, preventing biotoxicity by removing the metals from the
microbial environment in the digester (Dvorak et aI., 1992). The operation of
the anaerobic digester at the maximum allowable pH will minimise the
toxicological influence of sulphide:
H2S +--+ H++ HS- +--+ 2H+ + S-2lowpH highpH
The digester mixed liquid pH is therefore a primary effector in this distribution
(Isa et aI., 1986). Results of batch activity experiments showed that the
methanogenic activity dropped sharply at pH values above 7.7 and below 6,
causing the predominance of sulphate-reducinq bacteria at pH values above
8 (Visser et aI., 1992; Lens et aI., 1998).
Desulfovibrio is one of the most commonly studied genera in the
sulphate-reducing group of bacteria. Other genera of sulphate-reducers
found in anaerobic digesters include members of the genera Desulfomonas,
Desulfotomaculum, Desulfonema, Desulfobacterium, Desulfobacter,
Thermodesulfobacterium, Desulfosarcina, Desulfobotulus, Desulfoarculus,
Desulfomicrobium and Desulfococcus (Mcl nerney & Bryant, 1981; Holland et
aI., 1987; Pfennig, 1989; Vainshtein et aI., 1992; Drzyzga et al., 1993; Tasaki
et aI., 1993; Van Houten et aI., 1996; Harper & Pohland, 1997; Lens et aI.,
1998).
D. Conclusion
Conventional wastewater remediation methods employing physical and
chemical treatment processes have been associated with a number of
intrinsic advantages and disadvantages. The advantages of applying physical
and chemical methods can be summarised as follows: start-up periods are
short; flexible; simple equipment can be used; processes are generally
insensitive to temperature; and many of the methods lend themselves to
automation. The disadvantages include the production of more toxic
intermediates, large amounts of sludge generated by the addition of
chemicals, high investment and operating costs, low levels of efficiency, and
applicability to limited effluent concentration ranges (Lema et aI., 1988;
Stellenbosch University http://scholar.sun.ac.za
40
Edwards et ai., 1998). These physical and chemical methods may become
exceedingly expensive when low effluent pollutant concentrations need to be
achieved (Sun et ai., 1992). Physical and chemical processes alone are
inadequate for the complete treatment of a high-strength, noxious industrial
effluent such as produced by the gelatin-manufacturing industry.
Great potential exists for the combination of various treatment options
for the gelatin-manufacturing effluent, but the most efficient approach is
considered to be biological wastewater treatment (Dall-Bauman et a/., 1990).
Anaerobic digestion is a "clean and green technology" with promising
possibilities for the removal of selective components in wastewater.
Anaerobic digestion is furthermore cost effective over a long term and offers a
viable option for the treatment of high concentration effluents, such as gelatin-
manufacturing effluents.
Future research on anaerobic digestion for specific industrial effluents
holds tremendous challenges in understanding the fundamental and
interdependent microbiology and biochemistry of the digestion process.
Furthermore, the need still exists to design the perfect anaerobic digester,
since all the present digester configurations show some limitations for a
specific industrial effluent. Whatever the means are to improve wastewater
treatment technology, the aspiration remains to engineer the perfect
anaerobic digester, inhabited by the perfect competitive microbial community.
E. References
Abeling, U. & Seyfried, C.F. (1992). Anaerobic-aerobic treatment of high-
strength ammonium wastewater - nitrogen removal via nitrite. Water
Science and Technology, 26, 1007-1010.
Ahiert, R.C. & Kosson, D.S. (1990). Treatment of hazardous landfill leachates
and contaminated groundwater. Journal of Hazardous Materials, 23,
331-335.
Stellenbosch University http://scholar.sun.ac.za
41
Ahmadun, F-R (1994). Ultrafiltration membrane separation for anaerobic
wastewater treatment. In: Preprints of the 7th International Symposium
on Anaerobic Digestion, RSA Litho Press, University of Cape Town,
South Africa, Pp. 560-566.
Ahring, B.K. & Schmidt, J.E. (1992). Methanogen1c subpopulations and
microbial structure of UASB granules. In: Proceedings of 3rd Southern
Africa Anaerobic Digestion Symposium, University of Natal,
Pietermaritzburg, South Africa, Pp. 24-36.
Atlas, RM. & Bartha, R (1993). Ecological aspects of biodeterioration control:
soil, waste and water management. In: Microbial Ecology:
Fundamentals and Applications, (E.B. Brady. eds.), The
Benjamin/Cummings Publishing Company Inc., California, Pp. 349-
382.
Augoustinos, M.T., Britz, T.J. & Tracey, RP. (1989). Anaerobic digestion of a
petrochemical effluent using an anaerobic hybrid digester.
Biotechnology Letters, 11, 369-374.
Aynagiotou, C., Papadopoulos, A. & Loizidou, M. (1993). Leachate treatment
by chemical and biological oxidation. Journal of Environmental Science
and Health, A28, 21-29.
Bache, R & Pfennig, N. (1981). Selective isolation of Acetobacterium woodii
on methoxylated aromatic acids and determination of growth yields.
Archives of Microbiology, 130,255-261.
Backlund, S.F., Tivchev, G.N. & Kasan, H.C. (1998). Anaerobic digestion of
high concentration dairy effluent. In: Biennial Conference and
Exhibition of the Water Institute of Southern Africa (Volume 1.) Baxter
Theatre, Cape Town, Paper 2, Pp. 1-4.
Balch, W.E., Schoberth, S., Tanner, RS. & Wolfe, RS. (1977).
Acetobacterium, a new genus of hydrogen-oxidizing, carbon dioxide-
reducing, anaerobic bacteria. International Journal of Systematic
Bacteriology, 27, 355-361.
Balch, W.E., Fos, G.E., Magrum, L.J., Woese, C.R & Wolfe, RS. (1979).
Methanogens: reevaluation of a unique biological group.
Microbiological Reviews, 43, 260-296.
Stellenbosch University http://scholar.sun.ac.za
42
Banister, S.S. & Pretorius, W.A. (1998). Optimisation of primary sludge
acidogenic fermentation for biological nutrient removal. Water SA, 24
(1),35-41.
Bessarabov, D. & Grimm, J. (1998). Electrochemical ozone generation based
on solid polyelectrolyte (SPE) membrane technology for water
disinfestion. In: Biennial Conference and Exhibition of the Water
Institute of Southem Africa (Volume 1.) Baxter Theatre, Cape Town,
Paper 4, Pp. 1-4.
Blakey, N.C & Maris, P.J. (1990). Methane recovery from the anaerobic
digestion of landfill leachate. Contractor report for the Water Research
Centre, Department of Energy, UK. ETSU B 1223. (As cited by Senior
1995).
Boone, D.R & Bryant, M.P. (1980). Propionate-degrading bacterium
Syntrophobacter wolinii sp. nov. gen. nov., from methanogenic
ecosystems. Applied Environmental Microbiology, 40(3), 626-632.
Boone, D.R & Mah, RA. (1989). Archaebacteria. In: Bergey's Manual of
Systematic Bacteriology Volume 3, (J.T. Staley, M.P. Bryant, N.
Pfennig, & J.G. Holt. eds.), Williams & Wilkins, London, Pp. 2171-
2214.
Braun, R & Huss, S. (1982). Anaerobic digestion of distillery effluents.
Process Biochemistry, 17, 25-27.
Britz, T.J. (1989). Die oerbakterieë: Antwoord op die 20ste eeu se
besoedelingsprobleme. Inaugural address, University of the Orange
Free-State, Bloemfontein, South Africa.
Britz, T.J. (1990). Treatment of landfill leachate. In: Proceedings of the
Summer School: Methane from Landfill. Grahamstown, South Africa.
Britz, T.J., Venter, C.A. & Tracey, RP. (1990). Anaerobic treatment of
sanitary landfill leachate using an anaerobic hybrid reactor. Biological
Wastes, 32,181-191.
Britz, T.J., Van Der Merwe, M. & Riedel, K-H.J. (1992). Influence of phenol
additions on the efficiency of an anaerobic hybrid digester treating
landfill leachate. Biotechnology Letters, 14, 323-328.
Stellenbosch University http://scholar.sun.ac.za
43
Britz, T.J., Van Der Merwe, M., Joubert, W.A & Strydom, J.C. (1997).
Optimization of biodegradation of recalcitrant materials using EVOP
statistical modelling systems. In: Proceedings of the 8th International
Conference on Anaerobic Digestion (Volume 1.) Sendai, Japan, Pp.
51-58.
Broughton, M.J., Thiele, J.H., Birch, E.J. & Cohen, A (1998). Anaerobic batch
digestion of sheep tallow. Water Research, 32, 1423-1428.
Bryant, M.P. (1976). The microbiology of anaerobic degradation and
methanogenesis with special references to sewage. In: Microbial
Energy Conversion, (H.G. Schlegel, & J. Barnea. eds.), Pergamon
Press, Oxford, Pp. 107-117.
Bryant, M.P. (1979). Microbial methane production - Theoretical aspects.
Journal of Animal Science, 48(1), 193-201.
Bryant, M.P., Wolin, E.A, Wolin, M.J. & Wolfe, R.S. (1967). Methanobacillus
omelianskii, a symbiotic association of two species of bacteria.
Archives of Microbiology, 59, 20-31.
Buckley, C.A, Kerr, C.A & Simpson, AE. (1992). Small-scale tests to
determine the feasibility of reverse osmosis and ultrafiltration for the
treatment of industrial effluents. Water SA, 18,63-67.
Bushhom, H., DOrre, P. & Gottschalk, G. (1992). Purification and properties of
the coenzyme A-linked acetaldehyde dehydrogenase of
Acetobacterium woodii. Archives of Microbiology, 158, 132-138.
Chian, E.S.K. & De Walle, F.B. (1976). Sanitary landfill leachates and their
treatment. Journal of the Environmental Engineering Division, 102,
411-431.
Ciftcl, T. & Ozturk, I. (1993). Anaerobic treatment of the high strength wastes
from the yeast industry. Water Science and Technology, 28, 199-209.
Cole, C.G.B. (1997). Personal communication, Leiner Davis Gelatin S.A.
(Pty.) Ltd., Krugersdorp, South Africa.
Conrad, E. & Wetter, B. (1990). Influence of temperature on energetics of
hydrogen metabolism in homoacetogenic, methanogenic, and other
anaerobic bacteria. Archives of Microbiology, 155, 94-98.
Stellenbosch University http://scholar.sun.ac.za
44
Cot, J., Aramón, C., Baucells, M., Lacort, G. & Roura, M. (1985). Waste
processing in the tannery: Production of gelatin, reconstituted collagen
and glue from chrome-tanned leather splits and trimmings subjected to
a modified detanning process. Journal of the Society of Leather
Technologists and Chemists, 70, 69-76.
Dall-Bauman, L., Shamsuddin, I. & Govind, R (1990). Analysis of hollow fibre
bioreactor wastewater treatment. Biotechnology and Bioengineering,
35, 837-842.
De Haast, J. & Britz, T.J. (1986). Characterization of aerobic and facultative
anaerobic bacteria from the liquid phase of an anaerobic fixed-bed
digester treating a cheese whey substrate. Microbial Ecology, 12, 173-
179.
Dehning, I., Stieb, M. & Schink, B. (1989). Sporomusa malonica sp. nov., a
homoacetogenic bacterium growing by decarboxylation of malonate or
succinate. Archives of Microbiology, 151,421-426.
Diekert, G. & Ritter, M. (1983). Carbon monoxide fixation into the carboxyl
group of acetate during growth of Acetobacterium woodii on H2 and
CO2. FEMS Microbiology Letters, 17,299-302.
Diekert, G., Hausch, M. & Conrad, R (1984). Acetate synthesis from 2C02 in
acetogenic bacteria: is carbon monoxide an intermediate. Archives of
Microbiology, 138, 224-228.
Dienemann, E.A., Kosson, D.S. & Ahiert, RC. (1990). Evaluation of serial
anaerobic/aerobic packed bed biorectors for treatment of a superfund
leachate. Journal of Hazardous Materials, 23, 21-27.
Dinopoulou, G. & Lester, J.N. (1989). Optimization of a two-phase anaerobic
digestion system treating a complex wastewater. Environmental
Technology Letters, 10,799-814.
Drzyzga, 0., KOver, J. & Blotevogel, K-H. (1993). Complete oxidation of
benzoate and 4-hydroxybenzoate by a new sulfate-reducing bacterium
resembling Desulfoarculus. Archives of Microbiology, 159, 109-113.
Stellenbosch University http://scholar.sun.ac.za
45
Duncan, J.R., Brady, D. & Stoll, A.D. (1995). The use of yeast biomass and
yeast products to accumulate toxic and valuable heavy metals from
wastewater. WRC Report No 464/1/94. Published by the Water
Research Commission, P.O. Box 824, Pretoria, 0001, South Africa.
Dvorak, D.H., Hedin, RS., Edenborn, H.M. & Mcintire, P.E. (1992). Treatment
of metal-contaminated water using bacterial sulfate reduction: Results
from pilot scale reactors. Biotechnology and Bioengineering, 40, 609-
616.
Edwards, W., Leukes, W.O., Jacobs, E.P., Sanderson, RD., Rose, P.O. &
Burton, S.G. (1998). Upscale of a transverse-flow capillary membrane
module to a demonstration size unit for the treatment of phenol-
containing industrial effluent. In: Biennial Conference and Exhibition of
the Water Institute of Southern Africa (Volume 3.) Baxter Theatre,
Cape Town, Paper 3E-6, Pp. 1-8.
Eichler, B. & Schink, B. (1984). Oxidation of primary aliphatic alcohols by
Acetobacterium carbinolicum, sp. nov. a homoacetogenic anaerobe.
Archives of Microbiology, 140, 147-152.
Enzminger, J.D., Robertson, D., Ahiert, RC. & Kosson, D.S. (1987).
Treatment of landfilileachates. Journal of Hazardous Materials, 14, 83-
87.
Fang, H.H.P. (1997). Microbial distribution and syntrophic association in
UASB granules. In: Proceedings of the 8th International Conference on
Anaerobic Digestion (Volume 1.) Sendai, Japan, Pp. 83-90.
Fang, H.H.P. & Liu, Y. (1995). X-ray analysis of anaerobic granules.
Biotechnology Techniques, 9(7), 513-518.
Forday, W. & Greenfield, P.F. (1983). Anaerobic digestion. Effluent Treatment
Journal, 10,405-413.
Gaydon, P.N. & De Haas, O.W. (1998). Removal of residual colour from a
treated textile effluent using coagulants. In: Biennial Conference and
Exhibition of the Water Institute of Southern Africa (Volume 3.) Baxter
Theatre, Cape Town, Paper 3B-8, Pp. 1-8.
Stellenbosch University http://scholar.sun.ac.za
46
Gorris, L.G.M., Van Deursen, J.M.A, Van Der Drift, C. & Vogels, G.O. (1989).
Inhibition of propionate degradation by acetate in methanogenie
fluidized bed reactors. Biotechnology Letters, 11,61-66.Gough, RH., Roy, D. & McDowell, T.R (1987). Methane generation from the
digestion of whey in a two-stage system. Journal of Environmental
Science and Health, A22(5), 463-483.
Grebenyuk, V.D., Linkov, N.A & Linkov, V.M. (1998). Removal of Ni and Cu
ions from aqueous solutions by means of a hybrid electrosorptionl
electrodialysis process. Water SA, 24(2), 123-127.
Guangsheng, C., Plugge, C.M., Roelofsen, W., Houwen, P. & Stams, J.M.
(1992). Selenomonas acidaminovorans sp. nov., a versatile
thermophilic proton-reducing anaerobe able to grow by decarboxylation
of succinate to propionate. Archives of Microbiology, 157, 169-175.
Guiot, S.R., Pauss, A & Costerton, J.W. (1992). A structured model of the
anaerobic granule consortium. Water Science and Technology, 25(7),
1-10.
Guiot, S.R, Darrah, B. & Hawari, J.A (1997). Hydrogen sulfide removal by
anaerobic I aerobic coupling. In: Proceedings of the 8th International
Conference on Anaerobic Digestion (Volume 2.) Sendai, Japan, Pp.
64-71.
Hakulinen, R, Woods, S., Ferguson, J. & Benjamin, M. (1985). The role of
facultative anaerobic micro-organisms in anaerobic biodegradation of
chlorophenols. Water Science and Technology, 17,289-301.
Hanaki, K., Matsuo, T. & Nagase, M. (1981). Mechanism of inhibition caused
by long-chian fatty acids in anaerobic digestion process. Biotechnology
and Bioengineering, 23, 1591-1610 (As cited by Dinopoulou & Lester
1989).
Harada, H., Momonoi, K., Yamazaki, S. & Takizawa, S. (1994). Application of
anaerobic-UF membrane reactor for treatment of a wastewater
containing high strength particulate organics. In: Preprints of the 7th
International Symposium on Anaerobic Digestion, RSA Litho Press,
University of Cape Town, South Africa, Pp. 540-554.
Stellenbosch University http://scholar.sun.ac.za
47
Harper, S.R & Pohland, F.G. (1997). Microbial consortia selection in
anaerobic filters operated in different reactor configurations. In:
Proceedings of the 8th International Conference of Anaerobic
Digestion (Volume 2.) Sendai, Japan, Pp. 371-382.
Harrington, O.W. & Maris, P.J. (1986). The treatment of leachate: a UK
perspective. Water Pollution Control, 85,45-47.
Heijthuijsen, J.H.F.G. & Hansen, T.A. (1987). Growth and product formation
in batch and continuous cultures of the anaerobic acidogenic
bacterium Butyribacterium methylotrophicum. In: Proceedings of the
4th European Congress on Biotechnology (Volume 3.) Amsterdam,
The Netherlands, Pp. 459-460.
Henry, J.G. (1985). New developments in landfill leachate treatment. Water
Pollution Research Journal of Canada, 20, 1-9.
Henson, J.M. & Smith, P.H. (1985). Isolation of a butyrate-utilizing bacterium
in coculture with Methanobacterium thermoautotrophicum from a
thermophilic digester. Applied Environmental Microbiology, 49, 1461-
1466.
Heppner, B., Zellner, G. & Diekman, D. (1992). Start-up and operation of a
propionate-degrading fluidized-bed reactor. Applied Microbiology and
Biotechnology, 36, 810-816.
Heyes, RH. & Hall, RJ. (1983). Kinetics of two subgroups of propionate
using organisms in anaerobic digestion. Applied Environmental
Microbiology, 46, 710-715.
Holland, K.T., Knapp, J.S. & Schoesmith, J.G. (1987). Anaerobic Bacteria, 1st
ed. New York: Chapman & Hall.
Iannotti, E.L., Meuler, RE. & Fischer, J.R (1987). Microbiology and
biochemistry of methane fermentations. In: Biomass Energy
Development, (W.H. Smith, eds.), Plenum Publishers Corporation,
New York, Pp. 415-438.
Isa, Z., Grusenmeyer, S. & Verstraete, W. (1986). Sulfate reduction relative to
methane production in high-rate anaerobic digestion: Technical
aspects. Applied Environmental Microbiology, 51, 572-577.
Stellenbosch University http://scholar.sun.ac.za
48
Jacobs, E.P. & Barnard, J.P. (1997). Investigation to upgrade secondary
treated sewage effluent by means of ultrafiltration and nanofiltration for
municipal and industrial use. WRC Report No 548/1/97. Published by
the Water Research Commission, P.O. Box 824, Pretoria, 0001, South
Africa.
Jacobs, E.P., Pillay, V.L., Swart, P., Botes, J.P., Maartens, A, Konig, E. &
Pryor, M. (1998). Ultrafiltration - A process for potable water treatment.
In: Biennial Conference and Exhibition of the Water Institute of
Southern Africa (Volume 3.) Baxter Theatre, Cape Town, Paper 3E-3,
Pp. 1-8.
Joubert, W.A & Britz, T.J. (1986). The effect of pH and temperature
manipulation on metabolite composition during acidogenesis in a
hybrid anaerobic digester. Applied Microbiology and Biotechnology, 24,
253-258.
Joubert, W.A & Britz, T.J. (1987). The performance and mixing
characteristics of an anaerobic hybrid reactor treating a synthetic fatty
acid containing substrate. Water SA, 13(2), 63-68.
Juby, G.J.G., Nel, D.J.C. & Van Der Merwe, LW. (1998). Application of
seeded reverse osmosis in South Africa for the recovery of water from
CaS04 scaling water. In: Biennial Conference and Exhibition of the
Water Institute of Southern Africa (Volume 3.) Baxter Theatre, Cape
Town, Paper 3E-5, Pp. 1-8.
Juby, G.J.G. & Schutte, C.F. (2000). Membrane life in a seeded-slurry reverse
osmosis system. Water SA, 26(2), 239-248.
Kalyuzhnyi, SV. (1997). Batch anaerobic digestion of glucose and its
mathematical modelling. II. Description, verification and application of
model. Bioresource Technology, 59, 249-256.
Kang, S.J., Englert, C.J., Astfalk, T.J. & Young, M.A (1990). Treatment of
leachate from a hazardous waste landfill. In: Proceedings of the 44th
Annual Industrial Waste Conference, Purdue University, Lafayette,
Indiana, USA, Pp. 573-579.
Kasan, H.C. (1988). Biological wastewater treatment: A biotechnological
application. IMIESA, June, 31-37.
Stellenbosch University http://scholar.sun.ac.za
49
Keenan, J.D., Steiner, RL. & Fungaroli, AA (1984). Landfill leachate
treatment. Journal of the Water Pollution Control Federation, 56, 27-
29.
Keenan, P.J., Iza, J. & Switzenbaum, M.S. (1993). Inorganic solids
development in a pilot-scale anaerobic reactor treating municipal solid
waste landfill leachate. Water Environment Research, 65,181-185.
Kellum, R & Drake, H.L. (1984). Effects of cultivation gas phase on
hydrogenase of the acetogen Clostridium thermoaceticum. Journal of
Bacteriology, 160,466-469.
Kettern, J.T. (1992). Biological or chemico-physical landfill leachate
purification - an alternative or a useful combination. Water Science and
Technology, 26,137-142.
Kitaura, S., Nishimura, N., Mimura, A & Takahara, Y. (1992). Isolation and
characterization of a fast-growing, thermophilic, hydrogenotrophic
methanogen. Journal of Fermentation and Bioengineering, 74, 244-
247.
Klass, D.L. (1984) Methane from anaerobic fermentation. Science, 223, 1021-
1028.
Knoll, G. & Winter, J. (1989). Degradation of phenol via carboxylation to
benzoate by a defined, obligate syntrophic consortium of anaerobic
bacteria. Applied Environmental Microbiology, 30, 318-324.
Knox, K. (1985). Leachate treatment with nitrification of ammonia. Water
Research, 19, 895-897.
Krug, T.A & McDougall, S. (1988). Preliminary assessment of a
microfiltration/reverse osmosis process for the treatment of landfill
leachate. In: Proceedings of the 4~ Annual Industrial Waste
Conference, Purdue University, Lafayette, Indiana, Indiana, USA, Pp.
10-12.
Krumholtz, L.R & Bryant, M.P. (1986). Syntrophococcus sucromutans sp.
nov. gen. nov. uses carbohydrates as electron donors and formate,
methoxymonobenzoids or Methanobrevibacter as electron acceptor
systems. Archives of Microbiology, 143, 313-318.
Stellenbosch University http://scholar.sun.ac.za
50
Labib, F., Ferguson, J.F., Benjamin, M.M., Merigh, M. & Ricker, N.L. (1992).
Anaerobic butyrate degradation in a fluidized-bed reactor: effects of
increased concentration of H2 and acetate. Environmental Science and
Technology, 26, 369-376.
Lema, J.M., Méndez, R. & Blazquez, R. (1988). Characteristics of landfill
leachates and alternatives for their treatment: a review. Water, Air and
Soil Pollution, 40, 223-250.
Lens, P.N.L., Visser, A., Janssen, A.J.H., Hulshoff Pol, L.W. & Lettinga, G.
(1998). Biotechnological treatment of sulfate-rich wastewaters. Critical
Reviews in Environmental Science and Technology, 28(1), 41-88.
Lettinga, G., Hulshoff Pol, L.W., Zeeman, G., Field, J., Van Lier, J.B., Van
Buuren, J.C.L., Janssen, A.J.H. & Lens, P. (1997). Anaerobic
treatment in sustainable environmental production concepts. In:
Proceedings of the 8th International Conference on Anaerobic
Digestion (Volume 1.) Sendai, Japan, Pp. 32-39.
Lin, C.-Y. (1991). Anaerobic digestion of landfill leachate. Water SA, 17, 301-
305.
Loizidou, M., Papadopoulos, A. & Kapetanios, E.G. (1993). Application of
chemical oxidation for the treatment of refractory substances in
leachates. Journal of Environmental Science and Health, A28, 385-
387.
Lugowski, A., Haycock, D., Poisson, R. & Beszedits, S. (1990). Biological
treatment of landfill leachate. In: Proceedings of the 44th Annual
Industrial Waste Conference, Purdue University, West Lafayette,
Canada, Pp. 565-571.
Lux, M.F., Keith, E., Hsu, T. & Drake, H.L. (1990). Biotransformation of
aromatic aldehydes by acetogenic bacteria. FEMS Microbiology
Letters, 67, 73-78.
Maartens, A., Swart, P. & Jacobs, E.P. (1998). Enzymatic cleaning of
ultrafiltration membranes fouled in wool-scouring effluent. Water SA,
24(1),71-76.
Mack, W.N., Mack, J.P. & Ackerson, O. (1975). Microbial film development in
a trickling filter. Microbial Ecology, 2, 215-226.
Stellenbosch University http://scholar.sun.ac.za
51
Marchaim, U. & Krause, C. (1993). Propionic to acetic acid ratios in
overloaded anaerobic digestion. Bioresource Technology, 43, 195-203.
Maree, J.P., Cole, C.G.B., Gerber, A. & Barnard, J.L. (1990). Treatment of
gelatin factory effluent. Water SA, 16, 265-268.
Matasci, RN., Kaempfer, C. & Heidman, J.A. (1986). Full-scale studies of the
trickling filter/solids contact process. Journal of the Water Pol/ution
Control Federation, 58, 1043-1049.
Mcinerney, M.J. & Bryant, M.P. (1981). Anaerobic degradation of lactate by
syntrophic association of Methanosarcina barkeri and Desulfovibrio
species and the effect of H2 on acetate degradation. Applied
Environmental Microbiology, 41,346-354.
McSweeney, C.S., Allison, M.J. & Mackie, RI. (1993). Amino acid utilization
by the ruminal bacterium Synergistes jonesii 78-1. Archives of
Microbiology, 159, 131-135.
Metcalf & Eddy, Inc. (1991). Wastewater Engineering: Treatment, Disposal
and Reuse. 3rd Edition. Revised by Tchobanoglous, G. & Burton, F.L.
McGraw-Hili, Inc., Singapore.
Miller, T.L. & Wolin, M.J. (1985). Methanosphaera stadtmaniae gen. nov. sp.:
a species that forms methane by reducing methanol with hydrogen.
Archives of Microbiology, 114, 116-122.
Mountford, O.M. & Bryant, M.P. (1982). Isolation and characterization of an
anaerobic syntrophic benzoate-degrading bacterium from sewage
sludge. Archives of Microbiology, 133,249-256.
Mountford, D.O., Brulla, W.J., Krumholz, L.R & Bryant, M.P. (1984).
Syntrophus buswel/ii gen. nov. sp. nov.: a benzoate catabolizer from
methanogenic ecosystems. International Journal of Systematic
Bacteriology, 34, 216-217.
NedweIl, O.B. & Reynolds, P.J. (1996). Treatment of landfill leachate by
methanogenic and sulphate-reducing digestion. Water Research,
30(1),21-28.
Stellenbosch University http://scholar.sun.ac.za
52
Nell, J.H. & Kafaar, A. (1996). The evaluation and improvement of the
anaerobic digestion ultrafiltration (ADUF) effluent treatment process.
WRC Report No 365/1/95. Published by the Water Research
Commission, P.O. Box 824, Pretoria, 0001, South Africa
Neytzell-de Wilde, F.G. (1985) Wet Air Oxidation. In: Research into the
treatment of industrial effluents with high salinity and organic contents.
Published by the Water Research Commission, P.O. Box 824, Pretoria,
0001, South Africa.
Nowak, 0., Svardal, K. & Kroiss, H. (1996). The impact of phosphorus
deficiency on nitrification - case study of a biological pretreatment plant
for rendering plant effluent. Water Science and Technology, 34, 229-
236.
Okamoto, M., Miyahara, T., Mizuno, O. & Noike, T. (2000). Biological
hydrogen potential of materials characteristic of the organic fraction of
municipal solid wastes. Water Science and Technology, 41(3), 25-32.
Pauss, A., Samson, R. & Guiot, S. (1990). Thermodynamic evidence of
trophic microniches in methanogenic granular sludge-bed reactors.
Applied Microbiology and Biotechnology, 33, 88-92.
Pfennig, N. (1989). Metabolic diversity among the dissimilatory sulfate-
reducing bacteria. Antonie van Leeuwenhoek, 56, 127-138.
Pohland, F.G. & Kang, S.J. (1975). Sanitary landfill stabilization with leachate
recycle and residual treatment. In: American Institute of Chemical
Engineers Symposium Series No. 145. Water 1974, 71, 308-318.
Pohland, F.G. & Kim, J.C. (2000). Microbially mediated attenuation potential
of landfill bioreactor systems. Water Science and Technology, 41(3),
247-254.
Prasad, D., Henry, J.G. & Elefsiniotis, P. (1985). Nitrogen removal from
anaerobically treated leachate. Water Pollution Research Journal of
Canada, 20, 138-148.
Ramlall, P.L. & Nozaic, D.J. (1998). Key success factors involved in the
design of the Wiggins WTP Ozone facility. In: Biennial Conference and
Exhibition of the Water Institute of Southern Africa (Volume 1.) Baxter
Theatre, Cape Town, Paper 44, Pp. 1-4.
Stellenbosch University http://scholar.sun.ac.za
53
Reeve, J.N. (1992). Molecular biology of methanogens. Annual Reviews of
Microbiology, 46, 165-191.
Reeve, J.N., Morgan, RM. & Nailing, J. (1997). Environmental and molecular
regulation of methanogenesis. In: Proceedings of the 8th International
Conference of Anaerobic Digestion (Volume 1.) Sendai, Japan, Pp. 24-
31.
Reis, M.A.M., Almeida, J.S., Lemos, P.C. & Carrondo, M.J.T. (1992). Effect of
hydrogen sulfide on growth of sulphate reducing bacteria.
Biotechnology and Bioengineering, 40, 593-600.
Ross, W.R (1989). Anaerobic treatment of industrial effluent's in South Africa.
Water SA, 15(4),231-246.
Ross, W.R, Barnard, J.P., Le Roux, J. & De Villiers, H.A. (1990). Application
of ultrafiltration membranes for solids-liquid separation in anaerobic
digestion systems: The ADUF process. Water SA, 16, 85-91.
Ross, W.R, Strohwaid, N.K.H., Grobler, C.J. & Sanetra, J. (1994).
Membrane-assisted anaerobic treatment of industrial effluents: the
South African ADUF process. In: Preprints of the 7th International
Symposium on Anaerobic Digestion, RSA Litho Press, University of
Cape Town, South Africa, Pp. 550-559.
Roy, F., Samain, E., Dubourguier, H.C. & Aabagnac, G. (1986).
Syntrophomonas sapovorans sp. nov., a new obligately proton
reducing anaerobe oxidizing saturated and unsaturated long chain fatty
acids. Archives of Microbiology, 145, 142-147.
Ruiz, I., Soto, M., Veiga, M.C., Ligero, P., Vega, A. & Blázquez, R (1998).
Performance of and biomass characterisation in a UASB reactor
treating domestic wastewater at ambient temperatures. Water SA,
24(3), 215-222.
Saayman, G.B., Van Leewen, J. & Schutte, C.F. (1997). Full-scale chemical
control of sludge bulking. WRC Report No 328/1/97. Published by the
Water Research Commission, P.O. Box 824, Pretoria 0001, South
Africa.
Stellenbosch University http://scholar.sun.ac.za
54
Saint-Forte, R (1992). Fate of municipal refuse deposited in sanitary landfills
and leachate treatibility. Journal of Environmental Science and Health,
A27,369-371.
Salminen, E., Rintala, J., Lokshina, L.Ya. & Vavilin, V.A. (2000). Anaerobic
batch degradation of solid poultry slaughterhouse waste. Water
Science and Technology, 41 (3), 33-41.
Sam-Soon, PALNS, Wentzel, M.E., Dold, P.L., Loewental, RE. & Marias,
G.v.R (1991). Mathematical modelling of upflow anaerobic sludge bed
(UASB) systems treating carbohydrate waste waters. Water SA, 17(2),
91-106.
Sanderson, RD. & Hurndall, M.J. (1995). Development of tolerant
membranes. WRC Report No 361/1/94. Published by the Water
Research Commission, P.O. Box 824, Pretoria, 0001, South Africa.
Sauvegrain, P., Tazi-Pain, A., Rogalla, F. & Valter, F. (1992). Anaerobic
biofiltration versus aerobic membrane filtration: comparison on a
difficult substrate. Water Science and Technology, 25, 211-218.
Scharer, J.M. & Moo-Young, M. (1979). Methane generation by anaerobic
digestion of cellulose-containing wastes. In: Advances in Biochemical
Engineering Volume 2, (l.K. Ghose, A. Fiechter, & N. Blakebrough.
eds.), Springer Verlag, New York ,Pp. 85-101.
Scherer, P.A., Vollmer, G.-R, Fakhouri, T. & Martensen, S. (2000).
Development of a methanogenic process to degrade exhaustively the
organic fraction of municipal "grey waste" under thermophilic and
hyperthermophilic conditions. Water Science and Technology, 41 (3),
83-91.
Schink, B. (1984). Clostridium magnum sp. nov., a non-autotrophic
homoacetogenic bacterium. Archives of Microbiology, 137,250-255.
Schoeman, J.J. & Steyn, A. (1995). Evaluation of membrane technology for
electroplating effluent treatment. WRC Report No 275/1/95. Published
by the Water Research Commission, P.O. Box 824, Pretoria, 0001,
South Africa.
Stellenbosch University http://scholar.sun.ac.za
55
Schoeman, J.J. & Steyn, A. (1996). Electrically driven membrane separation
processes for the treatment of industrial effluents. WRC Report No
532/5/95. Published by the Water Research Commission, P.O. Box
824, Pretoria, 0001, South Africa.
Schoeman, J.J. & Steyn, A. (1997). Evaluation of membrane technology for
the treatment of industrial effluents. WRC Report No 590/1/97.
Published by the Water Research Commission, P.O. Box 824, Pretoria,
0001, South Africa.
Schuppert, B. & Schink, B. (1990). Fermentation of methoxyacetate to
glycolate and acetate by newly isolated strains of Acetobacterium sp.
Archives of Microbiology, 153, 200-204.
Senior, E. (1995). Landfill leachate treatment. In: Microbiology of Landfill
Sites, 2nd ed. (Edited by E. Senior), CRC Press, Boca Raton, Pp. 131-
164.
Shin, H.S., Oh, S.E. & Bae, B.U. (1996). Competition between SRB and MPB
according to temperature change in the anaerobic treatment of tannery
wastes containing high sulfate. Environmental Technology, 17, 361-
370.
Shipin, ov., Dunn, K.M., Shipin, V.Y. & Rose, P.O. (1994). Saline anaerobic
digestion in advanced algal high rate oxidation ponding for the
treatment of organics in saline effluents. In: 7th International
Symposium on Anaerobic Digestion, Cape Town, Pp 397-404.
Siebert, M.T. & Toerien, D.F. (1969). The proteolytic bacteria present in the
anaerobic digestion of raw sewage sludge. Water Research, 3, 241-
250.
Silverio, C.M., Anglo, P.G., Montero, G.V., Pacheco, V., Alamis, L. & Luis,
V.S. (1986). Anaerobic treatment of distillery slops using an upflow
anaerobic filter reactor. Process Biochemistry, 21, 192-195.
Silvey, P., Pullammanappallil, P.C., Blackall, L. & Nichols, P. (2000). Microbial
ecology of the leach bed anaerobic digestion of unsorted municipal
solid waste. Water Science and Technology, 41(3), 9-16.
Stellenbosch University http://scholar.sun.ac.za
56
Smith, P.G. & Arab, F.K. (1988). The role of air bubbles in the desorption of
ammonia from landfill leachates in high pH aerated lagoons. Water, Air
and Soil Pollution, 38, 333-343.
Spengel, O.B. & Dzombak, D.A (1992). Biokinetic modelling and scale-up
considerations for rotating biological contractors. Water Environment
Research, 64, 223-226.
Stieb, M. & Schink, B. (1985). Anaerobic oxidation of fatty acids by
Clostridium bryantii sp. nov., a sporeforming, obligately syntrophic
bacterium. Archives of Microbiology, 140, 387-390.
Strohwaid, N.K.H. (1996). An investigation into the application of the
anaerobic digestion-ultrafiltration process for the treatment of metal-
cutting fluid wastewater. WRC Report No 593/1/95. Published by the
Water Research Commission, P.O. Box 824, Pretoria, 0001, South
Africa.
Sun, W-Q., Payne, G.F., Moas, M.S.G.L., Chu, J.H. & Wallace, K.K. (1992).
Tyrosinase reaction/chitosan adsorption for removing phenols from
wastewater. Biotechnology Progress, 8, 179-186.
Swart, P., Maartens, A, Swart, AC. & Jacobs, E.P. (1996). The development
of characterising and cleaning techniques to classify foulants and to
remove them from ultra- and microfiltration membranes by biochemical
means. WRC Report No 531/1/96. Published by the Water Research
Commission, P.O. Box 824, Pretoria, 0001, South Africa.
Tasaki, M., Kamagata, Y., Nakamura, K., Okamura, K. & Minami, K. (1993).
Acetogenesis from puryvate by Desulfotomaculum thermobenzoicum
and differences in puruvate metabolism among three sulfate-reducing
bacteria in the absence of sulfate. FEMS Microbiology Letters, 106,
259-264.
Tracey, R.P., Spangenberg, G.J. & Britz, T.J. (1989). Isolation and
characterization of aerobic, facultative and anaerobic non-
methanogenic acetate-utilizing bacteria from anaerobic digesters. In:
Proceedings of the 2nd Anaerobic Digestion Symposium, University of
the Orange Free State, Bloemfontein, South Africa, Pp. 184-195.
Stellenbosch University http://scholar.sun.ac.za
57
Tursman, J.F. & Cork, D.J. (1989). Influence of sulfate and sulfate-reducing
bacteria on anaerobic digestion technology. In: Biological Waste
Treatment, (A Mizrahi. eds.), Alan R Liss, Inc., New York, Pp. 273-
285.
Ubisi, M.F., Jood, T.W., Wentzel, M.C. & Ekama, G.A (1997). Activated
sludge mixed liquor heterotrophic active biomass. Water SA, 23(3),
239-248.
Ueki, A, Miyagawa, A, Minato, H, Azuma, R & Suto, T. (1978). Enumeration
and isolation of anaerobic bacteria in sewage digester fluids. Journal of
General Applied Microbiology, 24, 317-332.
Vainshtein, M., Hippe, H. & Kroppenstedt, RM. (1992). Cellular fatty acid
composition of Desulfovibrio species and its use in classification of
sulfate-reducing bacteria. Systematic and Applied Microbiology, 15,
554-566.
Van Der Merwe, M. (1994). Microbial ecology and anaerobic treatment of
baker's yeast effluent. Ph.D. Thesis, University of the Orange Free
State, Bloemfontein, South Africa.
Van Der Merwe, M. & Britz, T.J. (1993). Anaerobic treatment of raw baker's
yeast effluent using an anaerobic filter and a hybrid digester.
Bioresource Technology, 43, 169-174.
Van Der Merwe, M. & Britz, T.J. (1994). The individual and combined
influence of temperature, time, pH and COD concentration on the
biodegradation activities of selected bacterial strains grown on raw
baker's yeast effluent. Water Science and Technology, 30, 97-106.
Van Der Walt, C.J. (1997). Guidelines for the use of peroxone and other
oxidants for the treatment of eurotrophic and coloured waters in South
Africa. WRC Report No 443/1/97. Published by the Water Research
Commission, P.O. Box 824, Pretoria, 0001, South Africa.
Van Der Walt, J.J. (1998). Is a sedimentation tank really that simple? In:
Biennial Conference and Exhibition of the Water Institute of Southern
Africa (Volume 1.) Baxter Theatre, Cape Town, Paper 57, Pp. 1-4.
Stellenbosch University http://scholar.sun.ac.za
58
Van Haandel, AC. & Lettinga, G. (1994). Application of anaerobic digestion to
sewage treatment. In: Anaerobic Sewage Treatment - A Practical
Guide for Regions with a Hot Climate, John Wiley & Sons Ltd., New
York, Pp. 33-62.
Van Houten, RT., Van Der Spoel, H., Van Aelst, AC., Hulshoff Pol, L.W. &
Lettinga, G. (1996). Biological sulphate reduction using synthesis gas
as energy and carbon source. Biotechnology and Bioengineering, 50,
136-144.
Van Niekerk, AM. & Rudert, G. (1998). The importance of hydrodynamic
aspects in the optimisation of biofilter performance. In: Biennial
Conference and Exhibition of the Water Institute of Southern Africa
(Volume 2.) Baxter Theatre, Cape Town, Paper 2E-5, Pp. 1-10.
Venkataramani, E.S., Ahiert, RC. & Corbo, P. (1988). Aerobic and anaerobic
treatment of high-strength hazardous liquid wastes. Journal of
Hazardous Materials, 17, 169-173.
Visser, A, Gao, Y. & Lettinga, G. (1992). Anaerobic treatment of synthetic
sulfate-containing wastewater under thermophilic conditions. Water
Science and Technology, 25, 193-202.
Weber, H., Kulbe, K.O., Chmiel, H. & Tresch, W. (1984). Microbial acetate
conversion to methane: kinetics, yields and pathways in a two-step
digestion process. Applied Microbiology and Biotechnology, 19, 224-
228.
Winter, J. & Zellner, G. (1990). Thermophilic anaerobic degradation of
carbohydrates - metabolic properties of micro-organisms from the
different phases. FEMS Microbiology Letters, 75, 139-154.
Wu, W-M., Jain, M.K., Conway de Macario, E., Thiele, J.H. & Zeikus, J.G.
(1992). Microbial composition and characterization of prevalent
methanogens and acetogens isolated from syntrophic methanogenie
granules. Applied Microbiology and Biotechnology, 38, 282-290.
Ying, W.-C., Bonk, RR & Sojka, S.A (1987). Treatment of a landfill leachate
in powered activated carbon enhanced sequencing batch bioreactors.
Environmental Progress, 6, 1-4.
Stellenbosch University http://scholar.sun.ac.za
59
Zehnder, AJ.B., Huser, B.A, Brock, T.D. & Wuhrmann, K. (1980).
Characterization of an acetate decarboxylating, non-hydrogen,
oxidizing methane bacterium. Archives of Microbiology, 124, 1-11.
Zehnder, AJ.B., Ingvorsen, K. & Marti, T. (1982). Microbiology of methane
bacteria. In: Anaerobic Digestion, (D.E. Hughes, O.A. Stafford, B.1.
Wheatly, W. Baader, G. Lettinga, E.T. Nyns, W. Verstraete, & R.L.
Wentworth. eds.), Elsevier Biomedical Press, Amsterdam, Pp. 45-67.
Zeikus, J.G. (1980). Microbial populations in digesters. In: Anaerobic
Digestion, (D.A Stafford, B.1.Wheatley, & D.E. Hughes. eds.), Applied
Science Publishers, London, Pp. 61-89.
Zellner, G. & Winter, J. (1987). Analysis of a highly efficient methanogenie
consortium producing biogas from whey. Systematic and Applied
Microbiology, 9, 284-292.
Zhao, H., Yang, D., Woese, C.R. & Bryant, M.P. (1990). Assignment of
Clostridium bryantii to Syntrophospora bryantii gen. nov., comb. nov.,
on the basis of a 16S rRNA sequence analysis of its crotonate-grown
pure culture. International Journal of Systematic Bacteriology, 40, 40-
44.
Zhi-rong, H., Wentzel, M.C. & Ekama, G.A (2000). External nitrification in
biological nutrient removal activated sludge systems. Water SA, 26(2),
225-238.
Zinder, S.H. (1984). Microbiology of anaerobic conversion of organic wastes
to methane: recent developments. ASM News, 50, 294-298.
Zu, J., Hu, J. & Gu, X. (1997). The bacterial numeration and an observation of
a new syntrophic association for granular sludge. In: Proceedings of
the 8th International Conference of Anaerobic Digestion (Volume 2.)
Sendai, Japan, Pp. 532-539.
Stellenbosch University http://scholar.sun.ac.za
60
CHAPTER 3
TREATMENT OF GELATIN-MANUFACTURING EFFLUENT USING
SINGLE-PHASE ANAEROBIC HYBRID DIGESTERS
Summary
Two different anaerobic hybrid laboratory-scale digester designs were used to
evaluate the biological treatment efficiency of a high-strength, highly variable
raw gelatin-manufacturing effluent (AD-1, UASB - polyethylene), as well as
the raw effluent supplemented with anaerobic supernatant (AD-2, UASB -
polyurethane), under mesophilic conditions. No chemical oxygen demand
(COD) standardisation was done on the effluent, as varying batch and
substrate composition were considered important in the simulation of the
actual field conditions. Successful inoculation and start-up of the digesters
resulted in good handling of the highly variable organic loading rates (OLR)
and decreasing hydraulic retention time (HRT), with immediate sulphate (S04)
(91 - 92%) and COD (22 - 30%) removal. During steady state, COD removal
efficiencies of up to 90% (AD-1) and 83% (AD-2) at OLR of 9.56 (AD-1) and
4.62 kg COD.m-3.d-1(AD-2), respectively, were achieved. High S04 removal
efficiencies of up to 96% and 98% were obtained with the AD-1 and AD-2
bioreactors, respectively. The methane content of the biogas varied between
70 and 88% for AD-1 and between 69 and 89% for AD-2. The total methane
yield per COD removed (YCH4) ranged between 0.41 and 7.16 m3.kg
CODremoved.d-1for AD-1 at OLR's of 1.89 to 9.56 kg COD.m-3.d-1,and for AD-2
the methane yield per COD removed varied between 0.45 and 6.75 m3.kg
CODremoved.d-1at OLR's of 1.48 to 9.30 kg COD.m-3.d-1. The digesters were
pre-inoculated with a selected microbial population. This specific treatment
process can be characterised as one having a short start-up period, good
handling of extremely variable loading conditions, with no need for any
additional pre-treatment of the gelatin-manufacturing effluent.
Stellenbosch University http://scholar.sun.ac.za
61
Introduction
South African industries are faced with critical pollution control issues and
need to adopt changing attitudes towards pollution matters. Many of the
problems that effluent producing industries face are attributed to the variable
quality and noxious nature of the process effluents. Local authorities are
increasingly and selectively reluctant to receive these effluents into communal
sewers and industries are often faced with high trade-effluent charges. Under
the new South African water and environmental laws, industries need to
reconsider their water quality management strategies and treatment options
(DEAT & DWAF, 1997) in order to accommodate the stricter water and
pollution control regulations.
The gelatin-manufacturing industry is one of the industries that
receives much attention (DEAT & DWAF, 1997) in terms of its influence on
the treatment processes of the local wastewater purification works and hence,
their compliance to water regulations (Van Der Merwe-Botha, 1998, Personal
communication). During the gelatin-manufacturing process, reject hides
which are not suitable for tanning purposes are conditioned, treated and
processed. This involves a process of protein hydrolysis and denaturation,
where insoluble hide collagen is converted into water soluble gelatin (Maree
et al., 1990). Effluents from the gelatin-manufacturing process have typically
high organic as well as inorganic loads, with chemical oxygen demand (COD)
values ranging between 500 - 77 000 rnq.l". Problems with high suspended
solids, sulphate, fats, lipid emulsions, proteins and salt concentrations also
contribute negatively to the effluent problems. The product process produces
substantial effluent volumes of varying quality, of which the disposal to
biological nutrient removal plants results in costly upsets of the treatment
process (Van Der Merwe-Botha, 1998, Personal communication).
The treatment of gelatin-manufacturing effluent has not received much
attention, hence little treatment data are available in this field. However,
numerous studies have been done on tanning effluent and other high salinity
wastewater types. These effluents are usually treated by means of expensive
physical or chemical pre-treatment methods, such as either electrochemical
methods, ion exchange, carbon adsorption, coagulation or flocculation
Stellenbosch University http://scholar.sun.ac.za
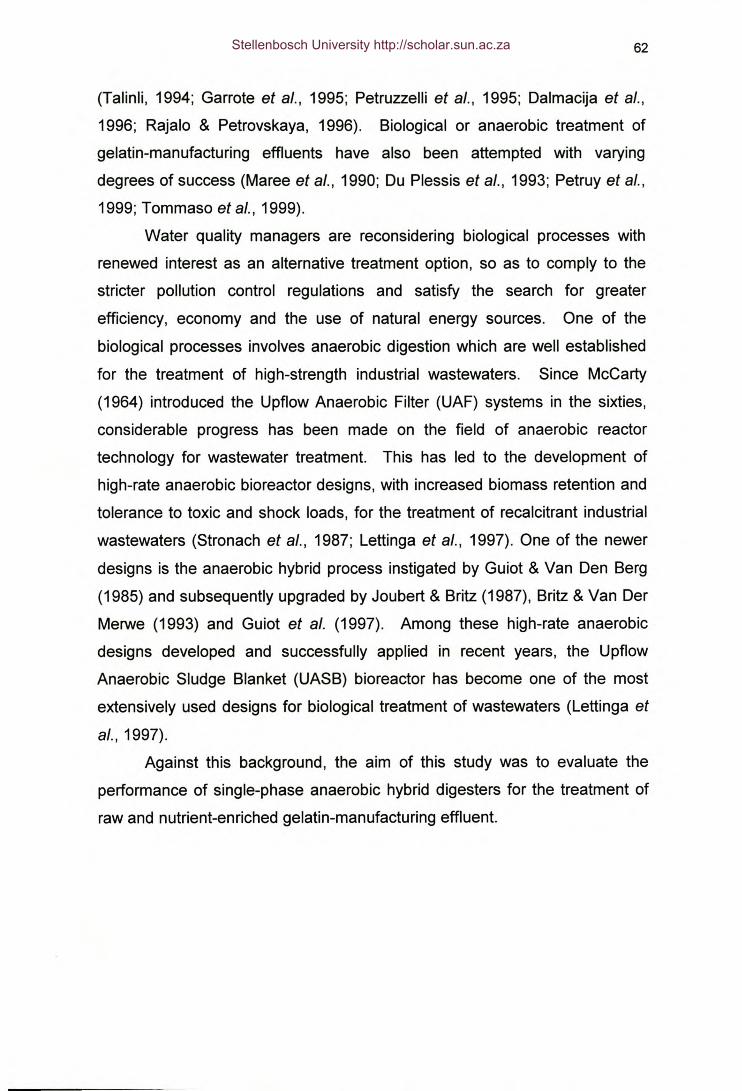
62
(Talinli, 1994; Garrote et al., 1995; Petruzzelli et al., 1995; Dalmacija et al.,
1996; Rajala & Petrovskaya, 1996). Biological or anaerobic treatment of
gelatin-manufacturing effluents have also been attempted with varying
degrees of success (Maree et al., 1990; Du Plessis et al., 1993; Petruy et al.,
1999; Tommaso et al., 1999).
Water quality managers are reconsidering biological processes with
renewed interest as an alternative treatment option, so as to comply to the
stricter pollution control regulations and satisfy the search for greater
efficiency, economy and the use of natural energy sources. One of the
biological processes involves anaerobic digestion which are well established
for the treatment of high-strength industrial wastewaters. Since McCarty
(1964) introduced the Upflow Anaerobic Filter (UAF) systems in the sixties,
considerable progress has been made on the field of anaerobic reactor
technology for wastewater treatment. This has led to the development of
high-rate anaerobic bioreactor designs, with increased biomass retention and
tolerance to toxic and shock loads, for the treatment of recalcitrant industrial
wastewaters (Stronach et aI., 1987; Lettinga et al., 1997). One of the newer
designs is the anaerobic hybrid process instigated by Guiot & Van Den Berg
(1985) and subsequently upgraded by Joubert & Britz (1987), Britz & Van Der
Merwe (1993) and Guiot et al. (1997). Among these high-rate anaerobic
designs developed and successfully applied in recent years, the Upflow
Anaerobic Sludge Blanket (UASB) bioreactor has become one of the most
extensively used designs for biological treatment of wastewaters (Lettinga et
al., 1997).
Against this background, the aim of this study was to evaluate the
performance of single-phase anaerobic hybrid digesters for the treatment of
raw and nutrient-enriched gelatin-manufacturing effluent.
Stellenbosch University http://scholar.sun.ac.za
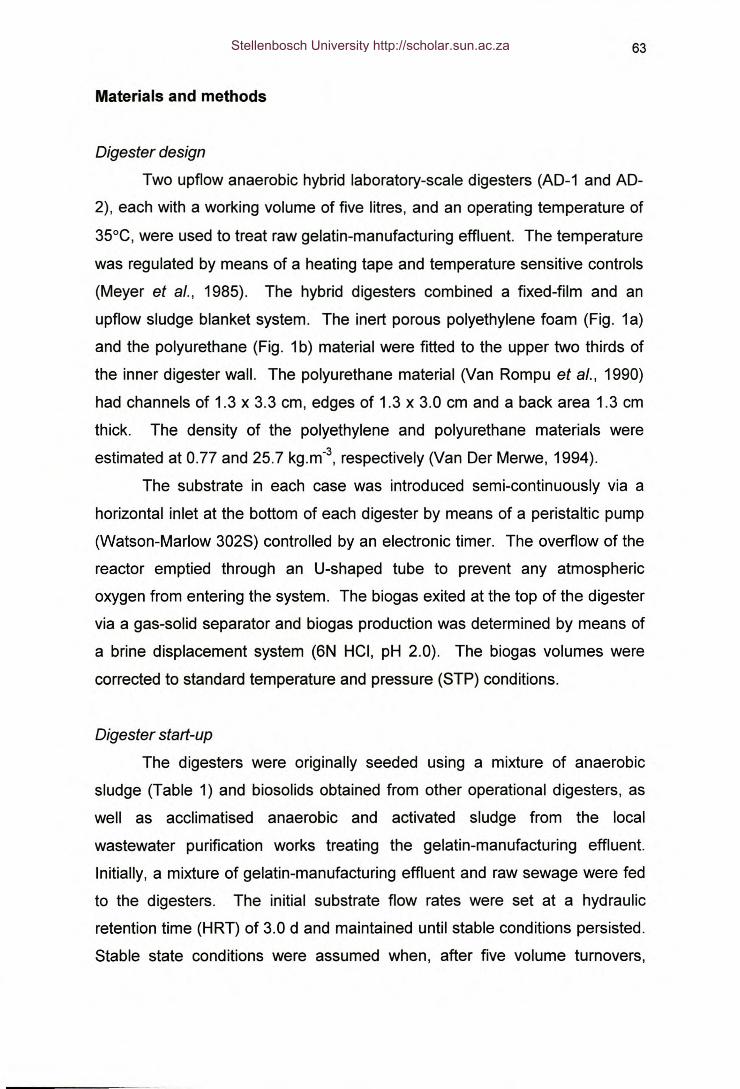
63
Materials and methods
Digester design
Two upflow anaerobic hybrid laboratory-scale digesters (AD-1 and AD-
2), each with a working volume of five litres, and an operating temperature of
35°e, were used to treat raw gelatin-manufacturing effluent. The temperature
was regulated by means of a heating tape and temperature sensitive controls
(Meyer et aI., 1985). The hybrid digesters combined a fixed-film and an
upflow sludge blanket system. The inert porous polyethylene foam (Fig. 1a)
and the polyurethane (Fig. 1b) material were fitted to the upper two thirds of
the inner digester wall. The polyurethane material (Van Rompu et aI., 1990)
had channels of 1.3 x 3.3 cm, edges of 1.3 x 3.0 cm and a back area 1.3 cm
thick. The density of the polyethylene and polyurethane materials were
estimated at 0.77 and 25.7 kg.m-3, respectively (Van Der Merwe, 1994).
The substrate in each case was introduced semi-continuously via a
horizontal inlet at the bottom of each digester by means of a peristaltic pump
(Watson-Marlow 302S) controlled by an electronic timer. The overflow of the
reactor emptied through an U-shaped tube to prevent any atmospheric
oxygen from entering the system. The biogas exited at the top of the digester
via a gas-solid separator and biogas production was determined by means of
a brine displacement system (6N Hel, pH 2.0). The biogas volumes were
corrected to standard temperature and pressure (STP) conditions.
Digester start-up
The digesters were originally seeded using a mixture of anaerobic
sludge (Table 1) and biosolids obtained from other operational digesters, as
well as acclimatised anaerobic and activated sludge from the local
wastewater purification works treating the gelatin-manufacturing effluent.
Initially, a mixture of gelatin-manufacturing effluent and raw sewage were fed
to the digesters. The initial substrate flow rates were set at a hydraulic
retention time (HRT) of 3.0 d and maintained until stable conditions persisted.
Stable state conditions were assumed when, after five volume turnovers,
Stellenbosch University http://scholar.sun.ac.za
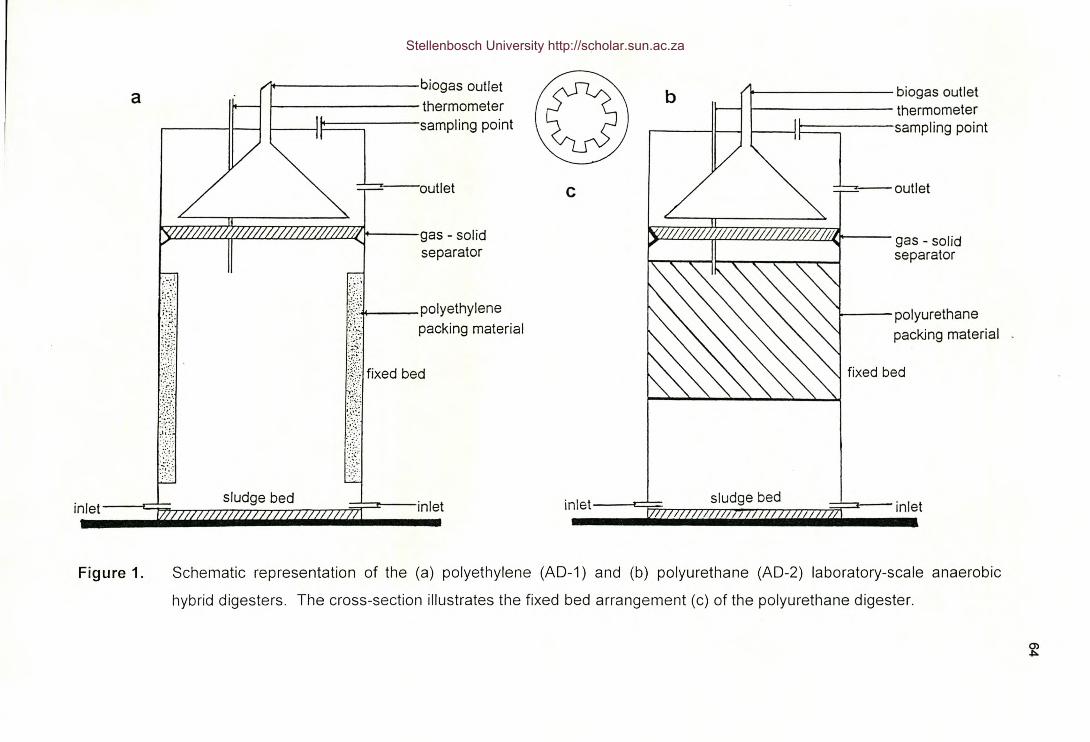
a (lI biogas outlet111-· -------- thermometerI--_-j~==~---sampling point
==::!---outlet
w/lZZll2J')ff/l///J//7/////Jl0Zll. gas - solidseparator
(;~;:.."f'::"r
~?;!::~:~:/4--polyethylene;~D;l packing material.!,;{..:;.'.~;..
U~~'i":'-;'
'.'':.}';:;:;:.:~~~
@t~~:~~{
WDI fixed bed~~(i~%;
:,:::.:,:::.-:;
~*.}.~::....
. ; _._-;:,~ ~~~ ; .Inlet jj JJ' j)}) j))))) } jj j)) ) }»)) )})}} Inlet
Figure 1.
c
10-------- biogas outlet1--------- thermometerI--_-II::==~---sampling point
- outlet
[YIII!I/!/(((1(/(/I/IIIIIIII///I/!{jo gas - solidseparator
10---- polyurethanepacking material
fixed bed
inlet r=;;;),)))});;;,-;:;,:;;)})},))}})i inlet
Schematic representation of the (a) polyethylene (AD-1) and (b) polyurethane (AD-2) laboratory-scale anaerobic
hybrid digesters. The cross-section illustrates the fixed bed arrangement (c) of the polyurethane digester.
~
Stellenbosch University http://scholar.sun.ac.za
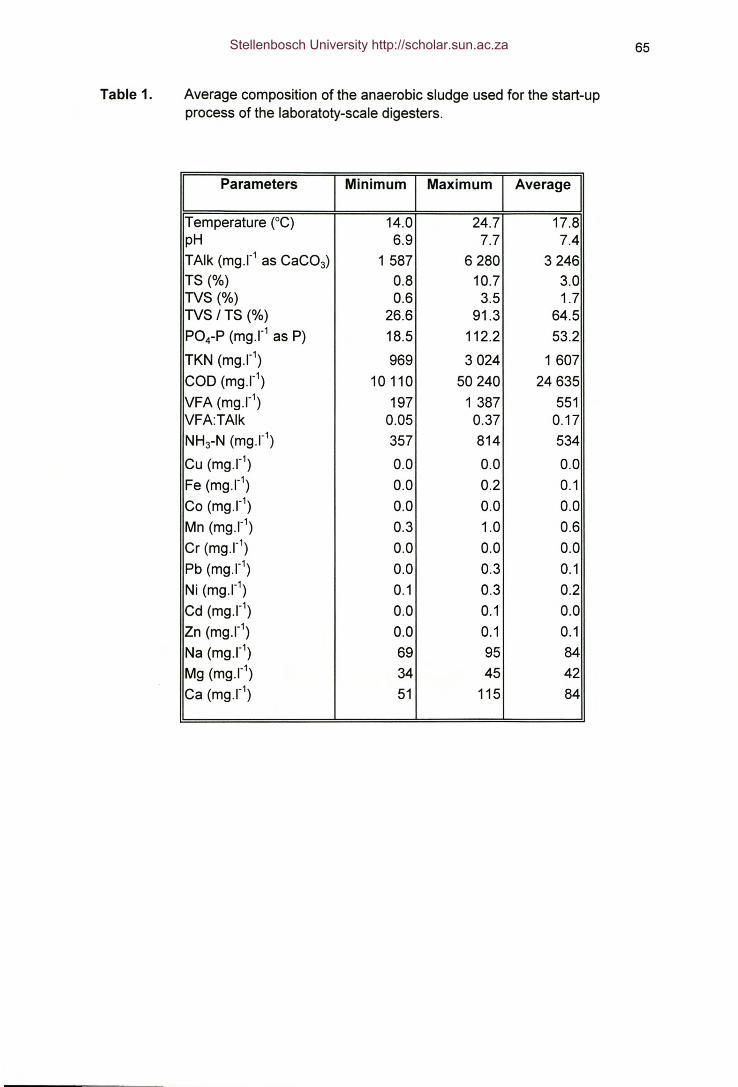
Table 1.
65
Average composition of the anaerobic sludge used for the start-upprocess of the laboratoty-scale digesters.
IParameters
IMinimum I Maximum
IAverage I
Temperature (0C) 14.0 24.7 17.8pH 6.9 7.7 7.4TAlk (rnq.l" as CaC03) 1 587 6280 3246TS(%) 0.8 10.7 3.0TVS(%) 0.6 3.5 1.7TVS / TS (%) 26.6 91.3 64.5P04-P (rnq.l" as P) 18.5 112.2 53.2
TKN (rnq.l") 969 3024 1 607COD (rnq.l") 10110 50240 24635VFA (rnq.I") 197 1 387 551VFATAlk 0.05 0.37 0.17NH3-N (mq.l') 357 814 534
Cu (rnq.I") 0.0 0.0 0.0Fe (rnq.I") 0.0 0.2 0.1Co (rnq.l") 0.0 0.0 0.0Mn (rnq.l") 0.3 1.0 0.6Cr (rnq.l') 0.0 0.0 0.0Pb (mg.r1) 0.0 0.3 0.1Ni (rnq.I") 0.1 0.3 0.2Cd (rnq.I") 0.0 0.1 0.0Zn (mg.r1) 0.0 0.1 0.1Na (mg.r1) 69 95 84Mg (rnq.l") 34 45 42Ca (rnq.l') 51 115 84
Stellenbosch University http://scholar.sun.ac.za
66
operational parameters showed a variation of less than 10%. Subsequently,
the HRT was lowered to 2.0 d and then to 1.0 d for the rest of the study.
Gelatin-manufacturing effluent
The gelatin effluent was obtained from the local gelatin-manufacturing
industry (Leiner Davis Gelatin South Africa (Pty) Ltd), in batches of 75 I and
stored at room temperature until required. No COD standardisation was done
on the effluent in an attempt to simulate the actual field conditions. However,
the pH of the effluent used as digester substrate was adjusted to 6.5 using a
standard 6N HCI solution. By this means, the direct effect of varying COD
concentrations (organic loading rates) on the anaerobic treatment efficiency
could be determined. The gelatin-manufacturing effluent used as digester
substrate was initially supplemented with 100 rnq.l" urea, 100 mq.l" K2HP04,
10 ml acetic acid (CH3COOH) and a sterile trace element solution (Nel et al.,
1985) during the start-up process, so as to stimulate the growth of the specific
microbial consortium and to prevent any nutrient limitations.
Analytical methods
The following parameters were monitored on the digester substrate
and effluent, according to Standard Methods (APHA, AWWA & WEF, 1995):
pH; total alkalinity (TAlk); chemical oxygen demand (COD); total Kjeldahl
nitrogen (TKN); volatile fatty acids (VFA); sulphate (SO/-); total solids (TS);
volatile solids (VS); total non-volatile solids (TNVS) and ortho-phosphate
(P04-P).
Total metals which include most of the heavy metals (Cu, Fe, Co, Mn,
Zn, Ni, Pb, Cr, Cd), as well as calcium and sodium concentrations, were
determined using an Atomic Absorbance Spectrophotometer (Varian Model
250 Plus), equipped with hollow cathode lamps for the different metals,
photoelectric detector with associated electronic amplifying and measuring
equipment. Air/acetylene and nitrous oxide/acetylene burners were used with
air as oxidant and acetylene (or nitrous oxide) as fuel. Pressure reducing
regulators were used for the supply of the fuel and oxidant at appropriate
levels. Control standards of known metal concentrations were prepared with
a matrix similar to the samples, for the construction of a calibration curve.
Stellenbosch University http://scholar.sun.ac.za
67
Additional standard solutions were analysed between samples to confirm test
control, as well as a blank to confirm the baseline stability. The sample
concentrations were determined by reference to the calibration curve. The
filtered samples (at room temperature) were aspirated into the air/acetylene
or nitrous oxide/acetylene flame and atomised.
Volatile fatty acids (as acetate) were determined according to the
titration method of Moosbrugger et al. (1992). The biogas composition
(methane and carbon dioxide) was determined volumetrically according to the
quantitative biogas carbon dioxide content method of Ross et al. (1992). The
biogas volumes were corrected to STP conditions.
The accuracy of all tested chemical parameters were confirmed by
participation in an inter-laboratory water testing program (SABS Water Check
Proficiency Program).
Experimental phases
The study consisted of two experimental phases, the first during which
the polyethylene hybrid digester (AD-1) was fed with full-strength raw gelatin-
manufacturing effluent and the second where the polyurethane hybrid
digester (AD-2) was fed with a mixture of 80% gelatin-manufacturing effluent
and 20% anaerobic digester supernatant (as nutrient supplement).
Standardisation was applied only to the extent of preparing the substrates
from the same effluent batch, to make direct comparisons possible. The
different batches were, however, not standardised in terms of COD
concentration, in an attempt to simulate the actual field conditions using
bench-scale systems.
Results and discussion
Gelatin-manufacturing effluent composition
The average composition of the different batches of gelatin-
manufacturing effluent, obtained from Leiner Davis Gelatin (Pty.) Ltd, is given
in Table 2. The average composition of the substrate fed to the hybrid
Stellenbosch University http://scholar.sun.ac.za
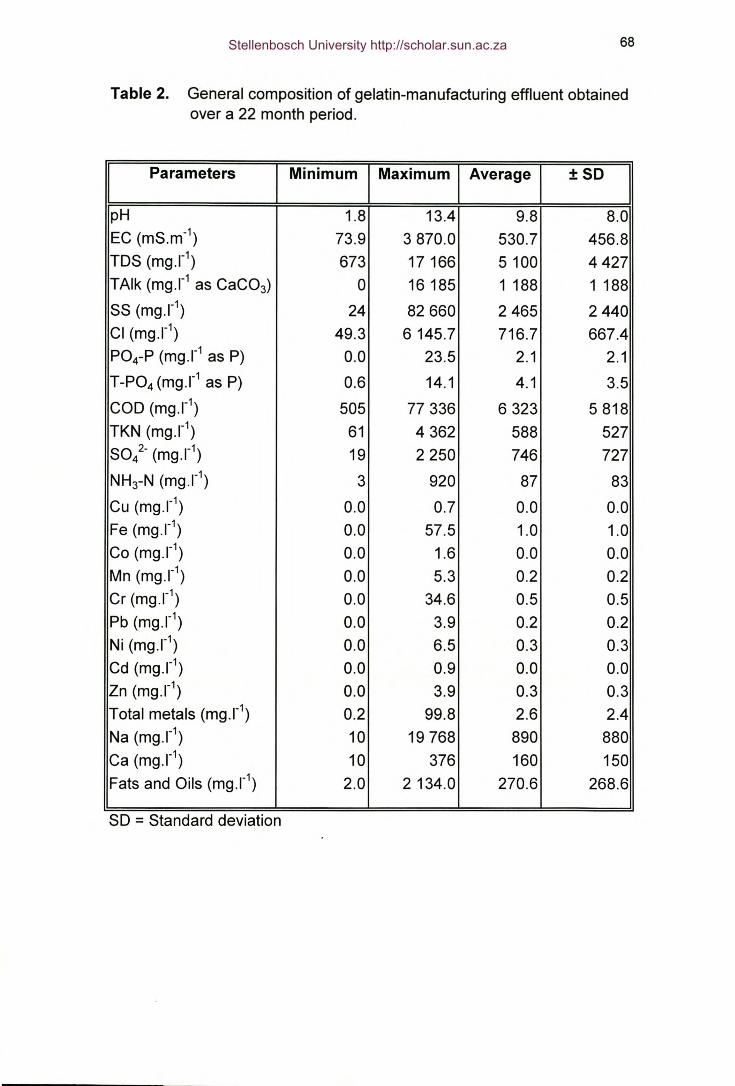
68
Table 2. General composition of gelatin-manufacturing effluent obtainedover a 22 month period.
Parameters Minimum Maximum Average ±SO
pH 1.8 13.4 9.8 8.0EC (ms.rn') 73.9 3870.0 530.7 456.8TOS (rnq.l') 673 17166 5 100 4427TAlk (rnq.l' as CaC03) 0 16 185 1 188 1 188SS (rnq.I") 24 82660 2465 2440Cl (rnq.I") 49.3 6 145.7 716.7 667.4P04-P (rnq.l' as P) 0.0 23.5 2.1 2.1T-P04 (rnq.l" as P) 0.6 14.1 4.1 3.5COD (mq.I") 505 77336 6323 5818TKN (rnq.l") 61 4362 588 527SO/- (mq.I") 19 2250 746 727NH3-N (rnq.l") 3 920 87 83Cu (mq.I") 0.0 0.7 0.0 0.0Fe (rnq.l") 0.0 57.5 1.0 1.0Co (rnq.I") 0.0 1.6 0.0 0.0Mn (rnq.I") 0.0 5.3 0.2 0.2Cr (rnq.l') 0.0 34.6 0.5 0.5Pb (rnq.l") 0.0 3.9 0.2 0.2Ni (rnq.I") 0.0 6.5 0.3 0.3Cd (rnq.l") 0.0 0.9 0.0 0.0Zn (rnq.l") 0.0 3.9 0.3 0.3Total metals (rnq.I") 0.2 99.8 2.6 2.4Na (rnq.I") 10 19768 890 880Ca (rnq.I") 10 376 160 150Fats and Oils (mq.I") 2.0 2 134.0 270.6 268.6SO = Standard deviation
Stellenbosch University http://scholar.sun.ac.za
69
digesters during the experimental phases, is given in Table 3. The OLR
ranging from 1.89 - 9.56 kg COD.m-3.d-1 for digester AD-1 and from 1.48 -
9.30 kg COD.m-3.d-1 for digester AD-2 clearly show the wide variation of OLR
which a purification works can expect from the gelatin-manufacturing industry.
Since the direct influence of varying batch and substrate composition was
considered important, no standardisation was done on the effluent. The
substrate pH was, however, adjusted to a value of 6.5.
Start-up period
A rapid start-up phase was observed for both digesters, with immediate
S04 (91 - 92%) and COD removal (22 - 30%) at an OLR of 2.21 kg COD.m-
3.d-1. This excellent start-up performance confirmed the successful selection
of an active microbial community which were used as inoculum for the
digesters. VFA production was observed in both digesters during the first 23
days, followed by VFA removal of 50% at an OLR of 2.04 kg COD.m-3.d-1
(AD-1) and 38% at an OLR of 1.76 kg COD.m-3.d-1 (AD-2). The VFA
production then increased again in both digesters up to day 92, and this was
followed by a steady increase in the removal efficiency of the VFA's. At this
stage, VFA removal efficiencies of 26% (AD-1) at an OLR of 4.73 kg COD.m-
3.d-1 and 61% (AD-2) at an OLR of 4.08 kg COD.m-3.d-1, were obtained,
respectively. The effluent pH and alkalinity increased during the start-up
period, also confirming the establishment of an active, balanced microbial
community.
Digester Efficiency (AD-1)
The composition of the substrates used for the AD-1 digester, the
digester effluent and the performance efficiency during the operational period,
are summarised in Tables 4a, band c. The data in Table 4 are arranged
according to the numerical increases in OLR. The prominent variation in OLR
over the 29 week period can clearly be seen (Fig. 2), with the higher OLR
operational conditions found during weeks 9 to 11 and 23 to 25. The data in
Fig. 2 reflects the variation in organic effluent composition which is found
under typical field conditions where balancing facilities are not available.
Stellenbosch University http://scholar.sun.ac.za
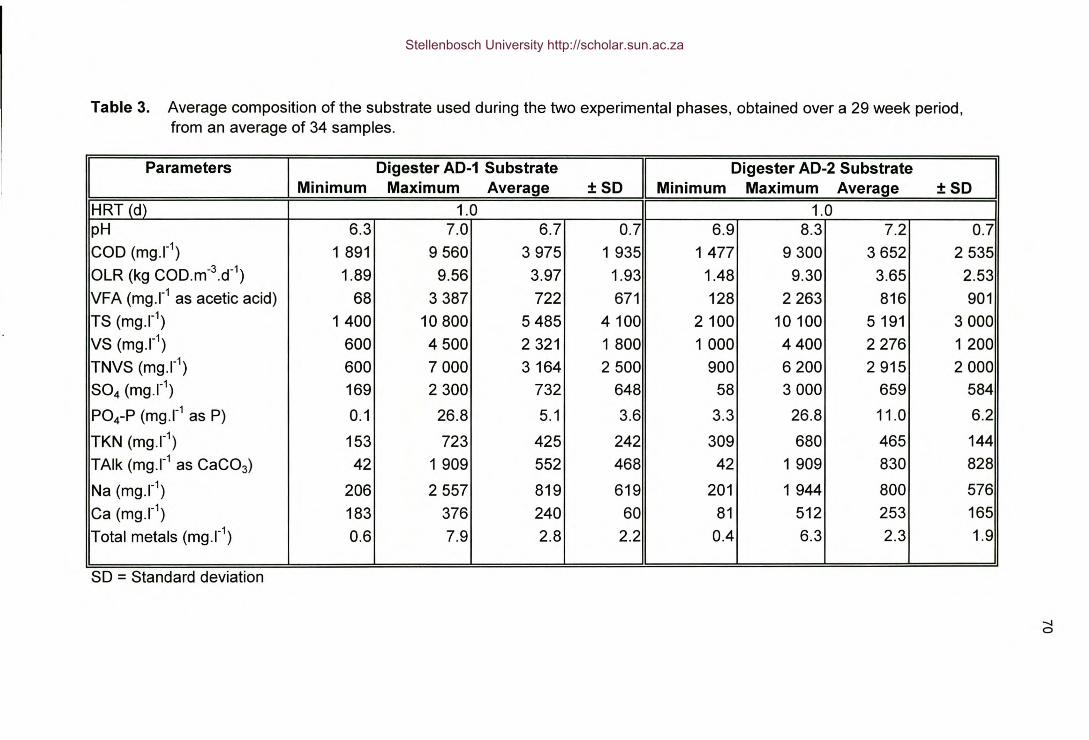
Table 3. Average composition of the substrate used during the two experimental phases, obtained over a 29 week period,from an average of 34 samples.
Parameters Digester AD-1 Substrate Digester AD-2 SubstrateMinimum Maximum Average ±SD Minimum Maximum Average ±SD
HRT (d) 1.0 1.0pH 6.3 7.0 6.7 0.7 6.9 8.3 7.2 0.7COD (rnq.I") 1 891 9560 3975 1 935 1 477 9300 3652 2535OLR (kg COD.m-3.d-1) 1.89 9.56 3.97 1.93 1.48 9.30 3.65 2.53VFA (mq.l" as acetic acid) 68 3387 722 671 128 2263 816 901TS (rnq.l") 1400 10800 5485 4100 2100 10 100 5 191 3000VS (mq.I") 600 4500 2321 1 800 1 000 4400 2276 1 200TNVS (rnq.l") 600 7000 3164 2500 900 6200 2915 2000S04 (rnq.l") 169 2300 732 648 58 3000 659 584
P04-P (rnq.l" as P) 0.1 26.8 5.1 3.6 3.3 26.8 11.0 6.2
TKN (mq.l") 153 723 425 242 309 680 465 144TAlk (rnq.I" as CaC03) 42 1 909 552 468 42 1 909 830 828
Na (mq.I") 206 2557 819 619 201 1 944 800 576Ca (rnq.l") 183 376 240 60 81 512 253 165Total metals (rnq.l') 0.6 7.9 2.8 2.2 0.4 6.3 2.3 1.9
SO = Standard deviation
-.jo
Stellenbosch University http://scholar.sun.ac.za
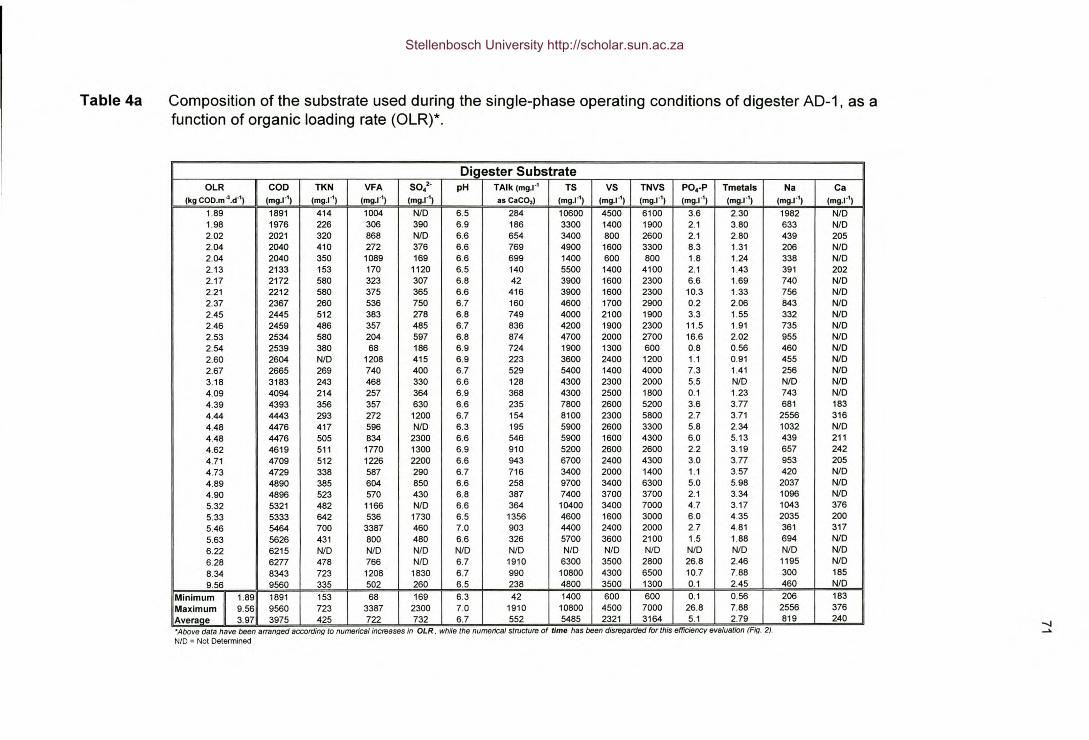
Table 4a Composition of the substrate used during the single-phase operating conditions of digester AD-1, as afunction of organic loading rate (OLR)*.
Digester SubstrateOLR COD TKN VFA SO;' pH TAlk (mg.r' TS VS TNVS PO.-P Tmetals Na Ca
(kg COD.m-3.d·') (mg.r') (mg.r') (mg.r') (mg.r') as CaCO,) (mg.r') (mg.r') (mg.r') (mg.r') (mg.r') (mg.r') (mg.r')
1.B9 1B91 414 1004 NID 6.5 2B4 10600 4500 6100 3.6 2.30 19B2 NfO1.9B 1976 226 306 390 6.9 1B6 3300 1400 1900 2.1 3.BO 633 NfO2.02 2021 320 B6B NfO 6.6 654 3400 BOO 2600 2.1 2.BO 439 2052.04 2040 410 272 376 6.6 769 4900 1600 3300 B.3 1.31 206 NfO2.04 2040 350 10B9 169 6.6 699 1400 600 BOO 1.B 1.24 33B NfO2.13 2133 153 170 1120 6.5 140 5500 1400 4100 2.1 1.43 391 2022.17 2172 5BO 323 307 6.B 42 3900 1600 2300 6.6 1.69 740 NfO2.21 2212 5BO 375 365 6.6 416 3900 1600 2300 10.3 1.33 756 NfO2.37 2367 260 536 750 6.7 160 4600 1700 2900 0.2 2.06 843 NfO2.45 2445 512 3B3 27B 6.B 749 4000 2100 1900 3.3 1.55 332 NfO2.46 2459 4B6 357 4B5 6.7 B36 4200 1900 2300 11.5 1.91 735 NfO2.53 2534 580 204 597 6.8 874 4700 2000 2700 16.6 2.02 955 NfO2.54 2539 380 68 186 6.9 724 1900 1300 600 0.8 0.56 460 NfO2.60 2604 NfO 1208 415 6.9 223 3600 2400 1200 1.1 0.91 455 NfO2.67 2665 269 740 400 6.7 529 5400 1400 4000 7.3 1.41 256 NID3.18 3183 243 468 330 6.6 128 4300 2300 2000 5.5 NfO NfO NfO4.09 4094 214 257 364 6.9 368 4300 2500 1800 0.1 1.23 743 NfO4.39 4393 356 357 630 6.6 235 7800 2600 5200 3.6 3.77 681 1834.44 4443 293 272 1200 6.7 154 8100 2300 5800 2.7 3.71 2556 3164.48 4476 417 596 NfO 6.3 195 5900 2600 3300 5.8 2.34 1032 NfO4.48 4476 505 834 2300 6.6 546 5900 1600 4300 6.0 5.13 439 2114.62 4619 511 1770 1300 6.9 910 5200 2600 2600 2.2 3.19 657 2424.71 4709 512 1226 2200 6.6 943 6700 2400 4300 3.0 3.77 953 2054.73 4729 338 587 290 6.7 716 3400 2000 1400 1.1 3.57 420 NfO4.89 4890 385 604 850 6.6 258 9700 3400 6300 5.0 5.98 2037 NfO4.90 4896 523 570 430 6.8 387 7400 3700 3700 2.1 3.34 1096 NfO5.32 5321 482 1166 NfO 6.6 364 10400 3400 7000 4.7 3.17 1043 3765.33 5333 842 536 1730 6.5 1356 4600 1600 3000 6.0 4.35 2035 2005.46 5484 700 3387 460 7.0 903 4400 2400 2000 2.7 4.81 361 3175.63 5626 431 BOO 4BO 6.6 326 5700 3600 2100 1.5 1.8B 694 NfO6.22 6215 NfO NfO NfO NfO NfO NID NID NfO NfO NID NfO NfO6.2B 6277 478 766 NfO 6.7 1910 6300 3500 2800 26.8 2.46 1195 NfO8.34 B343 723 1208 1830 6.7 990 10800 4300 6500 10.7 7.88 300 1859.56 9560 335 502 260 6.5 23B 4800 3500 1300 0.1 2.45 460 NfO
Minimum 11.89 1891 153 68 169 6.3 42 1400 600 600 0.1 0.56 206 183Maximum 9.56 9560 723 3387 2300 7.0 1910 10BOO 4500 7000 26.8 7.88 2556 376Averace 3.97 3975 425 722 732 6.7 552 54B5 2321 3184 5.1 2.79 819 240
-...(--"'Above data have been arran!~ed according to numerical increases in OLR. while the numericat structure of time has been disrer:larded for this efficiency evaluation (Fir:l. 2).
N/D = Not Determined
Stellenbosch University http://scholar.sun.ac.za
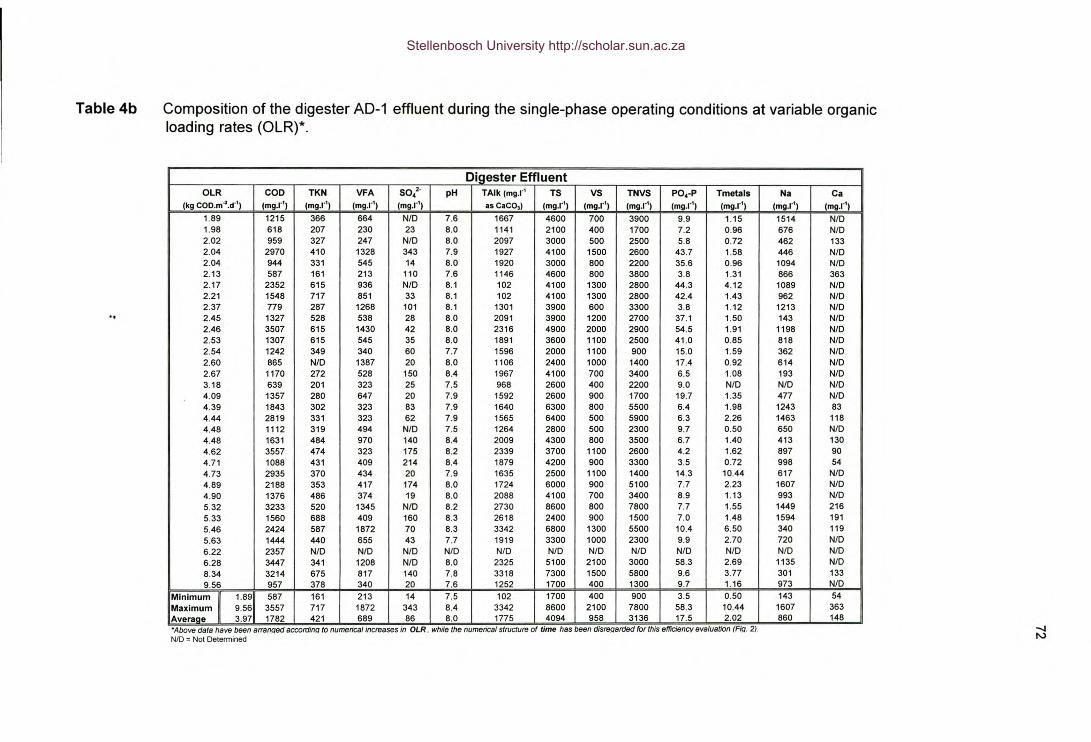
Table 4b Composition of the digester AD-1 effluent during the single-phase operating conditions at variable organicloading rates (OLR)*.
Digester EffluentOLR COD TKN VFA 50/· pH TAlk (mg.r' TS vs TNVS PO.-P Tmetals Na Ca
(kg COD.m".d·') (mg.!"') (mg.!"') (mg.!"') (mg.!"') as CaCO,) (mg.!"') (mg.!"') (mg.!"') (mg.!"') (mg.!"') (mg.!"') (mg.!"')
1.89 1215 366 664 NfO 7.6 1667 4600 700 3900 9.9 1.15 1514 NfO1.98 618 207 230 23 8.0 1141 2100 400 1700 7.2 0.96 676 NfO2.02 959 327 247 NfO 8.0 2097 3000 500 2500 5.8 0.72 462 1332.04 2970 410 1328 343 7.9 1927 4100 1500 2600 43.7 1.58 446 NfO2.04 944 331 545 14 8.0 1920 3000 800 2200 35.6 0.96 1094 NfO2.13 587 161 213 110 7.6 1146 4600 800 3800 3.8 1.31 866 3632.17 2352 615 936 NfO 8.1 102 4100 1300 2800 44.3 4.12 1089 NfO2.21 1548 717 851 33 8.1 102 4100 1300 2800 42.4 1.43 962 NfO2.37 779 287 1268 101 8.1 1301 3900 600 3300 3.8 1.12 1213 NfO2.45 1327 528 538 28 8.0 2091 3900 1200 2700 37.1 1.50 143 NfO2.46 3507 615 1430 42 8.0 2316 4900 2000 2900 54.5 1.91 1198 NfO2.53 1307 615 545 35 8.0 1891 3600 1100 2500 41.0 0.85 818 NfO2.54 1242 349 340 60 7.7 1596 2000 1100 900 15.0 1.59 362 NfO2.60 865 NfO 1387 20 8.0 1106 2400 1000 1400 17.4 0.92 614 NfO2.67 1170 272 528 150 8.4 1967 4100 700 3400 6.5 1.08 193 NfO3.18 639 201 323 25 7.5 968 2600 400 2200 9.0 NfO NfO NfO4.09 1357 280 647 20 7.9 1592 2600 900 1700 19.7 1.35 477 NfO4.39 1843 302 323 83 7.9 1640 6300 800 5500 6.4 1.98 1243 834.44 2819 331 323 62 7.9 1565 6400 500 5900 6.3 2.26 1463 1184.48 1112 319 494 NfO 7.5 1264 2800 500 2300 9.7 0.50 650 NfO4.48 1631 484 970 140 8.4 2009 4300 800 3500 6.7 1.40 413 1304.62 3557 474 323 175 8.2 2339 3700 1100 2600 4.2 1.62 897 904.71 1088 431 409 214 8.4 1879 4200 900 3300 3.5 0.72 998 544.73 2935 370 434 20 7.9 1635 2500 1100 1400 14.3 10.44 617 NfO4.89 2188 353 417 174 8.0 1724 6000 900 5100 7.7 2.23 1607 NfO4.90 1376 486 374 19 8.0 2088 4100 700 3400 8.9 1.13 993 NfO5.32 3233 520 1345 NfO 8.2 2730 8600 800 7800 7.7 1.55 1449 2165.33 1560 688 409 160 8.3 2618 2400 900 1500 7.0 1.48 1594 1915.46 2424 587 1872 70 8.3 3342 6800 1300 5500 10.4 6.50 340 1195.63 1444 440 655 43 7.7 1919 3300 1000 2300 9.9 2.70 720 NfO6.22 2357 NfO NfO NfO NfO NfO NfO NfO NfO NfO NfO NfO NfO6.28 3447 341 1208 NfO 8.0 2325 5100 2100 3000 58.3 2.69 1135 NfO8.34 3214 675 817 140 7.8 3318 7300 1500 5800 9.6 3.77 301 1339.56 957 378 340 20 7.6 1252 1700 400 1300 9.7 1.16 973 NfO
MinimUm! 1.89 587 161 213 14 7.5 102 1700 400 900 3.5 0.50 143 54Maximum 9.56 3557 717 1872 343 8.4 3342 8600 2100 7800 58.3 10.44 1607 363Avera!le 3.97 1782 421 689 86 8.0 1775 4094 _jl5_8 ~136 17.5 2.02 860 148'Above data have been arranaed accordina to numerical increases in OLR, while the numerical structure of time has been disreaarded for this efficiency evaluation (Fiq. 2).NID = Not Detennined
-.jN
Stellenbosch University http://scholar.sun.ac.za
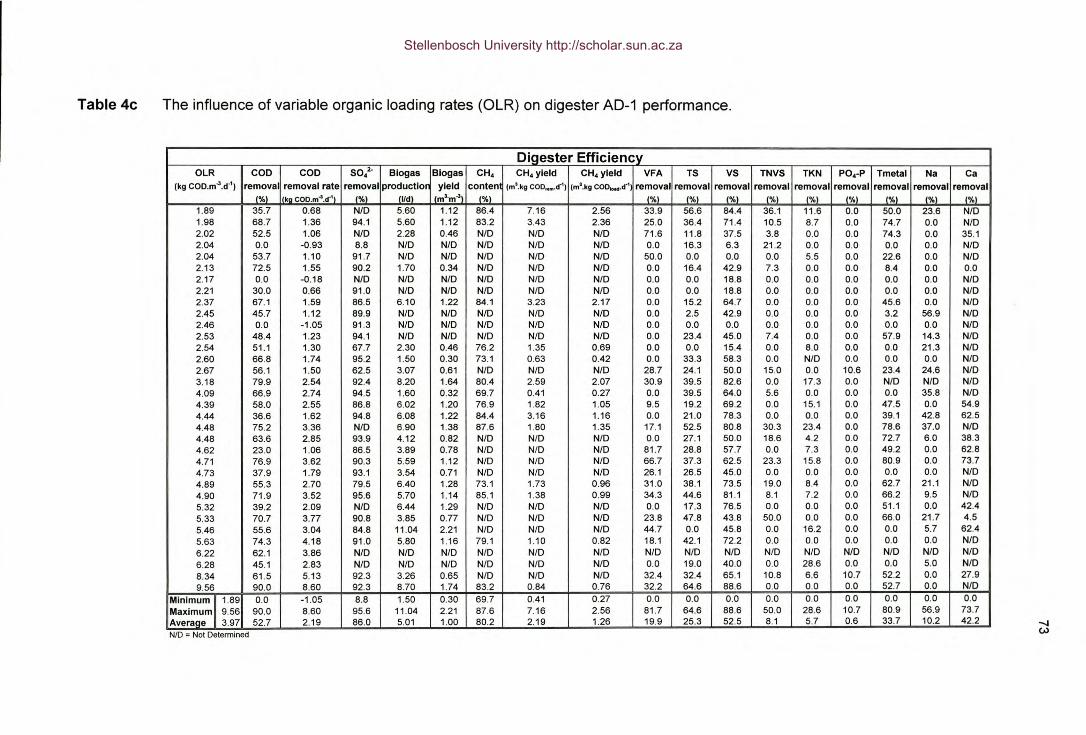
Table 4c The influence of variable organic loading rates (OLR) on digester AD-1 performance.
Digester EfficiencyOLR COD COD 50/· Biogas Biogas CHo CH.yield CHo yield VFA TS VS TNVS TKN PO.-P Tmetal Na Ca
(kg COD.m..:s.d·') removal removal rate removal productior yield conten (m3.kg cOO,.,.,..d-1) (m'.kg COD..... d·' removal removal removal removal removal removal removal removal removal('lo) kg COD.m".d·') ('lo) (lId) (m'·m..:s) ('lo) ('IoJ ('lo) ('lo) ('IoJ {'IoJ {'IoJ (%J ('lo) ('lo)
1.89 35.7 0.68 NID 5.60 1.12 86.4 7.16 2.56 33.9 56.6 84.4 36.1 11.6 0.0 50.0 23.6 NfO1.98 68.7 1.36 94.1 5.60 1.12 83.2 3.43 2.36 25.0 36.4 71.4 10.5 8.7 0.0 74.7 0.0 NfO2.02 52.5 1.06 NfO 2.28 0.46 NfO NfO NfO 71.6 11.8 37.5 3.8 0.0 0.0 74.3 0.0 35.12.04 0.0 -0.93 8.8 NID NfO NfO NfO NfO 0.0 16.3 6.3 21.2 0.0 0.0 0.0 0.0 NfO2.04 53.7 1.10 91.7 NfO NfO NfO NfO NfO 50.0 0.0 0.0 0.0 5.5 0.0 22.6 0.0 NID2.13 72.5 1.55 90.2 1.70 0.34 NfO NfO NfO 0.0 16.4 42.9 7.3 0.0 0.0 8.4 0.0 0.02.17 0.0 -0.18 NfO NfO NfO NfO NfO NfO 0.0 0.0 18.8 0.0 0.0 0.0 0.0 0.0 NfO2.21 30.0 0.66 91.0 NfO NfO NfO NfO NfO 0.0 0.0 18.8 0.0 0.0 0.0 0.0 0.0 NfO2.37 67.1 1.59 86.5 6.10 1.22 84.1 3.23 2.17 0.0 15.2 64.7 0.0 0.0 0.0 45.6 0.0 NfO2.45 45.7 1.12 89.9 NfO NfO NfO NfO NfO 0.0 2.5 42.9 0.0 0.0 0.0 3.2 56.9 NfO2.46 0.0 -1.05 91.3 NfO NfO NfO NfO NfO 0.0 0.0 0.0 0.0 0.0 0.0 0.0 0.0 NfO2.53 48.4 1.23 94.1 NfO NfO NfO NfO NfO 0.0 23.4 45.0 7.4 0.0 0.0 57.9 14.3 NfO2.54 51.1 1.30 67.7 2.30 0.46 76.2 1.35 0.69 0.0 0.0 15.4 0.0 8.0 0.0 0.0 21.3 NID2.60 66.8 1.74 95.2 1.50 0.30 73.1 0.63 0.42 0.0 33.3 58.3 00 NfO 0.0 0.0 0.0 NfO2.67 56.1 1.50 62.5 3.07 0.61 NID NfO NfO 28.7 24.1 50.0 15.0 0.0 10.6 23.4 24.6 NID3.18 79.9 2.54 92.4 8.20 1.64 80.4 2.59 2.07 30.9 39.5 82.6 0.0 17.3 0.0 NfO NfO NfO4.09 66.9 2.74 94.5 1.60 0.32 69.7 0.41 0.27 0.0 39.5 64.0 5.6 0.0 0.0 0.0 35.8 NID4.39 58.0 2.55 86.8 6.02 1.20 76.9 1.82 1.05 9.5 19.2 69.2 0.0 15.1 0.0 47.5 0.0 54.94.44 36.6 1.62 94.8 6.08 1.22 84.4 3.16 1.16 0.0 21.0 78.3 0.0 0.0 0.0 39.1 42.8 62.54.48 75.2 3.36 NfO 6.90 1.38 87.6 1.80 1.35 17.1 52.5 80.8 30.3 23.4 0.0 78.6 37.0 NfO4.48 63.6 2.85 93.9 4.12 0.82 NfO NfO NfO 0.0 27.1 50.0 18.6 4.2 0.0 72.7 6.0 38.34.62 23.0 1.06 86.5 3.89 0.78 NfO NfO NfO 81.7 28.8 57.7 0.0 7.3 0.0 49.2 0.0 62.84.71 76.9 3.62 90.3 5.59 1.12 NfO NfO NfO 66.7 37.3 62.5 23.3 15.8 0.0 80.9 0.0 73.74.73 37.9 1.79 93.1 3.54 0.71 NfO NfO NfO 26.1 26.5 45.0 00 0.0 0.0 0.0 0.0 NfO4.89 55.3 2.70 79.5 6.40 1.28 73.1 1.73 0.96 31.0 38.1 73.5 19.0 8.4 0.0 62.7 21.1 NfO4.90 71.9 3.52 95.6 5.70 1.14 85.1 1.38 0.99 34.3 44.6 81.1 8.1 7.2 0.0 66.2 9.5 NfO5.32 39.2 2.09 NfO 6.44 1.29 NfO NfO NfO 0.0 17.3 76.5 0.0 0.0 0.0 51.1 0.0 42.4
5.33 70.7 3.77 90.8 3.85 0.77 NID NfO NfO 23.8 47.8 43.8 50.0 0.0 0.0 66.0 21.7 4.55.46 55.6 3.04 84.8 11.04 2.21 NID NfO NfO 44.7 0.0 45.8 0.0 16.2 0.0 0.0 5.7 62.45.63 74.3 4.18 91.0 5.80 1.16 79.1 1.10 0.82 18.1 42.1 72.2 0.0 0.0 0.0 0.0 0.0 NfO
6.22 62.1 3.86 NfO NfO NfO NfO NfO NfO NID NfO NfO NfO NID NfO NfO NfO NfO
6.28 45.1 2.83 NfO NfO NfO NfO NID NfO 0.0 19.0 40.0 0.0 28.6 0.0 0.0 5.0 NfO
8.34 61.5 5.13 92.3 3.26 0.65 NfO NfO NfO 32.4 32.4 65.1 10.8 6.6 10.7 52.2 0.0 27.99.56 90.0 8.60 92.3 8.70 1.74 83.2 0.84 0.76 32.2 64.6 88.6 0.0 0.0 0.0 52.7 0.0 NfO
Minimuml11.89 0.0 -1.05 8.8 1.50 0.30 69.7 0.41 0.27 0.0 0.0 0.0 0.0 0.0 0.0 0.0 0.0 0.0
Maximum 9.56 90.0 8.60 95.6 11.04 2.21 87.6 7.16 2.56 81.7 64.6 88.6 50.0 28.6 10.7 80.9 56.9 73.7Average 3.97 52.7 2.19 86.0 5.01 1.00 80.2 2.19 1.26 19.9 25.3 52.5 8.1 5.7 0.6 33.7 10.2 42.2 -.J
(JJNID = Not Determined
Stellenbosch University http://scholar.sun.ac.za
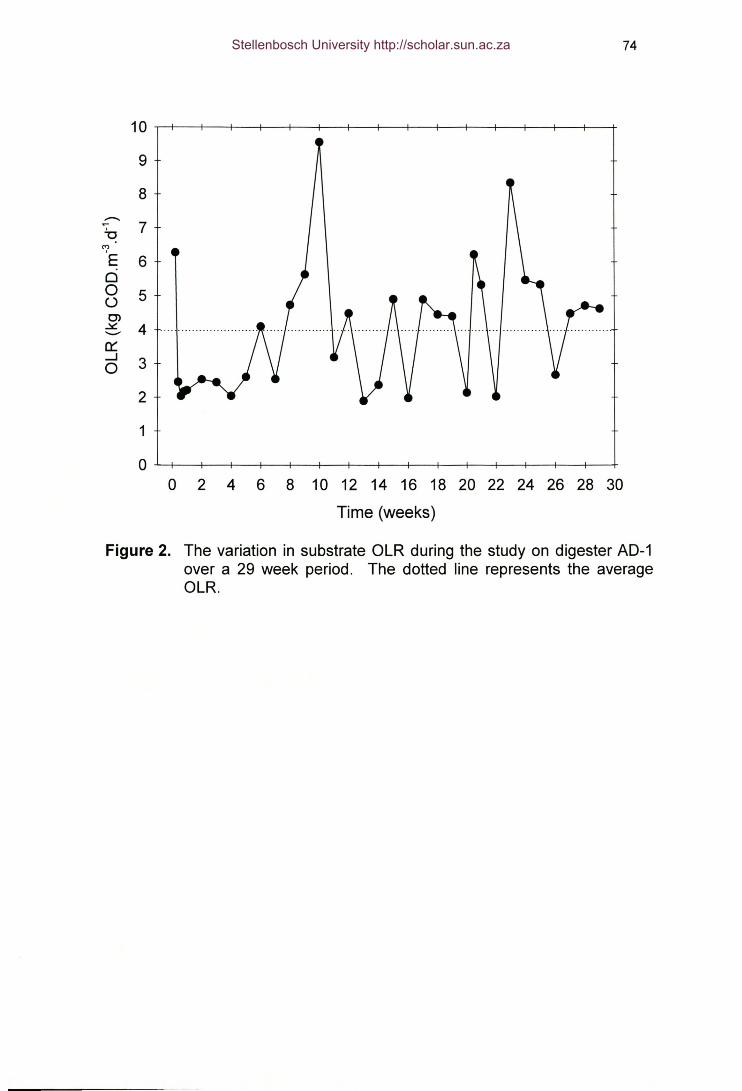
10
9
8.........~ 7'?E 6c0 5U0>.::.::. 4..........0:::.....J 30
2
1
0
74
o 2 4 6 8 10 12 14 16 18 20 22 24 26 28 30
Time (weeks)
Figure 2. The variation in substrate OLR during the study on digester AD-1over a 29 week period. The dotted line represents the averageOLR.
Stellenbosch University http://scholar.sun.ac.za
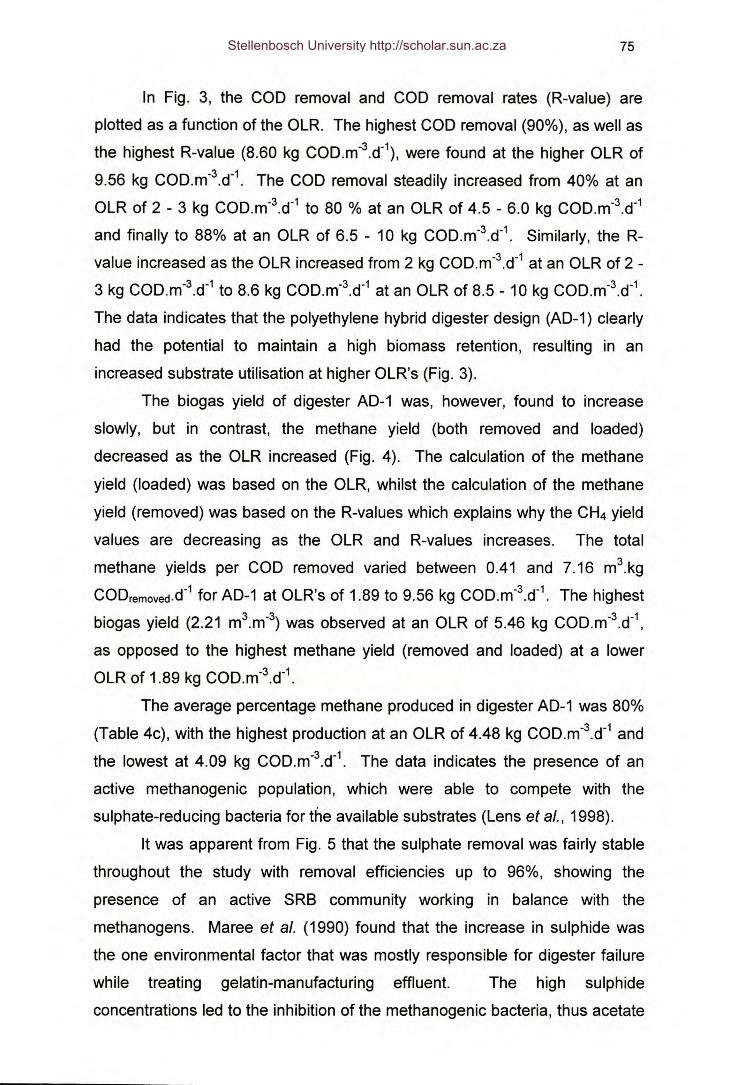
75
In Fig. 3, the COD removal and COD removal rates (R-value) are
plotted as a function of the OLR. The highest COD removal (90%), as well as
the highest R-value (8.60 kg COD.m-3.d-1), were found at the higher OLR of
9.56 kg COD.m-3.d-1. The COD removal steadily increased from 40% at an
OLR of 2 - 3 kg COD.m-3.d-1 to 80 % at an OLR of 4.5 - 6.0 kg COD.m-3.d-1
and finally to 88% at an OLR of 6.5 - 10 kg COD.m-3.d-1. Similarly, the R-
value increased as the OLR increased from 2 kg COD.m-3.d-1 at an OLR of 2 -
3 kg COD.m-3.d-1 to 8.6 kg COD.m-3.d-1 at an OLR of 8.5 - 10 kg COD.m-3.d-1.
The data indicates that the polyethylene hybrid digester design (AD-1) clearly
had the potential to maintain a high biomass retention, resulting in an
increased substrate utilisation at higher OLR's (Fig. 3).
The biogas yield of digester AD-1 was, however, found to increase
slowly, but in contrast, the methane yield (both removed and loaded)
decreased as the OLR increased (Fig. 4). The calculation of the methane
yield (loaded) was based on the OLR, whilst the calculation of the methane
yield (removed) was based on the R-values which explains why the CH4 yield
values are decreasing as the OLR and R-values increases. The total
methane yields per COD removed varied between 0.41 and 7.16 m3.kg
CODremoved.d-1for AD-1 at OLR's of 1.89 to 9.56 kg COD.m-3.d-1. The highest
biogas yield (2.21 m3.m-3) was observed at an OLR of 5.46 kg COD.m-3.d-1,
as opposed to the highest methane yield (removed and loaded) at a lower
OLR of 1.89 kg COD.m-3.d-1.
The average percentage methane produced in digester AD-1 was 80%
(Table 4c), with the highest production at an OLR of 4.48 kg COD.m-3.d-1 and
the lowest at 4.09 kg COD.m-3.d-1. The data indicates the presence of an
active methanogenic population, which were able to compete with the
sulphate-reducing bacteria for the available substrates (Lens et al., 1998).
It was apparent from Fig. 5 that the sulphate removal was fairly stable
throughout the study with removal efficiencies up to 96%, showing the
presence of an active SRB community working in balance with the
methanogens. Maree et al. (1990) found that the increase in sulphide was
the one environmental factor that was mostly responsible for digester failure
while treating gelatin-manufacturing effluent. The high sulphide
concentrations led to the inhibition of the methanogenic bacteria, thus acetate
Stellenbosch University http://scholar.sun.ac.za
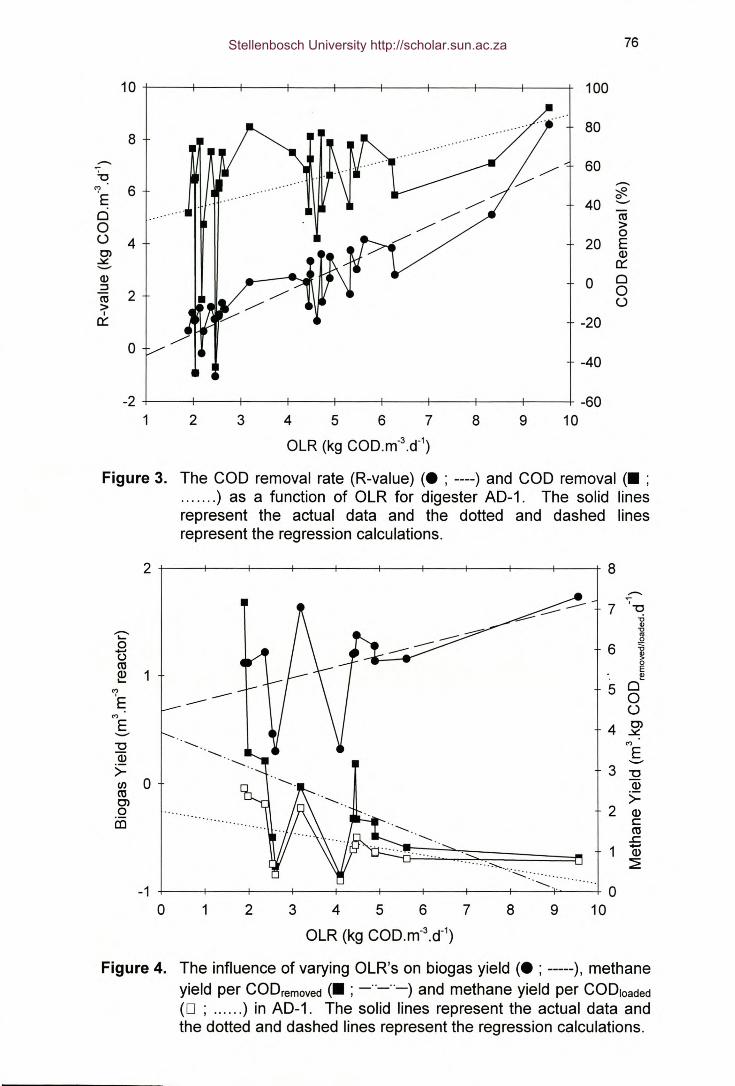
1 2 3
76
100
80
60"""'~0
40 _.(ti>0
20 EQ)a:::
0 00o
-20
-40
-608 9 10
8
~'? 6E00o 4Cl~_.Q)::::::l(ti 2>Ia:::
0
4 5 6 7
OLR (kg COD.m·3.d-1)
Figure 3. The COD removal rate (R-value) (. ; ----) and COD removal (. ;....... ) as a function of OLR for digester AD-1. The solid linesrepresent the actual data and the dotted and dashed linesrepresent the regression calculations.
2 8
-e--7
,:::..-- '0
~ uQ)- '0
'",_0
0 6 :a...... Q)o >(ti 0
E~ 1 ~
'? 5 0--- 0E ---M oE 4 Cl_. ~'0 <, M
Q) .......... E->= 3 '0CJ) 0 Q)(ti >=Cl0 ..... 2 Q)
in ....... e(ti..c:.
1......Q)
..... _----~-----.:..:.:...---.-------- ~
-1<;
00 1 2 3 4 5 6 7 8 9 10
OLR (kg COD.m-3.d-1)
Figure 4. The influence of varying OLR's on biogas yield (. ; -----), methaneyield per CODremoved(. ; _OO_OO_) and methane yield per CODloaded(0 ; ...... ) in AD-1. The solid lines represent the actual data andthe dotted and dashed lines represent the regression calculations.
Stellenbosch University http://scholar.sun.ac.za
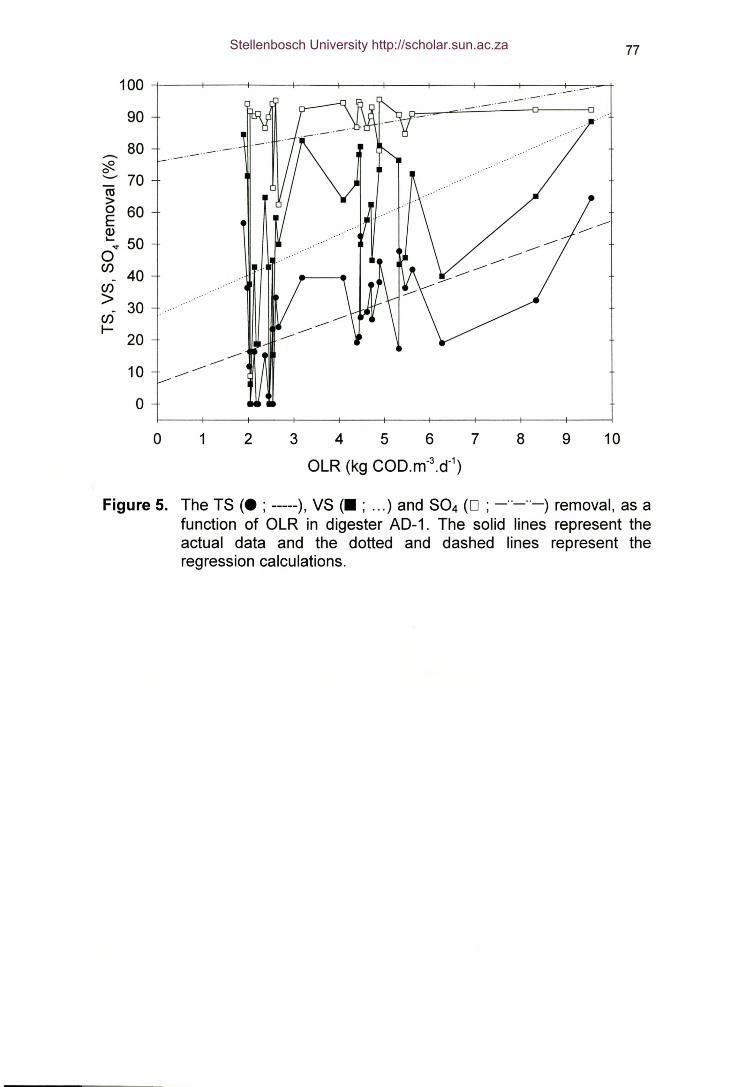
,........~.._ 70Ol>~ 60ID........50oCl) 40Cl)
> 30Cl)I- 20
10o
77
100 T---~---+--~~--+---~---r--~----r---+-~~
9080
o 1 2 3 4 567OLR (kg COD.m-3.d-1)
8 9 10
Figure 5. The TS (. ; -----), VS (. ; ...) and S04 (0 ; _ .._ .._) removal, as afunction of OLR in digester AD-1. The solid lines represent theactual data and the dotted and dashed lines represent theregression calculations.
Stellenbosch University http://scholar.sun.ac.za
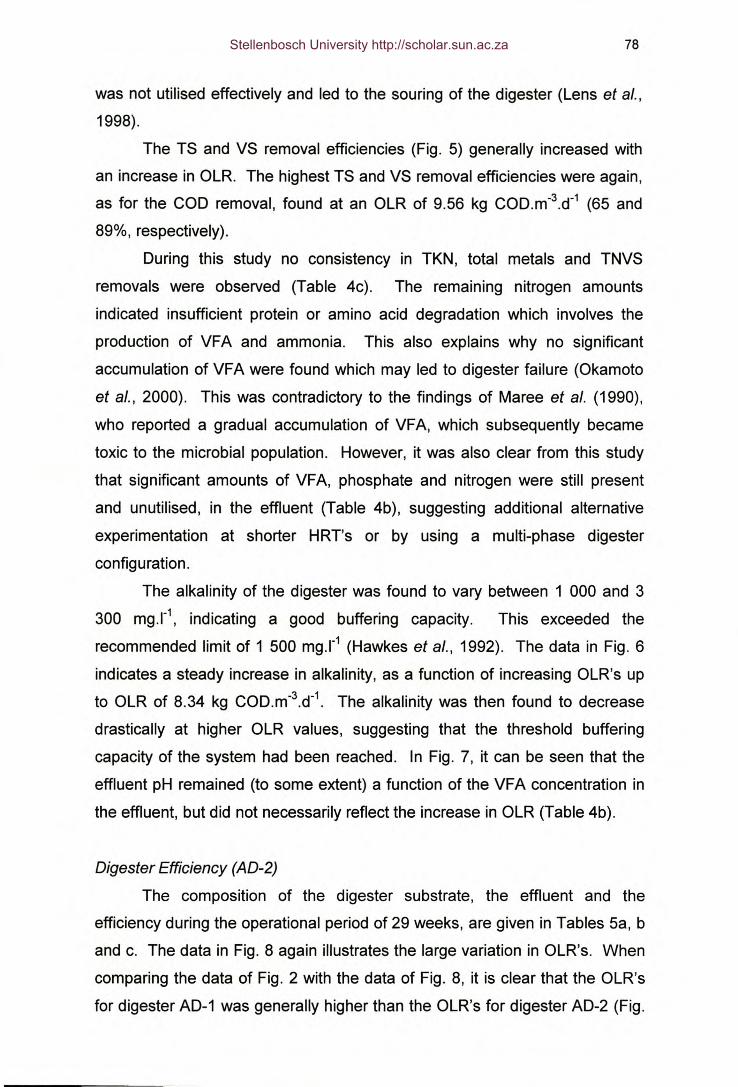
78
was not utilised effectively and led to the souring of the digester (Lens et al.,
1998).
The TS and VS removal efficiencies (Fig. 5) generally increased with
an increase in OLR. The highest TS and VS removal efficiencies were again,
as for the COD removal, found at an OLR of 9.56 kg COD.m-3.d-1 (65 and
89%, respectively).
During this study no consistency in TKN, total metals and TNVS
removals were observed (Table 4c). The remaining nitrogen amounts
indicated insufficient protein or amino acid degradation which involves the
production of VFA and ammonia. This also explains why no significant
accumulation of VFA were found which may led to digester failure (Okamoto
et ai., 2000). This was contradictory to the findings of Maree et al. (1990),
who reported a gradual accumulation of VFA, which subsequently became
toxic to the microbial population. However, it was also clear from this study
that significant amounts of VFA, phosphate and nitrogen were still present
and unutilised, in the effluent (Table 4b), suggesting additional alternative
experimentation at shorter HRT's or by using a multi-phase digester
configuration.
The alkalinity of the digester was found to vary between 1 000 and 3
300 mq.I", indicating a good buffering capacity. This exceeded the
recommended limit of 1 500 rnq.l" (Hawkes et ai., 1992). The data in Fig. 6
indicates a steady increase in alkalinity, as a function of increasing OLR's up
to OLR of 8.34 kg COD.m-3.d-1. The alkalinity was then found to decrease
drastically at higher OLR values, suggesting that the threshold buffering
capacity of the system had been reached. In Fig. 7, it can be seen that the
effluent pH remained (to some extent) a function of the VFA concentration in
the effluent, but did not necessarily reflect the increase in OLR (Table 4b).
Digester Efficiency (AD-2)
The composition of the digester substrate, the effluent and the
efficiency during the operational period of 29 weeks, are given in Tables 5a, b
and c. The data in Fig. 8 again illustrates the large variation in OLR's. When
comparing the data of Fig. 2 with the data of Fig. 8, it is clear that the OLR's
for digester AD-1 was generally higher than the OLR's for digester AD-2 (Fig.
Stellenbosch University http://scholar.sun.ac.za
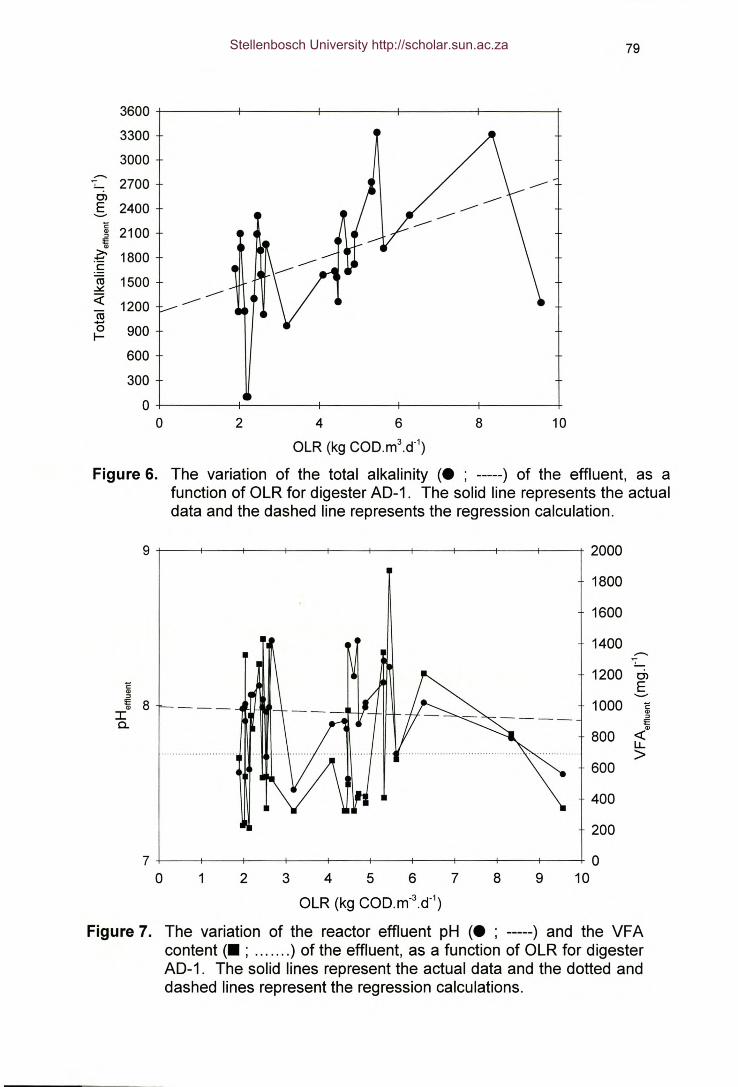
79
360033003000
- 27000>E 2400'-"ë 2100.,:JE.,>- 1800~cn; 1500~<{ 1200co-0 900I-
600300
00
Figure 6.
2 4 6 8 10OLR (kg COD.m3.d-1)
The variation of the total alkalinity (. ; -----) of the effluent, as afunction of OLR for digester AD-1. The solid line represents the actualdata and the dashed line represents the regression calculation.
9 2000180016001400
-1200 0>ë E.,:J ----E 8 1000 ë., ---
I Q):J
0.. EQ)800 -c
LL>600
400200
7 00 1 2 3 4 5 6 7 8 9 10
OLR (kg COD.m-3.d-1)
Figure 7. The variation of the reactor effluent pH (. ; -----) and the VFAcontent (. ; ....... ) of the effluent, as a function of OLR for digesterAD-1. The solid lines represent the actual data and the dotted anddashed lines represent the regression calculations.
Stellenbosch University http://scholar.sun.ac.za
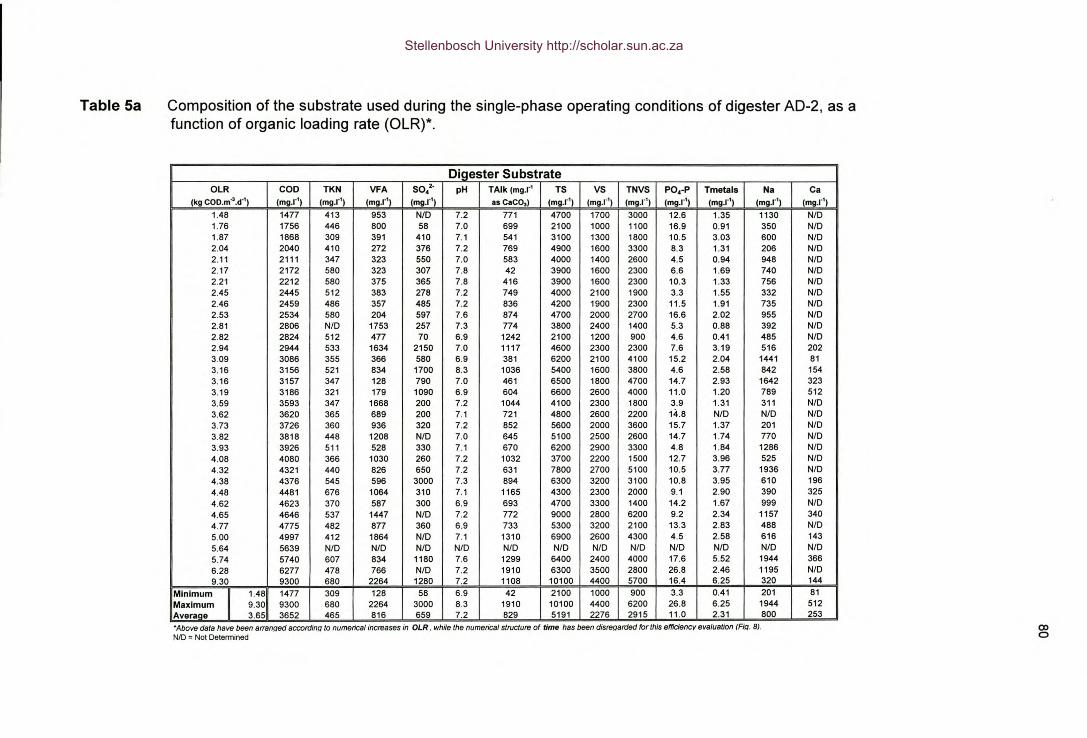
Table 5a Composition of the substrate used during the single-phase operating conditions of digester AD-2, as afunction of organic loading rate (OLR)*.
Digester SubstrateOLR coo TKN VFA so," pH TAlk (mg.r' TS vs TNVS PO,-P Tmetals Na Ca
(kgCOD.m".d·') (mg.r') (mg.r') (mg.r') (mg.r') asCaCO,) (mg.r') (mg.r') (mg.r') (mg.r') (mg.r') (mg.r') (mg.r')1.48 1477 413 953 NfO 7.2 771 4700 1700 3000 12.6 1.35 1130 NfO I1.76 1756 446 800 58 7.0 699 2100 1000 1100 16.9 0.91 350 NID1.87 1868 309 391 410 7.1 541 3100 1300 1800 10.5 3.03 600 NfO2.04 2040 410 272 376 7.2 769 4900 1600 3300 8.3 1.31 206 NfO2.11 2111 347 323 550 7.0 583 4000 1400 2600 4.5 0.94 948 NfO2.17 2172 580 323 307 7.8 42 3900 1600 2300 6.6 1.69 740 NfO2.21 2212 580 375 365 7.8 416 3900 1600 2300 10.3 1.33 756 NfO2.45 2445 512 383 278 7.2 749 4000 2100 1900 3.3 1.55 332 NfO2.46 2459 486 357 485 7.2 836 4200 1900 2300 11.5 1.91 735 NfO2.53 2534 580 204 597 7.6 874 4700 2000 2700 16.6 2.02 955 NfO ,
2.81 2806 NfO 1753 257 7.3 774 3800 2400 1400 5.3 0.88 392 NfO2.82 2824 512 477 70 6.9 1242 2100 1200 900 4.6 0.41 485 NfO2.94 2944 533 1634 2150 7.0 1117 4600 2300 2300 7.6 3.19 516 2023.09 3086 355 366 580 6.9 381 6200 2100 4100 15.2 2.04 1441 813.16 3156 521 834 1700 8.3 1036 5400 1600 3800 4.6 2.58 842 154
I3.16 3157 347 128 790 7.0 461 6500 1800 4700 14.7 2.93 1642 3233.19 3186 321 179 1090 6.9 604 6600 2600 4000 11.0 1.20 789 5123.59 3593 347 1668 200 7.2 1044 4100 2300 1800 3.9 1.31 311 NfO3.62 3620 365 689 200 7.1 721 4800 2600 2200 14.8 NfO NfO NfO3.73 3726 360 936 320 7.2 852 5600 2000 3600 15.7 1.37 201 NfO3.82 3818 448 1208 NfO 7.0 645 5100 2500 2600 14.7 1.74 770 NfO3.93 3926 511 528 330 7.1 670 6200 2900 3300 4.8 1.84 1286 NfO4.08 4080 366 1030 260 7.2 1032 3700 2200 1500 12.7 3.96 525 NfO4.32 4321 440 826 650 7.2 631 7800 2700 5100 10.5 3.77 1936 NfO4.38 4376 545 596 3000 7.3 894 6300 3200 3100 10.8 3.95 610 1964.48 4481 676 1064 310 7.1 1165 4300 2300 2000 9.1 2.90 390 3254.62 4623 370 587 300 6.9 693 4700 3300 1400 14.2 1.67 999 NfO4.65 4646 537 1447 NfO 7.2 772 9000 2800 6200 9.2 2.34 1157 3404.77 4775 482 877 360 6.9 733 5300 3200 2100 13.3 2.83 488 NfO5.00 4997 412 1864 NfO 7.1 1310 6900 2600 4300 4.5 2.58 616 1435.64 5639 NfO NfO NfO NfO NfO NfO NfO NfO NfO NfO NfO NfO5.74 5740 607 834 1180 7.6 1299 6400 2400 4000 17.6 5.52 1944 3666.28 6277 478 766 NfO 7.2 1910 6300 3500 2800 26.8 2.46 1195 NfO9.30 9300 680 2264 1280 7.2 1108 10100 4400 5700 16.4 6.25 320 144
Minimum i 1.48 1477 309 128 58 6.9 42 2100 1000 900 3.3 0.41 201 81Maximum 9.30 9300 680 2264 3000 8.3 1910 10100 4400 6200 26.8 6.25 1944 512~~I!_ 3.65 3652 465 816 659 7.2 829 5191 2276 2915 11.0 2.31 800 253-Above data have been arranQed accordinQ to numerical increases in OLR. while the numerical structure of time has been disreQarded for this efficiency evaluation (Firl. Bi.NID = Not Determined
CX)o
Stellenbosch University http://scholar.sun.ac.za
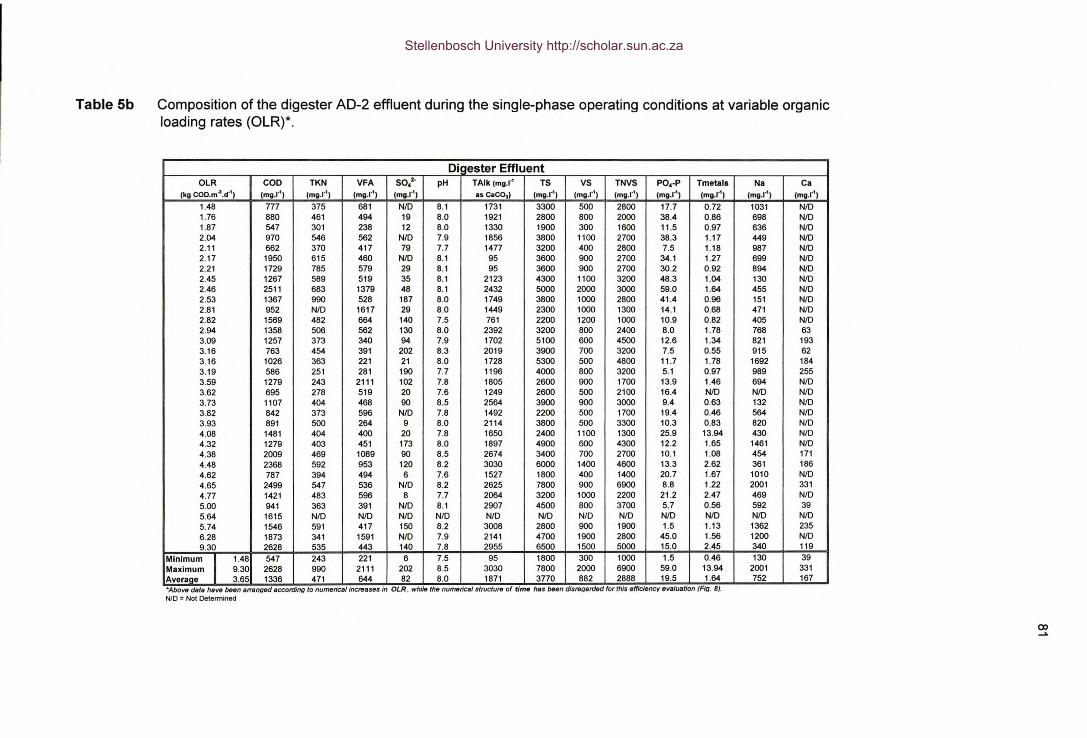
Table 5b Composition of the digester AD-2 effluent during the single-phase operating conditions at variable organicloading rates (OLR)*.
Di gester EffluentOLR COD TKN VFA SO;' pH TAlk {mg.r' TS VS TNVS PO.·p Tmetals Na Ca
(kg COD.m~.d·') (mg.r') (mg.r') (mg.r') (mg.r') IScaCO,) (mg.r') (mg.r') (mg.r') (mg.r') (mg.r') (mg.r') (mg.r')
1.48 777 375 681 N/D 8.1 1731 3300 500 2800 17.7 0.72 1031 N/D1.76 880 461 494 19 8.0 1921 2800 800 2000 38.4 0.86 698 NID1.87 547 301 238 12 8.0 1330 1900 300 1600 11.5 0.97 636 N/D2.04 970 546 562 N/D 7.9 1856 3800 1100 2700 38.3 1.17 449 N/D2.11 662 370 417 79 7.7 1477 3200 400 2800 7.5 1.18 987 N/D2.17 1950 615 460 N/D 8.1 95 3600 900 2700 34.1 1.27 699 N/D2.21 1729 785 579 29 8.1 95 3600 900 2700 30.2 0.92 894 N/D2.45 1267 589 519 35 8.1 2123 4300 1100 3200 48.3 1.04 130 N/D2.46 2511 683 1379 48 8.1 2432 5000 2000 3000 59.0 1.64 455 N/D2.53 1367 990 528 187 8.0 1749 3800 1000 2800 41.4 0.96 151 N/D2.81 952 N/D 1617 29 8.0 1449 2300 1000 1300 14.1 0.68 471 N/D2.82 1569 482 664 140 7.5 761 2200 1200 1000 10.9 0.82 405 N/D2.94 1358 506 562 130 8.0 2392 3200 800 2400 8.0 1.78 768 633.09 1257 373 340 94 7.9 1702 5100 600 4500 12.6 1.34 821 1933.16 763 454 391 202 8.3 2019 3900 700 3200 7.5 0.55 915 623.16 1026 363 221 21 8.0 1728 5300 500 4800 11.7 1.78 1692 1843.19 586 251 281 190 7.7 1196 4000 800 3200 5.1 0.97 989 2553.59 1279 243 2111 102 7.8 1805 2600 900 1700 13.9 1.46 694 N/D3.62 695 278 519 20 7.6 1249 2600 500 2100 16.4 N/D N/D N/D3.73 1107 404 468 90 8.5 2564 3900 900 3000 9.4 0.63 132 N/D3.82 842 373 596 N/D 7.8 1492 2200 500 1700 19.4 0.46 564 N/D3.93 891 500 264 9 8.0 2114 3800 500 3300 10.3 0.83 820 N/D4.08 1481 404 400 20 7.8 1650 2400 1100 1300 25.9 13.94 430 N/D4.32 1279 403 451 173 8.0 1897 4900 600 4300 12.2 1.65 1461 N/D4.38 2009 469 1089 90 8.5 2674 3400 700 2700 10.1 1.08 454 1714.48 2368 592 953 120 8.2 3030 6000 1400 4600 13.3 2.62 361 1864.62 787 394 494 6 7.6 1527 1800 400 1400 20.7 1.67 1010 N/D4.65 2499 547 536 N/D 8.2 2625 7800 900 6900 8.8 1.22 2001 3314.77 1421 483 596 8 7.7 2064 3200 1000 2200 21.2 2.47 469 N/D5.00 941 363 391 N/D 8.1 2907 4500 800 3700 5.7 0.56 592 395.64 1615 N/D N/D N/D N/D N/D N/D N/D N/D N/D N/D N/D N/D5.74 1546 591 417 150 8.2 3008 2800 900 1900 1.5 1.13 1362 2356.28 1873 341 1591 NID 7.9 2141 4700 1900 2800 45.0 1.56 1200 N/D9.30 2628 535 443 140 7.8 2955 6500 1500 5000 15.0 2.45 340 119
Minimum I 1.48 547 243 221 6 7.5 95 1800 300 1000 1.5 0.46 130 39Maximum 9.30 2628 990 2111 202 8.5 3030 7800 2000 6900 59.0 13.94 2001 331Avera!le 3.65 1336 471 644 82 8.0 1871 3770 882 2888 19.5 1.64 752 167'Above data have been arrarlfled accordil1(J to numerical increases in OLR, while the numerical structure of time has been disregarded for this efficiency evaluation (F(Q. 8).NfO = Not Determined
co_..
Stellenbosch University http://scholar.sun.ac.za
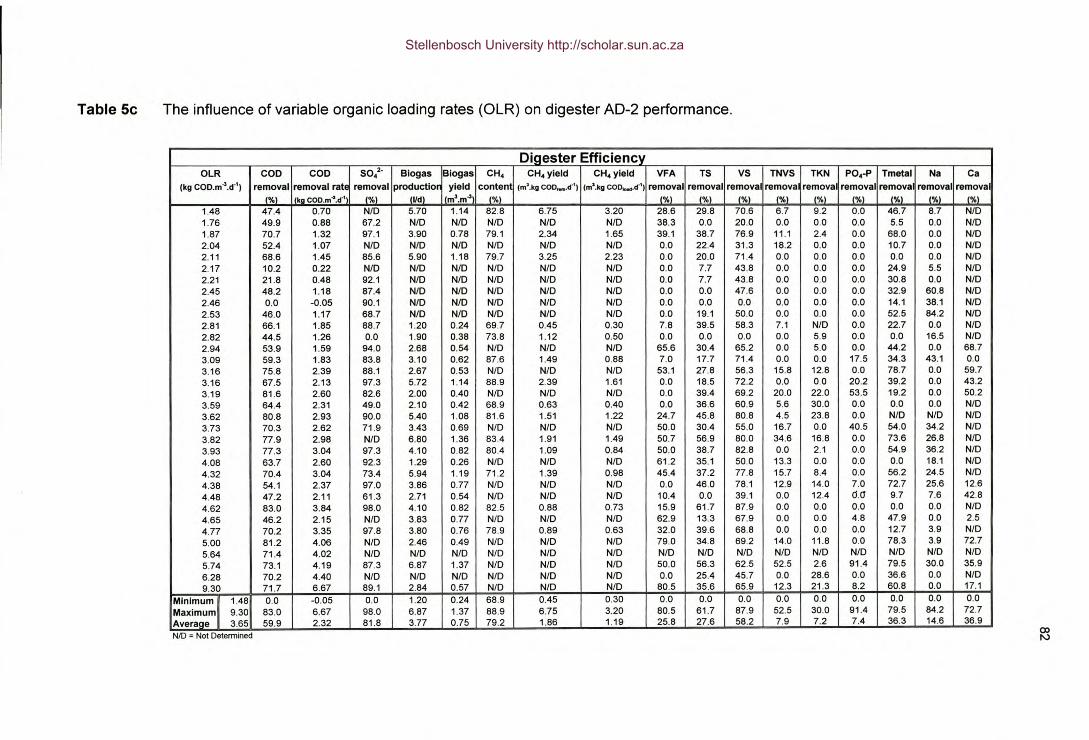
Table 5c The influence of variable organic loading rates (OLR) on digester AD-2 performance.
Diaester Efficienc\lOLR COD COD SO/' Biogas Biogas CH, CH,yield CHo yield VFA TS VS TNVS TKN PO.-P Tmetal Na Ca
(kg COD.m~.d·'t removal removal rate removal productior yield conten (m3.kg COOrem.d-') (m3.kg COO ..... d·') removal removal removal remova removal removal rem ova removal removal('lo) I (kg COO.m".d·' /%1 IIJdl /m3.m~ /'/ol 1%1 1%1 1'10) 1%1 ('lo) 1%1 1%1 1%1 1%1
1.48 47.4 0.70 NfO 5.70 1.14 82.8 6.75 3.20 28.6 29.8 70.6 6.7 9.2 0.0 46.7 8.7 NID1.76 49.9 0.88 67.2 NfO NfO NID NfO NfO 38.3 0.0 20.0 0.0 0.0 0.0 5.5 0.0 NfO1.87 70.7 1.32 97.1 3.90 0.78 79.1 2.34 1.65 39.1 38.7 76.9 11.1 2.4 0.0 68.0 0.0 NfO2.04 52.4 1.07 NfO NfO NfO NID NfO NfO 0.0 22.4 31.3 18.2 0.0 0.0 10.7 0.0 NfO2.11 68.6 1.45 85.6 5.90 1.18 79.7 3.25 2.23 0.0 20.0 71.4 0.0 0.0 0.0 0.0 0.0 NfO2.17 10.2 0.22 NfO NfO NfO NfO NfO NfO 0.0 7.7 43.8 0.0 0.0 0.0 24.9 5.5 NfO2.21 21.8 0.48 92.1 NfO NfO NfO NfO NfO 0.0 7.7 43.8 0.0 0.0 0.0 30.8 0.0 NfO2.45 48.2 1.18 87.4 NfO NfO NfO NfO NfO 0.0 0.0 47.6 0.0 0.0 0.0 32.9 60.8 NfO2.46 0.0 -0.05 90.1 NfO NfO NID NfO NfO 0.0 0.0 0.0 0.0 0.0 0.0 14.1 38.1 NfO2.53 46.0 1.17 68.7 NfO NfO NfO NfO NfO 0.0 19.1 50.0 0.0 0.0 0.0 52.5 84.2 NfO2.81 66.1 1.85 88.7 1.20 0.24 69.7 0.45 0.30 7.8 39.5 58.3 7.1 NfO 0.0 22.7 0.0 NfO2.82 44.5 1.26 0.0 1.90 0.38 73.8 1.12 0.50 0.0 0.0 0.0 0.0 5.9 0.0 0.0 16.5 NfO2.94 53.9 1.59 94.0 2.68 0.54 NfO NfO NID 65.6 30.4 65.2 00 5.0 0.0 44.2 0.0 68.73.09 59.3 1.83 83.8 3.10 0.62 87.6 1.49 0.88 7.0 17.7 71.4 0.0 0.0 17.5 34.3 43.1 0.03.16 75.8 2.39 88.1 2.67 0.53 NfO NfO NID 53.1 27.8 56.3 15.8 12.8 0.0 78.7 0.0 59.73.16 67.5 2.13 97.3 5.72 1.14 88.9 2.39 1.61 0.0 18.5 72.2 0.0 00 20.2 39.2 0.0 43.2
3.19 81.6 2.60 82.6 2.00 0.40 NfO NfO NfO 0.0 39.4 69.2 20.0 22.0 53.5 19.2 0.0 50.2
3.59 64.4 2.31 49.0 2.10 0.42 68.9 0.63 0.40 0.0 36.6 60.9 5.6 30.0 0.0 0.0 0.0 NfO3.62 80.8 2.93 90.0 5.40 1.08 81.6 1.51 1.22 24.7 45.8 80.8 4.5 23.8 0.0 NfO NfO NfO3.73 70.3 2.62 71.9 3.43 0.69 NfO NfO NfO 50.0 30.4 55.0 16.7 0.0 40.5 54.0 34.2 NID
3.82 77.9 2.98 NfO 6.80 1.36 83.4 1.91 1.49 50.7 56.9 80.0 34.6 16.8 0.0 73.6 26.8 NfO3.93 77.3 3.04 97.3 4.10 0.82 80.4 1.09 0.84 50.0 38.7 82.8 0.0 2.1 0.0 54.9 36.2 NfO4.08 63.7 2.60 92.3 1.29 0.26 NfO NID NfO 61.2 35.1 50.0 13.3 0.0 0.0 0.0 18.1 NfO4.32 70.4 3.04 73.4 5.94 1.19 71.2 1.39 0.98 45.4 37.2 77.8 15.7 8.4 0.0 56.2 24.5 NfO4.38 54.1 2.37 97.0 3.86 0.77 NfO NfO NfO 0.0 46.0 78.1 12.9 14.0 7.0 72.7 25.6 12.6
4.48 47.2 2.11 61.3 2.71 0.54 NfO NfO NfO 10.4 0.0 39.1 0.0 12.4 cJ.O 9.7 7.6 42.8
4.62 83.0 3.84 98.0 4.10 0.82 82.5 0.88 0.73 15.9 61.7 87.9 0.0 0.0 0.0 0.0 0.0 NfO4.65 46.2 2.15 NfO 3.83 0.77 NfO NfO NfO 62.9 13.3 67.9 0.0 0.0 4.8 47.9 0.0 2.5
4.77 70.2 3.35 97.8 3.80 0.76 78.9 0.89 0.63 32.0 39.6 68.8 0.0 0.0 0.0 12.7 3.9 NfO
5.00 81.2 4.06 NID 2.46 0.49 NfO NfO NID 79.0 34.8 69.2 14.0 11.8 0.0 78.3 3.9 72.7
5.64 71.4 4.02 NfO NfO NfO NfO NfO NfO NID NfO NfO NfO NfO NID NfO NfO NfO
5.74 73.1 4.19 87.3 6.87 1.37 NfO NfO NfO 50.0 56.3 62.5 52.5 2.6 91.4 79.5 30.0 35.9
6.28 70.2 4.40 NfO NfO NfO NfO NfO NfO 0.0 25.4 45.7 0.0 28.6 0.0 36.6 0.0 NfO9.30 71.7 6.67 89.1 2.84 0.57 NfO NfO NfO 80.5 35.6 65.9 12.3 21.3 8.2 60.8 0.0 17.1
MinimUml11.48 0.0 -0.05 0.0 1.20 0.24 68.9 0.45 0.30 0.0 0.0 0.0 0.0 0.0 0.0 0.0 0.0 0.0
Maximum 9.30 83.0 6.67 98.0 6.87 1.37 88.9 6.75 3.20 80.5 61.7 87.9 52.5 30.0 91.4 79.5 84.2 72.7
Averace 3.65 59.9 2.32 81.8 3.77 0.75 79.2 1.86 1.19 25.8 27.6 58.2 7.9 7.2 7.4 36.3 14.6 36.9coNNID = Not Detennined
Stellenbosch University http://scholar.sun.ac.za
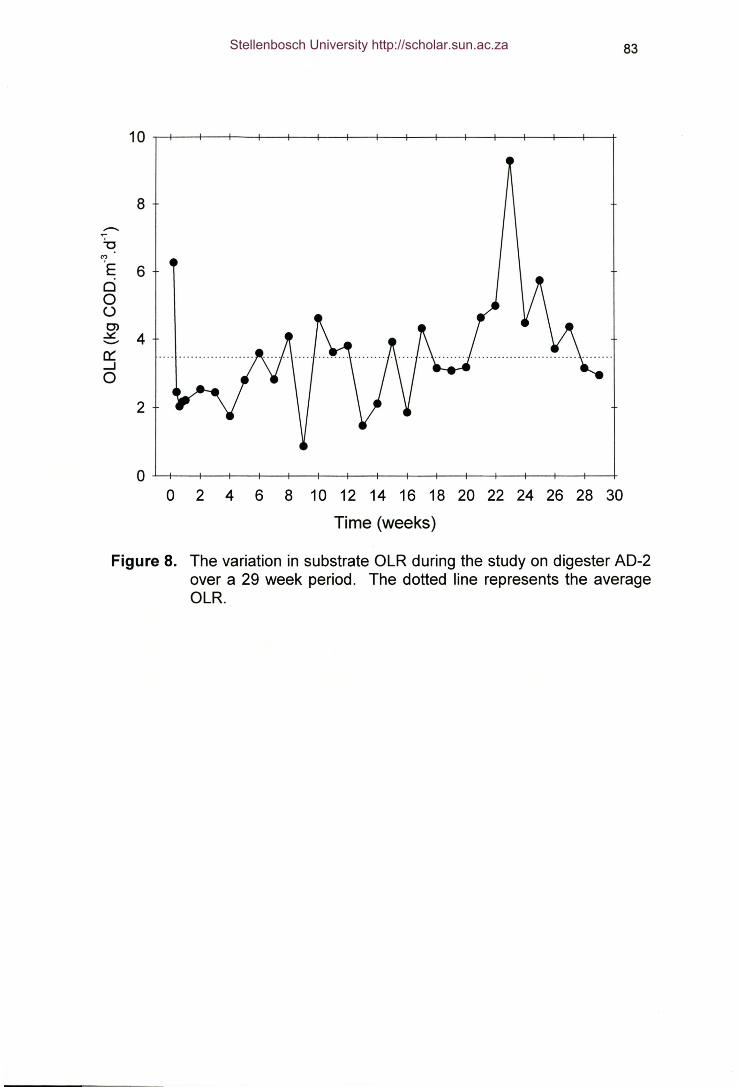
83
8...-...
-e-
~'?E 600o0>~ 4...._,0::.....I0
2
o 2 4 6 8 10 12 14 16 18 20 22 24 26 28 30
Time (weeks)
Figure 8. The variation in substrate OLR during the study on digester AD-2over a 29 week period. The dotted line represents the averageOLR.
Stellenbosch University http://scholar.sun.ac.za
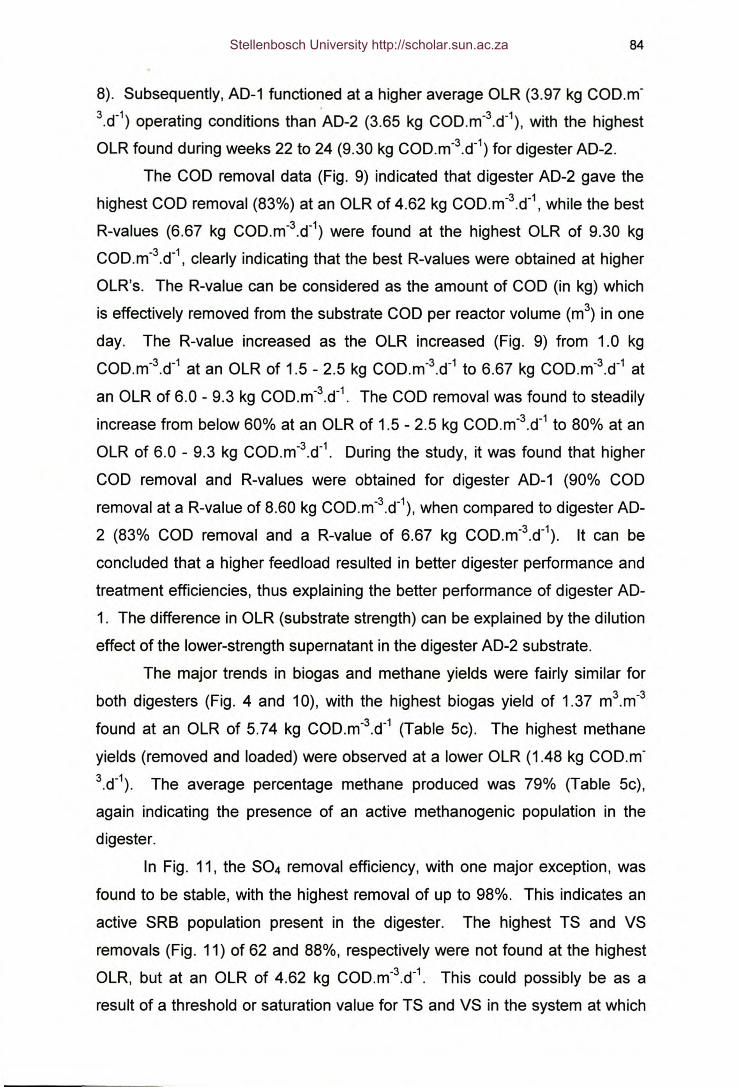
84
8). Subsequently, AD-1 functioned at a higher average OLR (3.97 kg COD.m-
3.d-1) operating conditions than 'AD-2 (3.65 kg COD.m-3.d-1), with the highest
OLR found during weeks 22 to 24 (9.30 kg COD.m-3.d-1) for digester AD-2.
The COD removal data (Fig. 9) indicated that digester AD-2 gave the
highest COD removal (83%) at an OLR of 4.62 kg COD.m-3.d-1, while the best
R-values (6.67 kg COD.m-3.d-1) were found at the highest OLR of 9.30 kg
COD.m-3.d-1, clearly indicating that the best R-values were obtained at higher
OLR's. The R-value can be considered as the amount of COD (in kg) which
is effectively removed from the substrate COD per reactor volume (rrr') in one
day. The R-value increased as the OLR increased (Fig. 9) from 1.0 kg
COD.m-3.d-1 at an OLR of 1.5 - 2.5 kg COD.m-3.d-1 to 6.67 kg COD.m-3.d-1 at
an OLR of 6.0 - 9.3 kg COD.m-3.d-1. The COD removal was found to steadily
increase from below 60% at an OLR of 1.5 - 2.5 kg COD.m-3.d-1 to 80% at an
OLR of 6.0 - 9.3 kg COD.m-3.d-1. During the study, it was found that higher
COD removal and R-values were obtained for digester AD-1 (90% COD
removal at a R-value of 8.60 kg COD.m-3.d-1), when compared to digester AD-
2 (83% COD removal and a R-value of 6.67 kg COD.m-3.d-1). It can be
concluded that a higher feed load resulted in better digester performance and
treatment efficiencies, thus explaining the better performance of digester AD-
1. The difference in OLR (substrate strength) can be explained by the dilution
effect of the lower-strength supernatant in the digester AD-2 substrate.
The major trends in biogas and methane yields were fairly similar for
both digesters (Fig. 4 and 10), with the highest biogas yield of 1.37 m3.m-3
found at an OLR of 5.74 kg COD.m-3.d-1 (Table 5c). The highest methane
yields (removed and loaded) were observed at a lower OLR (1.48 kg COD.m-
3.d-1). The average percentage methane produced was 79% (Table 5c),
again indicating the presence of an active methanogenic population in the
digester.
In Fig. 11, the S04 removal efficiency, with one major exception, was
found to be stable, with the highest removal of up to 98%. This indicates an
active SRB population present in the digester. The highest TS and VS
removals (Fig. 11) of 62 and 88%, respectively were not found at the highest
OLR, but at an OLR of 4.62 kg COD.m-3.d-1. This could possibly be as a
result of a threshold or saturation value for TS and VS in the system at which
Stellenbosch University http://scholar.sun.ac.za
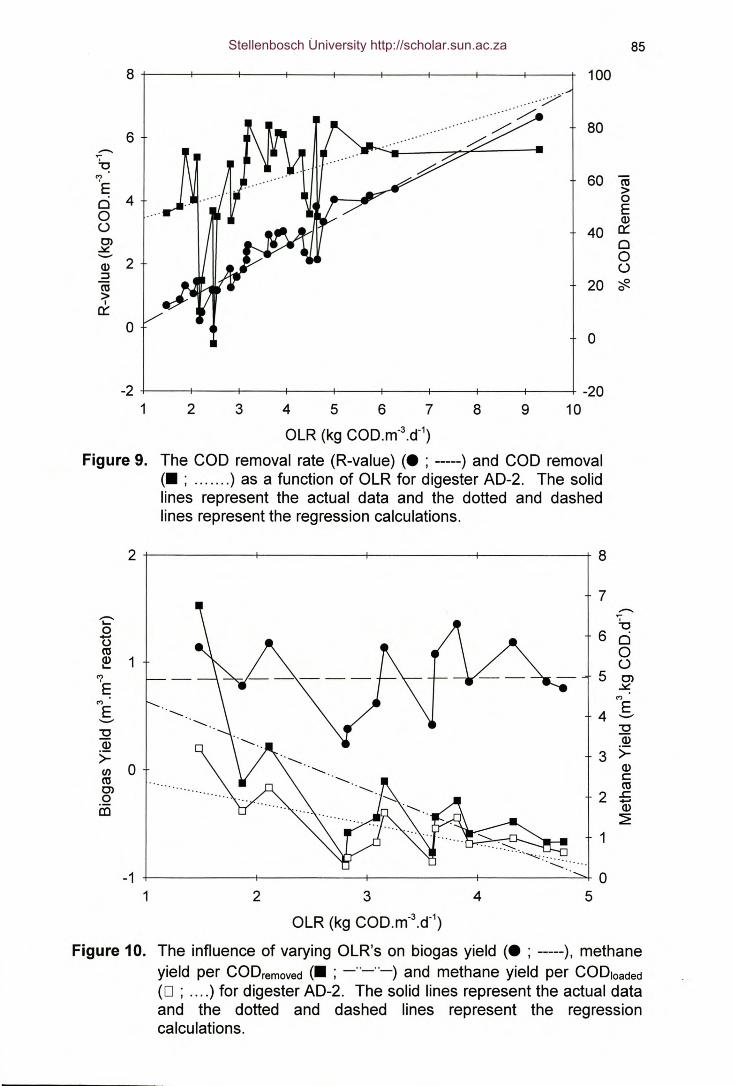
85
100
6 80
1:;,'? 60 caE >4 00 E0 Q)o 40 Il:::Ol 0~"'-" 2 0Q) o::J
~ca 20 0>IIl:::
0 0
-2~---r--~~--~---+----+----r----r---~---4-201 2 3 4 5 6 7 8 9 10
OLR (kg COD.m-3.d-1)
Figure 9. The COD removal rate (R-value) (. ; -----) and COD removal(. ; ....... ) as a function of OLR for digester AD-2. The solidlines represent the actual data and the dotted and dashedlines represent the regression calculations.
'C'o1:5ca~ 1
"0Q)
>=en 0caOloco
8
7..-...1:;,
6 00o
5 Ol~(")- 4E--"0Q)
3 >=Q)cca
2 ~-Q)
:2:1
02 3 4 5
OLR (kg COD.m-3.d-1)
2 r----------+----------+---------~----------~
1
Figure 10. The influence of varying OLR's on biogas yield (. ; -----), methaneyield per CODremoved(. ; _,,_ .._) and methane yield per CODloaded(0 ; .... ) for digester AD-2. The solid lines represent the actual dataand the dotted and dashed lines represent the regressioncalculations.
Stellenbosch University http://scholar.sun.ac.za
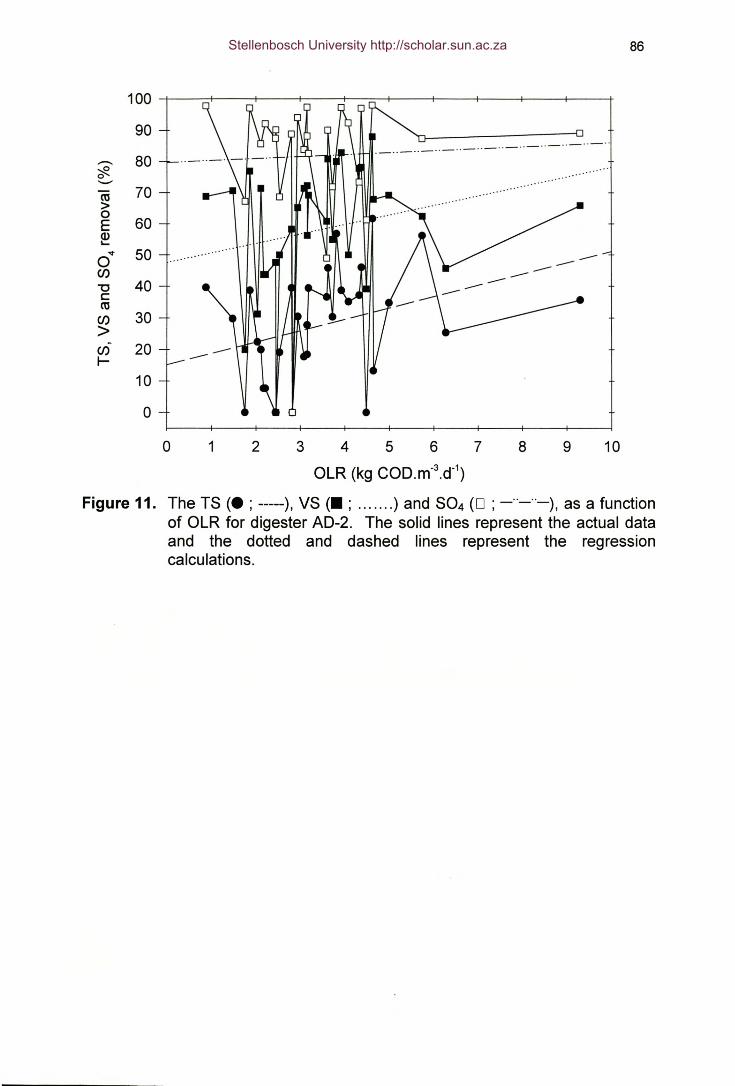
86
10090
-- 80:::R.0--ca 70>0E 60Q)....
'ot 500Cl)
"'C 40ccaCl) 30>Cl) 20I-
100
0 1 2 3 4 5 6 7 8 9 10OLR (kg COD.m-3.d-1)
Figure 11. The TS (. ; -----), VS (. ; ) and S04 (0 ; _"_"_), as a functionof OLR for digester AD-2. The solid lines represent the actual dataand the dotted and dashed lines represent the regressioncalculations.
Stellenbosch University http://scholar.sun.ac.za
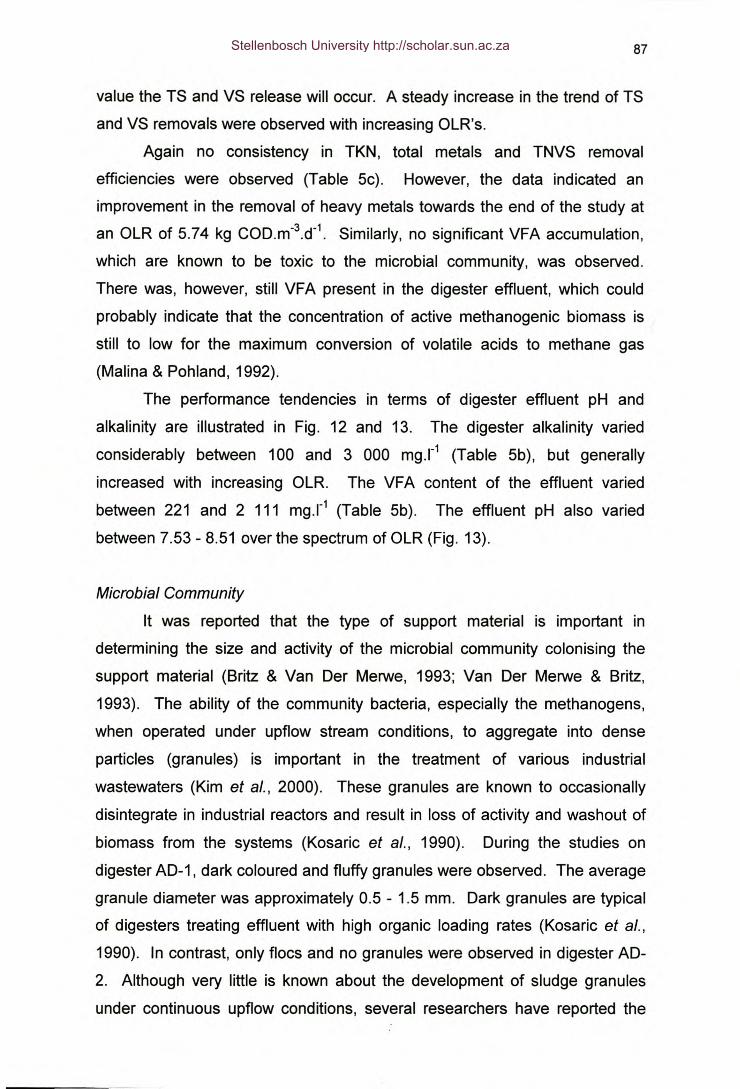
87
value the TS and VS release will occur. A steady increase in the trend of TS
and VS removals were observed with increasing OLR's.
Again no consistency in TKN, total metals and TNVS removal
efficiencies were observed (Table Sc). However, the data indicated an
improvement in the removal of heavy metals towards the end of the study at
an OLR of 5.74 kg COD.m-3.d-1. Similarly, no significant VFA accumulation,
which are known to be toxic to the microbial community, was observed.
There was, however, still VFA present in the digester effluent, which could
probably indicate that the concentration of active methanogenic biomass is (
still to low for the maximum conversion of volatile acids to methane gas
(Malina & Pohland, 1992).
The performance tendencies in terms of digester effluent pH and
alkalinity are illustrated in Fig. 12 and 13. The digester alkalinity varied
considerably between 100 and 3 000 rnq.l" (Table Sb), but generally
increased with increasing OLR. The VFA content of the effluent varied
between 221 and 2 111 rnq.l" (Table Sb). The effluent pH also varied
between 7.53 - 8.51 over the spectrum of OLR (Fig. 13).
Microbial Community
It was reported that the type of support material is important in
determining the size and activity of the microbial community colonising the
support material (Britz & Van Der Merwe, 1993; Van Der Merwe & Britz,
1993). The ability of the community bacteria, especially the methanogens,
when operated under upflow stream conditions, to aggregate into dense
particles (granules) is important in the treatment of various industrial
wastewaters (Kim et al., 2000). These granules are known to occasionally
disintegrate in industrial reactors and result in loss of activity and washout of
biomass from the systems (Kosaric et aI., 1990). During the studies on
digester AD-1, dark coloured and fluffy granules were observed. The average
granule diameter was approximately 0.5 - 1.5 mm. Dark granules are typical
of digesters treating effluent with high organic loading rates (Kosaric et al.,
1990). In contrast, only flocs and no granules were observed in digester AD-
2. Although very little is known about the development of sludge granules
under continuous upflow conditions, several researchers have reported the
Stellenbosch University http://scholar.sun.ac.za
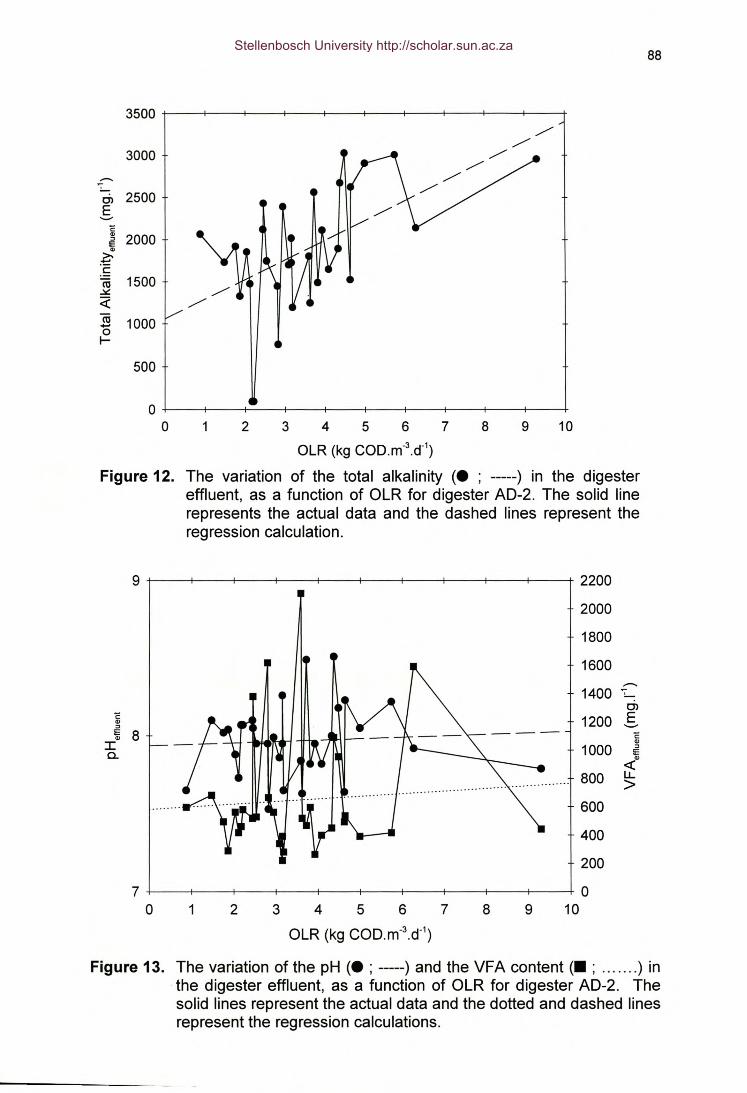
88
3500
3000
Ol 2500E'-"ê:., 2000::>I!:.,
>-~C
!ti 1500~«(ij 1000-0I-
500
00 1 3 4 5 6 7
OLR (kg COD.m·3.d·1)
Figure 12. The variation of the total alkalinity (. ; -----) in the digestereffluent, as a function of OLR for digester AD-2. The solid linerepresents the actual data and the dashed lines represent theregression calculation.
9 2200200018001600
----1400 ~!.....;en
ê: 1200 E.,::> .._..II: 8 ê:.,I Cl>1000 ::>
0.. ECl>
~800 LL>
600400200
7 00 1 2 3 4 5 6 7 8 9 10
OLR (kgCOD.m·3.d·1)
2 8 109
Figure 13. The variation of the pH (. ; -----) and the VFA content (. ; ) in.the digester effluent, as a function of OLR for digester AD-2. Thesolid lines represent the actual data and the dotted and dashed linesrepresent the regression calculations.
Stellenbosch University http://scholar.sun.ac.za
89
presence of bacterial granules in their hybrid digesters (Alibhai & Forster,
1986; Kosaric et ai., 1990; Moosbrugger et ai., 1993). After a continuous
operation of 22 months no signs of clogging in the digesters were observed.
Conclusions
Anaerobic digestion is one of the most promising possibilities for the
treatment of recalcitrant waste (Lettinga et ai., 1997). Therefore, the disposal
strategies must always be based on knowledge of the-interactions between
organic/inorganic chemicals present in the effluent, wastewater variations
over time, digester designs and the condition of the microbial community
present in the specific digester. The data from this study demonstrate the
potential of the anaerobic hybrid digesters with an increased fixed-bed
surface area, to treat a highly variable high-strength, complex and problematic
wastewater. The extent of large variations in most of the operational
parameters for the two digesters are an indication and reflection of the type of
wastewater variation produced by the industry and thus in the substrate fed to
the digesters.
The results obtained in this study show that the use of numerical OLR
increases resulted in a better representation and indication of the
performance efficiency compared to a time function. Higher OLR's generally
resulted in higher COD removal rates and biogas yields. For both digesters it
were found that extreme variations occurred in the COD removal efficiencies
and other parameters, although an increase in biogas yield, alkalinity, TS, VS
and S04 removal, occurred. This could be an indication of the selection of a
suitable and specific microbial community as part of the stabilisation in the
digester and subsequent adaptation and enhancement of the microbial
degradation properties. Since the study was conducted over an extended
period of 29 weeks, it can be assumed that an optimally adapted consortium
of microbes were present. A longer operational period may even have
resulted in more specific species selection.
The data from this study clearly indicates that anaerobic digestion with
upflow anaerobic sludge digester designs can be considered a successful
Stellenbosch University http://scholar.sun.ac.za
90
pre-treatment method for the generally noxious full-strength gelatin-
manufacturing effluent, without the need for nutrient supplementation.
Implementation of these results on commercial scale, would directly benefit
the industry - by reducing the COD and SS concentration in their effluent and
thereby also reducing the trade effluent charge. The local wastewater
purification works will also benefit by receiving a reduced organic load which
has been anaerobically pre-balanced and treated before disposing off to the
plant.
The results from this study do present the opportunity for further
research. Average concentrations of VFA (689 rnq.l" as acetic acid),
phosphate (18 mq.l" as P) and nitrogen (421 rnq.l") were still present and
unutilised in the effluent, suggesting alternative experimentation at shorter
HRT's or using a multi-phase digester configuration. With cases of such
complex effluents with rate-limiting steps during the treatment process, it will
thus be worthwhile to evaluate multi-phase systems in order to facilitate more
prominent species differentiation with enhanced degrading abilities.
References
Alibhai, K.R.K. & Forster, C.F. (1986). An examination of the granulation
process in UASB reactors. Environmental Technology Letters, 7, 193-
200.
APHA, AWWA & WEF (1995). Standard Methods for the Examination of
Water and Wastewater (19th ed.), American Public Health Association,
Washington DC, USA.
Britz, T.J. & Van Der Merwe, M. (1993). Anaerobic treatment of baker's yeast
effluent using a hybrid digester with polyurethane as support material.
Biotechnology Letters, 15(7), 755-760.
Dalmacija, B., Karlovic, E., Tamas, Z. & Miskovic, D. (1996). Purification of
high-salinity wastewater by activated sludge process. Water Research,
30, 295-298.
Stellenbosch University http://scholar.sun.ac.za
91
DEAT & DWAF (1997). White paper: Integrated Pollution Control and Waste
Management, May 1997. Department of Environmental Affairs and
Tourism, Department of Water Affairs and Forestry, Gauteng, South
Africa.
Du Plessis, P., Maree, J.P. & Cole, C.G.B. (1993). Anaerobic treatment of
gelatin factory effluent. In: Proceedings of the 3rd Biennial Conference
on Anaerobic Digestion (Volume 1). Durban, South Africa, Pp. 223-
233.
Garrote, J.I., Bao, M., Castro, P. & Bao, M.J. (1995). Treatment of tannery
effluents by a two step coagulation/flocculation process. Water
Research, 29, 2605-2608.
Guiot, S.R & Van Den Berg, L. (1985). Performance of an upflow anaerobic
bioreactor combining a sludge blanket and a filter treating sugar waste.
Biotechnology and Bioengineering, 27, 800-806.
Guiot, S.R., Darrah, B. & Hawari, J.A (1997). Hydrogen sulphide removal by
anaerobic/aerobic coupling. In: Proceedings of the 8th International
Conference on Anaerobic Digestion (Volume 2.) Sendai, Japan, Pp.
64-71.
Hawkes, F.R, Rozzi, A, Black, K., Guwy, A & Hawkes, D.L. (1992). The
stability of anaerobic digesters operating on a food-processing
wastewater. Water Science and Technology, 25, 73-82.
Joubert, W.A & Britz, T.J. (1987). The performance and mixing
characteristics of an anaerobic hybrid reactor treating a synthetic fatty
acid containing substrate. Water SA, 13(2), 63-68.
Kim, l.S., Kim, D.H. & Hyun, S-H. (2000). Effect of particle size and sodium
ion concentration on anaerobic thermophilic food waste digestion.
Water Science and Technology, 41(3), 67-73.
Kosaric, N., Blaszczyk, R, Orphan, L. & Valladares, J. (1990). The
characteristics of granules from upflow anaerobic sludge blanket
reactors. Water Research, 24, 1473-1477.
Lens, P.N.L., Visser, A, Janssen, AJ.H., Hulshoff Pol, L.W. & Lettinga, G.
(1998). Biotechnological treatment of sulfate-rich wastewaters. Critical.
Reviews in Environmental Science and Technology, 28(1),41-88.
Stellenbosch University http://scholar.sun.ac.za
92
Lettinga, G., Hulshoff Pol, L.W., Zeeman, G., Field, J., Van Lier, J.B., Van
Buuren, J.C.L., Janssen, AJ.H. & Lens, P. (1997). Anaerobic
treatment in sustainable environmental production concepts. In:
Proceedings of the 8th International Conference on Anaerobic
Digestion (Volume 1.) Sendai, Japan, Pp. 32-39.
Malina. J.F. & Pohland, F.G. (1992). Anaerobic sludge digestion. In: Design of
Anaerobic Processes for the Treatment of Industrial and Municipal
Wastes, Volume 7, (F.G. Pohland & J.F. Malina. eds.), Techonomic
Publishing Company: Pennsylvania, Pp. 167-212.
Maree, J.P., Cole, C.G.B., Gerber, A & Barnard, J.L. (1990). Treatment of
gelatin factory effluent. Water SA, 16, 265-268.
McCarty, P.L. (1964). Anaerobic Waste Treatment Fundamentals. Public
Works, September, 107-112, October, 123-126, November, 91-94,
December, 95-99. (As cited by Lettinga et al., 1997).
Meyer, L.H., Britz, 1.J. & Lategan, P.M. (1985). Temperature control for
laboratory scale anaerobic digesters. Water SA, 9, 79-80.
Moosbrugger, RE., Wentzel, M.C., Ekama, G.A & Marais, G.v.R (1992).
Simple titration procedures to determine H2C03 alkalinity and short-
chain fatty acids in aqueous solutions containing known concentrations
of ammonium, phosphate and sulphide weak acid/bases. WRC Report
No TT 57/92. Published by the Water Research Commission, P.O. Box
824, Pretoria 0001, South Africa.
Moosbrugger, RE., Wentzel, M.C., Ekama, G.A & Marias, G.v.R (1993).
Lauter turn (brewery) waste in UASB systems-feasibility, alkalinity
requirements and pH control. Water SA, 19(1),41-52.
Nel, L.H., Britz, 1.J. & Lategan, P.M. (1985). The effect of trace elements on
the performance efficiency of an anaerobic fixed film reactor treating a
petrochemical effluent. Water SA, 11(3), 107-110.
Okamoto, M., Miyahara, 0., Minzuno, O. & Noike, 1. (2000). Biological
hydrogen potential of materials chracteristic of the organic fraction of
municipal solid wastes. Water Science and Technology, 41 (3), 25-32.
Stellenbosch University http://scholar.sun.ac.za
93
Petruy, R, Field, J.A. & Lettinga, G. (1999). Pilot-scale expanded granular
sludge bed (EGSB) reactor. In: Proceedings of the 4th IAWQ-IWA
Conference on Biofims Systems, October, 17-20, New York, USA.
Petruzzelli, D., Passino, R & Tiravanti, G. (1995). Ion exchange process for
chromium removal and recovery from tannery wastes. Industrial and
Engineering Chemistry Research, 34, 2612-2617.
Rajalo, G. & Petrovskaya, T. (1996). Selective electrochemical oxidation of
sulphides in tannery wastewater. Environmental Technology, 17, 605-
612.
Ross, W.R, Novella, P.H., Pitt, A.J., Lund, P., Thomson, B.A., King, P.B. &
Fawcett, K.S. (1992). Anaerobic digestion of waste-water sludge:
Operating guide. WRC Report No 390 TT 55/92. Published by the
Water Research Commission, P.O. Box 824, Pretoria 0001, South
Africa.
Stronach, S.M., Rudd, T. & Lester, J.N. (1987). Start-up of anaerobic
bioreactors on high-strength industrial wastes. Biomass, 13, 173-197.
Talinli, I. (1994). Pretreatment of tannery wastewaters. Water Science and
Technology, 29, 175-178.
Tommaso, G., Varesche, M.B., Zaiat, M., Vazzoler, RF. & Foresti, E. (1999).
Formation, microbial characterization and kinetics of anaerobic biofilms
in polyurethane foam differential reactors treating gelatin containing
wastewater. In: Proceedings of the 4th IAWQ-IWA Conference on
Biofims Systems, October, 17-20, New York, USA.
Van Der Merwe, M. (1994). Microbial ecology and anaerobic treatment of
baker's yeast effluent. Ph.D. Thesis, University of the Orange Free
State, Bloemfontein, South Africa.
Van Der Merwe, M. & Britz, T.J. (1993). Anaerobic treatment of baker's yeast
factory effluent using an anaerobic filter and a hybrid digester.
Bioresource Technology, 43, 169-174.
Van Der Merwe-Botha, M. (1998). Personal communication, Local Council of
Krugersdorp, Krugersdorp, South Africa.
Stellenbosch University http://scholar.sun.ac.za
94
Van Rompu, K., D'Haene, S. & Verstraete, W. (1990). Mass transport in
anaerobic polyurethane carrier reactors. Process Biochemistry, 25, 3-
6.
Stellenbosch University http://scholar.sun.ac.za
95
CHAPTER4
TREATMENT OF GELATIN-MANUFACTURING EFFLUENT USING MULTI-
PHASE ANAEROBIC HYBRID DIGESTERS
Summary
Multi-phase anaerobic digestion has often been reported to be beneficial for
the treatment of complex and high-strength wastewater (Battistoni et al.,
2000). It was found by researchers that phase-separation improves process
stability due to better working conditions for the acidogenic and methanogenic
bacteria (Anderson et al., 1994; Fongsatitkul et al., 1995; Battistoni et al.,
2000). This study was therefore conducted as an extension of the single-
phase digesters to determine the effect of phase-separation on the
performance of the two digesters operated in series, while treating gelatin-
manufacturing effluent. Two anaerobic mesophilic hybrid digesters AD-1
(UASB, polyethylene) and AD-2 (UASB, polyurethane), operated in series,
were evaluated for the treatment of a highly variable raw gelatin-
manufacturing effluent. This was done by coupling the digesters so that
digester AD-2 received the effluent from digester AD-1 which in turn received
the full-strength raw gelatin-manufacturing effluent. No chemical oxygen
demand (COD) standardisation was done on the raw gelatin-manufacturing
effluent so as to simulate actual field conditions. The pH of the raw effluent
from the gelatin-manufacturing industry, was adjusted to 6.5 and the hydraulic
retention time (HRT) set at 1.0 d. In the first section of this study the two
reactors were evaluated separately. The two reactors achieved COD removal
efficiencies of up to 93% (AD-1) and 80% (AD-2) at OLR's of 8.32 (AD-1) and
3.00 kg COD.m-3.d-1(AD-2). High sulphate (S04) removal efficiencies were
also obtained in both separate digesters (97% and 84%, respectively). The
methane content varied between 70 and 84% for digester AD-1 and 39 and
95% for digester AD-2. A methane yield per COD removed of 0.96 m3.kg
CODremoved.d-1at an OLR of 7.56 kg COD.m-3.d-1for digester AD-1 and a
Stellenbosch University http://scholar.sun.ac.za
96
methane yield per COD removed of 0.56 m3.kg CODremoved.d-1at an OLR of
5.53 kg COD.m-3.d-1 for digester AD-2, were obtained.
In the second section of this study the total removal efficiency of the
multi-phase system was evaluated. The substrate of digester AD-1 and the
effluent of digester AD-2 were used for the calculation of the total removal
efficiencies in this section. A total COD removal efficiency of 97% at an OLR
of 8.32 kg COD.m-3.d-1, was achieved. Total S04 removal of 96% was
obtained at OLR's of 4.33 kg COD.m-3.d-1. Higher total COD and sulphate
removal efficiencies were obtained with the combined digesters than with the
single-phase digestion, as well as with the phase separated digesters.
Introduction
The general performance of the anaerobic digestion process and the wide
diversity of waste that can be treated, has increased steadily over the last few
years, due to an array of breakthroughs related to reactor design, operating
conditions and shock loadings (Austermann-Haun et aI., 1997). This
treatment option has also been evaluated extensively by other scientists
(Guiot & Van Den Berg, 1985; Stronach et aI., 1987; Van Der Merwe & Britz,
1993; Guiot et aI., 1997; Lettinga et aI., 1997; Verstraete & Vandevivere,
1997; Battistoni et a/., 2000).
Substantial proof exists that phasing/staging of the anaerobic process
can improve the overall performance of the biological process (Speece et aI.,
1997; Battistoni et aI., 2000). Separate phasing/staging seems to be the most
effective approach to optimise environmental conditions for each phase, while
using single-phase processes, both classes of organisms are forced to
operate in a common environment (Speece et aI., 1997; Ghosh et aI., 2000).
Potential advantages of phase separation include: improved process stability
due to optimised environmental conditions for both acidogenic and
methanogenic bacteria; altered intermediate product formation; enhanced
volatile solid (VS) reduction efficiency; minimised H2 concentration and
maximised free energy for propionate conversion; minimised inhibitory
Stellenbosch University http://scholar.sun.ac.za
97
acetate concentrations in the presence of propionate degrading bacteria and
visa versa; increased potential for a better organic loading rate (OLR);
reducing risk of digester overloading; minimised residual volatile fatty acids
(VFA) in the effluents as well as altered energy yields to various classes of
microbial populations (Ghosh & Klass, 1978; Massey & Pohland, 1978; Shin
ef aI., 1992; Fongsatitkul ef aI., 1995; Battistoni ef aI., 2000; Ghosh ef aI.,
2000). Anderson ef al. (1994) studied the changes in microbial populations in
multi-phase digestion systems and confirmed that these designs have
advantages over single-phase systems, especially in terms of the selection
and enrichment of different bacteria in each phase, increased process
stability and that the methanogenic phase is buffered by the first acid phase
(Ghosh ef al., 2000).
The process used by gelatin-manufacturing industries to convert
insoluble hide collagen into water soluble gelatin produces a large volume of
effluent, high in COD, suspended solids (SS), S04 and salts. This result
costly upsets to the treatment processes of the local wastewater purification
process (Van Der Merwe-Botha, 1998, Personal communication). Aiming at
the reduction of the load of the discharged wastewater, it was decided to
evaluate anaerobic digestion as a pre-treatment option for this gelatin-
manufacturing effluent before it is discharged into the municipal wastewater
purification works.
This study was done as an extension to the previous laboratory-scale
single-phase studies (Chapter 3 of this thesis) in an attempt to separate the
dominant microbial populations and establish their interactions in two
separately phased digesters, thereby optimising the nutrient utilising and
metabolite formation dynamics by these specific phase-dominating
populations. The aim of this study was thus to evaluate the performance
efficiencies of both individually operated digesters, as well as the overall
performance of the same two digesters operated in series, while treating raw
gelatin-manufacturing effluent.
Stellenbosch University http://scholar.sun.ac.za
98
Materials and methods
Digester design
The two digesters were operated in series, each with a working volume
of five litres, and operated at 35°C. The temperature was regulated by means
of a heating tape and temperature sensitive controls (Meyer et al., 1985).
The hybrid digesters combined a fixed-film and an upflow sludge blanket
design. The inert porous polyethylene (AD-1) foam and the polyurethane
(AD-2) materials were fitted to the upper two thirds of each of the inner
digester walls. The polyurethane material (Van Rompu et al., 1990) had
channels of 1.3 x 3.3 cm, edges of 1.3 x 3.0 cm and a back area 1.3 cm thick.
The density of the polyethylene and polyurethane materials were estimated at
0.77 and 25.7 kg.m-3, respectively (Van Der Merwe, 1994).
The substrate was introduced semi-continuously via a horizontal inlet
at the bottom of each digester by means of a peristaltic pump (Watson-
Marlow 302S) controlled by an electronic timer. The final overflow of the
reactor system emptied through an U-shaped tube to prevent any
atmospheric oxygen from entering the system. The biogas exited at the top
of the digester via a gas-solid separator and biogas production was
determined by means of a brine displacement system (6N HCI, pH 2.0). The
biogas volumes were corrected to standard temperature and pressure (STP)
conditions. Stable state conditions were assumed when, after five volume
turnovers, operational parameters showed a variation of less than 10%. The
hydraulic retention time (HRT) was set at 1.0 d for the entire duration of the
experimental study for both digesters.
There was no need for a start-up process since the digesters were
already activated using the same substrate used for the single-phase
digestion reported in Chapter 3 of this thesis.
Gelatin-manufacturing effluent
The gelatin effluent was obtained from a local gelatin-manufacturing
industry in batches of 75 I and were stored at room temperature until required.
In an attempt to simulate the actual field conditions, no standardisation was
Stellenbosch University http://scholar.sun.ac.za
99
done on the effluent, except for the pH of the substrate which had to be
adjusted to 6.5. The direct influence of varying COD concentrations (organic
loading rates) on the anaerobic treatment efficiency can thus be studied. The
gelatin-manufacturing effluent used as digester substrate was initially
supplemented with 100 rnq.l" urea, 100 rnq.l" K2HP04, 10 ml acetic acid
(CH3COOH) and a sterile trace element solution (Nel et aI., 1985), to
stimulate the growth of the specific microbial consortium and to prevent any
nutrient limitations.
Analytical methods
The following parameters were determined on the digester substrate
and effluent during the experimental study according to Standard Methods
(APHA, AWWA & WEF, 1995): pH; total alkalinity (TAlk); chemical oxygen
demand (COD); total Kjeldahl nitrogen (TKN); chlorides (Cl); ammonia (NH3-
N); volatile fatty acids (VFA); sulphate (SO/-); total solids (TS); volatile solids
(VS); total non-volatile solids (TNVS) and ortho-phosphate (P04-P).
Total heavy metals (Tmetais) comprising of Cu, Fe, Co, Mn, Cr, Pb, Ni,
Zn, Cd, as well as calcium and sodium cocentrations, were determined using
an Atomic Absorbance Spectrophotometer (Varian Model 250 Plus),
equipped with hollow cathode lamps for the different metals, photoelectric
detector with associated electronic amplifying and measuring equipment.
Air/acetylene and nitrous oxide/acetylene burners were used with air as
oxidant and acetylene or nitrous oxide as fuel. Pressure reducing regulators
were used for the supply of the fuel and oxidant at appropriate and prescribed
levels. Control standards of known metal concentrations were prepared with
a matrix similar to the samples, for the construction of a calibration curve.
Additional standard solutions were analysed between samples to confirm test
control, as well as a blank to confirm the baseline stability. The sample
concentrations were determined by reference to the calibration curve. The
filtered samples (at room temperature) were aspirated into the air/acetylene
or nitrous oxide/acetylene flame and atomised.
Volatile fatty acids (as acetate) were determined according to the
titration method of Moosbrugger et al. (1992). The biogas composition
Stellenbosch University http://scholar.sun.ac.za
100
(methane and carbon dioxide) was determined volumetrically according to the
quantitative biogas carbon dioxide content method of Ross et al. (1992). The
biogas volumes were corrected to standard temperature and pressure (STP)
conditions.
The accuracy of all tested parameters were confirmed by participation
in an inter-laboratory water testing program (SABS Water Check Proficiency
Program).
Experimental phases
During the multi-phase experimental study, the two hybrid digesters
were operated in series, with digester AD-1 (UASB, polyethylene) receiving
the raw gelatin-manufacturing effluent as digester substrate (pH correction to
6.5 with 6N HCI), and digester AD-2 (UASB, polyurethane) receiving the
treated effluent from AD-1, as substrate (pH 6.5). In the first section of the
study the two reactors were evaluated separately to determine if phase-
separation was possible. Thereafter, in the second section of the study the
total removal efficiency of the multi-phase system treating gelatin-
manufacturing, was evaluated.
Results and discussion
Digester substrate
The average composition of the substrate fed to the hybrid digesters
during the multi-phase digestion, is given in Table 1. Since the direct
influence of varying batch and thus substrate composition was considered as
important field and bench parameters, no standardisation was done on the
effluent, with the exception of the pH.
Digester efficiency (AD-1)
The composition of the digester substrate, effluent and digester
efficiency, are given in Tables 2a, band c. The first phase substrate (AD-1)
was used as baseline in all efficiency calculations. The data in Fig. 1 shows
Stellenbosch University http://scholar.sun.ac.za
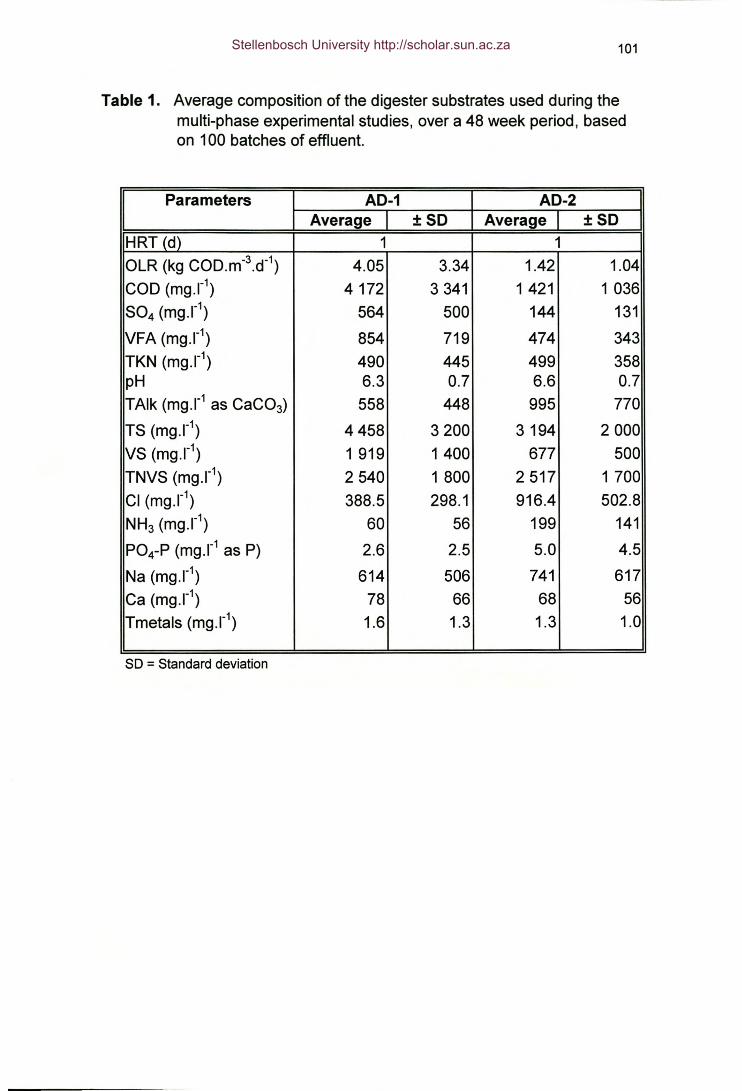
101
Table 1. Average composition of the digester substrates used during themulti-phase experimental studies, over a 48 week period, basedon 100 batches of effluent.
Parameters AO-1 AO-2Average ±SO Average ±SO
HRT (d) 1 1OLR (kg COD.m-3.d-1) 4.05 3.34 1.42 1.04COD (rnq.I") 4172 3341 1 421 1 036S04 (rnq.l") 564 500 144 131
VFA (rnq.l") 854 719 474 343TKN (rnq.l") 490 445 499 358pH 6.3 0.7 6.6 0.7TAlk (rnq.I" as CaC03) 558 448 995 770
TS (rnq.l") 4458 3200 3194 2000VS (rnq.l") 1 919 1400 677 500TNVS (rnq.l") 2540 1 800 2517 1 700Cl (mq.I") 388.5 298.1 916.4 502.8NH3 (rnq.I") 60 56 199 141
P04-P (rnq.l" as P) 2.6 2.5 5.0 4.5
Na (rnq.l") 614 506 741 617Ca (mg.r1) 78 66 68 56Tmetals (rnq.l") 1.6 1.3 1.3 1.0
SD = Standard deviation
Stellenbosch University http://scholar.sun.ac.za
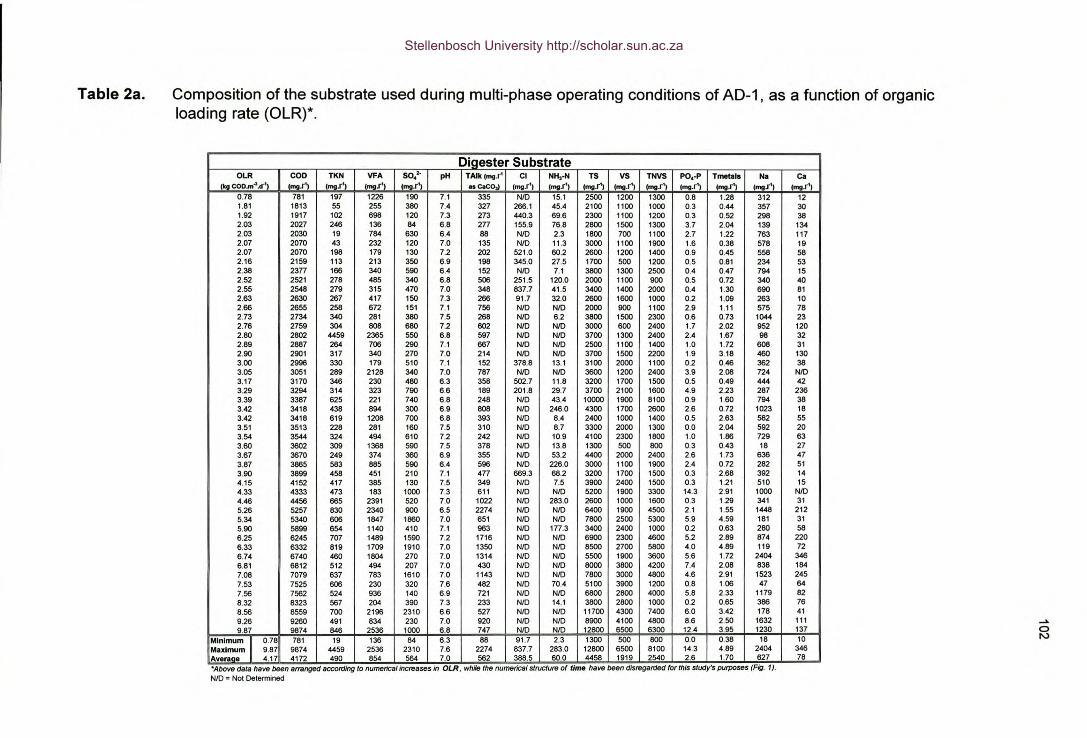
Table 2a. Composition of the substrate used during multi-phase operating conditions of AD-1, as a function of organicloading rate (OLR)*.
Digester SubstrateOLR COD TKN VFA 504
2• pH TAlk (mg.r' Cl NH,-N TS VS TNVS PO.-p Tmelals Na ca(kg COD.m-3.d·1) (mg.r', (mg.r', (mg.r', (mg.r', ... C.C03) (mg.r', (mg.r', (mg.r', (mg.r', (mgr', (mg.r', (mg.r', (mgr', (mg.r',
0.78 781 197 1226 190 7.1 335 NID 15.1 2500 1200 1300 0.8 1.28 312 121.81 1813 55 255 380 7.4 327 266.1 45.4 2100 1100 1000 0.3 0.44 357 301.92 1917 102 698 120 7.3 273 440.3 69.6 2300 1100 1200 0.3 0.52 298 382.03 2027 246 138 84 6.8 277 155.9 76.8 2800 1500 1300 3.7 2.04 139 1342.03 2030 19 784 630 6.4 88 NID 2.3 1800 700 1100 2.7 1.22 763 1172.07 2070 43 232 120 7.0 135 N/D 11.3 3000 1100 1900 1.6 0.38 578 192.07 2070 198 179 130 7.2 202 521.0 60.2 2600 1200 1400 0.9 0.45 558 582.16 2159 113 213 350 6.9 198 345.0 27.5 1700 500 1200 0.5 0.81 234 532.38 2377 166 340 590 6.4 152 NID 7.1 3800 1300 2500 0.4 0.47 794 152.52 2521 278 465 340 6.8 506 251.5 120.0 2000 1100 900 0.5 0.72 340 402.55 2548 279 315 470 7.0 348 837.7 41.5 3400 1400 2000 0.4 1.30 690 812.63 2630 267 417 150 7.3 266 91.7 32.0 2800 1600 1000 0.2 1.09 263 102.66 2655 258 672 151 7.1 756 NID NID 2000 900 1100 2.9 1.11 575 782.73 2734 340 281 380 7.5 268 N/D 6.2 3800 1500 2300 0.6 0.73 1044 232.76 2759 304 808 680 7.2 602 N/D NID 3000 600 2400 1.7 2.02 952 1202.80 2802 4459 2385 550 6.8 597 N/D NID 3700 1300 2400 2.4 1.67 98 322.89 2887 264 706 290 7.1 667 NID NID 2500 1100 1400 1.0 1.72 606 312.90 2901 317 340 270 7.0 214 NID NID 3700 1500 2200 1.9 3.18 460 1303.00 2996 330 179 510 7.1 152 378.8 13.1 3100 2000 1100 0.2 0.46 382 383.05 3051 289 2128 340 7.0 787 NID NID 3600 1200 2400 3.9 2.06 724 NID3.17 3170 346 230 480 6.3 358 502.7 11.8 3200 1700 1500 0.5 0.49 444 423.29 3294 314 323 790 6.6 189 201.8 29.7 3700 2100 1600 4.9 2.23 287 2383.39 3387 625 221 740 6.8 248 N/D 43.4 10000 1900 8100 0.9 1.60 794 383.42 3418 438 894 300 6.9 808 NID 246.0 4300 1700 2600 2.6 0.72 1023 183.42 3418 619 1208 700 6.8 393 NID 8.4 2400 1000 1400 0.5 2.63 582 553.51 3513 228 281 160 7.5 310 NID 8.7 3300 2000 1300 0.0 2.04 592 203.54 3544 324 494 610 7.2 242 NID 10.9 4100 2300 1800 1.0 1.66 729 633.60 3802 309 1388 590 7.5 378 NID 13.8 1300 500 800 0.3 0.43 18 273.67 3870 249 374 380 6.9 355 NID 53.2 4400 2000 2400 2.6 1.73 638 473.87 3865 583 885 590 6.4 596 NID 226.0 3000 1100 1900 2.4 0.72 282 513.90 3899 458 451 210 7.1 477 669.3 68.2 3200 1700 1500 0.3 2.68 392 144.15 4152 417 385 130 7.5 349 N/D 7.5 3900 2400 1500 0.3 1.21 510 154.33 4333 473 183 1000 7.3 611 N/D NID 5200 1900 3300 14.3 2.91 1000 NID4.46 4456 665 2391 520 7.0 1022 NID 283.0 2600 1000 1600 0.3 1.29 341 315.26 5257 830 2340 900 6.5 2274 NID NID 6400 1900 4500 2.1 1.55 1448 2125.34 5340 606 1847 1860 7.0 651 NID N/D 7800 2500 5300 5.9 4.59 181 315.90 5899 654 1140 410 7.1 963 NID 177.3 3400 2400 1000 0.2 0.63 280 586.25 6245 707 1489 1590 7.2 1716 NID NID 6900 2300 4600 5.2 2.89 874 2206.33 6332 819 1709 1910 7.0 1350 NID NID 8500 2700 5800 4.0 4.89 119 726.74 6740 460 1804 270 7.0 1314 NID NID 5500 1900 3600 5.6 1.72 2404 3466.81 6812 512 494 207 7.0 430 N/D N/D 8000 3800 4200 7.4 2.08 838 1847.08 7079 637 783 1610 7.0 1143 NID NID 7800 3000 4800 4.6 2.91 1523 2457.53 7525 606 230 320 7.6 482 NID 70.4 5100 3900 1200 0.8 1.06 47 647.56 7562 524 936 140 6.9 721 NID NID 8800 2800 4000 5.8 2.33 1179 828.32 8323 567 204 390 7.3 233 NID 14.1 3600 2800 1000 0.2 0.65 386 768.56 8559 700 2196 2310 6.6 527 NID N/D 11700 4300 7400 6.0 3.42 178 419.26 9260 491 834 230 7.0 920 NID N/D 8900 4100 4800 8.6 2.50 1632 1119.87 9874 846 2538 1000 6.8 747 NID N/D 12800 6500 6300 12.4 3.95 1230 137
Minimum I 0.78 781 19 136 84 6.3 88 91.7 2.3 1300 500 800 0.0 0.38 18 10Maximum 9.87 9874 4459 2536 2310 7.6 2274 837.7 283.0 12800 6500 8100 14.3 4.89 2404 346Average 4.17 4172 490 854 584 7.0 562 388.5 60.0 4458 1919 2540 2.6 1.70 627 78
......oN
'Above dala have been arranged according to numerical increases in OLR, while the numerical structure of time have been disregarded for this study's purposes (Fig. 1J.NID = Not Delermined
Stellenbosch University http://scholar.sun.ac.za
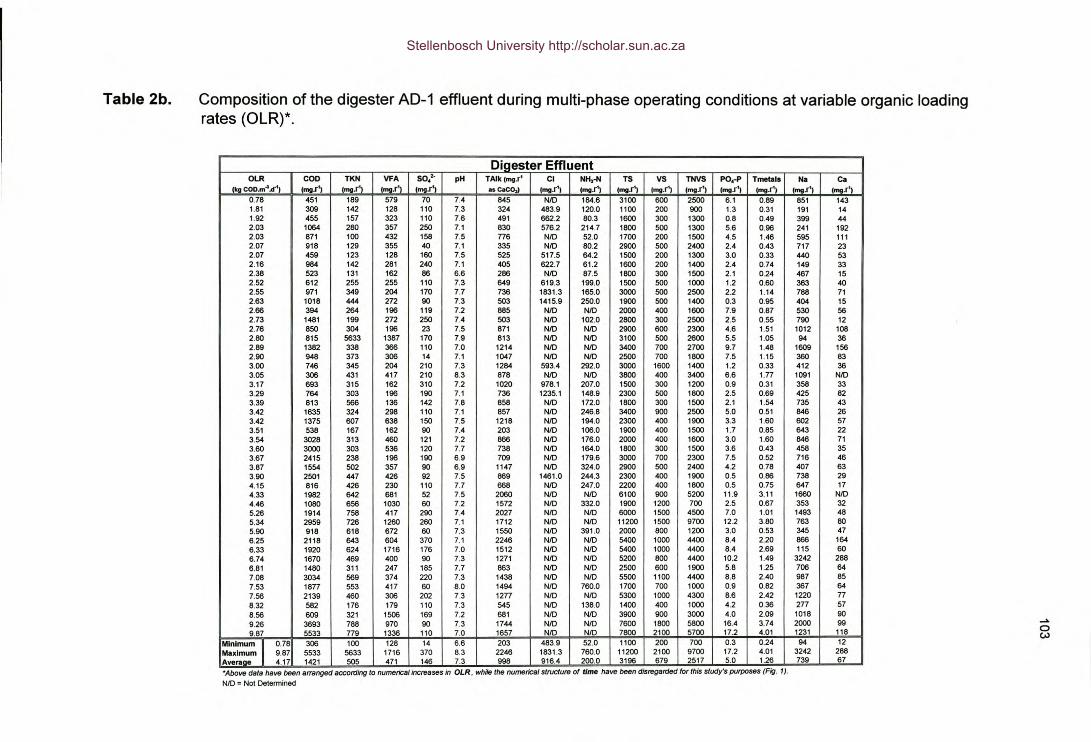
Table 2b. Composition of the digester AD-1 effluent during multi-phase operating conditions at variable organic loadingrates (OLR)*.
Digester EffluentOLR COD TKN VFA sol' pH TAlk (mg.r' Cl NH,-N TS vs THYS PO.-P Tmetal. Ns Cs
(kg COD.m.) .cr') (mg.r') (mg.r') (mg.r') (mg.r') nC.CO,) (mg.r'l (mg.r') (mg.r') (mg.r'l (mg.r') (mg.r'l (mg.r') (mg.r') (mg.r')0.78 451 189 579 70 7.4 845 NID 184.6 3100 600 2500 6.1 0.89 851 1431.81 309 142 128 110 7.3 324 483.9 120.0 1100 200 900 1.3 0.31 191 141.92 455 157 323 110 7.6 491 662.2 80.3 1600 300 1300 0.8 0.49 399 442.03 1064 260 357 250 7.1 830 576.2 214.7 1800 500 1300 5.6 0.96 241 1922.03 871 100 432 158 7.5 776 NID 52.0 1700 200 1500 4.5 1.46 595 1112.07 918 129 355 40 7.1 335 NID 80.2 2900 500 2400 2.4 0.43 717 232.07 459 123 128 160 7.5 525 517.5 64.2 1500 200 1300 3.0 0.33 440 532.16 984 142 281 240 7.1 405 622.7 61.2 1600 200 1400 2.4 0.74 149 332.38 523 131 162 86 6.6 286 NID 87.5 1800 300 1500 2.1 0.24 467 152.52 612 255 255 110 7.3 649 619.3 199.0 1500 500 1000 1.2 0.60 363 402.55 971 349 204 170 7.7 736 1831.3 165.0 3000 500 2500 2.2 1.14 788 712.63 1018 444 272 90 7.3 503 1415.9 250.0 1900 500 1400 0.3 0.95 404 152.66 394 264 196 119 7.2 885 NID NID 2000 400 1800 7.9 0.87 530 562.73 1481 199 272 250 7.4 503 NID 102.0 2800 300 2500 2.5 0.55 790 122.76 850 304 196 23 7.5 871 NID NID 2900 600 2300 4.6 1.51 1012 1082.80 815 5633 1367 170 7.9 813 NID NID 3100 500 2600 5.5 1.05 94 362.89 1362 336 366 110 7.0 1214 NID NID 3400 700 2700 9.7 1.48 1609 1562.90 948 373 306 14 7.1 1047 NID NID 2500 700 1800 7.5 1.15 360 833.00 746 345 204 210 7.3 1284 593.4 292.0 3000 1600 1400 1.2 0.33 412 363.05 306 431 417 210 8.3 878 NID NID 3800 400 3400 6.6 1.77 1091 NID3.17 693 315 162 310 7.2 1020 978.1 207.0 1500 300 1200 0.9 0.31 358 333.29 764 303 196 190 7.1 736 1235.1 148.9 2300 500 1800 2.5 0.69 425 823.39 813 566 136 142 7.8 858 NID 172.0 1800 300 1500 2.1 1.54 735 433.42 1635 324 298 110 7.1 857 NID 246.8 3400 900 2500 5.0 0.51 846 263.42 1375 607 636 150 7.5 1218 NID 194.0 2300 400 1900 3.3 1.60 602 573.51 536 167 162 90 7.4 203 NID 106.0 1900 400 1500 1.7 0.85 643 223.54 3028 313 460 121 7.2 866 NID 176.0 2000 400 1600 3.0 1.60 848 713.60 3000 303 536 120 7.7 736 NID 164.0 1800 300 1500 3.6 0.43 458 353.67 2415 236 196 190 6.9 709 NID 179.6 3000 700 2300 7.5 0.52 716 463.87 1554 502 357 90 6.9 1147 NID 324.0 2900 500 2400 4.2 0.78 407 633.90 2501 447 426 92 7.5 869 1481.0 244.3 2300 400 1900 0.5 0.86 736 294.15 816 426 230 110 7.7 688 NID 247.0 2200 400 1800 0.5 0.75 647 174.33 1982 642 881 52 7.5 2060 NID NID 6100 900 5200 11.9 3.11 1660 NID4.46 1080 658 1030 60 7.2 1572 NID 332.0 1900 1200 700 2.5 0.67 353 325.26 1914 758 417 290 7.4 2027 NID NID 6000 1500 4500 7.0 1.01 1493 485.34 2959 726 1260 260 7.1 1712 NID NID 11200 1500 9700 12.2 3.80 763 805.90 918 618 672 60 7.3 1550 NID 391.0 2000 800 1200 3.0 0.53 345 476.25 2118 643 604 370 7.1 2246 NID NID 5400 1000 4400 8.4 2.20 866 1646.33 1920 624 1716 176 7.0 1512 NID NID 5400 1000 4400 8.4 2.69 115 606.74 1670 469 400 90 7.3 1271 NID NID 5200 800 4400 10.2 1.49 3242 2886.81 1480 311 247 185 7.7 863 NID NID 2500 600 1900 5.8 1.25 706 647.08 3034 569 374 220 7.3 1438 NID NID 5500 1100 4400 8.8 2.40 987 857.53 1877 553 417 60 8.0 1494 NID 760.0 1700 700 1000 0.9 0.82 367 647.56 2139 460 306 202 7.3 1277 NID NID 5300 1000 4300 8.6 2.42 1220 778.32 582 176 179 110 7.3 545 NID 138.0 1400 400 1000 4.2 0.36 277 578.56 609 321 1506 169 7.2 881 NID NID 3900 900 3000 4.0 2.09 1018 909.26 3693 788 970 90 7.3 1744 NID NID 7600 1800 5800 16.4 3.74 2000 999.87 5533 779 1336 110 7.0 1657 NID NID 7800 2100 5700 17.2 4.01 1231 118
Minimum I 0.78 306 100 128 14 6.6 203 483.9 52.0 1100 200 700 0.3 0.24 94 12
Maximum 9.87 5533 5633 1716 370 8.3 2246 1831.3 760.0 11200 2100 9700 17.2 4.01 3242 288
Average 4.17 1421 505 471 146 7.3 998 916.4 200.0 3196 679 2517 5.0 1.26 739 67
'Above data have been arranged according to numerical increases in OLR, while the numerical structure of time have been disregarded for this study's purposes (Fig. 1).
NID = Not Determined
~ow
Stellenbosch University http://scholar.sun.ac.za
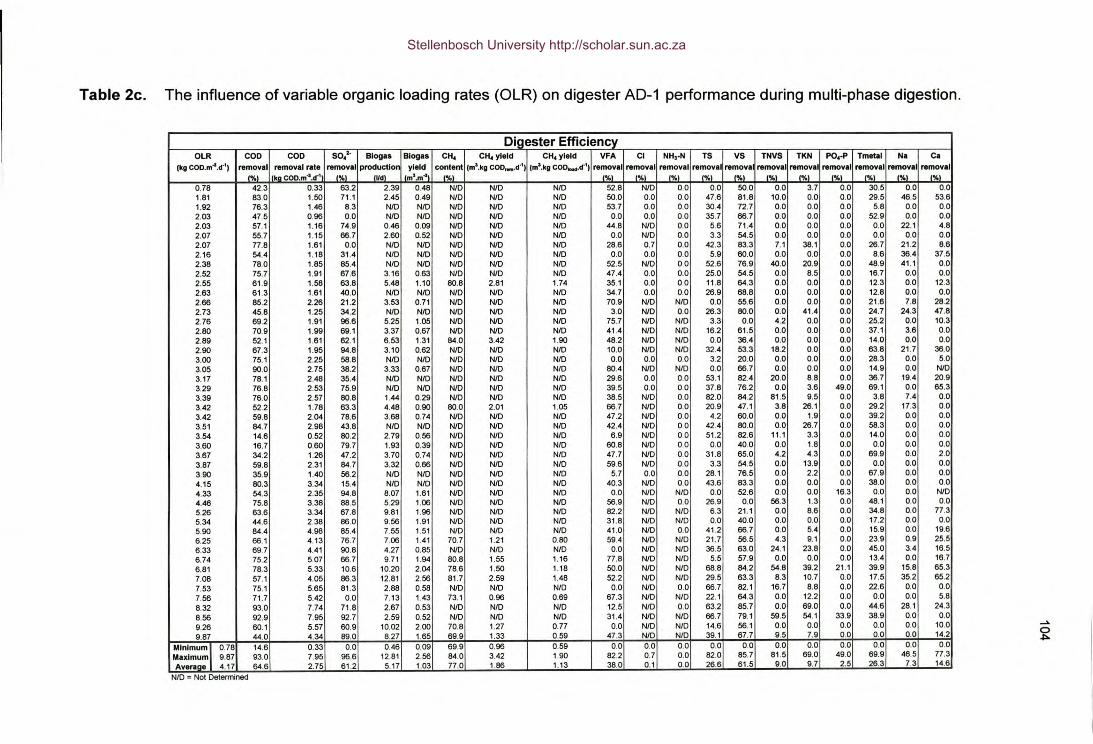
Table 2c. The influence of variable organic loading rates (OLR) on digester AD-1 performance during multi-phase digestion.
Digester EfficiencyOLR COD COD SO;· Biogas Biogas CH. CH. yield CH. yield VFA Cl NH,·N TS VS TNVS TKN PO.·p Tmetal Na Ca
(kg COD.m_'.d·') removal removal rate removal producnon yield content (m'.kg COD~.d·') (m'.kg COD..... cr" removal removal removal removal remeva removal removal removal removal removal removal
% ka COD.m_'.d·' 1%' IUd' m'.m4\ %' 1%' 1%' 1%1 1%1 1%1 1%1 1%1 1%1 1%1 1%1 1%10.78 42.3 0.33 63.2 2.39 0.48 NfO NfO NID 52.8 NfO 0.0 0.0 50.0 0.0 3.7 0.0 30.5 0.0 0.01.81 83.0 1.50 71.1 2.45 0.49 NfO NfO NfO 50.0 0.0 0.0 47.6 81.8 10.0 0.0 0.0 29.5 46.5 53.61.92 76.3 1.46 8.3 NID NfO NfO NfO NfO 53.7 0.0 0.0 30.4 72.7 0.0 0.0 0.0 5.8 0.0 0.02.03 47.5 0.96 0.0 NfO NID NfO NfO NfO 0.0 0.0 0.0 35.7 66.7 0.0 0.0 0.0 52.9 0.0 0.02.03 57.1 1.16 74.9 0.46 0.09 NfO NfO NfO 44.8 NfO 0.0 5.6 71.4 0.0 0.0 0.0 0.0 22.1 4.82.07 55.7 1.15 66.7 2.60 0.52 NfO NfO NfO 0.0 NfO 0.0 3.3 54.5 0.0 0.0 0.0 0.0 0.0 0.02.07 77.8 1.61 0.0 NfO NfO NfO NfO NID 28.6 0.7 0.0 42.3 83.3 7.1 38.1 0.0 26.7 21.2 8.62.16 54.4 1.18 31.4 NfO NfO NfO NfO NfO 0.0 0.0 0.0 5.9 60.0 0.0 0.0 0.0 8.6 36.4 37.52.38 78.0 1.85 85.4 NfO NfO NfO NfO NfO 52.5 NfO 0.0 52.6 76.9 40.0 20.9 0.0 48.9 41.1 0.02.52 75.7 1.91 67.6 3.16 0.63 NfO NfO NfO 47.4 0.0 0.0 25.0 54.5 0.0 8.5 0.0 16.7 0.0 0.02.55 61.9 1.58 63.8 5.48 1.10 80.8 2.81 1.74 35.1 0.0 0.0 11.8 64.3 0.0 0.0 0.0 12.3 0.0 12.32.63 61.3 1.61 40.0 NfO NfO NfO NfO NfO 34.7 0.0 0.0 26.9 68.8 0.0 0.0 0.0 12.8 0.0 0.02.66 85.2 2.26 21.2 3.53 0.71 NfO NfO NfO 70.9 NfO NfO 0.0 55.6 0.0 0.0 0.0 21.6 7.8 28.22.73 45.8 1.25 34.2 NfO NfO NfO NID NfO 3.0 NfO 0.0 26.3 60.0 0.0 41.4 0.0 24.7 24.3 47.82.76 69.2 1.91 96.6 5.25 1.05 NfO NfO NID 75.7 NfO NfO 3.3 0.0 4.2 0.0 0.0 25.2 0.0 10.32.80 70.9 1.99 69.1 3.37 0.67 NfO NfO NfO 41.4 NfO NfO 16.2 61.5 0.0 0.0 0.0 37.1 3.6 0.02.89 52.1 1.61 62.1 6.53 1.31 84.0 3.42 1.90 48.2 NfO NfO 0.0 36.4 0.0 0.0 0.0 14.0 0.0 0.0
2.90 67.3 1.95 84.8 3.10 0.62 NfO NfO NID 10.0 NID NfO 32.4 53.3 18.2 0.0 0.0 63.8 21.7 36.03.00 75.1 2.25 58.8 NfO NfO NfO NfO NfO 0.0 0.0 0.0 3.2 20.0 0.0 0.0 0.0 28.3 0.0 5.03.05 90.0 2.75 38.2 3.33 0.67 NfO NfO NfO 60.4 NID NfO 0.0 66.7 0.0 0.0 0.0 14.9 0.0 NfO
3.17 78.1 2.48 35.4 NID NfO NfO NfO NfO 29.6 0.0 0.0 53.1 82.4 20.0 8.8 0.0 36.7 19.4 20.9
3.29 76.8 2.53 75.9 NfO NfO NfO NfO NfO 39.5 0.0 0.0 37.8 76.2 0.0 3.6 49.0 69.1 0.0 65.3
3.39 76.0 2.57 80.8 1.44 0.29 NfO NfO NfO 38.5 NfO 0.0 82.0 84.2 81.5 9.5 0.0 3.8 7.4 0.0
3.42 52.2 1.78 63.3 4.48 0.90 60.0 2.01 1.05 66.7 NfO 0.0 20.9 47.1 3.8 26.1 0.0 29.2 17.3 0.0
3.42 59.8 2.04 78.6 3.68 0.74 NfO NfO NfO 47.2 NfO 0.0 4.2 60.0 0.0 1.9 0.0 39.2 0.0 0.0
3.51 84.7 2.98 43.8 NfO NfO NfO NfO NfO 42.4 NfO 0.0 42.4 80.0 0.0 26.7 0.0 58.3 0.0 0.0
3.54 14.6 0.52 80.2 2.79 0.56 NfO NfO NfO 6.9 NfO 0.0 51.2 82.6 11.1 3.3 0.0 14.0 0.0 0.0
3.60 16.7 0.60 79.7 1.93 0.39 NfO NfO NfO 60.8 NfO 0.0 0.0 40.0 0.0 1.8 0.0 0.0 0.0 0.0
3.67 34.2 1.26 47.2 3.70 0.74 NfO NfO NfO 47.7 NfO 0.0 31.8 65.0 4.2 4.3 0.0 69.9 0.0 2.0
3.87 59.8 2.31 84.7 3.32 0.66 NfO NfO NfO 59.6 NfO 0.0 3.3 54.5 0.0 13.9 0.0 0.0 0.0 0.0
3.90 35.9 1.40 56.2 NfO NfO NfO NfO NfO 5.7 0.0 0.0 28.1 76.5 0.0 2.2 0.0 67.9 0.0 0.0
4.15 80.3 3.34 15.4 NfO NfO NfO NID NfO 40.3 NfO 0.0 43.6 83.3 0.0 0.0 0.0 38.0 0.0 0.0
4.33 54.3 2.35 94.8 8.07 1.61 NfO NfO NfO 0.0 NfO NfO 0.0 52.6 0.0 0.0 16.3 0.0 0.0 NfO
4.46 75.8 3.38 88.5 5.29 1.06 NfO NfO NfO 56.9 NfO 0.0 26.9 0.0 56.3 1.3 0.0 48.1 0.0 0.0
5.26 63.6 3.34 67.8 9.81 1.96 NfO NfO NID 82.2 NfO NfO 6.3 21.1 0.0 8.6 0.0 34.8 0.0 77.3
5.34 44.6 2.38 86.0 9.56 1.91 NfO NfO NfO 31.8 NfO NfO 0.0 40.0 0.0 0.0 0.0 17.2 0.0 0.0
5.90 84.4 4.98 85.4 7.55 1.51 NfO NfO NfO 41.0 NfO 0.0 41.2 66.7 0.0 5.4 0.0 15.9 0.0 19.6
6.25 66.1 4.13 76.7 7.06 1.41 70.7 1.21 0.80 59.4 NfO NfO 21.7 56.5 4.3 9.1 0.0 23.9 0.9 25.5
6.33 69.7 4.41 90.8 4.27 0.85 NfO NfO NfO 0.0 NfO NfO 36.5 63.0 24.1 23.8 0.0 45.0 3.4 16.5
6.74 75.2 5.07 66.7 9.71 1.94 80.8 1.55 1.16 77.8 NfO NfO 5.5 57.9 0.0 0.0 0.0 13.4 0.0 16.7
6.81 78.3 5.33 10.6 10.20 2.04 78.6 1.50 1.18 50.0 NfO NfO 88.8 84.2 54.8 39.2 21.1 39.9 15.8 65.3
7.08 57.1 4.05 86.3 12.81 2.56 81.7 2.59 1.48 52.2 NfO NfO 29.5 63.3 8.3 10.7 0.0 17.5 35.2 65.2
7.53 75.1 5.65 81.3 2.88 0.58 NfO NfO NfO 0.0 NfO 0.0 66.7 82.1 16.7 8.8 0.0 22.6 0.0 0.0
7.56 71.7 5.42 0.0 7.13 1.43 73.1 0.96 0.69 67.3 NfO NfO 22.1 64.3 0.0 12.2 0.0 0.0 0.0 5.8
8.32 93.0 7.74 718 2.67 0.53 NfO NfO NfO 12.5 NfO 0.0 63.2 85.7 0.0 69.0 0.0 44.6 28.1 24.3
8.56 92.9 7.95 92.7 2.59 0.52 NfO NfO NfO 31.4 NfO NfO 86.7 79.1 59.5 54.1 33.9 38.9 0.0 0.0
9.26 60.1 5.57 60.9 10.02 2.00 70.8 1.27 0.77 0.0 NfO NfO 14.6 56.1 0.0 0.0 0.0 0.0 0.0 10.0
9.87 44.0 4.34 89.0 8.27 1.65 69.9 1.33 0.59 47.3 NfO NID 39.1 67.7 9.5 7.9 0.0 0.0 0.0 14.2
Mlnlmumlo.78 14.6 0.33 0.0 0.46 0.09 69.9 0.96 0.59 0.0 0.0 0.0 0.0 0.0 0.0 0.0 0.0 0.0 0.0 0.0
Maximum 9.87 93.0 7.95 96.6 12.81 2.56 84.0 3.42 1.90 82.2 0.7 0.0 82.0 85.7 81.5 69.0 49.0 69.9 46.5 77.3
Averaae 4.17 64.6 2.75 61.2 5.17 1.03 77.0 1.86 1.13 38.0 0.1 0.0 26.6 61.5 9.0 9.7 2.5 26.3 7.3 14.6
....>.
~
NfO = Not Oetermined
Stellenbosch University http://scholar.sun.ac.za
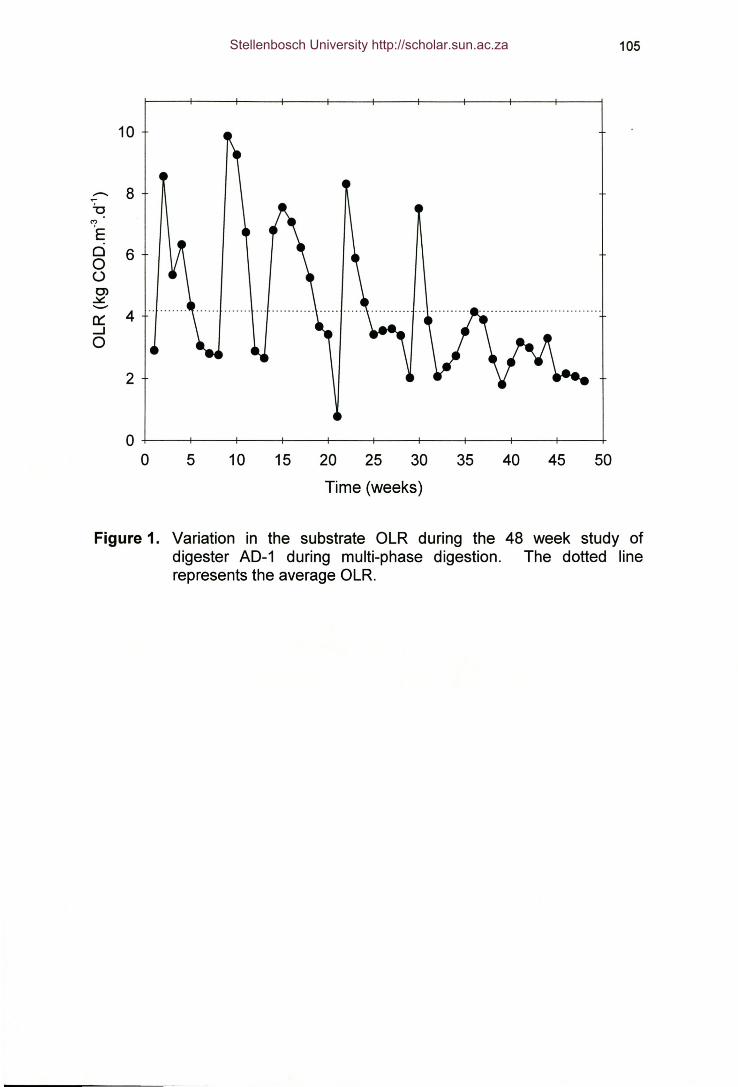
2
105
o 6oo0>
...lol::-0:: 4 .--'o
.- 8~
10
o +---~---+--~----+---4----r---1----~--,_---+o 5 10 15 20 25 30 35 40 45 50
Time (weeks)
Figure 1. Variation in the substrate OLR during the 48 week study ofdigester AD-1 during multi-phase digestion. The dotted linerepresents the average OLR.
Stellenbosch University http://scholar.sun.ac.za
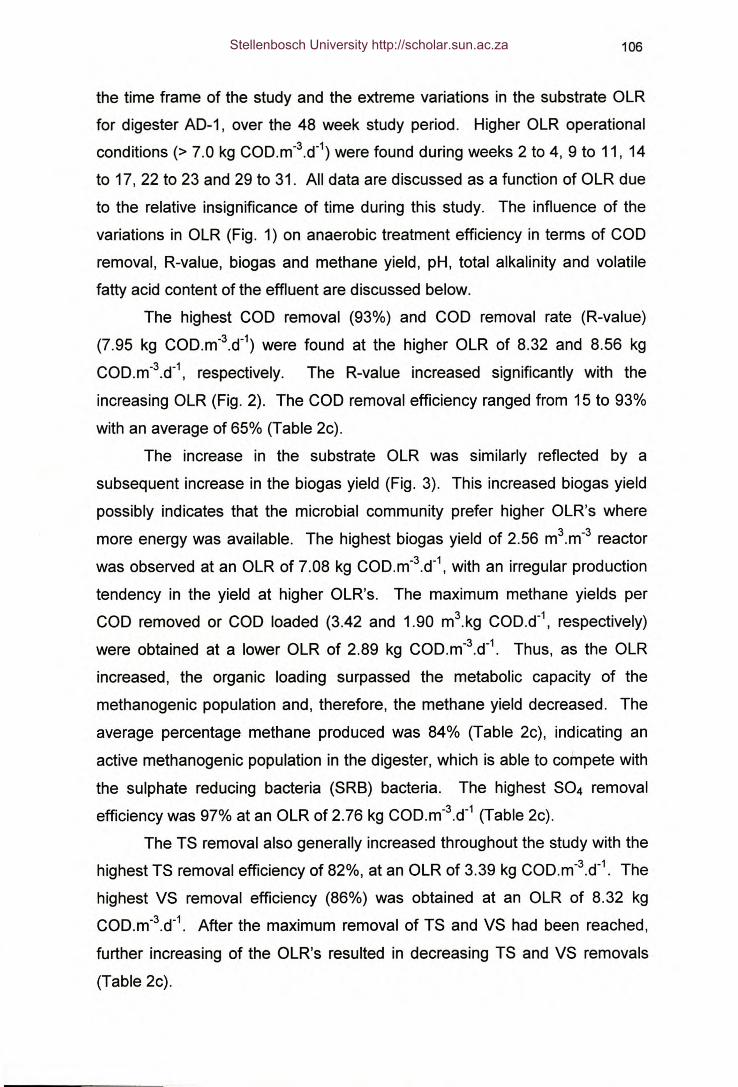
106
the time frame of the study and the extreme variations in the substrate OLR
for digester AD-1, over the 48 week study period. Higher OLR operational
conditions (> 7.0 kg COD.m-3.d-1)were found during weeks 2 to 4, 9 to 11, 14
to 17, 22 to 23 and 29 to 31. All data are discussed as a function of OLR due
to the relative insignificance of time during this study. The influence of the
variations in OLR (Fig. 1) on anaerobic treatment efficiency in terms of COD
removal, R-value, biogas and methane yield, pH, total alkalinity and volatile
fatty acid content of the effluent are discussed below.
The highest COD removal (93%) and COD removal rate (R-value)
(7.95 kg COD.m-3.d-1) were found at the higher OLR of 8.32 and 8.56 kg
COD.m-3.d-1, respectively. The R-value increased significantly with the
increasing OLR (Fig. 2). The COD removal efficiency ranged from 15 to 93%
with an average of 65% (Table 2c).
The increase in the substrate OLR was similarly reflected by a
subsequent increase in the biogas yield (Fig. 3). This increased biogas yield
possibly indicates that the microbial community prefer higher OLR's where
more energy was available. The highest biogas yield of 2.56 m3.m-3 reactor
was observed at an OLR of 7.08 kg COD.m-3.d-1,with an irregular production
tendency in the yield at higher OLR's. The maximum methane yields per
COD removed or COD loaded (3.42 and 1.90 m3.kg COD.d-1, respectively)
were obtained at a lower OLR of 2.89 kg COD.m-3.d-1. Thus, as the OLR
increased, the organic loading surpassed the metabolic capacity of the
methanogenic population and, therefore, the methane yield decreased. The
average percentage methane produced was 84% (Table 2c), indicating an
active methanogenic population in the digester, which is able to compete with
the sulphate reducing bacteria (SRB) bacteria. The highest S04 removal
efficiency was 97% at an OLR of 2.76 kg COD.m-3.d-1 (Table 2c).
The TS removal also generally increased throughout the study with the
highest TS removal efficiency of 82%, at an OLR of 3.39 kg COD.m-3.d-1. The
highest VS removal efficiency (86%) was obtained at an OLR of 8.32 kg
COD.m-3.d-1. After the maximum removal of TS and VS had been reached,
further increasing of the OLR's resulted in decreasing TS and VS removals
(Table 2c).
Stellenbosch University http://scholar.sun.ac.za
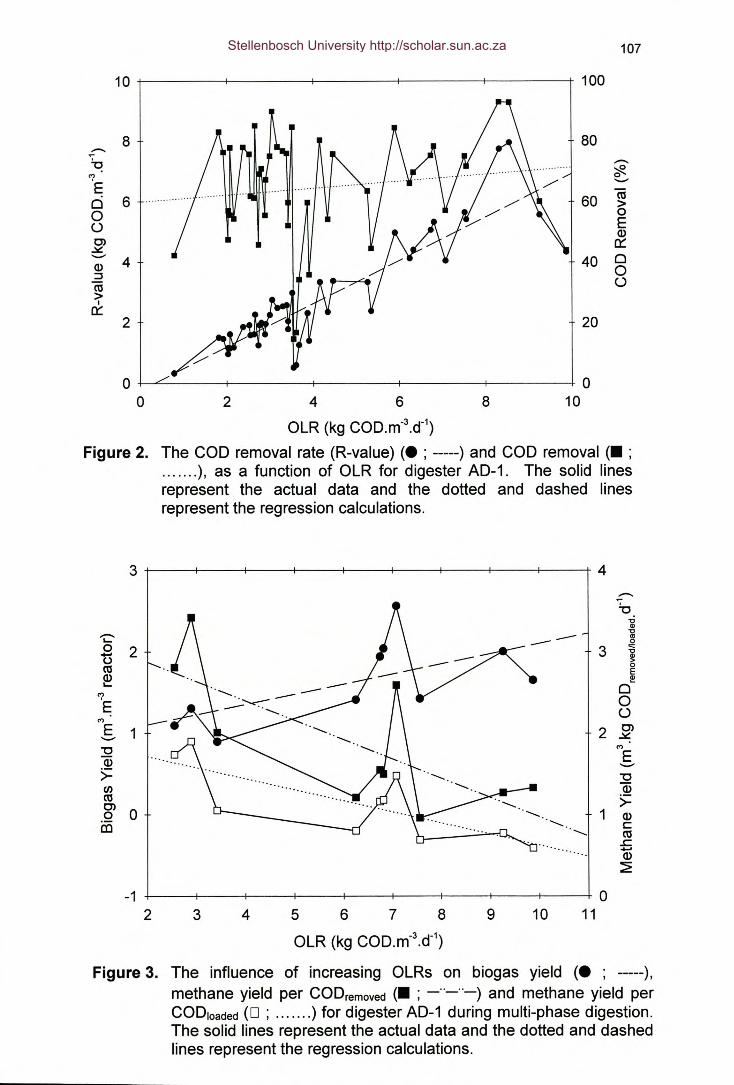
107
8 80.--.~~ .--.
~'7 0
E --cu0 6 60 >0 0o E
ID0'> 0::~-- 4 40 0ID 0:::JCU o>I
0::2 20
o ~~----~------~--------+--------+--------+ 0o 2 4 6 8 10
OLR (kg COD.m-3.d-1)
Figure 2. The COD removal rate (R-value) (. ; -----) and COD removal (. ;....... ), as a function of OLR for digester AD-1. The solid linesrepresent the actual data and the dotted and dashed linesrepresent the regression calculations.
3 4.--.~,;.,
.--. "C-- Ol,_0
0 2 3 '""Ct5 ~CU 0
EID I!!,_
0'7 0E<')
oE 1 2 0'>........ ~"C
<')
ID E>=
........"C
f/) IDCU >=0'>0 0 1 IDëi5 <, c
<, CU..c+-'ID~
-1 02 3 4 5 6 7 8 9 10 11
OLR (kg COD.m-3.d-1)
Figure 3. The influence of increasing OLRs on biogas yield (. ; -----),methane yield per CODremoved(. ; _ .._ .._) and methane yield perCODloaded(0 ; ....... ) for digester AD-1 during multi-phase digestion.The solid lines represent the actual data and the dotted and dashedlines represent the regression calculations.
Stellenbosch University http://scholar.sun.ac.za
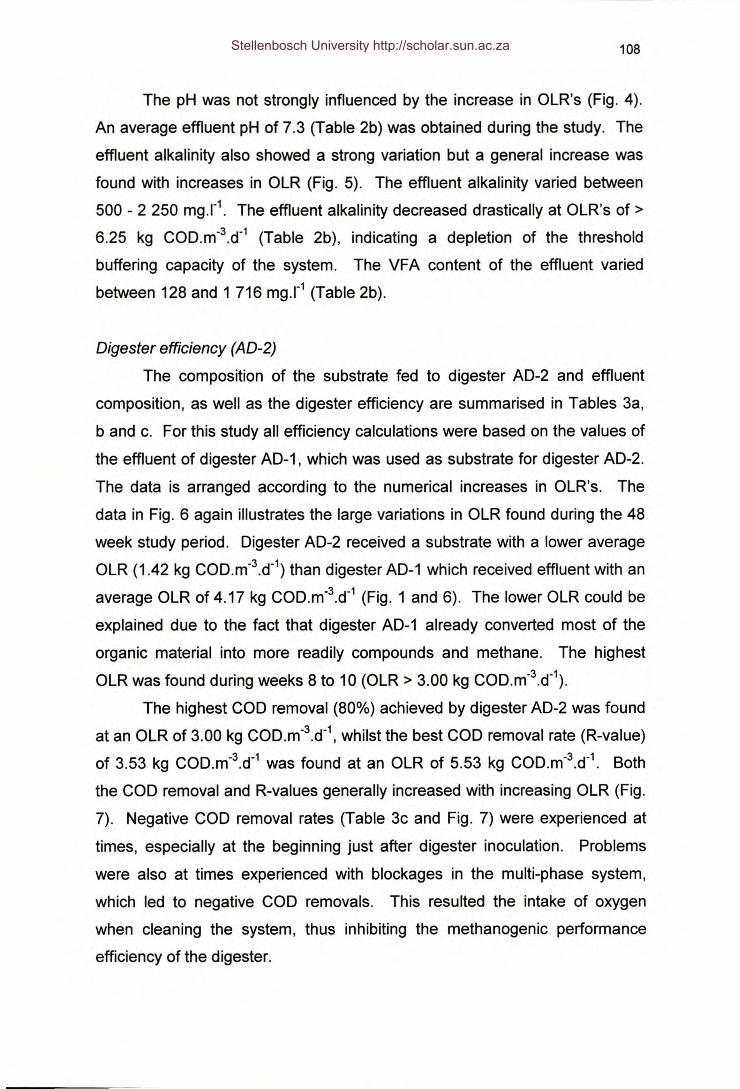
108
The pH was not strongly influenced by the increase in OLR's (Fig. 4).
An average effluent pH of 7.3 (Table 2b) was obtained during the study. The
effluent alkalinity also showed a strong variation but a general increase was
found with increases in OLR (Fig. 5). The effluent alkalinity varied between
500 - 2 250 rnq.I". The effluent alkalinity decreased drastically at OLR's of>
6.25 kg COD.m-3.d-1 (Table 2b), indicating a depletion of the threshold
buffering capacity of the system. The VFA content of the effluent varied
between 128 and 1 716 mq.I" (Table 2b).
Digester efficiency (AD-2)
The composition of the substrate fed to digester AD-2 and effluent
composition, as well as the digester efficiency are summarised in Tables 3a,
band c. For this study all efficiency calculations were based on the values of
the effluent of digester AD-1, which was used as substrate for digester AD-2.
The data is arranged according to the numerical increases in OLR's. The
data in Fig. 6 again illustrates the large variations in OLR found during the 48
week study period. Digester AD-2 received a substrate with a lower average
OLR (1.42 kg COD.m-3.d-1) than digester AD-1 which received effluent with an
average OLR of 4.17 kg COD.m-3.d-1 (Fig. 1 and 6). The lower OLR could be
explained due to the fact that digester AD-1 already converted most of the
organic material into more readily compounds and methane. The highest
OLR was found during weeks 8 to 10 (OLR > 3.00 kg COD.m-3.d-1).
The highest COD removal (80%) achieved by digester AD-2 was found
at an OLR of 3.00 kg COD.m-3.d-1,whilst the best COD removal rate (R-value)
of 3.53 kg COD.m-3.d-1was found at an OLR of 5.53 kg COD.m-3.d-1. Both
the COD removal and R-values generally increased with increasing OLR (Fig.
7). Negative COD removal rates (Table 3c and Fig. 7) were experienced at
times, especially at the beginning just after digester inoculation. Problems
were also at times experienced with blockages in the multi-phase system,
which led to negative COD removals. This resulted the intake of oxygen
when cleaning the system, thus inhibiting the methanogenic performance
efficiency of the digester.
Stellenbosch University http://scholar.sun.ac.za
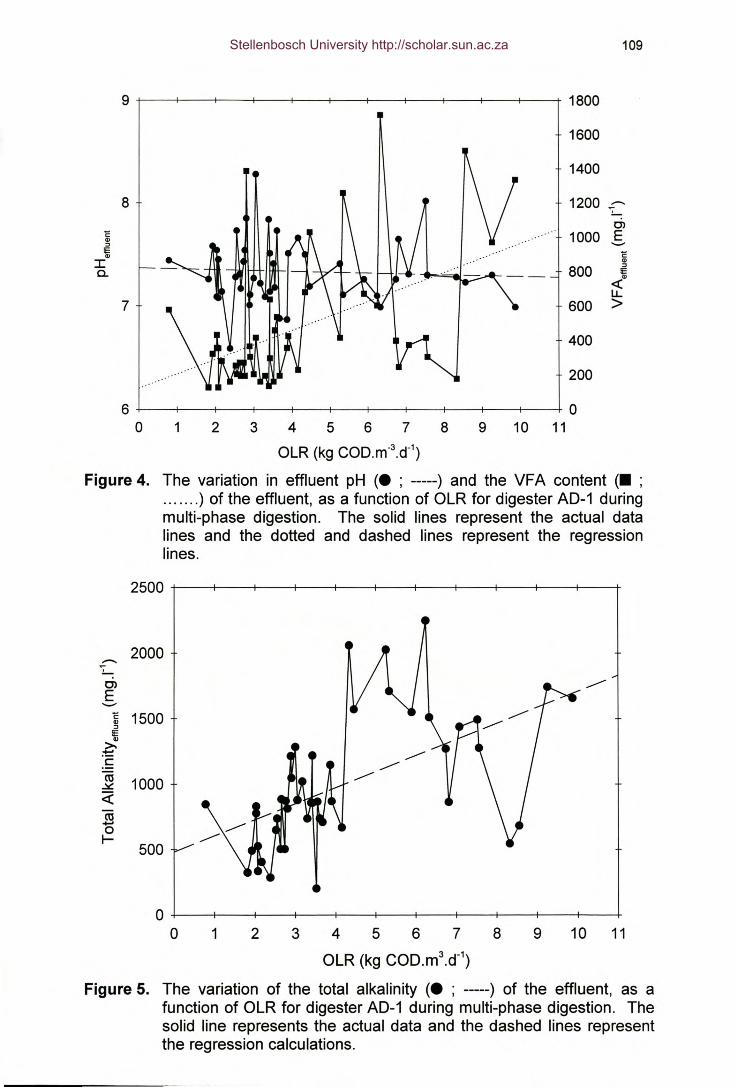
109
6 ~--r---r-~~~--~---+---+---r--~--~--4o 1 2
18001600
1400
1200 .;--Cl
1000 E'-"ëQ)
800 :IIEQ)«
LL600 >
400
200
09 10 11
8
7
3 4 567 8OLR (kg COD.m-3.d-1)
Figure 4. The variation in effluent pH (. ; -----) and the VFA content (. ;....... ) of the effluent, as a function of OLR for digester AD-1 duringmulti-phase digestion. The solid lines represent the actual datalines and the dotted and dashed lines represent the regressionlines.
2000..-..
ClE--ë 1500Q):IlEQ)
>-~c(ij 1000~«ell-0I- 500
o ~--+---+---~--4---4---~--~--~--~---r---+o 1 2 3 4 5 6 7 8 9 10 11
OLR (kg COD.m3.d-1)
Figure 5. The variation of the total alkalinity (. ; -----) of the effluent, as afunction of OLR for digester AD-1 during multi-phase digestion. Thesolid line represents the actual data and the dashed lines representthe regression calculations.
Stellenbosch University http://scholar.sun.ac.za
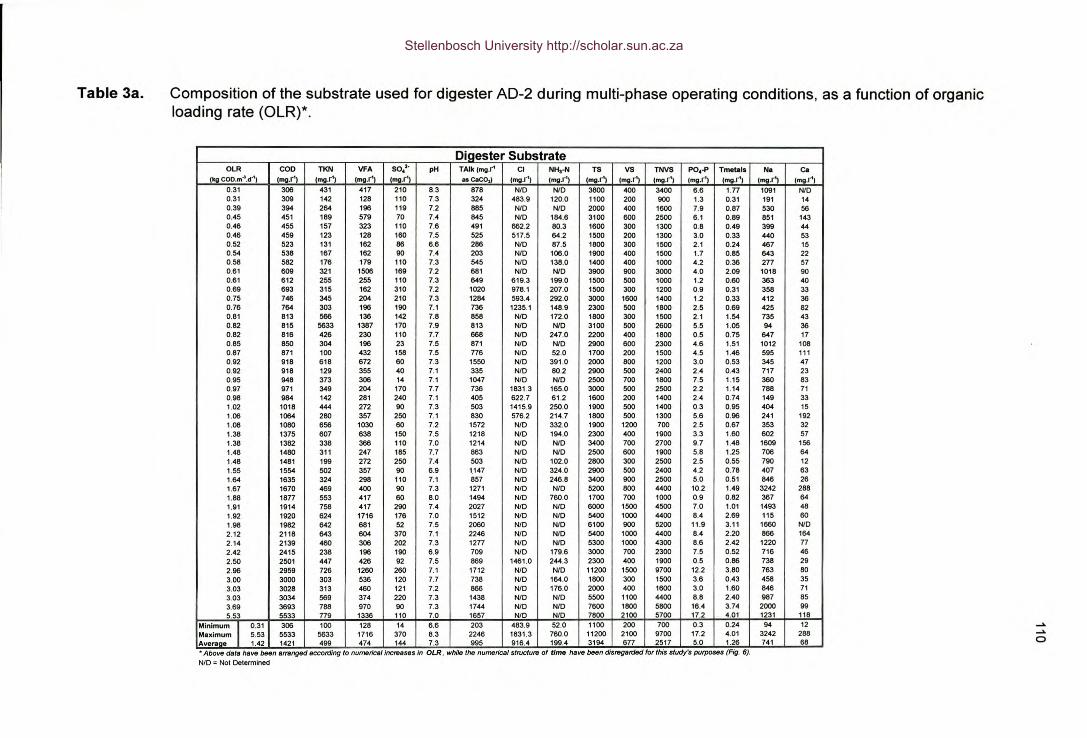
Table 3a. Composition of the substrate used for digester AD-2 during multi-phase operating conditions, as a function of organicloading rate (OLR)*.
Digester SubstrateOLR coo TKN VFA SO ..2. pH TAlk (mg.r' Cl NH,-N TS vs TNVS PO.-P Tm_tals N. ca
(kg COO.m-l.d"1 (mg.r') (mg.r') (mg.rt) (mg.r') .. caco,) (mg.r') (mg.r') (mg.r') (mg.rt) (mg.r') (mg.r') (mg.r') (mg.r') (mg.r')0.31 306 431 417 210 8.3 878 NIO NID 3800 400 3400 6.6 1.77 1091 NfO0.31 309 142 128 110 7.3 324 483.9 120.0 1100 200 900 1.3 0.31 191 140.39 394 264 196 119 7.2 885 NIO NfO 2000 400 1600 7.9 0.87 530 560.45 451 189 579 70 7.4 645 NfO 184.6 3100 600 2500 6.1 0.89 851 1430.46 455 157 323 110 7.6 491 882.2 80.3 1600 300 1300 0.8 0.49 399 440.46 459 123 128 160 7.5 525 517.5 64.2 1500 200 1300 3.0 0.33 440 530.52 523 131 162 88 6.6 286 NfO 87.5 1800 300 1500 2.1 0.24 467 150.54 538 167 162 90 7.4 203 NfO 106.0 1900 400 1500 1.7 0.85 643 220.58 582 176 179 110 7.3 545 NfO 138.0 1400 400 1000 4.2 0.36 277 57
,
0.61 609 321 1506 169 7.2 881 NIO NfO 3900 900 3000 4.0 2.09 1018 900.61 612 255 255 110 7.3 649 619.3 199.0 1500 500 1000 1.2 0.60 363 400.69 693 315 162 310 7.2 1020 978.1 207.0 1500 300 1200 0.9 0.31 358 330.75 746 345 204 210 7.3 1264 593.4 292.0 3000 1800 1400 1.2 0.33 412 360.76 764 303 196 190 7.1 736 1235.1 148.9 2300 500 1800 2.5 0.69 425 820.81 813 588 136 142 7.8 858 NfO 172.0 1800 300 1500 2.1 1.54 735 430.82 815 5633 1387 170 7.9 813 NfO NfO 3100 500 2600 5.5 1.05 94 360.82 816 426 230 110 7.7 888 NfO 247.0 2200 400 1800 0.5 0.75 647 170.85 850 304 196 23 7.5 871 NfO NfO 2900 600 2300 4.6 1.51 1012 1080.87 871 100 432 158 7.5 776 NfO 52.0 1700 200 1500 4.5 1.46 595 1110.92 918 618 672 60 7.3 1550 NfO 391.0 2000 800 1200 3.0 0.53 345 470.92 918 129 355 40 7.1 335 NfO 80.2 2900 500 2400 2.4 0.43 717 230.95 948 373 306 14 7.1 1047 NfO NfO 2500 700 1800 7.5 1.15 360 830.97 971 349 204 170 7.7 736 1831.3 165.0 3000 500 2500 2.2 1.14 788 710.98 964 142 281 240 7.1 405 622.7 61.2 1600 200 1400 2.4 0.74 149 331.02 1018 444 272 90 7.3 503 1415.9 250.0 1900 500 1400 0.3 0.95 404 151.06 1064 280 357 250 7.1 830 576.2 214.7 1800 500 1300 5.6 0.96 241 1921.08 1080 656 1030 60 7.2 1572 NfO 332.0 1900 1200 700 2.5 0.67 353 321.38 1375 607 638 150 7.5 1218 NfO 194.0 2300 400 1900 3.3 1.60 602 571.38 1382 338 388 110 7.0 1214 NfO NfO 3400 700 2700 9.7 1.48 1609 1561.48 1480 311 247 185 7.7 863 NfO NfO 2500 600 1900 5.8 1.25 706 641.48 1481 199 272 250 7.4 503 NfO 102.0 2800 300 2500 2.5 0.55 790 121.55 1554 502 357 90 6.9 1.147 NfO 324.0 2900 500 2400 4.2 0.78 407 631.64 1635 324 298 110 7.1 857 NfO 246.8 3400 900 2500 5.0 0.51 846 261.67 1670 469 400 90 7.3 1271 NID NIO 5200 800 4400 10.2 1.49 3242 2881.88 1877 553 417 60 8.0 1494 NIO 760.0 1700 700 1000 0.9 0.82 367 641.91 1914 758 417 290 7.4 2027 NfO NfO 6000 1500 4500 7.0 1.01 1493 481.92 1920 624 1716 176 7.0 1512 NfO NfO 5400 1000 4400 8.4 2.69 115 801.98 1982 642 681 52 7.5 2060 NfO NfO 6100 900 5200 11.9 3.11 1660 NfO2.12 2118 643 604 370 7.1 2246 NfO NfO 5400 1000 4400 8.4 2.20 866 1642.14 2139 460 306 202 7.3 1277 NfO NfO 5300 1000 4300 8.6 2.42 1220 772.42 2415 238 196 190 6.9 709 NfO 179.6 3000 700 2300 7.5 0.52 716 462.50 2501 447 426 92 7.5 869 1461.0 244.3 2300 400 1900 0.5 0.86 738 292.96 2959 726 1260 260 7.1 1712 NIO NfO 11200 1500 9700 12.2 3.80 763 803.00 3000 303 536 120 7.7 738 NfO 164.0 1800 300 1500 3.6 0.43 458 353.03 3028 313 460 121 7.2 866 NIO 176.0 2000 400 1600 3.0 1.60 846 713.03 3034 569 374 220 73 1438 NfO NfO 5500 1100 4400 8.8 2.40 987 853.69 3693 788 970 90 7.3 1744 NfO NfO 7600 1800 5800 16.4 3.74 2000 995.53 5533 779 1336 110 7.0 1657 NfO NfO 7800 2100 5700 17.2 4.01 1231 118
Minimum I 0.31 306 100 128 14 6.6 203 483.9 52.0 1100 200 700 0.3 0.24 94 12Maximum 5.53 5533 5633 1716 370 8.3 2246 1831.3 760.0 11200 2100 9700 17.2 4.01 3242 288Average 1.42 1421 499 474 144 7.3 995 916.4 199.4 3194 677 2517 5.0 1.26 741 68
............o
Above data have been arranged according to numen"csl increasBs in OLR, while the numerical structure of time have been disregarded for this study's purposes (Fig. 6).
N/O = Not Determined
Stellenbosch University http://scholar.sun.ac.za
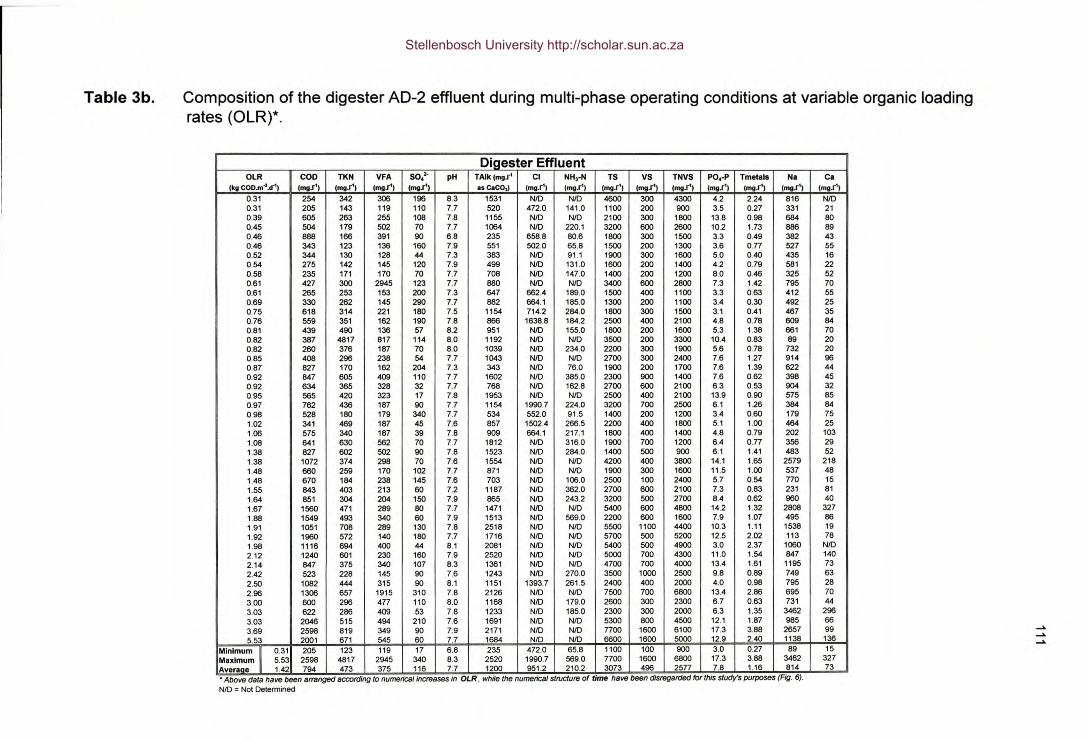
Table 3b. Composition of the digester AD-2 effluent during multi-phase operating conditions at variable organic loadingrates (OLR)*.
Digester EffluentOLR COD TKN VFA sot pH TAlk Img.r' Cl NH,·N TS VS TNVS Po,·p Tmetals Na Ca I
(kg COD.m4.d·') (mg.r') (mg.r') (mg.r') (mg.r') os CoCO,} (mg.r') (mg.r') (mg.r') (mg.r') (mg.r') (mg.r') (mg.r') (mgI') (mg.r') I
0.31 254 342 306 196 8.3 1531 NID N/D 4600 300 4300 4.2 2.24 816 NID0.31 205 143 119 110 7.7 520 472.0 141.0 1100 200 900 3.5 0.27 331 210.39 SOS 263 255 108 7.8 1155 N/D N/D 2100 300 1800 13.8 0.98 684 800.45 504 179 502 70 7.7 1064 NID 220.1 3200 SOO 2600 10.2 1.73 686 890.46 888 166 391 90 6.8 235 658.8 SO.6 1800 300 1500 3.3 0.49 382 430.46 343 123 136 1SO 7.9 551 502.0 65.8 1500 200 1300 3.6 0.77 527 550.52 344 130 128 44 7.3 383 NID 91.1 1900 300 1600 5.0 0.40 435 160.54 275 142 145 120 7.9 499 NID 131.0 1600 200 1400 4.2 0.79 581 220.58 235 171 170 70 7.7 708 NID 147.0 1400 200 1200 8.0 0.46 325 520.61 427 300 2945 123 7.7 880 NID NID 3400 600 2800 7.3 1.42 795 700.61 265 253 153 200 7.3 647 662.4 189.0 1500 400 1100 3.3 0.83 412 550.69 330 262 145 290 7.7 882 664.1 185.0 1300 200 1100 3.4 0.30 492 250.75 618 314 221 180 7.5 1154 714.2 264.0 1800 300 1500 3.1 0.41 467 350.76 559 351 162 190 7.8 866 1638.8 184.2 2500 400 2100 4.8 0.78 609 840.81 439 490 136 57 8.2 951 NID 155.0 1800 200 1600 5.3 1.38 661 700.82 387 4817 817 114 8.0 1192 NID N/D 3500 200 3300 10.4 0.83 89 200.82 2SO 376 187 70 8.0 1039 NID 234.0 2200 300 1900 5.6 0.78 732 200.85 408 296 238 54 7.7 1043 NID NID 2700 300 2400 7.6 1.27 914 960.87 827 170 162 204 7.3 343 NID 76.0 1900 200 1700 7.6 1.39 622 440.92 847 605 409 110 7.7 1S02 N/D 385.0 2300 900 1400 7.6 0.62 398 450.92 634 365 328 32 7.7 768 NID 162.8 2700 800 2100 6.3 0.53 904 320.95 565 420 323 17 7.8 1953 NID NID 2500 400 2100 13.9 0.90 575 850.97 762 436 187 90 7.7 1154 1990.7 224.0 3200 700 2500 6.1 1.26 384 840.98 528 180 179 340 7.7 534 552.0 91.5 1400 200 1200 3.4 O.SO 179 751.02 341 469 187 45 7.6 857 1502.4 266.5 2200 400 1800 5.1 1.00 464 251.06 575 340 187 39 7.8 909 664.1 217.1 1800 400 1400 4.8 0.79 202 1031.08 641 830 562 70 7.7 1812 NID 316.0 1900 700 1200 6.4 0.77 356 291.38 827 S02 502 90 7.8 1523 N/D 284.0 1400 500 900 6.1 1.41 483 521.38 1072 374 298 70 7.6 1554 NID NID 4200 400 3800 14.1 1.85 2579 2181.48 660 259 170 102 7.7 871 NID NID 1900 300 1600 11.5 1.00 537 481.48 670 184 238 145 7.6 703 NID 106.0 2500 100 2400 5.7 0.54 770 151.55 843 403 213 60 7.2 1187 NID 362.0 2700 600 2100 7.3 0.83 231 811.64 851 304 204 150 7.9 865 NID 243.2 3200 500 2700 8.4 0.62 960 401.67 1560 471 289 80 7.7 1471 NID N/D 5400 600 4800 14.2 1.32 2808 3271.88 1549 493 340 60 7.9 1513 NID 569.0 2200 600 1800 7.9 1.07 495 861.91 1051 708 289 130 7.8 2518 NID NID 5500 1100 4400 10.3 1.11 1538 191.92 1960 572 140 180 7.7 1716 NID NID 5700 500 5200 12.5 2.02 113 781.98 1116 694 400 44 8.1 2081 NID NID 5400 500 4900 3.0 2.37 1060 NID2.12 1240 601 230 160 7.9 2520 N/D N/D 5000 700 4300 11.0 1.54 847 1402.14 847 375 340 107 8.3 1361 NID N/D 4700 700 4000 13.4 1.61 1195 732.42 523 228 145 90 7.6 1243 NID 270.0 3500 1000 2500 9.8 0.89 749 632.50 1082 444 315 90 8.1 1151 1393.7 261.5 2400 400 2000 4.0 0.98 795 282.96 1306 657 1915 310 7.8 2126 NID NID 7500 700 6800 13.4 2.86 695 703.00 600 296 477 110 8.0 1168 N/D 179.0 2600 300 2300 6.7 0.63 731 44 II
3.03 622 286 409 53 7.8 1233 N/D 185.0 2300 300 2000 6.3 1.35 3462 2963.03 2046 515 494 210 7.6 1691 NID NID 5300 800 4500 12.1 1.87 985 663.69 2598 819 349 90 7.9 2171 NID NID 7700 1600 6100 17.3 3.88 2857 995.53 2001 671 545 60 7.7 1684 NID NID 6600 1600 5000 12.9 2.40 1138 136 I
Minimum 1 0.31 205 123 119 17 6.8 235 472.0 65.8 1100 100 900 3.0 0.27 89 15Maximum 5.53 2598 4817 2945 340 8.3 2520 1990.7 569.0 7700 1600 6800 17.3 3.88 3462 327Averaae 1.42 794 473 375 116 7.7 1200 951.2 210.2 3073 496 2577 7.8 1.16 814 73
..................
• Above data have been arranged according to numerical increases in OLR, while the numerical structure of time have been disregarded for this study's purposes (Fig. 61·NID = Not Determined
Stellenbosch University http://scholar.sun.ac.za
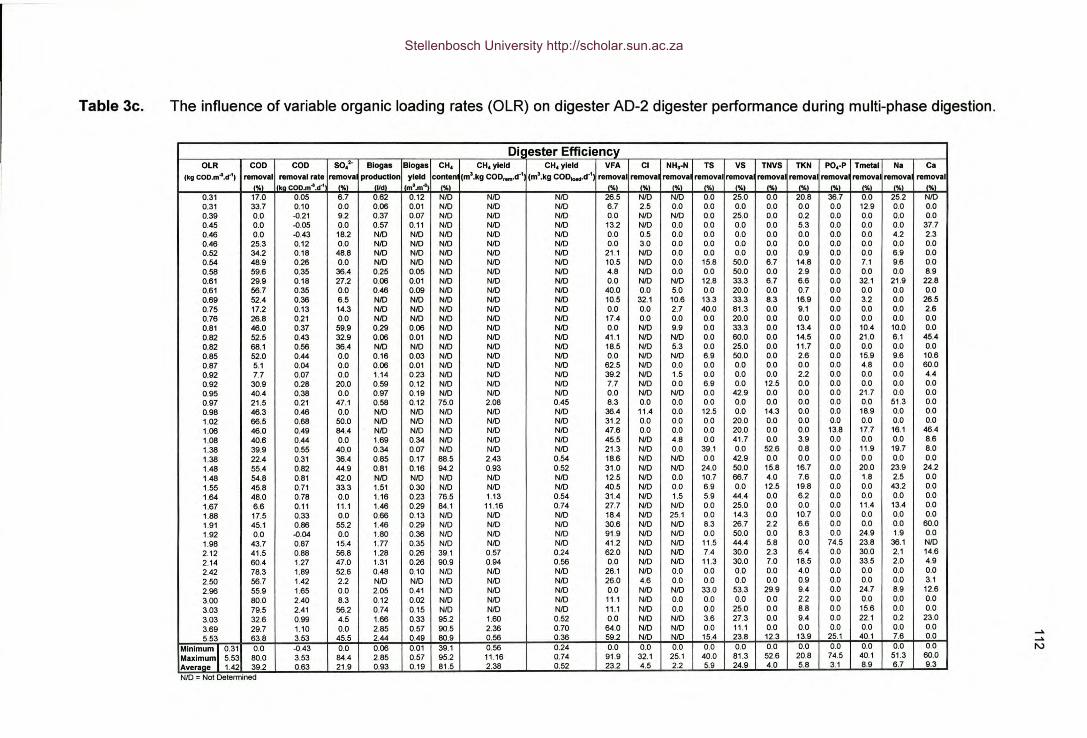
Table 3c. The influence of variable organic loading rates (OLR) on digester AD-2 digester performance during multi-phase digestion.
Di~ester EfficiencyOLR COD COD sot Biogas Biogas CH. CH. yield CH. yield VFA Cl NH.·N TS VS TNVS TKN PO••P Tmelal Na Ca
(kg COD.m4.cr', removal removal rale remova production yield contem (m'.kg COD ..... d·' (m'.kg COD""",.d·' removal removal remeva removal remova remova remeva remova remova remeva removalf%1 kg COD.m-l.d·1 f%1 Vd m~.m-3 f%1 f%1 f%1 %J L% % LIII t% %1 (%1 % %
0.31 17.0 0.05 6.7 0.62 0.12 NID NID NID 26.5 NID NID 0.0 25.0 0.0 20.8 36.7 0.0 25.2 NID0.31 33.7 0.10 0.0 0.06 0.01 NID NID NID 6.7 2.5 0.0 0.0 0.0 0.0 0.0 0.0 12.9 0.0 0.00.39 0.0 -0.21 9.2 0.37 0.07 NID NID NID 0.0 NID NID 0.0 25.0 0.0 0.2 0.0 0.0 0.0 0.00.45 0.0 -0.05 0.0 0.57 0.11 NfO NID NID 13.2 NfO 0.0 0.0 0.0 0.0 5.3 0.0 0.0 0.0 37.70.46 0.0 -0.43 18.2 NID NID NID NID NID 0.0 0.5 0.0 0.0 0.0 0.0 0.0 0.0 0.0 4.2 2.30.46 25.3 0.12 0.0 NID NID NID NID NID 0.0 3.0 0.0 0.0 0.0 0.0 0.0 0.0 0.0 0.0 0.00.52 34.2 0.18 48.8 NID NID NID NID NID 21.1 NID 0.0 0.0 0.0 0.0 0.9 0.0 0.0 6.9 0.00.54 48.9 0.26 0.0 NID NID NID NID NID 10.5 NID 0.0 15.8 SO.O 6.7 14.8 0.0 7.1 9.6 0.00.56 59.6 0.35 36.4 0.25 0.05 NID NID NID 4.8 NID 0.0 0.0 SO.O 0.0 2.9 0.0 0.0 0.0 8.90.61 29.9 0.18 27.2 0.06 0.01 NID NfO NID 0.0 NID NID 12.8 33.3 6.7 6.6 0.0 32.1 21.9 22.80.61 56.7 0.35 0.0 0.46 0.09 NID NfO NID 40.0 0.0 5.0 0.0 20.0 0.0 0.7 0.0 0.0 0.0 0.00.69 52.4 0.36 6.5 NID NID NID NID NfO 10.5 32.1 10.6 13.3 33.3 8.3 16.9 0.0 3.2 0.0 26.50.75 17.2 0.13 14.3 NID NID NID NID NID 0.0 0.0 2.7 40.0 81.3 0.0 9.1 0.0 0.0 0.0 2.60.76 26.8 0.21 0.0 NID NID NID NID NID 17.4 0.0 0.0 0.0 20.0 0.0 0.0 0.0 0.0 0.0 0.00.81 46.0 0.37 59.9 0.29 0.06 NID NID NID 0.0 NID 9.9 0.0 33.3 0.0 13.4 0.0 10.4 10.0 0.00.82 52.5 0.43 32.9 0.06 0.01 NID NID NID 41.1 NID NID 0.0 60.0 0.0 14.5 0.0 21.0 6.1 45.40.82 68.1 0.56 36.4 NID NID NID NID NID 18.5 NID 5.3 0.0 25.0 0.0 11.7 0.0 0.0 0.0 0.00.85 52.0 0.44 0.0 0.16 0.03 NID NID NID 0.0 NID NID 6.9 so.o 0.0 2.6 0.0 15.9 9.6 10.60.87 5.1 0.04 0.0 0.06 0.01 NID NID NID 62.5 NID 0.0 0.0 0.0 0.0 0.0 0.0 4.8 0.0 60.00.92 7.7 0.07 0.0 1.14 0.23 NID NID NID 39.2 NID 1.5 0.0 0.0 0.0 2.2 0.0 0.0 0.0 4.40.92 30.9 0.28 20.0 0.59 0.12 NID NID NID 7.7 NID 0.0 6.9 0.0 12.5 0.0 0.0 0.0 0.0 0.00.95 40.4 0.38 0.0 0.97 0.19 NID NID NfO 0.0 NID NID 0.0 42.9 0.0 0.0 0.0 21.7 0.0 0.00.97 21.5 0.21 47.1 0.58 0.12 75.0 2.08 0.45 8.3 0.0 0.0 0.0 0.0 0.0 0.0 0.0 0.0 51.3 0.00.98 46.3 0.46 0.0 NID NfO NID NfO NfO 36.4 11.4 0.0 12.5 0.0 14.3 0.0 0.0 18.9 0.0 0.01.02 66.5 0.68 SO.O NfO NID NfO NfO NfO 31.2 0.0 0.0 0.0 20.0 0.0 0.0 0.0 0.0 0.0 0.01.06 46.0 0.49 84.4 NfO NfO NfO NfO NfO 47.6 0.0 0.0 0.0 20.0 0.0 0.0 13.8 17.7 16.1 46.41.08 40.6 0.44 0.0 1.69 0.34 NID NID NID 45.5 NID 4.8 0.0 41.7 0.0 3.9 0.0 0.0 0.0 8.61.38 39.9 0.55 40.0 0.34 0.07 NID NID NID 21.3 NID 0.0 39.1 0.0 52.6 0.8 0.0 11.9 19.7 8.01.38 22.4 0.31 36.4 0.85 0.17 68.5 2.43 0.54 18.6 NID NID 0.0 42.9 0.0 0.0 0.0 0.0 0.0 0.01.48 55.4 0.82 44.9 0.81 0.16 94.2 0.93 0.52 31.0 NID NID 24.0 SO.O 15.8 16.7 0.0 20.0 23.9 24.21.48 54.8 0.81 42.0 NID NID NID NID NID 12.5 NfO 0.0 10.7 66.7 4.0 7.6 0.0 1.8 2.5 0.01.55 45.8 0.71 33.3 1.51 0.30 NID NfO NID 40.5 NfO 0.0 6.9 0.0 12.5 19.8 0.0 0.0 43.2 0.01.64 48.0 0.78 0.0 1.16 0.23 76.5 1.13 0.54 31.4 NID 1.5 5.9 44.4 0.0 6.2 0.0 0.0 0.0 0.01.67 6.6 0.11 11.1 1.46 0.29 84.1 11.16 0.74 27.7 NID NfO 0.0 25.0 0.0 0.0 0.0 11.4 13.4 0.01.68 17.5 0.33 0.0 0.66 0.13 NID NfO NfO 18.4 NID 25.1 0.0 14.3 0.0 10.7 0.0 0.0 0.0 0.01.91 45.1 0.86 55.2 1.46 0.29 NID NID NfO 30.6 NID NfO 8.3 26.7 2.2 6.6 0.0 0.0 0.0 60.01.92 0.0 -0.04 0.0 1.80 0.36 NfO NID NID 91.9 NID NID 0.0 50.0 0.0 8.3 0.0 24.9 1.9 0.01.98 43.7 0.87 15.4 1.77 0.35 NID NID NID 41.2 NID NID 11.5 44.4 5.8 0.0 74.5 23.8 36.1 NID2.12 41.5 0.88 56.8 1.28 0.26 39.1 0.57 0.24 62.0 NID NID 7.4 30.0 2.3 6.4 0.0 30.0 2.1 14.62.14 60.4 1.27 47.0 1.31 0.26 90.9 0.94 0.56 0.0 NfO NID 11.3 30.0 7.0 18.5 0.0 33.5 2.0 4.92.42 78.3 1.89 52.6 0.48 0.10 NfO NID NfO 26.1 NfO 0.0 0.0 0.0 0.0 4.0 0.0 0.0 0.0 0.02.50 56.7 1.42 2.2 NID NID NID NID NID 26.0 4.6 0.0 0.0 0.0 0.0 0.9 0.0 0.0 0.0 3.12.96 55.9 1.65 0.0 2.05 0.41 NID NID NID 0.0 NfO NID 33.0 53.3 29.9 9.4 0.0 24.7 8.9 12.63.00 80.0 2.40 8.3 0.12 0.02 NID NID NID 11.1 NID 0.0 0.0 0.0 0.0 2.2 0.0 0.0 0.0 0.03.03 79.5 2.41 56.2 0.74 0.15 NID NID NID 11.1 NID 0.0 0.0 25.0 0.0 8.8 0.0 15.6 0.0 0.03.03 32.6 0.99 4.5 1.66 0.33 95.2 1.60 0.52 0.0 NID NID 3.6 27.3 0.0 9.4 0.0 22.1 0.2 23.03.69 29.7 1.10 0.0 2.85 0.57 90.5 2.36 0.70 64.0 NID NID 0.0 11.1 0.0 0.0 0.0 0.0 0.0 0.05.53 63.8 3.53 45.5 2.44 0.49 80.9 0.56 0.36 59.2 NID NfO 15.4 23.8 12.3 13.9 25.1 40.1 7.6 0.0
Mlnlmum'l 0.31 0.0 -0.43 0.0 0.06 0.01 39.1 0.56 0.24 0.0 0.0 0.0 0.0 0.0 0.0 0.0 0.0 0.0 0.0 0.0Maximum 5.53 80.0 3.53 84.4 2.85 0.57 95.2 11.16 0.74 91.9 32.1 25.1 40.0 81.3 52.6 20.8 74.5 40.1 51.3 60.0Average 1.42 39.2 0.63 21.9 0.93 0.19 81.5 2.38 0.52 23.2 4.5 2.2 5.9 24.9 4.0 5.8 3.1 8.9 6.7 9.3NID = Not Detennined
............I\.)
Stellenbosch University http://scholar.sun.ac.za
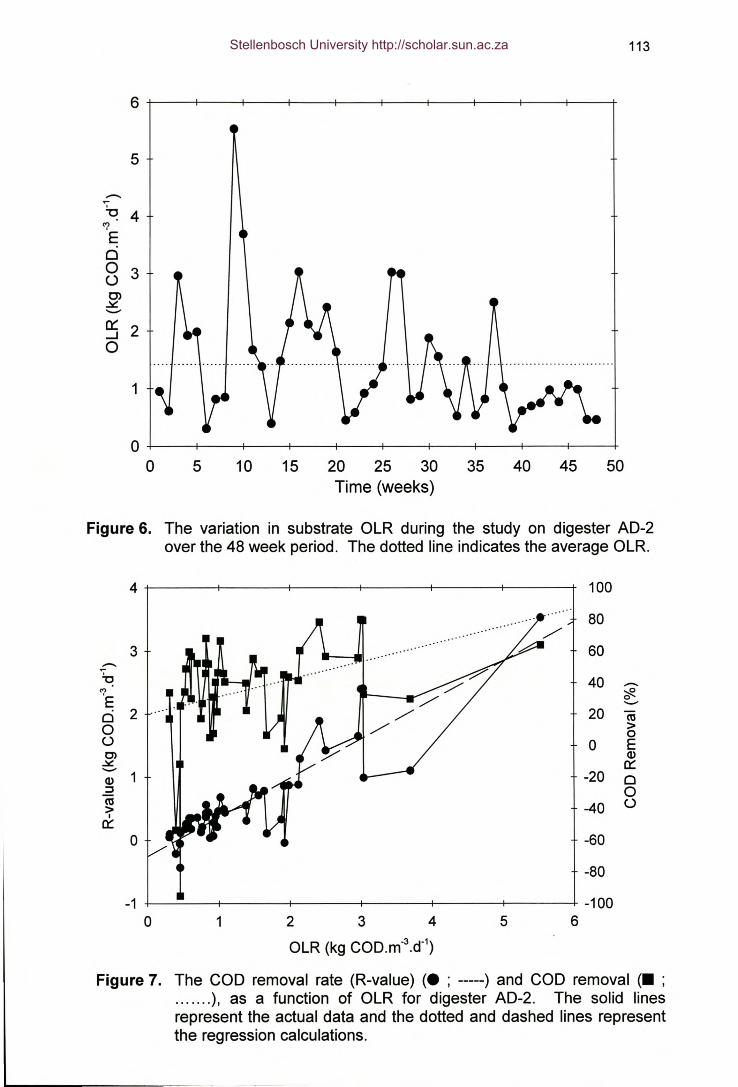
5
........~U 4'?E00 3oC)~.._0::: 2_J
0
1
113
o ~--~---+--~~--+----r---+----~--~--~---4o 5 15 20 25 30 35 40 45 50
Time (weeks)10
Figure 6. The variation in substrate OLR during the study on digester AD-2over the 48 week period. The dotted line indicates the average OLR.
3-~'?E0 2 ...
0oCl~- 1Q)::::I(ij>I
~0
100
80
60
40 -~0-20 nl>0
0 EQ)~
-20 00
-40 o
-60
-80
-1002 3 4 5 6
OLR (kg COD.m·3.d-1)
4~----~------~----~------~----~-----4
-1 ~~---+------~----~------~----~------+o 1
Figure 7. The COD removal rate (R-value) (. ; -----) and COD removal (. ;....... ), as a function of OLR for digester AD-2. The solid linesrepresent the actual data and the dotted and dashed lines representthe regression calculations.
Stellenbosch University http://scholar.sun.ac.za
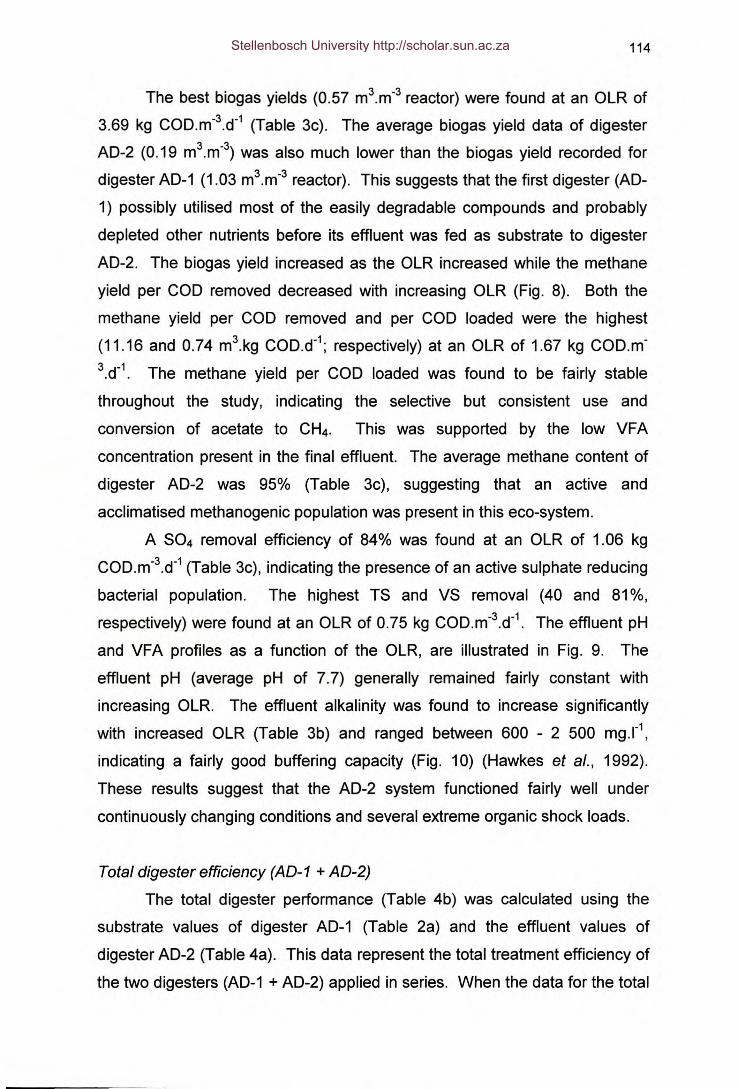
114
The best biogas yields (0.57 m3.m-3 reactor) were found at an OLR of
3.69 kg COD.m-3.d-1 (Table 3c). The average biogas yield data of digester
AD-2 (0.19 m3.m-3) was also much lower than the biogas yield recorded for
digester AD-1 (1.03 m3.m-3 reactor). This suggests that the first digester (AD-
1) possibly utilised most of the easily degradable compounds and probably
depleted other nutrients before its effluent was fed as substrate to digester
AD-2. The biogas yield increased as the OLR increased while the methane
yield per COD removed decreased with increasing OLR (Fig. 8). Both the
methane yield per COD removed and per COD loaded were the highest
(11.16 and 0.74 m3.kg COD.d-1; respectively) at an OLR of 1.67 kg COD.m-
3.d-1. The methane yield per COD loaded was found to be fairly stable
throughout the study, indicating the selective but consistent use and
conversion of acetate to CH4. This was supported by the low VFA
concentration present in the final effluent. The average methane content of
digester AD-2 was 95% (Table 3c), suggesting that an active and
acclimatised methanogenic population was present in this eco-system.
A S04 removal efficiency of 84% was found at an OLR of 1.06 kg
COD.m-3.d-1 (Table 3c), indicating the presence of an active sulphate reducing
bacterial population. The highest TS and VS removal (40 and 81%,
respectively) were found at an OLR of 0.75 kg COD.m-3.d-1. The effluent pH
and VFA profiles as a function of the OLR, are illustrated in Fig. 9. The
effluent pH (average pH of 7.7) generally remained fairly constant with
increasing OLR. The effluent alkalinity was found to increase significantly
with increased OLR (Table 3b) and ranged between 600 - 2 500 mq.l",
indicating a fairly good buffering capacity (Fig. 10) (Hawkes et al., 1992).
These results suggest that the AD-2 system functioned fairly well under
continuously changing conditions and several extreme organic shock loads.
Total digester efficiency (AD-1 + AD-2)
The total digester performance (Table 4b) was calculated using the
substrate values of digester AD-1 (Table 2a) and the effluent values of
digester AD-2 (Table 4a). This data represent the total treatment efficiency of
the two digesters (AD-1 + AD-2) applied in series. When the data for the total
Stellenbosch University http://scholar.sun.ac.za
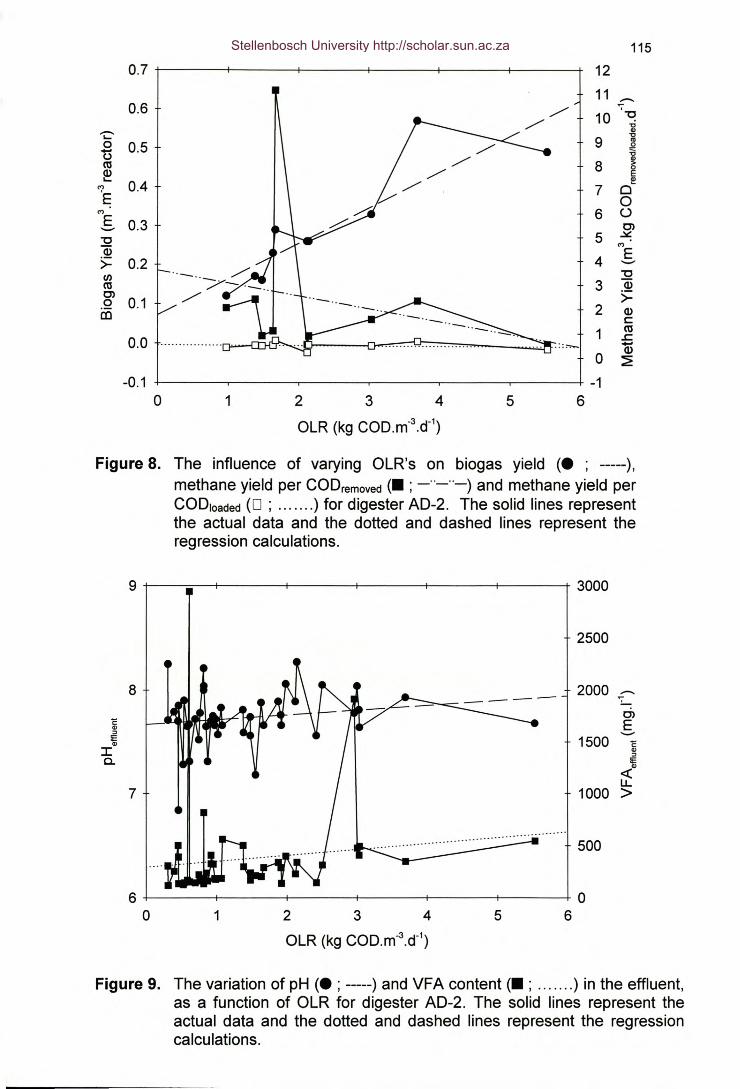
115
0.7 1211 -0.6 10 "0
"- Cl>
".... 9 lV0 0.5 ,g-o ~CU 8 0
~ E
0.4 e'7 7 0E 0'" 6 oE 0.3 Ol'-'
"0 5 ~'"Q) E
>= 0.2 4 '-'
IJ) "0CU 3 Q)Ol 0.1 >=.Q 2 Q)CD c:
1 CU
0.0 .c:-0 Q)
~-0.1 -1
0 1 2 3 4 5 6OLR (kg COD.m·3.d-1)
Figure 8. The influence of varying OLR's on biogas yield (. ; -----),methane yield per CODremoved(. ; _ .._ .._) and methane yield perCODloaded(0 ; ) for digester AD-2. The solid lines representthe actual data and the dotted and dashed lines represent theregression calculations.
2500
8 2000 -Ol
1': EQ)::J '-'ii: 1500 1':Q)
I Q)::Ja. ii:Q)«u,7 1000 >
500
6 ~-----+------+-----~------~-----1------40o 1 234 5 6
OLR (kg COD.m-3.d-1)
Figure 9. The variation of pH (. ; -----) and VFA content (. ; ) in the effluent,as a function of OLR for digester AD-2. The solid lines represent theactual data and the dotted and dashed lines represent the regressioncalculations.
Stellenbosch University http://scholar.sun.ac.za
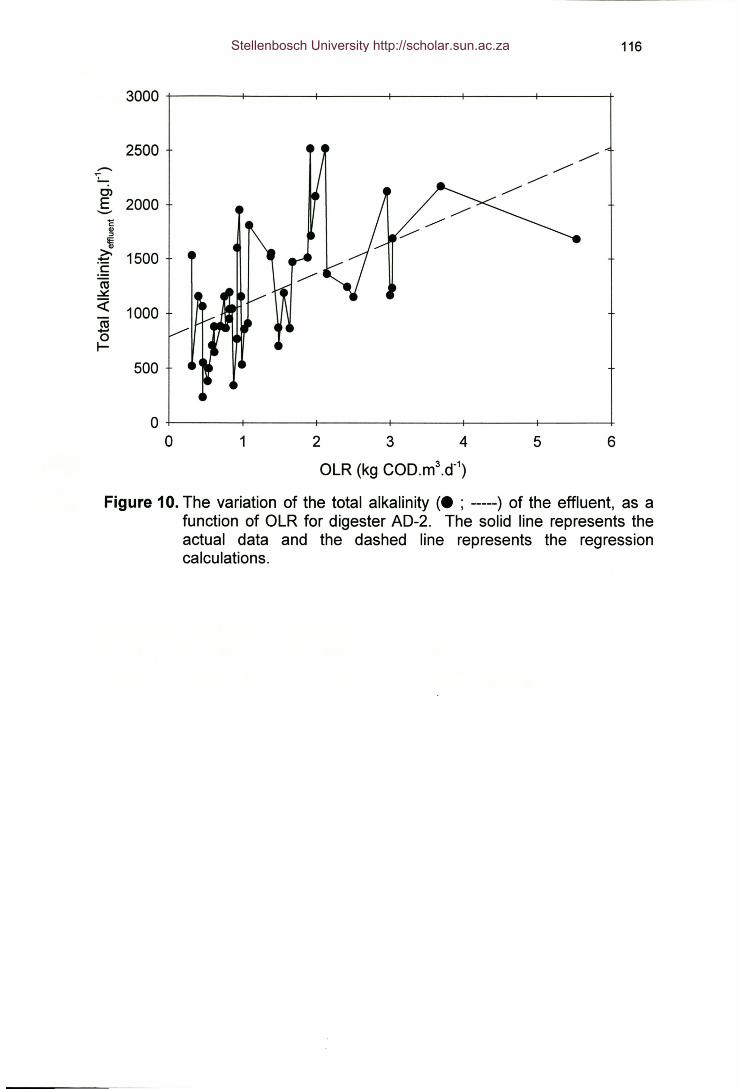
116
3000~-----+------~----~------~------~----~
2500 ,..-- »:, ,..-0> ,..-E 2000..........ECl)::J
\1~ 1500c(ij..:.:::« 1000(ij.....0I-
500
o ~-----+------~------~----~------+-----~o 1 2 3 4 5 6
OLR (kg COD.m3.d-1)
Figure 10. The variation of the total alkalinity (. ; -----) of the effluent, as afunction of OLR for digester AD-2. The solid line represents theactual data and the dashed line represents the regressioncalculations.
Stellenbosch University http://scholar.sun.ac.za
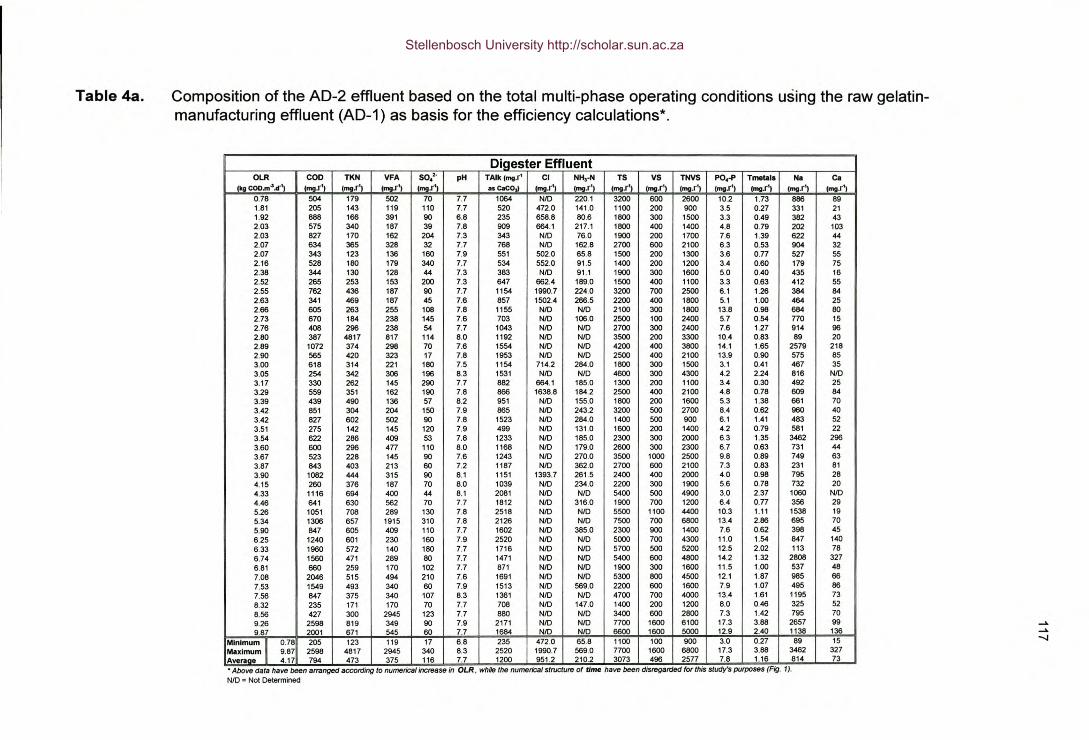
Table 4a. Composition of the AD-2 effluent based on the total multi-phase operating conditions using the raw gelatin-manufacturing effluent (AD-1) as basis for the efficiency calculations*.
Diaester EffluentOLR COD TKN VFA SO." pH TAlk IRIg.r' Cl NH,·N TS VS TNVS PO.OP Tmetals Na Ca
(kg coo.m4..r'l (RIg.r', (RIg.r', (RIgI', (RIg.r', .. coco,) (RIg.r', (RIg.r', (RIgI', (RIg.r', (RIg.r', (RIgI', (RIgI', (RIg.r', (RIg.r',
0.78 504 179 502 70 7.7 1064 NID 220.1 3200 600 2600 10.2 1.73 886 891.81 205 143 119 110 7.7 520 472.0 141.0 1100 200 900 3.5 0.27 331 211.92 888 188 391 90 6.8 235 658.8 80.6 1800 300 1500 3.3 0.49 382 432.03 575 340 187 39 7.8 909 664.1 217.1 1800 400 1400 4.8 0.79 202 1032.03 827 170 162 204 7.3 343 NID 76.0 1900 200 1700 7.6 1.39 622 442.07 634 365 328 32 7.7 788 NID 162.8 2700 600 2100 6.3 0.53 904 322.07 343 123 136 160 7.9 551 502.0 65.8 1500 200 1300 3.6 0.77 527 552.16 528 160 179 340 7.7 534 552.0 91.5 1400 200 1200 3.4 0.60 179 752.38 344 130 128 44 7.3 383 NID 91.1 1900 300 1600 5.0 0.40 435 162.52 265 253 153 200 7.3 647 662.4 189.0 1500 400 1100 3.3 0.63 412 552.55 762 436 187 90 7.7 1154 1990.7 224.0 3200 700 2500 6.1 1.26 384 842.63 341 469 187 45 7.6 857 1502.4 266.5 2200 400 1800 5.1 1.00 484 252.66 605 263 255 108 7.8 1155 NID NID 2100 300 1800 13.8 0.98 684 602.73 670 184 238 145 7.6 703 NID 106.0 2500 100 2400 5.7 0.54 770 152.76 408 296 238 54 7.7 1043 N/D NID 2700 300 2400 7.6 1.27 914 962.80 387 4817 817 114 8.0 1192 N/D NID 3500 200 3300 10.4 0.83 89 202.89 1072 374 298 70 7.6 1554 NID NID 4200 400 3800 14.1 1.65 2579 2182.90 565 420 323 17 7.8 1953 NID NID 2500 400 2100 13.9 0.90 575 853.00 618 314 221 180 7.5 1154 714.2 284.0 1800 300 1500 3.1 0.41 467 353.05 254 342 306 196 8.3 1531 NID N/D 4600 300 4300 4.2 2.24 816 NID3.17 330 262 145 290 7.7 882 664.1 185.0 1300 200 1100 3.4 0.30 492 253.29 559 351 162 190 7.8 866 1638.8 184.2 2500 400 2100 4.8 0.78 609 843.39 439 490 136 57 8.2 951 NID 155.0 1800 200 1600 5.3 1.38 661 703.42 851 304 204 150 7.9 665 NID 243.2 3200 500 2700 8.4 0.62 960 403.42 827 602 502 90 7.8 1523 NID 284.0 1400 500 900 6.1 1.41 483 523.51 275 142 145 120 7.9 499 N/D 131.0 1600 200 1400 4.2 0.79 581 223.54 622 286 409 53 7.8 1233 N/D 185.0 2300 300 2000 6.3 1.35 3462 2963.60 600 296 477 110 8.0 1168 N/D 179.0 2600 300 2300 6.7 0.63 731 443.67 523 228 145 90 7.6 1243 NID 270.0 3500 1000 2500 9.8 0.89 749 633.87 843 403 213 60 7.2 1187 NID 362.0 2700 600 2100 7.3 0.83 231 813.90 1082 444 315 90 8.1 1151 1393.7 261.5 2400 400 2000 4.0 0.98 795 284.15 260 376 187 70 8.0 1039 NID 234.0 2200 300 1900 5.6 0.78 732 204.33 1116 694 400 44 8.1 2081 NID NID 5400 500 4900 3.0 2.37 1060 NID4.46 641 630 562 70 7.7 1812 NID 316.0 1900 700 1200 6.4 077 356 295.26 1051 708 289 130 7.8 2518 NID NID 5500 1100 4400 10.3 1.11 1538 195.34 1306 657 1915 310 7.8 2126 NID NID 7500 700 6600 13.4 2.66 695 705.90 847 605 409 110 7.7 1602 NID 385.0 2300 900 1400 7.6 0.62 398 456.25 1240 601 230 160 7.9 2520 NID NID 5000 700 4300 11.0 1.54 847 1406.33 1960 572 140 180 7.7 1716 N/D NfD 5700 500 5200 12.5 2.02 113 786.74 1560 471 289 80 7.7 1471 NID NID 5400 600 4800 14.2 1.32 2808 3276.81 660 259 170 102 7.7 871 N/D NID 1900 300 1600 11.5 1.00 537 487.08 2046 515 494 210 7.6 1691 N/D NID 5300 800 4500 12.1 1.87 985 667.53 1549 493 340 60 7.9 1513 N/D 569.0 2200 600 1600 7.9 1.07 495 867.56 847 375 340 107 8.3 1361 N/D N/D 4700 700 4000 13.4 1.61 1195 738.32 235 171 170 70 7.7 708 NID 147.0 1400 200 1200 8.0 0.46 325 528.56 427 300 2945 123 7.7 880 NID NID 3400 600 2800 7.3 1.42 795 709.26 2598 819 349 90 7.9 2171 NID NID 7700 1600 6100 17.3 3.88 2657 999.87 2001 671 545 60 7.7 1684 NID NID 6600 1600 5000 12.9 2.40 1138 136
MInImum 1 0.78 205 123 119 17 6.8 235 472.0 65.8 1100 100 900 3.0 0.27 89 15Maximum 9.87 2598 4817 2945 340 8.3 2520 1990.7 569.0 7700 1600 6800 17.3 3.88 3462 327Averaae 4.17 794 473 375 116 7.7 1200 951.2 210.2 3073 496 2577 7.8 1.16 814 73
~~-...J
Above dala have been arranged according lo numericalincrease in OLR, while Ihe numerical slructure of time have been disregarded for Ihis study's purposes (Fig. I).N/D = Not Determined
Stellenbosch University http://scholar.sun.ac.za
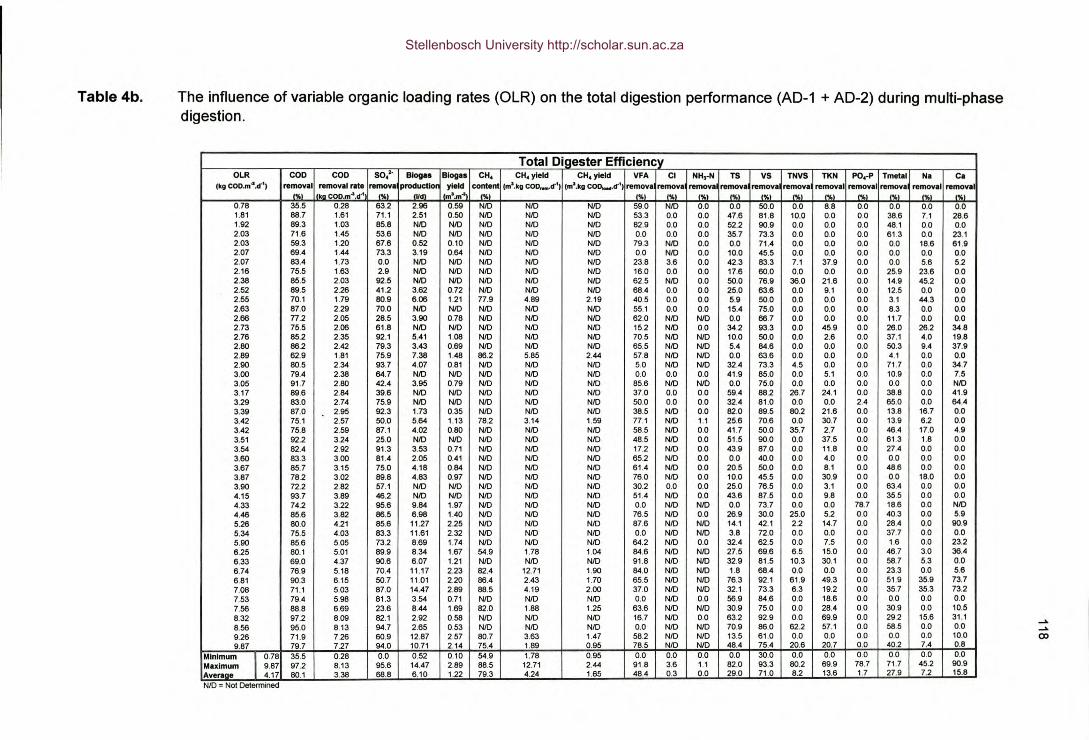
Table 4b. The influence of variable organic loading rates (OLR) on the total digestion performance (AD-1 + AD-2) during multi-phasedigestion.
Total Digester EfficiencyOLR COD COD SO.'· Bloga. Bloga. CH. CH. yield CH. yield VFA Cl NH •.N TS VS TNVS TKN PO.·p Tmetll NI C.
(kgCOD.m4.cr') removal remoyal rate removI productlo. yield content (ma.kg coo_crt) (m'.kg coa_.cr') remeva remova remova removi remov. remeva removal removal remova removal removal% ka COO.m4.dot % Ud ma.n"~ %1 % (%) (%) (%) (%) (%) (%) (%) (%) (%) (%)
0.78 35.5 0.28 63.2 2.96 0.59 NID NID NID 59.0 NID 0.0 0.0 SO.O 0.0 8.8 0.0 0.0 0.0 0.01.81 88.7 1.61 71.1 2.51 O.SO NID NID NID 53.3 0.0 0.0 47.6 81.8 10.0 0.0 0.0 38.6 7.1 28.61.92 89.3 1.03 85.8 NID NID NID NID NID 82.9 0.0 0.0 52.2 90.9 0.0 0.0 0.0 48.1 0.0 0.02.03 71.6 1.45 53.6 NID NID NID NID NID 0.0 0.0 0.0 35.7 73.3 0.0 0.0 0.0 61.3 0.0 23.12.03 59.3 1.20 67.6 0.52 0.10 NID NID NID 79.3 NID 0.0 0.0 71.4 0.0 0.0 0.0 0.0 18.6 61.92.07 69.4 1.44 73.3 3.19 0.84 NID NID NID 0.0 NID 0.0 10.0 45.5 0.0 0.0 0.0 0.0 0.0 0.02.07 83.4 1.73 0.0 NID NID NID NID NfO 23.8 3.6 0.0 42.3 83.3 7.1 37.9 0.0 0.0 5.6 5.22.16 75.5 1.63 2.9 NfO NID NID NID NID 16.0 0.0 0.0 17.6 60.0 0.0 0.0 0.0 25.9 23.6 0.02.38 85.5 2.03 92.5 NID NID NID NID NID 62.5 NID 0.0 SO.O 76.9 36.0 21.6 0.0 14.9 45.2 0.02.52 89.5 2.26 41.2 3.62 0.72 NID NID NID 68.4 0.0 0.0 25.0 63.6 0.0 9.1 0.0 12.5 0.0 0.02.55 70.1 1.79 80.9 6.06 121 77.9 4.89 2.19 40.5 0.0 0.0 5.9 SO.O 0.0 0.0 0.0 3.1 44.3 0.02.63 87.0 2.29 70.0 NID NID NID NID NID 55.1 0.0 0.0 15.4 75.0 0.0 0.0 0.0 8.3 0.0 0.02.66 77.2 2.05 28.5 3.90 0.78 NID NID NID 62.0 NID NID 0.0 66.7 0.0 0.0 0.0 11.7 0.0 0.02.73 75.5 2.06 61.8 NID NfO NID NID NID 15.2 NfO 0.0 34.2 93.3 0.0 45.9 0.0 26.0 26.2 34.82.76 85.2 2.35 92.1 5.41 1.08 NID NID NID 70.5 NID NID 10.0 SO.O 0.0 2.6 0.0 37.1 4.0 19.82.80 66.2 2.42 79.3 3.43 0.69 NID NID NID 65.5 NID NID 5.4 84.6 0.0 0.0 0.0 SO.3 9.4 37.92.89 62.9 1.81 75.9 7.38 1.48 86.2 5.85 2.44 57.8 NID NID 0.0 63.6 0.0 0.0 0.0 4.1 0.0 0.02.90 80.5 2.34 93.7 4.07 0.81 NID NID NID 5.0 NID NID 32.4 73.3 4.5 0.0 0.0 71.7 0.0 34.73.00 79.4 2.38 84.7 NID NID NID NID NID 0.0 0.0 0.0 41.9 85.0 0.0 5.1 0.0 10.9 0.0 7.53.05 91.7 2.80 42.4 3.95 0.79 NID NID NID 85.6 NID NIO 0.0 75.0 0.0 0.0 0.0 0.0 0.0 NID3.17 89.6 2.84 39.6 NID NID NID NID NID 37.0 0.0 0.0 59.4 88.2 26.7 24.1 0.0 38.8 0.0 41.93.29 83.0 2.74 75.9 NID NID NID NID NfO SO.O 0.0 0.0 32.4 81.0 0.0 0.0 2.4 65.0 0.0 84.43.39 87.0 2.95 92.3 1.73 0.35 NID NID NID 38.5 NID 0.0 82.0 89.5 80.2 21.6 0.0 13.8 16.7 0.03.42 75.1 2.57 SO.O 5.84 1.13 78.2 3.14 1.59 77.1 NID 1.1 25.6 70.6 0.0 30.7 0.0 13.9 6.2 0.03.42 75.8 2.59 87.1 4.02 0.80 NID NfO NfO 58.5 NID 0.0 41.7 50.0 35.7 2.7 0.0 46.4 17.0 4.93.51 92.2 3.24 25.0 NID NID NID NfO NfO 48.5 NID 0.0 51.5 90.0 0.0 37.5 0.0 61.3 1.8 0.03.54 82.4 2.92 91.3 3.53 0.71 NID NID NfO 17.2 NID 0.0 43.9 87.0 0.0 11.8 0.0 27.4 0.0 0.03.60 83.3 3.00 81.4 2.05 0.41 NID NID NID 65.2 NID 0.0 0.0 40.0 0.0 4.0 0.0 0.0 0.0 0.03.67 85.7 3.15 75.0 4.18 0.84 NID NID NID 61.4 NID 0.0 20.5 SO.O 0.0 8.1 0.0 48.6 0.0 0.03.87 78.2 3.02 89.8 4.83 0.97 NID NID NID 76.0 NID 0.0 10.0 45.5 0.0 30.9 0.0 0.0 18.0 0.03.90 72.2 2.82 57.1 NID NID NID NID NID 30.2 0.0 0.0 25.0 76.5 0.0 3.1 0.0 63.4 0.0 0.04.15 93.7 3.89 46.2 NID NID NID NID NID 51.4 NID 0.0 43.6 87.5 0.0 9.8 0.0 35.5 0.0 0.04.33 74.2 3.22 95.6 9.84 1.97 NID NID NID 0.0 NID NID 0.0 73.7 0.0 0.0 78.7 18.6 0.0 NID4.46 85.6 3.82 86.5 6.98 1.40 NID NID NID 76.5 NID 0.0 26.9 30.0 25.0 5.2 0.0 40.3 0.0 5.95.26 80.0 4.21 85.6 11.27 2.25 NID NID NID 87.6 NID NID 14.1 42.1 2.2 14.7 0.0 28.4 0.0 90.95.34 75.5 4.03 83.3 11.61 2.32 NID NID NID 0.0 NID NID 3.8 72.0 0.0 0.0 0.0 37.7 0.0 0.05.90 85.6 5.05 73.2 8.69 1.74 NID NID NID 84.2 NID 0.0 32.4 62.5 0.0 7.5 0.0 1.6 0.0 23.26.25 80.1 5.01 89.9 8.34 1.67 54.9 1.78 1.04 84.6 NID NID 27.5 69.6 6.5 15.0 0.0 46.7 3.0 36.46.33 69.0 4.37 90.6 6.07 1.21 NID NID NID 91.8 NID NID 32.9 81.5 10.3 30.1 0.0 58.7 5.3 0.06.74 76.9 5.18 70.4 11.17 2.23 82.4 12.71 1.90 84.0 NID NID 1.8 88.4 0.0 0.0 0.0 23.3 0.0 5.66.81 90.3 6.15 SO.7 11.01 2.20 86.4 2.43 170 65.5 NID NID 76.3 92.1 61.9 49.3 0.0 51.9 35.9 73.77.08 71.1 5.03 87.0 14.47 2.89 88.5 4.19 2.00 37.0 NID NID 32.1 73.3 6.3 19.2 0.0 35.7 35.3 73.27.53 79.4 5.98 81.3 3.54 0.71 NfO NfO NfO 0.0 NID 0.0 56.9 84.6 0.0 18.6 0.0 0.0 0.0 0.07.56 88.8 6.69 23.6 8.44 1.69 82.0 1.88 1.25 63.6 NID NID 30.9 75.0 0.0 28.4 0.0 30.9 0.0 10.58.32 97.2 8.09 82.1 2.92 0.58 NfO NfO NID 16.7 NID 0.0 63.2 92.9 0.0 69.9 0.0 29.2 15.6 31.18.56 95.0 8.13 94.7 2.65 0.53 NID NfO NID 0.0 NID NfO 70.9 86.0 62.2 57.1 0.0 58.5 0.0 0.09.26 71.9 7.26 60.9 12.87 2.57 80.7 3.63 1.47 58.2 NID NID 13.5 61.0 0.0 0.0 0.0 0.0 0.0 10.09.87 79.7 7.27 94.0 10.71 2.14 75.4 1.89 0.95 78.5 NfO NID 48.4 75.4 20.6 20.7 0.0 40.2 7.4 0.8
Minimum I 0.78 35.5 0.28 0.0 0.52 0.10 54.9 1.78 0.95 0.0 0.0 0.0 0.0 30.0 0.0 0.0 0.0 0.0 0.0 0.0Maximum 9.87 97.2 8.13 95.6 14.47 2.89 88.5 12.71 2.44 91.8 3.6 1.1 82.0 93.3 80.2 69.9 78.7 71.7 45.2 90.9Average 4.17 80.1 3.38 88.8 6.10 1.22 79.3 4.24 1.65 48.4 0.3 0.0 29.0 71.0 8.2 13.6 1.7 27.9 7.2 15.8
_.._..CX)
NfO = Not Oetennined
Stellenbosch University http://scholar.sun.ac.za
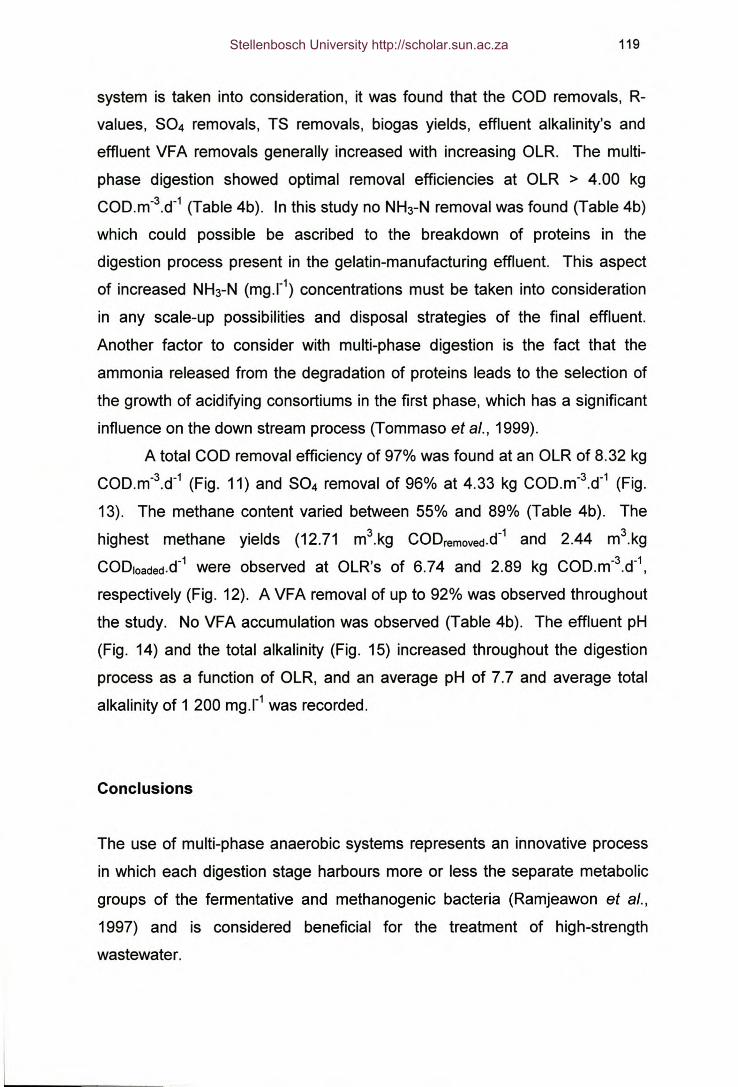
119
system is taken into consideration, it was found that the COD removals, R-
values, S04 removals, TS removals, biogas yields, effluent alkalinity's and
effluent VFA removals generally increased with increasing OLR. The muIti-
phase digestion showed optimal removal efficiencies at OLR > 4.00 kg
COD.m-3.d-1(Table 4b). In this study no NH3-N removal was found (Table 4b)
which could possible be ascribed to the breakdown of proteins in the
digestion process present in the gelatin-manufacturing effluent. This aspect
of increased NH3-N (rnq.I") concentrations must be taken into consideration
in any scale-up possibilities and disposal strategies of the final effluent.
Another factor to consider with multi-phase digestion is the fact that the
ammonia released from the degradation of proteins leads to the selection of
the growth of acidifying consortiums in the first phase, which has a significant
influence on the down stream process (Tommaso et aI., 1999).
A total COD removal efficiency of 97% was found at an OLR of 8.32 kg
COD.m-3.d-1(Fig. 11) and S04 removal of 96% at 4.33 kg COD.m-3.d-1(Fig.
13). The methane content varied between 55% and 89% (Table 4b). The
highest methane yields (12.71 m3.kg CODremoved.d-1and 2.44 m3.kg
CODloaded.d-1were observed at OLR's of 6.74 and 2.89 kg COD.m-3.d-1,
respectively (Fig. 12). A VFA removal of up to 92% was observed throughout
the study. No VFA accumulation was observed (Table 4b). The effluent pH
(Fig. 14) and the total alkalinity (Fig. 15) increased throughout the digestion
process as a function of OLR, and an average pH of 7.7 and average total
alkalinity of 1 200 rnq.l" was recorded.
Conclusions
The use of multi-phase anaerobic systems represents an innovative process
in which each digestion stage harbours more or less the separate metabolic
groups of the fermentative and methanogenic bacteria (Ramjeawon et aI.,
1997) and is considered beneficial for the treatment of high-strength
wastewater.
Stellenbosch University http://scholar.sun.ac.za
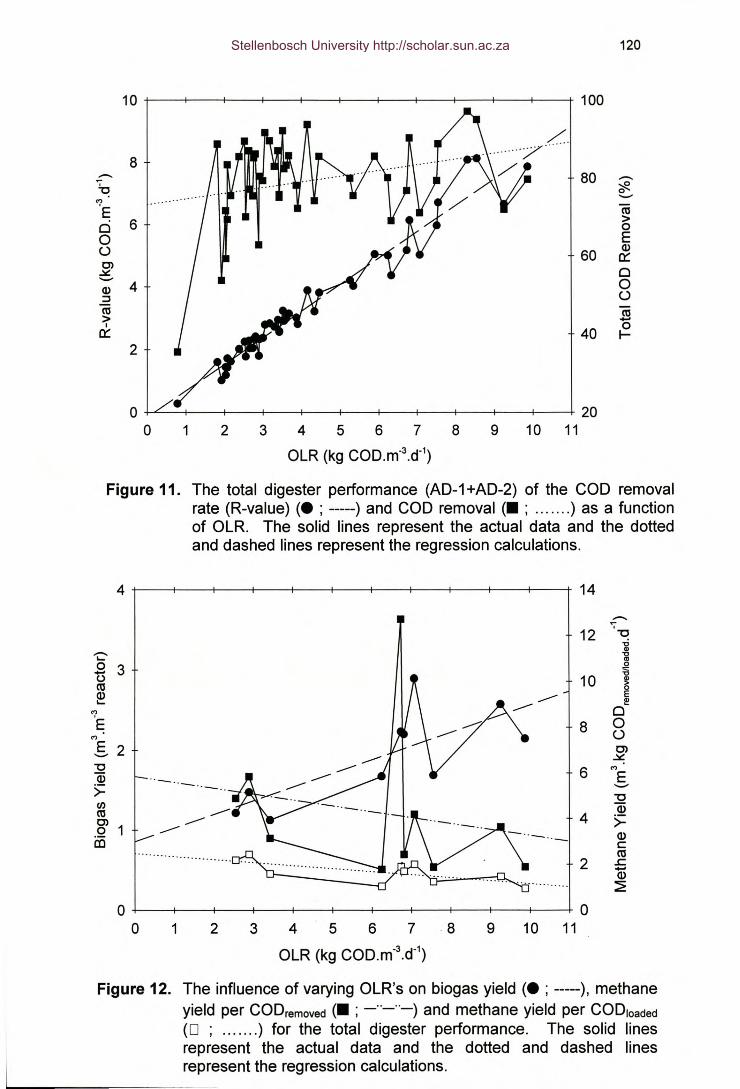
120
880 -~ :::R0-'?
caE 6 >0 00 Eo 60 Q)
c:::0')
0~- 4 0Q)::J o(ij ca> -I 0c::: 40 I-
2
o ~--r---~~r-~--_'--~---+---+---+---r---+20o 1 2 3 4 5 6 7 8 9 10 11
OLR (kg COD.m-3.d-1)
Figure 11. The total digester performance (AD-1 +AD-2) of the COD removalrate (R-value) (. ; -----) and COD removal (. ; ....... ) as a functionof OLR. The solid lines represent the actual data and the dottedand dashed lines represent the regression calculations.
CJ)ca0')
.2 1III
............
14.-..~
12 "0~'CIV0
'"10 'C
~0EI!!0
8 0o0')~
6 (ry
E-"04 Q)
>=Q)cca2 s:-Q)~
0+----+----+----+----+----+----+----+----+-----+-----+-----+0o 1 2 3 4 5 6 7 8 9 10 11
OLR (kg COD.m-3.d-1)
Figure 12. The influence of varying OLR's on biogas yield (. ; -----), methaneyield per CODremoved(. ; _"_"_) and methane yield per CODloaded(0 ; ....... ) for the total digester performance. The solid linesrepresent the actual data and the dotted and dashed linesrepresent the regression calculations.
Stellenbosch University http://scholar.sun.ac.za
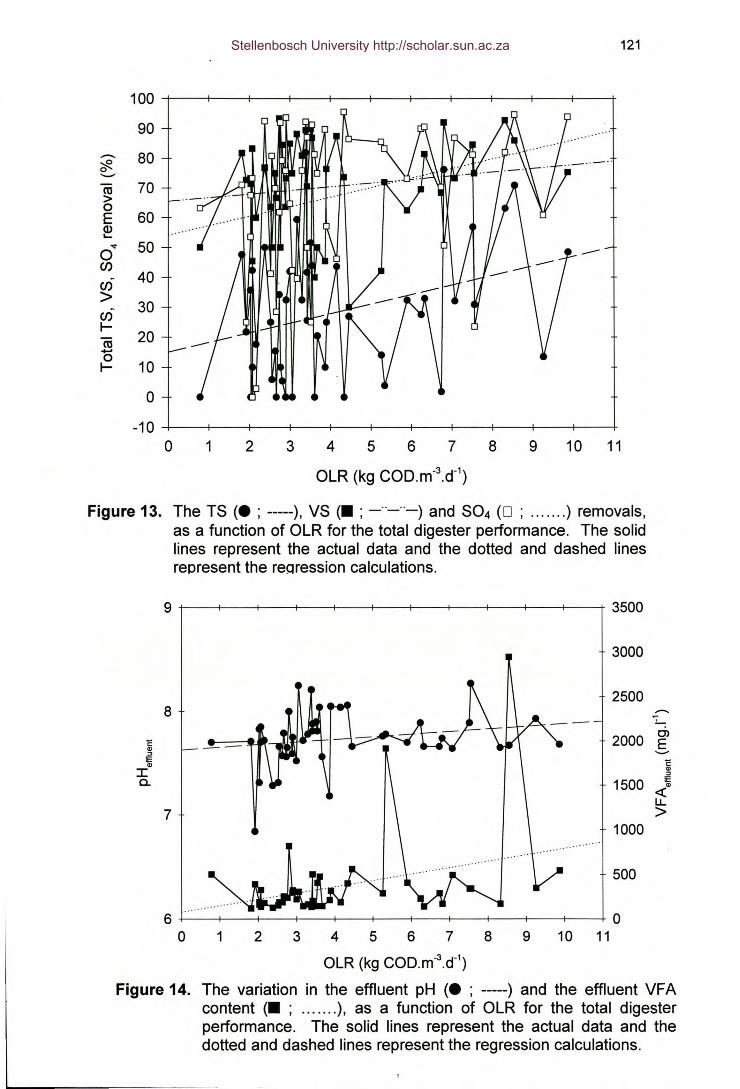
10090
.- 80'*'.......,(ij 70>0E 60ID.....
.... 500Cl)
Cl) 40> 30Cl)I- 20Ol+-'0 10I-
0-10
0 1
121
2 9 10 113 4 5 6 7 8
OLR (kg COD.m-3.d-1)
Figure 13. The TS (. ; -----), VS (. ; _"_"_) and S04 (0 ; ....... ) removals,as a function of OLR for the total digester performance. The solidlines represent the actual data and the dotted and dashed linesrepresent the reeression calculations.
ë..;:J
IE..Io,
500
8
3500
3000
2500-
2000 0)
E.__,ë..;:J
1500 IE..«u,>
10007
6+---I----+---+---+---+---t----j--+---I----+--+0o 1 2 3 4 5 6 7 8 9 10 11
OLR (kg COD.m-3.d-1)
Figure 14. The variation in the effluent pH (. ; -----) and the effluent VFAcontent (. ; ....... ), as a function of OLR for the total digesterperformance. The solid lines represent the actual data and thedotted and dashed lines represent the regression calculations.
Stellenbosch University http://scholar.sun.ac.za
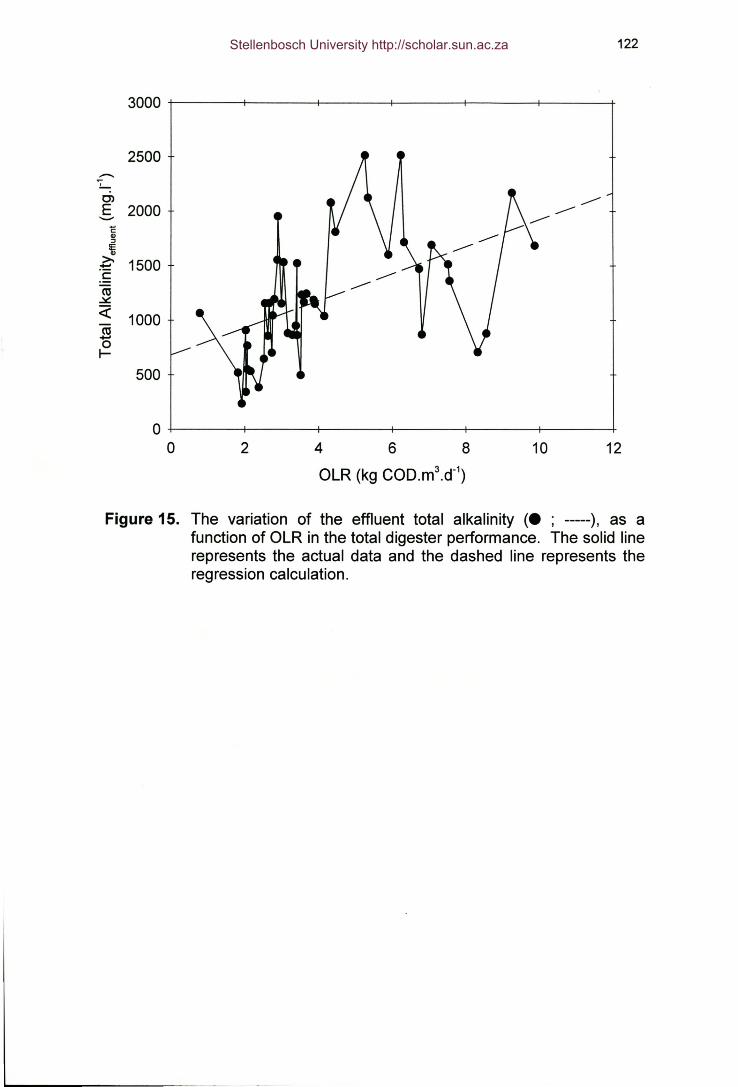
122
2500....-..,
OlE 2000--ë
cu::J
13>- 1500-·e(ij~« 1000(ti-0I-
500
o r-----_,-------r------1-------r------+------~o 2 468
OLR (kg COD.m3.d-1)10 12
Figure 15. The variation of the effluent total alkalinity (. ; -----), as afunction of OLR in the total digester performance. The solid linerepresents the actual data and the dashed line represents theregression calculation.
Stellenbosch University http://scholar.sun.ac.za
123
In this study, large variations were found in most of the operational
performance parameters, which in turn were indicative of the variation in
substrate and the organic load applied to the digesters. For both digesters
(AD-1 and AD-2) therefore, significant and inconsistent variations occurred in
the COD removal efficiencies and other parameters, although an overall
increase in biogas yield, alkalinity, TS, VS, as well as S04 removal, occurred.
This could also be an indication of the natural process selection of a specific
microbial community as part of the stabilisation in the digester.
From the results obtained in this study and data from Chapter 3, the
options and performances of single vs multi-phase anaerobic digestion of
gelatin-manufacturing effluent can be compared (Table 5). Digester AD-1
and digester AD-2 of the single-phase digestion and the total multi-phase
digesters (AD-1 + AD-2) operated at OLR's as high as 9.56, 9.30 and 9.87 kg
COD.m-3.d-1, respectively. Although very good results were obtained with
single-phase digestion, the best digester performance efficiencies were found
during the multi-phase treatment of the gelatin-manufacturing effluent: COD
(97%); biogas production (14.47 I.d-\ biogas yield (2.89 m3.m-3); methane
yield per COD removed (12.71 m3.kg COD.d-\ VFA (92%); TS (82%); VS
(93%) and TNVS (80%). From the data it is clear that the multi-phase system
can be successfully incorporated when a need arises to optimise the
fermentation steps, by separating certain stages in separate digesters.
Hence, the results of the overall process efficiency are better than those of
conventional single-phase processes (Ghosh et al., 2000).
One disadvantage of the use of this technology is, however, the high
capital costs required to implement this type of treatment on commercial
basis. The high capital costs involved in upscaling of a multi-phase reactor
system must be seriously considered especially when comparing and
evaluating the option of achieving good final effluent qualities with a lower
cost single-phase digester with satisfactory final effluent qualities. Although
these bench-scale studies clearly indicated the greater advantage of phase
separation, pilot and full-scale studies will have to be done to address the
economic viability of such treatment systems.
Stellenbosch University http://scholar.sun.ac.za
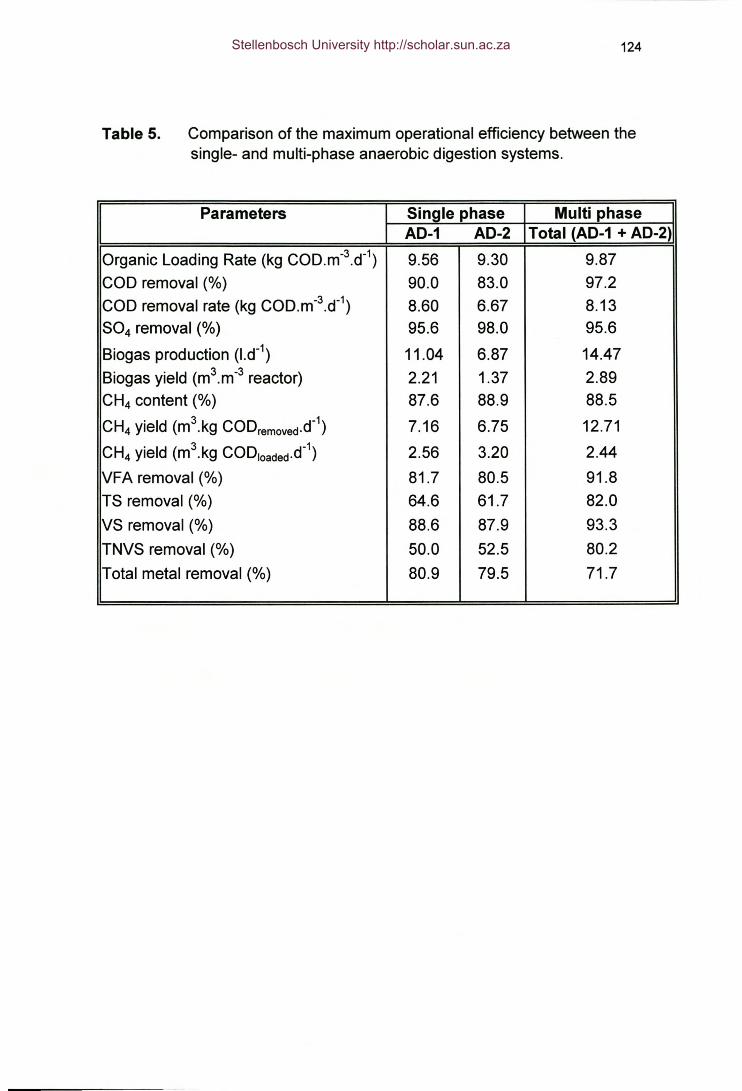
124
Table 5. Comparison of the maximum operational efficiency between thesingle- and multi-phase anaerobic digestion systems.
Parameters Single phase Multi phaseAD-1 AD-2 Total (AD-1 + AD-2)
Organic Loading Rate (kg COD.m-3.d-1) 9.56 9.30 9.87COD removal (%) 90.0 83.0 97.2COD removal rate (kg COD.m-3.d-1) 8.60 6.67 8.13S04 removal (%) 95.6 98.0 95.6
Biogas production (l.d-1) 11.04 6.87 14.47Biogas yield (m3.m-3 reactor) 2.21 1.37 2.89CH4 content (%) 87.6 88.9 88.5
CH4 yield (m3.kg CODremoved.d-1) 7.16 6.75 12.71
CH4 yield (m3.kg CODloaded.d-1) 2.56 3.20 2.44
VFA removal (%) 81.7 80.5 91.8TS removal (%) 64.6 61.7 82.0
VS removal (%) 88.6 87.9 93.3
TNVS removal (%) 50.0 52.5 80.2
Total metal removal (%) 80.9 79.5 71.7
Stellenbosch University http://scholar.sun.ac.za
125
References
Anderson, G.K., Kasapgil, B. & Ince, O. (1994). Microbiological study of two
stage anaerobic digestion start-up. Water Research, 28, 2383-2392.
APHA, AWWA & WEF (1995). Standard Methods for the Examination of
Water and Wastewater (19th ed.), American Public Health Association,
Washington DC, USA
Austermann-Haun, U., Seyfried, C.F. & Rosenwinkel, K-H. (1997). UASB-
reactor in the fruit juice industry. In: Proceedings of the 8th
International Conference on Anaerobic Digestion (Volume 1.) Sendai,
Japan, Pp. 413-420.
Battistoni, P., Pavan, P., Mata-Alvarez, J., Prisciandaro, M. & Cecchi, F.
(2000). Rheology of sludge from the double phase anaerobic digestion
of organic fraction of municipal solid waste. Water Science and
Technology, 41(3),51-59.
Fongsatitkul, P., Mavinic, D.S. & Lo, K.V. (1995). A two-phase anaerobic
digestion process (UASB-UASB): Induced failure and system recovery
using a step loading reduction approach and modified recycle ratio
(RR). Environmental Technology, 16, 137-146.
Ghosh, S. & Klass, D.L. (1978). Two-phase anaerobic digestion. Process
Biochemistry, 15,2-3.
Ghosh, S., Henry, M.P., Sajjad, A, Mensinger, M.C. & Arora, J.L. (2000).
Pilot-scale gasification of municipal solid wastes by high rate and two-
phase anaerobic digestion (TPAD). Water Science and Technology,
41(3), 101-110.
Guiot, S.R. & Van Den Berg, L. (1985). Performance of an upflow anaerobic
bioreactor combining a sludge blanket and a filter treating sugar waste.
Biotechnology and Bioengineering, 27, 800-806.
Guiot, S.R., Darrah, B. & Hawari, J.A (1997). Hydrogen sulfide removal by
anaerobic/aerobic coupling. In: Proceedings of the 8th International
Conference on Anaerobic Digestion (Volume 2.) Sendai, Japan, Pp.
64-71.
Stellenbosch University http://scholar.sun.ac.za
126
Hawkes, F.R, Rozzi, A, Black, K., Guwy, A & Hawkes, D.L. (1992). The
stability of anaerobic digesters operating on a food-processing
wastewater. Water Science and Technology, 25, 73-82.
Lettinga, G., Hulshoff Pol, L.W., Zeeman, G., Field, J., Van Lier, J.B., Van
Buuren, J.G.L., Janssen, AJ.H. & Lens, P. (1997). Anaerobic
treatment in sustainable environmental production concepts. In:
Proceedings of the 8th International Conference on Anaerobic
Digestion (Volume 1.) Sendai, Japan, Pp. 32-39.
Massey, M.L. & Pohland, F.G. (1978). Phase separation of anaerobic
stabilization by kinetic controls. Journal of Water and Pollution Control
Federation, 50, 2204-2222.
Meyer, L.H., Britz, T.J. & Lategan, P.M. (1985). Temperature control for
laboratory scale anaerobic digesters. Water SA, 9, 79-80.
Moosbrugger, RE., Wentzel, M.G., Ekama, G.A & Marais, G.v.R (1992).
Simple titration procedures to determine H2G03 alkalinity and short-
chain fatty acids in aqueous solutions containing known concentrations
of ammonium, phosphate and sulphide weak acid/bases. WRG Report
No TT 57/92. Published by the Water Research Commission, P.O. Box
824, Pretoria 0001, South Africa.
Nel, L.H., Britz, T.J. & Lategan, P.M. (1985). The effect of trace elements on
the performance efficiency of an anaerobic fixed film reactor treating a
petrochemical effluent. Water SA, 11(3), 107-110.
Ramjeawon, T., Baguant, J. & Horan, N. (1997). Anaerobic treatment of a
weakly buffered carbohydrate wastewater by a two-stage upflow
anaerobic sludge blanket (UASB) process. In: Proceedings of the 8th
International Conference on Anaerobic Digestion (Volume 1.) Sendai,
Japan, Pp. 141-155.
Ross, W.R, Novella, P.H., Pitt, AJ., Lund, P., Thomson, B.A, King, P.B. &
Fawcett, K.S. (1992). Anaerobic digestion of waste-water sludge:
Operating guide. WRG Report No 390 TT 55/92. Published by the
Water Research Commission, P.O. Box 824, Pretoria 0001, South
Africa.
Stellenbosch University http://scholar.sun.ac.za
127
Shin, H-S., Bae, B-U., Lee, J-J. & Paik, B-C. (1992). Anaerobic digestion of
distillery wastewater in a two-phased UASB system. Water Science
and Technology, 25(7), 361-371.
Speece, R.E., Duran, M., Demirer, G., Zhang, H. & Distefano, T. (1997). The
role of process configuration in the performance of anaerobic systems.
In: Proceedings of the 8th International Conference on Anaerobic
Digestion (Volume 1.) Sendai, Japan, Pp. 1-8.
Stronach, S.M., Rudd, T. & Lester, J.N. (1987). Start-up of anaerobic
bioreactors on high-strength industrial wastes. Biomass, 13, 173-197.
Tommaso, G., Varesche, M.B., Zaiat, M., Vazzoler, R.F. & Foresti, E. (1999).
Formation, microbial characterization and kinetics of anaerobic biofilms
in polyurethane foam differential reactors treating gelatin containing
wastewater. In: Proceedings of the 4th IAWQ-IWA Conference on
Biofifms Systems, October 17-20, New York, USA.
Van Der Merwe, M. (1994). Microbial ecology and anaerobic treatment of
baker's yeast effluent. Ph.D. Thesis, University of the Orange Free
State, Bloemfontein, South Africa.
Van Der Merwe, M. & Britz, T.J. (1993). Anaerobic treatment of baker's yeast
effluent using a hybrid digester with polyurethane as support material.
Biotechnology Letters, 15,755-760.
Van Der Merwe-Botha, M. (1998). Personal communication, Local Council of
Krugersdorp, Krugersdorp, South Africa.
Van Rompu, K., D'Haene, S. & Verstraete, W. (1990). Mass transport in
anaerobic polyurethane carrier reactors. Process Biochemistry, 25, 3-
6.
Verstraete, W. & Vandevivere, P. (1997). Broader and newer applications of
anaerobic digestion. In: Proceedings of the 8th International
Conference on Anaerobic Digestion (Volume 1.) Sendai, Japan, Pp.
67-74.
Stellenbosch University http://scholar.sun.ac.za
128
CHAPTER 5
TREATMENT OF GELATIN-MANUFACTURING EFFLUENT USING AN
UPFLOW ANAEROBIC SLUDGE BLANKET (UASB) BIOREACTOR
Summary
The gelatin-manufacturing industry produces high volumes of high-strength
effluent with distinctive peak and low periods in terms of organic, hydraulic
and toxic loads. These must then be accommodated by the local wastewater
purification works. As a result of the large volumes of noxious effluent
received, the purification works has in the past experienced many operational
problems. In order to secure the position of the industry and minimise the
toxic load disposed to the wastewater purification works an efficient and cost-
effective pre-treatment technology has to be developed. This will also lead to
the reduction of high municipal trade-effluent charges of the industry and
enable compliance to the legal effluent disposal requirements. Anaerobic
digestion appears to be a feasible and economic option for the treatment of
this effluent, as excellent treatment results were obtained in previous studies
using hybrid reactor designs. The importance of upscaling the digester
design has necessitated further evaluation of other anaerobic process
configurations to treat the gelatin-manufacturing effluent.
During this study, a mesophilic laboratory-scale upflow anaerobic
sludge bed (UASB) bioreactor design with recirculation was evaluated for its
suitability in treating high-strength, highly variable raw gelatin-manufacturing
effluent. Successful inoculation and start-up of the digester resulted in good
handling and led to increases in removal efficiencies. The digester was
operated at a pH of 6.5. Immediate sulphate (S04) (66 - 79%) and chemical
oxygen demand (COD) (45 - 72%) removals were achieved during the start-
up period at a hydraulic retention time (HRT) of 3.0 d. Chemical oxygen
demand (COD), S04 and total solid (TS) removal efficiencies of up to 96, 86
and 79%, respectively, were achieved at the 3.0 d HRT. At an HRT of 1.0 d,
Stellenbosch University http://scholar.sun.ac.za
129
COD, S04 and TS removal efficiencies of up to 95, 97 and 67%, respectively,
were observed. The biogas production, however, was found to be very low
throughout the study (0.05 - 0.63 I.d-\
Introduction
Different wastewater types are produced daily which must be accommodated
by local wastewater purification works. This often presents a problem to the
local authorities, as the disposal of certain noxious industrial effluents can
inhibit the biological treatment processes, with significant adverse cost and
effluent quality implications. Gelatin-manufacturing effluent specifically, can
be considered as one of the most difficult effluents to treat and poses a
potential environmental pollution hazard due to its highly variable and
complex nature. It is, therefore, imperative that this effluent be treated in an
environmentally responsible manner.
Considerable interest has been shown in the application of anaerobic
digestion, due to it being seen as a "clean technology", its cost-effectiveness
and adaptable nature. The general performance of the anaerobic digestion
process and the wide diversity of wastewaters that can be treated has
increased steadily over the past few years. This is mainly as a result of an
array of breakthroughs related to digester designs, operating conditions and
shock loads, for the treatment of recalcitrant industrial wastewater
(Austermann-Haun et al., 1997; Guiot et al., 1997).
Among the different high-rate anaerobic reactors developed and
successfully applied in recent years, the upflow anaerobic sludge blanket
(UASB) system represents a popular design for the biological treatment of
effluents (Lettinga et al., 1997). The ability of bacterial cells when grown in an
upflow stream, to aggregate into dense particles (granules) is one of the
reasons why the UASB configuration is one of the more suitable designs
(Britz et al., 1999). The microbial "blanket" is retained by its own mass and by
baffles or screens forming the settler unit in the upper portion of the reaction
vessel, whilst gas and liquid escape from the top of the tank. This mode of
Stellenbosch University http://scholar.sun.ac.za
130
bacterial growth can increase the performances of high-rate digesters, since
the favourable settling properties of granules can minimise biomass wash-out
and the close cell packing improves the metabolite interspecies transfer and
the overall granular activity (Schmidt & Ahring, 1996). However, the
development of sludge granulation and augmentation under continuous
upflow conditions is not yet fully understood as it is a complex process with
many factors involved in this development (Wu et a/., 1985; Van Lier et a/.,
1996; Verstraete et a/., 1996). Granules have been reported to vary in size
from 1 - 3 mm (Fang, 1997) and is known that granules occasionally
disintegrate for unknown reasons and thus result in a washout of biomass
(Kosaric et a/., 1990; Lettinga et a/., 1997).
The advantages of an UASB contact bioreactor design includes: less
dead digester volume (Visser et a/., 1993); higher loading rates; lower HRT's;
the ability to retain high biomass concentrations despite the upflow velocity of
the wastewater; no support material is required for the retention of a high
density of anaerobic activated sludge (Fukuzaki et a/., 1991); and the
production of biogas. The disadvantages of this digester configuration are the
slow start-up time and the dependence on the formation of a well-settleable
granular sludge. This particular design can therefore be seen as an attractive
alternative option to comply with the stricter pollution control regulations
currently enforced on industries and authorities by the National Water Act
(1998) and the National Environmental Management Act (1998).
The aim of this study was to evaluate the operational performance of
an UASB anaerobic bioreactor design for the treatment of full-strength
gelatin-manufacturing effluent. This digester option is the third design (AD-3)
in a series of design tests and comparisons to provide a database for future
full-scale application of the anaerobic biological technology for the treatment
of gelatin-manufacturing effluent.
Stellenbosch University http://scholar.sun.ac.za
131
Materials and methods
Digester design
A laboratory-scale upflow anaerobic sludge blanket bioreactor (UASB),
with an operational volume of 2.3 litres, was used. The total height of the
digester was 830 mm with an internal diameter of 50 mm. The digester (AD-
3) combined an upflow anaerobic sludge blanket design with a gas/solids
separator at the top of the bioreactor (Fig. 1). The biogas exited at the top,
while the substrate was introduced into the bioreactor at the base. The
overflow of the bioreactor emptied through an U-shaped tube to prevent any
atmospheric oxygen from entering the system. The temperature of the
bioreactor was maintained at 35°C, using a heating tape and an electronic
control unit (Meyer et al., 1985). The substrate was introduced semi-
continuously to the bioreactor by means of a peristaltic pump (Watson-Marlow
302S) controlled by an electronic timer. The upflow velocity within the reactor
was set at 2 m.h" by means of recirculation (Trnovec & Britz, 1998). The
biogas production was measured automatically by means of an electronic
counter with a gas-tight valve. The biogas volumes were corrected to
standard temperature and pressure (STP) conditions.
Digester start-up
The bioreactor was seeded using a mixture of acclimatised and
activated anaerobic sludge, as well as gelatin-manufacturing effluent from the
local wastewater purification works. The biomass in the bioreactor was then
allowed to stabilise for 72 h to allow the bacterial community to acclimatise.
The substrate flow rate was initially set at an hydraulic retention time (HRT) of
3.0 d and was maintained until stable state conditions were observed. After
the start-up phase, the HRT was decreased to 2.0 d and later to 1.0 d where
it was kept constant for the rest of the study.
Digester substrate
Full-strength gelatin-manufacturing effluent obtained from a local
gelatin-manufacturing industry, was used as substrate for the bioreactor. The
Stellenbosch University http://scholar.sun.ac.za
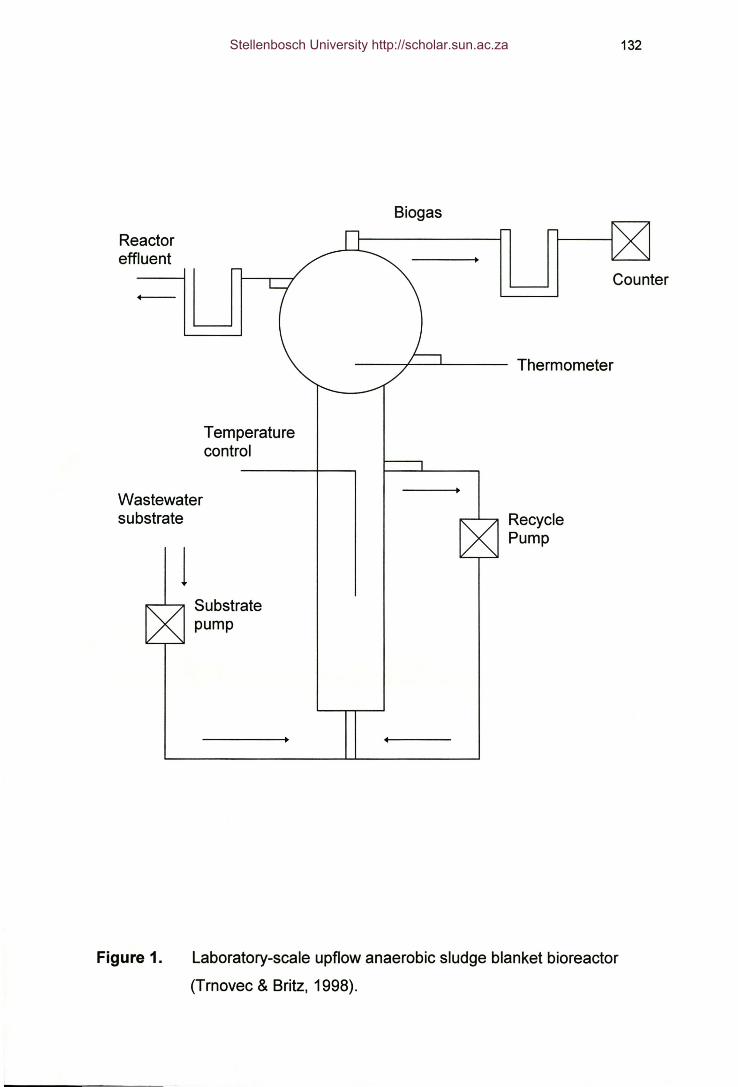
Reactoreffluent
-
Temperaturecontrol
132
Biogas
Counter
Wastewatersubstrate
j1<"""""""""""""" Substrate
pump
RecyclePump
Figure 1. Laboratory-scale upflow anaerobic sludge blanket bioreactor
(Trnovec & Britz, 1998).
Stellenbosch University http://scholar.sun.ac.za
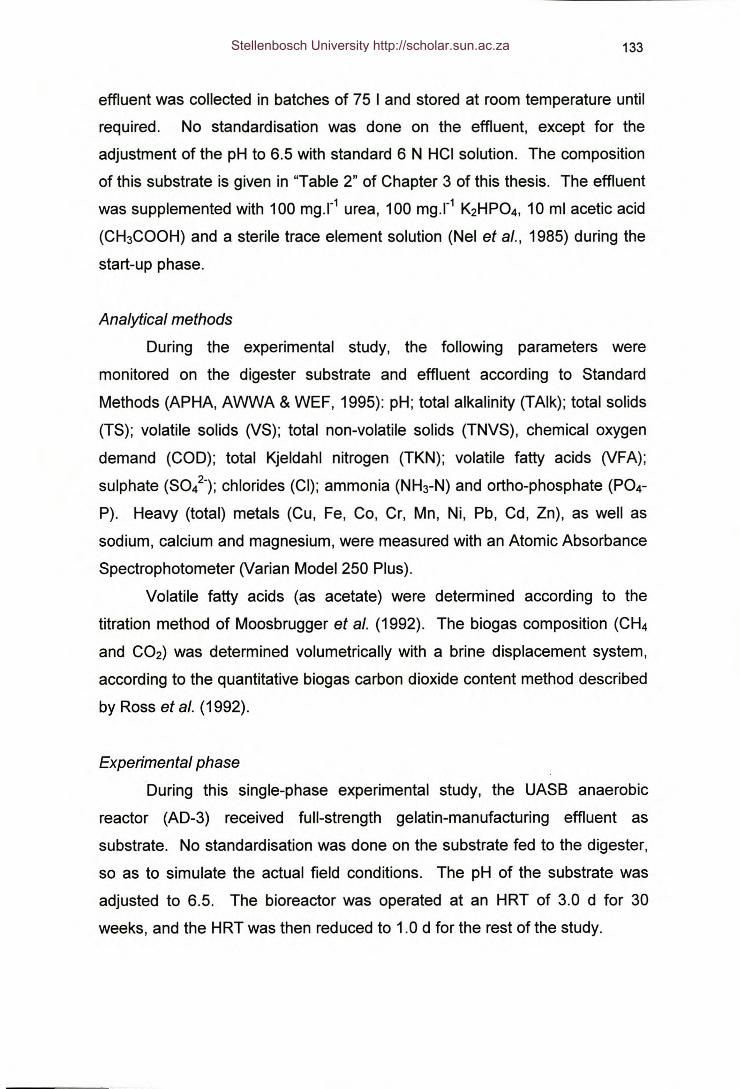
133
effluent was collected in batches of 75 I and stored at room temperature until
required. No standardisation was done on the effluent, except for the
adjustment of the pH to 6.5 with standard 6 N HCI solution. The composition
of this substrate is given in "Table 2" of Chapter 3 of this thesis. The effluent
was supplemented with 100 rnq.l" urea, 100 rnq.l" K2HP04, 10 ml acetic acid
(CH3COOH) and a sterile trace element solution (Nel et a/., 1985) during the
start-up phase.
Analytical methods
During the experimental study, the following parameters were
monitored on the digester substrate and effluent according to Standard
Methods (APHA, AWWA & WEF, 1995): pH; total alkalinity (TAlk); total solids
(TS); volatile solids (VS); total non-volatile solids (TNVS), chemical oxygen
demand (COD); total Kjeldahl nitrogen (TKN); volatile fatty acids (VFA);
sulphate (SO/-); chlorides (Cl); ammonia (NH3-N) and ortho-phosphate (P04-
P). Heavy (total) metals (Cu, Fe, Co, Cr, Mn, Ni, Pb, Cd, Zn), as well as
sodium, calcium and magnesium, were measured with an Atomic Absorbance
Spectrophotometer (Varian Model250 Plus).
Volatile fatty acids (as acetate) were determined according to the
titration method of Moosbrugger et al. (1992). The biogas composition (CH4
and CO2) was determined volumetrically with a brine displacement system,
according to the quantitative biogas carbon dioxide content method described
by Ross et al. (1992).
Experimental phase
'During this single-phase experimental study, the UASB anaerobic
reactor (AD-3) received full-strength gelatin-manufacturing effluent as
substrate. No standardisation was done on the substrate fed to the digester,
so as to simulate the actual field conditions. The pH of the substrate was
adjusted to 6.5. The bioreactor was operated at an HRT of 3.0 d for 30
weeks, and the HRT was then reduced to 1.0 d for the rest of the study.
Stellenbosch University http://scholar.sun.ac.za
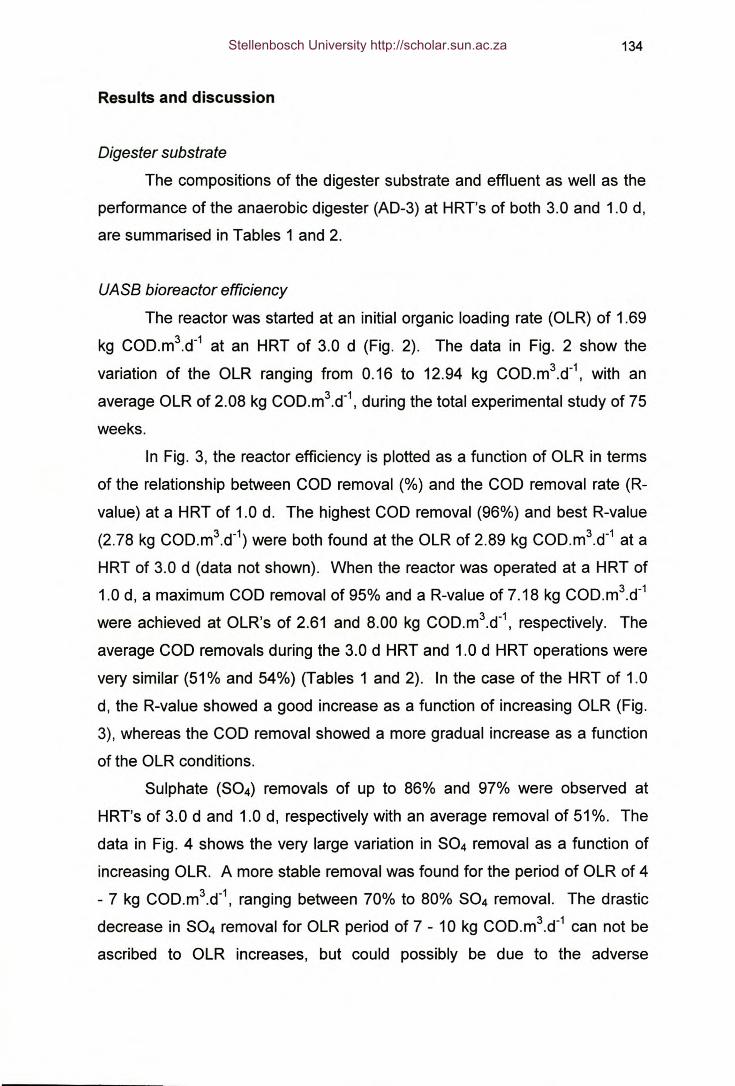
134
Results and discussion
Digester substrate
The compositions of the digester substrate and effluent as well as the
performance of the anaerobic digester (AD-3) at HRT's of both 3.0 and 1.0 d,
are summarised in Tables 1 and 2.
VAsa bioreactor efficiency
The reactor was started at an initial organic loading rate (OLR) of 1.69
kg COD.m3.d-1 at an HRT of 3.0 d (Fig. 2). The data in Fig. 2 show the
variation of the OLR ranging from 0.16 to 12.94 kg COD.m3.d-1, with an
average OLR of 2.08 kg COD.m3.d-1, during the total experimental study of 75
weeks.
In Fig. 3, the reactor efficiency is plotted as a function of OLR in terms
of the relationship between COD removal (%) and the COD removal rate (R-
value) at a HRT of 1.0 d. The highest COD removal (96%) and best R-value
(2.78 kg COD.m3.d-1) were both found at the OLR of 2.89 kg COD.m3.d-1 at a
HRT of 3.0 d (data not shown). When the reactor was operated at a HRT of
1.0 d, a maximum COD removal of 95% and a R-value of 7.18 kg COD.m3.d-1
were achieved at OLR's of 2.61 and 8.00 kg COD.m3.d-1, respectively. The
average COD removals during the 3.0 d HRT and 1.0 d HRT operations were
very similar (51% and 54%) (Tables 1 and 2). In the case of the HRT of 1.0
d, the R-value showed a good increase as a function of increasing OLR (Fig.
3), whereas the COD removal showed a more gradual increase as a function
of the OLR conditions.
Sulphate (S04) removals of up to 86% and 97% were observed at
HRT's of 3.0 d and 1.0 d, respectively with an average removal of 51%. The
data in Fig. 4 shows the very large variation in S04 removal as a function of
increasing OLR. A more stable removal was found for the period of OLR of 4
- 7 kg COD.m3.d-1, ranging between 70% to 80% S04 removal. The drastic
decrease in S04 removal for OLR period of 7 - 10 kg COD.m3.d-1 can not be
ascribed to OLR increases, but could possibly be due to the adverse
Stellenbosch University http://scholar.sun.ac.za
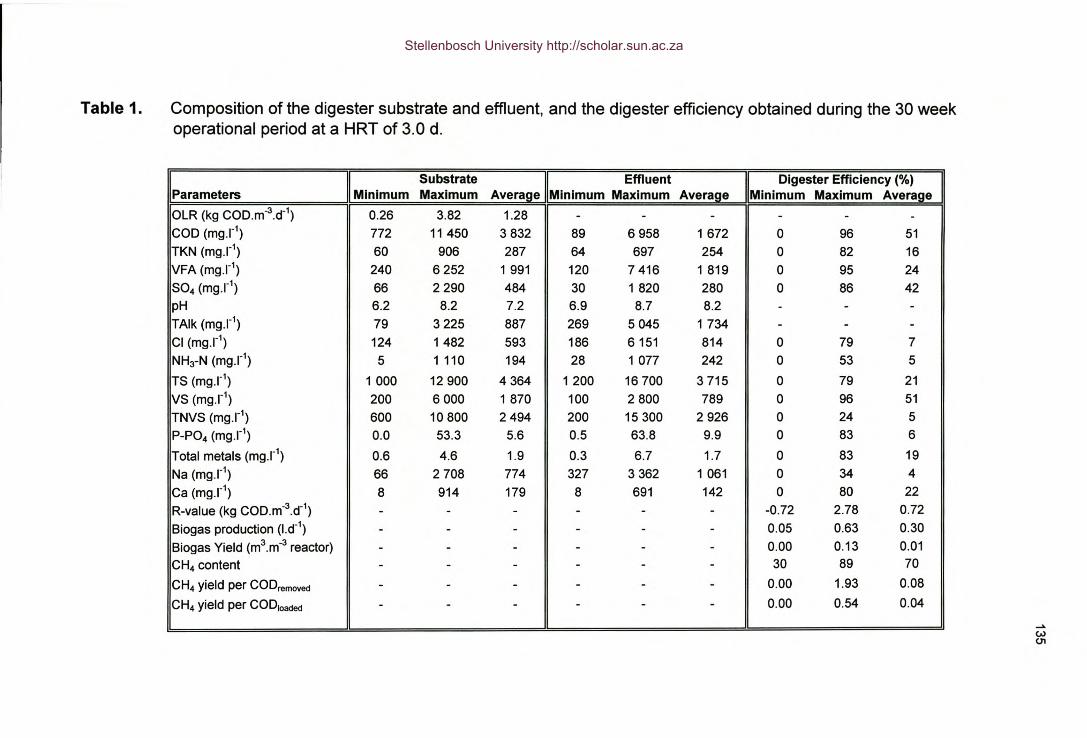
Table 1. Composition of the digester substrate and effluent, and the digester efficiency obtained during the 30 weekoperational period at a HRT of 3.0 d.
IParam:tersI Substrate Effluent Digester Efficiency (%). Mmlmum Maximum Average Minimum Maximum Average Minimum Maximum Average
OLR (kg COD.m-3.d-l) 0.26 3.82 1.28 - - - - - -COD (rnq.l") 772 11450 3832 89 6958 1672 0 96 51TKN (rnq.l") 60 906 287 64 697 254 0 82 16VFA (mq.l") 240 6252 1 991 120 7416 1 819 0 95 24S04 (rnq.I") 66 2290 484 30 1 820 280 0 86 42pH 6.2 8.2 7.2 6.9 8.7 8.2 - - -TAlk (rnq.l") 79 3225 887 269 5045 1734 - - -Cl (rnq.l") 124 1482 593 186 6151 814 0 79 7NH3-N (rnq.I") 5 1 110 194 28 1077 242 0 53 5TS (rnq.l") 1 000 12900 4364 1200 16700 3715 0 79 21VS (rnq.l") 200 6000 1870 100 2800 789 0 96 51TNVS (rnq.l") 600 10800 2494 200 15300 2926 0 24 5P-P04 (rnq.l") 0.0 53.3 5.6 0.5 63.8 9.9 0 83 6Total metals (rnq.l") 0.6 4.6 1.9 0.3 6.7 1.7 0 83 19Na (mq.l") 66 2708 774 327 3362 1 061 0 34 4Ca (rnq.I") 8 914 179 8 691 142 0 80 22R-value (kg COD.m-3.d-l) - - - - - - -0.72 2.78 0.72Biogas production (I.d-l) - - - - - - 0.05 0.63 0.30Biogas Yield (m3.m-3 reactor) - - - - - - 0.00 0.13 0.01CH4 content - - - - - - 30 89 70
CH4 yield per CODremoved - - - - - - 0.00 1.93 0.08
CH4 yield per CODloaded - - - - - - 0.00 0.54 0.04
-"CJ.)01
Stellenbosch University http://scholar.sun.ac.za
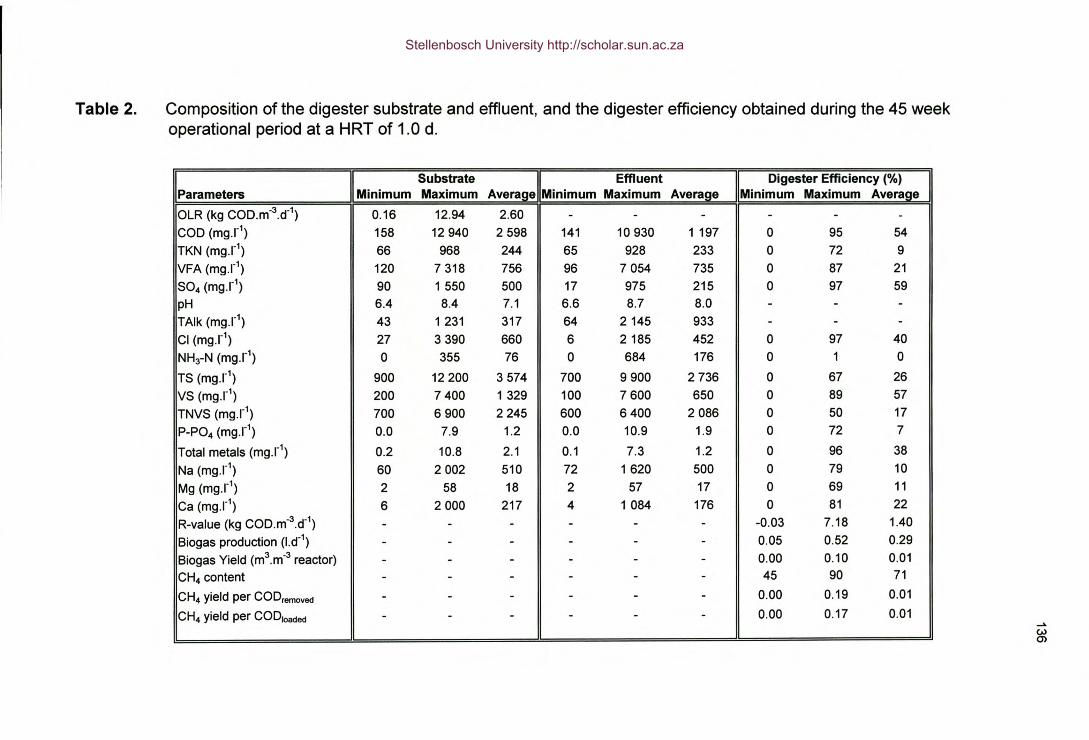
Table 2. Composition of the digester substrate and effluent, and the digester efficiency obtained during the 45 weekoperational period at a HRT of 100 do
IParametersI Substrate Effluent Digester Efficiency (%)oMinimum Maximum Average Minimum Maximum Average Minimum Maximum Average
OLR (kg CODom030d01) 0016 12.94 2.60 - - - - - -COD (rnq.l") 158 12940 2598 141 10930 1 197 0 95 54
TKN (rnq.l") 66 968 244 65 928 233 0 72 9
VFA (rnq.I") 120 7318 756 96 7054 735 0 87 21
S04 (mq.l") 90 1 550 500 17 975 215 0 97 59
pH 6.4 8.4 7.1 606 807 8.0 - - -TAlk (rnq.l") 43 1 231 317 64 2145 933 - - -Cl (mq.l") 27 3390 660 6 2185 452 0 97 40
NH3-N (mq.l") 0 355 76 0 684 176 0 1 0
TS (mq.l") 900 12200 3574 700 9900 2736 0 67 26
VS (rnq.I") 200 7400 1 329 100 7600 650 0 89 57
TNVS (rnq.l") 700 6900 2245 600 6400 2086 0 50 17
P-P04 (mq.l") 0.0 7.9 1.2 000 10.9 1.9 0 72 7
Total metals (mq.l") 0.2 10.8 2.1 0.1 7.3 1.2 0 96 38
Na (rnq.l") 60 2002 510 72 1620 500 0 79 10
Mg (rnq.l") 2 58 18 2 57 17 0 69 11
Ca (mq.l") 6 2000 217 4 1084 176 0 81 22
R-value (kg COD.m-3.d-1) - - - - - - -0.03 7.18 1040
Biogas production (l.d-1) - - - - - - 0.05 0.52 0.29
Biogas Yield (m3.m-3 reactor) - - - - - - DoOD 0.10 0.01
CH4 content - - - - - - 45 90 71
CH4 yield per CODremoved - - - - - - 0.00 0.19 0.01
CH4 yield per CODloaded - - - - - - 0.00 0.17 0.01 ......(IJ0>
Stellenbosch University http://scholar.sun.ac.za
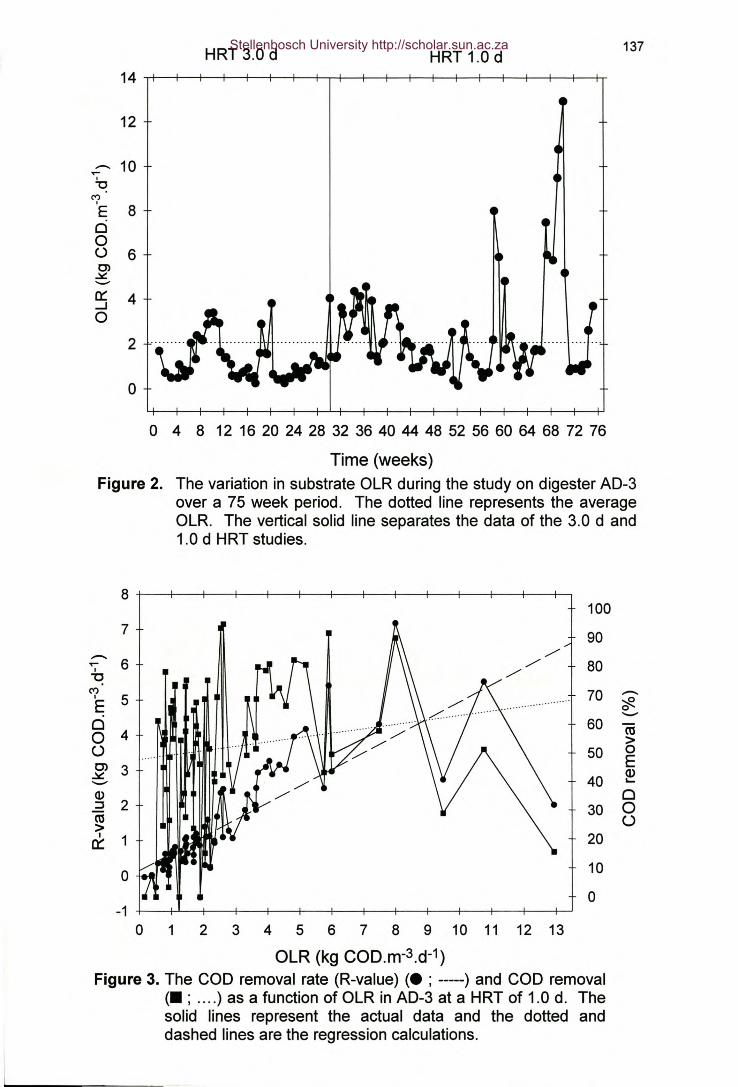
.- 10..-!o
(")
'E 8oo(.)6C>~-0::: 4--'o
HRT 3.0 d 137HRT 1.0 d
12
2
o
o 4 8 12 16 20 24 28 32 36 40 44 48 52 56 60 64 68 72 76
Time (weeks)Figure 2. The variation in substrate OLR during the study on digester AD-3
over a 75 week period. The dotted line represents the averageOLR. The vertical solid line separates the data of the 3.0 d and1.0 d HRT studies.
8100
7 90-.
6...- 80I
"'CC') 70 -.I 5 ~E 0--0 60 ca0 4 >o 50 0C> 3 E~ Q)-- 40 .....Q) 0::J 2 30 0co o>I 1 20c::
0 10
0-1
0 1 2 3 4 5 6 7 8 9 10 11 12 13
OLR (kg COD.m-3.d-1)Figure 3. The COD removal rate (R-value) (. ; -----) and COD removal
(. ; .... ) as a function of OLR in AD-3 at a HRT of 1.0 d. Thesolid lines represent the actual data and the dotted anddashed lines are the regression calculations.
Stellenbosch University http://scholar.sun.ac.za
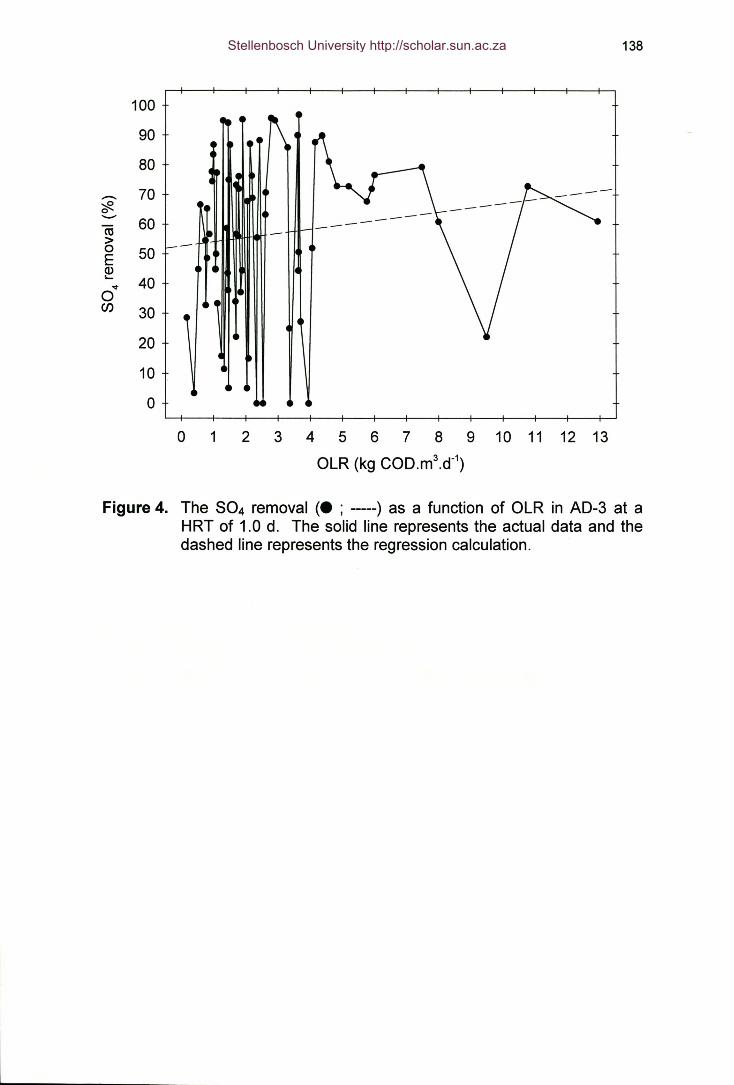
1009080
..-.. 70:::R.0- 60rn>0 50EID..... 40....0Cf) 30
20100
138
o 1 2 3 4 5 6 7 8 9 10 11 12 13OLR (kg COD.m3.d-l)
Figure 4. The 804 removal (. ; -----) as a function of OLR in AD-3 at aHRT of 1.0 d. The solid line represents the actual data and thedashed line represents the regression calculation.
Stellenbosch University http://scholar.sun.ac.za
139
influence of the introduction of other chemicals at the gelatin-manufacturing
industry.
The variations in the UASB bioreactor effluent pH and the total effluent
alkalinity during the total experimental study, are shown in Fig. 5. During the
study a very high average effluent pH of 8.71 and a fairly good average total
alkalinity of 1 334 rnq.l", were obtained. In a balanced anaerobic digestion
system, the volatile fatty acids are proportionally converted to methane and
carbon dioxide and an optimum operational pH of 6.8 to 7.4, should be
maintained. When the pH in an anaerobic system decreases, the alkalinity
produced in the anaerobic system should provide an efficient buffering
capacity (Malina & Pohland, 1992). If the pH is lower than 6.3 or higher than
7.8, the rate of methanogenesis is known to decrease leading to a lower
operational efficiency (Van Haandel & Lettinga, 1994). During this study, very
little biogas production was observed, which probably relates to the non-
optimal operational pH of the system. This would also influence the methane
production negatively. It was also seen that gas bubbles adhered to the
bacterial floes, which in turn resulted in poor settling properties of the
anaerobic biomass. The biomass and bubbles thereby were lost from the
system via the digester overflow to the open effluent collection flask. This
phenomenon was also reported by other researchers when treating protein
and lipid containing gelatin effluent (Tommaso et al., 1999) and ascribed to
the absence of the formation of suitable granules in the bioreactor.
Conclusions
Anaerobic wastewater treatment processes can provide several advantages
over other aerobic biological, chemical and/or physical applications if a
suitable digester is properly selected, designed and operated for the
treatment of a specific effluent.
The UASB configuration can be utilised to overcome some of the
disadvantages of the other digesters by recycling the biomass of the digester
to obtain an optimal food-biomass contact situation. With this recirculation
Stellenbosch University http://scholar.sun.ac.za
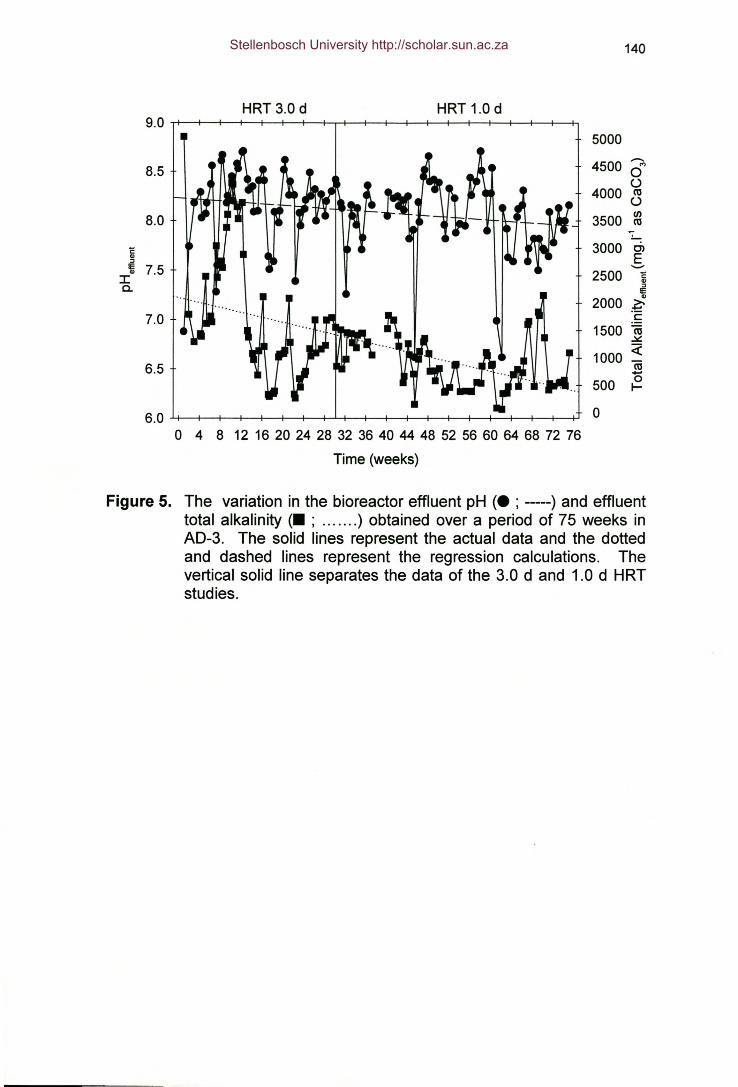
HRT 3.0 d HRT 1.0 d9.0
8.5
8.0EQ)::J
IE 7.5Q)
Ia.
7.0
6.5
6.00 4 8 12 16 20 24 28 32 36 40 44 48 52 56 60 64 68 72 76
Time (weeks)
140
50004500 d'
o4000 c33500 ~3000 ~
.........2500 ~
::J
IE
2000 lic:
1500 ~1000 «cu....500 {3.
o
Figure 5. The variation in the bioreactor effluent pH (. ; -----) and effluenttotal alkalinity (. ; ) obtained over a period of 75 weeks inAD-3. The solid lines represent the actual data and the dottedand dashed lines represent the regression calculations. Thevertical solid line separates the data of the 3.0 d and 1.0 d HRTstudies.
Stellenbosch University http://scholar.sun.ac.za
141
option it will be possible to retain both active microorganisms and undigested
substrate suspended solids, which can promote more extensive
biodegradation of the wastewater particles. The UASB bioreactor retains
most of the advantages of a conventional digester with the extra benefits of
shorter sludge retention times (SRT), smaller reactor volumes, better alkalinity
control, as well as optimal food-biomass contact.
However, one disadvantage of the UASB digester found during this
study, was the poor settleability and retention of the granular biomass within
the digester. Adequate biomass settleability is crucial for successful
operation of this digester configuration. Tommaso et al. (1999) also reported
the washout of biomass when treating a complex protein and lipid containing
gelatin effluent. Usually pre-treatment of the sludge in the bioreactor is
needed before it is recirculated back into the digester, to produce a more
settleable floc. A number of approaches have been developed to enhance
sludge settleability, such as gas stripping, stirred or vacuum degasification, as
well as the addition of coagulants and flocculants to promote floc formation in
the digester (Malina & Pohland, 1992). Petruy et al. (1999) reported that the
inflow of low lipid concentrations (100 mq.I") in the form of milk-fat emulsion
did not affect the COD removal of their expanded granular sludge bed
(EGSB) system. Even a concentration of 100 000 mq.l" was not toxic,
however, a lipid/fat removal mechanism of adsorption into the sludge is
activated under such conditions, which again affects biogas and methane
yields. These reports correspond well with the data from this study which
reflect the relatively high COD removal at a short HRT of 1.0 d, but in
contrast, only low methane yields were obtained.
During this study it was found that the UASB bioreactor had a stable
operation at an HRT of 1.0 d. A good COD removal was also observed
during a 1.0 d HRT operation with an average of 54 % and maximum at 94%.
There are several advantages of this system that must be kept in mind
for upscaling possibilities. These include the fact that the system operation
was stable and a fairly good COD removal was obtained at a HRT of 1.0 d.
Thus, future studies must be done to incorporate and evaluate some of these
approaches to deliver a better granular biomass quality. Further
Stellenbosch University http://scholar.sun.ac.za
142
experimentation with shorter hydraulic retention times may also improve the
digester efficiencies (Trnovec & Britz, 1998). The use of tailored made
granules, as described by Britz et al. (1999), especially to treat this type of
effluent, can also be evaluated.
References
APHA, AWWA & WEF (1995). Standard Methods for the Examination of
Water and Wastewater (19th ed.), American Public Health Association,
Washington DC, USA.
Austermann-Haun, U., Seyfried, C.F. & Rosenwinkel, K-H. (1997). UASB-
reactor in the fruit juice industry. In: Proceedings of the 8th
International Conference on Anaerobic Digestion (Volume 1.) Sendai,
Japan, Pp. 413-420.
Britz, T.J., Trnovec, W., Van Schalkwyk, C. & Roos, P. (1999). Enhanced
granulation in upflow sludge-bed digesters (UASB) by process
induction and microbial stimulation. WRC Report No. 667/1/99.
Published by the Water Research Commission, P.O. Box 824, Pretoria
0001, South Africa.
Fang, H.H.P. (1997). Microbial distribution and syntrophic association in
UASB granules. In: Proceedings of the 8th International Conference on
Anaerobic Digestion (Volume 1.) Sendai, Japan, Pp. 83-90.
Fukuzaki, S., Nishio, N., Sakurai, H. & Nagai, S. (1991). Characteristics of
methanogenic granules grown on propionate in an Upflow Anaerobic
Sludge Blanket (UASB) reactor. Journal of Fermentation and
Biotechnology, 71, 50-71.
Guiot, S.R., Darrah, B. & Hawari, J.A. (1997). Hydrogen sulfide removal by
anaerobic/aerobic coupling. In: Proceedings of the 8th International
Conference on Anaerobic Digestion (Volume 2.) Sendai, Japan, Pp.
64-71.
Stellenbosch University http://scholar.sun.ac.za
143
Kosaric, N., Blaszczyk, R, Orphan, L. & Valladares, J. (1990). The
characteristics of granules from upflow anaerobic sludge blanket
reactors. Water Research, 24, 1473-1477.
Lettinga, G., Hulshoff Pol, L.W., Zeeman, G., Field, J., Van Lier, J.B., Van
Buuren, J.C.L., Jansen, AJ.H. & Lens, P. (1997). Anaerobic treatment
in sustainable environment production concepts. In: Proceedings of the
8th International Conference on Anaerobic Digestion (Volume 1.)
Sendai, Japan, Pp. 32-39.
Malina, J.F. & Pohland, F.G. (1992). Anaerobic sludge digestion. In: Design of
Anaerobic Processes for the Treatment of Industrial and Municipal
Wastes, Volume 7, (F.G. Pohland & J.F. Malina. eds.), Techonomie
Publishing Company: Pennsylvania, Pp. 167-212.
Meyer, L.H., Britz, T.J. & Lategan, P.M. (1985). Temperature control for
laboratory scale anaerobic digesters. Water SA, 9, 79-80.
Moosbrugger, RE., Wentzel, M.C., Ekama, G.A & Marais, G.v.R (1992).
Simple titration procedures to determine H2C03 alkalinity and short-
chain fatty acids in aqueous solutions containing known concentrations
of ammonium, phosphate and sulphide weak acid/bases. WRC Report
No TT 57/92. Published by the Water Research Commission, P.O. Box
824, Pretoria 0001, South Africa.
Nel, L.H., Britz, T.J. & Lategan P.M. (1985). The effect of trace elements on
the performance efficiency of an anaerobic fixed film reactor treating a
petrochemical effluent. Water SA, 11(3), 107-110.
Petruy, R, Field, J.A & Lettinga, G. (1999). Pilot-scale expanded granular
sludge bed (EGSB) reactor. In: Proceedings of the 4th IAWQ-IWA
Conference on Biofilms Systems, October 17-20, New York, USA
Ross, W.R, Novella, P.H., Pitt, AJ., Lund. P., Thomson, B.A, King, P.B. &
Fawcett, K.S. (1992). Anaerobic digestion of waste-water sludge:
Operating guide. WRC Report No 390 TT 55/92. Published by the
Water Research Commission, P.O. Box 824, Pretoria 0001, South
Africa.
Stellenbosch University http://scholar.sun.ac.za
144
Schmidt, J.E. & Ahring, B.K. (1996). Granular sludge formation in upflow
anaerobic sludge blanket UASB reactors. Biotechnology and
Bioengineering, 49, 229-246.
Tommaso, G., Varesche, M.B., Zaiat, M., Vazzoler, R.F. & Foresti, E. (1999).
Formation, microbial characterization and kinetics of anaerobic biofilms
in polyurethane foam differential reactors treating gelatin containing
wastewater. In: Proceedings of the 4th IAWQ-IWA Conference on
Biofilms Systems, October 17-20, NewYork, USA
Trnovec, W. & Britz, T.J. (1998). Influence of organic loading rate and
hydraulic retention time on the efficiency of an UASB bioreactor
treating a canning factory effluent. Water SA, 24(2),147-152.
Van Haandel, AC. & Lettinga, G. (1994). Application of anaerobic digestion to
sewage treatment. In: Anaerobic Sewage Treatment: A Practical Guide
for Regions with a Hot Climate. John Wiley & Sons Ltd.: New York, Pp.
33-62.
Van Lier, J.B., Groeneveld, N. & Lettinga, G. (1996). Development of
thermophilic methanogenic sludge in compartmentalized upflow
reactors. Biotechnology and Bioengineering, 50, 549-569.
Verstraete, W., De Beer, D., Pena, M., Lettinga, G. & Lens, P. (1996).
Anaerobic bioprocessing of organic wastes. World Journal of
Microbiology and Biotechnology, 12, 221-238.
Visser, A, Alphenaar, P.A, Gao, Y. & Lettinga, G. (1993). Granulation and
immobilisation of methanogenic and sulphate-reducing bacteria in high
rate anaerobic reactors. Applied Microbiological and Biotechnology, 40,
575-581.
Wu, W., Hu, J. & Gu, X. (1985). Properties of granular sludge in upflow
anaerobic sludge blanket (UASB) reactor and its formation. In:
Proceedings of the 4th International Symposium on Anaerobic
Digestion, Guang Zhou, China, Pp. 11-15.
Stellenbosch University http://scholar.sun.ac.za
145
CHAPTER6
PILOT-SCALE ANAEROBIC PRE-TREATMENT OF UNDILUTED GELATIN-
MANUFACTURING EFFLUENT USING AN UASB AND A CONTACT
CONFIGURATION
Summary
Based on the laboratory-scale studies, a pilot-scale digester was evaluated
under actual field conditions, while treating full-strength gelatin-manufacturing
effluent. The pilot-scale anaerobic digester had an operational volume of 300
litre with an alternate UASB- and contact process configuration. In the first
phase, the anaerobic treatment of the gelatin-manufacturing effluent using an
UASB configuration resulted in excellent chemical oxygen demand (COD)
removal efficiencies of up to 96% (average 58%) at a hydraulic retention time
(HRT) of 1.0 d. The organic loading rates (OLR) ranged from 1.42 to 63.09
kg COD.m-3.d-1. The highly variable OLR's applied resulted in extreme
performance variations with total solids (TS), volatile fatty acids (VFA) and
sulphate (S04) removals of up to 93, 80 and 96%, respectively. Biogas
production volumes of up to 176 I.d-1 (average 49 I.d-1) were observed, with
an average methane content of 85%. From the data obtained it was clear
that the microbial community which developed in the UASB system could
handle the highly variable and unfavourable feed composition and shockloads
efficiently and thus this reactor configuration was considered as an
acceptable option for the pre-treatment of the gelatin-manufacturing effluent.
In the second phase, the contact process was used and resulted in
fairly low COD, S04, VFA and TS removal efficiencies of 41,62,64 and 39%,
respectively, at a HRT of 1.0 d. Due to the varying quality of the gelatin-
manufacturing effluent and high solids content (2 900 to 53 800 rnq.I") during
this study, several serious and limiting operational problems were
experienced, one being the constant blocking/obstruction (calcium carbonate
precipitation, grit, hair and fat) in the feed and recirculation lines. The data
Stellenbosch University http://scholar.sun.ac.za
146
from this study, where the contact configuration was used, indicated that this
configuration was not entirely suitable as a treatment option.
Based on the data obtained using the 300 litre anaerobic pilot plant
and two reactor configurations, it was concluded that gelatin-manufacturing
effluent can be successfully treated under actual field conditions, with highly
variable pH, OLR, TS values and temperature shockloads, using an UASB
digester configuration, while the contact design appeared to be less suitable
for this application.
Introduction
Gelatin-manufacturing wastewater is characterised by a high organic matter
load originating mainly from the hide processing and the chemical addition
during the gelatin-manufacturing process and is thus very difficult to treat. In
addition to a high COD concentration, the wastewater also has high
concentrations of suspended solids (SS), fats, S04 and salts, which may
inhibit biological processes. Currently, biological wastewater treatment
systems offer a number of significant advantages and fewer serious
drawbacks compared to other physical and chemical methods of wastewater
treatment.
The complex nature of the gelatin-manufacturing effluent prescribes
the vital importance of implementing a wastewater pre-treatment step prior to
discharge to the conventional municipal plant. This pre-treatment step must
combine acceptable treatment efficiencies with low maintenance costs and
operational problems. For this reason, anaerobic treatment, with the benefit
of a low energy consumption and low sludge generation system, was selected
to reduce the high organic loads during the pre-treatment of gelatin-
manufacturing effluent.
To determine effective removal efficiencies during wastewater
treatment, several factors have to be considered, namely: the nature of the
organic matter to be removed; the suitability of environmental factors for
anaerobic digestion; the retained amount of viable biomass; the design of the
Stellenbosch University http://scholar.sun.ac.za
147
anaerobic bioreactor system and the retention time of the sludge in the
anaerobic digester (Van Haandel & Lettinga, 1994).
Taking all these requirements into consideration, it was decided to
evaluate an UASB and a contact configuration to pre-treat the gelatin-
manufacturing effluent. Data from previous studies (Chapters 3, 4 and 5)
showed good removal efficiencies using laboratory-scale digesters treating
the effluent. As a follow-up study, a 300 litre pilot-scale digester was
constructed and operated at actual field conditions.
The aim of this study was to evaluate the stability and overall
performance of a 300 litre pilot-scale reactor treating gelatin-manufacturing
effluent at actual field conditions and to use this useful database for future
full-scale considerations and applications of this technology.
Materials and methods
Digester design
The pilot-scale anaerobic digester had an operational volume of 300
litres and could either be operated as an UASB or as a contact process
configuration by switching the mixing device in the digester on or off (Fig. 1).
The substrate was introduced continuously at the bottom of the reactor by
means of a peristaltic pump (Watson-Marlow 504S) and the biogas exited at
the top of the digester. The biogas production was determined by means of a
brine displacement system (6N HCI, pH 2.0) and the biogas volumes were
corrected to standard temperature and pressure (STP) conditions.
The overflow of the reactor emptied through a U-tube to prevent
atmospheric oxygen from entering the system. For the UASB configuration,
the overflow emptied into a container for sampling purposes only, from there
the overflow went to the inletworks of the purification plant, to be treated with
the rest of the incoming wastewater.
For the contact configuration, the overflow of the digester emptied into
a settling cone (clarifier). The settled sludge (biosolids) from the bottom of
the clarifier was then recirculated back to the digester with the substrate. The
Stellenbosch University http://scholar.sun.ac.za
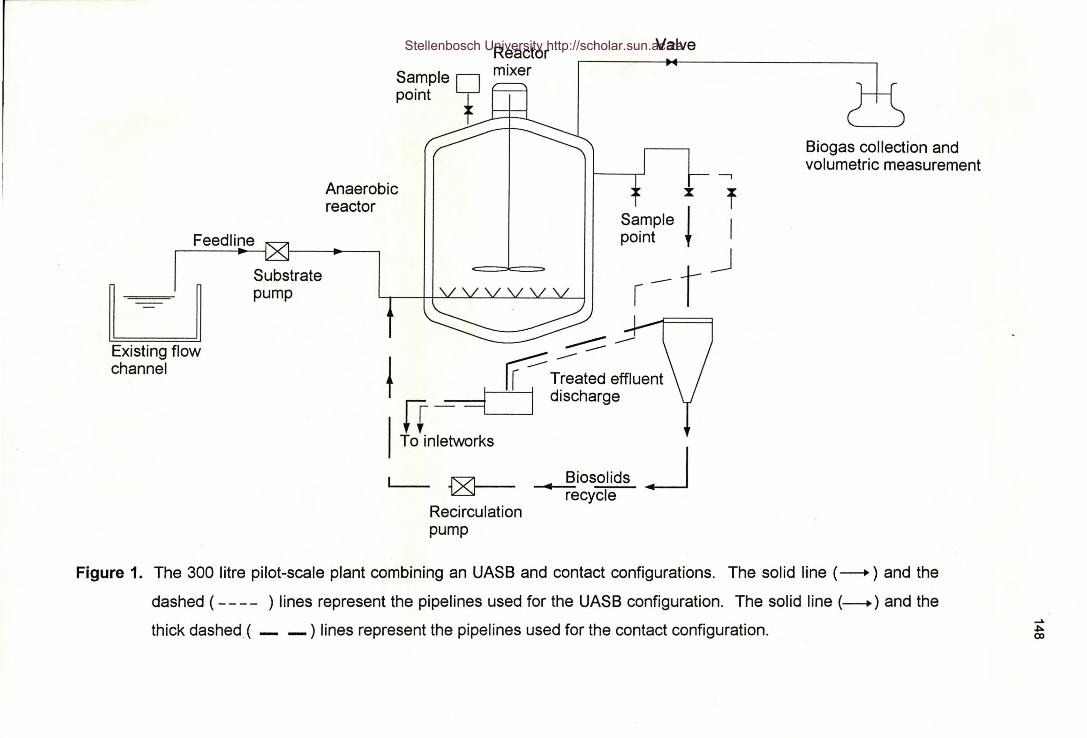
Anaerobicreactor
Feedline
LJExisting flowchannel
Substratepump
Reactormixer
Valve
Biogas collection andvolumetric measurement
Sample crpoint
~
--,
xSample I rpoint + I
r~t_j
~
--:::::. --rr:~ated effluent~ I dischargeIT
To inletworks ..Figure 1. The 300 litre pilot-scale plant combining an UASB and contact configurations. The solid line (--+) and the
dashed ( - - - - ) lines represent the pipelines used for the UASB configuration. The solid line (--+) and the
thick dashed ( _ _) lines represent the pipelines used for the contact configuration.
0-- Biosolids4- --recycle
Recirculationpump
......J>-eD
Stellenbosch University http://scholar.sun.ac.za
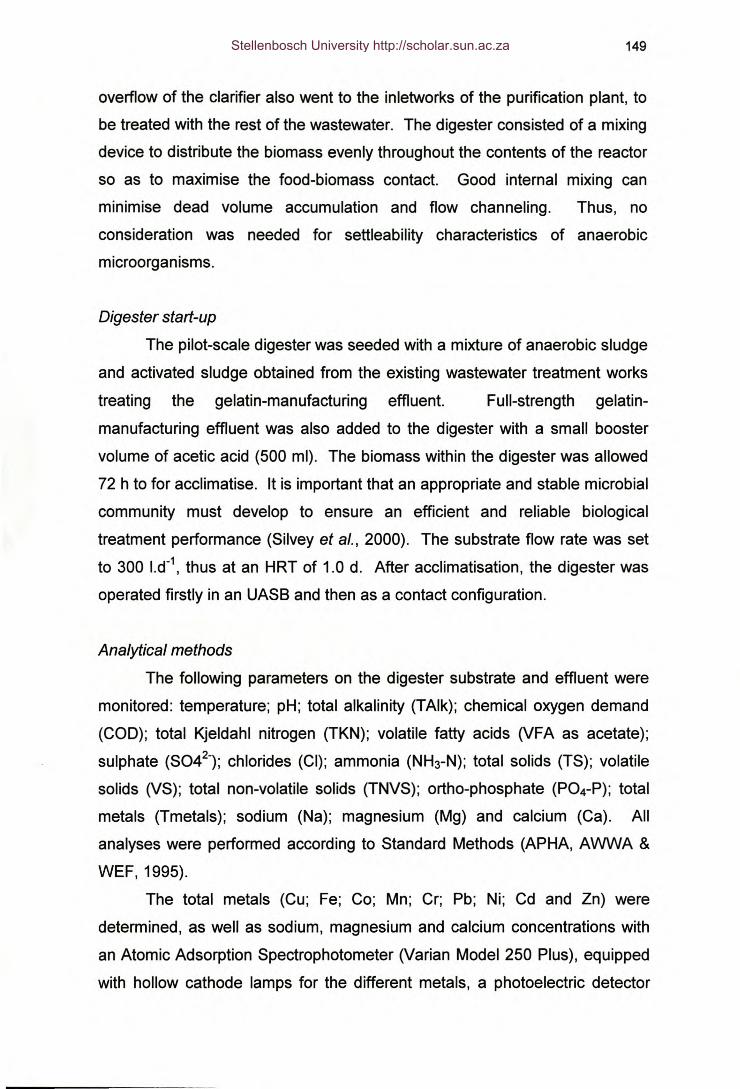
149
overflow of the clarifier also went to the inletworks of the purification plant, to
be treated with the rest of the wastewater. The digester consisted of a mixing
device to distribute the biomass evenly throughout the contents of the reactor
so as to maximise the food-biomass contact. Good internal mixing can
minimise dead volume accumulation and flow channeling. Thus, no
consideration was needed for settleability characteristics of anaerobic
microorganisms.
Digester start-up
The pilot-scale digester was seeded with a mixture of anaerobic sludge
and activated sludge obtained from the existing wastewater treatment works
treating the gelatin-manufacturing effluent. Full-strength gelatin-
manufacturing effluent was also added to the digester with a small booster
volume of acetic acid (500 ml). The biomass within the digester was allowed
72 h to for acclimatise. It is important that an appropriate and stable microbial
community must develop to ensure an efficient and reliable biological
treatment performance (Silvey et aI., 2000). The substrate flow rate was set
to 300 I.d-1, thus at an HRT of 1.0 d. After acclimatisation, the digester was
operated firstly in an UASB and then as a contact configuration.
Analytical methods
The following parameters on the digester substrate and effluent were
monitored: temperature; pH; total alkalinity (TAlk); chemical oxygen demand
(COD); total Kjeldahl nitrogen (TKN); volatile fatty acids 01FA as acetate);
sulphate (S042-); chlorides (Cl); ammonia (NH3-N); total solids (TS); volatile
solids (VS); total non-volatile solids (TNVS); ortho-phosphate (P04-P); total
metals (Tmetais); sodium (Na); magnesium (Mg) and calcium (Ca). All
analyses were performed according to Standard Methods (APHA, AWWA &
WEF,1995).
The total metals (Cu; Fe; Co; Mn; Cr; Pb; Ni; Cd and Zn) were
determined, as well as sodium, magnesium and calcium concentrations with
an Atomic Adsorption Spectrophotometer (Varian Model 250 Plus), equipped
with hollow cathode lamps for the different metals, a photoelectric detector
Stellenbosch University http://scholar.sun.ac.za
150
with associated electronic amplifying and measuring equipment.
Air/acetylene and nitrous oxide/acetylene burners were used with air as
oxidant and acetylene/nitrous oxide as fuel. Standards of known metal
concentrations were used to calibrate the instrument and also to verify the
accuracy of the data obtained.
Volatile fatty acids (as acetate) were determined according to the
titration method of Moosbrugger et al. (1992). The biogas production and
composition was measured volumetrically with a brine displacement system,
according to the quantitative biogas carbon dioxide content method of Ross et
al. (1992). The accuracy of all tested chemical parameters were confirmed by
the participation in an inter-laboratory water testing program (SABS Water
Check Proficiency Program).
Experimental studies
The study consisted of two experimental studies (I and II). In the first
study (I), the pilot-scale digester was operated as an UASB process
configuration for 25 weeks. In the second study (II), the digester was
operated as a contact process configuration for 14 weeks. Since the digester
was started during winter and was made of stainless steel, the need arises to
isolate the digester to maintain a constant temperature at all times. No other
external heat was applied to maintain the digester at a specific temperature.
The performance efficiencies of both the UASB and contact configurations
were evaluated under field conditions at an HRT of 1.0 d.
Results and discussion
Digester substrate
The average composition (Table 2) and large compositional variations
of the gelatin-manufacturing effluent was discussed in detail in Chapter 3 of
this thesis. The pilot-scale digester was fed directly from the gelatin-
manufacturing effluent discharge channel. No standardisation was done on
Stellenbosch University http://scholar.sun.ac.za
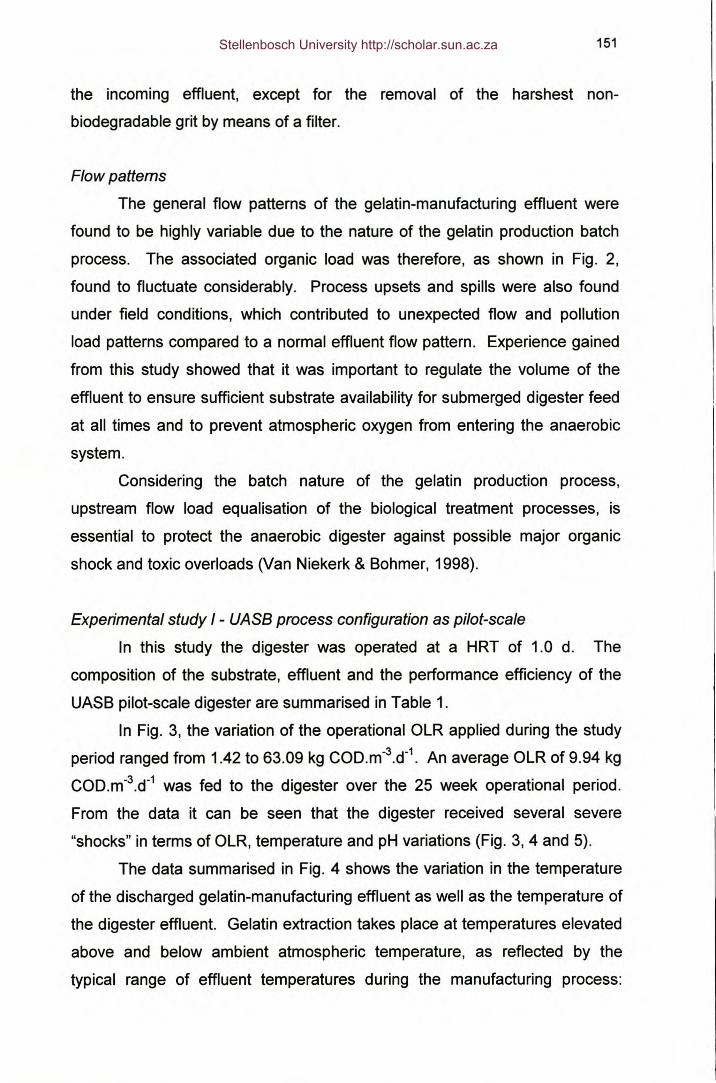
151
the incoming effluent, except for the removal of the harshest non-
biodegradable grit by means of a filter.
Flow patterns
The general flow patterns of the gelatin-manufacturing effluent were
found to be highly variable due to the nature of the gelatin production batch
process. The associated organic load was therefore, as shown in Fig. 2,
found to fluctuate considerably. Process upsets and spills were also found
under field conditions, which contributed to unexpected flow and pollution
load patterns compared to a normal effluent flow pattern. Experience gained
from this study showed that it was important to regulate the volume of the
effluent to ensure sufficient substrate availability for submerged digester feed
at all times and to prevent atmospheric oxygen from entering the anaerobic
system.
Considering the batch nature of the gelatin production process,
upstream flow load equalisation of the biological treatment processes, is
essential to protect the anaerobic digester against possible major organic
shock and toxic overloads (Van Niekerk & Bohmer, 1998).
Experimental study I - UASa process configuration as pilot-scale
In this study the digester was operated at a HRT of 1.0 d. The
composition of the substrate, effluent and the performance efficiency of the
UASB pilot-scale digester are summarised in Table 1.
In Fig. 3, the variation of the operational OLR applied during the study
period ranged from 1.42 to 63.09 kg COD.m-3.d-1. An average OLR of 9.94 kg
COD.m-3.d-1 was fed to the digester over the 25 week operational period.
From the data it can be seen that the digester received several severe
"shocks" in terms of OLR, temperature and pH variations (Fig. 3, 4 and 5).
The data summarised in Fig. 4 shows the variation in the temperature
of the discharged gelatin-manufacturing effluent as well as the temperature of
the digester effluent. Gelatin extraction takes place at temperatures elevated
above and below ambient atmospheric temperature, as reflected by the
typical range of effluent temperatures during the manufacturing process:
Stellenbosch University http://scholar.sun.ac.za
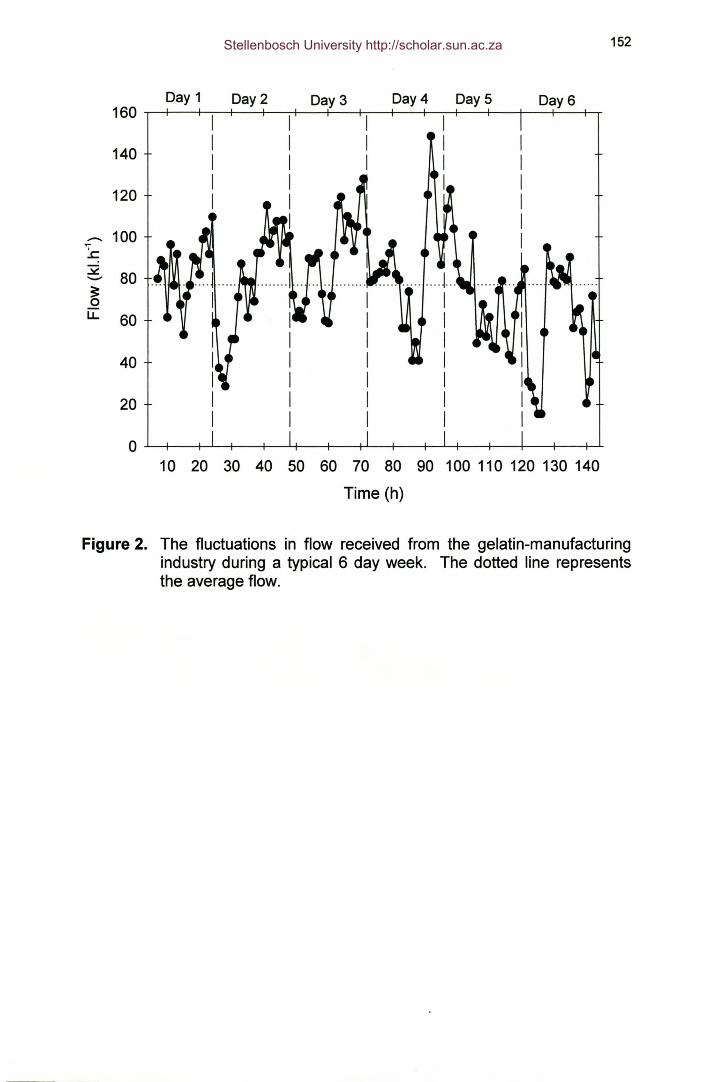
152
Day 2 Day 3 Day 4 Day 5 Day 6160~r-~~--+-~--r-~~--+-~--r-~~--~Day 1
20
140
120
- 100:.c~ 80~IL 60
40
10 20 30 40 50 60 70 80 90 100 110 120 130 140Time (h)
Figure 2. The fluctuations in flow received from the gelatin-manufacturingindustry during a typical 6 day week. The dotted line representsthe average flow.
Stellenbosch University http://scholar.sun.ac.za
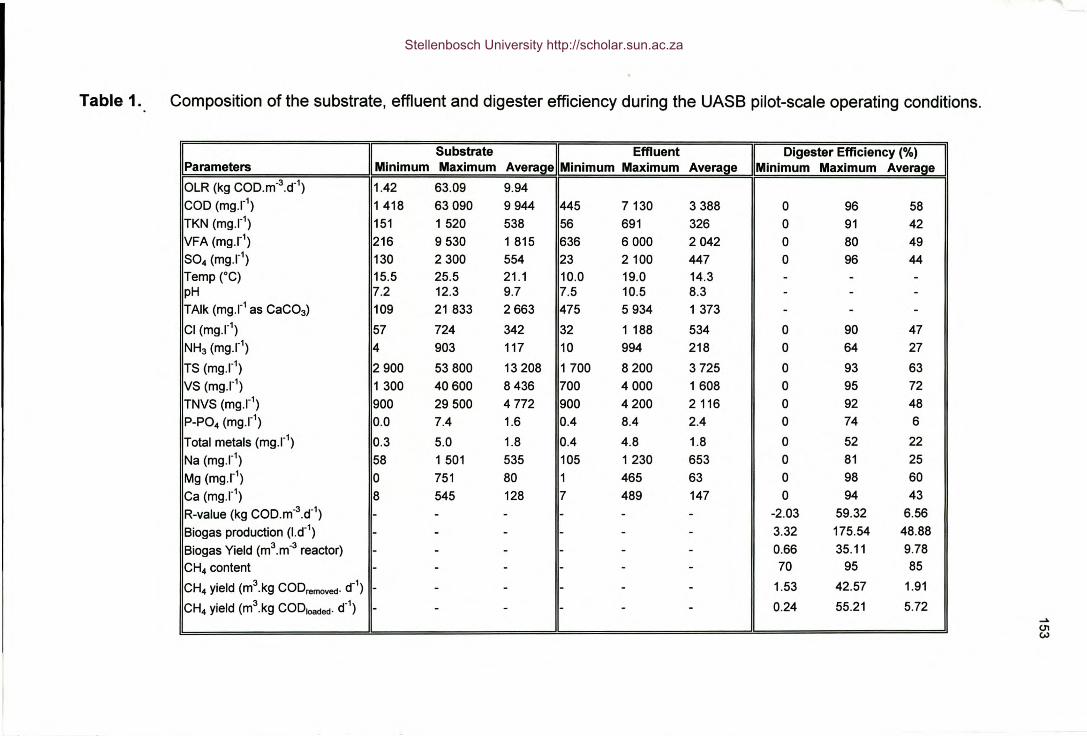
Table 1. Composition of the substrate, effluent and digester efficiency during the UASB pilot-scale operating conditions.
- --_.- - -- ------ ---I I Substrate Effluent Digester Efficiency (%)Parameters Minimum Maximum Average Minimum Maximum Average Minimum Maximum AverageOLR (kg COD.m-3.d-1) 1.42 63.09 9.94COD (mg.r1) 1 418 63090 9944 445 7130 3388 0 96 58TKN (mq.l") 151 1 520 538 56 691 326 0 91 42VFA (mq.l") 216 9530 1 815 636 6000 2042 0 80 49SOdmg.r1) 130 2300 554 23 2100 447 0 96 44Temp (0C) 15.5 25.5 21.1 10.0 19.0 14.3 - - -pH 7.2 12.3 9.7 7.5 10.5 8.3 - - -TAlk (mq.l" as CaC03) 109 21 833 2663 475 5934 1 373 - - -
Cl (mq.l") 57 724 342 32 1 188 534 0 90 47NH3 (rnq.l") 4 903 117 10 994 218 0 64 27
TS (rnq.l") 2 900 53 800 13 208 1 700 8 200 3 725 0 93 63VS (mq.l") 1 300 40600 8436 700 4000 1 608 0 95 72TNVS (mq.l") 900 29500 4772 900 4200 2116 0 92 48P-P04 (mq.l") 0.0 7.4 1.6 0.4 8.4 2.4 0 74 6
Total metals (rnq.l") 0.3 5.0 1.8 0.4 4.8 1.8 0 52 22Na (rnq.l") 58 1 501 535 105 1 230 653 0 81 25Mg (rnq.l") 0 751 80 1 465 63 0 98 60Ca (rnq.l") 8 545 128 7 489 147 0 94 43R-value (kg COD.m-3.d-1) - - - - - - -2.03 59.32 6.56Biogas production (l.d-1) - - - - - - 3.32 175.54 48.88Biogas Yield (m3.m-3 reactor) - - - - - - 0.66 35.11 9.78CH4 content - - - - - - 70 95 85
CH4 yield (m3.kg CODremoved'd-1) - - - - - - 1.53 42.57 1.91
CH4 yield (m3.kg CODloaded.d-1) - - - - - - 0.24 55.21 5.72......C11W
Stellenbosch University http://scholar.sun.ac.za
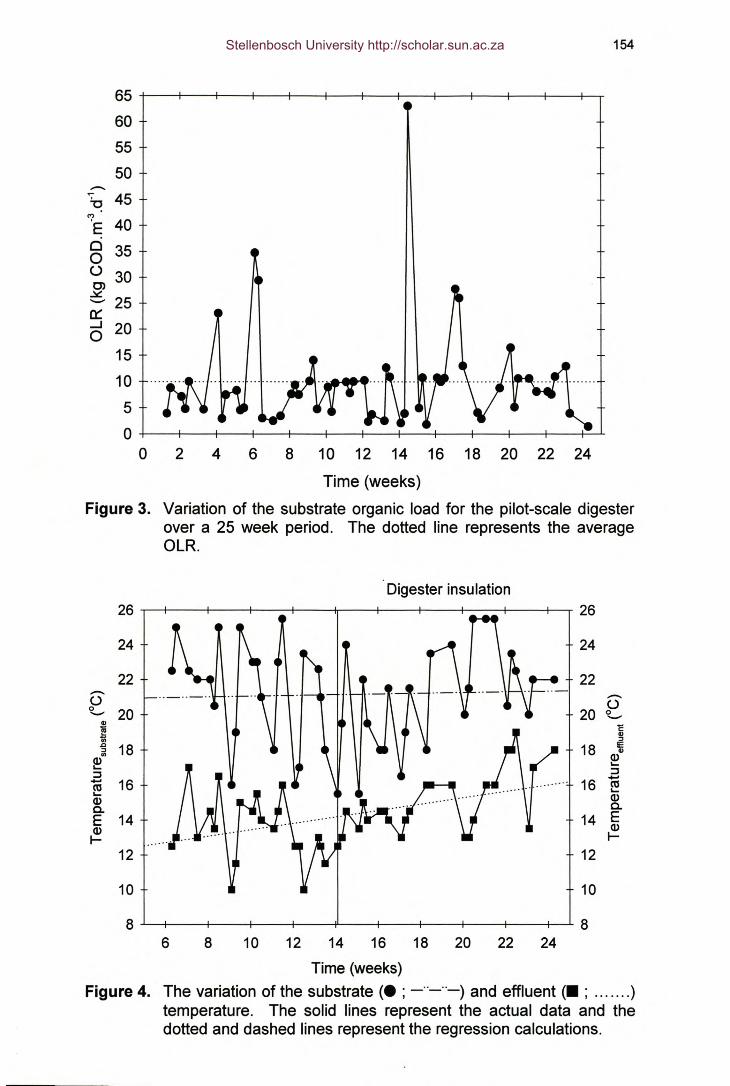
-U 45M'E 40o 35oo 30C>
~ 25a:::_J 20o
154
65+-~r--+---r--~--~_'---+--~--+---~~---+-r605550
15105o +-~~-+---r--~--~_'---+---r--+---r-_'---+~o 2 4 6 8 10 12 14 16 18 20 22 24
Time (weeks)
Figure 3. Variation of the substrate organic load for the pilot-scale digesterover a 25 week period. The dotted line represents the averageOLR.
Digesterinsulation26 26
24 24
22 22- -o o0 20- 20 0-.,ë
~ .,:::J
J:1 18 18 ~:::JCl) OJOJ ........ :::J:::J ........ 16 coco ........ OJOJa. a.
E 14 14 EOJ OJl- I-
12 12
10 10
8 86 8 10 12 14 16 18 20 22 24
Time (weeks)Figure 4. The variation of the substrate (. ; _ .._ .._) and effluent (. ; )
temperature. The solid lines represent the actual data and thedotted and dashed lines represent the regression calculations.
Stellenbosch University http://scholar.sun.ac.za
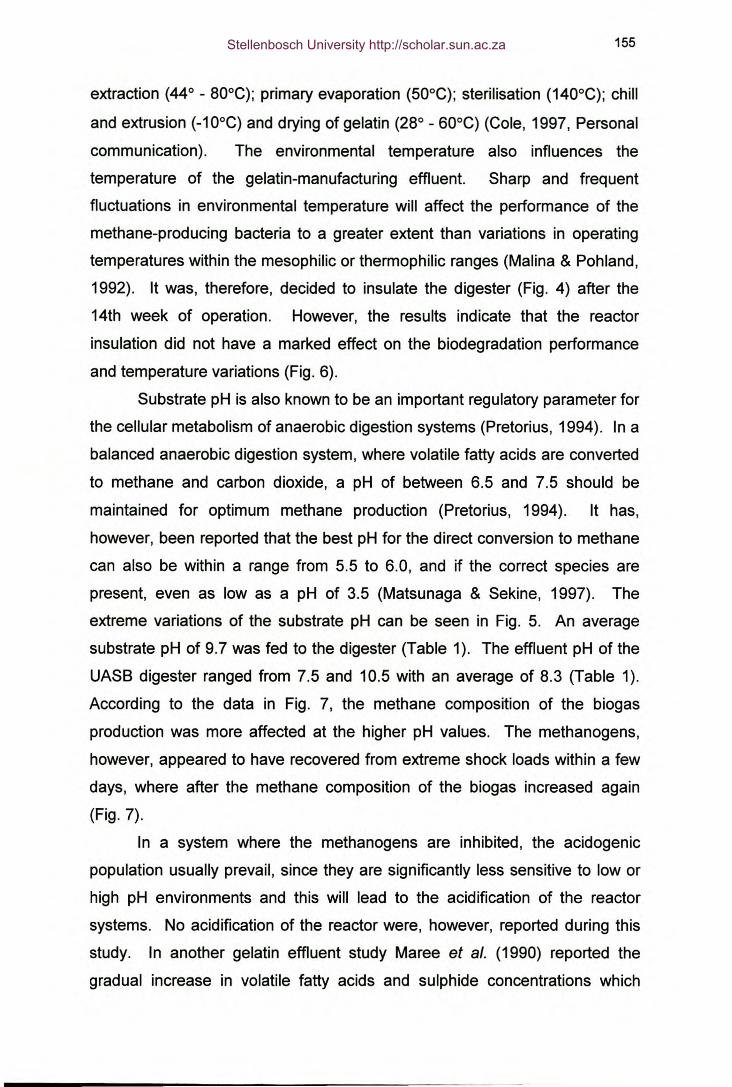
155
extraction (44° - 80°C); primary evaporation (50°C); sterilisation (140°C); chill
and extrusion (-10°C) and drying of gelatin (28° - 60°C) (Cole, 1997, Personal
communication). The environmental temperature also influences the
temperature of the gelatin-manufacturing effluent. Sharp and frequent
fluctuations in environmental temperature will affect the performance of the
methane-producing bacteria to a greater extent than variations in operating
temperatures within the mesophilic or thermophilic ranges (Malina & Pohland,
1992). It was, therefore, decided to insulate the digester (Fig. 4) after the
14th week of operation. However, the results indicate that the reactor
insulation did not have a marked effect on the biodegradation performance
and temperature variations (Fig. 6).
Substrate pH is also known to be an important regulatory parameter for
the cellular metabolism of anaerobic digestion systems (Pretorius, 1994). In a
balanced anaerobic digestion system, where volatile fatty acids are converted
to methane and carbon dioxide, a pH of between 6.5 and 7.5 should be
maintained for optimum methane production (Pretorius, 1994). It has,
however, been reported that the best pH for the direct conversion to methane
can also be within a range from 5.5 to 6.0, and if the correct species are
present, even as low as a pH of 3.5 (Matsunaga & Sekine, 1997). The
extreme variations of the substrate pH can be seen in Fig. 5. An average
substrate pH of 9.7 was fed to the digester (Table 1). The effluent pH of the
UASB digester ranged from 7.5 and 10.5 with an average of 8.3 (Table 1).
According to the data in Fig. 7, the methane composition of the biogas
production was more affected at the higher pH values. The methanogens,
however, appeared to have recovered from extreme shock loads within a few
days, where after the methane composition of the biogas increased again
(Fig.7).
In a system where the methanogens are inhibited, the acidogenic
population usually prevail, since they are significantly less sensitive to low or
high pH environments and this will lead to the acidification of the reactor
systems. No acidification of the reactor were, however, reported during this
study. In another gelatin effluent study Maree et al. (1990) reported the
gradual increase in volatile fatty acids and sulphide concentrations which
Stellenbosch University http://scholar.sun.ac.za
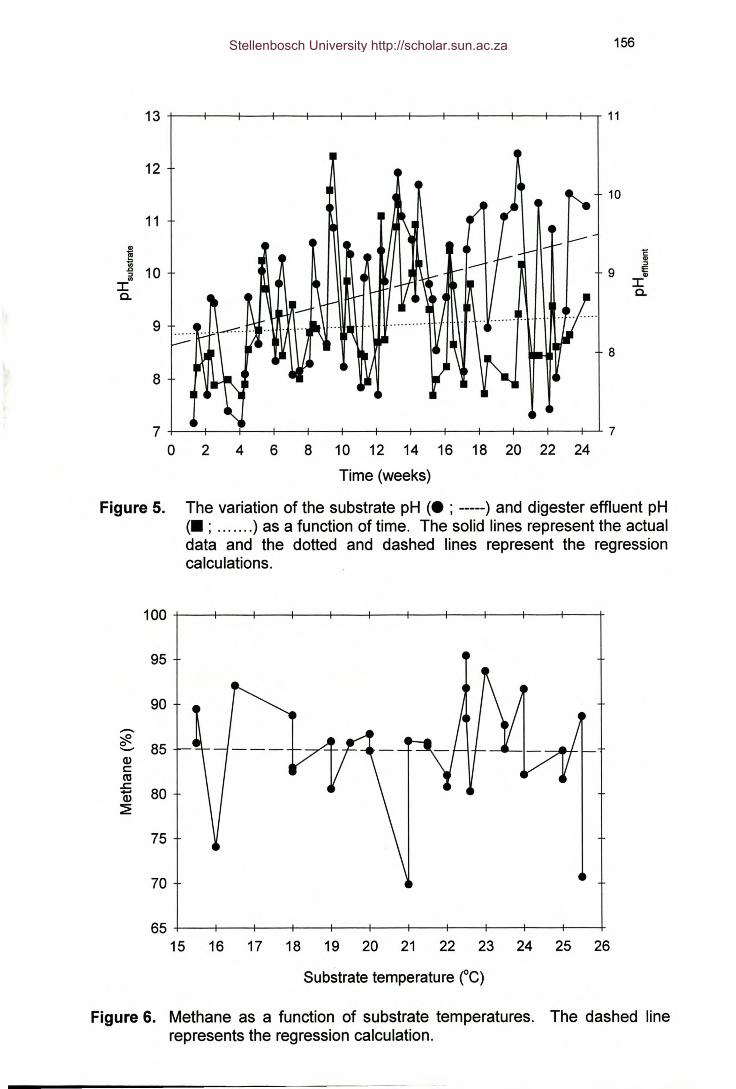
1210
11
i 'E'":::J.c 10 9 E
:::J '"UI IIa. a.
98
8
156
7 7o 2 4 6 8 10 12 14 16 18 20 22 24
Time (weeks)
Figure 5. The variation of the substrate pH (. ; -----) and digester effluent pH(. ; ) as a function of time. The solid lines represent the actualdata and the dotted and dashed lines represent the regressioncalculations.
100
95
90........
"*' 85-Q)c:cus: 80-Q)::2E
75
70
65 +-----+-----~----~~~~----~----~-----+-----+-----+-----+15 16 17 18 19 20 21 22 23 24 25 26
Substratetemperature(OC)
Figure 6. Methane as a function of substrate temperatures. The dashed linerepresents the regression calculation.
Stellenbosch University http://scholar.sun.ac.za
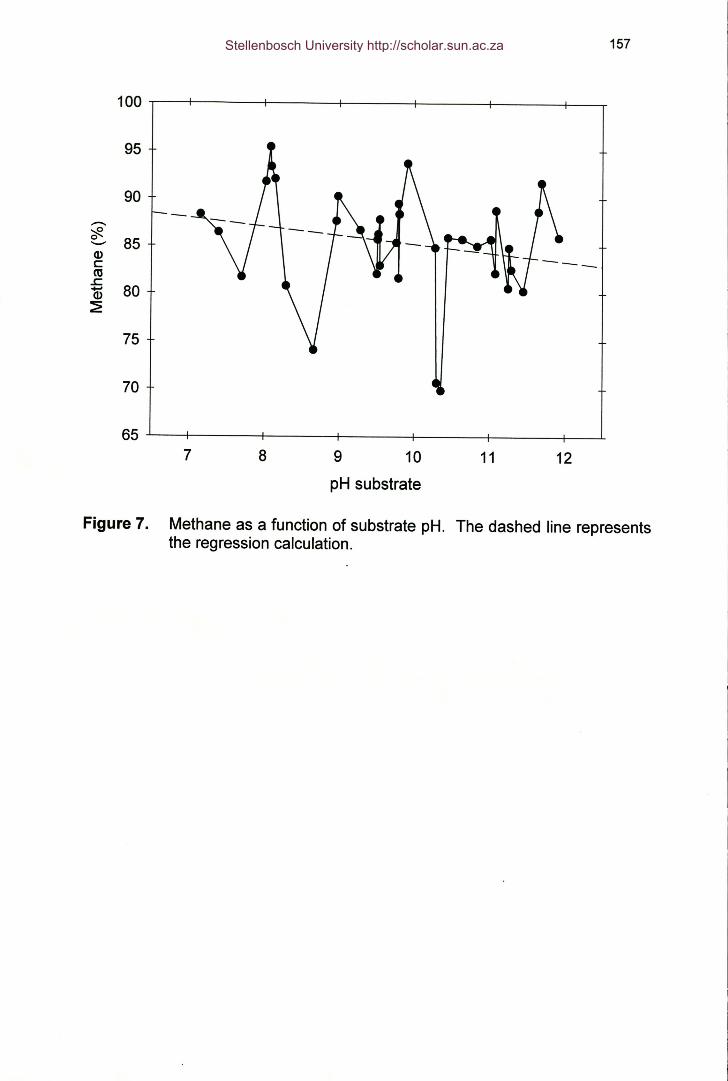
157
100
95
90.......~ 85...__.IDcca..c 80.....ID~
75
70
657 8 9 10 11 12
pH substrate
Figure 7. Methane as a function of substrate pH. The dashed line representsthe regression calculation.
Stellenbosch University http://scholar.sun.ac.za
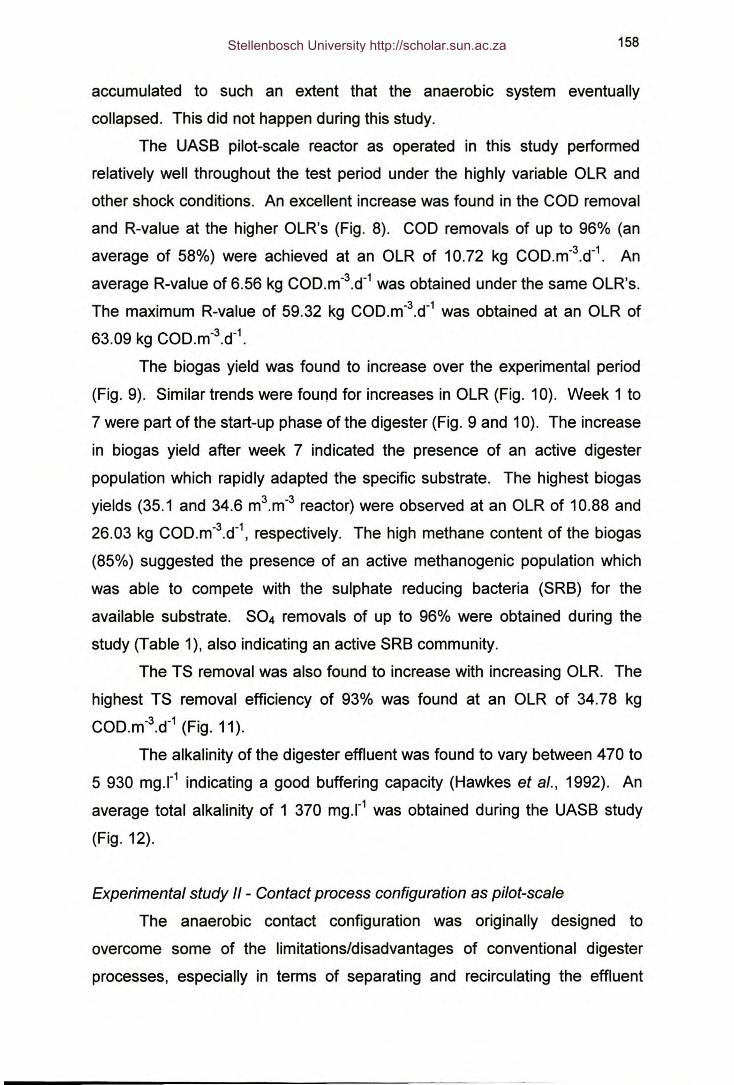
158
accumulated to such an extent that the anaerobic system eventually
collapsed. This did not happen during this study.
The UASB pilot-scale reactor as operated in this study performed
relatively well throughout the test period under the highly variable OLR and
other shock conditions. An excellent increase was found in the COD removal
and R-value at the higher OLR's (Fig. 8). COD removals of up to 96% (an
average of 58%) were achieved at an OLR of 10.72 kg COD.m-3.d-1. An
average R-value of 6.56 kg COD.m-3.d-1 was obtained under the same OLR's.
The maximum R-value of 59.32 kg COD.m-3.d-1 was obtained at an OLR of
63.09 kg COD.m-3.d-1.
The biogas yield was found to increase over the experimental period
(Fig. 9). Similar trends were found for increases in OLR (Fig. 10). Week 1 to
7 were part of the start-up phase of the digester (Fig. 9 and 10). The increase
in biogas yield after week 7 indicated the presence of an active digester
population which rapidly adapted the specific substrate. The highest biogas
yields (35.1 and 34.6 m3.m-3 reactor) were observed at an OLR of 10.88 and
26.03 kg COD.m-3.d-1, respectively. The high methane content of the biogas
(85%) suggested the presence of an active methanogenic population which
was able to compete with the sulphate reducing bacteria (SRB) for the
available substrate. S04 removals of up to 96% were obtained during the
study (Table 1), also indicating an active SRB community.
The TS removal was also found to increase with increasing OLR. The
highest TS removal efficiency of 93% was found at an OLR of 34.78 kg
COD.m-3.d-1 (Fig. 11).
The alkalinity of the digester effluent was found to vary between 470 to
5 930 rnq.l" indicating a good buffering capacity (Hawkes et aI., 1992). An
average total alkalinity of 1 370 rnq.l" was obtained during the UASB study
(Fig. 12).
Experimental study /I - Contact process configuration as pilot-scale
The anaerobic contact configuration was originally designed to
overcome some of the limitations/disadvantages of conventional digester
processes, especially in terms of separating and recirculating the effluent
Stellenbosch University http://scholar.sun.ac.za
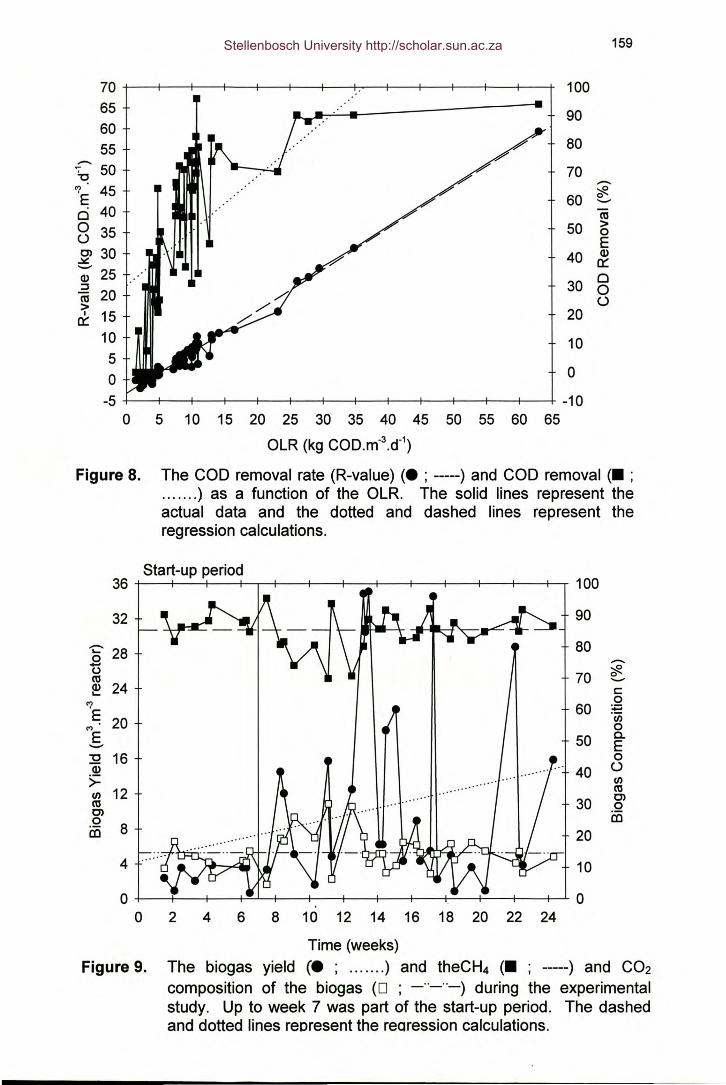
70656055- 50!o
'? 45E0 400 35oOl 30~;- 25~ 20>I 150::
1050-5
0
100908070 -:::R60 0
'-"
(ij50 >
0E
40 Q)0::
30 00o
20100-10
50 55 60 65
159
5 10 15 20 25 30 35 40 45OLR (kg COD.m-3.d-1)
Figure 8. The COD removal rate (R-value) (. ; -----) and COD removal (. ;....... ) as a function of the OLR. The solid lines represent theactual data and the dotted and dashed lines represent theregression calculations.
36Start-upperiod
100
32 90
'§' 28 80-o 70caQ) 24,_
'? 60E 20M
E 50'-"
'C 16ai>=CJ) 12caOloëC 8
4
c:oECJ)oa.EooCJ)caOloëC
o 2 4 6 8 10 12 14 16 18 20 22 24Time (weeks)
Figure 9. The biogas yield (. ; ....... ) and theCH4 (. ; -----) and C02composition of the biogas (0 ; _ .._ .._) during the experimentalstudy. Up to week 7 was part of the start-up period. The dashedand dotted lines represent the rearession calculations.
30
20
10O-+---+--+---t=-.l...-f--+--+---+--+--+---t--t--+--'-O
Stellenbosch University http://scholar.sun.ac.za
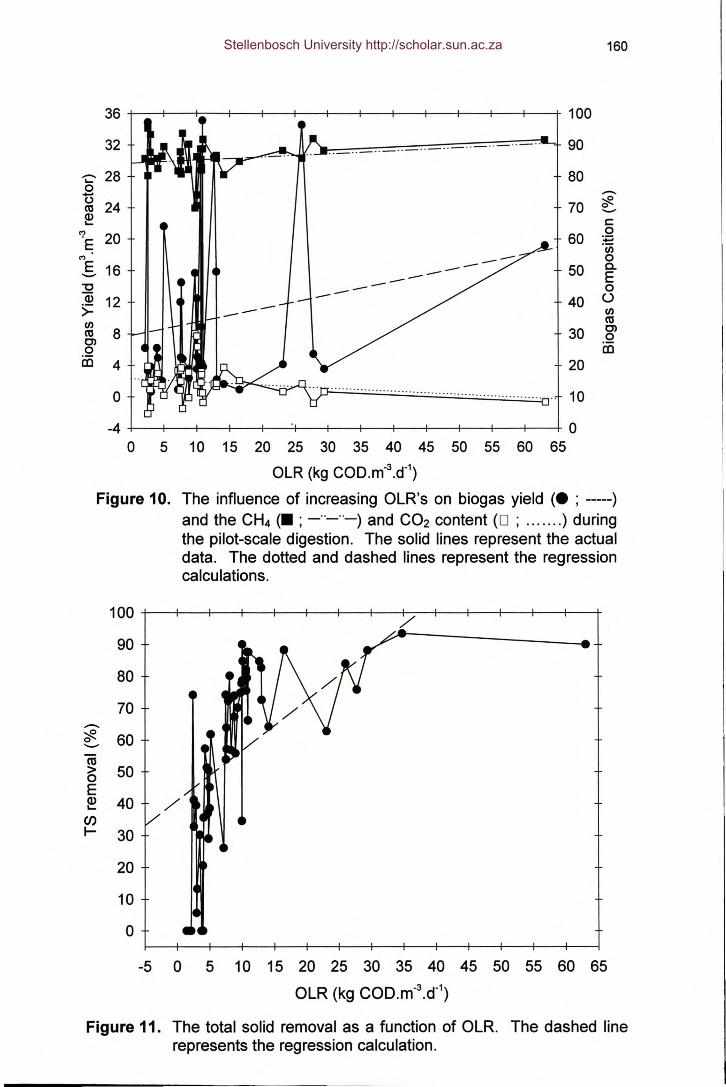
160
36+--+--~--~~--+--+--1---~~--+--+--1---+32
o
-4 0o 5 10 15 20 25 30 35 40 45 50 55 60 65
OLR (kg eOD.m-3.d-l)
Figure 10. The influence of increasing OLR's on biogas yield (. ; -----)and the CH4 (. ; _ .._ .._) and CO2 content (0 ; ) duringthe pilot-scale digestion. The solid lines represent the actualdata. The dotted and dashed lines represent the regressioncalculations.
'i:' 28ouca 24~
'? 20E(')
5 16""C
.~ 12>-~ 8Cl.QOl 4
100.._ ..-- _ .._ .. 90.._.,- ..-"_"-
80 -70 ~0-c:60 0
:.;::;"iii0-- 50 Cl.-- E-- 0- 40 oI/)ca
30 Cl0ii5
20............... ......... .. 10
100 /'908070
...-..:::R 600-cu> 500EID 40 /'l-
C/)I- 30
20100
~ 0 5 10 15 20 25 30 35 40 45 50 55 60 65OLR (kg COD.m-3.d-l)
Figure 11. The total solid removal as a function of OLR. The dashed linerepresents the regression calculation.
Stellenbosch University http://scholar.sun.ac.za
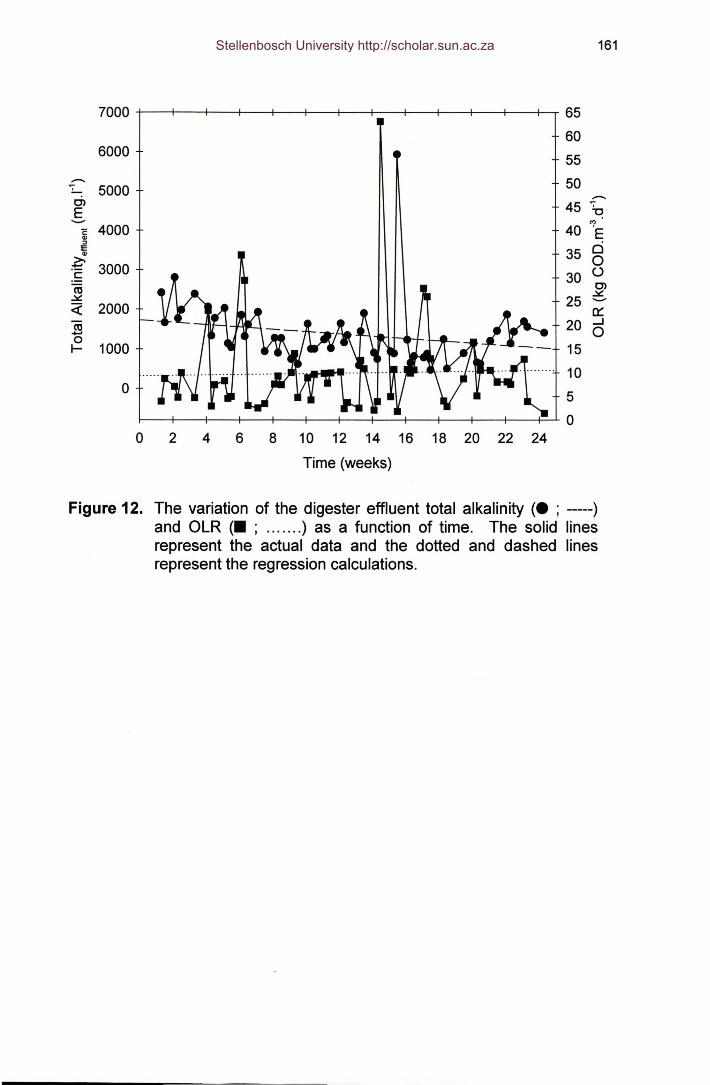
161
7000 6560
6000 555000 50-
C>..-..
E 45 \,......... '?
'E 4000 40 EIl>::J
0IE 35Il>
~ 0c 3000 30 ons C>.::,c:,.::,c:, 25 .........oe{ 2000 0::::ns 20 _...... 00I- 1000 15
100 5
00 2 4 6 8 10 12 14 16 18 20 22 24
Time(weeks)
Figure 12. The variation of the digester effluent total alkalinity (. ; -----)and OLR (. ; ) as a function of time. The solid linesrepresent the actual data and the dotted and dashed linesrepresent the regression calculations.
Stellenbosch University http://scholar.sun.ac.za
162
suspended solids back to the anaerobic reactor (Malina & Pohland, 1992).
The separation and the recirculation of the biomass using this configuration
has the advantage of retaining both the active microorganisms as well as the
slowly biodegradable suspended solids, thus promoting a more complete
biodegradation of wastewater particles. A possible problem that can be
expected while using anaerobic contact systems is that the configuration is
heavily dependent on the settling properties of the anaerobic sludge (Malina
& Pohland, 1992). Active anaerobic sludge flocs are usually associated with
biogas, thus solids settleability may be problematic.
The contact process configuration as used in this study (Fig. 1),
suffered from constant blocking (grit, fat, salts and calcium carbonate) in the
feed and recirculation lines. Relatively poor performances were achieved in
COD, S04, VFA, TS and VS removals, (a maximum of 41, 62, 64, 39 and
60%, respectively) at a HRT of 1.0 d (Table 2). A relatively low digester total
alkalinity (1 257 rnq.l") was apparent throughout the study of 14 weeks,
indicating a poor system buffering capacity. The high reactor effluent pH
(over 8.1) (Table 2) did influence the complete conversion of fatty acids to
methane by inhibiting the rate of methanogenesis, when considering the
optimal pH for methanogenesis is between 6.5 and 7.5 (Pretorius, 1994).
The volume of biogas produced was low, but when biogas production
could be measured an average of 86% methane content was present in the
biogas. This indicated that, although constant blocking was experienced, the
contact configuration could be effective if the current problems could be
eliminated. The high methane production indicated that an active
methanogenic population were present. Furthermore, solid washout occurred
from time to time. Various researchers have previously reported problems
with foaming and scum formation while treating a gelatin effluent containing
high protein and lipid contents (Tommaso et aI., 1999). This again induced
sludge flotation and led to solids and biomass washout.
Stellenbosch University http://scholar.sun.ac.za
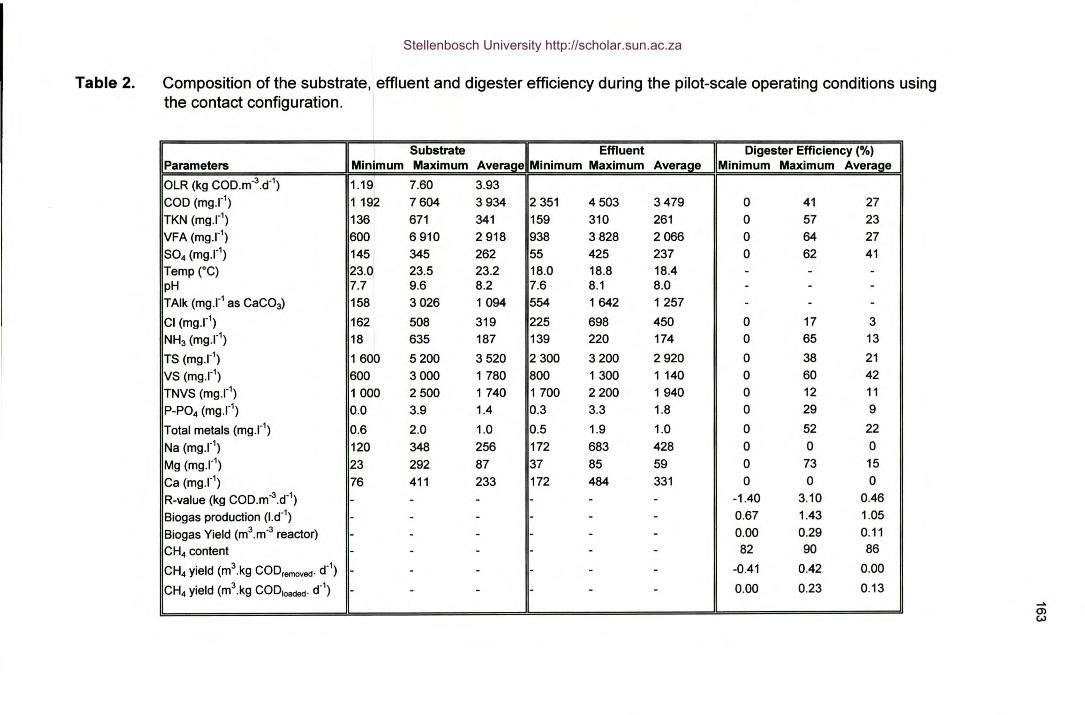
Table 2. Composition of the substrate, effluent and digester efficiency during the pilot-scale operating conditions usingthe contact configuration. I
IParametersI I Substrate Effluent Digester Efficiency (%). Min~mum Maximum Average Minimum Maximum Average Minimum Maximum Average
OLR (kg COD.m-3.d-1) 1.19 7.60 3.93COD (rnq.l") 1 192 7604 3934 2351 4503 3479 0 41 27TKN (mq.l") 136 671 341 159 310 261 0 57 23VFA (mq.l") 600 6910 2918 938 3828 2 066 0 64 27S04 (mq.l") 145 345 262 55 425 237 0 62 41Temp ("C) 23.0 23.5 23.2 18.0 18.8 18.4 - - -pH 7.7 9.6 8.2 7.6 8.1 8.0 - - -TAlk (rnq.l" as CaC03) 158 3 026 1094 554 1642 1257 - - -Cl (rnq.l") 162 508 319 225 698 450 0 17 3NH3 (rnq.l") 18 635 187 139 220 174 0 65 13
TS (mq.I") 1600 5200 3520 2300 3200 2920 0 38 21VS (mq.l") 600 3 000 1 780 800 1300 1140 0 60 42TNVS (rnq.l") 1000 2500 1740 1700 2200 1940 0 12 11P-P04 (mq.l") 0.0 3.9 1.4 0.3 3.3 1.8 0 29 9
Total metals (rnq.l") 0.6 2.0 1.0 0.5 1.9 1.0 0 52 22Na (mgX1
) 120 348 256 172 683 428 0 0 0Mg (rnq.l") 23 292 87 37 85 59 0 73 15Ca (rnq.l") 76 411 233 172 484 331 0 0 0 I
R-value (kg COD.m-3.d-1) - - - - - - -1.40 3.10 0.46I
Biogas production (l.d-1) - - - - - - 0.67 1.43 1.05Biogas Yield (m3.m-3 reactor) - - - - - - 0.00 0.29 0.11CH4content - - - - - - 82 90 86
CH4yield (m3.kg CODremoved.d-1) - - - - - - -0.41 0.42 0.00
CH4yield (m3.kg CODloaded.d-1) - - - - - - 0.00 0.23 0.13......(»w
Stellenbosch University http://scholar.sun.ac.za
164
Operational Problems
Several major problems were experienced during the studies while using the
UASB and contact process configurations and included the following:
1. The nature of the effluent plays an important role in the determination of
the removal efficiency of the organic matter while being treated
anaerobically. As used in this study, the effluent contained non-
biodegradable material such as hair, grit, fats, reject hide pieces and large
sludge volumes, which are part of the gelatin-manufacturing process. Due
to the nature of the effluent, a filter had to be inserted at the beginning of
the feedline to prevent hair and large grit/solids particles from entering the
system. However, this resulted in clogging of the filter and the filter had to
be cleaned regularly. The result of the filter being clogged was that no
substrate could enter the feedline, thereby causing a vacuum in the
feedline which affected peristaltic pumping negatively;
2. The gelatin-manufacturing industry utilises a batch process and therefore
discharge variable volumes of effluent. To eliminate this problem and to
ensure a submerged system at all times, a sluice was incorporated to
regulate and ensure a regular flow of the effluent, since the digester
system was fed continuously. The sluice channel had to be cleaned daily
to prevent the build-up of solids/sludge/grit in the channel;
3. Problems were also experienced with the blocking of the feedline as the
main channel was situated ± 20 m from the digester. With time, fats and
grit accumulated in the feedline and led to blockages that had to be
removed regularly;
4. As previously stated more problems were experienced during the
operation of the contact process. The solids present in the digester were
forced into the outlet of the digester, which resulted in further down-stream
blockages preventing the effluent to exit the system. This was followed by
an increased pressure in the digester which forced the contents of the
digester in the opposite direction back to the main channel through the
feedline of the digester; and
Stellenbosch University http://scholar.sun.ac.za
165
5. Another problem experienced during the contact process was at the cone
shaped clarifier. The effluent of the digester exited via the top into the
clarifier. The biosolids were then extracted at the bottom of the clarifier to
be recirculated with a peristaltic pump, back into the digester. These
settled solids often blocked the bottom of the clarifier. Therefore, no
effluent could be recirculated and a vacuum was created in the
recirculation lines, which affected the recirculation pump negatively. It was
vital to clean the clarifier regularly by forcing air or substrate into the
pipelines to remove all blockages.
All these problems emphasised the need for the continuous attention and
monitoring of the pilot-scale digester, especially the contact process, to
prevent failure. The above mentioned problems are typical operational
problems that must be taken into consideration when planning a full-scale
reactor.
Conclusion
Gelatin-manufacturing effluents contain relatively high concentrations
of nominal or slowly biodegradable organic compounds. It was taken that,
due to the highly variable nature and the complex composition of the effluent,
biological breakdown would be a slow process. Hence, it was decided to
evaluate different high-rate anaerobic digester configurations to determine the
ideal design and conditions for optimal biological breakdown. In previous
studies (Chapters 3, 4 and 5) the laboratory-scale UASB and contact
digesters proved that successful breakdown of the compounds can be
obtained.
As a continuance to the results of the laboratory-scale digesters, a 300
litre pilot-scale digester was subsequently evaluated in this study under actual
field conditions. From the results obtained during the two experimental
studies (I and II) it was found that the UASB pilot plant (Study I) can be
efficiently used as a pre-treatment option for this effluent. There was no need
for chemical pre-treatment of the effluent, such as neutralisation of pH, before
Stellenbosch University http://scholar.sun.ac.za
166
anaerobic digestion. Maximum performance efficiencies were achieved with
COD, TS, VFA and S04 of up to 96, 93, 80 and 96%, respectively for the
UASB configuration. Relatively few operational problems were experienced
with this configuration.
The contact process (Study II) only gave maximum removals of up to
41, 39, 64 and 62% of COD, TS, VFA and S04, respectively. Continuous
operational problems were, however, experienced during the contact process
due to the constant blocking of the reactor system, and specifically, sludge
wash-out was experienced during the different stages while using this
configuration. Tommaso et al. (1999) also reported the wash-out of biomass
while treating a complex protein and lipid containing gelatin effluent using a
similar reactor configuration.
One possible reason for the successful start-up of the anaerobic
digesters can be the use of well-acclimatised sludge, which may already have
a highly selective and adapted microbial consortium for the gelatin-
manufacturing effluent, another good advantage for the construction of a
possible full-scale digester. The problems experienced during this study,
especially with the contact configuration should be addressed appropriately.
References
APHA, AWWA & WEF (1995). Standard Methods for the Examination of
Water and Wastewater (19th ed.), American Public Health Association,
Washington DC, USA
Cole, C.G.B. (1997). Personal communication, Leiner Davis Gelatin S.A.
(Pty.) Ltd., Krugersdorp, South Africa.
Hawkes, F.R., Rozzi, A, Black, K., Guwy, A & Hawkes, D.L. (1992). The
stability of anaerobic digesters operating on a food-processing
wastewater. Water Science and Technology, 25, 73-82.
Stellenbosch University http://scholar.sun.ac.za
167
Malina. J.F. & Pohland, F.G. (1992). Anaerobic sludge digestion. In: Design of
Anaerobic Processes for the Treatment of Industrial and Municipal
Wastes, Volume 7, (F.G. Pohland & J.F. Malina, eds.), Techonomie
Publishing Company: Pennsylvania, Pp. 167-212.
Maree, J.P., Cole, C.G.B., Gerber, A & Barnard, J.L. (1990). Treatment of
gelatin factory effluent. Water SA, 16, 265-268.
Matsunaga, A & Sekine, T. (1997). The pH depending properties and the
inhibition of un-ionized volatile fatty acids in the methane fermentations
of some lower alcohols and volatile fatty acids. In: Proceedings of the
8th International Conference on Anaerobic Digestion (Volume 3.)
Sendai, Japan, Pp. 5-8.
Moosbrugger, RE., Wentzel, M.C., Ekama, G.A & Marais, G.v.R (1992).
Simple titration procedures to determine H2C03 alkalinity and short-
chain fatty acids in aqueous solutions containing known concentrations
of ammonium, phosphate and sulphide weak acid/bases. WRC Report
No TT 57/92. Published by the Water Research Commission, P.O. Box
824, Pretoria 0001, South Africa.
Pretorius, W.A (1994). pH-controlled feed-on-demand for high-rate anaerobic
systems. Water Science and Technology, 30 (8), 1-8.
Ross, W.R, Novella, P.H., Pitt, AJ., Lund, P., Thomson, B.A, King, P.B. &
Fawcett, K.S. (1992). Anaerobic digestion of waste-water sludge:
Operating guide. WRC Report No 390 TT 55/92. Published by the
Water Research Comission, P.O. Box 824, Pretoria 0001, South Africa.
Silvey, P., Pullammanappallil, P.C., Blackall, L. & Nichols, P. (2000). Microbial
ecology of the leach bed anaerobic digestion of unsorted municipal
solid waste. Water Science and Technology, 41(3),9-16.
Tommaso, G., Varesche, M.B., Zaiat, M., Vazzoler, RF. & Foresti, E. (1999).
Formation, microbial characterization and kinetics of anaerobic biofilms
in polyurethane foam differential reactors treating gelatin containing
wastewater. In: Proceedings of the 4th IAWQ-IWA Conference on
Biofilms Systems, October 17-20, New York, USA
Stellenbosch University http://scholar.sun.ac.za
168
Van Haandel, A.C. & Lettinga, G. (1994). Application of anaerobic digestion to
sewage treatment. In: Anaerobic Sewage Treatment: A Practical Guide
for Regions with a Hot Climate. John Wiley & Sons, Ltd.: New York,
Pp.33-62.
Van Niekerk, A.M. & Bohmer, V.J. (1998). Biological wastewater treatment in
the pulp and paper industry. In: Biennial Conference and Exhibition of
the Water Institute of Southern Africa, Vol. 1, Paper 1A-2, Pp. 1-8.
Baxter Theatre Centre, Cape Town.
Stellenbosch University http://scholar.sun.ac.za
169
CHAPTER 7
GENERAL DISCUSSION, CONCLUSIONS AND RECOMMENDATIONS
Background
Adequate long term conservation and management of South Africa's water
resources is of vital importance for sustained economic growth and
development. The country is situated in a semi-arid region where rainfall and
waterbodies are unevenly distributed. The rapidly expanding demand arising
from positive population growth and demographic changes has resulted in
water becoming increasingly scarce in many parts of South Africa. Greater
pollution loads and reduced flows in the country's rivers, due to the expanding
demand, will in future place additional pressure on the already limited water
resources. For these reasons water must be treated, whether to produce
water for general consumption, or for specific industrial uses, or to limit the
discharge of pollution into the environment. Nationally, local authorities are
thus forced to implement higher trade-effluent charges, especially to
wastewater producing industries, in an attempt to reduce the pollution load on
conventional purification facilities and to minimise downstream water and
environmental pollution. The purification facilities often experience difficulties
with the treatment of discharged wastewaters, due to the noxious nature of
the effluents. These effluents often inhibit biological treatment processes,
consequently resulting in higher chemical dosing demands, operational
problems and inefficient treatment of the sewage.
One such industrial effluent which has recently received much
attention, is that of the gelatin-manufacturing industry. This is the only
industry in South Africa that produces edible and technical gelatin and is
situated in Krugersdorp, Gauteng. During this process, reject hides received
from abattoirs and tanneries are conditioned, treated and processed.
Insoluble hide collagen is converted into water soluble gelatin through a
process of alkali conditioning, protein hydrolysis and denaturation (Maree et
ai., 1990). The gelatin-manufacturing industry use approximately 57 000 MI
Stellenbosch University http://scholar.sun.ac.za
170
of water per month, based on a 6 working day operation. The effluent which
the industry produce varies considerably in volume as a result of the large
volume of water consumption. The organic strength also varies from batch to
batch, and typically has an alkaline nature with high concentrations of COD,
SS, fats, lipid emulsions, protein and salts.
The composition of the effluent has a negative influence on the
biological treatment processes of the local wastewater purification works. The
main problems that have been experienced include a loss of nitrification and
denitrification ability, reduced ortho-phosphate (P-P04) and chemical oxygen
demand (COD) removal, as well as biosolid carry-over during secondary
clarification. Approximately 12% (v/v) of the total flow received at this specific
purification works and 65% of the organic load into the purification works, are
contributed by the gelatin-manufacturing industry.
Considering the impact of these high and irregular organic discharges
to the purification works and the subsequent high trade-effluent charges paid
by the industry, it was decided to find a mutually suitable pre-treatment
method to deal with the effluent before discharging to the local purification
works.
Pre-treatment options
Considering the various options available (physical vs chemical vs biological)
for the treatment of industrial effluents, anaerobic biological treatment with
concomitant production of methane has distinct advantages over other
processes. Recognition of these benefits have resulted in the wide
international application of anaerobic processes, mainly because it compares
favourably with the costly physical and chemical technologies.
Very little application data are unfortunately available on the biological
and anaerobic treatment of gelatin-manufacturing effluent (Maree et aI., 1990;
Du Plessis et aI., 1993; Petruy et aI., 1999; Tommaso et ai., 1999).
Numerous studies have, however, been done on the biological treatment of
Stellenbosch University http://scholar.sun.ac.za
171
similar tannery and high salinity wastewaters (Shipin et al., 1994; Petruzelli et
al., 1995; Dalmacija et al., 1996; Rajala & Petrovskaya, 1996).
The successful improvements of the basic digester design has over the
last decade led to a remarkable improvement in the removal efficiencies of
compounds present in effluents, compared to the conventional anaerobic
systems. Among these designs, UASB digesters have become one of the
most extensively used designs for treatment of high-strength wastewaters
(Lettinga et al., 1997).
Against this background, this study was conducted to evaluate the
performance of different laboratory and pilot-scale anaerobic digester
configurations for the pre-treatment of the gelatin-manufacturing effluent.
This was also done to obtain a suitable database for future reference in
reactor upscaling and application of anaerobic effluent treatment.
Laboratory-scale investigation
Different experimental studies were conducted on laboratory-scale anaerobic
digesters to determine the optimal operational conditions and digester design.
The studies included three single-phase UASB anaerobic digesters (AD-
1;polyethylene, AD-2; polyurethane, AD-3; contact) and a multi-phase unit
(AD-1 + AD-2). For the laboratory-scale studies, with the exception of pH
adjustment to 6.5 and implementation of mesophilic temperatures, no
standardisation was done on the effluent in an attempt to simulate actual field\
conditions. The laboratory-scale digesters were started at a hydraulic
retention time (HRT) of 3.0 d and the HRT was subsequently decreased to
1.0 d after stable state conditions had been reached. The average
operational efficiencies of the four laboratory-scale systems treating gelatin-
manufacturing effluent, are summarised in Table 1.
Single-phase systems
In the first study (AD-1), an upflow hybrid digester, fitted with
polyethylene foam as fixed-film basis, was evaluated while treating the full-
Stellenbosch University http://scholar.sun.ac.za
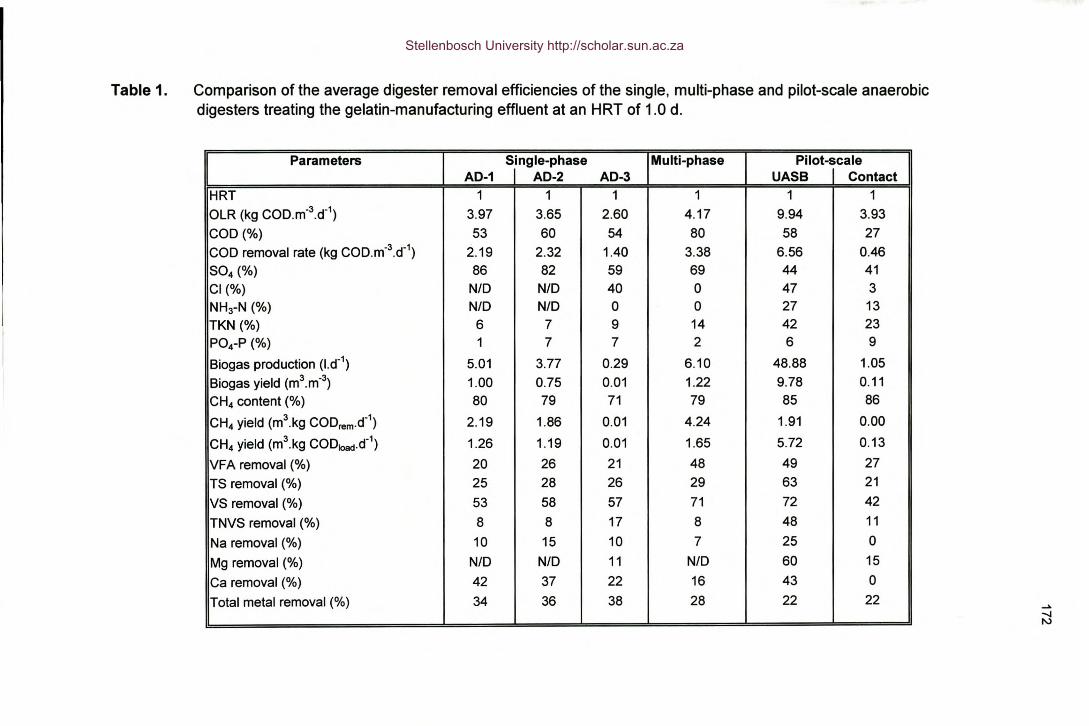
Table 1. Comparison of the average digester removal efficiencies of the single, multi-phase and pilot-scale anaerobicdigesters treating the gelatin-manufacturing effluent at an HRT of 1.0 d.
Parameters Single-phase Multi-phase Pilot-scaleAD-1 AD-2 AD-3 UASB Contact
HRT 1 1 1 1 1 1OLR (kg COD.m-3.d-1) 3.97 3.65 2.60 4.17 9.94 3.93COD (%) 53 60 54 80 58 27COD removal rate (kg COD.m-3.d-1) 2.19 2.32 1.40 3.38 6.56 0.46S04 (%) 86 82 59 69 44 41Cl (%) NfD NfD 40 0 47 3NH3-N (%) NfD NfD 0 0 27 13TKN(%) 6 7 9 14 42 23P04-P (%) 1 7 7 2 6 9
Biogas production (l.d-1) 5.01 3.77 0.29 6.10 48.88 1.05Biogas yield (m3.m-3) 1.00 0.75 0.01 1.22 9.78 0.11CH4 content (%) 80 79 71 79 85 86
CH4 yield (m3.kg CODrem.d-1) 2.19 1.86 0.01 4.24 1.91 0.00
CH4 yield (m3.kg CODload.d-1) 1.26 1.19 0.01 1.65 5.72 0.13
VFA removal (%) 20 26 21 48 49 27TS removal (%) 25 28 26 29 63 21VS removal (%) 53 58 57 71 72 42TNVS removal (%) 8 8 17 8 48 11Na removal (%) 10 15 10 7 25 0
Mg removal (%) NfD NfD 11 NfD 60 15Ca removal (%) 42 37 22 16 43 0Total metal removal (%) 34 36 38 28 22 22 _..
-....I~
Stellenbosch University http://scholar.sun.ac.za
173
strength gelatin-manufacturing effluent. The highest COD removal (90%) and
organic removal rate (R-value) (8.6 kg COD.m-3.d-1)was observed at an OLR
of 9.56 kg COD.m-3.d-1(Chapter 3). However, other process parameters were
found to vary considerately, both as a function of time and of OLR. These
variations were indicative of the adverse influence of the unstable and
inconsistent substrate composition on the performance of the succeeding
microbial populations. Good results were obtained with S04 removals (up to
96%), indicating the presence of an active SRB community working in
balance with the system methanogenic population. The methane content
varied between 70 and 88%, with an average methane yield per COD
removed of 2.2 m3.kg CODremoved.d-1.The alkalinity of digester AD-1 varied
between 100 to 3 300 rnq.l" showing good buffering capacities to neutralise
possible toxic and I or loads. These alkalinity levels exceeded the
recommended limit of 1 500 mq.l" for a properly balanced and stable system
(Hawkes et aI., 1992). Furthermore, no VFA accumulation was observed
during the study, which is contradictory to other studies where a gradual
accumulation of VFA was reported, which eventually became toxic to the
microbial population. No consistent trends in TKN, total metals and TNVS
removals were observed during the study. These results are contradictory to
the results reported by Maree et al. (1990), who found, while using a different
digester design, failure as a result of increasing sulphide concentrations.
The aim of the second phase of the study was to determine if substrate
nutrient supplementation would contribute to better digester performance and
to prevent digester failure. An upflow hybrid digester (AD-2), fitted with
polyurethane foam received 80% gelatin-manufacturing effluent enriched with
20% supernatant from an existing full-scale sewage sludge digester. The
highest COD removal (83%) and R-value (6.7 kg COD.m-3.d-1)was observed
at OLR of 4.62 and 9.30 kg COD.m-3.d-1, respectively (Chapter 3). The
performance tendencies of digester AD-2 were similar to digester AD-1, but
digester AD-2 only functioned at a relatively lower OLR. The only distinctive
difference between digester AD-1 and digester AD-2 was the granule
formation which was observed in digester AD-1. The granules observed were
fluffy and dark coloured with an average diameter of 0.5 to 1.5 mm. Thus, it
Stellenbosch University http://scholar.sun.ac.za
174
was concluded that the raw substrate used in this study lent itself to granule
production under the specific conditions of anaerobic dynamics. Even though
the type granules could be classified as a stable high quality granule, it was
clearly consistent in its production cycle and immediately reflected reactor
upset by washout of the granules along with the biomass particles. The
results obtained from these studies on digester AD-1 and digester AD-2,
indicated the feasibility of UASB systems while treating high-strength gelatin-
manufacturing effluent. It was also clear from this study that nutrient
supplementation, using high VFA supernatant with the raw substrate, did not
benefit the total reactor performance and no reason could be argued to
pursue the supplementation project.
It was decided to determine the influence of a higher biomass contact
area in an upflow contact digester configuration during a third study (AD-3)
while treating the same effluent. At an HRT of 1.0 d, the highest COD
removal (95%) and R-value (7.2 kg COD.m-3.d-1)was observed at an OLR of
2.61 and 8.00 kg COD.m-3.d-1, respectively (Chapter 5). The average COD
removals at HRT's set at 3.0 d and 1.0 d, were 51 and 54%, respectively.
The R-value was found to increase rapidly as a function of increasing OLR,
whereas the COD removal showed a more gradual increase. Again the
efficiency tendencies for all the process parameters were fairly similar to
those found for digester AD-1 and digester AD-2. Sulphate removals of
between 86 and 97%, were observed and a very high average pH (8.71) and
very low total alkalinity (933 mq.l") was found in this study and it was
concluded that the alkalinity was not high enough to buffer the system
effectively. During the study very little biogas production was observed, which
probably could be the result of the non-optimal operational pH of the digester.
Furthermore, gas bubbles were found to adhere to the bacterial flocs, which
in turn resulted in biomass carry over and poor settling of the anaerobic
biomass in the reactor. These results corresponds with the data reported by
Petruy et al. (1999) who found that the inflow of low lipid concentrations (100
rnq.l") in the form of milk-fat emulsion did not affect the COD removal of a
EGSB system. Even a concentration of 100 000 rnq.I" was not toxic, but a
Stellenbosch University http://scholar.sun.ac.za
175
lipid/fat removal of adsorption to the sludge is activated under anaerobic
conditions, which again affects the biogas and methane yields.
It was also found in this study that the contact digester required a
shorter period to stabilise after the start-up period. The digester also
recovered more rapidly from toxic and shock loads, probably due to the
recirculation in the reactor. Cost considerations for upscaling an anaerobic
contact reactor would include: higher capital costs; more intensive operation
and maintenance of the process; higher energy consumption for recirculation
practices and additional sludge settling infrastructures.
Multi-phase system
The same two laboratory-scale digesters used during the single-phase
digestion (AD-1 and AD-2) were connected in series during this study.
Digester AD-1 received the full-strength gelatin-manufacturing effluent as
substrate and digester AD-2 received the effluent from digester AD-1 as
substrate for further digestion. This research was done in an attempt to try
and partially separate the dominant microbial populations and to establish
their interactions in two separate digesters, as well as to demonstrate the
feasibility of a multi-phase system while treating gelatin-manufacturing
effluent. It was originally argued that an increased bacterial activity and
higher density biomass would occur as a result of creating optimum digester
operating conditions for the different microbial populations. This phase
separation could also be seen to represent a specific nutrient separation for
the phase-dominating populations as well as a metabolite production system
for the subsequent dependent populations. Other researchers have already
confirmed the feasibility of using multi-phase separations in UASB biosystems
(Shin et aI., 1992; Fongastitkul et aI., 1995; Speece et aI., 1997).
This multi-phase system showed optimal COD (97%) and S04 (96%)
removal efficiencies at OLR's of 8.3 and 4.3 kg COD.m-3.d-1, respectively.
The methane content varied between 55 and 89%. A significant difference
between the single and multi-phase systems was noticed, namely the
production and removal of VFA's, which occurred in the multi-phase system,
but which was not so clear or incomplete in the single-phase systems. Up to
Stellenbosch University http://scholar.sun.ac.za
176
92% of the VFA's were removed during this study with the multi-phase
system. Petruy et al. (1999) also found that ammonia released from the
degradation of proteins leads to the selection of an acidifying consortium
during the first phase, which had a significant influence on the downstream
process. The high ammonia gelatin-manufacturing effluent also appeared to
enhance the activity of the acidogenic population in the first digester, with
subsequent high VFA removal in the total process.
From the data generated during the multi-phase study it can be
concluded that the multi-phase system is highly effective for the treatment of
high-strength gelatin-manufacturing effluent. Higher removal efficiencies
were achieved during multi-phase digestion than with the tested single-phase
systems, mainly as a result of the second "finishing" digestion process during
multi-phase digestion. In commercial practise, however, this enhanced
performance would not motivate the additional mechanical and civil costs
associated with the construction of two digesters.
Pilot-scale investigation
The successful application of the different types of hybrid and contact
configurations on laboratory-scale led to the evaluation of the stability and
overall performances of a 300 litre pilot-scale reactor at actual field
conditions. This was also done so as to obtain a useful database for possible
future full-scale application. Again, no standardisation was done on the
effluent, with the exception of the removal of the harshest non-biodegradable
solids.
The 300 litre pilot-scale reactor performed relatively well throughout the
study (Chapter 6), under highly variable shock and organic loads. The COD
removals and R-values increased strongly during OLR's increments. COD
removals of up to 96%, with an average of 58%, were obtained at OLR's of up
to 10.72 kg COD.m-3.d-1. The average R-values (6.56 kg COD.m-3.d-1) were
achieved under similar loading rates. Sulphate and TS removals of up to 96
Stellenbosch University http://scholar.sun.ac.za
177
and 93%, respectively, were achieved. An average methane content of 85%
was also recorded, suggesting that rate-limiting factors were minimal.
The data generated was of great value for the future planning and
design of a full-scale digester. Many operational problems were experienced
and valuable experience in operating larger digesters gained. These
problems were mainly associated with the clogging and blocking of the
system, pumps, nozzles and recirculation lines, as well as sludge washout.
Concluding remarks
The study on the laboratory-scale investigations proved that the hybrid
design, especially the configuration used in digester AD-1, had the potential
to retain a high portion of the active biomass, and subsequently resulted in
good substrate utilisation by the adapted microbial consortium. The results
also clearly showed that no nutrient supplementation was needed, as it did
not contribute significantly to enhance the digester performance. The data
also showed that at higher organic loads, better digester performance
efficiencies were obtained, thereby also explaining the better performance of
digester AD-1 over digester AD-2.
With the anaerobic contact configuration (AD-3) some of the
disadvantages of this type of design could be overcome by returning the
biomass back into the digester. It would then be possible to retain both the
active microorganisms and undigested suspended solids, which would lead to
a better solid retention time and further biodegradation of the solids. The
major disadvantage of this configuration is the dependence on good biomass
settleability for successful operation and the option of recirculation in the
digester will also increase operational costs of the digester. This
configuration is more suitable for wastewaters with low or intermediate levels
of suspended solids, lipids and proteins. Relatively short HRT's can result in
reduced equalisation capacities when receiving shock loads. It must be taken
into consideration that the digester will serve a multiple purpose on larger
Stellenbosch University http://scholar.sun.ac.za
178
scale, namely the equalisation (balancing) of peak organic concentrations in
the incoming substrate and the subsequent treatment thereof.
The average results of the three laboratory-scale digesters also
indicated that the conventional UASB anaerobic hybrid digesters with support
material achieved more reliable average treatment results than the UASB
bioreactor. However, according to the effect of the increasing OLR's on the
efficiencies of the different anaerobic digester designs, it is clear that the
digesters reacted in a similar manner.
During the multi-phase digestion good removal efficiencies and phase
separation were achieved. High capital costs will, however, be required to
implement the use of this technology on commercial scale, although the
bench-scale study clearly indicate the greater advantage of phase separation.
Careful consideration should thus be given to the economic viability of pilot to
full-scale systems. The promising results obtained from the different studies,
thus motivated further experimentation to implement a pilot-scale digester.
The pilot-scale digester also revealed valuable information on the
application of shock loads to a single-phase UASB and a contact
configuration at actual field conditions. The pilot-scale studies indicated the
need for mechanical removal of solids in excess of 5 to 10 mm in size, fat and
grit removal of particles bigger than 0.3 mm, equalisation and solid and fats
separation. The application of a contact configuration may also prove to be
successful, if the problems experienced during the field set-up can be clearly
identified and addressed appropriately for full-scale application. This implies
that, in addition to the construction of a large-scale digester, a fully equipped
inletworks with adequate screening and grit removal will have to precede the
digester.
Recommendations
It could be concluded that the UASB design, both on laboratory and
pilot-scale, was feasible for the treatment of the complex high-strength
gelatin-manufacturing effluent. It was shown in this study that highly variable
Stellenbosch University http://scholar.sun.ac.za
179
gelatin-manufacturing effluent can successfully be treated at actual field
conditions, with fluctuating pH, organic and solid concentrations.
Based on the data obtained in this study, a mutual decision was made
by the management of the gelatin-manufacturing industry and the local
municipal authority, that a full-scale treatment can be applied successfully
(Van Niekerk & Der Merwe-Botha, 1999, Personal communication). The pilot-
seale UASB functioned satisfactorily under field conditions and experienced
relatively few operational problems. Although an average COD removal of
58% was obtained, it was decided to use a 50% COD removal target for full-
scale considerations. This is an acceptable engineering approach which
reduces the risk to the client and the authority and allows for unexpected
negative influences on digester performance and full-scale digester design
inefficiencies. These figures will result in a treated COD of 1 500 to 2 000
rnq.I", which is acceptable both from a downstream treatment point of view
and economic viewpoint. As mentioned, screening to remove solids, grit
removal and equalisation. should be seriously considered to prevent
shockloads from entering the anaerobic system.
This proposed plant upgrading will extend the life of the existing plant
and will allow the local wastewater purification works to produce an
acceptable effluent quality. This full-scale application will also be a good
investment for the gelatin-manufacturing industry, since it will have a positive
impact on the trade-effluent tariffs. The cost structure associated with the
gelatin-wastewater collection and treatment will incorporate capital
redemption, interest on capital loans, operational and maintenance costs.
The use of this technology has been well received by the industry (Van Der
Merwe-Botha, 1999, Personal communication), who view this pre-treatment
plant as an alternative approach to comply with the stricter pollution control
legislations. This approach will also have positive implications for the industry
regarding lower trade-effluent tariffs, the enhancement of the industry's
environmental policy and continuance of their core business in a suitable and
economically viable manner.
Stellenbosch University http://scholar.sun.ac.za
180
References
Dalmacija, B., Karlovic, E., Tamas, Z. & Miskovic, D. (1996). Purification of
high-salinity wastewater by activated sludge process. Water Research,
30, 295-298.
Du Plessis, P., Maree, J.P. & Cole, C.G.B. (1993). Anaerobic treatment of
gelatin factory effluent. In: Proceedings of the Third Biennial
Conference on Anaerobic Digestion (Volume I), Durban, South Africa,
Pp. 223-233.
Fongsatitkul, P., Mavinic, D.S. & Lo, K.v. (1995). A two-phase anaerobic
digestion process (UASB-UASB): Induced failure and system recovery
using a step loading reduction approach and modified recycle ratio
(RR). Environmental Technology, 16, 137-146.
Hawkes, F.R, Rozzi, A., Black, K., Guwy, A. & Hawkes, D.L. (1992). The
stability of anaerobic digesters operating on a food-processing
wastewater. Water Science and Technology, 25, 73-82.
Lettinga, G., Hulshoff Pol, L.W., Zeeman, G., Field, J., Van Lier, J.B., Van
Buuren, J.C.L., Janssen, A.J.H. & Lens, P. (1997). Anaerobic
treatment in sustainable environmental production concepts. In:
Proceedings of the Elh International Conference on Anaerobic
Digestion (Volume I) Sendai, Japan, Pp 32-39.
Maree, J.P., Cole, C.G.B, Gerber, A. & Barnard, L. (1990). Treatment of
gelatin factory effluent. Water SA, 16,265-268.
Petruy, R Field, J.A. & Lettinga, G. (1999). Pilot-scale expanded granular
sludge bed (EGSB) reactor. In: Proceedings of the 4th IAWQ-IWA
Conference on Biofilm Systems, October 17-20, New York, USA.
Petruzelli, D., Passino, R & Tiravanti, G. (1995). Ion exchange process for
chromium removal and recovery from tannery wastes. Industrial and
Engineering Chemistry Research, 34, 2612-2617.
Rajalo, G. & Petrovskaya, T. (1996). Selective electrochemical oxidation of
sulphides in tannery wastewater. Environmental Technology, 17, 605-
612.
Stellenbosch University http://scholar.sun.ac.za
181
Shin, H.-S., Bae, B.-U., Lee, J.-J. & Paik, B.-C. (1992). Anaerobic digestion of
distillery wastewater in a two-phase UASB system. Water Science and
Technology, 25(7), 361-371.
Shipin, ov., Dunn, K.M., Shipin, V.Y. & Rose, P.O. (1994). Saline anaerobic
digestion in advanced algal high rate oxidation ponding for the
treatment of organics in saline effluents. In: 7th International
Symposium on Anaerobic Digestion, Cape Town, Pp. 397-404.
Speece, R.E., Duran, M., Demirer, G., Zhang, H. & Distefano, T. (1997). The
role of process configuration in the performance of anaerobic systems.
In: Proceedings of the Efh International Conference on Anaerobic
Digestion (Volume I) Sendai, Japan, Pp 1-8.
Tommaso, G., Varesche, M.B., Zaiat, M., Vazzoler, R.F. & Foresti, E. (1999).
Formation, microbial characterization and kinetics of anaerobic biofilms
in polyurethane foam differential reactors treating gelatin containing
wastewaters. In: Proceedings of the 4th IAWQ-IWA Conference on
Biofilm Systems, October 17-20, New York, USA.
Van Der Merwe-Botha, M. (1999). Personal communication, Local Council of
Krugersdorp, Krugersdorp, South Africa.
Van Niekerk, A. & Van Der Merwe-Botha, M. (1999). Personal
communication, Wates Meiring & Barnard, Halfway House, South
Africa.
Stellenbosch University http://scholar.sun.ac.za