Embed Size (px)
Citation preview
water
Article
Thermophilic Anaerobic Co-Digestion of Exhausted Sugar BeetPulp with Cow Manure to Boost the Performance of the Process:The Effect of Manure Proportion
Xiomara Gómez-Quiroga 1,* , Kaoutar Aboudi 1, Luis Alberto Fernández-Güelfo 2,Carlos José Álvarez-Gallego 1 and Luis Isidoro Romero-García 1
�����������������
Citation: Gómez-Quiroga, X.;
Aboudi, K.; Fernández-Güelfo, L.A.;
Álvarez-Gallego, C.J.;
Romero-García, L.I. Thermophilic
Anaerobic Co-Digestion of Exhausted
Sugar Beet Pulp with Cow Manure to
Boost the Performance of the Process:
The Effect of Manure Proportion.
Water 2021, 13, 67. https://doi.org/
10.3390/w13010067
Received: 27 November 2020
Accepted: 27 December 2020
Published: 31 December 2020
Publisher’s Note: MDPI stays neu-
tral with regard to jurisdictional clai-
ms in published maps and institutio-
nal affiliations.
Copyright: © 2020 by the authors. Li-
censee MDPI, Basel, Switzerland.
This article is an open access article
distributed under the terms and con-
ditions of the Creative Commons At-
tribution (CC BY) license (https://
creativecommons.org/licenses/by/
4.0/).
1 Department of Chemical Engineering and Food Technology, Faculty of Sciences, Wine and Agri-FoodResearch Institute-IVAGRO, International Campus of Excellence-ceiA3, University of Cádiz,Republic Saharawi Avenue, P.O. Box 40, 11510 Puerto Real, Cádiz, Spain; [email protected] (K.A.);[email protected] (C.J.Á.-G.); [email protected] (L.I.R.-G.)
2 Department of Environmental Technologies, Faculty of Marine and Environmental Sciences, Wine andAgri-Food Research Institute-IVAGRO, International Campus of Excellence-ceiA3, 11510 Puerto Real, Cádiz,Spain; [email protected]
* Correspondence: [email protected]
Abstract: Sugar beet by-products are a lignocellulosic waste generated from sugar beet industryduring the sugar production process and stand out for their high carbon content. Moreover, cowmanure (CM) is hugely produced in rural areas and livestock industry, which requires properdisposal. Anaerobic digestion of such organic wastes has shown to be a suitable technology for thesewastes valorization and bioenergy production. In this context, the biomethane production fromthe anaerobic co-digestion of exhausted sugar beet pulp (ESBP) and CM was investigated in thisstudy. Four mixtures (0:100, 50:50, 75:25, and 90:10) of cow manure and sugar beet by-products wereevaluated for methane generation by thermophilic batch anaerobic co-digestion assays. The resultsshowed the highest methane production was observed in mixtures with 75% of CM (159.5 mL CH4/gVolatileSolids added). Nevertheless, the hydrolysis was inhibited by volatile fatty acids accumulationin the 0:100 mixture, which refers to the assay without CM addition. The modified Gompertz modelwas used to fit the experimental results of methane productions and the results of the modeling showa good fit between the estimated and the observed data.
Keywords: exhausted sugar beet pulp; cow manure; anaerobic co-digestion; thermophilic
1. Introduction
Anaerobic co-digestion (AcoD) of lignocellulosic biomass and animal manure toproduce biogas has gained increasing recognition over the years thanks to the synergyproduced between this type of wastes, creating a positive energy balance, which leads toa high yield of biogas and elimination of organic matter. The anaerobic digestion (AD)process is defined in the literature as a complex biological process of four stages: hydrolysis,acidogenesis, acetogenesis, and methanogenesis. Moreover, the AD process involves a widevariety of micro-organisms acting individually and/or in parallel in the consumption oforganic matter to produce biogas [1,2]. One of the main factors influencing the performanceof the AD process lies on the inhibition due to the accumulation of volatile fatty acids(VFA). Zhao et al. [3], reported that AD of agro-industrial waste could lead to an inhibitionof the process due to its high carbon content since VFAs are derived from organic carbon.AcoD can be considered as an improvement of the AD due to several considerations suchas the optimization in the nutritional balance of the microorganisms in the system, themaintenance of a resistant microbial mixture in the reactor, the balance between the fourphases of the AD process, and the improvement of the biomass biodegradability [4]. Allthese aspects are directly influenced by the characteristics of the co-substrates used.
Water 2021, 13, 67. https://doi.org/10.3390/w13010067 https://www.mdpi.com/journal/water
Water 2021, 13, 67 2 of 18
Exhausted sugar beet pulp (ESBP) is classified as lignocellulosic biomass. However,this type of high-value agro-industrial waste is difficult to degrade in AD due to itshemicellulose, cellulose, and lignin content [5,6]. Whereas the cattle manure, anotherorganic waste that has been widely studied in the AD process, is characterized by its highenergy density and nutrient content, as well as being easily accessible [7]. Therefore, theuse of residues such as cattle manure as a co-substrate in AcoD offers buffer capacity and asource of additional microorganisms/enzymatic capacity to the anaerobic process [1,8].
Cow manure (CM) is one of the most interesting wastes that is used as a co-substratein the anaerobic co-digestion of agro-industrial waste [9,10]. In the Statistical Yearbook ofSpain 2019, they reported that in Spain there are more than 6 million heads of cattle [11].Therefore, the use of CM in AcoD processes would help to mitigate the negative effectson climate change in the country due to GHG emissions from CM during storage andprocessing [8].
Li et al. [12] investigated the co-digestion of rice straw with cow dung (VS ratio (1:1))and obtained a 9.6% improvement in methane production yield with respect to anaerobicdigestion of rice straw individually. In the same line, Akyol et al. [13] reported that theco-digestion process of cow dung and barley was more efficient in all the mixing ratiosstudied (cow dung:barley ratios of 1:1, 2:1 and 1:2) compared to the mono-digestion ofcow dung with an improvement in the specific CH4 production of 35%, 31% and 22.8%,respectively. Moreover, they reported that the high acidification in the reactors was fromthe barley, but there was no accumulation of volatile fatty acids at the end of the digestion.In another study of co-digestion of tomato and maize stubble residues with cow dung,they found that the mixtures containing 13%, 33% and 54% of cow dung have 10.2, 0.9 and0.5 times higher methane yield than the digestion of individual substrates, respectively [14].In a study of Wang et al. [15], they investigated the co-digestion of cattle manure, chickenmanure, and wheat straw and reported that co-digestion improved process yield due tothe synergistic effect of these substrates. Similarly, Montoro et al. [16] reported that AcoDof dairy manure and sweet potato had positive synergistic effects, increased buffer capacityand the nutrients balance in the system, leading to improve the substrates biodegradation.
Several researchers have studied the influence of temperature on the anaerobic co-digestion of agro-industrial waste. Li et al. [17] reported that operating under thermophilicconditions can help in the degradation of recalcitrant material in the hydrolysis phase of theAD of waste classified as lignocellulosic biomass. However, if there is no balance betweenthe hydrolysis, acidogenesis, and methanogenesis phases there may be the accumulation ofVFAs, delaying the AD process and lowering methane productivities. Chuenchart et al. [18]studied the mono-digestion and co-digestion of chicken manure and food waste under ther-mophilic conditions and reported that the process was better in co-digestion thanks to thesyntrophic association between the oxidants of the substrate and hydrogenic methanogens,these methanogens use carbon dioxide and hydrogen produced by the acetoclastic bacteriafor their transformation into methane. The presence of these methanogens is due to the factthat the process of syntrophic oxidation of acetate is common in thermophilic conditions.
In another study, they report that temperature as a variable in the AD process is acritical factor that affects the rate, reaction, and activity of microorganisms. Thus, high-temperature conditions accelerate the hydrolysis stage resulting in higher yields of methaneand elimination of pathogens. Nevertheless, compared with mesophilic processes, ther-mophilic temperatures present instability of the process by being more sensitive to changesthat may occur in the reactor, such as the accumulation of VFAs [19].
With regard to the problems of inhibition by the accumulation of VFAs in AD men-tioned above, Fdez-Güelfo et al. [20] used interesting parameters as criteria to identify thestage of the AD process that causes destabilization of the system. These parameters are thedissolved acid carbon (DAC) which refers to the sum of the carbon present in the VFAsform, the dissolved organic carbon (DOC) which refers to the concentration of solubilizedcarbon in the hydrolysis stage, and the carbon as acid substrate (ASC) which refers to thedifference between DOC and DAC. Angeriz-Campoy et al. [21] used these parameters in
Water 2021, 13, 67 3 of 18
their research on AD of food wastes and reported that high values of ASC are related to animbalance between the hydrolysis and acidogenesis stages.
The objective of this study is to evaluate the effect of cow manure as co-substrate inthe thermophilic anaerobic co-digestion with exhausted sugar beet pulp at four differentmixtures. In addition, indirect and kinetic parameters have been evaluated aiming tounderstand the balance between the different AD steps and compare experimental andpredicted data, respectively. In this study, it is highlighted that the use of CM as a co-substrate in the anaerobic digestion of ESBP helped in the stabilization of the anaerobicprocess and in the degradation of VFA into methane. It should be borne in mind that theuse of thermophilic temperature conditions in co-digestion of sugar-beet by-products withcow manure has not been addressed previously.
2. Material and Methods2.1. Substrates
Exhausted sugar beet pulp (ESBP) was provided by AB SugarTM from its factorylocated in Jerez de la Frontera (Cádiz, Spain). The substrate was presented in smallcylindrical dry pellets which were stored at −20 ◦C prior their use. A 24 h rehydrationprocedure was applied in order to obtain the final total solids content of 8% [22]. On theother hand, the cow manure (CM) was collected from a medium sized local farm located inEl Puerto Santa María (Cádiz, Spain) where the liquid slurry was discarded in an industrialsedimentation tank. CM was also stored at −20 ◦C.
Inoculum for batch tests was sampled from a semicontinuous thermophilic anaerobicdigester operating at 30-days hydraulic retention time and fed with a CM:ESBP mixture at8% a wet weight proportion of 90:10. This inoculum reactor was operated in a stable wayduring a year.
Physicochemical characteristics of substrates and inoculum are shown in Table 1.
Table 1. Characterization of substrates and inoculum.
Parameters Units CM ESBP Inoculum
pH - 6.98 ± 0.02 6.22 ± 0.04 7.66 ± 0.04Total solids (TS) (%) 31.91 ± 0.37 87.07 ± 0.02 4.20 ± 0.04Volatile solids (%TS) 45.45 ± 0.41 87.79 ± 0.54 57.92 ± 0.07
Alkalinity (gCaCO3/kg) 38.05 ± 0.57 0.43 ± 0.10 4.8 ± 0.10Total volatile fatty acidity (TVFA) (g/kg) 1.28 ± 0.04 219.34 ± 0.42 0.15 ± 0.01
Solubilized organic matter (sCOD) (g/kg) 23.50 ± 2.79 217.44 ± 5.95 4.20 ± 0.11Dissolved organic carbon (DOC) (g/kg) 8.38 ± 0.05 93.14 ± 0.01 1.55 ± 0.02
Total kjeldahl nitrogen (TKN) (%) 1.40± 0.45 1.36 ± 0.34 2.11 ± 0.05C:N ratio - 16.63 ± 0.40 28.66 ± 0.20 13.94 ± 0.02
Protein and pectins (%) - 55.54 -Insoluble lignin (%) - 3.5 -
Soluble lignin and cellulose (%) - 21.14 -Hemicellulose (%) - 22.52 -
2.2. Experimental Design
Four duplicated batch tests were performed in order to study the effect of addingdifferent proportions of CM on anaerobic digestion of ESBP.
The tested mixtures (CM:ESBP) were 0:100, 50:50, 75:25, and 90:10. All the testswere carried out at 8% TS content by initial distilled water addition. Table 2 shows thecharacterization of initial substrates in each condition.
Water 2021, 13, 67 4 of 18
Table 2. Initial Characterization of CM:ESBP mixtures.
Parameters Units 0:100 50:50 75:25 90:10
pH - 7.69 ± 0.05 7.05 ± 0.01 7.11 ± 0.04 7.16 ± 0.01sCOD g/L 6.97 ± 0.31 6.77 ± 0.75 6.61 ± 0.08 4.92 ± 0.50
Alkalinity gCaCO3/L 7.88 ± 2.04 2.74 ± 0.01 3.02 ± 0.08 3.07 ± 0.48C:N - 18.06 17.01 16.85 14.46VS (%TS) 67.03 ± 1.79 65.65 ± 0.10 64.43 ± 0.17 58.90 ± 0.06
2.3. Experimental Device and Procedure
Eight stainless steel reactors (1.7 L working volume) were used for the assays. Tem-perature (55 ◦C) and agitation (20 rpm) were electronically controlled in each reactor. Thestirring system consists of a central shaft with blades. The temperature was controlled by aPID control system, by means of a PT-100 probe that was inserted inside the vessel of thereactor. The heating system consists of a heating plate located at the base of the reactor thatdistributed the heat evenly throughout the cylindrical body of a stainless steel jacket thatsurrounds the reactor. The reactor cover is made of glass with several input/output portsthat were used for the temperature control, sampling, safety valve, and biogas outlet.
Inoculation ratio was fitted to 50% (wet weight proportion) and initial pH was notfixed in order to observe the initial spontaneous reaction of anaerobic assays, althoughthese were subsequently controlled. Therefore, a pH of 7.0 was established as a minimumvalue and lower values were daily adjusted by adding K2CO3 to the reactors.
The air in the headspace was displaced by nitrogen at day 0 and every time reactorswere opened for sampling purpose.
2.4. Analytical Methods
Biogas composition and production was measured through an on-line device. SpecificCH4, H2, and CO2 sensors (BCP-series, Bluesens®, Germany) were placed in biogas lineand volumetric on-line totalizers (Milligascounter®, Ritter®, Germany) were used for gasproduction measurement.
Volatile and total solids (VS and TS), total and soluble chemical oxygen demand (CODand sCOD), dissolved organic carbon (DOC), total Kjeldahl nitrogen (TKN), alkalinity andpH were measured according to APHA-AWWA-WPCF Standard Methods [23].
A total organic carbon (TOC) analyzer (Analytik-Jena® multi N/C 3100, Germany)was used for the dissolved organic carbon (DOC) determination and gas chromatographywas applied for volatile fatty acids (VFAs) determination. Acetic (C2), propionic (C3),isobutyric (iC4), butyric (C4), isovaleric (iC5), valeric (C5), isocaproic (iC6), caproic (C6),and heptanoic (C7) individual acids were measured in a FID-GC (Shimadzu® GC-2010,Japan) [22].
Fiber content analysis (cellulose, hemicellulose, protein/pectin, and lignin) was per-formed according to Van Soest method [24] in a fiber digester (FIBERTEC 8000, FOSS®,Spain). Fiber content fractioning was measured only for the initial characterization.
All the analysis in solid samples were performed three times a week except for pHmeasurement which was daily determined inside the reactor.
Samples for VFAs, DOC and sCOD measurement were previously centrifuged (3220 gduring 15 min) and filtered by 0.45 µm (Durarpore® PVDF Millipore®, USA). In addition,samples for VFAs analysis were filtered again by 0.22 µm (Syringe PTFE filter, Millipore®
USA) [25].
2.5. Statistical Analysis
Duplicates were performed to ensure reproducibility. One-way variance analysis(ANOVA: single factor) was applied using Microsoft® Excel® software to determine statis-tical differences in the results obtained from different proportions of CM and ESBP tested.This test consisted of obtaining a statistical value F, which reflects the degree of similarity
Water 2021, 13, 67 5 of 18
between the means that have been compared. If the probability level (p) associated withthe F-value is less than 0.05, the hypothesis of equality of means is rejected [26].
2.6. Methane Production Modelling
Modified Gompertz model [27–29] equation was used for kinetic modelling. Equation (1)was fitted to experimental methane production data.
Y(t) = Y × exp{−exp
(Rm × e
Y(λ − t) + 1
)}(1)
where Y(t) is the accumulated CH4 production (mL), Y is the maximum potential CH4production (mL), Rm is the maximum production rate (mL/d), e is the Euler number(e ≈ 2.71828), λ is the lag phase time (d), and t is the time (days). The model fitting wasperformed by STATISTICA® software.
2.7. Indirect Parameters
A set of indirect parameters has been defined to analyze the evolution of the anaerobicprocess and identifying the limiting phase [21]. According to Fdez-Guelfo et al. [20],acidogenic substrate as carbon (ASC) and dissolved acid carbon (DAC) could be usedto deepen in explaining how hydrolysis and acidogenesis stages are carried out in well-balanced or destabilized anaerobic reactors.
DAC is estimated as the weighted sum of C2–C7 individual VFAs expressed in carbonunits. On the other hand, ASC is the fraction of solubilized organic matter that hasnot been converted into VFAs. ASC values are determined by the difference betweenDOC and DAC parameters. DAC and ASC formulas are shown in Equation (2) andEquation (3), respectively:
DAC =i=7
∑i=2
Ai H × ni × 12MWi
(2)
ASC = DOC − DAC = DOC −i=7
∑i=2
Ai H × ni × 12MWi
(3)
AiH is the individual concentration of each VFA (C2–C7)—it must be noted thanisoacids has been included in linear acids—ni is the number of carbons and MWi is themolecular weight. DAC, ASC, and DOC are expressed as concentrations (M/L3).
A well-balanced batch anaerobic process runs with a slight or not detected initialincrease in DAC concentration and a stable and very low level of ASC concentration.Once the process turns to imbalanced process, DAC and ASC accumulations could beobserved. In a partial or totally inhibited batch reactor, if the acidogenic stage is limited orinhibited, ASC shows a clear increase (located in a period or maintained in time) with DACconsumption or not. In the case that the hydrolysis is affected, ASC is very low meanwhileDAC could very much higher.
3. Results and Discussion3.1. Substrate Characterization
The characteristics of CM, ESBP, and the inoculum used are shown in Table 1. Theresults indicate that ESBP has a higher content of organic matter than CM in terms of VSand solubilized organic matter (sCOD). However, the C:N ratio of ESBP is 28.66, fallingwithin the optimum range 20–30 for anaerobic digestion.
3.2. Statistical Significance of Results from Batch Tests
An ANOVA analysis has been used to determine if there are statistically significantdifferences between the mean values of the different parameters (pH, TVFA, Alkalinity, andsCOD) in the two reactors used for each mixture tested. The results are shown in Table 3.
Water 2021, 13, 67 6 of 18
Table 3. Statistical analysis.
Mixtures pH Alkalinity sCOD TVFA
CM:ESBP F p F p F p F p
0:100 0.009 0.927 1.093 0.307 0.241 0.628 0.024 0.87850:50 0.008 0.930 1.884 0.184 0.510 0.483 0.788 0.38475:25 0.000 0.992 0.733 0.400 0.091 0.765 0.015 0.90590:10 0.006 0.940 1.480 0.237 - - 2.822 0.107
The ANOVA analysis indicates that the results between replicates do not presentstatistically significant differences for a confidence level of 95%. The only case for whichthe data are not comparable is the sCOD for the 10:90 mix (p < 0.05). The reason could bethat, in this case, there was an error in the experimental determination of the COD of oneof the reactors, therefore, only data from one reactor is available.
3.3. pH and Total Acidity (TVFA) in Anaerobic Co-Digestion of Exhausted Sugar Beet Pulp andCattle Manure
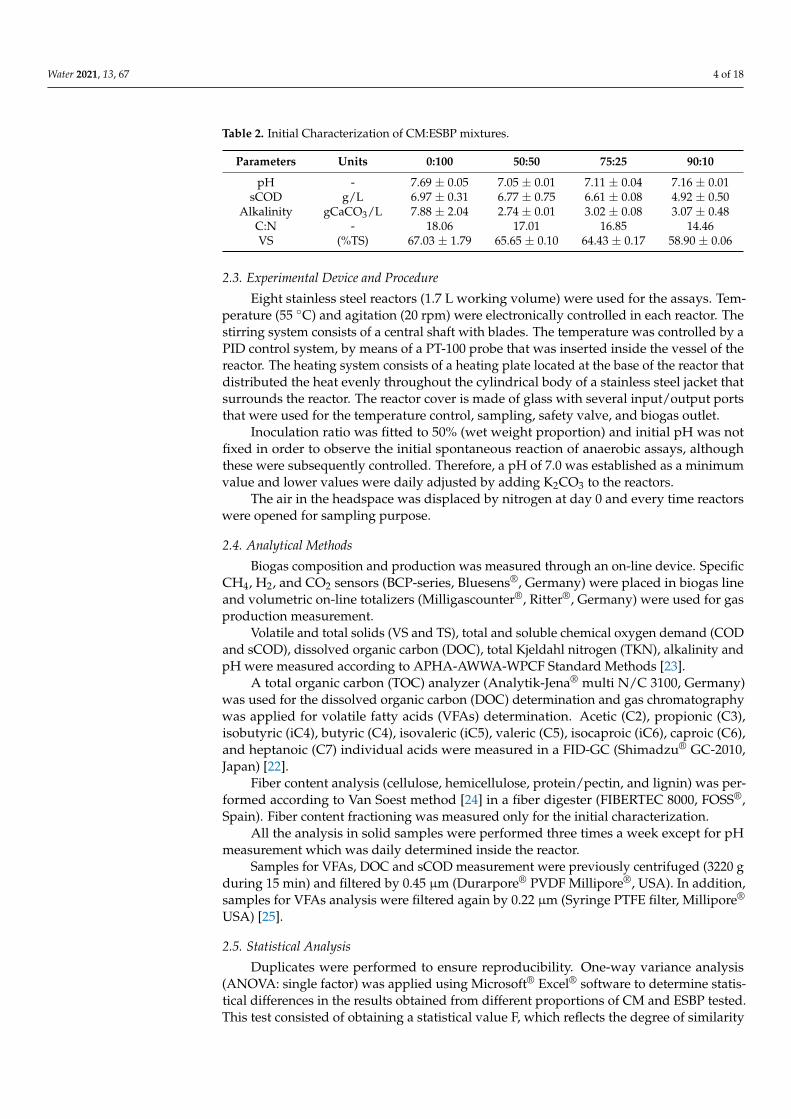
Figure 1 shows the pH evolution together with the addition of alkali performed ineach test for the different mixtures studied.
Water 2021, 13, x FOR PEER REVIEW 6 of 19
3. Results and Discussion 3.1. Substrate Characterization
The characteristics of CM, ESBP, and the inoculum used are shown in Table 1. The results indicate that ESBP has a higher content of organic matter than CM in terms of VS and solubilized organic matter (sCOD). However, the C:N ratio of ESBP is 28.66, falling within the optimum range 20–30 for anaerobic digestion.
3.2. Statistical Significance of Results from Batch Tests An ANOVA analysis has been used to determine if there are statistically significant
differences between the mean values of the different parameters (pH, TVFA, Alkalinity, and sCOD) in the two reactors used for each mixture tested. The results are shown in Table 3.
Table 3. Statistical analysis.
Mixtures pH Alkalinity sCOD TVFA CM:ESBP F p F p F p F p
0:100 0.009 0.927 1.093 0.307 0.241 0.628 0.024 0.878 50:50 0.008 0.930 1.884 0.184 0.510 0.483 0.788 0.384 75:25 0.000 0.992 0.733 0.400 0.091 0.765 0.015 0.905 90:10 0.006 0.940 1.480 0.237 - - 2.822 0.107
The ANOVA analysis indicates that the results between replicates do not present sta-tistically significant differences for a confidence level of 95%. The only case for which the data are not comparable is the sCOD for the 10:90 mix (p < 0.05). The reason could be that, in this case, there was an error in the experimental determination of the COD of one of the reactors, therefore, only data from one reactor is available.
3.3. pH and Total Acidity (TVFA) in Anaerobic Co-Digestion of Exhausted Sugar Beet Pulp and Cattle Manure
Figure 1 shows the pH evolution together with the addition of alkali performed in each test for the different mixtures studied.
Figure 1. Evolution of pH and amounts of potassium carbonate added to the different reactors.
As can be seen, initially (first two days) there is a decrease in the pH value for all reactors. However, for the 90:10 and 75:25 mixtures, the drop in pH was lower due to the buffering capacity provided by the CM.
The optimal pH range for the activity of methanogenic microorganisms and biogas production is 6.5–8.0 [30]. The addition of K2CO3 was necessary to prevent destabilization
Figure 1. Evolution of pH and amounts of potassium carbonate added to the different reactors.
As can be seen, initially (first two days) there is a decrease in the pH value for allreactors. However, for the 90:10 and 75:25 mixtures, the drop in pH was lower due to thebuffering capacity provided by the CM.
The optimal pH range for the activity of methanogenic microorganisms and biogasproduction is 6.5–8.0 [30]. The addition of K2CO3 was necessary to prevent destabilizationof the process due to the fast initial hydrolysis of the more easily degradable fractions. Thepotassium carbonate additions had to be higher and held for longer the higher the ESBPcontent in the mixture. Therefore, the neutralization requirements of the reactors and thetime required for pH stabilization to be achieved were different for the different reactors.Thus, the pH stabilized at values suitable for the process (around 7.3) [31] on the thirdday of testing for the 90:10 and 75:25 mixtures, while 10 days were required for the 50:50mixture. For the 0:100 assay, the pH approached 7.0 on day 12, after multiple additions ofthe alkaline agent, but subsequently, it dropped again and did not stabilize until day 22 ofthe test.
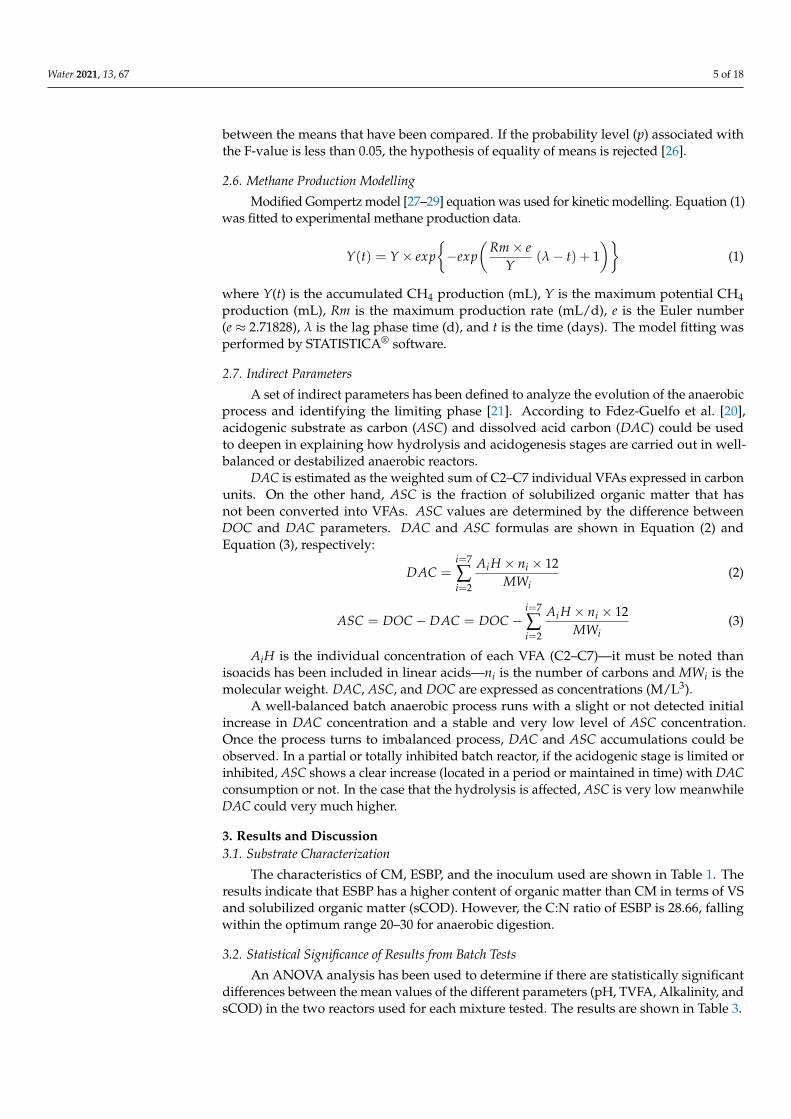
The pH is closely related to the formation of volatile fatty acids (VFAs) due to thedecomposition of organic matter [32]. Thus, the decrease in pH in the first days of the testswas due to the production and accumulation of VFAs, as can be seen in Figure 2. VFAproduction is more pronounced in the reactors with a higher content of organic matter (i.e.,
Water 2021, 13, 67 7 of 18
higher content of ESBP). This causes higher requirements for the addition of alkaline agentfor its neutralization, as well as the delay in reaching the stabilization of the pH at suitablevalues in the 0:100 and 50:50 mixtures, with respect to the other reactors.
Water 2021, 13, x FOR PEER REVIEW 7 of 18
of the process due to the fast initial hydrolysis of the more easily degradable fractions.
The potassium carbonate additions had to be higher and held for longer the higher the
ESBP content in the mixture. Therefore, the neutralization requirements of the reactors
and the time required for pH stabilization to be achieved were different for the different
reactors. Thus, the pH stabilized at values suitable for the process (around 7.3) [31] on the
third day of testing for the 90:10 and 75:25 mixtures, while 10 days were required for the
50:50 mixture. For the 0:100 assay, the pH approached 7.0 on day 12, after multiple addi-
tions of the alkaline agent, but subsequently, it dropped again and did not stabilize until
day 22 of the test.
The pH is closely related to the formation of volatile fatty acids (VFAs) due to the
decomposition of organic matter [32]. Thus, the decrease in pH in the first days of the tests
was due to the production and accumulation of VFAs, as can be seen in Figure 2. VFA
production is more pronounced in the reactors with a higher content of organic matter
(i.e., higher content of ESBP). This causes higher requirements for the addition of alkaline
agent for its neutralization, as well as the delay in reaching the stabilization of the pH at
suitable values in the 0:100 and 50:50 mixtures, with respect to the other reactors.
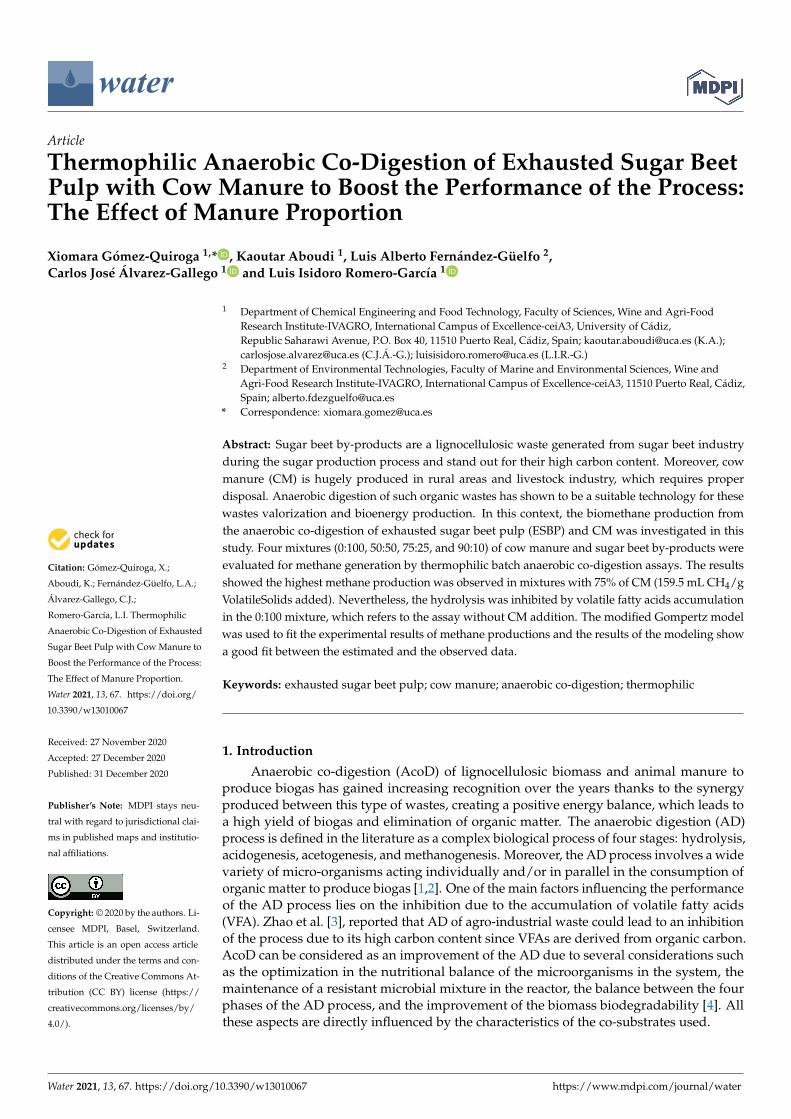
Figure 2. Comparison of the evolution of the individual VFAs (acetic, propionic, butyric, and valeric acids) and of the total
acidity (TVFA) in the reactors. (a) Evolution of the acetic acid (Hac). (b) Evolution of the propionic acid (HPr). (c) Evolution
of the butyric acid (HBr). (d) Evolution of the valeric acid (HIval). (e) Evolution of total volatile fatty acidity (expressed as
g Hac/L).
Figure 2. Comparison of the evolution of the individual VFAs (acetic, propionic, butyric, and valeric acids) and of the totalacidity (TVFA) in the reactors. (a) Evolution of the acetic acid (Hac). (b) Evolution of the propionic acid (HPr). (c) Evolutionof the butyric acid (HBr). (d) Evolution of the valeric acid (HIval). (e) Evolution of total volatile fatty acidity (expressed asg Hac/L).
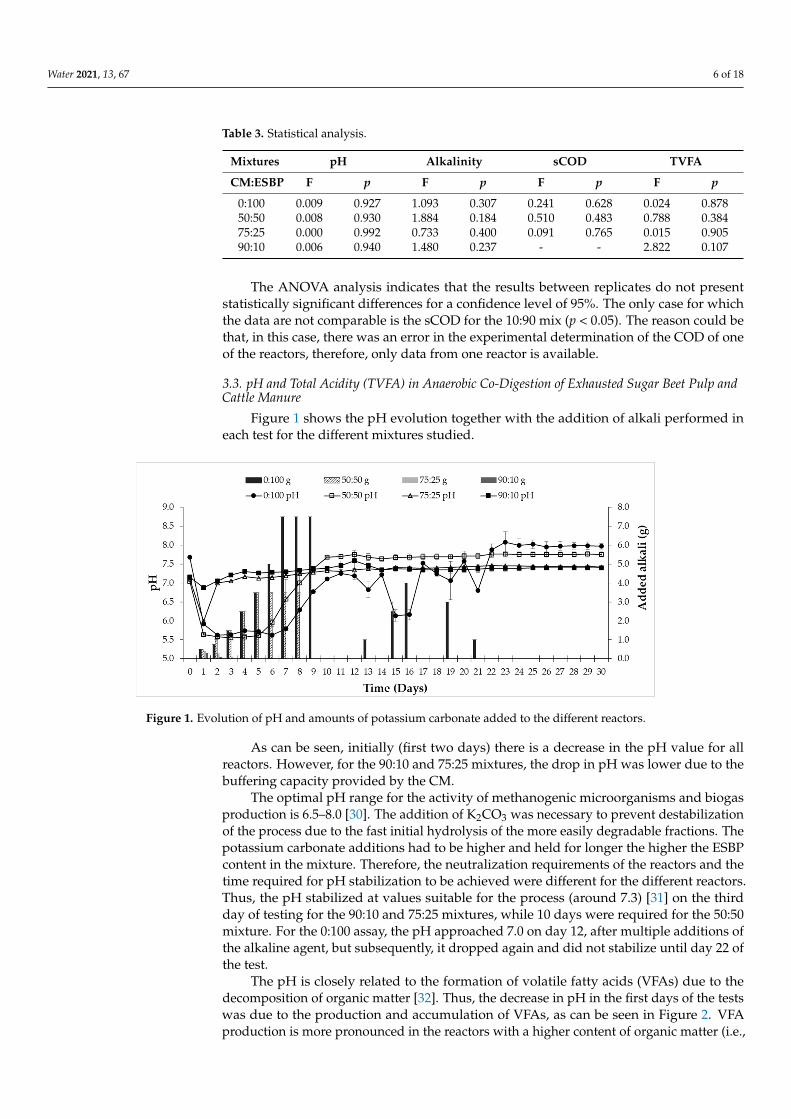
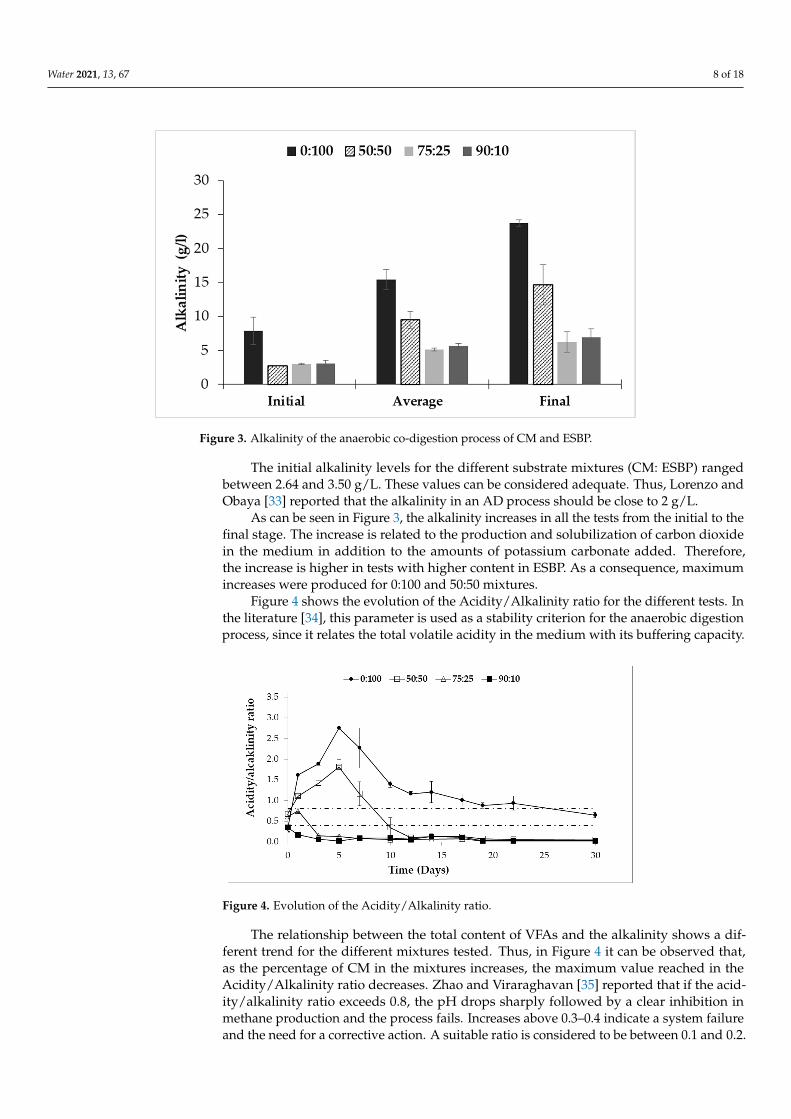
Alkalinity is a variable of great importance for the stability of the anaerobic digestionprocess. A high value of alkalinity allows the system to be able to absorb the production ofVFAs, without producing sharp drops in pH. In general, operating at thermophilic range(55 ◦C) a higher alkalinity value is required to maintain the stability of the process and toavoid the acidification caused by the production of VFAs. This fact is related to the increasein hydrolysis and acidogenesis rates when operating in the thermophilic range. Figure 3shows the initial, average, and final alkalinity data for the different co-digestion mixtures.
Water 2021, 13, 67 8 of 18
Water 2021, 13, x FOR PEER REVIEW 8 of 19
Alkalinity is a variable of great importance for the stability of the anaerobic digestion process. A high value of alkalinity allows the system to be able to absorb the production of VFAs, without producing sharp drops in pH. In general, operating at thermophilic range (55 °C) a higher alkalinity value is required to maintain the stability of the process and to avoid the acidification caused by the production of VFAs. This fact is related to the increase in hydrolysis and acidogenesis rates when operating in the thermophilic range. Figure 3 shows the initial, average, and final alkalinity data for the different co-digestion mixtures.
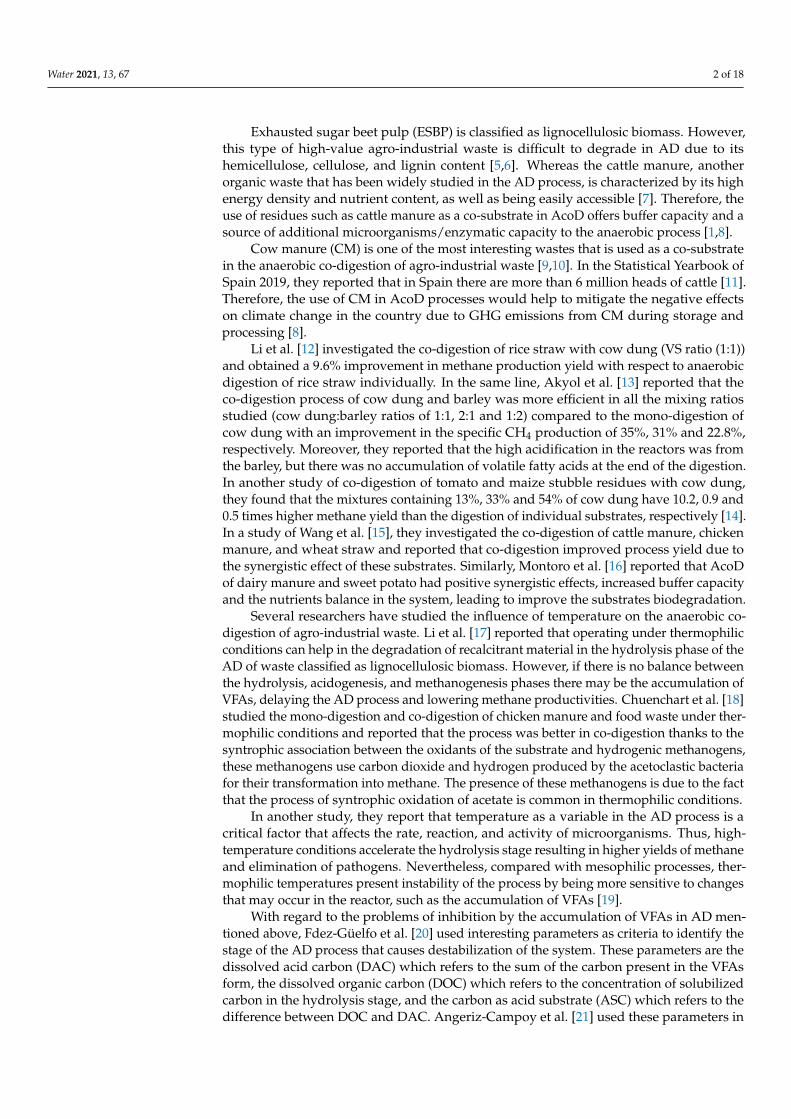
Figure 3. Alkalinity of the anaerobic co-digestion process of CM and ESBP.
Figure 3. Alkalinity of the anaerobic co-digestion process of CM and ESBP.
The initial alkalinity levels for the different substrate mixtures (CM: ESBP) rangedbetween 2.64 and 3.50 g/L. These values can be considered adequate. Thus, Lorenzo andObaya [33] reported that the alkalinity in an AD process should be close to 2 g/L.
As can be seen in Figure 3, the alkalinity increases in all the tests from the initial to thefinal stage. The increase is related to the production and solubilization of carbon dioxidein the medium in addition to the amounts of potassium carbonate added. Therefore,the increase is higher in tests with higher content in ESBP. As a consequence, maximumincreases were produced for 0:100 and 50:50 mixtures.
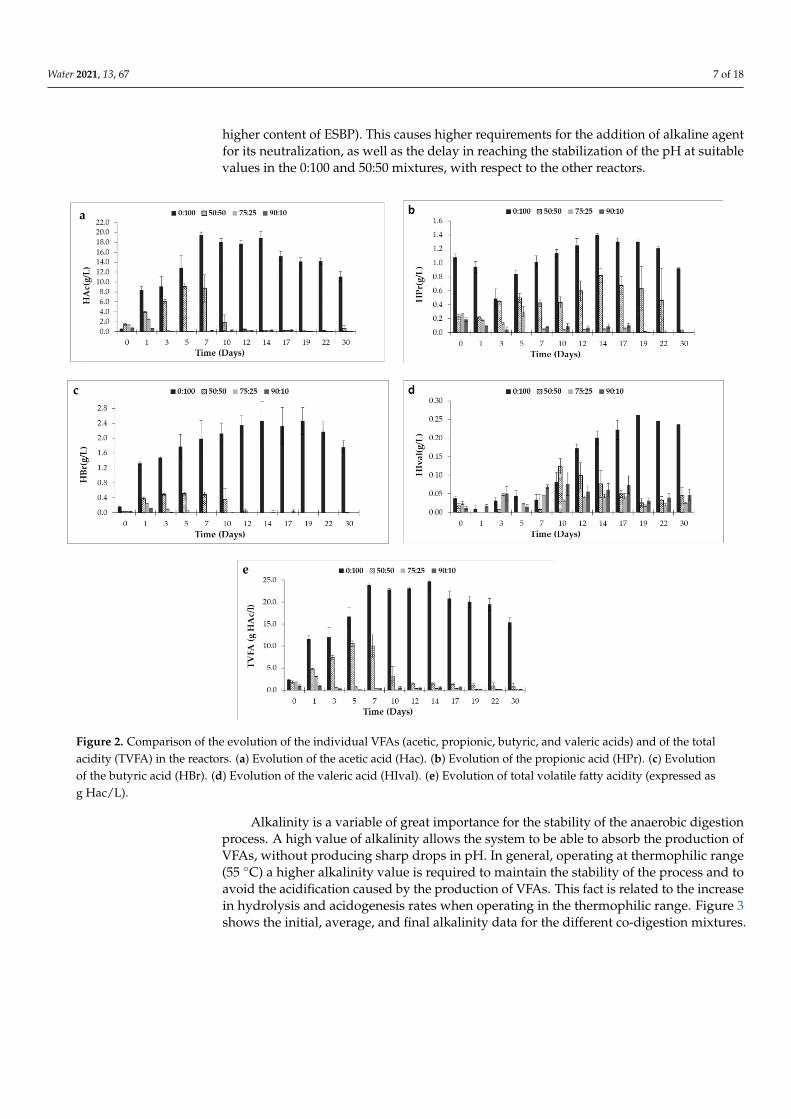
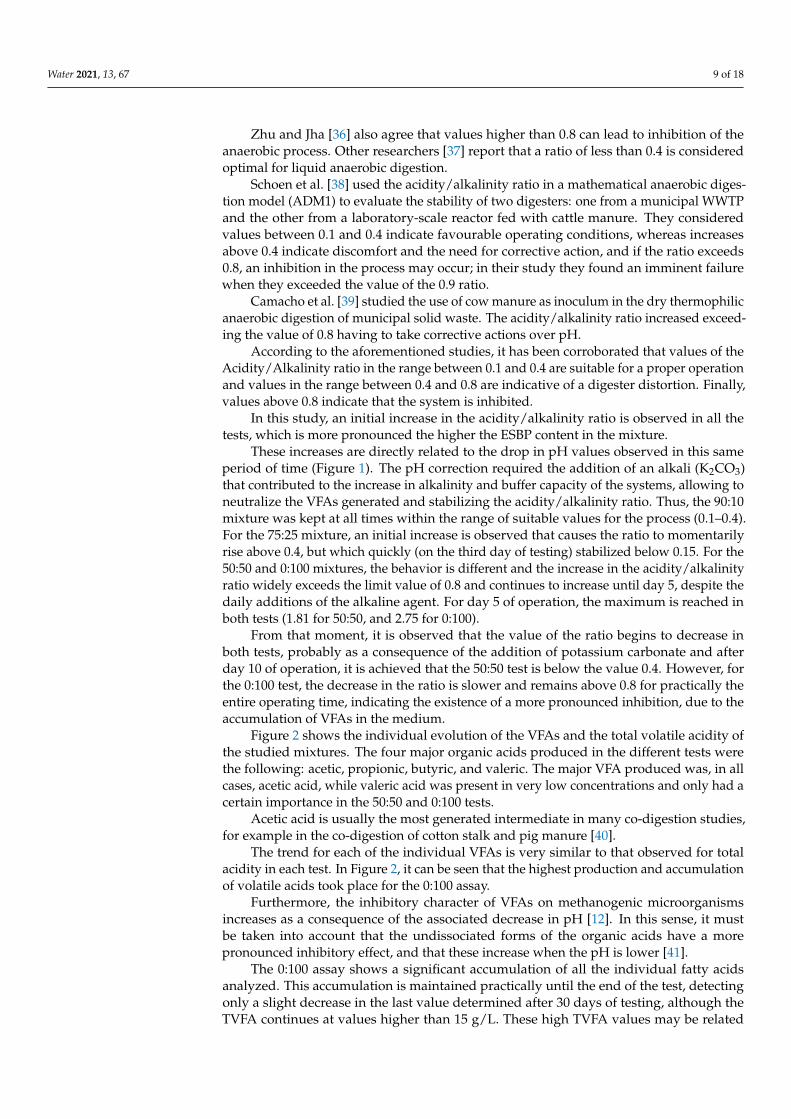
Figure 4 shows the evolution of the Acidity/Alkalinity ratio for the different tests. Inthe literature [34], this parameter is used as a stability criterion for the anaerobic digestionprocess, since it relates the total volatile acidity in the medium with its buffering capacity.
Water 2021, 13, x FOR PEER REVIEW 8 of 18
Alkalinity is a variable of great importance for the stability of the anaerobic digestion
process. A high value of alkalinity allows the system to be able to absorb the production
of VFAs, without producing sharp drops in pH. In general, operating at thermophilic
range (55 °C) a higher alkalinity value is required to maintain the stability of the process
and to avoid the acidification caused by the production of VFAs. This fact is related to the
increase in hydrolysis and acidogenesis rates when operating in the thermophilic range.
Figure 3 shows the initial, average, and final alkalinity data for the different co-digestion
mixtures.
Figure 3. Alkalinity of the anaerobic co-digestion process of CM and ESBP.
The initial alkalinity levels for the different substrate mixtures (CM: ESBP) ranged
between 2.64 and 3.50 g/L. These values can be considered adequate. Thus, Lorenzo and
Obaya [33] reported that the alkalinity in an AD process should be close to 2 g/L.
As can be seen in Figure 3, the alkalinity increases in all the tests from the initial to
the final stage. The increase is related to the production and solubilization of carbon diox-
ide in the medium in addition to the amounts of potassium carbonate added. Therefore,
the increase is higher in tests with higher content in ESBP. As a consequence, maximum
increases were produced for 0:100 and 50:50 mixtures.
Figure 4 shows the evolution of the Acidity/Alkalinity ratio for the different tests. In
the literature [34], this parameter is used as a stability criterion for the anaerobic digestion
process, since it relates the total volatile acidity in the medium with its buffering capacity.
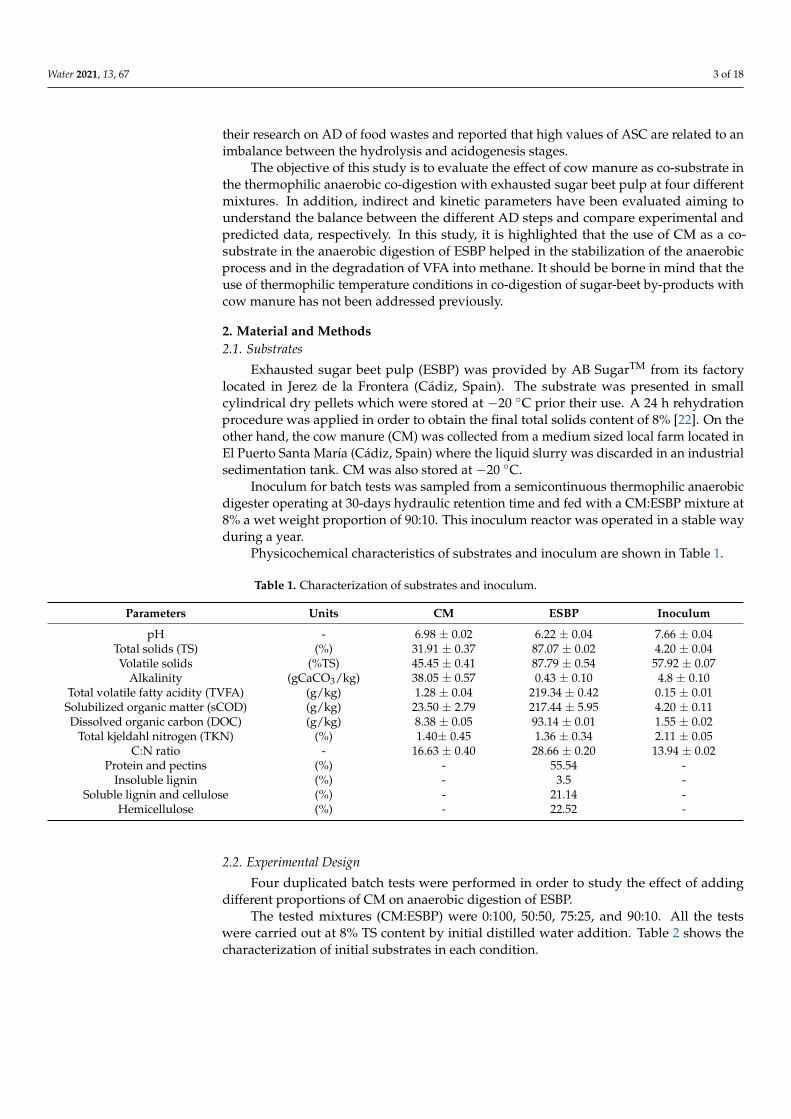
Figure 4. Evolution of the Acidity/Alkalinity ratio. Figure 4. Evolution of the Acidity/Alkalinity ratio.
The relationship between the total content of VFAs and the alkalinity shows a dif-ferent trend for the different mixtures tested. Thus, in Figure 4 it can be observed that,as the percentage of CM in the mixtures increases, the maximum value reached in theAcidity/Alkalinity ratio decreases. Zhao and Viraraghavan [35] reported that if the acid-ity/alkalinity ratio exceeds 0.8, the pH drops sharply followed by a clear inhibition inmethane production and the process fails. Increases above 0.3–0.4 indicate a system failureand the need for a corrective action. A suitable ratio is considered to be between 0.1 and 0.2.
Water 2021, 13, 67 9 of 18
Zhu and Jha [36] also agree that values higher than 0.8 can lead to inhibition of theanaerobic process. Other researchers [37] report that a ratio of less than 0.4 is consideredoptimal for liquid anaerobic digestion.
Schoen et al. [38] used the acidity/alkalinity ratio in a mathematical anaerobic diges-tion model (ADM1) to evaluate the stability of two digesters: one from a municipal WWTPand the other from a laboratory-scale reactor fed with cattle manure. They consideredvalues between 0.1 and 0.4 indicate favourable operating conditions, whereas increasesabove 0.4 indicate discomfort and the need for corrective action, and if the ratio exceeds0.8, an inhibition in the process may occur; in their study they found an imminent failurewhen they exceeded the value of the 0.9 ratio.
Camacho et al. [39] studied the use of cow manure as inoculum in the dry thermophilicanaerobic digestion of municipal solid waste. The acidity/alkalinity ratio increased exceed-ing the value of 0.8 having to take corrective actions over pH.
According to the aforementioned studies, it has been corroborated that values of theAcidity/Alkalinity ratio in the range between 0.1 and 0.4 are suitable for a proper operationand values in the range between 0.4 and 0.8 are indicative of a digester distortion. Finally,values above 0.8 indicate that the system is inhibited.
In this study, an initial increase in the acidity/alkalinity ratio is observed in all thetests, which is more pronounced the higher the ESBP content in the mixture.
These increases are directly related to the drop in pH values observed in this sameperiod of time (Figure 1). The pH correction required the addition of an alkali (K2CO3)that contributed to the increase in alkalinity and buffer capacity of the systems, allowing toneutralize the VFAs generated and stabilizing the acidity/alkalinity ratio. Thus, the 90:10mixture was kept at all times within the range of suitable values for the process (0.1–0.4).For the 75:25 mixture, an initial increase is observed that causes the ratio to momentarilyrise above 0.4, but which quickly (on the third day of testing) stabilized below 0.15. For the50:50 and 0:100 mixtures, the behavior is different and the increase in the acidity/alkalinityratio widely exceeds the limit value of 0.8 and continues to increase until day 5, despite thedaily additions of the alkaline agent. For day 5 of operation, the maximum is reached inboth tests (1.81 for 50:50, and 2.75 for 0:100).
From that moment, it is observed that the value of the ratio begins to decrease inboth tests, probably as a consequence of the addition of potassium carbonate and afterday 10 of operation, it is achieved that the 50:50 test is below the value 0.4. However, forthe 0:100 test, the decrease in the ratio is slower and remains above 0.8 for practically theentire operating time, indicating the existence of a more pronounced inhibition, due to theaccumulation of VFAs in the medium.
Figure 2 shows the individual evolution of the VFAs and the total volatile acidity ofthe studied mixtures. The four major organic acids produced in the different tests werethe following: acetic, propionic, butyric, and valeric. The major VFA produced was, in allcases, acetic acid, while valeric acid was present in very low concentrations and only had acertain importance in the 50:50 and 0:100 tests.
Acetic acid is usually the most generated intermediate in many co-digestion studies,for example in the co-digestion of cotton stalk and pig manure [40].
The trend for each of the individual VFAs is very similar to that observed for totalacidity in each test. In Figure 2, it can be seen that the highest production and accumulationof volatile acids took place for the 0:100 assay.
Furthermore, the inhibitory character of VFAs on methanogenic microorganismsincreases as a consequence of the associated decrease in pH [12]. In this sense, it mustbe taken into account that the undissociated forms of the organic acids have a morepronounced inhibitory effect, and that these increase when the pH is lower [41].
The 0:100 assay shows a significant accumulation of all the individual fatty acidsanalyzed. This accumulation is maintained practically until the end of the test, detectingonly a slight decrease in the last value determined after 30 days of testing, although theTVFA continues at values higher than 15 g/L. These high TVFA values may be related
Water 2021, 13, 67 10 of 18
to the inhibition of acetoclastic methanogenesis [42]. Li, X. et al. [43] reported that in theAD process, valeric acid is not normally generated in appreciable amounts and that theformation of this VFA is due to the reversibility of the biochemical reactions of acetic acid,propionic acid, and hydrogen.
It is important to note that in the case of the 50:50 mixture, acid concentrationsabove 10 g/L have been reached in the first days, which clearly fall within the range ofmethanogenic inhibition [44–47]. However, the biological system has been able to reversethe situation by consuming these acids in a very short time. This behavior is different fromthat observed for the 0:100 assay for which a higher value of TVFA is reached (greater than23 g/L) and the system is not able to recover itself and degrade them effectively during the30-day period.
The maximum TVFA reached in the tested mixtures increased as a function of theproportion of ESBP in the mixture, which is related to the carbohydrate content of thissubstrate [48].
The maximum TVFA concentration is also reached for different times in each mixture.Thus, for the 90:10 mixture, the TVFA concentration constantly decreases from the initialvalue of 1.01 g/L. For the 75:25 mixture, the maximum is reached on the first test daywith a value of 3.07 g/L, but the VFAs were rapidly degraded. For the 50:50 mixture, themaximum is reached between days 5 and 7, with an average value of 10.30 g/L. Finally, forthe 0:100 assay, the maximum is reached and maintained between days 7 and 14, reachingan average value of 23.63 g/L.
In a study of co-digestion of ESBP with cow manure in the mesophilic range, Aboudiet al., [49] reported that the maximum TVFA achieved for the mixture (CM:ESBP) 0:100 was15.29 g/L which is slightly minor, but comparable, to the data obtained in this study. Instable anaerobic reactors, the VFAs produced by acidogenic bacteria should be consumed bythe action of the acetoclastic methanogenic archaea, reaching a low level from the first days.This behavior was observed in the 90:10 and 75:25 mixtures, and it denotes a good couplingof the acidogenic and methanogenic activities. However, the temporary accumulation ofundegraded VFAs for extended periods of time implies an imbalance between the activitiesof acidogenic bacteria and methanogenic archaea, as occurs in reactors with lower CMcontent (0:100 and 50:50) (Figure 2).
Regarding the evolution of the different individual VFAs, the following can be discussed:
• Acetic acid is clearly, the principal acid in all the tests and its evolution is, therefore,very similar to that already mentioned for TVFA.
• Butyric acid reaches much lower values (an order of magnitude lower) but its evolutionis practically the same that for acetic acid, in all cases.
• Propionic acid, however, shows a different behavior. It can be seen that it is practicallyresidual in the 90:10 and 75:25 mixtures but its concentration increases and accumu-lates in the system up to 14 days for both 50:50 and 0:100. From that moment on, aslightly decreasing trend is observed in both cases, which ends with the completeconsumption of propionic acid in the 50:50 test for day 30 of operation, while for the0:100 assay it remains at values close to 1 g/L. It is known that propionic acid is themost inhibitory of the short-chain volatile fatty acids (acetic, propionic, and butyricacids) in the anaerobic digestion process [50,51].
• Valeric acid has very low concentrations in all cases, although it is observed that itincreases at the end of the test. This trend is especially marked for the 0:100 testand is in agreement with what has been previously commented on that this acid isgenerated as a consequence of the reversibility of the biochemical reactions of aceticacid, propionic acid and hydrogen [43].
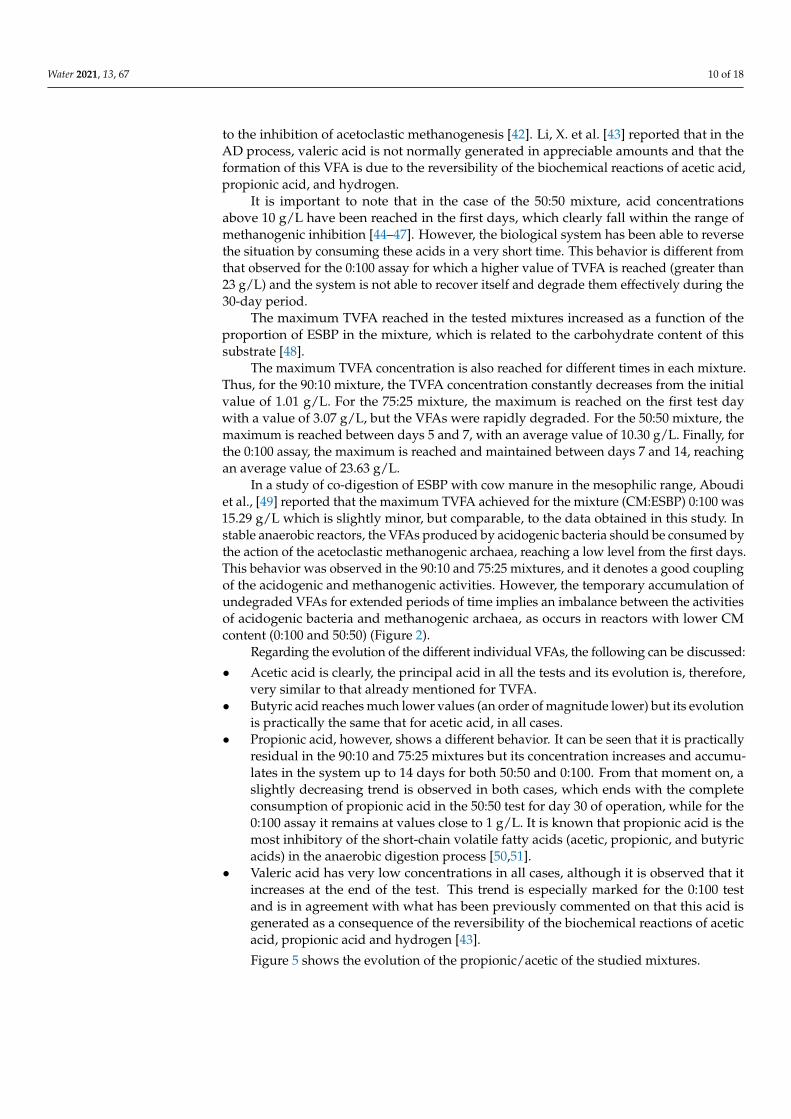
Figure 5 shows the evolution of the propionic/acetic of the studied mixtures.
Water 2021, 13, 67 11 of 18
Water 2021, 13, x FOR PEER REVIEW 11 of 19
day with a value of 3.07 g/L, but the VFAs were rapidly degraded. For the 50:50 mixture, the maximum is reached between days 5 and 7, with an average value of 10.30 g/L. Finally, for the 0:100 assay, the maximum is reached and maintained between days 7 and 14, reach-ing an average value of 23.63 g/L.
In a study of co-digestion of ESBP with cow manure in the mesophilic range, Aboudi et al., [49] reported that the maximum TVFA achieved for the mixture (CM:ESBP) 0:100 was 15.29 g/L which is slightly minor, but comparable, to the data obtained in this study. In stable anaerobic reactors, the VFAs produced by acidogenic bacteria should be con-sumed by the action of the acetoclastic methanogenic archaea, reaching a low level from the first days. This behavior was observed in the 90:10 and 75:25 mixtures, and it denotes a good coupling of the acidogenic and methanogenic activities. However, the temporary accumulation of undegraded VFAs for extended periods of time implies an imbalance between the activities of acidogenic bacteria and methanogenic archaea, as occurs in reac-tors with lower CM content (0:100 and 50:50) (Figure 2).
Regarding the evolution of the different individual VFAs, the following can be dis-cussed: • Acetic acid is clearly, the principal acid in all the tests and its evolution is, therefore,
very similar to that already mentioned for TVFA. • Butyric acid reaches much lower values (an order of magnitude lower) but its evolu-
tion is practically the same that for acetic acid, in all cases. • Propionic acid, however, shows a different behavior. It can be seen that it is practi-
cally residual in the 90:10 and 75:25 mixtures but its concentration increases and ac-cumulates in the system up to 14 days for both 50:50 and 0:100. From that moment on, a slightly decreasing trend is observed in both cases, which ends with the com-plete consumption of propionic acid in the 50:50 test for day 30 of operation, while for the 0:100 assay it remains at values close to 1 g/L. It is known that propionic acid is the most inhibitory of the short-chain volatile fatty acids (acetic, propionic, and butyric acids) in the anaerobic digestion process [50,51].
• Valeric acid has very low concentrations in all cases, although it is observed that it increases at the end of the test. This trend is especially marked for the 0:100 test and is in agreement with what has been previously commented on that this acid is gen-erated as a consequence of the reversibility of the biochemical reactions of acetic acid, propionic acid and hydrogen [43]. Figure 5 shows the evolution of the propionic/acetic of the studied mixtures.
Figure 5. Evolution of the propionic/acetic ratio. Figure 5. Evolution of the propionic/acetic ratio.
The 75:25 and 50:50 mixtures exceeded the value of 1.4 in the propionic/acetic ratio, avalue determined as a limit for the correct functioning of the AD process [52]. However,these mixtures reached admissible values over time, recovering the stability of the system.The 90:10 mixture was maintained with a propionic/acetic ratio below 0.40, the concentra-tion of propionic acid did not exceed 0.19 g/L. Although, the propionic/acetic ratio of the0:100 assay had very low values, possibly, in this case, acetoclastic methanogens were notcapable of converting acetate to methane, resulting in the accumulation of acetic acid gen-erated from propionic acid and the accumulation of propionate that was not transformedinto acetate, due to inhibition of hydrogenotrophic methanogens, which it caused low pro-duction of CH4 as a consequence of the decoupling of the AD process. Leng Li et al. [53],reported that approximately 6 to 35% of the total methanogenesis is derived from thedegradation of propionic acid in acetate, H2/CO2, therefore, the degradation of propionicacid is decisive in the stability of the methanogenic stage and the digestion performance.Furthermore, they indicate that the inhibition by acetate and propionate is due to free acidsinstead of the anions because it depends on the pH.
3.4. Parameters Related to the Organic Material Evolution
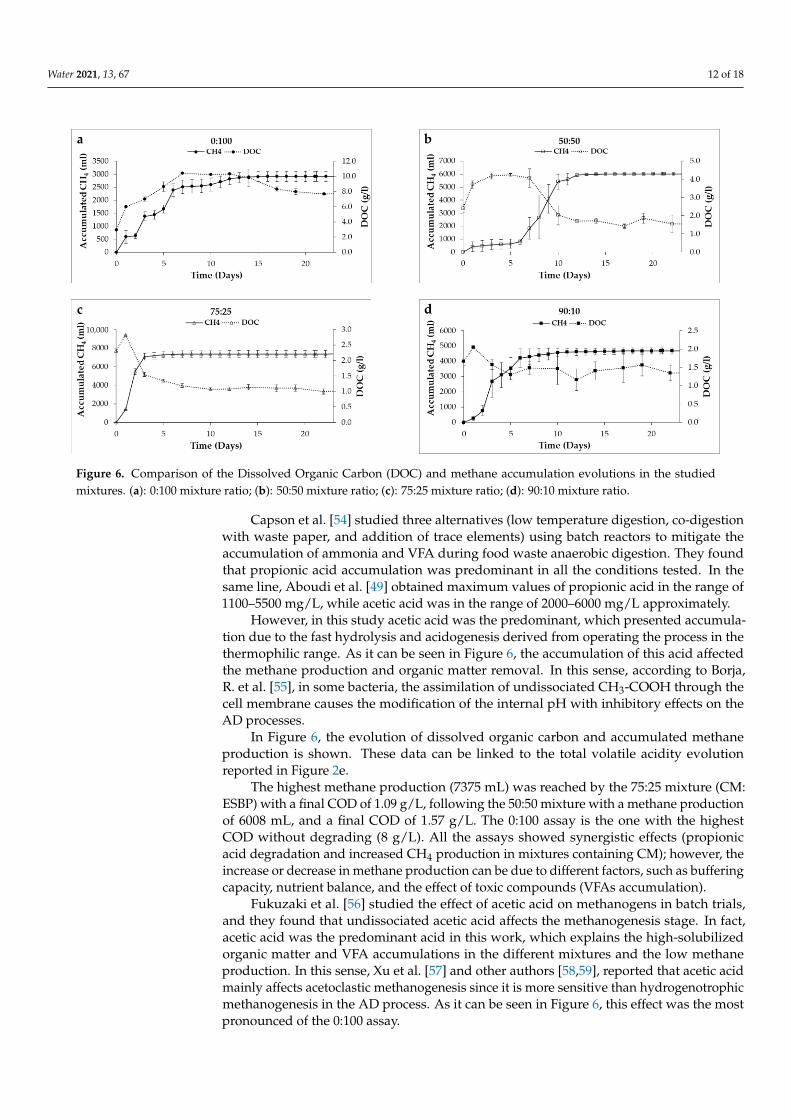
ESBP is a lignocellulosic by-product that presents difficulties in the use of structuralsugars, which is due to the recalcitrance generated by lignin. In fact, as it can be seenin Figure 6, for 0:100 assay the dissolved organic matter removal (measured in termsof DOC) was very low, since a significant fraction remained in the medium as VFAs.Aboudi et al. [49] found the same trend in the increase of the maximum values of DOCwhen the proportion of ESBP in the mixture increases.
According to other authors, in mesophilic anaerobic co-digestion processes, the propi-onic acid is the predominant. Li et al. [12] studied the anaerobic mesophilic co-digestion ofrice straw and cow manure, they detected that increasing the organic load in the reactorincreased the production of VFA and reported that propionic acid (1802–2761 mg/L) wasthe strongest inhibitor in biogas production.
Similarly, Borowski and Kucner [45] investigated the anaerobic mesophilic co-digestionof sugar beet pulp stillage with poultry manure and municipal sewage sludge. In the co-digestion of stillage with 20% poultry manure, the total volatile fatty acids production wasin the range of 5500–8500 g/m3, (propionic ranged between 72 and 76% of the TVFA) whilein the co- digestion of stillage with 60% of sewage sludge, the predominant acid was aceticacid with 72–82% of the total acidity.
Water 2021, 13, 67 12 of 18Water 2021, 13, x FOR PEER REVIEW 12 of 18
Figure 6. Comparison of the Dissolved Organic Carbon (DOC) and methane accumulation evolutions in the studied mix-
tures. (a): 0:100 mixture ratio; (b): 50:50 mixture ratio; (c): 75:25 mixture ratio; (d): 90:10 mixture ratio
According to other authors, in mesophilic anaerobic co-digestion processes, the pro-
pionic acid is the predominant. Li et al. [12] studied the anaerobic mesophilic co-digestion
of rice straw and cow manure, they detected that increasing the organic load in the reactor
increased the production of VFA and reported that propionic acid (1802–2761 mg/L) was
the strongest inhibitor in biogas production.
Similarly, Borowski and Kucner [45] investigated the anaerobic mesophilic co-diges-
tion of sugar beet pulp stillage with poultry manure and municipal sewage sludge. In the
co-digestion of stillage with 20% poultry manure, the total volatile fatty acids production
was in the range of 5500–8500 g/m3, (propionic ranged between 72 and 76% of the TVFA)
while in the co- digestion of stillage with 60% of sewage sludge, the predominant acid was
acetic acid with 72–82% of the total acidity.
Capson et al. [54] studied three alternatives (low temperature digestion, co-digestion
with waste paper, and addition of trace elements) using batch reactors to mitigate the ac-
cumulation of ammonia and VFA during food waste anaerobic digestion. They found that
propionic acid accumulation was predominant in all the conditions tested. In the same
line, Aboudi et al. [49] obtained maximum values of propionic acid in the range of 1100–
5500 mg/L, while acetic acid was in the range of 2000–6000 mg/L approximately.
However, in this study acetic acid was the predominant, which presented accumula-
tion due to the fast hydrolysis and acidogenesis derived from operating the process in the
thermophilic range. As it can be seen in Figure 6, the accumulation of this acid affected
the methane production and organic matter removal. In this sense, according to Borja, R.
et al. [55], in some bacteria, the assimilation of undissociated CH3-COOH through the cell
membrane causes the modification of the internal pH with inhibitory effects on the AD
processes.
In Figure 6, the evolution of dissolved organic carbon and accumulated methane pro-
duction is shown. These data can be linked to the total volatile acidity evolution reported
in Figure 2e.
The highest methane production (7375 mL) was reached by the 75:25 mixture (CM:
ESBP) with a final COD of 1.09 g/L, following the 50:50 mixture with a methane produc-
tion of 6008 mL, and a final COD of 1.57 g/L. The 0:100 assay is the one with the highest
COD without degrading (8 g/L). All the assays showed synergistic effects (propionic acid
Figure 6. Comparison of the Dissolved Organic Carbon (DOC) and methane accumulation evolutions in the studiedmixtures. (a): 0:100 mixture ratio; (b): 50:50 mixture ratio; (c): 75:25 mixture ratio; (d): 90:10 mixture ratio.
Capson et al. [54] studied three alternatives (low temperature digestion, co-digestionwith waste paper, and addition of trace elements) using batch reactors to mitigate theaccumulation of ammonia and VFA during food waste anaerobic digestion. They foundthat propionic acid accumulation was predominant in all the conditions tested. In thesame line, Aboudi et al. [49] obtained maximum values of propionic acid in the range of1100–5500 mg/L, while acetic acid was in the range of 2000–6000 mg/L approximately.
However, in this study acetic acid was the predominant, which presented accumula-tion due to the fast hydrolysis and acidogenesis derived from operating the process in thethermophilic range. As it can be seen in Figure 6, the accumulation of this acid affectedthe methane production and organic matter removal. In this sense, according to Borja,R. et al. [55], in some bacteria, the assimilation of undissociated CH3-COOH through thecell membrane causes the modification of the internal pH with inhibitory effects on theAD processes.
In Figure 6, the evolution of dissolved organic carbon and accumulated methaneproduction is shown. These data can be linked to the total volatile acidity evolutionreported in Figure 2e.
The highest methane production (7375 mL) was reached by the 75:25 mixture (CM:ESBP) with a final COD of 1.09 g/L, following the 50:50 mixture with a methane productionof 6008 mL, and a final COD of 1.57 g/L. The 0:100 assay is the one with the highestCOD without degrading (8 g/L). All the assays showed synergistic effects (propionicacid degradation and increased CH4 production in mixtures containing CM); however, theincrease or decrease in methane production can be due to different factors, such as bufferingcapacity, nutrient balance, and the effect of toxic compounds (VFAs accumulation).
Fukuzaki et al. [56] studied the effect of acetic acid on methanogens in batch trials,and they found that undissociated acetic acid affects the methanogenesis stage. In fact,acetic acid was the predominant acid in this work, which explains the high-solubilizedorganic matter and VFA accumulations in the different mixtures and the low methaneproduction. In this sense, Xu et al. [57] and other authors [58,59], reported that acetic acidmainly affects acetoclastic methanogenesis since it is more sensitive than hydrogenotrophicmethanogenesis in the AD process. As it can be seen in Figure 6, this effect was the mostpronounced of the 0:100 assay.
Water 2021, 13, 67 13 of 18
In addition, Zyhang et al. [60] reported that the hydrogenotrophic methanogensinhibition may be mainly due to the accumulation of free acetic acid. However, theyindicated that, under mesophilic conditions, there is no difference among the toxicitycaused by free acetic, propionic, and butyric acids [61].
About the specific methane yield in term of VS fed, for the 75:25 mixture it wasapproximately 3.3 times greater than for the 0:100 assay. This fact is due to an increase inthe CM proportion as co-substrate. The higher specific methane production reached in thismixture may be due to the balanced carbon and nitrogen contents.
Aboudi et al. [49] studied the anaerobic co-digestion of by-product of sugar beet andCM and they found the highest methane yield in the 25:75 mixture (ESBP-DP and CM).This value was 1.8 times higher than for the 100:0 (ESBP-DP and CM) mixture. In anotherstudy of co-digestion under thermophilic conditions with pig manure as co-substrate,authors obtained the highest methane production in the 25:75 (ESBP: PM) mixture and itwas 4.4 times higher than for the 100:0 mixture (ESBP:PM) [22].
3.5. The Kinetic Model
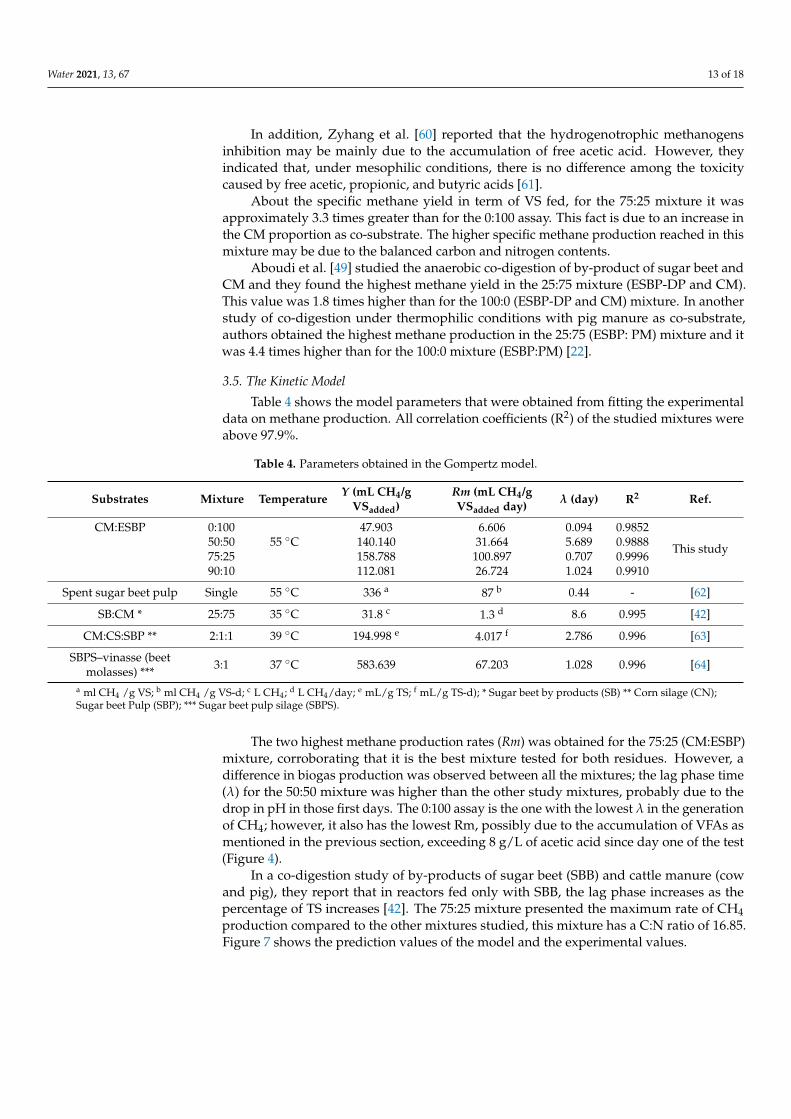
Table 4 shows the model parameters that were obtained from fitting the experimentaldata on methane production. All correlation coefficients (R2) of the studied mixtures wereabove 97.9%.
Table 4. Parameters obtained in the Gompertz model.
Substrates Mixture Temperature Y (mL CH4/gVSadded)
Rm (mL CH4/gVSadded day) λ (day) R2 Ref.
CM:ESBP 0:100 47.903 6.606 0.094 0.9852
This study50:50 55 ◦C 140.140 31.664 5.689 0.988875:25 158.788 100.897 0.707 0.999690:10 112.081 26.724 1.024 0.9910
Spent sugar beet pulp Single 55 ◦C 336 a 87 b 0.44 - [62]
SB:CM * 25:75 35 ◦C 31.8 c 1.3 d 8.6 0.995 [42]
CM:CS:SBP ** 2:1:1 39 ◦C 194.998 e 4.017 f 2.786 0.996 [63]
SBPS–vinasse (beetmolasses) *** 3:1 37 ◦C 583.639 67.203 1.028 0.996 [64]
a ml CH4 /g VS; b ml CH4 /g VS-d; c L CH4; d L CH4/day; e mL/g TS; f mL/g TS-d); * Sugar beet by products (SB) ** Corn silage (CN);Sugar beet Pulp (SBP); *** Sugar beet pulp silage (SBPS).
The two highest methane production rates (Rm) was obtained for the 75:25 (CM:ESBP)mixture, corroborating that it is the best mixture tested for both residues. However, adifference in biogas production was observed between all the mixtures; the lag phase time(λ) for the 50:50 mixture was higher than the other study mixtures, probably due to thedrop in pH in those first days. The 0:100 assay is the one with the lowest λ in the generationof CH4; however, it also has the lowest Rm, possibly due to the accumulation of VFAs asmentioned in the previous section, exceeding 8 g/L of acetic acid since day one of the test(Figure 4).
In a co-digestion study of by-products of sugar beet (SBB) and cattle manure (cowand pig), they report that in reactors fed only with SBB, the lag phase increases as thepercentage of TS increases [42]. The 75:25 mixture presented the maximum rate of CH4production compared to the other mixtures studied, this mixture has a C:N ratio of 16.85.Figure 7 shows the prediction values of the model and the experimental values.
Water 2021, 13, 67 14 of 18
Water 2021, 13, x FOR PEER REVIEW 15 of 19
in the generation of CH4; however, it also has the lowest Rm, possibly due to the accumu-lation of VFAs as mentioned in the previous section, exceeding 8 g/L of acetic acid since day one of the test (Figure 4).
In a co-digestion study of by-products of sugar beet (SBB) and cattle manure (cow and pig), they report that in reactors fed only with SBB, the lag phase increases as the percentage of TS increases [42]. The 75:25 mixture presented the maximum rate of CH4 production compared to the other mixtures studied, this mixture has a C:N ratio of 16.85. Figure 7 shows the prediction values of the model and the experimental values.
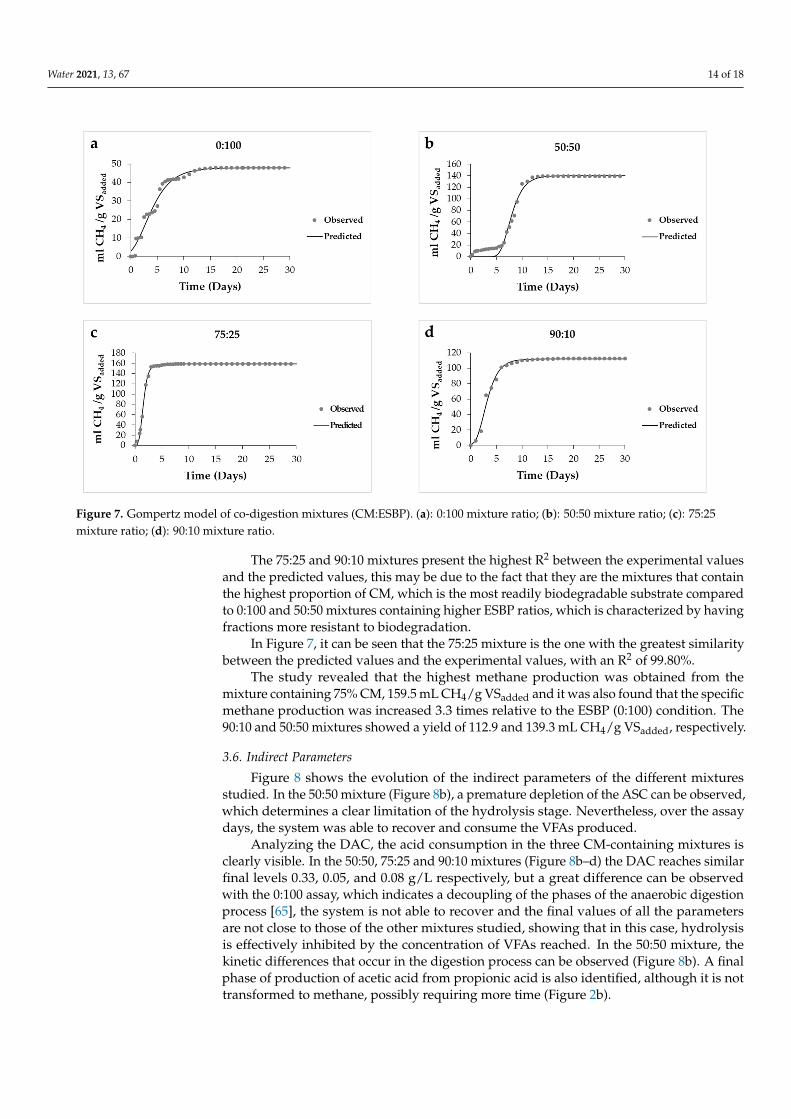
Figure 7. Gompertz model of co-digestion mixtures (CM:ESBP). (a): 0:100 mixture ratio; (b): 50:50 mixture ratio; (c): 75:25 mixture ratio; (d): 90:10 mixture ratio .
The 75:25 and 90:10 mixtures present the highest R2 between the experimental values and the predicted values, this may be due to the fact that they are the mixtures that contain the highest proportion of CM, which is the most readily biodegradable substrate com-pared to 0:100 and 50:50 mixtures containing higher ESBP ratios, which is characterized by having fractions more resistant to biodegradation.
In Figure 7, it can be seen that the 75:25 mixture is the one with the greatest similarity between the predicted values and the experimental values, with an R2 of 99.80%.
The study revealed that the highest methane production was obtained from the mix-ture containing 75% CM, 159.5 mL CH4/g VSadded and it was also found that the specific methane production was increased 3.3 times relative to the ESBP (0:100) condition. The 90:10 and 50:50 mixtures showed a yield of 112.9 and 139.3 mL CH4/g VSadded, respectively.
3.6. Indirect Parameters Figure 8 shows the evolution of the indirect parameters of the different mixtures
studied. In the 50:50 mixture (Figure 8b), a premature depletion of the ASC can be ob-served, which determines a clear limitation of the hydrolysis stage. Nevertheless, over the assay days, the system was able to recover and consume the VFAs produced.
Figure 7. Gompertz model of co-digestion mixtures (CM:ESBP). (a): 0:100 mixture ratio; (b): 50:50 mixture ratio; (c): 75:25mixture ratio; (d): 90:10 mixture ratio.
The 75:25 and 90:10 mixtures present the highest R2 between the experimental valuesand the predicted values, this may be due to the fact that they are the mixtures that containthe highest proportion of CM, which is the most readily biodegradable substrate comparedto 0:100 and 50:50 mixtures containing higher ESBP ratios, which is characterized by havingfractions more resistant to biodegradation.
In Figure 7, it can be seen that the 75:25 mixture is the one with the greatest similaritybetween the predicted values and the experimental values, with an R2 of 99.80%.
The study revealed that the highest methane production was obtained from themixture containing 75% CM, 159.5 mL CH4/g VSadded and it was also found that the specificmethane production was increased 3.3 times relative to the ESBP (0:100) condition. The90:10 and 50:50 mixtures showed a yield of 112.9 and 139.3 mL CH4/g VSadded, respectively.
3.6. Indirect Parameters
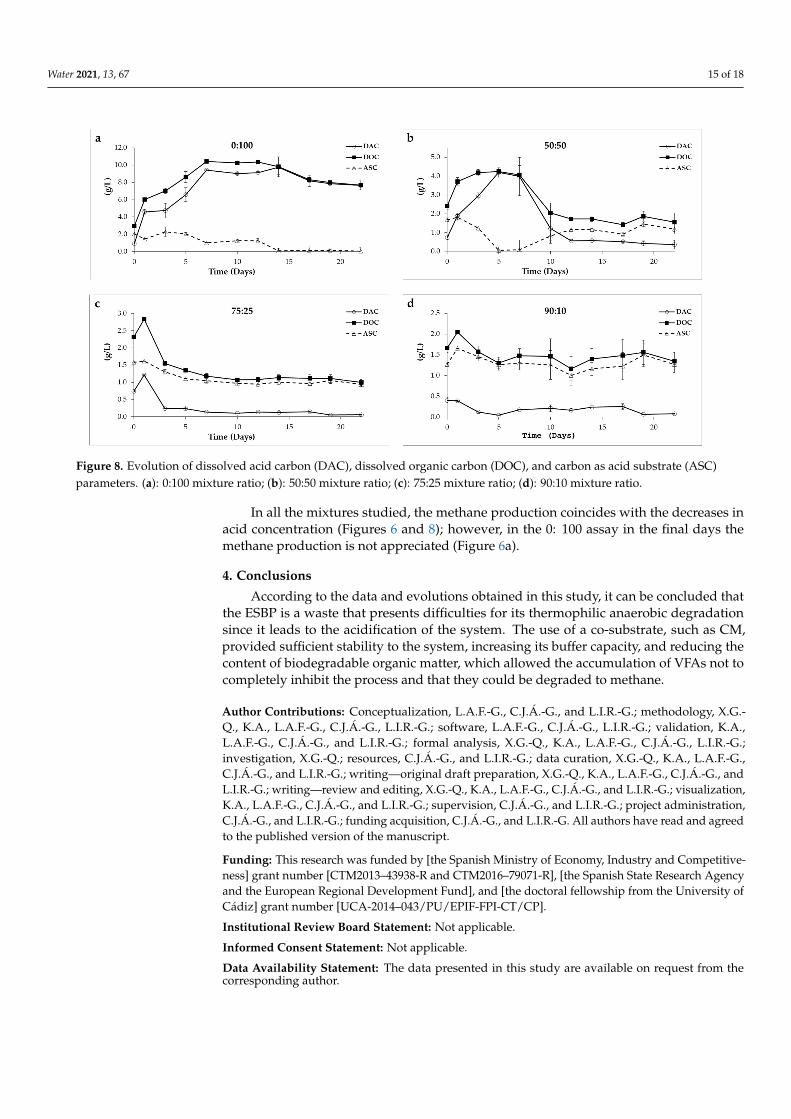
Figure 8 shows the evolution of the indirect parameters of the different mixturesstudied. In the 50:50 mixture (Figure 8b), a premature depletion of the ASC can be observed,which determines a clear limitation of the hydrolysis stage. Nevertheless, over the assaydays, the system was able to recover and consume the VFAs produced.
Analyzing the DAC, the acid consumption in the three CM-containing mixtures isclearly visible. In the 50:50, 75:25 and 90:10 mixtures (Figure 8b–d) the DAC reaches similarfinal levels 0.33, 0.05, and 0.08 g/L respectively, but a great difference can be observedwith the 0:100 assay, which indicates a decoupling of the phases of the anaerobic digestionprocess [65], the system is not able to recover and the final values of all the parametersare not close to those of the other mixtures studied, showing that in this case, hydrolysisis effectively inhibited by the concentration of VFAs reached. In the 50:50 mixture, thekinetic differences that occur in the digestion process can be observed (Figure 8b). A finalphase of production of acetic acid from propionic acid is also identified, although it is nottransformed to methane, possibly requiring more time (Figure 2b).
Water 2021, 13, 67 15 of 18Water 2021, 13, x FOR PEER REVIEW 16 of 19
Figure 8. Evolution of dissolved acid carbon (DAC), dissolved organic carbon (DOC), and carbon as acid substrate (ASC) parameters. (a): 0:100 mixture ratio; (b): 50:50 mixture ratio; (c): 75:25 mixture ratio; (d): 90:10 mixture ratio.
Analyzing the DAC, the acid consumption in the three CM-containing mixtures is clearly visible. In the 50:50, 75:25 and 90:10 mixtures (Figure 8b–d) the DAC reaches sim-ilar final levels 0.33, 0.05, and 0.08 g/L respectively, but a great difference can be observed with the 0:100 assay, which indicates a decoupling of the phases of the anaerobic digestion process [65], the system is not able to recover and the final values of all the parameters are not close to those of the other mixtures studied, showing that in this case, hydrolysis is effectively inhibited by the concentration of VFAs reached. In the 50:50 mixture, the ki-netic differences that occur in the digestion process can be observed (Figure 8b). A final phase of production of acetic acid from propionic acid is also identified, although it is not transformed to methane, possibly requiring more time (Figure 2b).
In all the mixtures studied, the methane production coincides with the decreases in acid concentration (Figures 6 and 8); however, in the 0: 100 assay in the final days the methane production is not appreciated (Figure 6a).
4. Conclusions According to the data and evolutions obtained in this study, it can be concluded that
the ESBP is a waste that presents difficulties for its thermophilic anaerobic degradation since it leads to the acidification of the system. The use of a co-substrate, such as CM, provided sufficient stability to the system, increasing its buffer capacity, and reducing the content of biodegradable organic matter, which allowed the accumulation of VFAs not to completely inhibit the process and that they could be degraded to methane.
Author Contributions: Conceptualization, L.A.F.-G., C.J.Á.-G., and L.I.R.-G.; methodology, X.G.-Q., K.A., L.A.F.-G., C.J.Á.-G., L.I.R.-G.; software, L.A.F.-G., C.J.Á.-G., L.I.R.-G.; validation, K.A., L.A.F.-G., C.J.Á.-G., and L.I.R.-G.; formal analysis, X.G.-Q., K.A., L.A.F.-G., C.J.Á.-G., L.I.R.-G.; investigation, X.G.-Q.; resources, C.J.Á.-G., and L.I.R.-G.; data curation, X.G.-Q., K.A., L.A.F.-G., C.J.Á.-G., and L.I.R.-G.; writing—original draft preparation, X.G.-Q., K.A., L.A.F.-G., C.J.Á.-G., and L.I.R.-G.; writing—review and editing, X.G.-Q., K.A., L.A.F.-G., C.J.Á.-G., and L.I.R.-G.; visualiza-
Figure 8. Evolution of dissolved acid carbon (DAC), dissolved organic carbon (DOC), and carbon as acid substrate (ASC)parameters. (a): 0:100 mixture ratio; (b): 50:50 mixture ratio; (c): 75:25 mixture ratio; (d): 90:10 mixture ratio.
In all the mixtures studied, the methane production coincides with the decreases inacid concentration (Figures 6 and 8); however, in the 0: 100 assay in the final days themethane production is not appreciated (Figure 6a).
4. Conclusions
According to the data and evolutions obtained in this study, it can be concluded thatthe ESBP is a waste that presents difficulties for its thermophilic anaerobic degradationsince it leads to the acidification of the system. The use of a co-substrate, such as CM,provided sufficient stability to the system, increasing its buffer capacity, and reducing thecontent of biodegradable organic matter, which allowed the accumulation of VFAs not tocompletely inhibit the process and that they could be degraded to methane.
Author Contributions: Conceptualization, L.A.F.-G., C.J.Á.-G., and L.I.R.-G.; methodology, X.G.-Q., K.A., L.A.F.-G., C.J.Á.-G., L.I.R.-G.; software, L.A.F.-G., C.J.Á.-G., L.I.R.-G.; validation, K.A.,L.A.F.-G., C.J.Á.-G., and L.I.R.-G.; formal analysis, X.G.-Q., K.A., L.A.F.-G., C.J.Á.-G., L.I.R.-G.;investigation, X.G.-Q.; resources, C.J.Á.-G., and L.I.R.-G.; data curation, X.G.-Q., K.A., L.A.F.-G.,C.J.Á.-G., and L.I.R.-G.; writing—original draft preparation, X.G.-Q., K.A., L.A.F.-G., C.J.Á.-G., andL.I.R.-G.; writing—review and editing, X.G.-Q., K.A., L.A.F.-G., C.J.Á.-G., and L.I.R.-G.; visualization,K.A., L.A.F.-G., C.J.Á.-G., and L.I.R.-G.; supervision, C.J.Á.-G., and L.I.R.-G.; project administration,C.J.Á.-G., and L.I.R.-G.; funding acquisition, C.J.Á.-G., and L.I.R.-G. All authors have read and agreedto the published version of the manuscript.
Funding: This research was funded by [the Spanish Ministry of Economy, Industry and Competitive-ness] grant number [CTM2013–43938-R and CTM2016–79071-R], [the Spanish State Research Agencyand the European Regional Development Fund], and [the doctoral fellowship from the University ofCádiz] grant number [UCA-2014–043/PU/EPIF-FPI-CT/CP].
Institutional Review Board Statement: Not applicable.
Informed Consent Statement: Not applicable.
Data Availability Statement: The data presented in this study are available on request from thecorresponding author.
Water 2021, 13, 67 16 of 18
Acknowledgments: This research was supported by the projects CTM2013–43938-R andCTM2016–79071-R (Spanish Ministry of Economy, Industry and Competitiveness) and financedby the Spanish State Research Agency (“Agencia Estatal de Investigación”—AEI), and by the Euro-pean Regional Development Fund (ERDF). The Authors also acknowledge the University of Cádiz(Spain) for the Scholarship UCA-2014–043/PU/EPIF-FPI-CT/CP, the Agri-food Campus of Interna-tional Excellence (Ceia3) and the Azucarera (an AB Sugar Company) for the supply of samples ofexhausted sugar beet pulp.
Conflicts of Interest: The authors declare no conflict of interest.
References1. Dai, X.; Chen, Y.; Zhang, D.; Yi, J. High-solid anaerobic co-digestion of sewage sludge and cattle manure: The effects of volatile
solid ratio and pH. Sci. Rep. 2016, 6, 35194. [CrossRef]2. Li, Q.; Qiao, W.; Wang, X.; Takayanagi, K.; Shofie, M.; Cheng, J. Kinetic characterization of thermophilic and mesophilic anaerobic
digestion for coffee grounds and waste activated sludge. Waste Manag. 2015, 36, 77–85. [CrossRef]3. Zhao, Y.; Sun, F.; Yu, J.; Cai, Y.; Luo, X.; Cui, Z.; Hu, Y.; Wang, X. Co-digestion of oat straw and cow manure during anaerobic
digestion: Stimulative and inhibitory effects on fermentation. Bioresour. Technol. 2018, 269, 143–152. [CrossRef]4. Li, C.; Strömberg, S.; Liu, G.; Nges, I.A.; Liu, J. Assessment of regional biomass as co-substrate in the anaerobic digestion of
chicken manure: Impact of co-digestion with chicken processing waste, seagrass and Miscanthus. Biochem. Eng. J. 2017, 118,1–10. [CrossRef]
5. Jiménez, J.; Guardia-Puebla, Y.; Cisneros-Ortiz, M.; Morgan-Sagastume, J.; Guerra, G.; Noyola, A. Optimization of the specificmethanogenic activity during the anaerobic co-digestion of pig manure and rice straw, using industrial clay residues as inorganicadditive. Chem. Eng. J. 2015, 259, 703–714. [CrossRef]
6. Yu, Q.; Sun, C.; Liu, R.; Yellezuome, D.; Zhu, X.; Bai, R.; Liu, M.; Sun, M. Anaerobic co-digestion of corn stover and chickenmanure using continuous stirred tank reactor: The effect of biochar addition and urea pretreatment. Bioresour. Technol. 2021, 319,124197. [CrossRef]
7. Zhou, J.; Zhang, Y.; Khoshnevisan, B.; Duan, N. Meta-analysis of anaerobic co-digestion of livestock manure in last decade:Identification of synergistic effect and optimization synergy range. Appl. Energy 2021, 282, 116128. [CrossRef]
8. Li, Y.; Zhao, J.; Krooneman, J.; Euverink, G.J.W. Strategies to boost anaerobic digestion performance of cow manure: Laboratoryachievements and their full-scale application potential. Sci. Total Environ. 2020, 142940. [CrossRef]
9. Xu, H.; Yun, S.; Wang, C.; Wang, Z.; Han, F.; Jia, B.; Chen, J.; Li, B. Improving performance and phosphorus content of anaerobicco-digestion of dairy manure with aloe peel waste using vermiculite. Bioresour. Technol. 2020, 301, 122753. [CrossRef]
10. Xing, B.-S.; Cao, S.; Han, Y.; Wen, J.; Zhang, K.; Wang, X.C. Stable and high-rate anaerobic co-digestion of food waste and cowmanure: Optimisation of start-up conditions. Bioresour. Technol. 2020, 307, 123195. [CrossRef]
11. Instituto Nacional de Estadística-INE, Anuario Estadístico de España. 2019, Volume 605. Available online: www.ine.es/infoine(accessed on 16 November 2020).
12. Li, D.; Liu, S.; Mi, L.; Li, Z.; Yuan, Y.; Yan, Z.; Liu, X. Effects of feedstock ratio and organic loading rate on the anaerobic mesophilicco-digestion of rice straw and cow manure. Bioresour. Technol. 2015, 189, 319–326. [CrossRef] [PubMed]
13. Akyol, Ç.; Ozbayram, E.G.; Ince, O.; Kleinsteuber, S.; Ince, B. Anaerobic co-digestion of cow manure and barley: Effect of cowmanure to barley ratio on methane production and digestion stability. Environ. Prog. Sustain. Energy 2016, 35, 589–595. [CrossRef]
14. Li, Y.; Li, Y.; Zhang, D.; Li, G.; Lu, J.; Li, S. Solid state anaerobic co-digestion of tomato residues with dairy manure and cornstover for biogas production. Bioresour. Technol. 2016, 217, 50–55. [CrossRef]
15. Wang, X.; Yang, G.; Feng, Y.; Ren, G.; Han, X. Optimizing feeding composition and carbon–nitrogen ratios for improvedmethane yield during anaerobic co-digestion of dairy, chicken manure and wheat straw. Bioresour. Technol. 2012, 120, 78–83.[CrossRef] [PubMed]
16. Montoro, S.B.; Lucas, J.; Santos, D.; Costa, M.S.S.D.M. Anaerobic co-digestion of sweet potato and dairy cattle manure: A technicaland economic evaluation for energy and biofertilizer production. J. Clean. Prod. 2019, 226, 1082–1091. [CrossRef]
17. Li, C.; Zhou, Y.; Lu, W.; Nges, I.A. Enhancement of the solid-state anaerobic digestion of rice straw by liquor supplementation.Bioresour. Technol. Rep. 2019, 5, 59–65. [CrossRef]
18. Chuenchart, W.; Logan, M.; Leelayouthayotin, C.; Visvanathan, C. Enhancement of food waste thermophilic anaerobic digestionthrough synergistic effect with chicken manure. Biomass Bioenergy 2020, 136, 105541. [CrossRef]
19. Li, Q.; Li, H.; Wang, G.; Wang, X.C. Effects of loading rate and temperature on anaerobic co-digestion of food waste and wasteactivated sludge in a high frequency feeding system, looking in particular at stability and efficiency. Bioresour. Technol. 2017, 237,231–239. [CrossRef]
20. Fernández-Güelfo, L.A.; Álvarez-Gallego, C.J.; Sales, D.; Romero-García, L.I. New indirect parameters for interpreting adestabilization episode in an anaerobic reactor. Chem. Eng. J. 2012, 180, 32–38. [CrossRef]
21. Angeriz-Campoy, R.; Fernández-Güelfo, L.A.; Tyagi, V.K.; Álvarez-Gallego, C.J.; Romero-García, L.I. New criteria to determinethe destabilization of the acidogenic anaerobic co-digestion of organic fraction of municipal solid waste (OFMSW) with mixedsludge (MS). Bioresour. Technol. 2018, 248, 174–179. [CrossRef]
Water 2021, 13, 67 17 of 18
22. Gómez-Quiroga, X.; Aboudi, K.; Álvarez-Gallego, C.J.; Romero-García, L.I. Enhancement of Methane Production in ThermophilicAnaerobic Co-Digestion of Exhausted Sugar Beet Pulp and Pig Manure. Appl. Sci. 2019, 9, 1791. [CrossRef]
23. APHA-AWWA-WPCF. Standards Methods for the Examination of Water and Wastewater, 20th ed.; American Public Health Association:Washington, DC, USA, 2005.
24. Van Soest, P.V.; Robertson, J.B.; Lewis, B.A. Methods for Dietary Fiber, Neutral Detergent Fiber, and Nonstarch Polysaccharides inRelation to Animal Nutrition. J. Dairy Sci. 1991, 74, 3583–3597. [CrossRef]
25. Álvarez-Gallego, C.J. Ensayo de Diferentes Procedimientos para el Arranque de un Proceso de Co-Digestión Anaerobia seca deFORSU y Lodos de Depuradora en Rango Termofílico. Ph.D. Thesis, Universidad de Cádiz, Cádiz, España, 2005.
26. Mahdy, A.; Fotidis, I.A.; Mancini, E.; Ballesteros, M.; González-Fernández, C.; Angelidaki, I. Ammonia tolerant inoculaprovide a good base for anaerobic digestion of microalgae in third generation biogas process. Bioresour. Technol. 2017, 225,272–278. [CrossRef]
27. Vats, N.; Khan, A.A.; Ahmad, K. Effect of substrate ratio on biogas yield for anaerobic co-digestion of fruit vegetable waste &sugarcane bagasse. Environ. Technol. Innov. 2019, 13, 331–339. [CrossRef]
28. Gaur, R.Z.; Khan, A.A.; Suthar, S. Effect of thermal pre-treatment on co-digestion of duckweed (Lemna gibba) and waste activatedsludge on biogas production. Chemosphere 2017, 174, 754–763. [CrossRef]
29. Kahm, M.; Hasenbrink, G.; Lichtenberg-Fraté, H.; Ludwig, J.; Kschischo, M. grofit: Fitting Biological Growth Curves with R. J.Stat. Softw. 2010, 33, 1–22. [CrossRef]
30. Cheng, J.; Lu, X.; Kobayashi, T.; Cheng, J.; Xu, K.; Zhao, Y. Mesophilic anaerobic co-digestion of waste activated sludge and Egeriadensa: Performance assessment and kinetic analysis. Appl. Energy 2015, 148, 78–86. [CrossRef]
31. Owamah, I.; Izinyon, O. The effect of organic loading rates (OLRs) on the performances of food wastes and maize husks anaerobicco-digestion in continuous mode. Sustain. Energy Technol. Assess. 2015, 11, 71–76. [CrossRef]
32. Haider, M.R.; Zeshan; Yousaf, S.; Malik, R.N.; Visvanathan, C. Effect of mixing ratio of food waste and rice husk co-digestion andsubstrate to inoculum ratio on biogas production. Bioresour. Technol. 2015, 190, 451–457. [CrossRef]
33. Lorenzo Acosta, Y.; Obaya Abreu, M.C. La Digestión Anaerobia. Aspectos Teóricos. Parte I, ICIDCA. Sobre los Derivados de la CañaAzúcar. Vol. XXXIX; núm 1; Redalyc [en linea]; 2005; pp. 35–48. Available online: https://www.redalyc.org/articulo.oa?id=223120659006 (accessed on 29 September 2020).
34. Bouallagui, H.; Lahdheb, H.; Ben Romdan, E.; Rachdi, B.; Hamdi, M. Improvement of fruit and vegetable waste anaerobicdigestion performance and stability with co-substrates addition. J. Environ. Manag. 2009, 90, 1844–1849. [CrossRef]
35. Zhao, H.W. Analysis of the performance of an anaerobic digestion system at the Regina wastewater treatment plant. Bioresour.Technol. 2004, 95, 301–307. [CrossRef]
36. Zhu, G.; Jha, A.K. Psychrophilic dry anaerobic digestion of cow dung for methane production: Effect of inoculum. Science 2013,39, 500–510. [CrossRef]
37. Brown, D.; Li, Y. Solid state anaerobic co-digestion of yard waste and food waste for biogas production. Bioresour. Technol. 2013,127, 275–280. [CrossRef]
38. Schoen, M.A.; Sperl, D.; Gadermaier, M.; Goberna, M.; Franke-Whittle, I.; Insam, H.; Ablinger, J.; Wett, B. Population dynamics atdigester overload conditions. Bioresour. Technol. 2009, 100, 5648–5655. [CrossRef]
39. Camacho, R.; Castillo, H.S.V.; Hoyos, J.L. Evaluación del Estiércol de Vaca como Inóculo en la Digestión Anaerobia Termófila deResiduos Sólidos Urbanos. Evaluation of Cow Manure as Inoculum in the Thermophilic Anaerobic Digestion of Municipal SolidWaste. Inf. Technol. 2017, 28, 29–36. [CrossRef]
40. Cheng, X.-Y.; Zhong, C. Effects of Feed to Inoculum Ratio, Co-digestion, and Pretreatment on Biogas Production from AnaerobicDigestion of Cotton Stalk. Energy Fuels 2014, 28, 3157–3166. [CrossRef]
41. Infantes, D.; Del Campo, A.G.; Villaseñor, J.; Fernández, F. Kinetic model and study of the influence of pH, temperature andundissociated acids on acidogenic fermentation. Biochem. Eng. J. 2012, 66, 66–72. [CrossRef]
42. Aboudi, K.; Álvarez-Gallego, C.; Romero-García, L. Influence of total solids concentration on the anaerobic co-digestion of sugarbeet by-products and livestock manures. Sci. Total Environ. 2017, 586, 438–445. [CrossRef]
43. Li, X.; Yang, Z.; Liu, G.; Ma, Z.; Wang, W. Modified anaerobic digestion model No.1 (ADM 1) for modeling anaerobic digestionprocess at different ammonium concentrations. Water Environ. Res. 2019, 91, 700–714. [CrossRef]
44. Rahman, A.; Saha, C.K.; Ward, A.J.; Møller, H.B.; Alam, M. Anaerobic co-digestions of agro-industrial waste blends using mixturedesign. Biomass Bioenergy 2019, 122, 156–164. [CrossRef]
45. Borowski, S.; Kucner, M. The use of sugar beet pulp stillage for co-digestion with sewage sludge and poultry manure. WasteManag. Res. 2019, 37, 1025–1032. [CrossRef]
46. Zhang, Z.; Zhang, G.; Li, W.; Li, C.; Xu, G. Enhanced biogas production from sorghum stem by co-digestion with cow manure.Int. J. Hydrogen Energy 2016, 41, 9153–9158. [CrossRef]
47. Estevez, M.M.; Sapci, Z.; Linjordet, R.; Schnürer, A.; Morken, J. Semi-continuous anaerobic co-digestion of cow manure andsteam-exploded Salix with recirculation of liquid digestate. J. Environ. Manag. 2014, 136, 9–15. [CrossRef]
48. Fang, C.; Boe, K.; Angelidaki, I. Anaerobic co-digestion of by-products from sugar production with cow manure. Water Res. 2011,45, 3473–3480. [CrossRef] [PubMed]
49. Aboudi, K.; Álvarez-Gallego, C.J.; Romero-García, L.I. Evaluation of methane generation and process stability from anaerobicco-digestion of sugar beet by-product and cow manure. J. Biosci. Bioeng. 2016, 121, 566–572. [CrossRef] [PubMed]
Water 2021, 13, 67 18 of 18
50. Bi, S.; Qiao, W.; Xiong, L.; Ricci, M.; Adani, F.; Dong, R. Effects of organic loading rate on anaerobic digestion of chicken manureunder mesophilic and thermophilic conditions. Renew. Energy 2019, 139, 242–250. [CrossRef]
51. Li, J.; Kumar Jha, A. Syntrophic Propionate Degradation in Anaerobic Digestion: A Review Biological Wastewater TreatmentView Project Microbiology View Project. 2012. Available online: http://www.fspublishers.org (accessed on 21 November 2020).
52. Ince, E.; Ince, M.; Önkal, E.G. Comparison of thermophilic and mesophilic anaerobic treatments for potato processing wastewaterusing a contact reactor. Glob. NEST J. 2017, 19, 318–326.
53. Leng, L.; Yang, P.; Singh, S.; Zhuang, H.; Xu, L.; Chen, W.-H.; Dolfing, J.; Ling, L.; Zhang, Y.; Zeng, H.; et al. A review on thebioenergetics of anaerobic microbial metabolism close to the thermodynamic limits and its implications for digestion applications.Bioresour. Technol. 2018, 247, 1095–1106. [CrossRef] [PubMed]
54. Capson-Tojo, G.; Ruiz, D.; Rouez, M.; Crest, M.; Steyer, J.-P.; Bernet, N.; Delgenès, J.-P.; Escudié, R. Accumulation of propionicacid during consecutive batch anaerobic digestion of commercial food waste. Bioresour. Technol. 2017, 245, 724–733. [CrossRef]
55. Borja, R.; Alba, J.; Martín, A.; Mancha, A. Influencia de la Velocidad de Carga Orgánica Sobre el Proceso de Digestión Anaerobiade Aguas de Lavado de Aceitunas de Almazara en Reactores de Lecho Fluidizado. 1998. Available online: http://grasasyaceites.revistas.csic.es (accessed on 14 September 2020).
56. Fukuzaki, S.; Nishio, N.; Nagai, S. Kinetics of the Methanogenic Fermentation of Acetate. Appl. Environ. Microbiol. 1990, 56,3158–3163. Available online: http://www.ncbi.nlm.nih.gov/pubmed/16348323 (accessed on 3 October 2019). [CrossRef]
57. Xu, Z.; Zhao, M.; Miao, H.; Huang, Z.; Gao, S.; Ruan, W. In situ volatile fatty acids influence biogas generation from kitchenwastes by anaerobic digestion. Bioresour. Technol. 2014, 163, 186–192. [CrossRef] [PubMed]
58. Li, D.; Chen, L.; Liu, X.; Mei, Z.; Ren, H.; Cao, Q.; Yan, Z. Instability mechanisms and early warning indicators for mesophilicanaerobic digestion of vegetable waste. Bioresour. Technol. 2017, 245, 90–97. [CrossRef] [PubMed]
59. Ziganshin, A.M.; Schmidt, T.; Lv, Z.; Liebetrau, J.; Richnow, H.H.; Kleinsteuber, S.; Nikolausz, M. Reduction of the hydraulicretention time at constant high organic loading rate to reach the microbial limits of anaerobic digestion in various reactor systems.Bioresour. Technol. 2016, 217, 62–71. [CrossRef] [PubMed]
60. Zhang, W.; Dai, K.; Xia, X.-Y.; Wang, H.-J.; Chen, Y.; Lu, Y.-Z.; Zhang, F.; Zeng, R.J. Free acetic acid as the key factor forthe inhibition of hydrogenotrophic methanogenesis in mesophilic mixed culture fermentation. Bioresour. Technol. 2018, 264,17–23. [CrossRef]
61. Zhang, W.; Zhang, F.; Li, Y.-X.; Jiang, Y.; Zeng, R.J. No difference in inhibition among free acids of acetate, propionate and butyrateon hydrogenotrophic methanogen of Methanobacterium formicicum. Bioresour. Technol. 2019, 294, 122237. [CrossRef]
62. Koppar, P. Pullammanappallil, Single-stage, batch, leach-bed, thermophilic anaerobic digestion of spent sugar beet pulp. Bioresour.Technol. 2008, 99, 2831–2839. [CrossRef]
63. Senol, H.; Açıkel, Ü.; Demir, S.; Oda, V. Anaerobic digestion of cattle manure, corn silage and sugar beet pulp mixtures afterthermal pretreatment and kinetic modeling study. Fuel 2020, 263, 116651. [CrossRef]
64. Zieminski, K.; Kowalska-Wentel, M. Effect of enzymatic pretreatment on anaerobic co-digestion of sugar beet pulp silage andvinasse. Bioresour. Technol. 2015, 180, 274–280. [CrossRef]
65. Aguilar, M.R.; Fdez-Güelfo, L.; Álvarez-Gallego, C.; Romero-García, L.I. Effect of HRT on hydrogen production and organicmatter solubilization in acidogenic anaerobic digestion of OFMSW. Chem. Eng. J. 2013, 219, 443–449. [CrossRef]