Embed Size (px)
Citation preview

Published: May 04, 2011
r 2011 American Chemical Society 6740 dx.doi.org/10.1021/jp2014836 | J. Phys. Chem. B 2011, 115, 6740–6748
ARTICLE
pubs.acs.org/JPCB
Analysis of the Mechanism of Lysozyme Pressure Denaturationfrom Raman Spectroscopy Investigations, and Comparisonwith Thermal DenaturationAlain H�edoux,* Yannick Guinet, and Laurent Paccou
Univ Lille Nord de France, F-59000 Lille, France; USTL, UMET, CNRS UMR 8207, F-59650 Villeneuve d’Ascq, France
1. INTRODUCTION
It is well-known that proteins are thermodynamically stableonly in a defined temperature interval, limited by two tempera-tures at which cooperative transitions lead to the loss of theprotein activity or to a change of its function. At high tempera-tures, protein thermal unfolding has been widely investigated,and the mechanism of thermal denaturation was currentlydescribed for model proteins,1�10 mainly from spectroscopicand calorimetric investigations. On the contrary cold-induceddenaturation is much less studied, probably because it occursbelow the freezing point of water. However, cold-induced de-naturation is recognized as the most widespread environmentalstress on many forms of life,11 and also involved in lyophilizationtechnologies currently used for the storage of foods and ther-apeutic materials.12 Several strategies can be used to analyze themolecular mechanisms of protein cold-induced denaturation.The freezing point of the aqueous solution can be depressed bythe addition of cosolvents to bring it below the temperature ofcold denaturation. The addition of denaturants such as urea12 orguanidine hydrochloride depressed the freezing point of theaqueous solution and also induces the increase of cold denatura-tion temperature. However, these cosolvents partially denaturethe native state of the proteins, and therefore the origin of thecold denaturation cannot be fully analyzed. Cryosolvents such asmethanol or glycerol are well-known to lower the freezing
temperature of the solvent, but also to stabilize the native stateof proteins.11 Alternatively, protein can be denatured by increas-ing the pressure at very high values (>500 MPa) in absence ofice,13�16 indicating that pressure can be used as a destabilizer ofstructure and as antifreeze, without chemical modification of thesolvent. It is now well recognized that the protein stability ischaracterized by an ellipsoidal (P,T)-phase diagram.13,17�19 Thisdescription is based on the assumption that there exist only twostates, the native � and the denatured � states of the protein.This suggests that all the denatured protein structures are of thesame kind. From calorimetric data, the unfolded states werefound to be similar20 after the cold and heat denaturation, whereasmore detailed spectroscopic studies did not support this descrip-tion. Previous studies have pointed out that conformationally andmechanistically, the pressure and cold unfolding processes arefound to be very alike, while the heat unfolding shows somepronounced differences.21,22 Structural differences have also beenfound between the cold- and heat-denatured states of β-lacto-globulin.23 Despite that, controversial considerations are reportedon similarities between cold, pressure, and heat induced structuralchanges,20�23 pressure appears as an interestingway to analyze the
Received: February 15, 2011Revised: April 12, 2011
ABSTRACT: Pressure denaturation of lysozyme dissolved in H2Oand D2O was analyzed using Raman investigations in a widefrequency range. The simultaneous analysis of regions correspond-ing to the molecular fingerprint of the protein (500�1800 cm�1),and the low- (50�450 cm�1) and high- (2600�3800 cm�1)frequency spectra, allow us to probe protein denaturation and theorganization of water molecules. The pressure- and heat-inducedtransformations are compared. Both pressure- and heat-denaturedstates are obtained through an intermediate state characterized byintact secondary structure and enhanced water penetration in thetertiary structure. As a consequence of a weaker penetration uponpressurizing, it was found that the pressure-denatured state waspartially unfolded compared with the heat-denatured state. Themechanism of pressure denaturation was related to the disruption of the hydrogen-bond network of water onto a set of clusterscharacterized by strengthened O � H interactions, inducing a hardening of protein dynamics. The mechanism is opposite to thatobserved upon heating, i.e., the softening of the hydrogen bond network of water inducing a softer protein dynamics. The analysis ofthe intramolecular O�H stretching reveals that pressurizing lysozyme aqueous solution favors the development of low-densitywater from the protein surface to the bulk, contrasting to the compression of pure water leading to crystallization of high-densityice-VI.

6741 dx.doi.org/10.1021/jp2014836 |J. Phys. Chem. B 2011, 115, 6740–6748
The Journal of Physical Chemistry B ARTICLE
mechanism of cold denaturation, since no cosolvent must be usedto reach the denatured state.
Spectroscopic techniques are suitable for analysis of the secon-dary structure from the investigation of amide modes5,24 andthen for monitoring the unfolding process of the secondarystructure.1,10 However, most of previous spectroscopy studiescarried out to investigate the pressure denaturation14�16,25,26
have been focused only on the vibrational bands of the protein,and then give the structural description of the denatured state,without direct information on the mechanism of denaturation.Raman investigations on protein thermal denaturation,1,10 si-multaneously performed in the amide I region and in the low-frequency (10�350 cm�1) have given a clear description of themechanism of thermal denaturation through the analysis of thesolvent dynamics and its coupling with that of the protein.
In the present work, we use the same methodology to analyzethe mechanism of pressure-induced denaturation of lysozyme toobtain information on the origin of the pressure denaturation.Lysozyme (LYS) is a globular protein (16 kDa) with a secondarystructure mainly composed of R-helices (∼40�45%) and alsocontainingβ-sheet structures (∼20%).5,24,27 Raman investigationswere carried out in the (500�1800 cm�1) region for monitoringthe secondary structure of the protein through the analysis ofamide I and III modes and to analyze the vibrations of the sidechains, in the OH-stretching region (2600�3800 cm�1) to probestructural changes in the hydrogen bond network of water, and inthe low-frequency range (50�450 cm�1) to analyze the dynamicsof the solvent, the protein, and the coupling between them.
2. MATERIALS AND METHODS
Lysozyme was purchased from Sigma as lyophilized powder(purity minimum 90%). Lysozyme solutions were prepared bydissolving lysozyme inH2O and inD2O (10wt%). Raman spectrawere recorded with Renishaw’s InVia Raman microscope, com-prising a single-grating spectrograph coupled to an optical micro-scope, and using∼150mWof 785 nm line of a Renishaw diode forexcitation. A Renishaw setting of four high-performance filtersleads to the rejection of the scattered light below 50 cm�1.
Pressure was generated in a gasketed membrane diamond-anvilcell (MDAC). Three ruby crystals (size∼10 μm) were included forin situ pressure measurements by the standard ruby fluorescencetechnique.28 The whole Raman spectrum (50 � 3800 cm�1) oflysozyme dissolved in H2O was recorded upon compression from20MPa up to 900MPa, while only amide I band was analyzed uponcompression and decompression. For lysozyme dissolved in D2O,only the amide I mode was analyzed upon compression. Pressuriza-tion of H2O was also investigated in the intramolecular O�Hstretching region between 2800 and 3800 cm�1.
High-temperature data on lysozyme dissolved in H2O andD2O were obtained from previous investigations.1
3. RESULTS
3.1. Fingerprint Region. The spectrum of the molecularfingerprint of LYS, lying on the 500�1800 cm�1 frequencyrange was decomposed in two regions.3.1.1. Analysis of the Amide I Mode. The 1500�1800 cm�1
region is dominated by the amide I band, which can be used forthe determination of the secondary structure,24 and then formonitoring the unfolding process of the secondary structure.This band arises mainly from the CdO stretching vibration withminor contributions of the C—N stretching vibration, and the
N—H in-plane bend. This latter is responsible for the sensitivityof the amide I band to NH/ND exchanges in the proteinbackbone.29 In this context, a frequency downshift of amide Iband was connected to enhanced isotopic exchanges associatedwith the solvent penetration in a more flexible tertiary structureduring thermal denaturation of globular proteins.1,10 Conse-quently, dissolving proteins in D2O gives the opportunity todetect the transformation of the tertiary structure, while amide Imode in proteins dissolved in H2O gives only information onconformational changes in the protein backbone. The pressuredependences of the amide I band are plotted in Figure 1a,b for LYSdissolved in H2O and D2O, respectively. Both figures showfrequency downshifts of amide I band upon pressurization, priorto a shift toward the high frequencies associated with a broadeningof the band, recognized as the signature of the unfolding process ofthe secondary structure upon heating1 and pressurizing.14,16 Theband shape of the amide I mode was fitted using a mixedcontribution of Lorentzian and Gaussian shapes, and the pressurebehavior of the frequency of the amide I band is reported inFigure 2a for lysozyme dissolved in H2O and in Figure 2b forlysozyme dissolved in D2O. It is clearly observed that the frequencydownshift is more marked for lysozyme dissolved in D2O. Thisfrequency downshift is probably resulting from two effects. (i) Thedecrease of the interatomic O 3 3 3H distances by compression thatfavors hydrogen bonding inR-helix andβ-sheet structures, and thenis observed for LYS dissolved in H2O and D2O. (ii) The secondeffect, only observed in D2O, corresponds to the enhancement ofthe NH/ND exchanges induced by the solvent penetration in theprotein interior as observed upon heating.1 This could be theindication that pressure unfolding could occur via a “molten globulestate” as previously suggested,16 in a process similar to that of thethermal denaturation.1 Consequently, the frequency downshiftobserved for LYS dissolved in H2O can be considered as theconsequence of the compression of R-helices, and the frequencydownshift of the amide I band should not be considered as thesignature of pressure unfolding, as previously reported from infraredspectroscopy measurements on human serum albumin15 (HSA)and lysozyme14,16 dissolved in D2O. An upshift in the frequency ofamide I band is clearly observed in Figure 2a upon depressurizationfrom the denatured state, probably inherent to the depressurizationeffect of the protein backbone. Upon further depressurization below600MPa, a downshift of the frequency is clearly observed reflectingrefolding process, at pressure significantly lower than the pressure of
Figure 1. Pressure dependence of the Raman spectrum in theamide I region, (a) for LYS dissolved in H2O, (b) for LYS dissolvedin D2O.
6742 dx.doi.org/10.1021/jp2014836 |J. Phys. Chem. B 2011, 115, 6740–6748
The Journal of Physical Chemistry B ARTICLE
unfolding. Similar frequencies determined near Patm before and afterdenaturation indicate the reversibility of pressure-induced transfor-mation of LYS. The pressure dependence of the frequency of amideI bandwas fitted using a sigmoid-shaped curve,ν= [(νN�νD)/(1þ(exp(P � Pm)/ΔP))]þνD, similar to that previously used todescribe LYS thermal unfolding,1,30 where νN and νD representamide I frequency in the native and denatured states, Pm themidpoint pressure and ΔP the half interval of denaturation. Thisfitting procedure gives the midpoint pressure denaturation Pm,and Δν = (νD � νN) representative of the degree ofdenaturation,31 reported in Table 1 for LYS dissolved in H2Oand D2O. The analysis of Table 1 and Figure 2a,b clearly reveals ahigher denaturation pressure of LYS in D2O with a midpointpressure estimated at about Pm ≈ 800 MPa, compared to thatdetermined in presence of H2O (Pm ≈ 690 MPa), but a similardegree of denaturation with Δν ≈ 3 cm�1.3.1.2. Analysis of 500�1200 cm�1 Region.The 500�1200 cm�1
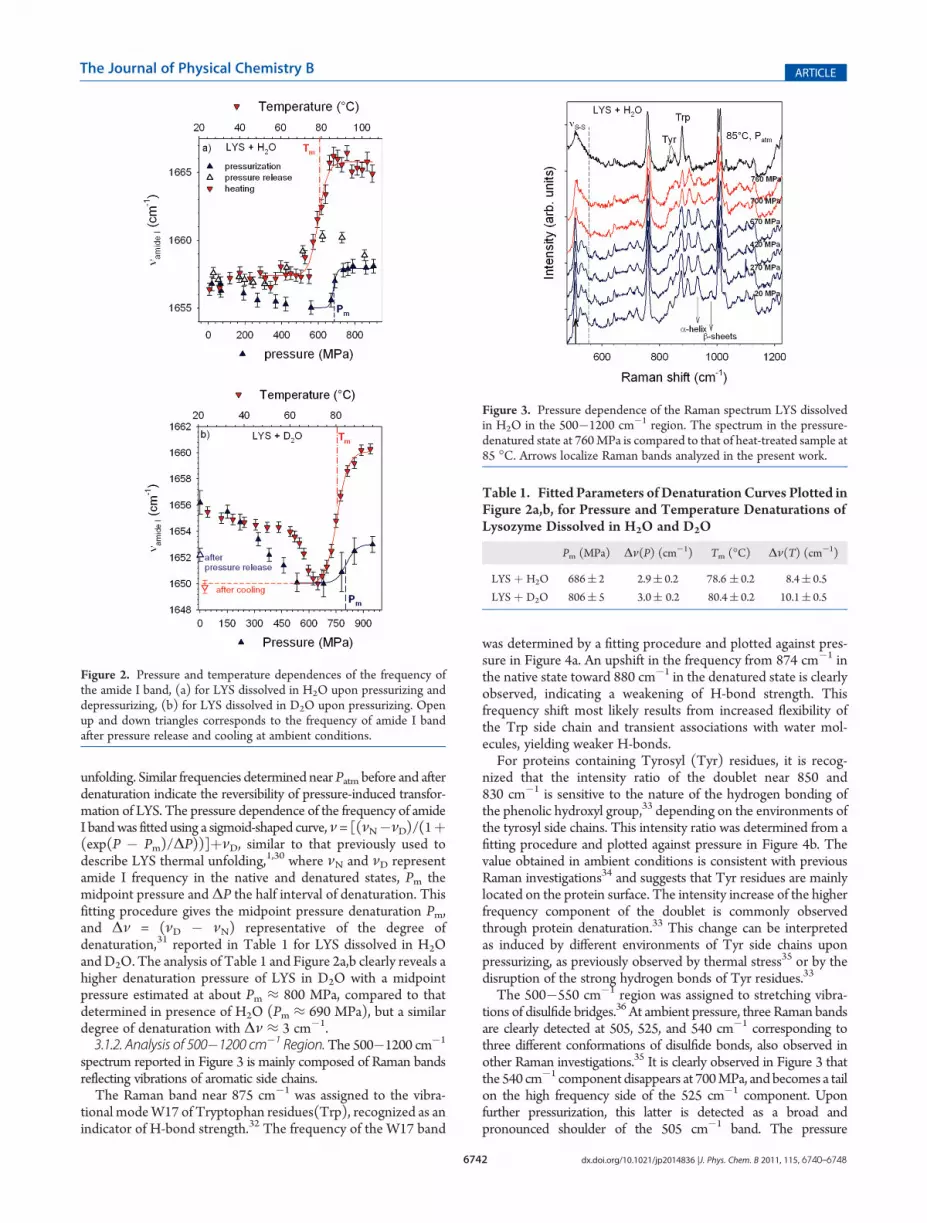
spectrum reported in Figure 3 is mainly composed of Raman bandsreflecting vibrations of aromatic side chains.The Raman band near 875 cm�1 was assigned to the vibra-
tional modeW17 of Tryptophan residues(Trp), recognized as anindicator of H-bond strength.32 The frequency of the W17 band
was determined by a fitting procedure and plotted against pres-sure in Figure 4a. An upshift in the frequency from 874 cm�1 inthe native state toward 880 cm�1 in the denatured state is clearlyobserved, indicating a weakening of H-bond strength. Thisfrequency shift most likely results from increased flexibility ofthe Trp side chain and transient associations with water mol-ecules, yielding weaker H-bonds.For proteins containing Tyrosyl (Tyr) residues, it is recog-
nized that the intensity ratio of the doublet near 850 and830 cm�1 is sensitive to the nature of the hydrogen bonding ofthe phenolic hydroxyl group,33 depending on the environments ofthe tyrosyl side chains. This intensity ratio was determined from afitting procedure and plotted against pressure in Figure 4b. Thevalue obtained in ambient conditions is consistent with previousRaman investigations34 and suggests that Tyr residues are mainlylocated on the protein surface. The intensity increase of the higherfrequency component of the doublet is commonly observedthrough protein denaturation.33 This change can be interpretedas induced by different environments of Tyr side chains uponpressurizing, as previously observed by thermal stress35 or by thedisruption of the strong hydrogen bonds of Tyr residues.33
The 500�550 cm�1 region was assigned to stretching vibra-tions of disulfide bridges.36 At ambient pressure, three Raman bandsare clearly detected at 505, 525, and 540 cm�1 corresponding tothree different conformations of disulfide bonds, also observed inother Raman investigations.35 It is clearly observed in Figure 3 thatthe 540 cm�1 component disappears at 700MPa, and becomes a tailon the high frequency side of the 525 cm�1 component. Uponfurther pressurization, this latter is detected as a broad andpronounced shoulder of the 505 cm�1 band. The pressure
Table 1. Fitted Parameters of Denaturation Curves Plotted inFigure 2a,b, for Pressure and Temperature Denaturations ofLysozyme Dissolved in H2O and D2O
Pm (MPa) Δν(P) (cm�1) Tm (�C) Δν(T) (cm�1)
LYS þ H2O 686( 2 2.9( 0.2 78.6 ( 0.2 8.4( 0.5
LYS þ D2O 806( 5 3.0( 0.2 80.4( 0.2 10.1( 0.5
Figure 3. Pressure dependence of the Raman spectrum LYS dissolvedin H2O in the 500�1200 cm�1 region. The spectrum in the pressure-denatured state at 760MPa is compared to that of heat-treated sample at85 �C. Arrows localize Raman bands analyzed in the present work.
Figure 2. Pressure and temperature dependences of the frequency ofthe amide I band, (a) for LYS dissolved in H2O upon pressurizing anddepressurizing, (b) for LYS dissolved in D2O upon pressurizing. Openup and down triangles corresponds to the frequency of amide I bandafter pressure release and cooling at ambient conditions.

6743 dx.doi.org/10.1021/jp2014836 |J. Phys. Chem. B 2011, 115, 6740–6748
The Journal of Physical Chemistry B ARTICLE
dependence of themost intense band located at 505 cm�1 is plottedin Figure 4c. This plot clearly shows an upshift of the frequencyupon pressurization from atmospheric pressure up to 600MPa, anda sudden frequency shift above 670 MPa, accompanying modifica-tions of the Raman band shape around 525 and 540 cm�1. Theanalysis of disulfide vibrations reveals a strong distortion of disulfidebonds accompanying the unfolding process. The spectrum at 760MPa in the denatured state indicates that the disulfide bonds inlysozyme are predominant in a slightly distorted gauche�gauche�gauche conformation.36
The Raman bands located at 930 and 960 cm�1 were assignedto CR�C�N stretching vibrations35 in R-helices and β-sheets,respectively, and then can be used to determine the content of R-helix andβ-sheet structures in the secondary structure. The intensityof the 930 cm�1 band related to the R-helix structures suddenlydecrease at 700 MPa, indicating a loss of R-helices. The intensityat 800 MPa is estimated to about 46% of that determined inthe native state. In contrast, the 960 cm�1 band broadens above700MPa, and gives distinguishable intensity to the spectrumplottedin Figure 3, not easily estimated because of its broadening.3.2. Analysis of the Low-Frequency Range (50�450 cm�1).
The low-frequency spectrumofproteins in solution gives informationon the dynamics of the protein, the solvent and their coupling.1,10,37
The Raman intensity is converted into Raman susceptibility χ00(ν),according to a procedure previously described,1,10,37,38 which isgenerally considered as representative of the vibrational density of
states in molecular disordered systems. The pressure dependence ofthe χ00(ν)-spectrum for LYS dissolved in water is plotted in Figure 5.The Raman susceptibility of water (W) is compared to those of dryLYS and LYS dissolved in water in the inset of Figure 5. Thiscomparison gives a clear assignment of both broad bands detected inthe spectrum of LYS in solution. The low-frequency band (I) locatedat 80 cm�1 mainly reflects the dynamics of LYS, and the solvent�protein interactions,38 while the band (II) at 180 cm�1 is assigned tointermolecularO—Hstretching vibrations in theH-bond network ofwater. Band (II) is then associated with the collective dynamics of theH-bond network of water,38 giving direct information on thestructural organization of water molecules. Inset of Figure 5 showsthat the intensity of band II is significantly lower in the spectrum oflysozyme aqueous solution than in water. The reduction in intensityof band (II) corresponding to collective vibrational modes of theH-bond network of water shows that H-bonded structure of watermolecules extends over a weaker range in presence of lysozyme. Thefrequencies of both Raman bands were determined from a fittingprocedure using a log-normal function and aGaussian to describe theshape of the bands I and II, respectively. Both fitted bands resultingfrom the fitting procedure by the residue method of the PEAKFITpeak analysis software (Jandel Scientific) are plotted in thick dashedlines in Figure 5 for hydrated LYS under ambient conditions. Thepressure dependences of these frequencies are reported in Figure 6.Upon low compression, the intensity of the νOH 3 3 3O band (II) (seeblue arrow in Figure 5) significantly decreases. Upon further com-pression, band (II) becomes a shoulder of the band (I) (dashed blueline) which is not distinguishable above 670MPa inFigure 5. Figure 6indicates that band II significantly shifts toward the high frequencies.Consequently, the observed effect on the H-bond network of waterby adding lysozyme is amplified upon pressurizing. The disruptionof the H-bond network leads to a set of clusters, characterized bystrengthened O—H interactions. At 700MPa, the χ00(ν)-spectrum
Figure 4. Pressure and temperature dependences of Raman modeparameters associated with side-chain vibrations: (a) frequency ofvibrations of tryptophan (Trp) residues; (b) intensity ratio of thedoublet located around 850 and 830 cm�1, corresponding to vibrationsof tyrosyl (Tyr) residues; (c) frequency of stretching vibrations ofdisulfide bridges. Pm and Tm reported on these plots correspond tomidpoint pressure and temperature determined from the fit of thepressure and dependences of the amide I frequency.
Figure 5. Pressure dependence of the low-frequency Raman spectrumin the 50�450 cm�1 region of LYS dissolved in H2O; the low-frequencyspectra of dry LYS, H2O and LYS dissolved in H2O are plotted in theinset. The log-normal and Gaussian components, corresponding tobands (I) and (II), respectively, determined from the fitting procedure ofthe low-frequency spectrum at atmospheric pressure and room tem-perature, are plotted in dashed line. Band (I) mainly reflects proteindynamics and solvent�protein interactions and band (II) correspondsto intermolecular O—H stretching vibrations in the H-bond network ofwater. The horizontal red arrow indicates the upshift of band (I) above670 MPa, while the blue arrow and associated dashed line shows thedisappearance of band (II) upon pressurization.

6744 dx.doi.org/10.1021/jp2014836 |J. Phys. Chem. B 2011, 115, 6740–6748
The Journal of Physical Chemistry B ARTICLE
is dominated by a broad band around 105 cm�1, and the contribu-tion of the band (II) was suppressed in the fitting procedure. Above670 MPa, a jump of band (I) toward the high frequencies is clearlyobserved in Figures 5 (see horizontal red arrow) and 6. Undersimilar pressures, the unfolding of the secondary structure isobserved in Figure 2a, through the frequency shift of the amide Iband, indicating a close relation between conformational changesand the protein dynamics, probably inherent to the distortion of theH-bond network of water.3.3. Analysis of the High-Frequency Region (2600�
3800 cm�1). The intramolecular O—H stretching vibrations(2600�3800 cm�1 region), which overlaps with the minor con-tribution of intramolecular C—H stretching vibrations in LYS isvery sensitive to the local H-bonding structure. The spectra of LYSdissolved in H2O (LW) and water (W) are plotted in Figure 7under room conditions. The spectrum can be fitted using only 3Gaussian components represented with dashed lines in Figure 7.
In this context, these bands can be attributed39 to (i) the O—Hstretch in the tetrabonded water molecules, named “open” com-ponent corresponding to the banddectected at 3250 cm�1, (ii) thesame vibration in the distorted H-bond network (“closed” com-ponent at 3450 cm�1), and (iii)O—Hstretching vibrations in freewater molecules at 3605 cm�1. In other studies, four componentsare used in the fitting procedure40,41 with different interpretations.However, it is commonly recognized that an increase of thestrength of the hydrogen bond induces a frequency downshift ofintramolecular OH stretching vibrations. The (LW-W) spectrumdifference plotted in figure 7, shows that addition of LYS in waterinduces very weak changes in the νO�H spectrum of water, andthen has only a very weak influence on the H-bond network ofwater, except around the protein surface. The enhanced intensityobserved in the (LW-W) spectrum difference and in the LWspectrum around 3300 cm�1 in Figure 7a,b, corresponds tointramolecular O—H stretching in LYS or/and additionalH-bonding between water and protein with intermediate strength.The pressure dependences of the νO�H spectra in water and LYSaqueous solution are plotted in Figure 8a,b, respectively. In bothcases, the intensity increase of the “open” component is clearlyobserved, with a concomitant decrease of the intensity of the“closed” component upon pressurizing. These changes are moremarked in the presence of LYS between atmospheric pressure and800 MPa. This unequivocally shows an increase of the strength ofhydrogen bonds upon pressurizing. Figure 8 shows that the solventtransforms into the crystallized ice-VI upon further pressurizing upto about 1GPa, in agreement with previous studies.42 The spectrumof ice-VI is dominated by an intense band around 3200 cm�1, asobserved in the Raman spectrum of the High Density Amorphous(HDA) state of ice.43 This band is observed to be upshifted about100 cm�1 above the position of the most intense band of thehexagonal ice-Ih spectrum,
44 reflecting a higher density and weakerH-bonding. A more detailed description of the local hydrogen-bonding structure in H2O in the absence and presence of lysozymecan be obtained from the νO�H-spectral differences betweenatmospheric and high pressure states plotted in Figure 9a. Thespectra of ice-Ih and ice-VI are plotted in Figure 9b,c to directlyanalyze the relationship between the features emerging frompressurization of water and LYS solution as a function of spectralsignatures of ice-Ih and ice-VI. The (LW1-LW) and (LW3-LW)spectrum differences indicate the emergence of a double hump in
Figure 6. Pressure dependence of the frequency of the low-frequencybands in the spectrum of LYS dissolved in H2O, obtained from a fittingprocedure described in the text. The temperature dependences of thesame bands are reported in the inset. Pm andTm are determined from thepressure and temperature dependences of the amide I frequency.
Figure 7. Comparison of the intramolecular O—H stretching spectraof H2O and LYS dissolved in H2O: (a) spectrum difference between(LYSþH2O) and H2O; and (b) Raman intensity of (LYSþH2O) andH2O.
Figure 8. Pressure dependence of the intramolecular O—H stretchingspectrum (a) For H2O and (b) For LYS dissolved in H2O.

6745 dx.doi.org/10.1021/jp2014836 |J. Phys. Chem. B 2011, 115, 6740–6748
The Journal of Physical Chemistry B ARTICLE
the 2950�3250 cm�1 range upon pressurizing, corresponding toboth low-frequency bands of ice-Ih (see vertical blue dashed lines inFigure 9), while the spectrum differences in H2O show thedevelopment of the predominant Raman bands of ice-VI around3200 cm�1. The features observed in the spectrum differences ofLYS aqueous solution, are too large to be only attributed to specificpressure behavior of the hydration water. However, Figure 9 showsthat the organization of the water molecules is widely influenced,upon pressurizing, by the protein in an extent probably dependingon its size,20,45,46 while under atmospheric pressure, the influence ofLYS on the local order of water molecules is hardly detectable inFigure 7. The region of the frequency where the emerging intensityis detected in Figure 9a (2900�3250 cm�1) indicates the develop-ment of the low-density tetrahedral structure of ice-Ih, probablyfrom the hydration shells into the bulk water, since high-density ice-VI develops upon compression in the absence of LYS (see theintensity increase around 3200 cm�1 in Figure 9).The fitting procedure of the νO�H spectrum for the lysozyme
solution and H2O gives the pressure dependence of the lowfrequency component for water in presence and in absence oflysozyme plotted in Figure 10. The intensity increase observed inFigure 9a in the 2950�3250 cm�1 is associated with thefrequency downshift of the νO�H band. The downshift is moremarked in the Patm � 800 MPa range in presence of lysozyme,because the intensity increase is observed at lower frequencies. Itcan be noticed that the frequency of the “open” component inwater is nearly pressure independent upon pressurizing to about600 MPa. Above 600 MPa, the component significantly shiftstoward lower frequencies, i.e., the position of the band in ice-VI,reflecting an increase in the hydrogen bond strength44 associatedto the increase of density. By contrast to water, the samecomponent in the lysozyme solution has clear linear pressuredependence up to 800 MPa. Above 800 MPa, i.e., in the pressuredenatured state of LYS, the H-bond network of water becomespressure independent. The discrepancies observed in Figures 8,9, and 10, between O—H stretching vibrations in LYS aqueoussolution and water reflect the considerable influence of LYS onthe pressure behavior of the H-bond network of water.
4. DISCUSSION
4.1. Comparison between Pressure and Thermal Dena-tured States. It is well recognized that pressurization of molec-ular compounds induces frequency shifts of intramolecularvibrational modes47,48 with negative (∂ν/∂P) for X—H bondsinvolved in H-bonding. Consequently, pressurization induces asignificant frequency downshift of the amide I mode, while thesecondary structure remains intact. To discriminate frequencyshifts induced by conformational changes from those induced bycompression of atomic bonds, we used the frequency difference(Δν = νD � νN) of amide I band, which has been recentlyconnected to the loss of protein activity.31 Table 1 indicatessimilar Δν-values in the pressure denatured state of LYS dis-solved in H2O and D2O, which are drastically different fromthose determined upon heating LYS solutions. This clearlyreveals that a large content of the secondary structure remainsin the folded conformation after denaturation at high pressure, aspreviously reported for other proteins.21,22,49 Additional infor-mation can be obtained from the comparison of the amide Ifrequency under ambient conditions after denaturation by com-pression and by heating of LYS dissolved in D2O. Assumingreversibility of the denaturation process upon heating fromprevious investigations1 and pressurizing from the present study(see Figure 2a), the frequency of amide I band plotted inFigure 2b under ambient conditions clearly indicates that (i)solvent penetration is detected upon pressurizing, and (ii) theenhancement of isotopic exchanges is more important when thesample is heated, since the frequency of the amide I mode islower after cooling than after decompression. This observationsuggests a deeper penetration of water in the protein interiorduring heating than during compression, and thus a minorexposition of hydrophobic residues to the solvent at highpressure compared to high temperature. Figure 3 clearly showsthat the 930 cm�1 Raman band corresponding to vibrations inR-helices is more intense at 760 MPa than at 85 �C, for LYSdissolved in H2O. In the thermal denatured state, the integratedintensity is determined to be about 10% of that measured atambient conditions, instead of 46% in the pressure denaturedstate. This indicates that about twice more R-helix structures areunfolded in the heat-treated sample compared with the pressuredenatured state. The 960 cm�1 band associated with β-sheets isclearly more broadened at 85 �C than at 760 MPa, reflecting ahigher degree of disorder at high temperature. Figure 4a�c
Figure 9. Influence of pressure on the O—H stretching spectrum;comparison between the following: (a) Spectrum differences betweenpressurized states (415, 1000 MPa) and ambient conditions of LYSaqueous solution, and between pressurized states (800, 1000 MPa) andambient conditions of water. The relative intensity of the (W3�W)spectrum difference is divided by 4 for clarity reasons; (b) Spectrum ofice-Ih recorded at �5 �C; and (c) Spectrum of ice-VI recorded at roomtemperature and about 1 GPa.
Figure 10. Pressure dependence of the frequency of the “open”component of O—H stretching vibrations in H2O and LYS dissolvedin H2O. Pm is the midpoint pressure determined from the pressuredependence of the amide I frequency.

6746 dx.doi.org/10.1021/jp2014836 |J. Phys. Chem. B 2011, 115, 6740–6748
The Journal of Physical Chemistry B ARTICLE
shows similar features in pressure and heat denatured states ofvarious side chains (Trp, Tyr, disulfide bridges) reflecting similardenaturation around the protein surface. A significant content ofsecondary structure remains intact upon pressurization, probablybecause of a lower water penetration within lysozyme. This resultis in line with the description of pressure unfolded proteins fromdifferent kinds of experiments, as relatively compact water-swollen structures with residual secondary structure,49,50 andthe determination of the high compactness of the pressure-denatured state.51,52 Small Angle X-ray Scattering (SAXS) mea-surements on T4 LYS mutants52 are also consistent with waterpenetration of the protein as the mechanism of pressure dena-turation. SAXS is generally used to probe the pressure depen-dence of the tertiary and quaternary structures53 via the analysisof the shape and the size of structural entities. Raman spectros-copy provides complementary specific and quantitative informa-tion on unfolding structures in pressure- and heat-treatedsamples at the molecular level, via intensity changes, broadeningand frequency shifts of internal modes in the fingerprint region oflysozyme. In this region, isolated bands corresponding to wellidentified internal vibrations (stretching of disulfide bridges, Tyrand Trp vibrations, amide I, II and III modes), are very sensitiveto the molecular conformation and the molecular organizationsurrounding the atomic bonds both in the protein backbone andaround side-chains residues. The description of the pressuredenatured state given in the present work in terms of morecompact molten globule and denatured states, is in agreementwith SAXS measurements on different proteins.49,52 No addi-tional conformational changes were detected at pressures above800 MPa, as previously reported,54 suggesting plurality ofpressure-denatured forms in lysozyme. The two-step changesupon pressurizing detected from the ultraviolet fluorescence ofLYS54 could correspond to the penetration of the solvent in theprotein prior the unfolding process, which is observed ascomplete around 800 MPa in the present work.4.2. Mechanism of Pressure Denaturation. It is known that
pressure denaturation is associated with a negative volumechange.55�57 The volume change, ΔV, for pressure denaturationof LYS, can be calculated from the relation56(∂lnKeq)/∂P = V/RT, where T is the temperature, R is the gas constant, and Keq isthe equilibrium constant of the two state-denaturation. It can becalculated from1 Keq = (νN � ν)/(ν � νD), νN and νDcorresponding to the frequencies of amide I mode in the nativeand denatured states. The volume change was calculated for LYSdissolved in D2O and H2O. A volume change of about �90((20) ml/mol was obtained at 800 MPa for LYS dissolved inD2O, in agreement with the estimation of ΔV between�50 and�100 mL/mol reported by Li et al.54 However, a value of�245((50) ml/mol was determined around Pm = 686 MPa in LYSdissolved in H2O. This difference between these two values ofΔV is not necessarily related to the nature of the solvent, butprobably to the lack of experimental data around Pm.The description of protein�water interactions is fundamental
for the prediction of protein physical properties,58 and proteinstabilization is recognized to be intimately related to hydrationwater.11,59 Table 1 clearly indicates higher temperature andpressure of denaturation in D2O than in H2O. The stabilizing effectof D2O, widely observed for protein thermal denaturation,
1,10,60�62
was mainly interpreted as resulting from an increase of the proteinrigidity61 in presence ofD2O.This effectwas determined to bemoremarked at higher temperature61 probably because of the tempera-ture dependence of the hydrogen-bond network in D2O.
1,10 In
opposition to heating, the pressure behavior of the hydrogen-bondnetwork in D2O could maintain the protein flexibility uponcompression. The present Raman study gives the opportunity tosimultaneously analyze the pressure behavior of the H-bond net-work of water and the pressure-induced transformation of LYS. It iswell-known that water influences protein dynamics with signaturesdetected in the very low-frequency region (<50 cm�1) by inelasticneutron scattering,63 not accessible with the spectrometer config-uration. However, present investigations reveal that LYS does notinduce significant modification of the local H-bonded structure inbulk water at atmospheric pressure while drastic differences can beobserved onwater dynamics in hydration shells and bulk water fromneutron quasi-elastic scattering.64 By contrast, LYS has a drasticinfluence on the organization of water molecules upon pressurizing.Figure 9 clearly reveals the strengthening of the hydrogen bondsbetween water molecules, in agreement with the pressure depen-dence of band (II) in the low-frequency range. In presence of LYS,the tetrahedral structure of ice-Ih develops upon pressurizing, whilein the absence of LYS the emerging Raman intensity betweenatmospheric and high pressure states, is distinctive of the high-density ice-VI crystalline phase. This result is in line with moleculardynamics simulations,58,65 which show that the hydration shellcompressibilities near protein surface decrease with increasingattraction. In this context, the development of ice-Ih organizationcould be favored upon pressurizing rather than the denser ice-VI,around folded structure of LYS. However, Monte Carlosimulations59 lead to a mechanism for cold denaturation at highpressure related to the loss of local low-density water structure. It isworth mentioning that the presence of low-density water organiza-tion around the protein surface is consistent with the weak waterpenetration into theprotein, and the lowdegree of protein unfoldingdetected in the pressure-treated sample compared with that in theheat-treated sample.Figure 6 shows that the development of the low-density water
structure upon pressurizing is accompanied with a drastic hard-ening of protein dynamics. Pressure denaturation of LYS isassociated with a discontinuous shift of band (I) toward the highfrequencies, and no distinction can be observed between proteinand water dynamics in the pressure denatured state. The inset ofFigure 6 shows an opposite temperature behavior (uponheating)1 of the protein and water dynamics, i.e., the softeningof the H-bond network of water inducing a downshift of band (I)in the heat denatured state in which only one band was detectedin the low-frequency range.
5. CONCLUSIONS
Raman investigations were carried out in a wide frequencyrange on LYS dissolved in H2O and D2O. Investigations in thefingerprint region (500�1800 cm�1) of lysozyme gives informa-tion on the pressure denatured state with regard to the heatdenatured state, while the analyzes of the low- and high-frequencyranges between 50�450 cm�1 and 2800�3800 cm�1 provideinformation on the organization of water molecules and then on themechanism of pressure-induced transformation of lysozyme. It wasfound that pressurization favors the development of local low-density water structure similar to ice-Ih environment. In an oppositeway to heat denaturation, the strengthening of intermolecularO�Hinteractions upon pressurizing, associated with structural modifica-tions of H-bond network, imposes a considerable stiffening ofprotein dynamics. Another consequence is the weak water penetra-tion into the protein, and then a low degree of unfolding in the

6747 dx.doi.org/10.1021/jp2014836 |J. Phys. Chem. B 2011, 115, 6740–6748
The Journal of Physical Chemistry B ARTICLE
pressure-denatured state compared to that in the heat-denaturedstate. The rate of unfolded helices is about two times higher in theheat-treated samples. In contrast to the protein backbone, vibrationalproperties of side-chains are found to be similar in the heat- andpressure-denatured states. In both heat and pressure denaturations,the unfolding process of the secondary structure occurs from anintermediate state characterized by enhanced water penetrationleading to a more flexible tertiary structure with intact secondarystructure. Controversial results are reported in the literature con-cerning the comparison between heat- and pressure- or cold-inducedprotein transitions, considering similar17,20,56 or different23,49,54,66
transformation mechanisms and denatured states. The present workindicates a similar denaturation mechanism via an intermediate state(molten globule), probably more compact at high pressure than thatobtained by heating, and a significantly lowdegree of unfolding in thepressure-denatured state with probably intact R-helix structuresdeeply buried in the tertiary structure. The two processes ofdenaturation at high pressure and temperature are closely relatedto the disruption of H-bonds in water structure leading to formationof clusters, which impose protein dynamics with inverse behaviorsupon compression and heating.
’AUTHOR INFORMATION
Corresponding Author*Tel: þ33 320434677; Fax: þ33 320436857; E-mail:[email protected].
’ACKNOWLEDGMENT
This work was supported by the ANR (Agence Nationale de laRecherche) through the BIOSTAB project (“Physique Chimiedu Vivant” program).
’REFERENCES
(1) H�edoux, A.; Ionov, R.; Willart, J. F.; Lerbret, A.; Affouard, F.;Guinet, Y.; Descamps, M.; Prevost, D.; Paccou, L.; Dan�ede, F. J. Chem.Phys. 2006, 124, 14703.(2) de Wit, J.; Klarenbeek, G. J. Dairy Res. 1981, 48, 293.(3) Bell, L. N.; Hageman, M. J.; Muraoka, L. M. J. Pharm. Sci. 1995,
84, 707.(4) Baum, J.; Dobson, C. M.; Evans, P. A.; Hanley, C. Biochemistry
1989, 28, 7.(5) Anderle, G.; Mendelsohn, R. Biophys. J. 1987, 52, 69.(6) Griko, Y. V.; Privalov, P. L. Biochemistry 1992, 31, 8810.(7) Ikeda, S.; Li-Chan, E. Food Hydrocolloids 2004, 18, 489.(8) Nonaka, M.; Li-Chan, E.; Nakai, S. J. Agric. Food Chem. 1993,
41, 1176.(9) Paulsson, M.; Hegg, P.-O.; Castberg, H. B. Thermochim. Acta
1985, 95, 435.(10) Hedoux, A.; Willart, J. F.; Paccou, L.; Guinet, Y.; Affouard, F.;
Lerbret, A.; Descamps, M. J. Phys. Chem. B 2009, 113, 6119.(11) Franks, F.; Hatley, R. H. Pure Appl. Chem. 1991, 63, 1367.(12) Tang, X. C.; Pikal, M. J. Pharm. Res. 2005, 22, 1167.(13) Meersman, F.; Smeller, L.; Heremans, K. Biochim. Biophys. Acta
2006, 1764, 346.(14) Heremans, K.; Wong, P. T. T. Chem. Phys. Lett. 1985, 118, 101.(15) Smeller, L.; Meersman, F.; Heremans, K. Eur Biophys J 2008,
37, 1127.(16) Smeller, L.; Meersman, F.; Heremans, K. Biochim. Biophys. Acta
2006, 1764, 497.(17) Hawley, S. A. Biochemistry 1971, 10, 2436.(18) Smeller, L. Biochim. Biophys. Acta 2002, 1595, 11.(19) Kunugi, S.; Tanaka, N. Biochim. Biophys. Acta 2002, 1595, 329.
(20) Privalov, P. L. Crit. Rev. Biochem. Mol. 1990, 25, 281.(21) Zhang, J.; Peng, X.; Jonas, A.; Jonas, J. Biochemistry 1995,
34, 8631.(22) Meersman, F.; Smeller, L.; Heremans, K. High Press. Res. 2000,
19, 263.(23) Griko, Y. V.; Kutyshenko, V. P. Biophys. J. 1994, 67, 356.(24) Williams, R. W.; Dunker, A. K. J. Mol. Biol. 1981, 152, 783.(25) Nash, D. P.; Jonas, J. Biochemistry 1997, 36, 14375.(26) Nash, D. P.; Jonas, J. Biochem. Biophys. Res. Commun. 1997,
238, 289.(27) Levitt, M.; Greer, J. J. Mol. Biol. 1977, 114, 181.(28) Mao, H. K.; Xu, J.; Bell, P. M. J. Geophys. Res. 1986, 91, 4673.(29) Surewicz, W. K.; Mantsch, H. H.; Chapman, D. Biochemistry
1993, 32, 389.(30) Ionov, R.; H�edoux, A.; Guinet, Y.; Bordat, P.; Lerbret, A.;
Affouard, F.; Prevost, D.; Descamps, M. J. Non-Cryst. Solids 2006,352, 4430.
(31) H�edoux, A.; Krenzlin, S.; Paccou, L.; Guinet, Y.; Flament, M. P.;Siepmann, J. Phys. Chem. Chem. Phys. 2010, 12, 13189.
(32) Miura, T.; Takeuchi, H.; Harada, I. Biochemistry 1988,27, 88.
(33) Siamwiza, M. N.; Lord, R. C.; Chen, M. C.; Takamatsu, T.;Harada, I.; Matsuura, H.; Shimanouchi, T. Biochemistry 1975, 14, 4870.
(34) Yu, N. T.; Jo, B. H. Arch. Biochem. Biophys. 1973, 156, 469.(35) Zhao, W.; Yang, R. J. Phys. Chem. B 2010, 114, 503.(36) Kudryavtsev, A. B.; Mirov, S. B.; DeLucas, L. J.; Nicolete, C.;
van-der-Woerd, M.; Bray, T. L.; Basiev, T. T. Acta Crystallogr. D 1998,54, 1216.
(37) H�edoux, A.; Willart, J. F.; Ionov, R.; Affouard, F.; Guinet, Y.;Paccou, L.; Lerbret, A.; Descamps, M. J. Phys. Chem. B 2006, 110,22886.
(38) Lerbret, A.; Affouard, F.; Bordat, P.; H�edoux, A.; Guinet, Y.;Descamps, M. J. Chem. Phys. 2009, 131, 245103.
(39) D’Arrigo, G.; Maisano, G.; Mallamace, F.; Migliardo, P.;Wanderlingh, F. J. Chem. Phys. 1981, 75, 4264.
(40) Walrafen, G. E. J. Chem. Phys. 1967, 47, 114.(41) Scherer, J. R.; Go, M. K.; Kint, S. J. Phys. Chem. 1974, 78,
1304.(42) Walrafen, G. E. J. Sol. Chem. 1973, 2, 159.(43) Yoshimura, Y. Chem. Phys. Lett. 2001, 349, 51.(44) Kanno, H.; Tomikawa, K.; Mishima, O. Chem. Phys. Lett. 1998,
293, 412.(45) Franks, H. S.; Evans, M. W. J. Chem. Phys. 1945, 13, 507.(46) Braibanti, A.; Fisicaro, E.; Compari, C. J. Therm. Anal. Calorim.
2000, 61, 461.(47) H�edoux, A.; Guinet, Y.; Capet, F.; Paccou, L.; Descamps, M.
Phys. Rev. B 2008, 77, 094205.(48) H�edoux, A.; Guinet, Y.; Derollez, P.; Willart, J. F.; Capet, F.;
Descamps, M. J Phys: Condens. Matter 2003, 15, 8647.(49) Panick, G.; Malessa, R.; Winter, R.; Rapp, G.; Frye, K. J.; Royer,
C. A. J. Mol. Biol. 1998, 275, 389.(50) Peng, X.; Jonas, J.; Silva, J. L. Proc. Natl. Acad. Sci. U.S.A. 1993,
90, 1776.(51) Schroer, M.; Paulus, M.; Jeworrek, C.; Krywka, C.; Schmacke,
S.; Zhai, Y.; Wieland, F.; Sahle, C.; Chimenti, M.; Royer, C. A.; Garcia-Moreno, B.; Tolan, M.; Winter, R. Biophys. J. 2010, 99, 3430.
(52) Ando, N.; Barstow, B.; Baase, W.; Fields, A.; Matthews, B.;Gruner, S. Biochemistry 2008, 47, 11097.
(53) Panick, G.; Malessa, R.; Winter, R. Biochemistry 1999, 38, 6512.(54) Li, T. M.; Hook, J. W.; Drickamer, H. G.; Weber, G. Biochem-
istry 1976, 15, 5571.(55) Royer, C. A. Biochim. Biophys. Acta 2002, 1595, 201.(56) Zip, A.; Kauzmann, W. Biochemistry 1973, 12, 4217.(57) Carter, J. V.; Knox, D. G.; Rosenberg, A. J. Biol. Chem. 1978,
253, 1947.(58) Dadarlat, V. M.; Post, C. B. Biophys. J. 2006, 91, 4544.(59) Marques, M. I.; Borreguero, J. M.; Stanley, H. E.; Dokholyan,
N. V. Phys. Rev. Lett. 2003, 91, 138103.

6748 dx.doi.org/10.1021/jp2014836 |J. Phys. Chem. B 2011, 115, 6740–6748
The Journal of Physical Chemistry B ARTICLE
(60) Efimova, Y. M.; Haemers, S.; Wierczinski, B.; Norde, W.;van-Well, A. A. Biopolymers 2007, 85, 264.(61) Cioni, P.; Strambini, G. B. Biophys. J. 2002, 82, 3246.(62) Makhatadze, G. I.; Glore, G.M.; Gronenborn, A. M.Nat. Struct.
Biol. 1995, 2, 852.(63) Diehl, M.; Doster, W.; Petry, W.; Schober, H. Biophys. J. 1997,
73, 2726.(64) Dellerue, S.; Bellissent-Funel, M.-C. Chem. Phys. 2000,
258, 315.(65) Sarupria, S.; Garde, S. Phys. Rev. Lett. 2009, 103, 037803.(66) Ngarize, S.; Herman, H.; Adams, A.; Howell, N. J. Agric. Food
Chem. 2004, 52, 6470.


