Embed Size (px)
Citation preview

DOI: 10.1016/j.jtcvs.2005.12.066 2006;131:1344-1351 J Thorac Cardiovasc Surg
Friedrich-Wilhelm Mohr Jacobs, Stefan Dhein, Thomas Walther, Jan Fritz Gummert, Volkmar Falk and
Jens Garbade, Cris Ullmann, Marcus Hollenstein, Markus Johannes Barten, Stephan angiography for intraoperative graft patency control
Modeling of temperature mapping for quantitative dynamic infrared coronary
http://jtcs.ctsnetjournals.org/cgi/content/full/131/6/1344located on the World Wide Web at:
The online version of this article, along with updated information and services, is
2006 American Association for Thoracic Surgery Association for Thoracic Surgery and the Western Thoracic Surgical Association. Copyright ©
is the official publication of the AmericanThe Journal of Thoracic and Cardiovascular Surgery
on June 1, 2013 jtcs.ctsnetjournals.orgDownloaded from

MipJS
Cardiopulmonary Support and Physiology Garbade et al
1
CSP
odeling of temperature mapping for quantitative dynamicnfrared coronary angiography for intraoperative graftatency control
ens Garbade, MD, Cris Ullmann, Marcus Hollenstein, Markus Johannes Barten, MD, Stephan Jacobs, MD,
tefan Dhein, MD, Thomas Walther, MD, Jan Fritz Gummert, MD, Volkmar Falk, MD, and Friedrich-Wilhelm Mohr, MDOdndmi
MogfcdSgfl
Rcftucta
Cgg
Semtcm
mb
From the Department of Cardiac Surgery,Heart Center, University of Leipzig, Leipzig,Germany.
Received for publication Sept 12, 2005;revisions received Dec 13, 2005; acceptedfor publication Dec 22, 2005.
Address for reprints: Jens Garbade, MD, De-partment of Cardiac Surgery, Heart CenterLeipzig, University of Leipzig, Struempell-strasse 39, 04289 Leipzig, Germany (E-mail:[email protected]).
J Thorac Cardiovasc Surg 2006;131:1344-51
0022-5223/$32.00
Copyright © 2006 by The American Asso-ciation for Thoracic Surgery
tdoi:10.1016/j.jtcvs.2005.12.066
344 The Journal of Thoracic and CardDown
bjectives: Intraoperative application of thermal coronary angiography based onynamic infrared imaging leads to useful qualitative information concerning coro-ary artery bypass graft flow and anatomy. Additional quantitative flow estimation isesirable to detect graft failures. The aim of this study was to develop a heat-transferodel for quantitative flow estimation in an experimental setup. The first clinical results
n coronary artery bypass grafting are reported.
ethods: Dynamic infrared imaging was applied in pig hearts to collect video dataf the rewarming process of the left anterior descending artery supplied by ante-rade perfusion. For mathematic description, we used the dynamic enthalpy balanceor open systems, and a Laplace transformation was carried out. Therefore the timeonstant � was calculated by performing a nonlinear fit procedure on the averagedynamic temperature curves recorded over a left anterior descending artery segment.ubsequently, left internal thoracic artery–left anterior descending artery bypassraft flow was assessed intraoperatively. Effective left anterior descending arteryow was determined by using a transit-time flowmeter.
esults: Tau is a system constant and changes depending on the flow and the systemapacity. Assuming system capacity to be constant, � only depends on the flow. Itollows from the differential equation that there is a potential relation between � andhe flow. An excellent comparison (R2 � 0.968, P �.005) was demonstrated. Bysing the algorithms, quantitative flow estimation in pig hearts was possible. Forlinical application, the formulas were applied to intraoperatively derived dynamicemperature curves with a good comparison to the actual left internal thoracicrtery–left anterior descending artery flow.
onclusion: The developed heat-transfer model allows for precise measurement ofraft flow by using dynamic infrared imaging and can be applied for noninvasiveraft flow estimation in beating-heart surgery.
everal noninvasive methods, such as transit-time Doppler flow measurement(TTFM), epicardial high-frequency ultrasonography, and indocyanine greenfluorescence angiography, have been used intraoperatively to assess the
fficacy of coronary artery bypass grafting (CABG).1-3 Nevertheless, there is noethod available to analyze qualitative and quantitative coronary blood flow simul-
aneously during bypass surgery. To date, angiography has been universally ac-epted as the gold standard for imaging the coronary arteries but is not available inost operating rooms.4
Qualitative evaluation of myocardial blood flow with epicardial temperatureaps obtained by using thermal coronary angiography (TCA) was initially studied
y Senyk and colleagues in 1971.5 Their results demonstrated that the detectable
emperature alterations of the epicardium correlate well with the level of coronaryiovascular Surgery ● June 2006 on June 1, 2013 jtcs.ctsnetjournals.orgloaded from

pdbtbcaesdnro
btbqcncacdbaf
MTtelph
HAsm
f
et
c
wdecaotE
btdtd
Flpws
Garbade et al Cardiopulmonary Support and Physiology
CSP
erfusion. Other studies have confirmed that there is aistinct dependence between epicardial temperature andlood flow.6-9 Robicsek and associates10 used thermographyo investigate anastomotic patency and coronary anatomy,ut they failed to show technical failures. With improvingamera sensitivity, TCA became possible and was discussednd validated against other methods by Mohr and cowork-rs.11-13 A single-center study in 1401 patients14 demon-trated that TCA is a useful real-time diagnostic tool toetect possible technical failures, graft occlusions, and ste-osis. The chance of immediate intraoperative revision andepair is given, which might lead to an improvement inutcome.
Some assumptions concerning qualitative myocardiallood supply and metabolic activity can be made in realime, but additional quantification of coronary flow woulde highly desirable.11 Different studies have approacheduantitative flow estimation,15-19 but either the dynamicharacter of the heat-transfer process in biologic bodies wasot sufficiently implemented or technical limitations oc-urred. In these studies only steady-state and low flows werenalyzed, limiting the ability to detect and evaluate rapidoronary flow changes. The purpose of this study was toevelop a reliable heat-transfer model of the epicardiallood vessels, which start to rewarm in accordance with themount of blood flow, to test the potential of such a modelor quantification of coronary flow.
aterials and Methodshe main principle of our experimental approach was to analyze
he temperature response of a homogeneous body (the heart) to thentering blood flow in the coronary tree. Assuming that the energyoss caused by convection or radiation is negligible and the tem-erature distribution within the coronary artery is homogeneous, aeat-transfer analysis can be applied.
eat-transfer Modeln equation originating in the dynamic enthalpy balance for open
ystems was used to enable quantitative infrared flow measure-ents:
dH
dt� Fin � Tin � Fout � Tout (1)
The dynamic enthalpy balance for open systems is defined as
Abbreviations and AcronymsCABG � coronary artery bypass graftingDIRI � dynamic infrared imagingLAD � left anterior descending arteryLITA � left internal thoracic arteryTCA � thermal coronary angiographyTTFM � transit-time Doppler flow measurement
ollows (potential and kinetic energy can be neglected): H is the c
The Journal of Thoracicjtcs.ctsnetjoDownloaded from
nthalpy in kilojules, T is the temperature in degrees kelvin, t is theime in seconds, and F is the volume flow in milliliters per second.
After transformation of equation 1, we used equation 8 foromputational and graphic � determination:
�Tout (t) � k�1 � e�t�� (8)
The complete mathematic model is described in the Appendix.For better system modeling, a substitute system was accepted,
hich does not describe the process accurately but has the sameynamic behavior (Figure 1). Analytic inaccuracies are going to beliminated by experimental adjustment of the parameters. The timeonstant � is a system constant and changes depending on the flownd the system capacity. Assuming system capacity to be constantnly depends on the flow. It follows from the differential equationhat there is a potential relation between � and the actual flow (seequation 5 in the Appendix).
For the heat-transfer model, the time constant � was calculatedy performing a nonlinear fit procedure on the averaged dynamicemperature curves recorded over the spot-detected left anteriorescending artery (LAD) segment for each flow. On the basis ofhe assumption that t (time) and � are the same values fromifferential equation 8, it can be concluded that � can be graphi-
igure 1. Dynamic infrared imaging of a pig heart with antegradeeft anterior descending artery perfusion to the steady-state tem-erature distribution of the left anterior descending artery net-ork. Experimental condition and mathematic description are
hown. LAD, Left anterior descending artery.
ally determined by using the 63% criterion (0.63 � 1 � e�1).
and Cardiovascular Surgery ● Volume 131, Number 6 1345 on June 1, 2013 urnals.org

Tr
AACdA
icamtsSbamawsm
uTSde
CTcfh(odms
TAnT
Cardiopulmonary Support and Physiology Garbade et al
1
CSP
hat means that by 63% of the maximal achieved temperatureesponse, � is identical to the corresponding t (time) value.
nimal Experimentsll animal procedures were approved by the Animal Care and Useommittee of the University of Leipzig and performed in accor-ance with the “Guide for the Care and Use of the Laboratorynimals” (1996).
Four pigs with a body weight of about 60 kg were used for thenvestigation. Premedication was performed by means of intramus-ular application of atropine (0.02 mg/kg), ketamine (10 mg/kg), andzaperone (8 mg/kg). After intravenous injection of midazolam (0.1g/kg) and fentanyl (6 �g/kg), the pigs were orally intubated. Anes-
hesia was maintained with isoflurane (1.5%-2.0%), continuous infu-ion of fentanyl, and positive pressure ventilation with 80% oxygen.tandard hemodynamic monitoring during the procedure, as well aslood gas analysis, was performed. At the end of the experiment, thenimals were killed by means of intravenous injection of T61. Afteredian sternotomy, right atrial and aortic cannulation was performed,
nd cardiopulmonary bypass commenced. The heart was arrestedith antegrade mild hypothermic cardioplegia (Bretschneider-HTK
olution; Custodiol, Dr. Franz Köhler GmbH, Alsbach-Hähnlein, Ger-
Figure 2. Experimental model. LAD, Left anterior descescanner and epicardium; T, temperature; TTFM, transit-ti
any). A roller pump (CAPS roller pump, Stoeckert, Munich) was a
346 The Journal of Thoracic and Cardiovascular Surgery ● Junjtcs.ctsnetjourDownloaded from
sed to quantify antegrade coronary perfusion through the aortic root.he LAD flow was confirmed by means of TTFM (Transsonicystems Inc, Ithaca, NY). Therefore the Doppler flow probe wasirectly placed around the dissected LAD. Figure 2 describes thexperimental setup.
linical Validationhe human study was reviewed and approved by the human ethicsommittee of the University of Leipzig. Subsequently, after in-ormed consent, 4 patients underwent elective CABG (beatingeart, n � 2; arrested heart, n � 2). Left internal thoracic arteryLITA)–LAD bypass graft patency and flow were assessed intra-peratively by using dynamic infrared imaging (DIRI) and theeveloped algorithm. In all patients LAD flow was confirmed byeans of TTFM. During data acquisition, the proximal LAD
egment was occluded to prevent competitive flow.
elethermometry Systemtelethermometry system with a novel, long-wave (8-10 �m),
arrow-band, focal plane array infrared photodetector was used.he infrared sensor consists of a 256 � 256–pixel array with
artery; I, distance between dynamic infrared imagingoppler flowmeter.
ndingme D
pproximately 65,000 pixels per frame that provides a temperature
e 2006 on June 1, 2013 nals.org

r1ymaT
usppyL
RTtnpa
cecfac
ra
dasmf�o
CFpostrfsbct
efltwdcmw�bt
DTp
Fio
Garbade et al Cardiopulmonary Support and Physiology
CSP
esolution of 0.006°C between pixels and a temporal resolution of00 Hz. The spatial resolution is 40 �m, with more than a 99.5%ield of operating pixels. The DIRI sensor was incorporated into aobile unit composed of a camera, light-emitting diode display,
nd computer for initial data analysis (BioScanIR; Omnicorderechnologies, Inc, Stony Brook, NY).
The thermal sensor was placed at a distance of 1 m perpendic-lar to the surface of the target vessel, and image acquisition of 20econds over a spot-detected arterial segment for each flow waserformed. All data were stored and analyzed by using the incor-orated software (BioScanIR Analysis Program). Additional anal-sis was performed with statistical software (Origin 7G; Originab Corp, Northampton, Mass).
esultshe temperature gradient caused by the rewarming process of
he LAD by using different flow rates delineated the vascularetwork of the LAD in detail at all different flow rates, and inarticular, low alteration of the epimyocardial temperaturelong the vascular structure could be demonstrated (Figure 1).
Figure 3 shows the resulting fitted exponential temperatureurves from the averaged spot-detected measurements, with anxcellent coefficient of determination and the calculated timeonstant � for different flow rates. The time constant � derivedrom the nonlinear curve fit decreased with the growing flow,nd a good comparison between the coronary flow and the �ould be observed (R2 � 0.968, P � .005, Figure 4).
By using the developed algorithms and the calculated cor-elation (Figures 3 and 4), quantitative flow assessment in therrested pig hearts was possible, such as for flow 1 and flow 2:
Flow1�165.4172 � 4.2�1.27008 � 26.73 mL ⁄ min;
Flow2�165.4172 � 6.7�1.27008 � 14.77 mL ⁄ min.
The � value of different flows can be read from the graphiciagram by using the 63% criterion (Figure 5; � flow 1 �pproximately 4.2 seconds, and � flow 2 � approximately 6.7econds). The synchronized reference values determined byeans of TTFM were 28 mL/min for flow 1 and 15 mL/min
or flow 2. Table 1 summarizes the computational and graphicvalues and the measured LAD flows, as determined by meansf TTFM.
linical Validationor the first clinical experience, the same formulas were ap-lied to intraoperatively derived dynamic temperature curvesf 4 patients. Before analysis, the epicardial surface waslightly cooled by means of application of normothermic/roomemperature saline solution. Figure 6 displays the temperature-esponse curve recorded during beating-heart surgery (datarom the arrested heart CABG are not shown). The BioScanIRystems’ spot detection was placed on top of the LAD in theeginning of the recording; however, its distance to the LADhanged in accordance with heart motion, which is reflected in
emperature alterations. Because temperature maximums were fThe Journal of Thoracicjtcs.ctsnetjoDownloaded from
xpected while the spot detection was right above the LAD,ow estimation for that vessel requires a connection of the
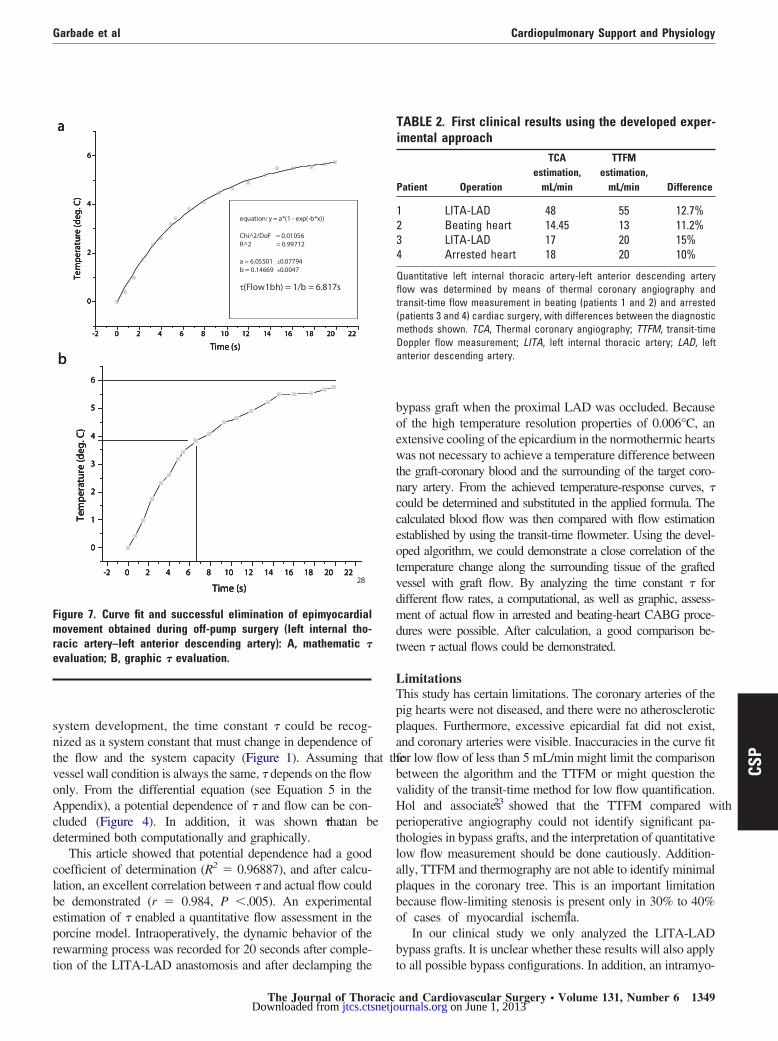
emperature peaks and neglecting the recorded temperaturehile the spot detection was not above the LAD. This isemonstrated in Figure 7, and the temperature-transfer curveould be described by using Equation 8 (Figure 7, A). Forathematic � calculation, Figure 7, A, was used (� � 6.817),hereas graphic � estimation was derived from Figure 7, B (� approximately 6.7). Table 2 shows the generated LAD flows
y using DIRI and TTFM and the calculated differences be-ween the methods.
iscussionhere is a requirement for qualitative and quantitative graftatency control to minimize complications caused by graft
42
-2 0 2 4 6 8 10 12 14 16 18 20 22
0
2
4
equation: y = a*(1 - exp(-b*x)
Chi^2/DoF = 0.00754R^2 = 0.98202
a = 2.7128 ±0.00363b = 0.23335 ±0.00114
τ(Flow1) = 1/b = 4.285s
Time (s)
Tem
pera
ture
(de
g. C
)
a
-2 0 2 4 6 8 10 12 14 16 18 20 22
0
2
4
equation: y = a*(1 - exp(-b*x)
Chi^2/DoF = 0.00754R^2 = 0.98202
a = 2.7128 ±0.00363b = 0.23335 ±0.00114
τ(Flow1) = 1/b = 4.285s
Time (s)
Tem
pera
ture
(de
g. C
)
a
-2 0 2 4 6 8 10 12 14 16 18 20 22
0
2
4
equation: y = a*(1 - exp(-b*x)
Chi^2/DoF = 0.00754R^2 = 0.98202
a = 2.7128 ±0.00363b = 0.23335 ±0.00114
τ(Flow1) = 1/b = 4.285s
Time (s)
Tem
pera
ture
(de
g. C
)
a
-2 0 2 4 6 8 10 12 14 16 18 20 22
0
2
equation: y = a*(1 - exp(-b*x))
Chi^2/DoF = 0.00479R^2 = 0.95266
a = 1.24645 ±0.00492b = 0.14667 ±0.00152
τ(Flow2) = 1/b = 6.818s
Time (s)
Te
mpe
ratu
re (
deg.
C)
b
-2 0 2 4 6 8 10 12 14 16 18 20 22
0
2
equation: y = a*(1 - exp(-b*x))
Chi^2/DoF = 0.00479R^2 = 0.95266
a = 1.24645 ±0.00492b = 0.14667 ±0.00152
τ(Flow2) = 1/b = 6.818s
Time (s)
Te
mpe
ratu
re (
deg.
C)
b
-2 0 2 4 6 8 10 12 14 16 18 20 22
0
2
equation: y = a*(1 - exp(-b*x))
Chi^2/DoF = 0.00479R^2 = 0.95266
a = 1.24645 ±0.00492b = 0.14667 ±0.00152
τ(Flow2) = 1/b = 6.818s
Time (s)
Te
mpe
ratu
re (
deg.
C)
b
igure 3. Curve fit for epimyocardial temperature measurementsn relation to the original data points. Mathematic � evaluationbtained for different flow rates: A, flow 1; B, flow 2.
ailure in coronary artery bypass surgery. Currently, there are
and Cardiovascular Surgery ● Volume 131, Number 6 1347 on June 1, 2013 urnals.org

sccatgflea
tcs
omptop
emhsiwaLsotd(
Fa(
Fam
Ft
T
GCCGD
Eicm
Cardiopulmonary Support and Physiology Garbade et al
1
CSP
everal technologies, some accepted and some evolving, thatan be used in intraoperative coronary bypass graft patencyontrol.20 Nevertheless, there is yet no method available tonalyze qualitative coronary blood distribution and quantita-ive coronary blood flow simultaneously during bypass sur-ery. In this study we investigated quantitative coronary bloodow assessment by using digital infrared thermal imaging inxperimental and clinical application. A specific heat-transferlgorithm was developed and applied.
It could be demonstrated that the epimyocardial tempera-ure response, as detected with TCA, has a close dynamicorrelation with actual coronary blood flow.5-10 TCA has beenhown to enable an intraoperative and noninvasive evaluation
4 6 8 10 12
4
6
8
10
12
14
16
18
20
22
24
26
28
30
32
equation: y = a*x^b
Chi^2/DoF = 0.91554R^2 = 0.96887
a = 165.4172 ±7.73746b = -1.27008 ±0.02629
Tau (s)
Flo
w (
ml/m
in)
4 6 8 10 12
4
6
8
10
12
14
16
18
20
22
24
26
28
30
32
equation: y = a*x^b
Chi^2/DoF = 0.91554R^2 = 0.96887
a = 165.4172 ±7.73746b = -1.27008 ±0.02629
Tau (s)
Flo
w (
ml/m
in)
igure 4. Comparison between different left anterior descendingrtery flow rates and the corresponding evaluated time constant�). Confidence and prediction lines are shown.
0
0,5
1
1,5
2
2,5
3
0 1 2 3 4 5 6 7 8
Time (s)
Tem
pera
ture
(de
g. C
)
Flow 1
63% Flow 1Flow 2
63% Flow 2
0
0,5
1
1,5
2
2,5
3
0 1 2 3 4 5 6 7 8
Time (s)
Tem
pera
ture
(de
g. C
)
Flow 1
63% Flow 1Flow 2
63% Flow 2
igure 5. Curve fit for epimyocardial temperature measurementsnd graphic � evaluation by using the 63% criterion for the
aximal achieved temperature: flow 1 and 2. s348 The Journal of Thoracic and Cardiovascular Surgery ● Junjtcs.ctsnetjourDownloaded from
f bypass graft patency, coronary anatomy, and qualitativeyocardial perfusion.11-13,21 From a recent study in 1401
atients undergoing coronary artery bypass,14 it was concludedhat TCA is a reliable method to obtain real-time informationn possible technical errors, such as unexpected occludinglaques or stenosis.
Different studies have approached quantitative TCA flowstimation15-19 but failed because of incomplete mathematicodeling of temperature mapping, the use of simple empiric
eat-exchange models, or the limitations of older infraredystems. In this experiment an equation (Equation 1) orig-nating in the dynamic enthalpy balance for open systemsas used. This model is able to describe the temperature-
nswer curve of the epicardium covering the region of theAD. This equation differs from that being used in othertudies16-18 and originating in a heat-transfer-model devel-ped by Oster and colleagues.22 The Laplace transforma-ion, a convenient mathematic tool to solve an ordinaryifferential equation, was used for further transformationsee Equations 2-8 in the Appendix). In the process of
-2 0 2 4 6 8 10 12 14 16 18 20 22-11,4
-11,2
-11,0
-10,8
-10,6
-10,4
-10,2
Tem
pera
ture
(deg
. C)
Time (s)
-2 0 2 4 6 8 10 12 14 16 18 20 22-11,4
-11,2
-11,0
-10,8
-10,6
-10,4
-10,2
Tem
pera
ture
(deg
. C)
Time (s)
igure 6. Epimyocardial movement of temperature response ofhe left anterior descending artery coronary tree in beating-heart
ABLE 1. Experimental coronary flow evaluationFlow 1 Flow 2
raphic � estimation 4.2 6.7omputational estimation 4.285 6.818alculated flow, mL/min 26.73 14.77old-standard flow (TTFM), mL/min 28 15ifference 4.5% 1.5%
xperimental � estimation with dynamic infrared imaging for 2 different flowss shown. The computational and graphic evaluated coronary blood flows areompared with the transit-time method. Differences between the investigatedethods are shown. TTFM, transit-time Doppler flow measurement.
urgery.
e 2006 on June 1, 2013 nals.org
sntvoAcd
clbeprt
boewtncceotvdmdt
LTppafbvHptlapbo
b
Fmre
Garbade et al Cardiopulmonary Support and Physiology
CSP
ystem development, the time constant � could be recog-ized as a system constant that must change in dependence ofhe flow and the system capacity (Figure 1). Assuming that theessel wall condition is always the same, � depends on the flownly. From the differential equation (see Equation 5 in theppendix), a potential dependence of � and flow can be con-
luded (Figure 4). In addition, it was shown that � can beetermined both computationally and graphically.
This article showed that potential dependence had a goodoefficient of determination (R2 � 0.96887), and after calcu-ation, an excellent correlation between � and actual flow coulde demonstrated (r � 0.984, P �.005). An experimentalstimation of � enabled a quantitative flow assessment in theorcine model. Intraoperatively, the dynamic behavior of theewarming process was recorded for 20 seconds after comple-
82
-2 0 2 4 6 8 10 12 14 16 18 20 22
0
2
4
6
equation: y = a*(1 - exp(-b*x))
Chi^2/DoF = 0.01056R^2 = 0.99712
a = 6.05501 ±0.07794b = 0.14669 ±0.0047
τ(Flow1bh) = 1/b = 6.817s
Time (s)
Tem
pera
ture
(deg
. C)
a
-2 0 2 4 6 8 10 12 14 16 18 20 22
0
2
4
6
equation: y = a*(1 - exp(-b*x))
Chi^2/DoF = 0.01056R^2 = 0.99712
a = 6.05501 ±0.07794b = 0.14669 ±0.0047
τ(Flow1bh) = 1/b = 6.817s
Time (s)
Tem
pera
ture
(deg
. C)
a
-2 0 2 4 6 8 10 12 14 16 18 20 22
0
2
4
6
equation: y = a*(1 - exp(-b*x))
Chi^2/DoF = 0.01056R^2 = 0.99712
a = 6.05501 ±0.07794b = 0.14669 ±0.0047
τ(Flow1bh) = 1/b = 6.817s
Time (s)
Tem
pera
ture
(deg
. C)
a
-2 0 2 4 6 8 10 12 14 16 18 20 22
0
1
2
3
4
5
6
Tem
pera
ture
(deg
. C)
Time (s)
b
-2 0 2 4 6 8 10 12 14 16 18 20 22
0
1
2
3
4
5
6
Tem
pera
ture
(deg
. C)
Time (s)
b
-2 0 2 4 6 8 10 12 14 16 18 20 22
0
1
2
3
4
5
6
Tem
pera
ture
(deg
. C)
Time (s)
b
igure 7. Curve fit and successful elimination of epimyocardialovement obtained during off-pump surgery (left internal tho-
acic artery–left anterior descending artery): A, mathematic �valuation; B, graphic � evaluation.
ion of the LITA-LAD anastomosis and after declamping the t
The Journal of Thoracicjtcs.ctsnetjoDownloaded from
ypass graft when the proximal LAD was occluded. Becausef the high temperature resolution properties of 0.006°C, anxtensive cooling of the epicardium in the normothermic heartsas not necessary to achieve a temperature difference between
he graft-coronary blood and the surrounding of the target coro-ary artery. From the achieved temperature-response curves, �ould be determined and substituted in the applied formula. Thealculated blood flow was then compared with flow estimationstablished by using the transit-time flowmeter. Using the devel-ped algorithm, we could demonstrate a close correlation of theemperature change along the surrounding tissue of the graftedessel with graft flow. By analyzing the time constant � forifferent flow rates, a computational, as well as graphic, assess-ent of actual flow in arrested and beating-heart CABG proce-
ures were possible. After calculation, a good comparison be-ween � actual flows could be demonstrated.
imitationshis study has certain limitations. The coronary arteries of theig hearts were not diseased, and there were no atheroscleroticlaques. Furthermore, excessive epicardial fat did not exist,nd coronary arteries were visible. Inaccuracies in the curve fitor low flow of less than 5 mL/min might limit the comparisonetween the algorithm and the TTFM or might question thealidity of the transit-time method for low flow quantification.ol and associates23 showed that the TTFM compared witherioperative angiography could not identify significant pa-hologies in bypass grafts, and the interpretation of quantitativeow flow measurement should be done cautiously. Addition-lly, TTFM and thermography are not able to identify minimallaques in the coronary tree. This is an important limitationecause flow-limiting stenosis is present only in 30% to 40%f cases of myocardial ischemia.4
In our clinical study we only analyzed the LITA-LADypass grafts. It is unclear whether these results will also apply
TABLE 2. First clinical results using the developed exper-imental approach
Patient Operation
TCAestimation,
mL/min
TTFMestimation,
mL/min Difference
1 LITA-LAD 48 55 12.7%2 Beating heart 14.45 13 11.2%3 LITA-LAD 17 20 15%4 Arrested heart 18 20 10%
Quantitative left internal thoracic artery-left anterior descending arteryflow was determined by means of thermal coronary angiography andtransit-time flow measurement in beating (patients 1 and 2) and arrested(patients 3 and 4) cardiac surgery, with differences between the diagnosticmethods shown. TCA, Thermal coronary angiography; TTFM, transit-timeDoppler flow measurement; LITA, left internal thoracic artery; LAD, leftanterior descending artery.
o all possible bypass configurations. In addition, an intramyo-
and Cardiovascular Surgery ● Volume 131, Number 6 1349 on June 1, 2013 urnals.org

caqflvDtnw
CIcactnfi
R
1
1
1
1
1
1
1
1
1
1
2
2
2
2
ATs
e
Lirttcfto
d
Cardiopulmonary Support and Physiology Garbade et al
1
CSP
ardial course of the LAD or fat tissue acts as a thermal isolatornd can cause artifacts in TCA. All these factors can alter theuality of thermal angiograms and render a quantification ofow impossible. Finally, our clinical data were observed in aery small cohort because of the limited availability of theIRI system. Therefore these clinical findings are a first step in
he translation from bench to bedside, and further studies areeeded to evaluate this new method in larger populations, asell as in other target vessels.
onclusionn summary, high-resolution real-time thermography systemsombined with DIRI allow for precise delineation of coronarynatomy and possible coronary stenosis. Intraoperative appli-ation of TCA enables no-touch noninvasive information onhe progress and success of an operation. Also, because of theow possible objective quantification of graft flow, technicalailures can potentially be recognized more easily and promptmmediate revision.
eferences
1. Leong KH, Ashok V, Nishkantha A, Shan YH, Sim KW. transit-timeflow measurement is essential in coronary artery bypass grafting. AnnThorac Surg. 2005;79:854-8.
2. Balacumarasawami L, Abu-Omar Y, Choudhary B, Pigott D, TaggartDP. a comparison of transit-time flowmetry and intraoperative fluo-rescence imaging for assessing coronary artery bypass graft patency.J Thorac Cardiovasc Surg. 2005;130:315-20.
3. Detter C, Russ D, Iffland A, et al. Near-infrared fluorescence coronaryangiography: a new noninvasive technology for intraoperative graftpatency control. Heart Surg Forum. 2002;5:364-9.
4. Rudd JH, Davies JR, Weissberg PL. Imaging of atherosclerosis—canwe predict plaque rupture? Trends Cardiovasc Med. 2005;15:17-24.
5. Senyk J, Malm A, Bornmyr S. Intraoperative cardiothermography. Anew method for detecting ischemic areas in the heart muscle and forinvestigating the results of revascularization procedures in coronarysurgery. Eur Surg Res. 1971;3:1-12.
6. Kekesi V, Papp L, Juhasz-Nagy A. Haemodynamic and thermographicsigns of intramyocardial venous outflow redistribution induced by coro-nary sinus occlusion in the canine heart. Acta Chir Hung. 1986;27:203-15.
7. Papp L, Allo G, Szabo Z, Juhasz-Nagy A. Natural history of acuteregional myocardial ischaemia revealed by infrared thermography inthe canine heart. Acta Morphol Hung. 1985;33:123-42.
8. Papp L, Mezei B, Osvath B, Szabo Z. Thermography in artificiallyinduced coronary circulatory disorders. Acta Chir Acad Sci Hung.1982;23:75-81.
9. Rogowski J, Mrozinski P, Jagielak D, Lango R, Narkiewicz M, Wu-jtewicz M. Thermographic assessment of stellate ganglion block effec-tiveness during cardiosurgical procedures. Med Sci Monit. 2000;6:407-10.
0. Robicsek F, Master TN, Svenson RH, et al. The application of thermog-raphy in the study of coronary blood flow. Surgery. 1978;84:858-64.
1. Mohr FW, Matloff J, Grundfest W, et al. Thermal coronary angiog-raphy: a method for assessing graft patency and coronary anatomy incoronary bypass surgery. Ann Thorac Surg. 1989;47:441-9.
2. Mohr FW, Falk V, Krieger H, et al. IMA-graft patency control bythermal coronary angiography during coronary bypass surgery. EurJ Cardiothorac Surg. 1991;5:534-41.
3. Mohr FW, Grundfest W, Litvack F, Forrster J, Matloff J, KirchhoffPG. Digital thermo-coronary angiography—development and valida-tion of the method in comparison with conventional cine-coronaryangiography. Z Kardiol. 1989;78:441-52.
4. Sönmez B, Arbatli H, Tansal S, et al. Real-time patency control with
thermal coronary angiography in 1401 coronary artery bypass graftingpatients. Eur J Cardiothorac Surg. 2003;24:961-6. i350 The Journal of Thoracic and Cardiovascular Surgery ● Junjtcs.ctsnetjourDownloaded from
5. Adachi H, Becker LC, Ambrosio G, et al. Assessment of myocardialblood flow by real-time infrared imaging. J Surg Res. 1987;43:94-102.
6. Falk V, Walther T, Kitzinger H, et al. An experimental approach toquantitative thermal coronary angiography. Thorac Cardiovasc Surg.1998;46:25-7.
7. Gordon N, Rispler S, Sideman S, Shofti R, Beyar R. Estimation ofcoronary blood flow by ECG gated cardiac thermography in open-chest conditions. Physiol Meas. 1998;19:353-66.
8. Gordon N, Rispler S, Sideman S, Shofti R, Beyar R. Thermographicimaging in the beating heart: a method for coronary flow estimationbased on a heat transfer model (F). Med Eng Phys. 1998;20:443-51.
9. Papp L, Allo G, Kekesi V, Szabo Z, Juhasz-Nagy A. Computer-aidedthermographic evaluation of disturbances of the coronary adaptivereserve: an experimental study. Acta Morphol Hung. 1985;33:179-88.
0. Wolf RK, Falk V. Intraoperative assessment of coronary artery bypassgrafts. J Thorac Cardiovasc Surg. 2003;126:634-7.
1. Falk V, Walther T, Philippi A, et al. Thermal coronary angiography forintraoperative patency control of arterial and saphenous vein coronaryartery bypass grafts: results in 370 patients. J Card Surg. 1995;10:147-60.
2. Oster H, Schollhorn J, Zuchner K, Leitz KH. Thermographic evalua-tion of myocardial temperature during infusion of cold cardioplegia.Thorac Cardiovasc Surg. 1983;31:31-4.
3. Hol PK, Fosse E, Lundblad R, et al. Graft control by transit-time flowmeasurement and intraoperative angiography in coronary artery bypasssurgery. Heart Surg Forum. 2002;4:254-8.
ppendixhe basis of the system is the dynamic enthalpy balance for openystems (Equation 1).
After transformation of Equation 1, we receive the followingquation for further treatment:
m
Fin�
d�Tout (t)
dt� �Tout (t) � �Tin (t) (2)
Function 2 can now be transferred to the s domain by means ofaplace transformation. The main use of the Laplace transformation
s to study the transients of the signals. Any function, f(t), can beegarded as a signal, which is a graph in the time domain. The Laplaceransformation transforms the time domain function to a function inhe s domain, which is called the frequency domain. Hence this is aonvenient tool to transform a problem in the time domain to arequency domain and vice versa. That is the practical application ofhe Laplace transformation. Mathematically, it is a tool to solve anrdinary differential equation.
Laplace transformation in the s domain (frequency domain) isefined as follows:
m
Fin� s�Tout (s) � �Tout (s) � �Tin (s)
Transfer function :Out
In�
�Tout
�Tin
(3)
� m
Fins � 1��Tout � �Tin )
�Tout
�Tin�
1
� m
Fout� s � 1� (4)
1
� m
Fin� s � 1�
s a PT1 element, a drag element first order with
e 2006 on June 1, 2013 nals.org

i
d
7
e
Garbade et al Cardiopulmonary Support and Physiology
� �m
Fin(5)
Unit jump in the Laplace domain is defined as follows:1
s.
In this case, however, there is no unit jump but a jump with the
ntensification k, and therefore we getk
s.
Tout �1
m�
k
s(6)
�Fin� s � 1�
The Journal of Thoracicjtcs.ctsnetjoDownloaded from
Finally, a transformation from the s domain back to the timeomain was performed:
Tout (t) � k�1 � e�t�� � Tin (t � 0) (7)
A description of the temperature-response curve with equationis reasonable and enables a � estimation by means of calculation.
Calculation of � for each flow by using the developed math-matic algorithm is performed as follows:
�Tout (t) � k�1 � e�t�� (8)
and Cardiovascular Surgery ● Volume 131, Number 6 1351
CSP
on June 1, 2013 urnals.org

DOI: 10.1016/j.jtcvs.2005.12.066 2006;131:1344-1351 J Thorac Cardiovasc Surg
Friedrich-Wilhelm Mohr Jacobs, Stefan Dhein, Thomas Walther, Jan Fritz Gummert, Volkmar Falk and
Jens Garbade, Cris Ullmann, Marcus Hollenstein, Markus Johannes Barten, Stephan angiography for intraoperative graft patency control
Modeling of temperature mapping for quantitative dynamic infrared coronary
Continuing Medical Education Activities
http://cme.ctsnetjournals.org/cgi/hierarchy/ctsnetcme_node;JTCSSubscribers to the Journal can earn continuing medical education credits via the Web at
Subscription Information
http://jtcs.ctsnetjournals.org/cgi/content/full/131/6/1344#BIBLThis article cites 23 articles, 6 of which you can access for free at:
Subspecialty Collections
http://jtcs.ctsnetjournals.org/cgi/collection/minimally_invasive_surgery Minimally invasive surgery http://jtcs.ctsnetjournals.org/cgi/collection/coronary_disease
Coronary disease http://jtcs.ctsnetjournals.org/cgi/collection/cardiac_other Cardiac - other http://jtcs.ctsnetjournals.org/cgi/collection/cardiac_physiology
Cardiac - physiologyThis article, along with others on similar topics, appears in the following collection(s):
Permissions and Licensing
http://www.elsevier.com/wps/find/obtainpermissionform.cws_home/obtainpermissionformreceipt, is available at: An on-line permission request form, which should be fulfilled within 10 working days of
. http://www.elsevier.com/wps/find/supportfaq.cws_home/permissionusematerialcan be found online at: General information about reproducing this article in parts (figures, tables) or in its entirety
on June 1, 2013 jtcs.ctsnetjournals.orgDownloaded from


