Embed Size (px)
Citation preview
Journal of X-Ray Science and Technology 14 (2006) 27–38 27IOS Press
Study of an adaptive bolus chasing CTangiography1
Er-Wei Baia,∗, James R. Bennettb, Robert McCabea, Melhem J. Sharafuddinb, Henri Baic,John Hallorand, Michael Vannierb, Ying Liue, Chenglin Wange and Ge Wangb
aDepartment of Electrical and Computer Engineering, University of Iowa, Iowa City, IA 52242, USAbDepartment of Radiology, University of Iowa Carver College of Medicine, Iowa City, IA 52242, USAcDepartment of Electrical and Computer Engineering, Iowa State University, Ames, IA 50011, USAdDepartment of Radiology, Cedar Valley Medical Specialists, 602 Ansborough Ave, Waterloo, IA50604, USAeControlled Cardiac CT, Iowa City, IA 52246, USA
Received 25 July 2005
Revised 20 November 2005
Accepted 23 November 2005
Abstract. To improve imaging quality and to reduce contrast dose and radiation exposure, an adaptive bolus chasing CTangiography was proposed so that the bolus peak position and the imaging aperture can be synchronized. The performance ofthe proposed adaptive bolus chasing CT angiography was experimentally evaluated based on the actual bolus dynamics. Theexperimental results show that the controlled table position and the bolus peak position were highly consistent. The resultsclearly demonstrate that the proposed adaptive bolus chasing CT angiography that synchronizes the bolus peak position withthe imaging aperture by a simple adaptive system is computationally and clinically feasible. Similar techniques may also beapplied to conventional angiography to improve imaging quality and to reduce contrast dose and/or radiation exposure.
Keywords: CT angiography, contrast studies, automatic control, nonlinear system
1. Introduction
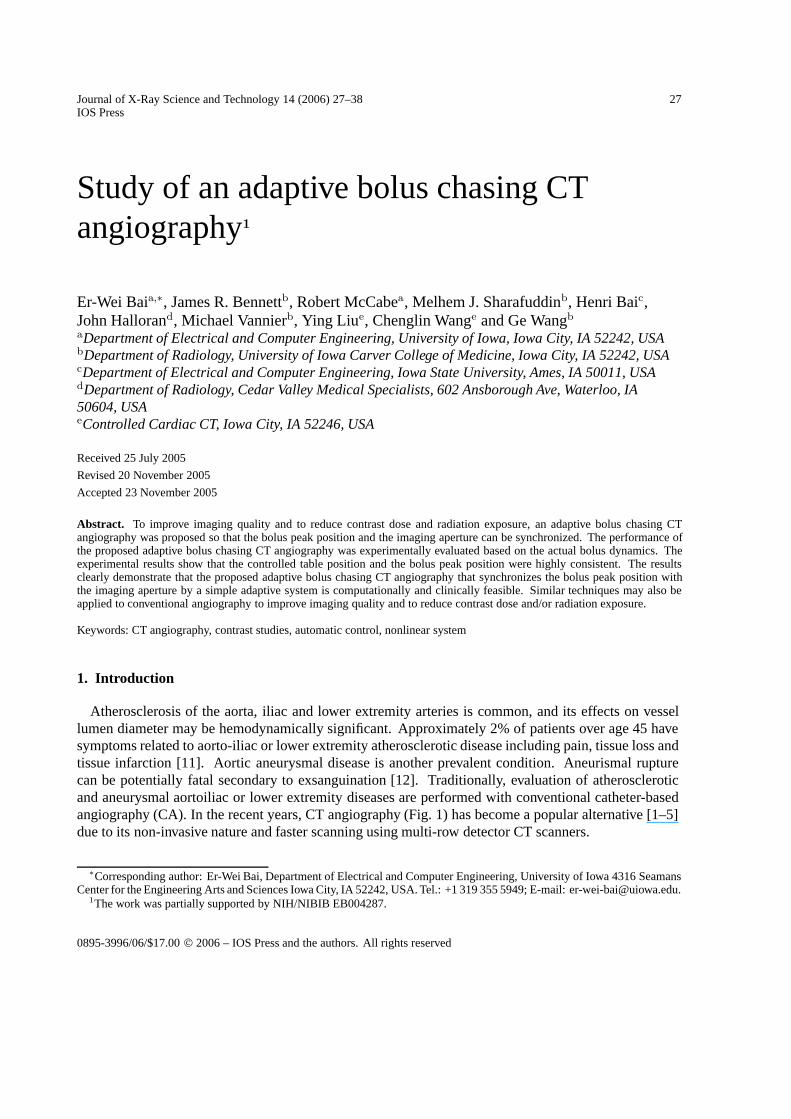
Atherosclerosis of the aorta, iliac and lower extremity arteries is common, and its effects on vessellumen diameter may be hemodynamically significant. Approximately 2% of patients over age 45 havesymptoms related to aorto-iliac or lower extremity atherosclerotic disease including pain, tissue loss andtissue infarction [11]. Aortic aneurysmal disease is another prevalent condition. Aneurismal rupturecan be potentially fatal secondary to exsanguination [12]. Traditionally, evaluation of atheroscleroticand aneurysmal aortoiliac or lower extremity diseases are performed with conventional catheter-basedangiography (CA). In the recent years, CT angiography (Fig. 1) has become a popular alternative [1–5]due to its non-invasive nature and faster scanning using multi-row detector CT scanners.
∗Corresponding author: Er-Wei Bai, Department of Electrical and Computer Engineering, University of Iowa 4316 SeamansCenter for the Engineering Arts and Sciences Iowa City, IA 52242, USA. Tel.: +1 319 355 5949; E-mail: [email protected].
1The work was partially supported by NIH/NIBIB EB004287.
0895-3996/06/$17.00 © 2006 – IOS Press and the authors. All rights reserved
28 E.-W. Bai et al. / Study of an adaptive bolus chasing CT angiography
Fig. 1. Computer simulated adaptive bolus chasing angiography. The purpose is to move the patient table according to thepredicted bolus propagation so that the bolus peak position is synchronized with the imaging aperture.
In CT angiography, contrast material is often administrated to allow a narrow temporal window toobtain optimal visualization of vessels, lesions and tumors [17–19]. The quality of scans dependson the ability to synchronize patient table position with the relatively narrow aperture of the imagingsystem during propagation of a contrast bolus after intravenous injection. Currently performance ofCT angiography routinely relies on scan initiation at a specific level after a pre-chosen threshold ofintravascular enhancement is reached but once initiated, no further synchronization of table motion withcontrast propagation is achieved. Linear table velocity may become problematic as time increases.
There is abundant literature on fluid mechanics and its applications including physiology [20,21],pharmacokinetics [22], and biomedical engineering [23,24]. Several clinical studies of CT contrastenhancement have been published in the past decade [18,25,26]. Bolus dynamics are complex andinfluenced by contrast administration protocol and patient characteristics (age, sex, weight, height,cardiovascular status, renal function, (etc.) [18,27]. Peak bolus velocity is rarely uniform; therefore syn-chronization of it with a fixed, preset table transport often results in less-desirable vascular enhancement.Lack of synchronization may be more problematic when scanning speed is fast, contrast volume is small,injection rate is high (leading to reduced peak duration), and/or variable vessel lumen diameter. Even fora normal individual, it is common that the contrast bolus velocity is rapid in the torso and relatively slowin the legs. Moreover, if asymmetric peripheral vascular disease exists, there may also be substantialvariability in flow velocity between the opposite legs. Obviously, adaptive bolus chasing techniques arerelevant to CT angiography because of the impact on image quality, as well as the need to limit contrastdose and radiation exposure.
To overcome these problems, several methods were reported in the literature [26,30–32] including, (1)test bolus timing, (2) ROI threshold triggering, and (3) visual cue triggering. The fundamental limitationof all these methods is that there is no table control component and the table motion is still linear whichmakes synchronization of the bolus peak position and the imaging aperture unlikely.
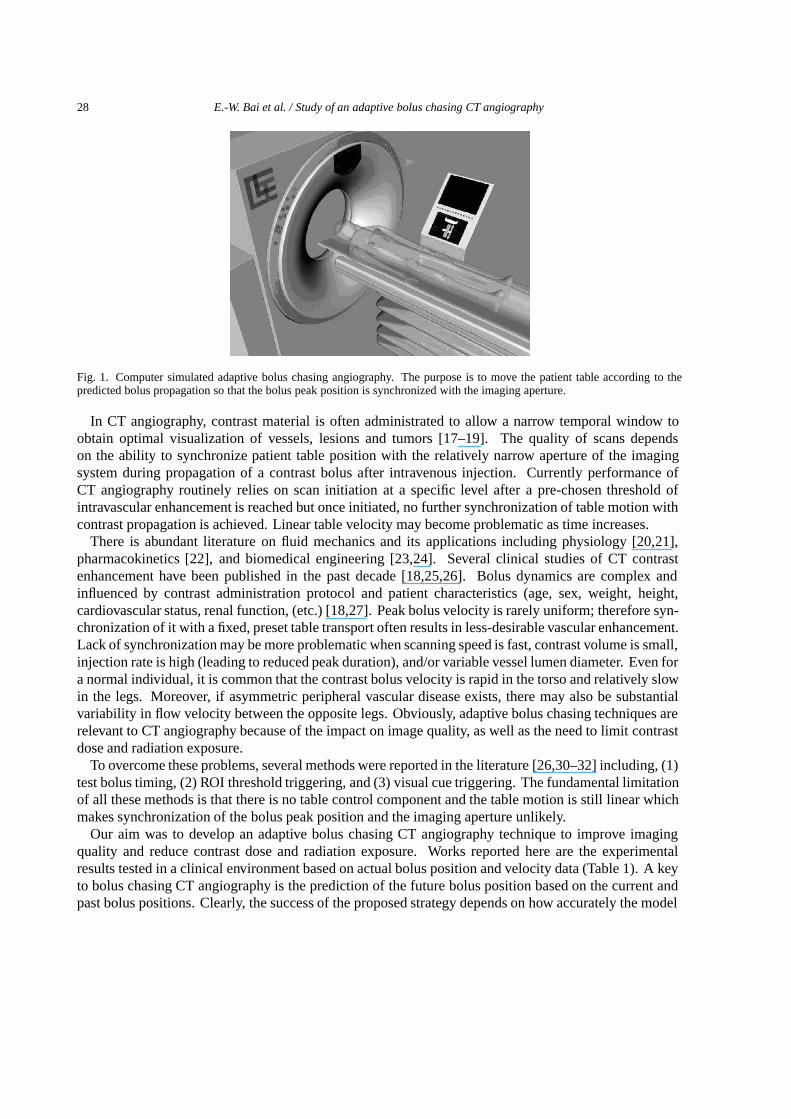
Our aim was to develop an adaptive bolus chasing CT angiography technique to improve imagingquality and reduce contrast dose and radiation exposure. Works reported here are the experimentalresults tested in a clinical environment based on actual bolus position and velocity data (Table 1). A keyto bolus chasing CT angiography is the prediction of the future bolus position based on the current andpast bolus positions. Clearly, the success of the proposed strategy depends on how accurately the model
E.-W. Bai et al. / Study of an adaptive bolus chasing CT angiography 29
Table 1Summary of bolus data sets. (M/F is for Male/Female, Wt for White, AA for African American, Hs forHispanic, Un for Unknown Race, St for Stricture, Ath for Atherosclerosis, Em for Embolism, Th forThrombosis, AAA for Abdominal Aortic Aneurysm, and DM I/II for Diabetes Mellitus I/II)
can predict. It was shown [34] that bolus propagation is governed by a set of very large number of partialdifferential equations which contains too many patient and circulatory stage-dependent parameters thatmake the model little use for adaptive bolus chasing CT angiography because real time estimation ofsuch a large number of parameters is impossible. Another commonly used model to describe bolusdynamics is the compartmental model [27–29] that is also of little use for adaptive bolus chasing CTangiography. First, the model is a set of equations involving dozens of unknown parameters that arepatient and circulatory stage dependent. Obviously, parameters about the patient vessel radius at eachstage of the vascular tree are difficult to have in advance. Also, disease-state related parameters areimpossible to be quantified prior to an angiogram. The second reason is that the compartmental modeldescribes contrast enhancement specific to a compartment (organ or vessel) [27–29] instead of predictingthe bolus dynamics as a function of time. To the best of our knowledge, there is no published resultfor contrast enhancement in CT which predicts both spatial and temporal propagation of the contrast
30 E.-W. Bai et al. / Study of an adaptive bolus chasing CT angiography
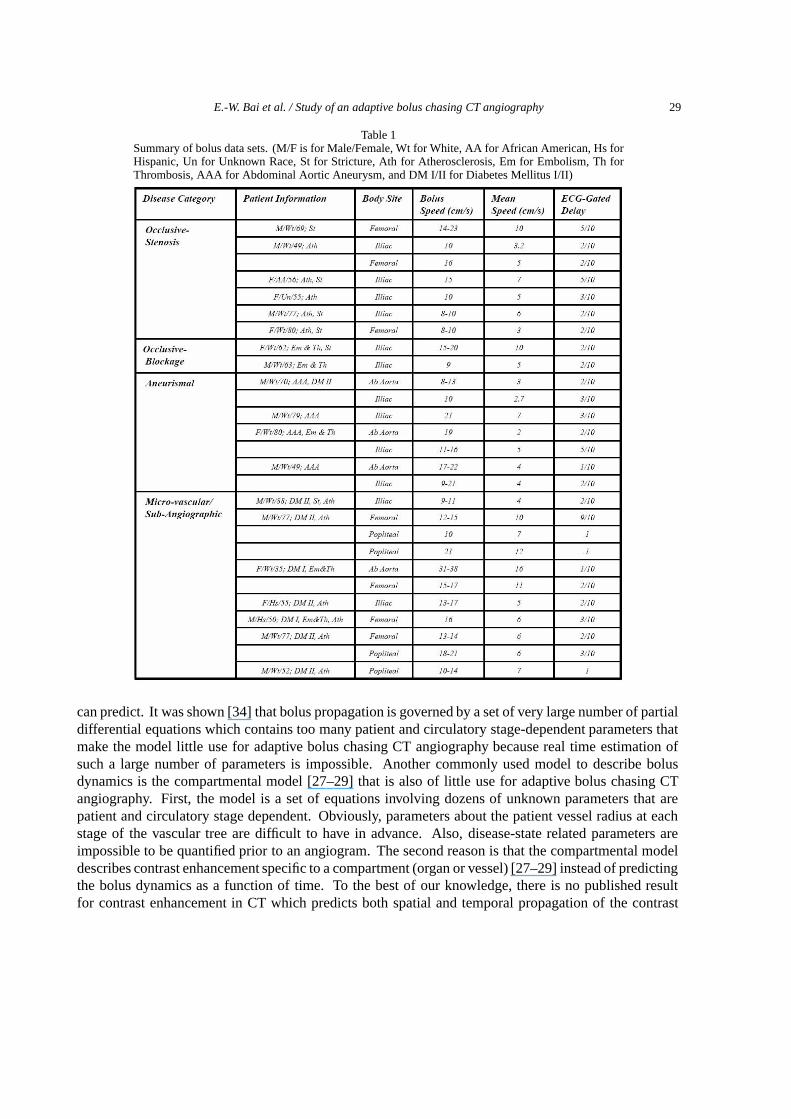
Table 2Tracking errors
Constant velocity CT Adaptive CTTracking errors Maximum (CM) Mean (CM) Maximum (CM) Mean (CM)
Patient #1 19.63 9.18 1.33 0.07Patient #2 7.09 4.22 1.89 0.20Patient #3 4.97 2.95 1.09 0.34Patient #4 29.17 12.99 1.01 0.08
Fig. 2. Extracted bolus position (cm) versus time (second).
bolus. To overcome this difficulty, an adaptive model is proposed that contains a minimum numberof parameters and allows for accurate real time estimation. Notice that due to the complexity of thecirculation system, the blood velocity surge during systole and may reverse during diastole. It is alsopossible that velocity of an intra-arterial bolus peak within a given peripheral vascular vessel differs fromthat of the blood within the same vessel. The goal of our adaptive system is to track the bolus peakposition and has the best opportunity to optimize the image quality of CTA.
2. Materials and methods
Using actual bolus positions and velocities extracted from patient data sets that we collected, theauthors performed an experiment to test the feasibility and performance of the proposed adaptive bolus-chasing CT angiography scheme that combines two main components: (1) an adaptive model based onreal time estimations and predictions of the bolus peak position, and (2) control of the patient table sothat the bolus peak position is synchronized with the imaging aperture.
2.1. Bolus data acquisition and extraction
Bolus velocities change substantially depending on vessel diameters which vary greatly relying on age,sex and arterial tree level. Bolus velocities also change significantly from systole to diastole. To be ableto test the proposed adaptive scheme in a clinical environment, we first collected actual bolus position
E.-W. Bai et al. / Study of an adaptive bolus chasing CT angiography 31
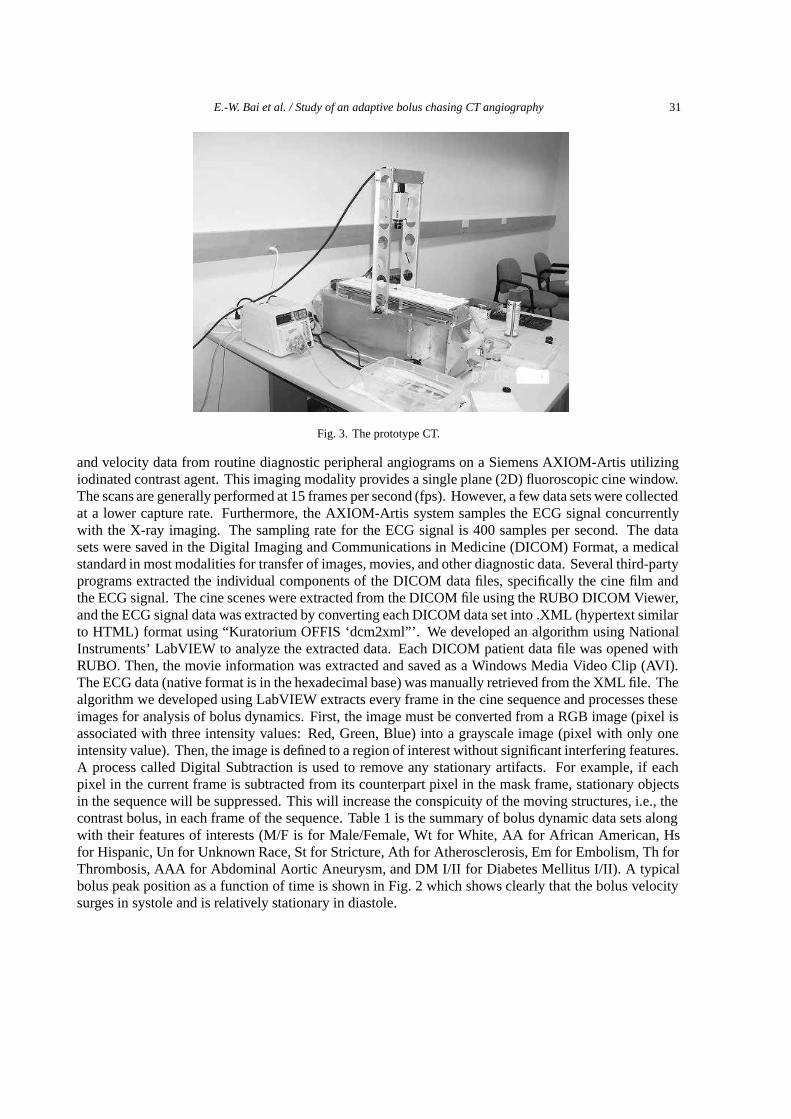
Fig. 3. The prototype CT.
and velocity data from routine diagnostic peripheral angiograms on a Siemens AXIOM-Artis utilizingiodinated contrast agent. This imaging modality provides a single plane (2D) fluoroscopic cine window.The scans are generally performed at 15 frames per second (fps). However, a few data sets were collectedat a lower capture rate. Furthermore, the AXIOM-Artis system samples the ECG signal concurrentlywith the X-ray imaging. The sampling rate for the ECG signal is 400 samples per second. The datasets were saved in the Digital Imaging and Communications in Medicine (DICOM) Format, a medicalstandard in most modalities for transfer of images, movies, and other diagnostic data. Several third-partyprograms extracted the individual components of the DICOM data files, specifically the cine film andthe ECG signal. The cine scenes were extracted from the DICOM file using the RUBO DICOM Viewer,and the ECG signal data was extracted by converting each DICOM data set into .XML (hypertext similarto HTML) format using “Kuratorium OFFIS ‘dcm2xml”’. We developed an algorithm using NationalInstruments’ LabVIEW to analyze the extracted data. Each DICOM patient data file was opened withRUBO. Then, the movie information was extracted and saved as a Windows Media Video Clip (AVI).The ECG data (native format is in the hexadecimal base) was manually retrieved from the XML file. Thealgorithm we developed using LabVIEW extracts every frame in the cine sequence and processes theseimages for analysis of bolus dynamics. First, the image must be converted from a RGB image (pixel isassociated with three intensity values: Red, Green, Blue) into a grayscale image (pixel with only oneintensity value). Then, the image is defined to a region of interest without significant interfering features.A process called Digital Subtraction is used to remove any stationary artifacts. For example, if eachpixel in the current frame is subtracted from its counterpart pixel in the mask frame, stationary objectsin the sequence will be suppressed. This will increase the conspicuity of the moving structures, i.e., thecontrast bolus, in each frame of the sequence. Table 1 is the summary of bolus dynamic data sets alongwith their features of interests (M/F is for Male/Female, Wt for White, AA for African American, Hsfor Hispanic, Un for Unknown Race, St for Stricture, Ath for Atherosclerosis, Em for Embolism, Th forThrombosis, AAA for Abdominal Aortic Aneurysm, and DM I/II for Diabetes Mellitus I/II). A typicalbolus peak position as a function of time is shown in Fig. 2 which shows clearly that the bolus velocitysurges in systole and is relatively stationary in diastole.
32 E.-W. Bai et al. / Study of an adaptive bolus chasing CT angiography
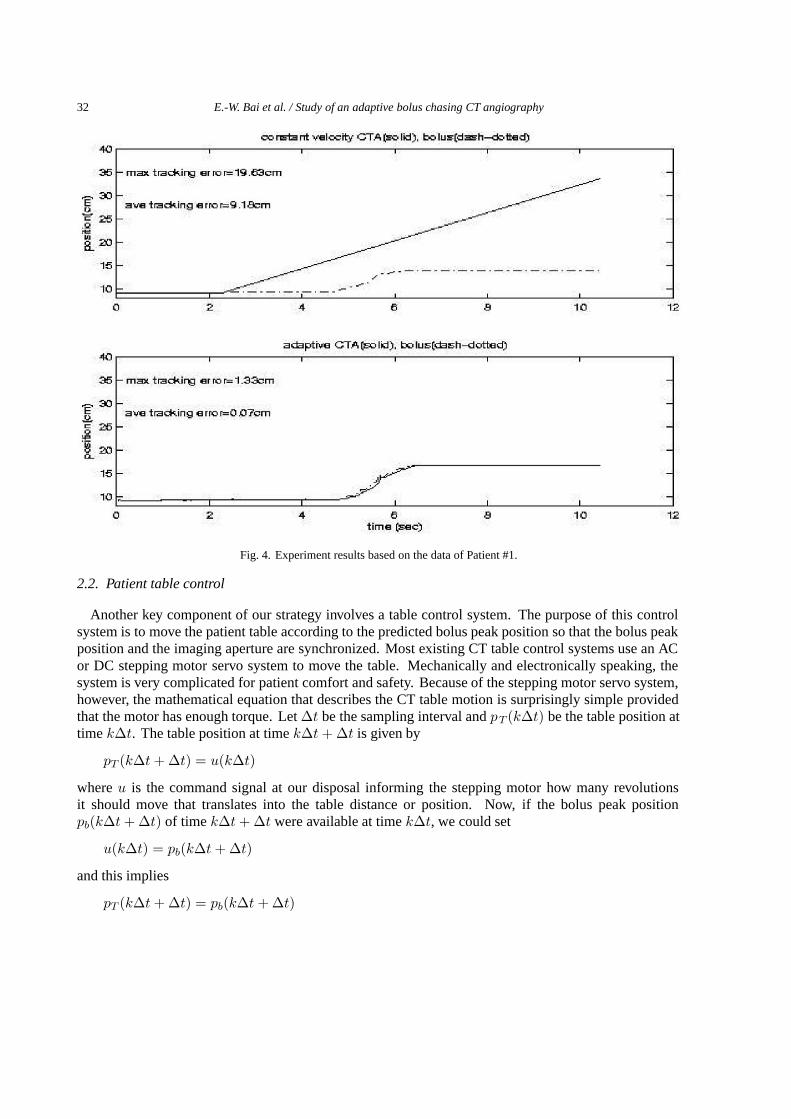
Fig. 4. Experiment results based on the data of Patient #1.
2.2. Patient table control
Another key component of our strategy involves a table control system. The purpose of this controlsystem is to move the patient table according to the predicted bolus peak position so that the bolus peakposition and the imaging aperture are synchronized. Most existing CT table control systems use an ACor DC stepping motor servo system to move the table. Mechanically and electronically speaking, thesystem is very complicated for patient comfort and safety. Because of the stepping motor servo system,however, the mathematical equation that describes the CT table motion is surprisingly simple providedthat the motor has enough torque. Let ∆t be the sampling interval and pT (k∆t) be the table position attime k∆t. The table position at time k∆t + ∆t is given by
pT (k∆t + ∆t) = u(k∆t)
where u is the command signal at our disposal informing the stepping motor how many revolutionsit should move that translates into the table distance or position. Now, if the bolus peak positionpb(k∆t + ∆t) of time k∆t + ∆t were available at time k∆t, we could set
u(k∆t) = pb(k∆t + ∆t)
and this implies
pT (k∆t + ∆t) = pb(k∆t + ∆t)
E.-W. Bai et al. / Study of an adaptive bolus chasing CT angiography 33
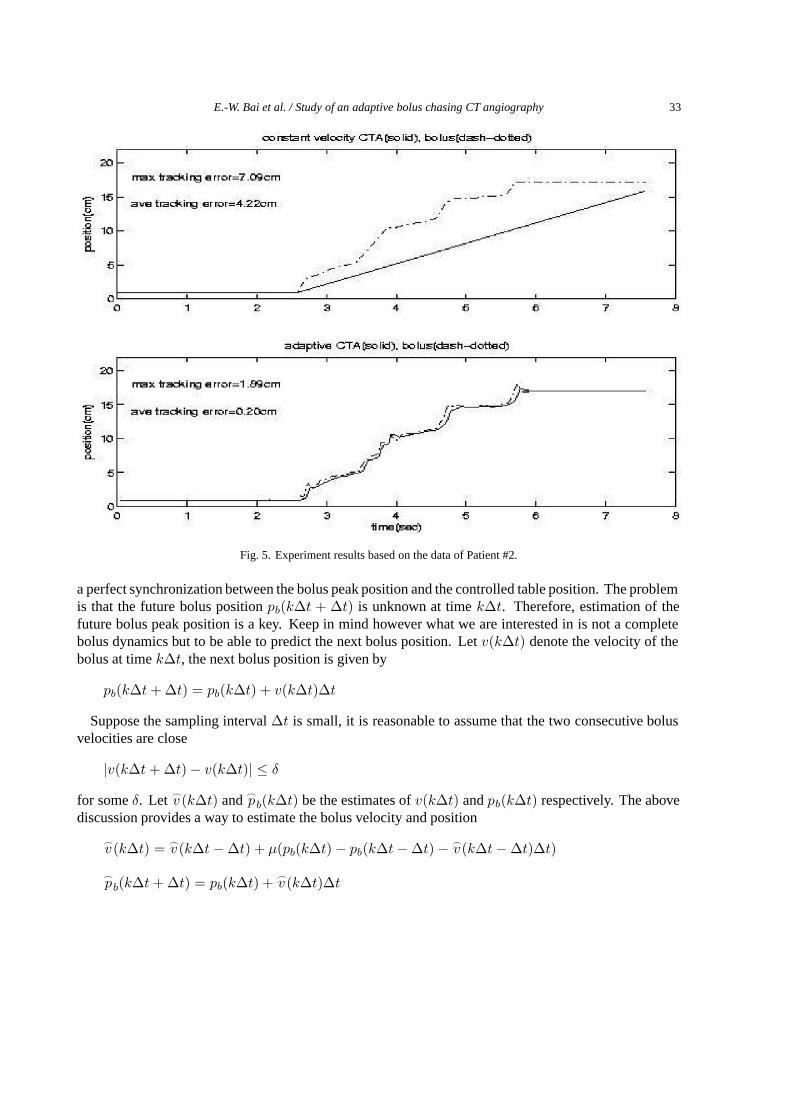
Fig. 5. Experiment results based on the data of Patient #2.
a perfect synchronization between the bolus peak position and the controlled table position. The problemis that the future bolus position pb(k∆t + ∆t) is unknown at time k∆t. Therefore, estimation of thefuture bolus peak position is a key. Keep in mind however what we are interested in is not a completebolus dynamics but to be able to predict the next bolus position. Let v(k∆t) denote the velocity of thebolus at time k∆t, the next bolus position is given by
pb(k∆t + ∆t) = pb(k∆t) + v(k∆t)∆t
Suppose the sampling interval ∆t is small, it is reasonable to assume that the two consecutive bolusvelocities are close
|v(k∆t + ∆t) − v(k∆t)| ≤ δ
for some δ. Let �v (k∆t) and �
pb(k∆t) be the estimates of v(k∆t) and pb(k∆t) respectively. The abovediscussion provides a way to estimate the bolus velocity and position
�v(k∆t) = �
v(k∆t − ∆t) + µ(pb(k∆t) − pb(k∆t − ∆t) − �v(k∆t − ∆t)∆t)
�pb(k∆t + ∆t) = pb(k∆t) + �
v(k∆t)∆t
34 E.-W. Bai et al. / Study of an adaptive bolus chasing CT angiography
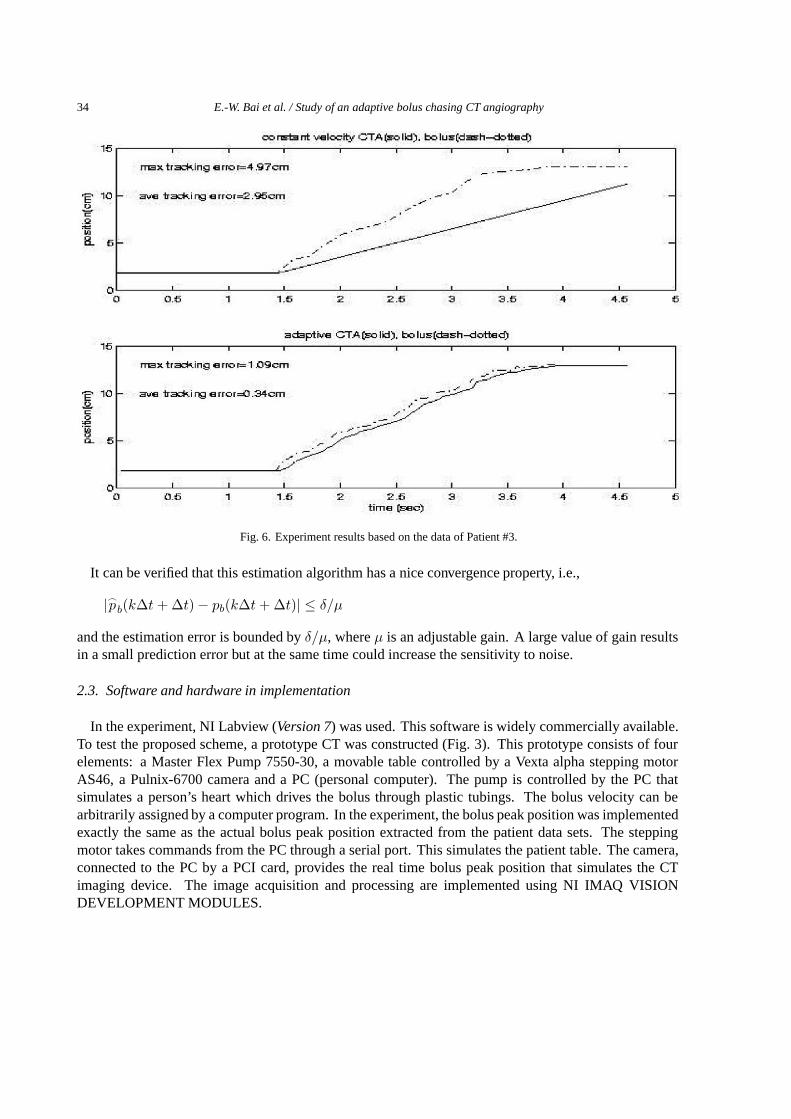
Fig. 6. Experiment results based on the data of Patient #3.
It can be verified that this estimation algorithm has a nice convergence property, i.e.,
|�pb(k∆t + ∆t) − pb(k∆t + ∆t)| ≤ δ/µ
and the estimation error is bounded by δ/µ, where µ is an adjustable gain. A large value of gain resultsin a small prediction error but at the same time could increase the sensitivity to noise.
2.3. Software and hardware in implementation
In the experiment, NI Labview (Version 7) was used. This software is widely commercially available.To test the proposed scheme, a prototype CT was constructed (Fig. 3). This prototype consists of fourelements: a Master Flex Pump 7550-30, a movable table controlled by a Vexta alpha stepping motorAS46, a Pulnix-6700 camera and a PC (personal computer). The pump is controlled by the PC thatsimulates a person’s heart which drives the bolus through plastic tubings. The bolus velocity can bearbitrarily assigned by a computer program. In the experiment, the bolus peak position was implementedexactly the same as the actual bolus peak position extracted from the patient data sets. The steppingmotor takes commands from the PC through a serial port. This simulates the patient table. The camera,connected to the PC by a PCI card, provides the real time bolus peak position that simulates the CTimaging device. The image acquisition and processing are implemented using NI IMAQ VISIONDEVELOPMENT MODULES.
E.-W. Bai et al. / Study of an adaptive bolus chasing CT angiography 35
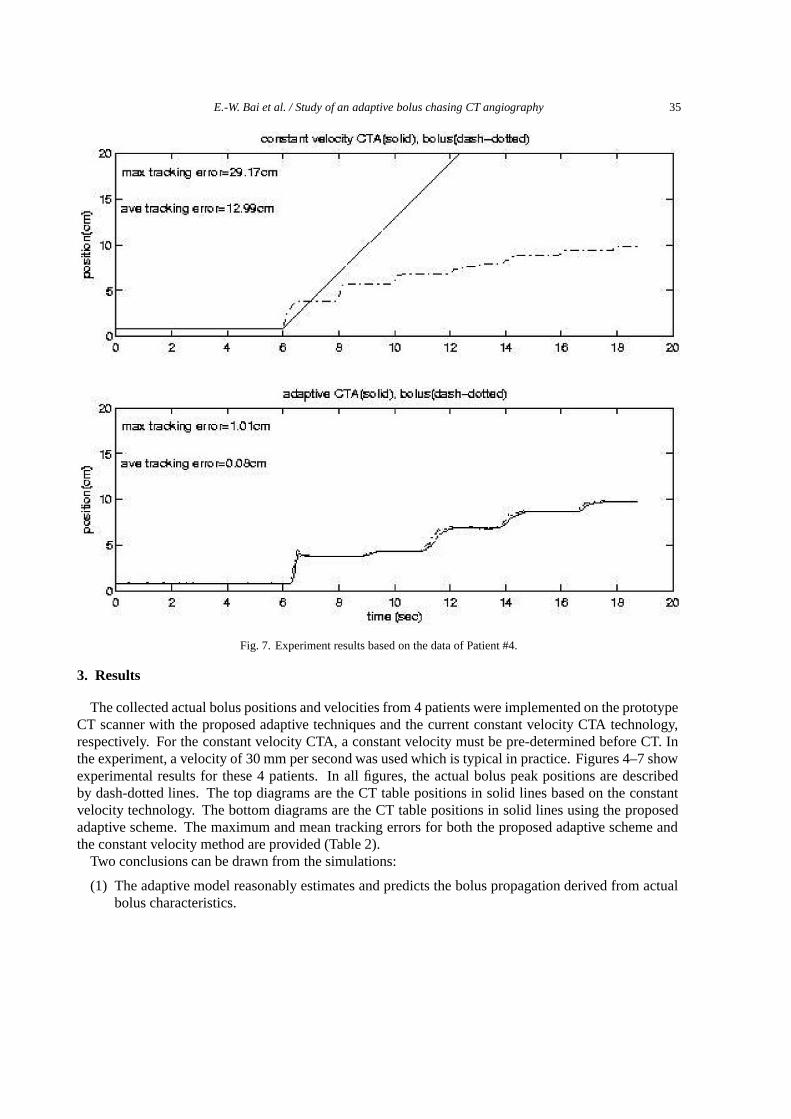
Fig. 7. Experiment results based on the data of Patient #4.
3. Results
The collected actual bolus positions and velocities from 4 patients were implemented on the prototypeCT scanner with the proposed adaptive techniques and the current constant velocity CTA technology,respectively. For the constant velocity CTA, a constant velocity must be pre-determined before CT. Inthe experiment, a velocity of 30 mm per second was used which is typical in practice. Figures 4–7 showexperimental results for these 4 patients. In all figures, the actual bolus peak positions are describedby dash-dotted lines. The top diagrams are the CT table positions in solid lines based on the constantvelocity technology. The bottom diagrams are the CT table positions in solid lines using the proposedadaptive scheme. The maximum and mean tracking errors for both the proposed adaptive scheme andthe constant velocity method are provided (Table 2).
Two conclusions can be drawn from the simulations:
(1) The adaptive model reasonably estimates and predicts the bolus propagation derived from actualbolus characteristics.
36 E.-W. Bai et al. / Study of an adaptive bolus chasing CT angiography
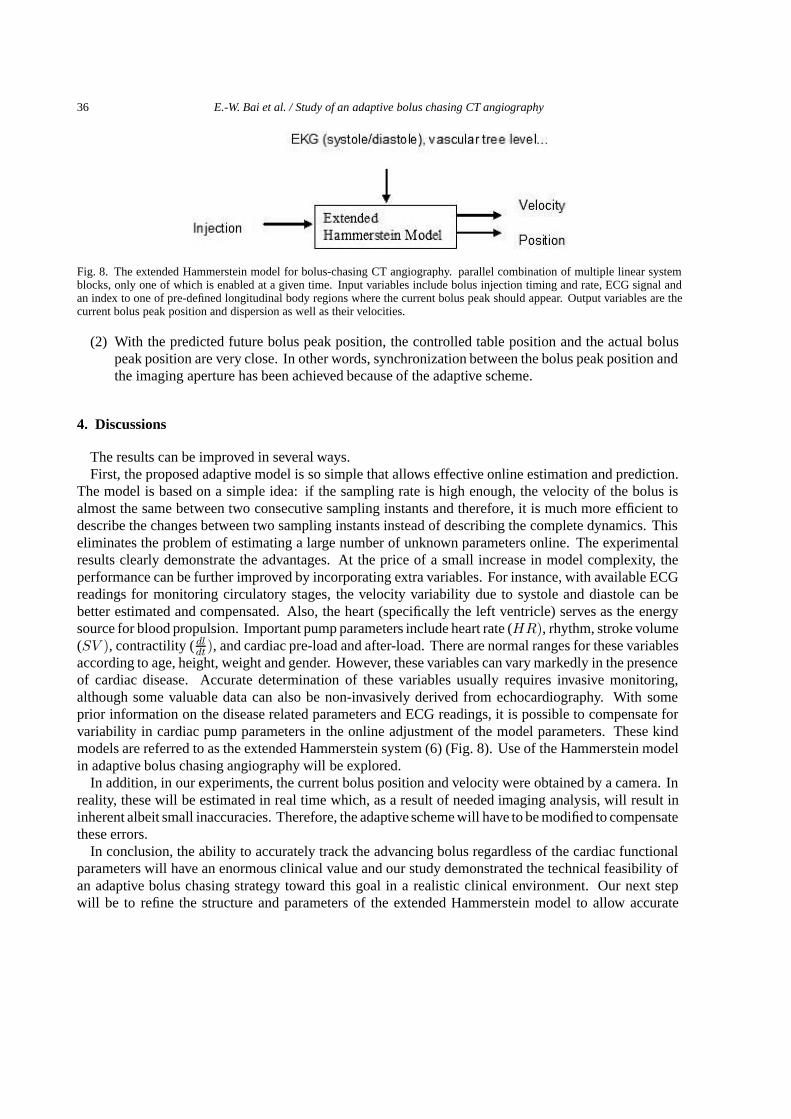
Fig. 8. The extended Hammerstein model for bolus-chasing CT angiography. parallel combination of multiple linear systemblocks, only one of which is enabled at a given time. Input variables include bolus injection timing and rate, ECG signal andan index to one of pre-defined longitudinal body regions where the current bolus peak should appear. Output variables are thecurrent bolus peak position and dispersion as well as their velocities.
(2) With the predicted future bolus peak position, the controlled table position and the actual boluspeak position are very close. In other words, synchronization between the bolus peak position andthe imaging aperture has been achieved because of the adaptive scheme.
4. Discussions
The results can be improved in several ways.First, the proposed adaptive model is so simple that allows effective online estimation and prediction.
The model is based on a simple idea: if the sampling rate is high enough, the velocity of the bolus isalmost the same between two consecutive sampling instants and therefore, it is much more efficient todescribe the changes between two sampling instants instead of describing the complete dynamics. Thiseliminates the problem of estimating a large number of unknown parameters online. The experimentalresults clearly demonstrate the advantages. At the price of a small increase in model complexity, theperformance can be further improved by incorporating extra variables. For instance, with available ECGreadings for monitoring circulatory stages, the velocity variability due to systole and diastole can bebetter estimated and compensated. Also, the heart (specifically the left ventricle) serves as the energysource for blood propulsion. Important pump parameters include heart rate (HR), rhythm, stroke volume(SV ), contractility ( dl
dt), and cardiac pre-load and after-load. There are normal ranges for these variablesaccording to age, height, weight and gender. However, these variables can vary markedly in the presenceof cardiac disease. Accurate determination of these variables usually requires invasive monitoring,although some valuable data can also be non-invasively derived from echocardiography. With someprior information on the disease related parameters and ECG readings, it is possible to compensate forvariability in cardiac pump parameters in the online adjustment of the model parameters. These kindmodels are referred to as the extended Hammerstein system (6) (Fig. 8). Use of the Hammerstein modelin adaptive bolus chasing angiography will be explored.
In addition, in our experiments, the current bolus position and velocity were obtained by a camera. Inreality, these will be estimated in real time which, as a result of needed imaging analysis, will result ininherent albeit small inaccuracies. Therefore, the adaptive scheme will have to be modified to compensatethese errors.
In conclusion, the ability to accurately track the advancing bolus regardless of the cardiac functionalparameters will have an enormous clinical value and our study demonstrated the technical feasibility ofan adaptive bolus chasing strategy toward this goal in a realistic clinical environment. Our next stepwill be to refine the structure and parameters of the extended Hammerstein model to allow accurate
E.-W. Bai et al. / Study of an adaptive bolus chasing CT angiography 37
and reliable tracking of variable, nonlinear, asymmetric and bilateral bolus propagation processes. Theproposed adaptive control techniques will also be tested on a multi-slice CT scanner, with the comparedend-points including improvement of the imaging quality and reduction in contrast dose.
References
[1] S. Napel, M.P. Marks, G.D. Rubin, R.B. Jeffrey, M.D. Dake, D.R. Enzmann et al., CT angiography using spiral CT andmaximum intensity projections, Radiology 185 (1992), 607–610.
[2] C.S. Richter, G. Biamino, V.T. Nieman, C. Ragg and R. Felix, CT-Angiographie und arterielle DSA zur Bewertung vonVerschluSprozessen der Bechenarterien, Fortschr. Rontgenstr. 161 (1994), 154–160.
[3] V. Raptopoulos, M.P. Rosen, K.C. Kent, L.M. Kuestner, R.G. Sheiman and J.D. Pearlman, Sequential helical CTangiography of aortoiliac disease, AJR 166 (1996), 1347–1354.
[4] O. Rieker, C. Duber, A. Neufang, M. Pitton, F. Schweden and M. Thelen, CT angiography versus intraarterial digitalsubtraction angiography for assessment of aortoiliac occlusive disease, AJR 169 (1997), 1133–1138.
[5] G.D. Rubin, D.S. Paik, P.C. Johnston and S. Napel, Measurement of the aorta and its branches with helical CT, Radiology206 (1998), 823–829.
[6] E.W. Bai, A blind approach to the Hammerstein-Wiener model identification, Autimatica 38 (2003), 967–979.[7] G. Wang, C.R. Crawford and W.A. Kalender, Multirow detector and cone-beam spiral/helical CT, IEEE Trans. Med.
Imaging 19 (2000), 817–821.[8] G. Wang, G.M. Raymond, Y. Li, G.D. Schweiger, M.J. Sharafuddin, A.H. Stolpen et al., A model of intravenous bolus
propagation for optimization of contrast enhancement, SPIE (2000), in press.[9] G.F. Franklin, J.D. Powell and A. Emami-Naeini, Feedback Control of Dynamic Systems, (4th ed.), Upper Saddle River,
NJ: Prentice-Hall, 2002.[10] E.W. Bai and Y. Huang, Variable gain parameter estimation algorithms for fast tracking and smooth steady state,
Automatica 36 (2000), 1001–1008.[11] J.E. Fielding, Smoking: Health effects and control: Parts 1 and 2, N. Eng. J. Med. 313 (1985), 491–498 and 555–561.[12] J. Collin, L. Auaujo and J. JW, Oxford screen programme for abdominal aortic aneurysm in men aged 65 to 74 years,
Lancet 2 (1988), 613–615.[13] B.S. Kuszyk, N.J. Beauchamp and E.K. Fishman, Neurovascular applications of CT angiography, Semin. Ultrasound.
CT MR 19 (1998), 394–404.[14] R.B. Schwartz, K.M. Jones, D.M. Chernoff, S.K. Mukherji, R. Khorasani, H.M. Tice et al., Common carotid artery
bifurcation: Evaluation with spiral CT. Work in progress, Radiology 185 (1992), 513–519.[15] J.L. Claves, S.W. Wise, K.D. Hpper, D. Tully, T.R. Ten Have and J. Weaver, Evaluation of contrast densities in the
diagnosis of carotid stenosis by CT angiography, AJR 169 (1997), 569–573.[16] C.P. Heussel, T. Viogtlaender, H. Kauczor, M. Braun, J. Meyer and M. Thelen, Detection of coronary artery calcifications
predictiong coronary heart disease: Comparison of flouroscopy and spiral CT, Eur. Radiol 8 (1998), 1016–1024.[17] M. Kormano, K. Partenen, S. Soimakallio and T. Kivimaki, Dynamic contrast enhancement of the upper abdomen: Effect
of contrast medium and body weight, Investigative Radiology 18 (1983), 364–367.[18] D.H. Sheafor, M.T. Keogan, D.M. DeLong and R.C. Nelson, Dynamic helical CT of the abdomen: Prospective comparison
of pre- and postprandial contrast enhancement, Radiology 206 (1998), 359–363.[19] M.E. Tublin, F.N. Tessler, S.L. Cheng, T.L. Peters and P.C. McGovern, Effect of injection rate of contrast medium on
pancreatic and hepatic helical CT, Radiology 210 (1999), 97–101.[20] J.B. Bassingthwaighte, I.S. Chan and C.Y. Wang, Computationally efficient algorithms for capillary convection-
permeation-diffusion models for blood-tissue exchange, Ann. Biomed. Eng. 20 (1992), 687–725.[21] K. Kroll, N. Wilke, M. Jerosch-Herold, Y. Wang, Y. Zhang, R.J. Bache et al., Modeling regional myocardial flows from
residue function of an intravascular indicator, Am. J. Physiol. 271 (1996), H1643–H1655.[22] S.B. Nadler and J.U. Hidalgo, Blood volume, in: Radioisotopes and circulation, G. Sevelius, ed., Boston, MA: Little,
Brown, 1965.[23] K.B. Chandran, Cardiovascular biomechanics, New York City, NY: New York University Press, 1992.[24] S.A. Berger, W. Goldsmith and E.R. Lewis, Introduction to bioengineering, Oxford, UK: Oxford University Press, 1996.[25] L.L. Berland, Slip-ring and conventional dynamic hepatic CT: Contrast material and timing considerations, Radiology
195 (1995), 1–8.[26] L. Kopka, J. Rodenwaldt, U. Fischer, D.W. Mueller, J.W. Oestmann and E. Grabbe, Dual-phase helical CT of the liver:
Effects of bolus tracking and different volumes of contrast material, Radiology 201 (1996), 321–326.[27] K.T. Bae, J.P. Heiken and J.A. Brink, Aortic and hepatic contrast medium enhancement at CT: Part II. Effect of reduced
cardiac output in a porcine model, Radiology 207 (1998), 647–655.
38 E.-W. Bai et al. / Study of an adaptive bolus chasing CT angiography
[28] K.T. Bae, J.P. Heiken and J.A. Brink, Aortic and hepatic contrast medium enhancement at CT: Part I. Prediction with acomputer model, Radiology 207 (1998), 647–655.
[29] K.T. Bae, J.P. Heiken and J.A. Brink, Aortic and hepatic contrast medium enhancement at CT: Part III. Effect of contrastmedium injection rate – Pharmacokinetic analysis and experimental porcine model, Radiology 207 (1998), 647–655.
[30] G.D. Schweiger, P.C. Chang and B.P. Brown, Optimizing contrast enhancement during helical CT of the liver: Acomparison of two bolus tracking techniques, AJR 171 (1998), 1551–1558.
[31] K.H. Hubener, W.A. Kalender and H.F. Metzger, Fast digital recording of x-ray dilution curves: A preliminary evaluation,Radiology 145 (1982), 545–547.
[32] P.M. Silverman, S.C. Roberts, I. Ducic, M.C. Tefft, M.C. Olson, C. Cooper et al., Assessment of a technology that permitsindividualized scan delays on helical hepatic CT: A technique to improve efficiency in use of contrast material, AJR 167(1996), 79–84.
[33] G. Wang and M.W. Vannier, Inventors; Bolus-chasing angiography with adaptive real-time computed tomography, USApatent 6,535,821. 2003 March 18, 2003.
[34] G. Wang, G. Raymond, Y. Li, D. Schweiger, K. Sharafuddin, A. Stolpen, S. Yang, Z. Li, J. Bassingthwaighte, B. Jamesand M. Vannier, A model on intervenous bolus propogation for optimization of contrast enhancement, Proceedings ofSPIE – The International Society for Optical Engineering 3978 (2000), 436–447.
[35] D. Evans, W. Mcdicken et al., in: Doppler application in the lower limb, D. Evans, ed., Doppler ultrasound. Physics,instrumentation and clinical applications. Chichester, NY, Wiley/Liss, 1989, pp. 233–242.
[36] R. Zierler and B. Zierle, in: Duplex sonography of the lower extremity arteries. Introduction to vascular ultrasound, W.Zwiebel, ed., Philadelphia, WB Sounders, 1992, pp. 237–251.

All in-text references underlined in blue are linked to publications on ResearchGate, letting you access and read them immediately.


![Kinetic analysis of the metabotropic glutamate subtype 5 tracer [18F]FPEB in bolus and bolus-plus-constant-infusion studies in humans](https://img.pdfslide.net/doc/110x75/6345f1b338eecfb33a06ca2e/kinetic-analysis-of-the-metabotropic-glutamate-subtype-5-tracer-18ffpeb-in-bolus.jpg)


