Embed Size (px)
Citation preview

Annual Abstract of Statistics
No 144 2008 Edition
Editor: Ian Macrory Office for National Statistics

ISBN 978-0-230-54560-1
ISSN 0072-5730
A National Statistics publication National Statistics are produced to high professional standards set out
in the National Statistics Code of Practice. They are produced free from
political influence. Not all the statistics contained within this publication
are national statistics because it is a compilation from various sources.
About usThe Office for National Statistics
The Office for National Statistics (ONS) is the executive office of the UK
Statistics Authority, a non-ministerial department which reports directly
to Parliament. ONS is the UK government’s single largest statistical
producer. It compiles information about the UK’s society and economy
which provides evidence for policy and decision-making and in the
allocation of resources.
The Director of ONS is also the National Statistician.
Palgrave Macmillan
This publication first published 2008 by Palgrave Macmillan,
Houndmills, Basingstoke, Hampshire RG21 6XS and 175 Fifth Avenue,
New York, NY 10010, USA
Companies and representatives throughout the world.
Palgrave Macmillan is the global academic imprint of the Palgrave
Macmillan division of St. Martin’s Press, LLC and of Palgrave Macmillan
Ltd. Macmillan® is a registered trademark in the United States, United
Kingdom and other countries. Palgrave is a registered trademark in the
European Union and other countries.
A catalogue record for this book is available from the British Library.
10 9 8 7 6 5 4 3 2 1
17 16 15 14 13 12 11 10 09 08
ContactsThis publication
For information about the content of this publication, contact the ONS
Core Table Unit
Tel: 01633 455851
Email: [email protected]
Other customer and media enquiries
ONS Customer Contact Centre
Tel: 0845 601 3034
International: +44 (0)845 601 3034
Minicom: 01633 812399
Email: [email protected]
Fax: 01633 652747
Post: Room 1015, Government Buildings,
Cardiff Road, Newport, South Wales NP10 8XG
www.statistics.gov.uk
Publication orders
To obtain the print version of this publication, contact Palgrave
Macmillan, tel: 01256 302611
www.palgrave.com/ons
Copyright and reproduction © Crown copyright 2008
Published with the permission of the Office for Public Sector
Information (OPSI)
You may re-use this publication (excluding logos) free of charge in any
format for research, private study or internal circulation within an
organisation providing it is used accurately and not in a misleading
context. The material must be acknowledged as Crown copyright and
you must give the title of the source publication. Where we have
identified any third party copyright material you will need to obtain
permission from the copyright holders concerned.
For re-use of this material you must apply for a Click-Use Public Sector
Information (PSI) Licence from:
Office of Public Sector Information, Crown Copyright Licensing and
Public Sector Information, St Clements House, 2–16 Colegate, Norwich
NR3 1BQ
Tel: 01603 621000
www.opsi.gov.uk/click-use/index.htm
Printing
This book is printed on paper suitable for recycling and made from
fully managed and sustained forest sources. Logging, pulping and
manufacturing processes are expected to conform to the environmental
regulations of the country of origin.
Printed and bound in Great Britain by Hobbs the Printer Ltd, Totton,
Southampton
Typeset by Kerrypress Typesetters Ltd, Luton, Bedfordshire

iii
Contents
Contents Page Type* Acknowledgements xiii
Unitsofmeasurement xiv
Introduction xv
1:Area
1.1 AreaoftheUnitedKingdom,2006 3 NS
2:Parliamentaryelections
2.1 Parliamentaryelections 6 NS2.2 Parliamentaryby-elections 6 NS2.3 Devolvedassemblyelections(WalesandScotland) 7 NS2.4 Devolvedassemblyelections(NorthernIreland) 7 NS
3:Internationaldevelopment
3.1 Grosspublicexpenditureonaid(GPEX) 12 NS3.2 Totalbilateralgrosspublicexpenditureonaid(GPEX):bymainrecipient countriesandregions 12 NS
4:Defence
4.1 UKDefenceexpenditure 18 NS4.2 IntakeofUKregularforcesfromcivilianlife:byservice 18 NS4.3 FormationoftheUKarmedforces 19 NS4.4 OutflowofUKregularforces:byservice 20 NS4.5 UKDefence:servicemanpowerstrengths 20 NS4.6 UKDefence:civilianmanpowerstrengths 21 NS4.7 Familyaccommodationanddefencelandholdings 21 NS4.8 LocationofUKservicepersonnel 22 NS4.9 UKregularforces:deaths 22 NS4.10 StrengthofuniformedUKmedicalstaff 23 NS4.11 UKDefenceservicesandtheciviliancommunity 24 NS
5:Population
5.1 Populationsummary:bycountryandsex 29 NS5.2 Populationchanges:bycountry 30 NS5.3 Agedistributionoftheresidentpopulation:bysexandcountry 31 NS5.4 Maritalcondition(dejure):estimatedpopulation:byageandsex 34 NS5.5 Geographicaldistributionofthepopulation 35 NS5.6 Population:byethnicgroupandage,2006 36 NS5.7 Totalinternationalmigrationestimates:citizenship 36 NS5.8 EstimatesofmigrationintoandoutoftheUnitedKingdom:byusual occupastionandsex 37 NS5.9 EstimatesofmigrationintoandoutoftheUnitedKingdombyciterzenshipand countryoflastornextresidence 38 NS5.10 Grantsofsettlementbynationality 40 NS

iv
Contents
Page Type*
5.11 ApplicationsreceivedforasylumintheUnitedKingdom,excluding dependants,bynationality 41 NS5.12 Marriages:bypreviousmaritalstatus,sex,ageandcountry 42 NS5.13 Divorce:bydurationofmarriage,ageofwifeandcountry 44 NS5.14 Divorceproceedings:bycountry 46 NS5.15 Births:bycountryandsex 48 NS5.16 Birthoccurrence:insideandoutsidemarriagebyageofmother 50 NS5.17 Livebirths:byageofmotherandcountry 51 NS5.18 Legalabortions:byageforresidents 53 NS5.19 Deaths:byageandsex 54 NS5.20 Infantandmaternalmortality 58 NS5.21 Deathrates:bysexandage 60 NS5.22 Interimlifetables 61 NS5.23 AdoptionsbydateofentryinAdoptedChildrenRegister:bysex,ageandcountry 62 NS
6:Education
6.1 Numberofschoolsbytypeandestablishmentsoffurtherandhighereducation 69 NS6.2 Full-timeandpart-timepupilsinschoolbyageandsex 70 NS6.3 Numberofpupilsandteachers,andpupil:teacherratiosbyschooltype 71 NS6.4 Full-timeandpart-timepupilswithspecialeducationalneeds(SEN) 72 NS6.5 GCE,GCSE,SCE/NQandvocationalqualificationsobtainedbypupilsandstudents 73 NS6.6 Studentsinfurthereducationbycountry,modeofstudy,sexandage 74 NS6.7 Studentsinfurthereducationbycountry,modeofstudy,sexandarea 75 NS6.8 Studentsinhighereducationbylevel,modeofstudy,sexandage 76 NS6.9 Studentsinhighereducationbylevel,modeofstudy,sexandsubjectgroup 77 NS6.10 Studentsobtaininghighereducationqualifications:bylevel,sexandsubjectgroup 78 NS6.11 Qualifiedteachers:bytypeofschoolandsex 79 NS
7:Labourmarket
7.1 LabourForcesummary:bysex 87 NS7.2 Employmentstatus,full-time/part-timeandtemporaryemployees 88 NS7.3 Employment:bysexandage 89 NS7.4 Distributionoftheworkforce:bysex 90 NS7.5 Employeejobsbyindustry 91 NS7.6 Weeklyhoursworked:bysex 95 NS7.7 Internationalcomparisons:Employmentandunemploymentrates 96 NS7.8 CivilServiceemploymentbydepartment 97 NS7.9 Unemployment:numberbysexandagegroup 97 NS7.10 Unemployment:percentagebysexandagegroup 98 NS7.11 Durationofunemployment:bysex 99 NS7.12 Claimantcount:byageandduration 100 NS7.13 Unemploymentrates:byregion 101 NS7.14 Claimantcountrates:byregion 101 NS7.15 Claimantcount:byregion 102 NS7.16 Economicactivity:bysexandage 103 NS7.17 Economicallyinactive:bysexandage 104 NS7.18 Economicallyinactive:byreasonandsex 105 NS7.19 Labourdisputes:byindustry 106 NS7.20 Averageearningsandhoursoffulltimeemployeesbyindustrydivisionbysex 107 NS7.21 Averageearningsandhoursoffull-timeemployees:bysex 109 NS7.22 Averageearningsindex:allemployees:bymainindustrialsectors 110 NS

v
Contents
Page Type*
7.23 Averageearningsindex:allemployeejobs:byindustry 111 NS7.24 Grossweeklyandhourlyearningsoffull-timeemployees:bysex 115 NS7.25 Medianearningsbyagegroupoffull-timeemployees:bysex 116 NS7.26 TradeUnions 116 NonNS
8:Incomeandwealth
8.1 Distributionoftotalincomebeforeandaftertax 120 NS8.2 Averageincomesofhouseholdsbeforeandaftertaxesandbenefits 122 NS8.3 Sourcesofgrosshouseholdincome 122 NS8.4 HouseholdexpenditurebasedonFESclassification 123 NS8.5 Percentageofhouseholdswithcertaindurablegoods 124 NS
9:Health
NationalHealthService 9.1 Hospitalandfamilyhealthservices:EnglandandWales 128 NS9.2 Hospitalandprimarycareservices:Scotland 129 NS9.3 Hospitalandgeneralhealthservices:NorthernIreland 130 NS9.4 Healthservices:workforcesummary 131 NS9.5 Healthandpersonalsocialservices:workforcesummary 132 NS
PublicHealth 9.6 Deaths:bycause 133 NS9.7 Notificationsofinfectiousdiseases:bycountry 136 NS9.8 Estimatednumberofcasesofwork-relateddiseasereportedby specialistphysicianstoTHOR 137 NS9.9 Deathsduetooccupationallyrelatedlungdisease 138 NS9.10 Injuriestoworkers:byindustryandseverityofinjury 138 NS
10:SocialProtection
10.1 NationalInsuranceFund 145 NS10.2 PersonswhopaidNationalInsurancecontributionsinataxyear:bysex 145 NS10.3 NationalInsurancecontributions 146 NS10.4 Weeklyratesofprincipalsocialsecuritybenefits 147 NS10.5 SocialSecurityActs:numberofpersonsreceivingbenefit 150 NS10.6 Jobseeker’sAllowanceclaimants:bybenefitentitlement 151 NS10.7 Sicknessbenefit,invaliditybenefitandincapacitybenefitclaimants:bysex, ageanddurationofspell 152 NS10.8 Sickness,invalidityandincapacitybenefit:daysofcertifiedincapacity 152 NS10.9 Childbenefits 153 NS10.10 FamilyCredit/WorkingFamilies'TaxCredit 153 NS10.11 In-workFamilieswithChildorWorkingTaxCreditawards. 153 NS10.12 WidowsBenefits(excludingbereavementpayment):bytypeofbenefit 154 NS10.13 BereavementBenefits(excludingbereavementpayment):bysex,typeofbenefit andageofwidow/er 155 NS10.14 Contributoryandnon-contributoryretirementpensions:bysexandageofclaimant 156 NS10.15 Warpensions:Estimatednumberofpensioners 157 NS10.16 Incomesupport(excludingMIG)bystatisticalgroup:numberofclaimants receivingweeklypayments 157 NS10.17 MIG/PensionCredit:numberofclaimants 157 NS10.18 Incomesupport:averageweeklyamountsofbenefit 158 NS10.19 MIG/PensionCredit:averageweeklyamountsofbenefit 158 NS10.20 Summaryofgovernmentexpenditureonsocialservicesandhousing 158 NS

vi
Contents
Page Type*
10.21 Summaryofgovernmentexpenditureoneducation 159 NS10.22 SummaryofgovernmentexpenditureonHealth 160 NS10.23 Summaryofgovernmentexpenditureonpersonalsocialservices 160 NS10.24 Summaryofgovernmentexpenditureonsocialsecuritybenefits andadministration 161 NS10.25 Summaryofgovernmentexpenditureonhousing 162 NS
11:Crimeandjustice
11.1 Policeforcestrength:bycountryandsex 167 NS11.2 PrisonPopulationinternationalcomparison 168 NS
EnglandandWales 11.3 Recordedcrimestatistics:byoffencegroup 169 NS11.4 Offendersfoundguilty:byoffencegroup 170 NS11.5 Offenderscautioned:byoffencegroup 171 NS11.6 Offendersfoundguiltyofoffences:byageandsex 172 NS11.7 Personscautionedbythepolice:byageandsex 172 NS11.8 Sentenceororderpassedonoffenderssentencedforindictableoffences:bysex 173 NS11.9 Personssentencedtolifeimprisonment:bysexandage 174 NS11.10 Receptionsandaveragepopulationincustody 175 NS11.11 Prisonpopulationservingsentences:byageandoffence 176 NS11.12 Expenditureonprisons 178 NS
Scotland 11.13 Crimesandoffencesrecordedbythepolice:bycrimegroup 179 NS11.14 Personswithachargeproved:bycrimegroup 180 NS11.15 Personswithachargeproved:bycourtprocedure 180 NS11.16 Personswithchargeproved:bymainpenalty 181 NS11.17 Personswithchargeproved:byageandsex 181 NS11.18 Penalestablishments:averagedailypopulationandreceptions 182 NS11.19 Expenditureonpenalestablishments 182 NS
NorthernIreland 11.20 Recordedcrimestatistics:byoffencegroup 183 NS11.21 Personsfoundguiltyatallcourts:byoffencegroup 183 NS11.22 Juvenilesfoundguiltyatallcourts:byoffencegroup 183 NS11.23 Disposalsgiventothoseconvictedbycourt 184 NS11.24 PrisonsandYoungOffendersCentres 185 NS
12:Lifestyles
12.1 ExpenditurebytheDepartmentforCulture,MediaandSport 189 NS12.2 Employmentintourismrelatedindustries 189 NS12.3 Employmentincreativeindustries 190 NS12.4 Cinemastatistics 190 NS12.5 Films 190 NS12.6 Domestictourism 191 NS12.7 Internationaltourism 191 NS12.8 Holidaysabroad:bydestination 191 NS12.9 Attendanceatleisureandculturalactivities 192 NS12.10 Gambling 192 NS12.11 Mostpopularboyandgirlbabynames2007 193 NS

vii
Contents
Page Type*
13:Environment
13.1 Governmentrevenuesfromenvironmentaltaxes 202 NS13.2 EstimatedatmosphericemissionsonaNationalAccountsbasis2005 202 NS13.3 EstimatedemissionsofgreenhousegasesonanIPCCbasis 203 NS13.4 Averagenumberofdaysofmoderateorhigherairpollutionpersite causedbyeachofthebasketof5pollutants 203 NS13.5 RoadTransportemissonsbypollutant 203 NS13.6 Estimatedemissionsofcarbondioxide(CO2) 204 NS13.7 Estimatedemissionsofmethane(CH4) 204 NS13.8 Estimatedemissionsofnitrousoxide(N2O) 204 NS13.9 Annualrainfall:byregion 205 NS13.10 UKannualweathersummary 205 NS13.11 Biologicalandchemicalwaterqualityofriversandcanals-England, WalesandNorthernIreland 206 NS13.12 Chemicalandbiologicalwaterqualityofriversandcanals-Scotland 207 NS13.13 ReservoirstocksinEnglandandWales:bymonth 207 NS13.14 Waterindustryexpenditure-EnglandandWales 208 NS13.15 Waterpollutionincidents 208 NS13.16 Bathingwater:byregion 209 NS13.17 Estimatedabstractionsfromallsurfaceandgroundwatersources:bypurpose 209 NS13.18 Estimatesofremainingrecoverableoilandgasreserves 210 NS13.19 Muncipalwastedisposal:bymethod 211 NS13.20 Amountsofdifferentmaterialsfromhouseholdsourcescollectedfor recyclingbycollectionmethod2005/06 212 NS13.21 NoiseincidentsreceivedbyEnvironmentalHealthOfficers-EnglandandWales 212 NS13.22 Materialflows 213 NS
14:Housing
14.1 Stockofdwellings:bytenureandcountry 217 NonNS14.2 Typeofaccommodation:bytenure 217 NS14.3 Permanentdwellingscompleted:bytenureandcountry 218 NS14.4 Stockofdwellings:Estimatedannualgainsandlosses 219 NonNS14.5 Housebuildingcompletions:bynumberofbedrooms 219 NonNS14.6 CountyCourtmortgagepossessionordersbyactions:byregion 220 NonNS14.7 Mortgages 221 NS14.8 Salesandtransfersoflocalauthoritydwellings 221 NS14.9 Householdsintemporaryaccommodation 221 NS
15:Transportandcommunications
15.1 Tripsperpersonperyear:bymainmodeandpurpose 227 NS15.2 RetailPricesIndex:transportcomponents 228 NS15.3 Domesticfreighttransport:bymode 229 NonNS15.4 Passengertransport:bymode 230 NS
RoadTransport GreatBritain 15.5 Motorvehicletraffic:byroadclass 230 NS15.6 Publicroadlength:byroadtype 231 NS15.7 Roadtraffic:bytypeofvehicle 231 NS15.8 Motorvehiclescurrentlylicenced 232 NS15.9 Newvehicleregistrations:bytaxationclass 232 NS

viii
Contents
Page Type*
15.10 Drivingtestpassrates:bysexandtypeofvehiclelicence 233 NS15.11 Fullcardrivinglicenceholders:bysexandage 233 NS15.12 Householdswithregularuseofcars 234 NS
NorthernIreland 15.13 Vehicleswithcurrentlicences 235 NS15.14 Newvehicleregistrations 235 NS
GreatBritain 15.15 Localbusservices:passengerjourneys:byarea 236 NS15.16 Localbusservices:fareindices:byarea 236 NS15.17 Roadaccidentcasualties:byroadusertypeandseverity 237 NS15.18 Freighttransportbyroad:goodsmovedbygoodsvehiclesover3.5tonnes 238 NS15.19 Freighttransportbyroad:goodsliftedbygoodsvehiclesover3.5tonnes 239 NS
RailTransport GreatBritain 15.20 Railsystemssummary 240 NonNS15.21 Nationalrailwaysfreight 241 NonNS
NorthernIreland 15.22 Railways:permanentwayandrollingstock 241 NonNS15.23 Operatingstatisticsofrailways 242 NonNS
AirTransport 242 NS15.24 MainoutputofUnitedKingdomairlines 15.25 AirtrafficbetweentheUnitedKingdomandabroad 242 NS15.26 Operationsandtrafficonscheduledservices:revenuetraffic 243 NS15.27 Accidentsonscheduledfixedwingpassenger-carryingservices 244 NS15.28 Activityatcivilaerodromes 244 NS
SeaTransport 15.29 UnitedKingdomports:foreign,coastwiseandone-porttraffic 245 NS15.30 Roll-on/roll-offferryandChannelTunneltraffic;roadgoodsvehiclesoutward tomainlandEurope:bycountryofregistration 247 NS
Communications 15.31 Postalservicesandtelevisionlicences 247 NS
16:Nationalaccounts
16.1 UnitedKingdomnationalanddomesticproduct:Mainaggregates 253 NS16.2 UnitedKingdomgrossdomesticproductandnationalincome:Currentprices 254 NS16.3 UnitedKingdomgrossdomesticproduct:Chainedvolumemeasures 255 NS16.4 Grossvalueaddedatcurrentbasicprices:byindustry 256 NS16.5 Grossvalueaddedatbasicprices:byindustry:Chainedvolumeindices 257 NS16.6 Non-financialcorporations:allocationofprimaryincomeaccount 258 NS16.7 Non-financialcorporations:secondarydistributionofincomeaccount 258 NS16.8 Generalgovernment:allocationofprimaryincomeaccount 259 NS16.9 Generalgovernment:secondarydistributionofincomeaccount 260 NS16.10 Householdsandnon-profitinstitutionsservinghouseholds:allocationof primaryincomeaccount 261 NS16.11 Householdsandnon-profitinstitutionsservinghouseholds:secondary distributionofincomeaccount 262 NS16.12 Householdsandnon-profitinstitutionsservinghouseholds:useofdisposable incomeaccount 262 NS16.13 Thesectoraccounts:keyeconomicindicators 263 NS

ix
Contents
Page Type*
16.14 Householdfinalconsumptionexpenditureatcurrentmarketprices:bypurpose 264 NS16.15 Householdfinalconsumptionexpenditure:bypurpose:Chained volumemeasures 265 NS16.16 Individualconsumptionexpenditurebyhouseholds,NPISHsandgeneral government:Currentmarketprices 266 NS16.17 Individualconsumptionexpenditure:byhouseholds,NPISHsandgeneral government:Chainedvolumemeasures 268 NS16.18 Changeininventories:Chainedvolumemeasures 269 NS16.19 Grossfixedcapitalformationatcurrentpurchasers’prices:bybroad sectorandtypeofasset 270 NS16.20 Grossfixedcapitalformationatcurrentpurchasers’prices:bytypeofasset 270 NS16.21 Grossfixedcapitalformation:bybroadsectorandtypeofasset: Chainedvolumemeasures 271 NS16.22 Grossfixedcapitalformation:bytypeofasset:Chainedvolumemeasures 271 NS
17:Prices
17.1 Producerpriceindexofmaterialsandfuelspurchased:byallmanufacturing andselectedindustriesSIC(92) 276 NS17.2 Producerpriceindexofoutput:byallmanufacturingandselected industriesSIC(92) 277 NS17.3 Internalpurchasingpowerofthepound 278 NS17.4 ConsumerPricesIndex:detailedfiguresbydivision 279 NS17.5 RetailPricesIndex 280 NS17.6 TaxandPriceIndex 281 NS17.7 Indexofpurchasepricesofthemeansofagriculturalproduction 282 NS17.8 Indexofproducerpricesofagriculturalproducts 283 NS17.9 Commoditypricetrends 284 NS
18:Governmentfinance
Centralgovernment 18.1 Sectoranalysisofkeyfiscalbalances 291 NS18.2 Publicsectortransactionsandfiscalbalances 292 NS18.3 Publicsectornetdebt 293 NS18.4 ConsolidatedFundandNationalLoansfund:revenueandexpenditure; receiptsandpayments 294 NS18.5 TaxespaidbyUKresidentstogeneralgovernmentandtheEuropeanUnion 296 NS18.6 Borrowingandrepaymentofdebt 298 NS18.7 ConsolidatedFundandNationalLoansFund:assetsandliabilities 299 NS18.8 Britishgovernmentandgovernmentguaranteedmarketablesecurities 301 NS18.9 Incometax:allowancesandreliefs 302 NS18.10 RatesofIncometax 302 NS18.11 Rateablevalues 303 NSLocalauthorities UnitedKingdom 18.12 Localauthorities:grossloandebtoutstanding 303 NS18.13 Revenueexpenditureoflocalauthorities 304 NSEnglandandWales 18.14 Financingofrevenueexpenditure 306 NS18.15 Localauthoritycapitalexpenditureandreceipts 307 NS18.16 Capitalexpenditureandincome 308 NS
x
Contents
Page Type*
Scotland 18.17 Expenditureoflocalauthorities 309 NS18.18 Incomeoflocalauthorities:classifiedaccordingtosource 310 NS18.19 Incomeoflocalauthoritiesfromgovernmentgrants 310 NSNorthernIreland 18.20 Expenditureoflocalauthorities 311 NS
19:Externaltradeandinvestment
19.1 Tradeingoods 318 NS19.2 Importpenetrationandexportsalesratiosforproductsof manufacturingindustry 319 NS19.3 UnitedKingdomexports:bycommodity 321 NS19.4 UnitedKingdomimports:bycommodity 322 NS19.5 UnitedKingdomexports:byarea 323 NS19.6 UnitedKingdomimports:byarea 324 NS19.7 Servicessupplied(exports)andpurchased(imports) 325 NS19.8 Internationaltradeinservices:bycountry 326 NS19.9 Summaryofbalanceofpayments 328 NS19.10 Summaryofbalanceofpayments:balances(creditslessdebits) 329 NS19.11 Balanceofpayments:currentaccount 330 NS19.12 Balanceofpayments:summaryofinternationalinvestmentposition, financialaccountandinvestmentincome 331 NS19.13 NetoutwardforeigndirectinvestmentbyUnitedKingdomcompanies: byareaandmaincountry 332 NS19.14 UnitedKingdomoutwardforeigndirectinternationalinvestmentposition: bookvalueofnetassets:byareaandmaincountry 333 NS19.15 NetearningsfromforeigndirectinvestmentabroadbyUnitedKingdom companies:byareaandmaincountry 334 NS19.16 NetinwardforeigndirectinvestmentintheUnitedKingdom:byarea andmaincountry 335 NS19.17 UnitedKingdominwardforeigndirectinternationalinvestmentposition: bookvalueofnetliabilities:byareaandmaincountry 336 NS19.18 NetearningsfromforeigndirectinvestmentintheUnitedKingdom: byareaandmaincountry 337 NS
20:ResearchandDevelopment
20.1 Costofresearchanddevelopment:bysector 341 NS20.2 Grosscentralgovernmentexpenditureonresearchanddevelopment 341 NS20.3 Netcentralgovernmentexpenditureonresearchanddevelopment: byEuropeanUnionobjectivesforresearchanddevelopmentexpenditure 341 NS20.4 IntramuralexpenditureonBusinessEnterpriseresearchanddevelopment: byindustry 342 NS20.5 SourcesoffundsforresearchanddevelopmentwithinBusinessEnterprises 342 NS
21:Agriculture,fisheriesandfood
21.1 Productionandincomeaccountatcurrentprices 346 NS21.2 Outputandinputvolumeindices 348 NS21.3 Agricultureland-use 350 NS21.4 Estimatedquantityofcropsandgrassharvested 351 NS21.5 Cattle,sheep,pigsandpoultryonagriculturalholdings 352 NS21.6 Forestry 353 NS21.7 Salesforfoodofagriculturalproduceandlivestock 354 NS
xi
Contents
Page Type*
21.8 Estimatesofproducersoforganicandin-conversionlivestock 354 NS21.9 Producersoforganicandin-conversionlivestock,Organicproducers, growers,processorsandimporters 355 NS21.10 Organicandin-conversionlandandlanduse 356 NS21.11 Averageweeklyandhourlyearningsandhoursoffulltimemale agriculturalworkers 357 NS21.12 Averageweeklyandhourlyearningsandhoursofagriculturalworkers: bytype,aged20andover 357 NS21.13 Workersemployedinagriculture:bytype 357 NS
Fisheries 21.14 SummaryofUKfishingindustry 358 NS21.15 Fishingfleet 359 NS
Foodconsumption 21.16 Estimatedhouseholdfoodconsumption 360 NS
22:Production
22.1 Productionandconstruction:summarytable 366 NS22.2 Manufacturers’sales:byindustry 370 NS22.3 Numbersoflocalunitsinmanufacturingindustries 375 NS
Energy 22.4 Productionofprimaryfuels 376 NS22.5 Totalinlandenergyconsumption 376 NS22.6 Coal:supplyanddemand 377 NS22.7 Fuelinputandgasoutput:gasconsumption 377 NS22.8 Electricity:generation,supplyandconsumption 378 NS22.9 Electricity:plantcapacityanddemand 379 NS22.10 Electricity:fuelusedingeneration 379 NS22.11 Indigenouspetroleumproduction,refineryreceipts,importsandexportsofoil 380 NS22.12 Throughputofcrudeandprocessoilsandoutputofrefined productsfromrefineries 380 NS22.13 Deliveriesofpetroleumproductsforinlandconsumption 381 NS
Industrialmaterials 22.14 Ironandsteel:Summaryofsteelsupplies,deliveriesandstocks 382 NS22.15 Ironandsteel:Ironore,manganeseore,pigironandironandsteelscrap 383 NS22.16 Ironandsteel:Furnacesandproductionofsteel 384 NS22.17 Non-ferrousmetals 385 NS22.18 Fertilisers 387 NS22.19 Minerals:production 387 NS
Buildingandconstruction 22.20 Buildingmaterialsandcomponents:production 388 NS22.21 Volumeofconstructionoutputbyallagenciesbytypeofworkat constant2000prices 389 NS22.22 Construction:Valueofnewordersobtainedbycontractors 389 NS
Manufacturedgoods 22.23 Totalengineering:TotalturnoverofUKbasedmanufacturers 390 NS22.24 Manufactureofmachineryandequipmentnotelsewhereclassified 391 NS22.25 Passengercars 392 NS22.26 Alcoholicdrink 393 NS22.27 Tobaccoproducts:releasedforhomeconsumption 393 NS

xii
Contents
Page Type*
23:Banking,insurance
23.1 BankofEnglandBalanceSheet 398 NS23.2 Valueofinter-bankclearings 399 NS23.3 Otherbanksbalancesheet 400 NS23.4 IndustrialanalysisofbanklendingtoUKresidents 403 NS23.5 IndustrialanalysisofbankdepositsfromUKresidents 406 NS23.6 Publicsectornetcashrequirementandothercounterpartstochangesin moneystockduringtheyear 408 NS23.7 Moneystockandliquidity 408 NS23.8 Selectedretailbanks’baserate 409 NS23.9 Averagethreemonthsterlingmoneymarketrates 410 NS23.10 Averageforeignexchangerates 411 NS23.11 Averagezerocouponyields 412 NS23.12 AverageratesonrepresentativeBritishGovernmentStocks 413 NS
Otherfinancialinstitutions 23.13 Buildingsocieties 414 NS23.14 Consumercredit 414 NS23.15 End-yearassetsandliabilitiesofinvestmenttrustcompanies,unittrusts andpropertyunittrusts 415 NS23.16 Self-administeredpensionfunds:marketvalueofassets 415 NS23.17 Insurancecompanies:balancesheetmarketvalues 416 NS
Insolvency 23.18 Individualinsolvencies 418 NS23.19 Companyinsolvencies 418 NS23.20 Selectedfinancialstatistics 419 NS23.21 Selectedinterestrates,exchangeratesandsecurityprices 420 NS23.22 MergersandacquisitionsintheUKbyUKcompanies:categoryofexpenditure 421 NS
24:Serviceindustry
24.1 Retailbusinesses 425 NS24.2 Retailtrade:indexnumbersofvalueandvolumeofsales 427 NS24.3 Motortrades 428 NS24.4 Cateringandalliedtrades 431 NS
Sources 434
Index 449
* Thispublicationcontainsamixtureof'NationalStatistics'and'OtherOfficialStatistics'.Statistics accreditedas'NationalStatistics'(NS)arefullycompliantwiththeNationalStatisticsCodeofPractice, andcarrytheNationalStatisticsKitemark.Statisticslabelledas'OtherOfficialStatistics'(NonNS)follow manyofthebestpracticeprinciplessetoutintheCodebuthavenotbeenaccreditedasfullycompliant.
xiii
Contributors and acknowledgements
Contributors and acknowledgements
The editor would like to thank the following people for their help in producing this book:
Production team: Angela Collin
Marc Evans
Dilys Rosen
Andrew White
Contributors The editor also wishes to thank all his colleagues in ONS, the rest of the Government Statistical Service and all contributors in other organisations for their generous support and helpful comments, without whose help this publication would not be possible.
Design: ONS Design Typesetting: Kerrypress Typesetters Ltd Publishing management: Mark Bristow

xiv
Units of measurement Length 1millimetre(mm) =0.03937inch 1centimetre(cm) =10millimetres =0.3937inch 1metre(m) =1,000millimetres =1.094yards 1kilometre(km) =1,000metres =0.6214mile 1inch(in.) =25.40millimetresor2.540centimetres 1foot(ft.) =12inches =0.3048metre 1yard(yd.) =3feet =0.9144metre 1mile =1,760yards =1.609kilometres
Area 1squaremillimetre(mm2) =0.001550squareinch 1squaremetre(m2) =1millionsquaremillimetres =1.196squareyards 1hectare(ha) =10,000squaremetres =2.471acres 1squarekilometre(km2) =1millionsquaremetres =247.1acres 1squareinch(sq.in.) =645.2squaremillimetresor6.452squarecentimetres 1squarefoot(sq.ft.) =144squareinches =0.09290squaremetreor929.0squarecentimetres 1squareyard(sq.yd.) =9squarefeet =0.8361squaremetre 1acre =4,840squareyards =4,046squaremetresor0.4047hectare 1squaremile(sq.mile) =640acres =2.590squarekilometresor259.0hectares
Volume 1cubiccentimetre(cm3) =0.06102cubicinch 1cubicdecimetre(dm3) =1,000cubiccentimetres =0.03531cubicfoot 1cubicmetre(m3) =onemillioncubiccentimetres =1.308cubicyards 1cubicinch(cu.in.) =16.39cubiccentimetres 1cubicfoot(cu.ft.) =1,728cubicinches =0.02832cubicmetreor28.32cubicdecimetres 1cubicyard(cu.yd.) =27cubicfeet =0.7646cubicmetre Capacity 1litre(l) =1cubicdecimetre =0.2200gallon 1hectolitre(hl) =100litres =22.00gallons 1pint =0.5682litre 1quart =2pints =1.137litres 1gallon =8pints =4.546litres 1bulkbarrel =36gallons(gal.) =1.637hectolitres Weight 1gram(g) =0.03527ounceavoirdupois 1hectogram(hg) =100grams =3.527ouncesor0.2205pound 1kilogram(kg) =1,000gramsor10hectograms =2.205pounds 1tonne(t) =1,000kilograms =1.102shorttonsor0.9842longton 1ounceavoirdupois(oz.) =437.5grains =28.35grams 1poundavoirdupois(lb.) =16ounces =0.4536kilogram 1hundredweight(cwt.) =112pounds =50.80kilograms 1shortton =2,000pounds =907.2kilogramsor0.9072tonne 1longton(referredtoaston) =2,240pounds =1,016kilogramsor1.016tonnes 1ouncetroy =480grains =31.10grams
Energy Britishthermalunit(Btu) =0.2520kilocalorie(kcal)=1.055kilojoule(kj) Therm =105Britishthermalunits=25,200kcal=105,506kj Megawatthour(MWh) =106watthours(Wh) Gigawatthour(GWh) =106kilowatthours=34,121therms Food and drink Butter 23,310litresmilk =1tonnebutter(average) Cheese 10,070litresmilk =1tonnecheese Condensedmilk 2,550litresmilk =1tonnefullcreamcondensedmilk 2,953litresskimmedmilk =1tonneskimmedcondensedmilk Milk 1millionlitres =1,030tonnes Milkpowder 8,054litresmilk =1tonnefullcreammilkpowder 10,740litresskimmedmilk =1tonneskimmedmilkpowder Eggs 17,126eggs =1tonne(approximate) Sugar 100tonnessugarbeet =92tonnesrefinedsugar 100tonnescanesugar =96tonnesrefinedsugar Shipping Grosstonnage =Thetotalvolumeofalltheenclosedspacesofavessel,theunitofmeasurementbeinga'ton' of100cubicfeet. Deadweighttonnage =Deadweighttonnageisthetotalweightintonsof2,240lbthatashipcanlegallycarry,thatis thetotalweightofcargo,bunkers,storesandcrew.

xv
IntroductionIntroduction
Introduction
Welcome to the 2008 edition of the Annual Abstract of Statistics. This compendium draws together statistics from a wide range of official and other authoritative sources. Their help is gratefully acknowledged.
Regional information, supplementary to the national figures in Annual Abstract, appear in Regional Trends. The latest edition of Regional Trends is available electronically on the National Statistics website free of charge. This can be accessed from the Regional Trends entry under the Compendia and Reference theme, or directly at: www.statistics.gov.uk/regionaltrends. Earlier editions are available via Palgrave Macmillan.
Current data for many of the series appearing in this Annual Abstract are contained in other ONS publications, such as Economic & Labour Market Review, Population Trends, Health Statistics Quarterly and Financial Statistics. All are published by Palgrave Macmillan.
Other Office for National Statistics (ONS) publications which contain related data are the Monthly Digest of Statistics and Social Trends; these are also published by Palgrave Macmillan or can be found directly at:
www.statistics.gov.uk/statbase/product.asp?vlnk=611
www.statistics.gov.uk/statbase/product.asp?vlnk=5748
The name (and telephone number, where this is available) of the organisation providing the statistics are shown under each table. In addition, a list of sources is given at the back of the book, which sets out the official publications or other sources to which further reference can be made.
Identification codes
The four-letter identification code at the top of each data column, or at the side of each row, is the ONS reference for this series of data on our database. Please quote the relevant code if you contact us requiring any further information about the data. On some tables it is not possible to include these codes, so please quote the table number in these cases.
Definitions and classification
Time series So far as possible annual totals are given throughout, but quarterly or monthly figures are given where these are more suitable to the type of series.
Explanatory notes Most sections are preceded by explanatory notes which should be read in conjunction with the tables. Definitions and explanatory notes for many of the terms occurring in the Annual Abstract are also given in the Annual Supplement to the Monthly Digest of Statistics, published annually in the January edition. Detailed notes on items which appear in both the Abstract and Financial Statistics are given in an annual supplement to the latter entitled Financial Statistics Explanatory Handbook. The original sources listed in the sources may also be consulted.
Standard Industrial Classification
A Standard Industrial Classification (SIC) was first introduced into the UK in 1948 for use in classifying business establishments and other statistical units by the type of economic activity in which they are engaged. The classification provides a framework for the collection, tabulation, presentation and analysis of data about economic activities. Its use promotes uniformity of data collected by various government departments and agencies. Since 1948 the classification has been revised in 1958, 1968, 1980, 1992, 2003 and 2007. One of the principal objectives of the 1980 revision was to eliminate differences from the activity classification issued by the Statistical Office of the European Communities (Eurostat) and entitled ‘Nomenclature générale des activités économiques dans les Communautés Européennes’, usually abbreviated to NACE. In 1990, the European Communities introduced a new statistical classification of economic activities (NACE Rev 1) by regulation. The regulation made it obligatory for the UK to introduce a new Standard Industrial Classification SIC(92), based on NACE Rev 1. UK SIC(92) was based exactly on NACE Rev 1 but, where it was thought necessary or helpful, a fifth digit was added to form subclasses of the NACE 1 four digit system. Classification systems need to be revised periodically because, over time, new products, processes and industries emerge. In January 2003, a minor revision of NACE Rev 1, known as NACE Rev 1.1, was published in the Official Journal of the European Communities.
Consequently, the UK was obliged to introduce a new Standard Industrial Classification (SIC(2003)) consistent with NACE Rev 1.1. The UK took the opportunity of the 2003 revision to also update the national Subclasses. Full details are available in UK Standard Industrial Classification of Economic Activities 2003 and the Indexes to the UK Standard Industrial Classification of Economic Activities 2003. These are the most recent

xvi
Introduction
that are currently used. The most up to date version is the UK Standard Industrial Classification of Economic activities 2007 (SIC2007). It will be implemented in five stages and came into effect on 1 January 2008.
• For reference year 2008, the Annual Business Inquiry (parts 1 & 2) will be based on SIC 2007
• Products of the European Community will also be based on SIC 2007 from reference year 2008
• Other annual outputs will be based on SIC 2007 from reference year 2009, unless otherwise determined by regulation
• Quarterly and monthly surveys will be based on SIC 2007 from the first reference period in 2010, unless otherwise determined by regulation
• National Accounts will move to SIC 2007 in September 2011
ONS is currently working on a detailed implementation plan for the introduction of the new classification, covering all of our surveys and outputs. For further information see www.statistics.gov.uk/statbase/Product.asp?vlnk=14012
Revisions to contents
Some of the figures, particularly for the latest year, are provisional and may be revised in a subsequent issue of the Annual Abstract.
Symbols and conventions used
Change of basis Where consecutive figures have been compiled on different bases and are not strictly comparable, a footnote is added indicating the nature of the difference.
Geographic coverage Statistics relate mainly to the UK. Where figures relate to other areas, this is indicated on the table.
Units of measurement The various units of measurement used are listed following the Contents.
Rounding of figures In tables where figures have been rounded to the nearest final digit, the constituent items may not add up exactly to the total.
Symbols The following symbols have been used throughout:
.. = not available or not applicable (also information supressed to avoid disclosure)
- = nil or less than half the final digit shown
National Statistics Online: www.statistics.gov.uk
Web-based access to time series, cross sectional data and metadata from across the Government Statistical Service (GSS) is available using the site search and index functions from the homepage. Users can also download many datasets, in whole or in part, or consult directory information for all GSS statistical resources, including censuses, surveys, periodicals and enquiry services. Information is posted as PDF electronic documents or in XLS and CSV formats, compatible with most spreadsheet packages. Complete copies of this publication are available to download free of charge on the following web page: www.statistics.gov.uk/statbase/product.asp?vlnk=94.
Contact point
The ONS welcomes any feedback on the content of the Annual Abstract, including comments on the format of the data and the selection of topics. Comments and requests for general information should be addressed to:
Core Table UnitSocial and Economic Micro-Analysis and Reporting Division Room 2.101 Office for National Statistics Government Buildings Cardiff Road Newport South Wales NP10 8XG
or
email: [email protected] July 2008

xi
Area
Area
Ch
apter 1

�
Area
Area
The UK comprises Great Britain and Northern Ireland. Great Britain comprises England, Wales and Scotland.
Physical Features
The UK constitutes the greater part of the British Isles. The largest of the islands is Great Britain. The next largest comprises Northern Ireland and the Irish Republic. Western Scotland is fringed by the large island chain known as the Hebrides, and to the north east of the Scottish mainland are the Orkney and Shetland Islands. All these, along with the Isle of Wight, Anglesey and the Isles of Scilly, form part of the UK. The Isle of Man, in the Irish Sea, and the Channel Islands, between Great Britain and France, are largely self-governing and are not part of the UK. The UK is one of the 27 member states of the European Union following the accession of Bulgaria and Romania on 1 January 2007. With an area of about 243,000 sq km (about 94,000 sq miles), the UK is just under 1,000 km (about 600 miles) from the south coast to the extreme north of Scotland and just under 500 km (around 300 miles) across at the widest point.
• Highest mountain: Ben Nevis, in the highlands of Scotland, at 1,343 m (4,406 ft)
• Longest river: the Severn, 354 km (220 miles) long, which rises in central Wales and flows through Shrewsbury, Worcester and Gloucester in England to the Bristol Channel
• Largest lake: Lough Neagh, Northern Ireland, at 396 sqkm (153 sq miles)
• Deepest lake: Loch Morar in the Highlands of Scotland, 310 m (1,017 ft) deep
• Highest waterfall: Eas a’Chual Aluinn, from Glas Bheinn, in the highlands of Scotland, with a drop of 200 m (660 ft)
• Deepest cave: Ogof Ffynnon Ddu, Wales, at 308 m (1,010 ft) deep
• Most northerly point on the British mainland: Dunnet Head, north-east Scotland
• Most southerly point on the British mainland: Lizard Point, Cornwall
• Closest point to mainland continental Europe: Dover, Kent. The Channel Tunnel, which links England and France, is a little over 50 km (31 miles) long, of which nearly 38 km (24 miles) are actually under the Channel

3
Area
1.1 Area of the United Kingdom1,2, 2006
sq km sq km
United Kingdom 242 495 Shropshire 3 197Staffordshire 2 620
Great Britain3 228 919 Warwickshire 1 975West Midlands (Met County) 902
England and Wales 151 013 Worcestershire 1 741
East 19 109
Luton UA 43England 130 279 Peterborough UA 343
Southend-on-Sea UA 42North East 8 573 Thurrock UA 163
Darlington UA 197 Bedfordshire 1 192Hartlepool UA 94 Cambridgeshire 3 046Middlesbrough UA 54 Essex 3 465Redcar and Cleveland UA 245 Hertfordshire 1 643Stockton-on-Tees UA 204 Norfolk 5 371
Suffolk 3 800Durham 2 226Northumberland 5 013 London 1 572Tyne and Wear (Met County) 540
Inner London 319North West 14 106 Outer London 1 253
Blackburn with Darwen UA 137 South East 19 069Blackpool UA 35Halton UA 79 Bracknell Forest UA 109Warrington UA 181 Brighton and Hove UA 83
Isle of Wight UA 380Cheshire 2 083 Medway UA 192Cumbria 6 768 Milton Keynes UA 309Greater Manchester (Met County) 1 276 Portsmouth UA 40Lancashire 2 903 Reading UA 40Merseyside (Met County) 645 Slough UA 33
Southampton UA 50Yorkshire and The Humber 15 408 West Berkshire UA 704
Windsor and Maidenhead UA 197East Riding of Yorkshire UA 2 408 Wokingham UA 179Kingston upon Hull, City of UA 71North East Lincolnshire UA 192 Buckinghamshire 1 565North Lincolnshire UA 846 East Sussex 1 709York UA 272 Hampshire 3 679
Kent 3 544North Yorkshire 8 038 Oxfordshire 2 605South Yorkshire (Met County) 1 552 Surrey 1 663West Yorkshire (Met County) 2 029 West Sussex 1 991
East Midlands 15 607 South West 23 837
Derby UA 78 Bath and North East Somerset UA 346Leicester UA 73 Bournemouth UA 46Nottingham UA 75 Bristol, City of UA 110Rutland UA 382 North Somerset UA 374
Plymouth UA 80Derbyshire 2 547 Poole UA 65Leicestershire 2 083 South Gloucestershire UA 497Lincolnshire 5 921 Swindon UA 230Northamptonshire 2 364 Torbay UA 63Nottinghamshire 2 085
Cornwall and the Isles of Scilly 2 563West Midlands 12 998 Devon 6 564
Dorset 2 542Herefordshire, County of UA 2 180 Gloucestershire 2 653Stoke-on-Trent UA 93 Somerset 3 451Telford and Wrekin UA 290 Wiltshire 3 255

4
Area
1.1 Area of the United Kingdom1,2, 2006
continued
sq km sq km
Wales 20 733 Dumfries & Galloway 6 426Dundee City 60
Blaenau Gwent 109 East Ayrshire 1 262Bridgend 251 East Dunbartonshire 175Caerphilly 277 East Lothian 679Cardiff 140Carmarthenshire 2 371 East Renfrewshire 174
Edinburgh, City of 264Ceredigion 1 785 Eilean Siar4 3 071Conwy 1 126 Falkirk 297Denbighshire 837 Fife 1 325Flintshire 438Gwynedd 2 535 Glasgow City 175
Highland 25 659Isle of Anglesey 711 Inverclyde 160Merthyr Tydfil 111 Midlothian 354Monmouthshire 849 Moray 2 238Neath Port Talbot 441Newport 190 North Ayrshire 885Pembrokeshire 1 619 North Lanarkshire 470
Orkney Islands 990Powys 5 181 Perth & Kinross 5 286Rhondda, Cynon, Taff 424 Renfrewshire 261Swansea 378 Scottish Borders 4 732Torfaen 126The Vale of Glamorgan 331 Shetland Islands 1 466Wrexham 504 South Ayrshire 1 222
South Lanarkshire 1 772Stirling 2 187
Scotland 77 925 West Dunbartonshire 159West Lothian 427
Aberdeen City 186Aberdeenshire 6 313Angus 2 182 Northern Ireland 13 576Argyll & Bute 6 909Clackmannanshire 159
1 Figures relate to land area only.2 The area measurements are a definitive set derived from boundaries main-
tained by Ordnance Survey and Ordnance Survey of Northern Ireland. Thecurrent measurements may differ from those published previously in tables,publications or other statistical outputs, even allowing for boundary changesor changes to the physical structure of the land because of improvements tothe source of the data.
3 Excludes inland water for all countries.4 Formerly known as the Western Isles.
Source: Office for National Statistics

xi
Area
Parliamentary elections
Ch
apter 2

6
Elections
2.1 Parliamentary elections1
United KingdomThousands and percentages
15 Oct 31 Mar 18 June 28 Feb 10 Oct 3 May 9 June 11 June 9 April 1 May 7 June 5 May1964 1966 19701 1974 1974 1979 1983 1987 1992 1997 2001 2005
United KingdomElectorate DZ5P 35 894 35 957 39 615 40 256 DZ6V 40 256 41 573 42 704 43 666 43 719 43 846 44 403 44 246Average-electors per seat DZ5T 57.0 57.1 62.9 63.4 DZ6R 63.4 65.5 66.7 67.2 67.2 66.5 67.4 68.5Valid votes counted DZ5X 27 657 27 265 28 345 31 340 DZ6N 29 189 31 221 30 671 32 530 33 614 31 286 26 367 27 149As percentage ofelectorate DZ63 77.1 75.8 71.5 77.9 DZ6J 72.5 75.1 71.8 74.5 76.7 71.4 59.4 61.4
England and WalesElectorate DZ5Q 31 610 31 695 34 931 35 509 DZ6W 35 509 36 695 37 708 38 568 38 648 38 719 39 228 39 266Average-electors per seat DZ5U 57.8 57.9 63.9 64.3 DZ6S 64.3 66.5 67.2 68.8 68.8 68.0 68.9 69.0Valid votes counted DZ5Y 24 384 24 116 24 877 27 735 DZ6O 25 729 27 609 27 082 28 832 29 897 27 679 23 243 24 097As percentage ofelectorate DZ64 77.1 76.1 71.2 78.1 DZ6K 72.5 75.2 71.8 74.8 77.5 71.5 59.3 61.4
ScotlandElectorate DZ5R 3 393 3 360 3 659 3 705 DZ6X 3 705 3 837 3 934 3 995 3 929 3 949 3 984 3 840Average-electors per seat DZ5V 47.8 47.3 51.5 52.2 DZ6T 52.2 54.0 54.6 55.5 54.6 54.8 55.3 65.1Valid votes counted DZ5Z 2 635 2 553 2 688 2 887 DZ6P 2 758 2 917 2 825 2 968 2 931 2 817 2 313 2 334As percentage ofelectorate DZ65 77.6 76.0 73.5 77.9 DZ6L 74.5 76.0 71.8 74.3 74.2 71.3 58.1 60.8
Northern IrelandElectorate DZ5S 891 902 1 025 1 027 DZ6Y 1 037 1 028 1 050 1 090 1 141 1 178 1 191 1 140Average-electors per seat DZ5W 74.2 75.2 85.4 85.6 DZ6U 86.4 85.6 61.8 64.1 67.1 65.4 66.2 63.3Valid votes counted DZ62 638 596 779 718 DZ6Q 702 696 765 730 785 791 810 718As percentage ofelectorate DZ66 71.7 66.1 76.0 69.9 DZ6M 67.7 67.7 72.9 67.0 68.8 67.1 68.0 62.9
Members of Parliamentelected: (numbers) DZV7 630 630 630 635 DZV8 635 635 650 650 651 659 659 646
Conservative DZ67 303 253 330 296 DZ6D 276 339 396 375 336 165 166 198Labour DZ68 317 363 287 301 DZ6E 319 268 209 229 271 418 412 355Liberal Democrat2 DZ69 9 12 6 14 DZ6F 13 11 23 22 20 46 52 62Scottish National Party DZ6A – – 1 7 DZ6G 11 2 2 3 3 6 5 6Plaid Cymru DZ6B – – – 2 DZ6H 3 2 2 3 4 4 4 3Other3 DZ6C 1 2 6 15 DZ6I 13 13 18 18 17 20 20 22
1 The Representation of the People Act 1969 lowered the minimum voting agefrom 21 to 18 years with effect from 16 February 1970.
2 Liberal before 1992. The figures for 1983 and 1987 include six and five MPsrespectively who were elected for the Social Democratic Party.
3 Including the Speaker.
Sources: British Electoral Facts 1832-2006.;University of Plymouth for the Electoral Commission: 01752 233207
2.2 Parliamentary by-electionsUnited Kingdom
General1,2 General1 General1
May 1997 - Election June 2001 - Election May 2005 - ElectionJune 2001 May 1997 November 2004 June 2001 July 2007 May 2005
Numbers of by-elections 17 6 7
Votes recordedBy party (percentages)Conservative 27.0 25.1 17.7 21.2 20.5 22.6Labour 29.7 40.1 40.8 58.3 29.1 38.1Liberal Democrat 22.1 14.4 31.3 13.7 29.0 21.7Scottish National Party 6.0 4.1 - - 7.6 5.8Plaid Cymru 2.5 2.3 2.7 2.1 0.8 0.3Other 12.7 14.1 7.4 4.7 13.0 11.6
Total votes recorded (percentages) 100.0 100.0 100.0 100.0 100.0 100.0(thousands) 435 723 140 205 222 304
1 Votes recorded in the same seats in the previous General Election.2 Proportions of ’other’ votes inflated by the fact that votes were cast for the
retiring Speaker as ’The Speaker seeking re-election’ and not as a partycandidate.
Source: University of Plymouth for the Electoral Commission: 01752 233207

7
Elections
2.3 Devolved assembly electionsWales and Scotland
Thousands and percentages
6 May 1 May 3 May1999 2003 2007
Welsh AssemblyElectorate E28K 2 205 2 230 2 248Average-electors per seat1 E28N 55.1 55.7 56.2Valid votes counted E28Q 1 023 850 978As percentage of electorate E28T 46.4 38.1 43.5
Members elected:2 (numbers) E2XI 60 60 60Conservative E2WG 9 11 12Labour E2WU 28 30 26Liberal Democrat E2WW 6 6 6Plaid Cymru E2X3 17 12 15Other E2WY – 1 1
Scottish ParliamentElectorate E28L 4 024 3 879 3 899Average-electors per seat1 E28O 55.1 53.1 53.4Valid votes counted E28R 2 342 1 916 2 017As percentage of electorate E28U 58.2 49.4 51.7
Members elected:3 (numbers) E2XJ 129 129 129Conservative E2WH 18 18 17Labour E2WV 56 50 46Liberal Democrat E2WX 17 17 16Scottish National Party E2X4 35 27 47Other E2WZ 3 17 3
1 This is the average in each first-past-the-post constituency. Additionalmembers are then elected on the basis of a regional ’list’ vote.
2 Comprising 40 from constituencies and 20 from the regional ’list’.3 Comprising 73 from constituencies and 56 from the regional ’list’.
Sources: British Electoral Facts 1832-2006;University of Plymouth for the Electoral Commission: 01752 233207
2.4 Devolved assembly electionsNorthern Ireland
Thousands and percentages
25 June 26 Nov 8 Mar1998 2003 2007
Electorate E28M 1 179 1 098 1 108Average-electors per seat1 E28P 65.5 61.0 61.6Valid votes counted E28S 810 702 690As percentage of electorate E28V 68.7 64.0 63.0
Members elected: (numbers) E2XK 108 108 108Alliance Party E2X5 6 6 7SDLP E2X6 24 18 16Sinn Fein E2X7 18 24 28Democratic Unionist Party E2X8 20 30 36UK Unionist Party E2X9 5 1 –Ulster Unionist Party E2XA 28 27 18Other E2X2 7 2 3
1 This is the average in each Westminster constituency. Six members areelected by single transferable vote (STV) in each constituency.
Sources: British Electoral Facts 1832-2006;University of Plymouth for the Electoral Commission: 01752 233207

�
International development

�
International development
International development
Ch
apter 3

10
International development
or area, the funds will be allocated as bilateral spend to that country or region. As a result, some organisations, such as UN agencies, have some of their DFID funding classified as bilateral and some as multilateral.
DFID is planning to introduce a new activity reporting system between 2007/08 and 2009/10. The new system will integrate all DFID’s current financial and project management systems. To coincide with the introduction of the new system, DFID is reviewing how it classifies its aid delivery types. The outcome of this review may lead to the introduction of a new set of classifications which may result in changes to format in future publications.
Table 3.1 shows the main groups of multilateral agencies, the International Development Association being the largest in the World Bank Group.
Bilateral assistance takes various forms:
Financial Aid – Poverty Reduction Budget Support (PRBS) – funds provided to developing countries for them to spend in support of their expenditure programmes whose long-term objective is to reduce poverty. Funds are spent using the overseas governments’ own financial management, procurement and accountability systems to increase ownership and long term sustainability. PRBS can take the form of a general contribution to the overall budget – general budget support – or support with a more restricted focus which is earmarked for a specific sector – sector budget support.
Other Financial Aid – funding of projects and programmes such as Sector Wide Programmes not classified as PRBS. Financial aid in its broader sense covers all bilateral aid expenditure other than technical cooperation and administrative costs, but Statistics on International Development (SID) separately categorises Humanitarian Assistance, DFID Debt Relief, and ‘other bilateral aid’. Aid and Trade Provision which was previously identified in SID has now been merged into ‘other financial aid’ as it is a rapidly declining flow.
Technical Co-operation – activities designed to enhance the knowledge, intellectual skills, technical expertise or the productive capability of people in recipient countries. It also covers funding of services which contribute to the design or implementation of development projects and programmes.
This assistance is mainly delivered through research and development, the use of consultants, training (generally overseas partners visiting the UK or elsewhere for a training programme) and employment of ‘other personnel’ (non-DFID experts on fixed term contracts). This latter category is growing less significant over time as existing contracted staff reach the end of their assignments.
International development
Overseas development assistance
(Tables 3.1 and 3.2)
The Department for International Development (DFID) is the UK government department with lead responsibility for overseas development. DFID’s aim is to eliminate poverty in poorer countries through achievement of the Millennium Development Goals (MDGs) by 2015. Statistics relating to international development are published on a financial year basis and on a calendar year basis. Statistics on a calendar year basis allow comparisons of aid expenditure with other donor countries. Aid flows can be measured before (gross) or after (net) deductions of repayments of principal on past loans. These tables show only the gross figures.
Aid is provided in two main ways: bilateral funding is provided directly to partner countries, while multilateral funding is provided through international organisations.
Funds can only be classified as multilateral if the organisation managing them is registered with the Development Assistance Committee (DAC) of the Organisation for Economic Co-operation and Development (OECD). The list held by the DAC also highlights some bodies that might appear to be multilateral but are actually bilateral (in particular this latter category includes some international non-governmental organisations such as the International Committee of the Red Cross and some Public-Private Partnerships such as the Global Alliance for Vaccines and Immunisation). The DAC list of multilaterals is updated annually based on members nominations and organisations must be engaged in development work to be classified as multilateral aid channels.1
While core funding to multilateral organisations is always classified as multilateral expenditure, additional funding channelled through multilaterals is often classified as bilateral expenditure. This would be the case in circumstances where a DFID country office transfers some money to a multilateral organisation such as the United Nations (UN) agency for a particular programme in that country or region. That is where DFID has control over what the money is being spent on and/or where it is being spent. Likewise, if DFID responds to an emergency appeal from an agency for a particular country
1. Money may be classified as bilateral while a case is being made for a new multilateral organisation to be recognised.

11
International development
Other Bilateral Aid – This category comprises support to the development work of UK and international voluntary organisations, grants to the British Council and for other development work by UK institutions and non-emergency special appeals through multilateral agencies. The remaining element of ‘other bilateral aid’ is made up of a number of categories including, for example, DFID’s contributions to two multi-donor trust funds for Sudan, the Development Awareness Fund and the provision of books, equipment and other supplies.
Humanitarian Assistance – provides food, aid and other humanitarian assistance including shelter, medical care and advice in emergency situations and their aftermath. Work of the conflict pools1 is also included.
DFID Debt Relief – This includes sums for debt relief on DFID aid loans and cancellation of debt under the Commonwealth Debt Initiative (CDI). The non-CDI DFID debt relief is reported on the basis of the ‘benefit to the recipient country’. This means that figures shown represent the money available to the country in the year in question that would otherwise have been spent on debt servicing. The CDI debt cancellation is reported on a ‘lump sum’ basis where all outstanding amounts on a loan are shown at the time the agreement to cancel is made.
CDC Investments – CDC Group plc (or CDC) replaced the former Commonwealth Development Corporation in 1999. CDC was founded in 1948 and is now the UK government’s instrument for investing in the private sector in developing economies (it does so through fund management companies, of whom the largest is Actis Capital Limited Liability Partnership (LLP) as in PLC etc. CDC has activities in more than 50 developing countries. CDC provides equities and concessional loans to companies in some aid-eligible countries and these disbursements and repayments are included as UK flows. Although CDC no longer provides loans to governments, it did in the past and these existing loans can become eligible for debt relief.
Non-DFID Debt Relief – Comprises CDC Debt and Export Credit Guarantee Department (ECGD) Debt. CDC has a portfolio of loans to governments which can become eligible for debt relief under the HIPC (Heavily Indebted Poor Countries) or other debt relief deals. In 2005/06 £90 million of debts owed to CDC were reorganised. ECGD is an agency of the Department for Business, Enterprise and Regulatory Reform which provides insurance for exporters against the main risks in selling overseas and guarantees to
banks providing export finance. It also negotiates debt relief arrangements on commercial debt.
Other – This includes contributions from other government departments to Central Statistics Offices, British Council and Global Conflict Pool, and small amounts of drug related assistance funded by the Home Office and British Foreign and Commonwealth Office.
Further details on the UK’s development assistance can be found in the Department for International Developments publication, Statistics on International Development, which can be found on the website www.dfid.gov.uk/pubs/files/sid2007/contents.asp. International Comparisons are available in the OECD Development Assistance Committee’s annual report.
1. Conflict pools are unstable regions (such as Sierra Leone) identified by the Foreign Office as requiring assistance in the form of food, shelter and military care.

12
International development
3.1 Gross public expenditure on aid (GPEX)1United Kingdom
£ Thousand
1998 1999 2000 2001 2002 2003 2004 2005 2006/99 /00 /01 /02 /03 /04 /05 /06 /07
Bilateral AssistanceDepartment for International Development
Poverty Reduction Budget Support (General) LUJS 10 000 15 000 239 900 245 500 184 500 288 750 286 500 347 320 297 553Poverty Reduction Budget Support (Sector) I4UJ 10 000 11 000 24 098 22 718 23 685 20 724 60 492 125 732 163 464Other Financial Aid LUJW 298 105 327 648 206 113 264 905 319 145 407 898 423 549 472 792 481 927Technical Co-operation Projects LUOS 452 253 457 188 455 401 473 519 508 574 459 755 462 633 481 052 522 722Other Bilateral Aid LUOT 214 027 222 123 243 834 294 386 394 669 431 881 530 435 628 325 692 082Humanitarian Assistance LUOU 113 711 224 700 222 431 192 446 294 981 310 602 332 318 405 978 336 473DFID Debt Relief LUOV 25 659 23 140 20 367 17 682 20 364 15 531 14 932 40 789 67 579
CDC Investments LUOX 166 716 268 518 201 427 159 352 237 324 350 356 238 279 172 808 278 787Debt Relief EQ4B 64 926 70 101 79 850 242 097 399 844 163 059 627 402 1 588 414 1 866 591
Other LUOY 22 221 30 620 66 978 67 795 79 459 111 197 143 564 153 535 196 122
Total LUOZ 1 377 619 1 650 037 1 760 400 1 980 400 2 462 546 2 559 752 3 120 103 4 416 746 4 903 300
Multilateral AssistanceEuropean Community2 LUPA 754 548 752 472 727 684 748 022 901 058 1 085 594 1 224 066 1 193 806 1 125 390World Bank Group LUPB 173 753 167 298 243 162 220 233 222 228 382 740 206 561 273 339 592 304IMF Poverty Reduction and Growth Facility LUPC 18 000 17 000 – 11 147 11 434 9 417 1 767 23 728 15Global Environmental Assistance EQ4C 15 320 17 095 21 144 25 337 27 338 61 213 52 445 53 460 50 260HIPC Trust Funds EQ4D .. .. 27 518 23 400 17 855 22 910 42 123 11 094 18 666UN Agencies LUPD 143 894 186 146 250 835 238 551 206 659 225 657 235 008 336 350 356 527Regional Development Banks LUPE 66 295 67 179 54 784 75 383 90 648 80 391 82 166 77 759 123 591Other LUPF 17 128 18 053 18 213 19 316 66 086 41 516 60 535 36 072 70 836
Total LUPG 1 188 939 1 225 243 1 343 341 1 361 390 1 543 307 1 909 439 1 904 671 2 005 608 2 337 590
Administrative costs LUPH 105 481 117 561 138 261 134 214 154 127 248 698 227 769 256 451 245 893
Total Gross Public Expenditure on Aid LUPI 2 672 038 2 992 842 3 242 002 3 476 004 4 159 979 4 717 890 5 252 544 6 678 804 7 486 783
1 See chapter text.2 The institution, not the member states of the European Union.
Source: Department for International Development: 01355 843764.
3.2 Total bilateral gross public expenditure on aid (GPEX): by main recipientcountries and regions1
United Kingdom £ Thousand
1998 1999 2000 2001 2002 2003 2004 2005 2006/99 /00 /01 /02 /03 /04 /05 /06 /07
Main recipientsNigeria C227 11 127 14 395 15 940 20 561 29 287 32 630 73 076 1 227 717 1 750 694India LUPJ 108 968 104 016 126 700 198 576 182 708 242 736 267 510 270 065 293 706Afghanistan C224 3 873 5 452 7 465 50 027 76 018 99 595 98 959 126 949 123 011Pakistan LUPY 26 937 23 472 15 890 44 838 46 852 66 299 55 277 97 688 118 150Cameroon I53M 3 589 7 005 5 467 3 652 28 971 7 764 16 547 3 170 115 408Tanzania LUPK 77 904 74 709 110 590 203 830 102 614 162 372 130 009 114 134 115 023Sudan EU5S 24 201 3 189 4 912 5 598 19 222 24 663 83 964 117 114 109 917Bangladesh LUPM 66 494 69 670 75 005 60 375 73 246 155 364 149 152 128 258 109 313Serbia I53N 273 6 393 15 670 11 531 305 036 7 552 6 431 51 890 98 892Ethiopia C225 9 793 7 299 16 484 12 088 44 224 43 665 73 044 62 562 90 507Malawi LUPP 52 572 49 058 54 648 46 651 49 266 54 437 56 429 68 653 88 686Ghana LUPL 62 868 51 887 74 700 54 479 86 294 73 448 145 336 96 249 80 001Congo, Dem Rep C223 1 546 2 132 6 752 10 262 15 574 148 695 36 585 58 832 79 283Uganda LUPN 64 251 89 978 98 352 68 091 54 041 59 694 62 928 72 064 79 035Iraq C222 5 749 6 585 9 545 7 760 18 853 214 313 391 507 426 249 71 829Kenya EU5W 42 027 32 665 62 620 34 227 63 404 28 647 37 824 65 086 67 053Zambia LUPO 33 537 46 657 93 345 59 203 45 140 32 304 163 537 101 707 63 412Indonesia LUPZ 25 494 58 812 28 405 18 232 42 613 17 449 34 526 58 553 62 290China LUPS 39 190 26 246 56 740 50 266 44 386 42 406 42 476 36 854 60 086Mozambique LUPV 28 902 70 643 43 876 134 133 39 101 36 713 47 941 56 540 56 273
Total LUQD 689 295 750 261 923 108 1 094 379 1 366 848 1 550 745 1 973 057 3 240 334 3 632 570
Total other countries LUQE 688 324 899 776 837 292 886 021 1 095 698 1 009 008 1 147 046 1 176 412 1 270 730
Regional totalsAfrica LUQF 574 450 628 719 774 692 865 317 891 954 1 051 958 1 280 003 2 423 279 2 991 871America LUQG 169 174 237 961 180 165 166 949 221 526 103 358 126 063 85 265 109 631Asia LUQH 347 776 375 839 413 294 534 954 609 138 967 820 1 241 408 1 355 615 1 072 286Europe LUQI 83 099 191 697 113 859 97 609 384 240 74 871 62 294 90 086 135 305Pacific LUQJ 20 249 7 248 5 029 6 885 5 362 4 484 3 272 3 823 2 670World unallocated2 LUQK 182 871 208 574 273 363 308 686 350 327 357 262 407 063 458 678 591 537
Total Bilateral GPEX LUQL 1 377 619 1 650 037 1 760 400 1 980 400 2 462 546 2 559 753 3 120 103 4 416 746 4 903 300
1 See chapter text.2 Includes grants to VSO, CSOs, Research Institutions and Commonwealth
Organisations based in the UK.
Source: Department for International Development: 01355 843764.

xi
Defence
Defence
Ch
apter 4
14
Defence
Departmental Expenditure Limits (DELs). Spending against the Resource DEL includes current items, which are explained in the following two paragraphs. The Capital DEL, while part of the overall DEL, reflects investment spending that will appear on the department’s balance sheet and be consumed over a number of years, net of the receipts from sale of assets. Departments are also responsible for Annually Managed Expenditure (AME). This spending is demand led (for example, payment of war pensions) and therefore cannot be controlled by departments in the same way.
In Stage 1 of RAB, which was introduced at the start of financial year 2001/02, the Resource DEL covered current costs such as in year personnel costs, equipment, maintenance of land and buildings. Non-cash costs, such as depreciation and the cost of capital charge, fell within Annually Managed Expenditure (AME) and were not controlled to the same degree as DELs. This allowed departments an interim period to gain experience of managing the new non-cash costs and to review their holdings of stocks and fixed assets, which impact the non-cash costs, prior to the charge impacting on the more tightly controlled DELs.
Stage 2 of RAB was introduced at the start of the financial year 2003/04. This involved the movement of the primary non-cash costs (depreciation and the cost of capital charge) from AME into the Resource DEL, and reduced the cost of capital charge to 3.5 per cent of the net value of assets.
The change in definition of the DELs, combined with volatile non-cash costs over the Stage 1 period, make time series comparisons over the period 2001/02–2003/04 complex.
From 2006/07, the MOD has transferred ownership of fixed assets into two Top Level Budgets (TLBs): Defence Estates (DE) for Land and Buildings, and Defence Equipment & Support (DE&S) for Plant and Machinery, Transport, IT and Communications equipment, and Single Use Military Equipment (SUME).
Factors affecting Cash to RAB data consistency
• There are timing differences as to when payments are recognised
• The movement of non-cash items of expenditure from AME into the Resource DEL from 2003/04 onwards has the ‘apparent’ effect of inflating the Resource DEL
• In financial year 2003/04 the rate of interest used to calculate the cost of capital charge was reduced from 6 per cent to 3.5 per cent
• The discount rate for provisions was changed from 3.5 per cent real to 2.2 per cent real with effect from
DefenceThis section includes figures on defence expenditure, on the size and role of the Armed Forces, and on related support activities.
Much of the material in this section can be found in UK Defence Statistics 2007 (The Stationery Office).
Defence expenditure
(Table 4.1)
UK Defence Expenditure – the move from cash to resource accounting
Up until financial year 1998/99, government expenditure was accounted for on a cash basis. In April 1999 the introduction of Resource Accounting and Budgeting (RAB) brought in an accruals-based accounting system, although government departments were still controlled on a cash basis. This transitional accounting regime remained for two financial years. Government expenditure has been accounted for on a resource basis only since 2001/02.
The main difference arising from the adoption of RAB is that costs are accounted for as they are incurred (the principle of accruals), rather than when payment is made (the principle of cash). This gives rise to timing differences in accounting between the cash and RAB systems and also to the recognition of depreciation, which expends the cost of an asset over its useful economic life, and the cost of capital charge, equivalent to an interest charge on the net assets held on the balance sheet. At the time that RAB was introduced the cost of capital charge was 6 per cent of the net value of assets, although this was reduced to 3.5 per cent in 2003/04.
The change from cash-based accounting to resource (accruals)-based accounting, and the two-stage introduction of RAB (outlined below), has affected the time series comparability of the data.
Please refer to UK Defence Statistics 2007 Chapter 1 – Resource Accounting and Budgeting (RAB) section for a summary of the key events leading to the introduction of RAB. Back copies of this publication are available at: www.dasa.mod.uk/natstats/natstatsindex.html
Control regime
Under Resource Accounting, government departments are accountable for their spending against Resource and Capital

15
Defence
1 April 2005
• The discount rate for pension’s liabilities was changed from 2.8 per cent real to 1.8 per cent real with effect from 1 April 2007
Resource DEL includes expenditure under the following headings:
– Equipment support: internal and contracted out costs for equipment repair and maintenance
– Stock consumption: consumption of armament, medical, dental, veterinary, oil, clothing and general stores
– Property management: estate and facilities management services and costs for building maintenance
– Movements: cost of transportation of freight and personnel
– Accommodation and utilities: charges include rent, rates, gas, electricity, water and sewerage costs
– Professional fees: fees, such as legal costs paid to professional organisations
– Fuel: relates to fuel consumption by military vehicles, ships and aircraft
– Other costs: includes stock and fixed assets written off, research and expensed development and rentals paid under operating leases
Expenditure on fixed asset categories in Capital DEL includes:
– Intangible assets: comprise the development costs of major equipment projects and Intellectual Property Rights
– Single Use Military Equipment (SUME): prior to 2004/05, this category was called Fighting Equipment. The category contains assets which only have a military use, such as tanks and fighter aircraft. Dual use items, such as those that also have a civilian use, are recorded under the other categories
– Assets under Construction: largely consist of major weapons platforms under construction in the Defence Procurement Agency, and a smaller element of buildings under construction. Once construction is complete, those platforms will transfer to the relevant Top Level Budget TLB holder as Single Use Military Equipment SUME on their balance sheets
– Transport/Capital Spares: from 2004/05 transport has been recorded as a separate category and Capital Spares has been removed as a category, with the costs previously recorded here being incorporated into Transport or SUME
– Other Costs: include, amongst others, items of Capital DEL and capital income
Annual Managed Expenditure includes:
– Other: for 2001/02 and 2002/03, AME included depreciation and the cost of capital charge. Under Stage 2 of RAB, this category now contains only demand led payments, such as cash release and cost of capital credit on nuclear provisions and QinetiQ loan repayments
In order to give a single measure of spending on public services under full resource budgeting, the Defence Spending line is presented as the sum of the resource and capital budgets, net of depreciation and impairments. This reflects the resources required plus the net investment in them, but avoids double counting the writing down of the existing capital stock and the cash outlay on new assets. Control is exercised separately on gross Capital and Resource DEL.
Service personnel
(Tables 4.2, 4.4, 4.5, 4.8 and 4.10)
The Regular Forces consist entirely of volunteer members serving on a whole-time basis, figures for which include both trained and untrained personnel and exclude Gurkhas, Full Time Reserve Service personnel, the Home Service battalions of the Royal Irish Regiment, mobilised reservists and Naval Activated Reservists.
Locally Entered Personnel are recruited outside the UK for whole-time service in special formations with special conditions of service and normally restricted locations. The Brigade of Gurkhas is an example.
The Regular Forces are supported by Reserves and Auxiliary Forces. There are both regular and volunteer Reserves. Regular Reserves consist of former Service personnel with a Reserve liability. Volunteer Reserves are open to both former service personnel and civilians. The call out liabilities of the various reserve forces differ in accordance with their roles.
All three services run cadet forces for young people and the Combined Cadet Force, which is found in certain schools where education is continued to the age of 17 or above, may operate sections for any or all of the services.

16
Defence
Full-Time Reserve Service personnel represent reserves serving full-time in regular posts. This was made possible by the Reserve Forces Act 1996. None existed before 1998. FTRS figures include Full Commitment (FC), Home Commitment (HC) and Limited Commitment (LC) individuals.
Home Service battalions of the Royal Irish Regiment. Up until 1 July 1992, this was the Ulster Defence Regiment. The figures for the Territorial Army include Officer Training Corps and non-regular permanent staff.
The figures for cadet forces for each service include the Combined Cadet Force. Naval Service figures include officers and civilian instructors. The Army and Royal Air Force figures exclude officers and civilian instructors.
Intake of UK regular forces from civilian life: by service
(Table 4.2)
This table shows all intakes to UK Regular Forces including re-enlistments and rejoined reservists.
Formation of the armed forces
(Table 4.3)
This table shows the number of units which comprise the ‘teeth’ elements of the Armed Forces and excludes supporting units.
Outflow of UK regular forces: by service
(Table 4.4)
This table does not include promotions to officer from other ranks and miscellaneous outflow.
Civilian personnel
(Table 4.6)
In previous years, the Ministry of Defence civilian workforce definition has reflected the historical requirement to understand the number of civil servants being directly funded. However, with changes in employment legislation and the requirement to plan the future of the civilian workforce there was a need to change the definition to a more inclusive one, better reflecting modern human resources methods and policies. In the longer term it will be used for skills planning, ensuring that the Ministry of Defence (MOD) has a well-equipped workforce able to provide the best support to the UK Armed Forces.
In summary, the change over previous years is the addition of two further categories of individuals:
Casual personnel - those employed on a short-term casual contract
Those not directly funded – personnel who are employed by the Ministry of Defence, but whose salaries are paid for by another department or agency. This includes personnel on loan to other government departments or working for NATO, as well as those on a career break or long term sickness absence.
These additions allow two levels of definition to be established:
Definition - Level 1 This includes permanent and casual personnel, Royal Fleet Auxiliaries, but excludes Trading Funds. This is generally used for internal reporting and planning.
Definition - Level 0 This contains all those at Level 1 plus Trading Funds and Locally Engaged Civilians. This is used for external reporting, including National Statistics publications CPS1 and UKDS, and Parliamentary business.
For more information on the revised civilian workforce definition, visit: www.dasa.mod.uk/natstats/consultation/consultation.html
As from 1 April 2000 a new top level budget was formed in the centre called Defence Logistics Organisation, replacing the top level budgets CinC Fleet Support, Quarter Master General and RAF Logistics Command.
At 1 April 2007, Chief of Defence Logistics and Defence Procurement Agency merged to form Defence Equipment and Support.
The QinetiQ portion of the Defence Evaluation and Research Agency was established as a private company in July 2001. The War Pensions Agency transferred from the Department of Work and Pensions in 2001. The Clyde Dockyards were contractorised in 2002.
Data on manually paid personnel before 1999 is not available, so estimates are used. Totals and subtotals have been rounded separately and so may not appear to be the sums of their parts.
Family accommodation and defence land holdings
(Table 4.7)
In November 1996 most of the MOD’s housing stock

17
Defence
in England and Wales was sold to a private company, Annington Homes. The homes, retained for use by service families, were leased back with the condition that the MOD releases a certain number of houses each year for disposal by Annington. The proceeds of the sale are being used to upgrade the housing stock.
The table also presents statistics of land and foreshore in the UK owned or leased by the MOD or over which it has limited rights under grants or licences. Land declared as surplus to Defence requirements is also included.
Location of Service personnel
(Table 4.8)
The figures for service personnel in England, Wales, Scotland and Northern Ireland are obtained from a different source from that used to compile the UK total. Consequently the sum of the national figures can differ from the UK total. The figures for Northern Ireland include all personnel who are serving on emergency tours of duty but exclude the former Ulster Defence Regiment, now the Home Services element of the Royal Irish Regiment. The figures for overseas countries include service personnel who are on loan to countries in the areas shown. Royal Navy and Royal Marines personnel on board ship are included in the UK figure if the ship was in home waters on the situation date or otherwise against the appropriate overseas area. All Defence Attaches and Advisers and their staffs are included under ’Other Locations‘ and not identified within specific areas. From 2001 the grouping of overseas locations has been changed to give a more relevant overview.
The table reports personnel against their stationed location (where they are normally based). It does not show the location of troops on operational deployments.
UK regular forces - deaths
(Table 4.9)
Rates have been standardised to 2004 Tri-Service age and gender structure. In previous publications, deaths among the Brigade of Gurkhas were excluded, even though they belong to the regular Army, owing to the lack of reliable data on date of birth from which to calculate mortality rates. Gurkhas have been included in the number of deaths provided in Table 4.9. However, they have been excluded from calculations for age and gender standardised rates.
Uniformed medical staff
(Table 4.10)
The services operate a number of hospitals in this country and in areas abroad where there is a significant British military presence. These hospitals take as patients, members of all three services and their dependants. In addition, the hospitals in the UK take civilian patients under arrangements agreed with the National Health Service. Medical support is also supplied by service medical staff at individual units, ships and stations.
Defence services and the civilian community
(Table 4.11)
Search & Rescue (SAR)
This table covers incidents attended by military Search and Rescue units. The Royal Air Force (RAF) and Royal Navy (RN) provide an essential service to the Search and Rescue (SAR) effort around the UK, forming part of the national UK SAR coverage throughout the year for air, land and maritime operations. The military SAR teams primary purpose is to recover aircrew from crashed military aircraft although, each year, over 90 per cent of callouts are to civilian incidents. The SAR force currently consists of six RAF and two RN SAR Sea King helicopter units, and four RAF mountain rescue teams operating from bases around the UK, plus specially equipped RAF Nimrod aircraft based in RAF Kinloss in Scotland.
The table also includes urgent medical incidents in which the military SAR facilities gave assistance (such as inter-hospital transfers). More than one SAR unit may be called to the same incident; consequently the number of callouts is likely to be greater than the number of incidents.
Persons moved involves moving people from a hostile environment to a safe environment or to a medical facility to receive urgent medical attention. People assisted by RAF mountain rescue teams, but subsequently transported from the scene by helicopter, are recorded as having been rescued by the helicopter unit concerned.
Fisheries Protection
The Royal Navy Fishery Protection squadron operates within the British fishery limits under contract to the Department for Environment, Food and Rural Affairs. Boardings carried out by vessels of the Scottish Executive Environment and Rural Affairs Department and the Department of Agriculture for Northern Ireland are not included.

18
Defence
4.1 United Kingdom defence expenditure1
Inclusive of non-recoverable VAT at current prices (£ million)
2001 2002 2003 2004 2005 2006/02 /03 /04 /05 /06 /07
Defence Spending C228 .. .. 30 861 32 515 33 164 34 045
Departmental Expenditure Limits (DEL) SNKJ 24 456 26 148 37 174 38 323 39 751 40 654
Resource DEL E2XV 18 905 19 944 31 266 31 798 32 911 33 457Expenditure on personnel SNKK 9 456 9 969 10 435 10 996 11 255 11 204
of which: Armed forces SNKL 7 014 7 385 7 974 8 047 8 263 8 423of which: Civilians SNKM 2 442 2 584 2 461 2 948 2 992 2 781
Depreciation/impairments SNKN .. .. 6 313 5 808 6 587 6 609Cost of capital SNKO .. .. 2 770 3 026 3 106 3 242Equipment support SNKP 2 419 3 135 3 804 3 623 3 542 3 793Stock consumption SNKQ 1 294 1 222 1 060 1 079 1 039 1 140Property management SNKR 1 222 1 453 1 393 1 509 1 367 1 258Movements SNKS 718 505 491 711 729 774Accommodation and utilities SNKT 573 544 643 581 735 786Professional fees SNKU 559 468 549 565 553 483Fuel SNKV 160 185 161 239 369 416Hospitality & Entertainment I4SS 7 7 8 6 5 4PFI Service Charges I4ST .. .. .. .. 870 1 148IT & Communications I4SU 527 628 738 678 643 719Other costs SNKW 1 970 1 827 2 900 2 977 2 111 1 882
Capital DEL E2XW 5 551 6 204 5 908 6 525 6 840 7 197Expenditure on fixed asset categories
Intangible assets SNKX 1 054 1 756 1 665 1 580 1 550 1 744Land and buildings SNKY 54 96 54 389 31 45Single Use Military Equipment SNKZ 42 42 90 434 402 404Plant, machinery and vehicles SNLA 96 45 78 124 64 32IT and communications equipment SNLB 87 96 183 134 180 206Assets under construction SNLC 4 444 3 986 3 931 4 335 4 879 5 099Transport E2XX .. .. .. 73 13 33Capital spares SNLD 360 467 581 .. .. ..Capital loan repayment E2XY – – –28 –25 –53 –8Other Costs E2Y3 –586 –284 –646 –519 –225 –358
Annually Managed Expenditure (AME) SNLF 14 962 19 293 1 011 908 890 582War pensions SNLG 1 237 1 166 1 116 1 110 1 067 1 039Other SNLH 13 725 18 127 –105 –202 –177 –457
1 See chapter text. Where rounding has been used, totals and sub-totalshave been rounded separately and so may not equal the sums of theirrounded parts.
Sources: Ministry of Defence/DASA (Economic Statistics);0117 913 4529/30
4.2 Intake of United Kingdom regular forces from civilian life: by service1
Numbers
1996 19972 1998 1999 2000 2001 2002 2003 2004 2005 20063
/97 /98 /99 /00 /01 /02 /03 /04 /05 /06 /07
All services:Male KCJB 19 230 20 190 22 560 22 390 20 410 20 950 23 040 20 760 15 660 16 410 17 830Female KCJC 2 940 3 340 3 440 3 160 2 610 2 700 3 240 2 710 1 900 1 740 1 960Total KCJA 22 170 23 530 26 000 25 550 23 020 23 650 26 280 23 470 17 560 18 150 19 790
Naval service:Male KCJE 3 400 3 970 4 110 4 250 3 990 4 270 4 420 3 530 3 240 3 480 3 300Female KCJF 560 630 660 700 630 740 800 580 460 460 460Total KCJD 3 960 4 600 4 770 4 950 4 620 5 010 5 220 4 120 3 690 3 940 3 770
Army:Male KCJJ 13 580 13 390 15 010 14 750 13 450 13 620 15 060 13 930 10 780 11 740 13 160Female KCJK 1 940 2 010 1 980 1 750 1 320 1 240 1 550 1 260 910 990 1 140Total KCJI 15 520 15 400 16 990 16 500 14 770 14 850 16 610 15 190 11 690 12 730 14 300
Royal Air Force:Male KCJM 2 250 2 830 3 450 3 380 2 980 3 070 3 550 3 290 1 640 1 190 1 370Female KCJN 430 700 800 710 660 720 890 870 530 290 360Total KCJL 2 680 3 530 4 250 4 100 3 630 3 780 4 450 4 160 2 180 1 480 1 720
1 See chapter text.2 The definitions of intake used have been standardised from 1997/98 to give
a more consistent picture across the three services.3 Due to ongoing validation of data from the new Personnel Administration
System, Naval Service statistics from 1 October 2006, Army statistics from1 April 2007 and RAF statistics from 1 May 2007 are provisional and subjectto review.
Source: Ministry of Defence/DASA (Quad-Service): 020 7218 1470

19
Defence
4.3 Formation of the United Kingdom armed forces1
As at 1 AprilNumbers
1997 1998 1999 2000 2001 2002 2003 2004 2005 2006 2007
Front Line UnitsRoyal Navy2 __________Submarines KCGA Vessels 15 15 15 16 16 16 16 15 15 143 134
Carriers and assault ships KCGB " 5 5 6 6 6 4 4 5 6 55 5Destroyers and frigates KCGC " 35 35 35 32 32 32 31 31 28 256 25Mine counter-measure KCGE " 19 19 20 21 23 22 22 19 16 16 16Patrol ships and craft KCGF " 34 28 24 23 23 23 22 26 26 227 22Fixed wing aircraft8 KCGG Squadrons 3 3 3 1 1 1 1 1 1 1 1Helicopters9 KCGH " 15 12 12 9 9 8 8 5 6 6 7
Royal Marines KCGI Commandos 3 3 3 3 3 3 3 3 3 3 3
Regular ArmyRoyal Armoured Corps10 KCGJ Regiments 11 11 11 10 10 10 10 10 10 10 10Royal Artillery KCGK " 15 15 15 15 15 15 15 14 14 14 14Royal Engineers11 KCGL " 10 10 10 11 11 11 11 11 11 11 11Infantry KCGM Battalions 40 40 40 40 40 40 40 40 40 36 36Special Air Service KCGN Regiments 1 1 1 .. .. .. .. .. .. .. ..Army Air Corps9 KCGO " 5 5 5 .. .. .. .. .. .. .. ..
Royal Air ForceStrike/attack KCGP Squadrons 6 6 5 5 5 5 5 5 5 )Offensive support8 KCGQ ZIZM " 5 5 5 2 2 2 2 2 1 ) 1112 1113
Reconnaissance KCGT " 5 5 5 5 5 5 5 5 5 )Air defence KCGR " 6 6 5 5 5 5 4 4 4 4 4Maritime patrol KCGS " 3 3 3 3 3 3 3 3 3 214 2Airborne early warning15 KCGU " 2 2 2 2 2 2 2 2 2 2 2Air transport and tankers
and helicopters9 KCGV " 13 14 14 8 9 9 9 9 9 8 8Search and rescue KCGX " 2 2 2 2 2 2 2 2 2 2 2RAF FP Wg GHN7 HQs .. .. .. .. 4 4 4 4 4 6 6RAF Ground based air defence GHN8 Squadrons .. .. .. .. 4 4 4 4 4 3 2RAF Regiment Field16 GJ2F " .. .. .. .. 6 6 6 6 6 6 6RAF Regt (Jt CBRN) I63Y " .. .. .. .. .. .. .. .. .. .. 1Tactical Provost Wg GJ2G HQs – – – – – – – – – 1 1Tactical Provost GJ2H Squadrons – – – – – – – – – 2 1
Joint Helicopter CommandRoyal Navy Helicopter JUAT " .. .. .. 4 4 4 4 4 4 4 4Army Aviation JUAU Regiments .. .. .. 5 5 5 5 5 5 5 5Royal Air Force Helicopter JUAV Squadrons .. .. .. 6 6 6 6 6 6 6 5
Joint Force HarrierRoyal Navy JUAW " .. .. .. 3 3 3 3 2 1 1 217
Royal Air Force JUAX " .. .. .. 3 3 3 3 3 3 2 2
1 See chapter text.2 Only active vessels are shown.3 HMS Spartan was withdrawn from service during the year.4 HMS Sovereign was withdrawn from the service during the year.5 HMS Invincible went into Extended Readiness in late 2005.6 HMS Cardiff, HMS Marlborough and HMS Grafton were withdrawn from ser-
vice during the year.7 HMS Leeds Castle and the NI Squadron, consisting of HMS Brecon, HMS
Cottesmore and HMS Dulverton, were withdrawn from service during theyear.
8 From 2000 excludes aircraft transferred to the Joint Force Harrier squadron9 From 2000 excludes helicopters transferred to the Joint Helicopter com-
mand.
10 From 2000 includes one Armoured Regiment which is committed to the newJoint Nuclear Biological and Chemical Regiment.
11 Figure for 2000 includes an additional Close Support Regiment formed as aresult of the Stategic Defence Review.
12 From 2006, these squadrons are multi-roled.13 Includes 6 Sqn (Jag) disbanded 30 Apr 07 but not Typhoon as no Offensive ca-
pability was held on 1 Apr 07.14 206 Sqn was disbanded on 1 Apr 05.15 Figure for 2001 includes an embedded Operational Conversion Unit at the Sen-
try Operation Establishments.16 In UKDS editions 2003 and 2004, Ground Based Air Defence and Field Squa-
drons for years 2001 to 2004 were also included under Regular Air Force17 The Fleet Air Arm Strike Wing, the equivalent to an RAF Squadron, comprises
800 and 801 Naval Air Squadrons.Source: Ministry of Defence/DASA (Tri-Service): 020 7218 0390

20
Defence
4.4 Outflow of United Kingdom regular forces: by service1
Numbers
1996 19972 1998 1999 2000 2001 2002 2003 2004 2005 20063
/97 /98 /99 /00 /01 /02 /03 /04 /05 /06 /07
All Services:Male KDNA 29 320 21 860 24 500 23 870 22 520 22 360 21 770 21 200 21 330 21 290 22 980Female KDNB 3 680 2 490 2 970 2 750 2 430 2 350 2 340 2 200 2 100 1 980 2 160Total KDNC 33 000 24 350 27 470 26 620 24 950 24 710 24 100 23 400 23 430 23 260 25 140
Naval Service:Male KDND 6 190 4 650 4 920 5 160 4 480 5 110 4 680 4 230 4 150 4 000 3 820Female KDNE 940 620 610 630 550 690 620 540 490 480 490Total KDNF 7 130 5 270 5 530 5 800 5 040 5 800 5 300 4 770 4 630 4 490 4 310
Army:Male KDNI 13 760 13 190 15 320 14 620 13 900 13 290 13 420 13 500 13 990 13 240 14 660Female KDNJ 1 600 1 280 1 730 1 580 1 330 1 090 1 140 1 090 1 080 950 1 110Total KDNK 15 350 14 470 17 050 16 200 15 230 14 380 14 560 14 600 15 070 14 190 15 770
Royal Air Force:Male KDNL 9 380 4 020 4 250 4 080 4 140 3 960 3 670 3 470 3 200 4 050 4 500Female KDNM 1 140 590 640 540 540 570 580 570 530 540 560Total KDNN 10 520 4 610 4 890 4 620 4 680 4 530 4 250 4 040 3 730 4 590 5 070
1 See chapter text. Comprises all those who left the Regular Forces and in-cludes deaths.
2 The definitions of outflow used have been standardised from 1997/98 togive a more consistent picture across the three services.
3 Due to ongoing validation of data from the new Personnel Administration Sys-tem, Naval Service statistics from 1 October 2006, Army statistics from 1 April2007 and RAF statistics from 1 May 2007 are provisional and subject to review.
Source: Ministry of Defence/DASA (Quad-Service): 020 7218 1470
4.5 United Kingdom Defence: service manpower strengths1
As at 1 AprilThousands
1997 1998 1999 2000 2001 2002 2003 2004 2005 2006 2007
UK service personnel
Full-time trained strength2 ZBTR 197.2 194.0 191.1 190.3 189.1 187.1 188.5 190.2 188.1 183.2 177.8Trained Naval Service ZBTS 41.7 40.5 39.3 38.9 38.5 37.5 37.6 37.5 36.4 35.6 34.9
UK regulars ZBTT 41.7 40.4 39.1 38.5 38.0 36.8 36.6 36.4 35.5 34.9 34.3Full-time reserve service ZBTU .. 0.1 0.3 0.3 0.5 0.7 1.0 1.1 0.9 0.7 0.6
Trained Army2 ZBTV 101.4 100.9 99.8 100.2 100.4 100.4 102.0 103.6 102.4 100.6 99.3UK regulars ZBTW 97.8 97.5 96.3 96.5 96.3 96.0 97.6 99.4 98.5 96.8 95.4Full-time reserve service2 ZBTX .. .. 0.2 0.5 0.7 0.9 1.0 0.7 0.4 0.5 0.7Gurkhas ZBTY 3.8 3.4 3.4 3.4 3.5 3.4 3.4 3.4 3.5 3.3 3.3
Trained Royal Air Force ZBTZ 54.2 52.7 51.9 51.2 50.1 49.2 48.9 49.1 49.2 46.9 43.6UK regulars ZBUA 54.2 52.7 51.8 51.0 49.8 48.9 48.5 48.7 48.8 46.6 43.2Full-time reserve service ZBUB .. .. 0.1 0.2 0.3 0.3 0.4 0.4 0.4 0.3 0.3
Untrained UK regulars ZBUC 17.2 19.7 21.5 21.6 21.5 23.0 24.2 22.5 18.3 17.5 17.5Naval Service ZBUD 3.5 4.1 4.6 4.3 4.4 4.9 5.0 4.5 4.4 4.5 4.5Army ZBUE 11.1 12.4 13.4 13.6 13.2 14.0 14.5 13.3 10.8 10.9 10.8Royal Air Force ZBUF 2.7 3.2 3.5 3.7 3.9 4.1 4.7 4.7 3.0 2.1 2.2
Locally Entered Personnel(excluding Gurkhas) ZBUG 0.4 0.4 0.4 0.4 0.3 0.4 0.4 0.4 0.4 0.4 0.4
Royal Irish RegimentHome Service batallions ZBUH 4.8 4.6 4.4 4.2 3.8 3.6 3.5 3.4 3.2 3.1 2.1
Reserve personnel ZBUI 323.5 319.4 307.0 294.8 284.2 273.4 259.7 246.7 235.6 .. ..Regular Reserves ZBUJ 259.4 254.9 247.6 241.6 234.9 224.9 212.6 201.4 191.5 .. ..
Naval Services ZBUK 24.1 24.8 24.7 24.2 23.5 23.5 23.2 22.8 22.2 .. ..Army3 ZBUL 190.1 186.2 180.5 175.5 169.8 161.1 151.5 141.9 134.2 127.6 121.8
of which mobilised: SNEO .. 0.2 0.1 0.3 0.2 0.3 0.4 0.1 0.2 0.3 0.1Royal Air Force ZBUM 45.3 43.9 42.4 41.9 41.5 40.2 37.7 36.4 35.0 34.4 33.4
of which mobilised: SNEP .. .. – – – – – – – – –Volunteer Reserves ZBUN 62.6 64.5 59.4 53.2 47.3 46.3 44.9 43.4 42.3 .. 42.7
Royal Naval Reserve andRoyal Marine Reserve ZBUO 4.3 4.4 4.5 4.8 4.8 5.0 4.9 4.5 4.4 .. 3.0of which mobilised: SNEQ .. .. .. .. .. .. 0.4 0.1 .. .. 0.1
Territorial Army3 ZBUP 57.7 57.6 52.3 45.6 41.7 40.7 39.3 38.1 37.3 38.5 36.8of which mobilised: SNER .. 0.6 0.5 0.8 0.4 0.5 4.1 2.9 1.5 1.1 1.0
Royal Auxilliary Air Force ZBUQ 1.4 2.5 2.6 2.7 1.6 1.5 1.5 1.4 1.4 1.4 1.3of which mobilised: SNES .. .. – – – 0.1 0.8 – .. 0.1 0.2
Cadet Forces ZBUR 151.0 150.2 151.0 154.5 151.0 152.3 155.6 155.6 153.1 .. 150.5Naval Service ZBUS 26.3 25.9 24.5 24.1 23.8 23.8 23.2 22.6 21.9 .. 18.2Army3 ZBUT 74.1 73.9 74.6 77.4 75.4 75.8 78.7 80.5 80.9 81.7 81.9Royal Air Force ZBUU 50.7 50.5 51.9 53.0 51.8 52.7 53.7 52.5 50.3 51.0 50.4
1 See chapter text.2 Data between 1997 and 2005 have been revised due to re-examination of
data.3 Due to ongoing validation of data from a new Personnell Administration.
System, 2007 Reserve data for Army are as at March 2007.
Source: Ministry of Defence/DASA (Quad-Service): 020 7218 1470

21
Defence
4.6 United Kingdom defence: civilian manpower strengths1
As at 1 AprilThousands: Full-time Equivalent
1997 1998 1999 2000 2001 2002 2003 2004 2005 2006 2007
Ministry of Defence civilians
MOD Head Office, HQ and centrally managedexpenditure2,3
Non-industrial KDQE 22.9 22.2 21.5 19.7 19.1 20.0 21.2 22.7 24.0 24.6 19.8Industrial KDQF 1.2 1.1 1.0 0.9 0.9 0.8 0.7 0.6 0.7 0.8 0.8
Defence Logistics Organisation3
Non-industrial ZBTJ .. .. .. 19.7 17.8 17.3 16.4 16.5 16.5 14.1 ..Industrial ZBTK .. .. .. 11.5 8.4 6.3 4.4 4.3 4.1 3.9 ..
Defence Equipment & Support3
Non-industrial I6P5 .. .. .. .. .. .. .. .. .. .. 17.3Industrial I6P6 .. .. .. .. .. .. .. .. .. .. 3.6
Naval ServiceNon-industrial KYCW 12.5 12.0 11.3 3.0 3.0 2.9 2.7 2.9 2.6 2.3 2.3Industrial KYCX 7.6 6.6 5.3 1.0 0.9 0.8 0.8 0.8 0.7 0.6 0.6Royal Fleet Auxiliary EQS9 2.2 2.4 2.4 2.4 2.4 2.4 2.5 2.3 2.3 2.3 2.4
ArmyNon-industrial KDQK 22.4 21.7 21.6 16.3 16.4 16.0 16.0 14.7 14.5 13.4 12.7Industrial KDQL 13.8 12.1 10.6 5.8 5.7 5.5 5.4 5.6 5.5 5.2 5.3
Royal Air ForceNon-industrial KDQM 11.5 11.7 12.2 7.1 7.0 7.1 7.0 7.3 7.0 6.7 6.0Industrial KDQN 7.8 7.3 7.1 4.5 4.4 4.3 4.4 4.4 4.0 4.0 3.0
Level 1 Total C7PE 101.9 97.1 94.1 91.9 86.0 83.6 81.5 82.2 82.0 78.1 73.8Non-industrial C7PF 69.4 67.6 66.6 65.8 63.4 63.4 63.3 64.1 64.7 61.3 58.1Industrial C7PG 30.3 27.1 25.1 23.7 20.2 17.8 15.7 15.7 15.0 14.5 13.3Royal Fleet Auxiliary EQT2 2.2 2.4 2.4 2.4 2.4 2.4 2.5 2.3 2.3 2.3 2.4
Locally engaged overseas KDQA 15.9 15.2 14.9 14.8 13.3 14.1 13.8 15.4 15.7 15.1 14.2Non-industrial KDQT 7.0 6.7 6.7 6.7 6.3 6.5 6.5 7.3 .. .. ..Industrial KDQU 8.9 8.4 8.1 8.2 7.0 7.6 7.4 8.1 .. .. ..
Trading funds GQHI 15.5 14.0 14.0 14.5 18.8 12.4 12.2 11.4 10.8 10.7 10.1
Level 0 Total C7PH 133.3 126.3 123.0 121.3 118.2 110.1 107.6 109.0 108.5 103.9 98.0
1 See chapter text. Individuals on temporary and geographic (T&G) promotionare classed as non-industrial. From 2004, personnel who cannot be correct-ly allocated to Top Level Budgets (TLBs) are included with the Centre fig-ures (numbering approx 200 in 2006).
2 The MOD Head Office, HQ and centrally managed expenditure budgetaryarea was formerly referred to as Centre.
3 At 1 April 2007, the Defence Logistics Organisation and the Defence Pro-curement Agency (formerly part of the MOD Head Office, HQ and centrallymanaged expenditure budgetary area) merged to form Defence Equipment& Support.
Source: Ministry of Defence/DASA (Quad-Service): 020 7218 5236
4.7 Family accommodation and defence land holdings1
As at 1 AprilThousands and thousand hectares
1997 1998 1999 2000 2001 2002 2003 2004 2005 2006 2007
Family accommodation (thousands)United Kingdom: Total KDPA 68.6 67.3 65.5 64.8 59.2 55.8 53.8 52.8 51.9 51.8 51.1
Land holdingsUnited KingdomLand2 KDPF 221.0 220.0 220.2 219.9 224.3 222.4 221.4 221.3 222.1 222.0 222.0Foreshore2 KDPH 18.6 18.6 18.6 18.6 18.6 18.6 18.6 18.6 18.6 18.6 18.6Rights held KDPJ 124.5 124.5 124.8 124.8 124.8 124.9 131.1 131.1 124.9 124.9 124.9
Defence land3
Used for agricultural purposes KDPL 96.2 103.5 114.5 92.2 98.6 91.8 103.0 100.5 106.3 ..3 ..3
Used for grazing only KDPM 51.9 59.6 65.5 50.3 66.6 60.0 70.2 68.3 71.0 .. ..Full agricultural use KDPN 44.3 43.9 49.0 41.9 32.0 31.8 32.8 32.2 35.3 .. ..
1 See chapter text.2 Freehold and leasehold.3 Following changes in the tenancies of agricultural land, these data are no
longer available. Alternative data are being sought.
Sources: Ministry of Defence/Defence Housing Executive: 020 7305 3051;Ministry of Defence/Defence Estates: 0121 311 3818

22
Defence
4.8 Location of United Kingdom service personnel1As at 1 July
Thousands
1997 1998 1999 2000 2001 2002 2003 2004 2005 2006 200712
UK Service personnel, Regular Forces:
UK distribution2,3
In United Kingdom4 KDOB 171.6 173.4 171.7 170.3 172.0 .. .. .. 169.7 167.3 161.4England KDOC 142.6 144.6 144.3 143.0 144.1 .. .. .. 145.0 142.1 141.4Wales KDOD 3.3 3.2 3.3 3.2 2.6 .. .. .. 2.9 3.3 2.6Scotland KDOE 13.9 14.2 14.9 15.1 14.5 .. .. .. 13.2 13.5 12.6Northern Ireland KDOF 11.5 11.0 9.0 8.4 9.4 .. .. .. 7.0 6.8 4.8
Global location2,3
United Kingdom MKCN 167.5 165.0 161.0 163.1 162.8 .. .. .. 169.7 167.3 161.4Overseas KDOG 42.6 43.1 47.1 43.0 40.9 .. .. .. 29.2 28.5 28.0
Mainland European States4,5 KDOI 6.2 6.9 15.2 8.2 8.6 .. .. .. 27.0 26.6 26.2Germany6 KDOH 21.2 20.3 18.0 19.5 17.3 .. .. .. 22.2 22.0 21.7Balkans MKCO .. .. .. .. .. .. .. .. 0.1 – 0.1Mediterranean7,8 KDOM 0.3 1.2 1.3 1.1 2.3 .. .. .. .. .. ..Gibraltar KDOJ 0.5 0.5 0.6 0.6 0.5 .. .. .. 0.4 0.3 0.3Cyprus KDOL 3.9 3.6 3.6 3.5 3.5 .. .. .. 3.2 3.0 3.0Far East/Asia9 MKCT 1.5 0.3 0.3 1.0 0.3 .. .. .. 0.3 0.3 0.2Africa10 MKCP .. .. .. .. – .. .. .. 0.6 0.6 0.5North America MKCQ .. .. .. .. 2.5 .. .. .. 0.7 0.7 0.7Central/South America MKCR .. .. .. .. – .. .. .. 0.1 0.1 0.1Falkland Islands MKCS .. .. .. .. 0.8 .. .. .. 0.3 0.3 0.3Other locations, including unallocated KDOQ 9.0 10.4 8.2 9.1 5.1 .. .. .. 1.1 1.0 1.1
Locally entered service personnel:11
United Kingdom KDOS 2.1 2.1 2.0 2.1 2.3 2.6 2.6 2.6 2.1 2.2 2.4Gibraltar KDOT 0.2 0.4 0.4 0.3 0.4 0.4 0.4 0.4 0.4 0.4 0.4Hong Kong KDOV 0.7 .. .. .. .. .. .. .. .. .. ..Brunei KDOW 1.0 0.9 0.8 0.8 0.8 0.8 0.8 0.7 0.8 0.8 0.8India/Nepal KDOX 0.9 0.5 0.5 0.5 0.4 0.3 0.4 0.4 0.3 0.3 0.1
Total KDOK 4.7 4.0 3.7 3.7 3.9 4.2 4.1 4.1 3.3 3.7 3.7
1 See chapter text.2 Prior to 2003, figures for UK distribution and global location are collated from
seperate sources. Comparison is therefore not possible between the twosets of UK personnel figures.
3 Includes personnel within the UK whose location is unknown.4 Includes the Balkans until 2002.5 Post 2002 Mainland European States figure includes Germany, Balkans,
Mediterranean, Gibraltar and Cyprus.6 Prior to 1996, figures for the Federal Republic of Germany and Mainland
European States were combined.
7 Includes Med Near East and Middle East until 2002.8 Post 2002 Mediterranean figure is not shown separately but is included in Main-
land European States figure.9 Prior to 1997 figures include personnel serving in Hong Kong.
10 Post 2002 Africa figure includes Middle East.11 Including Gurkhas.12 All data for 2007 is provisional.
Source: Ministry of Defence/DASA (Quad-Service): 020 7218 1470
4.9 United Kingdom regular forces: deaths1
Numbers and rates per thousand
1997 1998 1999 2000 2001 2002 2003 2004 2005 2006
DeathsTotal SNIA 164 165 141 147 142 147 173 169 158 190Male SNIB 155 157 138 143 139 138 166 163 150 183Female SNIC 9 8 3 4 3 9 7 6 8 7
Rates per thousand2
Tri-service SNIH 0.81 0.78 0.66 0.71 0.69 0.71 0.82 0.81 0.78 0.96Navy SNII 0.87 0.62 0.60 0.63 0.79 0.66 0.90 0.92 0.69 0.84Army SNIJ 0.93 0.87 0.72 0.78 0.70 0.82 0.79 0.78 0.81 0.93RAF SNIK 0.47 0.65 0.49 0.61 0.48 0.51 0.70 0.63 0.71 0.83
1 See chapter text.2 Rates age and gender standarised to 2005 Tri-Service strengths structure.
Source: Ministry of Defence/DASA (Health Information): 01225 468615

23
Defence
4.10 Strength of uniformed United Kingdom medical staff1As at 1 April
Numbers
1997 1998 1999 2000 2001 2002 2003 2004 2005 2006 20078
Qualified doctors:2
Naval Service KDMA 210 210 210 210 220 220 230 240 260 260 290Army3 KDMB 430 440 450 460 470 490 550 600 610 650 550Royal Air Force KDMC 220 210 200 180 180 180 190 200 220 230 220All Services KDMD 870 850 860 860 870 890 970 1 040 1 090 1 140 1 060
Qualified dentists:2
Naval Service KDME 60 60 60 60 60 60 60 60 60 60 50Army3 KDMF 140 140 140 140 150 140 150 150 150 140 130Royal Air Force KDMG 90 80 80 80 80 70 70 80 70 70 60All Services KDMH 290 280 290 280 290 280 270 290 280 270 240
Support staff:4
Naval Service5 KDMI 1 020 990 970 1 000 1 030 1 010 1 060 1 110 1 110 1 120 1 130Nursing services5 ZBTL .. .. 200 210 210 220 250 280 290 300 300Support5 ZBTM .. .. 770 790 820 790 810 840 820 820 830
Army3 KDMJ 3 020 3 090 3 120 3 210 3 260 3 320 3 410 3 560 .. .. 3 000Nursing services3,4,6 ZBTN .. .. 520 570 610 650 710 770 770 800 790Support3 ZBTO .. .. 2 600 2 640 2 650 2 670 2 700 2 800 .. .. 2 210
Royal Air Force KDMK 1 210 1 190 1 360 1 460 1 480 1 500 1 600 1 680 1 660 1 550 1 340Nursing services7 ZBTP .. .. 330 400 420 450 470 480 510 480 490Support ZBTQ .. .. 1 030 1 060 1 070 1 050 1 130 1 200 1 160 1 070 850
All Services KDML 5 260 5 230 5 540 5 760 5 800 5 930 6 180 6 440 .. .. ..
1 See chapter text. Includes staff employed at units (including ships) and inhospitals.
2 The Medical and Dental Officers are trained only and exclude Late EntryPersonnel. For 2007 includes all those individuals who hold a basicregistrable qualification but may not necessarily be fully trained in theirspeciality. "Qualified" Doctors and Dentists refers to personnel who hold abasic registrable qualification, but may not necessarily have completed theircareer directed professional training, and as such may not necessarily befully trained in their speciality.
3 Due to a change in source data, Army figures prior to 2005 cannotbe verified.
4 Includes all members of the Nursing Services/Nursing Corps. From 1999,figures for support staff have been split so that nurses are separate from othersupport staff. From 2007, includes all medical support staff which the DefenceMedical Services Department collects in its tri-service return.
5 From 2007, includes trained and untrained.6 The 2006 Nursing Services figure is trained and untrained Soldiers with Nursing
trades in the QARANC and all trained Officers in QARANC. From 2007, in-cludes trained and untrained.
7 From 2007, includes trained and untrained.8 Figures from 2007 provided by DMSD.
Source: Ministry of Defence/DASA (Tri- Service): 020 7218 1470

24
4.11 United Kingdom defence services and the civilian community1
Numbers
1997 1998 1999 2000 2001 2002 2003 2004 2005 2006 2007
Military Search and rescue operations at home
Call outs: total GPYC 1 941 1 898 1 912 1 941 1 763 1 684 1 714 1 638 1 702 1 875 1 973Royal Navy helicopters GPXO 495 463 499 499 502 436 424 453 478 497 592Royal Air Force helicopters GPXP 1 258 1 257 1 235 1 278 1 115 1 122 1 173 1 079 1 114 1 258 1 258Contractorised and other helicopters GPXQ 16 20 – – – – – – – 1 –Royal Air Force Nimrod aircraft GPXR 79 71 65 71 54 46 37 37 37 32 21Other fixed wing aircraft2 GPXS 2 2 – 1 1 1 – 2 – 1 –HM ships and auxilliary vessels2 KCMG 3 3 – – – – – – – – –Royal Air Force mountain rescue teams KCMH 88 82 113 92 91 79 80 67 73 86 102
Persons moved: total KCMI 1 226 1 243 1 204 1 316 1 182 1 224 1 273 1 412 1 384 1 463 1 767Persons moved by rescue service
Royal Navy helicopters GPXT 328 283 355 360 386 314 320 416 380 479 507Royal Air Force helicopters GPXU 877 937 832 934 781 900 922 978 907 968 1 219Royal Air Force mountain rescue teams GPXV 15 12 17 22 15 10 31 17 97 16 41Other GPXW 6 11 – – – – – 1 – – –
Persons moved by type of assistanceRescue3 GPXX 219 317 307 276 281 343 280 494 408 384 582Medrescue4 GPXY 721 667 640 713 629 654 779 672 778 830 946Medevac5 GPXZ 224 209 216 241 228 201 174 195 143 175 198Recovery6 GPYA 54 43 32 29 36 21 25 33 31 43 24Airlift7 GPYB 8 7 9 57 8 5 15 18 24 31 17
Search and rescue incidents: total KCMM 1 750 1 697 1 714 1 781 1 608 1 544 1 600 1 504 1 584 1 703 1 803
Source: Ministry of Defence/DASA (Logistics): 01225 67144/72112
1997 1998 1999 2000 2001 2002 2003 2004 2005 2006/98 /99 /00 /01 /02 /03 /04 /05 /06 /07
Fishery protectionVessels boarded KCMO 1 715 1 879 1 716 1 603 1 464 1 375 1 709 1 747 1 371 1 335
1 See chapter text.2 Not permanently on stand-by.3 Rescue: Moving an uninjured person from a hostile to a benign environment.4 Medrescue: Moving an injured casualty from a hostile environment to a
medical facility.
Source: Fisheries Protection - Ministry of Defence
5 Medtransfer (formerly Medevac): Moving a sick person between medical facili-ties such as a hospital or occasionally to move transplant organs.
6 Recovery: Moving people declared dead on scene or confirmed dead on arrivalby a qualified doctor.
7 Transfer (formerly Airlift): Moving military personnel, or their families, on com-passionate grounds.

xi
Population and vital statistics
Population and vital statistics
Ch
apter 5

26
Population and vital statistics
The population projections in Tables 5.1 – 5.3 are based on the estimates of the population of the UK at mid-2006 made by the Registrars General.
Marital condition (de jure): estimated population
(Table 5.4)
This table shows population estimates by marital status.
Geographical distribution of the population
(Table 5.5)
The population enumerated in the censuses for 1911-1951, and the mid-year population estimates for later years, are provided for standard regions of the UK, for metropolitan areas, for broad groupings of local authority districts by type within England and Wales, and for some of the larger cities. Projections of future sub-national population levels are prepared from time to time by the Registrar General, but are not shown in this publication.
Migration into and out of the UK
(Tables 5.7–5.9)
A migrant is defined as a person who changes his or her country of usual residence for a period of at least a year, so that the country of destination effectively becomes the country of usual residence.
The main source of international migration data is the International Passenger Survey (IPS). This is a continuous voluntary sample survey that provides information on passengers entering and leaving the UK by the principal air, sea and tunnel routes. Being a sample survey, the IPS is subject to some uncertainty; therefore it should be noted that international migration estimates, in particular the difference between inflow and outflow, may be subject to large sampling errors. The IPS excludes routes between the Channel Islands and Isle of Man and the rest of the world.
The IPS data are supplemented with three types of additional information in order to provide a full picture of total international migration:
1. The IPS is based on intentions to migrate and intentions are liable to change. Adjustments are made for visitor switchers (those who intend to stay in the UK or abroad for less than one year but subsequently stay for longer and become migrants) and for migrant switchers (those who intend to stay in the UK or abroad for one year or more but then return earlier so are no longer migrants).
Population and vital statisticsThis section begins with a summary of population figures for the UK and constituent countries for 1851 to 2026, and for Great Britain from 1801 (Table 5.1). Table 5.2 analyses the components of population change. Table 5.3 gives details of the national sex and age structures for years up to the present date, with projected figures up to the year 2026. Legal marital condition of the population is shown in Table 5.4. The distribution of population at regional and local levels is summarised in Table 5.5.
In the main, historical series relate to census information, while mid-year estimates, which make allowance for under-enumeration in the census, are given for the recent past and the present (from 1961 onwards).
Population
(Tables 5.1–5.3)
Figures shown in these tables relate to the population enumerated at successive censuses (up to 1951), mid-year estimates (from 1961 to 2006) and population projections (up to 2026). Further information can be found on the National Statistics website: www.statistics.gov.uk/popest.
Population projections are 2006-based and were published by the Office for National Statistics (ONS) on 23 October 2007. Further information can be found at: www.statistics.gov.uk/cci/nugget.asp?id=1352
Definition of resident population
The estimated resident population of an area includes all people who usually live there, whatever their nationality. Members of HM and US Armed Forces in England and Wales are included on a residential basis wherever possible. HM Forces stationed outside England and Wales are not included. Students are taken to be resident at their term time address.
The projections of the resident population of the UK and constituent countries were prepared by the National Statistics Centre for Demography within ONS, in consultation with the Registrars General, as a common framework for use in national planning in a number of different fields. New projections are made every second year on assumptions regarding future fertility, mortality and migration which seem most appropriate on the basis of the statistical evidence available at the time.

27
Population and vital statistics
These adjustments are primarily based on IPS data but for years prior to 2001, Home Office data on short-term visitors who were subsequently granted an extension of stay for a year or longer for other reasons have been incorporated.
2. Home Office data on applications for asylum and dependants of asylum seekers entering the UK are used to estimate inflows of asylum seekers and dependants not already captured by the IPS. In addition, Home Office data on removals and refusals are used to estimate outflows of failed asylum seekers not identified by the IPS.
3. Migration flows between the UK and the Irish Republic are added to these data, as the IPS did not cover this route until recently and the quality of these data are still being assessed. Migration flows are obtained mainly from the Quarterly National Household Survey and are agreed between the Irish Central Statistics Office and ONS.
The international migration estimates in Table 5.7 are derived from all these sources and represent total international migration. The estimates in Tables 5.8 and 5.9 are based on the IPS only (without the three adjustments outlined above).
Grants for settlement in the United Kingdom
(Table 5.10)
This table presents in geographic regions, the statistics of individual nationalities, arranged alphabetically within each region. The figures are on a different basis from those derived from IPS (Tables 5.8 and 5.9) and relate only to people subject to immigration control. Persons granted settlements are allowed to stay indefinitely in the UK. They exclude temporary migrants such as students and generally relate only to non-European Economic Area nationals. Settlement can occur several years after entry to the country.
Applications received for asylum in the UK, excluding dependants
(Table 5.11)
This table shows statistics of applications for asylum in the UK. Figures are shown for the main applicant nationalities by geographic region. The basis of assessing asylum applications, and hence of deciding whether to grant asylum in the UK, is the 1951 United Nations Convention on Refugees.
Marriages
(Table 5.12)
The figures in this table relate to marriages solemnised in the constituent countries of the UK. They take no account of the growing trend towards marrying abroad.
Divorces
(Tables 5.13 and 5.14)
A marriage may be either dissolved following a petition for divorce and the granting of a decree absolute, or annulled following a petition for nullity and the awarding of a decree of nullity. The first group of decrees are known as dissolutions of marriage and the second as annulments of marriage. In Table 5.13 the term ‘divorce’ includes both types of decrees, although strictly speaking, it should refer only to dissolutions.
Births
(Tables 5.15–5.17)
For Scotland and Northern Ireland the number of births relate to those registered during the year. For England and Wales the figures up to and including 1930–32 are for those registered, while later figures relate to births occurring in each year.
All data for England and Wales and for Scotland include births occurring in those countries to mothers not usually resident in them. Data for Northern Ireland, and hence the UK, prior to 1981 include births occurring in Northern Ireland to non-resident mothers; from 1981, such births are excluded.
Deaths
(Tables 5.19 and 5.21)
The figures relate to the number of deaths registered during each calendar year.
Infant and maternal mortality
(Table 5.20)
On 1 October 1992 the legal definition of a stillbirth was altered from a baby born dead after 28 completed weeks gestation or more, to one born after 24 completed weeks of gestation or more. The 258 stillbirths of 24 to 27 weeks gestation that which occurred between 1 October and 31 December 1992 are excluded from this table.

28
Population and vital statistics
Life tables
(Table 5.22)
The current set of interim life tables are constructed from the estimated populations in 2004–2006 and corresponding data on births, infant deaths and deaths by individual age occurring in those years.
The estimates used in these interim life tables are the estimates, or revised estimates, issued on the following dates:
Mid-year England Wales Scotland Northern population Ireland estimates
2004 August August July July 2007 2007 2007 2005
2005 August August July October 2007 2007 2007 2006
2006 August August July July 2007 2007 2007 2007
Adoptions
(Tables 5.23)
The figures shown within these tables relate to the date the adoption was entered in the Adopted Children Register. Figures based on the date of court order are available for England and Wales in the volume Marriage, divorce and adoption statistics 2003 (no. 31 in the FM2 series) available on the National Statistics website www.statistics.gov.uk, or from the enquiry point in the ONS shown at the foot of the tables.

29
Population and vital statistics
5.1 Population summary: by country and sex
Thousands
United Kingdom England and Wales Wales Scotland Northern Ireland
Persons Males Females Persons Males Females Persons Persons Males Females Persons Males Females
Enumerated population: Census figures
1801 .. .. .. 8 893 4 255 4 638 587 1 608 739 869 .. .. ..1851 22 259 10 855 11 404 17 928 8 781 9 146 1 163 2 889 1 376 1 513 1 442 698 7451901 38 237 18 492 19 745 32 528 15 729 16 799 2 013 4 472 2 174 2 298 1 237 590 6471911 42 082 20 357 21 725 36 070 17 446 18 625 2 421 4 761 2 309 2 452 1 251 603 64819211 44 027 21 033 22 994 37 887 18 075 19 811 2 656 4 882 2 348 2 535 1 258 610 648
19311 46 038 22 060 23 978 39 952 19 133 20 819 2 593 4 843 2 326 2 517 1 243 601 6421951 50 225 24 118 26 107 43 758 21 016 22 742 2 599 5 096 2 434 2 662 1 371 668 7031961 52 709 25 481 27 228 46 105 22 304 23 801 2 644 5 179 2 483 2 697 1 425 694 731
Resident population: mid-year estimates
DYAY BBAB BBAC BBAD BBAE BBAF KGJM BBAG BBAH BBAI BBAJ BBAK BBAL1971 55 928 27 167 28 761 49 152 23 897 25 255 2 740 5 236 2 516 2 720 1 540 755 7861972 56 097 27 259 28 837 49 327 23 989 25 339 2 755 5 231 2 513 2 717 1 539 758 7821973 56 223 27 332 28 891 49 459 24 061 25 399 2 773 5 234 2 515 2 719 1 530 756 7741974 56 236 27 349 28 887 49 468 24 075 25 393 2 785 5 241 2 519 2 722 1 527 755 7721975 56 226 27 361 28 865 49 470 24 091 25 378 2 795 5 232 2 516 2 716 1 524 753 770
1976 56 216 27 360 28 856 49 459 24 089 25 370 2 799 5 233 2 517 2 716 1 524 754 7701977 56 190 27 345 28 845 49 440 24 076 25 364 2 801 5 226 2 515 2 711 1 523 754 7691978 56 178 27 330 28 849 49 443 24 067 25 375 2 804 5 212 2 509 2 704 1 523 754 7701979 56 240 27 373 28 867 49 508 24 113 25 395 2 810 5 204 2 505 2 699 1 528 755 7731980 56 330 27 411 28 919 49 603 24 156 25 448 2 816 5 194 2 501 2 693 1 533 755 778
1981 56 357 27 412 28 946 49 634 24 160 25 474 2 813 5 180 2 495 2 685 1 543 757 7861982 56 291 27 364 28 927 49 582 24 119 25 462 2 804 5 165 2 487 2 677 1 545 757 7881983 56 316 27 371 28 944 49 617 24 133 25 484 2 803 5 148 2 479 2 669 1 551 759 7921984 56 409 27 421 28 989 49 713 24 185 25 528 2 801 5 139 2 475 2 664 1 557 761 7961985 56 554 27 489 29 065 49 861 24 254 25 606 2 803 5 128 2 470 2 658 1 565 765 800
1986 56 684 27 542 29 142 49 999 24 311 25 687 2 811 5 112 2 462 2 649 1 574 768 8051987 56 804 27 599 29 205 50 123 24 371 25 752 2 823 5 099 2 455 2 644 1 582 773 8091988 56 916 27 652 29 265 50 254 24 434 25 820 2 841 5 077 2 444 2 633 1 585 774 8121989 57 076 27 729 29 348 50 408 24 510 25 898 2 855 5 078 2 443 2 635 1 590 776 8141990 57 237 27 819 29 419 50 561 24 597 25 964 2 862 5 081 2 444 2 637 1 596 778 818
1991 57 439 27 909 29 530 50 748 24 681 26 067 2 873 5 083 2 445 2 639 1 607 783 8241992 57 585 27 977 29 608 50 876 24 739 26 136 2 878 5 086 2 445 2 640 1 623 792 8311993 57 714 28 039 29 675 50 986 24 793 26 193 2 884 5 092 2 448 2 644 1 636 798 8371994 57 862 28 108 29 754 51 116 24 853 26 263 2 887 5 102 2 453 2 649 1 644 802 8421995 58 025 28 204 29 821 51 272 24 946 26 326 2 889 5 104 2 453 2 650 1 649 804 845
1996 58 164 28 287 29 877 51 410 25 030 26 381 2 891 5 092 2 447 2 645 1 662 810 8511997 58 314 28 371 29 943 51 560 25 113 26 446 2 895 5 083 2 442 2 641 1 671 816 8561998 58 475 28 458 30 017 51 720 25 201 26 519 2 900 5 077 2 439 2 638 1 678 819 8591999 58 684 28 578 30 106 51 933 25 323 26 610 2 901 5 072 2 437 2 635 1 679 818 8612000 58 886 28 690 30 196 52 140 25 438 26 702 2 907 5 063 2 432 2 631 1 683 820 862
2001 59 113 28 832 30 281 52 360 25 574 26 786 2 910 5 064 2 434 2 630 1 689 824 86520022 59 323 28 964 30 359 52 572 25 704 26 868 2 920 5 055 2 432 2 623 1 697 829 86820032 59 557 29 109 30 449 52 797 25 841 26 956 2 931 5 057 2 435 2 623 1 703 833 87020042 59 846 29 278 30 568 53 057 25 995 27 062 2 946 5 078 2 446 2 632 1 710 836 87420052 60 238 29 497 30 741 53 419 26 197 27 223 2 954 5 095 2 456 2 639 1 724 844 880
2006 60 587 29 694 30 893 53 729 26 371 27 358 2 966 5 117 2 469 2 647 1 742 853 888
Resident population: projections (mid-year)3
C59J C59K C59L C59M C59N C59O C59P C59Q C59R C59S C59T C59U C59V2011 62 761 30 893 31 868 55 744 27 482 28 262 3 038 5 206 2 520 2 685 1 812 890 921
2016 64 975 32 088 32 887 57 837 28 610 29 226 3 113 5 270 2 557 2 713 1 868 921 947
2021 67 191 33 252 33 938 59 943 29 717 30 226 3 186 5 326 2 587 2 739 1 922 949 973
2026 69 260 34 313 34 946 61 931 30 737 31 194 3 248 5 363 2 605 2 758 1 966 972 994
2031 71 100 35 243 35 857 63 727 31 646 32 081 3 296 5 374 2 609 2 765 1 999 988 1 011
1 Figures for Northern Ireland are estimated. The population at the Census of1926 was 1 257 thousand (608 thousand males and 649 thousand females).
2 Mid 2002 to mid 2005 population estimates for the UK and England & Waleshave been updated to include the latest revised revised estimates that takeinto account improved estimates of international migration.
3 These projections are 2006-based. See chapter text for more detail.
Sources: Office for National Statistics: 01329 813233;General Register Office for Scotland;
Northern Ireland Statistics and Research Agency

30
Population and vital statistics
5.2 Population changes: by country
Thousands
Average annual change
Population1 Overall Net migrationat start annual Natural and other
of period change Births Deaths2 change changes
United Kingdom
1901 - 1911 38 237 385 1 091 624 467 -821911 - 1921 42 082 195 975 689 286 -921921 - 1931 44 027 201 824 555 268 -671931 - 1951 46 038 213 793 603 190 221951 - 1961 50 225 258 839 593 246 12
1961 - 1971 52 807 312 962 638 324 -121971 - 1981 55 928 42 736 666 69 -271981 - 1991 56 357 108 757 655 103 51991 - 2001 57 439 161 731 631 100 612001 - 20053 59 113 281 692 600 92 1892001 - 2006 59 113 295 701 595 106 189
2011 - 2021 62 761 443 802 551 252 191
England and Wales
1901 - 1911 32 528 354 929 525 404 -501911 - 1921 36 070 182 828 584 244 -621921 - 1931 37 887 207 693 469 224 -171931 - 1951 39 952 193 673 518 155 381951 - 1961 43 758 244 714 516 197 47
1961 - 1971 46 196 296 832 560 272 231971 - 1981 49 152 48 638 585 53 -51981 - 1991 49 634 111 664 576 89 231991 - 2001 50 748 155 647 556 92 632001 - 20053 52 360 265 618 528 90 1752001 - 2006 52 360 274 626 524 102 172
2011 - 2021 55 744 420 722 484 238 182
Scotland
1901 - 1911 4 472 29 131 76 54 -251911 - 1921 4 761 12 118 82 36 -241921 - 1931 4 882 -4 100 65 35 -391931 - 1951 4 843 13 92 67 25 -121951 - 1961 5 096 9 95 62 34 -25
1961 - 1971 5 184 5 97 63 34 -301971 - 1981 5 236 -6 70 64 6 -111981 - 1991 5 180 -7 66 63 3 -101991 - 2001 5 083 -2 60 60 -1 -12001 - 2005 5 064 8 53 57 -5 122001 - 2006 5 064 11 53 57 -4 14
2011 - 2021 5 206 12 56 52 3 9
Northern Ireland
1901 - 1911 1 237 1 31 23 8 -61911 - 1921 1 251 1 29 22 7 -61921 - 1931 1 258 -2 30 21 9 -111931 - 1951 1 243 6 28 18 10 -41951 - 1961 1 371 6 30 15 15 -9
1961 - 1971 1 427 11 33 16 17 -61971 - 1981 1 540 - 28 17 11 -111981 - 1991 1 543 6 27 16 12 -51991 - 2001 1 607 8 24 15 9 -2001 - 2005 1 689 9 22 14 7 12001 - 2006 1 689 10 22 14 8 3
2011 - 2021 1 812 11 25 14 10 1
1 Census enumerated population up to 1951; mid-year estimates of residentpopulation from 1961 to 2001 and mid-2006-based projections of residentpopulation thereafter.
2 Including deaths of non-civilians and merchant seamen who died outside thecountry. These numbered 577 000 in 1911-1921 and 240 000 in 1931-1951for England and Wales; 74 000 in 1911-1921 and 34 000 in 1931-1951 forScotland; and 10 000 in 1911-1926 for Northern Ireland.
3 Mid-2005 population estimates for the United Kingdom and England & Waleshave been updated to include the latest revised estimates that take intoaccount improved estimates of international migration.
Sources: Office for National Statistics: 01329 813233;General Register Office for Scotland;
Northern Ireland Statistics and Research Agency
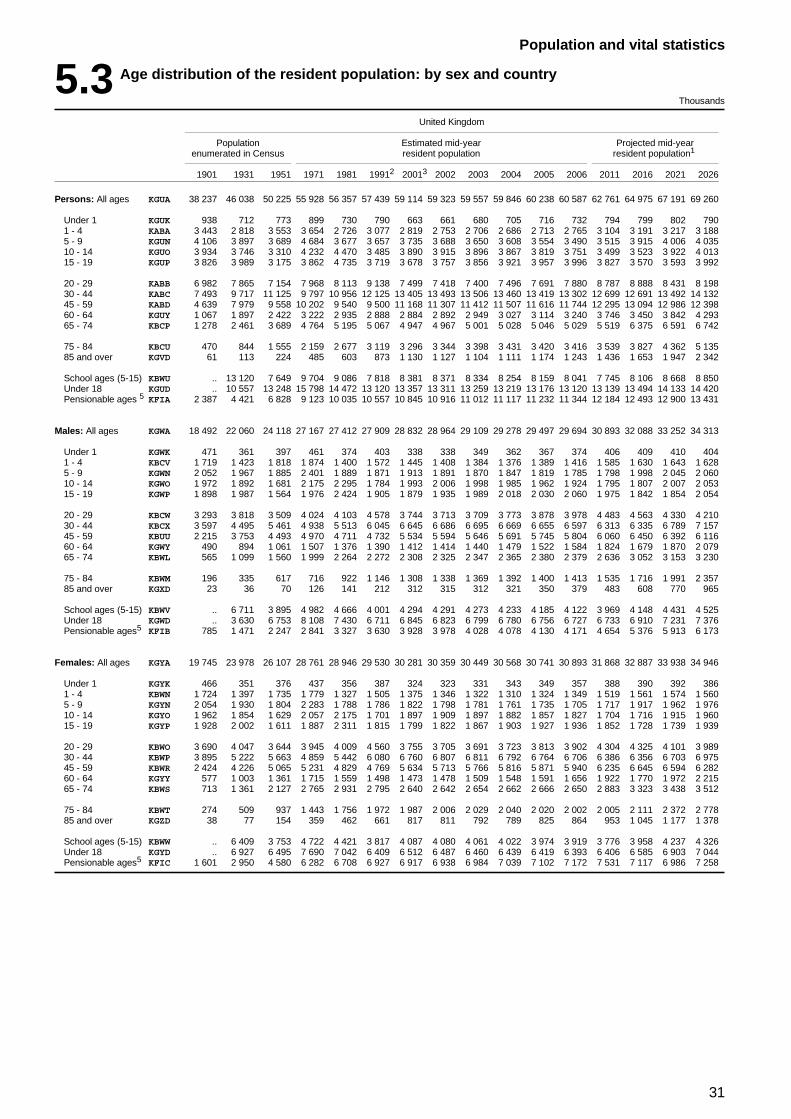
31
Population and vital statistics
5.3 Age distribution of the resident population: by sex and country
Thousands
United Kingdom
Population Estimated mid-year Projected mid-yearenumerated in Census resident population resident population1
1901 1931 1951 1971 1981 19912 20013 2002 2003 2004 2005 2006 2011 2016 2021 2026
Persons: All ages KGUA 38 237 46 038 50 225 55 928 56 357 57 439 59 114 59 323 59 557 59 846 60 238 60 587 62 761 64 975 67 191 69 260
Under 1 KGUK 938 712 773 899 730 790 663 661 680 705 716 732 794 799 802 7901 - 4 KABA 3 443 2 818 3 553 3 654 2 726 3 077 2 819 2 753 2 706 2 686 2 713 2 765 3 104 3 191 3 217 3 1885 - 9 KGUN 4 106 3 897 3 689 4 684 3 677 3 657 3 735 3 688 3 650 3 608 3 554 3 490 3 515 3 915 4 006 4 03510 - 14 KGUO 3 934 3 746 3 310 4 232 4 470 3 485 3 890 3 915 3 896 3 867 3 819 3 751 3 499 3 523 3 922 4 01315 - 19 KGUP 3 826 3 989 3 175 3 862 4 735 3 719 3 678 3 757 3 856 3 921 3 957 3 996 3 827 3 570 3 593 3 992
20 - 29 KABB 6 982 7 865 7 154 7 968 8 113 9 138 7 499 7 418 7 400 7 496 7 691 7 880 8 787 8 888 8 431 8 19830 - 44 KABC 7 493 9 717 11 125 9 797 10 956 12 125 13 405 13 493 13 506 13 460 13 419 13 302 12 699 12 691 13 492 14 13245 - 59 KABD 4 639 7 979 9 558 10 202 9 540 9 500 11 168 11 307 11 412 11 507 11 616 11 744 12 295 13 094 12 986 12 39860 - 64 KGUY 1 067 1 897 2 422 3 222 2 935 2 888 2 884 2 892 2 949 3 027 3 114 3 240 3 746 3 450 3 842 4 29365 - 74 KBCP 1 278 2 461 3 689 4 764 5 195 5 067 4 947 4 967 5 001 5 028 5 046 5 029 5 519 6 375 6 591 6 742
75 - 84 KBCU 470 844 1 555 2 159 2 677 3 119 3 296 3 344 3 398 3 431 3 420 3 416 3 539 3 827 4 362 5 13585 and over KGVD 61 113 224 485 603 873 1 130 1 127 1 104 1 111 1 174 1 243 1 436 1 653 1 947 2 342
School ages (5-15) KBWU .. 13 120 7 649 9 704 9 086 7 818 8 381 8 371 8 334 8 254 8 159 8 041 7 745 8 106 8 668 8 850Under 18 KGUD .. 10 557 13 248 15 798 14 472 13 120 13 357 13 311 13 259 13 219 13 176 13 120 13 139 13 494 14 133 14 420Pensionable ages 5 KFIA 2 387 4 421 6 828 9 123 10 035 10 557 10 845 10 916 11 012 11 117 11 232 11 344 12 184 12 493 12 900 13 431
Males: All ages KGWA 18 492 22 060 24 118 27 167 27 412 27 909 28 832 28 964 29 109 29 278 29 497 29 694 30 893 32 088 33 252 34 313
Under 1 KGWK 471 361 397 461 374 403 338 338 349 362 367 374 406 409 410 4041 - 4 KBCV 1 719 1 423 1 818 1 874 1 400 1 572 1 445 1 408 1 384 1 376 1 389 1 416 1 585 1 630 1 643 1 6285 - 9 KGWN 2 052 1 967 1 885 2 401 1 889 1 871 1 913 1 891 1 870 1 847 1 819 1 785 1 798 1 998 2 045 2 06010 - 14 KGWO 1 972 1 892 1 681 2 175 2 295 1 784 1 993 2 006 1 998 1 985 1 962 1 924 1 795 1 807 2 007 2 05315 - 19 KGWP 1 898 1 987 1 564 1 976 2 424 1 905 1 879 1 935 1 989 2 018 2 030 2 060 1 975 1 842 1 854 2 054
20 - 29 KBCW 3 293 3 818 3 509 4 024 4 103 4 578 3 744 3 713 3 709 3 773 3 878 3 978 4 483 4 563 4 330 4 21030 - 44 KBCX 3 597 4 495 5 461 4 938 5 513 6 045 6 645 6 686 6 695 6 669 6 655 6 597 6 313 6 335 6 789 7 15745 - 59 KBUU 2 215 3 753 4 493 4 970 4 711 4 732 5 534 5 594 5 646 5 691 5 745 5 804 6 060 6 450 6 392 6 11660 - 64 KGWY 490 894 1 061 1 507 1 376 1 390 1 412 1 414 1 440 1 479 1 522 1 584 1 824 1 679 1 870 2 07965 - 74 KBWL 565 1 099 1 560 1 999 2 264 2 272 2 308 2 325 2 347 2 365 2 380 2 379 2 636 3 052 3 153 3 230
75 - 84 KBWM 196 335 617 716 922 1 146 1 308 1 338 1 369 1 392 1 400 1 413 1 535 1 716 1 991 2 35785 and over KGXD 23 36 70 126 141 212 312 315 312 321 350 379 483 608 770 965
School ages (5-15) KBWV .. 6 711 3 895 4 982 4 666 4 001 4 294 4 291 4 273 4 233 4 185 4 122 3 969 4 148 4 431 4 525Under 18 KGWD .. 3 630 6 753 8 108 7 430 6 711 6 845 6 823 6 799 6 780 6 756 6 727 6 733 6 910 7 231 7 376Pensionable ages5 KFIB 785 1 471 2 247 2 841 3 327 3 630 3 928 3 978 4 028 4 078 4 130 4 171 4 654 5 376 5 913 6 173
Females: All ages KGYA 19 745 23 978 26 107 28 761 28 946 29 530 30 281 30 359 30 449 30 568 30 741 30 893 31 868 32 887 33 938 34 946
Under 1 KGYK 466 351 376 437 356 387 324 323 331 343 349 357 388 390 392 3861 - 4 KBWN 1 724 1 397 1 735 1 779 1 327 1 505 1 375 1 346 1 322 1 310 1 324 1 349 1 519 1 561 1 574 1 5605 - 9 KGYN 2 054 1 930 1 804 2 283 1 788 1 786 1 822 1 798 1 781 1 761 1 735 1 705 1 717 1 917 1 962 1 97610 - 14 KGYO 1 962 1 854 1 629 2 057 2 175 1 701 1 897 1 909 1 897 1 882 1 857 1 827 1 704 1 716 1 915 1 96015 - 19 KGYP 1 928 2 002 1 611 1 887 2 311 1 815 1 799 1 822 1 867 1 903 1 927 1 936 1 852 1 728 1 739 1 939
20 - 29 KBWO 3 690 4 047 3 644 3 945 4 009 4 560 3 755 3 705 3 691 3 723 3 813 3 902 4 304 4 325 4 101 3 98930 - 44 KBWP 3 895 5 222 5 663 4 859 5 442 6 080 6 760 6 807 6 811 6 792 6 764 6 706 6 386 6 356 6 703 6 97545 - 59 KBWR 2 424 4 226 5 065 5 231 4 829 4 769 5 634 5 713 5 766 5 816 5 871 5 940 6 235 6 645 6 594 6 28260 - 64 KGYY 577 1 003 1 361 1 715 1 559 1 498 1 473 1 478 1 509 1 548 1 591 1 656 1 922 1 770 1 972 2 21565 - 74 KBWS 713 1 361 2 127 2 765 2 931 2 795 2 640 2 642 2 654 2 662 2 666 2 650 2 883 3 323 3 438 3 512
75 - 84 KBWT 274 509 937 1 443 1 756 1 972 1 987 2 006 2 029 2 040 2 020 2 002 2 005 2 111 2 372 2 77885 and over KGZD 38 77 154 359 462 661 817 811 792 789 825 864 953 1 045 1 177 1 378
School ages (5-15) KBWW .. 6 409 3 753 4 722 4 421 3 817 4 087 4 080 4 061 4 022 3 974 3 919 3 776 3 958 4 237 4 326Under 18 KGYD .. 6 927 6 495 7 690 7 042 6 409 6 512 6 487 6 460 6 439 6 419 6 393 6 406 6 585 6 903 7 044Pensionable ages5 KFIC 1 601 2 950 4 580 6 282 6 708 6 927 6 917 6 938 6 984 7 039 7 102 7 172 7 531 7 117 6 986 7 258

32
Population and vital statistics
5.3 Age distribution of the resident population: by sex and country
continued Thousands
England Wales
Estimated mid-year Projected Estimated mid-year Projectedresident population population1 resident population population1
19912 20013 20024 20034 20044 20054 2006 2011 2026 1991220013200242003420044200542006 2011 2026
Persons: All ages KCCI 47 875 49 450 49 652 49 866 50 111 50 466 50 763 52 706 58 682 KERY 2 873 2 910 2 920 2 931 2 946 2 954 2 966 3 038 3 248
Under 1 KCCJ 660 558 559 576 597 606 620 677 681 KFAC 38 32 30 31 32 32 33 35 341 - 4 KCCK 2 560 2 366 2 313 2 275 2 262 2 289 2 335 2 639 2 741 KFBX 153 136 132 129 127 126 127 139 1395 - 9 KCCL 3 019 3 121 3 084 3 055 3 020 2 976 2 922 2 966 3 452 KFCA 186 185 183 180 178 175 172 164 18210 - 14 KCCM 2 865 3 238 3 264 3 250 3 225 3 185 3 130 2 925 3 418 KFCB 177 196 197 197 195 193 189 175 18615 - 19 KCCN 3 067 3 045 3 115 3 203 3 261 3 297 3 334 3 195 3 391 KFCC 187 186 190 196 199 200 202 194 186
20 - 29 KCEG 7 651 6 307 6 244 6 232 6 315 6 483 6 633 7 420 7 008 KFCD 415 336 333 334 340 348 359 401 35630 - 44 KCEH 10 147 11 257 11 347 11 369 11 337 11 318 11 230 10 770 12 097 KFCE 583 608 610 608 606 599 590 547 60845 - 59 KCEQ 7 920 9 327 9 439 9 522 9 591 9 675 9 777 10 241 10 486 KFCF 486 572 578 582 586 589 592 605 56860 - 64 KCEW 2 399 2 395 2 399 2 445 2 509 2 586 2 697 3 117 3 580 KFCG 154 154 156 161 166 171 177 204 21865 - 74 KCGD 4 222 4 113 4 129 4 155 4 175 4 189 4 171 4 585 5 576 KFCH 284 264 265 268 270 271 273 306 362
75 - 84 KCJG 2 626 2 764 2 803 2 850 2 875 2 865 2 860 2 955 4 289 KFCI 164 183 185 187 188 186 186 189 28685 and over KCKJ 739 959 956 936 942 996 1 055 1 214 1 964 KFCK 45 59 59 59 60 63 67 78 125
School ages (5-15) KCWX 6 439 6 985 6 984 6 960 6 895 6 817 6 719 6 502 7 552 KFCL 397 420 419 417 413 407 401 375 404Under 18 KCWY 10 840 11 146 11 119 11 089 11 064 11 036 10 997 11 068 12 326 KFCM 662 662 659 654 651 646 641 625 651Pensionable ages5 KEAA 8 827 9 055 9 111 9 188 9 273 9 370 9 462 10 161 11 175 KFEB 573 584 589 595 602 608 615 665 732
Males: All ages KEAB 23 291 24 166 24 290 24 419 24 563 24 758 24 926 25 995 29 134 KFEI 1 391 1 409 1 414 1 423 1 432 1 439 1 445 1 487 1 603
Under 1 KEAC 336 285 286 296 306 310 317 346 348 KFEJ 20 16 16 16 16 17 17 18 171 - 4 KEAD 1 307 1 212 1 182 1 163 1 159 1 172 1 196 1 348 1 400 KFEK 78 69 68 66 65 65 65 71 715 - 9 KEAE 1 545 1 599 1 581 1 564 1 546 1 522 1 493 1 517 1 762 KFEL 95 95 94 92 91 90 88 84 9310 - 14 KEAF 1 467 1 658 1 672 1 667 1 657 1 638 1 606 1 500 1 750 KFFA 91 101 101 101 100 99 97 90 9515 - 19 KECA 1 572 1 558 1 607 1 654 1 679 1 691 1 720 1 650 1 746 KFFN 95 94 97 100 102 103 104 99 95
20 - 29 KECB 3 835 3 155 3 130 3 126 3 182 3 270 3 349 3 785 3 594 KFHA 207 166 164 166 170 176 181 206 18530 - 44 KECC 5 064 5 600 5 644 5 658 5 639 5 637 5 591 5 372 6 132 KFHB 289 297 297 296 295 292 287 267 30945 - 59 KECD 3 957 4 624 4 673 4 715 4 748 4 791 4 839 5 063 5 198 KFHW 242 283 285 287 288 290 291 295 27460 - 64 KECE 1 159 1 176 1 176 1 197 1 228 1 267 1 320 1 518 1 741 KFQO 74 75 77 79 82 84 87 100 10565 - 74 KECF 1 900 1 928 1 942 1 958 1 972 1 984 1 981 2 194 2 678 KFQV 128 124 125 127 128 129 130 147 174
75 - 84 KECG 970 1 103 1 128 1 154 1 172 1 179 1 190 1 289 1 972 KFUK 60 73 74 75 76 77 77 83 13385 and over KECH 181 267 269 267 274 298 324 411 814 KFUL 11 16 16 16 17 19 20 26 52
School ages (5-15) KECI 3 295 3 578 3 580 3 569 3 536 3 497 3 444 3 331 3 862 KFUV 204 215 215 214 212 209 206 193 207Under 18 KECJ 5 545 5 712 5 699 5 686 5 675 5 658 5 638 5 672 6 306 KFVE 339 340 338 336 335 332 329 321 333Pensionable ages5 KECK 3 050 3 298 3 339 3 379 3 419 3 461 3 494 3 894 5 148 KFVF 198 212 215 218 221 224 227 256 339
Females: All ages KEJV 24 584 25 284 25 362 25 448 25 548 25 708 25 837 26 711 29 549 KFVL 1 482 1 502 1 506 1 508 1 514 1 515 1 521 1 550 1 645
Under 1 KEJW 324 273 273 280 291 296 303 331 332 KFYW 19 15 15 15 15 16 16 17 161 - 4 KEJX 1 253 1 154 1 131 1 112 1 103 1 117 1 139 1 291 1 341 KFZJ 75 66 65 63 62 61 62 68 685 - 9 KEKP 1 474 1 522 1 503 1 490 1 474 1 454 1 428 1 450 1 690 KGCK 91 90 89 88 87 85 84 80 8910 - 14 KEKQ 1 399 1 580 1 591 1 583 1 569 1 547 1 523 1 425 1 669 KGCM 86 95 96 95 95 94 92 85 9115 - 19 KEKR 1 495 1 487 1 508 1 549 1 582 1 606 1 615 1 545 1 646 KGCN 91 92 93 95 97 97 98 94 91
20 - 29 KEKS 3 816 3 152 3 114 3 106 3 133 3 213 3 284 3 635 3 414 KGCO 208 170 168 167 170 172 178 195 17130 - 44 KENR 5 083 5 657 5 703 5 711 5 699 5 682 5 638 5 397 5 965 KGCP 294 312 313 312 311 307 303 280 29945 - 59 KEOQ 3 964 4 702 4 767 4 808 4 843 4 885 4 938 5 179 5 289 KGGZ 244 289 293 295 298 299 301 310 29360 - 64 KEOZ 1 239 1 219 1 223 1 248 1 280 1 319 1 377 1 599 1 839 KGIY 80 78 80 82 84 87 90 104 11365 - 74 KEQJ 2 323 2 185 2 187 2 197 2 203 2 206 2 190 2 391 2 898 KGKR 156 141 140 141 142 142 143 158 189
75 - 84 KEQK 1 656 1 661 1 676 1 696 1 703 1 686 1 670 1 666 2 316 KGTQ 104 110 111 112 112 110 108 106 15385 and over KEQL 558 692 687 669 667 697 731 803 1 150 KGTZ 34 43 43 42 42 44 47 52 73
School ages (5-15) KEQM 3 143 3 406 3 404 3 392 3 359 3 320 3 275 3 171 3 690 KGVG 194 204 204 203 201 198 195 183 198Under 18 KEQN 5 295 5 434 5 419 5 403 5 389 5 377 5 358 5 396 6 020 KGVH 323 323 321 318 317 314 311 304 318Pensionable ages5 KEQO 5 777 5 757 5 772 5 809 5 854 5 908 5 968 6 267 6 027 KGVK 375 372 374 377 380 383 387 408 393
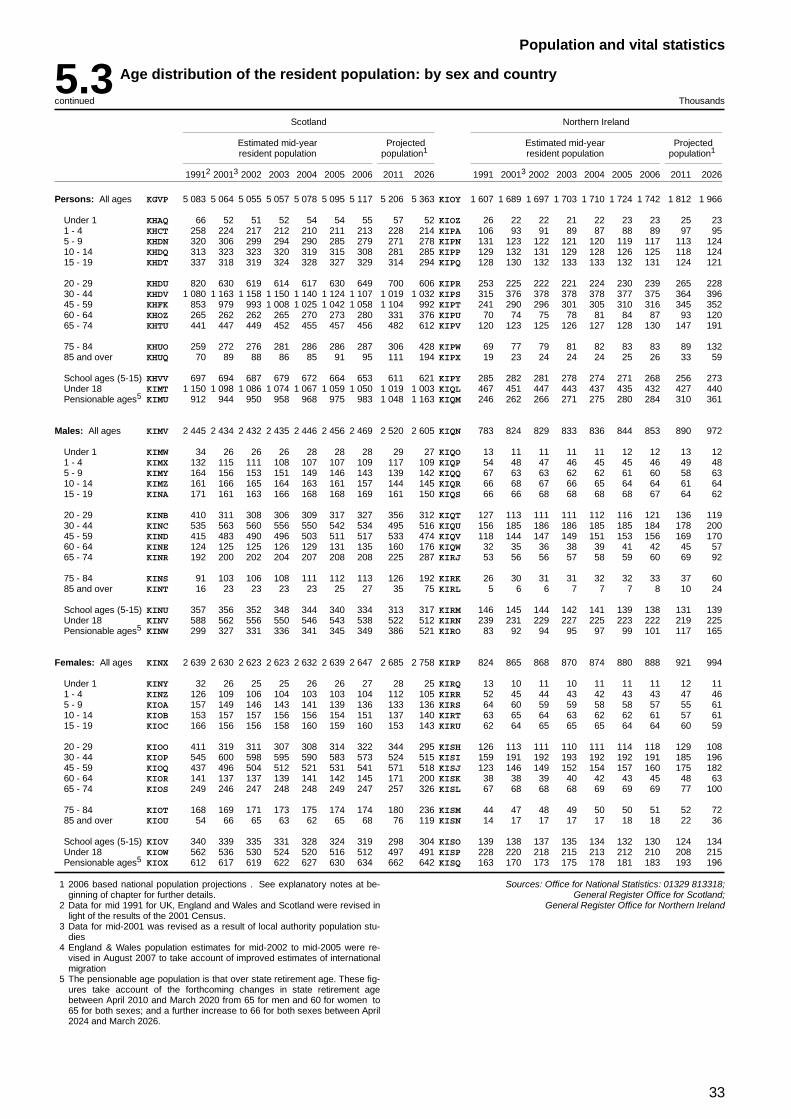
33
Population and vital statistics
5.3 Age distribution of the resident population: by sex and country
continued Thousands
Scotland Northern Ireland
Estimated mid-year Projected Estimated mid-year Projectedresident population population1 resident population population1
19912 20013 2002 2003 2004 2005 2006 2011 2026 1991 20013 2002 2003 2004 2005 2006 2011 2026
Persons: All ages KGVP 5 083 5 064 5 055 5 057 5 078 5 095 5 117 5 206 5 363 KIOY 1 607 1 689 1 697 1 703 1 710 1 724 1 742 1 812 1 966
Under 1 KHAQ 66 52 51 52 54 54 55 57 52 KIOZ 26 22 22 21 22 23 23 25 231 - 4 KHCT 258 224 217 212 210 211 213 228 214 KIPA 106 93 91 89 87 88 89 97 955 - 9 KHDN 320 306 299 294 290 285 279 271 278 KIPN 131 123 122 121 120 119 117 113 12410 - 14 KHDQ 313 323 323 320 319 315 308 281 285 KIPP 129 132 131 129 128 126 125 118 12415 - 19 KHDT 337 318 319 324 328 327 329 314 294 KIPQ 128 130 132 133 133 132 131 124 121
20 - 29 KHDU 820 630 619 614 617 630 649 700 606 KIPR 253 225 222 221 224 230 239 265 22830 - 44 KHDV 1 080 1 163 1 158 1 150 1 140 1 124 1 107 1 019 1 032 KIPS 315 376 378 378 378 377 375 364 39645 - 59 KHFK 853 979 993 1 008 1 025 1 042 1 058 1 104 992 KIPT 241 290 296 301 305 310 316 345 35260 - 64 KHOZ 265 262 262 265 270 273 280 331 376 KIPU 70 74 75 78 81 84 87 93 12065 - 74 KHTU 441 447 449 452 455 457 456 482 612 KIPV 120 123 125 126 127 128 130 147 191
75 - 84 KHUO 259 272 276 281 286 286 287 306 428 KIPW 69 77 79 81 82 83 83 89 13285 and over KHUQ 70 89 88 86 85 91 95 111 194 KIPX 19 23 24 24 24 25 26 33 59
School ages (5-15) KHVV 697 694 687 679 672 664 653 611 621 KIPY 285 282 281 278 274 271 268 256 273Under 18 KIMT 1 150 1 098 1 086 1 074 1 067 1 059 1 050 1 019 1 003 KIQL 467 451 447 443 437 435 432 427 440Pensionable ages5 KIMU 912 944 950 958 968 975 983 1 048 1 163 KIQM 246 262 266 271 275 280 284 310 361
Males: All ages KIMV 2 445 2 434 2 432 2 435 2 446 2 456 2 469 2 520 2 605 KIQN 783 824 829 833 836 844 853 890 972
Under 1 KIMW 34 26 26 26 28 28 28 29 27 KIQO 13 11 11 11 11 12 12 13 121 - 4 KIMX 132 115 111 108 107 107 109 117 109 KIQP 54 48 47 46 45 45 46 49 485 - 9 KIMY 164 156 153 151 149 146 143 139 142 KIQQ 67 63 63 62 62 61 60 58 6310 - 14 KIMZ 161 166 165 164 163 161 157 144 145 KIQR 66 68 67 66 65 64 64 61 6415 - 19 KINA 171 161 163 166 168 168 169 161 150 KIQS 66 66 68 68 68 68 67 64 62
20 - 29 KINB 410 311 308 306 309 317 327 356 312 KIQT 127 113 111 111 112 116 121 136 11930 - 44 KINC 535 563 560 556 550 542 534 495 516 KIQU 156 185 186 186 185 185 184 178 20045 - 59 KIND 415 483 490 496 503 511 517 533 474 KIQV 118 144 147 149 151 153 156 169 17060 - 64 KINE 124 125 125 126 129 131 135 160 176 KIQW 32 35 36 38 39 41 42 45 5765 - 74 KINR 192 200 202 204 207 208 208 225 287 KIRJ 53 56 56 57 58 59 60 69 92
75 - 84 KINS 91 103 106 108 111 112 113 126 192 KIRK 26 30 31 31 32 32 33 37 6085 and over KINT 16 23 23 23 23 25 27 35 75 KIRL 5 6 6 7 7 7 8 10 24
School ages (5-15) KINU 357 356 352 348 344 340 334 313 317 KIRM 146 145 144 142 141 139 138 131 139Under 18 KINV 588 562 556 550 546 543 538 522 512 KIRN 239 231 229 227 225 223 222 219 225Pensionable ages5 KINW 299 327 331 336 341 345 349 386 521 KIRO 83 92 94 95 97 99 101 117 165
Females: All ages KINX 2 639 2 630 2 623 2 623 2 632 2 639 2 647 2 685 2 758 KIRP 824 865 868 870 874 880 888 921 994
Under 1 KINY 32 26 25 25 26 26 27 28 25 KIRQ 13 10 11 10 11 11 11 12 111 - 4 KINZ 126 109 106 104 103 103 104 112 105 KIRR 52 45 44 43 42 43 43 47 465 - 9 KIOA 157 149 146 143 141 139 136 133 136 KIRS 64 60 59 59 58 58 57 55 6110 - 14 KIOB 153 157 157 156 156 154 151 137 140 KIRT 63 65 64 63 62 62 61 57 6115 - 19 KIOC 166 156 156 158 160 159 160 153 143 KIRU 62 64 65 65 65 64 64 60 59
20 - 29 KIOO 411 319 311 307 308 314 322 344 295 KISH 126 113 111 110 111 114 118 129 10830 - 44 KIOP 545 600 598 595 590 583 573 524 515 KISI 159 191 192 193 192 192 191 185 19645 - 59 KIOQ 437 496 504 512 521 531 541 571 518 KISJ 123 146 149 152 154 157 160 175 18260 - 64 KIOR 141 137 137 139 141 142 145 171 200 KISK 38 38 39 40 42 43 45 48 6365 - 74 KIOS 249 246 247 248 248 249 247 257 326 KISL 67 68 68 68 69 69 69 77 100
75 - 84 KIOT 168 169 171 173 175 174 174 180 236 KISM 44 47 48 49 50 50 51 52 7285 and over KIOU 54 66 65 63 62 65 68 76 119 KISN 14 17 17 17 17 18 18 22 36
School ages (5-15) KIOV 340 339 335 331 328 324 319 298 304 KISO 139 138 137 135 134 132 130 124 134Under 18 KIOW 562 536 530 524 520 516 512 497 491 KISP 228 220 218 215 213 212 210 208 215Pensionable ages5 KIOX 612 617 619 622 627 630 634 662 642 KISQ 163 170 173 175 178 181 183 193 196
1 2006 based national population projections . See explanatory notes at be-ginning of chapter for further details.
2 Data for mid 1991 for UK, England and Wales and Scotland were revised inlight of the results of the 2001 Census.
3 Data for mid-2001 was revised as a result of local authority population stu-dies
4 England & Wales population estimates for mid-2002 to mid-2005 were re-vised in August 2007 to take account of improved estimates of internationalmigration
5 The pensionable age population is that over state retirement age. These fig-ures take account of the forthcoming changes in state retirement agebetween April 2010 and March 2020 from 65 for men and 60 for women to65 for both sexes; and a further increase to 66 for both sexes between April2024 and March 2026.
Sources: Office for National Statistics: 01329 813318;General Register Office for Scotland;
General Register Office for Northern Ireland

34
Population and vital statistics
5.4 Marital condition (de jure): estimated population: by age and sexEngland and Wales
Thousands
Males Females
19911 2001 20022 20032 20042 20052 2006 19911 2001 20022 20032 20042 20052 2006
All ages:Single KRPL 11 131 12 270 12 432 12 596 12 778 12 978 13 188 KUBS 9 824 10 917 11 048 11 190 11 342 11 537 11 730Married KRPM 11 636 11 090 11 008 10 929 10 851 10 801 10 723 KVCC 11 833 11 150 11 075 11 000 10 935 10 882 10 812Widowed KRPN 727 733 730 727 724 722 720 KVCD 2 951 2 745 2 710 2 669 2 629 2 589 2 549Divorced KRPO 1 187 1 482 1 534 1 589 1 642 1 696 1 739 KVCE 1 459 1 975 2 036 2 096 2 156 2 215 2 266
Age groups:0 - 14: Single KRPP 4 939 5 036 4 999 4 967 4 941 4 912 4 880 KVCF 4 720 4 796 4 763 4 726 4 696 4 670 4 648
15 - 19: Single KRPQ 1 659 1 645 1 698 1 749 1 778 1 792 1 822 KVCG 1 554 1 560 1 587 1 632 1 667 1 694 1 706Married KRPR 8 5 4 4 3 2 2 KVCH 32 16 13 12 11 9 7Widowed KRPS – 1 1 1 – – – KVCI – 1 1 1 – – –Divorced KRPT – 1 1 1 – – – KVCJ – 1 1 – – – –
20 - 24: Single KRPU 1 717 1 501 1 533 1 573 1 639 1 700 1 749 KVCK 1 421 1 390 1 430 1 465 1 497 1 547 1 599Married KRPV 242 74 69 68 69 66 59 KVCL 490 178 167 161 157 150 138Widowed KRPW – 1 1 1 1 1 1 KVCM 1 1 1 1 2 2 1Divorced KRPX 12 3 3 3 3 3 3 KVCN 29 8 8 8 8 8 7
25 - 34: Single KRPY 1 652 2 227 2 245 2 260 2 285 2 345 2 409 KVCO 1 135 1 770 1 796 1 826 1 866 1 934 1 997Married KRPZ 2 028 1 391 1 293 1 205 1 129 1 068 998 KVCP 2 488 1 768 1 662 1 568 1 483 1 421 1 347Widowed KRQA 2 3 3 3 3 3 3 KVCQ 8 10 9 8 8 7 7Divorced KRQB 237 136 131 126 121 115 107 KVCR 312 231 219 208 196 185 173
35 - 44: Single KRQC 477 963 1 031 1 089 1 141 1 195 1 249 KVEH 280 692 751 804 858 910 965Married KRQD 2 632 2 494 2 490 2 471 2 441 2 417 2 371 KVEI 2 760 2 649 2 650 2 631 2 613 2 583 2 543Widowed KRQE 11 12 12 12 11 11 11 KVEJ 34 36 35 34 32 31 30Divorced KRQF 384 411 424 435 443 450 448 KVEK 444 558 572 583 593 597 595
45 - 54: Single KRQG 251 419 432 451 474 501 534 KVEL 144 256 271 289 310 335 365Married KUAR 2 347 2 511 2 429 2 377 2 347 2 334 2 337 KVEM 2 322 2 548 2 475 2 426 2 398 2 385 2 390Widowed KUBA 31 37 35 34 33 32 31 KVEN 118 111 105 99 96 93 90Divorced KUBB 290 448 454 466 481 499 518 KVEO 332 557 566 578 594 613 636
55 - 59: Single KUBC 101 128 141 150 158 165 170 KVEP 69 74 81 86 91 97 102Married KUBD 1 050 1 156 1 237 1 276 1 285 1 281 1 265 KVEQ 982 1 125 1 212 1 255 1 270 1 270 1 258Widowed KUBE 34 34 36 37 37 37 37 KVER 136 112 115 114 112 109 106Divorced KUBF 95 174 194 210 221 231 239 KVES 107 210 235 255 270 282 291
60 - 64: Single KUBG 104 97 97 100 104 108 114 KVET 80 62 61 62 63 65 69Married KUBH 997 980 976 990 1 011 1 037 1 074 KVEU 908 906 910 931 958 987 1 028Widowed KUBI 63 50 49 48 47 48 49 KVEV 250 178 172 167 163 160 159Divorced KUBJ 70 125 131 138 148 158 170 KVEW 82 151 159 169 181 194 210
65 - 74: Single KUBK 150 155 154 153 152 151 149 KMGN 176 130 126 123 120 117 113Married KUBL 1 574 1 569 1 580 1 594 1 605 1 612 1 608 KMGO 1 317 1 322 1 336 1 356 1 373 1 388 1 392Widowed KUBM 229 188 183 179 175 171 166 KMGP 879 697 675 655 634 611 584Divorced KUBN 74 139 149 158 169 179 188 KMGQ 107 177 190 204 218 232 243
75 andover: Single KUBO 81 99 101 103 106 109 112 KMGR 246 188 182 177 173 169 166
Married KUBP 759 909 928 944 961 984 1 010 KMGS 536 639 651 661 673 689 709Widowed KUBQ 357 407 411 414 417 420 423 KMGT 1 526 1 598 1 597 1 590 1 583 1 576 1 571Divorced KUBR 25 44 48 51 56 61 66 KMGU 46 81 86 90 96 103 110
1 Mid-1991 marital status estimates are revised in light of the 2001 Census2 Mid-2002 to Mid-2005 marital status estimates for England and Wales have
been updated to include the latest revised estimates that take into accountimproved estimates of international migration.
Source: Office for National Statistics: 01329 813318

35
Population and vital statistics
5.5 Geographical distribution of the population
Thousands
Population Mid-yearenumerated in Census population estimates
1911 1931 1951 1971 1981 1991 2001 20021 20031 20041 20051 2006
United Kingdom KIUR 42 082 46 074 50 225 55 928 56 357 57 439 59 113 59 323 59 557 59 846 60 238 60 587
Great Britain KISR 40 831 44 795 48 854 54 388 54 815 55 831 57 424 57 627 57 855 58 136 58 514 58 846
England KKOJ 33 650 37 359 41 159 46 412 46 821 47 875 49 450 49 652 49 866 50 111 50 466 50 763Standard Regions
North KKNA 2 729 2 938 3 009 3 152 3 117 3 073 3 028 3 029 3 033 3 037 3 045 3 052Yorkshire and Humberside KKNB 3 896 4 319 4 567 4 902 4 918 4 936 4 977 5 002 5 028 5 064 5 108 5 142East Midlands KKNC 2 467 2 732 3 118 3 652 3 853 4 011 4 190 4 222 4 254 4 291 4 328 4 364East Anglia KKND 1 191 1 231 1 381 1 688 1 894 2 068 2 181 2 195 2 220 2 242 2 268 2 287South East KKNE 11 613 13 349 14 877 17 125 17 011 17 511 18 566 18 646 18 706 18 783 18 936 19 069South West KKNF 2 818 2 984 3 479 4 112 4 381 4 688 4 943 4 973 5 005 5 042 5 087 5 124West Midlands KKNG 3 277 3 743 4 423 5 146 5 187 5 230 5 281 5 295 5 312 5 327 5 351 5 367North West KKNH 5 659 6 062 6 305 6 634 6 459 6 357 6 285 6 290 6 309 6 325 6 344 6 357
Government Office RegionsNorth East JZBU .. – – 2 679 2 636 2 587 2 540 2 541 2 541 2 542 2 550 2 556North West (including Merseyside) JZBV .. – – 7 108 6 940 6 843 6 773 6 778 6 800 6 820 6 840 6 853Yorkshire and The Humber JZBX .. – – 4 902 4 918 4 936 4 977 5 002 5 028 5 064 5 108 5 142East Midlands JZBY .. – – 3 652 3 853 4 011 4 190 4 222 4 254 4 291 4 328 4 364West Midlands JZBZ .. – – 5 146 5 187 5 230 5 281 5 295 5 312 5 327 5 351 5 367South West JZCA .. – – 4 112 4 381 4 688 4 943 4 973 5 005 5 042 5 087 5 124East of England JZCB .. – – 4 454 4 854 5 121 5 400 5 433 5 475 5 511 5 563 5 607London JZCC .. – – 7 529 6 806 6 829 7 322 7 362 7 364 7 389 7 456 7 512South East JZCD .. – – 6 830 7 245 7 629 8 023 8 047 8 087 8 125 8 185 8 238
Wales KKNI 2 421 2 593 2 599 2 740 2 813 2 873 2 910 2 920 2 931 2 946 2 954 2 966Scotland KGJB 4 761 4 843 5 096 5 236 5 180 5 083 5 064 5 055 5 057 5 078 5 095 5 117Northern Ireland4 KGJC 1 251 1 280 1 371 1 540 1 543 1 607 1 689 1 697 1 703 1 710 1 724 1 742
Greater London KKNJ 7 161 8 110 8 197 7 529 6 806 6 829 7 322 7 362 7 364 7 389 7 456 7 512Inner London2 KISS 4 998 4 893 3 679 3 060 2 550 2 599 2 859 2 886 2 891 2 907 2 944 2 973Outer London2 KITF 2 162 3 217 4 518 4 470 4 255 4 230 4 463 4 475 4 473 4 482 4 512 4 539
Metropolitan areas of England and Wales KITG 9 716 10 770 11 365 11 862 11 353 11 085 10 888 10 907 10 930 10 956 11 010 11 049Tyne and Wear KGJN 1 105 1 201 1 201 1 218 1 155 1 124 1 087 1 087 1 085 1 083 1 086 1 088West Yorkshire KGJP 1 852 1 939 1 985 2 090 2 067 2 062 2 083 2 094 2 103 2 119 2 142 2 161South Yorkshire KGJO 963 1 173 1 253 1 331 1 317 1 289 1 266 1 270 1 273 1 279 1 288 1 293West Midlands KGJQ 1 780 2 143 2 547 2 811 2 673 2 619 2 568 2 574 2 578 2 582 2 594 2 600Greater Manchester KGJR 2 638 2 727 2 716 2 750 2 619 2 554 2 516 2 518 2 528 2 534 2 543 2 554Merseyside KGJS 1 378 1 587 1 663 1 662 1 522 1 438 1 368 1 364 1 362 1 359 1 357 1 354
Principal Metropolitan Cities2 KITH 3 154 3 906 3 915 3 910 3 550 3 415 3 344 3 356 3 364 3 382 3 417 3 441Newcastle KGJT 267 286 292 312 284 275 266 267 267 267 270 270Leeds KGJX 446 483 505 749 718 707 716 720 723 729 741 750Sheffield KGJV 455 512 513 579 548 520 513 514 513 517 522 526Birmingham KGKF 526 1 003 1 113 1 107 1 021 1 005 985 989 992 996 1 003 1 007Manchester KGKJ 714 766 703 554 463 433 423 426 431 436 445 452Liverpool KGKM 746 856 789 610 517 476 442 441 439 437 437 436
Other metropolitan districts2 KITI 6 562 6 864 7 450 7 952 7 803 7 670 7 544 7 551 7 565 7 574 7 593 7 608
Non-metropolitan districts of England and Wales KITJ 19 194 21 072 24 196 29 761 31 475 32 834 31 239 31 383 31 572 31 766 32 000 32 201Non-metropolitan cities2,3 KITK .. – – 4 715 4 617 – – – – – – ..Incl. Kingston-upon-Hull KKNZ 278 314 299 288 274 263 250 250 251 253 255 256
Leicester KKOA 227 239 285 285 283 281 283 282 282 283 286 290Nottingham KKNX 260 269 308 302 278 279 269 272 275 279 283 286Bristol KKNV 357 397 443 433 401 392 390 391 394 397 406 410Plymouth KITL 207 215 225 249 253 251 241 242 242 244 246 248Stoke-on-Trent KKOD 235 277 275 265 252 249 240 239 239 239 239 240Cardiff KKOB 182 224 244 291 281 297 310 311 310 312 314 318Newport IFX3 84 89 106 137 132 135 138 139 139 139 140 140
Industrial districts2,3 KITM .. – – 6 486 6 713 .. – – – – – –New Towns2,3 KITN .. – – 1 895 2 194 .. – – – – – –Resort, port and retirement districts2,3 KITO .. – – 3 184 3 368 – – – – – – –Urban and mixed urban/rural districts2,3 KITP .. – – 8 821 9 446 – – – – – – –Remoter, mainly rural districts2,3 KITQ .. – – 4 661 5 137 – – – – – – –
City of Edinburgh local government district KGKU 320 439 467 478 446 436 449 448 448 455 458 464City of Glasgow local government district KGKT 784 1 088 1 090 983 774 629 579 577 577 578 579 581Belfast4 KGKV 387 438 444 – 316 293 277 274 272 269 268 267
1 Mid 2002 to mid 2005 population estimates for the UK and England & Waleshave been updated to include the latest revised estimates that take im-proved estimates of international migration into account.
2 Details of the classification by broad area type are given in recent issues ofthe ONS annual reference volume Key Population and Vital Statistics; localand health authority areas (Series VS). The ten broad area types include alllocal authorities in England and Wales.
3 The breakdown of non-metropolitan districts by area type has not been pro-vided from mid-2001 onwards. This is because the effect of boundarychanges due to the major local government reorganisation on 1 April 1995and 1 April 1996 (particularly in Wales) make the comparison of 2001 datawith data for earlier years invalid.
4 1931 figures shown for Northern Ireland and the City of Belfast relate to the1937 Census.
Sources: Office for National Statistics: 01329 813318;General Register Office for Scotland;
Northern Ireland Statistics and Research Agency
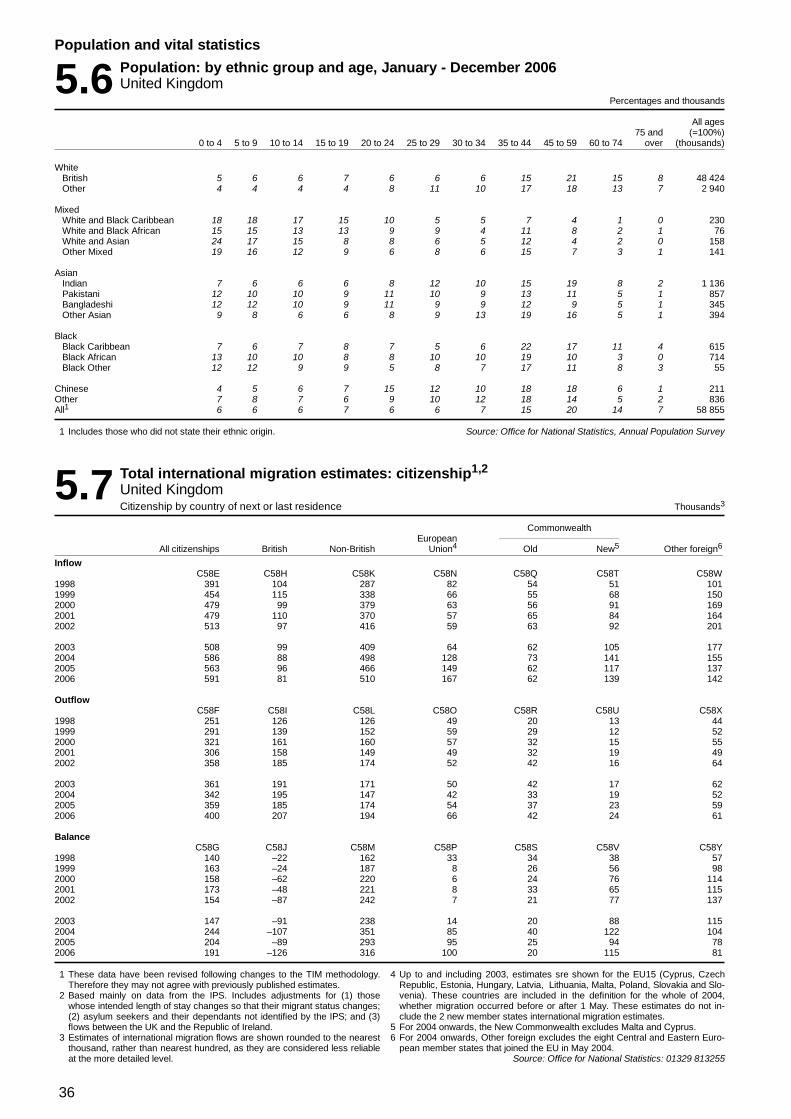
36
Population and vital statistics
5.6 Population: by ethnic group and age, January - December 2006United Kingdom
Percentages and thousands
All ages75 and (=100%)
0 to 4 5 to 9 10 to 14 15 to 19 20 to 24 25 to 29 30 to 34 35 to 44 45 to 59 60 to 74 over (thousands)
WhiteBritish 5 6 6 7 6 6 6 15 21 15 8 48 424Other 4 4 4 4 8 11 10 17 18 13 7 2 940
MixedWhite and Black Caribbean 18 18 17 15 10 5 5 7 4 1 0 230White and Black African 15 15 13 13 9 9 4 11 8 2 1 76White and Asian 24 17 15 8 8 6 5 12 4 2 0 158Other Mixed 19 16 12 9 6 8 6 15 7 3 1 141
AsianIndian 7 6 6 6 8 12 10 15 19 8 2 1 136Pakistani 12 10 10 9 11 10 9 13 11 5 1 857Bangladeshi 12 12 10 9 11 9 9 12 9 5 1 345Other Asian 9 8 6 6 8 9 13 19 16 5 1 394
BlackBlack Caribbean 7 6 7 8 7 5 6 22 17 11 4 615Black African 13 10 10 8 8 10 10 19 10 3 0 714Black Other 12 12 9 9 5 8 7 17 11 8 3 55
Chinese 4 5 6 7 15 12 10 18 18 6 1 211Other 7 8 7 6 9 10 12 18 14 5 2 836All1 6 6 6 7 6 6 7 15 20 14 7 58 855
1 Includes those who did not state their ethnic origin. Source: Office for National Statistics, Annual Population Survey
5.7 Total international migration estimates: citizenship1,2
United KingdomCitizenship by country of next or last residence Thousands3
CommonwealthEuropean
All citizenships British Non-British Union4 Old New5 Other foreign6
InflowC58E C58H C58K C58N C58Q C58T C58W
1998 391 104 287 82 54 51 1011999 454 115 338 66 55 68 1502000 479 99 379 63 56 91 1692001 479 110 370 57 65 84 1642002 513 97 416 59 63 92 201
2003 508 99 409 64 62 105 1772004 586 88 498 128 73 141 1552005 563 96 466 149 62 117 1372006 591 81 510 167 62 139 142
OutflowC58F C58I C58L C58O C58R C58U C58X
1998 251 126 126 49 20 13 441999 291 139 152 59 29 12 522000 321 161 160 57 32 15 552001 306 158 149 49 32 19 492002 358 185 174 52 42 16 64
2003 361 191 171 50 42 17 622004 342 195 147 42 33 19 522005 359 185 174 54 37 23 592006 400 207 194 66 42 24 61
BalanceC58G C58J C58M C58P C58S C58V C58Y
1998 140 –22 162 33 34 38 571999 163 –24 187 8 26 56 982000 158 –62 220 6 24 76 1142001 173 –48 221 8 33 65 1152002 154 –87 242 7 21 77 137
2003 147 –91 238 14 20 88 1152004 244 –107 351 85 40 122 1042005 204 –89 293 95 25 94 782006 191 –126 316 100 20 115 81
1 These data have been revised following changes to the TIM methodology.Therefore they may not agree with previously published estimates.
2 Based mainly on data from the IPS. Includes adjustments for (1) thosewhose intended length of stay changes so that their migrant status changes;(2) asylum seekers and their dependants not identified by the IPS; and (3)flows between the UK and the Republic of Ireland.
3 Estimates of international migration flows are shown rounded to the nearestthousand, rather than nearest hundred, as they are considered less reliableat the more detailed level.
4 Up to and including 2003, estimates sre shown for the EU15 (Cyprus, CzechRepublic, Estonia, Hungary, Latvia, Lithuania, Malta, Poland, Slovakia and Slo-venia). These countries are included in the definition for the whole of 2004,whether migration occurred before or after 1 May. These estimates do not in-clude the 2 new member states international migration estimates.
5 For 2004 onwards, the New Commonwealth excludes Malta and Cyprus.6 For 2004 onwards, Other foreign excludes the eight Central and Eastern Euro-
pean member states that joined the EU in May 2004.Source: Office for National Statistics: 01329 813255

37
Population and vital statistics
5.8 Estimates of migration into and out of the United Kingdom by usualoccupation1,2 and sex
Thousands
Total Professional and managerial Manual and clerical Not gainfully employed3
Persons Males Females Persons Males Females Persons Males Females Persons Males Females
Inflow
KGOA KGOB KGOC KGOD KGOE KGOF KGOG KGOH KGOI KGOJ KGOK KGOL1998 318 160 158 112 65 47 71 35 35 136 60 761999 354 181 173 131 77 54 75 40 35 148 63 842000 359 188 171 162 98 64 64 33 31 133 57 762001 372 187 185 138 77 62 77 39 38 157 72 852002 386 200 186 139 78 62 83 45 38 163 77 87
2003 427 211 215 146 76 71 92 46 46 189 90 992004 518 261 257 175 102 73 132 66 65 212 92 1192005 496 273 223 168 97 71 145 90 55 184 86 982006 529 280 249 154 82 72 136 79 57 239 120 119
Outflow
KGPA KGPB KGPC KGPD KGPE KGPF KGPG KGPH KGPI KGPJ KGPK KGPL1998 206 103 103 82 48 34 42 22 21 82 33 481999 245 132 114 97 60 38 69 32 37 79 41 392000 278 154 124 128 80 48 59 36 23 90 37 532001 250 135 115 102 66 36 60 30 30 88 39 492002 305 161 144 123 79 45 80 40 40 102 42 59
2003 314 165 149 108 60 49 103 59 44 102 46 572004 310 152 158 114 65 49 73 40 33 123 47 762005 328 187 141 137 88 50 83 47 37 108 53 552006 369 208 162 125 77 48 119 73 46 126 58 68
Balance
KGRA KGRB KGRC KGRD KGRE KGRF KGRG KGRH KGRI KGRJ KGRK KGRL1998 113 57 55 30 17 13 28 13 15 54 27 271999 109 49 60 34 18 16 6 8 –2 69 23 462000 82 35 47 34 18 16 5 –3 8 43 20 232001 122 52 70 36 11 25 17 9 8 70 33 362002 81 39 42 16 –1 17 3 5 –2 62 34 27
2003 113 47 67 38 16 22 –11 –13 2 86 44 422004 208 109 99 61 37 24 58 26 32 89 45 432005 168 86 82 31 9 21 61 43 18 76 34 432006 160 72 87 29 5 24 17 6 11 113 62 51
1 See chapter text.2 These data have been revised in line with recent changes to the weightings
used to gross up the IPS data. Therefore they may not agree with previousestimates that have been published.
3 Includes housepersons, students, children and retired persons.
Source: Office for National Statistics: 01329 813255

38
Population and vital statistics
5.9 Estimates of migration into and out of the United Kingdom1 by citizenshipand country of last or next residence
Thousands
European Union citizens1
British citizens (excluding British)----------------- --------------
Country of last/next residence Country of last/next residenceAll
migrants Old New UnitedEuropean Common- Common- States of Other European Other Other
Total Total Union1 wealth wealth2 America countries3 Total Union1 Europe3 countries4
Inflow
KEZR KGLA KGLB KGLC KGLD KGLE KGLF KGLG KGLH KGLI KGLJ1998 318 104 28 29 15 16 17 70 64 – 51999 354 115 30 37 15 13 20 59 54 – 52000 359 99 28 29 14 8 20 59 52 – 62001 372 110 26 34 18 10 22 53 50 – 32002 386 97 30 23 10 9 25 55 50 2 3
2003 427 99 37 25 11 10 15 61 54 1 62004 518 84 21 23 15 9 16 106 99 – 62005 496 91 35 24 14 8 11 118 110 2 72006 529 77 32 16 7 4 18 136 129 1 7
Outflow
KEZS KGMA KGMB KGMC KGMD KGME KGMF KGMG KGMH KGMI KGMJ1998 206 114 37 36 8 15 19 26 21 1.0 41999 245 115 37 41 8 14 14 47 41 – 62000 278 141 41 48 9 19 24 46 39 1.0 62001 250 133 41 47 7 15 22 40 34 1.0 52002 305 164 68 44 10 18 24 42 38 – 4
2003 314 170 71 55 9 13 22 42 33 3.0 52004 310 184 68 62 12 16 27 34 30 1.0 32005 328 174 74 62 6 10 22 47 42 1.0 42006 369 196 71 69 10 16 30 59 52 – 7
Balance
KEZT KGNA KGNB KGNC KGND KGNE KGNF KGNG KGNH KGNI KGNJ1998 113 –10 –10 –6 7 1 –2 44 43 –1 11999 109 .. –8 –4 7 –2 6 12 13 – –12000 82 –42 –14 –19 6 –11 –3 13 14 –1 –2001 122 –23 –15 –13 11 –5 – 13 16 –1 –22002 81 –66 –37 –21 – –9 1 13 11 2 –1
2003 113 –70 –34 –29 2 –2 –7 19 21 –3 12004 208 –100 –47 –39 3 –7 –11 72 69 –1 32005 168 –83 –39 –38 8 –2 –12 72 67 1 32006 160 –119 –39 –53 –3 –12 –12 78 78 1 –
These data have been revised in line with recent changes to the weightingsused to gross up the IPS data. Therefore they may not agree with previousestimates that have been published.
1 Up to and including 2003, estimates are shown for the EU15 (Austria, Belgi-um, Denmark, Finland, France, Germany, Greece, the Irish Republic, Italy,Luxembourg, Netherlands, Portugal, Spain and Sweden). From 2004 on-wards , the estimates are for the EU25 (EU15 plus the 10 countries ofCyprus, the Czech Republic, Estonia, Hungary, Latvia, Lithuania, Malta,Poland, Slovakia and Slovenia). These estimates do not include the 2 newmember states admitted to the EU in January 2007. These will be includedin the 2007 international migration estimates.
2 From 2004 onwards, the New Commonwealth excludes Malta and Cyprus.3 From 2004 onwards these categories exclude the 8 central and Eastern4 From 2004 onwards Other countries excludes Malta and cyprus.

39
Population and vital statistics
5.9 Estimates of migration into and out of the United Kingdom1 by citizenshipand country of last or next residence
continued Thousands
Commonwealth6 citizens Other foreign citizens4
------------------------- -------------------Country of last/next residence Country of last/next residence
OtherIndian2 African Other3 Euro- United Other
Aust- New South sub- Common- count- pean Other States of coun-Total ralia Canada Zealand Africa continent wealth ries Total Union5 Europe6 America tries
Inflow
KGLK KGLL KGLM KGLN KTDK IBH3 KGLQ IBH4 KGLU KGLV KGLW KGLX KGLY1998 88 24 5 13 11 13 10 12 56 4 7 18 271999 101 27 2 12 12 22 14 12 79 3 18 15 432000 113 22 6 11 13 30 13 18 89 2 11 13 632001 120 30 4 9 13 31 17 17 89 1 13 12 632002 121 20 4 9 20 33 22 11 113 2 11 16 84
2003 142 21 5 7 20 46 24 18 124 2 22 17 842004 204 24 5 8 30 77 38 21 125 1 12 14 982005 172 22 4 11 23 74 24 13 115 3 13 14 852006 193 29 6 8 16 95 17 21 122 9 13 15 86
Outflow
KGMK KGML KGMM KGMN KTDL IBH5 KGMQ IBH7 KGMU KGMV KGMW KGMX KGMY1998 30 9 1 3 4 3 2 7 35 2 7 9 181999 38 11 2 6 4 2 1 11 45 – 9 14 212000 43 12 3 8 5 3 2 10 48 3 11 9 242001 44 15 3 6 5 4 2 9 33 1 9 7 162002 52 18 6 9 5 5 2 7 47 2 12 16 18
2003 53 19 2 8 9 5 2 8 48 2 12 8 262004 50 17 4 5 7 4 3 12 42 5 2 8 282005 59 15 4 8 9 13 2 7 49 1 7 14 282006 65 17 5 7 13 11 3 8 50 3 7 11 29
Balance
KGNK KGNL KGNM KGNN KTDM IBH6 KGNQ IBH8 KGNU KGNV KGNW KGNX KGNY1998 59 15 3 10 7 10 8 6 21 2 1 9 91999 63 16 – 5 8 20 13 1 34 3 8 2 212000 70 10 4 2 9 26 10 8 41 –1 – 4 382001 76 15 1 3 8 27 14 8 56 – 3 6 472002 69 2 –1 – 15 29 21 4 66 – –1 – 66
2003 89 2 3 –1 11 41 23 10 76 –1 10 9 572004 153 7 1 3 23 74 35 10 83 –4 10 7 712005 113 7 1 3 14 61 22 7 66 2 7 1 572006 128 13 2 1 3 84 14 12 72 5 6 4 57
These data have been revised in line with recent changes to the weightingsused to gross up the IPS data. Therefore they may not agree with previousestimates that have been published.
1 From 2004 onwards, the Commonwealth excludes Malta and Cyprus.2 The Indian sub-contitent consists of Bangladesh, India, Sir Lanka and
Pakistan.3 From 2004 onwards Other countries includes Malta and Cyprus.4 From 2004 onwards Other foreign citizens excludes the 8 Central and
Eastern European countries that joined the EU in 2004.5 Up to and including 2003, estimates are shown for the EU15 (UK, Austria,
Belgium, Denmark, Finland, France, Germany, Greece, the Irish Republic,Italy, Luxembourg, Netherlands, Portugal, Spain and Sweden). From 2004onwards, the estimates are for the EU25 (EU15 plus the 8 Central andEastern European countries, Malta and Cyprus). These do not include the 2new member states admitted to the EU in January 2007. These will be in-cluded in the 2007 international migration estimates.
6 From 2004 onwards Other Europe excludes the 8 Central and EasternEuropean countries that joined the EU in 2004.
Source: Office for National Statistics: 01329 813255

40
Population and vital statistics
5.10 Grants of settlement by nationality1,2
United KingdomNumber of persons
20043 2005 20067 20043 2005 20067
Geographical region and Geographical region andnationality nationality_____________________ ___________________
All nationalities KGFA 139 210 179 120 134 430 Africa (continued)Somalia KGHG 3 825 8 255 2 125
Europe1 South Africa KGHH 7 560 9 385 5 675Sudan KGHI 745 730 405
Accession States Tanzania KGHJ 570 700 490Cyprus KGFN 160 .. .. Tunisia KGHK 115 135 195Czech Republic LQLS 520 .. .. Uganda KGHL 960 1 065 685Estonia LQLU 165 .. .. Zambia KGHM 500 830 455Hungary KGFZ 100 .. .. Zimbabwe KGHN 3 765 4 520 3 420Latvia I8RF 210 .. .. Other Africa KOSU 3 585 5 600 3 380Lithuania LQLW 610 .. ..Malta KGFP 25 .. .. Africa KGHO 39 430 54 080 32 230Poland KGGA 1 220 .. ..Slovakia LQLT 255 .. .. AsiaSlovenia LQMB 5 .. .. Indian sub-continent
Bangladesh KGHP 3 115 3 085 2 860Accession States EL2O 3 275 .. .. India KGHQ 11 100 16 720 11 220
Pakistan KGHR 10 020 9 185 11 000Remainder of Europe
Albania I4UK 1 105 1 015 1 185 Indian sub-continent KGHS 24 235 28 990 25 080Bulgaria KGFW 625 1 225 4 250 Middle EastCroatia LQMA 985 625 185 Iran KGHT 1 725 2 055 1 050Romania KGGB 560 955 1 620 Iraq KGHU 1 725 4 675 6 875Russia LQLX 1 620 1 795 1 380 Israel KGHV 505 590 340Serbia & Montenegro LQMC 9 590 6 805 2 185 Jordan KGHW 250 310 150Turkey KGFT 6 060 5 330 3 095 Kuwait KGHX 90 70 20Ukraine LQLY 1 050 1 195 860 Lebanon KGHY 490 535 270Other former USSR LQLZ 830 1 015 635 Saudi Arabia KGHZ 60 70 60Other former Yugoslavia LQMD 285 385 295 Syria KGIA 255 295 220Other Europe KOSO 595 470 115 Yemen KOSV 420 410 320
Other Middle East KOSW 525 380 110Remainder of Europe EL2P 23 310 20 810 15 800
Middle East KGIB 6 045 9 395 9 405Europe1 KOSP 26 585 20 810 15 800
Remainder of AsiaAmericas Afghanistan I4UL 1 405 9 215 7 410
Argentina KGGF 95 145 125 China5 KGIC 2 515 4 215 3 365Barbados KGGG 145 120 130 Hong Kong6 KOSX 540 805 1 065Brazil KGGH 565 645 850 Indonesia KGID 195 300 255Canada KGGI 1 225 1 215 1 125 Japan KGIE 1 360 1 540 1 260Chile KGGJ 65 50 105 Malaysia KGIF 955 1 945 1 785Colombia KGGK 1 745 1 555 880 Nepal I4UM 515 3 610 6 940Guyana KGGM 170 235 165 Philippines KGIG 8 200 14 710 6 325Jamaica KGGN 2 930 2 780 2 900 Singapore KGIH 305 290 205Mexico KGGO 130 140 220 South Korea KOTE 570 815 620Peru KGGP 110 220 200 Sri Lanka KGII 4 870 5 475 3 135Trinidad and Tobago KGGQ 565 505 375 Thailand KGIJ 985 1 945 2 425USA KGGR 4 120 4 350 3 845 Other Asia KOSZ 405 490 525Venezuela KGGT 85 155 145Other Americas KOSR 2 175 1 790 1 065 Remainder of Asia KGIL 22 815 45 355 35 305
Americas KGGU 14 130 13 905 12 130 Asia KGIM 53 095 83 740 69 795
Africa OceaniaAlgeria KGGV 1 005 940 750 Australia KGIN 3 240 3 740 2 645Angola KOSS 1 090 1 695 980 New Zealand KGIO 2 370 2 505 1 405Congo (Dem. Rep.)4 KOST 2 410 2 960 1 190 Other Oceania KOTA 85 90 165Egypt KGGW 485 615 510Ethiopia KGGX 520 735 370 Oceania KGIP 5 690 6 335 4 215Ghana KGGY 2 305 2 880 2 910Kenya KGHA 2 255 2 690 1 685 British Overseas citizens KGIQ 75 95 65Libya KGHB 465 360 260 Nationality unknown KGIS 205 160 190Mauritius KGHC 530 860 675Morocco KGHD 305 390 390 All nationalities KGFA 139 210 179 120 134 430Nigeria KGHE 4 620 5 310 4 510Sierra Leone KGHF 1 805 3 420 1 160
1 Excluding European Economic Area and Swiss nationals throughout theperiod covered.
2 Data from 2003 also excludes dependants of EEA and Swiss nationals inconfirmed relationships granted permanent residence.
3 Includes nationals of the Czech Republic, Cyprus, Estonia, Hungary, Latvia,Luthuania, Malta, Poland, Slovakia and Slovenia before 1 May, but excludesthem from this date.
4 Formerly known as Zaire.5 Includes Taiwan.6 Hong Kong (Special Administrative Region of China) includes British overseas
territories citizens and stateless persons from Hong Kong and British Nationals(overseas).
7 Provisional
Source: Home Office: 020 8760 8341

41
Population and vital statistics
5.11 Applications1 received for asylum in the United Kingdom, excluding dependants,by nationality
Number of principal applicants
1998 19992 20002 2001 2002 2003 2004 2005 20063
EuropeAlbania LQME 560 1 310 1 490 1 065 1 150 595 295 175 155Macedonia PTDW 50 90 65 755 310 60 15 5 –Moldova VQHP 25 180 235 425 820 380 170 115 45Romania KEAV 1 015 1 985 2 160 1 400 1 210 550 295 115 75Russia ZAEQ 185 685 1 000 450 295 280 190 130 115Serbia & Montenegro ZAFA 7 395 11 465 6 070 3 230 2 265 815 290 155 70Turkey KEAW 2 015 2 850 3 990 3 695 2 835 2 390 1 230 755 425Ukraine ZAER 370 775 770 445 365 300 120 55 50E U Accession States GH5T 4 975 5 350 3 745 2 025 3 200 310 75 10 10Other Former USSR ZAES 300 875 1 050 485 615 520 315 265 220Europe Other ZAEU 855 2 715 2 310 245 175 85 35 35 45
Total KEAZ 17 745 28 280 22 880 14 215 13 235 6 295 3 025 1 810 1 210
AmericasColombia KEBZ 425 1 000 505 365 420 220 120 70 60Ecuador KYDB 280 610 445 255 315 150 35 10 15Jamaica PTDX 105 180 310 525 1 310 965 455 325 215Americas Other PTDY 165 240 155 170 240 230 130 100 95
Total KECT 975 2 025 1 420 1 315 2 290 1 560 740 505 385
AfricaAlgeria KOTB 1 260 1 385 1 635 1 140 1 060 550 490 255 225Angola KECU 150 545 800 1 015 1 420 850 400 145 95Burundi PTDZ 215 780 620 610 700 650 265 90 35Cameroon VQHU 95 245 355 380 615 505 360 290 260Congo PTEA 150 450 485 540 600 320 150 65 45Dem. Rep. Congo KEEH 660 1 240 1 030 1 370 2 215 1 540 1 475 1 080 570Eritrea PTEC 345 565 505 620 1 180 950 1 105 1 760 2 585Ethiopia KECW 345 455 415 610 700 640 540 385 200Gambia DMMA 45 30 50 65 130 95 100 90 110Ghana KECX 225 195 285 190 275 325 355 230 130Ivory Coast DMLZ 95 190 445 275 315 390 280 210 170Kenya KOTC 885 485 455 305 350 220 145 100 95Liberia C53K 70 65 55 115 450 740 405 175 50Nigeria KECY 1 380 945 835 810 1 125 1 010 1 090 1 025 790Rwanda ZAEV 280 820 760 530 655 260 75 40 20Sierra Leone KOTD 565 1 125 1 330 1 940 1 155 380 230 135 125Somalia KECZ 4 685 7 495 5 020 6 420 6 540 5 090 2 585 1 760 1 845Sudan KEEE 250 280 415 390 655 930 1 305 885 670Tanzania DMMC 80 80 60 80 40 30 20 20 15Uganda KEEG 210 420 740 480 715 705 405 205 165Zimbabwe GRFS 80 230 1 010 2 140 7 655 3 295 2 065 1 075 1 650Africa Other PTEB 305 400 615 555 845 895 910 615 480
Total KEEJ 12 380 18 435 17 920 20 590 29 390 20 370 14 745 10 640 10 340
Middle EastIran KEEK 745 1 320 5 610 3 420 2 630 2 875 3 455 3 150 2 375Iraq KEEL 1 295 1 800 7 475 6 680 14 570 4 015 1 695 1 415 945Libya GH5U 115 115 155 140 200 145 160 125 90Syria GH5V 65 95 140 110 70 110 350 330 160Middle East Other ZAEX 565 835 1 035 915 850 825 870 715 735
Total KEGY 2 785 4 165 14 415 11 265 18 315 7 970 6 525 5 730 4 305
AsiaAfghanistan DMLY 2 395 3 975 5 555 8 920 7 205 2 280 1 395 1 580 2 400Bangladesh ZAEY 460 530 795 510 720 735 510 425 440China KEGZ 1 925 2 625 4 000 2 390 3 675 3 450 2 365 1 730 1 945India KEIL 1 030 1 365 2 120 1 850 1 865 2 290 1 405 940 680Pakistan KEIM 1 975 2 615 3 165 2 860 2 405 1 915 1 710 1 145 965Sri Lanka KEIN 3 505 5 130 6 395 5 510 3 130 705 330 395 525Vietnam VQIB 35 105 180 400 840 1 125 755 380 90Asia Other PTEE 615 1 120 1 025 1 040 915 655 375 320 275
Total KEJO 11 940 17 465 23 230 23 480 20 755 13 155 8 850 6 915 7 320
Nationality not known KEJP 190 785 450 160 145 55 70 105 50
Grand Total KEJQ 46 015 71 160 80 315 71 025 84 130 49 405 33 960 25 710 23 610
1 Figures rounded to the nearest 5.2 May exclude some cases lodged at Local Enforcement Offices between
January 1999 and March 2000.3 Provisional figures.
Source: Home Office: 020 8760 8274
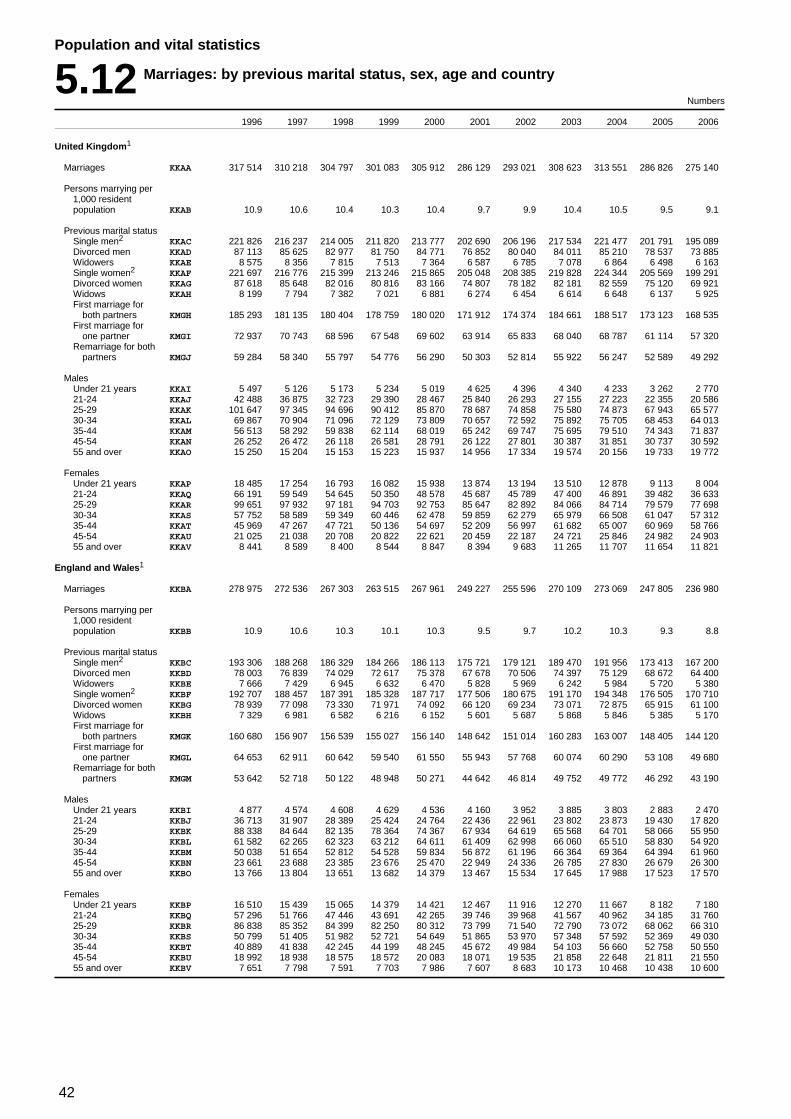
42
Population and vital statistics
5.12 Marriages: by previous marital status, sex, age and country
Numbers
1996 1997 1998 1999 2000 2001 2002 2003 2004 2005 2006
United Kingdom1
Marriages KKAA 317 514 310 218 304 797 301 083 305 912 286 129 293 021 308 623 313 551 286 826 275 140
Persons marrying per1,000 residentpopulation KKAB 10.9 10.6 10.4 10.3 10.4 9.7 9.9 10.4 10.5 9.5 9.1
Previous marital statusSingle men2 KKAC 221 826 216 237 214 005 211 820 213 777 202 690 206 196 217 534 221 477 201 791 195 089Divorced men KKAD 87 113 85 625 82 977 81 750 84 771 76 852 80 040 84 011 85 210 78 537 73 885Widowers KKAE 8 575 8 356 7 815 7 513 7 364 6 587 6 785 7 078 6 864 6 498 6 163Single women2 KKAF 221 697 216 776 215 399 213 246 215 865 205 048 208 385 219 828 224 344 205 569 199 291Divorced women KKAG 87 618 85 648 82 016 80 816 83 166 74 807 78 182 82 181 82 559 75 120 69 921Widows KKAH 8 199 7 794 7 382 7 021 6 881 6 274 6 454 6 614 6 648 6 137 5 925First marriage for
both partners KMGH 185 293 181 135 180 404 178 759 180 020 171 912 174 374 184 661 188 517 173 123 168 535First marriage for
one partner KMGI 72 937 70 743 68 596 67 548 69 602 63 914 65 833 68 040 68 787 61 114 57 320Remarriage for both
partners KMGJ 59 284 58 340 55 797 54 776 56 290 50 303 52 814 55 922 56 247 52 589 49 292
MalesUnder 21 years KKAI 5 497 5 126 5 173 5 234 5 019 4 625 4 396 4 340 4 233 3 262 2 77021-24 KKAJ 42 488 36 875 32 723 29 390 28 467 25 840 26 293 27 155 27 223 22 355 20 58625-29 KKAK 101 647 97 345 94 696 90 412 85 870 78 687 74 858 75 580 74 873 67 943 65 57730-34 KKAL 69 867 70 904 71 096 72 129 73 809 70 657 72 592 75 892 75 705 68 453 64 01335-44 KKAM 56 513 58 292 59 838 62 114 68 019 65 242 69 747 75 695 79 510 74 343 71 83745-54 KKAN 26 252 26 472 26 118 26 581 28 791 26 122 27 801 30 387 31 851 30 737 30 59255 and over KKAO 15 250 15 204 15 153 15 223 15 937 14 956 17 334 19 574 20 156 19 733 19 772
FemalesUnder 21 years KKAP 18 485 17 254 16 793 16 082 15 938 13 874 13 194 13 510 12 878 9 113 8 00421-24 KKAQ 66 191 59 549 54 645 50 350 48 578 45 687 45 789 47 400 46 891 39 482 36 63325-29 KKAR 99 651 97 932 97 181 94 703 92 753 85 647 82 892 84 066 84 714 79 579 77 69830-34 KKAS 57 752 58 589 59 349 60 446 62 478 59 859 62 279 65 979 66 508 61 047 57 31235-44 KKAT 45 969 47 267 47 721 50 136 54 697 52 209 56 997 61 682 65 007 60 969 58 76645-54 KKAU 21 025 21 038 20 708 20 822 22 621 20 459 22 187 24 721 25 846 24 982 24 90355 and over KKAV 8 441 8 589 8 400 8 544 8 847 8 394 9 683 11 265 11 707 11 654 11 821
England and Wales1
Marriages KKBA 278 975 272 536 267 303 263 515 267 961 249 227 255 596 270 109 273 069 247 805 236 980
Persons marrying per1,000 residentpopulation KKBB 10.9 10.6 10.3 10.1 10.3 9.5 9.7 10.2 10.3 9.3 8.8
Previous marital statusSingle men2 KKBC 193 306 188 268 186 329 184 266 186 113 175 721 179 121 189 470 191 956 173 413 167 200Divorced men KKBD 78 003 76 839 74 029 72 617 75 378 67 678 70 506 74 397 75 129 68 672 64 400Widowers KKBE 7 666 7 429 6 945 6 632 6 470 5 828 5 969 6 242 5 984 5 720 5 380Single women2 KKBF 192 707 188 457 187 391 185 328 187 717 177 506 180 675 191 170 194 348 176 505 170 710Divorced women KKBG 78 939 77 098 73 330 71 971 74 092 66 120 69 234 73 071 72 875 65 915 61 100Widows KKBH 7 329 6 981 6 582 6 216 6 152 5 601 5 687 5 868 5 846 5 385 5 170First marriage for
both partners KMGK 160 680 156 907 156 539 155 027 156 140 148 642 151 014 160 283 163 007 148 405 144 120First marriage for
one partner KMGL 64 653 62 911 60 642 59 540 61 550 55 943 57 768 60 074 60 290 53 108 49 680Remarriage for both
partners KMGM 53 642 52 718 50 122 48 948 50 271 44 642 46 814 49 752 49 772 46 292 43 190
MalesUnder 21 years KKBI 4 877 4 574 4 608 4 629 4 536 4 160 3 952 3 885 3 803 2 883 2 47021-24 KKBJ 36 713 31 907 28 389 25 424 24 764 22 436 22 961 23 802 23 873 19 430 17 82025-29 KKBK 88 338 84 644 82 135 78 364 74 367 67 934 64 619 65 568 64 701 58 066 55 95030-34 KKBL 61 582 62 265 62 323 63 212 64 611 61 409 62 998 66 060 65 510 58 830 54 92035-44 KKBM 50 038 51 654 52 812 54 528 59 834 56 872 61 196 66 364 69 364 64 394 61 96045-54 KKBN 23 661 23 688 23 385 23 676 25 470 22 949 24 336 26 785 27 830 26 679 26 30055 and over KKBO 13 766 13 804 13 651 13 682 14 379 13 467 15 534 17 645 17 988 17 523 17 570
FemalesUnder 21 years KKBP 16 510 15 439 15 065 14 379 14 421 12 467 11 916 12 270 11 667 8 182 7 18021-24 KKBQ 57 296 51 766 47 446 43 691 42 265 39 746 39 968 41 567 40 962 34 185 31 76025-29 KKBR 86 838 85 352 84 399 82 250 80 312 73 799 71 540 72 790 73 072 68 062 66 31030-34 KKBS 50 799 51 405 51 982 52 721 54 649 51 865 53 970 57 348 57 592 52 369 49 03035-44 KKBT 40 889 41 838 42 245 44 199 48 245 45 672 49 984 54 103 56 660 52 758 50 55045-54 KKBU 18 992 18 938 18 575 18 572 20 083 18 071 19 535 21 858 22 648 21 811 21 55055 and over KKBV 7 651 7 798 7 591 7 703 7 986 7 607 8 683 10 173 10 468 10 438 10 600

43
Population and vital statistics
5.12 Marriages: by previous marital status, sex, age and country
continued Numbers
1996 1997 1998 1999 2000 2001 2002 2003 2004 2005 2006
Scotland
Marriages KKCA 30 242 29 611 29 668 29 940 30 367 29 621 29 826 30 757 32 154 30 881 29 898
Persons marrying per1,000 residentpopulation KKCB 11.9 11.7 11.7 11.8 12.0 11.7 11.8 12.2 12.7 12.1 11.7
Previous marital statusSingle men2 KKCC 21 454 20 994 20 987 21 052 21 201 20 737 20 671 21 477 22 526 21 421 20 912Divorced men KKCD 8 048 7 845 7 934 8 142 8 427 8 238 8 475 8 574 8 930 8 796 8 330Widowers KKCE 740 772 747 746 739 646 680 706 698 664 656Single women2 KKCF 21 799 21 303 21 241 21 308 21 608 21 223 21 180 21 974 22 884 21 991 21 460Divorced women KKCG 7 718 7 621 7 754 7 949 8 141 7 825 8 008 8 157 8 622 8 244 7 802Widows KKCH 725 687 673 683 618 573 638 626 648 646 636First marriage for
both partners KEZV 18 071 17 751 17 677 17 680 17 864 17 468 17 426 18 232 19 039 18 221 17 922First marriage for
one partner KEZW 7 111 6 795 6 874 7 000 7 081 7 024 6 999 6 987 7 332 6 970 6 528Remarriage for
both partners KEZX 5 060 5 065 5 117 5 260 5 422 5 129 5 401 5 538 5 783 5 690 5 448
MalesUnder 21 years KKCI 452 406 421 490 364 371 367 361 336 304 22821-24 KKCJ 4 191 3 494 3 147 2 853 2 720 2 489 2 395 2 507 2 501 2 120 2 01225-29 KKCK 10 056 9 495 9 439 9 031 8 536 7 949 7 468 7 219 7 365 6 981 6 79530-34 KKCL 6 574 6 911 6 988 7 179 7 419 7 464 7 692 7 752 7 992 7 516 6 93535-44 KKCM 5 412 5 649 5 945 6 470 7 018 7 215 7 328 8 007 8 553 8 390 8 23445-54 KKCN 2 288 2 459 2 412 2 575 2 960 2 816 3 033 3 213 3 503 3 588 3 77255 and over KKCO 1 269 1 197 1 316 1 342 1 350 1 317 1 543 1 698 1 904 1 982 1 922
FemalesUnder 21 years KKCP 1 423 1 302 1 289 1 322 1 171 1 111 996 1 007 954 724 63521-24 KKCQ 6 474 5 568 5 248 4 778 4 581 4 343 4 171 4 199 4 358 3 772 3 47325-29 KKCR 9 818 9 574 9 764 9 539 9 495 8 994 8 520 8 321 8 528 8 339 8 23030-34 KKCS 5 675 5 927 6 036 6 433 6 463 6 618 6 832 7 110 7 235 7 016 6 51135-44 KKCT 4 378 4 722 4 726 5 150 5 633 5 712 6 115 6 583 7 163 7 083 7 00345-54 KKCU 1 794 1 844 1 900 1 994 2 279 2 147 2 322 2 589 2 821 2 862 2 97555 and over KKCV 680 674 705 724 745 696 870 948 1 095 1 085 1 071
Northern Ireland
Marriages KKDA 8 297 8 071 7 826 7 628 7 584 7 281 7 599 7 757 8 328 8 140 8 259
Persons marrying per1,000 residentpopulation KKDB 10.0 9.7 9.3 9.1 9.0 8.6 9.0 9.1 9.7 9.4 8.0
Previous marital statusSingle men2 KKDC 7 066 6 975 6 689 6 502 6 463 6 232 6 404 6 587 6 995 6 957 6 977Divorced men KKDD 1 062 941 1 014 991 966 936 1 059 1 040 1 151 1 069 1 155Widowers KKDE 169 155 123 135 155 113 136 130 182 114 127Single women2 KKDF 7 191 7 016 6 767 6 610 6 540 6 319 6 530 6 684 7 112 7 073 7 121Divorced women KKDG 961 929 932 896 933 862 940 953 1 062 961 1 019Widows KKDH 145 126 127 122 111 100 129 120 154 106 119First marriage for
both partners KEZY 6 542 6 477 6 188 6 052 6 016 5 802 5 934 6 146 6 471 6 497 6 493First marriage for
one partner KEZZ 1 173 1 037 1 080 1 008 971 947 1 066 979 1 165 1 036 1 112Remarriage for
both partners KFBI 582 557 558 568 597 532 599 632 692 607 654
MalesUnder 21 years KKDI 168 146 144 115 119 94 77 94 94 75 7221-24 KKDJ 1 584 1 474 1 187 1 113 983 915 937 846 849 805 75425-29 KKDK 3 253 3 206 3 122 3 017 2 967 2 804 2 771 2 793 2 807 2 896 2 83230-34 KKDL 1 711 1 728 1 785 1 738 1 779 1 784 1 902 2 080 2 203 2 107 2 15835-44 KKDM 1 063 989 1 081 1 116 1 167 1 155 1 223 1 324 1 593 1 559 1 64345-54 KKDN 303 325 321 330 361 357 432 389 518 470 52055 and over KKDO 215 203 186 199 208 172 257 231 264 228 280
FemalesUnder 21 years KKDP 552 513 439 381 346 296 282 233 257 207 18921-24 KKDQ 2 421 2 215 1 951 1 881 1 732 1 598 1 650 1 634 1 571 1 525 1 40025-29 KKDR 2 995 3 006 3 018 2 914 2 946 2 854 2 832 2 955 3 114 3 178 3 15830-34 KKDS 1 278 1 257 1 331 1 292 1 366 1 376 1 477 1 521 1 681 1 662 1 77135-44 KKDT 702 707 750 787 819 825 898 996 1 184 1 128 1 21345-54 KKDU 239 256 233 256 259 241 330 274 377 309 37855 and over KKDV 110 117 104 117 116 91 130 144 144 131 150
1 Figures for 2006 are rounded and provisional.2 Single men and single women are those who have never been married.
Sources: Office for National Statistics: 01329 444110;General Register Office for Scotland;
Northern Ireland Statistics and Research Agency

44
Population and vital statistics
5.13 Divorce: by duration of marriage, age of wife and country
Numbers
1996 1997 1998 1999 2000 2001 2002 2003 2004 2005 2006
United Kingdom
Decrees absolute granted1,2,5
Number ZBRL 171 729 161 087 160 057 158 746 154 628 156 814 160 726 166 737 167 138 155 052 148 141
Duration of marriage0-4 years ZBRM 37 016 33 719 33 087 31 047 28 933 28 306 28 591 28 781 28 746 26 549 25 0055-9 years ZBRN 48 670 45 040 44 243 43 357 41 621 42 360 42 924 43 558 42 855 39 070 37 11610-14 years ZBRO 30 159 29 085 29 706 30 270 30 166 30 849 31 257 32 564 31 775 29 007 27 64715-19 years ZBRP 21 379 20 211 20 078 20 147 19 902 20 568 21 881 23 119 23 898 22 593 21 24420 years and over ZBRQ 34 487 33 020 32 935 33 916 34 000 34 729 36 073 38 713 39 844 37 824 37 116Not stated ZBRR 18 12 8 9 6 2 .. 2 20 9 13
Age of wife at marriage16-19 years ZBRS 33 590 28 987 27 627 25 440 23 505 22 558 22 107 22 367 20 948 18 507 16 70720-24 years ZBRT 78 075 72 971 71 416 69 509 66 215 66 282 66 264 67 070 65 671 58 829 55 08525-29 years ZBRU 33 634 33 452 34 195 35 585 36 009 37 418 39 116 41 464 42 544 40 143 38 81230-34 years ZBRV 13 122 12 968 13 719 14 420 14 892 15 842 17 374 18 658 19 729 19 366 19 41935-39 years ZBRW 6 470 6 155 6 571 6 848 6 993 7 417 8 070 8 742 9 456 9 275 9 26140-44 years ZBRX 3 507 3 375 3 360 3 557 3 568 3 778 4 104 4 404 4 550 4 703 4 67745 years and over ZBRY 3 239 3 094 3 086 3 291 3 352 3 429 3 572 3 917 4 093 4 042 3 985Not stated ZBRZ 92 85 83 96 94 90 119 115 147 187 195
Age of wife at divorce16-24 years ZBSA 9 298 7 371 6 758 5 671 5 115 4 874 4 998 5 092 4 885 4 388 3 73925-29 years ZBSB 32 808 28 814 26 968 24 120 21 280 19 635 18 340 17 633 16 972 14 870 14 21630-34 years ZBSC 39 497 37 257 36 795 36 052 34 356 34 194 33 555 32 774 30 754 26 431 23 64135-39 years ZBSD 31 497 30 641 31 688 32 605 32 588 33 997 35 050 36 465 35 894 32 722 30 56740-44 years ZBSE 22 843 22 246 22 810 23 614 23 879 25 579 27 564 30 154 31 372 30 359 29 41245 years and over ZBSF 35 684 34 662 34 947 36 578 37 311 38 442 41 102 44 498 47 108 46 085 46 352Not stated ZBSG 102 96 91 106 99 93 117 121 153 197 214
Divorces in which there were3,4
No children aged under 16 ZBSH .. .. .. .. .. .. .. .. .. .. ..One or more children aged under 16 ZBSI .. .. .. .. .. .. .. .. .. .. ..
England and Wales
Decrees absolute granted1,2
Number KKEA 157 107 146 689 145 214 144 556 141 135 143 818 147 735 153 490 153 399 141 750 132 562
Rate per 1,000 married couples KKEB 13.8 13.0 12.9 12.9 12.7 12.9 13.4 14.0 14.1 13.0 12.2
Duration of marriage0-4 years KKEC 34 924 31 767 31 136 29 307 27 474 26 987 27 344 27 511 27 389 25 345 23 4275-9 years KKED 44 609 41 260 40 239 39 676 38 206 39 079 39 730 40 599 39 779 36 161 33 86410-14 years KKEE 27 332 26 215 26 698 27 384 27 459 28 176 28 592 29 831 29 086 26 394 24 68015-19 years KKEF 19 321 18 027 17 934 18 072 17 870 18 603 19 784 20 923 21 591 20 363 18 79220 years and over KKEG 30 912 29 408 29 199 30 108 30 120 30 971 32 285 34 624 35 554 33 478 31 786Not stated KKEH 9 12 8 9 6 2 – 2 – 9 13
Age of wife at marriage16-19 years KKEI 29 927 25 579 24 276 22 486 20 930 20 218 19 828 20 063 18 709 16 519 14 47820-24 years KKEJ 71 123 66 167 64 453 62 853 59 874 60 211 60 353 61 057 59 548 53 041 48 55025-29 years KKEK 31 396 31 022 31 533 32 867 33 282 34 759 36 387 38 722 39 575 37 103 35 17730-34 years KKEL 12 335 12 094 12 788 13 507 13 972 14 890 16 339 17 567 18 545 18 138 17 83435-39 years KKEM 6 051 5 767 6 153 6 432 6 562 6 956 7 623 8 249 8 912 8 755 8 56040-44 years KKEN 3 254 3 156 3 135 3 331 3 378 3 559 3 841 4 154 4 274 4 421 4 31845 years and over KKEO 3 021 2 904 2 876 3 080 3 137 3 225 3 364 3 678 3 836 3 773 3 645
Age of wife at divorce16-24 years KKEP 8 615 6 871 6 298 5 318 4 839 4 643 4 808 4 867 4 658 4 216 3 52525-29 years KKEQ 30 075 26 435 24 586 22 173 19 650 18 231 17 227 16 539 15 867 13 905 13 18230-34 years KKER 36 274 33 967 33 446 32 837 31 420 31 489 30 982 30 345 28 368 24 381 21 40935-39 years KKES 28 727 27 715 28 605 29 663 29 820 31 164 32 282 33 519 33 013 29 864 27 47940-44 years KKET 20 774 20 125 20 521 21 325 21 469 23 190 25 017 27 610 28 558 27 570 26 12845 years and over KKEU 32 633 31 564 31 750 33 231 33 931 35 099 37 419 40 608 42 935 41 805 40 826Not stated KKEV 9 12 8 9 6 2 – 2 – 9 13
Divorces in which there were3
No children aged under 16 ZBSJ 70 174 66 019 64 738 65 258 64 359 64 541 66 738 69 681 71 382 88 349 62 667One or more children aged under 16 ZBSK 86 933 80 670 80 476 79 298 76 776 79 277 80 997 83 809 82 017 75 340 69 895

45
Population and vital statistics
5.13 Divorce: by duration of marriage, age of wife and country
continued Numbers
1996 1997 1998 1999 2000 2001 2002 2003 2004 2005 2006
Scotland
Decrees absolute granted2
Number KKFA 12 308 12 222 12 384 11 864 11 143 10 631 10 826 10 928 11 227 10 940 13 014
Rate per 1,000 married couples KKFB 10.9 11.0 11.3 10.9 10.3 9.7 10.0 10.2 10.5 10.3 12.3
Duration of marriage0-4 years KKFC 1 914 1 793 1 766 1 588 1 304 1 159 1 128 1 141 1 204 1 089 1 4445-9 years KKFD 3 432 3 224 3 360 3 095 2 890 2 721 2 689 2 450 2 536 2 403 2 75910-14 years KKFE 2 310 2 385 2 456 2 368 2 168 2 163 2 183 2 222 2 173 2 113 2 41815-19 years KKFF 1 709 1 804 1 729 1 686 1 622 1 562 1 705 1 773 1 810 1 789 2 03320 years and over KKFG 2 934 3 016 3 073 3 127 3 159 3 026 3 121 3 342 3 504 3 546 4 360Not stated ZBSL 9 – – – – – – – – – –
Age of wife at marriage16-19 years ZBSM 2 939 2 749 2 654 2 374 2 043 1 839 1 845 1 816 1 753 1 557 1 76420-24 years ZBSN 5 822 5 714 5 744 5 453 5 142 4 873 4 823 4 869 4 892 4 721 5 37325-29 years KKFJ 1 933 2 151 2 314 2 333 2 318 2 233 2 316 2 307 2 462 2 515 3 07530-34 years KKFK 697 791 824 829 805 827 895 958 1 025 1 065 1 38735-39 years KKFL 393 360 382 379 378 401 407 432 489 455 61940-44 years KKFM 234 199 198 208 170 193 235 219 252 252 32545 years and over KKFN 198 173 185 192 193 175 186 212 221 232 312Not stated KKFO 92 85 83 96 94 90 119 115 133 143 159
Age of wife at divorce16-24 years KKFP 583 426 377 301 232 182 180 191 192 148 19025-29 years KKFQ 2 269 2 021 1 957 1 597 1 330 1 109 974 884 869 777 87730-34 years KKFR 2 708 2 736 2 767 2 642 2 381 2 215 2 174 1 943 1 918 1 641 1 83735-39 years KKFS 2 307 2 469 2 562 2 450 2 298 2 311 2 281 2 388 2 278 2 304 2 54440-44 years KKFT 1 761 1 819 1 951 1 929 1 999 1 963 2 110 2 106 2 341 2 330 2 75145 years and over KKFU 2 587 2 667 2 687 2 848 2 810 2 760 2 990 3 297 3 496 3 596 4 650Not stated KKFV 93 84 83 97 93 91 117 119 133 144 165
Divorces in which there were3,4
No children aged under 16 KKFW .. .. .. .. .. .. .. .. .. .. ..One or more children under 16 KKFX .. .. .. .. .. .. .. .. .. .. ..
Northern Ireland
Decrees absolute granted:2,5
Number ZBSO 2 314 2 176 2 459 2 326 2 350 2 365 2 165 2 319 2 512 2 362 2 565
Duration of marriage0-4 years ZBSP 178 159 185 152 155 160 119 129 153 115 1345-9 years ZBSQ 629 556 644 586 525 560 505 509 540 506 49310-14 years ZBSR 517 485 552 518 539 510 482 511 516 500 54915-19 years ZBSS 349 380 415 389 410 403 392 423 497 441 41920 years and over ZBST 641 596 663 681 721 732 667 747 786 800 970Not stated5 EK8B – – – – – – – – 20 – ..
Age of wife at marriage16-19 years ZBSU 724 659 697 580 532 501 434 488 486 431 46520-24 years ZBSV 1 130 1 090 1 219 1 203 1 199 1 198 1 088 1 144 1 231 1 067 1 16225-29 years ZBSW 305 279 348 385 409 426 413 435 507 525 56030-34 years ZBSX 90 83 107 84 115 125 140 133 159 163 19835-39 years ZBSY 26 28 36 37 53 60 40 61 55 65 8240-44 years ZBSZ 19 20 27 18 20 26 28 31 24 30 3445 years and over ZBTA 20 17 25 19 22 29 22 27 36 37 28Not stated6 EK8C – – – – – – – – 14 44 ..
Age of wife at divorce16-24 years ZBTB 100 74 83 52 44 49 10 34 35 24 2425-29 years ZBTC 464 358 425 350 300 295 139 210 236 188 15730-34 years ZBTD 515 554 582 573 555 490 399 486 468 409 39535-39 years ZBTE 463 457 521 492 470 522 487 558 603 554 54440-44 years ZBTF 308 302 338 360 411 426 437 438 473 459 53345 years and over ZBTG 464 431 510 499 570 583 693 593 677 684 876Not stated6 EK8D – – – – – – – – 20 44 36
Divorces in which there were3
No children aged under 16 ZBTH 1 676 1 573 1 807 1 649 1 051 1 054 972 1 050 1 218 982 662One or more children aged under 16 ZBTI 638 603 652 677 1 299 1 311 1 193 1 269 1 282 1 380 1 903Not stated6 EK8E – – – – – – – – 12 – ..
1 Data for 2006 are provisional.2 Includes decrees of nullities.3 Children of the family as defined by the Matrimonial Causes Act 1973.4 Data not available in Scotland.5 Marital estimates are not available for Northern Ireland - no divorce rate for
UK/Northern Ireland.6 Due to some incomplete records.
Sources: Office for National Statistics: 01329 444410;General Register Office for Scotland;
Northern Ireland Statistics and Research Agency

46
Population and vital statistics
5.14 Divorce proceedings: by country
Numbers
1996 1997 1998 1999 2000 2001 2002 2003 2004 2005 2006
United Kingdom
Dissolution of marriage1,4
Decree absolute/decree granted ZBXR 171 309 160 733 159 688 158 418 154 273 156 562 160 528 166 536 166 937 154 879 147 989
On grounds of:Adultery ZBXS 41 127 38 652 37 302 35 545 34 082 33 452 33 389 33 844 32 586 28 411 25 293Behaviour ZBXT 72 581 68 546 68 685 67 851 65 687 66 818 68 499 70 866 70 879 66 824 63 782Desertion ZBXU 1 101 956 828 748 722 718 727 697 675 612 516Separation (2 years and
consent) ZBXV 42 265 39 398 39 627 40 368 39 763 40 699 42 579 44 012 44 819 41 433 36 917Separation(5 years) ZBXW 13 547 12 552 12 697 13 389 13 653 14 575 15 076 16 831 17 714 17 101 15 297Combination of more than
one ground and other ZBXX 688 629 549 517 366 300 258 286 264 498 601Separation2
1 year and consent IE9T .. .. .. .. .. .. .. .. .. .. 1 4562 years IE9U .. .. .. .. .. .. .. .. .. .. 4 217
Decree absolute/decree granted to:the wife ZBXY 119 569 111 910 111 555 109 824 106 957 107 345 108 104 114 664 113 970 105 008 100 003the husband ZBXZ 51 247 48 393 47 764 48 236 47 069 49 015 52 251 51 691 52 793 49 725 47 847both ZBYA 493 430 369 358 247 202 173 181 174 146 139
Nullity of marriageDecree absolute/decree granted ZBYB 420 354 369 328 355 252 198 201 201 173 152
England and Wales
Dissolution of marriage4
Petitions filed3 KKGA 177 970 163 769 165 870 162 137 157 809 172 341 177 224 173 265 167 340 151 824 148 564Decree nisi granted3 KKGM 157 588 148 310 144 231 143 446 143 729 163 146 170 980 168 037 166 334 150 917 145 242Decree absolute granted KKGN 156 692 146 339 144 851 144 233 140 783 143 568 147 538 153 294 153 199 141 583 132 418
On grounds of:Adultery KKGB 40 012 37 592 36 319 34 584 33 310 32 839 32 829 33 331 32 035 27 992 24 936Behaviour KKGC 68 986 65 047 65 257 64 816 63 182 64 768 66 480 68 944 68 859 65 169 62 234Desertion KKGD 1 030 912 790 713 680 689 681 665 654 593 499Separation (2 years and
consent) KKGE 35 422 32 638 32 394 33 482 32 820 33 703 35 476 36 931 37 543 34 388 31 794Separation(5 years) KKGF 10 626 9 592 9 616 10 193 10 498 11 355 11 896 13 239 13 933 13 196 12 628Combination of more than
one ground and other ZBYC 616 558 475 445 293 214 176 184 175 245 327
Decree absolute granted to:the wife ZBYD 109 489 102 173 101 583 100 469 98 227 98 992 102 676 106 208 105 381 96 855 90 587the husband ZBYE 46 712 43 739 42 902 43 413 42 311 44 378 44 694 46 915 47 651 44 583 41 702both ZBYF 491 427 366 351 245 198 168 171 167 145 129
Nullity of marriagePetitions filed3 KKGO 702 485 505 549 452 492 443 463 495 440 406Decree nisi granted3 KKGR 332 248 281 495 274 160 216 204 308 260 240Decree absolute granted KKGS 415 350 363 323 352 250 197 196 200 167 144
Judicial separationPetitions filed4 KKGT 1 584 1 078 916 882 650 1 078 1 001 826 745 697 613Decrees granted4 KKGW 1 199 589 519 696 540 925 560 467 419 387 353

47
Population and vital statistics
5.14 Divorce proceedings: by country
continued Numbers
1996 1997 1998 1999 2000 2001 2002 2003 2004 2005 2006
Scotland
Dissolution of marriage1
Decree granted ZBYG 12 307 12 220 12 383 11 860 11 142 10 631 10 825 10 927 11 226 10 939 13 013
On grounds of:Adultery ZBYH 943 909 832 770 610 473 428 401 413 327 263Behaviour ZBYI 3 184 3 081 3 005 2 611 2 099 1 639 1 656 1 537 1 546 1 344 1 215Desertion ZBYJ 61 33 28 18 34 24 42 23 15 17 15Separation (2 years and
consent) ZBYK 5 835 5 773 6 121 5 908 5 878 5 943 6 101 6 016 6 122 5 989 4 014Separation(5 years) ZBYL 2 284 2 424 2 397 2 553 2 521 2 552 2 598 2 950 3 130 3 262 1 923
Separation2
1 year and consent IE9T .. .. .. .. .. .. .. .. .. .. 1 4562 years IE9U .. .. .. .. .. .. .. .. .. .. 4 217
Decree granted to2
the wife ZBYM 8 558 8 266 8 328 7 770 7 190 6 775 6 800 6 926 6 938 6 653 7 750the husband ZBYN 3 749 3 954 4 055 4 090 3 952 3 856 4 025 4 001 4 288 4 286 5 263
Nullity of marriageDecree granted ZBYO 1 2 1 4 1 – 1 1 1 1 1
Northern Ireland
Dissolution of marriagePetitions filed ZBYP 2 695 2 808 2 760 2 414 3 005 2 869 2 929 3 192 2 808 3 299 3 098Decree nisi granted ZBYQ 2 419 2 532 2 904 2 393 2 456 2 615 2 454 2 616 2 697 2 594 2 607Decree absolute granted ZBYR 2 310 2 174 2 454 2 325 2 348 2 363 2 165 2 315 2 512 2 357 2 558
On grounds of:Adultery ZBYS 172 151 151 191 162 140 132 112 138 92 94Behaviour ZBYT 411 418 423 424 406 411 363 385 474 311 333Desertion ZBYU 10 11 10 17 8 5 3 9 6 2 2Separation (2 years and
consent) ZBYV 1 010 991 1 112 978 1 065 1 053 1 002 1 065 1 154 1 056 1 109Separation(5 years) ZBYW 637 536 684 643 634 668 582 642 651 643 746Combination of more than
one ground and other ZBYX 70 67 74 72 73 86 83 102 89 253 274
Decree absolute granted to:the wife ZBYY 1 522 1 473 1 644 1 585 1 540 1 578 1 405 1 530 1 651 1 500 1 666the husband ZBYZ 786 698 807 733 806 781 755 775 854 856 882both ZBZA 2 3 3 7 2 4 5 10 7 1 10
Nullity of marriagePetitions filed ZBZB 5 7 5 1 2 1 5 4 8 9 –Decree nisi granted ZBZC 5 2 6 2 5 2 2 5 3 3 3Decree absolute granted ZBZD 4 2 5 1 2 2 – 4 – 5 7
Judicial separationPetitions filed ZBZE 63 70 64 50 54 40 27 35 18 3 7Decrees granted ZBZF 22 34 40 31 23 25 15 22 12 4 8
1 The terms petition filed, decree nisi granted, decree absolute and judicialseparation are not used in Scotland. Decree absolute granted to ’both’ and’Combination of more than one ground and other’ are not procedures usedin Scotland.
2 New categories introduced with effect from 4 May 2006 by the Family Law(Scotland) Act 2006. These replace the two ’non-cohabitation’ categories(non-cohabiation is a category that is used in Scotland only) of 2 years withconsent and 5 years.
3 Data supplied by Ministry of Justice (12 February 2008) see Judicial andCourt Statistics 2006.
4 2006 data are provisional.
Sources: Office for National Statistics: 01329 444410;General Register Office for Scotland;
Northern Ireland Statistics and Research Agency;Ministry of Justice (England & Wales);
Scottish Courts Administration;Northern Ireland Courts Administration

48
Population and vital statistics
5.15 Births:1 by country and sex
Thousands
Live births Rates
Crude General Still-Sex birth fertility Still- birth
Total Male Female ratio2 rate3 rate4 TFR5 births6 rate6
United Kingdom7
1900 - 02 1 095 558 537 1 037 28.6 115.1 .. .. ..1910 - 12 1 037 528 508 1 039 24.6 99.4 .. .. ..1920 - 22 1 018 522 496 1 052 23.1 93.0 .. .. ..1930 - 32 750 383 367 1 046 16.3 66.5 .. .. ..1940 - 42 723 372 351 1 062 15.0 .. 1.89 .. ..1950 - 52 803 413 390 1 061 16.0 73.7 2.21 .. ..1960 - 62 946 487 459 1 063 17.9 90.3 2.80 18.6 19.21970 - 72 880 453 427 1 064 15.8 82.5 2.36 11.3 12.71980 - 82 735 377 358 1 053 13.0 62.5 1.83 5.0 6.81990 - 92 790 405 385 1 051 13.8 63.7 1.81 3.6 4.62000 - 02 672 345 328 1 052 11.4 54.7 1.64 3.6 5.4
BBCA KBCZ KBCY KMFW KBCT KBCS KBCR KBCQ KMFX1996 733 376 357 1 055 12.6 60.2 1.73 4.1 5.51997 727 372 354 1 051 12.6 59.6 1.72 3.9 5.31998 717 367 350 1 052 12.3 58.8 1.71 3.9 5.41999 700 359 341 1 056 11.9 57.3 1.68 3.7 5.32000 679 348 331 1 051 11.5 55.4 1.64 3.6 5.3
2001 669 343 326 1 050 11.3 54.3 1.63 3.6 5.32002 669 343 326 1 054 11.3 54.2 1.64 3.8 5.62003 696 357 339 1 052 11.7 56.2 1.71 4.0 5.72004 716 368 348 1 055 12.0 57.7 1.77 4.1 5.72005 723 370 353 1 050 12.0 57.8 1.78 3.9 5.3
2006 749 383 366 1 047 12.4 59.7 1.84 4.0 5.3
England and Wales
1900 - 02 932 475 458 1 037 28.6 114.7 .. .. ..1910 - 12 884 450 433 1 040 24.5 98.6 .. .. ..1920 - 22 862 442 420 1 051 22.8 91.1 .. .. ..1930 - 32 632 323 309 1 047 15.8 64.4 .. 27.0 ..1940 - 42 607 312 295 1 057 15.6 61.3 1.81 22.0 ..1950 - 52 683 351 332 1 058 15.6 72.1 2.16 16.0 ..1960 - 62 812 418 394 1 061 17.6 88.9 2.77 15.6 18.91970 - 72 764 394 371 1 061 15.6 81.4 2.31 9.7 12.51980 - 82 639 328 311 1 053 12.9 61.8 1.81 4.3 6.71990 - 92 698 358 340 1 051 13.8 63.8 1.82 3.2 4.52000 - 02 598 307 292 1 052 11.4 55.2 1.65 3.2 5.4
BBCB KMFY KMFZ KMGA KMGB KMGC KMGD KMGE KMGF1996 649 333 316 1 055 12.6 60.6 1.74 3.5 5.41997 643 330 314 1 051 12.5 60.0 1.73 3.4 5.31998 636 326 310 1 051 12.3 59.2 1.72 3.4 5.31999 622 319 303 1 055 12.0 57.8 1.70 3.3 5.32000 604 310 295 1 050 11.6 55.9 1.65 3.2 5.3
2001 595 305 290 1 050 11.4 54.7 1.63 3.2 5.32002 596 306 290 1 055 11.3 54.7 1.65 3.4 5.62003 621 318 303 1 051 11.8 56.8 1.73 3.6 5.82004 640 328 311 1 054 12.1 58.2 1.78 3.7 5.72005 646 331 315 1 049 12.1 58.3 1.79 3.5 5.4
2006 670 342 327 1 047 12.5 60.2 1.86 3.6 5.4

49
Population and vital statistics
5.15 Births:1 by country and sex
continued Thousands
Live births Rates
Crude General Still-Sex birth fertility Still- birth
Total Male Female ratio2 rate3 rate4 TFR5 births6 rate6
Scotland
1900 - 02 132 67 65 1 046 29.5 120.6 .. .. ..1910 - 12 123 63 60 1 044 25.9 107.4 .. .. ..1920 - 22 125 64 61 1 046 25.6 105.9 .. .. ..1930 - 32 93 47 45 1 040 19.1 78.8 .. .. ..1940 - 42 89 46 43 1 051 18.5 73.7 .. 4.0 ..1950 - 52 91 47 44 1 060 17.9 81.4 2.41 2.0 ..1960 - 62 102 53 50 1 060 19.7 97.8 2.98 2.2 20.81970 - 72 84 43 41 1 057 16.1 83.3 2.46 1.1 13.51980 - 82 68 35 33 1 051 13.1 62.2 1.80 0.4 6.31990 - 92 66 34 32 1 052 13.0 59.2 1.68 0.4 5.72000 - 02 52 27 26 1 046 10.3 48.6 1.48 0.3 5.6
BBCD KMEU KMEV KMEW KMEX KMEY KMEZ KMFM KMFN1996 59 31 29 1 061 11.6 54.1 1.56 0.4 6.41997 59 31 29 1 055 11.7 54.4 1.58 0.3 5.31998 57 29 28 1 060 11.3 52.7 1.55 0.4 6.11999 55 28 27 1 050 10.9 50.9 1.51 0.3 5.22000 53 27 26 1 051 10.5 49.2 1.48 0.3 5.6
2001 53 27 26 1 041 10.4 48.8 1.49 0.3 5.72002 51 26 25 1 047 10.1 48.1 1.48 0.3 5.42003 52 27 26 1 054 10.4 49.4 1.54 0.3 5.62004 54 28 26 1 060 10.6 51.0 1.60 0.3 5.82005 54 28 26 1 068 10.7 51.5 1.62 0.3 5.3
2006 56 28 27 1 046 10.9 52.8 1.67 0.3 5.3
Northern Ireland7
1900 - 02 .. .. .. .. .. .. .. .. ..1910 - 12 .. .. .. .. .. .. .. .. ..1920 - 22 31 16 15 1 048 24.2 105.9 .. .. ..1930 - 32 26 13 12 1 047 20.5 78.8 .. .. ..1940 - 42 27 14 13 1 078 20.8 73.7 .. .. ..1950 - 52 29 15 14 1 066 20.9 81.4 .. .. ..1960 - 62 31 16 15 1 068 22.5 111.5 3.47 0.7 22.01970 - 72 31 16 15 1 074 20.4 105.7 3.13 0.5 14.31980 - 82 28 14 13 1 048 18.0 87.5 2.59 0.2 8.41990 - 92 26 13 13 1 051 16.1 74.8 2.15 0.1 4.62000 - 02 22 11 11 1 054 12.8 58.8 1.78 0.1 5.0
BBCE KMFO KMFP KMFQ KMFR KMFS KMFT KMFU KMFV1996 24 12 12 1 032 14.7 67.8 1.95 0.2 6.21997 24 12 12 1 048 14.4 66.4 1.93 0.1 5.41998 24 12 12 1 039 14.1 65.0 1.90 0.1 5.11999 23 12 11 1 084 13.7 62.9 1.86 0.1 5.72000 22 11 10 1 070 12.8 58.7 1.75 0.1 4.3
2001 22 11 11 1 058 13.0 59.7 1.80 0.1 5.12002 21 11 11 1 035 12.6 58.1 1.77 0.1 5.72003 22 11 10 1 081 12.7 59.0 1.81 0.1 5.02004 22 11 11 1 059 13.0 60.6 1.87 0.1 5.02005 22 11 11 1 032 12.9 60.4 1.87 0.1 4.0
2006 23 12 11 1 066 13.4 62.5 1.94 0.1 3.8
1 See chapter text.2 Males per 1,000 females (calculated using whole numbers).3 Rate per 1,000 population (calculated using whole numbers).4 Rate per 1,000 women aged 15 - 44.5 Total fertility rate is the average number of children which would be born to a
woman if she experienced the age-specific fertility rates of the period inquestion throughout her child-bearing life span. UK figures for the years1970-72 and earlier are estimates.
6 On 1 October 1992 the legal definition of a stillbirth was changed from ababy born dead after 28 completed weeks gestation or more to one born
dead after 24 completed weeks gestation or more. Between 1 October and 31December 1992 in the UK there were 258 babies born dead between 24 and 27completed weeks gestation (216 in England and Wales, 35 in Scotland and 7 inNorthern Ireland). If these babies were included in the stillbirth figures given,the stillbirth rate would be 4.7 for the UK and England and Wales, while Scot-land and Northern Ireland stillbirth rate would remain as stated.
7 From 1981, data for the United Kingdom and Northern Ireland have been re-vised to exclude births in Northern Ireland to non-residents of Northern Ireland.
Sources: Office for National Statistics: 01329 444410;General Register Office for Scotland;
Northern Ireland Statistics and Research Agency

50
Population and vital statistics
5.16 Birth occurrence inside and outside marriage by age of mother
Thousands
Inside marriage Outside marriage
Mean1 Mean1
age ageAll ages Under 20 20 - 24 25 - 29 Over 30 (Years) All ages Under 20 20 - 24 25 - 29 Over 30 (Years)
United Kingdom2
KKEY KKEZ KKFY KKFZ KKGX KKGY KKGZ KKIC KKID KKIE KKIF KKIG1961 890 55 273 280 282 27.7 54 13 17 10 13 25.5
1971 828 70 301 271 185 26.4 74 24 25 13 12 23.8
1981 640 36 193 231 180 27.3 91 30 33 16 13 23.4
1986 596 21 159 231 185 27.9 158 45 60 31 22 23.71987 598 18 153 235 192 28.1 178 48 68 37 26 23.91988 589 16 144 234 195 28.2 198 51 76 42 29 24.11989 570 14 130 228 198 28.4 207 49 79 46 32 24.31990 576 13 121 233 209 28.6 223 51 83 53 37 24.5
1991 556 10 109 224 213 28.9 236 50 87 58 41 24.81992 540 9 98 216 218 29.1 241 46 86 62 46 25.11993 520 8 87 204 221 29.3 242 44 84 64 50 25.41994 510 7 78 194 231 29.6 240 41 80 65 55 25.71995 486 6 69 180 232 29.8 246 42 79 66 60 25.9
1996 473 6 61 170 237 30.1 260 45 80 69 66 26.01997 460 6 55 159 240 30.3 267 47 79 71 71 26.11998 447 6 51 149 243 30.5 270 49 77 70 74 26.21999 428 6 47 136 239 30.7 272 49 77 68 77 26.32000 411 5 44 126 237 30.9 268 47 77 66 78 26.4
2001 401 5 44 116 236 30.9 268 45 77 64 82 26.72002 397 5 44 109 239 31.1 272 44 80 62 85 26.72003 407 5 44 110 249 31.2 288 45 86 65 92 26.82004 413 4 44 110 255 31.3 303 47 90 69 97 26.92005 412 4 43 111 254 31.4 310 47 93 72 98 26.9
2006 422 3 43 115 260 31.4 327 48 99 78 102 26.9
Great Britain
KKIH KKII KKIJ KKIK KKIL KKIM KKIN KKIO KKIP KKIQ KKIR KKIS1961 859 53 264 270 272 27.7 53 13 17 10 13 25.5
1971 797 68 293 261 176 26.4 73 24 25 13 12 23.8
1981 614 34 186 223 171 27.2 89 29 32 16 13 23.3
1986 572 20 153 222 177 27.9 155 44 59 30 22 22.91987 574 17 147 227 184 28.0 174 46 66 36 25 23.41988 566 16 138 226 186 28.2 194 49 74 42 29 23.61989 549 13 125 220 190 28.4 202 48 77 45 32 24.21990 554 12 116 225 201 28.6 218 49 81 52 36 24.6
1991 535 10 105 216 205 28.9 231 48 85 57 41 24.81992 520 9 94 208 210 29.1 235 45 84 61 46 25.11993 500 7 84 196 213 29.3 236 42 82 62 49 25.41994 492 7 75 188 222 29.6 235 41 78 63 53 25.71995 468 6 66 173 223 29.8 240 40 77 65 59 25.9
1996 455 6 59 163 227 30.1 254 44 78 68 65 26.01997 442 6 53 152 231 30.3 261 46 76 69 69 26.21998 430 6 49 143 233 30.5 263 48 74 68 73 26.31999 412 6 46 131 230 30.7 265 48 74 67 76 26.42000 396 5 43 121 228 30.9 261 46 74 65 77 26.5
2001 386 5 43 112 227 30.9 261 44 75 62 80 26.62002 383 5 43 105 230 31.1 265 43 77 61 84 26.72003 393 4 43 106 239 31.2 281 44 83 64 90 26.92004 399 4 43 106 245 31.3 295 45 88 67 95 26.92005 398 4 42 107 245 31.4 302 45 90 70 97 26.9
2006 407 3 42 111 251 31.4 318 46 96 76 100 26.9
1 The mean ages presented in this table are unstandardised and thereforetake no account of the age structure of the population.
2 From 1981, data for the United Kingdom have been revised to excludebirths in Northern Ireland to non-residents of Northern Ireland.
Sources: Office for National Statistics: 01329 444410;General Register Office for Scotland;
Northern Ireland Statistics and Research Agency

51
Population and vital statistics
5.17 Live births: by age of mother and country
Numbers
All ages Under 20 20 - 24 25 - 29 30 - 34 35 - 39 40 - 44 45 and over
United Kingdom
All live births1,2
KMBZ KMDV KMDW KMDX KMDY KMDZ KMES KMET1996 733 163 50 793 141 090 238 857 210 490 78 335 12 832 6381997 726 622 52 851 133 257 229 429 212 162 84 508 13 731 6181998 716 888 54 822 127 230 218 072 212 876 88 729 14 453 6401999 699 976 54 921 124 036 204 808 208 986 91 272 15 210 6952000 679 029 52 059 120 305 191 583 202 893 95 400 16 032 708
2001 669 123 50 157 121 664 179 776 202 017 97 379 17 271 8312002 668 777 49 165 123 844 171 852 203 261 101 379 18 273 9682003 695 549 49 874 129 867 175 473 210 071 109 038 20 233 9332004 715 996 50 752 134 614 179 050 213 620 114 852 22 107 9752005 722 549 50 396 135 891 183 513 211 076 116 902 23 518 1 176
2006 748 563 51 066 142 171 192 800 212 333 123 867 24 999 1 288
Age-specific fertility rates3
KMBY KMBR KMBS KMBT KMBU KMBV KMBW KMBX1996 60.2 29.6 75.7 106.6 89.6 37.2 6.8 0.31997 59.6 30.2 74.9 104.2 89.8 39.1 7.1 0.31998 58.8 30.8 73.6 101.4 90.4 40.0 7.4 0.31999 57.3 30.7 71.8 98.0 89.4 40.2 7.6 0.42000 55.4 29.2 68.7 93.9 87.7 41.0 7.8 0.4
2001 54.3 27.9 68.0 91.5 88.0 41.3 8.2 0.42002 54.2 27.0 68.0 91.3 89.7 42.6 8.4 0.52003 56.2 26.7 70.2 95.4 94.6 45.9 9.1 0.52004 57.7 26.7 71.5 97.3 99.2 48.6 9.7 0.52005 57.8 26.2 70.4 97.4 100.5 50.0 10.6 0.6
2006 59.7 26.4 72.0 100.1 104.6 53.4 10.6 0.6
England and Wales
All live births
KGSH KGSA KGSB KGSC KGSD KGSE KGSF KGSG1996 649 485 44 667 125 732 211 103 186 377 69 503 11 516 5871997 643 095 46 372 118 589 202 792 187 528 74 900 12 332 5821998 635 901 48 285 113 537 193 144 188 499 78 881 12 980 5751999 621 872 48 375 110 722 181 931 185 311 81 281 13 617 6352000 604 441 45 846 107 741 170 701 180 113 84 974 14 403 663
2001 594 634 44 189 108 844 159 926 178 920 86 495 15 499 7612002 596 122 43 467 110 959 153 379 180 532 90 449 16 441 8952003 621 469 44 236 116 622 156 931 187 214 97 386 18 205 8752004 639 721 45 094 121 072 159 984 190 550 102 228 19 884 9092005 645 835 44 830 122 145 164 348 188 153 104 113 21 155 1 091
2006 669 601 45 509 127 828 172 642 189 407 110 509 22 512 1 194
Age-specific fertility rates3
KGSP KGSI KGSJ KGSK KGSL KGSM KGSN KGSO1996 60.6 29.7 77.0 106.6 89.8 37.5 6.9 0.31997 60.0 30.2 76.0 104.3 89.8 39.4 7.3 0.31998 59.2 30.9 74.9 101.5 90.6 40.4 7.5 0.31999 57.8 30.9 73.0 98.3 89.6 40.6 7.7 0.42000 55.9 29.3 70.0 94.3 87.9 41.4 8.0 0.4
2001 54.7 28.0 69.0 91.7 88.0 41.5 8.4 0.52002 54.7 27.0 69.1 91.5 89.9 43.0 8.6 0.52003 56.8 26.9 71.1 95.8 94.9 46.4 9.3 0.52004 58.2 26.9 72.8 97.6 99.6 48.8 9.9 0.52005 58.3 26.3 71.6 97.9 100.7 50.3 10.8 0.6
2006 60.2 26.6 73.2 100.6 104.8 53.8 10.8 0.6

52
Population and vital statistics
5.17 Live births: by age of mother and country
continued Numbers
All ages Under 20 20 - 24 25 - 29 30 - 34 35 - 39 40 - 44 45 and over
Scotland
All live births1
KGTH KGTA KGTB KGTC KGTD KGTE KGTF KGTG1996 59 296 4 544 11 026 19 511 17 038 6 126 891 321997 59 440 4 835 10 607 18 782 17 455 6 740 936 191998 57 319 4 802 9 804 17 477 17 207 6 893 1 027 431999 55 147 4 755 9 440 16 011 16 722 7 034 1 096 412000 53 076 4 599 8 962 14 676 16 233 7 395 1 133 29
2001 52 527 4 444 9 121 13 763 16 206 7 701 1 224 402002 51 270 4 195 9 267 12 694 16 038 7 727 1 267 472003 52 432 4 155 9 626 12 725 16 085 8 310 1 432 392004 53 957 4 172 9 950 13 131 16 085 8 912 1 631 502005 54 386 4 171 10 008 13 229 15 962 9 179 1 694 66
2006 55 690 4 130 10 399 13 876 15 878 9 535 1 775 58
Age-specific fertility rates3
KGTP KGTI KGTJ KGTK KGTL KGTM KGTN KGTO1996 54.1 29.7 64.5 98.5 81.9 31.4 5.2 0.21997 54.4 31.0 65.5 97.4 83.9 34.0 5.3 0.11998 52.7 30.6 62.8 94.3 83.2 34.1 5.7 0.31999 50.9 30.3 61.0 90.4 82.0 34.3 5.9 0.22000 49.2 29.3 57.6 86.5 81.3 35.6 6.0 0.2
2001 48.8 28.4 57.8 85.1 82.2 36.9 6.3 0.22002 48.1 26.8 58.3 83.3 83.6 37.1 6.4 0.32003 49.4 26.3 60.1 86.5 86.8 40.0 7.1 0.22004 51.0 26.1 61.8 89.4 90.3 43.3 7.9 0.32005 51.5 26.2 60.9 88.6 93.2 45.4 8.1 0.3
2006 52.8 25.8 61.9 90.2 97.1 47.8 8.4 0.3
Northern Ireland
All live births2
KMDM KMDF KMDG KMDH KMDI KMDJ KMDK KMDL1996 24 382 1 582 4 332 8 243 7 075 2 706 425 191997 24 087 1 644 4 061 7 855 7 179 2 868 463 171998 23 668 1 735 3 889 7 451 7 170 2 955 446 221999 22 957 1 791 3 874 6 866 6 953 2 957 497 192000 21 512 1 614 3 602 6 206 6 547 3 031 496 16
2001 21 962 1 524 3 699 6 087 6 891 3 183 548 302002 21 385 1 502 3 619 5 779 6 691 3 203 565 262003 21 648 1 483 3 619 5 817 6 772 3 342 596 192004 22 318 1 486 3 592 5 935 6 985 3 712 592 162005 22 328 1 395 3 738 5 936 6 961 3 610 669 19
2006 23 272 1 427 3 944 6 282 7 048 3 823 712 36
Age-specific fertility rates2,3
KMDU KMDN KMDO KMDP KMDQ KMDR KMDS KMDT1996 67.8 25.7 73.8 129.4 108.3 45.4 8.4 0.41997 66.4 26.4 71.1 124.2 109.2 46.6 8.8 0.31998 65.0 27.8 69.6 119.0 108.4 47.2 8.2 0.41999 62.9 28.6 70.6 112.3 105.6 46.1 8.9 0.42000 58.7 25.6 66.0 103.9 100.4 46.2 8.5 0.3
2001 59.7 23.9 67.5 105.1 106.0 48.0 9.1 0.62002 58.1 23.3 66.0 102.9 104.2 48.2 9.2 0.52003 59.0 22.9 65.5 106.8 107.0 50.2 9.8 0.32004 60.6 23.0 62.8 109.8 112.6 56.1 9.5 0.32005 60.4 21.7 63.2 108.6 114.8 55.0 10.2 0.3
2006 62.5 22.5 63.6 112.0 119.2 58.2 10.8 0.6
1 The ’All ages’ figure for Scotland includes births to mothers whose age wasnot known. There were 128 such births in 1996, 66 in 1997, 66 in 1998, 48in 1999, 49 in 2000, 28 in 2001, 35 in 2002, 60 in 2003, 26 in 2004, 77 in2005 and 39 in 2006.
2 From 1981 data for the United Kingdom and Northern Ireland have been re-vised to exclude births in Northern Ireland to non residents in Northern Ire-land.
3 The rates for women of all ages, under 20, and 45 and over are based uponthe populations of women aged 15-44, 15-19 and 45 respectively.
Sources: Office for National Statistics: 01329 444410;General Register Office for Scotland;
Northern Ireland Statistics and Research Agency

53
Population and vital statistics
5.18 Legal abortions1: by age for residents
Numbers
45 and NotAll ages Under 15 15 16 - 19 20 - 24 25 - 29 30 - 34 35 - 39 40 - 44 over stated
England and Wales
C53Z C542 C543 C544 C545 C546 C547 C548 C549 C54A C54B1986 147 619 924 2 970 33 819 45 316 28 656 18 005 12 977 4 521 409 221987 156 191 907 2 858 35 167 49 256 31 243 18 960 12 639 4 757 390 141988 168 298 859 2 709 37 928 54 067 34 584 20 000 12 681 5 047 412 111989 170 463 803 2 580 36 182 54 880 36 604 21 284 12 713 5 020 388 91990 173 900 873 2 549 35 520 55 281 38 770 22 431 12 956 5 104 404 12
1991 167 376 886 2 272 31 130 52 678 38 611 23 445 13 035 4 901 408 101992 160 501 905 2 095 27 589 49 052 38 430 23 870 13 252 4 844 452 121993 157 846 964 2 119 25 806 46 846 38 139 24 690 13 885 4 889 494 141994 156 539 1 080 2 166 25 223 44 871 38 081 25 507 14 156 5 008 440 71995 154 315 946 2 324 24 945 43 394 37 254 25 759 14 352 4 868 457 16
1996 167 916 1 098 2 547 28 790 46 356 39 311 28 228 16 118 5 027 428 131997 170 145 1 020 2 414 29 947 44 960 40 159 28 892 16 858 5 413 482 ..1998 177 871 1 103 2 656 33 236 45 766 40 366 30 449 18 174 5 576 511 341999 173 701 1 066 2 537 32 807 45 004 38 492 29 139 18 341 5 755 502 582000 175 542 1 048 2 700 33 218 47 099 37 852 28 735 18 589 5 794 459 48
2001 176 364 1 066 2 592 33 431 48 267 36 506 28 782 19 146 6 094 456 242002 175 932 1 075 2 658 32 985 48 359 35 795 28 503 19 450 6 531 457 1192003 181 582 1 171 2 796 34 247 51 2012 36 018 28 749 19 868 7 032 500 –2004 185 415 1 034 2 722 35 386 52 7012 37 759 28 064 19 820 7 422 507 –2005 186 416 1 083 2 703 35 313 53 3422 38 330 27 836 19 782 7 459 568 –
2006 193 737 1 042 2 948 37 296 55 3402 40 396 28 153 20 074 7 825 663 –
Scotland
C54C C54D C54E C54F C54G C54H C54I C54J C54K C54L EVH41986 9 611 74 236 2 526 2 984 1 740 1 080 702 247 22 –1987 9 449 70 210 2 415 2 991 1 728 1 082 695 241 17 –1988 10 111 65 217 2 526 3 299 1 965 1 105 662 257 15 –1989 10 191 53 209 2 554 3 199 1 967 1 225 704 266 14 –1990 10 198 54 185 2 536 3 235 2 061 1 157 698 253 19 –
1991 11 046 77 203 2 567 3 479 2 247 1 443 740 262 28 –1992 10 791 73 173 2 368 3 383 2 283 1 444 798 252 17 –1993 11 059 92 193 2 297 3 365 2 443 1 489 889 262 29 –1994 11 371 78 214 2 311 3 480 2 427 1 640 876 315 30 –1995 11 131 79 233 2 168 3 395 2 437 1 606 885 295 33 –
1996 11 957 87 234 2 360 3 569 2 595 1 798 957 330 27 –1997 12 087 85 204 2 429 3 438 2 644 1 849 1 091 322 25 –1998 12 458 73 213 2 703 3 419 2 740 1 801 1 148 339 22 –1999 12 145 69 182 2 629 3 351 2 548 1 807 1 178 358 23 –2000 11 979 93 181 2 608 3 349 2 400 1 765 1 174 381 28 –
2001 12 114 66 210 2 718 3 461 2 317 1 816 1 126 377 23 –2002 11 840 79 194 2 646 3 447 2 165 1 731 1 166 382 29 12003 12 267 71 242 2 781 3 673 2 224 1 725 1 112 411 28 –2004 12 349 101 206 2 887 3 666 2 250 1 652 1 171 382 32 22005 12 543 93 247 2 949 3 745 2 319 1 678 1 091 396 25 –
20063 13 028 90 272 3 071 3 943 2 417 1 605 1 192 410 28 –
1 Refers to therapeutic abortions notified in accordance with the Abortion Act1967.
2 Records with missing ages were assigned to the 20 - 24 age group.3 Provisional.
Sources: Department of Health;Information Services Division Scotland
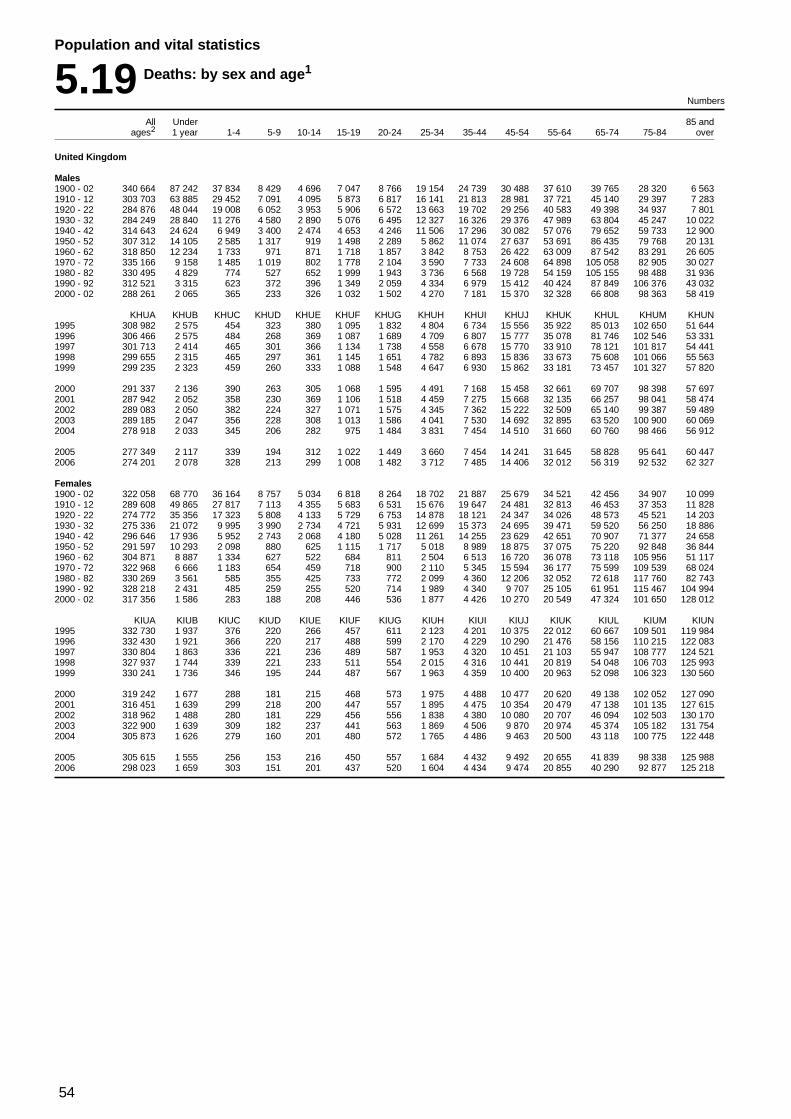
54
Population and vital statistics
5.19 Deaths: by sex and age1
Numbers
All Under 85 andages2 1 year 1-4 5-9 10-14 15-19 20-24 25-34 35-44 45-54 55-64 65-74 75-84 over
United Kingdom
Males1900 - 02 340 664 87 242 37 834 8 429 4 696 7 047 8 766 19 154 24 739 30 488 37 610 39 765 28 320 6 5631910 - 12 303 703 63 885 29 452 7 091 4 095 5 873 6 817 16 141 21 813 28 981 37 721 45 140 29 397 7 2831920 - 22 284 876 48 044 19 008 6 052 3 953 5 906 6 572 13 663 19 702 29 256 40 583 49 398 34 937 7 8011930 - 32 284 249 28 840 11 276 4 580 2 890 5 076 6 495 12 327 16 326 29 376 47 989 63 804 45 247 10 0221940 - 42 314 643 24 624 6 949 3 400 2 474 4 653 4 246 11 506 17 296 30 082 57 076 79 652 59 733 12 9001950 - 52 307 312 14 105 2 585 1 317 919 1 498 2 289 5 862 11 074 27 637 53 691 86 435 79 768 20 1311960 - 62 318 850 12 234 1 733 971 871 1 718 1 857 3 842 8 753 26 422 63 009 87 542 83 291 26 6051970 - 72 335 166 9 158 1 485 1 019 802 1 778 2 104 3 590 7 733 24 608 64 898 105 058 82 905 30 0271980 - 82 330 495 4 829 774 527 652 1 999 1 943 3 736 6 568 19 728 54 159 105 155 98 488 31 9361990 - 92 312 521 3 315 623 372 396 1 349 2 059 4 334 6 979 15 412 40 424 87 849 106 376 43 0322000 - 02 288 261 2 065 365 233 326 1 032 1 502 4 270 7 181 15 370 32 328 66 808 98 363 58 419
KHUA KHUB KHUC KHUD KHUE KHUF KHUG KHUH KHUI KHUJ KHUK KHUL KHUM KHUN1995 308 982 2 575 454 323 380 1 095 1 832 4 804 6 734 15 556 35 922 85 013 102 650 51 6441996 306 466 2 575 484 268 369 1 087 1 689 4 709 6 807 15 777 35 078 81 746 102 546 53 3311997 301 713 2 414 465 301 366 1 134 1 738 4 558 6 678 15 770 33 910 78 121 101 817 54 4411998 299 655 2 315 465 297 361 1 145 1 651 4 782 6 893 15 836 33 673 75 608 101 066 55 5631999 299 235 2 323 459 260 333 1 088 1 548 4 647 6 930 15 862 33 181 73 457 101 327 57 820
2000 291 337 2 136 390 263 305 1 068 1 595 4 491 7 168 15 458 32 661 69 707 98 398 57 6972001 287 942 2 052 358 230 369 1 106 1 518 4 459 7 275 15 668 32 135 66 257 98 041 58 4742002 289 083 2 050 382 224 327 1 071 1 575 4 345 7 362 15 222 32 509 65 140 99 387 59 4892003 289 185 2 047 356 228 308 1 013 1 586 4 041 7 530 14 692 32 895 63 520 100 900 60 0692004 278 918 2 033 345 206 282 975 1 484 3 831 7 454 14 510 31 660 60 760 98 466 56 912
2005 277 349 2 117 339 194 312 1 022 1 449 3 660 7 454 14 241 31 645 58 828 95 641 60 4472006 274 201 2 078 328 213 299 1 008 1 482 3 712 7 485 14 406 32 012 56 319 92 532 62 327
Females1900 - 02 322 058 68 770 36 164 8 757 5 034 6 818 8 264 18 702 21 887 25 679 34 521 42 456 34 907 10 0991910 - 12 289 608 49 865 27 817 7 113 4 355 5 683 6 531 15 676 19 647 24 481 32 813 46 453 37 353 11 8281920 - 22 274 772 35 356 17 323 5 808 4 133 5 729 6 753 14 878 18 121 24 347 34 026 48 573 45 521 14 2031930 - 32 275 336 21 072 9 995 3 990 2 734 4 721 5 931 12 699 15 373 24 695 39 471 59 520 56 250 18 8861940 - 42 296 646 17 936 5 952 2 743 2 068 4 180 5 028 11 261 14 255 23 629 42 651 70 907 71 377 24 6581950 - 52 291 597 10 293 2 098 880 625 1 115 1 717 5 018 8 989 18 875 37 075 75 220 92 848 36 8441960 - 62 304 871 8 887 1 334 627 522 684 811 2 504 6 513 16 720 36 078 73 118 105 956 51 1171970 - 72 322 968 6 666 1 183 654 459 718 900 2 110 5 345 15 594 36 177 75 599 109 539 68 0241980 - 82 330 269 3 561 585 355 425 733 772 2 099 4 360 12 206 32 052 72 618 117 760 82 7431990 - 92 328 218 2 431 485 259 255 520 714 1 989 4 340 9 707 25 105 61 951 115 467 104 9942000 - 02 317 356 1 586 283 188 208 446 536 1 877 4 426 10 270 20 549 47 324 101 650 128 012
KIUA KIUB KIUC KIUD KIUE KIUF KIUG KIUH KIUI KIUJ KIUK KIUL KIUM KIUN1995 332 730 1 937 376 220 266 457 611 2 123 4 201 10 375 22 012 60 667 109 501 119 9841996 332 430 1 921 366 220 217 488 599 2 170 4 229 10 290 21 476 58 156 110 215 122 0831997 330 804 1 863 336 221 236 489 587 1 953 4 320 10 451 21 103 55 947 108 777 124 5211998 327 937 1 744 339 221 233 511 554 2 015 4 316 10 441 20 819 54 048 106 703 125 9931999 330 241 1 736 346 195 244 487 567 1 963 4 359 10 400 20 963 52 098 106 323 130 560
2000 319 242 1 677 288 181 215 468 573 1 975 4 488 10 477 20 620 49 138 102 052 127 0902001 316 451 1 639 299 218 200 447 557 1 895 4 475 10 354 20 479 47 138 101 135 127 6152002 318 962 1 488 280 181 229 456 556 1 838 4 380 10 080 20 707 46 094 102 503 130 1702003 322 900 1 639 309 182 237 441 563 1 869 4 506 9 870 20 974 45 374 105 182 131 7542004 305 873 1 626 279 160 201 480 572 1 765 4 486 9 463 20 500 43 118 100 775 122 448
2005 305 615 1 555 256 153 216 450 557 1 684 4 432 9 492 20 655 41 839 98 338 125 9882006 298 023 1 659 303 151 201 437 520 1 604 4 434 9 474 20 855 40 290 92 877 125 218

55
Population and vital statistics
5.19 Deaths: by sex and age1
continued Numbers
All Under 85 andages2 1 year 1-4 5-9 10-14 15-19 20-24 25-34 35-44 45-54 55-64 65-74 75-84 over
England and Wales
Males1900 - 02 288 886 76 095 32 051 7 066 3 818 5 611 7 028 15 869 21 135 26 065 31 600 33 568 23 835 5 1441910 - 12 257 253 54 678 24 676 5 907 3 348 4 765 5 596 13 603 18 665 24 820 32 217 38 016 24 928 6 0361920 - 22 240 605 39 796 15 565 5 151 3 314 4 901 5 447 11 551 17 004 25 073 34 639 42 025 29 685 6 4551930 - 32 243 147 23 331 9 099 3 844 2 435 4 354 5 580 10 600 14 041 25 657 41 581 54 910 39 091 8 6241940 - 42 268 876 19 393 5 616 2 834 2 051 3 832 3 156 9 484 14 744 25 983 50 058 68 791 51 779 11 1581950 - 52 266 879 11 498 2 131 1 087 778 1 248 1 947 4 990 9 489 23 815 46 948 75 774 69 496 17 6771960 - 62 278 369 10 157 1 444 812 742 1 523 1 624 3 278 7 524 22 813 54 908 77 000 73 180 23 3641970 - 72 293 934 7 818 1 259 860 677 1 524 1 788 3 079 6 637 21 348 56 667 92 389 73 365 26 5221980 - 82 290 352 4 168 657 452 555 1 716 1 619 3 169 5 590 16 909 47 144 92 485 87 338 28 5511990 - 92 275 550 2 926 545 325 338 1 157 1 757 3 717 6 057 13 258 34 977 77 063 94 672 38 7572000 - 02 253 706 1 836 323 200 282 862 1 244 3 619 6 104 13 184 27 696 58 114 87 481 52 761
KHVA KHVB KHVC KHVD KHVE KHVF KHVG KHVH KHVI KHVJ KHVK KHVL KHVM KHVN1995 272 709 2 285 398 278 332 890 1 555 4 099 5 860 13 399 30 827 74 524 91 617 46 6451996 269 825 2 285 436 237 308 908 1 405 4 027 5 861 13 546 30 111 71 459 91 164 48 0781997 266 164 2 160 421 268 327 970 1 468 3 915 5 718 13 565 29 110 68 275 90 659 49 3081998 264 202 2 058 415 254 309 962 1 404 4 111 5 886 13 606 28 947 65 989 90 048 50 2131999 263 166 2 080 408 221 289 905 1 265 3 978 5 918 13 633 28 532 64 017 89 963 51 957
2000 256 698 1 902 345 227 263 898 1 328 3 849 6 135 13 355 28 003 60 801 87 449 52 1432001 253 608 1 818 329 192 320 927 1 276 3 830 6 184 13 424 27 599 57 638 87 238 52 8332002 254 390 1 831 329 198 286 912 1 310 3 665 6 255 13 011 27 807 56 584 88 493 53 7092003 254 433 1 827 310 203 263 852 1 348 3 478 6 440 12 697 28 291 55 064 89 596 54 0642004 245 208 1 809 303 174 252 833 1 257 3 281 6 360 12 417 27 117 52 709 87 367 51 329
2005 243 870 1 877 297 166 272 856 1 217 3 146 6 362 12 158 27 292 51 019 84 661 54 5472006 240 888 1 863 292 187 261 844 1 212 3 132 6 315 12 256 27 551 48 881 81 912 56 182
Females1900 - 02 269 432 60 090 30 674 7 278 4 010 5 265 6 497 15 065 18 253 21 474 28 424 35 307 29 118 7 9771910 - 12 242 079 42 642 23 335 5 883 3 519 4 522 5 256 12 742 16 363 20 611 27 571 38 489 31 363 9 7821920 - 22 229 908 29 178 14 174 4 928 3 456 4 719 5 533 12 244 15 142 20 580 28 633 41 010 38 439 11 8711930 - 32 233 915 16 929 8 013 3 338 2 293 3 969 5 039 10 716 13 022 21 190 33 798 50 844 48 531 16 2341940 - 42 253 702 14 174 4 726 2 265 1 695 3 426 4 198 9 470 12 093 20 413 36 814 60 987 61 891 21 5501950 - 52 252 176 8 367 1 727 732 520 893 1 365 4 131 7 586 16 161 31 875 65 087 81 154 32 5791960 - 62 266 849 7 409 1 103 527 444 591 700 2 147 5 576 14 389 31 083 63 543 93 548 45 7891970 - 72 284 181 5 677 1 020 562 396 620 806 1 814 4 585 13 417 31 222 65 817 96 952 61 2931980 - 82 290 026 3 064 511 301 365 635 670 1 821 3 740 10 420 27 606 63 023 103 676 74 1941990 - 92 288 851 2 161 420 227 217 455 625 1 718 3 765 8 347 21 466 53 783 101 752 93 9142000 - 02 279 482 1 412 251 168 182 382 455 1 629 3 805 8 893 17 659 40 734 89 387 114 525
KIVA KIVB KIVC KIVD KIVE KIVF KIVG KIVH KIVI KIVJ KIVK KIVL KIVM KIVN1995 293 193 1 683 339 192 226 390 521 1 842 3 642 8 987 18 810 52 666 96 416 107 4791996 293 182 1 704 331 181 189 425 517 1 882 3 672 8 841 18 314 50 462 97 316 109 3481997 291 888 1 664 300 183 206 428 503 1 711 3 734 9 055 18 053 48 553 96 009 111 4891998 289 233 1 547 301 185 207 432 466 1 768 3 705 9 077 17 872 46 742 94 281 112 6501999 290 366 1 555 308 168 219 399 484 1 707 3 773 8 999 17 949 44 958 93 360 116 487
2000 281 179 1 497 257 160 191 403 504 1 702 3 853 9 108 17 722 42 318 89 651 113 8132001 278 890 1 449 272 198 171 386 472 1 665 3 858 8 984 17 608 40 639 89 036 114 1522002 280 966 1 337 240 160 204 391 467 1 597 3 767 8 689 17 807 39 645 90 213 116 4492003 284 718 1 479 278 159 209 370 485 1 636 3 884 8 554 18 001 39 001 92 694 117 9682004 269 042 1 462 251 140 173 410 494 1 536 3 855 8 139 17 649 37 041 88 404 109 488
2005 269 123 1 371 222 134 189 379 478 1 481 3 805 8 175 17 797 35 913 86 309 112 8702006 261 711 1 505 267 135 169 381 444 1 382 3 802 8 098 17 948 34 502 81 210 111 868

56
Population and vital statistics
5.19 Deaths: by sex and age1
continued Numbers
All Under 85 andages2 1 year 1-4 5-9 10-14 15-19 20-24 25-34 35-44 45-54 55-64 65-74 75-84 over
Scotland
Males1900 - 02 40 224 9 189 4 798 1 083 672 1 069 1 292 2 506 2 935 3 591 4 597 4 531 3 117 8341910 - 12 35 981 7 510 3 935 962 595 826 910 1 969 2 469 3 325 4 356 5 113 3 182 8131920 - 22 34 649 6 757 2 847 710 489 747 791 1 616 2 128 3 314 4 785 5 624 3 928 9111930 - 32 32 476 4 426 1 771 610 365 568 706 1 352 1 848 2 979 5 095 6 906 4 839 1 0101940 - 42 36 384 3 973 1 011 449 321 668 888 1 643 2 090 3 348 5 728 8 556 6 317 1 3371950 - 52 32 236 1 949 349 175 105 200 265 693 1 267 3 151 5 574 8 544 8 094 1 8711960 - 62 32 401 1 578 222 121 102 146 185 456 1 013 2 986 6 682 8 505 7 980 2 4251970 - 72 32 446 944 168 119 93 178 233 396 875 2 617 6 641 10 176 7 383 2 6241980 - 82 31 723 451 80 56 71 206 233 423 776 2 280 5 601 10 152 8 804 2 5911990 - 92 29 421 287 57 34 40 137 230 485 744 1 730 4 402 8 611 9 311 3 3532000 - 02 27 526 165 30 23 30 119 196 523 882 1 775 3 781 7 038 8 535 4 430
KHWA KHWB KHWC KHWD KHWE KHWF KHWG KHWH KHWI KHWJ KHWK KHWL KHWM KHWN1995 28 791 197 37 30 30 152 195 563 698 1 746 4 144 8 449 8 604 3 9461996 29 223 206 41 23 46 139 212 556 755 1 845 4 087 8 259 8 926 4 1281997 28 305 186 32 22 27 114 208 521 788 1 794 3 876 7 909 8 791 4 0371998 28 132 183 37 34 39 134 200 524 843 1 796 3 828 7 746 8 585 4 1831999 28 605 161 31 23 33 138 215 545 818 1 820 3 773 7 569 8 908 4 571
2000 27 511 173 33 24 28 115 198 512 842 1 716 3 789 7 224 8 523 4 3342001 27 324 155 22 27 35 131 179 510 902 1 820 3 751 6 950 8 433 4 4092002 27 743 167 34 17 27 111 211 546 901 1 789 3 804 6 940 8 648 4 5482003 27 832 146 35 15 31 122 186 469 893 1 634 3 787 6 797 8 994 4 7232004 26 775 160 29 21 23 105 181 449 889 1 676 3 629 6 507 8 733 4 373
2005 26 522 159 33 19 30 106 150 385 882 1 654 3 478 6 352 8 691 4 5832006 26 251 145 21 18 21 112 206 461 938 1 697 3 567 5 966 8 353 4 746
Females1900 - 02 39 891 7 143 4 477 1 162 747 1 058 1 246 2 625 2 732 3 130 4 485 5 273 4 305 1 5081910 - 12 36 132 5 854 3 674 981 618 836 910 2 149 2 473 2 909 3 960 5 636 4 588 1 5521920 - 22 34 449 5 029 2 602 687 489 711 889 1 947 2 266 2 828 4 157 5 587 5 443 1 8141930 - 32 32 377 3 319 1 602 527 339 568 666 1 508 1 812 2 731 4 380 6 630 6 178 2 1171940 - 42 33 715 2 852 921 373 283 595 656 1 382 1 672 2 528 4 630 7 674 7 613 2 5361950 - 52 31 525 1 432 284 115 84 185 293 714 1 127 2 188 4 204 8 157 9 310 3 4311960 - 62 30 559 1 107 170 80 63 72 87 287 762 1 897 4 115 7 752 9 991 4 1771970 - 72 30 978 694 118 69 46 73 74 231 608 1 769 4 036 7 823 10 112 5 3241980 - 82 32 326 337 49 37 44 74 73 213 493 1 456 3 565 7 781 11 333 6 8711990 - 92 31 747 190 45 20 29 49 72 218 458 1 093 2 966 6 630 11 079 8 8982000 - 02 30 235 123 24 14 21 50 64 199 493 1 110 2 341 5 326 9 785 10 685
KIWA KIWB KIWC KIWD KIWE KIWF KIWG KIWH KIWI KIWJ KIWK KIWL KIWM KIWN1995 31 709 178 26 16 26 50 70 231 435 1 100 2 601 6 449 10 452 10 0751996 31 448 159 24 31 21 49 67 218 453 1 172 2 573 6 206 10 256 10 2191997 31 189 130 23 28 21 43 71 199 496 1 128 2 480 5 985 10 164 10 4211998 31 032 137 26 28 19 55 68 198 485 1 106 2 416 5 955 9 913 10 6261999 31 676 115 26 20 17 65 58 201 467 1 128 2 431 5 837 10 198 11 113
2000 30 288 132 20 10 21 46 56 222 510 1 086 2 324 5 512 9 875 10 4742001 30 058 135 20 16 21 47 71 189 480 1 111 2 361 5 235 9 695 10 6772002 30 360 103 32 15 20 58 65 185 489 1 134 2 339 5 232 9 784 10 9042003 30 640 119 24 18 20 57 64 181 489 1 062 2 446 5 194 9 977 10 9892004 29 412 106 19 15 22 52 62 179 492 1 065 2 291 4 924 9 924 10 261
2005 29 225 125 27 11 18 55 58 163 506 1 073 2 316 4 841 9 620 10 4122006 28 842 103 26 11 17 40 58 170 497 1 090 2 351 4 722 9 303 10 454

57
Population and vital statistics
5.19 Deaths: by sex and age1
continued Numbers
All Under 85 andages2 1 year 1-4 5-9 10-14 15-19 20-24 25-34 35-44 45-54 55-64 65-74 75-84 over
Northern Ireland
Males1900 - 02 11 554 1 958 985 280 206 367 446 779 669 832 1 413 1 666 1 368 5851910 - 12 10 469 1 697 841 222 152 282 311 569 679 836 1 148 2 011 1 287 4341920 - 22 9 622 1 491 596 191 150 258 334 496 570 869 1 159 1 749 1 324 4351930 - 32 8 626 1 083 406 126 90 154 209 375 437 740 1 313 1 988 1 317 3881940 - 42 9 383 1 258 322 117 102 153 202 379 462 751 1 290 2 305 1 637 4051950 - 52 8 197 658 105 55 36 50 77 179 318 671 1 169 2 117 2 178 5831960 - 62 8 080 499 67 38 27 49 48 108 216 623 1 419 2 037 2 131 8161970 - 72 8 786 396 58 40 32 76 83 115 221 643 1 590 2 493 2 157 8811980 - 82 8 420 211 37 20 26 77 92 144 202 539 1 414 2 518 2 346 7951990 - 92 7 550 102 21 13 18 55 73 132 178 423 1 044 2 175 2 393 9222000 - 02 7 029 64 13 11 14 50 62 128 195 411 851 1 656 2 347 1228
KHXA KHXB KHXC KHXD KHXE KHXF KHXG KHXH KHXI KHXJ KHXK KHXL KHXM KHXN1995 7 482 93 19 15 18 53 82 142 176 411 951 2 040 2 429 1 0531996 7 418 84 7 8 15 40 72 126 191 386 880 2 028 2 456 1 1251997 7 244 68 12 11 12 50 62 122 172 411 924 1 937 2 367 1 0961998 7 321 74 13 9 13 49 47 147 164 434 898 1 873 2 433 1 1671999 7 464 82 20 16 11 45 68 124 194 409 876 1 871 2 456 1 292
2000 7 128 61 12 12 14 55 69 130 191 387 869 1 682 2 426 1 2202001 7 010 79 7 11 14 48 63 119 189 424 785 1 669 2 370 1 2322002 6 950 52 19 9 14 48 54 134 206 422 898 1 616 2 246 1 2322003 6 920 74 11 10 14 39 52 94 197 361 817 1 659 2 310 1 2822004 6 935 64 13 11 7 37 46 101 205 417 914 1 544 2 366 1 210
2005 6 957 81 9 9 10 60 82 129 210 429 875 1 457 2 289 1 3172006 7 062 70 15 8 17 52 64 119 232 453 894 1 472 2 267 1 399
Females1900 - 02 12 735 1 537 1 013 317 277 495 521 1 012 902 1 075 1 612 1 876 1 484 6141910 - 12 11 397 1 369 808 249 218 325 365 785 811 961 1 282 2 328 1 402 4941920 - 22 10 415 1 149 547 193 188 299 331 687 713 939 1 236 1 976 1 639 5181930 - 32 9 044 824 380 125 102 184 226 475 539 774 1 293 2 046 1 541 5351940 - 42 9 229 910 305 105 90 159 174 409 490 688 1 207 2 246 1 873 5721950 - 52 7 896 494 87 33 21 37 59 173 276 526 996 1 976 2 384 8341960 - 62 7 463 371 61 20 15 21 24 70 175 434 880 1 823 2 417 1 1511970 - 72 7 809 295 45 23 17 25 20 65 152 408 919 1 959 2 475 1 4071980 - 82 7 917 160 26 17 17 23 29 65 127 329 881 1 813 2 752 1 6781990 - 92 7 620 80 20 12 9 16 17 53 117 267 672 1 538 2 636 2 1822000 - 02 7 638 50 9 7 5 13 17 49 129 266 548 1 263 2 479 2 802
KIXA KIXB KIXC KIXD KIXE KIXF KIXG KIXH KIXI KIXJ KIXK KIXL KIXM KIXN1995 7 828 76 11 12 14 17 20 50 124 288 601 1 552 2 633 2 4301996 7 800 58 11 8 7 14 15 70 104 277 589 1 488 2 643 2 5161997 7 727 69 13 10 9 18 13 43 90 268 570 1 409 2 604 2 6111998 7 672 60 12 8 7 24 20 49 126 258 531 1 351 2 509 2 7171999 8 199 66 12 7 8 23 25 55 119 273 583 1 303 2 765 2 960
2000 7 775 48 11 11 3 19 13 51 125 283 574 1 308 2 526 2 8032001 7 503 55 7 4 8 14 14 41 137 259 510 1 264 2 404 2 7862002 7 636 48 8 6 5 7 24 56 124 257 561 1 217 2 506 2 8172003 7 542 41 7 5 8 14 14 52 133 254 527 1 179 2 511 2 7972004 7 419 58 9 5 6 18 16 50 139 259 560 1 153 2 447 2 699
2005 7 267 59 7 8 9 16 21 40 121 244 542 1 085 2 409 2 7062006 7 470 51 10 5 15 16 18 52 135 286 556 1 066 2 364 2 896
1 See chapter text.2 In some years the totals include a small number of persons whose age was
not stated.
Sources: Office for National Statistics: 020 7533 5249;General Register Office for Scotland;
Northern Ireland Statistics and Research Agency

58
Population and vital statistics
5.20 Infant and maternal mortality1
(i) - By country. (ii) - Infant mortality by country, type of death and sex
Maternal deaths per thousandDeaths of Infants under 1 year of age per thousand live births live births3
United Kingdom England and Wales2 Scotland Northern Ireland EnglandUnited and Northern
Total Males Females Total Males Females Total Males Females Total Males Females Kingdom Wales Scotland Ireland
1900 - 02 142 156 128 146 160 131 124 136 111 113 123 103 4.71 4.67 4.74 6.031910 - 12 110 121 98 110 121 98 109 120 97 101 110 92 3.95 3.67 5.65 5.281920 - 22 82 92 71 80 90 69 94 106 82 86 95 77 4.37 4.03 6.36 5.621930 - 32 67 75 58 64 72 55 84 94 73 75 83 66 4.54 4.24 6.40 5.241940 - 42 59 66 51 55 62 48 77 87 66 80 89 70 3.29 2.74 4.50 3.79
1950 - 52 30 34 26 29 33 25 37 42 32 40 45 36 0.88 0.79 1.09 1.091960 - 62 22 25 19 22 24 19 26 30 22 27 30 24 0.36 0.36 0.37 0.431970 - 72 18 20 16 18 20 15 19 22 17 22 24 20 0.17 0.17 0.17 0.121980 - 82 12 13 10 11 13 10 12 13 10 13 15 12 0.09 0.09 0.14 0.061990 - 92 7 8 6 7 8 6 7 8 6 7 8 6 0.07 0.07 0.10 -2000 - 02 5 6 5 5 6 5 5 6 5 5 6 5 0.07 0.06 0.12 0.05
KKAW KKAX KKAY KKAZ KKBW KKBX KKBY KKBZ KKCW KKCX KKCY KKCZ KKDW KKDX KKDY KKDZ1995 6.2 6.9 5.4 6.1 6.9 5.3 6.2 6.4 6.1 7.1 7.5 6.6 0.07 0.07 0.10 –1996 6.1 6.8 5.4 6.1 6.9 5.4 6.2 6.7 5.5 5.8 6.7 4.8 0.07 0.07 0.10 0.041997 5.8 6.4 5.3 5.9 6.5 5.3 5.3 6.1 4.5 5.6 5.5 5.8 0.06 0.06 0.07 –1998 5.7 6.3 5.0 5.7 6.4 5.0 5.6 6.2 4.9 5.6 6.1 5.1 0.07 0.07 0.09 0.041999 5.8 6.4 5.1 5.8 6.5 5.1 5.0 5.7 4.3 6.4 6.8 5.9 0.05 0.05 0.13 –
2000 5.6 6.1 5.0 5.6 6.1 5.1 5.7 6.4 5.1 5.1 5.5 4.6 0.07 0.06 0.15 –2001 5.5 6.0 5.0 5.4 5.9 4.9 5.5 5.8 5.2 6.1 7.0 5.2 0.07 0.07 0.11 0.092002 5.2 5.9 4.5 5.2 5.9 4.5 5.3 6.4 4.1 4.7 4.8 4.6 0.06 0.06 0.10 0.052003 5.3 5.7 4.9 5.3 5.7 4.9 5.1 5.4 4.7 5.2 6.5 3.9 0.10 0.07 0.10 0.142004 5.0 5.5 4.6 5.0 5.5 4.6 4.9 5.8 4.0 5.3 5.4 5.2 0.07 0.07 0.11 0.04
2005 5.1 5.7 4.5 5.0 5.7 4.4 5.2 5.7 4.8 6.1 7.0 5.3 0.06 0.06 0.07 0.042006 5.0 5.4 4.5 5.0 5.4 4.6 4.5 5.1 3.8 5.2 5.8 4.5 0.07 0.06 0.13 0.13

59
Population and vital statistics
5.20 Infant and maternal mortality1
(i) - By country. (ii) - Infant mortality by country, type of death and sexcontinued Deaths per thousand live births
1996 1997 1998 1999 2000 2001 2002 2003 2004 2005 2006
Total
United Kingdom:Stillbirths4 KHNQ 5.5 5.3 5.4 5.3 5.3 5.3 5.6 5.7 5.7 5.3 5.3Perinatal4 KHNR 8.7 8.3 8.3 8.2 8.1 8.0 8.3 8.5 8.3 8.0 7.9Neonatal KHNS 4.1 3.9 3.8 3.9 3.9 3.6 3.5 3.6 3.4 3.5 3.5Post neonatal KHNT 2.0 2.0 1.9 1.9 1.7 1.8 1.7 1.7 1.6 1.6 1.5
England and Wales:Stillbirths4 KHNU 5.4 5.3 5.3 5.3 5.3 5.3 5.6 5.7 5.7 5.4 5.4Perinatal4 KHNV 8.6 8.3 8.2 8.2 8.2 8.0 8.3 8.5 8.4 8.0 8.0Neonatal KHNW 4.1 3.9 3.8 3.9 3.9 3.6 3.6 3.6 3.5 3.4 3.5Post neonatal KHNX 2.0 2.0 1.9 1.9 1.7 1.9 1.7 1.7 1.6 1.6 1.5
Scotland:Stillbirths4 KHNY 6.4 5.3 6.1 5.2 5.6 5.7 5.4 5.6 5.8 5.3 5.3Perinatal4 KHNZ 9.2 7.8 8.7 7.6 8.4 8.5 7.6 8.0 8.1 7.7 7.4Neonatal KHOA 3.9 3.2 3.6 3.3 4.0 3.8 3.2 3.4 3.1 3.5 3.5Post neonatal KHOB 2.2 2.1 2.0 1.7 1.8 1.7 2.1 1.7 1.9 1.7 1.5
Northern Ireland:Stillbirths4 KHOC 6.3 5.4 5.1 5.7 4.3 5.1 5.7 4.9 5.0 4.0 3.8Perinatal4 KHOD 9.4 8.2 8.1 10.0 7.3 8.5 8.9 8.0 8.0 8.1 7.1Neonatal KHOE 3.7 4.2 3.9 4.8 3.8 4.5 3.5 3.9 3.6 4.9 4.1Post neonatal KHOF 2.0 1.4 1.7 1.6 1.3 1.6 1.2 1.3 1.7 1.3 1.4
Males
United Kingdom:Perinatal4 KHOG 9.1 8.7 8.8 8.7 8.7 8.6 8.9 8.8 8.8 8.3 8.3Neonatal KHOH 4.6 4.2 4.2 4.3 4.2 4.0 4.0 3.9 3.8 3.9 3.9Infant mortality KHOI 6.8 6.4 6.3 6.4 6.1 6.0 5.9 5.7 5.5 5.7 5.5
England and Wales:Perinatal4 KHOK 9.0 8.7 8.8 8.6 8.7 8.5 8.9 8.9 8.8 8.4 8.3Neonatal KHOL 4.6 4.2 4.3 4.3 4.2 3.9 4.0 3.8 3.8 3.8 3.8Infant mortality KHOM 6.9 6.5 6.4 6.5 6.1 5.9 5.9 5.7 5.5 5.7 5.4
Scotland:Perinatal4 KHOO 10.0 8.1 9.6 8.4 9.5 9.2 7.9 8.4 8.8 7.6 7.7Neonatal KHOP 4.3 3.4 4.0 3.8 4.5 4.0 3.7 3.6 3.6 3.8 4.0Infant mortality KHOQ 6.7 6.1 6.2 5.7 6.4 5.8 6.4 5.4 5.8 5.7 5.6
Northern Ireland:Perinatal4 KHOS 10.1 8.5 8.9 10.5 8.0 9.8 10.0 8.2 8.2 9.2 7.5Neonatal KHOT 4.3 4.3 4.4 5.5 4.2 5.3 3.8 4.6 3.7 5.5 5.0Infant mortality KHOU 6.7 5.5 6.1 6.8 5.5 7.0 4.8 6.5 5.4 7.0 5.8
Females
United Kingdom:Perinatal4 KHOW 8.2 7.9 7.7 7.8 7.5 7.4 7.7 8.2 7.9 7.6 7.5Neonatal KHOX 3.6 3.5 3.3 3.4 3.5 3.3 3.1 3.4 3.1 3.1 3.2Infant mortality KHOY 5.4 5.3 5.0 5.1 5.0 5.0 4.5 4.9 4.6 4.5 4.5
England and Wales:Perinatal4 KHPA 8.2 7.9 7.7 7.8 7.6 7.3 7.7 8.2 8.0 7.6 7.6Neonatal KHPB 3.6 3.6 3.3 3.5 3.5 3.2 3.1 3.4 3.1 3.0 3.2Infant mortality KHPC 5.4 5.3 5.0 5.1 5.1 4.9 4.5 4.9 4.6 4.4 4.6
Scotland:Perinatal4 KHPE 8.4 7.5 7.9 6.7 7.2 7.8 7.2 7.7 7.3 7.9 7.1Neonatal KHPF 3.5 2.9 3.2 2.8 3.5 3.5 2.6 3.1 2.5 3.2 2.9Infant mortality KHPG 5.5 4.5 4.9 4.3 5.1 5.2 4.1 4.7 4.0 4.8 3.8
Northern Ireland:Perinatal4 KHPI 8.6 8.0 7.3 9.5 6.5 7.0 7.8 7.8 7.8 6.9 6.6Neonatal KHPJ 3.1 4.0 3.4 4.1 3.4 3.6 3.1 3.2 3.5 4.2 3.1Infant mortality KHPK 4.8 5.8 5.1 5.9 4.6 5.2 4.6 3.9 5.2 5.3 4.5
1 See chapter text.2 From 1937 to 1956 death rates are based on the births to which they relate
in the current and preceding years.3 Deaths in pregnancy and childbirth.4 Deaths per 1,000 live and stillbirths. See chapter introduction.
Sources: Office for National Statistics;General Register Office for Scotland;
General Register Office (Northern Ireland)

60
Population and vital statistics
5.21 Death rates by sex and age1
United KingdomRates per 1,000 population
All 85 andages 0-4 5-9 10-14 15-19 20-24 25-34 35-44 45-54 55-64 65-74 75-84 over
Males1900 - 02 18.4 57.0 4.1 2.4 3.7 5.0 6.6 11.0 18.6 35.0 69.9 143.6 289.61910 - 12 14.9 40.5 3.3 2.0 3.0 3.9 5.0 8.0 14.9 29.8 62.1 133.8 261.51920 - 22 13.5 33.4 2.9 1.8 2.9 3.9 4.5 6.9 11.9 25.3 57.8 131.8 259.11930 - 32 12.9 22.3 2.3 1.5 2.6 3.3 3.5 5.7 11.3 23.7 57.9 134.2 277.01940 - 42 .. .. .. .. .. .. .. .. .. .. .. .. ..1950 - 52 12.6 7.7 0.7 0.5 0.9 1.4 1.6 3.0 8.5 23.2 55.2 127.6 272.01960 - 62 12.5 6.4 0.5 0.4 0.9 1.1 1.1 2.5 7.4 22.2 54.4 123.4 251.01970 - 72 12.4 4.6 0.4 0.4 0.9 1.0 1.0 2.4 7.3 20.9 52.9 116.3 246.11980 - 82 12.1 3.2 0.3 0.3 0.8 0.9 0.9 1.9 6.3 18.2 46.7 107.1 224.91990 - 92 11.2 2.0 0.2 0.2 0.7 0.9 1.0 1.8 4.6 14.2 38.6 93.0 201.42000 - 02 10.0 1.4 0.1 0.2 0.5 0.8 1.0 1.6 4.0 10.4 28.9 75.2 187.7
KHZA KHZB KHZC KHZD KHZE KHZF KHZG KHZH KHZJ KHZK KHZL KHZM KHZN1995 11.0 1.6 0.2 0.2 0.6 0.9 1.0 1.7 4.2 12.6 36.7 90.0 202.11996 10.8 1.6 0.1 0.2 0.6 0.9 1.0 1.7 4.2 12.3 35.2 86.0 199.61997 10.6 1.5 0.2 0.2 0.6 1.0 1.0 1.7 4.1 11.8 33.9 83.2 196.71998 10.5 1.5 0.1 0.2 0.6 0.9 1.1 1.7 4.1 11.6 33.0 81.8 193.61999 10.5 1.5 0.1 0.2 0.6 0.9 1.0 1.7 4.1 11.2 32.2 80.9 195.7
2000 10.1 1.4 0.1 0.2 0.6 0.8 1.0 1.6 4.0 10.7 30.3 76.8 187.92001 9.9 1.3 0.1 0.2 0.6 0.8 1.0 1.6 4.0 10.4 28.6 74.8 186.92002 9.9 1.4 0.1 0.2 0.5 0.8 1.0 1.6 4.0 10.1 27.8 74.1 188.22003 9.9 1.4 0.1 0.1 0.5 0.8 1.0 1.6 3.9 9.9 27.0 73.6 191.72004 9.5 1.4 0.1 0.1 0.5 0.7 0.9 1.6 3.8 9.3 25.5 70.6 176.3
2005 9.5 1.4 0.1 0.1 0.5 0.7 0.9 1.6 3.7 9.3 24.8 68.7 187.82006 9.2 1.3 0.1 0.2 0.5 0.7 0.9 1.6 3.7 9.1 23.7 65.5 164.5
Females1900 - 02 16.3 47.9 4.3 2.6 3.5 4.3 5.8 9.0 14.4 27.9 59.3 127.0 262.61910 - 12 13.3 34.0 3.3 2.1 2.9 3.4 4.4 6.7 11.5 23.1 50.7 113.7 234.01920 - 22 11.9 26.9 2.8 1.9 2.8 3.4 4.1 5.6 9.3 19.2 45.6 111.5 232.41930 - 32 11.5 17.7 2.1 1.5 2.4 2.9 3.3 4.6 8.3 17.6 43.7 110.1 246.31940 - 42 .. .. .. .. .. .. .. .. .. .. .. .. ..1950 - 52 11.2 6.0 0.5 0.4 0.7 1.0 1.4 2.3 5.3 12.9 35.5 98.4 228.81960 - 62 11.2 4.9 0.3 0.3 0.4 0.5 0.8 1.8 4.5 11.0 30.8 87.3 218.51970 - 72 11.3 3.6 0.3 0.2 0.4 0.4 0.6 1.6 4.5 10.5 27.5 76.7 196.11980 - 82 11.4 2.3 0.2 0.2 0.3 0.4 0.5 1.3 3.9 9.9 24.8 67.2 179.51990 - 92 11.1 1.5 0.1 0.2 0.3 0.3 0.4 1.1 2.9 8.4 22.1 58.7 157.22000 - 02 10.5 1.1 0.1 0.1 0.2 0.3 0.4 1.0 2.6 6.4 17.9 51.1 157.3
KHZO KHZP KHZQ KHZR KHZS KHZT KHZU KHZV KHZW KHZX KHZY KHZZ KHZI1995 11.2 1.2 0.1 0.1 0.3 0.3 0.5 1.1 2.8 7.5 21.7 57.8 161.41996 11.1 1.2 0.1 0.1 0.3 0.3 0.5 1.1 2.7 7.3 21.0 56.4 159.41997 11.0 1.2 0.1 0.1 0.3 0.3 0.4 1.1 2.7 7.1 20.5 55.2 160.31998 11.0 1.2 0.1 0.1 0.3 0.3 0.4 1.0 2.7 7.0 20.2 54.4 159.81999 11.0 1.2 0.1 0.1 0.3 0.3 0.4 1.0 2.7 6.9 19.6 54.2 163.7
2000 10.5 1.1 0.1 0.1 0.3 0.3 0.5 1.0 2.7 6.6 18.5 51.6 155.82001 10.4 1.1 0.1 0.1 0.2 0.3 0.4 1.0 2.6 6.4 17.8 50.8 155.82002 10.5 1.0 0.1 0.1 0.2 0.3 0.4 1.0 2.6 6.2 17.4 51.0 160.32003 10.6 1.2 0.1 0.1 0.2 0.3 0.4 1.0 2.6 6.1 17.1 51.8 166.42004 10.0 1.1 0.1 0.1 0.2 0.3 0.4 1.0 2.4 5.8 16.2 49.3 155.2
2005 10.0 1.1 0.1 0.1 0.2 0.3 0.4 0.9 2.5 5.9 15.8 48.2 160.12006 9.6 1.1 0.1 0.1 0.2 0.3 0.4 0.9 2.4 5.7 15.2 46.4 144.9
1 See chapter text. Sources: Office for National Statistics;General Register Office for Scotland;
Northern Ireland Statistics and Research Agency

61
Population and vital statistics
5.22 Interim life tables, 2004-06
United Kingdom England and Wales
Males Females Males Females
lx e0x lx e0
x lx e0x lx e0
x
Age(x)
0 years 100 000 76.9 100 000 81.3 100 000 77.2 100 000 81.55 years 99 347 72.4 99 462 76.7 99 350 72.7 99 461 76.910 years 99 291 67.4 99 417 71.7 99 295 67.7 99 417 71.915 years 99 216 62.5 99 362 66.8 99 221 62.7 99 364 67.020 years 98 972 57.6 99 245 61.9 98 988 57.9 99 250 62.0
25 years 98 608 52.8 99 103 56.9 98 644 53.1 99 112 57.130 years 98 201 48.0 98 928 52.0 98 255 48.3 98 940 52.235 years 97 687 43.3 98 689 47.2 97 764 43.5 98 707 47.340 years 97 023 38.6 98 320 42.3 97 131 38.8 98 350 42.545 years 96 100 33.9 97 748 37.6 96 243 34.1 97 793 37.7
50 years 94 693 29.4 96 819 32.9 94 886 29.6 96 886 33.155 years 92 504 25.0 95 373 28.3 92 757 25.2 95 475 28.560 years 89 284 20.8 93 211 23.9 89 622 21.0 93 364 24.165 years 84 083 16.9 89 852 19.7 84 567 17.1 90 097 19.970 years 76 420 13.4 84 658 15.8 77 043 13.5 85 031 15.9
75 years 65 210 10.2 76 589 12.2 65 966 10.3 77 114 12.280 years 49 706 7.6 63 976 9.0 50 508 7.6 64 627 9.185 years 31 432 5.5 46 476 6.5 32 094 5.5 47 152 6.590 years 14 886 3.9 26 341 4.4 15 313 3.9 26 856 4.5
Scotland Northern Ireland
Males Females Males Females
lx e0x lx e0
x lx e0x lx e0
x
Age(x)
0 years 100 000 74.6 100 000 79.6 100 000 76.1 100 000 81.05 years 99 348 70.1 99 488 75.0 99 274 71.6 99 410 76.410 years 99 282 65.1 99 444 70.0 99 198 66.7 99 358 71.515 years 99 206 60.2 99 382 65.1 99 112 61.8 99 279 66.520 years 98 890 55.4 99 230 60.2 98 750 57.0 99 150 61.6
25 years 98 363 50.6 99 052 55.3 98 240 52.3 98 998 56.730 years 97 788 45.9 98 841 50.4 97 770 47.5 98 812 51.835 years 97 009 41.3 98 533 45.5 97 235 42.7 98 595 46.940 years 96 023 36.7 98 044 40.7 96 528 38.0 98 204 42.145 years 94 751 32.1 97 349 36.0 95 581 33.4 97 606 37.3
50 years 92 907 27.7 96 201 31.4 94 011 28.9 96 693 32.755 years 90 186 23.5 94 427 26.9 91 717 24.6 95 204 28.160 years 86 188 19.4 91 749 22.7 88 263 20.4 93 035 23.765 years 79 701 15.8 87 549 18.6 82 601 16.6 89 560 19.570 years 70 712 12.5 81 187 14.9 75 142 13.0 84 393 15.6
75 years 58 395 9.6 71 840 11.4 63 605 9.9 76 135 12.080 years 42 599 7.2 58 075 8.5 47 641 7.3 63 548 8.885 years 25 588 5.3 40 308 6.2 29 567 5.3 46 058 6.290 years 11 199 3.9 21 688 4.3 13 263 3.8 25 737 4.2
Note Column lx shows the number who would survive to exact age(x), outof 100,000 born, who were subject throughout their lives to the death ratesexperienced in the three-year period indicated. Column e0
x is ‘the expecta-tion of life’, that is, the average future lifetime which would be lived by a per-son aged exactly x if likewise subject to the death rates experienced in thethree-year period indicated. See introductory notes.
Source: Office for National Statistics: 020 7533 5222

62
Population and vital statistics
5.23 Adoptions by date of entry in Adopted Children Register: by sex, age and country
Numbers and Percentages
All ages Under 1 1-4 5-9 10-14 15-17
Numbers Percentages Numbers Percentages Numbers Percentages Numbers Percentages Numbers Percentages Numbers Percentages
United KingdomPersons
VOXI VOXJ VOXK VOXL VOXM VOXN VOXO VOXP VOXQ VOXR VOXS VOXT2001 6 588 100 272 4 2 874 44 2 047 31 1 103 17 290 42002 6 239 100 313 5 2 737 44 1 937 31 999 16 253 42003 5 426 100 212 4 2 481 46 1 716 32 789 15 228 42004 6 116 100 274 5 2 843 46 1 856 30 847 14 269 42005 6 151 100 242 4 3 127 51 1 757 29 798 13 227 4
2006 5 539 100 216 4 2 788 50 1 608 29 696 13 226 4
Males
VOXU VOXV VOXW VOXX VOXY VOXZ VOYA VOYB VOYC VOYD VOYE VOYF2001 3 314 100 138 4 1 483 45 1 006 30 547 17 139 42002 3 140 100 176 6 1 425 45 935 30 488 16 116 42003 2 634 100 104 4 1 224 46 844 32 351 13 111 42004 3 051 100 145 5 1 426 47 936 31 418 14 126 42005 3 072 100 121 4 1 566 51 910 30 370 12 105 3
2006 2 708 100 97 4 1 377 51 806 30 314 12 113 4
Females
VOYG VOYH VOYI VOYJ VOYK VOYL VOYM VOYN VOYO VOYP VOYQ VOYR2001 3 274 100 134 4 1 391 42 1 041 32 556 17 151 52002 3 099 100 137 4 1 312 42 1 002 32 511 16 137 42003 2 792 100 108 4 1 257 45 872 31 438 16 117 42004 3 065 100 129 4 1 417 46 920 30 456 15 143 52005 3 079 100 121 4 1 561 51 847 28 428 14 122 4
2006 2 831 100 119 4 1 411 50 802 28 382 13 113 4
England and Wales1
Persons
GQTP GQTQ GQTR GQTS GQTT GQTU GQTV GQTW GQTX GQTY GQTZ GQUA2001 5 981 100 246 4 2 648 44 1 845 31 983 16 257 42002 5 680 100 287 5 2 532 45 1 748 31 900 16 213 42003 4 818 100 183 4 2 260 47 1 503 31 683 14 189 42004 5 562 100 253 5 2 627 47 1 651 30 786 14 245 42005 5 565 100 222 4 2 906 52 1 555 28 683 12 199 4
2006 4 980 100 197 4 2 592 52 1 406 28 585 12 195 4
Males
GQUB GQUC GQUD GQUE GQUF GQUG GQUH GQUI GQUJ GQUK GQUL GQUM2001 3 011 100 124 4 1 370 45 904 30 494 16 118 42002 2 871 100 160 6 1 324 46 846 29 443 15 98 32003 2 339 100 91 4 1 115 48 737 32 301 13 95 42004 2 777 100 132 5 1 327 48 831 30 373 13 114 42005 2 791 100 112 4 1 461 52 808 29 320 11 90 3
2006 2 446 100 95 4 1 282 52 707 29 267 11 94 4
Females
GQUN GQUO GQUP GQUQ GQUR GQUS GQUT GQUU GQUV GQUW GQUX GQUY2001 2 970 100 122 4 1 278 43 941 32 489 16 139 52002 2 809 100 127 5 1 208 43 902 32 457 16 115 42003 2 479 100 92 4 1 145 46 766 31 382 15 94 42004 2 785 100 121 4 1 300 47 820 29 413 15 131 52005 2 774 100 110 4 1 445 52 747 27 363 13 109 4
2006 2 534 100 102 4 1 310 52 699 28 318 13 101 4

63
Population and vital statistics
5.23 Adoptions by date of entry in Adopted Children Register: by sex, age and country
continued Numbers and Percentages
All ages Under 1 1-4 5-9 10-14 15-17
Numbers Percentages Numbers Percentages Numbers Percentages Numbers Percentages Numbers Percentages Numbers Percentages
Scotland1
Persons
GQUZ GQVA GQVB GQVC GQVD GQVE GQVF GQVG GQVH GQVI GQVJ GQVK2001 468 100 18 4 176 38 161 34 92 20 21 42002 385 100 13 3 143 37 130 34 73 19 26 72003 468 100 25 5 153 33 170 36 88 19 32 72004 393 100 21 5 144 37 143 36 67 17 18 52005 439 100 18 4 162 37 155 35 81 18 23 5
2006 418 100 16 4 153 37 150 36 73 17 26 6
Males
GQVL GQVM GQVN GQVO GQVP GQVQ GQVR GQVS GQVT GQVU GQVV GQVW2001 241 100 11 5 93 39 83 34 40 17 14 62002 193 100 8 4 75 39 60 31 37 19 13 72003 228 100 11 5 78 34 85 37 43 19 11 52004 200 100 13 7 67 34 77 39 34 17 9 52005 217 100 9 4 80 37 79 36 36 17 13 6
2006 194 100 2 1 72 37 78 40 25 13 17 9
Females
GQVX GQVY GQVZ GQWA GRFK GRFL GRFM GRFN GRFO GRFP GRFQ GRFR2001 227 100 7 3 83 37 78 34 52 23 7 32002 192 100 5 3 68 35 70 36 36 19 13 72003 240 100 14 6 75 31 85 35 45 19 21 92004 193 100 8 4 77 40 66 34 33 17 9 52005 222 100 9 4 82 37 76 34 45 20 10 5
2006 224 100 14 6 81 36 72 32 48 22 9 4
Northern IrelandPersons
VOYS VOYT VOYU VOYV VOYW VOYX VOYY VOYZ VOZA VOZB VOZC VOZD2001 139 100 8 6 50 36 41 29 28 20 12 92002 174 100 13 7 62 36 59 34 26 15 14 82003 140 100 4 3 68 49 43 31 18 13 7 52004 161 100 – 2 72 43 62 38 21 12 6 42005 147 100 2 4 59 38 47 32 34 21 5 4
2006 141 100 2 2 44 31 52 36 38 27 5 4
Males
VOZE VOZF VOZG VOZH VOZI VOZJ VOZK VOZL VOZM VOZN VOZO VOZP2001 62 100 3 5 20 32 19 31 13 21 7 112002 76 100 8 11 26 34 29 38 8 11 5 72003 67 100 2 3 31 46 22 33 7 10 5 72004 74 100 – – 32 43 28 38 11 15 3 42005 64 100 – – 25 39 23 36 14 22 2 3
2006 68 100 – – 23 35 21 29 22 32 2 3
Females
VOZQ VOZR VOZS VOZT VOZU VOZV VOZW VOZX VOZY VOZZ VPAA VPVD2001 77 100 5 6 30 39 22 29 15 19 5 62002 98 100 5 5 36 37 30 31 18 18 9 92003 73 100 2 3 37 51 21 29 11 15 2 32004 87 100 – – 40 46 34 39 10 11 3 32005 83 100 2 2 34 41 24 29 20 24 3 4
2006 73 100 3 4 20 27 31 42 16 22 3 4
1 England & Wales: number of persons aged over 17 (counted into ’All ages’)Year Persons Male Female2001 2 1 12006 5 1 4Scotland: number of persons aged over 17 (counted into 15-17 age group)2001 1 1 -2002 4 1 32003 4 3 12004 3 - 32006 5 5 -
Sources: Office for National Statistics: 01329 444410;General Register Office for Scotland;
Northern Ireland Statistics and Research Agency

64
Education

65
Education
Education
Ch
apter 6

66
Education
Special schools
Provide education for children with Special Educational Needs (SEN) (Record of Needs or a Coordinated Support Plan in Scotland) who cannot be educated satisfactorily in an ordinary school. Maintained special schools are run by LAs, while non-maintained special schools are financed as shown at (b) above.
Pupil Referral Units
Pupil Referral Units (PRUs) operate in England and Wales and provide education outside of a mainstream or special school setting, to meet the needs of difficult or disruptive children.
Schools in Scotland are categorised as Education Authority, Grant-Aided, Opted-out/Self-governing (these three being grouped together as ‘Publicly funded’ schools), Independent schools and Partnership schools.
The home government departments dealing with education statistics are:
Department for Children, Schools and Families (DCSF)
Department for Innovation, Universities and Skills (DIUS)
Welsh Assembly Government (WAG)
Scottish Government (SG)
Northern Ireland Department of Education (DENI)
Northern Ireland Department for Employment and Learning (DELNI)
Each of the home education departments in Great Britain, along with the Northern Ireland Department of Education, have overall responsibility for funding the schools sectors in their own country.
Up to March 2001, further education (FE) courses in FE sector colleges in England and in Wales were largely funded through grants from the respective Further Education Funding Councils. In April 2001, however, the Learning and Skills Council (LSC) took over the responsibility for funding the FE sector in England, and the National Council for Education and Training for Wales (part of Education and Learning Wales (ELWa)) did so for Wales. The LSC in England is also responsible for funding provision for FE and some non-prescribed higher education in FE sector colleges; it also funds some FE provided by LA maintained and other institutions referred to as ‘external institutions’. In Wales, the National Council – ELWa funds FE provision made by FE institutions via a third party or sponsored arrangements. The Scottish Further
EducationEducational establishments in the UK are administered and financed in several ways. Most schools are controlled by local authorities (LAs), which are part of the structure of local government, but some are ‘assisted’, receiving grants direct from central government sources and being controlled by governing bodies that have a substantial degree of autonomy. Completely outside the public sector are nonmaintained schools run by individuals, companies or charitable institutions.
For the purposes of UK education statistics, schools fall under the following broad categories:
Mainstream state schools (grant-aided mainstream schools in Northern Ireland)
These schools work in partnership with other schools and LAs and they receive funding from LAs. Since 1 September 1999, the categories (typically in England) are:
Community - schools formerly known as ‘county’ plus some former grant-maintained (GM) schools
Foundation - most former GM schools
Voluntary Aided - schools formerly known as ‘aided’ and some former GM schools
Voluntary Controlled - schools formerly known as ‘controlled’
Non-maintained mainstream schools consisting of
(a) Independent schools
Schools which charge fees and may also be financed by individuals, companies or charitable institutions. These include Direct Grant schools, where the governing bodies are assisted by departmental grants and a proportion of the pupils attending them do so free or under an arrangement by which LAs meet tuition fees. City Technology Colleges (CTCs) and Academies (applicable in England only) are also included as independent schools.
(b) Non-maintained schools
Run by voluntary bodies which may receive some grant from central government for capital work and for equipment, but the current expenditure is met primarily from the fees charged to the LAs for pupils placed in schools.

67
Education
Education Funding Council (SFEFC) funds FE colleges in Scotland, while the Department for Employment and Learning funds FE colleges in Northern Ireland.
Higher education (HE) courses in higher education establishments are largely publicly funded through block grants from the HE funding councils in England and Scotland, the Higher Education Council – ELWa in Wales - and the Department for Employment and Learning in Northern Ireland. In addition, some designated HE (mainly HND/HNC Diplomas and Certificates of HE) courses are also funded by these sources. The FE sources mentioned above fund the remainder.
Statistics for the separate systems obtained in England, Wales, Scotland and Northern Ireland are collected and processed separately in accordance with the particular needs of the responsible departments. Since 1994/95 the Higher Education Statistics Agency (HESA) has undertaken the data collection for all higher education institutions (HEIs) in the UK. This includes the former Universities Funding Council (UFC) funded UK universities previously collected by the Universities Statistical Record. There are some structural differences in the information collected for schools, further and higher education in each of the four home countries and in some tables the GB/UK data presented are amalgamations from sources that are not entirely comparable.
Stages of education
There are five stages of education: early years, primary, secondary, FE and HE, and education is compulsory for all children between the ages of five (four in Northern Ireland) and 16. The non-compulsory fourth stage, FE, covers non-advanced education, which can be taken at further (including tertiary) education colleges, HEIs and increasingly in secondary schools. The fifth stage, HE, is study beyond GCE A levels and their equivalent which, for most full-time students, takes place in universities and other HEIs.
Early years education
Children under five attend a variety of settings including state nursery schools, nursery classes within primary schools and, in England and Wales, reception classes within primary schools, as well as settings outside the state sector such as voluntary pre-schools or privately run nurseries. In recent years there has been a major expansion of early years education, and the Education Act 2002 extended the National Curriculum for England to include the foundation stage.The foundation stage was introduced in September 2000, and covers children’s education from the age of three to the end of the reception year, when
most are just five and some almost six years old. The Early Years Foundation Stage (EYFS), which is due to come into force in September 2008, will be a single framework for care, learning and development for children in all registered early years settings from birth to five.
Children born in Scotland between March and December are eligible for early years education at the time the Pre-School Education and Day Care Census is carried out. In Scotland, early years education is called ante-pre-school education for those aged three to four years old, and pre-school education for those aged four.
Primary education
The primary stage covers three age ranges: nursery (under five), infant (five to seven or eight) and junior (up to 11 or 12), but in Scotland and Northern Ireland there is generally no distinction between infant and junior schools. Most public sector primary schools take both boys and girls in mixed classes. It is usual to transfer straight to secondary school at the age of 11 (in England, Wales and Northern Ireland) or 12 (in Scotland), but in England some children make the transition via middle schools catering for various age ranges between eight and 14. Depending on their individual age ranges, middle schools are classified as either primary or secondary.
Secondary education
Public provision of secondary education in an area may consist of a combination of different types of school, the pattern reflecting historical circumstance and the policy adopted by the local authority. Comprehensive schools largely admit pupils without reference to ability or aptitude and cater for all the children in a neighbourhood, but in some areas they co-exist with grammar, secondary modern or technical schools.
In 2005/06, 88 per cent of secondary pupils in England attended comprehensive schools, while all secondary schools in Wales are comprehensive schools. The majority of education authority secondary schools in Scotland are comprehensive in character and offer six years of secondary education; however in remote areas there are several two-year and four-year secondary schools. In Northern Ireland, post primary education is provided by grammar schools and non-selective secondary schools.
In England, the Specialist Schools Programme helps schools, in partnership with private sector sponsors and supported by additional government funding, to establish distinctive identities through their chosen specialisms and achieve their targets to raise standards. Specialist schools have a special focus on their chosen subject area

68
Education
but must meet the National Curriculum requirements and deliver a broad and balanced education to all pupils. Any maintained secondary school in England can apply to be designated as a specialist school in one of ten specialist areas: arts, business and enterprise, engineering, humanities, languages, mathematics and computing, music, science, sports and technology. Schools can also combine any two specialisms.
Academies, operating in England, are publicly funded independent local schools that provide free education. They are all ability schools established by sponsors from business, faith or voluntary groups working with partners from the local community. The DCSF Secretary of State announced in July 2007 that future academies would be required to follow the National Curriculum programmes of study in English, mathematics, science and information and communication technology (ICT). This is different to the previous model whereby academies had to teach English, mathematics, science and ICT to all pupils and the curriculum had to be broad and balanced.
Special schools
Special schools (day or boarding) provide education for children who require specialist support to complete their education, for example because they have physical or other difficulties. Many pupils with special educational needs are educated in mainstream schools. All children attending special schools are offered a curriculum designed to overcome their learning difficulties and to enable them to become self-reliant. Since December 2005, special schools have also been able to apply for the Special Educational Needs (SEN) specialism, under the Specialist Schools Programme. They can apply for a curriculum specialism, but not for both the SEN and a curriculum specialism.
Further education
The term further education may be used in a general sense to cover all non-advanced courses taken after the period of compulsory education, but more commonly it excludes those staying on at secondary school and those in higher education, such as courses in universities and colleges leading to qualifications above GCE A Level, SCE H Grade, GNVQ/NVQ level 3, and their equivalents. Since 1 April 1993, sixth form colleges in England and Wales have been included in the further education sector.
Higher education
Higher education is defined as courses that are of a standard that is higher than GCE A level, the Higher
Grade of the Scottish Certificate of Education/National Qualification, GNVQ/NVQ level 3 or the Edexcel (formerly BTEC) or SQA National Certificate/Diploma. There are three main levels of HE course:
(i) Postgraduate courses leading to higher degrees, diplomas and certificates (including postgraduate certificates of education (PGCE) and professional qualifications), which usually require a first degree as entry qualification
(ii) undergraduate courses which includes first degrees, first degrees with qualified teacher status, enhanced first degrees, first degrees obtained concurrently with a diploma, and intercalated first degrees (where first degree students, usually in medicine, dentistry or veterinary medicine, interrupt their studies to complete a one-year course of advanced studies in a related topic)
(iii) other undergraduate courses which includes all other higher education courses, for example HND’s and Diplomas in HE
As a result of the 1992 Further and Higher Education Act, former polytechnics and some other HEIs were designated as universities in 1992/93. Students normally attend HE courses at HEIs, but some attend at FE colleges. Some also attend institutions which do not receive public grant (such as the University of Buckingham) and these numbers are excluded from the tables; however, the University of Buckingham is included in Table 6.10.

69
Education
6.1 Number of schools by type and establishments of further and higher educationAcademic years
Numbers
1995 2001 2002 2003 20041 20051 2006/96 /02 /03 /04 /05 /06 /07
United Kingdom:Public sector mainstream
Nursery2,3 KBFK 1 486 3 227 3 394 3 438 3 425 3 349 3 326Primary KBFA 23 441 22 800 22 638 22 509 22 343 22 156 21 968Secondary4 KBFF 4 463 4 306 4 284 4 255 4 230 4 206 4 176
of which 6th form colleges KPGM .. .. .. .. .. .. ..Non-maintained mainstream5 KBFU 2 500 2 407 2 380 2 524 2 476 2 493 2 542Special - all KBFP 1 560 1 483 1 473 1 465 1 436 1 416 1 391
maintained KPVX 1 456 1 387 1 369 1 362 1 329 1 311 1 285non maintained KPGO 104 96 104 103 107 105 106
Pupil referral units KXEP 315 340 390 457 478 481 489Universities (including Open University)6 KAHG 96 97 96 114 119 123 124All other further and higher education institutions KJPQ 609 541 520 520 527 519 504
Higher education institutions KPVY 66 58 54 55 47 43 45Further education institutions KSNY 543 483 466 465 480 476 459
of which 6th form colleges KPGP 110 101 103 102 102 102 96
England:Public sector mainstream
Nursery KBAK 547 494 475 468 456 453 446Primary KBAA 18 480 17 985 17 861 17 762 17 642 17 504 17 361Secondary4 KBAF 3 594 3 457 3 436 3 409 3 385 3 367 3 343
of which 6th form colleges KPGS .. .. .. .. .. .. ..Non-maintained5 KBAU 2 266 2 206 2 180 2 330 2 283 2 301 2 342Special - all KBAP 1 263 1 161 1 160 1 148 1 122 1 105 1 078
maintained KPGT 1 191 1 098 1 088 1 078 1 049 1 033 1 006non maintained KPGU 72 63 72 70 73 72 72
Pupil referral units KXEQ 291 312 360 426 447 449 448Universities (including Open University)6 KAHM 72 73 72 90 96 100 100All other further and higher education institutions KJPR 503 441 422 422 414 422 409
Higher education institutions KPXA 50 45 41 42 34 31 32Further education institutions KPWC 453 396 381 380 395 391 377
of which 6th form colleges KPGV 110 101 103 102 102 102 96
Wales:Public sector mainstream
Nursery KBBK 52 40 37 34 34 33 31Primary KBBA 1 681 1 624 1 602 1 588 1 572 1 555 1 527Secondary KBBF 228 227 227 227 227 224 224
of which 6th form colleges KPGY .. .. .. .. .. .. ..Non-maintained KBBU 62 56 59 60 58 56 66Special (Maintained) KBBP 54 44 43 43 43 43 44Pupil referral units KZBF 24 28 30 31 31 32 41Universities KAHS 9 9 9 9 8 8 8All other further and higher education institutions KJQP 31 28 27 27 27 27 27
Higher education institutions KSNZ 5 4 4 4 4 4 4Further education institutions KPGZ 26 24 23 23 23 23 23
Scotland:Public sector mainstream
Nursery2 KBDK 796 2 597 2 782 2 836 2 836 2 763 2 750Primary KBDA 2 332 2 271 2 258 2 248 2 217 2 194 2 184Secondary KBDF 405 387 386 386 386 385 381
Non-maintained KBDU 151 120 119 117 118 117 116Special - all KBDP 196 230 223 227 226 223 224
maintained KYCZ 164 197 191 194 192 190 190non-maintained KYDA 32 33 32 33 34 33 34
Universities KAHX 13 13 13 13 13 13 14All other further and higher education institutions KJRA 56 53 53 53 53 52 50
Higher education institutions KPWE 9 7 7 7 7 6 7Further education institutions KPHB 47 46 46 46 46 46 43
Northern Ireland:Grant aided mainstream
Nursery3 KBEK 91 96 100 100 99 100 99Primary KBEA 948 920 917 911 912 903 896Secondary KBEF 236 235 235 233 232 230 228
Non-maintained KBEU 21 25 22 17 17 19 18Special (Maintained) KBEP 47 48 47 47 45 45 45Universities KIAD 2 2 2 2 2 2 2Colleges of education KIAE 2 2 2 2 2 2 2Further education colleges KIAG 17 17 16 16 16 16 16
1 Includes revised data.2 Nursery schools figures for Scotland prior to 1998/99 only include data for
Local Authority pre-schools. Data thereafter include partnership pre-schools. From 2005/06, figures exclude pre-school education centres not inpartnership with the Local Authority.
3 Excludes voluntary and private pre-school education centres in NorthernIreland (372 in total in 2006/07).
4 From 1995/96, includes Specialist schools in England, operational from Sep-tember of the first year shown (2,611 in total in 2006/07).
5 From 2002/03, includes Acadamies in England (46 in total in 2006/07).6 From 2003/04, universities includes the members of the University of London
separately. For earlier years, its member institutions are counted as one institu-tion.
Source: Education Departments: 01325 392754

70
Education
6.2 Full-time and part-time pupils in school1 by age and sex2
United KingdomAll schools at January3 Thousands
1997 1998 1999 2000 2001 2002 2003 2004 2005 20064 20075
Age at previous 31 August8
Number (thousands)England7 KBIA 8 195 8 261 8 310 8 346 8 374 8 369 8 367 8 335 8 274 8 216 8 149Wales KBIB 510 513 513 512 512 511 509 506 501 495 490Scotland KBIC 848 850 844 874 882 876 874 866 851 850 844Northern Ireland2 KBID 354 352 352 349 348 346 345 341 337 333 329United Kingdom KBIE 9 907 9 975 10 020 10 081 10 116 10 102 10 095 10 048 9 963 9 893 9 813
Boys and girls2 - 48 KBIF 1 148 1 149 1 154 1 184 1 187 1 180 1 189 1 145 1 138 1 130 1 1395 - 10 KBIG 4 628 4 668 4 661 4 629 4 597 4 537 4 489 4 403 4 378 4 321 4 26411 KBIH 744 746 762 783 771 783 791 784 758 756 73912 - 14 KBII 2 151 2 182 2 211 2 256 2 297 2 320 2 343 2 355 2 369 2 344 2 309
15 KBIK 716 701 706 705 732 737 751 775 764 777 78616 KBIL 289 288 283 285 287 298 290 314 304 304 31417 KBIM 206 217 218 213 219 223 217 238 226 235 23418 and over KBIN 22 24 25 27 27 23 24 32 27 26 28
Boys14 KBIO 365 368 367 381 384 391 401 394 402 407 40415 KBIP 365 358 361 359 374 377 384 394 390 397 40116 KBIQ 141 140 137 138 139 145 140 150 146 146 15017 KBIR 100 104 104 101 105 107 104 112 107 111 11018 and over KBIS 12 13 13 14 15 13 13 17 14 15 15
Girls14 KBIT 349 350 352 364 365 373 384 378 384 388 38515 KBIU 351 343 345 346 358 360 368 379 375 380 38516 KBIV 148 149 146 147 148 153 150 161 159 159 16417 KBIW 107 113 114 111 114 116 113 124 119 123 12418 and over KBIX 10 11 11 13 12 11 11 15 12 12 13
1 From 1 April 1993 excludes 6th form colleges in England and Wales whichwere reclassified as further education colleges.
2 In Northern Ireland, a gender split is not collected by age but is available byyear group and so this is used as a proxy.
3 In Scotland, as at the previous September.4 Includes revised figures for pre-school education in Scotland.5 Provisional.6 1 July for Northern Ireland and 31 December for non-maintained primary
and secondary schools pupils in Scotland and age at census date in Janu-ary for pre-school education in Scotland.
7 From 1992, figures for independent schools in England include pupils agedless than 2.
8 Includes the so-called "rising 5s" (i.e. those pupils who become 5 during theautumn term).
Source: Education Departments: 01325 392754

71
Education
6.3 Number of pupils and teachers, and pupil:teacher ratios:1 by school typeUnited KingdomAt January2 Numbers
2002 2003 2004 20053 20063,4 20074,5
All schools or departments
TotalPupils (thousands)
Full-time and full-timeequivalent of part-time KBCA 9 858.1 9 852.2 9 812.6 9 686.7 9 613.9 9 527.6
Teachers6 (thousands) KBCB 558.3 561.6 561.4 562.6 568.6 570.1
Pupils per teacher6:United Kingdom KBCC 17.7 17.6 17.6 17.3 17.0 16.8
England KBCD 18.0 17.9 17.8 17.5 17.2 17.1Wales KBCE 18.1 18.0 18.0 18.0 17.6 17.6Scotland KBCF 15.4 14.9 15.0 14.3 13.8 13.0Northern Ireland KBCG 16.4 16.3 16.5 16.5 16.7 16.8
Public sector mainstream schools ordepartments
NurseryPupils (thousands)
Full-time and full-timeequivalent of part-time KBFM 85.6 84.8 83.9 29.1 29.1 29.4
Teachers6 (thousands) KBFN 3.6 3.6 3.5 1.7 1.7 1.7Pupils per teacher6 KBFO 23.6 23.6 23.7 17.6 17.3 17.7
Primary7
Pupils (thousands)Full-time and full-time
equivalent of part-time KBFB 5 083.4 5 021.9 4 953.9 4 896.6 4 831.9 4 778.8Teachers6 (thousands) KBFD 231.5 228.9 224.9 224.2 226.6 226.3Pupils per teacher6 KBFE 22.0 21.9 22.0 21.8 21.3 21.1
Secondary8
Pupils (thousands)Full-time and full-time
equivalent of part-time KBFG 3 948.0 3 994.0 4 014.1 4 001.9 3 987.1 3 941.3Teachers6 (thousands) KBFH 241.2 243.3 243.8 246.6 248.5 247.6Pupils per teacher6 KBFI 16.4 16.4 16.5 16.2 16.0 15.9
Special schools
Pupils (thousands)Full-time and full-time
equivalent of part-time KPGE 105.4 104.5 102.2 100.4 99.5 99.4Teachers6 (thousands) KPGG 17.0 17.0 16.9 16.8 17.0 17.0Pupils per teacher6 KPGI 6.2 6.1 6.1 6.0 5.9 5.9
1 ’All schools’ pupil:teacher ratios exclude Pupil Referral Units and non-main-tained special schools.
2 In Scotland, as at the previous September.3 Excluding nursery school figures for Scotland as FTE pupils numbers are
not available.4 Nursery schools for Scotland, from 2005/06 exclude pre-school education
centres not in partnership with Local Authority.5 Provisional6 Figures of teachers and of pupil/teacher ratios take account of the full-time
equivalent of part-time teachers.
7 Includes grammar schools in Northern Ireland8 Includes grammar schools in Northern Ireland.9 England and Scotland only.
Source: Education Departments: 01325 392754

72
Education
6.4 Full-time and part-time pupils with special educational needs (SEN)1, 2006/072
United KingdomBy type of school Thousands and percentages
United NorthernKingdom England3 Wales Scotland Ireland
All schoolsTotal pupils 9 819.5 8 149.2 489.6 845.0 335.7
SEN pupils with statements 270.6 229.1 15.3 13.7 12.5Incidence (%)4 2.8 2.8 3.1 1.6 3.7
Maintained schools5
Nursery6
Total pupils7 163.5 37.6 1.8 111.7 12.4SEN pupils with statements 2.1 0.3 - 1.7 0.1Incidence (%)4 1.3 0.8 0.8 1.5 0.5Placement (%)8 0.8 0.1 0.1 12.3 0.5
Primary9
Total pupils 4 921.9 4 107.7 263.3 382.8 168.2SEN pupils without statements 817.8 727.7 49.8 12.8 27.4SEN pupils with statements 73.9 61.3 5.0 3.2 4.4Pupils with statements -incidence (%)4 1.5 1.5 1.9 0.8 2.6Pupils with statements - placement (%)8 27.3 26.7 33.0 23.1 35.5
SecondaryTotal pupils 3 941.6 3 268.5 210.4 313.0 149.8SEN pupils without statements 587.3 529.8 32.3 9.3 15.9SEN pupils with statements 83.1 69.5 5.8 3.9 3.8Pupils with statements - incidence (%)4 2.1 2.1 2.7 1.3 2.6Pupils with statements - placement (%)8 30.7 30.3 37.8 28.8 30.8
Special10,11
Total pupils 100.2 84.7 4.0 7.0 4.6SEN pupils with statements 95.3 82.5 4.0 4.7 4.2Incidence (%)4 95.1 97.4 100.0 66.9 91.2Placement (%)8 35.2 36.0 26.2 34.1 33.3
Pupil referral units10,12
Total pupils 15.7 15.2 0.6 .. ..SEN pupils with statements 2.1 2.0 0.2 .. ..Incidence (%)4 13.6 13.1 27.2 .. ..Placement (%)8 0.8 0.9 1.0 .. ..
Other schoolsIndependentTotal pupils 670.8 630.8 9.7 29.4 0.8SEN pupils with statements 9.3 8.9 0.3 0.1 ..Incidence (%)4 1.4 1.4 3.0 0.2 ..Placement (%)8 3.4 3.9 1.9 0.4 ..
Non-maintained special10
Total pupils 5.8 4.7 .. 1.1 ..SEN pupils with statements 4.8 4.6 .. 0.2 ..Incidence (%)4 82.4 97.7 .. 16.9 ..Placement (%)8 1.8 2.0 .. 1.4 ..
1 For Scotland, a Coordinating Support Plan, including some who also had anIndividualised Education Programme (IEP)
2 Provisional.3 Includes new codes for recording SEN status following the introduction of a
new SEN Code of Practice from January 2002.4 Incidence of pupils - as a proportion of the total number of people on roll in
each school type.5 Grant-Aided schools in Northern Ireland.
6 Includes 6,327 pupils in Voluntary and Private Pre-School Centres in NorthernIreland funded under the Pre-School Expansion Programme which began in1998/99.
7 In Scotland, on pupils in centres providing pre-school education as a Local Au-thority centre or in partnership with the Local Authority only. Children are count-ed once for each centre they are registered with.
8 Placement of pupils - the number of pupils with statements within each schooltype expressed as a proportion of the number of pupils with statements in allschools.
9 Includes nursery classes (except for Scotland, where they are included withNursery schools) and reception classes in Primary schools.
10 England and Wales figures exclude dually registered pupils.11 Including general and hospital special schools.12 England and Wales only.
Source: Education Departments: 01325 392754

73
Education
6.5 GCE, GCSE and SCE/NQ1 and vocational qualifications obtainedby pupils and studentsUnited Kingdom Percentages and thousands
Pupils in their last year of compulsory education2 Pupils/students in education3
% achieving GCE ALevels and
equivalent4,5
1-4 Grades No Total Population5 or more grades D-G7 graded (=100%) 2 or more aged 17
grades A*-C6 A*-C6 only results (Thousands) passes 8 (thousands)
2000/01All 51.0 24.1 19.4 5.5 729.7 37.4 717.9Males 45.7 24.6 23.1 6.5 372.1 33.4 366.6Females 56.5 23.6 15.5 4.4 357.6 41.6 351.3
2001/029
All 52.5 23.7 18.4 5.4 732.5 37.4 739.0Males 47.2 24.3 22.0 6.4 374.0 33.0 379.8Females 58.0 23.1 14.6 4.3 358.5 42.0 359.2
2002/03All 53.5 23.1 18.2 5.2 750.2 38.4 771.2Males 48.3 23.6 21.8 6.3 382.7 33.9 397.2Females 58.8 22.7 14.4 4.1 367.6 43.2 374.0
2003/04All 54.2 22.7 18.8 4.4 772.0 39.2 769.5Males 49.2 23.1 22.4 5.3 392.6 34.7 395.8Females 59.3 22.2 15.0 3.4 379.4 44.0 373.7
2004/059
All 57.0 22.1 17.9 3.0 759.1 38.3 788.5Males 52.1 22.8 21.4 3.7 385.5 33.8 405.2Females 62.1 21.4 14.2 2.3 373.5 43.1 383.4
2005/0610
All 59.0 21.4 16.9 2.7 773.8 37.3 807.3Males 54.3 22.1 20.3 3.3 394.2 32.7 415.5Females 63.9 20.6 13.5 2.1 379.6 42.1 391.8
1 From 1999/00, National Qualifications (NQ) were introduced in Scotland butare not all shown until 2001/01. NQs include Standard Grades, Intermediate1 & 2 and Higher Grades. The figures for Higher Grades combine the newNQ Higher and the old SCE Higher and include Advanced Highers.
2 Pupils aged 15 at the start of the acadamic year, pupils in Year S4 in Scot-land. From 2004/05, pupils at the end of Key Stage 4 in England.
3 Pupils in schools and students in further education institutions generallyaged 16-18 at the start of the academic year in England, Wales and North-ern Ireland as a percentage of the 17 year old population. Data from2002/03 for Wales and Northern Ireland however, relate to schools only.Pupils in Scotland generally sit Highers one year earlier than their A levelcounterparts and the figures relate to the results of pupils in Year S5/S6.
4 Figures, other than for Scotland, include Vocational Certificates of Education(VCE) and, previously, Advanced level GNVQ which is equivalent to 2 GCEA level or AS equivalents.
5 2 AS levels or 2 Highers/1Adavanced Higher or 1 each in Scotland, count as1 A level pass.
6 Standard Grades 1-3/Intermediate 2 A-C/Intermediate 1 A in Scotland.7 Grades D-G at GCSE and Scottish Standard Grades 4-6/Intermediate 1 B
and C/Access 3 (pass).8 3 or more SCE/NQ Higher Grades/2 or more Advanced Highers/1 Ad-
vanced Higher with 2 or more Higher Passes in Scotland.9 Includes revised data.
10 Provisional.
Source: Source: Education Departments: 01325 392754

74
Education
6.6 Students in further1 education: by country, mode of study,2 sex and age,3during 2005/064
United Kingdom (home and overseas students) Thousands
United Kingdom England5 Wales Scotland6 Northern Ireland
Full-time Part-time Full-time Part-time Full-time Part-time Full-time Part-time Full-time Part-time
All
Age under 16 4.4 55.3 2.0 10.2 0.8 4.9 1.5 32.8 0.1 7.416 305.3 72.9 274.7 46.4 13.5 3.0 8.7 12.1 8.4 11.417 265.6 81.4 235.3 54.4 11.7 3.6 9.7 14.9 8.9 8.518 121.3 86.7 103.3 65.4 5.5 4.6 6.9 11.4 5.6 5.319 49.0 78.3 41.1 61.6 2.3 4.0 3.3 9.0 2.2 3.620 27.7 75.9 23.3 61.9 1.3 3.8 2.1 7.2 1.0 3.021 19.6 75.7 16.8 63.6 0.8 3.6 1.4 5.9 0.5 2.622 16.8 79.5 14.7 67.4 0.7 4.0 1.1 5.4 0.4 2.723 14.9 81.4 13.2 69.3 0.5 4.1 1.0 5.4 0.3 2.624 13.5 84.5 12.0 72.5 0.4 4.2 0.9 5.4 0.2 2.425 12.9 87.0 11.7 75.1 0.4 4.2 0.7 5.2 0.1 2.526 11.7 82.3 10.6 71.2 0.3 3.9 0.6 4.9 0.1 2.227 10.5 75.9 9.5 65.6 0.3 3.5 0.6 4.7 0.1 2.028 9.4 71.8 8.6 62.1 0.3 3.4 0.4 4.3 0.1 2.029 9.1 72.1 8.3 62.6 0.3 3.5 0.5 4.3 0.1 1.830+ 162.6 2 218.7 151.8 1 884.9 4.0 134.7 5.8 153.4 1.1 45.7Unknown 0.7 16.0 0.7 12.2 0.1 3.4 - - - 0.4
All ages 1 055.0 3 395.4 937.5 2 806.5 43.3 196.4 45.1 286.2 29.2 106.2
Males
Age under 16 2.5 30.3 1.2 5.2 0.4 2.8 0.8 17.4 0.1 4.916 149.4 37.2 133.2 24.4 6.8 1.4 4.6 5.8 4.9 5.517 127.2 41.1 112.2 27.6 5.6 2.0 4.6 7.7 4.8 3.818 61.1 43.3 52.2 31.3 2.7 2.5 3.2 7.1 3.0 2.419 26.6 37.7 22.3 28.2 1.3 2.1 1.7 5.6 1.3 1.720 15.1 34.9 12.7 27.6 0.7 1.8 1.1 4.1 0.6 1.321 10.1 32.5 8.7 26.8 0.4 1.6 0.7 3.0 0.3 1.122 8.3 32.8 7.3 27.5 0.3 1.7 0.5 2.5 0.2 1.123 7.1 32.9 6.3 27.9 0.2 1.7 0.4 2.3 0.1 1.024 6.4 33.6 5.8 28.9 0.2 1.7 0.4 2.2 0.1 0.825 6.2 35.0 5.7 30.2 0.2 1.7 0.3 2.1 0.1 0.926 5.5 32.9 5.0 28.6 0.1 1.6 0.3 2.0 - 0.827 4.8 30.3 4.5 26.3 0.1 1.5 0.2 1.8 - 0.828 4.4 28.9 4.1 25.1 0.1 1.4 0.2 1.7 - 0.729 4.3 29.6 4.0 25.8 0.1 1.4 0.2 1.7 - 0.730+ 77.3 805.2 73.8 684.0 1.2 50.0 1.8 55.5 0.5 15.8Unknown 0.5 6.6 0.5 5.1 - 1.3 - - - 0.2
All Ages 516.8 1 324.7 459.4 1 080.5 20.5 78.2 20.9 122.5 16.0 43.6
Females
Age under 16 1.9 24.9 0.9 4.9 0.4 2.1 0.7 15.3 - 2.516 155.9 35.7 141.5 22.0 6.7 1.5 4.1 6.3 3.6 5.917 138.4 40.3 123.1 26.8 6.1 1.7 5.0 7.2 4.1 4.718 60.2 43.3 51.1 34.0 2.8 2.2 3.7 4.3 2.7 2.919 22.4 40.6 18.8 33.4 1.1 2.0 1.7 3.4 0.8 1.920 12.6 41.0 10.6 34.3 0.6 1.9 1.1 3.1 0.4 1.721 9.6 43.3 8.1 36.8 0.4 2.0 0.8 2.9 0.2 1.522 8.5 46.7 7.4 39.9 0.4 2.2 0.6 2.9 0.2 1.723 7.8 48.5 6.8 41.4 0.3 2.4 0.5 3.1 0.1 1.624 7.1 50.9 6.2 43.7 0.3 2.5 0.5 3.2 0.1 1.625 6.7 52.0 6.0 44.9 0.3 2.4 0.4 3.1 0.1 1.626 6.2 49.3 5.6 42.7 0.2 2.3 0.3 2.9 0.1 1.527 5.7 45.6 5.0 39.3 0.2 2.1 0.4 2.9 0.1 1.328 5.0 42.9 4.5 37.0 0.2 2.0 0.3 2.7 - 1.329 4.8 42.6 4.3 36.8 0.2 2.0 0.3 2.6 - 1.130+ 85.3 1 413.5 77.9 1 200.9 2.8 84.8 4.0 98.0 0.6 29.8Unknown 0.2 9.4 0.2 7.1 - 2.1 - - - 0.2
All ages 538.2 2 070.6 478.0 1 726.0 22.8 118.2 24.2 163.8 13.2 62.7
1 Further education (FE) institution figures are whole year counts. Higher edu-cation (HE) institution figures are based on the HESA ’standard registration’count.
2 Full-time includes sandwich. Part-time comprises both day and evening, in-cluding block release and open/distance learning.
3 Ages as at 31 August 2005 (1 July in Northern Ireland and 31 December inScotland).
4 Provisional.
5 Further education institution figures for England include LSC funded studentsonly.
6 Figures for Scotland further education colleges are vocational course enrol-ments rather than headcounts.
Source: Education Departments: 01325 392754

75
Education
6.7 Students in further education:1 by country, mode of study,2 sex and area3 2005/06United Kingdom - Home and overseas students
Thousands
United Kingdom England5 Wales Scotland6 Northern Ireland
Full- Part- Full- Part- Full- Part- Full- Part- Full- Part-time time time time time time time time time time
All persons
Health, Public Services and Care 146.5 579.6 135.9 510.6 - - 7.4 60.1 3.3 8.9Science and Mathermatics 60.8 57.1 56.3 40.3 - - 1.7 6.3 2.8 10.5Agriculture, Horticulture and Animal Care 22.8 47.1 21.4 37.4 - - 1.2 8.9 0.2 0.7Engineering and Manufacturing Technologies 54.9 142.3 47.6 113.9 - 0.1 4.9 22.9 2.4 5.5Construction, Planning and the Built Environment 49.8 90.6 40.0 69.4 - - 4.2 15.0 5.6 6.3Information & Communication Technology 60.5 555.1 55.4 487.3 - - 3.1 51.9 2.0 15.9Retail and Commercial Enterprise 68.1 140.1 64.5 125.5 - - 0.1 4.3 3.5 10.3Leisure,Travel and Tourism 63.4 96.9 56.9 64.9 - - 4.6 31.0 1.9 1.0Arts, Media and Publishing 117.2 170.3 109.5 146.8 - - 4.8 19.5 2.9 4.0History, Philosophy and Theology 14.9 27.5 14.5 27.1 - - - - 0.4 0.4Social Sciences 19.2 12.3 18.2 10.3 - - - - 1.0 1.9Languages, Literature and Culture 30.3 217.0 27.4 178.7 - 2.9 2.6 23.5 0.4 12.0Education and Training 4.6 96.9 4.3 83.2 - - - - 0.3 13.7Preparation for Life and Work 167.3 638.2 166.9 633.1 - - - - 0.4 5.0Business Adiminstration & Law 63.1 195.3 57.1 163.3 - 0.1 4.0 21.8 2.0 10.2Other subjects7 / Unknown 111.5 329.1 61.7 114.6 43.2 193.3 6.6 21.1 - -
All subjects 1 055.0 3 395.4 937.5 2 806.5 43.3 196.4 45.1 286.2 29.2 106.2
Males
Health, Public Services and Care 51.5 164.2 50.0 141.2 - - 1.3 21.4 0.2 1.6Science and Mathematics 27.4 17.8 25.7 11.6 - - 0.5 2.6 1.2 3.7Agriculture, Horticulture and Animal Care 11.1 22.7 10.3 17.1 - - 0.7 5.4 0.1 0.3Engineering and Manufacturing Technologies 51.2 110.7 44.2 86.7 - 0.1 4.6 18.9 2.4 4.9Construction, Planning and the Built Environment 48.0 83.5 38.5 64.2 - - 4.0 13.8 5.5 5.6Information & Communication Technology 43.2 208.4 39.5 184.0 - - 2.0 18.5 1.6 5.9Retail and Commercial Enterprise 10.5 41.3 9.8 35.6 - - 0.1 3.7 0.6 2.1Leisure, Travel and Tourism 36.7 47.5 33.2 35.8 - - 2.4 11.1 1.0 0.6Arts Media and Publishing 53.8 47.7 50.0 39.9 - - 2.2 6.6 1.6 1.3History, Philosophy and Theology 6.4 8.9 6.3 8.7 - - - - 0.2 0.2Social Sciences 7.7 3.6 7.3 2.9 - - - - 0.4 0.7Languages, Literature and Culture 10.5 77.7 9.3 62.4 - 1.0 1.1 9.2 0.1 5.1Education and Training 1.7 25.9 1.5 20.2 - - - - 0.2 5.7Preparation for Life and Work 80.3 267.2 80.0 246.3 - - - - 0.3 2.9Business Administration & Law 28.6 70.2 27.1 60.1 - - 0.9 7.1 0.6 3.0Other Subjects7/Unknown 48.2 127.3 26.7 45.9 20.5 77.2 1.1 4.2 - -
All subjects 516.8 1 324.7 459.4 1 080.5 20.5 78.2 20.9 122.5 16.0 43.6
Females
Health, Public Services and Care 95.1 415.3 85.9 369.5 - - 6.0 38.6 3.1 7.2Science and Mathematics 33.4 39.2 30.6 28.7 - - 1.1 3.7 1.7 6.8Agriculture, Horticulture and Animal Care 11.8 24.4 11.1 20.4 - - 0.5 3.6 0.1 0.4Engineering and Manufacturing Technologies 3.7 31.6 3.3 27.2 - - 0.3 3.9 0.1 0.5Construction, Planning and the Built Environment 1.8 7.1 1.5 5.1 - - 0.3 1.2 0.1 0.7Information & Communication Technology 17.3 346.7 15.8 303.3 - - 1.1 33.4 0.4 10.0Retail and Commercial Enterprise 57.6 98.8 54.7 89.9 - - - 0.7 2.9 8.2Leisure, Travel and Tourism 26.7 49.4 23.7 29.1 - - 2.2 19.9 0.9 0.4Arts, Media and Publishing 63.3 122.6 59.5 106.9 - - 2.5 12.9 1.3 2.7History, Philosophy and Theology 8.5 18.7 8.2 18.4 - - - - 0.2 0.2Social Sciences 11.5 8.7 10.9 7.5 - - - - 0.6 1.2Language, Literature and Culture 19.8 139.3 18.1 116.3 - 2.0 1.5 14.2 0.2 6.9Education and Training 2.9 71.0 2.8 63.1 - - - - 0.1 8.0Preparation for Life and Work 87.1 370.9 86.9 368.8 - - - - 0.1 2.1Business Administration & Law 34.6 125.1 30.0 103.3 - - 3.1 14.6 1.4 7.2Other subjects7/Unknown 63.2 201.8 35.0 68.7 22.8 116.2 5.5 16.9 - -
All subjects 538.2 2 070.6 478.0 1 726.0 22.8 118.2 24.2 163.8 13.2 62.7
1 Further education (FE) institution figures are whole year counts. Highereducation (HE) institution figures are based on the HESA ’standard registra-tion’ count.
2 Full-time includes sandwich. Part-time comprises both day and evening in-cluding block release and open/distance learning.
3 Data are shown by sector subject area and not directly comparable withprevious years.
4 Provisional.5 Further education institution figures for England include LSC funded stu-
dents only.
6 Figures for Scotland further education colleges are vocational course enrol-ments rather than headcounts.
7 For UK higher education institutions, includes the previous subject groups notallocated to specific sector subject areas, i e. medicine & dentistry, subjects al-lied to medicine, biological, veterinary, physical, mathematical and computersciences and creative arts & design.
Source: Education Departments/DIUS: 01325 392754

76
Education
6.8 Students in higher1 education by level, mode of study,2 sex and age,3 2005/064,5,6
United Kingdom (home and overseas students)Thousands
Total higherPostgraduate level First degree Other undergraduate education7
PhD and Masters Totalequivalent and others Postgraduate
Full-time Part-time Full-time Part-time Full-time Part-time Full-time Part-time Full-time Part-time Full-time Part-time
AllAge under 16 - - - - - - - - - 0.4 - 0.416 - - - - - - 0.3 - 0.5 3.3 0.8 3.317 - - - - - - 10.0 0.1 4.4 2.6 14.4 2.718 - - - - - - 180.3 1.3 20.7 6.8 201.1 8.119 - - 0.1 - 0.1 - 231.5 4.2 24.8 11.2 256.5 15.520 - - 1.5 0.3 1.5 0.3 237.8 6.8 19.7 12.9 259.0 20.121 0.6 - 16.2 1.8 16.8 1.8 155.6 9.0 13.5 12.2 186.0 23.022 2.7 0.1 27.7 5.9 30.4 6.0 76.2 9.2 10.0 13.4 116.7 28.623 5.0 0.2 27.5 10.1 32.5 10.4 40.4 8.7 7.9 14.4 80.8 33.524 6.3 1.0 21.1 12.0 27.3 12.9 25.0 8.2 6.7 15.2 59.0 36.325 5.8 2.4 16.2 12.7 22.0 15.1 17.8 8.0 5.9 15.8 45.6 38.826 4.8 2.8 12.3 12.2 17.2 15.0 13.1 7.3 4.9 15.4 35.2 37.727 3.7 2.3 9.2 11.3 12.9 13.7 9.9 6.5 4.2 13.9 27.0 34.128 3.1 2.2 7.6 10.6 10.7 12.8 7.9 6.1 3.6 13.3 22.2 32.229 2.5 2.0 6.0 10.2 8.5 12.3 6.9 5.8 3.4 13.2 18.9 31.330+ 15.2 31.3 39.5 183.9 54.7 215.2 69.6 131.1 48.6 342.7 173.0 689.6Unknown - 0.1 0.1 1.7 0.2 1.7 0.2 0.2 0.2 6.6 0.5 8.5
All ages 49.9 44.4 185.1 272.8 234.9 317.2 1 082.6 212.3 179.0 513.3 1 497.0 1 043.8
MalesAge under 16 - - - - - - - - - 0.2 - 0.216 - - - - - - 0.1 - 0.2 1.4 0.4 1.417 - - - - - - 4.4 0.1 1.9 1.3 6.3 1.318 - - - - - - 80.1 0.6 9.0 3.8 89.1 4.419 - - - - - - 104.9 2.0 11.0 6.1 116.1 8.220 - - 0.7 0.1 0.7 0.1 107.7 3.4 8.6 6.7 117.0 10.221 0.3 - 6.6 0.6 6.9 0.6 75.2 4.4 5.7 5.9 87.9 10.922 1.6 - 11.8 2.3 13.3 2.3 39.1 4.4 4.1 5.7 56.6 12.523 2.8 0.1 12.4 4.0 15.1 4.1 21.0 4.1 3.1 5.6 39.2 13.824 3.5 0.5 10.0 4.8 13.5 5.2 12.5 3.4 2.6 5.6 28.7 14.325 3.2 1.4 7.8 4.9 11.0 6.3 8.5 3.1 2.1 5.5 21.7 14.926 2.6 1.6 6.2 4.9 8.8 6.5 6.2 2.8 1.8 5.5 16.7 14.827 2.0 1.3 4.7 4.7 6.7 6.0 4.5 2.5 1.5 5.0 12.6 13.528 1.7 1.2 3.8 4.4 5.6 5.6 3.4 2.3 1.2 4.8 10.2 12.729 1.4 1.1 3.2 4.4 4.6 5.5 3.1 2.2 1.1 4.6 8.8 12.330+ 8.8 17.0 20.5 80.5 29.3 97.5 23.1 47.0 12.6 115.0 65.1 259.7Unknown - - 0.1 0.7 0.1 0.7 0.1 0.1 0.1 2.3 0.3 3.1
All ages 28.0 24.3 87.8 116.2 115.8 140.4 493.9 82.3 66.7 185.0 676.7 408.2
FemalesAge under 16 - - - - - - - - - 0.2 - 0.216 - - - - - - 0.2 - 0.3 1.9 0.5 1.917 - - - - - - 5.5 0.1 2.6 1.3 8.1 1.418 - - - - - - 100.2 0.7 11.8 3.0 112.0 3.719 - - - - 0.1 - 126.6 2.1 13.8 5.1 140.4 7.320 - - 0.8 0.3 0.8 0.3 130.1 3.4 11.1 6.2 142.0 9.921 0.3 - 9.6 1.2 9.9 1.2 80.4 4.6 7.8 6.3 98.1 12.122 1.1 - 16.0 3.7 17.1 3.7 37.1 4.7 5.8 7.7 60.1 16.123 2.2 0.1 15.2 6.2 17.4 6.3 19.4 4.6 4.8 8.8 41.6 19.724 2.8 0.5 11.1 7.2 13.8 7.7 12.5 4.7 4.1 9.6 30.4 22.025 2.6 1.0 8.4 7.7 11.0 8.8 9.2 4.9 3.7 10.3 23.9 23.926 2.2 1.2 6.1 7.3 8.4 8.5 7.0 4.5 3.1 9.9 18.5 22.927 1.8 1.0 4.5 6.6 6.3 7.7 5.4 4.0 2.7 9.0 14.4 20.628 1.4 1.0 3.7 6.2 5.1 7.2 4.5 3.8 2.4 8.5 12.0 19.529 1.1 0.9 2.8 5.9 3.9 6.8 3.9 3.7 2.3 8.6 10.1 19.030+ 6.4 14.3 19.0 103.4 25.4 117.7 46.6 84.1 35.9 227.7 107.9 429.9Unknown - - 0.1 1.0 0.1 1.0 0.1 0.1 0.1 4.3 0.3 5.4
All ages 21.9 20.2 97.3 156.6 119.2 176.8 588.6 130.0 112.3 328.3 820.3 635.6
1 Includes Open University students. Part-time figures include dormantmodes, those writing up at home and on sabbaticals.
2 Full-time includes sandwich. Part-time comprises both day and evening, in-cluding block release and open/distance learning.
3 Ages as at 31 August 2005 (1 July in Northern Ireland and 31 December inScotland).
4 Provisional.5 Figures for higher education (HE) institutions are based on the HESA ’stan-
dard registration’ count. Figure for further education (FE) institutions arewhole year enrolments.
6 FE institution figures for England include Learning and Skills Council (LSC)funded students only.
7 Includes data for higher education students in further education institutionsin Wales which cannot be split by level.
Source: Education Departments: 01325 392754
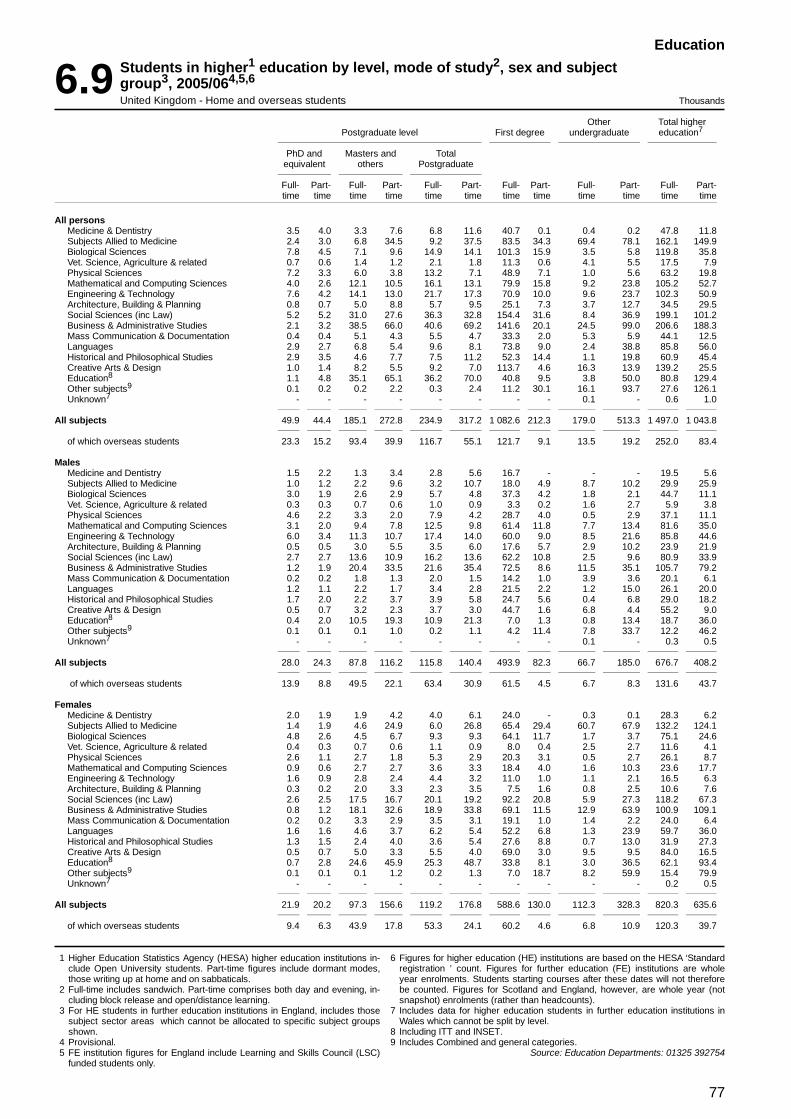
77
Education
6.9 Students in higher1 education by level, mode of study2, sex and subjectgroup3, 2005/064,5,6
United Kingdom - Home and overseas students Thousands
Other Total higherPostgraduate level First degree undergraduate education7
PhD and Masters and Totalequivalent others Postgraduate
Full- Part- Full- Part- Full- Part- Full- Part- Full- Part- Full- Part-time time time time time time time time time time time time
All personsMedicine & Dentistry 3.5 4.0 3.3 7.6 6.8 11.6 40.7 0.1 0.4 0.2 47.8 11.8Subjects Allied to Medicine 2.4 3.0 6.8 34.5 9.2 37.5 83.5 34.3 69.4 78.1 162.1 149.9Biological Sciences 7.8 4.5 7.1 9.6 14.9 14.1 101.3 15.9 3.5 5.8 119.8 35.8Vet. Science, Agriculture & related 0.7 0.6 1.4 1.2 2.1 1.8 11.3 0.6 4.1 5.5 17.5 7.9Physical Sciences 7.2 3.3 6.0 3.8 13.2 7.1 48.9 7.1 1.0 5.6 63.2 19.8Mathematical and Computing Sciences 4.0 2.6 12.1 10.5 16.1 13.1 79.9 15.8 9.2 23.8 105.2 52.7Engineering & Technology 7.6 4.2 14.1 13.0 21.7 17.3 70.9 10.0 9.6 23.7 102.3 50.9Architecture, Building & Planning 0.8 0.7 5.0 8.8 5.7 9.5 25.1 7.3 3.7 12.7 34.5 29.5Social Sciences (inc Law) 5.2 5.2 31.0 27.6 36.3 32.8 154.4 31.6 8.4 36.9 199.1 101.2Business & Administrative Studies 2.1 3.2 38.5 66.0 40.6 69.2 141.6 20.1 24.5 99.0 206.6 188.3Mass Communication & Documentation 0.4 0.4 5.1 4.3 5.5 4.7 33.3 2.0 5.3 5.9 44.1 12.5Languages 2.9 2.7 6.8 5.4 9.6 8.1 73.8 9.0 2.4 38.8 85.8 56.0Historical and Philosophical Studies 2.9 3.5 4.6 7.7 7.5 11.2 52.3 14.4 1.1 19.8 60.9 45.4Creative Arts & Design 1.0 1.4 8.2 5.5 9.2 7.0 113.7 4.6 16.3 13.9 139.2 25.5Education8 1.1 4.8 35.1 65.1 36.2 70.0 40.8 9.5 3.8 50.0 80.8 129.4Other subjects9 0.1 0.2 0.2 2.2 0.3 2.4 11.2 30.1 16.1 93.7 27.6 126.1Unknown7 - - - - - - - - 0.1 - 0.6 1.0
All subjects 49.9 44.4 185.1 272.8 234.9 317.2 1 082.6 212.3 179.0 513.3 1 497.0 1 043.8
of which overseas students 23.3 15.2 93.4 39.9 116.7 55.1 121.7 9.1 13.5 19.2 252.0 83.4
MalesMedicine and Dentistry 1.5 2.2 1.3 3.4 2.8 5.6 16.7 - - - 19.5 5.6Subjects Allied to Medicine 1.0 1.2 2.2 9.6 3.2 10.7 18.0 4.9 8.7 10.2 29.9 25.9Biological Sciences 3.0 1.9 2.6 2.9 5.7 4.8 37.3 4.2 1.8 2.1 44.7 11.1Vet. Science, Agriculture & related 0.3 0.3 0.7 0.6 1.0 0.9 3.3 0.2 1.6 2.7 5.9 3.8Physical Sciences 4.6 2.2 3.3 2.0 7.9 4.2 28.7 4.0 0.5 2.9 37.1 11.1Mathematical and Computing Sciences 3.1 2.0 9.4 7.8 12.5 9.8 61.4 11.8 7.7 13.4 81.6 35.0Engineering & Technology 6.0 3.4 11.3 10.7 17.4 14.0 60.0 9.0 8.5 21.6 85.8 44.6Architecture, Building & Planning 0.5 0.5 3.0 5.5 3.5 6.0 17.6 5.7 2.9 10.2 23.9 21.9Social Sciences (inc Law) 2.7 2.7 13.6 10.9 16.2 13.6 62.2 10.8 2.5 9.6 80.9 33.9Business & Administrative Studies 1.2 1.9 20.4 33.5 21.6 35.4 72.5 8.6 11.5 35.1 105.7 79.2Mass Communication & Documentation 0.2 0.2 1.8 1.3 2.0 1.5 14.2 1.0 3.9 3.6 20.1 6.1Languages 1.2 1.1 2.2 1.7 3.4 2.8 21.5 2.2 1.2 15.0 26.1 20.0Historical and Philosophical Studies 1.7 2.0 2.2 3.7 3.9 5.8 24.7 5.6 0.4 6.8 29.0 18.2Creative Arts & Design 0.5 0.7 3.2 2.3 3.7 3.0 44.7 1.6 6.8 4.4 55.2 9.0Education8 0.4 2.0 10.5 19.3 10.9 21.3 7.0 1.3 0.8 13.4 18.7 36.0Other subjects9 0.1 0.1 0.1 1.0 0.2 1.1 4.2 11.4 7.8 33.7 12.2 46.2Unknown7 - - - - - - - - 0.1 - 0.3 0.5
All subjects 28.0 24.3 87.8 116.2 115.8 140.4 493.9 82.3 66.7 185.0 676.7 408.2
of which overseas students 13.9 8.8 49.5 22.1 63.4 30.9 61.5 4.5 6.7 8.3 131.6 43.7
FemalesMedicine & Dentistry 2.0 1.9 1.9 4.2 4.0 6.1 24.0 - 0.3 0.1 28.3 6.2Subjects Allied to Medicine 1.4 1.9 4.6 24.9 6.0 26.8 65.4 29.4 60.7 67.9 132.2 124.1Biological Sciences 4.8 2.6 4.5 6.7 9.3 9.3 64.1 11.7 1.7 3.7 75.1 24.6Vet. Science, Agriculture & related 0.4 0.3 0.7 0.6 1.1 0.9 8.0 0.4 2.5 2.7 11.6 4.1Physical Sciences 2.6 1.1 2.7 1.8 5.3 2.9 20.3 3.1 0.5 2.7 26.1 8.7Mathematical and Computing Sciences 0.9 0.6 2.7 2.7 3.6 3.3 18.4 4.0 1.6 10.3 23.6 17.7Engineering & Technology 1.6 0.9 2.8 2.4 4.4 3.2 11.0 1.0 1.1 2.1 16.5 6.3Architecture, Building & Planning 0.3 0.2 2.0 3.3 2.3 3.5 7.5 1.6 0.8 2.5 10.6 7.6Social Sciences (inc Law) 2.6 2.5 17.5 16.7 20.1 19.2 92.2 20.8 5.9 27.3 118.2 67.3Business & Administrative Studies 0.8 1.2 18.1 32.6 18.9 33.8 69.1 11.5 12.9 63.9 100.9 109.1Mass Communication & Documentation 0.2 0.2 3.3 2.9 3.5 3.1 19.1 1.0 1.4 2.2 24.0 6.4Languages 1.6 1.6 4.6 3.7 6.2 5.4 52.2 6.8 1.3 23.9 59.7 36.0Historical and Philosophical Studies 1.3 1.5 2.4 4.0 3.6 5.4 27.6 8.8 0.7 13.0 31.9 27.3Creative Arts & Design 0.5 0.7 5.0 3.3 5.5 4.0 69.0 3.0 9.5 9.5 84.0 16.5Education8 0.7 2.8 24.6 45.9 25.3 48.7 33.8 8.1 3.0 36.5 62.1 93.4Other subjects9 0.1 0.1 0.1 1.2 0.2 1.3 7.0 18.7 8.2 59.9 15.4 79.9Unknown7 - - - - - - - - - - 0.2 0.5
All subjects 21.9 20.2 97.3 156.6 119.2 176.8 588.6 130.0 112.3 328.3 820.3 635.6
of which overseas students 9.4 6.3 43.9 17.8 53.3 24.1 60.2 4.6 6.8 10.9 120.3 39.7
1 Higher Education Statistics Agency (HESA) higher education institutions in-clude Open University students. Part-time figures include dormant modes,those writing up at home and on sabbaticals.
2 Full-time includes sandwich. Part-time comprises both day and evening, in-cluding block release and open/distance learning.
3 For HE students in further education institutions in England, includes thosesubject sector areas which cannot be allocated to specific subject groupsshown.
4 Provisional.5 FE institution figures for England include Learning and Skills Council (LSC)
funded students only.
6 Figures for higher education (HE) institutions are based on the HESA ‘Standardregistration ’ count. Figures for further education (FE) institutions are wholeyear enrolments. Students starting courses after these dates will not thereforebe counted. Figures for Scotland and England, however, are whole year (notsnapshot) enrolments (rather than headcounts).
7 Includes data for higher education students in further education institutions inWales which cannot be split by level.
8 Including ITT and INSET.9 Includes Combined and general categories.
Source: Education Departments: 01325 392754

78
Education
6.10 Students1,2 obtaining higher education qualifications3,4: by level, sex and subjectgroup, 2005/06United Kingdom Thousands
Postgraduate
PhD and Total higherSub-degree3 First degree equivalent Other Total education
All persons
Subject groupMedicine & Dentistry 0.1 7.7 1.7 3.4 5.2 13.0Subjects Allied to Medicine 44.9 29.8 0.9 9.8 10.7 85.4Biological Sciences 3.3 27.8 2.5 6.6 9.1 40.2Vet. Science, Agriculture & related 1.3 2.8 0.3 1.2 1.5 5.6Physical Sciences 2.3 12.9 2.3 4.0 6.3 21.5Mathematical & Computer Sciences 7.5 24.3 1.2 9.3 10.5 42.3Engineering & Technology 4.8 19.8 2.2 11.0 13.2 37.8Architecture, Building & Planning 2.8 7.4 0.2 5.4 5.6 15.7Social Studies (inc Law) 14.7 45.2 1.5 27.6 29.1 89.0Business & Administrative Studies 13.0 42.4 0.7 40.4 41.1 96.5Mass Communication & Documentation 1.3 9.1 0.1 4.6 4.7 15.1Languages 4.3 20.2 0.9 5.5 6.4 30.9Historical and Philosophical Studies 2.2 15.8 1.0 4.5 5.5 23.5Creative Arts & Design 5.9 31.3 0.3 6.8 7.2 44.4Education5 15.9 12.3 0.6 41.6 42.1 70.4Combined, general 2.2 7.1 0.1 0.1 0.2 9.5
All subjects 126.6 316.0 16.5 181.8 198.3 640.8
Males
Subject groupMedicine and Dentistry - 3.2 0.8 1.5 2.3 5.5Subjects Allied to Medicine 5.7 5.3 0.4 2.5 2.8 13.9Biological Sciences 1.4 9.6 1.0 2.1 3.1 14.1Vet. Science, Agriculture & related 0.6 0.9 0.2 0.6 0.7 2.2Physical Sciences 1.4 7.3 1.5 2.1 3.6 12.2Mathematical & Computer Sciences 5.5 18.2 0.9 7.0 7.9 31.6Engineering & Technology 4.4 16.6 1.7 8.7 10.5 31.4Architecture, Building & Planning 2.0 5.2 0.1 3.3 3.4 10.6Social Studies (inc Law) 4.3 17.7 0.8 11.9 12.7 34.7Business & Administrative Studies 5.9 20.1 0.4 20.8 21.2 47.2Mass Communication & Documentation 0.7 3.5 - 1.5 1.6 5.8Languages 1.5 5.5 0.4 1.7 2.1 9.1Historical and Philosophical Studies 0.9 7.2 0.6 2.1 2.7 10.7Creative Arts & Design 2.5 12.0 0.2 2.7 2.9 17.4Education5 3.9 1.9 0.2 12.0 12.3 18.1Combined, general 0.8 3.0 - 0.1 0.1 3.9
All subjects 41.5 137.1 9.4 80.4 89.8 268.4
Females
Subject groupMedicine & Dentistry 0.1 4.5 0.9 1.9 2.9 7.5Subjects Allied to Medicine 39.2 24.5 0.5 7.4 7.9 71.6Biological Sciences 1.9 18.2 1.5 4.4 5.9 26.0Vet. Science, Agriculture & related 0.7 1.9 0.1 0.6 0.7 3.4Physical Sciences 1.0 5.6 0.8 1.9 2.7 9.3Mathematical & Computer Sciences 2.0 6.1 0.3 2.4 2.6 10.7Engineering & Technology 0.5 3.2 0.5 2.3 2.7 6.4Architecture, Building & Planning 0.8 2.2 0.1 2.1 2.2 5.2Social Studies (inc Law) 10.4 27.5 0.7 15.7 16.4 54.3Business & Administrative Studies 7.0 22.4 0.3 19.6 19.9 49.3Mass Communication & Documentation 0.6 5.5 0.1 3.1 3.2 9.3Languages 2.8 14.7 0.5 3.8 4.3 21.8Historical and Philosophical Studies 1.4 8.6 0.4 2.4 2.8 12.8Creative Arts & Design 3.4 19.4 0.1 4.1 4.2 27.0Education5 12.0 10.4 0.3 29.6 29.9 52.3Combined, general 1.4 4.2 - 0.1 0.1 5.6
All subjects 85.1 178.9 7.1 101.4 108.5 372.5
1 Includes students on Open University courses.2 Includes students qualifying on all modes of study.3 Includes higher education in higher education institutions in the UK only. Ex-
cludes qualifications from the private sector, except for the University ofBuckingham who returned data to HESA in 2005/06, and higher educationqualifications in further education institutions (approximately 8% of the totalnumber of students).
4 Excludes students who successfully completed courses for which formal qualifi-cations are not awarded.
5 Includes ITT and INSET.
Source: Education Departments: 01325 392754

79
Education
6.11 Qualified teachers: by type of school and sex1
Thousands
Public sector mainstream schools Non-maintained All
Nursery and mainstream specialprimary Secondary2 schools schools Total3
All full-time teachers
United Kingdom1990/914 208.8 233.1 44.9 19.0 505.71995/964,5 211.8 222.1 48.6 17.2 499.72000/016,7 211.2 225.7 52.3 16.5 505.72001/02 211.2 227.1 52.8 16.3 507.32002/038 210.5 229.7 53.6 19.8 513.62003/049 210.6 229.7 55.8 19.8 516.02004/059 208.5 232.5 56.3 19.9 517.22005/0610 208.4 233.8 57.2 20.4 519.8
of which:England and Wales1 178.9 200.1 54.5 17.5 451.0Scotland 21.7 23.7 2.6 2.1 50.1Northern Ireland 7.9 10.0 0.1 0.7 18.7
Full-time male teachers
United Kingdom1990/914 37.7 120.7 20.6 5.9 184.91995/964,5 35.5 107.9 21.1 5.4 169.82000/016,7 32.1 102.9 21.3 5.0 161.32001/02 31.8 102.6 21.5 4.9 160.82002/038 31.7 101.6 21.6 5.9 160.82003/049 31.7 101.5 22.7 5.9 161.92004/059 31.2 101.6 22.9 5.9 161.62005/0610 31.0 100.8 23.5 6.0 161.4
of which:England and Wales1 28.0 86.6 22.4 5.4 142.5Scotland 1.6 10.3 1.0 0.5 13.4Northern Ireland 1.4 3.9 - 0.1 5.4
Full-time female teachers
United Kingdom1990/914 171.1 112.3 24.3 13.1 320.81995/964,5 176.3 114.2 27.4 11.8 329.92000/016,7 179.1 122.8 30.9 11.6 344.42001/02 179.4 124.5 31.2 11.4 346.52002/038 178.8 128.2 32.0 13.9 352.82003/049 178.9 128.2 33.0 13.9 354.02004/059 177.3 130.9 33.4 14.0 355.62005/0610 177.4 133.1 33.7 14.3 358.4
of which:England and Wales1 150.8 113.4 32.1 12.1 308.5Scotland 20.1 13.5 1.5 1.6 36.6Northern Ireland 6.5 6.2 0.1 0.6 13.3
All full time equivalents (FTE) of part-time teachers
United Kingdom1990/91 .. .. .. .. 30.01995/964,5 19.1 17.7 8.9 1.5 47.22000/016,7 21.9 16.7 10.2 1.6 50.42001/02 23.4 17.4 10.4 1.8 53.02002/038 23.8 17.8 11.1 1.7 54.42003/049 26.4 19.5 11.4 1.9 59.32004/059 27.5 20.6 11.5 1.9 61.42005/0610 30.4 21.5 11.6 2.0 65.5
1 Public sector teachers numbers in England & Wales have been providedfrom the 618G survey and gender split has been calculated by using theproportions from the Database of Teacher Records (DTR).
2 From 1993/94 excludes sixth form colleges in England and Wales whichwere reclassified as further education colleges on 1 April 1993.
3 Excludes Pupil Referral Units (PRUs).4 Figures for non-maintained mainstream schools refer to Great Britain.5 Includes 1994/95 data for Northern Ireland.6 Includes 1999/00 pre-school data for Scotland.
7 Includes 2001/02 data for Northern Ireland.8 Includes 2001/02 pre-school and 2003/04 school data for Scotland.9 Includes revised data.
10 Provisional.Source: Education Departments: 01325 392754

80
Labour Market

81
Labour Market
Labour market
Ch
apter 7

82
Labour Market
The LFS was carried out every two years from 1973 to 1983. The ILO definition was first used in 1984. This was also the first year in which the survey was conducted on an annual basis with results available for every spring quarter (representing an average of the period from March to May). The survey moved to a continuous basis in spring 1992 in Great Britain and in winter 1994/95 in Northern Ireland, with average quarterly results published four times a year for seasonal quarters: spring (March to May), summer (June to August), autumn (September to November) and winter (December to February). From April 1998, results are published 12 times a year for the average of three consecutive months.
The LFS collects information on a sample of the population. To convert this information to give estimates for the population the data must be grossed. This is achieved by calculating weighting factors (often referred to simply as weights) which can be applied to each sampled individual in such a way that the weighted-up results match estimates or projections of the total population in terms of age distribution, sex, and region of residence.
Strengths and limitations of the LFS
The LFS produces coherent labour market information on the basis of internationally standard concepts and definitions. It is a rich source of data on a wide variety of labour market and personal characteristics. It is the most suitable source for making comparisons between countries. The LFS is designed so that households interviewed in each three month period constitute a representative sample of UK households. The survey covers those living in private households and nurses in National Health Service accommodation. Students living in halls of residence have been included since 1992 as information about them is collected at their parents’ address.
However the LFS has its limitations. It is a sample survey and is therefore subject to sampling variability. The survey does not include people living in institutions such as hostels or residential homes. ‘Proxy’ reporting (when members of the household are not present at the interview, another member of the household answers the questions on their behalf) can affect the quality of information on topics such as earnings, hours worked, benefit receipt and qualifications. Around one-third of interviews are conducted ‘by proxy’, usually by a spouse or partner but sometimes by a parent or other near relation.
Sampling variability
Survey estimates are prone to sampling variability. The easiest way to explain this concept is by example. In the September to November 1997 period, ILO unemployment in Great Britain
Labour market
Labour Force Survey
(Tables 7.1–7.3, 7.6, 7.9, 7.10–7.11, 7.13 and 7.16–7.18)
The impact of Census 2001 on LFS data
(Tables 7.1–7.3, 7.6, 7.9, 7.10–7.11, 7.16–7.18)
The first results of the 2001 Census, published on 30 September 2002, showed that previous estimates of the total UK population were about one million too high. Please see the Introduction of this publication for more details. Estimates of employment and unemployment levels from the Labour Force Survey (LFS) released before 30 October 2002 are therefore too high, with rates also affected. This has led to the LFS needing to reweight their estimates to the new population figures.
The Office for National Statistics (ONS) has published interim reweighted LFS estimates for the UK, which have been used in this chapter. The interim reweighted figures only cover top-level seasonally adjusted series published in the ONS Labour Market Statistics First Release. The non-seasonally adjusted series, used in previous editions of the Annual Abstract of Statistics, were not available in time for this publication.
Future editions of the Annual Abstract of Statistics will continue to show seasonally adjusted data for these tables, in line with other headline publications. These figures are not directly comparable to the non-seasonally adjusted figures previously published in the Annual Abstract of Statistics.
Background
The LFS is the largest regular household survey in the UK LFS interviews are conducted continuously throughout the year. In any three-month period, a nationally representative sample of approximately 102,000 people aged 16 or over in around 52,000 households are interviewed. Each household is interviewed five times, at three-monthly intervals. The initial interview is done face-to-face by an interviewer visiting the address. The other interviews are done by telephone wherever possible. The survey asks a series of questions about respondents’ personal circumstances and their labour market activity. Most questions refer to activity in the week before the interview.
The concepts and definitions used in the LFS are agreed by the International Labour Organisation (ILO) – an agency of the United Nations. The definitions are used by European Union member countries and members of the Organisation for Economic Co-operation and Development (OECD).

83
Labour Market
(seasonally adjusted) stood at 1,847,000. If we drew another sample for the same period we could get a different result, perhaps 1,900,000 or 1,820,000.
In theory, we could draw many samples, and each would give a different result. This is because each sample would be made up of different people who would give different answers to the questions. The spread of these results is the sampling variability. Sampling variability is determined by a number of factors including the sample size, the variability of the population from which the sample is drawn and the sample design. Once we know the sampling variability we can calculate a range of values about the sample estimate that represents the expected variation with a given level of assurance. This is called a confidence interval. For a 95 per cent confidence interval we expect that in 95 per cent of the samples (19 times out of 20) the confidence interval will contain the true value that would be obtained by surveying the entire population. For the example given above, we can be 95 per cent confident that the true value was in the range 1,791,000 to 1,903,000.
Unreliable estimates
Very small estimates have relatively wide confidence intervals making them unreliable. For this reason, ONS does not publish LFS estimates below 10,000.
Non-response
Non-response can introduce bias to a survey, particularly if the people not responding have characteristics that are different from those who do respond. The LFS has a response rate of around 80 per cent to the first interview, and over 90 per cent of those who are interviewed once go on to complete all five interviews. These are relatively high levels for a household survey. Any bias from non-response is minimised by weighting the results.
Weighting (or grossing) converts sample data to represent the full population. In the LFS, the data are weighted separately by age, sex and area of residence to population estimates based on the census. Weighting also adjusts for people not in the survey and thus minimises non-response bias.
LFS concepts and definitions
Discouraged workers – a sub-group of the economically inactive population, defined as those neither in employment nor unemployed (on the ILO measure) who said they would like a job and whose main reason for not seeking work was because they believed there were no jobs available.
Economically active – people aged 16 and over who are either in employment or ILO unemployed.
Economic activity rate – the percentage of people aged 16 and over who are economically active.
Economically inactive – people who are neither in employment nor unemployed. This group includes, for example, all those who were looking after a home or retired.
Employment – people aged 16 or over who did at least one hour of paid work in the reference week (whether as an employee or self-employed); those who had a job that they were temporarily away from (on holiday, for example); those on government-supported training and employment programmes (from spring 1983); and those doing unpaid family work (from spring 1992).
Employees – the division between employees and self-employed is based on survey respondents’ own assessment of their employment status.
Full Time – the classification of employees, self-employed and unpaid family workers in their main job as full-time or part-time is on the basis of self-assessment. Up until autumn 1995, people who were on government work-related training programmes are classified as full-time or part-time according to whether their usual hours of work per week were over 30 or 30 and under; from winter 1995/96 onwards, the full-time/part-time classification for this group has been changed to self-assessment, in line with the other groups outlined above. People on government-supported training and employment programmes who are at college in the survey reference week are classified, by convention, as part-time.
Government-supported training and employment programmes – comprise all people aged 16 and over participating in one of the government’s employment and training programmes (Youth Training, Training for Work and Community Action), together with those on similar programmes administered by Training and Enterprise Councils in England and Wales, or Local Enterprise Companies in Scotland.
Hours worked – respondents to the LFS are asked a series of questions enabling the identification of both their usual hours and their actual hours. Total hours include overtime (paid and unpaid) and exclude lunchbreaks.
Unemployment – Unemployment figures from the LFS, which are based upon the ILO definition, were re-labelled ‘unemployment’ rather than ‘ILO unemployment’ in January 2003. This emphasises that the LFS figures provide the official and only internationally comparable measure

84
Labour Market
of unemployment in the UK. For more details see the National Statistics website at: www.statistics.gov.uk/cci/nugget.asp?id=251
The ILO measure of unemployment used throughout this publication refers to people without a job who were available to start work in the two weeks following their LFS interview and who had either looked for work in the four weeks prior to interview or were waiting to start a job they had already obtained. This definition of unemployment is in accordance with that adopted by the 13th International Conference of Labour Statisticians, further clarified at the 14th ICLS, and promulgated by the ILO in its publications.
Unemployment (rate) – the percentage of economically active people who are unemployed on the ILO measure.
Unemployment (duration) – defined as the shorter of the following two periods:
• duration of active search for work
• length of time since employment Part-time – see full-time.
Second jobs – jobs which LFS respondents hold in addition to a main full-time or part-time job.
Self-employment – See Employees.
Temporary employees – in the LFS these are defined as those employees who say that their main job is non permanent in one of the following ways: fixed period contract; agency temping; casual work; seasonal work; other temporary work.
Unpaid family workers – the separate identification from spring 1992 of this group in the LFS is in accordance with international recommendations. The group comprises persons doing unpaid work for a business they own or for a business that a relative owns.
Distribution of workforce
(Table 7.4)
Claimant unemployed – those people who were claiming unemployment-related benefits (contributions or income related Jobseeker's Allowance and/or National Insurance credits) at Jobcentre Plus local offices on the day of the monthly count. The seasonally adjusted claimant unemployment series allows for all relevant changes
which, unless adjusted for, would distort comparisons over time.
Workforce jobs (formerly workforce in employment) – comprises employee jobs, self-employment jobs (from the LFS), HM Forces and government-supported trainees.
HM Forces (provided by Ministry of Defence) – represent the total number of UK service personnel, male and female, in HM Regular. Full Time Reserve personnel, mobilised reservists, the Ghurkhas and the Home Service battalions of the Royal Irish Regiment, wherever serving and including those on leave.
Self-employed jobs – estimates are based on the results of the Labour Force Survey. The Northern Ireland estimates are not seasonally adjusted.
Government-supported trainees – include all participants on government training and employment programmes who are receiving some work experience on their placement but who do not have a contract of employment (those with a contract are included in the employee jobs series). The numbers are not subject to seasonal adjustment.
International Employment Comparisons
(Table 7.7)
All employment rates for European Union (EU) countries published by Eurostat (including the rate for the UK) are based on the population aged 15–64. The rates for Canada and Japan are also based on the population aged 15–64, but the rate for the US is for those aged 16–64. The employment rate for the UK published by ONS is based on the working age population aged 16–64 (men) and 16–59 (women) and therefore takes into account both the current school leaving age and state pension ages.
The unemployment rate published by Eurostat for most EU countries (but not for the UK), are calculated by extrapolating from the most recent LFS data using monthly registered unemployment data. A standard population basis (15–74) is used by Eurostat except for Spain and the UK (16–74). The unemployment rate for the US is based on those aged 16 and over, but the rates for Canada and Japan are for those aged 15 and over. All unemployment rates are seasonally adjusted.
The unemployment rate for the UK published by Eurostat is based on the population aged 16–74 while the unemployment rate for the UK published by ONS is based on those aged 16 and over. There are other minor definitional differences.

85
Labour Market
Persons employed in local authorities
(Table 7.9)
The full-time equivalents for local authorities are derived by applying factors to the numbers of part-time workers in three groups based on average hours worked in each group nationally.
Jobseekers allowance claimant count
(Tables 7.14 and 7.15)
This is a count of all those people who are claiming Jobseeker’s Allowance (JSA) at Jobcentre Plus local offices. People claiming JSA must declare that they are:
• out of work
• capable of work
• available for work
• actively seeking work
during the week in which the claim is made.
All people claiming JSA on the day of the monthly count are included in the claimant count, irrespective of whether they are actually receiving benefits. Also see table 10.6 in Social protection chapter.
Labour disputes
(Table 7.19)
These figures exclude details of stoppages involving fewer than ten workers or lasting less than one day except any in which the aggregate number of working days lost is 100 or more. There may be some under-recording of small or short stoppages; this would have much more effect on the total of stoppages than of working days lost. Some stoppages which affected more than one industry group have been counted under each of the industries but only once in the totals. Stoppages have been classified using the Standard Industrial Classification (SIC) 1992.
The figures for working days lost and workers involved have been rounded and consequently the sum of the constituent items may not agree with the totals. Classifications by size are based on the full duration of stoppages where these continue into the following year. Working days lost per thousand employees are based on the latest available mid-year (June) estimates of employee jobs.
Earnings
(Tables 7.20 to 7.25)
The total gross remuneration employees receive before any statutory deductions (tax, national insurance). Income in kind and pension funds are excluded.
Annual Survey of Hours and Earnings
(Tables 7.20, 7.21, 7.24 and 7.25)
The Annual Survey of Hours and Earnings (ASHE) is a new survey that has been developed to replace the New Earnings Survey (NES). The ASHE includes improvements to the coverage of employees and to the weighting of earnings estimates. The data variables collected remain broadly the same, although an improved questionnaire was introduced for the 2005 survey. The change in methodology means that statistics on pay and hours published from the ASHE, including the calculation of ONS's low pay statistics, are discontinuous with previous NES surveys.
To improve coverage and make the survey more representative, supplementary information was collected for the 2004 ASHE survey on businesses not registered for VAT and for people who changed or started new jobs between sample selection and the survey reference period. The 2004 ASHE results are therefore discontinuous with the results for 2003, for which no supplementary information was collected. However, for 2004 two sets of results are available; the headline results that include supplementary information and results that exclude this information. These second set of results are given solely for comparison to earlier results.
The ASHE methodology includes imputation and weighting, the main impact of these changes when applied to existing NES data for 1997 to 2003 are:
• to increase the estimates of the level of average weekly pay over estimates published from the NES
• for males the increase in estimates of earnings is more than the increase for females. In particular this affects hourly pay excluding overtime, which is used in the calculation of ONS's preferred measure of the gender pay gap. The estimate of hourly pay for males is increased more then the estimate for females, which widens the estimate of the gap between male and female hourly pay
• estimates of the level of earnings for people working in London are increased more than estimates for other regions. This widens the estimate of the difference in pay between London and other regions of the UK

86
Labour Market
For information about methodological changes to the 2007 ASHE survey see: www.statistics.gov.uk/downloads/theme_labour/ASHE/ChangeInASHE07.pdf
Average Earnings Index
(Tables 7.22 and 7.23)
The Average Earnings Index (AEI) is designed to measure changes in the level of earnings, that is, wage inflation in Great Britain. Average earnings are calculated as the total wages and salaries paid by firms, divided by the number of employees paid. Like all indices, changes are measured against a base year, whose index value is set to 100. The current base year is 2000 for Tables 7.22 and 7.23.
Users should note that the data contained in Table 7.23 of the Annual Abstract of Statistics since 2003 are not comparable with that published up until 2002. Table 7.23 now shows the set of 20 industry sectors. That better reflect the current state of the economy, and supersedes the previous set of 26 industry sectors. The new series are available in the format of excluding bonus index, including bonus index, and an annual percentage change for including and excluding bonuses. An article covering the reasons for the change can be found on the National Statistics website: www.statistics.gov.uk/labour.
The AEI is published monthly in the ONS Labour Market Statistics First Release. The main indicator of growth, the headline rate, is based on the annual change in the seasonally adjusted index values for the latest three months compared with the same period a year ago. The use of a three-month average reduces the level of volatility seen in the data on a month-on-month basis.
Strengths of the AEI
The AEI, based on monthly survey data, is a timely indicator of changes in the level of earnings.
Limitations of the AEI
The index is not adjusted for any changes in the composition of the workforce such as changes in the share of full-time and part-time workers, or in the share of skilled and unskilled workers. Similarly, the index does not account for changes in the number of hours worked, or any temporary factors that affect earnings.
The sample of the Monthly Wages and Salaries Survey on which the AEI is based is not designed to provide information on the level of earnings. The sample is not completely representative of the economy as firms with fewer than 20
employees are excluded, as are the earnings of self-employed persons.
The AEI only covers earnings in Great Britain as earnings information is not collected for Northern Ireland and regional data are not available.
Trade unions
(Table 7.26)
The statistics relate to all organisations of employees known to Certification Officer with head offices in the UK that fall within the appropriate definition of a trade union in the Trade Union and Labour Relations (Consolidation) Act 1992. Included in the data are home and overseas membership figures of contributory and non-contributory members. Employment status of members is not provided and the figures may therefore include some people who are self-employed, unemployed or retired.
The membership part of this table was revised in 2001, so that statistics presented here are on a consistent basis with the Great Britain table produced by the Certification Officer in his Annual Report and with tables produced in the annual Trade Union membership article published by the Department for Business, Enterprise & Regulatory Reform (BERR). There is a break in the time series for the figures in this table between the years 1988 (contained within previous publications) and 1989. Great Britain data for 1989–95 are BERR analyses of annual returns, with 1996–1999 as published in the Certification Officer’s Annual Report. Data for Northern Ireland for 1989–1991 are BERR analyses of annual returns, with 1992–1999 from the Certification Officer’s Annual Report.

87
Labour Market
7.1 Labour force summary:1 by sexUnited KingdomAt Quarter 2 each year2. Seasonally adjusted Thousands and percentages
All aged 16 and over Percentages
Total Economic Employment rateeconomically Total in Total Economically activity rate all aged 16 and Employment rate Unemployment
Total3 active employment unemployed inactive 16-59/644 over5 16-59/646 rate7
AllPersons
MGSL MGSF MGRZ MGSC MGSI MGSO MGSR MGSU MGSX1997 45 509 28 561 26 513 2 048 16 949 78.6 58.3 72.9 7.21998 45 675 28 509 26 721 1 788 17 166 78.3 58.5 73.3 6.31999 45 880 28 833 27 090 1 743 17 047 78.7 59.0 73.9 6.02000 46 128 29 061 27 461 1 599 17 067 78.8 59.5 74.4 5.52001 46 441 29 167 27 694 1 472 17 274 78.6 59.6 74.5 5.0
2002 46 727 29 422 27 906 1 516 17 305 78.6 59.7 74.5 5.22003 47 016 29 656 28 192 1 464 17 361 78.7 60.0 74.8 4.92004 47 361 29 857 28 423 1 434 17 504 78.5 60.0 74.7 4.82005 47 787 30 163 28 727 1 435 17 624 78.6 60.1 74.7 4.82006 48 185 30 670 28 983 1 687 17 515 79.0 60.2 74.6 5.5
2007 48 590 30 814 29 153 1 661 17 776 78.8 60.0 74.4 5.4
MaleMGSM MGSG MGSA MGSD MGSJ MGSP MGSS MGSV MGSY
1997 21 883 15 707 14 442 1 265 6 175 84.8 66.0 77.9 8.11998 21 968 15 650 14 576 1 074 6 318 84.1 66.4 78.3 6.91999 22 081 15 790 14 731 1 059 6 291 84.5 66.7 78.7 6.72000 22 213 15 854 14 897 957 6 359 84.4 67.1 79.2 6.02001 22 393 15 876 14 994 882 6 518 83.9 67.0 79.2 5.6
2002 22 565 15 981 15 071 910 6 584 83.8 66.8 79.0 5.72003 22 735 16 184 15 298 886 6 551 84.2 67.3 79.5 5.52004 22 930 16 212 15 369 843 6 719 83.6 67.0 79.2 5.22005 23 166 16 342 15 507 835 6 824 83.4 66.9 79.1 5.12006 23 391 16 595 15 618 978 6 796 83.7 66.8 78.7 5.9
2007 23 618 16 735 15 785 951 6 883 83.6 66.8 78.8 5.7
FemaleMGSN MGSH MGSB MGSE MGSK MGSQ MGST MGSW MGSZ
1997 23 627 12 853 12 071 783 10 773 72.0 51.1 67.5 6.11998 23 707 12 859 12 144 715 10 847 72.0 51.2 67.9 5.61999 23 799 13 043 12 359 684 10 756 72.6 51.9 68.7 5.22000 23 915 13 207 12 565 642 10 708 72.9 52.5 69.3 4.92001 24 047 13 291 12 700 591 10 756 72.9 52.8 69.5 4.4
2002 24 162 13 440 12 835 606 10 721 73.1 53.1 69.7 4.52003 24 281 13 471 12 894 578 10 810 72.9 53.1 69.7 4.32004 24 431 13 646 13 054 592 10 785 73.1 53.4 69.8 4.32005 24 620 13 820 13 220 600 10 800 73.4 53.7 70.0 4.32006 24 794 14 075 13 366 709 10 719 74.0 53.9 70.1 5.0
2007 24 972 14 079 13 369 710 10 893 73.6 53.5 69.7 5.0
1 See chapter text. In August 2007, ONS published the mid-year populationestimates for 2006. These estimates have now been incorporated into theLFS estimates from 2001 onwards. Further details can be found athttp://www.statistics.gov.uk/cci/article.asp?id=1919
2 The Labour Force Survey has now moved to calendar quarters from May2006. More information can be found on page 5 of the Concepts and Defini-tions.pdf by following this link:- www.statistics.gov.uk/downloads/theme_la-bour/Concepts_Definitions_HQS.pdf
3 Population aged 16 and over in private households and student halls ofresidence.
4 Economically active of working age as a percentage of all persons of work-ing age (men 16-64, women 16-59).
5 Total employed as a percentage of all persons aged 16 and over.6 Total employed of working age as a percentage of all persons of working
age (men 16-64, women 16-59).7 Total unemployed as a percentage of all economically active.
Sources: Labour Force Survey, Office for National Statistics;Helpline: 01633 456901

88
Labour Market
7.2 Employment status: full-time, part-time and temporary employees1
United KingdomAt Quarter 2 each year2. Seasonally adjusted Thousands
All in employment3 Total employment3 Employees3 Self-employed3
Governmentsupported
training WorkersUnpaid and with
Self family employment second TemporaryTotal Employees employed workers programmes4 Full-time Part-time Full-time Part-time Full-time Part-time jobs5 employees
AllPersons
MGRZ MGRN MGRQ MGRT MGRW YCBE YCBH YCBK YCBN YCBQ YCBT YCBW YCBZ1997 26 513 22 709 3 470 115 218 19 832 6 680 16 948 5 761 2 730 740 1 242 1 7871998 26 721 23 088 3 368 100 164 20 000 6 721 17 261 5 827 2 616 752 1 197 1 7111999 27 090 23 509 3 324 100 156 20 288 6 802 17 593 5 916 2 590 735 1 299 1 6732000 27 461 23 948 3 255 113 146 20 524 6 937 17 897 6 051 2 519 736 1 167 1 7052001 27 694 24 177 3 276 96 145 20 718 6 976 18 037 6 141 2 580 697 1 185 1 717
2002 27 906 24 366 3 337 97 106 20 779 7 127 18 147 6 219 2 561 775 1 133 1 5902003 28 192 24 453 3 559 88 92 20 919 7 273 18 135 6 317 2 722 837 1 110 1 4892004 28 423 24 523 3 678 98 123 21 062 7 361 18 154 6 369 2 828 850 1 073 1 5042005 28 727 24 878 3 635 101 114 21 394 7 334 18 496 6 381 2 815 820 1 077 1 4432006 28 983 25 068 3 727 93 94 21 632 7 352 18 711 6 357 2 859 869 1 049 1 456
2007 29 153 25 108 3 829 103 114 21 729 7 424 18 753 6 355 2 914 915 1 106 1 505
MaleMGSA MGRO MGRR MGRU MGRX YCBF YCBI YCBL YCBO YCBR YCBU YCBX YCCA
1997 14 442 11 734 2 538 35 135 13 164 1 278 10 794 940 2 275 263 536 8101998 14 576 11 984 2 456 30 107 13 282 1 294 11 030 953 2 173 283 511 7651999 14 731 12 154 2 439 34 103 13 373 1 358 11 143 1 012 2 165 273 550 7752000 14 897 12 413 2 360 37 87 13 529 1 368 11 389 1 025 2 076 284 489 7752001 14 994 12 459 2 404 34 97 13 623 1 371 11 411 1 048 2 142 262 485 769
2002 15 071 12 537 2 442 31 61 13 593 1 478 11 427 1 110 2 125 317 473 7422003 15 298 12 607 2 607 32 52 13 708 1 590 11 411 1 195 2 257 351 455 6832004 15 369 12 555 2 702 41 72 13 742 1 627 11 348 1 206 2 343 359 451 6962005 15 507 12 727 2 673 37 70 13 865 1 642 11 476 1 251 2 336 337 463 6862006 15 618 12 816 2 711 36 54 13 947 1 671 11 554 1 263 2 356 355 450 649
2007 15 785 12 890 2 794 39 63 14 048 1 737 11 614 1 276 2 396 398 460 697
FemaleMGSB MGRP MGRS MGRV MGRY YCBG YCBJ YCBM YCBP YCBS YCBV YCBY YCCB
1997 12 071 10 975 932 80 84 6 668 5 403 6 154 4 821 455 478 706 9761998 12 144 11 105 912 71 58 6 718 5 426 6 231 4 873 443 469 685 9451999 12 359 11 355 886 66 53 6 915 5 444 6 451 4 904 424 461 749 8972000 12 565 11 534 895 76 60 6 995 5 569 6 508 5 026 443 452 679 9302001 12 700 11 719 872 62 48 7 095 5 605 6 626 5 093 438 434 700 948
2002 12 835 11 829 895 65 45 7 185 5 649 6 720 5 109 436 459 660 8482003 12 894 11 846 952 57 39 7 211 5 683 6 724 5 122 465 487 655 8062004 13 054 11 969 976 58 51 7 320 5 734 6 806 5 163 485 491 622 8082005 13 220 12 151 962 64 44 7 529 5 691 7 021 5 130 479 483 614 7572006 13 366 12 252 1 016 57 41 7 685 5 681 7 158 5 095 503 513 599 807
2007 13 369 12 218 1 036 64 51 7 681 5 687 7 139 5 079 518 518 646 808
1 See chapter text. In August 2007, ONS published the mid-year populationestimates for 2006. These estimates have now been incorporated into theLFS estimates from 2001 onwards. Further details can be found athttp://www.statistics.gov.uk/cci/article.asp?id=1919
2 The Labour Force Survey has now moved to calendar quarters from May2006. More information can be found on page 5 of the Concepts and Defini-tions.pdf by following this link:- www.statistics.gov.uk/downloads/theme_la-bour/Concepts_Definitions_HQS.pdf
3 People whose main job is full or part-time and based on respondents’ selfassessment.
4 Those on employment and training programmes are classified as in employ-ment. Some of those on programmes may consider themselves to be em-ployees or self employed so appear in other categories.
5 Second jobs reported in LFS in addition to person’s main full or part-timejob.
Sources: Labour Force Survey, Office for National Statistics;Helpline: 01633 456901
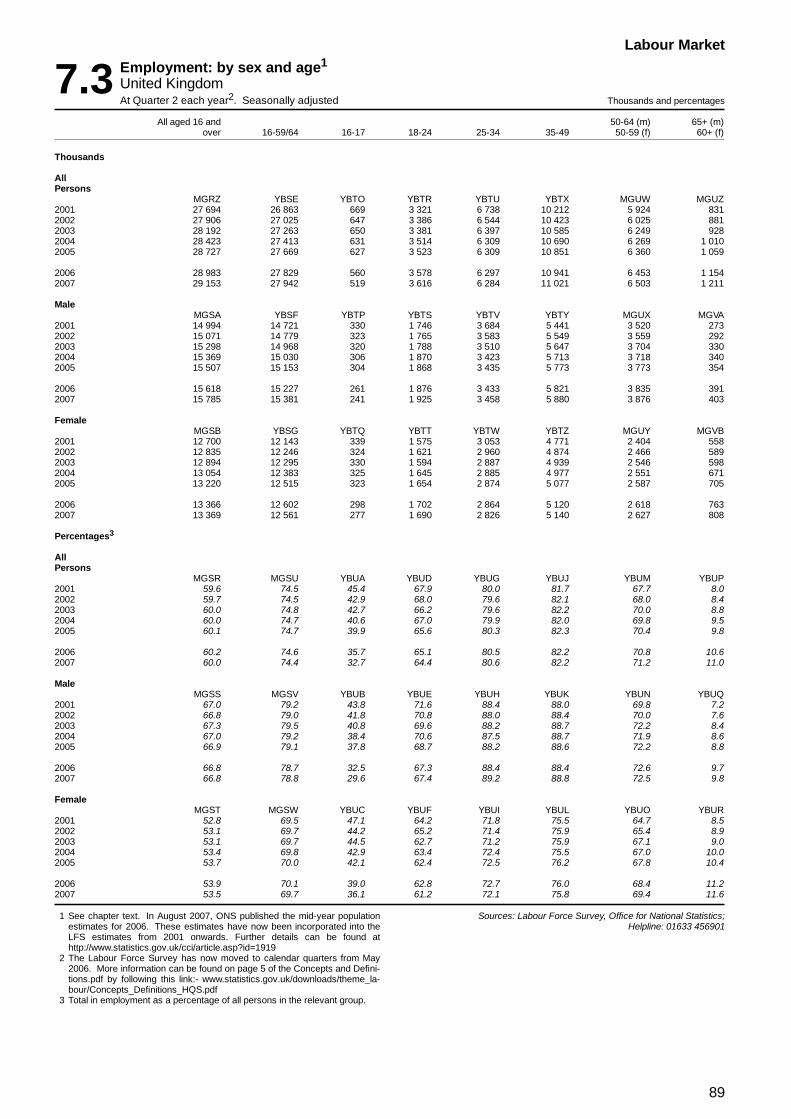
89
Labour Market
7.3 Employment: by sex and age1
United KingdomAt Quarter 2 each year2. Seasonally adjusted Thousands and percentages
All aged 16 and 50-64 (m) 65+ (m)over 16-59/64 16-17 18-24 25-34 35-49 50-59 (f) 60+ (f)
Thousands
AllPersons
MGRZ YBSE YBTO YBTR YBTU YBTX MGUW MGUZ2001 27 694 26 863 669 3 321 6 738 10 212 5 924 8312002 27 906 27 025 647 3 386 6 544 10 423 6 025 8812003 28 192 27 263 650 3 381 6 397 10 585 6 249 9282004 28 423 27 413 631 3 514 6 309 10 690 6 269 1 0102005 28 727 27 669 627 3 523 6 309 10 851 6 360 1 059
2006 28 983 27 829 560 3 578 6 297 10 941 6 453 1 1542007 29 153 27 942 519 3 616 6 284 11 021 6 503 1 211
MaleMGSA YBSF YBTP YBTS YBTV YBTY MGUX MGVA
2001 14 994 14 721 330 1 746 3 684 5 441 3 520 2732002 15 071 14 779 323 1 765 3 583 5 549 3 559 2922003 15 298 14 968 320 1 788 3 510 5 647 3 704 3302004 15 369 15 030 306 1 870 3 423 5 713 3 718 3402005 15 507 15 153 304 1 868 3 435 5 773 3 773 354
2006 15 618 15 227 261 1 876 3 433 5 821 3 835 3912007 15 785 15 381 241 1 925 3 458 5 880 3 876 403
FemaleMGSB YBSG YBTQ YBTT YBTW YBTZ MGUY MGVB
2001 12 700 12 143 339 1 575 3 053 4 771 2 404 5582002 12 835 12 246 324 1 621 2 960 4 874 2 466 5892003 12 894 12 295 330 1 594 2 887 4 939 2 546 5982004 13 054 12 383 325 1 645 2 885 4 977 2 551 6712005 13 220 12 515 323 1 654 2 874 5 077 2 587 705
2006 13 366 12 602 298 1 702 2 864 5 120 2 618 7632007 13 369 12 561 277 1 690 2 826 5 140 2 627 808
Percentages3
AllPersons
MGSR MGSU YBUA YBUD YBUG YBUJ YBUM YBUP2001 59.6 74.5 45.4 67.9 80.0 81.7 67.7 8.02002 59.7 74.5 42.9 68.0 79.6 82.1 68.0 8.42003 60.0 74.8 42.7 66.2 79.6 82.2 70.0 8.82004 60.0 74.7 40.6 67.0 79.9 82.0 69.8 9.52005 60.1 74.7 39.9 65.6 80.3 82.3 70.4 9.8
2006 60.2 74.6 35.7 65.1 80.5 82.2 70.8 10.62007 60.0 74.4 32.7 64.4 80.6 82.2 71.2 11.0
MaleMGSS MGSV YBUB YBUE YBUH YBUK YBUN YBUQ
2001 67.0 79.2 43.8 71.6 88.4 88.0 69.8 7.22002 66.8 79.0 41.8 70.8 88.0 88.4 70.0 7.62003 67.3 79.5 40.8 69.6 88.2 88.7 72.2 8.42004 67.0 79.2 38.4 70.6 87.5 88.7 71.9 8.62005 66.9 79.1 37.8 68.7 88.2 88.6 72.2 8.8
2006 66.8 78.7 32.5 67.3 88.4 88.4 72.6 9.72007 66.8 78.8 29.6 67.4 89.2 88.8 72.5 9.8
FemaleMGST MGSW YBUC YBUF YBUI YBUL YBUO YBUR
2001 52.8 69.5 47.1 64.2 71.8 75.5 64.7 8.52002 53.1 69.7 44.2 65.2 71.4 75.9 65.4 8.92003 53.1 69.7 44.5 62.7 71.2 75.9 67.1 9.02004 53.4 69.8 42.9 63.4 72.4 75.5 67.0 10.02005 53.7 70.0 42.1 62.4 72.5 76.2 67.8 10.4
2006 53.9 70.1 39.0 62.8 72.7 76.0 68.4 11.22007 53.5 69.7 36.1 61.2 72.1 75.8 69.4 11.6
1 See chapter text. In August 2007, ONS published the mid-year populationestimates for 2006. These estimates have now been incorporated into theLFS estimates from 2001 onwards. Further details can be found athttp://www.statistics.gov.uk/cci/article.asp?id=1919
2 The Labour Force Survey has now moved to calendar quarters from May2006. More information can be found on page 5 of the Concepts and Defini-tions.pdf by following this link:- www.statistics.gov.uk/downloads/theme_la-bour/Concepts_Definitions_HQS.pdf
3 Total in employment as a percentage of all persons in the relevant group.
Sources: Labour Force Survey, Office for National Statistics;Helpline: 01633 456901

90
Labour Market
7.4 Distribution of the workforce:1,2 by sexAt mid-June each year. Seasonally adjusted
Thousands
1997 1998 1999 2000 2001 2002 2003 2004 2005 2006 2007
United Kingdom
Claimant count BCJD 1 584.5 1 347.8 1 248.1 1 088.4 969.9 946.6 933.0 853.3 861.7 944.7 863.9Males DPAE 1 214.9 1 029.4 955.0 831.6 739.6 717.1 700.3 636.2 639.7 697.3 630.9Females DPAF 369.6 318.4 293.1 256.8 230.3 229.6 232.8 217.1 222.0 247.4 233.0
Workforce jobs DYDC 28 705 28 835 29 165 29 604 29 923 30 078 30 375 30 683 31 040 31 294 31 536Males KAMS 15 149 15 338 15 681 15 795 16 001 16 002 16 256 16 372 16 497 16 668 16 775Females KAMT 13 556 13 496 13 484 13 810 13 921 14 075 14 118 14 311 14 542 14 625 14 762
HM Forces KAMU 220 219 218 217 214 214 223 218 209 203 197Males KAMV 204 203 201 199 196 197 203 199 191 185 179Females KAMW 16 17 17 18 18 18 19 19 18 18 18
Self-employment jobs DYZN 3 854 3 699 3 692 3 583 3 608 3 677 3 894 3 974 3 962 4 072 4 216Males KAMZ 2 753 2 647 2 647 2 556 2 596 2 640 2 797 2 874 2 856 2 893 2 990Females KANA 1 101 1 052 1 045 1 028 1 011 1 036 1 098 1 100 1 106 1 179 1 226
Employees jobs BCAJ 24 460 24 786 25 125 25 685 26 002 26 096 26 165 26 383 26 771 26 953 27 068Males KANC 12 087 12 413 12 754 12 967 13 147 13 111 13 201 13 233 13 392 13 552 13 573Females KAND 12 373 12 373 12 371 12 719 12 855 12 986 12 964 13 149 13 379 13 401 13 495of whomTotal, production and
construction industries KANF 5 398 5 525 5 382 5 349 5 194 4 952 4 748 4 594 4 474 4 422 4 361Total, all manufacturing
industries KANG 4 191 4 208 4 059 3 959 3 805 3 599 3 411 3 246 3 103 2 973 2 917Government-supported trainees KANH 171 131 131 119 99 91 92 108 97 65 55
Males KANI 105 76 81 73 62 55 55 65 58 38 33Females KANJ 66 55 50 46 38 36 37 44 38 27 22
Great Britain
Claimant count DPAG 1 521.1 1 290.3 1 197.3 1 046.3 930.5 910.2 898.5 822.5 833.1 916.9 839.5Males ZSDP 1 165.0 984.6 915.7 799.6 709.7 689.3 673.9 612.8 618.0 676.5 612.5Females ZSDQ 356.1 305.7 281.6 246.8 220.8 220.9 224.6 209.8 215.1 240.4 227.0
Workforce jobs KANQ 27 990 28 112 28 432 28 853 29 158 29 305 29 583 29 884 30 217 30 458 30 692Males KANR 14 761 14 946 15 285 15 388 15 588 15 590 15 833 15 945 16 058 16 220 16 324Females KANS 13 229 13 165 13 146 13 465 13 570 13 715 13 750 13 939 14 158 14 238 14 368
HM Forces BCAH 220 219 218 217 214 214 223 218 209 203 197Males KANU 204 203 201 199 196 197 203 199 191 185 179Females KANV 16 17 17 18 18 18 19 19 18 18 18
Self-employment jobs KANW 3 752 3 603 3 596 3 484 3 502 3 576 3 784 3 863 3 842 3 949 4 097Males KANX 2 672 2 569 2 569 2 474 2 509 2 558 2 706 2 784 2 758 2 794 2 894Females KANY 1 080 1 035 1 026 1 010 993 1 018 1 078 1 079 1 084 1 155 1 202
Employee jobs KANZ 23 862 24 172 24 499 25 043 25 350 25 431 25 491 25 701 26 075 26 246 26 350Males KAOA 11 790 12 108 12 442 12 649 12 826 12 785 12 873 12 902 13 055 13 207 13 222Females KAOB 12 072 12 064 12 056 12 394 12 524 12 646 12 618 12 799 13 020 13 039 13 127of whomTotal, production and
construction industries KAOC 5 256 5 383 5 239 5 205 5 052 4 813 4 615 4 463 4 344 4 288 4 223Total, all manufacturing
industries KAOD 4 083 4 101 3 954 3 856 3 704 3 501 3 318 3 157 3 015 2 886 2 828Government-supported trainees KAOE 157 117 120 110 92 84 86 102 90 59 48
Males KAOF 96 67 73 67 57 50 51 60 54 34 28Females KAOG 61 50 47 43 35 34 35 42 36 25 20
Note. Because the figures have been rounded independently totals maydiffer from the sum of the components. Also the totals may include someemployees whose industrial classification could not be ascertained.
1 The data in this table have not been adjusted to reflect the 2001 Censuspopulation data. See chapter text.
2 There is a discontinuity in the employee jobs series between December2005 and September 2006 due to improvements to the annual benchmark.Further information can be found at:http://www.statistics.gov.uk/statbase/product.asp?vlnk=9765
Sources: Employment, Earnings and Innovations Division, Office for NationalStatistics;
Customer Helpline: 01633 456776

91
Labour Market
7.5 Employee jobs: by industry1,2,3
Standard Industrial Classification 2003At June each year. Not seasonally adjusted Thousands
United Kingdom Great Britain
2003 2004 2005 2006 2007 2003 2004 2005 2006 2007
SIC2003
__________
All sections KAOH A - O 26 139 26 351 26 376 26 916 27 030 LMAB 25 466 25 671 26 042 26 212 26 313Index of production and construction
industries KAOI C - F 4 738 4 583 4 462 4 409 4 348 LMAH 4 606 4 453 4 332 4 276 4 210Index of production industries KAOJ C - E 3 594 3 413 3 258 3 133 3 084 LMAF 3 497 3 320 3 166 3 041 2 991
of which, manufacturing industries KAOK D 3 409 3 245 3 102 2 973 2 917 KAPQ 3 317 3 156 3 015 2 886 2 829Service industries KAOL G - O 21 172 21 543 22 036 22 280 22 443 LMAJ 20 647 21 007 21 484 21 722 21 875
Agriculture, hunting and forestry and fishing KAOM A/B 228 226 239 227 240 KAPS 213 211 225 215 228Agriculture hunting and forestry KPHI A 221 219 233 220 233 KOVW 207 204 220 208 221Agriculture hunting & related activities KPHJ 01 210 209 223 211 224 KOVX 196 195 210 199 212
Fishing KPHK B 7 7 5 7 7 KOVY 7 7 5 7 7
Mining and quarrying KPHL C 62 58 57 58 60 KOVZ 60 56 55 56 58Mining and quarrying of energy
producing materials KPHM CA 38 35 34 35 38 KOWA 37 35 34 35 38Mining KAPG 10/12 .. .. .. .. .. KOWB 10 9 7 6 7Extraction of crude petroleum KPHN 11 .. .. .. .. .. KOWC 27 25 27 29 30Mining and quarrying except of
energy producing materials KPHO CB(13/14) 24 23 23 22 22 KOWD 23 22 21 20 20Energy and water supply industries KAOO C/E 185 168 156 160 167 LMAM 180 163 151 155 162
Manufacturing KPHP D 3 409 3 245 3 102 2 973 2 917 LMAD 3 317 3 156 3 015 2 886 2 829
Manufacture of food productsBeverages and tobacco KPHQ DA 456 443 428 418 411 LMAN 437 424 409 399 393Of food KPHR 151 to 158 .. .. .. .. .. KOWH 387 375 364 355 351Of beverages and tobacco KPHS 159/16 .. .. .. .. .. KOWI 50 48 45 44 42
Manufacture of textiles andtextile products KPHT DB 163 142 123 107 98 KOWJ 154 135 118 103 95Of textiles KPHU 17 106 95 84 74 69 KOWK 101 90 81 71 67Of made-up textile articles
except apparel KPHV 174 .. .. .. .. .. KOWL 31 29 27 25 24Of textiles excluding made-up textile KPHW Rest of 17 .. .. .. .. .. KOWM 70 61 54 46 42Of wearing apparel,dressing and
dyeing of fur KPHX 18 57 47 39 33 29 KOWN 54 45 38 31 28
Manufacture of leather and leatherproducts including footwear KPHY DC 14 12 11 11 12 KOWO 14 12 11 11 12Of leather and leather goods KPHZ 191/192 .. .. .. .. .. KOWP 6 6 5 7 7Of footwear KPIA 193 .. .. .. .. .. KOWQ 8 6 5 5 5
Manufacture of wood and wood products KPIB DD(20) 83 83 81 77 79 LMAP 79 79 77 73 75
Manufacture of pulp paper and paperproducts, publishing and printing KPIC DE 426 412 400 381 366 LMAQ 420 406 394 375 361Of pulp paper and paper products KPID 21 87 82 77 71 68 KOWT 85 80 76 70 66Publishing printing and reproduction
of recorded media KPIE 22 339 330 322 310 299 KOWU 335 326 318 305 294
Manufacture of coke refined petroleumproducts and nuclear fuel KPIF DF(23) 25 24 23 23 23 KOWV 25 23 23 23 23
Manufacture of chemicals, chemicalproducts and man-made fibres KPIG DG(24) 226 210 199 193 189 LMAR 222 207 196 190 186
Manufacture of rubber and plastics KPIH DH(25) 214 212 203 196 194 LMAS 206 205 196 189 187
Manufacture of other non-metallicmineral products KPII DI(26) 121 118 111 107 104 KOWZ 115 112 105 101 98
Manufacture of basic metals andfabricated metal products KPIJ DJ 443 417 398 387 381 KOXA 436 409 391 379 374Of basic metals KPIK 27 92 81 74 73 71 KOXB 91 81 73 72 71
except machinery KPIL 28 351 335 325 314 310 KOXC 344 328 317 307 303

92
Labour Market
7.5 Employee jobs: by industry1,2,3
Standard Industrial Classification 2003At June each year. Not seasonally adjustedcontinued Thousands
United Kingdom Great Britain
2003 2004 2005 2006 2007 2003 2004 2005 2006 2007
SIC2003
_________
Manufacture of Machinery andEquipment not elsewhere classified KPIM DK(29) 301 285 280 270 270 LMAU 294 279 273 263 263
Manufacture of electrical andoptical equipment KPIN DL 380 351 333 315 305 LMAV 370 341 324 305 295Of office machinery and computers KPIO 30 37 33 30 26 23 KOXF 34 30 28 23 20Of electrical machinery and apparatus KPIP 31 138 127 122 117 116 KOXG 135 123 118 113 112Of electric motors etc control
apparatus and insulated cable KPIQ 311 to 313 .. .. .. .. .. KOXH 74 66 63 61 61Of accumulators, primary cells,
batteries, lamps and electricalequipment KPIR 314 to 316 .. .. .. .. .. KOXI 61 58 56 52 51
Radio television and communicationequipment KPIS 32 81 74 66 61 60 KOXJ 79 72 64 59 58
Of electronic components KPIT 321 .. .. .. .. .. KOXK 29 29 27 24 23Of radio TV and telephone apparatus,
sound and video recorders KPIU 322/323 .. .. .. .. .. KOXL 49 42 37 35 34Of medical precision and optical
equipment, watches KPIV 33 124 118 116 111 107 KOXM 122 116 114 109 106
Manufacture of transport equipment KPIW DM 356 343 329 315 308 LMAW 345 333 320 306 299Of motor vehicles and trailers KPIX 34 205 196 184 171 162 KOXO 200 193 180 168 159Of other transport equipment KPIY 35 151 146 146 144 146 KOXP 145 140 139 138 140
Manufacturing not elsewhere classified KPIZ DN(36/37) 203 197 182 175 176 KOXQ 199 193 178 170 170
Electricity gas and water supply KPJA E 123 110 99 102 107 KOXR 120 107 96 99 104Electricity gas steam and hot
water supply KPJB 40 .. .. .. .. .. KOXT 90 82 73 73 76Collection purification and
distribution of water KPJC 41 .. .. .. .. .. KOXU 30 25 24 26 28
Construction KPJD F(45) 1 145 1 169 1 204 1 276 1 264 LMAY 1 109 1 133 1 166 1 235 1 219
Services KPJE G - O 21 172 21 543 22 036 22 280 22 443 KOXX 20 647 21 007 21 484 21 722 21 875
Wholesale and retail trade; Repair ofmotor vehicles, motorcycles andpersonal household goods KPJF G (50 - 52) 4 535 4 562 4 597 4 554 4 582 LMAZ 4 422 4 445 4 478 4 432 4 459
Sale maintenance and repair of motorvehicles, retail of automotive fuel KPJG 50 563 561 565 565 566 KOXZ 548 546 550 549 549Sale of motor vehicles, motorcycles
and parts, motorcycle repair andsale of automotive fuel KPJH 501/503 - 505 .. .. .. .. .. KOYA 381 379 380 374 377
Maintenance and repair of motorvehicles KPJI 502 .. .. .. .. .. KOYB 167 168 169 175 172
Wholesale trade and commission tradeexcept motor vehicles KPJJ 51 1 127 1 119 1 131 1 127 1 131 KOYC 1 104 1 095 1 108 1 103 1 107Wholesale on a fee of contract basis KPJK 511 .. .. .. .. .. KOYD 59 60 61 66 70Wholesale agricultural raw materials
and live animals KPJL 512 .. .. .. .. .. KPLD 23 23 22 19 19
Wholesale food beverages & tobacco KPJM 513 .. .. .. .. .. KPLE 190 188 190 195 196Wholesale household goods KPJN 514 .. .. .. .. .. KPLF 264 267 274 272 269Wholesale of non-agricultural
intermediate products waste & scrap KPJO 515 .. .. .. .. .. KPLG 232 232 232 230 236Wholesale machinery eqpt. & supplies KPJP 516 .. .. .. .. .. KPLH 238 230 238 232 230Other wholesale KPJQ 517 .. .. .. .. .. KPLI 98 95 91 89 87Retail trade except of motor vehicles
and motorcycles;repair of personal andhousehold goods KPJR 52 2 845 2 882 2 901 2 862 2 886 KPLJ 2 770 2 804 2 820 2 781 2 804
Non-specialised stores sellingmainly food beverages & tobacco KPJS 5211/5221-4,5227 .. .. .. .. .. KPLK 1 143 1 120 1 140 1 111 1 107
Other non-specialised stores secondhand shops & sales not in stores KPJT 5212/525-526 .. .. .. .. .. KPLL 365 360 353 338 335

93
Labour Market
7.5 Employee jobs: by industry1,2,3
Standard Industrial Classification 2003At June each year. Not seasonally adjustedcontinued Thousands
United Kingdom Great Britain
2003 2004 2005 2006 2007 2003 2004 2005 2006 2007
SIC2003
__________
Alcoholic & other beverages, tobacco KPJU 5225 to 5226 .. .. .. .. .. KPLM 56 54 49 46 43Pharmaceutical & medical goods
cosmetics & toilet articles KPJV 523 .. .. .. .. .. KPLN 93 99 103 105 106Clothing footwear & leather goods KPJW 5242/5243 .. .. .. .. .. KPLO 369 409 415 417 431Textile furniture lighting equipment
electrical household appliances radioand TV paints glass hardware andhousehold goods not elsewhere classified KPJX 5241/5244-46 .. .. .. .. .. KPLP 296 304 299 296 302
Books newspapers and stationery, otherretail in specialised stores KPJY 5247/5248 .. .. .. .. .. KPLQ 421 432 435 447 457
Repair of personal and household goods KPJZ 527 .. .. .. .. .. KPLR 27 26 26 22 22
Hotels and restaurants KPKA H 1 792 1 839 1 855 1 844 1 843 LMBA 1 751 1 798 1 813 1 801 1 800Hotels camp sites short-stay accom. KPKB 551/552 .. .. .. .. .. KPLT 369 379 386 384 393Restaurants KPKC 553 .. .. .. .. .. KPLU 575 594 614 633 637Bars KPKD 554 .. .. .. .. .. KPLV 540 558 552 542 531Canteens and catering KPKE 555 .. .. .. .. .. KPLW 267 267 261 243 239
Transport, storage and communication KPKF I 1 587 1 570 1 594 1 581 1 563 KPLX 1 559 1 542 1 565 1 552 1 532
Land transport, transport via pipelines KPKG 60 518 519 534 546 547 KPLY 505 505 521 533 533Transport via railways KPKH 601 .. .. .. .. .. KPLZ 49 50 53 52 52Other land transport and via pipelines KPKI 602/603 .. .. .. .. .. KPMA 457 456 468 481 482
Water transport KPKJ 61 17 17 19 18 16 KPMB 16 17 18 17 16Air transport KPKK 62 90 85 88 90 88 KPMC 90 85 88 89 87
Supporting and auxiliary transportactivities, activities of travel agents KPKL 63 412 440 453 442 440 KPMD 406 435 447 437 434Travel agencies and tour operators KPKM 633 .. .. .. .. .. KPME 124 133 120 107 105
Post and telecommunications KPKN 64 551 509 500 485 472 LMBC 542 500 491 476 462National post and courier activities KPKO 641 .. .. .. .. .. KPMG 297 275 275 266 254
Telecommunications KPKR 6420 .. .. .. .. .. KPMJ 245 225 216 210 208
Financial intermediation KPKS J 1 104 1 073 1 062 1 047 1 044 LMBD 1 087 1 056 1 044 1 029 1 025Financial intermediation except
insurance and pension funding KPKT 65 639 621 609 593 584 KPML 627 609 596 580 571Insurance and pension funding except
compulsory social security KPKU 66 215 197 183 181 181 KPMM 213 196 181 179 179Activities auxiliary to financial
intermediation KPKV 67 249 255 271 273 279 KPMN 246 252 267 270 275Except insurance and pension funding KPKW 671 .. .. .. .. .. KPMO 113 123 136 137 143Auxiliary to insurance and pension funding KPKX 672 .. .. .. .. .. KPMP 133 129 131 132 132
Real estate renting & businessactivities KPKY K 3 996 4 129 4 336 4 546 4 680 KPMQ 3 938 4 065 4 268 4 476 4 608
Real estate activities KPKZ 70 381 409 449 451 457 LMBE 378 402 441 442 449Activities with own property, letting
of own property KPLA 701/702 .. .. .. .. .. KPMS 224 236 252 248 250Activities on a fee or contract basis KPLB 703 .. .. .. .. .. KPMT 154 166 189 194 199

94
Labour Market
7.5 Employee jobs: by industry1,2,3
Standard Industrial Classification 2003At June each year. Not seasonally adjustedcontinued Thousand
United Kingdom Great Britain
2003 2004 2005 2006 2007 2003 2004 2005 2006 2007
SIC2003
__________
Renting of machinery and equipment withoutoperator & of personal & household goods KPLC 71 151 153 157 161 162 KPMU 149 150 155 158 159Construction and civil engineering
machinery KOUU 7132 .. .. .. .. .. KPMV 42 41 42 45 46All other goods and equipment KOUV Rest of 71 .. .. .. .. .. KPMW 107 109 113 114 113
Computer and related equipment KOUW 72 501 488 493 522 520 KPMX 495 482 486 515 512Research and development KOUX 73 106 101 104 109 113 KPMY 105 100 103 107 111Other business activities KOUY 74 2 857 2 978 3 133 3 304 3 428 KPMZ 2 811 2 930 3 083 3 253 3 376
Legal, accounting, book-keeping & auditing activities KOUZ 741 .. .. .. .. .. KPNA .. 840 889 962 993Legal activities KOVA 7411 .. .. .. .. .. KPNB 250 254 260 280 295
Accounting, book-keeping auditing,tax consultancy KOVB 7412 .. .. .. .. .. KPNC 191 194 203 216 215
Market research business andconsultancy activities KOVC 7413/7414 .. .. .. .. .. KPND 272 291 316 357 374
Management activities of holding companies4 KOVD 7415 .. .. .. .. .. KPNE .. 101 110 109 109Architectural engineering activities
and related technical consultancy,technical testing KOVE 742/743 .. .. .. .. .. KPNF 332 340 347 373 399
Advertising KOVF 744 .. .. .. .. .. KPNG 83 80 84 81 90Industrial cleaning KOVG 747 .. .. .. .. .. KPNH 418 414 436 448 451
Public administration and defence,compulsory social security KOVH L(75) 1 469 1 496 1 520 1 518 1 514 LMBG 1 405 1 435 1 460 1 458 1 454
Education KOVI M(80) 2 229 2 307 2 355 2 390 2 394 LMBH 2 160 2 238 2 282 2 318 2 322
Health and social work KOVJ N 3 079 3 180 3 300 3 361 3 390 LOJV 2 973 3 072 3 189 3 249 3 275Human health, veterinary activities KOVK 851/852 .. .. .. .. .. KPNL 1 965 2 027 2 103 2 113 2 124Social work activities KOVL 853 .. .. .. .. .. KPNM 1 009 1 045 1 086 1 135 1 151
Other community social and personalservice activities, private householdswith employed persons, extra-territorialorganisations and bodies KOVM O 1 383 1 388 1 417 1 440 1 432 LMBK 1 351 1 357 1 385 1 408 1 400
Sewage and refuse disposal; sanitation KOVN 90 96 100 104 108 114 KPNO 93 97 101 105 111Activities of membership organisations KOVO 91 224 212 215 225 232 KPNP 216 204 206 217 224Recreational cultural and sporting activities KOVP 92 741 762 779 783 764 KPNQ 725 747 764 767 748
Motion picture video radio TV newsagencies and entertainment activities KOVQ 921 to 924 .. .. .. .. .. KPNR 220 225 221 223 206
Other service activities, privatehouseholds with employed persons,extra territorial organisations KOVT 93/95/99 322 314 318 324 322 KPNU 317 309 313 319 317
Washing, dry cleaning of textileand fur products KOVU 9301 .. .. .. .. .. KPNV 46 42 40 42 42
Hairdressing, other beauty treatment,physical and well-being activities KOVV 9302/9304 .. .. .. .. .. KPNW 104 105 114 122 121
Note. Because the figures have been rounded independently totals maydiffer from the sum of the components. Also the totals may include someemployees whose industrial classification could not be ascertained.
1 See chapter text. The data in this table have not been adjusted to reflectthe 2001 Census population data.
2 All figures have been revised. For further information see: http://www.statistics.gov.uk/cci/article.asp?id=1340
3 There is a discontinuity in the employee jobs series between December2005 and September 2006 due to improvements to the annual benchmark.Further information can be found at: http://www.statistics.gov.uk/Stat-base/Product.asp?vlnk=9765
4 Head office and holding company local units were reclassified to Class74.15 (within Section K) from December 2003 as a result of the SIC 2003update.
Sources: Department of Manpower Services (Northern Ireland);;Employment, Earnings and Innovations Division, ONS: 01633 456776

95
Labour Market
7.6 Weekly hours worked: by sex1,2
United KingdomAt Quarter 2 each year3. Seasonally adjusted Hours
All workers’ weekly hours4,5 Average actual weekly hours of work5
Total (millions) Average Full-time employment4,6 Part-time employment6 Second jobs7
AllPersons
YBUS YBUV YBUY YBVB YBVE1997 877.2 33.2 38.6 15.2 9.41998 884.5 33.2 38.6 15.2 9.21999 890.3 32.9 38.2 15.3 9.02000 895.2 32.7 38.0 15.4 9.02001 906.0 32.8 38.0 15.7 9.3
2002 897.9 32.2 37.4 15.5 9.42003 908.1 32.2 37.5 15.6 9.22004 908.5 32.0 37.3 15.6 8.82005 919.4 32.0 37.2 15.7 9.62006 928.1 32.1 37.2 15.6 9.5
2007 937.6 32.2 37.4 15.6 9.4
MaleYBUT YBUW YBUZ YBVC YBVF
1997 558.7 38.8 40.6 15.0 10.61998 563.0 38.7 40.6 14.8 9.81999 562.2 38.3 40.2 15.1 9.82000 564.7 38.0 39.9 15.1 9.72001 568.7 38.0 39.9 15.5 10.2
2002 558.9 37.1 39.2 15.0 10.32003 567.1 37.1 39.2 15.5 10.22004 566.6 36.9 39.1 15.4 9.72005 570.6 36.8 39.0 15.6 10.62006 573.0 36.7 38.9 15.4 10.2
2007 581.9 36.9 39.2 15.7 10.3
FemaleYBUU YBUX YBVA YBVD YBVG
1997 318.5 26.4 34.5 15.3 8.41998 321.4 26.5 34.6 15.3 8.81999 328.1 26.6 34.5 15.4 8.52000 330.5 26.3 34.2 15.5 8.52001 337.3 26.6 34.3 15.7 8.7
2002 339.0 26.4 34.1 15.7 8.72003 340.9 26.5 34.2 15.7 8.62004 341.9 26.2 33.8 15.7 8.12005 348.8 26.4 33.8 15.7 8.82006 355.1 26.6 34.0 15.7 8.9
2007 355.7 26.7 34.1 15.6 8.7
1 See chapter text. In August 2007, ONS published the mid-year populationestimates for 2006. These estimates have now been incorporated into theLFS estimates from 2001 onwards. Further details can be found athttp://www.statistics.gov.uk/cci/article.asp?id=1919
2 Average hours actually worked in the reference week which includes hoursworked in second jobs.
3 The Labour Force Survey has now moved to calendar quarters from May2006. More information can be found on page 5 of the Concepts and Defini-tions.pdf by following this link:- www.statistics.gov.uk/downloads/theme_la-bour/Concepts_Definitions_HQS.pdf
4 Main and second job.5 Includes both paid and unpaid overtime.
6 People whose main job is full-time or part-time and based on respondents’ selfassessment.
7 Second jobs reported in the LFS in addition to persons’ main full time job.
Sources: Labour Force Survey, Office for National Statistics;Helpline: 01633 456901

96
Labour Market
7.7 International comparisonsEmployment and unemployment rates1,2
2005 2005 2005 2005 2006 2006 2006 2006 2007 2007 2007 2007Q1 Q2 Q3 Q4 Q1 Q2 Q3 Q4 Q1 Q2 Q3 Q4
EUROSTAT Employment ratesAustria YXSN 67.6 68.4 69.8 68.8 68.2 70.0 71.9 70.6 70.3 71.5 72.5 71.3Belgium YXSO 60.9 61.0 61.2 61.2 60.3 60.4 61.2 62.1 61.7 61.6 62.1 62.7Bulgaria A495 53.0 56.2 57.9 56.0 55.5 59.1 60.3 59.8 59.7 61.6 62.7 62.9Cyprus A4AC 68.4 68.7 68.7 68.1 68.2 69.5 70.4 70.4 69.8 71.2 71.3 71.5Czech Republic A4AD 64.1 64.7 65.2 65.2 64.8 65.3 65.4 65.6 65.5 66.0 66.3 66.5Denmark YXSP 75.2 75.5 76.1 76.8 76.5 76.9 78.2 77.9 76.7 77.3 77.1 77.4Estonia A4AE 63.2 64.9 64.7 65.0 67.4 68.8 67.9 68.1 68.6 69.7 70.2 69.1Finland YXSQ 66.7 69.2 69.6 68.0 67.7 69.9 70.8 69.0 68.3 71.3 71.7 69.9France YXSR 63.5 64.1 64.3 63.5 63.2 63.8 64.4 63.9 63.8 64.6 65.1 64.9Germany YXSS 65.4 65.8 66.3 66.5 66.4 67.4 68.1 68.3 68.4 69.1 69.9 70.0Greece YXST 59.5 60.3 60.3 60.3 60.4 61.0 61.5 61.0 60.8 61.5 61.8 61.5Hungary A4AF 56.4 56.8 57.3 57.1 56.7 57.3 57.6 57.6 56.9 57.6 57.7 57.1Ireland YXSU 66.8 67.1 68.8 67.8 68.0 68.1 69.6 68.7 68.5 68.9 69.9 69.0Italy YXSV 57.3 57.8 57.4 57.8 57.9 58.9 58.4 58.5 57.9 58.9 59.1 58.7Latvia A4AG 62.5 63.0 63.8 63.9 64.3 65.5 68.0 67.4 66.4 67.6 69.0 70.3Lithuania A4AH 61.4 62.6 63.4 63.1 63.0 63.7 64.2 63.5 63.9 65.4 66.1 64.4Luxembourg YXSW 63.6 63.6 63.6 63.6 63.6 63.6 63.6 63.6 63.0 63.0 64.1 64.0Malta A4AI 54.6 53.6 53.5 53.8 54.4 54.3 55.5 55.1 55.1 55.7 56.1 55.7Netherlands YXSX 72.5 73.2 73.6 73.6 73.5 74.2 74.7 75.0 75.0 76.0 76.5 76.4Poland A4AJ 51.5 52.2 53.7 53.7 52.6 53.9 55.6 55.7 55.4 56.8 57.8 58.1Portugal YXSY 67.3 67.6 67.5 67.4 67.6 68.1 68.2 67.6 67.4 67.6 68.1 68.1Romania A494 56.6 58.7 57.8 57.2 57.2 59.6 60.9 57.4 57.2 59.6 60.5 57.9Slovak Republic A4AK 56.9 57.4 58.0 58.5 58.3 59.3 59.9 60.2 60.1 60.4 60.7 61.6Slovenia A4AL 65.2 66.0 66.6 66.0 65.9 67.1 67.2 66.0 66.0 68.3 69.0 67.7Spain YXSZ 62.1 63.2 63.9 64.0 64.0 64.7 65.2 65.2 65.1 65.8 66.0 65.5Sweden YXTA 70.7 72.6 73.6 72.3 71.5 73.1 74.7 73.2 72.7 74.3 75.7 74.0United Kingdom ANZ6 71.8 71.5 71.9 71.6 71.4 71.3 71.7 71.5 70.9 71.1 71.4 71.7Total EU3 A496 62.9 63.5 63.9 63.8 63.5 64.4 65.0 64.8 64.5 65.4 65.9 65.7Eurozone3 YXTC 63.3 63.9 64.2 64.1 64.0 64.8 65.2 65.1 64.9 65.8 66.2 66.0
National Statistical Offices Employment RatesCanada IUUK 71.0 72.8 73.5 72.6 71.3 73.4 74.0 73.0 72.1 74.0 74.6 73.8Japan YXTF 68.2 69.6 69.8 69.4 69.1 70.4 70.3 70.1 69.7 71.3 70.8 70.9United Kingdom MGSU 74.9 74.7 74.8 74.5 74.6 74.6 74.5 74.5 74.3 74.4 74.4 74.7United States YXTE 71.3 71.5 71.7 71.5 71.9 71.9 72.0 72.2 72.1 71.8 71.6 71.5
2007 2007 2007 2007 2007 2007 2007 2007 2007 2007 2007 2008 2008 2008Feb Mar Apr May Jun Jul Aug Sep Oct Nov Dec Jan Feb Mar
EUROSTAT Unemployment ratesAustria ZXDS 4.5 4.5 4.5 4.4 4.4 4.4 4.4 4.3 4.3 4.3 4.2 4.2 4.1 4.1Belgium ZXDI 7.8 7.7 7.9 7.8 7.6 7.3 7.3 7.1 7.1 7.0 7.0 7.0 6.9 6.9Bulgaria A492 7.7 7.5 7.3 7.1 7.0 6.9 6.7 6.5 6.3 6.0 5.9 6.1 6.0 5.9Cyprus A4AN 4.1 4.1 4.0 4.0 3.9 3.9 3.9 3.7 3.8 3.8 3.8 3.7 3.7 3.7Czech Republic A4AO 5.8 5.6 5.6 5.6 5.4 5.3 5.1 5.0 5.0 4.9 4.7 4.7 4.6 4.5Denmark ZXDJ 4.1 4.1 3.8 3.8 3.7 4.1 3.9 3.8 3.5 3.4 3.3 3.2 3.1 ..Estonia A4AP 4.8 4.9 4.9 5.0 4.8 4.5 4.5 4.7 4.5 4.6 4.6 5.3 5.4 5.5Finland ZXDU 7.1 7.0 6.9 6.9 6.9 6.9 6.8 6.8 6.7 6.6 6.5 6.4 6.3 6.3France ZXDN 8.7 8.6 8.5 8.5 8.4 8.3 8.2 8.1 8.0 7.9 7.9 7.9 7.8 7.8Germany ZXDK 8.7 8.6 8.5 8.5 8.4 8.4 8.3 8.2 8.1 8.0 7.8 7.6 7.4 7.3Greece ZXDL 8.6 8.6 8.4 8.4 8.4 8.2 8.2 8.2 7.9 7.9 7.9 .. .. ..Hungary A4AQ 7.2 7.3 7.1 7.1 7.2 7.3 7.4 7.3 7.7 7.8 7.9 7.6 7.6 7.6Ireland ZXDO 4.4 4.6 4.6 4.7 4.6 4.6 4.6 4.6 4.7 4.8 5.1 5.2 5.4 5.6Italy ZXDP 6.1 6.1 6.0 6.0 6.0 6.1 6.1 6.1 6.1 6.1 6.1 .. .. ..Latvia A4AR 6.6 6.4 5.9 5.9 5.8 6.2 6.0 5.8 5.5 5.4 5.4 5.4 5.3 5.3Lithuania A4AS 4.8 4.6 4.5 4.2 3.9 4.2 4.1 4.1 4.1 4.2 4.3 4.6 4.5 4.5Luxembourg ZXDQ 4.9 4.9 4.8 4.7 4.7 4.7 4.7 4.6 4.7 4.7 4.6 4.6 4.7 4.5Malta A4AT 6.6 6.6 6.5 6.5 6.4 6.3 6.4 6.3 6.3 6.1 5.8 5.8 5.7 5.6Netherlands ZXDR 3.5 3.4 3.3 3.3 3.2 3.1 3.1 3.0 2.9 2.8 2.8 2.7 2.6 2.6Poland A4AU 10.8 10.3 10.1 9.9 9.6 9.5 9.3 9.0 8.9 8.6 8.2 8.3 8.0 7.7Portugal ZXDT 8.2 8.2 8.2 8.1 8.1 8.1 8.0 7.9 7.7 7.6 7.6 7.5 7.5 7.4Romania A48Z 6.6 6.6 6.6 6.6 6.6 6.3 6.3 6.3 6.2 6.2 6.2 .. .. ..Slovak Republic A4AV 11.5 11.3 11.5 11.4 11.3 11.3 11.2 11.1 10.6 10.4 10.3 10.1 9.9 9.8Slovenia A4AW 5.4 5.2 4.8 4.7 4.7 4.7 4.7 4.5 4.6 4.5 4.5 4.5 4.4 4.3Spain ZXDM 8.1 8.1 8.1 8.1 8.2 8.3 8.3 8.3 8.5 8.6 8.7 9.0 9.1 9.3Sweden ZXDV 6.6 6.6 6.4 6.3 5.8 5.7 5.8 6.0 6.0 6.0 5.8 5.7 5.6 5.6United Kingdom ZXDW 5.5 5.5 5.3 5.3 5.3 5.3 5.3 5.2 5.1 5.0 5.0 5.1 .. ..Total EU3 A493 7.4 7.3 7.2 7.2 7.1 7.1 7.1 7.0 6.9 6.8 6.8 6.8 6.7 6.7Eurozone3 ZXDH 7.6 7.5 7.5 7.5 7.4 7.4 7.4 7.3 7.3 7.2 7.2 7.1 7.1 7.1
National Statistical Offices Unemployment RatesCanada ZXDZ 6.1 6.1 6.2 6.0 6.1 6.0 6.0 5.9 5.8 5.9 6.0 5.8 5.8 6.0Japan ZXDY 4.0 4.0 3.8 3.8 3.7 3.6 3.8 4.0 4.0 3.8 3.8 3.8 3.9 3.8United Kingdom MGSX 5.5 5.5 5.4 5.4 5.4 5.4 5.4 5.3 5.3 5.2 .. .. .. ..United States ZXDX 4.5 4.4 4.5 4.5 4.6 4.7 4.7 4.7 4.8 4.7 5.0 4.9 4.8 5.1
1 See chapter text.2 The UK employment rate as published by the Office for National Statistics is
seasonally adjusted. All other employment and unemployment rates are notseasonally adjusted.
3 The "Total EU" series consists of all 27 EU countries. The Eurozone series con-sists of the following EU countries: Austria, Belgium, Cyprus, Finland, France,Germany, Greece, Ireland, Italy, Luxembourg, Malta, Netherlands, Portugal,Slovenia and Spain.
Sources: Office for National Statistics; Eurostat; StatsBLS; StatCan;Stat.go.JP;
Labour Market Statistics Helpline: 01633 456901

97
Labour Market
7.8 Civil Service employment by department1Great Britain
Full-time equivalents, not seasonally adjusted
2006 2007 2007 2007 2007Q4 Q1 Q2 Q3 Q4
Attorney General’s Departments GB3F 9 590 9 520 9 480 9 770 9 750Cabinet Office BBGD 1 660 1 410 1 430 1 270 1 270
Other Cabinet Office Agencies GB3G 780 1 020 900 920 920HM Treasury GB3H 1 110 1 130 1 170 1 170 1 140Chancellor’s other departments GB3I 5 170 5 050 4 970 4 760 4 800
Charity Commission GB3J 500 500 490 460 460Communities and Local Government YEGA 5 520 5 400 5 370 5 390 5 350Ministry of Justice GB3K 33 640 33 550 83 210 83 560 83 880Culture, Media and Sport DMTC 630 620 620 610 600Defence BCDW 84 670 83 120 82 300 81 150 80 250Education and Skills (former) LNFW 3 940 3 850 3 840 – –Children, Schools and Families I44Z .. .. – 3 320 3 290Innovation, Universities and Skills I452 .. .. – 1 770 1 850Environment, Food and Rural Affairs LNFX 11 580 12 120 12 240 11 870 11 580Export Credits Guarantee Department GB3L 270 260 260 250 240Foreign and Commonwealth BCDK 6 050 6 060 6 120 6 070 6 030Health BAKR 5 870 3 610 3 630 3 480 3 520Food Standards Agency H6NX .. 810 810 800 790Meat Hygiene Service H6NY .. 1 390 1 360 1 330 1 270HM Revenue and Customs GB3M 94 880 93 320 91 060 89 210 88 420Home Office BCDL 73 490 74 270 24 990 24 920 24 760International Development DMUA 1 750 1 720 1 730 1 680 1 660Northern Ireland Office BBGG 140 140 140 130 130Office for Standards in Education GB3N 2 370 2 190 2 550 2 520 2 480Security and Intelligence Services GB3O 4 960 4 960 5 000 5 060 5 070Business, Enterprise and Regulatory Reform BCDQ 10 110 9 870 9 580 8 380 8 440Transport BCDR 18 780 18 790 18 810 18 880 18 910Work and Pensions LNGA 115 530 112 070 110 570 109 000 107 960
Central Governments Departments Total GB3P 493 000 486 740 482 610 477 730 474 820
Scottish Executive GB3Q 15 830 15 930 16 040 15 940 15 780Welsh Assembly GB3R 6 410 6 380 5 950 5 840 5 720
TOTAL BCDX 515 240 509 050 504 600 499 510 496 320
1 Numbers are rounded to the nearest ten. Source: Office for National Statistics
7.9 Unemployment: number by sex and age group1
United KingdomAt Quarter 2 each year2. Seasonally adjusted Thousands
All aged 16 and 50-64 (m) 65+ (m)over 16-59/64 16-17 18-24 25-34 35-49 50-59 (w) 60+ (w)
AllPersons
MGSC YBSH YBVH YBVN YCGM YCGS MGVL MGVO2001 1 472 1 458 152 377 340 387 202 142002 1 516 1 493 161 386 341 385 220 222003 1 464 1 446 176 400 310 345 215 182004 1 434 1 417 172 404 291 353 197 172005 1 435 1 418 176 438 278 335 193 17
2006 1 687 1 659 178 522 333 415 211 272007 1 661 1 632 195 521 302 390 223 29
MaleMGSD YBSI YBVI YBVO YCGN YCGT MGVM MGVP
2001 882 875 91 221 203 213 147 ..2002 910 900 92 242 192 225 149 102003 886 877 98 244 175 213 147 ..2004 843 834 98 232 177 187 139 ..2005 835 828 100 264 153 183 127 ..
2006 978 966 104 314 183 228 137 112007 951 937 109 313 160 205 151 13
FemaleMGSE YBSJ YBVJ YBVP YCGO YCGU MGVN MGVQ
2001 591 584 62 156 138 174 55 ..2002 606 593 69 145 149 160 70 132003 578 569 78 156 136 131 68 ..2004 592 583 74 172 113 166 58 ..2005 600 591 76 173 124 151 66 ..
2006 709 693 74 208 150 187 74 162007 710 695 87 209 142 185 72 15
1 See chapter text. In August 2007, ONS published the mid-year populationestimates for 2006. These estimates have now been incorporated into theLFS estimates from 2001 onwards. Further details can be found athttp://www.statistics.gov.uk/cci/article.asp?id=1919
2 The LFS has now moved to calendar quarters from May 2006. More informa-tion is on page 5 of the Concepts and Definitions.pdf :www.statistics.gov.uk/downloads/theme_labour/Concepts_Definitions_HQS.pdf
Source: LFS, Office for National Statistics; Helpline: 01633 456901

98
Labour Market
7.10 Unemployment: percentage by sex and age group1,2
United KingdomAt Quarter 2 each year3. Seasonally adjusted Percentages
All aged 16 and 50-64 (m) 65+ (m)over 16-59/64 16-17 18-24 25-34 35-49 50-59 (w) 60+ (w)
All PersonsMGSX YBTI YBVK YBVQ YCGP YCGV MGXE MGXH
2000 5.5 5.6 19.7 10.7 5.1 3.9 4.2 2.12001 5.0 5.1 18.5 10.2 4.8 3.7 3.3 1.62002 5.2 5.2 19.9 10.2 5.0 3.6 3.5 2.42003 4.9 5.0 21.3 10.6 4.6 3.2 3.3 1.92004 4.8 4.9 21.5 10.3 4.4 3.2 3.0 1.7
2005 4.8 4.9 21.9 11.1 4.2 3.0 2.9 1.62006 5.5 5.6 24.1 12.7 5.0 3.7 3.2 2.32007 5.4 5.5 27.4 12.6 4.6 3.4 3.3 2.3
MaleMGSY YBTJ YBVL YBVR YCGQ YCGW MGXF MGXI
2000 6.0 6.1 21.3 12.1 5.3 4.1 5.1 ..2001 5.6 5.6 21.6 11.2 5.2 3.8 4.0 ..2002 5.7 5.7 22.2 12.0 5.1 3.9 4.0 3.22003 5.5 5.5 23.5 12.0 4.7 3.6 3.8 ..2004 5.2 5.3 24.3 11.1 4.9 3.2 3.6 ..
2005 5.1 5.2 24.7 12.4 4.3 3.1 3.3 ..2006 5.9 6.0 28.4 14.4 5.1 3.8 3.4 2.82007 5.7 5.7 31.0 14.0 4.4 3.4 3.8 3.2
FemaleMGSZ YBTK YBVM YBVS YCGR YCGX MGXG MGXJ
2000 4.9 5.0 18.1 9.1 4.7 3.6 3.0 1.92001 4.4 4.6 15.4 9.0 4.3 3.5 2.2 ..2002 4.5 4.6 17.6 8.2 4.8 3.2 2.8 2.12003 4.3 4.4 19.0 8.9 4.5 2.6 2.6 ..2004 4.3 4.5 18.6 9.5 3.8 3.2 2.2 ..
2005 4.3 4.5 19.1 9.5 4.1 2.9 2.5 ..2006 5.0 5.2 19.9 10.9 5.0 3.5 2.8 2.12007 5.0 5.2 23.8 11.0 4.8 3.5 2.7 1.9
Note: Where figure denoted as .. it is not shown as it is based on a smallsample size and is subject to a margin of uncertainty.
1 See chapter text. In August 2007, ONS published the mid-year populationestimates for 2006. These estimates have now been incorporated into theLFS estimates from 2001 onwards. Further details can be found athttp://www.statistics.gov.uk/cci/article.asp?id=1919
2 Total unemployment as a percentage of all economically active persons inthe relevant age group.
3 The Labour Force Survey has now moved to calendar quarters from May2006. More information can be found on page 5 of the Concepts and Defini-tions.pdf by following this link:- www.statistics.gov.uk/downloads/theme_la-bour/Concepts_Definitions_HQS.pdf
Sources: Labour Force Survey, Office for National Statistics;Helpline: 01633 456901

99
Labour Market
7.11 Duration of unemployment: by sex1,2
United KingdomAt Quarter 2 each year3. Seasonally adjusted Thousands
1997 1998 1999 2000 2001 2002 2003 2004 2005 2006 2007
All PersonsAll unemployed4 MGSC 2 048 1 788 1 743 1 599 1 472 1 516 1 464 1 434 1 435 1 687 1 661Duration of unemployment
Less than 6 months YBWF 1 009 980 986 920 878 977 947 923 912 1 026 1 0006 months & less than 1 year YBWG 298 252 268 240 219 218 205 228 215 304 2651 year or more YBWH 741 556 490 439 376 320 312 284 308 357 396
1 year or more as % of total YBWI 36.2 31.1 28.1 27.5 25.5 21.1 21.3 19.8 21.5 21.2 23.8
MaleAll unemployed4 MGSD 1 265 1 074 1 059 957 882 910 886 843 835 978 951Duration of unemployment
Less than 6 months MGYK 550 518 536 500 481 537 537 504 488 548 5286 months & less than 1 year MGYM 178 160 165 140 131 147 131 141 138 177 1541 year or more MGYO 538 396 359 317 269 227 218 198 210 252 269
1 year or more as % of total YBWJ 42.5 36.9 33.9 33.1 30.5 24.9 24.6 23.5 25.1 25.8 28.3
FemaleAll unemployed4 MGSE 783 715 684 642 591 606 578 592 600 709 710Duration of unemployment
Less than 6 months MGYL 459 462 450 420 396 441 410 419 425 478 4736 months & less than 1 year MGYN 121 93 102 100 87 71 74 86 77 126 1111 year or more MGYP 203 160 131 122 107 94 94 86 98 105 127
1 year or more as % of total YBWK 26.0 22.4 19.2 19.0 18.1 15.4 16.3 14.6 16.3 14.8 17.8
1 All aged 16 and over. See chapter text.2 In August 2007, ONS published the mid-year population estimates for 2006.
These estimates have now been incorporated into the LFS estimates from2001 onwards. Further details can be found at http://www.statis-tics.gov.uk/cci/article.asp?id=1919
3 The Labour Force Survey has now moved to calendar quarters from May2006. More information can be found on page 5 of the Concepts and Defini-tions.pdf by following this link:- www.statistics.gov.uk/downloads/theme_la-bour/Concepts_Definitions_HQS.pdf
4 Totals include people who did not state their duration of unemployment.
Sources: Labour Force Survey, Office for National Statistics;Helpline: 01633 456901

100
Labour Market
7.12 Claimant count:1 by age and durationComputerised claims onlyUnited Kingdom. Seasonally adjusted Thousands
2001 2002 2003 2004 2005 2006 2007
Annual averages
Males
All agesAll durations AGNG 733.6 708.3 693.0 630.7 635.0 694.0 628.7Up to 6 months AGXK 449.4 457.4 451.2 408.8 423.4 438.5 405.1Over 6 and up to 12 months ELNP 125.4 124.2 127.1 113.7 113.3 136.4 111.2All over 12 months ELON 158.8 126.7 114.7 108.2 98.3 119.0 112.3All over 24 months IKBS 77.5 50.7 37.6 34.6 33.1 34.5 33.8
Aged 18 to 24All durations JLGC 167.9 168.1 171.9 161.8 174.5 195.5 176.9Up to 6 months JLGD 141.4 141.0 143.8 134.3 143.6 154.9 145.8Over 6 and up to 12 months JLGE 23.4 23.8 24.5 23.3 25.9 33.0 25.3All over 12 months JLGF 3.1 3.3 3.6 4.2 5.0 7.5 5.8All over 24 months JLGH 0.3 0.3 0.4 0.5 0.6 0.9 1.1
Aged 25 to 49All durations AGMA 445.9 421.8 404.8 362.3 357.5 387.5 352.5Up to 6 months JLHG 248.2 254.9 248.0 221.3 225.9 228.9 211.4Over 6 and up to 12 months JLHH 83.1 80.9 82.9 72.9 70.3 83.4 69.6All over 12 months JLHI 114.7 86.1 73.8 68.1 61.2 75.2 71.5All over 24 months JLHK 52.4 29.2 17.0 14.1 14.2 15.2 14.5
Aged 50 and overAll durations JLHL 119.8 118.4 116.3 106.7 103.0 111.0 99.3Up to 6 months JLHM 59.9 61.6 59.4 53.2 53.8 54.7 48.0Over 6 and up to 12 months JLHN 18.9 19.6 19.7 17.5 17.0 20.0 16.3All over 12 months JLHO 41.0 37.3 37.2 35.9 32.1 36.3 35.0All over 24 months JLHQ 24.8 21.1 20.2 19.9 18.3 18.4 18.2
Females
All agesAll durations JLGI 227.9 226.8 230.1 214.7 220.0 245.9 231.9Up to 6 months JLGK 160.4 163.6 166.3 153.2 159.2 171.5 164.3Over 6 and up to 12 months JLGJ 35.1 35.5 37.2 34.9 35.6 43.6 37.5All over 12 months JLGL 32.5 27.6 26.5 26.7 25.2 30.8 30.1All over 24 months JLGN 13.9 9.7 8.1 8.0 7.9 8.4 8.4
Aged 18 to 24All durations JLGO 73.4 75.0 77.3 74.0 79.0 90.1 85.4Up to 6 months JLGP 62.1 62.9 64.9 61.5 65.3 72.2 70.9Over 6 and up to 12 months JLGQ 9.8 10.4 10.6 10.4 11.4 14.6 12.0All over 12 months JLGR 1.4 1.8 1.8 2.1 2.3 3.3 2.5All over 24 months JLGT 0.2 0.2 0.3 0.3 0.4 0.5 0.5
Aged 25 to 49All durations JLHR 113.3 111.4 112.1 102.1 101.8 111.8 105.1Up to 6 months JLHS 74.4 76.7 77.3 69.0 70.3 73.6 69.3Over 6 and up to 12 months JLHT 18.6 18.5 19.9 18.2 17.7 21.2 18.8All over 12 months JLHU 20.4 16.2 14.9 14.9 13.8 16.9 17.0All over 24 months JLHW 8.2 4.7 3.1 2.9 3.0 3.3 3.2
Aged 50 and overAll durations JLHX 41.3 40.4 40.7 38.7 39.1 44.0 41.4Up to 6 months JLHY 23.9 24.1 24.1 22.7 23.6 25.6 24.1Over 6 and up to 12 months JLHZ 6.7 6.6 6.8 6.3 6.5 7.8 6.8All over 12 months JLIA 10.7 9.7 9.8 9.7 9.1 10.6 10.6All over 24 months JLIC 5.5 4.8 4.7 4.8 4.5 4.7 4.7
1 Count of claimants of unemployment-related benefits. Source: Office for National Statistics: 01633 456901

101
Labour Market
7.13 Unemployment rates: by region1,2,3
At Quarter 2 each year4. Seasonally adjusted5
Percentages
1997 1998 1999 2000 2001 2002 2003 2004 2005 2006 2007
North East YCNC 9.8 8.3 9.6 8.9 7.4 6.5 6.1 5.5 6.8 6.1 6.5North West YCND 7.1 6.9 6.3 5.3 5.3 5.5 5.0 4.4 4.4 5.3 5.8Yorkshire and The Humber YCNE 7.5 7.3 6.3 6.1 5.5 5.3 5.1 4.6 4.8 5.8 5.7
East Midlands YCNF 5.9 4.9 5.4 4.8 5.0 4.6 4.3 4.2 4.2 5.4 5.0West Midlands YCNG 6.8 5.9 6.9 6.1 5.5 5.7 5.6 5.5 4.7 5.7 6.8
East YCNH 6.3 4.9 4.3 3.7 3.6 3.7 3.9 3.8 3.9 5.0 4.6London YCNI 9.3 8.6 7.5 7.4 6.2 6.8 7.2 7.0 7.1 7.8 7.4South East YCNJ 5.3 4.4 4.0 3.3 3.2 3.8 3.9 3.7 3.8 4.7 4.2South West YCNK 5.8 4.8 4.5 4.3 3.6 3.7 3.4 3.7 3.2 3.7 4.0
Wales YCNM 8.3 7.0 7.5 6.1 6.1 5.7 4.5 4.2 4.6 5.7 5.6Scotland YCNN 8.6 7.4 7.1 7.1 6.3 6.3 5.3 6.0 5.4 5.4 4.5Northern Ireland ZSFB 8.1 6.9 7.6 6.7 6.1 5.6 5.2 5.1 4.9 4.2 3.7
1 Total unemployed as a percentage of all economically active persons.2 All aged 16 and over. See chapter text.3 In August 2007, ONS published the mid-year population estimates for 2006.
These estimates have now been incorporated into the LFS estimates from2001 onwards. Further details can be found at http://www.statis-tics.gov.uk/cci/article.asp?id=1919
4 The Labour Force Survey has now moved to calendar quarters from May2006. More information can be found on page 5 of the Concepts and Defini-tions.pdf by following this link:- www.statistics.gov.uk/downloads/theme_la-bour/Concepts_Definitions_HQS.pdf
5 Previously not seasonally adjusted data was shown.
Sources: Labour Force Survey, Office for National Statistics;Helpline: 01633 456901
7.14 Claimant count rates: by region1
Seasonally adjusted annual averagesPercentages
1997 1998 1999 2000 2001 2002 2003 2004 2005 2006 2007
United Kingdom BCJE 5.3 4.5 4.1 3.6 3.1 3.1 3.0 2.7 2.7 2.9 2.8North East DPDM 7.9 7.0 6.9 6.2 5.6 5.0 4.5 4.0 3.9 4.1 4.3North West IBWC 5.7 5.0 4.6 4.1 3.7 3.5 3.2 2.8 2.9 3.3 3.2Yorkshire and the Humber DPBI 6.0 5.4 5.0 4.3 3.9 3.6 3.3 2.8 2.9 3.3 3.2
East Midlands DPBJ 4.6 3.9 3.6 3.3 3.1 2.9 2.8 2.5 2.5 2.8 2.8West Midlands DPBN 5.2 4.5 4.4 4.0 3.7 3.5 3.5 3.3 3.4 3.9 3.8
East DPDP 4.0 3.2 2.9 2.4 2.0 2.1 2.1 2.0 2.1 2.3 2.2London DPDQ 6.2 5.1 4.4 3.7 3.3 3.5 3.6 3.5 3.4 3.4 3.1South East DPDR 3.3 2.6 2.3 1.8 1.5 1.6 1.7 1.6 1.6 1.8 1.6South West DPBM 4.1 3.4 3.0 2.5 2.1 1.9 1.9 1.6 1.6 1.8 1.6
England VASQ 5.1 4.3 3.9 3.4 3.0 2.9 2.9 2.6 2.6 2.9 2.7Wales DPBP 6.1 5.4 5.0 4.4 3.9 3.5 3.3 3.0 3.0 3.1 3.1Scotland DPBQ 5.9 5.3 5.0 4.5 3.9 3.8 3.7 3.4 3.2 3.2 2.9Northern Ireland DPBR 8.0 7.3 6.3 5.3 4.9 4.4 4.1 3.6 3.3 3.2 2.9
Great Britain DPAJ 5.2 4.4 4.0 3.5 3.1 3.0 3.0 2.7 2.7 2.9 2.8
1 The number of unemployment-related benefit claimants as a percentage ofthe estimated total workforce (the sum of claimants, employee jobs, self-em-ployed, participants on work-related government training programmes andHM Forces) at mid-year. Excluded are claimants under 18, consistent withcurrent coverage. See chapter text.
Source: Office for National Statistics: 01633 456901

102
Labour Market
7.15 Claimant count:1 by regionSeasonally adjusted
Thousands
YorkshireNorth North and the East West South South Great Northern UnitedEast West Humber Midlands Midlands East London East West England Wales Scotland Britain Ireland Kingdom
DPDG IBWA DPAX DPAY DPBC DPDJ DPDK DPDL DPBB IBWK DPBE DPBF DPAG DPBG BCJD1992 Jan 133.9 325.4 222.7 160.4 250.6 183.3 389.8 258.4 188.4 2 112.6 121.3 228.0 2 462.2 102.2 2 564.4
Apr 135.7 332.8 227.6 168.0 260.0 196.0 409.6 277.7 199.0 2 205.5 123.4 231.8 2 561.6 103.4 2 665.0Jul 136.7 335.2 232.4 172.1 266.1 205.1 426.2 288.9 206.6 2 268.9 124.1 235.2 2 628.6 104.6 2 733.2Oct 141.4 343.6 240.2 178.8 277.4 218.6 448.0 308.4 215.3 2 371.1 129.2 242.4 2 743.3 105.1 2 848.4
1993 Jan 146.2 348.3 247.5 185.2 286.2 229.5 464.6 325.2 222.6 2 454.4 131.4 245.3 2 832.0 105.5 2 937.5Apr 148.0 345.2 246.5 183.6 285.1 228.2 469.5 321.4 220.0 2 446.6 130.3 243.2 2 821.0 104.5 2 925.5Jul 148.5 338.0 240.9 180.8 278.7 223.5 466.3 314.0 214.4 2 404.4 129.3 241.2 2 775.6 102.5 2 878.1Oct 147.5 331.1 237.8 177.8 271.5 216.6 460.4 306.6 208.4 2 356.8 127.8 236.6 2 722.1 101.8 2 823.9
1994 Jan 145.6 325.1 233.7 174.7 262.3 210.0 451.4 296.7 203.6 2 302.3 126.7 236.0 2 665.8 100.2 2 766.0Apr 141.6 314.5 227.4 170.7 252.0 200.4 440.4 280.9 194.5 2 221.7 123.3 231.7 2 577.4 98.9 2 676.3Jul 139.1 304.2 222.7 166.3 242.3 191.0 428.1 268.1 188.1 2 148.8 119.0 227.4 2 496.3 97.2 2 593.5Oct 136.0 291.7 215.9 160.1 230.5 180.5 415.4 251.1 178.9 2 059.0 112.9 218.1 2 391.1 93.8 2 484.9
1995 Jan 133.0 280.1 210.6 153.2 218.5 172.3 401.4 237.9 171.4 1 977.5 108.3 209.3 2 296.0 91.3 2 387.3Apr 130.0 270.8 206.8 148.1 211.0 167.1 395.0 229.7 166.0 1 923.8 106.2 200.3 2 231.0 88.6 2 319.6Jul 128.2 266.1 204.6 145.3 206.9 165.0 390.2 225.1 162.5 1 892.8 106.7 195.3 2 195.9 87.6 2 283.5Oct 126.4 260.9 200.7 142.3 201.3 160.7 383.2 219.1 159.4 1 852.7 105.4 193.5 2 152.9 85.8 2 238.7
1996 Jan 123.1 255.8 197.0 140.0 196.5 157.2 376.8 213.3 155.6 1 814.6 104.0 193.2 2 112.5 85.9 2 198.4Apr 121.7 254.9 195.7 137.7 194.2 153.5 367.9 207.6 152.3 1 785.1 104.6 194.9 2 085.0 86.1 2 171.1Jul 116.9 248.2 188.8 131.8 187.6 146.8 357.5 198.9 146.8 1 722.5 101.8 191.9 2 017.0 86.4 2 103.4Oct 110.5 238.4 181.1 124.9 177.8 138.5 341.6 185.5 137.9 1 635.0 98.2 186.3 1 920.7 81.7 2 002.4
1997 Jan 101.0 218.5 166.4 111.8 160.1 123.5 312.6 163.3 126.0 1 483.2 90.3 173.8 1 747.3 71.1 1 818.4Apr 95.2 201.3 154.7 102.4 147.3 110.6 284.9 144.4 112.1 1 352.9 82.5 162.2 1 597.6 65.0 1 662.6Jul 92.4 188.9 148.2 95.0 138.0 102.5 264.3 131.0 100.7 1 261.0 78.1 153.6 1 492.7 61.4 1 554.1Oct 90.4 177.6 142.0 87.6 131.7 94.3 246.4 120.4 93.0 1 183.4 73.6 146.5 1 403.5 60.6 1 464.1
1998 Jan 87.6 170.6 137.2 82.8 126.1 88.5 234.3 112.3 88.7 1 128.1 70.9 141.6 1 340.6 59.9 1 400.5Apr 84.1 165.4 134.1 79.9 122.3 85.2 229.4 108.0 85.1 1 093.5 69.3 138.7 1 301.5 57.9 1 359.4Jul 81.8 163.7 133.3 80.0 121.4 83.7 225.2 105.5 84.1 1 078.7 68.6 139.4 1 286.7 57.3 1 344.0Oct 82.1 160.9 130.9 79.9 121.4 82.0 219.3 102.5 81.8 1 060.8 68.1 136.9 1 265.8 56.1 1 321.9
1999 Jan 82.6 159.5 129.5 79.0 122.6 80.3 214.5 101.2 81.2 1 050.4 67.8 135.6 1 253.8 55.9 1 309.7Apr 82.5 157.2 127.0 78.2 123.1 79.1 207.8 98.8 78.4 1 032.1 67.1 133.9 1 233.1 55.0 1 288.1Jul 80.3 153.8 122.4 75.9 120.2 76.6 202.2 94.4 74.9 1 000.7 63.8 130.2 1 194.7 50.0 1 244.7Oct 76.7 150.0 118.3 73.6 115.9 73.6 196.5 91.1 71.4 967.1 61.0 126.1 1 154.2 46.5 1 200.7
2000 Jan 75.7 145.7 114.6 73.2 112.1 70.3 189.4 87.2 68.0 936.2 59.3 123.2 1 118.7 44.2 1 162.9Apr 73.6 139.9 108.9 70.0 108.1 66.9 181.6 81.3 63.8 894.1 57.8 119.0 1 070.9 42.4 1 113.3Jul 72.0 135.4 104.9 68.7 107.2 62.5 172.0 77.5 61.1 861.3 57.1 115.1 1 033.5 41.2 1 074.7Oct 69.5 131.0 102.5 67.7 106.5 60.7 165.0 74.3 58.1 835.3 56.4 111.7 1 003.4 41.3 1 044.7
2001 Jan 66.2 127.4 99.9 66.6 104.0 57.2 158.2 69.7 54.9 804.1 54.9 108.8 967.8 40.8 1 008.6Apr 63.2 124.9 97.6 65.1 100.8 54.8 151.8 66.1 53.6 777.9 52.4 105.3 935.6 39.9 975.5Jul 61.4 121.5 95.1 63.0 97.4 53.7 151.0 65.1 52.1 760.3 49.8 102.4 912.5 39.3 951.8Oct 61.5 121.4 93.2 61.6 95.7 54.3 156.3 65.9 51.1 761.0 49.2 104.2 914.4 38.6 953.0
2002 Jan 60.9 121.3 91.4 60.6 95.4 55.4 163.1 68.6 51.1 767.8 48.1 104.3 920.2 38.0 958.2Apr 59.2 119.4 89.4 59.4 93.6 56.4 166.2 71.0 50.9 765.5 47.5 104.4 917.4 37.5 954.9Jul 58.5 118.1 89.1 58.6 93.4 57.5 167.3 72.3 50.1 764.9 46.8 101.9 913.6 36.4 950.0Oct 55.9 116.1 87.6 57.9 93.7 57.2 167.6 72.3 49.3 757.6 46.7 100.1 904.4 35.1 939.5
2003 Jan 54.8 115.9 87.0 58.0 94.3 57.4 168.6 72.9 48.9 757.8 46.3 100.2 904.3 35.0 939.3Apr 53.5 112.7 84.1 58.8 94.7 58.5 171.3 75.6 48.6 757.8 45.2 99.1 902.1 34.0 936.1Jul 52.6 112.5 84.2 59.9 94.9 58.7 171.7 76.4 49.1 760.0 45.0 100.6 905.6 34.6 940.2Oct 51.1 108.7 81.6 58.8 94.2 57.3 170.2 76.0 47.4 745.3 43.1 98.9 887.3 34.7 922.0
2004 Jan 49.8 104.6 78.3 56.2 93.0 56.7 167.8 75.0 45.3 726.7 42.0 97.0 865.7 33.5 899.2Apr 47.5 101.3 75.6 53.7 89.7 56.0 165.5 72.3 42.7 704.3 41.4 94.4 840.1 31.8 871.9Jul 45.4 96.7 71.6 51.1 86.7 54.6 162.0 68.5 40.4 677.0 39.5 90.0 806.5 29.9 836.4Oct 45.1 96.5 71.1 50.9 86.0 55.0 158.8 69.2 40.6 673.2 39.2 89.5 801.9 29.6 831.5
2005 Jan 43.9 94.5 70.1 50.8 85.6 55.3 158.6 68.3 40.8 667.9 38.9 87.4 794.2 29.1 823.3Apr 44.9 97.9 73.2 51.8 87.6 56.3 162.2 70.1 41.3 685.3 39.5 86.1 810.9 28.8 839.7Jul 46.2 102.0 76.2 54.6 96.6 58.9 162.2 71.6 42.6 710.9 41.7 84.7 837.3 28.4 865.7Oct 47.3 105.9 79.7 56.5 99.3 60.1 165.7 73.6 43.0 731.1 42.9 85.3 859.3 28.1 887.4
2006 Jan 47.2 109.1 84.0 58.7 102.6 62.3 168.0 78.0 44.0 753.9 43.8 84.9 882.6 28.3 910.9Apr 49.7 115.0 87.1 61.9 108.7 65.5 167.8 81.7 47.9 785.3 45.2 88.3 918.8 28.3 947.1Jul 50.5 116.8 88.4 62.7 109.3 65.8 168.3 83.7 49.2 794.7 44.2 88.5 927.4 27.7 955.1Oct 51.2 118.1 88.7 63.2 109.8 67.4 165.9 82.7 49.2 796.2 44.0 87.2 927.4 27.7 955.1
2007 Jan 51.0 115.3 85.8 61.7 109.5 66.2 158.9 77.8 47.2 773.4 42.2 81.4 897.0 26.1 923.1Apr 50.3 111.6 83.5 60.2 104.3 63.4 151.4 74.7 44.6 744.0 41.2 79.2 864.4 25.3 889.7Jul 49.3 109.0 81.1 58.6 101.1 61.0 144.5 71.5 42.2 718.3 40.4 74.8 833.5 23.6 857.1Oct 47.9 107.3 77.6 55.9 99.4 57.5 136.0 67.4 39.8 688.8 39.7 72.4 800.9 23.2 824.1
1 The figures are based on the number of claimants receiving unemploymentrelated benefits and are adjusted for seasonality and discontinuities to beconsistent with current coverage. See chapter text.
The latest national and regional seasonally adjusted claimant count figures areprovisional and subject to revision in the following month.
Source: Office for National Statistics: 01633 456901

103
Labour Market
7.16 Economic activity: by sex and age1
United KingdomAt Quarter 2 each year2. Seasonally adjusted Thousands and percentages
All aged 16 and 50-64 (m) 65+ (m)over 16-59/64 16-17 18-24 25-34 35-49 50-59 (w) 60+ (w)
Thousands
All PersonsMGSF YBSK YBZL YBZO YBZR YBZU YBZX YCAD
2001 29 167 28 322 821 3 698 7 078 10 599 6 125 8452002 29 422 28 519 808 3 773 6 885 10 808 6 245 9032003 29 656 28 709 826 3 781 6 707 10 930 6 464 9462004 29 857 28 830 803 3 919 6 599 11 043 6 466 1 0282005 30 163 29 087 803 3 960 6 586 11 185 6 553 1 075
2006 30 670 29 488 738 4 100 6 630 11 356 6 665 1 1822007 30 814 29 574 714 4 137 6 586 11 411 6 726 1 240
MaleMGSG YBSL YBZM YBZP YBZS YBZV YBZY YCAE
2001 15 876 15 595 421 1 966 3 887 5 654 3 667 2802002 15 981 15 680 415 2 007 3 776 5 774 3 708 3022003 16 184 15 845 418 2 031 3 685 5 860 3 851 3392004 16 212 15 863 404 2 102 3 601 5 900 3 857 3482005 16 342 15 981 404 2 133 3 588 5 957 3 900 361
2006 16 595 16 193 365 2 191 3 616 6 048 3 972 4022007 16 735 16 319 350 2 238 3 618 6 085 4 027 417
FemaleMGSH YBSM YBZN YBZQ YBZT YBZW YBZZ YCAF
2001 13 291 12 726 401 1 731 3 191 4 945 2 459 5652002 13 440 12 839 393 1 766 3 109 5 034 2 536 6012003 13 471 12 864 408 1 750 3 023 5 070 2 613 6072004 13 646 12 966 400 1 816 2 999 5 143 2 609 6792005 13 820 13 106 399 1 828 2 998 5 229 2 653 714
2006 14 075 13 295 372 1 909 3 014 5 308 2 693 7792007 14 079 13 256 364 1 899 2 968 5 326 2 699 823
Percentages3
All PersonsMGWG MGSO YCAG YCAJ YCAM YCAP MGWP MGWS
2001 62.8 78.6 55.8 75.6 84.1 84.8 70.0 8.12002 63.0 78.6 53.6 75.7 83.8 85.1 70.5 8.62003 63.1 78.7 54.2 74.0 83.5 84.9 72.4 9.02004 63.0 78.5 51.7 74.7 83.6 84.7 72.0 9.62005 63.1 78.6 51.1 73.7 83.8 84.8 72.5 10.0
2006 63.7 79.0 47.0 74.6 84.7 85.3 73.1 10.92007 63.4 78.8 45.0 73.6 84.5 85.1 73.6 11.2
MaleMGWH MGSP YCAH YCAK YCAN YCAQ MGWQ MGWT
2001 70.9 83.9 55.8 80.7 93.3 91.5 72.8 7.32002 70.8 83.8 53.7 80.5 92.7 92.0 72.9 7.82003 71.2 84.2 53.4 79.1 92.6 92.1 75.1 8.72004 70.7 83.6 50.7 79.3 92.0 91.6 74.6 8.82005 70.5 83.4 50.2 78.4 92.1 91.4 74.7 9.0
2006 70.9 83.7 45.4 78.6 93.1 91.9 75.1 9.92007 70.9 83.6 42.9 78.4 93.3 91.9 75.3 10.2
FemaleMGWI MGSQ YCAI YCAL YCAO YCAR MGWR MGWU
2001 55.3 72.9 55.7 70.6 75.0 78.2 66.2 8.62002 55.6 73.1 53.6 71.0 75.0 78.4 67.2 9.12003 55.5 72.9 55.0 68.9 74.6 77.9 68.9 9.12004 55.9 73.1 52.7 70.0 75.3 78.0 68.5 10.12005 56.1 73.4 52.0 68.9 75.6 78.4 69.5 10.6
2006 56.8 74.0 48.7 70.5 76.5 78.8 70.3 11.42007 56.4 73.6 47.3 68.7 75.8 78.5 71.3 11.8
1 See chapter text. In August 2007, ONS published the mid-year populationestimates for 2006. These estimates have now been incorporated into theLFS estimates from 2001 onwards. Further details can be found athttp://www.statistics.gov.uk/cci/article.asp?id=1919
2 The Labour Force Survey has now moved to calendar quarters from May2006. More information can be found on page 5 of the Concepts and Defini-tions.pdf by following this link:- www.statistics.gov.uk/downloads/theme_la-bour/Concepts_Definitions_HQS.pdf
3 Total economically active as a percentage of all persons in the relevant agegroup.
Sources: Labour Force Survey, Office for National Statistics;Helpline: 01633 456901

104
Labour Market
7.17 Economically inactive: by sex and age1
United KingdomAt Quarter 2 each year2. Seasonally adjusted Thousands and percentages
All aged 16 and 50-64 (m) 65+ (m)over 16-59/64 16-17 18-24 25-34 35-49 50-59 (w) 60+ (w)
Thousands
All PersonsMGSI YBSN YCAS YCAV YCAY YCBB MGWA MGWD
2001 17 274 7 717 652 1 192 1 342 1 901 2 629 9 5572002 17 305 7 743 699 1 208 1 333 1 888 2 615 9 5622003 17 361 7 755 698 1 327 1 327 1 943 2 460 9 6062004 17 504 7 879 751 1 327 1 298 1 988 2 516 9 6242005 17 624 7 940 768 1 412 1 274 2 000 2 486 9 684
2006 17 515 7 830 832 1 394 1 195 1 961 2 449 9 6842007 17 776 7 965 872 1 482 1 210 1 993 2 410 9 811
MaleMGSJ YBSO YCAT YCAW YCAZ YCBC MGWB MGWE
2001 6 518 2 983 333 471 280 526 1 373 3 5352002 6 584 3 022 358 486 296 502 1 380 3 5612003 6 551 2 980 365 535 296 505 1 279 3 5712004 6 719 3 109 393 548 313 539 1 316 3 6102005 6 824 3 178 400 586 308 561 1 323 3 646
2006 6 796 3 150 440 595 269 532 1 314 3 6462007 6 883 3 201 466 618 260 534 1 323 3 682
FemaleMGSK YBSP YCAU YCAX YCBA YCBD MGWC MGWF
2001 10 756 4 734 319 721 1 062 1 375 1 256 6 0222002 10 721 4 721 341 722 1 037 1 386 1 235 6 0012003 10 810 4 775 334 792 1 031 1 437 1 182 6 0342004 10 785 4 771 358 779 985 1 449 1 200 6 0142005 10 800 4 762 368 825 966 1 439 1 163 6 038
2006 10 719 4 681 392 799 926 1 429 1 135 6 0392007 10 893 4 764 405 864 950 1 459 1 087 6 129
Percentages3
All PersonsYBTC YBTL LWEX LWFA LWFD LWFG LWFJ LWFM
2001 37.2 21.4 44.2 24.4 15.9 15.2 30.0 91.92002 37.0 21.4 46.4 24.3 16.2 14.9 29.5 91.42003 36.9 21.3 45.8 26.0 16.5 15.1 27.6 91.02004 37.0 21.5 48.3 25.3 16.4 15.3 28.0 90.42005 36.9 21.4 48.9 26.3 16.2 15.2 27.5 90.0
2006 36.3 21.0 53.0 25.4 15.3 14.7 26.9 89.12007 36.6 21.2 55.0 26.4 15.5 14.9 26.4 88.8
MaleYBTD YBTM LWEY LWFB LWFE LWFH LWFK LWFN
2001 29.1 16.1 44.2 19.3 6.7 8.5 27.2 92.72002 29.2 16.2 46.3 19.5 7.3 8.0 27.1 92.22003 28.8 15.8 46.6 20.9 7.4 7.9 24.9 91.32004 29.3 16.4 49.3 20.7 8.0 8.4 25.4 91.22005 29.5 16.6 49.8 21.6 7.9 8.6 25.3 91.0
2006 29.1 16.3 54.6 21.4 6.9 8.1 24.9 90.12007 29.1 16.4 57.1 21.6 6.7 8.1 24.7 89.8
FemaleYBTE YBTN LWEZ LWFC LWFF LWFI LWFL LWFO
2001 44.7 27.1 44.3 29.4 25.0 21.8 33.8 91.42002 44.4 26.9 46.4 29.0 25.0 21.6 32.8 90.92003 44.5 27.1 45.0 31.1 25.4 22.1 31.1 90.92004 44.1 26.9 47.3 30.0 24.7 22.0 31.5 89.92005 43.9 26.6 48.0 31.1 24.4 21.6 30.5 89.4
2006 43.2 26.0 51.3 29.5 23.5 21.2 29.7 88.62007 43.6 26.4 52.7 31.3 24.2 21.5 28.7 88.2
1 See chapter text. In August 2007, ONS published the mid-year populationestimates for 2006. These estimates have now been incorporated into theLFS estimates from 2001 onwards. Further details can be found athttp://www.statistics.gov.uk/cci/article.asp?id=1919
2 The Labour Force Survey has now moved to calendar quarters from May2006. More information can be found on page 5 of the Concepts and Defini-tions.pdf by following this link:- www.statistics.gov.uk/downloads/theme_la-bour/Concepts_Definitions_HQS.pdf
3 Total economically inactive as a percentage of all persons in the relevantage group.
Sources: Labour Force Survey, Office for National Statistics;Helpline: 01633 456901

105
Labour Market
7.18 Economically inactive:1,2 by reason and sexUnited KingdomAt Quarter 2 each year3. Seasonally adjusted Thousands and percentages
Economic inactivity by reason: by:All
Looking after Temporary Long-term Discouraged Does not want economicallyStudent family/home sick sick workers4 Retired Other a job Wants a job inactive
Thousands
All PersonsBEDZ BEEC BEBK BEBN YCFO BEEI BEEL YBVZ YBWC YBSN
2000 1 433 2 371 187 2 149 69 553 810 5 258 2 314 7 5712001 1 505 2 391 192 2 212 34 593 790 5 526 2 191 7 7172002 1 519 2 384 177 2 228 32 584 818 5 495 2 248 7 7432003 1 645 2 400 193 2 110 38 569 801 5 612 2 143 7 7552004 1 697 2 341 191 2 171 35 598 845 5 858 2 021 7 879
2005 1 786 2 335 189 2 151 33 624 822 5 860 2 080 7 9402006 1 809 2 306 189 2 087 36 592 811 5 754 2 076 7 8302007 1 896 2 355 199 2 045 35 621 815 5 878 2 088 7 965
MaleBEEX BEAQ BEDI BEDL YCFP BEDR BEDU YBWA YBWD YBSO
2000 705 163 88 1 202 38 383 299 1 939 939 2 8782001 731 180 91 1 242 21 405 313 2 078 905 2 9832002 750 182 87 1 242 21 396 343 2 086 936 3 0222003 819 181 88 1 150 20 389 333 2 065 915 2 9802004 858 188 94 1 185 23 410 350 2 252 857 3 109
2005 887 193 100 1 191 21 427 357 2 335 843 3 1782006 897 197 94 1 143 26 437 354 2 254 895 3 1502007 948 207 89 1 144 21 453 339 2 313 888 3 201
FemaleBEBL BEBO BEEG BEEJ YCFQ BEEP BEES YBWB YBWE YBSP
2000 729 2 207 99 947 31 170 511 3 319 1 375 4 6942001 774 2 212 101 970 13 188 477 3 449 1 285 4 7342002 769 2 202 90 986 11 187 475 3 409 1 312 4 7212003 826 2 218 105 960 18 180 468 3 548 1 228 4 7752004 839 2 153 97 986 12 188 495 3 606 1 165 4 771
2005 899 2 142 89 960 12 196 464 3 524 1 237 4 7622006 911 2 109 94 944 10 154 457 3 500 1 181 4 6812007 948 2 148 110 901 14 168 475 3 564 1 200 4 764
Percentages5
All PersonsBEDJ BEDM BEDP BEDS BEDV BEDY BEEB BEEE BEBM BEAR
2000 18.9 31.3 2.5 28.4 0.9 7.3 10.7 69.4 30.6 100.02001 19.5 31.0 2.5 28.7 0.4 7.7 10.2 71.6 28.4 100.02002 19.6 30.8 2.3 28.8 0.4 7.5 10.6 71.0 29.0 100.02003 21.2 30.9 2.5 27.2 0.5 7.3 10.3 72.4 27.6 100.02004 21.5 29.7 2.4 27.6 0.4 7.6 10.7 74.3 25.7 100.0
2005 22.5 29.4 2.4 27.1 0.4 7.9 10.3 73.8 26.2 100.02006 23.1 29.5 2.4 26.7 0.5 7.6 10.4 73.5 26.5 100.02007 23.8 29.6 2.5 25.7 0.4 7.8 10.2 73.8 26.2 100.0
MaleBEEH BEEK BEEN BEEQ BEET BEEW BEEZ BEAS BEGT BEBP
2000 24.5 5.7 3.0 41.8 1.3 13.3 10.4 67.4 32.6 100.02001 24.5 6.0 3.1 41.6 0.7 13.6 10.5 69.7 30.3 100.02002 24.8 6.0 2.9 41.1 0.7 13.1 11.3 69.0 31.0 100.02003 27.5 6.1 3.0 38.6 0.7 13.0 11.2 69.3 30.7 100.02004 27.6 6.1 3.0 38.1 0.7 13.2 11.3 72.4 27.6 100.0
2005 27.9 6.1 3.2 37.5 0.7 13.4 11.2 73.5 26.5 100.02006 28.5 6.3 3.0 36.3 0.8 13.9 11.2 71.6 28.4 100.02007 29.6 6.5 2.8 35.7 0.6 14.2 10.6 72.3 27.7 100.0
FemaleBEGZ BEHC BEHF BEHI BEHL BEHO BEBQ BEHR BEHU BEGW
2000 15.5 47.0 2.1 20.2 0.7 3.6 10.9 70.7 29.3 100.02001 16.4 46.7 2.1 20.5 0.3 4.0 10.1 72.8 27.2 100.02002 16.3 46.7 1.9 20.9 0.2 4.0 10.1 72.2 27.8 100.02003 17.3 46.5 2.2 20.1 0.4 3.8 9.8 74.3 25.7 100.02004 17.6 45.1 2.0 20.7 0.3 3.9 10.4 75.6 24.4 100.0
2005 18.9 45.0 1.9 20.2 0.3 4.1 9.8 74.0 26.0 100.02006 19.5 45.1 2.0 20.2 0.2 3.3 9.8 74.8 25.2 100.02007 19.9 45.1 2.3 18.9 0.3 3.5 10.0 74.8 25.2 100.0
1 All persons aged 16-59(women)/ 64 (men). See chapter text.2 In August 2007, ONS published the mid-year population estimates for 2006.
These estimates have now been incorporated into the LFS estimates from2001 onwards. Further details can be found at http://www.statis-tics.gov.uk/cci/article.asp?id=1919
3 The Labour Force Survey has now moved to calendar quarters from May2006. More information can be found on page 5 of the Concepts and Defini-tions.pdf by following this link:- www.statistics.gov.uk/downloads/theme_la-bour/Concepts_Definitions_HQS.pdf
4 People whose reason for not seeking work was that they believed no jobs wereavailable.
5 Reasons for inactivity as a percentage of all economically inactive.Sources: Labour Force Survey, Office for National Statistics;
Helpline: 01633 456901

106
Labour Market
7.19 Labour disputes: by industry1
United KingdomStandard Industrial Classification 2003 Thousands and numbers
2000 2001 2002 2003 2004 2005 2006
Working days lost through all stoppages in progress (thousands) KBBZ 499 525 1 323 499 905 157 755
Analysis by industryMining, quarrying, electricity, gas and water DMME 3 25 – – 5 6 12Manufacturing BBFX 52 43 21 63 31 16 18Construction DMMG 49 10 17 14 – 2 15Transport, storage and communication BBFY 97 107 96 126 44 33 41Public administration and defence BBFZ 50 216 488 138 437 23 627Education BBGA 50 43 376 131 379 43 31Health and social work BBGB 122 73 148 15 4 – 5Other community, social and personal services DMML 36 4 107 10 4 6 2All other industries and services DMMM 40 4 70 2 2 29 5
Analysis by number of working days lost in each stoppageUnder 250 days KBFC 12 9 7 6 7 5 7250 and under 500 days KBFJ 9 11 8 6 5 4 8500 and under 1,000 days KBFL 21 15 15 13 12 7 81,000 and under 5,000 days KBFY 71 59 47 69 51 80 665,000 and under 25,000 days KBFZ 85 140 104 46 59 61 6925,000 and under 50,000 days KBGS – 72 122 112 – – –50,000 days and over KBGT 301 220 1 021 248 770 – 597
Working days lost per 1 000 employees all industries and services KBHA 20 20 51 19 34 6 28
Workers directly and indirectly involved (thousands) KBHB 183 180 943 151 293 93 713
Analysis by industryMining, quarrying, electricity, gas and water DMMN 1 3 – – 1 6 1Manufacturing DMMO 28 17 10 18 14 3 11Construction DMMP 16 3 17 2 – 1 2Transport, storage and communications DMMQ 39 69 33 52 12 13 14Public administration and defence DMMR 29 46 171 56 207 15 654Education DMMS 17 34 388 15 55 43 28Health and social work DMMT 28 6 144 3 1 – 2Other community, social and personal services DMMU 13 1 103 3 3 6 1All other industries and services DMMV 12 1 76 1 1 5 2
Analysis by duration of stoppageNot more than 5 days KBHM 82 98 828 78 222 89 706Over 5 but not more than 10 days KBHN 9 43 57 23 47 3 5Over 10 but not more than 20 days KBJQ 8 4 3 31 1 1 2Over 20 but not more than 30 days KBJR – – 1 – 3 – 1Over 30 but not more than 50 days KBJS 83 6 1 – – 1 –Over 50 days KBJT 1 30 55 20 20 – –
Numbers of stoppages in progress: total KBLG 212 194 146 133 130 116 158
Analysis by industryMining, quarrying, electricity, gas and water DMMW 3 3 2 1 3 2 2Manufacturing DMMX 38 32 33 43 30 19 25Construction DMMY 16 9 3 4 1 3 5Transport, storage and communications DMMZ 116 94 51 45 46 42 30Public administration and defence DMNA 7 22 20 12 19 13 18Education DMNB 18 16 16 15 16 22 53Health and social work DMNC 10 12 14 7 4 1 4Other community, social and personal services DMND 13 10 11 9 12 5 8All other industries and services DMNE 5 9 12 4 4 10 13
Analysis of number of stoppages by durationNot more than 5 days KBNH 187 162 118 113 111 102 126Over 5 but not more than 10 days KBNI 14 15 16 10 10 8 19Over 10 but not more than 20 days KBNJ 5 7 3 5 4 3 10Over 20 but not more than 30 days KBNK 1 1 3 1 2 – 1Over 30 but not more than 50 days KBNL 3 4 1 1 1 3 2Over 50 days KBNM 2 5 5 3 2 – –
1 See chapter text. Source: Labour Market Statistics, Office for National Statistics: 01633 819205

107
Labour Market
7.20 Average earnings and hours of full-time employees by industry division:1 by sexUnited KingdomAt April. Standard Industrial Classification 1992
Wholesale andRetail Trade;
repair of motorAgriculture, vehicles, cycles,
Hunting and Mining and Electricity, Gas personal andForestry Fishing Quarrying Manufacturing and Water Supply Construction household goods
All employeesWeekly earnings
C9EG C9EI C9EK C9EM C9EO C9EP C9EQ
20042 362.5 419.0 633.5 493.1 591.9 509.4 433.3355.8 415.7 617.1 485.0 579.2 505.1 421.3
2005 364.7 440.6 657.9 508.0 612.2 524.6 425.2
20063 379.9 450.7 753.4 526.8 625.8 554.2 447.5379.7 445.1 749.9 524.2 624.8 553.4 445.6
2007 397.0 359.4 757.6 539.3 630.8 567.9 459.5Total hours worked
C5TJ C5TK C5TL C5TV C5TW C5TX C5U3
20042 44.5 43.5 43.4 41.0 40.0 43.1 40.443.8 43.2 43.2
2005 43.7 43.1 43.5 40.6 39.3 43.0 40.3
20063 44.1 42.3 42.6 40.7 40.3 43.1 40.342.2 40.4
2007 43.9 43.6 44.1 40.9 39.7 43.0 40.3Hourly earnings excluding overtime
C9HV C9HX C9HZ C9I3 C9I5 C9I7 C9IA
20042 8.03 9.57 14.97 12.01 14.61 11.81 10.747.87 9.41 14.60 11.80 14.29 11.68 10.44
2005 8.27 10.14 15.56 12.50 15.33 12.15 10.57
20063 8.53 10.72 18.17 12.94 15.23 12.82 11.1210.60 18.08 12.87 15.19 12.80 11.07
2007 8.96 7.92 17.67 13.18 15.66 13.16 11.43
Male employeesWeekly earnings
C9FZ C9F4 C9F6 C9F8 C9FA C9FC C9FE
20042 375.4 433.2 653.7 519.4 626.1 521.5 483.2368.8 426.6 637.1 511.2 607.9 517.8 470.3
2005 381.9 445.7 675.4 533.8 647.3 537.6 469.5
20063 395.2 433.6 787.6 553.0 668.8 570.0 493.3428.2 783.4 551.4 666.5 569.8 491.1
2007 409.2 313.9 773.0 568.7 678.4 582.6 504.8Total hours worked
C5W8 C5WE C5WH C5WK C5WN C5WQ C5WT
20042 45.6 45.4 44.4 41.6 40.5 43.7 41.445.5 44.2 43.8
2005 44.7 43.4 44.4 41.2 39.9 43.5 41.2
20063 44.9 43.3 43.6 41.3 41.1 43.6 41.345.0 43.2
2007 44.6 44.2 45.0 41.5 40.3 43.6 41.2Hourly earnings excluding overtime
C9IS C9IU C9IW C9IY C9J2 C9J4 C9J6
20042 8.11 9.47 15.16 12.49 15.29 11.95 11.717.96 9.26 14.80 12.28 14.82 11.83 11.38
2005 8.46 10.13 15.72 12.98 15.96 12.30 11.42
20063 8.71 10.01 18.66 13.42 15.90 13.04 12.008.70 9.91 18.55 13.38 15.89 13.02 11.94
2007 9.11 6.64 17.71 13.72 16.61 13.34 12.27
Female employeesWeekly earnings
C9G6 C9G8 C9GA C9GC C9GE C9GG C9GI
20042 297.5 – 511.0 388.1 453.0 403.8 339.3290.9 496.3 380.8 464.8 392.8 330.9
2005 287.6 – 552.5 404.3 490.2 411.5 343.2
20063 316.1 – 581.4 420.9 490.7 419.3 364.1580.3 415.9 486.5 415.7 361.8
2007 337.1 – 661.5 423.8 474.7 438.0 375.5Total hours worked
C7NN C7NP C7NR C7NT C7NV C7OA C7OC
20042 39.2 36.5 37.2 38.7 38.1 38.2 38.537.3 38.3
2005 39.0 42.2 38.1 38.4 37.3 38.0 38.5
20063 40.6 – 37.7 38.6 37.8 38.6 38.740.5
2007 40.8 – 38.0 38.6 37.9 38.2 38.4Hourly earnings excluding overtime
C9JO C9JQ C9JS C9JU C9JW C9JY C9K2
20042 7.55 – 13.73 10.02 11.83 10.55 8.827.38 13.31 9.84 12.17 10.25 8.60
2005 7.35 – 14.54 10.51 13.13 10.82 8.92
20063 7.77 – 15.54 10.93 12.98 10.87 9.457.78 10.80 12.87 10.78 9.39
2007 8.24 – 17.44 10.99 12.50 11.46 9.78
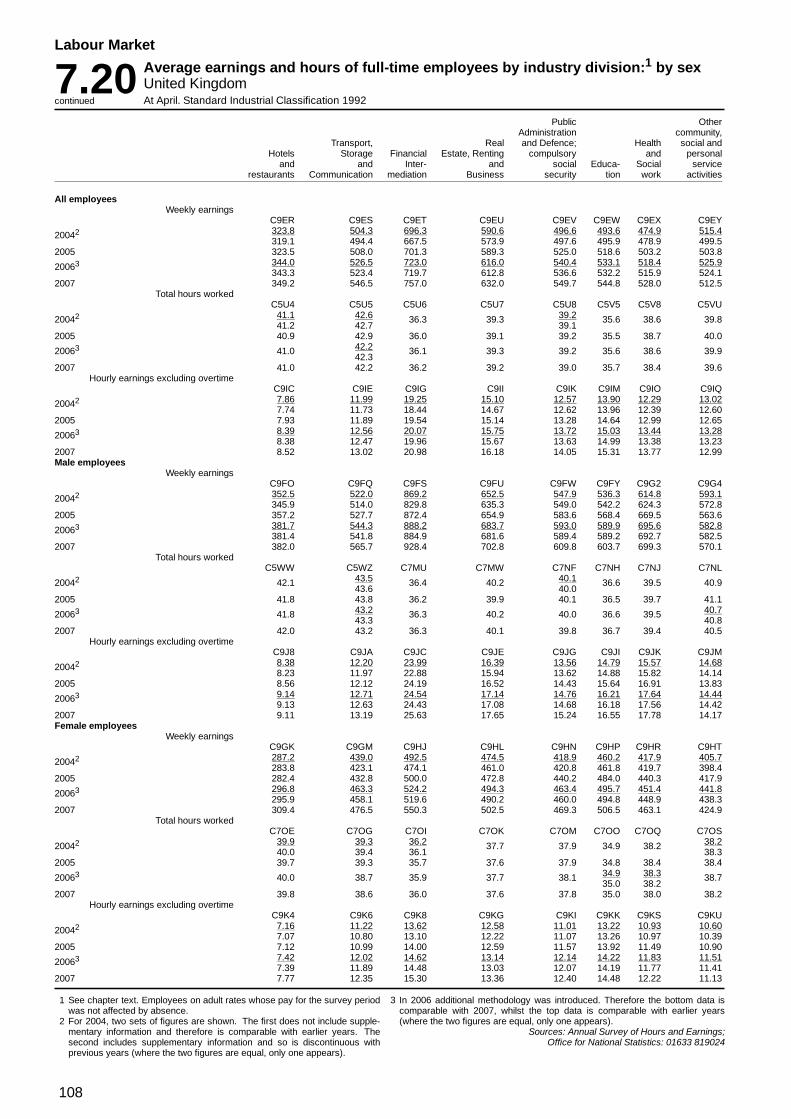
108
Labour Market
7.20 Average earnings and hours of full-time employees by industry division:1 by sexUnited KingdomAt April. Standard Industrial Classification 1992continued
Public OtherAdministration community,
Transport, Real and Defence; Health social andHotels Storage Financial Estate, Renting compulsory and personal
and and Inter- and social Educa- Social servicerestaurants Communication mediation Business security tion work activities
All employeesWeekly earnings
C9ER C9ES C9ET C9EU C9EV C9EW C9EX C9EY
20042 323.8 504.3 696.3 590.6 496.6 493.6 474.9 515.4319.1 494.4 667.5 573.9 497.6 495.9 478.9 499.5
2005 323.5 508.0 701.3 589.3 525.0 518.6 503.2 503.8
20063 344.0 526.5 723.0 616.0 540.4 533.1 518.4 525.9343.3 523.4 719.7 612.8 536.6 532.2 515.9 524.1
2007 349.2 546.5 757.0 632.0 549.7 544.8 528.0 512.5Total hours worked
C5U4 C5U5 C5U6 C5U7 C5U8 C5V5 C5V8 C5VU
20042 41.1 42.6 36.3 39.3 39.2 35.6 38.6 39.841.2 42.7 39.1
2005 40.9 42.9 36.0 39.1 39.2 35.5 38.7 40.0
20063 41.0 42.2 36.1 39.3 39.2 35.6 38.6 39.942.3
2007 41.0 42.2 36.2 39.2 39.0 35.7 38.4 39.6Hourly earnings excluding overtime
C9IC C9IE C9IG C9II C9IK C9IM C9IO C9IQ
20042 7.86 11.99 19.25 15.10 12.57 13.90 12.29 13.027.74 11.73 18.44 14.67 12.62 13.96 12.39 12.60
2005 7.93 11.89 19.54 15.14 13.28 14.64 12.99 12.65
20063 8.39 12.56 20.07 15.75 13.72 15.03 13.44 13.288.38 12.47 19.96 15.67 13.63 14.99 13.38 13.23
2007 8.52 13.02 20.98 16.18 14.05 15.31 13.77 12.99Male employees
Weekly earningsC9FO C9FQ C9FS C9FU C9FW C9FY C9G2 C9G4
20042 352.5 522.0 869.2 652.5 547.9 536.3 614.8 593.1345.9 514.0 829.8 635.3 549.0 542.2 624.3 572.8
2005 357.2 527.7 872.4 654.9 583.6 568.4 669.5 563.6
20063 381.7 544.3 888.2 683.7 593.0 589.9 695.6 582.8381.4 541.8 884.9 681.6 589.4 589.2 692.7 582.5
2007 382.0 565.7 928.4 702.8 609.8 603.7 699.3 570.1Total hours worked
C5WW C5WZ C7MU C7MW C7NF C7NH C7NJ C7NL
20042 42.1 43.5 36.4 40.2 40.1 36.6 39.5 40.943.6 40.0
2005 41.8 43.8 36.2 39.9 40.1 36.5 39.7 41.1
20063 41.8 43.2 36.3 40.2 40.0 36.6 39.5 40.743.3 40.8
2007 42.0 43.2 36.3 40.1 39.8 36.7 39.4 40.5Hourly earnings excluding overtime
C9J8 C9JA C9JC C9JE C9JG C9JI C9JK C9JM
20042 8.38 12.20 23.99 16.39 13.56 14.79 15.57 14.688.23 11.97 22.88 15.94 13.62 14.88 15.82 14.14
2005 8.56 12.12 24.19 16.52 14.43 15.64 16.91 13.83
20063 9.14 12.71 24.54 17.14 14.76 16.21 17.64 14.449.13 12.63 24.43 17.08 14.68 16.18 17.56 14.42
2007 9.11 13.19 25.63 17.65 15.24 16.55 17.78 14.17Female employees
Weekly earningsC9GK C9GM C9HJ C9HL C9HN C9HP C9HR C9HT
20042 287.2 439.0 492.5 474.5 418.9 460.2 417.9 405.7283.8 423.1 474.1 461.0 420.8 461.8 419.7 398.4
2005 282.4 432.8 500.0 472.8 440.2 484.0 440.3 417.9
20063 296.8 463.3 524.2 494.3 463.4 495.7 451.4 441.8295.9 458.1 519.6 490.2 460.0 494.8 448.9 438.3
2007 309.4 476.5 550.3 502.5 469.3 506.5 463.1 424.9Total hours worked
C7OE C7OG C7OI C7OK C7OM C7OO C7OQ C7OS
20042 39.9 39.3 36.2 37.7 37.9 34.9 38.2 38.240.0 39.4 36.1 38.3
2005 39.7 39.3 35.7 37.6 37.9 34.8 38.4 38.4
20063 40.0 38.7 35.9 37.7 38.1 34.9 38.3 38.735.0 38.2
2007 39.8 38.6 36.0 37.6 37.8 35.0 38.0 38.2Hourly earnings excluding overtime
C9K4 C9K6 C9K8 C9KG C9KI C9KK C9KS C9KU
20042 7.16 11.22 13.62 12.58 11.01 13.22 10.93 10.607.07 10.80 13.10 12.22 11.07 13.26 10.97 10.39
2005 7.12 10.99 14.00 12.59 11.57 13.92 11.49 10.90
20063 7.42 12.02 14.62 13.14 12.14 14.22 11.83 11.517.39 11.89 14.48 13.03 12.07 14.19 11.77 11.41
2007 7.77 12.35 15.30 13.36 12.40 14.48 12.22 11.13
1 See chapter text. Employees on adult rates whose pay for the survey periodwas not affected by absence.
2 For 2004, two sets of figures are shown. The first does not include supple-mentary information and therefore is comparable with earlier years. Thesecond includes supplementary information and so is discontinuous withprevious years (where the two figures are equal, only one appears).
3 In 2006 additional methodology was introduced. Therefore the bottom data iscomparable with 2007, whilst the top data is comparable with earlier years(where the two figures are equal, only one appears).
Sources: Annual Survey of Hours and Earnings;Office for National Statistics: 01633 819024

109
Labour Market
7.21 Average earnings and hours of full-time employees:1 by sexUnited KingdomAt April £ and numbers
All Industries Manufacturing industries
Total Average hourly earnings Total Average hourly earningsAverage hours Average hours
weekly worked including excluding weekly worked including excludingearnings (numbers) overtime overtime earnings (numbers) overtime overtime
All employeesC7Q5 C7QX C7Q7 C7Q9 C7PU C7QL C7PV C7PW
2002 472.2 39.6 11.94 11.98 455.6 41.0 11.12 11.092003 487.1 39.5 12.32 12.34 476.5 40.9 11.65 11.62
20042 506.1 39.5 12.80 12.84 493.1 41.0 12.03 12.01498.2 12.60 12.63 485.0 11.83 11.80
2005 516.5 39.4 13.11 13.15 508.0 40.6 12.51 12.50
20063 537.5 39.4 13.63 13.68 526.8 40.7 12.94 12.94535.0 13.56 13.61 524.2 12.87 12.87
2007 549.9 39.4 13.96 14.00 539.3 40.9 13.19 13.18
Male employeesC7QA C7QZ C7QC C7QE C7PX C7QT C7PY C7PZ
2002 523.4 40.8 12.83 12.92 482.9 41.6 11.62 11.622003 539.3 40.8 13.21 13.28 503.2 41.5 12.13 12.12
20042 557.4 40.8 13.67 13.76 519.4 41.6 12.50 12.49548.1 13.44 13.51 511.2 12.30 12.28
2005 568.1 40.6 13.98 14.05 533.8 41.2 12.97 12.98
20063 592.0 40.7 14.56 14.64 553.0 41.3 13.40 13.42589.8 14.50 14.58 551.4 13.36 13.38
2007 606.1 40.7 14.90 14.98 568.7 41.5 13.71 13.72
Female employeesC7QF C7SA C7QH C7QJ C7Q2 C7QV C7Q3 C7Q4
2002 386.8 37.5 10.32 10.32 350.8 38.8 9.04 9.032003 400.7 37.4 10.71 10.70 372.8 38.7 9.64 9.62
20042 422.1 37.5 11.26 11.27 388.1 38.7 10.02 10.02416.8 11.11 11.12 380.8 9.83 9.84
2005 435.7 37.4 11.64 11.65 404.3 38.4 10.52 10.51
20063 453.0 37.5 12.06 12.10 420.9 38.6 10.91 10.93450.0 11.99 12.02 415.9 10.78 10.80
2007 462.8 37.4 12.38 12.40 423.8 38.6 10.99 10.99
1 See chapter text. Employees on adult rates whose pay for the survey periodwas not affected by absence.
2 For 2004, two sets of figures are shown. The first does not include supple-mentary information and therefore is comparable with earlier years. Thesecond includes supplementary information and so is discontinuous withprevious years (where the two figures are equal, only one appears).
3 In 2006 additional methodology was introduced. Therefore the bottom data iscomparable with 2007, whilst the top data is comparable with earlier years(where the two figures are equal, only one appears).
Sources: Annual Survey of Hours and Earnings;Office for National Statistics: 01633 819024

110
Labour Market
7.22 Average earnings index:1 all employees by main industrial sectorsGreat BritainAnalyses by industry based on Standard Industrial Classification 1992 Indices (2000=100)
Not seasonally adjusted
Annual Jan- Feb- Sept- Oct- Nov- Dec-averages uary ruary March April May June July August ember ober ember ember
Whole economy(Divisions 01 - 93)
LNMM2005 121.4 123.3 124.9 127.5 119.9 119.2 120.4 120.5 119.0 118.8 119.1 119.9 124.62006 126.4 127.2 131.6 133.2 124.1 124.5 126.4 125.2 123.5 123.7 123.9 124.6 129.42007 131.5 133.3 138.8 137.8 128.0 129.0 130.5 129.7 128.7 128.8 128.2 130.2 134.4
Manufacturing industries(Divisions 15 - 37)
LNMN2005 120.1 116.3 119.2 126.6 120.0 117.5 118.2 119.9 118.1 119.2 120.4 120.5 125.12006 126.2 121.9 125.5 133.0 126.8 124.1 125.2 125.5 124.4 125.6 126.5 126.1 130.02007 130.7 125.9 130.1 137.8 130.8 129.6 130.4 131.1 127.9 128.6 130.0 130.8 135.6
Production industries(Divisions 10 - 41)
LNMO2005 120.0 116.3 119.6 126.6 120.2 117.4 118.5 119.6 117.9 118.9 120.1 120.1 125.32006 126.0 121.7 125.2 133.0 126.9 124.1 125.6 125.3 124.0 125.2 126.0 125.9 129.42007 130.9 125.7 129.7 138.8 131.0 129.7 131.0 131.3 127.9 128.8 130.0 131.1 135.2
Service industries(Divisions 50 - 93)
LNMP2005 121.6 125.0 126.4 127.6 119.8 119.4 120.7 120.5 119.2 118.3 118.5 119.4 123.82006 126.5 128.6 133.4 133.5 123.5 124.6 126.6 125.1 123.5 123.3 123.4 124.2 129.12007 131.7 135.3 141.4 137.8 127.5 129.0 130.6 129.5 129.1 128.7 127.9 129.8 133.9
Private sector services(Divisions 50-99)
JJGF2005 120.1 125.9 127.8 129.1 117.9 116.3 118.7 118.8 116.7 115.7 115.9 116.9 122.12006 125.2 129.2 135.1 135.3 121.5 121.6 125.1 123.0 121.0 120.8 121.0 121.7 127.32007 130.7 136.7 144.6 139.8 125.5 126.1 129.1 128.1 127.0 126.8 125.7 127.1 131.9
Seasonally adjusted
Annual Jan- Feb- Sept- Oct- Nov- Dec-averages uary ruary March April May June July August ember ober ember ember
Whole economy(Divisions 01 - 93)
LNMQ2005 121.5 119.4 119.7 120.3 120.6 120.8 121.0 122.1 122.2 122.5 122.6 123.2 123.92006 126.5 123.3 125.2 125.3 125.5 126.0 127.0 126.7 126.8 127.4 128.0 127.9 128.82007 131.5 129.3 131.3 129.7 129.8 130.5 131.1 131.5 132.1 132.7 132.7 133.2 133.5
Manufacturing industries(Divisions 15 - 37)
LNMR2005 120.2 117.9 118.4 119.6 118.9 118.4 119.4 120.1 120.9 121.4 121.9 122.4 123.32006 126.4 124.0 124.6 125.1 126.2 125.2 126.3 125.8 127.3 128.2 128.4 128.1 128.02007 130.8 128.4 129.1 129.5 130.2 130.7 131.2 131.1 130.9 131.1 131.6 132.6 133.4
Production industries(Divisions 10 - 41)
LNMS2005 120.0 117.9 118.5 118.7 118.8 118.5 119.0 119.8 120.6 121.1 121.6 121.8 123.62006 126.0 123.7 124.2 124.3 125.9 125.4 125.9 125.4 126.9 127.6 127.9 127.7 127.62007 130.7 128.1 128.6 129.5 129.9 130.6 131.1 131.2 130.9 131.1 131.7 132.7 133.3
Service industries(Divisions 50 - 93)
LNMT2005 121.7 119.5 119.9 120.4 121.3 121.2 121.2 122.5 122.2 122.4 122.5 123.3 123.82006 126.6 123.1 125.2 126.0 125.5 126.2 127.0 127.0 126.8 127.4 128.0 128.2 129.12007 131.8 129.5 131.9 130.1 130.0 130.6 131.1 131.8 132.6 133.2 133.1 133.6 133.7
Private sector services(Divisions 50-93)
JJGH2005 120.4 118.3 118.6 119.2 120.2 119.5 120.0 121.4 121.1 121.2 121.1 121.9 122.52006 125.5 121.5 124.0 124.9 124.5 125.0 126.4 125.8 125.7 126.3 127.1 127.2 128.22007 131.0 128.7 131.6 129.1 129.0 129.7 130.4 131.1 131.9 132.6 132.3 132.8 132.8
1 See chapter text.2 Provisional.
Source: Office for National Statistics: 01633 819024

111
Labour Market
7.23 Average earnings index:1 all employee jobs: by industryGreat BritainNot seasonally adjusted Indices (2000=100)
FoodAgriculture, products,
forestry Mining beverages Textiles, Chemicals Basic metals Engineering Electricity,and and and leather and and man- and metal and allied Other gas and
fishing quarrying tobacco clothing made fibres products industries manufacturing water supply Construction
Excluding bonuses
(DK, (DD,DE,DF,SIC 1992 (A,B) (C) (DA) (DB,DC) (DG) (DJ) DL,DM) DH,DI,DN) (E) (F)
JVUZ JVVA JVVB JVVC JVVD JVVE JVVF JVVG JVVH JVVI2006 134.5 129.1 127.6 122.5 122.8 127.4 126.6 126.5 116.0 127.92007 127.4 139.1 128.6 125.4 127.2 130.8 133.0 132.2 121.3 130.6
2005 Jul 122.2 122.1 121.2 119.1 118.5 122.2 122.7 120.3 115.3 125.1Aug 122.5 122.5 122.0 117.0 119.7 122.2 121.7 121.0 115.2 123.3Sep 131.7 123.5 122.6 118.9 119.2 123.2 122.5 122.1 113.7 125.7Oct 130.3 125.2 123.1 121.6 119.4 122.9 123.6 122.3 115.2 126.2Nov 126.8 125.6 125.2 121.9 121.1 122.1 123.1 122.9 116.1 128.1Dec 127.6 125.1 126.2 122.4 121.3 120.0 123.6 124.2 117.8 126.4
2006 Jan 129.0 127.4 125.0 122.1 121.3 124.0 123.0 124.1 115.7 126.6Feb 132.0 124.9 124.3 123.1 121.6 124.5 124.7 124.7 116.3 127.6Mar 133.0 126.1 125.2 121.4 121.1 125.7 125.2 125.1 115.2 127.0Apr 141.3 127.6 129.4 122.5 122.1 125.2 126.4 125.2 114.2 126.6May 140.2 128.1 128.4 123.2 122.0 126.9 126.3 125.9 118.3 127.2Jun 141.4 128.4 127.8 124.0 123.0 129.5 126.5 126.9 118.2 127.9
Jul 137.2 128.7 128.3 122.8 121.6 128.4 126.4 126.5 118.7 128.2Aug 139.9 129.0 128.2 120.1 122.5 127.9 126.2 127.1 116.2 126.7Sep 135.7 131.0 128.1 122.1 124.3 129.3 127.7 127.7 114.6 128.5Oct 130.3 131.3 128.2 122.0 125.1 129.2 128.8 127.8 113.0 129.5Nov 123.8 131.7 127.7 122.4 123.9 129.9 129.1 128.8 116.6 130.0Dec 130.5 134.7 130.0 124.4 125.2 127.9 128.6 128.6 114.9 129.3
2007 Jan 129.5 133.1 126.7 124.2 123.2 128.0 129.6 128.7 114.3 130.6Feb 121.7 132.5 125.2 125.6 124.9 129.4 130.6 129.8 115.1 129.7Mar 129.8 134.0 125.4 123.5 125.6 130.0 132.6 131.4 118.9 131.5Apr 133.3 139.6 127.5 123.0 125.0 130.3 133.3 131.7 118.6 129.8May 132.0 140.4 130.2 124.2 127.5 128.4 133.0 131.3 122.2 129.5Jun 124.5 141.7 128.0 129.1 128.7 131.6 133.6 132.3 122.9 130.2
Jul 124.9 140.3 128.2 127.6 127.8 130.8 134.3 132.6 124.4 131.6Aug 127.7 141.6 128.8 127.8 127.1 130.9 132.8 132.2 121.5 129.3Sep 126.6 140.3 129.1 126.4 126.6 131.5 133.1 133.2 122.5 130.8Oct 128.1 142.3 130.3 126.6 129.2 132.8 134.2 134.4 124.3 131.3Nov 126.3 140.8 130.3 124.4 129.5 133.5 134.5 134.7 127.3 132.0Dec 125.0 143.2 133.2 122.2 131.0 132.5 134.3 134.2 123.3 131.0
2008 Jan 125.4 145.4 129.3 125.2 127.9 135.0 134.3 133.7 122.3 131.3Feb 125.5 146.0 129.9 123.3 130.8 134.9 134.7 134.7 122.5 133.1
Percentage change on the year
JVVT JVVU JVVV JVVW JVVX JVVY JVVZ JVWA JVWB JVWC2006 Jul 12.2 5.5 5.8 3.1 2.6 5.1 3.0 5.1 2.9 2.4
Aug 14.2 5.3 5.1 2.7 2.3 4.7 3.7 5.1 0.8 2.8Sep 3.0 6.1 4.5 2.7 4.3 5.0 4.2 4.6 0.8 2.2Oct – 4.9 4.1 0.4 4.9 5.1 4.3 4.5 –1.9 2.7Nov –2.4 4.8 2.0 0.4 2.3 6.4 4.9 4.8 0.4 1.5Dec 2.2 7.6 3.0 1.6 3.2 6.6 4.0 3.5 –2.4 2.3
2007 Jan 0.4 4.5 1.3 1.8 1.6 3.3 5.4 3.7 –1.2 3.1Feb –7.8 6.1 0.7 2.0 2.7 4.0 4.7 4.1 –1.0 1.7Mar –2.5 6.3 0.2 1.7 3.7 3.5 5.9 5.0 3.2 3.5Apr –5.7 9.4 –1.5 0.4 2.4 4.1 5.5 5.2 3.8 2.6May –5.8 9.5 1.4 0.8 4.5 1.1 5.3 4.3 3.2 1.9Jun –11.9 10.4 0.1 4.1 4.6 1.6 5.6 4.3 4.0 1.8
Jul –8.9 9.0 – 3.9 5.1 1.9 6.2 4.8 4.8 2.7Aug –8.7 9.7 0.4 6.4 3.8 2.3 5.2 4.0 4.6 2.0Sep –6.7 7.1 0.7 3.5 1.9 1.7 4.2 4.4 6.9 1.8Oct –1.7 8.4 1.7 3.8 3.3 2.8 4.2 5.1 10.0 1.4Nov 2.0 7.0 2.0 1.7 4.5 2.8 4.2 4.6 9.2 1.6Dec –4.2 6.3 2.5 –1.8 4.7 3.6 4.5 4.4 7.2 1.3
2008 Jan –3.2 9.2 2.1 0.8 3.8 5.5 3.6 3.9 7.0 0.6Feb 3.1 10.2 3.8 –1.8 4.7 4.3 3.1 3.8 6.4 2.6

112
Labour Market
7.23 Average earnings index:1 all employee jobs: by industryGreat BritainNot seasonally adjustedcontinued Indices (2000=100)
Real estateTransport, Financial renting and Public
Wholesale Retail trade Hotels and storage and interm- business admini- Health and Othertrade and repairs restaurants communication ediation activities stration Education social work services
Excluding bonuses
SIC 1992 (G:51) (G:50,52) (H) (I) (J) (K) (L) (M) (N) (O)
JVVJ JVVK JVVL JVVM JVVN JVVO JVVP JVVQ JVVR JVVS2006 121.9 118.8 133.2 126.8 125.3 127.8 128.3 128.7 137.5 121.82007 127.2 122.3 140.3 130.0 128.6 133.7 130.7 134.0 142.7 126.0
2005 Jul 118.0 117.8 127.1 123.9 121.8 123.5 124.3 124.5 133.0 121.3Aug 118.1 118.3 127.3 123.4 121.1 123.0 124.7 126.1 132.9 118.8Sep 118.0 115.8 126.2 125.8 119.5 123.2 125.3 126.8 132.9 118.6Oct 119.1 116.0 126.7 124.9 121.0 123.7 125.4 126.3 133.2 115.4Nov 119.1 115.2 127.4 125.2 121.3 124.3 125.7 124.9 135.0 116.8Dec 119.3 115.4 132.5 126.4 123.3 124.7 126.9 125.4 134.7 119.8
2006 Jan 119.8 117.9 127.2 124.9 123.9 126.3 126.0 124.8 135.3 120.0Feb 119.8 115.8 127.8 124.6 123.1 125.4 129.5 125.0 135.9 118.8Mar 119.8 116.6 130.9 125.3 123.9 126.2 127.5 125.8 136.2 120.2Apr 120.9 117.9 131.8 127.2 126.4 127.3 127.9 127.8 136.5 122.0May 120.9 120.0 133.1 127.5 126.5 127.3 127.9 127.1 137.2 122.3Jun 122.1 118.5 132.1 127.9 125.7 128.0 128.4 127.6 138.7 124.6
Jul 122.0 119.2 134.0 126.8 125.8 128.0 128.5 128.8 138.7 123.0Aug 122.1 120.1 134.1 126.8 125.6 128.1 127.2 131.6 137.7 122.7Sep 122.4 120.5 134.7 128.3 124.9 128.3 128.4 132.2 137.7 121.4Oct 123.6 120.5 136.2 127.0 126.3 129.3 128.2 131.3 137.8 121.2Nov 124.4 118.7 136.1 127.4 125.8 129.4 128.8 130.9 139.4 122.3Dec 125.3 119.7 139.8 128.0 125.8 130.1 131.4 131.4 139.2 123.3
2007 Jan 124.8 122.0 135.9 127.7 127.1 130.9 129.2 130.4 139.8 124.1Feb 125.0 119.6 137.2 127.7 127.5 131.5 129.6 130.2 139.3 123.1Mar 126.3 120.9 138.1 128.2 126.3 132.5 129.4 130.5 139.8 122.7Apr 126.8 123.7 137.6 129.0 127.7 132.6 130.2 132.6 141.0 123.3May 127.0 122.7 140.6 130.0 128.6 133.9 130.2 132.5 142.0 125.8Jun 127.5 122.2 141.0 131.0 129.0 134.0 130.0 132.8 142.8 127.9
Jul 128.0 122.4 141.4 130.6 129.2 134.2 130.0 133.8 142.0 127.8Aug 126.9 124.1 142.4 131.4 128.6 134.5 131.6 136.2 142.8 128.1Sep 127.2 123.5 141.4 130.4 129.2 133.9 131.3 137.3 143.2 127.3Oct 128.0 122.8 141.4 130.3 129.8 134.9 130.8 135.9 144.5 126.4Nov 128.4 122.1 142.8 131.4 130.3 135.3 132.1 137.5 148.8 127.2Dec 130.1 122.1 143.5 132.6 130.2 136.5 133.4 138.8 146.9 128.2
2008 Jan 129.4 125.7 141.2 131.0 130.7 137.0 133.4 134.7 146.2 129.7Feb 129.6 124.0 141.6 131.7 132.0 138.2 134.3 134.3 145.8 129.2
Percentage change on the year
JVWD JVWE JVWF JVYJ JVYK JVYL JVYM JVYN JVYO JVYP2006 Jul 3.3 1.2 5.4 2.4 3.3 3.7 3.4 3.5 4.3 1.3
Aug 3.4 1.5 5.4 2.8 3.8 4.1 2.0 4.3 3.6 3.3Sep 3.7 4.0 6.8 1.9 4.5 4.2 2.5 4.3 3.6 2.4Oct 3.8 3.9 7.5 1.7 4.4 4.5 2.3 3.9 3.4 5.0Nov 4.4 3.1 6.8 1.8 3.7 4.1 2.4 4.8 3.3 4.6Dec 5.0 3.7 5.5 1.3 2.0 4.4 3.5 4.7 3.3 2.9
2007 Jan 4.1 3.4 6.8 2.2 2.6 3.6 2.6 4.4 3.3 3.5Feb 4.3 3.2 7.4 2.5 3.5 4.9 0.1 4.2 2.5 3.7Mar 5.4 3.7 5.5 2.4 1.9 5.0 1.5 3.7 2.7 2.1Apr 4.9 4.9 4.4 1.4 1.0 4.2 1.8 3.8 3.3 1.1May 5.0 2.3 5.6 2.0 1.7 5.2 1.8 4.2 3.5 2.8Jun 4.4 3.1 6.8 2.5 2.7 4.7 1.3 4.1 2.9 2.7
Jul 5.0 2.7 5.5 3.0 2.7 4.8 1.2 3.9 2.4 3.9Aug 4.0 3.3 6.2 3.6 2.4 5.0 3.4 3.5 3.7 4.4Sep 3.9 2.5 4.9 1.7 3.5 4.3 2.2 3.8 4.0 4.8Oct 3.6 1.9 3.8 2.6 2.8 4.3 2.0 3.5 4.8 4.3Nov 3.2 2.8 4.9 3.1 3.6 4.6 2.6 5.0 6.7 4.1Dec 3.9 2.0 2.6 3.6 3.5 4.9 1.6 5.7 5.5 4.0
2008 Jan 3.7 3.0 3.9 2.6 2.8 4.6 3.2 3.3 4.6 4.5Feb 3.7 3.7 3.2 3.1 3.5 5.1 3.6 3.1 4.6 4.9

113
Labour Market
7.23 Average earnings index:1 all employee jobs: by industryGreat BritainNot seasonally adjustedcontinued Indices (2000=100)
FoodAgriculture, products,
forestry Mining beverages Textiles, Chemicals Basic metals Engineering Electricity,and and and leather and and man- and metal and allied Other gas and
fishing quarrying tobacco clothing made fibres products industries manufacturing water supply Construction
Including bonuses
(DK, (DD,DE,DF,SIC 1992 (A,B) (C) (DA) (DB,DC) (DG) (DJ) DL,DM) DH,DI,DN) (E) (F)
JVUF JVUG JVUH JVUI JVUJ JVUK JVUL JVUM JVUN JVUO2006 132.7 134.9 123.2 124.9 119.7 132.5 129.0 123.3 117.6 125.82007 129.0 144.4 122.0 131.7 123.6 138.6 135.0 128.2 126.1 129.3
2005 Jul 119.4 117.8 117.8 120.0 115.5 126.9 121.7 116.8 115.0 124.4Aug 120.1 120.1 116.6 117.2 115.6 122.8 119.3 115.8 112.7 120.9Sep 143.4 125.6 118.0 118.1 115.8 125.2 120.3 116.7 110.2 124.3Oct 127.5 121.8 115.3 126.6 115.1 128.8 121.8 118.1 112.7 124.9Nov 125.6 123.5 116.2 121.3 116.1 124.9 122.5 119.0 111.4 127.6Dec 125.9 124.6 122.9 126.6 122.0 124.5 126.9 124.2 130.8 132.9
2006 Jan 126.1 130.8 117.0 123.7 117.4 127.8 123.4 120.4 113.7 123.9Feb 129.2 131.0 120.8 123.6 121.2 125.4 132.1 121.0 115.7 125.2Mar 130.5 160.6 132.4 125.5 146.2 130.5 135.4 127.2 118.8 130.3Apr 138.9 150.4 127.2 124.4 121.1 132.3 130.4 121.8 116.9 122.8May 137.3 130.3 122.0 124.4 112.9 130.2 126.7 122.3 121.3 123.0Jun 139.0 128.8 122.5 125.6 115.4 131.8 127.0 124.1 129.6 125.8
Jul 134.5 126.8 122.5 125.4 114.8 135.2 127.4 123.6 119.2 125.1Aug 137.2 126.6 120.4 121.8 114.7 130.4 126.3 124.0 115.6 121.6Sep 133.0 130.6 125.1 122.7 117.8 135.6 127.6 121.9 114.4 125.1Oct 127.6 130.2 121.6 125.1 116.5 139.6 129.6 122.6 114.3 125.1Nov 121.2 136.8 121.4 125.5 114.5 133.2 130.5 123.4 116.5 127.8Dec 138.2 135.7 125.7 131.2 123.5 138.2 132.3 127.3 115.1 133.8
2007 Jan 127.6 137.7 117.9 128.1 116.0 132.0 130.7 123.9 114.3 126.7Feb 120.0 141.5 119.4 130.4 120.1 135.3 138.2 126.3 115.7 128.3Mar 135.4 177.0 128.3 134.4 152.2 135.1 141.1 134.6 136.2 135.9Apr 133.6 147.6 125.4 126.7 124.8 140.2 134.6 127.1 124.3 125.9May 134.9 140.1 121.2 127.7 119.1 137.5 134.0 128.1 126.4 126.6Jun 124.9 144.1 119.1 133.9 123.1 143.0 133.6 128.0 135.8 128.3
Jul 125.3 139.0 121.0 137.2 120.0 141.9 134.3 129.9 130.2 128.2Aug 130.8 138.3 119.9 134.7 118.6 134.8 132.3 125.5 122.9 124.2Sep 128.4 143.0 122.6 136.6 120.1 135.4 132.3 125.5 124.9 130.0Oct 128.7 138.6 121.2 131.4 119.8 140.6 133.9 127.6 126.9 126.8Nov 128.8 143.0 120.0 130.6 121.5 138.8 135.4 129.4 130.7 132.5Dec 129.3 143.3 128.5 128.8 127.8 148.6 139.1 132.1 125.0 138.3
2008 Jan 130.3 143.7 119.6 135.2 121.1 142.3 134.2 128.6 125.1 ..Feb 127.0 149.7 126.6 128.5 126.1 142.3 139.8 131.3 126.0 ..
Percentage change on the year
JVYQ JVYR JVYS JVYT JVYU JVYV JVYW JVYX JVYY JVYZ2006 Jul 12.6 7.7 4.0 4.5 –0.6 6.5 4.7 5.8 3.6 0.6
Aug 14.2 5.4 3.3 3.9 –0.8 6.2 5.8 7.1 2.5 0.6Sep –7.3 4.0 6.0 3.9 1.7 8.3 6.0 4.5 3.8 0.6Oct 0.1 6.9 5.4 –1.2 1.2 8.4 6.4 3.7 1.4 0.2Nov –3.5 10.7 4.4 3.5 –1.4 6.6 6.5 3.7 4.6 0.1Dec 9.8 8.9 2.3 3.7 1.2 10.9 4.3 2.4 –12.1 0.7
2007 Jan 1.2 5.3 0.8 3.6 –1.2 3.3 5.9 3.0 0.5 2.2Feb –7.2 8.0 –1.1 5.5 –0.9 7.9 4.6 4.4 – 2.5Mar 3.8 10.2 –3.1 7.1 4.1 3.5 4.2 5.8 14.7 4.2Apr –3.8 –1.9 –1.4 1.8 3.1 6.0 3.2 4.3 6.4 2.5May –1.7 7.5 –0.7 2.6 5.6 5.6 5.8 4.7 4.2 2.9Jun –10.2 11.9 –2.8 6.6 6.6 8.5 5.2 3.1 4.8 2.0
Jul –6.8 9.6 –1.2 9.4 4.5 5.0 5.5 5.1 9.2 2.5Aug –4.7 9.3 –0.4 10.6 3.4 3.4 4.8 1.2 6.4 2.2Sep –3.5 9.5 –2.0 11.3 2.0 –0.1 3.7 2.9 9.2 3.9Oct 0.8 6.5 –0.3 5.0 2.8 0.7 3.3 4.1 11.1 1.4Nov 6.2 4.6 –1.2 4.0 6.1 4.2 3.8 4.9 12.2 3.7Dec –6.5 5.6 2.2 –1.9 3.5 7.6 5.1 3.8 8.7 3.4
2008 Jan 2.1 4.3 1.4 5.5 4.4 7.8 2.6 3.7 9.4 –Feb 5.9 5.8 6.1 –1.4 5.0 5.2 1.2 4.0 8.9 –0.9

114
Labour Market
7.23 Average earnings index:1 all employee jobs: by industryGreat BritainNot seasonally adjustedcontinued Indices (2000=100)
Real estateTransport, Financial renting and Public
Wholesale Retail trade Hotels and storage and interm- business admini- Health and Othertrade and repairs restaurants communication ediation activities stration Education social work services
Including bonuses
SIC 1992 (G:51) (G:50,52) (H) (I) (J) (K) (L) (M) (N) (O)
JVUP JVUQ JVUR JVUS JVUT JVUU JVUV JVUW JVUX JVUY2006 124.0 119.4 137.1 127.5 123.9 123.8 129.1 128.4 137.5 123.22007 132.6 123.7 143.8 131.5 130.2 129.5 131.2 133.8 142.6 129.5
2005 Jul 118.7 117.2 130.2 125.5 97.0 120.7 124.2 124.3 133.0 122.2Aug 115.3 116.9 130.9 121.4 96.1 117.1 126.4 125.9 133.0 120.3Sep 115.5 114.1 128.5 122.8 94.8 115.3 124.6 126.5 132.8 119.7Oct 119.9 115.6 129.8 122.0 93.1 116.0 125.2 126.0 133.4 116.3Nov 121.3 114.3 131.7 123.6 96.4 117.1 125.6 124.5 134.9 117.2Dec 123.8 116.1 140.5 130.4 108.1 122.8 129.0 125.1 134.8 122.8
2006 Jan 121.1 118.0 129.9 123.6 168.7 120.9 125.5 124.4 135.2 121.1Feb 121.4 115.6 134.7 124.1 209.8 121.1 129.1 124.8 135.9 121.1Mar 129.6 122.2 136.5 125.7 175.6 129.8 127.5 125.5 137.1 123.3Apr 121.0 119.3 134.5 124.3 105.4 122.9 127.9 127.4 136.4 123.2May 120.2 119.7 138.4 139.0 103.4 122.3 127.7 126.8 137.0 125.4Jun 123.0 120.8 134.7 138.2 113.2 124.7 129.1 127.3 138.5 124.9
Jul 123.9 121.3 136.5 127.5 103.4 124.9 131.2 128.7 138.5 123.9Aug 121.3 119.0 136.9 124.6 99.3 122.2 130.1 131.3 137.4 123.2Sep 121.9 119.6 137.6 124.6 96.7 122.3 128.6 131.9 137.4 121.6Oct 124.6 120.2 139.4 122.9 97.7 122.6 128.6 130.9 137.6 120.6Nov 126.6 118.0 140.7 124.4 100.4 122.7 129.1 130.7 139.2 123.5Dec 133.9 118.9 145.5 130.8 113.5 129.5 134.7 131.2 139.2 126.7
2007 Jan 129.1 120.5 139.3 125.5 195.0 125.3 128.9 130.0 139.8 126.8Feb 133.7 120.0 142.5 127.5 243.1 127.4 129.6 129.9 139.5 125.1Mar 140.6 128.4 146.3 129.7 176.0 134.4 129.3 130.3 140.5 129.2Apr 129.9 126.4 139.3 126.3 105.1 127.5 130.4 132.3 140.7 127.8May 128.8 124.1 145.8 140.9 108.0 127.2 130.3 132.1 141.7 127.8Jun 132.3 126.3 142.5 145.2 106.4 130.0 131.1 132.4 142.5 132.4
Jul 130.2 126.7 142.6 129.0 104.3 132.1 130.4 133.8 141.8 133.0Aug 129.0 122.8 144.6 130.7 102.7 129.9 134.4 135.8 142.5 131.0Sep 131.1 122.4 143.0 127.9 106.4 128.1 131.1 136.9 143.1 129.3Oct 130.4 123.6 143.8 127.7 99.0 128.1 130.6 135.9 144.2 128.4Nov 135.4 121.0 145.8 130.0 103.9 128.7 133.0 137.5 148.6 129.9Dec 140.4 122.3 150.4 137.0 113.1 135.0 135.6 138.9 146.8 133.0
2008 Jan 138.3 123.7 144.2 129.5 196.9 131.3 134.1 134.4 145.8 135.2Feb 142.9 125.4 149.0 132.5 247.5 132.7 134.4 134.3 145.5 136.7
Percentage change on the year
JVZA JVZB JVZC JVZD JVZE JVZF JVZG JVZH JVZI JVZJ2006 Jul 4.3 3.5 4.9 1.6 6.6 3.5 5.7 3.5 4.1 1.4
Aug 5.2 1.8 4.6 2.6 3.3 4.3 2.9 4.3 3.3 2.4Sep 5.5 4.8 7.0 1.5 2.0 6.1 3.1 4.2 3.5 1.6Oct 3.9 4.0 7.4 0.7 4.9 5.8 2.7 3.9 3.2 3.8Nov 4.4 3.3 6.9 0.6 4.2 4.8 2.8 5.0 3.2 5.4Dec 8.1 2.3 3.6 0.3 5.0 5.4 4.5 4.8 3.2 3.1
2007 Jan 6.6 2.2 7.3 1.5 15.6 3.6 2.7 4.5 3.4 4.7Feb 10.1 3.8 5.8 2.8 15.9 5.2 0.4 4.1 2.6 3.3Mar 8.5 5.0 7.2 3.1 0.2 3.5 1.4 3.8 2.5 4.8Apr 7.3 6.0 3.5 1.6 –0.3 3.7 1.9 3.8 3.1 3.7May 7.2 3.7 5.4 1.4 4.5 4.0 2.0 4.2 3.4 1.9Jun 7.6 4.6 5.8 5.1 –6.0 4.2 1.6 4.0 2.9 6.0
Jul 5.1 4.5 4.5 1.2 0.9 5.7 –0.6 3.9 2.4 7.3Aug 6.3 3.2 5.6 4.9 3.4 6.4 3.3 3.4 3.7 6.3Sep 7.6 2.3 4.0 2.7 10.0 4.8 2.0 3.8 4.1 6.3Oct 4.6 2.8 3.2 3.9 1.3 4.5 1.6 3.8 4.8 6.5Nov 7.0 2.5 3.6 4.6 3.5 4.9 3.1 5.2 6.7 5.1Dec 4.8 2.9 3.4 4.8 –0.3 4.3 0.6 5.9 5.5 5.0
2008 Jan 7.1 2.6 3.5 3.2 1.0 4.8 4.0 3.4 4.4 6.6Feb 6.9 4.5 4.6 3.9 1.8 4.2 3.7 3.4 4.3 9.3
1 See chapter text. Source: Office for National Statistics: 01633 819024

115
Labour Market
7.24 Gross weekly and hourly earnings of full-time employees:1 by sexUnited KingdomAt April £
Gross weekly earnings Gross hourly earnings
Lowest Lower Upper Highest Lowest Lower Upper Highestdecile quartile Median quartile decile decile quartile Median quartile decile
All employeesC5U9 C5UC C5UF C5UI C5UL C5UO C5UR C5UU C5V2 C5UX
2002 214.4 279.1 390.9 551.8 767.8 5.44 6.97 9.74 14.36 20.602003 222.7 288.0 404.0 572.6 794.2 5.68 7.23 10.07 14.82 21.27
20042 231.9 301.3 422.8 595.0 827.3 5.91 7.54 10.56 15.41 22.18230.3 298.0 419.2 590.6 814.4 5.84 7.45 10.44 15.32 21.83
2005 235.4 305.3 431.2 611.6 850.5 6.00 7.68 10.77 15.91 22.86
20063 244.1 316.2 446.4 632.5 886.2 6.24 7.96 11.20 16.46 23.63243.8 315.2 443.6 630.5 881.6 7.93 11.12 16.39 23.49
2007 252.3 325.8 456.7 649.5 905.9 6.47 8.21 11.45 16.87 24.18
Male employeesC5UA C5UD C5UG C5UJ C5UM C5UP C5US C5UV C5V3 C5UY
2002 239.0 310.2 430.1 599.9 857.5 5.78 7.41 10.40 15.32 22.562003 246.6 320.3 444.6 622.8 881.9 6.00 7.68 10.75 15.83 23.17
20042 254.5 333.3 463.0 647.8 916.8 6.21 7.99 11.23 16.42 24.08250.0 329.4 460.0 640.5 900.7 6.13 7.89 11.10 16.25 23.67
2005 255.6 335.4 471.0 666.0 939.1 6.27 8.08 11.42 16.88 24.74
20063 264.9 347.1 487.1 689.9 985.5 6.50 8.39 11.83 17.50 25.79264.5 346.0 484.3 687.5 980.5 8.37 11.76 17.38 25.64
2007 274.4 358.2 498.3 706.7 1 009.6 6.73 8.65 12.09 17.92 26.46
Female employeesC5UB C5UE C5UH C5UK C5UN C5UQ C5UT C5UW C5V4 C5UZ
2002 192.1 241.8 330.7 474.0 623.7 5.04 6.35 8.70 12.80 17.662003 201.3 251.6 343.0 490.2 645.7 5.30 6.63 9.07 13.28 18.33
20042 210.8 265.3 360.8 515.5 678.8 5.53 6.96 9.57 13.96 19.19209.3 262.3 356.7 510.0 673.9 5.50 6.91 9.42 13.82 18.96
2005 217.5 271.6 371.4 532.8 704.7 5.71 7.16 9.85 14.45 20.01
20063 226.6 282.2 385.8 554.1 728.5 5.99 7.44 10.24 15.04 20.48226.3 282.1 383.3 550.0 724.9 5.98 7.42 10.16 14.92 20.39
2007 233.3 289.5 394.0 563.5 747.4 6.17 7.67 10.48 15.31 20.94
1 See chapter text. Employees on adult rates whose pay for the survey periodwas not affected by absence.
2 For 2004, two sets of figures are shown. The first does not include supple-mentary information and therefore is comparable with earlier years. Thesecond includes supplementary information and so is discontinuous withprevious years (where the two figures are equal, only one appears).
3 In 2006 additional methodology was introduced. Therefore the bottom data iscomparable with 2007, whilst the top data is comparable with earlier years(where the two figures are equal, only one appears).
Sources: Annual Survey of Hours and Earnings;Office for National Statistics: 01633 819024

116
Labour Market
7.25 Median earnings by age group of full-time employees:1 by sex, 2007United KingdomAt April £ and numbers
Median weeklyhours (numbers) Median gross hourly
Median gross weekly pay Median gross weekly earnings excludingexcluding overtime overtime Total Overtime overtime
All employees16 to 17 172.5 .. 39.0 4.1 4.4518 to 21 254.7 29.5 38.9 3.6 6.622 to 29 374.9 40.6 37.5 3.7 9.7830 to 39 483.8 56.3 37.5 4.3 12.7540 to 49 486.7 62.6 37.5 4.8 12.7650 to 59 452.0 57.8 37.5 4.5 11.8960+ 391.7 57.7 38.1 5.3 10.12All ages 431.7 53.0 37.5 4.3 11.34
Male employees16 to 17 167.0 .. 40.0 .. 4.3418 to 21 263.9 38.7 40.0 4.3 6.6522 to 29 383.3 48.7 39.0 4.1 9.7930 to 39 508.8 66.0 39.0 5.0 13.1040 to 49 535.7 74.9 39.0 5.5 13.7950 to 59 494.0 72.0 38.9 5.5 12.7860+ 406.1 64.0 39.6 5.5 10.38All ages 464.1 64.8 39.0 5.0 11.96
Female employees16 to 17 180.5 .. 37.8 .. 4.5318 to 21 246.9 19.8 37.5 2.4 6.5322 to 29 364.1 28.7 37.5 2.6 9.7630 to 39 450.0 33.8 37.0 2.7 12.2540 to 49 407.1 31.7 37.0 2.8 11.1250 to 59 387.8 28.5 37.0 2.7 10.5460+ 351.6 23.9 37.0 .. 9.50All ages 385.6 29.3 37.0 2.6 10.46
1 See chapter text. Employees on adult rates whose pay for the survey periodwas not affected by absence.
Sources: Annual Survey of Hours and Earnings, Office for National Statistics;01633 819024
7.26 Trade unions1
United KingdomYear ending 31st March2 Percentages
1998 1999 2000 2001 2002 2003 2004 2005/99 /00 /01 /02 /03 /04 /05 /06
Number of trade unions KCLB 238 237 226 216 210 206 193 192Analysis by number of members:
Under 100 members KCLC 16.4 18.6 22.1 19.0 19.5 19.9 17.6 17.7100 and under 500 KCLD 21.8 20.7 18.1 18.5 19.0 17.5 20.7 18.2500 and under 1,000 KCLE 10.9 9.3 9.3 11.6 10.5 10.7 9.3 9.91,000 and under 2,500 KCLF 13.0 14.3 12.4 10.2 11.0 11.7 13.0 12.52,500 and under 5,000 KCLG 9.7 9.7 9.3 11.6 11.0 10.7 10.9 11.55,000 and under 10,000 KCLH 5.90 5.10 5.30 4.20 4.80 5.30 5.70 6.2510,000 and under 15,000 KCLI 2.1 1.7 1.8 2.8 3.3 2.4 2.1 1.615,000 and under 25,000 KCLJ 2.9 4.2 5.3 6.0 4.3 4.9 4.1 4.725,000 and under 50,000 KCLK 8.0 7.6 6.6 6.5 7.1 7.3 7.8 8.950,000 and under 100,000 KCLL 2.5 2.1 2.7 2.3 1.9 2.4 1.6 1.6100,000 and under 250,000 KCLM 2.5 2.1 2.2 2.3 2.9 2.4 2.6 2.6250,000 and over KCLN 4.2 4.6 4.9 5.1 4.8 4.9 4.7 4.7
All sizes KCLP 100 100 100 100 100 100 100 100
MembershipAnalysis by size of union:
Under 100 members KCLQ – – – – – – – –100 and under 500 KCLR 0.2 0.2 0.2 0.2 0.2 0.1 0.1 0.1500 and under 1,000 KCLS 0.2 0.2 0.2 0.2 0.2 0.2 0.2 0.21,000 and under 2,500 KCLT 0.7 0.7 0.6 0.5 0.5 0.5 0.6 0.52,500 and under 5,000 KCLU 1.1 1.1 1.0 1.2 1.1 1.0 1.0 1.05,000 and under 10,000 KCLV 1.3 1.2 1.1 0.9 0.9 1.1 1.2 1.210,000 and under 15,000 KCLW 0.9 0.7 0.6 0.9 1.1 0.8 0.6 0.515,000 and under 25,000 KCLX 1.6 2.3 2.9 3.3 2.2 2.5 1.9 2.225,000 and under 50,000 KCLY 8.0 7.8 6.6 6.3 6.7 6.9 7.1 8.150,000 and under 100,000 KCLZ 4.5 3.8 4.6 4.0 3.1 4.4 2.6 2.7100,000 and under 250,000 KCMA 12.0 10.0 9.8 9.6 10.2 9.0 10.6 10.6250,000 and over KCMB 69.5 72.1 72.4 73.0 73.9 73.3 74.1 72.9
All sizes KCMC 100 100 100 100 100 100 100 100
Total membership (thousands) KCMD 7 851 904 7 897 519 7 779 393 7 750 990 7 735 983 7 559 062 7 473 000 7 602 842
1 See chapter text.2 Data derived from trade union annual returns with periods which ended
between October and September each year. The majority, however, ended
in December. In the case of year 2004/05, for example, the data derived fromannual returns with periods which ended between October 2004 and Sep-tember 2005 - approximately 73% ended in December.
Source: Certification Office

xi
Personal income, expenditure and wealth
Personal income, expenditure and wealth
Ch
apter 8

118
Personal income, expenditure and wealth
employment, investment income and occupational pensions. Gross income is original income plus cash benefits received from government (retirement pensions, child benefit, etc). Disposal income is the income available for consumption. It is equal to gross income less direct taxes which include income tax, National Insurance (NI) contributions, and council tax. By further allowing for taxes paid on goods and services purchased, such as VAT, an estimate of post-tax income is derived. These income figures are derived from estimates made by the Office for National Statistics, based largely on information from the Expenditure and Food Survey (EFS), and published each year on the National Statistics website.
For the purposes of Table 8.2, a retired household is defined as one where the combined income of retired members amounts to at least half the total gross income of the household, where a retired person is defined as anyone who describes themselves as ‘retired’ or anyone over the minimum NI pension age describing themselves as ‘unoccupied’ or ‘sick or injured but not intending to seek work’.
Children are defined as persons aged under 16 or aged between 16 and 18, unmarried and receiving full-time non-advanced further education.
Expenditure and Food Survey
(Tables 8.3–8.5)
The Expenditure and Food Survey (EFS) is a sample survey of 12,096 private households in the UK, with an achieved response of around 7,000 private households. The survey was introduced in April 2001 as a result of the amalgamation of the Family Expenditure and National Food Surveys (FES and NFS). The EFS sample is representative of all regions of the UK and of different types of households. The survey is continuous with interviews spread evenly over the year to ensure that estimates are not biased by seasonal variation. The survey results show how households spend their money – how much goes on food, clothing and so on – and how spending patterns vary depending upon income, household composition, and regional location of households. From January 2006, the survey has been conducted on a calendar year basis; therefore the latest results refer to the January to December 2006 period.
One of the main purposes of the EFS is to define the ‘basket of goods’ for the Retail Price Index (RPI) and the Consumer Price Index (CPI). The RPI has a vital role in the up rating of state pensions and welfare benefits, while the CPI is a key instrument of the government’s monetary policy. Information from the survey is also a major source for estimates of household expenditure in the UK National Accounts. In addition, many other government departments use EFS
Personal income, expenditure and wealthDistribution of total incomes
(Table 8.1)
The information shown in Table 8.1 comes from the Survey of Personal Incomes for the financial years, 2002/03, 2003/04, 2004/05 and 2005/06. This is an annual survey that covers approximately 540,000 individuals across the whole of the UK. It is based on administrative data held by HM Revenue & Customs offices on individuals who could be liable to tax.
The table relates only to those individuals who are taxpayers. The distributions cover only incomes as computed for tax purposes and above a level which for each year corresponds approximately to the single person’s allowance. Incomes below these levels are not shown because the information about them is incomplete.
Investment income from which tax has been deducted at source is not always known to local tax offices. Estimates of missing bank and building society interest and dividends from UK companies are included in these tables. The missing investment income is distributed, in a manner consistent with information from the Expenditure and Food Survey and the National Accounts, to individuals for whom there is no investment income already reported by the tax office.
Superannuation contributions are estimated and included in total income. They have been distributed among earners in the Survey of Personal Incomes sample by a method consistent with information about the number of employees who are contracted in or out of the State Earnings Related Pension Scheme and the proportion of their earnings contributed.
When comparing results of these surveys across years, it should be noted that the Survey of Personal Incomes is not a longitudinal survey. However, sample sizes have increased in recent years to increase precision.
Average incomes of households
(Table 8.2)
Original income is the total income in cash of all the members of the household before receipt of state benefits or the deduction of taxes. It includes income from employment, self-

119
Personal income, expenditure and wealth
data as a basis for policy making, for example in the areas of housing and transport. The Department for Environment, Food and Rural Affairs (DEFRA) uses EFS data to report on trends in food consumption and nutrient intake within the UK. Users of the EFS outside government include independent research institutes, academic researcher and business and market researchers. Like all surveys based on a sample of the population, its results are subject to sampling variability and potentially to some bias due to non response. The results of the survey are published in an annual report, the latest being Family Spending 2007 edition. The report includes a list of definitions used in the survey, items on which information is collected and a brief account of the fieldwork procedure.

120
Personal income, expenditure and wealth
8.1 Distribution of total income before and after taxUnited KingdomYears ending 5 April
2002/2003 Annual Survey 2003/04 Annual Survey
£ million £ millionNumber of Number ofindividuals Total income Total income individuals Total income Total income
(Thousands) before tax Total tax after tax (Thousands) before tax Total tax after tax
Lower limit of Lower limit ofrange of income range of income
All incomes1 28 900 624 000 108 800 515 200 All incomes1 28 500 624 900 110 600 514 300
Income before tax Income before tax(£) (£)
4 615 439 2 110 8 2 100 4 615 498 2 390 8 2 3805 000 1 050 5 760 88 5 670 5 000 1 090 6 000 93 5 9006 000 2 860 20 100 652 19 400 6 000 2 710 19 100 636 18 4008 000 2 840 25 600 1 630 23 900 8 000 2 660 23 900 1 570 22 300
10 000 2 660 29 200 2 550 26 600 10 000 2 570 28 300 2 500 25 80012 000 2 520 32 600 3 470 29 200 12 000 2 430 31 600 3 400 28 20014 000 2 310 34 600 4 130 30 500 14 000 2 270 33 900 4 130 29 80016 000 2 060 34 900 4 510 30 400 16 000 1 990 33 700 4 450 29 30018 000 1 740 33 100 4 540 28 600 18 000 1 730 32 900 4 610 28 300
20 000 5 700 138 900 21 200 117 700 20 000 5 710 139 400 21 800 117 50030 000 3 300 122 400 22 500 100 000 30 000 3 360 124 500 22 800 101 70050 000 1 090 72 100 19 100 53 000 50 000 1 110 73 600 19 300 54 200100 000 249 33 100 10 600 22 500 100 000 256 34 000 10 800 23 200200 000 and over 91 39 500 13 900 25 700 200 000 and over 95 41 600 14 400 27 200
Income after tax Income after tax(£) (£)
4 615 488 2 350 10 2 340 4 615 545 2 620 10 2 6105 000 1 160 6 510 109 6 400 5 000 1 220 6 820 116 6 7106 000 3 390 24 800 983 23 800 6 000 3 190 23 500 955 22 5008 000 3 440 33 400 2 490 30 900 8 000 3 270 31 900 2 470 29 400
10 000 3 280 40 000 4 000 36 000 10 000 3 160 38 600 3 920 34 70012 000 2 930 43 100 5 090 38 000 12 000 2 890 42 600 5 120 37 50014 000 2 500 43 000 5 600 37 400 14 000 2 460 42 400 5 660 36 80016 000 2 110 41 600 5 580 35 800 16 000 2 090 41 300 5 910 35 40018 000 1 720 38 200 5 620 32 500 18 000 1 720 38 400 5 840 32 600
20 000 4 900 140 900 22 600 118 300 20 000 4 900 141 600 23 300 118 30030 000 2 270 105 700 23 000 82 600 30 000 2 280 106 000 22 800 83 20050 000 578 53 800 16 000 37 900 50 000 601 55 700 16 300 39 400100 000 113 22 800 7 690 15 100 100 000 119 23 800 7 930 15 800200 000 and over 43 27 900 9 840 18 100 200 000 and over 45 29 600 10 200 19 300

121
Personal income, expenditure and wealth
8.1 Distribution of total income before and after taxUnited KingdomYears ending 5 Aprilcontinued
2004/05 Annual Survey 2005/06 Annual Survey
£ million £ millionNumber of Number ofindividuals Total income Total income individuals Total income Total income
(Thousands) before tax Total tax after tax (Thousands) before tax Total tax after tax
Lower limit of Lower limit ofrange of income range of income
All incomes1 30 300 691 000 123 000 568 000 All incomes1 31 100 756 000 138 000 618 000
Income before tax Income before tax(£) (£)
4 745 329 1 600 4 1 600 4 895 112 555 - 5555 000 1 110 6 090 80 6 010 5 000 1 040 5 750 62 5 6906 000 2 760 19 500 600 18 900 6 000 2 540 18 000 522 17 5008 000 2 950 26 500 1 600 24 900 8 000 2 920 26 200 1 450 24 800
10 000 2 760 30 300 2 580 27 700 10 000 2 810 30 900 2 500 28 40012 000 2 470 32 100 3 350 28 700 12 000 2 550 33 100 3 380 29 70014 000 2 280 34 200 4 080 30 100 14 000 2 340 35 000 4 140 30 90016 000 2 050 34 800 4 520 30 300 16 000 2 100 35 700 4 610 31 10018 000 1 790 34 100 4 720 29 300 18 000 1 880 35 700 4 930 30 800
20 000 6 000 146 000 22 700 124 000 20 000 6 200 152 000 23 400 128 00030 000 4 090 152 000 27 300 125 000 30 000 4 540 170 000 29 900 140 00050 000 1 270 83 700 21 600 62 100 50 000 1 500 98 800 25 000 73 700100 000 300 40 000 12 600 27 400 100 000 366 49 300 15 300 34 000200 000 and over 111 49 500 17 300 32 200 200 000 and over 144 66 000 22 900 43 000
Income after tax Income after tax(£) (£)4 745 364 1 770 5 1 770 4 895 129 636 1 6365 000 1 220 6 830 98 6 730 5 000 1 160 6 500 77 6 4206 000 3 270 24 100 902 23 200 6 000 3 000 22 000 767 21 3008 000 3 600 34 800 2 510 32 300 8 000 3 590 34 600 2 300 32 300
10 000 3 280 40 000 3 920 36 000 10 000 3 390 41 100 3 890 37 20012 000 2 920 43 000 5 050 37 900 12 000 3 020 44 300 5 120 39 20014 000 2 540 43 700 5 730 38 000 14 000 2 650 45 600 5 940 39 60016 000 2 180 43 200 6 090 37 100 16 000 2 260 44 600 6 270 38 30018 000 1 850 41 400 6 210 35 200 18 000 1 850 41 300 6 140 35 100
20 000 5 320 154 000 25 100 129 000 20 000 5 630 163 000 26 400 137 00030 000 2 840 131 000 27 100 104 000 30 000 3 310 152 000 30 700 121 00050 000 681 63 200 18 300 44 800 50 000 817 75 500 21 600 53 900100 000 143 28 400 9 420 19 000 100 000 188 37 100 12 100 24 900200 000 and over 53 35 500 12 500 23 000 200 000 and over 69 47 900 16 800 31 100
1 See chapter text. All figures have been independently rounded. Sources: Survey of Personal Incomes;Board of HM Revenue & Customs:020 7438 7055

122
Personal income, expenditure and wealth
8.2 Average incomes of households before and after taxes and benefits,1 2005/06United Kingdom
Retired households Non-retired households
3 or2 adults more
2 or 3 or 1 adult 2 adults 2 adults with 3 adults Allmore more with with with 2 or more with house-
1 adult adults 1 adult 2 adults adults children 1 child children children children holds
Number of households inthe population (thousands) 3 489 3 195 3 621 5 287 2 076 1 422 1 859 2 088 830 933 24 799
Average per household(£ per year)
Original income 4 533 12 810 19 698 39 954 48 887 9 933 40 256 45 548 39 451 45 388 28 224Gross income 11 694 22 435 21 804 42 085 51 631 17 864 43 288 48 543 44 947 50 655 32 779Disposable income 10 469 19 422 16 825 32 172 40 624 16 073 33 751 37 528 35 497 41 176 26 039Post-tax income 8 629 15 325 13 773 26 541 33 161 12 559 28 035 30 996 28 655 33 325 21 277
1 See chapter text. Figures taken from the article "Effects of taxes and bene-fits on household income, 2005/06", published on the National Statisticswebsite www.statistics.gov.uk/taxesbenefits
Source: Office for National Statistics: 020 7533 5770
8.3 Sources of gross household income1
United Kingdom
1996 1997 19982 1999 2000 20013 2002 2003 2004 2005 20066
/97 /98 /99 /00 /01 /02 /03 /04 /05 /06
Weighted number of households (thousands) GH92 24 310 24 560 24 660 25 330 25 030 24 450 24 350 24 670 24 430 24 800 24 790Number of households supplying data KPDA 6 420 6 410 6 630 7 100 6 640 7 470 6 930 7 050 6 800 6 790 6 650
Average weekly householdincome by source (£)
Wages and salaries KPCB 256.30 280.20 309.20 315.40 336.70 369.30 373.90 383.90 409.70 414.80 432.40Self-employment KPCC 37.50 32.90 37.20 46.00 44.50 43.10 44.50 49.80 49.00 50.80 56.20Investments KPCD 17.70 18.70 18.80 21.80 20.00 20.00 18.80 16.70 16.50 19.50 21.20Annuities and pensions (other
than social security benefits) KPCE 26.00 28.90 30.30 32.80 35.00 37.00 39.90 40.90 41.70 45.50 45.40Social security benefits4 KPCF 54.10 55.00 55.80 58.00 60.10 64.50 68.50 72.50 76.90 78.00 79.90Other sources KPCH 5.30 5.20 5.70 5.90 6.20 6.70 6.70 6.40 6.90 7.40 6.60
Total5 KPCI 396.90 420.80 457.00 479.90 502.50 540.60 552.30 570.30 600.70 615.90 641.90
Sources of household income as apercentage of total household income
Wages and salaries KPCJ 65 67 68 66 67 68 68 67 68 67 67Self-employment KPCK 9 8 8 10 9 8 8 9 8 8 9Investments KPCL 4 4 4 5 4 4 3 3 3 3 3Annuities and pensions (other
than social security benefits) KPCM 7 7 7 7 7 7 7 7 7 7 7Social security benefits4 KPCN 14 13 12 12 12 12 12 13 13 13 12Other sources KPCP 1 1 1 1 1 1 1 1 1 1 1
Total5 KPCQ 100 100 100 100 100 100 100 100 100 100 100
1 See chapter text.2 Based on weighted data from 1998/99.3 From 2001/02 onwards, weighting is based on the population estimates from
the 2001 census.4 Excluding housing benefit and council tax benefit (rates rebate in Northern
Ireland) and their predecessors in earlier years.5 Does not include imputed income from owner-occupied and rent-free occu-
pancy.6 For the 2006 results the survey has moved onto a calendar year basis.
Sources: Expenditure and Food Survey and Family Expenditure Survey;Office for National Statistics;
01633 455282

123
Personal income, expenditure and wealth
8.4 Household expenditure based on FES classification1
United Kingdom
19952 1996 1997 1998 1999 2000 20013 2002 2003 2004 2005 20064
/96 /97 /98 /99 /00 /01 /02 /03 /04 /05 /06
Weighted number of households (thousands) GH92 24 130 24 310 24 560 24 660 25 330 25 030 24 450 24 350 24 670 24 430 24 800 24 790Number of households supplying data KPDA 6 800 6 420 6 410 6 630 7 100 6 640 7 470 6 930 7 050 6 800 6 790 6 650
Average weekly household expenditure on commodities and services (£)
Housing (NET) KPEV 48.30 63.10 64.20 69.20 67.90 73.90 75.10 74.50 75.90 80.80 83.00 85.40Fuel and power KPEW 12.90 17.10 15.70 14.10 13.50 13.70 13.40 13.10 13.00 13.20 14.20 15.90Food and non-alcoholic drinks KPEX 52.90 72.30 71.20 71.30 71.00 71.60 70.50 71.80 70.50 70.90 69.70 70.40Alcoholic drink KPEY 11.40 16.90 17.70 16.90 18.20 17.40 16.30 16.50 16.00 15.60 15.20 14.90Tobacco KPEZ 5.80 8.00 7.90 7.00 7.10 7.00 6.20 6.10 5.90 5.20 4.70 4.60Clothing and footwear KCWC 17.20 24.10 25.30 26.30 25.00 25.40 25.50 24.50 24.30 24.70 23.00 22.90Household goods KCWH 23.50 34.30 33.60 35.90 36.60 37.70 37.60 37.80 38.10 37.50 34.40 34.50Household services KCWI 15.10 20.90 22.10 22.90 22.50 25.40 26.90 26.10 27.00 27.70 27.80 26.60Personal goods and services KCWJ 11.60 15.20 15.80 16.10 16.50 17.00 17.00 17.00 17.50 16.90 17.40 17.60Motoring KCWK 37.00 54.30 59.00 62.60 62.60 63.70 66.00 68.80 67.70 65.90 65.50 62.40Fares and other travel costs KCWL 6.20 9.90 10.70 10.00 10.90 10.90 10.60 10.80 10.50 10.00 11.40 11.10Leisure goods KCWM 13.20 20.40 21.70 21.60 22.10 22.80 22.40 22.90 23.30 22.60 19.90 19.60Leisure services KCWN 32.10 45.10 49.30 50.70 52.30 58.50 59.10 59.80 59.70 62.70 64.60 66.30Miscellaneous KCWO 2.40 1.30 1.30 1.50 1.70 0.80 2.10 2.20 2.10 2.10 2.20 2.10
Total KCWP 289.90 402.90 415.50 426.10 427.90 445.80 448.70 451.90 451.50 455.80 453.00 454.30
Expenditure on commodity or service as a percentage of total expenditure
Housing (NET) KPFH 17 16 15 16 16 17 17 16 17 18 18 19Fuel and power KPFI 4 4 4 3 3 3 3 3 3 3 3 3Food and non-alcoholic drinks KPFJ 18 18 17 17 17 16 16 16 16 16 15 15Alcoholic drink KPFK 4 4 4 4 4 4 4 4 4 3 3 3Tobacco KPFL 2 2 2 2 2 2 1 1 1 1 1 1Clothing and footwear KPFM 6 6 6 6 6 6 6 5 5 5 5 5Household goods KCWQ 8 9 8 8 8 8 8 8 8 8 8 8Household services KCWR 5 5 5 5 5 6 6 6 6 6 6 6Personal goods and services KCWS 4 4 4 4 4 4 4 4 4 4 4 4Motoring KCWT 13 13 14 15 15 14 15 15 15 14 14 14Fares and other travel costs KCWU 2 2 3 2 2 2 2 2 2 2 3 2Leisure goods KCWV 5 5 5 5 5 5 5 5 5 5 4 4Leisure services KCWW 11 11 12 12 12 13 13 13 13 14 14 15Miscellaneous KPFR 1 – – – – – – – – – – –
Total KPFS 100 100 100 100 100 100 100 100 100 100 100 100
1 Data are based on the Family Expenditure Survey (FES) classification andnot the Expenditure and Food Survey (EFS) standard classification: Clas-sification of Individual Consumption by Purpose (COICOP). This has beendone to preserve an historical time-series, as COICOP data are only avail-able from 2001/02.
2 From this version of 1995-96 figures shown are based on weighted data, in-cluding children’s expenditure. Weighting is based on the population figuresfrom the 1991 and 2001 Censuses.
3 From 2001/02 onwards, weighting is based on population estimates from the2001 census.
4 For the 2006 results the survey has moved onto a calendar year basis.Sources: Expenditure and Food Survey and Family Expenditure Survey;
Office for National Statistics;01633 455282

124
8.5 Percentage of households with certain durable goodsUnited Kingdom
Percentages
1996 1997 19981 1999 2000 20012 2002 2003 2004 2005 20064
/97 /98 /99 /00 /01 /02 /03 /04 /05 /06
Weighted number of households (thousands) GH92 24 310 24 560 24 660 25 330 25 030 24 450 24 350 24 670 24 430 24 800 24 790Number of households supplying data KPDA 6 420 6 410 6 630 7 100 6 640 7 470 6 930 7 050 6 800 6 790 6 650
Car/van KPDB 69 70 72 71 72 74 74 75 75 74 76One KPDC 43 44 44 43 44 44 44 44 42 46 44Two KPDD 22 21 23 21 22 23 25 25 27 23 26Three or more KPDE 5 5 5 6 6 6 6 6 6 5 6
Central heating, full orpartial KPDF 87 89 89 90 91 92 93 94 95 94 95
Washing machine KPDG 91 91 92 91 92 93 94 94 95 95 96Fridge/freezer
or deep freezer KPDI 91 90 92 91 94 95 96 96 96 97 97Dishwasher GPTL 20 22 23 23 25 27 29 31 33 35 38Telephone KPDL 93 94 95 95 93 94 94 92 93 92 91Mobile phone GH96 16 20 27 44 47 64 70 76 78 79 80Home computer KPDM 27 29 33 38 44 49 55 58 62 65 67DVD player/Video recorder KPDN 82 84 85 86 87 90 90 90 88 86 83Digital television service3 GH97 19 26 28 32 40 43 45 49 58 65 71Internet connection ZBUZ .. .. 10 19 32 39 45 49 53 55 59
1 Based on weighted data from 1998/99.2 From 2001/02 onwards, weighting is based on the population estimates from
the 2001 census.3 Includes digital, satelite and cable receivers.4 For the 2006 results the survey has moved onto a calendar year basis.
Sources: Expenditure and Food Survey and Family Expenditure Survey;Office for National Statistics;
01633 455282

xi
Health
Health
Ch
apter 9

126
Health
underlying cause of death from the neonatal death certificate used in England and Wales. Also, for England and Wales only, the total number shown for Homicide and assault, X85–Y09, will not be a true representation because the registration of these deaths is often delayed by adjourned inquests.
Occupational ill-health
(Tables 9.8 and 9.9)
There are a number of sources of data on the extent of occupational or work-related ill-health in Great Britain. For some potentially severe lung diseases caused by exposures which are highly unlikely to be found in a non-occupational setting, it is useful to count the number of death certificates issued each year. This is also true for mesothelioma, a cancer affecting the lining of the lungs and stomach, for which the number of cases with non-occupational causes is likely to be larger (although still a minority). Table 9.9 shows the number of deaths for mesothelioma and asbestosis (linked to exposure to asbestos), pneumoconiosis (linked to coal dust or silica), byssinosis (linked to cotton dust) and some forms of allergic alveolitis (including farmer’s lung). For asbestos-related diseases the figures are derived from a special register maintained by the Health and Safety Executive (HSE).
Most conditions which can be caused or made worse by work can also arise from other factors. The remaining sources of data on work-related ill health rely on attribution of individual cases of illness to work causes. In The Health and Occupation Reporting Network (THOR), this is done by specialist doctors – either occupational physicians or those working in particular disease specialisms (covering musculoskeletal, psychological, respiratory, skin, audiological and infectious disease). Table 9.8 presents data from THOR for the last three years. It should be noted that not all cases of occupational disease will be seen by participating specialists; for example, the number of deaths due to mesothelioma (shown in Table 9.9) is known to be greater than the number of cases reported to THOR.
Injuries at work
(Table 9.10)
The appropriate ‘responsible person’ is required to report injuries arising from workplace activities to HSE or the local authority under the Reporting of Injuries, Diseases and Dangerous Occurrences Regulations 1995 (RIDDOR 95). This includes fatal injuries, non-fatal major injuries, as defined by the Regulations, and other injuries causing incapacity for work for more than three days. As of 1 April 2001, reports are to be made to an Incident Centre (ICC), based at Caerphilly.
HSE gets to know about virtually all workplace fatalities. However, it is known that employers and others do not report
HealthHospital and family health services
(Table 9.1)
The courses of treatment are for the General Dental Services (GDS). A course of treatment is complete when the treatment that is required – or such of it that the patient is willing to undergo – has been carried out. A dentist in accepting a patient for continuing care (adults) or capitation (children), undertakes to provide the care and treatment necessary to secure and maintain oral health.
Deaths: analysed by cause
(Table 9.6)
All figures in this table for England and Wales represent the number of deaths occurring in each calendar year. All data for Scotland and Northern Ireland relate to the number of deaths registered during each calendar year. From 2001, all three constituent countries of the UK are coding their causes of death using the latest, tenth, revision of the International Statistical Classification of Diseases and Related Health Problems (ICD-10). All cause of death information from 2001 (also for 2000 for Scotland) presented in this table is based on the revised classification.
To assist users in assessing any discontinuities arising from the introduction of the revised classification, bridge-coding exercises were carried out on all deaths registered in 1999 in England and Wales and also in Scotland. For further information about ICD-10 and the bridge-coding carried out by the Office for National Statistics (ONS), see the ONS Report: ‘Results of the ICD-10 bridge-coding study, England and Wales, 1999’, Health Statistics Quarterly 14 (2002), pages 75–83 or on the National Statistics website at: www.statistics.gov.uk. For information on the Scottish bridge-coding exercise, consult the Annual Report of the General Register Office for Scotland or at: www.gro-scotland.gov.uk. No bridge-coding exercise was conducted for Northern Ireland.
Neonatal deaths and homicide and assault
For England and Wales, neonatal deaths (those at age under 28 days) are included in the number of total deaths but excluded from the cause figures. This has particular impact on the totals shown for the chapters covered by the ranges P and Q, ‘Conditions originating in the perinatal period’ and ‘Congenital malformations, deformations and chromosomal abnormalities’. These are considerably lower than the actual number of deaths because it is not possible to assign an

127
Health
all non-fatal reportable injuries. To estimate the level of under-reporting by employers, HSE place questions each year with the Labour Force Survey (LFS), asking respondents if they have suffered a workplace injury in the past year.
The results from the latest LFS show that in Great Britain employers report around 54 per cent of reportable injuries (2006/07). When compared to the previous year, these results also indicate a drop of in the non-fatal injury rate of 3 per cent. The self-employed report between 5 and 10 per cent of reportable non-fatal injuries.

128
Health
9.1 Hospital and family health servicesEngland and Wales
England Wales
2002 2003 2004 2005 2006 2002 2003 2004 2005 2006
Hospital services1
Average daily number ofavailable beds KNMY Thousands 184 184 181 175 167 KNHY 14 14 14 14 14
Average daily occupation ofbeds:All departments KNMX " 157 158 154 148 141 KNHX 12 12 12 11 11Psychiatric departments KNMW " .. .. .. .. .. KNGZ 2 2 2 2 2
Persons waiting for admissionat 31 March2 KNMV " 992 906 822 809 .. KNGY 75 75 66 69 62
Finished consultant episodes3
Day case admissions KNLY " 3 703 3 757 3 848 4 113 4 373 KNBZ 107 109 109 111 111Ordinary admissions KIBS " 9 012 9 417 9 859 10 310 10 411 KNEO 493 503 499 502 514
Out-patientsNew cases KNLX " 12 879 13 431 13 370 .. .. KNBY 737 739 741 776 813Total attendances KNLW " 43 765 45 120 44 768 .. .. KNBX 2 843 2 868 2 804 2 882 2 933
Accident and Emergency:New cases KOTH " 12 945 15 313 16 712 17 775 18 011 KTCO 889 916 937 942 980Total attendances KOTI " 14 046 16 517 17 837 18 759 18 922 KTCP 1 005 1 036 1 059 1 061 1 090
Ward attendances KOTJ " 1 179 .. .. .. .. KTCQ .. .. .. .. ..
Family health services4
Medical services:Doctors on the list5 KNKX Numbers .. .. .. .. .. KNBR 1 808 1 822 1 816 1 849 1 882Number of GPs LQZZ " 29 202 30 358 31 523 32 738 33 091 ZCMA 1 808 1 822 1 816 1 849 1 882
(exc. Retainers and Registrars)6
Number of patients per GP(exc. Retainers and Registrars) KNKW " 1 764 1 736 1 666 1 613 1 610 KNBQ 1 679 1 659 1 674 1 650 1 650
Paid to doctors7 KNKV £ million .. .. .. .. .. KNBP 241 269 .. .. ..Pharmaceutical services:8,9
Number of prescription forms KWUK Millions 326 .. .. 366 .. VQEU .. .. .. .. ..Number of prescription items KWUL " 617 650 686 733 .. KNBO 49 51 54 57 59Total cost KWUM £ million 7 162 .. .. 8 542 .. KNBN .. .. .. .. ..Average total cost per
prescription KWUN £ 12.0 .. .. 12.0 .. KNBK .. .. .. .. ..Income from patients KWUO £ million 423 .. .. 368 .. KNBM 23 23 .. .. 22
General Dental Services (GDS) andPersonal Dental Services (PDS):Dentists as at 30 September10 KIAZ Numbers 19 056 19 339 19 722 20 890 .. KIBG 927 919 927 928 1 186Number of adult courses of
treatment11 KIBA Thousands 26 637 26 726 27 032 26 488 25 844 KIBH 1 886 1 629 1 689 .. 1 643Number of adults registered12 KIBB " 17 281 17 064 17 374 17 237 17 670 KIBI 1 065 1 079 1 050 1 023 1 220Number of children registered12 KIBC " 6 982 6 841 6 964 6 891 7 044 KIBJ 400 397 384 389 423Gross expenditure13 KIBD £ million – .. .. .. .. KIBK 99 104 107 .. 137Paid by patients13 KIBE " – .. .. .. .. KIBL 25 27 26 .. 23Paid out of public funds13 KIBF " – .. .. .. .. KIBM 74 76 82 .. ..
General ophthalmic services:Sight tests14 KNJL Thousands 9 662 9 845 10 149 10 355 10 485 KNBD 647 646 656 674 676Pairs of spectacles for which
NHS vouchers redeemed KNJK " 3 472 3 520 3 624 3 678 3 765 KNBC 252 252 251 252 253Cost of services (gross)13 KNJJ £ million 304 .. .. .. .. KNBA 22 22 23 .. ..
Paid out of public funds:13
For sight testing KNJH " 166 .. .. .. .. KMZZ 11 11 11 .. ..For cost of vouchers12 WMPC " 137 .. .. .. .. KMZX 9 9 10 .. ..
1 Reflects data for the financial year commencing the year in the heading.Out-patient figures do not include accident and emergency figures or wardattenders which are given separately. Information on general practitionermaternity clinics is not collected separately in England but is included forWales.
2 People awaiting elective admission at NHS Trusts in England and Wales, asan inpatient or a day case.
3 Finished Consultant Episode (FCE), is defined as a period of admitted pa-tient care under one consultant within one healthcare provider. Please notethat the figures do not represent the number of patients, as a person mayhave more than one episode of care within the year.
4 Welsh FHS expenditure and income is based upon cash payments and re-ceipts in each financial year, as accrued gross expenditure is not availablein a common format for all years shown in this series. Welsh Dental Ser-vices data excludes refunds of dental charges.
5 For Wales, all practitioners (excluding GP registrars and GP retainers) at 30September.
6 GP’s includes Contracted GP’s, GMS Others and PMS Others. English GPdata are at 30 September.
7 For Wales, includes PFMA but excludes GPFH drugs and payments to pro-viders.
8 Welsh data are based on pricing bureau totals of prescriptions dispensed ina calendar year and paid during the financial year. Data shown reflects datafor the year commencing the year in the heading. Financial year is from 1April to 31 March.
9 The data cover all prescription items dispensed by community pharmacists andappliance contractors, dispensing doctors and prescriptions submitted byprescribing doctors for items personally administered. Total cost refers to thecost of the drug less discounts and includes on cost allowance, dispensingfees, container allowance, oxygen payments and VAT. Income from patients re-lates to financial years and from 2001/2002 is taken from HA annual accounts.Previous years taken from the Appropriation Account. Income includes chargesretained by pharmacists & dispensing doctors, sales of pre-payment certificatesand recoveries from patients.
10 Dentist consist of principals, assistants and trainees. Information on NHS den-tistry in the community dental services, in hospitals and prisons are excluded.
11 Data shown reflect data for the financial year ending in the year in the heading.12 Personal Dental Services (PDS) schemes had varying registrations periods. To
ensure comparibility with corresponding General Dental Services (GDS) data,PDS registrations are estimated using "proxy registrations", namely the numberof patients seen by PDS practices in the previous 15 months. PDS proxy regis-trations were not estimated for the periods before September 2003 - actualregistrations were used before this date.
13 Figures for England are based on provisional outturn figures, with gross expen-diture and patient figures having been adjusted from previous publications to in-clude refunds of dental charges. For Wales, figures are for the financial yearand based on the Appropriation account.
14 Number of NHS sight tests paid for by FHSAs/HAs in the period.
Sources: Department of Health;The Information Centre for health and social care;
NHS Business Services Authority;Welsh Assembly Government

129
Health
9.2 Hospital and primary care servicesScotland
1996 1997 1998 1999 2000 2001 2002 2003 2004 2005 2006
Hospital and community servicesIn-patients:1,2
Average available staffed beds KDEA Thousands 40.6 38.4 36.8 35.2 33.5 32.1 30.9 29.8 28.9 28.1 27.4Average occupied beds:
All departments KDEB " 32.8 30.9 29.5 28.2 26.9 25.8 25.1 24.2 23.2 22.5 22.1Psychiatric and learning disability KDEC " 11.7 10.8 10.0 9.1 8.3 7.6 7.0 6.4 5.9 5.5 5.2
Discharges or deaths3 KDED " 973 965 978 977 965 957 952 939 968 1 003 1 014Outpatients:2,4
New cases KDEE " 2 666 2 675 2 715 2 734 2 766 2 748 2 728 2 730 2 748 2 720 2 763Total attendances KDEF " 6 338 6 272 6 331 6 424 6 451 6 381 6 254 6 192 6 144 5 990 6 083
Medical and dental staff:5 JYXO Numbers 8 699 9 018 9 081 9 273 9 325 9 644 10 256 10 407 10 658 10 871 11 201Whole-time KDEG " 6 729 7 024 7 057 7 185 7 216 7 530 8 115 8 349 8 612 8 796 9 201Part-time KDEH " 1 461 1 510 1 550 1 632 1 648 1 681 1 697 1 636 1 630 1 670 1 607Honorary JYXN " 534 521 506 495 495 468 468 437 431 418 411
Professional and technical staff:6
Whole-time KDEI " 10 584 10 740 10 884 11 261 11 261 11 705 12 265 12 942 13 258 13 750 14 323Part-time KDEJ " 4 370 4 738 4 928 5 218 5 483 5 852 6 273 6 708 6 968 7 440 7 990
Nursing and midwifery staff:7
Whole-time KDEK " 32 560 32 218 32 156 32 356 32 401 33 334 34 294 34 939 35 338 36 093 37 104Part-time KDEL " 29 917 29 736 29 178 29 242 29 131 29 004 29 015 29 354 29 484 29 688 29 995
Administrative and clerical staff:8
Whole-time KDEM " 15 155 14 707 14 564 14 541 14 710 15 361 16 200 17 260 17 806 18 434 18 907Part-time KDEN " 6 986 7 174 7 265 7 456 7 677 8 075 8 630 9 307 9 943 10 707 11 375
Domestic, transport, etc, staff:9
Whole-time KDEO 8 596 8 187 8 090 7 972 7 848 7 625 7 768 8 234 8 305 8 516 8 697Part-time KDEP 13 554 13 082 12 716 12 424 12 272 11 522 11 915 12 588 12 324 12 545 12 675
Primary care servicesMedical services
Doctors on the list:11
Principals12 KDET Numbers 3 581 3 631 3 666 3 702 3 710 3 761 3 769 3 805 3 782 3 801 3 807Assistants KDEU " 62 70 85 88 99 108 114 155 188 267 330
Average number of patients perprincipal doctor13 KDEV " 1 499 1 476 1 462 1 449 1 441 1 423 1 418 1 404 1 421 1 418 1 421
Payments to doctor14 KDEW £ million 333.2 356.4 365.9 377.5 404.7 429.6 467.5 519.0 628.4 701.0 699.8Pharmaceutical services15
Prescriptions dispensed KDEX Millions 54.62 56.64 58.52 60.36 62.34 65.56 69.13 71.83 74.66 76.74 79.03Payments to pharmacists (gross) KDEY £ million 543.4 588.4 627.2 693.7 731.0 788.6 868.9 946.3 988.0 993.7 1 043.0Average gross cost per
prescription KDEZ £ 10.0 10.4 10.7 11.5 11.7 12.0 12.6 13.2 13.2 12.9 13.2Dental services
Dentists on list16 KDFA Numbers 1 709 1 710 1 739 1 786 1 808 1 808 1 844 1 869 1 882 1 900 1 936Number of courses of treatment
completed KDFB Thousands 2 711 2 825 3 406 3 388 3 389 3 359 3 420 3 359 3 375 3 348 3 387Payments to dentists (gross) KDFC £ million 137.3 139.2 154.9 157.5 160.6 162.9 165.1 172.3 170.4 173.5 179.0
Payments by patients KDFD " 41.7 41.4 45.9 47.4 48.8 50.6 52.3 54.7 53.3 53.9 54.1Payments out of public funds KDFE " 95.6 97.8 109.0 110.1 111.8 112.3 112.9 117.6 117.1 119.6 124.9
Average gross cost per course KDFF £ 38.0 40.1 36.5 38.0 38.0 37.0 38.0 40.0 40.0 40.0 40.5General ophthalmic services
Number of sight tests given17 KDFG Thousands 618 635 656 657 850 861 877 907 920 935 960Number of pairs of glasses
supplied18 KDFH " 461 474 488 485 494 439 463 458 450 457 457Payments out of public fundsfor sight testing and dispensing KDFK £ million 27.7 29.1 29.8 32.0 33.1 .. .. 34.9 35.5 37.8 39.4
1 Excludes joint user and contractual hospitals.2 In year to 31 March.3 Includes transfers out and emergency inpatients treated in day bed units.4 Including attendances at accident and emergency consultant clinics.5 As at 30 September. Figures exclude officers holding honorary locum ap-
pointments. Part-time includes maximum part-time appointments. There isan element of double counting of "heads" in this table as doctors can holdmore than one contract. For example, they may hold contracts of differenttype, eg part time and honorary. Doctors holding two or more contracts ofthe same type, eg part time, are not double counted. Doctors, whose sumof contracts amounts to whole time, are classed as such. Figures have beenrevised due to coding changes.
6 As at 30 September. Comprises Therapeutic, Healthcare science, Technicaland Pharmacy staff.
7 As at 30 September. Includes Health Care Assistants. Figures post 2003have been amended due to a coding error resulting in some staff previouslyin this group being moved to the admin and clerical group.
8 As at 30 September. Comprises Senior Management and Administrative andClerical staff. Figures from 2003 onwards have been amended due to the in-clusion of some staff previously in the nursing and midwifery staff group
9 As at 30 September. Comprises Ambulance, Works, Ancillary and Trades.10 These figures are for Health Boards only and do not include the 2 NHS Trusts
in 1995 and 47 in 1995/96. Estimated from financial years.11 At 1 October for 1996-2004 and 30 Sept for 2005-07. Source www.isdscot-
land.org/workforce12 Performer GPs only ( known prior to 2004 as Unrestricted and restricted princi-
pals)13 For 1996-2003 this group comprises salaried GPs plus associates, assistants
and ‘other’ GPs. Terminology changed with the introduction of the new GMScontract in 2004.
14 Average number of registered patients for Performer (Principal) GPs only. Notethis is based only on GP headcount, not Whole Time Equivalence (WTE).Source: ISD General Medical Practice Team.
15 For prescriptions dispensed in calendar year by all community pharmacists (in-cluding stock orders), dispensing doctors and appliance Total expenditure onGeneral Medical Services/Primary Medical Service NHS Scotland Costs Book,"R390" tables. www.isdscotland.org/costs. Note, the contractual arrangementsfor payments to many general practices changed with the introduction of thenew GMS contract in April 2004.
16 Comprises principals only as at 31 March only.17 Figure represents sight tests paid for by health boards, hospital eye service re-
ferrals and GOS(s) ST (v) claimants. From 1995, data refers to financial year,(eg 1995 data is for year ending 31st March 1995). 1994 calender year data ismissing.
18 Does not include hospital eye service.
Sources: ISD Scotland, NHS National Services Scotland;0131 275 7777

130
Health
9.3 Hospital and general health servicesNorthern Ireland
1997 1998 1999 2000 2001 2002 2003 2004 2005 2006
Hospital services1
In-patients:Beds available2 KDGA Numbers 9 006 8 818 8 639 8 571 8 419 8 301 8 347 8 323 8 238 8 049Average daily occupation of
beds KDGB Percentages 80.8 81.9 81.5 82.0 83.3 84.3 84.1 84.2 83.6 83.2Discharges or deaths3 KDGC Thousands 305 335 332 333 328 327 332 337 343 359
Out-patients:4
New cases KDGD " 952 962 984 994 997 992 1 014 1 027 1 043 1 081Total attendances KDGE " 2 084 2 091 2 111 2 114 2 131 2 122 2 161 2 175 2 221 2 233
General health servicesMedical services1
Doctors (principals) on thelist5,6 KDGF Numbers 1 039 1 042 1 054 1 066 1 073 1 076 1 076 1 078 1 084 1 100Number of patients per
doctor KDGG " 1 690 1 693 1 678 1 661 1 651 1 652 1 658 1 663 1 655 1 631GrossPayments to doctors7 KDGH £ thousand 69 889 71 385 78 604 82 471 84 664 88 194 96 894 .. .. ..
Pharmaceutical services8
Prescription forms dispensed KDGI Thousands 13 246 13 489 13 454 13 666 14 277 14 622 15 158 15 283 15 860 16 393Number of prescriptions KDGJ " 22 047 22 754 23 249 23 985 24 705 25 501 26 656 27 401 28 417 29 599Gross Cost9 KDGK £ thousand 236 746 248 845 266 535 278 405 303 489 327 045 362 401 382 789 390 763 408 771Charges10 KDGL " 6 784 7 007 8 183 8 499 9 074 9 597 9 798 10 262 10 676 11 298Net Cost9 KDGM " 229 962 241 837 258 353 269 906 294 415 317 448 352 602 372 527 380 087 397 473Average gross cost per
prescription9 KDGN £ 10.74 10.94 11.46 11.61 12.28 12.82 13.60 13.97 13.75 13.81Dental services8,11
Dentists on the list5 KDGO Numbers 592 612 632 661 673 689 696 720 722 751Number of courses ofpaid treatment KDGP Thousands 1 053 1 088 1 086 1 113 1 126 1 123 1 107 1 086 1 084 1 064Gross cost KDGQ £ thousand 53 735 56 835 58 712 61 237 64 454 66 201 66 910 67 294 69 480 65 172Patients KDGR Thousands 12 433 13 686 14 358 15 302 16 041 930 919 907 910 900Contributions (Net cost) KDGS £ thousand 41 303 43 149 44 354 46 152 48 413 49 376 50 282 50 498 52 308 50 068Average gross cost per
paid treatment KDGT £ 50 52 54 55 57 59 60 62 64 61Ophthalmic services8
Number of sight tests given12 KDGU Thousands 227 236 305 307 326 334 346 347 360 368Number of optical appliances
supplied13 KDGV " 159 179 178 181 187 190 192 189 194 196Cost of service (gross)14 KDGW £ thousand 10 271 10 303 11 509 12 035 12 738 13 473 13 981 14 395 15 868 16 280
Health and social services15
Medical and dental staff:Whole-time KDGZ Numbers 2 156 2 196 2 231 2 224 2 281 2 411 2 607 2 749 2 948 3 152Part-time KDHA " 1 041 1 009 1 014 580 597 626 620 627 562 556
Nursing and midwifery staff:Whole-time KDHB " 10 114 10 117 10 135 9 926 9 828 10 248 10 729 11 137 11 416 11 477Part-time KDHC " 9 015 8 287 8 813 7 591 7 814 8 395 8 706 8 887 9 047 9 107
Administrative and clerical staff:Whole-time KDHD " 6 915 7 019 7 230 7 373 7 536 7 966 8 370 8 846 9 047 9 113Part-time KDHE " 2 708 2 776 2 910 2 972 3 136 3 372 3 609 3 858 4 190 4 249
Professional and technical staff:Whole-time KDHF " 2 933 3 014 3 177 3 642 3 762 3 975 4 163 4 528 4 695 4 772Part-time KDHG " 1 060 1 146 1 226 1 283 1 369 1 499 1 616 1 731 1 827 2 032
Social services staff(excludingcasual home helps):Whole-time KDHH " 3 349 3 262 3 319 3 017 3 127 3 284 3 461 3 716 3 777 3 893Part-time KDHI " 2 394 2 241 2 358 868 911 986 1 105 1 207 1 297 1 429
Ancillary and other staff:Whole-time KDHJ " 3 569 3 423 3 426 3 506 3 472 3 426 3 418 3 470 3 725 3 836Part-time KDHK " 3 482 3 558 3 913 4 508 4 925 5 125 5 420 5 588 5 498 5 904
Cost of services (gross)14 KDHL £ thousand 1 153 741 1 292 348 1 422 920 1 576 657 1 639 283 1 868 538 2 113 453 .. .. ..Payments by recipients KDHM Thousands 49 498 59 484 65 533 71 411 78 478 88 860 87 999 .. .. ..Payments out of public funds KDHN £ thousand 1 104 243 1 232 864 1 357 387 1 505 246 1 560 805 1 779 678 2 025 454 .. .. ..
1 Financial Year.2 Average available beds in wards open overnight during the year.3 Includes transfers to other hospitals.4 Includes consultant outpatient clinics and Accident and Emergency depart-
ments.5 At beginning of period for Dentists. Doctors numbers at 2002 (Oct), 2003
(Nov), 2004, 2005 & 2006 (Oct).6 From 2003 onwards (UPE’s).7 These costs refer to the majority of non-cash limited services: further ex-
penditure under GMS is allocated through HSS Boards on a cash limitedbasis. Change between 2002 and 2003 is due to advance payments beingmade in relation to the new GMS contract introduced in April 2004.
8 From 1995 onwards figures are taken from financial year.9 Gross cost is defined as net ingredient costs plus on-cost, fees and other
payments.10 Excludes amount paid by patients for pre-payment certificates.11 Due to changes in the Dental Contract which came into force in October
1990 dentists are paid under a combination of headings relating to Capita-tion and Continuing Care patients. Prior to this, payment was simply on anitem of service basis.
12 Excluding sight tests given in hospitals and under the school health service andin the home.
13 Relates to the number of vouchers supplied and excludes repair/replace spec-tacles.
14 Figures relate to the costs of the hospital, community health and personal socialservices, and have been estimated from financial year data.
15 Workforce figures until 1999 refer to 31st December and are taken from theTrust and Board payroll system. Figures from 2000 onwards are at 30th Sep-tember and are taken from the Trust and Board Human Resource ManagementSystems. Figures for 2000 onwards exclude all home helps and all agen-cy/bank staff but include Ambulance and Works staff in the Ancillary & OtherStaff category. As a result, backward comparison of the workforce is not advis-able as definitions differ. Some figures for 2000 have been revised.
Sources: Central Services Agency Northern Ireland: 028 9032 4431;Dept of Health, Social Services & Public Safety Northern Ireland: 028 9052
2509;(Figures on Hospital Services: 028 9052 2800)

131
Health
9.4 Health services: workforce summary1,2,
Great BritainAs at 30 September Whole-time equivalent
1997 1998 1999 2000 2001 2002 2003 2004 2005 2006
Health service staff andpractitioners
Medical staff: total14 KDBC 64 316 67 408 69 089 70 939 73 206 78 024 82 294 89 450 93 532 92 670
Hospital medical staff: total3 KDBD 61 937 65 088 66 812 68 767 71 107 76 122 80 537 87 641 13 452 92 284
Consultant KDBE 21 699 23 139 24 250 25 067 26 106 27 951 29 566 31 628 33 844 33 390Staff grade KADJ 2 785 3 458 3 868 4 423 4 720 5 409 5 462 5 648 5 576 5 508Associate specialist KDBF 1 340 1 439 1 527 1 572 1 609 1 780 1 993 2 263 2 485 2 577Registrar group4 KWUG 12 435 12 863 13 299 13 372 13 826 14 530 15 580 17 890 19 337 19 359Senior house officer KDBI 17 353 17 760 17 518 17 945 18 377 19 850 21 525 23 567 24 702 21 020House officer15 KADK 4 163 4 287 4 364 4 518 4 560 4 944 4 985 5 276 5 637 4 892Hospital practitioner5 KDBL 198 220 230 231 223 248 247 256 211 178Clinical assistant5 KDBM 1 924 1 907 1 744 1 638 1 684 1 407 1 179 1 064 765 578Other staff6 KDBK 38 16 11 1 1 3 – 50 542 197
Public health medicine and communityhealth services medical staff3 KDBN 2 379 2 320 2 278 2 172 2 100 1 902 1 756 1 809 434 386
Dental staff: total14 KDBO 3 078 3 193 3 147 3 107 3 152 3 357 3 429 3 571 3 680 3 466
Hospital dental staff: total3 KDBP 1 696 1 807 1 816 1 781 1 816 1 944 1 981 2 021 357 3 135
Consultant KDBQ 524 570 581 580 578 610 664 689 726 640Staff grade KADL 86 99 113 118 135 154 158 163 181 172Associate specialist KDBR 62 68 70 73 74 75 79 93 97 114Registrar group4 LQMZ .. 309 314 295 311 339 329 344 388 373Senior house officer KDBU 491 531 496 497 513 572 584 580 616 480Dental house officer KDBV 58 59 68 60 61 60 38 31 28 36Hospital practitioner7 KDBX 22 21 23 21 18 20 20 22 17 42Clinical assistant7 KDBY 152 144 146 136 126 112 108 98 89 77Other staff6 KDBW 6 5 6 – – 1 – 1 1 137 1 424
Community health dental staff3, KDBZ 1 382 1 386 1 331 1 326 1 336 1 413 1 448 1 550 401 1 423
Non-medical staff: total KWUH 849 426 855 305 870 921 890 282 927 831 974 390 1 022 837 1 061 640 1 093 439 1 021 324
Nursing and midwifery staff:8,9,10
(excluding agency): total KDCA 407 760 409 045 415 786 423 737 437 417 455 361 474 263 485 180 492 391 485 289of which:
qualified KSBR 298 483 299 654 303 644 309 682 320 685 335 313 349 701 360 910 368 276 369 453unqualified10 KSBS 106 313 106 773 109 687 111 931 114 532 117 582 121 896 121 194 121 129 113 381learners KSBT 2 356 2 178 1 961 2 054 2 201 2 387 2 591 3 076 2 985 2 454
All Professional and Technicalstaff (excluding works)11,12 KSBM 120 439 123 902 128 116 131 943 138 348 146 804 155 507 164 419 171 326 174 091
Health care assistants KWUI 19 268 22 026 22 746 24 919 30 047 33 301 36 027 37 829 39 272 37 876Support staff KWUJ 72 608 71 043 69 883 68 449 69 245 69 628 69 553 69 749 73 457 71 269Ancillary, Works & Maintainance13 KSBN 26 037 25 131 24 468 23 962 23 013 23 430 23 820 24 708 23 438 23 132Administrative and Estates staff KSBO 183 112 184 711 190 421 197 327 209 004 224 490 241 634 256 412 269 131 262 919Ambulance staff KSBP 18 751 18 382 18 552 19 209 19 888 20 864 21 449 22 753 23 888 23 147Others KSBQ 1 079 906 780 746 711 512 584 590 535 549
1 Whole-time equivalent. Figures exclude locums and occasional seasonalstaff.
2 Medical and dental data (1996-2004) have been revised for comparabilitypurposes. Since 2005, data can no longer be split by sector (hospital andcommunity).
3 Does not include England data as hospital and community staff are nolonger split.
4 Includes Specialist Registrar (SpR), Senior Registrar and Registrar. TheSpR grade was introduced formally on 1 April 1996.
5 Scottish figures not available 2005.6 Includes Senior clinical medical officiers, clinical medical officers, GDP/GMP
grades (including Clinical Assistant (Para. 94 and Para. 107 appointments),Hospital Practitioner and Limited Specialist. Staff in these grades may alsohold General Medical services, or General Dental Service appointments),Medical Adviser, Assistant Prescribing Adviser, Dental Adviser, Dental Off-icer, Senior Dental Officer, Assistant/ Chief Administrative Dental Officers,Clinical Director/Assistant Clinical Director.
7 Excludes bank nurses for Wales & Scotland.8 Nursing total includes qualified, unqualified and others only. England &
Wales.9 Nursing total includes Registered and Unregistered nurses and midwives
only. Scotland.10 Excludes health care assistants.11 GP Registrars were formally referred to as Trainees.12 Include Therapeutic, Healthcare Science, Technical & Pharmacy staff.13 Welsh figures not available 2005.14 Only total figures ie, breakdown not available for 200615 For England data - " A new curriculum for doctors in training and equivalents
was introduced in 2005 as part of the Modernising Medical Careers Pro-gramme. The workforce census now records two foundation programmes;foundation doctors in their 2nd year (F2) and foundation doctors in their 1styear (F1), which are added into the House Officer grade.
Sources: Information Centre for Health and Social Care;Welsh Assembly Government;
ISD Scotland;NHS National Services Scotland

132
Health
9.5 Health and personal social services: workforce summaryGreat Britain
Numbers
1997 1998 19993 2000 2001 2002 2003 2004 2005 2006
Family Health services:
General medical practitioners1
All practitioners: total2,3 GPYL .. .. 36 954 37 583 38 172 38 656 40 021 41 322 42 531 40 634All practitioners (excluding GP Retainees) LQZN 35 204 35 618 35 957 36 233 36 761 37 283 38 769 40 273 41 650 39 813
GP Registrars4 LQZU 1 677 1 830 1 902 2 028 2 278 2 386 2 626 2 959 2 973 2 588GP Retainees5 GPYM – – 997 1 350 1 411 1 373 1 252 1 049 903 823
General dental practitioners: total6,7 KDCQ 19 598 20 216 20 833 21 316 21 929 22 194 22 507 22 997 24 123 2 301
General Dental Service GPYN 19 598 20 216 20 750 21 124 21 462 21 538 21 701 20 826 17 943 2 301Personal Dental Service GPYO .. .. 83 192 467 656 806 2 171 5 149 ..
Ophthalmic medical practitioners 8 KDCT 833 863 827 819 754 686 644 614 498 439Ophthalmic opticians 8 KDCU 7 790 8 024 8 423 8 742 8 650 8 761 9 123 9 349 9 599 10 228
Personal Social Services staff: total9 KDDE 283 000 276 000 274 000 269 400 264 000 263 300 274 000 278 300 283 600 279 400of which:
Home help service KSBU 53 600 50 500 47 200 42 900 40 200 37 800 34 900 34 400 38 200 31 700Field Social Workers KSBX 33 000 33 400 33 900 34 700 35 200 35 900 37 100 37 800 40 800 40 100Day care establishments staff KADV 30 800 30 300 30 800 30 800 29 500 29 500 28 800 28 600 30 600 27 300Residential care staff KADW 65 400 62 100 59 200 56 600 53 800 51 500 51 300 49 000 52 200 46 400
Note Scotland GPs figures included in this totals will be slightly different toGPs ’headcount’ figures published on the ISD Scotland website as GPsholding more than one contract will be counted in this table by the ’numberof contracts held’ in each year rather than the ’headcount’ of GPs.
1 All GP data as at 1 October except England and Wales as at 30 Septemberfrom 2000 and Scotland from 2005.
2 The ’All practitioners’ totals do not equal the sum of their parts, having beenadjusted in respect of some Scottish GPs who have posts in two separatecategories.
3 All Practitioners data for1997-1999 does not include Scotland retainees asthese were first collected in April 2000.
4 GP Registrars were formerly referred to as Trainees. From 2004 GP Regis-trars are known as Performer Registrars in Scotland and these data includePerformer Registrars working in 2C practices.
5 From 2004 GP Retainees are known as Performer Retainees in Scotlandand these data include Performer Retainees working in 2C practices.
6 Includes principals, assistants and trainees. Prison contracts and salarieddentists are excluded. A small proportion of dentists work in both the GDSand PDS. These dentists have been counted only within GDS figures toavoid double counting. (Data at 30th Sept for 1997-2005)
7 The methodology for reporting dental workforce information in England andWales since the introduction of the new dental contract on 1 April 2006 iscurrently under review. No update on workforce figures for England andWales will be available until this review has been completed.
8 Figures for Scotland are as at 31 March, and figures for England and Walesare as at 31 December, of that year. Count of OMPs and OOs holding con-tracts with FHSAs/HA’s/LHBs and/ or Scottish NHS Boards to carry outNHS Sight Tests. Practitioners with contracts in both England and Scotlandare counted twice for these statistics. The OMP figure for 2003 (644) in-cludes an estimate of 22 OMP’s for Scotland, the OMP figure for Scotlandbeing unavailable for 2003.
9 Split of Personal Social Services staff are for England only.
Sources: The NHS Information Centre for health and social care;Dental Practice Board;
Welsh Assembly Government;ISD Scotland;
NHS National Services Scotland

133
Health
9.6 Deaths: by causeInternational Statistical Classification of Diseases, Injuries and Causes of Death1
Tenth Revision 2001 Numbers
England and Wales
ICD-10 code 2002 2003 2004 2005 2006
Total deaths 533 527 538 254 512 541 512 692 502 599
Deaths from natural causes A00-R99 515 262 519 297 493 835 494 054 482 745Certain infectious and parasitic diseases A00-B99 4 330 4 763 5 009 6 141 7 632
Intestinal infectious diseases A00-A09 847 1 063 1 382 2 221 3 630Respiratory and other tuberculosis including late effects A15-A19,B90 443 451 388 406 432Meningococcal infection A39 115 118 72 86 52Viral hepatitis B15-B19 170 209 197 205 205AIDS (HIV - disease) B20-B24 198 224 209 230 235
Neoplasms C00-D48 140 174 139 360 138 062 138 454 138 777Malignant neoplasms C00-97 136 777 135 955 134 856 135 252 135 635Malignant neoplasm of oesophagus C15 6 330 6 427 6 298 6 490 6 495Malignant neoplasm of stomach C16 5 588 5 285 5 098 4 927 4 562Malignant neoplasm of colon C18 9 504 9 152 9 130 9 076 8 954Malignant neoplasm of rectum and anus C20-C21 3 907 3 982 3 917 3 995 3 870Malignant neoplasm of pancreas C25 6 142 6 242 6 294 6 509 6 584Malignant neoplasm of trachea, bronchus and lung C33-C34 28 806 28 765 28 328 28 792 29 332Malignant neoplasm of skin C43 1 480 1 585 1 597 1 622 1 649Malignant neoplasm of breast C50 11 557 11 276 11 031 11 121 11 011Malignant neoplasm of cervix uteri C53 1 001 951 957 911 831Malignant neoplasm of prostate C61 8 973 9 166 9 169 9 042 9 057Leukaemia C91-C95 3 911 3 916 3 828 3 910 3 859
Diseases of the blood and blood-forming organs andcertain disorders involving the immune mechanism D50-D89 1 086 1 065 1 014 1 096 1 013
Endocrine, nutritional and metabolic diseases E00-E90 7 897 8 016 7 519 7 433 7 153Diabetes mellitus E10-E14 6 192 6 316 5 837 5 677 5 490
Mental and behavioural disorders F00-F99 14 444 14 846 14 299 14 563 14 863Vascular and unspecified dementia F01,F03 12 753 13 401 12 756 12 995 13 289Alcohol abuse (inc. alcoholic psychosis) F10 435 469 538 523 545Drug dependence and non-dependent abuse of drugs F11-F16,F18-F19 882 655 718 762 739
Diseases of the nervous system and sense organs G00-H95 14 796 15 793 14 645 15 253 15 218Meningitis (including meningococcal) G00-G03 173 229 182 187 164Alzheimer’s disease G30 4 771 5 055 4 821 4 914 4 901
Diseases of the circulatory system I00-I99 209 433 205 508 190 603 183 997 174 637Ischaemic heart diseases I20-I25 102 833 99 790 92 528 88 271 82 619Cerebrovascular diseases I60-I69 59 068 57 808 52 899 50 772 48 389
Diseases of the respiratory system J00-J99 69 900 75 138 69 213 72 517 68 599Influenza J10-J11 38 77 25 44 17Pneumonia J12-J18 32 631 34 400 30 649 31 443 28 674Bronchitis, emphysema and other chronic obstructivepulmonary diseases J40-J44 24 159 25 765 23 204 24 230 23 319
Asthma J45-J46 1 264 1 284 1 243 1 186 1 082Diseases of the digestive system K00-K93 24 124 24 948 24 912 25 213 25 786
Gastric and duodenal ulcer K25-K27 3 746 3 678 3 495 3 266 3 145Chronic liver disease K70,K73-K74 5 376 5 844 5 824 5 873 6 250
Diseases of the skin and subcutaneous tissue L00-L99 1 470 1 661 1 670 1 788 1 812Diseases of the musculo-skeletal system andconnective tissue M00-M99 4 647 4 634 4 393 4 378 4 238Rheumatoid arthritis and juvenile arthritis M05-M06,M08 966 907 794 835 743Osteoporosis M80-M81 1 605 1 583 1 478 1 416 1 390
Diseases of the genito-urinary system N00-N99 8 452 9 120 9 397 10 231 10 722Diseases of the kidney and ureter N00-N29 4 072 4 135 4 024 3 967 3 988
Complications of pregnancy, childbirthand the puerperium O00-O99 34 45 46 36 41
Certain conditions originating in the perinatal period(excluding neonatals)1 P00-P96 208 207 213 205 160
Congenital malformations, deformations andchromasomal abnormalities (excluding neonatals)1 Q00-Q99 1 233 1 299 1 274 1 292 1 214Congenital malformations of the nervous system Q00-Q07 127 142 116 123 117Congenital malformations of the circulatory system Q20-Q28 541 540 527 535 484
Symptoms, signs and abnormal clinical and laboratoryfindings not elsewhere classified R00-R99 13 034 12 894 11 566 11 457 10 880Senility without mention of psychosis (old age) R54 11 645 11 394 9 905 9 785 9 169Sudden infant death syndrome R95 137 136 148 164 143
Deaths from external causes V01-Y89 16 139 16 693 16 497 16 411 17 509All accidents V01-X59,Y85,Y86 10 382 10 979 10 735 11 053 11 824Land transport accidents V01-V89 2 929 2 943 2 693 2 697 2 990Accidental falls W00-W19 2 509 2 732 2 915 3 006 3 226Accidental poisonings X40-X49 814 835 927 910 1 072Suicide and intentional self-harm X60-X84,Y87.0 3 269 3 270 3 306 3 172 3 331Homicide and assault1 X85-Y09,Y87.1 373 318 363 326 342Event of undetermined intent Y10-Y34, Y87.2 1 754 1 776 1 685 1 486 1 616

134
Health
9.6 Deaths: by causeInternational Statistical Classification of Diseases, Injuries and Causes of Death1
Tenth Revision 2001continued Numbers
Scotland
ICD-10 code 2002 2003 2004 2005 2006
Total deaths 58 103 58 472 56 187 55 747 55 093
Deaths from natural causes A00-R99 55 689 56 161 53 759 53 535 52 856Certain infectious and parasitic diseases A00-B99 651 660 688 719 791
Intestinal infectious diseases A00-A09 96 85 104 99 128Respiratory and other tuberculosis including late effects A15-A19,B90 52 59 52 49 43Meningococcal infection A39 13 5 8 4 6Viral hepatitis B15-B19 13 23 20 16 20AIDS (HIV - disease) B20-B24 33 33 16 31 19
Neoplasms C00-D48 15 391 15 412 15 336 15 408 15 360Malignant neoplasms C00-C97 15 051 15 116 15 047 15 135 15 084Malignant neoplasm of oesophagus C15 763 776 801 798 765Malignant neoplasm of stomach C16 621 579 615 590 552Malignant neoplasm of colon C18 975 966 917 966 922Malignant neoplasm of rectum and anus C20-21 384 368 383 367 390Malignant neoplasm of pancreas C25 562 641 615 603 567Malignant neoplasm of trachea, bronchus and lung C33-34 4 039 3 893 3 923 4 009 4 062Malignant neoplasm of skin C43 132 146 151 158 158Malignant neoplasm of breast C50 1 110 1 149 1 093 1 151 1 112Malignant neoplasm of cervix uteri C53 100 120 102 127 92Malignant neoplasm of prostate C61 775 786 802 765 779Leukaemia C91-C95 330 367 352 351 362
Diseases of the blood and blood-forming organs andcertain disorders involving the immune mechanism D50-D89 122 148 111 118 113
Endocrine, nutritional and metabolic diseases E00-E90 902 958 972 988 1 018Diabetes mellitus E10-E14 676 709 760 745 751
Mental and behavioural disorders F00-F99 2 446 2 637 2 670 2 454 2 817Vascular and unspecified dementia F01,F03 1 763 1 997 1 955 1 835 2 101Alcohol abuse (inc. alcoholic psychosis) F10 339 356 421 343 378Drug dependence and non-dependent abuse of drugs F11-F16,F18-F19 294 228 238 217 293
Diseases of the nervous system and sense organs G00-H95 1 317 1 303 1 254 1 306 1 333Meningitis (including meningococcal) G00-G03 6 19 25 18 15Alzheimer’s disease G30 388 354 399 415 452
Diseases of the circulatory system I00-I99 22 688 22 102 20 837 20 060 18 771Ischaemic heart diseases I20-I25 11 692 11 441 10 778 10 331 9 532Cerebrovascular diseases I60-I69 6 722 6 497 6 155 5 789 5 466
Diseases of the respiratory system J00-J99 6 806 7 454 6 743 7 093 7 183Influenza J10-J11 6 15 3 11 2Pneumonia J12-J18 2 466 2 859 2 399 2 483 2 513Bronchitis, emphysema and other chronic obstructivepulmonary diseases J40-J44 2 840 3 014 2 752 2 857 2 848Asthma J45-J46 131 98 94 100 82
Diseases of the digestive system K00-K93 3 153 3 215 3 065 3 221 3 208Gastric and duodenal ulcer K25-K27 350 316 305 230 262Chronic liver disease K70,K73-K74 1 128 1 170 1 044 1 152 1 162
Diseases of the skin and subcutaneous tissue L00-L99 118 131 131 127 130Diseases of the musculo-skeletal system andconnective tissue M00-M99 384 369 350 326 354Rheumatoid arthritis and juvenile arthritis M05-M06,M08 133 103 107 109 108Osteoporosis M80-M81 59 70 52 47 40
Diseases of the genito-urinary system N00-N99 1 013 1 056 965 1 063 1 112Diseases of the kidney and ureter N00-N29 627 670 574 617 578
Complications of pregnancy, childbirthand the puerperium O00-O99 5 7 6 4 7
Certain conditions originating in the perinatal period P00-P96 155 149 151 164 139Congenital malformations, deformations andchromasomal abnormalities Q00-Q99 168 172 134 159 151Congenital malformations of the nervous system Q00-Q07 31 23 21 15 25Congenital malformations of the circulatory system Q20-Q28 60 63 53 58 46
Symptoms, signs and abnormal clinical and laboratoryfindings not elsewhere classified R00-R99 370 388 346 325 369Senility without mention of psychosis (old age) R54 191 236 193 210 206Sudden infant death syndrome R95 32 43 28 20 27
Deaths from external causes V01-Y89 2 414 2 311 2 428 2 212 2 237All accidents V01-X59,Y85,Y86 1 315 1 326 1 390 1 284 1 264Land transport accidents V01-V89 321 357 325 293 326Accidental falls W00-W19 668 668 690 676 642Accidental poisonings X40-X49 37 30 57 48 70Suicide and intentional self-harm X60-X84,Y87.0 636 560 606 547 542Homicide and assault X85-Y09,Y87.1 118 101 121 80 115Event of undetermined intent Y10-Y34, Y87.2 263 234 229 216 223
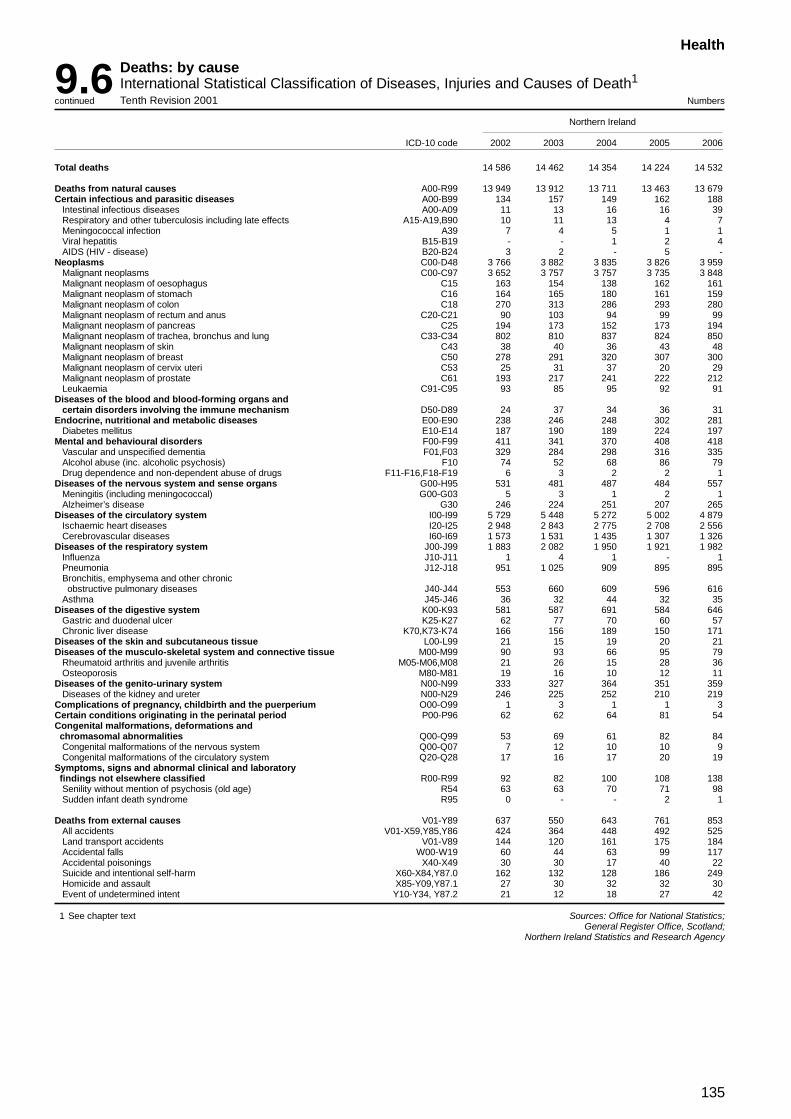
135
Health
9.6 Deaths: by causeInternational Statistical Classification of Diseases, Injuries and Causes of Death1
Tenth Revision 2001continued Numbers
Northern Ireland
ICD-10 code 2002 2003 2004 2005 2006
Total deaths 14 586 14 462 14 354 14 224 14 532
Deaths from natural causes A00-R99 13 949 13 912 13 711 13 463 13 679Certain infectious and parasitic diseases A00-B99 134 157 149 162 188
Intestinal infectious diseases A00-A09 11 13 16 16 39Respiratory and other tuberculosis including late effects A15-A19,B90 10 11 13 4 7Meningococcal infection A39 7 4 5 1 1Viral hepatitis B15-B19 - - 1 2 4AIDS (HIV - disease) B20-B24 3 2 - 5 -
Neoplasms C00-D48 3 766 3 882 3 835 3 826 3 959Malignant neoplasms C00-C97 3 652 3 757 3 757 3 735 3 848Malignant neoplasm of oesophagus C15 163 154 138 162 161Malignant neoplasm of stomach C16 164 165 180 161 159Malignant neoplasm of colon C18 270 313 286 293 280Malignant neoplasm of rectum and anus C20-C21 90 103 94 99 99Malignant neoplasm of pancreas C25 194 173 152 173 194Malignant neoplasm of trachea, bronchus and lung C33-C34 802 810 837 824 850Malignant neoplasm of skin C43 38 40 36 43 48Malignant neoplasm of breast C50 278 291 320 307 300Malignant neoplasm of cervix uteri C53 25 31 37 20 29Malignant neoplasm of prostate C61 193 217 241 222 212Leukaemia C91-C95 93 85 95 92 91
Diseases of the blood and blood-forming organs andcertain disorders involving the immune mechanism D50-D89 24 37 34 36 31
Endocrine, nutritional and metabolic diseases E00-E90 238 246 248 302 281Diabetes mellitus E10-E14 187 190 189 224 197
Mental and behavioural disorders F00-F99 411 341 370 408 418Vascular and unspecified dementia F01,F03 329 284 298 316 335Alcohol abuse (inc. alcoholic psychosis) F10 74 52 68 86 79Drug dependence and non-dependent abuse of drugs F11-F16,F18-F19 6 3 2 2 1
Diseases of the nervous system and sense organs G00-H95 531 481 487 484 557Meningitis (including meningococcal) G00-G03 5 3 1 2 1Alzheimer’s disease G30 246 224 251 207 265
Diseases of the circulatory system I00-I99 5 729 5 448 5 272 5 002 4 879Ischaemic heart diseases I20-I25 2 948 2 843 2 775 2 708 2 556Cerebrovascular diseases I60-I69 1 573 1 531 1 435 1 307 1 326
Diseases of the respiratory system J00-J99 1 883 2 082 1 950 1 921 1 982Influenza J10-J11 1 4 1 - 1Pneumonia J12-J18 951 1 025 909 895 895Bronchitis, emphysema and other chronicobstructive pulmonary diseases J40-J44 553 660 609 596 616
Asthma J45-J46 36 32 44 32 35Diseases of the digestive system K00-K93 581 587 691 584 646
Gastric and duodenal ulcer K25-K27 62 77 70 60 57Chronic liver disease K70,K73-K74 166 156 189 150 171
Diseases of the skin and subcutaneous tissue L00-L99 21 15 19 20 21Diseases of the musculo-skeletal system and connective tissue M00-M99 90 93 66 95 79
Rheumatoid arthritis and juvenile arthritis M05-M06,M08 21 26 15 28 36Osteoporosis M80-M81 19 16 10 12 11
Diseases of the genito-urinary system N00-N99 333 327 364 351 359Diseases of the kidney and ureter N00-N29 246 225 252 210 219
Complications of pregnancy, childbirth and the puerperium O00-O99 1 3 1 1 3Certain conditions originating in the perinatal period P00-P96 62 62 64 81 54Congenital malformations, deformations andchromasomal abnormalities Q00-Q99 53 69 61 82 84Congenital malformations of the nervous system Q00-Q07 7 12 10 10 9Congenital malformations of the circulatory system Q20-Q28 17 16 17 20 19
Symptoms, signs and abnormal clinical and laboratoryfindings not elsewhere classified R00-R99 92 82 100 108 138Senility without mention of psychosis (old age) R54 63 63 70 71 98Sudden infant death syndrome R95 0 - - 2 1
Deaths from external causes V01-Y89 637 550 643 761 853All accidents V01-X59,Y85,Y86 424 364 448 492 525Land transport accidents V01-V89 144 120 161 175 184Accidental falls W00-W19 60 44 63 99 117Accidental poisonings X40-X49 30 30 17 40 22Suicide and intentional self-harm X60-X84,Y87.0 162 132 128 186 249Homicide and assault X85-Y09,Y87.1 27 30 32 32 30Event of undetermined intent Y10-Y34, Y87.2 21 12 18 27 42
1 See chapter text Sources: Office for National Statistics;General Register Office, Scotland;
Northern Ireland Statistics and Research Agency

136
Health
9.7 Notifications of infectious diseases: by country
Numbers
1996 1997 1998 1999 2000 2001 2002 2003 2004 2005 2006
United Kingdom1
Measles KHQD 6 866 4 844 4 540 2 951 2 865 2 661 3 675 2 726 2 703 2 326 4 016Mumps KWNN 2 182 2 264 1 917 2 000 3 367 3 433 2 333 4 565 20 742 66 541 15 867Rubella KWNO 11 720 4 205 4 064 2 575 2 064 1 782 2 002 1 525 1 548 1 327 1 402Whooping cough KHQE 2 721 3 669 1 902 1 461 866 1 059 1 051 509 619 679 639Scarlet fever KHQC 6 101 4 639 4 708 2 956 2 544 2 320 2 749 3 252 2 642 2 075 2 648Dysentery KHQG 2 643 2 427 1 934 1 630 1 613 1 495 1 167 1 144 1 301 1 346 1 238Food poisoning KHQH 94 923 105 579 105 060 96 866 98 076 95 752 81 562 79 073 78 812 78 959 79 059Typhoid and Paratyphoid fevers KHQB 291 249 252 278 205 254 183 277 282 300 390Hepatitis KWNP 2 876 3 601 3 781 4 365 4 530 4 419 5 035 5 203 5 054 5 246 5 034Tuberculosis KHQI 6 238 6 367 6 605 6 701 7 100 7 204 7 239 6 978 7 259 8 017 8 020Malaria KWNQ 1 743 1 549 1 163 1 038 1 166 1 118 866 820 634 700 637
England and Wales2
Measles KHRD 5 614 3 962 3 728 2 438 2 378 2 250 3 187 2 488 2 356 2 089 3 705Mumps KWNR 1 747 1 914 1 587 1 691 2 162 2 741 1 997 4 204 16 367 56 256 12 841Rubella KWNS 9 081 3 260 3 208 1 954 1 653 1 483 1 660 1 361 1 287 1 155 1 221Whooping cough KHRE 2 387 2 989 1 577 1 139 712 888 883 409 504 594 550Scarlet fever KHRC 4 873 3 569 3 339 2 086 1 933 1 756 2 159 2 553 2 201 1 678 2 166Dysentery KHRG 2 312 2 274 1 813 1 538 1 494 1 388 1 087 1 047 1 203 1 237 1 122Food poisoning KHRH 83 233 93 901 93 932 86 316 86 528 85 468 72 649 70 895 70 311 70 407 70 603Typhoid and Paratyphoid fevers KHRB 276 241 243 276 204 250 175 275 280 298 386Viral hepatitis KWNT 2 437 3 186 3 183 3 424 3 541 3 388 3 859 4 004 3 932 4 109 4 007Tuberculosis3 KHRJ 5 654 5 859 6 087 6 144 6 572 6 714 6 753 6 518 6 723 7 628 7 621Malaria KWNU 1 659 1 476 1 110 1 005 1 128 1 081 847 791 609 679 613Total meningitis KHRO 2 686 2 345 2 072 2 094 2 432 2 623 1 545 1 472 1 267 1 381 1 494
Meningococcal meningitis KHRP 1 164 1 220 1 152 1 145 1 164 1 020 706 646 554 579 618Meningococcal septicaemia KWNV 1 129 1 440 1 509 1 822 1 614 1 238 842 732 691 721 657Ophthalmia neonatorum KHRI 246 224 198 163 176 115 91 102 85 87 100
Scotland1
Measles KHSE 1 055 762 700 434 395 315 399 181 257 186 259Mumps KWNW 368 282 251 216 199 155 259 181 3 595 5 698 2 821Rubella KWNX 2 449 818 745 548 349 234 292 130 222 141 148Whooping cough KHSF 186 545 225 214 93 106 99 60 87 51 61Scarlet fever KHSD 750 645 883 438 301 281 376 395 213 208 269Dysentery KHSH 176 124 103 82 95 85 73 83 90 103 109Food poisoning4 KHSI 10 234 10 144 9 186 8 517 9 263 8 640 7 693 6 910 6 835 6 918 6 987Typhoid and Paratyphoid fevers KHSB 14 6 6 2 1 3 4 2 2 1 3Viral hepatitis KWNY 360 359 490 863 943 1 008 1 165 1 159 1 063 1 002 982Tuberculosis4 KHSL 509 433 457 496 469 442 418 422 463 389 351Malaria KWUC 70 57 30 20 27 24 17 28 20 20 18Meningococcal infection KWUD 201 271 313 329 301 256 175 117 147 139 136Erysipelas KHSC 84 95 66 64 41 39 41 28 28 17 26
Northern IrelandMeasles KHTD 197 120 112 79 92 96 89 57 90 56 52Mumps KHTR 67 68 79 93 1 006 537 77 180 780 4 556 205Rubella KHTQ 190 127 111 73 62 65 50 34 39 31 33Whooping cough KHTE 148 135 100 108 61 65 69 40 28 28 28Scarlet fever KHTC 478 425 486 432 310 283 214 304 228 186 213Dysentery KHTG 155 29 18 10 24 22 7 14 8 7 7Food poisoning KHTH 1 456 1 534 1 942 2 033 2 285 1 644 1 220 1 268 1 666 1 409 1 469Typhoid and Paratyphoid fevers KHTB 1 2 3 – – 1 4 – – 1 1Infective hepatitis KHTO 79 56 108 78 46 23 11 40 59 74 45Tuberculosis KHTI 75 75 61 61 59 48 68 38 73 68 48Malaria KWUE 14 16 23 13 11 13 2 1 5 2 6Acute encephalitis/meningitis KHTM 105 91 64 99 130 97 98 78 64 66 58Meningococcal septicaemia KWUF 67 56 87 145 123 90 98 76 82 66 75Gastro-enteritis (children under 2 years) KHTP 745 896 1 371 1 121 1 205 1 106 882 867 697 736 718
1 The figures show the corrected number of notifications, incorporating revi-sions of diagnosis, either by the notifying medical practitioner or by the med-ical superintendent of the infectious diseases hospital. Cases notified in PortHealth Authorities are included
2 Formal notifications of new cases only. The figures exclude chemoprophy-laxis.
3 Scotland’s food poisoning includes ’otherwise ascertained’ for the first time in1995.
4 Figures include cases of tuberculosis not notified before death.
Sources: Information and Statistics Division, NHS in Scotland;Communicable Disease Surveillance Centre (Northern Ireland);
Health Protection Agency, Centre for Infections, IM&T Dept: 020 8200 6868

137
Health
9.8 Estimated number of cases of work-related disease reported by specialistphysicians to THOR1
Great Britain Numbers
All physicians Disease specialist Occupational physicians
2003 2004 2005 2006 2003 2004 2005 2006 2003 2004 2005 2006
Musculoskeletal disordersMOSS OPRA
Upper limb 3 359 4 189 3 654 3 324 1 477 1 534 1 521 1 499 1 882 2 655 2 133 1 825Spine/ back 1 997 2 028 1 761 1 348 501 394 447 392 1 496 1 634 1 314 956Lower limb 352 580 441 406 40 175 122 158 312 405 319 248Other 176 252 221 204 68 29 33 55 108 223 188 149Total number of diagnoses 5 981 7 161 6 205 5 343 2 123 2 181 2 204 2 127 3 858 4 980 4 001 3 216Total number of individuals2 5 804 6 879 5 932 5 156 2 066 2 063 2 064 2 032 3 738 4 816 3 868 3 124
Mental ill healthSOSMI OPRA
Stress/ anxiety/ depression 6 529 6 440 6 063 5 609 1 705 1 804 1 751 1 423 4 824 4 636 4 312 4 186Other 880 869 912 908 604 663 702 660 276 206 210 248Total number of diagnoses 7 409 7 309 6 975 6 517 2 309 2 467 2 453 2 083 5 100 4 842 4 522 4 434Total number of individuals2 6 747 6 801 6 396 5 879 2 175 2 282 2 223 1 975 4 572 4 519 4 173 3 904
Respiratory diseaseSWORD OPRA
Asthma 667 555 492 592 351 386 374 448 316 169 118 144Malignant mesothelioma 875 830 762 636 869 819 754 632 6 11 8 4Benign pleural disease 1 094 1 132 1 496 1 258 1 082 1 120 1 481 1 246 12 12 15 12Other 820 837 906 537 549 567 620 479 271 270 286 58Total number of diagnoses 3 456 3 342 3 656 3 023 2 851 2 892 3 229 2 805 605 450 427 218Total number of individuals2 3 357 3 249 3 609 2 977 2 764 2 799 3 207 2 760 593 450 402 217
Skin diseaseEPIDERM OPRA
Contact dermatitis 2 617 2 374 2 285 2 395 1 668 1 750 1 698 1 799 949 624 587 596Skin neoplasia 361 616 434 760 361 615 434 760 - 1 - -Other 419 325 361 389 220 215 176 295 199 110 185 94Total number of diagnoses 3 397 3 315 3 080 3 544 2 249 2 580 2 308 2 854 1 148 735 772 690Total number of individuals2 3 331 3 281 3 045 3 495 2 183 2 546 2 275 2 817 1 148 735 770 678
Audiological diseaseOSSA OPRA
Sensorineural hearing loss 488 291 315 264 212 33 53 28 276 258 262 236Other 170 41 48 31 146 12 22 15 24 29 26 16Total number of diagnoses 658 332 363 295 358 45 75 43 300 287 288 252Total number of individuals2 529 321 340 280 229 34 54 28 300 287 286 252
InfectionsSIDAW OPRA
Diarrhoeal diseases 962 916 1 429 1 408 959 915 1 396 1 408 3 1 33 -Other 181 192 149 168 160 123 121 165 75 69 28 3Total number of diagnoses 1 143 1 108 1 578 1 576 1 065 1 038 1 517 1 573 78 70 61 3Total number of individuals2 1 143 1 108 1 578 1 576 1 065 1 038 1 517 1 573 78 70 61 3
1 THOR: The Health and Occupation Reporting Network (formerly know asODIN) comprises of the following schemes: MOSS: Musculoskeletal Occu-pation Surveillance Scheme; SOSMI: Surveillance of Occupational Stressand Mental Illness; SWORD: Surveillance or Work-related and OccupationalRespiratory Disease; EPIDERM: Occupational Skin Disease Surveillance byDermatologists; OSSA: Occupational Surveillance Scheme for Audiologists;SIDAW: Surveillance of Infectious Disease at Work.
2 Individuals may have more than one diagnosis.
Sources: Health and Safety Executive: 0151 951 4842/4604;[email protected]

138
Health
9.9 Deaths due to occupationally related lung diseaseGreat Britain
Numbers
1995 1996 1997 1998 1999 2000 2001 2002 2003 2004 2005
Asbestosis (without mesothelioma)1,3 KADY 166 196 191 165 171 186 233 234 235 266 301Mesothelioma2 KADZ 1 317 1 322 1 367 1 541 1 615 1 633 1 862 1 868 1 886 1 978 2 037Pneumoconiosis (other than asbestosis) KAEA 287 223 230 268 321 279 240 271 231 214 194Byssinosis KAEB 6 3 5 5 6 4 2 – 3 4 3Farmer’s lung and other occupational
allergic alveolitis KAEC 10 1 5 8 9 7 7 6 7 5 13
Total KAED 1 786 1 745 1 798 1 987 2 122 2 109 2 344 2 373 2 362 2 467 2 548
1 By definition every case of asbestosis is due to asbestos; the associationwith mesothelioma is also very strong, though there is thought to be a lownatural background incidence.
2 For the inclusion into the Mesothelioma register the cause of death on thedeath certificate must mention the word Mesothelioma.
3 For inclusion into the Asbestosis register the cause of death on the deathcertificate must mention the word Asbestosis.
Sources: Office for National Statistics;Health and Safety Executive: 0151 951 4842/4604;
9.10 Injuries to workers:1 by industry and severity of injuryGreat BritainAs reported to all enforcing authorities Numbers
Fatal Major Over 3 Days2
2004 2005 2006 2004 2005 2006 2004 2005 2006/05 /06 /07 /05 /06 /07 /05 /06 /07
Section SIC (92)
Agriculture, hunting, forestry and fishing3 KSYS A,B 01,02,05 42 34 34 KSZN 586 538 487 KTAZ 933 893 856Energy and water supply industries KSYT C,E 10-14,40/41 2 5 10 KSZO 411 402 395 KTBH 1 565 1 344 1 347Mining and quarrying KSYU C 10-14 2 4 9 KSZP 235 220 197 KTBI 722 589 605Mining and quarrying of energy producing
materials KSON CA 10-12 1 2 7 KSZQ 141 128 118 KTBJ 484 362 377Mining and quarrying except energy
producing materials KSOO CB 13/14 1 2 2 KSZR 94 92 79 KTBK 238 227 228Electricity, gas and water supply KSOP E 40/41 – 1 1 KSZS 176 182 198 KTBL 843 755 742Manufacturing KSOQ D 15-37 43 45 35 KSZT 6 201 5 525 5 175 KTBM 26 408 24 220 21 769
of food products; beverages and tobacco KSOR DA 15/16 3 4 5 KSZU 1 133 1 060 922 KTBN 6 523 5 987 5 232of textile and textile products KSOS DB 17/18 1 2 – KSZV 157 132 128 KTBO 618 525 437of leather and leather products KSOT DC 19 – – – KSZW 13 8 5 KTBP 38 30 24of wood and wood products KSOU DD 20 3 4 3 KSZX 288 231 226 KTBQ 678 690 697of pulp, paper and paper products;
publishing and printing KSOV DE 21/22 2 1 2 KSZY 398 311 341 KTBR 1 600 1 520 1 317of coke, refined petroleum products and
nuclear fuel KSOW DF 23 – – 1 KSZZ 16 22 21 KTBS 40 52 49of chemicals, chemical products and
man-made fibres KSOX DG 24 3 3 2 KTAE 327 261 216 KTBT 1 230 1 063 979of rubber and plastic products KSOY DH 25 9 4 – KTAF 444 388 367 KTBU 1 959 1 747 1 522of other non-metallic mineral products KSOZ DI 26 4 7 1 KTAG 331 280 268 KTBV 1 349 1 171 977of basic metals and fabricated metal
products KSYV DJ 27/28 7 5 9 KTAH 1 301 1 220 1 203 KTBW 4 122 3 921 3 846of machinery and equipment not
elsewhere classified KSYW DK 29 3 2 7 KTAI 332 313 323 KTBX 1 604 1 415 1 370of electrical and optical equipment KSYX DL 30-33 1 – – KTAJ 221 187 197 KTBY 1 180 1 021 936of transport equipment KSYY DM 34/35 5 5 3 KTAK 534 474 470 KTBZ 2 725 2 541 2 377
Manufacturing not elsewhere classified KSYZ DN 36/37 2 8 2 KTAL 706 638 487 KTCA 2 742 2 537 2 006Construction KSZA F 45 69 60 77 KTAM 4 496 4 472 4 430 KTCB 8 288 8 384 7 857Total service industries KSZB G-Q 50-99 67 73 85 KTAN 20 008 19 280 18 964 KTCC 85 728 85 427 82 393Wholesale and retail trade, and repairs KSZC G 50-52 11 16 6 KTAO 3 967 3 759 3 648 KTCD 15 355 15 020 14 067Hotel and restaurants KSZD H 55 3 3 4 KTAP 1 256 1 190 1 092 KTCE 4 001 4 068 4 088Transport, storage and communication4 KSZE I 60-64 22 20 34 KTAQ 3 782 3 541 3 331 KTCF 22 303 22 035 20 439Financial intermediation KSZF J 65-67 – 1 – KTAR 326 250 274 KTCG 895 747 726Real estate, renting and business activities KSZG K 70-74 8 19 14 KTAS 2 694 2 573 2 471 KTCH 7 248 7 182 7 157Public administration and defence KSZH L 75 9 2 5 KTAT 3 280 3 393 3 377 KTCI 16 951 16 873 16 290Education KSZI M 80 1 1 2 KTAU 1 042 1 073 1 151 KTCJ 2 625 2 679 2 881Health and social work KSZJ N 85 – 2 5 KTAV 2 339 2 334 2 385 KTCK 13 266 13 812 13 807Other community, social and personal
services activities KSZK O-Q 90-99 13 9 15 KTAW 1 322 1 167 1 235 KTCL 3 084 3 011 2 938
All industries KSZM 223 217 241 KTAY 31 702 30 217 29 450 KTCN 122 922 120 268 114 222
1 See chapter text.2 Injuries causing incapacity for normal work for more than 3 days.3 Excludes sea fishing.
4 Injuries arising from shore based services only. Excludes incidents reportedunder merchant shipping legislation.
Sources: Health and Safety Executive (HSE): 0151 951 4842/4604;[email protected]

xi
Social protection
Social protection
Ch
apter 10

140
Social protection
Class 4 Profit-relatedcontributionspaidbytheselfemployed inadditiontoClass2contributions. Class4contributionsstopatStatePensionage.
Undersomecircumstancespeoplewhoarenot inemploymentdonothavetomakevoluntary contributionstoaccrueaqualifyingyearfor BasicStatePension.
Home Responsibilities Protection
HomeResponsibilitiesProtection(HRP)helpstoprotectthebasicStatePensionofthoseprecludedfromregularemploymentbecausetheyarecaringforchildrenorasickordisabledpersonathome.TobeentitledtoHRP,apersonmusthavebeenprecludedfromregularemploymentforafulltaxyear.HRPreducestheamountofqualifyingyearsapersonwouldotherwiseneedforaBasicStatePension.
National Insurance Credits
Inadditiontopaying,orbeingtreatedashavingpaidcontributions,apersoncanbecreditedwithNationalInsurance.Contributioncreditshelptoprotectpeople’srightstoStateRetirementPensionandotherSocialSecurityBenefits.
Apersonislikelytobeentitledtocontributionscreditsiftheyare:astudentinfulltimeeducationortraining,inreceiptofJobseeker’sAllowance,unabletoworkduetosicknessordisability,entitledtoStatutoryMaternityPayorStatutoryAdoptionPay,ortheyhavereceivedCarer’sAllowance.
Creditsareautomaticallyawardedformenaged60to65providedtheyarenotliabletopayClass1or2NICs,andtoyoungpeopleforthetaxyearscontainingtheir16th,17thand18thbirthdays.
Jobseeker’s Allowance
(Table 10.6)
Jobseeker’sAllowanceJSAreplacedUnemploymentBenefitandIncomeSupportforunemployedclaimantson7October1996.Itisaunifiedbenefitwithtworoutesofentry:contribution-based,whichdependsmainlyuponNationalInsurancecontributions,andincome-based,whichdependsmainlyuponameanstest.Someclaimantscanqualifybyeitherroute.Inpracticetheyreceiveincome-basedJSAbuthaveanunderlyingentitlementtothecontribution-basedelement.
Social protection
(Tables 10.2 to 10.11, 10.13 and 10.15 to 10.19)
Tables10.2to10.6,10.9to10.11and10.13to10.19givedetailsofcontributorsandbeneficiariesundertheNationalInsuranceandIndustrialInjuryActs,supplementarybenefitsandwarpensions.
TherearefourclassesofNationalInsuranceContributions(NICs):
Class 1 Earnings-relatedcontributionspaidonearnings fromemployment.Employeespayprimary Class1contributionsandemployerspaysecondary Class1contributions.PaymentofClass1 contributionsbuildsupentitlementtocontributory benefitswhichincludeBasicStatePension; AdditionalStatePension(StateEarningsRelated PensionSchemeSERPSandfromApril2002, StateSecondPension,S2P);ContributionBased Jobseeker’sAllowance;BereavementBenefits;and IncapacityBenefit.
Primaryclass1contributionsstopatStatePension age,butnotClass1secondarycontributionspaid byemployers.
Therearereducedcontributionrateswherethe employeecontractsoutofS2P(previouslySERPS). TheystillreceiveaBasicStatePensionbutan OccupationalorPersonalPensioninsteadofthe AdditionalStateSecondPension.
Class 2 Flatratecontributionspaidbytheself-employed whoseprofitsareabovethesmallearnings exception.PaymentofClass2contributionsbuilds upentitlementtothecontributorybenefits,which includeBasicStatePension,BereavementBenefits, MaternityAllowanceandIncapacityBenefit,butnot AdditionalStateSecondPensionorContribution BasedJobseeker’sAllowance(JSA).
Class2contributionsstopatStatePensionage.
Class 3 Flatratevoluntarycontributions,whichcanbe paidbysomeonewhosecontributionrecordis insufficient.PaymentofClass3contributionsbuilds upentitlementtocontributorybenefitswhich includeBasicStatePensionandBereavement Benefits.

141
Social protection
Sickness Benefit, Invalidity Benefit and Incapacity Benefit
(Tables 10.7 and 10.8)
IncapacityBenefitreplacedSicknessBenefitandInvalidityBenefitfrom13April1995.Thefirstconditionforentitlementtothesecontributorybenefitsisthattheclaimantsareincapableofworkbecauseofillnessordisablement.Thesecondisthattheysatisfythecontributionconditionswhichdependoncontributionspaidasanemployed(Class1)orself-employedperson(Class2).UnderSicknessandInvalidityBenefitsthecontributionconditionswereautomaticallytreatedassatisfiedifapersonwasincapableofworkbecauseofanindustrialaccidentorprescribeddisease.UnderIncapacityBenefitthosewhodonotsatisfythecontributionconditionsinthiscasedonothavethemtreatedassatisfied.Class1Acontributionspaidbyemployersareinrespectofthebenefitofcarsprovidedfortheprivateuseofemployees,andthefreefuelprovidedforprivateuse.Thesecontributionsdonotprovideanytypeofbenefitcover.
Since6April1983,mostpeopleworkingforanemployerandpayingNationalInsurancecontributionsasemployedpersonsreceiveStatutorySickPay(SSP)fromtheiremployerwhentheyareoffworksick.SSPwaspayableforamaximumofeightweeksuntil5April1986,and28weeksthereafter.Peoplewhodonotworkforanemployer,andemployeeswhoareexcludedfromtheSSPscheme,orthosewhohaverunoutofSSPbeforereachingthemaximumof28weeksandarestillsick,canclaimbenefit.AnyperiodofSSPisexcludedfromthetables.
Spellsofincapacityofthreedaysorlessdonotcountasperiodsofinterruptionofemploymentandareexcludedfromthetables.Exceptionsarewherepeoplearereceivingregularweeklytreatmentbydialysisortreatmentbyradiotherapy,chemotherapyorplasmapheresiswheretwodaysinanysixconsecutivedaysmakeupaperiodofinterruptionofemployment,andthosewhoseincapacityforworkendswithinthreedaysoftheendofSSPentitlement.
Atthebeginningofaperiodofincapacity,benefitissubjecttothreewaitingdays,exceptwheretherewasanearlierspellofincapacityofmorethanthreedaysinthepreviouseightweeks.EmployeesentitledtoSSPforlessthan28weeksandwhoarestillsickcangetSicknessBenefitorIncapacityBenefitShortTerm(Low)untiltheyreachatotalof28weeksprovidedtheysatisfytheconditions.After28weeksSSPand/orSicknessBenefit(SB),InvalidityBenefit(IVB)waspayableuptopensionageforaslongastheincapacitylasts.FrompensionageIVBwaspaidattheperson’sStatePensionrate,untilentitlementceaseswhenSPispaidoratdeemedpensionage(70foraman,65forawoman).ForpeopleonIncapacityBenefitunder
StatePensionagetherearetwoshort-termrates:thelowerrateispaidforthefirst28weeksofsicknessandthehigherrateforweeks29to52.Fromweek53theLongTermrateIncapacityBenefitispayable.TheShortTermrateIncapacityBenefitisbasedonStatePensionentitlementforpeopleoverStatePensionageandispaidforuptoayearifincapacitybeganbeforepensionage.
Thelong-termrateofIncapacityBenefitappliestopeopleunderStatePensionagewhohavebeensickformorethanayear.Peoplewithaterminalillness,orwhoarereceivingthehigherratecarecomponentofDisabilityLivingAllowance,willgettheLongTermrate.TheLongTermrateisnotpaidforpeopleoverpensionage.
UnderIncapacityBenefit,forthefirst28weeksofincapacity,peoplepreviouslyinworkwillbeassessedonthe‘ownoccupation’test–theclaimant’sabilitytodotheirownjob.Otherwise,incapacitywillbebasedonapersonalcapabilityassessment,whichwillassessabilitytocarryoutarangeofwork-relatedactivities.Thetestwillapplyafter28weeksofincapacityorfromthestartoftheclaimforpeoplewhodidnotpreviouslyhaveajob.Certainpeoplewillbeexemptedfromthistest.
Thetablesexcludeallmenagedover65andwomenagedover60whoareinreceiptofStatePension,andallpeopleoverdeemedpensionage(70foramanand65forawoman),membersofthearmedforces,marinerswhileatsea,andmarriedwomenandcertainwidowswhohavechosennottobeinsuredforsicknessbenefit.Thetablesincludeanumberofindividualswhowereunemployedpriortoincapacity.
TheShortTerm(Higher)andLongTermratesofIncapacityBenefitaretreatedastaxableincome.ThereweretransitionalprovisionsforpeoplewhowereonSicknessorInvalidityBenefiton12April1995.TheywereautomaticallytransferredtoIncapacityBenefit,payableonthesamebasisasbefore.FormerIVBrecipientscontinuetogetAdditionalPensionentitlement,butfrozenat1994levels.AlsotheirIVBisnotsubjecttotax.IftheywereoverStatePensionageon12April1995theymaygetIncapacityBenefitforuptofiveyearsbeyondpensionage.
Child Benefits
(Table 10.9)
ChildBenefit(CB)ispaidtothoseresponsibleforchildren(agedunder16)orqualifyingyoungpeople.Thelatterincludes:
a) apersonundertheageof19infull-timenon-advanced educationor(fromApril2006)oncertainapproved vocationaltrainingprogrammes

142
Social protection
b) apersonwhoisaged19whobegantheircourseof full-time,non-advancededucationorapprovedtraining beforereachingage19(note:thosereaching19upto 9April2006ceasedtoqualifyontheir19thbirthdays)
c) apersonwhohasreachedtheageof16untilthe 31Augustfollowingtheir16thbirthday
d) apersonaged16or17whohaslefteducationand trainingwhoisregisteredwiththeCareersserviceorwith Connexionsandisawaitingaplacementinemployment ortrainingforthelimitedperiodofupto20weeksfrom thedatetheylefteducationortraining
Entitlementforaqualifyingyoungpersoncontinuesuntiltheterminaldatefollowingthedatetheyleavefull-timeeducationorapprovedtraining.TheterminaldatesareattheendofAugust,November,FebruaryandMay(thereisaslightvariationforScotland).Entitlementisalsomaintainedforapersonwhoisenteredforexternalexaminationsconnectedwiththeircoursethroughouttheperiodbetweenapersonleavingeducationortrainingandcompletingthoseexaminations.
Entitlementinallcasesceaseswhenapersonreachestheageof20.
Guardian’sAllowanceisanadditionalallowanceforpeoplebringingupachildbecauseoneorbothoftheirparentshasdied.TheymustbegettingChildBenefit(CB)forthechild.
ThetableshowsthenumberoffamiliesintheUKinreceiptofCB.Thenumbersshowninthetableareestimatesbasedonarandom5percentsampleofawardscurrentat31August,andarethereforesubjecttosamplingerror.Thefigurestakenoaccountofnewclaims,orrevisionstoclaimsthatwerereceivedorprocessedafter31August,eveniftheyarebackdatedtostartbefore31August.
Family Credit/ Working Families’ Tax Credit
(Table 10.10)
WorkingFamilies’TaxCredit(WFTC)replacedFamilyCreditfrom5October1999.
FamilyCreditwas,andWorkingFamilies’TaxCreditis,availabletofamilieswithatleastoneadultinremunerativeworkforatleast16hoursperweekandwhoisresponsibleforatleastonechildunder16(under19ifinfulltimeeducationuptoA-levelorequivalentstandard).TherateofpaymentofWFTCdependsonthenumberofsuchchildrenandexpenditureincurredoneligiblechildcare.Itisalsohigheriftheworkerworksforatleast30hoursperweek,oriftherearedisabledchildrenorseverelydisabledadultsinthefamily.
Itistaperedawayaboveanincomethreshold.FurtherdetailscanbeobtainedfromtheInlandRevenue.
Child and Working Tax Credits (New Tax Credits)
(Table 10.11)
ChildandWorkingTaxCredits(CTCandWTC)replacedWorkingFamilies’TaxCredit(WFTC)from6thApril2003.
CTCandWTCareclaimedbyindividuals,orjointlybycouples,whetherornottheyhavechildren.
CTCprovidessupporttofamiliesforthechildren(uptothe31Augustaftertheir16thbirthdays)andthe‘qualifying’youngpeople(infull-timenon-advancededucationuntiltheir19thbirthdays)forwhichtheyareresponsible.ItispaidinadditiontoCB.
WTCtopsuptheearningsoffamiliesonlowormoderateincomes.Peopleworkingforatleast16hoursaweekcanclaimitifthey:(a)areresponsibleforatleastonechildorqualifyingyoungperson,(b)haveadisabilitywhichputsthematadisadvantageingettingajob,or(c)inthefirstyearofwork,havingreturnedtoworkagedatleast50afteraperiodofatleastsixmonthsreceivingout-of-workbenefits.Otheradultsalsoqualifyiftheyareagedatleast25andworkforatleast30hoursaweek.
Widow’s Benefit and Bereavement Benefit
(Table 10.12 and 10.13)
Widow’sBenefitispayabletowomenwidowedonorafter11April1988anduptoandincluding8April2001.TherearethreetypesofWidow’sBenefits:Widow’sPayment,WidowedMother’sAllowanceandWidow’sPension.Womenwidowedbefore11April1988continuetoreceiveWidow’sBenefitbasedontherulesthatexistedbeforethatdate.BereavementBenefitwasintroducedon9April2001asareplacementofWidow’sBenefit,payabletobothmenandwomenwidowedonorafter9April2001.TherearethreetypesofBereavementBenefitsavailable:BereavementPayment,WidowedParent’sAllowanceandBereavementAllowance.
Government expenditure on social services and housing
(Table 10.20 to 10.25)
ThetablesofgeneralgovernmentexpenditureonsocialservicesandhousingintheUKcompriseasummarytablefollowedbyseparatetablesforeachofthesocialservicesandhousingcategories.Thedefinitionofgovernmentexpenditure

143
Social protection
usedinthetablesisconsistentwithTable5.2.4SandTable11.2oftheBlue Book2006Edition,andcoversbothcurrentandcapitalexpenditureofcentralgovernment(includingtheNationalInsuranceFund)andlocalauthorities.
ThefiguresinthetableshavebeencompiledbasedontheUnitedNationsClassificationoftheFunctionsofGovernment(COFOG)andareconsistentwiththeEuropeanSystemofAccounts1995(ESA95).Theformatofthetableswasrevisedinthe2007edition.AssuchtheymaynotbecomparablewithearliereditionsoftheAnnualAbstractofStatistics,whichwerebasedondatainformationsupplieddirectlybygovernmentdepartments.Thisinformationfromgovernmentdepartmentsisgenerallynolongeravailable,assuchthetablesarecompiledunderthecategoriesofNationalAccounts.
Useful links
NationalAccountsBlue Bookwww.statistics.gov.uk/statbase/Product.asp?vlnk=1143
UNCoFoGclassificationhttp://unstats.un.org/unsd/cr/registry/regcst.asp?Cl=4
Themaincategoriesofexpenditurenowusedare:
FinalConsumptionExpenditure–Theexpenditureongoodsandservicesthatareusedforthedirectsatisfactionofindividualneedsorthecollectiveneedsofmembersofthecommunityasdistinctfromtheirpurchaseforuseintheproductiveprocess.Itmaybecontrastedwithactualfinalconsumption,whichisthevalueofgoodsconsumedbutnotnecessarilypurchasedbythatsector.
CompensationofEmployees–Totalremunerationpayabletoemployeesincashorinkind.Includesthevalueofsocialcontributionspayablebytheemployer
NetProcurement–currentexpenditurelessreceiptsforsalesandcharges.
GrossCapitalFormation–acquisitionlessdisposalsoffixedassetsandtheimprovementofland.
Subsidies–currentunrequitedpaymentsmadebygeneralgovernmentortheEuropeanUniontoenterprises.Thosemadeonthebasisofaquantityorvalueofgoodsorservicesareclassifiedas‘subsidiesonproducts’.Othersubsidiesbasedonlevelsofproductiveactivity(e.g.numbersemployed)aredesignatedOthersubsidiesonproduction.
CapitalTransfers–transferswhicharerelatedtotheacquisitionordisposalofassetsbytherecipientorpayer.Theymaybeincashorkind,andmaybeimputedtoreflecttheassumptionorforgivenessofdebt.
Non-producedfinancialornonfinancialassets–assetsproducedeitherthroughproductionorotherwiseofanon-financialnature.
Non-marketcapitalconsumption–outputofownaccountproductionofgoodsandservicesprovidedfreeoratpricesthatarenoteconomicallysignificant.Non-marketoutputisproducedmainlybythegeneralgovernmentandNonProfitInstitutionsServingHouseholdssectors.
Education
(Table 10.21)
Table10.21includesexpenditurebytheeducationdepartments,localeducationauthoritiesandtheUniversityGrantsCommitteeoneducationinschools,trainingcolleges,technicalinstitutionsanduniversities.CompensationofemployeesfiguresarebasedonrevenueoutturnreturnsproducedbyDepartmentforCommunitiesandLocalGovernment,WelshAssemblyGovernmentandtheScottishGovernment.
National Health Service
(Table 10.22)
Table10.22includesexpenditurebycentralgovernmentonhospitalandcommunityhealth,familypractitionerandotherhealthservices.ThefiguresarebasedondepartmentalexpenditurereportedtoHMTreasury.
Welfare services
(Table 10.23)
Personalsocialservices:thistablecoverslocalauthorityandcentralgovernmentexpenditure,onsuchthingsastheaged,handicapped,homeless,childcare,careofmothersandyoungchildren,mentalhealth,domestichelp,etc.
Social security
(Table 10.24)
Table10.24comprisesbothbenefitsundertheSocialSecurityschemesandnon-contributorybenefitsandallowances,administeredbytheDepartmentforWorkandPensions.Benefitspaidoverseasarealsoincluded,asareunfundedsocialbenefitssuchasvoluntaryemployersocialcontributions.TheanalysisbytypeofIncomeSupportisnotexact;theestimatesarederivedfromaveragenumbersinreceiptofbenefitandaverageamountspaid.Warpensionswhichare
144
Social protection
nowadministeredbytheMinistryofDefenceareincludedinthistable.ChildandWorkingTaxCredits(NTC’s)replacedWorkingFamilies’TaxCredit(WFTC)from6April2003andareadministeredbytheHMRC.
Housing
(Table 10.25)
Thetableshowsgovernmentexpenditureonhousing.Itincludesexpendituremadebythecentralandlocalgovernmentsectors,butexcludesexpenditurebypubliccorporations.TheHousingRevenueAccountisclassifiedasaquasi-publiccorporation,sothatmostofitscurrentandcapitalexpenditureandincomeisincludedinthecorporateratherthangovernmentsector.Alloverheadandadministrationexpensesareincludedinfinalcurrentexpenditure.Non-capitalisedsupportforpubliccorporationsandothermarketbodiesrelatingtohousingisrecordedassubsidies.Capitaltransfersarepaidmainlybylocalgovernmenttoindividualsforrepairandimprovementofprivatelyownedhousing.Currenttransferspaidincludeinsurancepremiums.GrosscapitalformationincludesthatofthecouncilhousesadministeredbytheHousingRevenueAccount.ThisisnetofanysalesofhousingeitherthroughRighttoBuyorLargeScaleVoluntaryTransfers.Housingbenefitintheformofrentrebatesandrentallowancesisnotincludedinthetable,astheyareregardedasformsofsocialsecurity.

145
Social protection
10.1 National Insurance Fund(Great Britain and Northern Ireland)Years ended 31 March £ million
1998 1999 2000 2001 2002 2003 2004 2005 2006/99 /00 /01 /02 /03 /04 /05 /06 /07
ReceiptsOpening balance KJFB 9 763 12 625 14 909 19 868 24 177 27 267 27 816 29 804 34 940Contributions JXVM 50 023 51 852 55 627 58 050 59 658 59 827 62 863 67 786 69 599State Scheme Premiums1 C59W .. .. .. .. 194 147 115 117 76Grant from Consolidated Fund KOTF 3 2 .. .. .. .. .. .. ..Compensation for SSP/SMP KJQM 576 625 688 710 775 1 346 1 470 1 392 1 197Transfers from Great Britian KOTG 315 230 200 110 350 260 270 185 630Income from
investments KJFE 667 724 884 1 146 1 457 1 292 1 288 1 399 1 867Other receipts KJFF 92 127 112 67 80 82 72 66 54Redundancy receipts KIBQ 21 21 23 22 24 28 32 38 43
Total JYJO 61 462 66 206 72 442 79 972 86 716 90 249 93 926 100 787 108 406
ExpenditureTotal benefits JYJP 46 822 50 026 50 960 54 550 54 201 56 255 58 572 61 304 63 695
Jobseeker’s Allowance(Contributory) LUQW 489 475 449 478 519 512 455 497 493
Incapacity JYXL 7 574 7 206 6 982 7 074 7 104 7 116 6 910 7 028 7 009Maternity KETY 39 40 46 57 70 128 153 128 180Bereavement Benefits KEWU 1 008 1 020 1 008 1 132 1 142 1 033 946 903 826Guardian’s allowances and
Child’s special allowance2 KJFK 2 2 2 2 2 2 1 2 2Retirement pensions3 JYJV 38 072 41 157 42 350 45 677 45 240 47 339 49 979 52 578 55 053Pensioners’ lump
sum payments KAAW 128 126 123 131 124 125 128 168 131Other payments KAAZ 18 19 21 29 27 34 30 33 40Administration KABE 1 053 847 1 197 873 1 280 1 794 1 521 1 464 1 473Transfers to Northern
Ireland KABF 315 230 200 110 350 260 270 185 630Redundancy payments KIBR 140 174 195 232 255 243 222 295 248Personal Pensions C59X .. .. .. .. 3 336 3 847 3 508 2 566 3 076
Total JYJU 48 837 51 297 52 574 55 795 59 449 62 433 64 123 65 847 69 161
Accumulated funds KABH 12 625 14 909 19 868 24 177 27 267 27 816 29 804 34 940 39 245
1 State Scheme Premiums are payable in respect of employed persons whocease to be covered, in certain circumstances, by a contracted out pensionscheme.
2 Includes Child’s special allowance for Northern Ireland3 Includes personal pensions up to 2001/02.
Sources: HM Revenue and Customs: 01702 367480;Department for Work and Pensions: 01253 856123 Ext 62436
10.2 Persons1 who paid National Insurance contributions2 in a tax year:3 by sexUnited Kingdom
Millions
Total Men Women
2003 2004 2005 2003 2004 2005 2003 2004 2005/04 /05 /06 /04 /05 /06 /04 /05 /06
Total4 KABI 28.51 28.31 28.26 KEYF 15.68 15.55 15.50 KEYP 12.84 12.76 12.76Class 1 KABJ 25.18 25.00 25.10 KEYG 13.34 13.22 13.25 KEYQ 11.84 11.78 11.85
Not contracted out5 KABK 16.42 16.83 17.10 KEYH 9.09 9.31 9.49 KEYR 7.33 7.52 7.61Contracted out KABL 7.36 6.96 6.85 KEYI 3.64 3.39 3.26 KEYS 3.72 3.57 3.58Mixed contracted in/out6 KABM 1.41 1.21 1.15 KEYJ 0.61 0.51 0.50 KEYT 0.80 0.69 0.66
Class 1 Reduced rate(including standard rate) KABO 0.07 0.06 0.04 KEYL .. .. .. KEYV 0.07 0.06 0.04
Class 2 exclusively7 KABP 2.32 2.36 2.34 KEYM 1.78 1.79 1.76 KEYW 0.54 0.56 0.58Mixed Class 1 and Class 2 KABQ 0.66 0.67 0.67 KEYN 0.45 0.45 0.45 KEYX 0.21 0.22 0.23
Class 3 exclusively8 KABR 0.18 0.15 0.10 KEYO 0.08 0.07 0.04 KEYY 0.10 0.08 0.06Mixed Class 1 and Class 3 I6CF 0.08 0.05 0.01 I6CI 0.02 0.01 – I6CL 0.05 0.04 0.01Mixed Class 2 and Class 3 I6CG 0.02 0.02 – I6CJ 0.01 0.01 – I6CM 0.01 0.01 –Mixed Class 1, 2 and 3 I6CH .. .. .. I6CK .. .. .. I6CN .. .. ..
1 Based on all persons making contributions and not only if they have a quali-fying year.
2 Estimates obtained from DWP Information Directorate: Lifetime LabourMarket Data Tabulation Tool which uses a 1% sample of the National In-surance Recording System (NIRS2) July 2007 extract.
3 The tax year commences on 6 April and ends on 5 April the following year.4 Components may not sum to totals as a result of rounding.
5 Includes those persons with an Appropriate Personal Pension (such personspay contributions at the not contracted out rate but then receive a rebate paiddirectly to their scheme).
6 Not included in the above rows.7 Persons who paid a mixture of Class 2 contributions and others are not includ-
ed in this category.8 Persons who paid a mixture of Class 3 contributions and others are not includ-
ed in this category.Sources: Department for Work and Pensions: 020 7122 2444;
HM:Revenue and Customs

146
Social protection
10.3 National Insurance contributionsUnited Kingdom
Employee’s standard contibutions1 Employer’s standard contributions1
not contracted- contracted-out not contracted- contracted-outout rate rate2 out rate rate3
Class 1
Weekly earnings
2001/02Below 72.00 (LEL) - - - -72.00-87.00 (PT/ST) - See note 4 - See note 587.01-575.00 (UEL) 10.0% 8.4% 11.9% 8.9%Above 575.00 (UEL) £48.80 £40.75 11.9% 11.9%
2002/03Below 75.00 (LEL) - - - -75.00-89.00 (PT/ST) - See note 4 - See note 689.01-585.00 (UEL) 10.0% 8.4% 11.8% 8.3%Above 585.00 (UEL) £49.60 £41.44 11.8% 11.8%
2003/04Below 77.00 (LEL) - - - -77.00-89.00 (PT/ST) - See note 4 - See note 689.01-595.00 (UEL) 11.0% 9.4% 12.8% 9.3%
£55.66 £47.37Above 595.00 (UEL) 1% 1% 12.8% 12.8%
2004/05Below 79.00 (LEL) - - - -79.00-91.00 (PT/ST) - See note 4 - See note 691.01-610.00 (UEL) 11.0% 9.4% 12.8% 9.3%
£57.09 £48.59Above 610.00(UEL) 1.0% 1.0% 12.8% 12.8%
2005/06Below 82.00 (LEL) - - - -82.00-94.00 (PT/ST) - See note 4 - See note 694.01-630.00 (UEL) 11.0% 9.4% 12.8% 9.3%
£58.96 £50.38Above 630.00(UEL) 1.0% 1.0% 12.8% 12.8%
2006/07Below 84.00 (LEL) - - - -84.00-97.00 (PT/ST) - See note 4 - See note 697.01-645.00 (UEL) 11.0% 9.4% 12.8% 9.3%
£60.28 £51.51Above 645.00(UEL) 1.0% 1.0% 12.8% 12.8%
2007/08Below 87.00 (LEL) - - - -87.00-100.00 (PT/ST) - See note 4 - See note 7100.01-670.00 (UEL) 11.0% 9.4% 12.8% 9.1%
£62.70 £53.58Above 670.00(UEL) 1.0% 1.0% 12.8% 12.8%
2001/02 2002/03 2003/04 2004/05 2005/06 2006/07 2007/08
Class 2Flat rate weekly £2.00 £2.00 £2.00 £2.05 £2.10 £2.10 £2.20Small earnings exception8 (per annum) £3,955 £4,025 £4,095 £4,215 £4,345 £4,465 £4,635
Class 3Flat-rate voluntary weekly contributions £6.75 £6.85 £6.95 £7.15 £7.35 £7.55 £7.80
Class 4 (Self-employed; profit-related)Rate on profits between LPL and UPL 7.0% 7.0% 8.0% 8.0% 8.0% 8.0% 8.0%Rate on profits above UPL .. .. 1.0% 1.0% 1.0% 1.0% 1.0%Lower profits limit (LPL) £4,535 £4,615 £4,615 £4,745 £4,895 £5,035 £5,225Upper profits limit (UPL) £29,900 £30,420 £30,940 £31,720 £32,760 £33,540 34,840
Note: LEL: Lower Earnings Limit; UEL: Upper Earnings Limit. PT: PrimaryThreshold; ST: Secondary Threshold.
1 Married women opting to pay contributions at the reduced rate at 3.85% be-fore 2003-04 and 4.85% from 2003-04 earn no entitlement to contributoryNational Insurance benefits as a result of these contributions. No womenhave been allowed to exercise this option since 1977, but around 70,000women who have been continually married or widowed and in the labourmarket since that time have retained their right to pay the reduced rate.
2 The contracted-out rebate for employees’ contributions is applied onlybetween LEL and UEL. Earnings below LEL are charged at the appropriatenot contracted-out rate (which depends on total earnings). Earnings abovethe UEL are not subject to employee NICs before 2003-04.
3 The rates shown only apply to Contracted-Out Salary Related schemes(COSR). Earnings below the LEL and above the UEL are charged at theappropriate
not-contracted out rate. The employers’ contracted-out rate applies onlybetween the LEL and the UEL.
4 The contracted-out rebate for primary contributions is 1.6% of earningsbetween the LEL and the UEL for all forms of contracting-out.
5 The contracted-out rebate for secondary contributions is 3.0% of earningsbetween the LEL and the UEL.
6 The contracted-out rebate for secondary contributions is 3.5% of earningsbetween the LEL and the UEL up to 2006-07.
7 Since 2007-08 the contracted-out rebate for secondary contributions is 3.7% ofearnings between the LEL and UEL.
8 If earnings from self-employment are below this annual limit and the contributorapplies for and is granted a small earnings exception Class 2 contributionsneed not be paid. Class 2 or 3 contributions may be paid voluntarily.
Source: HM Revenue and Customs: 020 7147 3045

147
Social protection
10.4 Weekly rates of principal social security benefits1
Great BritainAt April £
1997 1998 1999 2000 2001 2002 2003 2004 2005 2006 2007
Jobseeker’s Allowance:Personal allowances
SingleAged under 18 KXDH 29.60 30.30 30.95 31.45 31.95 32.50 32.90 33.50 33.85 34.60 35.65Aged 18 - 24 KXDJ 38.90 39.85 40.70 41.35 42.00 42.70 43.25 44.05 44.50 45.50 46.85Aged 25 or over KXDK 49.15 50.35 51.40 52.20 53.05 53.95 54.65 55.65 56.20 57.45 59.15
Lone parentAged under 18 - usual rate F92E .. .. .. 31.45 31.95 32.50 32.90 33.50 33.85 34.60 36.65Aged under 18 - higher rate payable in specific circumstances F92F .. .. .. 41.35 42.00 42.70 43.25 44.05 44.50 45.50 46.85Aged 18 or over F92G .. .. .. 52.20 53.05 53.95 54.65 55.65 56.20 57.45 59.15
CoupleBoth aged under 182 KXDL 58.70 30.30 30.95 31.45 31.95 32.50 32.90 33.50 33.85 34.60 35.65Both under 18, one disabled KXDI 38.90 39.85 40.70 41.35 42.00 42.70 43.25 44.05 44.50 45.50 46.85Both under 18, with a child F92H .. .. .. 62.35 63.35 64.45 65.30 66.50 67.15 68.65 70.70One under 18, one 18 - 24 KXDI 38.90 39.85 40.70 41.35 42.00 42.70 43.25 44.05 44.50 45.50 46.85One under 18, one 25+ F92I .. .. .. 52.20 53.05 53.95 54.65 55.65 56.20 57.45 59.15Both aged 18 or over KXDM 77.15 79.00 80.65 81.95 83.25 84.65 85.75 87.30 88.15 90.10 92.80
Dependant children and young peopleAged under 11 - 16 KXDN 16.90 17.30 20.20 26.60 31.45 33.50 38.50 42.27 43.88 45.58 47.45Aged 16 - 18 KXDP 29.60 30.30 30.95 31.75 32.25 34.30 38.50 42.27 43.88 45.58 47.45
Invalidity allowanceHigh rate KJND 13.15 13.60 14.05 14.20 14.65 14.90 15.15 15.55 16.05 16.50 17.10Middle rate KJNE 8.30 8.60 8.90 9.00 9.30 9.50 9.70 10.00 10.30 10.60 11.00Low rate KJNF 4.15 4.30 4.45 4.50 4.65 4.75 4.85 5.00 5.15 5.30 5.50
Increase for dependantsAdult KJNG 37.35 38.70 39.95 40.40 41.75 42.45 43.15 44.35 45.70 46.95 48.65Each child3 KJNH 11.20 11.30 11.35 11.35 11.35 11.35 11.35 11.35 11.35 11.35 11.35
Incapacity Benefit:Short term (Lower) Under pension age KOSB 47.10 48.80 50.35 50.90 52.60 53.50 54.40 55.90 57.65 59.20 61.35Increase for adult dependant KOSC 29.15 30.20 31.15 31.50 32.55 33.10 33.65 34.60 35.65 36.60 37.90Short term (Lower) Over pension age KOSD 59.90 62.05 64.05 64.75 66.90 68.05 69.20 71.15 73.35 75.35 78.05Increase for adult dependant KOSE 35.90 37.20 38.40 38.80 40.10 42.45 41.50 42.65 43.95 45.15 46.80Short term (Higher) KOSF 55.70 57.70 59.55 60.20 62.20 63.25 64.35 66.15 68.20 70.05 72.55Increase for dependants:
Adult KOSG 29.15 30.20 31.15 31.50 32.55 33.10 33.65 34.60 35.65 36.60 37.90Child3 KOSH 11.20 11.30 11.35 11.35 11.35 11.35 11.35 11.35 11.35 11.35 11.35
Long term KOSI 62.45 64.70 66.75 67.50 69.75 70.95 72.15 74.15 76.45 78.50 81.35Increase for dependants:
Adult KOSJ 37.35 38.70 39.95 40.40 41.75 42.45 43.15 44.35 45.70 46.95 48.65Child3 KOSK 11.20 11.30 11.35 11.35 11.35 11.35 11.35 11.35 11.35 11.35 11.35
Incapacity age addition:4
Higher rate KOSL 13.15 13.60 14.05 14.20 14.65 14.90 15.15 15.55 16.05 16.50 17.10Lower rate KOSM 6.60 6.80 7.05 7.10 7.35 7.45 7.60 7.80 8.05 8.25 8.55
Attendance Allowance:Higher rate KJNI 49.50 51.30 52.95 53.55 55.30 56.25 57.20 58.80 60.60 62.25 64.50Lower rate KJNJ 33.10 34.30 35.40 35.80 37.00 37.65 38.30 39.35 40.55 41.65 43.15
Disability Living Allowance:Care component
Higher rate KXDC 49.50 51.30 52.95 53.55 55.30 56.25 57.20 58.80 60.60 62.25 64.50Middle rate KXDD 33.10 34.30 35.40 35.80 37.00 37.65 38.30 39.35 40.55 41.65 43.15Lower rate KXDE 13.15 13.60 14.05 14.20 14.65 14.90 15.15 15.55 16.05 16.50 17.10
Mobility componentHigher rate KXDF 34.60 35.85 37.00 37.40 38.65 39.30 39.95 41.05 42.30 43.45 45.00Lower rate KXDG 13.15 13.60 14.05 14.20 14.65 14.90 15.15 15.55 16.05 16.50 17.10

148
Social protection
10.4 Weekly rates of principal social security benefits1
Great BritainAt Aprilcontinued £
1997 1998 1999 2000 2001 2002 2003 2004 2005 2006 2007
Maternity Benefit:Maternity allowances for insured
women5
Higher rate KOSN 55.70 57.70 59.55 60.20 .. .. .. .. .. .. ..Lower rate6 KJNL 48.35 50.10 51.70 52.25 .. .. .. .. .. .. ..Standard rate7 GPTJ .. .. .. .. 62.20 75.00 100.00 102.80 106.00 108.85 112.75Threshold8 GPTK .. .. .. .. 30.00 30.00 30.00 30.00 30.00 30.00 30.00
Guardian’s Allowance KJNN 11.20 11.30 11.35 11.35 11.35 11.35 11.55 11.85 12.20 12.50 12.95
Widow’s Benefit:Widow’s pension KJNO 62.45 64.70 66.75 67.50 72.50 75.50 77.45 79.60 82.05 84.25 87.30Widowed mother’s allowance KJNP 62.45 64.70 66.75 67.50 72.50 75.50 77.45 79.60 82.05 84.25 87.30
Addition for each child KJNQ 11.20 11.30 11.35 11.35 11.35 11.35 11.35 11.35 11.35 11.35 11.35
Bereavement Benefit:Bereavement allowance WMPF .. .. .. .. 72.50 75.50 77.45 79.60 82.05 84.25 87.30Widowed parent’s allowance WMOZ .. .. .. .. 72.50 72.50 77.45 79.60 82.05 84.25 87.30
Addition for each child WMPA .. .. .. .. 11.35 11.35 11.35 11.35 11.35 11.35 11.35
State Pension contributory:9
Single person KJNR 62.45 64.70 66.75 67.50 72.50 75.50 77.45 79.60 82.05 84.25 87.30Married couple KJNS 99.80 103.40 106.70 107.90 115.90 120.70 122.80 127.25 131.20 134.75 139.60
State Pension non contributory:Man or woman KJNT 37.35 38.70 39.95 40.40 43.40 45.20 45.45 47.65 49.15 50.50 52.30Married woman KJNU 22.35 23.15 23.90 24.15 24.95 27.00 27.70 28.50 29.40 30.20 31.30
Industrial Injuries Benefit:Disablement pension at 100 percent rate KJNW 101.10 104.70 108.10 109.30 112.90 114.80 116.80 120.10 123.80 127.10 131.70Widow’s or widower’s pension KJNX 62.45 .. .. .. .. .. .. .. .. .. ..
Child Benefit:First child KJOA 11.05 11.45 14.40 15.00 15.50 15.75 16.05 16.50 17.00 17.45 18.10Subsequent children KETZ 9.00 9.30 9.60 10.00 10.35 10.55 10.75 11.05 11.40 11.70 12.10
Family Credit10
(maximum awards payable):11
Families with 1 childBirth to September following
11th birthday KJOB 59.70 61.15 64.95 .. .. .. .. .. .. .. ..From September following 11th birthday
to September following 16th birthday KJOC 67.60 69.25 70.70 .. .. .. .. .. .. .. ..From September following 16th birthday
to day before 19th birthday KJOD 72.45 74.20 75.95 .. .. .. .. .. .. .. ..
Increase for each additional childBirth to September following
11th birthday KJOF 12.05 12.35 15.15 .. .. .. .. .. .. .. ..From September following 11th birthday
to September following 16th birthday KJOG 19.95 20.45 20.90 .. .. .. .. .. .. .. ..From September following 16th birthday
to day before 19th birthday KJOH 24.80 25.40 25.95 .. .. .. .. .. .. .. ..
War pension:Ex-private (100 per cent assessment) KJOJ 107.20 111.10 114.70 116.00 119.80 121.80 127.38 130.16 123.90 133.63 138.40War widow KJOK 81.00 83.90 86.60 87.55 90.45 92.00 92.69 95.27 98.08 100.76 104.26

149
Social protection
10.4 Weekly rates of principal social security benefits1
Great BritainAt Aprilcontinued £
1997 1998 1999 2000 2001 2002 2003 2004 2005 2006 2007
Income Support:Personal allowances12
Singleaged 16-17 usual rate KJOW 29.60 30.30 30.95 31.45 31.95 32.50 32.90 33.50 33.85 34.60 35.65aged 16-17 higher rate in specific circumstances KABS 38.90 39.85 40.70 41.35 42.00 42.70 43.25 44.05 44.50 45.50 46.85aged 18-24 KJOX 38.90 39.85 40.70 41.35 42.00 42.70 43.25 44.05 44.50 45.50 46.85aged 25 or over KJOY 49.15 50.35 51.40 52.20 53.05 53.95 54.65 55.65 56.20 57.45 59.15
Coupleboth aged under 182 KJOZ .. .. .. 31.45 31.95 32.50 32.90 33.50 33.85 34.60 35.65both aged under 18, one disabled F92J .. .. .. 41.35 42.00 42.70 43.25 44.05 44.50 45.50 46.85both aged under 18, with a child F92K .. .. .. 62.35 63.35 64.45 65.30 66.50 67.15 68.65 70.70One aged under 18, one 18-24 F92L .. .. .. 41.35 42.00 42.70 43.25 44.05 44.50 45.50 46.85One aged under 18, one 25+ F92M .. .. .. 52.20 53.05 53.95 54.65 55.65 56.20 57.45 59.15Both aged 18 or over KJPA 77.15 79.00 80.65 81.95 83.25 84.65 85.75 87.30 88.15 90.10 92.80
Lone parentaged 16-17 usual rate KJPB 29.60 30.30 30.95 31.45 31.95 32.50 32.90 33.50 33.85 34.60 35.65aged 16-17 higher rate in specific circumstances KABT 38.90 39.85 40.70 41.35 42.00 42.70 43.25 44.05 44.50 45.50 46.85aged 18 or over KJPC 49.15 50.35 51.40 52.20 53.05 53.95 54.65 55.65 56.20 57.45 59.15
Dependant children and youngpeople12
From 1997 to 1999Birth to September following
11th birthday KXDQ 16.90 17.30 20.20 .. .. .. .. .. .. .. ..From September following
11th birthday to September following 16th KXDR 24.75 25.35 25.90 .. .. .. .. .. .. .. ..From September following
16th birthday to day before 19th KXDS 29.60 30.30 30.95 .. .. .. .. .. .. .. ..Dependant children and young people - from 2000
Birth to September following 16th birthday WMOD .. .. .. 26.60 31.45 33.50 38.50 42.27 43.88 45.58 47.45From September following 16th birthday to day before 19th WMOP .. .. .. 31.75 32.25 34.30 38.50 42.27 43.88 45.58 47.45
Pension Credit13
Standard minimum guarantee:single C59Y .. .. .. .. .. .. 102.10 105.45 109.45 114.05 119.05couple C59Z .. .. .. .. .. .. 155.80 160.95 167.05 174.05 181.70
Additional amount for severe disabilitysingle C5A2 .. .. .. .. .. .. 42.95 44.15 45.50 46.75 48.45couple (one qualifies) C5A3 .. .. .. .. .. .. 42.95 44.15 45.50 46.75 48.45couple (both qualifies) C5A4 .. .. .. .. .. .. 85.90 88.30 91.00 93.50 96.90
Additional amount for carers C5A8 .. .. .. .. .. .. 25.10 25.55 25.80 26.35 27.15
savings creditthreshold single C5A9 .. .. .. .. .. .. 77.45 79.60 82.05 84.25 87.30threshold couple C5AA .. .. .. .. .. .. 123.80 127.25 131.20 134.75 139.60maximum single C5AB .. .. .. .. .. .. 14.79 15.51 16.44 17.88 19.05maximum couple C5AC .. .. .. .. .. .. 19.20 20.22 21.51 23.58 25.26
1 See chapter text2 From 12 April 1999 the personal allowance for couples where both
members are not yet 18 or one of the couples is aged 18 or over dependson the couple’s circumstances. They may be entitled to a couple allowanceor a single person’s allowance dependant on certain criteria.
3 For the first child only the Child Dependency increase is reduced by £1.30to £9.90 because of child benefit.
4 The rate of age addition depends on age at date of onset of incapacity:higher rate for under age 35 and lower rate for age 35-44.
5 Following a EU Directive, employee’s maternity benefit is aligned with thestate benefit they would receive if off work sick.
6 Women who were either not employed or self-employed received the lowerrate.
7 New Standard rate introduced from April 2000.8 MA Earnings Threshold introduced April 2000.9 Retirement pensioners over 80 receive 25p addition.
10 Family credit was replaced by In-work Families with Child or Working Child TaxCredit awards. Some children have protected rights. Further information isavailable from the Department for Work and Pensions.
11 Maximum award does not include the 30 hour credit.12 In addition to personal allowances, a claimant may also be entitled to premiums.
The types of premiums are family, lone parent, pensioner, higher pensioner, di-sability, severe disability and disabled child.
13 Pension Credit replaced Minimum Income Guarantee (MIG) for Income Sup-port for those aged 60 and over on 6th Ocotober 2003.
Sources: Department for Work and Pensions;Information and Analysis Directorate : 0191 225 7373;
HM Revenue and Customs: 020 7438 7370;Ministry of Defence/DASA (Pay & Pensions): 020 7218 4271

150
Social protection
10.5 Social Security Acts: number of persons receiving benefit1Great BritainAt any one time Thousands
1997 1998 1999 2000 2001 2002 2003 2004 2005 2006 2007
Persons receiving:
Jobseeker’s Allowance JYXM 1 406.30 1 181.20 1 105.80 1 060.40 936.40 906.06 914.52 806.35 830.11 930.86 837.50Incapacity benefit KXDT 1 749.20 1 671.20 1 557.10 2 352.50 2 420.90 2 471.14 2 494.89 2 508.77 2 490.85 2 449.99 2 417.70Attendance Allowance2 KXDU 1 183.20 1 225.60 1 243.80 1 556.10 1 570.90 1 290.77 1 315.64 1 377.35 1 419.42 1 465.59 1 507.50Disability Living Allowance2 KXDW 1 886.50 1 995.90 2 061.30 2 193.10 2 306.40 2 424.35 2 547.09 2 644.28 2 729.72 2 799.16 2 881.80Widows’ Benefits3 KJHF 296.40 278.70 267.60 265.10 255.00 223.41 191.50 163.43 138.96 117.65 96.90Bereavement Benefits3 VQAA .. .. .. .. .. 41.49 47.68 51.18 55.24 57.66 58.50
National InsuranceState pension contributory3:
Males KJHH 3 786.50 3 880.40 3 956.30 4 039.40 4 083.90 4 149.16 4 211.37 4 275.67 4 336.81 4 374.18 4 432.30Females KJHL 6 783.20 6 850.70 6 886.30 6 928.00 6 959.70 6 972.20 7 037.15 7 117.78 7 197.92 7 245.71 7 391.10
Total KJHG 10 569.7010 731.1010 842.6010 967.4011 043.6011 121.3511 248.5211 393.4511 534.7311 619.8911 823.40
State pension non contributory3:Males KJHI 5.60 5.50 5.10 5.20 5.10 5.26 5.37 5.39 5.34 5.36 5.68Females KJHJ 20.90 19.80 18.80 18.00 18.20 18.06 17.73 17.31 16.74 16.58 17.34
Total KJHK 26.50 25.20 23.90 23.20 23.30 23.32 23.10 22.70 22.08 21.94 23.03
Industrial Injuries DisablementPensions assessments4 KJHN 257.80 269.10 278.20 274.60 275.40 273.70 267.13 266.48 267.12 266.45 264.88
Reduced Earnings Allowance/Retirement Allowance assessments5,6 KEYC 155.60 152.80 153.50 82.90 82.60 81.00 76.22 74.81 73.15 71.38 69.36
Income Support (Excluding MIG)7 KABV 3 958.00 3 853.10 3 814.40 2 237.10 2 260.60 2 238.76 2 236.38 2 192.64 2 139.78 2 114.77 2 117.70
Pension Credit7 C5AP .. .. .. .. .. .. .. 2 490.76 2 682.73 2 717.39 2 733.50Housing Benefit and Council Tax Benefit8,9
Housing Benefit Total EW3X 4 639.40 4 474.70 4 313.10 4 033.30 3 874.40 3 812.60 3 796.40 3 879.40 3 957.10 3 990.00 4 039.75Social Landlord10 KABY 2 792.30 2 664.10 2 518.50 3 218.40 3 131.10 3 093.80 3 081.67 3 135.49 3 165.89 3 152.25 3 146.30Private Landlord KABZ 1 847.10 1 810.60 1 794.60 815.00 743.30 718.83 714.75 743.93 790.93 837.79 893.40Council tax benefit11 KJPO 5 498.30 5 325.70 5 166.10 4 830.10 4 673.40 4 601.73 4 627.78 4 800.22 4 959.69 5 049.97 5 096.60
War pensions12 KADG 324.64 317.65 306.06 295.67 284.33 272.78 260.79 247.59 235.30 223.85 212.54
1 See chapter text. Figures as at May each year unless otherwise stated.Taken from DWP 100% Work and Pensions Longitudinal Study (WPLS)data.
2 AA and DLA figures based on WPLS data from 2002. Prior to 2002 a con-sistent series for caseload, based on WPLS levels, has been created bycombining older information, available from the previously published 5%sample data, with the WPLS data.
3 Includes overseas cases up to 2002.4 Figures for IIDB include those receiving both IIDB and REA, at March.5 Figures show REA only from 2000, at March.6 Figures from 2000 to 2001 are based on 10% data at March, 2002 and 2003
are at March from 100% data, from 2004 are as at May.7 Pension Credit replaced MIG on 6th October 2003 and extended Income
Support entitlement to customers aged 60+. MIG claimants have been ex-cluded from the IS figures in order to keep the series consistent.
8 Housing Benefit figures excludes any Extended Payment cases.9 As at February.
10 Social landlord figures include registered social landlord tenants.11 Figure excludes Second Adult Rebate Claims.12 Includes overseas cases. As at end of March.
Sources: Department for Work and Pensions;Information and Analysis Directorate : 0191 225 7373;
HM Revenue and Customs: 020 7438 7370;Ministry of Defence/DASA (Pay & Pensions): 020 7218 4271

151
Social protection
10.6 Jobseeker’s Allowance1,2,3 claimants: by benefit entitlementGreat BritainAs at May Thousands
2001 2002 2003 2004 2005 2006 2007
All Persons
All with benefit - total KXDX 843.2 816.2 823.8 725.7 755.1 843.7 758.1Contribution-based JSA only KXDY 146.1 160.4 165.6 135.9 144.6 139.8 117.8Contribution based JSA & income-based JSA KXDZ 18.1 19.1 18.7 14.0 14.0 13.5 12.4Income-based JSA only payment KXEA 679.0 636.7 639.5 575.8 596.4 690.4 627.9No benefit in payment KXEB 93.2 89.8 90.7 80.7 75.0 87.1 79.3
Total KXEC 936.4 906.1 914.5 806.3 830.1 930.9 837.5
Males
All with benefit - total KXED 655.4 626.0 625.3 546.9 565.4 630.4 557.9Contribution-based JSA only KXEE 103.8 114.4 117.8 97.3 103.1 99.6 82.6Contribution based JSA & income-based JSA KXEF 16.6 17.3 16.4 12.7 13.1 12.4 11.1Income-based JSA only payment KXEG 534.9 494.3 491.1 436.8 449.2 518.4 464.2No benefit in payment KXEH 61.5 61.4 62.3 54.7 51.6 58.8 53.6
Total KXEI 716.9 687.4 687.6 601.6 617.0 689.3 611.5
Females
All with benefit - total KXEJ 187.8 190.3 198.5 178.8 189.7 213.3 200.2Contribution-based JSA only KXEK 42.3 46.0 47.8 38.6 41.5 40.3 35.3Contribution based JSA & income-based JSA KXEL 1.5 1.8 2.3 1.3 0.9 1.0 1.3Income-based JSA only payment KXEM 144.0 142.4 148.4 139.0 147.3 172.0 163.7No benefit in payment KXEN 31.7 28.4 28.5 26.0 23.4 28.3 25.7
Total KXEO 219.5 218.6 227.0 204.8 213.1 241.6 225.9
1 See chapter text. Jobseeker’s Allowance (JSA) has two routes of entry:contribution-based which depends mainly upon national insurance contribu-tions and income-based which depends mainly on a means test. Someclaimants can qualify by either route. In practice they receive income-basedJSA but have an underlying entitlement to the contribution-based element.
2 Figures are given at May each year and have been derived by applying 5%proportions to 100% totals taken from the DWP 100% Work and PensionsLongitudinal Study (WPLS).
3 Figures are rounded to the nearest hundred.
Sources: Department for Work and Pensions;Information and Analysis Directorate: 0191 225 7373

152
Social protection
10.7 Sickness Benefit, Invalidity Benefit and Incapacity Benefit1,2 claimants: by sex, ageand duration of spellGreat Britain. At end of May Thousands
2002 2003 2004 2005 2006 2007
MalesAll durations: All ages KJJA 1 526.17 1 525.02 1 517.62 1 492.38 1 455.52 1 428.65
Under 20 KJJB 21.79 21.81 22.04 21.45 19.95 18.6620-29 KJJC 133.83 138.54 142.68 143.24 141.80 146.0730-39 KJJD 250.79 254.30 253.32 245.61 233.70 224.2940-49 KJJE 304.47 311.85 318.04 320.77 319.77 320.2450-59 KJJF 478.01 472.03 463.37 451.93 439.54 418.2660-64 KJJG 337.22 326.45 318.12 309.36 300.73 301.1065 and over KJJH 0.05 0.05 0.05 0.04 0.02 0.03
Over six months: All ages KJJI 1 346.80 1 359.53 1 359.08 1 347.43 1 323.20 1 291.32
Under 20 KJJJ 6.91 13.40 13.78 13.51 12.85 11.7020-29 KJJK 96.61 105.72 110.85 114.57 115.21 117.8330-39 KJJL 213.19 217.05 217.81 213.91 205.36 195.2240-49 KJJM 271.25 278.53 285.90 290.72 291.36 289.9450-59 KJJN 438.55 434.04 427.06 418.60 409.46 387.7660-64 KJJO 320.26 310.75 303.64 296.10 288.93 288.8565 and over KJJP 0.03 0.03 0.04 0.02 0.02 0.03
FemalesAll durations: All ages KJJQ 944.44 969.44 990.84 998.20 994.33 988.93
Under 20 KJJR 21.51 21.49 21.48 20.51 18.92 17.8620-29 KJJS 96.66 100.78 105.02 108.61 109.73 114.4230-39 KJJT 175.37 177.70 177.91 173.45 167.36 162.3940-49 KJJU 252.82 262.20 270.90 276.62 279.32 283.4550-59 KJJV 398.06 407.24 415.52 418.99 418.99 410.8060 and over KJJW 0.03 0.03 0.02 0.02 0.02 0.02
Over six months: All ages KJJX 825.25 858.03 880.52 894.57 896.33 885.69
Under 20 KJJY 7.41 12.35 12.40 12.10 11.13 10.2020-29 KJJZ 72.32 79.63 84.02 88.98 90.99 93.6030-39 KJKA 151.59 154.19 154.95 152.48 148.00 142.2840-49 KJKB 225.65 234.71 243.52 250.11 253.50 255.9950-59 KJKC 368.25 377.12 385.61 390.88 392.69 383.6060 and over KJKD 0.03 0.03 0.02 0.02 0.02 0.02
Unknown GenderAll durations EW44 0.54 0.44 0.31 0.26 0.15 0.13Over 6 months EW45 0.29 0.21 0.16 0.13 0.10 0.09
1 See chapter text. Figures are given at May each year and are based on100% Work and Pensions Longitudinal Study (WPLS) data.
2 Figures will Include a small number of overseas cases.
Sources: Department for Work and Pensions;Information and Analysis Directorate: 0191 225 7373
10.8 Sickness, Invalidity and Incapacity Benefit: days of certified incapacityGreat Britain analysis by age at end of period1
Years starting on first Monday in April2 Millions
1992 1993 19943 1995 1996 1997 1998 1999 2000 2001 2002/93 /94 /95 /96 /97 /98 /99 /00 /01 /02 /03
Age at 31 March4
Males: All ages KJKH 445.5 468.8 507.9 596.2 576.3 563.5 538.6 526.7 531.7 536.1 540.3
Under 20 KJKI 1.5 1.6 1.8 3.4 3.1 3.5 3.7 3.3 2.6 3.5 5.420 - 29 KJKJ 24.5 27.0 30.4 43.7 42.4 43.2 41.7 38.3 38.9 40.4 44.330 - 39 KJKK 41.4 46.6 56.0 72.3 73.9 77.7 78.2 75.8 81.3 84.0 85.140 - 49 KJKL 64.6 72.7 78.9 98.5 98.5 97.7 97.6 98.0 103.9 106.0 106.850 - 59 KJKM 121.7 129.8 141.4 172.0 170.7 172.2 170.0 161.9 165.9 168.5 168.160 - 64 KJKN 102.4 107.3 112.6 127.9 127.8 126.7 124.3 126.0 125.8 120.2 116.365 and over KJKO 80.4 83.9 86.8 78.4 59.9 41.7 23.0 23.4 13.3 13.4 14.4
Females: All ages KJKP 190.7 211.4 237.5 279.5 285.8 292.8 294.8 315.0 325.1 338.7 344.6
Under 20 KJKQ 2.1 2.4 2.6 4.8 4.1 4.4 4.5 4.0 3.5 3.9 5.420 - 29 KJKR 22.1 22.1 23.9 31.9 32.0 32.1 31.3 30.7 30.3 32.3 34.430 - 39 KJKS 28.5 32.7 37.6 48.0 49.8 51.4 53.4 54.9 58.9 59.9 61.340 - 49 KJKT 46.6 51.5 58.9 72.1 74.0 75.8 77.1 79.1 82.8 88.9 89.850 - 59 KJKU 71.3 79.1 88.4 101.0 107.5 115.3 120.0 134.3 142.2 145.9 146.060 and over KJKV 20.1 23.6 26.1 21.7 18.4 13.8 8.4 12.0 7.3 7.9 7.7
1 See chapter text. The end of the statistical year up to 1993/94 was the Sa-turday before the first Monday in April.
2 Up to and including 1994/95 years start first Monday in April. The 1995/96year started 13 April and ended 31 March. From 1996/97 years start 1 April.
3 The statistical year for 1994/95 was extended to 12 April 1995, the day beforethe introduction of the new Incapacity Benefit which replaced Sickness and In-validity Benefit.
4 Until 1995/96 then at 1 March.
Sources: Department for Work and Pensions;Taken from 1% extract;
Information and Analysis Directorate: 0191 225 7373

153
Social protection
10.9 Child benefits1
Thousands
Great Britain United KingdomAs at 31 December As at 31 August
19972 19982 1999 2000 2001 2002 2003 2004 2005 2006 2007
Families receiving allowances:Total KJMU 6 956 6 976 7 102 VOWX 7 340 7 335 7 336 7 342 7 353 7 375 7 441 7 530
With 1 child KJMV .. .. 3 015 VOWY 3 128 3 143 3 162 3 189 3 219 3 260 3 329 3 4142 children KJMW .. .. 2 822 VOWZ 2 898 2 891 2 894 2 890 2 885 2 882 2 884 2 8933 children KJMX .. .. 943 VOXA 977 970 954 942 931 920 917 9114 children KJMY .. .. 241 VOXB 251 247 242 239 235 233 231 2315 or more children KJMZ .. .. 82 VOXC 86 84 83 82 82 80 80 81
Families receiving Guardian’s Allowance VOXG 2.3 2.3 2.3 VOXH 2.5 2.3 2.5 2.6 2.9 2.8 3.2 3.3
1 See chapter text.2 Figures provided by Child Benefit Centre Management Information Statistics
as a new scan was being developed.
Source: HM Revenue and Customs: 020 7147 3021
10.10 Family Credit/ Working Families’ Tax Credit1,2
Thousands
Great Britain United KingdomAs at 31 December As at 30 November
1994 1995 1996 1997 1998 1999 2000 2001 2002
Families in receipt:Total KJTO 578.0 646.5 716.7 751.4 779.7 ZCMK 965.3 1 167.8 1 293.7 1 377.3
Two-parent families: total KJTP 324.6 356.9 390.2 388.0 383.4 ZCML 467.6 565.9 617.2 639.8
With 1 child KJTQ 80.1 89.7 98.6 96.6 95.4 ZCMM 116.8 144.8 151.6 159.02 children KJTR 122.4 135.1 146.1 144.4 141.7 ZCMN 178.4 220.1 243.5 252.73 children KJTS 76.4 83.4 91.1 91.4 89.1 ZCMO 107.8 129.2 142.9 147.34 children or more children ZIYM 45.8 48.6 54.4 55.6 57.3 ZCMP 64.6 71.8 79.2 80.8
One-parent families: total KJTW 253.4 289.6 326.5 363.4 396.3 ZIYI 497.8 601.8 676.5 737.6
With 1 child KJTX 133.8 152.2 170.4 189.3 203.4 ZIYJ 259.6 313.7 349.5 381.22 children KJTY 86.0 99.1 111.2 121.8 136.1 ZIYK 169.6 207.6 238.7 261.63 or more children KJTZ 33.5 38.3 45.0 52.3 56.9 ZIYL 68.6 80.5 88.3 94.8
1 See chapter text. Family Credit was replaced by Working Families TaxCredit (WFTC) in October 1999. The WFTC figures for December 1999 in-clude Family Credit awards made before October 1999 and still current(both FC and WFTC awards last for 26 weeks).
2 WFTC was replaced by Child Credit and Working Tax Credit on 6th April2003. See table 10.11.
Sources: Board of Inland Revenue: 020 7438 7370;Department for Work and Pensions;
Information and Analysis Directorate: 0191 225 7373
10.11 In-work families with Child Tax Credit or Working Tax Credit awardsUnited KingdomAs at December Thousands
20031 2004 2005 2006 2007
In-work families with positive award: C5PF 4 423 4 519 4 538 4 526 4 541
With children C5PG 4 208.0 4 261.0 4 218.0 4 204.0 4 189.0Receiving Working Tax Credit and Child Tax Credit C5PH 1 548.0 1 492.0 1 497.0 1 596.0 1 650.0Receiving Child Tax Credit only C5PI 2 660.0 2 769.0 2 721.0 2 608.0 2 539.0
Without childrenWorking Tax Credit only C5PL 215.0 258.0 320.0 323.0 352.0
1 Child and Working Tax Credits replaced Working Families’ Tax Credit on6th April 2003. Figures for 2003 are based on awards current at 5th January2004. All other figures at December each year. See chapter text.
Source: HM Revenue and Customs: 020 7147 3083

154
Social protection
10.12 Widows’ Benefit (excluding bereavement payment1,2,3): by type of benefitGreat BritainNumber in receipt of windows benefit as at May 2007 Thousands
2002 2003 2004 2005 2006 2007
All Widows’ Benefit (excludingbereavement allowance)All ages KJGA 223.40 191.50 163.40 139.00 117.70 96.89
Unknown Age EW4O 0.20 0.10 – – – 0.0218 - 24 EW4P 0.1 – – – .. ..25 - 29 EW4Q 0.50 0.30 0.20 0.10 0.10 0.0430 - 34 EW4R 2.30 1.70 1.20 0.80 0.50 0.3235 - 39 EW4S 6.40 5.10 3.90 2.90 2.10 1.5340 - 44 EW4T 10.80 9.10 7.50 6.10 4.90 3.9345 - 49 EW4U 20.10 16.30 13.20 11.00 9.10 7.5850 - 54 EW4V 50.20 40.60 33.30 26.90 21.80 17.6955 - 59 EW4W 103.40 90.90 77.70 66.90 57.30 45.7860 - 64 EW4X 29.50 27.40 26.40 24.30 21.80 20.01
Widowed parents’ allowance -with dependant childrenAll ages KJGG 40.7 34.2 28.2 23.2 19.0 15.6
Unknown Age EW4Y 0.1 0.1 – – .. ..18 - 24 EW4Z 0.1 – – – .. ..25 - 29 EW52 0.50 0.30 0.20 0.10 0.10 0.0330 - 34 EW53 2.30 1.60 1.10 0.80 0.50 0.3135 - 39 EW54 6.20 4.90 3.80 2.80 2.10 1.4940 - 44 EW55 10.00 8.40 7.00 5.70 4.60 3.7545 - 49 EW56 10.80 9.30 7.80 6.70 5.60 4.7150 - 54 EW57 7.60 6.60 5.70 4.80 4.10 3.5855 - 59 EW58 3.00 2.70 2.30 2.00 1.80 1.5760 - 64 EW59 0.20 0.30 0.30 0.30 0.20 0.17
Widowed parents’ allowance -without dependant childrenAll ages KJGM 2.30 1.80 1.40 1.10 0.80 0.69
Unknown Age EW5A – – – – .. ..18 - 24 EW5B – – – – .. ..25 - 29 EW5C – – – – .. ..30 - 34 EW5D 0.10 – – – – 0.0135 - 39 EW5E 0.20 0.20 0.10 0.10 0.10 0.0440 - 44 EW5F 0.50 0.40 0.30 0.20 0.20 0.1345 - 49 EW5G 0.60 0.50 0.40 0.30 0.20 0.2150 - 54 EW5H 0.60 0.50 0.30 0.30 0.20 0.1755 - 59 EW5I 0.40 0.30 0.20 0.20 0.10 0.1160 - 64 EW5J 0.10 0.10 – – – 0.02
Age -related bereavement allowanceAll ages KJGS 138.70 124.30 110.10 96.60 84.00 70.13
Unknown Age EW5K – – – – – 0.0118 - 24 EW5L – – – – .. ..25 - 29 EW5M – – – – .. ..30 - 34 EW5N – – – – .. ..35 - 39 EW5O – – – – .. ..40 - 44 EW5P 0.30 0.20 0.20 0.20 0.10 0.0645 - 49 EW5Q 8.70 6.60 5.10 4.00 3.30 2.6650 - 54 EW5R 41.00 32.80 26.70 21.40 17.20 13.7555 - 59 EW5S 77.70 73.50 66.30 59.00 50.90 40.5760 - 64 EW5T 11.00 11.20 11.90 12.00 12.50 13.08
Bereavement allowance (Not age related)All ages KJGW 41.70 31.30 23.70 18.10 13.90 10.47
Unknown Age EW5U – – – – .. ..18 - 24 EW5V – – – – .. ..25 - 29 EW5W – – – – .. ..30 - 34 EW5X – – – – .. ..35 - 39 EW5Y – – – – .. ..40 - 44 EW5Z – – – – .. ..45 - 49 EW62 – – – – .. ..50 - 54 EW63 1.1 0.8 0.6 0.5 0.3 0.255 - 59 EW64 22.40 14.40 8.80 5.60 4.40 3.5360 - 64 EW65 18.20 16.00 14.20 12.00 9.10 6.74
1 Definitions and Conventions: "-" Nil or Negligible; "." Not applicable;Caseload figures are rounded to the nearest hundred and displayed inthousands.
2 Caseload (Thousands) All Claimants of Widows Benefit are female. No newclaims for WB have been accepted since April 2001 when it was replacedby Bereavement Benefit.
3 Figures include overseas cases.
Sources: DWP Information Directorate: Work and Pensions Longitudinal Study100% data;
Information and Analysis Directorate: 0191 225 7373

155
Social protection
10.13 Bereavement Benefit1,2 (excluding bereavement payment): by sex, type ofbenefit and age of widow/erGreat Britain. Thousands
Males Females
2005 2006 2007 2005 2006 2007
All Bereavement Benefit (excludingbereavement allowance)All ages WLSX 17.60 17.97 17.77 WLTC 37.64 39.69 40.77
18 - 24 EVW9 .. .. .. EVY2 0.10 0.09 0.0725 - 29 EVX2 0.05 0.05 0.05 EVY3 0.48 0.49 0.5330 - 34 EVX3 0.38 0.33 0.28 EVY4 1.58 1.67 1.6335 - 39 EVX4 1.24 1.20 1.15 EVY5 3.49 3.82 4.0540 - 44 EVX5 2.48 2.60 2.50 EVY6 5.66 6.49 7.0145 - 49 EVX6 3.31 3.46 3.61 EVY7 7.39 8.14 8.9250 - 54 EVX7 3.35 3.43 3.47 EVY8 7.99 8.32 8.6555 - 59 EVX8 3.63 3.70 3.43 EVY9 10.96 10.67 9.9060 - 64 EVX9 3.16 3.20 3.29 EVZ2 – .. ..
Widowed parents’ allowance -with dependant childrenAll ages WLUD 10.69 11.05 11.27 WLUH 21.36 24.40 26.86
18 - 24 EVZ3 – .. .. EW24 0.09 0.09 0.0725 - 29 EVZ4 0.05 0.05 0.05 EW25 0.48 0.47 0.5230 - 34 EVZ5 0.37 0.33 0.28 EW26 1.55 1.65 1.6135 - 39 EVZ6 1.23 1.20 1.14 EW27 3.43 3.77 4.0140 - 44 EVZ7 2.47 2.58 2.48 EW28 5.56 6.41 6.9345 - 49 EVZ8 2.81 2.94 3.13 EW29 5.40 6.31 7.2350 - 54 EVZ9 2.14 2.25 2.36 EW2A 3.39 4.04 4.6155 - 59 EW22 1.19 1.24 1.29 EW2B 1.46 1.67 1.8960 - 64 EW23 0.43 0.46 0.53 EW2C – .. ..
Widowed parents’ allowance -without dependant childrenAll ages WLVK 0.06 0.06 0.05 WMMR 0.40 0.37 0.34
18 - 24 EW2D – .. .. EW2M – .. ..25 - 29 EW2E – .. .. EW2N 0.01 0.01 0.0130 - 34 EW2F – .. .. EW2O 0.03 0.03 0.0235 - 39 EW2G 0.01 0.01 0.01 EW2P 0.06 0.05 0.0540 - 44 EW2H 0.02 0.02 0.02 EW2Q 0.10 0.08 0.0845 - 49 EW2I 0.01 0.02 0.01 EW2R 0.09 0.08 0.0850 - 54 EW2J 0.01 0.01 0.01 EW2S 0.08 0.07 0.0655 - 59 EW2K 0.01 0.01 0.01 EW2T 0.05 0.04 0.0460 - 64 EW2L – .. .. EW2U – .. ..
Age-related bereavement allowanceAll ages WMOB 1.87 1.87 1.17 WMOC 7.08 6.58 6.17
18 - 24 EW2V – .. .. EW36 – .. ..25 - 29 EW2W – .. .. EW37 – .. ..30 - 34 EW2X – .. .. EW38 – .. ..35 - 39 EW2Y – .. .. EW39 – .. ..40 - 44 EW2Z – .. .. EW3A – .. ..45 - 49 EW32 0.49 0.50 0.46 EW3B 1.90 1.75 1.6150 - 54 EW33 1.20 1.17 1.10 EW3C 4.52 4.21 3.9755 - 59 EW34 0.18 0.20 0.15 EW3D 0.66 0.62 0.5860 - 64 EW35 – .. .. EW3E – .. ..
Bereavement allowance (not age related)All ages WMOX 4.97 4.98 4.74 WMOY 8.79 8.34 7.39
18 - 24 EW3F – .. .. EW3O – .. ..25 - 29 EW3G – .. .. EW3P – .. ..30 - 34 EW3H – .. .. EW3Q – .. ..35 - 39 EW3I – .. .. EW3R – .. ..40 - 44 EW3J – .. .. EW3S – .. ..45 - 49 EW3K – .. .. EW3T – .. ..50 - 54 EW3L – .. .. EW3U – .. ..55 - 59 EW3M 2.25 2.24 1.98 EW3V 8.79 8.34 7.3960 - 64 EW3N 2.72 2.74 2.76 EW3W – .. ..
1 Figures include overseas cases.2 Figures are given at May each year and are taken from the DWP 100%
Work and Pensions Longitudinal Study (WPLS).
Source: DWP Information Directorate: 0191 225 7874

156
Social protection
10.14 Contributory and non-contributory retirement pensions:1 by sex andage of claimantGreat Britain. Numbers in payment at end of May Thousands and percentages
2003 2004 2005 2006 2007
Men:
Age-groups:65-69 KJSB 1 330.2 1 354.3 1 364.1 1 341.5 1 332.8
Percentage KJSC 31.5 31.6 31.4 30.6 30.0
70-74 KJSD 1 136.6 1 140.3 1 150.0 1 160.1 1 178.0Percentage KJSE 27.0 26.6 26.5 26.5 26.5
75-79 KJSF 867.1 875.0 887.1 903.0 918.5Percentage KJSG 20.6 20.4 20.4 20.6 20.7
80-84 KJSH 565.3 593.7 593.3 596.9 604.7Percentage KJSI 13.4 13.9 13.7 13.6 13.6
85-89 KJSJ 225.9 221.4 246.4 273.1 296.4Percentage KJSK 5.4 5.2 5.7 6.2 6.7
90 and over KJSL 90.6 95.5 100.2 103.6 106.1Percentage KJSM 2.1 2.2 2.3 2.4 2.4
Unknown age EW3Y 1.0 0.8 1.1 1.2 1.5Percentage EW3Z – – – – –
Total all ages KJSA 4 216.7 4 281.1 4 342.2 4 379.5 4 438.0
Women:
Age-groups:60-64 KJSO 1 402.7 1 451.3 1 498.7 1 524.0 1 628.2
Percentage KJSP 19.9 20.3 20.8 21.0 22.0
65-69 KJSQ 1 429.7 1 452.7 1 464.2 1 453.1 1 456.1Percentage KJSR 20.3 20.4 20.3 20.0 19.7
70-74 KJSS 1 329.1 1 319.2 1 314.5 1 312.7 1 322.1Percentage KJST 18.8 18.5 18.2 18.1 17.8
75-79 KJSU 1 161.9 1 156.7 1 158.6 1 165.5 1 168.9Percentage KJSV 16.5 16.2 16.1 16.0 15.8
80-84 KJSW 939.4 973.9 951.6 933.3 923.7Percentage KJSX 13.3 13.6 13.2 12.9 12.5
85-89 KJSY 491.3 473.1 511.0 552.7 587.9Percentage KJSZ 7.0 6.6 7.1 7.6 7.9
90 and over KJTA 298.8 307.2 314.9 319.4 319.9Percentage KJTB 4.2 4.3 4.4 4.4 4.3
Unknown age EW42 2.0 1.1 1.3 1.5 1.7Percentage EW43 – – – – –
Total all ages KJSN 7 054.9 7 135.1 7 214.7 7 262.3 7 408.4
1 See chapter text. Including pensions payable to persons residing overseas. Sources: Department for Work and Pensions;Work and Pensions Longitudinal Study (WPLS);
Information and Analysis Directorate: 0191 225 7373

157
Social protection
10.15 War pensions: estimated number of pensioners1
Great BritainAt 31 March each year Thousands
1997 1998 1999 2000 2001 2002 2003 2004 2005 20062 2007
Disablement KADH 264.59 259.16 248.93 240.76 231.62 221.80 212.18 201.55 191.75 182.80 173.85Widows and dependants KADI 60.05 58.49 55.85 54.92 52.71 50.98 48.61 46.04 43.55 41.05 38.69
Total KADG 324.64 317.65 306.06 295.67 284.33 272.78 260.79 247.59 235.30 223.85 212.54
1 See chapter text. From 1914 war, 1939 war and later service.2 The discontinuity between 2005 and 2006 is due to improvements in data
processing.
Source: Ministry of Defence/DASA (Health Information): 01225 467801
10.16 Income support1 (excluding MIG)2 by statistical group3: number ofclaimants receiving weekly paymentGreat Britain Thousands4
2002 2003 2004 2005 2006 2007
All income support claimants (excluding MIG)5 F8YY 2 238.8 2 236.4 2 192.6 2 139.8 2 114.8 2 117.7
Incapacity Benefits F8YZ 1 197.9 1 215.1 1 205.2 1 193.8 1 183.2 1 184.7Lone Parent F8Z2 865.9 853.3 823.3 789.3 774.9 765.6Carer F8Z3 75.70 77.50 78.40 79.00 80.20 82.80Others on Income Related Benefits F8Z4 99.30 90.50 85.90 77.70 76.50 84.60
1 Figures are given at May each year and are taken from the DWP 100%Work and Pensions Longitudinal Study (WPLS).
2 Figures exclude MIG claimants. Pension Credit replaced MIG on 6th Oc-tober 2003 and extended Income Support entitlements to customers aged60 and over.
3 Statistical groups are defined as follows:Incapacity Benefits- claimants aged under 60 on Incapacity Benefit orSevere Disablement Allowance;Lone Parent - single claimants aged under 60 with dependants not in receiptof IB/SDA;Carer- claimants aged under 60 entitled to Carer’s Allowance;Other Income Related Benefit- claimants not in one of the above categories.
4 Figures are rounded to the nearest hundred and quoted in thousands.5 Totals may not sum due to rounding.
Sources: Department for Work and Pensions;Information and Analysis Directorate: 0191 225 7373
10.17 MIG/Pension Credit1,2: number of claimantsGreat BritainEnd of May Thousands3
20024 20034 20045 20055 20065 20075
All Pension Credit F8Z5 .. .. 2 490.8 2 682.7 2 717.4 2 733.5
Guarantee Credit Only F8Z6 .. .. 735.0 767.3 775.6 805.7Guarantee Credit Only and Savings Credit F8Z7 .. .. 1 269.5 1 321.7 1 343.2 1 330.1Savings Credit F8Z8 .. .. 486.0 593.7 598.6 597.7(Residual)6 MIG Case F8Z9 1 737.5 1 777.8 0.3 – – –
1 Source: DWP 100% Work and Pensions Longitudinal study (WPLS).2 Pension Credit was introduced on 6th October 2003 and replaced Monthly
Income Guarantee (Income Support for people aged 60 or over). The vastmajority of people who were in receipt of MIG transferred to PC in October2003.
3 Figures are rounded to the nearest hundred and expressed in thousands.4 Columns 2002 - 2003 represent MIG caseloads.5 Columns 2004 onwards represent Pension Credit Caseloads.6 When MIG was replaced by Pension Credit in October 2003 some cases
continued to be MIG cases. These were cases where the partner agedunder 60 continued as the claimant. These cases are minimal and arereducing each quarter.
Sources: Department for Work and Pensions;Information and Analysis Directorate: 0191 225 7373

158
Social protection
10.18 Income support: average weekly amounts of benefit1,2
Great BritainAs at May £ per week
2002 2003 2004 2005 2006 2007
All income support claimants (excluding MIG)3 F8ZF 84.83 91.07 91.14 85.81 83.41 82.29
Incapacity benefits4 F8ZG 72.32 76.10 77.70 76.93 78.12 79.78Lone Parent4 F8ZH 105.85 116.52 114.96 102.85 94.88 89.70Carer4 F8ZI 71.50 76.63 76.78 72.42 70.40 69.97Others on income related benefits4 F8ZJ 62.45 64.43 64.25 62.69 62.62 62.33
1 Figures are given at May each year and are taken from the DWP 100%Work and Pensions Longitudinal Study (WPLS).
2 Average amounts are rounded to the nearest penny.3 Figures exclude MIG claimants. Pension Credit replaced MIG on 6 October
2003 and extended Income Support entitlement to customers aged 60 andover.
4 Statistical groups are defined as follows:Incapacity Benefits- claimants under 60 on incapacity benefit or Severe Dis-ablement Allowance;Lone Parent- single claimants aged under 60 with dependants not in receiptof IB/SDA;Carer- claimants aged under 60 entitled to Carer’s Allowance;Other Income Related Benefit- claimants not in one of the above categories.
Sources: Department for Work and Pensions;Information and Analysis Directorate: 0191 225 7373
10.19 MIG/Pension Credit: average weekly amounts of benefit1,2
Great BritainAs at May £ per week3
20024 20034 20045 20055 20065 20075
All Pension Credit F8ZA .. .. 42.30 43.62 46.75 50.04
Guarantee Credit Only F8ZB .. .. 71.91 75.43 79.56 83.74Guarantee Credit and Savings Credit F8ZC .. .. 37.51 39.87 43.11 46.11Savings Credit only F8ZD .. .. 10.03 10.83 12.39 13.36(Residual) MIG Case6 F8ZE 49.45 50.37 47.49 68.89 110.60 110.49
1 Figures are given in each May from 2000 - 2005 and are taken from theDWP 100% Work and Pensions Longitudinal Study (WPLS).
2 Pension Credit was introduced on 6th October 2003 and replaced MinimumIncome Guarantee (Income Support for people aged 60 or over).
3 Average amounts are shown as pounds per week and rounded to thenearest penny.
4 Columns 2002-2003 represent MIG average amounts.5 Columns 2004 onwards represent Pension Credit Average amounts.6 When MIG replaced pension credit in October 2003 some cases continued
to be MIG cases. These were cases where the partner aged under 60 con-tinued as the claimant. These cases are minimal and are reducing eachquarter.
Sources: Department for Work and Pensions;Information and Analysis Directorate: 0191 225 7373
10.20 Summary of government expenditure on social services and housing1
Years ended 31 March£ million
1999 2000 2001 2002 2003 2004 2005 2006/00 /01 /02 /03 /04 /05 /06 /07
Final Consumption Expenditure
Education QYWZ 43 044 46 933 52 752 57 475 61 983 65 653 70 087 75 632Health QYXA 52 901 57 362 62 727 69 065 75 585 83 989 90 394 96 889Personal social services GB7F 12 659 13 717 15 033 17 232 19 930 21 922 23 239 24 217Social benefits GG5O 106 998 110 417 121 098 126 345 135 571 141 612 145 616 150 614Housing QYXD 6 168 6 387 6 590 7 236 10 802 11 222 12 294 13 707
Total government expenditure GH2K 221 770 234 816 258 200 277 353 303 871 324 398 341 630 361 059
Total government expenditure on social services and housingas a percentage of GDP GGN7 24.1 24.4 25.6 26.1 27.0 27.2 27.8 27.4
1 See chapter text. Source: Office for National Statistics: 0207 014 2125

159
Social protection
10.21 Summary of Government expenditure on education1
Years ended 31 March£ million
1999 2000 2001 2002 2003 2004 2005 2006/00 /01 /02 /03 /04 /05 /06 /07
EducationFinal consumption expenditure
Current expenditureCompensation of employeesLocal Authorities2
Nursery and primary schools G8ZX 8 396 9 092 10 079 10 740 11 955 13 132 13 879 14 638Secondary schools G8ZY 7 991 8 652 9 592 10 356 11 570 13 115 13 891 14 651Special schools G8ZZ 858 929 1 030 1 164 1 145 1 362 1 746 1 842
Central GovernmentNorthern Ireland wages and salaries HMPM 666 709 769 841 928 959 997 1 251Other wages and salaries3 GB7H 275 297 463 529 610 661 703 872
Total Central Government expenditure MMTF 941 1 006 1 232 1 370 1 538 1 620 1 700 2 123Tertiary Education & Other Education4 G922 3 284 3 569 3 840 4 127 3 728 2 553 2 524 2 332
Total Compensation of employees QYSA 21 470 23 248 25 773 27 757 29 936 31 782 33 740 35 586
Net procurementLocal Government Net procurement5 QTKJ 5 839 6 154 6 407 7 620 7 785 8 418 9 741 10 726Central Government Net procurement6 QTLN 1 560 1 737 1 623 1 787 1 933 2 020 2 186 2 445Nursery/Primary schoolssecondary schoolsTertiary educationTotal QYSB 7 399 7 891 8 030 9 407 9 718 10 438 11 927 13 171
Non-market capital consumption QYSD 1 108 1 142 1 200 1 248 1 305 1 409 1 568 1 778Total final consumption expenditure QYSE 29 977 32 281 35 003 38 412 40 959 43 629 47 235 50 535
Other current transfers QZNU 11 061 12 123 14 315 15 407 17 050 17 862 17 321 18 531Gross capital formation QYVD 1 843 2 188 2 863 2 753 2 936 3 094 3 853 4 766Non-produced non-financial assets QYWM –167 –151 –187 –191 –206 –217 –229 –240Capital transfers QZKJ 330 492 758 1 094 1 244 1 285 1 907 2 040
Total Central Government Expediture G924 15 584 17 411 20 623 22 239 24 519 25 690 26 769 30 705Total Local Government Expediture G925 27 460 29 522 32 129 35 236 37 464 39 963 43 318 44 927
Total government expenditure QYWZ 43 044 46 933 52 752 57 475 61 983 65 653 70 087 75 632
Total government education expenditure asa percentage of GDP GGN8 4.7 4.9 5.2 5.4 5.5 5.5 5.7 5.8
1 See chapter text.2 Based on pay figures published by Dept for Communities and Local Govern-
ment , Scottish Executive and National Assembly for Wales.3 Includes wages/salaries for Scotland, Wales and Non-Departmental Public
Bodies (NDPBs).4 Includes Higher, Further, Adult and Continuing education.5 Net of VAT.6 Includes Central Government Net Procurement on NDPBs, Scotland,
Wales, Northern Ireland and Education in Healthcare.
Sources: Office for National Statistics: 0207 014 2125;Department for Communities and Local Government;
Scottish Government;Welsh Assembly Government

160
Social protection
10.22 Summary of Government expenditure on Health1
Years ended 31 March£ million
1999 2000 2001 2002 2003 2004 2005 2006/00 /01 /02 /03 /04 /05 /06 /07
Final Consumption expenditure2
Current expenditure3
Compensation of employees QWWQ 26 560 28 794 31 470 34 954 38 140 42 574 45 069 46 430non-market capital consumption QYOB 1 492 1 593 1 574 1 680 1 787 1 884 2 113 2 342other QTLP 22 413 23 954 26 155 28 407 31 218 34 446 38 149 42 383
Total Final consumption expenditure QYOT 50 465 54 341 59 199 65 041 71 145 78 904 85 331 91 155Subsidies CBRA – 28 34 33 21 21 21 38other current transfers QZMR 931 1 277 1 312 1 171 1 220 1 248 1 658 1 452Grosss capital formation QYVE 1 440 1 643 2 067 2 581 3 049 3 727 3 215 4 063Non produced non financial assets QYWN – – – – – – – –Capital transfers HMSF 65 73 115 239 150 89 169 181total outlays QYXA 52 901 57 362 62 727 69 065 75 585 83 989 90 394 96 889
Total NHS expenditure as a GGN9 5.8 5.9 6.2 6.5 6.7 7.1 7.2 7.3percentage of GDP
1 See chapter text.2 Figures are based on Departmental Expenditure reported to HM Treasury
Statistics database.3 Includes expenditure by Dept. of Health, NHS Trusts, Scottish Government,
Welsh Assembly Government and Northern Ireland Executive.
Source: Office for National Statistics: 0208 014 2125
10.23 Summary of Government expenditure on personal social services1
Years ended 31 March£ million
1999 2000 2001 2002 2003 2004 2005 2006/00 /01 /02 /03 /04 /05 /06 /07
Personal social services
Central government Current ExpenditureCompensation of employees ADQ7 282 318 331 376 462 482 508 541Net Procurement ADR2 252 311 343 532 489 667 410 395
Total GB7D 534 629 674 908 951 1 149 918 936
Local Authorities Current ExpenditureCompensation of employees CFCR 5 735 5 760 5 936 6 385 6 960 7 506 7 959 8 278Net Procurement QWSB 6 326 7 259 8 349 9 859 11 934 13 165 14 244 14 863
Total GB7E 12 061 13 019 14 285 16 244 18 894 20 671 22 203 23 141
Capital Expenditure GDZU 64 69 74 80 85 102 118 140
Total Final Consumption Expenditure GB7F 12 659 13 717 15 033 17 232 19 930 21 922 23 239 24 217
Total government expenditure asa percentage of GDP GGO2 1.4 1.4 1.5 1.6 1.8 1.8 1.9 1.8
1 See chapter text. Source: Office for National Statistics: 0208 014 2125

161
Social protection
10.24 Summary of Government expenditure on social security benefits1
and administrationYears ended 31 March £ million
1999 2000 2001 2002 2003 2004 2005 2006/00 /01 /02 /03 /04 /05 /06 /07
Social benefitsSocial security benefits in cash
National Insurance fundRetirement pensions CSDG 37 965 38 923 42 157 44 590 46 701 48 969 51 579 53 766Widows and Guardians allowances CSDH 989 980 1 099 1 093 1 006 923 873 792Unemployment Benefit CSDI –1 –1 – –2 – – –3 –Jobseeker’s Allowance CJTJ 462 435 470 520 506 445 486 474Incapacity Benefit CUNL 6 896 6 677 6 678 6 839 6 801 6 754 6 635 6 563Maternity Benefit CSDL 41 45 56 69 124 152 164 175Statutory sick pay CSDQ 29 29 22 18 72 75 80 85Statutory maternity pay GTKZ 577 635 665 737 1 261 1 339 1 295 1 303Payment in lieu of benefits foregone GTKV – – – – – – – –Total national insurance fund benefits ACHH 46 958 47 723 51 147 53 864 56 471 58 657 61 109 63 158
Redundancy fund benefit GTKN 147 168 205 280 240 186 253 205Maternity fund benefit GTKO – – – – – – – –Social fund benefit GTLQ 1 024 1 784 1 883 1 925 2 159 2 200 2 249 2 279Benefits paid to overseas residents FJVZ 1 112 1 176 1 262 1 357 1 445 1 522 1 607 1 724
Total social security benefits in cash QYRJ 49 241 50 851 54 497 57 426 60 315 62 565 65 218 67 366
Total unfunded social benefits2: QYJT 12 148 12 445 13 728 14 539 15 962 15 676 18 083 19 365
Social assistance benefits in cashWar pensions and allowances3 CSDD 1 254 1 201 1 200 1 186 1 100 1 114 1 009 983Income Support CSDE 12 227 13 076 14 100 14 527 15 106 16 356 15 506 15 616Income tax credits and reliefs RYCQ 2 623 4 654 5 745 6 711 9 485 11 566 12 938 14 316Child benefit EKY3 10 167 8 532 8 795 8 955 9 414 9 565 9 756 10 132Non-contributory job seekers allowance EKY4 2 813 2 442 2 124 2 118 2 062 1 780 1 890 2 082Care allowances EKY5 2 834 2 955 5 096 5 214 5 445 5 714 6 218 6 487Disability benefits EKY6 5 653 6 021 7 310 7 863 8 389 8 900 9 376 9 997Other benefits EKY7 4 242 4 360 4 387 3 924 4 473 4 554 5 574 4 222Benefits paid to overseas residents RNNF 59 54 55 48 48 48 48 48
Total social assistance benefits in cash NZGO 41 872 43 295 48 812 50 546 55 522 59 597 62 315 63 883
Total social benefits NMDR 103 261 106 591 117 037 122 511 131 799 137 838 145 616 150 614
Administration4 KJEE 3 737 3 826 4 061 3 834 3 772 3 774 – –
Total benefits and administration GG5O 106 998 110 417 121 098 126 345 135 571 141 612 145 616 150 614
Total government benefit expenditure asa percentage of GDP GGO3 11.7 11.5 11.2 11.9 12.0 11.9 11.7 11.4
1 See chapter text. Figures are based on table 5.2.4s of the Blue Book 2007.They are not fully comparable with earlier editions of the Annual Abstract.
2 Includes Civil & Defence, voluntary employer social contributions, teachers& NHS inflationary pensions increase payments.
3 From 2002/03 War Pensions are administered by the Ministry of Defence.4 Figures published by HM Treasury in Public Expenditure Statistical Ana-
lyses. A separate figure for administration is no longer published.
Sources: Office for National Statistics: 0208 014 2125;Department for Work and Pensions;
HM Treasury

162
Social protection
10.25 Summary of Government expenditure on housing1
Years ended 31 March£ million
1999 2000 2001 2002 2003 2004 2005 2006/00 /01 /02 /03 /04 /05 /06 /07
Housing
Final consumption expenditure
Compensation of employees QYSV 748 776 851 985 1 077 1 172 1 359 1 599Other current expenditure on goods and services QYSW 709 935 1 068 1 295 3 023 2 940 3 636 4 195Capital consumption QYSY 1 117 1 181 1 301 1 407 1 454 1 632 1 563 1 596
Total QYSZ 2 574 2 892 3 220 3 687 5 554 5 744 6 558 7 390
Subsidies QYVP 798 759 613 611 495 302 478 554
Other current transfers QZNY 30 42 129 93 539 119 227 249Gross Fixed Capital Formation QYVH 312 434 497 552 1 184 1 408 1 458 1 598
Non-produced financial assets QYWQ – – – – – – – –Capital transfers GVFX 2 454 2 260 2 131 2 293 3 030 3 649 3 573 3 916
Total government expenditure QYXD 6 168 6 387 6 590 7 236 10 802 11 222 12 294 13 707
Total public sector housing expenditure asa percentage of GDP GGO4 0.7 0.7 0.7 0.7 1.0 1.0 1.0 1.0
1 See chapter text. Source: Office for National Statistics: 0208 014 2125

xi
Crime and Justice
Crime and Justice
Ch
apter 11

164
Crime and Justice
serious crimes such as serious assault, sexual assault, robbery or housebreaking.
The Sexual Offences Act 2003 introduced in May 2004 altered the definition and coverage of sexual offences. In particular, it redefined indecent exposure as a sexual offence which is likely to account for much of the increase in sexual offences.
Further information is available from the Home Office: Crime in England and Wales 2006/2007, editors: Sian Nicholas, Chris Kershaw and Alison Walker.
Court proceedings and police cautions
(Tables 11.4–11.8, 11.13–11.17, 11.20–11.22)
The statistical basis of the tables of court proceedings is broadly similar in England and Wales, Scotland and Northern Ireland; the tables show the number of persons found guilty, recording a person under the heading of the principal offence of which he is found guilty, excluding additional findings of guilt at the same proceedings. A person found guilty at a number of separate court proceedings is included more than once.
The statistics on offenders cautioned in England and Wales cover only those who, on admission of guilt, were given a formal caution by, or on the instructions of, a senior police officer as an alternative to prosecution. Written warnings by the police for motor offences and persons paying fixed penalties for certain motoring offences are excluded. Formal cautions are not issued in Scotland. There are no statistics on cautioning available for Northern Ireland.
The Crime and Disorder Act 1998 created provisions in relation to reprimands and final warnings, new offences and orders which have been implemented nationally since 1 June 2000. They replace the system of cautioning for offenders aged under 18. Reprimands can be given to first-time offenders for minor offences. Any further offending results in either a final warning or a charge.
For persons proceeded against in Scotland, the statistics relate to the High Court of Justiciary, the Sheriff Court and the District Court. The High Court deals with serious solemn (that is, Jury) cases and has unlimited sentencing power. The Sheriff Court is limited to imprisonment of three years for solemn cases, or three months (six months when specified in legislation for second or subsequent offences and 12 months for certain statutory offences) for summary (that is, non-Jury) cases. The District Court deals only with summary cases and is limited to 60 days imprisonment and level 4 fines. Stipendiary Magistrates sit in Glasgow District Court and have the summary sentencing powers of a Sheriff.
Crime and JusticeThere are differences in the legal and judicial systems of England and Wales, Scotland and Northern Ireland which make it impossible to provide tables covering the UK as a whole in this section. These differences concern the classification of offences, the meaning of certain terms used in the statistics, the effects of the several Criminal Justice Acts and recording practices.
Recorded crime statistics
(Table 11.3)
Crimes recorded by the police provide a measure of the amount of crime committed. The statistics are based on counting rules, revised with effect from 1 April 1998, which are standard for all the police forces in England, Wales and Northern Ireland and now include all indictable and triable-either-way offences together with a few summary offences which are closely linked to these offences. The new rules have changed the emphasis of measurement more towards one crime per victim, and have also increased the coverage of offences. These changes have particularly impacted on the offence groups of violence against the person, fraud and forgery, drugs offences and other offences.
For a variety of reasons many offences are either not reported to the police or not recorded by them. The changes in the number of offences recorded do not necessarily provide an accurate reflection of changes in the amount of crime committed.
In order to further improve the consistency of recorded crime statistics and to take a more victim oriented approach to crime recording, the National Crime Recording Standard (NCRS) was introduced in England, Wales and Northern Ireland from 1 April 2002. Some police forces implemented the principles of NCRS in advance of its implementation across all forces in April 2002. The NCRS had the effect of increasing the number of offences recorded by the police.
Similarly, the Scottish Crime Recording Standard (SCRS) was introduced by the eight Scottish police forces with effect from 1 April 2004. This means that no corroborative evidence is required initially to record a crime related incident as a crime if so perceived by the victim. Again, the introduction of this new recording standard was expected to increase the numbers of minor crimes recorded by the police, such as minor crimes of vandalism and minor thefts and offences of petty assault and breach of the peace. However, it was expected that the SCRS would not have much impact on the figures for the more

165
Crime and Justice
In England and Wales, indictable offences are offences which are:
• triable only on indictment. These offences are the most serious breaches of the criminal law and must be tried at the Crown Court. ‘Indictable-only’ offences include murder, manslaughter, rape and robbery
• triable either way. These offences may be tried at the Crown Court or Magistrates’ Court
The Criminal Justice Act 1991 led to the following main changes in the sentences available to the courts in England and Wales:
• introduction of combination orders
• introduction of the ‘unit fine scheme’ at Magistrates’ courts
• abolishing the sentence of detention in a young offender institution for 14 year old boys and changing the minimum and maximum sentence lengths for 15 to 17 year olds to ten and 12 months respectively
• abolishing partly suspended sentences of imprisonment and restricting the use of a fully suspended sentence
The Criminal Justice Act 1993 abolished the ‘Unit Fine Scheme’ in Magistrates’ courts which had been introduced under the Criminal Justice Act 1991.
A charging standard for assault was introduced in England and Wales on 31 August 1994 with the aim to promote consistency between the police and prosecution on the appropriate level of charge to be brought.
The Criminal Justice and Public Order Act 1994 created several new offences in England and Wales, mainly in the area of Public Order, but also including male rape (there is no statutory offence of ‘male rape’ in Scotland, although such a crime may be charged as serious assault). The Act also:
• extended the provisions of section 53 of the Children and Young Persons Act 1993 for ten to 13 year olds
• increased the maximum sentence length for 15 to 17 year olds to two years
• increased the upper limit from £2,000 to £5,000 for offences of criminal damage proceeded against as if triable only summarily
• introduced provisions for the reduction of sentences for early guilty pleas
• increased the maximum sentence length for certain firearm offences
Provisions within the Crime (Sentences) Act 1997 (as amended by the Powers of Criminal Courts Sentencing Act 2000), in England and Wales, and the Crime and Punishment (Scotland) Act 1997, in Scotland, included:
• an automatic life sentence for a second serious violent or sexual offence unless there are exceptional circumstances (this provision has not been enacted in Scotland)
• a minimum sentence of seven years for an offender convicted for a third time of a class A drug trafficking offence unless the court considers this to be unjust in all the circumstances, and in England and Wales
• the new section 38A of the Magistrates’ Courts’ Act 1980 extending the circumstances in which a magistrates’ court may commit a person convicted of an offence triable either way to the Crown Court for sentence. It was implemented in conjunction with section 49 of the Criminal Procedure and Investigations Act 1996, which involves the magistrates’ courts in asking defendants to indicate plea before the mode of trial decision is taken and compels the court to sentence or commit for sentence any defendant who indicates a guilty plea
Under the Criminal Justice and Court Service Act 2000 new terms were introduced for certain orders. Community rehabilitation order is the new name for a probation order. A community service order is now known as a community punishment order. Finally, the new term for a combination order is community punishment and rehabilitation order. In April 2000 the secure training order was replaced by the detention and training order. Section 53 of the Children and Young Persons Act 1993 was repealed on 25 August 2000 and its provisions were transferred to Sections 90–92 of the Powers of Criminal Courts (Sentencing) Act 2000. Reparation and Action plan order were implemented nationally from 1 June 2000. Drug treatment and testing order was implemented in England, Scotland and Wales from October 2000. Referral order was implemented in England, Scotland and Wales from April 2000. These changes are now reflected in Table 11.8.
The system of Magistrates’ courts and Crown Courts in Northern Ireland operates in a similar way to that in England and Wales. A particularly significant statutory development, however, has been the Criminal Justice (NI) Order 1996 which introduces a new sentencing regime into Northern Ireland, largely replicating that which was introduced into England and Wales by the Criminal Justice Acts of 1991 and 1993. The order makes many changes to both community and custodial sentences, while introducing new orders such as the combination order, the custody probation order and orders for release on licence of sexual offenders.

166
Crime and Justice
Expenditure on penal establishments in Scotland
(Table 11.19)
The results shown in this table are reported on a cash basis for financial years 1996–97 to 2000–01 in line with funding arrangements. Financial year 2001–02 is reported on a resource accounting basis in line with the introduction of Resource Budgeting. Capital Charges were introduced with Resource Accounting and Budgeting.

167
Crime and justice
11.1 Police force strength1: by country and sexAs at 31 March
Numbers
1997 1998 1999 2000 2001 2002 2003 2004 2005 2006 2007
England and WalesRegular Police(FTE)
Strength:Men KERB 106 271 105 145 103 956 101 801 102 321 104 483 106 996 110 150 110 597 109 327 108 118Women KERC 18 780 19 611 19 885 20 155 21 155 22 784 24 430 26 956 28 898 30 307 31 914
Seconded:2,3
Men KERD 1 882 1 836 2 017 2 077 1 914 2 031 1 689 1 811 1 514 1 545 422Women KERE 225 222 238 307 292 305 251 284 222 203 60
Additional Officers:4
Men KERF 200 267 324 361 493 567 375 394 522 676 657Women KERG 158 514 582 519 509 564 709 969 1 042 1 213 1 203
Special constablesStrength:5
Men KERH 12 886 11 977 10 860 9 623 8 630 8 014 7 718 7 645 8 074 8 829 9 327Women KERI 6 988 6 279 5 624 4 724 4 108 3 584 3 319 3 343 3 844 4 350 4 694
ScotlandRegular police
Strength:6
Men KERK 12 752 12 753 12 545 12 374 12 547 12 513 12 590 12 685 12 798 12 820 12 687Women KERL 2 037 2 227 2 265 2 325 2 602 2 738 2 897 2 898 3 203 3 401 3 547
Central service:7
Men KERM 85 85 88 95 87 116 131 166 195 171 153Women KERN 4 6 9 13 10 12 17 29 29 25 28
Seconded:8
Men KERO 101 101 85 130 140 133 166 192 216 200 195Women KERP 13 10 12 18 14 18 24 30 31 27 3
Additional regular police:Men HFVM 71 88 85 80 83 80 79 88 79 85 107Women HFVN 1 9 6 4 5 12 10 13 21 15 12
Special constablesStrength:
Men KERS 1 336 1 286 1 229 981 924 812 711 773 718 888 1 4289
Women KERT 450 437 422 355 336 307 280 328 437 432 ..Northern Ireland
Regular police10,11
Strength:Men KERU 7 562 7 523 7 406 6 844 6 227 6 057 6 171 6 108 6 016 5 992 5 957Women KERV 923 933 987 966 1 009 1 080 1 266 1 418 1 547 1 534 1 605
Reserve12
Strength:Men KERW 3 587 3 469 3 199 2 962 2 629 2 223 1 983 1 824 1 431 1 424 1 212Women KERX 719 705 641 607 556 510 453 485 410 402 400
1 Figures for England and Wales excluding those on career breaks ormaternity/paternity leave. From 1999, figures for Northern Ireland reflectthe position at the end of the financial year, prior to this figures were as at31 December.
2 Figures exclude secondments outside the police service in England andWales (eg to the private sector or to law enforcement agencies overseas).
3 From 31 March 2007 onwards details of officers seconded to NCIS andNCS will no longer appear following the launch of Serious Organised CrimeAgency (SOCA) in April 2006.
4 Figures include those officers on career breaks or maternity/paternity leave.Prior to 2003, these figures were not collected centrally.
5 Special constable figures are given as a headcount measure.6 ’Strength’ is WTE police strength, only excluding special constables.7 Instructors at Training Establishments, etc, formerly shown as second-
ments.
8 Includes Scottish Crime and Drug Enforcement Agency .9 Split between Male and Female special constables is unavailable for 2007.
10 Does not include officers on secondment.11 Also includes student officers.12 Includes part-time reserve and full-time reserve, FTR -745 as at 31 March 2007
(693 males and 52 females). PTR - 867 as at 31 March 2007 (519 males and348 females).
Sources: Home Office: 020 7035 0289;Scottish Government Justice Analytical Services: 0131 244 2226;The Police Service of Northern Ireland: 028 9065 0222 ext 24070
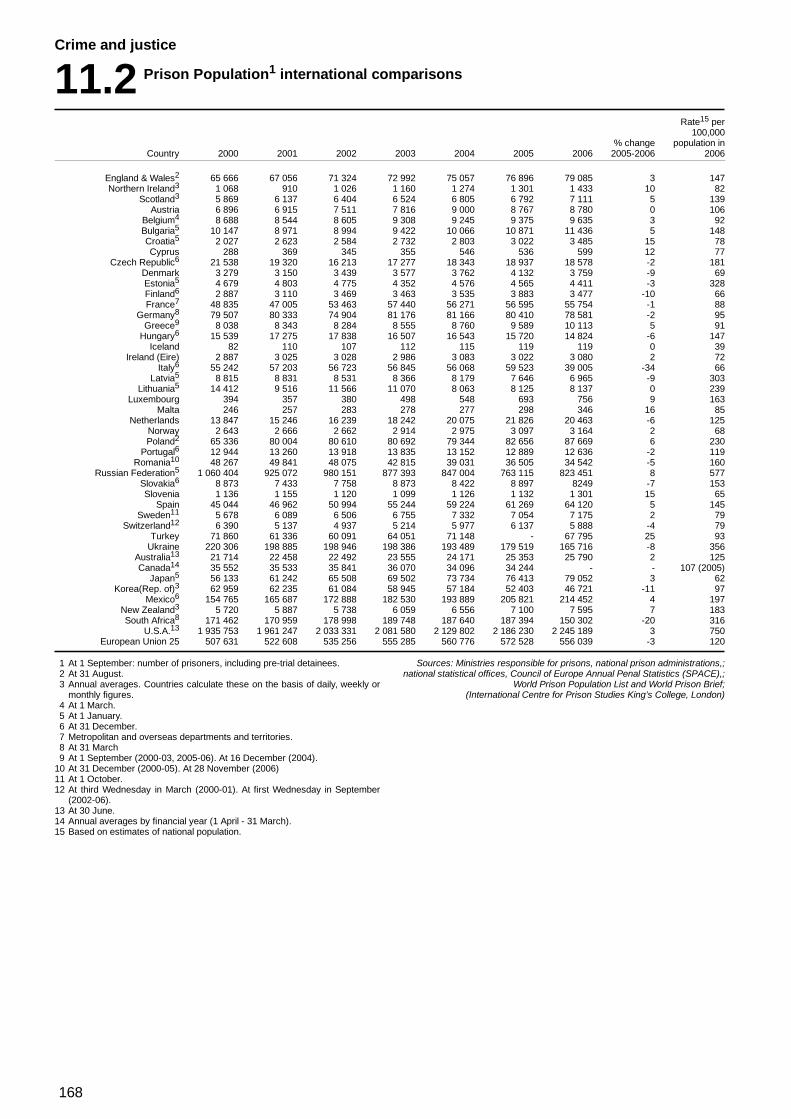
168
Crime and justice
11.2 Prison Population1 international comparisons
Rate15 per100,000
% change population inCountry 2000 2001 2002 2003 2004 2005 2006 2005-2006 2006
England & Wales2 65 666 67 056 71 324 72 992 75 057 76 896 79 085 3 147Northern Ireland3 1 068 910 1 026 1 160 1 274 1 301 1 433 10 82
Scotland3 5 869 6 137 6 404 6 524 6 805 6 792 7 111 5 139Austria 6 896 6 915 7 511 7 816 9 000 8 767 8 780 0 106
Belgium4 8 688 8 544 8 605 9 308 9 245 9 375 9 635 3 92Bulgaria5 10 147 8 971 8 994 9 422 10 066 10 871 11 436 5 148Croatia5 2 027 2 623 2 584 2 732 2 803 3 022 3 485 15 78Cyprus 288 369 345 355 546 536 599 12 77
Czech Republic6 21 538 19 320 16 213 17 277 18 343 18 937 18 578 -2 181Denmark 3 279 3 150 3 439 3 577 3 762 4 132 3 759 -9 69Estonia5 4 679 4 803 4 775 4 352 4 576 4 565 4 411 -3 328Finland6 2 887 3 110 3 469 3 463 3 535 3 883 3 477 -10 66France7 48 835 47 005 53 463 57 440 56 271 56 595 55 754 -1 88
Germany8 79 507 80 333 74 904 81 176 81 166 80 410 78 581 -2 95Greece9 8 038 8 343 8 284 8 555 8 760 9 589 10 113 5 91
Hungary6 15 539 17 275 17 838 16 507 16 543 15 720 14 824 -6 147Iceland 82 110 107 112 115 119 119 0 39
Ireland (Eire) 2 887 3 025 3 028 2 986 3 083 3 022 3 080 2 72Italy6 55 242 57 203 56 723 56 845 56 068 59 523 39 005 -34 66
Latvia5 8 815 8 831 8 531 8 366 8 179 7 646 6 965 -9 303Lithuania5 14 412 9 516 11 566 11 070 8 063 8 125 8 137 0 239
Luxembourg 394 357 380 498 548 693 756 9 163Malta 246 257 283 278 277 298 346 16 85
Netherlands 13 847 15 246 16 239 18 242 20 075 21 826 20 463 -6 125Norway 2 643 2 666 2 662 2 914 2 975 3 097 3 164 2 68Poland2 65 336 80 004 80 610 80 692 79 344 82 656 87 669 6 230
Portugal6 12 944 13 260 13 918 13 835 13 152 12 889 12 636 -2 119Romania10 48 267 49 841 48 075 42 815 39 031 36 505 34 542 -5 160
Russian Federation5 1 060 404 925 072 980 151 877 393 847 004 763 115 823 451 8 577Slovakia6 8 873 7 433 7 758 8 873 8 422 8 897 8249 -7 153Slovenia 1 136 1 155 1 120 1 099 1 126 1 132 1 301 15 65
Spain 45 044 46 962 50 994 55 244 59 224 61 269 64 120 5 145Sweden11 5 678 6 089 6 506 6 755 7 332 7 054 7 175 2 79
Switzerland12 6 390 5 137 4 937 5 214 5 977 6 137 5 888 -4 79Turkey 71 860 61 336 60 091 64 051 71 148 - 67 795 25 93
Ukraine 220 306 198 885 198 946 198 386 193 489 179 519 165 716 -8 356Australia13 21 714 22 458 22 492 23 555 24 171 25 353 25 790 2 125Canada14 35 552 35 533 35 841 36 070 34 096 34 244 - - 107 (2005)
Japan5 56 133 61 242 65 508 69 502 73 734 76 413 79 052 3 62Korea(Rep. of)3 62 959 62 235 61 084 58 945 57 184 52 403 46 721 -11 97
Mexico6 154 765 165 687 172 888 182 530 193 889 205 821 214 452 4 197New Zealand3 5 720 5 887 5 738 6 059 6 556 7 100 7 595 7 183South Africa8 171 462 170 959 178 998 189 748 187 640 187 394 150 302 -20 316
U.S.A.13 1 935 753 1 961 247 2 033 331 2 081 580 2 129 802 2 186 230 2 245 189 3 750European Union 25 507 631 522 608 535 256 555 285 560 776 572 528 556 039 -3 120
1 At 1 September: number of prisoners, including pre-trial detainees.2 At 31 August.3 Annual averages. Countries calculate these on the basis of daily, weekly or
monthly figures.4 At 1 March.5 At 1 January.6 At 31 December.7 Metropolitan and overseas departments and territories.8 At 31 March9 At 1 September (2000-03, 2005-06). At 16 December (2004).
10 At 31 December (2000-05). At 28 November (2006)11 At 1 October.12 At third Wednesday in March (2000-01). At first Wednesday in September
(2002-06).13 At 30 June.14 Annual averages by financial year (1 April - 31 March).15 Based on estimates of national population.
Sources: Ministries responsible for prisons, national prison administrations,;national statistical offices, Council of Europe Annual Penal Statistics (SPACE),;
World Prison Population List and World Prison Brief;(International Centre for Prison Studies King’s College, London)
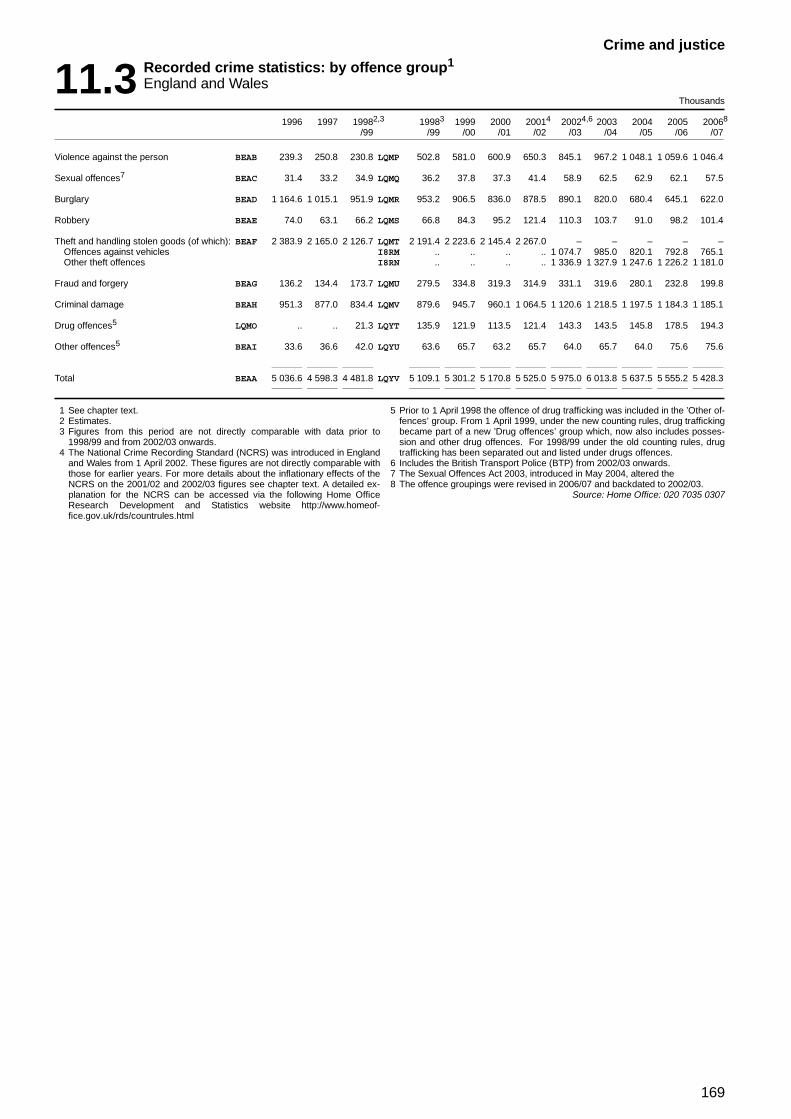
169
Crime and justice
11.3 Recorded crime statistics: by offence group1
England and WalesThousands
1996 1997 19982,3 19983 1999 2000 20014 20024,6 2003 2004 2005 20068
/99 /99 /00 /01 /02 /03 /04 /05 /06 /07
Violence against the person BEAB 239.3 250.8 230.8 LQMP 502.8 581.0 600.9 650.3 845.1 967.2 1 048.1 1 059.6 1 046.4
Sexual offences7 BEAC 31.4 33.2 34.9 LQMQ 36.2 37.8 37.3 41.4 58.9 62.5 62.9 62.1 57.5
Burglary BEAD 1 164.6 1 015.1 951.9 LQMR 953.2 906.5 836.0 878.5 890.1 820.0 680.4 645.1 622.0
Robbery BEAE 74.0 63.1 66.2 LQMS 66.8 84.3 95.2 121.4 110.3 103.7 91.0 98.2 101.4
Theft and handling stolen goods (of which): BEAF 2 383.9 2 165.0 2 126.7 LQMT 2 191.4 2 223.6 2 145.4 2 267.0 – – – – –Offences against vehicles I8RM .. .. .. .. 1 074.7 985.0 820.1 792.8 765.1Other theft offences I8RN .. .. .. .. 1 336.9 1 327.9 1 247.6 1 226.2 1 181.0
Fraud and forgery BEAG 136.2 134.4 173.7 LQMU 279.5 334.8 319.3 314.9 331.1 319.6 280.1 232.8 199.8
Criminal damage BEAH 951.3 877.0 834.4 LQMV 879.6 945.7 960.1 1 064.5 1 120.6 1 218.5 1 197.5 1 184.3 1 185.1
Drug offences5 LQMO .. .. 21.3 LQYT 135.9 121.9 113.5 121.4 143.3 143.5 145.8 178.5 194.3
Other offences5 BEAI 33.6 36.6 42.0 LQYU 63.6 65.7 63.2 65.7 64.0 65.7 64.0 75.6 75.6
Total BEAA 5 036.6 4 598.3 4 481.8 LQYV 5 109.1 5 301.2 5 170.8 5 525.0 5 975.0 6 013.8 5 637.5 5 555.2 5 428.3
1 See chapter text.2 Estimates.3 Figures from this period are not directly comparable with data prior to
1998/99 and from 2002/03 onwards.4 The National Crime Recording Standard (NCRS) was introduced in England
and Wales from 1 April 2002. These figures are not directly comparable withthose for earlier years. For more details about the inflationary effects of theNCRS on the 2001/02 and 2002/03 figures see chapter text. A detailed ex-planation for the NCRS can be accessed via the following Home OfficeResearch Development and Statistics website http://www.homeof-fice.gov.uk/rds/countrules.html
5 Prior to 1 April 1998 the offence of drug trafficking was included in the ’Other of-fences’ group. From 1 April 1999, under the new counting rules, drug traffickingbecame part of a new ’Drug offences’ group which, now also includes posses-sion and other drug offences. For 1998/99 under the old counting rules, drugtrafficking has been separated out and listed under drugs offences.
6 Includes the British Transport Police (BTP) from 2002/03 onwards.7 The Sexual Offences Act 2003, introduced in May 2004, altered the8 The offence groupings were revised in 2006/07 and backdated to 2002/03.
Source: Home Office: 020 7035 0307

170
Crime and justice
11.4 Offenders found guilty: by offence group1,2,3,
England and WalesMagistrates’ courts and the Crown Court Thousands
1996 1997 1998 1999 2000 2001 2002 2003 2004 2005 2006
All ages4
Indictable offences
Violence against the person: KJEJ 30.0 34.6 35.7 34.4 34.0 35.3 37.7 38.0 39.1 40.9 41.9Murder KESB 0.3 0.3 0.3 0.3 0.3 0.3 0.3 0.3 0.4 0.4 0.4Manslaughter KESC 0.3 0.3 0.3 0.3 0.3 0.3 0.3 0.2 0.3 0.3 0.2Wounding KESD 28.3 32.7 35.2 33.9 33.5 33.5 35.7 35.9 36.9 38.6 39.8Other offences of violence
against the person KESE 1.2 1.3 1.3 1.3 1.3 1.2 1.4 1.5 1.3 1.3 1.2Sexual offences KESF 4.4 4.5 4.6 4.3 3.9 3.8 4.4 4.4 4.8 4.8 4.9Burglary KESG 32.2 31.7 30.8 29.3 26.2 24.8 26.7 25.7 24.3 23.0 23.0Robbery KESH 5.9 5.6 5.5 5.6 6.0 6.8 7.7 7.3 7.5 7.1 8.1Theft and handling stolen goods KESI 114.5 118.4 125.7 131.2 128.0 127.0 127.3 119.1 110.6 103.8 99.0Fraud and forgery KESJ 16.3 17.0 19.8 20.3 19.2 18.3 18.1 18.0 18.1 18.5 18.2Criminal damage KESK 9.8 10.5 10.9 10.9 10.2 10.7 11.0 11.2 11.7 11.7 12.7Drugs KBWX 34.1 40.7 48.8 48.7 44.6 45.6 49.0 51.2 54.5 39.1 39.6Other offences (excluding
motoring) KESL 43.5 47.6 49.6 47.9 44.5 44.2 48.0 51.4 54.7 53.1 50.0Motoring offences KESM 9.9 9.5 9.0 8.1 7.6 7.7 8.2 8.7 8.0 6.6 5.9Total KESA 300.6 320.1 341.7 342.0 325.5 324.2 338.3 335.1 317.8 308.5 303.2
Summary offences
Assaults KESO 30.0 32.0 35.3 37.5 37.4 37.7 40.7 45.6 53.4 60.4 64.5Betting and gaming KESP – – – – – – – – – – –Offences with pedal cycles KBWY 1.3 1.5 2.1 1.3 0.8 0.6 0.5 0.6 0.7 0.7 0.7Other Highways Acts offences KBWZ 2.8 3.2 3.1 2.9 2.7 2.4 2.2 1.9 1.8 2.0 2.1Breach of local or other
regulations KESQ 5.9 6.4 5.8 6.5 5.0 4.3 3.9 3.4 3.1 2.6 1.9Intoxicating Liquor Laws:
Drunkenness KESR 24.2 28.8 30.8 28.7 27.2 26.2 26.9 27.7 21.1 16.1 15.7Other offences KESS 0.5 0.6 0.6 0.5 0.4 0.3 0.4 0.7 0.8 1.0 1.2
Education Acts KEST 3.5 3.7 5.0 5.1 5.1 5.6 5.8 5.8 6.5 6.4 7.4Game Laws KESU 0.4 0.3 0.4 0.3 0.2 0.2 0.3 0.2 0.2 0.4 –Labour Laws KESV – 0.1 0.1 0.1 0.1 – – – – – –Summary offences of criminal
damage and malicious damage KESW 23.4 24.7 26.5 27.9 28.0 26.9 28.3 29.8 31.5 31.1 30.2Offences by prostitutes KESX 6.6 6.6 6.0 4.0 4.1 3.7 4.2 3.9 2.9 2.2 1.6Railway offences KESY 9.1 11.4 12.6 15.2 17.4 22.6 29.4 34.8 35.0 40.2 44.6Revenue Laws KESZ 139.1 143.5 174.7 165.8 175.0 146.9 167.8 172.5 175.5 130.5 104.4Vagrancy Acts KETB 2.0 2.0 2.2 2.7 3.3 3.2 3.8 3.8 2.9 2.2 2.2Wireless Telegraphy Acts KETC 164.9 77.0 76.6 55.8 105.7 83.8 96.6 79.9 89.3 105.0 115.6Other summary offences KETD 74.7 74.7 80.9 79.3 78.1 77.8 76.4 82.9 97.9 108.2 103.6Motoring offences (summary) KETA 649.0 649.3 665.2 632.9 607.5 583.3 595.8 662.6 707.9 667.1 622.5Total KESN 1 137.4 1 065.8 1 128.0 1 066.5 1 098.2 1 025.5 1 083.0 1 156.1 1 230.7 1 175.9 1 118.2
Persons aged 10 to under 185
Indictable offences
Violence against the person: KETF 5.3 5.9 5.9 6.2 6.4 6.9 6.9 6.6 6.9 7.4 7.5Murder KBXA – – – – – – – – – – –Manslaughter KBXB – – – 0.2 – – – – – – –Wounding KBXC 5.3 5.8 5.9 5.9 6.3 6.8 6.8 6.5 6.5 7.3 7.4Other offences of violence
against the person KCAA – 0.1 0.1 – 0.1 0.1 0.1 0.1 0.3 0.2 0.1Sexual offences KETG 0.4 0.5 0.5 0.5 0.5 0.5 0.6 0.4 0.6 0.6 0.5Burglary KETH 8.6 8.6 8.5 7.8 6.8 6.3 6.4 5.8 5.9 6.0 6.2Robbery KETI 2.4 2.3 2.2 2.0 2.2 2.8 2.8 2.6 3.0 3.1 3.7Theft and handling stolen goods KETJ 19.0 19.6 21.9 22.7 21.0 20.6 18.4 16.5 16.8 17.1 16.3Fraud and forgery KETK 0.7 0.8 1.0 1.1 1.0 1.0 1.2 0.8 0.8 0.7 0.6Criminal damage KETL 2.2 2.3 2.3 2.7 2.6 2.9 2.9 2.9 3.2 3.3 3.7Drugs KCAB 1.6 1.8 2.7 3.1 3.7 4.3 5.0 5.1 4.5 4.6 4.5Other offences (excluding
motoring) KETM 3.8 4.2 4.2 4.3 4.4 4.4 4.4 4.3 4.6 4.5 4.1Motoring KETN 0.4 0.4 0.4 0.4 0.6 0.7 0.8 0.8 0.7 0.6 0.5Total KETE 44.4 46.4 49.7 50.6 49.2 50.3 49.1 46.0 47.0 47.8 47.6
Summary offences
Offences with pedal cycles KETP 0.2 0.2 0.3 0.3 0.2 0.2 0.2 0.2 0.2 0.3 0.2Breach of local or other
regulations KETR 0.3 0.2 0.2 0.2 0.2 0.2 0.1 0.1 0.1 0.1 0.1Summary offences of criminal
damage and malicious damage KETS 3.9 4.4 5.2 6.1 6.7 6.9 7.0 7.2 8.3 8.8 8.6Railway offences KETT 0.4 0.5 0.5 0.5 0.4 0.4 0.4 0.3 0.4 0.4 0.4Other summary offences KETU 8.8 16.6 19.4 20.0 20.2 20.8 20.6 20.9 23.1 24.0 24.7Motoring offences (summary) KCAC 10.8 10.8 11.3 12.6 14.5 16.7 17.1 17.8 17.0 14.8 12.1Total KETO 30.3 22.0 36.8 39.6 42.2 45.2 45.4 46.6 49.2 48.3 46.1
1 See chapter text.2 Data provided on the principal offence basis.3 Every effort is made to ensure that the figures presented are accurate and
complete. However, it is important to note that these data have been ex-tracted from large administrative data systems generated by the courts
and police forces. As a consequence, care should be taken to ensure data col-lection processes and their inevitable limitations are taken into account whenthose data are used.
4 Includes ’Companies’, etc .5 Figures for persons aged 10 to under 18 are included in the totals above.
Source: Office for Criminal Justice Reform: 020 7035 4955

171
Crime and justice
11.5 Offenders cautioned: by offence group1,2,3
England and WalesThousands
1996 1997 1998 1999 2000 2001 2002 2003 2004 2005 2006
All ages4
Indictable offences
Violence against the person KELB 21.8 23.6 23.5 21.2 19.9 19.5 23.6 28.8 36.6 51.0 57.3Murder KCAD – – – – – – – – – – –Manslaughter KCAE – – – – – – – – – – –Wounding KCAF 21.4 23.3 22.9 20.6 19.3 18.9 22.9 27.9 35.4 49.6 55.7
Other violence against theperson KCAG 0.4 0.4 0.6 0.6 0.6 0.6 0.7 0.8 1.2 1.4 1.5
Sexual offences KELC 2.0 1.9 1.7 1.5 1.3 1.2 1.2 1.4 1.6 1.8 1.9Burglary KELD 10.2 9.4 8.4 7.7 6.6 6.4 5.8 5.6 5.6 6.5 7.7Robbery KELE 0.6 0.7 0.6 0.6 0.6 0.5 0.4 0.4 0.5 0.6 0.7Theft and handling stolen goods KELF 93.6 82.8 83.6 75.4 67.6 63.5 54.2 54.5 61.9 67.6 72.4Fraud and forgery KELG 7.5 7.2 7.4 7.2 6.2 5.8 5.3 5.5 6.0 6.9 8.0Criminal damage KELH 3.1 2.8 2.7 3.0 3.2 3.4 3.1 3.7 5.5 7.2 9.0Drug offences KCAI 47.5 56.0 58.7 49.4 41.1 39.4 44.9 45.7 32.6 34.4 37.4Other offences KELI 4.4 5.0 5.0 4.6 4.4 4.1 4.4 5.3 6.0 6.9 9.3
All offenders cautioned KELA 190.8 189.4 191.7 170.6 150.9 143.9 142.9 150.7 156.3 182.9 203.7
Summary offences
Assaults KELK 9.1 9.1 13.2 17.0 17.2 18.2 17.3 19.8 26.1 40.8 64.6Betting and gaming KELL – – – – – – – – – – –Offences with pedal cycles KCAK 0.9 0.9 0.8 0.7 0.3 0.2 0.1 0.1 0.3 0.3 0.3Other Highways Acts offences KCAL 0.8 0.8 0.8 0.7 0.4 0.3 0.2 0.3 0.3 0.2 0.3Breach of local or other
regulations KELM 0.8 0.9 0.9 0.7 0.5 0.3 0.3 0.2 0.2 0.2 0.1Intoxicating Liquor Laws:
Drunkenness KELN 25.9 25.7 22.8 20.3 18.1 16.6 16.2 18.1 13.5 8.6 5.8Other offences KELO 0.9 0.9 0.7 0.4 0.3 0.3 0.3 0.3 0.3 0.3 0.2
Education Acts KELP – – – – – – – 0.1 0.1 0.1 0.1Game Laws KELQ 0.1 0.1 0.1 0.1 – – – – – – –Labour Laws KELR – – – – – – – – – – –Summary offences of criminal
damage and malicious damage KELS 27.7 27.6 28.3 28.7 26.8 26.7 24.7 27.6 33.3 38.0 43.2Offences by prostitutes KELT 3.5 3.5 3.5 2.1 1.3 1.0 1.8 1.3 1.6 1.4 1.2Railway offences KELU 0.2 0.1 – – – – – – – 0.1 0.1Revenue Laws KELV 0.1 0.1 0.1 0.1 – – – – – – –Vagrancy Acts KELX 0.6 0.6 1.2 0.8 0.4 0.3 0.3 0.3 0.2 0.3 0.4Wireless Telegraphy Acts KELY – – – – – – – – – – –Other summary offences KELZ 24.7 22.3 37.0 24.1 22.5 21.9 21.0 22.9 23.4 25.2 29.2
All offenders cautioned KELJ 95.4 92.7 96.2 95.6 88.1 85.9 82.4 91.1 99.5 115.5 145.6
Persons aged 10 to under 185
Indictable offences
Violence against the person KEMB 9.4 9.6 9.5 8.5 8.3 8.7 9.3 11.0 13.6 16.5 16.6Murder KCAN – – – – – – – – – – –Manslaughter KCAO – – – – – – – – – – –Wounding KCAP 9.4 9.6 9.4 8.4 8.2 8.6 9.2 10.9 13.5 16.4 16.5
Other violence against theperson KCCE – – 0.1 0.1 0.1 0.1 0.1 0.1 0.1 0.1 0.1
Sexual offences KEMC 0.7 0.7 0.6 0.6 0.5 0.5 0.4 0.5 0.5 0.6 0.6Burglary KEMD 8.2 7.5 6.7 6.1 5.4 5.3 4.6 4.4 4.2 4.6 5.0Robbery KEME 0.6 0.6 0.5 0.5 0.5 0.5 0.4 0.4 0.4 0.5 0.6Theft and handling stolen goods KEMF 48.2 40.9 44.0 39.6 36.9 35.2 28.1 28.3 33.1 36.8 39.4Fraud and forgery KEMG 1.5 1.4 1.6 1.7 1.5 1.3 1.1 1.0 1.0 1.1 1.3Criminal damage KEMH 2.0 1.8 1.7 1.9 2.1 2.3 1.9 2.3 3.1 3.9 4.7Drug offences KCCF 7.9 9.7 11.0 9.6 7.9 8.5 9.5 9.6 8.3 7.8 7.1Other offences KEMI 1.3 1.5 1.5 1.4 1.3 1.3 1.3 1.4 1.6 1.6 1.9
All offenders cautioned KEMA 79.9 73.7 77.2 69.8 64.3 63.5 56.6 58.7 65.9 73.4 77.1
Summary offences
Offences with pedal cycles KEMK 0.5 0.5 0.4 0.3 0.2 0.1 0.1 0.1 0.2 0.2 0.2Breach of local or other
regulations KEMM 0.3 0.3 0.3 0.2 0.2 0.1 0.1 0.1 0.1 0.1 0.1Summary offences of criminal
damage and malicious damage KEMN 13.8 13.5 14.2 14.7 14.4 15.2 12.6 14.3 17.1 19.8 21.9Railway offences KEMO 0.1 0.1 – – – – – – – – –Other summary offences KEMP 10.8 16.4 17.7 19.0 18.4 19.1 17.1 18.8 21.7 25.1 29.6
All offenders cautioned KEMJ 33.2 30.8 32.5 34.2 33.2 34.5 29.9 33.3 39.1 45.1 51.7
1 See chapter text.2 Data provided on the principal offence basis.3 Every effort is made to ensure that the figures presented are accurate and
complete. However, it is important to note that these data have been ex-tracted from large administrative data systems generated by police
forces. As a consequence, care should be taken to ensure data collectionprocesses and their inevitable limitations are taken into account when thosedata are used.
4 Includes ’Companies’, etc.5 Figures for persons aged 10 to under 18 are included in the totals above.
Source: Office for Criminal Justice Reform: 020 7035 4955

172
Crime and justice
11.6 Offenders found guilty of offences: by age and sex1,2,3
England and WalesMagistrates’ courts and the Crown Court Thousands
1996 1997 1998 1999 2000 2001 2002 2003 2004 2005 2006
MalesIndictable offences
All ages KEFA 261.1 276.5 292.9 291.7 276.5 275.5 287.1 283.4 268.4 261.3 258.410 and under 15 years KEFB 6.6 7.1 8.1 8.9 8.7 9.0 8.8 8.0 8.5 8.6 8.315 and under 18 years KEFC 32.5 33.6 35.2 35.1 33.8 34.4 33.7 31.4 31.8 32.0 32.518 and under 21 years KEFD 46.3 48.4 51.8 52.6 49.9 48.2 46.6 43.8 39.9 38.5 39.021 years and over KEFE 175.6 187.3 197.9 195.0 184.0 183.9 198.0 200.2 188.2 182.2 178.7
Summary offencesAll ages KEFF 903.6 880.9 929.0 886.6 881.0 826.6 866.4 937.1 990.0 931.2 877.710 and under 15 years KEFG 2.8 3.0 3.9 5.1 5.8 6.2 6.1 6.1 6.7 7.2 7.015 and under 18 years KEFH 24.6 25.9 28.5 30.3 32.2 34.5 34.6 35.3 36.4 34.6 32.318 and under 21 years KEFI 88.4 91.0 96.3 94.8 93.0 92.2 94.7 99.9 98.2 89.4 85.121 years and over KEFJ 787.9 761.0 800.3 756.5 750.0 693.6 731.0 795.8 848.8 800.1 753.4
FemalesIndictable offences
All ages KEFK 38.0 42.2 47.3 49.0 47.7 47.4 50.0 50.2 48.4 46.1 43.710 and under 15 years KEFL 1.0 1.0 1.4 1.4 1.5 1.6 1.6 1.6 1.7 1.7 1.715 and under 18 years KEFM 4.2 4.6 5.1 5.2 5.2 5.3 5.1 4.9 5.0 5.5 5.118 and under 21 years KEFN 5.7 6.3 7.1 7.6 7.5 7.0 6.9 6.2 5.7 5.3 4.821 years and over KEFO 27.2 30.4 33.7 34.7 33.5 33.5 36.5 37.5 35.9 33.6 32.1
Summary offencesAll ages KEFP 222.9 174.9 188.3 171.0 208.3 190.2 208.7 210.5 231.2 236.6 233.910 and under 15 years KEFQ 0.4 0.5 0.6 0.8 0.9 0.9 1.1 1.2 1.4 1.6 1.615 and under 18 years KEFR 2.6 3.4 3.8 3.4 3.3 3.6 3.6 4.0 4.6 4.9 5.218 and under 21 years KEFS 12.1 11.1 12.1 10.8 11.8 11.1 11.6 12.6 13.0 13.5 14.221 years and over KEFT 207.9 160.0 171.7 155.4 192.3 174.7 192.4 192.7 212.1 216.6 212.9
Companies, etcIndictable offences KEFU 1.5 1.3 1.5 1.3 1.3 1.3 1.2 1.4 1.1 1.1 1.0Summary offences KEFV 10.9 10.0 10.7 8.9 8.8 8.6 7.9 8.6 9.4 8.1 6.6
1 See chapter text.2 These data are on the principal offence basis.3 Every effort is made to ensure that the figures presented are accurate and
complete. However, it is important to note that these data have been ex-tracted from large administrative data systems generated by the courts
and police forces. As a consequence, care should be taken to ensure datacollection processes and their inevitable limitations are taken into account whenthose data are used.
Source: Office for Criminal Justice Reform: 020 7035 4955
11.7 Persons cautioned by the police: by age and sex1,3,4
England and WalesThousands
1996 1997 1998 1999 2000 2001 2002 2003 2004 2005 2006
MalesIndictable offences
All ages KEGA 142.6 143.3 142.9 126.1 109.7 103.8 104.4 109.8 110.0 129.9 147.610 and under 15 years2 KEGB 25.1 22.9 23.7 22.0 20.3 19.7 16.7 16.9 18.7 21.0 21.715 and under 18 years2 KEGC 33.0 32.0 32.0 28.7 25.0 24.5 23.3 24.1 25.9 28.0 30.218 and under 21 years KEGD 24.3 25.2 25.7 22.7 20.1 18.5 18.9 19.4 16.7 19.8 22.921 years and over KEGE 60.2 63.2 61.5 52.7 44.3 41.2 45.6 49.4 48.7 61.1 72.8
Summary offencesAll ages KEGF 79.2 75.7 76.9 76.1 69.6 68.0 63.8 70.9 76.0 87.6 112.010 and under 15 years2 KEGG 10.3 9.9 10.6 11.7 12.0 12.7 10.3 10.9 12.6 15.5 17.915 and under 18 years2 KEGH 18.0 16.1 16.1 16.1 14.9 15.2 13.3 15.1 17.2 18.6 21.318 and under 21 years KEGI 13.0 12.9 13.2 13.0 11.9 11.0 11.0 12.4 12.3 12.2 15.021 years and over KEGJ 37.9 36.9 37.0 35.3 30.9 29.0 29.2 32.5 33.9 41.2 57.8
FemalesIndictable offences
All ages KEGK 48.2 46.0 48.8 44.5 41.2 40.1 38.5 41.0 46.3 53.0 56.210 and under 15 years2 KEGL 10.8 9.2 11.1 9.8 10.0 10.1 8.4 8.6 10.6 12.2 12.515 and under 18 years2 KEGM 10.9 9.5 10.3 9.3 9.0 9.3 8.3 9.1 10.7 12.2 12.718 and under 21 years KEGN 5.6 5.7 5.9 5.7 5.2 4.9 4.8 4.9 5.2 5.8 6.221 years and over KEGO 20.9 21.5 21.4 19.6 17.0 15.9 17.0 18.4 19.9 22.8 24.7
Summary offencesAll ages KEGP 16.2 17.0 19.2 9.4 18.5 18.0 18.6 20.2 23.5 28.5 34.210 and under 15 years2 KEGQ 1.8 1.7 2.1 2.5 2.8 2.9 2.7 3.0 3.9 5.1 5.615 and under 18 years2 KEGR 3.2 3.2 3.7 3.9 3.7 3.8 3.6 4.3 5.4 6.2 7.118 and under 21 years KEGS 2.1 2.3 2.6 2.7 2.5 2.3 2.4 2.7 2.9 3.3 4.121 years and over KEGT 9.1 9.9 10.8 10.3 9.6 9.0 9.8 10.2 11.3 13.9 17.4
1 See chapter text.2 From 1 June 2000 the Crime and Disorder Act 1998 came into force nation-
ally and removed the use of cautions for persons under 18 and replacedthem with reprimands and final warnings.
3 These data are on the principal offence basis.
4 Every effort is made to ensure that the figures presented are accurate andcomplete. However, it is important to note that these data have been extractedfrom large administrative data systems generated by police forces. As aconsequence, care should be taken to ensure data collection processes andtheir inevitable limitations are taken into account when those data are used.
Source: Office for Criminal Justice Reform:020 7035 4955

173
Crime and justice
11.8 Sentence or order passed on persons sentenced for indictable offences: by sex1
England and WalesMagistrates’ courts and the Crown Court Percentages and thousands
1996 1997 1998 1999 2000 2001 2002 2003 2004 2005 2006
Males
Sentence or orderAbsolute discharge KEJB 0.8 0.7 0.7 0.6 0.6 0.6 0.8 0.9 0.8 0.7 0.7Conditional discharge KEJC 15.6 15.5 15.3 15.0 14.1 13.4 12.4 13.0 12.2 11.9 11.3Fine KEJF 28.6 28.2 28.4 27.7 25.7 24.5 23.9 24.0 20.9 19.4 17.4Community rehabilitation order KEJD 9.9 10.0 10.0 10.1 10.1 10.7 10.6 10.1 9.5 5.6 0.8Supervision order KEJE 2.9 2.7 2.7 2.7 2.4 2.3 2.1 1.8 2.0 2.1 2.3Community punishment order KEJG 9.9 9.5 9.3 9.3 9.5 9.0 8.6 8.3 8.8 6.3 1.2Attendance centre order KEJH 1.9 1.8 1.7 1.8 1.5 1.2 0.7 0.6 0.6 0.6 0.6Community punishment and KIJW 3.5 3.7 3.8 3.7 3.6 2.6 2.6 2.6 2.8 2.1 0.5rehabilitation orderCurfew order LUJP 0.1 0.1 0.2 0.3 0.5 0.7 1.1 1.6 2.7 2.3 1.3Reparation order SNFI .. .. .. .. 0.7 1.3 0.8 0.4 0.4 0.5 0.6Action plan order SNFJ .. .. .. .. 0.9 1.7 1.1 0.7 0.8 0.8 0.8Drug treatment and testing order SNFK .. .. .. .. 0.1 1.2 1.4 1.9 2.3 1.6 0.1Referral order SNFL .. .. .. .. .. .. 3.0 4.0 4.4 5.2 5.2Community order2 GN7P .. .. .. .. .. .. .. .. .. 8.7 19.8Suspended sentence order KEJL 0.8 0.8 0.7 0.6 0.7 0.6 0.5 0.5 0.6 1.7 6.7ImprisonmentSec 90-92 LUJQ 0.2 0.3 0.2 0.2 0.2 0.2 0.2 0.2 0.2 0.2 0.2Detention and training order LUJR .. .. .. .. 1.4 1.9 1.8 1.5 1.6 1.6 1.7Young offender institution KEJK 6.1 6.1 6.0 6.2 5.2 4.5 4.2 3.6 3.8 3.7 3.6Unsuspended imprisonment KEJM 17.2 17.9 18.2 18.7 19.9 20.0 20.9 20.6 21.5 21.2 20.4
Other sentence or order KEJN 2.4 3.0 2.6 3.1 3.1 3.4 3.3 3.5 4.1 3.9 4.4
Total number of males(thousands) = 100 per cent KEJA 260.8 275.4 292.4 291.3 277.1 274.6 285.6 282.3 267.5 259.4 258.4
Females
Sentence or orderAbsolute discharge KEKB 0.9 0.8 0.7 0.7 0.6 0.6 0.9 1.0 0.8 0.8 0.7Conditional discharge KEKC 30.6 29.4 28.7 26.9 24.9 23.9 22.0 22.5 21.8 20.7 20.1Fine KEKF 22.5 21.8 21.3 20.8 20.1 18.6 17.9 18.5 16.7 15.2 12.8Community rehabilitation order KEKD 19.0 19.1 19.1 19.4 19.6 19.1 19.2 17.0 15.4 9.0 1.4Supervision order KEKE 2.9 2.9 3.1 2.9 2.8 2.7 2.1 2.1 2.1 2.4 2.5Community punishment order KEKG 6.5 6.5 6.5 7.1 7.5 7.3 6.8 6.6 7.6 6.1 1.6Attendance centre order KEKH 1.0 1.0 0.9 0.9 0.8 0.6 0.4 0.3 0.3 0.3 0.5Community punishment and KIJX 3.0 3.2 3.4 3.3 3.0 2.1 2.1 1.8 1.9 1.5 0.5rehabilitation orderCurfew order LUJT – 0.1 0.1 0.3 0.4 0.6 0.8 1.4 2.2 2.3 1.1Reparation order SNFX .. .. .. .. 0.8 1.6 0.8 0.4 0.5 0.5 0.5Action plan order SNFZ .. .. .. .. 1.0 2.0 1.2 0.8 0.8 1.0 0.9Drug treatment and testing order SNGA .. .. .. .. 0.1 1.4 1.7 2.4 3.2 2.1 0.2Referral order SNGB .. .. .. .. .. .. 3.9 5.1 5.6 6.7 6.9Community order2 GN7Q .. .. .. .. .. .. .. .. .. 9.9 23.3Suspended sentence order KEKL 1.5 1.6 1.5 1.3 1.3 1.2 1.1 1.0 1.3 2.5 7.8ImprisonmentSec 90-92 LUJU 0.1 0.1 .. 0.1 0.1 0.1 0.1 0.1 0.1 0.1 –Detention and training order LUJV .. .. .. .. 0.6 0.8 0.8 0.7 0.7 0.8 0.7Young offender institution KEKK 1.8 1.9 2.2 2.4 2.2 2.0 1.9 1.7 1.4 1.6 1.6Unsuspended imprisonment KEKM 8.4 9.4 10.0 11.0 11.5 12.1 12.7 12.8 13.2 12.6 12.8
Other sentence or order KEKN 2.0 2.2 2.5 3.0 2.9 3.5 3.4 3.8 4.3 3.8 4.3
Total number of females(thousands) = 100 per cent KEKA 38.0 42.1 47.2 49.0 47.8 47.3 49.9 50.2 48.3 46.1 43.7
1 See chapter text. Every effort is made to ensure that the figures presentedare accurate and complete. However, it is important to note that these datahave been extracted from large administrative data systems generated bythe courts and police forces. As a consequence, care should
be taken to ensure data collection processes and their inevitable limitations aretaken into account when those data are used.
2 The community order was introduced on 4 April 2005 and applies to offencescommitted on or after that date.
Source: Office for Justice Reform: 020 7035 4955
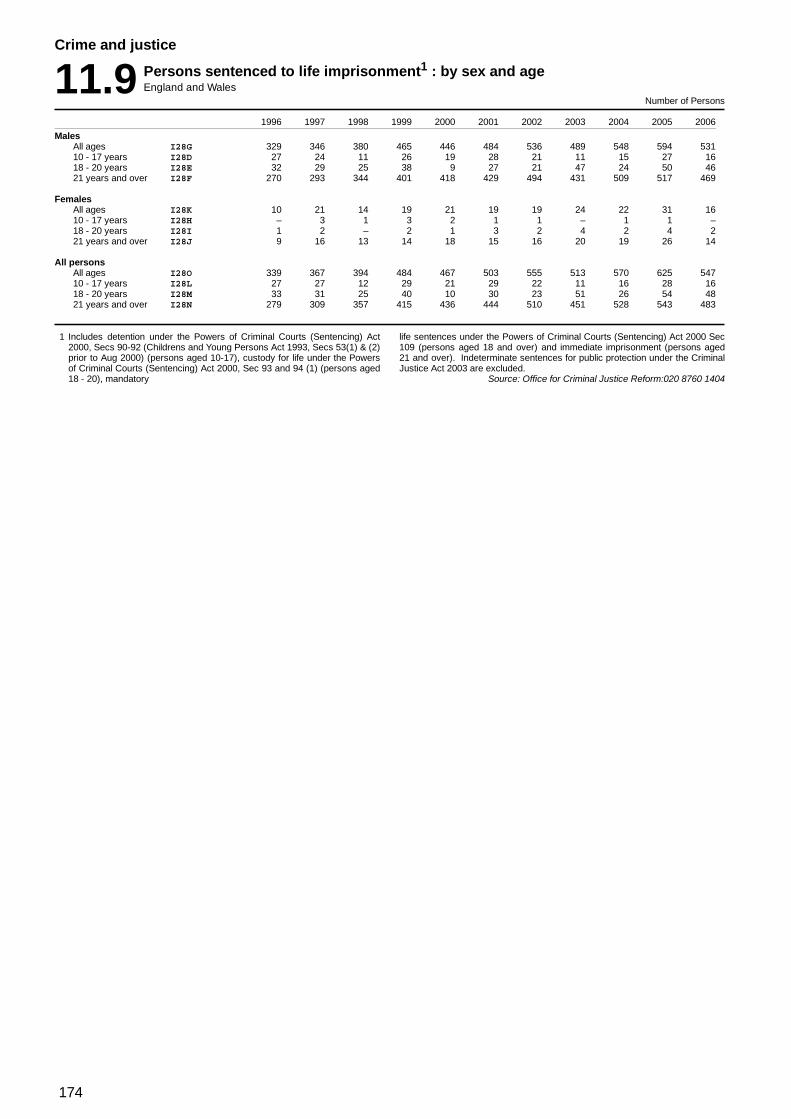
174
Crime and justice
11.9 Persons sentenced to life imprisonment1 : by sex and ageEngland and Wales
Number of Persons
1996 1997 1998 1999 2000 2001 2002 2003 2004 2005 2006
MalesAll ages I28G 329 346 380 465 446 484 536 489 548 594 53110 - 17 years I28D 27 24 11 26 19 28 21 11 15 27 1618 - 20 years I28E 32 29 25 38 9 27 21 47 24 50 4621 years and over I28F 270 293 344 401 418 429 494 431 509 517 469
FemalesAll ages I28K 10 21 14 19 21 19 19 24 22 31 1610 - 17 years I28H – 3 1 3 2 1 1 – 1 1 –18 - 20 years I28I 1 2 – 2 1 3 2 4 2 4 221 years and over I28J 9 16 13 14 18 15 16 20 19 26 14
All personsAll ages I28O 339 367 394 484 467 503 555 513 570 625 54710 - 17 years I28L 27 27 12 29 21 29 22 11 16 28 1618 - 20 years I28M 33 31 25 40 10 30 23 51 26 54 4821 years and over I28N 279 309 357 415 436 444 510 451 528 543 483
1 Includes detention under the Powers of Criminal Courts (Sentencing) Act2000, Secs 90-92 (Childrens and Young Persons Act 1993, Secs 53(1) & (2)prior to Aug 2000) (persons aged 10-17), custody for life under the Powersof Criminal Courts (Sentencing) Act 2000, Sec 93 and 94 (1) (persons aged18 - 20), mandatory
life sentences under the Powers of Criminal Courts (Sentencing) Act 2000 Sec109 (persons aged 18 and over) and immediate imprisonment (persons aged21 and over). Indeterminate sentences for public protection under the CriminalJustice Act 2003 are excluded.
Source: Office for Criminal Justice Reform:020 8760 1404

175
Crime and justice
11.10 Receptions and average population in custodyEngland and Wales
Numbers1
1996 1997 1998 1999 2000 2001 2002 2003 2004 2005 2006
Receptions
Type of inmate:Untried KEDA 58 888 62 066 64 697 64 572 54 892 53 467 58 708 58 696 54 556 55 455 55 809Convicted, unsentenced KEDB 34 987 36 424 43 387 45 893 43 889 46 851 53 301 53 246 50 115 49 104 47 995
Sentenced KEDE 82 861 87 168 91 282 93 965 93 671 91 978 94 807 93 495 95 161 92 452 90 038Immediate custodial sentence KEDF 74 306 80 832 85 908 90 238 91 195 90 523 93 615 92 245 93 326 90 414 88 134
Young offenders KEDG 17 593 18 743 19 599 21 020 21 333 20 969 20 236 18 179 18 264 17 819 17 985Up to 12 months KEDH 11 285 11 867 12 942 14 330 14 639 14 234 12 891 11 850 11 855 11 610 11 52612 months up to 4 years KEDJ 5 497 5 949 5 921 5 904 5 877 5 856 6 355 5 412 5 426 5 243 5 3174 years up to and including life KEDL 811 927 736 786 817 879 990 917 983 966 1 142
Adults KFBO 56 713 62 089 66 309 69 218 69 862 69 554 73 379 74 066 75 062 72 595 70 149Up to 12 months KEDV 34 864 38 702 42 513 45 662 46 759 46 146 47 870 48 962 49 814 48 190 45 76812 months up to 4 years KEDW 16 560 17 546 18 100 17 751 17 290 17 116 18 313 17 968 17 988 17 397 16 9704 years up to and including life KEDX 5 289 5 841 5 696 5 805 5 813 6 292 7 196 7 136 7 260 7 008 7 411
Committed in default of paymentof a fine KEDY 8 555 6 336 5 374 3 727 2 476 1 455 1 192 1 250 1 835 1 876 1 904Young offenders KEEA 885 555 568 366 216 138 110 116 155 162 118Adults KAFQ 7 670 5 781 4 806 3 361 2 260 1 317 1 082 1 134 1 680 1 714 1 786
Non-criminal prisoners KEDM 3 128 3 204 3 290 3 271 3 153 4 630 2 674 3 142 3 669 3 668 4 734Immigration Act 1971 KEDN 1 857 2 122 2 348 2 443 2 455 4 035 2 093 2 457 3 041 3 093 4 073Others KEDO 1 271 1 082 942 828 698 595 581 685 628 575 661
Average population
Total in custody KEDP 55 281 61 114 65 298 64 771 64 602 66 301 70 861 73 038 74 657 75 979 78 150
Total in prison serviceestablishments KFBQ 55 281 61 114 65 298 64 771 64 602 66 301 70 778 73 038 74 657 75 979 78 127
Police cells2 KFBN – – – – – – 83 – – – 22
Untried KEDQ 8 374 8 453 8 157 7 947 7 098 6 924 7 727 7 862 7 735 8 088 8 293
Convicted, unsentenced KEDR 3 238 3 678 4 411 4 571 4 177 4 314 5 064 5 060 4 750 4 806 4 967
Sentenced KEDU 43 043 48 413 52 176 51 691 52 685 54 051 57 222 59 007 61 071 61 991 63 504Immediate custodial sentence KFBR 42 863 48 272 52 045 51 596 52 620 54 006 57 184 58 959 61 012 61 925 63 429
Young offenders KFBS 6 700 7 821 8 490 8 336 8 435 8 558 8 777 8 421 8 290 8 239 8 535Determinate sentence I7IJ 6 614 7 707 8 363 8 197 8 288 8 408 8 616 8 262 8 123 8 030 8 141Indeterminate sentence I7IL 86 114 127 139 147 150 161 159 167 209 394
Adults KFCO 36 162 40 451 43 556 43 261 44 185 45 448 48 408 50 536 52 721 53 686 54 894Determinate sentence I7IK 32 756 36 838 39 733 39 183 39 779 40 768 43 411 45 278 47 264 47 914 47 885Indeterminate sentence I7IM 3 406 3 613 3 823 4 078 4 406 4 680 4 997 5 258 5 457 5 772 7 009
Committed in default of paymentof a fine KFCS 180 141 131 95 64 45 37 48 59 71 82Young offenders KFEW 22 13 15 9 4 6 2 3 4 3 3Adults KFEX 158 128 116 86 59 39 35 45 54 68 79
Non-criminal prisoners KEEB 627 572 554 558 641 1 012 847 1 107 1 100 1 087 1 355Immigration Act 1971 KEEC 516 485 474 485 576 955 777 1 041 1 033 1 022 1 288Others KEED 111 87 79 73 63 57 69 67 68 65 65
Accommodation3 I7IQ 53 152 56 329 61 253 62 369 63 436 63 757 64 232 66 104 67 576 69 443 70 585
1 The components do not always add up to the totals as they have beenrounded independently.
2 Mostly untried prisoners.3 In use certified normal accomodation at 30 June.
Source: Ministry of Justice: 020 7210 0638

176
Crime and justice
11.11 Prison population serving sentences: by age and offence1,2
England and WalesNumbers
Age in years
15 - 17 18 - 20 21 - 24 25 - 29 30 - 39 40 - 49 50 - 59 60 and over Total
At 30 June 2001OffencesMales
Total 1 918 5 864 9 051 9 964 14 538 6 044 2 723 1 211 51 313Violence against the person 343 1 180 1 810 1 997 3 432 1 631 702 252 11 347Sexual offences 53 145 265 406 1 368 1 172 953 686 5 048Burglary 383 1 176 2 039 2 190 2 158 389 61 15 8 410Robbery 429 1191 1 436 1 309 1 652 360 60 12 6 449Theft, handling, fraud and forgery 318 742 1 086 1 080 1 362 510 217 55 5 370Drugs offences 47 423 1 126 1 686 2 828 1 278 479 113 7 980Other offences 285 840 1 146 1 163 1 541 616 213 66 5 868Offences not known 61 165 143 133 196 90 40 13 841
FemalesTotal 63 305 493 589 906 406 119 18 2 899
Violence against the person 18 63 55 72 123 81 24 6 441Sexual offences - 2 1 1 7 10 2 2 25Burglary 9 29 44 29 36 5 2 - 153Robbery 10 53 63 54 55 13 1 - 248Theft, handling, fraud and forgery 12 53 100 155 178 64 29 4 594Drugs offences 3 72 183 215 411 193 49 4 1130Other offences 8 27 40 50 82 32 9 2 249Offences not known 3 7 8 14 14 9 4 - 59
At 30 June 2002OffencesMales
Total 1 986 5 821 9 722 10 196 15 415 6 630 2 832 1 365 53 967Violence against the person 336 1 187 1 942 1 937 3 490 1 769 749 267 11 678Sexual offences 58 167 262 406 1 347 1 241 996 794 5 270Burglary 396 1 130 2 159 2 331 2 379 448 58 15 8 917Robbery 503 1 285 1 647 1 390 1 865 443 66 10 7 208Theft, handling, fraud and forgery 302 570 1 055 1 105 1 416 480 213 62 5 203Drugs offences 43 431 1 255 1 763 3 142 1 496 495 129 8 754Other offences 275 875 1 195 1 103 1 555 640 205 73 5 921Offences not known 72 174 207 162 222 113 50 15 1 016
FemalesTotal 103 356 596 662 1 030 439 134 19 3 339
Violence against the person 27 67 73 85 163 84 33 6 538Sexual offences - 1 - 1 11 6 3 1 23Burglary 9 37 58 54 68 12 1 - 239Robbery 19 63 89 65 60 14 3 1 314Theft, handling, fraud and forgery 22 56 103 139 168 68 20 4 581Drugs offences 8 94 206 256 474 216 60 6 1 319Other offences 12 32 52 50 73 34 9 1 262Offences not known 6 7 16 13 13 5 4 - 63
At 30 June 2003OffencesMales
Total 1 724 5 740 10 112 10 441 16 304 7 252 2 975 1 413 55 962Violence against the person 310 1 257 2 112 2 068 3 733 1 932 780 290 12 482Sexual offences 42 183 310 390 1 376 1 353 1 023 838 5 514Burglary 289 919 2 003 2 204 2 555 527 71 11 8 579Robbery 436 1 370 1 910 1 546 2 022 514 69 12 7 879Theft, handling, fraud and forgery 291 543 1 020 1 060 1 437 472 201 45 5 069Drugs offences 43 452 1 256 1 791 3 215 1 579 528 127 8 993Other offences 271 884 1 329 1 218 1 760 787 263 69 6 581Offences not known 42 133 172 164 205 89 40 21 865
FemalesTotal 57 305 670 702 1 100 492 123 28 3 477
Violence against the person 10 61 91 66 155 82 32 7 506Sexual offences - - 2 1 11 7 3 2 26Burglary 1 24 64 60 77 12 2 - 240Robbery 21 60 105 100 93 24 4 - 407Theft, handling, fraud and forgery 10 56 117 128 199 70 18 11 609Drugs offences 6 73 226 271 453 253 54 8 1 343Other offences 7 27 58 66 108 39 6 - 311Offences not known 2 3 8 10 5 4 4 - 36

177
Crime and justice
11.11 Prison population serving sentences: by age and offence1,2
England and Walescontinued Numbers
Age in years
15 - 17 18 - 20 21 - 24 25 - 29 30 - 39 40 - 49 50 - 59 60 and over Total
At 30 June 2004OffencesMales
Total 1 706 5 585 10 095 10 738 17 021 7 858 3 013 1 508 57 523Violence against the person 326 1 353 2 247 2 272 3 965 2 107 799 304 13 373Sexual offences 55 193 329 424 1 433 1 416 1 030 865 5 747Burglary 242 855 1 807 2 141 2 662 608 71 11 8 397Robbery 449 1 254 1 865 1 691 2 127 583 70 17 8 056Theft, handling, fraud and forgery 272 502 903 1 045 1 479 573 180 63 5 017Drugs offences 51 471 1 383 1 789 3 258 1 615 537 150 9 256Other offences 286 848 1 390 1 249 1 895 868 284 87 6 908Offences not known 25 108 171 126 202 87 41 10 769
FemalesTotal 58 300 632 727 1 056 507 152 20 3 453
Violence against the person 15 70 98 89 192 95 36 9 603Sexual offences - - 3 3 8 7 4 2 27Burglary 6 19 59 83 56 22 3 - 247Robbery 8 65 93 90 114 20 2 - 392Theft, handling, fraud and forgery 11 28 100 140 171 67 25 1 543Drugs offences 6 78 197 245 392 246 65 6 1 235Other offences 11 37 75 72 108 44 13 2 361Offences not known 2 3 8 7 15 7 4 - 46
At 30 June 2005OffencesMales
Total 1 782 5 595 9 937 10 969 16 843 8 731 3 256 1 594 58 707Violence against the person 366 1 493 2 553 2 553 4 015 2 402 840 319 14 541Sexual offences 65 186 397 505 1 436 1 552 1 084 922 6 147Burglary 285 719 1 559 1 947 2 570 669 78 17 7 844Robbery 422 1 307 1 819 1 705 2 035 649 83 15 8 035Theft, handling, fraud and forgery 240 433 858 1 074 1 449 650 238 55 4 997Drugs offences 76 491 1 332 1 834 3 263 1 741 544 148 9 429Other offences 310 870 1 306 1 245 1 902 987 360 99 7 079Offences not known 18 96 113 106 173 81 29 19 635
FemalesTotal 55 269 614 680 1 073 585 179 24 3 479
Violence against the person 23 68 109 85 190 114 40 9 638Sexual offences - 2 3 4 12 8 7 3 39Burglary 4 18 50 62 79 23 3 - 239Robbery 16 59 61 82 102 20 3 - 343Theft, handling, fraud and forgery 4 35 105 119 202 88 27 3 583Drugs offences 3 54 195 255 366 268 84 9 1 234Other offences 5 30 84 68 117 56 14 - 374Offences not known - 3 7 5 5 8 1 - 29
At 30 June 2006OffencesMales
Total 1 814 5 716 9 612 11 349 16 828 9 349 3 511 1 719 59 898Violence against the person 381 1 563 2 616 2 977 4 109 2 609 935 348 15 537Sexual offences 67 213 452 560 1 497 1 683 1 118 971 6 561Burglary 275 707 1 363 1 838 2 554 715 97 15 7 563Robbery 486 1 413 1 739 1 674 1 975 706 91 16 8 100Theft, handling, fraud and forgery 200 451 830 1 093 1 598 707 214 54 5 147Drugs offences 68 492 1 232 1 913 3 153 1 829 623 174 9 484Other offences 327 835 1 326 1 231 1 838 1 040 406 129 7 129Offences not known 12 43 55 64 105 60 28 10 378
FemalesTotal 50 271 551 707 1 094 604 189 39 3 506
Violence against the person 11 75 111 101 205 118 48 9 678Sexual offences 1 3 2 2 8 13 5 3 37Burglary 7 13 39 63 80 24 2 - 228Robbery 17 48 67 76 86 18 2 - 315Theft, handling, fraud and forgery 3 30 97 171 232 106 24 7 671Drugs offences 4 62 158 217 354 253 88 17 1 163Other offences 7 36 61 72 120 67 19 3 385Offences not known 1 5 5 4 9 5 1 - 30
1 The data presented in this table are drawn from administrative IT systems.Where figures in the table have been rounded to the nearest whole number,the rounded components do not always add to the totals, which are calculat-ed and rounded independently. Reconciliation exercises with publishedHome Office figures may demonstrate differences due to rounded com-ponents. A programme of work is currently being undertaken to audit thequality of the data and to identify priorities for improvements.
2 Excludes persons committed in default of payment of a fine.
Source: Ministry of Justice: 020 7210 0630

178
Crime and justice
11.12 Expenditure on prisonsEngland and WalesOperating cost and total capital employed, years ending 31 March £ thousand
2000 2001 2002 2003 2004 2005 2006/01 /02 /03 /04 /05 /06 /07
Expenditure
Staff costs KWUV 1 094 500 1 138 400 1 259 502 1 364 193 1 439 882 1 498 446 1 586 126Accommodation costs KXCO 153 700 193 100 200 000 194 000 185 400 150 270 138 322Other operating costs KXCP 654 200 706 100 756 198 653 007 694 618 528 529 498 913Depreciation KXCQ 117 200 128 100 132 600 129 600 143 800 7 974 11 044Cost of capital KXCR 259 900 284 900 292 700 164 400 170 300 279 905
Total expenditure KXCS 2 279 500 2 450 600 2 641 000 2 505 200 2 634 000 2 185 498 2 235 310
Income
Contributions from industries KXCT –10 600 –11 600 –10 100 –11 000 –10 600 –11 154 –7 698Other operating income KXCU –10 300 –13 100 –15 500 –21 000 –38 400 –41 323 –45 411Income from Other Government Departments1 GDPM –123 900 –180 600 –210 200 –368 000 –381 500 –302 549 –245 917
Total income KXCV –144 800 –205 300 –235 800 –400 000 –430 500 –355 026 –299 026
Net operating costs KXCW 2 134 700 2 245 300 2 405 200 2 105 200 2 203 500 1 830 472 1 936 284
Total capital employed KXCX 4 726 200 4 859 600 4 821 500 5 228 600 5 116 700 5 716 –52 207
1 Income from the Youth Justice Board (a non-departmental public body of theHome Office) for the provision of juvenile custody within the Prison Service,Department for Education and Skills for the provision of education servicesand Department of Health and PCTs for the provision of healthcare.
Source: Ministry of Justice

179
Crime and justice
11.13 Crimes and offences recorded by the police: by crime group1
ScotlandThousands
1997 1998 1999 2000 2001 2002 2003 20043 2005 2006/98 /99 /00 /01 /02 /03 /04 /05 /06 /07
Non-sexual crimes of violenceagainst the person BEBC 13.4 14.7 15.8 14.8 15.7 16.1 15.2 14.7 13.7 14.1Serious assault, etc KAFS 6.2 6.7 7.3 6.9 7.5 7.6 7.5 7.8 7.2 7.5Robbery KAFU 4.6 5.0 4.9 4.3 4.6 4.6 4.2 3.7 3.6 3.6Other KAFV 2.6 3.0 3.6 3.6 3.5 3.8 3.5 3.2 3.0 3.0
Crimes involving indecency BEBD 7.4 7.1 5.9 5.7 6.0 6.6 6.8 7.3 6.6 6.7Rape and attempted rape1 OXBQ 0.8 0.8 0.8 0.7 0.8 0.9 1.0 1.1 1.2 1.1Indecent assault1 OXBR 1.3 1.3 1.1 1.0 1.2 1.4 1.4 1.5 1.5 1.7Lewd and indecent behaviour KAFY 3.0 2.9 2.3 2.4 2.4 2.8 2.6 2.8 2.7 2.6Other KAFZ 2.4 2.1 1.7 1.6 1.6 1.6 1.7 1.9 1.2 1.4
Crimes involving dishonesty BEBE 266.9 277.0 275.6 253.3 242.9 224.8 211.0 210.4 187.8 183.8Housebreaking KAGB 55.6 55.8 52.9 47.7 45.5 40.6 36.4 35.0 31.3 30.6Theft by opening lockfast places KAGC 10.5 12.1 11.6 10.6 8.2 7.8 7.4 7.9 8.3 7.4Theft from a motor vehicle (OLP) EPI4 39.8 39.5 38.0 32.0 32.7 30.4 26.8 20.4 16.5 16.1Theft of a motor vehicle KAGD 27.9 29.3 28.9 25.6 23.1 20.9 17.6 15.6 14.0 15.0Shoplifting KAGE 27.0 30.8 32.1 32.3 31.6 28.3 27.9 28.5 28.2 28.8Other theft KAGF 80.0 80.1 81.2 76.6 76.0 73.2 72.5 77.6 72.1 70.2Fraud KAGG 16.2 18.4 20.6 20.0 17.4 15.8 15.3 18.3 11.1 9.3Other KAGH 9.9 11.1 10.3 8.4 8.4 7.9 7.0 7.1 6.3 6.4
Fire-raising, vandalism, etc BEBF 81.0 77.6 81.2 85.8 94.9 97.6 103.7 128.6 127.9 129.7Fire-raising KAGJ 2.7 2.5 2.3 2.4 2.9 3.8 4.2 4.7 4.9 5.0Vandalism, etc KAGK 78.3 75.2 78.9 83.4 92.0 93.8 99.6 123.9 123.0 124.8
Other crimes BEBG 52.3 57.7 57.0 58.9 66.8 73.2 77.5 77.1 81.8 84.9Crimes against public justice KAGM 16.6 17.7 18.4 18.6 20.9 22.7 25.8 25.6 27.7 32.1Handling offensive weapons2 KAFT 6.2 7.1 8.1 8.1 9.0 9.4 9.3 9.5 9.6 10.1Drugs KAGN 29.4 32.8 30.4 32.1 36.8 40.9 42.3 41.8 44.2 42.4Other KAGO 0.1 0.1 0.1 0.1 0.1 0.2 0.2 0.2 0.3 0.4
Total crimes KAGQ 421.0 434.1 435.5 418.5 426.2 418.3 414.2 438.1 417.8 419.3
Miscellaneous offences BEBH 156.6 153.3 151.9 154.9 163.5 169.6 181.0 214.3 219.5 232.4Minor assault KAGS 50.2 51.6 54.6 54.1 55.4 55.0 57.4 73.7 72.3 78.2Breach of the peace KAGT 73.3 71.7 71.3 70.2 72.7 74.7 77.9 90.0 89.6 93.4Drunkenness KAGU 9.6 8.4 7.6 7.8 7.8 7.3 7.5 7.2 7.0 6.7Other KAGV 23.4 21.6 18.4 22.8 27.6 32.6 38.2 43.4 50.6 54.2
Motor vehicle offences BEBI 339.6 367.2 347.5 341.2 368.5 354.6 434.9 424.3 380.4 375.0Dangerous and careless driving KAGX 16.2 15.8 13.2 12.0 12.2 12.7 12.0 13.1 13.0 13.6Drunk driving KAGY 11.1 10.6 10.9 10.8 11.5 11.8 11.6 11.1 11.3 11.7Speeding KAGZ 95.6 119.7 123.4 113.9 126.8 117.2 199.2 210.1 167.7 162.9Unlawful use of a motor vehicle KAHA 77.3 76.0 80.7 84.3 94.6 99.5 99.5 76.7 75.1 73.1Vehicle defect offences KAHB 62.3 63.8 48.0 46.8 45.5 46.5 37.2 27.0 23.9 21.2Other KAHC 77.0 81.3 71.2 73.3 77.9 66.9 75.4 86.3 89.4 92.6
Total offences KAHD 496.2 520.5 499.4 496.1 532.0 524.1 615.9 638.6 600.0 607.4
Total crimes and offences BEBB 917.2 954.6 934.9 914.6 958.1 942.4 1 030.1 1 076.7 1 017.7 1 026.7
1 See chapter text.2 ’Handling offensive weapons’ used to be included in the group ’non-sexual
crimes of violence’.3 The introduction of the Scottish Crime Recording Standard on 1 April 2004
has increased the number of minor crimes recorded, such as minor crimesof theft, vandalism, petty assault and breach of the peace.
Source: The Scottish Government Justice Department: 0131 244 2635

180
Crime and justice
11.14 Persons with a charge proved: by crime group1,2
ScotlandNumbers
1995 1996 1997 1998 1999 2000 2001 2002 2003 2004 20054
/96 /97 /98 /99 /00 /01 /02 /03 /04 /05 /06
Non-sexual crimes of violence KEHC 1 812 2 002 2 039 2 000 2 003 1 976 2 092 2 381 2 596 2 422 2 083Homicide KEHD 125 119 104 92 105 100 103 99 131 143 106Serious assault, etc KEHE 847 954 1 039 1 036 1 053 1 089 1 171 1 360 1 475 1 371 1 274Robbery KEHG 640 720 666 652 659 603 627 682 689 609 443Other violence KEHH 200 209 230 220 186 184 191 240 301 299 260
Crimes of indecency KEHI 1 259 938 1 329 1 280 790 633 614 562 666 810 838Rape and attempted rape HFVU 56 57 55 58 48 52 67 55 58 69 60Indecent assault KEHJ 73 67 91 83 84 60 48 65 93 88 84Lewd and libidinous practices KEHK 300 292 343 320 302 256 298 273 297 321 314Other indecency KEHL 830 522 840 819 356 265 201 169 218 332 380
Crimes of dishonesty KEHM 27 626 26 779 25 272 24 726 22 652 20 571 21 536 21 700 19 887 19 659 17 485Housebreaking KEHN 4 249 3 736 3 174 3 071 2 860 2 676 2 672 2 752 2 508 2 373 1 989Theft by opening lockfast places KEHO 2 394 2 362 1 940 1 770 1 614 1 504 1 478 1 448 1 288 1 194 922Theft of motor vehicle KEHP 2 402 2 313 2 006 1 882 1 536 1 426 1 386 1 486 1 268 1 098 957Shoplifting KEHQ 6 648 7 197 7 313 7 559 7 753 7 345 8 366 8 826 8 123 8 424 7 928Other theft KEHR 6 177 6 031 5 866 5 796 5 026 4 303 4 234 3 783 3 521 3 550 3 096Fraud KEHS 2 215 1 956 1 992 1 920 1 595 1 448 1 479 1 459 1 444 1 354 1 185Other dishonesty KEHT 3 541 3 184 2 981 2 728 2 268 1 869 1 921 1 946 1 735 1 666 1 408
Fire-raising, vandalism, etc KEHU 4 870 5 211 4 871 4 591 3 979 3 942 4 051 4 212 4 759 5 026 4 801Fire-raising KEHV 132 146 112 125 102 109 125 147 169 192 173Vandalism, etc KEHW 4 738 5 065 4 759 4 466 3 877 3 833 3 926 4 065 4 590 4 834 4 628
Other crime KEHX 15 172 15 061 14 551 13 698 12 888 12 558 13 823 13 954 15 453 16 792 16 385Crime against public justice KFBK 7 362 6 553 5 096 4 776 4 589 4 929 5 257 5 048 5 290 5 764 5 598Handling offensive weapons KEHF 1 867 2 309 2 173 2 033 2 118 2 340 2 633 2 771 2 875 3 447 3 392Drugs offences KFBL 5 912 6 162 7 236 6 861 6 158 5 279 5 913 6 111 7 258 7 550 7 288Other KFBM 31 37 46 28 23 10 20 24 30 31 107
Total crimes KEHB 50 739 49 991 48 062 46 295 42 312 39 680 42 116 42 809 43 361 44 709 41 592
Miscellaneous offences KEHZ 46 305 45 599 45 816 39 241 34 189 33 262 34 661 37 007 39 631 42 803 42 380Common assault KEIA 11 926 12 387 12 441 11 677 10 749 10 270 10 823 11 745 12 317 13 571 13 956Breach of the peace KEIB 18 451 19 292 19 355 17 156 14 023 13 031 13 950 14 384 15 050 16 168 16 346Drunkenness KEIC 1 270 1 028 937 626 454 430 374 370 418 311 290Breach of social work orders HFVT 2 842 3 260 3 765 4 217 4 684 4 611 4 509 4 945 5 095 5 317 4 141Other miscellaneous offences KEID 11 816 9 632 9 318 5 565 4 279 4 920 5 005 5 563 6 751 7 436 7 647
Motor vehicle offences KEIE 57 987 55 975 55 456 51 638 51 603 40 264 44 821 47 956 50 622 47 497 44 483Dangerous and careless driving KEIF 4 847 4 825 4 577 3 764 3 431 2 561 3 319 3 628 4 118 3 810 3 568Drunk driving KEIG 7 578 8 367 8 173 7 290 7 366 6 265 6 538 9 508 8 158 8 001 7 884Speeding3 KEIH 14 546 12 141 12 220 12 971 15 293 9 427 9 988 9 832 12 700 13 537 12 111Unlawful use of vehicle KEII 19 609 19 870 20 052 18 662 16 950 15 987 18 553 19 192 19 563 16 690 14 402Vehicle defect offences KEIJ 3 259 3 221 3 198 2 470 2 075 1 302 1 252 1 510 1 859 1 791 1 633Other motor vehicle offences KEIK 8 148 7 551 7 236 6 481 6 488 4 722 5 171 4 286 4 224 3 668 4 885
Total offences KEHY 104 292 101 574 101 272 90 879 85 792 73 526 79 482 84 963 90 253 90 300 86 863
Total crimes and offences KEHA 155 031 151 565 149 334 137 174 128 104 113 206 121 598 127 772 133 614 135 009 128 455
1 See chapter text. Data as at 18 February 2008.2 All figures are now reported as financial years.3 Includes motorway and clearway offences.
4 Figures for 2005-06 for some categories dealt with by the High Court - includinghomicide, rape and major drug cases - may be underestimated slightly due tolate recording of disposals on SCRO.
Source: Scottish Government Justice Department: 0131 244 2229
11.15 Persons with a charge proved: by court procedure1,2
ScotlandNumbers
1995 1996 1997 1998 1999 2000 2001 2002 2003 2004 2005/96 /97 /98 /99 /00 /01 /02 /03 /04 /05 /06
Court procedure
High Court3 KEIQ 1 093 1 086 1 126 1 062 1 183 1 099 1 142 1 205 1 228 978 863Sheriff Court KEIU 84 327 84 973 82 150 78 362 74 913 70 043 76 244 84 835 85 043 86 032 82 011District Court4 KEIV 60 188 56 803 57 500 50 953 46 228 38 580 38 665 41 732 47 340 47 998 45 579Stipendiary Magistrate Court4 KEIW 9 420 8 703 8 556 6 797 5 779 3 482 5 543 .. .. .. ..
Total called to court5 KEIZ 155 031 151 565 149 334 137 174 128 104 113 206 121 598 127 772 133 614 135 009 128 455
1 See chapter text.2 All figures are now reported as financial years.3 Including cases remitted to the High Court from the Sheriff Court. Figure for
2004/05 may be an underestimate due to late recording of disposals onSCRO.
4 District Court figures from 2002/03 include the Stipendiary Magistrate Court.5 Includes court type not known.
Source: Scottish Government Justice Department: 0131 244 2229

181
Crime and justice
11.16 Persons with charge proved: by main penalty1,2
ScotlandNumbers
1995 1996 1997 1998 1999 2000 2001 2002 2003 2004 2005/96 /97 /98 /99 /00 /01 /02 /03 /04 /05 /06
Main penalty
Restriction of liberty order3 ZBRE .. .. .. 125 230 189 193 743 1 048 1 312 1 198Supervised attendance order4 ZBRF .. 11 93 78 97 64 58 54 38 43 108Drug treatment and testing order5 OEWA .. .. .. .. 5 147 327 428 696 787 801Absolute discharge KEXA 927 1 045 1 046 914 991 978 1 055 1 020 1 102 1 209 1 050Admonition or caution KEXB 15 972 15 582 14 707 13 841 12 647 11 649 12 176 12 828 13 445 14 271 13 725Probation KEXC 6 176 6 604 6 817 7 464 7 258 7 344 8 496 9 438 8 902 9 433 9 033Remit to children’s hearing KEXD 189 194 208 176 120 116 159 230 196 221 246Community service order KEXE 5 399 5 705 5 605 5 254 4 776 4 744 4 726 5 279 4 881 5 432 5 342Fine KEXF 108 525 103 969 103 091 91 904 84 778 71 104 76 641 78 957 84 797 83 764 79 458Compensation order KEXG 1 494 1 367 1 308 1 261 1 171 1 087 1 164 1 362 1 789 1 716 1 413Insanity, hospital, guardianship order KYAN 143 151 160 130 136 128 104 105 132 94 97Prison KEXI 11 593 12 070 11 754 11 456 11 519 11 390 12 418 13 560 13 153 13 498 12 731Young offenders’ institution KEXJ 4 576 4 823 4 521 4 547 4 363 4 253 4 067 3 741 3 406 3 196 3 225Detention of child KEXM 37 44 24 24 13 13 14 25 25 20 23
Total persons with charge proved6 KEXO 155 031 151 565 149 334 137 174 128 104 113 206 121 598 127 772 133 614 135 009 128 455
1 See chapter text.2 All figures are now reported as financial years.3 A community sentence introduced by Section 5 of the Crime and Punish-
ment (Scotland) Act 1995 and available on a pilot basis to 3 Scottish sheriffcourts since August 1998. This sentence was made available to High Court,Sheriff Courts and Stipendiary Magistrates court from 1 May 2002.
4 The pilot scheme under the Crime and Punishment (S) Act 1995, wherefines for 16 & 17 year olds were replaced by supervised attendance orders,was discontinued in December 1999. The majority of supervised attendanceorders recorded from the year 2000-01 onwards were disposals relating tothe breach of an existing order.
5 Drug treatment and testing orders are new measures made available on a pilotbasis to the High Court and to Sheriff Courts for residents in Glasgow (from Oc-tober 1999), Fife (from July 2000) and Aberdeen/Aberdeenshire (from De-cember 2001). They are now available to all Sheriff courts and the High Court.
6 Totals from 2002/03 include a small number of cases where penalty is un-known.
Source: Scottish Government Justice Department: 0131 244 2229
11.17 Persons with charge proved1: by age and sexScotland
Numbers
1995 1996 1997 1998 1999 2000 2001 2002 2003 2004 2005/96 /97 /98 /99 /00 /01 /02 /03 /04 /05 /06
Males KEWA 131 710 130 331 128 079 118 583 110 742 96 917 104 785 108 456 112 292 112 947 108 202
Under 16 KEWB 160 150 136 112 75 56 79 132 97 108 12816 to 20 KEWC 30 114 31 871 30 742 29 145 26 489 23 632 25 153 25 423 24 925 24 543 24 28721 to 30 KEWD 53 321 51 687 50 105 45 055 41 768 36 992 40 251 41 371 42 133 41 389 38 587Over 30 KEWE 47 007 45 506 46 096 43 354 41 597 35 555 39 011 41 511 45 132 46 901 45 197Age not known KEWF 1 108 1 117 1 000 917 813 682 291 19 5 6 3
Females KEWG 22 413 20 452 20 535 17 923 16 784 15 915 16 469 18 961 20 854 21 564 19 902
Under 16 KEWH 16 12 14 2 5 10 4 5 18 18 716 to 20 KEWI 3 104 3 358 3 426 3 401 3 278 2 952 2 906 3 013 3 045 3 016 2 94121 to 30 KEWJ 9 297 8 090 8 183 7 121 6 506 6 155 6 528 7 309 7 939 8 082 7 402Over 30 KEWK 9 405 8 394 8 497 7 091 6 734 6 555 6 960 8 630 9 850 10 448 9 552Age not known KEWL 591 598 415 308 261 243 71 4 2 – –
Males and Females KEWM 154 123 150 783 148 614 136 506 127 526 112 832 121 254 127 417 133 146 134 511 128 104
Under 16 KEWN 176 162 150 114 80 66 83 137 115 126 13516 to 20 KEWO 33 218 35 229 34 168 32 546 29 767 26 584 28 059 28 436 27 970 27 559 27 22821 to 30 KEWP 62 618 59 777 58 288 52 176 48 274 43 147 46 779 48 680 50 072 49 471 45 989Over 30 KEWQ 56 412 53 900 54 593 50 445 48 331 42 110 45 971 50 141 54 982 57 349 54 749Age not known KEWR 1 699 1 715 1 415 1 225 1 074 925 362 23 7 6 3
Companies KEWS 905 772 718 659 562 316 320 343 451 480 343
Total persons with charge proved2 KEWT 155 031 151 565 149 334 137 174 128 104 113 206 121 598 127 772 133 614 135 009 128 455
1 See chapter text.2 Includes sex unknown.
Source: Scottish Government Justice Department: 0131 244 2229

182
Crime and justice
11.18 Penal establishments: average daily population and receptionsScotland
Numbers
1997 1998 1999 2000 2001 2002 2003 2004 2005 2006/98 /99 /00 /01 /02 /03 /04 /05 /06 /07
Average daily population
Male KEPB 5 874 5 830 5 765 5 676 5 929 6 193 6 307 6 447 6 523 6 830Female KEPC 186 199 210 207 257 282 314 332 334 353
Total KEPA 6 059 6 029 5 975 5 883 6 186 6 475 6 621 6 779 6 857 7 183Analysis by type of custodyRemand KEPD 927 971 976 881 1 019 1 247 1 246 1 216 1 242 1 567Persons under sentence: total KEPE 5 129 5 056 4 997 5 001 5 165 5 226 5 375 5 561 5 614 5 615
Adult prisoners KEPF 4 357 4 347 4 317 4 346 4 537 4 624 4 802 5 001 4 989 4 970Young offenders KEPI 773 708 679 655 628 601 573 560 625 645Persons recalled from
supervision/licence1 KEPN 51 78 100 145 202 250 310 356 400 519Others1 KEPO 18 21 28 36 37 6 6 5 1 –
Persons sentenced by court martial1 KEPP 1 – 2 – – – – 1 – –Civil prisoners1 KEPQ 2 1 1 1 1 2 – 1 1 1
Receptions to penal establishments
Remand KEPR 14 685 15 713 14 626 14 062 15 725 19 198 18 963 18 892 19 593 23 181Male KEPS 13 677 14 527 13 450 13 042 14 402 17 455 17 111 17 085 17 796 21 129Female KEPT 1 008 1 186 1 176 1 020 1 323 1 743 1 852 1 807 1 797 2 052
Persons under sentence: total KEPU 21 910 22 376 20 336 19 136 18 953 20 084 19 357 18 584 19 477 20 403Male KEPV 20 698 20 952 19 125 17 953 17 755 18 779 18 013 17 272 18 161 19 018Female KEPW 1 212 1 424 1 211 1 183 1 198 1 305 1 344 1 312 1 316 1 385Imprisoned: Adults:
directly KEPX 9 697 9 887 9 217 8 943 9 470 10 571 10 255 10 299 10 746 11 684in default of fine2 KEPY 7 650 7 907 7 030 6 450 5 882 6 081 6 063 5 404 5 442 5 265
Sentenced to young offenders’institution:
directly KEQA 2 811 2 824 2 582 2 436 2 312 2 207 1 949 1 908 2 170 2 286in default of fine2 KEQB 1 695 1 606 1 328 1 116 1 109 1 016 825 694 771 698
Persons recalled from supervision/licence3 JYYD 57 152 179 191 180 209 265 279 348 470Persons sentenced by court martial KEQH 6 2 3 2 2 3 1 5 – –Civil prisoners2 KEQI 22 10 17 10 8 11 10 7 4 4
1 Persons recalled from supervision/licence and others are included in per-sons under sentence. Persons sentenced by court martial and civil prison-ers are not included in persons under sentence.
2 Includes in default of compensation orders.3 Now covers all recalls from supervised release orders.
Source: The Scottish Government Justice Department: 0131 244 8740
11.19 Expenditure on penal establishments1
ScotlandYears ended 31 March £ thousand
1996 1997 1998 1999 2000 2001 2002 2003 2004 2005 2006/97 /98 /99 /00 /01 /02 /03 /04 /05 /06 /07
Departmental Expenditure
Manpower and Associated Services KPHC 143 107 137 890 144 660 170 347 160 242 172 490 168 593 169 784 181 931 200 742 199 854Prisoner and Associated Costs KPHD 13 377 16 313 18 891 22 930 23 501 24 652 23 363 51 070 42 767 28 582 41 821Capital Expenditure KPHE 22 577 22 136 23 697 28 918 24 283 24 955 36 519 34 617 72 812 70 406 81 818
Gross Expenditure KPHF 179 061 176 339 187 248 222 195 208 026 222 097 228 475 255 471 297 510 299 730 323 493
Less Receipts KPHG 2 600 2 810 8 160 6 668 8 380 8 194 3 485 3 298 3 312 2 872 –2 178
Net Departmental Expenditure KPHH 176 461 173 529 179 088 215 527 199 646 213 903 224 990 252 173 294 198 296 858 321 315
Plus Annually Managed ExpenditureCapital Charges DSJI .. .. .. .. .. 31 341 40 432 41 728 48 497 52 840 41 816
Total Net Expenditure DSNX 176 461 173 529 179 088 215 527 199 646 245 244 265 422 293 901 342 695 349 698 363 131
1 See chapter text. Source: The Scottish Government Justice Department: 0131 244 2225

183
Crime and justice
11.20 Recorded crime statistics: by offence group1
Northern IrelandThousands
Old counting rules New counting rules
1995 1996 1997 1998 1999 2000 2001 2002 2003 2004 2005 2006/99 /00 /01 /02 /03 /04 /05 /06 /07
Violence against the person RVCP 5.2 5.6 5.2 6.6 RVCQ 21.4 21.4 26.1 28.5 29.0 29.3 31.0 31.8Sexual offences RVCR 1.7 1.7 1.4 1.5 RVCS 1.3 1.2 1.4 1.5 1.8 1.7 1.7 1.8Burglary RVCT 16.5 16.1 14.3 15.5 RVCU 16.1 15.8 17.1 18.7 16.4 13.4 12.8 11.6Robbery RVCV 1.5 1.7 1.7 1.4 RVCW 1.4 1.8 2.2 2.5 2.0 1.5 1.7 1.6Theft RVCX 33.5 32.8 29.5 34.6 RVCY 37.0 36.9 41.7 41.9 35.7 31.1 29.5 27.8Fraud and forgery RVCZ 4.9 4.1 3.8 5.3 RVDA 7.9 8.0 8.6 8.8 6.3 5.2 5.1 4.5Criminal damage RVDB 3.8 4.8 4.7 9.8 RVDC 31.2 32.3 40.0 36.6 32.4 31.4 34.8 36.3Offences against the state RVDD 0.3 0.4 0.5 0.5 RVDE 0.7 0.8 1.2 1.8 1.3 1.2 1.3 1.3Other notifiable offences RVDF 1.5 1.2 1.1 1.5 RVDG 2.1 1.7 1.4 2.4 3.2 3.3 5.3 4.5
of which drug offences RVDH 1.4 1.1 1.0 1.4 RVDI 1.7 1.5 1.1 1.9 2.6 2.6 2.9 2.4
Total RVDR 68.8 68.5 62.2 76.6 RVDS 119.1 119.9 139.8 142.5 128.0 118.1 123.2 121.1
1 See chapter text. Source: The Police Service of Northern Ireland
11.21 Persons found guilty at all courts: by offence group1
Northern IrelandNumbers
1995 1996 1997 1998 1999 2000 2001 2002 2003 2004 2005
Violence against the person KYCT 1 685 1 597 1 594 1 596 1 699 1 858 1 621 1 790 1 965 2 012 2 009Sexual offences KEVG 182 184 130 128 90 130 112 84 108 137 136Burglary KYBW 951 801 715 647 703 703 496 595 602 620 557Robbery KYBX 195 161 166 134 129 122 121 152 192 159 135Theft KYBY 3 128 2 765 2 596 2 342 1 995 2 111 1 831 1 695 1 803 1 819 1 819Fraud and forgery KYBZ 533 467 491 426 476 403 398 362 314 359 330Criminal damage KYCA 1 008 1 076 1 163 1 043 931 1 060 917 957 1 034 1 094 1 168Offences against the state KYCB 166 147 165 198 178 174 158 215 274 252 270Other indictable2 KYCC 863 899 739 936 943 700 495 453 527 636 722
Total indictable3 KYCD 8 711 8 097 7 759 7 450 7 144 7 261 6 149 6 303 6 819 7 088 7 146Summary4 KYCE 4 137 4 402 4 435 4 062 3 598 3 967 3 735 3 453 3 514 3 622 3 575Motoring5 KYCF 20 124 18 177 18 770 15 369 15 782 15 390 14 466 14 344 16 342 17 215 15 534
All offences KYCG 32 972 30 676 30 964 26 881 26 524 26 618 24 350 24 100 26 675 27 925 26 255
1 See chapter text.2 1998 and 1999 figures include ’dangerous driving’ (a triable-either-way
offence).3 From 2000, includes ’indictable-only’ motoring offences.
4 Excludes motoring offences.5 Prior to 2000, includes all motoring offences (except for note 2 above). From
2000, includes summary and triable-either-way motoring offences.
Source: Northern Ireland Office: 028 9052 7157
11.22 Juveniles found guilty at all courts:1 by offence groupNorthern Ireland
Numbers
1995 1996 1997 1998 1999 2000 2001 2002 2003 2004 2005
Violence against the person KYCH 51 75 49 97 73 77 66 82 75 78 146Sexual offences KAHF 7 4 8 12 12 4 1 6 5 7 9Burglary KYCI 170 137 124 108 117 125 73 77 89 66 113Robbery KYCJ 22 13 18 4 7 15 8 14 10 6 8Theft KYCK 345 338 334 304 227 254 244 212 173 183 291Fraud and forgery KYCL 21 14 11 4 10 2 9 3 7 2 6Criminal damage KYCM 116 121 136 139 102 143 152 132 162 129 241Offences against the state KYCN 9 6 10 11 12 8 10 20 26 18 19Other indictable2 KYCO 14 24 10 20 17 10 12 7 19 22 46
Total indictable3 KYCP 755 732 700 699 577 638 575 553 566 511 879Summary4 KYCQ 180 182 198 187 163 180 203 194 174 135 296Motoring5 KYCR 74 58 57 98 97 82 102 89 94 76 280
All offences KYCS 1 009 972 955 984 837 900 880 836 834 722 1 455
1 See chapter text. For the purpose of criminal proceedings, prior to30 August 2005, a juvenile refers to a person aged 10 years or more butunder 17. From 30 August 2005, the youth justice system was extended toinclude those under the age of 18. The number of juveniles convicted in2005 refers to those aged 10-17, while the term juvenile refers to 10-16year olds for the years prior to this.
2 1998 and 1999 figures include ’dangerous driving’.3 From 2000, includes ’indictable-only’ motoring offences.4 Excludes motoring offences.5 Prior to 2000 includes all motoring offences (except for note 2 above).
From 2000, includes summary and triable-either-way motoring offences.
Source: Northern Ireland Office: 028 9052 7157

184
Crime and justice
11.23 Disposals given to those convicted by courtNorthern Ireland
Numbers
1995 1996 1997 1998 1999 2000 2001 2002 2003 2004 2005
Magistrates court - all offences
Prison1 KYAO 1 046 1 003 989 996 1 278 1 356 1 048 1 107 1 133 1 101 977Custody Probation Order1 EOG9 .. .. .. .. .. .. .. .. 7 7 9Young offenders centre KYAP 483 443 430 326 243 191 209 288 395 456 416Training school2 KYAQ 169 147 148 136 13 .. .. .. .. .. ..Juvenile Justice Centre order2 OEUX .. .. .. .. 22 78 72 58 48 50 50
Total immediate custody KYAR 1 698 1 593 1 567 1 458 1 556 1 625 1 329 1 453 1 583 1 614 1 452
Prison suspended KYAS 1 674 1 722 1 506 1 025 1 080 1 247 1 215 1 278 1 407 1 469 1 584YOC suspended KYAT 385 444 461 139 104 93 77 100 201 372 375Attendance centre KYAU 101 91 66 55 14 20 37 84 91 108 127Probation/supervision3 KYAV 1 137 1 134 1 155 1 473 1 246 1 096 1 070 1 005 974 991 977Community service order KYAW 547 591 561 622 678 726 587 643 623 647 628Combination order OEUZ .. .. .. 38 7 48 24 36 96 78 106Fine4 KYAX 22 726 20 614 21 313 17 956 18 076 17 716 16 439 15 968 17 546 18 520 17 231Recognizance KYAY 1 001 1 203 1 267 1 134 1 089 1 357 810 912 1 091 913 853Conditional discharge KYAZ 1 928 1 679 1 597 1 538 1 439 1 286 1 559 1 497 1 526 1 524 1 326Absolute discharge KYBA 608 509 424 303 223 242 209 163 201 183 148Youth conference order5 GGL8 .. .. .. .. .. .. .. .. .. 21 74Community responsibility order GGL9 .. .. .. .. .. .. .. .. .. 1 32Other KYBC 10 15 8 123 221 57 61 104 215 190 122
Total KYBD 31 815 29 595 29 925 25 864 25 733 25 513 23 417 23 243 25 554 26 631 25 035
Crown court - all offences
Prison1 KYBE 533 469 475 520 386 521 407 410 238 259 248Custody Probation Order1 EOH2 .. .. .. .. .. .. .. .. 331 332 370Young offenders centre KYBF 76 106 111 63 67 32 42 23 51 47 41Training school2 KYBG 6 – 4 2 – .. .. .. .. .. ..Juvenile Justice Centre order2 VQEV .. .. .. – – – – 2 – – –
Total immediate custody KYBH 615 575 590 585 453 553 449 435 620 638 659
Prison suspended KYBI 265 253 220 199 185 313 262 220 240 262 260YOC suspended KYBJ 63 71 60 49 41 48 37 35 50 72 45Attendance centre KYBK – – – – – – – 1 – – –Probation/supervision3 KYBL 60 49 47 70 43 68 48 49 63 93 79Community service order KYBM 60 54 37 33 24 29 45 25 27 33 31Combination order ZAEP .. .. .. 13 6 7 5 18 34 33 40Fine4 KYBN 27 39 40 25 20 40 38 32 49 108 57Recognizance KYBO – 7 10 7 – 4 11 12 8 6 9Conditional discharge KYBR 64 30 31 23 17 38 36 20 24 45 28Absolute discharge KYBS 1 – 1 6 – 3 – 6 1 1 6Other KYBU 2 3 3 7 2 2 2 4 5 3 6
Total KYBV 1 157 1 081 1 039 1 017 791 1 105 933 857 1 121 1 294 1 220
1 Custody Probation Orders cannot be separately identified from ’prison’sentences from 1998 to 2002. Thus during this timeframe, figures forprison include custody probation orders.
2 The Juvenile Justice Centre order replaced the training school orderfrom 31st January 1999.
3 Supervision orders were abolished with the introduction of the CriminalJustice (Children) Northern Ireland Order 1998.
4 From 2000, fine incorporates ’fine plus disqualification’ and ’fine plus penaltypoints’.
5 Refers to the number of youth conference orders completed.Source: Northern Ireland Office: 028 9052 7157

185
Crime and justice
11.24 Prisons and Young Offenders CentresNorthern IrelandReceptions and average population Numbers
1996 1997 1998 1999 2000 2001 2002 2003 2004 2005 2006
Receptions:Reception of untried
prisoners KEOA 2 292 2 188 2 284 2 497 2 197 1 922 2 337 2 439 2 440 2 776 3 193
Reception of sentenced prisoners:Imprisonment under
sentence of immediate custody1 KEOB 1 070 1 062 949 963 1 001 791 916 1 032 975 966 1 075Imprisonment in default
of payment of a fine KEOC 1 374 1 513 1 530 1 423 1 261 1 090 990 1 140 1 296 1 437 1 569Total KEOD 2 444 2 575 2 479 2 386 2 262 1 881 1 906 2 172 2 271 2 403 2 644
Reception into YoungOffender Centres:
Detention under sentenceof immediate custody KEOE 362 331 347 346 282 252 315 268 287 222 229
Detention in default ofpayment of a fine KEOF 373 366 385 417 389 303 250 313 351 377 382
Total KEOG 735 697 732 763 671 555 565 581 638 599 611
Other receptions2 KEOL 27 42 70 38 56 58 57 117 106 134 24
Daily average population:Unconvicted3 KEON 337 376 383 377 317 272 347 393 456 450 531Convicted4 KEOP 1 302 1 256 1 124 867 751 638 679 767 818 851 902
Total KEOM 1 639 1 632 1 507 1 244 1 068 910 1 026 1 160 1 274 1 301 1 433
1 Includes those detained under Section 73 of the Children and Young Per-sons (NI) Act 1968.
2 Non-criminal prisioners including those imprisoned for non-payment ofmaintenance, non-payment of debt, contempt of court or are being heldunder the terms of an Immigration Act.
3 Prisoners on remand or awaiting trial and prisoners committed by civil process.4 Includes those sentenced to immediate custody and fine defaulters.
Sources: The Northern Ireland Prison Population in 2006;Northern Ireland Office: 028 9052 7534

186
Lifestyles

187
Lifestyles
Lifestyles
Ch
apter 12

188
Lifestyles
Gambling
(Table 12.10)
The National Lottery figures in this table are the latest figures at the time of going to press which have been released by the National Lottery Commission, and represent ticket sales (money staked) for each of the games which comprise the lottery. The figures have been adjusted to real terms using the Retail Prices Index (RPI).
The National Lottery commenced on the 19 November 1994, with the first instant ticket being sold in March 1995. Various other games have been started since, the latest shown in the table being the Euromillions game. The sum of the individual games may not agree exactly with the figures for total sales. Total sales also include the Easy Play games which commenced in 1998, but were dropped in 1999.
The other gambling figures in this table are obtained from the Gaming Board and H.M. Revenue and Customs. The figures have been adjusted to real terms using the RPI.
The money staked at bingo clubs refers to licensed clubs only.
Most popular boy and girl baby names
(Table 12.11)
The list comprises of the most popular names from England, Wales and Scotland. This is taken from the publications produced by ONS (England and Wales) and General Register Office Scotland.
Lifestyles
Expenditure by the Department for Culture, Media and Sport
(Table 12.1)
The figures in this table are taken from the Department’s Annual Report and are outturn figures for each of the headings shown (later figures are the estimated outturn). The Department’s planned expenditure for future years is also shown.
Cinema statistics
(Table 12.4)
This table now includes data from CAA, Gallup and Nielsen EDI which replaces the previous Office for National Statistics (ONS) inquiry data which are no longer collected.
Domestic tourism
(Table 12.6)
The figures in this table are compiled using data from the United Kingdom Tourism Survey (UKTS) and represent trips of one or more nights away from home. The UKTS changed survey methodology in 2000 and 2005. Data from 1995 to 1999 were reworked to allow comparisons to be made with 2000-04 data. Data from 2004 should be used and interpreted with caution. Data from 2005 is not comparable with previous years.
International tourism and holidays abroad
(Tables 12.7 and 12.8)
The figures in these tables are compiled using data from the International Passenger Survey. A holiday abroad is a visit made for holiday purposes. Business trips and visits to friends and relatives are excluded.
Attendances at leisure and cultural activities
(Table 12.9)
The definitions used in this table differ from those normally used to define regular attendees by the Department for Culture, Media and Sport.

189
Lifestyles
12.1 Expenditure by the Department for Culture, Media and Sport1
£ million
Architect-ure Comme-
and the Broad- morativeMuseums, Historic The casting Admin- Gambling services Regional
galleries Environ- Royal and istration and the (Queen’s Cultural Unallocat- Totaland The arts Sports ment Parks Tourism media and National Golden Consortiu- ed Resource
libraries2 (England) (UK) (England) (UK) (UK) (UK) research Lottery3 Jubilee) ms Provision Budget
GQIF KWFP KWFQ KWFR LQYY KWFS KWFT GQIG SNKA SNKB GLZ8 GLZ9 GM222000/01 407 239 52 137 24 48 2 490 29 801 – – – 4 2282001/02 302 254 67 133 42 68 2 337 33 897 – – – 4 1342002/03 425 286 123 143 26 75 2 638 38 654 6 – – 4 4132003/04 764 329 67 348 26 52 2 559 42 664 – – – 4 8512004/05 443 367 106 162 27 51 2 610 42 611 – 2 – 4 421
2005/06 483 407 121 146 31 51 2 659 49 797 – 2 5 4 7502006/074 596 424 155 179 20 52 2 843 55 726 – 2 9 5 0602007/085 548 421 170 159 19 54 2 931 51 631 – 2 17 5 003
1 See chapter text.2 Includes museums and galleries (England), libraries (UK) and museums
library archives (UK).3 DCMS and Treasury undertook a complete overhaul of the way Lottery ex-
penditure is recorded.4 Data is estimated.5 Data are forecasts.
Source: Department for Culture, Media and Sport: 020 7211 6121
12.2 Employment in tourismUnited KingdomNon seasonally adjusted. At June each year Thousands
All tourism related industries
Of which:Hotels and Restaurants,
other tourist bars and Travel agents, Recreation Rest of the Self-employmentaccommodation canteens Transport tour operators services economy All Employee jobs jobs
EUR7 EUR8 EUR9 EUS2 EUS3 EUS4 EUS5 EUS6 EUS72000 230.0 556.1 132.2 135.2 73.2 205.2 1 331.9 1 214.4 117.52001 229.3 578.9 136.7 146.5 76.6 213.0 1 380.9 1 261.9 119.02002 225.4 601.1 135.5 140.0 82.1 213.8 1 397.8 1 278.0 119.82003 228.4 616.4 137.7 134.4 81.2 215.4 1 413.4 1 294.4 119.02004 238.0 634.0 136.0 144.0 87.2 217.2 1 456.5 1 326.9 129.6
2005 234.7 635.9 138.7 131.8 89.9 219.8 1 450.9 1 330.7 120.22006 235.3 632.9 143.5 118.1 93.3 221.6 1 444.7 1 317.8 126.92007 246.3 629.3 141.6 114.8 93.4 223.4 1 448.9 1 316.5 132.4
Sources: Department for Culture, Media and Sport: 020 7211 6451;using data from Labour Force Survey, Office for National Statistics

190
Lifestyles
12.3 Employment in creative industriesGreat Britain
Thousands
Music and Softwarethe visual computer
Design and Film, video and games anddesigner and performing electronic Television
Advertising Architecture Crafts fashion photography arts Publishing publishing and radio Art/antiques All
EUS8 EUS9 EUT2 EUT3 EUT4 EUT5 EUT6 EUT7 EUT8 EUT9 EUU21998 204.2 101.5 119.8 88.8 64.1 217.8 317.1 426.0 101.5 19.8 1 660.71999 200.9 101.5 96.8 93.5 61.9 255.7 317.0 488.6 92.5 20.8 1 729.32000 206.0 102.6 111.3 98.5 67.5 224.3 283.9 544.6 109.8 20.9 1 769.42001 220.5 103.4 115.1 103.0 75.5 224.6 293.3 567.7 104.1 20.9 1 828.12002 215.4 102.9 114.1 115.0 68.9 240.8 286.8 556.7 108.8 21.4 1 830.7
2003 213.8 103.1 108.7 113.2 74.3 245.8 305.2 581.2 110.9 22.5 1 878.82004 200.0 102.6 112.9 110.4 65.5 232.3 274.3 593.9 110.6 22.5 1 825.02005 223.4 108.2 95.5 115.5 63.8 236.3 253.3 596.8 108.7 22.9 1 824.42006 230.3 111.3 99.3 118.7 57.5 257.2 269.7 631.3 109.4 21.7 1 906.3
Sources: Creative Industries Economic Estimates Statistical Bulletin;Department for Culture, Media and Sport
12.4 Cinema statistics1,2
United Kingdom
GrossTotal box Revenue Revenue
number of office per perSites Screens admissions3 takings4 admission3 screen
(numbers) (numbers) (millions) (£ million) (£) (£ thousand)
JMHX JMHY JMHZ JMIA JMIB JMIC1998 761 2 638 135.2 504.9 3.73 191.41999 751 2 825 139.1 549.7 3.95 194.62000 754 3 017 142.4 572.8 4.02 189.92001 766 3 248 155.9 645.0 4.14 198.62002 775 3 402 175.9 755.3 4.29 222.0
2003 776 3 433 167.3 742.0 4.44 216.12004 773 3 475 171.3 769.1 4.49 221.32005 771 3 486 164.7 768.3 4.66 220.42006 783 3 569 156.6 767.0 4.90 214.92007 775 3 596 162.4 823.4 5.10 229.0
1 See chapter text.2 Includes Isle of Man and the Channel Islands.3 Admissions are based on all cinemas taking advertising.4 Box office takings are for UK only
Source: CAA/Nielsen EDI
12.5 FilmsUnited Kingdom
Numbers and £ million
Production of UK films Expenditure on feature films (Current prices)
Films Box office,produced Production Subscriptions video,in the UK costs UK Video Video to movie subscription
(numbers) (1998 prices) box office rental retail1 channels channels
KWGD KWGE KWHU KWHV KWHW KWHX KWHY1996 128 726.0 411 382 733 1 319 2 9301997 116 558.0 489 369 784 .. 1 7331998 88 487.0 547 437 896 .. 1 8921999 100 570.0 563 408 878 .. 1 8962000 98 793.0 583 444 1 100 .. 2 176
2001 96 .. 645 465 1 417 .. ..2002 119 550.0 755 476 1 895 .. ..2003 173 1 158.0 742 450 2 244 .. ..2004 133 812.0 770 461 2 478 .. ..2005 131 577.0 770 399 2 317 .. ..
2006 134 842.0 762 340 2 161 .. ..
1 In 2005 the British Video Association changed its methodology for producingmarket value which has necessitated a change to historical figures quoted.
Source: UK Film Council

191
Lifestyles
12.6 Domestic tourism1
United Kingdom
Number Expenditure Average AverageNumber of nights at current nights expenditureof trips spent prices spent per trip
(millions) (millions) (£ million) (numbers) (£)
GQGY GQGZ GQHA GQHB GQHC1997 162.2 555.3 24 137 3.4 148.81998 148.8 516.0 22 814 3.5 153.31999 173.1 568.6 25 635 3.3 148.12000 175.4 576.4 26 133 3.3 149.02001 163.1 529.6 26 094 3.2 160.0
2002 167.3 531.9 26 699 3.2 159.62003 151.0 490.5 26 482 3.2 175.420042 126.6 408.9 24 357 3.2 192.420053 138.7 442.3 22 667 3.2 163.42006 126.3 400.1 20 965 3.2 165.9
1 See chapter text.2 There were concerns that data for 2004 was not truly representative of the
United Kingdom population. Data for 2004 should be used and interpretedwith caution.
3 The UKTS underwent a methodological change in 2005 and results should notbe compared with previous years. The survey did not run between Jan-April2005, as a result full-year estimates were made using Jan-April 2003 data.
Source: United Kingdom Tourism Survey, VisitBritain: 020 8563 3317
12.7 International tourism1
Thousands and £ million
Spending in the UK Spending overseasVisits to by overseas residents Visits by UK residents
the UK by overseasoverseas Constant by UK Constantresidents Current 1995 residents Current 1995
(thousands) prices prices (thousands) prices prices
GMAA GMAK CQPR GMAF GMAM CQPS1997 25 515 12 244 11 542 45 957 16 931 18 6521998 25 745 12 671 11 573 50 872 19 489 21 8471999 25 394 12 498 11 133 53 881 22 020 24 6762000 25 209 12 805 11 102 56 837 24 251 27 2812001 22 835 11 306 9 528 58 281 25 332 27 710
2002 24 180 11 737 9 641 59 377 26 962 29 3112003 24 715 11 855 9 451 61 424 28 550 28 6772004 27 755 13 047 10 146 64 194 30 285 30 4442005 29 970 14 248 10 714 66 441 32 154 30 9542006 32 713 16 002 11 637 69 536 34 411 30 904
2007 32 558 15 955 11 462 70 029 35 475 32 953
1 See chapter text. Sources: International Passenger Survey, Office for National Statistics;01633 455277
12.8 Holidays abroad:1 by destination
Percentages
1971 1981 1991 2000 2001 2002 2003 2004 2005 2006 2007
Spain2 JTKC 34.30 29.80 21.30 27.80 27.90 28.50 29.80 28.40 27.20 27.80 26.20France JTKD 15.90 18.10 25.80 18.30 18.30 19.00 18.10 17.30 16.60 15.90 16.50Greece JTKF 4.50 6.60 7.60 6.80 7.80 7.00 6.60 5.70 5.10 5.00 5.00United States JTKE 1.00 5.50 6.80 7.30 6.30 5.40 5.50 6.10 6.00 5.10 5.30Italy JTKG 9.20 5.00 3.50 4.20 4.30 4.60 5.00 5.00 5.40 5.40 5.50Ireland JTKI – 3.70 3.00 4.60 4.10 4.10 3.70 3.80 3.80 4.00 3.30Portugal JTKH 2.60 4.00 4.80 3.90 3.60 4.00 4.00 3.50 3.60 3.70 4.10Cyprus JTKL 1.00 2.70 2.40 3.30 3.50 3.00 2.70 2.60 2.80 2.40 2.40
Netherlands JTKK 3.60 2.60 3.50 2.20 2.60 2.80 2.60 2.60 2.50 2.70 2.40Turkey JTKJ – 2.30 0.70 1.80 2.00 2.20 2.30 2.30 2.70 2.70 2.80Belgium JTKM – 2.20 2.10 1.80 2.10 2.00 2.20 1.80 1.90 2.00 2.20Germany JTKN 3.40 1.20 2.70 1.70 1.40 1.50 1.20 1.60 1.70 1.70 2.00Austria JTKP 5.50 1.10 2.40 1.00 1.10 1.40 1.10 1.40 1.30 1.20 1.20Malta JTKO – 1.00 1.70 1.10 1.00 1.00 1.00 1.00 1.10 1.00 0.90Other countries JTKQ 19.00 14.20 11.80 14.10 13.80 13.60 14.20 16.80 18.40 19.70 20.30
1 See chapter text.2 Excludes the Canary Islands prior to 1981.
Sources: International Passenger Survey, Office for National Statistics;01633 455277
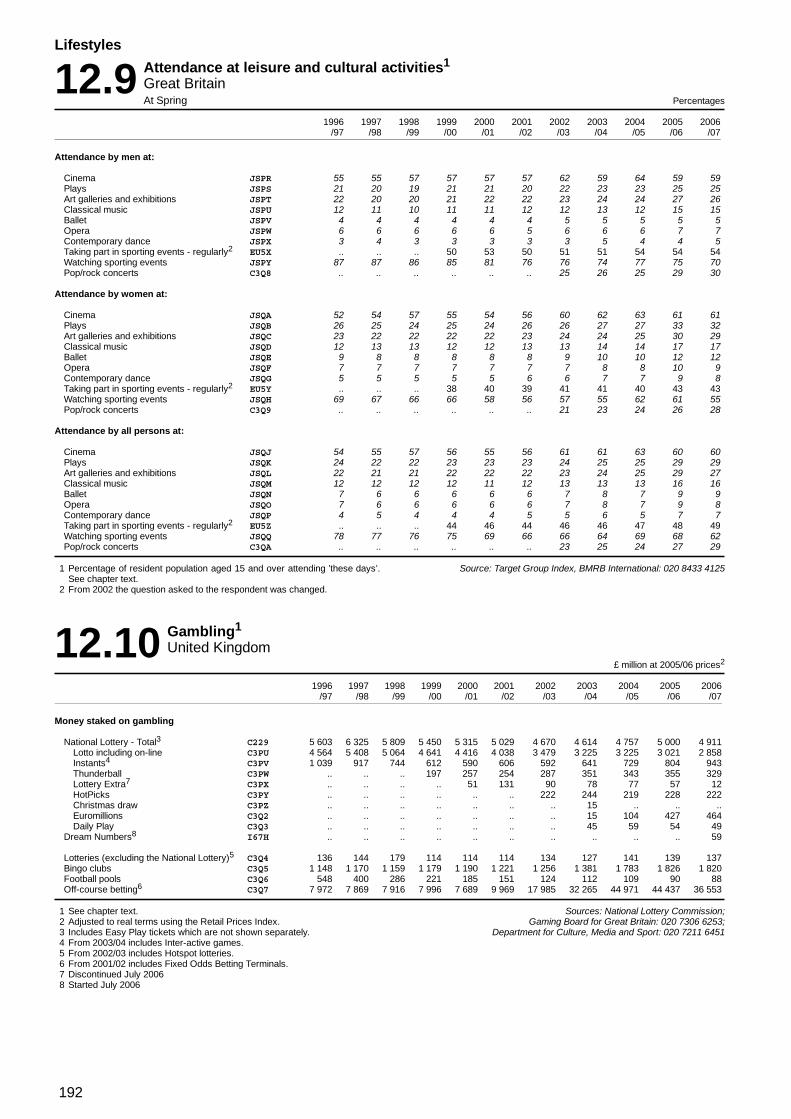
192
Lifestyles
12.9 Attendance at leisure and cultural activities1
Great BritainAt Spring Percentages
1996 1997 1998 1999 2000 2001 2002 2003 2004 2005 2006/97 /98 /99 /00 /01 /02 /03 /04 /05 /06 /07
Attendance by men at:
Cinema JSPR 55 55 57 57 57 57 62 59 64 59 59Plays JSPS 21 20 19 21 21 20 22 23 23 25 25Art galleries and exhibitions JSPT 22 20 20 21 22 22 23 24 24 27 26Classical music JSPU 12 11 10 11 11 12 12 13 12 15 15Ballet JSPV 4 4 4 4 4 4 5 5 5 5 5Opera JSPW 6 6 6 6 6 5 6 6 6 7 7Contemporary dance JSPX 3 4 3 3 3 3 3 5 4 4 5Taking part in sporting events - regularly2 EU5X .. .. .. 50 53 50 51 51 54 54 54Watching sporting events JSPY 87 87 86 85 81 76 76 74 77 75 70Pop/rock concerts C3Q8 .. .. .. .. .. .. 25 26 25 29 30
Attendance by women at:
Cinema JSQA 52 54 57 55 54 56 60 62 63 61 61Plays JSQB 26 25 24 25 24 26 26 27 27 33 32Art galleries and exhibitions JSQC 23 22 22 22 22 23 24 24 25 30 29Classical music JSQD 12 13 13 12 12 13 13 14 14 17 17Ballet JSQE 9 8 8 8 8 8 9 10 10 12 12Opera JSQF 7 7 7 7 7 7 7 8 8 10 9Contemporary dance JSQG 5 5 5 5 5 6 6 7 7 9 8Taking part in sporting events - regularly2 EU5Y .. .. .. 38 40 39 41 41 40 43 43Watching sporting events JSQH 69 67 66 66 58 56 57 55 62 61 55Pop/rock concerts C3Q9 .. .. .. .. .. .. 21 23 24 26 28
Attendance by all persons at:
Cinema JSQJ 54 55 57 56 55 56 61 61 63 60 60Plays JSQK 24 22 22 23 23 23 24 25 25 29 29Art galleries and exhibitions JSQL 22 21 21 22 22 22 23 24 25 29 27Classical music JSQM 12 12 12 12 11 12 13 13 13 16 16Ballet JSQN 7 6 6 6 6 6 7 8 7 9 9Opera JSQO 7 6 6 6 6 6 7 8 7 9 8Contemporary dance JSQP 4 5 4 4 4 5 5 6 5 7 7Taking part in sporting events - regularly2 EU5Z .. .. .. 44 46 44 46 46 47 48 49Watching sporting events JSQQ 78 77 76 75 69 66 66 64 69 68 62Pop/rock concerts C3QA .. .. .. .. .. .. 23 25 24 27 29
1 Percentage of resident population aged 15 and over attending ’these days’.See chapter text.
2 From 2002 the question asked to the respondent was changed.
Source: Target Group Index, BMRB International: 020 8433 4125
12.10 Gambling1
United Kingdom£ million at 2005/06 prices2
1996 1997 1998 1999 2000 2001 2002 2003 2004 2005 2006/97 /98 /99 /00 /01 /02 /03 /04 /05 /06 /07
Money staked on gambling
National Lottery - Total3 C229 5 603 6 325 5 809 5 450 5 315 5 029 4 670 4 614 4 757 5 000 4 911Lotto including on-line C3PU 4 564 5 408 5 064 4 641 4 416 4 038 3 479 3 225 3 225 3 021 2 858Instants4 C3PV 1 039 917 744 612 590 606 592 641 729 804 943Thunderball C3PW .. .. .. 197 257 254 287 351 343 355 329Lottery Extra7 C3PX .. .. .. .. 51 131 90 78 77 57 12HotPicks C3PY .. .. .. .. .. .. 222 244 219 228 222Christmas draw C3PZ .. .. .. .. .. .. .. 15 .. .. ..Euromillions C3Q2 .. .. .. .. .. .. .. 15 104 427 464Daily Play C3Q3 .. .. .. .. .. .. .. 45 59 54 49
Dream Numbers8 I67H .. .. .. .. .. .. .. .. .. .. 59
Lotteries (excluding the National Lottery)5 C3Q4 136 144 179 114 114 114 134 127 141 139 137Bingo clubs C3Q5 1 148 1 170 1 159 1 179 1 190 1 221 1 256 1 381 1 783 1 826 1 820Football pools C3Q6 548 400 286 221 185 151 124 112 109 90 88Off-course betting6 C3Q7 7 972 7 869 7 916 7 996 7 689 9 969 17 985 32 265 44 971 44 437 36 553
1 See chapter text.2 Adjusted to real terms using the Retail Prices Index.3 Includes Easy Play tickets which are not shown separately.4 From 2003/04 includes Inter-active games.5 From 2002/03 includes Hotspot lotteries.6 From 2001/02 includes Fixed Odds Betting Terminals.7 Discontinued July 20068 Started July 2006
Sources: National Lottery Commission;Gaming Board for Great Britain: 020 7306 6253;
Department for Culture, Media and Sport: 020 7211 6451

193
Lifestyles
12.11 Most Popular Boy and Girl Baby Names 2007Great Britain1
Names Names Names NamesRank Boys Rank Boys Rank Girls Rank Girls
1 Jack 51 Isaac 1 Grace 51 Isabel2 Thomas 52 Finlay 2 Olivia 52 Paige3 Oliver 53 Rhys 3 Emily 53 Anna4 Joshua 54 Noah 4 Ruby 54 Eleanor5 Harry 55 Mason 5 Jessica 55 Lola6 James 56 Kieran 6 Sophie 56 Libby7 Daniel 57 Toby 7 Chloe 57 Isla8 Charlie 58 Charles 8 Lily 58 Niamh9 William 59 Alex 9 Ella 59 Sarah10 Samuel 60 Riley 10 Lucy 60 Lilly11 Alfie 61 David 11 Ellie 61 Skye12 Lewis 62 Louis 12 Amelia 62 Isobel13 George 63 Kai 13 Charlotte 63 Amelie14 Joseph 64 Reece 14 Mia 64 Maisie15 Benjamin 65 Brandon 15 Hannah 65 Rosie16 Ethan 66 Freddie 16 Evie 66 Aimee17 Dylan 67 Kian 17 Katie 67 Zara18 Callum 68 John 18 Megan 68 Matilda19 Jake 69 Bradley 19 Amy 69 Maddison20 Mohammed 70 Aidan 20 Emma 70 Eve21 Alexander 71 Harley 21 Erin 71 Sienna22 Luke 72 Luca 22 Isabella 72 Zoe23 Ryan 73 Bailey 23 Millie 73 Gracie24 Matthew 74 Sam 24 Abigail 74 Tia25 Jacob 75 Robert 25 Isabelle 75 Abbie26 Adam 76 Mohammad 26 Freya 76 Alisha27 Liam 77 Leon 27 Daisy 77 Nicole28 Tyler 78 Evan 28 Holly 78 Harriet29 Cameron 79 Theo 29 Molly 79 Courtney30 Max 80 Andrew 30 Poppy 80 Maya31 Jayden 81 Christopher 31 Caitlin 81 Faith32 Jamie 82 Hayden 32 Jasmine 82 Sofia33 Harvey 83 Taylor 33 Phoebe 83 Layla34 Harrison 84 Joe 34 Imogen 84 Madeleine35 Connor 85 Ashton 35 Ava 85 Lacey36 Archie 86 Ellis 36 Keira 86 Shannon37 Nathan 87 Joel 37 Madison 87 Julia38 Ben 88 Jay 38 Rebecca 88 Lydia39 Lucas 89 Zachary 39 Leah 39 Martha40 Henry 90 Sean 40 Elizabeth 90 Francesca41 Kyle 91 Sebastian 41 Sophia 91 Lexie42 Owen 92 Billy 42 Lauren 92 Hollie43 Michael 93 Elliot 43 Georgia 93 Maria44 Logan 94 Reuben 44 Brooke 94 Alexandra45 Aaron 95 Gabriel 45 Eva 95 Rose46 Leo 96 Zak 46 Summer 96 Alicia47 Muhammad 97 Morgan 47 Alice 97 Victoria48 Oscar 98 Corey 48 Scarlett 98 Sara49 Edward 99 Louie 49 Amber 99 Evelyn50 Finlay 100 Dominic 50 Bethany 100 Tilly
1 Great Britain compiled from Top 100 names from England & Wales andmost popular names Scotland publications. See chapter text.
Sources: Office for National Statistics;General Register Office Scotland

194
Enviroment

195
Enviroment
Environment
Ch
apter 13

196
Enviroment
fossil fuel exploration, production, transport and offshore oil – venting and flaring.
Business total: iron and steel – combustion, other industrial combustion and miscellaneous industrial and commercial combustion.
Transport total: road transport – passenger cars, light duty vehicles, buses, HGVs, mopeds, motorcycles; gasoline evaporation from vehicles, tyre and brake wear.
Other transport: civil aviation (domestic cruise, take off and landing cycles), railway locomotives, railway – stationary combustion, shipping, national navigation, fishing vessels, and other mobile sources including agricultural machinery; gardening, construction and aircraft support equipment and mobile industrial equipment powered by diesel or petrol engines.
Residential total: residential plant, household and gardening (mobile).
Agriculture total: stationary combustion, manure liquid systems, manure solid storage and dry lot, other manure management, direct soil emission, field burning of agricultural wastes.
Industrial process total: industrial process sinter production, iron and steel – flaring, nitric acid production, adipic acid production and metal production.
Solvent and other product use: paint application, degreasing and dry cleaning, chemical products, manufacture and processing wood impregnation and tyre manufacture.
Land-use change: emissions from managed and unmanaged forests, and forest and grassland conversion.
Waste management total: treatment of domestic, industrial and other waste, including landfill and waste incineration.
Estimated atmospheric emissions on a National Accounts basis
(Table 13.2)
The National Accounts figures in Table 13.2 differ from those on an IPCC basis in that they include estimated emissions from fuels purchased by UK resident households and companies either at home or abroad. These include emissions from UK international shipping and aircraft operators, and exclude emissions in the UK resulting from the activities of non-residents.
Environment
Environmental Taxes
(Table 13.1)
In 2006, government revenue from environmental taxes was £35.4 billion. As a proportion of Gross Domestic Product (GDP) this amounts to 2.7 per cent, and as a proportion of total taxes and social contributions, environmental taxes were 7.3 per cent in 2006. These proportions are lower than in previous years because growth in the economy and total taxes and social contributions has exceeded that of environmental taxes.
Air emissions
(Table 13.2 to 13.8)
Emissions of air pollutants arise from a wide variety of sources. The National Atmospheric Emissions Inventory (NAEI) is prepared annually for the Government and the devolved administrations by AEA Energy and Environment, with the work being co-ordinated by the Department for Food and Rural Affairs (Defra). Information is available for a range of point sources, including the most significant polluters. However, a different approach has to be taken for diffuse sources, such as transport and domestic emissions, where this type of information is not available and estimates for these are derived from statistical information and from research on emission factors for stationary and mobile sources. Although for any given year considerable uncertainties surround the emission estimates for each pollutant, trends over time are likely to be more reliable.
UK national emission estimates are updated annually and any developments in methodology are applied retrospectively to earlier years. Adjustments in the methodology are made to accommodate new technical information and to improve international comparability.
Three different classification systems are used in the tables presented here: a National Accounts basis (Table 13.2); the format required by the Inter-governmental Panel on Climate Change (IPCC) (Table 13.3); and the National Communications (NC) categories (Tables 13.6-13.8).
The NC source categories are detailed below, together with details of the main sources of these emissions:
Energy supply total: power stations, petroleum refining, manufacture of solid fuels and other energy industries,

197
Enviroment
Greenhouse gases include carbon dioxide, methane, nitrous oxide, hydro-fluorocarbons, perfluorocarbons and sulphur hexafluoride which are expressed in thousand tonnes of carbon dioxide equivalent.
Acid rain precursors include sulphur dioxide, nitrogen oxides and ammonia which are expressed as thousand tonnes of sulphur dioxide equivalent.
PM10 are carbon particles in the air arising from incomplete combustion.
Estimated total emissions of greenhouse gases on an IPCC basis
(Table 13.3)
The IPCC classification is used to report greenhouse gas emissions under the Framework Convention on Climate Change and includes land use change and all emissions from domestic aviation and shipping, but excludes international marine and aviation bunker fuels. Estimates of the relative contribution to global warming of the main greenhouse gases, or classes of gases, is presented weighted by their global warming potential.
Average number of days of moderate or higher air pollution
(Table 13.4)
The air quality indicator is one of the 68 indicators of the Government’s Sustainable Development Strategy. The indicator is split into two parts covering: (a) measures annual levels of pollution from particulates (PM10) and ozone (O3), the two pollutants thought to have the greatest health impacts; and (b) the number of days on which levels of any one of a basket of five pollutants were ‘moderate or higher’.
Table 13.4 details the second part of this indicator according to the Air Pollution Information Service bandings used in the air pollution forecasting. At a moderate level, the effects of pollution may start to be noticeable to sensitive people. There is no clear trend in the number of pollution days, due to the effects of variability in weather patterns from year to year.
The bandings are based on five pollutants consisting of carbon monoxide, nitrogen oxide, ozone, particulates and sulphur dioxide. These are recognised as the most important for causing short-term health effects. The main causes of days of moderate or higher air pollution at urban sites are ozone and particulates (PM10). Sulphur dioxide also used to make a significant contribution but has now fallen to relatively very low levels. Carbon monoxide and nitrogen oxide have rarely
reached moderate or higher levels since the urban index began in 1992.
Emissions of carbon dioxide
(Table 13.6)
Carbon dioxide is the main man-made contributor to global warming. The UK contributes about 2 per cent to global man-made emissions, which, according to the IPCC, was estimated to be 38 billion tonnes carbon dioxide in 2004. Carbon dioxide accounted for about 85 per cent of the UK’s man-made greenhouse gas emissions in 2006.
Emissions of methane
(Table 13.7)
Weighted by global warming potential, methane accounted for about 7.5 per cent of the UK’s greenhouse gas emissions in 2006. Methane emissions, excluding those from natural sources, were 53 per cent below 1990 levels. In 2006, the main sources of methane were landfill sites (40 per cent of total) and agriculture (38 per cent). Emissions from landfill have reduced by 61 per cent and emissions from agriculture by 13 per cent since 1990.
Emissions of nitrous oxide
(Table 13.8)
Weighted by global warming potential, nitrous oxide emissions accounted for about 6 per cent of the UK’s man-made greenhouse gas emissions in 2006. Nitrous oxide emissions fell by 40 per cent between 1990 and 2006. The largest reductions were in emissions from adipic acid production between 1998 and 1999. This leaves agriculture as the main source, accounting for over two thirds of emissions, mainly from agricultural soils. Nitrous oxide emissions from road transport were more than five times higher in 2006 than in 1990, increasing from 2 per cent of the total to 14 per cent in 2006. This is a result of the introduction of the three way catalytic converters, which significantly reduce emissions of various other harmful gases such as carbon monoxide, hydrocarbons and nitrogen oxides, but have a side-effect of producing higher emissions of nitrous oxide.
Annual Rainfall
(Table 13.9)
Regional rainfall is derived by the Met Office's National Climate Information Centre for the National Hydrological

198
Enviroment
Monitoring Programme at the Centre for Ecology and Hydrology. These monthly area rainfalls are based initially on a subset of rain gauges (circa 350) but are updated after four to five months with figures using the majority of the UK's rain gauge network.
The regions of England shown in this table correspond to the original nine English regions of the National Rivers Authority (NRA). The NRA became part of the Environment Agency upon its creation in April 1996. The figures in this table relate to the country of Wales, not the Environment Agency Welsh Region.
UK Weather Summary
(Table 13.10)
For 2007 data these initial averages use data available from about 180 observing sites available on 1 January 2008. They represent an initial assessment of the weather that was experienced across the UK during 2007 and how it compares with the 1961 to 1990 average.
For all other years, these final averages use quality controlled data from the UK climate network of observing stations. They show the Met Office's best assessment of the weather that was experienced across the UK during the years and how it compares with the 1961 to 1990 average. The columns headed 'Anom' (anomaly) show the difference from, or percentage of, the 1961 to 1990 long-term average.
Biological and chemical quality of rivers and canals
(Table 13.11)
The chemical quality of river and canal waters is monitored in a series of separate national surveys in England and Wales and Northern Ireland. The General Quality Assessment (GQA) Scheme used in the surveys provides a rigorous and objective method for assessing the basic chemical quality of rivers and canals based on three determinants: dissolved oxygen, biochemical oxygen demand and ammoniacal nitrogen. The GQA grades river stretches into six categories (A-F) of chemical quality, and these in turn have been grouped into four broader groups: good (classes A and B), fair (C and D), poor (E) and bad (F).
To provide a more comprehensive picture of the health of rivers and canals, biological testing has also been carried out. The biological grading is based on the monitoring of tiny animals (invertebrates) which live in or on the bed of the river. Research has shown that there is a relationship between species composition and water quality. Using a procedure known as the River Invertebrate Prediction and Classification System, species groups recorded at a site were compared
with those which would be expected to be present in the absence of pollution, allowing for the different environmental characteristics in different parts of the country. Two different summary statistics (known as ecological quality indices) were calculated and then the biological quality was assigned to one of six bands based on a combination of these two statistics.
It should be noted that the monitoring network only covers stretches the Environment Agency are required to monitor, that is rivers and streams with a flow greater than 1m3 /second. On this basis, 40,000km of river network are monitored in England and Wales out of an estimated total river length of 150,000km. No canals are classified in Northern Ireland.
Biological and chemical quality of rivers and canals Scotland
(Table 13.12)
In Scotland, river and canal water quality is based on the Scottish River Classification Scheme of 20 June 1997, which combines chemical, biological, nutrient and aesthetic quality using the following classes: excellent (A1), good (A2), fair (B), poor (C) and seriously polluted (D). The figures in the table are also rounded to the nearest 10km and may not sum to totals.
During 2000 a new digitised river network (DRN) was developed, based on 1:50,000 ordnance survey data digitised by the Institute of Hydrology. The new network ensures consistency between all Scottish Environment Protection Agency areas and includes the Scottish Islands which were not previously covered. Data based on this network are published for the first time in the 2004 edition of Annual Abstract and are not consistent with data which have previously been published. The DRN includes:
All mainland and islands rivers with a catchment area of 10 km2 or more. This is known as the ‘baseline network’
Mainland and islands stream stretches with a catchment of less than 10 km2 which are classified as fair, poor or seriously polluted and have been monitored. These are added to the baseline network to give a ’classification network’
It is intended that future emphasis will be placed on the baseline network, which will be the reportable network for the purposes of the European Commission Water Framework Directive. Efforts to improve the quality of the downgraded smaller streams will continue, but once this has been sustainably achieved, their monitoring may be reduced. Many of these streams are the subject of current attention because of their influence on the quality of larger classification network rivers.

199
Enviroment
Using the DRN scheme, data for every routine sampling point are automatically applied to an identified river stretch of predetermined length. The loss in total river length in moving to the DRN (that is despite the first time inclusion of islands rivers) arises mainly from the exclusion from classification of thousands of small remote headwater streams which were never monitored, but assumed to be of excellent quality. The smaller reduction in length of downgraded waters arises mainly from using 1:50,000 maps for the DRN; in the former system lengths were hand measured from 1:10,000 maps, so more minor channel bends were included.
Reservoir stocks in England and Wales
(Table 13.13)
Data are collected for a network of major reservoirs (or reservoir groups) in England and Wales for the National Hydrological Monitoring Programme at the Centre for Ecology and Hydrology. Figures of usable capacity are supplied by the Water Plcs and the Environment Agency at the start of each month and are aggregated to provide an index of the total reservoir stocks for England and Wales.
Water industry expenditure
(Table 13.14)
The table is informed by the annual and regulatory accounts of water and sewerage companies and water companies of England and Wales. The elements which make up operating expenditure are as follows: manpower costs, other costs of employment, power, agencies, associated companies, Environment Agency charges, bulk supply imports, general and support, customer services, scientific services, other business activities, local authority rates, water charges, local authority sewerage agencies, materials and consumables, hired and contracted services, charge for bad and doubtful debts, depreciation, infrastructure renewals expenditure, infrastructure renewals accrual, exceptional items and other operating costs. Capital expenditure figures are the addition to tangible fixed assets including management and general expenditure but excluding infrastructure renewals expenditure. Adopted assets at nil cost are also included.
Water pollution incidents
(Table 13.15)
The Environment Agency responds to complaints and reported incidents of pollution in England and Wales. Each incident is then logged and categorised according to its severity. The category describes the impact of each incident on our water,
land and air. The impact of an incident on each medium is considered and reported separately. If no impact has occurred for a particular medium, the incident is reported as a category 4. Before 1999, the reporting system was used only for water pollution incidents; thus the total number of substantiated incidents was lower, as it did not include incidents not relating to the water environment.
Bathing waters
(Table 13.16)
Under the EC Bathing Water Directive 76/160/EEC, 11 physical, chemical and microbiological parameters are measured including total and faecal coliforms which are generally considered to be the most important indicators of the extent to which water is contaminated by sewage. The mandatory value for total coli forms is 10,000 per 100 ml, and for faecal coli forms 2,000 per 100 ml. For a bathing water to comply with the coli form standards, the Directive requires that at least 95 per cent of samples taken for each of these parameters over the bathing season are less than or equal to the mandatory values. In the UK a minimum of 20 samples are normally taken at each site. In practice this means that where 20 samples are taken, a maximum of only one sample may exceed the mandatory value for the bathing water to comply, and where less than 20 samples are taken none may exceed the mandatory value for the bathing water to comply.
The bathing water season is from mid-May to end-September in England and Wales, but shorter in Scotland and Northern Ireland. Bathing waters which are closed for the season are excluded for that year.
The table shows Environment Agency regions for England and Wales, the boundaries of which are based on river catchment areas and not county borders. In particular, the figures shown for Wales are the Environment Agency Welsh Region, the boundary of which does not coincide with the boundary of Wales.
Surface and groundwater abstractions
(Table 13.17)
Significant changes in the way data is collected and/or reported were made in 1991 (due to Water Resources Act 1991) and 1999 (commission of National Abstraction Licensing Database). Figures are therefore not strictly comparable with those in previous/intervening years. From 1999, data has been stored and retrieved from one system nationally and is therefore more accurate and reliable. Some regions report licensed and actual abstracts for financial rather than calendar years. As figures represent an average for the

200
Enviroment
whole year expressed as daily amounts, differences between amounts reported for financial and calendar years are small.
Under the Water Act 2003, abstraction of less than 20m3/day became exempt from the requirement to hold a licence as of 1 April 2005. As a result over 22,000 licences were deregulated, mainly for agricultural or private water supply purposes. However, due to the small volumes involved, this has had a minimal affect on the estimated licensed and actual abstraction totals.
The following changes have occurred in the classification of individual sources:
Spray irrigation: this category includes small amounts of non-agricultural spray irrigation
Mineral washing: from 1999 this was not reported as a separate category; licences for ‘Mineral washing’ are now contained in ‘Other industry’
Private water supply: was shown as separate category from 1992 and includes private abstractions for domestic use and individual households
Fish farming, cress growing, amenity ponds: Includes amenity ponds, but excludes miscellaneous from 1991
Estimates of remaining recoverable oil and gas reserves
(Table 13.18)
The latest oil and gas data for 2006 shows that UK reserves of oil were estimated to be around 2.9 billion tonnes, while UK gas reserves were around 2016 billion cubic meters. Of these, proven reserves of oil were 0.5 billion tonnes and proven reserves of gas were 412 billion cubic meters. Compared with a year earlier, proven reserves were 7.2 per cent lower for oil and 14.3 per cent lower for gas. The monetary value of oil reserves increased from £100.1 billion in 2005 to £114.2 billion in 2006, a rise of 14.1 per cent reflecting rising oil prices. At £85.3 billion, the vale of gas reserves increased by 30.4 per cent from £65.4 billion between 2005 and 2006.
Municipal waste disposal
(Table 13.19)
Municipal waste includes household and non-household waste that is collected and disposed of by local authorities. It includes regular household collections, specific recycling collections, special collections of bulky items, waste received at civic amenity sites, and waste collected from non-household sources that come under the control of local authorities.
Amounts of different materials from household sources collected for recycling
(Table 13.20)
Household recycling includes those materials collected for recycling, composting or reuse by local authorities and those collected from household sources by ‘private/voluntary’ organisations where this material comes under the possession or control of local authorities. It includes residual waste from the household stream which was diverted for recycling by sorting or further treatment.
‘Bring sites’ are facilities where members of the public can bring recyclable materials (such as paper, glass, cans, textiles, shoes, etc). These are often located at supermarkets or similar locations, but exclude civic amenity sites.
‘Civic Amenity sites’ refers to household waste collected at sites provided by local authorities for the disposal of excess household and garden waste free of charge, as required by the Refuse Disposal (Amenity) Act 1978. These are also known as Household Waste Recycling Centres.
Noise incidents
(Table 13.21)
The table shows trends in the number of incidents reported by local authority Environmental Health Officers (EHO). The figures are from those authorities making returns and are calculated per million people based on the population of the authorities making returns. Environmental health has changed from calculating complaints per million of population to incidents per million of the population in 2004/05. The reason for asking about incidents is to better reflect both the local noise environment and investigatory workloads during the reporting year, while avoiding the double counting which occurs with complaints (i.e. multiple complaints about the same incident). As a result the data does reflect this change by a drop in numbers across all categories.
Most complaints about traffic noise are addressed to highways authorities or Department for Transport (DfT) Regional Directors, and will not necessarily be included in the figures. Similarly, complaints about noise from civil aircraft are generally received by aircraft operators, the airport companies, the DfT or Civil Aviation Authority. Complaints about military flying are dealt with either by Station Commanding Officers or by Ministry of Defence headquarters. It is also true that railway noise will be reported elsewhere. Thus the figures in this table will not necessarily include these complaints and are likely to be considerably understated. Therefore, the information reported to the EHO is considered to give, at best, only a very

201
Enviroment
approximate indication of the trend in noise complaints from these sources.
Over time some of the categories shown in this table have changed. These have included, up until 1996/97, Section 62 of the Control of Pollution Act 1974 covered noise in the streets; it primarily included the chimes of ice-cream vendors and the use of loudspeakers other than for strictly defined purposes. From 1997/98, all complaints about noise in the street are included with ‘vehicles machinery and equipment in streets’. From 1997/98, complaints about road works are included with ‘vehicles machinery and equipment in streets’.
Material flows
(Table 13.22)
Economy-wide material flow accounts record the total mass of natural resources and products that are used by the UK economy, either directly in the production and distribution of products and services, or indirectly through the movement of materials which are displaced in order for production to take place.
The direct movement of materials into the economy derives primarily from domestic extraction that is from biomass (agricultural harvest, timber, fish and animal grazing), fossil fuel extraction (such as coal, crude oil and natural gas) and mineral extraction (metal ores, industrial minerals such as pottery clay, and construction material such as crushed rock, sand and gravel). This domestic extraction is supplemented by the imports of products, which may be of raw materials such as unprocessed agricultural products, but can also be of semi-manufactured or finished products. In a similar way the UK produces exports of raw materials, semi-manufactured and finished goods which can be viewed as inputs to the production and consumption of overseas economies.
Indirect flows of natural resources consist of the unused material resulting from domestic extraction, such as mining and quarrying overburden and the soil removed during construction and dredging activities. They also include the movement of used and unused material overseas which is associated with the production and delivery of imports. Water, except for that included directly in products, is excluded from the accounts.
There are three main indicators used to measure inputs. The Direct Material Input measures the input of used materials into the economy, that is all materials which are of economic value and are used in production and consumption activities (including the production of exports). Domestic Material Consumption measures the total amount of material directly used in the economy, that is it includes imports but excludes
exports. The Total Material Requirement (TMR) measures the total material basis of the economy, that is the total primary resource requirements of all the production and consumption activities. It includes not only the direct use of resources for producing exports, but also indirect flows from the production of imports and the indirect flows associated with domestic extraction. Although TMR is widely favoured as a resource use indicator, the estimates of indirect flows are less reliable than those for materials directly used by the economy, and the indicator therefore needs to be considered alongside other indicators.

202
Environment
13.1 Government revenues from environmental taxesUnited Kingdom
£ million
1993 1995 1998 1999 2000 2001 2002 2003 2004 2005 2006
Energy
Duty on hydrocarbon oils GTAP 12 497 15 360 20 996 22 391 23 041 22 046 22 070 22 476 23 412 23 346 23 448including
Unleaded petrol1 GBHE 4 242 5 901 9 897 11 952 11 573 1 938 – – – – –Leaded petrol/LRP2 GBHL 4 502 4 088 2 984 1 630 1 115 661 310 320 75 20 15Ultra low sulphur petrol ZXTK – – – – 976 10 285 12 453 11 891 12 171 11 723 11 354Diesel3 GBHH 3 484 5 127 7 088 1 274 23 66 – – – – –Ultra low sulphur diesel GBHI – – 806 7 338 9 086 8 633 9 137 9 579 10 298 10 808 10 811
VAT on duty CMYA 2 187 2 688 3 674 3 918 4 032 3 858 3 862 3 933 4 097 4 086 4 103Fossil fuel levy CIQY 1 331 1 306 181 104 56 86 32 – – – –Gas levy GTAZ 240 161 32 – – – – – – – –Climate change levy LSNT – – – – – 585 825 828 756 747 711Hydro-benefit LITN 22 27 32 35 42 46 44 44 40 10 –
Road vehicles
Vehicle excise duty CMXZ 3 482 3 954 4 631 4 873 4 606 4 102 4 294 4 720 4 763 4 762 5 010
Other environmental taxes
Air passenger duty CWAA – 339 823 884 940 824 814 781 856 896 963Landfill tax BKOF – – 333 430 461 502 541 607 672 733 808Aggregates levy MDUQ – – – – – – 213 340 328 327 325
Total environmental taxes JKVW 19 755 23 835 30 702 32 635 33 178 32 049 32 695 33 729 34 924 34 907 35 358
Environmental taxes as a % of:Total taxes and social contributions JKVX 9.0 9.3 9.7 9.7 9.3 8.6 8.7 8.5 8.3 7.7 7.3Gross domestic product JKVY 3.1 3.3 3.5 3.6 3.5 3.2 3.1 3.0 2.9 2.8 2.7
1 Unleaded petrol includes superunleaded petrol.2 Lead Replacement Petrol (the alternative to 4-Star leaded petrol introduced
in 2000) is lead-free.3 Duty incentives have concentrated production on ultra low sulphur varieties.
Sources: ONS, Department for Business Enterprise & Regulatory Reform;[email protected]
13.2 Estimated atmospheric emissions on a National Accounts basis1, 2005United Kingdom
Thousand tonnes
Emissions affecting air quality
VolatileGreenhouse Acid rain Carbon organic Lead Cadmium Mercury
gases2 precursors3 PM10 monoxide compounds4 Benzene Butadiene (Tonnes) (Tonnes) (Tonnes)
Agriculture 51 302 555.78 22.30 49.07 83.26 0.23 0.09 0.41 0.030 0.032Mining and quarrying 29 155 87.09 12.80 38.75 111.86 0.37 0.02 0.26 0.064 0.021Manufacturing 119 745 436.76 32.95 573.56 347.25 2.37 0.47 86.70 2.049 3.586Electricity, gas and water supply 188 216 638.72 10.09 75.01 49.23 0.52 0.01 9.66 0.709 2.272Construction 11 302 49.98 9.50 59.64 65.07 0.25 0.12 0.37 0.042 0.020Wholesale and retail trade 18 809 54.39 6.66 75.67 60.93 0.28 0.18 12.90 0.096 0.035
Transport and communication 104 466 1003.96 68.97 160.51 58.88 3.62 0.73 4.86 3.716 0.211Financial intermediation 7 066 14.17 1.99 52.40 4.70 0.11 0.04 0.14 0.034 0.006Public administration 9 226 39.79 2.01 44.45 4.96 0.28 0.05 0.54 0.030 0.044Education, health and social work 11 029 15.29 1.10 13.13 2.29 0.06 0.01 0.43 0.021 0.039Other services 27 159 44.40 1.51 97.31 28.97 1.80 0.20 0.36 0.030 1.352Domestic 155 972 271.43 36.89 1 258.95 257.22 7.34 0.76 4.84 0.439 0.135
Total 733 446 3 211.75 206.77 2 498.45 1 074.62 17.24 2.68 121.47 7.26 7.752
Of which, emissions from road transport 128 057 415.50 34.34 1 139.79 121.10 2.94 1.64 2.11 0.42 0.004
1 See chapter text.2 Thousand tonnes of carbon dioxide equivalent.3 Thousand tonnes of sulphur dioxide equivalent.4 Excluding methane, but including benzene and 1,3-butadiene.
Sources: National Environmental Technology Centre;Office for National Statistics: 020 7014 2079;
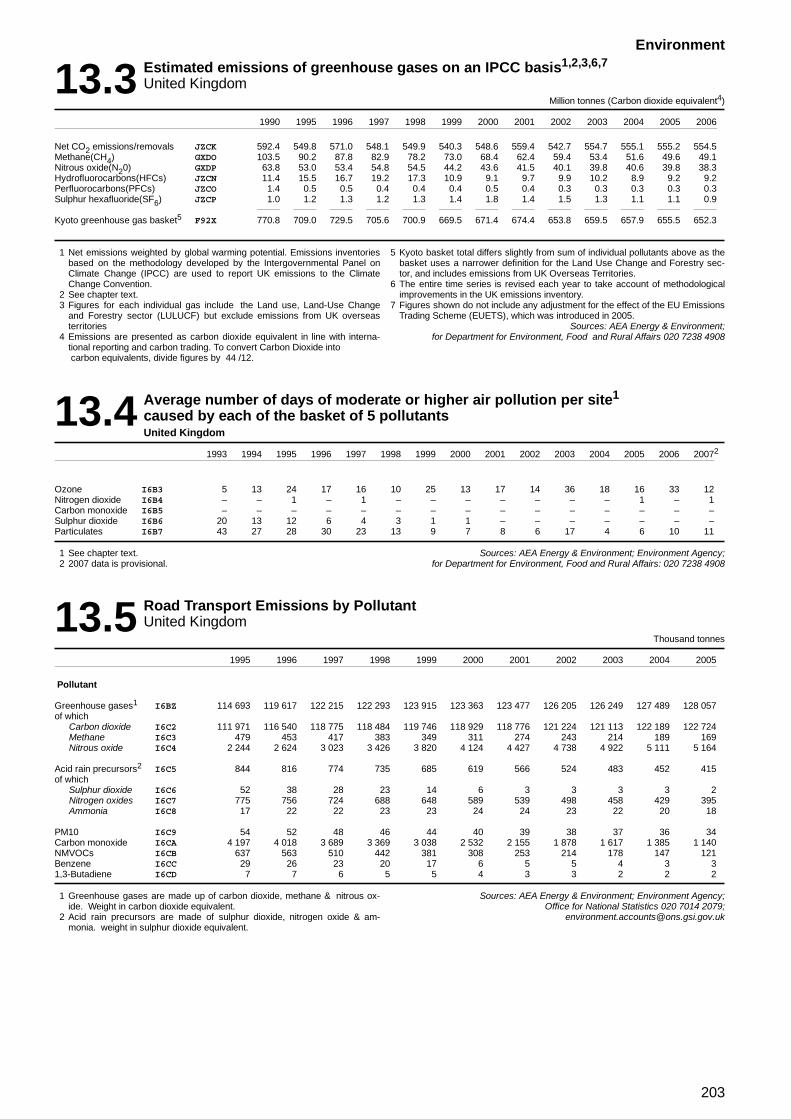
203
Environment
13.3 Estimated emissions of greenhouse gases on an IPCC basis1,2,3,6,7
United KingdomMillion tonnes (Carbon dioxide equivalent4)
1990 1995 1996 1997 1998 1999 2000 2001 2002 2003 2004 2005 2006
Net CO2 emissions/removals JZCK 592.4 549.8 571.0 548.1 549.9 540.3 548.6 559.4 542.7 554.7 555.1 555.2 554.5Methane(CH4) GXDO 103.5 90.2 87.8 82.9 78.2 73.0 68.4 62.4 59.4 53.4 51.6 49.6 49.1Nitrous oxide(N20) GXDP 63.8 53.0 53.4 54.8 54.5 44.2 43.6 41.5 40.1 39.8 40.6 39.8 38.3Hydrofluorocarbons(HFCs) JZCN 11.4 15.5 16.7 19.2 17.3 10.9 9.1 9.7 9.9 10.2 8.9 9.2 9.2Perfluorocarbons(PFCs) JZCO 1.4 0.5 0.5 0.4 0.4 0.4 0.5 0.4 0.3 0.3 0.3 0.3 0.3Sulphur hexafluoride(SF6) JZCP 1.0 1.2 1.3 1.2 1.3 1.4 1.8 1.4 1.5 1.3 1.1 1.1 0.9
Kyoto greenhouse gas basket5 F92X 770.8 709.0 729.5 705.6 700.9 669.5 671.4 674.4 653.8 659.5 657.9 655.5 652.3
1 Net emissions weighted by global warming potential. Emissions inventoriesbased on the methodology developed by the Intergovernmental Panel onClimate Change (IPCC) are used to report UK emissions to the ClimateChange Convention.
2 See chapter text.3 Figures for each individual gas include the Land use, Land-Use Change
and Forestry sector (LULUCF) but exclude emissions from UK overseasterritories
4 Emissions are presented as carbon dioxide equivalent in line with interna-tional reporting and carbon trading. To convert Carbon Dioxide intocarbon equivalents, divide figures by 44 /12.
5 Kyoto basket total differs slightly from sum of individual pollutants above as thebasket uses a narrower definition for the Land Use Change and Forestry sec-tor, and includes emissions from UK Overseas Territories.
6 The entire time series is revised each year to take account of methodologicalimprovements in the UK emissions inventory.
7 Figures shown do not include any adjustment for the effect of the EU EmissionsTrading Scheme (EUETS), which was introduced in 2005.
Sources: AEA Energy & Environment;for Department for Environment, Food and Rural Affairs 020 7238 4908
13.4 Average number of days of moderate or higher air pollution per site1
caused by each of the basket of 5 pollutantsUnited Kingdom
1993 1994 1995 1996 1997 1998 1999 2000 2001 2002 2003 2004 2005 2006 20072
Ozone I6B3 5 13 24 17 16 10 25 13 17 14 36 18 16 33 12Nitrogen dioxide I6B4 – – 1 – 1 – – – – – – – 1 – 1Carbon monoxide I6B5 – – – – – – – – – – – – – – –Sulphur dioxide I6B6 20 13 12 6 4 3 1 1 – – – – – – –Particulates I6B7 43 27 28 30 23 13 9 7 8 6 17 4 6 10 11
1 See chapter text.2 2007 data is provisional.
Sources: AEA Energy & Environment; Environment Agency;for Department for Environment, Food and Rural Affairs: 020 7238 4908
13.5 Road Transport Emissions by PollutantUnited Kingdom
Thousand tonnes
1995 1996 1997 1998 1999 2000 2001 2002 2003 2004 2005
Pollutant
Greenhouse gases1 I6BZ 114 693 119 617 122 215 122 293 123 915 123 363 123 477 126 205 126 249 127 489 128 057of which
Carbon dioxide I6C2 111 971 116 540 118 775 118 484 119 746 118 929 118 776 121 224 121 113 122 189 122 724Methane I6C3 479 453 417 383 349 311 274 243 214 189 169Nitrous oxide I6C4 2 244 2 624 3 023 3 426 3 820 4 124 4 427 4 738 4 922 5 111 5 164
Acid rain precursors2 I6C5 844 816 774 735 685 619 566 524 483 452 415of which
Sulphur dioxide I6C6 52 38 28 23 14 6 3 3 3 3 2Nitrogen oxides I6C7 775 756 724 688 648 589 539 498 458 429 395Ammonia I6C8 17 22 22 23 23 24 24 23 22 20 18
PM10 I6C9 54 52 48 46 44 40 39 38 37 36 34Carbon monoxide I6CA 4 197 4 018 3 689 3 369 3 038 2 532 2 155 1 878 1 617 1 385 1 140NMVOCs I6CB 637 563 510 442 381 308 253 214 178 147 121Benzene I6CC 29 26 23 20 17 6 5 5 4 3 31,3-Butadiene I6CD 7 7 6 5 5 4 3 3 2 2 2
1 Greenhouse gases are made up of carbon dioxide, methane & nitrous ox-ide. Weight in carbon dioxide equivalent.
2 Acid rain precursors are made of sulphur dioxide, nitrogen oxide & am-monia. weight in sulphur dioxide equivalent.
Sources: AEA Energy & Environment; Environment Agency;Office for National Statistics 020 7014 2079;

204
Environment
13.6 Estimated emissions1 of carbon dioxide (CO2)United Kingdom
Million tonnes as CO2
1970 1980 1990 1995 1996 1997 1998 1999 2000 2001 2002 2003 2004 2005 2006
By source NC category
Energy Supply Total I6AH 260.07 261.75 242.30 207.52 209.28 195.04 199.01 189.27 199.76 209.75 207.91 215.87 214.68 217.64 220.83Business Total I6AI 204.08 131.34 108.87 103.73 105.88 104.08 103.07 104.08 104.17 104.08 93.72 95.28 93.31 93.36 91.86Transport Total I6AJ 72.00 90.17 122.46 122.09 126.84 128.08 126.87 127.60 126.60 126.25 128.36 129.20 130.68 131.88 133.55Public I6AK 23.71 19.67 13.48 13.17 14.22 13.80 12.61 12.39 11.66 12.09 10.28 10.14 11.09 10.94 10.46Residential Total I6AL 96.24 84.40 79.77 81.15 92.26 85.21 87.20 86.30 86.96 89.16 85.92 86.83 88.36 84.64 81.27Agriculture Total I6AM 6.19 5.22 5.15 5.28 5.35 5.24 5.05 5.05 4.72 4.80 4.76 4.72 4.62 4.47 4.28Industrial Process Total I6AN 21.08 14.31 16.30 14.88 15.43 15.59 15.59 15.44 14.67 13.37 12.41 13.35 13.80 13.94 13.87Land-use change I6AO – – 2.89 1.16 0.90 0.57 –0.03 –0.31 –0.44 –0.58 –1.14 –1.17 –1.92 –2.08 –2.02Waste treatment I6AP 1.40 1.40 1.20 0.87 0.88 0.50 0.50 0.46 0.46 0.50 0.48 0.46 0.45 0.44 0.42
Total I6AQ 684.76 608.25 592.42 549.83 571.04 548.11 549.87 540.29 548.55 559.41 542.71 554.70 555.08 555.22 554.52
1 See chapter text. Data are for the UK and exclude overseas territories Source: Department for Environment, Food and Rural Affairs: 020 7238 4908
13.7 Estimated emissions1 of methane (CH4)United Kingdom
Thousand tonnes
1990 1995 1996 1997 1998 1999 2000 2001 2002 2003 2004 2005 2006
By source NC category
Energy Supply Total I6AR 1 368.22 1 067.40 1 011.10 962.49 875.32 786.37 720.30 691.23 680.84 542.09 528.30 474.46 441.47Business Total I6AS 15.79 15.96 16.35 16.46 16.13 15.91 15.60 14.53 13.29 14.13 13.74 13.63 13.60Transport Total I6AT 29.78 23.10 21.87 20.10 18.43 16.81 15.01 13.24 11.75 10.37 9.23 8.32 7.62Public I6AU 1.27 1.38 1.46 1.37 1.26 1.22 1.13 1.18 1.00 0.98 1.07 1.06 1.01Residential Total I6AV 68.99 38.41 41.51 38.38 39.90 42.66 32.47 29.21 24.24 22.58 21.23 18.85 18.91Agriculture Total I6AW 1 023.99 995.36 1 003.85 991.74 989.78 987.29 954.19 899.26 890.52 893.32 894.68 873.97 886.45Industrial Process Total I6AX 10.02 8.29 9.48 8.00 6.10 5.24 4.78 4.14 3.97 4.15 4.19 4.58 4.48Land Use Change I6AY 0.80 1.41 1.02 1.20 0.91 0.83 1.19 1.47 1.27 1.21 1.18 1.01 1.37Waste Management Total I6AZ 2 409.04 2 142.70 2 072.48 1 908.54 1 778.19 1 618.83 1 512.62 1 318.44 1 202.30 1 056.25 982.89 967.69 964.87
Total I6B2 4 927.90 4 294.00 4 179.09 3 948.28 3 726.01 3 475.16 3 257.29 2 972.70 2 829.17 2 545.07 2 456.51 2 363.57 2 339.80
1 See chapter text. Data are for the UK and exclude overseas territories Source: Department for Environment, Food and Rural Affairs: 020 7238 4908
13.8 Estimated emissions1 of nitrous oxide (N2O)United Kingdom
Thousand tonnes
1990 1995 1996 1997 1998 1999 2000 2001 2002 2003 2004 2005 2006
By source NC Category
Energy Supply Total I6A7 6.2 4.8 4.6 4.1 4.2 3.7 4.1 4.4 4.2 4.4 4.3 5.3 5.4Business Total I6A8 5.1 4.7 4.6 4.4 4.3 4.3 4.2 4.3 4.1 4.1 4.1 4.2 4.2Transport Total I6A9 4.3 8.2 9.4 10.7 12.0 13.2 14.2 15.2 16.1 16.8 17.4 17.6 18.0Public Total I6AA 0.2 0.1 0.1 0.1 0.1 0.1 0.1 0.1 – – – – –Residential Total I6AB 0.9 0.7 0.8 0.7 0.7 0.7 0.6 0.6 0.5 0.5 0.4 0.4 0.4Agriculture Total I6AC 105.8 100.8 101.3 104.4 101.3 99.1 95.3 89.6 91.3 89.1 88.8 87.4 83.4Industrial Processes Total I6AD 79.7 48.2 47.9 48.5 49.4 17.5 18.1 15.7 8.8 9.3 11.7 9.2 7.8Land-use change I6AE – – – – – – – – – – – – –Waste Management Total I6AF 3.5 3.5 3.6 3.9 4.0 3.8 4.0 4.1 4.1 4.1 4.1 4.1 4.2
Total I6AG 205.9 171.0 172.2 176.9 175.9 142.5 140.5 133.9 129.2 128.3 130.9 128.3 123.5
1 See chapter text. Data are for the UK and exclude overseas territories Source: Department for Environment, Food and Rural Affairs: 020 7238 4908

205
Environment
13.9 Annual rainfall: by regionUnited Kingdom
Millimetres and percentages
Annual rainfall as a percentage of the 1961-1990 average
1997 1998 1999 2000 2001 2002 2003 2004 2005 2006 20073
Region1 1961 - 1990rainfall
average(= 100%)
millimetres
United Kingdom JSJB 1 080 95 117 115 124 97 119 83 112 100 109 111
North West JSJC 1 201 90 115 109 129 92 118 84 113 94 112 108Northumbria JSJD 853 93 120 103 129 103 121 78 117 108 98 102Severn Trent JSJE 754 95 116 121 133 105 120 82 111 93 103 124Yorkshire JSJF 821 92 114 109 135 99 124 81 113 95 109 114
Anglian JSJG 596 95 120 115 130 125 120 87 117 90 103 120Thames JSLK 688 89 119 113 140 118 130 83 105 80 108 120Southern JSLL 778 98 110 106 149 115 130 85 97 79 101 107Wessex JSLM 839 101 119 121 140 103 136 86 102 92 103 117South West JSLN 1 173 100 122 117 132 95 125 80 101 93 94 112
England JSLO 823 94 116 112 133 105 122 82 108 91 103 114Wales2 JSLP 1 355 94 122 117 135 100 120 84 110 96 108 111Scotland JSLQ 1 436 95 117 116 113 91 113 84 117 110 115 110Northern Ireland JSLR 1 059 98 119 117 115 85 133 88 103 101 109 104
1 The regions of England shown in this table correspond to the original nineEnglish regions of the National Rivers Authority (NRA); the NRA becamepart of the Environment Agency upon its creation in April 1996.
2 The figures in this table relate to the country of Wales, not the EnvironmentAgency Welsh Region.
3 Data from September 2007 are provisional and subject to revision.
Sources: The Met Office;Centre for Ecology and Hydrology: 01491 838800
13.10 UK Annual Weather Summary
Max Temp Min Temp Mean Temp Sunshine Rainfall
Actual Anomaly Actual Anomaly Actual Anomaly Actual Anomaly Actual Anomaly(degrees (degrees (degrees (degrees (degrees (degrees (hours/celsius) celsius) celsius) celsius) celsius) celsius) day) (%) (mm) (%)
WLRL WLRM WLRO WLRP WLRR WLRS WLRX WLRY WLSH WLSI1987 11.4 –0.4 4.7 –0.2 8.1 –0.3 1 249.5 93.4 1 034.6 94.11988 12.2 0.3 5.4 0.6 8.8 0.5 1 324.3 99.0 1 131.2 102.91989 13.1 1.2 5.5 0.7 9.3 1.0 1 563.8 116.9 1 018.5 92.61990 13.1 1.2 5.8 0.9 9.4 1.1 1 490.7 111.4 1 172.8 106.71991 12.1 0.3 5.1 0.2 8.6 0.3 1 302.0 97.3 998.2 90.8
1992 12.3 0.4 5.2 0.4 8.7 0.4 1 290.8 96.5 1 186.8 107.91993 11.8 –0.1 5.0 0.1 8.4 – 1 218.6 91.1 1 121.1 102.01994 12.4 0.5 5.5 0.6 8.9 0.6 1 366.9 102.2 1 184.7 107.71995 13.0 1.1 5.4 0.6 9.2 0.9 1 588.5 118.7 1 023.7 93.11996 11.7 –0.1 4.7 –0.1 8.2 –0.2 1 403.5 104.9 916.6 83.4
1997 13.1 1.3 5.8 1.0 9.4 1.1 1 430.3 106.9 1 024.0 93.11998 12.6 0.8 5.8 1.0 9.1 0.8 1 268.4 94.8 1 265.1 115.11999 13.0 1.1 5.9 1.0 9.4 1.1 1 419.4 106.1 1 237.2 112.52000 12.7 0.8 5.6 0.8 9.1 0.8 1 367.5 102.2 1 335.6 121.52001 12.4 0.6 5.3 0.5 8.8 0.5 1 411.9 105.5 1 049.9 95.5
2002 13.0 1.1 6.0 1.2 9.5 1.2 1 304.0 97.5 1 280.5 116.52003 13.5 1.6 5.6 0.7 9.5 1.2 1 587.4 118.7 901.5 82.02004 13.0 1.2 6.0 1.2 9.5 1.2 1 361.4 101.8 1 210.1 110.12005 13.1 1.2 5.9 1.1 9.5 1.1 1 399.2 104.6 1 083.0 98.42006 13.4 1.5 6.1 1.3 9.7 1.4 1 495.9 111.8 1 175.9 106.8
2007 13.2 1.4 6.0 1.1 9.6 1.3 1 453.2 109.0 1 197.0 109.0
Anomalies are with respect to the 1961-90 averaging period. Source: Met Office

206
Environment
13.11 Biological1 and chemical2 water quality of rivers and canals3
England, Wales and Northern IrelandLength surveyed (Kilometres)5 and percentages
Length surveyed Percentage of total
Good Fair
Years A B C D Poor E Bad F Total Good or fair Poor or bad
Biological quality
North East 1990 1 358 1 223 551 377 364 259 4 132 85 152006 2 186 1 726 851 503 296 79 5 641 93 7
North West 1990 470 1 251 656 367 770 508 4 022 68 322006 994 1 847 1 020 649 427 68 5 005 90 10
Midlands 1990 493 929 1 405 673 229 83 3 811 92 82006 1 480 2 416 1 585 642 356 129 6 607 93 7
Anglian 1990 813 1 665 1 287 266 120 19 4 170 97 32006 1 685 1 894 771 152 79 7 4 587 98 2
Thames 1990 851 1 027 623 312 228 52 3 093 91 92006 1 215 1 193 750 255 141 14 3 568 96 4
Southern 1990 426 490 366 102 27 8 1 419 97 32006 1 007 729 347 74 43 2 2 202 98 2
South West 1990 2 348 2 223 655 154 107 59 5 547 97 32006 3 606 1 714 376 72 29 27 5 824 99 1
England4 1990 6 984 9 006 5 642 2 297 1 853 988 26 771 89 112006 12 534 11 489 5 754 2 352 1 374 325 33 828 95 5
Wales 1990 1 239 1 377 477 181 52 5 3 331 98 22006 1 379 2 397 687 99 42 - 4 603 99 1
Northern Ireland 1991 713 952 415 100 10 - 2 190 100 -2006 891 2 048 1 845 566 110 - 5 460 98 2
Chemical quality
North East 1990 840 1 603 557 441 607 176 4 224 81 192006 1 980 2 508 952 420 297 32 6 188 95 5
North West 1990 719 598 556 436 648 204 3 161 73 272006 2 354 1 408 1 083 592 393 49 5 880 92 8
Midlands 1990 450 1 519 1 619 968 956 131 5 643 81 192006 1 891 2 620 1 395 594 467 27 6 993 93 7
Anglian 1990 36 759 1 691 1 189 786 102 4 564 81 192006 583 1 693 1 320 698 501 9 4 803 89 11
Thames 1990 293 992 1 098 519 618 42 3 563 81 192006 971 1 471 718 365 267 16 3 808 93 7
Southern 1990 238 713 672 292 238 33 2 186 88 122006 384 874 563 224 174 11 2 229 92 8
South West 1990 1 644 2 700 1 301 695 363 68 6 771 94 62006 2 679 2 363 640 202 176 3 6 063 97 3
England4 1990 4 197 9 164 7 670 4 643 4 297 772 30 742 84 162006 10 842 12 936 6 672 3 095 2 273 146 35 964 93 7
Wales 1990 1 825 1 209 269 130 57 27 3 518 98 22006 3 724 830 100 33 80 10 4 777 98 2
Northern Ireland 1991 103 642 682 174 64 18 1 685 95 52006 1 264 2 401 881 205 156 23 4 930 96 4
1 Based on the River Invertebrate Prediction and Classification System(RIVPACS).
2 Based on the General Quality Assessment (GQA) Scheme.3 See chapter text.4 Figures for the English regions will not add to the national figure for England
because a small amount of river lengths which are located along the
border between England and Wales are counted in both the national figures forEngland and Wales.
5 Lengths are rounded to the nearest 1 km and may not exactly sum to totals.
Sources: Environment Agency;Environment and Heritage Service

207
Environment
13.12 Chemical and biological water quality of rivers and canals1
ScotlandKilometres and percentages
Length surveyed Percentage of total
Unclassified Seriously Poor orExcellent Good assumed Fair Poor polluted Good seriously
A1 A2 good B C D Total or fair2 polluted
Scottish Environment Protection Agency Regions
North
DYO4 DYO5 DYO6 DYO7 DYO8 DYO9 DYP2 DYP3 DYP42001 1 420 1 560 7 950 380 90 20 11 420 99 12002 2 020 3 480 5 140 660 90 10 11 400 99 12003 2 610 4 310 3 950 430 90 10 11 390 99 12004 3 330 5 010 2 570 370 110 10 11 390 99 12005 3 110 6 240 1 390 550 90 – 11 390 99 1
2006 2 970 6 500 1 360 470 100 – 11 390 99 1
South East Scotland
DYP5 DYP6 DYP7 DYP8 DYP9 DYQ2 DYQ3 DYQ4 DYQ52001 1 520 2 450 1 670 1 000 520 20 7 170 93 72002 2 260 2 800 610 980 510 10 7 160 93 72003 2 570 2 810 430 990 360 10 7 160 95 52004 2 550 2 810 300 1 170 310 20 7 160 95 52005 2 830 2 760 260 950 340 10 7 160 95 5
2006 2 770 2 820 250 980 340 10 7 160 95 5
South West Scotland
DYQ6 DYQ7 DYQ8 DYQ9 DYR2 DYR3 DYR4 DYR5 DYR62001 930 2 320 2 340 960 320 40 6 920 95 52002 1 000 2 370 2 230 930 310 40 6 880 95 52003 1 630 2 430 1 530 960 300 40 6 880 95 52004 1 780 2 790 940 1 050 300 30 6 880 95 52005 2 040 3 020 510 980 290 40 6 880 95 5
2006 2 130 3 010 470 980 270 20 6 880 96 4
Scotland
DZ38 DZ39 DZ3A DZ3B DZ3C DZ3D DZ3E DZ3F DZ3G2001 3 870 6 320 11 960 2 340 930 80 25 510 96 42002 5 280 8 660 7 990 2 560 900 60 25 440 96 42003 6 820 9 540 5 900 2 370 750 50 25 440 97 32004 7 660 10 610 3 810 2 590 720 50 25 430 97 32005 8 000 12 050 2 130 2 470 720 50 25 430 97 3
2006 7 860 12 330 2 080 2 430 700 40 25 430 97 3
1 See chapter text.2 Classes A1, A2, B and unclassified.
Source: Scottish Environment Protection Agency: 01786 457700
13.13 Reservoir stocks in England and Wales:1 by month
Percentages
1997 1998 1999 2000 2001 2002 2003 2004 2005 2006 2007
January JTAS 79.1 90.5 95.8 95.8 94.8 86.5 95.1 79.9 91.2 85.9 92.2February JTAT 75.6 93.1 97.0 95.9 94.4 93.7 95.0 93.8 92.3 88.7 93.7March JTAU 91.6 92.3 96.5 97.4 95.0 95.5 92.1 92.1 92.1 91.2 96.7April JTAV 92.3 96.9 96.9 95.2 95.5 94.5 92.3 94.4 93.6 96.2 95.2May JTAW 87.1 97.0 97.0 97.0 96.7 91.9 88.6 94.7 95.0 93.4 91.9June JTAX 87.7 93.9 95.4 95.7 91.9 97.0 93.1 90.5 93.0 94.4 91.1
July JTAY 87.8 95.1 92.0 93.8 85.1 94.9 87.0 84.8 85.6 88.4 94.4August JTAZ 81.3 93.5 82.6 88.5 80.7 91.1 81.1 78.5 77.9 77.2 93.5September JTBA 73.8 88.3 76.9 83.2 77.9 85.9 69.9 82.4 71.5 70.7 88.3October JTBB 70.6 86.6 79.7 88.0 77.0 77.3 60.4 84.2 67.4 67.8 86.1November JTBC 69.1 93.3 81.7 95.2 85.5 82.9 53.0 87.5 77.2 80.0 81.2December JTBD 76.4 93.1 84.9 96.7 87.9 91.8 60.9 86.2 83.8 89.8 82.4
1 Reservoir stocks are the percentage of useable capacity based on arepresentative selection of reservoirs; the percentages relate to the begin-ning of each month.
Sources: Water PLCs;Environment Agency;
Centre for Ecology and Hydrology: 01491 838800

208
Environment
13.14 Water industry expenditure1
England and Wales£ million
1996 1997 1998 1999 2000 2001 2002 2003 2004 2005 2006/97 /98 /99 /00 /01 /02 /03 /04 /05 /06 /07
Operating expenditureWater supply KQQX 2 314.9 2 339.3 2 386.1 2 448.1 2 391.0 2 426.9 2 544.2 2 676.5 2 690.7 2 942.7 3 118.6Sewerage services KQQY 1 780.7 1 854.6 1 971.3 2 069.8 2 087.1 2 167.6 2 265.2 2 319.4 2 499.3 2 708.1 2 876.2
Capital expenditureWater supply KQSX 1 314.3 1 467.2 1 294.1 1 290.0 935.0 1 132.5 1 347.1 1 346.4 1 309.0 1 282.5 1 681.7Sewerage KQSY 479.9 455.2 507.5 488.5 352.0 362.4 507.2 617.6 601.4 476.1 585.3Sewage treatment and disposal KQSZ 959.4 1 296.3 1 374.5 1 440.8 1 040.9 996.0 1 066.2 1 235.6 1 185.6 1 046.2 1 289.6
1 See chapter text. Source: Office of Water Services: 0121 625 1300
13.15 Water pollution incidents1, 3
United KingdomNumbers
1996 1997 1998 19992 20002 20012 20022 20032 20042 20052 20062
Categories 1 to 3
Environment Agency RegionsNorth West JZIA 2 818 2 160 2 201 MKDB 1 668 1 757 1 734 1 805 1 534 1 091 1 056 913North East JZIB 2 143 2 404 1 993 MKDC 1 828 1 822 1 952 1 789 1 971 1 692 1 448 1 132Midlands JZKR 4 305 4 411 4 061 MKDD 2 804 3 106 2 862 2 843 2 464 1 955 1 890 1 914Anglian JZKS 2 417 2 411 2 163 MKDE 1 726 1 369 1 606 1 716 1 616 1 418 1 290 1 223
Thames JZKT 1 959 1 917 1 819 MKDF 1 208 1 379 1 510 1 630 1 447 1 211 1 203 1 159Southern JZKU 1 189 1 174 1 138 MKDG 1 317 1 540 1 585 1 511 1 543 1 218 955 1 020South West JZKV 3 042 2 847 2 603 MKDH 2 463 2 294 2 292 1 929 1 882 1 689 1 744 1 539Welsh JZKW 2 285 2 247 1 885 MKDI 1 360 1 395 1 475 1 287 1 356 1 309 1 260 1 202
England and Wales JZKX 20 158 19 571 17 863 MKDJ 14 374 14 662 15 016 14 510 13 813 11 583 10 846 10 102Scotland3 JZKY 2 878 3 356 2 329 MKDK 2 306 2 345 1 829 1 409 1 708 1 480 1 377 1 641Northern Ireland JZKZ 2 087 1 826 1 644 MKDL 1 507 1 705 1 546 1 510 1 551 1 227 1 174 1 133
By category in England and Wales
Category 1 MKCW 156 194 128 MKDM 90 77 118 82 94 114 99 86Category 2 MKCX 1 510 1 354 1 238 MKDN 863 758 860 784 685 594 562 519Category 3 MKCY 18 492 18 023 16 497 MKDO 13 421 13 827 14 038 13 644 13 034 10 875 10 185 9 497Category 42,4 MKCZ .. .. .. MKDP 16 548 21 744 18 706 15 370 15 813 13 613 12 658 11 932
Total substantiated incidents4 MKDA 20 158 19 571 17 863 MKDQ 30 922 36 406 33 722 29 880 29 626 25 196 23 504 32 136
1 See chapter text. Substantiated incidents to water, unless otherwise speci-fied.
2 From 1999, categories 1-3 do not include all substantiated incidents to wa-ter. An additional category (Category 4) was introduced which includes allincidents which were substantiated, but which had no impact on the waterenvironment. Therefore, data are not comparable to previous years.
3 Data for all years refer to financial years.4 Category 4 and Total substantiated incidents include incidents to other media
(air, land), which did not involve the water environment.
Sources: Environment Agency;Scottish Environment Protection Agency;
Environment and Heritage Service

209
Environment
13.16 Bathing water:1 by regionUnited Kingdom
Numbers and percentages
Compliance with EC Bathing Water Directive coliform standards during the bathing season
Identified bathing waters Percentage(numbers) Numbers complying complying
2003 2004 2005 2006 2007 2003 2004 2005 2006 2007 2007
Coastal bathing waters
Environment Agency RegionsUnited Kingdom GPKA 554 556 559 561 567 GPKN 545 543 550 559 547 GPLA 97
North East GPKB 55 55 55 55 55 GPKO 53 53 53 54 52 GPLB 95North West GPKC 34 34 34 33 32 GPKP 33 33 32 33 29 GPLC 91Anglian GPKE 38 38 39 39 39 GPKR 38 38 39 39 39 GPLE 100
Thames GPKF 8 8 8 8 8 GPKS 8 8 8 8 8 GPLF 100Southern GPKG 79 79 79 78 81 GPKT 79 78 79 78 81 GPLG 100South West GPKH 188 190 190 191 190 GPKU 186 187 189 191 187 GPLH 98
England GPKI 402 404 405 404 405 GPKV 397 397 400 403 396 GPLI 98Wales GPKJ 78 78 80 80 80 GPKW 77 78 80 79 78 GPLJ 98Scotland GPKL 58 58 58 61 59 GPKY 55 54 55 61 52 GPLL 88Northern Ireland GPKM 16 16 16 16 23 GPKZ 16 14 15 16 21 GPLM 91
Inland bathing waters
United Kingdom JTIG 11 11 11 11 11 JTIH 11 11 11 10 11 JTII 100
1 See chapter text. Sources: Environment Agency;Scottish Environment Protection Agency;
Environment and Heritage Service, Northern Ireland
13.17 Estimated abstractions from all surface and groundwater sources: by purpose1
England and WalesMegalitres per day
1995 1996 1997 1998 1999 2000 2001 2002 2003 2004 2005
Public water supply JZLA 17 346 17 453 16 820 16 765 16 255 16 990 16 231 16 938 16 920 17 210 17 370Spray irrigation JZLB 352 369 292 282 325 291 259 248 315 225 226Agriculture (excl spray irrigation)4 JZLC 103 136 108 111 142 152 108 120 132 122 60Electricity supply industry2 JZLD 29 510 31 294 33 307 34 587 29 490 31 546 32 263 35 447 31 378 30 568 30 021Other industry3 JZLE 3 808 4 960 4 352 4 964 5 428 5 433 4 772 4 883 6 623 6 585 6 339Mineral washing JZLF 262 250 297 223 .. .. .. .. .. .. ..Fish farming, cress growing, amenity ponds JYXG 4 268 4 338 4 211 5 495 4 867 4 709 4 657 3 215 3 077 4 068 3 654Private water supply JZLG 98 171 162 175 91 102 92 54 61 30 26Other JZLH 223 531 408 289 526 559 108 77 86 77 60
Total JZLI 55 970 59 503 59 957 62 891 57 123 59 782 58 489 60 981 58 593 58 885 57 757
1 See chapter text.2 Increased electricity supply abstraction from 2002 due to increased produc-
tion from power station in Anglian Region and two new licences issued inSouthern Region.
3 Three abstraction licences re-assigned to other industry from electricty supplyin Midlands Region (2003).
4 Reduction in agricultural abstraction due to deregulation of licences with effectfrom 1 April 2005
Source: Environment Agency

210
Environment
13.18 Estimates of remaining recoverable oil and gas reservesUnited Kingdom
1995 1998 1999 2000 2001 2002 2003 2004 2005 2006
Oil (Million tonnes)
Reserves
Proven JKOV 605 685 665 630 605 593 571 533 516 479Probable JKOW 765 575 455 380 350 327 286 283 300 298Proven plus Probable JKOX 1 370 1 260 1 120 1 010 955 920 857 816 816 776Possible JKOY 520 540 545 480 475 425 410 512 451 478Maximum JKOZ 1 890 1 800 1 665 1 490 1 430 1 344 1 267 1 328 1 267 1 254
Range of undiscovered resources
Lower JKNY 380 275 250 225 205 272 323 396 346 438Upper JKNZ 2 920 2 550 2 600 2 300 1 930 1 770 1 826 1 830 1 581 1 637
Range of total reserves
Lower1 JKOA 985 960 915 855 810 865 894 929 862 917Upper2 JKOB 4 810 4 350 4 265 3 790 3 360 3 115 3 093 3 158 2 848 2 892
Expected level of reserves3
Opening stocks JKOC 1 975 1 675 1 535 1 370 1 235 1 160 1 192 1 180 1 212 1 162Extraction5 JKOD –130 –132 –137 –126 –117 –117 –106 –95 –85 –77Other volume changes JKOE –95 –8 –28 –9 42 149 94 127 35 130Closing stocks JKOF 1 750 1 535 1 370 1 235 1 160 1 192 1 180 1 212 1 162 1 215
Life expectancy4 (years) JKOG 13 12 10 10 10 10 11 13 14 16
Gas (billion cubic metres)
Reserves
Proven JKOH 700 755 760 735 695 628 590 531 481 412Probable JKOI 780 585 500 460 445 369 315 296 247 272Proven plus Probable JKOJ 1 480 1 340 1 260 1 195 1 140 998 905 826 728 684Possible JKOK 435 455 490 430 395 331 336 343 278 283Maximum JKOL 1 915 1 795 1 750 1 630 1 535 1 329 1 241 1 169 1 006 967
Range of undiscovered resources
Lower JKOM 395 440 355 325 290 238 279 293 226 301Upper JKON 1 412 1 595 1 465 1 440 1 680 1 386 1 259 1 245 1 035 1 049
Range of total reserves
Lower1 JKOO 1 095 1 195 1 115 1 060 985 866 869 824 707 713Upper2 JKOP 3 327 3 390 3 215 3 065 3 215 2 714 2 500 2 415 2 041 2 016
Expected level of reserves3
Opening stocks JKOQ 1 945 1 885 1 780 1 615 1 520 1 430 1 235 1 184 1 120 954Extraction5 JKOR –70 –89 –99 –108 –104 –102 –102 –95 –86 –78Other volume changes JKOS – –16 –66 13 14 –93 51 31 –80 109Closing stocks JKOT 1 875 1 780 1 615 1 520 1 430 1 235 1 184 1 120 954 985
Life expectancy4 (years) JKOU 27 20 16 14 14 12 12 12 11 13
1 The lower end of the range of total reserves has been calculated as the sumof proven reserves and the lower end of the range of undiscoveredreserves.
2 The upper end of the range of total reserves is the sum of proven, probableand possible reserves and the upper end of the range of undiscoveredreserves.
3 Expected reserves are the sum of proven reserves, probable reserves andthe lower end of the range of undiscovered reserves.
4 Based on expected level of reserves at year end and current extractionrates (source: ONS).
5 Negative extraction is shown here for the purposes of the calculation only.Of itself, extraction should be considered as a positive value.
Sources: ONS and Department for Business Enterprise & Regulatory Reform;[email protected]

211
Environment
13.19 Municipal waste disposal: by methodUnited Kingdom
Thousand tonnes
2000 2001 2002 2003 2004 2005 2006/01 /02 /03 /04 /05 /06 /07
EnglandHousehold
Disposed I6EB 22 270 22 327 22 092 20 927 19 873 18 658 17 799Recycled/composted I6EC 2 809 3 197 3 740 4 521 5 785 6 796 7 976Total I6ED 25 079 25 524 25 832 25 448 25 658 25 454 25 775
Non HouseholdDisposed I6EE 2 342 2 656 2 730 2 650 2 795 2 289 2 408Recycled/composted I6EF 636 724 832 1 016 1 167 1 003 961Total I6EG 2 978 3 380 3 562 3 666 3 962 3 292 3 369
Total Municipal WasteDisposed I6EH 24 612 24 983 24 822 23 577 22 668 20 947 20 207Recycled/composted I6EI 3 445 3 921 4 572 5 537 6 952 7 799 8 937Total I6EJ 28 057 28 905 29 394 29 114 29 619 28 745 29 144
WalesHousehold
Disposed I6EK 1 314 1 330 1 309 1 271 1 298 1 210 1 153Recycled/composted I6EL 90 126 179 252 286 332 419Total I6EM 1 404 1 456 1 488 1 522 1 585 1 542 1 572
Non HouseholdDisposed I6EN 223 244 238 227 213 204 132Recycled/composted I6EO 25 18 43 71 131 152 130Total I6EP 247 262 281 298 344 356 262
Total Municipal WasteDisposed I6EQ 1 537 1 573 1 547 1 498 1 511 1 414 1 285Recycled/composted I6ER 115 144 222 323 418 484 549Total I6ES 1 652 1 718 1 769 1 820 1 928 1 898 1 834
ScotlandHousehold
Disposed I6ET 2 405 2 472 2 477 2 375 2 276 2 221 ..Recycled/composted I6EU 122 149 206 330 522 665 ..Total I6EV 2 527 2 621 2 683 2 705 2 798 2 886 ..
Non HouseholdDisposed I6EW 662 619 602 545 584 508 ..Recycled/composted I6EX 22 27 60 66 125 265 ..Total I6EY 684 646 663 611 709 773 ..
Total Municipal WasteDisposed I6EZ 3 067 3 091 3 079 2 920 2 860 2 729 ..Recycled/composted I6F2 145 176 267 397 647 930 ..Total I6F3 3 211 3 267 3 345 3 317 3 506 3 658 ..
1999 2001 2002 2003 2004 2005 2006/00 /05 /06 /07
Northern IrelandHousehold
Disposed I6F4 776 785 813 786 746 708 679Recycled/composted I6F5 55 94 90 112 173 235 260Total I6F6 831 879 902 898 919 937 939
Non HouseholdDisposed I6F7 .. .. 119 116 114 106 108Recycled/composted I6F8 .. .. 2 13 18 20 12Total I6F9 173 178 121 129 132 126 125
Total Municipal WasteDisposed I6FA .. .. 932 902 860 813 787Recycled/composted I6FB .. .. 92 125 191 250 272Total I6FC 1 004 1 056 1 023 1 027 1 051 1 064 1 064
Sources: Department for Environment, Food and Rural Affairs 020 7238 4908;Welsh Assembly Government 029 2082 6822;
Scottish Environment Protection Agency 01786 457700;Environment & Heritage Services Northern Ireland 028 9069 429

212
Environment
13.20 Amounts of different materials from household sources collected for recyclingby collection method 2005/061
United Kingdom Thousand tonnes
Scrap Metal &Paper & Card Glass Compost White Goods Textiles Cans Plastics Co-Mingled Other Total
England2
Kerbside collection 1 043 373 1 324 29 11 56 22 930 47 3 834Bring site collection 219 325 12 3 34 8 10 6 6 623Civic Amenity site collection 188 57 1 104 502 24 9 6 4 455 2 349Private/voluntary collection schemes3 27 6 4 1 18 1 - 2 5 64
Total 1 477 760 2 444 534 87 74 39 942 514 6 870
Wales
Kerbside collection 59 24 41 2 1 5 6 5 4 148Bring site collection 19 13 3 - 2 1 1 - - 39Civic Amenity site collection 10 3 57 27 1 - 1 - 38 138Private/voluntary collection schemes3 2 1 1 - - - - - 3 7
Total 90 42 102 30 4 6 8 5 45 332
Scotland
Kerbside collection 80 14 158 8 - 2 2 72 13 349Bring site & Civic Amenity collection 30 39 65 33 12 1 1 24 91 296Private/voluntary collection schemes3 14 2 - 1 - - - 1 2 20
Total 124 55 223 42 12 3 3 97 106 665
Northern Ireland
Kerbside collection 56 3 30 - - 3 7 3 1 103Bring site collection 2 4 - - 1 - - - - 7Civic Amenity site collection 8 6 86 17 1 - 1 1 4 125
Total 66 13 116 17 3 3 8 4 6 235
1 See chapter text.2 Total amount of household waste collected for recycling is greater than that
sent for recycling as some material is subsequently rejected during sortingor by the reprocessor.
3 Includes household waste collected from municipal parks, community skipsand other methods of capture for recycling/composting.
Sources: Department for Environment Food and Rural Affairs 020 7238 4908;Welsh Assembly Government 029 2082 6822;
Scottish Environment Protection Agency 01786 457700;Environment & Heritage Services 028 9069 429.
13.21 Noise incidents1 received by Environmental Health Officers2
England and WalesNumber per million people
2000 2001 2002 2003 2004 2005 2006/01 /02 /03 /04 /05 /06 /07
Not controlled by the Environmental ProtectionAct 1990:Road traffic JZLJ 44 37 36 32 .. .. ..Aircraft JZLK 26 101 104 120 .. .. ..Railway JTHH 16 12 18 21 .. .. ..
Total JUZR 86 150 158 173 .. .. ..
Controlled by the Environmental ProtectionAct 1990:Industrial/commercial premises JZLN 1 381 1 273 1 315 1 480 1 260 936 1 036
Industrial EAC3 .. .. 301 284 219 191 176Commercial/leisure3 EAC4 .. .. 1 014 1 196 1 041 745 860
Construction/Demolition sites SNLE 325 347 325 335 343 212 246Domestic premises JZLP 5 001 5 540 5 573 5 973 5 903 4 058 4 409Vehicles, machinery and equipment in streets JZLQ 365 372 377 346 330 181 205Traffic I4SR .. .. .. .. .. 116 154Miscellaneous4 EAC2 .. .. .. .. 433 265 414
Total JZLR 7 072 7 532 7 590 8 134 8 269 5 838 5 620
1 From 2004/05 Data reported is for incidents per million where previouslycomplaints per million was reported.
2 See chapter text.3 Includes railway noise and airports (non aircraft).4 From 2004/05 includes ’traffic’ which consists of commercial vehicles, cars
motorbikes, fixed-wing aircraft in flight and helicopters in flight. From2005/06 this data is recorded separately as ’traffic’.
Sources: The Chartered Institute of Environmental Health;020 7827 6322
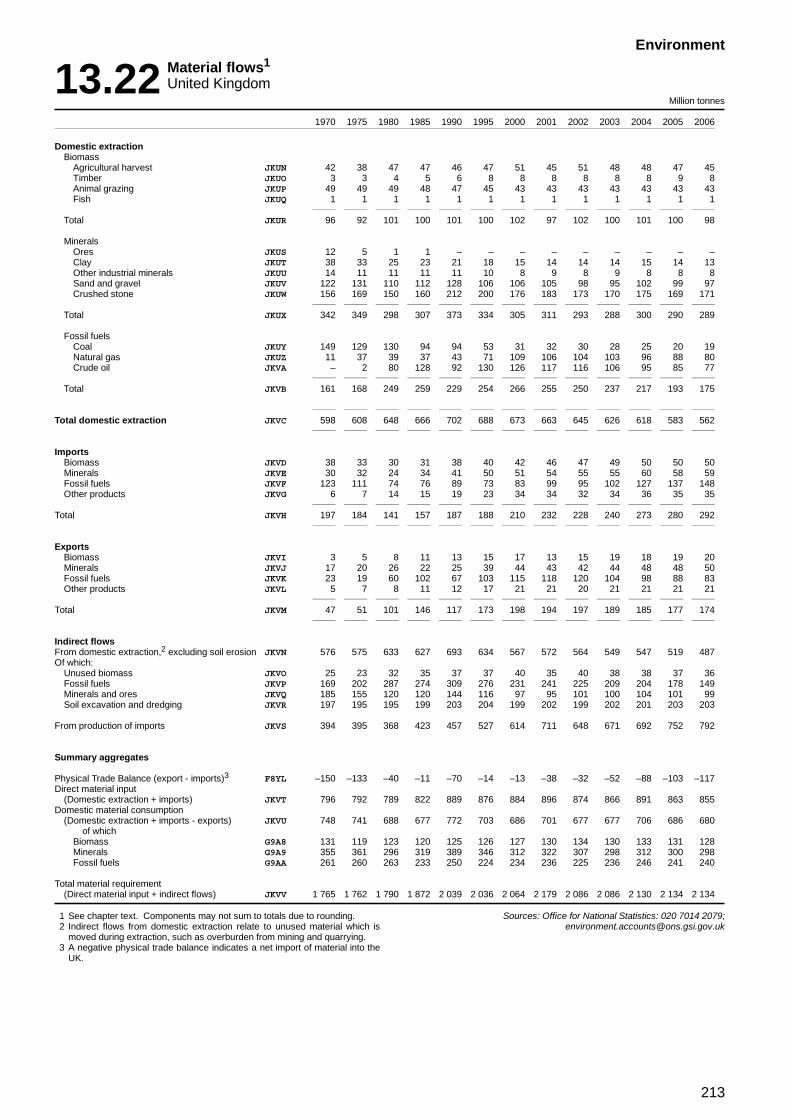
213
Environment
13.22 Material flows1
United KingdomMillion tonnes
1970 1975 1980 1985 1990 1995 2000 2001 2002 2003 2004 2005 2006
Domestic extractionBiomass
Agricultural harvest JKUN 42 38 47 47 46 47 51 45 51 48 48 47 45Timber JKUO 3 3 4 5 6 8 8 8 8 8 8 9 8Animal grazing JKUP 49 49 49 48 47 45 43 43 43 43 43 43 43Fish JKUQ 1 1 1 1 1 1 1 1 1 1 1 1 1
Total JKUR 96 92 101 100 101 100 102 97 102 100 101 100 98
MineralsOres JKUS 12 5 1 1 – – – – – – – – –Clay JKUT 38 33 25 23 21 18 15 14 14 14 15 14 13Other industrial minerals JKUU 14 11 11 11 11 10 8 9 8 9 8 8 8Sand and gravel JKUV 122 131 110 112 128 106 106 105 98 95 102 99 97Crushed stone JKUW 156 169 150 160 212 200 176 183 173 170 175 169 171
Total JKUX 342 349 298 307 373 334 305 311 293 288 300 290 289
Fossil fuelsCoal JKUY 149 129 130 94 94 53 31 32 30 28 25 20 19Natural gas JKUZ 11 37 39 37 43 71 109 106 104 103 96 88 80Crude oil JKVA – 2 80 128 92 130 126 117 116 106 95 85 77
Total JKVB 161 168 249 259 229 254 266 255 250 237 217 193 175
Total domestic extraction JKVC 598 608 648 666 702 688 673 663 645 626 618 583 562
ImportsBiomass JKVD 38 33 30 31 38 40 42 46 47 49 50 50 50Minerals JKVE 30 32 24 34 41 50 51 54 55 55 60 58 59Fossil fuels JKVF 123 111 74 76 89 73 83 99 95 102 127 137 148Other products JKVG 6 7 14 15 19 23 34 34 32 34 36 35 35
Total JKVH 197 184 141 157 187 188 210 232 228 240 273 280 292
ExportsBiomass JKVI 3 5 8 11 13 15 17 13 15 19 18 19 20Minerals JKVJ 17 20 26 22 25 39 44 43 42 44 48 48 50Fossil fuels JKVK 23 19 60 102 67 103 115 118 120 104 98 88 83Other products JKVL 5 7 8 11 12 17 21 21 20 21 21 21 21
Total JKVM 47 51 101 146 117 173 198 194 197 189 185 177 174
Indirect flowsFrom domestic extraction,2 excluding soil erosion JKVN 576 575 633 627 693 634 567 572 564 549 547 519 487Of which:
Unused biomass JKVO 25 23 32 35 37 37 40 35 40 38 38 37 36Fossil fuels JKVP 169 202 287 274 309 276 231 241 225 209 204 178 149Minerals and ores JKVQ 185 155 120 120 144 116 97 95 101 100 104 101 99Soil excavation and dredging JKVR 197 195 195 199 203 204 199 202 199 202 201 203 203
From production of imports JKVS 394 395 368 423 457 527 614 711 648 671 692 752 792
Summary aggregates
Physical Trade Balance (export - imports)3 F8YL –150 –133 –40 –11 –70 –14 –13 –38 –32 –52 –88 –103 –117Direct material input
(Domestic extraction + imports) JKVT 796 792 789 822 889 876 884 896 874 866 891 863 855Domestic material consumption
(Domestic extraction + imports - exports) JKVU 748 741 688 677 772 703 686 701 677 677 706 686 680of which
Biomass G9A8 131 119 123 120 125 126 127 130 134 130 133 131 128Minerals G9A9 355 361 296 319 389 346 312 322 307 298 312 300 298Fossil fuels G9AA 261 260 263 233 250 224 234 236 225 236 246 241 240
Total material requirement(Direct material input + indirect flows) JKVV 1 765 1 762 1 790 1 872 2 039 2 036 2 064 2 179 2 086 2 086 2 130 2 134 2 134
1 See chapter text. Components may not sum to totals due to rounding.2 Indirect flows from domestic extraction relate to unused material which is
moved during extraction, such as overburden from mining and quarrying.3 A negative physical trade balance indicates a net import of material into the
UK.
Sources: Office for National Statistics: 020 7014 2079;[email protected]

214
Housing

215
Housing
Housing
Ch
apter 14

216
Housing
Housing
Permanent dwellings
(Table 14.1, 14.3)
Local housing authorities include the Commission for the New Towns and New Towns Development Corporations, Communities Scotland and the Northern Ireland Housing Executive. The figures shown for housing associations include dwellings provided by housing associations other than the Communities Scotland and the Northern Ireland Housing Executive and provided or authorised by government departments for the families of police, prison staff, the armed forces and certain other services.
Households in Temporary Accommodation under homelessness provisions
(Table 14.9)
Comprises households in accommodation arranged by local authorities pending enquiries or after being accepted as owed a main duty under homelessness legistation under the 1996 Act (includes residual cases awaiting re-housing under the 1985 Act). Excludes 'homeless at home' cases.

217
Housing
14.1 Stock of dwellings: 1 by tenure and country
Thousands
1996 1997 1998 1999 2000 2001 2002 2003 2004 2005 2006
EnglandOwner occupied JUTY 13 865 14 041 14 237 14 433 14 635 14 818 14 956 15 110 15 261 15 325 15 442Rented JUUC 6 603 6 582 6 541 6 495 6 440 6 388 6 381 6 371 6 375 6 480 6 547
Local Authority JUTZ 3 470 3 401 3 309 3 178 3 012 2 812 2 706 2 457 2 335 2 166 2 086Privately JUUA 2 191 2 196 2 192 2 171 2 155 2 152 2 208 2 293 2 375 2 497 2 611Registered Social Landlords JUUB 942 985 1 040 1 146 1 273 1 424 1 467 1 621 1 665 1 817 1 850
All dwellings JUUD 20 468 20 622 20 778 20 927 21 075 21 207 21 337 21 481 21 636 21 804 21 989
WalesOwner occupied JUUE 878 891 888 915 903 905 932 925 946 951 955Rented JUUI 104 100 112 94 117 127 110 130 125 133 137
Local Authority JUUF 207 204 201 197 193 188 183 177 162 158 156Privately JUUG 104 105 106 108 109 111 112 113 125 133 137Registered Social Landlords JUUH 45 48 50 52 54 55 57 57 65 65 66
All dwellings JUUJ 1 233 1 243 1 252 1 259 1 267 1 275 1 282 1 290 1 298 1 306 1 314
Scotland4
Owner occupied JUUK 1 327 1 366 1 400 1 435 1 472 1 468 1 496 1 548 1 580 1 614 ..Rented JUUO 921 899 883 869 849 855 847 814 805 793 ..
Local Authority JUUL 668 630 608 583 557 535 514 388 377 363 ..Privately JUUM 154 154 154 155 155 176 175 177 178 178 ..Registered Social Landlords JUUN 99 115 121 131 137 144 158 249 250 252 ..
All dwellings JUUP 2 248 2 266 2 283 2 303 2 322 2 323 2 343 2 363 2 385 2 407 ..
Northern Ireland2
Owner occupied JUUQ 422 434 446 455 489 – 481 491 501 505 508Rented JUUU 186 183 180 180 184 – 187 188 183 193 198
Local Authority JUUR 148 142 137 131 130 – 120 113 100 102 100Privately JUUS 23 26 27 32 34 – 47 54 61 69 75Registered Social Landlords JUUT 15 15 16 17 20 – 20 21 22 22 23
All dwellings JUUV 608 618 626 636 674 – 668 679 684 698 706
United Kingdom3
Owner occupied JUVY 16 492 16 726 16 977 17 225 17 507 17 206 17 873 18 107 18 280 18 360 18 522Rented JUWC 8 065 8 021 7 961 7 901 7 829 7 597 7 752 7 698 7 699 7 833 7 890
Local Authority JUVZ 4 493 4 377 4 255 4 089 3 892 3 535 3 520 3 131 2 985 2 803 2 704Privately JUWA 2 472 2 481 2 479 2 466 2 453 2 439 2 529 2 618 2 713 2 876 2 995Registered Social Landlords JUWB 1 101 1 163 1 227 1 346 1 484 1 623 1 703 1 949 2 001 2 154 2 191
All dwellings JUWD 24 557 24 749 24 938 25 125 25 338 24 804 25 625 25 806 25 980 26 912 26 412
1 At 31 March for England and Wales and at 31 December for Scotland. At 31March for Northern Ireland, but data prior to 2002 are at 31 December.
2 To include estimates for vacants in the tenure figures the total dwelling stockfigures in Northern Ireland have been apportioned according to the % of oc-cupied dwellings.
3 Calculated from data for England, Wales and Northern Ireland for thecurrent year with Scotland data for the previous year, except for 2001 andearlier where Northern Ireland data for the previous year are used.
4 Figures for 2006 for Scotland unavailable.
Sources: Communities and Local Government;National Assembly for Wales;
Scottish Government;Department for Social Development (Northern Ireland)
14.2 Type Of Accommodation by Tenure 1 , 2006Great Britain
Weighted Percentages
Type of accommodation2
Purpose-Semi- Terraced built flat or Converted flat
Detached House detached house All Houses maisonette maisonette/rooms All flats
Owner-occupiedOwned outright 36 34 21 91 7 2 9Owned with mortgage 27 34 31 91 7 2 9
All owners 31 34 27 91 7 2 9
Rented from social sectorCouncil3 1 24 28 54 45 1 46Housing association4 1 19 34 54 41 5 46
All rented from social sector 1 22 30 54 43 3 46
Rented privately6
Unfurnished5 14 24 34 71 16 13 29Furnished 8 13 29 50 30 20 50
Private renters6 12 21 32 65 20 15 35
All Tenures 23 30 28 81 15 3 19
1 Results for 2006 include longitudinal data2 Tables for type of accommodation exclude households living in caravans3 Council includes local authority4 Since 1996, housing associations are more correctly described as Re-
gistered Social Landlords (RSLs)5 Unfurnished includes the answer ‘partly furnished’6 Tenants whose accommodation goes with the job of someone in the house-
holds have been allocated to ‘rented privately’. Squatters are also included.
Source: General Household Survey, Office for National Statistics

218
Housing
14.3 Permanent dwellings completed:1 by tenure and country
Numbers
United Kingdom England and Wales
Registered RegisteredLocal Private Social Local Private Social
All dwellings authorities2 enterprise Landlords3 4 All dwellings authorities2 enterprise Landlords3 4
KAAD KAAE KAAF KAAG KAAH KAAI KAAJ KAAK1980 242 017 88 534 131 989 21 494 214 934 78 539 116 179 20 2161981 206 915 68 554 118 647 19 714 180 147 58 633 104 069 17 4451982 181 894 40 091 128 088 13 715 159 407 33 544 113 893 11 9701983 207 496 39 161 151 638 16 697 181 391 31 625 134 901 14 8651984 220 414 37 573 165 555 17 286 191 112 31 338 145 263 14 511
1985 205 938 30 420 161 828 13 690 178 284 24 359 142 020 11 9051986 214 471 25 377 175 905 13 189 187 710 20 496 156 056 11 1581987 226 167 21 833 191 250 13 084 198 732 17 435 169 895 11 4021988 242 233 21 448 207 423 13 362 214 156 16 921 185 733 11 5021989 221 494 19 323 187 542 14 629 190 990 15 332 163 344 12 314
1991/92 191 849 10 027 160 664 21 158 165 553 7 447 139 583 18 5231992/93 178 872 4 433 144 367 30 072 152 452 2 706 123 045 26 7011993/94 185 960 3 611 145 914 36 435 157 813 1 726 122 779 33 3081994/95 197 169 2 970 156 547 37 652 168 301 997 133 002 34 3021995/96 198 212 3 045 156 696 38 471 164 581 954 130 891 32 736
1996/97 185 654 1 538 153 165 30 951 156 334 474 128 682 27 1781997/98 190 748 1 519 160 675 28 554 157 987 325 134 327 23 3351998/99 178 700 865 154 968 22 867 148 445 207 128 084 20 1541999/00 185 315 317 160 685 24 313 150 752 58 132 576 18 1182000/01 156 957 291 134 916 21 750 141 851 226 124 293 17 332
2001/02 173 585 221 151 771 21 593 138 265 131 123 321 14 8132002/03 183 061 390 162 796 19 875 146 287 205 132 217 13 8652003/04 190 340 199 170 935 19 206 152 254 207 137 959 14 0882004/05 205 327 116 182 821 22 390 164 385 131 147 118 17 1362005/065 215 024 326 190 305 24 393 171 655 326 152 820 18 509
2006/076 218 543 251 191 050 27 242 176 911 245 154 371 22 295
Scotland Northern Ireland
Registered RegisteredLocal Private Social Local Private Social
All dwellings authorities2 enterprise Landlords3 All dwellings authorities2 enterprise Landlords3
BLFI BAEZ BLFK BLFO BLGI BAFA BLGK BLGO1979 23 782 4 755 15 175 3 852 7 312 3 507 3 574 2311980 20 611 7 488 12 242 881 6 456 2 563 3 568 3251981 20 011 7 062 11 021 1 928 6 827 3 082 3 557 1881982 16 423 3 733 11 523 1 167 7 033 3 032 3 606 3951983 17 929 3 492 13 166 1 271 9 698 4 093 4 971 634
1984 18 838 2 647 14 115 2 076 10 464 3 594 6 177 6931985 18 411 2 828 14 435 1 148 10 770 3 235 6 940 5951986 18 637 2 301 14 870 1 466 10 197 2 580 7 082 5351987 17 707 2 634 13 904 1 169 9 795 1 764 7 451 5801988 18 272 2 815 14 179 1 278 9 931 1 715 7 511 705
1989 20 190 2 283 16 287 1 620 10 283 1 708 7 911 664
1991/92 18 787 1 495 15 483 1 809 7 318 971 5 553 7941992/93 18 994 773 15 620 2 601 7 559 992 5 759 8081993/94 22 107 976 18 314 2 817 7 083 907 5 642 5341994/95 21 812 1 127 17 894 2 791 7 212 877 5 859 4761995/96 24 694 722 19 195 4 777 8 990 1 325 6 750 915
1996/97 20 695 241 17 491 2 963 6 420 668 5 035 7171997/98 22 586 114 17 983 4 489 10 181 1 080 8 371 7301998/99 20 657 120 18 784 1 753 9 618 538 8 120 9601999/00 24 220 69 19 048 5 103 10 349 190 9 067 1 0922000/01 23 478 112 18 048 5 318 11 670 46 10 512 1 112
2001/02 23 585 65 18 041 5 479 13 487 29 12 072 1 3862002/03 23 416 94 18 627 4 695 14 415 2 13 387 1 0262003/04 23 812 – 20 085 3 727 14 511 – 13 951 5602004/05 26 411 – 21 659 4 752 15 768 – 14 940 8282005/06 25 959 – 20 857 5 102 17 410 – 16 628 782
2006/07 23 684 6 20 058 3 620 17 948 – 16 621 1 327
1 See chapter text.2 Including the Commission for the New Towns Development Corporations,
Communities Scotland, the Northern Ireland Housing Executive.3 Dwellings provided by housing associations other than Communities Scot-
land and the Northern Ireland Housing Trust and provided or authorised bygovernment departments for families of police, prison staff, the armed forcesand certain other services.
4 Includes non-registered social landlords5 Reviseed6 Provisional
Sources: Communities and Local Government;Scottish Government;
Welsh Assembly Government;Department for Social Development, Northern Ireland

219
Housing
14.4 Stock of dwellings: Estimated annual gains and lossesEngland
Thousands of dwellings
1995 1996 1997 1998 1999 20002 2001 2002 2003 2004 2005/96 /97 /98 /99 /00 /01 /02 /03 /04 /05 /06
Dwelling stock at start of financial year GRWM 20 305 20 468 20 622 20 778 20 927 21 075 21 207 21 337 21 481 21 636 21 804
Gains to dwelling stock:Housebuilding completions GRWN 154.6 146.2 149.6 138.6 141.4 133.1 129.8 137.7 144.0 155.9 163.4Conversions (net gain)1 GRWO 8.9 8.6 2.8 4.2 3.5 2.8 .. .. .. .. ..Change of use GRWP .. .. 11.6 15.9 13.9 10.1 .. .. .. .. ..Non-permanent dwellings additions GRWQ .. .. 0.2 0.2 0.3 0.3 .. .. .. .. ..
Losses from dwelling stock:Slum clearance (non LA owned dwelling demolished) GRWR 2.7 2.9 1.3 1.3 1.4 1.7 .. .. .. .. ..Other demolitions1 GRWS 4.8 4.1 12.8 13.2 15.8 18.3 .. .. .. .. ..Change of use GRWT .. .. 0.7 1.4 0.8 0.7 .. .. .. .. ..Non-permanent dwelling losses GRWU .. .. 0.1 0.2 0.1 0.3 .. .. .. .. ..
New gain in year GRWV 156.0 147.8 149.3 143.0 140.9 125.3 130.5 143.7 154.8 167.9 185.3Adjustment3 VQDN 6.6 6.6 6.6 6.6 6.6 6.6 .. .. .. .. ..
Dwelling stock at end of financial year GRWW 20 468 20 622 20 778 20 927 21 075 21 207 21 337 21 481 21 636 21 804 21 989
1 Conversion figures prior to 1997/98 include change of use.2 Figures for 2000/01 conversions, change of use and non permanent dwel-
lings are based on reported figures and do not include estimates for missingreturns.
3 Series has been adjusted so that the 2000/01 estimates matches the 2001Census.
Source: Communities and Local Government - 020 7944 4178
14.5 Housebuilding completions: by number of bedrooms
Percentages
1996 1997 1998 1999 2000 20011 20021 20031 20041 20051 20061
/97 /98 /99 /00 /01 /02 /03 /04 /05 /06 /07
England1 bedroom JUWJ 8 7 7 7 7 7 6 8 10 10 112 bedrooms JUWK 29 27 27 26 27 25 29 33 38 42 423 bedrooms JUWL 36 38 36 35 34 31 30 29 28 27 274 or more bedrooms JUWM 26 28 30 32 32 37 34 30 23 21 20
All houses and flats JUWN 100 100 100 100 100 100 100 100 100 100 100
Wales1 bedroom JUWO 5 4 3 5 5 4 6 6 7 9 112 bedrooms JUWP 27 24 21 19 18 19 18 20 21 27 283 bedrooms JUWQ 47 46 46 43 42 39 35 37 35 35 334 or more bedrooms JUWR 21 26 31 34 34 38 41 37 37 30 28
All houses and flats JUWS 100 100 100 100 100 100 100 100 100 100 100
1 Figures for 2001/02 onwards are based on just NHBC figures, so there issome degree of variability owing to partial coverage.
Sources: Communities and Local Government;Welsh Assembly Government

220
Housing
14.6 County Court mortgage possession actions:1 by region
Thousands
1997 1998 1999 2000 2001 2002 2003 2004 2005 2006 2007
Claims Issued3
England and Wales JURS 67.1 84.8 77.9 70.4 65.9 63.2 65.9 77.3 114.8 131.2 137.6North East3 JURT 3.0 4.3 4.0 4.0 3.5 3.2 3.1 3.4 5.5 7.1 8.1North West JURU 11.0 14.2 14.1 12.7 12.1 11.1 10.0 10.6 15.3 19.2 21.7Yorkshire and the Humber JURV 6.9 8.2 8.8 7.8 7.1 6.1 5.9 6.6 10.1 12.0 13.7
East Midlands4 JURW 4.9 6.4 6.5 5.7 5.2 4.7 4.8 5.8 8.6 10.2 10.7West Midlands4 JURX 6.7 8.1 8.5 8.2 7.5 6.8 7.2 8.6 12.2 14.8 16.2
East5 JURY 6.7 8.5 6.8 6.2 5.6 5.5 6.4 7.8 11.2 12.0 12.4London JURZ 9.2 11.4 8.7 7.0 7.6 8.7 10.5 13.4 21.1 21.9 20.1South East JUSA 9.1 11.2 9.9 9.0 8.4 8.3 9.3 11.4 16.5 17.4 16.9South West JUSB 5.7 7.3 5.7 4.9 4.4 4.3 4.5 5.4 7.8 8.5 8.6
England JUSC 63.1 79.4 72.9 65.4 61.3 58.7 61.7 72.9 108.3 123.0 128.4Wales JUSD 3.9 5.4 5.0 5.0 4.6 4.5 4.2 4.3 6.5 8.2 9.2
Northern Ireland2 JUSE .. .. 1.9 1.7 1.6 1.6 1.7 2.2 2.6 2.5 ..
Suspended ordersEngland and Wales JUSF 34.6 40.8 32.9 31.1 29.4 25.1 24.5 26.6 38.1 44.5 43.9
North East3 JUSG 1.6 2.3 2.0 2.0 1.8 1.4 1.3 1.3 1.9 2.6 7.0North West JUSH 5.5 6.5 6.2 5.7 5.5 4.9 4.0 3.8 5.0 6.7 7.2Yorkshire and the Humber JUSI 3.5 4.3 3.9 3.6 3.4 2.5 2.3 2.4 3.5 4.3 ..
East Midlands4 JUSJ 2.6 3.1 2.8 2.5 2.5 1.9 1.8 2.1 2.9 3.4 8.9West Midlands4 JUSK 3.4 3.8 3.7 3.7 3.7 2.9 2.9 3.1 4.3 5.2 ..
East5 JUSL 3.0 3.9 2.8 2.6 2.3 2.2 2.3 2.7 3.8 4.0 9.1London JUSM 4.7 5.3 3.3 2.7 2.7 2.8 3.3 4.0 6.5 6.9 6.0South East JUSN 5.4 5.8 4.0 3.8 3.5 3.1 3.3 3.8 5.4 5.9 ..South West JUSO 2.7 3.0 2.3 2.2 1.9 1.6 1.7 1.9 2.7 2.9 2.6
England JUSP 32.3 38.0 30.9 28.7 27.3 23.2 22.8 25.1 36.0 41.9 40.9Wales JUSQ 2.4 2.8 2.0 2.3 2.1 1.9 1.7 1.5 2.2 2.7 3.0
Northern Ireland2 JUSR .. .. 0.3 0.2 0.2 0.2 0.3 0.4 0.5 0.4 ..
Orders madeEngland and Wales JUSS 22.5 25.3 23.0 19.9 18.6 16.7 16.5 20.1 32.8 46.0 51.5
North East3 JUST 1.0 1.2 1.3 1.2 1.2 0.9 0.8 0.9 1.4 2.5 8.1North West JUSU 3.3 3.7 4.3 4.0 3.7 3.2 2.6 2.7 4.1 6.5 7.9Yorkshire and the Humber JUSV 2.3 3.1 2.7 2.4 2.3 1.8 1.6 1.7 2.8 4.2 ..
East Midlands4 JUSW 1.7 1.7 2.0 1.6 1.6 1.4 1.2 1.5 2.6 3.8 10.1West Midlands4 JUSX 2.0 2.4 2.3 2.1 2.2 1.8 1.7 2.2 3.3 5.0 ..
East5 JUSY 2.5 2.6 1.9 1.6 1.4 1.3 1.5 2.0 3.2 4.4 11.1London JUSZ 3.4 3.5 2.5 1.8 1.9 2.2 2.7 3.8 6.6 8.3 7.9South East JUTA 3.1 3.4 2.6 2.2 1.9 1.9 2.2 2.9 4.6 5.7 ..South West JUTB 1.9 2.1 1.8 1.3 1.1 1.0 1.0 1.4 2.3 2.9 3.1
England JUTC 21.3 23.6 21.4 18.3 17.2 15.4 15.4 19.0 31.0 43.3 48.2Wales JUTD 1.3 1.7 1.6 1.6 1.4 1.3 1.1 1.1 1.8 2.7 3.2
Northern Ireland2 JUTE .. .. 0.7 0.6 0.7 0.5 0.6 0.7 0.9 0.9 ..
Note In 1999 the data extraction method changed. From 1999 the data arecollected electronically from Caseman, the main administrative system inthe county courts. Previously they were collected from Stats Module, amanual form completed monthly by all county courts.
1 Suspended possession/suspended possession combined final orders2 Possession/sale & possession final orders3 Orders figures for North East in 2007 include those for Yorkshire and the
Humber.4 Orders figures for the Midlands in 2007 are combined.5 Orders figures for the East in 2007 include those for South East
Sources: Ministry of Justice 0207 210 8846;Northern Ireland Court Service: 028 9032 8594

221
Housing
14.7 MortgagesUnited Kingdom
1997 1998 1999 2000 2001 2002 2003 2004 2005 2006 2007
Mortgages1 (Thousands) JUTH 10 738 10 821 10 982 11 173 11 270 11 364 11 448 11 511 11 604 11 742 11 822
Arrears and repossessions1 (Thousands)Loans in arrears at end-period
By 6-12 months JUTI 74 74 57 48 42 34 31 30 39 36 41By over 12 months JUTJ 45 35 30 21 18 17 13 11 15 16 16
Properties repossessed in period JUTK 33 34 30 23 18 12 9 8 15 22 27
Type of mortgage for house purchase2 (Percentages)Standard repayment JUTL 39.6 42.6 46.2 60.1 72.0 82.8 81.7 79.0 69.8 65.1 61.1Endowment JUTM 36.0 33.7 27.0 17.5 9.6 5.4 4.2 4.4 4.2 7.2 8.5Other3 JUTN 24.4 23.6 26.8 22.5 18.3 11.4 14.1 16.6 25.9 27.6 30.3
1 Estimates cover only members of the Council of Mortgage Lenders; theseaccount for 98 per cent of all mortgages outstanding.
2 Includes new mortgages advanced by building societies, banks and othermajor lenders. Includes sitting tenants.
3 Includes interest only, PEP/ISA and pension.
4 Figures are estimates of arrears on first charge loans held by CML members.They do not include arrears relating relating to other secured lending or to firmsthat are not CML members.
5 Figures are subject to revision as better information about rates of growth andperformance in different parts of the market is received, or lenders report forthe first time or re-submit earlier figures.
Source: Council of Mortgage Lenders
14.8 Sales and transfers of local authority dwellingsGreat Britain
Thousands
1996 1997 1998 1999 2000 2001 2002 2003 2004 2005 2006
Right to buy sales JUQV 45.0 58.1 56.0 66.8 71.3 66.6 78.5 94.1 74.7 41.6 26.1Large scale voluntary transfers1 JUQW 29.9 21.1 36.9 88.7 111.4 100.8 102.5 104.6 67.9 81.7 82.7Other sales and transfers2 JUQX 3.0 3.4 2.7 3.3 2.4 1.6 1.4 0.6 0.5 0.3 3.7
Total sales and transfers JUQY 77.9 82.6 95.5 158.8 185.2 168.9 182.4 199.4 143.1 123.6 105.6
1 Except for 2003 large scale and voluntary transfers are included in othersales and transfers for Wales.
2 Excludes new town and Scottish Homes sales and transfers.
Sources: Communities and Local Government;Welsh Assembly Government;
Scottish Governmant
14.9 Households in Temporary Accommodation1
Great BritainAs at 31st March of each year Households
1997 1998 1999 2000 2001 2002 2003 2004 2005 2006/98 /99 /00 /01 /02 /03 /04 /05 /06 /07
Bed and breakfast hotels JUWF 5 269 7 062 9 254 11 436 13 404 13 654 8 985 9 100 7 288 6 253Hostels/women’s refuges JUWG 11 356 11 567 12 068 12 273 11 128 11 707 12 753 12 205 10 979 9 580Social sector accommodation2 JXVN 16 077 20 686 23 510 27 826 30 310 31 719 31 821 31 295 27 758 23 463Private sector accommodation and other3 JXVO 19 282 21 934 25 067 28 533 30 391 38 715 52 456 58 129 61 086 58 586
All accommodation4 JUWI 52 070 61 393 70 100 80 334 85 665 96 015 107 146 111 960 108 092 99 436
1 Households in temporary accommodation arranged by the local authoritypending enquiries, or after being accepted as owed a main duty underhomelessness legislation. Excludes ’homeless at home’ cases who haveremained in their existing accommodation after acceptance but have thesame rights to suitable alternative housing as those in accommodation ar-ranged directly by authorities.
2 Local authorities’ and Registered Social Landlords’ own stock.
3 Includes private sector properties leased by social sector landlords, householdsplaced directly with a private sector landlord and other accommodation. From2002 some self-contained B&B Annexe-style units, previously recorded underB&B have been more appropriately attributed to private sector accommodation.
4 Includes ’homeless at home’ for Wales.Sources: Communities and Local Government;
Welsh Assembly Government;Scottish Executive

222
Transport and communications

223
Transport and communications
Transport and communications
Ch
apter 15

224
Transport and communications
urban/rural classification of the road and the road class) and traffic flow levels. The groupings range from lightly-trafficked, rural minor roads in holiday areas such as Cornwall and Devon, to major roads in central London.
With the increasing interest in sub-regional statistics, we have undertaken a detailed study of traffic counts on minor roads carried out in the last ten years. This has been done in conjunction with a Geographic Information System to enable us to establish general patterns of minor road traffic in each local authority. As a result of this, we have been able to produce more reliable estimate of traffic levels in each authority in our base year of 1999. This in turn has enabled us to produce better estimates of traffic levels back to 1993, as well as more reliable estimates for 1999 onwards.
The Department created a database for major roads based on a Geographic Information System and Ordnance Survey data. This was checked by local authorities and discussed with Government Regional Offices and the Highways Agency to ensure that good local knowledge supplemented the available technical data.
Road class
(Tables 15.5 and 15.6)
Urban major and minor roads, from 1993 onwards, are defined as being within an urban area with a population of more than 10,000 people, based on the 2001 urban settlements. The definition for urban settlement can be found on the Communities and Local Government website at:
www.communities.gov.uk/planningandbuilding/planningbuilding/planningstatistics/urbanrural.
Rural major and minor roads, from 1993 onwards, are defined as being outside an urban settlement.
New vehicle registrations
(Table 15.9)
Special concession group
Various revisions to the vehicle taxation system were introduced on 1 July 1995 and on 29 November 1995. Separate taxation classes for farmers’ goods vehicles were abolished on 1 July 1995; after this date new vehicles of this type were registered as Heavy Goods Vehicles (HGVs). The total includes 5,900 vehicles registered between 1 January and 30 June in the (now abolished) agricultural and special machines group in classes which were not eligible to register in the special concession group. The old agricultural and
Transport and communications
Road data
(Tables 15.4, 15.5, 15.6 and 15.7)
The Department for Transport has undertaken significant development work over the last two years to improve its traffic estimates and measurement of traffic flow on particular stretches of the road network. This work has previously been outlined in a number of publications (Road Traffic Statistics: 2001 SB(02)23, Traffic in Great Britain Q4 2002 Data SB(03)5 and Traffic in Great Britain Q1 2003 SB(03)6).
The main point to note is that figures for 1993 to 2004 have been calculated on a different basis from years prior to 1993. Therefore, figures prior to 1993 are not directly comparable with estimates for later years. Estimates on the new basis for 1993 and subsequent years were first published by the Department on 8 May 2003 in Traffic in Great Britain Q1 2003 SB(03)6. A summary of the main methodological changes to take place over the last couple of years appears below.
Traffic estimates are now disaggregated for roads in urban and rural areas rather than between built-up and non built-up roads. Built-up roads were defined as those with a speed limit of 40mph or lower. This created difficulties in producing meaningful disaggregated traffic estimates because an increasing number of clearly rural roads were subject to a 40mph speed limit for safety reasons. The urban/rural split of roads is largely determined by whether roads lie within the boundaries of urban areas with a population of 10,000 or more with adjustments in some cases for major roads at the boundary.
Traffic estimates are based on the results of many 12-hour manual counts in every year, which are grossed up to estimates of annual average daily flows using expansion factors based on data from automatic traffic counters on similar roads. These averages are needed so that traffic in off-peak times, at weekends and in the summer and winter months (when only special counts are undertaken) can be taken into account when assessing the traffic at each site. For this purpose roads are now sorted into 22 groupings (previously there were only seven) and this allows a better match of manual count sites with our automatic count sites. These groupings are based on a detailed analysis of the results from all the individual automatic count sites and take into account regional groupings, road category (that is both the
225
Transport and communications
special machines taxation group was abolished at end June 1995. The group includes agricultural and mowing machines, snow ploughs and gritting vehicles. Electric vehicles are also included in this group and are no longer exempt from Vehicle Excise Duty (VED). Steam propelled vehicles were added to this group from November 1995.
Other licensed vehicles
Includes three wheelers, pedestrian controlled vehicles, general haulage and showmen’s tractors and recovery vehicles. Recovery vehicle tax class introduced January 1988.
Special vehicles group
The special vehicles group was created on 1 July 1995 and consists of various vehicle types over 3.5 tonnes gross weight but not required to pay VED as heavy goods vehicles. The group includes mobile cranes, work trucks, digging machines, road rollers and vehicles previously taxed as showman’s goods and haulage. Figure shown for 1995 covers period from 1 July to 31 December only.
National Travel Survey data
(Tables 15.1, 15.11)
The National Travel Survey (NTS) is designed to provide a databank of personal travel information for Great Britain. It has been conducted as a continuous survey since July 1988, following ad hoc surveys since the mid-1960s. The survey is designed to identify long-term trends and is not suitable for monitoring short-term trends.
For the first time, the 2005 NTS results were based on weighted data, and data from 1995 onwards have now been weighted. The weighting methodology adjusts for non-response bias and also adjusts for the drop-off in the number of trips recorded by respondents during the course of the travel week. All results now published for 1995 onwards are based on weighted data, and direct comparisons cannot be made to earlier years or previous publications.
During 2005, over 8,400 households provided details of their personal travel by filling in travel diaries over the course of a week. The drawn sample size from 2002 was nearly trebled compared with previous years following recommendations in a National Statistics Review of the NTS. This enables most results to be presented on a single year basis from 2002.
Travel included in the NTS covers all trips by British residents within Great Britain for personal reasons, including travel in the course of work. A trip is defined as a one-way course of travel having a single main purpose. It is the basic unit of
personal travel defined in the survey. A round trip is split into two trips, with the first ending at a convenient point about half-way round as a notional stopping point for the outward destination and return origin. A stage is that portion of a trip defined by the use of a specific method of transport or of a specific ticket (a new stage being defined if either the mode or ticket changes). The main mode of a trip is that used for the longest stage of the trip. With stages of equal length the mode of the latest stage is used. Walks of less than 50 yards are excluded.
Travel details provided by respondents include trip purpose, method of travel, time of day and trip length. The households also provided personal information, such as their age, sex, working status, driving licence holding, and details of the cars available for their use.
Because estimates made from a sample survey depend on the particular sample chosen, they generally differ from the true values of the population. This is not usually a problem when considering large samples (such as all car trips in Great Britain), but it may give misleading information when considering data from small samples even after weighting.
The most recent editions of all NTS publications are available on the DfT website at: www.dft.gov.uk/transtat/personaltravel. Bulletins of key results are published annually. The most recent bulletin is National Travel Survey: 2005.
Households with regular use of cars
(Table 15.12)
The mid-year estimates of the percentage of households with regular use of a car or van are based on combined unweighted data from the NTS, the Expenditure and Food Survey (previously the Family Expenditure Survey) and the General Household Survey, where available data by area type are based on weighted data from the NTS only.
Continuing Survey of Road Goods Transport
(Tables 15.3, 15.18, 15.19)
The estimates are derived from the Continuing Survey of Road Goods Transport (CSRGT) which in 2005 was based on an average weekly returned sample of some 330 HGVs. The samples are drawn from the computerised vehicle licence records held by the Driver and Vehicle Licensing Agency. Questionnaires are sent to the registered keepers of the sampled vehicles asking for a description of the vehicle and its activity during the survey week. The estimates are grossed to the vehicle population, and at the overall national level have a 2 per cent margin of error (at 95 per cent confidence
226
Transport and communications
level). Further details and results are published in Road Freight Statistics 2005, and previously in Transport of Goods by Road in Great Britain.
Methodological changes
A key component of National Statistics outputs is a programme of quality reviews carried out at least every five years to ensure that such statistics are fit for purpose and that their quality and value continue to improve. A quality review of the Department for Transport's road freight surveys, including the CSRGT, was carried out in 2003. A copy of the report can be accessed at:
www.statistics.gov.uk/nsbase/methods_quality/quality_review/downloads/NSQR30FinalReport.doc
The quality review made a number of recommendations about the CSRGT. The main methodological recommendation was that, to improve the accuracy of survey estimates, the sample strata should be amended to reflect current trends in vehicle type, weight and legislative groups. These new strata are described more fully in Appendix C of the survey report. For practical and administrative reasons, changes were also made to the sample selection methodology (see Appendix B of the report). These changes have resulted in figures from 2004 not being fully comparable with those for 2003 and earlier years. Detailed comparisons should therefore be made with caution.
Railways: permanent way and rolling stock
(Table 15.22)
1. Locomotives – locos owned by Northern Ireland Railways (NIR), does not include those from the Republic of Ireland Railway System.
2. Diesel electric etc rail motor vehicles – powered passenger carrying vehicles, includes diesel electric (DE) power cars and all Construcciones y Auxiliar de Ferocarriles (CAF) vehicles. (Note: only 16 of the CAF sets were delivered to NIR at the time.)
3. Loco hauled coaches – NIR owned De Dietrich plus Gatwick but not including gen van.
4. Rail car trailers – 80 class and 450 class trailers. Not CAF, they are all powered.
5. Rolling stock for maintenance and repair – a ‘standalone’ figure – may or may not be included in the above totals. Anything listed as ‘repair’ or ‘workshop’ in the motive power sheets is included. Also, those CAF vehicles not yet delivered at the time.
6. The information is a ‘snapshot’ taken from the motive power sheets at end of March, together with any other known information.
Activity at civil aerodromes
(Table 15.28)
Figures exclude Channel Island airports. Other covers local pleasure flights, scheduled service, positioning flights and non-transport charter flights for reward (for example: aerial survey work, crop dusting and delivery of empty aircraft). Non-commercial covers test and training flights, private, aeroclub, military and official flights, and business aviation, etc.
Roll-on/roll-off enquiry
(Table 15.30)
Statistics on the number of lorries and unaccompanied trailers travelling from Great Britain to mainland Europe and Ireland are compiled from quarterly returns provided by roll-on/roll-off ferry operators and Eurotunnel. (Unaccompanied trailers are not carried on the Eurotunnel freight service.) The results are broken down by country of vehicle registration, by country of disembarkation and by Great Britain port group. Separate figures are given for powered vehicles and unaccompanied trailers. The statistics presented in Table 15.30 refer to vehicles travelling to mainland Europe only and exclude those to Ireland.
Powered vehicles comprise rigid vehicles, lorries with semi-trailers (articulated units) and lorries with drawbar trailers. (Some vehicles under 3.5 tonnes gross vehicle weight are also included.) Unaccompanied trailers are trailers and semi-trailers not accompanied on the ferry by a powered unit. Up until 1978 inward traffic was also recorded, but because it was similar to outward traffic, the data requirement was discontinued to save respondent effort.
More detailed analyses are provided in the Department's quarterly publication Road Goods Vehicles Travelling to Mainland Europe, available on the Department's website.
Postal services and television licences
(Table 15.31)
Letters posted category includes printed papers, newspapers, postcards and sample packets, where airmail includes letters without special charge for air transport. Business reply and freepost is now known as Response Services.

227
Transport and communications
15.1 Trips per person per year: by sex, main mode and trip purpose1, 2006Great Britain
Numbers
Males
BusCar Walk and coach Rail2 Other3 All modes
Social/entertainment 154 44 11 5 12 226Shopping 123 49 13 2 6 193Other escort 82 10 2 0 1 95Other personal business 66 22 5 1 4 99Commuting 131 15 11 13 14 185Education 20 27 10 2 6 64Escort education 17 8 0 0 0 25Business 37 3 0 2 2 45Holiday/day trip 28 2 2 1 5 38Other, including just walk 0 43 0 0 0 44
All purpose (=100%) (number) 659 225 53 27 50 1014
BaseUnweighted Base(Trips) 114,000 40,000 9,000 4,000 8,000 175,000
Females
BusCar Walk and coach Rail2 Other3 All modes
Social/entertainment 165 48 13 4 9 239Shopping 149 60 26 3 5 243Other escort 82 13 2 0 1 99Other personal business 71 29 8 1 3 111Communting 87 19 14 9 5 135Education 18 26 10 1 3 60
Escort education 34 25 1 0 1 62Business 19 4 1 1 1 26Holiday/day trip 30 3 2 1 3 39Other, including just walk 1 45 0 0 0 46
All purposes (numbers) 657 272 77 22 32 1060
BaseUnweighted Base(Trips) 119,000 52,000 14,000 4,000 6,000 194,000
All persons
BusCar Walk and coach Rail2 Other3 All modes
Social/entertainment 160 46 12 5 11 233Shopping 136 55 20 2 6 219Other escort 82 12 2 0 1 97Other personal business 69 26 6 1 3 105Commuting 109 17 12 11 10 160Education 19 27 10 2 5 62
Escort education 26 17 1 0 0 44Business 28 3 1 2 1 35Holiday/daytrip 29 2 2 1 4 38Other, including just walk 1 44 0 0 0 45
All purposes (numbers) 658 249 65 24 40 1037
BaseUnweighted Base(Trips) 233,000 92,000 22,000 8,000 14,000 369,000
1 Main mode is that used for the longest part of the trip.2 Includes London Underground.3 Includes bicycles, two-wheeled motor vehicles, motorcaravans, taxis/ mini-
cabs, domestic air travel and other private and public transport.
Source: National Travel Survey, Department for Transport 020 7944 3097
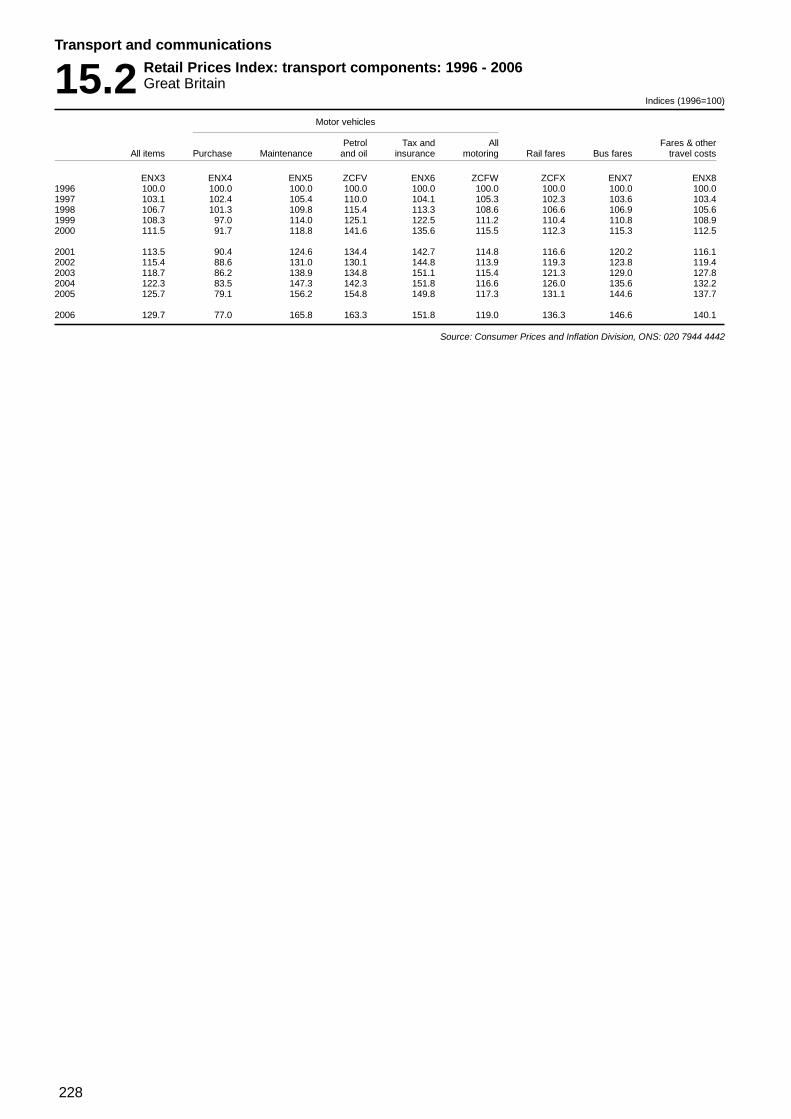
228
Transport and communications
15.2 Retail Prices Index: transport components: 1996 - 2006Great Britain
Indices (1996=100)
Motor vehicles
Petrol Tax and All Fares & otherAll items Purchase Maintenance and oil insurance motoring Rail fares Bus fares travel costs
ENX3 ENX4 ENX5 ZCFV ENX6 ZCFW ZCFX ENX7 ENX81996 100.0 100.0 100.0 100.0 100.0 100.0 100.0 100.0 100.01997 103.1 102.4 105.4 110.0 104.1 105.3 102.3 103.6 103.41998 106.7 101.3 109.8 115.4 113.3 108.6 106.6 106.9 105.61999 108.3 97.0 114.0 125.1 122.5 111.2 110.4 110.8 108.92000 111.5 91.7 118.8 141.6 135.6 115.5 112.3 115.3 112.5
2001 113.5 90.4 124.6 134.4 142.7 114.8 116.6 120.2 116.12002 115.4 88.6 131.0 130.1 144.8 113.9 119.3 123.8 119.42003 118.7 86.2 138.9 134.8 151.1 115.4 121.3 129.0 127.82004 122.3 83.5 147.3 142.3 151.8 116.6 126.0 135.6 132.22005 125.7 79.1 156.2 154.8 149.8 117.3 131.1 144.6 137.7
2006 129.7 77.0 165.8 163.3 151.8 119.0 136.3 146.6 140.1
Source: Consumer Prices and Inflation Division, ONS: 020 7944 4442

229
Transport and communications
15.3 Domestic freight transport: by modeGreat Britain
1996 1997 1998 1999 2000 2001 2002 2003 2004 2005 2006
Goods moved (billion tonnes kilometres)
Petroleum productsRoad1 ZBZP 6.1 5.8 5.2 5.0 6.4 5.8 5.2 5.5 5.7 5.5 5.7Rail2 ZBZQ .. .. 1.6 1.5 1.4 1.2 1.2 1.2 1.27 1.27 1.5Water3 ZBZR 45.9 38.3 45.2 48.6 52.7 43.5 51.7 46.9 46.9 47.2 37.8of which: coastwise ZBZS 38.7 33.8 36.4 33.3 26.0 23.1 24.2 23.3 26.6 30.3 22.8Pipeline ZBZT 11.6 11.2 11.7 11.6 11.4 11.5 10.9 10.5 10.7 10.8 10.8All modes ZBZU 63.64 55.34 63.7 66.7 71.9 62.0 69.0 64.1 64.5 64.7 ..
Coal and cokeRoad1 ZBZV 2.5 2.7 2.0 2.2 1.5 2.1 1.5 1.5 1.2 1.5 1.3Rail2 ZBZW 3.8 4.4 4.5 4.8 4.8 6.2 5.7 5.8 6.77 8.37 8.8Water3 ZBZX 0.6 0.6 0.5 0.5 0.2 0.5 0.3 0.5 0.3 0.4 0.5All modes ZBZY 6.9 7.7 7.0 7.5 6.5 8.8 7.5 7.9 8.5 10.2 ..
Other trafficRoad1 ZBZZ 145.3 148.9 153.1 150.5 151.5 150.6 152.7 154.7 155.6 156.4 159.9Rail2 ZCAA 11.3 12.5 11.2 11.9 11.9 12.0 11.7 11.9 12.57 12.27 11.8Water3 ZCAB 8.70 9.20 11.20 9.60 14.60 14.80 15.20 13.50 12.30 13.30 13.49All modes ZCAC 165.3 170.6 175.5 172.0 178.0 177.4 179.6 180.0 180.4 181.9 ..
All trafficRoad1 KCTA 153.9 157.4 160.3 157.7 159.4 158.5 159.4 161.7 162.55 163.45 166.95
Rail2 KCTB 15.1 16.9 17.3 18.2 18.1 19.4 18.5 18.9 20.47 21.77 22.1Water3 ZCAD 55.30 48.10 56.90 58.70 67.40 58.80 67.20 60.90 59.50 61.00 51.85Pipeline KCTE 11.6 11.2 11.7 11.6 11.4 11.5 10.9 10.5 10.7 10.8 10.8All modes KCTF 235.9 233.6 246.2 246.2 256.3 248.2 256.0 252.0 253.0 256.9 251.7
Percentage of all trafficRoad1 ZCAE 65 67 65 64 62 64 62 64 64 64 66Rail2 ZCAF 6 7 7 7 7 8 7 7 8 8 9Water3 ZCAG 23 21 23 24 26 24 26 24 23 24 21Pipeline ZCAH 5 5 5 5 4 5 4 4 4 4 4All modes ZCAI 100 100 100 100 100 100 100 100 100 100 100
Goods lifted (million tonnes)
Petroleum productsRoad1 ZCAJ 75 73 61 61 75 74 59 64 67 70 69Rail2 ZCAK .. .. .. .. .. .. .. .. .. .. ..Water3 ZCAL 71 69 76 72 72 60 67 64 63 66 57of which: coastwise ZCAM 54 52 55 52 40 34 36 35 38 42 34Pipeline ZCAN 157 148 153 155 151 151 146 141 158 168 159All modes ZCAO 3034 2904 2904 2884 2984 2854 2724 2694 2884 3044 ..
Coal and cokeRoad1 ZCAP 32 37 26 28 22 21 17 22 14 21 15Rail2 ZCAQ 52 50 45 368 35 40 34 35 446 49 49Water3 ZCAR 3 4 3 3 3 3 2 2 1 2 2All modes ZCAS 87 91 70 75 60 64 53 59 67 72 ..
Other trafficRoad1 ZCAT 1 623 1 630 1 640 1 575 1 596 1 587 1 658 1 667 1 782 1 777 1 852Rail2 ZCAU 50 55 57 61 60 55 53 54 57 59 60Water3 ZCAV 67 69 70 70 62 68 70 67 63 65 66All modes ZCAW 1 740 1 754 1 767 1 706 1 718 1 710 1 781 1 788 1 902 1 901 ..
All trafficRoad1 KCTG 1 730 1 740 1 727 1 664 1 693 1 682 1 734 1 753 1 8635 1 8685 1 9365
Rail2 KCTH 102 105 102 978 96 94 87 89 1016 108 108Water3 ZCAX 142.0 142.0 149.0 144.0 137.0 131.0 139.0 133.0 127.0 133.0 126.3Pipeline KCTK 157.0 148.0 153.0 155.0 151.0 151.0 146.0 141.0 158.0 168.0 159.1All modes KCTL 2 131 2 135 2 131 2 060 2 077 2 058 2 106 2 116 2 250 2 277 2 330
Percentage of all trafficRoad1 ZCAY 81 81 81 81 82 82 82 83 83 82 83Rail2 ZCAZ 5 5 5 58 5 5 4 4 4 5 5Water3 ZCBA 7 7 7 7 7 6 7 6 6 6 5Pipeline ZCBB 7 7 7 8 7 7 7 7 7 7 7All modes ZCBC 100 100 100 100 100 100 100 100 100 100 100
1 All goods vehicles, including those up to 3.5 tonnes gross vehicle weight.2 Figures for rail are for financial years e.g 1996/97 etc3 Figures for water are for UK traffic.4 Excludes rail.5 Figures for 2004, 2005 and 2006 are not fully comparable with those for
2003 and earlier years. Detailed comparisons should therefore be madewith caution.
6 Break in the series increase largely due to changes in coverage.7 There have been revisions to data since the last TSGB publication8 Goods lifted data from 1999 onwards have been revised since the last
TSGB publication
Sources: Department for Transport;Rail: 020 7944 4977;
Road 020 7944 4261;Water: 020 7944 3087;
Pipeline : 020 7215 2718;Sources - Rail : ORR;
Pipeline : Department for Business Enterprise and Regulatory Reform

230
Transport and communications
15.4 Passenger transport by modeGreat Britain
1996 1997 1998 1999 2000 2001 2002 2003 2004 2005 2006
Billion passenger kilometresRoad
Buses and coaches GRXK 43 44 45 46 47 47 47 47 48 49 50Cars, vans and taxis GRXG 622 632 636 642 640 654 677 673 678 674 686Motor cycles GRXH 4 4 4 5 5 5 5 6 6 6 6Pedal cycles GRXI 4 4 4 4 4 4 4 5 4 4 5All road GRXJ 674 685 689 697 695 710 733 731 736 733 747
Rail1 KCTN 39 42 44 46 47 47 48 49 50 52 55Air KCTM 6 7 7 7 8 8 8 9 10 10 10
All modes2 GRXM 719 733 740 751 749 765 790 789 796 795 812
PercentagesRoad
Buses and coaches GRXN 6 6 6 6 6 6 6 6 6 6 6Cars, vans and taxis GRXO 87 86 86 86 85 85 86 85 85 85 85Motor cycles GRXP 1 1 1 1 1 1 1 1 1 1 1Pedal cycles GRXQ 1 1 1 1 1 1 1 1 – 1 1All road GRXR 94 93 93 93 93 93 93 93 92 92 92
Rail1 ZCBJ 5 6 6 6 6 6 6 6 6 7 7Air ZCBK 1 1 1 1 1 1 1 1 1 1 1
All modes2 GRXU 100 100 100 100 100 100 100 100 100 100 100
1 Financial years. National Rail, urban metros and modern trams2 Excluding travel by water
Sources: Department for Transport;Bus & coach: 020 7944 3076;
Car, m/cycle & pedal cycle: 020 7944 3097;Rail: 020 7944 8874;
Air: 020 7944 3088
15.5 Motor vehicle traffic: by road class: 1996-2006Great Britain
Billion vehicle kilometres
1996 1997 1998 1999 20001 20012 2002 2003 2004 2005 2006
Motorways JSZV 78.3 82.1 85.7 87.8 88.4 90.8 92.6 93.0 96.6 97.0 99.2
Rural ’A’ roads3
Trunk5 JSZW 60.4 62.5 63.3 64.7 64.2 65.9 64.6 61.5 59.7 58.0 59.2Principal5 JSZX 63.1 64.1 65.4 66.0 65.8 67.4 71.8 77.7 81.6 83.3 84.6All rural ’A’ roads JSZY 123.5 126.6 128.7 130.7 130.0 133.3 136.4 139.3 141.3 141.3 143.8
Urban ’A’ roads4
Trunk5 JSZZ 13.9 13.8 13.8 14.0 14.0 7.6 7.4 6.7 6.0 5.5 5.6Principal5 JTAA 67.0 67.1 67.5 67.9 67.7 74.2 74.8 75.1 76.8 76.2 76.7All urban ’A’ roads JTAB 80.9 80.9 81.3 81.9 81.7 81.8 82.2 81.7 82.8 81.7 82.2
All Major Roads I45C 282.7 289.6 295.7 300.4 300.0 305.9 311.2 314.0 320.7 320.1 325.3
Minor roadsMinor rural roads JTAC 58.9 60.0 60.4 61.3 61.5 61.6 64.5 64.4 65.9 66.8 68.5Minor urban roads JTAD 99.6 100.7 102.4 105.3 105.5 106.9 110.8 111.9 112.0 112.5 112.6All minor roads JTAE 158.5 160.7 162.8 166.6 167.0 168.5 175.3 176.4 177.9 179.3 181.1
All roads JTAF 441.1 450.3 458.5 467.0 467.1 474.4 486.5 490.4 498.6 499.4 506.4
1 The decline in the use of cars and taxis in 2000 was due to the fuel dispute.2 Figures affected by the impact of Foot and Mouth disease during 2001.3 Rural roads; Major and minor roads, from 1993 onwards, are defined as be-
ing outside an urban area. (see definition below).4 Urban roads; Major and minor roads, from 1993 onwards, are defined as
within an urban area with a population of 10,000 or more. These are basedon the 2001 urban settlements. The definition for ‘urban settlement’ is in Ur-ban and Rural area definitions: a user guide which can be found on theDepartment for Communities and Local Government web site at:http:/www.communities.gov.uk/index.asp?id=1147748
5 Figures for trunk and principal ‘A’ roads in England, from 2001 onwards areaffected by the detrunking programme.
Source: Department for Transport: 020 7944 3095

231
Transport and communications
15.6 Public road length:1 by road typeGreat Britain
Kilometres
1996 1997 1998 1999 2000 2001 2002 2003 2004 2005 2006
Trunk motorway JSZD 3 253 3 333 3 376 3 404 3 422 3 431 3 433 3 432 3 478 3 466 3 503Principal motorway JSZE 45 45 44 45 45 45 45 46 46 54 53
Rural ’A’ roads2:Trunk3 JSZF 10 598 10 690 10 585 10 611 10 627 10 607 9 973 9 027 8 641 8 239 8 277Principal3 JSZG 24 592 24 636 24 783 24 852 24 866 24 915 25 559 26 498 26 889 27 312 27 336All rural ’A’ roads JSZH 35 190 35 326 35 369 35 463 35 493 35 522 35 532 35 525 35 530 35 550 35 612
Urban ’A’ roads4:Trunk3 JSZI 1 117 1 108 1 096 1 087 1 074 762 705 587 506 444 446Principal3 JSZJ 9 885 9 923 9 931 10 019 10 040 10 370 10 436 10 539 10 632 10 663 10 696All urban ’A’ roads JSZK 11 002 11 031 11 027 11 106 11 114 11 132 11 141 11 127 11 138 11 107 11 143
Minor rural roads5:B roads JSZL 24 603 24 594 24 586 24 579 24 570 24 562 24 554 24 547 24 640 24 639 23 950C roads JSZM 73 218 73 312 73 405 73 500 73 593 73 688 73 783 73 878 73 363 73 581 72 985Unclassified JSZN 110 698 110 915 111 132 111 350 111 568 111 787 112 006 112 231 109 561 109 426 113 826All minor rural roads JSZO 208 518 208 820 209 123 209 429 209 731 210 037 210 343 210 656 207 565 207 646 210 761
Minor urban roads5:B roads JSZP 5 615 5 618 5 622 5 626 5 630 5 633 5 638 5 641 5 538 5 550 6 209C roads JSZQ 10 943 10 966 10 986 11 009 11 031 11 054 11 076 11 098 10 859 10 878 11 514Unclassified JSZR 112 417 112 754 113 093 113 432 113 772 114 114 114 456 114 816 113 520 113 757 119 556All minor urban roads JSZS 128 975 129 338 129 702 130 068 130 432 130 802 131 169 131 556 129 917 130 186 137 279
All major roads GG5B 49 490 49 735 49 816 50 018 50 074 50 130 50 152 50 130 50 192 50 176 50 310
All minor roads5 JSZT 337 494 338 158 338 825 339 496 340 163 340 838 341 512 342 212 337 482 337 832 348 040
All roads JSZU 386 983 387 893 388 641 389 515 390 237 390 969 391 663 392 342 387 674 388 008 398 350
1 A number of minor revisions have been made to the lengths of major roadsfrom 1993 onwards.
2 Rural roads: Major and minor roads, from 1993 onwards, are defined as be-ing outside an urban area.
3 Figures for trunk and principal ’A’ roads in England, from 2001 onwards, areaffected by the detrunking programme.
4 Urban roads: Major and minor roads, from 1993 onwards, are defined as withinan urban area with a population of 10,000 or more. These are based on the2001 urban settlements. The definition for ‘urban settlement’ is in Urban andrural area definitions : a user guide can be found on the Department for Com-munities and Local Government web site at : http://www.communi-ties.gov.uk/index.asp?id=1147748
5 New information from 2004 and from 2006 has enabled better estimates ofminor road lengths to be made
Sources: National Road Traffic Survey;Department for Transport 020 7944 3095
15.7 Road traffic: by type of vehicleGreat Britain
Billion vehicle kilometres
1996 1997 1998 1999 20001 20012 2002 2003 2004 2005 2006
Cars and taxis JTAH 359.9 365.8 370.6 377.4 376.8 382.8 392.9 393.1 398.1 397.2 402.4
Motor cycles etc. JTAI 3.8 4.0 4.1 4.5 4.6 4.8 5.1 5.6 5.2 5.4 5.2
Larger buses and coaches JTAJ 5.0 5.2 5.2 5.3 5.2 5.2 5.2 5.4 5.2 5.2 5.4
Light vans3 JTAK 46.2 48.6 50.8 51.6 52.3 53.7 55.0 57.9 60.8 62.6 64.3
Goods vehicles4:2 axles rigid JTAL 10.9 11.0 11.1 11.6 11.7 11.5 11.6 11.7 11.7 11.5 11.33 axles rigid JTAM 1.6 1.6 1.9 1.7 1.7 1.8 1.8 1.8 1.9 1.9 1.94 or more axles rigid JTAN 1.5 1.5 1.6 1.5 1.5 1.5 1.5 1.6 1.6 1.7 1.73 and 4 axles artic JTAO 3.3 3.2 3.0 3.0 2.7 2.5 2.3 2.2 2.2 2.0 1.95 axles artic JTAP 6.6 7.1 7.3 7.2 6.7 6.4 6.4 6.2 6.5 6.4 6.56 or more axles artic JTAQ 2.3 2.5 2.9 3.3 4.1 4.5 4.8 5.0 5.4 5.5 5.7
All JTAR 26.2 26.9 27.7 28.1 28.2 28.1 28.3 28.5 29.4 29.0 29.1
All motor vehicles JURA 441.1 450.3 458.5 467.0 467.1 474.4 486.5 490.4 498.6 499.4 506.4
Pedal cycles JURB 4.1 4.1 4.0 4.1 4.2 4.2 4.4 4.5 4.2 4.4 4.6
1 The decline in the use of cars and taxis in 2000 was due to the fuel dispute.2 Figures affected by the impact of Foot and Mouth disease during 2001.3 Not exceeding 3,500 kgs gross vehicle weight.4 Over 3,500 kgs gross vehicle weight.
Sources: National Road Traffic Survey;Department for Transport 020 7944 3095

232
Transport and communications
15.8 Motor vehicles currently licencedGreat BritainAt end of year Thousands
Private and light goods Body type carsSpecial
Motor machines/ Crown Percent-cycles, Public special and Special age of
Private Other scooters transport Goods conces- Other exempt vehicles All companycars vehicles and mopeds vehicles1 vehicles sionary1 vehicles vehicles1 group vehicles4 All cars
BMBJ BMBK BMBB BMBE BMBD KSBY BMBF BMBL KSBZ BMBI ZCGR ZCGS1996 21 172 2 267 609 77 413 254 40 1 424 48 26 302 22 238 10.31997 21 681 2 317 626 79 414 249 38 1 522 48 26 974 22 832 10.51998 22 115 2 362 684 80 412 243 37 1 558 47 27 538 23 293 10.41999 22 785 2 427 760 84 415 241 36 1 573 47 28 368 23 975 10.02000 23 196 2 469 825 86 418 233 34 1 590 46 28 898 24 406 10.3
2001 23 899 2 544 882 89 422 233 33 1 602 45 29 747 25 126 9.72002 24 543 2 622 941 92 425 243 32 1 855 46 30 557 25 782 9.02003 24 985 2 730 1 005 96 426 258 32 1 887 47 31 207 26 240 8.42004 25 754 2 900 1 060 100 434 – 32 1 929 50 32 259 27 028 8.52005 26 208 3 019 1 075 103 433 – 31 1 978 51 32 897 27 520 8.8
2006 26 508 3 137 1 094 107 446 – 31 1 991 54 33 369 27 830 8.7
1 The ‘Special concession’ vehicles form part of the ‘Crown and exempt’ taxa-tion class from 2002
Source: Department for Transport 020 7944 3077
15.9 New vehicle registrations by taxation classGreat Britain
Thousands
1996 1997 1998 1999 2000 2001 2002 2003 2004 2005 2006
Cars BMAA 1 888.4 2 015.9 2 123.5 2 100.4 2 174.9 2 431.8 2 528.8 2 497.1 2 437.4 2 266.3 2 161.0
Other Vehicles BMAE 205.0 228.4 244.5 241.6 254.9 277.9 286.8 323.5 347.3 337.2 338.0
Motor Cycles, Scooters and Mopeds BMAL 89.6 121.3 143.3 168.4 182.9 177.1 162.2 157.3 133.7 132.3 132.0
Goods BBJY 45.5 41.8 49.1 48.3 50.4 48.6 44.9 48.4 48.0 51.2 48.0
Buses BBJZ 6.5 6.6 7.4 8.0 7.5 6.8 7.8 8.4 8.3 8.9 8.0
Special machines/special concessionary1: DMNR 8.1 8.6 7.6 7.6 6.5 7.0 7.2 8.1 7.6 8.0 8.0
Other Vehicles2 I8B3 150.0 162.0 157.0 174.0 176.0 169.0 192.0 189.0 204.0 218.0 219.0
All Vehicles BBKD 2 410.1 2 597.7 2 740.3 2 765.8 2 870.9 3 137.7 3 229.4 3 231.9 3 185.4 3 021.4 2 914.0
1 From 2002 the Special Concessionary group was abolished and becamepart of the exempt category.
2 Includes crown and exempt vehicles, three wheelers, and others. From2002 the former ‘special concessionary group ’ vehicles are also included.
Source: Department for Transport: 020 7944 3077
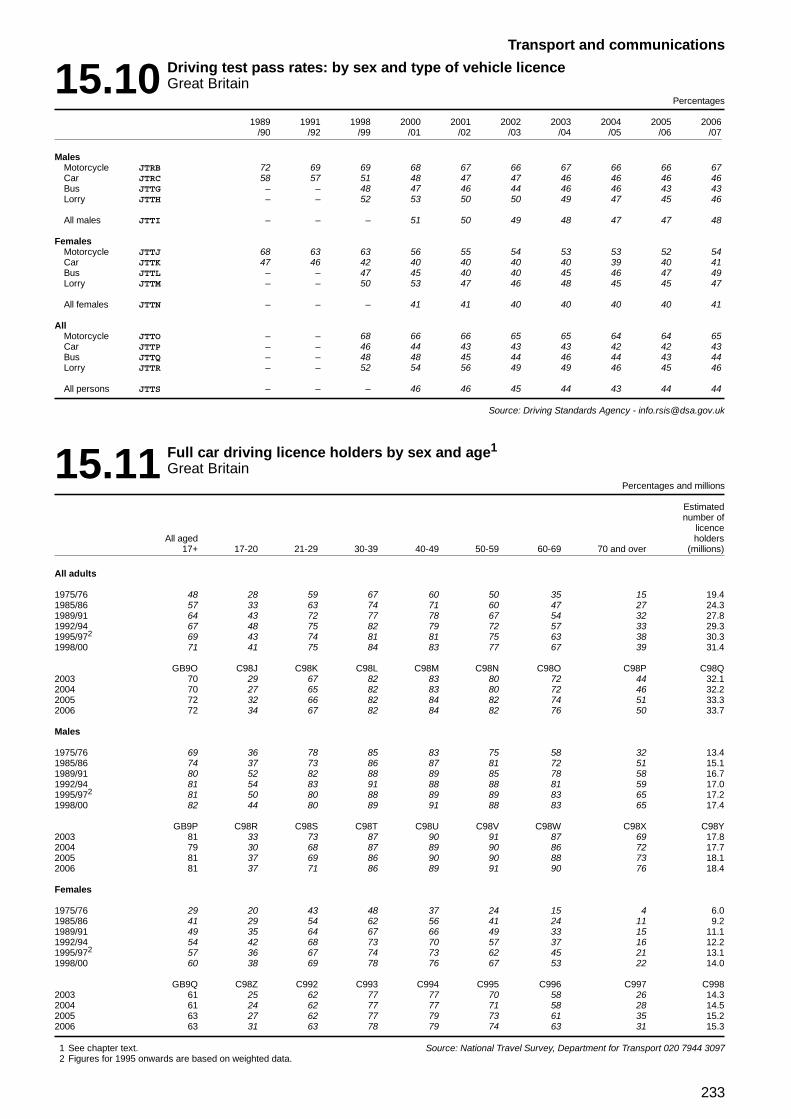
233
Transport and communications
15.10 Driving test pass rates: by sex and type of vehicle licenceGreat Britain
Percentages
1989 1991 1998 2000 2001 2002 2003 2004 2005 2006/90 /92 /99 /01 /02 /03 /04 /05 /06 /07
MalesMotorcycle JTRB 72 69 69 68 67 66 67 66 66 67Car JTRC 58 57 51 48 47 47 46 46 46 46Bus JTTG – – 48 47 46 44 46 46 43 43Lorry JTTH – – 52 53 50 50 49 47 45 46
All males JTTI – – – 51 50 49 48 47 47 48
FemalesMotorcycle JTTJ 68 63 63 56 55 54 53 53 52 54Car JTTK 47 46 42 40 40 40 40 39 40 41Bus JTTL – – 47 45 40 40 45 46 47 49Lorry JTTM – – 50 53 47 46 48 45 45 47
All females JTTN – – – 41 41 40 40 40 40 41
AllMotorcycle JTTO – – 68 66 66 65 65 64 64 65Car JTTP – – 46 44 43 43 43 42 42 43Bus JTTQ – – 48 48 45 44 46 44 43 44Lorry JTTR – – 52 54 56 49 49 46 45 46
All persons JTTS – – – 46 46 45 44 43 44 44
Source: Driving Standards Agency - [email protected]
15.11 Full car driving licence holders by sex and age1
Great BritainPercentages and millions
Estimatednumber of
licenceAll aged holders
17+ 17-20 21-29 30-39 40-49 50-59 60-69 70 and over (millions)
All adults
1975/76 48 28 59 67 60 50 35 15 19.41985/86 57 33 63 74 71 60 47 27 24.31989/91 64 43 72 77 78 67 54 32 27.81992/94 67 48 75 82 79 72 57 33 29.31995/972 69 43 74 81 81 75 63 38 30.31998/00 71 41 75 84 83 77 67 39 31.4
GB9O C98J C98K C98L C98M C98N C98O C98P C98Q2003 70 29 67 82 83 80 72 44 32.12004 70 27 65 82 83 80 72 46 32.22005 72 32 66 82 84 82 74 51 33.32006 72 34 67 82 84 82 76 50 33.7
Males
1975/76 69 36 78 85 83 75 58 32 13.41985/86 74 37 73 86 87 81 72 51 15.11989/91 80 52 82 88 89 85 78 58 16.71992/94 81 54 83 91 88 88 81 59 17.01995/972 81 50 80 88 89 89 83 65 17.21998/00 82 44 80 89 91 88 83 65 17.4
GB9P C98R C98S C98T C98U C98V C98W C98X C98Y2003 81 33 73 87 90 91 87 69 17.82004 79 30 68 87 89 90 86 72 17.72005 81 37 69 86 90 90 88 73 18.12006 81 37 71 86 89 91 90 76 18.4
Females
1975/76 29 20 43 48 37 24 15 4 6.01985/86 41 29 54 62 56 41 24 11 9.21989/91 49 35 64 67 66 49 33 15 11.11992/94 54 42 68 73 70 57 37 16 12.21995/972 57 36 67 74 73 62 45 21 13.11998/00 60 38 69 78 76 67 53 22 14.0
GB9Q C98Z C992 C993 C994 C995 C996 C997 C9982003 61 25 62 77 77 70 58 26 14.32004 61 24 62 77 77 71 58 28 14.52005 63 27 62 77 79 73 61 35 15.22006 63 31 63 78 79 74 63 31 15.3
1 See chapter text.2 Figures for 1995 onwards are based on weighted data.
Source: National Travel Survey, Department for Transport 020 7944 3097

234
Transport and communications
15.12 Households with regular use of cars1
Great BritainPercentages and millions
Two Three or TotalNo car One car cars more cars (millions)
ZCGA ZCGB ZCGC ZCGD ZCGE1995 30 45 21 4 22.91996 30 45 21 4 23.01997 30 45 21 5 23.11998 28 44 23 5 23.31999 28 44 22 5 23.4
2000 27 45 23 5 23.62001 26 45 23 5 23.92002 26 44 24 5 24.12003 26 44 25 5 24.42004 25 44 25 5 24.6
2005 25 44 26 5 24.8
Two orNo car One car more cars Total
Government Office Regions, 20051,2
Great Britain 25 44 31 100
North East 35 42 23 100North West 26 43 30 100Yorkshire and The Humber 27 44 29 100
East Midlands 22 44 34 100West Midlands 23 43 34 100
East 17 44 38 100London 35 44 21 100South East 18 43 39 100South West 17 47 36 100
England 24 44 32 100Wales 23 47 31 100Scotland 31 44 25 100Northern Ireland 24 45 31 100
Two orNo car One car more cars Total
Area type, 2006
Great Britain 25 44 32 100
London 38 46 16 100Metropolitan areas 31 42 26 100
Other urban areas with population:Over 250,000 23 45 32 10025,000 - 250,000 24 45 31 10010,000 - 25,000 23 45 33 1003,000 - 10,000 20 42 38 100
Rural areas 11 38 51 100
1 Includes cars and light vans normally available to the household.2 Based on combined survey data sources - Family Expenditure Survey,
ONS, General Household Survey, ONS, National Survey DfT.
Sources: Office for National Statistics;Department for Transport 020 7944 3097

235
Transport and communications
15.13 Vehicles with current licences1
Northern IrelandNumbers
1996 1997 1998 1999 2000 20015 2002 2003 2004 2005 2006
Private light goods, etc KNKA 540 083 575 923 584 706 608 316 615 180 644 968 666 731 711 913 737 198 765 061 800 969Motorcycles, Scooters and mopeds KNKB 10 026 10 932 11 663 13 087 14 116 15 205 17 598 23 820 24 533 25 998 27 083
Public road passenger vehicles2:Taxis,buses,coaches KNKD .. .. .. .. .. .. .. .. – .. ..Buses, coaches (9 seats or more) KNKE 2 090 2 144 2 175 2 204 2 266 2 315 2 322 2 353 2 378 2 566 2 670
Total KNKC 2 090 2 144 2 175 2 204 2 266 2 315 2 322 2 353 2 378 2 566 2 670
General (HGV) goods vehicles: KNKF 17 401 18 172 18 312 17 075 17 864 19 415 20 244 22 100 23 062 23 517 24 806Agricultural tractors and engines, etc3 KNKM 5 911 6 378 5 906 5 505 5 048 4 901 5 731 7 503 8 674 9 584 10 586
Other KNKN 1 019 1 188 1 193 1 446 1 287 1 366 1 347 1 671 1 794 1 898 2 039
Vehicles exempt from duty:Government owned KNKP 3 753 3 705 3 785 4 032 3 822 6 427 6 383 6 172 6 116 6 367 7 315Other:
Ambulances KNKQ 371 389 425 417 452 318 299 325 355 355 388Fire engines KNKR 292 291 285 286 290 181 174 170 178 179 166Other exempt4 KNKS 58 340 64 447 66 981 68 277 70 405 72 209 73 648 76 715 78 973 81 874 82 655
Total KNKO 62 756 68 832 71 476 73 012 74 969 79 135 80 504 83 382 85 622 88 775 90 524
Total KNKT 639 286 683 569 695 431 720 645 730 730 767 305 794 477 852 742 883 261 917 399 958 677
1 Licences current at 31 December.2 Tax class change from ‘Hackney’ to ‘Bus’ with effect from July 2005. Only
Vehicles with 9 or more seats are included in ‘Bus’ class. Vehicles with 8seats or less previously recorded in ‘ Hackney ’ class moved into ‘PrivateLight Goods’ class.
3 Owned by a farmer and availalble for hauling produce and requisites for hisfarm.
4 Changes in the Mobility Allowance (DWP) have contributed to the increasein Other exempt.
5 Taxation classes have been revised.
Source: Driver and Vehicle Agency: 028 7034 6903
15.14 New vehicle registrationsNorthern Ireland
Numbers
1996 1997 1998 1999 2000 2001 2002 2003 2004 2005 2006
Private cars KNLA 77 817 83 968 91 141 89 078 84 973 88 592 83 402 87 506 85 190 86 366 91 224Motorcycles KNLB 2 803 3 376 4 307 5 310 6 010 5 591 5 596 6 804 4 601 4 648 4 289
Public road passenger vehicles KNLC 724 714 486 568 565 451 439 609 467 621 677
Goods vehicles:General haulage vehicles:
Under 3.5 tonnes KNLH 7 232 8 468 10 107 11 054 12 617 13 274 12 007 11 492 11 090 12 300 13 4573.5 tonnes and over KNLJ 3 492 3 521 3 572 3 697 3 502 4 534 3 669 4 059 3 987 3 768 4 080
Agricultural tractors1 KNLM 1 292 1 364 971 987 1 313 301 1 9 2 2 8
Vehicles exempt from duty KNLR 10 520 10 885 10 718 11 083 10 789 12 126 12 515 11 907 12 881 13 987 13 031General haulage and special types JTAG .. .. .. .. .. .. 15 12 11 16 32
Total KNLS 103 880 112 296 121 302 121 777 119 769 124 869 117 644 122 398 118 229 121 708 126 798
1 Agricultural tractors driven on public roads. From April 2001 tractors wereexempt.
Source: Driver and Vehicle Agency : 028 7034 6903

236
Transport and communications
15.15 Local bus services: passenger journeys by area: 1995/96-2005/061
Millions
1996 1997 1998 1999 2000 2001 2002 2003 2004 2005 2006/97 /98 /99 /00 /01 /02 /03 /04 /05 /06 /07
Great Britain ZCET 4 455 4 429 4 350 4 376 4 420 4 455 4 550 4 681 4 737 4 791 4 972
London KILS 1 230 1 281 1 266 1 294 1 347 1 422 1 527 1 692 1 802 1 881 1 993English Metropolitan Counties KILT 1 310 1 292 1 256 1 213 1 203 1 196 1 182 1 162 1 128 1 111 1 109English other areas KILU 1 304 1 286 1 286 1 297 1 292 1 263 1 255 1 233 1 210 1 204 1 269
All outside London ZCES 3 225 3 148 3 084 3 082 3 073 3 033 3 023 2 989 2 935 2 910 2 979
England ZCER 3 844 3 859 3 808 3 804 3 842 3 881 3 964 4 087 4 140 4 196 4 371Scotland KILV 478 448 424 455 458 466 471 478 479 477 482Wales KILW 133 122 118 117 119 108 115 116 118 118 119
1 Previous years figures have been revised. Source: Department for Transport 020 7944 3076
15.16 Local bus services: fare indices: by areaCurrent prices
Indices (1995=100)
1996 1997 1998 1999 2000 2001 2002 2003 2004 2005 2006/97 /98 /99 /00 /01 /02 /03 /04 /05 /06 /07
Great Britain KNEU 106.2 112.1 117.1 121.8 126.4 130.6 134.5 139.2 146.5 157.5 159.0
London KNEP 105.5 109.4 113.8 117.2 117.3 115.5 114.8 116.9 126.8 139.7 151.5English Metropolitan Counties KILD 106.4 112.8 117.9 123.5 128.6 135.5 140.7 146.7 153.3 166.0 168.3English other areas KILE 106.2 112.0 117.3 122.6 129.2 136.1 142.4 149.0 155.9 166.2 159.5
All outside London ZCEQ 106.5 112.9 118.2 123.2 129.0 135.1 140.4 146.0 152.3 162.2 160.7
England ZCEP 106.0 111.5 116.4 121.4 125.8 130.3 134.3 139.4 147.2 159.4 160.1Scotland KILF 107.8 116.2 121.2 124.1 129.1 131.1 133.8 136.1 140.0 143.9 151.0Wales KILG 103.6 109.6 116.0 121.9 128.4 135.7 142.3 147.2 153.7 159.9 169.7
Retail Prices Index(1995=100) KNEV 103.1 106.5 109.9 111.6 114.9 116.6 119.1 122.4 126.2 129.5 134.4
Source: Department for Transport 020 7944 3076

237
Transport and communications
15.17 Road accident casualties: by road user type and severityGreat Britain
Numbers
1996 1997 1998 1999 2000 2001 2002 2003 2004 2005 2006
Child pedestrians1:Killed ZCDH 131 138 103 107 107 107 79 74 77 63 71Killed or seriously injured KIJS 4 132 3 954 3 737 3 457 3 226 3 144 2 828 2 381 2 339 2 134 2 025All severities ZCDI 18 510 18 407 17 971 16 876 16 184 15 819 14 231 12 544 12 234 11 250 10 131
Adult pedestrians2:Killed ZCDJ 858 835 803 760 750 712 688 695 589 604 602Killed or seriously injured KIJT 7 300 6 925 6 592 6 221 6 112 5 745 5 644 5 422 5 005 4 847 4 894All severities ZCDK 26 827 26 223 25 827 24 806 24 481 23 463 23 258 22 531 21 404 20 725 19 774
Child pedal cyclists1:Killed ZCDL 54 33 32 36 27 25 22 18 25 20 31Killed or seriously injured KIJU 1 231 1 016 915 950 758 674 594 595 577 527 503All severities ZCDM 8 217 7 899 6 930 7 290 6 260 5 451 4 809 4 769 4 682 4 286 3 765
Adult pedal cyclists2:Killed ZCDN 148 150 126 135 98 111 107 95 109 127 115Killed or seriously injured KIJV 2 517 2 542 2 345 2 172 1 954 1 951 1 801 1 776 1 697 1 787 1 898All severities ZCDO 15 778 16 181 15 326 14 834 13 630 12 974 11 712 11 643 11 366 11 637 11 911
Motorcyclists3 and passengers:Killed ZCDP 440 509 498 547 605 583 609 693 585 569 599Killed or seriously injured ZCDQ 6 208 6 446 6 442 6 908 7 374 7 305 7 500 7 652 6 648 6 508 6 484All severities BMDH 23 133 24 492 24 610 26 192 28 212 28 810 28 353 28 411 25 641 24 824 23 326
Car drivers and passengers:Killed ZCDS 1 806 1 795 1 696 1 687 1 665 1 749 1 747 1 769 1 671 1 675 1 612Killed or seriously injured ZCDT 24 048 23 191 21 676 20 368 19 719 19 424 18 728 17 291 16 144 14 617 14 254All severities ZCDU 205 336 211 448 210 474 205 735 206 799 202 802 197 425 188 342 183 858 178 302 171 000
Bus/coach drivers and passengers:Killed ZCDV 11 14 18 11 15 14 19 11 20 9 19Killed or seriously injured KCUZ 695 601 631 611 578 562 551 500 488 363 426All severities ZCDW 9 345 9 439 9 839 10 252 10 088 9 884 9 005 9 068 8 820 7 920 7 253
LGV drivers and passengers:Killed ZCDX 61 64 67 65 66 64 70 72 62 54 52Killed or seriously injured ZCDY 989 928 949 867 813 811 780 765 631 587 564All severities ZCDZ 7 215 7 476 7 672 7 124 7 007 7 304 7 007 6 897 6 166 6 048 5 914
HGV drivers and passengers:Killed ZCEA 63 45 60 52 55 54 63 44 47 55 39Killed or seriously injured ZCEB 555 573 560 540 571 500 524 429 406 395 383All severities ZCEC 3 245 3 302 3 444 3 484 3 597 3 388 3 178 3 061 2 883 2 843 2 530
All road users4:Killed BMDC 3 598 3 599 3 421 3 423 3 409 3 450 3 431 3 508 3 221 3 201 3 172Killed or seriously injured ZCEE 48 097 46 583 44 255 42 545 41 564 40 560 39 407 37 215 34 351 32 155 31 845All severities BMDA 320 578 327 803 325 212 320 310 320 283 313 309 302 605 290 607 280 840 271 017 258 404
1 Casualities aged 0 - 15.2 Casualties aged 16 and over.3 Includes mopeds and scooters.4 Includes other motor or non-motor vehicle users, and unknown road user
type and casualty age.
Source: Department for Transport 020 7944 3078

238
Transport and communications
15.18 Freight transport by road: goods moved by goods vehicles over 3.5 tonnes1
Great BritainBillion tonne kilometres
1996 1997 1998 1999 2000 2001 2002 2003 20042 20052 20062
By mode of working
Mainly public haulage KNND 109.1 112.2 114.3 110.9 113.0 114.7 110.6 114.3 110.8 109.7 112.1Mainly own account KNNC 37.7 37.4 37.6 38.3 37.5 34.7 39.2 37.4 41.4 43.0 43.6
All modes KNNB 146.8 149.6 151.9 149.2 150.5 149.4 149.8 151.7 152.2 152.7 155.8
By gross weight of vehicle
Rigid vehicles:Over 3.5 tonnes to 17 tonnes ZCIL 19.5 19.2 17.8 17.9 15.8 13.1 11.9 10.1 9.1 8.1 7.3Over 17 tonnes to 25 tonnes ZCIM 5.3 4.7 4.2 4.3 4.8 5.7 6.3 6.8 7.9 8.3 8.7Over 25 tonnes ZCIN 13.5 14.3 14.7 15.3 15.4 15.6 17.3 18.3 18.9 20.3 20.9
All rigids ZCIO 38.3 38.1 36.6 37.5 36.0 34.5 35.6 35.2 35.9 36.7 36.8
Articulated vehicles:Over 3.5 tonnes to 33 tonnes ZCIP 15.9 14.3 14.4 14.0 14.0 12.8 9.9 8.8 7.0 6.3 6.2Over 33 tonnes ZCIQ 92.6 97.1 100.9 97.7 100.4 102.1 104.4 107.7 109.4 109.7 112.8
All articulated vehicles ZCIR 108.5 111.4 115.3 111.7 114.4 114.9 114.3 116.5 116.4 116.0 118.9
All vehiclesOver 3.5 tonnes to 25 tonnes ZCIS 25.3 24.3 22.5 22.7 21.3 19.3 18.7 17.3 17.3 16.7 16.4Over 25 tonnes KNNG 121.5 125.2 129.4 126.5 129.2 130.1 131.1 134.4 134.9 136.0 139.4
All weights ZCIT 146.8 149.6 151.9 149.2 150.5 149.4 149.8 151.7 152.2 152.7 155.8
By commodity
Food, drink and tobacco ZCIU 39.3 40.8 42.5 41.5 44.3 41.4 43.1 42.2 41.7 40.6 42.0Wood, timber and cork ZCIV 3.8 3.5 3.6 3.8 3.7 3.9 3.8 4.1 4.5 4.7 4.1Fertiliser ZCIW 1.5 1.3 1.2 1.4 1.2 1.2 1.2 1.2 0.8 1.1 0.8Crude minerals ZCIX 13.5 13.6 13.3 12.7 12.4 13.0 13.9 13.8 14.1 14.8 15.6Ores ZCIY 1.3 1.7 1.1 1.3 1.2 1.2 1.1 1.2 1.4 1.7 1.3Crude materials ZCIZ 2.1 2.1 2.6 2.6 2.6 2.3 2.7 2.3 3.3 2.4 2.7Coal and coke ZCJA 2.5 2.7 2.0 2.2 1.5 2.1 1.5 1.5 1.2 1.5 1.3Petrol and petroleum products ZCJB 6.1 5.8 5.2 5.0 6.4 5.8 5.2 5.5 5.7 5.5 5.7Chemicals ZCJC 7.7 8.2 7.9 7.4 6.8 7.2 6.5 6.8 6.3 7.6 6.1Building materials ZCJD 9.6 11.1 10.7 10.6 10.6 11.7 10.9 12.0 12.1 10.9 11.6Iron and steel products ZCJE 7.2 7.9 7.7 6.8 6.8 5.7 5.3 5.4 5.4 5.2 4.7Other metal products ZCJF 1.7 1.5 1.7 1.7 1.7 1.4 1.5 1.5 1.9 2.1 2.2Machinery and transport equipment ZCJG 7.7 8.4 9.1 8.7 9.1 8.9 8.5 8.7 8.9 9.3 9.4Miscellaneous manufactures ZCJH 14.2 14.2 15.9 15.7 15.1 15.4 16.2 15.8 16.3 15.5 16.3Miscellaneous transactions ZCJI 28.4 26.8 27.5 27.9 27.1 28.2 28.4 29.5 28.8 29.8 31.8
All commodities ZCJJ 146.8 149.6 151.9 149.2 150.5 149.4 149.8 151.7 152.2 152.7 155.8
1 Rigid vehicles or articulated vehicles (tractive unit and trailer) with grossvehicle weight over 3.5 tonnes.
2 Figures for 2004 , 2005 and 2006 are not fully comparable with those for2003 and earlier years. Detailed comparisons should therefore be madewith caution.
Source: Department for Transport 020 7944 3093

239
Transport and communications
15.19 Freight transport by road: goods lifted by goods vehicles over 3.5 tonnes1
Great BritainMillion tonnes
1996 1997 1998 1999 2000 2001 2002 2003 20042 20052 20062
By mode of working
Mainly public haulage ZCJK 1 011 1 044 1 041 991 1 038 1 052 1 019 1 053 1 101 1 079 1 123Mainly own account ZCJL 618 599 589 576 556 529 608 590 643 667 686
All modes ZCJM 1 628 1 643 1 630 1 567 1 593 1 581 1 627 1 643 1 744 1 746 1 810
By gross weight of vehicle
Rigid vehicles:Over 3.5 tonnes to 17 tonnes ZCJN 306 294 268 254 229 203 188 159 160 135 130Over 17 tonnes to 25 tonnes ZCJO 133 120 106 86 87 86 90 100 113 118 121Over 25 tonnes ZCJP 371 380 401 408 424 443 491 506 539 559 597
All rigids ZCJQ 811 793 776 748 741 733 768 765 812 812 849
Articulated vehicles:Over 3.5 tonnes to 33 tonnes ZCJR 138 124 125 113 107 97 81 69 60 51 51Over 33 tonnes ZCJS 679 726 729 706 746 751 778 809 872 883 910
All articulated vehicles ZCJT 817 850 854 819 852 848 859 878 932 934 961
All vehiclesOver 3.5 tonnes to 25 tonnes ZCJU 447 419 382 346 325 294 283 265 277 257 257Over 25 tonnes ZCJV 1 181 1 224 1 248 1 221 1 268 1 287 1 343 1 378 1 467 1 489 1 553
All weights ZCJW 1 628 1 643 1 630 1 567 1 593 1 581 1 627 1 643 1 744 1 746 1 810
By commodity
Food, drink and tobacco ZCJX 326 342 346 333 346 321 339 333 351 339 358Wood, timber and cork ZCJY 27 26 27 28 26 28 28 32 42 36 30Fertiliser ZCJZ 13 10 9 11 10 9 11 12 7 14 7Crude minerals ZCKA 320 329 327 297 308 298 333 327 364 370 381Ores ZCKB 18 25 18 20 16 16 17 21 22 23 19Crude materials ZCKC 18 17 20 20 18 20 21 19 25 22 23Coal and coke ZCKD 32 37 26 28 22 21 17 22 14 21 15Petrol and petroleum products ZCKE 75 73 61 61 75 74 59 64 67 70 69Chemicals ZCKF 51 53 53 47 49 50 41 47 46 53 48Building materials ZCKG 142 156 161 159 165 165 167 165 185 169 180Iron and steel products ZCKH 52 55 54 48 49 44 39 41 43 42 41Other metal products ZCKI 15 16 18 17 16 14 14 16 19 19 22Machinery and transport equipment ZCKJ 59 71 73 67 69 70 68 66 70 76 79Miscellaneous manufactures ZCKK 88 90 96 91 97 97 105 98 111 109 112Miscellaneous transactions ZCKL 393 343 342 340 328 353 367 379 378 384 426
All commodities ZCKM 1 628 1 643 1 630 1 567 1 593 1 581 1 627 1 643 1 744 1 746 1 810
1 Rigid vehicles or articulated vehicles (tractive unit and trailer) with grossvehicle weight over 3.5 tonnes.
2 Figures for 2004, 2005 and 2006 are not fully comparable with those for2003 and earlier years. Detailed comparison should therefore be made withcaution.
Source: Department for Transport 020 7944 3093

240
Transport and communications
15.20 Rail systems summary
1996 1997 1998 1999 2000 2001 2002 2003 2004 2005 2006/97 /98 /99 /00 /01 /02 /03 /04 /05 /06 /07
Passenger journeys (millions)National Rail network1 ZCKN 801 846 892 931 957 960 976 1 012 1 045 1 082 1 164London Underground KNOE 772 832 866 927 970 953 942 948 976 970 1 040Docklands Light Railway ZCKO 17 21 28 31 38 41 46 48 50 54 64Glasgow Underground ZCKP 14 14 15 15 14 14 13 13 13 13 13Tyne and Wear Metro2 ZCKQ 35 35 34 33 33 33 37 38 37 36 38Blackpool trams3 EL9L 5 5 4 4 4 5 4 4 4 4 3Manchester Metrolink4 ZCKS 13 14 13 14 17 18 19 19 20 20 20Midland Metro5 ZCKR – – – 5 5 5 5 5 5 5 5Croydon Tramlink6 GEOE – – – – 15 18 19 20 22 23 25Sheffield Supertram ZCKT 8 9 10 11 11 11 12 12 13 13 14Nottingham NET7 C3MI – – – – – – – – 8 10 10
All rail ZCKU 1 665 1 776 1 862 1 971 2 065 2 059 2 072 2 119 2 193 2 229 2 396All light rail GENZ 92 98 104 113 138 146 154 160 172 177 192
Passenger revenue (£ million at current prices)National Rail network KNDL 2 573 2 821 3 089 3 368 3 413 3 548 3 663 3 901 4 158 4 493 5 038London Underground KNOA 797 899 977 1 058 1 129 1 151 1 138 1 161 1 241 1 309 1 417Docklands Light Railway ZCKV 12 14 20 22 29 32 36 37 40 46 54Glasgow Underground ZCKW 8 9 9 10 10 10 10 10 11 11 14Tyne and Wear Metro ZCKX 21 22 23 24 24 25 29 31 33 34 40Blackpool trams EL9M 4 5 4 4 4 5 5 4 4 4 5Manchester Metrolink ZCKZ 13 14 .. .. 18 20 20 21 22 23 24Midland Metro ZCKY – – – .. 3 4 5 5 5 6 7Croydon Tramlink GEOF – – – – 12 13 15 16 18 19 21Sheffield Supertram ZCLA 5 6 6 7 7 8 10 9 11 10 13Nottingham NET C3MJ – – – – – – – .. 6 7 8
All rail ZCLB 3 433 3 790 4 128 4 493 4 650 4 815 4 931 5 197 5 550 5 963 6 640All light rail GEOA 63 70 62 68 108 117 130 135 151 161 185
Passenger kilometres (millions)National Rail network KNDZ 32 100 34 700 36 280 38 472 38 179 39 141 39 678 40 937 41 762 43 211 46 497London Underground KNOI 6 153 6 479 6 716 7 171 7 470 7 451 7 367 7 340 7 606 7 586 7 947Docklands Light Railway ZCLC 86 103 144 172 200 207 232 235 245 257 301Glasgow Underground ZCLD 40 45 47 47 46 44 43 43 43 42 42Tyne and Wear Metro ZCLE 254 249 238 230 229 238 275 284 283 279 295Blackpool trams EL9N .. .. .. 13 13 15 14 11 12 11 10Manchester Metrolink ZCLG 86 88 117 126 152 161 167 169 204 206 208Midland Metro ZCLF – – – 50 56 50 50 54 52 54 51Croydon Tramlink GEOG – – – – 96 99 100 105 112 117 128Sheffield Supertram ZCLH 29 34 35 37 38 39 40 42 44 44 42Nottingham NET C3MK – – – – – – – 2 37 42 43
All rail ZCLI 38 748 41 698 43 577 46 318 46 479 47 446 47 965 49 222 50 401 51 849 55 564All light rail GEOB 495 519 581 675 830 854 920 945 1 033 1 052 1 120
Route kilometres open for passenger traffic (numbers)National Rail network8 ZCLJ 15 034 15 024 15 038 15 038 15 042 15 042 15 042 14 883 14 328 14 356 14 353London Underground ZCLK 392 392 392 408 408 408 408 408 408 408 408Docklands Light Railway ZCLM 22 22 22 26 26 26 26 26 26 30 31Glasgow Underground ZCLN 11 11 11 11 11 11 11 11 11 10 10Tyne and Wear Metro ZCLO 59 59 59 59 59 78 78 78 78 78 78Blackpool trams EL9O 18 18 18 18 18 18 18 18 18 18 18Manchester Metrolink ZCLQ 31 31 31 39 39 39 39 39 39 39 39Midland Metro ZCLP – – – 20 20 20 20 20 20 20 20Croydon Tramlink GEOH – – – – 28 28 28 28 28 28 28Sheffield Supertram ZCLR 29 29 29 29 29 29 29 29 29 29 29Nottingham NET C3ML – – – – – – – 14 14 15 14
All rail ZCLS 15 596 15 586 15 600 15 648 15 680 15 699 15 699 15 554 14 999 15 032 15 028All light rail GEOC 170 170 170 202 230 249 249 263 263 268 267
Stations served (numbers)National Rail network ZCLT 2 498 2 495 2 499 2 503 2 508 2 508 2 508 2 507 2 508 2 510 2 520London Underground KNOO 245 245 246 253 253 253 253 253 253 253 253Docklands Light Railway ZCLU 28 29 29 34 34 34 34 34 34 38 34Glasgow Underground ZCLV 15 15 15 15 15 15 15 15 15 15 15Tyne and Wear Metro ZCLW 46 46 46 46 46 58 58 58 58 59 59Blackpool trams EL9P 124 124 124 124 124 124 124 124 124 124 121Manchester Metrolink ZCLY 26 26 26 36 36 36 37 37 37 37 37Midland Metro ZCLX – – – 23 23 23 23 23 23 23 23Croydon Tramlink GEOI – – – – 38 38 38 38 38 39 39Sheffield Supertram ZCLZ 45 46 47 47 47 48 48 48 48 48 48Nottingham NET C3MM – – – – – – – 23 23 23 23
All rail ZCLL 3 027 3 026 3 032 3 081 3 124 3 137 3 138 3 160 3 161 3 169 3 172All light rail GSOC 284 286 287 325 363 376 377 400 400 406 399
1 Franchised train operating companies from Feb 1996 after privatisation.2 Tyne & Wear Metro extension to Sunderland opened in March 2002.3 Blackpool Trams shown as a self-contained system.4 Transfer of 20 stations from the rail network to Manchester Metrolink.
5 Midland Metro opened in 1999.6 Croydon Tramlink opened in 2000.7 Nottingham Express Transit opened in March 2004.8 Break in series due to change in methodology.
Sources: Department for Transport: 020 7944 3076;Network Rail, former Railtrack,ORR, TfL, light rail operators and PTEs

241
Transport and communications
15.21 National railways freightGreat Britain
Billion tonne kilometres
19962 1997 1998 1999 2000 2001 2002 2003 2004 2005 2006/97 /98 /99 /00 /01 /02 /03 /04 /05 /06 /07
Freight moved by commodity1
Coal ZCGG 3.9 4.4 4.5 4.8 4.8 6.2 5.7 5.8 6.7 8.3 8.8Metals ZCGH .. .. 2.1 2.2 2.1 2.4 2.7 2.4 2.6 2.2 2.1Construction ZCGI .. .. 2.1 2.0 2.4 2.8 2.5 2.7 2.9 2.9 2.7Oil and petroleum ZCGJ .. .. 1.6 1.5 1.4 1.2 1.2 1.2 1.2 1.2 1.5Other traffic ZCGK 11.2 12.5 7.1 7.6 7.4 6.7 6.6 6.8 7.0 7.1 7.0
All traffic VOXD 15.1 16.9 17.3 18.2 18.1 19.4 18.5 18.9 20.4 21.7 22.1
Million tonnes
1996 1997 1998 1999 2000 2001 2002 2003 2004 2005 2006/97 /98 /99 /00 /01 /02 /03 /04 /05 /06 /07
Freight lifted by commodity6
Coal ZCGL 52.2 50.3 45.3 35.93 35.3 39.5 34.0 35.2 44.04 48.95 48.8Metals ZCGM .. .. .. .. .. .. .. .. .. .. ..Construction ZCGN .. .. .. .. .. .. .. .. .. .. ..Oil and petroleum ZCGO .. .. .. .. .. .. .. .. .. .. ..Other traffic ZCGP 49.6 55.1 56.8 60.63 60.3 54.5 53.0 53.7 57.14 58.75 59.6
All traffic VOXE 101.8 105.4 102.1 96.53 95.6 93.9 87.0 88.9 101.14 107.65 108.4
1 Revised series on new basis from 1998/99.2 Owing to changes in the way freight traffic has been estimated following
privatisation, data since 1996/97 are not comparable to those for previousyears. Freight excludes parcels and materials carried for rail infrastructure..
3 Break in series from 1999/2000.4 Break in series, increase largely due to changes in data collection method.5 Break in series due to change in coverage.6 Goods lifted data from 1999 onwards have been revised since last TSGB
publication.
Source: Department for Transport: 020 7944 4977
15.22 Railways: permanent way and rolling stockNorthern IrelandAt end of year Numbers
1996 1997 1998 1999 2000 2001 2002 2003 2004 2005 2006
Length of road open for traffic1 (Km) KNRA 335 335 335 335 356 334 334 334 299 299 299
Length of track open for traffic (Km)Total KNRB 506 506 526 526 547 480 480 480 445 445 445
Running lines KNRC 464 464 484 484 505 464 464 464 427 427 427Sidings (as single track) KNRD 42 42 42 42 42 16 16 16 18 18 18
LocomotivesDiesel-electrics KNRE 8 6 5 6 6 6 6 5 6 5 5
Passenger carrying vehiclesTotal KNRF 112 112 120 105 105 106 100 100 102 124 125
Rail motor vehicles:Diesel-electric, etc KNRG 30 30 28 30 30 29 28 28 28 70 85
Trailer carriages:Total locomotive hauled KNRH 28 28 38 21 21 25 22 22 22 22 22
Ordinary coaches KNRI 26 26 36 19 19 23 20 20 20 20 20Restaurant cars KNRJ 2 2 2 2 2 2 2 2 2 2 2
Rail car trailers KNRK 54 54 54 54 54 52 50 50 52 32 18
Rolling stock for maintenanceand repair KNRT 41 41 26 18 18 18 18 39 46 48 48
1 The total length of railroad open for traffic irrespective of the number oftracks comprising the road.
Sources: Department for Regional Development;Northern Ireland: 028 9054 0800

242
Transport and communications
15.23 Operating statistics of railwaysNorthern Ireland
1996 1997 1998 1999 2000 2001 2002 2003 2004 2005 2006
UnitMaintenance of way and works
Material used:Ballast KNSA Thousand m2 27.0 51.3 38.5 40.0 47.0 80.0 40.0 130.0 70.0 90.0 30.0
ThousandRails KNSB tonnes 2.1 0.4 2.5 3.0 3.5 2.5 1.0 4.5 1.0 3.2 1.0Sleepers KNSC Thousands 27.5 5.1 32.0 30.0 40.0 50.0 5.0 40.0 28.0 45.0 2.0
Track renewed KNSD Km 20.0 2.4 22.5 7.0 29.0 15.0 5.0 25.8 2.0 29.0 1.0New Track laid KPGD Km – – – – 21.0 – – – – – –
Engine kilometres
Total1 KNSE Thousand Km 4 100 4 100 4 100 4 100 4 100 4 056 4 056 4 170 4 110 3 610 3 900Train kilometres:
Total KNSF " 3 670 3 670 3 670 3 670 3 670 3 626 3 626 3 704 3 610 3 610 3 900Coaching KNSG " 3 666 3 666 3 666 3 666 3 666 3 622 3 622 3 700 3 610 3 610 3 900Freight KNSH " 4 4 4 4 4 4 4 4 – – –
1 Including shunting, assisting, light, departmental, maintenance and repair. Sources: Department for Regional Development;Northern Ireland: 028 9054 0800
15.24 Main output of United Kingdom airlines
Available tonne kilometres (millions)
1997 1998 1999 2000 2001 2002 2003 2004 2005 2006 2007
All services KNTA 35 538 40 021 42 002 43 379 42 370 40 550 42 784 43 883 48 186 50 391 54 181Percentage growth on previous year KNTB 10.3 12.5 5.0 3.6 –2.4 –4.3 5.5 2.6 9.8 4.4 7.5
Scheduled services KNTC 26 504 29 756 31 815 32 938 31 866 30 433 31 513 32 422 36 937 38 590 40 971Percentage growth on previous year KNTD 11.4 12.3 6.9 3.5 –3.3 –4.5 3.6 2.9 13.9 4.5 6.2
Non-scheduled services KNTE 9 034 10 265 10 186 10 440 10 505 10 117 11 271 11 461 11 249 11 801 13 209Percentage growth on previous year KNTF 7.3 13.3 –0.7 4.1 0.6 –3.7 11.4 1.7 –1.8 4.3 11.9
Source: Civil Aviation Authority: 020 7453 6246
15.25 Air traffic between the United Kingdom and abroad1
Thousands
1997 1998 1999 2000 2001 2002 2003 2004 2005 2006 2007
Flights
United Kingdom airlinesScheduled services KNUA 410.3 443.7 480.9 520.3 536.7 531.3 517.7 546.5 584.2 596.3 621.9Non-scheduled services KNUB 208.2 218.7 212.6 216.2 208.5 218.6 211.0 198.6 200.6 209.6 207.1
Overseas airlines2
Scheduled services KNUC 399.6 426.4 467.6 467.6 496.8 487.5 487.0 544.2 584.5 629.5 656.9Non-scheduled services KNUD 32.5 34.8 31.7 31.7 26.0 36.7 27.1 28.8 33.7 28.4 27.2
Total KNUE 1 050.6 1 123.6 1 192.8 1 235.8 1 268.0 1 274.1 1 242.8 1 318.1 1 403.0 1 463.8 1 513.1
Passengers carried
United Kingdom airlinesScheduled services KNUF 41 854.7 46 747.7 50 148.5 54 522.8 53 591.7 54 360.0 56 476.7 63 216.1 69 106.2 72 196.4 76 959.9Non-scheduled services KNUG 28 699.5 31 616.6 32 603.8 33 185.9 34 009.1 33 935.7 33 385.6 32 195.7 30 179.4 29 725.5 28 524.0
Overseas airlines2
Scheduled services KNUH 39 900.7 42 554.5 46 628.0 46 627.9 51 107.8 51 317.6 54 504.0 60 278.0 67 634.9 74 670.8 79 820.1Non-scheduled services KNUI 4 413.0 4 569.7 4 156.5 4 156.5 3 966.1 3 956.3 3 947.1 4 068.3 4 169.1 4 107.7 3 803.3
Total KNUJ 114 867.9 125 488.5 133 536.8 138 493.1 142 674.7 143 569.6 148 313.4 159 758.1 171 089.6 180 700.4 189 107.3
1 Excludes travel to and from the Channel Islands.2 Includes airlines of overseas UK Territories.
Source: Civil Aviation Authority: 020 7453 6246

243
Transport and communications
15.26 Operations and traffic on scheduled services: revenue trafficUnited Kingdom airlines1
1997 1998 1999 2000 2001 2002 2003 2004 2005 2006 2007
UnitAll services __________
Aircraft stage flights:Number KNFA Numbers 749 806 797 682 835 031 878 582 921 556 911 518 895 095 926 498 1 016 354 1 037 729 1 052 799Average length KNFB Kilometres 1 079 1 111 1 134 1 156 1 138 1 149 1 215 1 227 1 304 1 349 1 400
Aircraft-kilometres flown KNFC Millions 809 886 947 1 016 1 049 1 047 1 088 1 137 1 325 1 400 1 474Passengers uplifted KNFD " 56 62 65 70 70 72 76 83 94 98 102Seat-kilometres used KNFE " 136 388 151 969 160 336 170 469 158 651 156 494 164 806 173 722 200 460 213 442 227 720
Cargo uplifted:2 KNFF Tonnes 782 855 831 436 860 291 897 184 742 705 768 736 800 645 842 912 921 412 946 365 941 421
Tonne-kilometres used: MillionsPassenger KNFH " 13 287 14 755 15 518 16 507 15 258 15 035 15 419 15 580 15 044 16 090 17 246Freight KNFI " 4 454 4 663 4 925 5 160 4 548 4 941 5 187 5 297 5 998 6 213 6 199Mail KNFJ " 172 178 153 179 102 57 55 75 90 99 112
Total KNFG " 17 913 19 596 20 596 21 846 19 908 20 032 20 660 20 952 21 133 22 402 23 557
Domestic services
Aircraft stage flights:Number KNFK Numbers 336 218 352 936 354 864 353 525 365 881 359 400 345 954 373 858 394 069 399 438 383 591Average length KNFL Kilometres 330 333 337 344 350 350 357 360 374 371 367
Aircraft-kilometres flown KNFM Millions 111 118 120 121 128 126 123 135 147 148 140Passengers uplifted KNFN " 16 17 17 18 18 20 21 22 23 23 22Seat-kilometres used KNFO " 6 646 6 948 7 184 7 542 7 645 8 322 8 904 9 263 9 795 9 800 9 449
Cargo uplifted:2 KNFP Tonnes 30 679 31 879 25 964 24 644 19 498 16 755 17 248 14 862 10 015 8 498 7 099
Tonne-kilometres used: MillionsPassenger KNFR " 569 593 610 640 649 703 738 757 784 759 733Freight KNFS " 6 6 6 6 4 4 3 3 3 2 2Mail KNFT " 6 6 4 4 4 3 3 3 – 1 1
Total KNFQ " 581 605 620 650 656 709 744 762 787 762 735
International services
Aircraft stage flights:Number KNFU Numbers 413 588 444 746 480 167 525 057 555 675 552 118 549 141 552 640 622 285 638 291 669 208Average length KNFV Kilometres 1 688 1 729 1 723 1 704 1 656 1 670 1 758 2 148 1 893 1 960 1 993
Aircraft-kilometres flown KNFW Millions 698 769 827 895 921 921 965 1 002 1 178 1 251 1 333Passengers uplifted KNFX " 40 45 48 52 52 52 56 61 71 75 80Seat-kilometres used KNFY " 129 743 145 022 153 153 162 927 151 006 148 172 155 903 164 459 190 666 203 642 218 271
Cargo uplifted:2 KNFZ Tonnes 752 176 799 557 834 327 872 540 723 206 751 975 783 397 828 051 911 398 937 868 934 323
Tonne-kilometres used: MillionsPassenger KNJX " 12 718 14 162 14 908 15 867 14 610 14 332 14 681 14 824 14 260 15 331 16 513Freight KNJY " 4 448 4 657 4 919 5 154 4 544 4 937 5 184 5 294 5 995 6 383 6 197Mail KNJZ " 166 172 149 176 98 54 51 72 90 99 111
Total KNJW " 17 333 18 991 19 976 21 197 19 252 19 322 19 916 20 190 20 345 21 813 22 822
1 Includes services of British Airways and other UK private companies.2 Cargo has re-defined as freight and mail.
Source: Civil Aviation Authority: 020 7453 6246

244
Transport and communications
15.27 Accidents on scheduled fixed wing passenger-carrying services1
United Kingdom airlines
Passenger casualties Crew casualties Fatal accidentsThousand Million Thousand Million Passengers
aircraft aircraft- passengers passenger per per killed perstage kms. carried kms. 100 000 hundred hundred
Number flights per flown per per flown per aircraft million millionof fatal Seriously Seriously fatal fatal passenger passenger stage aircraft- passenger-accidents Killed injured Killed injured accident accident killed killed flights kms. kms.
1950-54 7 194 9 28 4 107.4 61.8 46.1 50.1 0.93 1.62 2.001955-59 7 123 28 29 8 158.3 92.1 155.2 158.5 0.63 1.09 0.631960-64 5 104 35 21 6 303.7 182.2 373.4 390.6 0.33 0.55 0.261965-69 6 273 2 32 2 282.7 194.9 222.2 255.2 0.35 0.51 0.391970-74 2 167 5 14 2 889.5 737.1 464.3 657.7 0.11 0.14 0.15
1975-79 1 54 6 9 - 1 773.0 1 523.5 1 688.2 3 239.9 0.06 0.07 0.031980-84 - - 4 - 1 - - - - - - -1985-89 2 47 79 1 8 1 220.0 1 014.5 3031.0 6 262.9 0.08 0.10 0.021990-94 - - 1 - 9 - - - - - - -1995-99 1 9 1 3 3 3 699.9 4 026.0 31 265.6 76 539.4 0.03 0.02 0.001
KCVN KCVO KCVP KCVQ KCVR2000 - - 1 - - - - - - - - -2001 - - - - - - - - - - - -2002 - - - - 3 - - - - - - -2003 - - 1 - 1 - - - - - - -2004 - - 2 - - - - - - - - -2005 - - - - - - - - - - - -2006 - - - - 1 - - - - - - -
1 Excluding accidents involving the deaths of third parties only. Source: Civil Aviation Authority: 01293 573446
15.28 Activity at civil aerodromesUnited Kingdom1
Thousands and tonnes
1998 1999 2000 2001 2002 2003 2004 2005 2006 2007
Movement of civil aircraft (thousands)
CommercialTransport KNQC 1 871 1 959 2 045 2 095 2 094 2 160 2 277 2 406 2 451 2 494Other2 KNQD 162 159 159 150 120 117 116 120 129 124
Total KNQB 2 033 2 118 2 204 2 245 2 214 2 277 2 393 2 526 2 580 2 609
Non-commercial3 KNQE 1 343 1 263 1 186 1 207 1 100 1 186 1 135 1 129 1 059 1 033
Total KNQA 3 376 3 381 3 390 3 452 3 314 3 463 3 528 3 655 3 639 3 637
Passengers handled
Terminal KNQG 158 856 168 363 179 885 181 231 188 761 199 950 215 681 228 214 235 139 240 722Transit KNQH 1 226 1 156 1 167 1 087 1 054 990 950 984 1 016 963
Total KNQF 160 082 169 519 181 052 182 318 189 815 200 940 216 631 229 198 236 155 241 685
Commercial freight handled4 (tonnes)
Set down KNQJ 1 072 127 1 135 065 1 174 635 1 093 142 1 124 026 1 172 552 1 267 411 1 282 724 1 277 177 1 316 359Picked up KNQK 1 008 358 1 053 902 1 139 292 1 052 379 1 071 407 1 035 680 1 103 539 1 080 620 1 038 261 1 009 414
Total KNQI 2 080 485 2 188 967 2 313 927 2 145 521 2 195 433 2 208 232 2 370 950 2 363 344 2 315 438 2 325 773
Mail handled
Set down KNQM 88 766 92 974 101 743 98 690 90 738 86 415 108 481 102 344 91 535 102 027Picked up KNQN 113 993 114 752 123 352 117 389 99 747 93 096 112 424 110 576 98 391 105 755
Total KNQL 202 759 207 726 225 095 216 079 190 485 179 511 220 905 212 920 189 926 207 790
1 Figures exclude Channel Island Airports.2 Local pleasure flights for reward (eg aerial survey work, crop dusting and
delivery of empty aircraft) and empty positioning flights.3 Test and Training flights, Other flights by Air Transport Operators, Aero-club,
Private, Official, Military & Business Aviation.
4 With effect from 2001, passengers, freight and mail handled exclude traffic car-ried on air taxi operations.
Source: Civil Aviation Authority: 020 7453 6258

245
Transport and communications
15.29 United Kingdom ports: foreign, coastwise and one-port traffic
Thousand tonnes
1996 1997 1998 1999 2000 2001 2002 2003 2004 2005 2006
Foreign
Liquid bulk trafficImports EL9Q 59 309 61 060 61 346 56 528 70 788 74 495 62 811 66 447 75 897 76 988 85 530Exports EL9R 106 169 104 654 106 041 110 591 118 509 110 321 107 516 100 772 95 974 87 995 82 883All EL9S 165 478 165 714 167 387 167 120 189 297 184 816 170 327 167 218 171 871 164 983 168 412
Dry bulk trafficImports EL9T 63 905 68 208 68 333 65 219 65 652 77 360 67 575 72 644 76 625 87 546 92 846Exports EL9U 19 549 19 596 20 840 18 905 19 739 17 206 18 026 20 559 18 098 18 010 18 113All EL9V 83 454 87 805 89 173 84 124 85 391 94 565 85 600 93 203 94 722 105 557 110 959
Container and roll-on trafficImports EL9W 52 008 58 822 61 191 64 272 64 753 65 721 68 371 69 199 75 520 77 431 80 288Exports EL9X 43 711 48 805 49 029 49 616 49 323 47 334 47 313 47 291 49 869 51 045 52 801All EL9Y 95 719 107 628 110 220 113 889 114 076 113 054 115 685 116 490 125 390 128 476 133 089
Semi-bulk trafficImports EL9Z 15 987 16 097 16 878 15 967 17 174 17 059 18 523 17 284 18 413 16 766 16 706Exports ELA2 5 267 5 142 4 897 4 519 4 411 3 737 3 613 3 848 4 342 5 287 5 299All ELA3 21 253 21 239 21 775 20 486 21 584 20 796 22 136 21 131 22 755 22 054 22 005
Conventional trafficImports ELA4 1 493 1 506 1 531 1 595 2 500 3 730 3 645 3 699 3 990 3 529 3 555Exports ELA5 1 094 1 100 854 735 1 145 1 786 1 705 1 535 1 314 1 393 1 456All ELA6 2 587 2 607 2 385 2 330 3 645 5 515 5 349 5 234 5 304 4 922 5 012
All foreign trafficImports ELA7 192 702 205 694 209 279 203 581 220 866 238 364 220 924 229 273 250 445 262 261 278 925Exports ELA8 175 790 179 298 181 661 184 367 193 127 180 383 178 173 174 003 169 597 163 731 160 552All ELA9 368 492 384 992 390 940 387 948 413 993 418 747 399 097 403 276 420 042 425 992 439 477
Coastwise traffic
Liquid bulk trafficInwards ELB2 52 354 49 981 51 514 48 164 36 677 37 008 38 694 36 973 39 236 41 308 35 487Outwards ELB3 57 146 53 753 52 622 51 966 41 696 36 049 37 535 35 371 38 788 42 477 33 941All ELB4 109 501 103 734 104 136 100 131 78 373 73 058 76 229 72 344 78 024 83 786 69 428
Dry bulk trafficInwards ELB5 7 613 6 678 7 599 6 792 8 243 8 032 7 245 7 956 6 453 6 717 7 914Outwards ELB6 7 942 6 963 7 882 7 229 8 201 7 112 7 785 8 438 7 814 8 366 8 675All ELB7 15 555 13 642 15 480 14 021 16 444 15 144 15 030 16 395 14 268 15 083 16 589
Container and roll-on trafficInwards ELB8 9 623 10 522 11 236 11 542 12 186 11 797 11 854 11 788 12 510 13 241 13 236Outwards ELB9 9 716 10 786 10 660 11 396 11 506 11 064 11 341 11 426 12 026 12 995 12 988All ELC2 19 339 21 307 21 895 22 938 23 692 22 861 23 195 23 214 24 537 26 236 26 224
Semi-bulk trafficInwards ELC3 187 166 176 203 247 364 324 373 320 217 351Outwards ELC4 251 188 477 221 311 570 546 544 519 565 373All ELC5 438 354 653 424 558 934 870 917 838 783 725
Conventional trafficInwards ELL6 139 161 212 274 96 74 99 194 73 278 167Outwards ELM5 261 314 306 285 139 131 124 368 518 451 482All ELN2 400 475 518 559 236 206 223 562 591 729 649
All coastwise trafficInwards ELN3 69 917 67 508 70 736 66 975 57 448 57 276 58 215 57 285 58 592 61 761 57 156Outwards ELN4 75 316 72 004 71 946 71 098 61 853 54 926 57 331 56 147 59 665 64 854 56 459All ELN5 145 233 139 512 142 682 138 073 119 302 112 202 115 546 113 432 118 257 126 615 113 614

246
Transport and communications
15.29 United Kingdom ports: foreign, coastwise and one-port traffic
continued Thousand tonnes
1996 1997 1998 1999 2000 2001 2002 2003 2004 2005 2006
One-port traffic
Liquid bulk trafficInwards ELN6 10 861 6 871 10 587 20 220 24 937 18 245 25 886 22 328 19 152 16 169 14 171Outwards ELN7 8 847 8 560 4 365 126 485 647 693 563 361 421 336All ELN8 19 708 15 431 14 951 20 346 25 422 18 892 26 579 22 892 19 513 16 590 14 506
Dry bulk trafficInwards ELN9 13 260 14 123 14 436 15 051 12 503 14 362 15 197 14 389 13 821 13 476 14 189Outwards ELO2 98 106 98 41 41 68 67 70 28 52 32All ELO3 13 357 14 229 14 534 15 092 12 544 14 430 15 264 14 460 13 849 13 529 14 221
Non-oil traffic with UKoff-shore installations
Inwards ELO4 984 851 1 063 1 136 589 643 606 490 414 724 672Outwards ELO5 3 468 3 515 4 332 3 019 1 199 1 452 1 234 1 112 995 1 470 1 249All ELO6 4 453 4 366 5 394 4 155 1 789 2 095 1 840 1 602 1 409 2 194 1 921
All one-port trafficInwards ELO7 25 105 21 844 26 085 36 407 38 030 33 250 41 688 37 208 33 388 30 369 29 031Outwards ELO8 12 413 12 181 8 794 3 186 1 725 2 167 1 994 1 745 1 383 1 944 1 617All ELO9 37 518 34 026 34 880 39 593 39 755 35 417 43 682 38 953 34 771 32 313 30 648
Foreign and domestic traffic
Liquid bulk trafficInwards ELP2 122 524 117 912 123 446 124 913 132 402 129 748 127 391 125 748 134 285 134 465 135 187Outwards ELP3 172 163 166 967 163 028 162 684 160 690 147 017 145 744 136 706 135 123 130 894 117 159All ELP4 294 687 284 879 286 474 287 597 293 092 276 765 273 134 262 454 269 408 265 359 252 347
Dry bulk trafficInwards ELP5 84 778 89 009 90 367 87 062 86 398 99 754 90 016 94 990 96 899 107 739 114 949Outwards ELP6 27 588 26 666 28 820 26 175 27 981 24 386 25 878 29 067 25 940 26 429 26 820All ELP7 112 366 115 675 119 187 113 237 114 379 124 140 115 894 124 057 122 839 134 168 141 769
Container and roll-on trafficInwards ELP8 61 631 69 344 72 427 75 814 76 939 77 518 80 225 80 987 88 030 90 672 93 524Outwards ELP9 53 427 59 591 59 689 61 013 60 829 58 398 58 654 58 717 61 896 64 040 65 789All ELQ2 115 058 128 935 132 115 136 827 137 768 135 915 138 879 139 704 149 926 154 712 159 313
Semi-bulk trafficInwards ELQ3 16 174 16 263 17 054 16 170 17 421 17 423 18 847 17 657 18 733 16 984 17 057Outwards ELQ4 5 518 5 330 5 374 4 740 4 721 4 307 4 159 4 392 4 860 5 853 5 672All ELQ5 21 692 21 593 22 428 20 910 22 142 21 730 23 006 22 049 23 593 22 836 22 729
Conventional trafficInwards ELQ6 1 632 1 667 1 744 1 869 2 596 3 804 3 744 3 893 4 063 3 807 3 722Outwards ELQ7 1 355 1 414 1 159 1 020 1 284 1 917 1 828 1 903 1 832 1 843 1 938All ELQ8 2 987 3 082 2 903 2 889 3 880 5 721 5 572 5 796 5 895 5 651 5 660
Non-oil traffic with UKoff-shore installations
Inwards ELQ9 984 851 1 063 1 136 589 643 606 490 414 724 672Outwards ELR2 3 468 3 515 4 332 3 019 1 199 1 452 1 234 1 112 995 1 470 1 249All ELR3 4 453 4 366 5 394 4 155 1 789 2 095 1 840 1 602 1 409 2 194 1 921
All foreign and domestic trafficInwards ELR4 287 724 295 046 306 100 306 963 316 344 328 890 320 828 323 766 342 425 354 391 365 112Outwards ELR5 263 519 263 484 262 402 258 651 256 706 237 477 237 497 231 896 230 645 230 529 218 627All ELR6 551 243 558 530 568 502 565 614 573 050 566 366 558 325 555 662 573 070 584 919 583 739
Source: Department for Transport; 020 7944 3087

247
Transport and communications
15.30 Roll-on/roll-off ferry and Channel Tunnel traffic; road goods vehicles outward tomainland Europe: by country of registration
Thousands
1996 1997 1998 1999 2000 2001 2002 2003 2004 2005 2006
Powered vehicles:
United Kingdom ZCGT 531.1 543.2 544.3 562.7 544.8 517.6 493.3 473.9 493.1 517.4 524.5
Austria ZCGU 8.6 5.3 10.1 14.7 17.1 42.0 45.8 42.9 30.0 27.0 26.2Belgium/Luxembourg ZCGV 41.0 53.6 72.7 96.7 114.1 119.3 121.4 104.3 112.3 112.4 119.2Denmark ZCGW 4.6 5.5 7.3 8.7 9.5 12.0 16.9 13.7 17.1 17.7 22.0Finland ZCGX 0.2 0.1 0.6 0.7 0.9 3.1 2.0 1.1 0.1 0.2 0.5Germany ZCGY 30.4 39.3 52.4 73.1 111.5 132.0 148.2 155.7 164.7 168.3 186.8France ZCGZ 181.7 234.2 272.4 319.1 338.8 352.4 363.1 363.2 388.0 361.4 367.2Greece ZCHA 2.1 2.6 1.9 2.6 2.9 2.6 2.8 3.6 4.0 3.6 3.4Irish Republic ZCHB 30.1 32.3 38.8 44.7 48.5 46.6 44.6 30.8 27.6 31.9 42.7Italy ZCHC 28.8 30.4 35.3 45.8 67.8 91.1 127.8 132.4 120.1 96.9 79.6Netherlands ZCHD 87.2 107.0 125.4 153.3 185.1 187.5 186.3 210.2 252.1 253.2 257.9Spain ZCHE 39.4 45.1 56.3 67.7 81.8 93.9 102.2 105.9 109.8 105.1 111.4Sweden ZCHF 0.9 8.9 10.3 1.0 1.4 1.8 1.8 1.4 1.4 1.3 1.7Portugal ZCHG 3.1 5.1 6.7 9.2 10.7 10.2 11.0 9.4 8.9 9.5 13.3
EU15 (excluding UK) ZCHH 458.1 569.5 692.1 837.3 990.0 1 094.5 1 173.9 1 174.6 1 236.2 1 188.5 1 231.8
Cyprus1 GG5P .. .. .. 0.1 0.2 0.1 0.2 0.2 0.1 0.1 0.1Czech Republic1 GG5Q .. .. .. 5.4 5.2 6.8 7.8 13.1 25.0 40.6 45.0Estonia1 GG5R .. .. .. – 0.1 0.2 0.3 0.3 0.8 1.6 3.1Hungary1 GG5S .. .. .. 6.9 8.0 11.1 12.4 12.7 24.6 38.0 45.0Latvia1 GG5T .. .. .. 0.3 0.3 0.1 0.2 0.2 0.2 1.3 1.2Lithuania1 GG5U .. .. .. 0.9 1.4 1.0 0.7 1.6 2.9 7.5 13.0Malta1 GG5V .. .. .. 0.2 0.3 0.3 0.3 0.2 0.1 0.1 0.1Poland1 GG5W .. .. .. 7.0 10.4 12.5 12.0 14.2 31.0 54.5 73.4Slovakia1 GG5X .. .. .. 0.2 0.2 0.4 1.0 2.4 8.0 12.7 18.9Slovenia1 GG5Y .. .. .. 1.5 1.9 3.5 4.7 4.7 10.0 10.8 13.2
NMS101 GG5Z .. .. .. 22.5 28.0 36.2 39.5 49.5 102.9 167.2 213.0
Non-European Union ZCHI 26.3 28.0 33.3 24.9 24.9 43.2 76.7 97.6 107.6 116.5 68.0Unknown ZCHJ 2.2 5.7 4.8 6.3 17.7 20.5 18.1 19.1 17.0 31.8 36.4
All countries ZCHK 1 017.7 1 146.4 1 274.8 1 453.7 1 605.4 1 711.9 1 801.5 1 814.7 1 956.8 2 021.4 2 073.9
Unaccompanied trailers ZCHL 626.4 740.0 737.5 737.8 712.9 686.4 726.0 780.4 782.2 756.0 786.2
Powered vehicles andunaccompanied trailers ZCHM 1 644.1 1 886.4 2 012.3 2 191.4 2 318.3 2 398.3 2 527.5 2 595.1 2 739.0 2 777.4 2 860.1
1 New Member State countries that joined the EU on 1st May 2004. There isno individual breakdown available before 1999 for these countries.
Source: Department for Transport; 0117 372 8484
15.31 Postal services and television licences1
United KingdomMillions and thousands
1997 1998 1999 2000 2001 2002 2003 2004 2005 2006 2007
Letters, etc posted (millions) KMRA 18 101 18 350 18 878 19 711 20 076 20 648 21 979 22 837 24 341 24 880 24 089of which:Registered and insured KMRB 25.6 28.7 31.6 30.2 32.3 36.1 38.5 41.4 45.3 45.3 44.7Airmail (Commonwealth and foreign) KMRC 684.5 658.4 693.2 672.3 659.2 600.7 541.6 512.0 457.9 502.2 541.0Business reply and freepost items KMRD 505.8 524.7 503.6 475.3 487.4 486.2 434.4 397.7 401.1 402.3 373.7
Postal ordersTotal issued (thousands)2 KMRH 33 404 31 907 30 289 30 153 30 931 29 150 28 666 28 888 29 344 20 489 19 714
Television licences (thousands)In force on 31 March KMQL 21 305 21 723 22 240 22 625 22 839 23 157 23 486 23 899 24 162 24 419 24 546
of which:Colour KMQM 20 849 21 344 21 944 22 413 22 684 23 040 23 392 23 824 24 103 24 370 24 505
1 See chapter text.2 Excluding those issued on HM ships, in many British possessions and in
other places abroad. Up to 1998 includes Postal Orders issued Overseasand by Ministry of Defence.
Sources: Royal Mail: 0207 2502890;Capita Business Services Limited: 0117 3021003;
Post Office Limited: 0207 3207424

248
National accounts

249
National accounts
National accounts
Ch
apter 16
250
National accounts
Gross Domestic Product and Gross National Income
(Tables 16.1, 16.2, 16.3)
Table 16.1 shows the main national accounts aggregates, both at current prices and chained volume measures.
Table 16.2 shows the various money flows which generate the GDP and GNI. The output approach to GDP shows the total output of goods and services, the use of goods and services in the production process (intermediate consumption) and taxes and subsidies on products. The expenditure approach to GDP shows consumption expenditure by households and government, gross capital formation and expenditure on UK exports by overseas purchasers. The sum of these items overstates the amount of income generated in the UK by the value of imports of goods and services. This item is therefore subtracted to produce GDP at market prices.
The income approach to GDP shows gross operating surplus, mixed income and compensation of employees (previously known as income from employment). Taxes are added and subsidies are deducted to produce the total of the income based components at market prices.
Table 16.2 also shows the primary incomes received from the rest of the world, which are added to GDP, and primary incomes payable to non-residents, which are deducted from GDP, to arrive at GNI. Primary income comprises compensation of employees, taxes less subsidies on production, and property and entrepreneurial income.
Table 16.3 shows the expenditure approach to the chained volume measure of GDP. When looking at the change in the economy over time the main concern is usually whether more goods and services are actually being produced now than at some time in the past. Over time changes in current price GDP show changes in the monetary value of the components of GDP and, as these changes in value can reflect changes in both price and volume, it is difficult to establish how much of an increase in the series is due either to increased activity in the economy or to an increase in the price level. As a result, when looking at the real growth in the economy over time, it is useful to look at volume estimates of GDP. In chained volume series, volume measures for each year are produced in prices of the previous year. These volume measures are then ‘chain-linked’ together to produce a continuous time series.
Industrial analysis
(Tables 16.4, 16.5)
The analysis of gross value added by industry at current prices shown in Table 16.4 reflects the estimates based on
National accounts
National accounts
(Tables 16.1 to 16.22)
The tables which follow are based on those in the Blue Book 2007 Edition. Some of the figures are provisional and may be revised later; this applies particularly to the figures for 2005 and 2006.
The accounts are based on the European System of Accounts 1995 (ESA95). The Blue Book contains an introduction to the system of the UK accounts outlining some of the main concepts and principles of measurement used. It explains how key economic indicators are derived from the sequence of accounts and how the figures describing the whole economy are broken down by sector and by industry. A detailed description of the structure for the accounts is provided in a separate Office for National Statistics publication United Kingdom National Accounts: Concepts, Sources and Methods (TSO 1998). Further information on the financial accounts is given in the Financial Statistics Explanatory Handbook.
In the tables in this chapter on national income, analyses by industry are based, as far as possible, on the Standard Industrial Classification Revised 1992. The principal aggregate measured in these tables is the Gross Domestic Product (GDP). This is a concept of the value of the total economic activity taking place in UK territory. It can be viewed as incomes earned, as expenditures incurred, or as production. Adding all primary incomes received from the rest of the world and deducting all primary incomes payable to non-residents produces Gross National Income (GNI) (previously known as Gross National Product). This is a concept of the value of all incomes earned by UK residents.
ESA95, the internationally compatible accounting framework, provides a systematic and detailed description of the UK economy. It includes the sector accounts which provide, by institutional sector, a description of the different stages of the economic process from production through income generation, distribution and use of income to capital accumulation and financing; and the input-output framework, which describes the production process in more detail. It contains all the elements required to compile such aggregate measures as GDP, GNI and saving.
251
National accounts
the Standard Industrial Classification, revised 1992 (SIC92). The table is based on current price data reconciled through the input-output process for 1992 to 2004. The estimates are valued at basic prices, that is, the only taxes included in the price will be taxes paid as part of the production process, such as business rates, and not any taxes specifically levied on the production of a unit of output, for example Value Added Tax. Table 16.5 shows chained volume measures of gross value added at basic prices by industry. Chained volume measures of gross value added (output approach) provides the lead indicator of economic change in the short term. The output analysis of gross value added is estimated in terms of change and expressed in index number form. It is therefore inappropriate to show as a statistical adjustment any divergence of an output measure of GDP derived from it from other measures of GDP. Such an adjustment does, however, exist implicitly.
Sector analysis – Distribution of income accounts and capital account
(Tables 16.6 to 16.13)
The National Accounts accounting framework includes the sector accounts which provide, by institutional sector, a description of the different stages of the economic process, from production through income generation, distribution and use of income to capital accumulation and financing.
Tables 16.6 to 16.12 show the allocation of primary income account and the secondary distribution of income account for the non-financial corporations, financial corporations, government and households sectors. Additionally, Table 16.12 shows the use of income account for the households sector and Table 16.13 provides a summary of the capital account. The full sequence of accounts is shown in the Blue Book.
The allocation of primary income account shows the resident units and institutional sectors as recipients rather than producers of primary income. It demonstrates the extent to which operating surpluses are distributed to the owners of the enterprises. The resources side of the allocation of primary income accounts includes the components of the income approach to measurement of GDP. The balance of this account is the gross balance of primary income (B.5g) for each sector, and if the gross balance is aggregated across all sectors of the economy the result is Gross National Income.
The secondary distribution of income account describes how the balance of income for each sector is allocated by redistribution; through transfers such as taxes on income, social contributions and benefits and other current transfers. The balancing item of this account is Gross Disposable Income (GDI) (B.6g). For the households sector, the chained volume measure of GDI is shown as real household disposable income.
Table 16.12 shows, for the households sector, the use of disposable income where the balancing item is saving (B.8g). For the non-financial corporations sector the balancing item of the secondary distribution of income account, GDI (B.6g), is equal to saving (B.8g).
The summary capital account (Table 16.13) brings together the saving and investment of the several sectors of the economy. It shows saving, capital transfers, gross capital formation and net acquisition of non-financial assets for each of the four sectors.
Household and non-profit institutions serving households consumption expenditure at current market prices and chained volume measures
(Tables 16.14 to 16.17)
Household and non-profit institutions serving households (NPISH) consumption expenditure is a major component of the expenditure measure of GDP, both at current prices (Table 16.2) and chained volume measures (Table 16.3).
Household final consumption expenditure includes the value of income-in-kind and imputed rent of owner-occupied dwellings, but excludes business expenditure allowed as deductions in computing income for tax purposes. It includes expenditure on durable goods, for instance motor cars, which from the point of view of the individual might more appropriately be treated as capital expenditure. The only exceptions are the purchase of land and dwellings and costs incurred in connection with the transfer of their ownership and expenditure on major improvements by occupiers, which are treated as personal capital expenditure.
The estimates of household consumption expenditure include purchases of second-hand as well as new goods, less the proceeds of sales of used goods.
The most detailed figures are published quarterly in Consumer Trends (available as a web-only publication on the National Statistics website: www.statistics.gov.uk).
Change in inventories (previously known as value of physical increase in stocks and work in progress)
(Table 16.18)
This table gives a broad analysis by industry and, for manufacturing industry, by asset, of the value of entries less withdrawals and losses of inventories (stocks).

252
National accounts
Gross fixed capital formation
(Table 16.19 to 16.22)
Gross fixed capital formation comprises expenditure on the replacement of, and additions to, fixed capital assets located in the UK, including all ships and aircraft of UK ownership.

253
National accounts
16.1 United Kingdom national and domestic product1Main aggregatesAt current prices and chained volume measures, reference year 2003 Indices (2003=100) and £ million
1999 2000 2001 2002 2003 2004 2005 2006 2007
INDICES (2003=100)
VALUES AT CURRENT PRICESGross domestic product at current market prices
("money GDP") YBEU 81.6 85.8 89.7 94.4 100.0 105.9 110.3 116.6 123.8Gross value added at current basic prices YBEX 81.1 85.2 89.5 94.3 100.0 105.9 110.4 116.7 124.0
CHAINED VOLUME MEASURESGross domestic product at market prices YBEZ 89.7 93.1 95.3 97.3 100.0 103.3 105.2 108.2 111.5Gross national disposable income at market prices YBFP 87.6 90.7 93.7 97.1 100.0 103.4 104.2 105.7 109.1Gross value added at basic prices CGCE 90.2 93.6 95.6 97.3 100.0 103.3 105.2 108.4 111.5
PRICESImplied deflator of GDP at market prices YBGB 90.9 92.1 94.1 97.0 100.0 102.6 104.9 107.7 111.1
VALUES AT CURRENT PRICES (£ million)
Gross measures (before deduction of fixedcapital consumption) at current market prices
Gross Domestic Product ("money GDP") YBHA 911 945 958 931 1 003 297 1 055 793 1 118 245 1 184 296 1 233 976 1 303 915 1 384 823Employment, property and entrepreneurial income
from the rest of the world (receipts less payments) YBGG 1 270 4 540 11 664 23 443 24 646 26 596 25 734 18 555 ..Subsidies (receipts) less taxes (payments) on
products from/to the rest of the world -QZOZ –3 438 –4 098 –3 920 –2 890 –2 596 –1 640 –4 260 –4 496 ..Other subsidies on production from/to the rest of the world-IBJL 309 292 298 519 .. .. .. .. ..
Gross National Income (GNI) ABMX 910 115 959 708 1 011 623 1 076 865 1 140 887 1 209 844 1 258 192 1 310 399 1 388 315Current transfers from the rest of the world
(receipts less payments) -YBGF –4 435 –6 253 –3 426 –6 711 –8 130 –9 920 –11 087 –10 697 ..
Gross National Disposable Income NQCO 905 680 953 455 1 008 197 1 070 154 1 132 757 1 199 924 1 247 102 1 299 703 1 376 183
Adjustment to current basic pricesGross Domestic Product (at current market prices) YBHA 911 945 958 931 1 003 297 1 055 793 1 118 245 1 184 296 1 233 976 1 303 915 1 384 823Adjustment to current basic prices
(less taxes plus subsidies on products) -NQBU –105 956 –112 248 –114 234 –118 470 –124 738 –132 362 –137 347 –144 658 –152 831
Gross Value Added (at current basic prices) ABML 805 989 846 683 889 063 937 323 993 507 1 051 934 1 096 629 1 159 257 ..
Net measures (after deduction of fixedcapital consumption) at current market prices -NQAE –105 507 –111 251 –115 796 –121 914 –125 553 –135 184 –138 354 –147 720 ..
Net domestic product NHRK 810 890 852 559 892 863 939 786 999 006 1 055 869 1 102 883 1 165 686 ..Net national income NSRX 809 060 853 336 901 189 960 858 1 021 648 1 081 417 1 127 629 1 183 020 ..Net national disposable income NQCP 804 625 847 083 897 763 954 147 1 013 518 1 071 497 1 116 542 1 172 323 ..
CHAINED VOLUME MEASURES(Reference year 2003, £ million)
Gross measures (before deduction of fixedcapital consumption) at market prices
Gross Domestic Product ABMI 1 003 370 1 041 517 1 066 217 1 088 108 1 118 245 1 154 685 1 175 916 1 210 288 1 246 895Terms of trade effect ("Trading gain or loss") YBGJ –5 461 –8 007 –9 966 –2 932 – 1 226 –6 950 –11 474 ..
Real gross domestic income YBGL 997 909 1 033 510 1 056 251 1 085 176 1 118 245 1 155 911 1 168 966 1 197 870 ..Real employment, property and entrepreneurial income
from the rest of the world (receipts less payments) YBGI 1 386 4 880 12 256 24 081 24 646 25 981 24 398 17 121 ..Subsidies (receipts) less taxes (payments) on
production from/to the rest of the world -QZPB –2 701 –3 686 –3 393 –2 624 –2 596 –1 762 –2 140 –2 664 ..Other subsidies on production from/to the rest of the world-IBJN 298 305 590 707 592 661 669 664 ..
Gross National Income (GNI) YBGM 996 838 1 034 615 1 065 447 1 107 294 1 140 887 1 180 791 1 191 893 1 212 991 ..Real current transfers from the rest of the world
(receipts less payments) -YBGP –4 842 –6 722 –3 600 –6 894 –8 130 –9 691 –10 511 –9 870 ..
Gross National Disposable Income YBGO 992 000 1 027 891 1 061 855 1 100 401 1 132 757 1 171 100 1 180 876 1 197 868 1 235 349
Adjustment to basic pricesGross Domestic Product (at market prices) ABMI 1 003 370 1 041 517 1 066 217 1 088 108 1 118 245 1 154 685 1 175 916 1 210 288 1 246 895Adjustment to basic prices
(less taxes plus subsidies on products) -NTAQ –107 873 –112 020 –116 584 –121 657 –124 738 –128 660 –130 432 –133 966 ..
Gross Value Added (at basic prices) ABMM 895 795 929 802 949 755 966 449 993 507 1 026 025 1 045 484 1 076 520 1 108 182
Net measures (after deduction of fixedcapital consumption) at market prices -CIHA –110 533 –114 722 –118 072 –123 405 –125 553 –133 203 –133 706 –139 227 ..
Net national income at market prices YBET 893 158 926 314 953 482 989 809 1 021 648 1 054 226 1 064 967 1 094 122 ..Net national disposable income at market prices YBEY 888 326 919 584 949 906 982 918 1 013 518 1 044 535 1 054 456 1 084 252 ..
1 See chapter text. Source: Office for National Statistics: 020 7014 2083
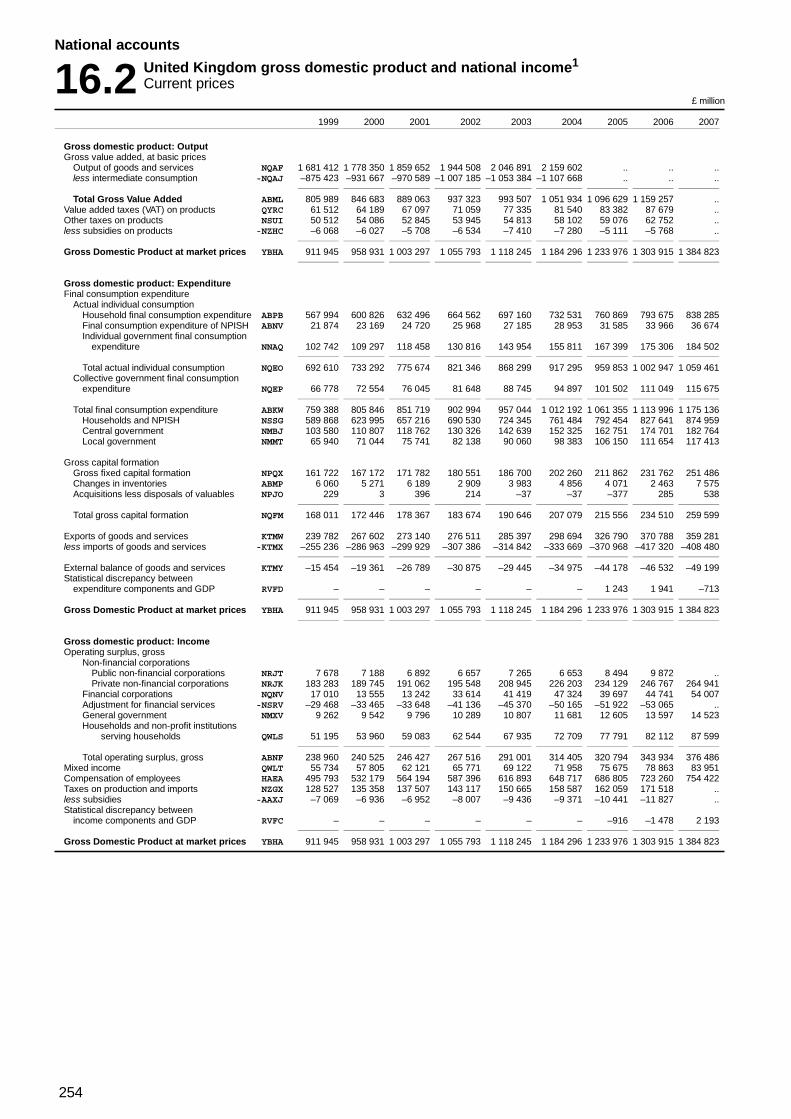
254
National accounts
16.2 United Kingdom gross domestic product and national income1
Current prices£ million
1999 2000 2001 2002 2003 2004 2005 2006 2007
Gross domestic product: OutputGross value added, at basic prices
Output of goods and services NQAF 1 681 412 1 778 350 1 859 652 1 944 508 2 046 891 2 159 602 .. .. ..less intermediate consumption -NQAJ –875 423 –931 667 –970 589 –1 007 185 –1 053 384 –1 107 668 .. .. ..
Total Gross Value Added ABML 805 989 846 683 889 063 937 323 993 507 1 051 934 1 096 629 1 159 257 ..Value added taxes (VAT) on products QYRC 61 512 64 189 67 097 71 059 77 335 81 540 83 382 87 679 ..Other taxes on products NSUI 50 512 54 086 52 845 53 945 54 813 58 102 59 076 62 752 ..less subsidies on products -NZHC –6 068 –6 027 –5 708 –6 534 –7 410 –7 280 –5 111 –5 768 ..
Gross Domestic Product at market prices YBHA 911 945 958 931 1 003 297 1 055 793 1 118 245 1 184 296 1 233 976 1 303 915 1 384 823
Gross domestic product: ExpenditureFinal consumption expenditure
Actual individual consumptionHousehold final consumption expenditure ABPB 567 994 600 826 632 496 664 562 697 160 732 531 760 869 793 675 838 285Final consumption expenditure of NPISH ABNV 21 874 23 169 24 720 25 968 27 185 28 953 31 585 33 966 36 674Individual government final consumption
expenditure NNAQ 102 742 109 297 118 458 130 816 143 954 155 811 167 399 175 306 184 502
Total actual individual consumption NQEO 692 610 733 292 775 674 821 346 868 299 917 295 959 853 1 002 947 1 059 461Collective government final consumption
expenditure NQEP 66 778 72 554 76 045 81 648 88 745 94 897 101 502 111 049 115 675
Total final consumption expenditure ABKW 759 388 805 846 851 719 902 994 957 044 1 012 192 1 061 355 1 113 996 1 175 136Households and NPISH NSSG 589 868 623 995 657 216 690 530 724 345 761 484 792 454 827 641 874 959Central government NMBJ 103 580 110 807 118 762 130 326 142 639 152 325 162 751 174 701 182 764Local government NMMT 65 940 71 044 75 741 82 138 90 060 98 383 106 150 111 654 117 413
Gross capital formationGross fixed capital formation NPQX 161 722 167 172 171 782 180 551 186 700 202 260 211 862 231 762 251 486Changes in inventories ABMP 6 060 5 271 6 189 2 909 3 983 4 856 4 071 2 463 7 575Acquisitions less disposals of valuables NPJO 229 3 396 214 –37 –37 –377 285 538
Total gross capital formation NQFM 168 011 172 446 178 367 183 674 190 646 207 079 215 556 234 510 259 599
Exports of goods and services KTMW 239 782 267 602 273 140 276 511 285 397 298 694 326 790 370 788 359 281less imports of goods and services -KTMX –255 236 –286 963 –299 929 –307 386 –314 842 –333 669 –370 968 –417 320 –408 480
External balance of goods and services KTMY –15 454 –19 361 –26 789 –30 875 –29 445 –34 975 –44 178 –46 532 –49 199Statistical discrepancy between
expenditure components and GDP RVFD – – – – – – 1 243 1 941 –713
Gross Domestic Product at market prices YBHA 911 945 958 931 1 003 297 1 055 793 1 118 245 1 184 296 1 233 976 1 303 915 1 384 823
Gross domestic product: IncomeOperating surplus, gross
Non-financial corporationsPublic non-financial corporations NRJT 7 678 7 188 6 892 6 657 7 265 6 653 8 494 9 872 ..Private non-financial corporations NRJK 183 283 189 745 191 062 195 548 208 945 226 203 234 129 246 767 264 941
Financial corporations NQNV 17 010 13 555 13 242 33 614 41 419 47 324 39 697 44 741 54 007Adjustment for financial services -NSRV –29 468 –33 465 –33 648 –41 136 –45 370 –50 165 –51 922 –53 065 ..General government NMXV 9 262 9 542 9 796 10 289 10 807 11 681 12 605 13 597 14 523Households and non-profit institutions
serving households QWLS 51 195 53 960 59 083 62 544 67 935 72 709 77 791 82 112 87 599
Total operating surplus, gross ABNF 238 960 240 525 246 427 267 516 291 001 314 405 320 794 343 934 376 486Mixed income QWLT 55 734 57 805 62 121 65 771 69 122 71 958 75 675 78 863 83 951Compensation of employees HAEA 495 793 532 179 564 194 587 396 616 893 648 717 686 805 723 260 754 422Taxes on production and imports NZGX 128 527 135 358 137 507 143 117 150 665 158 587 162 059 171 518 ..less subsidies -AAXJ –7 069 –6 936 –6 952 –8 007 –9 436 –9 371 –10 441 –11 827 ..Statistical discrepancy between
income components and GDP RVFC – – – – – – –916 –1 478 2 193
Gross Domestic Product at market prices YBHA 911 945 958 931 1 003 297 1 055 793 1 118 245 1 184 296 1 233 976 1 303 915 1 384 823

255
National accounts
16.2 United Kingdom gross domestic product and national income1
Current pricescontinued
1999 2000 2001 2002 2003 2004 2005 2006 2007
Gross Domestic Product at market prices YBHA 911 945 958 931 1 003 297 1 055 793 1 118 245 1 184 296 1 233 976 1 303 915 1 384 823Compensation of employees
receipts from the rest of the world KTMN 960 1 032 1 087 1 121 1 116 1 171 974 1 058 1 105less payments to the rest of the world -KTMO –759 –882 –1 021 –1 054 –1 057 –1 100 –1 584 –1 803 –1 727
Total KTMP 201 150 66 67 59 71 –610 –745 –622
less Taxes on products paid to the rest of the worldplus Subsidies received from the rest of the world -QZOZ –3 438 –4 098 –3 920 –2 890 –2 596 –1 640 –4 260 –4 496 ..
Other subsidies on production -IBJL 309 292 298 519 .. .. .. .. ..
Property and entrepreneurial incomereceipts from the rest of the world HMBN 101 952 134 114 139 848 123 505 124 881 141 030 186 259 234 143 281 674less payments to the rest of the world -HMBO –100 883 –129 724 –128 250 –100 129 –100 294 –114 505 –160 445 –225 638 –275 772
Total HMBM 1 069 4 390 11 598 23 376 24 587 26 525 25 814 8 505 5 902
Gross National Income at market prices ABMX 910 115 959 708 1 011 623 1 076 865 1 140 887 1 209 844 1 258 192 1 310 399 1 388 315
1 See chapter text. Source: Office for National Statistics: 020 7014 2083
16.3 United Kingdom gross domestic product1Chained volume measures, reference year 2003
£ million
1999 2000 2001 2002 2003 2004 2005 2006 2007
Gross domestic product: expenditure approachFinal consumption expenditure
Actual individual consumptionHousehold final consumption expenditure ABPF 606 648 633 662 653 326 676 833 697 160 721 434 732 005 745 737 768 397Final consumption expenditure of non-profit
institutions serving households ABNU 25 023 27 177 27 155 27 130 27 185 27 327 28 167 29 858 31 079Individual government final consumption expenditure NSZK 109 554 111 763 114 159 117 238 120 288 .. .. .. ..
Total actual individual consumption YBIO 760 172 792 076 815 286 843 504 868 299 897 055 911 168 929 237 ..Collective government final consumption expenditure NSZL 76 926 80 829 82 502 85 331 88 745 91 835 95 531 99 097 ..
Total final consumption expenditure ABKX 837 119 872 899 897 801 928 849 957 044 988 890 1 006 699 1 028 334 ..
Gross capital formationGross fixed capital formation NPQR 169 117 173 710 178 203 184 701 186 700 197 655 200 654 215 985 229 423Changes in inventories ABMQ 5 803 4 648 5 577 2 289 3 982 4 597 3 611 2 416 6 523Acquisitions less disposals of valuables NPJP – –28 342 183 –37 –42 –354 290 525
Total gross capital formation NPQU 175 118 178 660 184 462 187 374 190 646 202 210 203 911 220 491 ..
Gross domestic final expenditure YBIK 1 012 457 1 051 600 1 082 333 1 116 239 1 147 690 1 191 099 1 210 610 1 244 916 1 291 263
Exports of goods and services KTMZ 247 289 269 830 277 694 280 593 285 397 299 289 323 749 358 356 339 434
Gross final expenditure ABME 1 259 336 1 321 604 1 360 205 1 396 862 1 433 087 1 490 388 1 534 359 1 603 272 1 630 698
less imports of goods and services -KTNB –257 809 –281 081 –294 449 –308 706 –314 842 –335 703 –359 626 –394 789 –383 162Statistical discrepancy between
expenditure components and GDP GIXS – – – – – – 1 183 1 805 –639
Gross Domestic Product at market prices ABMI 1 003 370 1 041 517 1 066 217 1 088 108 1 118 245 1 154 685 1 175 916 1 210 288 1 246 895
of which External balance of goods and services KTNC –10 520 –11 251 –16 755 –28 113 –29 445 –36 414 –35 877 –36 433 –43 728
1 See chapter text. Source: Office for National Statistics: 020 7014 2083

256
National accounts
16.4 Gross value added at current basic prices: by industry1,2
United Kingdom£ million
1998 1999 2000 2001 2002 2003 2004 2005 2006
Agriculture, hunting, forestry and fishing EWSH 9 457 9 270 8 789 8 566 9 218 10 031 10 323 .. ..
Production
Mining and quarryingMining and quarrying of energy producing materials
Mining of coal QTOQ 817 642 611 548 534 468 385 370 334Extraction of mineral oil and natural gas QTOR 13 054 14 694 22 283 20 940 20 006 19 542 19 845 23 082 26 144
Other mining and quarrying QTOS 1 645 1 716 1 795 1 760 1 474 1 524 1 646 1 656 1 615
Total mining and quarrying EWSL 15 516 17 053 24 689 23 251 22 012 21 534 21 876 .. ..
ManufacturingFood; beverages and tobacco QTOU 20 047 20 220 20 261 20 914 21 052 21 654 22 288 22 890 23 048Textiles and textile products QTOV 6 803 6 270 5 863 5 390 4 857 4 318 3 823 3 685 3 448Leather and leather products QTOW 822 808 750 650 594 463 347 347 360Wood and wood products QTOX 2 329 2 248 2 336 2 369 2 516 2 694 2 904 3 063 3 109Pulp, paper and paper products; publishing and printing QTOY 18 781 19 619 20 207 20 155 19 988 19 698 20 157 19 648 19 099Coke, petroleum products and nuclear fuel QTOZ 2 524 2 569 2 361 2 493 2 433 2 358 2 420 2 837 2 833Chemicals, chemical products and man-made fibres QTPA 14 873 15 136 14 982 15 979 15 984 15 980 16 233 17 082 17 228Rubber and plastic products QTPB 8 026 7 794 7 692 7 730 7 627 7 569 7 824 8 219 8 707Other non-metal mineral products QTPC 5 028 4 952 5 013 5 084 5 333 5 452 5 686 5 870 6 077Basic metals and fabricated metal products QTPD 17 633 16 675 16 023 15 637 14 957 14 807 15 097 15 963 16 713Machinery and equipment not elsewhere classified QTPE 13 591 12 731 12 343 12 265 12 056 12 071 12 198 12 923 13 137Electrical and optical equipment QTPF 19 826 20 442 20 414 18 382 16 501 15 529 15 625 14 530 14 794Transport equipment QTPG 16 179 16 064 16 016 16 100 16 136 15 801 16 318 16 038 16 735Manufacturing not elsewhere classified QTPH 6 282 6 422 6 555 6 704 6 588 6 438 6 548 6 710 6 958
Total manufacturing EWSP 152 744 151 951 150 819 149 852 146 621 144 830 147 468 .. ..
Electricity, gas and water supply EWST 15 887 15 784 15 942 15 826 16 084 16 482 17 103 .. ..
Total production QTPK 184 146 184 791 191 452 188 928 184 706 182 844 186 443 199 977 211 861
Construction EWSX 39 970 42 511 45 975 50 903 55 020 59 855 64 747 .. ..
Service industries
Wholesale and retail trade (including motor trade);repair of motor vehicles, personal and household goods QTPM 93 572 99 981 103 910 110 658 113 988 120 605 127 520 132 784 139 795
Hotels and restaurants QTPN 22 547 24 476 26 004 27 384 29 023 30 509 33 074 32 707 35 573
Transport, storage and communicationTransport and storage QTPO 40 072 41 138 42 648 43 360 44 633 47 108 49 516 53 237 55 263Communication QTPP 22 297 23 935 26 652 27 142 28 346 29 376 29 762 28 960 27 679
Total EWTF 62 369 65 073 69 299 70 502 72 980 76 485 79 279 .. ..
Financial intermediation QTPR 46 952 46 229 46 093 46 956 68 120 77 852 86 145 96 686 108 869Adjustment for financial services (FISIM) -NSRV –27 658 –29 468 –33 465 –33 648 –41 136 –45 370 –50 165 –51 922 –53 065
Real estate, renting and business activitiesLetting of dwellings including imputed rent
of owner occupiers QTPS 56 741 60 501 63 176 68 802 72 531 77 913 83 037 83 332 87 806Other real estate, renting and business activities QTPT 108 523 119 892 131 348 142 806 150 399 162 851 175 333 187 440 198 443
Total QTPU 165 264 180 393 194 525 211 608 222 930 240 765 258 370 270 772 286 249
Public administration and defence (PAD) EWTN 39 561 40 909 42 712 45 025 47 528 51 302 55 280 .. ..Education QTPW 41 687 44 879 48 069 51 616 55 025 58 246 61 786 63 286 64 692Health and social work QTPX 48 800 51 688 55 390 59 623 64 552 70 630 75 817 .. ..Other social and personal services,
private households with employeesand extra-territorial organisations EWTV 37 011 39 881 42 228 44 629 48 331 51 802 55 543 .. ..
Total service industries QTPZ 530 106 564 043 594 765 634 354 681 342 732 825 782 647 821 083 866 597
All industries ABML 768 594 805 989 846 683 889 063 937 323 993 507 1 051 934 1 096 629 1 159 257
1 See chapter text. Components may not sum to totals as a result of rounding.2 Because of differences in the annual and monthly production inquiries, esti-
mates of current price output and value added by industry derived from thecurrent price input-output supply-use balances are not consistent with theequivalent measures of constant price growth given in Table 16.5. Thesedifferences do not affect GDP totals. For further information see "Experi-mental Constant Price Input-Output Supply-Use Balances: An approach toimproving the quality of the national accounts" Nadim Ahmad, EconomicTrends, July 1999 (No. 548).
Source: Office for National Statistics: 020 7014 2083
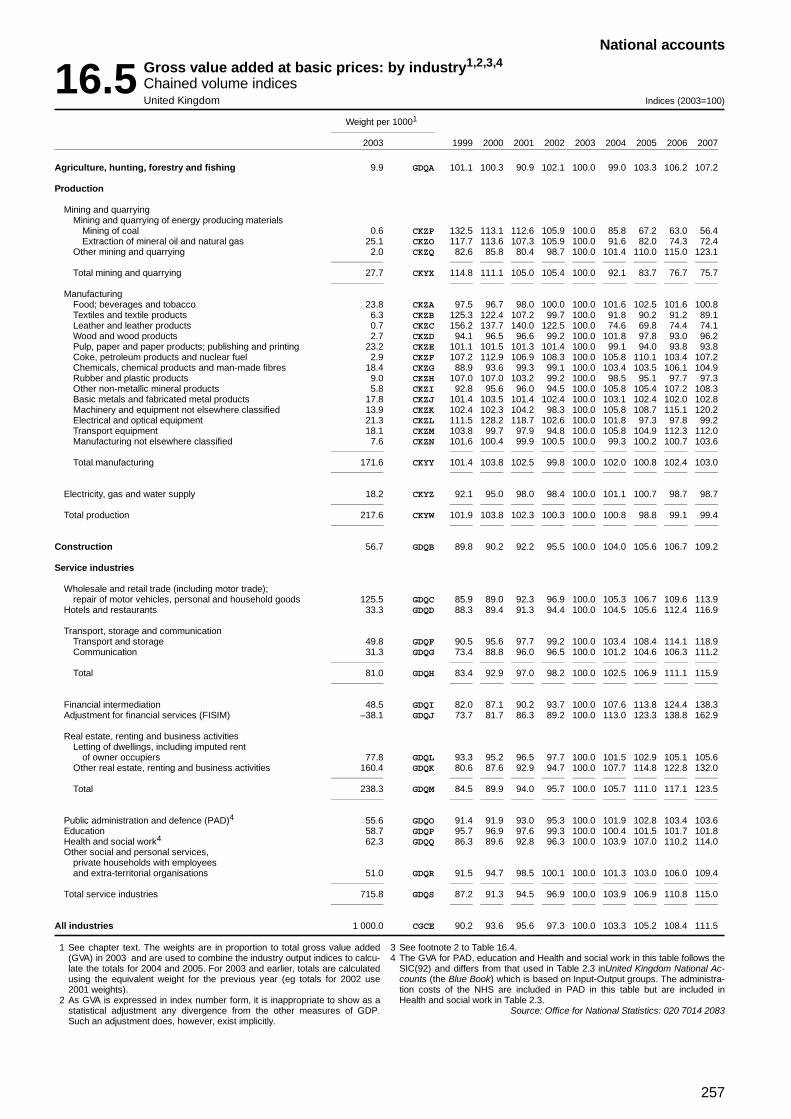
257
National accounts
16.5 Gross value added at basic prices: by industry1,2,3,4
Chained volume indicesUnited Kingdom Indices (2003=100)
Weight per 10001
2003 1999 2000 2001 2002 2003 2004 2005 2006 2007
Agriculture, hunting, forestry and fishing 9.9 GDQA 101.1 100.3 90.9 102.1 100.0 99.0 103.3 106.2 107.2
Production
Mining and quarryingMining and quarrying of energy producing materials
Mining of coal 0.6 CKZP 132.5 113.1 112.6 105.9 100.0 85.8 67.2 63.0 56.4Extraction of mineral oil and natural gas 25.1 CKZO 117.7 113.6 107.3 105.9 100.0 91.6 82.0 74.3 72.4
Other mining and quarrying 2.0 CKZQ 82.6 85.8 80.4 98.7 100.0 101.4 110.0 115.0 123.1
Total mining and quarrying 27.7 CKYX 114.8 111.1 105.0 105.4 100.0 92.1 83.7 76.7 75.7
ManufacturingFood; beverages and tobacco 23.8 CKZA 97.5 96.7 98.0 100.0 100.0 101.6 102.5 101.6 100.8Textiles and textile products 6.3 CKZB 125.3 122.4 107.2 99.7 100.0 91.8 90.2 91.2 89.1Leather and leather products 0.7 CKZC 156.2 137.7 140.0 122.5 100.0 74.6 69.8 74.4 74.1Wood and wood products 2.7 CKZD 94.1 96.5 96.6 99.2 100.0 101.8 97.8 93.0 96.2Pulp, paper and paper products; publishing and printing 23.2 CKZE 101.1 101.5 101.3 101.4 100.0 99.1 94.0 93.8 93.8Coke, petroleum products and nuclear fuel 2.9 CKZF 107.2 112.9 106.9 108.3 100.0 105.8 110.1 103.4 107.2Chemicals, chemical products and man-made fibres 18.4 CKZG 88.9 93.6 99.3 99.1 100.0 103.4 103.5 106.1 104.9Rubber and plastic products 9.0 CKZH 107.0 107.0 103.2 99.2 100.0 98.5 95.1 97.7 97.3Other non-metallic mineral products 5.8 CKZI 92.8 95.6 96.0 94.5 100.0 105.8 105.4 107.2 108.3Basic metals and fabricated metal products 17.8 CKZJ 101.4 103.5 101.4 102.4 100.0 103.1 102.4 102.0 102.8Machinery and equipment not elsewhere classified 13.9 CKZK 102.4 102.3 104.2 98.3 100.0 105.8 108.7 115.1 120.2Electrical and optical equipment 21.3 CKZL 111.5 128.2 118.7 102.6 100.0 101.8 97.3 97.8 99.2Transport equipment 18.1 CKZM 103.8 99.7 97.9 94.8 100.0 105.8 104.9 112.3 112.0Manufacturing not elsewhere classified 7.6 CKZN 101.6 100.4 99.9 100.5 100.0 99.3 100.2 100.7 103.6
Total manufacturing 171.6 CKYY 101.4 103.8 102.5 99.8 100.0 102.0 100.8 102.4 103.0
Electricity, gas and water supply 18.2 CKYZ 92.1 95.0 98.0 98.4 100.0 101.1 100.7 98.7 98.7
Total production 217.6 CKYW 101.9 103.8 102.3 100.3 100.0 100.8 98.8 99.1 99.4
Construction 56.7 GDQB 89.8 90.2 92.2 95.5 100.0 104.0 105.6 106.7 109.2
Service industries
Wholesale and retail trade (including motor trade);repair of motor vehicles, personal and household goods 125.5 GDQC 85.9 89.0 92.3 96.9 100.0 105.3 106.7 109.6 113.9
Hotels and restaurants 33.3 GDQD 88.3 89.4 91.3 94.4 100.0 104.5 105.6 112.4 116.9
Transport, storage and communicationTransport and storage 49.8 GDQF 90.5 95.6 97.7 99.2 100.0 103.4 108.4 114.1 118.9Communication 31.3 GDQG 73.4 88.8 96.0 96.5 100.0 101.2 104.6 106.3 111.2
Total 81.0 GDQH 83.4 92.9 97.0 98.2 100.0 102.5 106.9 111.1 115.9
Financial intermediation 48.5 GDQI 82.0 87.1 90.2 93.7 100.0 107.6 113.8 124.4 138.3Adjustment for financial services (FISIM) –38.1 GDQJ 73.7 81.7 86.3 89.2 100.0 113.0 123.3 138.8 162.9
Real estate, renting and business activitiesLetting of dwellings, including imputed rent
of owner occupiers 77.8 GDQL 93.3 95.2 96.5 97.7 100.0 101.5 102.9 105.1 105.6Other real estate, renting and business activities 160.4 GDQK 80.6 87.6 92.9 94.7 100.0 107.7 114.8 122.8 132.0
Total 238.3 GDQM 84.5 89.9 94.0 95.7 100.0 105.7 111.0 117.1 123.5
Public administration and defence (PAD)4 55.6 GDQO 91.4 91.9 93.0 95.3 100.0 101.9 102.8 103.4 103.6Education 58.7 GDQP 95.7 96.9 97.6 99.3 100.0 100.4 101.5 101.7 101.8Health and social work4 62.3 GDQQ 86.3 89.6 92.8 96.3 100.0 103.9 107.0 110.2 114.0Other social and personal services,
private households with employeesand extra-territorial organisations 51.0 GDQR 91.5 94.7 98.5 100.1 100.0 101.3 103.0 106.0 109.4
Total service industries 715.8 GDQS 87.2 91.3 94.5 96.9 100.0 103.9 106.9 110.8 115.0
All industries 1 000.0 CGCE 90.2 93.6 95.6 97.3 100.0 103.3 105.2 108.4 111.5
1 See chapter text. The weights are in proportion to total gross value added(GVA) in 2003 and are used to combine the industry output indices to calcu-late the totals for 2004 and 2005. For 2003 and earlier, totals are calculatedusing the equivalent weight for the previous year (eg totals for 2002 use2001 weights).
2 As GVA is expressed in index number form, it is inappropriate to show as astatistical adjustment any divergence from the other measures of GDP.Such an adjustment does, however, exist implicitly.
3 See footnote 2 to Table 16.4.4 The GVA for PAD, education and Health and social work in this table follows the
SIC(92) and differs from that used in Table 2.3 inUnited Kingdom National Ac-counts (the Blue Book) which is based on Input-Output groups. The administra-tion costs of the NHS are included in PAD in this table but are included inHealth and social work in Table 2.3.
Source: Office for National Statistics: 020 7014 2083

258
National accounts
16.6 Non-financial corporations1
Allocation of primary income account2
United Kingdom. ESA95 sector S.11 £ million
1999 2000 2001 2002 2003 2004 2005 2006 2007
ResourcesOperating surplus, gross NQBE 190 961 196 933 197 954 202 205 216 210 232 856 242 623 256 549 275 515Property income, received
Interest EABC 10 794 14 427 12 860 9 338 9 032 11 428 15 040 18 547 ..Distributed income of corporations EABD 21 501 26 631 36 868 32 210 .. .. .. .. ..Reinvested earnings on direct foreign investment HDVR 16 214 20 118 22 950 26 893 12 492 24 181 33 199 36 426 40 664Attributed property income of insurance policy-holders FAOF 338 489 280 302 .. .. .. .. ..Rent FAOG 117 117 117 118 .. .. .. .. ..
Total FAKY 48 935 61 471 73 796 67 240 72 370 80 188 95 498 99 842 109 789
Total resources FBXJ 239 896 258 404 271 750 269 445 288 580 313 044 338 121 356 391 385 304
UsesProperty income, paid
Interest EABG 31 857 38 389 40 056 37 134 36 445 42 002 49 725 62 369 ..Distributed income of corporations NVCS 87 100 83 202 100 810 91 868 .. .. .. .. ..Reinvested earnings on direct foreign investment HDVB 2 776 7 348 1 699 1 614 3 955 6 729 4 983 16 802 20 390Rent FBXO 564 1 319 1 896 1 853 .. .. .. .. ..
Total FBXK 123 593 133 583 149 517 130 849 140 764 149 298 163 317 183 468 199 278Balance of primary incomes, gross NQBG 116 303 124 821 122 233 138 596 147 816 163 746 174 804 172 923 186 026
Total uses FBXJ 239 896 258 404 271 750 269 445 288 580 313 044 338 121 356 391 385 304
After deduction of fixed capital consumption -DBGF –60 263 –62 465 –64 028 –65 775 –67 438 –69 979 –71 335 –72 737 ..Balance of primary incomes, net FBXQ 56 040 62 356 58 205 72 821 80 378 93 767 103 659 111 062 ..
1 See chapter text.2 Before deduction of fixed capital formation.
Source: Office for National Statistics: 020 7014 2014
16.7 Non-financial corporations1
Secondary distribution of income accountUnited Kingdom. ESA95 sector S.11 £ million
1999 2000 2001 2002 2003 2004 2005 2006 2007
Resources
Balance of primary incomes, gross NQBG 116 303 124 821 122 233 138 596 147 816 163 746 174 804 172 923 186 026
Social contributionsImputed social contributions NSTJ 3 845 4 175 4 357 4 575 4 229 3 864 3 612 3 490 3 508
Current transfers other than taxes,social contributions and benefitsNon-life insurance claims FCBP 4 151 4 456 4 565 7 789 .. .. .. .. ..Miscellaneous transfers NRJY 611 622 619 616 .. .. .. .. ..
Total NRJB 4 260 6 008 5 122 5 599 6 595 6 619 7 248 8 524 6 335
Total resources FCBR 124 408 135 004 131 712 148 770 158 640 174 229 185 664 184 937 195 869
UsesCurrent taxes on income, wealth etc.
Taxes on income FCBS 22 948 24 497 23 177 24 038 23 702 27 348 33 610 37 182 40 882
Social benefits other than social transfers in kind NSTJ 3 845 4 175 4 357 4 575 4 229 3 864 3 612 3 490 3 508
Current transfers other than taxes,social contributions and benefitsNet non-life insurance premiums FCBY 4 151 4 456 4 565 7 789 .. .. .. .. ..Miscellaneous current transfers FDBI 569 413 411 422 434 446 .. .. ..
Total, other current transfers FCBX 4 860 6 476 5 506 5 932 6 933 7 042 7 736 9 001 6 823Gross Disposable Income NRJD 92 755 99 856 98 672 114 225 123 776 135 975 140 706 135 264 144 656
Total uses FCBR 124 408 135 004 131 712 148 770 158 640 174 229 185 664 184 937 195 869
After deduction of fixed capital consumption -DBGF –60 263 –62 465 –64 028 –65 775 –67 438 –69 979 –71 335 –72 737 ..Disposable income, net FCCF 32 492 37 391 34 644 48 450 56 338 65 996 69 564 73 364 ..
1 See chapter text. Source: Office for National Statistics: 020 7014 2014
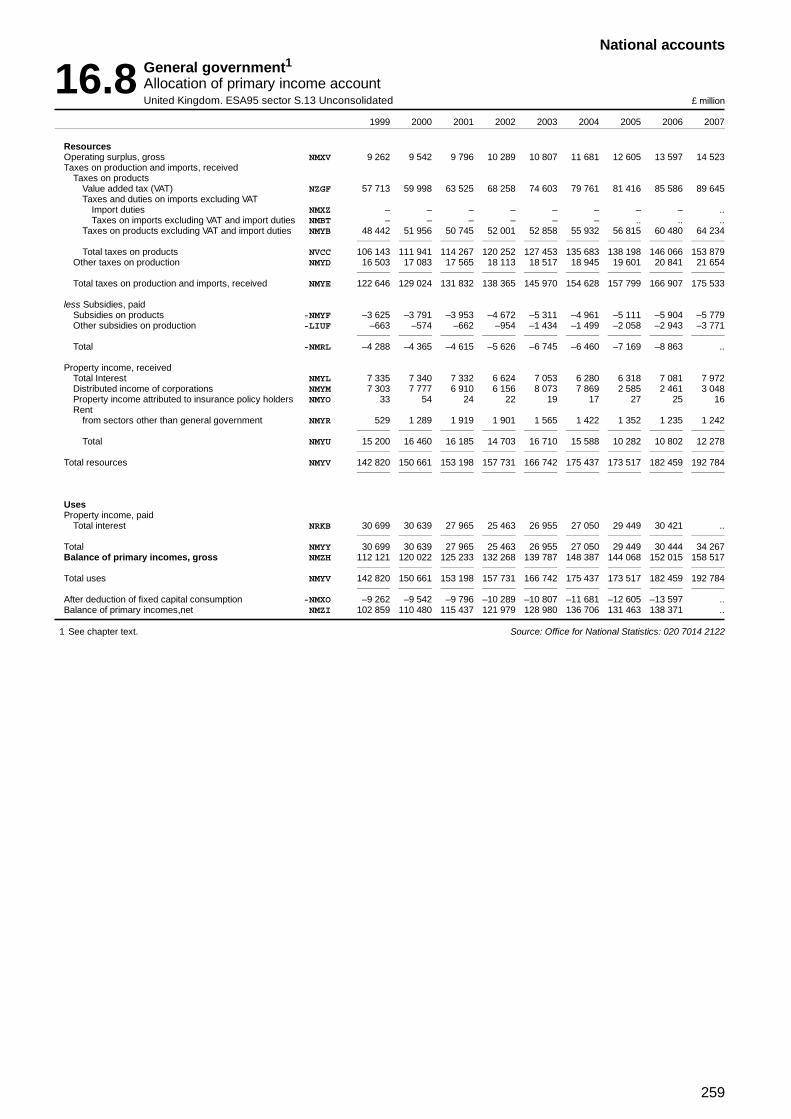
259
National accounts
16.8 General government1Allocation of primary income accountUnited Kingdom. ESA95 sector S.13 Unconsolidated £ million
1999 2000 2001 2002 2003 2004 2005 2006 2007
ResourcesOperating surplus, gross NMXV 9 262 9 542 9 796 10 289 10 807 11 681 12 605 13 597 14 523Taxes on production and imports, received
Taxes on productsValue added tax (VAT) NZGF 57 713 59 998 63 525 68 258 74 603 79 761 81 416 85 586 89 645Taxes and duties on imports excluding VAT
Import duties NMXZ – – – – – – – – ..Taxes on imports excluding VAT and import duties NMBT – – – – – – .. .. ..
Taxes on products excluding VAT and import duties NMYB 48 442 51 956 50 745 52 001 52 858 55 932 56 815 60 480 64 234
Total taxes on products NVCC 106 143 111 941 114 267 120 252 127 453 135 683 138 198 146 066 153 879Other taxes on production NMYD 16 503 17 083 17 565 18 113 18 517 18 945 19 601 20 841 21 654
Total taxes on production and imports, received NMYE 122 646 129 024 131 832 138 365 145 970 154 628 157 799 166 907 175 533
less Subsidies, paidSubsidies on products -NMYF –3 625 –3 791 –3 953 –4 672 –5 311 –4 961 –5 111 –5 904 –5 779Other subsidies on production -LIUF –663 –574 –662 –954 –1 434 –1 499 –2 058 –2 943 –3 771
Total -NMRL –4 288 –4 365 –4 615 –5 626 –6 745 –6 460 –7 169 –8 863 ..
Property income, receivedTotal Interest NMYL 7 335 7 340 7 332 6 624 7 053 6 280 6 318 7 081 7 972Distributed income of corporations NMYM 7 303 7 777 6 910 6 156 8 073 7 869 2 585 2 461 3 048Property income attributed to insurance policy holders NMYO 33 54 24 22 19 17 27 25 16Rent
from sectors other than general government NMYR 529 1 289 1 919 1 901 1 565 1 422 1 352 1 235 1 242
Total NMYU 15 200 16 460 16 185 14 703 16 710 15 588 10 282 10 802 12 278
Total resources NMYV 142 820 150 661 153 198 157 731 166 742 175 437 173 517 182 459 192 784
UsesProperty income, paid
Total interest NRKB 30 699 30 639 27 965 25 463 26 955 27 050 29 449 30 421 ..
Total NMYY 30 699 30 639 27 965 25 463 26 955 27 050 29 449 30 444 34 267Balance of primary incomes, gross NMZH 112 121 120 022 125 233 132 268 139 787 148 387 144 068 152 015 158 517
Total uses NMYV 142 820 150 661 153 198 157 731 166 742 175 437 173 517 182 459 192 784
After deduction of fixed capital consumption -NMXO –9 262 –9 542 –9 796 –10 289 –10 807 –11 681 –12 605 –13 597 ..Balance of primary incomes,net NMZI 102 859 110 480 115 437 121 979 128 980 136 706 131 463 138 371 ..
1 See chapter text. Source: Office for National Statistics: 020 7014 2122

260
National accounts
16.9 General government1Secondary distribution of income accountUnited Kingdom. ESA95 sector S.13 Unconsolidated £ million
1999 2000 2001 2002 2003 2004 2005 2006 2007
ResourcesBalance of primary incomes, gross NMZH 112 121 120 022 125 233 132 268 139 787 148 387 144 068 152 015 158 517Current taxes on income, wealth etc.
Taxes on income NMZJ 129 553 140 002 147 264 142 842 144 234 154 717 172 619 192 805 200 068Other current taxes NVCM 19 519 20 287 22 068 23 664 26 016 27 718 29 253 30 906 32 643
Total NMZL 149 072 160 289 169 332 166 506 170 250 182 435 201 872 223 711 232 711
Social contributionsActual social contributions
Employers’ actual social contributions NMZM 33 401 36 397 38 460 38 780 45 067 49 602 52 904 56 024 59 834Employees’ social contributions NMZN 26 645 27 293 28 725 29 568 34 376 38 150 41 538 44 378 46 380Social contributions by self- and non-employed persons NMZO 1 883 2 049 2 183 2 318 2 595 2 727 2 825 2 930 2 890
Total NMZP 61 929 65 739 69 368 70 666 82 038 90 479 97 267 103 332 109 104Imputed social contributions NMZQ 6 927 7 395 7 577 8 348 6 456 5 928 7 282 7 283 7 698
Total NMZR 68 856 73 134 76 945 79 014 88 494 96 407 104 549 110 615 116 802
Other current transfersNon-life insurance claims NMZS 410 403 353 400 296 285 328 373 275Current transfers within general government NMZT 64 446 66 187 72 522 77 592 85 224 91 910 100 224 110 297 112 789Current international cooperation NMZU 3 176 2 084 4 568 3 112 3 570 3 604 3 668 3 674 3 559Miscellaneous current transfers
from sectors other than general government NMZX 392 447 460 502 562 610 627 589 591
Other current transfers NNAA 68 424 69 121 77 903 81 606 89 652 96 409 104 847 114 933 117 214
Total resources NNAB 398 473 422 566 449 413 459 394 488 183 523 638 555 336 601 274 625 244
UsesSocial benefits other than social transfers in kind NNAD 117 685 120 163 129 591 136 801 146 066 154 216 161 979 167 243 177 179Other current transfers
Net non-life insurance premiums NNAE 410 403 353 400 296 285 328 373 275Current transfers within general government NNAF 64 446 66 187 72 522 77 592 85 224 91 910 100 224 110 297 112 789Current international cooperation NNAG 1 667 2 418 2 434 2 573 2 720 3 180 3 300 3 640 4 066Miscellaneous current transfers
to sectors other than general government NNAI 18 466 20 913 22 131 27 351 30 275 32 550 34 947 34 708 36 019Of which: GNP based fourth own resource NMFH 4 632 4 379 3 858 5 335 6 772 7 549 8 732 8 521 8 323
Other current transfers NNAN 84 989 89 921 97 440 107 916 118 515 127 925 138 799 149 018 153 149Gross Disposable Income NNAO 194 938 211 622 221 480 213 801 222 760 240 660 253 561 283 938 293 805
Total uses NNAB 398 473 422 566 449 413 459 394 488 183 523 638 555 336 601 274 625 244
After deduction of fixed capital consumption -NMXO –9 262 –9 542 –9 796 –10 289 –10 807 –11 681 –12 605 –13 597 ..Disposable income, net NNAP 185 676 202 080 211 684 203 512 211 953 228 979 240 956 268 305 ..
1 See chapter text. Source: Office for National Statistics: 020 7014 2122

261
National accounts
16.10 Households and non-profit institutions serving households1
Allocation of primary income accountUnited Kingdom. ESA95 sectors S.14 and S.15 £ million
1999 2000 2001 2002 2003 2004 2005 2006 2007
ResourcesOperating surplus, gross QWLS 51 195 53 960 59 083 62 544 67 935 72 709 77 791 82 112 87 599Mixed income, gross QWLT 55 734 57 805 62 121 65 771 69 122 71 958 75 675 78 863 83 951Compensation of employees
Wages and salaries QWLW 431 795 462 505 491 044 508 681 527 689 550 654 578 300 606 710 636 205Employers’ social contributions QWLX 64 199 69 824 73 216 78 782 89 263 98 134 107 895 115 805 117 595
Total QWLY 495 994 532 329 564 260 587 463 616 952 648 788 686 195 722 515 753 800
Property incomeInterest QWLZ 24 147 28 239 26 823 20 878 20 966 26 242 31 422 32 824 40 937Distributed income of corporations QWMA 40 411 44 408 49 881 43 695 44 843 46 239 51 628 49 154 46 856Attributed property income of insurance policy holders QWMC 56 303 56 048 56 109 55 057 54 997 54 589 63 725 66 960 72 984Rent QWMD 105 105 105 106 108 110 110 112 106
Total QWME 120 966 128 800 132 918 119 736 120 914 127 180 146 885 149 050 160 883
Total resources QWMF 723 889 772 894 818 382 835 514 874 923 920 635 986 546 1 032 540 1 086 233
UsesProperty income
Interest QWMG 47 434 52 875 52 141 51 513 53 576 62 677 69 497 73 381 86 326Rent QWMH 215 215 215 216 220 224 224 224 230
Total QWMI 47 649 53 090 52 356 51 729 53 796 62 901 69 721 73 605 86 556Balance of primary incomes, gross QWMJ 676 240 719 804 766 026 783 785 821 127 857 734 916 825 958 935 999 677
Total uses QWMF 723 889 772 894 818 382 835 514 874 923 920 635 986 546 1 032 540 1 086 233
After deduction offixed capital consumption -QWLL –27 976 –30 518 –32 908 –36 043 –36 903 –42 509 –43 257 –48 623 ..
Balance of primary incomes, net QWMK 648 264 689 287 733 117 747 742 784 224 815 368 874 204 916 423 ..
1 See chapter text. Source: Office for National Statistics: 020 7014 2131

262
National accounts
16.11 Households and non-profit institutions serving households1
Secondary distribution of income accountUnited Kingdom. ESA95 sectors S.14 and S.15 £ million
1999 2000 2001 2002 2003 2004 2005 2006 2007
ResourcesBalance of primary incomes, gross QWMJ 676 240 719 804 766 026 783 785 821 127 857 734 916 825 958 935 999 677Imputed social contributions RVFH 450 476 502 530 505 495 500 508 516Social benefits other than social transfers in kind QWML 157 647 162 833 171 814 182 673 193 596 202 074 213 858 222 618 232 143
Other current transfersNon-life insurance claims QWMM 13 762 16 150 15 607 17 177 14 824 15 494 17 172 20 729 15 371Miscellaneous current transfers QWMN 24 392 27 520 29 080 33 041 34 687 36 284 38 489 38 742 39 782Total QWMO 38 154 43 670 44 687 50 218 49 511 51 778 55 661 59 471 55 153
Total resources QWMP 872 491 926 783 983 029 1 017 206 1 064 739 1 112 081 1 186 844 1 241 532 1 287 489
UsesCurrent taxes on income, wealth etc
Taxes on income QWMQ 96 528 105 299 111 888 112 171 113 087 120 253 130 342 139 962 151 574Other current taxes NVCO 18 658 19 427 21 166 22 788 25 174 26 881 28 256 29 831 31 532
Total QWMS 115 186 124 726 133 054 134 959 138 261 147 134 158 598 169 793 183 106
Social contributionsActual social contributions
Employers’ actual social contributions QWMT 52 529 57 288 60 296 64 805 77 571 87 347 95 997 104 016 105 361Employees’ social contributions QWMU 57 434 58 806 60 599 62 458 66 490 69 576 78 033 83 495 87 548Social contributions by self and non-employed QWMV 1 883 2 049 2 183 2 318 2 595 2 727 2 825 2 930 2 890
Total QWMW 111 846 118 143 123 078 129 581 146 656 159 650 176 855 189 696 ..Imputed social contributions QWMX 11 670 12 536 12 920 13 977 11 692 10 787 11 898 11 789 12 234
Total QWMY 123 516 130 679 135 998 143 558 158 348 170 437 188 753 202 230 208 033
Social benefits other than social transfers in kind QWMZ 922 948 977 1 006 987 984 994 1 004 1 012
Other current transfersNet non-life insurance premiums QWNA 13 762 16 150 15 607 17 177 14 824 15 494 17 172 20 729 15 371Miscellaneous current transfers QWNB 10 117 10 865 11 081 11 458 11 930 12 349 13 340 13 269 13 550
Total QWNC 23 879 27 015 26 688 28 635 26 754 27 843 30 512 33 998 28 921Gross Disposable Income2 QWND 608 988 643 415 686 312 709 048 740 389 765 683 807 987 834 507 866 417
Total uses QWMP 872 491 926 783 983 029 1 017 206 1 064 739 1 112 081 1 186 844 1 241 532 1 287 489
After deduction of fixed capital consumption -QWLL –27 976 –30 518 –32 908 –36 043 –36 903 –42 509 –43 257 –48 623 ..Disposable income, net QWNE 581 012 612 898 653 403 673 005 703 486 723 317 765 366 793 314 ..
1 See chapter text.2 Gross household disposable income revalued by the implied households
and NPISH’s final consumption expenditure deflator. For more details seetable 6.1.4 on page 217 in United Kingdom National Accounts (the Bluebook).
Source: Office for National Statistics: 020 7014 2131
16.12 Households and non-profit institutions serving households1
Use of disposable income accountUnited Kingdom. ESA95 sectors S.14 and S.15 £ million and percentages
1999 2000 2001 2002 2003 2004 2005 2006 2007
ResourcesDisposable income, gross QWND 608 988 643 415 686 312 709 048 740 389 765 683 807 987 834 507 866 417Adjustment for the change in net equity
of households in pension funds NSSE 14 016 14 164 16 041 17 783 21 377 25 108 31 210 35 043 34 955
Total resources NSSF 623 004 657 579 702 353 726 831 761 766 790 791 839 197 869 550 901 372
UsesFinal consumption expenditure
Individual consumption expenditure NSSG 589 868 623 995 657 216 690 530 724 345 761 484 792 454 827 641 874 959Saving, gross NSSH 33 136 33 584 45 137 36 301 37 421 29 307 46 743 41 909 26 413
Total uses NSSF 623 004 657 579 702 353 726 831 761 766 790 791 839 197 869 550 901 372
Saving ratio (percentages) RVGL 5.3 5.1 6.4 5.0 4.9 3.7 5.6 4.8 2.9
1 See chapter text. Source: Office for National Statistics: 020 7014 2131

263
National accounts
16.13 The sector accounts: key economic indicators1
United Kingdom£ million and indices (2003=100)
1999 2000 2001 2002 2003 2004 2005 2006 2007
Net lending/borrowing by:
Non-financial corporations EABO –13 157 –7 541 –10 509 6 529 18 181 26 255 21 040 13 796 7 556Financial corporations NHCQ –14 185 –27 457 –22 800 7 018 19 335 26 479 7 830 3 226 25 592General government NNBK 8 749 13 338 6 727 –20 164 –37 013 –40 144 –41 969 –33 307 –40 095Households and NPISH’s NSSZ –4 112 –4 205 2 938 –11 841 –14 687 –32 241 –13 954 –28 565 –50 464Rest of the world NHRB 20 970 23 130 20 566 15 581 13 455 17 265 29 494 49 872 55 336
Private non-financial corporations
Gross trading profitsContinental shelf profits CAGJ 13 864 21 458 20 397 18 742 .. .. .. .. ..Others CAED 160 743 160 153 159 134 167 068 181 339 199 272 202 699 210 125 231 637
Rental of buildings FCBW 10 821 11 747 12 394 12 904 13 891 14 864 15 404 16 005 16 787less Holding gains of inventories -DLQZ –1 800 –2 941 438 –2 856 –4 266 –6 158 –6 619 –5 486 –6 306
Gross operating surplus NRJK 183 283 189 745 191 062 195 548 208 945 226 203 234 129 246 767 264 941
Households and NPISH
Household gross disposable income QWND 608 988 643 415 686 312 709 048 740 389 765 683 807 987 834 507 866 417Implied deflator of household and NPISH individual
consumption expenditure indicies (2003=100) YBFS 93.4 94.4 96.6 98.1 100.0 101.7 104.2 106.7 109.4Real household disposable income:
Chained volume measures (Reference year 2003) RVGK 652 060 681 249 710 531 722 823 740 389 752 890 775 072 782 029 791 672Indices (2003=100) OSXR 88.1 92.0 96.0 97.6 100.0 101.7 104.7 105.7 106.9
Gross saving NSSH 33 136 33 584 45 137 36 301 37 421 29 307 46 743 41 909 26 413Households total resources NSSJ 725 746 766 876 820 811 857 647 905 720 946 602 1 006 596 1 044 856 1 085 874
Saving ratio (percentages) RVGL 5.3 5.1 6.4 5.0 4.9 3.7 5.6 4.8 2.9
1 See chapter text. Source: Office for National Statistics: 020 7014 2083

264
National accounts
16.14 Household final consumption expenditure: by purpose1
Current market pricesUnited Kingdom £ million
1999 2000 2001 2002 2003 2004 2005 2006 2007
Durable goodsFurnishings, household equipment and
routine maintenance of the house LLIJ 16 566 18 006 19 275 20 470 21 595 22 363 22 535 23 192 24 426Health LLIK 1 881 1 997 2 109 2 411 2 604 2 727 2 710 3 091 3 220Transport LLIL 31 888 33 291 35 864 36 574 38 016 38 792 38 319 38 646 39 827Communication LLIM 512 601 636 644 810 859 958 935 978Recreation and culture LLIN 14 262 14 878 15 970 16 471 17 752 19 373 19 593 20 297 21 003Miscellaneous goods and services LLIO 3 398 3 403 3 750 4 204 4 284 4 539 4 357 4 540 4 542
Total durable goods UTIA 68 507 72 176 77 604 80 774 85 061 88 653 88 472 90 701 93 996
Semi-durable goodsClothing and footwear LLJL 32 661 34 759 36 092 38 351 40 389 42 006 43 170 45 213 47 041Furnishings, household equipment and
routine maintenance of the house LLJM 10 577 11 677 12 400 13 361 13 932 14 462 13 641 14 273 14 706Transport LLJN 3 018 2 772 2 783 3 112 3 423 3 381 3 537 3 785 3 821Recreation and culture LLJO 19 049 20 405 21 606 23 910 26 009 28 228 28 692 29 810 30 987Miscellaneous goods and services LLJP 1 926 2 018 2 427 2 886 3 356 3 754 3 432 3 299 3 471
Total semi-durable goods UTIQ 67 231 71 631 75 308 81 620 87 109 91 831 92 472 96 380 100 026
Non-durable goodsFood & drink ABZV 57 040 58 628 59 804 61 310 63 174 65 521 67 539 70 929 76 505Alcohol & tobacco ADFL 24 458 24 617 25 158 25 966 27 297 27 713 28 073 28 522 29 780Housing, water, electricity, gas and
other fuels LLIX 21 800 22 265 23 076 23 444 24 241 27 011 28 441 32 789 35 101Furnishings, household equipment and
routine maintenance of the house LLIY 2 657 2 786 2 972 3 169 3 338 3 391 3 456 3 681 3 652Health LLIZ 3 111 3 268 3 613 3 855 3 938 4 023 3 815 3 852 3 879Transport LLJA 18 210 19 987 19 391 19 129 20 072 21 873 23 689 23 843 23 818Recreation and culture LLJB 12 665 12 959 13 107 13 392 13 507 13 650 13 831 14 088 14 559Miscellaneous goods and services LLJC 9 121 9 463 9 884 11 272 12 602 13 486 14 108 14 347 15 674
Total non-durable goods UTII 149 062 153 973 157 005 161 537 168 169 176 668 182 952 192 051 202 968
Total goods UTIE 284 800 297 780 309 917 323 931 340 339 357 152 363 896 379 132 396 990
ServicesClothing and footwear LLJD 714 720 730 741 766 786 843 902 929Housing, water, electricity, gas and
other fuels LLJE 81 393 85 785 92 829 97 794 104 810 111 029 118 484 125 572 134 803Furnishings, household equipment and
routine maintenance of the house LLJF 3 046 3 206 3 327 3 448 3 601 3 813 4 013 4 142 4 200Health LLJG 3 783 3 943 4 254 4 512 4 793 5 182 5 577 5 533 6 108Transport LLJH 34 121 37 002 38 397 41 332 43 058 45 167 47 393 49 909 52 533Communication LLJI 11 493 12 755 13 521 14 031 14 844 15 589 15 814 15 993 16 691Recreation and culture LLJJ 21 505 21 912 22 769 25 349 27 118 29 806 32 003 33 524 35 325Education ADIE 8 943 9 534 9 409 9 381 9 610 9 990 10 409 10 998 12 157Restaurants and hotels ADIF 64 387 68 557 71 620 76 426 78 902 83 595 88 934 92 012 96 442Miscellaneous goods and services LLJK 48 431 52 691 56 199 57 054 57 161 58 381 61 454 63 999 69 327
Total services UTIM 277 816 296 105 313 055 330 068 344 663 363 338 384 924 402 584 428 515
Final consumption expenditure in the UKby resident and non-resident households(domestic concept) ABQI 562 616 593 885 622 972 653 999 685 002 720 490 748 820 781 716 825 505
Final consumption expenditure outside the UKby UK resident households ABTA 19 690 21 654 22 907 24 435 26 314 27 739 29 209 30 564 32 362
less Final consumption expenditure in the UKby households resident in the rest of the world CDFD –14 312 –14 713 –13 383 –13 872 –14 156 –15 698 –17 160 –18 605 –19 582
Final consumption expenditure by UK residenthouseholds in the UK and abroad(national concept) ABPB 567 994 600 826 632 496 664 562 697 160 732 531 760 869 793 675 838 285
1 See chapter text. Additional detail is published in Consumer Trends andtable A7 of UK Economic Accounts, available from the National Statisticswebsite www.statistics.gov.uk/statbase/Product.asp?vlnk=1904.
Source: Office for National Statistics: 020 7014 2116

265
National accounts
16.15 Household final consumption expenditure: by purpose1
Chained volume measures, reference year 2003United Kingdom £ million
1999 2000 2001 2002 2003 2004 2005 2006 2007
Durable goodsFurnishings, household equipment and
routine maintenance of the house LLME 16 764 18 442 19 542 20 603 21 595 22 030 21 892 22 228 22 641Health LLMF 2 585 2 455 2 337 2 421 2 604 2 612 2 562 2 938 3 010Transport LLMG 29 455 31 680 35 100 36 057 38 016 39 107 39 571 40 364 41 453Communication LLMH 428 536 582 640 810 883 1 082 1 133 1 427Recreation and culture LLMI 9 657 11 243 13 344 14 911 17 752 21 381 24 909 28 982 35 010Miscellaneous goods and services LLMJ 3 656 3 618 3 932 4 360 4 284 4 445 4 227 4 146 3 984
Total durable goods UTIC 61 603 67 366 74 551 78 825 85 061 90 458 94 243 99 791 107 525
Semi-durable goodsClothing and footwear LLNG 27 921 30 969 33 712 37 727 40 389 43 327 45 637 48 279 50 892Furnishings, household equipment and
routine maintenance of the house LLNH 10 177 11 473 12 221 13 215 13 932 14 426 13 862 14 615 14 888Transport LLNI 3 136 2 856 2 880 3 172 3 423 3 313 3 369 3 486 3 474Recreation and culture LLNJ 17 229 19 175 20 339 23 040 26 009 29 115 30 179 31 868 32 765Miscellaneous goods and services LLNK 1 932 2 053 2 438 2 920 3 356 3 771 3 354 3 175 3 255
Total semi-durable goods UTIS 60 277 66 478 71 563 80 058 87 109 93 952 96 401 101 423 105 274
Non-durable goodsFood & drink ADIP 59 904 61 944 61 048 62 143 63 174 65 181 66 231 67 970 70 453Alcohol & tobacco ADIS 27 623 26 704 26 497 26 884 27 297 27 444 27 325 26 900 27 347Housing, water, electricity, gas and
other fuels LLMS 22 594 23 189 23 958 23 881 24 241 25 723 24 743 24 445 24 312Furnishings, household equipment and
routine maintenance of the house LLMT 2 492 2 666 2 878 3 101 3 338 3 519 3 582 3 687 3 593Health LLMU 3 314 3 397 3 686 3 895 3 938 4 043 3 830 3 930 3 894Transport LLMV 19 691 19 114 19 550 19 825 20 072 20 731 20 719 19 809 19 233Recreation and culture LLMW 13 713 13 657 13 537 13 681 13 507 13 463 13 571 13 483 13 770Miscellaneous goods and services LLMX 8 669 9 248 9 586 11 124 12 602 13 631 14 399 15 146 16 137
Total non-durable goods UTIK 157 573 159 677 160 597 164 482 168 169 173 735 174 400 175 370 178 739
Total goods UTIG 277 468 292 390 306 198 323 179 340 339 358 145 365 044 376 584 391 538
ServicesClothing and footwear LLMY 819 805 790 775 766 760 773 791 777Housing, water, electricity, gas and
other fuels LLMZ 101 184 102 168 102 778 104 106 104 810 105 767 107 013 108 882 110 118Furnishings, household equipment and
routine maintenance of the house LLNA 3 874 3 821 3 718 3 646 3 601 3 602 3 595 3 548 3 433Health LLNB 4 531 4 612 4 683 4 665 4 793 4 954 5 244 5 124 5 489Transport LLNC 41 413 43 153 40 971 42 611 43 058 43 459 43 657 44 277 45 111Communication LLND 10 527 12 167 13 877 14 158 14 844 15 478 16 038 16 222 17 408Recreation and culture LLNE 24 795 25 101 25 960 26 216 27 118 28 930 29 935 29 874 30 336Education ADMJ 11 394 11 489 10 692 10 091 9 610 9 541 9 476 9 480 9 757Restaurants and hotels ADMK 74 191 76 252 76 434 78 303 78 902 81 796 83 893 83 648 84 763Miscellaneous goods and services LLNF 53 735 55 696 57 368 57 336 57 161 56 232 55 739 55 843 57 241
Total services UTIO 325 416 334 699 337 218 341 883 344 663 350 519 355 363 357 689 364 433
Final consumption expenditure in the UKby resident and non-resident households(domestic concept) ABQJ 600 627 625 437 642 595 664 790 685 002 708 664 720 407 734 273 755 971
Final consumption expenditure outside the UKby UK resident households ABTC 21 899 24 189 24 897 26 376 26 314 28 068 27 750 28 419 29 658
less Final consumption expenditure in the UKby households resident in the rest of the world CCHX –16 031 –16 038 –14 164 –14 292 –14 156 –15 298 –16 152 –16 955 –17 232
Final consumption expenditure by UK residenthouseholds in the UK and abroad(national concept) ABPF 606 648 633 662 653 326 676 833 697 160 721 434 732 005 745 737 768 397
1 See chapter text. Additional detail is published in Consumer Trends andtable A7 of UK Economic Accounts, available from the National Statisticswebsite www.statistics.gov.uk/statbase/Product.asp?vlnk=1904.
Source: Office for National Statistics: 020 7014 2116
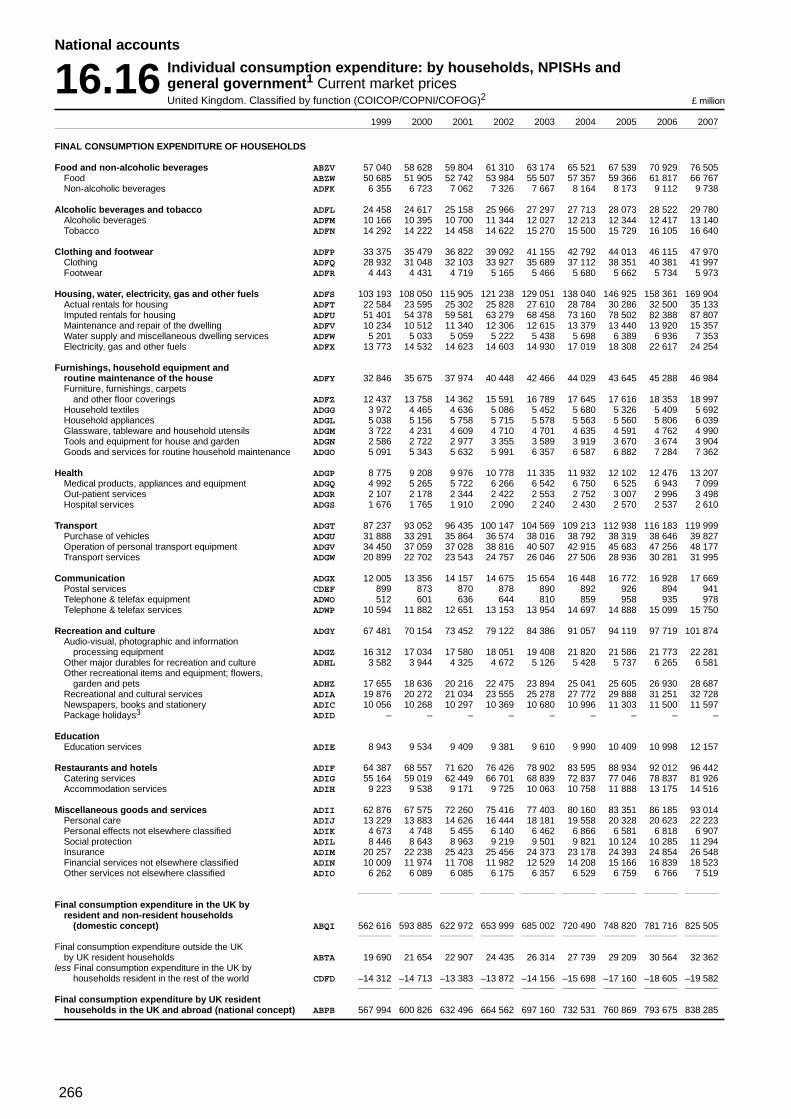
266
National accounts
16.16 Individual consumption expenditure: by households, NPISHs andgeneral government1 Current market pricesUnited Kingdom. Classified by function (COICOP/COPNI/COFOG)2 £ million
1999 2000 2001 2002 2003 2004 2005 2006 2007
FINAL CONSUMPTION EXPENDITURE OF HOUSEHOLDS
Food and non-alcoholic beverages ABZV 57 040 58 628 59 804 61 310 63 174 65 521 67 539 70 929 76 505Food ABZW 50 685 51 905 52 742 53 984 55 507 57 357 59 366 61 817 66 767Non-alcoholic beverages ADFK 6 355 6 723 7 062 7 326 7 667 8 164 8 173 9 112 9 738
Alcoholic beverages and tobacco ADFL 24 458 24 617 25 158 25 966 27 297 27 713 28 073 28 522 29 780Alcoholic beverages ADFM 10 166 10 395 10 700 11 344 12 027 12 213 12 344 12 417 13 140Tobacco ADFN 14 292 14 222 14 458 14 622 15 270 15 500 15 729 16 105 16 640
Clothing and footwear ADFP 33 375 35 479 36 822 39 092 41 155 42 792 44 013 46 115 47 970Clothing ADFQ 28 932 31 048 32 103 33 927 35 689 37 112 38 351 40 381 41 997Footwear ADFR 4 443 4 431 4 719 5 165 5 466 5 680 5 662 5 734 5 973
Housing, water, electricity, gas and other fuels ADFS 103 193 108 050 115 905 121 238 129 051 138 040 146 925 158 361 169 904Actual rentals for housing ADFT 22 584 23 595 25 302 25 828 27 610 28 784 30 286 32 500 35 133Imputed rentals for housing ADFU 51 401 54 378 59 581 63 279 68 458 73 160 78 502 82 388 87 807Maintenance and repair of the dwelling ADFV 10 234 10 512 11 340 12 306 12 615 13 379 13 440 13 920 15 357Water supply and miscellaneous dwelling services ADFW 5 201 5 033 5 059 5 222 5 438 5 698 6 389 6 936 7 353Electricity, gas and other fuels ADFX 13 773 14 532 14 623 14 603 14 930 17 019 18 308 22 617 24 254
Furnishings, household equipment androutine maintenance of the house ADFY 32 846 35 675 37 974 40 448 42 466 44 029 43 645 45 288 46 984Furniture, furnishings, carpets
and other floor coverings ADFZ 12 437 13 758 14 362 15 591 16 789 17 645 17 616 18 353 18 997Household textiles ADGG 3 972 4 465 4 636 5 086 5 452 5 680 5 326 5 409 5 692Household appliances ADGL 5 038 5 156 5 758 5 715 5 578 5 563 5 560 5 806 6 039Glassware, tableware and household utensils ADGM 3 722 4 231 4 609 4 710 4 701 4 635 4 591 4 762 4 990Tools and equipment for house and garden ADGN 2 586 2 722 2 977 3 355 3 589 3 919 3 670 3 674 3 904Goods and services for routine household maintenance ADGO 5 091 5 343 5 632 5 991 6 357 6 587 6 882 7 284 7 362
Health ADGP 8 775 9 208 9 976 10 778 11 335 11 932 12 102 12 476 13 207Medical products, appliances and equipment ADGQ 4 992 5 265 5 722 6 266 6 542 6 750 6 525 6 943 7 099Out-patient services ADGR 2 107 2 178 2 344 2 422 2 553 2 752 3 007 2 996 3 498Hospital services ADGS 1 676 1 765 1 910 2 090 2 240 2 430 2 570 2 537 2 610
Transport ADGT 87 237 93 052 96 435 100 147 104 569 109 213 112 938 116 183 119 999Purchase of vehicles ADGU 31 888 33 291 35 864 36 574 38 016 38 792 38 319 38 646 39 827Operation of personal transport equipment ADGV 34 450 37 059 37 028 38 816 40 507 42 915 45 683 47 256 48 177Transport services ADGW 20 899 22 702 23 543 24 757 26 046 27 506 28 936 30 281 31 995
Communication ADGX 12 005 13 356 14 157 14 675 15 654 16 448 16 772 16 928 17 669Postal services CDEF 899 873 870 878 890 892 926 894 941Telephone & telefax equipment ADWO 512 601 636 644 810 859 958 935 978Telephone & telefax services ADWP 10 594 11 882 12 651 13 153 13 954 14 697 14 888 15 099 15 750
Recreation and culture ADGY 67 481 70 154 73 452 79 122 84 386 91 057 94 119 97 719 101 874Audio-visual, photographic and information
processing equipment ADGZ 16 312 17 034 17 580 18 051 19 408 21 820 21 586 21 773 22 281Other major durables for recreation and culture ADHL 3 582 3 944 4 325 4 672 5 126 5 428 5 737 6 265 6 581Other recreational items and equipment; flowers,
garden and pets ADHZ 17 655 18 636 20 216 22 475 23 894 25 041 25 605 26 930 28 687Recreational and cultural services ADIA 19 876 20 272 21 034 23 555 25 278 27 772 29 888 31 251 32 728Newspapers, books and stationery ADIC 10 056 10 268 10 297 10 369 10 680 10 996 11 303 11 500 11 597Package holidays3 ADID – – – – – – – – –
EducationEducation services ADIE 8 943 9 534 9 409 9 381 9 610 9 990 10 409 10 998 12 157
Restaurants and hotels ADIF 64 387 68 557 71 620 76 426 78 902 83 595 88 934 92 012 96 442Catering services ADIG 55 164 59 019 62 449 66 701 68 839 72 837 77 046 78 837 81 926Accommodation services ADIH 9 223 9 538 9 171 9 725 10 063 10 758 11 888 13 175 14 516
Miscellaneous goods and services ADII 62 876 67 575 72 260 75 416 77 403 80 160 83 351 86 185 93 014Personal care ADIJ 13 229 13 883 14 626 16 444 18 181 19 558 20 328 20 623 22 223Personal effects not elsewhere classified ADIK 4 673 4 748 5 455 6 140 6 462 6 866 6 581 6 818 6 907Social protection ADIL 8 446 8 643 8 963 9 219 9 501 9 821 10 124 10 285 11 294Insurance ADIM 20 257 22 238 25 423 25 456 24 373 23 178 24 393 24 854 26 548Financial services not elsewhere classified ADIN 10 009 11 974 11 708 11 982 12 529 14 208 15 166 16 839 18 523Other services not elsewhere classified ADIO 6 262 6 089 6 085 6 175 6 357 6 529 6 759 6 766 7 519
Final consumption expenditure in the UK byresident and non-resident households
(domestic concept) ABQI 562 616 593 885 622 972 653 999 685 002 720 490 748 820 781 716 825 505
Final consumption expenditure outside the UKby UK resident households ABTA 19 690 21 654 22 907 24 435 26 314 27 739 29 209 30 564 32 362
less Final consumption expenditure in the UK byhouseholds resident in the rest of the world CDFD –14 312 –14 713 –13 383 –13 872 –14 156 –15 698 –17 160 –18 605 –19 582
Final consumption expenditure by UK residenthouseholds in the UK and abroad (national concept) ABPB 567 994 600 826 632 496 664 562 697 160 732 531 760 869 793 675 838 285

267
National accounts
16.16 Individual consumption expenditure: by households, NPISHs andgeneral government1 Current market pricesUnited Kingdom. Classified by function (COICOP/COPNI/COFOG)2continued £ million
1999 2000 2001 2002 2003 2004 2005 2006 2007
FINAL CONSUMPTION EXPENDITURE OF UK RESIDENTHOUSEHOLDS
Final consumption expenditure of UK residenthouseholds in the UK and abroad ABPB 567 994 600 826 632 496 664 562 697 160 732 531 760 869 793 675 838 285
FINAL INDIVIDUAL CONSUMPTION EXPENDITUREOF NPISH
Final individual consumption expenditureof NPISH ABNV 21 874 23 169 24 720 25 968 27 185 28 953 31 585 33 966 36 674
FINAL INDIVIDUAL CONSUMPTION EXPENDITURE OFOF GENERAL GOVERNMENTHealth QYOT 50 254 53 236 58 032 63 388 69 888 76 855 83 579 85 331 ..Recreation and culture QYSU 3 736 3 898 4 049 4 335 4 513 4 272 .. .. ..Education QYSE 29 484 31 521 33 900 37 535 39 876 42 727 11 058 47 235 ..Social protection QYSP 16 843 18 055 19 441 22 464 25 517 28 028 .. .. ..Housing QYXO – – – – .. .. .. .. ..
Final individual consumption expenditureof general government NNAQ 102 742 109 297 118 458 130 816 143 954 155 811 167 399 175 306 184 502
Total, individual consumption expenditure/actual individual consumption NQEO 692 610 733 292 775 674 821 346 868 299 917 295 959 853 1 002 947 1 059 461
1 See chapter text.2 "Purpose" or "function" classifications are designed to indicate the "soci-
economic objectives" that institutional units aim to achieve through variouskinds of outlays. COICOP is the Classification of Individual Consumption byPurpose and applies to households. COPNI is the Classification of the Pur-poses of Non-Profit Institutions Serving Households and COFOG the Clas-sification of the Functions of Government. The introduction of ESA95 coin-cides with the redefinition of these classifications and data will be availableon a consistent basis for all European Union member states.
3 Package holidays data are dispersed between components (transport etc).
Source: Office for National Statistics: 020 7014 2116

268
National accounts
16.17 Individual consumption expenditure: by households, NPISHs and generalgovernment1 Chained volume measures, reference year 2003United Kingdom. Classified by function (COICOP/COPNI/COFOG)2 £ million
1999 2000 2001 2002 2003 2004 2005 2006 2007
FINAL CONSUMPTION EXPENDITURE OF HOUSEHOLDS
Food and non-alcoholic beverages ADIP 59 904 61 944 61 048 62 143 63 174 65 181 66 231 67 970 70 453Food ADIQ 53 697 55 255 53 992 54 835 55 507 56 946 57 997 59 124 61 317Non-alcoholic beverages ADIR 6 260 6 725 7 063 7 312 7 667 8 235 8 234 8 846 9 136
Alcoholic beverages and tobacco ADIS 27 623 26 704 26 497 26 884 27 297 27 444 27 325 26 900 27 347Alcoholic beverages ADIT 10 309 10 476 10 831 11 516 12 027 12 369 12 590 12 471 13 136Tobacco ADIU 17 541 16 341 15 716 15 380 15 270 15 075 14 735 14 429 14 211
Clothing and footwear ADIW 28 689 31 744 34 485 38 499 41 155 44 087 46 410 49 070 51 669Clothing ADIX 24 424 27 394 29 827 33 315 35 689 38 407 40 606 43 106 45 522Footwear ADIY 4 324 4 360 4 660 5 185 5 466 5 680 5 804 5 964 6 147
Housing, water, electricity, gas and other fuels ADIZ 123 662 125 299 126 749 127 979 129 051 131 490 131 756 133 327 134 430Actual rentals for housing ADJA 27 366 27 345 27 418 27 084 27 610 27 555 27 782 28 838 29 193Imputed rentals for housing ADJB 64 980 65 704 66 495 67 872 68 458 69 617 70 651 71 089 71 474Maintenance and repair of the dwelling ADJC 11 791 11 675 12 139 12 702 12 615 13 007 12 683 12 735 13 407Water supply and miscellaneous dwelling services ADJD 5 228 5 386 5 379 5 424 5 438 5 412 5 522 5 615 5 599Electricity, gas and other fuels ADJE 14 363 15 149 15 277 14 891 14 930 15 899 15 118 15 050 14 757
Furnishings, household equipment androutine maintenance of the house ADJF 33 130 36 305 38 310 40 552 42 466 43 577 42 931 44 078 44 555Furniture, furnishings, carpets
and other floor coverings ADJG 13 120 14 514 14 860 15 896 16 789 17 206 16 715 17 016 16 928Household textiles ADJH 3 743 4 361 4 534 5 043 5 452 5 604 5 375 5 577 5 927Household appliances ADJI 4 648 4 922 5 549 5 566 5 578 5 649 5 735 6 158 6 264Glassware, tableware and household utensils ADJJ 3 699 4 266 4 655 4 717 4 701 4 620 4 674 4 856 4 955Tools and equipment for house and garden ADJK 2 435 2 590 2 856 3 238 3 589 3 972 3 796 3 723 3 889Goods and services for routine household maintenance ADJL 5 556 5 708 5 859 6 092 6 357 6 526 6 636 6 748 6 592
Health ADJM 10 362 10 421 10 697 10 980 11 335 11 609 11 636 11 992 12 393Medical products, appliances and equipment ADJN 5 839 5 819 6 020 6 315 6 542 6 655 6 392 6 868 6 904Out-patient services ADJO 2 556 2 528 2 560 2 492 2 553 2 685 2 903 2 797 3 172Hospital services ADJP 1 976 2 082 2 122 2 173 2 240 2 269 2 341 2 327 2 317
Transport ADJQ 92 969 96 209 98 485 101 621 104 569 106 610 107 316 107 936 109 271Purchase of vehicles ADJR 29 455 31 680 35 100 36 057 38 016 39 107 39 571 40 364 41 453Operation of personal transport equipment ADJS 39 617 39 124 39 225 40 668 40 507 40 578 40 225 39 437 38 711Transport services ADJT 24 661 25 913 24 214 24 965 26 046 26 925 27 520 28 135 29 107
Communication ADJU 10 948 12 698 14 452 14 796 15 654 16 361 17 120 17 355 18 835Postal services CCGZ 960 916 901 906 890 866 941 995 1 146Telephone & telefax equipment ADQF 428 536 582 640 810 883 1 082 1 133 1 427Telephone & telefax services ADQG 9 604 11 264 12 978 13 254 13 954 14 612 15 097 15 227 16 262
Recreation and culture ADJV 63 601 68 038 72 552 77 597 84 386 92 889 98 594 104 207 111 881Audio-visual, photographic and information
processing equipment ADJW 11 178 13 022 14 690 16 301 19 408 24 316 27 665 31 332 37 022Other major durables for recreation and culture ADJX 3 798 4 182 4 560 4 817 5 126 5 261 5 489 5 974 6 296Other recreational items and equipment; flowers,
gardens and pets ADJY 16 190 17 455 18 980 21 642 23 894 25 585 26 490 28 302 29 873Recreational and cultural services ADJZ 22 827 23 206 24 049 24 333 25 278 26 993 28 012 27 891 28 160Newspapers, books and stationery ADKM 11 242 11 181 10 910 10 756 10 680 10 734 10 938 10 708 10 530Package holidays3 ADMI – – – – – – – – –
EducationEducation services ADMJ 11 394 11 489 10 692 10 091 9 610 9 541 9 476 9 480 9 757
Restaurants and Hotels ADMK 74 191 76 252 76 434 78 303 78 902 81 796 83 893 83 648 84 763Catering services ADML 63 354 65 644 66 815 68 462 68 839 71 244 72 812 71 945 72 304Accommodation services ADMM 10 851 10 610 9 620 9 843 10 063 10 552 11 081 11 703 12 459
Miscellaneous goods and services ADMN 67 867 70 524 73 239 75 715 77 403 78 079 77 719 78 310 80 617Personal care ADMO 13 497 14 251 14 719 16 526 18 181 19 482 20 113 20 709 21 756Personal effects not elsewhere classified ADMP 4 871 4 922 5 607 6 289 6 462 6 791 6 428 6 371 6 236Social protection ADMQ 10 778 10 357 10 058 9 760 9 501 9 306 9 033 8 638 9 142Insurance ADMR 22 511 23 526 25 453 24 880 24 373 22 776 22 399 22 175 21 813Financial services not elsewhere classified ADMS 8 966 10 421 10 694 11 733 12 529 13 678 13 815 14 793 15 622Other services not elsewhere classified ADMT 7 937 7 336 6 827 6 536 6 357 6 046 5 931 5 624 6 048
Final consumption expenditure in the UK byresident and non-resident households
(domestic concept) ABQJ 600 627 625 437 642 595 664 790 685 002 708 664 720 407 734 273 755 971
Final consumption expenditure outside the UKby UK resident households ABTC 21 899 24 189 24 897 26 376 26 314 28 068 27 750 28 419 29 658
less Final consumption expenditure in the UK byhouseholds resident in the rest of the world CCHX –16 031 –16 038 –14 164 –14 292 –14 156 –15 298 –16 152 –16 955 –17 232
Final consumption expenditure by UK residenthouseholds in the UK and abroad (national concept) ABPF 606 648 633 662 653 326 676 833 697 160 721 434 732 005 745 737 768 397

269
National accounts
16.17 Individual consumption expenditure: by households, NPISHs and generalgovernment1 Chained volume measures, reference year 2003United Kingdom. Classified by function (COICOP/COPNI/COFOG)2continued £ million
1999 2000 2001 2002 2003 2004 2005 2006 2007
FINAL CONSUMPTION EXPENDITURE OF UK RESIDENTHOUSEHOLDS
Final consumption expenditure of UK residenthouseholds in the UK and abroad ABPF 606 648 633 662 653 326 676 833 697 160 721 434 732 005 745 737 768 397
FINAL INDIVIDUAL CONSUMPTION EXPENDITUREOF NPISH
Final individual consumption expenditureof NPISH ABNU 25 023 27 177 27 155 27 130 27 185 27 327 28 167 29 858 31 079
FINAL INDIVIDUAL CONSUMPTION EXPENDITUREOF GENERAL GOVERNMENTHealth EMOA 56 805 58 517 61 019 63 272 65 611 68 758 .. .. ..Recreation and culture QYXK 3 930 4 051 3 968 4 470 4 717 .. .. .. ..Education EMOB 36 520 36 876 37 100 37 535 37 732 37 944 .. .. ..Social protection QYXM 23 359 23 454 23 645 24 864 25 843 26 811 26 698 27 323 ..Housing QYXN – – – – – .. .. .. ..
Final individual consumption expenditureof general government NSZK 109 554 111 763 114 159 117 238 120 288 .. .. .. ..
Total, individual consumption expenditure/actual individual consumption YBIO 760 172 792 076 815 286 843 504 868 299 897 055 911 168 929 237 ..
1 See chapter text.2 "Purpose" or "function" classifications are designed to indicate the "soci-
economic objectives" that institutional units aim to achieve through variouskinds of outlays. COICOP is the Classification of Individual Consumption byPurpose and applies to households. COPNI is the Classification of the Pur-poses of Non-Profit Institutions Serving Households (NPISH) and COFOGthe Classification of the Functions of Government. The introduction ofESA95 coincides with the redefinition of these classifications and data willbe available on a consistent basis for all European Union member states.
3 Package holidays data are dispersed between components (transport etc).
Source: Office for National Statistics: 020 7014 2116
16.18 Change in inventories1,2
Chained volume measures, reference year 2003United Kingdom Reference year 2003, £ million
DistributiveManufacturing industries Electricity, trades
Mining gas andand Materials Work in Finished water Other Change in
quarrying and fuel progress goods Total supply Wholesale3 Retail3 industries4 inventories
FADO FBID FBIE FBIF DHBH FADP FAJM FBYH DLWV ABMQ1998 367 537 –703 317 151 –163 666 1 186 2 636 4 2911999 –325 503 –259 –430 –186 –167 1 743 1 722 3 464 5 8032000 –263 543 358 418 1 319 202 1 939 1 480 –283 4 6482001 87 –513 369 160 16 16 887 1 113 3 458 5 5772002 –37 –496 –149 –372 –1 017 –132 788 1 716 971 2 289
2003 –66 –198 –650 –138 –986 –13 407 1 241 3 399 3 9822004 –46 7 –614 –296 –903 8 304 1 000 4 234 4 5972005 –47 –179 863 56 740 586 978 –412 1 766 3 6112006 –58 –273 598 –234 91 210 490 677 1 006 2 4162007 –104 280 –398 633 515 –270 293 1 995 4 093 6 523
1 See chapter text. Estimates are given to the nearest £ million but cannot beregarded as accurate to this degree.
2 Components may not sum to totals due to rounding.
3 Wholesaling and retailing estimates exclude the motor trades.4 Quarterly alignment adjustment included in this series.
Source: Office for National Statistics 020 7014 2083

270
National accounts
16.19 Gross fixed capital formation at current purchasers’ prices: by broad sectorand type of asset1,2
United Kingdom. Total economy £ million
1999 2000 2001 2002 2003 2004 2005 2006 2007
Private sectorNew dwellings, excluding land DFDF 23 921 25 604 27 085 31 455 34 804 40 927 44 398 49 628 52 492Other buildings and structures EQBU 31 828 31 966 32 730 33 580 35 366 36 994 39 575 43 429 ..Transport equipment EQBV 13 919 12 859 13 897 15 637 14 708 13 735 14 030 14 831 ..Other machinery and equipment
and cultivated assets EQBW 57 957 61 236 58 062 53 498 50 228 52 359 52 923 56 169 ..Intangible fixed assets EQBX 3 624 4 048 4 285 4 674 4 894 5 258 5 594 .. ..Costs associated with the transfer of
ownership of non-produced assets EQBY 9 784 11 174 12 697 15 399 16 385 20 752 19 901 24 611 27 445
Total EQBZ 141 033 146 887 148 756 154 243 156 385 170 025 177 123 .. ..
Public non-financial corporationsNew dwellings, excluding land DEER 1 529 1 421 2 387 2 837 3 509 3 235 3 574 4 049 4 202Other buildings and structures DEES 1 692 1 775 1 854 2 304 2 236 1 493 2 111 1 819 ..Transport equipment DEEP 155 178 171 110 126 193 334 235 ..Other machinery and equipment
and cultivated assets DEEQ 617 600 628 787 1 037 1 042 16 478 1 192 ..Intangible fixed assets DLXJ 625 551 397 556 623 737 754 769 ..Costs associated with the transfer of
ownership of non-produced assets DLXQ –1 906 –2 171 –2 254 –2 764 –5 674 –5 440 –2 675 –2 375 –2 227
Total FCCJ 2 712 2 354 3 183 3 830 1 857 1 260 20 576 5 440 6 079
General governmentNew dwellings, excluding land DFHW 250 369 334 207 149 137 71 6 ..Other buildings and structures EQCH 9 414 9 434 10 348 11 678 14 693 15 866 18 884 21 204 ..Transport equipment EQCI 609 540 588 567 758 1 011 610 431 ..Other machinery and equipment
and cultivated assets EQCJ 2 096 1 699 2 239 2 867 3 176 3 652 –12 438 2 580 ..Intangible fixed assets EQCK 396 367 334 358 384 400 304 515 ..Costs associated with the transfer of
ownership of non-produced assets EQCL –166 –182 –310 –225 1 349 2 140 –301 –589 ..
Total NNBF 12 599 12 227 13 533 15 452 20 509 23 206 7 130 23 667 26 128
Total gross fixed capital formation NPQX 161 722 167 172 171 782 180 551 186 700 202 260 211 862 231 762 251 486
1 See chapter text.2 Components may not sum to totals due to rounding.
Source: Office for National Statistics: 020 7014 2083
16.20 Gross fixed capital formation at current purchasers’ prices: by type of asset1,2
United Kingdom. Total economy£ million
1999 2000 2001 2002 2003 2004 2005 2006 2007
Tangible fixed assets
New dwellings, excluding land DFDK 25 700 27 394 29 806 34 499 38 462 44 299 48 043 53 686 56 725Other buildings and structures DLWS 42 934 43 175 44 932 47 562 52 295 54 353 60 570 66 452 ..Transport equipment DLWZ 14 683 13 577 14 656 16 314 15 592 14 939 14 974 15 436 15 772Other machinery and equipment
and cultivated assets DLXI 60 670 63 535 60 929 57 152 54 441 57 053 56 963 59 344 66 171
Total EQCQ 143 987 147 681 150 323 155 527 160 790 170 644 180 550 197 519 ..
Intangible fixed assets DLXP 10 023 10 670 11 326 12 614 13 850 14 164 14 387 15 531 16 475
Costs associated with the transfer ofownership of non-produced assets DFBH 7 712 8 821 10 133 12 410 12 060 17 452 16 925 21 587 ..
Total gross fixed capital formation NPQX 161 722 167 172 171 782 180 551 186 700 202 260 211 862 231 762 251 486
1 See chapter text.2 Components may not sum to totals due to rounding.
Source: Office for National Statistics: 020 7014 2083

271
National accounts
16.21 Gross fixed capital formation: by broad sector and type of asset1,2,3
Chained volume measures, reference year 2003United Kingdom. Total economy £ million
1999 2000 2001 2002 2003 2004 2005 2006 2007
Private sectorNew dwellings, excluding land DFDP 30 928 31 041 31 318 33 748 34 804 38 245 38 845 41 930 43 702Other buildings and structures EQCU 33 931 33 206 33 251 33 406 35 366 35 786 38 155 41 754 ..Transport equipment EQCV 13 778 12 713 13 863 15 708 14 708 13 704 13 831 14 446 ..Other machinery and equipment
and cultivated assets EQCW 49 522 53 869 54 140 52 405 50 228 53 997 54 572 59 100 ..Intangible fixed assets EQCX 10 185 10 702 11 228 11 680 12 843 13 043 13 072 13 916 ..Costs associated with the transfer of
ownership of non-produced assets EQCY 16 821 16 293 16 173 17 369 16 385 19 616 16 773 18 437 18 656
Total EQCZ 154 580 158 347 160 569 164 304 164 334 174 391 175 248 189 559 ..
Public non-financial corporationsNew dwellings, excluding land DEEW 1 747 1 552 2 521 2 898 3 509 3 161 3 423 3 807 3 779Other buildings and structures DEEX 1 890 1 939 1 961 2 342 2 236 1 426 1 928 1 568 ..Transport equipment DEEU 164 186 180 114 126 193 326 230 ..Other machinery and equipment
and cultivated assets DEEV 504 516 588 765 1 037 1 063 16 173 1 230 ..Intangible fixed assets EQDE 684 586 415 572 623 716 711 710 ..Costs associated with the transfer of
ownership of non-produced assets EQDF –3 141 –3 093 –2 825 –3 092 –5 674 –5 561 –2 813 –1 869 –1 823
Total EQDG 1 796 1 695 2 424 3 019 1 857 998 19 748 5 610 ..
General governmentNew dwellings, excluding land DFID 286 404 354 213 149 135 69 6 ..Other buildings and structures EQDI 10 792 10 513 11 107 12 115 14 693 14 877 16 506 17 283 ..Transport equipment EQDJ 676 606 672 586 758 809 751 809 ..Other machinery and equipment
and cultivated assets EQDK 1 632 1 424 2 063 2 801 3 176 3 757 –11 906 3 189 ..Intangible fixed assets EQDL 241 219 196 211 384 698 294 495 ..Costs associated with the transfer of
ownership of non-produced assets EQDM –1 728 –542 –548 –261 1 349 1 991 –56 –282 ..
Total EQDN 13 059 12 665 13 980 15 740 20 509 22 266 5 658 21 338 22 307
Total gross fixed capital formation NPQR 169 117 173 710 178 203 184 701 186 700 197 655 200 654 215 985 229 423
1 See chapter text.2 For the years before 2003, the total differs from the sum of their com-
ponents.3 Components may not sum to totals due to rounding.
Source: Office for National Statistics: 020 7014 2083
16.22 Gross fixed capital formation: by type of asset1,2,3
Chained volume measures, reference year 2003United Kingdom. Total economy £ million
1999 2000 2001 2002 2003 2004 2005 2006 2007
Tangible fixed assets
New dwellings, excluding land DFDV 32 863 32 888 34 172 36 839 38 462 41 541 42 337 45 746 47 508Other buildings and structures EQDP 46 738 45 780 46 413 47 913 52 295 52 089 56 589 60 605 ..Transport equipment DLWJ 14 602 13 489 14 698 16 414 15 592 14 706 14 908 15 361 15 631Other machinery and equipment
and cultivated assets DLWM 51 667 55 774 56 780 55 971 54 441 58 817 58 839 62 878 69 745
Total EQDS 145 621 148 509 152 571 157 257 160 790 167 152 172 672 185 300 ..
Intangible fixed assets EQDT 11 079 11 445 11 742 12 371 13 850 14 457 14 077 14 979 15 521
Costs associated with the transfer ofownership of non-produced assets DFDW 13 088 12 810 12 960 14 097 12 060 16 046 13 904 16 247 ..
Total gross fixed capital formation NPQR 169 117 173 710 178 203 184 701 186 700 197 655 200 654 215 985 229 423
1 See chapter text.2 For the years before 2003, the total differs from the sum of their com-
ponents.3 Components may not sum to totals due to rounding.
Source: Office for National Statistics: 020 7014 2083

272
Prices

273
Prices
Prices
Ch
apter 17

274
Prices
index of retail prices (RPI) from January 1962 onwards. The CED shows the movement in prices implied by the national accounts estimates of consumers’ expenditure valued at current and at constant prices, while the RPI is constructed directly by weighting together monthly movements in prices according to a given pattern of household expenditure derived from the Expenditure and Food Survey. If the purchasing power of the pound is taken to be 100p in a particular month (quarter, year), the comparable purchasing power in a subsequent month (quarter, year) is:
100 × earlier period price index
later period price index
where the price index used is the CED for years 1946–1961 and the RPI for periods after 1961.
Consumer prices index
(Table 17.4)
The consumer prices index (CPI) is the main UK domestic measure of inflation for macro-economic purposes. Like the RPI (see below) it measures the average change from month to month in the prices of consumer goods and services purchased in the UK, but there are differences in coverage and methodology. A detailed description of these differences is given in the paper entitled ‘The New Inflation Target: the Statistical Perspective’. This paper is available on the National Statistics website at: www.statistics.gov.uk/StatBase/Product. asp?vlnk=10913.
Since 10 December 2003, the Government inflation target for the UK has been defined in terms of the CPI measure of inflation. Prior to that the CPI had been published in the UK as the harmonised index of consumer prices (HICP); the two shall remain one and the same index.
The HICPs are calculated in each Member State of the European Union (EU), according to rules specified in a series of European Regulations developed by the EU statistical office in conjunction with the EU Member States. The HICPs are used to compare inflation rate across the EU. Since January 1999 it has also been used by the European Central Bank (ECB) as the measure of price stability across the euro area. Additional information on HICPs is available from the National Statistics website at: www.statistics.gov.uk/hicp
CPI inflation rates prior to 1997 and index levels prior to 1996 are estimated. See article on National Statistics website at: www.statistics.gov.uk/cci/article.asp?ID=31. Also the coverage of CPI categories for health, education and miscellaneous goods and services have been extended between 2000 and 2002. Details are given in articles available on the National
Prices
Producer price index numbers
(Tables 17.1 and 17.2)
The producer price indices (PPIs) were published for the first time in August 1983, replacing the former wholesale price indices. Full details of the differences between the two indices were given in an article published in British Business, 15 April 1983. The producer price indices are calculated using the same general methodology as that used by the wholesale price indices.
The high level index numbers in Tables 17.1 and 17.2 are constructed on a net sector basis. That is to say, they are intended to measure only transactions between the sector concerned and other sectors. Within sector transactions are excluded. Index numbers for the whole of manufacturing are thus not weighted averages of sector index numbers.
The index numbers for selected industries in Tables 17.1 and 17.2 are constructed on a gross sector basis, that is, all transactions are included in deriving the weighting patterns, including sales within the same industry.
All the index numbers are compiled exclusive of value-added tax. Excise duties on cigarettes, manufactured tobacco and alcoholic liquor are included, as is the duty on hydrocarbon oils.
The indices relate to the average prices for a year. The movement in these prices are weighted to reflect the relative importance of the composite products in a chosen year (known as the base year), currently 2000.
Since July 1995, PPIs have been published fully reclassified to the 1992 version of the Standard Industrial Classification (SIC).
Further details are available from the National Statistics website: www.statistics.gov.uk/ppi.
Purchasing power of the pound
(Table 17.3)
Changes in the internal purchasing power of a currency may be defined as the ‘inverse’ of changes in the levels of prices; when prices go up, the amount which can be purchased with a given sum of money goes down. Movements in the internal purchasing power of the pound are based on the consumers’ expenditure deflator (CED) prior to 1962 and on the General

275
Prices
Statistics website at: www.statistics. gov.uk/cci/searchres2.asp?ct=6&term=HICP
Further details on the CPI are available from the National Statistics website at: www.statistics.gov.uk/cpi
Retail prices index
(Table 17.5)
The retail prices index (RPI) is the most familiar general purpose measure of inflation in the UK, measuring the percentage changes month by month in the average level of prices of the goods and services purchased by the great majority of households in the UK. The uses of the RPI include indexation of pensions, state benefits and index-linked gilts. The expenditure pattern on which the index is based is revised each year using information from the Expenditure and Food Survey. The expenditure of certain higher income households and households of retired people dependent mainly on social security benefits is excluded.
The index covers a large and representative selection of more than 650 separate goods and services, for which price movements are regularly measured in around 150 locations throughout the country. Around 120,000 separate price quotations are used in compiling the index.
Further details are available from the National Statistics website: www.statistics.gov.uk/rpi
Tax and price index (TPI)
(Table 17.6)
The purpose and methodology of the TPI were described in an article in the August 1979 issue (No. 310) of Economic Trends. The TPI measures the change in gross taxable income needed for taxpayers to maintain their purchasing power, allowing for changes in retail prices. The TPI thus takes account of the changes to direct taxes (and employees’ National Insurance (NI) contributions) facing representative cross-section of taxpayers as well as changes in the retail prices index (RPI).
When direct taxation or employees’ NI contributions change, the TPI will rise by less than or more than the RPI according to the type of changes made. Between Budgets, the monthly increase in the TPI is normally slightly larger than that in the RPI, since all the extra income needed to offset any rise in retail prices is fully taxed.
Index numbers of agricultural prices
(Tables 17.7 and 17.8)
The indices of producer prices of agricultural products are currently based on the calendar year 2000. They are designed to provide short-term and medium-term indications of movements in these prices. All annual series are base-weighted Laspeyres type, using value weights derived from the Economic Accounts for Agriculture prepared for the Statistical Office of the European Union. Prices are measured exclusive of VAT. For Table 17.7, it has generally been necessary to measure the prices of materials (inputs) ex-supplier. For Table 17.8, it has generally been necessary to measure the prices received by producers (outputs) at the first marketing stage. The construction of the indices enables them to be combined with similar indices for other member countries of the EU to provide an overall indication of trends within the Union which appears in the Union’s Eurostat series of publications.
Index numbers at a more detailed level and for earlier based series are available from the Department for Environment, Food and Rural Affairs, SSP, Room 146 Foss House, Kingspool 1–2 Peasholme Green, York, YO1 7PX, tel 01904 455249.

276
Prices
17.1 Producer price index of materials and fuels purchased: by all manufacturingand selected industries SIC(92)1United Kingdom: Annual averages Indices (2000=100)
2000 2001 2002 2003 2004 2005 2006 2007
Net sector
Materials and fuel purchased by manufacturing industry2 RNNK 6292000050 100.0 98.8 94.4 95.7 99.5 111.1 121.8 125.8
Materials PLKX 6292000010 100.0 98.1 93.7 95.2 98.7 108.1 116.1 121.2pFuels2 RNNL 6292000060 100.0 107.1 103.4 102.1 109.9 152.1 198.7 187.9
Materials and fuels purchased by manufacturing industry-seasonally adjusted2 RNPE 6292008950 100.0 98.8 94.4 95.7 99.5 111.0 121.8r 125.9#
Materials and fuels purchased by manufacturing industryother than food, beverages, petroleum and tobacco2 RNNQ 6292990050 100.0 98.7 94.0 93.7 95.4 103.0 111.1 113.9p
Materials RWCJ 6292990010 100.0 98.1 93.2 93.0 94.2 98.9 103.8 107.7Fuel2 RNNS 6292990060 100.0 106.8 103.1 101.8 109.6 151.6 198.3 187.7
Materials and fuels purchased by manufacturing industriesother than food, beverages, petroleum and tobacco-seasonally adjusted2 RNPF 6292998950 100.0 98.7 94.0 93.7 95.4 103.0 111.1r 113.9#
Gross sector3
All manufacturing RBBO 6192000000 100.0 99.3 97.1 98.4 102.1 109.7 116.9 121.3
Other mining and quarrying products4 RABE 6112140000 100.0 96.9 92.3 93.1 96.0 107.6 114.5 116.5pManufacture of food products RBBQ 6192151600 100.0 103.2 102.3 105.2 108.5 109.3 113.6 120.1p
Food products and beverages RABF 6112150000 100.0 103.3 102.3 105.2 108.6 109.3 113.6 120.2#Tobacco products RABG 6112160000 100.0 100.0 101.2 106.9 107.0 107.9 110.9 112.2p
Manufacture of textiles RBBR 6192171800 100.0 100.5 98.4 99.2 99.6 103.3 106.4 107.5#Textiles RABH 6112170000 100.0 100.5 98.6 99.8 100.0 105.4 109.3 110.3pWearing apparel RABI 6112180000 100.0 100.4 97.8 98.0 98.7 99.8 101.4 102.6p
Manufacture of leather RBBS 6192190000 100.0 101.9 100.0 101.1 102.0 105.7 109.5 112.0pManufacture of wood and wood products RBBT 6192200000 100.0 99.2 96.5 96.8 99.5 104.1 109.5 119.9pManufacture of pulp, paper, publishing and printing RBBU 6192212200 100.0 100.9 99.2 99.4 100.4 103.8 108.0 110.3p
Pulp and paper products RABL 6112210000 100.0 100.7 97.5 96.5 96.9 100.7 106.5 108.9pPrinted matter and recording material RABM 6112220000 100.0 101.0 100.0 100.8 102.2 105.3 108.8 111.0p
Manufacture of coke RBBV 6192230000 100.0 92.0 89.2 95.4 109.1 150.9 175.6 180.4p
Manufacture of chemical products RBBW 6192240000 100.0 101.1 99.4 103.0 105.5 114.4 120.6 122.2pManufacture of rubber products RBBX 6192250000 100.0 99.1 97.7 99.5 102.6 110.8 116.2 118.7pManufacture of other non-metallic mineral products RBBY 6192260000 100.0 100.5 99.6 100.7 103.0 111.8 120.0 121.4#Manufacture of basic metals RBBZ 6192272800 100.0 98.5 96.6 99.8 111.8 123.0 137.3 147.5#
Basic metals RABV 6112270000 100.0 98.6 96.8 101.3 115.7 127.0 144.8 157.0#Fabricated metal products RABW 6112280000 100.0 98.4 96.4 98.6 108.4 119.5 130.9 139.4p
Manufacture of machinery and equipmentnot elsewhere classified RBCA 6192290000 100.0 98.9 97.1 97.8 102.4 109.3 116.7 122.0p
Manufacture of electrical and optical equipment RBCB 6192303300 100.0 97.2 92.5 88.8 87.7 90.1 93.9 95.4#Office machinery and computers RABY 6112300000 100.0 95.5 87.4 80.7 78.5 79.3 81.1 78.5#Electrical machinery and apparatus
not elsewhere classified RACB 6112310000 100.0 98.5 95.8 94.5 96.1 101.5 108.8 111.8#Radio, television and communication equipment RACC 6112320000 100.0 98.1 94.5 92.1 92.4 96.6 103.5 107.1#Medical, precision, optical instruments and clocks RACD 6112330000 100.0 98.2 95.2 92.3 90.6 93.3 97.0 97.3#
Manufacture of transport equipment RBCC 6192343500 100.0 99.1 97.3 98.1 100.1 105.3 110.4 115.0pMotor vehicles, trailers and semi-trailers RACE 6112340000 100.0 99.3 98.1 99.3 101.5 106.8 111.6 116.6pOther transport equipment RACF 6112350000 100.0 98.7 95.4 95.5 97.0 102.0 107.7 111.4p
Manufacturing not elsewhere classified RBCD 6192363700 100.0 99.1 97.8 99.9 104.4 109.9 116.4 122.9pElectricity including Climate Change Levy RCVR 7167850000 100.0 96.2 92.5 89.3 95.2 127.5 173.2 175.9Gas including Climate Change Levy RCVW 7167860000 100.0 140.7 136.5 141.3 155.5 231.8 286.9 230.5Collected and purified water PQNB 7167870000 100.0 101.6 103.4 107.0 113.9 131.1 144.5 155.1
1 See chapter text.2 These indices include the Climate Change Levy which was introduced in
April 2001.3 The Climate Change Levy is excluded from the detailed industry input index.4 These indices include the Aggregates Levy which was introduced in April
2002.
Source: Office for National Statistics: 01633 815783

277
Prices
17.2 Producer price index of output: by all manufacturing and selectedindustries SIC(92)1United Kingdom: Annual averages Indices (2000=100)
2000 2001 2002 2003 2004 2005 2006 2007
Net sector
Output of manufactured products PLLU 7209200000 100.0 99.7 99.8 101.3 103.8 106.7 109.3 112.6pAll manufacturing excluding duty PVNP 7209200010 100.0 99.7 99.7 101.2 103.7 106.8 109.7 112.9pAll manufacturing excluding duty - seasonally adjusted PVNQ 7209200890 100.0 99.7 99.8 101.2 103.7 106.8 109.7r 113.0#
Products of manufacturing industries other than thefood, beverages, petroleum and tobacco manufacturingindustries - not seasonally adjusted PLLV 7209299000 100.0 99.4 99.3 100.6 102.5 104.7 107.1 109.6p
All manufacturing excluding food, beverages, tobaccoand petroleum - seasonally adjusted PLLW 7209299890 100.0 99.4 99.3 100.6 102.5 104.7 107.1 109.7
Gross sector
Manufactured products excluding duty POKE 7109200000 100.0 99.4 99.1 100.8 104.0 108.8 112.6 116.1Manufactured products excluding food, drink, tobacco POKF 7109299000 100.0 99.4 99.3 100.5 103.0 106.2 109.2 112.4
and petroleumOther mining and quarrying products2 ROFV 7112148000 100.0 104.4 120.3 126.9 129.1 129.9 133.4 137.6
Food products, beverages and tobacco excluding duty POKH 7111151600 100.0 101.9 103.3 104.6 106.9 108.4 110.7 116.0
Food products, beverages and tobacco including duty RBGA 7111151680 100.0 102.0 103.3 104.7 107.2 108.9 111.2 116.0Food products and beverages including duty RPUN 7112150080 100.0 101.5 102.6 103.6 105.9 107.1 109.0 113.6
Food products excluding beverages RBGD 7112159900 100.0 101.7 102.7 103.7 106.0 107.1 108.8 113.8Alcoholic beverages including duty RPUX 7113159080 100.0 101.6 103.1 103.7 106.8 108.2 110.2 113.3Tobacco products including duty RPUS 7112160080 100.0 105.0 107.8 111.2 115.3 119.8 124.7 130.7
Textiles and textile products POKI 7111171800 100.0 99.2 98.8 98.7 98.5 100.0 101.2 102.4Textiles POKZ 7112170000 100.0 99.4 99.2 99.4 99.2 101.2 102.7 104.4Wearing apparel: Furs POLA 7112180000 100.0 99.0 97.9 97.2 97.0 97.4 98.1 98.4
Leather and leather products POKJ 7111190000 100.0 102.5 102.7 102.9 102.9 104.5 106.5 107.0Wood and wood products POKK 7111200000 100.0 99.9 100.0 101.8 105.2 110.0 113.0 123.6Pulp, paper and paper products, recorded media and
printing services POKL 7111212200 100.0 101.5 102.1 104.0 106.0 108.6 110.7 112.9Pulp, paper and paper products POLD 7112210000 100.0 101.0 100.3 100.1 99.7 99.0 100.8 104.3Printed matter and recorded media POLE 7112220000 100.0 101.7 102.7 105.5 108.4 112.2 114.3 116.1
Chemicals, chemical, products and manmade fibres POKN 7111240000 100.0 100.2 100.5 103.9 106.7 111.6 115.8 118.4Rubber and plastic products POKO 7111250000 100.0 100.3 100.4 100.5 101.5 106.4 109.8 111.1Other non-metallic mineral products POKP 7111260000 100.0 101.9 105.0 107.8 109.6 113.9 118.2 123.7Base metals and fabricated metal products POKQ 7111272800 100.0 99.9 99.5 101.3 108.8 118.4 125.4 132.7
Base metals POLJ 7112270000 100.0 98.4 96.0 99.2 113.1 126.6 141.5 154.9Fabricated metal products, except machinery and
equipment POLK 7112280000 100.0 100.6 101.1 102.3 106.8 114.6 118.0 122.5
Machinery and equipment not elsewhere classified POKR 7111290000 100.0 100.9 101.8 101.9 103.3 106.5 109.2 112.5Electrical and optical equipment POKS 7111343500 100.0 94.7 90.0 87.5 86.6 85.9 86.8 86.6
Office machinery and computers POLM 7112300000 100.0 75.2 64.6 57.1 52.2 46.7 44.3 41.6Electrical machinery and apparatus not elsewhere
classified POLN 7112310000 100.0 99.9 100.4 100.6 102.8 106.2 111.5 115.0Radio, television and communication equipment
and apparatus POLO 7112320000 100.0 97.3 88.0 84.3 82.1 80.1 79.3 76.9
Medical precision and optical instruments, watchesand clocks POLP 7112330000 100.0 101.1 102.4 103.3 103.6 104.1 104.8 105.1
Transport equipment POKT 7111343500 100.0 98.4 98.8 99.2 100.3 102.4 103.9 105.2Motor vehicles, trailers and semi-trailers POLQ 7112340000 100.0 96.6 96.3 96.1 97.2 98.6 99.5 99.5Other transport POLR 7112350000 100.0 102.3 103.8 105.8 107.0 110.5 113.2 117.3
Furniture: other manufactured goods not elsewhereclassified POLS 7112360000 100.0 100.3 100.9 103.8 104.4 104.5 105.7 108.1
1 See chapter text.2 These indices include the Aggregates Levy which was introduced in April
2002. These indices do not feed into Net Sector output (PLLU).
Source: Office for National Statistics: 01633 815783

278
Prices
17.3 Internal purchasing power of the pound1,2
United KingdomPence
Year in which purchasing power was 100p
1988 1989 1990 1991 1992 1993 1994 1995 1996 1997 1998 1999 2000 2001 2002 2003 2004 2005 2006 2007
BAMU BAMV BAMW BASX CZVM CBXX DOFX DOHR DOLM DTUL CDQG JKZZ ZMHO IKHI FAUI SEZH C687 E9AO GB4Y HT4R1988 100 108 118 125 130 132 135 139 143 147 152 155 159 162 165 170 175 180 185 1931989 93 100 109 116 120 122 125 129 133 137 141 144 148 150 153 157 162 167 172 1791990 85 91 100 106 110 112 114 118 121 125 129 131 135 137 140 144 148 152 157 1641991 80 86 94 100 104 105 108 112 114 118 122 124 128 130 132 136 140 144 148 1551992 77 83 91 96 100 102 104 108 110 114 118 119 123 125 127 131 135 139 143 149
1993 76 82 90 95 98 100 102 106 109 112 116 118 121 123 125 129 133 136 141 1471994 74 80 88 93 96 98 100 103 106 109 113 115 118 120 122 126 130 133 137 1431995 72 77 85 90 93 94 97 100 102 106 109 111 114 116 118 122 125 129 133 1391996 70 75 83 87 91 92 94 98 100 103 107 108 112 113 115 119 122 126 130 1351997 68 73 80 85 88 89 92 95 97 100 103 105 108 110 112 115 119 122 126 131
1998 66 71 77 82 85 86 88 92 94 97 100 102 105 106 108 111 115 118 122 1271999 65 70 76 81 84 85 87 90 92 95 98 100 103 105 107 110 113 116 120 1252000 63 68 74 78 81 83 85 88 90 92 96 97 100 102 103 106 110 113 116 1212001 62 66 73 77 80 81 83 86 88 91 94 95 98 100 102 105 108 111 114 1192002 61 65 72 76 79 80 82 85 87 89 92 94 97 98 100 103 106 109 112 117
2003 59 64 70 74 76 78 79 82 84 87 90 91 94 96 97 100 103 106 109 1142004 57 62 68 72 74 75 77 80 82 84 87 89 91 93 94 97 100 103 106 1112005 56 60 66 70 72 73 75 78 80 82 85 86 89 90 92 94 97 100 103 1082006 54 58 64 67 70 71 73 75 77 80 82 83 86 87 89 92 94 97 100 1042007 52 56 61 65 67 68 70 72 74 76 79 80 82 84 85 88 90 93 96 100
1 See chapter text. These figures are calculated by taking the inverse ratio ofthe respective annual averages of the Retail Prices Index (RPI).
2 To find the purchasing power of the pound in 1995, given that it was 100pence in 1990, select the column headed 1990 and look at the 1995 row.The result is 85 pence.
Source: Office for National Statistics: 020 7533 5874

279
Prices
17.4 Consumer Prices Index:1 detailed figures by divisionUnited Kingdom
Indices (2005=100)
Housing, Furniture,water, household Miscell-
Food and Alcoholic electric- equipment aneousnon- beverages Clothing ity, gas & & routine Recreation Restaur- goods CPI
alcoholic and and other mainte- Commun- and ants and and (overallbeverages tobacco footwear fuels nance Health Transport ication culture Education hotels services index)
COICOP Division 01 02 03 04 05 06 07 08 09 10 11 12
Weights 2006 102 44 65 108 73 24 155 25 147 17 134 106 1000
D7BU D7BV D7BW D7BX D7BY D7BZ D7C2 D7C3 D7C4 D7C5 D7C6 D7C7 D7BT2005 Sep 99.7 100.3 99.9 100.7 100.2 100.7 102.2 99.8 99.6 100.8 100.8 100.8 100.6
Oct 99.5 100.7 99.9 101.7 99.4 101.0 102.0 99.5 99.7 103.3 101.2 101.2 100.7Nov 100.1 100.7 100.5 102.3 100.5 101.0 100.4 99.6 99.5 103.3 101.2 101.4 100.7Dec 100.7 100.2 100.1 102.8 102.8 100.3 100.7 99.4 99.5 103.3 101.4 101.5 101.0
2006 Jan 100.4 101.0 96.0 103.3 97.8 101.0 101.2 100.9 98.6 103.3 101.5 102.0 100.5Feb 101.0 100.8 95.9 103.6 98.5 101.1 101.4 101.0 99.4 103.3 101.9 102.1 100.9Mar 100.4 101.1 96.5 104.5 100.3 101.0 101.4 100.9 98.9 103.3 102.2 102.4 101.1Apr 100.2 102.3 96.5 107.3 98.5 102.2 102.9 100.9 99.1 103.3 102.5 103.3 101.7May 101.7 102.5 97.2 108.8 99.3 102.6 103.5 99.7 98.9 103.3 103.0 103.4 102.2Jun 102.4 103.6 96.7 109.7 100.2 102.5 103.5 100.0 98.7 103.3 103.1 103.9 102.5
Jul 102.6 103.4 92.2 110.5 98.1 103.0 105.5 99.8 98.4 103.3 103.5 104.0 102.5Aug 103.0 103.8 94.4 110.9 99.1 103.4 105.8 99.2 98.4 103.3 103.6 104.5 102.9Sep 103.6 103.7 96.4 111.5 100.6 103.6 102.9 99.6 98.6 107.9 103.8 104.7 103.0Oct 104.2 103.9 96.6 112.7 99.0 104.2 101.5 100.4 98.6 117.8 104.2 105.0 103.2Nov 105.1 103.4 97.2 113.7 100.0 104.1 101.1 100.3 98.7 117.8 104.5 105.0 103.4Dec 105.4 103.0 96.0 114.5 103.3 104.2 102.8 99.9 99.2 117.8 104.7 104.9 104.0
2007 Jan 104.4 104.5 92.0 114.9 98.3 104.8 102.1 99.0 98.3 117.8 104.9 105.1 103.2Feb 105.4 105.1 91.9 115.1 99.6 104.9 102.8 98.1 98.4 117.8 105.2 105.8 103.7Mar 106.0 105.6 92.8 115.0 102.9 104.8 103.1 98.1 98.2 117.8 105.7 106.2 104.2Apr 106.2 107.0 93.7 115.7 100.7 105.5 104.5 97.2 98.3 117.8 106.3 105.8 104.5May 106.7 106.8 93.7 115.0 101.8 105.8 106.1 96.6 98.0 117.8 106.6 105.7 104.8Jun 107.3 107.1 93.6 114.5 104.0 106.1 106.8 96.1 97.6 117.8 106.9 105.8 105.0
Jul 105.5 106.9 89.8 114.3 99.7 106.6 108.0 94.8 97.0 117.8 107.2 106.1 104.4Aug 106.1 107.0 91.1 114.0 100.3 106.8 108.6 97.2 97.5 117.8 107.4 105.6 104.7Sep 107.4 107.1 92.5 114.0 102.1 107.1 105.7 96.6 97.6 122.9 107.6 105.8 104.8Oct 109.1 106.8 92.5 114.3 100.8 107.5 106.6 96.2 97.7 133.2 107.9 106.4 105.3Nov 110.1 106.4 92.9 114.6 101.6 107.3 107.0 96.3 97.6 133.2 108.0 106.6 105.6Dec 111.1 105.7 92.2 114.7 104.2 107.6 108.7 96.2 98.0 133.2 108.3 106.8 106.2
Percentage change on a year earlier
D7G8 D7G9 D7GA D7GB D7GC D7GD D7GE D7GF D7GG D7GH D7GI D7GJ D7G72005 Sep 2.0 1.4 –5.3 6.5 –0.2 3.1 6.0 –1.2 –1.6 4.7 3.7 5.1 2.5
Oct 1.5 1.9 –5.3 6.5 –0.2 3.0 5.8 –1.6 –1.5 4.7 3.7 4.2 2.3Nov 1.7 2.5 –5.1 6.5 0.1 2.9 4.1 –1.2 –1.5 4.7 3.5 4.3 2.1Dec 1.7 2.5 –4.2 6.4 – 2.4 2.8 –1.0 –1.7 4.7 3.5 4.2 1.9
2006 Jan 1.2 2.3 –4.7 6.3 –0.8 2.3 5.1 0.5 –2.1 4.7 3.4 3.5 1.9Feb 1.1 1.6 –4.7 6.4 –0.5 2.3 4.2 0.4 –0.8 4.7 3.5 3.6 2.0Mar –0.4 2.5 –4.7 7.0 –0.4 2.1 3.5 0.5 –1.4 4.7 3.6 3.7 1.8Apr 0.3 2.5 –4.4 7.7 –0.8 2.7 4.4 0.3 –1.6 4.7 3.0 4.0 2.0May 1.1 2.2 –3.7 9.0 –0.8 2.9 4.0 –0.4 –1.6 4.7 3.2 4.1 2.2Jun 1.8 3.3 –3.9 9.8 –0.1 2.7 3.9 –0.3 –1.6 4.7 3.2 4.4 2.5
Jul 3.2 2.8 –4.5 10.0 –1.3 2.4 3.3 0.3 –1.4 4.7 3.2 3.6 2.4Aug 3.4 3.3 –3.9 10.5 –0.5 2.6 2.4 –0.7 –0.9 4.7 3.0 3.9 2.5Sep 4.0 3.4 –3.5 10.7 0.3 2.8 0.6 –0.2 –1.0 7.1 2.9 3.9 2.4Oct 4.7 3.2 –3.3 10.8 –0.4 3.1 –0.5 0.9 –1.1 14.0 3.0 3.8 2.4Nov 5.0 2.7 –3.2 11.1 –0.5 3.1 0.8 0.7 –0.7 14.0 3.2 3.5 2.7Dec 4.6 2.7 –4.1 11.4 0.6 3.9 2.1 0.5 –0.3 14.0 3.2 3.3 3.0
2007 Jan 3.9 3.5 –4.1 11.2 0.5 3.8 0.9 –1.8 –0.3 14.0 3.3 3.1 2.7Feb 4.4 4.2 –4.2 11.1 1.2 3.7 1.4 –2.8 –1.0 14.0 3.3 3.6 2.8Mar 5.6 4.4 –3.9 10.1 2.7 3.7 1.6 –2.8 –0.7 14.0 3.4 3.7 3.1Apr 6.0 4.5 –2.8 7.9 2.2 3.2 1.5 –3.7 –0.8 14.0 3.8 2.4 2.8May 5.0 4.2 –3.6 5.7 2.5 3.1 2.5 –3.2 –0.8 14.0 3.5 2.2 2.5Jun 4.8 3.4 –3.2 4.3 3.8 3.4 3.2 –3.9 –1.1 14.0 3.7 1.8 2.4
Jul 2.8 3.4 –2.6 3.5 1.6 3.4 2.4 –5.0 –1.4 14.0 3.6 2.0 1.9Aug 3.0 3.1 –3.5 2.8 1.2 3.3 2.6 –2.0 –0.9 14.0 3.6 1.1 1.8Sep 3.7 3.2 –4.0 2.3 1.5 3.4 2.7 –3.0 –1.0 13.9 3.7 1.0 1.8Oct 4.7 2.7 –4.3 1.4 1.8 3.2 5.1 –4.2 –0.9 13.2 3.5 1.3 2.1Nov 4.8 2.9 –4.4 0.8 1.7 3.1 5.8 –4.0 –1.1 13.2 3.4 1.6 2.1Dec 5.4 2.7 –3.9 0.2 0.9 3.3 5.8 –3.8 –1.3 13.2 3.4 1.9 2.1
1 See chapter text. Prior to 10 December 2003, the consumer prices index(CPI) was published in the UK as the harmonised index of consumer prices(HICP).
Source: Office for National Statistics: 020 7533 5874
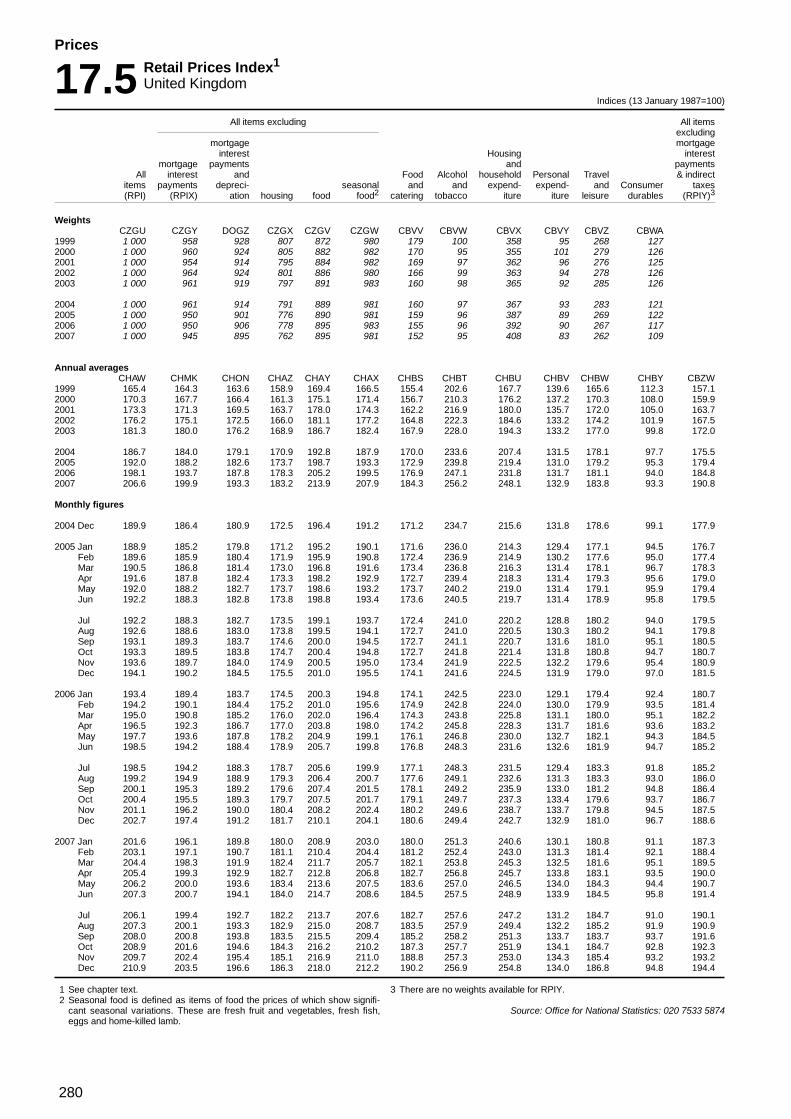
280
Prices
17.5 Retail Prices Index1
United KingdomIndices (13 January 1987=100)
All items excluding All itemsexcluding
mortgage mortgageinterest Housing interest
mortgage payments and paymentsAll interest and Food Alcohol household Personal Travel & indirect
items payments depreci- seasonal and and expend- expend- and Consumer taxes(RPI) (RPIX) ation housing food food2 catering tobacco iture iture leisure durables (RPIY)3
WeightsCZGU CZGY DOGZ CZGX CZGV CZGW CBVV CBVW CBVX CBVY CBVZ CBWA
1999 1 000 958 928 807 872 980 179 100 358 95 268 1272000 1 000 960 924 805 882 982 170 95 355 101 279 1262001 1 000 954 914 795 884 982 169 97 362 96 276 1252002 1 000 964 924 801 886 980 166 99 363 94 278 1262003 1 000 961 919 797 891 983 160 98 365 92 285 126
2004 1 000 961 914 791 889 981 160 97 367 93 283 1212005 1 000 950 901 776 890 981 159 96 387 89 269 1222006 1 000 950 906 778 895 983 155 96 392 90 267 1172007 1 000 945 895 762 895 981 152 95 408 83 262 109
Annual averagesCHAW CHMK CHON CHAZ CHAY CHAX CHBS CHBT CHBU CHBV CHBW CHBY CBZW
1999 165.4 164.3 163.6 158.9 169.4 166.5 155.4 202.6 167.7 139.6 165.6 112.3 157.12000 170.3 167.7 166.4 161.3 175.1 171.4 156.7 210.3 176.2 137.2 170.3 108.0 159.92001 173.3 171.3 169.5 163.7 178.0 174.3 162.2 216.9 180.0 135.7 172.0 105.0 163.72002 176.2 175.1 172.5 166.0 181.1 177.2 164.8 222.3 184.6 133.2 174.2 101.9 167.52003 181.3 180.0 176.2 168.9 186.7 182.4 167.9 228.0 194.3 133.2 177.0 99.8 172.0
2004 186.7 184.0 179.1 170.9 192.8 187.9 170.0 233.6 207.4 131.5 178.1 97.7 175.52005 192.0 188.2 182.6 173.7 198.7 193.3 172.9 239.8 219.4 131.0 179.2 95.3 179.42006 198.1 193.7 187.8 178.3 205.2 199.5 176.9 247.1 231.8 131.7 181.1 94.0 184.82007 206.6 199.9 193.3 183.2 213.9 207.9 184.3 256.2 248.1 132.9 183.8 93.3 190.8
Monthly figures
2004 Dec 189.9 186.4 180.9 172.5 196.4 191.2 171.2 234.7 215.6 131.8 178.6 99.1 177.9
2005 Jan 188.9 185.2 179.8 171.2 195.2 190.1 171.6 236.0 214.3 129.4 177.1 94.5 176.7Feb 189.6 185.9 180.4 171.9 195.9 190.8 172.4 236.9 214.9 130.2 177.6 95.0 177.4Mar 190.5 186.8 181.4 173.0 196.8 191.6 173.4 236.8 216.3 131.4 178.1 96.7 178.3Apr 191.6 187.8 182.4 173.3 198.2 192.9 172.7 239.4 218.3 131.4 179.3 95.6 179.0May 192.0 188.2 182.7 173.7 198.6 193.2 173.7 240.2 219.0 131.4 179.1 95.9 179.4Jun 192.2 188.3 182.8 173.8 198.8 193.4 173.6 240.5 219.7 131.4 178.9 95.8 179.5
Jul 192.2 188.3 182.7 173.5 199.1 193.7 172.4 241.0 220.2 128.8 180.2 94.0 179.5Aug 192.6 188.6 183.0 173.8 199.5 194.1 172.7 241.0 220.5 130.3 180.2 94.1 179.8Sep 193.1 189.3 183.7 174.6 200.0 194.5 172.7 241.1 220.7 131.6 181.0 95.1 180.5Oct 193.3 189.5 183.8 174.7 200.4 194.8 172.7 241.8 221.4 131.8 180.8 94.7 180.7Nov 193.6 189.7 184.0 174.9 200.5 195.0 173.4 241.9 222.5 132.2 179.6 95.4 180.9Dec 194.1 190.2 184.5 175.5 201.0 195.5 174.1 241.6 224.5 131.9 179.0 97.0 181.5
2006 Jan 193.4 189.4 183.7 174.5 200.3 194.8 174.1 242.5 223.0 129.1 179.4 92.4 180.7Feb 194.2 190.1 184.4 175.2 201.0 195.6 174.9 242.8 224.0 130.0 179.9 93.5 181.4Mar 195.0 190.8 185.2 176.0 202.0 196.4 174.3 243.8 225.8 131.1 180.0 95.1 182.2Apr 196.5 192.3 186.7 177.0 203.8 198.0 174.2 245.8 228.3 131.7 181.6 93.6 183.2May 197.7 193.6 187.8 178.2 204.9 199.1 176.1 246.8 230.0 132.7 182.1 94.3 184.5Jun 198.5 194.2 188.4 178.9 205.7 199.8 176.8 248.3 231.6 132.6 181.9 94.7 185.2
Jul 198.5 194.2 188.3 178.7 205.6 199.9 177.1 248.3 231.5 129.4 183.3 91.8 185.2Aug 199.2 194.9 188.9 179.3 206.4 200.7 177.6 249.1 232.6 131.3 183.3 93.0 186.0Sep 200.1 195.3 189.2 179.6 207.4 201.5 178.1 249.2 235.9 133.0 181.2 94.8 186.4Oct 200.4 195.5 189.3 179.7 207.5 201.7 179.1 249.7 237.3 133.4 179.6 93.7 186.7Nov 201.1 196.2 190.0 180.4 208.2 202.4 180.2 249.6 238.7 133.7 179.8 94.5 187.5Dec 202.7 197.4 191.2 181.7 210.1 204.1 180.6 249.4 242.7 132.9 181.0 96.7 188.6
2007 Jan 201.6 196.1 189.8 180.0 208.9 203.0 180.0 251.3 240.6 130.1 180.8 91.1 187.3Feb 203.1 197.1 190.7 181.1 210.4 204.4 181.2 252.4 243.0 131.3 181.4 92.1 188.4Mar 204.4 198.3 191.9 182.4 211.7 205.7 182.1 253.8 245.3 132.5 181.6 95.1 189.5Apr 205.4 199.3 192.9 182.7 212.8 206.8 182.7 256.8 245.7 133.8 183.1 93.5 190.0May 206.2 200.0 193.6 183.4 213.6 207.5 183.6 257.0 246.5 134.0 184.3 94.4 190.7Jun 207.3 200.7 194.1 184.0 214.7 208.6 184.5 257.5 248.9 133.9 184.5 95.8 191.4
Jul 206.1 199.4 192.7 182.2 213.7 207.6 182.7 257.6 247.2 131.2 184.7 91.0 190.1Aug 207.3 200.1 193.3 182.9 215.0 208.7 183.5 257.9 249.4 132.2 185.2 91.9 190.9Sep 208.0 200.8 193.8 183.5 215.5 209.4 185.2 258.2 251.3 133.7 183.7 93.7 191.6Oct 208.9 201.6 194.6 184.3 216.2 210.2 187.3 257.7 251.9 134.1 184.7 92.8 192.3Nov 209.7 202.4 195.4 185.1 216.9 211.0 188.8 257.3 253.0 134.3 185.4 93.2 193.2Dec 210.9 203.5 196.6 186.3 218.0 212.2 190.2 256.9 254.8 134.0 186.8 94.8 194.4
1 See chapter text.2 Seasonal food is defined as items of food the prices of which show signifi-
cant seasonal variations. These are fresh fruit and vegetables, fresh fish,eggs and home-killed lamb.
3 There are no weights available for RPIY.
Source: Office for National Statistics: 020 7533 5874

281
Prices
17.6 Tax and Price Index1
United KingdomIndices and percentages
Tax and Price Index: (January 1988=100)
DQAB
1993 1994 1995 1996 1997 1998 1999 2000 2001 2002 2003 2004 2005 2006 2007
January 128.7 132.1 137.2 141.6 143.6 147.1 150.5 152.7 156.7 156.5 161.4 166.9 172.1 175.9 183.3February 129.6 132.9 138.2 142.3 144.2 147.9 150.8 153.7 157.6 157.0 162.3 167.6 172.8 176.7 184.8March 130.2 133.4 138.8 143.0 144.6 148.4 151.2 154.6 157.8 157.7 163.0 168.4 173.7 177.4 186.1April 131.3 135.3 140.3 141.7 143.8 149.7 151.2 155.7 156.3 158.6 164.9 168.9 174.1 178.3 186.3May 131.8 135.8 141.0 142.0 144.4 150.6 151.7 156.3 157.4 159.1 165.2 169.7 174.5 179.5 187.1June 131.7 135.8 141.2 142.1 145.0 150.5 151.7 156.7 157.6 159.1 165.0 170.0 174.7 180.3 188.2July 131.4 135.1 140.4 141.5 145.0 150.1 151.1 156.1 156.5 158.8 165.0 170.0 174.7 180.3 187.0August 132.1 135.8 141.3 142.2 146.0 150.8 151.5 156.1 157.2 159.3 165.4 170.6 175.1 181.0 188.2September 132.7 136.1 142.0 143.0 146.9 151.5 152.3 157.3 157.8 160.6 166.3 171.3 175.6 181.9 188.9October 132.6 136.4 141.2 143.0 147.1 151.6 152.6 157.2 157.5 160.9 166.4 171.8 175.8 182.2 189.8November 132.4 136.5 141.2 143.1 147.2 151.5 152.8 157.7 156.8 161.2 166.5 172.2 176.1 182.8 190.6December 132.7 137.2 142.1 143.6 147.6 151.5 153.4 157.8 156.6 161.5 167.3 173.1 176.6 184.4 191.8
Retail Prices Index: (January 1988=100)
CHAW
1993 1994 1995 1996 1997 1998 1999 2000 2001 2002 2003 2004 2005 2006 2007
January 137.9 141.3 146.0 150.2 154.4 159.5 163.4 166.6 171.1 173.3 178.4 183.1 188.9 193.4 201.6February 138.8 142.1 146.9 150.9 155.0 160.3 163.7 167.5 172.0 173.8 179.3 183.8 189.6 194.2 203.1March 139.3 142.5 147.5 151.5 155.4 160.8 164.1 168.4 172.2 174.5 179.9 184.6 190.5 195.0 204.4April 140.6 144.2 149.0 152.6 156.3 162.6 165.2 170.1 173.1 175.7 181.2 185.7 191.6 196.5 205.4May 141.1 144.7 149.6 152.9 156.9 163.5 165.6 170.7 174.2 176.2 181.5 186.5 192.0 197.7 206.2June 141.0 144.7 149.8 153.0 157.5 163.4 165.6 171.1 174.4 176.2 181.3 186.8 192.2 198.5 207.3July 140.7 144.0 149.1 152.4 157.5 163.0 165.1 170.5 173.3 175.9 181.3 186.8 192.2 198.5 206.1August 141.3 144.7 149.9 153.1 158.5 163.7 165.5 170.5 174.0 176.4 181.6 187.4 192.6 199.2 207.3September 141.9 145.0 150.6 153.8 159.3 164.4 166.2 171.7 174.6 177.6 182.5 188.1 193.1 200.1 208.0October 141.8 145.2 149.8 153.8 159.5 164.5 166.5 171.6 174.3 177.9 182.6 188.6 193.3 200.4 208.9November 141.6 145.3 149.8 153.9 159.6 164.4 166.7 172.1 173.6 178.2 182.7 189.0 193.6 201.1 209.7December 141.9 146.0 150.7 154.4 160.0 164.4 167.3 172.2 173.4 178.5 183.5 189.9 194.1 202.7 210.9
Percentage changes on one year earlier1
1994 1995 1996 1997 1998 1999 2000 2001 2002 2003 2004 2005 2006 2007
Tax and Price Index1
January 2.6 3.9 3.2 1.4 2.4 2.3 1.5 2.6 –0.1 3.1 3.4 3.1 2.2 4.2February 2.5 4.0 3.0 1.3 2.6 2.0 1.9 2.5 –0.4 3.4 3.3 3.1 2.3 4.6March 2.5 4.0 3.0 1.1 2.6 1.9 2.2 2.1 –0.1 3.4 3.3 3.1 2.1 4.9April 3.0 3.7 1.0 1.5 4.1 1.0 3.0 0.4 1.5 4.0 2.4 3.1 2.4 4.5May 3.0 3.8 0.7 1.7 4.3 0.7 3.0 0.7 1.1 3.8 2.7 2.8 2.9 4.2June 3.1 4.0 0.6 2.0 3.8 0.8 3.3 0.6 1.0 3.7 3.0 2.8 3.2 4.4July 2.8 3.9 0.8 2.5 3.5 0.7 3.3 0.3 1.5 3.9 3.0 2.8 3.2 3.7August 2.8 4.1 0.6 2.7 3.3 0.5 3.0 0.7 1.3 3.8 3.1 2.6 3.4 4.0September 2.6 4.3 0.7 2.7 3.1 0.5 3.3 0.3 1.8 3.5 3.0 2.5 3.6 3.8October 2.9 3.5 1.3 2.9 3.1 0.7 3.0 0.2 2.2 3.4 3.2 2.3 3.6 4.2November 3.1 3.4 1.3 2.9 2.9 0.9 3.2 –0.6 2.8 3.3 3.4 2.3 3.8 4.3December 3.4 3.6 1.1 2.8 2.6 1.3 2.9 –0.8 3.1 3.6 3.5 2.0 4.4 4.0
Retail Prices Index
January 2.5 3.3 2.9 2.8 3.3 2.4 2.0 2.7 1.3 2.9 2.6 3.2 2.4 4.2February 2.4 3.4 2.7 2.7 3.4 2.1 2.3 2.7 1.0 3.2 2.5 3.2 2.4 4.6March 2.3 3.5 2.7 2.6 3.5 2.1 2.6 2.3 1.3 3.1 2.6 3.2 2.4 4.8April 2.6 3.3 2.4 2.4 4.0 1.6 3.0 1.8 1.5 3.1 2.5 3.2 2.6 4.5May 2.6 3.4 2.2 2.6 4.2 1.3 3.1 2.1 1.1 3.0 2.8 2.9 3.0 4.3June 2.6 3.5 2.1 2.9 3.7 1.3 3.3 1.9 1.0 2.9 3.0 2.9 3.3 4.4July 2.3 3.5 2.2 3.3 3.5 1.3 3.3 1.6 1.5 3.1 3.0 2.9 3.3 3.8August 2.4 3.6 2.1 3.5 3.3 1.1 3.0 2.1 1.4 2.9 3.2 2.8 3.4 4.1September 2.2 3.9 2.1 3.6 3.2 1.1 3.3 1.7 1.7 2.8 3.1 2.7 3.6 3.9October 2.4 3.2 2.7 3.7 3.1 1.2 3.1 1.6 2.1 2.6 3.3 2.5 3.7 4.2November 2.6 3.1 2.7 3.7 3.0 1.4 3.2 0.9 2.6 2.5 3.4 2.4 3.9 4.3December 2.9 3.2 2.5 3.6 2.8 1.8 2.9 0.7 2.9 2.8 3.5 2.2 4.4 4.0
1 See chapter text. Source: Office for National Statistics: 020 7533 5874

282
Prices
17.7 Index of purchase prices of the means of agricultural production1
United KingdomAnnual averages Indices (2000=100)
1997 1998 1999 2000 2001 2002 2003 2004 2005 2006 2007
Weights__________
Goods and services currentlyconsumed2 C3FU 100 105.5 99.5 98.1 100.0 104.3 103.7 106.5 113.7 116.0 120.7 132.5
Seeds C3FV 3.3 119.2 119.2 109.0 100.0 109.2 105.5 116.0 110.3 108.2 104.0 153.6
Energy, lubricants C3FW 8.1 82.1 75.1 82.4 100.0 96.7 92.4 100.5 108.8 137.4 154.4 158.0Fuels for heating C3FX 1.0 77.3 61.6 66.6 100.0 95.5 87.2 104.5 118.3 158.9 185.0 203.0Motor fuel C3FY 5.1 73.1 66.7 77.8 100.0 96.7 91.6 100.7 110.3 143.4 157.6 159.7Electricity C3FZ 1.8 109.6 104.8 102.9 100.0 96.9 96.2 96.5 98.9 110.7 132.0 132.0Lubricants C3G2 0.2 86.2 88.5 98.1 100.0 101.2 106.2 112.7 113.1 113.1 113.1 113.1
Fertilisers and soil improvers C3G3 9.1 106.6 95.3 93.3 100.0 115.8 110.3 119.0 130.5 143.3 151.4 170.1Straight nitrogen C3G4 3.9 104.4 87.0 82.9 100.0 129.1 120.2 133.1 148.5 168.7 181.8 187.7Compound fertilisers C3G5 4.6 109.6 101.9 101.3 100.0 106.7 103.0 109.1 118.4 126.0 130.4 160.0Other fertiliser (mainly lime and chalk) C3G6 0.4 93.5 95.9 96.7 100.0 100.5 104.0 103.4 103.8 105.6 109.1 116.1
Plant protection products C3G7 7.2 116.6 108.2 105.8 100.0 96.8 95.8 95.7 100.6 102.9 103.4 104.9
Animal feedstuffs C3G8 26.4 125.4 106.5 99.1 100.0 107.4 103.5 104.9 111.6 103.0 108.1 130.4Feed wheat C3G9 2.2 133.8 113.8 110.7 100.0 110.9 97.3 106.5 119.4 97.6 111.9 156.2Whole barley C3GA 2.1 125.3 108.5 111.5 100.0 101.8 89.5 103.2 112.8 97.8 108.8 157.1Whole oats C3GB 0.2 123.3 98.0 104.7 100.0 97.8 90.7 85.1 94.3 94.6 102.6 125.8Maize glutten feed C3GC 0.4 117.8 95.3 100.2 100.0 110.0 102.9 122.9 123.8 110.1 124.6 165.8Oilcake C3GD 2.1 131.5 91.9 83.5 100.0 109.4 100.4 109.5 112.0 100.0 100.6 127.0White fish meal C3GE 0.4 125.3 137.9 93.2 100.0 115.1 134.7 129.1 120.3 126.6 182.6 173.7Other straight feedstuffs C3GF 3.3 121.7 98.2 91.8 100.0 114.1 109.3 109.9 115.1 109.8 109.1 142.3All straight feedstuffs C3GG 10.6 127.3 104.1 97.1 100.0 109.7 101.3 108.2 114.9 102.9 110.5 146.3Feedstuffs non-concentrates C3GH 0.1 127.3 104.1 97.1 100.0 109.7 101.3 108.2 114.9 102.9 110.5 146.3
Compound feedstuffs C3GI 15.8 124.1 108.1 100.4 100.0 105.8 104.9 102.7 109.4 103.1 106.5 119.8for:
Cattle and calves C3GJ 6.2 122.0 105.0 99.9 100.0 106.4 105.9 102.5 108.1 103.9 105.4 117.2Pigs C3GK 3.5 130.5 112.8 101.9 100.0 105.9 103.3 101.0 107.7 100.2 105.3 117.7Poultry C3GL 5.0 121.7 108.7 100.6 100.0 105.9 104.5 104.9 112.8 104.5 109.7 126.3Sheep C3GM 1.1 126.5 108.3 98.0 100.0 102.2 106.2 99.4 105.9 101.6 101.5 112.0
Maintenance and repair ofplant C3GN 7.9 91.0 93.4 96.6 100.0 104.3 109.4 116.0 122.5 130.3 137.8 143.4
Maintenance and repair ofbuildings C3GO 3.6 97.3 98.5 97.7 100.0 101.9 105.1 108.3 113.4 118.1 125.1 134.3
Veterinary services C3GP 3.2 100.1 101.1 101.2 100.0 98.6 97.8 101.6 104.6 103.9 111.1 112.5
Other goods and services C3GQ 31.2 95.6 98.5 99.9 100.0 102.5 105.5 105.2 114.0 114.5 115.5 119.7
Goods and services contributingto investment in agriculture C3GR 100 98.1 99.8 100.2 100.0 99.0 100.0 101.5 104.4 108.7 111.7 115.4
Materials C3GS 71.5 100.5 101.6 101.7 100.0 97.3 97.0 97.5 99.4 103.4 105.3 107.2Machinery and other equipment C3GT 28.4 95.0 97.7 99.2 100.0 97.4 95.7 95.1 96.1 103.8 108.2 114.0
Machinery and plant forcultivation C3GU 8.0 93.3 97.7 99.1 100.0 99.6 98.6 98.7 103.8 109.4 111.0 115.9
Machinery and plant forharvesting C3GV 14.3 96.8 98.4 100.0 100.0 92.3 88.8 88.2 87.3 97.9 105.4 113.2
Farm machinery andinstallations C3GW 6.0 93.2 96.1 97.5 100.0 106.3 108.2 106.8 107.0 110.2 111.2 113.2
Tractors C3GX 28.6 101.0 101.6 102.4 100.0 96.8 98.4 101.4 106.1 110.5 111.8 111.8Other vehicles C3GY 14.5 110.0 109.1 105.1 100.0 98.3 96.7 94.4 92.4 88.6 86.7 84.9
Buildings C3GZ 19.5 93.2 95.6 96.6 100.0 103.3 107.8 112.1 118.1 123.7 130.9 140.0
Engineering and soilimprovement operations C3H2 9.0 89.8 94.8 96.9 100.0 101.4 107.2 110.3 113.3 118.0 118.8 124.7
1 See chapter text.2 The sum of the percentages of categories included does not add up to
100% due to the exclusion of some minor categories.
Source: Department for Environment, Food and Rural Affairs: 01904 455249

283
Prices
17.8 Index of producer prices of agricultural products1
United KingdomAnnual averages Indices (2000=100)
1997 1998 1999 2000 2001 2002 2003 2004 2005 2006 2007
Weights__________
All products2 C3H6 100 117.1 107.0 103.6 100.0 108.3 103.3 109.9 113.3 109.7 114.2 129.3
All crop products C3H7 40.2 108.9 111.7 109.0 100.0 112.0 104.0 110.7 115.1 108.6 118.1 143.9
Cereals (including cereal seeds) C3H8 13.3 132.4 113.8 111.0 100.0 107.8 95.0 105.2 114.2 99.1 110.5 163.7Wheat for:
breadmaking C3H9 1.1 139.5 122.8 112.9 100.0 109.6 101.4 110.6 120.8 102.1 107.4 172.6other milling C3HA 1.5 133.7 116.0 110.9 100.0 107.5 92.9 104.1 116.8 96.6 108.6 177.1feeding C3HB 6.4 135.4 114.0 110.5 100.0 110.5 96.7 105.6 117.6 98.2 112.0 154.1
Barley for:feeding C3HC 2.5 123.9 109.2 112.9 100.0 102.6 89.1 103.7 110.8 98.7 108.4 159.8malting C3HD 1.4 128.2 115.1 108.9 100.0 104.8 96.5 107.1 101.6 104.5 112.8 199.1
Oats for:milling C3HE 0.1 128.8 104.9 109.9 100.0 109.8 89.0 90.7 96.3 104.9 113.8 149.6feeding C3HF 0.2 119.0 97.0 106.1 100.0 98.5 91.2 86.7 94.4 96.3 104.3 130.5
Potatoes: C3HG 4.5 63.5 138.8 143.5 100.0 131.0 90.0 105.6 140.3 109.2 141.7 161.1early C3HH 0.4 46.3 100.7 51.9 100.0 114.5 73.0 90.0 124.8 98.0 131.8 102.1main crop C3HI 4.1 63.4 141.1 151.5 100.0 132.5 90.6 106.0 141.6 109.7 143.1 166.5
Industrial crops C3HJ 4.3 127.9 118.4 103.4 100.0 111.9 114.4 120.3 121.6 114.3 118.3 124.0Oilseed rape (non set-aside) C3HK 1.2 135.6 140.0 102.0 100.0 119.2 121.2 140.3 136.1 112.9 134.5 158.8Sugar beet C3HL 2.2 124.9 111.4 108.7 100.0 107.3 114.8 112.1 115.4 117.1 112.6 86.6
Fresh vegetables C3HM 7.7 97.4 105.2 99.2 100.0 113.6 112.7 125.5 113.7 120.3 129.7 143.5Cauliflowers C3HN 0.4 79.1 87.9 82.4 100.0 103.9 117.7 119.8 102.4 127.1 123.2 166.2Lettuce C3HO 0.7 114.0 98.6 102.9 100.0 129.2 128.6 151.5 130.2 140.7 151.7 150.2Tomatoes C3HP 0.7 86.9 91.8 100.3 100.0 100.1 107.6 135.6 99.8 117.7 124.3 126.6Carrots C3HQ 0.7 88.1 125.4 119.3 100.0 166.5 150.4 157.2 144.7 170.5 184.2 208.9Cabbage C3HR 0.4 83.2 94.5 94.2 100.0 123.0 109.8 119.7 109.3 122.6 133.1 161.7Beans C3HS 0.2 87.3 107.8 102.8 100.0 124.3 118.0 119.1 128.7 127.2 172.5 188.6Onions C3HT 0.5 122.8 165.8 104.7 100.0 128.6 126.7 136.1 138.8 113.1 150.8 196.7Mushrooms C3HU 1.3 99.1 98.9 98.1 100.0 91.0 95.9 100.6 94.4 83.4 81.3 70.9
Fresh fruit C3HV 1.9 109.1 105.4 100.0 100.0 99.0 113.9 124.2 112.4 120.1 114.6 126.7Dessert apples C3HW 0.3 124.7 110.5 104.3 100.0 109.8 111.3 124.6 120.7 116.4 122.5 140.4Dessert pears C3HX 0.1 118.2 110.4 108.7 100.0 128.7 124.8 115.3 114.6 115.0 123.0 122.9Cooking apples C3HY 0.2 135.6 150.9 100.7 100.0 105.6 109.4 152.1 142.5 118.8 129.7 144.1Strawberries C3HZ 0.7 106.9 93.7 102.4 100.0 94.5 121.7 124.4 97.1 111.8 106.5 113.2Raspberries C3I2 0.2 103.3 114.3 104.9 100.0 102.9 128.9 125.7 114.3 152.9 133.4 158.6
Seeds (excluding cereal seeds) C3I3 0.5 130.9 98.6 97.7 100.0 104.0 95.7 113.6 112.9 114.1 113.1 113.1
Flowers and plants C3I4 5.9 102.4 103.1 105.3 100.0 105.3 106.8 107.9 105.3 105.6 108.8 115.3
Other crop products C3I5 0.7 122.2 98.7 97.0 100.0 106.0 98.9 108.6 109.7 110.8 110.6 114.0
Animals and animal products C3I6 59.8 122.6 103.9 99.9 100.0 105.8 102.7 109.4 112.0 110.4 111.6 119.5Animals for slaughter C3I7 35.3 118.0 97.2 95.2 100.0 101.3 103.2 109.3 111.7 110.3 113.8 115.8
Calves C3I8 0.1 179.3 149.4 115.1 100.0 94.2 120.2 143.9 140.8 108.3 131.5 135.9Clean cattle C3I9 9.7 107.1 95.0 101.7 100.0 100.8 103.8 106.7 113.4 114.6 123.9 125.9Clean pigs C3IA 7.0 117.5 85.8 83.4 100.0 103.6 98.7 109.0 109.3 109.8 110.9 114.3Sows and boars C3IB 0.2 157.1 81.1 81.0 100.0 107.4 94.0 103.2 123.9 124.1 126.1 99.8Clean sheep and lambs C3IC 5.2 131.0 97.1 90.2 100.0 101.3 118.5 132.5 131.4 122.9 125.5 111.7Ewes and rams C3ID 0.4 198.5 116.3 81.3 100.0 152.4 149.6 188.2 182.5 148.9 158.9 155.4
All poultry C3IE 11.5 116.8 103.3 99.0 100.0 98.6 97.2 99.4 101.2 100.8 99.4 108.2Chickens C3IF 7.9 126.6 105.9 101.3 100.0 100.1 99.5 100.2 103.4 102.0 100.0 107.5Turkeys C3IG 2.9 89.5 91.3 90.0 100.0 94.4 89.5 97.8 95.0 94.7 94.0 108.6
Cows’ milk C3IH 20.1 130.6 114.4 108.3 100.0 113.7 101.0 106.4 109.0 109.0 106.0 122.4
Eggs C3II 3.2 121.1 109.4 98.0 100.0 104.9 109.5 130.7 135.1 121.0 127.4 144.3
Other animal products: C3IJ 1.1 129.4 108.0 103.0 100.0 107.7 100.0 107.4 110.4 107.5 93.5 111.1Wool (clip) C3IK 0.2 150.1 98.6 93.5 100.0 87.0 96.4 108.4 107.3 92.3 33.6 71.7
1 See chapter text.2 The sum of the percentages of all the categories does not add up to 100%
due to the exclusion of some minor categories.
Source: Department for Environment, Food and Rural Affairs: 01904 455249

284
Prices
17.9 Commodity price trends1
United Kingdom
1997 1998 1999 2000 2001 2002 2003 2004 2005 2006 200716
Wheat Average ex-farm£ per tonne KVAA price2,3 91.8 77.8 75.4 68.1 76.9 65.6 77.3 .. .. .. ..
Barley Average ex-farm£ per tonne KVAB price2,3 86.3 79.2 74.2 70.1 72.1 64.8 75.5 .. .. .. ..
Oats Average ex-farm£ per tonne KVAC price2,3 82.3 66.4 71.1 65.0 67.7 56.6 62.1 .. .. .. ..
Rye Average ex-farm£ per tonne KVAD price2 .. .. .. .. 78.10 61.40 71.80 86.40 .. .. ..
Hops Average farm-gate£ per tonne KVAE price 3 550 3 500 4 000 4 017 4 081 3 255 3 212 2 496 3 277 3 241 ..
Potatoes Average farm-gate£ per tonne KVAF price4 66.10 121.50 119.10 83.30 111.40 81.10 102.50 123.20 100.60 128.90 143.50
Sugar beet KVAG Producer price5 29.70 29.80 26.40 27.80 30.80 29.60 30.50 30.80 30.90 24.10 22.80£ per tonne
Oilseed rape Average market£ per tonne KVAH price6 160.20 164.30 112.90 120.40 148.40 148.20 171.60 .. .. .. ..
Apples Dessert average£ per tonne KPUE farm-gate price7 525.0 480.3 436.8 357.8 352.2 385.2 460.3 412.2 418.6 433.6 491.9
" Dessert average" KVAI market price 462.0 431.5 405.4 408.7 418.2 453.1 551.3 526.1 471.5 .. ..
" Culinary average" KVAJ market price 517.7 575.5 384.1 378.1 422.4 419.4 652.6 592.0 458.7 .. ..
" Culinary average" KPUJ farm-gate price 335.1 341.4 248.9 215.3 175.7 285.7 471.7 359.1 316.5 378.7 377.1
Pears Average farm-gate£ per tonne KPUG price 441.9 405.1 426.4 283.3 352.1 402.9 344.0 349.2 350.3 392.1 387.4
" Average market" KVAK price 429.5 413.3 396.8 374.0 412.5 463.6 443.0 437.2 426.3 .. ..
Tomatoes Average farm-gate£ per tonne LQMH price7 546.9 594.6 576.5 751.6 724.9 793.7 1 042.3 751.6 870.8 989.7 1 009.9
" Average market" KVAL price7 549.3 636.0 583.6 629.7 651.3 736.3 824.8 647.2 754.8 .. ..
Cauliflowers Average farm-gate£ per tonne KPUI price7 236.76 216.28 211.33 274.10 285.30 329.60 331.70 296.31 344.40 331.10 376.76
" Average market" KVAM price7 309.8 284.8 242.5 282.9 304.9 365.6 368.2 330.8 408.3 .. ..
Cattle (rearing) 1st qualityHereford/cross bull
£ per head KVAN calves8,9,10 147.00 107.90 88.20 79.50 .. 84.90 112.70 113.70 81.50 73.40 93.10
" 1st quality beef/cross yearling
" KVAO steers9,10 427.00 369.00 382.00 400.05 .. 403.85 451.54 395.90 429.10 .. ..
Cattle (fat) KVAP Clean cattle11 96.89 86.10 92.12 89.68 87.53 91.38 95.15 101.18 102.22 .. ..p per kg liveweight

285
Prices
17.9 Commodity price trends1
United Kingdomcontinued
1997 1998 1999 2000 2001 2002 2003 2004 2005 2006 200716
Sheep (store) 1st quality lambs,£ per head KVAQ hoggets and tegs8 53.42 31.28 28.62 34.50 .. .. 36.03 37.70 30.52 .. ..
Sheep (fat) KVAR Great Britain12 239.02 192.46 180.27 196.44 .. 233.40 271.08 262.55 250.10 .. ..p per kg estimated dressed KVAS Northern Ireland13 228.23 179.06 165.71 182.67 .. 228.80 239.91 227.83 223.75 .. ..
carcase weight
Pigs Average price£ per kg deadweight KVAT clean pigs 110.80 80.60 78.60 95.08 97.75 93.32 102.64 102.85 102.08 .. ..
Broilers Average producerp per kg carcass weight KVAU price 86.2 76.7 72.1 70.7 70.6 68.8 68.6 73.6 73.2 .. ..
Milk Average net returnp per litre KVAV to producers14 22.12 19.37 18.35 16.93 19.26 17.10 18.03 18.47 18.47 .. ..
Eggs Average producerp per dozen KVAW price15 39.33 36.35 34.45 39.28 40.72 42.08 45.95 48.92 45.27 .. ..
Wool Average producerp per kg price for clip paid
to producers by theBritish Wool
KHWQ Marketing Board 74.90 48.00 46.60 51.30 47.00 50.00 55.70 53.10 50.20 .. ..
1 This table gives indications of the movement in commodity prices at the firstpoint of sale. The series do not always show total receipts by farmers; forsome commodities additional premiums or deficiency payments are made toachieve support price levels.
2 Weighted average ex-farm prices of United Kingdom cereals.3 Data from 1997 onwards have been revised and are not directly comparable
with earlier years.4 Weighted average price paid to growers for early and main crop potatoes in
the United Kingdom (includes all potatoes and a value for sacks).5 Returns to growers figures since 1986 prices per ’adjusted’ tonne at 16%
sugar content.6 Typical contract price adjusted to delivered basis and 40 per cent oil con-
tent.7 Weighted average wholesale prices for England and Wales. Average farm-
gate price for England and Wales, crop year (June-May).
8 Average prices at representative markets in England and Wales.9 Consists of Hereford/cross, Charolais/cross, Limousin/cross, Simmental/cross,
Belgian/cross, other continental cross, other beef/dairy cross, other beef/beefcross.
10 From 2002 no differentiation between class 1 and class 2 animals.11 Based on Meat and Livestock Commission all clean cattle prices.12 Average of Great Britain weekly market prices as used to determine the level of
ewe premium.13 Average of Northern Ireland weekly market prices used to determine the level
of ewe premium.14 Derived by dividing total value of output by the total quantity of output available
for human consumption.15 Average price of all Class A eggs weighted according to quantity in each grade.16 Provisional.
Source: Department for Environment, Food and Rural Affairs: 01904 455332

286
Government finance
287
Government finance
Government finance
Ch
apter 18

288
Government finance
Consolidated Fund and National Loans Fund
(Tables 18.4, 18.6 and 18.7)
The central government embraces all bodies for whose activities a Minister of the Crown, or other responsible person, is accountable to Parliament. It includes, in addition to the ordinary government departments, a number of bodies administering public policy, but without the substantial degree of financial independence which characterises the public corporations. It also includes certain extra-budgetary funds and accounts controlled by departments.
The government’s financial transactions are handled through a number of statutory funds or accounts. The most important of these is the Consolidated Fund, which is the government’s main account with the Bank of England. Up to 31 March 1968 the Consolidated Fund was virtually synonymous with the term ‘Exchequer’, which was then the government’s central cash account. From 1 April 1968 the National Loans Fund, with a separate account at the Bank of England, was set up by the National Loans Act, 1968. The general effect of this Act was to remove from the Consolidated Fund most of the government’s domestic lending and the whole of the government’s borrowing transactions, and to provide for them to be brought to account in the National Loans Fund.
Revenue from taxation and miscellaneous receipts, including interest and dividends on loans made from votes, continue to be paid into the Consolidated Fund.
After meeting the ordinary expenditure on Supply Services and the Consolidated Fund Standing Services, the surplus or deficit of the Consolidated Fund (Table 18.4), is payable into or met by the National Loans Fund. Table 18.4 also provides a summary of the transactions of the National Loans Fund. The service of the National Debt, previously borne by the Consolidated Fund, is now met from the National Loans Fund which receives:
(a) interest payable on loans to the nationalised industries, local authorities and other bodies, whether the loans were made before or after 1 April 1968, and
(b) the profits of the Issue Department of the Bank of England, mainly derived from interest on government securities, which were formerly paid into the Exchange Equalisation Account. The net cost of servicing the National Debt after applying these interest receipts and similar items is a charge on the Consolidated Fund as part of the standing services. Details of National Loans Fund loans outstanding are shown in Table 18.7. Details of borrowing and repayments of debt, other than loans from the National Loans Fund, are shown in Table 18.6.
Government finance
Public sector
(Tables 18.1 to 18.3 and 18.5)
In Table 18.1 the term public sector describes the consolidation of central government, local government and public corporations. General government is the consolidated total of central government and local government. The table shows details of the key public sector finances’ indicators, consistent with the European System of Accounts 1995 (ESA95), by sub sector.
The concepts in Table 18.1 are consistent with the format for public finances in the Economic and Fiscal Strategy Report (EFSR), published by HM Treasury on 11 June 1998, and The Budget. The public sector current budget is equivalent to net saving in national accounts plus capital tax receipts. Net investment is gross capital formation, plus payments less receipts of investment grants, less depreciation. Net borrowing is net investment less current budget. Net borrowing differs from the net cash requirement (see below) in that it is measured on an accruals basis whereas the net cash requirement is mainly a cash measure which includes some financial transactions. Table 18.2 shows the public sector key fiscal balances. The table shows the component detail of the public sector key fiscal balance by economic category. The tables are consistent with the budget.
Table 18.3 shows public sector net debt. Public sector net debt consists of the public sector’s financial liabilities at face value, minus its liquid assets – mainly foreign currency exchange reserves and bank deposits. General government gross debt (consolidated) in Table 18.3 is consistent with the definition of general government gross debt reported to the European Commission under the requirements of the Maastricht Treaty.
More information on the concepts in Table 18.1, 18.2 and 18.3 can be found in a guide to monthly public sector finance statistics, GSS Methodology Series No 12, the Office for National Statistics First Release 'Public Sector Finances' and Financial Statistics Explanatory Handbook.
Table 18.5 shows the taxes and National Insurance contributions paid to central government, local government, and to the institutions of the European Union. The table is the same as table 11.1 of the National Accounts Blue Book. More information on the data and concepts in the table can be found in Chapter 11 of the Blue Book.

289
Government finance
Income tax
(Table 18.9, 18.10)
Following the introduction of Independent Taxation from 1990–91, the Married Couple’s Allowance was introduced. It is payable in addition to the Personal Allowance and between 1990–91 and 1992–93 went to the husband unless the transfer condition was met. The condition was that the husband was unable to make full use of the allowance himself and in that case he could transfer only part or all of the Married Couple’s Allowance to his wife. In 1993–94 all or half of the allowance could be transferred to the wife if the couple had agreed beforehand. The wife has the right to claim half the allowance. The Married Couple’s Allowance, and allowances linked to it, were restricted to 20 per cent in 1994–95 and to 15 per cent from 1995–96. From 2000–01 only people born before 6 April 1935 are entitled to Married Couple’s Allowance.
The age allowance replaces the single allowance, provided the taxpayer’s income is below the limits shown in the table. From 1989–90, for incomes in excess of the limits, the allowance is reduced by £1 for each additional £2 of income until the ordinary limit is reached (before it was £2 for each £3 of additional income). The relief is due where the taxpayer is aged 65 or over in the year of assessment.
The additional Personal Allowance could be claimed by a single parent (or by a married man if his wife was totally incapacitated) who maintained a resident child at his or her own expense. Widow’s Bereavement Allowance was due to a widow in the year of her husband’s death and in the following year provided the widow had not remarried before the beginning of that year. Both the additional Personal Allowance and the Widow’s Bereavement Allowance were abolished from April 2000.
The Blind Person’s Allowance may be claimed by blind persons (in England and Wales, registered as blind by a local authority) and surplus Blind Person’s Allowance may be transferred to a husband or wife. Relief on life assurance premiums is given by deduction from the premium payable. From 1984–85, it is confined to policies made before 14 March 1984.
From 1993–94 until 1998–99 a number of taxpayers with taxable income in excess of the lower rate limit only paid tax at the lower rate. This was because it was only their dividend income and (from 1996–97) their savings income which took their taxable income above the lower rate limit but below the basic rate limit, and such income was chargeable to tax at the lower rate and not the basic rate.
In 1999–2000 the 10 per cent starting rate replaced the lower rate and taxpayers with savings or dividend income at the basic rate of tax are taxed at 20 per cent and 10 per cent respectively. Before 1999–2000 these people would have been classified as lower rate taxpayers.
Rateable values
(Table 18.11)
Major changes to local government finance in England and Wales took effect from 1 April 1990. These included the abolition of domestic rating – replaced by the Community Charge (replaced in 1993 by the Council Tax), the revaluation of all non-domestic properties, and the introduction of the Uniform Business Rate. Also in 1990, a new classification scheme was introduced which has resulted in differences in coverage. Further differences are caused by legislative changes which have changed the treatment of certain types of property. There was little change in the total rateable value of non-domestic properties when all these properties were revalued in April 1995. Rateable values for offices fell and there was a rise for all other property types shown in the table.
With effect from 1 April 2000, all non-domestic properties were revalued. Overall there was an increase in rateable values of over 25 per cent compared to the last year of the 1995 list. The largest proportionate increase was for offices and cinemas, with all property types given in the table showing rises.
The latest revaluation affecting all non domestic properties took effect from 1 April 2005. In this revaluation the overall increase in rateable values between 1 April of the first year of the new list and the same day on the last year of the 2000 list was 17 per cent. The largest proportionate increase was for theatres and music halls with again, all property types in the table showing rises.
Local authority capital expenditure and receipts
(Table 18.15)
Capital spending by local authorities is mainly for buying, constructing or improving physical assets such as:
– buildings – schools, houses, libraries and museums, police and fire stations.
– land – for development, roads, playing fields; vehicles, plant and machinery – including street lighting and road signs. It also includes grants and advances made to the private sector or the rest of the public sector for capital purposes, such as advances to Registered Social Landlords

290
Government finance
Local authority capital expenditure has risen by almost 42 per cent since 2002–03.
Capital expenditure by local authorities in England was £16.3 billion in 2006–07 compared with £16.6 billion in 2005–06, a decrease of 2 per cent. The refinancing of the National Exhibition Centre in Birmingham and major rail development funded by the Greater London Authority (GLA) in 2005–06 account for most of the decrease between 2005–06 and 2006–07.
New construction, conversion and renovation forms the major part of capital spending.
Local authority capital expenditure on social services has risen by 83 per cent since 2002–03, although it remains a small proportion of total spending.
Education and Transport sectors have maintained their share of total spending over the last four years.
Other spending (mainly relating to libraries and the arts, fire service, parks, waste collection, general administration, planning and development) rose by 77 per cent over the same period, increasing its share of total spending to 30 per cent.
Housing’s share of spending fell from 34 per cent to 28 per cent over this period.
Local authority financing for capital expenditure
(Table 18.16)
Authorities finance capital spending in a number of ways, including use of their own revenue funds, borrowing or grants and contributions from elsewhere. Up until 31 March 2004, the capital finance system laid down in Part 4 of the Local Government and Housing Act 1989 (the ‘1989 Act’) provided the framework within which authorities were permitted to finance capital spending from sources other than revenue – that is by the use of borrowing, long-term credit or capital receipts.
Up until 31 March 2004, capital spending could be financed by:
- revenue resources – either the General Fund Revenue Account, the Housing Revenue Account (HRA) or the Major Repairs Reserve – but an authority could not charge council tenants for spending on general services, or spending on council houses to local taxpayers
- borrowing or long-term credit as authorised by the credit approvals issued by central government. Credit approvals were
normally accompanied by an element of Revenue Support Grant (RSG) covering most of the costs of borrowing
- grants received from central government
- contributions or grants from elsewhere – including the National Lottery and Non-Departmental Public Bodies such as Sport England, English Heritage and Natural England, as well as private sector partners, capital receipts (that is proceeds from the sale of land, buildings or other fixed assets) and sums set aside as Provision for Credit Liabilities (PCL). This required the use of a credit approval, unless the authority was debt-free.
From 1 April 2004, capital spending can be financed in the same ways, except that central government no longer issues credit approvals to allow authorities to finance capital spending by borrowing. However, it continues to provide financial support in the usual way, via RSG or HRA subsidy, towards some capital spending financed by borrowing that is Supported Capital Expenditure (Revenue). Authorities are now free to finance capital spending by self-financed borrowing within limits of affordability set, having regard to the 2003 Act and the Chartered Institute of Public Finance and Accountancy Prudential Code. The concept of PCL has not been carried forward into the new system, although authorities which were debt-free and had a negative credit ceiling at the end of the old system could still spend amounts of PCL built up under the old rules.
In 2006–07 capital expenditure of almost £2.3 billion (about 14 per cent) was financed by self-financed borrowing, an increase of 2 per cent from the amount financed in 2005–06. Self-financed borrowing in 2005–06 includes a bond issued as part of the refinancing of the National Exhibition Centre in Birmingham, and if this is excluded, capital expenditure financed by self-financed borrowing in 2006–07 shows an increase of 13 per cent over 2005–06.
In 2001–02 credit approvals were the principal financing source for capital expenditure, accounting for 26 per cent of the total. By 2006–07, government grants accounted for 25 per cent of the total financing.

291
Government finance
18.1 Sector analysis of key fiscal balances1
United KingdomNot seasonally adjusted £ million2
1997 1998 1999 2000 2001 2002 2003 2004 2005 2006 2007/98 /99 /00 /01 /02 /03 /04 /05 /06 /07 /08
Surplus on current budget3
Central Government ANLV 920 12 529 24 456 26 836 13 906 –7 969 –17 562 –17 953 –13 686 –5 330 –7 799Local government NMMX –420 –406 –2 179 –1 531 –1 657 –1 270 817 –1 846 –5 485 –2 972 ..General Government ANLW –746 11 086 20 878 21 996 10 861 –11 103 –19 005 –19 516 –21 569 –10 283 ..Public corporations FDDP –1 046 –1 220 –1 675 –1 828 –631 –2 580 –2 918 –685 5 171 4 183 ..Public sector ANMU –930 10 415 21 005 23 487 12 213 –11 095 –17 422 –18 965 –14 098 –4 307 –7 554
Net investment4
Central government -ANNS 7 734 8 085 9 368 8 669 13 543 17 174 18 582 20 018 19 272 26 478 30 909Local government -ANNT –536 –313 –832 –1 882 –1 824 –3 595 –1 001 –230 549 –672 ..General Government -ANNV 7 297 7 848 6 461 6 574 10 951 12 487 16 371 19 499 18 318 24 517 ..Public corporations -ANNU –2 080 –1 033 –2 944 –2 141 –456 –922 –2 941 –1 378 3 759 –285 ..Public sector -ANNW 4 765 5 897 5 395 5 225 11 831 13 707 15 590 20 616 23 550 25 779 28 002
Net borrowing5
Central government -NMFJ 6 814 –4 444 –15 088 –18 167 –363 25 143 36 144 37 971 32 958 31 808 38 708Local government -NMOE 1 595 1 820 3 136 2 490 2 081 1 074 183 3 795 5 445 2 371 784General Government -NNBK 8 409 –2 624 –11 952 –15 677 1 718 26 217 36 327 41 766 38 403 34 179 39 492Public corporations -CPCM –2 714 –1 894 –3 658 –2 585 –2 100 –1 415 –3 315 –2 185 –755 –4 093 –3 936Public sector -ANNX 5 695 –4 518 –15 610 –18 262 –382 24 802 33 012 39 581 37 648 30 086 35 556
Net cash requirementCentral government6 RUUX 2 751 –6 344 –10 664 –37 251 3 366 24 214 42 717 37 454 35 908 36 891 29 593Local government ABEG –820 –404 979 –611 –423 –2 715 –2 712 1 270 4 153 58 –907General Government RUUS 1 931 –6 748 –9 685 –37 862 2 943 21 499 40 005 38 724 40 061 36 949 28 686Public corporations ABEM –669 698 1 712 1 541 1 159 3 095 –1 539 –184 270 –1 657 –2 071Public sector RURQ 1 262 –6 050 –7 973 –36 321 4 102 24 594 38 466 38 540 40 331 35 292 26 615
Public sector debtPublic sector net debt (£ billion) RUTN 352.9 351.6 345.4 312.4 315.5 347.1 382.8 423.6 463.0 499.5 527.7Public sector net debt as
a percentage of GDP RUTO 41.3 39.2 36.4 31.4 30.3 31.5 32.8 34.7 36.0 36.6 36.7
1 National accounts entities as defined under the European System of Ac-counts 1995 (ESA95) consistent with the latest national accounts. Seechapter text.
2 Unless otherwise stated3 Net saving plus capital taxes.4 Gross capital formation plus payments less receipts of investment grants
less depreciation.
5 Net investment less surplus on current budget. A version of General govern-ment net borrowing is reported to the European Commision under the require-ments of the Maastricht Treaty.
6 Central government net cash requirement (own account).
Source: Office for National Statistics: 020 7014 2124

292
Government finance
18.2 Public sector transactions and fiscal balances1
United Kingdom£ million
1997 1998 1999 2000 2001 2002 2003 2004 2005 2006 2007/98 /99 /00 /01 /02 /03 /04 /05 /06 /07 /08
Current receiptsTaxes on income and wealth ANSO 114 939 123 875 133 720 144 157 145 122 143 228 145 505 160 974 179 909 194 177 ..Taxes on production NMYE 111 502 116 519 125 099 129 273 133 043 139 827 148 817 154 958 159 295 170 026 ..Other current taxes2 MJBC 16 223 17 688 18 916 19 698 21 569 23 192 25 748 27 236 28 679 30 313 ..Taxes on capital NMGI 1 684 1 805 2 054 2 236 2 365 2 370 2 521 2 941 3 276 3 623 ..Social contributions ANBO 51 692 54 746 56 935 62 068 63 162 63 529 75 148 80 408 85 335 90 701 ..Gross operating surplus ANBP 16 655 16 755 16 897 16 617 16 861 17 182 18 367 18 852 22 080 23 930 ..Interest and dividends from private sector
and Rest of World ANBQ 4 809 5 232 4 307 6 175 4 891 4 541 4 506 5 696 6 613 6 126 ..Rent and other current transfers3 ANBS 1 084 891 1 037 2 036 2 427 2 474 2 081 2 062 1 961 1 872 ..
Total current receipts ANBT 316 383 336 218 358 965 382 260 389 458 396 343 422 693 453 127 487 148 520 768 ..
Current expenditureCurrent expenditure on goods and services4 GZSN 150 967 159 336 172 168 185 763 198 864 217 387 237 126 254 999 274 792 288 711 ..Subsidies NMRL 5 912 4 528 5 400 5 046 5 077 6 043 6 716 7 200 7 633 8 709 ..Social benefits ANLY 105 881 106 585 105 555 108 010 118 269 122 636 130 873 137 492 143 083 148 273 ..Net current grants abroad5 GZSI 102 –847 –253 –146 –1 861 –626 –995 –579 –26 109 ..Other current grants NNAI 14 441 16 163 16 957 19 313 21 481 27 555 31 065 33 719 34 143 34 004 ..Interest and dividends paid to private sector
and Rest of World ANLO 29 661 29 364 25 381 26 462 22 565 21 619 22 777 24 605 26 758 28 711 ..
Total current expenditure ANLT 305 490 313 801 326 172 346 177 366 273 394 614 427 562 457 436 486 364 508 449 ..
Saving, gross plus capital taxes ANSP 10 893 22 417 32 793 36 083 23 185 1 729 –4 869 –4 309 784 12 319 ..Depreciation -ANNZ –12 320 –12 390 –12 764 –13 092 –13 548 –14 446 –14 996 –16 044 –17 182 –18 419 ..Surplus on current budget ANMU –930 10 415 21 005 23 487 12 213 –11 095 –17 422 –18 965 –14 098 –4 307 –7 554
Net investmentGross fixed capital formation6 ANSQ 13 472 14 055 14 146 13 427 17 307 20 122 21 067 25 650 27 895 29 390 ..Less depreciation -ANNZ –12 320 –12 390 –12 764 –13 092 –13 548 –14 446 –14 996 –16 044 –17 182 –18 419 ..Increase in inventories and valuables ANSR 139 231 –472 –126 –10 –74 107 –47 –16 5 ..Capital grants to private sector and Rest
of World ANSS 4 420 4 942 4 304 3 875 7 958 7 564 9 918 10 851 12 582 14 635 ..Capital grants from private sector and Rest
of World -ANST –516 –367 –427 –756 –989 –1 091 –1 500 –1 222 –1 202 –1 379 ..
Total net investment -ANNW 4 765 5 897 5 395 5 225 11 831 13 707 15 590 20 616 23 550 25 779 28 002
Net borrowing7 -ANNX 5 695 –4 518 –15 610 –18 262 –382 24 802 33 012 39 581 37 648 30 086 35 556
Financial transactions determining net cashrequirement
Net lending to private sectorand Rest of World ANSU –359 171 2 212 3 174 2 677 2 877 2 657 1 076 874 145 ..
Net acquisition of UK company securities ANSV –1 336 704 –310 949 –408 765 593 408 653 –2 262 ..Accounts receivable/payable ANSW –747 803 8 393 –17 163 2 200 –2 921 8 975 2 630 2 357 10 618 ..Adjustment for interest on gilts ANSX –2 350 –2 446 –1 294 –2 630 –361 –1 444 –1 186 –2 305 –2 749 –1 279 ..Other financial transcations8 ANSY 359 –764 –1 364 –2 389 376 515 –4 527 –2 955 1 216 –2 153 ..
Public sector net cash requirement RURQ 1 262 –6 050 –7 973 –36 321 4 102 24 594 38 466 38 540 40 331 35 292 26 615
1 See chapter text.2 Includes domestic rates, council tax, community charge, motor vehicle duty
paid by household and some licence fees.3 ESA95 transactions D44, D45, D74, D75 and D72-D71: includes rent of
land, oil royalties, other property income and fines.4 Includes non-trading capital consumption.
5 Net of current grants received from abroad.6 Including net acquisition of land.7 Net investment less surplus on current budget.8 Includes statistical discrepancy, finance leasing and similar borrowing, in-
surance technical reserves and some other minor adjustments.
Source: Office for National Statistics: 020 7014 2124

293
Government finance
18.3 Public sector net debt1United Kingdom
£ million
1999 2000 2001 2002 2003 2004 2005 2006 2007/00 /01 /02 /03 /04 /05 /06 /07 /08
Central government sterling gross debt:
British government stockConventional gilts BKPK 218 687 204 285 200 833 206 119 232 877 261 373 287 481 306 489 320 622Index linked gilts BKPL 65 740 70 316 70 417 75 966 78 982 86 749 98 654 113 090 132 404Total BKPM 284 427 274 601 271 250 282 085 311 859 348 122 386 135 419 579 453 026
Sterling Treasury bills BKPJ 4 453 3 521 9 700 15 000 19 300 20 350 19 100 15 600 17 569National savings ACUA 63 331 62 611 62 275 63 087 66 522 68 504 73 365 78 929 84 735Tax instruments ACRV 535 491 478 376 407 350 308 353 428Other sterling debt2 BKSK 28 689 30 230 28 276 32 711 35 032 32 272 36 468 41 280 39 543
Central government sterling gross debt total BKSL 381 435 371 454 371 979 393 259 433 120 469 598 515 376 555 741 595 301
Central government foreign currency gross debt:
US$ bonds BKPG 4 388 4 924 2 107 – 1 632 1 587 1 730 1 530 1 509ECU bonds EYSJ 1 500 – – – – – – – –ECU/Euro Treasury notes EYSV 2 701 2 486 1 225 – – – – – –ECU/Euro Treasury bills EYSN – – – – – – – – –Other foreign currency debt BKPH 364 291 243 172 105 57 1 – –
Central government foreign currency gross debt total BKPI 8 954 7 701 3 575 172 1 738 1 644 1 731 1 530 1 509
Central government gross debt total BKPW 390 389 379 155 375 554 393 431 434 858 471 242 517 107 557 271 596 810
Local government gross debt total EYKP 51 707 52 522 52 566 51 353 50 547 53 300 60 114 62 420 66 212
lessCentral government holdings of local government debt -EYKZ –46 563 –47 789 –47 530 –44 836 –41 540 –42 339 –47 384 –48 199 –51 036Local government holdings of central government debt -EYLA –77 –31 –29 –184 –510 –62 –62 – –74
General government gross debt (consolidated) BKPX 395 456 383 857 380 561 399 764 443 355 482 141 529 775 571 492 611 912
Public corporations gross debt EYYD 8 721 9 414 8 859 18 660 13 895 14 875 15 191 14 336 13 527
less:Central government holdings of public corporations debt -EYXY –4 307 –4 714 –4 308 –4 171 –5 188 –5 740 –6 222 –4 984 –5 092Local government holdings of public corporations debt -EYXZ –123 –124 –122 –121 –120 –121 –112 –103 –105Public corporations holdings of central government debt -BKPZ –6 615 –6 414 –4 638 –4 928 –4 780 –5 080 –2 822 –2 255 –4 119Public corporations holdings of local government debt -EYXV –141 –106 –60 –50 –84 –100 –79 –194 –26
Public sector gross debt (consolidated) BKQA 392 991 381 913 380 292 409 154 447 078 485 937 535 731 578 292 616 097
Public sector liquid assets:
Official reserves AIPD 21 498 30 423 28 055 26 387 25 266 25 813 27 835 26 631 ..Central government deposits3 BKSM 1 879 2 797 2 802 2 900 3 879 3 868 5 212 6 171 5 450Other central government BKSN 4 756 15 670 10 743 8 141 7 077 3 044 8 498 11 369 14 834Local government deposits3 BKSO 10 221 11 522 13 698 14 797 16 797 18 718 20 923 23 670 28 212Other local government short term assets BKQG 5 468 5 719 5 990 6 061 5 573 5 057 5 381 4 709 4 975Public corporations deposits3 BKSP 2 619 2 215 2 336 2 133 2 813 3 411 2 430 3 665 2 858Other public corporations short term assets BKSQ 1 128 1 212 1 180 1 586 2 845 2 457 2 453 2 605 2 481
Public sector liquid assets total BKQJ 47 569 69 558 64 804 62 005 64 250 62 368 72 732 78 820 88 371
Public sector net debt BKQK 345 422 312 355 315 488 347 149 382 828 423 569 462 999 499 472 527 726as percentage of GDP4 RUTO 36.4 31.4 30.3 31.5 32.8 34.7 36.0 36.6 36.7
1 See chapter text.2 Including overdraft with Bank of England.3 Bank and building society deposits.4 Gross domestic product at market prices from 12 months centred on the
end of the month.
Source: Office for National Statistics: 020 7014 2124

294
Government finance
18.4 Consolidated Fund and National Loans Fund:1 revenue and expenditure; receiptsand paymentsUnited Kingdom, years ending 31 March £ million
Consolidated Fund
Revenue Expenditure
HM Revenue andCustoms Standing services Surplus
(+) orNational Service deficit
Customs Vehicle non Interest of European Contin- Other (-) ofInland and excise domestic and Other Supply national Northern community gencies expend- Consolid-
Total Revenue1 Excise duties rates dividends receipts Total services debt2 Ireland etc. Fund iture3 ated Fund
1 2 3 4 5 6 7 8 9 10 11 12 13 14 15
ACAA EYJN ACAC ACAD RUUD ACAG ACBC ACAI ACAJ ACAK ACAL ACAM ACAN ACAO ACAP2003 293 885 144 533 113 520 4 613 19 975 367 10 877 338 191 317 808 14 042 – 7 405 –1 277 211 –44 3082004 301 011 153 699 119 726 4 816 13 468 516 8 786 345 938 322 672 15 201 – 7 301 501 261 –44 9262005 329 708 170 130 121 109 4 865 17 326 389 15 889 368 821 342 414 17 654 – 8 910 –500 344 –39 1162006 359 954 192 715 124 219 5 055 19 597 398 17 970 401 411 373 074 19 263 – 8 858 – 212 –41 4562007 373 040 200 127 130 808 5 355 17 334 2 610 16 806 429 078 399 947 19 959 – 8 934 3 233 –56 035
2003/04 293 052 145 555 115 660 4 712 16 580 352 10 193 335 274 313 072 14 501 – 7 494 1 203 –42 2232004/05 313 323 158 974 120 924 4 752 15 990 578 12 105 351 237 325 541 16 966 – 8 460 – 267 –37 9142005/06 336 031 178 707 120 845 5 001 17 762 351 13 365 382 230 355 429 18 323 – 8 139 – 340 –46 2002006/07 369 841 195 598 125 846 5 108 19 698 2 340 21 251 400 394 371 574 19 895 – 8 685 3 232 –30 5512007/08 378 538 205 681 132 043 5 398 .. 953 15 530 427 567 398 160 19 390 – 9 786 6 224 –49 028
2003 Q2 61 171 31 634 28 296 1 191 – – 50 82 949 75 030 4 760 – 2 102 1 000 56 –21 780Q3 75 368 37 098 28 474 1 209 6 009 57 2 521 78 159 72 938 3 054 – 2 116 – 51 –2 790Q4 66 468 30 442 30 349 1 116 3 132 32 1 397 92 836 87 567 4 130 – 1 090 – 47 –26 368
2004 Q1 90 045 46 381 28 541 1 196 7 439 263 6 225 81 330 77 537 2 557 – 2 186 –999 49 8 715Q2 64 213 32 911 30 061 1 199 – 1 41 83 020 76 032 4 086 – 1 793 1 000 108 –18 808Q3 72 074 38 847 29 840 1 239 1 316 29 803 87 069 81 009 3 884 – 2 124 – 53 –14 994Q4 74 679 35 560 31 284 1 182 4 713 223 1 717 94 519 88 094 4 674 – 1 198 500 51 –19 839
2005 Q1 102 357 51 656 29 739 1 132 9 961 325 9 544 86 629 80 406 4 322 – 3 345 –1 500 55 15 727Q2 67 425 36 762 29 379 1 242 – 3 39 94 409 86 970 4 426 – 1 883 1 000 132 –26 984Q3 84 896 43 353 30 516 1 391 5 657 54 3 925 92 502 85 379 4 817 – 2 198 – 106 –7 606Q4 75 030 38 359 31 475 1 100 1 708 7 2 381 95 281 89 659 4 089 – 1 484 – 51 –20 253
2006 Q1 108 680 60 233 29 475 1 268 10 397 287 7 020 100 038 93 421 4 991 – 2 574 –1 000 51 8 643Q2 72 430 39 406 30 606 1 284 303 29 802 101 986 94 934 4 382 – 1 612 1 000 58 –29 555Q3 79 869 47 921 30 571 1 348 – – 29 99 192 91 420 5 588 – 2 132 – 49 –19 323Q4 98 975 45 155 33 567 1 155 8 897 82 10 119 100 195 93 299 4 302 – 2 540 – 54 –1 221
2007 Q1 118 567 63 116 31 102 1 321 10 498 2 229 10 301 99 021 91 921 5 623 – 2 401 –997 71 19 548Q2 75 241 38 704 32 917 1 394 – 89 2 137 106 166 99 627 4 005 – 1 478 1 000 56 –30 925Q3 90 954 52 463 32 173 1 407 3 224 30 1 657 101 387 93 820 5 452 – 2 064 – 51 –10 433Q4 88 278 45 844 34 616 1 233 3 612 262 2 711 122 504 114 579 4 879 – 2 991 – 55 –34 225
2008 Q1 124 065 68 670 32 337 1 364 .. 572 9 025 97 510 90 134 5 054 – 3 253 –994 62 26 555

295
Government finance
18.4 Consolidated Fund and National Loans Fund:1 revenue and expenditure; receiptsand paymentsUnited Kingdom, years ending 31 Marchcontinued £ million
Other central government fundsNational Loans Fund and accounts
Receipts Payments
Service ofSurplus the CG Surplus
(+) or national Transacti- (+) or Depart-deficit Interest debt met ons with deficit mental Northern Central(-) of receipts from issue dept (-) of balances Ireland government
Consol- and Consol- Service of for asset National and central net cashidated Total profits of idated Total national revaluati- Net Borrowing Insurance miscell- government requireme-Fund receipts note issue Fund payments debt on lending4 required Fund aneous debt1 nt
16 17 18 19 20 21 22 23 24 25 26 27 28
ACAP ACAQ RUUC ACAK ACAU ACAV RUUB ACAW ACAX ACAY ACAZ ACBA RUUW2003 –44 308 21 043 7 000 14 042 17 012 21 044 3 –4 036 40 276 –238 2 890 –9 37 6152004 –44 926 22 659 7 455 15 201 23 242 22 658 –1 586 45 510 3 203 –890 –4 43 1932005 –39 116 23 777 6 123 17 654 26 612 23 991 – 2 619 41 948 4 303 –2 779 –2 40 4222006 –41 456 24 788 5 524 19 263 27 323 24 708 – 2 616 43 990 7 973 –3 592 3 39 6122007 –56 035 25 425 5 466 19 959 27 144 25 898 – 1 246 57 758 7 593 16 391 4 33 778
2003/04 –42 223 21 968 7 465 14 501 18 691 21 969 11 –3 289 38 947 2 270 –2 724 –10 39 3912004/05 –37 914 23 673 6 705 16 966 24 245 23 672 –7 580 38 486 1 436 –1 484 –2 38 5322005/06 –46 200 24 164 5 842 18 323 29 455 24 379 – 5 075 51 488 7 022 3 654 1 40 8132006/07 –30 551 25 265 5 367 19 895 26 229 25 184 – 1 046 31 516 3 996 –9 546 3 37 0692007/08 –49 028 25 014 .. 19 390 28 077 25 486 .. 2 589 52 093 10 536 9 007 4 32 554
2003 Q2 –21 780 6 238 1 477 4 760 5 464 6 238 – –775 21 005 51 3 572 –3 17 379Q3 –2 790 4 627 1 573 3 054 3 613 4 628 14 –1 029 1 776 –1 390 –3 196 –3 6 359Q4 –26 368 5 943 1 813 4 130 5 021 5 943 –9 –913 25 447 –868 9 909 –1 16 405
2004 Q1 8 715 5 160 2 602 2 557 4 593 5 160 6 –572 –9 281 4 477 –13 009 –3 –752Q2 –18 808 5 637 1 550 4 086 5 464 5 637 –4 –169 18 634 –1 212 6 089 –1 13 756Q3 –14 994 5 412 1 528 3 884 6 146 5 775 1 371 15 729 2 533 5 892 – 7 304Q4 –19 839 6 450 1 775 4 674 7 039 6 086 –4 956 20 428 –2 595 138 – 22 885
2005 Q1 15 727 6 174 1 852 4 322 5 596 6 174 – –578 –16 305 2 710 –13 603 –1 –5 413Q2 –26 984 5 761 1 336 4 426 8 031 5 761 – 2 268 29 253 1 710 8 513 – 19 030Q3 –7 606 6 183 1 365 4 817 6 793 6 359 – 434 8 215 532 –383 –1 8 065Q4 –20 253 5 659 1 570 4 089 6 192 5 697 – 495 20 785 –649 2 694 – 18 740
2006 Q1 8 643 6 561 1 571 4 991 8 439 6 562 – 1 878 –6 765 5 429 –7 170 2 –5 022Q2 –29 555 5 517 1 134 4 382 5 326 5 384 – –59 29 364 1 952 4 152 1 23 261Q3 –19 323 6 827 1 238 5 588 7 688 6 827 – 861 20 184 2 233 10 715 – 7 236Q4 –1 221 5 883 1 581 4 302 5 870 5 935 – –64 1 207 –1 641 –11 289 – 14 137
2007 Q1 19 548 7 038 1 414 5 623 7 345 7 038 – 308 –19 239 1 452 –13 124 2 –7 565Q2 –30 925 5 280 1 274 4 005 4 772 5 753 – –982 30 418 4 305 8 644 – 17 469Q3 –10 433 6 734 1 283 5 452 8 251 6 734 – 1 518 11 951 1 628 6 964 2 3 361Q4 –34 225 6 373 1 495 4 879 6 776 6 373 – 402 34 628 208 13 907 – 20 513
2008 Q1 26 555 6 627 .. 5 054 8 278 6 626 .. 1 651 –24 904 4 395 –20 508 2 –8 789
1 See chapter text.2 Payment to National Loans Fund representing its payments for the service
of the National Debt less its receipts of interest on loans outstanding, etc.3 Includes net issues to Contingencies Fund.4 Minus sign indicates a net issue repayment.
Sources: HM Treasury;National Statistics 020 7014 2124

296
Government finance
18.5 Taxes paid by UK residents to general government and the European Union1
Total economy sector S.1£ million
1997 1998 1999 2000 2001 2002 2003 2004 2005 2006/98 /99 /00 /01 /02 /03 /04 /05 /06 /07
Generation of income
Uses
Taxes on production and importsTaxes on products and imports
Value added tax (VAT)Paid to central government NZGF 52 308 54 209 58 688 60 746 64 735 69 087 76 638 79 978 81 496 87 728Paid to the European Union FJKM 3 531 4 105 3 451 4 172 3 592 2 518 2 574 1 905 1 964 2 288
Total QYRC 55 485 57 845 62 127 64 908 68 322 71 599 79 201 81 869 83 421 89 855
Taxes and duties on imports excluding VATPaid to EU: import duties FJWE 2 261 2 042 2 049 2 103 2 024 1 893 1 957 2 207 2 264 2 332
Taxes on products excluding VAT and import dutiesPaid to central government
Customs and Excise revenueBeer GTAM 2 699 2 733 2 848 2 798 2 907 2 952 3 084 3 099 3 092 3 068Wines, cider, perry & spirits GTAN 3 057 3 301 3 652 3 814 4 068 4 430 4 526 4 790 4 784 4 846Tobacco GTAO 7 622 7 551 7 796 7 638 7 639 8 046 8 092 8 113 7 952 8 146Hydrocarbon oils GTAP 19 451 21 553 22 510 22 630 21 916 22 147 22 780 23 313 23 438 23 585Betting, gaming & lottery CJQY 1 539 1 527 1 500 1 517 1 317 977 898 876 884 958Air passenger duty CWAA 522 845 882 956 802 804 799 872 906 1 114Insurance premium tax CWAD 1 179 1 248 1 511 1 751 1 921 2 189 2 313 2 353 2 349 2 317Landfill tax BKOF 364 322 456 475 501 545 639 673 754 837Other ACDN – – – – – – – – – –
Fossil fuel levy CIQY 256 164 84 52 92 9 – – – –Gas levy GTAZ 188 –44 – – – – – – – –Stamp duties GTBC 3 456 4 623 6 898 8 165 6 983 7 549 7 544 8 966 10 918 13 386Camelot payments to National Lottery
Distribution Fund LIYH 1 572 1 665 1 593 1 542 1 520 1 382 1 311 1 354 1 397 1 366Hydro-benefit LITN 32 32 38 44 44 44 43 40 – –Aggregates Levy MDUQ – – – – – 293 341 326 323 327Climate change levy LSNT – – – – 822 813 816 750 741 711Renewable energy obligations EP89 – – – – – 265 375 368 381 389Other taxes and levies GCSP – – – – – – – – – –
Total paid to central government NMBV 42 504 45 971 49 768 51 382 50 551 52 486 53 624 55 965 57 931 61 166
Paid to the European UnionSugar levy GTBA 72 44 46 43 27 25 19 24 24 –European Coal & Steel Community levy GTBB – – – – – – – – – –
Total paid to the European Union FJWG 72 44 46 43 27 25 19 24 24 –
Total taxes on products excluding VAT & import duties QYRA 42 080 45 613 49 814 51 425 50 578 52 511 53 643 55 989 57 945 61 050
Total taxes on products and imports NZGW 99 826 105 500 113 990 118 436 120 924 126 003 134 801 140 065 143 630 153 236
Production taxes other than on productsPaid to central government
Consumer Credit Act fees CUDB 168 158 156 171 157 200 211 223 189 234National non-domestic rates CUKY 13 283 13 764 14 353 15 154 16 252 16 728 16 941 17 355 18 160 19 181Old style non-domestic rates NSEZ 159 145 123 132 131 136 140 146 193 326Levies paid to CG levy-funded bodies LITK 162 171 234 213 215 190 194 218 239 244Motor vehicle duties paid by businesses EKED 1 405 1 503 1 559 1 230 751 736 787 802 850 869Regulator fees GCSQ 53 52 86 105 95 94 101 88 74 71
Total NMBX 16 820 16 698 16 511 17 005 17 601 18 084 18 374 18 832 19 705 20 925
Paid to local governmentOld style non-domestic rates NMYH 126 127 144 150 161 176 192 197 187 207
Total production taxes other than on products NMYD 15 335 15 918 16 655 17 155 17 762 18 260 18 566 19 029 19 892 21 132
Total taxes on production and imports, paidPaid to central government NMBY 111 376 116 054 124 727 129 536 133 199 140 152 148 758 154 963 159 265 169 819Paid to local government NMYH 126 127 144 150 161 176 192 197 187 207Paid to the European Union FJWB 5 864 6 191 5 546 6 318 5 643 4 436 4 550 4 136 4 252 4 620
Total NZGX 117 701 124 454 133 100 137 868 141 085 144 263 153 367 159 094 163 486 174 793

297
Government finance
18.5 Taxes paid by UK residents to general government and the European Union1
Total economy sector S.1continued £ million
1997 1998 1999 2000 2001 2002 2003 2004 2005 2006/98 /99 /00 /01 /02 /03 /04 /05 /06 /07
Secondary distribution of income
Uses
Current taxes on income, wealth etcTaxes on income
Paid to central governmentHousehold income taxes DRWH 81 901 89 728 96 977 106 866 108 526 110 407 112 356 121 746 130 754 141 202Petroleum revenue tax DBHA 963 502 853 1 518 1 310 958 1 179 1 284 2 016 2 155Windfall tax EYNK 2 610 2 614 – – – – – – – –Other corporate taxes BMNX –593 1 231 1 842 3 458 3 302 2 657 3 974 4 445 5 539 7 006
Total NMCU 115 902 124 238 133 994 144 263 145 180 143 238 145 488 160 479 180 138 194 409
Other current taxesPaid to central government
Motor vehicle duty paid by households CDDZ 3 046 3 134 3 296 3 039 3 540 3 600 3 902 3 935 4 100 4 270Old style domestic rates NSFA 88 93 117 108 109 104 100 94 120 247Licences NSNP 11 8 8 2 – – – – – –National non-domestic rates paid by non-market sectors BMNY 929 971 1 002 997 1 065 1 013 994 996 1 221 1 265Passport fees E8A6 – 41 89 113 139 153 198 237 285 346Television licence fee DH7A 2 009 2 179 2 286 2 064 2 183 2 287 2 391 2 508 2 623 2 734
Total NMCV 3 139 5 763 6 798 6 325 7 036 7 155 7 585 7 770 8 354 8 898
Paid to local governmentOld style domestic rates NMHK 64 62 68 76 80 85 92 111 149 157Council tax NMHM 10 850 12 037 12 918 14 155 15 371 16 809 18 911 20 190 21 227 22 299
Total NMIS 10 914 12 099 12 986 14 231 15 451 16 894 19 003 20 301 21 376 22 499
Total NVCM 17 023 18 528 19 784 20 556 22 487 24 049 26 588 28 071 29 730 31 397
Total current taxes on income, wealth etcPaid to central government NMCP 119 041 130 001 140 792 150 588 152 215 150 445 153 171 168 818 188 492 203 367Paid to local government NMIS 10 914 12 099 12 986 14 231 15 451 16 894 19 003 20 301 21 376 22 499
Total NMZL 129 268 139 451 150 547 161 324 166 043 167 339 172 174 189 119 209 868 225 866
Social contributionsActual social contributions
Paid to central government(National Insurance Contributions)
Employers’ compulsory contributions CEAN 27 761 29 779 31 705 35 212 35 816 35 476 41 459 44 576 47 302 50 283Employees’ compulsory contributions GCSE 21 495 23 607 23 289 24 772 25 130 25 701 31 013 33 088 35 181 37 426Self- and non-employed persons’
compulsory contributions NMDE 1 884 1 828 1 941 2 084 2 216 2 352 2 676 2 744 2 852 2 956
Total AIIH 51 692 54 746 56 935 62 068 63 162 63 529 75 148 80 923 85 335 90 976
Capital account
Changes in liabilities and net worth
Other capital taxesPaid to central government
Inheritance tax GILF 1 649 1 764 2 016 2 181 2 346 2 323 2 486 2 874 .. ..Tax on other capital transfers GILG 35 41 38 55 37 47 35 48 .. ..Development land tax and other GCSV – – – – – – – – – –
Total NMGI 1 684 1 805 2 054 2 236 2 365 2 370 2 521 2 941 3 276 3 623
Total taxes andcompulsory social contributions
Paid to central government GCSS 283 208 303 493 324 736 344 015 350 642 355 995 379 465 406 928 436 107 467 323Paid to local government GCST 10 992 12 181 13 130 14 381 15 612 17 070 19 195 20 498 21 563 22 663Paid to the European Union FJWB 5 864 6 191 5 546 6 318 5 643 4 436 4 550 4 136 4 252 4 620
Total GCSU 300 705 320 271 343 290 365 330 372 169 377 839 403 282 431 735 462 280 494 836
Total taxes and social contributionsas percentage of GDP GDWM 36.2 36.5 37.0 37.6 36.7 35.3 35.5 36.1 37.0 37.4
1 See chapter text. Sources: HM Treasury;Office for National Statistics: 020 7014 2129

298
Government finance
18.6 Borrowing and repayment of debt1United KingdomYears ending 31 March £ million
1997 1998 1999 2000 2001 2002 2003 2004 2005 2006/98 /99 /00 /01 /02 /03 /04 /05 /06 /07
Borrowing
Government securities: new issues KQGA 28 484.4 12 048.0 26 426.5 25 789.8 43 433.4 54 068.9 53 220.9 57 290.5 80 668.9 66 233.4National savings securities:
National savings certificates KQGB 4 435.2 3 028.7 1 962.7 3 086.2 2 580.7 2 434.3 1 940.4 1 696.4 1 206.8 1 464.7Capital bonds KQGC 619.0 469.6 35.4 29.0 40.9 107.3 65.0 25.2 34.3 20.7Income bonds KQGD 1 043.4 1 371.7 653.4 760.5 625.6 484.8 415.3 426.6 567.5 593.5Deposit bonds KQGE .. .. .. .. .. .. – .. .. ..British savings bonds KQGF .. .. .. .. .. .. – .. .. ..Premium savings bonds KQGG 3 158.8 3 652.8 3 449.4 3 296.0 3 859.6 4 604.5 7 530.1 5 737.8 7 817.5 8 432.5Save As You Earn KQGH 20.7 11.4 5.0 0.3 .. .. – .. .. ..Yearly plan KQGI .. 5.2 .. .. .. .. – .. .. ..National savings stamps and gift
tokens KQGJ .. .. .. .. .. .. – .. .. ..National Savings Bank Investments KQGK 1 282.3 1 085.0 901.6 955.3 864.9 1 012.4 809.9 817.5 643.6 558.4Children’s Bonus Bonds KGVO 255.3 205.0 58.5 53.4 45.0 54.0 51.7 66.8 59.5 54.1First Option Bonds KIAR 1 152.9 1 001.8 34.3 .. .. .. – .. .. ..Pensioners Guaranteed Income Bond KJDW 1 126.9 201.0 590.7 687.2 603.5 662.9 274.2 323.9 142.7 216.4
Treasurer’s account KWNF 39.9 17.1 13.6 12.5 15.2 19.4 13.9 11.1 10.9 11.6Individual Savings Account ZAFC .. .. 257.8 265.9 397.8 405.6 335.4 276.4 261.3 1 015.1Fixed Rate Savings Bonds ZAFD .. .. 175.9 284.7 192.7 193.0 82.0 86.3 51.2 69.5Guaranteed Equity Bonds ECPU .. .. .. .. 27.2 274.8 227.9 317.1 81.4 62.1Easy Access Savings Account C3OM .. .. .. .. .. .. 126.9 903.5 608.6 513.2
Certificate of tax deposit KQGL 84.1 66.4 121.4 76.5 77.6 59.6 145.2 114.8 110.6 100.2Nationalised industries’, etc
temporary deposits KQGM 46 375.9 39 962.4 40 343.3 56 106.6 62 150.0 55 395.1 47 958.6 25 022.0 22 039.1 35 224.0Sterling Treasury bills (net receipt) KQGO .. 3 546.2 .. .. .. .. – .. .. ..ECU Treasury bills (net receipt) KQGP .. .. .. .. .. .. – .. .. ..ECU Treasury notes (net receipt) KDZZ .. .. 721.1 .. .. .. – .. .. ..Ways and means (net receipt) KQGQ .. 183.6 5 599.0 12 126.0 12 095.3 3 899.9 22 700.2 .. .. 23 428.0Other debt : payable in sterling :
Interest free notes KQGR 32.4 2 130.9 373.5 972.7 1 427.2 754.0 1 213.2 662.3 1 858.9 1 049.9Other debt : payable in external currencies KHCY .. .. .. .. .. .. 1 792.5 .. .. ..
Total receipts KHCZ 88 111.2 68 986.8 81 723.1 104 502.6 128 436.6 124 430.5 138 903.3 93 778.2 116 162.8 139 047.3
Repayment of debt
Government securities: redemptions KQGS 20 678.9 18 575.5 19 815.8 33 722.2 43 642.3 42 109.9 35 087.4 25 130.1 17 456.5 62 406.9Statutory sinking funds KQGT 2.1 2.0 2.0 2.0 1.9 1.9 1.8 1.8 0.4 ..Terminable annuities:
National Debt Commissioners KQGU .. .. .. .. .. .. – .. .. ..National savings securities:
National savings certificates KQGV 4 058.5 3 449.0 2 405.2 4 546.8 4 177.7 4 146.7 2 769.1 1 979.6 1 107.4 1 172.1Capital bonds KQGW 1 160.5 888.3 324.2 375.0 175.9 155.9 116.9 121.1 159.2 137.4Income bonds KQGX 1 148.9 880.8 1 686.3 857.0 933.8 1 144.2 977.1 879.5 724.6 719.2Deposit bonds KQGY 72.6 84.2 70.2 71.1 45.4 369.9 4.4 .. .. ..Yearly Plan KQGZ 113.2 120.0 141.8 18.4 4.5 3.0 2.0 .. .. 0.8British savings bonds KQHA .. .. .. .. .. .. – .. .. ..Premium savings bonds KQHB 1 203.1 1 398.4 1 923.8 1 872.6 1 942.9 2 343.3 2 967.4 3 492.4 3 289.2 4 279.8Save As You Earn KQHC 68.2 37.1 34.5 22.9 8.0 3.2 0.5 .. 0.5 0.5National savings stamps and gift
tokens KQHD .. .. .. .. .. .. – 1.2 .. ..National Savings Bank Investments
(repayments) KQHE 2 175.7 2 027.0 1 886.3 1 654.1 1 415.8 1 350.1 1 342.7 1 554.0 1 153.3 1 172.4Children’s Bonus Bonds KGVQ 187.9 183.2 69.3 95.0 114.5 92.6 79.8 84.5 95.8 105.7First Option Bonds KIAS 1 283.0 1 055.5 298.1 225.2 111.6 77.4 62.2 33.4 36.1 25.6Pensioners Guaranteed Income Bond KPOB 318.8 897.8 935.3 2 003.8 1 640.4 703.9 538.5 445.0 428.6 452.7Treasurer’s account KWNG 11.8 13.7 16.4 13.9 16.5 16.9 14.2 16.2 18.3 11.7
Individual Savings Account ZAFE .. .. 12.3 39.9 70.3 105.9 157.6 202.2 194.1 193.6Fixed Rate Savings Bonds ZAFF .. .. 2.8 62.1 110.1 133.6 153.1 92.1 105.0 77.2
Guaranteed Equity Bonds JUWE .. .. .. .. .. 3.9 3.3 .. 0.2 3.7Easy Access Savings Account C3ON .. .. .. .. .. .. 126.9 189.3 400.6 509.7Certificates of tax deposit KQHF 229.0 199.9 159.9 120.1 91.4 161.5 113.1 171.9 152.1 56.0Tax reserve certificates KQHG .. .. .. .. .. .. – .. .. ..Nationalised industries’, etc
temporary deposits KQHH 46 835.7 41 776.9 41 089.4 56 004.0 63 127.9 55 695.6 47 757.7 25 949.5 21 943.1 35 686.5Debt to the Bank of England KPOC .. .. .. .. .. .. – .. .. ..Sterling Treasury bills (net repayment) KQHJ 1 928.5 .. 3 014.8 6 194.2 .. .. – .. .. ..ECU Treasury bills (net repayment) KJEG .. .. 2 492.9 .. .. .. – .. .. ..ECU Treasury notes (net repayment) KSPA 3.3 13.2 .. 1 391.9 1 359.6 1 453.1 – .. .. ..Ways and means (net repayment) KQHK 5 815.4 .. .. .. .. .. – 9 760.2 36 207.3 ..Other debt: payable in sterling :
Interest free notes KQHL 1 215.5 850.5 246.4 458.2 1 723.3 1 393.3 990.5 300.4 222.3 586.4Other KQHM .. .. .. .. .. .. – .. .. ..
Other debt : payable in external currencies KQHN 2 082.7 92.0 98.1 1 835.6 2 838.1 1 960.3 47.0 46.5 98.9 52.4
Total payments KQHO 90 593.3 72 545.0 76 725.8 111 586.0 123 551.9 113 426.1 93 313.2 70 450.9 83 793.5 107 650.3
Net borrowing KQHP .. .. 4 997.3 .. 4 884.7 11 004.4 45 590.1 23 327.3 32 369.3 31 397.0Net repayment KHDD 2 482.1 3 558.2 .. 7 083.4 .. .. – .. .. ..
1 See chapter text. Source: HM Treasury: 020 7270 4761

299
Government finance
18.7 Consolidated Fund and National Loans Fund: assets and liabilities1
United KingdomAt 31 March each year £ million
1995 1996 1997 1998 1999 2000 2001 2002 2003
CONSOLIDATED FUND
Total estimated assets KQIA 33 992.4 33 809.0 36 177.4 36 061.0 36 148.0 33 932.1 35 967.9 37 458.5 39 694.1
Subscriptions and contributions tointernational financialorganisations KQIB 5 898.1 6 470.8 6 528.9 6 660.8 7 059.7 6 903.6 7 298.4 7 564.4 8 540.3
International Bank forReconstruction and Development KQIC 265.2 271.6 265.0 262.5 266.0 267.1 279.2 279.0 268.2
International Finance Corporation KQID 62.0 73.1 74.9 72.9 75.6 76.5 85.8 85.7 77.2International Development
Association KQIE 3 005.5 3 205.8 3 372.7 3 562.2 3 733.3 3 900.0 4 134.0 4 347.8 4 567.5African Development Bank KQIF 141.2 148.3 162.9 180.0 199.1 215.7 229.8 259.8 293.9Asian Development Bank KQIG 201.5 214.6 240.4 272.5 304.6 339.3 365.5 393.3 420.4Caribbean Development Bank KQIH 32.6 34.2 34.1 34.6 36.8 40.7 41.9 44.0 49.1European Investment Bank KQII 1 876.4 2 166.6 2 036.5 1 840.7 2 083.1 1 706.6 1 767.3 1 742.1 2 419.2European Bank for
Reconstruction and Development KPOD 146.3 189.4 175.6 164.2 179.2 170.0 187.4 197.6 239.3Inter-American Development Bank KQIJ 107.2 119.6 117.5 219.3 127.8 130.6 145.7 147.3 135.6International Fund for Agricultural
Development KQIK 42.7 44.2 46.1 48.8 51.0 53.7 56.4 59.1 62.1Multilateral Investment Guarantee
Agency KQIL 3.2 3.4 3.2 3.1 3.2 3.3 5.4 8.7 7.8
Loans from Votes KQIP 13 599.7 12 967.0 13 684.7 14 050.0 11 546.3 3 970.3 7 015.3 9 006.1 11 097.1
Issues of public dividend capital: KQIQ 11 467.0 12 161.1 12 424.8 13 157.1 16 238.5 21 338.3 20 083.6 19 546.2 18 982.3Army Base Repair Organisation (ABRO) C3QV .. .. .. .. .. .. .. .. 19.4Royal Mint KQIV 7.0 7.0 7.0 7.0 7.0 7.0 7.0 5.5 5.5Welsh Development Agency KQIY 10.9 9.8 8.9 8.8 8.6 9.1 9.1 11.0 12.7British Shipbuilders KQJA 1 598.3 1 598.3 1 598.5 1 598.3 50.0 21.0 21.0 21.0 21.0Patent Office KIAT 6.3 6.3 6.3 6.3 6.3 6.3 6.3 6.3 6.3NHS Trusts KIAU 9 603.1 10 173.8 10 349.7 11 078.0 14 158.7 19 216.6 19 539.2 19 184.1 18 600.7Companies House KIAV 15.9 15.9 15.9 15.9 15.9 15.9 15.9 15.9 15.9Central Office of Information KIAW 0.3 0.3 0.3 0.3 0.3 0.3 0.3 0.3 0.3Chessington Computer Centre KPOE 3.5 3.5 .. .. .. .. .. .. ..OGC Buying Solutions2 KWNH 0.1 0.4 0.4 0.4 0.4 0.4 0.4 0.4 0.4Defence Aviation Repair Agency JRVU .. .. .. .. .. .. .. 50.4 42.3Defence Evaluation and Research
Agency KWNI 128.8 253.0 274.5 274.5 275.4 275.4 275.4 .. ..Defence Scientific Technology
Laboratory JRVV .. .. .. .. .. .. .. 42.3 50.4Fire Service College KWNJ 16.7 16.7 16.7 16.7 16.7 16.7 16.7 16.7 16.7Forensic Science Service GPVB .. .. .. .. – 18.0 18.0 18.0 18.0Hydrographic Office GPVC .. .. .. .. .. 13.3 13.3 13.3 13.3Land Registry KWNK 55.4 55.4 61.5 61.5 61.5 61.5 61.5 61.5 61.5Medicines Control Agency KWNL 1.6 1.6 1.6 1.6 1.6 1.6 1.6 1.6 ..Meteorological Office KZAZ .. .. 58.9 58.9 58.9 58.9 58.9 58.9 58.9NHS Estates GPVD .. .. .. .. .. 0.4 0.4 0.4 0.4Registers of Scotland KZBA .. .. 4.3 4.3 4.3 .. .. .. ..Vehicle Inspectorate KWNM 19.1 19.1 20.3 20.3 20.3 20.3 20.3 20.3 20.3Driving Standards Agency LQMI .. .. .. 3.5 3.5 3.5 3.5 3.5 3.5Ordnance Survey GPVE .. .. .. .. .. 14.0 14.0 14.0 14.0Queen Elizabeth II Conference Centre LQMJ .. .. .. 0.8 0.8 0.8 0.8 0.8 0.8
Contingencies Fund - capital KQJB 447.0 297.0 977.0 577.0 277.0 277.0 277.0 277.0 ..Balance on revenue accounts KQJC 1 433.6 1 096.1 954.9 1 546.0 1 026.5 1 442.9 1 293.6 1 064.8 1 074.4Privatisation receipts KIAX 1 147.0 817.0 1 607.1 70.1 .. .. .. .. ..
Total liabilities KQJD .. 333 927.9 364 803.0 364 950.8 363 625.5 354 807.7 327 180.6 341 162.2 366 453.7
Liability to balance National LoansFund KQJE 286 055.9 331 164.9 362 506.5 362 582.5 361 065.3 351 626.3 324 336.7 338 550.1 362 496.5
Payment from Votes: KQJF 64.3 63.4 62.4 61.3 60.2 59.0 57.7 56.4 54.9Married quarters for Armed Forces KQJG 64.3 63.4 62.4 61.3 60.2 59.0 57.7 56.4 54.9
Liability to Post OfficePost-war credits outstanding and
interest due - estimated KQJI 46.0 45.9 45.9 45.9 45.9 45.8 45.8 45.8 45.8Revenue paid over in advance
of collection KQJJ 37.0 .. 28.2 13.8 177.9 259.7 301.7 635.6 1 293.7Inland Revenue KQJK – – – – 177.9 259.7 301.7 635.6 1 293.7Customs and Excise KQJL .. .. 28.2 .. .. .. .. .. ..
Vehicle Excise Duty KQJN 37.0 .. .. 13.8 .. .. .. .. ..
Promissory notes issued byMinister of Overseas Development KQJQ 996.7 1 005.8 1 021.9 822.1 963.1 783.1 939.9 891.9 954.7
International Development Association KQJR 656.5 663.2 673.6 484.0 612.3 445.6 553.1 509.7 589.4African Development Fund KQJS 93.2 86.2 95.3 95.2 105.6 89.1 141.6 145.5 152.3Asian Development Bank KQJT – – – – – 1.9 2.5 2.4 2.3Asian Development Fund KQJU 140.5 127.6 136.0 120.5 105.4 87.8 78.6 73.2 68.3Caribbean Development Bank KQJV 1.3 1.4 1.3 1.3 1.3 1.3 1.5 1.5 1.4Special Development Fund KQKC 9.5 10.6 13.2 15.8 16.4 16.9 15.9 13.8 17.3Inter-American Development Bank KQJY 1.3 2.0 1.8 1.9 1.0 2.0 1.4 0.7 0.2
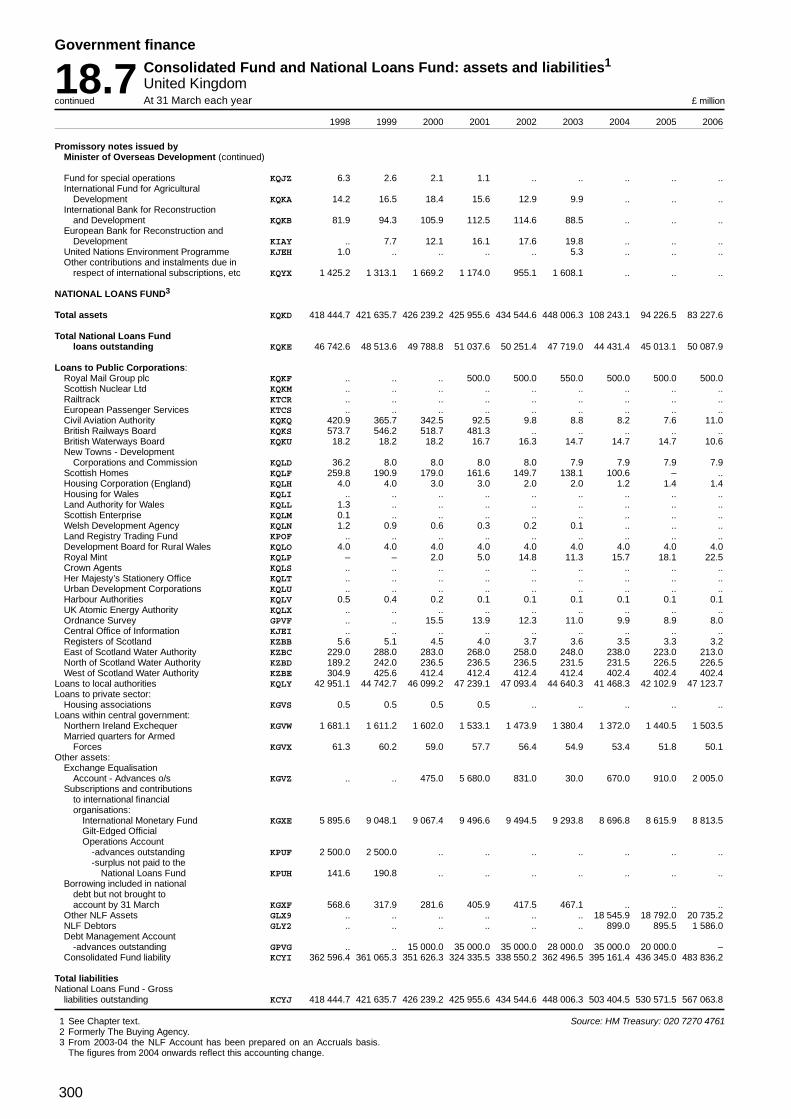
300
Government finance
18.7 Consolidated Fund and National Loans Fund: assets and liabilities1
United KingdomAt 31 March each yearcontinued £ million
1998 1999 2000 2001 2002 2003 2004 2005 2006
Promissory notes issued byMinister of Overseas Development (continued)
Fund for special operations KQJZ 6.3 2.6 2.1 1.1 .. .. .. .. ..International Fund for Agricultural
Development KQKA 14.2 16.5 18.4 15.6 12.9 9.9 .. .. ..International Bank for Reconstruction
and Development KQKB 81.9 94.3 105.9 112.5 114.6 88.5 .. .. ..European Bank for Reconstruction and
Development KIAY .. 7.7 12.1 16.1 17.6 19.8 .. .. ..United Nations Environment Programme KJEH 1.0 .. .. .. .. 5.3 .. .. ..Other contributions and instalments due in
respect of international subscriptions, etc KQYX 1 425.2 1 313.1 1 669.2 1 174.0 955.1 1 608.1 .. .. ..
NATIONAL LOANS FUND3
Total assets KQKD 418 444.7 421 635.7 426 239.2 425 955.6 434 544.6 448 006.3 108 243.1 94 226.5 83 227.6
Total National Loans Fundloans outstanding KQKE 46 742.6 48 513.6 49 788.8 51 037.6 50 251.4 47 719.0 44 431.4 45 013.1 50 087.9
Loans to Public Corporations:Royal Mail Group plc KQKF .. .. .. 500.0 500.0 550.0 500.0 500.0 500.0Scottish Nuclear Ltd KQKM .. .. .. .. .. .. .. .. ..Railtrack KTCR .. .. .. .. .. .. .. .. ..European Passenger Services KTCS .. .. .. .. .. .. .. .. ..Civil Aviation Authority KQKQ 420.9 365.7 342.5 92.5 9.8 8.8 8.2 7.6 11.0British Railways Board KQKS 573.7 546.2 518.7 481.3 .. .. .. .. ..British Waterways Board KQKU 18.2 18.2 18.2 16.7 16.3 14.7 14.7 14.7 10.6New Towns - Development
Corporations and Commission KQLD 36.2 8.0 8.0 8.0 8.0 7.9 7.9 7.9 7.9Scottish Homes KQLF 259.8 190.9 179.0 161.6 149.7 138.1 100.6 – ..Housing Corporation (England) KQLH 4.0 4.0 3.0 3.0 2.0 2.0 1.2 1.4 1.4Housing for Wales KQLI .. .. .. .. .. .. .. .. ..Land Authority for Wales KQLL 1.3 .. .. .. .. .. .. .. ..Scottish Enterprise KQLM 0.1 .. .. .. .. .. .. .. ..Welsh Development Agency KQLN 1.2 0.9 0.6 0.3 0.2 0.1 .. .. ..Land Registry Trading Fund KPOF .. .. .. .. .. .. .. .. ..Development Board for Rural Wales KQLO 4.0 4.0 4.0 4.0 4.0 4.0 4.0 4.0 4.0Royal Mint KQLP – – 2.0 5.0 14.8 11.3 15.7 18.1 22.5Crown Agents KQLS .. .. .. .. .. .. .. .. ..Her Majesty’s Stationery Office KQLT .. .. .. .. .. .. .. .. ..Urban Development Corporations KQLU .. .. .. .. .. .. .. .. ..Harbour Authorities KQLV 0.5 0.4 0.2 0.1 0.1 0.1 0.1 0.1 0.1UK Atomic Energy Authority KQLX .. .. .. .. .. .. .. .. ..Ordnance Survey GPVF .. .. 15.5 13.9 12.3 11.0 9.9 8.9 8.0Central Office of Information KJEI .. .. .. .. .. .. .. .. ..Registers of Scotland KZBB 5.6 5.1 4.5 4.0 3.7 3.6 3.5 3.3 3.2East of Scotland Water Authority KZBC 229.0 288.0 283.0 268.0 258.0 248.0 238.0 223.0 213.0North of Scotland Water Authority KZBD 189.2 242.0 236.5 236.5 236.5 231.5 231.5 226.5 226.5West of Scotland Water Authority KZBE 304.9 425.6 412.4 412.4 412.4 412.4 402.4 402.4 402.4
Loans to local authorities KQLY 42 951.1 44 742.7 46 099.2 47 239.1 47 093.4 44 640.3 41 468.3 42 102.9 47 123.7Loans to private sector:
Housing associations KGVS 0.5 0.5 0.5 0.5 .. .. .. .. ..Loans within central government:
Northern Ireland Exchequer KGVW 1 681.1 1 611.2 1 602.0 1 533.1 1 473.9 1 380.4 1 372.0 1 440.5 1 503.5Married quarters for Armed
Forces KGVX 61.3 60.2 59.0 57.7 56.4 54.9 53.4 51.8 50.1Other assets:
Exchange EqualisationAccount - Advances o/s KGVZ .. .. 475.0 5 680.0 831.0 30.0 670.0 910.0 2 005.0
Subscriptions and contributionsto international financialorganisations:
International Monetary Fund KGXE 5 895.6 9 048.1 9 067.4 9 496.6 9 494.5 9 293.8 8 696.8 8 615.9 8 813.5Gilt-Edged OfficialOperations Account
-advances outstanding KPUF 2 500.0 2 500.0 .. .. .. .. .. .. ..-surplus not paid to the
National Loans Fund KPUH 141.6 190.8 .. .. .. .. .. .. ..Borrowing included in national
debt but not brought toaccount by 31 March KGXF 568.6 317.9 281.6 405.9 417.5 467.1 .. .. ..
Other NLF Assets GLX9 .. .. .. .. .. .. 18 545.9 18 792.0 20 735.2NLF Debtors GLY2 .. .. .. .. .. .. 899.0 895.5 1 586.0Debt Management Account
-advances outstanding GPVG .. .. 15 000.0 35 000.0 35 000.0 28 000.0 35 000.0 20 000.0 –Consolidated Fund liability KCYI 362 596.4 361 065.3 351 626.3 324 335.5 338 550.2 362 496.5 395 161.4 436 345.0 483 836.2
Total liabilitiesNational Loans Fund - Gross
liabilities outstanding KCYJ 418 444.7 421 635.7 426 239.2 425 955.6 434 544.6 448 006.3 503 404.5 530 571.5 567 063.8
1 See Chapter text.2 Formerly The Buying Agency.3 From 2003-04 the NLF Account has been prepared on an Accruals basis.
The figures from 2004 onwards reflect this accounting change.
Source: HM Treasury: 020 7270 4761

301
Government finance
18.8 British government and government guaranteed marketable securities1
Nominal values of official and market holdings by maturity2,3
At 31 March each year £ million
1997 1998 1999 2000 2001 2002 2003 2004 2005 2006 2007
Total holdings KQMO 290 259 297 366 291 788 290 629 285 915 278 808 292 777 321 051 355 553 411 525 442 862Up to 5 years KQMP 90 357 86 094 95 112 95 131 92 090 92 780 106 074 88 678 110 477 127 844 119 129Over 5 and up to 15 years KQMQ 125 401 131 758 124 603 116 910 120 101 106 044 101 465 131 665 124 754 146 309 167 274Over 15 years (including undated) KQMR 74 501 79 515 72 074 78 587 73 724 79 984 85 238 97 500 120 322 137 372 156 458
Official holdings:3
Total HHAW 6 858 6 345 6 394 6 204 8 210 7 558 10 650 9 118 7 432 25 391 23 282Up to 5 years HHAY 2 850 2 499 2 600 2 849 4 652 3 928 4 797 3 321 2 586 8 206 7 321Over 5 and up to 15 years HHAZ 3 041 2 726 2 989 2 567 3 009 2 844 4 115 4 015 3 245 9 622 9 502Over 15 years (including undated) HHBA 967 1 120 805 788 549 786 1 738 1 540 1 600 7 563 6 459
Market holdings:Total HHBB 283 402 291 021 285 394 284 425 277 705 271 250 282 127 311 933 348 121 386 134 419 580Up to 5 years HHBD 87 508 83 595 92 512 92 282 87 438 88 852 101 277 85 357 107 891 119 638 111 808Over 5 and up to 15 years HHBE 122 360 129 032 121 614 114 343 117 092 103 200 97 350 127 650 121 509 136 687 157 772Over 15 years (including undated) HHBF 73 536 78 395 71 269 77 800 73 175 79 198 83 500 95 960 118 721 129 809 150 000
1 The government guaranteed securities of nationalised industries only. A re-latively small amount of other government guaranteed securities is exclud-ed.
2 Securities with optional redemption dates are classified according to the fi-nal redemption date. The nominal value of index-linked British GovernmentStock has been raised by the amount of accrued capital uplift.
3 Official holdings were changed following the introduction of the central banksector in the UK national accounts. These holdings now principally includethose of the Debt Management Office and other government departments. TheIssue and Banking Departments of the Bank of England are classified within thecentral bank sector and are therefore part of market holdings.
Source: Office for National Statistics: 020 7014 2124

302
Government finance
18.9 Income tax: allowances and reliefs1
United Kingdom£
1997 1998 1999 2000 2001 2002 2003 2004 2005 2006 2007/98 /99 /00 /01 /02 /03 /04 /05 /06 /07 /08
Personal allowances
Personal allowance KDZP 4 045 4 195 4 335 4 385 4 535 4 615 4 615 4 745 4 895 5 035 5 225Married couple’s (both partnersunder 65)2 KDZR 1 830 1 900 1 970 .. .. .. .. .. .. .. ..Age allowance:
Personal (aged 65-74) KSOH 5 220 5 410 5 720 5 790 5 990 6 100 6 610 6 830 7 090 7 280 7 550Personal (aged 75 or over) KSOI 5 400 5 600 5 980 6 050 6 260 6 370 6 720 6 950 7 220 7 420 7 690Married couple’s (either partnerbetween 65-74 but neitherpartner 75 or over)2,3 KEDI 3 185 3 305 5 125 5 185 5 365 5 465 5 565 5 725 5 905 6 065 6 285Married couple’s (either partner75 or over)2 KEIY 3 225 3 345 5 195 5 255 5 435 5 535 5 635 5 795 5 975 6 135 6 365Minimum married couple’s allowance C58D 1 830 1 900 1 970 2 000 2 070 2 110 2 150 2 210 2 280 2 350 2 440Income limit4 KEOO 15 600 16 200 16 800 17 000 17 600 17 900 18 300 18 900 19 500 20 100 20 900
Additional personal allowance2 KEPG 1 830 1 900 1 970 .. .. .. .. .. .. .. ..Widow’s bereavement allowance KEPH 1 830 1 900 1 970 .. .. .. .. .. .. .. ..Blind person’s allowance
Single or married (one spouse blind) KSOJ 1 280 1 330 1 380 1 400 1 450 1 480 1 510 1 560 1 610 1 660 1 730Married (both spouses blind) KSOK 2 560 2 660 2 760 2 800 2 900 2 960 3 020 3 120 3 220 3 320 3 460
Life Assurance ReliefPercentage of gross premium KFDR 12.5 12.5 12.5 12.5 12.5 12.5 12.5 12.5 12.5 12.5 12.5
or Nil or Nil or Nil or Nil or Nil or Nil or Nil or Nil or Nil or Nil or Nil
1 See chapter text.2 The allowance was restricted to 20 per cent in 1994-95, 15 per cent from
1995-96 and 10 per cent from 1999-003 At least one of the partners must be aged 65 before April 2000 to be entitled
to the married couple’s allowance (MCA). From 2000-01 only people bornbefore 6 April 1935 are entitled to MCA.
4 If the total income, less allowable deductions of a taxpayer aged 65 or overexceeds the limit, the age-related allowances are reduced by £1 for each £2 ofincome over the aged income level until the basic levels of the personal andmarried couple’s allowances are reached.
Source: HM Revenue & Customs: 020 7147 3045
18.10 Rates of Income taxUnited Kingdom
1998/99 1999/00 2000/01 2001/02 2002/03
Rate of Rate of Rate of Rate of Rate ofBands of tax - Bands of tax - Bands of tax - Bands of tax - Bands of tax -
taxable Percent- taxable Percent- taxable Percent- taxable Percent- taxable Percent-income (£)1 ages income (£)1 ages income (£)1 ages income (£)1 ages income (£)1 ages
Lower rate or starting rate2 1 - 4 300 20 1 - 1 500 104 1 - 1 520 104 1 - 1 880 104 1 - 1 920 104
Basic rate 4 301 - 27 100 233 1 501 - 28 000 235 1 521 - 28400 225 1 881 - 29 400 225 1 921 - 29 900 225
Higher rate over 27 100 40 over 28 000 406 over 28 400 406 over 29 400 406 over 29 900 406
2003/04 2004/05 2005/06 2006/07 2007/08
Rate of Rate of Rate of Rate of Rate ofBands of tax - Bands of tax - Bands of tax - Bands of tax - Bands of tax -
taxable Percent- taxable Percent- taxable Percent- taxable Percent- taxable Percent-income (£)1 ages income (£)1 ages income (£)1 ages income (£)1 ages income (£)1 ages
Starting rate 1 - 1 960 104 1 - 2 020 104 1 - 2 090 104 1 - 2 150 104 1 - 2 230 104
Basic rate 1 961 - 30 500 225 2 021 - 31 400 225 2 091 - 32 400 225 2 151 - 33 300 225 2 231 - 34 600 225
Higher rate over 30 500 406 over 31 400 406 over 32 400 406 over 33 300 406 over 34 600 406
1 Taxable income is defined as gross income for income tax purposes lessany allowances and reliefs available at the taxpayer’s marginal rate.
2 In 1999/00 the starting rate replaced the lower rate.3 The basic rate of tax on dividends and savings income is 20%.4 The starting rate also applies to savings and dividends.5 The basic rate of tax on dividends is 10% and savings income is 20%6 The higher rate of tax on dividends is 32.5%.
Source: HM Revenue & Customs: 020 7147 3045

303
Government finance
18.11 Rateable values1
England and WalesAt 1 April each year
1997 1998 1999 2000 2001 2002 2003 2004 2005 2006 2007
Number of properties (Thousands)
Commercial KMIN 1 225 1 223 1 219 1 223 1 230 1 234 1 236 1 239 1 234 1 245 1 258Shops and cafes KMIO 491 488 484 478 476 473 469 466 462 459 457Offices KMIP 255 257 258 261 269 273 279 284 287 296 304Other KMIQ 479 478 477 484 485 487 488 490 485 490 497
On-licensed premises KMIR 59 59 60 61 61 60 60 60 66 65 65Entertainment and recreational: KMIS 87 81 80 79 79 80 80 80 78 79 81
Cinemas KMIT 1 1 1 1 1 1 1 1 1 1 1Theatres and music-halls KMIU 1 1 1 1 1 1 1 1 1 1 1Other KMIV 86 80 79 76 76 77 77 78 76 78 80
Public utility KMIW 8 9 9 8 8 8 8 8 8 8 8Educational and cultural KMIX 41 41 41 41 42 42 42 43 45 45 45Miscellaneous KMIY 55 56 61 67 70 70 72 74 74 77 80Industrial KMIZ 249 250 250 250 251 250 250 250 252 251 252
Total KMIH 1 725 1 719 1 720 1 729 1 740 1 745 1 749 1 754 1 756 1 771 1 788
Value of assessments (£ million)
Commercial KMHG 19 859 19 733 19 652 26 320 27 255 27 622 27 713 27 878 33 013 33 548 33 566Shops and cafes KMHH 5 959 5 860 5 840 6 801 6 972 6 953 6 863 6 845 8 257 8 311 8 289Offices KMHI 5 641 5 624 5 575 8 625 9 191 9 388 9 555 9 591 10 840 11 034 10 904Other KMHJ 8 259 8 249 8 237 10 894 11 092 11 281 11 295 11 441 13 916 14 203 14 373
On-licensed premises KMHK 970 980 997 1 311 1 347 1 345 1 334 1 320 1 667 1 652 1 615Entertainment and recreational KMHL 1 033 1 040 1 045 1 310 1 369 1 430 1 416 1 362 1 467 1 483 1 481
Cinemas KMHM 36 39 45 79 92 104 106 96 117 115 110Theatres and music-halls KMHN 21 21 20 24 25 26 26 26 34 35 35Other KMHO 975 979 980 1 207 1 252 1 300 1 284 1 240 1 316 1 333 1 337
Public utility KMHP 3 488 3 380 3 361 3 828 3 411 3 460 3 444 3 410 3 680 3 668 3 668Educational and cultural KMHQ 1 894 1 773 1 672 1 829 1 872 1 902 1 895 1 904 2 359 2 411 2 407Miscellaneous KMHR 1 494 1 464 1 439 2 142 2 172 2 220 2 218 2 022 2 582 2 646 2 687Industrial KMHS 5 561 5 540 5 463 6 249 6 202 6 157 6 034 5 935 6 651 6 575 6 453
Total KMHA 34 299 33 909 33 649 42 985 43 626 44 136 44 053 43 831 51 419 51 983 51 878
1 See chapter text. Source: HM Revenue & Customs: 020 7147 2941
18.12 Local authorities: gross loan debt outstanding1
At 31 March each year£ billion
2003 2004 2005 2006 2007
United Kingdom
Total debt KQBR 51.2 50.5 52.9 59.7 62.3
Public Works Loan Board KQBS 44.6 41.3 42.4 47.1 47.9Northern Ireland Consolidated Fund KQBT 0.3 0.3 0.3 .. ..Other debt KQBU 6.3 8.8 10.5 .. ..
England
Total debt C3OO 38.2 37.7 40.1 46.1 48.6of which Public Works Loan Board C3OP 33.4 31.1 32.2 36.6 37.6
Wales
Total debt C3OQ 3.7 3.6 3.7 3.8 3.8of which Public Works Loan Board C3OR 3.3 3.1 3.1 3.3 3.1
Scotland
Total debt KQBX 8.8 8.8 8.7 9.4 9.5of which Public Works Loan Board KQBY 7.9 7.1 6.8 7.2 7.1
Northern Ireland
Total debt KQBZ 0.3 0.3 0.3 0.3 0.3of whichNorthern Ireland Consolidated Fund KQBT 0.3 0.3 0.3 .. ..
1 The sums shown exclude inter-authority loans. Sources: Communities and Local Government: 020 7944 4176;Public Works Loan Board: 020 7862 6610;
Department of Finance and Personnel for Northern Ireland: 028 9185 8131

304
Government finance
18.13 Revenue expenditure of local authorities
£ million
2004/05 2005/06 2006/07 2007/08outturn outturn outturn budget
England
Education1 33 290 36 020 37 972 39 620Transport 4 673 4 843 5 313 5 600of which:Highways 2 163 2 205 2 262 2 320Public transport 2 511 2 635 3 051 3 280
Social Services2 16 310 17 359 18 094 18 469Housing (excluding HRA)3 13 288 14 066 14 963 15 246Cultural, environmental and planning 8 519 9 162 9 651 9 902of which:Cultural 2 835 2 967 3 158 3165Environmental 3 864 4 248 4 519 4 872Planning and development 1 822 1 947 1 973 1 866
Police 10 206 10 957 11 651 11 609Fire 1 925 2 040 2 193 2 227Courts 460 58 62 62Central services 2 953 2 432 3 453 3 350Other 275 206 159 248
Net current expenditure 91 902 97 142 103 513 106 333
Capital financing 2 362 2 473 2 993 3 352Capital Expenditure charged to Revenue Account 957 891 1 106 1 245Interest receipts -1 125 -1 214 -1 481 -1 123Pension Interest Costs 3 947 4 785 4 534 3 531Other non-current expenditure4 3 062 3 194 3 350 3 417
Specific grants outside Aggregate External Finance (AEF) -17 311 -18 267 -19 643 -19 444
Revenue expenditure 83 795 89 004 94 372 97 312
Specific and special grants inside AEF -14 090 -14 785 -41 771 -43 035
Net revenue expenditure 69 705 74 219 52 601 54 277
Appropriation to/from reserves (excluding pension reserves) 1 347 816 695 -890Appropriation to/from Pension Reserves -4 492 -4 582 -5 890 -3 990Other adjustments 2 24 16 0
Budget requirement 66 561 70 477 47 422 49 398
SSA reduction grant - - - -Police grant -4 168 -4 353 -3 936 -4 028Revenue support grant -26 964 -26 663 -3 378 -3 105Central Support Protection Grant - - - -Council Tax Benefit Subsid Limitation Scheme - - - -Redistributed business rates -15 004 -18 004 -17 506 -18 506General Greater London Authority Grant -36 -37 -38 -38Other items -90 -104 -111 -112
Council tax requirement 20 299 21 315 22 453 23 608
Scotland
Net revenue expenditure on general fund 9 847 10 603 10 708 11 032

305
Government finance
18.13 Revenue expenditure of local authorities
continued £ million
2004/05 2005/06 2006/07 2007/08outturn outturn outturn budget
Wales5
Education 2 011.3 2 121.8 2 213.0 2 312.7Personal social services 1 069.2 1 164.7 1 253.6 1 307.8Housing6 632.4 674.6 716.7 730.7Local environmental services7 289.6 318.9 353.9 358.9Roads and transport 256.7 270.8 283.3 300.3Libraries, culture, heritage, sport and recreation 239.4 248.3 259.9 263.0Planning, economic development and community development 98.6 108.4 115.2 111.2Council tax benefit and administration8 30.0 31.0 32.1 30.0Debt financing costs: counties 258.8 272.4 278.0 312.9Central administrative and other revenue expenditure: counties9 221.5 206.7 207.4 239.1
Total county and county borough council expenditure 5 107.3 5 417.4 5 713.1 5 966.6
Total police expenditure 538.2 557.9 601.4 616.4Total fire expenditure 124.5 135.7 142.1 137.2Total national park expenditure 15.7 17.0 15.8 17.1
Gross revenue expenditure 5 785.7 6 128.0 6 472.4 6 737.3
less specific and special government grants(except council tax benefit grant) -1 380.8 -1 473.5 -1 529.7 -1 489.4
Net revenue expenditure 4 404.9 4 654.5 4 942.7 5 247.9
Putting to (+)/drawing from (-) reserves 5.7 13.5 24.6 -42.1
Budget requirement 4 410.6 4 668.0 4 967.3 5 205.9
Plus discretionary non-domestic rate relief 2.2 2.5 2.6 2.5less revenue support grant -2 591.0 -2 751.6 -2 951.8 -3 061.6less police grant -225.8 -235.0 -217.0 -225.0less re-distributed non-domestic rates income -672.0 -672.0 -730.0 -791.0
Council tax requirement 924.1 1 012.0 1 071.2 1 130.8
of which:Paid by council tax benefit grant from the Department for Work and Pensions 155.0 170.1 177.2 178.2Paid directly by council tax payers 769.1 841.9 894.0 952.6
1 Includes mandatory student awards and inter-authority education recoup-ment.
2 Includes supported employment.3 Includes mandatory rent allowances and rent rebates.4 Includes:
(i) Gross expenditure on council tax benefit.(ii) Expenditure on council tax reduction scheme.(iii) Discretionary (non-domestic) rate relief.(iv) Flood defence payments to the Environment Agency(v) Bad debt provision.
5 Service expenditure is shown excluding that financed by sales, fees andcharges, but including that financed by specific and special governmentgrants.
6 Includes housing benefit and private sector costs such as provision for thehomeless. Includes rent rebates granted to HRA tenants which is 100%grant funded. Excludes council owned housing.
7 Includes cemeteries and crematoria, community safety, environmental health,consumer protection, waste collection/disposal and central services to the pub-lic such as birth registration and elections.
8 Excludes council tax benefit expednditure funded by the specific grant from theDepartment for Work and Pensions.
9 Includes agricultural services, coastal and flood defence and community coun-cils. Also includes central administrative costs of corporate management,democratic representation and certain costs, such as those relating to back-year or additional pension contributions which should not be allocated to indivi-dual services, capital expenditure charged to the revenue account and is net ofany interest expected to accrue on balances.
Sources: Communities and Local Government: 020 7944 4158;Scottish Government, Statistical Support for Local Government: 0131 244
7033;Welsh Assembly Government: 029 2082 5355

306
Government finance
18.14 Financing of revenue expenditureEngland and WalesYears ending 31 March £ million
1997 1998 1999 2000 2001 2002 2003 2004 2005 2006 20071
/98 /99 /00 /01 /02 /03 /04 /05 /06 /07 /08
England2
Revenue expenditure3
Cash £m KRTN 47 256 50 189 53 651 57 329 61 952 65 898 75 244 79 303 84 422 88 482 93 321
Government grantsCash £m KRTO 23 840 25 291 26 421 27 809 31 469 32 634 41 777 45 258 45 838 49 123 50 206Percentage of revenue expenditure KRTP 50 50 49 49 50 50 56 57 54 56 54
Redistributed business rates4
Cash £m KRTQ 12 034 12 531 13 619 15 407 15 144 16 639 15 611 15 004 18 004 17 506 18 506Percentage of revenue expenditure KRTR 25 25 25 27 24 25 21 19 21 20 20
Council taxCash £m KRTS 11 241 12 332 13 278 14 200 15 246 16 648 18 946 20 299 21 315 22 453 23 608Percentage of revenue expenditure KRTT 24 25 25 25 25 25 25 26 25 25 25
Wales
Gross revenue expenditure5 ZBXH 3 121 3 246 3 424 3 605 4 350 4 709 5 243 5 786 6 128 6 472 6 737General government grants6 ZBXI 1 957 2 009 2 093 2 234 2 345 2 541 2 743 2 817 2 987 3 169 3 287Specific government grants7 ZBXG 75 84 80 94 601 779 1 005 1 381 1 473 1 530 1 489Share of redistributed
business rates ZBXJ 584 612 656 638 697 643 660 672 672 730 791Council tax income8 ZBXK 483 542 596 670 716 776 861 924 1 012 1 071 1 131Other9 ZBXL 22 .. –1 –31 –10 –30 –25 –8 –16 –28 40
1 Budget estimates2 Produced on a non-Financial Reporting Standard 17 (FRS17) basis.3 The sum of government grants, business rates and local taxes does not
normally equal revenue expenditure because of the use of reserves.4 1993-94 to 2003-04 includes City of London Offset.5 Gross revenue expenditure is total local authority expenditure on services,
plus capital charges, but net of any income from sales, fees, and chargesand other non-grant sources. It includes expenditure funded by specificgrants. The figures have been adjusted to account for FRS17 pensioncosts.
6 Includes all unhypothecated grants, namely revenue support grant, policegrant, council tax reduction scheme grant, transitional grant and the adjustmentto reverse the transfer.
7 Comprises specific and supplementary grants, excluding police grant.8 This includes community council precepts, and income covered by
charge/council tax benefit grant, but excludes council tax reduction scheme9 This includes use of, or contributors to, local authority reserves and other minor
adjustments.
Sources: Communities and Local Government: 020 7944 4158;Welsh Assembly Government: 029 2082 5355

307
Government finance
18.15 Local authority capital expenditure and receiptsEnglandFinal outturn: Years ending 31 March £ million
2001 2002 2003 2004 2005 2006/02 /03 /04 /05 /06 /07
Expenditure1
Education KRUD 2 064 2 287 2 780 3 087 3 492 3 442Personal Social Services KRUE 158 199 260 285 387 364Transport KRUC 1 877 2 461 2 552 2 906 3 461 3 480Housing KRUB 3 110 3 828 3 485 3 987 4 534 4 507Arts and libraries GEKZ 213 208 196 227 329 296Agriculture and fisheries GELA 38 65 72 66 93 96Sport and recreation KRUH 314 307 263 305 424 415Other2 GELB 1 513 1 631 2 056 2 725 3 218 3 052Fire and civil defence GELC 62 72 68 81 96 126Police and probation GELD 359 408 513 561 606 531Magistrates courts GELE 33 40 37 46 1 –
Total KRUR 9 741 11 508 12 282 14 276 16 641 16 307
Receipts3
Education KRUT 146 233 221 210 217 261Personal social services KRUV 71 75 74 75 85 85Transport KRUU 138 107 92 101 87 130Housing KRUS 2 245 3 474 3 622 3 193 2 179 1 769Arts and libraries GELF 19 22 5 10 7 10Agriculture and fisheries GELG 42 49 53 45 63 65Sport and recreation KRUX 12 21 7 11 48 51Other2 GELH 801 975 1 145 931 987 1 172Fire and civil defence GELI 7 10 18 6 8 9Police and probation GELJ 86 70 78 71 96 117Magistrates court GELK 12 4 6 8 1 –
Total KRVB 3 579 5 040 5 322 4 661 3 777 3 671
1 Includes aquisition of share and loan capital.2 Environmental services, consumer protection and employment services.3 Includes disposal of share and loan capital and disposal of other invest-
ments.
Source: Department for Communities and Local Government: 020 7944 4075

308
Government finance
18.16 Capital expenditure and incomeEngland
£ million
Other borrowing andcredit arrangements
Central government Other grants and Use of usable BCA/SCE(R)Single BCA/SCE(R)Separate not supported bygrants contributions1 capital receipts Capital Pot Programme Element central government
Financial yearKRVM I4V9 I4VA I4VB I4VC I4VD
1991/92 1 041 159 1 305 2 327 813 ..1992/93 1 210 148 1 119 2 230 999 ..1993/94 1 279 140 1 901 1 743 1 205 ..1994/95 1 176 223 1 520 1 784 938 ..1995/96 1 484 230 1 216 1 493 771 ..
1996/97 1 388 281 1 192 1 291 829 ..1997/98 1 262 389 1 184 968 1 131 ..1998/99 1 160 485 1 223 1 048 1 286 ..1999/00 1 161 571 1 599 1 051 1 250 ..2000/01 1 298 762 1 592 2 271 945 ..
2001/02 2 027 757 1 975 1 173 1 378 ..2002/03 2 474 716 2 426 2 281 935 ..2003/04 2 642 869 1 988 2 583 1 326 ..2004/05 3 196 1 080 2 647 2 959 704 1 0612005/06 3 909 1 377 2 812 2 932 947 2 251
2006/07 4 083 1 344 2 628 2 734 630 2 291
Revenue financing of capital espenditure, of which:
Use of other resources 2 Housing revenue account Major repairs reserve General Fund Total resources used
Financial yearI4VE I4VF I4VG I4VH I4VI
1991/92 – 213 .. 819 6 6781992/93 22 239 .. 712 6 6791993/94 67 314 .. 571 7 2191994/95 97 449 .. 853 7 0401995/96 236 552 .. 1 039 7 021
1996/97 172 511 .. 914 6 5781997/98 196 491 .. 891 6 5121998/99 253 408 .. 847 6 7101999/00 231 327 .. 808 6 9982000/01 304 218 .. 896 8 288
2001/02 387 1 505 .. 825 10 0282002/03 375 175 1 465 825 11 6722003/04 262 212 1 388 1 055 12 3262004/05 .. 187 1 440 1 130 14 4042005/06 .. 238 1 327 1 004 16 797
2006/07 .. 240 1 337 1 185 16 472
1 Includes grants and contributions for private developers, Non-DepartmentalPublic Bodies, National Lottery and European Structural Fund.
2 Use of monies set aside as provision for credit liabilities to finance capitalexpenditure (debt free authorities).
Source: Department for Communities and Local Government: 020 7944 4075

309
Government finance
18.17 Expenditure of local authoritiesScotlandYear ending 31 March £ thousand
1997 1998 1999 2000 2001 2002 2003 2004 2005 2006/98 /99 /00 /01 /02 /03 /04 /05 /06 /07
Out of revenue:1 Total KQTA 9 566 936 10 033 985 10 439 999 10 924 634 11 553 927 12 858 533 13 658 834 14 527 867 15 746 429 15 986 751
General Fund Services: KQTB 6 679 396 7 021 038 7 429 626 7 884 168 8 428 217 9 290 268 10 139 679 10 964 598 12 021 453 12 143 056Education KQTC 2 512 725 2 649 170 2 855 945 3 037 780 3 283 827 3 533 853 3 872 786 4 180 675 4 406 876 4 596 832Libraries, museums and
galleries KQTD 121 387 124 648 131 696 134 174 138 318 152 308 160 540 161 650 168 953 164 976Social work KQTE 1 315 387 1 394 142 1 519 191 1 632 843 1 793 732 2 173 752 2 400 652 2 621 134 2 808 040 2 994 486Law, order and
protective services KQTF 931 795 952 940 1 006 000 1 047 034 1 088 791 1 130 693 1 226 067 1 306 085 1 501 854 1 469 644Roads and Transport2 KQTG 440 712 546 945 527 018 564 738 506 326 601 454 611 721 635 329 673 167 625 341Environmental services KQTH 343 565 349 413 373 050 393 333 414 975 484 177 525 556 581 220 635 475 670 308Planning KQTI 163 380 179 078 198 285 194 771 223 414 265 315 282 572 299 182 351 617 366 803Leisure and recreation KQTJ 364 853 368 023 375 579 387 115 401 904 426 495 472 120 494 237 520 612 543 047Other services KQTL 456 219 430 790 435 155 465 612 572 136 515 661 585 425 681 288 948 167 702 554Other general fund expenditure3 KQTM 29 373 25 889 7 707 26 768 4 794 6 560 2 240 3 798 6 692 9 065
Housing KQTN 1 658 935 1 754 686 1 821 380 1 886 189 1 954 444 2 224 209 2 295 005 2 459 146 2 609 228 2 740 592
Trading services: KQTO 75 976 79 644 87 321 80 355 61 899 74 062 92 782 106 445 103 461 102 336Passenger transport KQTR 1 524 121 336 162 343 427 441 282 353 355Ferries KQTS 7 512 8 930 9 709 10 005 9 650 11 493 11 768 13 759 14 308 18 483Harbours, docks and piers KQTT 12 884 15 697 15 923 13 604 10 912 12 222 13 405 12 407 11 995 8 495Road bridges KQTV 16 064 16 408 8 231 8 606 6 914 7 267 11 235 13 276 12 366 16 279Slaughterhouses KQTW 850 228 4 .. .. .. .. .. .. ..Markets KQTX 13 479 13 161 14 106 23 844 16 657 17 995 14 824 15 353 17 447 16 793Other trading services KQTY 23 663 25 099 39 012 24 134 17 423 24 658 41 109 51 368 46 992 41 931
Loan charges:4 Total KQTZ 1 126 637 1 152 728 1 109 379 1 100 690 1 114 161 1 269 994 1 131 368 997 678 1 012 287 1 000 767Allocated to :
General Fund services KMHV 651 982 710 371 701 515 708 822 739 351 738 870 772 852 772 648 792 404 782 002Housing KMHW 471 274 438 556 402 936 386 512 369 943 525 201 348 180 212 440 210 856 214 395Trading services KMHX 3 381 3 801 4 928 5 356 4 867 5 923 10 336 12 590 9 027 4 370
On capital works:4 Total KQUA 813 900 815 981 816 473 802 672 929 631 972 049 1 052 310 1 264 031 1 572 281 1 952 249
General Fund Services: KQUB 540 096 541 769 557 119 538 843 610 485 662 869 767 122 1 006 150 1 160 818 1 462 620Education KQUC 112 753 125 341 136 508 127 781 143 268 157 439 172 227 199 387 310 054 402 865Libraries, museums and galleries KQUD 9 974 13 231 10 261 5 834 8 683 19 018 12 043 24 796 22 762 24 210Social work KQUE 19 660 22 554 22 097 21 539 31 359 30 116 31 966 33 450 37 877 50 327Law, order and
protective services KQUF 37 701 37 727 37 132 35 761 39 901 53 268 65 477 65 154 51 146 60 287Roads and Transport KQUG 108 227 113 954 108 500 117 485 147 975 147 357 200 278 258 071 308 366 418 987Environmental services KQUH 21 193 18 397 14 936 17 944 16 396 17 957 20 567 40 773 55 020 43 104Planning KQUI 69 648 50 854 52 045 47 684 33 312 40 241 36 496 61 544 76 043 66 063Leisure and recreation KQUJ 29 692 40 926 52 365 44 516 39 240 50 558 71 486 74 116 83 681 98 275Administrative buildings and
equipment KQUK 45 374 35 107 35 824 34 633 53 189 68 438 48 896 64 414 84 569 113 896Other services KQUL 85 814 83 678 87 451 85 666 97 162 78 477 107 686 184 445 131 300 184 606
Housing KQUM 270 005 268 135 255 019 255 189 300 054 284 418 261 715 241 107 382 697 454 838
Trading Services: KQUN 3 799 6 077 4 335 8 640 19 092 24 762 23 473 16 774 28 766 34 791Ferries KQUR 770 268 1 030 23 467 1 111 608 195 547Harbours, docks and piers KQUS 1 175 1 626 1 389 6 192 15 898 20 361 19 503 12 024 12 899 5 855Airports KQUT 439 .. .. 607 663 1 031 609 572 663 798Road bridges KQUU 973 2 791 600 964 882 2 386 2 395 442 12 106 22 865Slaughterhouses KQUV 69 54 12 .. 40 116 82 – – –Other trading services KMHY 373 1 338 1 304 854 1 142 867 773 3 128 2 903 4 726
1 Gross expenditure less inter-authority and inter-account transfers.2 Including general fund support for transport (LA and NON-LA).3 General fund contributions to Housing and Trading services (excluding tran-
sport), are also included in the expenditure figures for these services.4 Expenditure out of loans, government grants and other capital receipts.
Source: Scottish Government, Statistical Support for Local Government: 0131244 7033

310
Government finance
18.18 Income of local authorities: classified according to sourceScotlandYear ending 31 March £ thousand
1996 1997 1998 1999 2000 2001 2002 2003 2004 2005 2006/97 /98 /99 /00 /01 /02 /03 /04 /05 /06 /07
Revenue accountNon-Domestic Rates1 KQXA 1 313 531 1 326 129 1 437 646 1 440 522 1 662 691 1 553 926 1 718 104 1 804 423 1 895 941 1 897 073 1 883 769Council tax KPUC 9 681 531 70 405 1 146 366 1 193 693 1 273 316 1 363 399 1 459 212 1 532 071 1 614 808 1 720 305 1 811 577Government grants
Revenue Support Grant KQXC 3 649 694 3 520 461 3 483 815 3 537 043 3 440 842 3 935 328 4 557 867 5 037 140 5 266 054 5 567 902 5 777 204Rate rebate grant KQXG 496 .. .. .. .. .. .. .. .. .. ..Council tax
rebate grants KPUD 226 132 260 424 274 940 275 789 279 459 285 131 293 606 307 733 344 899 354 067 359 159Other grants and
subsidies KQXI 1 347 706 1 480 890 1 642 045 1 778 216 1 891 839 2 061 297 2 141 543 2 479 311 2 823 820 2 940 137 3 147 497Sales KQXJ 59 059 46 874 39 595 43 660 49 826 .. .. .. .. .. ..Fees and charges2 KQXK 1 539 611 1 625 952 1 668 223 1 682 385 1 776 455 1 789 428 1 954 337 1 785 672 1 845 161 1 951 315 2 039 217Other income KQXL 238 985 290 427 324 932 398 894 453 458 490 574 712 423 515 897 709 226 1 003 925 961 693
Capital accountSale of fixed assets KQXM 499 143 327 569 335 037 303 582 149 504 165 016 207 388 222 844 355 069 366 302 451 353Revenue contributions
to capital KQXP 119 641 149 423 204 982 213 564 210 912 147 760 239 778 212 533 219 593 247 693 199 749Transfer from special
funds KMHZ 2 652 36 929 26 959 125 365 27 317 37 087 39 650 52 619 82 991 72 195 20 935Other receipts3 KMGV 45 067 32 118 45 028 39 014 45 351 90 360 75 846 114 745 130 575 261 872 595 722
1 This is the Distributable Amount of Non-Domestic Rates.2 From 2001-02 onwards, fees & charges incorporates sales.
3 Figures include public sector contributions from 2001-02 onwards.
Source: Scottish Government, Statistical Support for Local Government: 0131244 7033
18.19 Income of local authorities from government grants1
ScotlandYear ending 31 March £ thousand
1997 1998 1999 2000 2001 2002 2003 2004 2005 2006/98 /99 /00 /01 /02 /03 /04 /05 /06 /07
General fund services KQYA 557 536 690 569 818 537 935 452 1 032 591 952 692 1 029 338 1 207 912 1 358 190 1 524 829Education KQYB 61 960 92 368 225 668 324 340 380 726 251 333 217 743 287 226 327 905 439 678Libraries, museums and
galleries KQYC 326 627 507 634 1 137 5 359 1 517 763 818 1 394Social work KQYD 59 892 62 167 71 611 78 611 86 533 114 591 205 229 240 665 236 774 222 551Law, order and
protective services KQYE 359 811 366 961 382 246 401 485 423 636 445 275 476 681 512 501 597 322 601 593Roads and Transport2 KQYF 237 97 649 68 429 57 702 49 900 57 664 27 280 35 038 31 704 49 295Environmental services KQYG 159 89 71 301 2 272 5 407 18 120 39 971 45 338 55 173Planning and
Economic Development KQYH 4 885 2 695 4 311 4 375 20 351 19 434 21 517 20 767 31 293 33 750Leisure and recreation KQYI 1 856 1 509 1 491 2 377 3 322 2 968 3 732 5 830 6 256 9 194Other services KQYK 68 410 66 504 64 203 65 627 64 714 50 661 57 519 65 151 80 780 112 201
Housing KQYL 920 700 948 232 959 276 956 239 1 028 529 1 188 626 1 449 616 1 614 976 1 580 504 1 622 049
Trading services KQYM .. .. 403 148 177 225 357 932 1 443 619Other trading services KQYP .. .. 403 148 177 225 357 932 1 443 619
Grants not allocated tospecific services3 KMGY 3 520 461 3 483 815 3 537 043 3 440 842 3 935 328 4 557 867 5 037 140 5 266 054 5 567 902 5 777 204
Total KMGZ 4 998 697 5 122 616 5 315 259 5 332 681 5 996 625 6 699 410 7 516 451 8 089 874 8 508 039 8 924 701
1 Including grants for capital works.2 The significant increase in 1998/99 is due to the different reporting of a grant
in aid of expenditure on rail passenger services in the StrathclydePassenger Transport area.
3 Revenue support grant.
Source: Scottish Government, Statistical Support for Local Government: 0131244 7033

311
Government finance
18.20 Expenditure of local authoritiesNorthern IrelandYears ending 31 March £ thousand
1995 1996 1997 1998 1999 2000 2001 2002 2003 2004 2005/96 /97 /98 /99 /00 /01 /02 /03 /04 /05 /06
Libraries, museums and art galleries KQVB 8 481 10 956 13 928 14 571 19 900 23 097 24 181 32 728 30 062 30 481 33 516
Environmental health services:Refuse collection and disposal KQVC 41 284 52 267 56 246 56 360 62 226 65 289 73 336 90 148 94 715 102 633 113 768Public baths KQVD 1 703 1 838 2 585 2 634 1 750 1 724 1 423 .. .. .. ..Parks, recreation grounds, etc KQVE 100 418 111 884 115 302 118 396 158 304 170 999 184 406 194 224 193 617 205 734 221 298Other sanitary services KQVF 35 706 39 545 39 682 42 923 44 214 45 552 48 784 52 075 55 349 59 906 66 294
Housing (grants and small dwellingsacquisition) KQVG 472 489 545 358 37 28 27 12 21 18 10
Trading services:Cemeteries KQVI 5 489 5 120 5 626 5 887 5 973 6 151 6 538 7 208 7 980 8 455 8 520Other trading services (including
markets, fairs and harbours) KQVJ 4 254 8 672 7 016 10 779 9 366 7 209 7 769 18 281 17 489 18 776 19 595
Miscellaneous KQVK 54 987 63 792 63 375 161 790 86 649 89 881 98 244 79 645 114 971 105 031 128 304
Total expenditure KQVA 252 794 294 563 304 305 413 698 388 419 409 930 444 708 474 321 490 619 531 034 591 305
Total loan charges KQVL 21 122 24 363 34 823 26 413 .. .. .. .. .. .. ..
Source: Department of the Environment for Northern Ireland: 028 9025 6085

312
External trade and investment

313
External trade and investment
External trade and investment
Ch
apter 19

314
External trade and investment
Performance of United Kingdom Industries’. The article described the conceptual and methodological problems involved in measuring such variables as import penetration.
The industries are grouped according to the 1992 Standard Industrial Classification. The four different ratios are defined as follows:
Ratio 1: percentage ratio of imports to home demand
Ratio 2: percentage ratio of imports to (home demand plus exports)
Ratio 3: percentage ratio of exports to total manufacturers’ sales
Ratio 4: percentage ratio of exports to (total manufacturers' sales plus imports)
Home demand is defined as total manufacturers’ sales plus imports minus exports. This is only an approximate estimate as different sources are used for the total manufacturers’ sales and the import and export data. Total manufacturers’ sales are determined by the Products of the European Community inquiry, and import and export data are provided by HM Revenue and Customs.
Ratio 1 is commonly used to describe the import penetration of the home market. Allowance is made for the extent of a domestic industry’s involvement in export markets by using Ratio 2; this reduces as exports increase.
Similarly, Ratio 3 is the measure normally used to relate exports to total sales by UK producers, and Ratio 4 makes an allowance for the extent that imports of the same product are coming into the UK.
International trade in services
(Tables 19.7 and 19.8)
These data relate to overseas trade in services and cover both production and non-production industries (excluding the public sector). In terms of types of services traded, this equates to trade in royalties, various forms of consultancy, computing and telecommunications services, advertising and market research and other business services. A separate inquiry covers the film and television industries. The surveys cover receipts from the provision of services to residents of other countries (exports) and payments to residents of other countries for services rendered (imports).
External trade and investment
External trade
(Table 19.1 and 19.3 to 19.6)
The statistics in this section are on a Balance of Payments (BoP) basis, compiled from information provided to HM Revenue and Customs by importers and exporters on an Overseas Trade Statistics (OTS) basis, which values exports ‘f.o.b.’ (free on board) and imports ‘c.i.f.’ (including insurance and freight). In addition to deducting these freight costs and insurance premiums from the OTS figures, coverage adjustments are made to convert the OTS data to a BoP basis. Adjustments are also made to the level of all exports and European Union (EU) imports to take account of estimated under-recording. The adjustments are set out and described in the annual Office for National Staistics (ONS) Pink Book (United Kingdom Balance of Payments). These adjustments are made to conform to the definitions in the 5th edition of the IMF Balance of Payments Manual.
Aggregate estimates of trade in goods, seasonally adjusted and on a BoP basis, are published monthly in the ONS First Release UK Trade. More detailed figures are available from Time Series Data on the National Statistics website and are also published in the Monthly Review of External Trade Statistics (Business Monitor MM24). Detailed figures for EU and non-EU trade on an OTS basis are published by The Stationery Office in Overseas Trade Statistics of the United Kingdom.
A fuller description of how trade statistics are compiled can be found in Statistics on Trade in Goods (Government Statistical Service Methodological Series).
Overseas Trade Statistics
HM Revenue and Customs provide accurate and up to date information via the website: www.uktradeinfo.com
They also produce publications ‘Overseas Trade Statistics’.
Import penetration and export sales ratios
(Table 19.2)
The ratios were first introduced in the August 1977 edition of Economic Trends in an article ‘The Home and Export

315
External trade and investment
Sources of data
The International Trade in Services (ITIS) surveys (which consist of a quarterly component addressed to the largest businesses and an annual component for the remainder) are based on a sample of companies derived from the Inter-departmental Business register. The companies are asked to show the amounts for their imports and exports against the geographical area to which they were paid or from which they were received — irrespective of where they were first earned.
The purpose of the ITIS survey is to record international transactions which impact on the UK’s BoP; hence companies are asked to exclude from their earnings trade expenses such as the cost of services purchased abroad. Exports and imports of services are excluded where they are included within an invoice for the import or export of goods; in this case they will already be counted in the estimate for Trade in Goods. However, earnings from third country trade — that is from arranging the sale of goods between two countries other than the UK and where the goods never physically enter the UK (known as merchanting) — are included. Earnings from commodity trading are also included. Together, these two comprise ‘Trade Related Services’.
‘Royalties’ are the largest part of the total trade in services collected in the ITIS survey. These cover transactions for items such as printed matter, sound recordings, performing rights, patents, licences, trademarks, designs, copyrights, manufacturing rights, the use of technical ‘know-how’ and technical assistance.
Balance of payments
(Tables 19.9 to 19.12)
Tables 19.9 to 19.12 are derived from United Kingdom Balance of Payments 2004 edition — the ONS Pink Book. The following general notes to the tables provide brief definitions and explanations of the figures and terms used. Further notes are included in the Pink Book.
Summary of Balance of Payments
The BoP consists of the current account, the capital account, the financial account and the International Investment Position (IIP). The current account consists of trade in goods and services, income and current transfers. Income consists of investment income and compensation of employees. The capital account mainly consists of capital transfers and the financial account covers financial transactions. The IIP covers balance sheet levels of UK external assets and liabilities. Every credit entry in the balance of payments accounts should, in theory, be matched by a corresponding debit entry so that
total current, capital and financial account credits should be equal to, and therefore offset by, total debits. In practice there is a discrepancy termed net errors and omissions.
The current account
Trade in goods
The goods account covers exports and imports of goods. Imports of motor cars from Japan, for example, are recorded as debits in the trade in goods account, whereas exports of vehicles manufactured in the UK are recorded as credits. Trade in goods forms a component of the expenditure measure of Gross Domestic Product (GDP).
Trade in services
The services account covers exports and imports of services (for example, civil aviation). Passenger tickets for travel on UK aircraft sold abroad, for example, are recorded as credits in the services account, whereas the purchases of airline tickets from foreign airlines by UK passengers are recorded as debits. Trade in services, along with trade in goods, forms a component of the expenditure measure of GDP.
Income
The income account consists of compensation of employees and investment income and is dominated by the latter. Compensation of employees covers employment income from cross-border and seasonal workers which is less significant in the UK than in other countries. Investment income covers earnings (for instance, profits, dividends and interest payments and receipts) arising from cross-border investment in financial assets and liabilities. For example, earnings on foreign bonds and shares held by financial institutions based in the UK are recorded as credits in the investment income account, whereas earnings on UK company securities held abroad are recorded as investment income debits. Investment income forms a component of Gross National Income (GNI) but not GDP.
Current transfers
Current transfers are composed of central government transfers (for instance, taxes and payments to, and receipts from, the EU) and other transfers (for instance, gifts in cash or kind received by private individuals from abroad or receipts from the EU, where the UK government acts as an agent for the ultimate beneficiary of the transfer). Current transfers do not form a component either of GDP or of GNI. For example, payments to the UK farming industry under the EU Agricultural Guarantee Fund are recorded as credits in the current transfers account, while payments of EU agricultural

316
External trade and investment
levies by the UK farming industry are recorded as debits in the current transfers account.
Capital account
Capital account transactions involve transfers of ownership of fixed assets, transfers of funds associated with acquisition or disposal of fixed assets, and cancellation of liabilities by creditors without any counterparts being received in return. The main components are migrants transfers, EU transfers relating to fixed capital formation (regional development fund and agricultural guidance fund) and debt forgiveness. Funds brought into the UK by new immigrants would, for example, be recorded as credits in the capital account, while funds sent abroad by UK residents emigrating to other countries would be recorded as debits in the capital account. The size of capital account transactions are quite minor compared with the current and financial accounts.
Financial account
While investment income covers earnings arising from cross-border investments in financial assets and liabilities, the financial account of the balance of payments covers the flows of such investments. Earnings on foreign bonds and shares held by financial institutions based in the UK are, for example, recorded as credits in the investment income account, but the acquisition of such foreign securities by UK-based financial institutions are recorded as net debits in the financial account or portfolio investment abroad. Similarly, the acquisitions of UK company securities held by foreign residents are recorded in the financial account as net credits or portfolio investment in the UK.
International Investment Position
While the financial account covers the flows of foreign investments and financial assets and liabilities, the IIP records the levels of external assets and liabilities. While the acquisition of foreign securities by UK-based financial institutions are recorded in the financial account, as net debits, the total holdings of foreign securities by UK-based financial institutions are recorded as levels of UK external assets. Similarly, the holdings of UK company securities held by foreign residents are recorded as levels of UK liabilities.
Foreign direct investment
(Tables 19.13 to 19.18)
Direct investment refers to investment that adds to, deducts from or acquires a lasting interest in an enterprise operating in an economy other than that of the investor, the investor’s
purpose being to have an effective voice in the management of the enterprise. (For the purposes of the statistical inquiry, an effective voice is taken as equivalent to a holding of 10 per cent or more in the foreign enterprise.) Other investments in which the investor does not have an effective voice in the management of the enterprise are mainly portfolio investments and these are not covered here. Cross-border investment by public corporations or in property (which is regarded as direct investment in the national accounts) are not covered here, but are shown in the BoP. Similarly, foreign direct investment earnings data are shown net of tax in Tables 19.15 and 19.18 but are gross of tax in the BoP.
Direct investment is a financial concept and is not the same as capital expenditure on fixed assets. It covers only the money invested in a related concern by the parent company, and the concern will then decide how to use the money. A related concern may also raise money locally without reference to the parent company.
The investment figures are published on a net basis; that is, they consist of investments net of disinvestments by a company into its foreign subsidiaries, associate companies and branches.
Definitional changes from 1997
The new European System of Accounts (ESA(95)) definitions were introduced from the 1997 estimates. The changes were as follows:
i) Previously for the measurement of direct investment, an effective voice in the management of an enterprise was taken as the equivalent of a 20 per cent shareholding. This is now 10 per cent.
ii) The Channel Islands (Jersey, Guernsey, etc) and the Isle of Man have been excluded from the definition of the economic territory of the UK. Prior to 1987, these islands were considered to be part of the UK.
iii) Interest received or paid was replaced by interest accrued in the figures on earnings from direct investment. There is deemed to be little or no impact arising from this definitional change on the estimates.
New register sources available from 1998 have led to revisions for the figures from that year onwards. These sources gave an improved estimate of the population satisfying the criteria for foreign direct investment.
The definitional changes have been introduced from 1997 and the register changes from 1998. The data prior to these years have not been reworked in Tables 19.13 to 19.18. For clarity, the Offshore Islands are identified separately on the

317
External trade and investment
tables. The breaks in the series for the other definitional changes are not quantified but are relatively small. More detailed information on the effect of these changes appears in the business monitor MA4 – Foreign Direct Investment 2002, which was published in February 2003 and is available from the National Statistics website.
Sources of data
The figures in Tables 19.13 to 19.18 are based on annual inquiries into foreign direct investment for 2002. These were sample surveys which involved sending around 1,250 forms to UK businesses investing abroad, and 2,250 forms to UK businesses in which foreign parents and associates had invested. The tables also contain some revisions to 2001 as a result of new information coming to light in the course of the latest surveys. Further details from the latest annual surveys, including analyses by industry and by components of direct investment, are available in business monitor MA4. Initial figures were published on the National Statistics website in a First Release ‘Foreign Direct Investment 2002’ in December 2003. Data for 2003 will be published in a First Release in December 2004, followed by the full business monitor MA4 in February 2005.
Country allocation
The analysis of inward investment is based on the country of ownership of the immediate parent company. Thus, inward investment in a UK company may be attributed to the country of the intervening overseas subsidiary, rather than the country of the ultimate parent. Similarly, the country analysis of outward investment is based on the country of ownership of the immediate subsidiary. As an example, to the extent that overseas investment in the UK is channelled through holding companies in the Netherlands, the underlying flow of investment from this country is overstated and the inflow from originating countries is understated.
Further information
More detailed statistics on foreign direct investment are available on request from Simon Harrington, Office for National Statistics, Financial & Accounting Surveys Division, Room 2.301, Government Buildings, Cardiff Road, Newport, South Wales, United Kingdom, NP108XG. Telephone: 01633 813314, fax: 01633 812855, email: [email protected].

318
External trade and investment
19.1 Trade in goods1
United KingdomBalance of payments basis £ million and indices (2003=100)
1997 1998 1999 2000 2001 2002 2003 2004 2005 2006 2007
Value (£ million)
Exports of goods BOKG 171 923 164 056 166 166 187 936 189 093 186 524 188 320 190 877 211 608 243 631 220 857Imports of goods BOKH 184 265 185 869 195 217 220 912 230 305 234 229 236 927 251 770 280 397 321 186 308 506Balance on trade in goods BOKI –12 342 –21 813 –29 051 –32 976 –41 212 –47 705 –48 607 –60 893 –68 789 –77 555 –87 649
Price index numbers
Exports of goods BQKR 106.1 100.9 98.8 99.9 98.3 98.2 100.0 100.3 104.3 107.5 108.8Imports of goods BQKS 107.9 102.4 100.8 104.2 103.3 100.7 100.0 99.5 103.7 107.5 109.0Terms of trade2 BQKT 98.3 98.5 98.0 95.9 95.2 97.5 100.0 100.8 100.6 100.0 99.8
Volume index numbers
Exports of goods BQKU 84.9 85.8 88.6 99.3 101.5 100.3 100.0 101.5 111.0 125.2 110.1Imports of goods BQKV 70.4 76.4 81.5 89.1 93.8 98.2 100.0 106.9 114.7 127.9 121.8
1 See chapter text. Statistics of trade in goods on a balance of paymentsbasis are obtained by making certain adjustments in respect of valuationand coverage to the statistics recorded in the Overseas Trade Statistics.These adjustments are described in detail in The Pink Book 2006.
2 Export price index as a percentage of the import price index.
Source: Office for National Statistics: 020 7533 6064
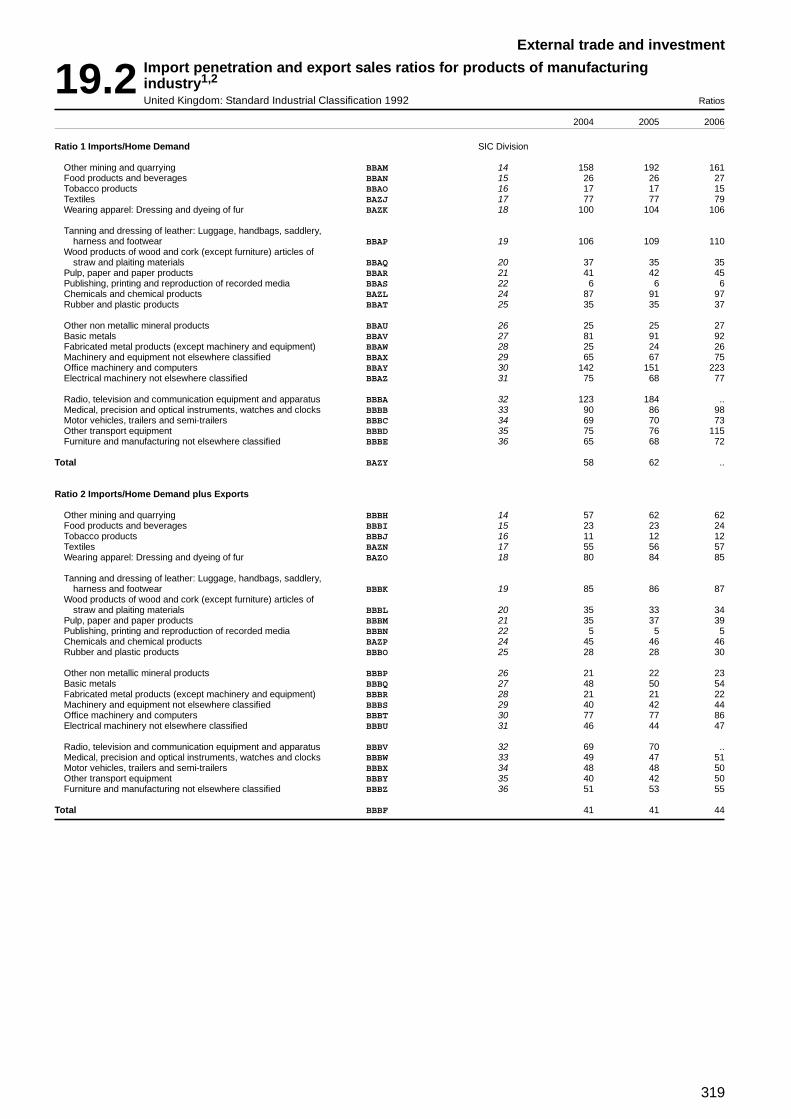
319
External trade and investment
19.2 Import penetration and export sales ratios for products of manufacturingindustry1,2
United Kingdom: Standard Industrial Classification 1992 Ratios
2004 2005 2006
Ratio 1 Imports/Home Demand SIC Division
Other mining and quarrying BBAM 14 158 192 161Food products and beverages BBAN 15 26 26 27Tobacco products BBAO 16 17 17 15Textiles BAZJ 17 77 77 79Wearing apparel: Dressing and dyeing of fur BAZK 18 100 104 106
Tanning and dressing of leather: Luggage, handbags, saddlery,harness and footwear BBAP 19 106 109 110
Wood products of wood and cork (except furniture) articles ofstraw and plaiting materials BBAQ 20 37 35 35
Pulp, paper and paper products BBAR 21 41 42 45Publishing, printing and reproduction of recorded media BBAS 22 6 6 6Chemicals and chemical products BAZL 24 87 91 97Rubber and plastic products BBAT 25 35 35 37
Other non metallic mineral products BBAU 26 25 25 27Basic metals BBAV 27 81 91 92Fabricated metal products (except machinery and equipment) BBAW 28 25 24 26Machinery and equipment not elsewhere classified BBAX 29 65 67 75Office machinery and computers BBAY 30 142 151 223Electrical machinery not elsewhere classified BBAZ 31 75 68 77
Radio, television and communication equipment and apparatus BBBA 32 123 184 ..Medical, precision and optical instruments, watches and clocks BBBB 33 90 86 98Motor vehicles, trailers and semi-trailers BBBC 34 69 70 73Other transport equipment BBBD 35 75 76 115Furniture and manufacturing not elsewhere classified BBBE 36 65 68 72
Total BAZY 58 62 ..
Ratio 2 Imports/Home Demand plus Exports
Other mining and quarrying BBBH 14 57 62 62Food products and beverages BBBI 15 23 23 24Tobacco products BBBJ 16 11 12 12Textiles BAZN 17 55 56 57Wearing apparel: Dressing and dyeing of fur BAZO 18 80 84 85
Tanning and dressing of leather: Luggage, handbags, saddlery,harness and footwear BBBK 19 85 86 87
Wood products of wood and cork (except furniture) articles ofstraw and plaiting materials BBBL 20 35 33 34
Pulp, paper and paper products BBBM 21 35 37 39Publishing, printing and reproduction of recorded media BBBN 22 5 5 5Chemicals and chemical products BAZP 24 45 46 46Rubber and plastic products BBBO 25 28 28 30
Other non metallic mineral products BBBP 26 21 22 23Basic metals BBBQ 27 48 50 54Fabricated metal products (except machinery and equipment) BBBR 28 21 21 22Machinery and equipment not elsewhere classified BBBS 29 40 42 44Office machinery and computers BBBT 30 77 77 86Electrical machinery not elsewhere classified BBBU 31 46 44 47
Radio, television and communication equipment and apparatus BBBV 32 69 70 ..Medical, precision and optical instruments, watches and clocks BBBW 33 49 47 51Motor vehicles, trailers and semi-trailers BBBX 34 48 48 50Other transport equipment BBBY 35 40 42 50Furniture and manufacturing not elsewhere classified BBBZ 36 51 53 55
Total BBBF 41 41 44

320
External trade and investment
19.2 Import penetration and export sales ratios for products of manufacturingindustry1,2
United Kingdom: Standard Industrial Classification 1992continued Ratios
2004 2005 2006
Ratio 3 Exports/Sales SIC Division
Other mining and quarrying BBCM 14 148 179 161Food products and beverages BBCN 15 15 15 15Tobacco products BBCO 16 40 35 27Textiles BAZR 17 63 62 64Wearing apparel: Dressing and dyeing of fur BAZS 18 100 119 131
Tanning and dressing of leather: Luggage, handbags, saddlery,harness and footwear BBCP 19 134 151 161
Wood products of wood and cork (except furniture) articles ofstraw and plaiting materials BBCQ 20 7 6 7
Pulp, paper and paper products BBCR 21 21 22 23Publishing, printing and reproduction of recorded media BBCS 22 9 9 9Chemicals and chemical products BAZT 24 88 92 97Rubber and plastic products BBCT 25 27 27 28
Other non metallic mineral products BBCU 26 18 18 20Basic metals BBCV 27 78 91 90Fabricated metal products (except machinery and equipment) BBCW 28 19 18 20Machinery and equipment not elsewhere classified BBCX 29 64 65 74Office machinery and computers BBCY 30 202 213 436Electrical machinery not elsewhere classified BBDK 31 72 63 74
Radio, television and communication equipment and apparatus BBDL 32 141 206 ..Medical, precision and optical instruments, watches and clocks BBDM 33 90 85 98Motor vehicles, trailers and semi-trailers BBDN 34 59 59 62Other transport equipment BBDO 35 77 78 113Furniture and manufacturing not elsewhere classified BBDP 36 43 48 53
Total BBCK 50 55 ..
Ratio 4 Exports/Sales plus Imports
Other mining and quarrying BBDS 14 64 68 62Food products and beverages BBDT 15 11 12 12Tobacco products BBDU 16 36 31 23Textiles BAZV 17 28 28 27Wearing apparel: Dressing and dyeing of fur BAZW 18 20 19 20
Tanning and dressing of leather: Luggage, handbags, saddlery,harness and footwear BBDV 19 20 20 21
Wood products of wood and cork (except furniture) articles ofstraw and plaiting materials BBDW 20 5 4 4
Pulp, paper and paper products BBDX 21 13 14 14Publishing, printing and reproduction of recorded media BBDY 22 9 8 8Chemicals and chemical products BAZX 24 48 50 52
Rubber and plastic products BBDZ 25 19 19 20Other non-metallic mineral products BBEA 26 14 14 16Basic metals BBEB 27 40 45 41Fabricated metal products (except machinery and equipment) BBEC 28 15 14 15Machinery and equipment not elsewhere classified BBED 29 38 38 41Office machinery and computers BBEE 30 46 49 61Electrical machinery not elsewhere classified BBEF 31 39 35 39
Radio, television and communication equipment and apparatus BBEG 32 44 62 ..Medical, precision and optical instruments, watches and clocks BBEH 33 46 45 48Motor vehicles, trailers and semi-trailers BBEI 34 31 31 31Other transport equipment BBEJ 35 46 45 57Furniture and manufacturing not elsewhere classified BBEK 36 21 22 24
Total BBDQ 30 31 35
1 See chapter text.2 Division 13 (Mining of metal ores) has not been published since 1995. Divi-
sion 23 (Coke, refined petroleum products and nuclear fuel) and SIC 24610(Manufacture of explosives) are excluded from the analysis. SIC 27100(Basic iron and steel and ferro-alloys) is not incorporated in PRODCOM andtherefore also does not form part of the analysis.
Source: Office for National Statistics: 01633 456746

321
External trade and investment
19.3 United Kingdom exports: by commodity1,2
Seasonally adjusted£ million
1998 1999 2000 2001 2002 2003 2004 2005 2006 2007
0. Food and live animals BOGG 6 286 5 925 5 827 5 491 5 693 6 478 6 462 6 552 6 766 7 390
of which:01. Meat and meat preparations BOGS 746 657 642 428 516 606 667 729 753 86502. Dairy products and eggs BQMS 745 689 660 614 625 760 780 718 711 80504 & 08. Cereals and animal feeding stuffs BQMT 1 714 1 568 1 604 1 383 1 444 1 681 1 553 1 554 1 586 1 79005. Vegetables and fruit BQMU 408 437 403 401 433 475 508 515 586 599
1. Beverages and tobacco BQMZ 3 930 4 022 4 081 4 139 4 300 4 401 4 116 4 095 4 174 4 395
11. Beverages BQNB 2 875 3 004 3 065 3 218 3 320 3 478 3 354 3 481 3 714 4 09312. Tobacco BQOW 1 055 1 018 1 016 921 980 923 762 614 460 302
2. Crude materials BQOX 2 267 2 087 2 447 2 422 2 645 3 069 3 566 3 746 4 619 5 177
of which:24. Wood, lumber and cork BQOY 55 66 72 70 81 106 117 131 145 14525. Pulp and waste paper BQOZ 47 54 78 81 106 180 244 283 338 41526. Textile fibres BQPA 493 447 496 440 472 492 520 516 542 49728. Metal ores BQPB 560 518 759 810 928 1 193 1 605 1 713 2 418 2 879
3. Fuels BOPN 7 513 9 929 17 057 16 386 16 000 16 558 17 885 21 496 25 400 24 767
33. Petroleum and petroleum products ELBL 7 018 9 123 15 584 14 815 14 321 14 608 16 200 19 794 23 274 22 81232, 34 & 35. Coal, gas and electricity BOQI 495 806 1 473 1 571 1 679 1 950 1 685 1 702 2 126 1 955
4. Animal and vegetable oils and fats BQPI 245 197 156 149 210 266 205 235 271 330
5. Chemicals ENDG 22 102 23 071 24 992 27 514 28 386 31 373 32 008 33 388 37 162 38 913
of which:51. Organic chemicals BQPJ 4 914 5 494 5 718 6 090 5 698 6 070 6 040 6 702 8 005 7 62452. Inorganic chemicals BQPK 1 153 1 137 1 491 1 636 1 367 1 460 1 543 1 555 2 142 2 84153. Colouring materials CSCE 1 542 1 534 1 555 1 521 1 583 1 627 1 630 1 635 1 601 1 67354. Medicinal products BQPL 5 850 6 279 7 217 9 067 10 103 11 897 12 326 12 320 13 780 14 49055. Toilet preparations CSCF 2 446 2 462 2 597 2 714 2 823 3 122 3 105 3 219 3 441 3 69957 & 58. Plastics BQQA 3 194 3 144 3 366 3 416 3 526 3 703 3 846 4 298 4 443 4 620
6. Manufactures classified chiefly by material BQQB 21 243 20 302 22 673 22 781 21 837 23 119 24 458 26 492 27 649 29 397
of which:63. Wood and cork manufactures BQQC 253 278 255 261 270 322 291 255 273 27064. Paper and paperboard manufactures BQQD 2 197 2 020 2 096 2 081 2 019 2 097 1 996 2 043 2 013 2 08965. Textile manufactures BQQE 3 259 3 020 3 051 3 022 2 847 2 956 2 846 2 647 2 678 2 61867. Iron and steel BQQF 3 321 2 576 2 848 2 879 2 916 3 319 4 245 5 183 5 128 6 05468. Non-ferrous metals BQQG 2 433 2 130 3 171 3 033 2 552 2 567 3 229 3 862 4 825 5 78869. Metal manufactures BQQH 3 591 3 553 3 595 3 853 3 660 3 766 3 856 4 066 4 517 4 636
7. Machinery and transport equipment3 BQQI 78 011 78 875 87 812 87 240 84 395 79 650 78 377 89 379 110 346 82 669
71 - 716, 72, 73 & 74. Mechanical machinery BQQK 22 695 21 888 22 140 24 244 22 704 24 231 23 810 25 795 28 231 28 913716, 75, 76 & 77. Electrical machinery BQQL 34 464 36 012 42 681 41 997 38 706 30 651 28 623 37 120 55 314 24 31178. Road vehicles BQQM 14 550 15 077 15 604 13 845 16 316 17 474 18 489 19 439 19 324 21 10379. Other transport equipment BQQN 6 302 5 898 7 387 7 154 6 669 7 294 7 455 7 025 7 477 8 342
8. Miscellaneous manufactures3 BQQO 20 563 20 263 21 206 21 948 21 985 22 543 22 919 25 105 25 958 26 650
of which:84. Clothing CSCN 2 976 2 804 2 722 2 578 2 507 2 708 2 729 2 712 2 875 3 09785. Footwear CSCP 535 532 514 484 452 426 419 470 521 53887 & 88. Scientific and photographic BQQQ 6 705 6 732 7 333 7 775 7 212 7 281 7 041 7 245 7 339 7 044
9. Other commodities and transactions BOQL 1 896 1 495 1 685 1 023 1 073 863 881 1 120 1 286 1 169
Total United Kingdom exports BOKG 164 056 166 166 187 936 189 093 186 524 188 320 190 877 211 608 243 631 220 857
1 See chapter text. The numbers on the left hand side of the table refer to thecode numbers of the Standard International Trade Classification, Revision 3,which was introduced in January 1988.
2 Balance of payments consistent basis.3 Sections 7 and 8 are shown by broad economic category in table G2 of the
Monthly Review of External Trade Statistics.
Source: Office for National Statistics: 020 7533 6064

322
External trade and investment
19.4 United Kingdom imports: by commodity1,2
Seasonally adjusted£ million
1998 1999 2000 2001 2002 2003 2004 2005 2006 2007
0. Food and live animals BQQR 13 223 13 336 13 310 14 269 14 874 16 452 17 208 18 593 19 814 21 291
of which:01. Meat and meat preparations BQQS 2 006 2 144 2 366 2 689 2 793 3 267 3 439 3 619 3 800 4 00502. Dairy products and eggs BQQT 1 112 1 167 1 165 1 245 1 291 1 501 1 609 1 700 1 808 1 83604 & 08. Cereals and animal feeding stuffs BQQU 1 806 1 719 1 762 1 957 1 985 2 219 2 308 2 363 2 497 2 92905. Vegetables and fruit BQQV 4 017 4 040 3 894 4 101 4 374 4 766 4 918 5 447 5 783 6 170
1. Beverages and tobacco BQQW 4 027 4 451 4 350 4 216 4 501 4 735 4 939 5 102 5 199 5 434
11. Beverages EGAT 2 881 3 064 2 910 2 854 3 028 3 237 3 474 3 625 3 701 3 95112. Tobacco EMAI 1 146 1 387 1 440 1 362 1 473 1 498 1 465 1 477 1 498 1 483
2. Crude materials ENVB 5 076 4 861 5 816 5 921 5 420 5 525 5 718 6 129 7 116 8 668
of which:24. Wood, lumber and cork ENVC 1 100 1 088 1 193 1 168 1 236 1 366 1 337 1 358 1 453 1 80525. Pulp and waste paper EQAH 477 510 763 606 488 489 480 477 512 50426. Textile fibres EQAP 452 413 412 393 361 337 340 314 298 31428. Metal ores EHAA 1 314 1 308 1 811 1 997 1 448 1 430 1 648 1 999 2 672 3 794
3. Fuels BQAT 4 892 5 428 10 016 10 795 10 279 12 311 17 547 25 921 31 627 31 262
33. Petroleum and petroleum products ENXO 3 976 4 675 9 048 9 525 9 213 11 232 15 307 21 989 26 706 26 11432, 34 & 35. Coal, gas and electricity BPBI 916 753 968 1 270 1 066 1 079 2 240 3 932 4 921 5 148
4. Animal and vegetable oils and fats EHAB 555 568 491 521 538 614 622 641 771 895
5. Chemicals ENGA 17 379 18 619 20 633 22 745 23 987 26 139 27 927 29 208 31 727 34 831
of which:51. Organic chemicals EHAC 4 508 4 788 5 374 5 529 5 673 6 102 6 801 7 183 7 692 8 62952. Inorganic chemicals EHAE 1 015 1 056 1 046 1 171 1 070 1 094 1 366 1 507 2 123 2 68953. Colouring materials CSCR 1 003 956 1 002 975 952 1 003 1 060 1 072 1 090 1 17954. Medicinal products EHAF 3 305 4 124 4 714 6 149 7 288 8 189 8 372 8 504 9 158 10 03655. Toilet preparations CSCS 1 617 1 774 2 005 2 261 2 499 2 745 2 881 3 035 3 336 3 47557 & 58. Plastics EHAG 3 903 3 819 4 144 4 096 4 063 4 403 4 749 5 038 5 409 5 712
6. Manufactures classified chiefly by material EHAH 27 695 26 930 29 232 30 165 28 735 29 906 32 299 33 469 37 615 39 767
of which:63. Wood and cork manufactures EHAI 1 089 1 145 1 245 1 340 1 436 1 449 1 585 1 505 1 575 1 73364. Paper and paperboard manufactures EHAJ 4 504 4 321 4 407 4 864 4 582 4 747 4 841 4 820 5 037 5 24365. Textile manufactures EHAK 4 862 4 380 4 365 4 303 4 149 4 089 4 124 3 844 4 018 4 06967. Iron and steel EHAL 3 205 2 473 2 731 3 051 3 047 3 237 4 198 4 402 4 981 5 94668. Non-ferrous metals EHAM 3 709 2 942 3 711 3 780 3 222 3 320 3 617 3 923 6 185 6 24669. Metal manufactures EHAN 3 721 3 789 4 065 4 324 4 501 4 765 4 977 5 355 5 852 6 548
7. Machinery and transport equipment3 EHAO 83 300 90 183 102 420 105 386 107 556 101 473 103 883 117 318 140 328 116 258
71 - 716, 72, 73 & 74. Mechanical machinery EHAQ 17 156 17 313 17 867 18 618 18 901 18 951 19 725 21 848 22 614 25 713716, 75, 76 & 77. Electrical machinery EHAR 36 900 42 423 53 631 50 842 49 917 43 656 45 497 55 735 75 587 44 93578. Road vehicles EHAS 22 472 24 000 23 117 26 289 28 449 29 921 30 732 31 436 32 674 36 29079. Other transport equipment EHAT 6 772 6 447 7 805 9 637 10 289 8 945 7 929 8 299 9 453 9 320
8. Miscellaneous manufactures3 EHAU 27 917 29 042 32 798 35 023 36 889 38 168 39 820 42 175 44 919 47 811
of which:84. Clothing CSDR 7 023 7 483 8 495 9 119 9 804 10 323 10 639 11 303 11 847 12 25885. Footwear CSDS 1 859 2 041 2 001 2 236 2 365 2 375 2 448 2 563 2 698 2 65387 & 88. Scientific and photographic EHAW 6 102 6 170 7 273 7 620 7 044 7 049 7 256 7 414 7 655 7 568
9. Other commodities and transactions BQAW 1 805 1 799 1 846 1 264 1 450 1 604 1 807 1 841 2 070 2 289
Total United Kingdom imports BOKH 185 869 195 217 220 912 230 305 234 229 236 927 251 770 280 397 321 186 308 506
1 See chapter text. The numbers on the left hand side of the table refer to thecode numbers of the Standard International Trade Classification, Revision 3,which was introduced in January 1988.
2 Balance of payments consistent basis.3 Sections 7 and 8 are shown by broad economic category in table G2 of the
Monthly Review of External Trade Statistics.
Source: Office for National Statistics: 020 7533 6064

323
External trade and investment
19.5 United Kingdom exports: by area1,2
Seasonally adjusted£ million
1998 1999 2000 2001 2002 2003 2004 2005 2006 2007
European Union:3 LGCK 99 336 101 537 112 459 114 406 114 737 111 286 111 653 121 486 152 353 127 886
EMU members: QAKW 89 819 92 359 102 138 104 202 103 908 100 631 100 601 109 506 134 778 113 452
Austria CHMY 1 190 1 168 1 146 1 224 1 265 1 264 1 094 1 332 1 699 1 372Belgium & Luxembourg CHNQ 8 445 9 241 10 322 9 893 10 552 11 374 10 511 11 394 15 081 12 150Finland CHMZ 1 434 1 354 1 471 1 611 1 442 1 493 1 362 1 514 1 872 1 965France ENYL 16 449 16 907 18 577 19 249 18 757 18 885 18 564 19 931 28 692 18 110Germany ENYO 20 590 20 464 22 789 23 655 22 064 20 805 21 671 23 025 27 601 24 701Greece CHNT 1 070 1 181 1 267 1 156 1 234 1 286 1 418 1 367 1 470 1 353Irish Republic CHNS 9 604 10 783 12 372 13 835 15 422 12 224 14 133 16 294 17 479 17 793Italy CHNO 8 608 7 831 8 429 8 404 8 506 8 603 8 401 8 790 9 494 9 170Netherlands CHNP 12 983 13 632 15 167 14 599 14 011 13 597 12 030 12 716 16 521 15 150Portugal CHNU 1 722 1 712 1 660 1 579 1 518 1 453 1 580 1 698 2 374 1 485Spain CHNV 7 171 7 526 8 302 8 363 8 490 8 943 9 100 10 677 12 295 10 000
Non-EMU members:3 BQIA 9 517 9 178 10 321 10 204 10 829 10 655 11 052 11 980 17 575 14 434
of which:Bulgaria WYUF 81 76 85 122 134 154 155 220 237 204Czech Rep FKML 713 733 927 1 075 1 031 1 003 975 1 080 1 526 1 394Denmark CHNR 2 057 2 054 2 315 2 267 2 729 2 180 2 042 2 314 3 715 2 198Hungary QALC 498 486 613 612 750 856 933 834 855 870Poland ERDR 1 213 1 169 1 299 1 297 1 318 1 462 1 413 1 653 2 705 2 388Romania WMDB 235 242 381 341 432 509 610 647 637 663Slovakia BQHB 103 114 157 203 201 237 224 259 272 381Sweden CHNA 4 392 4 035 4 211 3 951 3 873 3 823 4 355 4 588 5 246 4 887
Other Western Europe: HCJD 7 392 6 244 7 223 6 786 6 334 6 629 7 027 9 730 9 224 9 120
of which:Iceland EPLW 158 159 193 150 131 141 167 179 188 195Norway EPLX 2 658 1 999 2 018 1 813 1 696 1 886 1 937 2 211 2 125 2 671Switzerland EPLV 2 892 2 768 3 061 3 496 3 080 2 786 2 840 4 985 4 190 3 768Turkey EOBA 1 562 1 198 1 800 1 150 1 287 1 638 1 903 2 160 2 426 2 242
North America: HBZQ 24 091 27 582 33 714 33 408 32 261 32 924 32 750 35 007 36 935 36 320
of which:Canada EOBC 2 147 2 532 3 487 3 203 3 107 3 239 3 339 3 277 3 895 3 259Mexico EPJX 516 577 675 681 704 687 629 638 747 792USA EOBB 21 082 24 040 29 276 29 244 28 197 28 672 28 576 30 913 32 103 32 109
Other OECD countries: HCII 6 321 6 728 8 028 7 542 7 469 7 824 8 226 8 577 8 716 8 701
of which:Australia EPMA 2 188 2 155 2 699 2 298 2 114 2 289 2 455 2 580 2 488 2 608Japan EOBD 3 127 3 300 3 672 3 673 3 583 3 710 3 862 3 900 4 109 3 832New Zealand EPMB 336 324 305 309 311 348 418 415 373 360South Korea ERDM 666 949 1 350 1 262 1 461 1 468 1 482 1 677 1 746 1 897
Oil exporting countries: HDII 7 289 5 524 6 031 6 474 6 229 7 615 7 997 10 851 9 061 9 646
of which:Brunei QALF 247 124 96 59 61 127 67 43 79 864Dubai QALI 830 790 966 1 012 940 1 383 2 019 4 657 2 830 1 914Indonesia FKMR 369 385 404 313 324 452 398 366 311 287Kuwait QATB 325 293 338 359 308 373 354 426 438 446Nigeria QATE 454 447 524 686 711 738 773 799 821 1 036Saudi Arabia ERDI 2 605 1 481 1 557 1 525 1 388 1 819 1 611 1 559 1 644 1 841
Rest of the World HCHW 19 627 18 551 20 481 20 477 19 494 22 042 23 224 25 957 27 342 29 184
of which:Brazil FKMO 899 739 775 808 880 825 790 836 918 1 099China ERDN 860 1 211 1 468 1 709 1 493 1 924 2 372 2 811 3 265 3 823Egypt QALL 505 539 498 452 463 458 667 543 578 681Hong Kong ERDG 2 671 2 312 2 673 2 683 2 411 2 481 2 632 3 088 2 864 2 700India ERDJ 1 242 1 450 2 058 1 772 1 755 2 284 2 235 2 798 2 695 2 942Israel ERDL 1 079 1 295 1 516 1 357 1 428 1 359 1 389 1 352 1 308 1 245Malaysia ERDK 677 934 907 1 029 877 1 028 995 1 088 877 965Pakistan FKMU 228 221 207 229 240 291 344 461 488 418Philippines FKMX 301 239 273 392 352 377 315 279 242 250Russia ERDQ 929 532 668 893 981 1 420 1 466 1 869 2 063 2 865Singapore ERDH 1 598 1 597 1 625 1 592 1 445 1 582 1 710 2 078 2 318 2 444South Africa EPME 1 520 1 281 1 413 1 534 1 597 1 766 1 877 2 073 2 184 2 223Taiwan ERDP 867 865 1 015 875 848 897 951 939 911 948Thailand ERDO 386 463 582 594 529 572 637 638 567 606
1 See chapter text.2 Balance of payments consistent basis.3 Includes Bulgaria and Romania after accession on 1 January 2007.
Source: Office for National Statistics: 020 7533 6064

324
External trade and investment
19.6 United Kingdom imports: by area1,2
Seasonally adjusted£ million
1998 1999 2000 2001 2002 2003 2004 2005 2006 2007
European Union:3 LGDC 105 048 109 622 117 644 126 973 136 931 137 404 142 512 158 363 184 440 168 250
EMU members QAKX 95 776 99 645 106 146 114 724 123 716 123 224 126 792 139 741 156 338 146 772
Austria CHNB 1 410 1 453 1 410 1 888 2 396 2 776 2 354 2 461 2 789 2 475Belgium & Luxembourg CHNY 9 831 10 156 10 927 12 159 13 201 13 205 13 845 15 155 18 202 15 716Finland CHNC 2 327 2 365 2 765 2 965 2 791 2 663 2 336 2 431 3 119 2 559France ENYP 17 949 18 410 18 644 20 127 20 798 20 389 20 132 22 184 26 902 21 823Germany ENYS 25 086 26 812 28 462 30 192 32 442 33 667 35 380 39 169 42 709 43 944Greece CHOB 372 408 459 476 555 613 625 703 796 611Irish Republic CHOA 7 801 8 705 10 261 12 141 13 176 9 920 10 133 10 411 10 779 11 390Italy CHNW 9 739 9 383 9 514 9 860 10 675 11 481 12 186 12 673 12 790 13 054Netherlands CHNX 13 404 13 768 15 380 15 395 16 143 16 692 18 195 20 436 22 301 22 960Portugal CHOC 1 790 1 822 1 735 1 625 1 761 1 966 1 928 2 018 3 055 1 480Spain CHOD 5 732 5 966 6 141 7 360 9 190 9 247 9 120 11 450 12 156 10 445
Non-EMU members:3 BQIB 9 272 9 977 11 498 12 249 13 215 14 180 15 720 18 622 28 102 21 478
of which:Bulgaria WYUT 76 69 85 101 116 124 150 169 208 226Czech Rep FKMM 560 580 802 1 097 1 250 1 412 1 291 1 883 2 989 2 918Denmark CHNZ 2 154 2 341 2 630 2 922 3 595 3 399 3 357 4 393 6 444 3 446Hungary QALD 544 668 683 710 846 1 120 1 579 1 860 2 351 2 365Poland ERED 668 676 905 1 166 1 265 1 545 1 834 2 320 3 625 3 609Romania WMDC 228 253 336 448 522 679 786 803 862 909Slovakia BQHC 74 102 136 177 211 259 261 370 815 1 258Sweden CHND 4 360 4 648 4 951 4 671 4 330 4 568 5 118 5 463 5 992 5 257
Other Western Europe: HBTS 9 701 10 554 13 040 12 240 12 523 13 331 15 726 20 072 23 445 24 268
of which:Iceland EPMW 251 282 365 281 289 296 355 346 402 414Norway EPMX 3 440 3 546 5 563 5 523 5 258 6 423 8 479 12 078 14 472 14 264Switzerland EPMV 4 755 5 341 5 485 4 544 4 595 3 759 3 439 3 882 4 376 4 726Turkey EOBU 1 103 1 204 1 450 1 669 2 164 2 619 3 246 3 511 3 950 4 615
North America: HCRB 27 815 28 035 33 460 34 617 29 811 27 480 27 087 27 128 31 439 32 229
of which:Canada EOBW 2 519 3 026 4 009 3 664 3 563 3 664 4 187 4 155 4 987 5 737Mexico EPJY 366 395 613 680 505 490 411 446 449 576USA EOBV 24 785 24 360 28 416 29 345 25 149 22 857 22 067 22 184 25 723 25 626
Other OECD countries: HDJQ 13 205 13 805 15 717 14 154 13 017 12 989 13 641 14 426 13 710 13 759
of which:Australia EPNA 1 363 1 338 1 543 1 776 1 688 1 789 1 868 2 100 2 119 2 228Japan EOBX 9 124 9 118 10 214 9 080 8 079 8 085 8 106 8 670 7 902 7 824New Zealand EPNB 517 565 544 542 522 552 584 592 604 659South Korea ERDY 2 201 2 784 3 416 2 756 2 728 2 563 3 083 3 064 3 085 3 048
Oil exporting countries: HCPC 3 201 3 228 4 258 3 969 3 780 3 923 4 865 6 017 7 011 6 388
of which:Brunei QALG 161 66 95 35 33 51 63 25 71 57Dubai QALJ 337 433 401 396 499 722 578 643 680 663Indonesia FKMS 854 931 1 081 1 128 1 006 875 917 839 960 926Kuwait QATC 164 121 314 296 271 313 396 367 743 696Nigeria QATF 121 112 89 65 90 83 106 152 206 271Saudi Arabia ERDU 791 783 977 933 677 715 1 158 1 714 1 234 820
Rest of the World HCIF 26 899 29 973 36 793 38 352 38 167 41 800 47 939 54 391 61 141 63 612
of which:Brazil FKMP 883 910 1 114 1 279 1 365 1 477 1 547 1 739 1 911 2 050China ERDZ 2 816 3 384 4 826 5 741 6 726 8 342 10 405 12 963 15 292 18 613Egypt QALM 277 255 411 406 416 432 496 350 665 538Hong Kong ERDS 4 391 4 909 5 917 5 754 5 561 5 500 5 771 6 601 7 366 6 896India ERDV 1 382 1 426 1 651 1 816 1 804 2 093 2 290 2 783 3 133 3 785Israel ERDX 875 996 1 025 939 880 861 923 1 002 967 1 040Malaysia ERDW 1 892 1 961 2 288 1 939 1 731 1 867 2 024 1 814 1 902 1 674Pakistan FKMV 340 318 363 421 472 519 554 487 512 511Philippines FKMY 855 983 1 155 1 155 944 713 657 712 743 714Russia EREC 1 406 1 324 1 496 2 047 1 950 2 454 3 511 5 009 5 760 5 224Singapore ERDT 2 343 2 348 2 395 2 067 1 959 2 672 3 382 3 829 3 771 4 221South Africa EPNE 1 351 1 636 2 553 2 841 2 685 2 949 3 277 3 938 3 919 3 041Taiwan EREB 2 217 2 626 3 561 2 784 2 385 2 198 2 344 2 225 2 349 2 402Thailand EREA 1 264 1 291 1 602 1 607 1 550 1 646 1 762 1 719 1 929 1 999
1 See chapter text.2 Balance of payments consistent basis.3 Includes Bulgaria and Romania after accession on 1 January 2007.
Source: Office for National Statistics: 020 7533 6064

325
External trade and investment
19.7 Services supplied (exports) and purchased (imports)1,2: 2005
£ million
Exports Imports Balances
Agricultural,Mining and On-site Processing servicesAgricultural 15 15 -Mining 66 27 39Waste treatment and depollution 10 19 -8Other on-site processing services 166 39 127
Business and Professional servicesAccountancy,auditing, bookkeeping and tax consul 1 037 328 709Advertising 1 987 914 1 073Management consulting 1 061 370 691Public relations services 105 31 74Recruitment 342 151 191Other Business Management 628 736 -108Legal Services 2 168 429 1 739Market research and public opinion polling 417 186 231Operational leasing services 313 350 -36Procurement 113 378 -265Property management 98 31 67Research and development 4 648 2 021 2 627Services between related enterprises 4 749 2 899 1 850Other business and professional services 1 108 400 708
Communications servicesPostal and courier 171 125 46Telecommunications 1 916 1 825 90
Computer servicesComputer 4 002 1 652 2 350
Information servicesNews agency services 772 138 633Publishing services 284 107 177Other information provision services 543 236 308
Construction Goods and ServicesConstruction in the UK 131 363 -231Construction outside the UK 538 277 262
Financial servicesFinancial 5 896 1 205 4 691
Insurance ServicesAuxiliary services 1 245 47 1 198Freight Insurance - Claims .. ..Freigh Insurance - Premiums 11 -11Life insurance and pension funding - Claims .. ..Life insurance and pension funding - Premiums 10 -10Reinsurance - Claims - -Reinsurance - Premiums 20 -20Other Direct insurance - Claims 16 16Other Direct insurance - Premiums 141 -141
Merchanting and Other Trade related ServicesMerchanting 982 982Other trade related services 1 925 409 1 516
Personal, Cultural and Recreational ServicesAudio-Visual and related services 265 43 221Health services 19 8 11Training and educational services 71 14 57Other personal, cultural and recreational services 302 180 122
Royalties and LicensesUse of Franchise and similar rights fees 3 948 1 959 1 989Other royalties and license fees 2 394 1 846 548Purchases and sales of franchises and similar right 125 217 -92Purchases and sales of other royalties and licenses 212 377 -164
Technical servicesArchitectural 95 5 90Engineering 3 092 1 067 2 025Surveying 226 89 138Other technical services 1 616 556 1 061
Other Trade in ServicesOther Trade in services 1 888 1 202 687
World Total 51 710 23 451 28 259
1 See chapter text.2 Due to rounding, the sum of constituent items may not always equal the total
shown. Data excludes the following industries: , Film and TV, Travel andTransport, Public Sector (including Education) and Law Society members.
3 (-) Denotes nil or less than £500,000.4 (..) Denotes disclosive data.
Source: Office for National Statistics: 01633 456644

326
External trade and investment
19.8 International trade in services:1,2 by country, 2005
£ million
Exports Imports Balances
European UnionAustria 562 166 396Belgium 1 128 539 589Cyprus 69 54 15Czech Republic 127 73 54Denmark 414 140 274Estonia 11 3 8Finland 495 138 357France 2 184 2 432 -248Germany 3 631 2 326 1 305Greece 323 78 244Hungary 288 59 230Irish Republic 3 539 1 088 2 451Italy 1 137 821 316Latvia 11 7 5Lithuania 18 10 8Luxembourg 585 103 482Malta 19 10 9Netherlands 3 329 971 2 358Poland 127 70 57Portugal 251 67 184Slovakia 23 9 14Slovenia 17 6 10Spain 973 586 387Sweden 617 724 -107EU Institutions 15 1 14
Total European Union 19892 10480 9412
EFTAIceland 42 5 37Liechtenstein 30 5 26Norway 696 267 429Switzerland 3 040 864 2 176
Total EFTA 3 808 1 141 2 667
Other European countriesRussia 319 130 189Channel Islands 480 85 395Isle of Man 56 7 49Turkey 124 39 84Rest of Europe 275 151 124Europe Unallocated 1 776 986 790
Total Europe 26 730 13 019 13 711
AfricaNigeria 191 29 162South Africa 339 115 225Rest of Africa 590 221 369Africa Unallocated 84 27 57
Total Africa 1 204 392 812
AmericaBrazil 75 66 9Canada 590 234 356Mexico 118 18 101USA 11 566 5 686 5 880Rest of America 2 285 424 1 860America Unallocated 213 95 117
Total America 14 846 6 523 8 323

327
External trade and investment
19.8 International trade in services:1,2 by country, 2005
continued £ million
Exports Imports Balances
AsiaChina 288 106 182Hong Kong 346 182 164India 315 278 36Indonesia 76 33 43Israel 267 116 150Japan 1 542 668 874Malaysia 139 81 58Pakistan 74 33 41Phillippines 27 21 6Saudi Arabia 1 131 444 687Singapore 1 783 276 1 507South Korea 223 33 190Taiwan 144 133 11Thailand 71 51 20Rest of Asia 1 344 610 734Asia Unallocated 189 60 129
Total Asia 7 959 3 126 4 833
Australiasia and OceaniaAustralia 583 231 353New Zealand 81 28 53Rest of Australia and Oceania 52 21 32Oceania Unallocated 5 5 -
Total Australasia and Oceania 722 284 438
Rest of World Unallocated and International orgainisations 249 106 143
World Total 51 710 23 451 28 259
Economic ZonesOECD 37 685 18 453 19 232NAFTA 11 606 5 927 5 679Central and Eastern Europe 797 317 480OPEC 2 142 731 1 411ASEAN 2 117 471 1 646CIS 823 463 361NICs1 2 496 624 1 872Offshore Financial centres 4 997 967 4 030ACP 1 032 500 532
1 Due to rounding, the sum of constituent items may not always equal the totalshown.
2 Data excludes the following industries: Financial, Film and TV, Travel andTransport, Public Sector (including Education) and Law Society Members
3 (-) Denotes nil or less than £500,000.
Source: Office for National Statistics: 01633 456644

328
External trade and investment
19.9 Summary of balance of payments,1 2006United Kingdom
£ million
Credits Debits
1. Current account
A. Goods and services 370 788 417 320
1. Goods 243 631 321 1862. Services 127 157 96 134
2.1. Transportation 16 704 19 4262.2. Travel 18 313 34 2912.3. Communications 4 259 3 9692.4. Construction 658 5292.5. Insurance 3 525 9602.6. Financial 28 420 5 8452.7. Computer and information 6 489 2 6582.8. Royalties and licence fees 7 381 5 4072.9. Other business 34 733 18 8842.10. Personal, cultural and recreational 2 031 7462.11. Government 2 073 2 677
B. Income 235 201 227 441
1. Compensation of employees 1 058 1 8032. Investment income 234 143 225 638
2.1 Direct investment 84 339 52 0132.2 Portfolio investment 55 114 56 8852.3 Other investment (including earnings on reserve assets) 94 690 116 740
C. Current transfers 18 346 30 299
1. General government 4 351 13 8822. Other sectors 13 995 16 417
Total current account 624 335 675 060
2. Capital and financial accounts
A. Capital account 3 818 2 988
1. Capital transfers 3 393 2 3582. Acquisition/disposal of non-produced, non-financial assets 425 630
B. Financial account 716 526 671 726
1. Direct investment 80 539 47 155Abroad 47 155
1.1. Equity capital 25 6471.2. Reinvested earnings 47 8751.3. Other capital2 –26 287
In United Kingdom 80 5391.1. Equity capital 56 0051.2. Reinvested earnings 22 9301.3. Other capital3 1 604
2. Portfolio investment 157 622 198 456Assets 198 456
2.1. Equity securities 18 5712.2. Debt securities 179 885
Liabilities 157 6222.1. Equity securities –5 5632.2. Debt securities 163 185
3. Financial derivatives (net) –7 4494. Other investment 478 365 433 990
Assets 433 9904.1 Trade credits 1 3614.2 Loans 117 3764.3 Currency and deposits 315 5424.4 Other assets –289
Liabilities 478 3654.1. Trade credits –4.2. Loans 142 9064.3. Currency and deposits 334 2384.4. Other liabilities 1 221
5. Reserve assets –4265.1. Monetary gold –45.2. Special drawing rights 515.3. Reserve position in the IMF –2255.4. Foreign exchange 62
Total capital and financial accounts 720 344 674 714
Total current, capital and financial accounts 1 344 679 1 349 774
Net errors and omissions 5 072
1 See chapter text.2 Other capital transaction on direct investment abroad represents claims on
affiliated enterprises less liabilities to affiliated enterprises3 Other capital transactions on direct investment in the United Kingdom
represents liabilities to direct investors less claims on direct investors
Source: Office for National Statistics

329
External trade and investment
19.10 Summary of balance of payments: balances (credits less debits)1United Kingdom
£ million
Current account
Total goods Compensati- CurrentTrade in Trade in and on of Investment Total Current Current balance as Capital Financial Net errors
goods services services employees income income transfers balance % of GDP2 account account & omissions
LQCT KTMS KTMY KTMP HMBM HMBP KTNF HBOG AA6H FKMJ HBNT HHDH1953 –244 123 –121 –25 207 182 143 204 1.2 –13 –177 –141954 –210 115 –95 –27 227 200 55 160 0.9 –13 –174 271955 –315 42 –273 –27 149 122 43 –108 –0.6 –15 34 891956 50 26 76 –30 203 173 2 251 1.2 –13 –250 121957 –29 121 92 –32 223 191 –5 278 1.3 –13 –313 48
1958 34 119 153 –34 261 227 4 384 1.7 –10 –411 371959 –116 118 2 –37 233 196 – 198 0.8 –5 –68 –1251960 –404 39 –365 –35 201 166 –6 –205 –0.8 –6 –7 2181961 –144 51 –93 –35 223 188 –9 86 0.3 –12 23 –971962 –104 50 –54 –37 301 264 –14 196 0.7 –12 –195 11
1963 –123 4 –119 –38 364 326 –37 170 0.6 –16 –30 –1241964 –551 –34 –585 –33 365 332 –74 –327 –1.0 –17 392 –481965 –263 –66 –329 –34 405 371 –75 –33 –0.1 –18 49 21966 –111 44 –67 –39 358 319 –91 161 0.4 –19 22 –1641967 –601 157 –444 –39 354 315 –118 –247 –0.6 –25 179 93
1968 –708 341 –367 –48 303 255 –119 –231 –0.5 –26 688 –4311969 –214 392 178 –47 468 421 –109 490 1.0 –23 –794 3271970 –18 455 437 –56 527 471 –89 819 1.6 –22 –818 211971 205 590 795 –63 481 418 –90 1 123 2.0 –23 –1 330 2301972 –736 665 –71 –52 407 355 –142 142 0.2 –35 477 –584
1973 –2 573 803 –1 770 –68 1 074 1 006 –336 –1 100 –1.5 –39 1 031 1081974 –5 241 1 118 –4 123 –92 1 184 1 092 –302 –3 333 –4.0 –34 3 185 1821975 –3 245 1 447 –1 798 –102 518 416 –313 –1 695 –1.6 –36 1 569 1621976 –3 930 2 532 –1 398 –140 1 100 960 –534 –972 –0.8 –12 507 4771977 –2 271 3 306 1 035 –152 –280 –432 –889 –286 –0.2 11 –3 286 3 561
1978 –1 534 3 777 2 243 –140 138 –2 –1 420 821 0.5 –79 –2 655 1 9131979 –3 326 4 076 750 –130 155 25 –1 777 –1 002 –0.5 –103 864 2411980 1 329 3 829 5 158 –82 –1 683 –1 765 –1 653 1 740 0.8 –4 –2 157 4211981 3 238 3 951 7 189 –66 –1 058 –1 124 –1 219 4 846 1.9 –79 –5 312 5451982 1 879 3 198 5 077 –95 –1 273 –1 368 –1 476 2 233 0.8 6 –1 233 –1 006
1983 –1 618 4 076 2 458 –89 280 191 –1 391 1 258 0.4 75 –3 287 1 9541984 –5 409 4 491 –918 –94 1 284 1 190 –1 566 –1 294 –0.4 107 –7 130 8 3171985 –3 416 6 767 3 351 –120 –877 –997 –2 924 –570 –0.2 185 –1 657 2 0421986 –9 617 6 403 –3 214 –156 1 850 1 694 –2 094 –3 614 –0.9 135 –122 3 6011987 –11 698 6 813 –4 885 –174 1 091 917 –3 570 –7 538 –1.8 333 10 764 –3 559
1988 –21 553 4 450 –17 103 –64 817 753 –3 500 –19 850 –4.2 235 17 201 2 4141989 –24 724 3 643 –21 081 –138 –654 –792 –4 448 –26 321 –5.1 270 18 001 8 0501990 –18 707 4 337 –14 370 –110 –2 869 –2 979 –4 932 –22 281 –4.0 497 15 083 6 7011991 –10 223 4 102 –6 121 –63 –3 244 –3 307 –1 231 –10 659 –1.8 290 5 269 5 1001992 –13 050 5 602 –7 448 –49 177 128 –5 534 –12 854 –2.1 421 5 090 7 343
1993 –13 066 6 741 –6 325 35 –226 –191 –5 243 –11 759 –1.8 309 11 332 1181994 –11 126 6 509 –4 617 –170 3 518 3 348 –5 369 –6 638 –1.0 33 2 126 4 4791995 –12 023 8 957 –3 066 –296 2 460 2 164 –7 574 –8 476 –1.2 533 2 552 5 3911996 –13 722 11 204 –2 518 93 463 556 –4 755 –6 717 –0.9 1 260 2 811 2 6461997 –12 342 14 106 1 764 83 3 231 3 314 –5 918 –840 –0.1 958 –8 771 8 653
1998 –21 813 14 672 –7 141 –10 12 330 12 320 –8 374 –3 195 –0.4 489 9 922 –7 2161999 –29 051 13 597 –15 454 201 1 069 1 270 –7 533 –21 717 –2.4 747 21 416 –4462000 –32 976 13 615 –19 361 150 4 390 4 540 –10 012 –24 833 –2.6 1 703 12 604 10 5262001 –41 212 14 423 –26 789 66 11 598 11 664 –6 759 –21 884 –2.2 1 318 17 503 3 0632002 –47 705 16 830 –30 875 67 23 376 23 443 –9 081 –16 513 –1.6 932 7 202 8 379
2003 –48 607 19 162 –29 445 59 24 587 24 646 –10 122 –14 921 –1.3 1 466 20 507 –7 0522004 –60 893 25 918 –34 975 71 26 525 26 596 –10 949 –19 328 –1.6 2 063 5 641 11 6242005 –68 789 24 611 –44 178 –610 25 814 25 204 –12 011 –30 985 –2.5 1 491 33 954 –4 4602006 –77 555 31 023 –46 532 –745 8 505 7 760 –11 953 –50 725 –3.9 853 44 800 5 0722007 –87 649 38 450 –49 199 –622 5 902 5 280 –13 876 –57 795 –4.2 2 459 61 988 –6 652
1 See chapter text.2 Using series YBHA: GDP at current market prices.
Source: Office for National Statistics

330
External trade and investment
19.11 Balance of payments:1 current accountUnited Kingdom
£ million
1997 1998 1999 2000 2001 2002 2003 2004 2005 2006 2007
CreditsExports of goods and services
Exports of goods LQAD 171 923 164 056 166 166 187 936 189 093 186 524 188 320 190 877 211 608 243 631 220 857Exports of services KTMQ 62 096 67 978 73 616 79 666 84 047 89 987 97 077 107 817 115 182 127 157 138 424
Total exports of goods and services KTMW 234 019 232 034 239 782 267 602 273 140 276 511 285 397 298 694 326 790 370 788 359 281
IncomeCompensation of employees KTMN 1 007 840 960 1 032 1 087 1 121 1 116 1 171 974 1 058 1 105Investment income HMBN 95 435 103 388 101 952 134 114 139 848 123 505 124 881 141 030 186 259 234 143 281 674
Total income HMBQ 96 442 104 228 102 912 135 146 140 935 124 626 125 997 142 201 187 233 235 201 282 779
Current transfersGeneral government FJUM 2 173 1 767 3 542 2 465 4 991 3 663 3 968 4 000 4 236 4 351 4 197Other sectors FJUN 10 898 10 597 9 678 8 076 9 453 8 572 8 235 8 917 13 021 13 995 11 405
Total current transfers KTND 13 071 12 364 13 220 10 541 14 444 12 235 12 203 12 917 17 257 18 346 15 602
Total HBOE 343 532 348 626 355 914 413 289 428 519 413 372 423 597 453 812 531 280 624 335 657 662
DebitsImports of goods and services
Imports of goods LQBL 184 265 185 869 195 217 220 912 230 305 234 229 236 927 251 770 280 397 321 186 308 506Imports of services KTMR 47 990 53 306 60 019 66 051 69 624 73 157 77 915 81 899 90 571 96 134 99 974
Total imports of goods and services KTMX 232 255 239 175 255 236 286 963 299 929 307 386 314 842 333 669 370 968 417 320 408 480
IncomeCompensation of employees KTMO 924 850 759 882 1 021 1 054 1 057 1 100 1 584 1 803 1 727Investment income HMBO 92 204 91 058 100 883 129 724 128 250 100 129 100 294 114 505 160 445 225 638 275 772
Total income HMBR 93 128 91 908 101 642 130 606 129 271 101 183 101 351 115 605 162 029 227 441 277 499
Current transfersGeneral government FJUO 5 260 6 787 7 482 8 015 7 584 9 296 10 944 12 304 13 663 13 882 14 228Other sectors FJUP 13 729 13 951 13 271 12 538 13 619 12 020 11 381 11 562 15 605 16 417 15 250
Total current transfers KTNE 18 989 20 738 20 753 20 553 21 203 21 316 22 325 23 866 29 268 30 299 29 478
Total HBOF 344 372 351 821 377 631 438 122 450 403 429 885 438 518 473 140 562 265 675 060 715 457
BalancesTrade in goods and services
Trade in goods LQCT –12 342 –21 813 –29 051 –32 976 –41 212 –47 705 –48 607 –60 893 –68 789 –77 555 –87 649Trade in services KTMS 14 106 14 672 13 597 13 615 14 423 16 830 19 162 25 918 24 611 31 023 38 450
Total trade in goods and services KTMY 1 764 –7 141 –15 454 –19 361 –26 789 –30 875 –29 445 –34 975 –44 178 –46 532 –49 199
IncomeCompensation of employees KTMP 83 –10 201 150 66 67 59 71 –610 –745 –622Investment income HMBM 3 231 12 330 1 069 4 390 11 598 23 376 24 587 26 525 25 814 8 505 5 902
Total income HMBP 3 314 12 320 1 270 4 540 11 664 23 443 24 646 26 596 25 204 7 760 5 280
Current transfersGeneral government FJUQ –3 087 –5 020 –3 940 –5 550 –2 593 –5 633 –6 976 –8 304 –9 427 –9 531 –10 031Other sectors FJUR –2 831 –3 354 –3 593 –4 462 –4 166 –3 448 –3 146 –2 645 –2 584 –2 422 –3 845
Total current transfers KTNF –5 918 –8 374 –7 533 –10 012 –6 759 –9 081 –10 122 –10 949 –12 011 –11 953 –13 876
Total (Current balance) HBOG –840 –3 195 –21 717 –24 833 –21 884 –16 513 –14 921 –19 328 –30 985 –50 725 –57 795
1 See chapter text. Source: Office for National Statistics

331
External trade and investment
19.12 Balance of payments:1 summary of international investment position,financial account and investment incomeUnited Kingdom £ billion
1997 1998 1999 2000 2001 2002 2003 2004 2005 2006 2007
Investment abroad
International investment positionDirect investment HBWD 232.4 309.8 438.3 618.8 616.9 637.2 691.1 689.0 705.9 733.6 851.9Portfolio investment HHZZ 651.0 703.8 838.3 906.1 937.4 844.0 935.8 1 092.3 1 374.3 1 599.9 1 808.4Other investment HLXV 1 070.4 1 107.7 1 129.7 1 427.5 1 573.1 1 635.8 1 885.1 2 156.2 2 745.3 2 947.3 3 759.0Reserve assets LTEB 22.8 23.3 22.2 28.8 25.6 25.5 23.8 23.3 24.7 22.9 26.7
Total HBQA 1 976.5 2 144.7 2 428.5 2 981.2 3 153.1 3 142.4 3 535.8 3 960.7 4 850.3 5 303.6 6 445.9
Financial account transactionsDirect investment -HJYP 37.3 73.8 125.6 155.6 42.8 35.0 40.9 53.8 44.0 47.2 114.9Portfolio investment -HHZC 51.9 32.1 21.4 65.6 86.6 1.0 36.3 140.9 160.3 198.5 134.2Financial derivatives (net) -ZPNN –1.2 3.0 –2.7 –1.6 –8.4 –1.0 5.4 7.9 –9.6 –7.4 17.5Other investment -XBMM 169.4 14.9 59.6 276.0 174.1 97.2 255.9 325.6 505.0 434.0 756.3Reserve assets -LTCV –2.4 –0.2 –0.6 3.9 –3.1 –0.5 –1.6 0.2 0.7 –0.4 ..
Total -HBNR 255.1 123.6 203.2 499.5 292.0 131.8 336.9 528.3 700.5 671.7 1 024.1
Investment incomeDirect investment HJYW 29.5 29.9 33.1 45.0 46.7 51.5 55.1 64.4 79.2 84.3 86.7Portfolio investment HLYX 23.8 29.3 25.9 33.0 34.9 32.5 32.5 36.7 45.4 55.1 64.3Other investment AIOP 40.8 43.0 41.8 55.1 57.3 38.7 36.4 39.2 61.0 94.0 130.1Reserve assets HHCB 1.4 1.1 1.2 1.0 1.0 0.8 0.8 0.7 0.7 0.6 0.6
Total HMBN 95.4 103.4 102.0 134.1 139.8 123.5 124.9 141.0 186.3 234.1 281.7
Investment in the UK
International investment positionDirect investment HBWI 173.7 213.6 250.2 310.4 363.5 340.6 355.5 384.4 494.2 577.4 642.9Portfolio investment HLXW 583.3 692.7 828.8 998.2 958.5 892.3 1 047.3 1 177.8 1 426.7 1 701.1 1 878.9Other investment HLYD 1 274.3 1 355.0 1 403.9 1 696.4 1 889.6 1 945.8 2 177.1 2 509.4 3 108.0 3 369.0 4 275.3
Total HBQB 2 031.3 2 261.4 2 482.9 3 005.0 3 211.5 3 178.7 3 579.9 4 071.6 5 028.9 5 647.5 6 797.2
Financial account transactionsDirect investment HJYU 22.9 45.1 55.1 80.6 37.3 16.8 16.8 42.4 97.8 80.5 92.9Portfolio investment HHZF 26.8 20.9 114.1 164.5 48.1 51.0 95.2 87.2 130.9 157.6 189.6Other investment XBMN 196.7 67.6 55.5 267.0 224.0 71.2 245.4 404.3 505.7 478.4 803.5
Total HBNS 246.4 133.5 224.6 512.1 309.5 139.0 357.4 534.0 734.4 716.5 1 086.1
Investment incomeDirect investment HJYX 14.9 8.6 17.0 27.4 21.4 16.0 21.9 27.9 36.2 52.0 49.2Portfolio investment HLZC 26.5 29.5 31.1 31.0 34.5 32.1 31.6 36.4 46.9 56.9 65.9Other investment HLZN 50.8 53.0 52.8 71.3 72.3 52.1 46.8 50.2 77.3 116.7 160.7
Total HMBO 92.2 91.1 100.9 129.7 128.3 100.1 100.3 114.5 160.4 225.6 275.8
Net investment
International investment positionDirect investment HBWQ 58.6 96.2 188.1 308.4 253.5 296.6 335.6 304.6 211.7 156.2 208.9Portfolio investment CGNH 67.7 11.1 9.5 –92.2 –21.1 –48.3 –111.5 –85.5 –52.4 –101.2 –70.5Other investment CGNG –204.0 –247.3 –274.2 –268.9 –316.5 –310.0 –292.0 –353.2 –362.7 –421.7 –516.4Reserve assets LTEB 22.8 23.3 22.2 28.8 25.6 25.5 23.8 23.3 24.7 22.9 26.7
Net investment position HBQC –54.8 –116.7 –54.4 –23.9 –58.4 –36.3 –44.1 –110.9 –178.7 –343.8 –351.3
Financial account transactionsDirect investment HJYV –14.4 –28.7 –70.5 –75.0 –5.5 –18.3 –24.1 –11.4 53.8 33.4 –21.9Portfolio investment HHZD –25.2 –11.2 92.7 99.0 –38.4 50.0 59.0 –53.6 –29.5 –40.8 55.4Financial derivatives ZPNN 1.2 –3.0 2.7 1.6 8.4 1.0 –5.4 –7.9 9.6 7.4 –17.5Other investment HHYR 27.3 52.8 –4.1 –9.0 49.9 –26.0 –10.5 78.7 0.7 44.4 47.2Reserve assets LTCV 2.4 0.2 0.6 –3.9 3.1 0.5 1.6 –0.2 –0.7 0.4 ..
Net transactions HBNT –8.8 9.9 21.4 12.6 17.5 7.2 20.5 5.6 34.0 44.8 62.0
Investment incomeDirect investment HJYE 14.6 21.3 16.1 17.6 25.3 35.5 33.2 36.5 43.0 32.3 37.5Portfolio investment HLZX –2.7 –0.2 –5.2 2.0 0.4 0.4 0.9 0.3 –1.6 –1.8 –1.7Other investment CGNA –10.0 –10.0 –11.0 –16.2 –15.1 –13.3 –10.3 –11.0 –16.3 –22.7 –30.5Reserve assets HHCB 1.4 1.1 1.2 1.0 1.0 0.8 0.8 0.7 0.7 0.6 0.6
Net earnings HMBM 3.2 12.3 1.1 4.4 11.6 23.4 24.6 26.5 25.8 8.5 5.9
1 See chapter text. Source: Office for National Statistics

332
External trade and investment
19.13 Net outward foreign direct investment by United Kingdom companies:1,2 by areaand main country
£ million
2002 2003 2004 2005 2006
Europe GQBX 27 300 16 600 10 814 12 105 15 965EU25 DG7S 28 865 13 339 11 900 13 217 3 577
Austria CBJD 797 165 1 322 –301 –107Belgium HIIL 1 046 –1 241 –544 970 –4 370Cyprus DG8D –79 –53 18 69 98Czech Republic DG8O 49 142 23 24 –162Denmark CAUW 543 –53 569 391 1 547Estonia DG8E 5 4 21 2 3Finland CBJE 1 124 99 –37 707 106France CAUX 4 112 6 627 793 3 138 224Germany CAUY 8 473 1 552 –366 –479 3 147Greece CAUZ –65 229 –253 63 14Hungary DG8F 163 527 336 1 821 29Irish Republic CAVA 1 674 985 3 325 –1 181 5 114Italy CAVB 572 500 667 191 –420Latvia DG8G 1 .. 1 –1 5Lithuania DG8H .. .. 1 –4 ..Luxembourg HIIM –2 046 1 313 –1 022 –1 213 –14 664Malta DG8I .. 58 178 142 ..Netherlands CAVC 13 152 728 4 805 4 821 2 195Poland DG8J 431 4 182 150 464Portugal CAVD 88 308 444 603 336Slovakia DG8K –22 –11 18 21 18Slovenia DG8L .. 37 –5 –5 14Spain CAVE 288 626 1 131 564 3 130Sweden CBJG –35 794 299 2 732 6 438
EFTA CAVG 994 2 313 –6 667 547 7 011of which
Norway CBJF –329 –274 367 –831 104Switzerland CBJH 1 329 2 591 –7 007 1 330 6 946
Other European Countries DG8M –2 559 948 5 582 –1 658 5 377of which
Russia GLAA 108 2 030 1 831 349 –17UK offshore islands GLAC –1 249 –1 031 3 528 –2 341 4 371
The Americas GQBZ –5 150 15 959 24 321 20 689 21 175of which
Bermuda CBKZ –4 371 –2 613 6 242 653 908Brazil CBLA 17 786 386 48 356Canada CAVK 536 2 521 1 143 3 372 8 211Chile GQCA 1 021 290 675 790 25Colombia GQCB –385 78 225 –687 315Mexico GLAD 939 261 1 386 168 334Panama GLAE .. 58 12 27 7USA CAVJ –984 19 300 9 732 15 041 259
Asia GQCI 5 538 3 601 7 689 5 399 8 327Near and Middle East Countries CBKF 376 82 486 398 1 368of which
Gulf Arabian countries3 GQCC 369 –85 293 577 483
Other Asian Countries GQCD 5 162 3 518 7 203 5 001 6 958of which
China HIIN 757 309 539 598 363Hong Kong CAVN 1 186 1 285 5 303 1 547 1 992India GLAF 276 193 274 616 282Indonesia GLAG 70 481 –289 –116 246Japan CAVM 388 338 37 247 433Malaysia CBKN 334 277 428 244 248Singapore CBKQ 1 619 –449 –161 –508 2 587South Korea GLAH 174 332 278 2 247 670Thailand GLAI –55 155 181 228 525
Australasia and Oceania GQCE 3 677 –1 524 1 026 423 3 631of which
Australia CBJO 3 322 –492 408 444 3 243New Zealand CBJP 337 –1 017 258 –56 405
Africa GQCF 2 196 3 454 5 863 5 843 293of which
Kenya GLAJ 32 58 47 73 62Nigeria CBJY 220 19 –44 –108 40South Africa CAVO 2 265 2 222 3 840 4 368 1 458Zimbabwe CBKD 33 37 91 18 10
World Total CDQD 33 561 38 088 49 713 44 458 49 390OECD GQCG 36 096 37 030 18 355 35 305 24 045Central and Eastern Europe4 GQCH 654 156 36 158 76
1 See chapter text. Net investment includes re-invested earnings.2 Minus sign indicates net disinvestment abroad.3 Includes Abu Dhabi, Bahrain, Dubai, Iraq, Kuwait, Oman, Other Gulf States,
Qatar, Saudi Arabia and Yemen.
4 From 2003 includes Albania, Bosnia & Herzegovina, Bulgaria, Croatia, FYR ofMacedonia, Romiania and Serbia & Montenegro. Prior to 2003 Czech Repub-lic, Estonia, Hungary, Latvia, Lithuania, Poland, Slovakia and Slovenia also in-cluded.
Source: ONS Foreign Direct Investments Surveys: 01633 456647; Bank ofEngland

333
External trade and investment
19.14 United Kingdom outward foreign direct international investment position: bookvalue of net assets: by area and main country1
At year end £ million
2002 2003 2004 2005 2006
Europe GQCJ 390 359 408 881 382 104 387 324 393 826EU25 DG8P 343 931 354 707 348 293 339 283 306 127
Austria CDLZ 2 679 3 339 4 102 4 005 2 388Belgium HIIO 10 364 8 662 7 828 13 492 4 459Cyprus DG8Q 84 80 64 59 561Czech Republic DG8R 1 088 954 793 823 656Denmark CDLP 3 165 3 021 5 256 5 090 7 790Estonia DG8S 29 21 78 7 5Finland CDMA 580 588 695 2 465 1 287France CDLQ 31 928 31 460 35 313 47 348 36 587Germany CDLR 13 924 13 486 12 164 20 753 17 159Greece CDLS 498 460 456 625 563Hungary DG8T 1 403 1 722 1 506 2 491 1 787Irish Republic CDLT 29 944 29 989 29 059 26 824 23 196Italy CDLU 5 505 10 178 11 322 10 872 7 954Latvia DG8U 51 13 25 22 28Lithuania DG8V 24 16 22 16 ..Luxembourg HIIP 62 556 79 208 81 709 97 260 59 907Malta DG8W –24 264 1 528 –459 ..Netherlands CDLV 158 478 146 345 131 143 64 511 90 804Poland DG8X 2 809 2 900 2 316 1 974 2 594Portugal CDLW 629 973 1 664 2 702 3 247Slovakia DG8Y 261 332 103 93 138Slovenia DG8Z 92 128 54 3 52Spain CDLX 7 156 9 460 11 318 25 604 26 202Sweden CDMD 10 712 11 108 9 776 12 702 17 774
EFTA CDLY 22 069 27 187 14 468 12 933 12 548of which
Norway CDMC 4 904 4 900 4 934 4 498 2 107Switzerland CDME 17 164 21 913 9 104 7 979 10 158
Other European Countries DG92 24 359 26 987 19 344 35 107 75 151of which
Russia GQAA 744 777 1 627 1 814 6 051UK offshore islands GQAB 15 203 22 717 15 678 29 954 65 266
The Americas GQCU 167 345 178 599 182 091 216 343 259 702of which
Bermuda CDOA 4 929 1 554 7 561 10 604 13 890Brazil CDOB 2 050 2 532 3 922 3 220 2 791Canada CDML 8 209 8 537 8 922 12 812 19 187Chile GQCT 2 036 1 919 2 133 2 814 562Colombia GQCS 1 752 2 434 1 874 1 132 995Mexico GQAC 1 450 1 431 2 461 2 860 2 271Panama GQAD .. 153 132 166 ..USA CDMM 131 800 150 021 140 321 164 405 184 204
Asia GQCL 28 914 43 118 47 311 54 919 53 045Near and Middle East Countries CDNH 1 619 1 559 3 008 3 733 4 371of which
Gulf Arabian countries2 GQCM 1 027 1 211 2 062 3 013 2 247
Other Asian Countries GQCR 27 295 41 559 44 303 51 187 48 674of which
China HIIQ 3 212 1 809 1 882 2 685 2 230Hong Kong CDNN 5 872 17 221 19 165 20 432 22 388India GQAE 1 409 1 555 1 682 2 126 2 302Indonesia GQAF 1 014 1 309 1 178 1 168 1 521Japan CDMP 1 896 2 361 5 829 6 076 2 461Malaysia CDNQ 1 214 1 476 1 592 1 455 1 316Singapore CDNT 6 797 9 510 6 610 7 144 6 628South Korea GQAG 927 1 339 1 218 4 586 3 777Thailand GQAH 1 513 1 357 947 1 281 1 405
Australasia and Oceania GQCN 16 652 17 486 16 888 16 694 12 646of which
Australia CDMO 13 936 16 283 14 586 14 627 11 391New Zealand CDMQ 2 524 1 060 1 459 1 176 1 084
Africa GQCQ 13 516 17 039 17 350 20 834 15 455of which
Kenya GQAI 278 285 238 281 315Nigeria CDNA 1 012 1 028 950 924 1 009South Africa CDMR 8 765 11 250 10 964 13 733 8 630Zimbabwe CDNF 62 48 103 50 58
World Total CDOO 616 786 665 123 645 744 696 113 734 674OECD GQCO 527 681 563 769 537 109 561 694 543 980Central & Eastern Europe3 GQCP 6 449 560 534 640 519
1 See chapter text.2 Includes Abu Dhabi, Bahrain, Dubai, Iraq, Kuwait, Oman, Other Gulf States,
Qatar, Saudi Arabia and Yemen.3 From 2003 includes Albania, Bosnia & Herzegovina, Bulgaria, Croatia, FYR
of Macedonia, Romiania and Serbia & Montenegro. Prior to 2003 Czech
Republic, Estonia, Hungary, Latvia, Lithuania, Poland, Slovakia and Sloveniaalso included.
Sources: ONS Foreign Direct Investment Surveys: 01633 456647;Bank of England
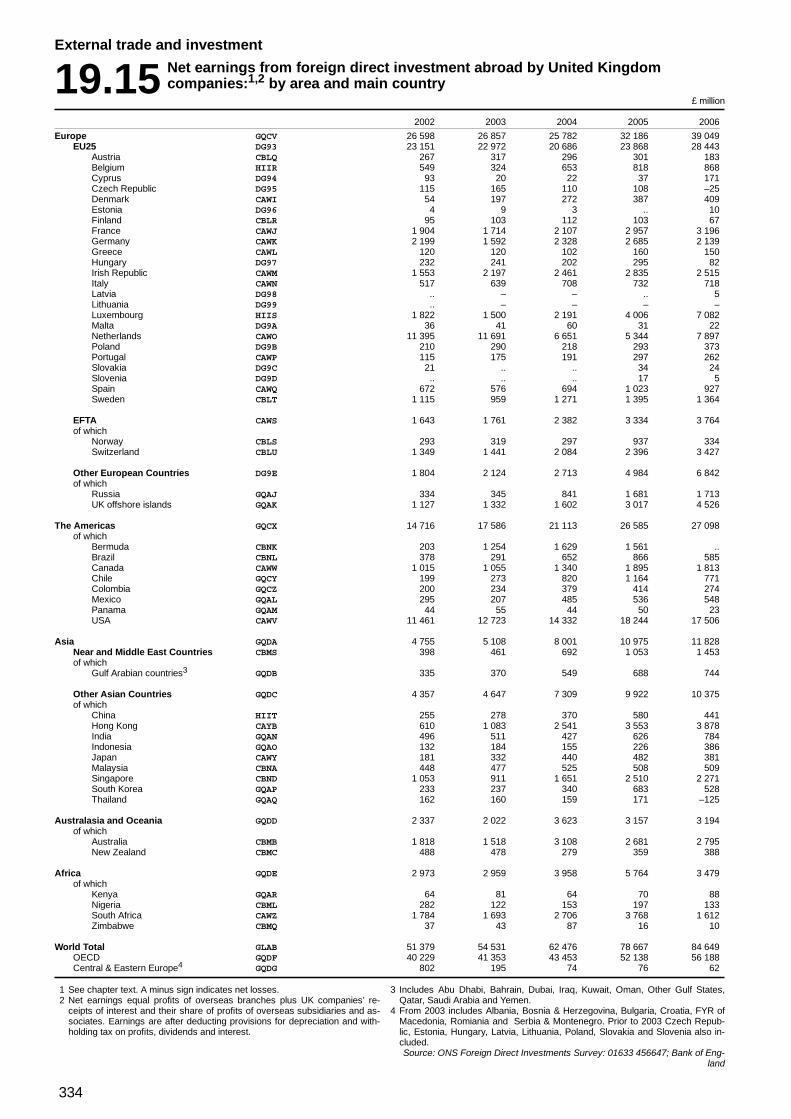
334
External trade and investment
19.15 Net earnings from foreign direct investment abroad by United Kingdomcompanies:1,2 by area and main country
£ million
2002 2003 2004 2005 2006
Europe GQCV 26 598 26 857 25 782 32 186 39 049EU25 DG93 23 151 22 972 20 686 23 868 28 443
Austria CBLQ 267 317 296 301 183Belgium HIIR 549 324 653 818 868Cyprus DG94 93 20 22 37 171Czech Republic DG95 115 165 110 108 –25Denmark CAWI 54 197 272 387 409Estonia DG96 4 9 3 .. 10Finland CBLR 95 103 112 103 67France CAWJ 1 904 1 714 2 107 2 957 3 196Germany CAWK 2 199 1 592 2 328 2 685 2 139Greece CAWL 120 120 102 160 150Hungary DG97 232 241 202 295 82Irish Republic CAWM 1 553 2 197 2 461 2 835 2 515Italy CAWN 517 639 708 732 718Latvia DG98 .. – – .. 5Lithuania DG99 .. – – – –Luxembourg HIIS 1 822 1 500 2 191 4 006 7 082Malta DG9A 36 41 60 31 22Netherlands CAWO 11 395 11 691 6 651 5 344 7 897Poland DG9B 210 290 218 293 373Portugal CAWP 115 175 191 297 262Slovakia DG9C 21 .. .. 34 24Slovenia DG9D .. .. .. 17 5Spain CAWQ 672 576 694 1 023 927Sweden CBLT 1 115 959 1 271 1 395 1 364
EFTA CAWS 1 643 1 761 2 382 3 334 3 764of which
Norway CBLS 293 319 297 937 334Switzerland CBLU 1 349 1 441 2 084 2 396 3 427
Other European Countries DG9E 1 804 2 124 2 713 4 984 6 842of which
Russia GQAJ 334 345 841 1 681 1 713UK offshore islands GQAK 1 127 1 332 1 602 3 017 4 526
The Americas GQCX 14 716 17 586 21 113 26 585 27 098of which
Bermuda CBNK 203 1 254 1 629 1 561 ..Brazil CBNL 378 291 652 866 585Canada CAWW 1 015 1 055 1 340 1 895 1 813Chile GQCY 199 273 820 1 164 771Colombia GQCZ 200 234 379 414 274Mexico GQAL 295 207 485 536 548Panama GQAM 44 55 44 50 23USA CAWV 11 461 12 723 14 332 18 244 17 506
Asia GQDA 4 755 5 108 8 001 10 975 11 828Near and Middle East Countries CBMS 398 461 692 1 053 1 453of which
Gulf Arabian countries3 GQDB 335 370 549 688 744
Other Asian Countries GQDC 4 357 4 647 7 309 9 922 10 375of which
China HIIT 255 278 370 580 441Hong Kong CAYB 610 1 083 2 541 3 553 3 878India GQAN 496 511 427 626 784Indonesia GQAO 132 184 155 226 386Japan CAWY 181 332 440 482 381Malaysia CBNA 448 477 525 508 509Singapore CBND 1 053 911 1 651 2 510 2 271South Korea GQAP 233 237 340 683 528Thailand GQAQ 162 160 159 171 –125
Australasia and Oceania GQDD 2 337 2 022 3 623 3 157 3 194of which
Australia CBMB 1 818 1 518 3 108 2 681 2 795New Zealand CBMC 488 478 279 359 388
Africa GQDE 2 973 2 959 3 958 5 764 3 479of which
Kenya GQAR 64 81 64 70 88Nigeria CBML 282 122 153 197 133South Africa CAWZ 1 784 1 693 2 706 3 768 1 612Zimbabwe CBMQ 37 43 87 16 10
World Total GLAB 51 379 54 531 62 476 78 667 84 649OECD GQDF 40 229 41 353 43 453 52 138 56 188Central & Eastern Europe4 GQDG 802 195 74 76 62
1 See chapter text. A minus sign indicates net losses.2 Net earnings equal profits of overseas branches plus UK companies’ re-
ceipts of interest and their share of profits of overseas subsidiaries and as-sociates. Earnings are after deducting provisions for depreciation and with-holding tax on profits, dividends and interest.
3 Includes Abu Dhabi, Bahrain, Dubai, Iraq, Kuwait, Oman, Other Gulf States,Qatar, Saudi Arabia and Yemen.
4 From 2003 includes Albania, Bosnia & Herzegovina, Bulgaria, Croatia, FYR ofMacedonia, Romiania and Serbia & Montenegro. Prior to 2003 Czech Repub-lic, Estonia, Hungary, Latvia, Lithuania, Poland, Slovakia and Slovenia also in-cluded.Source: ONS Foreign Direct Investments Survey: 01633 456647; Bank of Eng-
land

335
External trade and investment
19.16 Net inward foreign direct investment in the United Kingdom:1,2 by areaand main country
£ million
2002 2003 2004 2005 2006
Europe GQDH 15 431 7 013 29 901 80 087 47 589EU25 DG9F 15 721 5 498 26 412 71 022 41 335
Austria CBOB .. 8 –31 171 –61Belgium HIIU –333 218 1 542 23 691Cyprus DG9G –3 – – 7 18Czech Republic DG9H .. – – – ..Denmark CAYQ 114 321 –11 –1 246 –232Estonia DG9I – – – – –Finland CBOC 5 26 32 238 51France CAYR 1 460 414 1 703 9 643 3 205Germany CAYS 11 340 1 437 11 131 7 279 –1 747Greece CAYT 7 33 13 14 17Hungary DG9J – – .. 1 3Irish Republic CAYU 210 206 936 723 866Italy CAYV –208 –468 1 327 –42 357Latvia DG9K – .. – .. ..Lithuania DG9L .. – .. – –Luxembourg HIIV 1 –105 –115 151 –183Malta DG9M .. – – 1 2Netherlands CAYW 1 756 2 452 1 226 50 366 14 336Poland DG9N 1 – – 1 50Portugal CAYX –12 .. .. –6 9Slovakia DG9O .. .. .. .. ..Slovenia DG9P .. .. .. .. ..Spain CAYY 232 518 .. 3 297 23 429Sweden CBOE 493 406 –14 393 519
EFTA CAZB –298 1 408 3 016 9 050 5 214of which
Norway CBOD –137 –179 –798 927 171Switzerland CBOF –162 1 411 3 488 7 405 4 679
Other European Countries DG9Q 9 107 473 15 1 040of which
Russia GQAS .. .. .. .. ..UK offshore islands GQAT –8 32 476 –60 950
The Americas GQDJ –2 051 3 396 –4 792 17 422 18 901of which
Brazil HP5A .. 4 .. 6 ..Canada CAZF 562 –325 683 1 632 3 529USA CAZE –2 157 2 676 –5 727 15 589 13 994
Asia GQDK 2 551 –449 4 081 –4 168 11 805Near and Middle East Countries GQAU –26 –34 384 736 5 035
Other Asian Countries GQAV 2 579 –415 3 697 –4 904 6 770of which
China HP5B .. 2 –26 13 12Hong Kong GQAW 63 63 .. 315 103India HP5C 1 7 –15 138 264Japan CAZH 2 352 –543 817 –5 575 3 714Singapore GQAX 157 –76 14 46 ..South Korea GQAY –26 –20 193 175 –85
Australasia and Oceania GQDL 31 310 1 420 3 396 1 835of which
Australia CBOJ 14 309 1 412 3 396 1 444New Zealand CBOK 18 2 8 – 54
Africa GQAZ 71 7 –43 66 138of which
South Africa CAZJ 63 21 –35 25 101
World Total CBDH 16 033 10 276 30 566 96 803 80 269OECD GQBA 16 194 8 984 26 762 95 187 69 151Central & Eastern Europe3 GQBB – 4 –32 .. 6
1 See chapter text. Net investment includes reinvested earnings.2 A minus sign indicates net disinvestment in the UK.3 From 2003 includes Albania, Bosnia & Herzegovina, Bulgaria, Croatia, FYR
of Macedonia, Romiania and Serbia & Montenegro. Prior to 2003 CzechRepublic, Estonia, Hungary, Latvia, Lithuania, Poland, Slovakia and Sloveniaalso included.
Sources: ONS Foreign Direct Investment Surveys: 01633 456647;Bank of England

336
External trade and investment
19.17 United Kingdom inward foreign direct international investment position:book value of net liabilities: by area and main country1
At year end £ million
2002 2003 2004 2005 2006
Europe GQDM 157 313 158 903 181 198 277 027 321 731EU25 DG9R 142 514 142 240 161 327 244 325 289 911
Austria CDPF 1 003 349 366 561 848Belgium HIIW 1 765 1 987 4 338 4 481 5 631Cyprus DG9S 68 67 78 100 162Czech Republic DG9T 3 9 6 3 ..Denmark CDOV 2 358 2 086 2 359 1 404 4 205Estonia DG9U – – – – –Finland CDPG 767 946 886 756 787France CDOW 37 195 36 565 41 100 56 309 51 862Germany CDOX 37 737 32 260 39 300 51 469 49 095Greece CDOY 89 86 100 103 121Hungary DG9V 8 9 12 9 12Irish Republic CDOZ 4 544 4 769 5 021 7 146 8 164Italy CDPA 5 788 4 580 6 708 6 122 4 548Latvia DG9W – .. – .. ..Lithuania DG9X .. .. .. – –Luxembourg HIIX 4 985 5 627 5 963 7 880 11 738Malta DG9Y 22 21 5 12 12Netherlands CDPB 39 512 46 876 47 579 95 579 118 778Poland DG9Z 13 10 7 21 96Portugal CDPC 97 115 113 111 122Slovakia DGA2 .. .. .. – –Slovenia DGA3 .. .. .. .. ..Spain CDPD 2 303 3 344 4 536 8 782 29 666Sweden CDPI 4 254 2 527 2 849 3 467 4 050
EFTA CDPE 10 951 13 758 15 752 25 033 21 917of which
Norway CDPH 1 019 831 242 1 085 969Switzerland CDPJ 9 717 12 439 14 685 21 624 18 592
Other European Countries DGA4 3 849 2 906 4 120 7 670 9 903of which
Russia GQBC .. .. .. .. ..UK offshore islands GQBD 3 393 2 361 3 500 7 059 9 133
The Americas GQDU 138 156 145 973 140 090 174 037 207 540of which
Brazil HP5D .. 5 .. 77 134Canada CDPM 8 718 11 176 12 108 15 587 19 335USA CDPN 124 597 130 512 122 069 149 759 177 783
Asia GQDO 20 323 19 869 24 800 24 101 39 490Near and Middle East Countries GQBE 1 697 1 627 2 765 2 970 10 158
Other Asian Countries GQBF 18 626 18 242 22 035 21 131 29 332of which
China HP5E 42 102 119 111 99Hong Kong GQBG .. .. .. .. ..India HP5F 162 194 164 518 795Japan CDPQ 11 791 11 949 12 300 10 513 14 809Singapore GQBH 1 684 830 925 1 034 4 048South Korea GQBI 448 635 635 638 798
Australasia and Oceania GQDP 8 462 14 336 16 804 12 537 7 303of which
Australia CDPP 8 309 14 160 16 631 12 313 7 132New Zealand CDPR 134 158 153 224 428
Africa GQBJ 427 560 530 510 515of which
South Africa CDPS 250 387 296 186 130
World Total CDPZ 324 680 339 641 363 422 488 212 576 580OECD GQBK 307 395 324 491 340 870 458 185 531 801Central & Eastern Europe2 GQBL 58 34 .. .. ..
1 See chapter text.2 From 2003 includes Albania, Bosnia & Herzegovina, Bulgaria, Croatia, FYR
of Macedonia, Romiania and Serbia & Montenegro. Prior to 2003 CzechRepublic, Estonia, Hungary, Latvia, Lithuania, Poland, Slovakia and Sloveniaalso included.
Sources: ONS Foreign Direct Investment Surveys 01633 456647;Bank of England

337
External trade and investment
19.18 Net earnings from foreign direct investment in the United Kingdom:1,2
by area and main country£ million
2002 2003 2004 2005 2006
Europe GQDQ 5 475 10 158 12 676 17 592 26 875EU25 DGA5 4 447 9 011 11 329 15 269 23 069
Austria CBOR 176 111 61 60 207Belgium HIIY 38 165 269 367 646Cyprus DGA6 16 24 20 24 44Czech Republic DGA7 – – – – ..Denmark CBDL 253 305 311 326 184Estonia DGA8 – – – – –Finland CBOS 70 36 62 61 93France CBDM 1 322 2 743 3 842 5 121 5 807Germany CBDN –1 109 1 754 2 900 4 037 4 044Greece CBDO 64 4 –4 49 70Hungary DGA9 – – – 1 3Irish Republic CBDP 561 578 471 724 1 015Italy CBDQ –148 174 408 483 475Latvia DGB2 – .. – .. ..Lithuania DGB3 .. – .. 1 1Luxembourg HIIZ 87 196 289 214 204Malta DGB4 – – – – 3Netherlands CBDR 2 455 2 405 2 585 2 800 7 352Poland DGB5 1 – – 1 8Portugal CBDS 13 49 47 30 48Slovakia DGB6 .. .. .. 5 5Slovenia DGB7 .. .. .. .. ..Spain CBDT 52 298 37 773 2 536Sweden CBOU 599 167 21 182 316
EFTA CBDW 735 822 849 1 495 2 647of which
Norway CBOT 40 – –20 82 169Switzerland CBOV 692 794 819 1 320 2 215
Other European Countries DGB8 293 325 499 829 1 159of which
Russia GQBM .. .. .. .. ..UK offshore islands GQBN 267 287 468 757 1 098
The Americas GQDV 7 314 10 013 12 278 16 460 20 845of which
Brazil HP5G .. .. 1 –4 –4Canada CBEA 659 639 1 021 1 348 1 450USA CBDZ 6 623 9 054 10 981 14 156 17 480
Asia GQDS 1 214 –781 168 937 2 692Near and Middle East Countries GQBO 33 114 188 354 561
Other Asian Countries GQBP 1 182 –895 –19 583 2 131of which
China HP5H .. .. 8 –63 –35Hong Kong GQBQ –52 –456 .. .. –611India HP5I 29 55 –2 65 132Japan CBEC 1 022 –538 608 1 089 1 955Singapore GQBS 100 62 32 85 259South Korea GQBT 16 –54 23 72 104
Australasia and Oceania GQDT 432 835 695 535 1 250of which
Australia CBOZ 396 802 690 521 867New Zealand CBPA 3 4 5 13 46
Africa GQBU 99 59 59 65 81of which
South Africa CBED 97 50 26 25 31
World Total CBEV 14 534 20 283 25 876 35 588 51 742OECD GQBV 13 904 19 715 25 471 33 927 47 547Central & Eastern Europe3 GQBW 2 1 1 .. ..
1 See chapter text. A minus sign indicates net losses.2 Net earnings equal profits of UK branches plus overseas investors’ receipts
of interest and their share of the profits of UK subsidiaries and associates.Earnings are after deducting provisions for depreciation and withholding taxon profits and interest.
3 From 2003 includes Albania, Bosnia & Herzegovina, Bulgaria, Croatia, FYRof Macedonia, Romiania and Serbia & Montenegro. Prior to 2003 CzechRepublic, Estonia, Hungary, Latvia, Lithuania, Poland, Slovakia and Sloveniaalso included.
Sources: ONS Foreign Direct Investment Surveys: 01633 456647;Bank of England

338
Research and development

339
Research and development
Research and development
Ch
apter 20

340
Research and development
in HEIs. This is based on the allocation of various Funding Council Grants. Full details of the new methodology are contained in SET Statistics available on the Department of Innovation, Universities and Science Web Site at www.berr.gov.uk/dius/science/science-funding/set-stats/index.html
The most comprehensive international comparisons of resources devoted to R&D appear in Main Science and Technology Indicators published by the Organisation for Economic Co-operation and Development (OECD). The Statistical Office of the European Union and the United Nations also compile R&D statistics based on figures supplied by member states.
To make international comparisons more reliable, the OECD has published a series of manuals giving guidance on how to measure various components of R&D inputs and outputs. The most important of these is the Frascati Manual, which defines R&D and recommends how resources for R&D should be measured. The UK follows the Frascati Manual as far as possible.
For information on available aggregated data on Research and Development, please contact Julie Owens on 01633 456765 (e-mail [email protected]).
Research and developmentResearch and experimental development (R&D) is defined for statistical purposes as ‘creative work undertaken on a systematic basis in order to increase the stock of knowledge, including knowledge of man, culture and society, and the use of this stock of knowledge to devise new applications’.
R&D is financed and carried out mainly by businesses, the Government, and institutions of higher education. A small amount is performed by non-profit-making bodies. Gross Expenditure on R&D (GERD) is an indicator of the total amount of R&D performed within the UK which, in recent years, has been approximately 2 per cent of GDP. Detailed figures are reported each year in a first release published in March and the August edition of Office for National Statistics (ONS)’ Economic and Labour Market Review. Table 20.1 shows the main components of GERD.
ONS conducts an annual survey of expenditure and employment on R&D performed by government, and of government funding of R&D. The survey collects data on outturn and planning years. Until 1993 the detailed results were reported in the Annual Review of Government Funded R&D produced by the Department of Innovation, Universities and Skills (DIUS). From 1997, the results have appeared in DIUS’ Science, Engineering and Technology Statistics publication. Table 20.2 gives some broad totals for gross expenditure by government (expenditure before deducting funds received by government for R&D). Table 20.3 gives a breakdown of net expenditure (receipts are deducted).
ONS conducts an annual survey of R&D in business. Tables 20.4 and 20.5 give a summary of the main trends up to 2006. The latest set of results from the survey became available in a first release dated 26 November 2007 and a business monitor (MA14) published on 18 January 2008.
Revisions were made to the business data for the period 2004 to 2006 and were published at the same time as the 2006 Business Enterprise R&D first release on 26th November 2007. The format of this report, similar to MA14, was used as it covers all aspects of the R&D data published by ONS.
Statistics on expenditure and employment on R&D in Higher Education Institutions (HEIs) are based on information collected by Higher Education Funding Councils and Higher Education Statistics Agency (HESA). In 1994 a new methodology was introduced to estimate expenditure on R&D

341
Research and development
20.1 Cost of research and development: by sector1
United Kingdom£ million and percentages
2000 2001 2002 2003 2004 2005 2006
£m % £m % £m % £m % £m % £m % £m %
Sector carrying out the workCash terms (£ million)
Government 1 593 9 1 160 6 1 053 5 1 243 6 1 240 6 1 238 6 1 264 5Research councils 647 4 674 4 713 4 825 4 930 5 1 051 5 1 054 5Business enterprise 11 510 65 11 978 66 12 469 65 12 677 64 12 668 63 13 310 61 14 306 62Higher education 3 691 21 4 149 22 4 618 24 4 785 24 5 004 25 5 580 26 6 062 26Private non-profit 296 2 325 2 374 2 369 2 406 2 502 2 518 2
Total 17 736 100 18 286 100 19 228 100 19 898 100 20 248 100 21 681 100 23 204 100
Sector providing the fundsCash terms (£ million)
Government 2 779 16 2 292 12 2 215 11 2 705 13 2 777 14 2 594 12 2 582 12Research councils 1 317 8 1 512 8 1 713 9 1 947 10 2 084 10 2 574 12 2 727 12Higher education funding councils 1 276 7 1 474 8 1 626 8 1 665 8 1 804 9 1 928 9 2 085 9Higher education 160 1 184 1 208 1 218 1 229 1 266 1 292 1Business enterprise2 8 559 49 8 329 46 8 366 44 8 394 42 8 922 44 9 119 42 10 487 45Private non-profit 815 5 888 5 962 5 931 5 960 5 1 022 5 1 076 5Abroad 2 830 16 3 607 20 4 138 22 4 038 20 3 472 17 4 178 19 3 954 17
Total 17 736 100 18 286 100 19 228 100 19 898 100 20 248 100 21 681 100 23 204 100
1 See chapter text.2 Including research associations and public corporations.
Source: Office for National Statistics: 01633 456765
20.2 Gross central government expenditure on research and development1United Kingdom
£ million
2000/01 2001/02 2002/03 2003/04 2004/05 2005/06
Intra- Extra- Intra- Extra- Intra- Extra- Intra- Extra- Intra- Extra- Intra- Extra-mural mural2 mural mural2 mural mural2 mural mural2 mural mural2 mural mural2
Defence3 932 .. 419 1 685 288 2 502 380 2 364 357 2 283 365 2 223Research councils 667 1 024 695 1 244 725 1 457 811 1 643 874 1 752 1 004 2 038Higher education institutes - 1 276 - 1 474 - 1 626 - 1 665 - 1 804 - 1 928Other programmes 283 841 282 977 297 1 163 338 1 111 327 870 316 1 542
Total (excluding NHS) 1 778 .. 1 396 5 380 1 310 6 748 1 529 6 783 1 558 6 709 1 685 7 731
1 See chapter text.2 Extramural Includes work performed overseas and excludes monies spent
with other government departments.
3 .. Denotes figures no longer available due to MOD revision between the years1997 - 2000. The details are outlined in Defence Statistics Bulletin 6, which isavailable at the following web address: www.dasa.mod.uk
Source: Office for National Statistics: 01633 456765
20.3 Net central government expenditure on research and development:1European Union objectives for research and development expenditureUnited Kingdom £ million
1995 1996 1997 1998 1999 2000 2001 2002 2003 2004 2005/96 /97 /98 /99 /00 /01 /02 /03 /04 /05 /06
Exploration and exploitation of the earth KDVP 105.2 95.4 81.3 78.5 79.5 85.5 106.0 138.3 176.8 193.0 239.0Infrastructure and general planning of land-use KDVQ 94.1 98.8 98.9 103.5 104.4 102.4 100.3 101.0 118.7 88.0 70.0Control of environmental pollution KDVR 131.8 128.7 136.2 142.8 147.0 151.1 129.1 126.5 150.1 149.0 158.0Protection and promotion of human health (ex NHS) KDVS 416.0 427.4 444.8 450.1 519.5 530.6 571.6 597.8 1 163.7 1 227.3 1 258.0Production, distribution and rational utilisation of energy KDVT 52.3 43.2 41.0 28.0 29.0 31.9 36.8 40.3 28.4 35.0 21.0Agricultural production and technology KDVU 281.9 257.0 268.9 255.5 260.6 266.6 265.2 267.8 275.9 278.0 273.0Industrial production and technology KDVV 165.8 144.6 116.9 61.6 56.5 109.2 237.0 423.4 426.5 138.4 94.0
Social structures and relationships KDVW 137.1 120.7 113.8 154.7 217.6 270.2 268.8 293.4 226.7 291.8 471.0Exploration and exploitation of space KDVX 153.0 164.1 164.4 142.5 142.7 146.3 139.8 155.5 168.6 168.9 192.0Research financed from general university funds KDVY 1 018.6 1 027.5 1 033.3 1 085.1 1 157.1 1 276.1 1 473.5 1 626.4 1 664.6 1 804.7 1 933.0Non-oriented research KDVZ 653.5 680.5 671.0 677.0 700.5 789.3 918.2 1 071.6 1 290.9 1 332.0 1 658.0Other civil research KDWA 24.7 20.5 21.6 25.8 20.6 22.3 19.7 36.3 39.9 38.4 38.0Defence KDWB 2 071.7 2 237.0 2 317.2 2 144.2 2 275.9 2 245.1 2 063.0 2 739.7 2 682.2 2 582.7 2 528.0
Total (Excluding NHS) KDWC 5 305.7 5 445.4 5 509.3 5 349.3 5 710.9 6 026.6 6 329.0 7 618.0 8 413.5 8 327.0 8 932.0
1 See chapter text. Source: Office for National Statistics: 01633 456765

342
Research and development
20.4 Intramural expenditure on Business Enterprise research and development:1by industryUnited Kingdom: At Current Prices and Constant 2006 Prices £ million
Total Civil Defence
2004 2005 2006 2004 2005 2006 2004 2005 2006
Current Prices
Chemicals KDWF 3 864 4 008 4 624 KDWP .. .. .. KDWZ .. .. ..Mechanical engineering KDWG 838 821 874 KDWQ 492 501 564 KDXA 346 320 310Electrical machinery KJRT 1 222 1 273 1 216 KJTC 935 969 880 KJUL 287 305 336Aerospace KDWJ 1 960 2 157 1 836 KDWT 934 890 912 KDXD 1 026 1 267 924Transport equipment KDWK 937 892 913 KDWU .. .. .. KDXE .. .. ..Other manufacturing KDWL 1 242 1 221 1 333 KDWV 1 134 1 131 1 262 KDXF 108 90 71
Manufacturing: Total KDWE 10 064 10 372 10 796 KDWO 8 186 8 274 9 035 KDWY 1 878 2 097 1 762
Services KDWM 2 378 2 730 3 322 KDWW .. 2 573 3 142 KDXG .. 157 180
Agriculture, hunting and forestry; fishing HFRV .. 127 88 HFSA .. .. 88 MKFC .. .. –Extractive industries HFRW 36 43 43 HFSB 36 43 43 MKFD – – –Electricity, gas and water supply HFRX 21 15 21 HFSC 21 15 21 MKFE – – –Construction HFRY .. 33 36 HFSE .. .. 36 MKFF .. .. –
Other: Total HFRU 226 208 187 HFRZ .. 208 187 MKFB .. – –
Total KDWD 12 668 13 310 14 306 KDWN 10 629 11 055 12 364 KDWX 2 039 2 254 1 942
2006 Prices
Chemicals HFXA 4 055 4 120 4 624 HFXJ .. .. .. HFYO .. .. ..Mechanical engineering HFXB 879 844 874 HFXK 516 515 564 HFYP 363 329 310Electrical machinery HFXC 1 282 1 308 1 216 HFYH 981 996 880 HFYQ 301 313 336Aerospace HFXD 2 057 2 217 1 836 HFYI 980 915 912 HFYR 1 077 1 302 924Transport equipment HFXE 983 917 913 HFYJ .. .. .. HFYS .. .. ..Other manufacturing HFXF 1 303 1 255 1 333 HFYK 1 190 1 162 1 262 HFYT 113 93 71
Manufacturing: Total HFWZ 10 561 10 661 10 796 HFXI 8 591 8 504 9 035 HFYN 1 971 2 155 1 762
Services HFXG 2 496 2 806 3 322 HFYL .. 2 645 3 142 HFYU .. 161 180
Agriculture, hunting and forestry: fishing HFSG .. 131 88 HFSL .. .. 88 MKFH .. .. –Extractive industries HFSH 38 44 43 HFSM 38 44 43 MKFI – – –Electricity, gas and water supply HFSI 22 15 21 HFSN 22 15 21 MKFJ – – –Construction HFSJ .. 34 36 HFSO .. .. 36 MKFK .. .. –
Other: Total HFSF 237 214 187 HFSK .. 214 187 MKFG .. – –
Total HFWY 13 294 13 681 14 306 HFXH 11 154 11 363 12 364 HFYM 2 140 2 317 1 942
1 See chapter text. Source: Office for National Statistics: 01633 456765
20.5 Sources of funds for research and development within Business Enterprises1
United Kingdom£ million and percentages
Total Civil Defence
2004 2005 2006 2004 2005 2006 2004 2005 2006
Cash terms (£ million)
Government funds KDYM 1 290 1 110 1 082 KDYU 162 165 172 KDZC 1 128 945 909Overseas funds KDYN 2 958 3 611 3 289 KDYV 2 440 2 683 2 714 KDZD 518 928 575Mainly own funds KDYO 8 420 8 588 9 934 KDYW 8 027 8 207 9 477 KDZE 393 381 458
Total KDYL 12 668 13 310 14 306 KDYT 10 629 11 055 12 364 KDZB 2 039 2 254 1 942
Percentages
Government funds KDYQ 10 8 8 KDYY 2 1 1 KDZG 55 42 47Overseas funds KDYR 23 27 23 KDYZ 23 24 22 KDZH 25 41 30Mainly own funds KDYS 66 65 69 KDZA 76 74 77 KDZI 19 17 24
Total KDYP 100 100 100 KDYX 100 100 100 KDZF 100 100 100
1 See chapter text. Source: Office for National Statistics: 01633 456765

xi
Agriculture, fisheries and food
Agriculture, fisheries and food
Ch
apter 21

344
Agriculture, fisheries and food
that part of tenanted land in Northern Ireland. (Although there has been some updating of the technical procedures for calculating this figure, it corresponds with the previous net rent variable.)
Agricultural censuses and surveys
(Tables 21.3, 21.5 and 21.13)
The coverage for holdings includes all main and minor holdings for each country. Northern Ireland data are now based on all active farm business.
Estimated quantity of crops and grass harvested
(Table 21.4)
The estimated yields of sugar beet and hops are obtained from production figures supplied by British Sugar plc, and the main hop producers in England and Wales. In Great Britain potato yields are estimated in consultation with the British Potato Council.
Forestry
(Table 21.6)
Statistics for state forestry are from Forestry Commission and Forest Service management information systems. For private forestry in Great Britain, statistics on new planting and restocking are based on records of grant aid and estimates of planting undertaken without grant aid, and timber removals are estimated from a survey of the largest timber harvesting companies.
Average weekly earnings and hours of agricultural and horticultural workers
(Tables 21.11 and 21.12)
Prior to 1998, data were collected from a monthly postal survey, which mainly covered male full-time workers. Between 1998 and 2002, the survey collected information on an annual basis via a telephone survey. The survey was reviewed in 2002 and it was concluded that the frequency of the survey should be increased to four times per year to enable the production of more representative annual estimates. The annual sample size has been retained and has been split between four quarterly telephone surveys.
Results for other quarters can be found on the Department for Environment, Food and Rural Affairs (DEFRA) website: www.defra.gov.uk
Agriculture, fisheries and food
Output and input
(Tables 21.1 and 21.2)
For both tables, output is a net of VAT collected on the sale of non-edible products. Figures for total output include subsidies on products, but not other subsidies. Unspecified crops include turf, other minor crops and arable area payments for fodder maize. Eggs include the value of duck eggs and exports of eggs for hatching. Landlords’ expenses are included within farm maintenance, miscellaneous expenditure and depreciation of buildings and works. Also included within ‘other farming costs’ are livestock and crop costs, water costs, insurance premia, bank charges, professional fees, rates, and other farming costs.
Other subsidies
Agri-Environment initiatives include the Environmentally and Nitrate Sensitive Areas, Countryside Stewardship, Countryside Premium, Tir Cymen, Tir Gofal, Moorland, Habitat, Farm Woodland and Organic Farming schemes. Included in ‘other’ subsidies are guidance premium for beef and sheep meat production, Pilot Beef and Sheep Extensification Scheme, non-agricultural horse grazing and farm accounts grant, as well as historic data for fertiliser and lime grant and payments to small scale cereal producers.
Compensation of employees and interest charges
Total compensation of employees excludes the value of work done by farm labour on own account capital formation in buildings and work. ‘Interest’ relates to interest charges on loans for current farming purposes and buildings and less interest on money held on short-term deposit.
Rent
Rent paid (after deductions) is the rent paid on all tenanted land including ‘conacre’ land in Northern Ireland, less landlords’ expenses and the benefit value of dwellings on that land. Rent received (after deductions) is the rent received by farming landowners from renting of land to other farmers, less landlords’ expenses and the benefit value of dwellings on that land. Total net rent is the net rent flowing out of the agricultural sector paid to non-farming landowners, including

345
Agriculture, fisheries and food
The survey covers seven main categories of workers and provides data which are used by the Agricultural Wages Board when considering wage claims and by in considering the cost of labour in agriculture and horticulture.
Data on earnings represents the total earnings of regular fulltime male workers, aged 20 and over. Figures include all payments-in-kind, valued where applicable in accordance with the Agricultural Wages Order. The earnings and hours of hire farm managers are excluded. Part-time workers are defined as those working less than 39 basic hours per week. Casual workers are those employed on a temporary basis.
Fisheries
(Table 21.15)
Fishing fleet information (Table 21.15) is obtained from vessel registers maintained by DEFRA in England and Wales, and the Scottish Executive Agriculture and Fisheries Department.
Estimated average household food consumption – ‘Family Food’ Expenditure and Food Survey
(Table 21.16)
The Expenditure and Food Survey replaced both the National Food Survey and the Family Expenditure Survey in April 2001. The new survey is a voluntary sample survey of private households throughout the UK and the results are produced for the financial year ending 31 March each year. This represents a break in the continuity of the data as results from the National Food Survey were produced for Great Britain and for the calendar year ended 31 December.
The basic unit of the survey is the household, which is defined as a group of persons living at the same address and sharing common catering arrangements. Each individual aged 16 or over in the household visited is asked to keep diary records, for a two-week period, of daily expenditure on, and weight and volume of, food and drink brought into the home and expenditure on food and drink eaten out. Children aged between 7 and 15 are asked to keep simplified diaries.
For the year 2005/06, the sample size was 12,096 households in Great Britain with a response rate of 57 per cent. In Northern Ireland the sample was 1,057 with a response rate of 50 per cent.
.

346
Agriculture, fisheries and food
21.1 Production and income account at current prices1
United Kingdom£ million
1997 1998 1999 2000 2001 2002 2003 2004 2005 2006 20072
Output3
1.Total cereals: C5X5 2 069.6 1 732.9 1 620.2 1 604.3 1 336.8 1 561.5 1 485.7 1 707.2 1 450.0 1 513.4 1 910.1Wheat KFKA 1 357.7 1 186.8 1 105.2 1 119.6 831.5 1 111.7 993.8 1 230.7 1 029.5 1 072.1 1 307.1Rye VQBG 3.1 2.8 1.8 1.5 1.8 1.2 1.4 1.6 1.3 1.4 1.5Barley KFKB 660.8 504.1 474.6 440.8 462.2 401.2 445.8 432.2 383.0 385.5 538.5Oats and summer cereal mixtures KFKC 47.3 38.8 37.9 41.6 40.8 46.5 43.9 41.8 35.2 53.5 62.0Other cereals VQBH 0.7 0.5 0.8 0.8 0.6 0.9 0.9 0.9 0.9 0.9 1.0
2.Total industrial crops VQBI 791.2 848.2 783.3 699.4 773.8 860.0 812.8 798.8 807.9 737.1 779.1Oilseeds VQBJ 254.2 282.9 225.0 143.8 177.2 220.4 314.3 266.2 278.7 318.2 425.8
Oilseed rape KFKG 239.4 262.6 194.8 139.0 171.5 217.4 303.8 256.9 261.7 310.4 421.5Other oil seeds KIBT 14.8 20.3 30.1 4.8 5.6 2.9 10.4 9.3 17.0 7.8 4.2
Sugar beet KFKH 329.1 298.5 279.7 252.1 256.4 282.9 279.7 278.1 268.8 178.2 171.9Other industrial crops VQBK 207.9 266.8 278.7 303.4 340.3 356.7 218.9 254.4 260.4 240.6 181.5
Fibre plants VQBL 3.2 2.6 2.3 1.3 1.7 1.0 1.8 1.3 1.0 1.2 1.2Hops KFKI 18.5 13.1 12.1 10.4 9.0 7.2 6.1 5.7 5.4 4.4 4.4Others4 VQBM 186.3 251.1 264.2 291.7 329.6 348.4 211.0 247.5 254.0 235.1 175.9
3.Total forage plants VQBO 93.4 71.0 75.9 80.9 103.4 90.3 103.7 93.3 94.9 85.1 104.0
4.Total vegetables and horticulturalproducts VQBP 1 621.1 1 627.6 1 667.5 1 561.1 1 612.6 1 591.1 1 672.6 1 621.5 1 690.3 1 760.0 1 843.7
5.Total potatoes (including seeds) KFKO 390.0 629.4 749.0 463.7 682.1 485.0 526.4 674.1 515.0 621.1 663.9
6.Total fruit KFKQ 198.5 258.8 256.9 232.2 238.8 251.2 310.3 315.8 388.1 382.8 444.6
7.Other crop products including seeds VQBQ 42.3 39.4 42.0 37.7 37.5 25.5 31.6 31.0 51.9 47.9 45.1
8.Total crop output (Sum 1 to 7) VQBR 5 206.1 5 207.2 5 194.8 4 679.3 4 785.1 4 864.5 4 943.0 5 241.6 4 998.1 5 147.5 5 790.5
9.Total livestock production VQBS 5 555.1 4 694.3 4 326.5 4 363.8 4 260.9 4 574.9 4 825.6 4 837.1 4 891.6 5 099.5 5 241.8Primarily for meat KFLA 4 834.5 4 099.6 3 929.2 3 970.0 3 634.4 3 868.4 4 094.2 4 179.8 4 232.4 4 339.5 4 418.6
Cattle KFKU 1 160.9 1 052.6 1 145.2 1 093.7 955.3 1 145.8 1 227.1 1 279.2 1 399.7 1 579.1 1 656.7Pigs KFKW 1 201.5 882.4 784.6 800.4 748.5 687.7 671.5 680.2 677.4 684.8 734.6Sheep VQBT 822.4 631.1 574.8 616.8 438.0 613.4 697.7 725.5 682.1 681.6 628.5Poultry KFXX 1 500.6 1 384.7 1 275.8 1 306.5 1 337.6 1 263.9 1 336.7 1 329.3 1 302.2 1 218.4 1 215.5Other animals KFKY 149.1 148.8 148.9 152.6 154.9 157.7 161.2 165.7 170.9 175.5 183.4
Gross fixed capital formation KFLI 720.6 594.7 397.3 393.8 626.5 706.6 731.4 657.2 659.3 760.1 823.1Cattle KUJZ 378.1 296.9 206.9 192.9 371.3 392.2 447.7 337.4 411.2 490.8 520.1Pigs LUKB 15.2 5.7 6.9 5.6 5.3 7.5 7.1 7.5 6.3 7.9 7.1Sheep LUKA 196.1 155.3 56.7 63.9 122.5 177.5 146.5 176.4 111.0 130.3 153.3Poultry LUKC 131.1 136.8 126.8 131.4 127.4 129.3 130.1 135.9 130.8 131.1 142.6
10.Total livestock products KFLF 3 540.3 3 067.1 2 963.0 2 711.3 3 088.1 2 834.2 3 032.1 3 040.2 3 009.5 2 917.8 3 293.5Milk KFLB 3 167.6 2 740.7 2 662.0 2 385.8 2 742.6 2 466.3 2 628.5 2 610.5 2 592.6 2 497.5 2 829.8Eggs KFLC 312.3 281.5 253.9 280.2 307.0 314.3 337.8 380.6 349.3 361.1 409.8Raw wool KFLD 35.1 23.9 21.4 22.7 17.3 19.1 20.8 20.2 19.6 11.5 13.5Other animal products KFLE 25.3 21.0 25.7 22.6 21.2 34.5 45.1 28.9 48.1 47.7 40.4
11.Total livestock output (9+10) VQBV 9 095.4 7 761.4 7 289.5 7 075.1 7 349.0 7 409.1 7 857.8 7 877.2 7 901.1 8 017.3 8 535.2
12.Total other agricultural activities LUOS 722.3 689.2 726.0 638.1 632.2 644.2 632.5 718.3 642.3 627.4 624.8Agricultural services LUKD 575.0 570.2 609.5 587.0 604.0 601.4 592.3 636.2 632.6 626.3 623.9Leasing out quota VQBW 147.2 119.1 116.5 51.2 28.1 42.8 40.2 82.0 9.7 1.0 0.9
13.Total inseparable non-agriculturalactivities LUOT 371.6 421.1 430.4 488.3 624.0 559.8 592.3 637.3 673.5 710.3 771.1
14.Gross output at market prices(8+11+12+13) LUOV 15 395.4 14 079.0 13 640.7 12 880.8 13 390.3 13 477.7 14 025.5 14 474.5 14 215.1 14 502.5 15 721.6
15.Total subsidies (less taxes) onproduct LUOU 2 402.9 2 260.0 2 213.6 2 011.7 1 749.7 1 941.8 1 976.1 2 167.5 208.3 81.6 60.0
16.Output at basic prices (14+15) KFLT 17 798.3 16 338.9 15 854.3 14 892.4 15 140.0 15 419.5 16 001.6 16 642.0 14 423.5 14 584.1 15 781.7of which transactions within theagricultural industry
Feed wheat LUNQ 77.3 78.8 64.4 39.8 41.0 42.5 69.6 103.1 87.0 75.9 93.7Feed barley LUNR 192.8 163.6 147.9 136.9 148.5 146.9 148.6 147.9 137.8 147.2 193.6Feed oats LUNS 11.8 11.5 14.5 12.6 12.8 12.2 12.0 14.3 12.2 14.9 17.0Seed potatoes LUNT 9.2 12.7 28.8 6.9 14.0 12.1 4.0 9.2 12.5 16.0 7.8Straw LUNU 160.3 222.1 232.9 258.6 291.2 306.5 177.0 209.0 210.8 191.0 136.6Contract work LUNV 575.0 570.2 609.5 587.0 604.0 601.4 592.3 636.2 632.6 626.3 623.9Leasing of quota LUNW 147.2 119.1 116.5 51.2 28.1 42.8 40.2 82.0 9.7 1.0 0.9Total capital formation in livestock LUNX 720.6 594.7 397.3 393.8 626.5 706.6 731.4 657.2 659.3 760.1 823.1
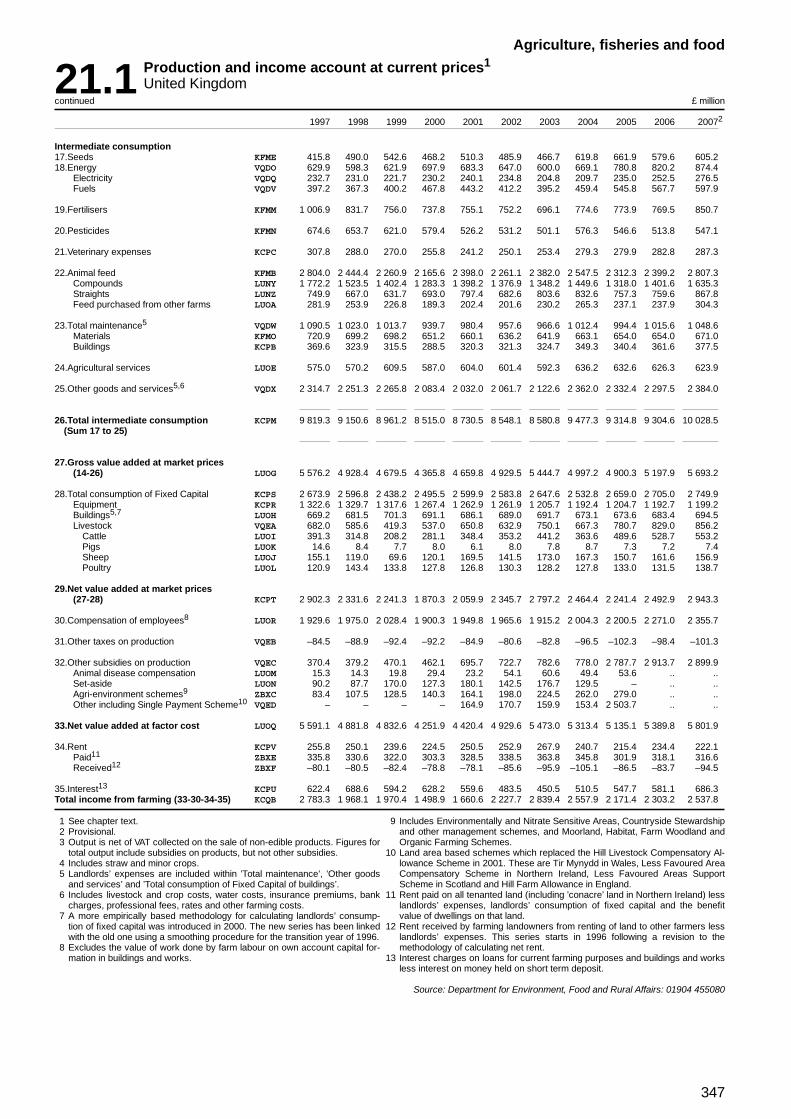
347
Agriculture, fisheries and food
21.1 Production and income account at current prices1
United Kingdomcontinued £ million
1997 1998 1999 2000 2001 2002 2003 2004 2005 2006 20072
Intermediate consumption17.Seeds KFME 415.8 490.0 542.6 468.2 510.3 485.9 466.7 619.8 661.9 579.6 605.218.Energy VQDO 629.9 598.3 621.9 697.9 683.3 647.0 600.0 669.1 780.8 820.2 874.4
Electricity VQDQ 232.7 231.0 221.7 230.2 240.1 234.8 204.8 209.7 235.0 252.5 276.5Fuels VQDV 397.2 367.3 400.2 467.8 443.2 412.2 395.2 459.4 545.8 567.7 597.9
19.Fertilisers KFMM 1 006.9 831.7 756.0 737.8 755.1 752.2 696.1 774.6 773.9 769.5 850.7
20.Pesticides KFMN 674.6 653.7 621.0 579.4 526.2 531.2 501.1 576.3 546.6 513.8 547.1
21.Veterinary expenses KCPC 307.8 288.0 270.0 255.8 241.2 250.1 253.4 279.3 279.9 282.8 287.3
22.Animal feed KFMB 2 804.0 2 444.4 2 260.9 2 165.6 2 398.0 2 261.1 2 382.0 2 547.5 2 312.3 2 399.2 2 807.3Compounds LUNY 1 772.2 1 523.5 1 402.4 1 283.3 1 398.2 1 376.9 1 348.2 1 449.6 1 318.0 1 401.6 1 635.3Straights LUNZ 749.9 667.0 631.7 693.0 797.4 682.6 803.6 832.6 757.3 759.6 867.8Feed purchased from other farms LUOA 281.9 253.9 226.8 189.3 202.4 201.6 230.2 265.3 237.1 237.9 304.3
23.Total maintenance5 VQDW 1 090.5 1 023.0 1 013.7 939.7 980.4 957.6 966.6 1 012.4 994.4 1 015.6 1 048.6Materials KFMO 720.9 699.2 698.2 651.2 660.1 636.2 641.9 663.1 654.0 654.0 671.0Buildings KCPB 369.6 323.9 315.5 288.5 320.3 321.3 324.7 349.3 340.4 361.6 377.5
24.Agricultural services LUOE 575.0 570.2 609.5 587.0 604.0 601.4 592.3 636.2 632.6 626.3 623.9
25.Other goods and services5,6 VQDX 2 314.7 2 251.3 2 265.8 2 083.4 2 032.0 2 061.7 2 122.6 2 362.0 2 332.4 2 297.5 2 384.0
26.Total intermediate consumption KCPM 9 819.3 9 150.6 8 961.2 8 515.0 8 730.5 8 548.1 8 580.8 9 477.3 9 314.8 9 304.6 10 028.5(Sum 17 to 25)
27.Gross value added at market prices(14-26) LUOG 5 576.2 4 928.4 4 679.5 4 365.8 4 659.8 4 929.5 5 444.7 4 997.2 4 900.3 5 197.9 5 693.2
28.Total consumption of Fixed Capital KCPS 2 673.9 2 596.8 2 438.2 2 495.5 2 599.9 2 583.8 2 647.6 2 532.8 2 659.0 2 705.0 2 749.9Equipment KCPR 1 322.6 1 329.7 1 317.6 1 267.4 1 262.9 1 261.9 1 205.7 1 192.4 1 204.7 1 192.7 1 199.2Buildings5,7 LUOH 669.2 681.5 701.3 691.1 686.1 689.0 691.7 673.1 673.6 683.4 694.5Livestock VQEA 682.0 585.6 419.3 537.0 650.8 632.9 750.1 667.3 780.7 829.0 856.2
Cattle LUOI 391.3 314.8 208.2 281.1 348.4 353.2 441.2 363.6 489.6 528.7 553.2Pigs LUOK 14.6 8.4 7.7 8.0 6.1 8.0 7.8 8.7 7.3 7.2 7.4Sheep LUOJ 155.1 119.0 69.6 120.1 169.5 141.5 173.0 167.3 150.7 161.6 156.9Poultry LUOL 120.9 143.4 133.8 127.8 126.8 130.3 128.2 127.8 133.0 131.5 138.7
29.Net value added at market prices(27-28) KCPT 2 902.3 2 331.6 2 241.3 1 870.3 2 059.9 2 345.7 2 797.2 2 464.4 2 241.4 2 492.9 2 943.3
30.Compensation of employees8 LUOR 1 929.6 1 975.0 2 028.4 1 900.3 1 949.8 1 965.6 1 915.2 2 004.3 2 200.5 2 271.0 2 355.7
31.Other taxes on production VQEB –84.5 –88.9 –92.4 –92.2 –84.9 –80.6 –82.8 –96.5 –102.3 –98.4 –101.3
32.Other subsidies on production VQEC 370.4 379.2 470.1 462.1 695.7 722.7 782.6 778.0 2 787.7 2 913.7 2 899.9Animal disease compensation LUOM 15.3 14.3 19.8 29.4 23.2 54.1 60.6 49.4 53.6 .. ..Set-aside LUON 90.2 87.7 170.0 127.3 180.1 142.5 176.7 129.5 – .. ..Agri-environment schemes9 ZBXC 83.4 107.5 128.5 140.3 164.1 198.0 224.5 262.0 279.0 .. ..Other including Single Payment Scheme10 VQED – – – – 164.9 170.7 159.9 153.4 2 503.7 .. ..
33.Net value added at factor cost LUOQ 5 591.1 4 881.8 4 832.6 4 251.9 4 420.4 4 929.6 5 473.0 5 313.4 5 135.1 5 389.8 5 801.9
34.Rent KCPV 255.8 250.1 239.6 224.5 250.5 252.9 267.9 240.7 215.4 234.4 222.1Paid11 ZBXE 335.8 330.6 322.0 303.3 328.5 338.5 363.8 345.8 301.9 318.1 316.6Received12 ZBXF –80.1 –80.5 –82.4 –78.8 –78.1 –85.6 –95.9 –105.1 –86.5 –83.7 –94.5
35.Interest13 KCPU 622.4 688.6 594.2 628.2 559.6 483.5 450.5 510.5 547.7 581.1 686.3Total income from farming (33-30-34-35) KCQB 2 783.3 1 968.1 1 970.4 1 498.9 1 660.6 2 227.7 2 839.4 2 557.9 2 171.4 2 303.2 2 537.8
1 See chapter text.2 Provisional.3 Output is net of VAT collected on the sale of non-edible products. Figures for
total output include subsidies on products, but not other subsidies.4 Includes straw and minor crops.5 Landlords’ expenses are included within ’Total maintenance’, ’Other goods
and services’ and ’Total consumption of Fixed Capital of buildings’.6 Includes livestock and crop costs, water costs, insurance premiums, bank
charges, professional fees, rates and other farming costs.7 A more empirically based methodology for calculating landlords’ consump-
tion of fixed capital was introduced in 2000. The new series has been linkedwith the old one using a smoothing procedure for the transition year of 1996.
8 Excludes the value of work done by farm labour on own account capital for-mation in buildings and works.
9 Includes Environmentally and Nitrate Sensitive Areas, Countryside Stewardshipand other management schemes, and Moorland, Habitat, Farm Woodland andOrganic Farming Schemes.
10 Land area based schemes which replaced the Hill Livestock Compensatory Al-lowance Scheme in 2001. These are Tir Mynydd in Wales, Less Favoured AreaCompensatory Scheme in Northern Ireland, Less Favoured Areas SupportScheme in Scotland and Hill Farm AIlowance in England.
11 Rent paid on all tenanted land (including ’conacre’ land in Northern Ireland) lesslandlords’ expenses, landlords’ consumption of fixed capital and the benefitvalue of dwellings on that land.
12 Rent received by farming landowners from renting of land to other farmers lesslandlords’ expenses. This series starts in 1996 following a revision to themethodology of calculating net rent.
13 Interest charges on loans for current farming purposes and buildings and worksless interest on money held on short term deposit.
Source: Department for Environment, Food and Rural Affairs: 01904 455080

348
Agriculture, fisheries and food
21.2 Output and input volume indices1
United KingdomIndices (2000=100)
1996 1997 1998 1999 2000 2001 2002 2003 2004 2005 2006
Outputs2
1. Total cereals: VQAN 102.5 97.7 95.0 92.1 100.0 79.5 95.9 89.9 93.0 88.3 86.6Wheat LUKH 96.5 89.5 92.4 89.0 100.0 70.2 95.9 86.0 93.3 89.4 88.5Rye VQAO 131.8 131.8 104.5 104.5 100.0 104.5 90.9 86.4 86.4 86.4 86.4Barley LUKI 119.1 120.1 102.2 100.8 100.0 102.2 94.3 97.8 89.0 85.2 81.6Oats and summer cereal mixtures LUKJ 92.7 90.8 92.1 84.2 100.0 97.0 103.5 113.3 116.0 84.7 81.4Other cereals VQAP 68.6 64.4 53.1 82.4 100.0 74.5 109.1 107.3 104.6 105.1 102.1
2. Total industrial crops: VQAQ 109.5 111.9 113.5 117.5 100.0 93.3 105.7 109.3 105.7 103.7 95.3Oil seeds VQAR 127.2 139.2 145.7 166.7 100.0 100.3 124.1 153.3 139.9 168.0 161.4Oilseed rape VQAS 124.2 135.1 138.9 148.5 100.0 100.7 127.2 153.8 140.6 165.8 163.0Other oil seeds LUKN 202.7 248.8 335.5 708.3 100.0 90.2 42.7 138.1 121.3 208.8 114.6Sugar beet C5X4 114.8 122.1 110.2 116.6 100.0 91.8 105.3 101.0 99.6 95.7 78.8
Other industrial crops VQAU 101.4 90.2 103.4 95.2 100.0 91.2 97.2 91.9 93.1 75.5 72.4Fibre plants VQAV 167.9 169.5 138.3 139.6 100.0 69.3 40.3 67.3 47.7 31.4 39.3Hops LUKP 203.1 192.5 131.9 112.4 100.0 94.3 94.5 72.4 72.4 61.9 51.1Others3 VQAW 96.8 85.4 102.1 94.4 100.0 91.2 97.6 92.5 94.0 76.1 73.2
3.Total forage plants VQAX 86.6 97.9 93.1 96.7 100.0 117.0 117.2 115.6 111.4 113.4 100.2
4.Total vegetables and horticulturalProducts: VQAY 104.4 102.9 100.4 102.4 100.0 96.8 96.1 93.5 95.2 95.0 89.8
Fresh vegetables LUKX 112.8 107.5 105.4 106.2 100.0 96.6 88.3 87.8 88.1 91.1 89.7Plants and flowers LUKZ 93.8 97.0 94.1 97.5 100.0 97.0 106.6 101.3 104.8 100.4 90.3
5.Total potatoes (including seeds) LUKW 114.0 108.3 95.6 113.4 100.0 105.9 106.8 92.1 101.3 92.2 95.0
6.Total fruit LUKY 122.2 81.3 103.9 108.2 100.0 105.8 99.8 109.7 127.7 149.6 160.3
7.Other crop products including seeds VQAZ 89.8 98.5 91.3 101.8 100.0 101.2 69.0 83.0 84.6 81.9 80.3
8.Total crop output VQBA 105.6 101.5 99.6 102.4 100.0 92.1 98.9 95.7 98.7 96.8 93.8
9.Total livestock production VQBB 102.6 108.2 109.1 105.4 100.0 94.4 97.4 95.9 98.1 99.1 100.2Mainly for meat processing LULH 101.3 106.5 107.9 104.7 100.0 91.9 95.3 95.1 97.5 99.4 100.0
Cattle LULC 94.5 98.5 101.2 103.1 100.0 88.6 102.6 105.9 104.3 112.6 118.1Pigs LULE 116.1 127.4 129.1 118.4 100.0 91.7 87.4 77.5 78.3 78.5 77.9Sheep LULD 93.3 98.4 104.2 104.1 100.0 71.7 81.8 83.4 88.5 89.5 88.7Poultry LULF 103.9 106.4 104.5 99.2 100.0 103.5 99.4 101.0 106.8 104.2 101.8Other animals LULG 100.1 100.5 100.6 100.0 100.0 99.7 99.8 99.3 99.1 99.6 98.9
Gross fixed capital formation LULR 114.2 123.3 121.0 113.2 100.0 115.8 115.9 106.6 107.1 102.0 105.8Cattle LULN 118.4 116.7 113.8 114.5 100.0 116.0 110.6 109.4 101.6 104.2 106.7Pigs LULP 165.3 173.7 131.0 147.1 100.0 84.5 127.6 101.0 94.7 80.3 101.5Sheep LULO 145.1 188.3 196.0 147.5 100.0 155.6 173.6 126.4 149.4 117.2 132.3Poultry LULQ 101.2 108.5 102.3 96.7 100.0 95.7 95.3 95.0 98.0 94.0 93.3
10.Total livestock products LULM 100.7 102.0 100.7 102.8 100.0 101.6 102.9 104.1 101.7 101.2 100.0Milk LULI 101.0 102.0 100.4 102.8 100.0 101.2 102.3 103.5 100.3 99.6 98.7Eggs LULJ 96.8 101.3 102.3 101.1 100.0 107.3 107.0 105.3 114.0 115.1 111.1Raw wool LULK 103.7 105.7 112.6 103.9 100.0 83.1 86.3 84.4 85.7 87.9 82.1Other animal products LULL 106.8 112.4 100.1 118.7 100.0 88.2 139.6 173.9 105.3 105.2 105.3
11.Total livestock output VQBC 101.8 105.6 105.7 104.4 100.0 97.2 99.6 99.1 99.5 100.0 100.2
12.Total other agricultural activities VQBD 115.9 111.0 110.6 116.2 100.0 99.0 100.7 101.5 106.5 96.2 95.7Agricultural services VQBE 92.7 94.0 99.1 105.9 100.0 102.9 102.5 100.9 106.3 103.3 103.3Leasing out quota VQBF 399.3 311.3 243.4 234.5 100.0 54.0 80.9 107.4 107.2 19.6 13.6
13.Total inseparable non-agriculturalActivities LULX 82.5 82.0 90.3 91.1 100.0 124.4 108.2 110.9 113.5 120.4 123.6

349
Agriculture, fisheries and food
21.2 Output and input volume indices1
United Kingdomcontinued Indices (2000=100)
1996 1997 1998 1999 2000 2001 2002 2003 2004 2005 2006
14.Gross output at market prices VQEG 102.9 103.5 103.1 103.7 100.0 96.4 99.7 98.4 100.1 99.4 98.6
15.Total subsidies (less taxes) on product VQEE .. .. .. .. .. .. .. .. .. .. ..
16.Output at basic prices LULY 102.3 103.7 103.6 104.3 100.0 94.9 99.5 98.5 100.0 99.8 98.9of which transactions within theagricultural industry
Feed wheat LULZ 101.2 146.4 174.7 145.6 100.0 95.8 103.2 163.3 221.7 218.0 192.7Feed barley LUMA 93.8 112.1 110.1 101.2 100.0 108.2 114.9 108.1 98.0 101.9 107.1Feed oats LUMB 82.0 75.0 92.1 108.6 100.0 103.3 97.1 96.7 93.7 75.6 80.5Seed potatoes LUMC 165.7 116.9 114.5 114.2 100.0 109.3 110.7 56.2 77.6 100.5 159.9Straw LUMD 97.4 84.4 102.9 93.9 100.0 89.8 95.8 89.9 90.9 71.3 67.5Contract work LUME 92.7 94.0 99.1 105.9 100.0 102.9 102.5 100.9 106.3 103.3 103.3Leasing of quota LUMF 399.3 311.3 243.4 234.5 100.0 54.0 80.9 107.4 107.2 19.6 13.6Total capital formation in livestock LUMG 114.1 123.3 121.0 113.2 100.0 115.8 116.0 106.7 107.2 102.0 105.9
Intermediate Consumption17.Seeds LUMO 112.9 109.5 105.0 104.9 100.0 104.2 99.1 98.8 99.9 100.9 103.4
Cereals LUMM .. .. .. .. .. .. .. .. .. .. ..Other LUMN .. .. .. .. .. .. .. .. .. .. ..
18.Energy VQEH 106.3 103.3 108.3 101.6 92.8 94.0 93.4 79.4 82.0 76.5 ..Electricity VQEI 106.2 104.0 113.7 108.1 100.0 108.2 110.3 89.6 86.6 85.4 83.4Fuels VQEJ 119.8 115.9 118.2 110.1 100.0 97.8 95.8 83.5 89.0 81.2 76.9
19.Fertilisers VQEK 119.6 130.3 122.1 114.2 100.0 87.4 91.2 78.2 79.4 71.2 68.9
20.Pesticides LUMQ 96.6 100.1 104.3 101.4 100.0 93.9 95.8 90.5 99.4 92.1 91.9
21.Veterinary expenses LUMW 118.1 120.4 111.4 104.3 100.0 95.6 100.0 97.6 104.6 104.2 95.9
22.Animal feed LUML 106.8 103.1 103.4 104.2 100.0 103.8 101.3 105.5 107.4 110.8 106.1Compounds LUMH 113.0 108.6 105.9 108.8 100.0 102.9 102.3 102.2 103.3 99.8 105.4Straights LUMI 98.5 88.4 92.8 93.2 100.0 105.2 96.7 107.9 110.2 127.8 101.8Feed purchased from other farms LUMJ 94.5 117.1 122.8 111.2 100.0 105.2 111.2 120.0 125.8 126.6 125.3
23.Total maintenance4 VQEL 124.8 121.2 112.9 110.6 100.0 102.1 96.2 92.7 93.1 86.3 85.7Materials LUMU 120.1 115.4 112.1 109.5 100.0 98.5 91.0 86.4 85.5 78.8 78.1Buildings LUMT 135.1 134.1 114.7 113.1 100.0 110.4 108.3 107.0 110.8 103.8 103.6
24.Agricultural services VQEM 92.7 94.0 99.1 105.9 100.0 102.9 102.5 100.9 106.3 103.3 103.3
25.Other goods and services4,5 VQEO 121.7 121.0 115.1 111.4 100.0 93.9 92.4 99.0 103.7 95.5 91.3
26.Total intermediate consumption LUNE 112.9 112.3 110.0 108.0 100.0 98.4 97.0 96.4 99.6 95.5 92.5
27.Gross value added at market prices LUNF 87.3 89.2 91.5 96.3 100.0 93.0 104.1 101.8 100.8 106.8 110.3
28.Total consumption of Fixed Capital LUNN 106.0 103.5 102.7 101.3 100.0 98.2 93.9 93.2 92.3 93.4 90.9Equipment LUNI 106.5 106.4 104.4 102.3 100.0 97.7 96.1 94.7 94.1 92.6 90.8Buildings4,6 LUNG 105.9 107.7 107.0 104.3 100.0 101.2 103.0 100.2 97.8 94.2 91.6Livestock VQES 101.9 91.3 92.8 94.3 100.0 96.0 81.2 83.4 83.3 92.3 88.8
Cattle LUNJ 98.6 87.0 86.1 88.1 100.0 86.4 76.0 81.0 80.9 92.2 87.8Pigs LUNL 111.4 121.3 130.0 117.4 100.0 68.2 99.3 79.4 79.6 69.3 64.5Sheep LUNK 99.4 82.9 85.1 95.1 100.0 120.7 78.9 78.1 79.0 86.6 85.5Poultry LUNM 102.3 102.8 110.3 105.0 100.0 98.0 98.8 96.2 94.7 98.1 95.6
29.Net value added at market prices LUNO 71.9 76.1 80.6 91.0 100.0 86.9 116.6 112.2 111.2 123.6 135.8
1 See chapter text.2 Output is net of VAT collected on the sale of non-edible products. Figures for
total output include subsidies on products, but not other subsidies.3 Includes straw and minor crops.4 Landlords’ expenses are included within ’Total maintenance’, ’Other goods
and services’ and ’Total consumption of Fixed Capital of buildings’.
5 Includes livestock and crop costs, water costs, insurance premiums, bankcharges, professional fees, rates, and other farming costs.
6 A more empirically based methodology for calculating landlords’ depreciationwas introduced in 2000. The new series has been linked with the old one usinga smoothing procedure for the transition year of 1996.
Source: Department for Environment, Food and Rural Affairs: 01904 455080

350
Agriculture, fisheries and food
21.3 Agriculture land-useUnited KingdomArea at the June Survey1 Thousand hectares
1997 1998 1999 2000 2001 2002 2003 2004 2005 2006 2007
Total agricultural area BFAH 18 653 18 604 18 579 18 311 18 594 18 537 18 464 18 432 18 502 18 713 18 602Crops BFAA 4 990 4 971 4 709 4 665 4 493 4 604 4 475 4 589 4 437 4 340 4 350Bare fallow BFAB 29 34 33 37 43 33 29 29 164 197 165
Total tillage KIJR 5 020 5 005 4 742 4 702 4 536 4 636 4 504 4 619 4 600 4 536 4 515All grass under 5 years old KFEM 1 405 1 301 1 226 1 226 1 205 1 243 1 200 1 246 1 193 1 137 1 176
Total arable land KFEN 6 425 6 306 5 968 5 928 5 741 5 879 5 705 5 864 5 794 5 673 5 691All grasses 5 years old and over KFEO 5 282 5 364 5 449 5 364 5 584 5 519 5 683 5 620 5 711 5 967 5 965
Total tillage and grass KFEP 11 706 11 671 11 417 11 292 11 325 11 397 11 388 11 485 11 505 11 641 11 656Sole right rough grazing BFAD 4 657 4 621 4 575 4 445 4 435 4 488 4 329 4 326 4 354 4 491 4 313Set aside DMNF 306 313 572 567 800 611 689 559 535 466 440All other land on agricultural holdingsincluding woodland BFAE 763 773 789 780 801 802 792 825 872 874 954
Total land on agricultural holdings BFAF 17 432 17 377 17 352 17 083 17 361 17 303 17 227 17 195 17 266 17 472 17 363Common rough grazing (estimated) BFAG 1 221 1 227 1 227 1 228 1 232 1 234 1 236 1 237 1 236 1 241 1 238
Crops BFAA 4 990 4 971 4 709 4 665 4 493 4 604 4 475 4 589 4 437 4 340 4 350Cereals BFAJ 3 514 3 418 3 141 3 348 3 014 3 245 3 057 3 130 2 919 2 861 2 871
Wheat BFAK 2 036 2 045 1 847 2 086 1 635 1 996 1 837 1 990 1 867 1 833 1 816Barley BFAL 1 359 1 253 1 179 1 128 1 245 1 101 1 076 1 007 938 881 898Oats BFAM 100 98 92 109 112 126 121 108 90 121 129Mixed corn BFAN 2 2 2 2 3 4 4 .. .. .. ..Rye2 BFAO 9 10 8 7 5 5 4 6 .. .. ..Triticale3 DMNH 8 11 13 16 14 14 15 15 13 13 16
Other arable crops (excluding potatoes) DMNI 1 125 1 210 1 211 979 1 141 1 024 1 098 1 136 1 211 1 172 1 170Oilseed rape BFAP 445 507 417 332 404 357 460 498 519 500 602Sugar beet not for stock feeding2 BFAQ 196 189 183 173 177 169 162 154 148 130 125Hops4 DMNJ 3 3 3 2 2 2 2 2 1 1 ..Peas for harvesting dry and field beans DMNK 197 213 202 208 276 249 235 242 239 231 161Linseed DMNL 73 100 209 71 31 12 32 30 45 33 11Other crops DMNM 210 200 197 192 214 204 201 203 252 278 272
Potatoes BFAR 166 164 178 166 165 158 145 148 137 140 140
Horticultural BFAV 184 180 179 172 173 176 176 175 170 166 169Vegetables grown in the open DMNN 126 125 126 119 120 124 125 125 121 119 121Orchard fruit5 BFBG 30 30 28 28 28 26 25 24 23 23 23Soft fruit DMNO 11 10 9 10 9 9 9 9 9 10 9Ornamentals DMNP 14 14 13 14 14 15 14 15 14 12 13Glasshouse crops DMNQ 2 2 2 2 2 2 2 2 2 2 2
1 Includes estimates for minor holdings for all countries. See chapter text.2 Figures are for England and Wales only.3 Figures for 2004 do not include Wales.4 Figures are for England only from 2005. From 2007 are included in Other
Crops.5 Includes non-commercial orchards.
Source: Agricultural Departments: 01904 455332

351
Agriculture, fisheries and food
21.4 Estimated quantity of crops and grass harvested1
United KingdomThousand tonnes
1996 1997 1998 1999 2000 2001 2002 2003 2004 2005 2006
Agricultural cropsWheat BADO 16 100 15 020 16 449 14 867 16 704 11 580 15 973 14 288 15 473 14 863 14 735Barley (Winter and Spring) . BADP 7 790 7 830 6 623 6 581 6 492 6 660 6 126 6 370 5 816 5 495 5 239Oats BADQ 590 575 586 541 640 621 753 749 627 532 728Sugar beet2 BADR 10 420 11 084 10 002 10 584 9 079 8 335 9 557 9 168 9 042 8 687 7 400Potatoes BADS 7 228 7 128 6 422 7 131 6 636 6 649 6 966 6 058 6 246 5 979 5 727
1996 1997 1998 1999 2000 2001 2002 2003 2004 2005 2006/97 /98 /99 /00 /01 /02 /03 /04 /05 /06 /07
Horticultural cropsField vegetables
Brussels sprouts BADT 82.6 74.2 72.5 78.5 67.3 54.8 42.7 55.8 45.1 46.1 44.8Cabbage (including savoys
and spring greens) BADU 360.1 309.7 283.6 269.1 254.3 282.1 244.0 229.2 222.0 262.7 274.9Cauliflowers BADV 217.1 191.0 191.7 172.4 156.1 107.4 115.8 126.3 168.3 133.2 123.7Carrots BADW 624.4 623.1 617.6 673.2 725.8 760.0 718.4 602.4 671.1 710.1 701.3Turnips and swedes BADX 135.6 106.9 117.5 123.3 132.1 141.8 104.7 96.5 97.0 103.1 105.7
Beetroot BADY 72.1 72.4 69.5 63.4 67.1 68.6 56.3 58.8 53.9 51.0 57.3Onions, dry bulb BADZ 313.3 329.3 342.0 391.4 392.7 374.9 283.4 373.6 340.9 413.6 358.8Peas, green for market
(in pod weight) BAEA 6.7 8.2 7.0 7.0 6.7 6.2 7.2 5.9 5.9 5.9 5.9Peas, green for processing
(shelled weight) BAEB 215.5 167.9 152.0 143.1 184.5 161.0 169.3 167.6 131.1 129.0 124.4Lettuce BAEC 187.5 157.7 151.8 155.2 135.8 123.9 109.9 125.6 140.9 131.7 126.4
Protected cropsTomatoes BAED 115.5 114.0 107.6 116.6 113.0 109.1 100.9 75.6 78.6 78.8 83.6Cucumbers BAEE 85.6 81.7 83.8 83.8 79.8 71.5 73.6 77.0 61.4 59.9 56.5Lettuce BAEF 26.5 24.1 20.6 19.9 18.7 20.9 16.0 16.6 10.4 8.1 8.2
FruitDessert apples BFCD 105.4 96.0 97.8 133.9 101.3 104.4 84.0 69.0 92.2 118.0 129.3Cooking apples BFCE 118.5 91.1 85.9 112.4 107.5 107.4 95.3 74.9 78.2 100.1 111.5Soft fruit BFCF 83.4 60.6 60.8 67.2 65.4 64.6 67.1 79.6 86.0 105.4 107.7Pears BFBQ 35.8 33.0 26.3 22.7 26.6 38.5 34.2 29.6 22.7 23.4 28.4
1 See chapter text.2 Figures are adjusted to constant 16% sugar content.
Source: Agricultural Departments: 01904 455332

352
Agriculture, fisheries and food
21.5 Cattle, sheep, pigs and poultry on agricultural holdings1
United KingdomAt June each year Thousands
1997 1998 1999 2000 2001 2002 2003 2004 2005 2006 2007
Total cattle and calves2 BFCG 11 637 11 519 11 423 11 135 10 602 10 345 10 508 10 588 10 770 10 579 10 304
of which:dairy cows BFCH 2 478 2 439 2 440 2 336 2 251 2 227 2 191 2 129 2 063 2 066 1 954beef cows BFCI 1 862 1 947 1 924 1 842 1 708 1 657 1 698 1 736 1 762 1 733 1 698heifers in calf BFCJ 848 787 763 718 701 728 679 690 638 645 ..
Total sheep and lambs BFCM 42 823 44 471 44 656 42 264 36 716 35 834 35 812 35 817 35 416 34 722 33 946
of which:ewes and shearlings CKUQ 20 696 21 260 21 458 20 449 17 921 17 630 17 580 17 630 16 935 16 637 16 064lambs under one year old BFCP 21 032 22 138 22 092 20 857 17 769 17 310 17 322 17 238 17 488 17 058 16 855
Total pigs BFCQ 8 072 8 146 7 284 6 482 5 845 5 588 5 046 5 159 4 862 4 933 4 834
of which:sows in pig and other sows for breeding CKUU 683 675 603 537 527 483 442 449 403 401 398gilts in pig CKUR 116 103 85 73 71 74 73 66 67 67 57
Total fowls KPSV .. .. .. .. .. .. 165 285 167 825 160 509 158 202 157 513
of which:table fowls including broilers CKUT .. 98 244 101 625 105 689 112 531 105 137 116 738 119 888 111 475 110 672 108 753laying fowls3 CKUV 34 286 29 483 29 258 28 687 29 895 28 778 29 274 29 655 29 544 28 632 27 321growing pullets CKUW 11 510 9 860 9 583 9 461 9 367 9 784 8 286 8 156 10 928 9 625 8 936
1 Includes estimates for minor holdings for all countries. See chapter text.2 In 2007 the cattle figures were sourced form the Cattle Tracin System (CTS)
in England and Wales, the equivalent APHIS system in Northern Ireland andsurvey data in Scotland and are therefore no directly comparable with earlieryears. To see comparable data for 2005-2007 please go to: http://statis-tics.defra.gov.uk/esg/statnot/june_uk.pdf
3 Excludes fowls laying eggs for hatching.
Sources: Department for Environment, Food and Rural Affairs;Farming Statistics: 01904 455332

353
Agriculture, fisheries and food
21.6 Forestry1
United Kingdom
1980 1990 2000 2002 2003 2004 2005 2006 2007
Woodland area2 - (Thousand hectares)
United Kingdom C5OF 2 175 2 400 2 793 2 800 2 807 2 816 2 825 2 829 2 837England3 C5OG 948 958 1 103 1 104 1 110 1 114 1 119 1 121 1 124Wales3 C5OI 241 248 289 288 285 286 286 285 285Scotland3 C5OH 920 1 120 1 318 1 324 1 327 1 330 1 334 1 337 1 341Northern Ireland C5OJ 67 74 83 84 85 86 85 86 87
Forestry Commission/Forest Service C5OK 946 956 886 855 848 842 838 832 827Other5 C5OL 1 230 1 443 1 907 1 945 1 960 1 974 1 987 1 997 2 010
Conifer C5OM 1 372 1 576 1 663 1 658 1 652 1 651 1 647 1 642 1 640Broadleaved6 C5ON 804 824 1 131 1 143 1 155 1 165 1 178 1 187 1 197
1996 1997 1998 1999 2000 2001 2002 2003 2004 2005 2006/97 /98 /99 /00 /01 /02 /03 /04 /05 /06 /07
New Planting7 - (Thousand hectares)
United Kingdom C5OO 17.6 16.9 17.0 17.9 18.7 14.4 13.5 12.4 11.9 8.7 10.7England C5OP 4.7 4.4 5.1 5.9 5.9 5.4 5.9 4.6 5.3 3.7 3.2Wales C5OR 0.4 0.5 0.6 0.7 0.4 0.3 0.3 0.5 0.5 0.5 0.4Scotland C5OQ 11.8 11.4 10.5 10.4 11.7 8.0 6.7 6.8 5.7 4.0 6.6Northern Ireland C5OS 0.8 0.6 0.7 0.8 0.7 0.7 0.6 0.5 0.4 0.6 0.5
Forestry Commission/Forest Service . C5OT 0.6 0.2 0.2 0.3 0.3 0.8 0.9 0.3 0.1 0.3 0.2Other8 C5OU 17.0 16.7 16.8 17.6 18.4 13.6 12.6 12.1 11.8 8.4 10.4
Conifer C5OV 7.7 7.0 6.6 6.5 5.1 3.9 4.0 2.9 2.1 1.1 2.1Broadleaved C5OW 9.9 9.9 10.4 11.4 13.6 10.5 9.5 9.5 9.8 7.6 8.5
Restocking7 - (Thousand hectares)
United Kingdom C5OX 15.1 14.2 14.1 15.2 15.3 13.8 14.5 14.9 14.8 14.8 17.7England C5OY 4.3 4.4 4.1 3.9 4.0 3.4 3.4 3.2 2.8 3.2 2.7Wales C5P2 3.0 2.7 3.0 2.6 2.2 1.9 1.9 1.8 1.6 2.5 2.7Scotland C5OZ 7.2 6.3 6.3 8.0 8.0 7.8 8.5 8.9 9.5 8.2 11.4Northern Ireland C5P3 0.6 0.7 0.6 0.6 1.1 0.8 0.7 1.0 1.0 0.9 0.8
Forestry Commission/Forest Service C5P4 8.4 8.5 8.5 8.8 8.9 9.1 9.1 9.9 9.4 9.3 9.7Other8 C5P5 6.7 5.7 5.6 6.4 6.4 4.7 5.3 5.0 5.5 5.5 8.0
Conifer C5P6 11.6 11.2 11.3 11.9 12.2 11.4 12.0 12.1 12.0 11.6 14.2Broadleaved C5P7 3.5 3.0 2.8 3.3 3.0 2.4 2.5 2.8 2.9 3.3 3.5
1998 1999 2000 2001 2002 2003 2004 2005 2006
Wood Production (volume -Thousand green tonnes9)
United Kingdom C5P8 7 540 7 960 8 090 8 140 8 270 8 900 9 040 9 080 8 940
Softwood total C5PA 6 830 7 280 7 430 7 500 7 650 8 330 8 530 8 490 8 500Forestry Commission/Forest Service C5PB 4 190 4 730 4 850 4 600 4 650 4 820 4 890 4 580 4 580Non-Forestry Commission/Forest Service C5PC 2 640 2 550 2 580 2 900 3 000 3 520 3 630 3 910 3 920
Hardwood10 C5PD 720 680 660 640 620 560 510 590 440
1 See chapter text.2 Areas as at 31 March.3 For England, Wales and Scotland, 1980 woodland area figures are the pub-
lished results from the 1979-1982 Census of Woodlands and Trees and fig-ures for 1990 are adjusted to reflect subsequent changes. From 1998 on-wards they are based on results from the 1995-1999 National Inventory ofWoodlands and Trees, adjusted to reflect subsequent changes.
4 The apparent fall in woodland cover in 2001 is due to the reclassification ofForestry Commission open land within the forest.
5 Includes private woodland and non-Forestry Commission / Forest Servicepublic woodland.
6 Broadleaved includes coppice. For data based on 1979-82 Census, all scruband other non-plantation woodland have been assumed to be broadleaved.
7 Figures shown are for the areas of new planting and restocking in the year to31 March.
8 Includes grant aided planting on non-Forestry Commission/ Forest Servicewoodland and estimates for areas planted without the aid of grants.
9 Figures have been rounded to the nearest 10 thousand green tonnes.10 Hardwood is timber from broadleaved species. Most hardwood production
comes from non-FC/FS woodland; the figures are estimates based on reporteddeliveries to wood processing industries.
Source: Forestry Commission: 0131 314 6171

354
Agriculture, fisheries and food
21.7 Sales for food of agricultural produce and livestockUnited Kingdom
1997 1998 1999 2000 2001 2002 2003 2004 2005 2006 2007
Cereals: ThousandWheat1 KCQK tonnes 5 535 5 707 5 668 5 617 5 672 5 628 5 611 5 600 5 642 5 625 5 702Barley KCQL " 5 498 5 548 5 280 5 363 5 714 5 771 5 438 5 418 4 962 4 971 4 904Oats2 KCQM " 259 272 266 261 287 312 322 321 343 373 420
Potatoes3 KCQN " 6 279 5 997 6 209 6 129 6 605 6 803 6 560 6 449 5 868 5 674 5 816
Milk:Utilised for liquid consumption KCQO Million litres 6 778 6 767 6 889 6 793 6 748 6 825 6 752 6 693 6 652 6 736 6 698Utilised for manufacture KCQP " 7 039 6 806 6 973 6 628 6 902 7 056 7 271 6 827 6 568 6 343 6 131Total available for domestic use4 KCQQ " 14 258 13 973 14 234 13 730 13 940 14 101 14 294 13 769 13 488 13 366 13 202
MillionHen eggs in shell KCQR dozens 794 774 738 712 753 746 733 778 772 743 714
Animals slaughtered:
Cattle and calves:Cattle KCQS Thousands 2 274 2 270 2 220 2 267 2 051 2 191 2 199 2 261 2 298 2 578 2 615Calves KCQT " 20 31 75 152 92 98 87 101 111 125 108
Total KCQU " 2 293 2 301 2 296 2 419 2 143 2 289 2 286 2 361 2 409 2 702 2 723
Sheep and lambs KCQV " 17 714 19 578 20 801 19 635 13 322 15 342 15 436 15 493 16 539 16 590 15 979
Pigs:Clean pigs MBGD " 15 097 15 539 14 310 12 165 10 383 9 983 8 760 8 597 8 496 8 520 8 862Sows and boars KCQZ " 381 414 379 325 182 317 247 244 213 211 222Total KCRA " 15 479 15 954 14 690 12 490 10 565 10 300 9 007 8 841 8 709 8 731 9 084
Poultry5 KCRB Millions 850 857 863 843 866 862 882 882 903 880 871
Note: The figures for cereals and for animals slaughtered relate to periodsof 52 weeks
1 Flour millers’ receipts of home-grown wheat.2 Oatmeal millers’ receipts of home-grown oats.3 Total sales for human consumption in the UK. Figures for 2007 are provi-
sional.
4 The totals of liquid consumption and milk used for manufacture may not add upto the total available for domestic use because of adjustments for dairy was-tage, stock changes and other uses, such as farmhouse consumption, milk fedto stock and on farm waste.
5 Total fowls, ducks, geese and turkeys.
Source: Department for Environment, Food and Rural Affairs: 01904 455332
21.8 Estimates of producers of organic and in-conversion livestock1
United KingdomAt January each year Thousand head
2004 2005 2006 2007
Cattle IDR8 126.8 174.8 214.3 244.8Sheep IDR9 440.7 571.6 691.0 747.3Pigs IDS2 48.8 43.7 30.0 32.9Poultry IDS3 2 166.2 2 431.6 3 439.5 4 421.3Goats IDS4 0.7 0.5 0.5 0.6Other Livestock IDS5 1.0 1.2 1.5 4.3
1 Certification bodies record production data at various times of the year sofigures should be treated with care as they will not represent an exactsnapshot of organic livestock farming.
Sources: Department for Environment, Food and Rural Affairs;Organic Statistics Team: 01904 455557

355
Agriculture, fisheries and food
21.9 Producers of organic and in-conversion livestock, Organic producers,growers, processors and importersUnited Kingdom Number of producers or businesses
20031 2004 2005 2006 2007
Producers of organic and in-conversion livestockNorth East IDZ2 .. 49 44 54 46North West IDZ3 .. 122 87 102 104Yorkshire and Humberside IDZ4 .. 82 54 82 82East Midlands IDZ5 .. 135 110 125 121West Midlands IDZ6 .. 196 162 196 174Eastern IDZ7 .. 99 69 86 91South West IDZ8 .. 761 553 724 706South East (including London) IDZ9 .. 220 162 201 179
England IE22 .. 1 664 1 241 1 570 1 503Wales IE23 .. 469 402 502 493Scotland IE24 .. 385 293 296 285Northern Ireland IE25 .. 119 110 140 167
United Kingdom IE26 .. 2 637 2 046 2 508 2 448
20031 2004 2005 2006 2007
Producers and growers businessesNorth East IE27 73 74 83 101 116North West IE28 171 169 176 168 173Yorkshire and Humberside IE29 136 134 149 138 155East Midlands IE2A 220 218 237 221 236West Midlands IE2B 330 325 337 335 351Eastern IE2C 248 258 259 253 267South West IE2D 1 026 1 020 1 123 1 152 1 282South East (including London) IE2E 418 409 463 417 423
England IE2F 2 622 2 607 2 827 2 785 3 003Wales IE2G 618 623 667 688 710Scotland IE2H 725 689 653 595 686Northern Ireland IE2I 139 153 174 217 240
United Kingdom IE2J 4 104 4 072 4 321 4 285 4 639
Processors and/or importers businesses2
North East IE2K 34 31 19 28 45North West IE2L 122 130 107 143 159Yorkshire and Humberside IE2M 118 126 121 141 164East Midlands IE2N 175 191 154 195 210West Midlands IE2O 138 139 114 143 169Eastern IE2P 224 249 209 255 289South West IE2Q 333 353 242 380 450South East (including London) IE2R 393 450 387 484 516
England IE2S 1 537 1 669 1 353 1 769 2 002Wales IE2T 103 112 85 112 125Scotland IE2U 152 174 152 197 225Northern Ireland IE2V 33 35 36 50 52
United Kingdom IE2W 1 825 1 990 1 626 2 128 2 404
1 As at March in 2003.2 Processers and importers include abattoirs, bakers, stores and wholesalers.
The recorded location depends on the address registered with the SectorBodies and so larger businesses may be recorded at their headquarters.
Sources: Department for Environment, Food and Rural Affairs;Organic Statistics Team:01904 455557

356
Agriculture, fisheries and food
21.10 Organic and in-conversion land and land useUnited Kingdom
Thousand hectares
20031 2004 2005 2006 2007
Land, in-conversionNorth East IDS6 15.3 6.8 4.6 6.6 6.9North West IDS7 7.7 2.6 2.5 3.2 1.8Yorkshire and Humberside IDS8 2.3 1.7 1.3 2.3 3.4East Midlands IDS9 2.9 1.6 1.2 2.4 2.1West Midlands IDT2 6.0 3.7 2.4 3.2 4.0Eastern IDT3 4.1 3.0 2.4 2.6 3.6South West IDT4 18.0 10.8 9.1 22.0 31.6South East (including London) IDT5 11.5 6.5 5.4 10.7 13.2
England IDT6 67.8 36.8 28.8 53.2 66.5Wales IDT7 13.7 8.0 8.6 12.8 15.4Scotland IDT8 121.3 20.4 13.7 16.7 35.2Northern Ireland IDT9 1.5 0.8 1.6 3.2 4.0
United Kingdom IDU2 204.3 66.0 52.7 86.0 121.1
Land, fully organicNorth East IDU3 12.4 20.5 25.3 29.3 22.6North West IDU4 15.1 19.9 19.8 18.9 19.4Yorkshire and Humberside IDU5 7.0 8.1 8.6 9.0 9.0East Midlands IDU6 12.0 16.1 13.4 13.2 12.5West Midlands IDU7 23.4 25.5 26.8 27.0 26.3Eastern IDU8 7.8 9.7 10.3 11.8 10.8South West IDU9 78.1 86.2 90.5 94.0 93.4South East (including London) IDV2 28.3 34.3 34.9 35.2 35.8
England IDV3 184.0 220.2 229.6 238.4 229.9Wales IDV4 41.4 50.2 55.6 58.0 63.5Scotland IDV5 307.3 351.9 331.6 231.2 200.1Northern Ireland IDV6 4.1 6.6 5.0 6.3 5.1
United Kingdom IDV7 536.9 629.0 621.8 533.9 498.6
20031 2004 2005 2006 2007
Land, in-conversionCereals IDV8 11.2 7.0 4.1 10.3 11.9Other Crops IDV9 6.5 1.9 2.7 3.5 3.4Fruit and Nuts2 IDW2 0.4 0.2 0.2 0.2 0.2Vegetables (including potatoes) IDW3 3.0 1.9 1.3 1.3 2.1Herbs and ornamentals3 IDW4 0.1 0.1 – 0.2 0.1Temporary pasture IDW5 18.1 12.7 10.4 15.9 22.9Set aside IDW6 3.5 2.3 1.3 1.4 1.1Permanent pasture4 IDW7 159.1 38.1 27.2 47.5 72.1Woodland IDW8 1.1 0.7 0.6 3.5 4.2Non cropping IDW9 0.2 0.3 2.9 1.1 2.3Other IDX2 0.4 0.3 1.7 1.1 0.2Unknown IDX3 0.8 0.5 0.1 0.1 0.8
Total IDX4 204.3 66.0 52.7 86.0 121.1
Land, fully organicCereals IDX5 25.7 35.4 35.1 37.4 35.5Other Crops IDX6 14.1 7.5 10.2 7.3 6.8Fruit and Nuts2 IDX7 1.5 1.4 1.5 1.5 1.6Vegetables (including potatoes) IDX8 9.7 11.7 12.7 12.4 13.5Herbs and ornamentals3 IDX9 0.2 0.2 0.2 0.6 0.6Temporary pasture IDY2 58.9 77.3 80.3 82.0 79.8Set aside IDY3 3.4 4.6 4.6 2.3 1.3Permanent pasture4 IDY4 413.9 481.3 467.8 380.9 350.5Woodland IDY5 5.6 4.8 5.2 3.3 4.0Non cropping IDY6 1.4 0.9 1.3 2.4 4.0Other IDY7 0.2 3.0 2.4 3.2 0.4Unknown IDY8 2.4 0.8 0.4 0.4 0.6
Total IDY9 536.9 629.0 621.8 533.9 498.6
1 As at March in 2003.2 Nuts not included in 2003.3 Included Nuts in 2003.4 Includes rough grazing.
Sources: Department for Environment, Food and Rural Affairs;Organic Statistics Team: 01904 455557

357
Agriculture, fisheries and food
21.11 Average weekly and hourly earnings and hours of full-time male agriculturalworkers1
England and Wales: At September each year
2002 2003 2004 2005 2006 2007
Average weekly earnings (£) LQML 366.82 352.88 380.75 422.15 359.48 359.6295% confidence interval (+/-£18.88) (+/-£30.30) (+/-£28.79) (+/-£29.39) (+/-£34.99) (+/-£25.17)
Average weekly hours worked LQMM 54.1 51.1 51.0 55.7 48.0 48.695% confidence interval (+/-2.1) (+/-3.0) (+/-2.8) (+/-3.2) (+/-3.1) (+/-2.4)
Average earnings/hours (£) LQMN 6.78 6.91 7.46 7.58 7.48 7.4095% confidence interval (+/-£0.19) (+/-£0.31) (+/-£0.31) (+/-£0.26) (+/-£0.43) (+/-£0.27)
Number of workers in the sample 204 72 94 76 50 68
1 See chapter text. Source: Department for Environment, Food and Rural Affairs: 01904 455332
21.12 Average weekly and hourly earnings and hours of agricultural workers1 : bytype, aged 20 and overEngland and Wales: At September 2007
Full-time Part-time Casual
Male Female Male Female Male Female Managers
Average weekly earnings (£) 359.62 287.92 143.13 147.33 245.53 168.00 491.1295% confidence interval (+/-£25.17) (+/-£16.99) (+/-£34.31) (+/-£29.89) (+/-£38.20) (+/-£54.13) (+/-£30.55)
Average weekly hours worked 48.6 43.0 21.5 23.0 35.6 28.2 ..95% confidence interval (+/-2.4) (+/-1.5) (+/-5.1) (+/-4.2) (+/-4.8) (+/-8.9)
Average earnings/hour (£) 7.40 6.69 6.64 6.41 6.89 5.96 ..95% confidence interval (+/-£0.27) (+/-£0.27) (+/-£0.73) (+/-£0.47) (+/-£0.53) (+/-£0.61)
Number of workers in the sample 68 58 16 23 42 11 48
1 See chapter text. Source: Department for Environment, Food and Rural Affairs: 01904 455332
21.13 Workers employed in agriculture 1,2: by typeUnited KingdomAt June each year Thousands
Regular Seasonal or casual AllSalaried
Full - time Part - time managers3
Total Male Female Male Female Total Male Female Total Male Female
BANC BAMY BAMZ BANA BANB BANF BAND BANE BANI BANG BANH KAYG1993 165.3 96.5 13.7 29.8 25.3 85.4 55.0 30.4 250.7 181.3 69.4 7.61994 161.0 93.6 13.2 30.0 24.2 82.2 53.9 28.4 243.2 177.5 65.7 7.81995 157.4 90.4 13.0 30.0 24.1 83.7 56.5 27.2 241.2 176.8 64.3 7.71996 156.4 89.2 12.6 31.2 23.4 81.5 55.6 25.8 237.9 176.0 61.9 7.81997 154.4 87.5 12.6 31.2 23.1 80.9 55.3 25.5 235.2 174.0 61.2 7.8
19984,5 155.6 88.0 13.1 29.7 24.7 79.5 55.6 23.8 235.0 172.8 62.2 12.11999 144.7 82.7 11.9 27.5 22.6 73.0 51.8 21.2 217.7 162.0 55.6 13.82000 128.9 73.4 10.3 24.6 20.6 64.4 45.9 18.5 193.3 143.9 49.4 11.1
20016 120.8 69.0 10.9 22.0 18.9 63.2 44.6 18.6 184.0 135.6 48.5 13.4123.5 70.3 11.2 22.5 19.4 64.1 45.4 18.8 187.6 138.2 49.4 14.1
2002 116.3 64.7 11.5 21.7 18.4 64.2 46.2 18.0 180.6 132.6 47.9 13.42003 108.4 60.4 10.0 21.0 17.0 62.6 44.8 17.8 170.9 126.2 44.8 12.7
2004 Jun 108.8 58.1 9.8 23.5 17.4 68.3 49.6 18.6 177.0 131.2 45.8 15.2
2005 Jun 109.2 57.2 10.3 24.5 17.2 65.1 46.4 18.7 174.3 128.1 46.2 15.7
2006 Jun 105.4 53.6 10.4 24.3 17.1 64.0 44.4 19.6 169.4 122.3 47.1 14.6
1 See chapter text. Includes estimates for minor holdings for all countries.2 Figures exclude schoolchildren, farmers, partners, directors and their
spouses and most trainees.3 Great Britain only.4 Results from 1998 onwards are not comparable with previous years, due to
changes in the labour questions on the June Agricultural and HorticulturalCensus in England, Wales and Scotland.
5 From 1998, all farmers managing holdings for limited companies or other insti-tutions in England and Wales were asked to classify themselves as salariedmanagers.
6 Due to an English register improvement only the top figure for 2001 is directlycomparable with 2000, while the bottom figure for 2001 is only comparable withdata from 2002.
Sources: Department for Environment, Food and Rural Affairs;Farming Statistics: 01904 455332

358
Agriculture, fisheries and food
21.14 Summary of UK fishing industryUnited Kingdom
£ million (unless otherwise stated)
1997 1998 1999 2000 2001 2002 2003 2004 2005 2006
GDP for fishing1
current pricegross valueadded at basic prices QTUF 412 400 406 398 376 374 376 389 399 469Output index (chain volumemeasures)2003 = 100 EWAC 132.4 136.5 124.2 112.0 110.4 109.0 100.0 96.5 95.9 93.4
GDP for agriculture, forestry and fishingCurrent price gross valueadded at basic prices QTOP 10 213 9 457 9 270 8 788 8 566 9 218 10 032 10 323 10 253 10 577Output index (chain volume GDQA 95.8 97.9 101.1 100.3 90.9 102.1 100.0 99.0 103.3 106.2measures) 2003 = 100
GDP at market pricesCurrent price GDP at market YBHA 815 881 865 710 911 945 958 931 1 003 297 1 055 793 1 118 245 1 184 296 1 233 976 1 303 915pricesChain volume measures YBEZ 84.3 87.1 89.7 93.1 95.3 97.3 100.0 103.3 105.2 108.2index 2003 = 100
Percentage contribution of GVA from fishingto GVA for agriculture, hunting, forestry& fishingCurrent prices 4.0% 4.2% 4.4% 4.5% 4.4% 4.1% 3.7% 3.8% 3.9% 4.4%
Current price gross value added for fishing2
2003=100 I3X3 109.6 106.4 108.0 105.9 100.0 99.5 100.0 103.5 106.1 124.7
1997 1998 1999 2000 2001 2002 2003 2004 2005 2006
Fleet size at end of year3
number of vessels I3TC 7 812 7 639 7 448 7 242 7 169 7 033 6 735 6 642 6 342 6 372
EmploymentNumber of fishermen I3TD 18 604 17 889 16 896 15 649 14 958 14 205 13 122 13 453 12 831 12 934
Total landings by UK vessels4
quantity (’000 tonnes) I3TE 891.3 923.8 836.2 748.1 737.8 685.5 639.7 653.7 707.8 614.2value I3TF 621.9 661.5 587.6 550.3 574.4 545.6 528.3 513.0 571.3 610.3
Importsquantity (’000 tonnes) I3TG 503.2 533.3 552.0 550.2 626.6 621.4 631.5 671.3 720.4 753.0value5 I3TH 1 055.2 1 065.6 1 301.6 1 325.2 1 435.1 1 438.7 1 438.7 1 473.9 1 696.0 1 919.1
Exportsquantity (’000 tonnes) I3TI 299.8 376.9 351.4 364.9 391.0 389.1 479.5 477.8 461.4 416.3value5 I3TJ 605.2 354.7 746.3 696.0 744.6 762.2 891.4 885.7 938.5 944.0
1997 1998 1999 2000 2001 2002 2003 2004 2005 2006
Household consumption(’000 tonnes)6) I3TK 448.0 450.5 446.8 442.9 482.5 479.0 484.6 486.9 493.5 524.9Population (’000 persons) I3TL 58 314 58 475 58 684 58 886 59 113 59 322 59 554 59 834 60 209 60 349
Consumer expenditureon fish I3TM 1 947 2 009 2 063 2 172 2 298 2 405 2 397 2 447 2 661 2 987on food I3TN 53 812 55 162 57 040 58 628 59 804 61 310 63 174 65 521 67 539 70 809Fish as a % of food7 I3TO 3.6 3.6 3.6 3.7 3.8 3.9 3.8 3.7 3.9 4.2
Landed Price index I3TP 122.6 138.3 144.1 148.6 156.4 153.1 157.2 166.0 181.8 204.41987 = 100Retail Price Index8 I3TQ 125.2 135.7 147.8 151.0 153.4 157.9 156.3 153.6 154.2 163.9
1 GDP for fish includes landings abroad.2 Year on year comparisons may be affected by changes in the industrial
classification of some contributors. For most businesses data are appropri-ate to a single activity heading; where information covers a mixture of activi-ties, the business is classified according to the main activity.
3 The number of vessels excludes those registered in the Channel Islandsand the Isle of Man.
4 The quantity of landed fish is expressed in terms of liveweight. The figuresrelate to landings both into the UK and abroad.
5 Imports are valued at cost, including insurance and freight terms whereas ex-ports are valued at free on board terms.
6 Data are derived from the National Food Survey prior to 2001, and from the Ex-penditure and Food Survey from 2001 onwards. Figures for 2001 onwards arebased on financial year data.
7 Including non-alcoholic beverages.8 The fish component of the RPI which includes canned and processed fish. The
index is calculated on a monthly basis with January 1987 = 100.
Source: Fisheries Statistics Unit: 020 7272 8096

359
Agriculture, fisheries and food
21.15 Fishing fleet1United KingdomAt 31 December each year Numbers
1996 1997 1998 1999 2000 2001 2002 2003 2004 2005 2006
By size
10m and under KSNF 5 606 5 474 5 487 5 409 5 273 5 227 5 287 5 113 5 092 4 833 4 89610.01 - 12.19m KSNG 800 732 628 577 547 536 514 486 465 449 44512.20 - 17.00m KSNH 540 523 491 468 467 442 409 405 393 387 38417.01 - 18.29m KSNI 164 162 154 154 131 143 129 121 115 112 11118.30 - 24.38m KSNJ 509 471 443 414 406 405 322 271 257 253 24424.39 - 30.48m KSNK 223 227 226 224 219 218 185 156 147 143 13930.49 - 36.58m KSNL 114 104 89 80 77 75 65 63 60 55 56over 36.58m KSNM 117 119 121 122 122 123 122 120 112 109 97
Total over 10m KSNN 2 467 2 338 2 152 2 039 1 969 1 942 1 746 1 622 1 549 1 508 1 476
Total UK fleet2 KSNO 8 073 7 812 7 639 7 448 7 242 7 169 7 033 6 735 6 641 6 341 6 372
By segment
Pelagic gears KSNP 58 49 50 46 44 47 45 42 31 23 16Beam trawl KSNQ 215 153 123 114 111 116 113 162 102 96 93Demersal, Seines and Nephrops JZCI .. 1 428 1 318 1 235 1 208 1 158 969 853 852 812 785Lines and Nets KSNR 224 214 187 172 165 146 136 118 123 114 111Shellfish: mobile KSNS 265 227 241 243 211 229 228 191 166 155 151Shellfish: fixed KSNT 339 352 311 301 297 301 304 307 253 236 230Distant water KSNU 15 13 14 12 13 11 10 8 10 10 8Under 10m KSNV 6 091 6 022 6 027 5 916 5 769 5 713 5 773 5 587 5 395 4 276 4 131Other: Mussel Dredgers JZCJ .. 3 2 2 2 7 15 15 13 7 6
Total UK fleet3 KSNX 8 658 8 461 8 273 8 041 7 820 7 728 7 593 7 283 7 022 6 716 6 752
1 See chapter text.2 Excluding Channel Islands and Isle of Man.3 Including Channel Islands and Isle of Man.
Source: Department for Environment, Food and Rural Affairs: 01904 455332

360
Agriculture, fisheries and food
21.16 Estimated household food consumption1
Grammes per person per week
Great Britain United Kingdom
1996 1997 1998 1999 2000 2001 2002 2003 2004 2005 2006/02 /03 /04 /05 /06
Liquid wholemilk2 (ml) KPQM 776 712 693 634 664 VQEW 599 555 585 484 460 477Fully skimmed (ml) KZBH 137 158 164 167 164 VQEX 160 166 154 158 159 163Semi skimmed (ml) KZBI 935 978 945 958 975 VQEZ 931 919 926 975 1 008 974Other milk and cream (ml) KZBJ 259 248 243 248 278 VQFA 333 350 358 366 385 395Cheese KPQO 111 109 104 104 110 VQFB 112 112 113 110 116 116
Butter KPQP 39 38 39 37 39 VQFC 42 37 35 35 38 40Margarine KPQQ 36 26 26 20 21 VQFD 13 13 12 11 20 18Low and reduced fat spreads KZBK 79 77 69 71 68 VQFE 72 70 71 68 55 57All other oils and fats (ml for oils) KPQR 71 62 62 58 58 VQFF 70 70 68 68 70 69
Eggs (number) KPQS 2 2 2 2 2 VQFG 2 2 2 2 2 2
Preserves and honey KPQT 41 41 38 33 33 VQFH 35 34 33 34 35 34Sugar KPQU 144 128 119 107 105 VQFI 112 111 102 99 94 92
Beef and veal KPQV 101 110 109 110 124 VQFJ 118 118 119 123 120 128Mutton and lamb KPQW 66 56 59 57 55 VQFK 51 51 49 50 53 54Pork KPQX 73 75 76 69 68 VQFL 61 61 56 56 52 55
Bacon and ham, uncooked KPQY 77 72 76 68 71 VQFM 68 69 70 70 68 66Bacon and ham, cooked (including
canned) KPQZ 33 41 40 39 41 VQFN 45 45 47 43 44 45Poultry uncooked JZCH 233 221 218 201 214 VQFO 206 199 200 197 212 207Cooked poultry (not purchased in cans) KYBP 23 33 33 35 39 VQFQ 43 44 11 10 12 12Other cooked and canned meats KPRB 62 52 49 48 51 VQFR 54 59 60 58 56 53Offals KPRC 7 7 5 5 5 VQFS 6 6 7 5 5 5Sausages, uncooked KPRD 63 63 60 58 60 VQFT 66 66 70 67 64 65Other meat products KPRE 207 209 216 221 239 VQFU 313 319 335 330 323 315
Fish, fresh and processed(including shellfish) KPRF 72 70 70 70 67
Canned fish KPRG 31 31 29 31 32Fish and fish products, frozen KPRH 50 46 46 42 44Fish, fresh chilled or frozen VQAI 51 48 45 42 45 47Other fish and fish products VQAJ 105 106 111 115 122 123
Potatoes (excluding processed) KPRI 805 745 715 673 707 VQFY 647 617 600 570 587 565
Fresh green vegetables KPRJ 233 251 246 245 240 VQAK 229 231 228 225 235 221Other fresh vegetables KPRK 489 497 486 500 492 VQAL 502 505 505 536 567 566Frozen potato products KYBQ 113 106 111 113 120Other frozen vegetables KPRL 94 94 88 87 80Potato products not frozen JZCF 92 90 89 86 82Canned beans KPRM 125 122 118 112 114Other canned vegetables (excl. potatoes) KPRN 113 104 99 92 97Other processed vegetables (excl. potatoes) LQZH 55 52 54 59 54All processed vegetables VQAM 620 613 611 597 608 601
Apples KPRO 175 179 181 169 180 VQGN 175 172 171 173 179 180Bananas KPRP 185 195 198 202 206 VQGO 203 208 211 217 225 226Oranges KPRQ 63 62 63 50 54 VQGP 55 62 64 57 59 55All other fresh fruit KPRR 263 276 274 290 304 VQGS 318 351 343 358 392 394Canned fruit KPRS 43 44 37 38 38 VQGT 40 39 40 38 36 39Dried fruit, nuts and fruit and
nut products KPRT 36 35 34 30 35 VQGU 39 41 40 46 51 53Fruit juices (ml) KPRU 258 277 304 284 303 VQGX 327 333 322 280 350 366
Flour KPRV 70 54 55 56 67 VQGY 55 61 52 55 60 54
Bread KPRW 752 746 742 717 720 VQGZ 769 756 728 695 701 692Buns, scones and teacakes KPRX 47 43 41 40 43 VQHA 37 41 44 47 46 45Cakes and pastries KPRY 87 93 88 87 89 VQHB 139 122 120 117 122 120Biscuits KPRZ 150 138 137 132 141 VQHC 166 174 163 165 165 165Breakfast cereals KPSA 140 135 136 134 143 VQHE 133 132 134 131 135 135Oatmeal and oat products KPSB 13 16 11 13 15 VQHF 12 13 12 14 19 17Other cereals and cereal products JZCG 304 293 270 284 291 VQHG 345 366 360 354 378 378
Tea KPSC 38 36 35 32 34 VQHK 34 34 31 31 33 30Instant coffee KPSD 13 11 12 11 11 VQHL 13 12 13 13 13 14
Canned soups KPSE 72 70 71 67 71 VQHM 79 80 77 76 82 79Pickles and sauces KPSF 84 92 96 91 107 VQHN 121 123 121 120 125 128
1 See chapter text.2 Including also school and welfare milk.
Sources: Expenditure and Food Survey;Department for Environment Food and Rural Affairs: 01904 455067

xi
Production
Production
Ch
apter 22

362
Production
the European Community Inquiry since its introduction in 1993. Some data are not available for confidentiality reasons or where data have not been published for a given period. Detailed product sales data together with exports and imports data are available in ONS’s Product Sales and Trade quarterly and annual reports (PRQ and PRA series).
Number of local units in manufacturing industries in 2003
(Table 22.3)
The table shows the number of local units (sites) in manufacturing by employment size band. The classification breakdown is at division level (2 digit) as classified to SIC(2003) held on the Inter-Departmental Business Register (IDBR). This register became fully operational in 1995 and combines information on Value Added Tax traders and Pay As You Earn employers in a statistical register comprising 2.1 million enterprises (businesses), representing nearly 99 per cent of economic activity. UK Business: Activity, Size and Location 2007 provides further details and contains detailed information on enterprises in the UK including size, classification and local units in the UK including size, classification and location.
For further information on the IDBR see the National Statistics website at: www.statistics.gov.uk/idbr.
Production of primary fuels
(Table 22.4)
This table shows indigenous production of primary fuels. It includes the extraction or capture of primary commodities and the generation or manufacture of secondary commodities. Production is always gross; that is, it includes the quantities used during the extraction or manufacturing process. Primary fuels are coal, natural gas (including colliery methane), oil, primary electricity (that is, electricity generated by hydro, nuclear wind and tide stations and also electricity imported from France through the interconnector) and renewables (includes solid renewables such as wood, straw and waste and gaseous renewables such as landfill gas and sewage gas). The figures are presented on a common basis, expressed in million tonnes of oil equivalent. Estimates of the gross calorific values used for converting the statistics for the various fuels to these are given in the Digest of UK Energy Statistics available at: www.berr.gov.uk/energy/statistics/publications/dukes/page39771.html
Production
Annual Business Inquiry
(Table 22.1)
The Annual Business Inquiry (ABI) estimates cover all UK businesses registered for Value Added Tax (VAT) and/or Pay As You Earn (PAYE), classified to the 2003 Standard Industrial Classification (SIC(2003)) headings listed in the tables. The ABI obtains details on these businesses from the Office for National Statistics (ONS) Inter-Departmental Business Register (IDBR).
As with all its statistical inquiries, ONS is concerned to minimise the form-filling burden of individual contributors and as such the ABI is a sample inquiry. The sample was designed as a stratified random sample of about 77,000 businesses, the inquiry population is stratified by SIC(2003) and employment using the information from the register.
The inquiry results are grossed up to the total population, so that they relate to all active UK businesses on the IDBR for the sectors covered.
The results meet a wide range of needs for government, economic analysts and the business community at large. In official statistics the inquiry is an important source for the national accounts and input-output tables, but also provides weights for the indices of production and producer prices. Inquiry results also enable the UK to meet statistical requirements of the European Union.
Data from 1995 and 1996 were calculated on a different basis from those for 1997 and later years. In order to provide a link between the two data series, the 1995 and 1996 data were subsequently reworked to provide estimates on a consistent basis.
Revised Annual Business Inquiry results down to SIC(2003) 4 digit class level for 1995–2005, giving both analysis and tabular detail, are available from the National Statistics Website at www.statistics.gov.uk/abi, with further extracts and bespoke analyses available on request. This service replaces existing publications.
Manufacturers’ sales by industry
(Table 22.2)
This table shows the total manufacturers’ sales for products classified to SIC(2003) and collected under the Products of

363
Production
Total inland energy consumption
(Table 22.5)
This table shows energy consumption by fuel and final energy consumption by fuel and class of consumer. Primary energy consumption covers consumption of all primary fuels (defined above) for energy purposes. This measure of energy consumption includes energy that is lost by converting primary fuels into secondary fuels, that is, the energy lost burning coal to generate electricity or the energy used by refineries to separate crude oil into fractions, in addition to losses in distribution. The other common way of measuring energy consumption is to measure the energy content of the fuels supplied to consumers. This is called final energy consumption. It is net of fuel used by the energy industries, conversion, transmission and distribution losses. The figures are presented on a common basis, measured as energy supplied and expressed in million tonnes of oil equivalent. Estimates of the gross calorific values used for converting the statistics for the various fuels to these are given in the Digest of UK Energy Statistics available at: www.berr.gov.uk/energy/statistics/publications/dukes/page39771.html
So far as practicable the user categories have been grouped on the basis of the SIC(2003) although the methods used by each of the supply industries to identify end users are slightly different. Chapter 1 of the Digest of UK Energy Statistics gives more information on these figures.
Coal
(Table 22.6)
Since 1995, aggregate data on coal production have been obtained from the Coal Authority. In addition, main coal producers provide data in response to an annual Department for Business, Enterprise & Regulatory Reform (BERR) inquiry which covers production (deepmined and opencast), trade, stocks and disposals. HM Revenue & Customs (HMRC) also provide trade data for solid fuels. BERR collects information on the use of coal from UK Iron and Steel Statistics Bureau, and consumption of coal for electricity generation is covered by data provided by the electricity generators.
Gas
(Table 22.7)
Production figures, covering the production of gas from the UK Continental Shelf offshore and onshore gas fields and gas obtained during the production of oil, are obtained from returns made under the BERR’s Petroleum Production Reporting System. Additional information is used on imports and exports of gas and details from the operators of gas terminals in the UK to complete the picture.
It is no longer possible to present information on fuels input into the gas industry and gas output and sales in the same format as in previous editions of this table. As such, users are directed to Chapter 4 of the 2002 edition of the Digest of UK Energy Statistics, where more detailed information on gas production and consumption in the UK is available.
BERR carry out an annual survey of gas suppliers to obtain details of gas sales to the various categories of consumer. Estimates are included for the suppliers with the smallest market share, since the BERR inquiry covers only the largest suppliers (that is, those known to supply more than 1,750 GWh per year).
Electricity
(Tables 22.8–22.10)
Tables 22.8 to 22.10 cover all generators and suppliers of electricity in the UK.
The relationship between generation, supply, availability and consumption is as follows:
Electricity generatedless electricity used on works
equals electricity supplied (gross)
less electricity used in pumping at pumped storage stations
equals electricity supplied (net)
plus imports (net of exports) of electricity
equals electricity available
less losses and statistical differences
equals electricity consumed
In Table 22.8 ‘major power producers’ are those generating companies corresponding to the old public sector supply system:
• AES Electric Ltd.
• Baglan Generation Ltd.
• Barking Power Ltd.
• BNFL British Nuclear Group
• British Energy plc
• Centrica Energy
• Coolkeeragh ESB Ltd.
• Corby Power Ltd.
• Coryton Energy Company Ltd.
• Derwent Cogeneration Ltd.

364
Production
• Drax Power Ltd.
• EDF Energy plc
• E.ON UK plc
• Energy Power Resources Ltd.
• First Hydro Company
• Immingham CHP
• International Power plc.
• Premier Power Ltd.
• RGS Energy Ltd.
• Rocksavage Power Company Ltd.
• RWE Npower plc
• Scottish Power plc
• Scottish and Southern Energy plc
• Seabank Power Ltd.
• SELCHP Ltd.
• Spalding Energy Company Ltd.
• Teesside Power Ltd.
• Uskmouth Power Company Ltd.
• Western Power Generation Ltd.
In Table 22.10 all fuels are converted to the common unit of million tonnes of oil equivalent, that is, the amounts of oil which would be needed to produce the output of electricity generated from those fuels.
More detailed statistics on energy are given in the Digest of United Kingdom Energy Statistics 2003. Readers may wish to note that the production and consumption of fuels are presented using commodity balances. A commodity balance shows the flows of an individual fuel through from production to final consumption, showing its use in transformation and energy industry own use.
Oil and oil products
(Tables 22.11–22.13)
The data on the production of crude oil, condensates and natural gases given in Table 22.11 are collected by BERR direct from the operators of production facilities and terminals situated on UK territory, either onshore or offshore, that is, on the UK Continental Shelf. Data are also collected from the companies on their trade in oil and oil products. These data are used in preference to the foreign trade as recorded by HMRC in Overseas Trade Statistics.
Data on the internal UK oil industry (that is, on the supply, refining and distribution of oil and oil products in the UK) are collected by the UK Petroleum Industry Association. These data, reported by individual refining companies and wholesalers, and supplemented where necessary by data from other sources, provide the contents of Tables 22.12 and 22.13. The data are presented in terms of deliveries to the inland UK market. This is regarded as an acceptable proxy for actual consumption of products. The main shortcoming is that, while changes in stocks held by companies in central storage areas are taken into account, changes in the levels of stocks further down the retail ladder (such as stocks held on petrol station forecourts) are not. This is not thought to result in a significant degree of difference in the data.
Iron and steel
(Tables 22.14–22.16)
Iron and steel industry
The general definition of the UK iron and steel industry is based on groups 271 ‘ECSC iron and steel’, 272 ‘Tubes’, and 273 ‘Primary Transformation’ of the UK SIC(92), except those parts of groups 272 and 273 which cover cast iron pipes, drawn wire, cold formed sections and Ferro alloys.
The definition excludes certain products which may be made by works within the industry, such as refined iron, finished steel castings, steel tyres, wheels, axles and rolled rings, open and closed die forgings, colliery arches and springs. Iron foundries and steel stockholders are also considered to be outside of the industry.
Statistics
The statistics for the UK iron and steel industry are compiled by the Iron and Steel Statistics Bureau (ISSB) Ltd from data collected from UK steel producing companies with the exception of trade data which is based on HMRC data.
Crude steel is the total of usable ingots, usable continuously cast semi-finished products and liquid steel for castings.
Production of finished products is the total production at the mill of that product after deduction of any material which is immediately scrapped.
Deliveries are based on invoiced tonnages and will include deliveries made to steel stockholders and service centres by the UK steel industry.
For more detailed information on definitions etc please contact ISSB Ltd. on 020 7343 3900.

365
Production
Minerals
(Table 22.19)
Table 22.19 gives, separately for Great Britain and Northern Ireland, the production of minerals extracted from the ground. The figures for chemicals and metals are estimated from the quality of the ore which is extracted. The data come from an annual census of the quarrying industry which, for Great Britain, is conducted by ONS for Communities and Local Government and BERR.
Building materials
(Table 22.20)
Table 22.20 gives the production of a number of building materials which are closely associated with material extracted from the ground. The data come from surveys conducted by ONS on behalf of BERR.
Construction
(Tables 22.21–22.22)
Figures for the construction industry are based on SIC(2003).
The value of output represents the value of construction work done during the quarter in Great Britain and is derived from returns made by private contractors and public authorities with their own direct labour forces. The series (and the accompanying index of the volume of output) include estimates of the output of small firms and self employed workers not recorded in the regular quarterly output inquiry.
The new orders statistics are collected from private contractors and analysed by the principal types of construction work involved. The series includes speculative work for eventual sale or lease undertaken on the initiative of the respondent where no formal contract or order is involved.
Engineering turnover and orders
(Tables 22.23–22.24)
The figures represent the output of UK-based manufacturers classified to Subsections DK and DL of the SIC(2003). They are derived from the monthly production inquiry (MPI) and include estimates for non-responders and for establishments which are not sampled.
Passenger cars
(Table 22.25)
The figures represent the output of UK based manufacturers classified to Class 34.10 (motor vehicles) of the SIC(2003).
They are derived from the Motor Vehicle Production Inquiry (MVPI). This inquiry ceased at July 2007.
These figures include vehicles produced in the form of kits for assembly. The value of the kit must be 50 per cent or more of the value of a corresponding complete vehicle.
Drink and tobacco
(Tables 22.26–22.27)
Data for these tables are derived by HMRC from the systems for collecting excise duties. Alcoholic drinks and tobacco products become liable to duty when released for consumption in the UK. Figures for releases include both home-produced products and commercial imports. Production figures are also available for potable spirits distilled and beer brewed in the UK.
Alcoholic drink
(Table 22.26)
The figures for imported and other spirits released for home consumption include gin and other UK produced spirits, for which a breakdown is not available.
Since June 1993 beer duty has been charged when the beer leaves the brewery or other registered premises. Previously duty was chargeable at an earlier stage (the worts stage) in the brewing process, and an allowance was made for wastage. Figures for years prior to 1994 include adjustments to bring them into line with current data. The change in June 1993 also led to the availability of data on the strength; a series in hectolitres of pure alcohol is shown from 1994.
Made wine with alcoholic strength from 1.2 per cent to 5.5 per cent is termed ‘coolers’. Included in coolers are alcoholic lemonade and similar products of appropriate strength. From 28 April 2002, duty on spirit-based ‘coolers’ (ready to drink products) is charged at the same rate as spirits per litre of alcohol. Made wine coolers include only wine based ‘coolers’ from this period.
Tobacco products
(Table 22.27)
Releases of cigarettes and other tobacco products tend to be higher in the period before a Budget. Products may then be stocked, duty paid, before being sold.

366
Production
22.1 Production and construction:1 summary tableUnited KingdomStandard Industrial Classfication 2003: Estimates for all firms £ million
Stocks and workin progress
CapitalGross Change expenditure Total
Total value At end during less employmentturnover added of year year disposals costs
Standard Industrial Classification: Revised 2003
Production and constructionSections C-F
ZIYQ KSCD KSCE KSCF KSCG AWKC2001 674 274 229 773 65 831 713 28 823 117 5602002 669 855 228 613 70 233 520 27 116 119 0372003 678 072 228 976 67 044 1 845 25 663 118 5402004 704 450 242 834 67 027 3 339 23 989 120 5122005 740 168 257 002 70 790 4 229 26 064 122 722
Production industries (Revised definitions)Sections C-E
ZIYR KSCL KSCM KSCN KSCO AWKH2001 544 210 182 243 52 732 –824 25 716 93 9932002 529 380 178 828 50 261 –753 23 182 93 0982003 527 180 175 826 49 122 –401 22 448 91 3172004 546 426 187 199 48 831 1 180 20 598 92 4232005 572 837 193 806 50 065 1 814 22 682 92 639
Mining and quarryingSection C
ZIYS KSCT KSCU KSCV KSCW AWKI2001 37 057 22 560 958 64 4 272 2 6982002 32 950 19 279 882 30 4 813 2 6822003 32 329 18 173 814 –29 4 420 2 7822004 34 159 17 890 798 30 3 992 2 7552005 44 103 24 981 973 101 5 746 3 199
Mining and quarrying of energy producing materialsSubsection CA
ZIYT KSDB KSDC KSDD KSDE KSDF2001 32 237 20 765 658 33 4 008 1 9452002 28 406 17 827 612 7 4 563 1 9742003 27 506 16 682 506 –47 4 116 1 9572004 29 012 16 163 492 12 3 680 1 9752005 37 479 22 785 627 84 5 432 2 184
Mining and quarrying except energy producing materialsSubsection CB
ZIYU KSDJ KSDK KSDL KSDM KSDN2001 4 820 1 795 300 31 264 7522002 4 544 1 452 271 23 249 7082003 4 823 1 491 308 18 304 8252004 5 147 1 728 307 17 312 7802005 6 624 2 195 346 17 314 1 015
Manufacturing (Revised definition)Section D
ZIYV KSDR KSDS KSDT KSDU AWKL2001 461 898 145 230 50 038 –816 16 278 87 5742002 450 090 144 149 47 669 –667 13 237 86 6912003 447 637 142 207 46 914 –371 12 677 84 5972004 459 880 148 864 46 807 975 11 689 85 2432005 466 731 146 487 47 697 1 452 10 886 84 853

367
Production
22.1 Production and construction:1 summary tableUnited KingdomStandard Industrial Classfication 2003: Estimates for all firmscontinued £ million
Stocks and workin progress
CapitalGross Change expenditure Total
Total value At end during less employmentturnover added of year year disposals costs
Standard Industrial Classification: Revised 2003
Manufacture of food; beverages and tobaccoSubsection DA
ZIYW KSDZ KSEA KSEB KSEC AWKM2001 74 692 20 324 7 633 87 2 638 10 0452002 76 764 20 721 7 557 53 2 161 10 4162003 78 759 21 870 7 677 63 2 364 10 5642004 81 985 22 516 7 846 177 1 966 10 6322005 82 618 22 766 7 935 –17 2 098 11 030
Manufacture of textile and textile productsSubsection DB
ZIYX KSEH KSEI KSEJ KSEK AWKN2001 13 229 5 051 2 046 41 258 3 0962002 12 203 4 480 1 881 41 307 2 8942003 11 396 4 147 1 713 23 234 2 5532004 10 840 3 825 1 639 7 117 2 3332005 10 318 3 891 1 474 20 132 2 336
Manufacture of leather and leather productsSubsection DC
ZIYY KSEP KSEQ KSER KSES AWKO2001 1 758 595 230 –28 23 3202002 1 541 571 228 –3 18 2752003 974 375 145 –1 11 1982004 920 326 138 –6 20 1972005 770 301 112 4 – 167
Manufacture of wood and wood productsSubsection DD
ZIYZ KSEX KSEY KSEZ KSFA AWKP2001 6 571 2 315 585 –17 219 1 3742002 7 016 2 459 658 37 186 1 6262003 7 134 2 669 713 49 211 1 4442004 7 421 2 958 702 6 177 1 6622005 7 462 2 943 699 46 187 1 555
Manufacture of pulp, paper and paper products; publishing and printingSubsection DE
ZIZA KSFF KSFG KSFH KSFI AWKQ2001 44 922 19 425 2 606 25 1 657 10 8562002 45 317 19 294 2 651 104 1 477 10 9272003 44 767 18 684 2 637 78 1 338 11 0562004 45 924 19 413 2 750 –30 1 251 11 0632005 44 086 18 612 2 411 37 1 756 10 881
Manufacture of coke, refined petroleum products and nuclear fuelSubsection DF
ZIZB KSFN KSFO KSFP KSFQ AWKR2001 25 369 2 401 1 000 –190 705 8982002 24 255 2 502 1 287 190 473 1 0992003 25 348 2 213 1 269 –13 604 1 1602004 27 881 2 651 1 362 97 484 1 1312005 34 273 2 094 2 200 505 285 1 065

368
Production
22.1 Production and construction:1 summary tableUnited KingdomStandard Industrial Classfication 2003: Estimates for all firmscontinued £ million
Stocks and workin progress
CapitalGross Change expenditure Total
Total value At end during less employmentturnover added of year year disposals costs
Standard Industrial Classification: Revised 2003
Manufacture of chemicals, chemical products and man-made fibresSubsection DG
ZIZC KSFV KSFW KSFX KSFY AWKS2001 48 915 15 821 6 205 –8 2 473 7 9592002 48 759 15 847 6 208 –14 2 147 8 2952003 49 779 15 700 6 190 –119 1 926 7 9642004 51 375 17 240 5 941 –15 1 915 8 3132005 50 225 16 582 5 887 –72 1 112 8 125
Manufacture of rubber and plastic productsSubsection DH
ZIZD KSGD KSGE KSGF KSGG AWKT2001 19 869 7 716 1 833 –1 742 4 7692002 19 637 7 536 1 769 27 690 4 6942003 19 803 7 533 1 779 78 751 4 7622004 20 790 7 799 1 878 116 579 4 9602005 21 328 7 821 1 850 –23 427 4 848
Manufacture of other non-metallic mineral productsSubsection DI
ZIZE KSGL KSGM KSGN KSGO AWKU2001 11 656 4 895 1 332 –4 488 2 8282002 12 139 5 011 1 354 21 602 2 7552003 12 573 5 315 1 321 11 579 2 7792004 13 715 5 846 1 434 87 525 3 0412005 12 534 5 244 1 398 80 549 2 881
Manufacture of basic iron and of ferro-alloysSubsection DJ
ZIZF KSGT KSGU KSGV KSGW AWKV2001 40 660 15 316 3 920 –43 1 122 10 0982002 38 360 14 640 3 626 88 1 179 9 6492003 38 125 14 623 3 744 216 1 121 9 5842004 40 873 15 234 3 963 540 1 049 9 4982005 43 154 15 375 4 289 294 972 9 724
Manufacture of machinery and equipment not elsewhere specifiedSubsection DK
ZIZG KSHB KSHC KSHD KSHE AWKW2001 32 825 11 770 4 460 –73 792 8 3022002 32 247 11 841 4 118 –141 673 8 1142003 32 078 11 785 4 913 134 644 7 9142004 33 838 12 170 5 020 118 505 8 0402005 34 744 12 206 4 992 63 521 8 077
Manufacture of electrical and optical equipmentSubsection DL
ZIZH KSHJ KSHK KSHL KSHM AWKX2001 63 227 15 813 7 280 –1 130 1 950 12 5762002 53 048 15 960 6 107 –693 868 11 2922003 46 638 15 302 5 228 –265 773 10 0242004 41 545 15 206 5 210 160 703 9 3892005 40 831 15 057 5 090 120 558 9 112

369
Production
22.1 Production and construction:1 summary tableUnited KingdomStandard Industrial Classfication 2003: Estimates for all firmscontinued £ million
Stocks and workin progress
CapitalGross Change expenditure Total
Total value At end during less employmentturnover added of year year disposals costs
Standard Industrial Classification: Revised 2003
Manufacture of transport equipmentSubsection DM
ZIZI KSHR KSHS KSHT KSHU AWKY2001 61 366 17 322 9 206 444 2 740 10 7402002 61 550 16 925 8 581 –473 2 028 10 8082003 63 338 15 838 7 975 –688 1 659 10 9632004 64 870 16 963 7 198 –429 1 913 11 2742005 66 558 17 074 7 582 331 1 920 11 409
Manufacture not elsewhere classifiedSubsection DN
ZIZJ KSHZ KSIA KSIB KSIC AWKZ2001 16 839 6 468 1 701 81 471 3 7142002 17 254 6 361 1 643 94 428 3 8462003 16 923 6 153 1 608 61 463 3 6332004 17 902 6 718 1 724 147 486 3 7102005 17 829 6 520 1 777 65 368 3 642
Electricity, gas and water supplySection E
ZIZK KSIH KSII KSIJ KSIK AWLA2001 45 256 14 453 1 736 –72 5 165 3 7212002 46 341 15 399 1 709 –116 5 132 3 7252003 47 214 15 446 1 393 –1 5 351 3 9382004 52 386 20 445 1 227 175 4 917 4 4252005 62 003 22 339 1 395 261 6 050 4 587
ConstructionSection F
ZIZL KSIP KSIQ KSIR KSIS AWLB2001 130 064 47 530 13 099 1 537 3 107 23 5672002 140 475 49 785 19 973 1 272 3 934 25 9392003 150 892 53 150 17 923 2 246 3 215 27 2232004 158 025 55 636 18 195 2 159 3 391 28 0882005 167 331 63 196 20 725 2 415 3 382 30 083
1 See chapter text. Source: Office for National Statistics: 01633 812435

370
Production
22.2 Manufacturers’ sales: by industry1
United KingdomStandard Industrial Classification 2003 £ million
2003 2004 2005 2006
Industry SIC (03)________
Other mining and quarrying
Quarrying of stone for construction KSPF 14110 .. .. .. ..Quarrying of limestone, gypsum and chalk KSPG 14120 .. .. .. ..Quarrying of slate KSPH 14130 .. .. .. ..Operation of gravel and sand pits KSPJ 14210 .. .. .. ..Mining of clays and kaolin KSPK 14220 .. .. .. ..Mining of chemical and fertilizer minerals KSPL 14300 .. .. .. ..Production of salt KSPM 14400 .. .. .. ..Other mining and quarrying not elsewhere classified KSPN 14500 62 46 52 44
Manufacture of food products and beverages
Production and preserving of meat KSPO 15110 3 659 3 937 4 159 4 281Production and preserving of poultry meat KSPP 15120 1 933 .. 2 064 2 123Bacon and ham production KSPQ 15131 1 274 1 365 1 466 1 600Other meat and poultry meat processing KSPR 15139 3 884 3 966 4 151 4 009Processing and preserving of fish and fish products KSPS 15200 1 706 1 741 1 802 1 859Processing and preserving of potatoes KSPT 15310 .. 1 233 .. ..Fruit and vegetable juice KSPU 15320 557 570 589 737Processing and preserving of fruit and vegetables
not elsewhere classified KSPV 15330 2 324 2 451 2 504 2 617Crude oils and fats KSPW 15410 431 399 237 144Refined oils and fats KSPX 15420 616 914 889 831
Margarine and similar edible fats KSPY 15430 471 .. .. 416Operation of dairies KTEH 15510 5 602 5 457 5 798 6 043Ice cream KSPZ 15520 .. .. 467 431Grain mill products KSQA 15610 2 672 2 788 2 573 2 755Starches and starch products KSQB 15620 389 380 429 355Prepared feeds for farm animals KSPI 15710 2 108 2 419 2 178 2 376Prepared pet foods KSQC 15720 928 1 189 .. 1 235Bread; fresh pastry goods and cakes KSQD 15810 4 345 4 407 4 186 4 348Rusks and biscuits; preserved pastry goods and cakes KSQE 15820 .. .. 3 294 3 132Sugar KSQF 15830 1 153 1 133 1 077 1 058
Cocoa; chocolate and sugar confectionery KSQG 15840 3 533 3 384 3 036 3 431Macaroni, noodles, couscous and similar farinaceous products KSQH 15850 496 .. .. 499Processing of tea and coffee KSQI 15860 .. 1 420 1 502 ..Condiments and seasonings KSQJ 15870 1 023 1 129 1 129 1 270Homogenised food preparations and dietetic foods KSQK 15880 .. .. 42 47Manufacture of other food products not elsewhere classified KSQL 15890 2 039 2 200 2 301 2 520Distilled potable alcoholic beverages KSQM 15910 2 123 2 216 .. ..Production of ethyl alcohol from fermented materials KSQN 15920 .. .. .. ..Wines KSQO 15930 .. 52 .. ..Cider and other fruit wines KSQP 15940 524 416 490 518
Other non-distilled fermented beverages KSQQ 15950 – – – –Beer KSQR 15960 3 769 4 073 3 805 3 774Malt KSQS 15970 253 255 239 242Mineral waters and soft drinks KSQT 15980 .. .. 3 021 3 204
Manufacture of tobacco products
Tobacco products KSQU 16000 1 829 1 838 1 718 1 875
Manufacture of textiles
Preparation and spinning of textile fibres KSQV 17100 438 486 434 400Textile weaving KSQW 17200 666 690 609 559Finishing of textiles KSQX 17300 409 472 478 468Soft furnishings KSQY 17401 592 576 582 655Canvas goods, sacks etc KSQZ 17402 113 101 81 109Household textiles KSRA 17403 730 654 642 616Carpets and rugs KSRB 17510 751 690 715 763Cordage, rope, twine and netting KSRC 17520 87 76 85 78
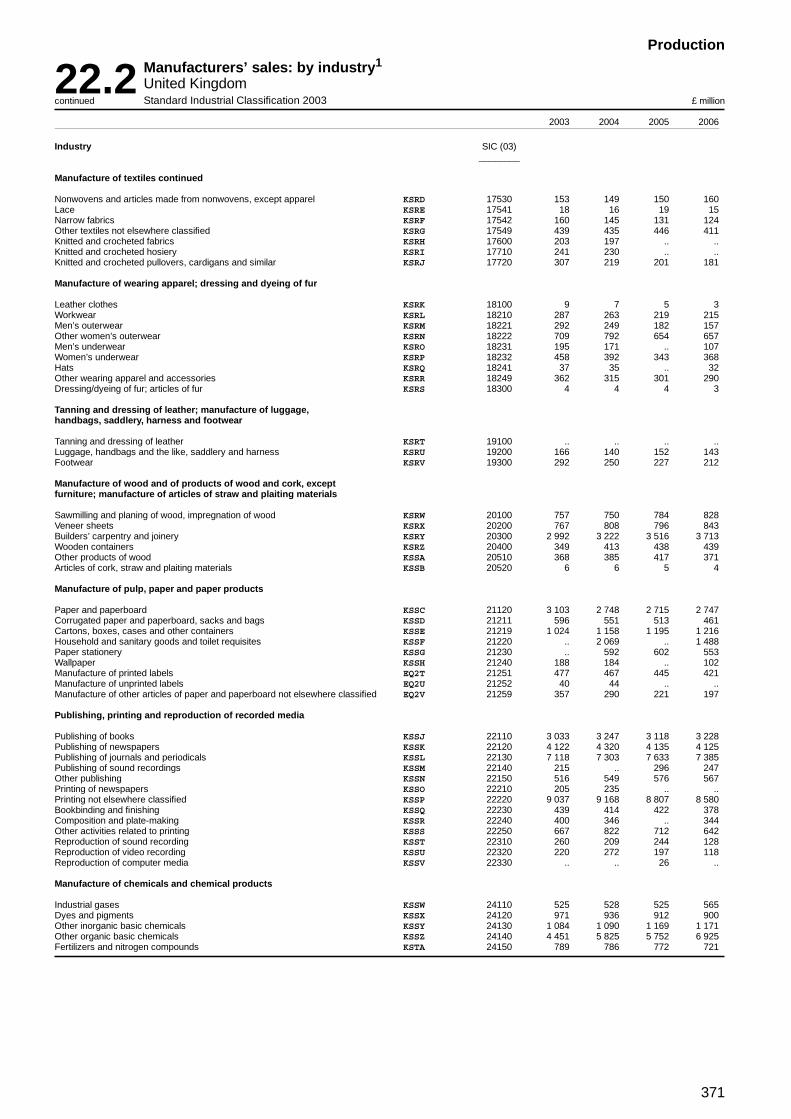
371
Production
22.2 Manufacturers’ sales: by industry1
United KingdomStandard Industrial Classification 2003continued £ million
2003 2004 2005 2006
Industry SIC (03)________
Manufacture of textiles continued
Nonwovens and articles made from nonwovens, except apparel KSRD 17530 153 149 150 160Lace KSRE 17541 18 16 19 15Narrow fabrics KSRF 17542 160 145 131 124Other textiles not elsewhere classified KSRG 17549 439 435 446 411Knitted and crocheted fabrics KSRH 17600 203 197 .. ..Knitted and crocheted hosiery KSRI 17710 241 230 .. ..Knitted and crocheted pullovers, cardigans and similar KSRJ 17720 307 219 201 181
Manufacture of wearing apparel; dressing and dyeing of fur
Leather clothes KSRK 18100 9 7 5 3Workwear KSRL 18210 287 263 219 215Men’s outerwear KSRM 18221 292 249 182 157Other women’s outerwear KSRN 18222 709 792 654 657Men’s underwear KSRO 18231 195 171 .. 107Women’s underwear KSRP 18232 458 392 343 368Hats KSRQ 18241 37 35 .. 32Other wearing apparel and accessories KSRR 18249 362 315 301 290Dressing/dyeing of fur; articles of fur KSRS 18300 4 4 4 3
Tanning and dressing of leather; manufacture of luggage,handbags, saddlery, harness and footwear
Tanning and dressing of leather KSRT 19100 .. .. .. ..Luggage, handbags and the like, saddlery and harness KSRU 19200 166 140 152 143Footwear KSRV 19300 292 250 227 212
Manufacture of wood and of products of wood and cork, exceptfurniture; manufacture of articles of straw and plaiting materials
Sawmilling and planing of wood, impregnation of wood KSRW 20100 757 750 784 828Veneer sheets KSRX 20200 767 808 796 843Builders’ carpentry and joinery KSRY 20300 2 992 3 222 3 516 3 713Wooden containers KSRZ 20400 349 413 438 439Other products of wood KSSA 20510 368 385 417 371Articles of cork, straw and plaiting materials KSSB 20520 6 6 5 4
Manufacture of pulp, paper and paper products
Paper and paperboard KSSC 21120 3 103 2 748 2 715 2 747Corrugated paper and paperboard, sacks and bags KSSD 21211 596 551 513 461Cartons, boxes, cases and other containers KSSE 21219 1 024 1 158 1 195 1 216Household and sanitary goods and toilet requisites KSSF 21220 .. 2 069 .. 1 488Paper stationery KSSG 21230 .. 592 602 553Wallpaper KSSH 21240 188 184 .. 102Manufacture of printed labels EQ2T 21251 477 467 445 421Manufacture of unprinted labels EQ2U 21252 40 44 .. ..Manufacture of other articles of paper and paperboard not elsewhere classified EQ2V 21259 357 290 221 197
Publishing, printing and reproduction of recorded media
Publishing of books KSSJ 22110 3 033 3 247 3 118 3 228Publishing of newspapers KSSK 22120 4 122 4 320 4 135 4 125Publishing of journals and periodicals KSSL 22130 7 118 7 303 7 633 7 385Publishing of sound recordings KSSM 22140 215 .. 296 247Other publishing KSSN 22150 516 549 576 567Printing of newspapers KSSO 22210 205 235 .. ..Printing not elsewhere classified KSSP 22220 9 037 9 168 8 807 8 580Bookbinding and finishing KSSQ 22230 439 414 422 378Composition and plate-making KSSR 22240 400 346 .. 344Other activities related to printing KSSS 22250 667 822 712 642Reproduction of sound recording KSST 22310 260 209 244 128Reproduction of video recording KSSU 22320 220 272 197 118Reproduction of computer media KSSV 22330 .. .. 26 ..
Manufacture of chemicals and chemical products
Industrial gases KSSW 24110 525 528 525 565Dyes and pigments KSSX 24120 971 936 912 900Other inorganic basic chemicals KSSY 24130 1 084 1 090 1 169 1 171Other organic basic chemicals KSSZ 24140 4 451 5 825 5 752 6 925Fertilizers and nitrogen compounds KSTA 24150 789 786 772 721

372
Production
22.2 Manufacturers’ sales: by industry1
United KingdomStandard Industrial Classification 2003continued £ million
2003 2004 2005 2006
Industry SIC (03)________
Manufacture of chemicals and chemical products continued
Plastics in primary forms KSTB 24160 3 394 3 740 3 812 3 858Synthetic rubber in primary forms KSTC 24170 .. .. .. ..Pesticides and other agro-chemical products KSTD 24200 431 470 427 461Paints, varnishes and similar coatings, printing ink and mastic KSTE 24300 2 745 2 776 2 684 2 708Basic pharmaceutical products KSTF 24410 740 734 895 1 054Pharmaceutical preparations KSTG 24420 9 194 8 761 9 863 9 830Soap and detergents, cleaning and polishing preparations KSTH 24510 1 718 1 805 1 656 1 649Perfumes and toilet preparations KSTI 24520 2 314 2 171 1 772 1 835Explosives KSTJ 24610 105 110 120 ..Glues and gelatines KSTK 24620 371 400 433 456Essential oils KSTL 24630 .. .. 504 556Photographic chemical material KSTM 24640 .. 250 260 244Prepared unrecorded media KSTN 24650 127 .. .. 33Other chemical products not elsewhere classified KSTO 24660 1 754 1 992 1 972 2 062Man-made fibres KSTP 24700 618 587 482 616
Manufacture of rubber and plastic products
Rubber tyres and tubes KSTQ 25110 647 569 .. 551Retreading and rebuilding of rubber tyres KSTR 25120 .. 99 .. ..Other rubber products KSTS 25130 1 562 1 608 1 566 1 598Plastic plates, sheets, tubes and profiles KSTT 25210 3 554 3 756 4 186 4 354Plastic packing goods KSTU 25220 .. .. .. ..Builders’ ware of plastic KSTV 25230 4 670 4 452 4 347 4 428Other plastic products KSTW 25240 3 411 3 425 3 283 3 421
Manufacture of other non-metallic mineral products
Flat glass KSTX 26110 278 .. .. ..Shaping and processing of flat glass KSTY 26120 969 1 033 940 929Hollow glass KSTZ 26130 627 638 632 537Glass fibres KSUA 26140 340 325 361 389Manufacturing and processing of other glass including technical glassware KSUB 26150 235 251 177 129Ceramic household and ornamental articles KSUC 26210 423 .. .. ..Ceramic sanitary fixtures KSUD 26220 .. .. 180 175Ceramic insulators and insulating fittings KSUE 26230 .. .. 22 24Other technical ceramic products KSUF 26240 22 21 20 21Other ceramic products KSUG 26250 18 .. .. ..
Refractory ceramic products KSUH 26260 344 340 335 335Ceramic tiles and flags KSUI 26300 91 97 98 89Bricks, tiles and construction products in baked clay KSUJ 26400 .. 656 644 652Cement KSUK 26510 778 763 .. ..Lime KSUL 26520 61 .. 78 ..Plaster KSUM 26530 123 125 131 148Concrete products for construction purposes KSUN 26610 .. 2 278 2 207 2 177Plaster products for construction purposes KSUO 26620 .. 394 429 ..Ready mixed concrete KSUP 26630 .. 1 017 898 737Mortars KSUQ 26640 132 143 146 ..
Fibre cement KSUR 26650 86 96 109 ..Other articles of concrete, plaster and cement KSUS 26660 106 113 96 95Cutting, shaping and finishing of stone KSUT 26700 445 .. .. 455Abrasive products KSUU 26810 157 167 180 174Other non-metallic mineral products not elsewhere classified KSUV 26820 642 713 754 814
Manufacture of basic metals
Cast iron tubes KSUW 27210 .. 164 190 ..Steel tubes KSUX 27220 939 1 096 1 159 1 219Cold drawing KSUY 27310 113 141 146 132

373
Production
22.2 Manufacturers’ sales: by industry1
United KingdomStandard Industrial Classification 2003continued £ million
2003 2004 2005 2006
Industry SIC (03)________
Manufacture of basic metals continued
Cold rolling of narrow strip KSUZ 27320 82 125 117 120Cold forming or folding KSVA 27330 104 .. .. ..Wire drawing KSVB 27340 231 .. 235 ..Precious metals production KSVD 27410 197 247 280 288Aluminium production KSVE 27420 1 783 1 780 1 780 2 341Lead, zinc and tin production KSVF 27430 258 .. 305 457Copper production KSVG 27440 625 766 683 ..Other non-ferrous metal production KSVH 27450 460 639 757 996Casting of iron KSVI 27510 440 440 438 404Casting of steel KSVJ 27520 107 108 136 142Casting of light metals KSVK 27530 307 289 278 308Casting of other non-ferrous metals KSVL 27540 356 292 250 224
Manufacture of fabricated metal products, except machineryand equipment
Metal structures and parts of structures KSVM 28110 4 910 5 390 5 882 6 081Builders’ carpentry and joinery of metal KSVN 28120 964 1 012 1 202 1 164Tanks, reservoirs and containers of metal KSVO 28210 290 291 314 347Central heating radiators and boilers KSVP 28220 580 652 804 ..Steam generators, except central heating hot water boilers KSVQ 28300 .. .. .. ..Forging, pressing, stamping and roll forming of metal KSVR 28400 1 833 1 816 1 900 1 889Treatment and coating of metals KSVS 28510 1 089 1 162 1 268 1 344General mechanical engineering KSVT 28520 2 500 2 832 2 972 3 356Cutlery KSVU 28610 .. 25 21 23Tools KSVV 28620 801 805 795 726Locks and hinges KSVW 28630 575 600 568 552Steel drums and similar containers KSVX 28710 113 122 138 121Light metal packaging KSVY 28720 1 079 1 079 1 093 1 160Wire products KSVZ 28730 482 503 537 629Fasteners, screw machine products, chain and spring KSWA 28740 607 612 609 587Other fabricated metal products not elsewhere classified KSWB 28750 1 636 1 694 1 659 1 718
Manufacture of machinery and equipment not elsewhere classified
Engines and turbines, except aircraft, vehicles and cycle engines KSWC 29110 2 082 2 295 2 437 2 598Pumps KSWD 29121 1 133 1 157 1 239 1 217Compressors KSWE 29122 1 079 1 177 1 087 1 231Taps and valves KSWF 29130 1 103 1 164 1 229 1 264Bearings, gears, gearing and driving elements KSWG 29140 844 887 962 1 014Furnaces and furnace burners KSWH 29210 259 273 258 260Lifting and handling equipment KSWI 29220 2 761 2 964 3 150 3 207Non-domestic cooling and ventilation equipment KSWJ 29230 2 727 2 840 2 805 2 938Other general purpose machinery not elsewhere classified KSWK 29240 2 028 2 021 2 176 2 249Agricultural tractors KSWL 29310 764 739 658 698
Other agricultural and forestry machinery KSWM 29320 476 528 499 536Manufacture of portable hand held power tools EQ2W 29410 229 146 148 ..Manufacture of other metal working machine tools EQ2X 29420 541 537 557 560Manufacture of other machine tools n.e.c. EQ2Y 29430 361 339 327 303Machinery for metallurgy KSWO 29510 82 72 82 78Machinery for mining KSWP 29521 432 524 804 671Earth-moving equipment KSWQ 29522 1 016 .. 1 287 1 423Equipment for concrete crushing and screening and roadworks KSWR 29523 562 .. .. ..Machinery for food, beverage and tobacco processing KSWS 29530 609 667 621 635Machinery for textile, apparel and leather production KSWT 29540 129 106 95 100Machinery for paper and paperboard production KSWU 29550 222 203 159 ..Other special purpose machinery not elsewhere classified KSWV 29560 1 570 1 663 1 600 1 596Weapons and ammunition KSWW 29600 1 638 2 095 107 95
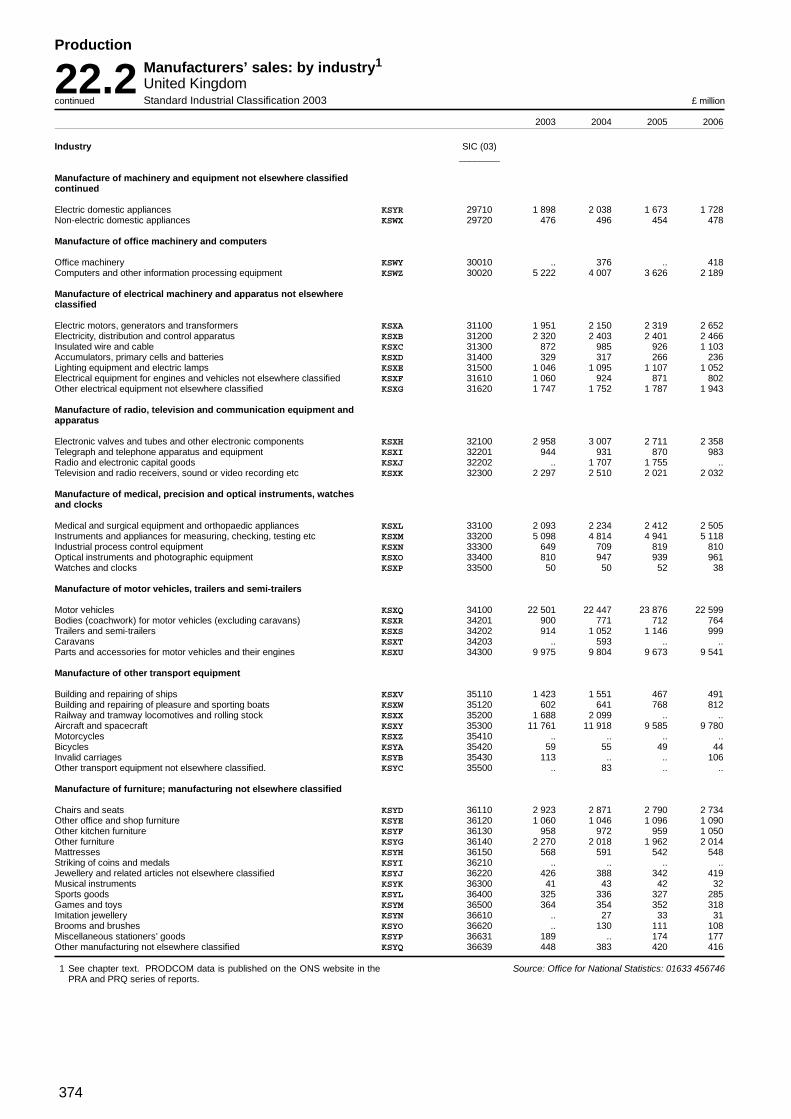
374
Production
22.2 Manufacturers’ sales: by industry1
United KingdomStandard Industrial Classification 2003continued £ million
2003 2004 2005 2006
Industry SIC (03)________
Manufacture of machinery and equipment not elsewhere classifiedcontinued
Electric domestic appliances KSYR 29710 1 898 2 038 1 673 1 728Non-electric domestic appliances KSWX 29720 476 496 454 478
Manufacture of office machinery and computers
Office machinery KSWY 30010 .. 376 .. 418Computers and other information processing equipment KSWZ 30020 5 222 4 007 3 626 2 189
Manufacture of electrical machinery and apparatus not elsewhereclassified
Electric motors, generators and transformers KSXA 31100 1 951 2 150 2 319 2 652Electricity, distribution and control apparatus KSXB 31200 2 320 2 403 2 401 2 466Insulated wire and cable KSXC 31300 872 985 926 1 103Accumulators, primary cells and batteries KSXD 31400 329 317 266 236Lighting equipment and electric lamps KSXE 31500 1 046 1 095 1 107 1 052Electrical equipment for engines and vehicles not elsewhere classified KSXF 31610 1 060 924 871 802Other electrical equipment not elsewhere classified KSXG 31620 1 747 1 752 1 787 1 943
Manufacture of radio, television and communication equipment andapparatus
Electronic valves and tubes and other electronic components KSXH 32100 2 958 3 007 2 711 2 358Telegraph and telephone apparatus and equipment KSXI 32201 944 931 870 983Radio and electronic capital goods KSXJ 32202 .. 1 707 1 755 ..Television and radio receivers, sound or video recording etc KSXK 32300 2 297 2 510 2 021 2 032
Manufacture of medical, precision and optical instruments, watchesand clocks
Medical and surgical equipment and orthopaedic appliances KSXL 33100 2 093 2 234 2 412 2 505Instruments and appliances for measuring, checking, testing etc KSXM 33200 5 098 4 814 4 941 5 118Industrial process control equipment KSXN 33300 649 709 819 810Optical instruments and photographic equipment KSXO 33400 810 947 939 961Watches and clocks KSXP 33500 50 50 52 38
Manufacture of motor vehicles, trailers and semi-trailers
Motor vehicles KSXQ 34100 22 501 22 447 23 876 22 599Bodies (coachwork) for motor vehicles (excluding caravans) KSXR 34201 900 771 712 764Trailers and semi-trailers KSXS 34202 914 1 052 1 146 999Caravans KSXT 34203 .. 593 .. ..Parts and accessories for motor vehicles and their engines KSXU 34300 9 975 9 804 9 673 9 541
Manufacture of other transport equipment
Building and repairing of ships KSXV 35110 1 423 1 551 467 491Building and repairing of pleasure and sporting boats KSXW 35120 602 641 768 812Railway and tramway locomotives and rolling stock KSXX 35200 1 688 2 099 .. ..Aircraft and spacecraft KSXY 35300 11 761 11 918 9 585 9 780Motorcycles KSXZ 35410 .. .. .. ..Bicycles KSYA 35420 59 55 49 44Invalid carriages KSYB 35430 113 .. .. 106Other transport equipment not elsewhere classified. KSYC 35500 .. 83 .. ..
Manufacture of furniture; manufacturing not elsewhere classified
Chairs and seats KSYD 36110 2 923 2 871 2 790 2 734Other office and shop furniture KSYE 36120 1 060 1 046 1 096 1 090Other kitchen furniture KSYF 36130 958 972 959 1 050Other furniture KSYG 36140 2 270 2 018 1 962 2 014Mattresses KSYH 36150 568 591 542 548Striking of coins and medals KSYI 36210 .. .. .. ..Jewellery and related articles not elsewhere classified KSYJ 36220 426 388 342 419Musical instruments KSYK 36300 41 43 42 32Sports goods KSYL 36400 325 336 327 285Games and toys KSYM 36500 364 354 352 318Imitation jewellery KSYN 36610 .. 27 33 31Brooms and brushes KSYO 36620 .. 130 111 108Miscellaneous stationers’ goods KSYP 36631 189 .. 174 177Other manufacturing not elsewhere classified KSYQ 36639 448 383 420 416
1 See chapter text. PRODCOM data is published on the ONS website in thePRA and PRQ series of reports.
Source: Office for National Statistics: 01633 456746

375
Production
22.3 Number of local units in manufacturing industries, March 20071
United KingdomStandard Industrial Classification 2003 Division by Employment Sizeband Numbers
Employment size
0 - 4 5 - 9 10 - 19 20 - 49 50 - 99 100 - 249 250 - 499 500+ Total
Division
15/16 Food products; beverages and tobacco 3 200 1 870 1 355 1 125 545 530 245 175 9 04517 Textiles and textile products 2 400 760 550 425 220 120 20 5 4 50018 Wearing apparel; dressing and dyeing of fur 2 075 650 370 265 60 25 10 0 3 45519 Leather and leather products 340 130 85 65 25 15 0 0 66020 Wood and wood products 4 585 1 545 970 570 170 75 10 5 7 93021 Pulp, paper and paper products 845 285 265 310 185 160 30 10 2 09022 Publishing, printing and reproduction of
recorded media 18 255 3 895 2 450 1 560 560 345 105 55 27 225
23 Coke, refined petroleum products andnuclear fuel 95 45 20 20 20 20 5 10 235
24 Chemicals, chemical products and man-madefibres 1 475 595 505 525 330 255 120 60 3 865
25 Rubber and plastic products 2 680 1 310 1 205 1 090 515 350 75 20 7 24526 Other non-metallic mineral products 3 185 985 680 600 275 185 50 5 5 96527 Basic metals 660 265 210 275 155 95 30 15 1 70528 Fabricated metal products, except
machinery and equipment 14 830 4 900 3 520 2 505 840 330 45 10 26 98029 Machinery and equipment not elsewhere
classified 6 290 2 140 1 780 1 430 555 360 120 50 12 725
30 Office machinery and computers 510 100 75 80 25 35 10 10 84531 Electrical machinery and apparatus not
elsewhere classified 2 510 795 670 605 265 190 60 20 5 11532 Radio, television and communication
equipment and apparatus 1 355 310 225 245 105 80 35 20 2 37533 Medical, precision and optical instruments,
watches and clocks 2 010 750 595 550 275 145 45 20 4 39034 Motor vehicles, trailers and semi-trailers 1 200 370 335 350 175 155 90 55 2 73035 Other transport equipment 1 285 365 265 190 120 120 45 55 2 44536/37 Manufacturing not elsewhere classified 11 360 3 090 1 635 995 335 185 50 15 17 665
Total manufacturing (15/37) 81 145 25 155 17 765 13 780 5 755 3 775 1 200 615 149 190
1 The data in this table is taken from the NS publication,UK Business: Activity, Size and Location 2007.The count of units refers to local units, i.e. individual sites, rather than wholebusinesses. All counts have been rounded to avoid disclosure.
Source: Office for National Statistics: 01633 812293

376
Production
22.4 Production of primary fuels1
United KingdomMillion tonnes of oil equivalent
1996 1997 1998 1999 2000 2001 2002 2003 2004 2005 2006
Coal HFZQ 31.1 30.3 25.8 23.2 19.6 20.0 18.8 17.6 15.6 12.7 11.4Petroleum2 HGCY 142.1 140.4 145.3 150.2 138.3 127.8 127.0 116.2 104.5 92.9 84.0Natural Gas3 HGDB 84.2 85.9 90.2 99.1 108.4 105.9 103.6 102.9 96.4 88.2 80.0Primary electricity4 HGDN 22.4 23.5 24.0 22.9 20.2 21.2 20.6 20.4 18.7 19.0 17.7Renewable energy5 HGDO 1.8 1.9 2.1 2.2 2.3 2.5 2.8 3.0 3.1 3.6 3.6
Total Production HGDP 281.6 282.1 287.2 297.7 288.7 277.4 272.9 260.2 238.4 216.4 196.7
1 See chapter text.2 Includes crude oil, natural gas liquids and feedstocks.3 Includes colliery methane.
4 Nuclear, natural flow hydro-electricity and generation at wind stations.5 Includes solar and geothermal heat, solid renewable sources (wood, waste,
etc), and gaseous renewable sources (landfill gas, sewage gas).
Source: Department for Business, Enterprise and Regulatory Reform: 020 72152710
22.5 Total inland energy consumptionUnited KingdomHeat supplied basis Million tonnes of oil equivalent
1996 1997 1998 1999 2000 2001 2002 2003 2004 2005 2006
Inland energy consumption ofprimary fuels and equivalents1 KLWA 230.0 226.8 230.8 230.7 233.7 236.3 229.9 232.0 233.5 234.9 232.1
Coal2 KLWB 45.7 40.8 40.9 36.7 38.6 41.0 37.7 40.5 39.0 39.8 43.4Petroleum3 KLWC 77.8 75.5 76.0 75.2 75.9 75.4 74.0 73.5 75.3 77.3 77.1Primary electricity KLWD 23.8 24.9 25.0 24.2 21.4 22.1 21.3 20.6 19.4 19.8 18.4Natural gas KLWE 81.0 83.5 86.9 92.5 95.6 95.4 94.2 94.5 96.6 94.0 89.2Renewables and waste GYUY 1.8 1.9 2.1 2.2 2.3 2.5 2.8 3.1 3.5 4.0 4.1less Energy used by fuel producers
and losses in conversion anddistribution KLWF 73.0 72.9 74.7 74.1 74.5 75.4 73.2 73.8 73.6 74.7 74.3
Total consumption by final users1 KLWG 157.0 153.9 155.9 156.5 159.2 160.9 156.5 158.0 159.8 160.1 157.8
Final energy consumption by type of fuel
Coal (direct use) KLWH 4.4 4.3 3.7 3.5 2.7 2.7 2.2 2.1 2.0 1.7 1.6Coke and breeze KLWI 1.0 0.8 0.9 0.9 0.8 0.8 0.7 0.7 0.6 0.6 0.5Other solid fuel4 KLWJ 0.8 0.7 0.7 0.6 0.4 0.5 0.5 0.3 0.3 0.4 0.4Coke oven gas KLWK 0.4 0.5 0.4 0.2 0.2 0.2 0.1 0.1 0.1 0.1 0.1Natural gas (direct use) KLWL 56.5 54.2 55.9 55.1 57.1 57.8 55.2 56.7 57.1 55.5 52.8Electricity KLWM 26.5 26.8 27.1 27.8 28.3 28.6 28.7 28.9 29.1 29.7 29.5Petroleum (direct use)5 KLWN 66.1 65.4 66.1 65.1 66.3 67.1 66.1 66.8 68.6 70.4 71.0Renewables GYVA 1.0 0.9 0.9 0.7 0.7 0.7 0.7 0.7 0.7 0.6 0.6
Final energy consumption by class of consumer
Agriculture KLWP 1.4 1.3 1.4 1.3 1.2 1.3 1.2 1.0 0.9 1.0 0.9Iron and steel industry KLWQ 4.2 4.2 4.0 3.8 2.2 2.3 2.0 1.9 1.9 1.8 1.8Other industries KLWR 30.3 30.4 30.5 30.5 33.1 33.2 32.0 32.2 31.3 31.8 30.7Railways6 KLWS 1.3 1.2 1.3 1.4 1.4 1.4 1.4 1.5 1.4 1.4 1.5Road transport KLWT 40.8 41.3 41.0 41.4 41.1 41.1 41.9 41.8 42.2 42.4 42.5Water transport KLWU 1.3 1.3 1.2 1.1 1.0 0.8 0.7 1.2 1.2 1.4 1.8Air transport KLWV 8.9 9.3 10.2 11.0 12.0 11.8 11.7 11.9 12.9 13.9 14.0Domestic KLWW 48.1 44.8 46.1 46.1 46.9 48.2 47.0 47.7 48.6 47.2 45.6Public administration KLWX 8.8 8.4 8.1 8.2 8.1 8.0 7.0 6.7 7.2 7.2 7.1Commercial and other services KLWY 11.9 11.7 12.0 11.8 12.2 12.8 11.6 12.0 12.2 12.1 11.9
1 Includes heat sold from 1999.2 Includes net trade and stock change in other solid fuels.3 Refinery throughput of crude oil, plus net foreign trade and stock change in
petroleum products. Petroleum products not used as fuels (chemicalfeedstock, industrial and white spirits, lubricants, bitumen and wax) are ex-cluded.
4 Includes briquettes, ovoids, Phurnacite, Coalite, etc., and wood, waste etc.,used for heat generation.
5 Includes manufactured liquid fuels from 1994.6 Includes fuel used at transport premises.
Source: Department for Business, Enterprise and Regulatory Reform: 020 72152710
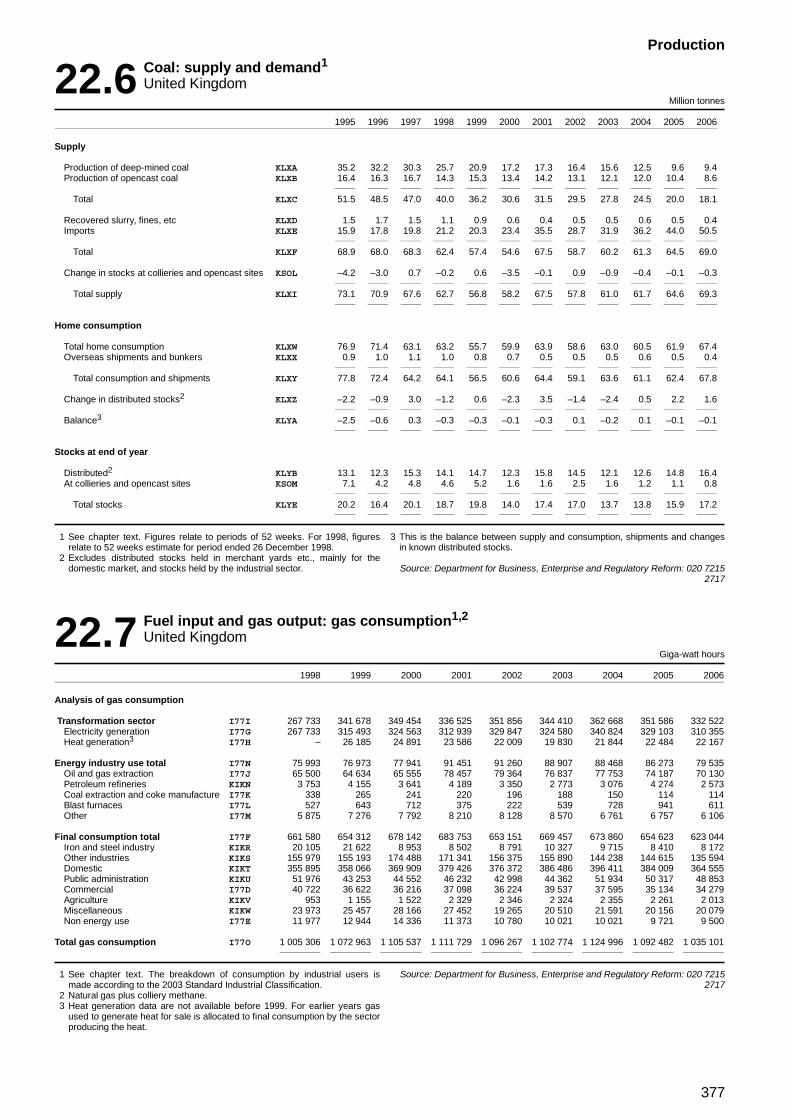
377
Production
22.6 Coal: supply and demand1
United KingdomMillion tonnes
1995 1996 1997 1998 1999 2000 2001 2002 2003 2004 2005 2006
Supply
Production of deep-mined coal KLXA 35.2 32.2 30.3 25.7 20.9 17.2 17.3 16.4 15.6 12.5 9.6 9.4Production of opencast coal KLXB 16.4 16.3 16.7 14.3 15.3 13.4 14.2 13.1 12.1 12.0 10.4 8.6
Total KLXC 51.5 48.5 47.0 40.0 36.2 30.6 31.5 29.5 27.8 24.5 20.0 18.1
Recovered slurry, fines, etc KLXD 1.5 1.7 1.5 1.1 0.9 0.6 0.4 0.5 0.5 0.6 0.5 0.4Imports KLXE 15.9 17.8 19.8 21.2 20.3 23.4 35.5 28.7 31.9 36.2 44.0 50.5
Total KLXF 68.9 68.0 68.3 62.4 57.4 54.6 67.5 58.7 60.2 61.3 64.5 69.0
Change in stocks at collieries and opencast sites KSOL –4.2 –3.0 0.7 –0.2 0.6 –3.5 –0.1 0.9 –0.9 –0.4 –0.1 –0.3
Total supply KLXI 73.1 70.9 67.6 62.7 56.8 58.2 67.5 57.8 61.0 61.7 64.6 69.3
Home consumption
Total home consumption KLXW 76.9 71.4 63.1 63.2 55.7 59.9 63.9 58.6 63.0 60.5 61.9 67.4Overseas shipments and bunkers KLXX 0.9 1.0 1.1 1.0 0.8 0.7 0.5 0.5 0.5 0.6 0.5 0.4
Total consumption and shipments KLXY 77.8 72.4 64.2 64.1 56.5 60.6 64.4 59.1 63.6 61.1 62.4 67.8
Change in distributed stocks2 KLXZ –2.2 –0.9 3.0 –1.2 0.6 –2.3 3.5 –1.4 –2.4 0.5 2.2 1.6
Balance3 KLYA –2.5 –0.6 0.3 –0.3 –0.3 –0.1 –0.3 0.1 –0.2 0.1 –0.1 –0.1
Stocks at end of year
Distributed2 KLYB 13.1 12.3 15.3 14.1 14.7 12.3 15.8 14.5 12.1 12.6 14.8 16.4At collieries and opencast sites KSOM 7.1 4.2 4.8 4.6 5.2 1.6 1.6 2.5 1.6 1.2 1.1 0.8
Total stocks KLYE 20.2 16.4 20.1 18.7 19.8 14.0 17.4 17.0 13.7 13.8 15.9 17.2
1 See chapter text. Figures relate to periods of 52 weeks. For 1998, figuresrelate to 52 weeks estimate for period ended 26 December 1998.
2 Excludes distributed stocks held in merchant yards etc., mainly for thedomestic market, and stocks held by the industrial sector.
3 This is the balance between supply and consumption, shipments and changesin known distributed stocks.
Source: Department for Business, Enterprise and Regulatory Reform: 020 72152717
22.7 Fuel input and gas output: gas consumption1,2
United KingdomGiga-watt hours
1998 1999 2000 2001 2002 2003 2004 2005 2006
Analysis of gas consumption
Transformation sector I77I 267 733 341 678 349 454 336 525 351 856 344 410 362 668 351 586 332 522Electricity generation I77G 267 733 315 493 324 563 312 939 329 847 324 580 340 824 329 103 310 355Heat generation3 I77H – 26 185 24 891 23 586 22 009 19 830 21 844 22 484 22 167
Energy industry use total I77N 75 993 76 973 77 941 91 451 91 260 88 907 88 468 86 273 79 535Oil and gas extraction I77J 65 500 64 634 65 555 78 457 79 364 76 837 77 753 74 187 70 130Petroleum refineries KIKN 3 753 4 155 3 641 4 189 3 350 2 773 3 076 4 274 2 573Coal extraction and coke manufacture I77K 338 265 241 220 196 188 150 114 114Blast furnaces I77L 527 643 712 375 222 539 728 941 611Other I77M 5 875 7 276 7 792 8 210 8 128 8 570 6 761 6 757 6 106
Final consumption total I77F 661 580 654 312 678 142 683 753 653 151 669 457 673 860 654 623 623 044Iron and steel industry KIKR 20 105 21 622 8 953 8 502 8 791 10 327 9 715 8 410 8 172Other industries KIKS 155 979 155 193 174 488 171 341 156 375 155 890 144 238 144 615 135 594Domestic KIKT 355 895 358 066 369 909 379 426 376 372 386 486 396 411 384 009 364 555Public administration KIKU 51 976 43 253 44 552 46 232 42 998 44 362 51 934 50 317 48 853Commercial I77D 40 722 36 622 36 216 37 098 36 224 39 537 37 595 35 134 34 279Agriculture KIKV 953 1 155 1 522 2 329 2 346 2 324 2 355 2 261 2 013Miscellaneous KIKW 23 973 25 457 28 166 27 452 19 265 20 510 21 591 20 156 20 079Non energy use I77E 11 977 12 944 14 336 11 373 10 780 10 021 10 021 9 721 9 500
Total gas consumption I77O 1 005 306 1 072 963 1 105 537 1 111 729 1 096 267 1 102 774 1 124 996 1 092 482 1 035 101
1 See chapter text. The breakdown of consumption by industrial users ismade according to the 2003 Standard Industrial Classification.
2 Natural gas plus colliery methane.3 Heat generation data are not available before 1999. For earlier years gas
used to generate heat for sale is allocated to final consumption by the sectorproducing the heat.
Source: Department for Business, Enterprise and Regulatory Reform: 020 72152717
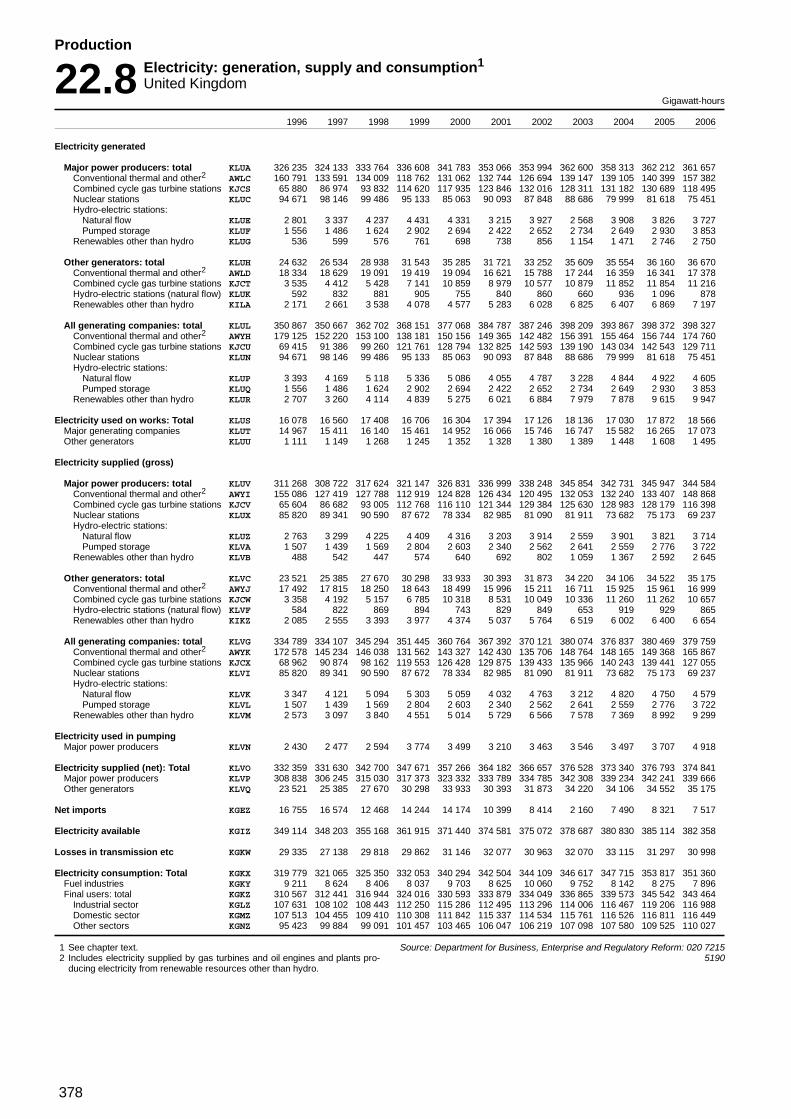
378
Production
22.8 Electricity: generation, supply and consumption1
United KingdomGigawatt-hours
1996 1997 1998 1999 2000 2001 2002 2003 2004 2005 2006
Electricity generated
Major power producers: total KLUA 326 235 324 133 333 764 336 608 341 783 353 066 353 994 362 600 358 313 362 212 361 657Conventional thermal and other2 AWLC 160 791 133 591 134 009 118 762 131 062 132 744 126 694 139 147 139 105 140 399 157 382Combined cycle gas turbine stations KJCS 65 880 86 974 93 832 114 620 117 935 123 846 132 016 128 311 131 182 130 689 118 495Nuclear stations KLUC 94 671 98 146 99 486 95 133 85 063 90 093 87 848 88 686 79 999 81 618 75 451Hydro-electric stations:
Natural flow KLUE 2 801 3 337 4 237 4 431 4 331 3 215 3 927 2 568 3 908 3 826 3 727Pumped storage KLUF 1 556 1 486 1 624 2 902 2 694 2 422 2 652 2 734 2 649 2 930 3 853
Renewables other than hydro KLUG 536 599 576 761 698 738 856 1 154 1 471 2 746 2 750
Other generators: total KLUH 24 632 26 534 28 938 31 543 35 285 31 721 33 252 35 609 35 554 36 160 36 670Conventional thermal and other2 AWLD 18 334 18 629 19 091 19 419 19 094 16 621 15 788 17 244 16 359 16 341 17 378Combined cycle gas turbine stations KJCT 3 535 4 412 5 428 7 141 10 859 8 979 10 577 10 879 11 852 11 854 11 216Hydro-electric stations (natural flow) KLUK 592 832 881 905 755 840 860 660 936 1 096 878Renewables other than hydro KILA 2 171 2 661 3 538 4 078 4 577 5 283 6 028 6 825 6 407 6 869 7 197
All generating companies: total KLUL 350 867 350 667 362 702 368 151 377 068 384 787 387 246 398 209 393 867 398 372 398 327Conventional thermal and other2 AWYH 179 125 152 220 153 100 138 181 150 156 149 365 142 482 156 391 155 464 156 744 174 760Combined cycle gas turbine stations KJCU 69 415 91 386 99 260 121 761 128 794 132 825 142 593 139 190 143 034 142 543 129 711Nuclear stations KLUN 94 671 98 146 99 486 95 133 85 063 90 093 87 848 88 686 79 999 81 618 75 451Hydro-electric stations:
Natural flow KLUP 3 393 4 169 5 118 5 336 5 086 4 055 4 787 3 228 4 844 4 922 4 605Pumped storage KLUQ 1 556 1 486 1 624 2 902 2 694 2 422 2 652 2 734 2 649 2 930 3 853
Renewables other than hydro KLUR 2 707 3 260 4 114 4 839 5 275 6 021 6 884 7 979 7 878 9 615 9 947
Electricity used on works: Total KLUS 16 078 16 560 17 408 16 706 16 304 17 394 17 126 18 136 17 030 17 872 18 566Major generating companies KLUT 14 967 15 411 16 140 15 461 14 952 16 066 15 746 16 747 15 582 16 265 17 073Other generators KLUU 1 111 1 149 1 268 1 245 1 352 1 328 1 380 1 389 1 448 1 608 1 495
Electricity supplied (gross)
Major power producers: total KLUV 311 268 308 722 317 624 321 147 326 831 336 999 338 248 345 854 342 731 345 947 344 584Conventional thermal and other2 AWYI 155 086 127 419 127 788 112 919 124 828 126 434 120 495 132 053 132 240 133 407 148 868Combined cycle gas turbine stations KJCV 65 604 86 682 93 005 112 768 116 110 121 344 129 384 125 630 128 983 128 179 116 398Nuclear stations KLUX 85 820 89 341 90 590 87 672 78 334 82 985 81 090 81 911 73 682 75 173 69 237Hydro-electric stations:
Natural flow KLUZ 2 763 3 299 4 225 4 409 4 316 3 203 3 914 2 559 3 901 3 821 3 714Pumped storage KLVA 1 507 1 439 1 569 2 804 2 603 2 340 2 562 2 641 2 559 2 776 3 722
Renewables other than hydro KLVB 488 542 447 574 640 692 802 1 059 1 367 2 592 2 645
Other generators: total KLVC 23 521 25 385 27 670 30 298 33 933 30 393 31 873 34 220 34 106 34 522 35 175Conventional thermal and other2 AWYJ 17 492 17 815 18 250 18 643 18 499 15 996 15 211 16 711 15 925 15 961 16 999Combined cycle gas turbine stations KJCW 3 358 4 192 5 157 6 785 10 318 8 531 10 049 10 336 11 260 11 262 10 657Hydro-electric stations (natural flow) KLVF 584 822 869 894 743 829 849 653 919 929 865Renewables other than hydro KIKZ 2 085 2 555 3 393 3 977 4 374 5 037 5 764 6 519 6 002 6 400 6 654
All generating companies: total KLVG 334 789 334 107 345 294 351 445 360 764 367 392 370 121 380 074 376 837 380 469 379 759Conventional thermal and other2 AWYK 172 578 145 234 146 038 131 562 143 327 142 430 135 706 148 764 148 165 149 368 165 867Combined cycle gas turbine stations KJCX 68 962 90 874 98 162 119 553 126 428 129 875 139 433 135 966 140 243 139 441 127 055Nuclear stations KLVI 85 820 89 341 90 590 87 672 78 334 82 985 81 090 81 911 73 682 75 173 69 237Hydro-electric stations:
Natural flow KLVK 3 347 4 121 5 094 5 303 5 059 4 032 4 763 3 212 4 820 4 750 4 579Pumped storage KLVL 1 507 1 439 1 569 2 804 2 603 2 340 2 562 2 641 2 559 2 776 3 722
Renewables other than hydro KLVM 2 573 3 097 3 840 4 551 5 014 5 729 6 566 7 578 7 369 8 992 9 299
Electricity used in pumpingMajor power producers KLVN 2 430 2 477 2 594 3 774 3 499 3 210 3 463 3 546 3 497 3 707 4 918
Electricity supplied (net): Total KLVO 332 359 331 630 342 700 347 671 357 266 364 182 366 657 376 528 373 340 376 793 374 841Major power producers KLVP 308 838 306 245 315 030 317 373 323 332 333 789 334 785 342 308 339 234 342 241 339 666Other generators KLVQ 23 521 25 385 27 670 30 298 33 933 30 393 31 873 34 220 34 106 34 552 35 175
Net imports KGEZ 16 755 16 574 12 468 14 244 14 174 10 399 8 414 2 160 7 490 8 321 7 517
Electricity available KGIZ 349 114 348 203 355 168 361 915 371 440 374 581 375 072 378 687 380 830 385 114 382 358
Losses in transmission etc KGKW 29 335 27 138 29 818 29 862 31 146 32 077 30 963 32 070 33 115 31 297 30 998
Electricity consumption: Total KGKX 319 779 321 065 325 350 332 053 340 294 342 504 344 109 346 617 347 715 353 817 351 360Fuel industries KGKY 9 211 8 624 8 406 8 037 9 703 8 625 10 060 9 752 8 142 8 275 7 896Final users: total KGKZ 310 567 312 441 316 944 324 016 330 593 333 879 334 049 336 865 339 573 345 542 343 464
Industrial sector KGLZ 107 631 108 102 108 443 112 250 115 286 112 495 113 296 114 006 116 467 119 206 116 988Domestic sector KGMZ 107 513 104 455 109 410 110 308 111 842 115 337 114 534 115 761 116 526 116 811 116 449Other sectors KGNZ 95 423 99 884 99 091 101 457 103 465 106 047 106 219 107 098 107 580 109 525 110 027
1 See chapter text.2 Includes electricity supplied by gas turbines and oil engines and plants pro-
ducing electricity from renewable resources other than hydro.
Source: Department for Business, Enterprise and Regulatory Reform: 020 72155190

379
Production
22.9 Electricity: plant capacity and demandUnited KingdomAt end of December Megawatts
1998 1999 2000 2001 2002 2003 2004 2005 2006
Major power producers:1
Total declared net capability GUFY 68 312 70 245 72 193 73 382 70 369 71 465 73 293 73 941 75 016Conventional steam stations GUFZ 35 081 35 647 34 835 34 835 30 687 30 327 31 982 32 292 33 628Combined cycle gas turbine stations GUGA 14 618 16 110 19 349 20 517 21 800 23 577 23 783 24 263 24 859Nuclear stations2 GUGB 12 956 12 956 12 486 12 486 12 240 11 852 11 852 11 852 10 969Gas turbines and oil engines GUGC 1 434 1 301 1 291 1 291 1 433 1 537 1 495 1 356 1 444Hydro-electric stations:
Natural flow GUGD 1 327 1 327 1 327 1 348 1 304 1 267 1 276 1 273 1 294Pumped storage GUGE 2 788 2 788 2 788 2 788 2 788 2 788 2 788 2 788 2 726
Renewables other than hydro GUGF 108 117 117 117 117 117 117 117 96
Other generators:Total capacity of own generating plant3 GUGG 4 990 5 388 6 258 6 296 6 336 6 829 6 829 7 452 8 029
Conventional steam stations4 GUGH 3 248 3 315 3 544 3 464 3 325 3 480 3 275 3 303 3 626Combined cycle gas turbine stations GUGI 1 005 1 243 1 709 1 777 1 854 1 927 1 968 2 182 2 200Hydro-electric stations (natural flow) GUGJ 148 150 158 160 162 165 132 127 130Renewables other than hydro GUGK 589 680 847 895 995 1 257 1 454 1 840 2 073
All generating companies: Total capacity3 GUGL 73 302 75 633 78 451 79 678 76 705 78 294 80 122 81 393 83 045Conventional steam stations4 GUGM 38 329 38 962 38 379 38 299 34 012 33 807 35 257 35 595 37 254Combined cycle gas turbine stations GUGN 15 623 17 353 21 058 22 294 23 654 25 504 25 751 26 445 27 059Nuclear stations GUGO 12 956 12 956 12 486 12 486 12 240 11 852 11 852 11 852 10 969Gas turbines and oil engines GUGP 1 434 1 301 1 291 1 291 1 433 1 537 1 495 1 356 1 444Hydro-electric stations:
Natural flow GUGQ 1 475 1 477 1 485 1 508 1 466 1 432 1 408 1 400 1 424Pumped storage GUGR 2 788 2 788 2 788 2 788 2 788 2 788 2 788 2 788 2 726
Renewables other than hydro GUGS 697 797 964 1 012 1 112 1 374 1 571 1 957 2 169
Major power producers:1
Simultaneous maximum load met5 GUGT 56 312 57 849 58 452 58 589 61 717 60 501 61 013 61 697 59 071
System load factor6 (percentages) GUGU 68.0 67.0 67.0 69.0 65.0 67.0 67.0 66.0 69.0
1 See chapter text.2 Nuclear generators are now included under "major power producers" only.3 Capacity figures for other generators are as at end-December of the previ-
ous year.
4 For other generators, conventional steam stations cover all types of stations notseparately listed.
5 Maximum load in year to end of March.6 The average hourly quantity of electricity available during the year ending
March expressed as a percentage of the maximum demand.
Source: Department for Business, Enterprise and Regulatory Reform: 020 72155190
22.10 Electricity: fuel used in generationUnited Kingdom
Million tonnes of oil equivalent
1996 1997 1998 1999 2000 2001 2002 2003 2004 2005 2006
Major power producers:1 total all fuels KGPS 74.60 71.50 74.90 73.60 74.40 77.38 75.79 77.53 76.82 78.19 78.68Coal FTAJ 32.40 27.10 28.70 24.50 27.80 30.60 28.60 31.60 30.40 31.70 34.90Oil2 FTAK 3.00 1.20 0.80 0.80 0.80 0.80 0.70 0.70 0.60 0.90 1.00Gas KGPT 15.2 19.3 20.3 24.2 24.4 23.8 25.0 24.5 26.2 25.4 23.9Nuclear3 FTAL 22.20 22.00 23.40 22.20 19.60 20.80 20.10 20.00 18.20 18.40 17.10Hydro (natural flow) FTAM 0.20 0.30 0.40 0.40 0.40 0.30 0.30 0.20 0.30 0.30 0.30Other fuels used by UK companies KGPU 0.1 0.2 0.2 0.2 0.2 0.3 0.3 0.4 0.5 0.8 0.7Net imports KGPV 1.4 1.4 1.1 1.2 1.2 0.9 0.7 0.2 0.6 0.7 0.6
Other generators: total all fuels KGPW 6.4 6.7 7.1 7.3 8.0 7.6 8.0 8.7 8.4 8.9 8.8Transport undertakings
Gas KGPX 0.200 0.200 0.200 0.200 0.200 0.200 0.200 0.008 0.002 0.003 0.002Undertakings in industrial sector
Coal KGPY 1.2 1.2 1.2 1.0 0.9 1.0 1.0 1.0 0.9 0.9 0.9Oil KGPZ 0.9 0.8 0.7 0.7 0.8 0.6 0.6 0.5 0.5 0.5 0.4Gas KGQM 1.9 2.2 2.5 2.7 3.3 2.9 3.2 3.4 3.1 2.8 2.7Hydro (natural flow) KGQO 0.1 0.1 0.1 0.1 0.1 0.1 0.1 0.1 0.1 0.1 0.1Other fuels KGQP 2.037 2.186 2.420 2.640 2.770 2.740 2.968 3.660 3.800 4.600 4.600
All generating companies: total fuels KGQQ 81.03 78.20 82.00 80.90 82.40 84.90 83.80 86.20 85.20 87.10 87.50Coal KGQR 33.6 28.3 29.9 25.5 28.7 31.6 29.6 32.5 31.3 32.6 35.9Oil KGQS 4.0 2.0 1.5 1.5 1.5 1.4 1.3 1.2 1.1 1.4 1.4Gas KGQT 17.4 21.7 23.0 27.1 27.9 26.9 28.4 27.9 29.3 28.2 26.6Nuclear3 KGQU 22.2 22.0 23.4 22.2 19.6 20.8 20.1 20.0 18.2 18.4 17.1Hydro (natural flow) KGQV 0.3 0.4 0.4 0.5 0.4 0.3 0.4 0.3 0.4 0.4 0.4Other fuels used by UK companies4 KGQW 2.183 2.351 2.597 2.863 3.007 2.993 3.242 4.041 4.300 5.400 5.400Net imports KGQX 1.4 1.4 1.1 1.2 1.2 0.9 0.7 0.2 0.6 0.7 0.6
1 See chapter text.2 Includes oil used in gas turbine and diesel plant for lighting up coal fired
boilers and Orimulsion.
3 Nuclear generators are now included under "major power producers" only.4 Main fuels included are coke oven gas, blast furnace gas, waste products from
chemical processes and sludge gas.
Source: Department for Business, Enterprise and Regulatory Reform: 020 72155190

380
Production
22.11 Indigenous petroleum production, refinery receipts, imports and exports of oil1
Thousand tonnes
1996 1997 1998 1999 2000 2001 2002 2003 2004 2005 2006
Total indigenous petroleumproduction2 KMBA 129 742 128 234 132 633 137 099 126 245 116 678 115 944 106 073 95 374 84 721 76 578
Crude petroleum:3
Refinery receipts total KMBB 96 660 97 023 93 797 88 286 88 014 83 343 84 784 84 585 89 821 86 135 83 213
Foreign trade4
Imports KMBF 50 099 49 994 47 958 44 869 54 387 53 551 56 968 54 177 62 516 58 886 59 443Exports AXRB 81 563 79 400 84 610 91 797 92 918 86 930 87 144 74 898 64 504 54 098 50 195
Net imports AXRC –31 464 –29 406 –36 652 –46 928 –38 531 –33 378 –30 176 –20 720 –1 988 4 787 9 249
Petroleum productsForeign trade
Imports4 BHMI 9 315 8 705 11 418 13 896 14 212 17 234 14 900 16 472 18 545 22 510 26 828Exports4 AXRD 23 681 26 755 24 375 21 730 20 677 19 088 23 444 23 323 30 495 29 722 29 009
Net imports4 AXRE –14 366 –18 049 –12 957 –7 834 –6 464 –1 854 –8 544 –6 851 –11 950 –7 211 –2 181International marine bunkers BHMK 2 664 2 961 3 080 2 329 2 079 2 274 1 913 1 764 2 085 2 055 2 348
1 See chapter text. The term ’indigenous’ is used in this table to cover oilproduced on the UK Continental Shelf.This includes small amounts produced onshore.
2 Crude oil plus condensates and petroleum gases derived at onshoretreatment plants.
3 Includes process (partly refined) oils.4 Foreign trade as recorded by the petroleum industry and may differ from figures
published in Overseas Trade Statistics.
Source: Department for Business, Enterprise and Regulatory Reform: 020 72156072
22.12 Throughput of crude and process oils and output of refined productsfrom refineries1
United Kingdom Thousand tonnes
1996 1997 1998 1999 2000 2001 2002 2003 2004 2005 2006
Throughput of crude andprocess oils KMAU 96 661 97 024 93 797 88 285 88 014 83 343 84 784 84 585 89 821 86 135 83 213
less: Refinery fuel: KMAA 6 623 6 572 6 177 5 538 5 252 5 059 5 677 5 456 5 417 5 602 4 728Losses KMAB 152 86 1 004 1 550 1 632 1 233 788 58 –5 132 133
Total output of refined products KMAC 89 885 90 366 86 616 81 197 81 130 77 051 78 319 79 071 84 409 80 402 78 352
Gases:Butane and propane KMAE 1 828 1 950 1 961 1 975 1 917 1 764 2 139 2 281 2 152 2 424 2 304Other petroleum KMAF 144 139 394 361 288 272 537 715 520 427 610
Naphtha and other feedstock KMAG 2 824 2 854 2 316 2 430 3 082 3 428 3 153 3 503 3 168 3 019 2 734Aviation spirit KMAH – – – 16 30 101 28 26 31 32 25Motor spirit KMAJ 28 046 28 260 27 166 25 230 23 445 21 455 22 944 22 627 24 589 22 620 21 443Industrial and white spirit KMAK 136 128 135 129 122 121 121 104 100 136 107Kerosene:
Aviation turbine fuel KMAL 8 305 8 342 7 876 7 249 6 484 5 910 5 365 5 277 5 615 5 167 6 261Burning oil KMAM 3 510 3 336 3 442 3 553 3 078 3 088 3 506 3 521 3 613 3 325 3 374
Gas/diesel oil KMAN 28 903 28 778 27 542 25 755 28 229 26 748 28 343 27 380 28 647 28 486 26 038Fuel oil KMAO 11 479 11 747 11 125 10 446 10 296 10 179 8 507 9 495 11 308 10 155 11 280Lubricating oil KMAP 1 111 1 231 1 125 907 702 656 509 576 1 136 936 617Bitumen KMAQ 2 189 2 258 2 172 1 644 1 438 1 707 1 918 1 925 2 196 1 912 1 749Petroleum wax KMAR 41 65 59 261 437 416 430 460 94 98 16Petroleum coke KMAS 714 598 678 648 657 513 441 612 633 660 606Other products KMAT 655 680 625 593 927 692 378 569 607 1 005 1 189
1 See chapter text. Crude and process oils comprise all feedstocks, otherthan distillation benzines, for treatment at refinery plants. Refinery produc-tion does not cover further treatment of finished products for special gradessuch as in distillation plant for the preparation of industrial spirits.
Source: Department for Business, Enterprise and Regulatory Reform: 020 72156072

381
Production
22.13 Deliveries of petroleum products for inland consumption1
United KingdomThousand tonnes
1996 1997 1998 1999 2000 2001 2002 2003 2004 2005 2006
Total (including refinery fuel) KMCA 82 013 79 073 78 438 77 974 77 196 76 413 76 233 77 154 79 053 81 035 79 990
Total (excluding refinery fuel) KMCB 75 390 72 501 72 261 72 436 71 944 71 354 70 556 71 697 73 636 75 433 75 262
Butane and propane ECAQ 2 439 2 426 2 368 2 249 2 070 2 097 2 553 3 017 3 114 3 554 3 327Other Petroleum Gases (includes Ethane) ECAR 1 482 1 561 1 752 2 041 1 886 2 077 2 181 2 114 1 918 2 021 1 870Naphtha ECAS 3 010 2 640 2 882 3 100 2 344 1 592 1 592 2 332 2 029 1 916 2 279Aviation spirit KMCI 32 37 36 45 52 59 50 46 49 52 46
Motor spirit:Retail deliveries:
Leaded Premium / Lead Replacement Petrol KMCK 7 043 6 138 4 595 2 629 1 462 838 401 183 74 25 19Super Premium Unleaded KMCL 698 506 409 473 403 420 706 861 810 924 719Premium Unleaded KMCM 14 228 15 188 16 432 18 307 19 008 19 100 19 167 18 291 17 795 16 954 16 704Total Retail Deliveries ECAT 21 969 21 832 21 436 21 409 20 873 20 358 20 274 19 335 18 679 17 903 17 442
Commercial consumers:Leaded Premium / Lead Replacement Petrol KMCO 135 112 91 61 44 34 19 19 14 1 2Super Premium Unleaded KMCP 11 9 4 6 6 9 17 22 26 16 63Premium Unleaded KMCQ 294 298 318 311 480 538 499 542 765 811 637Total Commercial Consumers ECAU 440 419 413 378 530 581 535 583 805 828 702
Total Motor spirit BHOD 22 409 22 251 21 849 21 787 21 403 20 939 20 809 19 918 19 484 18 731 18 144
Industrial and white spirits KMCS 184 195 179 174 170 151 157 147 281 284 156Kerosene:
Aviation turbine fuel BHOE 8 049 8 411 9 241 9 939 10 806 10 614 10 519 10 765 11 637 12 497 12 641Burning oil KMCT 3 336 3 343 3 575 3 633 3 839 4 236 3 578 3 569 3 950 3 869 4 016
Gas/diesel oil:Derv fuel:
Retail Deliveries ECAV 5 537 6 127 6 602 7 137 7 181 7 846 8 153 9 057 9 517 10 679 11 453Commercial Consumers ECAW 8 828 8 849 8 541 8 371 8 451 8 213 8 774 8 655 8 997 8 757 8 693Total Derv fuel BHOI 14 365 14 976 15 143 15 508 15 632 16 059 16 927 17 712 18 514 19 436 20 146
Other gas/diesel oil (includes Mdf) ECAX 8 349 8 053 7 908 7 454 7 576 6 960 6 099 6 326 6 017 6 797 6 565Fuel oil BHOK 6 854 3 936 3 105 2 701 2 119 2 578 1 721 1 540 2 063 2 023 2 151Lubricating oils BHOL 864 872 813 790 801 846 829 868 914 750 713Bitumen BHOM 2 146 2 015 1 967 1 928 1 975 1 935 2 002 1 959 1 991 1 906 1 610Petroleum wax KMCU 44 44 18 37 32 33 51 57 50 72 48Petroleum coke KMCV 1 210 1 095 887 660 776 702 893 880 1 145 1 042 925Miscellaneous products KMCW 617 646 537 388 463 475 596 449 476 484 628
1 See chapter text. Source: Department for Business, Enterprise and Regulatory Reform: 020 72156072

382
Production
22.14 Iron and steel:1 summary of steel supplies, deliveries and stocksUnited Kingdom
1996 1997 1998 1999 2000 2001 2002 2003 2004 2005 2006
Supply, disposal and consumption - (Finishedproduct weight - Thousand tonnes)
UK producers’ home deliveries KLTA 8 383 8 626 8 260 7 652 7 255 6 762 6 506 6 227 7 083 6 279 6 757Imports excluding steelworks receipts KLTB 5 147 5 894 6 466 6 014 6 387 6 978 6 793 6 893 7 272 6 297 7 403Total deliveries to home market (a) KLTC 13 530 14 520 14 726 13 666 13 642 13 740 13 299 13 120 14 355 12 576 14 160
Total exports (producers,consumers, merchants) KLTD 8 917 9 060 8 008 7 623 7 446 6 512 6 320 7 007 7 455 8 408 7 862
Exports by UK producers KLTE 8 305 8 534 7 876 7 416 7 163 6 182 5 594 6 202 6 275 6 594 6 852Derived consumers’ and
merchants’ exports (b) KLTF 612 526 132 207 283 330 708 806 1 179 1 814 1 010
Net home disposals (a)-(b) KLTG 12 918 13 994 14 594 13 460 13 359 13 410 12 591 12 314 13 176 10 762 13 150
Estimated home consumption KLTI 12 918 13 994 14 594 13 460 13 359 13 410 12 591 12 114 13 176 10 762 13 150
Stocks - (Finished product weight -Thousand tonnes)
Producers- ingots & semis KLTJ 767 946 717 747 727 705 690 706 765 869 790- finished steel KLTK 1 515 1 358 1 495 1 318 1 039 981 932 917 901 947 876
Estimated home consumption - (Crudesteel equivalent - Million tonnes)
Crude steel production2 KLTN 17.99 18.50 17.32 16.28 15.15 13.54 11.53 13.13 13.77 13.23 13.90Producers’ stock change KLTO .. 0.03 .. .. .. .. .. .. .. 0.18 –Re-usable material KLTP 0.07 0.06 0.02 .. .. .. .. .. .. .. –Total supply from home sources KLTQ 18.13 18.53 17.45 16.47 15.48 13.68 11.61 13.13 13.77 13.20 13.90Total imports3 KLTR 7.01 7.49 8.38 7.81 8.43 9.11 9.86 9.32 10.31 9.82 10.30Total exports3 KLTS 10.26 10.43 9.25 8.70 8.61 7.53 7.39 8.65 9.15 8.93 10.40Net home disposals KLTT 14.88 15.59 16.58 15.58 15.30 15.26 14.08 14.20 14.99 13.09 14.70
Estimated home consumption KLTV 14.88 15.59 16.58 15.58 15.30 15.26 14.08 14.20 14.99 13.09 14.70
1 See chapter text. The figures relate to periods of 52 weeks.2 Includes liquid steel for castings only up to 2003.
3 Based on HM Customs Statistics, reflecting total trade rather than producers’trade.
Source: Iron and Steel Statistics Bureau: 020 8686 9050 ext 126

383
Production
22.15 Iron and steel:1 iron ore, manganese ore, pig iron and iron and steel scrapUnited Kingdom
Thousand tonnes
1996 1997 1998 1999 2000 2001 2002 2003 2004 2005 2006
Iron ore2 KLOF 19 720 20 820 19 532 18 754 16 991 15 113 13 185 15 766 16 013 15 991 16 539
Manganese ore2 KLOG 48 37 22 14 36 4 4 .. 6 3 6
Pig iron (and blast furnace ferro-alloys)
Average number of furnaces inblast during period KLOH 9 9 9 9 8 7 5 6 6 6 7
ProductionSteelmaking iron KLOI 12 830 13 054 12 746 12 139 10 890 9 870 8 561 10 228 10 180 10 189 10 696
In blast furnaces: total KLOL 12 830 13 054 12 746 12 139 10 890 9 870 8 561 10 228 10 180 10 189 10 696
In steel works KLOM 12 753 13 044 12 746 12 139 10 890 9 870 8 561 10 228 10 180 10 189 10 696
Consumption of pig iron: total KLOO 12 753 13 044 12 746 12 139 10 890 9 870 8 561 10 228 10 180 10 189 10 696
Iron and steel scrap
Steelworks and steel foundriesCirculating scrap KLOQ 2 639 2 459 2 380 2 488 2 287 2 019 1 882 1 926 1 787 1 737 1 669Purchased receipts KLOR 4 130 5 418 4 045 3 433 3 327 3 001 2 271 2 617 3 371 2 779 3 171Consumption KLOS 6 828 7 207 6 408 5 884 5 675 5 006 4 216 4 469 5 123 4 531 4 811Stocks (end of period) KLOT 260 236 253 290 229 224 161 234 242 228 257
1 See chapter text. The figures relate to periods of 52 weeks.2 Consumption.
Source: Iron and Steel Statistics Bureau: 020 8686 9050 ext 126

384
Production
22.16 Iron and steel:1 furnaces and production of steelUnited Kingdom
Number and thousand tonnes
1996 1997 1998 1999 2000 2001 2002 2003 2004 2005 2006
Steel furnaces (numbers2) KLPA 192 192 190 181 181 181 173 .. .. .. ..
Oxygen converters KLPC 11 11 11 11 11 11 8 .. .. .. ..Electric KLPD 181 181 179 170 170 170 165 .. .. .. ..
Production of crude steel KLPF 17 992 18 499 17 315 16 284 15 155 13 543 11 667 13 268 13 766 13 239 13 905
by processOxygen converters KLPH 13 758 13 986 13 426 12 634 11 551 10 271 8 956 10 630 10 667 10 550 11 203Electric KLPI 4 234 4 513 3 889 3 650 3 604 3 272 2 711 2 639 3 099 2 685 2 702
by cast methodCast to ingot KLPK 1 892 1 660 784 534 539 369 339 354 383 281 206Continuously cast KLPL 15 912 16 653 16 346 15 637 14 470 13 024 11 182 12 766 13 383 12 958 13 698Steel for castings KLPM 188 186 185 127 146 150 146 148 .. .. ..
by qualityNon alloy steel KLPN 16 708 17 193 16 145 15 263 14 004 12 482 10 657 12 294 12 809 12 376 ..Stainless and other alloy steel KLPO 1 284 1 306 1 170 1 035 1 151 1 061 1 010 974 957 863 760
Production of finished steel products(All quantities)3
Rods and bars for reinforce-ment (in coil and lengths) KLPP 1 182 1 118 1 133 893 812 755 487 294 769 730 902
Wire rods and other rods andbars in coil KLPQ 1 536 1 565 1 492 1 407 1 408 1 389 1 394 1 316 1 392 1 035 962
Hot rolled bars in lengths KLPR 1 499 1 716 1 791 1 542 1 545 1 449 1 267 1 107 1 179 1 142 1 249Bright steel bars4 KLPS 357 385 336 311 337 296 271 273 277 233 226Light sections other than rails KLPT 298 302 318 264 183 201 188 116 136 130 149Heavy sections KGQZ 2 557 2 397 2 346 2 303 1 915 1 931 1 873 1 774 1 694 1 414 1 527Hot rolled plates, sheets and
strip in coil and lengths KLPW 8 512 8 956 8 454 7 893 7 293 5 841 5 756 6 145 6 437 5 823 6 010Cold rolled plates and sheets
in coil and lengths KLPX 4 221 4 437 4 288 3 914 3 612 2 944 2 951 2 958 3 001 2 769 2 726Cold rolled strip4 KLPZ 246 255 259 233 218 201 179 186 156 131 98Tinplate KLQW 739 754 772 736 753 602 562 493 507 471 421Other coated sheet KLQX 2 366 2 534 2 610 2 475 2 471 1 773 1 786 1 811 1 713 1 644 1 773Tubes and pipes4 KLQY 1 317 1 310 1 276 1 100 1 061 1 096 940 1 066 1 076 932 993Forged bars4 KLQZ 3 3 3 2 1 1 1 .. .. .. ..
1 See chapter text. The figures relate to periods of 52 weeks.2 Includes steel furnaces at steel foundries, only up to 2003.
3 Includes material for conversion into other products listed in the table.4 Based on producers’ deliveries.
Source: Iron and Steel Statistics Bureau: 020 8686 9050 ext 126

385
Production
22.17 Non-ferrous metalsUnited Kingdom
Thousand tonnes
1996 1997 1998 1999 2000 2001 2002 2003 2004 2005 2006
Copper
Production of refined copper:Primary KLAA 13.0 9.1 6.4 1.7 – – – – – – –Secondary KLAB 43.6 51.3 47.4 48.6 – – – – – – –
Home consumption:Refined KLAC 396.0 408.3 374.1 305.3 322.7 285.9 260.8 242.2 243.4 165.4 172.1Scrap (metal content) KLAD 81.0 69.0 64.6 112.5 132.4 127.0 120.0 120.0 120.0 120.0 120.0
Stocks (end of period)1,2 KLAE 6.6 12.8 7.5 7.3 10.4 7.3 .. .. .. .. ..
Analysis of home consumption(refined and scrap):3,4 total KLAF 477.3 477.4 438.7 417.8 455.5 212.7 .. .. .. .. ..
Wire5 KLAG 309.4 312.5 287.2 276.1 310.2 151.8 .. .. .. .. ..Rods, bars and sections KLAH 58.3 58.3 53.6 46.9 43.6 21.6 .. .. .. .. ..Sheet, strip and plate KLAI 34.0 36.5 30.5 27.7 32.3 16.9 .. .. .. .. ..Tubes KLAJ 75.6 70.1 67.4 67.1 69.4 22.4 .. .. .. .. ..
Zinc
Slab zinc:Production KLAL 96.9 107.7 99.6 132.8 99.6 99.6 99.6 16.6 – – –Home consumption KLAM 195.7 194.8 187.9 198.9 206.5 197.1 202.4 176.2 150.1 161.7 161.7Stocks (end of period) KLAN 10.5 10.1 10.6 10.9 10.9 9.5 9.2 8.9 8.9 8.9 8.9
Other zinc (metal content):Consumption KLAO 41.3 41.5 37.3 41.6 46.3 48.2 51.8 52.3 55.4 – –
Analysis of home consumption(slab and scrap): total KLAP 237.1 236.5 221.6 232.1 237.9 226.6 230.4 226.8 232.0 .. ..
Brass KLAQ 39.1 41.6 36.6 33.6 34.4 32.2 30.0 30.0 31.2 .. ..Galvanized products KLAR 110.3 108.4 103.8 116.6 120.9 111.8 117.3 113.3 116.2 .. ..Zinc sheet and strip KLAS 3.0 3.3 3.3 3.3 3.3 3.3 3.4 3.3 3.3 .. ..Zinc alloy die castings KLAT 46.5 46.5 46.5 46.5 46.5 46.5 46.5 46.5 46.5 .. ..Zinc oxide KLAU 20.7 20.6 20.4 21.1 21.8 21.8 22.2 22.7 23.8 .. ..Other products KLAV 17.5 16.1 11.0 11.0 11.0 11.0 11.0 11.0 11.0 .. ..
Refined lead
Production6,7 KLAW 351.4 384.1 349.7 351.0 328.0 366.3 366.3 364.6 245.9 304.3 306.7Home consumption7,8
Refined lead KLAX 272.8 270.4 275.5 283.3 294.0 298.3 298.3 314.7 330.3 281.6 300.0Scrap and remelted lead7 KLAY 43.4 39.1 38.4 32.2 39.5 40.6 40.7 34.1 40.8 .. ..
Stocks (end of period)9
Lead bullion KLAZ 32.9 15.5 20.9 17.1 10.0 17.2 17.2 24.0 23.0 23.0 23.0Refined soft lead at consumers KLBA 28.8 29.1 27.4 25.7 25.8 26.1 26.1 25.3 25.9 25.9 25.9In LME Warehouses (UK) KLBB 3.0 2.4 0.1 0.1 0.1 0.1 0.1 0.1 0.1 0.1 ..
Analysis of home consumption(refined and scrap): total KLBC 316.2 309.5 313.9 315.5 333.5 338.9 339.0 348.8 371.1 281.6 300.0
Cables KLBD 9.8 9.7 9.7 9.7 9.6 9.6 9.7 9.7 9.7 .. ..Batteries (excluding oxides) KLBE 52.3 54.7 51.6 47.4 50.5 48.2 48.2 51.9 54.1 .. ..Oxides and compounds:
Batteries KLBF 54.9 56.1 54.4 53.1 55.9 54.7 54.7 55.9 59.0 .. ..Other uses KLBG 56.1 54.5 56.4 57.0 56.8 53.8 53.8 60.6 64.5 .. ..
Sheets and pipes KLBH 94.1 91.1 96.1 94.9 102.3 102.3 102.3 109.8 111.4 .. ..Solder KLBJ 7.4 7.4 7.4 7.4 7.4 7.4 7.4 7.2 7.4 .. ..Alloys KLBK 12.1 9.4 9.4 11.9 15.2 24.3 24.3 25.7 33.3 .. ..Other uses KLBL 29.5 26.6 28.9 34.1 35.8 38.6 38.6 28.0 31.7 .. ..

386
Production
22.17 Non-ferrous metalsUnited Kingdom
continued Thousand tonnes
1996 1997 1998 1999 2000 2001 2002 2003 2004 2005 2006
Tin
Tin ore (metal content):Production KLBM 2.1 2.3 0.4 0.4 .. .. 1.9 1.9 – – –
Tin metal:10
Production11 KLBO – .. .. .. .. .. 1.9 1.9 – – –Home consumption11 VQIX 10.5 10.4 10.6 9.6 10.0 10.3 6.9 7.1 5.3 3.2 4.1Exports and re-exports12 KLBQ 0.6 0.3 3.4 0.1 0.1 0.4 1.9 0.3 0.6 1.7 11.8Stocks (end of period):
Consumers KLBR 1.0 1.0 1.0 1.0 1.0 1.0 1.0 1.0 1.0 1.0 1.0
Analysis of home consumption(excluding scrap): total KLBT 10.5 10.4 17.5 16.5 17.0 18.8 18.8 1.9 18.4 .. ..Tinplate KLBU 3.6 2.8 2.6 3.0 3.0 3.0 1.9 1.9 3.0 .. ..Alloys KLBV 3.5 3.4 12.1 11.2 11.6 2.6 1.9 1.9 2.6 .. ..Solder KLBW 1.1 1.1 1.1 0.6 0.8 1.5 1.9 1.9 1.5 .. ..Other uses KLBX 0.4 0.4 0.4 0.4 0.4 0.4 1.9 1.9 0.4 .. ..
Aluminium
Ingot productionPrimary KLBY 240.0 247.7 258.4 269.7 305.1 340.8 344.3 342.7 359.6 368.5 360.3Secondary13 KLCA 260.0 242.7 274.8 285.3 237.7 248.6 205.4 205.4 205.4 205.3 197.9Wrought remelt production14 C6EW 500.0 490.4 533.2 555.0 542.8 589.4 549.7 548.1 565.0 573.8 558.2
Wrought and cast despatchesBar, section and tube15 C6EX 149.6 160.8 168.0 181.7 184.7 177.1 168.3 158.7 157.0 – –Plate, sheet, strip and circles C6EY 327.9 350.4 352.5 349.7 419.1 384.8 312.2 274.3 267.3 – –Castings KLCH 156.0 152.4 148.0 137.3 134.9 138.2 159.4 127.5 139.7 – –
ExportsPrimary ingot C6EZ 53.1 219.6 68.7 233.6 347.7 203.4 214.7 244.3 305.1 – –Secondary ingot KLCC 152.2 153.3 156.6 143.1 84.2 59.9 35.7 26.9 30.8 – –Extruded products C6F2 45.8 56.8 59.7 47.5 25.5 20.7 15.3 14.2 15.8 – –Rolled products C6F3 155.5 157.7 160.1 166.6 222.9 198.3 208.8 193.9 192.2 – –
Refined nickel
Production (including ferro-nickel) KLCM 38.6 36.1 39.1 39.5 38.0 33.8 33.8 26.8 38.6 37.6 36.8
1 Unwrought copper (electrolytic, fire refined and blister).2 Reported stocks of refined copper held by consumers and those held in
London Metal Exchange (LME) warehouses in the United Kingdom.3 2001 figures only cover the period January to June.4 Copper content.5 Consumption for high-conductivity copper and cadmium copper wire
represented by consumption of wire rods, production of which for export isalso included.
6 Lead reclaimed from secondary and scrap material and lead refined frombullion and domestic ores.
7 Figures for production and consumption of refined lead include antimonial lead,and for scrap and remelted lead, exclude secondary antimonial lead.
8 Including toll transactions involving fabrication.9 Excluding goverment stocks.
10 Including production from imported scrap and residues refined on toll.11 Primary and secondary metal.12 Including re-exports on toll transactions.13 Predominantly from old scrap.14 Predominantly using recycled scrap from fabrication.15 Excluding forging bars
Sources: World Bureau of Metal Statistics: 01920 461274;Aluminium Federation: 0121 456 1103

387
Production
22.18 FertilisersYears ending 30 June
Thousand tonnes
1997 1998 1999 2000 2001 2002 2003 2004 2005 2006 2007
Nutrient Content
Nitrogen (N):Straight KGRM 957 912 819 819 714 751 664 662 691 631 656Compounds KGRN 483 463 465 449 448 446 467 463 370 372 352
Phosphate (P2O5) KGRO 412 383 347 317 279 283 282 278 259 235 224Potash (K2O) KGRP 501 487 451 409 369 391 375 375 352 325 317
Compounds - total product KGRQ 3 238 3 037 3 013 2 851 2 471 2 511 2 558 2 550 2 221 2 134 2 039
Source: Agricultural Industries Confederation: 01733 385230
22.19 Minerals: production1
United KingdomThousand tonnes
1996 1997 1998 1999 2000 2001 2002 2003 2004 2005 2006
Great Britain
Limestone KLEA 82 442 84 252 85 382 82 714 80 810 83 492 88 013 84 445 86 846 81 830 82 598Sandstone KLEB 12 581 12 457 13 545 11 870 12 056 11 897 11 788 11 665 11 929 11 609 11 827Igneous rock KLEC 43 731 42 370 39 838 45 294 44 633 45 053 44 544 45 305 46 193 45 992 47 867Clay/shale KLED 11 804 11 322 12 230 11 355 10 838 10 426 10 306 10 680 11 164 10 898 10 432Industrial sand KLEE 4 861 4 704 4 662 4 092 4 095 3 848 3 833 4 073 5 011 4 146 5 174Chalk KLEF 9 239 9 550 9 934 9 667 9 213 8 205 8 587 8 066 7 997 7 105 7 376Fireclay KLEG 536 338 577 545 595 459 491 528 402 395 228Barium sulphate KLEH 93 57 64 59 54 70 56 .. .. 62 44Calcium fluoride KLEI .. 58 52 46 21 46 22 .. .. 44 133Copper KLEJ – – – – – – – – .. – –Lead KLEK .. .. 1 1 .. 1 .. .. .. 1 4Tin KLEL 2.1 2.0 – – – – – – .. – –Zinc KLEM .. – – – – – – – .. – –Iron ore: crude KLEN 1 2 2 1 1 1 1 – .. – –Iron ore: iron content KLEO 1 1 1 1 1 .. .. – .. – –Calcspar KLEP .. 13 15 .. .. 12 .. – .. – ..China clay KILC 2 654 2 798 2 866 2 841 2 779 2 804 2 467 2 378 2 148 1 908 ..Ball clay KIMS .. .. .. .. .. .. .. .. .. .. ..Chert and flint KLER .. .. .. 6 .. 2 2 .. 2 2 ..Fuller’s earth KLES 183 162 111 83 103 .. 33 19 11 – –Lignite KLET – – – – – – – – .. – –Salt2 I8AV .. .. .. .. .. .. .. .. .. 5 770 5 224Anhydrite KLEX – – – – – – – – .. – –Dolomite KLEY 16 555 17 282 15 632 13 698 13 069 14 314 12 946 .. .. 11 514 12 100Gypsum KLEZ .. .. .. .. .. .. .. .. 1 686 .. ..Slate3 KLFA 408 347 425 361 479 551 742 832 901 928 865Soapstone and talc KLFB 5 5 5 6 5 5 6 6 4 6 4Sand and gravel
(land-won) KLFC 70 489 74 362 73 016 74 785 74 877 74 599 69 889 68 090 73 061 69 368 66 268Sand and gravel
(marine dredged) KLFD 11 508 12 004 12 952 13 424 14 356 13 611 12 832 12 131 12 996 13 024 13 974
Northern Ireland
Sand and gravel KLFG 7 684 5 138 5 300 5 517 5 073 6 194 5 512 4 894 5 084 5 803 5 150Basalt and igneous
rock (other thangranite) KLFH 6 974 6 286 6 107 7 861 9 480 6 448 6 681 6 051 6 844 7 112 6 087
Limestone KLFI 4 122 3 500 3 892 4 219 3 538 4 746 4 514 4 887 5 634 5 588 6 385Sandstone4 KLFJ 4 941 6 042 6 584 3 615 2 844 8 070 6 574 6 594 6 915 7 076 6 211Granite KLFL – – – – – – – – .. .. ..Others5 KLFN 1 392 625 473 1 579 3 098 753 242 1 055 1 266 2 090 1 698
1 See chapter text.2 Includes rock salt, salt from brine and salt in brine.3 Roofing and vertically hanging slates, includes ‘true’ slate and stone slates
produced from thinly bedded sandstones and limestones. Also includes‘true’ and stone slates sold as sawn slabs for decorative cladding.
4 Prior to 1993 the ‘Sandstone’ heading was called ‘Grit and conglomerate’. Thenew heading is all encompassing and was confirmed as correct with the Geo-logical Survey in Northern Ireland.
5 Rock salt, Chalk, Diatomite and Fireclay.
Source: Office for National Statistics: 01633 812082

388
Production
22.20 Building materials and components: production1
Great Britain
1997 1998 1999 2000 2001 2002 2003 2004 2005 2006 2007
Building bricks2 KLGA Millions 2 997 3 000 2 939 2 864 2 754 2 750 2 772 2 868 2 748 2 510 2 478
Common bricks GRTD " 422 385 367 342 320 332 315 318 319 304 312Facing bricks GRTE " 2 386 2 411 2 369 2 287 2 211 2 209 2 244 2 327 2 202 2 013 1 950Engineering bricks GRTF " 190 204 204 235 223 210 213 224 227 193 216
Clay bricks (including sand-lime) GRTG " 2 828 2 830 2 759 2 694 2 595 2 600 2 606 2 707 2 601 2 359 2 313Concrete bricks GRTH " 169 171 180 170 159 150 167 161 147 150 165
ThousandCement (grey Portland)3 KLGB tonnes 12 638 12 409 12 697 12 452 11 090 11 089 11 215 11 405 11 216 11 469 ..
Sand and gravel GRTI " 86 366 85 968 88 209 89 234 88 210 82 721 80 221 86 057 82 392 80 242 75 506Building sand4 KLGC " 15 337 13 810 13 941 14 219 13 772 13 221 13 617 13 125 13 730 12 555 10 360Concreting sand KLGD " 30 130 30 244 31 730 31 167 31 656 31 224 31 411 32 529 29 848 29 815 29 787Gravel5 KLGE " 40 899 41 914 42 538 43 847 42 782 38 276 35 193 40 404 38 814 37 871 35 359
Crushed rock GRTJ " 133 787 131 716 132 598 130 307 133 759 126 568 122 885 127 674 121 860 126 895 ..Coated roadstone KLGF " 23 906 23 131 22 260 21 785 23 340 23 281 23 139 18 721 20 136 21 367 ..Uncoated roadstone KLGG " 40 186 36 816 38 114 36 509 34 638 27 323 28 950 25 260 25 902 27 234 ..Fill and ballast KLGH " 51 396 51 623 52 144 53 417 47 225 49 622 42 208 62 460 58 945 58 431 ..Concrete aggregate KLGI " 18 300 20 146 20 080 18 595 28 556 26 342 28 588 21 231 16 876 19 863 ..
ThousandReady mixed concrete6 GRXA cubic metres 22 327 22 983 23 550 23 043 23 008 22 597 22 289 22 856 22 432 23 029 23 548
ThousandConcrete building blocks GRTK square metres 82 537 84 662 87 767 90 219 87 922 91 474 95 645 96 256 89 997 87 510 89 958
Dense aggregate KLGN " 37 250 39 439 38 439 37 629 36 598 35 744 36 745 37 677 36 188 34 956 36 698Lightweight aggregate KLGO " 17 783 19 110 20 830 22 991 22 684 23 478 24 991 25 462 25 561 25 345 25 960Aerated concrete KLGP " 27 505 26 113 28 497 29 599 28 639 32 252 33 909 33 117 28 248 27 209 27 300
Concrete roofing tiles KLGM " 24 958 24 981 25 972 26 765 24 825 25 023 21 437 20 739 25 719 23 730 23 551
Roofing and architectural slates GRXB Tonnes 44 578 46 159 46 998 41 214 45 604 50 530 50 094 .. .. .. ..
ThousandFibre cement products KLGK tonnes 164.0 161.0 156.0 .. .. .. .. .. .. .. ..
1 See chapter text.2 Excluding refractory and glazed bricks.3 United Kingdom up until 2000. Great Britain for 2001 onwards.4 Includes sand and gravel used for coating.5 Includes hoggin.6 United Kingdom.
Source: Department for Business, Enterprise and Regulatory Reform: 020 72151555

389
Production
22.21 Volume of construction output by all agencies1 by type of work at constant 2000prices (seasonally adjusted)Standard Industrial Classification 2003. Great Britain. £ millions
Repair andNew work maintenance
All workNew housing for Other new work for Housing Other work for (seasona-
llyPrivate sector Total adjusted
Total repair volumePublic Private Infrastr- Public Industri- Commerci- new Public Private and main- Total all indexsector sector ucture sector al al work Public Private sector sector tenance work numbers)
BLAC BLAD BAXF BLAE BLAF BLAG BLAB BLBK BLBL BLAJ BLAK BLAH FGAY SFZX2005 1 831 11 232 5 328 7 341 3 582 12 888 42 202 6 730 12 044 7 003 11 562 37 338 79 540 114.22006 2 238 11 433 4 930 6 969 3 981 14 616 44 167 6 527 11 674 6 483 11 576 36 260 80 426 115.420072 2 612 11 360 4 985 6 622 4 002 16 485 46 065 6 336 11 746 5 777 12 500 36 359 82 424 118.3
2005 Q1 485 2 669 1 297 1 867 819 3 053 10 189 1 930 3 015 1 905 2 902 9 752 19 941 114.5Q2 482 2 875 1 322 1 844 874 3 221 10 618 1 778 3 069 1 712 2 872 9 432 20 049 115.1Q3 431 2 873 1 386 1 796 909 3 241 10 636 1 530 2 941 1 711 2 958 9 140 19 776 113.5Q4 434 2 815 1 323 1 833 980 3 373 10 758 1 492 3 019 1 674 2 830 9 015 19 773 113.5
2006 Q1 563 2 755 1 301 1 807 976 3 398 10 801 1 707 2 961 1 730 2 775 9 174 19 975 114.7Q2 596 2 834 1 223 1 741 961 3 540 10 895 1 589 3 019 1 647 2 848 9 103 19 998 114.8Q3 562 2 937 1 235 1 711 978 3 778 11 201 1 653 2 804 1 636 2 844 8 935 20 136 115.6Q4 517 2 907 1 170 1 710 1 066 3 900 11 270 1 578 2 890 1 471 3 109 9 047 20 317 116.8
2007 Q1 670 2 811 1 140 1 650 1 037 3 868 11 176 1 712 2 886 1 501 3 095 9 194 20 370 116.9Q2 693 2 868 1 216 1 608 1 025 4 045 11 455 1 542 3 031 1 431 3 064 9 069 20 523 117.8Q3 650 2 908 1 332 1 647 970 4 236 11 743 1 482 2 820 1 446 3 168 8 917 20 660 118.6Q42 599 2 774 1 297 1 717 969 4 335 11 691 1 600 3 010 1 399 3 172 9 180 20 872 119.8
1 Estimates of unrecorded output by small firms and self-employed workers,and output by the public sector’s direct labour department are included.
2 Provisional
Note: Responsibility for these statistics transferred from BERR (formerlyDTI) to the ONS on 1st March 2008.
Sources: Office for National Statistics;Tel : 020 7215 1953
22.22 Value of new orders obtained by contractors for new work1 atcurrent pricesGreat Britain £ millions
New housing2 Other new work
Public andhousing Private Private
association Private Total Infrastructure Other public industrial commercial Total New work total
BLBC BLBD FGAU BAWT BAWU BAWV BAWW BLBE FHAA2005 1 951 13 171 15 122 5 532 6 694 3 421 13 163 28 811 43 9322006 2 653 13 468 16 121 4 319 6 162 3 634 17 528 31 643 47 7642007 2 968 13 115 16 084 5 622 7 338 3 281 18 244 34 485 50 569
2005 Q1 552 3 203 3 756 1 483 1 606 679 3 283 7 052 10 807Q2 448 3 605 4 053 1 463 1 693 856 3 248 7 259 11 312Q3 390 3 626 4 016 1 488 1 867 842 3 114 7 311 11 328Q4 560 2 737 3 297 1 098 1 528 1 044 3 518 7 188 10 485
2006 Q1 833 3 333 4 166 1 025 1 625 961 4 410 8 021 12 187Q2 586 3 704 4 290 1 279 1 375 804 5 133 8 590 12 880Q3 696 3 317 4 014 1 089 1 672 955 4 386 8 102 12 116Q4 537 3 114 3 651 926 1 491 914 3 599 6 929 10 581
2007 Q1 1 056 3 473 4 529 1 677 1 651 876 4 189 8 393 12 922Q2 707 3 547 4 254 1 533 1 912 851 5 386 9 680 13 934Q3 568 3 150 3 718 1 225 1 992 756 4 588 8 562 12 279Q4 638 2 946 3 583 1 187 1 783 799 4 081 7 850 11 433
2007 Jul 241 1 119 1 360 312 866 281 1 433 2 892 4 253Aug 122 1 096 1 218 309 521 276 1 680 2 786 4 004Sep 205 935 1 140 604 604 199 1 476 2 883 4 022Oct 193 992 1 185 403 588 333 1 197 2 521 3 707Nov 198 1 181 1 379 410 599 271 1 700 2 980 4 358Dec 246 773 1 019 374 596 195 1 184 2 349 3 368
2008 Jan3 241 1 005 1 246 375 890 230 1 082 2 577 3 824
1 Including the value of speculative building when work starts on site.2 Excluding orders for home improvement work.3 Provisional.
Note: Responsibility for these statistics transferred from BERR (formerlyDTI) to the ONS on 1st March 2008.
Sources: Office for National Statistics;Tel : 020 7215 1953

390
Production
22.23 Total engineering: total turnover of UK based manufacturers1
Standard Industrial Classification 2003£ millions
Total Home Export
Orders New Orders New Orders Newon Hand Orders Turnover on Hand Orders Turnover on Hand Orders Turnover
HP62 HP65 HP5X HP64 HP67 HP5Z HP63 HP66 HP5Y2003 27 538.2 76 096.0 76 099.8 20 361.6 47 801.0 47 153.7 7 176.6 28 295.2 28 946.02004 27 256.9 79 680.2 79 961.2 19 980.7 48 174.6 48 555.3 7 276.2 31 505.3 31 405.72005 28 502.9 79 077.7 77 831.5 20 436.9 48 276.8 47 820.8 8 066.0 30 801.0 30 011.02006 29 131.0 81 089.5 80 461.3 19 729.9 47 417.5 48 124.5 9 401.1 33 672.2 32 336.92007 32 970.9 88 268.7 84 428.9 23 141.9 53 780.8 50 368.8 9 829.0 34 487.7 34 059.9
2005 Q4 28 502.9 19 591.2 19 890.0 20 436.9 11 845.4 12 023.3 8 066.0 7 745.8 7 866.7
2006 Q1 28 734.3 19 776.9 19 545.6 20 321.3 11 481.7 11 597.3 8 413.0 8 295.3 7 948.3Q2 29 249.4 20 506.9 19 991.6 20 479.5 12 217.7 12 059.4 8 769.9 8 289.2 7 932.3Q3 29 640.0 20 343.9 19 953.2 20 437.6 12 166.6 12 208.5 9 202.4 8 177.4 7 744.7Q4 29 131.0 20 461.8 20 970.9 19 729.9 11 551.5 12 259.3 9 401.1 8 910.3 8 711.6
2007 Q1 29 652.1 21 396.6 20 875.5 20 295.9 13 169.4 12 603.5 9 356.2 8 227.0 8 271.9Q2 30 249.3 21 416.1 20 819.0 20 582.8 12 459.4 12 172.5 9 666.5 8 956.7 8 646.4Q3 32 721.7 23 467.5 20 995.1 22 389.6 14 388.6 12 581.7 10 332.1 9 078.9 8 413.4Q4 32 970.9 21 988.5 21 739.3 23 141.9 13 763.4 13 011.1 9 829.0 8 225.1 8 728.2
2006 May 29 129.0 6 660.1 6 723.3 20 270.0 3 752.9 4 025.5 8 859.0 2 907.2 2 697.8Jun 29 249.4 7 396.2 7 275.7 20 479.5 4 620.0 4 410.4 8 769.9 2 776.2 2 865.3
Jul 29 295.7 6 427.5 6 381.2 20 512.5 3 956.6 3 923.6 8 783.2 2 471.0 2 457.6Aug 29 473.1 6 685.7 6 508.3 20 726.0 4 273.7 4 060.2 8 747.0 2 412.0 2 448.1Sep 29 640.0 7 230.7 7 063.7 20 437.6 3 936.3 4 224.7 9 202.4 3 294.4 2 839.0Oct 29 490.7 6 762.1 6 911.4 20 245.2 3 839.3 4 031.8 9 245.6 2 922.7 2 879.6Nov 29 341.5 7 217.0 7 366.2 19 765.0 3 877.9 4 358.1 9 576.5 3 339.1 3 008.1Dec 29 131.0 6 482.7 6 693.3 19 729.9 3 834.3 3 869.4 9 401.1 2 648.5 2 823.9
2007 Jan 28 916.1 6 263.9 6 478.8 19 568.8 3 734.8 3 895.9 9 347.2 2 529.0 2 582.9Feb 28 788.6 6 376.6 6 504.1 19 729.2 4 106.1 3 945.7 9 059.4 2 270.5 2 558.3Mar 29 652.1 8 756.1 7 892.6 20 295.9 5 328.5 4 761.9 9 356.2 3 427.5 3 130.7Apr 30 030.1 6 851.0 6 473.1 20 546.2 4 150.9 3 900.6 9 483.9 2 700.1 2 572.4May 30 020.4 6 962.9 6 972.6 20 574.1 4 148.9 4 121.0 9 446.2 2 813.9 2 851.6Jun 30 249.3 7 602.2 7 373.3 20 582.8 4 159.6 4 150.9 9 666.5 3 442.7 3 222.4
Jul 32 209.7 8 880.5 6 920.1 22 105.8 5 669.5 4 146.5 10 103.9 3 211.0 2 773.6Aug 32 426.8 7 016.4 6 799.3 22 480.2 4 484.2 4 109.8 9 946.6 2 532.2 2 689.5Sep 32 721.7 7 570.6 7 275.7 22 389.6 4 234.9 4 325.4 10 332.1 3 335.7 2 950.3Oct 32 418.1 7 077.1 7 380.7 22 237.1 4 222.8 4 375.3 10 181.0 2 854.3 3 005.4Nov 32 457.5 7 539.7 7 500.3 22 413.4 4 652.6 4 476.3 10 044.1 2 887.1 3 024.0Dec 32 970.9 7 371.7 6 858.3 23 141.9 4 888.0 4 159.5 9 829.0 2 483.7 2 698.8
2008 Jan 34 365.9 8 187.2 6 792.2 23 826.1 4 764.4 4 080.2 10 539.9 3 422.9 2 712.0
1 New methodology was introduced from January 2008 affecting all historicestimates. See details in February ELMR in-brief page 3 found at:http://nswebcopy/elmr/02_08/downloads/ELMR_Feb08.pdf published on 11February.
Source: Office for National Statistics 01633 812126
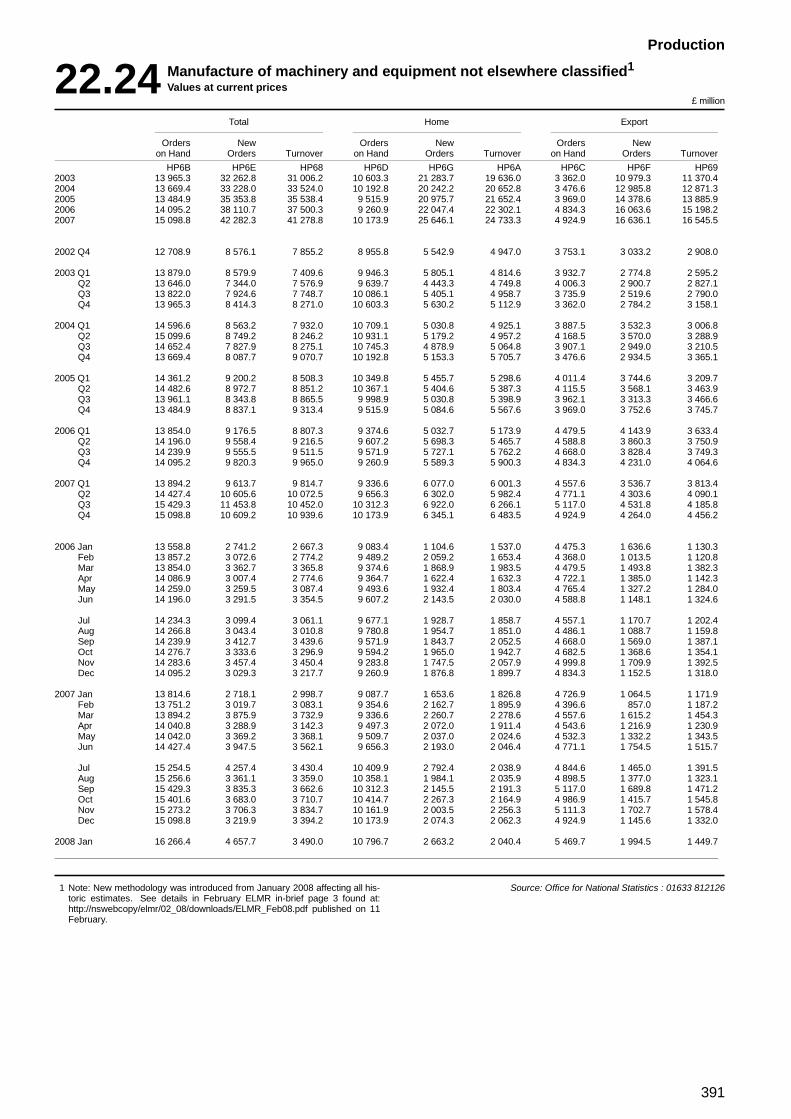
391
Production
22.24 Manufacture of machinery and equipment not elsewhere classified1
Values at current prices£ million
Total Home Export
Orders New Orders New Orders Newon Hand Orders Turnover on Hand Orders Turnover on Hand Orders Turnover
HP6B HP6E HP68 HP6D HP6G HP6A HP6C HP6F HP692003 13 965.3 32 262.8 31 006.2 10 603.3 21 283.7 19 636.0 3 362.0 10 979.3 11 370.42004 13 669.4 33 228.0 33 524.0 10 192.8 20 242.2 20 652.8 3 476.6 12 985.8 12 871.32005 13 484.9 35 353.8 35 538.4 9 515.9 20 975.7 21 652.4 3 969.0 14 378.6 13 885.92006 14 095.2 38 110.7 37 500.3 9 260.9 22 047.4 22 302.1 4 834.3 16 063.6 15 198.22007 15 098.8 42 282.3 41 278.8 10 173.9 25 646.1 24 733.3 4 924.9 16 636.1 16 545.5
2002 Q4 12 708.9 8 576.1 7 855.2 8 955.8 5 542.9 4 947.0 3 753.1 3 033.2 2 908.0
2003 Q1 13 879.0 8 579.9 7 409.6 9 946.3 5 805.1 4 814.6 3 932.7 2 774.8 2 595.2Q2 13 646.0 7 344.0 7 576.9 9 639.7 4 443.3 4 749.8 4 006.3 2 900.7 2 827.1Q3 13 822.0 7 924.6 7 748.7 10 086.1 5 405.1 4 958.7 3 735.9 2 519.6 2 790.0Q4 13 965.3 8 414.3 8 271.0 10 603.3 5 630.2 5 112.9 3 362.0 2 784.2 3 158.1
2004 Q1 14 596.6 8 563.2 7 932.0 10 709.1 5 030.8 4 925.1 3 887.5 3 532.3 3 006.8Q2 15 099.6 8 749.2 8 246.2 10 931.1 5 179.2 4 957.2 4 168.5 3 570.0 3 288.9Q3 14 652.4 7 827.9 8 275.1 10 745.3 4 878.9 5 064.8 3 907.1 2 949.0 3 210.5Q4 13 669.4 8 087.7 9 070.7 10 192.8 5 153.3 5 705.7 3 476.6 2 934.5 3 365.1
2005 Q1 14 361.2 9 200.2 8 508.3 10 349.8 5 455.7 5 298.6 4 011.4 3 744.6 3 209.7Q2 14 482.6 8 972.7 8 851.2 10 367.1 5 404.6 5 387.3 4 115.5 3 568.1 3 463.9Q3 13 961.1 8 343.8 8 865.5 9 998.9 5 030.8 5 398.9 3 962.1 3 313.3 3 466.6Q4 13 484.9 8 837.1 9 313.4 9 515.9 5 084.6 5 567.6 3 969.0 3 752.6 3 745.7
2006 Q1 13 854.0 9 176.5 8 807.3 9 374.6 5 032.7 5 173.9 4 479.5 4 143.9 3 633.4Q2 14 196.0 9 558.4 9 216.5 9 607.2 5 698.3 5 465.7 4 588.8 3 860.3 3 750.9Q3 14 239.9 9 555.5 9 511.5 9 571.9 5 727.1 5 762.2 4 668.0 3 828.4 3 749.3Q4 14 095.2 9 820.3 9 965.0 9 260.9 5 589.3 5 900.3 4 834.3 4 231.0 4 064.6
2007 Q1 13 894.2 9 613.7 9 814.7 9 336.6 6 077.0 6 001.3 4 557.6 3 536.7 3 813.4Q2 14 427.4 10 605.6 10 072.5 9 656.3 6 302.0 5 982.4 4 771.1 4 303.6 4 090.1Q3 15 429.3 11 453.8 10 452.0 10 312.3 6 922.0 6 266.1 5 117.0 4 531.8 4 185.8Q4 15 098.8 10 609.2 10 939.6 10 173.9 6 345.1 6 483.5 4 924.9 4 264.0 4 456.2
2006 Jan 13 558.8 2 741.2 2 667.3 9 083.4 1 104.6 1 537.0 4 475.3 1 636.6 1 130.3Feb 13 857.2 3 072.6 2 774.2 9 489.2 2 059.2 1 653.4 4 368.0 1 013.5 1 120.8Mar 13 854.0 3 362.7 3 365.8 9 374.6 1 868.9 1 983.5 4 479.5 1 493.8 1 382.3Apr 14 086.9 3 007.4 2 774.6 9 364.7 1 622.4 1 632.3 4 722.1 1 385.0 1 142.3May 14 259.0 3 259.5 3 087.4 9 493.6 1 932.4 1 803.4 4 765.4 1 327.2 1 284.0Jun 14 196.0 3 291.5 3 354.5 9 607.2 2 143.5 2 030.0 4 588.8 1 148.1 1 324.6
Jul 14 234.3 3 099.4 3 061.1 9 677.1 1 928.7 1 858.7 4 557.1 1 170.7 1 202.4Aug 14 266.8 3 043.4 3 010.8 9 780.8 1 954.7 1 851.0 4 486.1 1 088.7 1 159.8Sep 14 239.9 3 412.7 3 439.6 9 571.9 1 843.7 2 052.5 4 668.0 1 569.0 1 387.1Oct 14 276.7 3 333.6 3 296.9 9 594.2 1 965.0 1 942.7 4 682.5 1 368.6 1 354.1Nov 14 283.6 3 457.4 3 450.4 9 283.8 1 747.5 2 057.9 4 999.8 1 709.9 1 392.5Dec 14 095.2 3 029.3 3 217.7 9 260.9 1 876.8 1 899.7 4 834.3 1 152.5 1 318.0
2007 Jan 13 814.6 2 718.1 2 998.7 9 087.7 1 653.6 1 826.8 4 726.9 1 064.5 1 171.9Feb 13 751.2 3 019.7 3 083.1 9 354.6 2 162.7 1 895.9 4 396.6 857.0 1 187.2Mar 13 894.2 3 875.9 3 732.9 9 336.6 2 260.7 2 278.6 4 557.6 1 615.2 1 454.3Apr 14 040.8 3 288.9 3 142.3 9 497.3 2 072.0 1 911.4 4 543.6 1 216.9 1 230.9May 14 042.0 3 369.2 3 368.1 9 509.7 2 037.0 2 024.6 4 532.3 1 332.2 1 343.5Jun 14 427.4 3 947.5 3 562.1 9 656.3 2 193.0 2 046.4 4 771.1 1 754.5 1 515.7
Jul 15 254.5 4 257.4 3 430.4 10 409.9 2 792.4 2 038.9 4 844.6 1 465.0 1 391.5Aug 15 256.6 3 361.1 3 359.0 10 358.1 1 984.1 2 035.9 4 898.5 1 377.0 1 323.1Sep 15 429.3 3 835.3 3 662.6 10 312.3 2 145.5 2 191.3 5 117.0 1 689.8 1 471.2Oct 15 401.6 3 683.0 3 710.7 10 414.7 2 267.3 2 164.9 4 986.9 1 415.7 1 545.8Nov 15 273.2 3 706.3 3 834.7 10 161.9 2 003.5 2 256.3 5 111.3 1 702.7 1 578.4Dec 15 098.8 3 219.9 3 394.2 10 173.9 2 074.3 2 062.3 4 924.9 1 145.6 1 332.0
2008 Jan 16 266.4 4 657.7 3 490.0 10 796.7 2 663.2 2 040.4 5 469.7 1 994.5 1 449.7
1 Note: New methodology was introduced from January 2008 affecting all his-toric estimates. See details in February ELMR in-brief page 3 found at:http://nswebcopy/elmr/02_08/downloads/ELMR_Feb08.pdf published on 11February.
Source: Office for National Statistics : 01633 812126

392
Production
22.25 Passenger carsUnited Kingdom
Number
Total production Production for export
Over 1000cc Over 1600cc Over 1000cc Over 1600cc1000cc and and not over and not over Over 1000cc and and not over and not over Over
under 1600cc 2500cc 2500cc Total under 1600cc 2500cc 2500cc Total
GKAB GKAD GKAF GKAH JCYM GKAC GKAE GKAG GKAI JCYL2000 96 043 676 438 723 294 145 677 1 641 452 56 556 375 528 509 591 121 315 1 062 9902001 93 695 632 747 634 573 131 350 1 492 365 56 426 329 944 400 648 107 236 894 2542002 79 545 711 553 720 067 118 579 1 629 744 35 866 442 975 470 285 98 158 1 047 2842003 23 985 750 840 740 486 142 247 1 657 558 12 380 503 950 509 050 118 379 1 143 7592004 15 471 796 174 690 759 144 346 1 646 750 10 316 560 505 492 564 116 371 1 179 756
2005 6 111 854 687 546 744 188 155 1 595 697 4 925 625 929 405 204 148 445 1 184 5032006 – 792 187 446 143 203 755 1 442 085 – 622 205 324 880 159 008 1 106 093
2006 Feb – 74 048 38 871 18 274 131 193 – 53 830 27 236 14 145 95 211Mar – 88 834 46 000 24 154 158 988 – 67 774 32 449 19 499 119 722Apr – 65 103 37 156 16 313 118 572 – 52 814 28 855 13 504 95 173May – 74 864 39 886 17 566 132 316 – 60 704 30 835 13 901 105 440Jun – 78 055 42 280 18 991 139 326 – 61 508 30 749 14 566 106 823
Jul – 66 528 37 241 14 060 117 829 – 51 223 26 995 10 692 88 910Aug – 35 223 23 067 14 669 72 959 – 25 963 15 333 10 810 52 106Sep – 67 981 37 354 16 977 122 312 – 53 839 25 365 13 083 92 287Oct – 66 536 35 526 14 081 116 143 – 56 995 27 157 11 620 95 772Nov – 68 181 38 726 21 656 128 563 – 56 623 28 557 17 085 102 265Dec – 44 381 29 740 10 641 84 762 – 35 789 22 513 7 615 65 917
2007 Jan – 58 476 44 747 20 974 124 197 – 45 690 32 511 16 683 94 884Feb – 50 765 45 021 19 863 115 649 – 35 745 34 582 14 634 84 961Mar – 60 556 57 299 20 154 138 009 – 43 991 39 465 16 697 100 153Apr – 51 685 52 171 16 584 120 440 – 39 791 41 062 13 694 94 547May – 52 566 55 754 19 063 127 383 – 42 253 44 341 15 687 102 281Jun – 58 890 58 327 20 312 137 529 – 46 020 45 812 16 984 108 816
Jul – 61 021 52 489 16 178 129 688 – 47 046 38 221 12 964 98 231
*Note: The survey and publication of motor vehicle production ceased atJuly reference period.
Source: Office for National Statistics: 01633 812394

393
Production
22.26 Alcoholic drink1
United Kingdom
1997 1998 1999 2000 2001 2002 2003 2004 2005 2006 2007
ThousandSpirits2 hectolitres
of alcoholProduction KMEA " 5 297 5 145 4 705 4 210 4 368 4 508 4 553 4 081 4 365 4 485 5 673
Released for home consumptionHome produced whisky KMEE " 312 289 323 314 321 321 318 319 301 283 286Spirit-based Ready-to-drink3 SNET " .. .. .. .. .. 105 124 114 84 65 52Imported and other KMEG " 533 505 596 615 647 689 744 792 822 767 832
Total KMEH " 845 794 919 929 968 1 115 1 187 1 226 1 207 1 114 1 170
ThousandBeer hectolitres
Production BFNK " 59 139 56 652 57 854 55 279 56 802 56 672 58 014 57 459 56 255 53 763 50 511
Released for home consumption BAYL " 61 114 58 835 58 917 57 007 58 234 59 384 60 301 59 195 57 572 55 748 53 315
ThousandProduction JYXJ hectolitres 2 406 2 333 2 364 2 299 2 358 2 352 2 414 2 433 2 338 2 249 2 133
of pureReleased for home consumption JYXK alcohol 2 504 2 439 2 428 2 382 2 429 2 473 2 515 2 499 2 398 2 335 2 247
Wine of fresh grapes
Released for home consumption ThousandFortified KMEM hectolitres 323 370 316 289 287 325 296 298 306 302 305Still table KMEN " 7 653 7 979 8 391 8 864 9 534 10 319 10 647 11 768 12 117 11 655 12 559Sparkling KMEO " 382 416 576 543 515 578 640 676 721 715 838
Total KMEP " 8 358 8 765 9 284 9 696 10 336 11 222 11 584 12 742 13 143 12 672 13 702
Made-wine
Released for home consumptionOther than coolers KMEQ " 485 406 416 431 364 367 339 351 334 317 348Coolers3 KJDD " 1 153 1 244 1 802 2 800 3 712 1 606 423 508 597 528 720
Cider and perry
Released for home consumption KMER " 5 513 5 548 6 022 6 006 5 911 5 939 5 876 6 139 6 377 7 523 8 046
1 See chapter text.2 Potable spirits distilled.3 Made wine with alcoholic strength 1.2% to 5.5%. Includes alcoholic
lemonade of appropriate strength and similar products. From 28 April 2002,duty on spirit-based "coolers" is charged at the same rate as spirits per litreof alcohol. Coolers for calendar year 2002 includes only wine based"coolers".
Sources: HM Revenue & Customs UK Trade Information website:;http://www.uktradeinfo.com/index.cfm?task=bulletins
22.27 Tobacco products: released for home consumption1
United Kingdom
1997 1998 1999 2000 2001 2002 2003 2004 2005 2006 2007
ThousandCigarettes: million
Home produced KMFA " 71.1 67.8 28.2 49.3 47.7 49.6 49.1 48.2 45.9 44.4 42.0Imported KMFB " 9.9 7.5 6.0 7.3 6.8 6.5 4.9 4.5 4.3 4.6 3.8
Total2 KMFC " 81.0 75.3 34.2 56.6 54.5 56.1 54.0 52.6 50.2 49.0 45.7
Cigars: Million kgHome produced KMFD " 1.3 1.2 0.9 1.0 0.9 0.9 0.8 0.7 0.6 0.6 0.5Imported KMFE " 0.1 0.1 0.1 0.1 0.1 0.1 0.1 0.1 0.1 0.1 0.1
Total2 KMFF " 1.4 1.3 1.0 1.1 1.0 1.0 0.9 0.8 0.8 0.7 0.6
Hand-rolling tobacco:Home produced KMFG " 1.8 1.7 2.0 2.1 2.8 2.8 2.9 3.0 3.2 3.4 3.6Imported KMFH " 0.1 0.1 – – – – – – – – –
Total2 KMFI " 1.9 1.8 2.0 2.2 2.8 2.8 2.9 3.1 3.2 3.5 3.6
Other smoking and chewing tobacco:Home produced KMFJ " 1.1 1.0 0.6 0.7 0.7 0.6 0.5 0.5 0.4 0.4 0.3Imported KMFK " 0.1 0.1 0.1 0.1 0.1 0.1 0.1 0.1 0.1 0.1 0.1
Total2 KMFL " 1.2 1.1 0.7 0.8 0.8 0.7 0.6 0.6 0.5 0.5 0.4
1 See chapter text.2 Any apparent discrepency between totals and the sum of the constituents is
due to rounding.
Sources: HM Revenue and Customs UK Trade Information website:;http://www.uktradeinfo.com/index.cfm?task=bulletins

394
Banking, insurance

395
Banking, insurance
Banking, insurance
Ch
apter 23

396
Banking, insurance
Bank lending to, and bank deposits from, UK residents
(Tables 23.4 and 23.5)
These are series statistics based on the Standard Industrial Classification (SIC) 1992.
Table 23.4. Until the third quarter of 2007, the analysis of lending covered loans, advances (including under reverse repos), finance leasing, acceptances and facilities (all in Sterling and other currencies) provided by reporting banks to their UK resident non-bank non-building society customers, as well as bank holdings of Sterling and Euro commercial paper issued by these resident customers. Following a review of statistical data collected, acceptances and holdings of Sterling and Euro commercial paper are no longer collected at the industry level detail with effect from fourth quarter 2007 data. Total lending therefore reflects loans and advances (including under reverse repos) only, from fourth quarter 2007 data.
Table 23.5 includes borrowing under sale and repo. Adjustments for transit items are not included.
Figures for both tables are supplied by monthly reporting banks and grossed to cover quarterly reporters. Following the transition of building societies’ statistical reporting from the Financial Services Authority to the Bank of England on 1st January 2008, both tables will include data reported by building societies from the first quarter of 2008 onwards. They exclude lending to building societies and to residents of the Channel Islands and Isle of Man.
Building societies
(Table 23.13)
Building society figures are sourced from societies’ annual returns and for each year relate to accounting years ending on dates between 1 February and 31 January of the following year. Figures are society-only as opposed to group consolidated.
Consumer credit
(Table 23.14)
Figures for net lending refer to changes in amounts outstanding adjusted to remove distortions caused by revaluations of debt outstanding, such as write-offs. Class 3 loans are advanced under the terms of the Building Societies Act 1986.
Banking, insurance
Other banks balance sheet
(Table 23.3)
Carrying out the review of banking statistics at the end of September 1997 resulted in several changes to this table:
(a) The table now includes the business of all monthly and quarterly reporting banks in the UK. It previously covered only the business of monthly reporting institutions.
(b) The Channel Islands and Isle of Man are no longer treated as part of the UK for statistical purposes. Banking institutions in the Channel Islands and Isle of Man no longer have the option of being within the UK banking sector and their business, along with the business of offshore island branches of UK mainland banks, is now excluded from the figures within this table. Additionally, the business of the UK banking sector with offshore island residents and entities has been reclassified from UK residents to non-residents.
(c) The table now contains more comprehensive detail of business with building societies. This business wasn’t previously distinguished within the UK private sector elements of the table.
(d) The aggregate balance sheet of the banking sector has been inflated because it is now reported on an accrual basis rather than a cash basis (accrued amounts that are payable and receivable are shown under liabilities and assets respectively). Additionally, acceptances have been brought onto the balance sheet and are shown under both liabilities and assets.
With effect from 1998, the balance sheet of the Banking Department of the Bank of England is excluded from this table, and other banks business with the Issue Department is reclassified from ’UK public sector‘ to ‘UK banks’.
Data for 1999 reflect the acquisition of Birmingham Midshires Building Society by Halifax during that year.
Data for the end of 2000 reflect the entry of Bradford and Bingley plc to the banking sector during the year. Data for the end of 2000 also reflect the new reporting during the year of agency business as a result of collateral management via repurchase agreements (repos) and reverse repos.

397
Banking, insurance
A high proportion of credit advanced in certain types of agreement, notably on credit cards, is repaid within a month. This reflects use of such agreements as a method of payment rather than a way of obtaining credit. As from December 2006 the Bank of England has ceased to update the separate data on consumer credit provided by other specialist lenders, retailers and insurance companies previously contained in these tables. These categories have been merged into ‘other consumer credit lenders’.

398
Banking, insurance
23.1 Bank of England Balance SheetLiabilities and assets outstanding at end of period
£ million
Consolidated statement
Liabilities Assets
ofwhich Bondsother and
of maturi- otherForeign Of which ty securi-
Standi- Short curren- Short which 1 fine-t- within Longer Ways tiesng term cy Standi- term week uning mainte- term and acqured
Notes facili- open public Cash ng open sterli- sterli- nance sterli- Means viain Reserve ty market securi- ratio Other facili- market ng ng period ng advanc- market Total
circu- balanc- deposi- operat- ties deposi- liabil- ty operat- reverse reverse reverse reverse es to transa- Other assets-lation es ts ions issued ts ities assets ions repo repo repos repo HMG ctions assets /liabilB55A B56A B57A B58A B59A B62A B63A B65A B66A B67A B68A IGL6 B69A B72A B73A B74A B75A
2007 45 022 25 768 – – 4 727 2 936 23 789 – 14 358 4 360 – 9 998 23 500 13 370 7 481 43 533 102 241
2007 Jan 38 465 18 437 – – 4 666 2 568 15 703 – 31 110 31 110 – – 15 000 13 370 7 073 13 286 79 839Feb 38 214 17 716 – – 3 314 2 568 15 180 – 30 110 30 110 – – 15 000 13 370 6 727 11 784 76 991Mar 38 541 18 310 – – 4 373 2 568 15 746 – 31 260 31 260 – – 15 000 13 370 7 827 12 082 79 539Apr 39 134 19 011 – – 4 345 2 568 16 029 – 32 870 32 870 – – 15 000 13 370 7 746 12 103 81 088May 39 271 18 475 – – 4 393 2 568 16 662 – 31 990 31 990 – – 15 000 13 370 7 790 13 220 81 369Jun 39 571 18 623 – – 4 333 2 716 15 784 – 32 550 32 550 – – 15 000 13 370 7 668 12 438 81 026
Jul 39 984 17 769 – – 4 314 2 716 15 246 – 32 440 32 440 – – 15 000 13 370 7 554 11 666 80 030Aug 41 219 19 023 – – 4 390 2 716 15 875 1 556 33 400 33 400 – – 15 000 13 370 7 739 12 158 83 222Sep 40 425 29 226 – – 4 521 2 716 21 192 – 40 950 40 950 – – 15 000 13 370 7 865 20 897 98 081Oct 40 817 20 062 – – 4 492 2 716 24 447 – 20 610 20 610 – – 14 900 13 370 7 663 35 991 92 533Nov 41 716 23 469 – – 4 602 2 716 24 307 – 18 349 18 349 – – 15 000 13 370 7 814 42 277 96 810Dec 45 022 25 768 – – 4 727 2 936 23 789 – 14 358 4 360 – 9 998 23 500 13 370 7 481 43 533 102 241
Issue Department
Liabilities Assets
Bonds andother
of which Ways and securitiesNotes in Short term Of which 1 fine-tuning Longer term Means acqured via Total
Notes in Banking open market week sterling sterling sterling advances to market assets/liabi-circu- lation Departemnt operations reverse repo reverse repo reverse repo HMG transactions Other assets lities
AEFA AEFB BL29 BL32 BL33 BL34 B54A BL35 BL36 BL372007 45 022 – 14 358 4 360 – 13 500 13 370 – 3 794 45 022
2007 Jan 38 465 – 10 052 10 052 – 15 000 13 370 – 44 38 465Feb 38 214 – 9 795 9 795 – 15 000 13 370 – 49 38 214Mar 38 541 – 10 122 10 122 – 15 000 13 370 – 49 38 541Apr 39 134 – 10 712 10 712 – 15 000 13 370 – 52 39 134May 39 271 – 10 853 10 853 – 15 000 13 370 – 48 39 271Jun 39 571 – 11 151 11 151 – 15 000 13 370 – 50 39 571
Jul 39 984 – 11 563 11 563 – 15 000 13 370 – 52 39 984Aug 41 219 – 12 805 12 805 – 15 000 13 370 – 44 41 219Sep 40 425 – 11 989 11 989 – 15 000 13 370 – 66 40 425Oct 40 817 – 12 497 12 497 – 14 900 13 370 – 50 40 817Nov 41 716 – 13 294 13 294 – 15 000 13 370 – 52 41 716Dec 45 022 – 14 358 4 360 – 13 500 13 370 – 3 794 45 022
Banking Department
Liabilities Assets
Bondsof which and
other othermaturity securit-
Short Foreign Short of which within iesterm currency term Of which fine-tu- mainten- Longer acquredopen public open 1 week ning ance term via
Standing market securit- Cash Other Standing market sterling sterling period sterling market Bank of TotalReserve facility operati- ies ratio liabili- facility operati- reverse reverse reverse reverse transac- England Other assets/-balances deposits ons issued deposits ties assets ons repo repo repos repo tions notes assets liabilit
BL38 BL39 BL42 BL43 BL44 BL45 BL47 BL48 BL49 BL52 IGL7 IGL8 BL53 BL54 BL55 BL562007 25 768 – – 4 727 2 936 27 583 – – – – – 10 000 7 481 – 43 533 61 013
2007 Jan 18 437 – – 4 666 2 568 15 747 – 21 059 21 059 – – – 7 073 – 13 286 41 418Feb 17 716 – – 3 314 2 568 15 229 – 20 315 20 315 – – – 6 727 – 11 784 38 826Mar 18 310 – – 4 373 2 568 15 796 – 21 138 21 138 – – – 7 827 – 12 082 41 048Apr 19 011 – – 4 345 2 568 16 081 – 22 158 22 158 – – – 7 746 – 12 103 42 006May 18 475 – – 4 393 2 568 16 710 – 21 137 21 137 – – – 7 790 – 13 220 42 146Jun 18 623 – – 4 333 2 716 15 833 – 21 399 21 399 – – – 7 668 – 12 438 41 505
Jul 17 769 – – 4 314 2 716 15 297 – 20 877 20 877 – – – 7 554 – 11 666 40 097Aug 19 023 – – 4 390 2 716 15 919 1 556 20 595 20 595 – – – 7 739 – 12 158 42 048Sep 29 226 – – 4 521 2 716 21 259 – 28 961 28 961 – – – 7 865 – 20 897 57 723Oct 20 062 – – 4 492 2 716 24 497 – 8 113 8 113 – – – 7 663 – 35 991 51 767Nov 23 469 – – 4 602 2 716 24 359 – 5 055 5 055 – – – 7 814 – 42 277 55 146Dec 25 768 – – 4 727 2 936 27 583 – – – – – 10 000 7 481 – 43 533 61 013
Source: Bank of England

399
Banking, insurance
23.2 Value of inter-bank clearingsUnited Kingdom
£ billion
1997 1998 1999 2000 2001 2002 2003 2004 2005 2006 2007
Bulk paper clearings1
Cheque (formerly general) KCYY 1 200 1 214 1 226 1 214 1 210 1 178 1 141 1 111 1 062 1 076 1 062Credit KCYZ 94 92 88 82 80 75 69 63 57 56 54
High-value clearings
Town KCZA – – – – – – – – – .. ..CHAPS Sterling only KCZB 36 032 41 501 44 704 49 146 52 913 51 896 51 613 52 348 52 672 59 437 69 352
Electronic clearing (BACS) KCZC 1 432 1 602 1 761 1 922 2 166 2 382 2 574 2 883 3 150 3 429 3 696
1 Excludes inter-branch clearings and clearings in Scotland and NorthernIreland.
Source: APACS - The UK payments association: 020 7711 6223

400
Banking, insurance
23.3 Other banks’ balance sheet1
£ million
1998 19992 20003,4 2001 2002 2003 2004 2005 2006 2007
Sterling liabilities
Notes outstanding & cash loaded cards TBFA 2 929 3 311 3 359 3 866 3 957 4 207 4 338 4 534 4 987 5 265Sight deposits5
UK banks6 TBFB 37 839 33 463 40 054 59 573 101 905 99 208 109 866 148 202 165 479 91 322UK building societies TBFC 1 277 841 1 168 1 466 2 403 1 736 1 697 2 314 2 277 2 653UK public sector7 TBFD 3 003 3 450 3 403 4 283 3 997 5 679 6 635 7 341 9 046 8 190Other UK residents TBFE 295 068 325 392 372 725 415 180 457 077 502 359 566 524 638 684 701 743 765 752Non-residents TBFF 43 528 44 581 55 489 55 837 57 218 65 157 72 452 83 608 94 822 107 795
Time depositsUK banks6 TBFG 111 970 112 530 110 955 125 261 141 401 164 433 230 749 289 656 455 672 116 025UK building societies TBFH 4 361 4 253 4 688 4 856 4 487 3 643 4 045 4 098 3 573 4 182UK public sector7 TBFI 9 748 8 064 8 241 8 306 8 936 8 934 10 872 11 378 16 504 16 820Other UK residents TBFJ 295 924 282 789 301 007 302 715 306 453 313 244 322 603 353 481 433 436 496 697of which TESSAs TBFK 21 568 22 868 24 265 9 752 5 235 1 832 – – – ..of which SAYE TBFL 2 604 2 840 2 726 2 439 2 367 2 226 2 301 2 164 1 900 1 049of which cash ISAs TFDG .. 5 210 13 684 31 298 42 269 52 118 61 033 68 584 76 323 83 827Non-residents TBFM 97 953 116 967 134 844 150 964 151 304 166 449 177 381 203 777 234 754 420 637
Acceptances granted TBFN 16 658 12 854 10 012 10 627 9 954 2 856 1 446 928 1 105 1 860
Liabilities under sale and repurchaseagreements
of which British govt. securities8 TBFU 55 561 56 145 83 819 83 330 78 155 114 468 109 692 180 087 234 606 ..UK banks7 TBFP 43 314 48 213 56 408 60 551 52 079 95 922 86 876 133 938 190 384 167 057UK building societies TBFQ 32 200 36 – 107 170 62 345 – 175UK public sector7 TBFR – – 14 351 5 127 1 402 1 521 113 155 35 3 792Other UK residents TBFS 20 918 17 165 22 974 25 732 19 759 19 906 35 038 55 378 58 312 71 150Non-residents TBFT 5 469 5 542 9 849 8 643 19 072 18 475 26 669 40 012 54 240 68 660
CDs and other short-term paper issued TBFV 138 248 158 826 151 153 153 768 157 354 148 606 160 173 165 923 179 554 199 834
Total sterling deposits TBFW 1 125 311 1 175 130 1 297 356 1 392 890 1 494 908 1 618 298 1 813 197 2 139 217 2 600 935 2 542 600
Sterling items in suspense andtransmission TBFX 15 714 17 307 15 261 16 702 13 318 18 371 17 923 27 479 34 047 29 469Net derivatives TBFY 8 342 8 324 10 992 4 029 2 491 –10 672 –15 457 9 894 –33 397 –26 271Accrued amounts payable TBFZ 24 632 22 122 23 726 22 836 21 541 22 624 26 262 27 108 35 267 44 916Sterling capital and other internal funds TBGA 103 868 100 575 133 436 148 294 173 320 204 295 265 344 243 392 299 359 274 180
Total sterling liabilities TBGB 1 280 796 1 326 769 1 484 130 1 588 618 1 709 535 1 857 123 2 111 607 2 451 625 2 941 199 2 870 160
Foreign currency liabilities
Sight and time depositsUK banks9 TBGC 77 128 77 684 99 447 106 368 111 536 139 018 151 946 153 024 184 880 179 934UK building societies TBGD 639 681 233 279 373 550 310 615 658 726UK public sector7 TBGE 149 126 1 808 926 833 865 898 1 098 2 279 616Other UK residents TBGF 60 513 65 203 79 627 95 666 81 590 89 034 111 035 137 651 162 328 207 907Non-residents TBGG 766 934 736 792 914 888 1 001 321 997 398 1 055 183 1 185 037 1 427 857 1 551 892 1 994 259
Acceptances granted TBGH 729 619 689 638 754 751 890 846 1 270 1 394
Sale and repurchase agreementsUK banks TBGJ 30 669 25 170 38 901 54 499 90 407 224 743 243 933 265 239 259 088 251 867UK building societies TBGK – – – – – – – – – –UK public sector TBGL – – 468 1 71 844 858 391 1 1 077Other UK residents TBGM 26 742 21 997 35 145 52 438 54 463 73 477 67 544 79 689 83 379 108 075Non-residents TBGN 118 909 115 357 139 656 154 976 211 276 289 674 379 695 433 712 419 744 526 493
CDs and other short-term paper issued TBGO 124 151 151 009 199 510 224 225 234 731 255 590 278 440 341 866 406 487 530 751
Total foreign currency deposits TBGP 1 206 562 1 194 637 1 510 373 1 691 336 1 783 432 2 129 730 2 420 587 2 841 988 3 072 007 3 803 098
Items in suspense and transmission TBGQ 25 026 30 548 46 678 47 363 38 355 60 465 92 173 108 217 95 421 123 779Net derivatives TBGR 2 656 3 704 –4 472 –3 854 5 816 14 774 22 765 3 347 66 215 30 761Accrued amounts payable TBGS 25 184 18 080 18 568 17 756 16 312 15 708 18 214 23 015 36 279 42 640Capital and other internal funds TBGT 46 952 69 798 89 359 85 489 87 047 81 778 45 835 93 991 50 759 93 472
Total foreign currency liabilities TBGU 1 306 380 1 316 767 1 660 506 1 838 090 1 930 961 2 302 455 2 599 575 3 070 557 3 320 680 4 093 750
Total liabilities TBGV 2 587 177 2 643 536 3 144 636 3 426 708 3 640 497 4 159 579 4 711 182 5 522 182 6 261 879 6 963 910

401
Banking, insurance
23.3 Other banks’ balance sheet1
continued £ million
1998 19992 20003,4 2001 2002 2003 2004 2005 2006 2007
Sterling assets
Notes and coins TBGW 6 699 9 047 8 007 6 566 6 621 7 464 10 559 9 500 9 279 7 798With UK central bank
Cash ratio deposits TBGX 1 068 1 141 1 275 1 386 1 495 1 609 1 759 1 953 2 271 2 597Other TBGY 383 676 117 143 249 54 100 1 388 17 645 21 268
Market loansUK banks5,6 TBGZ 148 138 144 537 149 174 181 350 237 771 263 004 342 699 438 572 618 742 185 858UK bank CDs TBHB 65 510 75 071 65 156 68 868 68 728 55 053 59 505 58 780 63 236 50 856UK bank commercial paper TBHC 130 208 8 52 62 5 54 75 410 399UK building societies CDs etc and deposits TBHD 4 505 5 093 4 748 3 933 4 293 7 200 7 222 5 655 7 481 7 827Non-residents TBHE 84 162 74 403 94 381 102 404 89 848 109 665 102 286 128 343 166 599 268 090
Acceptances grantedUK building societies TBHF – – – – – – – – – –UK public sector7 TBHG – – – – – – – – – –Other UK residents TBHH 15 394 11 933 9 496 9 992 9 111 2 777 1 348 817 956 1 032Non-residents TBHI 1 264 920 516 635 842 79 99 111 148 828
BillsTreasury bills TBHJ 779 2 749 1 612 8 474 18 752 18 265 14 507 15 707 11 984 4 837UK bank bills TBHA 14 110 11 426 7 011 8 098 8 491 1 265 646 24 103 51UK building societies TBHK – – – – – – – – 375 –Other UK TBHL 1 221 818 1 202 1 601 485 1 013 955 779 1 636 320Non-residents TBHM 207 206 287 744 979 733 702 1 063 1 831 4 099
Claims under sale and repurchase agreementsof which British govt. securities8 TBHT 56 639 64 943 86 362 84 068 77 460 114 091 116 652 187 606 237 177 ..UK banks TBHO 41 969 39 667 46 088 46 585 37 197 77 691 64 353 113 540 160 380 140 564UK building societies TBHP 134 91 116 327 86 114 263 1 048 76 3 885UK public sector TBHQ – – 9 067 4 692 5 159 5 231 10 801 11 695 9 168 8 025Other UK residents TBHR 23 803 30 338 35 058 36 222 31 363 35 885 50 371 61 311 65 569 103 692Non-residents TBHS 5 907 6 310 7 266 7 010 14 271 12 981 20 456 36 261 52 300 68 570
AdvancesUK public sector TBHU 3 403 2 567 2 746 2 442 3 783 4 414 6 078 6 838 8 092 9 589Other UK residents10 TBHV 672 812 732 649 823 787 891 790 986 835 1 062 650 1 159 833 1 252 836 1 376 190 1 555 617Non-residents TBHW 21 039 23 364 24 494 29 483 31 380 34 603 38 447 49 223 62 314 82 026Banking dept. lending to central govt. (net) TBNU – – – – – – – – .. ..
InvestmentsBritish government stocks TBHX 14 714 9 243 2 867 499 –3 545 –8 525 –4 210 –6 203 –11 173 –12 950Other public sector TBHY 215 124 88 116 158 385 328 459 569 767UK banks11 TBHZ 13 415 13 584 22 935 23 965 23 542 34 971 34 664 36 365 36 655 37 633UK building societies TBIA 2 223 2 506 2 251 2 099 1 835 1 702 1 889 2 068 1 891 1 009Other UK residents12 TBIB 48 781 57 391 77 647 82 013 76 773 84 813 100 892 112 593 165 898 165 949Non-residents TBIC 11 834 13 775 20 572 23 462 22 821 22 505 26 029 30 487 39 000 46 211
Items in suspense and collection TBID 23 888 23 441 21 982 24 024 19 577 22 434 22 066 29 714 34 629 40 301Accrued amounts receivable TBIE 17 352 15 173 15 919 13 528 15 486 17 204 19 987 19 510 24 909 30 816Other assets TBIF 12 593 13 036 12 654 12 876 12 685 11 955 12 875 15 522 14 430 14 749
Total sterling assets13 TBIG 1 257 652 1 321 486 1 468 527 1 595 380 1 727 136 1 889 200 2 107 562 2 436 032 2 943 591 2 852 313

402
Banking, insurance
23.3 Other banks’ balance sheet1
continued £ million
1998 19992 20003,4 2001 2002 2003 2004 2005 2006 2007
Foreign currency assets
Market loans and advancesUK banks9 TBIH 72 263 74 250 93 269 104 107 114 809 137 417 149 119 146 316 173 211 177 957UK banks’ CDs etc TBII 11 065 14 364 13 171 13 298 10 128 13 162 11 026 18 412 13 023 12 851UK building societies CDs etc. and deposits TBIJ 259 451 173 354 357 591 448 411 422 608UK public sector7 TBIK 45 20 30 13 83 91 50 153 105 170Other UK residents TBIL 83 968 88 847 107 707 118 106 117 669 134 894 153 574 161 488 199 147 279 600Non-residents TBIM 616 832 599 146 743 781 783 057 783 168 779 983 839 535 1 013 764 1 104 494 1 492 863
Claims under sale and repurchase agreementUK banks TBIO 31 900 28 008 41 801 61 188 91 488 225 027 250 209 272 361 257 856 248 960UK building societies TBIP – – – – – – – 100 67 2 152UK public sector7 TBIQ – – 737 23 486 1 420 1 590 1 125 1 1 118Other UK residents TBIR 39 764 33 027 57 876 73 237 86 866 100 817 106 973 135 018 131 709 171 482Non-residents TBIS 147 562 146 756 199 990 219 449 256 663 382 672 506 157 612 065 595 615 751 407
Acceptances granted TBIT 729 619 689 638 754 751 890 846 1 270 1 394Bills TBIU 15 239 19 508 21 878 25 399 20 803 31 429 24 250 24 230 25 917 35 841Investments
British government stocks TBIV 4 755 4 473 3 518 890 226 19 –20 –30 104 9Other public sector TBIW – – – 4 18 7 – – 1 –UK banks TBIX 4 310 8 607 11 706 10 633 10 298 11 688 13 187 13 176 12 384 13 805UK building societies TBIY 526 631 939 850 1 170 1 570 2 400 2 974 2 683 2 590Other UK residents TBIZ 4 584 5 679 12 298 18 129 20 130 21 846 32 882 45 283 57 858 68 537Non-residents TBJA 234 563 243 147 297 404 324 073 326 035 334 371 398 040 484 874 566 025 662 101
Items in suspense and collection TBJB 30 229 29 706 44 885 55 026 44 037 60 804 81 937 112 089 117 498 122 409Accrued amounts receivable TBJC 27 821 20 163 21 279 18 969 19 434 18 129 19 561 22 397 32 639 42 051Other assets TBJD 3 111 4 648 2 978 3 880 8 735 13 683 11 802 19 089 26 251 23 691
Total foreign currency assets14 TBJE 1 329 525 1 322 050 1 676 109 1 831 322 1 913 355 2 270 372 2 603 610 3 086 141 3 318 281 4 111 597
Total assets TBJF 2 587 177 2 643 536 3 144 636 3 426 702 3 640 491 4 159 572 4 711 173 5 522 173 6 261 872 6 963 910
Holdings of own sterling acceptances TBJG 2 137 1 725 1 231 916 1 220 411 265 24 19 20Holdings of own FC acceptances TBJH 170 150 135 118 58 104 170 222 247 526Eligible banks’ total sterling acceptances TBJI 18 722 14 523 10 597 11 320 10 805 3 035 1 217 152 .. ..Eligible liabilities TBJJ 807 803 849 289 952 062 1 012 194 1 087 877 1 163 917 1 266 726 1 420 348 1 636 053 1 874 899
1 See chapter text.2 Data for 1999 reflect the acquisition of Birmingham Midshires Building
Society by Halifax during that year.3 Data for 2000 reflect the entry of Bradford & Bingley plc to the banking
sector during the year.4 Data for 2000 reflect the new reporting during the year of agency business
as a result of collateral management via repos and reverse repos.5 Sterling sight deposits from UK banks and sterling market loans to UK
banks in 2003 were depressed by £19 bn following the consolidation of twobanks balance sheets.
6 Sterling deposits (sight plus time) from, and lending to banks in 2007 werereduced by £386bn following changes in the reporting population.
7 From 2000 the UK public sector series reflects assumption by the DebtManagement Office (an executive agency of HM Treasury) of responsibilityfor government cash management.
8 Due to changes to the forms completed by reporting institutions, the break-down of sale and repurchase agreements into gilt and non-gilt collateral isnot available after 2006.
9 Foreign currency sight and time deposits from UK banks and foreign currencymarket loans and advances to UK banks in 2001, 2003 and 2004 were eachdepressed by £14.5 bn, £0.5 bn and £4.7 bn respectively as a result ofpositions being consolidated out on the merger of two banks.
10 During 2000, 2001, 2002, 2003, 2004 and 2005 sterling advances to other UKresidents were reduced by £10.3 bn, £12.9 bn, £16.2 bn, £29.1bn, £30.4bn and£33.6 bn respectively as a result of securitisations and other loan transfers tonon-banks or non-residents.
11 Sterling investments in UK banks in 2000 were boosted by Barclay’s £5.8 bninvestment in Woolwich.
12 Sterling investments in other UK residents in 2000 were boosted by LloydsTSB’s £5.8 bn investment in Scottish Widows Group.
13 Changes in the reporting populations in 1998, 1999, 2000, 2001, 2003 and2004 account for a net decrease of £7.3 bn, £11.3 bn £0.8 bn, £0.7bn, £0.2 bnand £4.5 bn respectively in sterling assets outstanding.
14 Changes in the reporting populations in 1998, 1999, 2000, 2001, 2003 and2004 account for a net decrease of £4.6 bn, £6.6 bn, £0.2 bn, £0.2 bn £0.2 bnand £5.2 bn of foreign currency assets outstanding.
Source: Bank of England: 020 7601 3236

403
Banking, insurance
23.4 Industrial analysis of bank lending to UK residents1
Not seasonally adjusted£ million
UK residents Manufacturing
Agriculture, Pulp, paper,of which hunting and Mining & Food, beverages Textiles & publishing &
Total sterling forestry Fishing quarrying Total & tobacco leather printing
Amounts outstanding (sterling & other currencies)
Loans & advances (including under repo & sterling commercial paper)TBOA TBOB TBOC TBOD TBOE TBOF TBOG TBOH TBOI
2005 1 632 663 1 333 243 9 363 371 3 262 48 485 11 817 1 641 6 9312006 1 793 840 1 460 380 9 620 413 4 205 47 476 11 434 1 512 6 405
AcceptancesTBQA TBQB TBQC TBQD TBQE TBQF TBQG TBQH TBQI
2005 1 015 816 – 1 2 83 7 26 12006 1 190 956 – – 1 104 5 28 1
TotalTBSA TBSC TBSD TBSE TBSF TBSG TBSH TBSI
2006 1 795 030 9 620 413 4 206 47 579 11 439 1 540 6 4062007 2 129 758 9 939 401 13 229 51 331 13 510 1 407 7 021
of which in sterlingTBUA TBUC TBUD TBUE TBUF TBUG TBUH TBUI
2006 1 461 336 9 375 399 1 934 32 396 8 630 1 015 4 9162007 1 676 924 9 590 394 1 827 31 682 8 563 925 4 573
Facilities grantedTCAA TCAC TCAD TCAE TCAF TCAG TCAH TCAI
2006 2 177 763 12 146 504 11 358 88 919 25 048 2 501 11 6362007 2 569 437 12 840 488 29 562 100 352 25 715 2 288 11 962
of which in sterlingTCCA TCCC TCCD TCCE TCCF TCCG TCCH TCCI
2006 1 746 462 11 834 490 2 586 54 208 15 251 1 689 7 4962007 1 966 032 12 436 478 2 924 51 412 13 015 1 476 6 925
Manufacturing Electricity, gas and water supply
Chemicals, Machinery, Electrical,man-made fibres, Non-metallic equipment & medical & Cold water
rubber & mineral products transport optical Other Electricity, gas purification &plastics & metals equipment equipment manufacturing & heated water supply Construction
Amounts outstanding (sterling & other currencies)
Loans & advances (including under repo & sterling commercial paper)TBOJ TBOK TBOL TBOM TBON TBOO TBOP TBOQ
2005 6 253 5 242 7 085 4 267 5 250 4 992 1 163 19 1542006 5 681 6 122 6 678 3 741 5 903 7 075 4 235 20 671
AcceptancesTBQJ TBQK TBQL TBQM TBQN TBQO TBQP TBQQ
2005 5 9 8 7 19 – 2 22006 4 10 8 14 33 – – 15
TotalTBSJ TBSK TBSL TBSM TBSN TBSO TBSP TBSQ
2006 .. 6 132 6 686 .. 5 936 7 075 4 235 20 6862007 .. 6 593 7 460 .. 6 481 6 484 2 449 27 183
of which in sterlingTBUJ TBUK TBUL TBUM TBUN TBUO TBUP TBUQ
2006 2 962 3 763 4 497 2 078 4 534 6 113 3 924 20 1412007 2 864 3 841 3 819 1 994 5 102 5 558 2 435 26 058
Facilities grantedTCAJ TCAK TCAL TCAM TCAN TCAO TCAP TCAQ
2006 .. 10 193 12 381 6 466 9 810 15 024 11 441 33 3812007 .. 10 793 14 122 7 873 10 092 12 930 6 452 40 256
of which in sterlingTCCJ TCCK TCCL TCCM TCCN TCCO TCCP TCCQ
2006 5 361 6 072 8 395 3 508 6 436 10 407 10 110 30 9122007 5 104 6 568 7 445 3 344 7 536 8 966 5 568 36 716
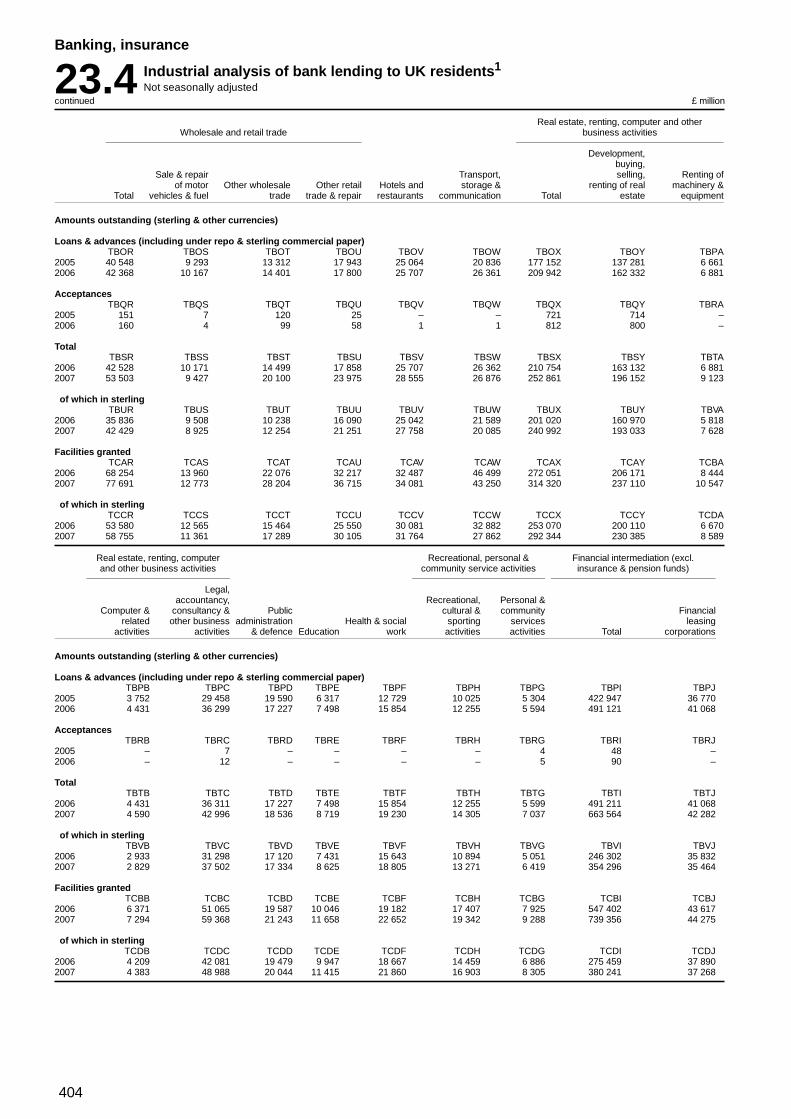
404
Banking, insurance
23.4 Industrial analysis of bank lending to UK residents1
Not seasonally adjustedcontinued £ million
Real estate, renting, computer and otherWholesale and retail trade business activities
Development,buying,
Sale & repair Transport, selling, Renting ofof motor Other wholesale Other retail Hotels and storage & renting of real machinery &
Total vehicles & fuel trade trade & repair restaurants communication Total estate equipment
Amounts outstanding (sterling & other currencies)
Loans & advances (including under repo & sterling commercial paper)TBOR TBOS TBOT TBOU TBOV TBOW TBOX TBOY TBPA
2005 40 548 9 293 13 312 17 943 25 064 20 836 177 152 137 281 6 6612006 42 368 10 167 14 401 17 800 25 707 26 361 209 942 162 332 6 881
AcceptancesTBQR TBQS TBQT TBQU TBQV TBQW TBQX TBQY TBRA
2005 151 7 120 25 – – 721 714 –2006 160 4 99 58 1 1 812 800 –
TotalTBSR TBSS TBST TBSU TBSV TBSW TBSX TBSY TBTA
2006 42 528 10 171 14 499 17 858 25 707 26 362 210 754 163 132 6 8812007 53 503 9 427 20 100 23 975 28 555 26 876 252 861 196 152 9 123
of which in sterlingTBUR TBUS TBUT TBUU TBUV TBUW TBUX TBUY TBVA
2006 35 836 9 508 10 238 16 090 25 042 21 589 201 020 160 970 5 8182007 42 429 8 925 12 254 21 251 27 758 20 085 240 992 193 033 7 628
Facilities grantedTCAR TCAS TCAT TCAU TCAV TCAW TCAX TCAY TCBA
2006 68 254 13 960 22 076 32 217 32 487 46 499 272 051 206 171 8 4442007 77 691 12 773 28 204 36 715 34 081 43 250 314 320 237 110 10 547
of which in sterlingTCCR TCCS TCCT TCCU TCCV TCCW TCCX TCCY TCDA
2006 53 580 12 565 15 464 25 550 30 081 32 882 253 070 200 110 6 6702007 58 755 11 361 17 289 30 105 31 764 27 862 292 344 230 385 8 589
Real estate, renting, computer Recreational, personal & Financial intermediation (excl.and other business activities community service activities insurance & pension funds)
Legal,accountancy, Recreational, Personal &
Computer & consultancy & Public cultural & community Financialrelated other business administration Health & social sporting services leasing
activities activities & defence Education work activities activities Total corporations
Amounts outstanding (sterling & other currencies)
Loans & advances (including under repo & sterling commercial paper)TBPB TBPC TBPD TBPE TBPF TBPH TBPG TBPI TBPJ
2005 3 752 29 458 19 590 6 317 12 729 10 025 5 304 422 947 36 7702006 4 431 36 299 17 227 7 498 15 854 12 255 5 594 491 121 41 068
AcceptancesTBRB TBRC TBRD TBRE TBRF TBRH TBRG TBRI TBRJ
2005 – 7 – – – – 4 48 –2006 – 12 – – – – 5 90 –
TotalTBTB TBTC TBTD TBTE TBTF TBTH TBTG TBTI TBTJ
2006 4 431 36 311 17 227 7 498 15 854 12 255 5 599 491 211 41 0682007 4 590 42 996 18 536 8 719 19 230 14 305 7 037 663 564 42 282
of which in sterlingTBVB TBVC TBVD TBVE TBVF TBVH TBVG TBVI TBVJ
2006 2 933 31 298 17 120 7 431 15 643 10 894 5 051 246 302 35 8322007 2 829 37 502 17 334 8 625 18 805 13 271 6 419 354 296 35 464
Facilities grantedTCBB TCBC TCBD TCBE TCBF TCBH TCBG TCBI TCBJ
2006 6 371 51 065 19 587 10 046 19 182 17 407 7 925 547 402 43 6172007 7 294 59 368 21 243 11 658 22 652 19 342 9 288 739 356 44 275
of which in sterlingTCDB TCDC TCDD TCDE TCDF TCDH TCDG TCDI TCDJ
2006 4 209 42 081 19 479 9 947 18 667 14 459 6 886 275 459 37 8902007 4 383 48 988 20 044 11 415 21 860 16 903 8 305 380 241 37 268

405
Banking, insurance
23.4 Industrial analysis of bank lending to UK residents1
Not seasonally adjustedcontinued £ million
Financial intermediation (excl. insurance & pension funds)
Investment &unit trusts
Non-bank credit Mortgage & excl. moneygrantors, excl. Factoring housing credit market mutual Money market Bank holding Securities Other financial
credit unions Credit unions corporations corporations funds mutual funds companies dealers (f) intermediaries
Amounts outstanding (sterling & other currencies)
Loans & advances (including under repo & sterling commercial paper)TBPK TBPL TBPM TBPN TBPO TBPP TBPQ TBPR TBPS
2005 17 833 28 4 633 62 869 20 394 1 377 19 707 165 421 93 9162006 21 496 60 5 593 84 959 20 131 674 17 969 183 551 115 620
AcceptancesTBRK TBRL TBRM TBRN TBRO TBRP TBRQ TBRR TBRS
2005 15 5 – – – – – – 272006 15 5 – – – – – – 69
TotalTBTK TBTL TBTM TBTN TBTO TBTP TBTQ TBTR TBTS
2006 21 511 66 5 593 84 959 20 131 674 17 969 183 551 115 6892007 23 678 80 6 523 99 216 20 975 327 44 382 219 265 206 835
of which in sterlingTBVK TBVL TBVM TBVN TBVO TBVP TBVQ TBVR TBVS
2006 20 205 65 4 673 74 403 6 972 91 12 472 25 830 65 7592007 21 439 80 5 520 82 563 6 132 77 32 358 37 996 132 667
Facilities grantedTCBK TCBL TCBM TCBN TCBO TCBP TCBQ TCBR TCBS
2006 23 625 89 5 916 92 587 33 310 752 18 902 186 663 141 9422007 25 527 92 6 774 103 965 47 525 391 44 612 228 585 237 610
of which in sterlingTCDK TCDL TCDM TCDN TCDO TCDP TCDQ TCDR TCDS
2006 21 977 88 4 946 81 888 13 042 106 12 413 26 540 76 5682007 22 869 89 5 724 87 071 12 775 88 32 153 38 565 143 640
Activities auxiliary to financialintermediation Individuals & individual trusts
Lending secured onInsurance companies & Fund management dwellings inc. Other loans &
pension funds activities Other Total bridging finance advances
Amounts outstanding (sterling & other currencies)
Loans & advances (including under repo & sterling commercial paper)TBPT TBPU TBPV TBPW TBPX TBPY
2006 26 355 34 316 55 836 729 712 587 069 142 6432007 .. .. .. 749 174 605 186 143 988
AcceptancesTBRT TBRU TBRV
2005 1 – –2006 1 – –
TotalTBTT TBTU TBTV TBTW TBTX TBTY
2006 26 356 34 316 55 836 729 712 587 069 142 6432007 30 301 52 769 93 312 749 174 605 186 143 988
of which in sterlingTBVT TBVU TBVV TBVW TBVX TBVY
2006 24 373 20 732 27 964 728 057 .. 141 4132007 27 960 15 771 58 145 747 490 .. 142 827
Facilities grantedTCBT TCBU TCBV TCBW TCBX TCBY
2006 38 596 37 898 57 901 829 754 640 095 189 6602007 57 824 55 907 94 807 865 139 667 412 197 727
of which in sterlingTCDT TCDU TCDV TCDW TCDX TCDY
2006 31 340 22 775 29 474 827 817 639 663 188 1542007 37 959 17 672 59 275 863 134 666 884 196 250
1 See chapter text. Source: Bank of England: 020 7601 3236

406
Banking, insurance
23.5 Industrial analysis of bank deposits from UK residents1
£ million
Manufacturing
Agriculture, Pulp, paper,Total from UK hunting and Mining & Food, beverages Textiles & publishing &
residents forestry Fishing quarrying Total & tobacco leather printing
Amounts outstanding (sterling & other currencies)
Deposit liabilities (including under repos)TDAA TDAB TDAC TDAD TDAE TDAF TDAG TDAH
2006 1 467 063 4 147 192 5 692 39 978 3 686 1 175 3 7102007 1 679 929 5 096 208 6 336 40 578 3 632 1 393 4 760
of which in sterlingTDCA TDCB TDCC TDCD TDCE TDCF TDCG TDCH
2006 1 219 076 4 063 170 3 136 30 083 3 031 957 3 1752007 1 362 254 4 969 176 3 149 30 692 2 738 1 042 4 246
Manufacturing Electricity, gas and water supply
Chemicals, Machinery, Electrical,man-made fibres, Non-metallic equipment & medical & Cold water
rubber & mineral products transport optical Other Electricity, gas purification &plastics & metals equipment equipment manufacturing & heated water supply Construction
Amounts outstanding (sterling & other currencies)
Deposit liabilities (including under repos)TDAI TDAJ TDAK TDAL TDAM TDAN TDAO TDAP
2006 4 083 5 612 9 280 6 283 6 150 5 368 3 681 17 5202007 4 531 4 851 10 427 6 103 4 880 5 292 2 840 19 639
of which in sterlingTDCI TDCJ TDCK TDCL TDCM TDCN TDCO TDCP
2006 2 752 4 792 7 511 3 533 4 333 4 564 3 486 17 2632007 3 012 4 152 7 731 3 752 4 020 4 713 2 141 18 604
Real estate, renting, computer and otherWholesale and retail trade business activities
Development,buying,
Sale & repair Transport, selling, Renting ofof motor Other wholesale Other retail Hotels and storage & renting of real machinery &
Total vehicles & fuel trade trade & repair restaurants communication Total estate equipment
Amounts outstanding (sterling & other currencies)
Deposit liabilities (including under repos)TDAQ TDAR TDAS TDAT TDAU TDAV TDAW TDAX TDAY
2006 29 012 3 531 12 952 12 530 5 069 20 352 113 658 33 331 1 5682007 32 478 4 008 14 592 13 878 5 339 20 753 123 626 36 580 1 623
of which in sterlingTDCQ TDCR TDCS TDCT TDCU TDCV TDCW TDCX TDCY
2006 24 735 3 251 9 819 11 664 4 935 16 440 105 300 32 067 1 4482007 27 713 3 558 11 110 13 045 5 042 16 350 113 982 35 531 1 419

407
Banking, insurance
23.5 Industrial analysis of bank deposits from UK residents1
continued £ million
Real estate, renting, computer Recreational, personal & Financial intermediation (excl.and other business activities community service activities insurance & pension funds)
Legal,accountancy, Recreational, Personal &
Computer & consultancy & Public cultural & community Financialrelated other business administration Health & social sporting services leasing
activities activities & defence Education work activities activities Total corporations
Amounts outstanding (sterling & other currencies)
Deposit liabilities (including under repos)TDAZ TDBA TDBB TDBC TDBD TDBF TDBE TDBG TDBH
2006 7 969 70 791 22 260 7 800 11 685 14 016 14 067 349 446 5 4162007 9 163 76 260 26 003 9 163 13 653 16 203 15 627 440 612 4 164
of which in sterlingTDCZ TDDA TDDB TDDC TDDD TDDF TDDE TDDG TDDH
2006 6 795 64 989 21 169 7 479 11 332 13 076 13 637 195 096 3 8952007 7 600 69 432 24 641 8 907 13 254 15 217 15 094 247 703 3 252
Financial intermediation (excl. insurance & pension funds)
Investment &unit trusts
Non-bank credit Mortgage & excl. moneygrantors, excl. Factoring housing credit market mutual Money market Bank holding Securities Other financial
credit unions Credit unions corporations corporations funds mutual funds companies dealers intermediaries
Amounts outstanding (sterling & other currencies)
Deposit liabilities (including under repos)TDBI TDBJ TDBK TDBL TDBM TDBN TDBO TDBP TDBQ
2006 10 433 400 890 13 508 35 089 254 25 719 115 581 142 1572007 9 557 438 768 12 887 36 033 489 39 870 154 351 182 056
of which in sterlingTDDI TDDJ TDDK TDDL TDDM TDDN TDDO TDDP TDDQ
2006 7 712 399 529 13 239 16 022 236 13 700 34 075 105 2892007 7 753 438 631 12 601 19 093 358 27 013 41 855 134 709
Activities auxiliary to financial intermediationInsurance companies & pension
funds Placed by fund managers Other Individuals & individual trusts
Amounts outstanding (sterling & other currencies)
Deposit liabilities (including under repos)TDBR TDBS TDBT TDBU
2006 62 561 65 595 71 090 603 8722007 67 759 88 179 94 639 645 906
of which in sterlingTDDR TDDS TDDT TDDU
2006 54 396 43 742 44 141 600 8342007 59 180 49 295 59 367 642 064
1 See chapter text. Source: Bank of England: 020 7601 3236
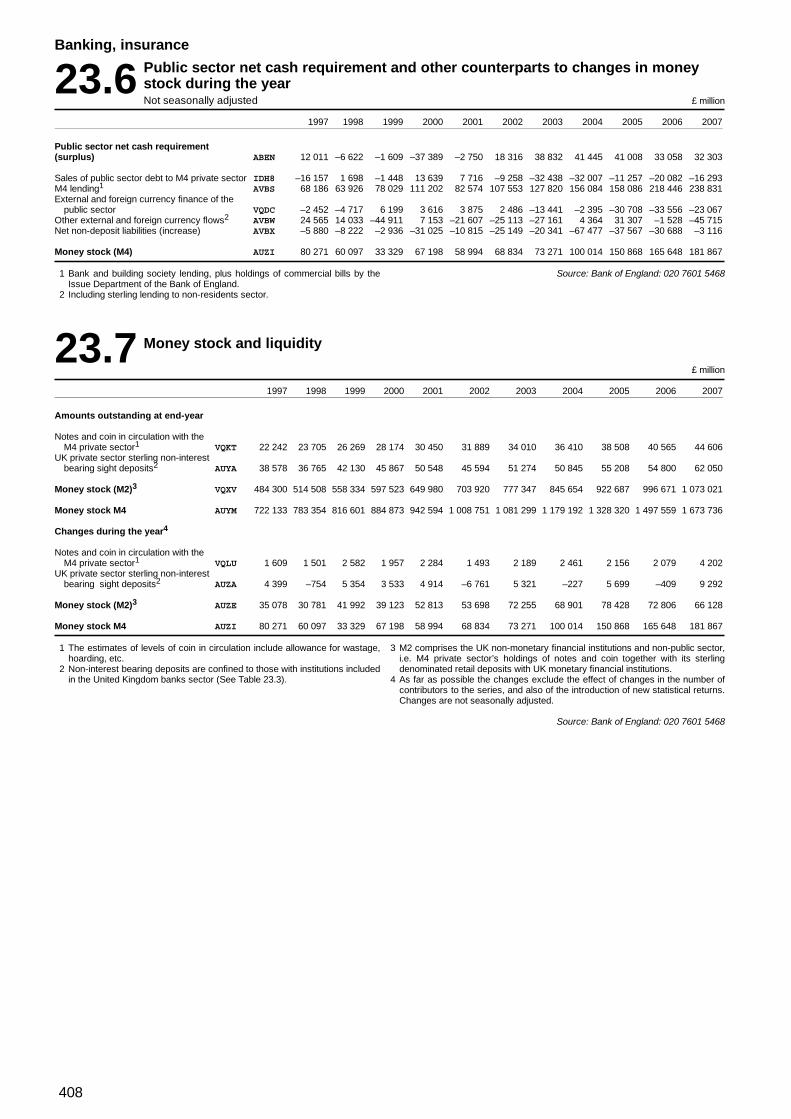
408
Banking, insurance
23.6 Public sector net cash requirement and other counterparts to changes in moneystock during the yearNot seasonally adjusted £ million
1997 1998 1999 2000 2001 2002 2003 2004 2005 2006 2007
Public sector net cash requirement(surplus) ABEN 12 011 –6 622 –1 609 –37 389 –2 750 18 316 38 832 41 445 41 008 33 058 32 303
Sales of public sector debt to M4 private sector IDH8 –16 157 1 698 –1 448 13 639 7 716 –9 258 –32 438 –32 007 –11 257 –20 082 –16 293M4 lending1 AVBS 68 186 63 926 78 029 111 202 82 574 107 553 127 820 156 084 158 086 218 446 238 831External and foreign currency finance of the
public sector VQDC –2 452 –4 717 6 199 3 616 3 875 2 486 –13 441 –2 395 –30 708 –33 556 –23 067Other external and foreign currency flows2 AVBW 24 565 14 033 –44 911 7 153 –21 607 –25 113 –27 161 4 364 31 307 –1 528 –45 715Net non-deposit liabilities (increase) AVBX –5 880 –8 222 –2 936 –31 025 –10 815 –25 149 –20 341 –67 477 –37 567 –30 688 –3 116
Money stock (M4) AUZI 80 271 60 097 33 329 67 198 58 994 68 834 73 271 100 014 150 868 165 648 181 867
1 Bank and building society lending, plus holdings of commercial bills by theIssue Department of the Bank of England.
2 Including sterling lending to non-residents sector.
Source: Bank of England: 020 7601 5468
23.7 Money stock and liquidity
£ million
1997 1998 1999 2000 2001 2002 2003 2004 2005 2006 2007
Amounts outstanding at end-year
Notes and coin in circulation with theM4 private sector1 VQKT 22 242 23 705 26 269 28 174 30 450 31 889 34 010 36 410 38 508 40 565 44 606
UK private sector sterling non-interestbearing sight deposits2 AUYA 38 578 36 765 42 130 45 867 50 548 45 594 51 274 50 845 55 208 54 800 62 050
Money stock (M2)3 VQXV 484 300 514 508 558 334 597 523 649 980 703 920 777 347 845 654 922 687 996 671 1 073 021
Money stock M4 AUYM 722 133 783 354 816 601 884 873 942 594 1 008 751 1 081 299 1 179 192 1 328 320 1 497 559 1 673 736
Changes during the year4
Notes and coin in circulation with theM4 private sector1 VQLU 1 609 1 501 2 582 1 957 2 284 1 493 2 189 2 461 2 156 2 079 4 202
UK private sector sterling non-interestbearing sight deposits2 AUZA 4 399 –754 5 354 3 533 4 914 –6 761 5 321 –227 5 699 –409 9 292
Money stock (M2)3 AUZE 35 078 30 781 41 992 39 123 52 813 53 698 72 255 68 901 78 428 72 806 66 128
Money stock M4 AUZI 80 271 60 097 33 329 67 198 58 994 68 834 73 271 100 014 150 868 165 648 181 867
1 The estimates of levels of coin in circulation include allowance for wastage,hoarding, etc.
2 Non-interest bearing deposits are confined to those with institutions includedin the United Kingdom banks sector (See Table 23.3).
3 M2 comprises the UK non-monetary financial institutions and non-public sector,i.e. M4 private sector’s holdings of notes and coin together with its sterlingdenominated retail deposits with UK monetary financial institutions.
4 As far as possible the changes exclude the effect of changes in the number ofcontributors to the series, and also of the introduction of new statistical returns.Changes are not seasonally adjusted.
Source: Bank of England: 020 7601 5468

409
Banking, insurance
23.8 Selected retail banks’ base rate1
Operative between dates shownPercentage rates
Date of change New rate Date of change New rate Date of change New rate
1986 Jan 9 12.50 Nov 25 13.00 Nov 6 7.25Mar 19 11.50
Apr 8 11.00-11.50 1989 May 24 14.00 1998 Jun 4 7.50Apr 9 11.00 Oct 5 15.00 Oct 8 7.25
Apr 21 10.50 Nov 5 6.75May 23 10.00-10.50 1990 Oct 8 14.00 Dec 10 6.25May 27 10.00Oct 14 10.00-11.00 1991 Feb 13 13.50 1999 Jan 7 6.00Oct 15 11.00 Feb 27 13.00 Feb 4 5.50
Mar 22 12.50 Apr 8 5.251987 Mar 10 10.50 Apr 12 12.00 Jun 10 5.00
Mar 18 10.00-10.50 May 24 11.50 Sep 8 5.00-5.25Mar 19 10.00 Jul 12 11.00 Sep 10 5.25Apr 28 9.50-10.00 Sep 4 10.50 Nov 4 5.50Apr 29 9.50
May 11 9.00 1992 May 5 10.00 2000 Jan 13 5.75Aug 6 9.00-10.00 Sep 162 12.00 Feb 10 6.00Aug 7 10.00 Sep 172 10.00-12.00
Oct 23 9.50-10.00 Sep 18 10.00 2001 Feb 8 5.75Oct 29 9.50 Sep 22 9.00 Apr 5 5.50Nov 4 9.00-9.50 Oct 16 8.00-9.00 May 10 5.25Nov 5 9.00 Oct 19 8.00 Aug 2 5.00Dec 4 8.50 Nov 13 7.00 Sep 18 4.75
Oct 4 4.501988 Feb 2 9.00 1993 Jan 26 6.00 Nov 8 4.00
Mar 17 8.50-9.00 Nov 23 5.50Mar 18 8.50 2003 Feb 6 3.75Apr 11 8.00 1994 Feb 8 5.25 Jul 10 3.50
May 17 7.50-8.00 Sep 12 5.75 Nov 6 3.75May 18 7.50 Dec 7 6.25
Jun 2 7.50-8.00 2004 Feb 5 4.00Jun 3 8.00 1995 Feb 22 6.25-6.75 May 6 4.25Jun 6 8.00-8.50 Feb 3 6.75 Jun 10 4.50Jun 7 8.50 Dec 13 6.50 Aug 5 4.75
Jun 22 8.50-9.00Jun 23 9.00 1996 Jan 18 6.25 2005 Aug 4 4.50Jun 28 9.00-9.50 Mar 8 6.00Jun 29 9.50 Jun 6 5.75 2006 Aug 3 4.75
Jul 4 9.50-10.00 Oct 30 5.75-6.00 Nov 9 5.00Jul 5 10.00 Oct 31 6.00
Jul 18 10.00-10.50 2007 Jan 11 5.25Jul 19 10.50 1997 May 6 6.25 May 10 5.50Aug 8 10.50-11.00 Jun 6 6.25-6.50 Jul 5 5.75Aug 9 11.00 Jun 9 6.50 Dec 6 5.50
Aug 25 11.00-12.00 Jul 10 6.75Aug 26 12.00 Aug 7 7.00 2008 Feb 7 5.25
1 Data obtained from Barclays Bank, Lloyds/TSB Bank, HSBC Bank andNational Westminster Bank whose rates are used to compile this series.
2 Where all the rates did not change on the same day a spread is shown.
Source: Bank of England: 020 7601 3644

410
Banking, insurance
23.9 Average three month sterling money market rates1
Percentage rates
1997 1998 1999 2000 2001 2002 2003 2004 2005 2006 2007
Treasury bills:2 KDMM
January 6.01 6.80 5.28 5.72 5.49 3.83 3.80 3.90 4.66 4.39 5.30February 5.81 6.88 5.04 5.83 5.46 3.87 3.50 3.98 4.69 4.38 5.34March 5.92 6.95 4.92 5.86 5.23 3.97 3.47 4.10 4.77 4.40 5.33April 6.09 7.00 4.90 5.92 5.12 3.97 3.45 4.19 4.70 4.42 5.43May 6.15 7.01 4.93 5.95 4.98 3.95 3.44 4.34 4.66 4.50 5.55June 6.37 7.29 4.76 5.85 4.99 3.98 3.47 4.58 4.62 4.54 5.67
July 6.63 7.22 4.76 5.83 5.01 3.84 3.31 4.64 4.46 4.53 5.77August 6.83 7.19 4.85 5.81 4.72 3.77 3.40 4.72 4.41 5.75 5.79September 6.88 6.94 5.12 5.78 4.43 3.79 3.52 4.69 4.40 4.84 5.69October 6.94 6.54 5.23 5.75 4.16 3.75 3.65 4.68 4.40 4.94 5.61November 7.09 6.31 5.20 5.68 3.78 3.80 3.81 4.66 4.42 5.01 5.50December 7.07 5.72 5.46 5.62 3.83 3.84 3.83 4.68 4.43 5.08 5.30
Eligible bill: KDMY3
January 6.15 7.28 5.63 5.90 5.64 3.91 3.87 3.94 4.75 .. ..February 5.99 7.24 5.28 6.01 5.56 3.92 3.65 4.06 4.78 .. ..March 6.01 7.25 5.11 5.98 5.37 3.99 3.54 4.19 4.88 .. ..April 6.26 7.24 5.02 6.05 5.21 4.04 3.52 4.28 4.84 .. ..May 6.31 7.20 5.08 6.09 5.06 4.01 3.52 4.42 4.80 .. ..June 6.50 7.42 4.94 6.03 5.08 4.04 3.45 4.68 4.76 .. ..
July 6.80 7.49 4.89 5.97 5.07 3.94 3.39 4.75 4.57 .. ..August 6.95 7.40 4.94 5.97 4.82 3.86 3.42 4.85 4.51 .. ..September 7.02 7.20 5.16 5.95 4.57 3.86 3.59 4.83 .. .. ..October 7.10 6.91 5.42 5.92 4.26 3.82 3.69 4.79 .. .. ..November 7.27 6.52 5.43 5.88 3.85 3.84 3.88 4.78 .. .. ..December 7.31 6.05 5.59 5.78 3.88 3.71 3.90 4.77 .. .. ..
Interbank rate: AMIJ
January 6.32 7.48 5.80 6.06 5.76 3.98 3.91 3.99 4.80 4.54 5.45February 6.19 7.46 5.43 6.15 5.69 3.98 3.69 4.10 4.82 4.52 5.52March 6.20 7.48 5.30 6.15 5.47 4.06 3.58 4.23 4.92 4.53 5.50April 6.38 7.44 5.23 6.21 5.33 4.11 3.58 4.33 4.88 4.57 5.61May 6.45 7.41 5.25 6.23 5.17 4.08 3.57 4.46 4.83 4.65 5.72June 6.66 7.63 5.12 6.14 5.19 4.11 3.57 4.73 4.78 4.69 5.83
July 6.96 7.71 5.07 6.11 5.19 3.99 3.42 4.79 4.59 4.68 5.98August 7.15 7.66 5.18 6.14 4.93 3.92 3.45 4.89 4.53 4.90 6.34September 7.21 7.38 5.32 6.12 4.65 3.93 3.63 4.87 4.54 4.98 6.58October 7.26 7.14 5.94 6.08 4.36 3.90 3.73 4.83 4.53 5.09 6.21November 7.54 6.89 5.78 6.00 3.93 3.91 3.91 4.82 4.56 5.18 6.36December 7.62 6.38 5.97 5.89 3.99 3.95 3.95 4.81 4.59 5.25 6.35
Certificate of deposits: KOSA
January 6.27 7.44 5.74 6.02 5.73 3.96 3.90 3.98 4.80 4.54 5.45February 6.14 7.42 5.38 6.10 5.66 3.96 3.68 4.09 4.82 4.52 5.51March 6.15 7.43 5.26 6.09 5.44 4.04 3.57 4.22 4.91 4.53 5.52April 6.33 7.40 5.19 6.17 5.30 4.08 3.57 4.32 4.86 4.57 5.69May 6.39 7.37 5.22 6.19 5.15 4.06 3.56 4.45 4.82 4.65 5.84June 6.62 7.59 5.09 6.10 5.16 4.09 3.56 4.72 4.78 4.69 5.94
July 6.92 7.66 5.03 6.08 5.17 3.97 3.41 4.79 4.60 4.68 6.11August 7.12 7.61 5.14 6.09 4.90 3.90 3.44 4.89 4.53 4.89 6.35September 7.17 7.34 5.28 6.08 4.62 3.91 3.62 4.87 4.54 4.98 6.54October 7.22 7.09 5.86 6.05 4.33 3.88 3.72 4.83 4.53 5.09 6.21November 7.50 6.82 5.72 5.98 3.91 3.89 3.90 4.81 4.57 5.18 6.34December 7.57 6.32 5.89 5.85 3.96 3.93 3.94 4.80 4.59 5.24 6.35
Local authority deposits: KDPX4
January 6.27 7.43 5.76 6.03 5.73 3.85 3.87 3.91 .. .. ..February 6.15 7.40 5.38 6.09 5.62 3.88 3.61 4.08 .. .. ..March 6.14 7.40 5.27 6.08 5.39 4.01 3.55 4.12 .. .. ..April 6.33 7.38 5.17 6.12 5.26 4.05 3.54 4.31 .. .. ..May 6.38 7.34 5.19 6.14 5.13 4.06 3.54 4.45 .. .. ..June 6.57 7.56 5.07 6.09 5.10 4.05 3.57 4.75 .. .. ..
July 6.90 7.64 5.01 6.04 5.12 3.95 3.39 4.82 .. .. ..August 7.11 7.55 5.11 6.06 4.86 3.87 3.43 4.92 .. .. ..September 7.19 7.35 5.19 6.05 4.58 3.88 3.61 4.90 .. .. ..October 7.21 7.08 5.83 6.03 4.29 3.86 3.71 4.85 .. .. ..November 7.49 6.85 5.64 5.96 3.82 3.87 3.90 4.84 .. .. ..December 7.56 6.35 5.88 5.80 3.87 3.93 3.92 4.82 .. .. ..
1 A full definition of these series is given in Section 7 of the ONS FinancialStatistics Explanatory Handbook.
2 Average rate of discount at weekly (Friday) tender.
3 This series discontinued at end of August 2005.4 This series discontinued at end of December 2004.
Source: Bank of England: 020 7601 3644

411
Banking, insurance
23.10 Average foreign exchange rates1
1997 1998 1999 2000 2001 2002 2003 2004 2005 2006 2007
Sterling exchangerate index (1990 = 100)2 AGBG
January 95.9 104.7 99.6 108.5 104.4 106.9 104.0 102.4 102.1 102.7 ..February 97.4 104.7 100.8 108.4 104.1 107.4 102.4 104.8 103.3 102.8 ..March 97.4 106.8 102.8 108.4 105.0 106.5 100.6 105.0 103.2 102.1 ..April 99.5 107.1 103.4 110.1 105.8 107.1 99.8 105.2 104.4 101.9 ..May 99.0 103.4 104.2 108.5 106.6 105.3 97.9 104.6 103.6 104.1 ..June 100.4 105.4 104.7 104.6 106.8 103.6 99.6 105.8 104.9 .. ..
July 104.5 105.3 103.5 105.6 107.2 105.3 99.4 105.9 102.1 .. ..August 102.5 104.6 103.3 107.4 105.1 105.4 99.0 105.2 102.8 .. ..September 100.4 103.3 104.7 106.2 106.1 106.5 99.2 103.3 103.9 .. ..October 101.1 100.7 105.4 109.2 105.8 106.7 99.8 102.2 103.1 .. ..November 103.8 100.6 105.7 107.3 106.1 105.9 100.4 101.7 103.2 .. ..December 104.4 100.4 106.7 106.4 106.5 105.5 100.3 103.2 103.3 .. ..
Effective Sterling exchangerate index (Jan 2005 = 100) BK67January 92.4 100.6 96.5 103.0 98.6 100.6 99.9 100.2 100.0 99.1 105.4February 93.3 100.3 97.3 102.6 98.1 100.9 98.5 102.5 101.0 99.0 104.9March 93.2 102.0 99.0 102.4 98.9 100.2 96.8 102.3 101.1 98.4 103.4April 95.0 102.3 99.0 103.8 99.5 100.9 96.1 102.3 102.0 98.4 104.1May 94.8 99.2 99.8 101.8 99.8 99.5 94.9 101.8 101.0 101.2 103.7June 96.0 101.1 99.8 98.8 99.7 98.3 96.6 103.1 101.8 100.9 104.4
July 99.5 101.0 98.6 99.5 100.2 100.4 96.1 103.2 98.9 100.9 105.0August 97.4 100.6 98.8 100.7 98.8 100.4 95.5 102.4 99.8 102.9 104.3September 95.7 99.9 100.0 99.2 100.0 101.5 95.8 100.7 100.7 102.9 103.0October 96.7 97.7 100.9 101.8 99.8 101.7 96.9 99.8 99.7 103.1 102.5November 99.6 97.5 100.8 100.1 99.9 101.1 97.5 99.7 99.5 103.4 101.5December 100.1 97.4 101.4 99.9 100.5 100.9 97.9 101.3 99.6 104.4 99.7
Sterling/US Dollar AUSS
January 1.6587 1.6353 1.6509 1.6402 1.4769 1.4323 1.6169 1.8234 1.8764 1.7678 1.9587February 1.6246 1.6407 1.6276 1.5998 1.4529 1.4231 1.6046 1.8673 1.8871 1.7470 1.9581March 1.6063 1.6620 1.6220 1.5802 1.4454 1.4225 1.5836 1.8267 1.9078 1.7435 1.9471April 1.6295 1.6733 1.6105 1.5837 1.4350 1.4434 1.5747 1.8005 1.8960 1.7685 1.9909May 1.6334 1.6366 1.6154 1.5075 1.4259 1.4593 1.6230 1.7876 1.8538 1.8702 1.9836June 1.6446 1.6507 1.5950 1.5089 1.4014 1.4863 1.6606 1.8275 1.8179 1.8428 1.9864
July 1.6702 1.6437 1.5747 1.5088 1.4139 1.5546 1.6242 1.8429 1.7509 1.8447 2.0338August 1.6034 1.6320 1.6073 1.4910 1.4365 1.5377 1.5950 1.8216 1.7943 1.8944 2.0111September 1.6015 1.6822 1.6243 1.4355 1.4635 1.5561 1.6131 1.7922 1.8081 1.8847 2.0185October 1.6329 1.6952 1.6572 1.4511 1.4517 1.5574 1.6787 1.8065 1.7640 1.8755 2.0446November 1.6890 1.6620 1.6214 1.4256 1.4358 1.5723 1.6901 1.8603 1.7341 1.9119 2.0701December 1.6597 1.6705 1.6132 1.4625 1.4409 1.5863 1.7507 1.9275 1.7462 1.9633 2.0185
Sterling/Euro THAP
January 1.3559 1.5166 1.4236 1.6201 1.5753 1.6222 1.5222 1.4447 1.4331 1.4582 1.5079February 1.3906 1.5196 1.4534 1.6266 1.5786 1.6348 1.4893 1.4774 1.4499 1.4637 1.4969March 1.3944 1.5507 1.4902 1.6377 1.5901 1.6224 1.4649 1.4890 1.4440 1.4500 1.4703April 1.4243 1.5490 1.5051 1.6730 1.6084 1.6282 1.4505 1.5022 1.4652 1.4402 1.4713May 1.4217 1.4834 1.5185 1.6655 1.6304 1.5914 1.4030 1.4894 1.4611 1.4637 1.4677June 1.4499 1.5110 1.5374 1.5882 1.6434 1.5515 1.4234 1.5050 1.4952 1.4560 1.4805
July 1.5247 1.5091 1.5204 1.6052 1.6433 1.5665 1.4277 1.5023 1.4547 1.4540 1.4821August 1.5043 1.4912 1.5146 1.6478 1.5955 1.5723 1.4286 1.4933 1.4592 1.4785 1.4762September 1.4591 1.4617 1.5458 1.6471 1.6060 1.5861 1.4338 1.4676 1.4761 1.4811 1.4515October 1.4623 1.4200 1.5491 1.6994 1.6024 1.5868 1.4334 1.4455 1.4674 1.4869 1.4370November 1.4914 1.4290 1.5706 1.6664 1.6166 1.5694 1.4426 1.4311 1.4719 1.4834 1.4106December 1.5053 1.4254 1.5953 1.6302 1.6151 1.5566 1.4246 1.4401 1.4725 1.4860 1.3863
1 Working day average. A full definition of these series is given in Section 7 ofthe ONS Explanatory Handbook.
2 Series discontinued from 31 May 2006.
Source: Bank of England: 020 7601 3644

412
Banking, insurance
23.11 Average zero coupon yields1
Percentage rates
1997 1998 1999 2000 2001 2002 2003 2004 2005 2006 2007
Nominal Five Year Yield ZBRG
January 7.15 6.18 4.30 6.28 5.07 4.90 4.15 4.61 4.43 4.11 5.06February 6.82 6.10 4.46 6.13 5.04 4.94 3.85 4.63 4.53 4.17 5.08March 7.07 6.09 4.69 5.89 4.86 5.22 3.93 4.56 4.73 4.33 5.00April 7.28 5.93 4.66 5.80 4.96 5.21 4.09 4.80 4.54 4.48 5.20May 6.94 5.95 4.95 5.82 5.14 5.22 3.85 5.01 4.31 4.67 5.32June 6.96 6.04 5.28 5.61 5.25 5.05 3.72 5.15 4.17 4.69 5.59
July 7.01 6.12 5.49 5.58 5.26 4.88 3.98 5.07 4.16 4.69 5.55August 6.97 5.80 5.75 5.65 5.03 4.54 4.36 4.96 4.23 4.74 5.25September 6.72 5.32 6.00 5.65 4.90 4.31 4.46 4.83 4.12 4.67 5.02October 6.51 4.94 6.25 5.46 4.74 4.36 4.73 4.65 4.26 4.76 4.95November 6.69 4.92 5.86 5.33 4.55 4.38 4.91 4.58 4.29 4.73 4.64December 6.46 4.51 5.90 5.14 4.88 4.34 4.71 4.43 4.21 4.80 4.57
Nominal Ten Year Yield ZBRH
January 7.52 5.96 4.24 5.62 4.75 4.85 4.39 4.76 4.50 4.02 4.76February 7.15 5.91 4.39 5.44 4.90 4.90 4.22 4.78 4.54 4.10 4.79March 7.41 5.85 4.60 5.18 4.64 5.18 4.34 4.67 4.74 4.26 4.72April 7.58 5.69 4.53 5.14 4.90 5.19 4.48 4.92 4.58 4.46 4.94May 7.08 5.73 4.83 5.23 5.05 5.22 4.23 5.06 4.38 4.58 5.03June 7.04 5.60 5.07 5.05 5.11 5.05 4.13 5.13 4.25 4.60 5.31
July 6.92 5.65 5.24 5.09 5.10 4.95 4.43 5.04 4.28 4.59 5.29August 6.97 5.41 5.25 5.18 4.88 4.68 4.59 4.95 4.29 4.58 5.05September 6.70 5.03 5.51 5.25 4.91 4.47 4.68 4.86 4.17 4.47 4.91October 6.37 4.93 5.68 5.09 4.77 4.60 4.88 4.72 4.31 4.53 4.88November 6.46 4.83 5.11 4.98 4.58 4.62 5.03 4.65 4.26 4.45 4.67December 6.22 4.44 5.19 4.80 4.83 4.55 4.87 4.49 4.17 4.53 4.65
Nominal Twenty Year Yield ZBRI
January 7.74 5.94 4.36 4.45 4.33 4.69 4.46 4.69 4.45 4.05 4.87February 7.39 5.88 4.44 4.38 4.42 4.72 4.40 4.72 4.45 4.13 4.90March 7.59 5.78 4.60 4.25 4.45 4.99 4.56 4.61 4.65 4.29 4.82April 7.73 5.61 4.53 4.35 4.76 5.02 4.69 4.79 4.53 4.48 5.04May 7.16 5.67 4.75 4.40 4.87 5.08 4.49 4.89 4.36 4.62 5.14June 7.08 5.42 4.77 4.37 4.98 4.93 4.44 4.87 4.23 4.64 5.42
July 6.80 5.45 4.67 4.38 4.90 4.82 4.70 4.80 4.24 4.63 5.40August 6.86 5.30 4.53 4.49 4.69 4.57 4.68 4.69 4.27 4.64 5.13September 6.64 4.91 4.62 4.63 4.88 4.40 4.74 4.65 4.16 4.54 4.96October 6.36 4.87 4.56 4.61 4.92 4.54 4.81 4.59 4.30 4.61 4.92November 6.37 4.73 4.07 4.39 4.53 4.60 4.87 4.50 4.28 4.55 4.68December 6.17 4.47 4.20 4.30 4.65 4.59 4.76 4.42 4.19 4.62 4.64
Real Ten Year Yield ZBRJ
January 3.45 3.10 2.00 2.10 2.22 2.52 2.00 1.94 1.75 1.29 1.78February 3.27 3.06 1.91 2.17 2.27 2.50 1.74 1.96 1.77 1.32 1.80March 3.43 3.00 1.85 2.05 2.33 2.53 1.79 1.81 1.87 1.41 1.70April 3.56 2.91 1.70 2.08 2.56 2.43 1.96 1.93 1.76 1.54 1.91May 3.57 2.92 1.91 2.14 2.58 2.43 1.81 2.05 1.70 1.63 2.05June 3.66 2.85 1.89 2.12 2.54 2.33 1.67 2.10 1.65 1.68 2.21
July 3.62 2.77 1.90 2.14 2.56 2.42 1.85 2.07 1.65 1.65 2.19August 3.60 2.65 2.19 2.25 2.42 2.33 1.95 2.03 1.61 1.55 1.97September 3.52 2.59 2.31 2.28 2.51 2.20 2.05 1.97 1.51 1.49 1.79October 3.23 2.67 2.26 2.33 2.53 2.36 2.15 1.89 1.57 1.57 1.75November 3.25 2.40 2.05 2.34 2.39 2.33 2.21 1.88 1.54 1.47 1.48December 3.11 2.11 1.98 2.23 2.58 2.24 2.03 1.76 1.47 1.56 1.50
Real Twenty Year Yield ZBRK
January 3.67 3.06 2.07 2.01 1.88 2.26 2.07 1.96 1.59 0.97 1.23February 3.49 3.05 1.99 1.95 1.88 2.30 1.98 1.90 1.59 0.99 1.25March 3.59 2.98 1.93 1.78 1.99 2.32 2.07 1.77 1.72 1.10 1.19April 3.68 2.85 1.81 1.84 2.25 2.25 2.12 1.85 1.64 1.28 1.36May 3.66 2.83 1.99 1.91 2.32 2.25 2.03 1.88 1.57 1.33 1.46June 3.69 2.63 1.97 1.87 2.27 2.17 1.97 1.88 1.53 1.39 1.54
July 3.57 2.58 2.00 1.90 2.24 2.24 2.16 1.87 1.54 1.31 1.52August 3.57 2.53 2.14 1.96 2.16 2.15 2.14 1.82 1.49 1.21 1.31September 3.48 2.49 2.26 1.96 2.31 2.06 2.18 1.80 1.40 1.12 1.24October 3.22 2.59 2.22 1.99 2.32 2.22 2.22 1.76 1.40 1.13 1.25November 3.18 2.36 1.92 1.94 2.12 2.25 2.21 1.71 1.29 1.03 1.09December 3.06 2.14 1.87 1.87 2.24 2.21 2.08 1.60 1.20 1.11 1.08
1 Working day average. Calculated using the Variable Roughness Penalty(VRP) model.
Source: Bank of England: 020 7601 3644

413
Banking, insurance
23.12 Average rates on representative British Government Stocks1
Percentage rates
1997 1998 1999 2000 2001 2002 2003 2004 2005 2006 2007
5 Year Conventional Rate2 KORP
January 7.19 6.33 4.25 6.36 5.17 4.94 4.15 4.59 4.43 4.27 ..February 6.86 6.24 4.41 6.23 5.13 4.96 3.88 4.46 4.61 4.34 ..March 7.08 6.26 4.65 6.01 4.94 5.23 3.93 4.44 4.77 4.41 ..April 7.30 6.11 4.66 5.95 4.97 5.26 4.08 4.66 4.58 4.44 ..May 6.98 6.14 4.93 5.97 5.15 5.48 3.83 4.89 4.36 4.44 ..June 7.01 6.31 5.27 5.78 5.32 5.10 3.68 5.08 4.24 4.66 ..
July 7.09 6.14 5.49 5.75 5.34 4.92 3.72 4.98 4.11 4.62 ..August 7.02 5.84 5.80 5.81 5.09 4.57 4.30 4.88 4.22 4.84 ..September 6.78 5.34 6.04 5.81 4.94 4.25 4.42 4.76 4.18 4.91 ..October 6.59 4.88 6.24 5.66 4.78 4.38 4.70 4.57 4.23 5.00 ..November 6.79 4.86 5.89 5.50 4.59 4.40 4.88 4.52 4.31 4.39 ..December 6.60 4.45 5.91 5.27 4.88 4.34 4.68 4.42 4.27 – ..
10 year Conventional Rate KORQ
January 7.53 6.07 4.16 5.75 4.86 4.84 4.37 4.78 4.51 4.19 5.21February 7.17 6.02 4.32 5.56 4.88 4.91 4.25 4.75 4.60 4.25 5.25March 7.41 5.97 4.54 5.29 4.75 5.15 4.51 4.65 4.79 4.39 5.15April 7.60 5.81 4.48 5.25 4.95 5.23 4.64 4.91 4.60 4.47 5.34May 7.13 5.85 4.77 5.35 5.13 5.51 4.26 5.07 4.38 4.39 5.39June 7.10 5.77 5.02 5.15 5.09 5.06 4.38 5.19 4.23 4.74 5.74
July 7.01 5.67 5.20 5.18 5.16 4.94 4.23 5.10 4.20 4.73 5.70August 7.05 5.56 5.24 5.27 4.92 4.66 4.59 4.99 4.25 4.78 5.39September 6.77 5.10 5.52 5.32 4.92 4.46 4.69 4.89 4.16 4.74 5.13October 6.47 4.93 5.70 5.15 4.76 4.57 4.89 4.73 4.31 4.85 5.07November 6.59 4.87 5.16 5.06 4.58 4.59 5.04 4.66 4.33 4.84 4.70December 6.34 4.49 5.24 4.88 4.88 4.52 4.94 4.50 4.27 4.93 4.60
20 Year Conventional Rate KORR
January 7.71 6.04 4.36 4.91 4.52 4.81 4.46 4.73 4.55 4.05 4.77February 7.35 5.98 4.47 4.80 4.58 4.83 4.37 4.80 4.58 4.13 4.80March 7.58 5.90 4.64 4.64 4.56 5.12 4.51 4.69 4.79 4.28 4.73April 7.74 5.73 4.58 4.71 4.84 5.14 4.64 4.91 4.63 4.38 4.95May 7.21 5.79 4.83 4.77 4.98 5.45 4.44 5.03 4.43 4.59 5.08June 7.15 5.59 4.92 4.68 5.10 5.03 4.38 5.07 4.30 4.60 5.32
July 6.93 5.63 4.88 4.70 5.05 4.92 4.59 4.99 4.33 4.60 5.28August 6.98 5.43 4.82 4.79 4.83 4.65 4.67 4.88 4.34 4.58 5.04September 6.74 5.02 4.97 4.90 4.94 4.46 4.74 4.83 4.24 4.49 4.89October 6.45 4.92 4.97 4.84 4.80 4.59 4.85 4.73 4.37 4.53 4.92November 6.50 4.79 4.46 4.64 4.55 4.65 4.93 4.64 4.31 4.48 4.73December 6.32 4.49 4.56 4.51 4.75 4.61 4.80 4.53 4.22 4.41 4.71
10 Year Index-Linked Rate KORS
January 3.44 3.01 2.00 2.11 2.21 2.61 2.07 1.88 1.73 1.48 2.24February 3.23 2.94 1.94 2.16 2.30 2.53 1.81 1.90 1.81 1.54 2.27March 3.41 2.89 1.90 2.06 2.34 2.55 1.88 1.76 1.99 1.65 2.18April 3.55 2.80 1.74 2.08 2.55 2.45 1.90 1.94 1.83 1.65 2.61May 3.52 2.83 1.96 2.15 2.61 2.58 1.74 2.10 1.71 1.96 2.59June 3.62 2.81 1.93 2.13 2.56 2.35 1.59 2.17 1.67 1.94 2.73
July 3.68 2.67 1.93 2.14 2.57 2.46 1.67 2.12 1.66 1.92 2.68August 3.59 2.55 2.20 2.25 2.45 2.37 1.89 2.04 1.63 1.80 2.37September 3.47 2.59 2.32 2.29 2.56 2.24 1.99 1.95 1.49 1.76 2.01October 3.17 2.66 2.26 2.33 2.55 2.42 2.08 1.83 1.89 1.89 1.99November 3.23 2.39 2.03 2.32 2.42 2.39 2.16 1.85 1.64 1.87 1.70December 3.01 2.11 1.99 2.20 2.65 2.30 1.97 1.74 1.27 1.96 1.80
20 Year Index-Linked rate KORT
January 3.62 3.01 2.06 2.01 1.96 2.35 2.10 1.95 1.68 1.17 1.63February 3.43 3.01 1.97 1.98 1.99 2.36 1.99 1.94 1.72 1.22 1.65March 3.55 2.92 1.93 1.83 2.09 2.39 2.07 1.80 1.89 1.34 1.57April 3.65 2.80 1.81 1.90 2.35 2.32 2.10 1.91 1.77 1.38 1.77May 3.61 2.79 1.99 1.97 2.41 2.43 2.00 1.99 1.67 1.56 1.91June 3.65 2.61 1.97 1.94 2.38 2.23 1.93 2.01 1.63 1.61 2.07
July 3.68 2.56 1.97 1.96 2.36 2.30 2.05 1.99 1.63 1.55 2.07August 3.54 2.51 2.12 2.03 2.25 2.21 2.09 1.93 1.58 1.45 1.83September 3.43 2.51 2.23 2.04 2.39 2.12 2.13 1.89 1.48 1.37 1.67October 3.17 2.58 2.18 2.08 2.38 2.29 2.17 1.84 1.51 1.44 1.65November 3.16 2.35 1.91 2.02 2.19 2.31 2.16 1.80 1.45 1.34 1.41December 3.02 2.12 1.88 1.94 2.33 2.26 2.04 1.69 1.38 1.43 1.41
1 Working day average.2 Discontinued from 6 December 2006.
Source: Bank of England: 020 7601 3644

414
Banking, insurance
23.13 Building societies1,2
United Kingdom
19973 19983 19993 20004 2001 2002 2003 2004 2005 2006
Number and balance sheets
Societies on register (numbers) KRNA 82 78 72 68 65 65 63 63 63 60
Share investors (thousands) KRNB 19 234 21 195 21 774 22 237 20 311 20 724 20 901 20 734 22 090 22 396Depositors (thousands) KRNC 882 820 642 660 501 440 452 446 370 391Borrowers (thousands) KRND 2 703 2 934 2 868 2 925 2 579 2 520 2 520 2 570 2 617 2 626
Assets and liabilities (£ million)
Liabilities:Shares KRNE 90 092.8 103 289.8 109 137.7 119 298.5 119 815.2 132 372.9 142 477.1 153 844.0 171 935.0 188 943.0Deposits and loans KRNF 31 033.7 33 311.2 34 746.6 44 262.4 37 358.9 37 933.0 49 552.6 64 025.2 70 845.1 75 443.0Taxation and other KRNG 1 338.8 1 586.4 1 665.4 1 664.0 1 244.9 1 088.4 1 179.0 1 394.9 2 619.4 6 838.5General reserves KRNH 7 331.2 7 926.4 8 301.5 8 987.1 8 511.2 9 043.4 9 489.8 10 123.9 10 677.4 10 845.3Other Capital KRNI 1 643.9 1 550.7 1 529.2 1 861.0 1 416.1 1 709.2 2 534.7 3 599.1 4 566.5 5 510.9
Assets:Mortgages KRNK 107 531.5 118 288.4 123 183.4 137 072.3 130 229.6 140 839.7 159 938.2 184 191.0 207 621.4 231 198.9Investments and cash KHVZ 21 869.8 27 102.0 29 917.8 36 574.2 35 925.9 38 952.7 43 067.9 46 234.1 49 240.3 52 349.4Other KRNN 2 039.1 2 274.1 2 279.2 2 426.6 2 190.7 2 354.4 2 226.9 2 562.0 3 781.7 4 032.3
Total KRNJ 131 440.4 147 664.5 155 380.4 176 073.0 168 346.2 182 146.8 205 233.1 232 987.1 260 643.3 287 580.6
Current transactions (£ million)
Mortgage advances KRNU 28 771.7 21 988.3 23 997.9 28 233.6 29 320.0 33 077.0 43 392.4 51 089.0 50 059.4 52 327.5Management expenses KRNX 2 270.5 1 501.7 1 573.8 1 640.7 1 528.0 1 623.6 1 746.4 1 844.2 1 939.9 2 116.2
1 See chapter text.2 The figures for each year relate to accounting years ending on dates
between 1 February of that year and 31 January of the following year.3 The societies which have converted to the banking sector, namely Chelten-
ham & Gloucester (August 1995), National & Provincial (August 1996), Alli-ance & Leicester (April 1997), Halifax (June 1997), Woolwich (July 1997),Bristol & West (July 1997), Northern Rock (October 1997), and BirminghamMidshires (April 1999) have been included in flow figures (using flows up tothe date of conversion), but have been excluded from the end of year bal-ances.
4 Bradford & Bingley, which converted to the banking sector in December 2000,is included within flow figures and the end of year balances.
Source: Financial Services Authority: 020 7066 1000
23.14 Consumer creditUnited Kingdom
£ million
1998 1999 2000 2001 2002 2003 2004 2005 2006 2007
Total amount outstanding VZRD 106 341 121 547 135 168 150 802 169 209 180 649 198 856 211 037 212 785 224 352
Total net lending VZQC 15 503 16 133 15 969 19 673 23 443 22 401 25 337 19 666 13 006 12 592
of whichCredit cards VZQS 4 858 5 676 6 686 6 229 7 579 8 710 9 998 6 166 1 951 2 251Other VZQT 10 647 10 457 9 284 13 445 15 867 13 692 15 340 13 497 11 052 10 045
Banks AIKN 11 738 11 057 13 217 16 055 17 452 15 269 19 370 11 316 9 348 5 751Building societies’ class 3 loans ALPY – 12 112 63 180 177 172 238 217 260Other consumer credit lenders BM59 3 764 5 065 2 640 3 554 5 811 6 954 5 796 8 111 3 440 6 346
Total gross lending VZQG 134 847 148 623 160 744 177 452 196 451 207 255 221 318 217 466 207 460 205 514
As from Dec 2006 the Bank of England has ceased to update the separatedata on consumer credit provided by other specialist lenders, retailers andinsurance companies previously contained in these tables. Thesecategories have been merged into ’other consumer credit lenders’.
Source: Office for National Statistics: 01633 456635

415
Banking, insurance
23.15 End-year assets and liabilities of investment trust companies, unit trusts1 andproperty unit trusts2
United Kingdom £ million
1996 1997 1998 1999 2000 2001 2002 2003 2004 2005 2006
Investment trust companiesShort-term assets and liabilities (net): CBPL 1 076 1 157 2 263 71 423 161 – 73 866 921 ..Cash and UK bank deposits AHAG 1 424 1 577 2 647 1 227 2 202 2 513 1 821 1 346 1 756 1 483 1 785Other short-term assets CBPN 794 1 445 1 734 1 097 1 082 656 805 1 189 1 344 1 549 353Short-term liabilities -CBPS –805 –1 865 –2 118 –2 253 –2 861 –3 008 –2 626 –2 462 –2 234 –2 111 ..
Medium and long-term liabilities and -CBPO –50 911 –54 117 –49 985 –57 616 –60 412 –54 630 –38 054 –48 076 –48 627 –55 076 ..capital:Issued share and loan capital -CBPQ –8 330 –8 625 –8 837 –8 565 –8 934 –8 796 –8 711 –9 873 –8 210 –7 155 –5 492Foreign currency borrowing -CBPR –638 –658 –607 –880 –994 –933 –780 –682 –607 –839 –1 043Other borrowing -CBQA –823 –1 296 –1 723 –1 716 –2 503 –3 251 –2 246 –2 181 –1 728 –1 420 ..Reserves and provisions, etc -AHBC –41 120 –43 538 –38 818 –46 455 –47 981 –41 650 –26 317 –35 340 –38 082 –38 082 –43 444
Investments: CBPM 50 034 53 076 46 313 56 491 59 948 54 822 37 748 48 035 47 212 53 265 50 052British government securities AHBF 1 422 1 052 815 1 217 821 645 471 303 466 769 533UK company securities:Loan capital and preference CBGZ 832 1 320 1 351 1 425 1 654 1 516 946 1 079 1 270 673 1 071sharesOrdinary and deferred shares CBGY 25 046 29 082 24 729 28 010 33 456 30 338 19 475 23 292 23 941 25 037 22 870
Overseas company securities:Loan capital and preference CBHA 279 1 165 768 979 963 1 143 458 603 682 937 741sharesOrdinary and deferred shares AHCC 21 047 17 747 17 741 23 330 21 355 19 476 14 453 20 294 18 967 23 065 21 659
Other investments CBPT 1 408 2 868 1 051 1 530 1 699 1 704 1 945 2 464 1 886 2 784 3 178
Unit trustsShort-term assets and liabilities: CBPU 3 822 5 048 6 883 5 894 8 340 7 979 8 041 10 256 10 229 13 944 ..Cash and UK bank deposits AGYE 3 895 4 731 6 020 4 797 6 969 5 748 5 321 5 243 6 302 7 740 12 336Other short-term assets CBPW 1 201 869 1 343 1 545 2 319 2 763 3 072 5 990 4 390 7 420 6 990Short-term liabilities -CBPX –1 274 –552 –480 –448 –948 –532 –352 –977 –463 –1 216 ..
Foreign currency borrowing -AGYK – – – – – – – – – – –
Investments: CBPZ 125 841 144 038 162 929 213 553 222 844 204 899 210 002 245 516 269 064 351 645 420 153British government securities CBHT 2 716 3 087 3 771 3 627 4 693 4 690 7 077 9 125 9 768 25 181 31 603UK company securities:Loan capital and preference CBHU 5 029 6 494 9 290 13 322 14 654 16 318 21 152 23 972 22 467 29 293 29 876sharesOrdinary and deferred shares RLIB 67 509 85 742 93 291 119 496 116 808 103 704 82 851 116 407 130 230 157 149 185 637
Overseas company securities:Loan capital and preference CBHV 1 288 1 834 1 801 3 032 3 212 4 113 5 916 9 840 13 142 16 057 25 617sharesOrdinary and deferred shares RLIC 47 346 42 898 51 119 70 256 79 601 71 329 63 152 75 074 81 034 105 443 127 409
Other assets CBQE 1 953 2 518 3 657 3 820 3 876 4 800 9 997 11 098 12 801 18 522 20 011
Property unit trustsShort-term assets and liabilities (net) AGVC 255 328 176 205 285 247 242 459 466 686 1 258Property CBQG 2 582 3 895 2 740 2 722 3 488 2 078 4 026 5 125 5 909 9 623 12 781Other assets AGVL 11 168 202 436 380 151 677 373 1 366 1 864 2 713Long-term borrowing -AGVM –45 –247 –106 –75 –391 –90 –75 –76 –63 –250 –90
Note: Assets are shown as positive: liabilities as negative.1 Including open ended investment companies (OEICs).2 Investments are at market value.
Source: Office for National Statistics: 01633 812789
23.16 Self-administered pension funds: market value of assetsUnited KingdomEnd year £ million
1994 1995 1996 1997 1998 1999 2000 2001 2002 2003 2004 2005 2006
Total pension funds1
Total net assets AHVA 443 467 508 581 543 879 656 874 699 191 812 228 765 199 711 572 610 441 6 926 947 61 066 914 955 1 010 794Short-term assets RYIQ 22 617 26 114 31 521 35 368 39 005 32 703 36 638 31 337 30 700 46 091 57 476 73 649 98 691British government securities AHVK 41 854 52 659 57 783 80 533 91 084 98 882 92 458 83 754 84 461 88 803 87 579 94 325 104 910UK local authority long-term debt AHVO 250 83 89 156 183 133 177 125 42 8 4 4 2Overseas government securities AHVT 11 092 11 721 11 800 13 079 15 493 16 684 19 206 20 383 16 031 16 340 15 075 19 037 21 776UK company securities
Ordinary shares AHVP 219 189 256 625 276 001 339 687 334 648 357 230 299 318 260 696 186 437 186 426 180 561 199 199 208 473Other AHVQ 3 935 7 064 6 180 5 618 8 168 9 258 16 978 22 301 30 450 37 082 43 027 48 065 54 902
Overseas company securitiesOrdinary shares AHVR 74 813 82 164 84 163 104 187 108 884 148 335 135 514 127 893 104 392 125 740 140 282 183 060 192 978Other AHVS 3 045 1 184 4 909 3 851 3 842 5 099 12 736 11 781 11 386 12 475 15 996 20 502 31 536
UK loans and mortgages RLDQ 44 34 83 160 22 14 7 3 .. 35 44 6 6UK land, property and ground rent AHWA 24 353 21 317 21 637 24 176 24 355 31 107 32 945 30 617 31 658 30 619 30 552 31 613 34 394Authorised unit trust units AHVU 13 345 15 212 21 767 21 979 30 596 33 731 34 587 38 083 36 530 62 029 67 482 86 660 94 638Property unit trusts AHVW 2 463 2 485 2 666 3 219 3 211 5 498 4 835 5 280 5 869 6 761 10 444 16 687 20 689Other assets RKPL 31 318 36 352 30 628 32 978 47 136 82 273 90 841 90 139 82 490 107 229 152 170 .. ..Total liabilities GQFX 4 852 4 412 5 347 8 118 7 436 8 719 11 041 10 819 10 005 26 944 39 626 .. ..
1 These figures cover funded schemes only and therefore exclude the mainsuperannuation arrangements in the central government sector.
Source: Office for National Statistics: 01633 812726

416
Banking, insurance
23.17 Insurance companies: balance sheet market valuesUnited KingdomEnd year £ million
1997 1998 1999 2000 2001 2002 2003 2004 2005 2006
Long-term insurance companies
AssetsTotal current assets (gross) RYEW 42 795 46 165 56 360 62 937 63 855 58 122 58 518 63 407 72 754 77 748Agents’ and reinsurance balances (net) AHNY 155 1 383 508 384 620 6 373 4 720 3 755 3 933 5 100Other debtors1 RKPN 15 708 18 210 18 613 21 045 27 285 34 391 35 414 30 504 27 591 52 253British government securities AHNJ 107 847 127 903 126 223 116 734 119 513 131 305 142 920 157 019 161 906 161 641UK local authority securities etc AHNN 914 1 722 1 456 1 170 1 407 1 427 1 547 2 044 1 840 1 614UK company securities2 RKPO 386 734 438 666 539 834 557 293 505 691 443 535 468 910 487 034 601 681 643 433Overseas company securities RKPP 73 428 82 122 120 665 107 439 127 259 110 738 110 193 130 098 165 452 194 997Overseas government securities AHNS 8 471 17 515 18 494 18 004 21 285 19 762 20 561 20 161 16 065 21 078Loans and mortgages RKPQ 8 271 11 027 10 914 9 687 10 048 10 994 12 107 12 917 13 502 15 330UK land, property and ground rent AHNX 42 275 45 903 50 387 49 705 53 726 52 658 57 174 60 502 61 037 58 918Overseas land, property and ground rent RGCP 98 252 206 1 975 498 158 184 94 27 61Other investments RKPR 3 416 5 654 8 334 8 385 7 420 9 513 17 985 26 480 18 146 27 783
Total RFXN 690 112 796 522 951 994 954 760 938 609 878 979 930 233 994 015 1 143 934 1 259 956
Net value of direct investment in:Non-insurance subsidiaries and associate
companies in the United Kingdom RYET 3 426 3 035 3 045 6 133 4 486 4 577 4 191 3 971 8 390 13 016UK associate and subsidiary insurance
companies and insurance holding companies RYEU –239 148 2 245 3 586 4 206 4 569 5 054 3 473 2 528 6 114Overseas subsidiaries and associates RYEV 1 104 1 087 3 638 4 002 5 581 5 463 6 330 2 181 4 455 3 341
Total assets RKBI 694 403 800 792 960 922 968 481 952 882 893 588 945 808 1 003 640 1 159 307 1 282 427
LiabilitiesBorrowing:
Borrowing from UK banks RGDF 3 027 3 252 6 064 8 272 8 790 4 958 4 164 5 358 5 037 2 862Other UK borrowing RGDE 786 1 040 3 070 2 823 5 350 7 406 10 923 8 385 9 036 9 542Borrowing from overseas RGDD 104 148 159 38 81 800 530 793 1 151 1 965
Long-term business:Funds RKDC 581 009 669 301 800 184 838 485 831 051 794 177 824 766 873 071 1 037 658 1 125 221Claims admitted but not paid RKBM 1 436 1 712 2 032 2 249 2 547 3 234 3 699 3 579 3 481 3 513
Provision for taxation net of amounts receivable:UK authorities RYPI 4 207 5 443 6 344 5 381 3 951 2 803 4 055 4 881 8 225 7 908Overseas authorities RYPJ 25 67 314 67 45 –20 2 –13 –2 199
Provision for recommended dividends RYPK 368 359 201 183 87 32 27 93 22 13Other creditors and liabilities RYPL 8 083 12 509 17 042 19 031 18 468 23 261 15 870 16 738 16 907 33 192Excess of assets over above liabilities:
Excess of value of assets over liabilities inrespect of long-term funds RKBR 89 790 96 456 116 951 79 173 63 337 36 517 62 546 65 641 59 132 71 017
Minority interests in UK subsidiary companies RKTI 2 – 25 – – – 1 267 – –Shareholders’ capital and reserves in respect
of general business RKBS 3 862 6 299 6 139 10 287 17 044 18 629 15 698 20 719 18 717 27 315Other reserves including profit and loss
account balances RKBT 1 704 4 206 2 396 2 492 2 130 1 791 3 527 4 129 –57 –320
Total liabilities RKBI 694 403 800 792 960 922 968 481 952 882 893 588 945 808 1 003 640 1 159 307 1 282 427

417
Banking, insurance
23.17 Insurance companies: balance sheet market valuesUnited KingdomEnd yearcontinued £ million
1997 1998 1999 2000 2001 2002 2003 2004 2005 2006
Other than long-term insurance companies
AssetsTotal current assets (gross) RYME 12 628 8 524 10 468 8 772 12 264 17 671 20 036 29 258 26 561 24 942Agents’ and reinsurance balances (net) AHMX 9 405 10 528 12 177 8 362 7 941 9 492 9 890 9 858 7 996 10 782Other debtors1 RKPS 5 998 6 277 7 059 7 179 9 056 14 437 13 255 12 618 13 310 16 881British government securities AHMJ 15 666 16 409 15 938 14 561 15 064 18 390 19 645 19 662 19 818 19 296UK local authority securities etc AHMN 16 14 10 8 6 10 10 49 44 –UK company securities2 RKPT 18 845 18 440 18 800 18 585 17 101 15 362 15 153 20 561 21 879 22 983Overseas company securities RKPU 6 594 8 676 6 284 8 190 6 402 7 394 7 124 11 520 12 645 18 636Overseas government securities AHMS 8 215 10 459 7 980 6 849 7 134 7 156 5 720 6 662 7 341 8 035Loans and mortgages RKPV 1 385 1 335 1 070 1 429 1 348 1 063 1 400 2 412 3 040 3 319UK land, property and ground rent AHMW 2 842 1 146 1 085 1 069 860 805 859 893 1 470 1 569Overseas land, property and ground rent RYNK 149 107 83 45 4 1 4 5 13 137Other investments RKPW 2 465 2 366 2 638 2 294 1 608 2 182 1 408 1 858 2 083 2 010
Total RKAL 84 208 84 281 84 027 77 343 78 789 93 965 94 504 115 356 116 200 128 590
Net value of direct investment in:Non-insurance subsidiaries and associate
companies in the United Kingdom RYNR 6 950 5 553 7 074 7 038 10 456 11 706 13 408 19 028 20 530 20 111UK associate and subsidiary insurance
companies and insurance holding companies RYNS 4 204 6 424 5 617 5 400 8 837 7 190 2 918 2 280 6 071 4 745Overseas subsidiaries and associates RYNT 16 402 14 239 17 775 15 993 14 260 9 014 5 718 5 507 6 446 9 657
Total assets RKBY 111 764 110 497 114 493 105 774 112 342 121 875 116 548 142 171 149 247 163 103
LiabilitiesBorrowing:
Borrowing from UK banks RYMB 3 029 1 825 1 392 783 481 1 384 2 046 4 519 893 3 148Other UK borrowing RYMC 2 996 1 551 3 186 4 239 10 621 10 472 9 342 10 261 11 080 10 445Borrowing from overseas RYMD 1 202 1 600 3 045 1 867 1 964 2 916 2 918 2 476 2 817 5 459
General business technical reserves RKCT 59 527 60 775 59 455 60 236 60 995 62 776 63 463 67 241 71 710 77 221Long-term business:
Funds RKTF – – – – – – – – – –Claims admitted but not paid RKTK – – – – – – – – – –
Provision for taxation net of amounts receivable:UK authorities RYPO 1 253 1 197 939 874 594 941 834 1 094 1 796 2 376Overseas authorities RYPP 7 11 11 11 7 5 84 24 5 10
Provision for recommended dividends RYPQ 2 048 1 318 1 817 2 682 1 957 958 1 082 1 311 5 270Other creditors and liabilities RYPR 3 873 3 793 4 981 6 293 6 410 8 025 9 567 10 817 10 718 16 226Excess of assets over above liabilities:
Excess of value of assets over liabilities inrespect of long-term funds RKCG – – – – – – – – – –
Minority interests in UK subsidiary companies RKCH 60 68 29 33 276 4 6 6 – –Shareholders’ capital and reserves in respect
of general business RKCI 35 172 34 397 35 372 24 699 26 190 31 982 25 153 39 695 43 264 42 186Other reserves including profit and loss
account balances RKCJ 2 597 4 215 4 265 4 056 2 847 2 411 2 053 4 727 6 959 5 762
Total liabilities RKBY 111 764 110 497 114 493 105 774 112 342 121 875 116 548 142 171 149 247 163 103
1 Including outstanding interest, dividends and rents (net).2 Including authorised unit trust units.
Source: Office for National Statistics: 01633 812726

418
Banking, insurance
23.18 Individual insolvenciesUnited Kingdom
Numbers
1997 1998 1999 2000 2001 2002 2003 2004 2005 2006 2007
England and Wales
Bankruptcies1 AIHW 19 892 19 647 21 611 21 550 23 477 24 292 28 022 35 898 47 291 62 956 64 480Individual voluntary
arrangements2,3 AIHI 4 549 4 902 7 195 7 978 6 298 6 295 7 583 10 752 20 293 44 332 42 165
Total AIHK 24 441 24 549 28 806 29 528 29 775 30 587 35 604 46 650 67 584 107 288 106 645
Scotland
Sequestrations4 KRHA 2 502 3 016 3 195 2 965 3 048 3 215 3 328 3 297 4 965 5 430 6 219Protected Trust Deeds GJ2I 686 1 449 2 144 2 801 3 779 5 174 5 452 6 024 6 881 8 208 7 595
Total GJ2J 3 188 4 465 5 339 5 766 6 827 8 389 8 780 9 321 11 846 13 638 13 814
Northern Ireland
Bankruptcies5 KRHB 393 394 401 349 292 334 517 666 821 1 036 897Individual voluntary
arrangements3,6 KJRK 84 123 172 267 176 207 318 449 633 774 440
Total KRHD 477 517 573 616 468 541 835 1 115 1 454 1 810 1 337
1 Comprises receiving and administration orders under the Bankruptcy Act1914 and bankruptcy orders under the Insolvency Act 1986. Orders laterconsolidated or rescinded are included in these figures.
2 Introduced under the Insolvency Act 1986.3 For statistical purposes deeds of arrangement are now included with indivi-
dual voluntary arrangements.4 Sequestrations awarded but not brought into operation are included in these
figures.
5 Comprises bankruptcy adjudication orders, arrangement protection orders andorders for the administration of estates of deceased insolvents. Orders later setaside or dismissed are included in these figures.
6 Introduced under the Insolvency Northern Ireland order 1989.
Source: Insolvency Service: 020 7637 6504/6443
23.19 Company insolvenciesUnited Kingdom
Numbers
1997 1998 1999 2000 2001 2002 2003 2004 2005 2006 2007
England and Wales
Compulsory liquidations AIHR 4 735 5 216 5 209 4 925 4 675 6 231 5 234 4 584 5 233 5 418 5 165Creditors’ voluntary
liquidations AIHS 7 875 7 987 9 071 9 392 10 297 10 075 8 950 7 608 7 660 7 719 7 261
Total AIHQ 12 610 13 203 14 280 14 317 14 972 16 306 14 184 12 192 12 893 13 137 12 426
Scotland
Compulsory liquidations KRGA 254 338 364 344 378 556 436 431 420 416 439Creditors’ voluntary
liquidations KRGB 223 228 208 239 224 232 195 190 149 133 100
Total KRGC 477 566 572 583 602 788 631 621 569 549 539
Northern Ireland1
Compulsory liquidations KRGD .. .. .. .. .. 49 95 76 85 78 122Creditors’ voluntary
liquidations KRGE .. .. .. .. .. 53 47 45 53 50 42
Total KRGF .. .. .. .. .. 102 142 121 138 128 164
1 Prior to 2002, the quality of the statistics on company liquidations inNorthern Ireland are not robust enough and have been removed from thistable.
Source: Insolvency Service: 020 7637 6504/6443
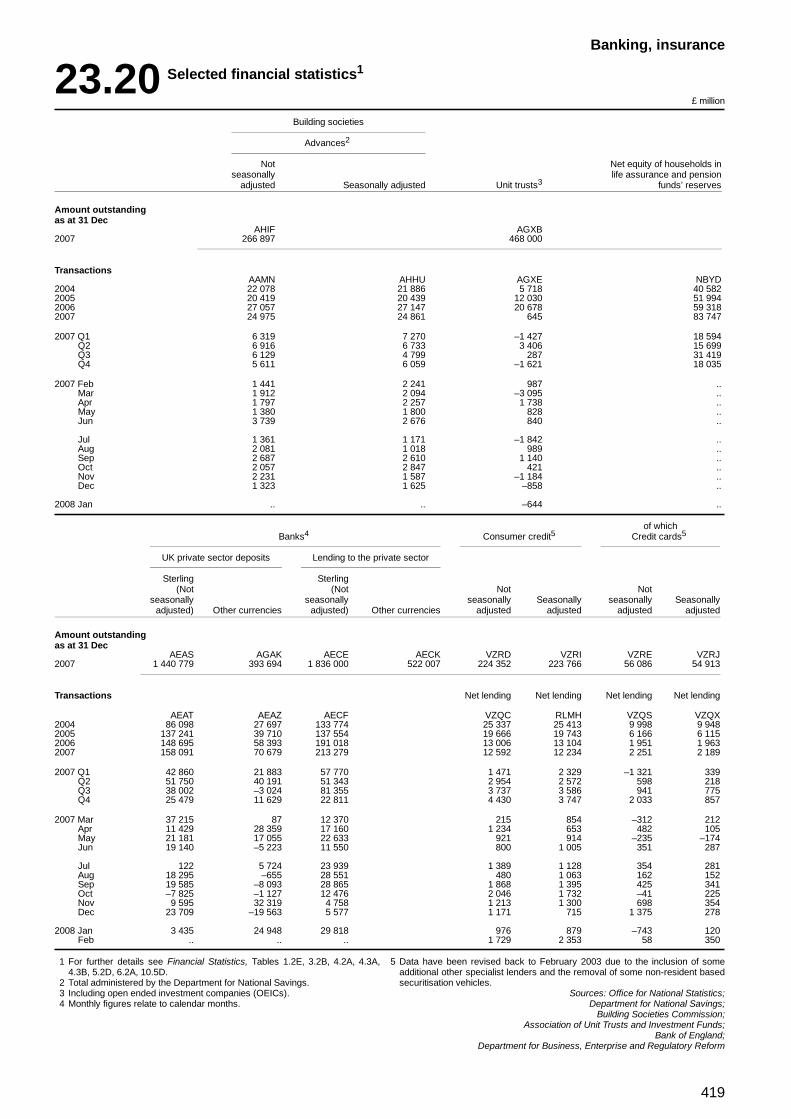
419
Banking, insurance
23.20 Selected financial statistics1
£ million
Building societies
Advances2
Not Net equity of households inseasonally life assurance and pension
adjusted Seasonally adjusted Unit trusts3 funds’ reserves
Amount outstandingas at 31 Dec
AHIF AGXB2007 266 897 468 000
TransactionsAAMN AHHU AGXE NBYD
2004 22 078 21 886 5 718 40 5822005 20 419 20 439 12 030 51 9942006 27 057 27 147 20 678 59 3182007 24 975 24 861 645 83 747
2007 Q1 6 319 7 270 –1 427 18 594Q2 6 916 6 733 3 406 15 699Q3 6 129 4 799 287 31 419Q4 5 611 6 059 –1 621 18 035
2007 Feb 1 441 2 241 987 ..Mar 1 912 2 094 –3 095 ..Apr 1 797 2 257 1 738 ..May 1 380 1 800 828 ..Jun 3 739 2 676 840 ..
Jul 1 361 1 171 –1 842 ..Aug 2 081 1 018 989 ..Sep 2 687 2 610 1 140 ..Oct 2 057 2 847 421 ..Nov 2 231 1 587 –1 184 ..Dec 1 323 1 625 –858 ..
2008 Jan .. .. –644 ..
of whichBanks4 Consumer credit5 Credit cards5
UK private sector deposits Lending to the private sector
Sterling Sterling(Not (Not Not Not
seasonally seasonally seasonally Seasonally seasonally Seasonallyadjusted) Other currencies adjusted) Other currencies adjusted adjusted adjusted adjusted
Amount outstandingas at 31 Dec
AEAS AGAK AECE AECK VZRD VZRI VZRE VZRJ2007 1 440 779 393 694 1 836 000 522 007 224 352 223 766 56 086 54 913
Transactions Net lending Net lending Net lending Net lending
AEAT AEAZ AECF VZQC RLMH VZQS VZQX2004 86 098 27 697 133 774 25 337 25 413 9 998 9 9482005 137 241 39 710 137 554 19 666 19 743 6 166 6 1152006 148 695 58 393 191 018 13 006 13 104 1 951 1 9632007 158 091 70 679 213 279 12 592 12 234 2 251 2 189
2007 Q1 42 860 21 883 57 770 1 471 2 329 –1 321 339Q2 51 750 40 191 51 343 2 954 2 572 598 218Q3 38 002 –3 024 81 355 3 737 3 586 941 775Q4 25 479 11 629 22 811 4 430 3 747 2 033 857
2007 Mar 37 215 87 12 370 215 854 –312 212Apr 11 429 28 359 17 160 1 234 653 482 105May 21 181 17 055 22 633 921 914 –235 –174Jun 19 140 –5 223 11 550 800 1 005 351 287
Jul 122 5 724 23 939 1 389 1 128 354 281Aug 18 295 –655 28 551 480 1 063 162 152Sep 19 585 –8 093 28 865 1 868 1 395 425 341Oct –7 825 –1 127 12 476 2 046 1 732 –41 225Nov 9 595 32 319 4 758 1 213 1 300 698 354Dec 23 709 –19 563 5 577 1 171 715 1 375 278
2008 Jan 3 435 24 948 29 818 976 879 –743 120Feb .. .. .. 1 729 2 353 58 350
1 For further details see Financial Statistics, Tables 1.2E, 3.2B, 4.2A, 4.3A,4.3B, 5.2D, 6.2A, 10.5D.
2 Total administered by the Department for National Savings.3 Including open ended investment companies (OEICs).4 Monthly figures relate to calendar months.
5 Data have been revised back to February 2003 due to the inclusion of someadditional other specialist lenders and the removal of some non-resident basedsecuritisation vehicles.
Sources: Office for National Statistics;Department for National Savings;
Building Societies Commission;Association of Unit Trusts and Investment Funds;
Bank of England;Department for Business, Enterprise and Regulatory Reform

420
Banking, insurance
23.21 Selected interest rates, exchange rates and security prices
Average discount rate British governmentSelected retail for 91 day Treasury Inter bank 3 months Inter bank 3 months securities 20 years
banks’ base rate bills bid rate offer rate yield1 Exchange rate US spot
ZCMG AJNB HSAJ HSAK AJLX LUSS2004 Jan 3.75 3.96 4.05 4.10 4.75 1.8202
Feb 4.00 4.07 4.11 4.16 4.78 1.8556Mar 4.00 4.19 4.30 4.33 4.67 1.8379Apr 4.00 4.26 4.35 4.39 4.87 1.7735May 4.25 4.49 4.56 4.59 4.98 1.8336Jun 4.50 4.60 4.77 4.79 5.00 1.8137
Jul 4.50 4.74 4.86 4.89 4.92 1.8187Aug 4.75 4.71 4.88 4.90 4.81 1.7992Sep 4.75 4.68 4.82 4.86 4.76 1.8094Oct 4.75 4.68 4.81 4.84 4.68 1.8324Nov 4.75 4.64 4.77 4.80 4.58 1.9119Dec 4.75 4.69 4.81 4.84 4.44 1.9199
2005 Jan 4.75 4.65 4.79 4.81 4.44 1.8859Feb 4.75 4.73 4.87 4.90 4.53 1.9257Mar 4.75 4.76 4.90 4.93 4.74 1.8904Apr 4.75 4.69 4.86 4.88 4.60 1.9100May 4.75 4.65 4.79 4.81 4.41 1.8225Jun 4.75 4.52 4.69 4.73 4.29 1.7925
Jul 4.75 4.43 4.54 4.56 4.33 1.7607Aug 4.50 4.38 4.52 4.54 4.34 1.7990Sep 4.50 4.40 4.52 4.55 4.26 1.7688Oct 4.50 4.42 4.54 4.56 4.36 1.7700Nov 4.50 4.40 4.55 4.58 4.25 1.7304Dec 4.50 4.43 4.57 4.59 4.14 1.7166
2006 Jan 4.50 4.40 4.52 4.54 3.81 1.7775Feb 4.50 4.39 4.51 4.53 3.96 1.7511Mar 4.50 4.41 4.54 4.56 4.15 1.7345Apr 4.50 4.45 4.60 4.63 4.32 1.8179May 4.50 4.51 4.66 4.68 4.43 1.8712Jun 4.50 4.54 4.71 4.73 4.46 1.8494
Jul 4.50 4.58 4.73 4.74 4.45 1.8671Aug 4.75 4.77 4.94 4.95 4.42 1.9018Sep 4.75 4.87 5.02 5.05 4.29 1.8682Oct 4.75 4.98 5.14 5.16 4.35 1.9073Nov 5.00 5.04 5.20 5.22 4.27 1.9670Dec 5.00 5.11 5.26 5.29 4.33 1.9570
2007 Jan 5.25 5.37 5.54 5.55 4.51 1.9574Feb 5.25 5.31 5.48 5.50 4.59 1.9600Mar 5.25 5.38 5.56 5.58 4.52 1.9613Apr 5.25 5.47 5.66 5.70 4.72 1.9997May 5.50 5.59 5.76 5.78 .. 1.9782Jun 5.50 5.77 5.93 5.98 .. 2.0064
Jul 5.75 5.75 6.00 6.02 .. 2.0322Aug 5.75 5.77 6.55 6.65 4.80 2.0171Sep 5.75 5.61 6.18 6.28 4.74 2.0374Oct 5.75 5.57 6.17 6.25 4.74 2.0774Nov 5.75 5.44 6.53 6.58 4.59 2.0561Dec 5.50 5.24 5.95 5.95 4.59 1.9909
2008 Jan 5.50 5.01 5.50 5.58 4.46 1.9882Feb 5.25 4.98 5.68 5.72 4.62 1.9892
1 Average of working days. Source: Bank of England

421
Banking, insurance
23.22 Mergers and acquisitions in the UK by UK companies:category of expenditure
£ million
Expenditure
CashIssues of
Number of companies Independent Issues of ordinary fixed interestacquired Total1 companies Subsidiaries shares2 securities2
AIHA DUCM DWVW DWVX AIHD AIHE1997 506 26 829 6 851 4 072 15 583 3231998 635 29 525 10 471 5 298 13 160 5951999 493 26 163 12 605 3 615 9 592 3512000 587 106 916 33 906 6 168 65 570 1 2722001 492 28 994 8 489 6 704 12 356 1 445
2002 430 25 236 9 574 7 991 6 780 8912003 558 18 679 8 956 7 183 1 667 8732004 741 31 408 12 080 7 822 10 338 1 1682005 769 25 134 13 425 8 510 2 768 4312006 777 28 501 .. 8 125 .. 335
1997 Q4 129 16 730 1 525 2 287 12 798 120
1998 Q1 140 4 790 1 760 1 761 1 156 113Q2 155 11 956 3 091 738 7 932 195Q3 178 6 193 3 530 1 618 817 228Q4 162 6 586 2 090 1 181 3 255 59
1999 Q1 117 8 735 2 299 625 5 735 76Q2 127 7 212 4 893 728 1 509 82Q3 145 6 479 2 618 1 682 2 098 81Q4 104 3 737 2 795 580 250 112
2000 Q1 139 33 739 17 483 1 136 14 960 160Q2 133 21 469 4 224 1 881 15 045 319Q3 163 16 852 6 934 2 237 7 367 314Q4 152 34 856 5 265 914 28 198 479
2001 Q1 131 6 181 2 606 2 255 982 338Q2 108 4 890 1 679 2 214 555 442Q3 129 16 079 3 457 1 526 10 649 447Q4 124 1 844 747 709 170 218
2002 Q1 83 3 853 2 201 1 298 104 250Q2 120 4 228 801 3 179 78 170Q3 88 6 333 4 695 1 426 184 28Q4 139 10 822 1 877 2 088 6 414 443
2003 Q1 107 3 857 1 003 1 892 609 353Q2 122 3 753 1 437 1 713 258 345Q3 153 4 700 2 495 1 919 153 133Q4 176 6 369 4 021 1 659 647 42
2004 Q1 151 12 639 2 819 655 8 807 358Q2 169 5 359 2 555 1 682 822 300Q3 211 8 109 3 469 4 026 240 374Q4 210 5 301 3 237 1 459 469 136
2005 Q1 166 3 516 1 334 1 918 166 98Q2 215 8 983 4 869 2 715 1 285 114Q3 211 7 287 4 106 1 878 1 207 96Q4 177 5 348 3 116 1 999 110 123
2006 Q1 207 6 969 4 069 2 427 431 42Q2 208 4 222 3 298 527 384 13Q3 163 11 372 .. 4 579 .. 216Q4 199 5 938 4 689 592 593 64
2007 Q1 191 5 637 2 817 346 2 332 142Q2 203 9 539 3 576 3 821 1 862 280Q3 216 7 262 5 375 612 331 944
Missing data for any series have been suppressed to avoid the disclosure ofinformation relating to individual enterprises.
1 Includes deferred payments.2 Issued to the vendor as payment.
Source: Office for National Statistics

422
Service industry

423
Service industry
Service industry
Ch
apter 24

424
Service industry
exercise is due to take place during 2008 when the base year will be updated to 2005=100.
The latest summary statistics are published each month by First Release. More disaggregated indices (not seasonally adjusted) are published each month in the Business Monitor SDM28, via the National Statistics website: www.statistics.gov.uk/rsi
Service industry
Annual Business Inquiry
(Tables 24.1, 24.3 and 24.4)
For details of the Annual Business Inquiry, see the text accompanying Table 22.1.
Retail trade: index numbers of value and volume
(Table 24.2)
The main purpose of the Retail Sales Inquiry (RSI) is to provide up to date information on short period movements in the level of retail sales. In principle, the RSI covers the retail activity of every business classified in the retail sector (Division 52 of the 2003 Standard Industrial Classification (SIC)) in Great Britain. A business will be classified to the retail sector if its main activity is one of the individual four digit SIC categories within Division 52. The retail activity of a business is then defined by its retail turnover, for instance the sale of all retail goods (note that petrol, for example, is not a retail good).
The RSI is compiled from the information returned to the statutory inquiries into the distribution and services sector. The inquiry is addressed to a stratified sample of 5,000 businesses classified to the retail sector, the stratification being by 'type of store' (the individual four digit SIC categories within Division 52) and by size. The sample structure is designed to ensure that the inquiry estimates are as accurate as possible. In terms of the selection, this means that:
- each of the individual four digit SIC categories are represented, their coverage depending upon the relative size of the category and the variability of the data
- within each four digit SIC category, the larger retailers tend to be fully enumerated with decreasing proportions of medium and smaller retailers
The structure of the inquiry is updated periodically, by reference to the more comprehensive results of the Annual Business Inquiry. The monthly inquiry also incorporates a rotation element for the smallest retailers. This helps to spread the burden more fairly, as well as improving the ability to represent between successive benchmarks.
During 2003, the retail sales index was rebased using detailed information from the 2000 annual business inquiry. The reference year is currently set at 2000=100. The next rebasing

425
Service industry
24.1 Retail businesses1
United Kingdom£ million and percentages
2001 2002 2003 2004 2005
Number of businesses ZABE 210 691 207 513 202 604 200 606 201 420
Total turnover2 ZABL 251 624 265 577 278 373 288 716 295 682Value Added Tax in total turnover ZABM 25 249 26 907 28 505 29 420 29 860
Retail turnover2 ZABN 227 298 238 456 250 849 258 903 263 859Non-retail turnover2 ZABO 24 327 27 121 27 524 29 812 31 823
Other incomeValue of commercial insurance claims received ZABP 89 105 65 40 76Subsidies received from UK government sources
and the EC ZAEN 24 4 5 10 16
Employment costs3 ZABQ 28 036 29 779 31 367 32 806 34 721Gross wages and salaries ZABR 25 320 26 933 28 294 29 481 30 929Redundancy and severance payments ZABS 130 130 134 158 251Employers’ National Insurance contributions ZABT 1 733 1 805 1 991 2 142 2 281Contributions to pension funds ZABU 853 911 948 1 026 1 260
StocksIncrease during year ZABV 900 1 284 978 957 766Value at end of year ZABW 21 509 22 400 23 024 23 527 24 345Total turnover3 divided by end-year stocks (Quotient) ZABX 10.5 10.7 10.9 11.0 10.9
Purchases of goods, materials and services3 ZABY 175 593 185 875 194 169 199 773 204 911Goods bought for resale without processing ZABZ 147 791 155 608 161 304 165 667 169 089Energy and water products for own consumption ZACA 2 028 1 918 2 048 2 191 2 516Goods and materials ZACB 3 544 3 845 3 917 4 166 4 394Hiring, leasing or renting of plant, machinery
and vehicles ZACC 788 924 946 727 575Commercial insurance premiums ZACD 688 827 1 001 1 061 1 039Road transport services ZACE 1 945 2 137 2 545 2 557 2 721Telecommunication services ZACF 603 561 624 626 607Computer and related services ZACG 581 756 765 915 823Advertising and marketing services ZACH 2 881 3 047 3 378 3 298 3 544Other services ZACI 14 745 16 252 17 642 18 565 19 603
Taxes, duties and levies ZACJ 4 432 4 576 4 715 4 896 5 834National non-domestic (business) rates ZACK 3 616 3 726 3 859 3 937 4 340Other amounts paid for taxes, duties and levies ZACL 816 850 855 958 1 495
Capital expenditureCost of acquisitions ZACM 8 469 9 355 8 776 9 936 10 157Proceeds from disposals ZACN 1 606 1 240 1 328 1 590 1 517Net capital expenditure ZACO 6 863 8 115 7 448 8 346 8 640Amount included in acquisitions for assets under
finance leasing arrangements ZACP 474 587 304 332 301Work of a capital nature carried out by own staff
(included in acquisitions) ZACQ 144 128 142 149 176
Gross marginAmount ZACR 78 913 83 708 88 904 93 830 96 253As a percentage of adjusted turnover4 ZACS 34.9 34.9 35.6 36.2 36.2
Approximate gross value added at basic prices ZACT 51 201 53 545 56 104 59 764 60 507
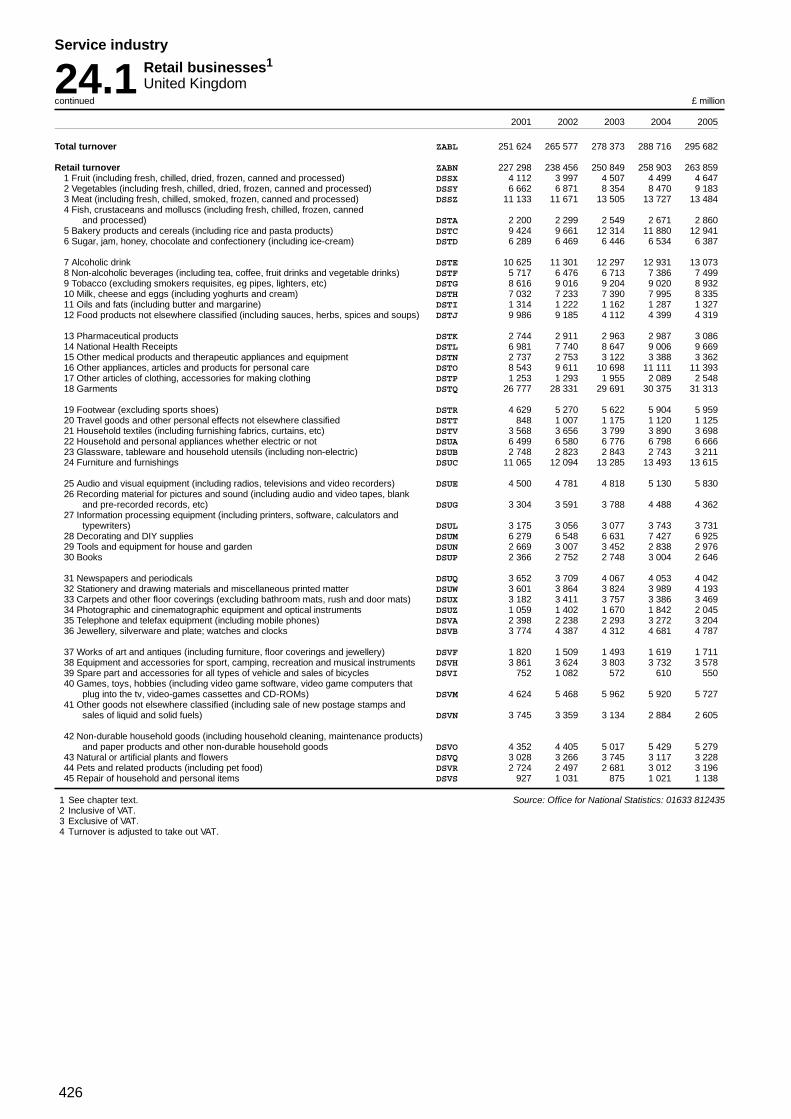
426
Service industry
24.1 Retail businesses1
United Kingdomcontinued £ million
2001 2002 2003 2004 2005
Total turnover ZABL 251 624 265 577 278 373 288 716 295 682
Retail turnover ZABN 227 298 238 456 250 849 258 903 263 8591 Fruit (including fresh, chilled, dried, frozen, canned and processed) DSSX 4 112 3 997 4 507 4 499 4 6472 Vegetables (including fresh, chilled, dried, frozen, canned and processed) DSSY 6 662 6 871 8 354 8 470 9 1833 Meat (including fresh, chilled, smoked, frozen, canned and processed) DSSZ 11 133 11 671 13 505 13 727 13 4844 Fish, crustaceans and molluscs (including fresh, chilled, frozen, canned
and processed) DSTA 2 200 2 299 2 549 2 671 2 8605 Bakery products and cereals (including rice and pasta products) DSTC 9 424 9 661 12 314 11 880 12 9416 Sugar, jam, honey, chocolate and confectionery (including ice-cream) DSTD 6 289 6 469 6 446 6 534 6 387
7 Alcoholic drink DSTE 10 625 11 301 12 297 12 931 13 0738 Non-alcoholic beverages (including tea, coffee, fruit drinks and vegetable drinks) DSTF 5 717 6 476 6 713 7 386 7 4999 Tobacco (excluding smokers requisites, eg pipes, lighters, etc) DSTG 8 616 9 016 9 204 9 020 8 93210 Milk, cheese and eggs (including yoghurts and cream) DSTH 7 032 7 233 7 390 7 995 8 33511 Oils and fats (including butter and margarine) DSTI 1 314 1 222 1 162 1 287 1 32712 Food products not elsewhere classified (including sauces, herbs, spices and soups) DSTJ 9 986 9 185 4 112 4 399 4 319
13 Pharmaceutical products DSTK 2 744 2 911 2 963 2 987 3 08614 National Health Receipts DSTL 6 981 7 740 8 647 9 006 9 66915 Other medical products and therapeutic appliances and equipment DSTN 2 737 2 753 3 122 3 388 3 36216 Other appliances, articles and products for personal care DSTO 8 543 9 611 10 698 11 111 11 39317 Other articles of clothing, accessories for making clothing DSTP 1 253 1 293 1 955 2 089 2 54818 Garments DSTQ 26 777 28 331 29 691 30 375 31 313
19 Footwear (excluding sports shoes) DSTR 4 629 5 270 5 622 5 904 5 95920 Travel goods and other personal effects not elsewhere classified DSTT 848 1 007 1 175 1 120 1 12521 Household textiles (including furnishing fabrics, curtains, etc) DSTV 3 568 3 656 3 799 3 890 3 69822 Household and personal appliances whether electric or not DSUA 6 499 6 580 6 776 6 798 6 66623 Glassware, tableware and household utensils (including non-electric) DSUB 2 748 2 823 2 843 2 743 3 21124 Furniture and furnishings DSUC 11 065 12 094 13 285 13 493 13 615
25 Audio and visual equipment (including radios, televisions and video recorders) DSUE 4 500 4 781 4 818 5 130 5 83026 Recording material for pictures and sound (including audio and video tapes, blank
and pre-recorded records, etc) DSUG 3 304 3 591 3 788 4 488 4 36227 Information processing equipment (including printers, software, calculators and
typewriters) DSUL 3 175 3 056 3 077 3 743 3 73128 Decorating and DIY supplies DSUM 6 279 6 548 6 631 7 427 6 92529 Tools and equipment for house and garden DSUN 2 669 3 007 3 452 2 838 2 97630 Books DSUP 2 366 2 752 2 748 3 004 2 646
31 Newspapers and periodicals DSUQ 3 652 3 709 4 067 4 053 4 04232 Stationery and drawing materials and miscellaneous printed matter DSUW 3 601 3 864 3 824 3 989 4 19333 Carpets and other floor coverings (excluding bathroom mats, rush and door mats) DSUX 3 182 3 411 3 757 3 386 3 46934 Photographic and cinematographic equipment and optical instruments DSUZ 1 059 1 402 1 670 1 842 2 04535 Telephone and telefax equipment (including mobile phones) DSVA 2 398 2 238 2 293 3 272 3 20436 Jewellery, silverware and plate; watches and clocks DSVB 3 774 4 387 4 312 4 681 4 787
37 Works of art and antiques (including furniture, floor coverings and jewellery) DSVF 1 820 1 509 1 493 1 619 1 71138 Equipment and accessories for sport, camping, recreation and musical instruments DSVH 3 861 3 624 3 803 3 732 3 57839 Spare part and accessories for all types of vehicle and sales of bicycles DSVI 752 1 082 572 610 55040 Games, toys, hobbies (including video game software, video game computers that
plug into the tv, video-games cassettes and CD-ROMs) DSVM 4 624 5 468 5 962 5 920 5 72741 Other goods not elsewhere classified (including sale of new postage stamps and
sales of liquid and solid fuels) DSVN 3 745 3 359 3 134 2 884 2 605
42 Non-durable household goods (including household cleaning, maintenance products)and paper products and other non-durable household goods DSVO 4 352 4 405 5 017 5 429 5 279
43 Natural or artificial plants and flowers DSVQ 3 028 3 266 3 745 3 117 3 22844 Pets and related products (including pet food) DSVR 2 724 2 497 2 681 3 012 3 19645 Repair of household and personal items DSVS 927 1 031 875 1 021 1 138
1 See chapter text.2 Inclusive of VAT.3 Exclusive of VAT.4 Turnover is adjusted to take out VAT.
Source: Office for National Statistics: 01633 812435

427
Service industry
24.2 Retail trade: index numbers of value and volume of sales1
Great BritainNot seasonally adjusted Weekly average (2000=100)
1997 1998 1999 2000 2001 2002 2003 2004 2005 2006 2007
Sales in2000
Value £ million
All retailing EAFY 207 149 89.9 93.4 96.5 100.0 105.9 110.6 113.7 118.8 119.9 123.3 127.7Large EAFZ 153 022 87.4 91.7 95.8 100.0 106.5 112.2 118.2 123.9 126.0 130.8 135.9Small EAGA 54 128 97.4 98.6 98.5 100.0 104.1 105.8 101.1 104.1 102.9 102.2 104.7
Predominantly food stores EAFS 89 041 88.9 93.4 96.6 100.0 106.0 110.4 114.8 119.6 123.6 128.3 132.5Predominantly non-food stores EAFT 106 359 90.6 93.2 96.3 100.0 106.8 111.8 114.8 119.9 119.1 121.6 125.8
Non specialised predominantlynon-food stores EAGE 18 781 91.5 92.6 95.2 100.0 105.0 107.4 109.2 111.2 110.8 114.0 118.0
Textiles, clothing, footwear andleather EAFU 27 880 93.4 93.8 96.0 100.0 108.4 114.9 118.9 124.7 126.5 131.8 136.3
Household goods stores EAFV 27 699 86.8 91.6 95.7 100.0 107.6 113.1 113.4 117.2 112.9 114.2 117.6Other specialised non-food stores EAFW 31 999 89.3 93.1 96.8 100.0 105.7 110.5 115.6 123.0 123.0 123.5 128.3
Other retail sale (non-store) andrepair EAFX 11 749 91.8 97.1 98.8 100.0 97.0 100.5 96.2 102.7 99.1 100.6 108.5
Volume
All retailing EAHC 207 149 89.9 92.5 95.7 100.0 106.1 112.2 116.3 123.3 125.8 129.8 135.2
Predominantly food stores EAGW 89 041 92.9 95.5 97.2 100.0 104.1 108.2 111.9 116.5 119.7 122.7 124.0Predominantly non-food stores EAGX 106 359 87.4 89.9 94.3 100.0 108.5 116.2 121.3 129.6 131.8 136.4 143.9
Non specialised predominantlynon-food stores EAHI 18 781 91.5 91.5 94.0 100.0 106.0 110.5 113.8 118.0 119.3 124.1 129.9
Textiles,clothing, footwear andleather EAGY 27 880 88.1 88.8 92.9 100.0 112.1 123.7 129.6 139.3 143.9 150.9 156.8
Household goods stores EAGZ 27 699 80.3 85.8 92.6 100.0 109.6 117.8 122.3 130.8 131.2 137.7 147.7Other specialised non-food stores EAHA 31 999 90.7 93.6 97.1 100.0 105.9 111.6 117.5 127.0 129.2 130.0 137.5
Other retail sale (non-store)and repair EAHB 11 749 88.2 93.2 96.2 100.0 99.6 106.5 105.4 117.1 118.0 123.6 141.1
1 See chapter text. Source: Office for National Statistics

428
Service industry
24.3 Motor trades1
United Kingdom£ million and percentages
Sale, maintenance and repairof,motor vehicles and motorcycles;
retail sale of automotive fuel Sale of motor vehicles(SIC 2003 50.00) (SIC 2003 50.10)
2002 2003 2004 2005 2002 2003 2004 2005
Number of businesses MKEQ 70 338 70 080 70 265 70 993 MKER 25 856 24 895 24 199 23 924
Total turnover CMRH 141 867 150 629 153 447 157 409 EWRI 96 968 102 242 103 594 106 901Motor trades turnover CMRI 136 346 145 739 147 850 152 616 FDFZ 95 885 101 377 102 579 105 881
Retail sales of:New cars CMRJ 28 433 31 050 30 645 30 152 FDGA 27 065 28 597 28 427 28 188Other new motor vehicles and motorcycles CMRK 4 404 4 070 5 223 4 963 FDGB 3 876 3 592 4 358 3 996
Sales to other dealers of:New cars CMRL 20 867 22 855 23 209 23 734 FDGC 20 773 22 336 22 790 23 415Other new motor vehicles and motorcycles CMRM 3 703 3 949 3 692 3 456 FDGD 3 085 3 486 3 074 2 897
Gross sales of used motor vehicles andmotorcycles CMRN 27 939 32 050 32 951 35 823 FDGE 26 337 30 106 30 560 33 565
Turnover from sales of petrol, diesel, oiland other petroleum products CMRO 16 978 17 738 17 998 18 145 FDGF 782 1 184 806 826
Other motor trades sales and receipts (includingparts and accessories, workshop receipts) CMRP 14 256 34 027 34 131 36 342 FDGG 4 916 12 076 12 564 12 993
Non-motor trades turnover CMRQ 5 521 4 890 5 598 4 793 FDHJ 1 083 865 1 015 1 021
Purchases of goods, materials and servicesTotal purchases CMNR 120 819 127 823 131 600 135 360 FDGH 84 354 89 198 91 714 94 363Energy, water and materials CMRS 1 379 1 631 1 696 2 017 FDGI 542 666 704 816Used motor vehicles and motorcycles COBU 24 391 27 910 29 352 31 083 FDGJ 22 939 26 239 27 397 29 192Parts used solely in repair and servicing activities CMRT 6 397 6 481 7 079 7 601 FDGK 2 616 2 521 2 682 2 980Other goods for resale CMRU 80 726 83 396 84 679 85 437 FDGL 53 512 55 108 55 864 56 129Hiring, leasing and renting of plant, machinery and
vehicles CMRV 326 349 369 301 FDGM 131 72 84 79Commercial insurance premiums CMRW 465 572 561 600 FDGN 198 224 215 235Road transport services CMRX 740 778 753 845 FDGO 373 368 415 446Telecommunication services CMRY 278 335 295 302 FDGP 129 150 128 140Computer and related services CMRZ 306 329 388 350 FDGQ 174 170 187 199Advertising and marketing services CMSA 1 847 2 076 2 267 2 413 FDGR 1 611 1 742 1 897 1 970Other services CMSB 3 964 3 967 4 161 4 411 FDGS 2 130 1 939 2 140 2 178
Taxes, duties and leviesTotal taxes and levies CMSC 1 002 1 048 972 1 054 FDGT 519 520 516 605National (non-domestic business) rates CMSD 536 611 613 644 FDGU 245 278 280 331Other amounts paid for taxes, duties and levies CMSE 466 437 359 409 FDGV 275 243 236 274
Capital expenditureCost of acquisitions CMSF 2 216 2 290 2 346 2 413 FDGW 1 374 1 380 1 425 1 529Cost of disposals CMSG 846 778 987 1 337 FDGX 593 566 671 720Net capital expenditure CMSH 1 370 1 512 1 359 1 076 FDGY 781 813 755 809Work of a capital nature carried out by own staff
(included in acquisitions) CMSI 12 31 5 10 FDGZ 6 1 5 9
StocksIncrease during year CMSJ 886 1 363 1 344 530 FDHA 661 1 191 1 138 263Value at end of year CMSK 13 217 14 437 14 923 15 528 FDHB 9 913 10 632 11 104 11 276Total turnover divided by end-year stocks (Quotient) CMSL 10.7 10.4 10.3 10.1 FDHC 9.6 9.6 9.3 9.5
Employment costsTotal employment costs CMSM 9 400 9 726 10 238 10 674 FDHD 5 024 5 056 5 327 5 546Gross wages and salaries paid COBP 8 409 8 669 9 062 9 361 FDHE 4 470 4 487 4 701 4 811National insurance and pension contributions COBQ 991 1 056 1 175 1 313 FDHF 554 569 625 735
Gross marginAmount COBR 31 064 34 080 33 580 33 679 FDHG 18 536 19 556 18 770 18 822As a percentage of adjusted turnover COBS 22.0 22.6 21.9 21.4 FDHH 19.7 19.1 18.1 17.6
Approximate gross value added at basic prices COBT 21 777 24 072 23 125 22 463 FDHI 13 259 14 242 13 011 12 778

429
Service industry
24.3 Motor trades1
United Kingdomcontinued £ million and percentages
Maintenance and repair Sale of motor vehicle partsof motor vehicles and accessories(SIC 2003 50.20) (SIC 2003 50.30)
2002 2003 2004 2005 2002 2003 2004 2005
Number of businesses MKES 28 438 29 188 30 050 30 973 MKET 7 715 7 799 7 952 8 066
Total turnover FDHK 11 964 12 542 13 337 14 530 FDIW 11 068 13 801 13 694 13 666Motor trades turnover FDHL 11 658 12 147 13 023 14 158 FDIX 10 567 13 304 12 702 12 720
Retail sales of:New cars FDHM 1 206 1 081 939 1 008 FDIY 19 1 168 1 241 ..Other new motor vehicles and motorcycles FDHN 162 153 213 164 FDIZ 161 .. 172 ..
Sales to other dealers of:New cars FDHO 4 8 .. .. FDJA 89 509 .. ..Other new motor vehicles and motorcycles FDHP – 3 .. .. FDJB – .. .. ..
Gross sales of used motor vehicles andmotorcycles FDHQ 1 079 1 109 1 380 1 296 FDJC 143 .. 374 352
Turnover from sales of petrol, diesel, oiland other petroleum products FDHR 334 117 100 126 FDJD 85 70 86 1
Other motor trades sales and receipts (includingparts and accessories, workshop receipts) FDHS 7 891 9 674 10 386 11 541 FDJE 1 029 11 085 10 362 10 884
Non-motor trades turnover FDHT 306 396 314 372 FDJF 501 497 992 945
Purchases of goods, materials and servicesTotal purchases FDHU 7 806 8 100 8 795 9 507 FDJG 8 611 11 062 10 958 11 273Energy, water and materials FDHV 528 572 652 750 FDJH 171 220 227 334Used motor vehicles and motorcycles FDHW 892 897 1 041 1 073 FDJI 91 .. 371 347Parts used solely in repair and servicing activities FDHX 3 053 3 374 3 980 4 237 FDJJ 544 410 183 201Other goods for resale FDHY 2 170 1 774 1 453 1 727 FDJK 6 657 .. 9 000 8 955Hiring, leasing and renting of plant, machinery and
vehicles FDHZ 75 77 111 120 FDJL 60 151 136 61Commercial insurance premiums FDIA 139 204 227 245 FDJM 85 89 78 84Road transport services FDIB 13 49 104 81 FDJN 228 267 126 206Telecommunication services FDIC 70 97 103 97 FDJO 57 60 45 45Computer and related services FDID 34 61 72 39 FDJP 78 75 107 96Advertising and marketing services FDIE 109 127 125 113 FDJQ 70 165 208 291Other services FDIF 724 868 926 1 025 FDJR 568 643 478 654
Taxes, duties and leviesTotal taxes and levies FDIG 194 197 215 217 FDJS 90 102 116 128National (non-domestic business) rates FDIH 142 162 152 145 FDJT 74 84 89 97Other amounts paid for taxes, duties and levies FDII 52 35 63 71 FDJU 16 19 27 31
Capital expenditureCost of acquisitions FDIJ 376 433 442 431 FDJV 170 221 199 193Cost of disposals FDIK 84 87 98 108 FDJW 106 47 54 75Net capital expenditure FDIL 292 346 345 323 FDJX 64 173 144 118Work of a capital nature carried out by own staff
(included in acquisitions) FDIM 2 1 – – FDJY 3 29 – –
StocksIncrease during year FDIN 51 102 36 23 FDJZ 66 76 81 127Value at end of year FDIO 805 881 835 1 006 FDKA 1 498 1 750 1 807 1 814Total turnover divided by end-year stocks (Quotient) FDIP 14.6 14.2 16.0 14.4 FDKB 7.8 7.9 7.6 7.5
Employment costsTotal employment costs FDIQ 2 298 2 480 2 581 2 700 FDKC 1 348 1 427 1 565 1 637Gross wages and salaries paid FDIR 2 075 2 233 2 315 2 432 FDKD 1 209 1 268 1 391 1 440National insurance and pension contributions FDIS 223 247 266 268 FDKE 139 159 174 197
Gross marginAmount FDIT 5 878 6 597 6 857 7 466 FDKF 3 833 4 501 4 199 4 269As a percentage of adjusted turnover FDIU 49.0 52.6 51.4 51.4 FDKG 30.6 32.6 30.7 31.2
Approximate gross value added at basic prices FDIV 4 187 4 552 4 548 4 999 FDKH 2 514 2 831 2 796 2 499

430
Service industry
24.3 Motor trades1
United Kingdomcontinued £ million and percentages
Sale, maintenance and repairof motorcycles and related
parts and accessories Retail sale of automotive fuel(SIC 2003 50.40) (SIC 2003 50.50)
2002 2003 2004 2005 2002 2003 2004 2005
Number of businesses MKEU 2 513 2 710 2 948 3 157 MKEV 5 816 5 488 5 116 4 873
Total turnover FDKI 1 812 1 955 2 116 2 229 FDLV 20 056 20 089 20 708 20 083Motor trades turnover FDKJ 1 737 1 887 2 102 2 218 FDLW 16 500 17 024 17 444 17 639
Retail sales of:New cars FDKK – 49 – 37 FDLX 142 154 38 39Other new motor vehicles and motorcycles FDKL 194 215 479 570 FDLY 11 19 – –
Sales to other dealers of:New cars FDKM – – – – FDLZ – 1 1 2Other new motor vehicles and motorcycles FDKN 618 419 564 484 FDMA – 2 – –
Gross sales of used motor vehicles andmotorcycles FDKO 186 333 499 531 FDMB 193 160 138 79
Turnover from sales of petrol, diesel, oiland other petroleum products FDKP – – – – FDMC 15 776 16 367 17 006 17 191
Other motor trades sales and receipts (includingparts and accessories, workshop receipts) FDKQ 172 872 558 596 FDMD 248 319 261 328
Non-motor trades turnover FDKR 75 68 14 11 FDME 3 556 3 065 3 263 2 444
Purchases of goods, materials and servicesTotal purchases FDKT 1 493 1 512 1 705 1 916 FDMF 18 554 17 951 18 428 18 301Energy, water and materials FDKU 39 59 13 21 FDMG 99 115 100 96Used motor vehicles and motorcycles FDKV 142 252 409 420 FDMH 328 140 134 51Parts used solely in repair and servicing activities FDKW 112 87 163 76 FDMI 72 90 71 108Other goods for resale FDKX 1 049 967 1 016 1 277 FDMJ 17 338 16 946 17 346 17 349Hiring, leasing and renting of plant, machinery and
vehicles FDKY 4 7 1 2 FDMK 56 41 37 38Commercial insurance premiums FDKZ 9 23 8 12 FDML 34 32 32 25Road transport services FDLA 33 15 21 18 COBV 93 79 86 95Telecommunication services FDLB 5 9 5 6 COBW 17 20 14 14Computer and related services FDLC 3 4 3 5 COBX 17 18 19 11Advertising and marketing services FDLD 35 21 22 28 COBY 22 22 14 11Other services FDLE 63 67 42 50 COBZ 479 449 574 504
Taxes, duties and leviesTotal taxes and levies FDLF 15 29 32 30 COCA 183 200 92 74National (non-domestic business) rates FDLG .. .. .. .. COCB .. .. .. ..Other amounts paid for taxes, duties and levies FDLH .. .. .. .. COCC .. .. .. ..
Capital expenditureCost of acquisitions FDLI 34 46 65 34 COCD 263 211 215 225Cost of disposals FDLJ 5 7 20 8 COCE 58 71 144 425Net capital expenditure FDLK 29 39 45 26 COCF 205 140 71 –201Work of a capital nature carried out by own staff
(included in acquisitions) FDLL 1 – – – COCG – – – –
StocksIncrease during year FDLM 35 –8 –1 –24 COCH 72 2 90 140Value at end of year FDLN 302 432 391 406 COCI 698 741 786 1 026Total turnover divided by end-year stocks (Quotient) FDLO 6.2 4.5 5.4 5.5 COCJ 28.8 27.1 26.3 19.6
Employment costsTotal employment costs FDLP 144 151 155 165 COCK 587 611 610 626Gross wages and salaries paid FDLQ 127 136 136 148 COCL 528 545 519 529National insurance and pension contributions FDLR 17 15 19 16 COCM 59 66 91 97
Gross marginAmount FDLS 542 630 517 422 COCN 2 275 2 796 3 238 2 701As a percentage of adjusted turnover FDLT 31.0 32.2 24.4 18.9 CMQN 11.4 13.9 15.6 13.4
Approximate gross value added at basic prices FDLU 353 424 400 279 CMQO 1 464 2 022 2 370 1 908
1 See chapter text. Figures are exclusive of VAT. Source: Office for National Statistics: 01633 812435

431
Service industry
24.4 Catering and allied trades1
United Kingdom£ million and percentages
Total catering and allied trades Hotels and motels(SIC 2003 55.00) (SIC 2003 55.11 and 55.12)
2002 2003 2004 2005 2002 2003 2004 2005
Number of businesses MKEK 122 714 123 491 126 706 130 180 MKEL 10 800 10 535 10 417 10 252
Total turnover2 CMKX 60 603 63 412 70 199 71 334 CMLW 11 824 12 172 13 009 12 898
Taxes and levies3
Total taxes and levies CMLM 1 594 1 622 1 848 1 928 CMML 373 395 427 446National (non-domestic business) rates CMLJ 1 481 1 495 1 673 1 733 CMMI 359 380 400 425Other amounts paid for taxes, duties
and levies CMLL 113 126 175 195 CMMK 14 15 27 22
Capital expenditure3
Capital acquisitions CMLP 4 491 4 068 4 122 4 591 CMMO 1 127 960 934 1 085Capital disposals CMLQ 670 850 612 1 169 CMMP 225 144 150 360Net capital expenditure CMLK 3 820 3 217 3 510 3 422 CMMJ 902 815 783 725Work of a capital nature carried out by your
own staff (included in acquisitions) CMLR 25 31 12 31 CMMQ 13 12 4 5
Stocks3
Increase during year CMLN 44 42 75 60 CMMM –12 2 2 5Value at end of year CMLO 1 132 1 106 1 253 1 463 CMMN 231 169 168 153
Purchases of goods and services3
Total purchases CMLI 27 408 29 230 31 813 33 190 CMMH 4 327 4 521 4 838 4 966Energy, water and materials CMKZ 10 608 12 130 13 374 12 786 CMLY 1 729 2 015 2 043 2 000Goods for resale CMLA 8 173 8 851 9 555 11 408 CMLZ 468 489 583 690Hiring, leasing of plant, machinery etc. CMLB 350 275 303 259 CMMA 51 54 66 45Commercial insurance premiums CMLC 430 494 545 522 CMMB 106 124 135 129Road transport services CMLD 115 96 103 146 CMMC 19 22 8 10Telecommunication services CMLE 239 260 265 249 CMMD 61 71 68 56Computer and related services CMLF 141 149 169 193 CMME 45 50 45 68Advertising and marketing services CMLG 661 686 713 721 CMMF 178 183 203 196Other services CMLH 6 691 6 289 6 786 6 905 CMMG 1 670 1 513 1 687 1 772
Employment costs3
Total employment costs CMKY 13 504 14 116 15 287 16 414 CMLX 3 021 3 159 3 270 3 520Gross wages and salaries paid CMKV 12 475 12 998 14 075 15 021 CMLU 2 760 2 865 2 993 3 171National insurance and pension
contributions CMKW 1 029 1 118 1 212 1 393 CMLV 260 294 277 350
Gross margin4
Amount CMQP 43 943 45 747 51 047 50 268 CMQS 9 610 9 889 10 525 10 312As a percentage of turnover CMQQ 84.2 83.7 84.1 81.4 CMQT 95.5 95.3 94.6 93.7
Value added at basic prices4 CMQR 24 786 25 435 28 833 28 511 CMQU 5 759 5 864 6 272 6 044
AccommodationNumber of establishments CMLS 23 559 28 209 28 332 83 134 CMMR 12 874 13 974 14 190 24 367Letting bedplaces CMLT 2 071 308 2 214 366 2 676 991 2 441 159 CMMS 1 022 079 1 198 410 964 733 1 589 498

432
Service industry
24.4 Catering and allied trades1
United Kingdomcontinued £ million and percentages
Camping sites and other provisionof short-stay accommodation Restaurants or cafes, take-away food shops
(SIC 2003 55.21 to 55.23) (SIC 2003 55.30)
2002 2003 2004 2005 2002 2003 2004 2005
Number of businesses MKEM 4 175 4 370 4 703 5 027 MKEN 54 340 55 475 57 674 60 539
Total turnover2 CMMV 2 631 3 032 3 620 3 696 CMNU 18 843 20 145 21 731 22 612
Taxes and levies3
Total taxes and levies CMNK 74 79 90 91 CMOJ 508 515 556 627National (non-domestic business) rates CMNH 73 75 81 83 CMOG 468 469 483 544Other amounts paid for taxes, duties
and levies CMNJ 1 4 8 7 CMOI 40 46 73 83
Capital expenditure3
Capital acquisitions CMNN 364 345 336 444 CMOM 1 222 1 117 1 153 1 341Capital disposals CMNO 38 192 55 47 CMON 112 187 130 254Net capital expenditure CMNI 326 153 281 397 CMOH 1 110 930 1 023 1 088Work of a capital nature carried out by your
own staff (included in acquisitions) CMNP – 2 – 17 CMOO 4 3 4 8
Stocks3
Increase during year CMNL 4 2 10 19 CMOK 25 5 12 13Value at end of year CMNM 89 102 137 194 CMOL 295 313 326 340
Purchases of goods and services3
Total purchases CMNG 1 184 1 461 1 747 1 753 CMOF 8 637 9 546 10 056 10 607Energy, water and materials CMMX 249 360 449 442 CMNW 4 144 4 775 5 080 4 810Goods for resale CMMY 390 411 594 585 CMNX 2 067 2 345 2 399 3 118Hiring, leasing of plant, machinery etc. CMMZ 9 8 14 10 CMNY 62 54 47 38Commercial insurance premiums CMNA 29 59 59 48 CMNZ 119 117 140 138Road transport services CMNB 10 7 11 17 CMOA 38 30 51 55Telecommunication services CMNC 12 19 17 18 CMOB 67 71 72 71Computer and related services CMND 7 8 13 15 CMOC 28 34 41 46Advertising and marketing services CMNE 73 112 111 101 CMOD 248 231 251 268Other services CMNF 405 476 480 516 CMOE 1 865 1 888 1 975 2 063
Employment costs3
Total employment costs CMMW 488 554 578 682 CMNV 4 031 4 276 4 642 5 137Gross wages and salaries paid CMMT 450 507 523 617 CMNS 3 751 3 971 4 305 4 731National insurance and pension
contributions CMMU 38 47 55 65 CMNT 280 305 337 406
Gross margin4
Amount CMQV 1 921 2 260 2 586 2 739 CMQY 14 085 14 936 16 289 16 366As a percentage of turnover CMQW 83.2 84.7 81.4 83.2 CMQZ 87.6 86.3 86.9 83.8
Value added at basic prices4 CMQX 1 128 1 212 1 435 1 573 CMRA 7 544 7 744 8 660 8 885
AccommodationNumber of establishments CMNQ 4 247 6 962 6 255 43 033 CMOP 1 809 1 965 1 604 4 195Letting bedplaces CMRR 895 191 857 489 1 533 656 674 684 CMOQ 55 406 51 974 42 383 65 339

433
Service industry
24.4 Catering and allied trades1
United Kingdomcontinued £ million and percentages
Licensed clubs with entertainment,independent, tenanted, managed
public houses or wine bars Canteen operator, catering contractor(SIC 2003 55.40)5 (SIC 2003 55.51 and 55.52)
2002 2003 2004 2005 2002 2003 2004 2005
Number of businesses MKEO 47 914 47 475 48 147 48 400 MKEP 5 485 5 636 5 765 5 962
Total turnover2 CMOT 20 681 21 392 24 455 23 826 CMPS 6 624 6 670 7 383 8 302
Taxes and levies3
Total taxes and levies CMPI 611 602 748 726 CMQH 27 31 28 38National (non-domestic business) rates CMPF 557 548 688 652 CMQE 24 23 21 28Other amounts paid for taxes, duties
and levies CMPH 54 53 59 73 CMQG 3 8 8 10
Capital expenditure3
Capital acquisitions CMPL 1 634 1 482 1 489 1 572 CMQK 144 164 211 148Capital disposals CMPM 284 317 260 483 CMQL 12 11 17 25Net capital expenditure CMPG 1 350 1 166 1 229 1 090 CMQF 132 153 194 123Work of a capital nature carried out by your
own staff (included in acquisitions) CMPN 8 13 4 1 CMQM – – – –
Stocks3
Increase during year CMPJ 19 28 41 8 CMQI 8 6 9 15Value at end of year CMPK 414 409 512 639 CMQJ 102 112 109 138
Purchases of goods and services3
Total purchases CMPE 10 222 10 675 11 844 12 001 CMQD 3 037 3 028 3 328 3 863Energy, water and materials CMOV 2 408 2 959 3 458 3 013 CMPU 2 078 2 022 2 344 2 521Goods for resale CMOW 4 836 5 151 5 522 6 425 CMPV 411 455 457 591Hiring, leasing of plant, machinery etc. CMOX 188 116 138 120 CMPW 42 44 38 45Commercial insurance premiums CMOY 148 150 182 170 CMPX 27 44 30 37Road transport services CMOZ 26 25 17 44 CMPY 23 13 15 20Telecommunication services CMPA 79 79 86 77 CMPZ 20 20 23 28Computer and related services CMPB 39 33 48 39 CMQA 22 24 22 26Advertising and marketing services CMPC 136 127 129 122 CMQB 26 32 19 35Other services CMPD 2 362 2 036 2 264 1 993 CMQC 389 374 380 561
Employment costs3
Total employment costs CMOU 3 745 3 834 4 294 4 373 CMPT 2 219 2 293 2 503 2 702Gross wages and salaries paid CMOR 3 484 3 566 3 974 4 034 CMPQ 2 029 2 090 2 281 2 469National insurance and pension
contributions CMOS 260 268 320 339 CMPR 190 204 222 233
Gross margin4
Amount CMRB 12 819 13 182 15 408 13 941 CMRE 5 508 5 480 6 238 6 911As a percentage of turnover CMRC 72.7 71.9 73.6 68.3 CMRF 90.9 92.3 93.2 92.3
Value added at basic prices4 CMRD 7 469 7 708 9 098 8 370 CMRG 2 885 2 907 3 368 3 639
AccommodationNumber of establishments CMPO 3 970 5 018 6 046 11 288Letting bedplaces CMPP 71 214 77 371 110 130 84 174
1 See chapter text.2 Inclusive of VAT.3 Exclusive of VAT.
4 The total turnover figure used to calculate these data excludes VAT.5 Includes figures for managed public houses owned by breweries.
Source: Office for National Statistics: 01633 812435

434
Sources
SourcesThis index of sources gives the titles of official publications or other sources containing statistics allied to those in the tables of this Annual Abstract. These publications provide more detailed analyses than are shown in the Annual Abstract. This index includes publications to which reference should be made for short-term (monthly or quarterly) series. Further advice on published statistical sources is available from the National Statistics Customer Contact Centre on the numbers provided on page ii.
Table number Government department Official publication or in Abstract or other organisation other source
Chapter 1: Area
1.1 Ordnance Survey Ordnance Survey of Northern Ireland Office for National Statistics Regional Trends (annual, Palgrave Macmillan)
Chapter 2: Parliamentary elections
Elections
2.1 University of Plymouth British Electoral Facts 1832-1999 (Ashgate) for the Electoral Commission Dod’s Parliamentary Companion (annual)
By-elections
2.2 University of Plymouth Vachers Parliamentary Companion (quarterly) for the Electoral Commission Social Trends (annual, Palgrave Macmillan)
Chapter 3: International development
3.1 – 3.2 Department for International Statistics on International Development Development 2002/03-2006/07, Tables 1, 2, 3, 14 and 18
Chapter 4: Defence
4.1 – 4.11 Ministry of Defence/DASA UK Defence Statistics 2005 (The Stationery Office (TSO))
Chapter 5: Population
Population Census
5.1, 5.2, 5.3, 5.5 Office for National Statistics England and Wales: Census reports 1911, 1921, 1931, 1951, 1961, 1971, 1981, 1991 and 2001 Key Population and Vital Statistics; Great Britain, Digest of Welsh Statistics (annual, Welsh Assembly Government) General Register Office Scotland: Census reports 1951, 1961, 1971, 1981, 1991 and Scotland 2001

435
Sources
Table number Government department Official publication or in Abstract or other organisation other source
Northern Ireland Statistics and Northern Ireland: Census of population 1951, 1961, 1966, Research Agency 1971, 1981, 1991 and 2001 Resident population: mid-year estimates
5.1,5.2, 5.3, 5.5 Office for National Statistics England and Wales: Series FM (Family statistics), DH (Death), MB (Morbidity), PP (Population estimates and projections), MN (Migration) and VS (Key population and vital statistics) Series PP1, Population estimates: The Registrar General’s estimates of the population of regions and local government areas of England and Wales Population Trends (quarterly Palgrave Macmillan)
Health Statistics Quarterly (Palgrave Macmillan)
General Register Office Scotland Scotland: Annual report of the Registrar General for Scotland Annual estimate of the population of Scotland
Northern Ireland Statistics and Northern Ireland: Annual report of the Registrar General Research Agency
5.6 Office for National Statistics
Projections
5.1, 5.2, 5.3 Office for National Statistics Series PP2, Population projections – national figures Government Actuary’s Department
Migration
5.7, 5.8, 5.9 Office for National Statistics International Migration - first release of 2006 estimates Series MN (International migration) Population Trends (quarterly, Palgrave Macmillan)
5.10 Home Office Control of immigration statistics United Kingdom (annual) Asylum Statistics United Kingdom (annual)
Vital statistics
5.4, 5.12 – 5.22 Office for National Statistics England and Wales: Series FM (Births, marriages and divorce statistics) DH (Deaths), MB (Morbidity), PP (Population estimates and projections), MN (International migration) and VS (Key population and vital statistics)
General Register Office Scotland Scotland: Annual report of the Registrar General for Scotland Quarterly return of births, deaths and marriages
Northern Ireland Statistics and Northern Ireland: Annual report of the Registrar General Research Agency Quarterly return of births, deaths and marriages
5.14 Northern Ireland Court Service Northern Ireland Judicial Statistics (annual)
5.18 Scottish Government Department of Health
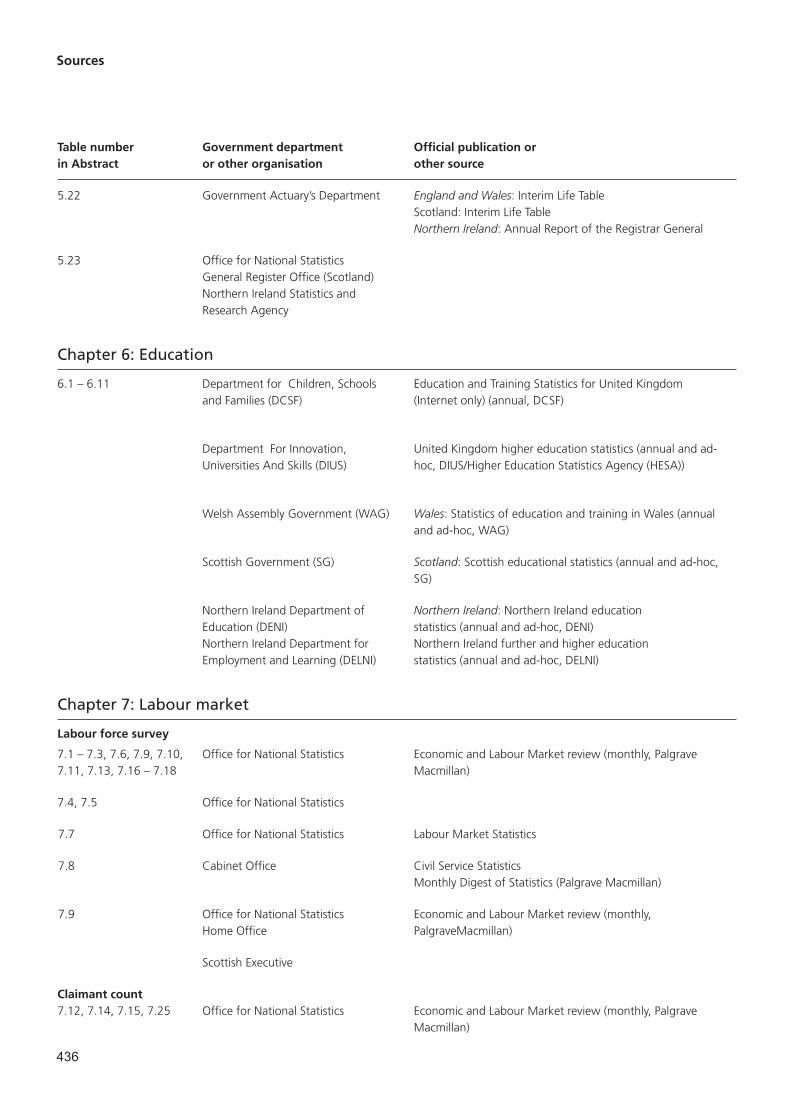
436
Sources
Table number Government department Official publication or in Abstract or other organisation other source
5.22 Government Actuary’s Department England and Wales: Interim Life Table Scotland: Interim Life Table Northern Ireland: Annual Report of the Registrar General
5.23 Office for National Statistics General Register Office (Scotland) Northern Ireland Statistics and Research Agency
Chapter 6: Education
6.1 – 6.11 Department for Children, Schools Education and Training Statistics for United Kingdom and Families (DCSF) (Internet only) (annual, DCSF)
Department For Innovation, United Kingdom higher education statistics (annual and ad- Universities And Skills (DIUS) hoc, DIUS/Higher Education Statistics Agency (HESA))
Welsh Assembly Government (WAG) Wales: Statistics of education and training in Wales (annual and ad-hoc, WAG)
Scottish Government (SG) Scotland: Scottish educational statistics (annual and ad-hoc, SG)
Northern Ireland Department of Northern Ireland: Northern Ireland education Education (DENI) statistics (annual and ad-hoc, DENI) Northern Ireland Department for Northern Ireland further and higher education Employment and Learning (DELNI) statistics (annual and ad-hoc, DELNI)
Chapter 7: Labour market
Labour force survey
7.1 – 7.3, 7.6, 7.9, 7.10, Office for National Statistics Economic and Labour Market review (monthly, Palgrave 7.11, 7.13, 7.16 – 7.18 Macmillan)
7.4, 7.5 Office for National Statistics
7.7 Office for National Statistics Labour Market Statistics
7.8 Cabinet Office Civil Service Statistics Monthly Digest of Statistics (Palgrave Macmillan)
7.9 Office for National Statistics Economic and Labour Market review (monthly, Home Office PalgraveMacmillan)
Scottish Executive
Claimant count 7.12, 7.14, 7.15, 7.25 Office for National Statistics Economic and Labour Market review (monthly, Palgrave Macmillan)
437
Sources
Table number Government department Official publication or in Abstract or other organisation other source
7.19 Office for National Statistics Economic and Labour Market review (monthly, Palgrave Macmillan) Monthly Digest of Statistics (Palgrave Macmillan)
Annual Survey of Hours and Earnings
7.20, 7.21, 7.24, 7.25 Office for National Statistics Annual Survey of Hours and Earnings (annual, ONS)
Average Earnings Index
7.22, 7.23 Office for National Statistics Economic and Labour Market review (monthly, Palgrave Macmillan) Monthly Digest of Statistics (Palgrave Macmillan)
7.26 Certification Office Certification Officers Annual Report
Chapter 8: Personal income, expenditure and wealth
8.1 Board of HMRC HMRC National Statistics www.hmrc.gov.uk www.statistics.gov.uk/cci/article.asp?ID=1804
8.2 Office for National Statistics National Statistics (www.statistics.gov.uk/cci/article.asp?ID=1804)
8.3 - 8.5 Office for National Statistics Expenditure and Food Survey, (annual) (1990 onwards edition-Family Spending) (annual, Palgrave Macmillan)
Chapter 9: Health
National Health Service
9.1 Information Centre for health and Hospital Episode Statistics, England (Annual) social care
General Pharmaceutical Services in England and Wales 1996 – 2006
Department of Health England: Appropriation Accounts (annual) Health and Personal Social Services Statistics for England (annual)
Welsh Assembly Government Wales: Health Statistics Wales (annual)
9.2 The Scottish Government, ISD Scotland part of NHS National Services Scotland
9.3 Department of Health, Social Summary of Health and Personal Social Services (Northern Services and Public Safety Ireland) Accounts (annual) Hospital Statistics (annual) (Northern Ireland)
9.4, 9.5 NHS Information Centre for health England: Health and Personal Social Services Statistics for and social care England (annual) NHS Hospital and Community Health Services (HCHS):

438
Sources
Table number Government department Official publication or in Abstract or other organisation other source
Welsh Assembly Government Wales: Health Statistics Wales (annual)
The Scottish Government, ISD Scotland part of NHS National Services Scotland
Public Health
9.6 Office for National Statistics England and Wales: Mortality statistics cause series DH2
General Register Office Scotland Scotland: Annual Report of the Registrar General for Scotland
Northern Ireland Statistics and Northern Ireland: Annual Report of the Registrar General for Research Agency Northern Ireland
9.7 HPA Centre for Infections England and Wales: Communicable Disease Statistics Series MB2 (annual) Annual Review of Communicable Diseases
NHS in Scotland Scotland: Scottish Health Statistics (annual) NHS National Services Scotland
Communicable Disease Surveillance Northern Ireland: Annual report of the Registrar General Centre (NI) Northern Ireland
9.8 – 9.10 Health and Safety Executive Health and Safety Statistics (annual)
Chapter 10: Social protection
Social security pensions, benefits and allowances
10.1 Department for Work and Pensions National Insurance Fund Account (annual) HM Revenue and Customs Department of Health, Social Services and Public Safety (Northern Ireland)
10.2 Department for Work and Pensions HM Revenue and Customs
10.3 HM Revenue and Customs
10.4, 10.5 Department for Work and Pensions Work and Pensions Longitudinal Study (WPLS, 100% sample) (Information and Analysis Directorate) Ministry of Defence/DASA (Pay and Pensions)
HM Revenue and Customs
10.6 – 10.8, 10.12 – 10.19 Department for Work and Pensions Work and Pensions Longitudinal Study (WPLS, 100% sample) (Information and Analysis Directorate)
10.9, 10.11 HM Revenue and Customs
10.15 Ministry of Defence/DASA (Health Information)

439
Sources
Table number Government department Official publication or in Abstract or other organisation other source
Working Family Tax Credit
10.10 Working Family Tax Credit Quarterly Enquiry United Kingdom (quarterly) Department for Work and Pensions (Information and Analysis Directorate)
Social services
10.20 – 10.24 Office for National Statistics Appropriation (annual) Department for Education and Skills Northern Ireland Annual Abstract of Statistics
10.20 HM Treasury HM Treasury Expenditure Statistical Analyses
Housing and community amenities
10.25 Office for National Statistics
Chapter 11: Crime and justice
11.1 Home Office England and Wales: Police Service Strength England and Wales 2007 Home Office Statistical Bulletin 02/08
Scottish Government Justice Analytical Services
The Police Service of Northern Ireland Northern Ireland: The Chief Constable’s Annual Report
11.3 Home Office Crime in England and Wales 2003/04 (Home Office Statistical Bulletin 10/04) Crime in England and Wales 2005/06 (Home Office Statistical Bulletin 12/06) Crime in England and Wales 2006/07 (Home Office Statistical Bulletin 11/07)
11.4 – 11.9 Office for Criminal Justice Reform Criminal Statistics, England and Wales (annual) (TSO) Offender Management Caseload Statistics 2003 (annual) Digest of Welsh Statistics (annual, Welsh Office)
11.2, 11.10, 11.11 Ministry of Justice Sentencing Statistics 2006 England & Wales Offender Management Caseload Statistics 2006
11.12 Ministry of Justice HM Prison Service Annual Report and Accounts April 2006 – March 2007
11.13 Scottish Government Justice Recorded Crime in Scotland, 2005/06 Analytical Services
11.14 – 11.17 Scottish Government Justice Criminal Proceedings in Scottish Courts, 2005/06 Analytical Services
11.18, 11.19 Scottish Government Justice Prison Statistics Scotland, 2002 Department Scottish Prison Service Annual Report and Accounts

440
Sources
Table number Government department Official publication or in Abstract or other organisation other source
11.20 The Police Service of Northern Ireland
11.21 – 11.24 Northern Ireland Office A Commentary on Northern Ireland Crime Statistics 2004 ‘Court Prosecutions and Sentencing 2005’ NIO Research and Statistical Bulletin 3/2008 The Northern Ireland Prison Population in 2006
Chapter 12: Lifestyles
12.1 Department for Culture, Media and Sports
12.2 Department for Culture, Media and Sports
12.3 Department for Culture, Media and Sports
12.4 CAA Nielsen EDI
12.5 UK Film Council
12.6 Visit Britain United Kingdom Tourism Survey
12.7 – 12.8 Office for National Statistics International Passenger Survey Overseas Travel & Tourism MQ6 Overseas Travel & Tourism First Release Travel Trends
12.9 Target Group Index, BMRB International
12.10 Department for Culture, Media and Sports Gaming Board for Great Britain www.gbgb.org.uk
Chapter 13: Environment
13.1, 13.2, 13.5, Office for National Statistics Environmental Accounts Autumn 2007 13.18, 13.22 www.statistics.gov.uk/downloads/theme_environment/ EADec2007.pdf
13.3, 13.4, 13.6, Department for Environment Food e-Digest of Environmental Statistics (annual) 13.7, 13.8, and Rural Affairs www.defra.gov.uk/environment/statistics/index.htm 13.11, 13.16 The Environment in your Pocket (annual)
13.9, 13.13 Centre for Ecology and Hydrology, www.ceh-nerc.ac.uk/data/NWA.htm Wallingford
13.10 The Met Office www.met-office.gov.uk

441
Sources
Table number Government department Official publication or in Abstract or other organisation other source
13.12 Scottish Environment Protection www.sepa.org.uk/pdf/data/classification/water_qual_ agency class_2006.pdf
13.14 Water Services Regulation Authority Companies 2007 June Return to OFWAT (OFWAT) (annual)
13.15 Environment Agency England and Wales: www.environment-agency.gov.uk
Scottish Environment Protection Scotland: www.sepa.org.uk agency
Environment & Heritage Services Northern Ireland: www.ehsni.gov.uk Northern Ireland
13.17 Environment Agency www.environment-agency.gov.uk
13.19, 13.20 Department for Environment Food England: www.defra.gov.uk/environment/statistics/index.htm and Rural Affairs
Welsh Assembly Government Wales: www.wales.gov.uk/statistics
Scottish Environment Protection Scotland: www.sepa.org.uk agency
Environment & Heritage Services Northern Ireland: www.ehsni.gov.uk Northern Ireland
13.21 The Chartered Institute of Environmental Health
The Royal Environmental Health Institute of Scotland
Chapter 14: Housing
14.1 Communities and Local Government
Welsh Assembly Government
Scottish Government
Department for Social Development, Northern Ireland
14.2 Office for National Statistics General Household Survey
14.3 Communities and Local Government
Welsh Assembly Government Wales: Welsh Housing Statistics (annual, WAG)
Scottish Government Scotland: Statistical Bulletins on Housing (SG)

442
Sources
Table number Government department Official publication or in Abstract or other organisation other source
Department for Social Development, Northern Ireland: Northern Ireland Housing Northern Ireland Statistics (annual)
14.4 Communities and Local Government
14.5 Communities and Local Government
Welsh Assembly Government
14.6 Council of Mortgage Lenders
14.7 HM Court Service Northern Ireland Court Service
14.8 Communities and Local Government
Welsh Assembly Government
Scottish Government
14.9 Communities and Local Government Statutory Homelessness Statistical Release (quarterly) www.communities.gov.uk/index.asp?id=1156302
Chapter 15: Transport and communications
General
15.1, 15.2, 15.4 Department for Transport
15.3 Office for National Statistics
Road Transport
15.5 – 15.12 Department for Transport Office for National Statistics (annual, TSO) Vehicle Licensing Statistics (annual, TSO) Monthly Digest of Statistics (Palgrave Macmillan) Road Casualties Great Britain (annual, TSO) Road accidents Wales (annual, National Assembly for Wales) Office for National Statistics: Department for Transport
15.11 Driving Standards Agency
15.13, 15.14 Department for Regional Publication: Transport Statistics NISource: Driver and Vehicle Development, Northern Ireland Agency
Rail Transport
15.20, 15.21 Department for Transport Office for National Statistics (annual, TSO) Health and Safety Executive: Industry and Services (annual) Bulletin of Rail Statistics (quarterly)
15.22, 15.23 Department for Regional Translink Development, Northern Ireland

443
Sources
Table number Government department Official publication or in Abstract or other organisation other source
Air Transport
15.24 – 15.28 Civil Aviation Authority Monthly Digest of Statistics (Palgrave Macmillan) Civil Aviation Authority; Annual Statements of Movements, Passengers and Cargo Civil Aviation Authority; Monthly Statements of Movements, Passengers and Cargo
Sea Transport
15.29, 15.30 Department for Transport Maritime Statistics (annual, TSO) Monthly Digest of Statistics (Palgrave Macmillan)
Communications
15.31 Royal Mail Parcel Force Monthly Digest of Statistics (Palgrave Macmillan) Capita Business Services Ltd Post Office Counters Ltd Post Office report and accounts (annual)
Chapter 16: National accounts
16.1 – 16.22 Office for National Statistics United Kingdom National Accounts (annual, Palgrave Macmillan) Monthly Digest of Statistics (Palgrave Macmillan)
Chapter 17: Prices
Producer Prices
17.1, 17.2 Office for National Statistics Producer Price Index Press Notice (monthly) Business Monitor MM22, Producer Price Indices Monthly Digest of Statistics (Palgrave Macmillan)
Consumer Prices
17.3 – 17.6 Office for National Statistics Monthly Digest of Statistics (Palgrave Macmillan) Economic and Labour Market review (monthly, Palgrave Macmillan) Focus on Consumer Price Indices (monthly, National Statistics website)
17.7, 17.8 Department for Environment, Agriculture in the UK (annual) Food and Rural Affairs Agricultural Price Indices, Statistical notice (monthly) Monthly Digest of Statistics (Palgrave Macmillan)
17.9 Department for Environment, Agriculture in the UK (annual) Food and Rural Affairs Economic & Labour Market Review (monthly, Palgrave Macmillan) UK Economic Accounts (quarterly, Palgrave Macmillan)
Chapter 18: Government finance
Central Government
18.1 – 18.3 Office for National Statistics Financial Statistics (monthly, Palgrave Macmillan)

444
Sources
Table number Government department Official publication or in Abstract or other organisation other source
18.4 HM Treasury Consolidated Fund and National Loans Fund Accounts Office for National Statistics Financial Statistics (monthly, Palgrave Macmillan)
18.5 HM Treasury United Kingdom National Accounts (annual, Palgrave Office for National Statistics Macmillan)
18.6 – 18.7 HM Treasury Consolidated Fund and National Loans Fund Accounts Financial Statistics (monthly, Palgrave Macmillan)
18.8 Office for National Statistics
18.9, 18.10 HM Revenue & Customs www.hmrc.gov.uk
Rateable values
18.11 HM Revenue & Customs www.hmrc.gov.uk
Local Authorities
18.12, 18.13 Communities and Local Government Local government financial statistics (England) (annual) Welsh Assembly Government Welsh local government financial statistics (annual) Public Works Loan Board Annual report of the Public Works Loan Board Scottish Executive Statistical Support Local Financial Returns (Scotland) (annual) for Local Government Department of Finance and Personnel for Northern Ireland Department of the Environment for Northern Ireland Chartered Institute of Public Finance and Accountancy
18.14 Communities and Local Government Local government financial statistics (England) (annual) Welsh Assembly Government Welsh local government financial statistics (annual)
18.15, 18.16 Communities and Local Government Local government financial statistics (England) (annual)
18.17 – 18.19 Scottish Executive Statistical Support Local financial returns (Scotland) (annual) for Local Government (Scotland) Capital Returns (annual)
18.20 Department of the Environment for District Council - Summary of Statement of Accounts Northern Ireland (annual)
Chapter 19: External trade and investment
19.1 – 19.8 HM Revenue & Customs OTS1 – Overseas Trade Statistics – Extra EC, (formerly MM20) (monthly) OTS2 – Overseas Trade Statistics – Intra EC and World (formerly MM20A) (monthly) OTSQ – Overseas Trade Statistics – Intra EC, (formerly MQ20) (quarterly) OTSA – Overseas Trade Statistics – Extra and Intra EC (formerly MA20) (annual)

445
Sources
Table number Government department Official publication or in Abstract or other organisation other source
Office for National Statistics Business Monitor MM24, Monthly Review of External Trade Statistics (monthly, Palgrave Macmillan) Overseas Trade Analysed in Terms of Industries MQ10 (quarterly, Palgrave Macmillan) Monthly Digest of Statistics (monthly, Palgrave Macmillan)
19.9 – 19.18 Office for National Statistics Bank United Kingdom Balance of Payments of England (annual, Palgrave Macmillan) (quarterly, Palgrave Macmillan) figures: UK Economic Accounts Financial Statistics (monthly, Palgrave Macmillan) Foreign Direct Investment MA4 (annual, National Statistics website)
Chapter 20: Research and development
20.1 – 20.5 Office for National Statistics Business Monitor MA14, Research and Development in UK Business (annual, ONS)
Chapter 21: Agriculture, fisheries and food
Agriculture
21.1, 21.2 Department for Environment Food Agriculture in the United Kingdom 2007 (annual) and Rural Affairs
21.3 – 21.5 Department for Environment Food Agriculture in the United Kingdom 2007 (annual) 21.7 – 21.13 and Rural Affairs
21.6 Forestry Commission Forestry Statistics (annual) Department of agriculture and Rural Northern Ireland Annual Abstract of statistics Development (Northern Ireland)
Fisheries
21.14, 21.15 Department for Environment Food and Rural Affairs Scottish Government Agricultural Departments
Family food
21.16 Department for Environment Food Expenditure and Food Survey (annual) and Rural Affairs (1990 onwards edition-Family Spending) (annual, Palgrave Macmillan)
Chapter 22: Production
Production and construction
22.1 Office for National Statistics Annual Business Inquiry (www.statistics.gov.uk/abi)

446
Sources
Table number Government department Official publication or in Abstract or other organisation other source
Manufacturers sales
22.2 Office for National Statistics ProdCom: Product Sales and Trade Annual Reports - PRA series (annual, ONS) Product Sales and Trade Quarterly Reports - PRQ series (quarterly, ONS)
22.3 Office for National Statistics UK Business: Activity, Size and Location (www.statistics.gov.uk/ukbusiness)
Energy
22.4 – 22.13 Department for Business, Enterprise Digest of United Kingdom Energy Statistics (annual) and Regulatory Reform (Energy Energy Trends (monthly and quarterly) Strategy and International Unit) Annual Business Inquiry (www.statistics.gov.uk/abi)
Iron and steel
22.14 – 22.16 Iron and Steel Statistics Bureau Iron and steel industry: annual statistics published by the Iron and Steel Statistics Bureau Corporation Regional Trends (annual, Palgrave Macmillan)
Industrial materials
22.17 World Bureau of Metal Statistics World Metal Statistics (monthly) Aluminium Federation Annual Business Inquiry (www.statistics.gov.uk/abi)
22.18 Agricultural Industries Confederation Annual Business Inquiry (www.statistics.gov.uk/abi)
Minerals
22.19 Communities and Local Government Minerals (Business Monitor PA 1007) (annual, ONS)
Department for Business, Enterprise Natural Environment Research Council: United Kingdom and Regulatory Reform
Department of Economic Development Minerals Yearbook Northern Ireland Annual Abstract of (Northern Ireland) Statistics
Building materials
22.20 Department for Business, Enterprise Monthly Statistics of Building Materials and and Regulatory Reform Components (BERR) Monthly Digest of Statistics (Palgrave Macmillan)
Construction
22.21, 22.22 Office for National Statistics Monthly Digest of Statistics (Palgrave Macmillan)
Engineering
22.23, 22.24 Office for National Statistics Annual Business Inquiry (www.statistics.gov.uk/abi) UK Business: Activity, Size and Location (www.statistics.gov.uk/Ukbusiness)
Motor vehicle production
22.25 Office for National Statistics Monthly Digest of Statistics (Palgrave Macmillan)

447
Sources
Table number Government department Official publication or in Abstract or other organisation other source
Drink and tobacco
22.26 HM Revenue & Customs Annual report of the Commissioners of HM Revenue and Customs (www.hmrc.gov.uk/stats/tax_receipts/menu.htm) and HMRC Statistical Bulletins on UK Trade Information website (www.uktradeinfo.com/index.cfm?task=bulletins) Monthly Digest of Statistics (Palgrave Macmillan)
22.27 Office for National Statistics
Chapter 23: Banking, insurance etc
Banking
23.1 Bank of England Bank of England Annual Report and Accounts
23.2 Association for Payment Clearing Yearbook of Payment Statistics 2004 Services
23.3 – 23.7 Bank of England Bank of England, Statistical Interactive Database
23.8 Bank of England Bank of England Quarterly Bulletin
23.9 – 23.12 Bank of England Monthly Digest of Statistics (Palgrave Macmillan) Financial Statistics (monthly, Palgrave Macmillan)
Other financial institutions
23.13 Financial Services Authority Building Societies: Statistical Tables www.fsa.gov.uk/pages/Library/Other_publications/ Miscellaneous/2007/bs_stats.shtml
23.14 Office for National Statistics Business Monitor SDQ7, Assets and Liabilities of Finance Houses and Other Credit Companies (quarterly, ONS)
23.15 Office for National Statistics Financial Statistics (monthly, Palgrave Macmillan) Monthly Digest of Statistics (Palgrave Macmillan) Business Monitor MQ5, Insurance Companies; Pension Funds and Trusts Investments (quarterly, ONS) First Release
23.16, 23.17 Office for National Statistics Financial Statistics (monthly, Palgrave Macmillan) Business Monitor MQ5, Insurance Companies; Pension Funds and InsolvencyTrusts Investments (quarterly, ONS)
23.18 – 23.19 Insolvency service
23.20 Association of Unit Trusts and Investment Funds
Bank of England
Building Societies Commission

448
Sources
Table number Government department Official publication or in Abstract or other organisation other source
Department for Business, Enterprise and Regulatory reform
Department for National Savings
Office for National Statistics
23.21 Bank of England
23.22 Office for National Statistics
Chapter 24: Service industry
Retail trades
24.1 Office for National Statistics Annual Business Inquiry (www.statistics.gov.uk/abi)
24.2 Office for National Statistics Business Monitor SDM 28, www.statistics.gov.uk/rsi
Motor trades
24.3 Office for National Statistics Annual Business Inquiry (www.statistics.gov.uk/abi)
Catering
24.4 Office for National Statistics Annual Business Inquiry (www.statistics.gov.uk/abi)

449
Index
Aircraft noise, 13.21 Airlines, UK:
accidents on, 15.27operations and traffic, 15.26, 15.28Air pollution, 13.4Alcoholic drink:
beer, spirits and wine: production and consumption, 22.26
Consumers Prices Index, 17.4 catering and allied trades, 24.4 household expenditure, 16.15 Retail Prices Index, 17.5
Alcohol abuse: deaths from, 9.6Allowance:
Attendance, 10.4, 10.5, 10.24 Child’s special, 10.1 Disability living, 10.4, 10.5 Guardian’s 10.1, 10.4 Jobseeker’s, 10.1,10.4, 10.5, 10.6,
10.24 Invalidity, 10.4 Mobility, 10.4
Aluminium: production and consumption, 22.17
Alzheimer's disease: deaths from, 9.6 Ambulances:
licences, current, 15.13 (Northern Ireland)
new registrations, 15.14 (Northern Ireland)
Animal feedstuffs: agricultural input, 21.1, 21.2 exports, 19.3 imports, 19.4 prices, 17.7 Animals: see also Livestock exports, 19.3 imports, 19.4 manufacturers’ sales, 22.2 on agricultural holdings, 21.5 price index, 17.8, 17.9
Area: by country, standard region, 1.1 cities, 5.5 conurbations, 5.5 crops, 21.3 forest, 21.6 land:
Index
Figures indicate table numbers
A
Abortions, 5.18Absolute discharge, 11.8, 11.23Accidents:
airways, 15.27 coal-mining, 9.10 industrial, 9.10 road, 15.17 transport, 9.10
Acid rain precursors, 13.5Adoptions, 5.23Aerodromes: activity, 15.28Aerospace Intramural expenditure,
20.4Agriculture:
crops and grass, 21.4 index of prices, 17.7, 17.8 land use, 21.3 livestock, 21.5 machinery, 22.2 numbers employed, 21.13
production and income, 21.1, 21.2 sales for food, 21.7
Agriculture, fisheries and food, 21.1- 21.16Agriculture, forestry and fishing:
commodity price trends, 17.8earnings of agricultural workers,
7.20, 7.23, 21.11, 21.12emissions from, 13.2, 13.6, 13.7,
13.8 employment, 7.5, 21.13 gross value added, 16.4 index of average earnings, 7.23index numbers of output, 16.5 injuries to workers, 9.10 production and disposals, 21.1,
21.2 woodland area, 21.6 wood production, 21.6
Aid, overseas, UK expenditure:by country, 3.2 by organisation, 3.1
Aids: deaths from, 9.6Air quality, 13.2Air transport, 15.4, 15.24-15.28
agricultural, 21.3total, 1.1
rural districts, 5.5 standard regions, 5.5 urban, 5.5
Armed Forces, see Army, Royal AirForce, Royal Navy and Royal MarinesArmy:
cadet forces, 4.5 civilian manpower, 4.6 deaths, 4.9 defence services and the civiliancommunity, 4.11 deployment of service personnel,
4.8 HM Forces employment, 7.4 formation, 4.3 medical staff, 4.10 outflow, 4.4 recruitment, 4.2strength, 4.5 uniformed medical staff, 4.10
Asbestosis: occupational deaths from, 9.9
Assault offences, 11.4, 11.5, 11.13, 11.14, 11.20-11.22
Assets, 23.3Asthma: deaths from, 9.6Atmospheric emissions, 13.2Attendance allowance, 10.4 10.24Attendance at leisure and cultural activities, 12.9Attendance centre orders, 11.8Average earnings: see EarningsAviation: civil accidents, 15.27Aviation spirit:
deliveries, 22.13 output, 22.12
B
Baby names, 12.11Balance of payments, 19.9-19.12
current balance, 19.11 investment and other capital flows,
19.9 official financing: overseas investment, 19.13-19.18

450
Index
summary, 19.9 Bank advances, 23.4Bank clearings, 23.2Bank deposits, 23.5Banking, finance, insurance, etc:
employment, 7.5 transactions, 23.20
Banking, insurance, etc, 23.1-23.22Bank of England Balance Sheet, 23.1Bankruptcies, 23.18Barley:
area, 21.3 harvested, 21.4 output, 21.1, 21.2 sales, 21.7
Base rates, 23.8Bathing water, 13.16 Beer:
manufacturers’ sales, 22.2 production and consumption, 22.26
Bereavement benefits, 10.13Betting and gaming:
expenditure, 12.10 offences, 11.4
Bicycles - see Cycles, pedalBirths:
annual changes, 5.2 by age of mother, 5.17 inside and outside marriage, 5.16 live births, 5.15 occurrences, 5.16 stillbirths, 5.15
Bitumen: deliveries, 22.13 output, 22.12
Blood diseases: deaths from, 9.6Books: retail trade, 24.1Bricks: production, 22.20Bronchitis: deaths from, 9.6Building materials: production, 22.20Building societies:
advances, 23.13 assets and liabilities, 23.13 balance sheet, 23.13 current transactions, 23.13
Bulk carriers: tonnage, 15.29Burglary offences, 11.3-11.5, 11.11,
11.20-11.22Buses, coaches, etc:
fares, indices of, 15.16 licences current, 15.8, 15.13 new vehicle registrations, 15.9,
15.14 (Northern Ireland) passenger journeys, 15.4, 15.15
Butane and propane: deliveries, 22.13 output, 22.12
C
Calcspar: production, 22.19Cameras: manufacturers’ sales, 22.2Camping sites, 24.4Canals: biological and chemical
quality, 13.11, 13.12Cancer: deaths from, 9.6Capital formation, 16.19-16.22 Caravans: manufacturers’ sales, 22.2Carbon dioxide: total emissions, 13.6Carbon monoxide: emissions by
source, 13.2Cargo liners: tonnage, 15.29Cars: see also Motor vehicles
households with use of, 15.12 licences current, 15.8, 15.13 new registrations, 15.9, 15.14 production, 22.25
Casualties in road accidents, 15.17Catering trades:
contractors, 24.4 employment, 7.5 hotels and motels, 24.4 licensed clubs, 24.4 restaurants and cafes, 24.4 turnover, 24.4
Cattle: agricultural output, 21.1, 21.2 on agricultural holdings, 21.5 prices, 17.8, 17.9 organic, 21.8 slaughtered, 21.7
Cement: production, 22.20Central government expenditure:
education, 10.21 housing and community amenities,
10.25 National Health Service, 10.22 social security benefits, 10.24 welfare services, 10.23 social services and housing, 10.20
Census of: marital condition, 5.4 population, 5.1-5.5 production, 22.1
Cereals, see also Wheat, Barley, Oats area, 21.3 exports, 19.3 harvested, 21.4
imports, 19.4 prices, 17.7-17.9 organic, 21.10 sales, 21.7
Cerebrovascular disease: deaths from, 9.6
Chalk: production, 22.19Channel Tunnel, 15.30Chemicals:
exports, 19.3 imports, 19.4 sales ratio, 19.2
Chemical industry census of production, 22.1 development, 20.4 employment, 7.5 expenditure on research and index
of average earnings, 7.23 materials and fuels used, 17.1 units by size, 22.3 producer price index, 17.1, 17.2
Chert and flint: production, 22.19Child Benefit, 10.4, 10.9, 10.24Child population, 5.3Childbirth:
deaths in, 9.6Child’s special allowance, 10.1Child Tax Credit, 10.11China clay: production, 22.19Cider and perry, 22.26Cinema, 12.4Cities: population, 5.5Citizenship: country of last/next
residence, 5.9Civil aviation:
accidents, 15.27 activity at aerodromes, 15.28
Civil Service employment, 7.8Civilian community and defence
services, 4.11Civilian migration, 5.7-5.9Claimant count, 7.12-7.14Clay:
production, 22.19Clearing banks, 23.2Clothing and footwear:
Consumer Prices Index, 17.4 employment, 7.5 expenditure on, 16.14 exports, 19.3 imports, 19.4retail trades, 24.1, 24.2
Coaches, buses, etc, see Buses, coaches, etc

451
Index
Coaches (railway): in use, 15.22 (Northern Ireland)
Coal census of production, 22.1 consumption, 22.5 opencast production, 22.6 production, 22.4, 22.6 stocks and supply, 22.6
Coal extraction and solid fuels: deaths and injuries, 9.10 employment, 7.5 gross value added, 16.4
Commodity price trends, 17.9Commonwealth migration into and
out of the United Kingdom, 5.9Community punishment order, 11.8,
11.23Companies:
insolvencies, 23.19 gross fixed capital formation, 16.19,
16.21 mergers and acquisitions, 23.22
Compound feedstuffs: prices, 17.7Concrete:
blocks, bricks, etc, production, 22.20
ready mixed, production, 22.20Conditional discharge, 11.8, 11.23Congenital anomalies: deaths from,
9.6Consolidated Fund:
assets and liabilities, 18.7 revenue and expenditure, 18.4
Construction: average earnings, 7.20, 7.22, 7.23 production, 22.1 employment, 7.5 gross value added, 16.4 industrial stoppages, 7.19 injuries to workers, 9.10 new work (volume), 22.21 noise from, 13.21 output:
index numbers, 16.5value, 22.22
Consumer credit, 23.14, 23.20Consumer Prices Index, 17.4Contributory pensions, 10.14Conurbations: population, 5.5Copper:
production, consumption and stocks, 22.17
tubing production, 22.17
Corn, mixed: acreage, 21.3
Corporate income 16.6, 16.7County Court mortgage possession
orders, 14.7Courts:
offenders found guilty, 11.4, 11.6, 11.21, 11.22
charge proved, 11.15 sentences, 11.8, 11.9, 11.23
Creative industries, 12.3Crime and justice, 11.1-11.24Criminal damage, 11.3-11.5,
11.20-11.22 Criminal offences:
age analysis, 11.6, 11.7, 11.17 sex analysis, 11.6, 11.7, 11.17 juvenile offenders, 11.4, 11.5,
11.17, 11.22 proceedings in court, 11.8, 11.14,
11.21-11.23 type of offence, 11.3-11.5, 11.13,
11.14, 11.20-11.22Crops:
area 21.3 harvested, 21.4 input/output volume, 21.2 producer price index, 17.8 production and income account,
21.1Crude oil:
deliveries, 22.13 output, 22.12
Cultural activities, 12.9Culture, media and sport: expenditure,
12.1Cycles, pedal:
accidents, 15.17 offences, 11.4, 11.5 road traffic, 15.4, 15.7
D
Dairy product: exports, 19.3 imports, 19.4
Death rates, 5.21Deaths:
age and sex analysis, 5.19 armed forces, 4.9 average annual changes, 5.2 by cause, 9.6 infant and maternal, 5.20 fatal accidents:
air, 15.27due to occupationally related
lung disease, 9.9industrial, 9.10motor vehicle, 15.17
Debt: Central government, 18.3 local authorities, 18.12 public sector, 18.3
Decrees absolute: granted, 5.13, 5.14Defence:
accommodation, 4.7 armed forces, 4.5 civilian manpower, 4.6 deaths of service personnel, 4.9 expenditure on, 4.1 formation, 4.3 location 4.8 manpower strengths, 4.5 outflow, 4.4 recruitment, 4.2 research, cost of, 20.2, 20.3, 20.4,
20.5 services and the civilian community,
4.11 Degrees obtained: by subject and
gender, 6.10Dentists: numbers on list, 9.1-9.5 payments, 9.1-9.3Diesel oil, see Gas/diesel oilDisablement benefits, 10.4, 10.5,
10.15, 10.18Diseases:
deaths from, 9.6 industrial, 9.8, 9.9 notification, 9.7
Distribution, hotels and catering repairs: employment, 7.5 gross value added, 16.4-16.5
Divorce: by age, 5.13 proceedings, 5.14
Doctors: numbers on list, 9.1-9.5 patients per doctor, 9.1-9.3 payments to, 9.1-9.3
Domestic premises: noise from, 13.21Domestic tourism, 12.6Drink industry, see Food, drink and
tobacco industryDriving licences, 15.11Driving test pass rates, 15.10

452
Index
Drug offences: persons found guilty, 11.4, 11.5,
11.14 persons serving sentences, 11.8,
11.11 recorded, 11.3, 11.13, 11.20
Drunk driving, 11.13, 11.14Drunkenness, 11.4, 11.5, 11.13, 11.14Durable goods, 8.5, 16.14-16.15 Dwellings:
gains and losses, 14.4 stock of, 14.1, 14.4
Dysentery: notifications, 9.7
E
Earnings: average, 7.20-7.23 agricultural workers, 21.11, 21.12
Earth-moving machinery: manufacturers’ sales, 22.2
Economic activity, 7.16Economic inactivity, 7.17-7.18Education, see also Schools, Students,
Teachers, Higher Education, Universities, 6.1-6.11 average earnings, 7.20, 7.23 employment, 7.5 government expenditure 10.20,
18.13, 18.15, 18.17 grants to, 18.19 gross value added by industry, 16.4-
16.5 higher and further, 6.1, 6.6-6.10 labour disputes, 7.19 nursery, 6.1, 6.3, 6.11 primary and secondary, 6.1-6.5,
6.11 pupils' qualifications, 6.5
Eggs: output, 21.1, 21.2 prices, 17.8, 17.9 sales, 21.7
Elections, Devolved assembly, 2.3, 2.4 Parliamentary: by-elections, 2.2 electorate, 2.1 General elections, 2.1
Electrical appliances: manufacturers’ sales, 22.22
Electrical and electronic engineering: employment, 7.5 expenditure on research and
development, 20.4 manufacturers’ sales, 22.2 producer price index, 17.2 production, 22.1 size of units, 22.3
Electrical machinery: exports, 19.3 imports, 19.4 manufacturers’ sales, 22.2
Electricity: capacity of generating plant, 22.9 consumption, production and sales,
22.8Electronics equipment:
manufacturers’ sales, 22.2Emigration, 5.7, 5.8Employers and self-employed, 7.2, 7.4Employment see also individual
industries, 7.1-7.5 agricultural, 21.13 by age, 7.3 by industry, 7.5 Civil Service, 7.8 International comparisons, 7.7 occupational analysis, 7.5 self-employment, 7.2, 7.4 status, 7.2 units by size, 22.3
Energy, 22.4-22.13 consumption, 22.5 used in agriculture, price, 17.7
Energy and water supply industry: average earnings, 7.20, 7.23 bank lending, 23.4 employees, 7.5 household expenditure, 16.15-
16.17 injuries to workers, 9.10 producer price index, 17.1 water industry expenditure, 13.14
Energy consumption: total inland, 22.5Engineering: total turnover, 22.23Entertainments: expenditure on, 16.17Ethnic group, 5.6Exchange rates, 23.10, 23.21Exchequer, see Consolidated Fund and
National Loans FundExpectation of life, 5.22Expenditure and Food Survey:
food consumption, 21.16 households and their expenditure,
8.4 household durable goods, 8.5 sources of household income, 8.3
Expenditure: by Department for Culture, Media
and Sport, 12.1 by households, 8.4 by Government, 10.20 - 10.25 on penal establishments, 11.19on prisons, 11.12
Exports: balance of payments, 19.9 basic materials, 19.3 basic metals 19.2 by commodity, 19.3 by destination, 19.5 food, beverages and tobacco, 19.2,
19.3 manufactured goods, 19.3 mineral fuels and lubricants, 19.2,
19.3 sales and import penetration, 19.2 value, 19.1
External trade, 19.1-19.8
F
Family Credit, 10.4, 10.5, 10.10, 10.24Family health services:
England and Wales, 9.1 Great Britain, 9.5
Feedstuffs: agricultural input, 21.1, 21.2 prices, 17.7
Ferry traffic, 15.30Fertilisers:
agricultural input, 21.1, 21.2 prices, 17.7 production and deliveries, 22.18
Fertility statistics, 5.15-5.17Films, 12.5Finance houses, 23.14Fines:
imprisoned due to default, 11.10, 11.18, 11.24
sentenced, 11.8, 11.16, 11.23Fire clay: production, 22.19Fire engines: licences current, 15.13Fish:
landings, 21.14Fishery protection, 4.11Fishing industry, 21.14, 21.15
average earnings, 7.20, 7.23 employment, 7.5 gross domestic produce, 21.14 size of fleet, 21.15
Flowers and plants:

453
Index
agricultural output, 21.1, 21.2 prices, 17.8
Fodder crops: area, 21.3 harvested, 21.4
Food: catering, allied trades, 24.4 Consumer Prices Index, 17.4 consumption, 21.16 exports, 19.3 household expenditure, 16.14-
16.17 imports, 19.4 index of producer prices, 17.8 producers of organic livestock, 21.9 Retail Prices Index, 17.5 retail trade, 24.1, 24.2 sales of agricultural produce, 21.7
Food, drink, and tobacco industry: census of production, 22.1 employment, 7.5 average earnings, 7.23 size of establishments, 22.3
Food poisoning, notifications, 9.7Food processing:
machinery manufacturers’ sales, 22.2Footwear, see Clothing and footwearForces, see Army, Royal Air Force, Royal Navy and Royal MarinesForeign trade:
imports and exports, 19.1-19.8 seaborne trade, 15.29
Foreign visitors, see MigrationForest area, 21.6Forestry industry, 21.6Fraud and forgery, 11.3-11.5, 11.11,
11.13, 11.14, 11.20-11.22 Freight transport see also Goods
transport, 15.3, 15.18, 15.19, 15.21Fresh fruit: producer price, 17.8Fruit:
agricultural output, 21.1, 21.2 area, 21.3 commodity prices, 17.9 organic, 21.10
Fuel and power: Consumer Prices Index, 17.4 household expenditure, 16.14 Retail Price Index, 17.5
Fuel consumption: by class of consumer, 22.5 by type of fuel, 22.6- 22.8
Fuel oil: deliveries, 22.13 outputs, 22.12
Furniture industry, see Timber and wooden furniture industries
Further education, 6.1, 6.6-6.7
G
Gambling, 12.10Gas:
census of production, 22.1 gross value added 16.4, 16.5 production, sales, 22.7remaining reserves, 13.18
Gas/diesel oil: deliveries, 22.13 extraction, 22.7 output, 22.12
General health services in N. Ireland, 9.3
Glass industry, 22.2Glass recycling, 13.20Goats, organic, 21.8Goods transport:
railway, 15.3, 15.21 road, 15.3, 15.18, 15.19 water, 15.3
Goods vehicles: licences current, 15.8, 15.13 registrations, 15.9, 15.14
Government: consolidated fund assets and liabilities, 18.7 exchequer financing, 18.4, 18.5 overseas trade, 19.8revenues from environmental tax,
13.1 securities, 23.1
Government expenditure: education, 10.20,10.21 housing, 10.20 National Health Service, 10.20,
10.22 research and development, 20.2-
20.3 school meals, 10.21 social security benefits, 10.4, 10.5,
10.24 social services, 10.20, 10.23 welfare services, 10.20, 10.23
Grants of settlement, 5.10Grass:
acreage, 21.3
harvest, 21.4Gravel and sand: production, 22.19Greenhouse gases: emissions, 13.2,
13.3, 13.5Gross Domestic Product (GDP), 16.1-
16.3Gross National Index (GNI), 16.1-16.3Gross public expenditure on aid (UK),
3.1Gross public expenditure on aid (Total
bilateral, by main recipient countries and regions) 3.2
Guardians’ allowances, 10.1, 10.4Gypsum: production, 22.19
H
Hay: harvested, 21.4Health, 9.1-9.10. see also National
Health Service, 9.1-9.10 average earnings, 7.20, 7.23 central government expenditure,
10.20, 10.22, 10.24 employment, 7.5 grants to local authorities, 18.15,
18.18, 18.9 labour disputes, 7.19 local authority expenditure, 10.20,
18.13-18.17, 18.20Heart disease: deaths from: 9.6Heavy goods vehicles: registrations,
15.9Herbs: organic, 21.10Higher education: 6.8-6.10
courses taken, 6.9 degrees and diplomas obtained,
6.10 expenditure on Research and
Development, 20.1, 20.2 government expenditure, 10.20 National Diplomas/Certificates, 6.10 students, 6.8-6.9
Hire purchase and loans, 23.14HM Forces, see Army, Royal Air Force,
Royal Navy and Royal MarinesHolidays, 12.6-12.8Home population, 5.1, 5.3, 5.5 Hops:
agricultural output, 21.1, 21.2 area, 21.3 harvested, 21.4 prices, 17.9
Horticultural crops: land use, 21.3Hospitals: services, 9.1-9.5, 10.22

454
Index
Hotels and motels, 24.4 employment, 7.5
Hours worked, 7.6, 7.20, 7.21, 7.25Housebreaking offences, 11.13Housebuilding completions, 14.5Household goods:
Consumer Prices Index, 17.4 household expenditure, 16.15 Retail Prices Index, 17.5 retail trade, 24.1, 24.2
Households: average incomes, 8.2 expenditure, 8.5, 16.14-16.17 food consumption, 21.16 in temporary accommodation, 14.9recycling, 13.20 source of income, 8.3
Housing: Benefit, 10.5 central government expenditure,
10.20, 10.24 Consumer Prices Index, 17.4 dwellings completed, 14.3 grants to local authorities, 18.18,
18.19 homeless households, 14.9 household expenditure, 16.16,
16.17 local authority expenditure, 10.20,
10.24, 18.13, 18.15, 18.17, 18.20
mortgages, 14.6 Retail Prices Index, 17.5 stock of dwellings, 14.1 tenure, 14.2
Hypertensive disease: deaths from, 9.6
I
Igneous rock: production, 22.19 IMF, official financing, 19.9Immigration, 5.8, 5.9
grants for settlement by nationality, 5.10
Imports: analysis by source, 19.6
balance of payments, 19.1, 19.9, 19.10
by commodity, 19.4 food, beverages and tobacco, 19.4 manufactured goods, 19.4 mineral fuels and lubricants, 19.4 penetration and export sales, 19.2
Imprisonment, 11.8, 11.9
Incapacity benefit, 10.1, 10.4, 10.5, 10.7, 10.8, 10.24
Income: before and after tax, 8.1 GDP, income based, 16.2 local authorities, 18.13-18.16,
18.18, 18.19national, 16.2 of households, 8.2, 8.3 personal, 16.2
Income support, 10.4, 10.5, 10.6, 10.16, 10.18, 10.24
Income tax: allowances, 18.9 personal incomes before and after,
8.1 rates, 18.10Index number of:
agricultural prices, 17.7, 17.8 average earnings, 7.22, 7.23 Consumer Prices Index, 17.4 Gross Domestic Product (GDP), 16.1 Gross National Index (GNI), 16.1 producer prices, 17.1-17.7 retail prices, 17.5 retail trade sales, 24.2 tax and price, 17.6
Indictable offences: juveniles found guilty, 11.22 offenders cautioned, 11.5, 11.7 offenders found guilty, 11.4, 11.6,
11.21, 11.22 sentence or order, 11.8
Industrial: deaths from accidents, 9.10 disablement pensions, 10.4, 10.5 diseases, 9.8, 9.9 injuries benefit, 10.4, 10.24 premises, noise from, 13.21 production, index of 22.1 spirit: deliveries, 22.13 output, 22.12 stoppages, 7.19
Infant mortality, 5.20Infectious diseases:
deaths from, 9.6 notifications, 9.7
Influenza: deaths from, 9.6Insolvencies:
company, 23.19 individual, 23.18
Instrument engineering: units by size, 22.3
Insurance, see also National Insurance, 23.17
Insurance companies balance sheet, 23.17
International development: 3.1, 3.2International tourism, 12.7Intoxication offences, 11.4, 11.5Invalidity benefits, 10.4, 10.7, 10.8,
10.24Investment overseas, 19.13-19.18Investment trusts, 23.15Iron and steel:
exports, 22.14 furnaces, 22.15 imports, 22.14 industry, fuel consumption, 22.5,
22.7 production, 22.14-22.16 scrap, 22.15 supplies, deliveries and stocks,
22.14
J
Jobseeker's Allowance, 10.1, 10.4, 10.5, 10.6, 10.24
K
Kerosene: deliveries, 22.13 output, 22.12
L
Labour disputes, 7.19Labour force, 7.1Lamps, electric: manufacturers’ sales,
22.2Land:
area, 1.1 held by Ministry of Defence, 4.7 organic, 21.9, 21.10
Law enforcement, 11.1-11.24Lead:
production, consumption and stocks, 22.17
Leather and leather goods: census of production, 22.1 employment, 7.5 size of establishments, 22.3
Leisure activities, 12.9Letter post, 15.31Leukaemia: deaths from, 9.6

455
Index
Liabilities: foreign currency, 23.3 sterling, 23.3
Licences: driving, 15.11 television, 15.31 vehicle, 15.8, 15.13
Life assurance: industrial business, 23.17 market value of insurance
companies, 23.17Life tables, 5.22Light rail: transport, 15.20Limestone: production, 22.19Liquidations, 23.19Livestock:
agricultural input and output, 21.1, 21.2
on agricultural holdings, 21.5 organic, 21.8, 21.9 prices, 17.8 purchase for slaughter, 21.7
Local authorities: education, 10.21 expenditure on housing, 10.20,
10.25 expenditure on the National Health
Service, 10.20, 10.22 grants by central government,
18.20 income and expenditure, 18.13-
18.20 loan debt, 18.12 persons employed, 7.8 sales and transfers of
dwellings, 14.8 social services expenditure, 10.20,
10.23 welfare services expenditure, 10.23Locomotives: railway, Northern Ireland,
15.22London Regional Transport, 15.15,
15.16, 15.20Lubricating oil:
deliveries, 22.13 output, 22.12
Lung disease: deaths, 9.9
M
Machinery: exports, 19.3 imports, 19.2, 19.4 manufacture, 22.24 manufacturers’ sales, 22.2
Maize: harvested, 21.4
Malicious damage, 11.4Manpower:
armed forces, 4.5, 7.4 Civil Service, 7.8 National Health Service, 9.4, 9.5 number of employees in industry,
7.5Manslaughter, offences, 11.4Manufactured goods:
exports, 19.2, 19.3 imports, 19.2, 19.4 production, 22.24
Manufacturing industries: capital formation, 16.19-16.22 census of production, 22.1 earnings, 7.20-7.23 employment, 7.5 expenditure on research and
development, 20.4 hours worked, 7.20, 7.21 index of average earnings, 7.22,
7.23 index of materials and fuels
purchased, 17.1 injuries to workers, 9.10 labour disputes, 7.19 units by size, 22.3
Marital condition, 5.4 by age and sex, 5.12 status, 5.12
Marriages, 5.12Material flows, 13.22Maternal death rates, 5.20Maternity benefits, 10.1, 10.4, 10.24Measles: notifications of, 9.7Meat:
prices, 17.8, 17.9Mechanical engineering industry:
expenditure on research and development, 20.4
index of average earnings, 7.23 units by size, 22.3
Mechanical handling equipment: manufacturers’ sales, 22.2
Medical services, 9.1-9.5Members of Parliament, elected, 2.1Mental disorders: deaths from, 9.6Metal goods engineering and vehicle
industries: census of production, 22.1 producer price index, 17.1, 17.2 units by size, 22.3
manufacturers’ sales, 22.2Methane, 13.7Midwifery staff, 9.2Migration, 5.2, 5.7-5.9
grants for settlement by nationality, 5.10
by sex, 5.8 citizenship, 5.9
country of last or next residence, 5.9
usual occupation, 5.8Milk:
agricultural output, 21.1, 21.2 prices, 17.8, 17.9 sales, 21.7
Mineral oil and natural gas: extraction of, 22.7
Minerals: production, 22.19Mining and quarrying:
average earnings, 7.20, 7.23 employment, 7.5 injuries to workers, 9.10 waste from, 13.17
Mining machinery: manufacturers’ sales, 22.2
Mobility allowance, 10.4, 10.24Money and bill rates, 23.9Money stock, 23.6, 23.7Mortality tables, 5.19Mortgages, 14.6Motor cycles:
licences current, 15.8, 15.13 new registrations, 15.9, 15.14
Motoring offences: called for trial, 11.14 recorded by police (Scotland), 11.13 offenders found guilty, 11.4 offenders cautioned, 11.5
Motor spirit: deliveries, 22.13 output, 22.12
Motor trades: commodity sales, 24.3Motor vehicles:
employment, 7.5 household expenditure, 16.16 licenced, 15.8, 15.13 production (cars), 22.25 registrations, 15.9, 15.14 repairs and servicing, 24.3
Motorways: length of, 15.6 vehicle traffic, 15.5
Municipal waste, 13.19Murder: persons found guilty, 11.4, 11.14

456
Index
Musculo-skeletal diseases: deaths from, 9.6
N
National accounts, 16.1-16.22National debt:
borrowing and repayment, 18.6 nominal amount outstanding, 18.3,
18.7National Health Service, 9.1-9.5,
10.22, National insurance, 10.1, 10.2, 10.3,
10.24National Loans Fund:
assets and liabilities, 18.7 receipts and payments, 18.4
National Lottery, 12.10National Rail see Rail transport and
RailwaysNatural gas, see GasNeoplasms: deaths from, 9.6Nickel: production, 22.17Nitrogen: production and deliveries,
22.18Nitrogen oxides: emissions, 13.5Nitrous oxide: total emissions, 13.8Noise: incidents received, 13.21Non-contributory benefits:
expenditure, 10.24Nuclear energy, 22.8-22.10Nursery schools, 6.1, 6.3, 6.11Nursing staff in hospital, 9.2-9.4
O
Oats: agricultural output, 21.1, 21.2 area, 21.3 harvested, 21.4 prices, 17.7-17.9 sales, 21.7
Occupation see EmploymentOffences, recorded, 11.3, 11.13, 11.20Offenders:
by age, 11.6, 11.17 cautioned, 11.5, 11.7 found guilty, 11.4, 11.6, 11.16,
11.17, 11.21, 11.22 sentenced, 11.8, 11.9, 11.23
Office machinery and data processing equipment: producer price index, 17.1, 17.2
Official reserves, 19.9Oil refining, 22.11, 22.12
Oils and fats: exports, 19.3 imports, 19.4 remaining reserves, 13.18
Oilseeds and nuts: agricultural output, 21.1, 21.2 harvested, 21.4
Opencast coal production, 22.6Ophthalmic services, 9.1-9.5Overseas:
aid, 3.1, 3.2 trade in services, 19.8
P
Packaging products: manufacturers’ sales, 22.2
Paper, printing and publishing: census of production, 22.1 employment, 7.5 exports, 19.2, 19.3 imports, 19.4 producer price index, 17.1, 17.2 recycling, 13.20 size of establishments, 22.3
Passenger cars, 22.25Passenger movement, 15.4Pasture: organic, 21.10Peas for stockfeed:
agricultural output, 21.1, 21.2 harvested, 21.4
Pedal cycles, see Cycles, pedalPensioners:
estimated number, 10.5, 10.14 pensions, 10.1, 10.4, 10.5, 10.14,
10.15, 10.24Pensions:
credits, 10.17, 10.19 disablement, 10.4, 10.5 fund assets, 23.16 government expenditure, 10.24 retirement, 10.1, 10.4, 10.5, 10.14,
10.24 war, 10.4, 10.5, 10.15, 10.24 widow's, 10.1, 10.4, 10.5, 10.12,
10.15Personal income, expenditure and
wealth, 8.1-8.5Personal social services: work force, 9.5Pesticides, agricultural input, 21.1,
21.2Petrol, see Motor spiritPetroleum:
consumption for fuel, 22.5
exports, 19.3 imports, 19.4 output, 22.12 retail sales, 24.3
Petroleum products: deliveries of, 22.13 output, 22.12
Petroleum coke: deliveries, 22.13 output, 22.12
Pharmaceutical services, 9.1-9.3Phosphate: production and deliveries,
22.18Photographic equipment:
manufacturers’ sales, 22.2Pig iron:
consumption, 22.15 production, 22.15
Pigs: agricultural output, 21.1, 21.2 on agricultural holdings, 21.5 organic, 21.8 prices, 17.7-17.9 sales, 21.7
Pipelines, goods transport, 15.3Plastics recycling, 13.20PM10 emissions, 13.2, 13.5Pneumonia: deaths from, 9.6Police:
establishment and strength, 11.1 expenditure of local authorities,
18.13, 18.15, 18.17 Population and vital statistics, 5.1-5.23
age and sex distribution, 5.1, 5.3 census based, 5.1, 5.4, 5.5 cities, 5.5 changes in, 5.2 electorate, 2.1 ethnic group, 5.6 life tables, 5.22 mid-year estimates, 5.1, 5.3, 5.5 migration, 5.2, 5.7-5.9 projections, 5.1, 5.3 regional distribution, 5.5 summary, 5.1 working, 7.1-7.5
Postal and postal order services, 15.31Postgraduate awards, 6.10Potash: deliveries, 22.18Potatoes:
agricultural output, 21.1, 21.2 area, 21.3 harvested, 21.4

457
Index
prices, 17.8, 17.9 sales, 21.7
Poultry: agricultural output, 21.1, 21.2 on agricultural holdings, 21.5 organic, 21.8 prices, 17.7-17.9 sales, 21.7
Pregnancy complications, deaths from, 9.6
Prescriptions: cost, 9.1-9.3 dispensed, 9.1-9.3
Prices, 17.1-17.9Prices:
agricultural, 17.7-17.9 Consumer Prices Index, 17.4 producer, 17.1, 17.2 Retail Prices Index, 17.5tax and price index, 17.6
Primary care services, in Scotland, 9.2Primary fuels, 22.4Primary schools, 6.1, 6.4Printing industry, see Paper, printing
and publishingPrisons:
expenditure on, 11.12, 11.19 persons sentenced to, 11.8, 11.9,
11.16, 11.23 receptions and population, 11.2,
11.10, 11.11, 11.18, 11.24Private sector liquidity, 23.7Probation, 11.16Producer price index, 17.1, 17.2Producers: organic, 21.8, 21.9Production, 22.1 - 22.27
average earnings, 7.21, 7.23Production: Census of, 22.1Propane:
deliveries, 22.13 output, 22.12
Property income: from abroad (net), 16.1
Public administration: average earnings, 7.20, 7.23 employment, 7.5, 7.8 labour disputes, 7.19
Public sector: debt, 18.3 net cash requirement, 18.1, 18.2,
23.6Publishing industry, see Paper, printing
and publishing
Pupils: in schools, 6.2-6.4Purchasing power of the pound, 17.3
Q
Qualification obtained: by age, 6.5 by higher education students, 6.10
Quarrying, see Clay, Stone and slate production
R
Radio and electronic goods: manufacturers’ sales, 22.2
Rail transport, 15.4, 15.20-15.23Railways:
fatal injuries, 9.10 fuel consumption, 22.5 goods traffic, 15.3, 15.21 London Regional Transport, 15.20 offences, 11.4 passenger transport 15.4, 15.20 permanent way, 15.20, 15.22 stations, 15.20
Rainfall, 13.9Rateable values, 18.11Rates (Scotland):
local authorities’ income from, 18.18
rebate grant, 18.18Recorded crime statistics:
England and Wales, 11.3 Northern Ireland, 11.20 Scotland, 11.13
Recycling of selected materials, 13.20Refinery fuel, 22.11, 22.12Refinery receipts, 22.11Refrigerating machinery: manufacture
of, 22.2Regional statistics:
area, 5.5 organic land use, 21.9, 21.10 population, 5.5 unemployment, 7.13-7.15
Rent: corporate income of central
government, 16.8 imputed - of owner-occupied
dwellings, 16.5 local authorities, 18.15, 18.18
Research and development, 20.1-20.5 analysis by sector, 20.1 expenditure by industry, 20.4, 20.5 government expenditure, 20.2, 20.3
Reservoir stocks: water, 13.13Restaurants and cafes, 24.4Retail Prices Index, 17.5Retail trade:
average earnings, 7.20, 7.23 turnover, 24.1 value of sales, 24.2 volume index numbers, 24.2
Retirement pensions, 10.1, 10.4, 10.5, 10.12, 10.24
Revenue: central government, 18.4, 18.5 local authorities, 18.13-18.15,
18.18, 18.19Rivers: biological and chemical quality,
13.11, 13.12Road transport, 15.1-15.19Road transport pollutants, 13.5Roads:
casualties, 15.17 goods transported by 15.3, 15.18,
15.19 length of, 15.6 traffic on, 15.7, 15.5 traffic noise, 13.21
Robbery, 11.3.11.4, 11.11, 11.13, 11.14, 11.20-11.22
Rolling stock: railway (Northern Ireland), 15.22
Roofing tiles, production, 22.20Royal Air Force, Royal Navy and Royal
Marines: cadet forces, 4.5 civilian manpower, 4.6 deaths, 4.9 deployment of, 4.8 HM Forces employment, 7.4 fishery protection, 4.11 formation, 4.3 medical staff, 4.10 outflow, 4.4 recruitment, 4.2 regular reserves, 4.5 search and rescue operations, 4.11 strength, 4.5 volunteer reserves and auxiliary
forces, 4.5Rural districts:
area, 5.5 population, 5.5
Rye (grain): acreage, 21.3 harvested, 21.4
458
Index
S
Sales: manufacturers by industry, 22.2Salt: production, 22.19Sand:
building and concreting, 22.20 industrial, 22.19
Sandstone: production, 22.19Scarlet fever: notifications of, 9.7Schools:
government expenditure on meals, 10.21
number of, by type, 6.1 pupils:
by age and sex, 6.2by school type, 6.3special educational needs, 6.4
pupil/teacher ratios, 6.3 special, 6.4 teachers in, 6.3, 6.11
Sea transport: balance of payments, 19.9 goods transport, 15.3, 15.29
Seaport traffic, 15.29, 15.30Search and rescue operations: by
Services, 4.11Securities:
government and government guaranteed, 18.8
prices, 23.21Seeds:
agricultural input and output, 21.1, 21.2
index of purchase price, 17.7Self-employed, 7.2, 7.4Services:
supplied and purchased, 19.7 overseas trade, 19.8
Sewage: disposal, 13.14
Sexual offences, 11.3-11.5, 11.11, 11.13, 11.14, 11.20-11.22
Sheep and lambs: agricultural output, 21.1, 21.2
on agricultural holdings, 21.5 organic, 21.8 prices, 17.7, 17.8 sales, 21.7
Sickness benefit, 10.5, 10.7, 10.8, 10.24
Slate: production, 22.19, 22.20Social conditions, 10.1- 10.24Social services:
expenditure on, 10.23 workforce, 9.5
Social security benefits: expenditure on, 10.20, 10.24
Solid fuels, see Coal, Coal extraction and solid fuels
Space research: central government expenditure on, 20.4
Spectacles: supplied, 9.1-9.3Spirit, industrial and white:
deliveries, 22.13 output, 22.12
Spirits, alcoholic: production and consumption, 22.26
Stateless persons, 5.11Steel, see Iron and steelStillbirths, 5.20Stock of dwellings, 14.1Stone and slate:
production, 22.19, 22.20Strikes, 7.19Students:
further education, 6.6, 6.7 higher education, 6.8, 6.9 qualifications, 6.5, 6.10
Subsidies, 16.1, Sugar beet:
area, 21.3 agricultural output, 21.1, 21.2 harvested, 21.4 prices, 17.8
Suicide: deaths by, 9.6Sulphur dioxide, 13.4Summary offences:
offenders cautioned, 11.5, 11.7 offenders found guilty, 11.4, 11.6,
11.21, 11.22Suspended sentences, 11.8, 11.23
T
Take-away food shops, 24.4Tax and price index, 17.6Taxes:
on expenditure, 16.8, 16.9 on income, 16.9, 16.11 paid by UK residents, 18.5 total income before and after, 8.1
Taxis: licences current, 15.13 new registrations, 15.9, 15.14 traffic on road, 15.5, 15.7
Teachers: full-time, 6.3, 6.11
part-time, 6.11 pupils per, 6.3
Television: licences, 15.31 manufacture of, 22.2
Temporary accommodation: homeless households, 14.9
Tenure of accommodation, 14.2Textile industry:
administrative, technical and clerical employees:
employment, 7.5exports, 19.2, 19.3imports, 19.2, 19.4index of average earnings, 7.23producer price index numbers,
17.1-17.2units by size, 22.3
Textile machinery: manufacture of, 22.2
Theft, 11.3-11.5, 11.11, 11.13, 11.14, 11.20-11.22
Tiles: production, 22.20Timber and wooden furniture
industries: producer price index, 17.1, 17.2 units by size, 22.3 wood production, 21.6
Tin: exports, 22.17
production, consumption and stocks, 22.17
Tobacco: clearances and stocks, 22.27 Consumer Prices Index, 17.4 household expenditure,
16.14-16.16 Retail Prices Index, 17.5
Tobacco industry, see Food, drink and tobacco industry
Tourism: domestic, 12.6 employment in, 12.2 international, 12.7
Tourist: expenditure in United Kingdom,
12.7Tractors, agricultural:
licences current, 15.8, 15.13 registrations, 15.9, 15.14 manufacturers’ sales, 22.2
Trade, external:balance of payments, 19.9-19.12value, 19.1-19.8

459
Index
Trade unions, 7.26Traffic accidents: deaths and injuries,
15.17Traffic offences:
persons found guilty, 11.4, 11.21, 11.22
recorded by the police, 11.13Trams: passenger transport, 15.20Transactions:
Financial, 23.20Transport and communications,
15.1-15.31Transport:
air, 15.24-15.28 cost, 15.2 employment, 7.5 goods, 15.3 local authority expenditure and
receipts, 18.15, 18.17 passenger, 15.4 rail, 15.20-15.23 road, 15.6-15.19 sea, 15.29 shipping, 15.29, 15.30
Transport industry, see Motor vehiclesTravel:
balance of payments, 19.9, 19.10 household expenditure, 16.16,
16.17 passenger movement, 15.1
Trawler fleet, 21.15Treasury bills:
assets, 23.3 increase in, 18.5 outstanding, 18.7
Trips, 15.1, 12.6Tuberculosis:
deaths from, 9.6 notifications, 9.7
Turbines:, manufacture of 22.2Typhoid fever: notifications, 9.7
U
Unemployment: 7.1, 7.4, 7.7, 7.9-7.15Unemployment benefit (Jobseeker’s
allowance), 10.1, 10.4, 10.5, 10.6, 10.24
Unit trusts: 23.20 assets, 23.16
Universities: government expenditure, 10.21 numbers, 6.1
Urban districts:
area, 5.5 population, 5.5
V
Vagrancy offences, 11.4, 11.5Vandalism, see also Criminal damage,
11.13Veal: production, 21.9Vegetables:
agricultural output, 21.1, 21.2 area, 21.3 harvested, 21.4 organic, 21.10 prices, 17.8, 17.9
Vehicles, see Motor vehiclesVehicles, machinery and equipment in
streets: noise from, 13.21Veterinary services: prices, 17.7Video rental, 12.5Violence against the person:
offence recorded, 11.3, 11.13, 11.20
offenders cautioned, 11.5 offenders found guilty, 11.4, 11.21,
11.22 prison population serving sentences,
11.11Vital statistics, see also Population birth rates, 5.15 outside marriage births, 5.16 death rates:
infant, 5.20maternal, 5.20
deaths:by age and sex, 5.19by cause, 9.6
divorce, 5.13, 5.14 life tables, 5.22 marital condition, 5.4 marriages, 5.12 still-births, 5.15
W
War pensions, 10.4, 10.5, 10.15, 10.24
Waste material: disposal, 13.19 recycled, 13.20
Watches: manufacture of 22.2Water:
abstractions, 13.17 household expenditure, 16.16 industry expenditure, 13.14
inland area, 1.1 goods transport, 15.3 pollution incidents, 13.15 reservoir stocks, 13.13
Water supply industry, see Energy and water supply industry
Weather, 13.10Welfare services: government
expenditure, 10.20, 10.23Wheat:
agricultural output, 21.1, 21.2 area, 21.3 harvested, 21.4 milled:
prices, 17.7-17.9sales, 21.7
White spirit: deliveries, 22.13 output, 22.12
Whooping cough: notifications of, 9.7Widow's pension and benefits, 10.1,
10.4, 10.5, 10.14, 10.15, 10.24Wine consumption, 22.26Women’s Forces:
outflow, 4.4 recruitment, 4.2
Woodland area, 21.6, 21.10Wood production, 21.6Wool:
agricultural output, 21.1, 21.2 prices, 17.8, 17.9
Work related diseases, Workers see EmploymentWorking Family Tax Credit, 10.10Working population, 7.1-7.4Working Tax Credit awards, 10.11Wounding offences, 11.4, 11.5
Y
Youth custody, 11.10, 11.16-11.18, 11.23, 11.24
Z
Zero coupon yields, 23.11Zinc:
production, consumption and stocks, 22.17

Annual Abstract Navigation Instructions
Overview
This PDF file of the Annual Abstract has been created from the pages of the book. These brief instructions will help you find your way around the electronic
publication.
Navigation
The PDF file has a ‘bookmarks’ panel down the left hand side, which allows you to jump from one section to another. The main chapters have lower levels of
bookmarks enabling you to jump to the tables and explanatory text contained in each chapter. You can show and hide the bookmarks panel using the Show/
Hide Navigation Pane toolbar to the right of the printer icon. Similarly, the contents, sources and index pages are linked to the relevant places in the
publication.
In the contents pages, clicking on a chapter or table number/ title will take you to the associated place in the file. If you are unsure whether a particular item is
in the publication, the index at the back of the file can be visited.
Searching
The first large binoculars (find) button at the top of the screen will do a simple search on a word in the current document. To see if the word appears again in
the publication click again on the binoculars button.
Spreadsheets
Clicking anywhere on a table number, table title or the main body of a table will launch an Excel file. A number of the tables in this pdf document are spread
over more than page. Efforts have been made to combine these into a single worksheet in each of the corresponding Excel files. Where this has not been
possible, as where units or periodicity differ from page to page, each page has been accorded its own separate worksheet within the same Excel file. The
worksheet tabs and the instructions appearing in red at the top of the affected tables indicate how each has been treated. To permit the data in the Excel
spreadsheets to be used in calculations, it has also been necessary to remove “flags” and footnote indicators from the numbers in the files.
In the event of differences between the data appearing in the Excel files and those presented in the corresponding pdf tables, the pdf versions are to be
regarded as definitive.
Index
Clicking on an index entry will take you automatically to the relevant table.
Screen Resolution
Adobe Acrobat works with any screen resolution. For this product 800x600 is acceptable, but 1024x768 works better if the monitor and graphics card will
support it. To change the view type to one which best suits your screen, use the View menu.
Other
If the text looks blurry on screen, this may be improved by visiting File Menu, Preferences, General and switching ‘Smooth Text and Monochrome images’ off.