Embed Size (px)
Citation preview
Monthly Digest of Statistics
Editor: Michael Crawley
London: TSO
MayNo 689
2003
© Crown copyright 2003Published with the permission of the Office for NationalStatistics on behalf of the Controller of Her Majesty’sStationery Office
ISBN 0116216212ISSN 0308 6666
Applications for reproduction should be submitted to HMSOunder HMSO’s Class Licence:www.clickanduse.hmso.gov.uk
Alternatively applications can be made in writing to:HMSO Licensing DivisionSt Clements House2-16 ColegateNorwich NR3 1BQ
Contact pointsFor enquiries about this publication, contactMichael CrawleyTel: 020 7533 5803E-mail: [email protected]
To order this publication, call TSOon 0870 600 5522. See also back cover.
For general enquiries, contact the National StatisticsPublic Enquiry Service on 0845 601 3034(minicom: 01633 812399)E-mail: [email protected]: 01633 652747Letters: Room 1.001, Government Buildings,Cardiff Road, Newport, NP10 8XG
You can also find National Statistics on the internet -go to www.statistics.gov.uk
About the Office for National StatisticsThe Office for National Statistics (ONS) is the governmentagency responsible for compiling, analysing anddisseminating many of the United Kingdom’s economic,social and demographic statistics, including the retail pricesindex, trade figures and labour market data, as well as theperiodic census of the population and health statistics. TheDirector of ONS is also the National Statistician and theRegistrar General for England and Wales, and the agencythat administers the statutory registration of births,marriages and deaths there.
A National Statistics publicationOfficial statistics bearing the National Statistics logo areproduced to high professional standards set out in theNational Statistics Code of Practice. They undergo regularquality assurance reviews to ensure that they meetcustomer needs. They are produced free from any politicalinterference.
ContentsPage
Units of measurement viIntroduction 1
Tables1 National accounts
1.1 Gross domestic product and gross national income 31.2 Gross domestic product: by category of expenditure 51.3 Gross domestic product: by category of income 71.4 Index numbers: gross domestic product, at 1995 basic prices: by industry of output 81.5 Households sector: allocation of primary income account 91.6 Households sector: secondary distribution of income account 101.7 Households sector: use of disposable income account 111.8 Household final consumption expenditure 121.9 Change in inventories at constant 1995 prices 14
1.10 Gross fixed capital formation by sector and type of asset 151.11 Business investment by industry at 1995 prices 171.12 Business investment by industry at current prices 181.13 Private sector manufacturing business investment by industry at 1995 prices 191.14 Private sector manufacturing business investment by industry at current prices 201.15 Private sector manufacturing business investment by asset 21
2 Population and vital statistics2.1 Mid-year estimates of resident population 222.2 Age distribution of estimated resident population 22
2.3 Births and marriages 232.4 Deaths registered 23
3 Labour market3.1 Labour market activity 243.2 Distribution of the workforce 243.3 Employee jobs: all industries 253.4 Civil Service staff: analysis by ministerial responsibilities 273.5 Intake and outflow of UK Regular Armed Forces Personnel 273.6 UK armed forces full-time strengths 283.7 Local authority staffing 293.8 Number of workers employed in agriculture 303.9 ILO unemployment in United Kingdom 30
3.10 Claimant count in United Kingdom - by duration 313.11 Claimant count - United Kingdom and Great Britain 323.12 ILO unemployed - by Government Office Regions 333.13 Claimant count - by Government Office Regions 343.14 Vacancies at Jobcentres and career offices - by Government Office Regions 353.15 Labour disputes 36
4 Social services4.1 National insurance and child benefit 374.2 Family Credit/ Working Families' Tax Credit 374.3 Income Support/Jobseeker's Allowance (income based) 384.4 Family health services 38
5 Law enforcement5.1 Recorded crime statistics - England and Wales 395.2 Crimes and offences recorded by the police - Scotland 39
6 Agriculture, food, drinks and tobacco6.1 Land use and crop areas 406.2 Crops: yields and production 406.3 Livestock 416.4 Animals slaughtered and meat produced 416.5 Cereals and cereal products 426.6 Production of compound feedingstuffs 426.7 Potatoes and Sugar 43
iii
Tables Page
6.8 Production of bacon, ham and canned meat and meat stocks in cold storage 436.9 Fish, oils and fats 44
6.10 Milk, milk products and eggs 446.11 Beverages and confectionery 456.12 Tobacco products released for home consumption 456.13 Alcoholic drink 46
7 Production, output and costs7.1 Output of the production industries 477.2 Productivity jobs and output per filled job 527.3 Productivity and unit labour costs 53
8 Energy8.1 Inland energy consumption: primary fuel input basis 548.2 Supply and use of fuels 558.3 Coal supply 578.4 Inland use and stocks of coal 578.5 Natural gas production and supply 588.6 Fuel used and electricity generated by the public supply system 588.7 Sales by the gas and public electricity and supply systems 598.8 Indigenous production, refinery receipts, arrivals and shipments of oil 598.9 Deliveries of petroleum products for inland consumption 60
9 Chemicals9.1 Fertilisers 619.2 Sulphur and sulphuric acid 629.3 Basic chemicals, pesticides and other agro-chemical products 639.4 Pharmaceutical products, soaps and other cleaning preparations and perfumes 639.5 Other chemical products 64
10 Metals, engineering and vehicles10.1 Iron and steel 6510.2 Supplies and deliveries of steel 6510.3 Aluminium 6610.4 Total engineering - total turnover of UK based manufacturers 6710.5 Mechanical, instrument and electrical engineering industries: volume index of turnover 6810.6 Mechanical, instrument and electrical engineering industries: volume index of orders on hand 6810.7 Mechanical, instrument and electrical engineering industries: volume index of net new orders 6910.8 Passenger cars 7010.9 Commercial motor vehicles 70
11 Textiles and other manufactures11.1 Index numbers of textiles and clothing industries 7111.2 Household textiles, non-woven products, canvas and ropes 7211.3 Knitted and crocheted products, lace and narrow fabrics 7211.4 Wearing apparel, dressing and dying of fur, leather clothes 7311.5 Miscellaneous products - goods not classified elsewhere 73
12 Construction12.1 Volume of construction output by all agencies by type of work at constant 1995 prices 7412.2 Value of new orders obtained by contractors for new work at current prices 7412.3 Building materials and components 7512.4 Permanent dwellings started and completed 76
13 Transport13.1 Motor vehicles: new registrations in Great Britain 7813.2 Motor vehicles currently licensed 7813.3 Index numbers of road traffic and goods transport by road 7913.4 Road casualties in Great Britain 7913.5 Local bus services: vehicle kilometres and passenger journeys 8013.6 Local bus services: fare indices 8013.7 National Rail and London Underground 8113.8 National Rail: freight traffic 8113.9 UK airlines: aircraft kilometres flown, passengers and cargo uplifted 82
13.10 Merchant vessels registered in the United Kingdom 8413.11 UK passenger movement by sea and air 8513.12 UK passenger movement by sea and air - analysis of countries of landing and of embarkation 86
Contents
iv
Tables Page
14 Retailing14.1 Index numbers of retail sales 8714.2 Index numbers of retail sales: value of retail sales at current prices 87
15 External trade in goods15.1 Values of United Kingdom total trade in goods 8915.2 Volume and price index numbers 9015.3 United Kingdom trade in goods, by commodity group 9115.4 Volume index numbers, by commodity group 9215.5 Price index numbers, by commodity group 9315.6 United Kingdom exports, by commodity 9415.7 United Kingdom imports, by commodity 9515.8 United Kingdom exports, by area 9615.9 United Kingdom imports, by area 97
15.10 Import penetration and export sales ratios for products of manufacturing industry 98
16 UK Balance of payments16.1 Balance of payments - summary 9916.2 Balance of payments - current account balances 10016.3 Balance of payments - summary of financial account 101
17 Government finance17.1 Public sector finances 10217.2 Central government transactions and fiscal balances 10317.3 Public sector aggregates 10417.4 Selected financial statistics 10517.5 Monetary aggregates 10617.6 Selected interest rates, exchange rates and security prices 106
18 Prices and wages18.1 Retail Prices Index 10718.2 Retail Prices Index - Groups, sub-groups and sections 10818.3 Retail Prices Index (all items) 11018.4 Consumer price indices - international comparisons: EU countries (HICPs) 11118.5 Internal purchasing power of the pound 11118.6 Tax and price index 11218.7 Index numbers of producer prices 11318.8 Average weekly and hourly earnings of full-time employees 11818.9 Average weekly and hourly earnings of full-time employees - by industry division 119
18.10 Average weekly and hourly earnings of full-time employees - by age group 12018.11 Average earnings index: all employee jobs: by industries 12118.12 Average earnings index: all eployees: main industrial sectors 12518.13 Index of purchase prices of the means of agricultural production and of producer prices of
agricultural products 127
19 Leisure19.1 Television licences 12819.2 Overseas travel and tourism: earnings and expenditure 12819.3 GB Cinema exhibitor statistics 129
20 Weather20.1 District summary 130
Index 131
v
Contents
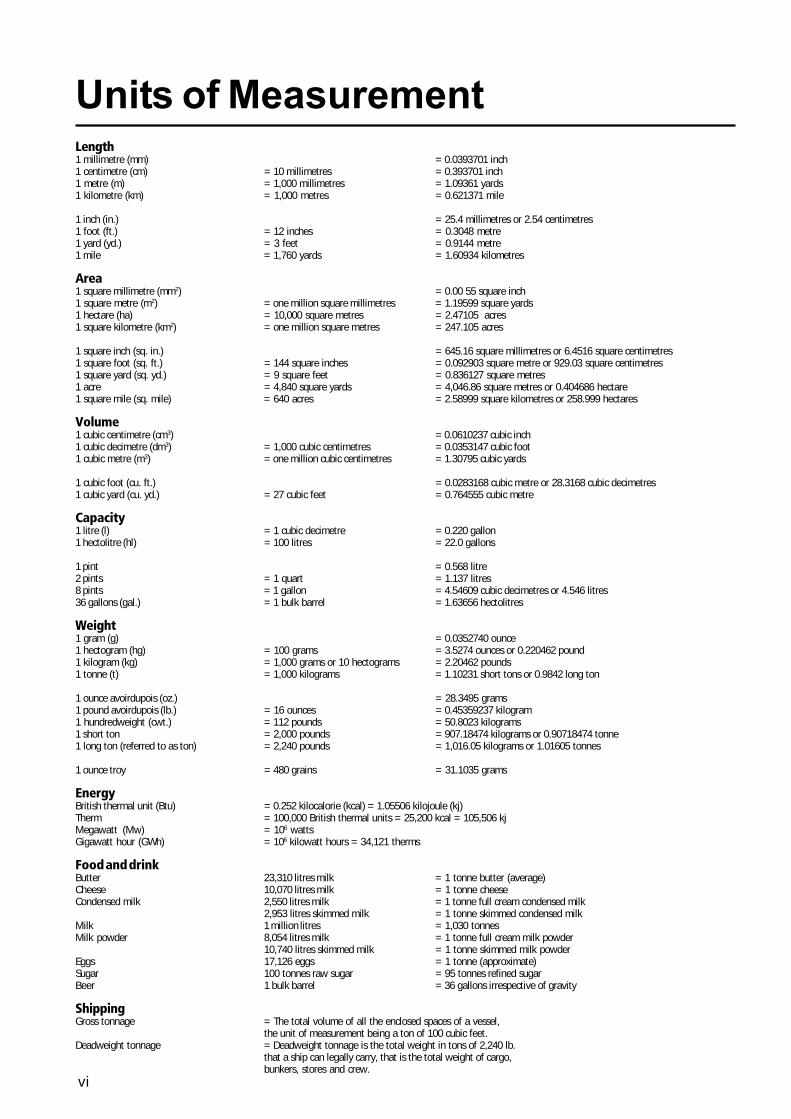
Length1 millimetre (mm) = 0.0393701 inch1 centimetre (cm) = 10 millimetres = 0.393701 inch1 metre (m) = 1,000 millimetres = 1.09361 yards1 kilometre (km) = 1,000 metres = 0.621371 mile
1 inch (in.) = 25.4 millimetres or 2.54 centimetres1 foot (ft.) = 12 inches = 0.3048 metre1 yard (yd.) = 3 feet = 0.9144 metre1 mile = 1,760 yards = 1.60934 kilometres
Area1 square millimetre (mm2) = 0.00 55 square inch1 square metre (m2) = one million square millimetres = 1.19599 square yards1 hectare (ha) = 10,000 square metres = 2.47105 acres1 square kilometre (km2) = one million square metres = 247.105 acres
1 square inch (sq. in.) = 645.16 square millimetres or 6.4516 square centimetres1 square foot (sq. ft.) = 144 square inches = 0.092903 square metre or 929.03 square centimetres1 square yard (sq. yd.) = 9 square feet = 0.836127 square metres1 acre = 4,840 square yards = 4,046.86 square metres or 0.404686 hectare1 square mile (sq. mile) = 640 acres = 2.58999 square kilometres or 258.999 hectares
Volume1 cubic centimetre (cm3) = 0.0610237 cubic inch1 cubic decimetre (dm3) = 1,000 cubic centimetres = 0.0353147 cubic foot1 cubic metre (m3) = one million cubic centimetres = 1.30795 cubic yards
1 cubic foot (cu. ft.) = 0.0283168 cubic metre or 28.3168 cubic decimetres1 cubic yard (cu. yd.) = 27 cubic feet = 0.764555 cubic metre
Capacity1 litre (l) = 1 cubic decimetre = 0.220 gallon1 hectolitre (hl) = 100 litres = 22.0 gallons
1 pint = 0.568 litre2 pints = 1 quart = 1.137 litres8 pints = 1 gallon = 4.54609 cubic decimetres or 4.546 litres36 gallons (gal.) = 1 bulk barrel = 1.63656 hectolitres
Weight1 gram (g) = 0.0352740 ounce1 hectogram (hg) = 100 grams = 3.5274 ounces or 0.220462 pound1 kilogram (kg) = 1,000 grams or 10 hectograms = 2.20462 pounds1 tonne (t) = 1,000 kilograms = 1.10231 short tons or 0.9842 long ton
1 ounce avoirdupois (oz.) = 28.3495 grams1 pound avoirdupois (lb.) = 16 ounces = 0.45359237 kilogram1 hundredweight (cwt.) = 112 pounds = 50.8023 kilograms1 short ton = 2,000 pounds = 907.18474 kilograms or 0.90718474 tonne1 long ton (referred to as ton) = 2,240 pounds = 1,016.05 kilograms or 1.01605 tonnes
1 ounce troy = 480 grains = 31.1035 grams
EnergyBritish thermal unit (Btu) = 0.252 kilocalorie (kcal) = 1.05506 kilojoule (kj)Therm = 100,000 British thermal units = 25,200 kcal = 105,506 kjMegawatt (Mw) = 106 wattsGigawatt hour (GWh) = 106 kilowatt hours = 34,121 therms
Food and drinkButter 23,310 litres milk = 1 tonne butter (average)Cheese 10,070 litres milk = 1 tonne cheeseCondensed milk 2,550 litres milk = 1 tonne full cream condensed milk
2,953 litres skimmed milk = 1 tonne skimmed condensed milkMilk 1 million litres = 1,030 tonnesMilk powder 8,054 litres milk = 1 tonne full cream milk powder
10,740 litres skimmed milk = 1 tonne skimmed milk powderEggs 17,126 eggs = 1 tonne (approximate)Sugar 100 tonnes raw sugar = 95 tonnes refined sugarBeer 1 bulk barrel = 36 gallons irrespective of gravity
ShippingGross tonnage = The total volume of all the enclosed spaces of a vessel,
the unit of measurement being a ton of 100 cubic feet.Deadweight tonnage = Deadweight tonnage is the total weight in tons of 2,240 lb.
that a ship can legally carry, that is the total weight of cargo,bunkers, stores and crew.
Units of Measurement
vi
Symbols and conventions used
Change of basis. Where consecutive figures have beencompiled on different bases and are not strictly comparable, afootnote is added indicating the nature of the difference. Also,a line may be drawn across a column between two consecutivefigures indicating that the figures above and below the linehave been compiled on different bases.
Units of measurement. The various units of measurementused in this digest are listed on the opposite page.
Symbols. The following symbols have been usedthroughout:
.. = not available (also information suppressedto avoid disclosure)
- = nil or less than half the final digit shown† = indicates that the data have been revised
since the last edition: the period marked isthe earliest in the table to have been revised
Also, some tables have symbols specific to them. These will beexplained in the footnotes to those tables.
Rounding of figures. In tables where figures have beenrounded to the nearest final digit, there may be a slightdiscrepancy between the sum of the constituent items and thetotal as shown.
Provisional data
Some figures are provisional and may be subject to revision inlater editions. This applies particularly to data for the mostrecent time periods. Where data has been revised a daggersymbol, as previously mentioned, will appear.
This publication has been prepared by the Office for NationalStatistics (ONS) in collaboration with a number of governmentdepartments and other organisations. The assistance providedby them is gratefully acknowledged.
The name of the department or organisation providing thestatistics is shown under each table, additionally, on sometables this is followed by a contact telephone number.
All the data series published in the Monthly Digest are containedon an ONS database, and nearly all are stored with a four letteridentification code (e.g. ABMZ). These codes appear at the startof columns or rows so that they can be quoted if you contact usrequiring any further information.
The latest Annual Supplement to Monthly Digest was publishedin edition 685. This gives detailed definitions and explanatorynotes. It also provides an index of sources and a breakdown ofthe regional classifications.
Definitions and classifications
The following general definitions should be noted in using theDigest:
Area covered. Except where otherwise stated, all statisticsrelate to the United Kingdom of Great Britain and NorthernIreland.
Seasonality. Except where otherwise stated, all statistics arenot adjusted to take account of seasonal factors.
The UK Standard Industrial Classification 1992 is used in anumber of tables in this digest to split economic activity. Fulldetails are available from UK Standard Industrial Classificationof Economic Activities 1992, and Indexes to the UK StandardIndustrial Classification of Economic Activities 1992, bothpublished by The Stationery Office.
Regional classification is based on the Government OfficeRegions. This has changed from the Standard StatisticalRegions.
Introduction
1
Introduction
2
National Statistics Online:www.statistics.gov.uk
Web-based access to time series, cross sectional data and metadatafrom across the Government Statistical Service (GSS), availableusing the site search and index functions from the homepage.Download many datasets, in whole or in part, or consult directoryinformation for all GSS statistical resources, including censuses,surveys, periodicals and enquiry services. Information is posted asPDF electronic documents or in XLS and CSV formats, compatiblewith most spreadsheet packages.
Time Series DataAccess to around 40,000 time series, of primarily macro-economicdata, drawn from the main tables in a range of our major economicand labour market publications. Download complete releases, orview and download your own customised selection of individual timeseries.
Complete copies of this publication are available to download freeof charge on the following web page.www.statistics.gov.uk/monthlydigest
AcknowledgementsThe Editor would like to thank Jonathan Elphick for his help in producing this book, without which this publication would not be possible.
Contributors
The Editor also wishes to thank all her colleagues in the ONS, the rest of the Government Statistical Service and all contributors inother organisations for their generous support and helpful comments.
3
1 National accounts
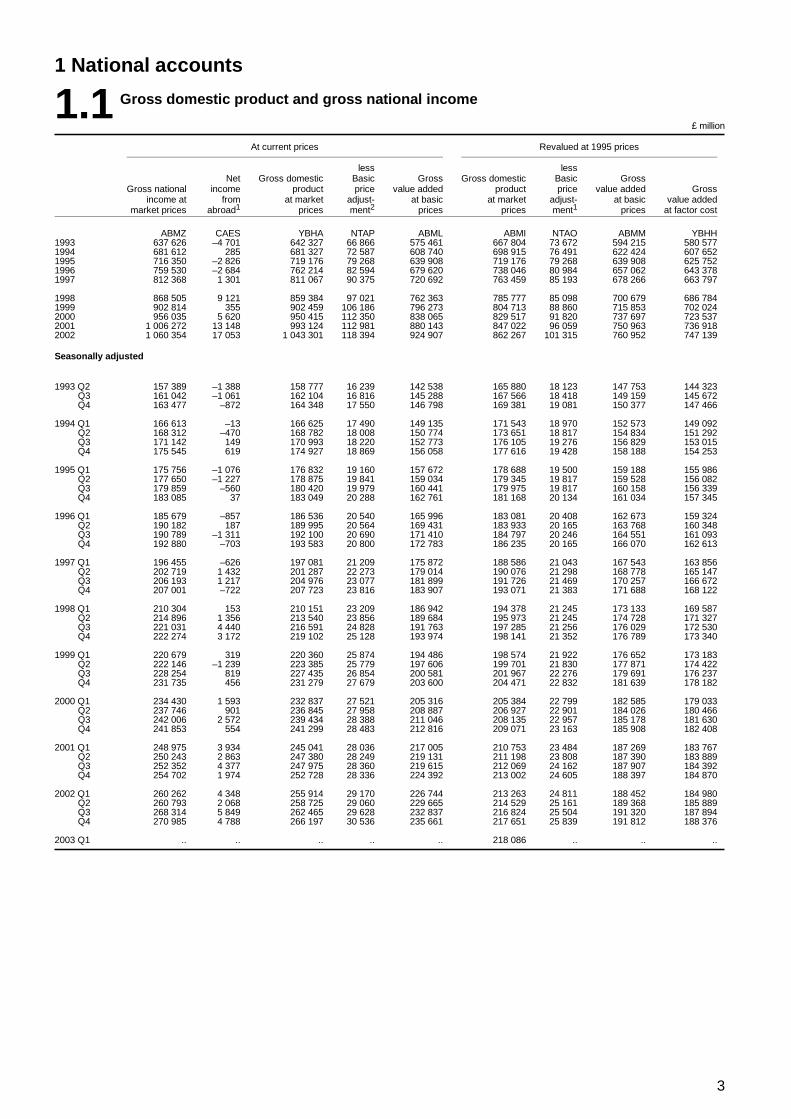
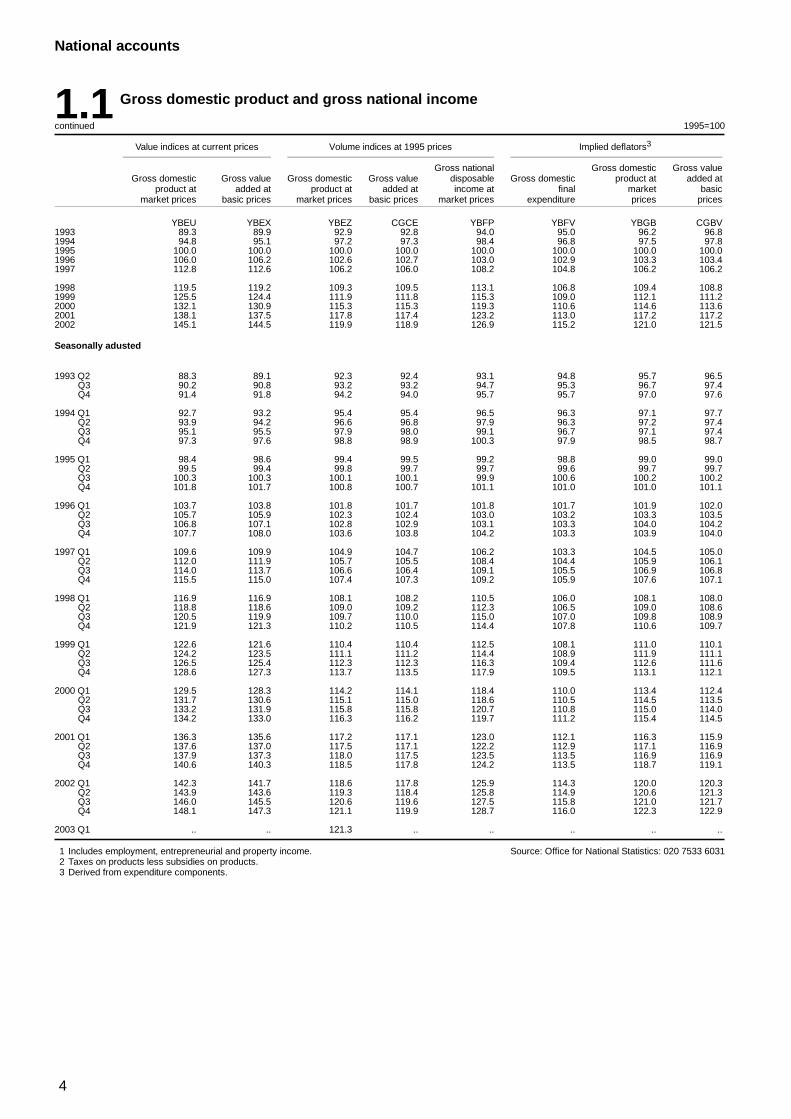
1.1 Gross domestic product and gross national income
£ million
At current prices Revalued at 1995 prices
less lessNet Gross domestic Basic Gross Gross domestic Basic Gross
Gross national income product price value added product price value added Grossincome at from at market adjust- at basic at market adjust- at basic value added
market prices abroad1 prices ment2 prices prices ment1 prices at factor cost
ABMZ CAES YBHA NTAP ABML ABMI NTAO ABMM YBHH1993 637 626 –4 701 642 327 66 866 575 461 667 804 73 672 594 215 580 5771994 681 612 285 681 327 72 587 608 740 698 915 76 491 622 424 607 6521995 716 350 –2 826 719 176 79 268 639 908 719 176 79 268 639 908 625 7521996 759 530 –2 684 762 214 82 594 679 620 738 046 80 984 657 062 643 3781997 812 368 1 301 811 067 90 375 720 692 763 459 85 193 678 266 663 797
1998 868 505 9 121 859 384 97 021 762 363 785 777 85 098 700 679 686 7841999 902 814 355 902 459 106 186 796 273 804 713 88 860 715 853 702 0242000 956 035 5 620 950 415 112 350 838 065 829 517 91 820 737 697 723 5372001 1 006 272 13 148 993 124 112 981 880 143 847 022 96 059 750 963 736 9182002 1 060 354 17 053 1 043 301 118 394 924 907 862 267 101 315 760 952 747 139
Seasonally adjusted
1993 Q2 157 389 –1 388 158 777 16 239 142 538 165 880 18 123 147 753 144 323Q3 161 042 –1 061 162 104 16 816 145 288 167 566 18 418 149 159 145 672Q4 163 477 –872 164 348 17 550 146 798 169 381 19 081 150 377 147 466
1994 Q1 166 613 –13 166 625 17 490 149 135 171 543 18 970 152 573 149 092Q2 168 312 –470 168 782 18 008 150 774 173 651 18 817 154 834 151 292Q3 171 142 149 170 993 18 220 152 773 176 105 19 276 156 829 153 015Q4 175 545 619 174 927 18 869 156 058 177 616 19 428 158 188 154 253
1995 Q1 175 756 –1 076 176 832 19 160 157 672 178 688 19 500 159 188 155 986Q2 177 650 –1 227 178 875 19 841 159 034 179 345 19 817 159 528 156 082Q3 179 859 –560 180 420 19 979 160 441 179 975 19 817 160 158 156 339Q4 183 085 37 183 049 20 288 162 761 181 168 20 134 161 034 157 345
1996 Q1 185 679 –857 186 536 20 540 165 996 183 081 20 408 162 673 159 324Q2 190 182 187 189 995 20 564 169 431 183 933 20 165 163 768 160 348Q3 190 789 –1 311 192 100 20 690 171 410 184 797 20 246 164 551 161 093Q4 192 880 –703 193 583 20 800 172 783 186 235 20 165 166 070 162 613
1997 Q1 196 455 –626 197 081 21 209 175 872 188 586 21 043 167 543 163 856Q2 202 719 1 432 201 287 22 273 179 014 190 076 21 298 168 778 165 147Q3 206 193 1 217 204 976 23 077 181 899 191 726 21 469 170 257 166 672Q4 207 001 –722 207 723 23 816 183 907 193 071 21 383 171 688 168 122
1998 Q1 210 304 153 210 151 23 209 186 942 194 378 21 245 173 133 169 587Q2 214 896 1 356 213 540 23 856 189 684 195 973 21 245 174 728 171 327Q3 221 031 4 440 216 591 24 828 191 763 197 285 21 256 176 029 172 530Q4 222 274 3 172 219 102 25 128 193 974 198 141 21 352 176 789 173 340
1999 Q1 220 679 319 220 360 25 874 194 486 198 574 21 922 176 652 173 183Q2 222 146 –1 239 223 385 25 779 197 606 199 701 21 830 177 871 174 422Q3 228 254 819 227 435 26 854 200 581 201 967 22 276 179 691 176 237Q4 231 735 456 231 279 27 679 203 600 204 471 22 832 181 639 178 182
2000 Q1 234 430 1 593 232 837 27 521 205 316 205 384 22 799 182 585 179 033Q2 237 746 901 236 845 27 958 208 887 206 927 22 901 184 026 180 466Q3 242 006 2 572 239 434 28 388 211 046 208 135 22 957 185 178 181 630Q4 241 853 554 241 299 28 483 212 816 209 071 23 163 185 908 182 408
2001 Q1 248 975 3 934 245 041 28 036 217 005 210 753 23 484 187 269 183 767Q2 250 243 2 863 247 380 28 249 219 131 211 198 23 808 187 390 183 889Q3 252 352 4 377 247 975 28 360 219 615 212 069 24 162 187 907 184 392Q4 254 702 1 974 252 728 28 336 224 392 213 002 24 605 188 397 184 870
2002 Q1 260 262 4 348 255 914 29 170 226 744 213 263 24 811 188 452 184 980Q2 260 793 2 068 258 725 29 060 229 665 214 529 25 161 189 368 185 889Q3 268 314 5 849 262 465 29 628 232 837 216 824 25 504 191 320 187 894Q4 270 985 4 788 266 197 30 536 235 661 217 651 25 839 191 812 188 376
2003 Q1 .. .. .. .. .. 218 086 .. .. ..
4
National accounts
1.1 Gross domestic product and gross national income
continued 1995=100
Value indices at current prices Volume indices at 1995 prices Implied deflators3
Gross national Gross domestic Gross valueGross domestic Gross value Gross domestic Gross value disposable Gross domestic product at added at
product at added at product at added at income at final market basicmarket prices basic prices market prices basic prices market prices expenditure prices prices
YBEU YBEX YBEZ CGCE YBFP YBFV YBGB CGBV1993 89.3 89.9 92.9 92.8 94.0 95.0 96.2 96.81994 94.8 95.1 97.2 97.3 98.4 96.8 97.5 97.81995 100.0 100.0 100.0 100.0 100.0 100.0 100.0 100.01996 106.0 106.2 102.6 102.7 103.0 102.9 103.3 103.41997 112.8 112.6 106.2 106.0 108.2 104.8 106.2 106.2
1998 119.5 119.2 109.3 109.5 113.1 106.8 109.4 108.81999 125.5 124.4 111.9 111.8 115.3 109.0 112.1 111.22000 132.1 130.9 115.3 115.3 119.3 110.6 114.6 113.62001 138.1 137.5 117.8 117.4 123.2 113.0 117.2 117.22002 145.1 144.5 119.9 118.9 126.9 115.2 121.0 121.5
Seasonally adusted
1993 Q2 88.3 89.1 92.3 92.4 93.1 94.8 95.7 96.5Q3 90.2 90.8 93.2 93.2 94.7 95.3 96.7 97.4Q4 91.4 91.8 94.2 94.0 95.7 95.7 97.0 97.6
1994 Q1 92.7 93.2 95.4 95.4 96.5 96.3 97.1 97.7Q2 93.9 94.2 96.6 96.8 97.9 96.3 97.2 97.4Q3 95.1 95.5 97.9 98.0 99.1 96.7 97.1 97.4Q4 97.3 97.6 98.8 98.9 100.3 97.9 98.5 98.7
1995 Q1 98.4 98.6 99.4 99.5 99.2 98.8 99.0 99.0Q2 99.5 99.4 99.8 99.7 99.7 99.6 99.7 99.7Q3 100.3 100.3 100.1 100.1 99.9 100.6 100.2 100.2Q4 101.8 101.7 100.8 100.7 101.1 101.0 101.0 101.1
1996 Q1 103.7 103.8 101.8 101.7 101.8 101.7 101.9 102.0Q2 105.7 105.9 102.3 102.4 103.0 103.2 103.3 103.5Q3 106.8 107.1 102.8 102.9 103.1 103.3 104.0 104.2Q4 107.7 108.0 103.6 103.8 104.2 103.3 103.9 104.0
1997 Q1 109.6 109.9 104.9 104.7 106.2 103.3 104.5 105.0Q2 112.0 111.9 105.7 105.5 108.4 104.4 105.9 106.1Q3 114.0 113.7 106.6 106.4 109.1 105.5 106.9 106.8Q4 115.5 115.0 107.4 107.3 109.2 105.9 107.6 107.1
1998 Q1 116.9 116.9 108.1 108.2 110.5 106.0 108.1 108.0Q2 118.8 118.6 109.0 109.2 112.3 106.5 109.0 108.6Q3 120.5 119.9 109.7 110.0 115.0 107.0 109.8 108.9Q4 121.9 121.3 110.2 110.5 114.4 107.8 110.6 109.7
1999 Q1 122.6 121.6 110.4 110.4 112.5 108.1 111.0 110.1Q2 124.2 123.5 111.1 111.2 114.4 108.9 111.9 111.1Q3 126.5 125.4 112.3 112.3 116.3 109.4 112.6 111.6Q4 128.6 127.3 113.7 113.5 117.9 109.5 113.1 112.1
2000 Q1 129.5 128.3 114.2 114.1 118.4 110.0 113.4 112.4Q2 131.7 130.6 115.1 115.0 118.6 110.5 114.5 113.5Q3 133.2 131.9 115.8 115.8 120.7 110.8 115.0 114.0Q4 134.2 133.0 116.3 116.2 119.7 111.2 115.4 114.5
2001 Q1 136.3 135.6 117.2 117.1 123.0 112.1 116.3 115.9Q2 137.6 137.0 117.5 117.1 122.2 112.9 117.1 116.9Q3 137.9 137.3 118.0 117.5 123.5 113.5 116.9 116.9Q4 140.6 140.3 118.5 117.8 124.2 113.5 118.7 119.1
2002 Q1 142.3 141.7 118.6 117.8 125.9 114.3 120.0 120.3Q2 143.9 143.6 119.3 118.4 125.8 114.9 120.6 121.3Q3 146.0 145.5 120.6 119.6 127.5 115.8 121.0 121.7Q4 148.1 147.3 121.1 119.9 128.7 116.0 122.3 122.9
2003 Q1 .. .. 121.3 .. .. .. .. ..
1 Includes employment, entrepreneurial and property income.2 Taxes on products less subsidies on products.3 Derived from expenditure components.
Source: Office for National Statistics: 020 7533 6031
5
National accounts
1.2 Gross domestic product: by category of expenditure
£ million1
Domestic expenditure on goods and services at market prices
Final consumption expenditure Gross capital formationStatis-
Acquisi- tical GrossNon- Change tions less discre- domesticprofit Gross fixed in disposals Total final pancy product at
House- instit- General capital inven- of Total expend- less Total (expen- marketholds utions 2 government formation tories3 valuables Total exports iture imports diture) prices
At current prices
ABPB ABNV NMRK NPQX ABMP NPJO YBIJ KTMW ABMD KTMX GIXM YBHA1993 401 970 13 981 131 534 101 027 329 –29 648 812 163 640 812 452 170 125 – 642 3271994 422 397 15 287 136 255 108 314 3 708 113 686 074 180 508 866 582 185 255 – 681 3271995 443 367 16 481 141 031 117 448 4 512 –121 722 718 203 509 926 227 207 051 – 719 1761996 473 800 18 385 146 779 125 762 1 771 –158 766 339 223 091 989 430 227 216 – 762 2141997 503 374 19 602 149 147 134 163 4 621 –26 810 881 231 622 1 042 503 231 436 – 811 067
1998 536 235 21 117 154 881 150 842 5 026 430 868 531 228 801 1 097 332 237 948 – 859 3841999 569 481 22 150 166 614 153 501 6 060 231 918 037 236 609 1 154 646 252 187 – 902 4592000 603 557 23 027 177 801 158 918 5 595 5 968 903 265 135 1 234 038 283 623 – 950 4152001 633 867 24 258 191 506 164 338 1 441 366 1 015 776 267 733 1 283 509 289 943 –442 993 1242002 663 265 25 683 208 936 164 501 –696 214 1 061 903 269 196 1 331 099 288 068 270 1 043 301
Unadjusted
1998 Q3 137 514 5 361 39 190 37 120 1 121 106 220 412 57 969 278 381 60 876Q4 142 238 5 403 39 953 39 475 1 405 124 228 598 57 694 286 292 59 861
1999 Q1 134 179 5 504 40 288 39 326 731 37 220 065 55 047 275 112 59 469Q2 139 495 5 542 41 773 36 156 1 040 132 224 138 57 589 281 727 61 160Q3 144 627 5 551 42 084 37 566 2 995 –87 232 736 61 127 293 863 65 908Q4 151 180 5 553 42 469 40 453 1 294 149 241 098 62 846 303 944 65 650
2000 Q1 142 949 5 564 42 505 40 122 2 861 59 234 060 62 752 296 812 65 658Q2 147 636 5 728 44 510 37 543 298 –29 235 686 65 381 301 067 69 997Q3 153 255 5 819 45 290 38 604 2 862 –53 245 777 67 468 313 245 73 861Q4 159 717 5 916 45 496 42 649 –426 28 253 380 69 534 322 914 74 107
2001 Q1 149 425 5 990 46 115 42 774 1 218 –56 245 466 69 110 314 576 72 690Q2 155 031 6 019 47 274 39 583 303 262 248 472 68 421 316 893 74 411Q3 161 223 6 096 48 289 39 992 1 997 33 257 630 64 231 321 861 72 972Q4 168 188 6 153 49 828 41 989 –2 077 127 264 208 65 971 330 179 69 870
2002 Q1 156 893 6 269 50 984 41 689 1 228 60 257 123 64 965 322 088 68 511Q2 162 626 6 382 51 665 39 390 –1 417 65 258 711 69 517 328 228 73 436Q3 167 980 6 483 52 686 40 497 1 023 74 268 743 68 586 337 329 75 112Q4 175 766 6 549 53 601 42 925 –1 530 15 277 326 66 128 343 454 71 009
Seasonally adjusted
ABJQ HAYE NMRP NPQS CAEX NPJQ YBIL IKBH ABMF IKBI1998 Q3 135 007 5 361 38 979 37 774 1 519 106 218 745 57 375 276 120 59 530 – 216 591
Q4 136 859 5 403 39 786 38 330 2 241 124 222 744 56 370 279 114 60 011 – 219 102
1999 Q1 139 575 5 504 40 696 38 050 1 525 50 225 400 56 042 281 442 61 082 – 220 360Q2 141 539 5 542 41 502 37 908 238 37 226 766 57 831 284 597 61 212 – 223 385Q3 142 970 5 551 41 912 38 213 2 108 32 230 786 60 834 291 620 64 185 – 227 435Q4 145 397 5 553 42 504 39 330 2 189 112 235 085 61 902 296 987 65 708 – 231 279
2000 Q1 148 336 5 564 42 939 38 655 956 82 236 532 63 007 299 539 66 702 – 232 837Q2 149 763 5 728 44 213 39 305 2 481 –132 241 358 65 698 307 056 70 211 – 236 845Q3 151 853 5 819 45 110 39 504 1 843 75 244 204 67 475 311 679 72 245 – 239 434Q4 153 605 5 916 45 539 41 454 315 –20 246 809 68 955 315 764 74 465 – 241 299
2001 Q1 155 304 5 990 46 464 41 099 972 –8 249 821 69 793 319 614 74 461 –112 245 041Q2 157 202 6 019 47 040 41 588 931 69 252 849 68 463 321 312 73 809 –123 247 380Q3 159 859 6 096 48 131 41 185 –180 186 255 277 63 947 319 224 71 133 –116 247 975Q4 161 502 6 153 49 871 40 466 –282 119 257 829 65 530 323 359 70 540 –91 252 728
2002 Q1 163 223 6 269 50 882 40 242 –45 120 260 691 66 084 326 775 70 887 26 255 914Q2 164 830 6 382 51 766 41 263 –2 333 –127 261 781 69 497 331 278 72 614 61 258 725Q3 166 497 6 483 52 722 41 297 145 246 267 390 67 663 335 053 72 672 84 262 465Q4 168 715 6 549 53 566 41 699 1 537 –25 272 041 65 952 337 993 71 895 99 266 197
6
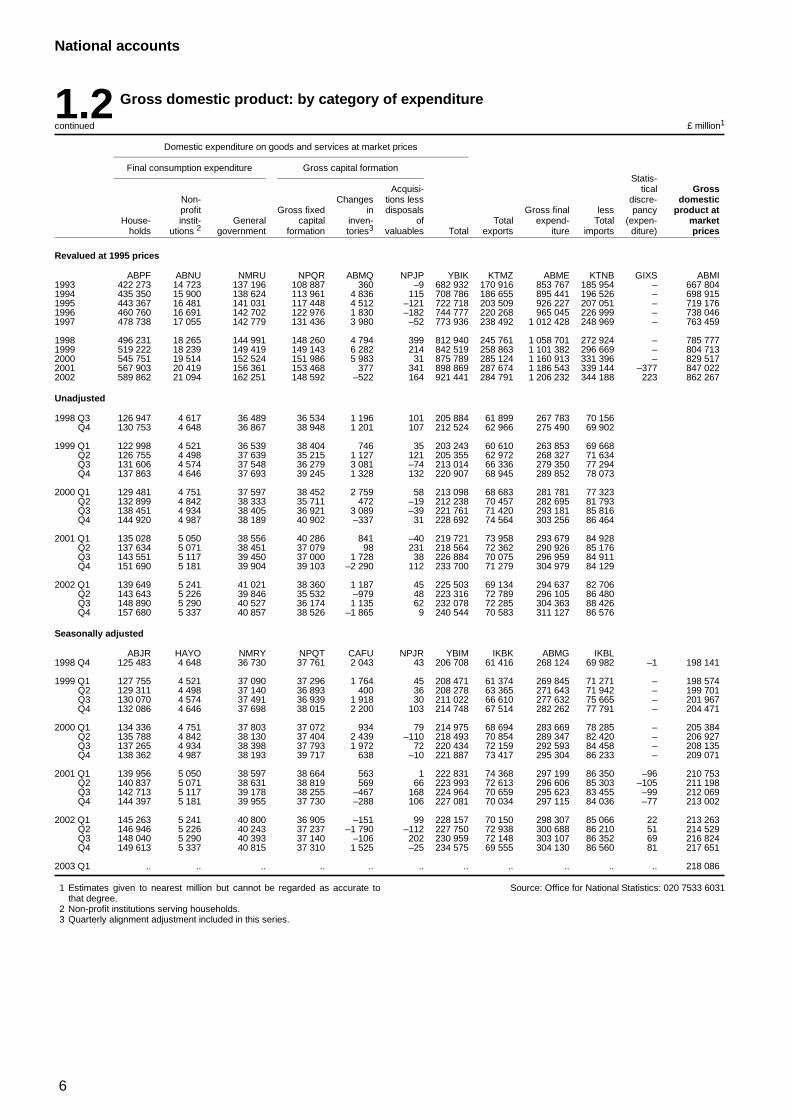
National accounts
1.2 Gross domestic product: by category of expenditure
continued £ million1
Domestic expenditure on goods and services at market prices
Final consumption expenditure Gross capital formationStatis-
Acquisi- tical GrossNon- Changes tions less discre- domesticprofit Gross fixed in disposals Gross final less pancy product at
House- instit- General capital inven- of Total expend- Total (expen- marketholds utions 2 government formation tories3 valuables Total exports iture imports diture) prices
Revalued at 1995 prices
ABPF ABNU NMRU NPQR ABMQ NPJP YBIK KTMZ ABME KTNB GIXS ABMI1993 422 273 14 723 137 196 108 887 360 –9 682 932 170 916 853 767 185 954 – 667 8041994 435 350 15 900 138 624 113 961 4 836 115 708 786 186 655 895 441 196 526 – 698 9151995 443 367 16 481 141 031 117 448 4 512 –121 722 718 203 509 926 227 207 051 – 719 1761996 460 760 16 691 142 702 122 976 1 830 –182 744 777 220 268 965 045 226 999 – 738 0461997 478 738 17 055 142 779 131 436 3 980 –52 773 936 238 492 1 012 428 248 969 – 763 459
1998 496 231 18 265 144 991 148 260 4 794 399 812 940 245 761 1 058 701 272 924 – 785 7771999 519 222 18 239 149 419 149 143 6 282 214 842 519 258 863 1 101 382 296 669 – 804 7132000 545 751 19 514 152 524 151 986 5 983 31 875 789 285 124 1 160 913 331 396 – 829 5172001 567 903 20 419 156 361 153 468 377 341 898 869 287 674 1 186 543 339 144 –377 847 0222002 589 862 21 094 162 251 148 592 –522 164 921 441 284 791 1 206 232 344 188 223 862 267
Unadjusted
1998 Q3 126 947 4 617 36 489 36 534 1 196 101 205 884 61 899 267 783 70 156Q4 130 753 4 648 36 867 38 948 1 201 107 212 524 62 966 275 490 69 902
1999 Q1 122 998 4 521 36 539 38 404 746 35 203 243 60 610 263 853 69 668Q2 126 755 4 498 37 639 35 215 1 127 121 205 355 62 972 268 327 71 634Q3 131 606 4 574 37 548 36 279 3 081 –74 213 014 66 336 279 350 77 294Q4 137 863 4 646 37 693 39 245 1 328 132 220 907 68 945 289 852 78 073
2000 Q1 129 481 4 751 37 597 38 452 2 759 58 213 098 68 683 281 781 77 323Q2 132 899 4 842 38 333 35 711 472 –19 212 238 70 457 282 695 81 793Q3 138 451 4 934 38 405 36 921 3 089 –39 221 761 71 420 293 181 85 816Q4 144 920 4 987 38 189 40 902 –337 31 228 692 74 564 303 256 86 464
2001 Q1 135 028 5 050 38 556 40 286 841 –40 219 721 73 958 293 679 84 928Q2 137 634 5 071 38 451 37 079 98 231 218 564 72 362 290 926 85 176Q3 143 551 5 117 39 450 37 000 1 728 38 226 884 70 075 296 959 84 911Q4 151 690 5 181 39 904 39 103 –2 290 112 233 700 71 279 304 979 84 129
2002 Q1 139 649 5 241 41 021 38 360 1 187 45 225 503 69 134 294 637 82 706Q2 143 643 5 226 39 846 35 532 –979 48 223 316 72 789 296 105 86 480Q3 148 890 5 290 40 527 36 174 1 135 62 232 078 72 285 304 363 88 426Q4 157 680 5 337 40 857 38 526 –1 865 9 240 544 70 583 311 127 86 576
Seasonally adjusted
ABJR HAYO NMRY NPQT CAFU NPJR YBIM IKBK ABMG IKBL1998 Q4 125 483 4 648 36 730 37 761 2 043 43 206 708 61 416 268 124 69 982 –1 198 141
1999 Q1 127 755 4 521 37 090 37 296 1 764 45 208 471 61 374 269 845 71 271 – 198 574Q2 129 311 4 498 37 140 36 893 400 36 208 278 63 365 271 643 71 942 – 199 701Q3 130 070 4 574 37 491 36 939 1 918 30 211 022 66 610 277 632 75 665 – 201 967Q4 132 086 4 646 37 698 38 015 2 200 103 214 748 67 514 282 262 77 791 – 204 471
2000 Q1 134 336 4 751 37 803 37 072 934 79 214 975 68 694 283 669 78 285 – 205 384Q2 135 788 4 842 38 130 37 404 2 439 –110 218 493 70 854 289 347 82 420 – 206 927Q3 137 265 4 934 38 398 37 793 1 972 72 220 434 72 159 292 593 84 458 – 208 135Q4 138 362 4 987 38 193 39 717 638 –10 221 887 73 417 295 304 86 233 – 209 071
2001 Q1 139 956 5 050 38 597 38 664 563 1 222 831 74 368 297 199 86 350 –96 210 753Q2 140 837 5 071 38 631 38 819 569 66 223 993 72 613 296 606 85 303 –105 211 198Q3 142 713 5 117 39 178 38 255 –467 168 224 964 70 659 295 623 83 455 –99 212 069Q4 144 397 5 181 39 955 37 730 –288 106 227 081 70 034 297 115 84 036 –77 213 002
2002 Q1 145 263 5 241 40 800 36 905 –151 99 228 157 70 150 298 307 85 066 22 213 263Q2 146 946 5 226 40 243 37 237 –1 790 –112 227 750 72 938 300 688 86 210 51 214 529Q3 148 040 5 290 40 393 37 140 –106 202 230 959 72 148 303 107 86 352 69 216 824Q4 149 613 5 337 40 815 37 310 1 525 –25 234 575 69 555 304 130 86 560 81 217 651
2003 Q1 .. .. .. .. .. .. .. .. .. .. .. 218 086
1 Estimates given to nearest million but cannot be regarded as accurate tothat degree.
2 Non-profit institutions serving households.3 Quarterly alignment adjustment included in this series.
Source: Office for National Statistics: 020 7533 6031
7
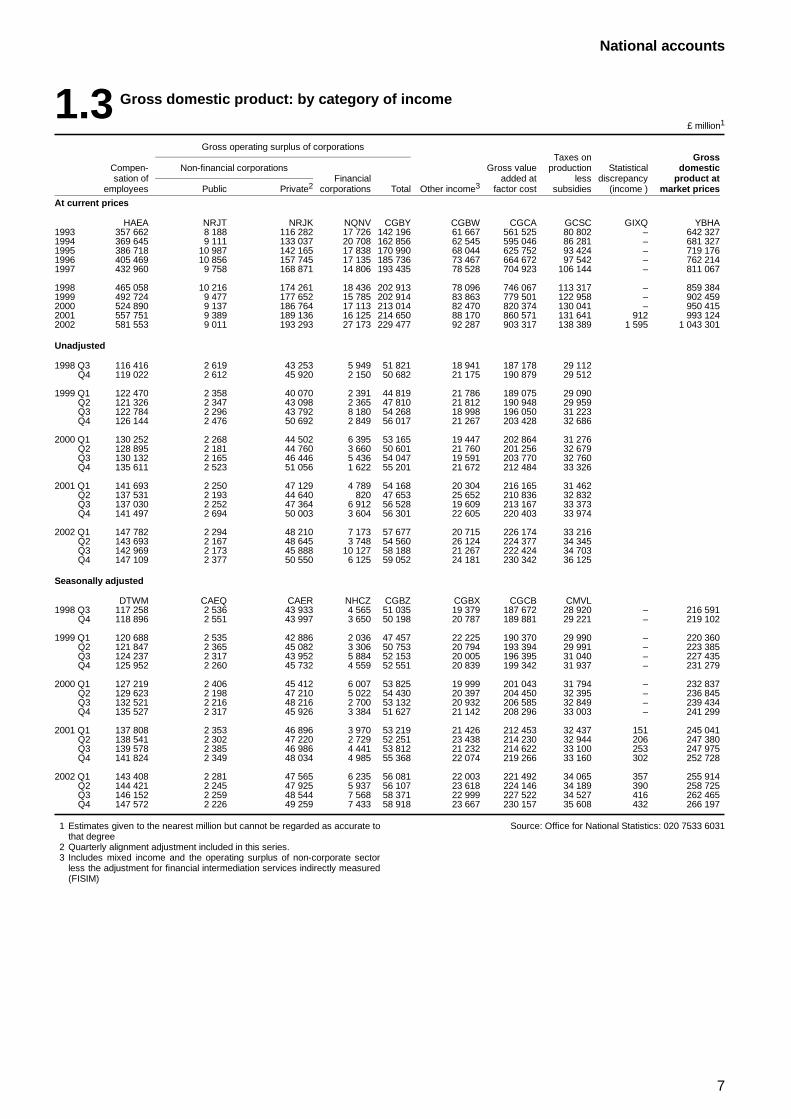
National accounts
1.3 Gross domestic product: by category of income
£ million1
Gross operating surplus of corporationsTaxes on Gross
Compen- Non-financial corporations Gross value production Statistical domesticsation of Financial added at less discrepancy product at
employees Public Private2 corporations Total Other income3 factor cost subsidies (income ) market prices
At current prices
HAEA NRJT NRJK NQNV CGBY CGBW CGCA GCSC GIXQ YBHA1993 357 662 8 188 116 282 17 726 142 196 61 667 561 525 80 802 – 642 3271994 369 645 9 111 133 037 20 708 162 856 62 545 595 046 86 281 – 681 3271995 386 718 10 987 142 165 17 838 170 990 68 044 625 752 93 424 – 719 1761996 405 469 10 856 157 745 17 135 185 736 73 467 664 672 97 542 – 762 2141997 432 960 9 758 168 871 14 806 193 435 78 528 704 923 106 144 – 811 067
1998 465 058 10 216 174 261 18 436 202 913 78 096 746 067 113 317 – 859 3841999 492 724 9 477 177 652 15 785 202 914 83 863 779 501 122 958 – 902 4592000 524 890 9 137 186 764 17 113 213 014 82 470 820 374 130 041 – 950 4152001 557 751 9 389 189 136 16 125 214 650 88 170 860 571 131 641 912 993 1242002 581 553 9 011 193 293 27 173 229 477 92 287 903 317 138 389 1 595 1 043 301
Unadjusted
1998 Q3 116 416 2 619 43 253 5 949 51 821 18 941 187 178 29 112Q4 119 022 2 612 45 920 2 150 50 682 21 175 190 879 29 512
1999 Q1 122 470 2 358 40 070 2 391 44 819 21 786 189 075 29 090Q2 121 326 2 347 43 098 2 365 47 810 21 812 190 948 29 959Q3 122 784 2 296 43 792 8 180 54 268 18 998 196 050 31 223Q4 126 144 2 476 50 692 2 849 56 017 21 267 203 428 32 686
2000 Q1 130 252 2 268 44 502 6 395 53 165 19 447 202 864 31 276Q2 128 895 2 181 44 760 3 660 50 601 21 760 201 256 32 679Q3 130 132 2 165 46 446 5 436 54 047 19 591 203 770 32 760Q4 135 611 2 523 51 056 1 622 55 201 21 672 212 484 33 326
2001 Q1 141 693 2 250 47 129 4 789 54 168 20 304 216 165 31 462Q2 137 531 2 193 44 640 820 47 653 25 652 210 836 32 832Q3 137 030 2 252 47 364 6 912 56 528 19 609 213 167 33 373Q4 141 497 2 694 50 003 3 604 56 301 22 605 220 403 33 974
2002 Q1 147 782 2 294 48 210 7 173 57 677 20 715 226 174 33 216Q2 143 693 2 167 48 645 3 748 54 560 26 124 224 377 34 345Q3 142 969 2 173 45 888 10 127 58 188 21 267 222 424 34 703Q4 147 109 2 377 50 550 6 125 59 052 24 181 230 342 36 125
Seasonally adjusted
DTWM CAEQ CAER NHCZ CGBZ CGBX CGCB CMVL1998 Q3 117 258 2 536 43 933 4 565 51 035 19 379 187 672 28 920 – 216 591
Q4 118 896 2 551 43 997 3 650 50 198 20 787 189 881 29 221 – 219 102
1999 Q1 120 688 2 535 42 886 2 036 47 457 22 225 190 370 29 990 – 220 360Q2 121 847 2 365 45 082 3 306 50 753 20 794 193 394 29 991 – 223 385Q3 124 237 2 317 43 952 5 884 52 153 20 005 196 395 31 040 – 227 435Q4 125 952 2 260 45 732 4 559 52 551 20 839 199 342 31 937 – 231 279
2000 Q1 127 219 2 406 45 412 6 007 53 825 19 999 201 043 31 794 – 232 837Q2 129 623 2 198 47 210 5 022 54 430 20 397 204 450 32 395 – 236 845Q3 132 521 2 216 48 216 2 700 53 132 20 932 206 585 32 849 – 239 434Q4 135 527 2 317 45 926 3 384 51 627 21 142 208 296 33 003 – 241 299
2001 Q1 137 808 2 353 46 896 3 970 53 219 21 426 212 453 32 437 151 245 041Q2 138 541 2 302 47 220 2 729 52 251 23 438 214 230 32 944 206 247 380Q3 139 578 2 385 46 986 4 441 53 812 21 232 214 622 33 100 253 247 975Q4 141 824 2 349 48 034 4 985 55 368 22 074 219 266 33 160 302 252 728
2002 Q1 143 408 2 281 47 565 6 235 56 081 22 003 221 492 34 065 357 255 914Q2 144 421 2 245 47 925 5 937 56 107 23 618 224 146 34 189 390 258 725Q3 146 152 2 259 48 544 7 568 58 371 22 999 227 522 34 527 416 262 465Q4 147 572 2 226 49 259 7 433 58 918 23 667 230 157 35 608 432 266 197
1 Estimates given to the nearest million but cannot be regarded as accurate tothat degree
2 Quarterly alignment adjustment included in this series.3 Includes mixed income and the operating surplus of non-corporate sector
less the adjustment for financial intermediation services indirectly measured(FISIM)
Source: Office for National Statistics: 020 7533 6031
8
National accounts
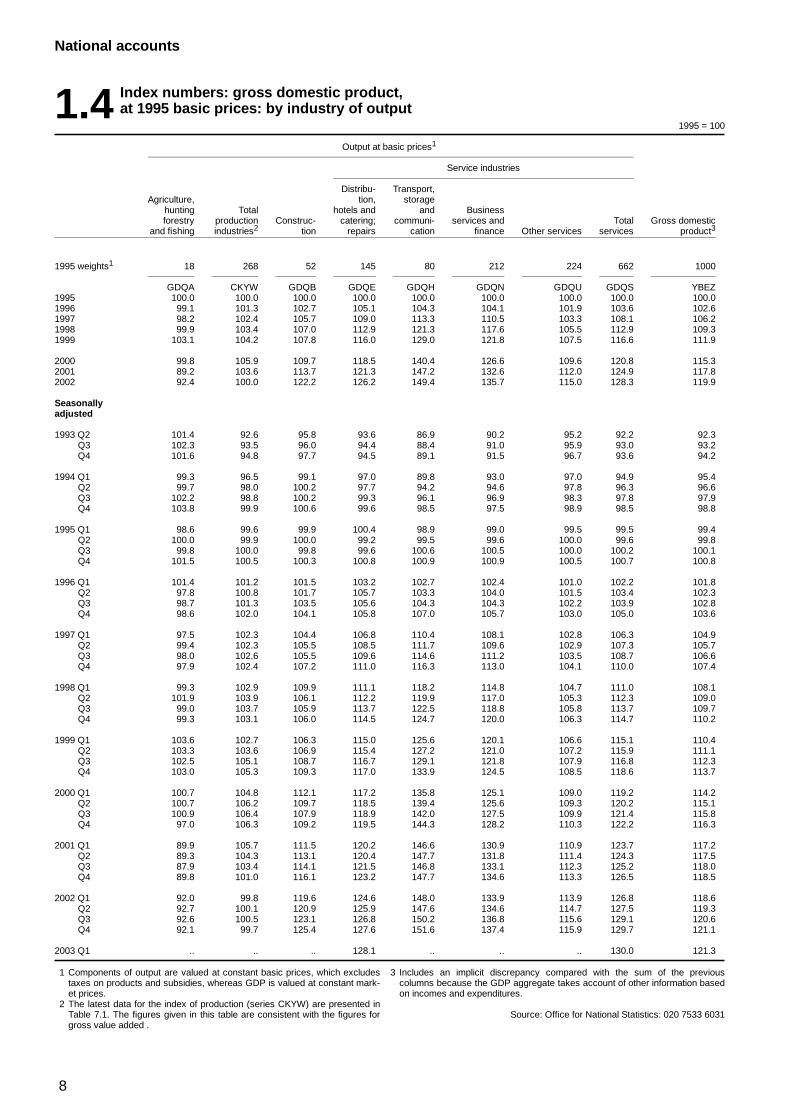
1.4 Index numbers: gross domestic product,at 1995 basic prices: by industry of output
1995 = 100
Output at basic prices1
Service industries
Distribu- Transport,Agriculture, tion, storage
hunting Total hotels and and Businessforestry production Construc- catering; communi- services and Total Gross domestic
and fishing industries2 tion repairs cation finance Other services services product3
1995 weights1 18 268 52 145 80 212 224 662 1000
GDQA CKYW GDQB GDQE GDQH GDQN GDQU GDQS YBEZ1995 100.0 100.0 100.0 100.0 100.0 100.0 100.0 100.0 100.01996 99.1 101.3 102.7 105.1 104.3 104.1 101.9 103.6 102.61997 98.2 102.4 105.7 109.0 113.3 110.5 103.3 108.1 106.21998 99.9 103.4 107.0 112.9 121.3 117.6 105.5 112.9 109.31999 103.1 104.2 107.8 116.0 129.0 121.8 107.5 116.6 111.9
2000 99.8 105.9 109.7 118.5 140.4 126.6 109.6 120.8 115.32001 89.2 103.6 113.7 121.3 147.2 132.6 112.0 124.9 117.82002 92.4 100.0 122.2 126.2 149.4 135.7 115.0 128.3 119.9
Seasonallyadjusted
1993 Q2 101.4 92.6 95.8 93.6 86.9 90.2 95.2 92.2 92.3Q3 102.3 93.5 96.0 94.4 88.4 91.0 95.9 93.0 93.2Q4 101.6 94.8 97.7 94.5 89.1 91.5 96.7 93.6 94.2
1994 Q1 99.3 96.5 99.1 97.0 89.8 93.0 97.0 94.9 95.4Q2 99.7 98.0 100.2 97.7 94.2 94.6 97.8 96.3 96.6Q3 102.2 98.8 100.2 99.3 96.1 96.9 98.3 97.8 97.9Q4 103.8 99.9 100.6 99.6 98.5 97.5 98.9 98.5 98.8
1995 Q1 98.6 99.6 99.9 100.4 98.9 99.0 99.5 99.5 99.4Q2 100.0 99.9 100.0 99.2 99.5 99.6 100.0 99.6 99.8Q3 99.8 100.0 99.8 99.6 100.6 100.5 100.0 100.2 100.1Q4 101.5 100.5 100.3 100.8 100.9 100.9 100.5 100.7 100.8
1996 Q1 101.4 101.2 101.5 103.2 102.7 102.4 101.0 102.2 101.8Q2 97.8 100.8 101.7 105.7 103.3 104.0 101.5 103.4 102.3Q3 98.7 101.3 103.5 105.6 104.3 104.3 102.2 103.9 102.8Q4 98.6 102.0 104.1 105.8 107.0 105.7 103.0 105.0 103.6
1997 Q1 97.5 102.3 104.4 106.8 110.4 108.1 102.8 106.3 104.9Q2 99.4 102.3 105.5 108.5 111.7 109.6 102.9 107.3 105.7Q3 98.0 102.6 105.5 109.6 114.6 111.2 103.5 108.7 106.6Q4 97.9 102.4 107.2 111.0 116.3 113.0 104.1 110.0 107.4
1998 Q1 99.3 102.9 109.9 111.1 118.2 114.8 104.7 111.0 108.1Q2 101.9 103.9 106.1 112.2 119.9 117.0 105.3 112.3 109.0Q3 99.0 103.7 105.9 113.7 122.5 118.8 105.8 113.7 109.7Q4 99.3 103.1 106.0 114.5 124.7 120.0 106.3 114.7 110.2
1999 Q1 103.6 102.7 106.3 115.0 125.6 120.1 106.6 115.1 110.4Q2 103.3 103.6 106.9 115.4 127.2 121.0 107.2 115.9 111.1Q3 102.5 105.1 108.7 116.7 129.1 121.8 107.9 116.8 112.3Q4 103.0 105.3 109.3 117.0 133.9 124.5 108.5 118.6 113.7
2000 Q1 100.7 104.8 112.1 117.2 135.8 125.1 109.0 119.2 114.2Q2 100.7 106.2 109.7 118.5 139.4 125.6 109.3 120.2 115.1Q3 100.9 106.4 107.9 118.9 142.0 127.5 109.9 121.4 115.8Q4 97.0 106.3 109.2 119.5 144.3 128.2 110.3 122.2 116.3
2001 Q1 89.9 105.7 111.5 120.2 146.6 130.9 110.9 123.7 117.2Q2 89.3 104.3 113.1 120.4 147.7 131.8 111.4 124.3 117.5Q3 87.9 103.4 114.1 121.5 146.8 133.1 112.3 125.2 118.0Q4 89.8 101.0 116.1 123.2 147.7 134.6 113.3 126.5 118.5
2002 Q1 92.0 99.8 119.6 124.6 148.0 133.9 113.9 126.8 118.6Q2 92.7 100.1 120.9 125.9 147.6 134.6 114.7 127.5 119.3Q3 92.6 100.5 123.1 126.8 150.2 136.8 115.6 129.1 120.6Q4 92.1 99.7 125.4 127.6 151.6 137.4 115.9 129.7 121.1
2003 Q1 .. .. .. 128.1 .. .. .. 130.0 121.3
1 Components of output are valued at constant basic prices, which excludestaxes on products and subsidies, whereas GDP is valued at constant mark-et prices.
2 The latest data for the index of production (series CKYW) are presented inTable 7.1. The figures given in this table are consistent with the figures forgross value added .
3 Includes an implicit discrepancy compared with the sum of the previouscolumns because the GDP aggregate takes account of other information basedon incomes and expenditures.
Source: Office for National Statistics: 020 7533 6031
9
National accounts
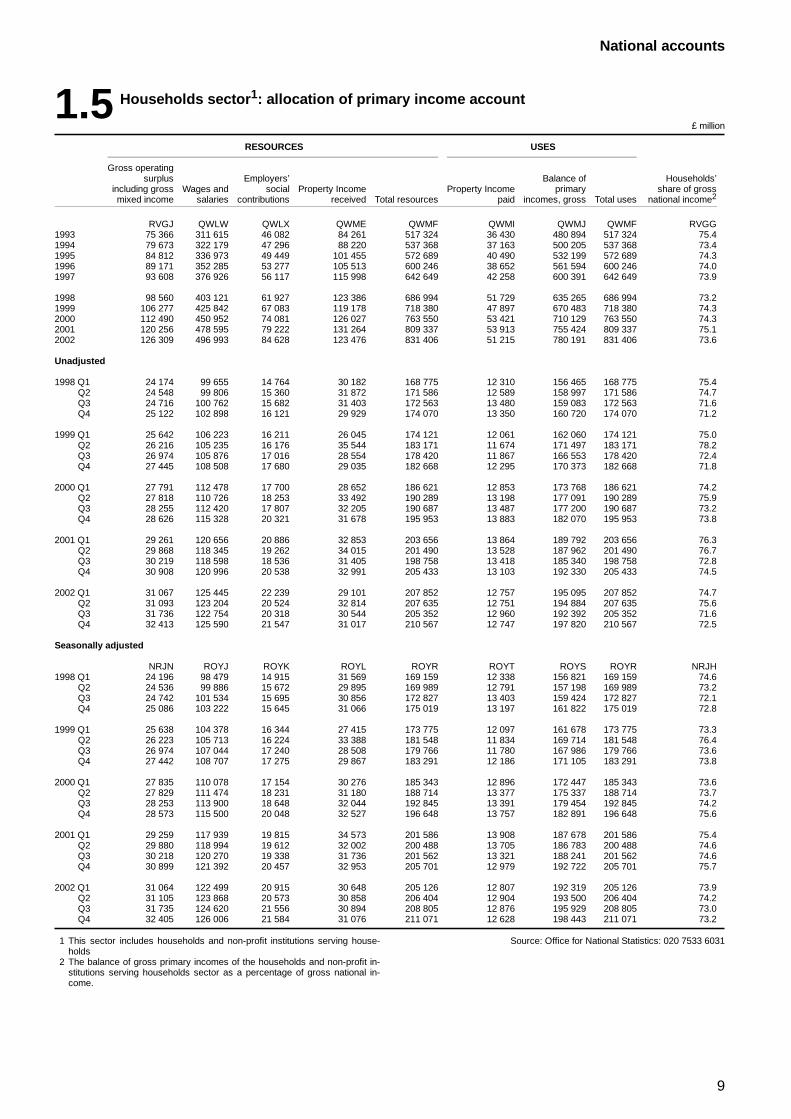
1.5 Households sector1: allocation of primary income account
£ million
RESOURCES USES
Gross operatingsurplus Employers’ Balance of Households’
including gross Wages and social Property Income Property Income primary share of grossmixed income salaries contributions received Total resources paid incomes, gross Total uses national income2
RVGJ QWLW QWLX QWME QWMF QWMI QWMJ QWMF RVGG1993 75 366 311 615 46 082 84 261 517 324 36 430 480 894 517 324 75.41994 79 673 322 179 47 296 88 220 537 368 37 163 500 205 537 368 73.41995 84 812 336 973 49 449 101 455 572 689 40 490 532 199 572 689 74.31996 89 171 352 285 53 277 105 513 600 246 38 652 561 594 600 246 74.01997 93 608 376 926 56 117 115 998 642 649 42 258 600 391 642 649 73.9
1998 98 560 403 121 61 927 123 386 686 994 51 729 635 265 686 994 73.21999 106 277 425 842 67 083 119 178 718 380 47 897 670 483 718 380 74.32000 112 490 450 952 74 081 126 027 763 550 53 421 710 129 763 550 74.32001 120 256 478 595 79 222 131 264 809 337 53 913 755 424 809 337 75.12002 126 309 496 993 84 628 123 476 831 406 51 215 780 191 831 406 73.6
Unadjusted
1998 Q1 24 174 99 655 14 764 30 182 168 775 12 310 156 465 168 775 75.4Q2 24 548 99 806 15 360 31 872 171 586 12 589 158 997 171 586 74.7Q3 24 716 100 762 15 682 31 403 172 563 13 480 159 083 172 563 71.6Q4 25 122 102 898 16 121 29 929 174 070 13 350 160 720 174 070 71.2
1999 Q1 25 642 106 223 16 211 26 045 174 121 12 061 162 060 174 121 75.0Q2 26 216 105 235 16 176 35 544 183 171 11 674 171 497 183 171 78.2Q3 26 974 105 876 17 016 28 554 178 420 11 867 166 553 178 420 72.4Q4 27 445 108 508 17 680 29 035 182 668 12 295 170 373 182 668 71.8
2000 Q1 27 791 112 478 17 700 28 652 186 621 12 853 173 768 186 621 74.2Q2 27 818 110 726 18 253 33 492 190 289 13 198 177 091 190 289 75.9Q3 28 255 112 420 17 807 32 205 190 687 13 487 177 200 190 687 73.2Q4 28 626 115 328 20 321 31 678 195 953 13 883 182 070 195 953 73.8
2001 Q1 29 261 120 656 20 886 32 853 203 656 13 864 189 792 203 656 76.3Q2 29 868 118 345 19 262 34 015 201 490 13 528 187 962 201 490 76.7Q3 30 219 118 598 18 536 31 405 198 758 13 418 185 340 198 758 72.8Q4 30 908 120 996 20 538 32 991 205 433 13 103 192 330 205 433 74.5
2002 Q1 31 067 125 445 22 239 29 101 207 852 12 757 195 095 207 852 74.7Q2 31 093 123 204 20 524 32 814 207 635 12 751 194 884 207 635 75.6Q3 31 736 122 754 20 318 30 544 205 352 12 960 192 392 205 352 71.6Q4 32 413 125 590 21 547 31 017 210 567 12 747 197 820 210 567 72.5
Seasonally adjusted
NRJN ROYJ ROYK ROYL ROYR ROYT ROYS ROYR NRJH1998 Q1 24 196 98 479 14 915 31 569 169 159 12 338 156 821 169 159 74.6
Q2 24 536 99 886 15 672 29 895 169 989 12 791 157 198 169 989 73.2Q3 24 742 101 534 15 695 30 856 172 827 13 403 159 424 172 827 72.1Q4 25 086 103 222 15 645 31 066 175 019 13 197 161 822 175 019 72.8
1999 Q1 25 638 104 378 16 344 27 415 173 775 12 097 161 678 173 775 73.3Q2 26 223 105 713 16 224 33 388 181 548 11 834 169 714 181 548 76.4Q3 26 974 107 044 17 240 28 508 179 766 11 780 167 986 179 766 73.6Q4 27 442 108 707 17 275 29 867 183 291 12 186 171 105 183 291 73.8
2000 Q1 27 835 110 078 17 154 30 276 185 343 12 896 172 447 185 343 73.6Q2 27 829 111 474 18 231 31 180 188 714 13 377 175 337 188 714 73.7Q3 28 253 113 900 18 648 32 044 192 845 13 391 179 454 192 845 74.2Q4 28 573 115 500 20 048 32 527 196 648 13 757 182 891 196 648 75.6
2001 Q1 29 259 117 939 19 815 34 573 201 586 13 908 187 678 201 586 75.4Q2 29 880 118 994 19 612 32 002 200 488 13 705 186 783 200 488 74.6Q3 30 218 120 270 19 338 31 736 201 562 13 321 188 241 201 562 74.6Q4 30 899 121 392 20 457 32 953 205 701 12 979 192 722 205 701 75.7
2002 Q1 31 064 122 499 20 915 30 648 205 126 12 807 192 319 205 126 73.9Q2 31 105 123 868 20 573 30 858 206 404 12 904 193 500 206 404 74.2Q3 31 735 124 620 21 556 30 894 208 805 12 876 195 929 208 805 73.0Q4 32 405 126 006 21 584 31 076 211 071 12 628 198 443 211 071 73.2
1 This sector includes households and non-profit institutions serving house-holds
2 The balance of gross primary incomes of the households and non-profit in-stitutions serving households sector as a percentage of gross national in-come.
Source: Office for National Statistics: 020 7533 6031
10
National accounts
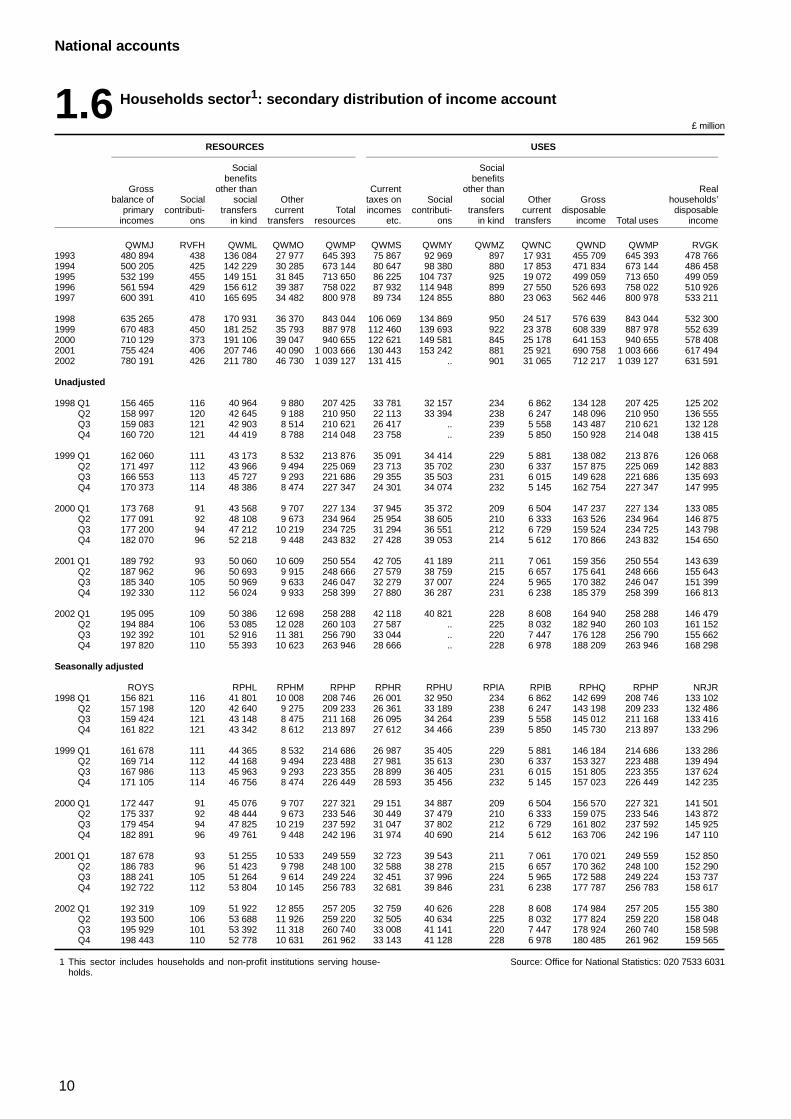
1.6 Households sector1: secondary distribution of income account
£ million
RESOURCES USES
Social Socialbenefits benefits
Gross other than Current other than Realbalance of Social social Other taxes on Social social Other Gross households’
primary contributi- transfers current Total incomes contributi- transfers current disposable disposableincomes ons in kind transfers resources etc. ons in kind transfers income Total uses income
QWMJ RVFH QWML QWMO QWMP QWMS QWMY QWMZ QWNC QWND QWMP RVGK1993 480 894 438 136 084 27 977 645 393 75 867 92 969 897 17 931 455 709 645 393 478 7661994 500 205 425 142 229 30 285 673 144 80 647 98 380 880 17 853 471 834 673 144 486 4581995 532 199 455 149 151 31 845 713 650 86 225 104 737 925 19 072 499 059 713 650 499 0591996 561 594 429 156 612 39 387 758 022 87 932 114 948 899 27 550 526 693 758 022 510 9261997 600 391 410 165 695 34 482 800 978 89 734 124 855 880 23 063 562 446 800 978 533 211
1998 635 265 478 170 931 36 370 843 044 106 069 134 869 950 24 517 576 639 843 044 532 3001999 670 483 450 181 252 35 793 887 978 112 460 139 693 922 23 378 608 339 887 978 552 6392000 710 129 373 191 106 39 047 940 655 122 621 149 581 845 25 178 641 153 940 655 578 4082001 755 424 406 207 746 40 090 1 003 666 130 443 153 242 881 25 921 690 758 1 003 666 617 4942002 780 191 426 211 780 46 730 1 039 127 131 415 .. 901 31 065 712 217 1 039 127 631 591
Unadjusted
1998 Q1 156 465 116 40 964 9 880 207 425 33 781 32 157 234 6 862 134 128 207 425 125 202Q2 158 997 120 42 645 9 188 210 950 22 113 33 394 238 6 247 148 096 210 950 136 555Q3 159 083 121 42 903 8 514 210 621 26 417 .. 239 5 558 143 487 210 621 132 128Q4 160 720 121 44 419 8 788 214 048 23 758 .. 239 5 850 150 928 214 048 138 415
1999 Q1 162 060 111 43 173 8 532 213 876 35 091 34 414 229 5 881 138 082 213 876 126 068Q2 171 497 112 43 966 9 494 225 069 23 713 35 702 230 6 337 157 875 225 069 142 883Q3 166 553 113 45 727 9 293 221 686 29 355 35 503 231 6 015 149 628 221 686 135 693Q4 170 373 114 48 386 8 474 227 347 24 301 34 074 232 5 145 162 754 227 347 147 995
2000 Q1 173 768 91 43 568 9 707 227 134 37 945 35 372 209 6 504 147 237 227 134 133 085Q2 177 091 92 48 108 9 673 234 964 25 954 38 605 210 6 333 163 526 234 964 146 875Q3 177 200 94 47 212 10 219 234 725 31 294 36 551 212 6 729 159 524 234 725 143 798Q4 182 070 96 52 218 9 448 243 832 27 428 39 053 214 5 612 170 866 243 832 154 650
2001 Q1 189 792 93 50 060 10 609 250 554 42 705 41 189 211 7 061 159 356 250 554 143 639Q2 187 962 96 50 693 9 915 248 666 27 579 38 759 215 6 657 175 641 248 666 155 643Q3 185 340 105 50 969 9 633 246 047 32 279 37 007 224 5 965 170 382 246 047 151 399Q4 192 330 112 56 024 9 933 258 399 27 880 36 287 231 6 238 185 379 258 399 166 813
2002 Q1 195 095 109 50 386 12 698 258 288 42 118 40 821 228 8 608 164 940 258 288 146 479Q2 194 884 106 53 085 12 028 260 103 27 587 .. 225 8 032 182 940 260 103 161 152Q3 192 392 101 52 916 11 381 256 790 33 044 .. 220 7 447 176 128 256 790 155 662Q4 197 820 110 55 393 10 623 263 946 28 666 .. 228 6 978 188 209 263 946 168 298
Seasonally adjusted
ROYS RPHL RPHM RPHP RPHR RPHU RPIA RPIB RPHQ RPHP NRJR1998 Q1 156 821 116 41 801 10 008 208 746 26 001 32 950 234 6 862 142 699 208 746 133 102
Q2 157 198 120 42 640 9 275 209 233 26 361 33 189 238 6 247 143 198 209 233 132 486Q3 159 424 121 43 148 8 475 211 168 26 095 34 264 239 5 558 145 012 211 168 133 416Q4 161 822 121 43 342 8 612 213 897 27 612 34 466 239 5 850 145 730 213 897 133 296
1999 Q1 161 678 111 44 365 8 532 214 686 26 987 35 405 229 5 881 146 184 214 686 133 286Q2 169 714 112 44 168 9 494 223 488 27 981 35 613 230 6 337 153 327 223 488 139 494Q3 167 986 113 45 963 9 293 223 355 28 899 36 405 231 6 015 151 805 223 355 137 624Q4 171 105 114 46 756 8 474 226 449 28 593 35 456 232 5 145 157 023 226 449 142 235
2000 Q1 172 447 91 45 076 9 707 227 321 29 151 34 887 209 6 504 156 570 227 321 141 501Q2 175 337 92 48 444 9 673 233 546 30 449 37 479 210 6 333 159 075 233 546 143 872Q3 179 454 94 47 825 10 219 237 592 31 047 37 802 212 6 729 161 802 237 592 145 925Q4 182 891 96 49 761 9 448 242 196 31 974 40 690 214 5 612 163 706 242 196 147 110
2001 Q1 187 678 93 51 255 10 533 249 559 32 723 39 543 211 7 061 170 021 249 559 152 850Q2 186 783 96 51 423 9 798 248 100 32 588 38 278 215 6 657 170 362 248 100 152 290Q3 188 241 105 51 264 9 614 249 224 32 451 37 996 224 5 965 172 588 249 224 153 737Q4 192 722 112 53 804 10 145 256 783 32 681 39 846 231 6 238 177 787 256 783 158 617
2002 Q1 192 319 109 51 922 12 855 257 205 32 759 40 626 228 8 608 174 984 257 205 155 380Q2 193 500 106 53 688 11 926 259 220 32 505 40 634 225 8 032 177 824 259 220 158 048Q3 195 929 101 53 392 11 318 260 740 33 008 41 141 220 7 447 178 924 260 740 158 598Q4 198 443 110 52 778 10 631 261 962 33 143 41 128 228 6 978 180 485 261 962 159 565
1 This sector includes households and non-profit institutions serving house-holds.
Source: Office for National Statistics: 020 7533 6031
11
National accounts
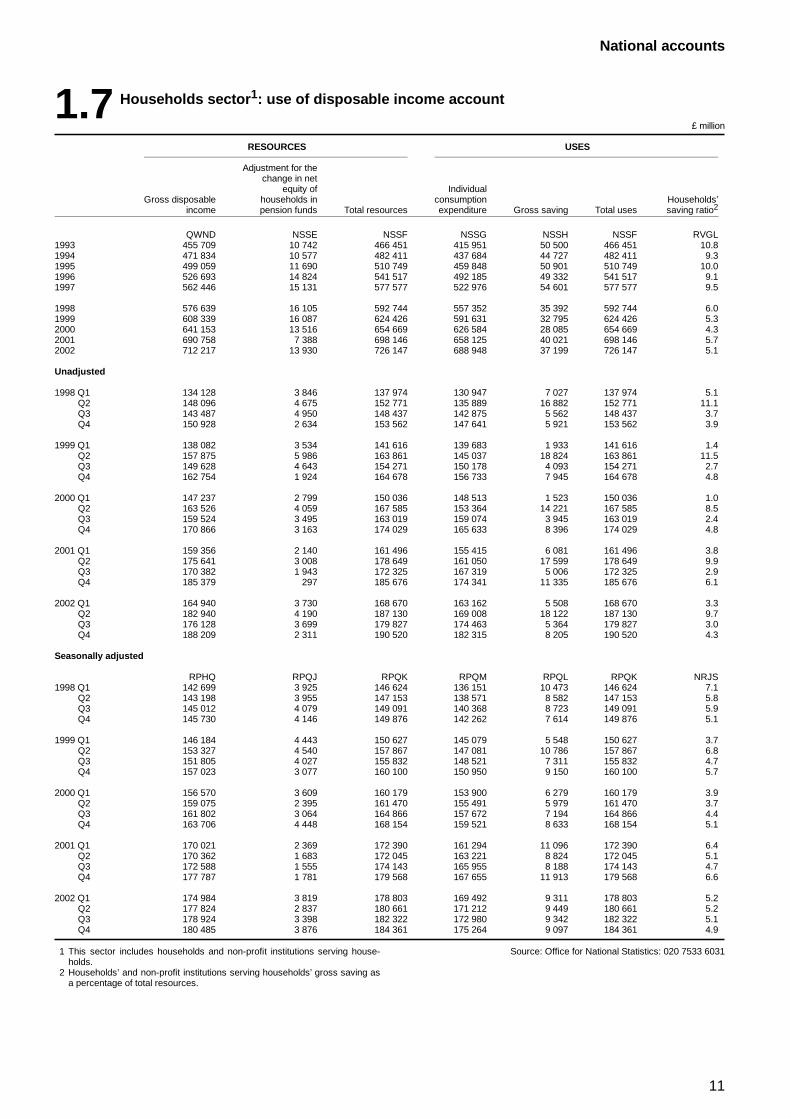
1.7 Households sector1: use of disposable income account
£ million
RESOURCES USES
Adjustment for thechange in net
equity of IndividualGross disposable households in consumption Households’
income pension funds Total resources expenditure Gross saving Total uses saving ratio2
QWND NSSE NSSF NSSG NSSH NSSF RVGL1993 455 709 10 742 466 451 415 951 50 500 466 451 10.81994 471 834 10 577 482 411 437 684 44 727 482 411 9.31995 499 059 11 690 510 749 459 848 50 901 510 749 10.01996 526 693 14 824 541 517 492 185 49 332 541 517 9.11997 562 446 15 131 577 577 522 976 54 601 577 577 9.5
1998 576 639 16 105 592 744 557 352 35 392 592 744 6.01999 608 339 16 087 624 426 591 631 32 795 624 426 5.32000 641 153 13 516 654 669 626 584 28 085 654 669 4.32001 690 758 7 388 698 146 658 125 40 021 698 146 5.72002 712 217 13 930 726 147 688 948 37 199 726 147 5.1
Unadjusted
1998 Q1 134 128 3 846 137 974 130 947 7 027 137 974 5.1Q2 148 096 4 675 152 771 135 889 16 882 152 771 11.1Q3 143 487 4 950 148 437 142 875 5 562 148 437 3.7Q4 150 928 2 634 153 562 147 641 5 921 153 562 3.9
1999 Q1 138 082 3 534 141 616 139 683 1 933 141 616 1.4Q2 157 875 5 986 163 861 145 037 18 824 163 861 11.5Q3 149 628 4 643 154 271 150 178 4 093 154 271 2.7Q4 162 754 1 924 164 678 156 733 7 945 164 678 4.8
2000 Q1 147 237 2 799 150 036 148 513 1 523 150 036 1.0Q2 163 526 4 059 167 585 153 364 14 221 167 585 8.5Q3 159 524 3 495 163 019 159 074 3 945 163 019 2.4Q4 170 866 3 163 174 029 165 633 8 396 174 029 4.8
2001 Q1 159 356 2 140 161 496 155 415 6 081 161 496 3.8Q2 175 641 3 008 178 649 161 050 17 599 178 649 9.9Q3 170 382 1 943 172 325 167 319 5 006 172 325 2.9Q4 185 379 297 185 676 174 341 11 335 185 676 6.1
2002 Q1 164 940 3 730 168 670 163 162 5 508 168 670 3.3Q2 182 940 4 190 187 130 169 008 18 122 187 130 9.7Q3 176 128 3 699 179 827 174 463 5 364 179 827 3.0Q4 188 209 2 311 190 520 182 315 8 205 190 520 4.3
Seasonally adjusted
RPHQ RPQJ RPQK RPQM RPQL RPQK NRJS1998 Q1 142 699 3 925 146 624 136 151 10 473 146 624 7.1
Q2 143 198 3 955 147 153 138 571 8 582 147 153 5.8Q3 145 012 4 079 149 091 140 368 8 723 149 091 5.9Q4 145 730 4 146 149 876 142 262 7 614 149 876 5.1
1999 Q1 146 184 4 443 150 627 145 079 5 548 150 627 3.7Q2 153 327 4 540 157 867 147 081 10 786 157 867 6.8Q3 151 805 4 027 155 832 148 521 7 311 155 832 4.7Q4 157 023 3 077 160 100 150 950 9 150 160 100 5.7
2000 Q1 156 570 3 609 160 179 153 900 6 279 160 179 3.9Q2 159 075 2 395 161 470 155 491 5 979 161 470 3.7Q3 161 802 3 064 164 866 157 672 7 194 164 866 4.4Q4 163 706 4 448 168 154 159 521 8 633 168 154 5.1
2001 Q1 170 021 2 369 172 390 161 294 11 096 172 390 6.4Q2 170 362 1 683 172 045 163 221 8 824 172 045 5.1Q3 172 588 1 555 174 143 165 955 8 188 174 143 4.7Q4 177 787 1 781 179 568 167 655 11 913 179 568 6.6
2002 Q1 174 984 3 819 178 803 169 492 9 311 178 803 5.2Q2 177 824 2 837 180 661 171 212 9 449 180 661 5.2Q3 178 924 3 398 182 322 172 980 9 342 182 322 5.1Q4 180 485 3 876 184 361 175 264 9 097 184 361 4.9
1 This sector includes households and non-profit institutions serving house-holds.
2 Households’ and non-profit institutions serving households’ gross saving asa percentage of total resources.
Source: Office for National Statistics: 020 7533 6031
12
National accounts
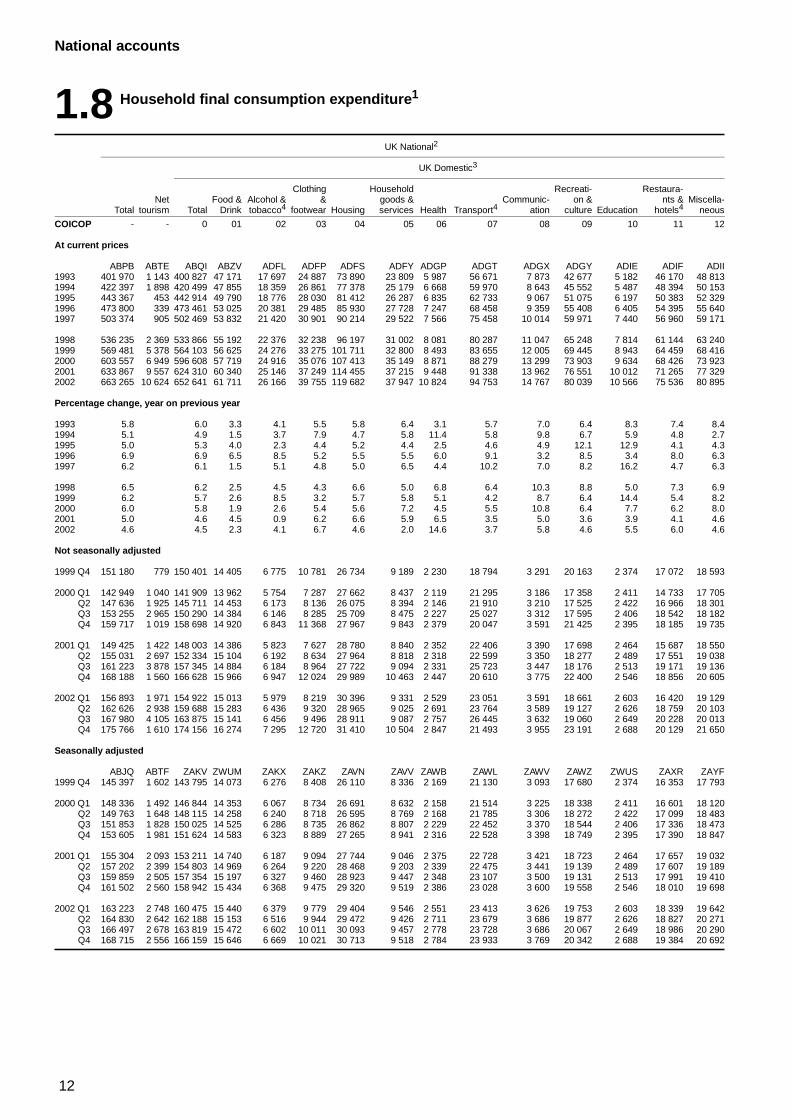
1.8 Household final consumption expenditure1
UK National2
UK Domestic3
Clothing Household Recreati- Restaura-Net Food & Alcohol & & goods & Communic- on & nts & Miscella-
Total tourism Total Drink tobacco4 footwear Housing services Health Transport4 ation culture Education hotels4 neous
COICOP - - 0 01 02 03 04 05 06 07 08 09 10 11 12
At current prices
ABPB ABTE ABQI ABZV ADFL ADFP ADFS ADFY ADGP ADGT ADGX ADGY ADIE ADIF ADII1993 401 970 1 143 400 827 47 171 17 697 24 887 73 890 23 809 5 987 56 671 7 873 42 677 5 182 46 170 48 8131994 422 397 1 898 420 499 47 855 18 359 26 861 77 378 25 179 6 668 59 970 8 643 45 552 5 487 48 394 50 1531995 443 367 453 442 914 49 790 18 776 28 030 81 412 26 287 6 835 62 733 9 067 51 075 6 197 50 383 52 3291996 473 800 339 473 461 53 025 20 381 29 485 85 930 27 728 7 247 68 458 9 359 55 408 6 405 54 395 55 6401997 503 374 905 502 469 53 832 21 420 30 901 90 214 29 522 7 566 75 458 10 014 59 971 7 440 56 960 59 171
1998 536 235 2 369 533 866 55 192 22 376 32 238 96 197 31 002 8 081 80 287 11 047 65 248 7 814 61 144 63 2401999 569 481 5 378 564 103 56 625 24 276 33 275 101 711 32 800 8 493 83 655 12 005 69 445 8 943 64 459 68 4162000 603 557 6 949 596 608 57 719 24 916 35 076 107 413 35 149 8 871 88 279 13 299 73 903 9 634 68 426 73 9232001 633 867 9 557 624 310 60 340 25 146 37 249 114 455 37 215 9 448 91 338 13 962 76 551 10 012 71 265 77 3292002 663 265 10 624 652 641 61 711 26 166 39 755 119 682 37 947 10 824 94 753 14 767 80 039 10 566 75 536 80 895
Percentage change, year on previous year
1993 5.8 6.0 3.3 4.1 5.5 5.8 6.4 3.1 5.7 7.0 6.4 8.3 7.4 8.41994 5.1 4.9 1.5 3.7 7.9 4.7 5.8 11.4 5.8 9.8 6.7 5.9 4.8 2.71995 5.0 5.3 4.0 2.3 4.4 5.2 4.4 2.5 4.6 4.9 12.1 12.9 4.1 4.31996 6.9 6.9 6.5 8.5 5.2 5.5 5.5 6.0 9.1 3.2 8.5 3.4 8.0 6.31997 6.2 6.1 1.5 5.1 4.8 5.0 6.5 4.4 10.2 7.0 8.2 16.2 4.7 6.3
1998 6.5 6.2 2.5 4.5 4.3 6.6 5.0 6.8 6.4 10.3 8.8 5.0 7.3 6.91999 6.2 5.7 2.6 8.5 3.2 5.7 5.8 5.1 4.2 8.7 6.4 14.4 5.4 8.22000 6.0 5.8 1.9 2.6 5.4 5.6 7.2 4.5 5.5 10.8 6.4 7.7 6.2 8.02001 5.0 4.6 4.5 0.9 6.2 6.6 5.9 6.5 3.5 5.0 3.6 3.9 4.1 4.62002 4.6 4.5 2.3 4.1 6.7 4.6 2.0 14.6 3.7 5.8 4.6 5.5 6.0 4.6
Not seasonally adjusted
1999 Q4 151 180 779 150 401 14 405 6 775 10 781 26 734 9 189 2 230 18 794 3 291 20 163 2 374 17 072 18 593
2000 Q1 142 949 1 040 141 909 13 962 5 754 7 287 27 662 8 437 2 119 21 295 3 186 17 358 2 411 14 733 17 705Q2 147 636 1 925 145 711 14 453 6 173 8 136 26 075 8 394 2 146 21 910 3 210 17 525 2 422 16 966 18 301Q3 153 255 2 965 150 290 14 384 6 146 8 285 25 709 8 475 2 227 25 027 3 312 17 595 2 406 18 542 18 182Q4 159 717 1 019 158 698 14 920 6 843 11 368 27 967 9 843 2 379 20 047 3 591 21 425 2 395 18 185 19 735
2001 Q1 149 425 1 422 148 003 14 386 5 823 7 627 28 780 8 840 2 352 22 406 3 390 17 698 2 464 15 687 18 550Q2 155 031 2 697 152 334 15 104 6 192 8 634 27 964 8 818 2 318 22 599 3 350 18 277 2 489 17 551 19 038Q3 161 223 3 878 157 345 14 884 6 184 8 964 27 722 9 094 2 331 25 723 3 447 18 176 2 513 19 171 19 136Q4 168 188 1 560 166 628 15 966 6 947 12 024 29 989 10 463 2 447 20 610 3 775 22 400 2 546 18 856 20 605
2002 Q1 156 893 1 971 154 922 15 013 5 979 8 219 30 396 9 331 2 529 23 051 3 591 18 661 2 603 16 420 19 129Q2 162 626 2 938 159 688 15 283 6 436 9 320 28 965 9 025 2 691 23 764 3 589 19 127 2 626 18 759 20 103Q3 167 980 4 105 163 875 15 141 6 456 9 496 28 911 9 087 2 757 26 445 3 632 19 060 2 649 20 228 20 013Q4 175 766 1 610 174 156 16 274 7 295 12 720 31 410 10 504 2 847 21 493 3 955 23 191 2 688 20 129 21 650
Seasonally adjusted
ABJQ ABTF ZAKV ZWUM ZAKX ZAKZ ZAVN ZAVV ZAWB ZAWL ZAWV ZAWZ ZWUS ZAXR ZAYF1999 Q4 145 397 1 602 143 795 14 073 6 276 8 408 26 110 8 336 2 169 21 130 3 093 17 680 2 374 16 353 17 793
2000 Q1 148 336 1 492 146 844 14 353 6 067 8 734 26 691 8 632 2 158 21 514 3 225 18 338 2 411 16 601 18 120Q2 149 763 1 648 148 115 14 258 6 240 8 718 26 595 8 769 2 168 21 785 3 306 18 272 2 422 17 099 18 483Q3 151 853 1 828 150 025 14 525 6 286 8 735 26 862 8 807 2 229 22 452 3 370 18 544 2 406 17 336 18 473Q4 153 605 1 981 151 624 14 583 6 323 8 889 27 265 8 941 2 316 22 528 3 398 18 749 2 395 17 390 18 847
2001 Q1 155 304 2 093 153 211 14 740 6 187 9 094 27 744 9 046 2 375 22 728 3 421 18 723 2 464 17 657 19 032Q2 157 202 2 399 154 803 14 969 6 264 9 220 28 468 9 203 2 339 22 475 3 441 19 139 2 489 17 607 19 189Q3 159 859 2 505 157 354 15 197 6 327 9 460 28 923 9 447 2 348 23 107 3 500 19 131 2 513 17 991 19 410Q4 161 502 2 560 158 942 15 434 6 368 9 475 29 320 9 519 2 386 23 028 3 600 19 558 2 546 18 010 19 698
2002 Q1 163 223 2 748 160 475 15 440 6 379 9 779 29 404 9 546 2 551 23 413 3 626 19 753 2 603 18 339 19 642Q2 164 830 2 642 162 188 15 153 6 516 9 944 29 472 9 426 2 711 23 679 3 686 19 877 2 626 18 827 20 271Q3 166 497 2 678 163 819 15 472 6 602 10 011 30 093 9 457 2 778 23 728 3 686 20 067 2 649 18 986 20 290Q4 168 715 2 556 166 159 15 646 6 669 10 021 30 713 9 518 2 784 23 933 3 769 20 342 2 688 19 384 20 692
13
National accounts
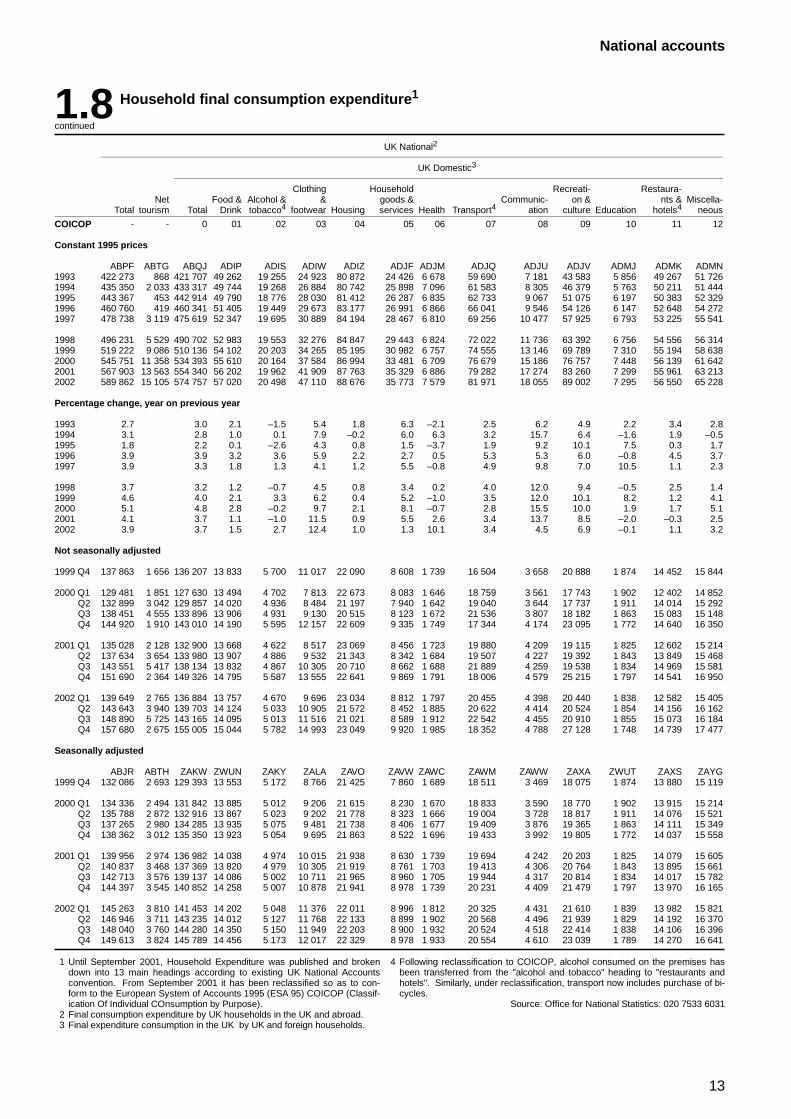
1.8 Household final consumption expenditure1
continued
UK National2
UK Domestic3
Clothing Household Recreati- Restaura-Net Food & Alcohol & & goods & Communic- on & nts & Miscella-
Total tourism Total Drink tobacco4 footwear Housing services Health Transport4 ation culture Education hotels4 neous
COICOP - - 0 01 02 03 04 05 06 07 08 09 10 11 12
Constant 1995 prices
ABPF ABTG ABQJ ADIP ADIS ADIW ADIZ ADJF ADJM ADJQ ADJU ADJV ADMJ ADMK ADMN1993 422 273 868 421 707 49 262 19 255 24 923 80 872 24 426 6 678 59 690 7 181 43 583 5 856 49 267 51 7261994 435 350 2 033 433 317 49 744 19 268 26 884 80 742 25 898 7 096 61 583 8 305 46 379 5 763 50 211 51 4441995 443 367 453 442 914 49 790 18 776 28 030 81 412 26 287 6 835 62 733 9 067 51 075 6 197 50 383 52 3291996 460 760 419 460 341 51 405 19 449 29 673 83 177 26 991 6 866 66 041 9 546 54 126 6 147 52 648 54 2721997 478 738 3 119 475 619 52 347 19 695 30 889 84 194 28 467 6 810 69 256 10 477 57 925 6 793 53 225 55 541
1998 496 231 5 529 490 702 52 983 19 553 32 276 84 847 29 443 6 824 72 022 11 736 63 392 6 756 54 556 56 3141999 519 222 9 086 510 136 54 102 20 203 34 265 85 195 30 982 6 757 74 555 13 146 69 789 7 310 55 194 58 6382000 545 751 11 358 534 393 55 610 20 164 37 584 86 994 33 481 6 709 76 679 15 186 76 757 7 448 56 139 61 6422001 567 903 13 563 554 340 56 202 19 962 41 909 87 763 35 329 6 886 79 282 17 274 83 260 7 299 55 961 63 2132002 589 862 15 105 574 757 57 020 20 498 47 110 88 676 35 773 7 579 81 971 18 055 89 002 7 295 56 550 65 228
Percentage change, year on previous year
1993 2.7 3.0 2.1 –1.5 5.4 1.8 6.3 –2.1 2.5 6.2 4.9 2.2 3.4 2.81994 3.1 2.8 1.0 0.1 7.9 –0.2 6.0 6.3 3.2 15.7 6.4 –1.6 1.9 –0.51995 1.8 2.2 0.1 –2.6 4.3 0.8 1.5 –3.7 1.9 9.2 10.1 7.5 0.3 1.71996 3.9 3.9 3.2 3.6 5.9 2.2 2.7 0.5 5.3 5.3 6.0 –0.8 4.5 3.71997 3.9 3.3 1.8 1.3 4.1 1.2 5.5 –0.8 4.9 9.8 7.0 10.5 1.1 2.3
1998 3.7 3.2 1.2 –0.7 4.5 0.8 3.4 0.2 4.0 12.0 9.4 –0.5 2.5 1.41999 4.6 4.0 2.1 3.3 6.2 0.4 5.2 –1.0 3.5 12.0 10.1 8.2 1.2 4.12000 5.1 4.8 2.8 –0.2 9.7 2.1 8.1 –0.7 2.8 15.5 10.0 1.9 1.7 5.12001 4.1 3.7 1.1 –1.0 11.5 0.9 5.5 2.6 3.4 13.7 8.5 –2.0 –0.3 2.52002 3.9 3.7 1.5 2.7 12.4 1.0 1.3 10.1 3.4 4.5 6.9 –0.1 1.1 3.2
Not seasonally adjusted
1999 Q4 137 863 1 656 136 207 13 833 5 700 11 017 22 090 8 608 1 739 16 504 3 658 20 888 1 874 14 452 15 844
2000 Q1 129 481 1 851 127 630 13 494 4 702 7 813 22 673 8 083 1 646 18 759 3 561 17 743 1 902 12 402 14 852Q2 132 899 3 042 129 857 14 020 4 936 8 484 21 197 7 940 1 642 19 040 3 644 17 737 1 911 14 014 15 292Q3 138 451 4 555 133 896 13 906 4 931 9 130 20 515 8 123 1 672 21 536 3 807 18 182 1 863 15 083 15 148Q4 144 920 1 910 143 010 14 190 5 595 12 157 22 609 9 335 1 749 17 344 4 174 23 095 1 772 14 640 16 350
2001 Q1 135 028 2 128 132 900 13 668 4 622 8 517 23 069 8 456 1 723 19 880 4 209 19 115 1 825 12 602 15 214Q2 137 634 3 654 133 980 13 907 4 886 9 532 21 343 8 342 1 684 19 507 4 227 19 392 1 843 13 849 15 468Q3 143 551 5 417 138 134 13 832 4 867 10 305 20 710 8 662 1 688 21 889 4 259 19 538 1 834 14 969 15 581Q4 151 690 2 364 149 326 14 795 5 587 13 555 22 641 9 869 1 791 18 006 4 579 25 215 1 797 14 541 16 950
2002 Q1 139 649 2 765 136 884 13 757 4 670 9 696 23 034 8 812 1 797 20 455 4 398 20 440 1 838 12 582 15 405Q2 143 643 3 940 139 703 14 124 5 033 10 905 21 572 8 452 1 885 20 622 4 414 20 524 1 854 14 156 16 162Q3 148 890 5 725 143 165 14 095 5 013 11 516 21 021 8 589 1 912 22 542 4 455 20 910 1 855 15 073 16 184Q4 157 680 2 675 155 005 15 044 5 782 14 993 23 049 9 920 1 985 18 352 4 788 27 128 1 748 14 739 17 477
Seasonally adjusted
ABJR ABTH ZAKW ZWUN ZAKY ZALA ZAVO ZAVW ZAWC ZAWM ZAWW ZAXA ZWUT ZAXS ZAYG1999 Q4 132 086 2 693 129 393 13 553 5 172 8 766 21 425 7 860 1 689 18 511 3 469 18 075 1 874 13 880 15 119
2000 Q1 134 336 2 494 131 842 13 885 5 012 9 206 21 615 8 230 1 670 18 833 3 590 18 770 1 902 13 915 15 214Q2 135 788 2 872 132 916 13 867 5 023 9 202 21 778 8 323 1 666 19 004 3 728 18 817 1 911 14 076 15 521Q3 137 265 2 980 134 285 13 935 5 075 9 481 21 738 8 406 1 677 19 409 3 876 19 365 1 863 14 111 15 349Q4 138 362 3 012 135 350 13 923 5 054 9 695 21 863 8 522 1 696 19 433 3 992 19 805 1 772 14 037 15 558
2001 Q1 139 956 2 974 136 982 14 038 4 974 10 015 21 938 8 630 1 739 19 694 4 242 20 203 1 825 14 079 15 605Q2 140 837 3 468 137 369 13 820 4 979 10 305 21 919 8 761 1 703 19 413 4 306 20 764 1 843 13 895 15 661Q3 142 713 3 576 139 137 14 086 5 002 10 711 21 965 8 960 1 705 19 944 4 317 20 814 1 834 14 017 15 782Q4 144 397 3 545 140 852 14 258 5 007 10 878 21 941 8 978 1 739 20 231 4 409 21 479 1 797 13 970 16 165
2002 Q1 145 263 3 810 141 453 14 202 5 048 11 376 22 011 8 996 1 812 20 325 4 431 21 610 1 839 13 982 15 821Q2 146 946 3 711 143 235 14 012 5 127 11 768 22 133 8 899 1 902 20 568 4 496 21 939 1 829 14 192 16 370Q3 148 040 3 760 144 280 14 350 5 150 11 949 22 203 8 900 1 932 20 524 4 518 22 414 1 838 14 106 16 396Q4 149 613 3 824 145 789 14 456 5 173 12 017 22 329 8 978 1 933 20 554 4 610 23 039 1 789 14 270 16 641
1 Until September 2001, Household Expenditure was published and brokendown into 13 main headings according to existing UK National Accountsconvention. From September 2001 it has been reclassified so as to con-form to the European System of Accounts 1995 (ESA 95) COICOP (Classif-ication Of Individual COnsumption by Purpose).
2 Final consumption expenditure by UK households in the UK and abroad.3 Final expenditure consumption in the UK by UK and foreign households.
4 Following reclassification to COICOP, alcohol consumed on the premises hasbeen transferred from the "alcohol and tobacco" heading to "restaurants andhotels". Similarly, under reclassification, transport now includes purchase of bi-cycles.
Source: Office for National Statistics: 020 7533 6031
14
National accounts
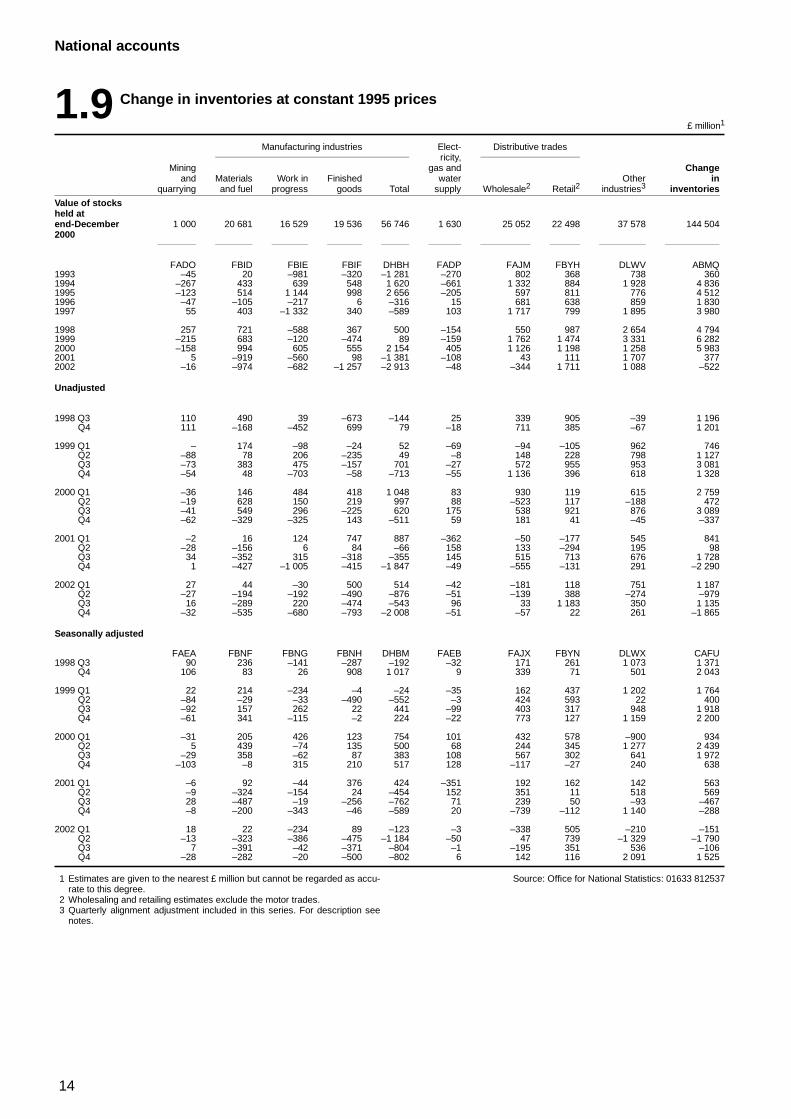
1.9 Change in inventories at constant 1995 prices
£ million1
Manufacturing industries Elect- Distributive tradesricity,
Mining gas and Changeand Materials Work in Finished water Other in
quarrying and fuel progress goods Total supply Wholesale2 Retail2 industries3 inventories
Value of stocksheld atend-December 1 000 20 681 16 529 19 536 56 746 1 630 25 052 22 498 37 578 144 5042000
FADO FBID FBIE FBIF DHBH FADP FAJM FBYH DLWV ABMQ1993 –45 20 –981 –320 –1 281 –270 802 368 738 3601994 –267 433 639 548 1 620 –661 1 332 884 1 928 4 8361995 –123 514 1 144 998 2 656 –205 597 811 776 4 5121996 –47 –105 –217 6 –316 15 681 638 859 1 8301997 55 403 –1 332 340 –589 103 1 717 799 1 895 3 980
1998 257 721 –588 367 500 –154 550 987 2 654 4 7941999 –215 683 –120 –474 89 –159 1 762 1 474 3 331 6 2822000 –158 994 605 555 2 154 405 1 126 1 198 1 258 5 9832001 5 –919 –560 98 –1 381 –108 43 111 1 707 3772002 –16 –974 –682 –1 257 –2 913 –48 –344 1 711 1 088 –522
Unadjusted
1998 Q3 110 490 39 –673 –144 25 339 905 –39 1 196Q4 111 –168 –452 699 79 –18 711 385 –67 1 201
1999 Q1 – 174 –98 –24 52 –69 –94 –105 962 746Q2 –88 78 206 –235 49 –8 148 228 798 1 127Q3 –73 383 475 –157 701 –27 572 955 953 3 081Q4 –54 48 –703 –58 –713 –55 1 136 396 618 1 328
2000 Q1 –36 146 484 418 1 048 83 930 119 615 2 759Q2 –19 628 150 219 997 88 –523 117 –188 472Q3 –41 549 296 –225 620 175 538 921 876 3 089Q4 –62 –329 –325 143 –511 59 181 41 –45 –337
2001 Q1 –2 16 124 747 887 –362 –50 –177 545 841Q2 –28 –156 6 84 –66 158 133 –294 195 98Q3 34 –352 315 –318 –355 145 515 713 676 1 728Q4 1 –427 –1 005 –415 –1 847 –49 –555 –131 291 –2 290
2002 Q1 27 44 –30 500 514 –42 –181 118 751 1 187Q2 –27 –194 –192 –490 –876 –51 –139 388 –274 –979Q3 16 –289 220 –474 –543 96 33 1 183 350 1 135Q4 –32 –535 –680 –793 –2 008 –51 –57 22 261 –1 865
Seasonally adjusted
FAEA FBNF FBNG FBNH DHBM FAEB FAJX FBYN DLWX CAFU1998 Q3 90 236 –141 –287 –192 –32 171 261 1 073 1 371
Q4 106 83 26 908 1 017 9 339 71 501 2 043
1999 Q1 22 214 –234 –4 –24 –35 162 437 1 202 1 764Q2 –84 –29 –33 –490 –552 –3 424 593 22 400Q3 –92 157 262 22 441 –99 403 317 948 1 918Q4 –61 341 –115 –2 224 –22 773 127 1 159 2 200
2000 Q1 –31 205 426 123 754 101 432 578 –900 934Q2 5 439 –74 135 500 68 244 345 1 277 2 439Q3 –29 358 –62 87 383 108 567 302 641 1 972Q4 –103 –8 315 210 517 128 –117 –27 240 638
2001 Q1 –6 92 –44 376 424 –351 192 162 142 563Q2 –9 –324 –154 24 –454 152 351 11 518 569Q3 28 –487 –19 –256 –762 71 239 50 –93 –467Q4 –8 –200 –343 –46 –589 20 –739 –112 1 140 –288
2002 Q1 18 22 –234 89 –123 –3 –338 505 –210 –151Q2 –13 –323 –386 –475 –1 184 –50 47 739 –1 329 –1 790Q3 7 –391 –42 –371 –804 –1 –195 351 536 –106Q4 –28 –282 –20 –500 –802 6 142 116 2 091 1 525
1 Estimates are given to the nearest £ million but cannot be regarded as accu-rate to this degree.
2 Wholesaling and retailing estimates exclude the motor trades.3 Quarterly alignment adjustment included in this series. For description see
notes.
Source: Office for National Statistics: 01633 812537
15
National accounts
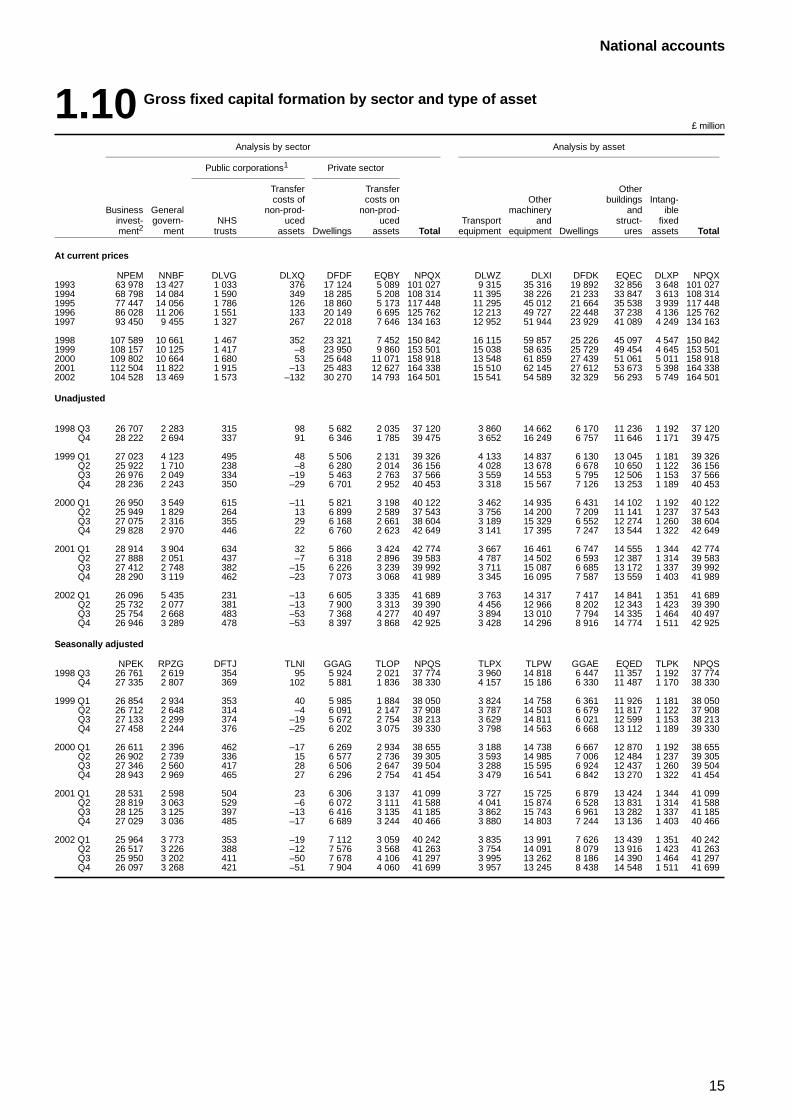
1.10 Gross fixed capital formation by sector and type of asset
£ million
Analysis by sector Analysis by asset
Public corporations1 Private sector
Transfer Transfer Othercosts of costs on Other buildings Intang-
Business General non-prod- non-prod- machinery and ibleinvest- govern- NHS uced uced Transport and struct- fixedment2 ment trusts assets Dwellings assets Total equipment equipment Dwellings ures assets Total
At current prices
NPEM NNBF DLVG DLXQ DFDF EQBY NPQX DLWZ DLXI DFDK EQEC DLXP NPQX1993 63 978 13 427 1 033 376 17 124 5 089 101 027 9 315 35 316 19 892 32 856 3 648 101 0271994 68 798 14 084 1 590 349 18 285 5 208 108 314 11 395 38 226 21 233 33 847 3 613 108 3141995 77 447 14 056 1 786 126 18 860 5 173 117 448 11 295 45 012 21 664 35 538 3 939 117 4481996 86 028 11 206 1 551 133 20 149 6 695 125 762 12 213 49 727 22 448 37 238 4 136 125 7621997 93 450 9 455 1 327 267 22 018 7 646 134 163 12 952 51 944 23 929 41 089 4 249 134 163
1998 107 589 10 661 1 467 352 23 321 7 452 150 842 16 115 59 857 25 226 45 097 4 547 150 8421999 108 157 10 125 1 417 –8 23 950 9 860 153 501 15 038 58 635 25 729 49 454 4 645 153 5012000 109 802 10 664 1 680 53 25 648 11 071 158 918 13 548 61 859 27 439 51 061 5 011 158 9182001 112 504 11 822 1 915 –13 25 483 12 627 164 338 15 510 62 145 27 612 53 673 5 398 164 3382002 104 528 13 469 1 573 –132 30 270 14 793 164 501 15 541 54 589 32 329 56 293 5 749 164 501
Unadjusted
1998 Q3 26 707 2 283 315 98 5 682 2 035 37 120 3 860 14 662 6 170 11 236 1 192 37 120Q4 28 222 2 694 337 91 6 346 1 785 39 475 3 652 16 249 6 757 11 646 1 171 39 475
1999 Q1 27 023 4 123 495 48 5 506 2 131 39 326 4 133 14 837 6 130 13 045 1 181 39 326Q2 25 922 1 710 238 –8 6 280 2 014 36 156 4 028 13 678 6 678 10 650 1 122 36 156Q3 26 976 2 049 334 –19 5 463 2 763 37 566 3 559 14 553 5 795 12 506 1 153 37 566Q4 28 236 2 243 350 –29 6 701 2 952 40 453 3 318 15 567 7 126 13 253 1 189 40 453
2000 Q1 26 950 3 549 615 –11 5 821 3 198 40 122 3 462 14 935 6 431 14 102 1 192 40 122Q2 25 949 1 829 264 13 6 899 2 589 37 543 3 756 14 200 7 209 11 141 1 237 37 543Q3 27 075 2 316 355 29 6 168 2 661 38 604 3 189 15 329 6 552 12 274 1 260 38 604Q4 29 828 2 970 446 22 6 760 2 623 42 649 3 141 17 395 7 247 13 544 1 322 42 649
2001 Q1 28 914 3 904 634 32 5 866 3 424 42 774 3 667 16 461 6 747 14 555 1 344 42 774Q2 27 888 2 051 437 –7 6 318 2 896 39 583 4 787 14 502 6 593 12 387 1 314 39 583Q3 27 412 2 748 382 –15 6 226 3 239 39 992 3 711 15 087 6 685 13 172 1 337 39 992Q4 28 290 3 119 462 –23 7 073 3 068 41 989 3 345 16 095 7 587 13 559 1 403 41 989
2002 Q1 26 096 5 435 231 –13 6 605 3 335 41 689 3 763 14 317 7 417 14 841 1 351 41 689Q2 25 732 2 077 381 –13 7 900 3 313 39 390 4 456 12 966 8 202 12 343 1 423 39 390Q3 25 754 2 668 483 –53 7 368 4 277 40 497 3 894 13 010 7 794 14 335 1 464 40 497Q4 26 946 3 289 478 –53 8 397 3 868 42 925 3 428 14 296 8 916 14 774 1 511 42 925
Seasonally adjusted
NPEK RPZG DFTJ TLNI GGAG TLOP NPQS TLPX TLPW GGAE EQED TLPK NPQS1998 Q3 26 761 2 619 354 95 5 924 2 021 37 774 3 960 14 818 6 447 11 357 1 192 37 774
Q4 27 335 2 807 369 102 5 881 1 836 38 330 4 157 15 186 6 330 11 487 1 170 38 330
1999 Q1 26 854 2 934 353 40 5 985 1 884 38 050 3 824 14 758 6 361 11 926 1 181 38 050Q2 26 712 2 648 314 –4 6 091 2 147 37 908 3 787 14 503 6 679 11 817 1 122 37 908Q3 27 133 2 299 374 –19 5 672 2 754 38 213 3 629 14 811 6 021 12 599 1 153 38 213Q4 27 458 2 244 376 –25 6 202 3 075 39 330 3 798 14 563 6 668 13 112 1 189 39 330
2000 Q1 26 611 2 396 462 –17 6 269 2 934 38 655 3 188 14 738 6 667 12 870 1 192 38 655Q2 26 902 2 739 336 15 6 577 2 736 39 305 3 593 14 985 7 006 12 484 1 237 39 305Q3 27 346 2 560 417 28 6 506 2 647 39 504 3 288 15 595 6 924 12 437 1 260 39 504Q4 28 943 2 969 465 27 6 296 2 754 41 454 3 479 16 541 6 842 13 270 1 322 41 454
2001 Q1 28 531 2 598 504 23 6 306 3 137 41 099 3 727 15 725 6 879 13 424 1 344 41 099Q2 28 819 3 063 529 –6 6 072 3 111 41 588 4 041 15 874 6 528 13 831 1 314 41 588Q3 28 125 3 125 397 –13 6 416 3 135 41 185 3 862 15 743 6 961 13 282 1 337 41 185Q4 27 029 3 036 485 –17 6 689 3 244 40 466 3 880 14 803 7 244 13 136 1 403 40 466
2002 Q1 25 964 3 773 353 –19 7 112 3 059 40 242 3 835 13 991 7 626 13 439 1 351 40 242Q2 26 517 3 226 388 –12 7 576 3 568 41 263 3 754 14 091 8 079 13 916 1 423 41 263Q3 25 950 3 202 411 –50 7 678 4 106 41 297 3 995 13 262 8 186 14 390 1 464 41 297Q4 26 097 3 268 421 –51 7 904 4 060 41 699 3 957 13 245 8 438 14 548 1 511 41 699
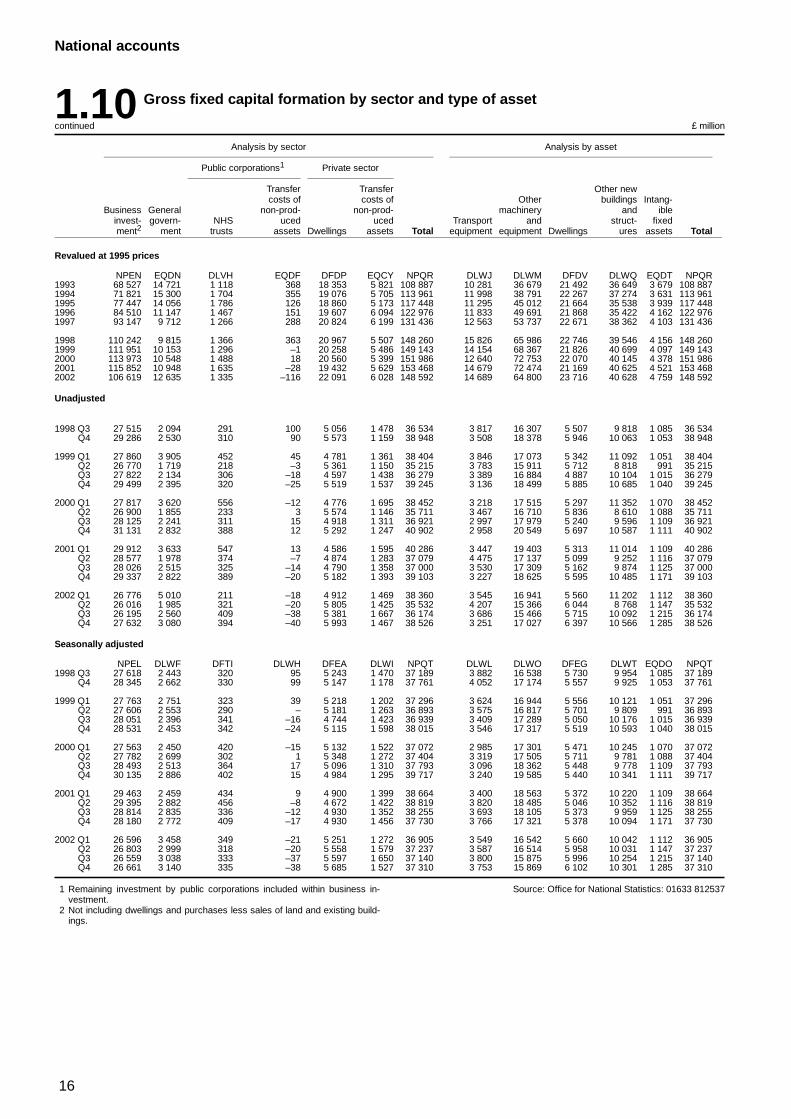
16
National accounts
1.10 Gross fixed capital formation by sector and type of asset
continued £ million
Analysis by sector Analysis by asset
Public corporations1 Private sector
Transfer Transfer Other newcosts of costs of Other buildings Intang-
Business General non-prod- non-prod- machinery and ibleinvest- govern- NHS uced uced Transport and struct- fixedment2 ment trusts assets Dwellings assets Total equipment equipment Dwellings ures assets Total
Revalued at 1995 prices
NPEN EQDN DLVH EQDF DFDP EQCY NPQR DLWJ DLWM DFDV DLWQ EQDT NPQR1993 68 527 14 721 1 118 368 18 353 5 821 108 887 10 281 36 679 21 492 36 649 3 679 108 8871994 71 821 15 300 1 704 355 19 076 5 705 113 961 11 998 38 791 22 267 37 274 3 631 113 9611995 77 447 14 056 1 786 126 18 860 5 173 117 448 11 295 45 012 21 664 35 538 3 939 117 4481996 84 510 11 147 1 467 151 19 607 6 094 122 976 11 833 49 691 21 868 35 422 4 162 122 9761997 93 147 9 712 1 266 288 20 824 6 199 131 436 12 563 53 737 22 671 38 362 4 103 131 436
1998 110 242 9 815 1 366 363 20 967 5 507 148 260 15 826 65 986 22 746 39 546 4 156 148 2601999 111 951 10 153 1 296 –1 20 258 5 486 149 143 14 154 68 367 21 826 40 699 4 097 149 1432000 113 973 10 548 1 488 18 20 560 5 399 151 986 12 640 72 753 22 070 40 145 4 378 151 9862001 115 852 10 948 1 635 –28 19 432 5 629 153 468 14 679 72 474 21 169 40 625 4 521 153 4682002 106 619 12 635 1 335 –116 22 091 6 028 148 592 14 689 64 800 23 716 40 628 4 759 148 592
Unadjusted
1998 Q3 27 515 2 094 291 100 5 056 1 478 36 534 3 817 16 307 5 507 9 818 1 085 36 534Q4 29 286 2 530 310 90 5 573 1 159 38 948 3 508 18 378 5 946 10 063 1 053 38 948
1999 Q1 27 860 3 905 452 45 4 781 1 361 38 404 3 846 17 073 5 342 11 092 1 051 38 404Q2 26 770 1 719 218 –3 5 361 1 150 35 215 3 783 15 911 5 712 8 818 991 35 215Q3 27 822 2 134 306 –18 4 597 1 438 36 279 3 389 16 884 4 887 10 104 1 015 36 279Q4 29 499 2 395 320 –25 5 519 1 537 39 245 3 136 18 499 5 885 10 685 1 040 39 245
2000 Q1 27 817 3 620 556 –12 4 776 1 695 38 452 3 218 17 515 5 297 11 352 1 070 38 452Q2 26 900 1 855 233 3 5 574 1 146 35 711 3 467 16 710 5 836 8 610 1 088 35 711Q3 28 125 2 241 311 15 4 918 1 311 36 921 2 997 17 979 5 240 9 596 1 109 36 921Q4 31 131 2 832 388 12 5 292 1 247 40 902 2 958 20 549 5 697 10 587 1 111 40 902
2001 Q1 29 912 3 633 547 13 4 586 1 595 40 286 3 447 19 403 5 313 11 014 1 109 40 286Q2 28 577 1 978 374 –7 4 874 1 283 37 079 4 475 17 137 5 099 9 252 1 116 37 079Q3 28 026 2 515 325 –14 4 790 1 358 37 000 3 530 17 309 5 162 9 874 1 125 37 000Q4 29 337 2 822 389 –20 5 182 1 393 39 103 3 227 18 625 5 595 10 485 1 171 39 103
2002 Q1 26 776 5 010 211 –18 4 912 1 469 38 360 3 545 16 941 5 560 11 202 1 112 38 360Q2 26 016 1 985 321 –20 5 805 1 425 35 532 4 207 15 366 6 044 8 768 1 147 35 532Q3 26 195 2 560 409 –38 5 381 1 667 36 174 3 686 15 466 5 715 10 092 1 215 36 174Q4 27 632 3 080 394 –40 5 993 1 467 38 526 3 251 17 027 6 397 10 566 1 285 38 526
Seasonally adjusted
NPEL DLWF DFTI DLWH DFEA DLWI NPQT DLWL DLWO DFEG DLWT EQDO NPQT1998 Q3 27 618 2 443 320 95 5 243 1 470 37 189 3 882 16 538 5 730 9 954 1 085 37 189
Q4 28 345 2 662 330 99 5 147 1 178 37 761 4 052 17 174 5 557 9 925 1 053 37 761
1999 Q1 27 763 2 751 323 39 5 218 1 202 37 296 3 624 16 944 5 556 10 121 1 051 37 296Q2 27 606 2 553 290 – 5 181 1 263 36 893 3 575 16 817 5 701 9 809 991 36 893Q3 28 051 2 396 341 –16 4 744 1 423 36 939 3 409 17 289 5 050 10 176 1 015 36 939Q4 28 531 2 453 342 –24 5 115 1 598 38 015 3 546 17 317 5 519 10 593 1 040 38 015
2000 Q1 27 563 2 450 420 –15 5 132 1 522 37 072 2 985 17 301 5 471 10 245 1 070 37 072Q2 27 782 2 699 302 1 5 348 1 272 37 404 3 319 17 505 5 711 9 781 1 088 37 404Q3 28 493 2 513 364 17 5 096 1 310 37 793 3 096 18 362 5 448 9 778 1 109 37 793Q4 30 135 2 886 402 15 4 984 1 295 39 717 3 240 19 585 5 440 10 341 1 111 39 717
2001 Q1 29 463 2 459 434 9 4 900 1 399 38 664 3 400 18 563 5 372 10 220 1 109 38 664Q2 29 395 2 882 456 –8 4 672 1 422 38 819 3 820 18 485 5 046 10 352 1 116 38 819Q3 28 814 2 835 336 –12 4 930 1 352 38 255 3 693 18 105 5 373 9 959 1 125 38 255Q4 28 180 2 772 409 –17 4 930 1 456 37 730 3 766 17 321 5 378 10 094 1 171 37 730
2002 Q1 26 596 3 458 349 –21 5 251 1 272 36 905 3 549 16 542 5 660 10 042 1 112 36 905Q2 26 803 2 999 318 –20 5 558 1 579 37 237 3 587 16 514 5 958 10 031 1 147 37 237Q3 26 559 3 038 333 –37 5 597 1 650 37 140 3 800 15 875 5 996 10 254 1 215 37 140Q4 26 661 3 140 335 –38 5 685 1 527 37 310 3 753 15 869 6 102 10 301 1 285 37 310
1 Remaining investment by public corporations included within business in-vestment.
2 Not including dwellings and purchases less sales of land and existing build-ings.
Source: Office for National Statistics: 01633 812537
17
National accounts
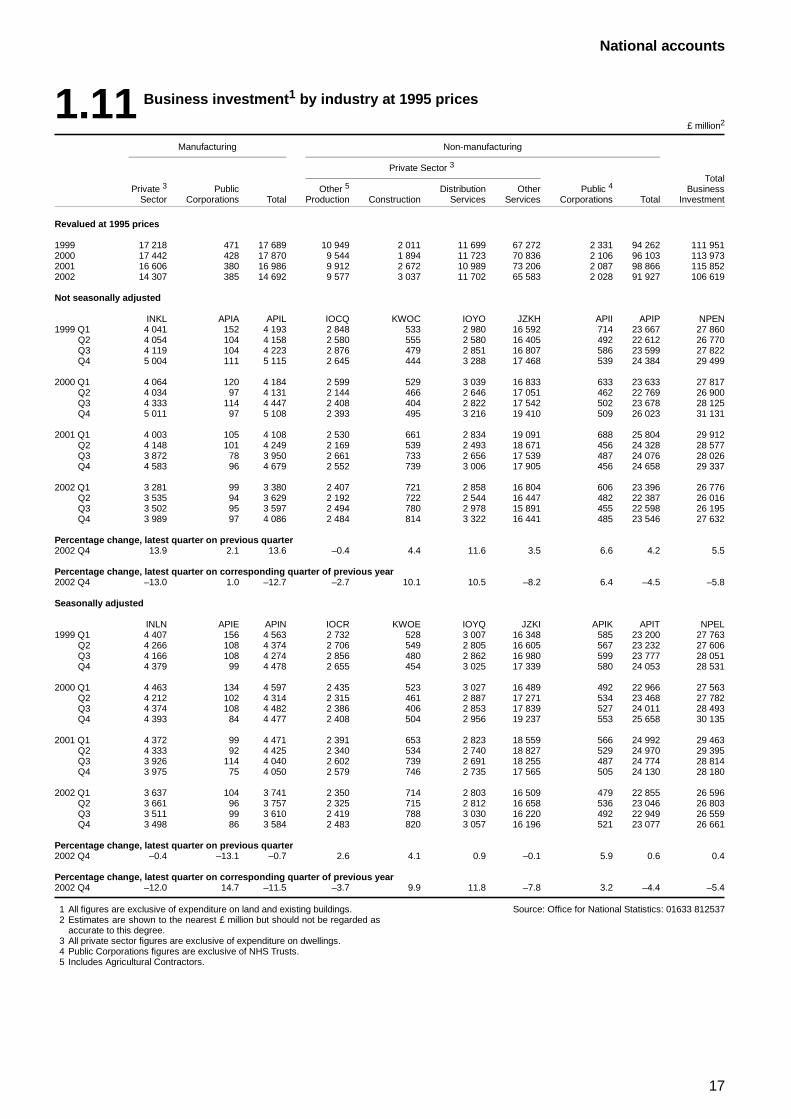
1.11 Business investment1 by industry at 1995 prices
£ million2
Manufacturing Non-manufacturing
Private Sector 3
TotalPrivate 3 Public Other 5 Distribution Other Public 4 Business
Sector Corporations Total Production Construction Services Services Corporations Total Investment
Revalued at 1995 prices
1999 17 218 471 17 689 10 949 2 011 11 699 67 272 2 331 94 262 111 9512000 17 442 428 17 870 9 544 1 894 11 723 70 836 2 106 96 103 113 9732001 16 606 380 16 986 9 912 2 672 10 989 73 206 2 087 98 866 115 8522002 14 307 385 14 692 9 577 3 037 11 702 65 583 2 028 91 927 106 619
Not seasonally adjusted
INKL APIA APIL IOCQ KWOC IOYO JZKH APII APIP NPEN1999 Q1 4 041 152 4 193 2 848 533 2 980 16 592 714 23 667 27 860
Q2 4 054 104 4 158 2 580 555 2 580 16 405 492 22 612 26 770Q3 4 119 104 4 223 2 876 479 2 851 16 807 586 23 599 27 822Q4 5 004 111 5 115 2 645 444 3 288 17 468 539 24 384 29 499
2000 Q1 4 064 120 4 184 2 599 529 3 039 16 833 633 23 633 27 817Q2 4 034 97 4 131 2 144 466 2 646 17 051 462 22 769 26 900Q3 4 333 114 4 447 2 408 404 2 822 17 542 502 23 678 28 125Q4 5 011 97 5 108 2 393 495 3 216 19 410 509 26 023 31 131
2001 Q1 4 003 105 4 108 2 530 661 2 834 19 091 688 25 804 29 912Q2 4 148 101 4 249 2 169 539 2 493 18 671 456 24 328 28 577Q3 3 872 78 3 950 2 661 733 2 656 17 539 487 24 076 28 026Q4 4 583 96 4 679 2 552 739 3 006 17 905 456 24 658 29 337
2002 Q1 3 281 99 3 380 2 407 721 2 858 16 804 606 23 396 26 776Q2 3 535 94 3 629 2 192 722 2 544 16 447 482 22 387 26 016Q3 3 502 95 3 597 2 494 780 2 978 15 891 455 22 598 26 195Q4 3 989 97 4 086 2 484 814 3 322 16 441 485 23 546 27 632
Percentage change, latest quarter on previous quarter2002 Q4 13.9 2.1 13.6 –0.4 4.4 11.6 3.5 6.6 4.2 5.5
Percentage change, latest quarter on corresponding quarter of previous year2002 Q4 –13.0 1.0 –12.7 –2.7 10.1 10.5 –8.2 6.4 –4.5 –5.8
Seasonally adjusted
INLN APIE APIN IOCR KWOE IOYQ JZKI APIK APIT NPEL1999 Q1 4 407 156 4 563 2 732 528 3 007 16 348 585 23 200 27 763
Q2 4 266 108 4 374 2 706 549 2 805 16 605 567 23 232 27 606Q3 4 166 108 4 274 2 856 480 2 862 16 980 599 23 777 28 051Q4 4 379 99 4 478 2 655 454 3 025 17 339 580 24 053 28 531
2000 Q1 4 463 134 4 597 2 435 523 3 027 16 489 492 22 966 27 563Q2 4 212 102 4 314 2 315 461 2 887 17 271 534 23 468 27 782Q3 4 374 108 4 482 2 386 406 2 853 17 839 527 24 011 28 493Q4 4 393 84 4 477 2 408 504 2 956 19 237 553 25 658 30 135
2001 Q1 4 372 99 4 471 2 391 653 2 823 18 559 566 24 992 29 463Q2 4 333 92 4 425 2 340 534 2 740 18 827 529 24 970 29 395Q3 3 926 114 4 040 2 602 739 2 691 18 255 487 24 774 28 814Q4 3 975 75 4 050 2 579 746 2 735 17 565 505 24 130 28 180
2002 Q1 3 637 104 3 741 2 350 714 2 803 16 509 479 22 855 26 596Q2 3 661 96 3 757 2 325 715 2 812 16 658 536 23 046 26 803Q3 3 511 99 3 610 2 419 788 3 030 16 220 492 22 949 26 559Q4 3 498 86 3 584 2 483 820 3 057 16 196 521 23 077 26 661
Percentage change, latest quarter on previous quarter2002 Q4 –0.4 –13.1 –0.7 2.6 4.1 0.9 –0.1 5.9 0.6 0.4
Percentage change, latest quarter on corresponding quarter of previous year2002 Q4 –12.0 14.7 –11.5 –3.7 9.9 11.8 –7.8 3.2 –4.4 –5.4
1 All figures are exclusive of expenditure on land and existing buildings.2 Estimates are shown to the nearest £ million but should not be regarded as
accurate to this degree.3 All private sector figures are exclusive of expenditure on dwellings.4 Public Corporations figures are exclusive of NHS Trusts.5 Includes Agricultural Contractors.
Source: Office for National Statistics: 01633 812537
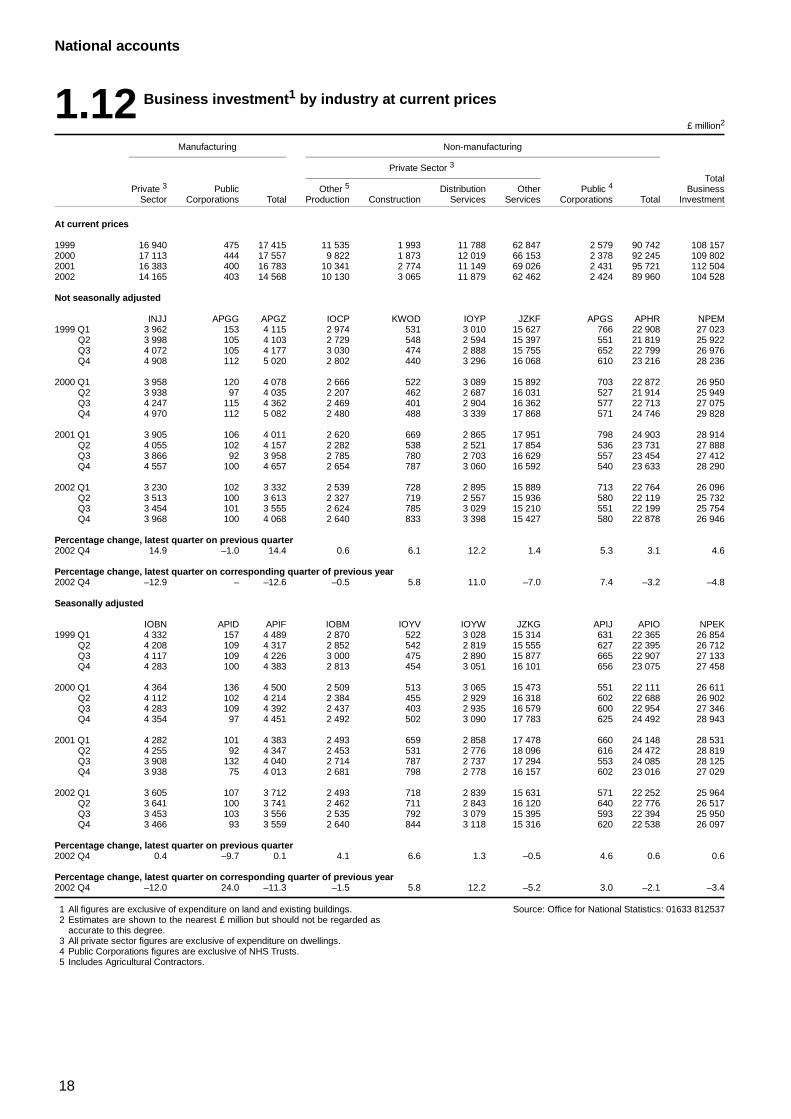
18
National accounts
1.12 Business investment1 by industry at current prices
£ million2
Manufacturing Non-manufacturing
Private Sector 3
TotalPrivate 3 Public Other 5 Distribution Other Public 4 Business
Sector Corporations Total Production Construction Services Services Corporations Total Investment
At current prices
1999 16 940 475 17 415 11 535 1 993 11 788 62 847 2 579 90 742 108 1572000 17 113 444 17 557 9 822 1 873 12 019 66 153 2 378 92 245 109 8022001 16 383 400 16 783 10 341 2 774 11 149 69 026 2 431 95 721 112 5042002 14 165 403 14 568 10 130 3 065 11 879 62 462 2 424 89 960 104 528
Not seasonally adjusted
INJJ APGG APGZ IOCP KWOD IOYP JZKF APGS APHR NPEM1999 Q1 3 962 153 4 115 2 974 531 3 010 15 627 766 22 908 27 023
Q2 3 998 105 4 103 2 729 548 2 594 15 397 551 21 819 25 922Q3 4 072 105 4 177 3 030 474 2 888 15 755 652 22 799 26 976Q4 4 908 112 5 020 2 802 440 3 296 16 068 610 23 216 28 236
2000 Q1 3 958 120 4 078 2 666 522 3 089 15 892 703 22 872 26 950Q2 3 938 97 4 035 2 207 462 2 687 16 031 527 21 914 25 949Q3 4 247 115 4 362 2 469 401 2 904 16 362 577 22 713 27 075Q4 4 970 112 5 082 2 480 488 3 339 17 868 571 24 746 29 828
2001 Q1 3 905 106 4 011 2 620 669 2 865 17 951 798 24 903 28 914Q2 4 055 102 4 157 2 282 538 2 521 17 854 536 23 731 27 888Q3 3 866 92 3 958 2 785 780 2 703 16 629 557 23 454 27 412Q4 4 557 100 4 657 2 654 787 3 060 16 592 540 23 633 28 290
2002 Q1 3 230 102 3 332 2 539 728 2 895 15 889 713 22 764 26 096Q2 3 513 100 3 613 2 327 719 2 557 15 936 580 22 119 25 732Q3 3 454 101 3 555 2 624 785 3 029 15 210 551 22 199 25 754Q4 3 968 100 4 068 2 640 833 3 398 15 427 580 22 878 26 946
Percentage change, latest quarter on previous quarter2002 Q4 14.9 –1.0 14.4 0.6 6.1 12.2 1.4 5.3 3.1 4.6
Percentage change, latest quarter on corresponding quarter of previous year2002 Q4 –12.9 – –12.6 –0.5 5.8 11.0 –7.0 7.4 –3.2 –4.8
Seasonally adjusted
IOBN APID APIF IOBM IOYV IOYW JZKG APIJ APIO NPEK1999 Q1 4 332 157 4 489 2 870 522 3 028 15 314 631 22 365 26 854
Q2 4 208 109 4 317 2 852 542 2 819 15 555 627 22 395 26 712Q3 4 117 109 4 226 3 000 475 2 890 15 877 665 22 907 27 133Q4 4 283 100 4 383 2 813 454 3 051 16 101 656 23 075 27 458
2000 Q1 4 364 136 4 500 2 509 513 3 065 15 473 551 22 111 26 611Q2 4 112 102 4 214 2 384 455 2 929 16 318 602 22 688 26 902Q3 4 283 109 4 392 2 437 403 2 935 16 579 600 22 954 27 346Q4 4 354 97 4 451 2 492 502 3 090 17 783 625 24 492 28 943
2001 Q1 4 282 101 4 383 2 493 659 2 858 17 478 660 24 148 28 531Q2 4 255 92 4 347 2 453 531 2 776 18 096 616 24 472 28 819Q3 3 908 132 4 040 2 714 787 2 737 17 294 553 24 085 28 125Q4 3 938 75 4 013 2 681 798 2 778 16 157 602 23 016 27 029
2002 Q1 3 605 107 3 712 2 493 718 2 839 15 631 571 22 252 25 964Q2 3 641 100 3 741 2 462 711 2 843 16 120 640 22 776 26 517Q3 3 453 103 3 556 2 535 792 3 079 15 395 593 22 394 25 950Q4 3 466 93 3 559 2 640 844 3 118 15 316 620 22 538 26 097
Percentage change, latest quarter on previous quarter2002 Q4 0.4 –9.7 0.1 4.1 6.6 1.3 –0.5 4.6 0.6 0.6
Percentage change, latest quarter on corresponding quarter of previous year2002 Q4 –12.0 24.0 –11.3 –1.5 5.8 12.2 –5.2 3.0 –2.1 –3.4
1 All figures are exclusive of expenditure on land and existing buildings.2 Estimates are shown to the nearest £ million but should not be regarded as
accurate to this degree.3 All private sector figures are exclusive of expenditure on dwellings.4 Public Corporations figures are exclusive of NHS Trusts.5 Includes Agricultural Contractors.
Source: Office for National Statistics: 01633 812537
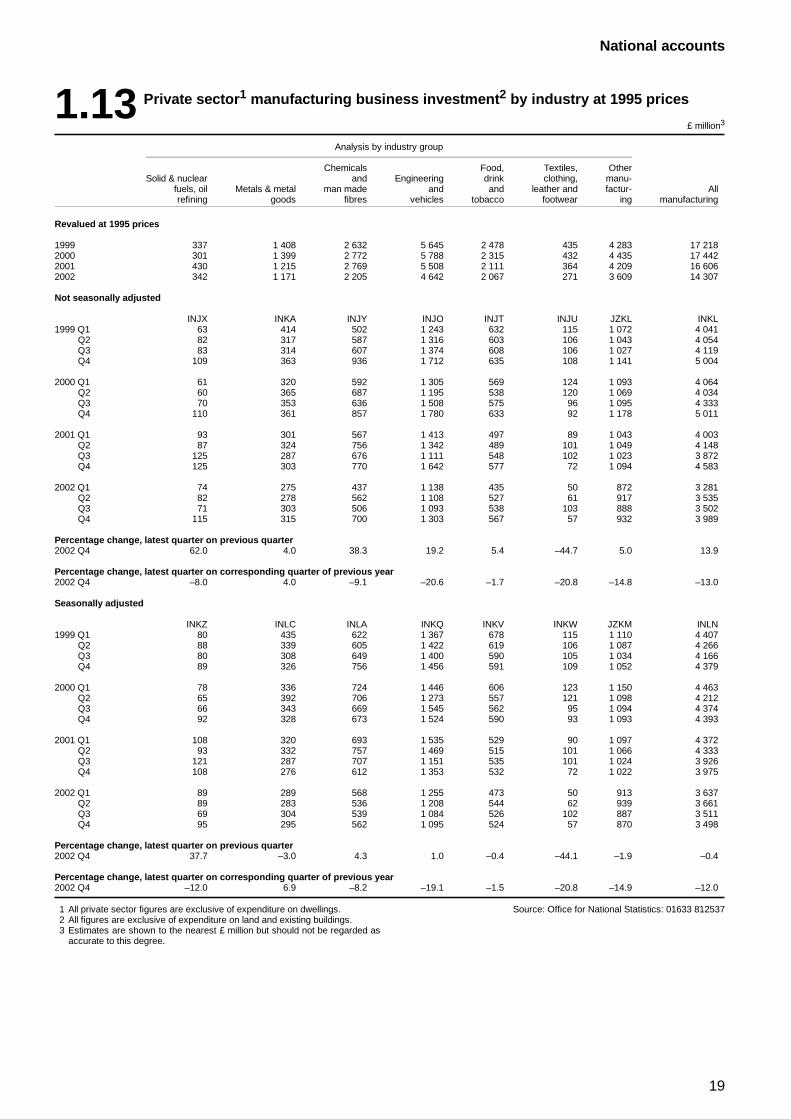
19
National accounts
1.13 Private sector1 manufacturing business investment2 by industry at 1995 prices
£ million3
Analysis by industry group
Chemicals Food, Textiles, OtherSolid & nuclear and Engineering drink clothing, manu-
fuels, oil Metals & metal man made and and leather and factur- Allrefining goods fibres vehicles tobacco footwear ing manufacturing
Revalued at 1995 prices
1999 337 1 408 2 632 5 645 2 478 435 4 283 17 2182000 301 1 399 2 772 5 788 2 315 432 4 435 17 4422001 430 1 215 2 769 5 508 2 111 364 4 209 16 6062002 342 1 171 2 205 4 642 2 067 271 3 609 14 307
Not seasonally adjusted
INJX INKA INJY INJO INJT INJU JZKL INKL1999 Q1 63 414 502 1 243 632 115 1 072 4 041
Q2 82 317 587 1 316 603 106 1 043 4 054Q3 83 314 607 1 374 608 106 1 027 4 119Q4 109 363 936 1 712 635 108 1 141 5 004
2000 Q1 61 320 592 1 305 569 124 1 093 4 064Q2 60 365 687 1 195 538 120 1 069 4 034Q3 70 353 636 1 508 575 96 1 095 4 333Q4 110 361 857 1 780 633 92 1 178 5 011
2001 Q1 93 301 567 1 413 497 89 1 043 4 003Q2 87 324 756 1 342 489 101 1 049 4 148Q3 125 287 676 1 111 548 102 1 023 3 872Q4 125 303 770 1 642 577 72 1 094 4 583
2002 Q1 74 275 437 1 138 435 50 872 3 281Q2 82 278 562 1 108 527 61 917 3 535Q3 71 303 506 1 093 538 103 888 3 502Q4 115 315 700 1 303 567 57 932 3 989
Percentage change, latest quarter on previous quarter2002 Q4 62.0 4.0 38.3 19.2 5.4 –44.7 5.0 13.9
Percentage change, latest quarter on corresponding quarter of previous year2002 Q4 –8.0 4.0 –9.1 –20.6 –1.7 –20.8 –14.8 –13.0
Seasonally adjusted
INKZ INLC INLA INKQ INKV INKW JZKM INLN1999 Q1 80 435 622 1 367 678 115 1 110 4 407
Q2 88 339 605 1 422 619 106 1 087 4 266Q3 80 308 649 1 400 590 105 1 034 4 166Q4 89 326 756 1 456 591 109 1 052 4 379
2000 Q1 78 336 724 1 446 606 123 1 150 4 463Q2 65 392 706 1 273 557 121 1 098 4 212Q3 66 343 669 1 545 562 95 1 094 4 374Q4 92 328 673 1 524 590 93 1 093 4 393
2001 Q1 108 320 693 1 535 529 90 1 097 4 372Q2 93 332 757 1 469 515 101 1 066 4 333Q3 121 287 707 1 151 535 101 1 024 3 926Q4 108 276 612 1 353 532 72 1 022 3 975
2002 Q1 89 289 568 1 255 473 50 913 3 637Q2 89 283 536 1 208 544 62 939 3 661Q3 69 304 539 1 084 526 102 887 3 511Q4 95 295 562 1 095 524 57 870 3 498
Percentage change, latest quarter on previous quarter2002 Q4 37.7 –3.0 4.3 1.0 –0.4 –44.1 –1.9 –0.4
Percentage change, latest quarter on corresponding quarter of previous year2002 Q4 –12.0 6.9 –8.2 –19.1 –1.5 –20.8 –14.9 –12.0
1 All private sector figures are exclusive of expenditure on dwellings.2 All figures are exclusive of expenditure on land and existing buildings.3 Estimates are shown to the nearest £ million but should not be regarded as
accurate to this degree.
Source: Office for National Statistics: 01633 812537
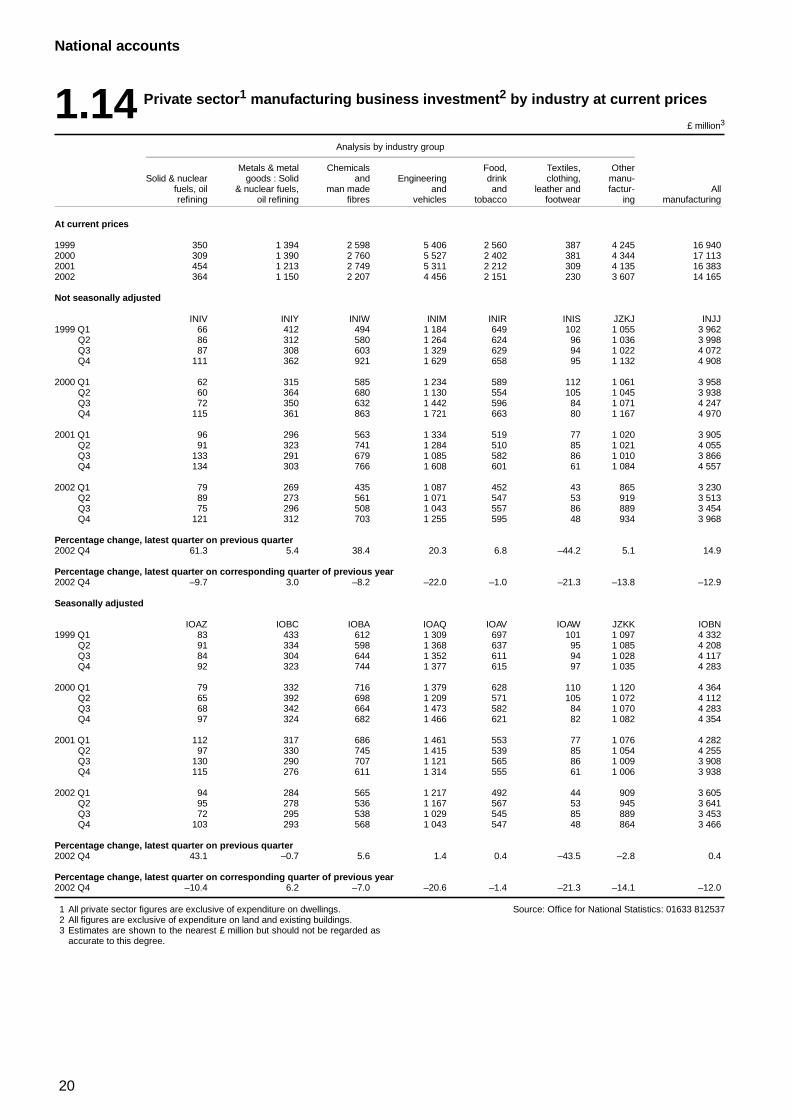
20
National accounts
1.14 Private sector1 manufacturing business investment2 by industry at current prices
£ million3
Analysis by industry group
Metals & metal Chemicals Food, Textiles, OtherSolid & nuclear goods : Solid and Engineering drink clothing, manu-
fuels, oil & nuclear fuels, man made and and leather and factur- Allrefining oil refining fibres vehicles tobacco footwear ing manufacturing
At current prices
1999 350 1 394 2 598 5 406 2 560 387 4 245 16 9402000 309 1 390 2 760 5 527 2 402 381 4 344 17 1132001 454 1 213 2 749 5 311 2 212 309 4 135 16 3832002 364 1 150 2 207 4 456 2 151 230 3 607 14 165
Not seasonally adjusted
INIV INIY INIW INIM INIR INIS JZKJ INJJ1999 Q1 66 412 494 1 184 649 102 1 055 3 962
Q2 86 312 580 1 264 624 96 1 036 3 998Q3 87 308 603 1 329 629 94 1 022 4 072Q4 111 362 921 1 629 658 95 1 132 4 908
2000 Q1 62 315 585 1 234 589 112 1 061 3 958Q2 60 364 680 1 130 554 105 1 045 3 938Q3 72 350 632 1 442 596 84 1 071 4 247Q4 115 361 863 1 721 663 80 1 167 4 970
2001 Q1 96 296 563 1 334 519 77 1 020 3 905Q2 91 323 741 1 284 510 85 1 021 4 055Q3 133 291 679 1 085 582 86 1 010 3 866Q4 134 303 766 1 608 601 61 1 084 4 557
2002 Q1 79 269 435 1 087 452 43 865 3 230Q2 89 273 561 1 071 547 53 919 3 513Q3 75 296 508 1 043 557 86 889 3 454Q4 121 312 703 1 255 595 48 934 3 968
Percentage change, latest quarter on previous quarter2002 Q4 61.3 5.4 38.4 20.3 6.8 –44.2 5.1 14.9
Percentage change, latest quarter on corresponding quarter of previous year2002 Q4 –9.7 3.0 –8.2 –22.0 –1.0 –21.3 –13.8 –12.9
Seasonally adjusted
IOAZ IOBC IOBA IOAQ IOAV IOAW JZKK IOBN1999 Q1 83 433 612 1 309 697 101 1 097 4 332
Q2 91 334 598 1 368 637 95 1 085 4 208Q3 84 304 644 1 352 611 94 1 028 4 117Q4 92 323 744 1 377 615 97 1 035 4 283
2000 Q1 79 332 716 1 379 628 110 1 120 4 364Q2 65 392 698 1 209 571 105 1 072 4 112Q3 68 342 664 1 473 582 84 1 070 4 283Q4 97 324 682 1 466 621 82 1 082 4 354
2001 Q1 112 317 686 1 461 553 77 1 076 4 282Q2 97 330 745 1 415 539 85 1 054 4 255Q3 130 290 707 1 121 565 86 1 009 3 908Q4 115 276 611 1 314 555 61 1 006 3 938
2002 Q1 94 284 565 1 217 492 44 909 3 605Q2 95 278 536 1 167 567 53 945 3 641Q3 72 295 538 1 029 545 85 889 3 453Q4 103 293 568 1 043 547 48 864 3 466
Percentage change, latest quarter on previous quarter2002 Q4 43.1 –0.7 5.6 1.4 0.4 –43.5 –2.8 0.4
Percentage change, latest quarter on corresponding quarter of previous year2002 Q4 –10.4 6.2 –7.0 –20.6 –1.4 –21.3 –14.1 –12.0
1 All private sector figures are exclusive of expenditure on dwellings.2 All figures are exclusive of expenditure on land and existing buildings.3 Estimates are shown to the nearest £ million but should not be regarded as
accurate to this degree.
Source: Office for National Statistics: 01633 812537
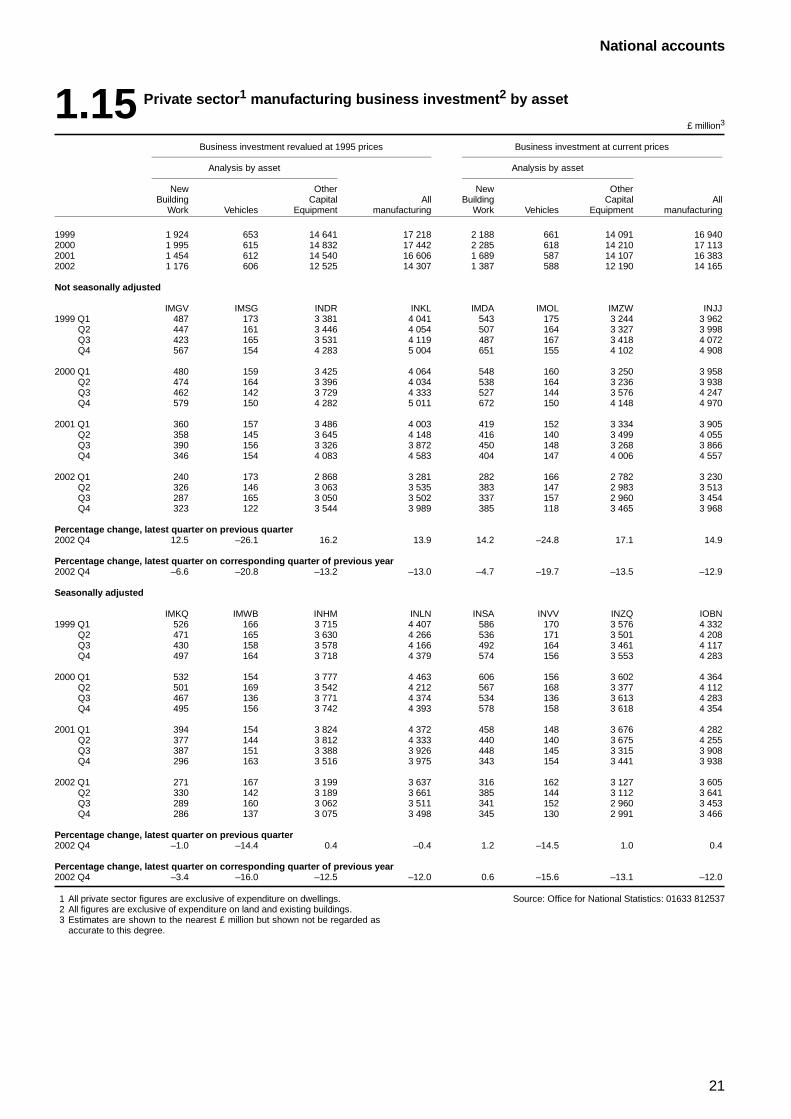
21
National accounts
1.15 Private sector1 manufacturing business investment2 by asset
£ million3
Business investment revalued at 1995 prices Business investment at current prices
Analysis by asset Analysis by asset
New Other New OtherBuilding Capital All Building Capital All
Work Vehicles Equipment manufacturing Work Vehicles Equipment manufacturing
1999 1 924 653 14 641 17 218 2 188 661 14 091 16 9402000 1 995 615 14 832 17 442 2 285 618 14 210 17 1132001 1 454 612 14 540 16 606 1 689 587 14 107 16 3832002 1 176 606 12 525 14 307 1 387 588 12 190 14 165
Not seasonally adjusted
IMGV IMSG INDR INKL IMDA IMOL IMZW INJJ1999 Q1 487 173 3 381 4 041 543 175 3 244 3 962
Q2 447 161 3 446 4 054 507 164 3 327 3 998Q3 423 165 3 531 4 119 487 167 3 418 4 072Q4 567 154 4 283 5 004 651 155 4 102 4 908
2000 Q1 480 159 3 425 4 064 548 160 3 250 3 958Q2 474 164 3 396 4 034 538 164 3 236 3 938Q3 462 142 3 729 4 333 527 144 3 576 4 247Q4 579 150 4 282 5 011 672 150 4 148 4 970
2001 Q1 360 157 3 486 4 003 419 152 3 334 3 905Q2 358 145 3 645 4 148 416 140 3 499 4 055Q3 390 156 3 326 3 872 450 148 3 268 3 866Q4 346 154 4 083 4 583 404 147 4 006 4 557
2002 Q1 240 173 2 868 3 281 282 166 2 782 3 230Q2 326 146 3 063 3 535 383 147 2 983 3 513Q3 287 165 3 050 3 502 337 157 2 960 3 454Q4 323 122 3 544 3 989 385 118 3 465 3 968
Percentage change, latest quarter on previous quarter2002 Q4 12.5 –26.1 16.2 13.9 14.2 –24.8 17.1 14.9
Percentage change, latest quarter on corresponding quarter of previous year2002 Q4 –6.6 –20.8 –13.2 –13.0 –4.7 –19.7 –13.5 –12.9
Seasonally adjusted
IMKQ IMWB INHM INLN INSA INVV INZQ IOBN1999 Q1 526 166 3 715 4 407 586 170 3 576 4 332
Q2 471 165 3 630 4 266 536 171 3 501 4 208Q3 430 158 3 578 4 166 492 164 3 461 4 117Q4 497 164 3 718 4 379 574 156 3 553 4 283
2000 Q1 532 154 3 777 4 463 606 156 3 602 4 364Q2 501 169 3 542 4 212 567 168 3 377 4 112Q3 467 136 3 771 4 374 534 136 3 613 4 283Q4 495 156 3 742 4 393 578 158 3 618 4 354
2001 Q1 394 154 3 824 4 372 458 148 3 676 4 282Q2 377 144 3 812 4 333 440 140 3 675 4 255Q3 387 151 3 388 3 926 448 145 3 315 3 908Q4 296 163 3 516 3 975 343 154 3 441 3 938
2002 Q1 271 167 3 199 3 637 316 162 3 127 3 605Q2 330 142 3 189 3 661 385 144 3 112 3 641Q3 289 160 3 062 3 511 341 152 2 960 3 453Q4 286 137 3 075 3 498 345 130 2 991 3 466
Percentage change, latest quarter on previous quarter2002 Q4 –1.0 –14.4 0.4 –0.4 1.2 –14.5 1.0 0.4
Percentage change, latest quarter on corresponding quarter of previous year2002 Q4 –3.4 –16.0 –12.5 –12.0 0.6 –15.6 –13.1 –12.0
1 All private sector figures are exclusive of expenditure on dwellings.2 All figures are exclusive of expenditure on land and existing buildings.3 Estimates are shown to the nearest £ million but shown not be regarded as
accurate to this degree.
Source: Office for National Statistics: 01633 812537
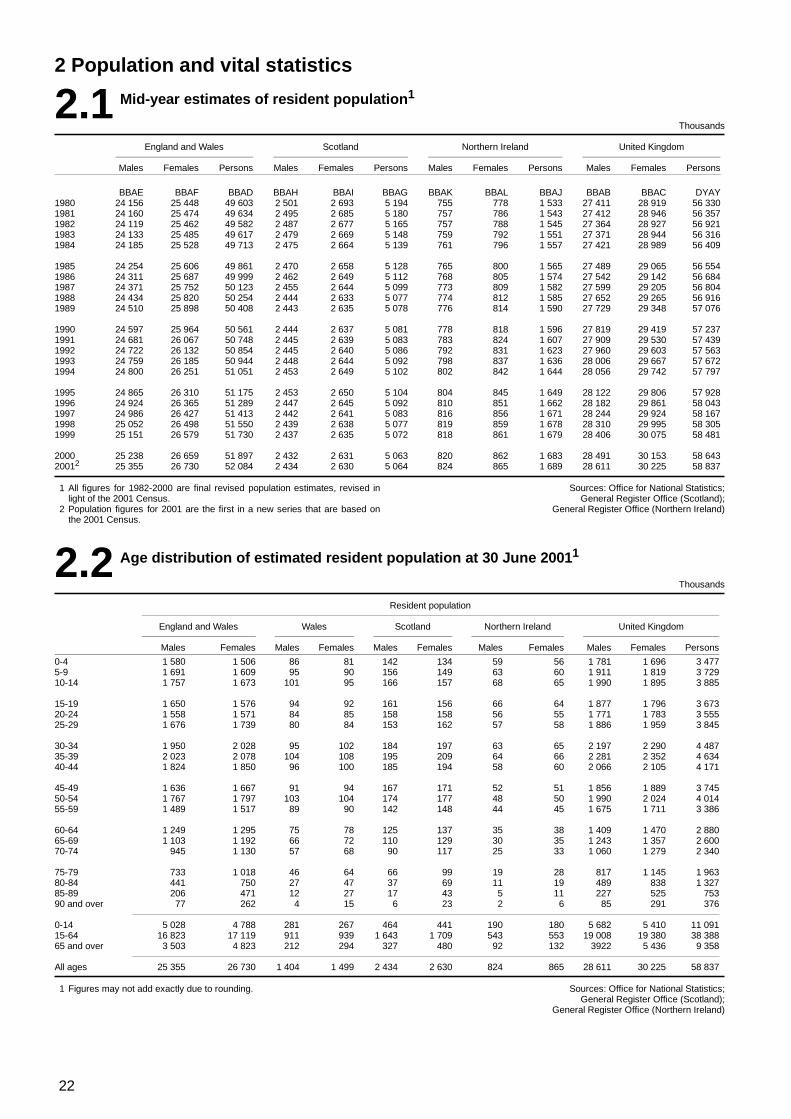
22
2 Population and vital statistics
2.1 Mid-year estimates of resident population1
Thousands
England and Wales Scotland Northern Ireland United Kingdom
Males Females Persons Males Females Persons Males Females Persons Males Females Persons
BBAE BBAF BBAD BBAH BBAI BBAG BBAK BBAL BBAJ BBAB BBAC DYAY1980 24 156 25 448 49 603 2 501 2 693 5 194 755 778 1 533 27 411 28 919 56 3301981 24 160 25 474 49 634 2 495 2 685 5 180 757 786 1 543 27 412 28 946 56 3571982 24 119 25 462 49 582 2 487 2 677 5 165 757 788 1 545 27 364 28 927 56 9211983 24 133 25 485 49 617 2 479 2 669 5 148 759 792 1 551 27 371 28 944 56 3161984 24 185 25 528 49 713 2 475 2 664 5 139 761 796 1 557 27 421 28 989 56 409
1985 24 254 25 606 49 861 2 470 2 658 5 128 765 800 1 565 27 489 29 065 56 5541986 24 311 25 687 49 999 2 462 2 649 5 112 768 805 1 574 27 542 29 142 56 6841987 24 371 25 752 50 123 2 455 2 644 5 099 773 809 1 582 27 599 29 205 56 8041988 24 434 25 820 50 254 2 444 2 633 5 077 774 812 1 585 27 652 29 265 56 9161989 24 510 25 898 50 408 2 443 2 635 5 078 776 814 1 590 27 729 29 348 57 076
1990 24 597 25 964 50 561 2 444 2 637 5 081 778 818 1 596 27 819 29 419 57 2371991 24 681 26 067 50 748 2 445 2 639 5 083 783 824 1 607 27 909 29 530 57 4391992 24 722 26 132 50 854 2 445 2 640 5 086 792 831 1 623 27 960 29 603 57 5631993 24 759 26 185 50 944 2 448 2 644 5 092 798 837 1 636 28 006 29 667 57 6721994 24 800 26 251 51 051 2 453 2 649 5 102 802 842 1 644 28 056 29 742 57 797
1995 24 865 26 310 51 175 2 453 2 650 5 104 804 845 1 649 28 122 29 806 57 9281996 24 924 26 365 51 289 2 447 2 645 5 092 810 851 1 662 28 182 29 861 58 0431997 24 986 26 427 51 413 2 442 2 641 5 083 816 856 1 671 28 244 29 924 58 1671998 25 052 26 498 51 550 2 439 2 638 5 077 819 859 1 678 28 310 29 995 58 3051999 25 151 26 579 51 730 2 437 2 635 5 072 818 861 1 679 28 406 30 075 58 481
2000 25 238 26 659 51 897 2 432 2 631 5 063 820 862 1 683 28 491 30 153 58 64320012 25 355 26 730 52 084 2 434 2 630 5 064 824 865 1 689 28 611 30 225 58 837
1 All figures for 1982-2000 are final revised population estimates, revised inlight of the 2001 Census.
2 Population figures for 2001 are the first in a new series that are based onthe 2001 Census.
Sources: Office for National Statistics;General Register Office (Scotland);
General Register Office (Northern Ireland)
2.2 Age distribution of estimated resident population at 30 June 20011
Thousands
Resident population
England and Wales Wales Scotland Northern Ireland United Kingdom
Males Females Males Females Males Females Males Females Males Females Persons
0-4 1 580 1 506 86 81 142 134 59 56 1 781 1 696 3 4775-9 1 691 1 609 95 90 156 149 63 60 1 911 1 819 3 72910-14 1 757 1 673 101 95 166 157 68 65 1 990 1 895 3 885
15-19 1 650 1 576 94 92 161 156 66 64 1 877 1 796 3 67320-24 1 558 1 571 84 85 158 158 56 55 1 771 1 783 3 55525-29 1 676 1 739 80 84 153 162 57 58 1 886 1 959 3 845
30-34 1 950 2 028 95 102 184 197 63 65 2 197 2 290 4 48735-39 2 023 2 078 104 108 195 209 64 66 2 281 2 352 4 63440-44 1 824 1 850 96 100 185 194 58 60 2 066 2 105 4 171
45-49 1 636 1 667 91 94 167 171 52 51 1 856 1 889 3 74550-54 1 767 1 797 103 104 174 177 48 50 1 990 2 024 4 01455-59 1 489 1 517 89 90 142 148 44 45 1 675 1 711 3 386
60-64 1 249 1 295 75 78 125 137 35 38 1 409 1 470 2 88065-69 1 103 1 192 66 72 110 129 30 35 1 243 1 357 2 60070-74 945 1 130 57 68 90 117 25 33 1 060 1 279 2 340
75-79 733 1 018 46 64 66 99 19 28 817 1 145 1 96380-84 441 750 27 47 37 69 11 19 489 838 1 32785-89 206 471 12 27 17 43 5 11 227 525 75390 and over 77 262 4 15 6 23 2 6 85 291 376
0-14 5 028 4 788 281 267 464 441 190 180 5 682 5 410 11 09115-64 16 823 17 119 911 939 1 643 1 709 543 553 19 008 19 380 38 38865 and over 3 503 4 823 212 294 327 480 92 132 3922 5 436 9 358
All ages 25 355 26 730 1 404 1 499 2 434 2 630 824 865 28 611 30 225 58 837
1 Figures may not add exactly due to rounding. Sources: Office for National Statistics;General Register Office (Scotland);
General Register Office (Northern Ireland)
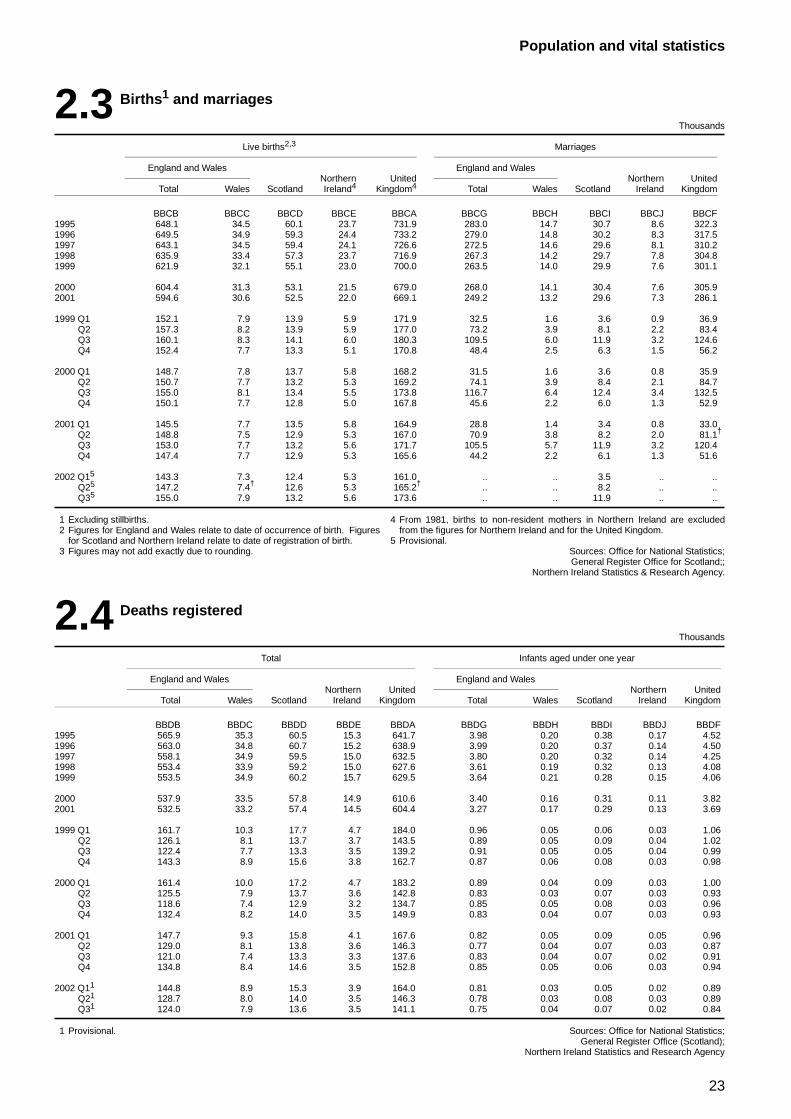
23
Population and vital statistics
2.3 Births1 and marriages
Thousands
Live births2,3 Marriages
England and Wales England and WalesNorthern United Northern United
Total Wales Scotland Ireland4 Kingdom4 Total Wales Scotland Ireland Kingdom
BBCB BBCC BBCD BBCE BBCA BBCG BBCH BBCI BBCJ BBCF1995 648.1 34.5 60.1 23.7 731.9 283.0 14.7 30.7 8.6 322.31996 649.5 34.9 59.3 24.4 733.2 279.0 14.8 30.2 8.3 317.51997 643.1 34.5 59.4 24.1 726.6 272.5 14.6 29.6 8.1 310.21998 635.9 33.4 57.3 23.7 716.9 267.3 14.2 29.7 7.8 304.81999 621.9 32.1 55.1 23.0 700.0 263.5 14.0 29.9 7.6 301.1
2000 604.4 31.3 53.1 21.5 679.0 268.0 14.1 30.4 7.6 305.92001 594.6 30.6 52.5 22.0 669.1 249.2 13.2 29.6 7.3 286.1
1999 Q1 152.1 7.9 13.9 5.9 171.9 32.5 1.6 3.6 0.9 36.9Q2 157.3 8.2 13.9 5.9 177.0 73.2 3.9 8.1 2.2 83.4Q3 160.1 8.3 14.1 6.0 180.3 109.5 6.0 11.9 3.2 124.6Q4 152.4 7.7 13.3 5.1 170.8 48.4 2.5 6.3 1.5 56.2
2000 Q1 148.7 7.8 13.7 5.8 168.2 31.5 1.6 3.6 0.8 35.9Q2 150.7 7.7 13.2 5.3 169.2 74.1 3.9 8.4 2.1 84.7Q3 155.0 8.1 13.4 5.5 173.8 116.7 6.4 12.4 3.4 132.5Q4 150.1 7.7 12.8 5.0 167.8 45.6 2.2 6.0 1.3 52.9
2001 Q1 145.5 7.7 13.5 5.8 164.9 28.8 1.4 3.4 0.8 33.0Q2 148.8 7.5 12.9 5.3 167.0 70.9 3.8 8.2 2.0 81.1†
Q3 153.0 7.7 13.2 5.6 171.7 105.5 5.7 11.9 3.2 120.4Q4 147.4 7.7 12.9 5.3 165.6 44.2 2.2 6.1 1.3 51.6
2002 Q15 143.3 7.3 12.4 5.3 161.0 .. .. 3.5 .. ..Q25 147.2 7.4† 12.6 5.3 165.2† .. .. 8.2 .. ..Q35 155.0 7.9 13.2 5.6 173.6 .. .. 11.9 .. ..
1 Excluding stillbirths.2 Figures for England and Wales relate to date of occurrence of birth. Figures
for Scotland and Northern Ireland relate to date of registration of birth.3 Figures may not add exactly due to rounding.
4 From 1981, births to non-resident mothers in Northern Ireland are excludedfrom the figures for Northern Ireland and for the United Kingdom.
5 Provisional.Sources: Office for National Statistics;General Register Office for Scotland;;
Northern Ireland Statistics & Research Agency.
2.4 Deaths registered
Thousands
Total Infants aged under one year
England and Wales England and WalesNorthern United Northern United
Total Wales Scotland Ireland Kingdom Total Wales Scotland Ireland Kingdom
BBDB BBDC BBDD BBDE BBDA BBDG BBDH BBDI BBDJ BBDF1995 565.9 35.3 60.5 15.3 641.7 3.98 0.20 0.38 0.17 4.521996 563.0 34.8 60.7 15.2 638.9 3.99 0.20 0.37 0.14 4.501997 558.1 34.9 59.5 15.0 632.5 3.80 0.20 0.32 0.14 4.251998 553.4 33.9 59.2 15.0 627.6 3.61 0.19 0.32 0.13 4.081999 553.5 34.9 60.2 15.7 629.5 3.64 0.21 0.28 0.15 4.06
2000 537.9 33.5 57.8 14.9 610.6 3.40 0.16 0.31 0.11 3.822001 532.5 33.2 57.4 14.5 604.4 3.27 0.17 0.29 0.13 3.69
1999 Q1 161.7 10.3 17.7 4.7 184.0 0.96 0.05 0.06 0.03 1.06Q2 126.1 8.1 13.7 3.7 143.5 0.89 0.05 0.09 0.04 1.02Q3 122.4 7.7 13.3 3.5 139.2 0.91 0.05 0.05 0.04 0.99Q4 143.3 8.9 15.6 3.8 162.7 0.87 0.06 0.08 0.03 0.98
2000 Q1 161.4 10.0 17.2 4.7 183.2 0.89 0.04 0.09 0.03 1.00Q2 125.5 7.9 13.7 3.6 142.8 0.83 0.03 0.07 0.03 0.93Q3 118.6 7.4 12.9 3.2 134.7 0.85 0.05 0.08 0.03 0.96Q4 132.4 8.2 14.0 3.5 149.9 0.83 0.04 0.07 0.03 0.93
2001 Q1 147.7 9.3 15.8 4.1 167.6 0.82 0.05 0.09 0.05 0.96Q2 129.0 8.1 13.8 3.6 146.3 0.77 0.04 0.07 0.03 0.87Q3 121.0 7.4 13.3 3.3 137.6 0.83 0.04 0.07 0.02 0.91Q4 134.8 8.4 14.6 3.5 152.8 0.85 0.05 0.06 0.03 0.94
2002 Q11 144.8 8.9 15.3 3.9 164.0 0.81 0.03 0.05 0.02 0.89Q21 128.7 8.0 14.0 3.5 146.3 0.78 0.03 0.08 0.03 0.89Q31 124.0 7.9 13.6 3.5 141.1 0.75 0.04 0.07 0.02 0.84
1 Provisional. Sources: Office for National Statistics;General Register Office (Scotland);
Northern Ireland Statistics and Research Agency
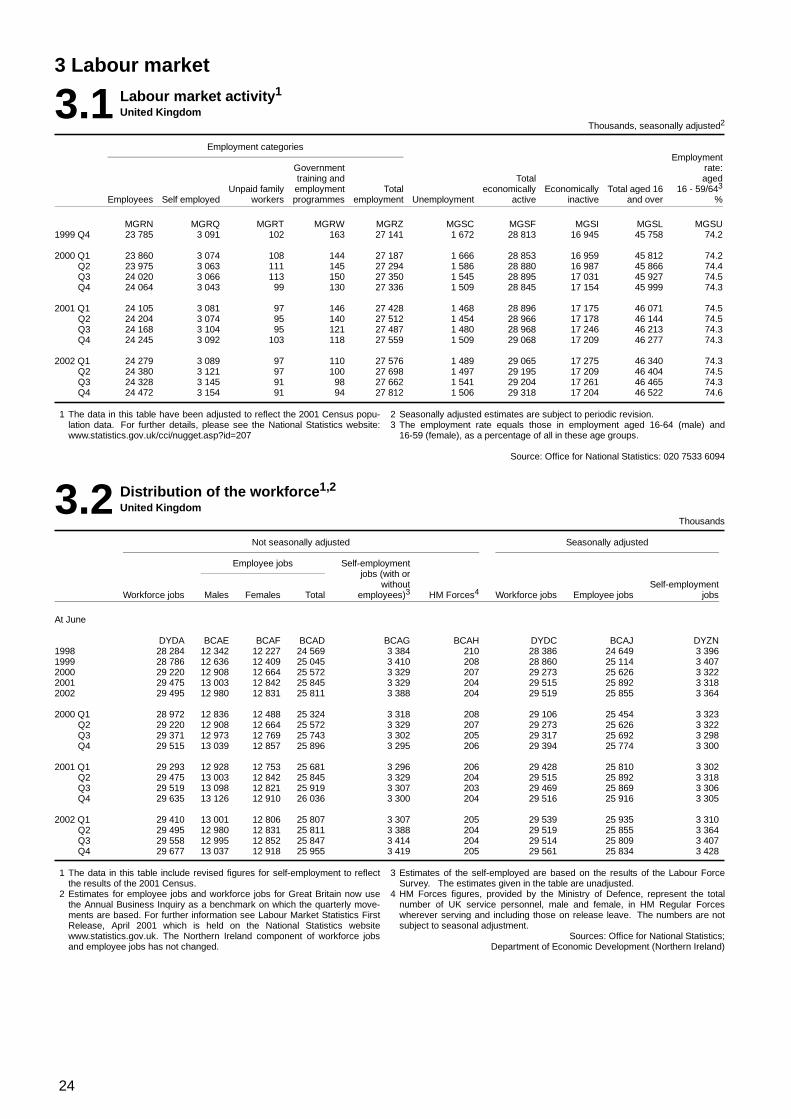
24
3 Labour market
3.1 Labour market activity1
United KingdomThousands, seasonally adjusted2
Employment categoriesEmployment
Government rate:training and Total aged
Unpaid family employment Total economically Economically Total aged 16 16 - 59/643
Employees Self employed workers programmes employment Unemployment active inactive and over %
MGRN MGRQ MGRT MGRW MGRZ MGSC MGSF MGSI MGSL MGSU1999 Q4 23 785 3 091 102 163 27 141 1 672 28 813 16 945 45 758 74.2
2000 Q1 23 860 3 074 108 144 27 187 1 666 28 853 16 959 45 812 74.2Q2 23 975 3 063 111 145 27 294 1 586 28 880 16 987 45 866 74.4Q3 24 020 3 066 113 150 27 350 1 545 28 895 17 031 45 927 74.5Q4 24 064 3 043 99 130 27 336 1 509 28 845 17 154 45 999 74.3
2001 Q1 24 105 3 081 97 146 27 428 1 468 28 896 17 175 46 071 74.5Q2 24 204 3 074 95 140 27 512 1 454 28 966 17 178 46 144 74.5Q3 24 168 3 104 95 121 27 487 1 480 28 968 17 246 46 213 74.3Q4 24 245 3 092 103 118 27 559 1 509 29 068 17 209 46 277 74.3
2002 Q1 24 279 3 089 97 110 27 576 1 489 29 065 17 275 46 340 74.3Q2 24 380 3 121 97 100 27 698 1 497 29 195 17 209 46 404 74.5Q3 24 328 3 145 91 98 27 662 1 541 29 204 17 261 46 465 74.3Q4 24 472 3 154 91 94 27 812 1 506 29 318 17 204 46 522 74.6
1 The data in this table have been adjusted to reflect the 2001 Census popu-lation data. For further details, please see the National Statistics website:www.statistics.gov.uk/cci/nugget.asp?id=207
2 Seasonally adjusted estimates are subject to periodic revision.3 The employment rate equals those in employment aged 16-64 (male) and
16-59 (female), as a percentage of all in these age groups.
Source: Office for National Statistics: 020 7533 6094
3.2 Distribution of the workforce1,2
United KingdomThousands
Not seasonally adjusted Seasonally adjusted
Employee jobs Self-employmentjobs (with or
without Self-employmentWorkforce jobs Males Females Total employees)3 HM Forces4 Workforce jobs Employee jobs jobs
At June
DYDA BCAE BCAF BCAD BCAG BCAH DYDC BCAJ DYZN1998 28 284 12 342 12 227 24 569 3 384 210 28 386 24 649 3 3961999 28 786 12 636 12 409 25 045 3 410 208 28 860 25 114 3 4072000 29 220 12 908 12 664 25 572 3 329 207 29 273 25 626 3 3222001 29 475 13 003 12 842 25 845 3 329 204 29 515 25 892 3 3182002 29 495 12 980 12 831 25 811 3 388 204 29 519 25 855 3 364
2000 Q1 28 972 12 836 12 488 25 324 3 318 208 29 106 25 454 3 323Q2 29 220 12 908 12 664 25 572 3 329 207 29 273 25 626 3 322Q3 29 371 12 973 12 769 25 743 3 302 205 29 317 25 692 3 298Q4 29 515 13 039 12 857 25 896 3 295 206 29 394 25 774 3 300
2001 Q1 29 293 12 928 12 753 25 681 3 296 206 29 428 25 810 3 302Q2 29 475 13 003 12 842 25 845 3 329 204 29 515 25 892 3 318Q3 29 519 13 098 12 821 25 919 3 307 203 29 469 25 869 3 306Q4 29 635 13 126 12 910 26 036 3 300 204 29 516 25 916 3 305
2002 Q1 29 410 13 001 12 806 25 807 3 307 205 29 539 25 935 3 310Q2 29 495 12 980 12 831 25 811 3 388 204 29 519 25 855 3 364Q3 29 558 12 995 12 852 25 847 3 414 204 29 514 25 809 3 407Q4 29 677 13 037 12 918 25 955 3 419 205 29 561 25 834 3 428
1 The data in this table include revised figures for self-employment to reflectthe results of the 2001 Census.
2 Estimates for employee jobs and workforce jobs for Great Britain now usethe Annual Business Inquiry as a benchmark on which the quarterly move-ments are based. For further information see Labour Market Statistics FirstRelease, April 2001 which is held on the National Statistics websitewww.statistics.gov.uk. The Northern Ireland component of workforce jobsand employee jobs has not changed.
3 Estimates of the self-employed are based on the results of the Labour ForceSurvey. The estimates given in the table are unadjusted.
4 HM Forces figures, provided by the Ministry of Defence, represent the totalnumber of UK service personnel, male and female, in HM Regular Forceswherever serving and including those on release leave. The numbers are notsubject to seasonal adjustment.
Sources: Office for National Statistics;Department of Economic Development (Northern Ireland)
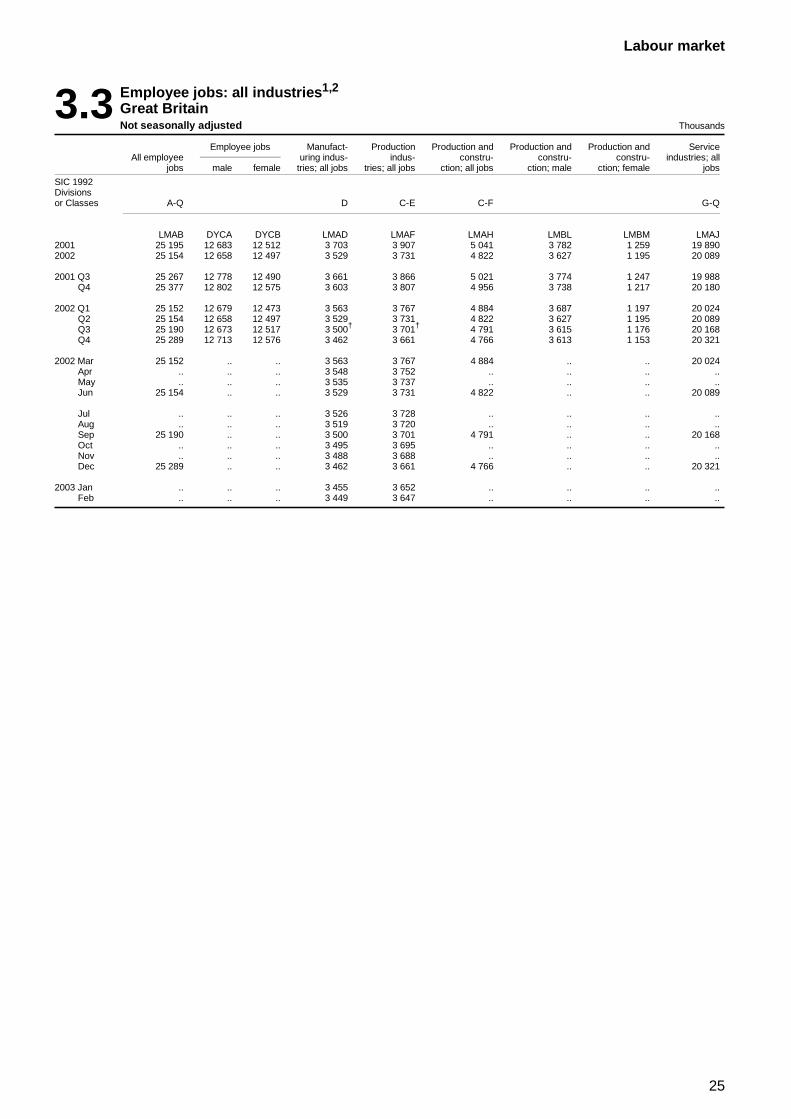
25
Labour market
3.3 Employee jobs: all industries1,2
Great BritainNot seasonally adjusted Thousands
Employee jobs Manufact- Production Production and Production and Production and ServiceAll employee uring indus- indus- constru- constru- constru- industries; all
jobs male female tries; all jobs tries; all jobs ction; all jobs ction; male ction; female jobs
SIC 1992Divisionsor Classes A-Q D C-E C-F G-Q
LMAB DYCA DYCB LMAD LMAF LMAH LMBL LMBM LMAJ2001 25 195 12 683 12 512 3 703 3 907 5 041 3 782 1 259 19 8902002 25 154 12 658 12 497 3 529 3 731 4 822 3 627 1 195 20 089
2001 Q3 25 267 12 778 12 490 3 661 3 866 5 021 3 774 1 247 19 988Q4 25 377 12 802 12 575 3 603 3 807 4 956 3 738 1 217 20 180
2002 Q1 25 152 12 679 12 473 3 563 3 767 4 884 3 687 1 197 20 024Q2 25 154 12 658 12 497 3 529 3 731 4 822 3 627 1 195 20 089Q3 25 190 12 673 12 517 3 500† 3 701† 4 791 3 615 1 176 20 168Q4 25 289 12 713 12 576 3 462 3 661 4 766 3 613 1 153 20 321
2002 Mar 25 152 .. .. 3 563 3 767 4 884 .. .. 20 024Apr .. .. .. 3 548 3 752 .. .. .. ..May .. .. .. 3 535 3 737 .. .. .. ..Jun 25 154 .. .. 3 529 3 731 4 822 .. .. 20 089
Jul .. .. .. 3 526 3 728 .. .. .. ..Aug .. .. .. 3 519 3 720 .. .. .. ..Sep 25 190 .. .. 3 500 3 701 4 791 .. .. 20 168Oct .. .. .. 3 495 3 695 .. .. .. ..Nov .. .. .. 3 488 3 688 .. .. .. ..Dec 25 289 .. .. 3 462 3 661 4 766 .. .. 20 321
2003 Jan .. .. .. 3 455 3 652 .. .. .. ..Feb .. .. .. 3 449 3 647 .. .. .. ..
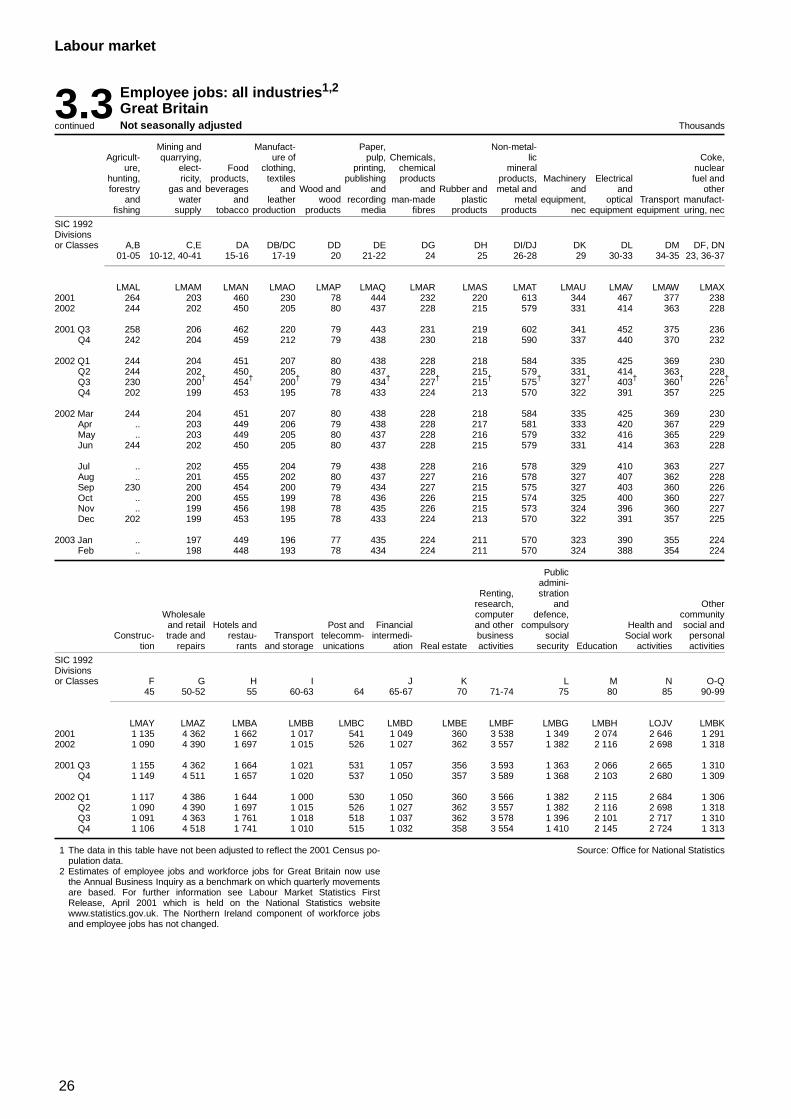
26
Labour market
3.3 Employee jobs: all industries1,2
Great BritainNot seasonally adjustedcontinued Thousands
Mining and Manufact- Paper, Non-metal-Agricult- quarrying, ure of pulp, Chemicals, lic Coke,
ure, elect- Food clothing, printing, chemical mineral nuclearhunting, ricity, products, textiles publishing products products, Machinery Electrical fuel andforestry gas and beverages and Wood and and and Rubber and metal and and and other
and water and leather wood recording man-made plastic metal equipment, optical Transport manufact-fishing supply tobacco production products media fibres products products nec equipment equipment uring, nec
SIC 1992Divisionsor Classes A,B C,E DA DB/DC DD DE DG DH DI/DJ DK DL DM DF, DN
01-05 10-12, 40-41 15-16 17-19 20 21-22 24 25 26-28 29 30-33 34-35 23, 36-37
LMAL LMAM LMAN LMAO LMAP LMAQ LMAR LMAS LMAT LMAU LMAV LMAW LMAX2001 264 203 460 230 78 444 232 220 613 344 467 377 2382002 244 202 450 205 80 437 228 215 579 331 414 363 228
2001 Q3 258 206 462 220 79 443 231 219 602 341 452 375 236Q4 242 204 459 212 79 438 230 218 590 337 440 370 232
2002 Q1 244 204 451 207 80 438 228 218 584 335 425 369 230Q2 244 202 450 205 80 437 228 215 579 331 414 363 228Q3 230 200† 454† 200† 79 434† 227† 215† 575† 327† 403† 360† 226†
Q4 202 199 453 195 78 433 224 213 570 322 391 357 225
2002 Mar 244 204 451 207 80 438 228 218 584 335 425 369 230Apr .. 203 449 206 79 438 228 217 581 333 420 367 229May .. 203 449 205 80 437 228 216 579 332 416 365 229Jun 244 202 450 205 80 437 228 215 579 331 414 363 228
Jul .. 202 455 204 79 438 228 216 578 329 410 363 227Aug .. 201 455 202 80 437 227 216 578 327 407 362 228Sep 230 200 454 200 79 434 227 215 575 327 403 360 226Oct .. 200 455 199 78 436 226 215 574 325 400 360 227Nov .. 199 456 198 78 435 226 215 573 324 396 360 227Dec 202 199 453 195 78 433 224 213 570 322 391 357 225
2003 Jan .. 197 449 196 77 435 224 211 570 323 390 355 224Feb .. 198 448 193 78 434 224 211 570 324 388 354 224
Publicadmini-
Renting, strationresearch, and Other
Wholesale computer defence, communityand retail Hotels and Post and Financial and other compulsory Health and social and
Construc- trade and restau- Transport telecomm- intermedi- business social Social work personaltion repairs rants and storage unications ation Real estate activities security Education activities activities
SIC 1992Divisionsor Classes F G H I J K L M N O-Q
45 50-52 55 60-63 64 65-67 70 71-74 75 80 85 90-99
LMAY LMAZ LMBA LMBB LMBC LMBD LMBE LMBF LMBG LMBH LOJV LMBK2001 1 135 4 362 1 662 1 017 541 1 049 360 3 538 1 349 2 074 2 646 1 2912002 1 090 4 390 1 697 1 015 526 1 027 362 3 557 1 382 2 116 2 698 1 318
2001 Q3 1 155 4 362 1 664 1 021 531 1 057 356 3 593 1 363 2 066 2 665 1 310Q4 1 149 4 511 1 657 1 020 537 1 050 357 3 589 1 368 2 103 2 680 1 309
2002 Q1 1 117 4 386 1 644 1 000 530 1 050 360 3 566 1 382 2 115 2 684 1 306Q2 1 090 4 390 1 697 1 015 526 1 027 362 3 557 1 382 2 116 2 698 1 318Q3 1 091 4 363 1 761 1 018 518 1 037 362 3 578 1 396 2 101 2 717 1 310Q4 1 106 4 518 1 741 1 010 515 1 032 358 3 554 1 410 2 145 2 724 1 313
1 The data in this table have not been adjusted to reflect the 2001 Census po-pulation data.
2 Estimates of employee jobs and workforce jobs for Great Britain now usethe Annual Business Inquiry as a benchmark on which quarterly movementsare based. For further information see Labour Market Statistics FirstRelease, April 2001 which is held on the National Statistics websitewww.statistics.gov.uk. The Northern Ireland component of workforce jobsand employee jobs has not changed.
Source: Office for National Statistics
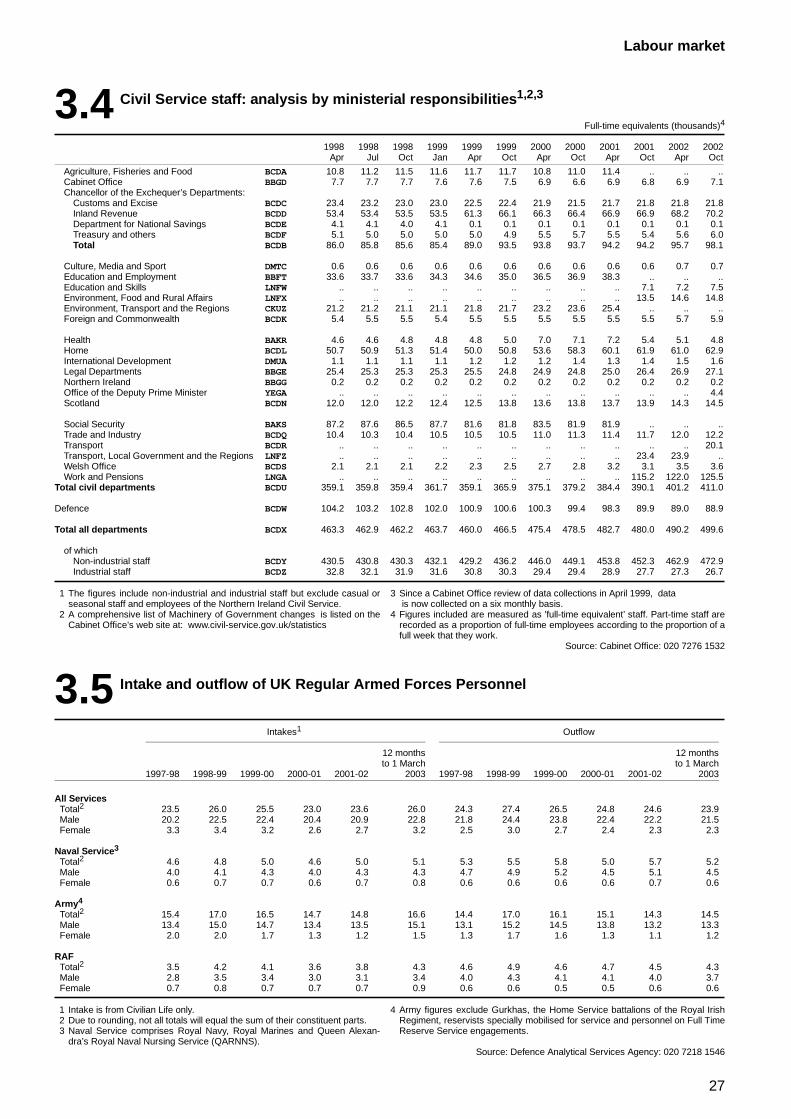
27
Labour market
3.4 Civil Service staff: analysis by ministerial responsibilities1,2,3
Full-time equivalents (thousands)4
1998 1998 1998 1999 1999 1999 2000 2000 2001 2001 2002 2002Apr Jul Oct Jan Apr Oct Apr Oct Apr Oct Apr Oct
Agriculture, Fisheries and Food BCDA 10.8 11.2 11.5 11.6 11.7 11.7 10.8 11.0 11.4 .. .. ..Cabinet Office BBGD 7.7 7.7 7.7 7.6 7.6 7.5 6.9 6.6 6.9 6.8 6.9 7.1Chancellor of the Exchequer’s Departments:
Customs and Excise BCDC 23.4 23.2 23.0 23.0 22.5 22.4 21.9 21.5 21.7 21.8 21.8 21.8Inland Revenue BCDD 53.4 53.4 53.5 53.5 61.3 66.1 66.3 66.4 66.9 66.9 68.2 70.2Department for National Savings BCDE 4.1 4.1 4.0 4.1 0.1 0.1 0.1 0.1 0.1 0.1 0.1 0.1Treasury and others BCDF 5.1 5.0 5.0 5.0 5.0 4.9 5.5 5.7 5.5 5.4 5.6 6.0Total BCDB 86.0 85.8 85.6 85.4 89.0 93.5 93.8 93.7 94.2 94.2 95.7 98.1
Culture, Media and Sport DMTC 0.6 0.6 0.6 0.6 0.6 0.6 0.6 0.6 0.6 0.6 0.7 0.7Education and Employment BBFT 33.6 33.7 33.6 34.3 34.6 35.0 36.5 36.9 38.3 .. .. ..Education and Skills LNFW .. .. .. .. .. .. .. .. .. 7.1 7.2 7.5Environment, Food and Rural Affairs LNFX .. .. .. .. .. .. .. .. .. 13.5 14.6 14.8Environment, Transport and the Regions CKUZ 21.2 21.2 21.1 21.1 21.8 21.7 23.2 23.6 25.4 .. .. ..Foreign and Commonwealth BCDK 5.4 5.5 5.5 5.4 5.5 5.5 5.5 5.5 5.5 5.5 5.7 5.9
Health BAKR 4.6 4.6 4.8 4.8 4.8 5.0 7.0 7.1 7.2 5.4 5.1 4.8Home BCDL 50.7 50.9 51.3 51.4 50.0 50.8 53.6 58.3 60.1 61.9 61.0 62.9International Development DMUA 1.1 1.1 1.1 1.1 1.2 1.2 1.2 1.4 1.3 1.4 1.5 1.6Legal Departments BBGE 25.4 25.3 25.3 25.3 25.5 24.8 24.9 24.8 25.0 26.4 26.9 27.1Northern Ireland BBGG 0.2 0.2 0.2 0.2 0.2 0.2 0.2 0.2 0.2 0.2 0.2 0.2Office of the Deputy Prime Minister YEGA .. .. .. .. .. .. .. .. .. .. .. 4.4Scotland BCDN 12.0 12.0 12.2 12.4 12.5 13.8 13.6 13.8 13.7 13.9 14.3 14.5
Social Security BAKS 87.2 87.6 86.5 87.7 81.6 81.8 83.5 81.9 81.9 .. .. ..Trade and Industry BCDQ 10.4 10.3 10.4 10.5 10.5 10.5 11.0 11.3 11.4 11.7 12.0 12.2Transport BCDR .. .. .. .. .. .. .. .. .. .. .. 20.1Transport, Local Government and the Regions LNFZ .. .. .. .. .. .. .. .. .. 23.4 23.9 ..Welsh Office BCDS 2.1 2.1 2.1 2.2 2.3 2.5 2.7 2.8 3.2 3.1 3.5 3.6Work and Pensions LNGA .. .. .. .. .. .. .. .. .. 115.2 122.0 125.5
Total civil departments BCDU 359.1 359.8 359.4 361.7 359.1 365.9 375.1 379.2 384.4 390.1 401.2 411.0
Defence BCDW 104.2 103.2 102.8 102.0 100.9 100.6 100.3 99.4 98.3 89.9 89.0 88.9
Total all departments BCDX 463.3 462.9 462.2 463.7 460.0 466.5 475.4 478.5 482.7 480.0 490.2 499.6
of whichNon-industrial staff BCDY 430.5 430.8 430.3 432.1 429.2 436.2 446.0 449.1 453.8 452.3 462.9 472.9Industrial staff BCDZ 32.8 32.1 31.9 31.6 30.8 30.3 29.4 29.4 28.9 27.7 27.3 26.7
1 The figures include non-industrial and industrial staff but exclude casual orseasonal staff and employees of the Northern Ireland Civil Service.
2 A comprehensive list of Machinery of Government changes is listed on theCabinet Office’s web site at: www.civil-service.gov.uk/statistics
3 Since a Cabinet Office review of data collections in April 1999, datais now collected on a six monthly basis.
4 Figures included are measured as ’full-time equivalent’ staff. Part-time staff arerecorded as a proportion of full-time employees according to the proportion of afull week that they work.
Source: Cabinet Office: 020 7276 1532
3.5 Intake and outflow of UK Regular Armed Forces Personnel
Intakes1 Outflow
12 months 12 monthsto 1 March to 1 March
1997-98 1998-99 1999-00 2000-01 2001-02 2003 1997-98 1998-99 1999-00 2000-01 2001-02 2003
All ServicesTotal2 23.5 26.0 25.5 23.0 23.6 26.0 24.3 27.4 26.5 24.8 24.6 23.9Male 20.2 22.5 22.4 20.4 20.9 22.8 21.8 24.4 23.8 22.4 22.2 21.5Female 3.3 3.4 3.2 2.6 2.7 3.2 2.5 3.0 2.7 2.4 2.3 2.3
Naval Service3
Total2 4.6 4.8 5.0 4.6 5.0 5.1 5.3 5.5 5.8 5.0 5.7 5.2Male 4.0 4.1 4.3 4.0 4.3 4.3 4.7 4.9 5.2 4.5 5.1 4.5Female 0.6 0.7 0.7 0.6 0.7 0.8 0.6 0.6 0.6 0.6 0.7 0.6
Army4
Total2 15.4 17.0 16.5 14.7 14.8 16.6 14.4 17.0 16.1 15.1 14.3 14.5Male 13.4 15.0 14.7 13.4 13.5 15.1 13.1 15.2 14.5 13.8 13.2 13.3Female 2.0 2.0 1.7 1.3 1.2 1.5 1.3 1.7 1.6 1.3 1.1 1.2
RAFTotal2 3.5 4.2 4.1 3.6 3.8 4.3 4.6 4.9 4.6 4.7 4.5 4.3Male 2.8 3.5 3.4 3.0 3.1 3.4 4.0 4.3 4.1 4.1 4.0 3.7Female 0.7 0.8 0.7 0.7 0.7 0.9 0.6 0.6 0.5 0.5 0.6 0.6
1 Intake is from Civilian Life only.2 Due to rounding, not all totals will equal the sum of their constituent parts.3 Naval Service comprises Royal Navy, Royal Marines and Queen Alexan-
dra’s Royal Naval Nursing Service (QARNNS).
4 Army figures exclude Gurkhas, the Home Service battalions of the Royal IrishRegiment, reservists specially mobilised for service and personnel on Full TimeReserve Service engagements.
Source: Defence Analytical Services Agency: 020 7218 1546
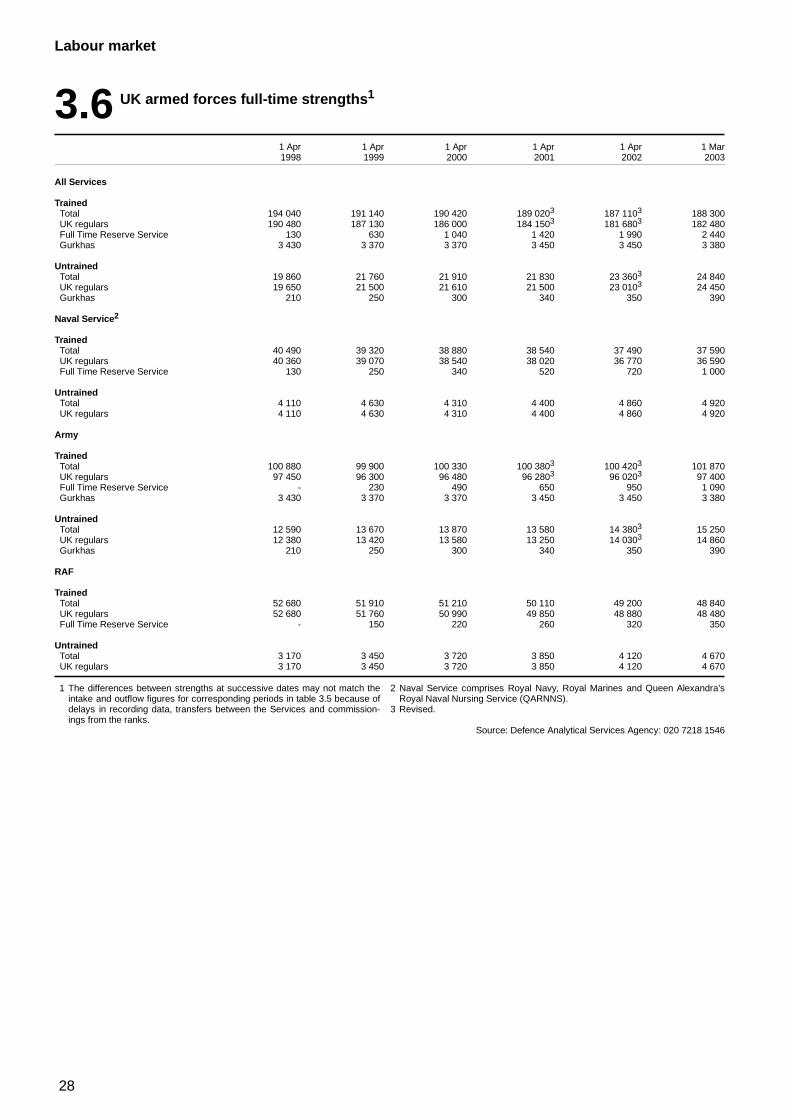
28
Labour market
3.6 UK armed forces full-time strengths1
1 Apr 1 Apr 1 Apr 1 Apr 1 Apr 1 Mar1998 1999 2000 2001 2002 2003
All Services
TrainedTotal 194 040 191 140 190 420 189 0203 187 1103 188 300UK regulars 190 480 187 130 186 000 184 1503 181 6803 182 480Full Time Reserve Service 130 630 1 040 1 420 1 990 2 440Gurkhas 3 430 3 370 3 370 3 450 3 450 3 380
UntrainedTotal 19 860 21 760 21 910 21 830 23 3603 24 840UK regulars 19 650 21 500 21 610 21 500 23 0103 24 450Gurkhas 210 250 300 340 350 390
Naval Service2
TrainedTotal 40 490 39 320 38 880 38 540 37 490 37 590UK regulars 40 360 39 070 38 540 38 020 36 770 36 590Full Time Reserve Service 130 250 340 520 720 1 000
UntrainedTotal 4 110 4 630 4 310 4 400 4 860 4 920UK regulars 4 110 4 630 4 310 4 400 4 860 4 920
Army
TrainedTotal 100 880 99 900 100 330 100 3803 100 4203 101 870UK regulars 97 450 96 300 96 480 96 2803 96 0203 97 400Full Time Reserve Service - 230 490 650 950 1 090Gurkhas 3 430 3 370 3 370 3 450 3 450 3 380
UntrainedTotal 12 590 13 670 13 870 13 580 14 3803 15 250UK regulars 12 380 13 420 13 580 13 250 14 0303 14 860Gurkhas 210 250 300 340 350 390
RAF
TrainedTotal 52 680 51 910 51 210 50 110 49 200 48 840UK regulars 52 680 51 760 50 990 49 850 48 880 48 480Full Time Reserve Service - 150 220 260 320 350
UntrainedTotal 3 170 3 450 3 720 3 850 4 120 4 670UK regulars 3 170 3 450 3 720 3 850 4 120 4 670
1 The differences between strengths at successive dates may not match theintake and outflow figures for corresponding periods in table 3.5 because ofdelays in recording data, transfers between the Services and commission-ings from the ranks.
2 Naval Service comprises Royal Navy, Royal Marines and Queen Alexandra’sRoyal Naval Nursing Service (QARNNS).
3 Revised.
Source: Defence Analytical Services Agency: 020 7218 1546
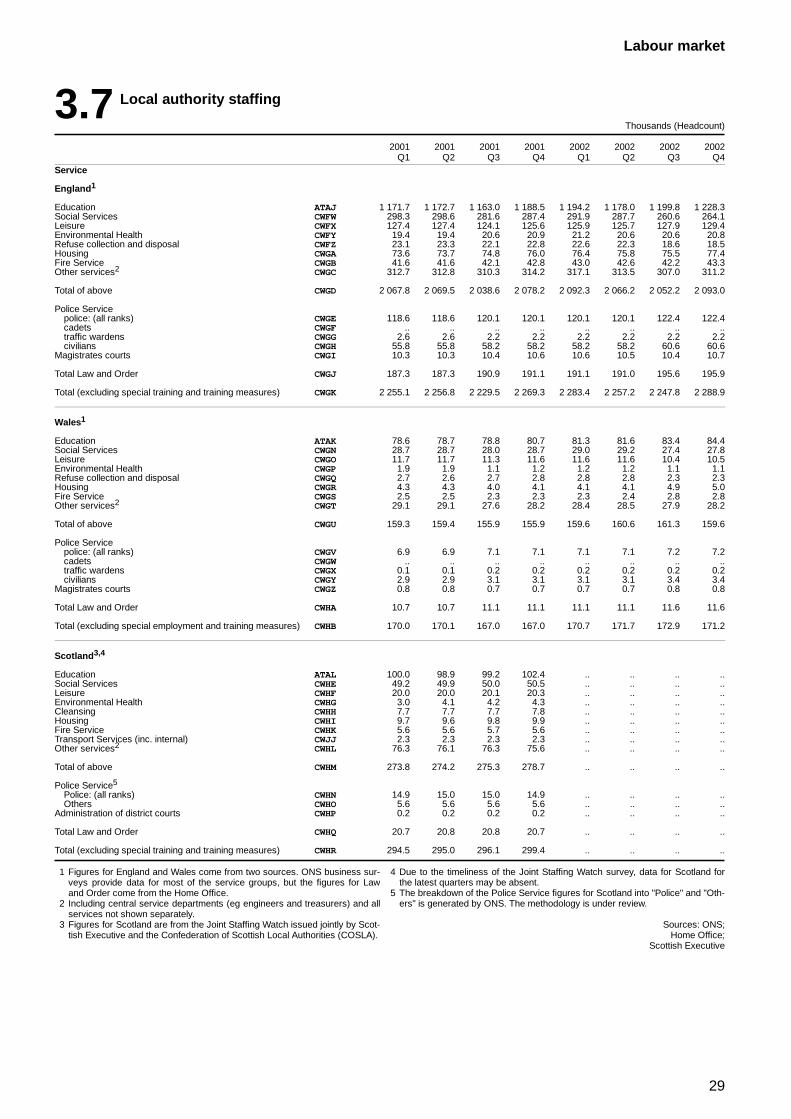
29
Labour market
3.7 Local authority staffing
Thousands (Headcount)
2001 2001 2001 2001 2002 2002 2002 2002Q1 Q2 Q3 Q4 Q1 Q2 Q3 Q4
Service
England1
Education ATAJ 1 171.7 1 172.7 1 163.0 1 188.5 1 194.2 1 178.0 1 199.8 1 228.3Social Services CWFW 298.3 298.6 281.6 287.4 291.9 287.7 260.6 264.1Leisure CWFX 127.4 127.4 124.1 125.6 125.9 125.7 127.9 129.4Environmental Health CWFY 19.4 19.4 20.6 20.9 21.2 20.6 20.6 20.8Refuse collection and disposal CWFZ 23.1 23.3 22.1 22.8 22.6 22.3 18.6 18.5Housing CWGA 73.6 73.7 74.8 76.0 76.4 75.8 75.5 77.4Fire Service CWGB 41.6 41.6 42.1 42.8 43.0 42.6 42.2 43.3Other services2 CWGC 312.7 312.8 310.3 314.2 317.1 313.5 307.0 311.2
Total of above CWGD 2 067.8 2 069.5 2 038.6 2 078.2 2 092.3 2 066.2 2 052.2 2 093.0
Police Servicepolice: (all ranks) CWGE 118.6 118.6 120.1 120.1 120.1 120.1 122.4 122.4cadets CWGF .. .. .. .. .. .. .. ..traffic wardens CWGG 2.6 2.6 2.2 2.2 2.2 2.2 2.2 2.2civilians CWGH 55.8 55.8 58.2 58.2 58.2 58.2 60.6 60.6
Magistrates courts CWGI 10.3 10.3 10.4 10.6 10.6 10.5 10.4 10.7
Total Law and Order CWGJ 187.3 187.3 190.9 191.1 191.1 191.0 195.6 195.9
Total (excluding special training and training measures) CWGK 2 255.1 2 256.8 2 229.5 2 269.3 2 283.4 2 257.2 2 247.8 2 288.9
Wales1
Education ATAK 78.6 78.7 78.8 80.7 81.3 81.6 83.4 84.4Social Services CWGN 28.7 28.7 28.0 28.7 29.0 29.2 27.4 27.8Leisure CWGO 11.7 11.7 11.3 11.6 11.6 11.6 10.4 10.5Environmental Health CWGP 1.9 1.9 1.1 1.2 1.2 1.2 1.1 1.1Refuse collection and disposal CWGQ 2.7 2.6 2.7 2.8 2.8 2.8 2.3 2.3Housing CWGR 4.3 4.3 4.0 4.1 4.1 4.1 4.9 5.0Fire Service CWGS 2.5 2.5 2.3 2.3 2.3 2.4 2.8 2.8Other services2 CWGT 29.1 29.1 27.6 28.2 28.4 28.5 27.9 28.2
Total of above CWGU 159.3 159.4 155.9 155.9 159.6 160.6 161.3 159.6
Police Servicepolice: (all ranks) CWGV 6.9 6.9 7.1 7.1 7.1 7.1 7.2 7.2cadets CWGW .. .. .. .. .. .. .. ..traffic wardens CWGX 0.1 0.1 0.2 0.2 0.2 0.2 0.2 0.2civilians CWGY 2.9 2.9 3.1 3.1 3.1 3.1 3.4 3.4
Magistrates courts CWGZ 0.8 0.8 0.7 0.7 0.7 0.7 0.8 0.8
Total Law and Order CWHA 10.7 10.7 11.1 11.1 11.1 11.1 11.6 11.6
Total (excluding special employment and training measures) CWHB 170.0 170.1 167.0 167.0 170.7 171.7 172.9 171.2
Scotland3,4
Education ATAL 100.0 98.9 99.2 102.4 .. .. .. ..Social Services CWHE 49.2 49.9 50.0 50.5 .. .. .. ..Leisure CWHF 20.0 20.0 20.1 20.3 .. .. .. ..Environmental Health CWHG 3.0 4.1 4.2 4.3 .. .. .. ..Cleansing CWHH 7.7 7.7 7.7 7.8 .. .. .. ..Housing CWHI 9.7 9.6 9.8 9.9 .. .. .. ..Fire Service CWHK 5.6 5.6 5.7 5.6 .. .. .. ..Transport Services (inc. internal) CWJJ 2.3 2.3 2.3 2.3 .. .. .. ..Other services2 CWHL 76.3 76.1 76.3 75.6 .. .. .. ..
Total of above CWHM 273.8 274.2 275.3 278.7 .. .. .. ..
Police Service5
Police: (all ranks) CWHN 14.9 15.0 15.0 14.9 .. .. .. ..Others CWHO 5.6 5.6 5.6 5.6 .. .. .. ..
Administration of district courts CWHP 0.2 0.2 0.2 0.2 .. .. .. ..
Total Law and Order CWHQ 20.7 20.8 20.8 20.7 .. .. .. ..
Total (excluding special training and training measures) CWHR 294.5 295.0 296.1 299.4 .. .. .. ..
1 Figures for England and Wales come from two sources. ONS business sur-veys provide data for most of the service groups, but the figures for Lawand Order come from the Home Office.
2 Including central service departments (eg engineers and treasurers) and allservices not shown separately.
3 Figures for Scotland are from the Joint Staffing Watch issued jointly by Scot-tish Executive and the Confederation of Scottish Local Authorities (COSLA).
4 Due to the timeliness of the Joint Staffing Watch survey, data for Scotland forthe latest quarters may be absent.
5 The breakdown of the Police Service figures for Scotland into "Police" and "Oth-ers" is generated by ONS. The methodology is under review.
Sources: ONS;Home Office;
Scottish Executive
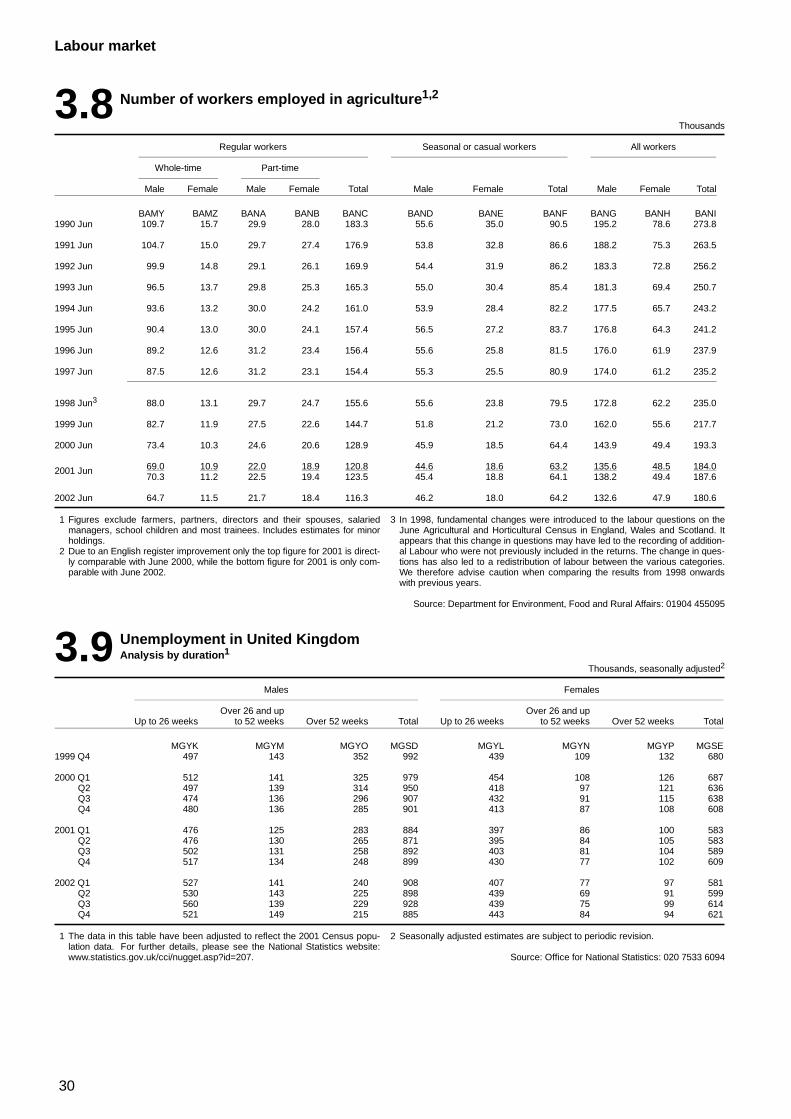
30
Labour market
3.8 Number of workers employed in agriculture1,2
Thousands
Regular workers Seasonal or casual workers All workers
Whole-time Part-time
Male Female Male Female Total Male Female Total Male Female Total
BAMY BAMZ BANA BANB BANC BAND BANE BANF BANG BANH BANI1990 Jun 109.7 15.7 29.9 28.0 183.3 55.6 35.0 90.5 195.2 78.6 273.8
1991 Jun 104.7 15.0 29.7 27.4 176.9 53.8 32.8 86.6 188.2 75.3 263.5
1992 Jun 99.9 14.8 29.1 26.1 169.9 54.4 31.9 86.2 183.3 72.8 256.2
1993 Jun 96.5 13.7 29.8 25.3 165.3 55.0 30.4 85.4 181.3 69.4 250.7
1994 Jun 93.6 13.2 30.0 24.2 161.0 53.9 28.4 82.2 177.5 65.7 243.2
1995 Jun 90.4 13.0 30.0 24.1 157.4 56.5 27.2 83.7 176.8 64.3 241.2
1996 Jun 89.2 12.6 31.2 23.4 156.4 55.6 25.8 81.5 176.0 61.9 237.9
1997 Jun 87.5 12.6 31.2 23.1 154.4 55.3 25.5 80.9 174.0 61.2 235.2
1998 Jun3 88.0 13.1 29.7 24.7 155.6 55.6 23.8 79.5 172.8 62.2 235.0
1999 Jun 82.7 11.9 27.5 22.6 144.7 51.8 21.2 73.0 162.0 55.6 217.7
2000 Jun 73.4 10.3 24.6 20.6 128.9 45.9 18.5 64.4 143.9 49.4 193.3
2001 Jun 69.0 10.9 22.0 18.9 120.8 44.6 18.6 63.2 135.6 48.5 184.070.3 11.2 22.5 19.4 123.5 45.4 18.8 64.1 138.2 49.4 187.6
2002 Jun 64.7 11.5 21.7 18.4 116.3 46.2 18.0 64.2 132.6 47.9 180.6
1 Figures exclude farmers, partners, directors and their spouses, salariedmanagers, school children and most trainees. Includes estimates for minorholdings.
2 Due to an English register improvement only the top figure for 2001 is direct-ly comparable with June 2000, while the bottom figure for 2001 is only com-parable with June 2002.
3 In 1998, fundamental changes were introduced to the labour questions on theJune Agricultural and Horticultural Census in England, Wales and Scotland. Itappears that this change in questions may have led to the recording of addition-al Labour who were not previously included in the returns. The change in ques-tions has also led to a redistribution of labour between the various categories.We therefore advise caution when comparing the results from 1998 onwardswith previous years.
Source: Department for Environment, Food and Rural Affairs: 01904 455095
3.9 Unemployment in United KingdomAnalysis by duration1
Thousands, seasonally adjusted2
Males Females
Over 26 and up Over 26 and upUp to 26 weeks to 52 weeks Over 52 weeks Total Up to 26 weeks to 52 weeks Over 52 weeks Total
MGYK MGYM MGYO MGSD MGYL MGYN MGYP MGSE1999 Q4 497 143 352 992 439 109 132 680
2000 Q1 512 141 325 979 454 108 126 687Q2 497 139 314 950 418 97 121 636Q3 474 136 296 907 432 91 115 638Q4 480 136 285 901 413 87 108 608
2001 Q1 476 125 283 884 397 86 100 583Q2 476 130 265 871 395 84 105 583Q3 502 131 258 892 403 81 104 589Q4 517 134 248 899 430 77 102 609
2002 Q1 527 141 240 908 407 77 97 581Q2 530 143 225 898 439 69 91 599Q3 560 139 229 928 439 75 99 614Q4 521 149 215 885 443 84 94 621
1 The data in this table have been adjusted to reflect the 2001 Census popu-lation data. For further details, please see the National Statistics website:www.statistics.gov.uk/cci/nugget.asp?id=207.
2 Seasonally adjusted estimates are subject to periodic revision.
Source: Office for National Statistics: 020 7533 6094
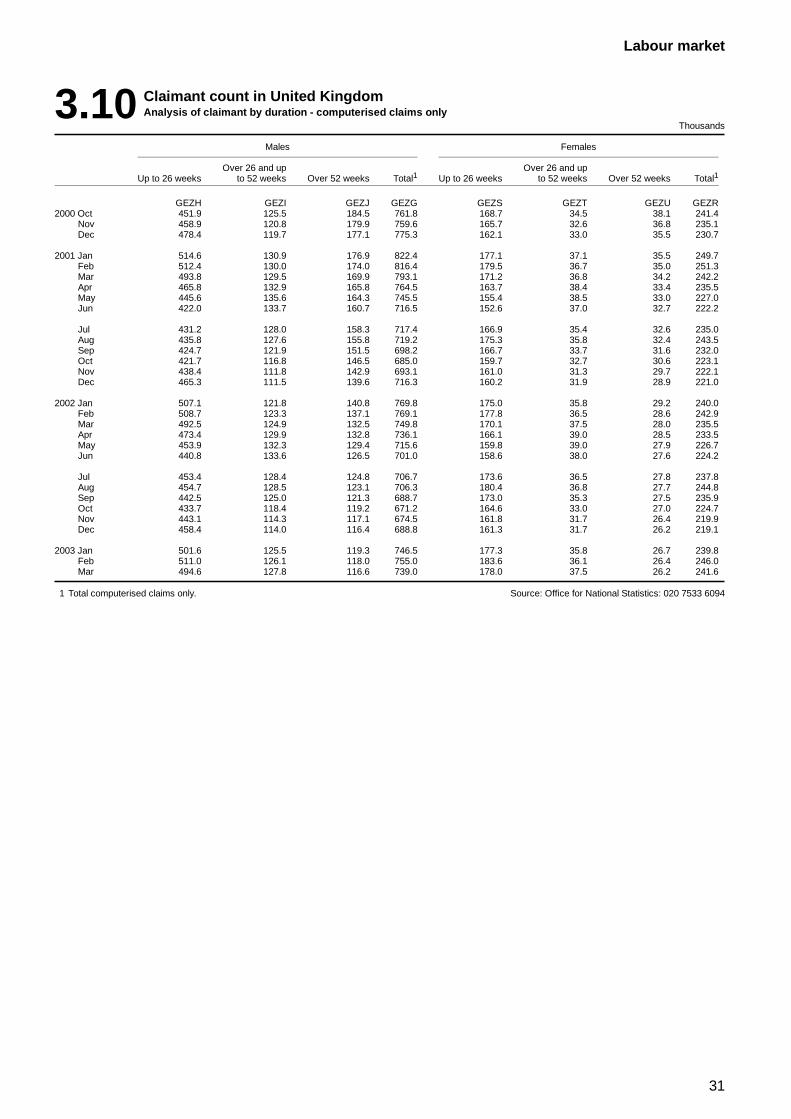
31
Labour market
3.10 Claimant count in United KingdomAnalysis of claimant by duration - computerised claims only
Thousands
Males Females
Over 26 and up Over 26 and upUp to 26 weeks to 52 weeks Over 52 weeks Total1 Up to 26 weeks to 52 weeks Over 52 weeks Total1
GEZH GEZI GEZJ GEZG GEZS GEZT GEZU GEZR2000 Oct 451.9 125.5 184.5 761.8 168.7 34.5 38.1 241.4
Nov 458.9 120.8 179.9 759.6 165.7 32.6 36.8 235.1Dec 478.4 119.7 177.1 775.3 162.1 33.0 35.5 230.7
2001 Jan 514.6 130.9 176.9 822.4 177.1 37.1 35.5 249.7Feb 512.4 130.0 174.0 816.4 179.5 36.7 35.0 251.3Mar 493.8 129.5 169.9 793.1 171.2 36.8 34.2 242.2Apr 465.8 132.9 165.8 764.5 163.7 38.4 33.4 235.5May 445.6 135.6 164.3 745.5 155.4 38.5 33.0 227.0Jun 422.0 133.7 160.7 716.5 152.6 37.0 32.7 222.2
Jul 431.2 128.0 158.3 717.4 166.9 35.4 32.6 235.0Aug 435.8 127.6 155.8 719.2 175.3 35.8 32.4 243.5Sep 424.7 121.9 151.5 698.2 166.7 33.7 31.6 232.0Oct 421.7 116.8 146.5 685.0 159.7 32.7 30.6 223.1Nov 438.4 111.8 142.9 693.1 161.0 31.3 29.7 222.1Dec 465.3 111.5 139.6 716.3 160.2 31.9 28.9 221.0
2002 Jan 507.1 121.8 140.8 769.8 175.0 35.8 29.2 240.0Feb 508.7 123.3 137.1 769.1 177.8 36.5 28.6 242.9Mar 492.5 124.9 132.5 749.8 170.1 37.5 28.0 235.5Apr 473.4 129.9 132.8 736.1 166.1 39.0 28.5 233.5May 453.9 132.3 129.4 715.6 159.8 39.0 27.9 226.7Jun 440.8 133.6 126.5 701.0 158.6 38.0 27.6 224.2
Jul 453.4 128.4 124.8 706.7 173.6 36.5 27.8 237.8Aug 454.7 128.5 123.1 706.3 180.4 36.8 27.7 244.8Sep 442.5 125.0 121.3 688.7 173.0 35.3 27.5 235.9Oct 433.7 118.4 119.2 671.2 164.6 33.0 27.0 224.7Nov 443.1 114.3 117.1 674.5 161.8 31.7 26.4 219.9Dec 458.4 114.0 116.4 688.8 161.3 31.7 26.2 219.1
2003 Jan 501.6 125.5 119.3 746.5 177.3 35.8 26.7 239.8Feb 511.0 126.1 118.0 755.0 183.6 36.1 26.4 246.0Mar 494.6 127.8 116.6 739.0 178.0 37.5 26.2 241.6
1 Total computerised claims only. Source: Office for National Statistics: 020 7533 6094
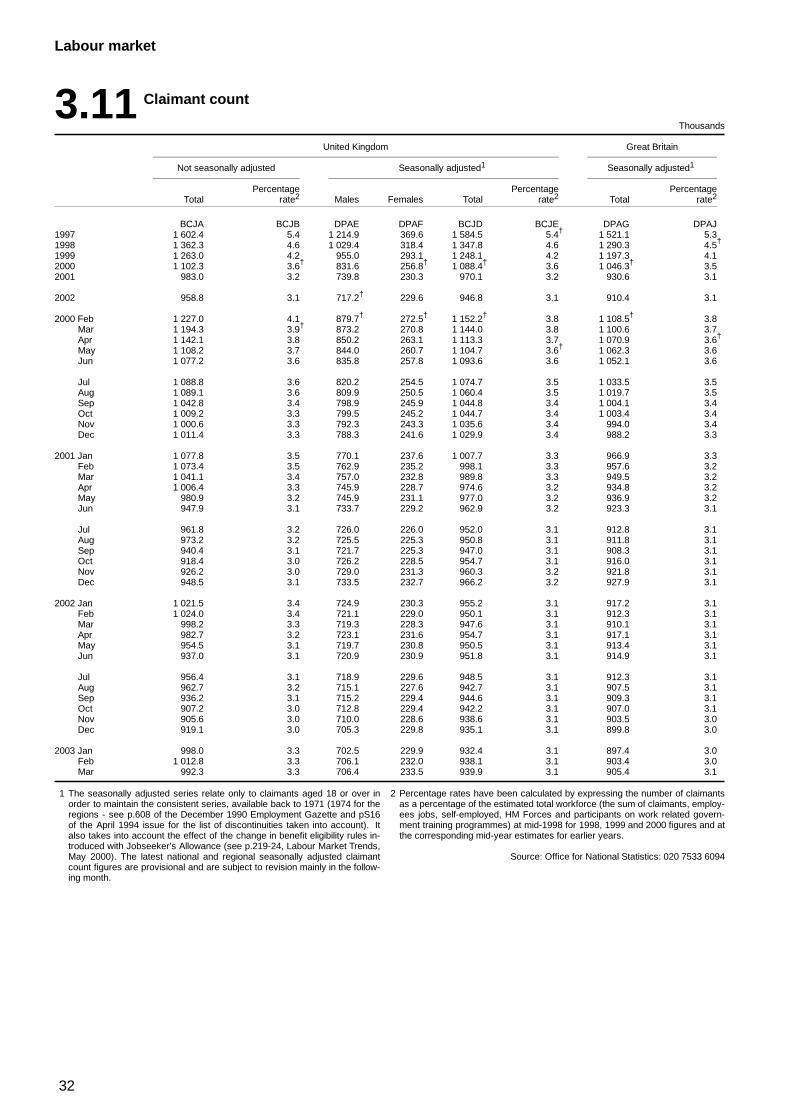
32
Labour market
3.11 Claimant count
Thousands
United Kingdom Great Britain
Not seasonally adjusted Seasonally adjusted1 Seasonally adjusted1
Percentage Percentage PercentageTotal rate2 Males Females Total rate2 Total rate2
BCJA BCJB DPAE DPAF BCJD BCJE DPAG DPAJ1997 1 602.4 5.4 1 214.9 369.6 1 584.5 5.4† 1 521.1 5.31998 1 362.3 4.6 1 029.4 318.4 1 347.8 4.6 1 290.3 4.5†
1999 1 263.0 4.2 955.0 293.1 1 248.1 4.2 1 197.3 4.12000 1 102.3 3.6† 831.6 256.8† 1 088.4† 3.6 1 046.3† 3.52001 983.0 3.2 739.8 230.3 970.1 3.2 930.6 3.1
2002 958.8 3.1 717.2† 229.6 946.8 3.1 910.4 3.1
2000 Feb 1 227.0 4.1 879.7† 272.5† 1 152.2† 3.8 1 108.5† 3.8Mar 1 194.3 3.9† 873.2 270.8 1 144.0 3.8 1 100.6 3.7Apr 1 142.1 3.8 850.2 263.1 1 113.3 3.7 1 070.9 3.6†
May 1 108.2 3.7 844.0 260.7 1 104.7 3.6† 1 062.3 3.6Jun 1 077.2 3.6 835.8 257.8 1 093.6 3.6 1 052.1 3.6
Jul 1 088.8 3.6 820.2 254.5 1 074.7 3.5 1 033.5 3.5Aug 1 089.1 3.6 809.9 250.5 1 060.4 3.5 1 019.7 3.5Sep 1 042.8 3.4 798.9 245.9 1 044.8 3.4 1 004.1 3.4Oct 1 009.2 3.3 799.5 245.2 1 044.7 3.4 1 003.4 3.4Nov 1 000.6 3.3 792.3 243.3 1 035.6 3.4 994.0 3.4Dec 1 011.4 3.3 788.3 241.6 1 029.9 3.4 988.2 3.3
2001 Jan 1 077.8 3.5 770.1 237.6 1 007.7 3.3 966.9 3.3Feb 1 073.4 3.5 762.9 235.2 998.1 3.3 957.6 3.2Mar 1 041.1 3.4 757.0 232.8 989.8 3.3 949.5 3.2Apr 1 006.4 3.3 745.9 228.7 974.6 3.2 934.8 3.2May 980.9 3.2 745.9 231.1 977.0 3.2 936.9 3.2Jun 947.9 3.1 733.7 229.2 962.9 3.2 923.3 3.1
Jul 961.8 3.2 726.0 226.0 952.0 3.1 912.8 3.1Aug 973.2 3.2 725.5 225.3 950.8 3.1 911.8 3.1Sep 940.4 3.1 721.7 225.3 947.0 3.1 908.3 3.1Oct 918.4 3.0 726.2 228.5 954.7 3.1 916.0 3.1Nov 926.2 3.0 729.0 231.3 960.3 3.2 921.8 3.1Dec 948.5 3.1 733.5 232.7 966.2 3.2 927.9 3.1
2002 Jan 1 021.5 3.4 724.9 230.3 955.2 3.1 917.2 3.1Feb 1 024.0 3.4 721.1 229.0 950.1 3.1 912.3 3.1Mar 998.2 3.3 719.3 228.3 947.6 3.1 910.1 3.1Apr 982.7 3.2 723.1 231.6 954.7 3.1 917.1 3.1May 954.5 3.1 719.7 230.8 950.5 3.1 913.4 3.1Jun 937.0 3.1 720.9 230.9 951.8 3.1 914.9 3.1
Jul 956.4 3.1 718.9 229.6 948.5 3.1 912.3 3.1Aug 962.7 3.2 715.1 227.6 942.7 3.1 907.5 3.1Sep 936.2 3.1 715.2 229.4 944.6 3.1 909.3 3.1Oct 907.2 3.0 712.8 229.4 942.2 3.1 907.0 3.1Nov 905.6 3.0 710.0 228.6 938.6 3.1 903.5 3.0Dec 919.1 3.0 705.3 229.8 935.1 3.1 899.8 3.0
2003 Jan 998.0 3.3 702.5 229.9 932.4 3.1 897.4 3.0Feb 1 012.8 3.3 706.1 232.0 938.1 3.1 903.4 3.0Mar 992.3 3.3 706.4 233.5 939.9 3.1 905.4 3.1
1 The seasonally adjusted series relate only to claimants aged 18 or over inorder to maintain the consistent series, available back to 1971 (1974 for theregions - see p.608 of the December 1990 Employment Gazette and pS16of the April 1994 issue for the list of discontinuities taken into account). Italso takes into account the effect of the change in benefit eligibility rules in-troduced with Jobseeker’s Allowance (see p.219-24, Labour Market Trends,May 2000). The latest national and regional seasonally adjusted claimantcount figures are provisional and are subject to revision mainly in the follow-ing month.
2 Percentage rates have been calculated by expressing the number of claimantsas a percentage of the estimated total workforce (the sum of claimants, employ-ees jobs, self-employed, HM Forces and participants on work related govern-ment training programmes) at mid-1998 for 1998, 1999 and 2000 figures and atthe corresponding mid-year estimates for earlier years.
Source: Office for National Statistics: 020 7533 6094
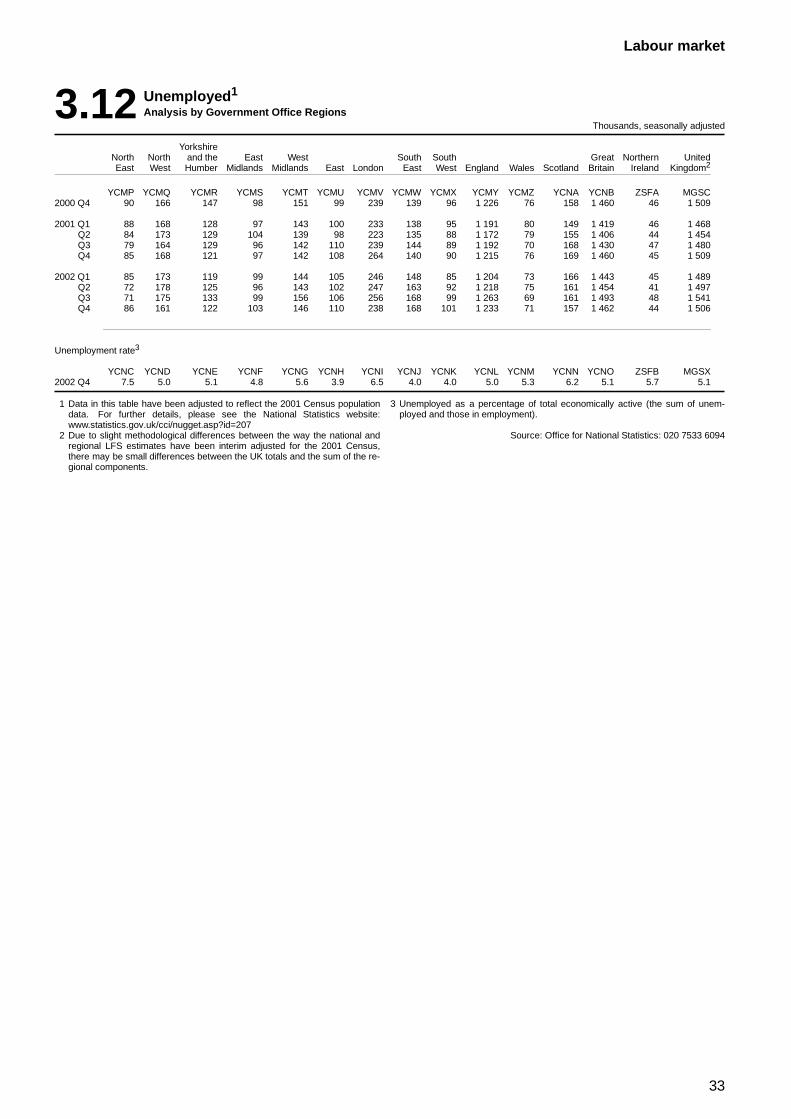
33
Labour market
3.12 Unemployed1
Analysis by Government Office RegionsThousands, seasonally adjusted
YorkshireNorth North and the East West South South Great Northern UnitedEast West Humber Midlands Midlands East London East West England Wales Scotland Britain Ireland Kingdom2
YCMP YCMQ YCMR YCMS YCMT YCMU YCMV YCMW YCMX YCMY YCMZ YCNA YCNB ZSFA MGSC2000 Q4 90 166 147 98 151 99 239 139 96 1 226 76 158 1 460 46 1 509
2001 Q1 88 168 128 97 143 100 233 138 95 1 191 80 149 1 419 46 1 468Q2 84 173 129 104 139 98 223 135 88 1 172 79 155 1 406 44 1 454Q3 79 164 129 96 142 110 239 144 89 1 192 70 168 1 430 47 1 480Q4 85 168 121 97 142 108 264 140 90 1 215 76 169 1 460 45 1 509
2002 Q1 85 173 119 99 144 105 246 148 85 1 204 73 166 1 443 45 1 489Q2 72 178 125 96 143 102 247 163 92 1 218 75 161 1 454 41 1 497Q3 71 175 133 99 156 106 256 168 99 1 263 69 161 1 493 48 1 541Q4 86 161 122 103 146 110 238 168 101 1 233 71 157 1 462 44 1 506
Unemployment rate3
YCNC YCND YCNE YCNF YCNG YCNH YCNI YCNJ YCNK YCNL YCNM YCNN YCNO ZSFB MGSX2002 Q4 7.5 5.0 5.1 4.8 5.6 3.9 6.5 4.0 4.0 5.0 5.3 6.2 5.1 5.7 5.1
1 Data in this table have been adjusted to reflect the 2001 Census populationdata. For further details, please see the National Statistics website:www.statistics.gov.uk/cci/nugget.asp?id=207
2 Due to slight methodological differences between the way the national andregional LFS estimates have been interim adjusted for the 2001 Census,there may be small differences between the UK totals and the sum of the re-gional components.
3 Unemployed as a percentage of total economically active (the sum of unem-ployed and those in employment).
Source: Office for National Statistics: 020 7533 6094
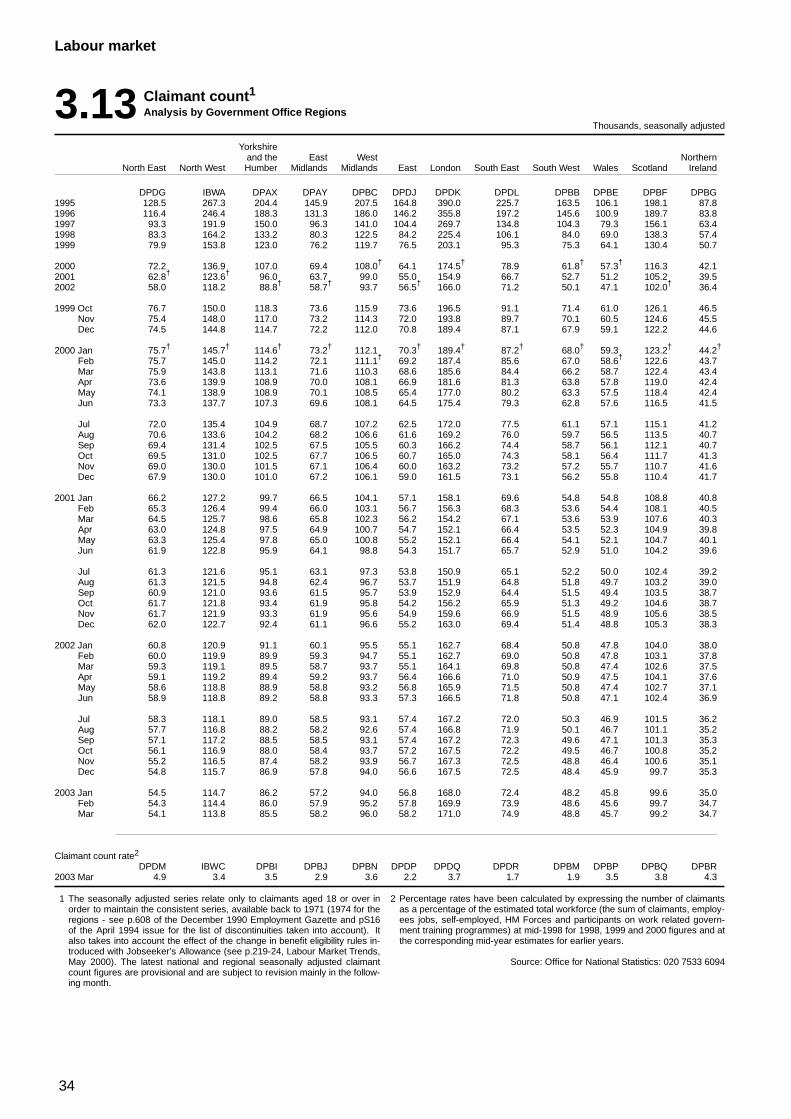
34
Labour market
3.13 Claimant count1Analysis by Government Office Regions
Thousands, seasonally adjusted
Yorkshireand the East West Northern
North East North West Humber Midlands Midlands East London South East South West Wales Scotland Ireland
DPDG IBWA DPAX DPAY DPBC DPDJ DPDK DPDL DPBB DPBE DPBF DPBG1995 128.5 267.3 204.4 145.9 207.5 164.8 390.0 225.7 163.5 106.1 198.1 87.81996 116.4 246.4 188.3 131.3 186.0 146.2 355.8 197.2 145.6 100.9 189.7 83.81997 93.3 191.9 150.0 96.3 141.0 104.4 269.7 134.8 104.3 79.3 156.1 63.41998 83.3 164.2 133.2 80.3 122.5 84.2 225.4 106.1 84.0 69.0 138.3 57.41999 79.9 153.8 123.0 76.2 119.7 76.5 203.1 95.3 75.3 64.1 130.4 50.7
2000 72.2 136.9 107.0 69.4 108.0† 64.1 174.5† 78.9 61.8† 57.3† 116.3 42.12001 62.8† 123.6† 96.0 63.7 99.0 55.0 154.9 66.7 52.7 51.2 105.2 39.52002 58.0 118.2 88.8† 58.7† 93.7 56.5† 166.0 71.2 50.1 47.1 102.0† 36.4
1999 Oct 76.7 150.0 118.3 73.6 115.9 73.6 196.5 91.1 71.4 61.0 126.1 46.5Nov 75.4 148.0 117.0 73.2 114.3 72.0 193.8 89.7 70.1 60.5 124.6 45.5Dec 74.5 144.8 114.7 72.2 112.0 70.8 189.4 87.1 67.9 59.1 122.2 44.6
2000 Jan 75.7† 145.7† 114.6† 73.2† 112.1 70.3† 189.4† 87.2† 68.0† 59.3 123.2† 44.2†
Feb 75.7 145.0 114.2 72.1 111.1† 69.2 187.4 85.6 67.0 58.6† 122.6 43.7Mar 75.9 143.8 113.1 71.6 110.3 68.6 185.6 84.4 66.2 58.7 122.4 43.4Apr 73.6 139.9 108.9 70.0 108.1 66.9 181.6 81.3 63.8 57.8 119.0 42.4May 74.1 138.9 108.9 70.1 108.5 65.4 177.0 80.2 63.3 57.5 118.4 42.4Jun 73.3 137.7 107.3 69.6 108.1 64.5 175.4 79.3 62.8 57.6 116.5 41.5
Jul 72.0 135.4 104.9 68.7 107.2 62.5 172.0 77.5 61.1 57.1 115.1 41.2Aug 70.6 133.6 104.2 68.2 106.6 61.6 169.2 76.0 59.7 56.5 113.5 40.7Sep 69.4 131.4 102.5 67.5 105.5 60.3 166.2 74.4 58.7 56.1 112.1 40.7Oct 69.5 131.0 102.5 67.7 106.5 60.7 165.0 74.3 58.1 56.4 111.7 41.3Nov 69.0 130.0 101.5 67.1 106.4 60.0 163.2 73.2 57.2 55.7 110.7 41.6Dec 67.9 130.0 101.0 67.2 106.1 59.0 161.5 73.1 56.2 55.8 110.4 41.7
2001 Jan 66.2 127.2 99.7 66.5 104.1 57.1 158.1 69.6 54.8 54.8 108.8 40.8Feb 65.3 126.4 99.4 66.0 103.1 56.7 156.3 68.3 53.6 54.4 108.1 40.5Mar 64.5 125.7 98.6 65.8 102.3 56.2 154.2 67.1 53.6 53.9 107.6 40.3Apr 63.0 124.8 97.5 64.9 100.7 54.7 152.1 66.4 53.5 52.3 104.9 39.8May 63.3 125.4 97.8 65.0 100.8 55.2 152.1 66.4 54.1 52.1 104.7 40.1Jun 61.9 122.8 95.9 64.1 98.8 54.3 151.7 65.7 52.9 51.0 104.2 39.6
Jul 61.3 121.6 95.1 63.1 97.3 53.8 150.9 65.1 52.2 50.0 102.4 39.2Aug 61.3 121.5 94.8 62.4 96.7 53.7 151.9 64.8 51.8 49.7 103.2 39.0Sep 60.9 121.0 93.6 61.5 95.7 53.9 152.9 64.4 51.5 49.4 103.5 38.7Oct 61.7 121.8 93.4 61.9 95.8 54.2 156.2 65.9 51.3 49.2 104.6 38.7Nov 61.7 121.9 93.3 61.9 95.6 54.9 159.6 66.9 51.5 48.9 105.6 38.5Dec 62.0 122.7 92.4 61.1 96.6 55.2 163.0 69.4 51.4 48.8 105.3 38.3
2002 Jan 60.8 120.9 91.1 60.1 95.5 55.1 162.7 68.4 50.8 47.8 104.0 38.0Feb 60.0 119.9 89.9 59.3 94.7 55.1 162.7 69.0 50.8 47.8 103.1 37.8Mar 59.3 119.1 89.5 58.7 93.7 55.1 164.1 69.8 50.8 47.4 102.6 37.5Apr 59.1 119.2 89.4 59.2 93.7 56.4 166.6 71.0 50.9 47.5 104.1 37.6May 58.6 118.8 88.9 58.8 93.2 56.8 165.9 71.5 50.8 47.4 102.7 37.1Jun 58.9 118.8 89.2 58.8 93.3 57.3 166.5 71.8 50.8 47.1 102.4 36.9
Jul 58.3 118.1 89.0 58.5 93.1 57.4 167.2 72.0 50.3 46.9 101.5 36.2Aug 57.7 116.8 88.2 58.2 92.6 57.4 166.8 71.9 50.1 46.7 101.1 35.2Sep 57.1 117.2 88.5 58.5 93.1 57.4 167.2 72.3 49.6 47.1 101.3 35.3Oct 56.1 116.9 88.0 58.4 93.7 57.2 167.5 72.2 49.5 46.7 100.8 35.2Nov 55.2 116.5 87.4 58.2 93.9 56.7 167.3 72.5 48.8 46.4 100.6 35.1Dec 54.8 115.7 86.9 57.8 94.0 56.6 167.5 72.5 48.4 45.9 99.7 35.3
2003 Jan 54.5 114.7 86.2 57.2 94.0 56.8 168.0 72.4 48.2 45.8 99.6 35.0Feb 54.3 114.4 86.0 57.9 95.2 57.8 169.9 73.9 48.6 45.6 99.7 34.7Mar 54.1 113.8 85.5 58.2 96.0 58.2 171.0 74.9 48.8 45.7 99.2 34.7
Claimant count rate2
DPDM IBWC DPBI DPBJ DPBN DPDP DPDQ DPDR DPBM DPBP DPBQ DPBR2003 Mar 4.9 3.4 3.5 2.9 3.6 2.2 3.7 1.7 1.9 3.5 3.8 4.3
1 The seasonally adjusted series relate only to claimants aged 18 or over inorder to maintain the consistent series, available back to 1971 (1974 for theregions - see p.608 of the December 1990 Employment Gazette and pS16of the April 1994 issue for the list of discontinuities taken into account). Italso takes into account the effect of the change in benefit eligibility rules in-troduced with Jobseeker’s Allowance (see p.219-24, Labour Market Trends,May 2000). The latest national and regional seasonally adjusted claimantcount figures are provisional and are subject to revision mainly in the follow-ing month.
2 Percentage rates have been calculated by expressing the number of claimantsas a percentage of the estimated total workforce (the sum of claimants, employ-ees jobs, self-employed, HM Forces and participants on work related govern-ment training programmes) at mid-1998 for 1998, 1999 and 2000 figures and atthe corresponding mid-year estimates for earlier years.
Source: Office for National Statistics: 020 7533 6094
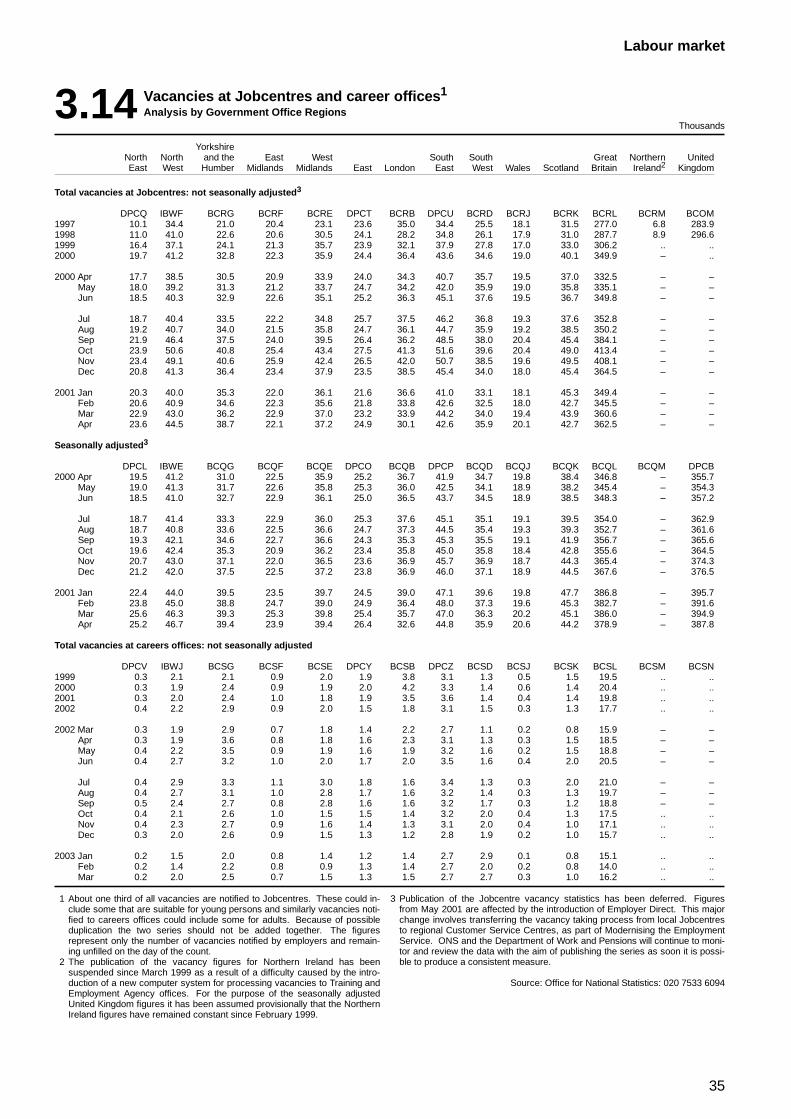
35
Labour market
3.14 Vacancies at Jobcentres and career offices1
Analysis by Government Office RegionsThousands
YorkshireNorth North and the East West South South Great Northern UnitedEast West Humber Midlands Midlands East London East West Wales Scotland Britain Ireland2 Kingdom
Total vacancies at Jobcentres: not seasonally adjusted3
DPCQ IBWF BCRG BCRF BCRE DPCT BCRB DPCU BCRD BCRJ BCRK BCRL BCRM BCOM1997 10.1 34.4 21.0 20.4 23.1 23.6 35.0 34.4 25.5 18.1 31.5 277.0 6.8 283.91998 11.0 41.0 22.6 20.6 30.5 24.1 28.2 34.8 26.1 17.9 31.0 287.7 8.9 296.61999 16.4 37.1 24.1 21.3 35.7 23.9 32.1 37.9 27.8 17.0 33.0 306.2 .. ..2000 19.7 41.2 32.8 22.3 35.9 24.4 36.4 43.6 34.6 19.0 40.1 349.9 – ..
2000 Apr 17.7 38.5 30.5 20.9 33.9 24.0 34.3 40.7 35.7 19.5 37.0 332.5 – –May 18.0 39.2 31.3 21.2 33.7 24.7 34.2 42.0 35.9 19.0 35.8 335.1 – –Jun 18.5 40.3 32.9 22.6 35.1 25.2 36.3 45.1 37.6 19.5 36.7 349.8 – –
Jul 18.7 40.4 33.5 22.2 34.8 25.7 37.5 46.2 36.8 19.3 37.6 352.8 – –Aug 19.2 40.7 34.0 21.5 35.8 24.7 36.1 44.7 35.9 19.2 38.5 350.2 – –Sep 21.9 46.4 37.5 24.0 39.5 26.4 36.2 48.5 38.0 20.4 45.4 384.1 – –Oct 23.9 50.6 40.8 25.4 43.4 27.5 41.3 51.6 39.6 20.4 49.0 413.4 – –Nov 23.4 49.1 40.6 25.9 42.4 26.5 42.0 50.7 38.5 19.6 49.5 408.1 – –Dec 20.8 41.3 36.4 23.4 37.9 23.5 38.5 45.4 34.0 18.0 45.4 364.5 – –
2001 Jan 20.3 40.0 35.3 22.0 36.1 21.6 36.6 41.0 33.1 18.1 45.3 349.4 – –Feb 20.6 40.9 34.6 22.3 35.6 21.8 33.8 42.6 32.5 18.0 42.7 345.5 – –Mar 22.9 43.0 36.2 22.9 37.0 23.2 33.9 44.2 34.0 19.4 43.9 360.6 – –Apr 23.6 44.5 38.7 22.1 37.2 24.9 30.1 42.6 35.9 20.1 42.7 362.5 – –
Seasonally adjusted3
DPCL IBWE BCQG BCQF BCQE DPCO BCQB DPCP BCQD BCQJ BCQK BCQL BCQM DPCB2000 Apr 19.5 41.2 31.0 22.5 35.9 25.2 36.7 41.9 34.7 19.8 38.4 346.8 – 355.7
May 19.0 41.3 31.7 22.6 35.8 25.3 36.0 42.5 34.1 18.9 38.2 345.4 – 354.3Jun 18.5 41.0 32.7 22.9 36.1 25.0 36.5 43.7 34.5 18.9 38.5 348.3 – 357.2
Jul 18.7 41.4 33.3 22.9 36.0 25.3 37.6 45.1 35.1 19.1 39.5 354.0 – 362.9Aug 18.7 40.8 33.6 22.5 36.6 24.7 37.3 44.5 35.4 19.3 39.3 352.7 – 361.6Sep 19.3 42.1 34.6 22.7 36.6 24.3 35.3 45.3 35.5 19.1 41.9 356.7 – 365.6Oct 19.6 42.4 35.3 20.9 36.2 23.4 35.8 45.0 35.8 18.4 42.8 355.6 – 364.5Nov 20.7 43.0 37.1 22.0 36.5 23.6 36.9 45.7 36.9 18.7 44.3 365.4 – 374.3Dec 21.2 42.0 37.5 22.5 37.2 23.8 36.9 46.0 37.1 18.9 44.5 367.6 – 376.5
2001 Jan 22.4 44.0 39.5 23.5 39.7 24.5 39.0 47.1 39.6 19.8 47.7 386.8 – 395.7Feb 23.8 45.0 38.8 24.7 39.0 24.9 36.4 48.0 37.3 19.6 45.3 382.7 – 391.6Mar 25.6 46.3 39.3 25.3 39.8 25.4 35.7 47.0 36.3 20.2 45.1 386.0 – 394.9Apr 25.2 46.7 39.4 23.9 39.4 26.4 32.6 44.8 35.9 20.6 44.2 378.9 – 387.8
Total vacancies at careers offices: not seasonally adjusted
DPCV IBWJ BCSG BCSF BCSE DPCY BCSB DPCZ BCSD BCSJ BCSK BCSL BCSM BCSN1999 0.3 2.1 2.1 0.9 2.0 1.9 3.8 3.1 1.3 0.5 1.5 19.5 .. ..2000 0.3 1.9 2.4 0.9 1.9 2.0 4.2 3.3 1.4 0.6 1.4 20.4 .. ..2001 0.3 2.0 2.4 1.0 1.8 1.9 3.5 3.6 1.4 0.4 1.4 19.8 .. ..2002 0.4 2.2 2.9 0.9 2.0 1.5 1.8 3.1 1.5 0.3 1.3 17.7 .. ..
2002 Mar 0.3 1.9 2.9 0.7 1.8 1.4 2.2 2.7 1.1 0.2 0.8 15.9 – –Apr 0.3 1.9 3.6 0.8 1.8 1.6 2.3 3.1 1.3 0.3 1.5 18.5 – –May 0.4 2.2 3.5 0.9 1.9 1.6 1.9 3.2 1.6 0.2 1.5 18.8 – –Jun 0.4 2.7 3.2 1.0 2.0 1.7 2.0 3.5 1.6 0.4 2.0 20.5 – –
Jul 0.4 2.9 3.3 1.1 3.0 1.8 1.6 3.4 1.3 0.3 2.0 21.0 – –Aug 0.4 2.7 3.1 1.0 2.8 1.7 1.6 3.2 1.4 0.3 1.3 19.7 – –Sep 0.5 2.4 2.7 0.8 2.8 1.6 1.6 3.2 1.7 0.3 1.2 18.8 – –Oct 0.4 2.1 2.6 1.0 1.5 1.5 1.4 3.2 2.0 0.4 1.3 17.5 .. ..Nov 0.4 2.3 2.7 0.9 1.6 1.4 1.3 3.1 2.0 0.4 1.0 17.1 .. ..Dec 0.3 2.0 2.6 0.9 1.5 1.3 1.2 2.8 1.9 0.2 1.0 15.7 .. ..
2003 Jan 0.2 1.5 2.0 0.8 1.4 1.2 1.4 2.7 2.9 0.1 0.8 15.1 .. ..Feb 0.2 1.4 2.2 0.8 0.9 1.3 1.4 2.7 2.0 0.2 0.8 14.0 .. ..Mar 0.2 2.0 2.5 0.7 1.5 1.3 1.5 2.7 2.7 0.3 1.0 16.2 .. ..
1 About one third of all vacancies are notified to Jobcentres. These could in-clude some that are suitable for young persons and similarly vacancies noti-fied to careers offices could include some for adults. Because of possibleduplication the two series should not be added together. The figuresrepresent only the number of vacancies notified by employers and remain-ing unfilled on the day of the count.
2 The publication of the vacancy figures for Northern Ireland has beensuspended since March 1999 as a result of a difficulty caused by the intro-duction of a new computer system for processing vacancies to Training andEmployment Agency offices. For the purpose of the seasonally adjustedUnited Kingdom figures it has been assumed provisionally that the NorthernIreland figures have remained constant since February 1999.
3 Publication of the Jobcentre vacancy statistics has been deferred. Figuresfrom May 2001 are affected by the introduction of Employer Direct. This majorchange involves transferring the vacancy taking process from local Jobcentresto regional Customer Service Centres, as part of Modernising the EmploymentService. ONS and the Department of Work and Pensions will continue to moni-tor and review the data with the aim of publishing the series as soon it is possi-ble to produce a consistent measure.
Source: Office for National Statistics: 020 7533 6094
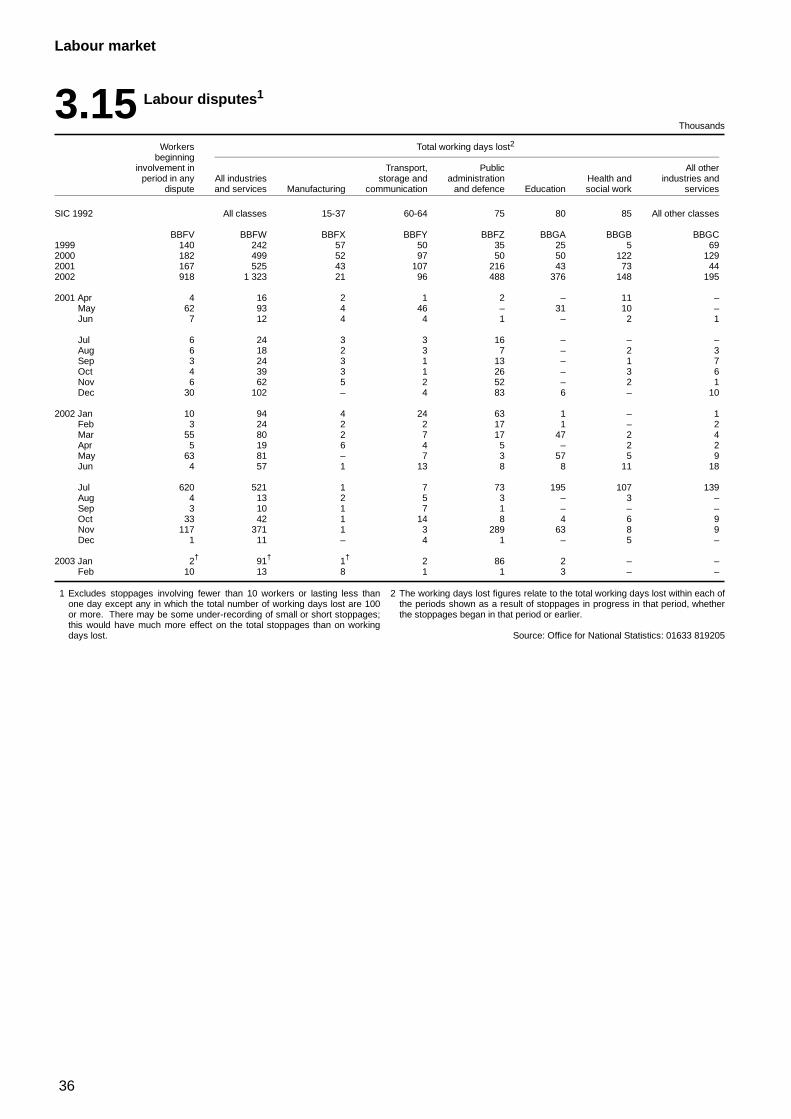
36
Labour market
3.15 Labour disputes1
Thousands
Workers Total working days lost2
beginninginvolvement in Transport, Public All other
period in any All industries storage and administration Health and industries anddispute and services Manufacturing communication and defence Education social work services
SIC 1992 All classes 15-37 60-64 75 80 85 All other classes
BBFV BBFW BBFX BBFY BBFZ BBGA BBGB BBGC1999 140 242 57 50 35 25 5 692000 182 499 52 97 50 50 122 1292001 167 525 43 107 216 43 73 442002 918 1 323 21 96 488 376 148 195
2001 Apr 4 16 2 1 2 – 11 –May 62 93 4 46 – 31 10 –Jun 7 12 4 4 1 – 2 1
Jul 6 24 3 3 16 – – –Aug 6 18 2 3 7 – 2 3Sep 3 24 3 1 13 – 1 7Oct 4 39 3 1 26 – 3 6Nov 6 62 5 2 52 – 2 1Dec 30 102 – 4 83 6 – 10
2002 Jan 10 94 4 24 63 1 – 1Feb 3 24 2 2 17 1 – 2Mar 55 80 2 7 17 47 2 4Apr 5 19 6 4 5 – 2 2May 63 81 – 7 3 57 5 9Jun 4 57 1 13 8 8 11 18
Jul 620 521 1 7 73 195 107 139Aug 4 13 2 5 3 – 3 –Sep 3 10 1 7 1 – – –Oct 33 42 1 14 8 4 6 9Nov 117 371 1 3 289 63 8 9Dec 1 11 – 4 1 – 5 –
2003 Jan 2† 91† 1† 2 86 2 – –Feb 10 13 8 1 1 3 – –
1 Excludes stoppages involving fewer than 10 workers or lasting less thanone day except any in which the total number of working days lost are 100or more. There may be some under-recording of small or short stoppages;this would have much more effect on the total stoppages than on workingdays lost.
2 The working days lost figures relate to the total working days lost within each ofthe periods shown as a result of stoppages in progress in that period, whetherthe stoppages began in that period or earlier.
Source: Office for National Statistics: 01633 819205
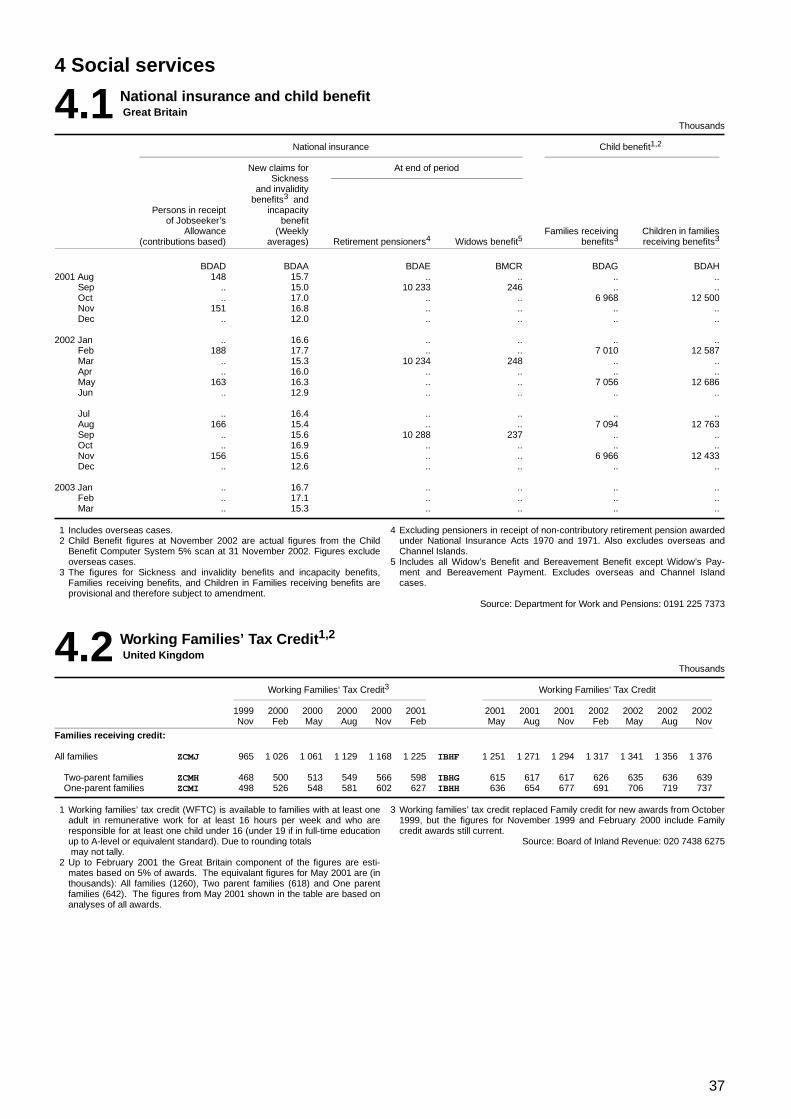
37
4 Social services
4.1 National insurance and child benefitGreat Britain
Thousands
National insurance Child benefit1,2
New claims for At end of periodSickness
and invaliditybenefits3 and
Persons in receipt incapacityof Jobseeker’s benefit
Allowance (Weekly Families receiving Children in families(contributions based) averages) Retirement pensioners4 Widows benefit5 benefits3 receiving benefits3
BDAD BDAA BDAE BMCR BDAG BDAH2001 Aug 148 15.7 .. .. .. ..
Sep .. 15.0 10 233 246 .. ..Oct .. 17.0 .. .. 6 968 12 500Nov 151 16.8 .. .. .. ..Dec .. 12.0 .. .. .. ..
2002 Jan .. 16.6 .. .. .. ..Feb 188 17.7 .. .. 7 010 12 587Mar .. 15.3 10 234 248 .. ..Apr .. 16.0 .. .. .. ..May 163 16.3 .. .. 7 056 12 686Jun .. 12.9 .. .. .. ..
Jul .. 16.4 .. .. .. ..Aug 166 15.4 .. .. 7 094 12 763Sep .. 15.6 10 288 237 .. ..Oct .. 16.9 .. .. .. ..Nov 156 15.6 .. .. 6 966 12 433Dec .. 12.6 .. .. .. ..
2003 Jan .. 16.7 .. .. .. ..Feb .. 17.1 .. .. .. ..Mar .. 15.3 .. .. .. ..
1 Includes overseas cases.2 Child Benefit figures at November 2002 are actual figures from the Child
Benefit Computer System 5% scan at 31 November 2002. Figures excludeoverseas cases.
3 The figures for Sickness and invalidity benefits and incapacity benefits,Families receiving benefits, and Children in Families receiving benefits areprovisional and therefore subject to amendment.
4 Excluding pensioners in receipt of non-contributory retirement pension awardedunder National Insurance Acts 1970 and 1971. Also excludes overseas andChannel Islands.
5 Includes all Widow’s Benefit and Bereavement Benefit except Widow’s Pay-ment and Bereavement Payment. Excludes overseas and Channel Islandcases.
Source: Department for Work and Pensions: 0191 225 7373
4.2 Working Families’ Tax Credit1,2
United KingdomThousands
Working Families‘ Tax Credit3 Working Families‘ Tax Credit
1999 2000 2000 2000 2000 2001 2001 2001 2001 2002 2002 2002 2002Nov Feb May Aug Nov Feb May Aug Nov Feb May Aug Nov
Families receiving credit:
All families ZCMJ 965 1 026 1 061 1 129 1 168 1 225 IBHF 1 251 1 271 1 294 1 317 1 341 1 356 1 376
Two-parent families ZCMH 468 500 513 549 566 598 IBHG 615 617 617 626 635 636 639One-parent families ZCMI 498 526 548 581 602 627 IBHH 636 654 677 691 706 719 737
1 Working families’ tax credit (WFTC) is available to families with at least oneadult in remunerative work for at least 16 hours per week and who areresponsible for at least one child under 16 (under 19 if in full-time educationup to A-level or equivalent standard). Due to rounding totalsmay not tally.
2 Up to February 2001 the Great Britain component of the figures are esti-mates based on 5% of awards. The equivalant figures for May 2001 are (inthousands): All families (1260), Two parent families (618) and One parentfamilies (642). The figures from May 2001 shown in the table are based onanalyses of all awards.
3 Working families’ tax credit replaced Family credit for new awards from October1999, but the figures for November 1999 and February 2000 include Familycredit awards still current.
Source: Board of Inland Revenue: 020 7438 6275
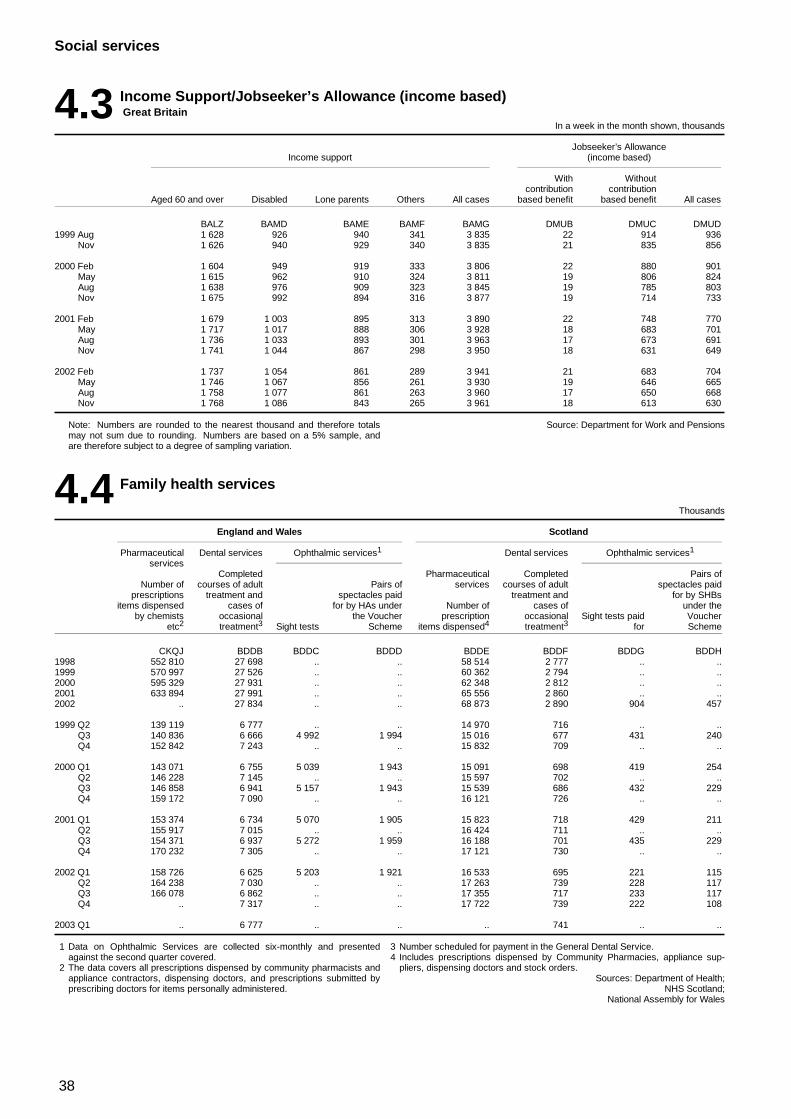
38
Social services
4.3 Income Support/Jobseeker’s Allowance (income based)Great Britain
In a week in the month shown, thousands
Jobseeker’s AllowanceIncome support (income based)
With Withoutcontribution contribution
Aged 60 and over Disabled Lone parents Others All cases based benefit based benefit All cases
BALZ BAMD BAME BAMF BAMG DMUB DMUC DMUD1999 Aug 1 628 926 940 341 3 835 22 914 936
Nov 1 626 940 929 340 3 835 21 835 856
2000 Feb 1 604 949 919 333 3 806 22 880 901May 1 615 962 910 324 3 811 19 806 824Aug 1 638 976 909 323 3 845 19 785 803Nov 1 675 992 894 316 3 877 19 714 733
2001 Feb 1 679 1 003 895 313 3 890 22 748 770May 1 717 1 017 888 306 3 928 18 683 701Aug 1 736 1 033 893 301 3 963 17 673 691Nov 1 741 1 044 867 298 3 950 18 631 649
2002 Feb 1 737 1 054 861 289 3 941 21 683 704May 1 746 1 067 856 261 3 930 19 646 665Aug 1 758 1 077 861 263 3 960 17 650 668Nov 1 768 1 086 843 265 3 961 18 613 630
Note: Numbers are rounded to the nearest thousand and therefore totalsmay not sum due to rounding. Numbers are based on a 5% sample, andare therefore subject to a degree of sampling variation.
Source: Department for Work and Pensions
4.4 Family health services
Thousands
England and Wales Scotland
Pharmaceutical Dental services Ophthalmic services1 Dental services Ophthalmic services1
servicesCompleted Pharmaceutical Completed Pairs of
Number of courses of adult Pairs of services courses of adult spectacles paidprescriptions treatment and spectacles paid treatment and for by SHBs
items dispensed cases of for by HAs under Number of cases of under theby chemists occasional the Voucher prescription occasional Sight tests paid Voucher
etc2 treatment3 Sight tests Scheme items dispensed4 treatment3 for Scheme
CKQJ BDDB BDDC BDDD BDDE BDDF BDDG BDDH1998 552 810 27 698 .. .. 58 514 2 777 .. ..1999 570 997 27 526 .. .. 60 362 2 794 .. ..2000 595 329 27 931 .. .. 62 348 2 812 .. ..2001 633 894 27 991 .. .. 65 556 2 860 .. ..2002 .. 27 834 .. .. 68 873 2 890 904 457
1999 Q2 139 119 6 777 .. .. 14 970 716 .. ..Q3 140 836 6 666 4 992 1 994 15 016 677 431 240Q4 152 842 7 243 .. .. 15 832 709 .. ..
2000 Q1 143 071 6 755 5 039 1 943 15 091 698 419 254Q2 146 228 7 145 .. .. 15 597 702 .. ..Q3 146 858 6 941 5 157 1 943 15 539 686 432 229Q4 159 172 7 090 .. .. 16 121 726 .. ..
2001 Q1 153 374 6 734 5 070 1 905 15 823 718 429 211Q2 155 917 7 015 .. .. 16 424 711 .. ..Q3 154 371 6 937 5 272 1 959 16 188 701 435 229Q4 170 232 7 305 .. .. 17 121 730 .. ..
2002 Q1 158 726 6 625 5 203 1 921 16 533 695 221 115Q2 164 238 7 030 .. .. 17 263 739 228 117Q3 166 078 6 862 .. .. 17 355 717 233 117Q4 .. 7 317 .. .. 17 722 739 222 108
2003 Q1 .. 6 777 .. .. .. 741 .. ..
1 Data on Ophthalmic Services are collected six-monthly and presentedagainst the second quarter covered.
2 The data covers all prescriptions dispensed by community pharmacists andappliance contractors, dispensing doctors, and prescriptions submitted byprescribing doctors for items personally administered.
3 Number scheduled for payment in the General Dental Service.4 Includes prescriptions dispensed by Community Pharmacies, appliance sup-
pliers, dispensing doctors and stock orders.Sources: Department of Health;
NHS Scotland;National Assembly for Wales
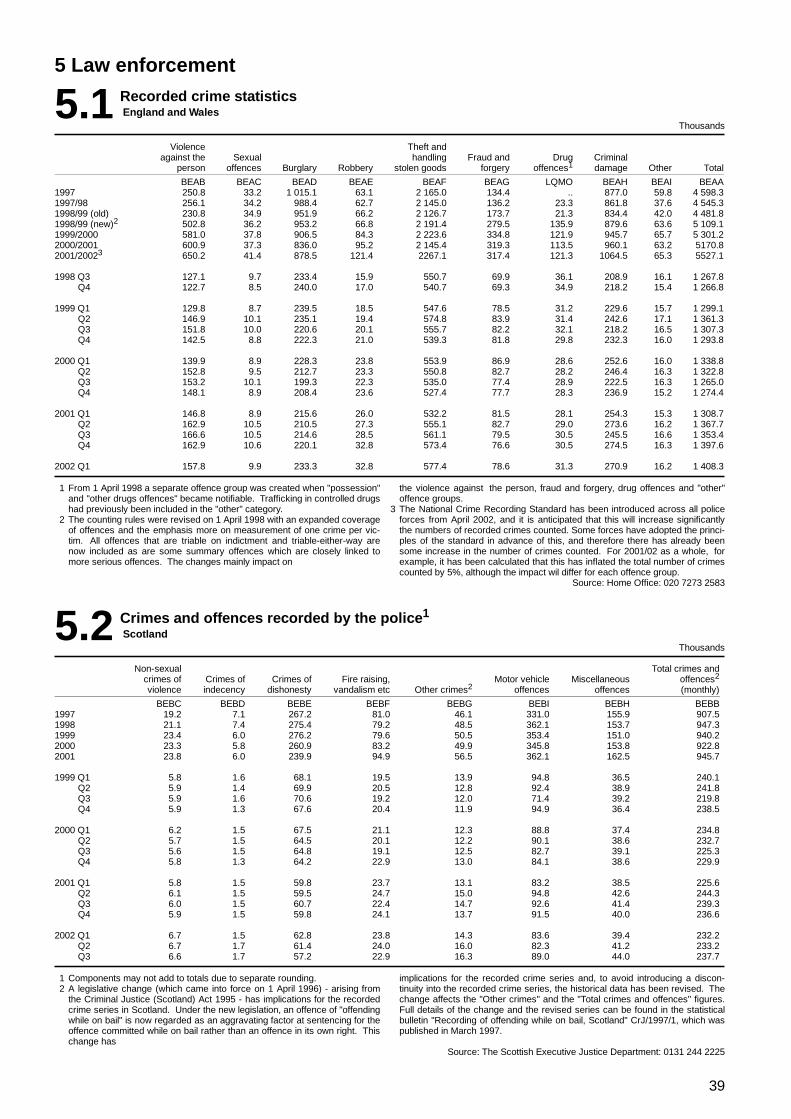
39
5 Law enforcement
5.1 Recorded crime statisticsEngland and Wales
Thousands
Violence Theft andagainst the Sexual handling Fraud and Drug Criminal
person offences Burglary Robbery stolen goods forgery offences1 damage Other Total
BEAB BEAC BEAD BEAE BEAF BEAG LQMO BEAH BEAI BEAA1997 250.8 33.2 1 015.1 63.1 2 165.0 134.4 .. 877.0 59.8 4 598.31997/98 256.1 34.2 988.4 62.7 2 145.0 136.2 23.3 861.8 37.6 4 545.31998/99 (old) 230.8 34.9 951.9 66.2 2 126.7 173.7 21.3 834.4 42.0 4 481.81998/99 (new)2 502.8 36.2 953.2 66.8 2 191.4 279.5 135.9 879.6 63.6 5 109.11999/2000 581.0 37.8 906.5 84.3 2 223.6 334.8 121.9 945.7 65.7 5 301.22000/2001 600.9 37.3 836.0 95.2 2 145.4 319.3 113.5 960.1 63.2 5170.82001/20023 650.2 41.4 878.5 121.4 2267.1 317.4 121.3 1064.5 65.3 5527.1
1998 Q3 127.1 9.7 233.4 15.9 550.7 69.9 36.1 208.9 16.1 1 267.8Q4 122.7 8.5 240.0 17.0 540.7 69.3 34.9 218.2 15.4 1 266.8
1999 Q1 129.8 8.7 239.5 18.5 547.6 78.5 31.2 229.6 15.7 1 299.1Q2 146.9 10.1 235.1 19.4 574.8 83.9 31.4 242.6 17.1 1 361.3Q3 151.8 10.0 220.6 20.1 555.7 82.2 32.1 218.2 16.5 1 307.3Q4 142.5 8.8 222.3 21.0 539.3 81.8 29.8 232.3 16.0 1 293.8
2000 Q1 139.9 8.9 228.3 23.8 553.9 86.9 28.6 252.6 16.0 1 338.8Q2 152.8 9.5 212.7 23.3 550.8 82.7 28.2 246.4 16.3 1 322.8Q3 153.2 10.1 199.3 22.3 535.0 77.4 28.9 222.5 16.3 1 265.0Q4 148.1 8.9 208.4 23.6 527.4 77.7 28.3 236.9 15.2 1 274.4
2001 Q1 146.8 8.9 215.6 26.0 532.2 81.5 28.1 254.3 15.3 1 308.7Q2 162.9 10.5 210.5 27.3 555.1 82.7 29.0 273.6 16.2 1 367.7Q3 166.6 10.5 214.6 28.5 561.1 79.5 30.5 245.5 16.6 1 353.4Q4 162.9 10.6 220.1 32.8 573.4 76.6 30.5 274.5 16.3 1 397.6
2002 Q1 157.8 9.9 233.3 32.8 577.4 78.6 31.3 270.9 16.2 1 408.3
1 From 1 April 1998 a separate offence group was created when "possession"and "other drugs offences" became notifiable. Trafficking in controlled drugshad previously been included in the "other" category.
2 The counting rules were revised on 1 April 1998 with an expanded coverageof offences and the emphasis more on measurement of one crime per vic-tim. All offences that are triable on indictment and triable-either-way arenow included as are some summary offences which are closely linked tomore serious offences. The changes mainly impact on
the violence against the person, fraud and forgery, drug offences and "other"offence groups.
3 The National Crime Recording Standard has been introduced across all policeforces from April 2002, and it is anticipated that this will increase significantlythe numbers of recorded crimes counted. Some forces have adopted the princi-ples of the standard in advance of this, and therefore there has already beensome increase in the number of crimes counted. For 2001/02 as a whole, forexample, it has been calculated that this has inflated the total number of crimescounted by 5%, although the impact wil differ for each offence group.
Source: Home Office: 020 7273 2583
5.2 Crimes and offences recorded by the police1
ScotlandThousands
Non-sexual Total crimes andcrimes of Crimes of Crimes of Fire raising, Motor vehicle Miscellaneous offences2
violence indecency dishonesty vandalism etc Other crimes2 offences offences (monthly)
BEBC BEBD BEBE BEBF BEBG BEBI BEBH BEBB1997 19.2 7.1 267.2 81.0 46.1 331.0 155.9 907.51998 21.1 7.4 275.4 79.2 48.5 362.1 153.7 947.31999 23.4 6.0 276.2 79.6 50.5 353.4 151.0 940.22000 23.3 5.8 260.9 83.2 49.9 345.8 153.8 922.82001 23.8 6.0 239.9 94.9 56.5 362.1 162.5 945.7
1999 Q1 5.8 1.6 68.1 19.5 13.9 94.8 36.5 240.1Q2 5.9 1.4 69.9 20.5 12.8 92.4 38.9 241.8Q3 5.9 1.6 70.6 19.2 12.0 71.4 39.2 219.8Q4 5.9 1.3 67.6 20.4 11.9 94.9 36.4 238.5
2000 Q1 6.2 1.5 67.5 21.1 12.3 88.8 37.4 234.8Q2 5.7 1.5 64.5 20.1 12.2 90.1 38.6 232.7Q3 5.6 1.5 64.8 19.1 12.5 82.7 39.1 225.3Q4 5.8 1.3 64.2 22.9 13.0 84.1 38.6 229.9
2001 Q1 5.8 1.5 59.8 23.7 13.1 83.2 38.5 225.6Q2 6.1 1.5 59.5 24.7 15.0 94.8 42.6 244.3Q3 6.0 1.5 60.7 22.4 14.7 92.6 41.4 239.3Q4 5.9 1.5 59.8 24.1 13.7 91.5 40.0 236.6
2002 Q1 6.7 1.5 62.8 23.8 14.3 83.6 39.4 232.2Q2 6.7 1.7 61.4 24.0 16.0 82.3 41.2 233.2Q3 6.6 1.7 57.2 22.9 16.3 89.0 44.0 237.7
1 Components may not add to totals due to separate rounding.2 A legislative change (which came into force on 1 April 1996) - arising from
the Criminal Justice (Scotland) Act 1995 - has implications for the recordedcrime series in Scotland. Under the new legislation, an offence of "offendingwhile on bail" is now regarded as an aggravating factor at sentencing for theoffence committed while on bail rather than an offence in its own right. Thischange has
implications for the recorded crime series and, to avoid introducing a discon-tinuity into the recorded crime series, the historical data has been revised. Thechange affects the "Other crimes" and the "Total crimes and offences" figures.Full details of the change and the revised series can be found in the statisticalbulletin "Recording of offending while on bail, Scotland" CrJ/1997/1, which waspublished in March 1997.
Source: The Scottish Executive Justice Department: 0131 244 2225
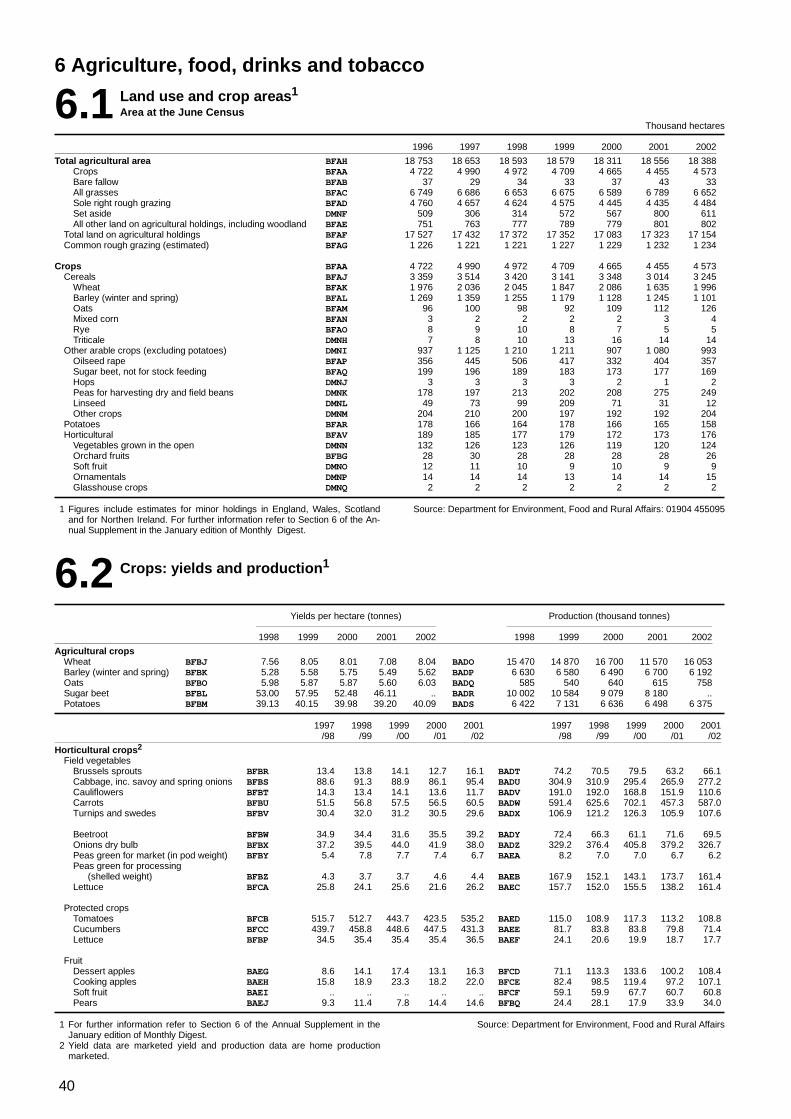
40
6 Agriculture, food, drinks and tobacco
6.1 Land use and crop areas1
Area at the June CensusThousand hectares
1996 1997 1998 1999 2000 2001 2002
Total agricultural area BFAH 18 753 18 653 18 593 18 579 18 311 18 556 18 388Crops BFAA 4 722 4 990 4 972 4 709 4 665 4 455 4 573Bare fallow BFAB 37 29 34 33 37 43 33All grasses BFAC 6 749 6 686 6 653 6 675 6 589 6 789 6 652Sole right rough grazing BFAD 4 760 4 657 4 624 4 575 4 445 4 435 4 484Set aside DMNF 509 306 314 572 567 800 611All other land on agricultural holdings, including woodland BFAE 751 763 777 789 779 801 802
Total land on agricultural holdings BFAF 17 527 17 432 17 372 17 352 17 083 17 323 17 154Common rough grazing (estimated) BFAG 1 226 1 221 1 221 1 227 1 229 1 232 1 234
Crops BFAA 4 722 4 990 4 972 4 709 4 665 4 455 4 573Cereals BFAJ 3 359 3 514 3 420 3 141 3 348 3 014 3 245
Wheat BFAK 1 976 2 036 2 045 1 847 2 086 1 635 1 996Barley (winter and spring) BFAL 1 269 1 359 1 255 1 179 1 128 1 245 1 101Oats BFAM 96 100 98 92 109 112 126Mixed corn BFAN 3 2 2 2 2 3 4Rye BFAO 8 9 10 8 7 5 5Triticale DMNH 7 8 10 13 16 14 14
Other arable crops (excluding potatoes) DMNI 937 1 125 1 210 1 211 907 1 080 993Oilseed rape BFAP 356 445 506 417 332 404 357Sugar beet, not for stock feeding BFAQ 199 196 189 183 173 177 169Hops DMNJ 3 3 3 3 2 1 2Peas for harvesting dry and field beans DMNK 178 197 213 202 208 275 249Linseed DMNL 49 73 99 209 71 31 12Other crops DMNM 204 210 200 197 192 192 204
Potatoes BFAR 178 166 164 178 166 165 158Horticultural BFAV 189 185 177 179 172 173 176
Vegetables grown in the open DMNN 132 126 123 126 119 120 124Orchard fruits BFBG 28 30 28 28 28 28 26Soft fruit DMNO 12 11 10 9 10 9 9Ornamentals DMNP 14 14 14 13 14 14 15Glasshouse crops DMNQ 2 2 2 2 2 2 2
1 Figures include estimates for minor holdings in England, Wales, Scotlandand for Northen Ireland. For further information refer to Section 6 of the An-nual Supplement in the January edition of Monthly Digest.
Source: Department for Environment, Food and Rural Affairs: 01904 455095
6.2 Crops: yields and production1
Yields per hectare (tonnes) Production (thousand tonnes)
1998 1999 2000 2001 2002 1998 1999 2000 2001 2002
Agricultural cropsWheat BFBJ 7.56 8.05 8.01 7.08 8.04 BADO 15 470 14 870 16 700 11 570 16 053Barley (winter and spring) BFBK 5.28 5.58 5.75 5.49 5.62 BADP 6 630 6 580 6 490 6 700 6 192Oats BFBO 5.98 5.87 5.87 5.60 6.03 BADQ 585 540 640 615 758Sugar beet BFBL 53.00 57.95 52.48 46.11 .. BADR 10 002 10 584 9 079 8 180 ..Potatoes BFBM 39.13 40.15 39.98 39.20 40.09 BADS 6 422 7 131 6 636 6 498 6 375
1997 1998 1999 2000 2001 1997 1998 1999 2000 2001/98 /99 /00 /01 /02 /98 /99 /00 /01 /02
Horticultural crops2
Field vegetablesBrussels sprouts BFBR 13.4 13.8 14.1 12.7 16.1 BADT 74.2 70.5 79.5 63.2 66.1Cabbage, inc. savoy and spring onions BFBS 88.6 91.3 88.9 86.1 95.4 BADU 304.9 310.9 295.4 265.9 277.2Cauliflowers BFBT 14.3 13.4 14.1 13.6 11.7 BADV 191.0 192.0 168.8 151.9 110.6Carrots BFBU 51.5 56.8 57.5 56.5 60.5 BADW 591.4 625.6 702.1 457.3 587.0Turnips and swedes BFBV 30.4 32.0 31.2 30.5 29.6 BADX 106.9 121.2 126.3 105.9 107.6
Beetroot BFBW 34.9 34.4 31.6 35.5 39.2 BADY 72.4 66.3 61.1 71.6 69.5Onions dry bulb BFBX 37.2 39.5 44.0 41.9 38.0 BADZ 329.2 376.4 405.8 379.2 326.7Peas green for market (in pod weight) BFBY 5.4 7.8 7.7 7.4 6.7 BAEA 8.2 7.0 7.0 6.7 6.2Peas green for processing
(shelled weight) BFBZ 4.3 3.7 3.7 4.6 4.4 BAEB 167.9 152.1 143.1 173.7 161.4Lettuce BFCA 25.8 24.1 25.6 21.6 26.2 BAEC 157.7 152.0 155.5 138.2 161.4
Protected cropsTomatoes BFCB 515.7 512.7 443.7 423.5 535.2 BAED 115.0 108.9 117.3 113.2 108.8Cucumbers BFCC 439.7 458.8 448.6 447.5 431.3 BAEE 81.7 83.8 83.8 79.8 71.4Lettuce BFBP 34.5 35.4 35.4 35.4 36.5 BAEF 24.1 20.6 19.9 18.7 17.7
FruitDessert apples BAEG 8.6 14.1 17.4 13.1 16.3 BFCD 71.1 113.3 133.6 100.2 108.4Cooking apples BAEH 15.8 18.9 23.3 18.2 22.0 BFCE 82.4 98.5 119.4 97.2 107.1Soft fruit BAEI .. .. .. .. .. BFCF 59.1 59.9 67.7 60.7 60.8Pears BAEJ 9.3 11.4 7.8 14.4 14.6 BFBQ 24.4 28.1 17.9 33.9 34.0
1 For further information refer to Section 6 of the Annual Supplement in theJanuary edition of Monthly Digest.
2 Yield data are marketed yield and production data are home productionmarketed.
Source: Department for Environment, Food and Rural Affairs
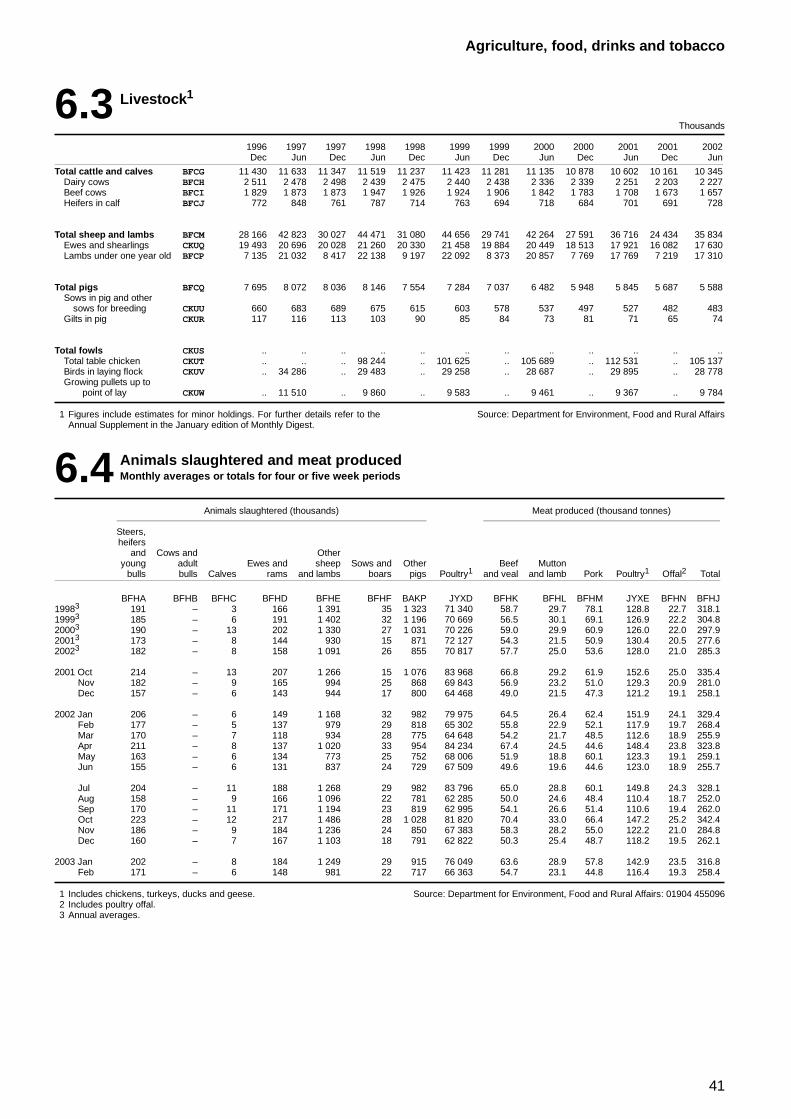
41
Agriculture, food, drinks and tobacco
6.3 Livestock1
Thousands
1996 1997 1997 1998 1998 1999 1999 2000 2000 2001 2001 2002Dec Jun Dec Jun Dec Jun Dec Jun Dec Jun Dec Jun
Total cattle and calves BFCG 11 430 11 633 11 347 11 519 11 237 11 423 11 281 11 135 10 878 10 602 10 161 10 345Dairy cows BFCH 2 511 2 478 2 498 2 439 2 475 2 440 2 438 2 336 2 339 2 251 2 203 2 227Beef cows BFCI 1 829 1 873 1 873 1 947 1 926 1 924 1 906 1 842 1 783 1 708 1 673 1 657Heifers in calf BFCJ 772 848 761 787 714 763 694 718 684 701 691 728
Total sheep and lambs BFCM 28 166 42 823 30 027 44 471 31 080 44 656 29 741 42 264 27 591 36 716 24 434 35 834Ewes and shearlings CKUQ 19 493 20 696 20 028 21 260 20 330 21 458 19 884 20 449 18 513 17 921 16 082 17 630Lambs under one year old BFCP 7 135 21 032 8 417 22 138 9 197 22 092 8 373 20 857 7 769 17 769 7 219 17 310
Total pigs BFCQ 7 695 8 072 8 036 8 146 7 554 7 284 7 037 6 482 5 948 5 845 5 687 5 588Sows in pig and other
sows for breeding CKUU 660 683 689 675 615 603 578 537 497 527 482 483Gilts in pig CKUR 117 116 113 103 90 85 84 73 81 71 65 74
Total fowls CKUS .. .. .. .. .. .. .. .. .. .. .. ..Total table chicken CKUT .. .. .. 98 244 .. 101 625 .. 105 689 .. 112 531 .. 105 137Birds in laying flock CKUV .. 34 286 .. 29 483 .. 29 258 .. 28 687 .. 29 895 .. 28 778Growing pullets up to
point of lay CKUW .. 11 510 .. 9 860 .. 9 583 .. 9 461 .. 9 367 .. 9 784
1 Figures include estimates for minor holdings. For further details refer to theAnnual Supplement in the January edition of Monthly Digest.
Source: Department for Environment, Food and Rural Affairs
6.4 Animals slaughtered and meat producedMonthly averages or totals for four or five week periods
Animals slaughtered (thousands) Meat produced (thousand tonnes)
Steers,heifers
and Cows and Otheryoung adult Ewes and sheep Sows and Other Beef Mutton
bulls bulls Calves rams and lambs boars pigs Poultry1 and veal and lamb Pork Poultry1 Offal2 Total
BFHA BFHB BFHC BFHD BFHE BFHF BAKP JYXD BFHK BFHL BFHM JYXE BFHN BFHJ19983 191 – 3 166 1 391 35 1 323 71 340 58.7 29.7 78.1 128.8 22.7 318.119993 185 – 6 191 1 402 32 1 196 70 669 56.5 30.1 69.1 126.9 22.2 304.820003 190 – 13 202 1 330 27 1 031 70 226 59.0 29.9 60.9 126.0 22.0 297.920013 173 – 8 144 930 15 871 72 127 54.3 21.5 50.9 130.4 20.5 277.620023 182 – 8 158 1 091 26 855 70 817 57.7 25.0 53.6 128.0 21.0 285.3
2001 Oct 214 – 13 207 1 266 15 1 076 83 968 66.8 29.2 61.9 152.6 25.0 335.4Nov 182 – 9 165 994 25 868 69 843 56.9 23.2 51.0 129.3 20.9 281.0Dec 157 – 6 143 944 17 800 64 468 49.0 21.5 47.3 121.2 19.1 258.1
2002 Jan 206 – 6 149 1 168 32 982 79 975 64.5 26.4 62.4 151.9 24.1 329.4Feb 177 – 5 137 979 29 818 65 302 55.8 22.9 52.1 117.9 19.7 268.4Mar 170 – 7 118 934 28 775 64 648 54.2 21.7 48.5 112.6 18.9 255.9Apr 211 – 8 137 1 020 33 954 84 234 67.4 24.5 44.6 148.4 23.8 323.8May 163 – 6 134 773 25 752 68 006 51.9 18.8 60.1 123.3 19.1 259.1Jun 155 – 6 131 837 24 729 67 509 49.6 19.6 44.6 123.0 18.9 255.7
Jul 204 – 11 188 1 268 29 982 83 796 65.0 28.8 60.1 149.8 24.3 328.1Aug 158 – 9 166 1 096 22 781 62 285 50.0 24.6 48.4 110.4 18.7 252.0Sep 170 – 11 171 1 194 23 819 62 995 54.1 26.6 51.4 110.6 19.4 262.0Oct 223 – 12 217 1 486 28 1 028 81 820 70.4 33.0 66.4 147.2 25.2 342.4Nov 186 – 9 184 1 236 24 850 67 383 58.3 28.2 55.0 122.2 21.0 284.8Dec 160 – 7 167 1 103 18 791 62 822 50.3 25.4 48.7 118.2 19.5 262.1
2003 Jan 202 – 8 184 1 249 29 915 76 049 63.6 28.9 57.8 142.9 23.5 316.8Feb 171 – 6 148 981 22 717 66 363 54.7 23.1 44.8 116.4 19.3 258.4
1 Includes chickens, turkeys, ducks and geese.2 Includes poultry offal.3 Annual averages.
Source: Department for Environment, Food and Rural Affairs: 01904 455096
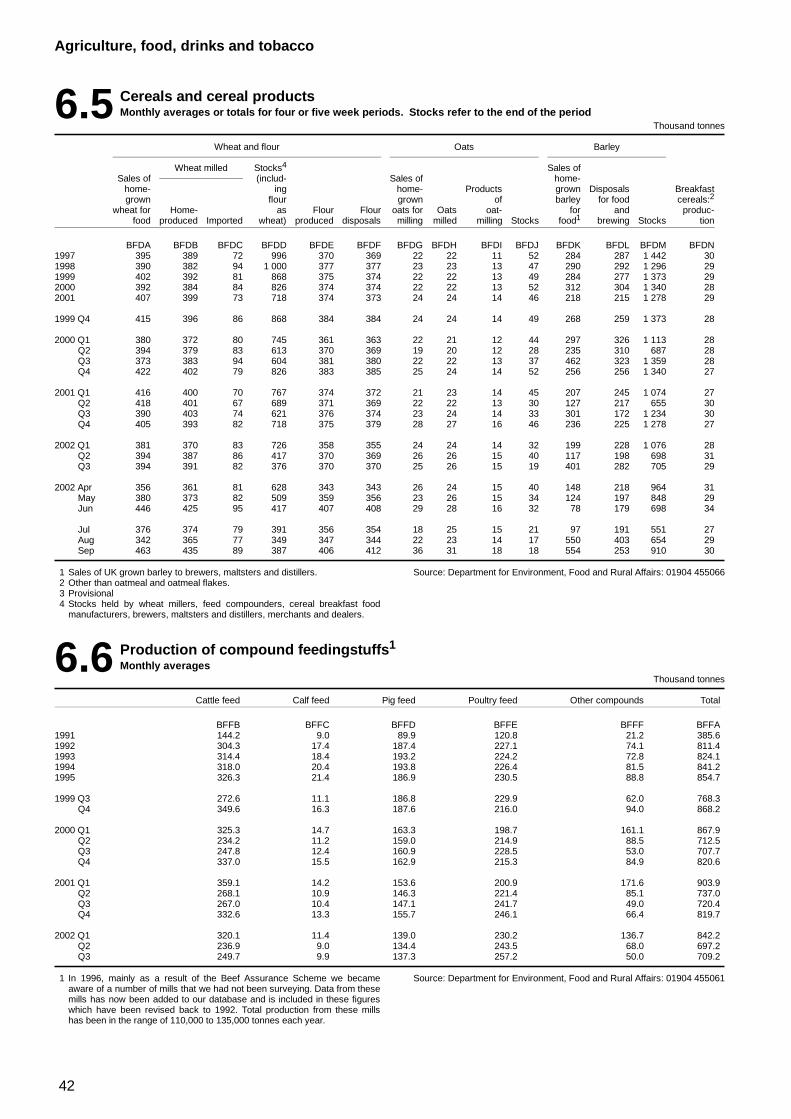
42
Agriculture, food, drinks and tobacco
6.5 Cereals and cereal productsMonthly averages or totals for four or five week periods. Stocks refer to the end of the period
Thousand tonnes
Wheat and flour Oats Barley
Wheat milled Stocks4 Sales ofSales of (includ- Sales of home-
home- ing home- Products grown Disposals Breakfastgrown flour grown of barley for food cereals:2
wheat for Home- as Flour Flour oats for Oats oat- for and produc-food produced Imported wheat) produced disposals milling milled milling Stocks food1 brewing Stocks tion
BFDA BFDB BFDC BFDD BFDE BFDF BFDG BFDH BFDI BFDJ BFDK BFDL BFDM BFDN1997 395 389 72 996 370 369 22 22 11 52 284 287 1 442 301998 390 382 94 1 000 377 377 23 23 13 47 290 292 1 296 291999 402 392 81 868 375 374 22 22 13 49 284 277 1 373 292000 392 384 84 826 374 374 22 22 13 52 312 304 1 340 282001 407 399 73 718 374 373 24 24 14 46 218 215 1 278 29
1999 Q4 415 396 86 868 384 384 24 24 14 49 268 259 1 373 28
2000 Q1 380 372 80 745 361 363 22 21 12 44 297 326 1 113 28Q2 394 379 83 613 370 369 19 20 12 28 235 310 687 28Q3 373 383 94 604 381 380 22 22 13 37 462 323 1 359 28Q4 422 402 79 826 383 385 25 24 14 52 256 256 1 340 27
2001 Q1 416 400 70 767 374 372 21 23 14 45 207 245 1 074 27Q2 418 401 67 689 371 369 22 22 13 30 127 217 655 30Q3 390 403 74 621 376 374 23 24 14 33 301 172 1 234 30Q4 405 393 82 718 375 379 28 27 16 46 236 225 1 278 27
2002 Q1 381 370 83 726 358 355 24 24 14 32 199 228 1 076 28Q2 394 387 86 417 370 369 26 26 15 40 117 198 698 31Q3 394 391 82 376 370 370 25 26 15 19 401 282 705 29
2002 Apr 356 361 81 628 343 343 26 24 15 40 148 218 964 31May 380 373 82 509 359 356 23 26 15 34 124 197 848 29Jun 446 425 95 417 407 408 29 28 16 32 78 179 698 34
Jul 376 374 79 391 356 354 18 25 15 21 97 191 551 27Aug 342 365 77 349 347 344 22 23 14 17 550 403 654 29Sep 463 435 89 387 406 412 36 31 18 18 554 253 910 30
1 Sales of UK grown barley to brewers, maltsters and distillers.2 Other than oatmeal and oatmeal flakes.3 Provisional4 Stocks held by wheat millers, feed compounders, cereal breakfast food
manufacturers, brewers, maltsters and distillers, merchants and dealers.
Source: Department for Environment, Food and Rural Affairs: 01904 455066
6.6 Production of compound feedingstuffs1
Monthly averagesThousand tonnes
Cattle feed Calf feed Pig feed Poultry feed Other compounds Total
BFFB BFFC BFFD BFFE BFFF BFFA1991 144.2 9.0 89.9 120.8 21.2 385.61992 304.3 17.4 187.4 227.1 74.1 811.41993 314.4 18.4 193.2 224.2 72.8 824.11994 318.0 20.4 193.8 226.4 81.5 841.21995 326.3 21.4 186.9 230.5 88.8 854.7
1999 Q3 272.6 11.1 186.8 229.9 62.0 768.3Q4 349.6 16.3 187.6 216.0 94.0 868.2
2000 Q1 325.3 14.7 163.3 198.7 161.1 867.9Q2 234.2 11.2 159.0 214.9 88.5 712.5Q3 247.8 12.4 160.9 228.5 53.0 707.7Q4 337.0 15.5 162.9 215.3 84.9 820.6
2001 Q1 359.1 14.2 153.6 200.9 171.6 903.9Q2 268.1 10.9 146.3 221.4 85.1 737.0Q3 267.0 10.4 147.1 241.7 49.0 720.4Q4 332.6 13.3 155.7 246.1 66.4 819.7
2002 Q1 320.1 11.4 139.0 230.2 136.7 842.2Q2 236.9 9.0 134.4 243.5 68.0 697.2Q3 249.7 9.9 137.3 257.2 50.0 709.2
1 In 1996, mainly as a result of the Beef Assurance Scheme we becameaware of a number of mills that we had not been surveying. Data from thesemills has now been added to our database and is included in these figureswhich have been revised back to 1992. Total production from these millshas been in the range of 110,000 to 135,000 tonnes each year.
Source: Department for Environment, Food and Rural Affairs: 01904 455061
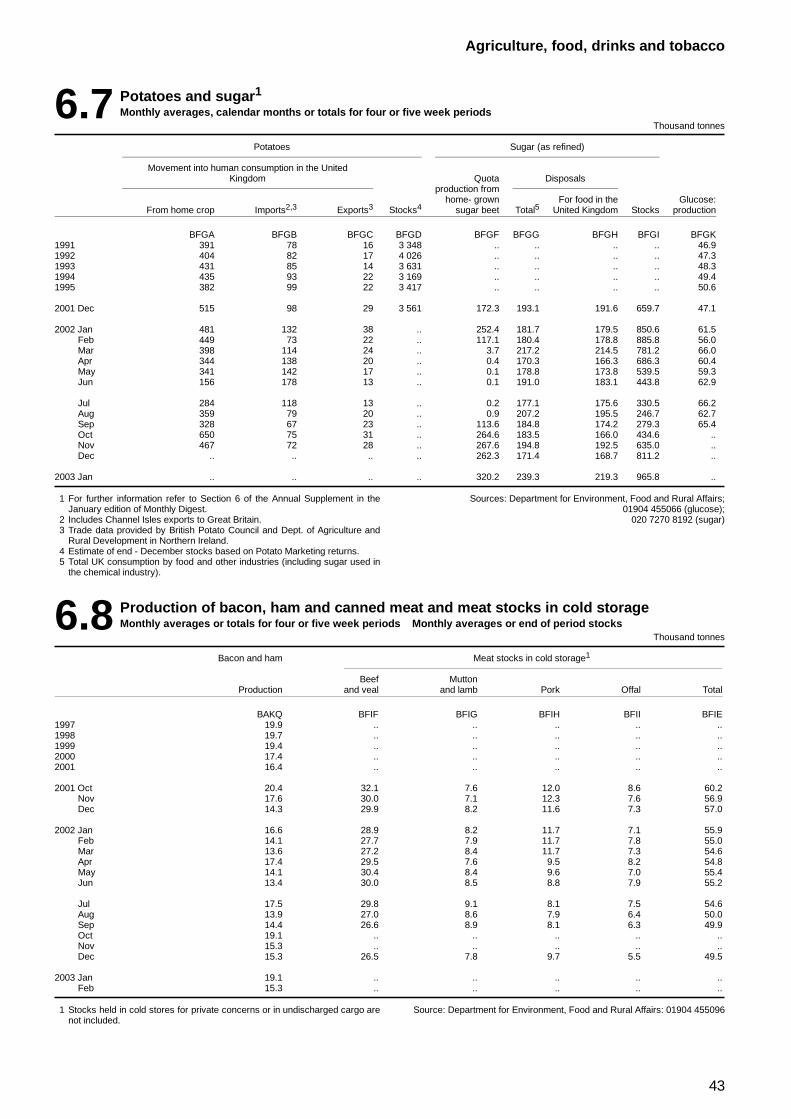
43
Agriculture, food, drinks and tobacco
6.7 Potatoes and sugar1
Monthly averages, calendar months or totals for four or five week periodsThousand tonnes
Potatoes Sugar (as refined)
Movement into human consumption in the UnitedKingdom Quota Disposals
production fromhome- grown For food in the Glucose:
From home crop Imports2,3 Exports3 Stocks4 sugar beet Total5 United Kingdom Stocks production
BFGA BFGB BFGC BFGD BFGF BFGG BFGH BFGI BFGK1991 391 78 16 3 348 .. .. .. .. 46.91992 404 82 17 4 026 .. .. .. .. 47.31993 431 85 14 3 631 .. .. .. .. 48.31994 435 93 22 3 169 .. .. .. .. 49.41995 382 99 22 3 417 .. .. .. .. 50.6
2001 Dec 515 98 29 3 561 172.3 193.1 191.6 659.7 47.1
2002 Jan 481 132 38 .. 252.4 181.7 179.5 850.6 61.5Feb 449 73 22 .. 117.1 180.4 178.8 885.8 56.0Mar 398 114 24 .. 3.7 217.2 214.5 781.2 66.0Apr 344 138 20 .. 0.4 170.3 166.3 686.3 60.4May 341 142 17 .. 0.1 178.8 173.8 539.5 59.3Jun 156 178 13 .. 0.1 191.0 183.1 443.8 62.9
Jul 284 118 13 .. 0.2 177.1 175.6 330.5 66.2Aug 359 79 20 .. 0.9 207.2 195.5 246.7 62.7Sep 328 67 23 .. 113.6 184.8 174.2 279.3 65.4Oct 650 75 31 .. 264.6 183.5 166.0 434.6 ..Nov 467 72 28 .. 267.6 194.8 192.5 635.0 ..Dec .. .. .. .. 262.3 171.4 168.7 811.2 ..
2003 Jan .. .. .. .. 320.2 239.3 219.3 965.8 ..
1 For further information refer to Section 6 of the Annual Supplement in theJanuary edition of Monthly Digest.
2 Includes Channel Isles exports to Great Britain.3 Trade data provided by British Potato Council and Dept. of Agriculture and
Rural Development in Northern Ireland.4 Estimate of end - December stocks based on Potato Marketing returns.5 Total UK consumption by food and other industries (including sugar used in
the chemical industry).
Sources: Department for Environment, Food and Rural Affairs;01904 455066 (glucose);
020 7270 8192 (sugar)
6.8 Production of bacon, ham and canned meat and meat stocks in cold storageMonthly averages or totals for four or five week periods Monthly averages or end of period stocks
Thousand tonnes
Bacon and ham Meat stocks in cold storage1
Beef MuttonProduction and veal and lamb Pork Offal Total
BAKQ BFIF BFIG BFIH BFII BFIE1997 19.9 .. .. .. .. ..1998 19.7 .. .. .. .. ..1999 19.4 .. .. .. .. ..2000 17.4 .. .. .. .. ..2001 16.4 .. .. .. .. ..
2001 Oct 20.4 32.1 7.6 12.0 8.6 60.2Nov 17.6 30.0 7.1 12.3 7.6 56.9Dec 14.3 29.9 8.2 11.6 7.3 57.0
2002 Jan 16.6 28.9 8.2 11.7 7.1 55.9Feb 14.1 27.7 7.9 11.7 7.8 55.0Mar 13.6 27.2 8.4 11.7 7.3 54.6Apr 17.4 29.5 7.6 9.5 8.2 54.8May 14.1 30.4 8.4 9.6 7.0 55.4Jun 13.4 30.0 8.5 8.8 7.9 55.2
Jul 17.5 29.8 9.1 8.1 7.5 54.6Aug 13.9 27.0 8.6 7.9 6.4 50.0Sep 14.4 26.6 8.9 8.1 6.3 49.9Oct 19.1 .. .. .. .. ..Nov 15.3 .. .. .. .. ..Dec 15.3 26.5 7.8 9.7 5.5 49.5
2003 Jan 19.1 .. .. .. .. ..Feb 15.3 .. .. .. .. ..
1 Stocks held in cold stores for private concerns or in undischarged cargo arenot included.
Source: Department for Environment, Food and Rural Affairs: 01904 455096
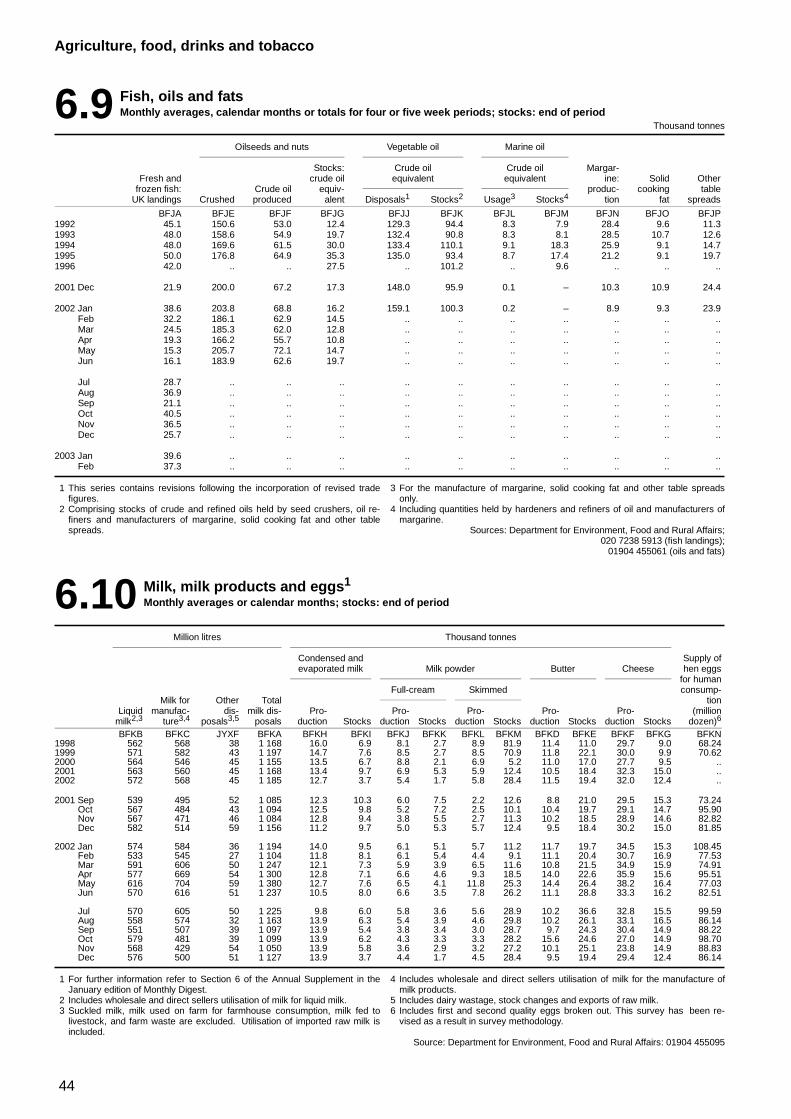
44
Agriculture, food, drinks and tobacco
6.9 Fish, oils and fatsMonthly averages, calendar months or totals for four or five week periods; stocks: end of period
Thousand tonnes
Oilseeds and nuts Vegetable oil Marine oil
Stocks: Crude oil Crude oil Margar-Fresh and crude oil equivalent equivalent ine: Solid Other
frozen fish: Crude oil equiv- produc- cooking tableUK landings Crushed produced alent Disposals1 Stocks2 Usage3 Stocks4 tion fat spreads
BFJA BFJE BFJF BFJG BFJJ BFJK BFJL BFJM BFJN BFJO BFJP1992 45.1 150.6 53.0 12.4 129.3 94.4 8.3 7.9 28.4 9.6 11.31993 48.0 158.6 54.9 19.7 132.4 90.8 8.3 8.1 28.5 10.7 12.61994 48.0 169.6 61.5 30.0 133.4 110.1 9.1 18.3 25.9 9.1 14.71995 50.0 176.8 64.9 35.3 135.0 93.4 8.7 17.4 21.2 9.1 19.71996 42.0 .. .. 27.5 .. 101.2 .. 9.6 .. .. ..
2001 Dec 21.9 200.0 67.2 17.3 148.0 95.9 0.1 – 10.3 10.9 24.4
2002 Jan 38.6 203.8 68.8 16.2 159.1 100.3 0.2 – 8.9 9.3 23.9Feb 32.2 186.1 62.9 14.5 .. .. .. .. .. .. ..Mar 24.5 185.3 62.0 12.8 .. .. .. .. .. .. ..Apr 19.3 166.2 55.7 10.8 .. .. .. .. .. .. ..May 15.3 205.7 72.1 14.7 .. .. .. .. .. .. ..Jun 16.1 183.9 62.6 19.7 .. .. .. .. .. .. ..
Jul 28.7 .. .. .. .. .. .. .. .. .. ..Aug 36.9 .. .. .. .. .. .. .. .. .. ..Sep 21.1 .. .. .. .. .. .. .. .. .. ..Oct 40.5 .. .. .. .. .. .. .. .. .. ..Nov 36.5 .. .. .. .. .. .. .. .. .. ..Dec 25.7 .. .. .. .. .. .. .. .. .. ..
2003 Jan 39.6 .. .. .. .. .. .. .. .. .. ..Feb 37.3 .. .. .. .. .. .. .. .. .. ..
1 This series contains revisions following the incorporation of revised tradefigures.
2 Comprising stocks of crude and refined oils held by seed crushers, oil re-finers and manufacturers of margarine, solid cooking fat and other tablespreads.
3 For the manufacture of margarine, solid cooking fat and other table spreadsonly.
4 Including quantities held by hardeners and refiners of oil and manufacturers ofmargarine.
Sources: Department for Environment, Food and Rural Affairs;020 7238 5913 (fish landings);
01904 455061 (oils and fats)
6.10 Milk, milk products and eggs1
Monthly averages or calendar months; stocks: end of period
Million litres Thousand tonnes
Condensed and Supply ofevaporated milk Milk powder Butter Cheese hen eggs
for humanFull-cream Skimmed consump-
Milk for Other Total tionLiquid manufac- dis- milk dis- Pro- Pro- Pro- Pro- Pro- (million
milk2,3 ture3,4 posals3,5 posals duction Stocks duction Stocks duction Stocks duction Stocks duction Stocks dozen)6
BFKB BFKC JYXF BFKA BFKH BFKI BFKJ BFKK BFKL BFKM BFKD BFKE BFKF BFKG BFKN1998 562 568 38 1 168 16.0 6.9 8.1 2.7 8.9 81.9 11.4 11.0 29.7 9.0 68.241999 571 582 43 1 197 14.7 7.6 8.5 2.7 8.5 70.9 11.8 22.1 30.0 9.9 70.622000 564 546 45 1 155 13.5 6.7 8.8 2.1 6.9 5.2 11.0 17.0 27.7 9.5 ..2001 563 560 45 1 168 13.4 9.7 6.9 5.3 5.9 12.4 10.5 18.4 32.3 15.0 ..2002 572 568 45 1 185 12.7 3.7 5.4 1.7 5.8 28.4 11.5 19.4 32.0 12.4 ..
2001 Sep 539 495 52 1 085 12.3 10.3 6.0 7.5 2.2 12.6 8.8 21.0 29.5 15.3 73.24Oct 567 484 43 1 094 12.5 9.8 5.2 7.2 2.5 10.1 10.4 19.7 29.1 14.7 95.90Nov 567 471 46 1 084 12.8 9.4 3.8 5.5 2.7 11.3 10.2 18.5 28.9 14.6 82.82Dec 582 514 59 1 156 11.2 9.7 5.0 5.3 5.7 12.4 9.5 18.4 30.2 15.0 81.85
2002 Jan 574 584 36 1 194 14.0 9.5 6.1 5.1 5.7 11.2 11.7 19.7 34.5 15.3 108.45Feb 533 545 27 1 104 11.8 8.1 6.1 5.4 4.4 9.1 11.1 20.4 30.7 16.9 77.53Mar 591 606 50 1 247 12.1 7.3 5.9 3.9 6.5 11.6 10.8 21.5 34.9 15.9 74.91Apr 577 669 54 1 300 12.8 7.1 6.6 4.6 9.3 18.5 14.0 22.6 35.9 15.6 95.51May 616 704 59 1 380 12.7 7.6 6.5 4.1 11.8 25.3 14.4 26.4 38.2 16.4 77.03Jun 570 616 51 1 237 10.5 8.0 6.6 3.5 7.8 26.2 11.1 28.8 33.3 16.2 82.51
Jul 570 605 50 1 225 9.8 6.0 5.8 3.6 5.6 28.9 10.2 36.6 32.8 15.5 99.59Aug 558 574 32 1 163 13.9 6.3 5.4 3.9 4.6 29.8 10.2 26.1 33.1 16.5 86.14Sep 551 507 39 1 097 13.9 5.4 3.8 3.4 3.0 28.7 9.7 24.3 30.4 14.9 88.22Oct 579 481 39 1 099 13.9 6.2 4.3 3.3 3.3 28.2 15.6 24.6 27.0 14.9 98.70Nov 568 429 54 1 050 13.9 5.8 3.6 2.9 3.2 27.2 10.1 25.1 23.8 14.9 88.83Dec 576 500 51 1 127 13.9 3.7 4.4 1.7 4.5 28.4 9.5 19.4 29.4 12.4 86.14
1 For further information refer to Section 6 of the Annual Supplement in theJanuary edition of Monthly Digest.
2 Includes wholesale and direct sellers utilisation of milk for liquid milk.3 Suckled milk, milk used on farm for farmhouse consumption, milk fed to
livestock, and farm waste are excluded. Utilisation of imported raw milk isincluded.
4 Includes wholesale and direct sellers utilisation of milk for the manufacture ofmilk products.
5 Includes dairy wastage, stock changes and exports of raw milk.6 Includes first and second quality eggs broken out. This survey has been re-
vised as a result in survey methodology.
Source: Department for Environment, Food and Rural Affairs: 01904 455095
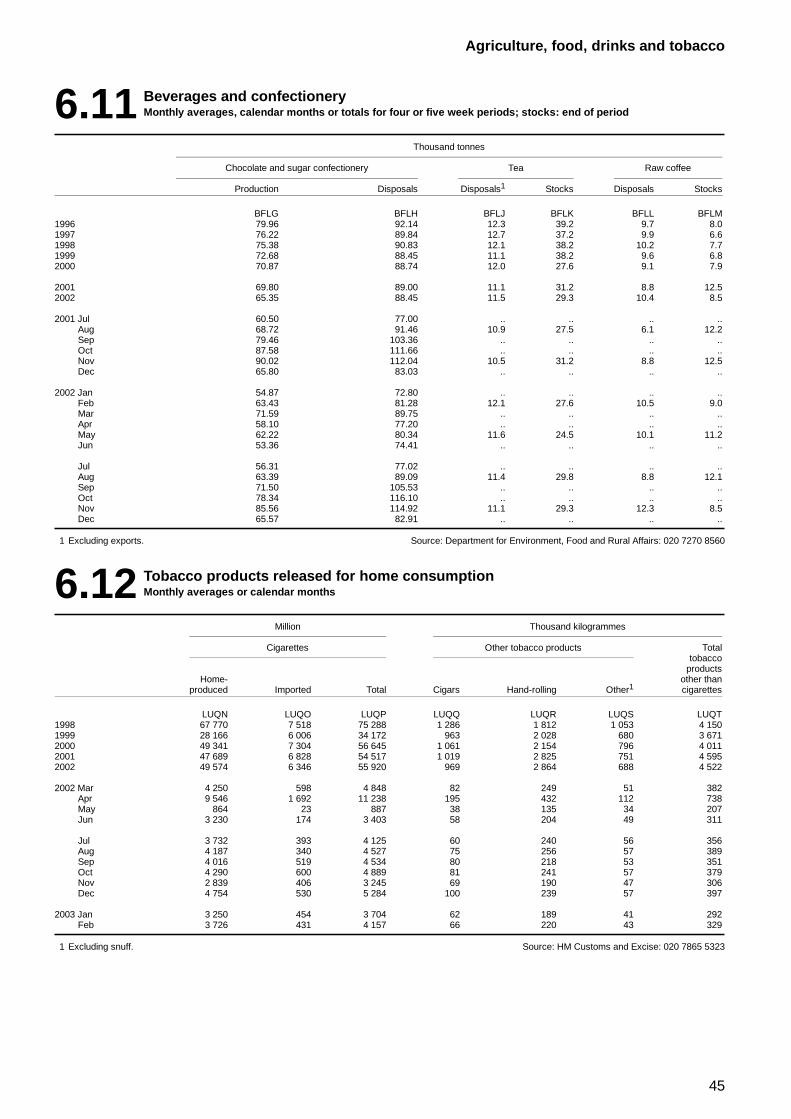
45
Agriculture, food, drinks and tobacco
6.11 Beverages and confectioneryMonthly averages, calendar months or totals for four or five week periods; stocks: end of period
Thousand tonnes
Chocolate and sugar confectionery Tea Raw coffee
Production Disposals Disposals1 Stocks Disposals Stocks
BFLG BFLH BFLJ BFLK BFLL BFLM1996 79.96 92.14 12.3 39.2 9.7 8.01997 76.22 89.84 12.7 37.2 9.9 6.61998 75.38 90.83 12.1 38.2 10.2 7.71999 72.68 88.45 11.1 38.2 9.6 6.82000 70.87 88.74 12.0 27.6 9.1 7.9
2001 69.80 89.00 11.1 31.2 8.8 12.52002 65.35 88.45 11.5 29.3 10.4 8.5
2001 Jul 60.50 77.00 .. .. .. ..Aug 68.72 91.46 10.9 27.5 6.1 12.2Sep 79.46 103.36 .. .. .. ..Oct 87.58 111.66 .. .. .. ..Nov 90.02 112.04 10.5 31.2 8.8 12.5Dec 65.80 83.03 .. .. .. ..
2002 Jan 54.87 72.80 .. .. .. ..Feb 63.43 81.28 12.1 27.6 10.5 9.0Mar 71.59 89.75 .. .. .. ..Apr 58.10 77.20 .. .. .. ..May 62.22 80.34 11.6 24.5 10.1 11.2Jun 53.36 74.41 .. .. .. ..
Jul 56.31 77.02 .. .. .. ..Aug 63.39 89.09 11.4 29.8 8.8 12.1Sep 71.50 105.53 .. .. .. ..Oct 78.34 116.10 .. .. .. ..Nov 85.56 114.92 11.1 29.3 12.3 8.5Dec 65.57 82.91 .. .. .. ..
1 Excluding exports. Source: Department for Environment, Food and Rural Affairs: 020 7270 8560
6.12 Tobacco products released for home consumptionMonthly averages or calendar months
Million Thousand kilogrammes
Cigarettes Other tobacco products Totaltobacco
productsHome- other than
produced Imported Total Cigars Hand-rolling Other1 cigarettes
LUQN LUQO LUQP LUQQ LUQR LUQS LUQT1998 67 770 7 518 75 288 1 286 1 812 1 053 4 1501999 28 166 6 006 34 172 963 2 028 680 3 6712000 49 341 7 304 56 645 1 061 2 154 796 4 0112001 47 689 6 828 54 517 1 019 2 825 751 4 5952002 49 574 6 346 55 920 969 2 864 688 4 522
2002 Mar 4 250 598 4 848 82 249 51 382Apr 9 546 1 692 11 238 195 432 112 738May 864 23 887 38 135 34 207Jun 3 230 174 3 403 58 204 49 311
Jul 3 732 393 4 125 60 240 56 356Aug 4 187 340 4 527 75 256 57 389Sep 4 016 519 4 534 80 218 53 351Oct 4 290 600 4 889 81 241 57 379Nov 2 839 406 3 245 69 190 47 306Dec 4 754 530 5 284 100 239 57 397
2003 Jan 3 250 454 3 704 62 189 41 292Feb 3 726 431 4 157 66 220 43 329
1 Excluding snuff. Source: HM Customs and Excise: 020 7865 5323
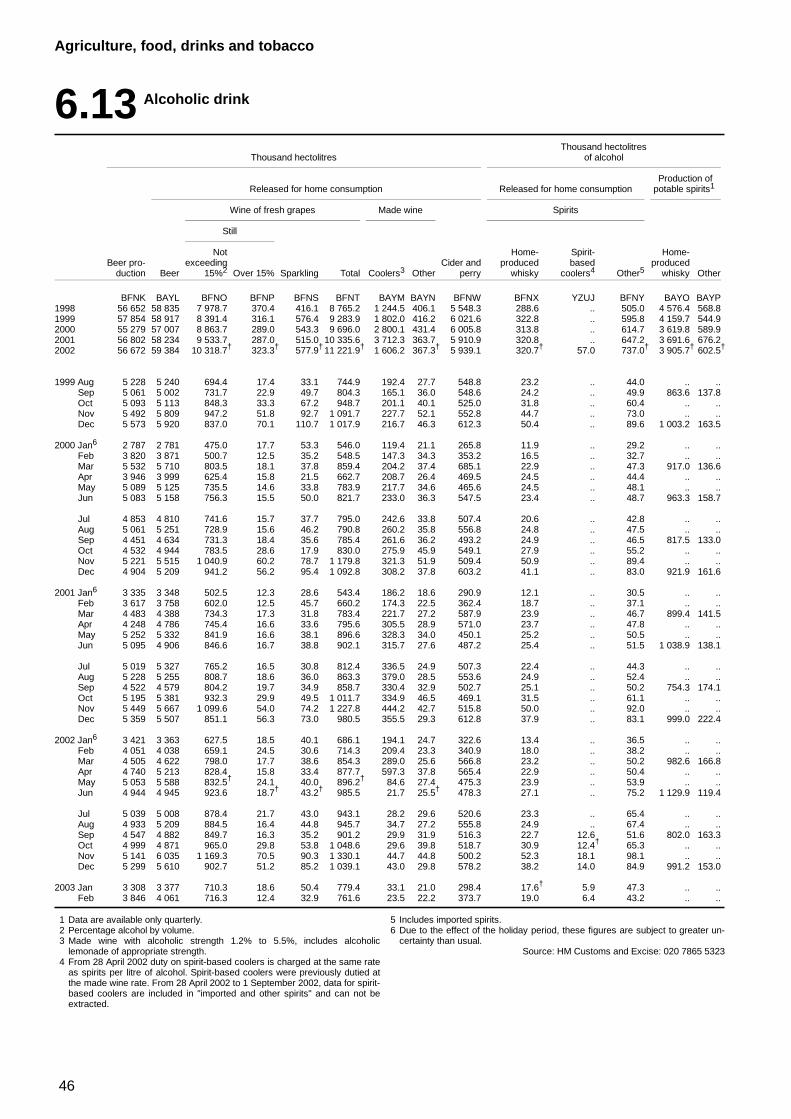
46
Agriculture, food, drinks and tobacco
6.13 Alcoholic drink
Thousand hectolitresThousand hectolitres of alcohol
Production ofReleased for home consumption Released for home consumption potable spirits1
Wine of fresh grapes Made wine Spirits
Still
Not Home- Spirit- Home-Beer pro- exceeding Cider and produced based produced
duction Beer 15%2 Over 15% Sparkling Total Coolers3 Other perry whisky coolers4 Other5 whisky Other
BFNK BAYL BFNO BFNP BFNS BFNT BAYM BAYN BFNW BFNX YZUJ BFNY BAYO BAYP1998 56 652 58 835 7 978.7 370.4 416.1 8 765.2 1 244.5 406.1 5 548.3 288.6 .. 505.0 4 576.4 568.81999 57 854 58 917 8 391.4 316.1 576.4 9 283.9 1 802.0 416.2 6 021.6 322.8 .. 595.8 4 159.7 544.92000 55 279 57 007 8 863.7 289.0 543.3 9 696.0 2 800.1 431.4 6 005.8 313.8 .. 614.7 3 619.8 589.92001 56 802 58 234 9 533.7 287.0 515.0 10 335.6 3 712.3 363.7 5 910.9 320.8 .. 647.2 3 691.6 676.22002 56 672 59 384 10 318.7† 323.3† 577.9† 11 221.9† 1 606.2 367.3† 5 939.1 320.7† 57.0 737.0† 3 905.7† 602.5†
1999 Aug 5 228 5 240 694.4 17.4 33.1 744.9 192.4 27.7 548.8 23.2 .. 44.0 .. ..Sep 5 061 5 002 731.7 22.9 49.7 804.3 165.1 36.0 548.6 24.2 .. 49.9 863.6 137.8Oct 5 093 5 113 848.3 33.3 67.2 948.7 201.1 40.1 525.0 31.8 .. 60.4 .. ..Nov 5 492 5 809 947.2 51.8 92.7 1 091.7 227.7 52.1 552.8 44.7 .. 73.0 .. ..Dec 5 573 5 920 837.0 70.1 110.7 1 017.9 216.7 46.3 612.3 50.4 .. 89.6 1 003.2 163.5
2000 Jan6 2 787 2 781 475.0 17.7 53.3 546.0 119.4 21.1 265.8 11.9 .. 29.2 .. ..Feb 3 820 3 871 500.7 12.5 35.2 548.5 147.3 34.3 353.2 16.5 .. 32.7 .. ..Mar 5 532 5 710 803.5 18.1 37.8 859.4 204.2 37.4 685.1 22.9 .. 47.3 917.0 136.6Apr 3 946 3 999 625.4 15.8 21.5 662.7 208.7 26.4 469.5 24.5 .. 44.4 .. ..May 5 089 5 125 735.5 14.6 33.8 783.9 217.7 34.6 465.6 24.5 .. 48.1 .. ..Jun 5 083 5 158 756.3 15.5 50.0 821.7 233.0 36.3 547.5 23.4 .. 48.7 963.3 158.7
Jul 4 853 4 810 741.6 15.7 37.7 795.0 242.6 33.8 507.4 20.6 .. 42.8 .. ..Aug 5 061 5 251 728.9 15.6 46.2 790.8 260.2 35.8 556.8 24.8 .. 47.5 .. ..Sep 4 451 4 634 731.3 18.4 35.6 785.4 261.6 36.2 493.2 24.9 .. 46.5 817.5 133.0Oct 4 532 4 944 783.5 28.6 17.9 830.0 275.9 45.9 549.1 27.9 .. 55.2 .. ..Nov 5 221 5 515 1 040.9 60.2 78.7 1 179.8 321.3 51.9 509.4 50.9 .. 89.4 .. ..Dec 4 904 5 209 941.2 56.2 95.4 1 092.8 308.2 37.8 603.2 41.1 .. 83.0 921.9 161.6
2001 Jan6 3 335 3 348 502.5 12.3 28.6 543.4 186.2 18.6 290.9 12.1 .. 30.5 .. ..Feb 3 617 3 758 602.0 12.5 45.7 660.2 174.3 22.5 362.4 18.7 .. 37.1 .. ..Mar 4 483 4 388 734.3 17.3 31.8 783.4 221.7 27.2 587.9 23.9 .. 46.7 899.4 141.5Apr 4 248 4 786 745.4 16.6 33.6 795.6 305.5 28.9 571.0 23.7 .. 47.8 .. ..May 5 252 5 332 841.9 16.6 38.1 896.6 328.3 34.0 450.1 25.2 .. 50.5 .. ..Jun 5 095 4 906 846.6 16.7 38.8 902.1 315.7 27.6 487.2 25.4 .. 51.5 1 038.9 138.1
Jul 5 019 5 327 765.2 16.5 30.8 812.4 336.5 24.9 507.3 22.4 .. 44.3 .. ..Aug 5 228 5 255 808.7 18.6 36.0 863.3 379.0 28.5 553.6 24.9 .. 52.4 .. ..Sep 4 522 4 579 804.2 19.7 34.9 858.7 330.4 32.9 502.7 25.1 .. 50.2 754.3 174.1Oct 5 195 5 381 932.3 29.9 49.5 1 011.7 334.9 46.5 469.1 31.5 .. 61.1 .. ..Nov 5 449 5 667 1 099.6 54.0 74.2 1 227.8 444.2 42.7 515.8 50.0 .. 92.0 .. ..Dec 5 359 5 507 851.1 56.3 73.0 980.5 355.5 29.3 612.8 37.9 .. 83.1 999.0 222.4
2002 Jan6 3 421 3 363 627.5 18.5 40.1 686.1 194.1 24.7 322.6 13.4 .. 36.5 .. ..Feb 4 051 4 038 659.1 24.5 30.6 714.3 209.4 23.3 340.9 18.0 .. 38.2 .. ..Mar 4 505 4 622 798.0 17.7 38.6 854.3 289.0 25.6 566.8 23.2 .. 50.2 982.6 166.8Apr 4 740 5 213 828.4 15.8 33.4 877.7 597.3 37.8 565.4 22.9 .. 50.4 .. ..May 5 053 5 588 832.5† 24.1 40.0 896.2† 84.6 27.4 475.3 23.9 .. 53.9 .. ..Jun 4 944 4 945 923.6 18.7† 43.2† 985.5 21.7 25.5† 478.3 27.1 .. 75.2 1 129.9 119.4
Jul 5 039 5 008 878.4 21.7 43.0 943.1 28.2 29.6 520.6 23.3 .. 65.4 .. ..Aug 4 933 5 209 884.5 16.4 44.8 945.7 34.7 27.2 555.8 24.9 .. 67.4 .. ..Sep 4 547 4 882 849.7 16.3 35.2 901.2 29.9 31.9 516.3 22.7 12.6 51.6 802.0 163.3Oct 4 999 4 871 965.0 29.8 53.8 1 048.6 29.6 39.8 518.7 30.9 12.4† 65.3 .. ..Nov 5 141 6 035 1 169.3 70.5 90.3 1 330.1 44.7 44.8 500.2 52.3 18.1 98.1 .. ..Dec 5 299 5 610 902.7 51.2 85.2 1 039.1 43.0 29.8 578.2 38.2 14.0 84.9 991.2 153.0
2003 Jan 3 308 3 377 710.3 18.6 50.4 779.4 33.1 21.0 298.4 17.6† 5.9 47.3 .. ..Feb 3 846 4 061 716.3 12.4 32.9 761.6 23.5 22.2 373.7 19.0 6.4 43.2 .. ..
1 Data are available only quarterly.2 Percentage alcohol by volume.3 Made wine with alcoholic strength 1.2% to 5.5%, includes alcoholic
lemonade of appropriate strength.4 From 28 April 2002 duty on spirit-based coolers is charged at the same rate
as spirits per litre of alcohol. Spirit-based coolers were previously dutied atthe made wine rate. From 28 April 2002 to 1 September 2002, data for spirit-based coolers are included in "imported and other spirits" and can not beextracted.
5 Includes imported spirits.6 Due to the effect of the holiday period, these figures are subject to greater un-
certainty than usual.Source: HM Customs and Excise: 020 7865 5323
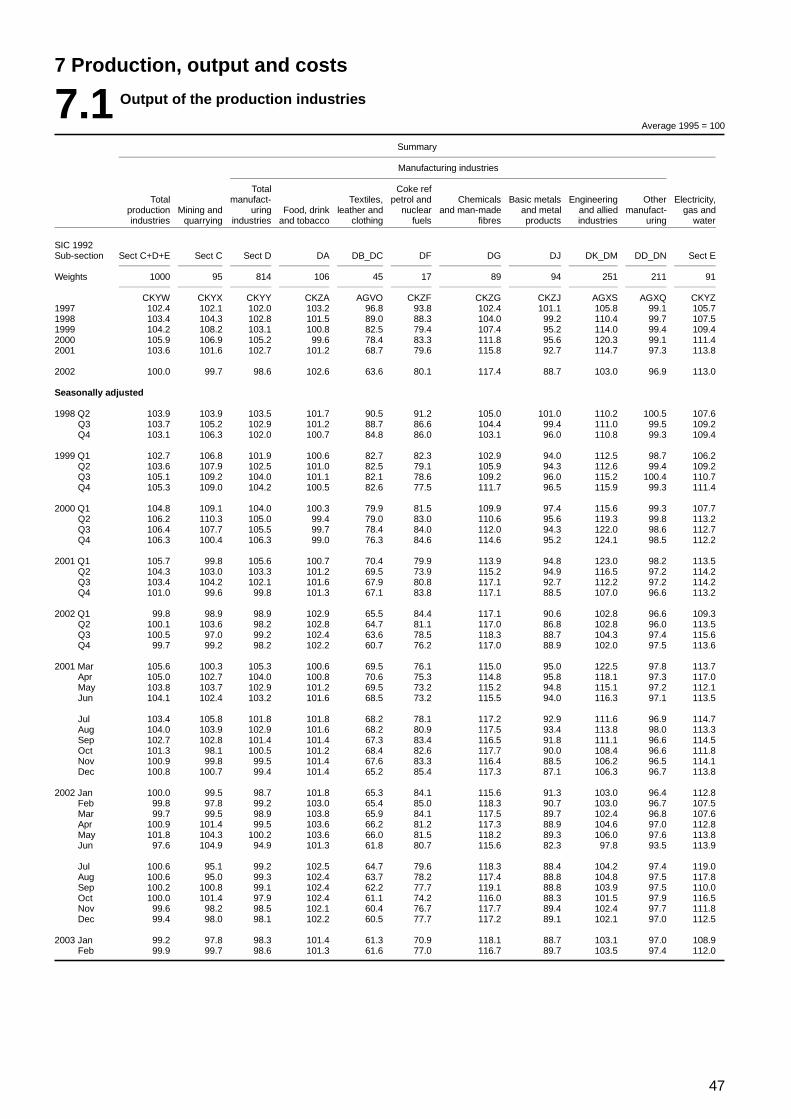
47
7 Production, output and costs
7.1 Output of the production industries
Average 1995 = 100
Summary
Manufacturing industries
Total Coke refTotal manufact- Textiles, petrol and Chemicals Basic metals Engineering Other Electricity,
production Mining and uring Food, drink leather and nuclear and man-made and metal and allied manufact- gas andindustries quarrying industries and tobacco clothing fuels fibres products industries uring water
SIC 1992Sub-section Sect C+D+E Sect C Sect D DA DB_DC DF DG DJ DK_DM DD_DN Sect E
Weights 1000 95 814 106 45 17 89 94 251 211 91
CKYW CKYX CKYY CKZA AGVO CKZF CKZG CKZJ AGXS AGXQ CKYZ1997 102.4 102.1 102.0 103.2 96.8 93.8 102.4 101.1 105.8 99.1 105.71998 103.4 104.3 102.8 101.5 89.0 88.3 104.0 99.2 110.4 99.7 107.51999 104.2 108.2 103.1 100.8 82.5 79.4 107.4 95.2 114.0 99.4 109.42000 105.9 106.9 105.2 99.6 78.4 83.3 111.8 95.6 120.3 99.1 111.42001 103.6 101.6 102.7 101.2 68.7 79.6 115.8 92.7 114.7 97.3 113.8
2002 100.0 99.7 98.6 102.6 63.6 80.1 117.4 88.7 103.0 96.9 113.0
Seasonally adjusted
1998 Q2 103.9 103.9 103.5 101.7 90.5 91.2 105.0 101.0 110.2 100.5 107.6Q3 103.7 105.2 102.9 101.2 88.7 86.6 104.4 99.4 111.0 99.5 109.2Q4 103.1 106.3 102.0 100.7 84.8 86.0 103.1 96.0 110.8 99.3 109.4
1999 Q1 102.7 106.8 101.9 100.6 82.7 82.3 102.9 94.0 112.5 98.7 106.2Q2 103.6 107.9 102.5 101.0 82.5 79.1 105.9 94.3 112.6 99.4 109.2Q3 105.1 109.2 104.0 101.1 82.1 78.6 109.2 96.0 115.2 100.4 110.7Q4 105.3 109.0 104.2 100.5 82.6 77.5 111.7 96.5 115.9 99.3 111.4
2000 Q1 104.8 109.1 104.0 100.3 79.9 81.5 109.9 97.4 115.6 99.3 107.7Q2 106.2 110.3 105.0 99.4 79.0 83.0 110.6 95.6 119.3 99.8 113.2Q3 106.4 107.7 105.5 99.7 78.4 84.0 112.0 94.3 122.0 98.6 112.7Q4 106.3 100.4 106.3 99.0 76.3 84.6 114.6 95.2 124.1 98.5 112.2
2001 Q1 105.7 99.8 105.6 100.7 70.4 79.9 113.9 94.8 123.0 98.2 113.5Q2 104.3 103.0 103.3 101.2 69.5 73.9 115.2 94.9 116.5 97.2 114.2Q3 103.4 104.2 102.1 101.6 67.9 80.8 117.1 92.7 112.2 97.2 114.2Q4 101.0 99.6 99.8 101.3 67.1 83.8 117.1 88.5 107.0 96.6 113.2
2002 Q1 99.8 98.9 98.9 102.9 65.5 84.4 117.1 90.6 102.8 96.6 109.3Q2 100.1 103.6 98.2 102.8 64.7 81.1 117.0 86.8 102.8 96.0 113.5Q3 100.5 97.0 99.2 102.4 63.6 78.5 118.3 88.7 104.3 97.4 115.6Q4 99.7 99.2 98.2 102.2 60.7 76.2 117.0 88.9 102.0 97.5 113.6
2001 Mar 105.6 100.3 105.3 100.6 69.5 76.1 115.0 95.0 122.5 97.8 113.7Apr 105.0 102.7 104.0 100.8 70.6 75.3 114.8 95.8 118.1 97.3 117.0May 103.8 103.7 102.9 101.2 69.5 73.2 115.2 94.8 115.1 97.2 112.1Jun 104.1 102.4 103.2 101.6 68.5 73.2 115.5 94.0 116.3 97.1 113.5
Jul 103.4 105.8 101.8 101.8 68.2 78.1 117.2 92.9 111.6 96.9 114.7Aug 104.0 103.9 102.9 101.6 68.2 80.9 117.5 93.4 113.8 98.0 113.3Sep 102.7 102.8 101.4 101.4 67.3 83.4 116.5 91.8 111.1 96.6 114.5Oct 101.3 98.1 100.5 101.2 68.4 82.6 117.7 90.0 108.4 96.6 111.8Nov 100.9 99.8 99.5 101.4 67.6 83.3 116.4 88.5 106.2 96.5 114.1Dec 100.8 100.7 99.4 101.4 65.2 85.4 117.3 87.1 106.3 96.7 113.8
2002 Jan 100.0 99.5 98.7 101.8 65.3 84.1 115.6 91.3 103.0 96.4 112.8Feb 99.8 97.8 99.2 103.0 65.4 85.0 118.3 90.7 103.0 96.7 107.5Mar 99.7 99.5 98.9 103.8 65.9 84.1 117.5 89.7 102.4 96.8 107.6Apr 100.9 101.4 99.5 103.6 66.2 81.2 117.3 88.9 104.6 97.0 112.8May 101.8 104.3 100.2 103.6 66.0 81.5 118.2 89.3 106.0 97.6 113.8Jun 97.6 104.9 94.9 101.3 61.8 80.7 115.6 82.3 97.8 93.5 113.9
Jul 100.6 95.1 99.2 102.5 64.7 79.6 118.3 88.4 104.2 97.4 119.0Aug 100.6 95.0 99.3 102.4 63.7 78.2 117.4 88.8 104.8 97.5 117.8Sep 100.2 100.8 99.1 102.4 62.2 77.7 119.1 88.8 103.9 97.5 110.0Oct 100.0 101.4 97.9 102.4 61.1 74.2 116.0 88.3 101.5 97.9 116.5Nov 99.6 98.2 98.5 102.1 60.4 76.7 117.7 89.4 102.4 97.7 111.8Dec 99.4 98.0 98.1 102.2 60.5 77.7 117.2 89.1 102.1 97.0 112.5
2003 Jan 99.2 97.8 98.3 101.4 61.3 70.9 118.1 88.7 103.1 97.0 108.9Feb 99.9 99.7 98.6 101.3 61.6 77.0 116.7 89.7 103.5 97.4 112.0
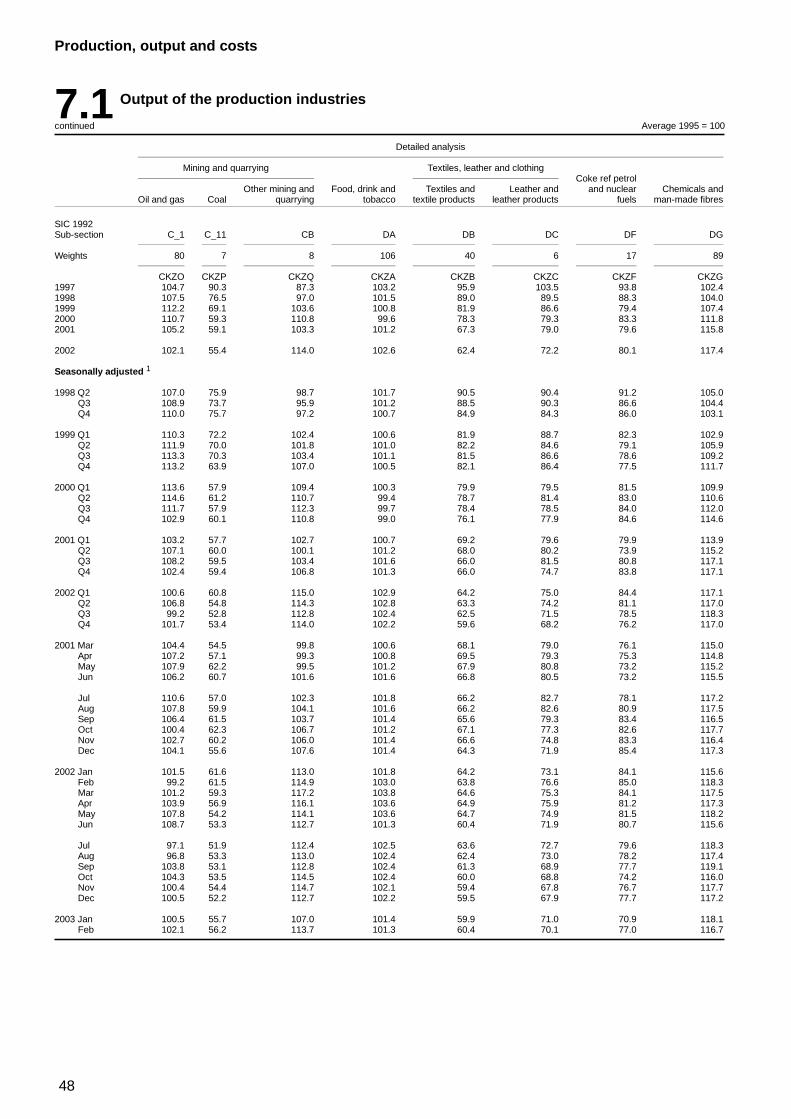
48
Production, output and costs
7.1 Output of the production industries
continued Average 1995 = 100
Detailed analysis
Mining and quarrying Textiles, leather and clothingCoke ref petrol
Other mining and Food, drink and Textiles and Leather and and nuclear Chemicals andOil and gas Coal quarrying tobacco textile products leather products fuels man-made fibres
SIC 1992Sub-section C_1 C_11 CB DA DB DC DF DG
Weights 80 7 8 106 40 6 17 89
CKZO CKZP CKZQ CKZA CKZB CKZC CKZF CKZG1997 104.7 90.3 87.3 103.2 95.9 103.5 93.8 102.41998 107.5 76.5 97.0 101.5 89.0 89.5 88.3 104.01999 112.2 69.1 103.6 100.8 81.9 86.6 79.4 107.42000 110.7 59.3 110.8 99.6 78.3 79.3 83.3 111.82001 105.2 59.1 103.3 101.2 67.3 79.0 79.6 115.8
2002 102.1 55.4 114.0 102.6 62.4 72.2 80.1 117.4
Seasonally adjusted 1
1998 Q2 107.0 75.9 98.7 101.7 90.5 90.4 91.2 105.0Q3 108.9 73.7 95.9 101.2 88.5 90.3 86.6 104.4Q4 110.0 75.7 97.2 100.7 84.9 84.3 86.0 103.1
1999 Q1 110.3 72.2 102.4 100.6 81.9 88.7 82.3 102.9Q2 111.9 70.0 101.8 101.0 82.2 84.6 79.1 105.9Q3 113.3 70.3 103.4 101.1 81.5 86.6 78.6 109.2Q4 113.2 63.9 107.0 100.5 82.1 86.4 77.5 111.7
2000 Q1 113.6 57.9 109.4 100.3 79.9 79.5 81.5 109.9Q2 114.6 61.2 110.7 99.4 78.7 81.4 83.0 110.6Q3 111.7 57.9 112.3 99.7 78.4 78.5 84.0 112.0Q4 102.9 60.1 110.8 99.0 76.1 77.9 84.6 114.6
2001 Q1 103.2 57.7 102.7 100.7 69.2 79.6 79.9 113.9Q2 107.1 60.0 100.1 101.2 68.0 80.2 73.9 115.2Q3 108.2 59.5 103.4 101.6 66.0 81.5 80.8 117.1Q4 102.4 59.4 106.8 101.3 66.0 74.7 83.8 117.1
2002 Q1 100.6 60.8 115.0 102.9 64.2 75.0 84.4 117.1Q2 106.8 54.8 114.3 102.8 63.3 74.2 81.1 117.0Q3 99.2 52.8 112.8 102.4 62.5 71.5 78.5 118.3Q4 101.7 53.4 114.0 102.2 59.6 68.2 76.2 117.0
2001 Mar 104.4 54.5 99.8 100.6 68.1 79.0 76.1 115.0Apr 107.2 57.1 99.3 100.8 69.5 79.3 75.3 114.8May 107.9 62.2 99.5 101.2 67.9 80.8 73.2 115.2Jun 106.2 60.7 101.6 101.6 66.8 80.5 73.2 115.5
Jul 110.6 57.0 102.3 101.8 66.2 82.7 78.1 117.2Aug 107.8 59.9 104.1 101.6 66.2 82.6 80.9 117.5Sep 106.4 61.5 103.7 101.4 65.6 79.3 83.4 116.5Oct 100.4 62.3 106.7 101.2 67.1 77.3 82.6 117.7Nov 102.7 60.2 106.0 101.4 66.6 74.8 83.3 116.4Dec 104.1 55.6 107.6 101.4 64.3 71.9 85.4 117.3
2002 Jan 101.5 61.6 113.0 101.8 64.2 73.1 84.1 115.6Feb 99.2 61.5 114.9 103.0 63.8 76.6 85.0 118.3Mar 101.2 59.3 117.2 103.8 64.6 75.3 84.1 117.5Apr 103.9 56.9 116.1 103.6 64.9 75.9 81.2 117.3May 107.8 54.2 114.1 103.6 64.7 74.9 81.5 118.2Jun 108.7 53.3 112.7 101.3 60.4 71.9 80.7 115.6
Jul 97.1 51.9 112.4 102.5 63.6 72.7 79.6 118.3Aug 96.8 53.3 113.0 102.4 62.4 73.0 78.2 117.4Sep 103.8 53.1 112.8 102.4 61.3 68.9 77.7 119.1Oct 104.3 53.5 114.5 102.4 60.0 68.8 74.2 116.0Nov 100.4 54.4 114.7 102.1 59.4 67.8 76.7 117.7Dec 100.5 52.2 112.7 102.2 59.5 67.9 77.7 117.2
2003 Jan 100.5 55.7 107.0 101.4 59.9 71.0 70.9 118.1Feb 102.1 56.2 113.7 101.3 60.4 70.1 77.0 116.7
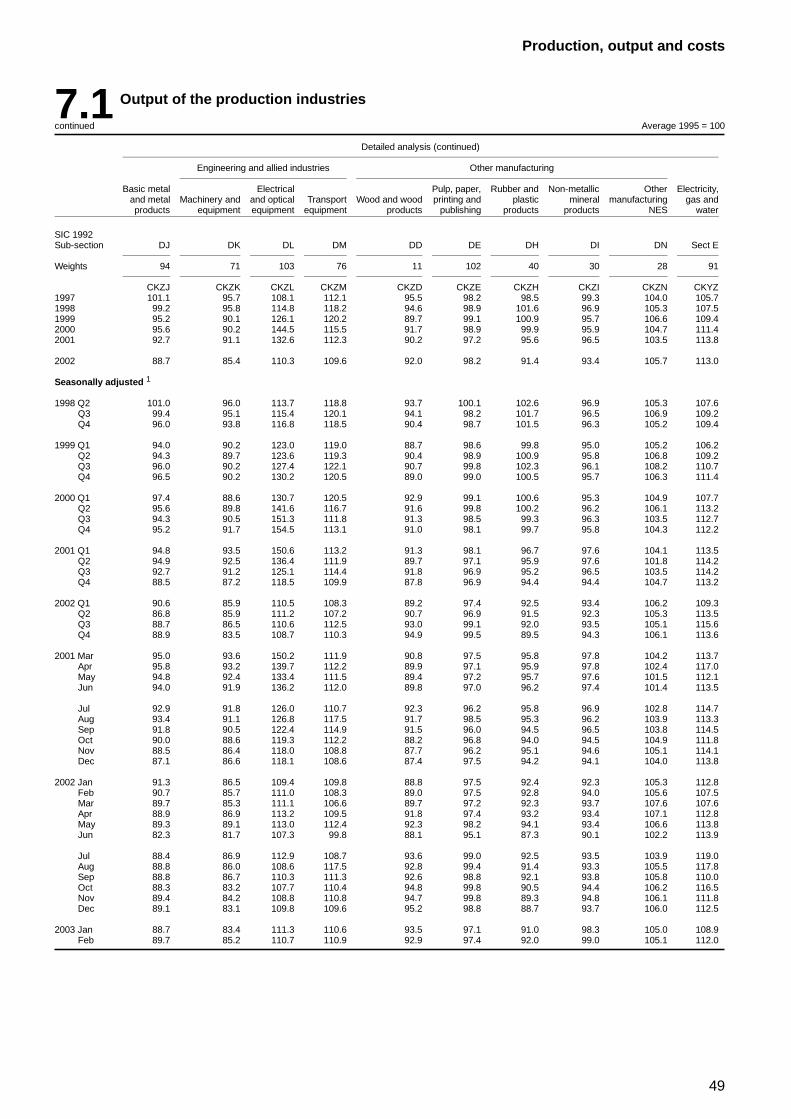
49
Production, output and costs
7.1 Output of the production industries
continued Average 1995 = 100
Detailed analysis (continued)
Engineering and allied industries Other manufacturing
Basic metal Electrical Pulp, paper, Rubber and Non-metallic Other Electricity,and metal Machinery and and optical Transport Wood and wood printing and plastic mineral manufacturing gas andproducts equipment equipment equipment products publishing products products NES water
SIC 1992Sub-section DJ DK DL DM DD DE DH DI DN Sect E
Weights 94 71 103 76 11 102 40 30 28 91
CKZJ CKZK CKZL CKZM CKZD CKZE CKZH CKZI CKZN CKYZ1997 101.1 95.7 108.1 112.1 95.5 98.2 98.5 99.3 104.0 105.71998 99.2 95.8 114.8 118.2 94.6 98.9 101.6 96.9 105.3 107.51999 95.2 90.1 126.1 120.2 89.7 99.1 100.9 95.7 106.6 109.42000 95.6 90.2 144.5 115.5 91.7 98.9 99.9 95.9 104.7 111.42001 92.7 91.1 132.6 112.3 90.2 97.2 95.6 96.5 103.5 113.8
2002 88.7 85.4 110.3 109.6 92.0 98.2 91.4 93.4 105.7 113.0
Seasonally adjusted 1
1998 Q2 101.0 96.0 113.7 118.8 93.7 100.1 102.6 96.9 105.3 107.6Q3 99.4 95.1 115.4 120.1 94.1 98.2 101.7 96.5 106.9 109.2Q4 96.0 93.8 116.8 118.5 90.4 98.7 101.5 96.3 105.2 109.4
1999 Q1 94.0 90.2 123.0 119.0 88.7 98.6 99.8 95.0 105.2 106.2Q2 94.3 89.7 123.6 119.3 90.4 98.9 100.9 95.8 106.8 109.2Q3 96.0 90.2 127.4 122.1 90.7 99.8 102.3 96.1 108.2 110.7Q4 96.5 90.2 130.2 120.5 89.0 99.0 100.5 95.7 106.3 111.4
2000 Q1 97.4 88.6 130.7 120.5 92.9 99.1 100.6 95.3 104.9 107.7Q2 95.6 89.8 141.6 116.7 91.6 99.8 100.2 96.2 106.1 113.2Q3 94.3 90.5 151.3 111.8 91.3 98.5 99.3 96.3 103.5 112.7Q4 95.2 91.7 154.5 113.1 91.0 98.1 99.7 95.8 104.3 112.2
2001 Q1 94.8 93.5 150.6 113.2 91.3 98.1 96.7 97.6 104.1 113.5Q2 94.9 92.5 136.4 111.9 89.7 97.1 95.9 97.6 101.8 114.2Q3 92.7 91.2 125.1 114.4 91.8 96.9 95.2 96.5 103.5 114.2Q4 88.5 87.2 118.5 109.9 87.8 96.9 94.4 94.4 104.7 113.2
2002 Q1 90.6 85.9 110.5 108.3 89.2 97.4 92.5 93.4 106.2 109.3Q2 86.8 85.9 111.2 107.2 90.7 96.9 91.5 92.3 105.3 113.5Q3 88.7 86.5 110.6 112.5 93.0 99.1 92.0 93.5 105.1 115.6Q4 88.9 83.5 108.7 110.3 94.9 99.5 89.5 94.3 106.1 113.6
2001 Mar 95.0 93.6 150.2 111.9 90.8 97.5 95.8 97.8 104.2 113.7Apr 95.8 93.2 139.7 112.2 89.9 97.1 95.9 97.8 102.4 117.0May 94.8 92.4 133.4 111.5 89.4 97.2 95.7 97.6 101.5 112.1Jun 94.0 91.9 136.2 112.0 89.8 97.0 96.2 97.4 101.4 113.5
Jul 92.9 91.8 126.0 110.7 92.3 96.2 95.8 96.9 102.8 114.7Aug 93.4 91.1 126.8 117.5 91.7 98.5 95.3 96.2 103.9 113.3Sep 91.8 90.5 122.4 114.9 91.5 96.0 94.5 96.5 103.8 114.5Oct 90.0 88.6 119.3 112.2 88.2 96.8 94.0 94.5 104.9 111.8Nov 88.5 86.4 118.0 108.8 87.7 96.2 95.1 94.6 105.1 114.1Dec 87.1 86.6 118.1 108.6 87.4 97.5 94.2 94.1 104.0 113.8
2002 Jan 91.3 86.5 109.4 109.8 88.8 97.5 92.4 92.3 105.3 112.8Feb 90.7 85.7 111.0 108.3 89.0 97.5 92.8 94.0 105.6 107.5Mar 89.7 85.3 111.1 106.6 89.7 97.2 92.3 93.7 107.6 107.6Apr 88.9 86.9 113.2 109.5 91.8 97.4 93.2 93.4 107.1 112.8May 89.3 89.1 113.0 112.4 92.3 98.2 94.1 93.4 106.6 113.8Jun 82.3 81.7 107.3 99.8 88.1 95.1 87.3 90.1 102.2 113.9
Jul 88.4 86.9 112.9 108.7 93.6 99.0 92.5 93.5 103.9 119.0Aug 88.8 86.0 108.6 117.5 92.8 99.4 91.4 93.3 105.5 117.8Sep 88.8 86.7 110.3 111.3 92.6 98.8 92.1 93.8 105.8 110.0Oct 88.3 83.2 107.7 110.4 94.8 99.8 90.5 94.4 106.2 116.5Nov 89.4 84.2 108.8 110.8 94.7 99.8 89.3 94.8 106.1 111.8Dec 89.1 83.1 109.8 109.6 95.2 98.8 88.7 93.7 106.0 112.5
2003 Jan 88.7 83.4 111.3 110.6 93.5 97.1 91.0 98.3 105.0 108.9Feb 89.7 85.2 110.7 110.9 92.9 97.4 92.0 99.0 105.1 112.0
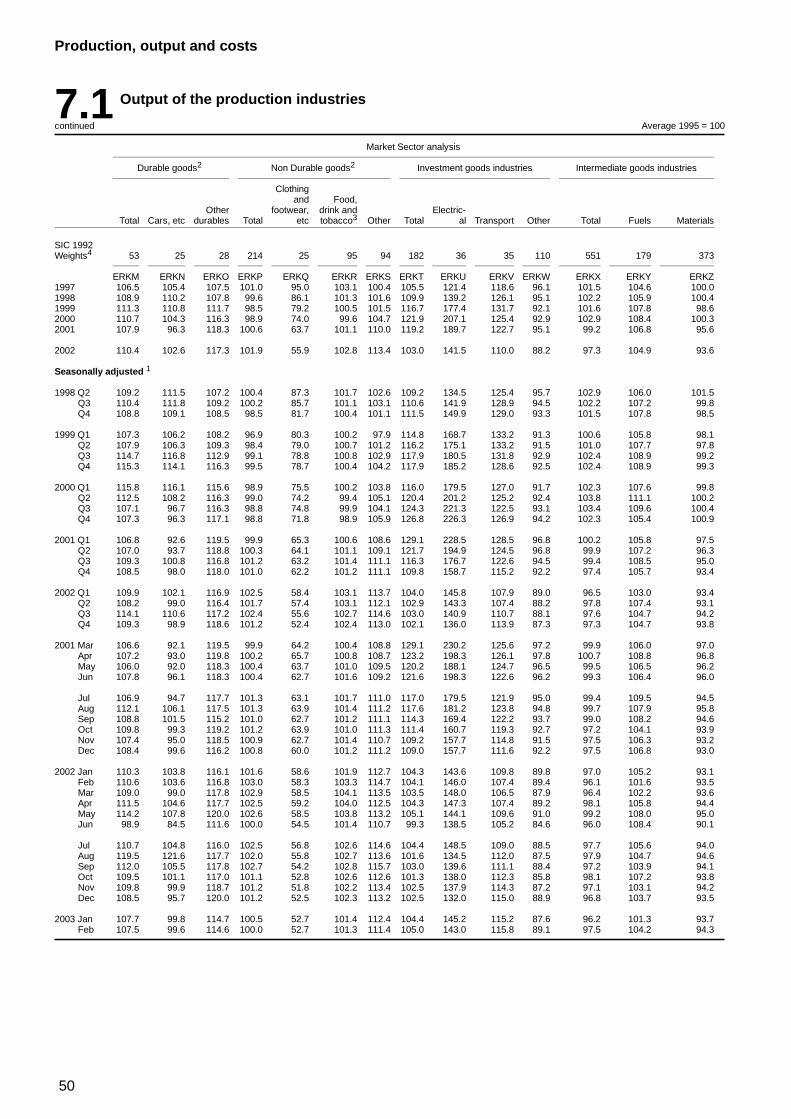
50
Production, output and costs
7.1 Output of the production industries
continued Average 1995 = 100
Market Sector analysis
Durable goods2 Non Durable goods2 Investment goods industries Intermediate goods industries
Clothingand Food,
Other footwear, drink and Electric-Total Cars, etc durables Total etc tobacco3 Other Total al Transport Other Total Fuels Materials
SIC 1992Weights4 53 25 28 214 25 95 94 182 36 35 110 551 179 373
ERKM ERKN ERKO ERKP ERKQ ERKR ERKS ERKT ERKU ERKV ERKW ERKX ERKY ERKZ1997 106.5 105.4 107.5 101.0 95.0 103.1 100.4 105.5 121.4 118.6 96.1 101.5 104.6 100.01998 108.9 110.2 107.8 99.6 86.1 101.3 101.6 109.9 139.2 126.1 95.1 102.2 105.9 100.41999 111.3 110.8 111.7 98.5 79.2 100.5 101.5 116.7 177.4 131.7 92.1 101.6 107.8 98.62000 110.7 104.3 116.3 98.9 74.0 99.6 104.7 121.9 207.1 125.4 92.9 102.9 108.4 100.32001 107.9 96.3 118.3 100.6 63.7 101.1 110.0 119.2 189.7 122.7 95.1 99.2 106.8 95.6
2002 110.4 102.6 117.3 101.9 55.9 102.8 113.4 103.0 141.5 110.0 88.2 97.3 104.9 93.6
Seasonally adjusted 1
1998 Q2 109.2 111.5 107.2 100.4 87.3 101.7 102.6 109.2 134.5 125.4 95.7 102.9 106.0 101.5Q3 110.4 111.8 109.2 100.2 85.7 101.1 103.1 110.6 141.9 128.9 94.5 102.2 107.2 99.8Q4 108.8 109.1 108.5 98.5 81.7 100.4 101.1 111.5 149.9 129.0 93.3 101.5 107.8 98.5
1999 Q1 107.3 106.2 108.2 96.9 80.3 100.2 97.9 114.8 168.7 133.2 91.3 100.6 105.8 98.1Q2 107.9 106.3 109.3 98.4 79.0 100.7 101.2 116.2 175.1 133.2 91.5 101.0 107.7 97.8Q3 114.7 116.8 112.9 99.1 78.8 100.8 102.9 117.9 180.5 131.8 92.9 102.4 108.9 99.2Q4 115.3 114.1 116.3 99.5 78.7 100.4 104.2 117.9 185.2 128.6 92.5 102.4 108.9 99.3
2000 Q1 115.8 116.1 115.6 98.9 75.5 100.2 103.8 116.0 179.5 127.0 91.7 102.3 107.6 99.8Q2 112.5 108.2 116.3 99.0 74.2 99.4 105.1 120.4 201.2 125.2 92.4 103.8 111.1 100.2Q3 107.1 96.7 116.3 98.8 74.8 99.9 104.1 124.3 221.3 122.5 93.1 103.4 109.6 100.4Q4 107.3 96.3 117.1 98.8 71.8 98.9 105.9 126.8 226.3 126.9 94.2 102.3 105.4 100.9
2001 Q1 106.8 92.6 119.5 99.9 65.3 100.6 108.6 129.1 228.5 128.5 96.8 100.2 105.8 97.5Q2 107.0 93.7 118.8 100.3 64.1 101.1 109.1 121.7 194.9 124.5 96.8 99.9 107.2 96.3Q3 109.3 100.8 116.8 101.2 63.2 101.4 111.1 116.3 176.7 122.6 94.5 99.4 108.5 95.0Q4 108.5 98.0 118.0 101.0 62.2 101.2 111.1 109.8 158.7 115.2 92.2 97.4 105.7 93.4
2002 Q1 109.9 102.1 116.9 102.5 58.4 103.1 113.7 104.0 145.8 107.9 89.0 96.5 103.0 93.4Q2 108.2 99.0 116.4 101.7 57.4 103.1 112.1 102.9 143.3 107.4 88.2 97.8 107.4 93.1Q3 114.1 110.6 117.2 102.4 55.6 102.7 114.6 103.0 140.9 110.7 88.1 97.6 104.7 94.2Q4 109.3 98.9 118.6 101.2 52.4 102.4 113.0 102.1 136.0 113.9 87.3 97.3 104.7 93.8
2001 Mar 106.6 92.1 119.5 99.9 64.2 100.4 108.8 129.1 230.2 125.6 97.2 99.9 106.0 97.0Apr 107.2 93.0 119.8 100.2 65.7 100.8 108.7 123.2 198.3 126.1 97.8 100.7 108.8 96.8May 106.0 92.0 118.3 100.4 63.7 101.0 109.5 120.2 188.1 124.7 96.5 99.5 106.5 96.2Jun 107.8 96.1 118.3 100.4 62.7 101.6 109.2 121.6 198.3 122.6 96.2 99.3 106.4 96.0
Jul 106.9 94.7 117.7 101.3 63.1 101.7 111.0 117.0 179.5 121.9 95.0 99.4 109.5 94.5Aug 112.1 106.1 117.5 101.3 63.9 101.4 111.2 117.6 181.2 123.8 94.8 99.7 107.9 95.8Sep 108.8 101.5 115.2 101.0 62.7 101.2 111.1 114.3 169.4 122.2 93.7 99.0 108.2 94.6Oct 109.8 99.3 119.2 101.2 63.9 101.0 111.3 111.4 160.7 119.3 92.7 97.2 104.1 93.9Nov 107.4 95.0 118.5 100.9 62.7 101.4 110.7 109.2 157.7 114.8 91.5 97.5 106.3 93.2Dec 108.4 99.6 116.2 100.8 60.0 101.2 111.2 109.0 157.7 111.6 92.2 97.5 106.8 93.0
2002 Jan 110.3 103.8 116.1 101.6 58.6 101.9 112.7 104.3 143.6 109.8 89.8 97.0 105.2 93.1Feb 110.6 103.6 116.8 103.0 58.3 103.3 114.7 104.1 146.0 107.4 89.4 96.1 101.6 93.5Mar 109.0 99.0 117.8 102.9 58.5 104.1 113.5 103.5 148.0 106.5 87.9 96.4 102.2 93.6Apr 111.5 104.6 117.7 102.5 59.2 104.0 112.5 104.3 147.3 107.4 89.2 98.1 105.8 94.4May 114.2 107.8 120.0 102.6 58.5 103.8 113.2 105.1 144.1 109.6 91.0 99.2 108.0 95.0Jun 98.9 84.5 111.6 100.0 54.5 101.4 110.7 99.3 138.5 105.2 84.6 96.0 108.4 90.1
Jul 110.7 104.8 116.0 102.5 56.8 102.6 114.6 104.4 148.5 109.0 88.5 97.7 105.6 94.0Aug 119.5 121.6 117.7 102.0 55.8 102.7 113.6 101.6 134.5 112.0 87.5 97.9 104.7 94.6Sep 112.0 105.5 117.8 102.7 54.2 102.8 115.7 103.0 139.6 111.1 88.4 97.2 103.9 94.1Oct 109.5 101.1 117.0 101.1 52.8 102.6 112.6 101.3 138.0 112.3 85.8 98.1 107.2 93.8Nov 109.8 99.9 118.7 101.2 51.8 102.2 113.4 102.5 137.9 114.3 87.2 97.1 103.1 94.2Dec 108.5 95.7 120.0 101.2 52.5 102.3 113.2 102.5 132.0 115.0 88.9 96.8 103.7 93.5
2003 Jan 107.7 99.8 114.7 100.5 52.7 101.4 112.4 104.4 145.2 115.2 87.6 96.2 101.3 93.7Feb 107.5 99.6 114.6 100.0 52.7 101.3 111.4 105.0 143.0 115.8 89.1 97.5 104.2 94.3
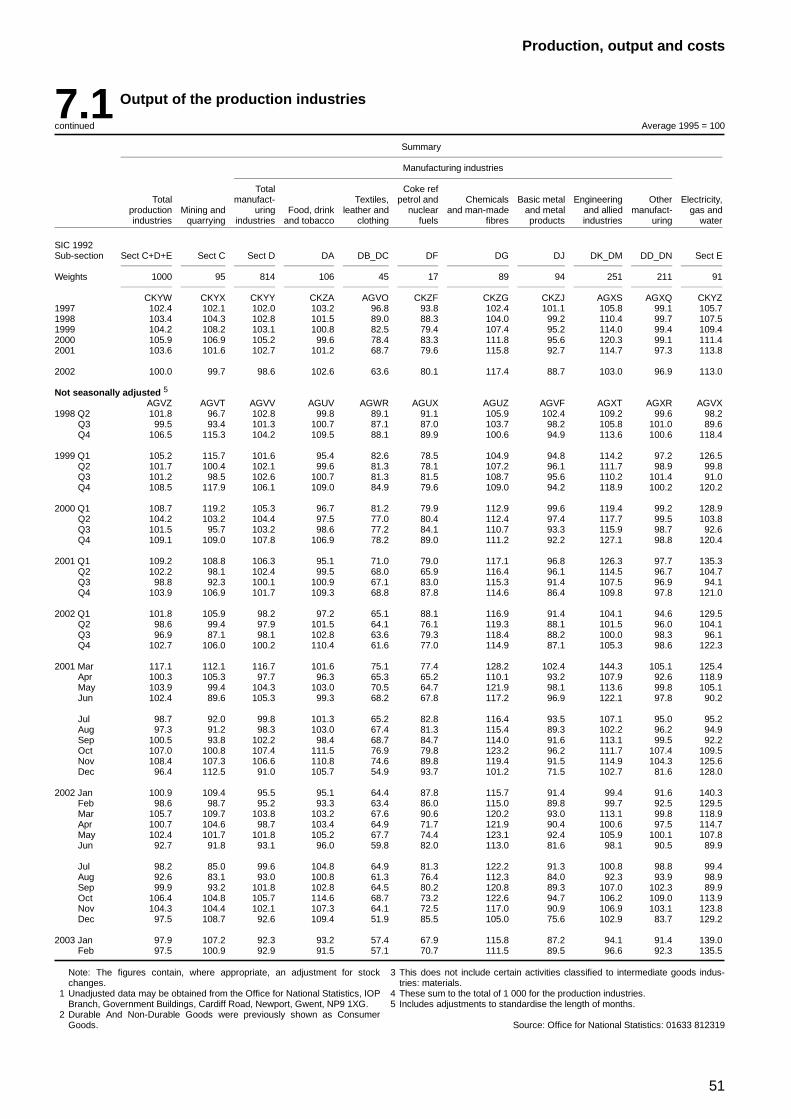
51
Production, output and costs
7.1 Output of the production industries
continued Average 1995 = 100
Summary
Manufacturing industries
Total Coke refTotal manufact- Textiles, petrol and Chemicals Basic metal Engineering Other Electricity,
production Mining and uring Food, drink leather and nuclear and man-made and metal and allied manufact- gas andindustries quarrying industries and tobacco clothing fuels fibres products industries uring water
SIC 1992Sub-section Sect C+D+E Sect C Sect D DA DB_DC DF DG DJ DK_DM DD_DN Sect E
Weights 1000 95 814 106 45 17 89 94 251 211 91
CKYW CKYX CKYY CKZA AGVO CKZF CKZG CKZJ AGXS AGXQ CKYZ1997 102.4 102.1 102.0 103.2 96.8 93.8 102.4 101.1 105.8 99.1 105.71998 103.4 104.3 102.8 101.5 89.0 88.3 104.0 99.2 110.4 99.7 107.51999 104.2 108.2 103.1 100.8 82.5 79.4 107.4 95.2 114.0 99.4 109.42000 105.9 106.9 105.2 99.6 78.4 83.3 111.8 95.6 120.3 99.1 111.42001 103.6 101.6 102.7 101.2 68.7 79.6 115.8 92.7 114.7 97.3 113.8
2002 100.0 99.7 98.6 102.6 63.6 80.1 117.4 88.7 103.0 96.9 113.0
Not seasonally adjusted 5
AGVZ AGVT AGVV AGUV AGWR AGUX AGUZ AGVF AGXT AGXR AGVX1998 Q2 101.8 96.7 102.8 99.8 89.1 91.1 105.9 102.4 109.2 99.6 98.2
Q3 99.5 93.4 101.3 100.7 87.1 87.0 103.7 98.2 105.8 101.0 89.6Q4 106.5 115.3 104.2 109.5 88.1 89.9 100.6 94.9 113.6 100.6 118.4
1999 Q1 105.2 115.7 101.6 95.4 82.6 78.5 104.9 94.8 114.2 97.2 126.5Q2 101.7 100.4 102.1 99.6 81.3 78.1 107.2 96.1 111.7 98.9 99.8Q3 101.2 98.5 102.6 100.7 81.3 81.5 108.7 95.6 110.2 101.4 91.0Q4 108.5 117.9 106.1 109.0 84.9 79.6 109.0 94.2 118.9 100.2 120.2
2000 Q1 108.7 119.2 105.3 96.7 81.2 79.9 112.9 99.6 119.4 99.2 128.9Q2 104.2 103.2 104.4 97.5 77.0 80.4 112.4 97.4 117.7 99.5 103.8Q3 101.5 95.7 103.2 98.6 77.2 84.1 110.7 93.3 115.9 98.7 92.6Q4 109.1 109.0 107.8 106.9 78.2 89.0 111.2 92.2 127.1 98.8 120.4
2001 Q1 109.2 108.8 106.3 95.1 71.0 79.0 117.1 96.8 126.3 97.7 135.3Q2 102.2 98.1 102.4 99.5 68.0 65.9 116.4 96.1 114.5 96.7 104.7Q3 98.8 92.3 100.1 100.9 67.1 83.0 115.3 91.4 107.5 96.9 94.1Q4 103.9 106.9 101.7 109.3 68.8 87.8 114.6 86.4 109.8 97.8 121.0
2002 Q1 101.8 105.9 98.2 97.2 65.1 88.1 116.9 91.4 104.1 94.6 129.5Q2 98.6 99.4 97.9 101.5 64.1 76.1 119.3 88.1 101.5 96.0 104.1Q3 96.9 87.1 98.1 102.8 63.6 79.3 118.4 88.2 100.0 98.3 96.1Q4 102.7 106.0 100.2 110.4 61.6 77.0 114.9 87.1 105.3 98.6 122.3
2001 Mar 117.1 112.1 116.7 101.6 75.1 77.4 128.2 102.4 144.3 105.1 125.4Apr 100.3 105.3 97.7 96.3 65.3 65.2 110.1 93.2 107.9 92.6 118.9May 103.9 99.4 104.3 103.0 70.5 64.7 121.9 98.1 113.6 99.8 105.1Jun 102.4 89.6 105.3 99.3 68.2 67.8 117.2 96.9 122.1 97.8 90.2
Jul 98.7 92.0 99.8 101.3 65.2 82.8 116.4 93.5 107.1 95.0 95.2Aug 97.3 91.2 98.3 103.0 67.4 81.3 115.4 89.3 102.2 96.2 94.9Sep 100.5 93.8 102.2 98.4 68.7 84.7 114.0 91.6 113.1 99.5 92.2Oct 107.0 100.8 107.4 111.5 76.9 79.8 123.2 96.2 111.7 107.4 109.5Nov 108.4 107.3 106.6 110.8 74.6 89.8 119.4 91.5 114.9 104.3 125.6Dec 96.4 112.5 91.0 105.7 54.9 93.7 101.2 71.5 102.7 81.6 128.0
2002 Jan 100.9 109.4 95.5 95.1 64.4 87.8 115.7 91.4 99.4 91.6 140.3Feb 98.6 98.7 95.2 93.3 63.4 86.0 115.0 89.8 99.7 92.5 129.5Mar 105.7 109.7 103.8 103.2 67.6 90.6 120.2 93.0 113.1 99.8 118.9Apr 100.7 104.6 98.7 103.4 64.9 71.7 121.9 90.4 100.6 97.5 114.7May 102.4 101.7 101.8 105.2 67.7 74.4 123.1 92.4 105.9 100.1 107.8Jun 92.7 91.8 93.1 96.0 59.8 82.0 113.0 81.6 98.1 90.5 89.9
Jul 98.2 85.0 99.6 104.8 64.9 81.3 122.2 91.3 100.8 98.8 99.4Aug 92.6 83.1 93.0 100.8 61.3 76.4 112.3 84.0 92.3 93.9 98.9Sep 99.9 93.2 101.8 102.8 64.5 80.2 120.8 89.3 107.0 102.3 89.9Oct 106.4 104.8 105.7 114.6 68.7 73.2 122.6 94.7 106.2 109.0 113.9Nov 104.3 104.4 102.1 107.3 64.1 72.5 117.0 90.9 106.9 103.1 123.8Dec 97.5 108.7 92.6 109.4 51.9 85.5 105.0 75.6 102.9 83.7 129.2
2003 Jan 97.9 107.2 92.3 93.2 57.4 67.9 115.8 87.2 94.1 91.4 139.0Feb 97.5 100.9 92.9 91.5 57.1 70.7 111.5 89.5 96.6 92.3 135.5
Note: The figures contain, where appropriate, an adjustment for stockchanges.
1 Unadjusted data may be obtained from the Office for National Statistics, IOPBranch, Government Buildings, Cardiff Road, Newport, Gwent, NP9 1XG.
2 Durable And Non-Durable Goods were previously shown as ConsumerGoods.
3 This does not include certain activities classified to intermediate goods indus-tries: materials.
4 These sum to the total of 1 000 for the production industries.5 Includes adjustments to standardise the length of months.
Source: Office for National Statistics: 01633 812319
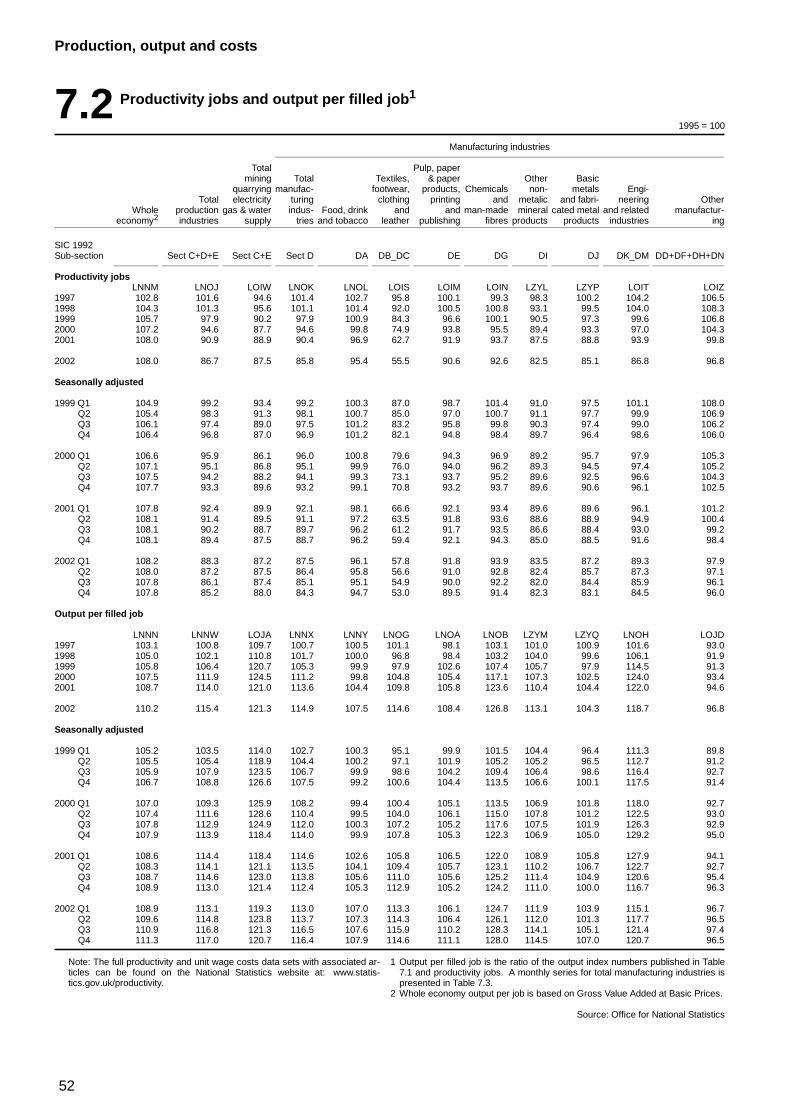
52
Production, output and costs
7.2 Productivity jobs and output per filled job1
1995 = 100
Manufacturing industries
Total Pulp, papermining Total Textiles, & paper Other Basic
quarrying manufac- footwear, products, Chemicals non- metals Engi-Total electricity turing clothing printing and metalic and fabri- neering Other
Whole production gas & water indus- Food, drink and and man-made mineral cated metal and related manufactur-economy2 industries supply tries and tobacco leather publishing fibres products products industries ing
SIC 1992Sub-section Sect C+D+E Sect C+E Sect D DA DB_DC DE DG DI DJ DK_DM DD+DF+DH+DN
Productivity jobsLNNM LNOJ LOIW LNOK LNOL LOIS LOIM LOIN LZYL LZYP LOIT LOIZ
1997 102.8 101.6 94.6 101.4 102.7 95.8 100.1 99.3 98.3 100.2 104.2 106.51998 104.3 101.3 95.6 101.1 101.4 92.0 100.5 100.8 93.1 99.5 104.0 108.31999 105.7 97.9 90.2 97.9 100.9 84.3 96.6 100.1 90.5 97.3 99.6 106.82000 107.2 94.6 87.7 94.6 99.8 74.9 93.8 95.5 89.4 93.3 97.0 104.32001 108.0 90.9 88.9 90.4 96.9 62.7 91.9 93.7 87.5 88.8 93.9 99.8
2002 108.0 86.7 87.5 85.8 95.4 55.5 90.6 92.6 82.5 85.1 86.8 96.8
Seasonally adjusted
1999 Q1 104.9 99.2 93.4 99.2 100.3 87.0 98.7 101.4 91.0 97.5 101.1 108.0Q2 105.4 98.3 91.3 98.1 100.7 85.0 97.0 100.7 91.1 97.7 99.9 106.9Q3 106.1 97.4 89.0 97.5 101.2 83.2 95.8 99.8 90.3 97.4 99.0 106.2Q4 106.4 96.8 87.0 96.9 101.2 82.1 94.8 98.4 89.7 96.4 98.6 106.0
2000 Q1 106.6 95.9 86.1 96.0 100.8 79.6 94.3 96.9 89.2 95.7 97.9 105.3Q2 107.1 95.1 86.8 95.1 99.9 76.0 94.0 96.2 89.3 94.5 97.4 105.2Q3 107.5 94.2 88.2 94.1 99.3 73.1 93.7 95.2 89.6 92.5 96.6 104.3Q4 107.7 93.3 89.6 93.2 99.1 70.8 93.2 93.7 89.6 90.6 96.1 102.5
2001 Q1 107.8 92.4 89.9 92.1 98.1 66.6 92.1 93.4 89.6 89.6 96.1 101.2Q2 108.1 91.4 89.5 91.1 97.2 63.5 91.8 93.6 88.6 88.9 94.9 100.4Q3 108.1 90.2 88.7 89.7 96.2 61.2 91.7 93.5 86.6 88.4 93.0 99.2Q4 108.1 89.4 87.5 88.7 96.2 59.4 92.1 94.3 85.0 88.5 91.6 98.4
2002 Q1 108.2 88.3 87.2 87.5 96.1 57.8 91.8 93.9 83.5 87.2 89.3 97.9Q2 108.0 87.2 87.5 86.4 95.8 56.6 91.0 92.8 82.4 85.7 87.3 97.1Q3 107.8 86.1 87.4 85.1 95.1 54.9 90.0 92.2 82.0 84.4 85.9 96.1Q4 107.8 85.2 88.0 84.3 94.7 53.0 89.5 91.4 82.3 83.1 84.5 96.0
Output per filled job
LNNN LNNW LOJA LNNX LNNY LNOG LNOA LNOB LZYM LZYQ LNOH LOJD1997 103.1 100.8 109.7 100.7 100.5 101.1 98.1 103.1 101.0 100.9 101.6 93.01998 105.0 102.1 110.8 101.7 100.0 96.8 98.4 103.2 104.0 99.6 106.1 91.91999 105.8 106.4 120.7 105.3 99.9 97.9 102.6 107.4 105.7 97.9 114.5 91.32000 107.5 111.9 124.5 111.2 99.8 104.8 105.4 117.1 107.3 102.5 124.0 93.42001 108.7 114.0 121.0 113.6 104.4 109.8 105.8 123.6 110.4 104.4 122.0 94.6
2002 110.2 115.4 121.3 114.9 107.5 114.6 108.4 126.8 113.1 104.3 118.7 96.8
Seasonally adjusted
1999 Q1 105.2 103.5 114.0 102.7 100.3 95.1 99.9 101.5 104.4 96.4 111.3 89.8Q2 105.5 105.4 118.9 104.4 100.2 97.1 101.9 105.2 105.2 96.5 112.7 91.2Q3 105.9 107.9 123.5 106.7 99.9 98.6 104.2 109.4 106.4 98.6 116.4 92.7Q4 106.7 108.8 126.6 107.5 99.2 100.6 104.4 113.5 106.6 100.1 117.5 91.4
2000 Q1 107.0 109.3 125.9 108.2 99.4 100.4 105.1 113.5 106.9 101.8 118.0 92.7Q2 107.4 111.6 128.6 110.4 99.5 104.0 106.1 115.0 107.8 101.2 122.5 93.0Q3 107.8 112.9 124.9 112.0 100.3 107.2 105.2 117.6 107.5 101.9 126.3 92.9Q4 107.9 113.9 118.4 114.0 99.9 107.8 105.3 122.3 106.9 105.0 129.2 95.0
2001 Q1 108.6 114.4 118.4 114.6 102.6 105.8 106.5 122.0 108.9 105.8 127.9 94.1Q2 108.3 114.1 121.1 113.5 104.1 109.4 105.7 123.1 110.2 106.7 122.7 92.7Q3 108.7 114.6 123.0 113.8 105.6 111.0 105.6 125.2 111.4 104.9 120.6 95.4Q4 108.9 113.0 121.4 112.4 105.3 112.9 105.2 124.2 111.0 100.0 116.7 96.3
2002 Q1 108.9 113.1 119.3 113.0 107.0 113.3 106.1 124.7 111.9 103.9 115.1 96.7Q2 109.6 114.8 123.8 113.7 107.3 114.3 106.4 126.1 112.0 101.3 117.7 96.5Q3 110.9 116.8 121.3 116.5 107.6 115.9 110.2 128.3 114.1 105.1 121.4 97.4Q4 111.3 117.0 120.7 116.4 107.9 114.6 111.1 128.0 114.5 107.0 120.7 96.5
Note: The full productivity and unit wage costs data sets with associated ar-ticles can be found on the National Statistics website at: www.statis-tics.gov.uk/productivity.
1 Output per filled job is the ratio of the output index numbers published in Table7.1 and productivity jobs. A monthly series for total manufacturing industries ispresented in Table 7.3.
2 Whole economy output per job is based on Gross Value Added at Basic Prices.
Source: Office for National Statistics
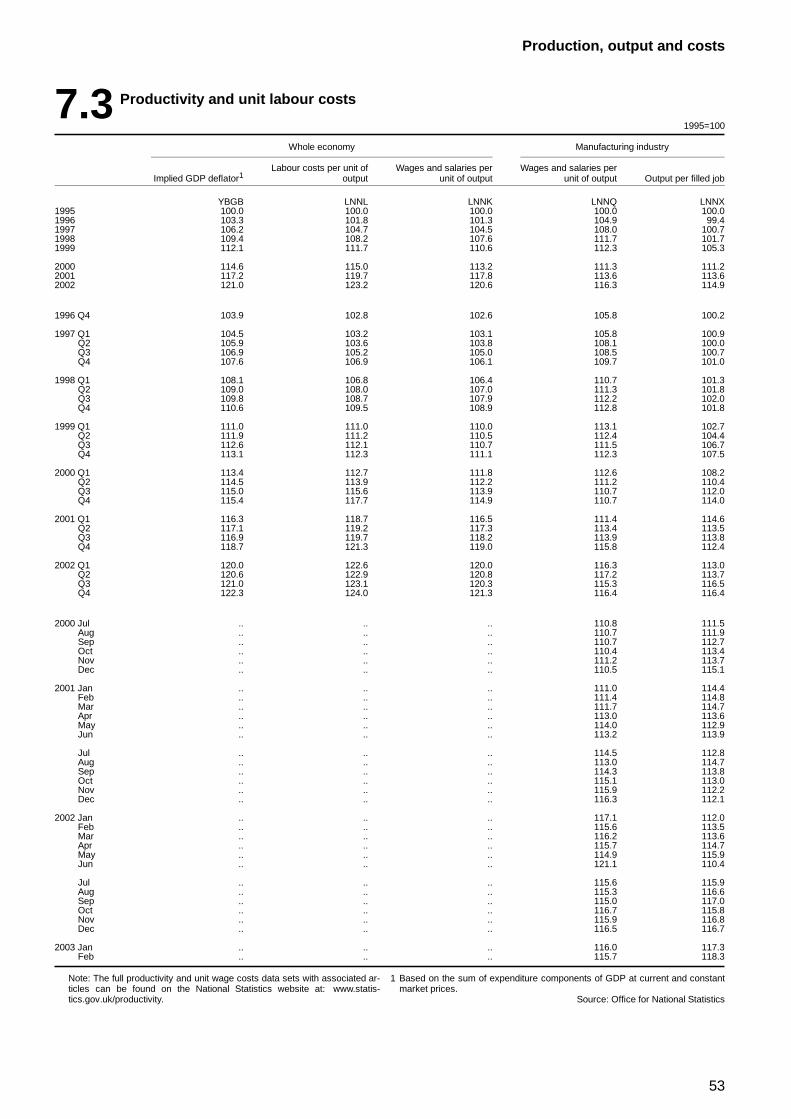
53
Production, output and costs
7.3 Productivity and unit labour costs
1995=100
Whole economy Manufacturing industry
Labour costs per unit of Wages and salaries per Wages and salaries perImplied GDP deflator1 output unit of output unit of output Output per filled job
YBGB LNNL LNNK LNNQ LNNX1995 100.0 100.0 100.0 100.0 100.01996 103.3 101.8 101.3 104.9 99.41997 106.2 104.7 104.5 108.0 100.71998 109.4 108.2 107.6 111.7 101.71999 112.1 111.7 110.6 112.3 105.3
2000 114.6 115.0 113.2 111.3 111.22001 117.2 119.7 117.8 113.6 113.62002 121.0 123.2 120.6 116.3 114.9
1996 Q4 103.9 102.8 102.6 105.8 100.2
1997 Q1 104.5 103.2 103.1 105.8 100.9Q2 105.9 103.6 103.8 108.1 100.0Q3 106.9 105.2 105.0 108.5 100.7Q4 107.6 106.9 106.1 109.7 101.0
1998 Q1 108.1 106.8 106.4 110.7 101.3Q2 109.0 108.0 107.0 111.3 101.8Q3 109.8 108.7 107.9 112.2 102.0Q4 110.6 109.5 108.9 112.8 101.8
1999 Q1 111.0 111.0 110.0 113.1 102.7Q2 111.9 111.2 110.5 112.4 104.4Q3 112.6 112.1 110.7 111.5 106.7Q4 113.1 112.3 111.1 112.3 107.5
2000 Q1 113.4 112.7 111.8 112.6 108.2Q2 114.5 113.9 112.2 111.2 110.4Q3 115.0 115.6 113.9 110.7 112.0Q4 115.4 117.7 114.9 110.7 114.0
2001 Q1 116.3 118.7 116.5 111.4 114.6Q2 117.1 119.2 117.3 113.4 113.5Q3 116.9 119.7 118.2 113.9 113.8Q4 118.7 121.3 119.0 115.8 112.4
2002 Q1 120.0 122.6 120.0 116.3 113.0Q2 120.6 122.9 120.8 117.2 113.7Q3 121.0 123.1 120.3 115.3 116.5Q4 122.3 124.0 121.3 116.4 116.4
2000 Jul .. .. .. 110.8 111.5Aug .. .. .. 110.7 111.9Sep .. .. .. 110.7 112.7Oct .. .. .. 110.4 113.4Nov .. .. .. 111.2 113.7Dec .. .. .. 110.5 115.1
2001 Jan .. .. .. 111.0 114.4Feb .. .. .. 111.4 114.8Mar .. .. .. 111.7 114.7Apr .. .. .. 113.0 113.6May .. .. .. 114.0 112.9Jun .. .. .. 113.2 113.9
Jul .. .. .. 114.5 112.8Aug .. .. .. 113.0 114.7Sep .. .. .. 114.3 113.8Oct .. .. .. 115.1 113.0Nov .. .. .. 115.9 112.2Dec .. .. .. 116.3 112.1
2002 Jan .. .. .. 117.1 112.0Feb .. .. .. 115.6 113.5Mar .. .. .. 116.2 113.6Apr .. .. .. 115.7 114.7May .. .. .. 114.9 115.9Jun .. .. .. 121.1 110.4
Jul .. .. .. 115.6 115.9Aug .. .. .. 115.3 116.6Sep .. .. .. 115.0 117.0Oct .. .. .. 116.7 115.8Nov .. .. .. 115.9 116.8Dec .. .. .. 116.5 116.7
2003 Jan .. .. .. 116.0 117.3Feb .. .. .. 115.7 118.3
Note: The full productivity and unit wage costs data sets with associated ar-ticles can be found on the National Statistics website at: www.statis-tics.gov.uk/productivity.
1 Based on the sum of expenditure components of GDP at current and constantmarket prices.
Source: Office for National Statistics
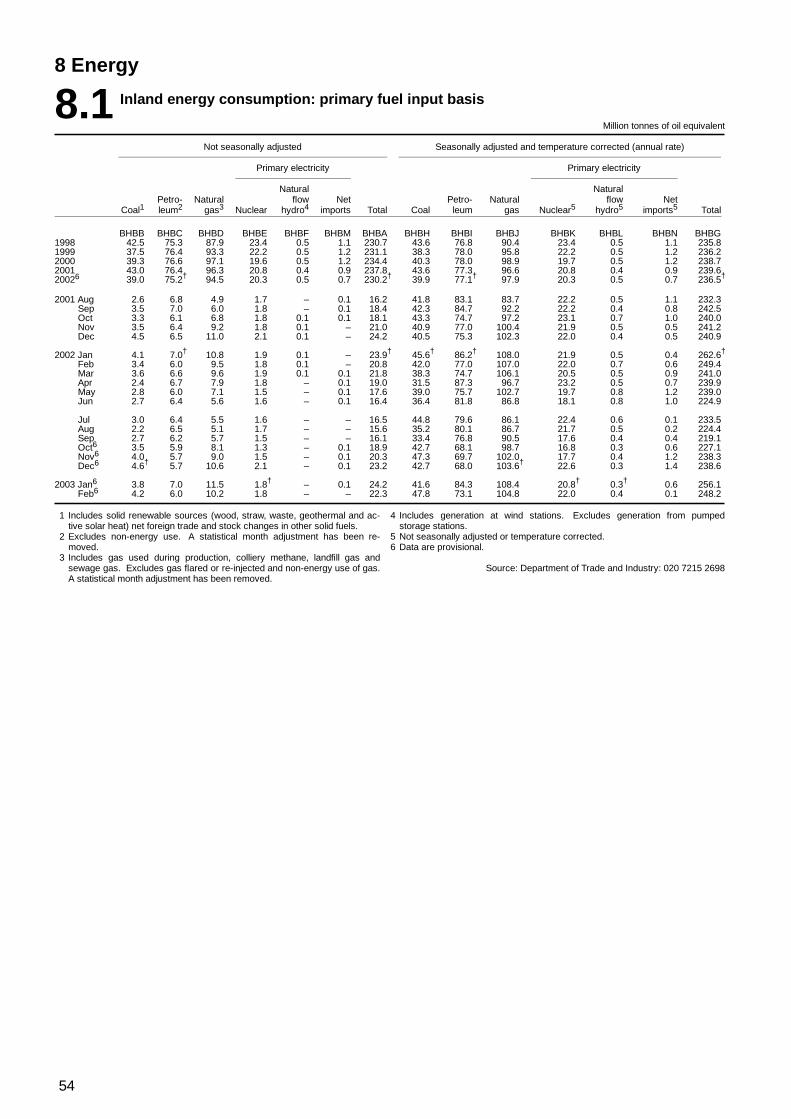
54
8 Energy
8.1 Inland energy consumption: primary fuel input basis
Million tonnes of oil equivalent
Not seasonally adjusted Seasonally adjusted and temperature corrected (annual rate)
Primary electricity Primary electricity
Natural NaturalPetro- Natural flow Net Petro- Natural flow Net
Coal1 leum2 gas3 Nuclear hydro4 imports Total Coal leum gas Nuclear5 hydro5 imports5 Total
BHBB BHBC BHBD BHBE BHBF BHBM BHBA BHBH BHBI BHBJ BHBK BHBL BHBN BHBG1998 42.5 75.3 87.9 23.4 0.5 1.1 230.7 43.6 76.8 90.4 23.4 0.5 1.1 235.81999 37.5 76.4 93.3 22.2 0.5 1.2 231.1 38.3 78.0 95.8 22.2 0.5 1.2 236.22000 39.3 76.6 97.1 19.6 0.5 1.2 234.4 40.3 78.0 98.9 19.7 0.5 1.2 238.72001 43.0 76.4 96.3 20.8 0.4 0.9 237.8 43.6 77.3 96.6 20.8 0.4 0.9 239.620026 39.0 75.2† 94.5 20.3 0.5 0.7 230.2† 39.9 77.1† 97.9 20.3 0.5 0.7 236.5†
2001 Aug 2.6 6.8 4.9 1.7 – 0.1 16.2 41.8 83.1 83.7 22.2 0.5 1.1 232.3Sep 3.5 7.0 6.0 1.8 – 0.1 18.4 42.3 84.7 92.2 22.2 0.4 0.8 242.5Oct 3.3 6.1 6.8 1.8 0.1 0.1 18.1 43.3 74.7 97.2 23.1 0.7 1.0 240.0Nov 3.5 6.4 9.2 1.8 0.1 – 21.0 40.9 77.0 100.4 21.9 0.5 0.5 241.2Dec 4.5 6.5 11.0 2.1 0.1 – 24.2 40.5 75.3 102.3 22.0 0.4 0.5 240.9
2002 Jan 4.1 7.0† 10.8 1.9 0.1 – 23.9† 45.6† 86.2† 108.0 21.9 0.5 0.4 262.6†
Feb 3.4 6.0 9.5 1.8 0.1 – 20.8 42.0 77.0 107.0 22.0 0.7 0.6 249.4Mar 3.6 6.6 9.6 1.9 0.1 0.1 21.8 38.3 74.7 106.1 20.5 0.5 0.9 241.0Apr 2.4 6.7 7.9 1.8 – 0.1 19.0 31.5 87.3 96.7 23.2 0.5 0.7 239.9May 2.8 6.0 7.1 1.5 – 0.1 17.6 39.0 75.7 102.7 19.7 0.8 1.2 239.0Jun 2.7 6.4 5.6 1.6 – 0.1 16.4 36.4 81.8 86.8 18.1 0.8 1.0 224.9
Jul 3.0 6.4 5.5 1.6 – – 16.5 44.8 79.6 86.1 22.4 0.6 0.1 233.5Aug 2.2 6.5 5.1 1.7 – – 15.6 35.2 80.1 86.7 21.7 0.5 0.2 224.4Sep 2.7 6.2 5.7 1.5 – – 16.1 33.4 76.8 90.5 17.6 0.4 0.4 219.1Oct6 3.5 5.9 8.1 1.3 – 0.1 18.9 42.7 68.1 98.7 16.8 0.3 0.6 227.1Nov6 4.0 5.7 9.0 1.5 – 0.1 20.3 47.3 69.7 102.0 17.7 0.4 1.2 238.3Dec6 4.6† 5.7 10.6 2.1 – 0.1 23.2 42.7 68.0 103.6† 22.6 0.3 1.4 238.6
2003 Jan6 3.8 7.0 11.5 1.8† – 0.1 24.2 41.6 84.3 108.4 20.8† 0.3† 0.6 256.1Feb6 4.2 6.0 10.2 1.8 – – 22.3 47.8 73.1 104.8 22.0 0.4 0.1 248.2
1 Includes solid renewable sources (wood, straw, waste, geothermal and ac-tive solar heat) net foreign trade and stock changes in other solid fuels.
2 Excludes non-energy use. A statistical month adjustment has been re-moved.
3 Includes gas used during production, colliery methane, landfill gas andsewage gas. Excludes gas flared or re-injected and non-energy use of gas.A statistical month adjustment has been removed.
4 Includes generation at wind stations. Excludes generation from pumpedstorage stations.
5 Not seasonally adjusted or temperature corrected.6 Data are provisional.
Source: Department of Trade and Industry: 020 7215 2698
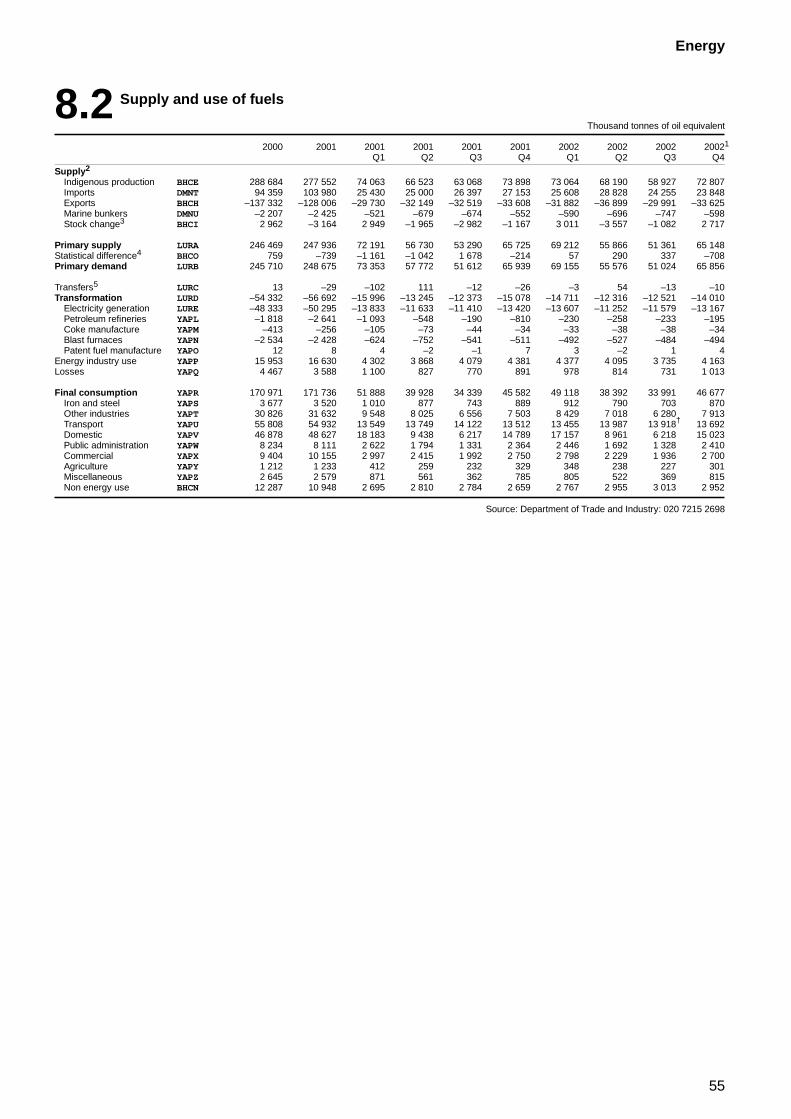
55
Energy
8.2 Supply and use of fuels
Thousand tonnes of oil equivalent
2000 2001 2001 2001 2001 2001 2002 2002 2002 20021
Q1 Q2 Q3 Q4 Q1 Q2 Q3 Q4
Supply2
Indigenous production BHCE 288 684 277 552 74 063 66 523 63 068 73 898 73 064 68 190 58 927 72 807Imports DMNT 94 359 103 980 25 430 25 000 26 397 27 153 25 608 28 828 24 255 23 848Exports BHCH –137 332 –128 006 –29 730 –32 149 –32 519 –33 608 –31 882 –36 899 –29 991 –33 625Marine bunkers DMNU –2 207 –2 425 –521 –679 –674 –552 –590 –696 –747 –598Stock change3 BHCI 2 962 –3 164 2 949 –1 965 –2 982 –1 167 3 011 –3 557 –1 082 2 717
Primary supply LURA 246 469 247 936 72 191 56 730 53 290 65 725 69 212 55 866 51 361 65 148Statistical difference4 BHCO 759 –739 –1 161 –1 042 1 678 –214 57 290 337 –708Primary demand LURB 245 710 248 675 73 353 57 772 51 612 65 939 69 155 55 576 51 024 65 856
Transfers5 LURC 13 –29 –102 111 –12 –26 –3 54 –13 –10Transformation LURD –54 332 –56 692 –15 996 –13 245 –12 373 –15 078 –14 711 –12 316 –12 521 –14 010
Electricity generation LURE –48 333 –50 295 –13 833 –11 633 –11 410 –13 420 –13 607 –11 252 –11 579 –13 167Petroleum refineries YAPL –1 818 –2 641 –1 093 –548 –190 –810 –230 –258 –233 –195Coke manufacture YAPM –413 –256 –105 –73 –44 –34 –33 –38 –38 –34Blast furnaces YAPN –2 534 –2 428 –624 –752 –541 –511 –492 –527 –484 –494Patent fuel manufacture YAPO 12 8 4 –2 –1 7 3 –2 1 4
Energy industry use YAPP 15 953 16 630 4 302 3 868 4 079 4 381 4 377 4 095 3 735 4 163Losses YAPQ 4 467 3 588 1 100 827 770 891 978 814 731 1 013
Final consumption YAPR 170 971 171 736 51 888 39 928 34 339 45 582 49 118 38 392 33 991 46 677Iron and steel YAPS 3 677 3 520 1 010 877 743 889 912 790 703 870Other industries YAPT 30 826 31 632 9 548 8 025 6 556 7 503 8 429 7 018 6 280 7 913Transport YAPU 55 808 54 932 13 549 13 749 14 122 13 512 13 455 13 987 13 918† 13 692Domestic YAPV 46 878 48 627 18 183 9 438 6 217 14 789 17 157 8 961 6 218 15 023Public administration YAPW 8 234 8 111 2 622 1 794 1 331 2 364 2 446 1 692 1 328 2 410Commercial YAPX 9 404 10 155 2 997 2 415 1 992 2 750 2 798 2 229 1 936 2 700Agriculture YAPY 1 212 1 233 412 259 232 329 348 238 227 301Miscellaneous YAPZ 2 645 2 579 871 561 362 785 805 522 369 815Non energy use BHCN 12 287 10 948 2 695 2 810 2 784 2 659 2 767 2 955 3 013 2 952
Source: Department of Trade and Industry: 020 7215 2698
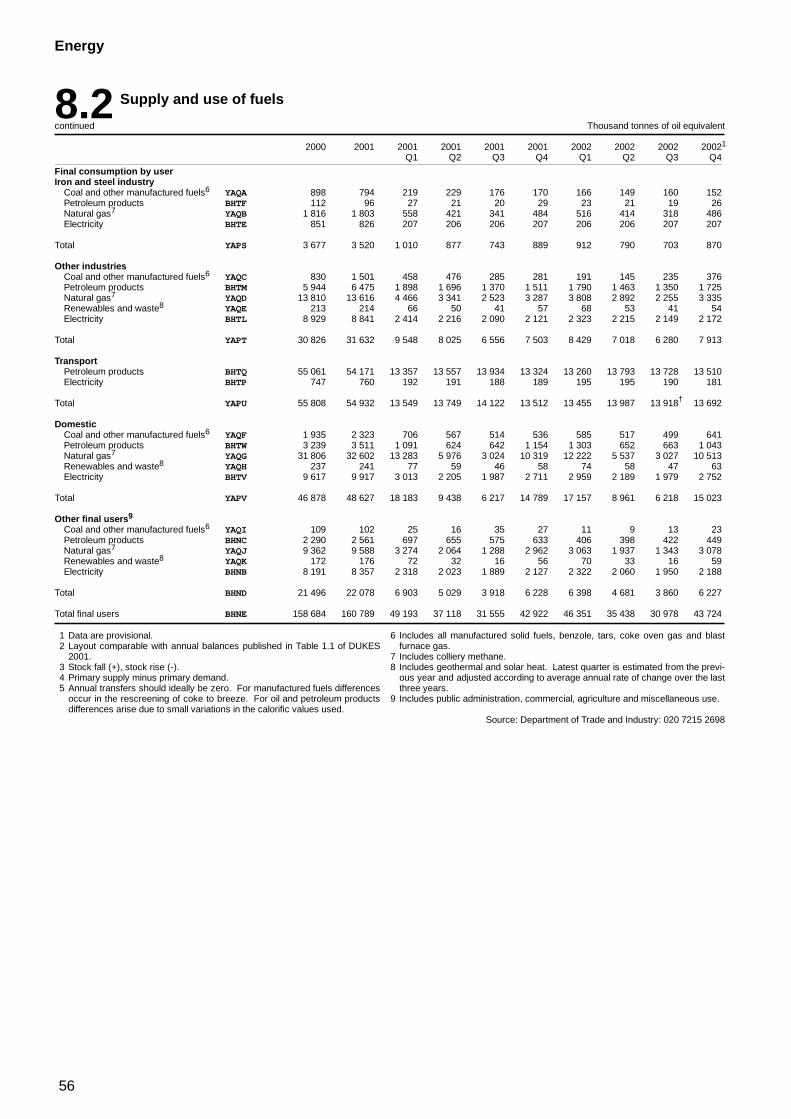
56
Energy
8.2 Supply and use of fuels
continued Thousand tonnes of oil equivalent
2000 2001 2001 2001 2001 2001 2002 2002 2002 20021
Q1 Q2 Q3 Q4 Q1 Q2 Q3 Q4
Final consumption by userIron and steel industry
Coal and other manufactured fuels6 YAQA 898 794 219 229 176 170 166 149 160 152Petroleum products BHTF 112 96 27 21 20 29 23 21 19 26Natural gas7 YAQB 1 816 1 803 558 421 341 484 516 414 318 486Electricity BHTE 851 826 207 206 206 207 206 206 207 207
Total YAPS 3 677 3 520 1 010 877 743 889 912 790 703 870
Other industriesCoal and other manufactured fuels6 YAQC 830 1 501 458 476 285 281 191 145 235 376Petroleum products BHTM 5 944 6 475 1 898 1 696 1 370 1 511 1 790 1 463 1 350 1 725Natural gas7 YAQD 13 810 13 616 4 466 3 341 2 523 3 287 3 808 2 892 2 255 3 335Renewables and waste8 YAQE 213 214 66 50 41 57 68 53 41 54Electricity BHTL 8 929 8 841 2 414 2 216 2 090 2 121 2 323 2 215 2 149 2 172
Total YAPT 30 826 31 632 9 548 8 025 6 556 7 503 8 429 7 018 6 280 7 913
TransportPetroleum products BHTQ 55 061 54 171 13 357 13 557 13 934 13 324 13 260 13 793 13 728 13 510Electricity BHTP 747 760 192 191 188 189 195 195 190 181
Total YAPU 55 808 54 932 13 549 13 749 14 122 13 512 13 455 13 987 13 918† 13 692
DomesticCoal and other manufactured fuels6 YAQF 1 935 2 323 706 567 514 536 585 517 499 641Petroleum products BHTW 3 239 3 511 1 091 624 642 1 154 1 303 652 663 1 043Natural gas7 YAQG 31 806 32 602 13 283 5 976 3 024 10 319 12 222 5 537 3 027 10 513Renewables and waste8 YAQH 237 241 77 59 46 58 74 58 47 63Electricity BHTV 9 617 9 917 3 013 2 205 1 987 2 711 2 959 2 189 1 979 2 752
Total YAPV 46 878 48 627 18 183 9 438 6 217 14 789 17 157 8 961 6 218 15 023
Other final users9
Coal and other manufactured fuels6 YAQI 109 102 25 16 35 27 11 9 13 23Petroleum products BHNC 2 290 2 561 697 655 575 633 406 398 422 449Natural gas7 YAQJ 9 362 9 588 3 274 2 064 1 288 2 962 3 063 1 937 1 343 3 078Renewables and waste8 YAQK 172 176 72 32 16 56 70 33 16 59Electricity BHNB 8 191 8 357 2 318 2 023 1 889 2 127 2 322 2 060 1 950 2 188
Total BHND 21 496 22 078 6 903 5 029 3 918 6 228 6 398 4 681 3 860 6 227
Total final users BHNE 158 684 160 789 49 193 37 118 31 555 42 922 46 351 35 438 30 978 43 724
1 Data are provisional.2 Layout comparable with annual balances published in Table 1.1 of DUKES
2001.3 Stock fall (+), stock rise (-).4 Primary supply minus primary demand.5 Annual transfers should ideally be zero. For manufactured fuels differences
occur in the rescreening of coke to breeze. For oil and petroleum productsdifferences arise due to small variations in the calorific values used.
6 Includes all manufactured solid fuels, benzole, tars, coke oven gas and blastfurnace gas.
7 Includes colliery methane.8 Includes geothermal and solar heat. Latest quarter is estimated from the previ-
ous year and adjusted according to average annual rate of change over the lastthree years.
9 Includes public administration, commercial, agriculture and miscellaneous use.
Source: Department of Trade and Industry: 020 7215 2698
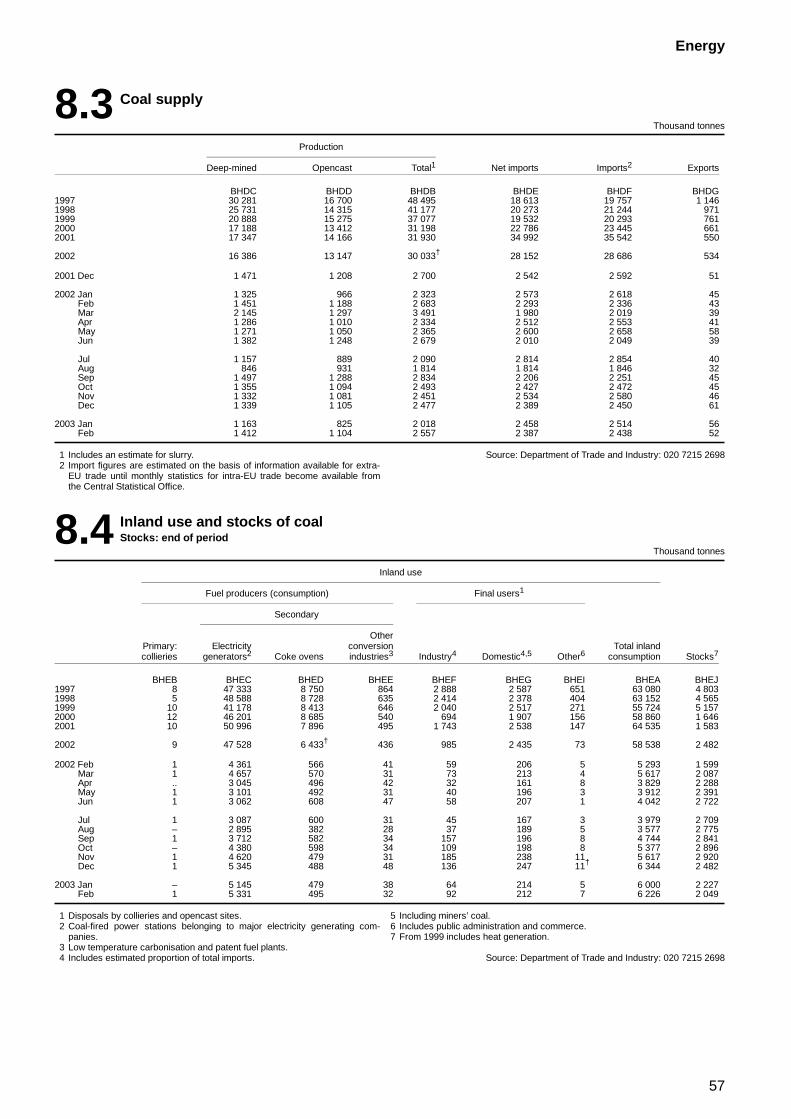
57
Energy
8.3 Coal supply
Thousand tonnes
Production
Deep-mined Opencast Total1 Net imports Imports2 Exports
BHDC BHDD BHDB BHDE BHDF BHDG1997 30 281 16 700 48 495 18 613 19 757 1 1461998 25 731 14 315 41 177 20 273 21 244 9711999 20 888 15 275 37 077 19 532 20 293 7612000 17 188 13 412 31 198 22 786 23 445 6612001 17 347 14 166 31 930 34 992 35 542 550
2002 16 386 13 147 30 033† 28 152 28 686 534
2001 Dec 1 471 1 208 2 700 2 542 2 592 51
2002 Jan 1 325 966 2 323 2 573 2 618 45Feb 1 451 1 188 2 683 2 293 2 336 43Mar 2 145 1 297 3 491 1 980 2 019 39Apr 1 286 1 010 2 334 2 512 2 553 41May 1 271 1 050 2 365 2 600 2 658 58Jun 1 382 1 248 2 679 2 010 2 049 39
Jul 1 157 889 2 090 2 814 2 854 40Aug 846 931 1 814 1 814 1 846 32Sep 1 497 1 288 2 834 2 206 2 251 45Oct 1 355 1 094 2 493 2 427 2 472 45Nov 1 332 1 081 2 451 2 534 2 580 46Dec 1 339 1 105 2 477 2 389 2 450 61
2003 Jan 1 163 825 2 018 2 458 2 514 56Feb 1 412 1 104 2 557 2 387 2 438 52
1 Includes an estimate for slurry.2 Import figures are estimated on the basis of information available for extra-
EU trade until monthly statistics for intra-EU trade become available fromthe Central Statistical Office.
Source: Department of Trade and Industry: 020 7215 2698
8.4 Inland use and stocks of coalStocks: end of period
Thousand tonnes
Inland use
Fuel producers (consumption) Final users1
Secondary
OtherPrimary: Electricity conversion Total inlandcollieries generators2 Coke ovens industries3 Industry4 Domestic4,5 Other6 consumption Stocks7
BHEB BHEC BHED BHEE BHEF BHEG BHEI BHEA BHEJ1997 8 47 333 8 750 864 2 888 2 587 651 63 080 4 8031998 5 48 588 8 728 635 2 414 2 378 404 63 152 4 5651999 10 41 178 8 413 646 2 040 2 517 271 55 724 5 1572000 12 46 201 8 685 540 694 1 907 156 58 860 1 6462001 10 50 996 7 896 495 1 743 2 538 147 64 535 1 583
2002 9 47 528 6 433† 436 985 2 435 73 58 538 2 482
2002 Feb 1 4 361 566 41 59 206 5 5 293 1 599Mar 1 4 657 570 31 73 213 4 5 617 2 087Apr .. 3 045 496 42 32 161 8 3 829 2 288May 1 3 101 492 31 40 196 3 3 912 2 391Jun 1 3 062 608 47 58 207 1 4 042 2 722
Jul 1 3 087 600 31 45 167 3 3 979 2 709Aug – 2 895 382 28 37 189 5 3 577 2 775Sep 1 3 712 582 34 157 196 8 4 744 2 841Oct – 4 380 598 34 109 198 8 5 377 2 896Nov 1 4 620 479 31 185 238 11 5 617 2 920Dec 1 5 345 488 48 136 247 11† 6 344 2 482
2003 Jan – 5 145 479 38 64 214 5 6 000 2 227Feb 1 5 331 495 32 92 212 7 6 226 2 049
1 Disposals by collieries and opencast sites.2 Coal-fired power stations belonging to major electricity generating com-
panies.3 Low temperature carbonisation and patent fuel plants.4 Includes estimated proportion of total imports.
5 Including miners’ coal.6 Includes public administration and commerce.7 From 1999 includes heat generation.
Source: Department of Trade and Industry: 020 7215 2698
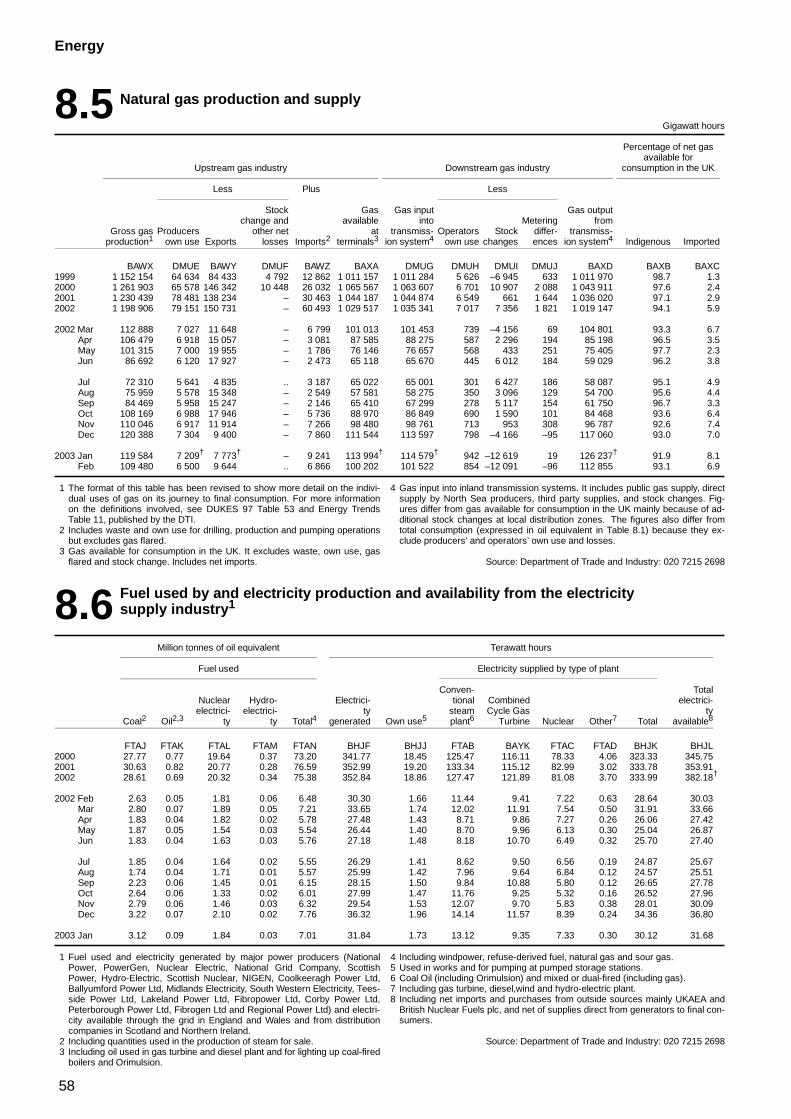
58
Energy
8.5 Natural gas production and supply
Gigawatt hours
Percentage of net gasavailable for
Upstream gas industry Downstream gas industry consumption in the UK
Less Plus Less
Stock Gas Gas input Gas outputchange and available into Metering from
Gross gas Producers other net at transmiss- Operators Stock differ- transmiss-production1 own use Exports losses Imports2 terminals3 ion system4 own use changes ences ion system4 Indigenous Imported
BAWX DMUE BAWY DMUF BAWZ BAXA DMUG DMUH DMUI DMUJ BAXD BAXB BAXC1999 1 152 154 64 634 84 433 4 792 12 862 1 011 157 1 011 284 5 626 –6 945 633 1 011 970 98.7 1.32000 1 261 903 65 578 146 342 10 448 26 032 1 065 567 1 063 607 6 701 10 907 2 088 1 043 911 97.6 2.42001 1 230 439 78 481 138 234 – 30 463 1 044 187 1 044 874 6 549 661 1 644 1 036 020 97.1 2.92002 1 198 906 79 151 150 731 – 60 493 1 029 517 1 035 341 7 017 7 356 1 821 1 019 147 94.1 5.9
2002 Mar 112 888 7 027 11 648 – 6 799 101 013 101 453 739 –4 156 69 104 801 93.3 6.7Apr 106 479 6 918 15 057 – 3 081 87 585 88 275 587 2 296 194 85 198 96.5 3.5May 101 315 7 000 19 955 – 1 786 76 146 76 657 568 433 251 75 405 97.7 2.3Jun 86 692 6 120 17 927 – 2 473 65 118 65 670 445 6 012 184 59 029 96.2 3.8
Jul 72 310 5 641 4 835 .. 3 187 65 022 65 001 301 6 427 186 58 087 95.1 4.9Aug 75 959 5 578 15 348 – 2 549 57 581 58 275 350 3 096 129 54 700 95.6 4.4Sep 84 469 5 958 15 247 – 2 146 65 410 67 299 278 5 117 154 61 750 96.7 3.3Oct 108 169 6 988 17 946 – 5 736 88 970 86 849 690 1 590 101 84 468 93.6 6.4Nov 110 046 6 917 11 914 – 7 266 98 480 98 761 713 953 308 96 787 92.6 7.4Dec 120 388 7 304 9 400 – 7 860 111 544 113 597 798 –4 166 –95 117 060 93.0 7.0
2003 Jan 119 584 7 209† 7 773† – 9 241 113 994† 114 579† 942 –12 619 19 126 237† 91.9 8.1Feb 109 480 6 500 9 644 .. 6 866 100 202 101 522 854 –12 091 –96 112 855 93.1 6.9
1 The format of this table has been revised to show more detail on the indivi-dual uses of gas on its journey to final consumption. For more informationon the definitions involved, see DUKES 97 Table 53 and Energy TrendsTable 11, published by the DTI.
2 Includes waste and own use for drilling, production and pumping operationsbut excludes gas flared.
3 Gas available for consumption in the UK. It excludes waste, own use, gasflared and stock change. Includes net imports.
4 Gas input into inland transmission systems. It includes public gas supply, directsupply by North Sea producers, third party supplies, and stock changes. Fig-ures differ from gas available for consumption in the UK mainly because of ad-ditional stock changes at local distribution zones. The figures also differ fromtotal consumption (expressed in oil equivalent in Table 8.1) because they ex-clude producers’ and operators’ own use and losses.
Source: Department of Trade and Industry: 020 7215 2698
8.6 Fuel used by and electricity production and availability from the electricitysupply industry1
Million tonnes of oil equivalent Terawatt hours
Fuel used Electricity supplied by type of plant
Conven- TotalNuclear Hydro- Electrici- tional Combined electrici-electrici- electrici- ty steam Cycle Gas ty
Coal2 Oil2,3 ty ty Total4 generated Own use5 plant6 Turbine Nuclear Other7 Total available8
FTAJ FTAK FTAL FTAM FTAN BHJF BHJJ FTAB BAYK FTAC FTAD BHJK BHJL2000 27.77 0.77 19.64 0.37 73.20 341.77 18.45 125.47 116.11 78.33 4.06 323.33 345.752001 30.63 0.82 20.77 0.28 76.59 352.99 19.20 133.34 115.12 82.99 3.02 333.78 353.912002 28.61 0.69 20.32 0.34 75.38 352.84 18.86 127.47 121.89 81.08 3.70 333.99 382.18†
2002 Feb 2.63 0.05 1.81 0.06 6.48 30.30 1.66 11.44 9.41 7.22 0.63 28.64 30.03Mar 2.80 0.07 1.89 0.05 7.21 33.65 1.74 12.02 11.91 7.54 0.50 31.91 33.66Apr 1.83 0.04 1.82 0.02 5.78 27.48 1.43 8.71 9.86 7.27 0.26 26.06 27.42May 1.87 0.05 1.54 0.03 5.54 26.44 1.40 8.70 9.96 6.13 0.30 25.04 26.87Jun 1.83 0.04 1.63 0.03 5.76 27.18 1.48 8.18 10.70 6.49 0.32 25.70 27.40
Jul 1.85 0.04 1.64 0.02 5.55 26.29 1.41 8.62 9.50 6.56 0.19 24.87 25.67Aug 1.74 0.04 1.71 0.01 5.57 25.99 1.42 7.96 9.64 6.84 0.12 24.57 25.51Sep 2.23 0.06 1.45 0.01 6.15 28.15 1.50 9.84 10.88 5.80 0.12 26.65 27.78Oct 2.64 0.06 1.33 0.02 6.01 27.99 1.47 11.76 9.25 5.32 0.16 26.52 27.96Nov 2.79 0.06 1.46 0.03 6.32 29.54 1.53 12.07 9.70 5.83 0.38 28.01 30.09Dec 3.22 0.07 2.10 0.02 7.76 36.32 1.96 14.14 11.57 8.39 0.24 34.36 36.80
2003 Jan 3.12 0.09 1.84 0.03 7.01 31.84 1.73 13.12 9.35 7.33 0.30 30.12 31.68
1 Fuel used and electricity generated by major power producers (NationalPower, PowerGen, Nuclear Electric, National Grid Company, ScottishPower, Hydro-Electric, Scottish Nuclear, NIGEN, Coolkeeragh Power Ltd,Ballyumford Power Ltd, Midlands Electricity, South Western Electricity, Tees-side Power Ltd, Lakeland Power Ltd, Fibropower Ltd, Corby Power Ltd,Peterborough Power Ltd, Fibrogen Ltd and Regional Power Ltd) and electri-city available through the grid in England and Wales and from distributioncompanies in Scotland and Northern Ireland.
2 Including quantities used in the production of steam for sale.3 Including oil used in gas turbine and diesel plant and for lighting up coal-fired
boilers and Orimulsion.
4 Including windpower, refuse-derived fuel, natural gas and sour gas.5 Used in works and for pumping at pumped storage stations.6 Coal Oil (including Orimulsion) and mixed or dual-fired (including gas).7 Including gas turbine, diesel,wind and hydro-electric plant.8 Including net imports and purchases from outside sources mainly UKAEA and
British Nuclear Fuels plc, and net of supplies direct from generators to final con-sumers.
Source: Department of Trade and Industry: 020 7215 2698
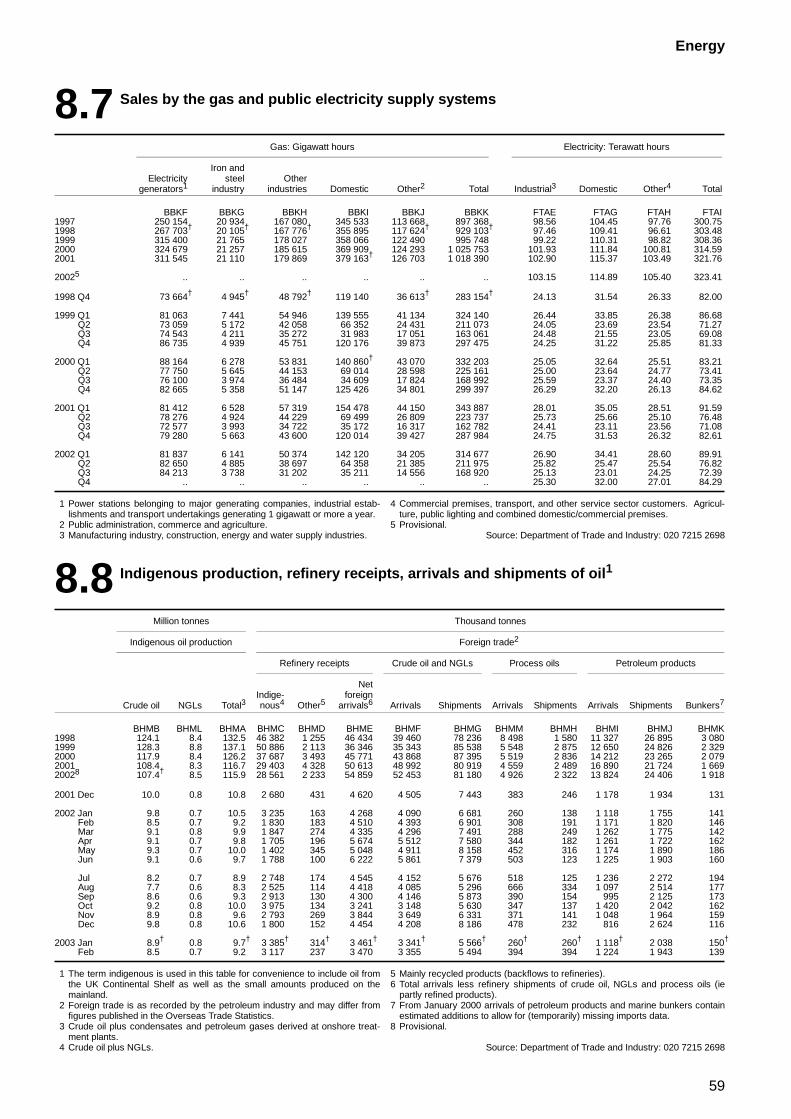
59
Energy
8.7 Sales by the gas and public electricity supply systems
Gas: Gigawatt hours Electricity: Terawatt hours
Iron andElectricity steel Other
generators1 industry industries Domestic Other2 Total Industrial3 Domestic Other4 Total
BBKF BBKG BBKH BBKI BBKJ BBKK FTAE FTAG FTAH FTAI1997 250 154 20 934 167 080 345 533 113 668 897 368 98.56 104.45 97.76 300.751998 267 703† 20 105† 167 776† 355 895 117 624† 929 103† 97.46 109.41 96.61 303.481999 315 400 21 765 178 027 358 066 122 490 995 748 99.22 110.31 98.82 308.362000 324 679 21 257 185 615 369 909 124 293 1 025 753 101.93 111.84 100.81 314.592001 311 545 21 110 179 869 379 163† 126 703 1 018 390 102.90 115.37 103.49 321.76
20025 .. .. .. .. .. .. 103.15 114.89 105.40 323.41
1998 Q4 73 664† 4 945† 48 792† 119 140 36 613† 283 154† 24.13 31.54 26.33 82.00
1999 Q1 81 063 7 441 54 946 139 555 41 134 324 140 26.44 33.85 26.38 86.68Q2 73 059 5 172 42 058 66 352 24 431 211 073 24.05 23.69 23.54 71.27Q3 74 543 4 211 35 272 31 983 17 051 163 061 24.48 21.55 23.05 69.08Q4 86 735 4 939 45 751 120 176 39 873 297 475 24.25 31.22 25.85 81.33
2000 Q1 88 164 6 278 53 831 140 860† 43 070 332 203 25.05 32.64 25.51 83.21Q2 77 750 5 645 44 153 69 014 28 598 225 161 25.00 23.64 24.77 73.41Q3 76 100 3 974 36 484 34 609 17 824 168 992 25.59 23.37 24.40 73.35Q4 82 665 5 358 51 147 125 426 34 801 299 397 26.29 32.20 26.13 84.62
2001 Q1 81 412 6 528 57 319 154 478 44 150 343 887 28.01 35.05 28.51 91.59Q2 78 276 4 924 44 229 69 499 26 809 223 737 25.73 25.66 25.10 76.48Q3 72 577 3 993 34 722 35 172 16 317 162 782 24.41 23.11 23.56 71.08Q4 79 280 5 663 43 600 120 014 39 427 287 984 24.75 31.53 26.32 82.61
2002 Q1 81 837 6 141 50 374 142 120 34 205 314 677 26.90 34.41 28.60 89.91Q2 82 650 4 885 38 697 64 358 21 385 211 975 25.82 25.47 25.54 76.82Q3 84 213 3 738 31 202 35 211 14 556 168 920 25.13 23.01 24.25 72.39Q4 .. .. .. .. .. .. 25.30 32.00 27.01 84.29
1 Power stations belonging to major generating companies, industrial estab-lishments and transport undertakings generating 1 gigawatt or more a year.
2 Public administration, commerce and agriculture.3 Manufacturing industry, construction, energy and water supply industries.
4 Commercial premises, transport, and other service sector customers. Agricul-ture, public lighting and combined domestic/commercial premises.
5 Provisional.Source: Department of Trade and Industry: 020 7215 2698
8.8 Indigenous production, refinery receipts, arrivals and shipments of oil1
Million tonnes Thousand tonnes
Indigenous oil production Foreign trade2
Refinery receipts Crude oil and NGLs Process oils Petroleum products
NetIndige- foreign
Crude oil NGLs Total3 nous4 Other5 arrivals6 Arrivals Shipments Arrivals Shipments Arrivals Shipments Bunkers7
BHMB BHML BHMA BHMC BHMD BHME BHMF BHMG BHMM BHMH BHMI BHMJ BHMK1998 124.1 8.4 132.5 46 382 1 255 46 434 39 460 78 236 8 498 1 580 11 327 26 895 3 0801999 128.3 8.8 137.1 50 886 2 113 36 346 35 343 85 538 5 548 2 875 12 650 24 826 2 3292000 117.9 8.4 126.2 37 687 3 493 45 771 43 868 87 395 5 519 2 836 14 212 23 265 2 0792001 108.4 8.3 116.7 29 403 4 328 50 613 48 992 80 919 4 559 2 489 16 890 21 724 1 66920028 107.4† 8.5 115.9 28 561 2 233 54 859 52 453 81 180 4 926 2 322 13 824 24 406 1 918
2001 Dec 10.0 0.8 10.8 2 680 431 4 620 4 505 7 443 383 246 1 178 1 934 131
2002 Jan 9.8 0.7 10.5 3 235 163 4 268 4 090 6 681 260 138 1 118 1 755 141Feb 8.5 0.7 9.2 1 830 183 4 510 4 393 6 901 308 191 1 171 1 820 146Mar 9.1 0.8 9.9 1 847 274 4 335 4 296 7 491 288 249 1 262 1 775 142Apr 9.1 0.7 9.8 1 705 196 5 674 5 512 7 580 344 182 1 261 1 722 162May 9.3 0.7 10.0 1 402 345 5 048 4 911 8 158 452 316 1 174 1 890 186Jun 9.1 0.6 9.7 1 788 100 6 222 5 861 7 379 503 123 1 225 1 903 160
Jul 8.2 0.7 8.9 2 748 174 4 545 4 152 5 676 518 125 1 236 2 272 194Aug 7.7 0.6 8.3 2 525 114 4 418 4 085 5 296 666 334 1 097 2 514 177Sep 8.6 0.6 9.3 2 913 130 4 300 4 146 5 873 390 154 995 2 125 173Oct 9.2 0.8 10.0 3 975 134 3 241 3 148 5 630 347 137 1 420 2 042 162Nov 8.9 0.8 9.6 2 793 269 3 844 3 649 6 331 371 141 1 048 1 964 159Dec 9.8 0.8 10.6 1 800 152 4 454 4 208 8 186 478 232 816 2 624 116
2003 Jan 8.9† 0.8 9.7† 3 385† 314† 3 461† 3 341† 5 566† 260† 260† 1 118† 2 038 150†
Feb 8.5 0.7 9.2 3 117 237 3 470 3 355 5 494 394 394 1 224 1 943 139
1 The term indigenous is used in this table for convenience to include oil fromthe UK Continental Shelf as well as the small amounts produced on themainland.
2 Foreign trade is as recorded by the petroleum industry and may differ fromfigures published in the Overseas Trade Statistics.
3 Crude oil plus condensates and petroleum gases derived at onshore treat-ment plants.
4 Crude oil plus NGLs.
5 Mainly recycled products (backflows to refineries).6 Total arrivals less refinery shipments of crude oil, NGLs and process oils (ie
partly refined products).7 From January 2000 arrivals of petroleum products and marine bunkers contain
estimated additions to allow for (temporarily) missing imports data.8 Provisional.
Source: Department of Trade and Industry: 020 7215 2698
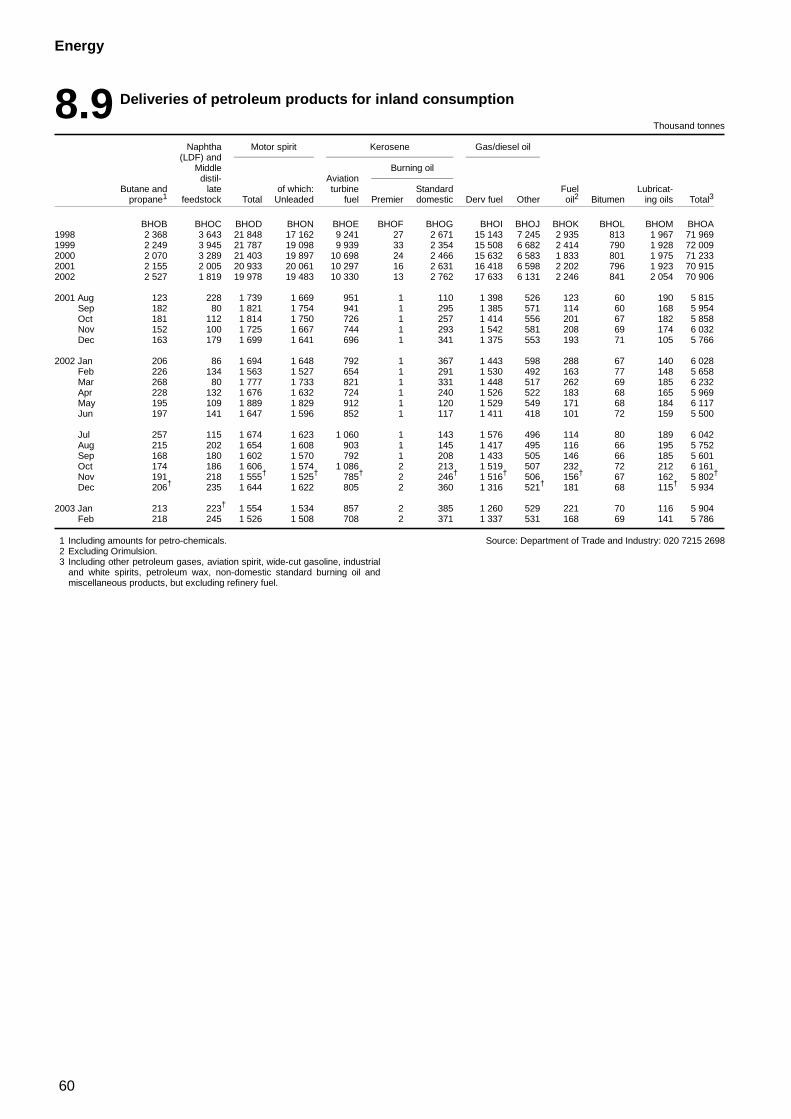
60
Energy
8.9 Deliveries of petroleum products for inland consumption
Thousand tonnes
Naphtha Motor spirit Kerosene Gas/diesel oil(LDF) and
Middle Burning oildistil- Aviation
Butane and late of which: turbine Standard Fuel Lubricat-propane1 feedstock Total Unleaded fuel Premier domestic Derv fuel Other oil2 Bitumen ing oils Total3
BHOB BHOC BHOD BHON BHOE BHOF BHOG BHOI BHOJ BHOK BHOL BHOM BHOA1998 2 368 3 643 21 848 17 162 9 241 27 2 671 15 143 7 245 2 935 813 1 967 71 9691999 2 249 3 945 21 787 19 098 9 939 33 2 354 15 508 6 682 2 414 790 1 928 72 0092000 2 070 3 289 21 403 19 897 10 698 24 2 466 15 632 6 583 1 833 801 1 975 71 2332001 2 155 2 005 20 933 20 061 10 297 16 2 631 16 418 6 598 2 202 796 1 923 70 9152002 2 527 1 819 19 978 19 483 10 330 13 2 762 17 633 6 131 2 246 841 2 054 70 906
2001 Aug 123 228 1 739 1 669 951 1 110 1 398 526 123 60 190 5 815Sep 182 80 1 821 1 754 941 1 295 1 385 571 114 60 168 5 954Oct 181 112 1 814 1 750 726 1 257 1 414 556 201 67 182 5 858Nov 152 100 1 725 1 667 744 1 293 1 542 581 208 69 174 6 032Dec 163 179 1 699 1 641 696 1 341 1 375 553 193 71 105 5 766
2002 Jan 206 86 1 694 1 648 792 1 367 1 443 598 288 67 140 6 028Feb 226 134 1 563 1 527 654 1 291 1 530 492 163 77 148 5 658Mar 268 80 1 777 1 733 821 1 331 1 448 517 262 69 185 6 232Apr 228 132 1 676 1 632 724 1 240 1 526 522 183 68 165 5 969May 195 109 1 889 1 829 912 1 120 1 529 549 171 68 184 6 117Jun 197 141 1 647 1 596 852 1 117 1 411 418 101 72 159 5 500
Jul 257 115 1 674 1 623 1 060 1 143 1 576 496 114 80 189 6 042Aug 215 202 1 654 1 608 903 1 145 1 417 495 116 66 195 5 752Sep 168 180 1 602 1 570 792 1 208 1 433 505 146 66 185 5 601Oct 174 186 1 606 1 574 1 086 2 213 1 519 507 232 72 212 6 161Nov 191 218 1 555† 1 525† 785† 2 246† 1 516† 506 156† 67 162 5 802†
Dec 206† 235 1 644 1 622 805 2 360 1 316 521† 181 68 115† 5 934
2003 Jan 213 223† 1 554 1 534 857 2 385 1 260 529 221 70 116 5 904Feb 218 245 1 526 1 508 708 2 371 1 337 531 168 69 141 5 786
1 Including amounts for petro-chemicals.2 Excluding Orimulsion.3 Including other petroleum gases, aviation spirit, wide-cut gasoline, industrial
and white spirits, petroleum wax, non-domestic standard burning oil andmiscellaneous products, but excluding refinery fuel.
Source: Department of Trade and Industry: 020 7215 2698
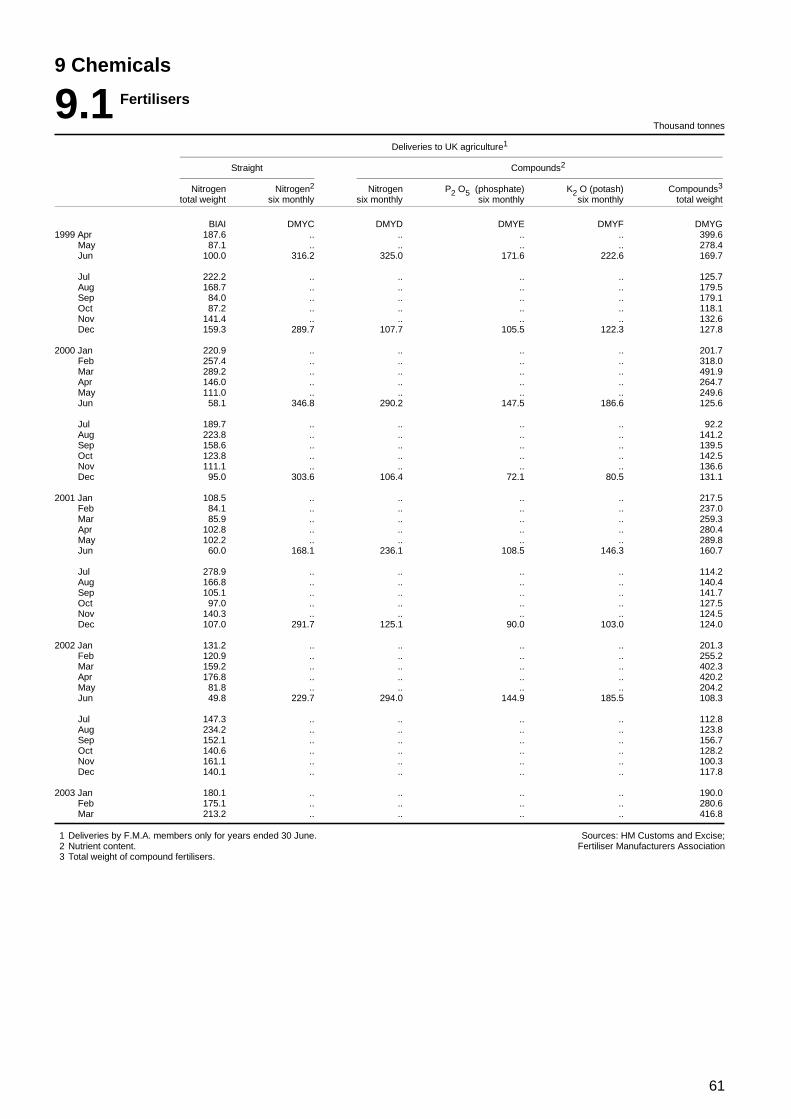
61
9 Chemicals
9.1 Fertilisers
Thousand tonnes
Deliveries to UK agriculture1
Straight Compounds2
Nitrogen Nitrogen2 Nitrogen P2 O5 (phosphate) K2 O (potash) Compounds3
total weight six monthly six monthly six monthly six monthly total weight
BIAI DMYC DMYD DMYE DMYF DMYG1999 Apr 187.6 .. .. .. .. 399.6
May 87.1 .. .. .. .. 278.4Jun 100.0 316.2 325.0 171.6 222.6 169.7
Jul 222.2 .. .. .. .. 125.7Aug 168.7 .. .. .. .. 179.5Sep 84.0 .. .. .. .. 179.1Oct 87.2 .. .. .. .. 118.1Nov 141.4 .. .. .. .. 132.6Dec 159.3 289.7 107.7 105.5 122.3 127.8
2000 Jan 220.9 .. .. .. .. 201.7Feb 257.4 .. .. .. .. 318.0Mar 289.2 .. .. .. .. 491.9Apr 146.0 .. .. .. .. 264.7May 111.0 .. .. .. .. 249.6Jun 58.1 346.8 290.2 147.5 186.6 125.6
Jul 189.7 .. .. .. .. 92.2Aug 223.8 .. .. .. .. 141.2Sep 158.6 .. .. .. .. 139.5Oct 123.8 .. .. .. .. 142.5Nov 111.1 .. .. .. .. 136.6Dec 95.0 303.6 106.4 72.1 80.5 131.1
2001 Jan 108.5 .. .. .. .. 217.5Feb 84.1 .. .. .. .. 237.0Mar 85.9 .. .. .. .. 259.3Apr 102.8 .. .. .. .. 280.4May 102.2 .. .. .. .. 289.8Jun 60.0 168.1 236.1 108.5 146.3 160.7
Jul 278.9 .. .. .. .. 114.2Aug 166.8 .. .. .. .. 140.4Sep 105.1 .. .. .. .. 141.7Oct 97.0 .. .. .. .. 127.5Nov 140.3 .. .. .. .. 124.5Dec 107.0 291.7 125.1 90.0 103.0 124.0
2002 Jan 131.2 .. .. .. .. 201.3Feb 120.9 .. .. .. .. 255.2Mar 159.2 .. .. .. .. 402.3Apr 176.8 .. .. .. .. 420.2May 81.8 .. .. .. .. 204.2Jun 49.8 229.7 294.0 144.9 185.5 108.3
Jul 147.3 .. .. .. .. 112.8Aug 234.2 .. .. .. .. 123.8Sep 152.1 .. .. .. .. 156.7Oct 140.6 .. .. .. .. 128.2Nov 161.1 .. .. .. .. 100.3Dec 140.1 .. .. .. .. 117.8
2003 Jan 180.1 .. .. .. .. 190.0Feb 175.1 .. .. .. .. 280.6Mar 213.2 .. .. .. .. 416.8
1 Deliveries by F.M.A. members only for years ended 30 June.2 Nutrient content.3 Total weight of compound fertilisers.
Sources: HM Customs and Excise;Fertiliser Manufacturers Association
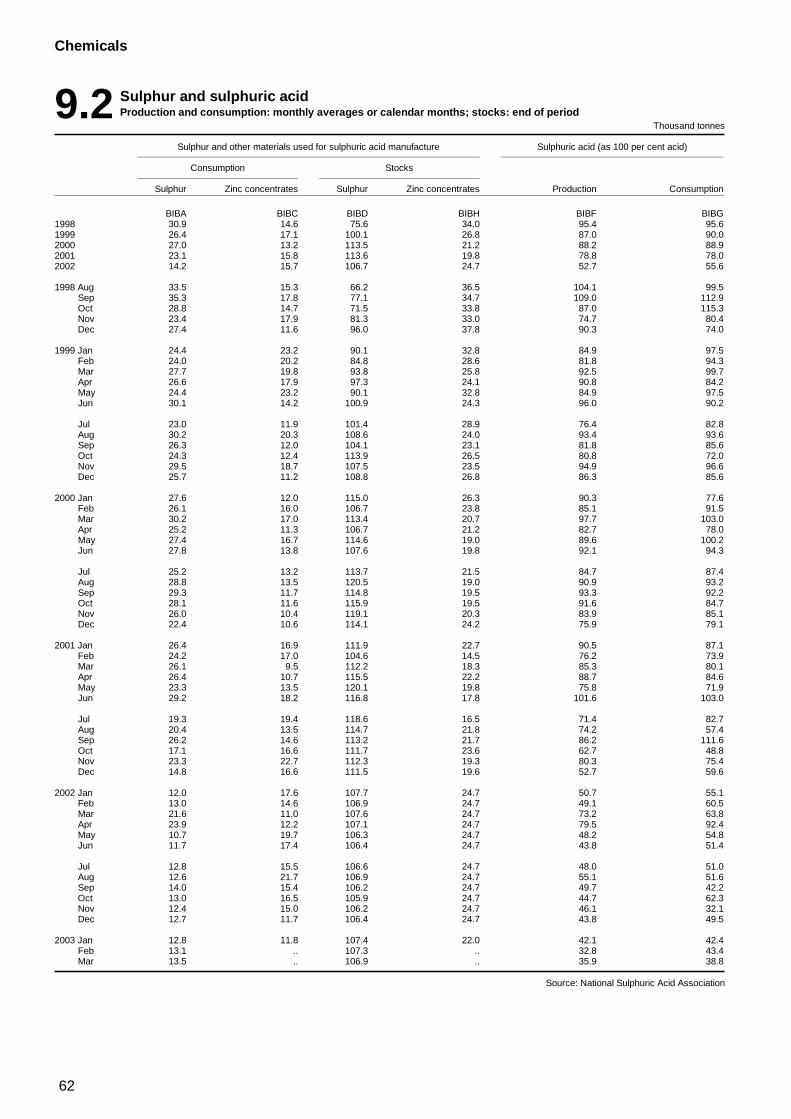
62
Chemicals
9.2 Sulphur and sulphuric acidProduction and consumption: monthly averages or calendar months; stocks: end of period
Thousand tonnes
Sulphur and other materials used for sulphuric acid manufacture Sulphuric acid (as 100 per cent acid)
Consumption Stocks
Sulphur Zinc concentrates Sulphur Zinc concentrates Production Consumption
BIBA BIBC BIBD BIBH BIBF BIBG1998 30.9 14.6 75.6 34.0 95.4 95.61999 26.4 17.1 100.1 26.8 87.0 90.02000 27.0 13.2 113.5 21.2 88.2 88.92001 23.1 15.8 113.6 19.8 78.8 78.02002 14.2 15.7 106.7 24.7 52.7 55.6
1998 Aug 33.5 15.3 66.2 36.5 104.1 99.5Sep 35.3 17.8 77.1 34.7 109.0 112.9Oct 28.8 14.7 71.5 33.8 87.0 115.3Nov 23.4 17.9 81.3 33.0 74.7 80.4Dec 27.4 11.6 96.0 37.8 90.3 74.0
1999 Jan 24.4 23.2 90.1 32.8 84.9 97.5Feb 24.0 20.2 84.8 28.6 81.8 94.3Mar 27.7 19.8 93.8 25.8 92.5 99.7Apr 26.6 17.9 97.3 24.1 90.8 84.2May 24.4 23.2 90.1 32.8 84.9 97.5Jun 30.1 14.2 100.9 24.3 96.0 90.2
Jul 23.0 11.9 101.4 28.9 76.4 82.8Aug 30.2 20.3 108.6 24.0 93.4 93.6Sep 26.3 12.0 104.1 23.1 81.8 85.6Oct 24.3 12.4 113.9 26.5 80.8 72.0Nov 29.5 18.7 107.5 23.5 94.9 96.6Dec 25.7 11.2 108.8 26.8 86.3 85.6
2000 Jan 27.6 12.0 115.0 26.3 90.3 77.6Feb 26.1 16.0 106.7 23.8 85.1 91.5Mar 30.2 17.0 113.4 20.7 97.7 103.0Apr 25.2 11.3 106.7 21.2 82.7 78.0May 27.4 16.7 114.6 19.0 89.6 100.2Jun 27.8 13.8 107.6 19.8 92.1 94.3
Jul 25.2 13.2 113.7 21.5 84.7 87.4Aug 28.8 13.5 120.5 19.0 90.9 93.2Sep 29.3 11.7 114.8 19.5 93.3 92.2Oct 28.1 11.6 115.9 19.5 91.6 84.7Nov 26.0 10.4 119.1 20.3 83.9 85.1Dec 22.4 10.6 114.1 24.2 75.9 79.1
2001 Jan 26.4 16.9 111.9 22.7 90.5 87.1Feb 24.2 17.0 104.6 14.5 76.2 73.9Mar 26.1 9.5 112.2 18.3 85.3 80.1Apr 26.4 10.7 115.5 22.2 88.7 84.6May 23.3 13.5 120.1 19.8 75.8 71.9Jun 29.2 18.2 116.8 17.8 101.6 103.0
Jul 19.3 19.4 118.6 16.5 71.4 82.7Aug 20.4 13.5 114.7 21.8 74.2 57.4Sep 26.2 14.6 113.2 21.7 86.2 111.6Oct 17.1 16.6 111.7 23.6 62.7 48.8Nov 23.3 22.7 112.3 19.3 80.3 75.4Dec 14.8 16.6 111.5 19.6 52.7 59.6
2002 Jan 12.0 17.6 107.7 24.7 50.7 55.1Feb 13.0 14.6 106.9 24.7 49.1 60.5Mar 21.6 11.0 107.6 24.7 73.2 63.8Apr 23.9 12.2 107.1 24.7 79.5 92.4May 10.7 19.7 106.3 24.7 48.2 54.8Jun 11.7 17.4 106.4 24.7 43.8 51.4
Jul 12.8 15.5 106.6 24.7 48.0 51.0Aug 12.6 21.7 106.9 24.7 55.1 51.6Sep 14.0 15.4 106.2 24.7 49.7 42.2Oct 13.0 16.5 105.9 24.7 44.7 62.3Nov 12.4 15.0 106.2 24.7 46.1 32.1Dec 12.7 11.7 106.4 24.7 43.8 49.5
2003 Jan 12.8 11.8 107.4 22.0 42.1 42.4Feb 13.1 .. 107.3 .. 32.8 43.4Mar 13.5 .. 106.9 .. 35.9 38.8
Source: National Sulphuric Acid Association
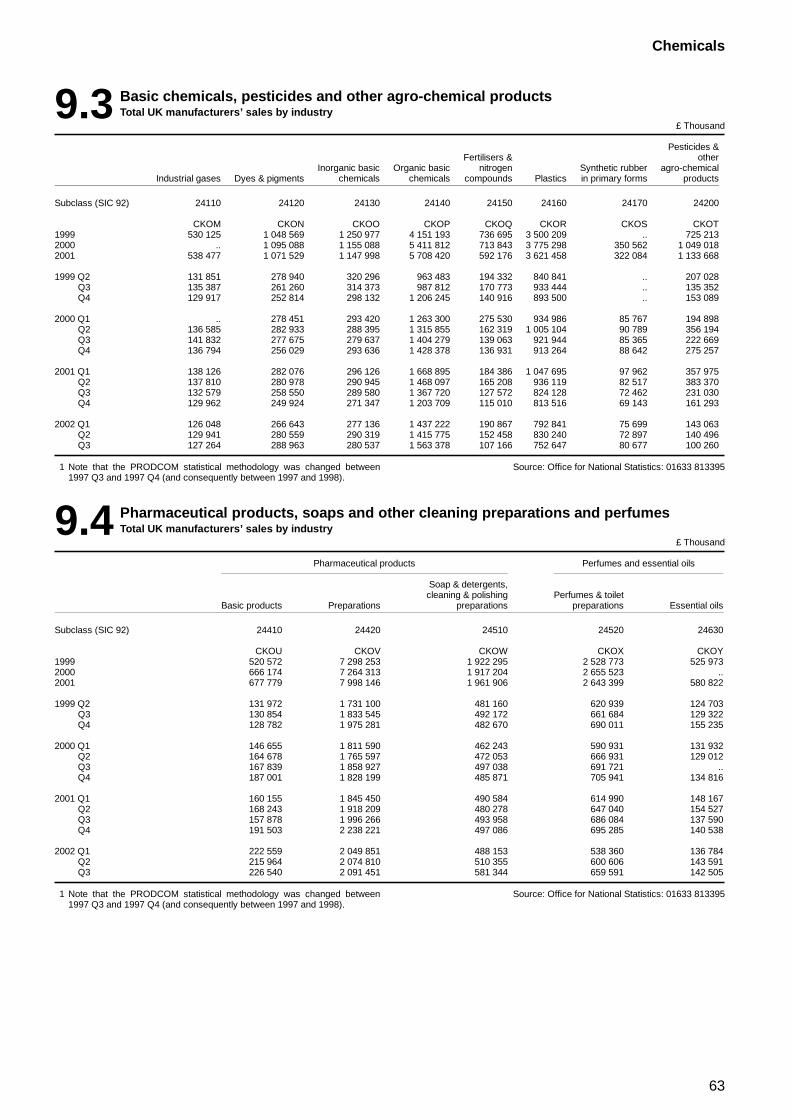
63
Chemicals
9.3 Basic chemicals, pesticides and other agro-chemical productsTotal UK manufacturers’ sales by industry
£ Thousand
Pesticides &Fertilisers & other
Inorganic basic Organic basic nitrogen Synthetic rubber agro-chemicalIndustrial gases Dyes & pigments chemicals chemicals compounds Plastics in primary forms products
Subclass (SIC 92) 24110 24120 24130 24140 24150 24160 24170 24200
CKOM CKON CKOO CKOP CKOQ CKOR CKOS CKOT1999 530 125 1 048 569 1 250 977 4 151 193 736 695 3 500 209 .. 725 2132000 .. 1 095 088 1 155 088 5 411 812 713 843 3 775 298 350 562 1 049 0182001 538 477 1 071 529 1 147 998 5 708 420 592 176 3 621 458 322 084 1 133 668
1999 Q2 131 851 278 940 320 296 963 483 194 332 840 841 .. 207 028Q3 135 387 261 260 314 373 987 812 170 773 933 444 .. 135 352Q4 129 917 252 814 298 132 1 206 245 140 916 893 500 .. 153 089
2000 Q1 .. 278 451 293 420 1 263 300 275 530 934 986 85 767 194 898Q2 136 585 282 933 288 395 1 315 855 162 319 1 005 104 90 789 356 194Q3 141 832 277 675 279 637 1 404 279 139 063 921 944 85 365 222 669Q4 136 794 256 029 293 636 1 428 378 136 931 913 264 88 642 275 257
2001 Q1 138 126 282 076 296 126 1 668 895 184 386 1 047 695 97 962 357 975Q2 137 810 280 978 290 945 1 468 097 165 208 936 119 82 517 383 370Q3 132 579 258 550 289 580 1 367 720 127 572 824 128 72 462 231 030Q4 129 962 249 924 271 347 1 203 709 115 010 813 516 69 143 161 293
2002 Q1 126 048 266 643 277 136 1 437 222 190 867 792 841 75 699 143 063Q2 129 941 280 559 290 319 1 415 775 152 458 830 240 72 897 140 496Q3 127 264 288 963 280 537 1 563 378 107 166 752 647 80 677 100 260
1 Note that the PRODCOM statistical methodology was changed between1997 Q3 and 1997 Q4 (and consequently between 1997 and 1998).
Source: Office for National Statistics: 01633 813395
9.4 Pharmaceutical products, soaps and other cleaning preparations and perfumesTotal UK manufacturers’ sales by industry
£ Thousand
Pharmaceutical products Perfumes and essential oils
Soap & detergents,cleaning & polishing Perfumes & toilet
Basic products Preparations preparations preparations Essential oils
Subclass (SIC 92) 24410 24420 24510 24520 24630
CKOU CKOV CKOW CKOX CKOY1999 520 572 7 298 253 1 922 295 2 528 773 525 9732000 666 174 7 264 313 1 917 204 2 655 523 ..2001 677 779 7 998 146 1 961 906 2 643 399 580 822
1999 Q2 131 972 1 731 100 481 160 620 939 124 703Q3 130 854 1 833 545 492 172 661 684 129 322Q4 128 782 1 975 281 482 670 690 011 155 235
2000 Q1 146 655 1 811 590 462 243 590 931 131 932Q2 164 678 1 765 597 472 053 666 931 129 012Q3 167 839 1 858 927 497 038 691 721 ..Q4 187 001 1 828 199 485 871 705 941 134 816
2001 Q1 160 155 1 845 450 490 584 614 990 148 167Q2 168 243 1 918 209 480 278 647 040 154 527Q3 157 878 1 996 266 493 958 686 084 137 590Q4 191 503 2 238 221 497 086 695 285 140 538
2002 Q1 222 559 2 049 851 488 153 538 360 136 784Q2 215 964 2 074 810 510 355 600 606 143 591Q3 226 540 2 091 451 581 344 659 591 142 505
1 Note that the PRODCOM statistical methodology was changed between1997 Q3 and 1997 Q4 (and consequently between 1997 and 1998).
Source: Office for National Statistics: 01633 813395
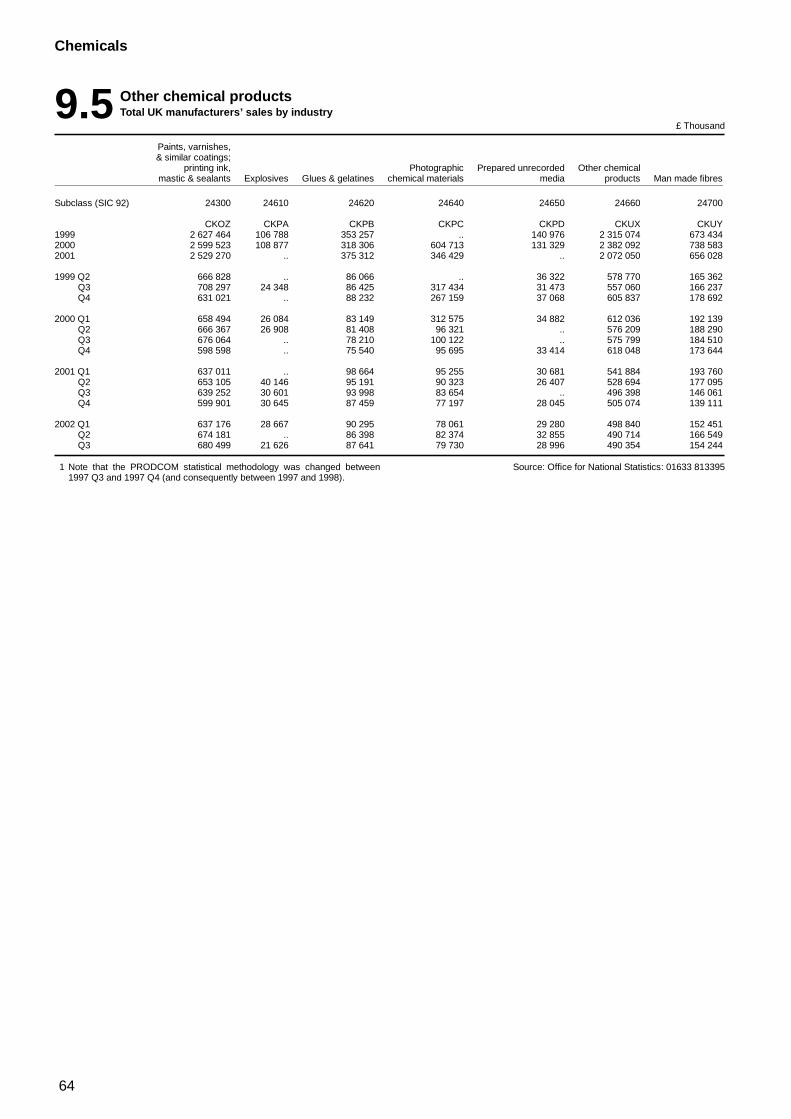
64
Chemicals
9.5 Other chemical productsTotal UK manufacturers’ sales by industry
£ Thousand
Paints, varnishes,& similar coatings;
printing ink, Photographic Prepared unrecorded Other chemicalmastic & sealants Explosives Glues & gelatines chemical materials media products Man made fibres
Subclass (SIC 92) 24300 24610 24620 24640 24650 24660 24700
CKOZ CKPA CKPB CKPC CKPD CKUX CKUY1999 2 627 464 106 788 353 257 .. 140 976 2 315 074 673 4342000 2 599 523 108 877 318 306 604 713 131 329 2 382 092 738 5832001 2 529 270 .. 375 312 346 429 .. 2 072 050 656 028
1999 Q2 666 828 .. 86 066 .. 36 322 578 770 165 362Q3 708 297 24 348 86 425 317 434 31 473 557 060 166 237Q4 631 021 .. 88 232 267 159 37 068 605 837 178 692
2000 Q1 658 494 26 084 83 149 312 575 34 882 612 036 192 139Q2 666 367 26 908 81 408 96 321 .. 576 209 188 290Q3 676 064 .. 78 210 100 122 .. 575 799 184 510Q4 598 598 .. 75 540 95 695 33 414 618 048 173 644
2001 Q1 637 011 .. 98 664 95 255 30 681 541 884 193 760Q2 653 105 40 146 95 191 90 323 26 407 528 694 177 095Q3 639 252 30 601 93 998 83 654 .. 496 398 146 061Q4 599 901 30 645 87 459 77 197 28 045 505 074 139 111
2002 Q1 637 176 28 667 90 295 78 061 29 280 498 840 152 451Q2 674 181 .. 86 398 82 374 32 855 490 714 166 549Q3 680 499 21 626 87 641 79 730 28 996 490 354 154 244
1 Note that the PRODCOM statistical methodology was changed between1997 Q3 and 1997 Q4 (and consequently between 1997 and 1998).
Source: Office for National Statistics: 01633 813395
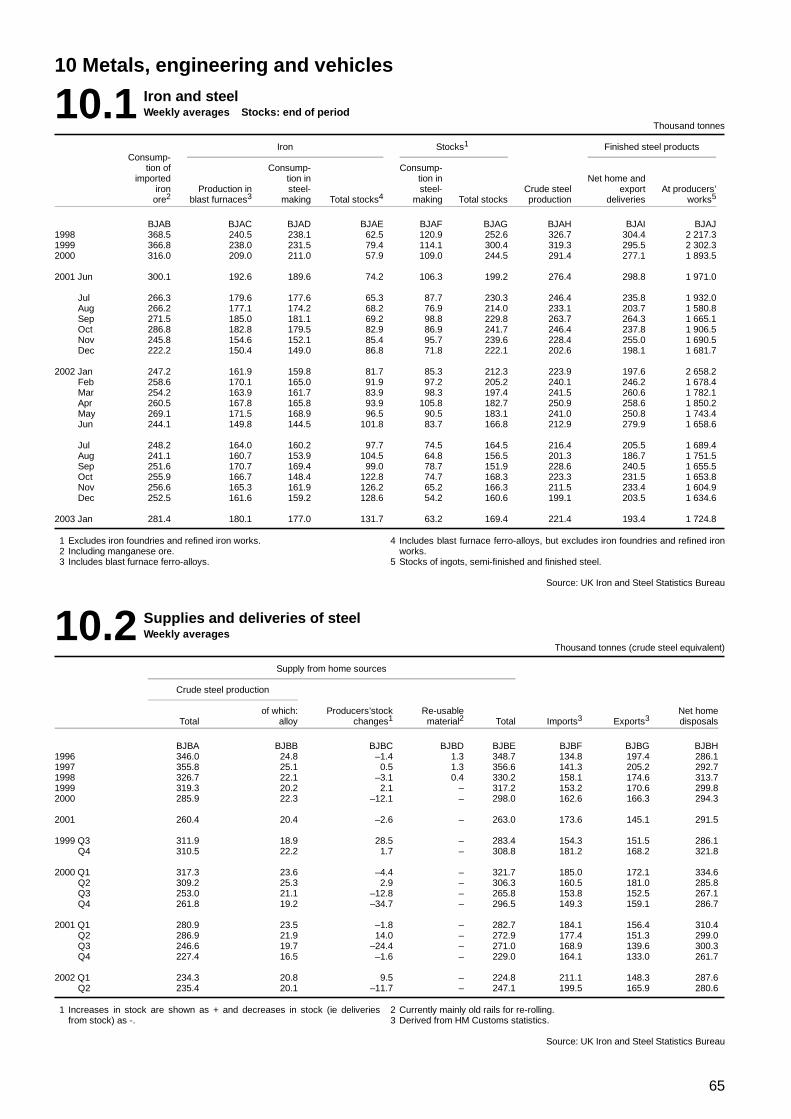
65
10 Metals, engineering and vehicles
10.1 Iron and steelWeekly averages Stocks: end of period
Thousand tonnes
Iron Stocks1 Finished steel productsConsump-
tion of Consump- Consump-imported tion in tion in Net home and
iron Production in steel- steel- Crude steel export At producers’ore2 blast furnaces3 making Total stocks4 making Total stocks production deliveries works5
BJAB BJAC BJAD BJAE BJAF BJAG BJAH BJAI BJAJ1998 368.5 240.5 238.1 62.5 120.9 252.6 326.7 304.4 2 217.31999 366.8 238.0 231.5 79.4 114.1 300.4 319.3 295.5 2 302.32000 316.0 209.0 211.0 57.9 109.0 244.5 291.4 277.1 1 893.5
2001 Jun 300.1 192.6 189.6 74.2 106.3 199.2 276.4 298.8 1 971.0
Jul 266.3 179.6 177.6 65.3 87.7 230.3 246.4 235.8 1 932.0Aug 266.2 177.1 174.2 68.2 76.9 214.0 233.1 203.7 1 580.8Sep 271.5 185.0 181.1 69.2 98.8 229.8 263.7 264.3 1 665.1Oct 286.8 182.8 179.5 82.9 86.9 241.7 246.4 237.8 1 906.5Nov 245.8 154.6 152.1 85.4 95.7 239.6 228.4 255.0 1 690.5Dec 222.2 150.4 149.0 86.8 71.8 222.1 202.6 198.1 1 681.7
2002 Jan 247.2 161.9 159.8 81.7 85.3 212.3 223.9 197.6 2 658.2Feb 258.6 170.1 165.0 91.9 97.2 205.2 240.1 246.2 1 678.4Mar 254.2 163.9 161.7 83.9 98.3 197.4 241.5 260.6 1 782.1Apr 260.5 167.8 165.8 93.9 105.8 182.7 250.9 258.6 1 850.2May 269.1 171.5 168.9 96.5 90.5 183.1 241.0 250.8 1 743.4Jun 244.1 149.8 144.5 101.8 83.7 166.8 212.9 279.9 1 658.6
Jul 248.2 164.0 160.2 97.7 74.5 164.5 216.4 205.5 1 689.4Aug 241.1 160.7 153.9 104.5 64.8 156.5 201.3 186.7 1 751.5Sep 251.6 170.7 169.4 99.0 78.7 151.9 228.6 240.5 1 655.5Oct 255.9 166.7 148.4 122.8 74.7 168.3 223.3 231.5 1 653.8Nov 256.6 165.3 161.9 126.2 65.2 166.3 211.5 233.4 1 604.9Dec 252.5 161.6 159.2 128.6 54.2 160.6 199.1 203.5 1 634.6
2003 Jan 281.4 180.1 177.0 131.7 63.2 169.4 221.4 193.4 1 724.8
1 Excludes iron foundries and refined iron works.2 Including manganese ore.3 Includes blast furnace ferro-alloys.
4 Includes blast furnace ferro-alloys, but excludes iron foundries and refined ironworks.
5 Stocks of ingots, semi-finished and finished steel.
Source: UK Iron and Steel Statistics Bureau
10.2 Supplies and deliveries of steelWeekly averages
Thousand tonnes (crude steel equivalent)
Supply from home sources
Crude steel production
of which: Producers’stock Re-usable Net homeTotal alloy changes1 material2 Total Imports3 Exports3 disposals
BJBA BJBB BJBC BJBD BJBE BJBF BJBG BJBH1996 346.0 24.8 –1.4 1.3 348.7 134.8 197.4 286.11997 355.8 25.1 0.5 1.3 356.6 141.3 205.2 292.71998 326.7 22.1 –3.1 0.4 330.2 158.1 174.6 313.71999 319.3 20.2 2.1 – 317.2 153.2 170.6 299.82000 285.9 22.3 –12.1 – 298.0 162.6 166.3 294.3
2001 260.4 20.4 –2.6 – 263.0 173.6 145.1 291.5
1999 Q3 311.9 18.9 28.5 – 283.4 154.3 151.5 286.1Q4 310.5 22.2 1.7 – 308.8 181.2 168.2 321.8
2000 Q1 317.3 23.6 –4.4 – 321.7 185.0 172.1 334.6Q2 309.2 25.3 2.9 – 306.3 160.5 181.0 285.8Q3 253.0 21.1 –12.8 – 265.8 153.8 152.5 267.1Q4 261.8 19.2 –34.7 – 296.5 149.3 159.1 286.7
2001 Q1 280.9 23.5 –1.8 – 282.7 184.1 156.4 310.4Q2 286.9 21.9 14.0 – 272.9 177.4 151.3 299.0Q3 246.6 19.7 –24.4 – 271.0 168.9 139.6 300.3Q4 227.4 16.5 –1.6 – 229.0 164.1 133.0 261.7
2002 Q1 234.3 20.8 9.5 – 224.8 211.1 148.3 287.6Q2 235.4 20.1 –11.7 – 247.1 199.5 165.9 280.6
1 Increases in stock are shown as + and decreases in stock (ie deliveriesfrom stock) as -.
2 Currently mainly old rails for re-rolling.3 Derived from HM Customs statistics.
Source: UK Iron and Steel Statistics Bureau
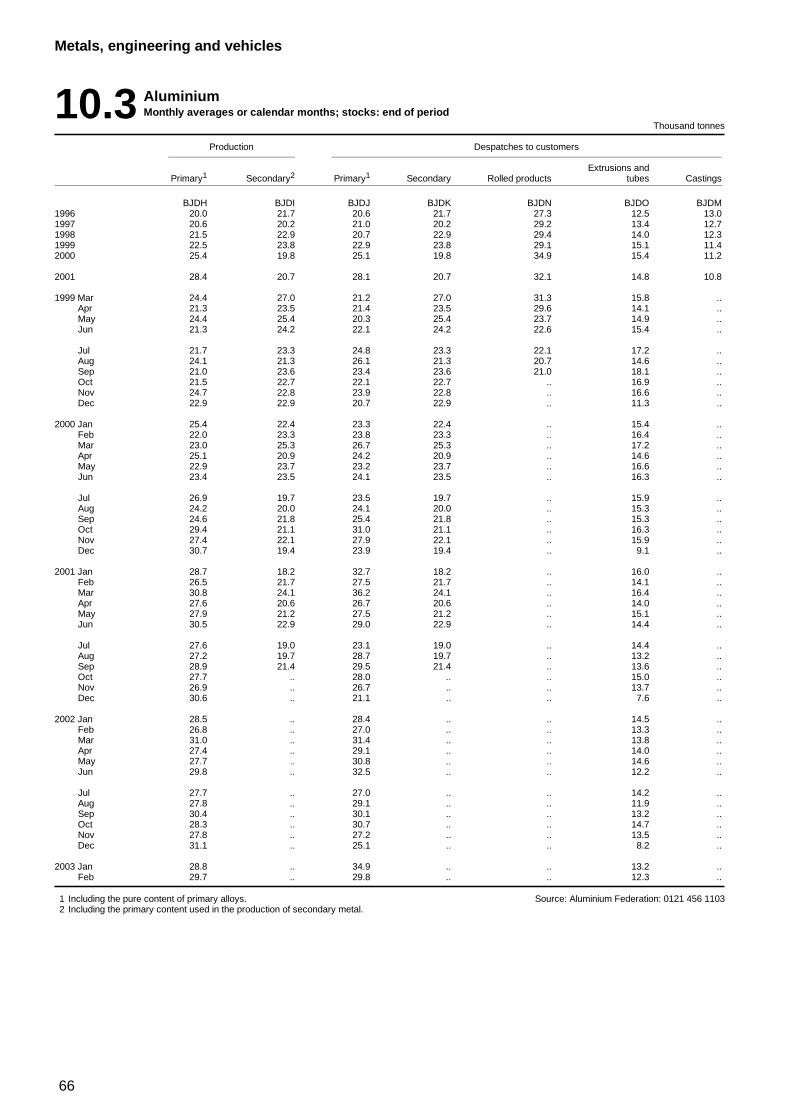
66
Metals, engineering and vehicles
10.3 AluminiumMonthly averages or calendar months; stocks: end of period
Thousand tonnes
Production Despatches to customers
Extrusions andPrimary1 Secondary2 Primary1 Secondary Rolled products tubes Castings
BJDH BJDI BJDJ BJDK BJDN BJDO BJDM1996 20.0 21.7 20.6 21.7 27.3 12.5 13.01997 20.6 20.2 21.0 20.2 29.2 13.4 12.71998 21.5 22.9 20.7 22.9 29.4 14.0 12.31999 22.5 23.8 22.9 23.8 29.1 15.1 11.42000 25.4 19.8 25.1 19.8 34.9 15.4 11.2
2001 28.4 20.7 28.1 20.7 32.1 14.8 10.8
1999 Mar 24.4 27.0 21.2 27.0 31.3 15.8 ..Apr 21.3 23.5 21.4 23.5 29.6 14.1 ..May 24.4 25.4 20.3 25.4 23.7 14.9 ..Jun 21.3 24.2 22.1 24.2 22.6 15.4 ..
Jul 21.7 23.3 24.8 23.3 22.1 17.2 ..Aug 24.1 21.3 26.1 21.3 20.7 14.6 ..Sep 21.0 23.6 23.4 23.6 21.0 18.1 ..Oct 21.5 22.7 22.1 22.7 .. 16.9 ..Nov 24.7 22.8 23.9 22.8 .. 16.6 ..Dec 22.9 22.9 20.7 22.9 .. 11.3 ..
2000 Jan 25.4 22.4 23.3 22.4 .. 15.4 ..Feb 22.0 23.3 23.8 23.3 .. 16.4 ..Mar 23.0 25.3 26.7 25.3 .. 17.2 ..Apr 25.1 20.9 24.2 20.9 .. 14.6 ..May 22.9 23.7 23.2 23.7 .. 16.6 ..Jun 23.4 23.5 24.1 23.5 .. 16.3 ..
Jul 26.9 19.7 23.5 19.7 .. 15.9 ..Aug 24.2 20.0 24.1 20.0 .. 15.3 ..Sep 24.6 21.8 25.4 21.8 .. 15.3 ..Oct 29.4 21.1 31.0 21.1 .. 16.3 ..Nov 27.4 22.1 27.9 22.1 .. 15.9 ..Dec 30.7 19.4 23.9 19.4 .. 9.1 ..
2001 Jan 28.7 18.2 32.7 18.2 .. 16.0 ..Feb 26.5 21.7 27.5 21.7 .. 14.1 ..Mar 30.8 24.1 36.2 24.1 .. 16.4 ..Apr 27.6 20.6 26.7 20.6 .. 14.0 ..May 27.9 21.2 27.5 21.2 .. 15.1 ..Jun 30.5 22.9 29.0 22.9 .. 14.4 ..
Jul 27.6 19.0 23.1 19.0 .. 14.4 ..Aug 27.2 19.7 28.7 19.7 .. 13.2 ..Sep 28.9 21.4 29.5 21.4 .. 13.6 ..Oct 27.7 .. 28.0 .. .. 15.0 ..Nov 26.9 .. 26.7 .. .. 13.7 ..Dec 30.6 .. 21.1 .. .. 7.6 ..
2002 Jan 28.5 .. 28.4 .. .. 14.5 ..Feb 26.8 .. 27.0 .. .. 13.3 ..Mar 31.0 .. 31.4 .. .. 13.8 ..Apr 27.4 .. 29.1 .. .. 14.0 ..May 27.7 .. 30.8 .. .. 14.6 ..Jun 29.8 .. 32.5 .. .. 12.2 ..
Jul 27.7 .. 27.0 .. .. 14.2 ..Aug 27.8 .. 29.1 .. .. 11.9 ..Sep 30.4 .. 30.1 .. .. 13.2 ..Oct 28.3 .. 30.7 .. .. 14.7 ..Nov 27.8 .. 27.2 .. .. 13.5 ..Dec 31.1 .. 25.1 .. .. 8.2 ..
2003 Jan 28.8 .. 34.9 .. .. 13.2 ..Feb 29.7 .. 29.8 .. .. 12.3 ..
1 Including the pure content of primary alloys.2 Including the primary content used in the production of secondary metal.
Source: Aluminium Federation: 0121 456 1103
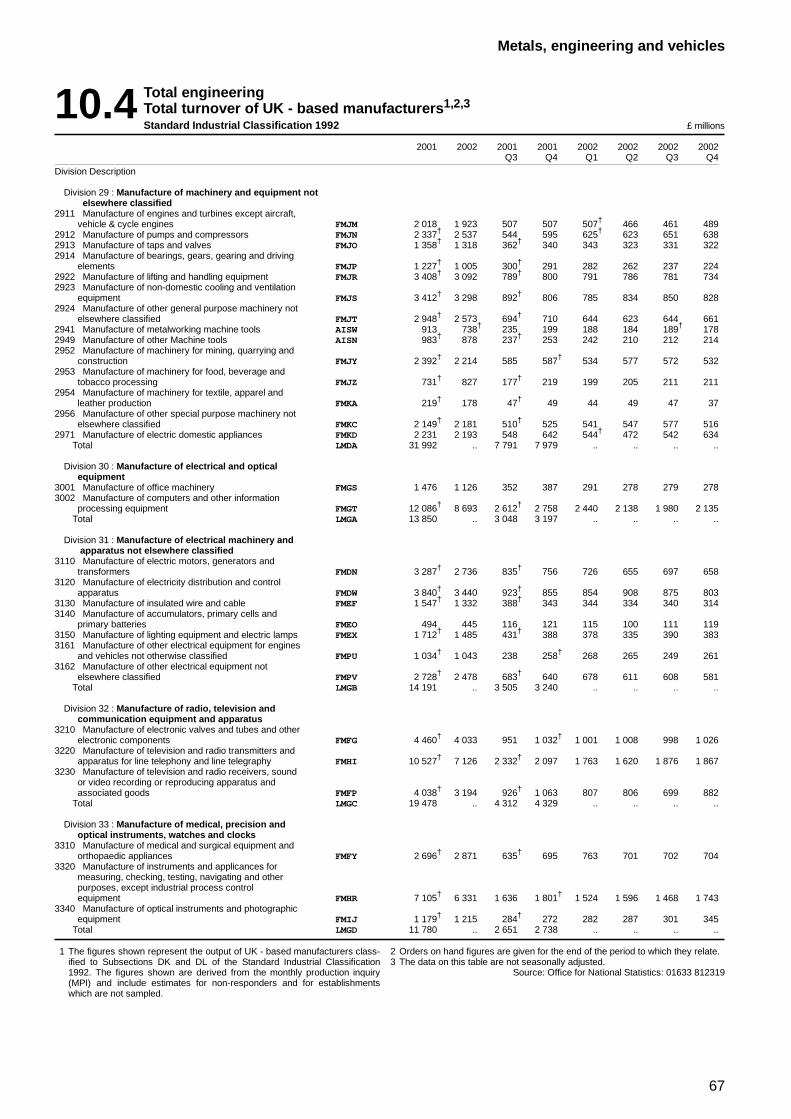
67
Metals, engineering and vehicles
10.4 Total engineeringTotal turnover of UK - based manufacturers1,2,3
Standard Industrial Classification 1992 £ millions
2001 2002 2001 2001 2002 2002 2002 2002Q3 Q4 Q1 Q2 Q3 Q4
Division Description
Division 29 : Manufacture of machinery and equipment notelsewhere classified
2911 Manufacture of engines and turbines except aircraft,vehicle & cycle engines FMJM 2 018 1 923 507 507 507† 466 461 489
2912 Manufacture of pumps and compressors FMJN 2 337† 2 537 544 595 625† 623 651 6382913 Manufacture of taps and valves FMJO 1 358† 1 318 362† 340 343 323 331 3222914 Manufacture of bearings, gears, gearing and driving
elements FMJP 1 227† 1 005 300† 291 282 262 237 2242922 Manufacture of lifting and handling equipment FMJR 3 408† 3 092 789† 800 791 786 781 7342923 Manufacture of non-domestic cooling and ventilation
equipment FMJS 3 412† 3 298 892† 806 785 834 850 8282924 Manufacture of other general purpose machinery not
elsewhere classified FMJT 2 948† 2 573 694† 710 644 623 644 6612941 Manufacture of metalworking machine tools AISW 913 738† 235 199 188 184 189† 1782949 Manufacture of other Machine tools AISN 983† 878 237† 253 242 210 212 2142952 Manufacture of machinery for mining, quarrying and
construction FMJY 2 392† 2 214 585 587† 534 577 572 5322953 Manufacture of machinery for food, beverage and
tobacco processing FMJZ 731† 827 177† 219 199 205 211 2112954 Manufacture of machinery for textile, apparel and
leather production FMKA 219† 178 47† 49 44 49 47 372956 Manufacture of other special purpose machinery not
elsewhere classified FMKC 2 149† 2 181 510† 525 541 547 577 5162971 Manufacture of electric domestic appliances FMKD 2 231 2 193 548 642 544† 472 542 634
Total LMDA 31 992 .. 7 791 7 979 .. .. .. ..
Division 30 : Manufacture of electrical and opticalequipment
3001 Manufacture of office machinery FMGS 1 476 1 126 352 387 291 278 279 2783002 Manufacture of computers and other information
processing equipment FMGT 12 086† 8 693 2 612† 2 758 2 440 2 138 1 980 2 135Total LMGA 13 850 .. 3 048 3 197 .. .. .. ..
Division 31 : Manufacture of electrical machinery andapparatus not elsewhere classified
3110 Manufacture of electric motors, generators andtransformers FMDN 3 287† 2 736 835† 756 726 655 697 658
3120 Manufacture of electricity distribution and controlapparatus FMDW 3 840† 3 440 923† 855 854 908 875 803
3130 Manufacture of insulated wire and cable FMEF 1 547† 1 332 388† 343 344 334 340 3143140 Manufacture of accumulators, primary cells and
primary batteries FMEO 494 445 116 121 115 100 111 1193150 Manufacture of lighting equipment and electric lamps FMEX 1 712† 1 485 431† 388 378 335 390 3833161 Manufacture of other electrical equipment for engines
and vehicles not otherwise classified FMPU 1 034† 1 043 238 258† 268 265 249 2613162 Manufacture of other electrical equipment not
elsewhere classified FMPV 2 728† 2 478 683† 640 678 611 608 581Total LMGB 14 191 .. 3 505 3 240 .. .. .. ..
Division 32 : Manufacture of radio, television andcommunication equipment and apparatus
3210 Manufacture of electronic valves and tubes and otherelectronic components FMFG 4 460† 4 033 951 1 032† 1 001 1 008 998 1 026
3220 Manufacture of television and radio transmitters andapparatus for line telephony and line telegraphy FMHI 10 527† 7 126 2 332† 2 097 1 763 1 620 1 876 1 867
3230 Manufacture of television and radio receivers, soundor video recording or reproducing apparatus andassociated goods FMFP 4 038† 3 194 926† 1 063 807 806 699 882
Total LMGC 19 478 .. 4 312 4 329 .. .. .. ..
Division 33 : Manufacture of medical, precision andoptical instruments, watches and clocks
3310 Manufacture of medical and surgical equipment andorthopaedic appliances FMFY 2 696† 2 871 635† 695 763 701 702 704
3320 Manufacture of instruments and applicances formeasuring, checking, testing, navigating and otherpurposes, except industrial process controlequipment FMHR 7 105† 6 331 1 636 1 801† 1 524 1 596 1 468 1 743
3340 Manufacture of optical instruments and photographicequipment FMIJ 1 179† 1 215 284† 272 282 287 301 345
Total LMGD 11 780 .. 2 651 2 738 .. .. .. ..
1 The figures shown represent the output of UK - based manufacturers class-ified to Subsections DK and DL of the Standard Industrial Classification1992. The figures shown are derived from the monthly production inquiry(MPI) and include estimates for non-responders and for establishmentswhich are not sampled.
2 Orders on hand figures are given for the end of the period to which they relate.3 The data on this table are not seasonally adjusted.
Source: Office for National Statistics: 01633 812319
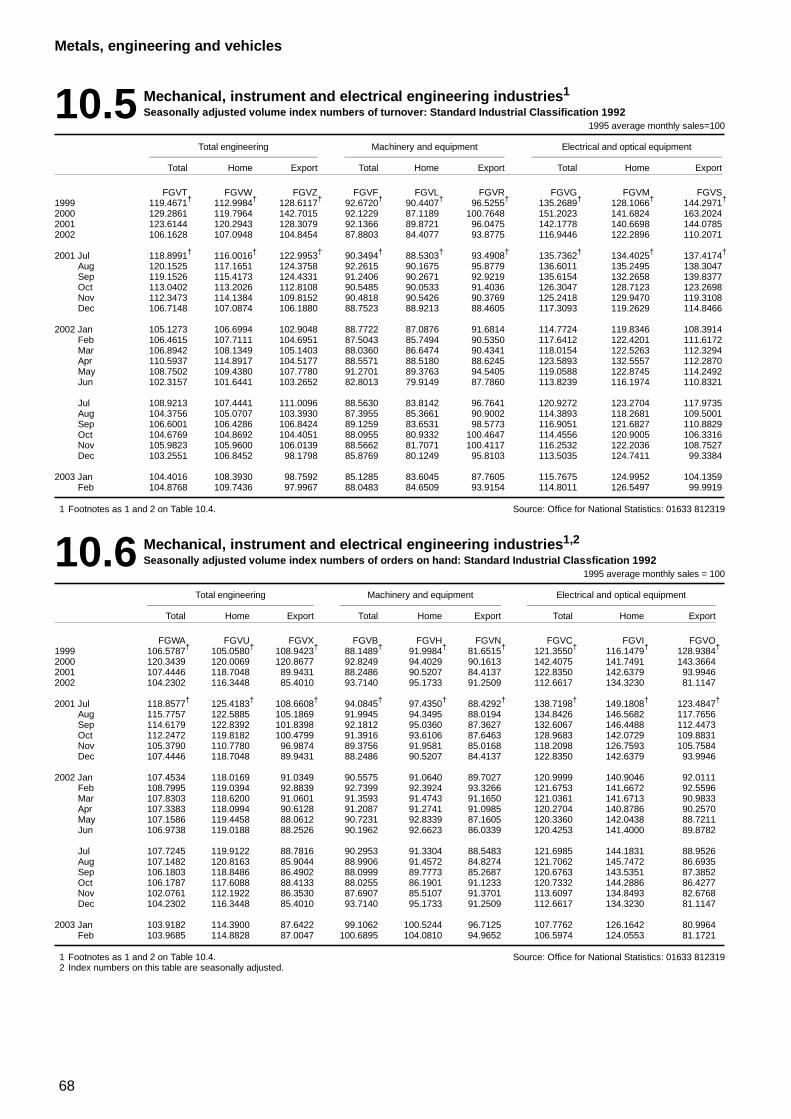
68
Metals, engineering and vehicles
10.5 Mechanical, instrument and electrical engineering industries1
Seasonally adjusted volume index numbers of turnover: Standard Industrial Classification 19921995 average monthly sales=100
Total engineering Machinery and equipment Electrical and optical equipment
Total Home Export Total Home Export Total Home Export
FGVT FGVW FGVZ FGVF FGVL FGVR FGVG FGVM FGVS1999 119.4671† 112.9984† 128.6117† 92.6720† 90.4407† 96.5255† 135.2689† 128.1066† 144.2971†
2000 129.2861 119.7964 142.7015 92.1229 87.1189 100.7648 151.2023 141.6824 163.20242001 123.6144 120.2943 128.3079 92.1366 89.8721 96.0475 142.1778 140.6698 144.07852002 106.1628 107.0948 104.8454 87.8803 84.4077 93.8775 116.9446 122.2896 110.2071
2001 Jul 118.8991† 116.0016† 122.9953† 90.3494† 88.5303† 93.4908† 135.7362† 134.4025† 137.4174†
Aug 120.1525 117.1651 124.3758 92.2615 90.1675 95.8779 136.6011 135.2495 138.3047Sep 119.1526 115.4173 124.4331 91.2406 90.2671 92.9219 135.6154 132.2658 139.8377Oct 113.0402 113.2026 112.8108 90.5485 90.0533 91.4036 126.3047 128.7123 123.2698Nov 112.3473 114.1384 109.8152 90.4818 90.5426 90.3769 125.2418 129.9470 119.3108Dec 106.7148 107.0874 106.1880 88.7523 88.9213 88.4605 117.3093 119.2629 114.8466
2002 Jan 105.1273 106.6994 102.9048 88.7722 87.0876 91.6814 114.7724 119.8346 108.3914Feb 106.4615 107.7111 104.6951 87.5043 85.7494 90.5350 117.6412 122.4201 111.6172Mar 106.8942 108.1349 105.1403 88.0360 86.6474 90.4341 118.0154 122.5263 112.3294Apr 110.5937 114.8917 104.5177 88.5571 88.5180 88.6245 123.5893 132.5557 112.2870May 108.7502 109.4380 107.7780 91.2701 89.3763 94.5405 119.0588 122.8745 114.2492Jun 102.3157 101.6441 103.2652 82.8013 79.9149 87.7860 113.8239 116.1974 110.8321
Jul 108.9213 107.4441 111.0096 88.5630 83.8142 96.7641 120.9272 123.2704 117.9735Aug 104.3756 105.0707 103.3930 87.3955 85.3661 90.9002 114.3893 118.2681 109.5001Sep 106.6001 106.4286 106.8424 89.1259 83.6531 98.5773 116.9051 121.6827 110.8829Oct 104.6769 104.8692 104.4051 88.0955 80.9332 100.4647 114.4556 120.9005 106.3316Nov 105.9823 105.9600 106.0139 88.5662 81.7071 100.4117 116.2532 122.2036 108.7527Dec 103.2551 106.8452 98.1798 85.8769 80.1249 95.8103 113.5035 124.7411 99.3384
2003 Jan 104.4016 108.3930 98.7592 85.1285 83.6045 87.7605 115.7675 124.9952 104.1359Feb 104.8768 109.7436 97.9967 88.0483 84.6509 93.9154 114.8011 126.5497 99.9919
1 Footnotes as 1 and 2 on Table 10.4. Source: Office for National Statistics: 01633 812319
10.6 Mechanical, instrument and electrical engineering industries1,2
Seasonally adjusted volume index numbers of orders on hand: Standard IndustriaI Classfication 19921995 average monthly sales = 100
Total engineering Machinery and equipment Electrical and optical equipment
Total Home Export Total Home Export Total Home Export
FGWA FGVU FGVX FGVB FGVH FGVN FGVC FGVI FGVO1999 106.5787† 105.0580† 108.9423† 88.1489† 91.9984† 81.6515† 121.3550† 116.1479† 128.9384†
2000 120.3439 120.0069 120.8677 92.8249 94.4029 90.1613 142.4075 141.7491 143.36642001 107.4446 118.7048 89.9431 88.2486 90.5207 84.4137 122.8350 142.6379 93.99462002 104.2302 116.3448 85.4010 93.7140 95.1733 91.2509 112.6617 134.3230 81.1147
2001 Jul 118.8577† 125.4183† 108.6608† 94.0845† 97.4350† 88.4292† 138.7198† 149.1808† 123.4847†
Aug 115.7757 122.5885 105.1869 91.9945 94.3495 88.0194 134.8426 146.5682 117.7656Sep 114.6179 122.8392 101.8398 92.1812 95.0360 87.3627 132.6067 146.4488 112.4473Oct 112.2472 119.8182 100.4799 91.3916 93.6106 87.6463 128.9683 142.0729 109.8831Nov 105.3790 110.7780 96.9874 89.3756 91.9581 85.0168 118.2098 126.7593 105.7584Dec 107.4446 118.7048 89.9431 88.2486 90.5207 84.4137 122.8350 142.6379 93.9946
2002 Jan 107.4534 118.0169 91.0349 90.5575 91.0640 89.7027 120.9999 140.9046 92.0111Feb 108.7995 119.0394 92.8839 92.7399 92.3924 93.3266 121.6753 141.6672 92.5596Mar 107.8303 118.6200 91.0601 91.3593 91.4743 91.1650 121.0361 141.6713 90.9833Apr 107.3383 118.0994 90.6128 91.2087 91.2741 91.0985 120.2704 140.8786 90.2570May 107.1586 119.4458 88.0612 90.7231 92.8339 87.1605 120.3360 142.0438 88.7211Jun 106.9738 119.0188 88.2526 90.1962 92.6623 86.0339 120.4253 141.4000 89.8782
Jul 107.7245 119.9122 88.7816 90.2953 91.3304 88.5483 121.6985 144.1831 88.9526Aug 107.1482 120.8163 85.9044 88.9906 91.4572 84.8274 121.7062 145.7472 86.6935Sep 106.1803 118.8486 86.4902 88.0999 89.7773 85.2687 120.6763 143.5351 87.3852Oct 106.1787 117.6088 88.4133 88.0255 86.1901 91.1233 120.7332 144.2886 86.4277Nov 102.0761 112.1922 86.3530 87.6907 85.5107 91.3701 113.6097 134.8493 82.6768Dec 104.2302 116.3448 85.4010 93.7140 95.1733 91.2509 112.6617 134.3230 81.1147
2003 Jan 103.9182 114.3900 87.6422 99.1062 100.5244 96.7125 107.7762 126.1642 80.9964Feb 103.9685 114.8828 87.0047 100.6895 104.0810 94.9652 106.5974 124.0553 81.1721
1 Footnotes as 1 and 2 on Table 10.4.2 Index numbers on this table are seasonally adjusted.
Source: Office for National Statistics: 01633 812319
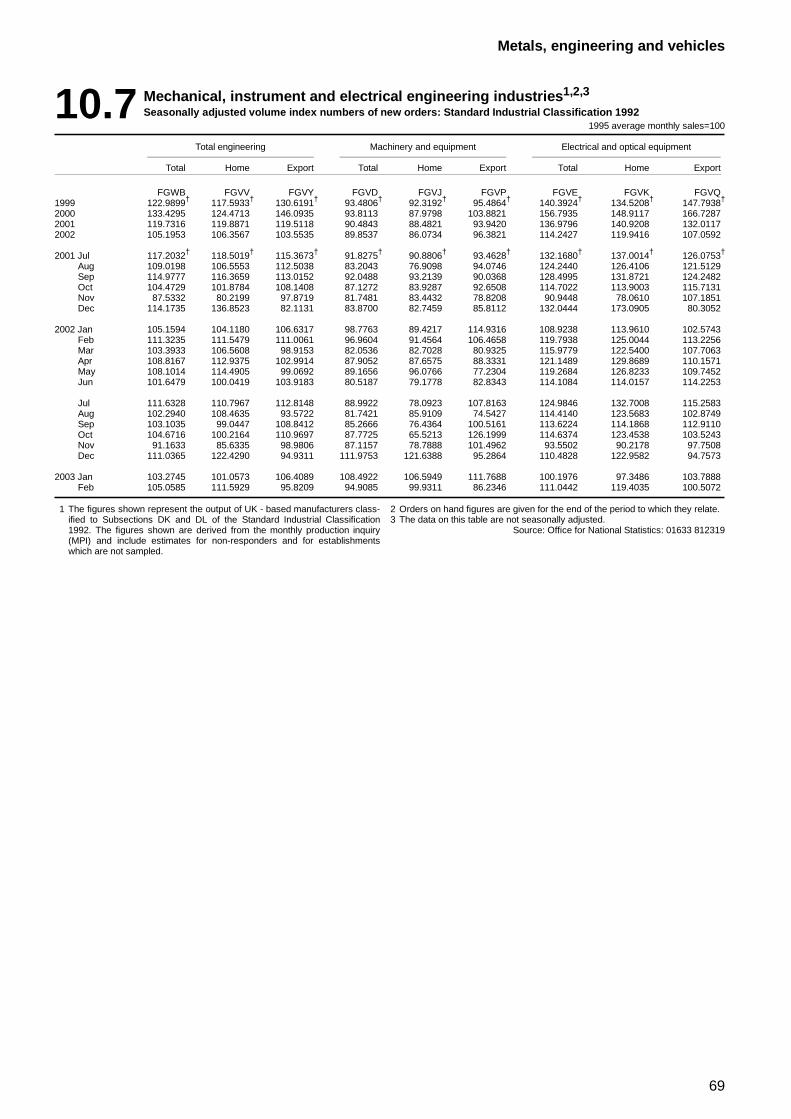
69
Metals, engineering and vehicles
10.7 Mechanical, instrument and electrical engineering industries1,2,3
Seasonally adjusted volume index numbers of new orders: Standard Industrial Classification 19921995 average monthly sales=100
Total engineering Machinery and equipment Electrical and optical equipment
Total Home Export Total Home Export Total Home Export
FGWB FGVV FGVY FGVD FGVJ FGVP FGVE FGVK FGVQ1999 122.9899† 117.5933† 130.6191† 93.4806† 92.3192† 95.4864† 140.3924† 134.5208† 147.7938†
2000 133.4295 124.4713 146.0935 93.8113 87.9798 103.8821 156.7935 148.9117 166.72872001 119.7316 119.8871 119.5118 90.4843 88.4821 93.9420 136.9796 140.9208 132.01172002 105.1953 106.3567 103.5535 89.8537 86.0734 96.3821 114.2427 119.9416 107.0592
2001 Jul 117.2032† 118.5019† 115.3673† 91.8275† 90.8806† 93.4628† 132.1680† 137.0014† 126.0753†
Aug 109.0198 106.5553 112.5038 83.2043 76.9098 94.0746 124.2440 126.4106 121.5129Sep 114.9777 116.3659 113.0152 92.0488 93.2139 90.0368 128.4995 131.8721 124.2482Oct 104.4729 101.8784 108.1408 87.1272 83.9287 92.6508 114.7022 113.9003 115.7131Nov 87.5332 80.2199 97.8719 81.7481 83.4432 78.8208 90.9448 78.0610 107.1851Dec 114.1735 136.8523 82.1131 83.8700 82.7459 85.8112 132.0444 173.0905 80.3052
2002 Jan 105.1594 104.1180 106.6317 98.7763 89.4217 114.9316 108.9238 113.9610 102.5743Feb 111.3235 111.5479 111.0061 96.9604 91.4564 106.4658 119.7938 125.0044 113.2256Mar 103.3933 106.5608 98.9153 82.0536 82.7028 80.9325 115.9779 122.5400 107.7063Apr 108.8167 112.9375 102.9914 87.9052 87.6575 88.3331 121.1489 129.8689 110.1571May 108.1014 114.4905 99.0692 89.1656 96.0766 77.2304 119.2684 126.8233 109.7452Jun 101.6479 100.0419 103.9183 80.5187 79.1778 82.8343 114.1084 114.0157 114.2253
Jul 111.6328 110.7967 112.8148 88.9922 78.0923 107.8163 124.9846 132.7008 115.2583Aug 102.2940 108.4635 93.5722 81.7421 85.9109 74.5427 114.4140 123.5683 102.8749Sep 103.1035 99.0447 108.8412 85.2666 76.4364 100.5161 113.6224 114.1868 112.9110Oct 104.6716 100.2164 110.9697 87.7725 65.5213 126.1999 114.6374 123.4538 103.5243Nov 91.1633 85.6335 98.9806 87.1157 78.7888 101.4962 93.5502 90.2178 97.7508Dec 111.0365 122.4290 94.9311 111.9753 121.6388 95.2864 110.4828 122.9582 94.7573
2003 Jan 103.2745 101.0573 106.4089 108.4922 106.5949 111.7688 100.1976 97.3486 103.7888Feb 105.0585 111.5929 95.8209 94.9085 99.9311 86.2346 111.0442 119.4035 100.5072
1 The figures shown represent the output of UK - based manufacturers class-ified to Subsections DK and DL of the Standard Industrial Classification1992. The figures shown are derived from the monthly production inquiry(MPI) and include estimates for non-responders and for establishmentswhich are not sampled.
2 Orders on hand figures are given for the end of the period to which they relate.3 The data on this table are not seasonally adjusted.
Source: Office for National Statistics: 01633 812319
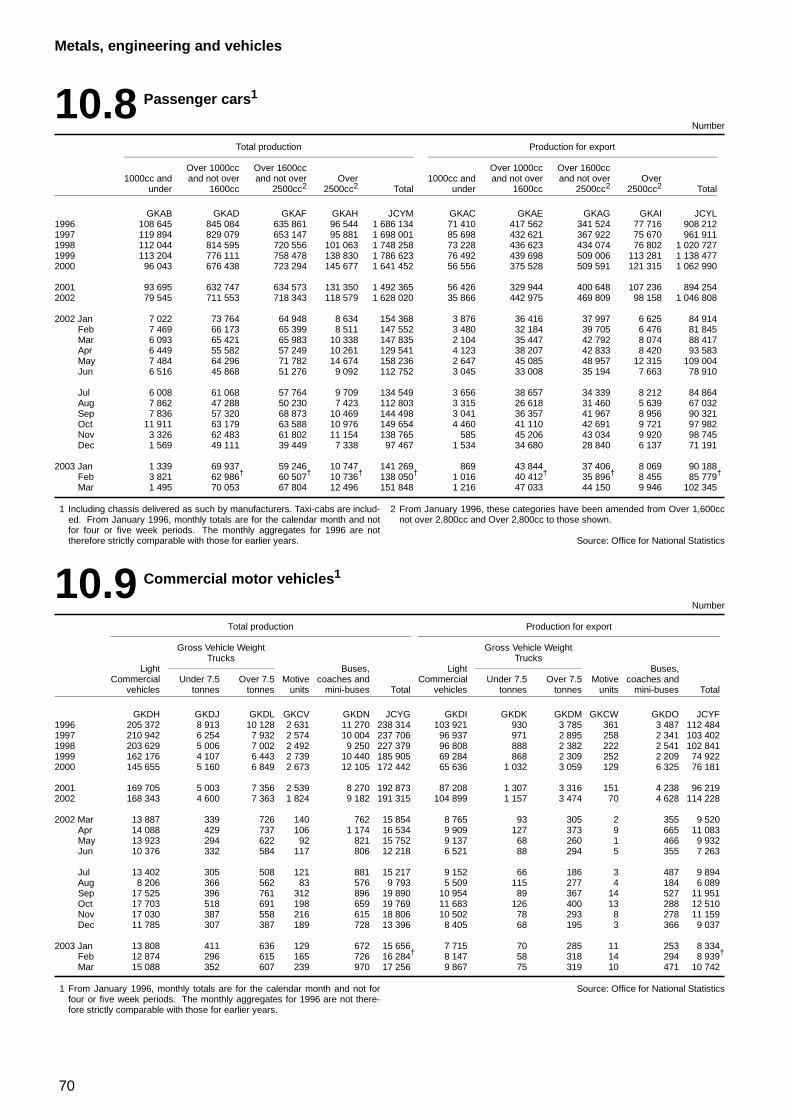
70
Metals, engineering and vehicles
10.8 Passenger cars1
Number
Total production Production for export
Over 1000cc Over 1600cc Over 1000cc Over 1600cc1000cc and and not over and not over Over 1000cc and and not over and not over Over
under 1600cc 2500cc2 2500cc2 Total under 1600cc 2500cc2 2500cc2 Total
GKAB GKAD GKAF GKAH JCYM GKAC GKAE GKAG GKAI JCYL1996 108 645 845 084 635 861 96 544 1 686 134 71 410 417 562 341 524 77 716 908 2121997 119 894 829 079 653 147 95 881 1 698 001 85 698 432 621 367 922 75 670 961 9111998 112 044 814 595 720 556 101 063 1 748 258 73 228 436 623 434 074 76 802 1 020 7271999 113 204 776 111 758 478 138 830 1 786 623 76 492 439 698 509 006 113 281 1 138 4772000 96 043 676 438 723 294 145 677 1 641 452 56 556 375 528 509 591 121 315 1 062 990
2001 93 695 632 747 634 573 131 350 1 492 365 56 426 329 944 400 648 107 236 894 2542002 79 545 711 553 718 343 118 579 1 628 020 35 866 442 975 469 809 98 158 1 046 808
2002 Jan 7 022 73 764 64 948 8 634 154 368 3 876 36 416 37 997 6 625 84 914Feb 7 469 66 173 65 399 8 511 147 552 3 480 32 184 39 705 6 476 81 845Mar 6 093 65 421 65 983 10 338 147 835 2 104 35 447 42 792 8 074 88 417Apr 6 449 55 582 57 249 10 261 129 541 4 123 38 207 42 833 8 420 93 583May 7 484 64 296 71 782 14 674 158 236 2 647 45 085 48 957 12 315 109 004Jun 6 516 45 868 51 276 9 092 112 752 3 045 33 008 35 194 7 663 78 910
Jul 6 008 61 068 57 764 9 709 134 549 3 656 38 657 34 339 8 212 84 864Aug 7 862 47 288 50 230 7 423 112 803 3 315 26 618 31 460 5 639 67 032Sep 7 836 57 320 68 873 10 469 144 498 3 041 36 357 41 967 8 956 90 321Oct 11 911 63 179 63 588 10 976 149 654 4 460 41 110 42 691 9 721 97 982Nov 3 326 62 483 61 802 11 154 138 765 585 45 206 43 034 9 920 98 745Dec 1 569 49 111 39 449 7 338 97 467 1 534 34 680 28 840 6 137 71 191
2003 Jan 1 339 69 937 59 246 10 747 141 269 869 43 844 37 406 8 069 90 188Feb 3 821 62 986† 60 507† 10 736† 138 050† 1 016 40 412† 35 896† 8 455 85 779†
Mar 1 495 70 053 67 804 12 496 151 848 1 216 47 033 44 150 9 946 102 345
1 Including chassis delivered as such by manufacturers. Taxi-cabs are includ-ed. From January 1996, monthly totals are for the calendar month and notfor four or five week periods. The monthly aggregates for 1996 are nottherefore strictly comparable with those for earlier years.
2 From January 1996, these categories have been amended from Over 1,600ccnot over 2,800cc and Over 2,800cc to those shown.
Source: Office for National Statistics
10.9 Commercial motor vehicles1
Number
Total production Production for export
Gross Vehicle Weight Gross Vehicle WeightTrucks Trucks
Light Buses, Light Buses,Commercial Under 7.5 Over 7.5 Motive coaches and Commercial Under 7.5 Over 7.5 Motive coaches and
vehicles tonnes tonnes units mini-buses Total vehicles tonnes tonnes units mini-buses Total
GKDH GKDJ GKDL GKCV GKDN JCYG GKDI GKDK GKDM GKCW GKDO JCYF1996 205 372 8 913 10 128 2 631 11 270 238 314 103 921 930 3 785 361 3 487 112 4841997 210 942 6 254 7 932 2 574 10 004 237 706 96 937 971 2 895 258 2 341 103 4021998 203 629 5 006 7 002 2 492 9 250 227 379 96 808 888 2 382 222 2 541 102 8411999 162 176 4 107 6 443 2 739 10 440 185 905 69 284 868 2 309 252 2 209 74 9222000 145 655 5 160 6 849 2 673 12 105 172 442 65 636 1 032 3 059 129 6 325 76 181
2001 169 705 5 003 7 356 2 539 8 270 192 873 87 208 1 307 3 316 151 4 238 96 2192002 168 343 4 600 7 363 1 824 9 182 191 315 104 899 1 157 3 474 70 4 628 114 228
2002 Mar 13 887 339 726 140 762 15 854 8 765 93 305 2 355 9 520Apr 14 088 429 737 106 1 174 16 534 9 909 127 373 9 665 11 083May 13 923 294 622 92 821 15 752 9 137 68 260 1 466 9 932Jun 10 376 332 584 117 806 12 218 6 521 88 294 5 355 7 263
Jul 13 402 305 508 121 881 15 217 9 152 66 186 3 487 9 894Aug 8 206 366 562 83 576 9 793 5 509 115 277 4 184 6 089Sep 17 525 396 761 312 896 19 890 10 954 89 367 14 527 11 951Oct 17 703 518 691 198 659 19 769 11 683 126 400 13 288 12 510Nov 17 030 387 558 216 615 18 806 10 502 78 293 8 278 11 159Dec 11 785 307 387 189 728 13 396 8 405 68 195 3 366 9 037
2003 Jan 13 808 411 636 129 672 15 656 7 715 70 285 11 253 8 334Feb 12 874 296 615 165 726 16 284† 8 147 58 318 14 294 8 939†
Mar 15 088 352 607 239 970 17 256 9 867 75 319 10 471 10 742
1 From January 1996, monthly totals are for the calendar month and not forfour or five week periods. The monthly aggregates for 1996 are not there-fore strictly comparable with those for earlier years.
Source: Office for National Statistics
71
11 Textiles and other manufactures
11.1 Index numbers of textile and clothing industriesStandard Industrial Classification 1992
1995=100, seasonally adjusted
Textile industry (production)
Manufacture of Manufacture ofPreparation and knitted and made-up textile
spinning of crocheted Finishing of Manufacture of articles exceptMan-made fibres All textiles1 textile fibres Textile weaving fabrics textiles other textiles apparel
SIC (92)classification 2 470 17 171 172 176 173 175 174
AHXI AIMS AIOE AIOF AHGJ AHGE AHGQ AHGF1999 118.0 87.4 102.2 85.6 80.5 74.3 90.5 84.92000 114.2 82.5 92.4 83.1 74.2 72.2 87.5 87.72001 105.5 70.7 80.0 69.4 68.2 57.9 81.7 84.22002 96.7 67.0 74.2 69.6 70.6 62.7 80.6 76.8
2000 Q3 117.7 81.6 92.9 80.9 72.7 72.8 87.6 84.7Q4 116.6 80.7 89.9 83.5 68.3 70.1 84.5 90.6
2001 Q1 117.7 72.9 86.2 74.3 67.6 57.4 82.8 84.1Q2 109.4 71.3 83.0 74.9 67.9 56.5 83.3 84.3Q3 100.2 69.3 78.4 69.4 69.9 56.3 78.8 82.7Q4 94.7 69.3 72.3 59.2 67.5 61.2 82.0 85.6
2002 Q1 93.4 68.8 79.0 68.1 70.9 62.3 80.0 80.5Q2 97.7 67.1 74.7 69.0 72.5 63.9 79.9 80.0Q3 99.8 66.9 73.2 71.2 69.1 63.5 81.4 77.5Q4 96.1 65.2 70.0 70.2 69.9 61.3 81.2 69.3
Clothing industry (production)
Manufacture of wearing Manufacture of otherapparel, dressing and Manufacture of other wearing apparel and
dyeing of fur2 outerwear Manufacture of workwear Manufacture of underwear accessories nec
SIC (92)classification 18 1822 1821 1823 1824
AIMT AHGU AHGT AHGV AHGW1999 74.3 67.0 75.8 81.9 93.62000 72.5 63.0 74.6 80.2 100.12001 62.6 55.1 72.0 65.7 87.82002 56.0 49.6 71.8 55.4 81.8
2000 Q3 74.1 64.1 72.8 81.9 105.4Q4 69.8 59.2 71.0 77.8 101.7
2001 Q1 64.0 54.9 72.6 69.3 91.9Q2 63.6 55.0 75.5 68.7 88.8Q3 61.5 54.2 72.1 63.6 87.1Q4 61.4 56.5 68.0 61.3 83.2
2002 Q1 57.8 51.3 66.8 56.0 90.0Q2 58.1 51.6 71.9 56.7 87.2Q3 56.3 49.7 73.3 56.7 81.0Q4 51.6 45.8 75.0 52.3 69.0
1 In addition to the sectors listed, this includes throwing, texturing, etc of con-tinuous filament yarn; spinning and weaving of flax, hemp and ramie; juteand polypropylene yarns and fabrics, and miscellaneous textiles (ie lace;rope, twine and net; narrow fabrics and other miscellaneous textiles).
2 In addition to the sectors listed, this includes hats, caps and millinery; gloves,other dress industries (ie swimwear and foundation garments; umbrellas andmiscellaneous industries).
Source: Office for National Statistics: 01633 812319
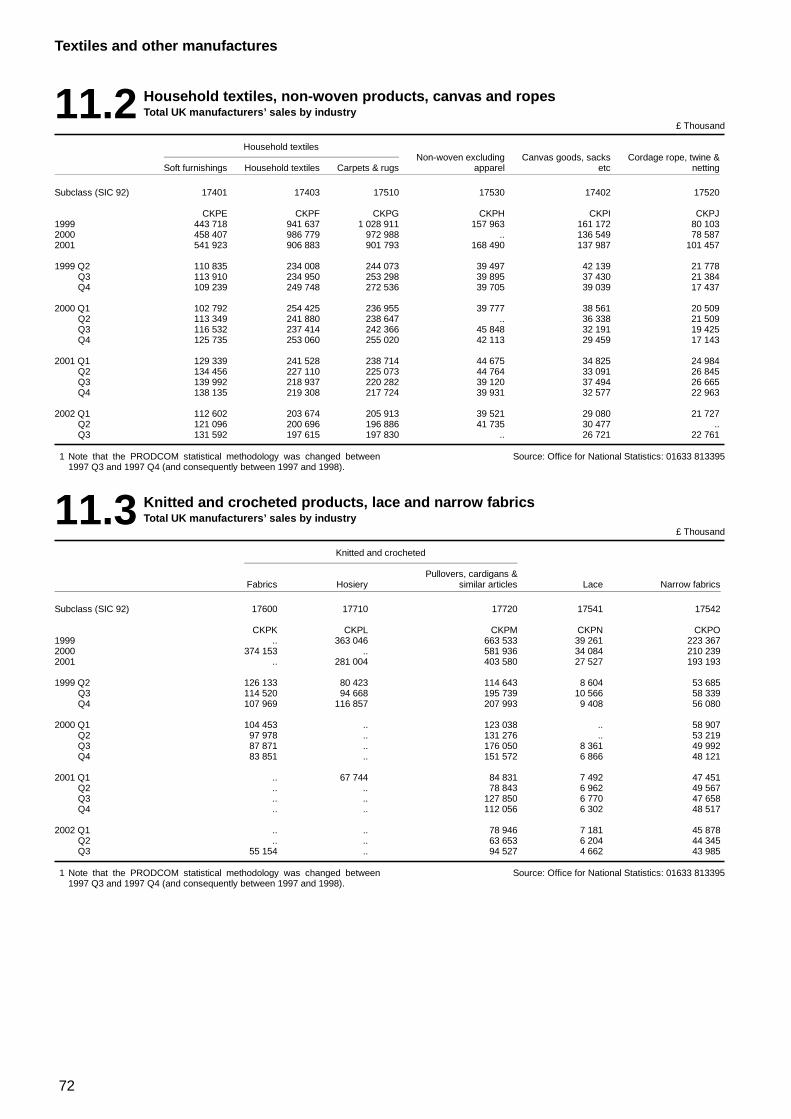
72
Textiles and other manufactures
11.2 Household textiles, non-woven products, canvas and ropesTotal UK manufacturers’ sales by industry
£ Thousand
Household textilesNon-woven excluding Canvas goods, sacks Cordage rope, twine &
Soft furnishings Household textiles Carpets & rugs apparel etc netting
Subclass (SIC 92) 17401 17403 17510 17530 17402 17520
CKPE CKPF CKPG CKPH CKPI CKPJ1999 443 718 941 637 1 028 911 157 963 161 172 80 1032000 458 407 986 779 972 988 .. 136 549 78 5872001 541 923 906 883 901 793 168 490 137 987 101 457
1999 Q2 110 835 234 008 244 073 39 497 42 139 21 778Q3 113 910 234 950 253 298 39 895 37 430 21 384Q4 109 239 249 748 272 536 39 705 39 039 17 437
2000 Q1 102 792 254 425 236 955 39 777 38 561 20 509Q2 113 349 241 880 238 647 .. 36 338 21 509Q3 116 532 237 414 242 366 45 848 32 191 19 425Q4 125 735 253 060 255 020 42 113 29 459 17 143
2001 Q1 129 339 241 528 238 714 44 675 34 825 24 984Q2 134 456 227 110 225 073 44 764 33 091 26 845Q3 139 992 218 937 220 282 39 120 37 494 26 665Q4 138 135 219 308 217 724 39 931 32 577 22 963
2002 Q1 112 602 203 674 205 913 39 521 29 080 21 727Q2 121 096 200 696 196 886 41 735 30 477 ..Q3 131 592 197 615 197 830 .. 26 721 22 761
1 Note that the PRODCOM statistical methodology was changed between1997 Q3 and 1997 Q4 (and consequently between 1997 and 1998).
Source: Office for National Statistics: 01633 813395
11.3 Knitted and crocheted products, lace and narrow fabricsTotal UK manufacturers’ sales by industry
£ Thousand
Knitted and crocheted
Pullovers, cardigans &Fabrics Hosiery similar articles Lace Narrow fabrics
Subclass (SIC 92) 17600 17710 17720 17541 17542
CKPK CKPL CKPM CKPN CKPO1999 .. 363 046 663 533 39 261 223 3672000 374 153 .. 581 936 34 084 210 2392001 .. 281 004 403 580 27 527 193 193
1999 Q2 126 133 80 423 114 643 8 604 53 685Q3 114 520 94 668 195 739 10 566 58 339Q4 107 969 116 857 207 993 9 408 56 080
2000 Q1 104 453 .. 123 038 .. 58 907Q2 97 978 .. 131 276 .. 53 219Q3 87 871 .. 176 050 8 361 49 992Q4 83 851 .. 151 572 6 866 48 121
2001 Q1 .. 67 744 84 831 7 492 47 451Q2 .. .. 78 843 6 962 49 567Q3 .. .. 127 850 6 770 47 658Q4 .. .. 112 056 6 302 48 517
2002 Q1 .. .. 78 946 7 181 45 878Q2 .. .. 63 653 6 204 44 345Q3 55 154 .. 94 527 4 662 43 985
1 Note that the PRODCOM statistical methodology was changed between1997 Q3 and 1997 Q4 (and consequently between 1997 and 1998).
Source: Office for National Statistics: 01633 813395
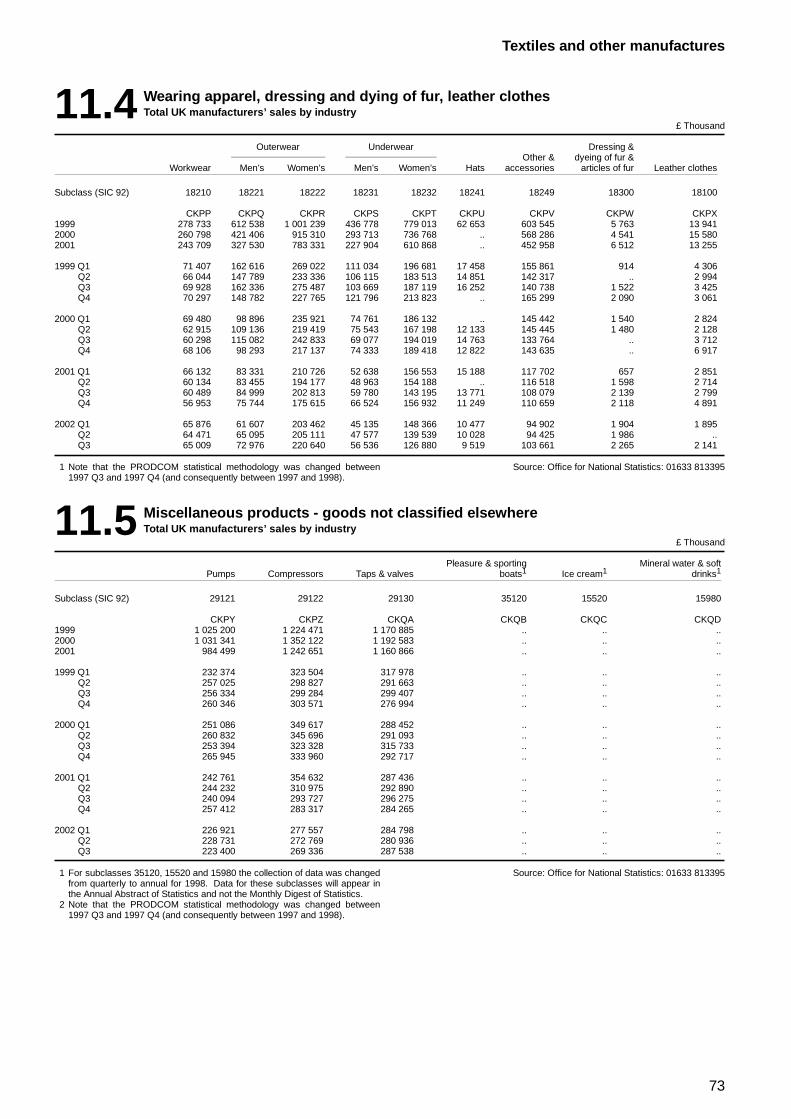
73
Textiles and other manufactures
11.4 Wearing apparel, dressing and dying of fur, leather clothesTotal UK manufacturers’ sales by industry
£ Thousand
Outerwear Underwear Dressing &Other & dyeing of fur &
Workwear Men’s Women’s Men’s Women’s Hats accessories articles of fur Leather clothes
Subclass (SIC 92) 18210 18221 18222 18231 18232 18241 18249 18300 18100
CKPP CKPQ CKPR CKPS CKPT CKPU CKPV CKPW CKPX1999 278 733 612 538 1 001 239 436 778 779 013 62 653 603 545 5 763 13 9412000 260 798 421 406 915 310 293 713 736 768 .. 568 286 4 541 15 5802001 243 709 327 530 783 331 227 904 610 868 .. 452 958 6 512 13 255
1999 Q1 71 407 162 616 269 022 111 034 196 681 17 458 155 861 914 4 306Q2 66 044 147 789 233 336 106 115 183 513 14 851 142 317 .. 2 994Q3 69 928 162 336 275 487 103 669 187 119 16 252 140 738 1 522 3 425Q4 70 297 148 782 227 765 121 796 213 823 .. 165 299 2 090 3 061
2000 Q1 69 480 98 896 235 921 74 761 186 132 .. 145 442 1 540 2 824Q2 62 915 109 136 219 419 75 543 167 198 12 133 145 445 1 480 2 128Q3 60 298 115 082 242 833 69 077 194 019 14 763 133 764 .. 3 712Q4 68 106 98 293 217 137 74 333 189 418 12 822 143 635 .. 6 917
2001 Q1 66 132 83 331 210 726 52 638 156 553 15 188 117 702 657 2 851Q2 60 134 83 455 194 177 48 963 154 188 .. 116 518 1 598 2 714Q3 60 489 84 999 202 813 59 780 143 195 13 771 108 079 2 139 2 799Q4 56 953 75 744 175 615 66 524 156 932 11 249 110 659 2 118 4 891
2002 Q1 65 876 61 607 203 462 45 135 148 366 10 477 94 902 1 904 1 895Q2 64 471 65 095 205 111 47 577 139 539 10 028 94 425 1 986 ..Q3 65 009 72 976 220 640 56 536 126 880 9 519 103 661 2 265 2 141
1 Note that the PRODCOM statistical methodology was changed between1997 Q3 and 1997 Q4 (and consequently between 1997 and 1998).
Source: Office for National Statistics: 01633 813395
11.5 Miscellaneous products - goods not classified elsewhereTotal UK manufacturers’ sales by industry
£ Thousand
Pleasure & sporting Mineral water & softPumps Compressors Taps & valves boats1 Ice cream1 drinks1
Subclass (SIC 92) 29121 29122 29130 35120 15520 15980
CKPY CKPZ CKQA CKQB CKQC CKQD1999 1 025 200 1 224 471 1 170 885 .. .. ..2000 1 031 341 1 352 122 1 192 583 .. .. ..2001 984 499 1 242 651 1 160 866 .. .. ..
1999 Q1 232 374 323 504 317 978 .. .. ..Q2 257 025 298 827 291 663 .. .. ..Q3 256 334 299 284 299 407 .. .. ..Q4 260 346 303 571 276 994 .. .. ..
2000 Q1 251 086 349 617 288 452 .. .. ..Q2 260 832 345 696 291 093 .. .. ..Q3 253 394 323 328 315 733 .. .. ..Q4 265 945 333 960 292 717 .. .. ..
2001 Q1 242 761 354 632 287 436 .. .. ..Q2 244 232 310 975 292 890 .. .. ..Q3 240 094 293 727 296 275 .. .. ..Q4 257 412 283 317 284 265 .. .. ..
2002 Q1 226 921 277 557 284 798 .. .. ..Q2 228 731 272 769 280 936 .. .. ..Q3 223 400 269 336 287 538 .. .. ..
1 For subclasses 35120, 15520 and 15980 the collection of data was changedfrom quarterly to annual for 1998. Data for these subclasses will appear inthe Annual Abstract of Statistics and not the Monthly Digest of Statistics.
2 Note that the PRODCOM statistical methodology was changed between1997 Q3 and 1997 Q4 (and consequently between 1997 and 1998).
Source: Office for National Statistics: 01633 813395
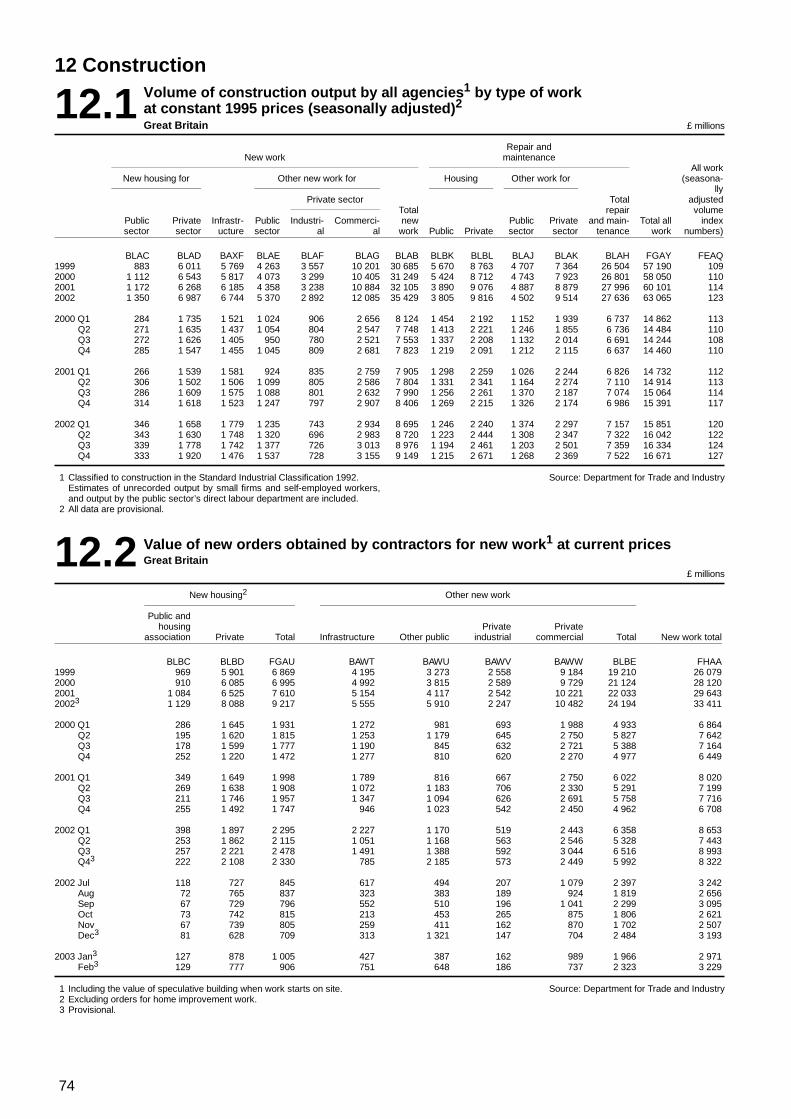
74
12 Construction
12.1 Volume of construction output by all agencies1 by type of workat constant 1995 prices (seasonally adjusted)2Great Britain £ millions
Repair andNew work maintenance
All workNew housing for Other new work for Housing Other work for (seasona-
llyPrivate sector Total adjusted
Total repair volumePublic Private Infrastr- Public Industri- Commerci- new Public Private and main- Total all indexsector sector ucture sector al al work Public Private sector sector tenance work numbers)
BLAC BLAD BAXF BLAE BLAF BLAG BLAB BLBK BLBL BLAJ BLAK BLAH FGAY FEAQ1999 883 6 011 5 769 4 263 3 557 10 201 30 685 5 670 8 763 4 707 7 364 26 504 57 190 1092000 1 112 6 543 5 817 4 073 3 299 10 405 31 249 5 424 8 712 4 743 7 923 26 801 58 050 1102001 1 172 6 268 6 185 4 358 3 238 10 884 32 105 3 890 9 076 4 887 8 879 27 996 60 101 1142002 1 350 6 987 6 744 5 370 2 892 12 085 35 429 3 805 9 816 4 502 9 514 27 636 63 065 123
2000 Q1 284 1 735 1 521 1 024 906 2 656 8 124 1 454 2 192 1 152 1 939 6 737 14 862 113Q2 271 1 635 1 437 1 054 804 2 547 7 748 1 413 2 221 1 246 1 855 6 736 14 484 110Q3 272 1 626 1 405 950 780 2 521 7 553 1 337 2 208 1 132 2 014 6 691 14 244 108Q4 285 1 547 1 455 1 045 809 2 681 7 823 1 219 2 091 1 212 2 115 6 637 14 460 110
2001 Q1 266 1 539 1 581 924 835 2 759 7 905 1 298 2 259 1 026 2 244 6 826 14 732 112Q2 306 1 502 1 506 1 099 805 2 586 7 804 1 331 2 341 1 164 2 274 7 110 14 914 113Q3 286 1 609 1 575 1 088 801 2 632 7 990 1 256 2 261 1 370 2 187 7 074 15 064 114Q4 314 1 618 1 523 1 247 797 2 907 8 406 1 269 2 215 1 326 2 174 6 986 15 391 117
2002 Q1 346 1 658 1 779 1 235 743 2 934 8 695 1 246 2 240 1 374 2 297 7 157 15 851 120Q2 343 1 630 1 748 1 320 696 2 983 8 720 1 223 2 444 1 308 2 347 7 322 16 042 122Q3 339 1 778 1 742 1 377 726 3 013 8 976 1 194 2 461 1 203 2 501 7 359 16 334 124Q4 333 1 920 1 476 1 537 728 3 155 9 149 1 215 2 671 1 268 2 369 7 522 16 671 127
1 Classified to construction in the Standard Industrial Classification 1992.Estimates of unrecorded output by small firms and self-employed workers,and output by the public sector’s direct labour department are included.
2 All data are provisional.
Source: Department for Trade and Industry
12.2 Value of new orders obtained by contractors for new work1 at current pricesGreat Britain
£ millions
New housing2 Other new work
Public andhousing Private Private
association Private Total Infrastructure Other public industrial commercial Total New work total
BLBC BLBD FGAU BAWT BAWU BAWV BAWW BLBE FHAA1999 969 5 901 6 869 4 195 3 273 2 558 9 184 19 210 26 0792000 910 6 085 6 995 4 992 3 815 2 589 9 729 21 124 28 1202001 1 084 6 525 7 610 5 154 4 117 2 542 10 221 22 033 29 64320023 1 129 8 088 9 217 5 555 5 910 2 247 10 482 24 194 33 411
2000 Q1 286 1 645 1 931 1 272 981 693 1 988 4 933 6 864Q2 195 1 620 1 815 1 253 1 179 645 2 750 5 827 7 642Q3 178 1 599 1 777 1 190 845 632 2 721 5 388 7 164Q4 252 1 220 1 472 1 277 810 620 2 270 4 977 6 449
2001 Q1 349 1 649 1 998 1 789 816 667 2 750 6 022 8 020Q2 269 1 638 1 908 1 072 1 183 706 2 330 5 291 7 199Q3 211 1 746 1 957 1 347 1 094 626 2 691 5 758 7 716Q4 255 1 492 1 747 946 1 023 542 2 450 4 962 6 708
2002 Q1 398 1 897 2 295 2 227 1 170 519 2 443 6 358 8 653Q2 253 1 862 2 115 1 051 1 168 563 2 546 5 328 7 443Q3 257 2 221 2 478 1 491 1 388 592 3 044 6 516 8 993Q43 222 2 108 2 330 785 2 185 573 2 449 5 992 8 322
2002 Jul 118 727 845 617 494 207 1 079 2 397 3 242Aug 72 765 837 323 383 189 924 1 819 2 656Sep 67 729 796 552 510 196 1 041 2 299 3 095Oct 73 742 815 213 453 265 875 1 806 2 621Nov 67 739 805 259 411 162 870 1 702 2 507Dec3 81 628 709 313 1 321 147 704 2 484 3 193
2003 Jan3 127 878 1 005 427 387 162 989 1 966 2 971Feb3 129 777 906 751 648 186 737 2 323 3 229
1 Including the value of speculative building when work starts on site.2 Excluding orders for home improvement work.3 Provisional.
Source: Department for Trade and Industry
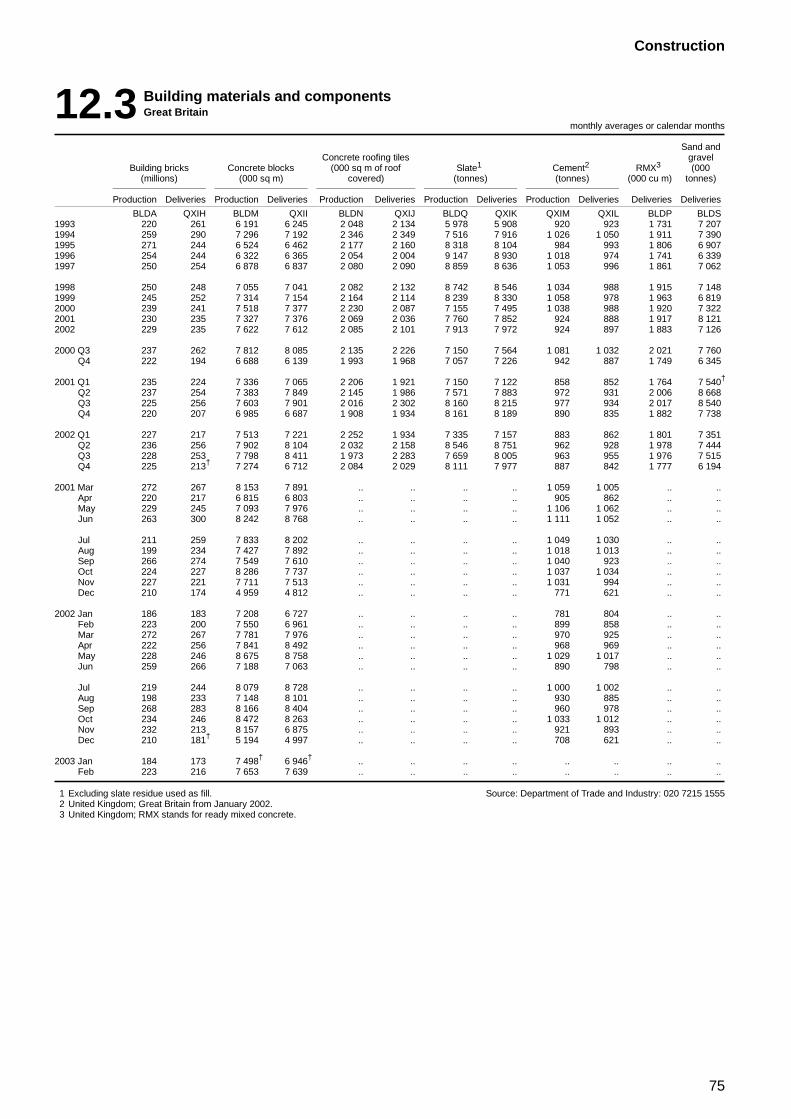
75
Construction
12.3 Building materials and componentsGreat Britain
monthly averages or calendar months
Sand andConcrete roofing tiles gravel
Building bricks Concrete blocks (000 sq m of roof Slate1 Cement2 RMX3 (000(millions) (000 sq m) covered) (tonnes) (tonnes) (000 cu m) tonnes)
Production Deliveries Production Deliveries Production Deliveries Production Deliveries Production Deliveries Deliveries Deliveries
BLDA QXIH BLDM QXII BLDN QXIJ BLDQ QXIK QXIM QXIL BLDP BLDS1993 220 261 6 191 6 245 2 048 2 134 5 978 5 908 920 923 1 731 7 2071994 259 290 7 296 7 192 2 346 2 349 7 516 7 916 1 026 1 050 1 911 7 3901995 271 244 6 524 6 462 2 177 2 160 8 318 8 104 984 993 1 806 6 9071996 254 244 6 322 6 365 2 054 2 004 9 147 8 930 1 018 974 1 741 6 3391997 250 254 6 878 6 837 2 080 2 090 8 859 8 636 1 053 996 1 861 7 062
1998 250 248 7 055 7 041 2 082 2 132 8 742 8 546 1 034 988 1 915 7 1481999 245 252 7 314 7 154 2 164 2 114 8 239 8 330 1 058 978 1 963 6 8192000 239 241 7 518 7 377 2 230 2 087 7 155 7 495 1 038 988 1 920 7 3222001 230 235 7 327 7 376 2 069 2 036 7 760 7 852 924 888 1 917 8 1212002 229 235 7 622 7 612 2 085 2 101 7 913 7 972 924 897 1 883 7 126
2000 Q3 237 262 7 812 8 085 2 135 2 226 7 150 7 564 1 081 1 032 2 021 7 760Q4 222 194 6 688 6 139 1 993 1 968 7 057 7 226 942 887 1 749 6 345
2001 Q1 235 224 7 336 7 065 2 206 1 921 7 150 7 122 858 852 1 764 7 540†
Q2 237 254 7 383 7 849 2 145 1 986 7 571 7 883 972 931 2 006 8 668Q3 225 256 7 603 7 901 2 016 2 302 8 160 8 215 977 934 2 017 8 540Q4 220 207 6 985 6 687 1 908 1 934 8 161 8 189 890 835 1 882 7 738
2002 Q1 227 217 7 513 7 221 2 252 1 934 7 335 7 157 883 862 1 801 7 351Q2 236 256 7 902 8 104 2 032 2 158 8 546 8 751 962 928 1 978 7 444Q3 228 253 7 798 8 411 1 973 2 283 7 659 8 005 963 955 1 976 7 515Q4 225 213† 7 274 6 712 2 084 2 029 8 111 7 977 887 842 1 777 6 194
2001 Mar 272 267 8 153 7 891 .. .. .. .. 1 059 1 005 .. ..Apr 220 217 6 815 6 803 .. .. .. .. 905 862 .. ..May 229 245 7 093 7 976 .. .. .. .. 1 106 1 062 .. ..Jun 263 300 8 242 8 768 .. .. .. .. 1 111 1 052 .. ..
Jul 211 259 7 833 8 202 .. .. .. .. 1 049 1 030 .. ..Aug 199 234 7 427 7 892 .. .. .. .. 1 018 1 013 .. ..Sep 266 274 7 549 7 610 .. .. .. .. 1 040 923 .. ..Oct 224 227 8 286 7 737 .. .. .. .. 1 037 1 034 .. ..Nov 227 221 7 711 7 513 .. .. .. .. 1 031 994 .. ..Dec 210 174 4 959 4 812 .. .. .. .. 771 621 .. ..
2002 Jan 186 183 7 208 6 727 .. .. .. .. 781 804 .. ..Feb 223 200 7 550 6 961 .. .. .. .. 899 858 .. ..Mar 272 267 7 781 7 976 .. .. .. .. 970 925 .. ..Apr 222 256 7 841 8 492 .. .. .. .. 968 969 .. ..May 228 246 8 675 8 758 .. .. .. .. 1 029 1 017 .. ..Jun 259 266 7 188 7 063 .. .. .. .. 890 798 .. ..
Jul 219 244 8 079 8 728 .. .. .. .. 1 000 1 002 .. ..Aug 198 233 7 148 8 101 .. .. .. .. 930 885 .. ..Sep 268 283 8 166 8 404 .. .. .. .. 960 978 .. ..Oct 234 246 8 472 8 263 .. .. .. .. 1 033 1 012 .. ..Nov 232 213 8 157 6 875 .. .. .. .. 921 893 .. ..Dec 210 181† 5 194 4 997 .. .. .. .. 708 621 .. ..
2003 Jan 184 173 7 498† 6 946† .. .. .. .. .. .. .. ..Feb 223 216 7 653 7 639 .. .. .. .. .. .. .. ..
1 Excluding slate residue used as fill.2 United Kingdom; Great Britain from January 2002.3 United Kingdom; RMX stands for ready mixed concrete.
Source: Department of Trade and Industry: 020 7215 1555
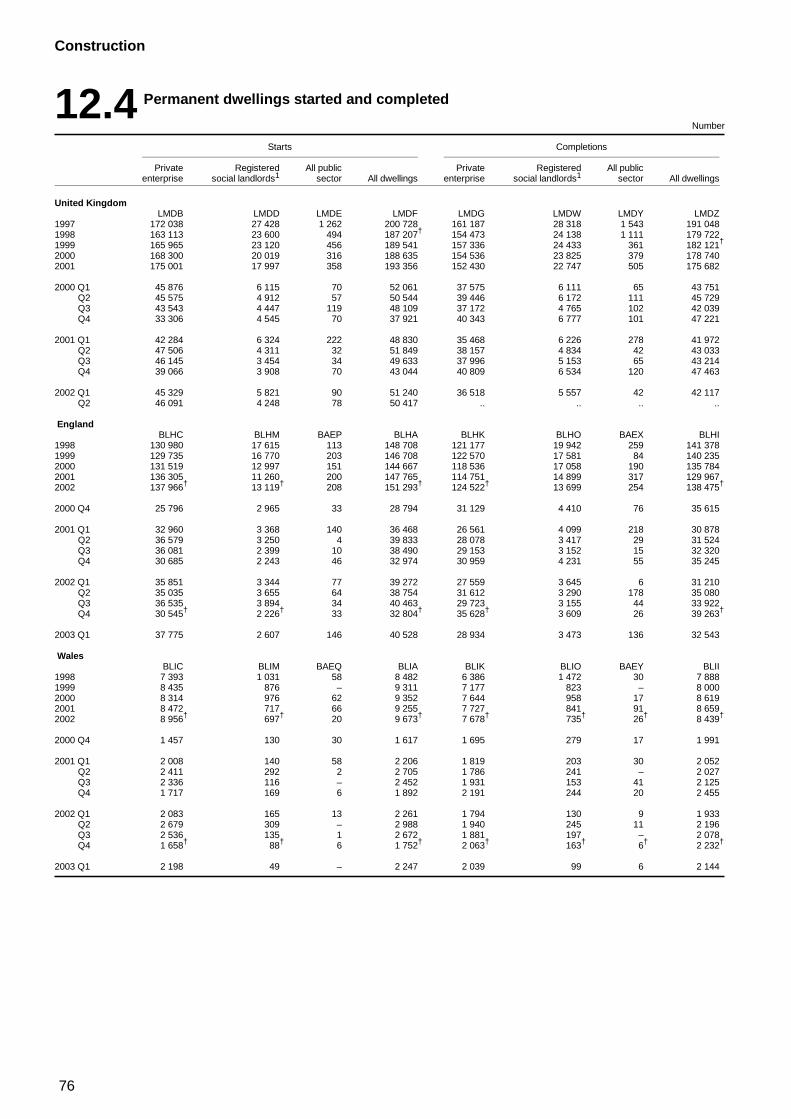
76
Construction
12.4 Permanent dwellings started and completed
Number
Starts Completions
Private Registered All public Private Registered All publicenterprise social landlords1 sector All dwellings enterprise social landlords1 sector All dwellings
United KingdomLMDB LMDD LMDE LMDF LMDG LMDW LMDY LMDZ
1997 172 038 27 428 1 262 200 728 161 187 28 318 1 543 191 0481998 163 113 23 600 494 187 207† 154 473 24 138 1 111 179 7221999 165 965 23 120 456 189 541 157 336 24 433 361 182 121†
2000 168 300 20 019 316 188 635 154 536 23 825 379 178 7402001 175 001 17 997 358 193 356 152 430 22 747 505 175 682
2000 Q1 45 876 6 115 70 52 061 37 575 6 111 65 43 751Q2 45 575 4 912 57 50 544 39 446 6 172 111 45 729Q3 43 543 4 447 119 48 109 37 172 4 765 102 42 039Q4 33 306 4 545 70 37 921 40 343 6 777 101 47 221
2001 Q1 42 284 6 324 222 48 830 35 468 6 226 278 41 972Q2 47 506 4 311 32 51 849 38 157 4 834 42 43 033Q3 46 145 3 454 34 49 633 37 996 5 153 65 43 214Q4 39 066 3 908 70 43 044 40 809 6 534 120 47 463
2002 Q1 45 329 5 821 90 51 240 36 518 5 557 42 42 117Q2 46 091 4 248 78 50 417 .. .. .. ..
EnglandBLHC BLHM BAEP BLHA BLHK BLHO BAEX BLHI
1998 130 980 17 615 113 148 708 121 177 19 942 259 141 3781999 129 735 16 770 203 146 708 122 570 17 581 84 140 2352000 131 519 12 997 151 144 667 118 536 17 058 190 135 7842001 136 305 11 260 200 147 765 114 751 14 899 317 129 9672002 137 966† 13 119† 208 151 293† 124 522† 13 699 254 138 475†
2000 Q4 25 796 2 965 33 28 794 31 129 4 410 76 35 615
2001 Q1 32 960 3 368 140 36 468 26 561 4 099 218 30 878Q2 36 579 3 250 4 39 833 28 078 3 417 29 31 524Q3 36 081 2 399 10 38 490 29 153 3 152 15 32 320Q4 30 685 2 243 46 32 974 30 959 4 231 55 35 245
2002 Q1 35 851 3 344 77 39 272 27 559 3 645 6 31 210Q2 35 035 3 655 64 38 754 31 612 3 290 178 35 080Q3 36 535 3 894 34 40 463 29 723 3 155 44 33 922Q4 30 545† 2 226† 33 32 804† 35 628† 3 609 26 39 263†
2003 Q1 37 775 2 607 146 40 528 28 934 3 473 136 32 543
WalesBLIC BLIM BAEQ BLIA BLIK BLIO BAEY BLII
1998 7 393 1 031 58 8 482 6 386 1 472 30 7 8881999 8 435 876 – 9 311 7 177 823 – 8 0002000 8 314 976 62 9 352 7 644 958 17 8 6192001 8 472 717 66 9 255 7 727 841 91 8 6592002 8 956† 697† 20 9 673† 7 678† 735† 26† 8 439†
2000 Q4 1 457 130 30 1 617 1 695 279 17 1 991
2001 Q1 2 008 140 58 2 206 1 819 203 30 2 052Q2 2 411 292 2 2 705 1 786 241 – 2 027Q3 2 336 116 – 2 452 1 931 153 41 2 125Q4 1 717 169 6 1 892 2 191 244 20 2 455
2002 Q1 2 083 165 13 2 261 1 794 130 9 1 933Q2 2 679 309 – 2 988 1 940 245 11 2 196Q3 2 536 135 1 2 672 1 881 197 – 2 078Q4 1 658† 88† 6 1 752† 2 063† 163† 6† 2 232†
2003 Q1 2 198 49 – 2 247 2 039 99 6 2 144
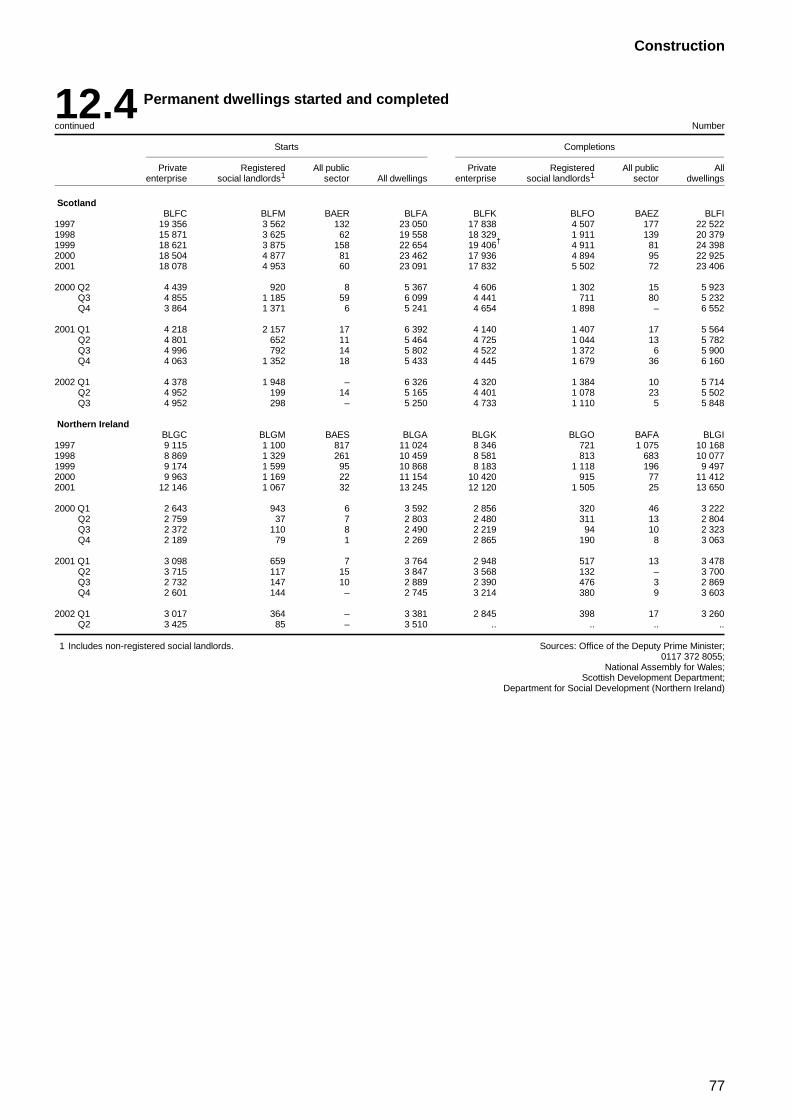
77
Construction
12.4 Permanent dwellings started and completed
continued Number
Starts Completions
Private Registered All public Private Registered All public Allenterprise social landlords1 sector All dwellings enterprise social landlords1 sector dwellings
ScotlandBLFC BLFM BAER BLFA BLFK BLFO BAEZ BLFI
1997 19 356 3 562 132 23 050 17 838 4 507 177 22 5221998 15 871 3 625 62 19 558 18 329 1 911 139 20 3791999 18 621 3 875 158 22 654 19 406† 4 911 81 24 3982000 18 504 4 877 81 23 462 17 936 4 894 95 22 9252001 18 078 4 953 60 23 091 17 832 5 502 72 23 406
2000 Q2 4 439 920 8 5 367 4 606 1 302 15 5 923Q3 4 855 1 185 59 6 099 4 441 711 80 5 232Q4 3 864 1 371 6 5 241 4 654 1 898 – 6 552
2001 Q1 4 218 2 157 17 6 392 4 140 1 407 17 5 564Q2 4 801 652 11 5 464 4 725 1 044 13 5 782Q3 4 996 792 14 5 802 4 522 1 372 6 5 900Q4 4 063 1 352 18 5 433 4 445 1 679 36 6 160
2002 Q1 4 378 1 948 – 6 326 4 320 1 384 10 5 714Q2 4 952 199 14 5 165 4 401 1 078 23 5 502Q3 4 952 298 – 5 250 4 733 1 110 5 5 848
Northern IrelandBLGC BLGM BAES BLGA BLGK BLGO BAFA BLGI
1997 9 115 1 100 817 11 024 8 346 721 1 075 10 1681998 8 869 1 329 261 10 459 8 581 813 683 10 0771999 9 174 1 599 95 10 868 8 183 1 118 196 9 4972000 9 963 1 169 22 11 154 10 420 915 77 11 4122001 12 146 1 067 32 13 245 12 120 1 505 25 13 650
2000 Q1 2 643 943 6 3 592 2 856 320 46 3 222Q2 2 759 37 7 2 803 2 480 311 13 2 804Q3 2 372 110 8 2 490 2 219 94 10 2 323Q4 2 189 79 1 2 269 2 865 190 8 3 063
2001 Q1 3 098 659 7 3 764 2 948 517 13 3 478Q2 3 715 117 15 3 847 3 568 132 – 3 700Q3 2 732 147 10 2 889 2 390 476 3 2 869Q4 2 601 144 – 2 745 3 214 380 9 3 603
2002 Q1 3 017 364 – 3 381 2 845 398 17 3 260Q2 3 425 85 – 3 510 .. .. .. ..
1 Includes non-registered social landlords. Sources: Office of the Deputy Prime Minister;0117 372 8055;
National Assembly for Wales;Scottish Development Department;
Department for Social Development (Northern Ireland)
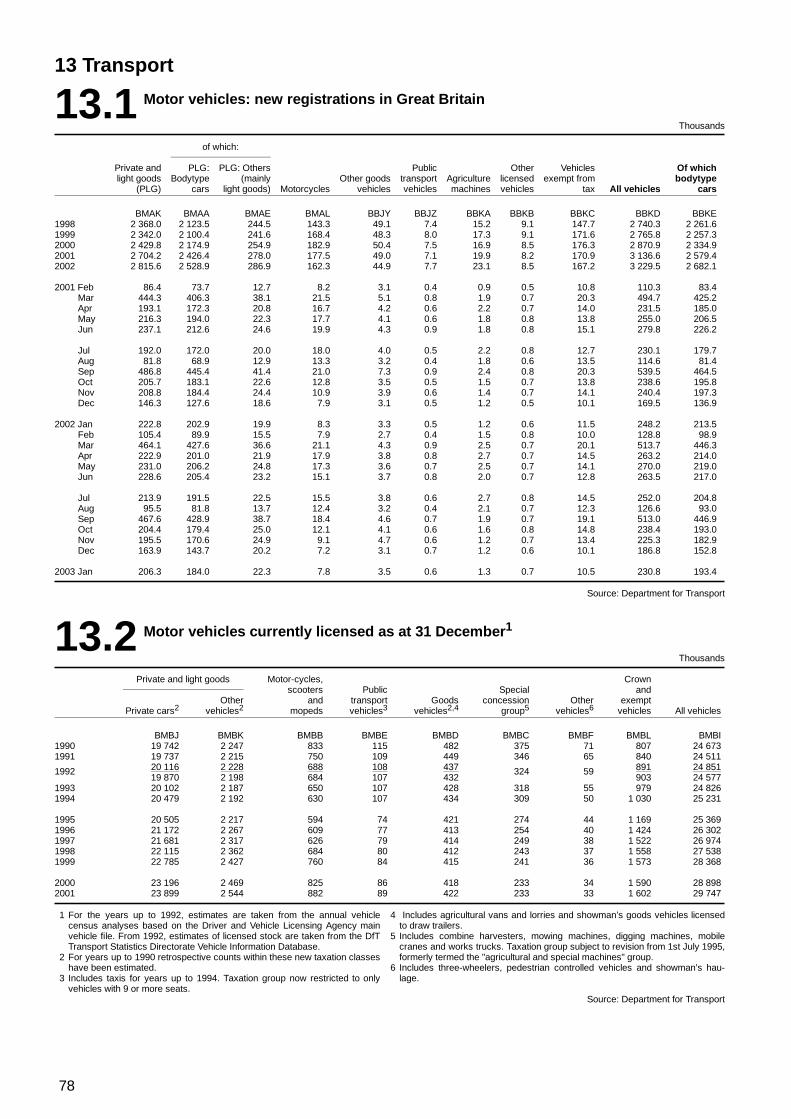
78
13 Transport
13.1 Motor vehicles: new registrations in Great Britain
Thousands
of which:
Private and PLG: PLG: Others Public Other Vehicles Of whichlight goods Bodytype (mainly Other goods transport Agriculture licensed exempt from bodytype
(PLG) cars light goods) Motorcycles vehicles vehicles machines vehicles tax All vehicles cars
BMAK BMAA BMAE BMAL BBJY BBJZ BBKA BBKB BBKC BBKD BBKE1998 2 368.0 2 123.5 244.5 143.3 49.1 7.4 15.2 9.1 147.7 2 740.3 2 261.61999 2 342.0 2 100.4 241.6 168.4 48.3 8.0 17.3 9.1 171.6 2 765.8 2 257.32000 2 429.8 2 174.9 254.9 182.9 50.4 7.5 16.9 8.5 176.3 2 870.9 2 334.92001 2 704.2 2 426.4 278.0 177.5 49.0 7.1 19.9 8.2 170.9 3 136.6 2 579.42002 2 815.6 2 528.9 286.9 162.3 44.9 7.7 23.1 8.5 167.2 3 229.5 2 682.1
2001 Feb 86.4 73.7 12.7 8.2 3.1 0.4 0.9 0.5 10.8 110.3 83.4Mar 444.3 406.3 38.1 21.5 5.1 0.8 1.9 0.7 20.3 494.7 425.2Apr 193.1 172.3 20.8 16.7 4.2 0.6 2.2 0.7 14.0 231.5 185.0May 216.3 194.0 22.3 17.7 4.1 0.6 1.8 0.8 13.8 255.0 206.5Jun 237.1 212.6 24.6 19.9 4.3 0.9 1.8 0.8 15.1 279.8 226.2
Jul 192.0 172.0 20.0 18.0 4.0 0.5 2.2 0.8 12.7 230.1 179.7Aug 81.8 68.9 12.9 13.3 3.2 0.4 1.8 0.6 13.5 114.6 81.4Sep 486.8 445.4 41.4 21.0 7.3 0.9 2.4 0.8 20.3 539.5 464.5Oct 205.7 183.1 22.6 12.8 3.5 0.5 1.5 0.7 13.8 238.6 195.8Nov 208.8 184.4 24.4 10.9 3.9 0.6 1.4 0.7 14.1 240.4 197.3Dec 146.3 127.6 18.6 7.9 3.1 0.5 1.2 0.5 10.1 169.5 136.9
2002 Jan 222.8 202.9 19.9 8.3 3.3 0.5 1.2 0.6 11.5 248.2 213.5Feb 105.4 89.9 15.5 7.9 2.7 0.4 1.5 0.8 10.0 128.8 98.9Mar 464.1 427.6 36.6 21.1 4.3 0.9 2.5 0.7 20.1 513.7 446.3Apr 222.9 201.0 21.9 17.9 3.8 0.8 2.7 0.7 14.5 263.2 214.0May 231.0 206.2 24.8 17.3 3.6 0.7 2.5 0.7 14.1 270.0 219.0Jun 228.6 205.4 23.2 15.1 3.7 0.8 2.0 0.7 12.8 263.5 217.0
Jul 213.9 191.5 22.5 15.5 3.8 0.6 2.7 0.8 14.5 252.0 204.8Aug 95.5 81.8 13.7 12.4 3.2 0.4 2.1 0.7 12.3 126.6 93.0Sep 467.6 428.9 38.7 18.4 4.6 0.7 1.9 0.7 19.1 513.0 446.9Oct 204.4 179.4 25.0 12.1 4.1 0.6 1.6 0.8 14.8 238.4 193.0Nov 195.5 170.6 24.9 9.1 4.7 0.6 1.2 0.7 13.4 225.3 182.9Dec 163.9 143.7 20.2 7.2 3.1 0.7 1.2 0.6 10.1 186.8 152.8
2003 Jan 206.3 184.0 22.3 7.8 3.5 0.6 1.3 0.7 10.5 230.8 193.4
Source: Department for Transport
13.2 Motor vehicles currently licensed as at 31 December1
Thousands
Private and light goods Motor-cycles, Crownscooters Public Special and
Other and transport Goods concession Other exemptPrivate cars2 vehicles2 mopeds vehicles3 vehicles2,4 group5 vehicles6 vehicles All vehicles
BMBJ BMBK BMBB BMBE BMBD BMBC BMBF BMBL BMBI1990 19 742 2 247 833 115 482 375 71 807 24 6731991 19 737 2 215 750 109 449 346 65 840 24 511
1992 20 116 2 228 688 108 437 324 59 891 24 85119 870 2 198 684 107 432 903 24 577
1993 20 102 2 187 650 107 428 318 55 979 24 8261994 20 479 2 192 630 107 434 309 50 1 030 25 231
1995 20 505 2 217 594 74 421 274 44 1 169 25 3691996 21 172 2 267 609 77 413 254 40 1 424 26 3021997 21 681 2 317 626 79 414 249 38 1 522 26 9741998 22 115 2 362 684 80 412 243 37 1 558 27 5381999 22 785 2 427 760 84 415 241 36 1 573 28 368
2000 23 196 2 469 825 86 418 233 34 1 590 28 8982001 23 899 2 544 882 89 422 233 33 1 602 29 747
1 For the years up to 1992, estimates are taken from the annual vehiclecensus analyses based on the Driver and Vehicle Licensing Agency mainvehicle file. From 1992, estimates of licensed stock are taken from the DfTTransport Statistics Directorate Vehicle Information Database.
2 For years up to 1990 retrospective counts within these new taxation classeshave been estimated.
3 Includes taxis for years up to 1994. Taxation group now restricted to onlyvehicles with 9 or more seats.
4 Includes agricultural vans and lorries and showman’s goods vehicles licensedto draw trailers.
5 Includes combine harvesters, mowing machines, digging machines, mobilecranes and works trucks. Taxation group subject to revision from 1st July 1995,formerly termed the "agricultural and special machines" group.
6 Includes three-wheelers, pedestrian controlled vehicles and showman’s hau-lage.
Source: Department for Transport
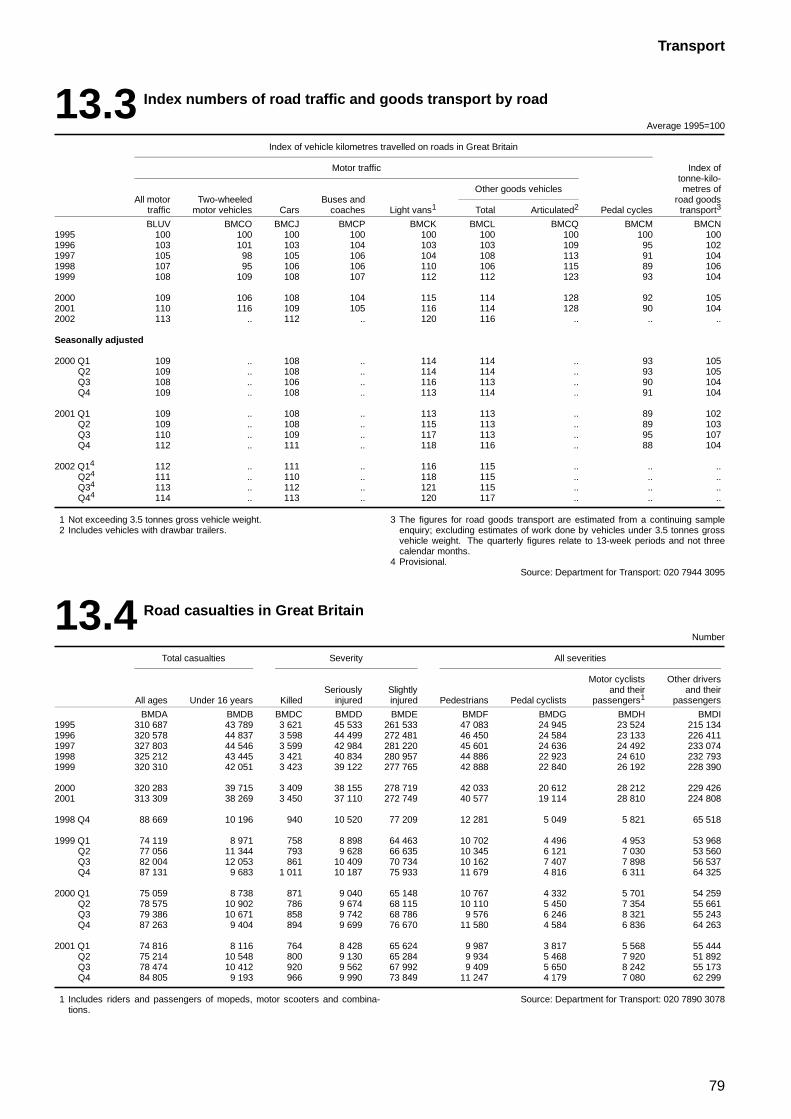
79
Transport
13.3 Index numbers of road traffic and goods transport by road
Average 1995=100
Index of vehicle kilometres travelled on roads in Great Britain
Motor traffic Index oftonne-kilo-
Other goods vehicles metres ofAll motor Two-wheeled Buses and road goods
traffic motor vehicles Cars coaches Light vans1 Total Articulated2 Pedal cycles transport3
BLUV BMCO BMCJ BMCP BMCK BMCL BMCQ BMCM BMCN1995 100 100 100 100 100 100 100 100 1001996 103 101 103 104 103 103 109 95 1021997 105 98 105 106 104 108 113 91 1041998 107 95 106 106 110 106 115 89 1061999 108 109 108 107 112 112 123 93 104
2000 109 106 108 104 115 114 128 92 1052001 110 116 109 105 116 114 128 90 1042002 113 .. 112 .. 120 116 .. .. ..
Seasonally adjusted
2000 Q1 109 .. 108 .. 114 114 .. 93 105Q2 109 .. 108 .. 114 114 .. 93 105Q3 108 .. 106 .. 116 113 .. 90 104Q4 109 .. 108 .. 113 114 .. 91 104
2001 Q1 109 .. 108 .. 113 113 .. 89 102Q2 109 .. 108 .. 115 113 .. 89 103Q3 110 .. 109 .. 117 113 .. 95 107Q4 112 .. 111 .. 118 116 .. 88 104
2002 Q14 112 .. 111 .. 116 115 .. .. ..Q24 111 .. 110 .. 118 115 .. .. ..Q34 113 .. 112 .. 121 115 .. .. ..Q44 114 .. 113 .. 120 117 .. .. ..
1 Not exceeding 3.5 tonnes gross vehicle weight.2 Includes vehicles with drawbar trailers.
3 The figures for road goods transport are estimated from a continuing sampleenquiry; excluding estimates of work done by vehicles under 3.5 tonnes grossvehicle weight. The quarterly figures relate to 13-week periods and not threecalendar months.
4 Provisional.Source: Department for Transport: 020 7944 3095
13.4 Road casualties in Great Britain
Number
Total casualties Severity All severities
Motor cyclists Other driversSeriously Slightly and their and their
All ages Under 16 years Killed injured injured Pedestrians Pedal cyclists passengers1 passengers
BMDA BMDB BMDC BMDD BMDE BMDF BMDG BMDH BMDI1995 310 687 43 789 3 621 45 533 261 533 47 083 24 945 23 524 215 1341996 320 578 44 837 3 598 44 499 272 481 46 450 24 584 23 133 226 4111997 327 803 44 546 3 599 42 984 281 220 45 601 24 636 24 492 233 0741998 325 212 43 445 3 421 40 834 280 957 44 886 22 923 24 610 232 7931999 320 310 42 051 3 423 39 122 277 765 42 888 22 840 26 192 228 390
2000 320 283 39 715 3 409 38 155 278 719 42 033 20 612 28 212 229 4262001 313 309 38 269 3 450 37 110 272 749 40 577 19 114 28 810 224 808
1998 Q4 88 669 10 196 940 10 520 77 209 12 281 5 049 5 821 65 518
1999 Q1 74 119 8 971 758 8 898 64 463 10 702 4 496 4 953 53 968Q2 77 056 11 344 793 9 628 66 635 10 345 6 121 7 030 53 560Q3 82 004 12 053 861 10 409 70 734 10 162 7 407 7 898 56 537Q4 87 131 9 683 1 011 10 187 75 933 11 679 4 816 6 311 64 325
2000 Q1 75 059 8 738 871 9 040 65 148 10 767 4 332 5 701 54 259Q2 78 575 10 902 786 9 674 68 115 10 110 5 450 7 354 55 661Q3 79 386 10 671 858 9 742 68 786 9 576 6 246 8 321 55 243Q4 87 263 9 404 894 9 699 76 670 11 580 4 584 6 836 64 263
2001 Q1 74 816 8 116 764 8 428 65 624 9 987 3 817 5 568 55 444Q2 75 214 10 548 800 9 130 65 284 9 934 5 468 7 920 51 892Q3 78 474 10 412 920 9 562 67 992 9 409 5 650 8 242 55 173Q4 84 805 9 193 966 9 990 73 849 11 247 4 179 7 080 62 299
1 Includes riders and passengers of mopeds, motor scooters and combina-tions.
Source: Department for Transport: 020 7890 3078
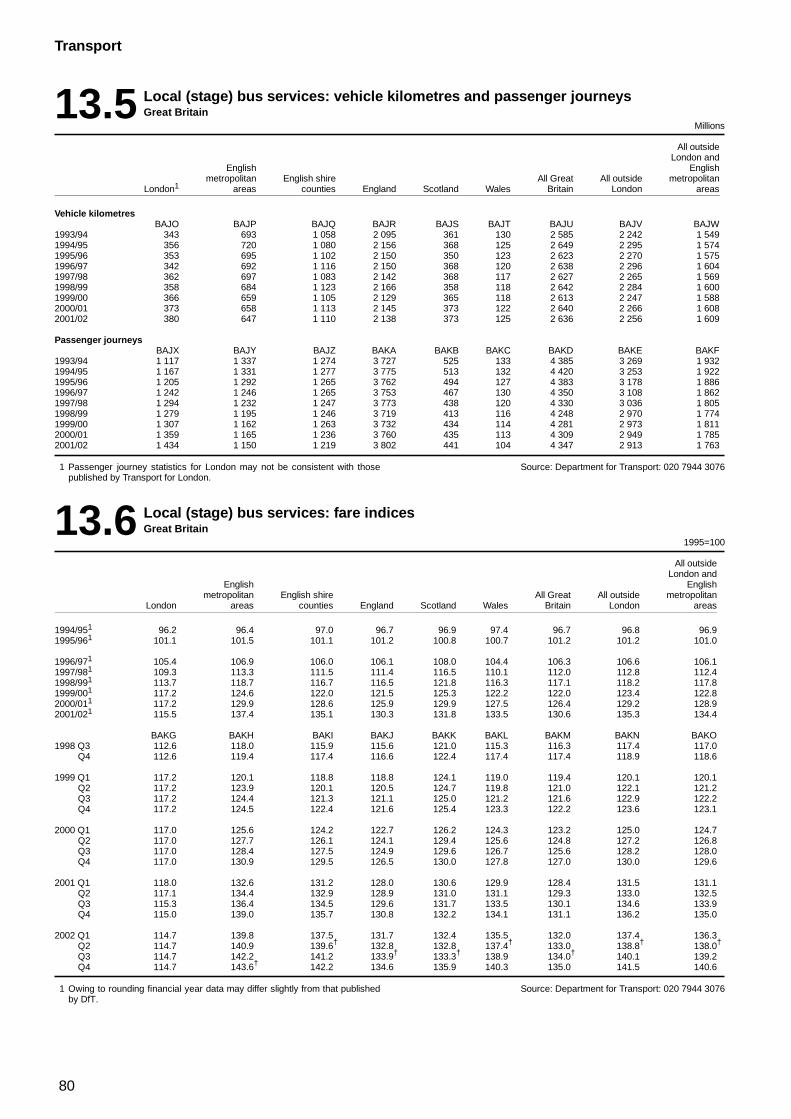
80
Transport
13.5 Local (stage) bus services: vehicle kilometres and passenger journeysGreat Britain
Millions
All outsideLondon and
English Englishmetropolitan English shire All Great All outside metropolitan
London1 areas counties England Scotland Wales Britain London areas
Vehicle kilometresBAJO BAJP BAJQ BAJR BAJS BAJT BAJU BAJV BAJW
1993/94 343 693 1 058 2 095 361 130 2 585 2 242 1 5491994/95 356 720 1 080 2 156 368 125 2 649 2 295 1 5741995/96 353 695 1 102 2 150 350 123 2 623 2 270 1 5751996/97 342 692 1 116 2 150 368 120 2 638 2 296 1 6041997/98 362 697 1 083 2 142 368 117 2 627 2 265 1 5691998/99 358 684 1 123 2 166 358 118 2 642 2 284 1 6001999/00 366 659 1 105 2 129 365 118 2 613 2 247 1 5882000/01 373 658 1 113 2 145 373 122 2 640 2 266 1 6082001/02 380 647 1 110 2 138 373 125 2 636 2 256 1 609
Passenger journeysBAJX BAJY BAJZ BAKA BAKB BAKC BAKD BAKE BAKF
1993/94 1 117 1 337 1 274 3 727 525 133 4 385 3 269 1 9321994/95 1 167 1 331 1 277 3 775 513 132 4 420 3 253 1 9221995/96 1 205 1 292 1 265 3 762 494 127 4 383 3 178 1 8861996/97 1 242 1 246 1 265 3 753 467 130 4 350 3 108 1 8621997/98 1 294 1 232 1 247 3 773 438 120 4 330 3 036 1 8051998/99 1 279 1 195 1 246 3 719 413 116 4 248 2 970 1 7741999/00 1 307 1 162 1 263 3 732 434 114 4 281 2 973 1 8112000/01 1 359 1 165 1 236 3 760 435 113 4 309 2 949 1 7852001/02 1 434 1 150 1 219 3 802 441 104 4 347 2 913 1 763
1 Passenger journey statistics for London may not be consistent with thosepublished by Transport for London.
Source: Department for Transport: 020 7944 3076
13.6 Local (stage) bus services: fare indicesGreat Britain
1995=100
All outsideLondon and
English Englishmetropolitan English shire All Great All outside metropolitan
London areas counties England Scotland Wales Britain London areas
1994/951 96.2 96.4 97.0 96.7 96.9 97.4 96.7 96.8 96.91995/961 101.1 101.5 101.1 101.2 100.8 100.7 101.2 101.2 101.0
1996/971 105.4 106.9 106.0 106.1 108.0 104.4 106.3 106.6 106.11997/981 109.3 113.3 111.5 111.4 116.5 110.1 112.0 112.8 112.41998/991 113.7 118.7 116.7 116.5 121.8 116.3 117.1 118.2 117.81999/001 117.2 124.6 122.0 121.5 125.3 122.2 122.0 123.4 122.82000/011 117.2 129.9 128.6 125.9 129.9 127.5 126.4 129.2 128.92001/021 115.5 137.4 135.1 130.3 131.8 133.5 130.6 135.3 134.4
BAKG BAKH BAKI BAKJ BAKK BAKL BAKM BAKN BAKO1998 Q3 112.6 118.0 115.9 115.6 121.0 115.3 116.3 117.4 117.0
Q4 112.6 119.4 117.4 116.6 122.4 117.4 117.4 118.9 118.6
1999 Q1 117.2 120.1 118.8 118.8 124.1 119.0 119.4 120.1 120.1Q2 117.2 123.9 120.1 120.5 124.7 119.8 121.0 122.1 121.2Q3 117.2 124.4 121.3 121.1 125.0 121.2 121.6 122.9 122.2Q4 117.2 124.5 122.4 121.6 125.4 123.3 122.2 123.6 123.1
2000 Q1 117.0 125.6 124.2 122.7 126.2 124.3 123.2 125.0 124.7Q2 117.0 127.7 126.1 124.1 129.4 125.6 124.8 127.2 126.8Q3 117.0 128.4 127.5 124.9 129.6 126.7 125.6 128.2 128.0Q4 117.0 130.9 129.5 126.5 130.0 127.8 127.0 130.0 129.6
2001 Q1 118.0 132.6 131.2 128.0 130.6 129.9 128.4 131.5 131.1Q2 117.1 134.4 132.9 128.9 131.0 131.1 129.3 133.0 132.5Q3 115.3 136.4 134.5 129.6 131.7 133.5 130.1 134.6 133.9Q4 115.0 139.0 135.7 130.8 132.2 134.1 131.1 136.2 135.0
2002 Q1 114.7 139.8 137.5 131.7 132.4 135.5 132.0 137.4 136.3Q2 114.7 140.9 139.6† 132.8 132.8 137.4† 133.0 138.8† 138.0†
Q3 114.7 142.2 141.2 133.9† 133.3† 138.9 134.0† 140.1 139.2Q4 114.7 143.6† 142.2 134.6 135.9 140.3 135.0 141.5 140.6
1 Owing to rounding financial year data may differ slightly from that publishedby DfT.
Source: Department for Transport: 020 7944 3076
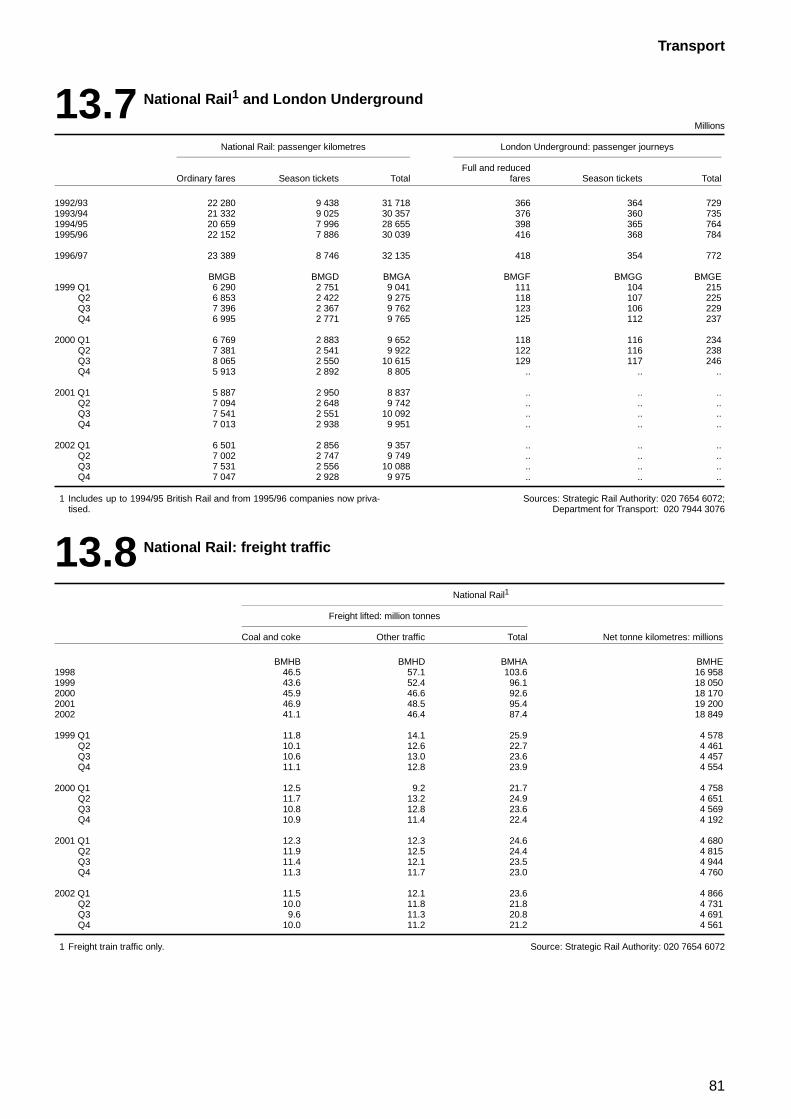
81
Transport
13.7 National Rail1 and London Underground
Millions
National Rail: passenger kilometres London Underground: passenger journeys
Full and reducedOrdinary fares Season tickets Total fares Season tickets Total
1992/93 22 280 9 438 31 718 366 364 7291993/94 21 332 9 025 30 357 376 360 7351994/95 20 659 7 996 28 655 398 365 7641995/96 22 152 7 886 30 039 416 368 784
1996/97 23 389 8 746 32 135 418 354 772
BMGB BMGD BMGA BMGF BMGG BMGE1999 Q1 6 290 2 751 9 041 111 104 215
Q2 6 853 2 422 9 275 118 107 225Q3 7 396 2 367 9 762 123 106 229Q4 6 995 2 771 9 765 125 112 237
2000 Q1 6 769 2 883 9 652 118 116 234Q2 7 381 2 541 9 922 122 116 238Q3 8 065 2 550 10 615 129 117 246Q4 5 913 2 892 8 805 .. .. ..
2001 Q1 5 887 2 950 8 837 .. .. ..Q2 7 094 2 648 9 742 .. .. ..Q3 7 541 2 551 10 092 .. .. ..Q4 7 013 2 938 9 951 .. .. ..
2002 Q1 6 501 2 856 9 357 .. .. ..Q2 7 002 2 747 9 749 .. .. ..Q3 7 531 2 556 10 088 .. .. ..Q4 7 047 2 928 9 975 .. .. ..
1 Includes up to 1994/95 British Rail and from 1995/96 companies now priva-tised.
Sources: Strategic Rail Authority: 020 7654 6072;Department for Transport: 020 7944 3076
13.8 National Rail: freight traffic
National Rail1
Freight lifted: million tonnes
Coal and coke Other traffic Total Net tonne kilometres: millions
BMHB BMHD BMHA BMHE1998 46.5 57.1 103.6 16 9581999 43.6 52.4 96.1 18 0502000 45.9 46.6 92.6 18 1702001 46.9 48.5 95.4 19 2002002 41.1 46.4 87.4 18 849
1999 Q1 11.8 14.1 25.9 4 578Q2 10.1 12.6 22.7 4 461Q3 10.6 13.0 23.6 4 457Q4 11.1 12.8 23.9 4 554
2000 Q1 12.5 9.2 21.7 4 758Q2 11.7 13.2 24.9 4 651Q3 10.8 12.8 23.6 4 569Q4 10.9 11.4 22.4 4 192
2001 Q1 12.3 12.3 24.6 4 680Q2 11.9 12.5 24.4 4 815Q3 11.4 12.1 23.5 4 944Q4 11.3 11.7 23.0 4 760
2002 Q1 11.5 12.1 23.6 4 866Q2 10.0 11.8 21.8 4 731Q3 9.6 11.3 20.8 4 691Q4 10.0 11.2 21.2 4 561
1 Freight train traffic only. Source: Strategic Rail Authority: 020 7654 6072
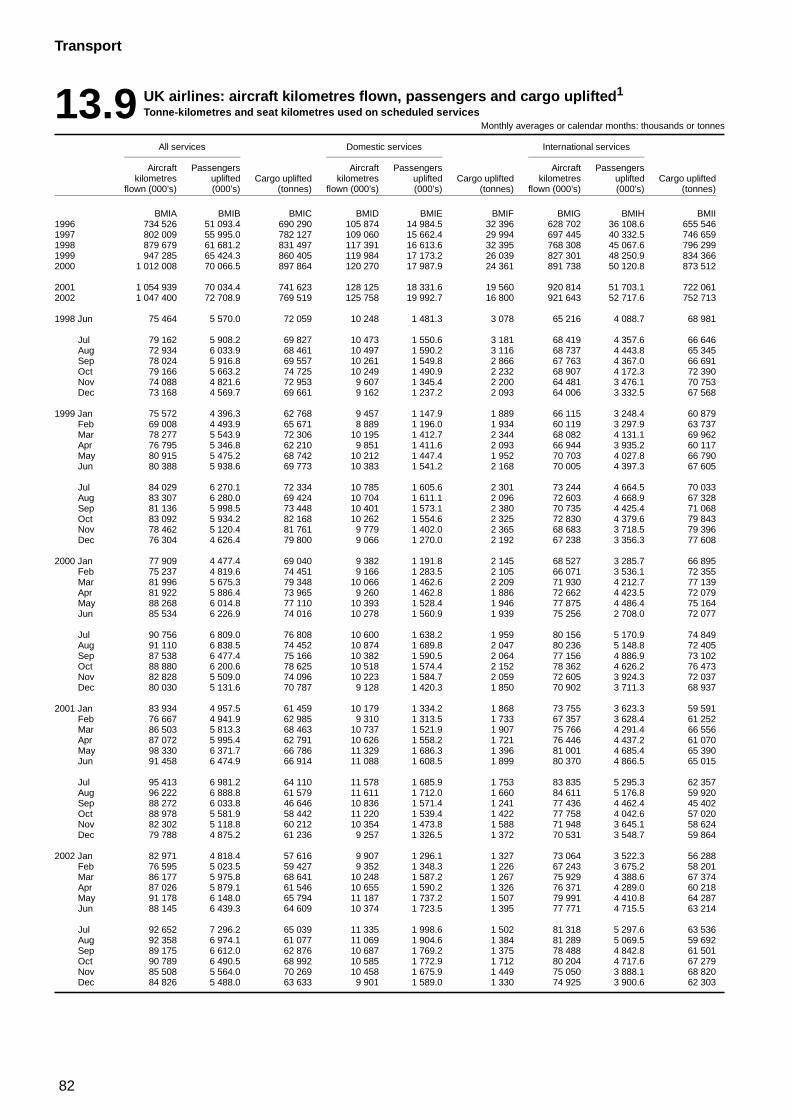
82
Transport
13.9 UK airlines: aircraft kilometres flown, passengers and cargo uplifted1
Tonne-kilometres and seat kilometres used on scheduled servicesMonthly averages or calendar months: thousands or tonnes
All services Domestic services International services
Aircraft Passengers Aircraft Passengers Aircraft Passengerskilometres uplifted Cargo uplifted kilometres uplifted Cargo uplifted kilometres uplifted Cargo uplifted
flown (000’s) (000’s) (tonnes) flown (000’s) (000’s) (tonnes) flown (000’s) (000’s) (tonnes)
BMIA BMIB BMIC BMID BMIE BMIF BMIG BMIH BMII1996 734 526 51 093.4 690 290 105 874 14 984.5 32 396 628 702 36 108.6 655 5461997 802 009 55 995.0 782 127 109 060 15 662.4 29 994 697 445 40 332.5 746 6591998 879 679 61 681.2 831 497 117 391 16 613.6 32 395 768 308 45 067.6 796 2991999 947 285 65 424.3 860 405 119 984 17 173.2 26 039 827 301 48 250.9 834 3662000 1 012 008 70 066.5 897 864 120 270 17 987.9 24 361 891 738 50 120.8 873 512
2001 1 054 939 70 034.4 741 623 128 125 18 331.6 19 560 920 814 51 703.1 722 0612002 1 047 400 72 708.9 769 519 125 758 19 992.7 16 800 921 643 52 717.6 752 713
1998 Jun 75 464 5 570.0 72 059 10 248 1 481.3 3 078 65 216 4 088.7 68 981
Jul 79 162 5 908.2 69 827 10 473 1 550.6 3 181 68 419 4 357.6 66 646Aug 72 934 6 033.9 68 461 10 497 1 590.2 3 116 68 737 4 443.8 65 345Sep 78 024 5 916.8 69 557 10 261 1 549.8 2 866 67 763 4 367.0 66 691Oct 79 166 5 663.2 74 725 10 249 1 490.9 2 232 68 907 4 172.3 72 390Nov 74 088 4 821.6 72 953 9 607 1 345.4 2 200 64 481 3 476.1 70 753Dec 73 168 4 569.7 69 661 9 162 1 237.2 2 093 64 006 3 332.5 67 568
1999 Jan 75 572 4 396.3 62 768 9 457 1 147.9 1 889 66 115 3 248.4 60 879Feb 69 008 4 493.9 65 671 8 889 1 196.0 1 934 60 119 3 297.9 63 737Mar 78 277 5 543.9 72 306 10 195 1 412.7 2 344 68 082 4 131.1 69 962Apr 76 795 5 346.8 62 210 9 851 1 411.6 2 093 66 944 3 935.2 60 117May 80 915 5 475.2 68 742 10 212 1 447.4 1 952 70 703 4 027.8 66 790Jun 80 388 5 938.6 69 773 10 383 1 541.2 2 168 70 005 4 397.3 67 605
Jul 84 029 6 270.1 72 334 10 785 1 605.6 2 301 73 244 4 664.5 70 033Aug 83 307 6 280.0 69 424 10 704 1 611.1 2 096 72 603 4 668.9 67 328Sep 81 136 5 998.5 73 448 10 401 1 573.1 2 380 70 735 4 425.4 71 068Oct 83 092 5 934.2 82 168 10 262 1 554.6 2 325 72 830 4 379.6 79 843Nov 78 462 5 120.4 81 761 9 779 1 402.0 2 365 68 683 3 718.5 79 396Dec 76 304 4 626.4 79 800 9 066 1 270.0 2 192 67 238 3 356.3 77 608
2000 Jan 77 909 4 477.4 69 040 9 382 1 191.8 2 145 68 527 3 285.7 66 895Feb 75 237 4 819.6 74 451 9 166 1 283.5 2 105 66 071 3 536.1 72 355Mar 81 996 5 675.3 79 348 10 066 1 462.6 2 209 71 930 4 212.7 77 139Apr 81 922 5 886.4 73 965 9 260 1 462.8 1 886 72 662 4 423.5 72 079May 88 268 6 014.8 77 110 10 393 1 528.4 1 946 77 875 4 486.4 75 164Jun 85 534 6 226.9 74 016 10 278 1 560.9 1 939 75 256 2 708.0 72 077
Jul 90 756 6 809.0 76 808 10 600 1 638.2 1 959 80 156 5 170.9 74 849Aug 91 110 6 838.5 74 452 10 874 1 689.8 2 047 80 236 5 148.8 72 405Sep 87 538 6 477.4 75 166 10 382 1 590.5 2 064 77 156 4 886.9 73 102Oct 88 880 6 200.6 78 625 10 518 1 574.4 2 152 78 362 4 626.2 76 473Nov 82 828 5 509.0 74 096 10 223 1 584.7 2 059 72 605 3 924.3 72 037Dec 80 030 5 131.6 70 787 9 128 1 420.3 1 850 70 902 3 711.3 68 937
2001 Jan 83 934 4 957.5 61 459 10 179 1 334.2 1 868 73 755 3 623.3 59 591Feb 76 667 4 941.9 62 985 9 310 1 313.5 1 733 67 357 3 628.4 61 252Mar 86 503 5 813.3 68 463 10 737 1 521.9 1 907 75 766 4 291.4 66 556Apr 87 072 5 995.4 62 791 10 626 1 558.2 1 721 76 446 4 437.2 61 070May 98 330 6 371.7 66 786 11 329 1 686.3 1 396 81 001 4 685.4 65 390Jun 91 458 6 474.9 66 914 11 088 1 608.5 1 899 80 370 4 866.5 65 015
Jul 95 413 6 981.2 64 110 11 578 1 685.9 1 753 83 835 5 295.3 62 357Aug 96 222 6 888.8 61 579 11 611 1 712.0 1 660 84 611 5 176.8 59 920Sep 88 272 6 033.8 46 646 10 836 1 571.4 1 241 77 436 4 462.4 45 402Oct 88 978 5 581.9 58 442 11 220 1 539.4 1 422 77 758 4 042.6 57 020Nov 82 302 5 118.8 60 212 10 354 1 473.8 1 588 71 948 3 645.1 58 624Dec 79 788 4 875.2 61 236 9 257 1 326.5 1 372 70 531 3 548.7 59 864
2002 Jan 82 971 4 818.4 57 616 9 907 1 296.1 1 327 73 064 3 522.3 56 288Feb 76 595 5 023.5 59 427 9 352 1 348.3 1 226 67 243 3 675.2 58 201Mar 86 177 5 975.8 68 641 10 248 1 587.2 1 267 75 929 4 388.6 67 374Apr 87 026 5 879.1 61 546 10 655 1 590.2 1 326 76 371 4 289.0 60 218May 91 178 6 148.0 65 794 11 187 1 737.2 1 507 79 991 4 410.8 64 287Jun 88 145 6 439.3 64 609 10 374 1 723.5 1 395 77 771 4 715.5 63 214
Jul 92 652 7 296.2 65 039 11 335 1 998.6 1 502 81 318 5 297.6 63 536Aug 92 358 6 974.1 61 077 11 069 1 904.6 1 384 81 289 5 069.5 59 692Sep 89 175 6 612.0 62 876 10 687 1 769.2 1 375 78 488 4 842.8 61 501Oct 90 789 6 490.5 68 992 10 585 1 772.9 1 712 80 204 4 717.6 67 279Nov 85 508 5 564.0 70 269 10 458 1 675.9 1 449 75 050 3 888.1 68 820Dec 84 826 5 488.0 63 633 9 901 1 589.0 1 330 74 925 3 900.6 62 303
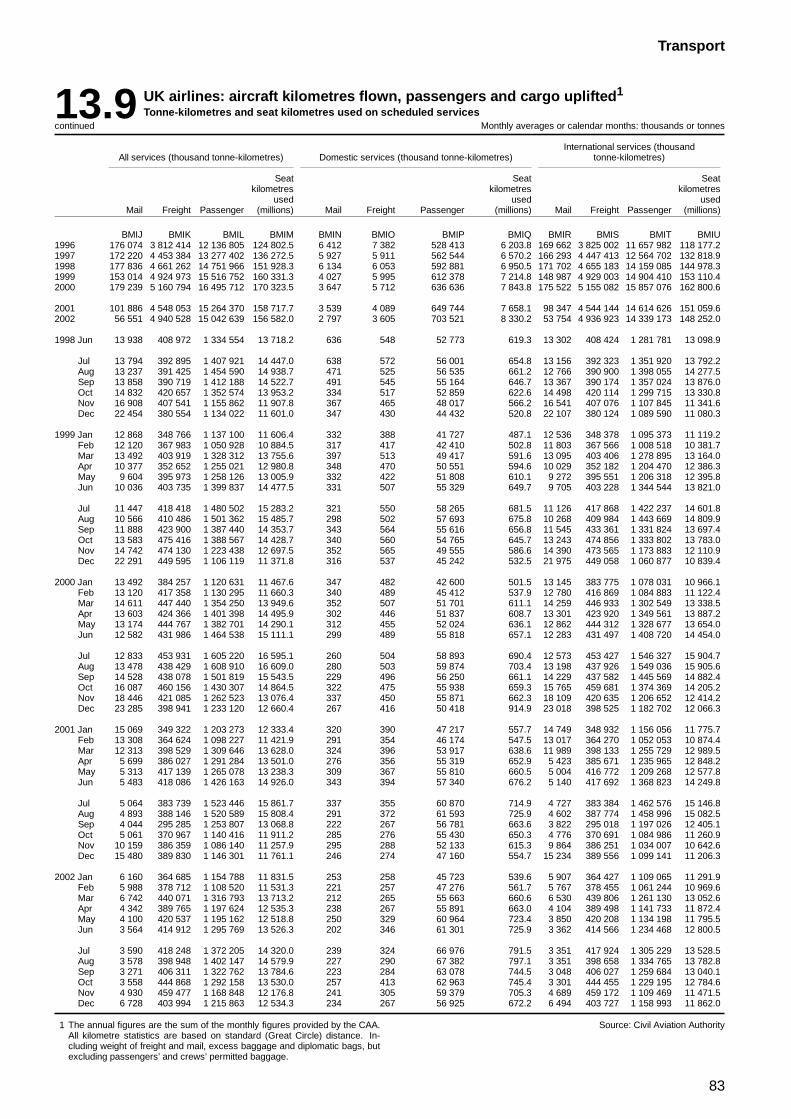
83
Transport
13.9 UK airlines: aircraft kilometres flown, passengers and cargo uplifted1
Tonne-kilometres and seat kilometres used on scheduled servicescontinued Monthly averages or calendar months: thousands or tonnes
International services (thousandAll services (thousand tonne-kilometres) Domestic services (thousand tonne-kilometres) tonne-kilometres)
Seat Seat Seatkilometres kilometres kilometres
used used usedMail Freight Passenger (millions) Mail Freight Passenger (millions) Mail Freight Passenger (millions)
BMIJ BMIK BMIL BMIM BMIN BMIO BMIP BMIQ BMIR BMIS BMIT BMIU1996 176 074 3 812 414 12 136 805 124 802.5 6 412 7 382 528 413 6 203.8 169 662 3 825 002 11 657 982 118 177.21997 172 220 4 453 384 13 277 402 136 272.5 5 927 5 911 562 544 6 570.2 166 293 4 447 413 12 564 702 132 818.91998 177 836 4 661 262 14 751 966 151 928.3 6 134 6 053 592 881 6 950.5 171 702 4 655 183 14 159 085 144 978.31999 153 014 4 924 973 15 516 752 160 331.3 4 027 5 995 612 378 7 214.8 148 987 4 929 003 14 904 410 153 110.42000 179 239 5 160 794 16 495 712 170 323.5 3 647 5 712 636 636 7 843.8 175 522 5 155 082 15 857 076 162 800.6
2001 101 886 4 548 053 15 264 370 158 717.7 3 539 4 089 649 744 7 658.1 98 347 4 544 144 14 614 626 151 059.62002 56 551 4 940 528 15 042 639 156 582.0 2 797 3 605 703 521 8 330.2 53 754 4 936 923 14 339 173 148 252.0
1998 Jun 13 938 408 972 1 334 554 13 718.2 636 548 52 773 619.3 13 302 408 424 1 281 781 13 098.9
Jul 13 794 392 895 1 407 921 14 447.0 638 572 56 001 654.8 13 156 392 323 1 351 920 13 792.2Aug 13 237 391 425 1 454 590 14 938.7 471 525 56 535 661.2 12 766 390 900 1 398 055 14 277.5Sep 13 858 390 719 1 412 188 14 522.7 491 545 55 164 646.7 13 367 390 174 1 357 024 13 876.0Oct 14 832 420 657 1 352 574 13 953.2 334 517 52 859 622.6 14 498 420 114 1 299 715 13 330.8Nov 16 908 407 541 1 155 862 11 907.8 367 465 48 017 566.2 16 541 407 076 1 107 845 11 341.6Dec 22 454 380 554 1 134 022 11 601.0 347 430 44 432 520.8 22 107 380 124 1 089 590 11 080.3
1999 Jan 12 868 348 766 1 137 100 11 606.4 332 388 41 727 487.1 12 536 348 378 1 095 373 11 119.2Feb 12 120 367 983 1 050 928 10 884.5 317 417 42 410 502.8 11 803 367 566 1 008 518 10 381.7Mar 13 492 403 919 1 328 312 13 755.6 397 513 49 417 591.6 13 095 403 406 1 278 895 13 164.0Apr 10 377 352 652 1 255 021 12 980.8 348 470 50 551 594.6 10 029 352 182 1 204 470 12 386.3May 9 604 395 973 1 258 126 13 005.9 332 422 51 808 610.1 9 272 395 551 1 206 318 12 395.8Jun 10 036 403 735 1 399 837 14 477.5 331 507 55 329 649.7 9 705 403 228 1 344 544 13 821.0
Jul 11 447 418 418 1 480 502 15 283.2 321 550 58 265 681.5 11 126 417 868 1 422 237 14 601.8Aug 10 566 410 486 1 501 362 15 485.7 298 502 57 693 675.8 10 268 409 984 1 443 669 14 809.9Sep 11 888 423 900 1 387 440 14 353.7 343 564 55 616 656.8 11 545 433 361 1 331 824 13 697.4Oct 13 583 475 416 1 388 567 14 428.7 340 560 54 765 645.7 13 243 474 856 1 333 802 13 783.0Nov 14 742 474 130 1 223 438 12 697.5 352 565 49 555 586.6 14 390 473 565 1 173 883 12 110.9Dec 22 291 449 595 1 106 119 11 371.8 316 537 45 242 532.5 21 975 449 058 1 060 877 10 839.4
2000 Jan 13 492 384 257 1 120 631 11 467.6 347 482 42 600 501.5 13 145 383 775 1 078 031 10 966.1Feb 13 120 417 358 1 130 295 11 660.3 340 489 45 412 537.9 12 780 416 869 1 084 883 11 122.4Mar 14 611 447 440 1 354 250 13 949.6 352 507 51 701 611.1 14 259 446 933 1 302 549 13 338.5Apr 13 603 424 366 1 401 398 14 495.9 302 446 51 837 608.7 13 301 423 920 1 349 561 13 887.2May 13 174 444 767 1 382 701 14 290.1 312 455 52 024 636.1 12 862 444 312 1 328 677 13 654.0Jun 12 582 431 986 1 464 538 15 111.1 299 489 55 818 657.1 12 283 431 497 1 408 720 14 454.0
Jul 12 833 453 931 1 605 220 16 595.1 260 504 58 893 690.4 12 573 453 427 1 546 327 15 904.7Aug 13 478 438 429 1 608 910 16 609.0 280 503 59 874 703.4 13 198 437 926 1 549 036 15 905.6Sep 14 528 438 078 1 501 819 15 543.5 229 496 56 250 661.1 14 229 437 582 1 445 569 14 882.4Oct 16 087 460 156 1 430 307 14 864.5 322 475 55 938 659.3 15 765 459 681 1 374 369 14 205.2Nov 18 446 421 085 1 262 523 13 076.4 337 450 55 871 662.3 18 109 420 635 1 206 652 12 414.2Dec 23 285 398 941 1 233 120 12 660.4 267 416 50 418 914.9 23 018 398 525 1 182 702 12 066.3
2001 Jan 15 069 349 322 1 203 273 12 333.4 320 390 47 217 557.7 14 749 348 932 1 156 056 11 775.7Feb 13 308 364 624 1 098 227 11 421.9 291 354 46 174 547.5 13 017 364 270 1 052 053 10 874.4Mar 12 313 398 529 1 309 646 13 628.0 324 396 53 917 638.6 11 989 398 133 1 255 729 12 989.5Apr 5 699 386 027 1 291 284 13 501.0 276 356 55 319 652.9 5 423 385 671 1 235 965 12 848.2May 5 313 417 139 1 265 078 13 238.3 309 367 55 810 660.5 5 004 416 772 1 209 268 12 577.8Jun 5 483 418 086 1 426 163 14 926.0 343 394 57 340 676.2 5 140 417 692 1 368 823 14 249.8
Jul 5 064 383 739 1 523 446 15 861.7 337 355 60 870 714.9 4 727 383 384 1 462 576 15 146.8Aug 4 893 388 146 1 520 589 15 808.4 291 372 61 593 725.9 4 602 387 774 1 458 996 15 082.5Sep 4 044 295 285 1 253 807 13 068.8 222 267 56 781 663.6 3 822 295 018 1 197 026 12 405.1Oct 5 061 370 967 1 140 416 11 911.2 285 276 55 430 650.3 4 776 370 691 1 084 986 11 260.9Nov 10 159 386 359 1 086 140 11 257.9 295 288 52 133 615.3 9 864 386 251 1 034 007 10 642.6Dec 15 480 389 830 1 146 301 11 761.1 246 274 47 160 554.7 15 234 389 556 1 099 141 11 206.3
2002 Jan 6 160 364 685 1 154 788 11 831.5 253 258 45 723 539.6 5 907 364 427 1 109 065 11 291.9Feb 5 988 378 712 1 108 520 11 531.3 221 257 47 276 561.7 5 767 378 455 1 061 244 10 969.6Mar 6 742 440 071 1 316 793 13 713.2 212 265 55 663 660.6 6 530 439 806 1 261 130 13 052.6Apr 4 342 389 765 1 197 624 12 535.3 238 267 55 891 663.0 4 104 389 498 1 141 733 11 872.4May 4 100 420 537 1 195 162 12 518.8 250 329 60 964 723.4 3 850 420 208 1 134 198 11 795.5Jun 3 564 414 912 1 295 769 13 526.3 202 346 61 301 725.9 3 362 414 566 1 234 468 12 800.5
Jul 3 590 418 248 1 372 205 14 320.0 239 324 66 976 791.5 3 351 417 924 1 305 229 13 528.5Aug 3 578 398 948 1 402 147 14 579.9 227 290 67 382 797.1 3 351 398 658 1 334 765 13 782.8Sep 3 271 406 311 1 322 762 13 784.6 223 284 63 078 744.5 3 048 406 027 1 259 684 13 040.1Oct 3 558 444 868 1 292 158 13 530.0 257 413 62 963 745.4 3 301 444 455 1 229 195 12 784.6Nov 4 930 459 477 1 168 848 12 176.8 241 305 59 379 705.3 4 689 459 172 1 109 469 11 471.5Dec 6 728 403 994 1 215 863 12 534.3 234 267 56 925 672.2 6 494 403 727 1 158 993 11 862.0
1 The annual figures are the sum of the monthly figures provided by the CAA.All kilometre statistics are based on standard (Great Circle) distance. In-cluding weight of freight and mail, excess baggage and diplomatic bags, butexcluding passengers’ and crews’ permitted baggage.
Source: Civil Aviation Authority
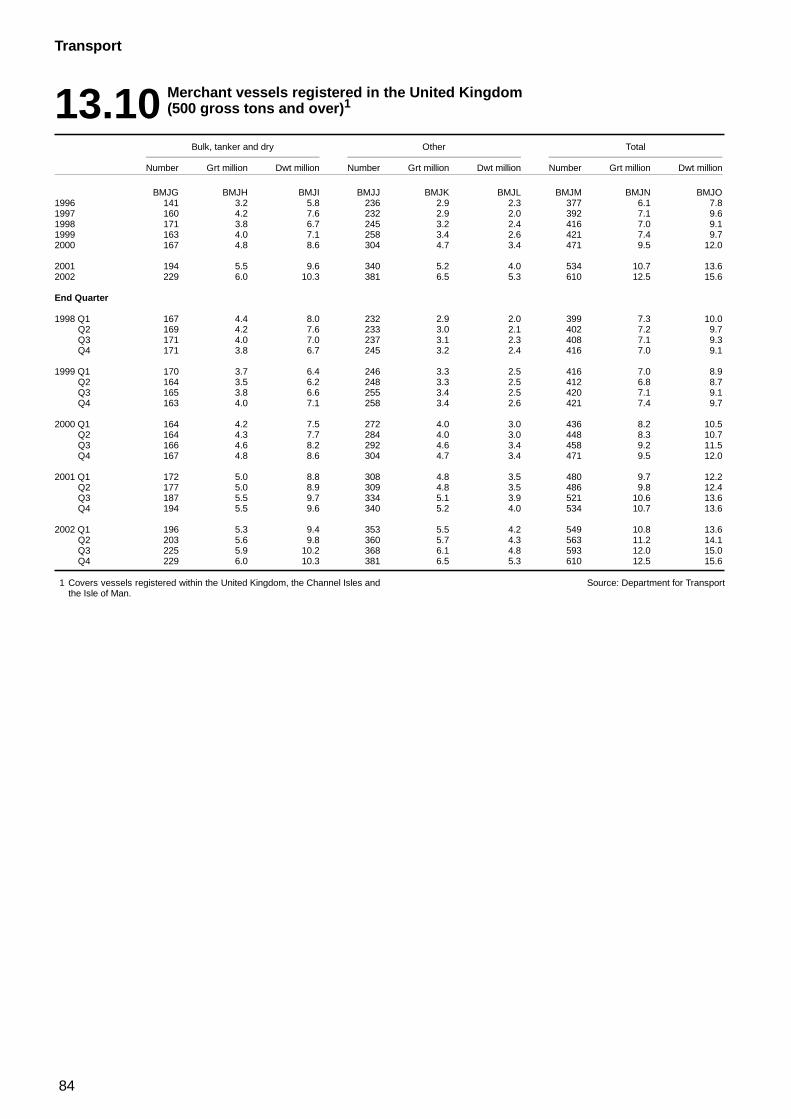
84
Transport
13.10 Merchant vessels registered in the United Kingdom(500 gross tons and over)1
Bulk, tanker and dry Other Total
Number Grt million Dwt million Number Grt million Dwt million Number Grt million Dwt million
BMJG BMJH BMJI BMJJ BMJK BMJL BMJM BMJN BMJO1996 141 3.2 5.8 236 2.9 2.3 377 6.1 7.81997 160 4.2 7.6 232 2.9 2.0 392 7.1 9.61998 171 3.8 6.7 245 3.2 2.4 416 7.0 9.11999 163 4.0 7.1 258 3.4 2.6 421 7.4 9.72000 167 4.8 8.6 304 4.7 3.4 471 9.5 12.0
2001 194 5.5 9.6 340 5.2 4.0 534 10.7 13.62002 229 6.0 10.3 381 6.5 5.3 610 12.5 15.6
End Quarter
1998 Q1 167 4.4 8.0 232 2.9 2.0 399 7.3 10.0Q2 169 4.2 7.6 233 3.0 2.1 402 7.2 9.7Q3 171 4.0 7.0 237 3.1 2.3 408 7.1 9.3Q4 171 3.8 6.7 245 3.2 2.4 416 7.0 9.1
1999 Q1 170 3.7 6.4 246 3.3 2.5 416 7.0 8.9Q2 164 3.5 6.2 248 3.3 2.5 412 6.8 8.7Q3 165 3.8 6.6 255 3.4 2.5 420 7.1 9.1Q4 163 4.0 7.1 258 3.4 2.6 421 7.4 9.7
2000 Q1 164 4.2 7.5 272 4.0 3.0 436 8.2 10.5Q2 164 4.3 7.7 284 4.0 3.0 448 8.3 10.7Q3 166 4.6 8.2 292 4.6 3.4 458 9.2 11.5Q4 167 4.8 8.6 304 4.7 3.4 471 9.5 12.0
2001 Q1 172 5.0 8.8 308 4.8 3.5 480 9.7 12.2Q2 177 5.0 8.9 309 4.8 3.5 486 9.8 12.4Q3 187 5.5 9.7 334 5.1 3.9 521 10.6 13.6Q4 194 5.5 9.6 340 5.2 4.0 534 10.7 13.6
2002 Q1 196 5.3 9.4 353 5.5 4.2 549 10.8 13.6Q2 203 5.6 9.8 360 5.7 4.3 563 11.2 14.1Q3 225 5.9 10.2 368 6.1 4.8 593 12.0 15.0Q4 229 6.0 10.3 381 6.5 5.3 610 12.5 15.6
1 Covers vessels registered within the United Kingdom, the Channel Isles andthe Isle of Man.
Source: Department for Transport
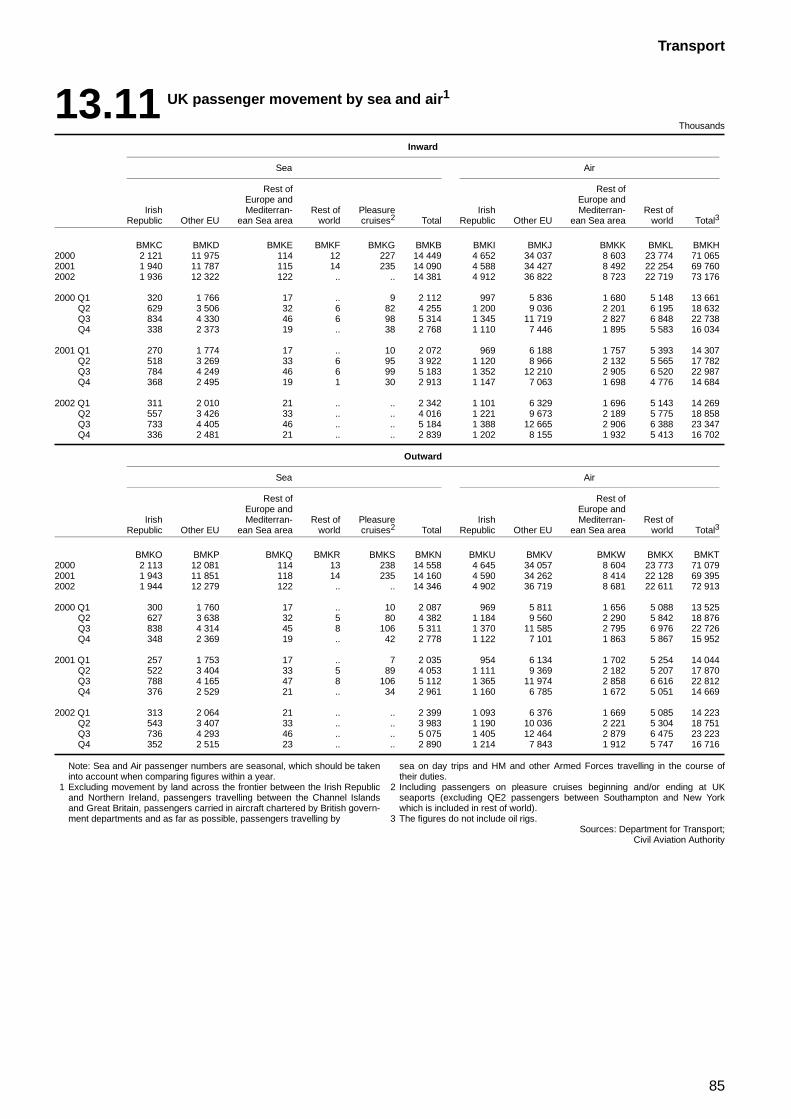
85
Transport
13.11 UK passenger movement by sea and air1
Thousands
Inward
Sea Air
Rest of Rest ofEurope and Europe and
Irish Mediterran- Rest of Pleasure Irish Mediterran- Rest ofRepublic Other EU ean Sea area world cruises2 Total Republic Other EU ean Sea area world Total3
BMKC BMKD BMKE BMKF BMKG BMKB BMKI BMKJ BMKK BMKL BMKH2000 2 121 11 975 114 12 227 14 449 4 652 34 037 8 603 23 774 71 0652001 1 940 11 787 115 14 235 14 090 4 588 34 427 8 492 22 254 69 7602002 1 936 12 322 122 .. .. 14 381 4 912 36 822 8 723 22 719 73 176
2000 Q1 320 1 766 17 .. 9 2 112 997 5 836 1 680 5 148 13 661Q2 629 3 506 32 6 82 4 255 1 200 9 036 2 201 6 195 18 632Q3 834 4 330 46 6 98 5 314 1 345 11 719 2 827 6 848 22 738Q4 338 2 373 19 .. 38 2 768 1 110 7 446 1 895 5 583 16 034
2001 Q1 270 1 774 17 .. 10 2 072 969 6 188 1 757 5 393 14 307Q2 518 3 269 33 6 95 3 922 1 120 8 966 2 132 5 565 17 782Q3 784 4 249 46 6 99 5 183 1 352 12 210 2 905 6 520 22 987Q4 368 2 495 19 1 30 2 913 1 147 7 063 1 698 4 776 14 684
2002 Q1 311 2 010 21 .. .. 2 342 1 101 6 329 1 696 5 143 14 269Q2 557 3 426 33 .. .. 4 016 1 221 9 673 2 189 5 775 18 858Q3 733 4 405 46 .. .. 5 184 1 388 12 665 2 906 6 388 23 347Q4 336 2 481 21 .. .. 2 839 1 202 8 155 1 932 5 413 16 702
Outward
Sea Air
Rest of Rest ofEurope and Europe and
Irish Mediterran- Rest of Pleasure Irish Mediterran- Rest ofRepublic Other EU ean Sea area world cruises2 Total Republic Other EU ean Sea area world Total3
BMKO BMKP BMKQ BMKR BMKS BMKN BMKU BMKV BMKW BMKX BMKT2000 2 113 12 081 114 13 238 14 558 4 645 34 057 8 604 23 773 71 0792001 1 943 11 851 118 14 235 14 160 4 590 34 262 8 414 22 128 69 3952002 1 944 12 279 122 .. .. 14 346 4 902 36 719 8 681 22 611 72 913
2000 Q1 300 1 760 17 .. 10 2 087 969 5 811 1 656 5 088 13 525Q2 627 3 638 32 5 80 4 382 1 184 9 560 2 290 5 842 18 876Q3 838 4 314 45 8 106 5 311 1 370 11 585 2 795 6 976 22 726Q4 348 2 369 19 .. 42 2 778 1 122 7 101 1 863 5 867 15 952
2001 Q1 257 1 753 17 .. 7 2 035 954 6 134 1 702 5 254 14 044Q2 522 3 404 33 5 89 4 053 1 111 9 369 2 182 5 207 17 870Q3 788 4 165 47 8 106 5 112 1 365 11 974 2 858 6 616 22 812Q4 376 2 529 21 .. 34 2 961 1 160 6 785 1 672 5 051 14 669
2002 Q1 313 2 064 21 .. .. 2 399 1 093 6 376 1 669 5 085 14 223Q2 543 3 407 33 .. .. 3 983 1 190 10 036 2 221 5 304 18 751Q3 736 4 293 46 .. .. 5 075 1 405 12 464 2 879 6 475 23 223Q4 352 2 515 23 .. .. 2 890 1 214 7 843 1 912 5 747 16 716
Note: Sea and Air passenger numbers are seasonal, which should be takeninto account when comparing figures within a year.
1 Excluding movement by land across the frontier between the Irish Republicand Northern Ireland, passengers travelling between the Channel Islandsand Great Britain, passengers carried in aircraft chartered by British govern-ment departments and as far as possible, passengers travelling by
sea on day trips and HM and other Armed Forces travelling in the course oftheir duties.
2 Including passengers on pleasure cruises beginning and/or ending at UKseaports (excluding QE2 passengers between Southampton and New Yorkwhich is included in rest of world).
3 The figures do not include oil rigs.Sources: Department for Transport;
Civil Aviation Authority
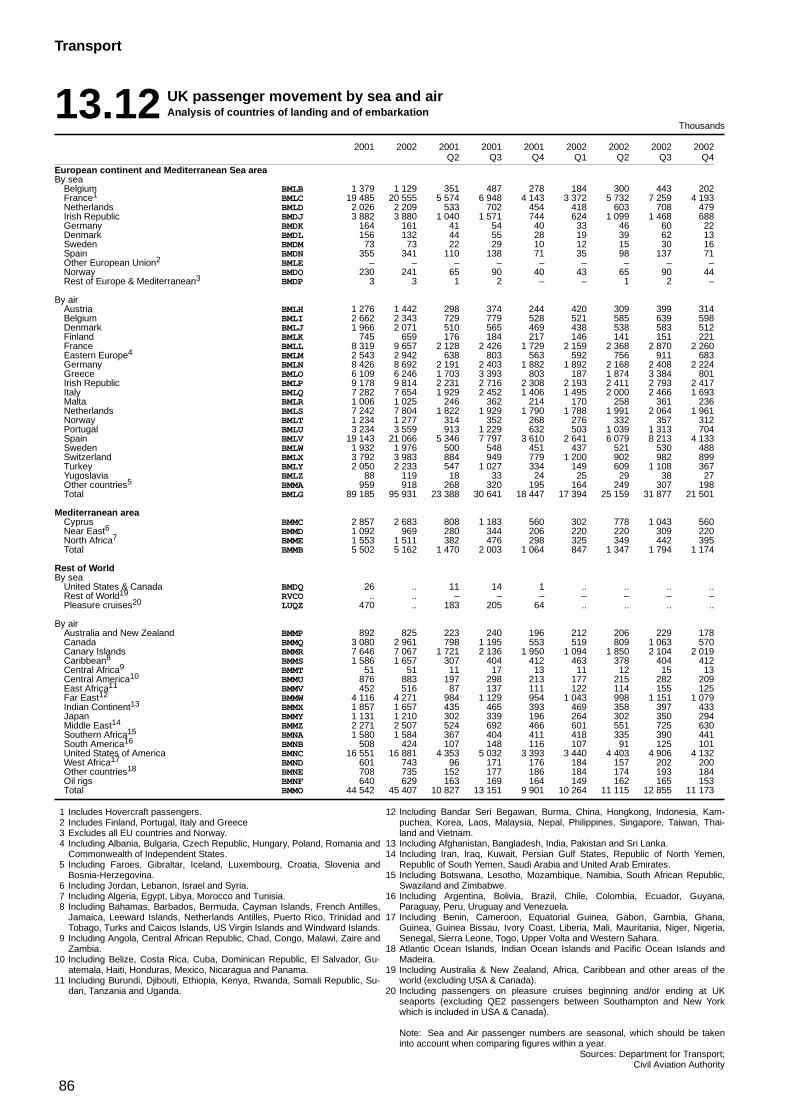
86
Transport
13.12 UK passenger movement by sea and airAnalysis of countries of landing and of embarkation
Thousands
2001 2002 2001 2001 2001 2002 2002 2002 2002Q2 Q3 Q4 Q1 Q2 Q3 Q4
European continent and Mediterranean Sea areaBy sea
Belgium BMLB 1 379 1 129 351 487 278 184 300 443 202France1 BMLC 19 485 20 555 5 574 6 948 4 143 3 372 5 732 7 259 4 193Netherlands BMLD 2 026 2 209 533 702 454 418 603 708 479Irish Republic BMDJ 3 882 3 880 1 040 1 571 744 624 1 099 1 468 688Germany BMDK 164 161 41 54 40 33 46 60 22Denmark BMDL 156 132 44 55 28 19 39 62 13Sweden BMDM 73 73 22 29 10 12 15 30 16Spain BMDN 355 341 110 138 71 35 98 137 71Other European Union2 BMLE – – – – – – – – –Norway BMDO 230 241 65 90 40 43 65 90 44Rest of Europe & Mediterranean3 BMDP 3 3 1 2 – – 1 2 –
By airAustria BMLH 1 276 1 442 298 374 244 420 309 399 314Belgium BMLI 2 662 2 343 729 779 528 521 585 639 598Denmark BMLJ 1 966 2 071 510 565 469 438 538 583 512Finland BMLK 745 659 176 184 217 146 141 151 221France BMLL 8 319 9 657 2 128 2 426 1 729 2 159 2 368 2 870 2 260Eastern Europe4 BMLM 2 543 2 942 638 803 563 592 756 911 683Germany BMLN 8 426 8 692 2 191 2 403 1 882 1 892 2 168 2 408 2 224Greece BMLO 6 109 6 246 1 703 3 393 803 187 1 874 3 384 801Irish Republic BMLP 9 178 9 814 2 231 2 716 2 308 2 193 2 411 2 793 2 417Italy BMLQ 7 282 7 654 1 929 2 452 1 406 1 495 2 000 2 466 1 693Malta BMLR 1 006 1 025 246 362 214 170 258 361 236Netherlands BMLS 7 242 7 804 1 822 1 929 1 790 1 788 1 991 2 064 1 961Norway BMLT 1 234 1 277 314 352 268 276 332 357 312Portugal BMLU 3 234 3 559 913 1 229 632 503 1 039 1 313 704Spain BMLV 19 143 21 066 5 346 7 797 3 610 2 641 6 079 8 213 4 133Sweden BMLW 1 932 1 976 500 548 451 437 521 530 488Switzerland BMLX 3 792 3 983 884 949 779 1 200 902 982 899Turkey BMLY 2 050 2 233 547 1 027 334 149 609 1 108 367Yugoslavia BMLZ 88 119 18 33 24 25 29 38 27Other countries5 BMMA 959 918 268 320 195 164 249 307 198Total BMLG 89 185 95 931 23 388 30 641 18 447 17 394 25 159 31 877 21 501
Mediterranean areaCyprus BMMC 2 857 2 683 808 1 183 560 302 778 1 043 560Near East6 BMMD 1 092 969 280 344 206 220 220 309 220North Africa7 BMME 1 553 1 511 382 476 298 325 349 442 395Total BMMB 5 502 5 162 1 470 2 003 1 064 847 1 347 1 794 1 174
Rest of WorldBy sea
United States & Canada BMDQ 26 .. 11 14 1 .. .. .. ..Rest of World19 RVCO .. .. – – – – – – –Pleasure cruises20 LUQZ 470 .. 183 205 64 .. .. .. ..
By airAustralia and New Zealand BMMP 892 825 223 240 196 212 206 229 178Canada BMMQ 3 080 2 961 798 1 195 553 519 809 1 063 570Canary Islands BMMR 7 646 7 067 1 721 2 136 1 950 1 094 1 850 2 104 2 019Caribbean8 BMMS 1 586 1 657 307 404 412 463 378 404 412Central Africa9 BMMT 51 51 11 17 13 11 12 15 13Central America10 BMMU 876 883 197 298 213 177 215 282 209East Africa11 BMMV 452 516 87 137 111 122 114 155 125Far East12 BMMW 4 116 4 271 984 1 129 954 1 043 998 1 151 1 079Indian Continent13 BMMX 1 857 1 657 435 465 393 469 358 397 433Japan BMMY 1 131 1 210 302 339 196 264 302 350 294Middle East14 BMMZ 2 271 2 507 524 692 466 601 551 725 630Southern Africa15 BMNA 1 580 1 584 367 404 411 418 335 390 441South America16 BMNB 508 424 107 148 116 107 91 125 101United States of America BMNC 16 551 16 881 4 353 5 032 3 393 3 440 4 403 4 906 4 132West Africa17 BMND 601 743 96 171 176 184 157 202 200Other countries18 BMNE 708 735 152 177 186 184 174 193 184Oil rigs BMNF 640 629 163 169 164 149 162 165 153Total BMMO 44 542 45 407 10 827 13 151 9 901 10 264 11 115 12 855 11 173
1 Includes Hovercraft passengers.2 Includes Finland, Portugal, Italy and Greece3 Excludes all EU countries and Norway.4 Including Albania, Bulgaria, Czech Republic, Hungary, Poland, Romania and
Commonwealth of Independent States.5 Including Faroes, Gibraltar, Iceland, Luxembourg, Croatia, Slovenia and
Bosnia-Herzegovina.6 Including Jordan, Lebanon, Israel and Syria.7 Including Algeria, Egypt, Libya, Morocco and Tunisia.8 Including Bahamas, Barbados, Bermuda, Cayman Islands, French Antilles,
Jamaica, Leeward Islands, Netherlands Antilles, Puerto Rico, Trinidad andTobago, Turks and Caicos Islands, US Virgin Islands and Windward Islands.
9 Including Angola, Central African Republic, Chad, Congo, Malawi, Zaire andZambia.
10 Including Belize, Costa Rica, Cuba, Dominican Republic, El Salvador, Gu-atemala, Haiti, Honduras, Mexico, Nicaragua and Panama.
11 Including Burundi, Djibouti, Ethiopia, Kenya, Rwanda, Somali Republic, Su-dan, Tanzania and Uganda.
12 Including Bandar Seri Begawan, Burma, China, Hongkong, Indonesia, Kam-puchea, Korea, Laos, Malaysia, Nepal, Philippines, Singapore, Taiwan, Thai-land and Vietnam.
13 Including Afghanistan, Bangladesh, India, Pakistan and Sri Lanka.14 Including Iran, Iraq, Kuwait, Persian Gulf States, Republic of North Yemen,
Republic of South Yemen, Saudi Arabia and United Arab Emirates.15 Including Botswana, Lesotho, Mozambique, Namibia, South African Republic,
Swaziland and Zimbabwe.16 Including Argentina, Bolivia, Brazil, Chile, Colombia, Ecuador, Guyana,
Paraguay, Peru, Uruguay and Venezuela.17 Including Benin, Cameroon, Equatorial Guinea, Gabon, Gambia, Ghana,
Guinea, Guinea Bissau, Ivory Coast, Liberia, Mali, Mauritania, Niger, Nigeria,Senegal, Sierra Leone, Togo, Upper Volta and Western Sahara.
18 Atlantic Ocean Islands, Indian Ocean Islands and Pacific Ocean Islands andMadeira.
19 Including Australia & New Zealand, Africa, Caribbean and other areas of theworld (excluding USA & Canada).
20 Including passengers on pleasure cruises beginning and/or ending at UKseaports (excluding QE2 passengers between Southampton and New Yorkwhich is included in USA & Canada).
Note: Sea and Air passenger numbers are seasonal, which should be takeninto account when comparing figures within a year.
Sources: Department for Transport;Civil Aviation Authority
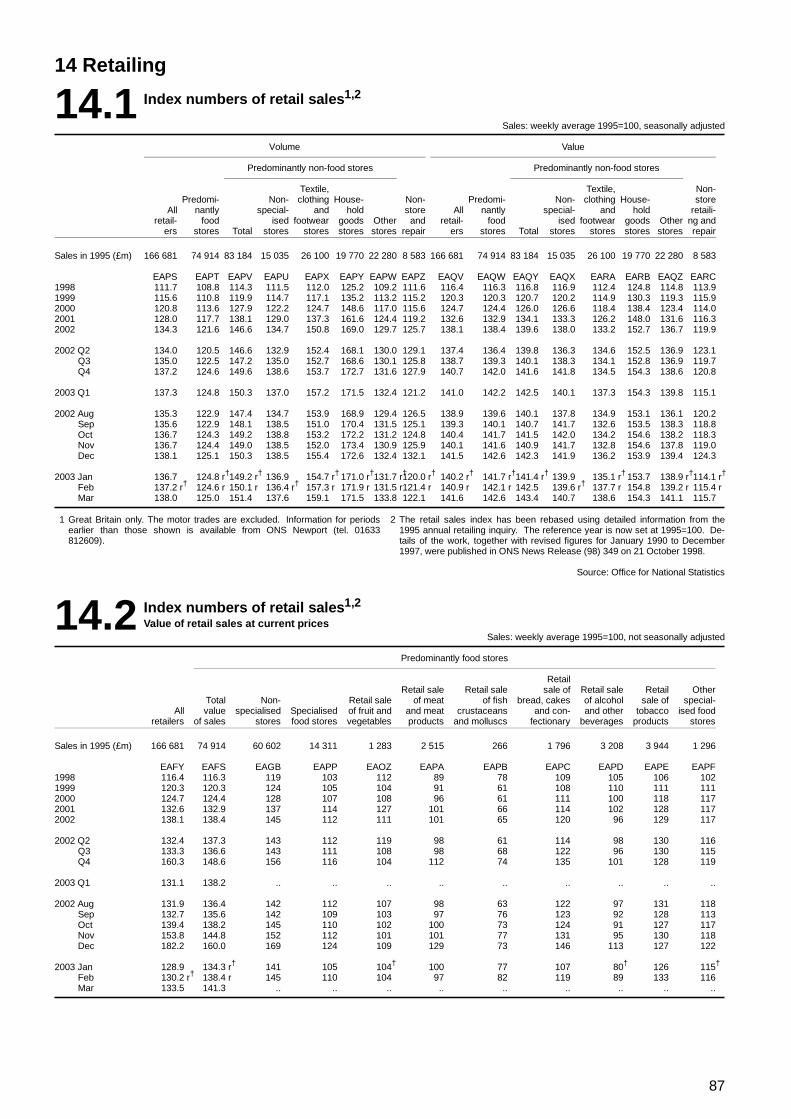
87
14 Retailing
14.1 Index numbers of retail sales1,2
Sales: weekly average 1995=100, seasonally adjusted
Volume Value
Predominantly non-food stores Predominantly non-food stores
Textile, Textile, Non-Predomi- Non- clothing House- Non- Predomi- Non- clothing House- store
All nantly special- and hold store All nantly special- and hold retaili-retail- food ised footwear goods Other and retail- food ised footwear goods Other ng and
ers stores Total stores stores stores stores repair ers stores Total stores stores stores stores repair
Sales in 1995 (£m) 166 681 74 914 83 184 15 035 26 100 19 770 22 280 8 583 166 681 74 914 83 184 15 035 26 100 19 770 22 280 8 583
EAPS EAPT EAPV EAPU EAPX EAPY EAPW EAPZ EAQV EAQW EAQY EAQX EARA EARB EAQZ EARC1998 111.7 108.8 114.3 111.5 112.0 125.2 109.2 111.6 116.4 116.3 116.8 116.9 112.4 124.8 114.8 113.91999 115.6 110.8 119.9 114.7 117.1 135.2 113.2 115.2 120.3 120.3 120.7 120.2 114.9 130.3 119.3 115.92000 120.8 113.6 127.9 122.2 124.7 148.6 117.0 115.6 124.7 124.4 126.0 126.6 118.4 138.4 123.4 114.02001 128.0 117.7 138.1 129.0 137.3 161.6 124.4 119.2 132.6 132.9 134.1 133.3 126.2 148.0 131.6 116.32002 134.3 121.6 146.6 134.7 150.8 169.0 129.7 125.7 138.1 138.4 139.6 138.0 133.2 152.7 136.7 119.9
2002 Q2 134.0 120.5 146.6 132.9 152.4 168.1 130.0 129.1 137.4 136.4 139.8 136.3 134.6 152.5 136.9 123.1Q3 135.0 122.5 147.2 135.0 152.7 168.6 130.1 125.8 138.7 139.3 140.1 138.3 134.1 152.8 136.9 119.7Q4 137.2 124.6 149.6 138.6 153.7 172.7 131.6 127.9 140.7 142.0 141.6 141.8 134.5 154.3 138.6 120.8
2003 Q1 137.3 124.8 150.3 137.0 157.2 171.5 132.4 121.2 141.0 142.2 142.5 140.1 137.3 154.3 139.8 115.1
2002 Aug 135.3 122.9 147.4 134.7 153.9 168.9 129.4 126.5 138.9 139.6 140.1 137.8 134.9 153.1 136.1 120.2Sep 135.6 122.9 148.1 138.5 151.0 170.4 131.5 125.1 139.3 140.1 140.7 141.7 132.6 153.5 138.3 118.8Oct 136.7 124.3 149.2 138.8 153.2 172.2 131.2 124.8 140.4 141.7 141.5 142.0 134.2 154.6 138.2 118.3Nov 136.7 124.4 149.0 138.5 152.0 173.4 130.9 125.9 140.1 141.6 140.9 141.7 132.8 154.6 137.8 119.0Dec 138.1 125.1 150.3 138.5 155.4 172.6 132.4 132.1 141.5 142.6 142.3 141.9 136.2 153.9 139.4 124.3
2003 Jan 136.7 124.8 r†149.2 r† 136.9 154.7 r† 171.0 r†131.7 r†120.0 r† 140.2 r† 141.7 r†141.4 r† 139.9 135.1 r† 153.7 138.9 r†114.1 r†
Feb 137.2 r† 124.6 r 150.1 r 136.4 r† 157.3 r 171.9 r 131.5 r121.4 r 140.9 r 142.1 r 142.5 139.6 r† 137.7 r 154.8 139.2 r 115.4 rMar 138.0 125.0 151.4 137.6 159.1 171.5 133.8 122.1 141.6 142.6 143.4 140.7 138.6 154.3 141.1 115.7
1 Great Britain only. The motor trades are excluded. Information for periodsearlier than those shown is available from ONS Newport (tel. 01633812609).
2 The retail sales index has been rebased using detailed information from the1995 annual retailing inquiry. The reference year is now set at 1995=100. De-tails of the work, together with revised figures for January 1990 to December1997, were published in ONS News Release (98) 349 on 21 October 1998.
Source: Office for National Statistics
14.2 Index numbers of retail sales1,2
Value of retail sales at current pricesSales: weekly average 1995=100, not seasonally adjusted
Predominantly food stores
RetailRetail sale Retail sale sale of Retail sale Retail Other
Total Non- Retail sale of meat of fish bread, cakes of alcohol sale of special-All value specialised Specialised of fruit and and meat crustaceans and con- and other tobacco ised food
retailers of sales stores food stores vegetables products and molluscs fectionary beverages products stores
Sales in 1995 (£m) 166 681 74 914 60 602 14 311 1 283 2 515 266 1 796 3 208 3 944 1 296
EAFY EAFS EAGB EAPP EAOZ EAPA EAPB EAPC EAPD EAPE EAPF1998 116.4 116.3 119 103 112 89 78 109 105 106 1021999 120.3 120.3 124 105 104 91 61 108 110 111 1112000 124.7 124.4 128 107 108 96 61 111 100 118 1172001 132.6 132.9 137 114 127 101 66 114 102 128 1172002 138.1 138.4 145 112 111 101 65 120 96 129 117
2002 Q2 132.4 137.3 143 112 119 98 61 114 98 130 116Q3 133.3 136.6 143 111 108 98 68 122 96 130 115Q4 160.3 148.6 156 116 104 112 74 135 101 128 119
2003 Q1 131.1 138.2 .. .. .. .. .. .. .. .. ..
2002 Aug 131.9 136.4 142 112 107 98 63 122 97 131 118Sep 132.7 135.6 142 109 103 97 76 123 92 128 113Oct 139.4 138.2 145 110 102 100 73 124 91 127 117Nov 153.8 144.8 152 112 101 101 77 131 95 130 118Dec 182.2 160.0 169 124 109 129 73 146 113 127 122
2003 Jan 128.9 134.3 r† 141 105 104† 100 77 107 80† 126 115†
Feb 130.2 r† 138.4 r 145 110 104 97 82 119 89 133 116Mar 133.5 141.3 .. .. .. .. .. .. .. .. ..
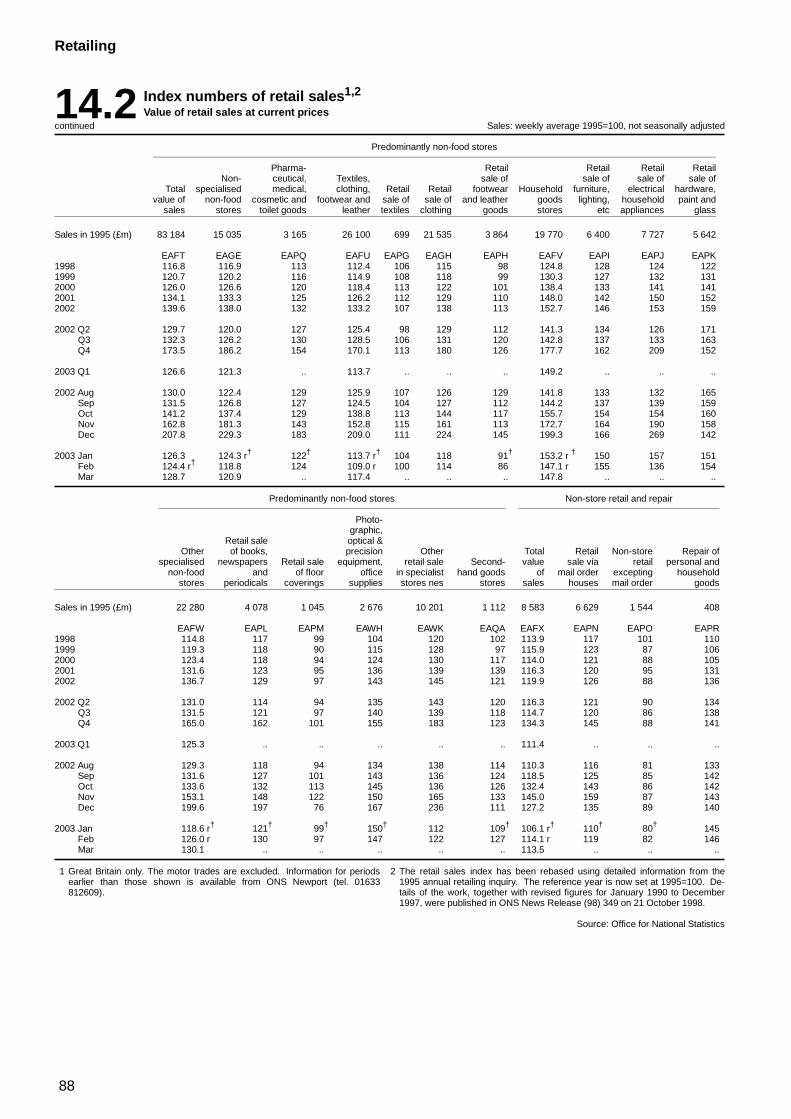
88
Retailing
14.2 Index numbers of retail sales1,2
Value of retail sales at current pricescontinued Sales: weekly average 1995=100, not seasonally adjusted
Predominantly non-food stores
Pharma- Retail Retail Retail RetailNon- ceutical, Textiles, sale of sale of sale of sale of
Total specialised medical, clothing, Retail Retail footwear Household furniture, electrical hardware,value of non-food cosmetic and footwear and sale of sale of and leather goods lighting, household paint and
sales stores toilet goods leather textiles clothing goods stores etc appliances glass
Sales in 1995 (£m) 83 184 15 035 3 165 26 100 699 21 535 3 864 19 770 6 400 7 727 5 642
EAFT EAGE EAPQ EAFU EAPG EAGH EAPH EAFV EAPI EAPJ EAPK1998 116.8 116.9 113 112.4 106 115 98 124.8 128 124 1221999 120.7 120.2 116 114.9 108 118 99 130.3 127 132 1312000 126.0 126.6 120 118.4 113 122 101 138.4 133 141 1412001 134.1 133.3 125 126.2 112 129 110 148.0 142 150 1522002 139.6 138.0 132 133.2 107 138 113 152.7 146 153 159
2002 Q2 129.7 120.0 127 125.4 98 129 112 141.3 134 126 171Q3 132.3 126.2 130 128.5 106 131 120 142.8 137 133 163Q4 173.5 186.2 154 170.1 113 180 126 177.7 162 209 152
2003 Q1 126.6 121.3 .. 113.7 .. .. .. 149.2 .. .. ..
2002 Aug 130.0 122.4 129 125.9 107 126 129 141.8 133 132 165Sep 131.5 126.8 127 124.5 104 127 112 144.2 137 139 159Oct 141.2 137.4 129 138.8 113 144 117 155.7 154 154 160Nov 162.8 181.3 143 152.8 115 161 113 172.7 164 190 158Dec 207.8 229.3 183 209.0 111 224 145 199.3 166 269 142
2003 Jan 126.3 124.3 r† 122† 113.7 r† 104 118 91† 153.2 r † 150 157 151Feb 124.4 r† 118.8 124 109.0 r 100 114 86 147.1 r 155 136 154Mar 128.7 120.9 .. 117.4 .. .. .. 147.8 .. .. ..
Predominantly non-food stores Non-store retail and repair
Photo-graphic,
Retail sale optical &Other of books, precision Other Total Retail Non-store Repair of
specialised newspapers Retail sale equipment, retail sale Second- value sale via retail personal andnon-food and of floor office in specialist hand goods of mail order excepting household
stores periodicals coverings supplies stores nes stores sales houses mail order goods
Sales in 1995 (£m) 22 280 4 078 1 045 2 676 10 201 1 112 8 583 6 629 1 544 408
EAFW EAPL EAPM EAWH EAWK EAQA EAFX EAPN EAPO EAPR1998 114.8 117 99 104 120 102 113.9 117 101 1101999 119.3 118 90 115 128 97 115.9 123 87 1062000 123.4 118 94 124 130 117 114.0 121 88 1052001 131.6 123 95 136 139 139 116.3 120 95 1312002 136.7 129 97 143 145 121 119.9 126 88 136
2002 Q2 131.0 114 94 135 143 120 116.3 121 90 134Q3 131.5 121 97 140 139 118 114.7 120 86 138Q4 165.0 162 101 155 183 123 134.3 145 88 141
2003 Q1 125.3 .. .. .. .. .. 111.4 .. .. ..
2002 Aug 129.3 118 94 134 138 114 110.3 116 81 133Sep 131.6 127 101 143 136 124 118.5 125 85 142Oct 133.6 132 113 145 136 126 132.4 143 86 142Nov 153.1 148 122 150 165 133 145.0 159 87 143Dec 199.6 197 76 167 236 111 127.2 135 89 140
2003 Jan 118.6 r† 121† 99† 150† 112 109† 106.1 r† 110† 80† 145Feb 126.0 r 130 97 147 122 127 114.1 r 119 82 146Mar 130.1 .. .. .. .. .. 113.5 .. .. ..
1 Great Britain only. The motor trades are excluded. Information for periodsearlier than those shown is available from ONS Newport (tel. 01633812609).
2 The retail sales index has been rebased using detailed information from the1995 annual retailing inquiry. The reference year is now set at 1995=100. De-tails of the work, together with revised figures for January 1990 to December1997, were published in ONS News Release (98) 349 on 21 October 1998.
Source: Office for National Statistics
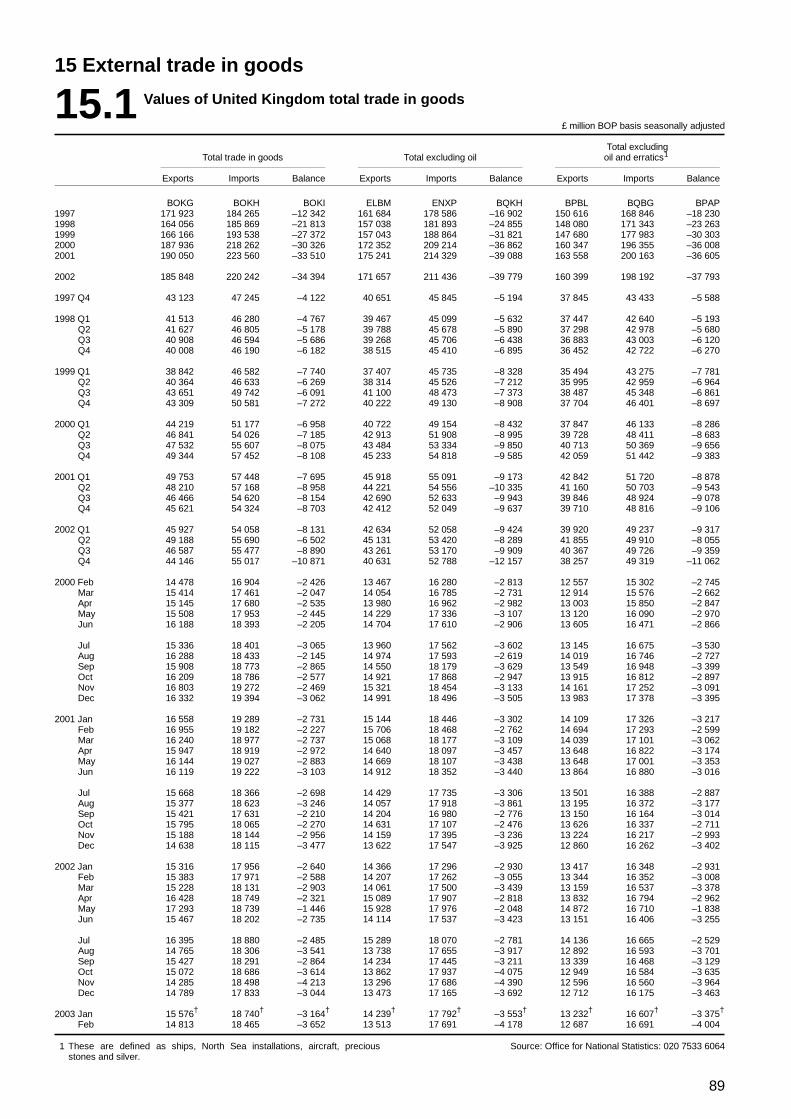
89
15 External trade in goods
15.1 Values of United Kingdom total trade in goods
£ million BOP basis seasonally adjusted
Total excludingTotal trade in goods Total excluding oil oil and erratics1
Exports Imports Balance Exports Imports Balance Exports Imports Balance
BOKG BOKH BOKI ELBM ENXP BQKH BPBL BQBG BPAP1997 171 923 184 265 –12 342 161 684 178 586 –16 902 150 616 168 846 –18 2301998 164 056 185 869 –21 813 157 038 181 893 –24 855 148 080 171 343 –23 2631999 166 166 193 538 –27 372 157 043 188 864 –31 821 147 680 177 983 –30 3032000 187 936 218 262 –30 326 172 352 209 214 –36 862 160 347 196 355 –36 0082001 190 050 223 560 –33 510 175 241 214 329 –39 088 163 558 200 163 –36 605
2002 185 848 220 242 –34 394 171 657 211 436 –39 779 160 399 198 192 –37 793
1997 Q4 43 123 47 245 –4 122 40 651 45 845 –5 194 37 845 43 433 –5 588
1998 Q1 41 513 46 280 –4 767 39 467 45 099 –5 632 37 447 42 640 –5 193Q2 41 627 46 805 –5 178 39 788 45 678 –5 890 37 298 42 978 –5 680Q3 40 908 46 594 –5 686 39 268 45 706 –6 438 36 883 43 003 –6 120Q4 40 008 46 190 –6 182 38 515 45 410 –6 895 36 452 42 722 –6 270
1999 Q1 38 842 46 582 –7 740 37 407 45 735 –8 328 35 494 43 275 –7 781Q2 40 364 46 633 –6 269 38 314 45 526 –7 212 35 995 42 959 –6 964Q3 43 651 49 742 –6 091 41 100 48 473 –7 373 38 487 45 348 –6 861Q4 43 309 50 581 –7 272 40 222 49 130 –8 908 37 704 46 401 –8 697
2000 Q1 44 219 51 177 –6 958 40 722 49 154 –8 432 37 847 46 133 –8 286Q2 46 841 54 026 –7 185 42 913 51 908 –8 995 39 728 48 411 –8 683Q3 47 532 55 607 –8 075 43 484 53 334 –9 850 40 713 50 369 –9 656Q4 49 344 57 452 –8 108 45 233 54 818 –9 585 42 059 51 442 –9 383
2001 Q1 49 753 57 448 –7 695 45 918 55 091 –9 173 42 842 51 720 –8 878Q2 48 210 57 168 –8 958 44 221 54 556 –10 335 41 160 50 703 –9 543Q3 46 466 54 620 –8 154 42 690 52 633 –9 943 39 846 48 924 –9 078Q4 45 621 54 324 –8 703 42 412 52 049 –9 637 39 710 48 816 –9 106
2002 Q1 45 927 54 058 –8 131 42 634 52 058 –9 424 39 920 49 237 –9 317Q2 49 188 55 690 –6 502 45 131 53 420 –8 289 41 855 49 910 –8 055Q3 46 587 55 477 –8 890 43 261 53 170 –9 909 40 367 49 726 –9 359Q4 44 146 55 017 –10 871 40 631 52 788 –12 157 38 257 49 319 –11 062
2000 Feb 14 478 16 904 –2 426 13 467 16 280 –2 813 12 557 15 302 –2 745Mar 15 414 17 461 –2 047 14 054 16 785 –2 731 12 914 15 576 –2 662Apr 15 145 17 680 –2 535 13 980 16 962 –2 982 13 003 15 850 –2 847May 15 508 17 953 –2 445 14 229 17 336 –3 107 13 120 16 090 –2 970Jun 16 188 18 393 –2 205 14 704 17 610 –2 906 13 605 16 471 –2 866
Jul 15 336 18 401 –3 065 13 960 17 562 –3 602 13 145 16 675 –3 530Aug 16 288 18 433 –2 145 14 974 17 593 –2 619 14 019 16 746 –2 727Sep 15 908 18 773 –2 865 14 550 18 179 –3 629 13 549 16 948 –3 399Oct 16 209 18 786 –2 577 14 921 17 868 –2 947 13 915 16 812 –2 897Nov 16 803 19 272 –2 469 15 321 18 454 –3 133 14 161 17 252 –3 091Dec 16 332 19 394 –3 062 14 991 18 496 –3 505 13 983 17 378 –3 395
2001 Jan 16 558 19 289 –2 731 15 144 18 446 –3 302 14 109 17 326 –3 217Feb 16 955 19 182 –2 227 15 706 18 468 –2 762 14 694 17 293 –2 599Mar 16 240 18 977 –2 737 15 068 18 177 –3 109 14 039 17 101 –3 062Apr 15 947 18 919 –2 972 14 640 18 097 –3 457 13 648 16 822 –3 174May 16 144 19 027 –2 883 14 669 18 107 –3 438 13 648 17 001 –3 353Jun 16 119 19 222 –3 103 14 912 18 352 –3 440 13 864 16 880 –3 016
Jul 15 668 18 366 –2 698 14 429 17 735 –3 306 13 501 16 388 –2 887Aug 15 377 18 623 –3 246 14 057 17 918 –3 861 13 195 16 372 –3 177Sep 15 421 17 631 –2 210 14 204 16 980 –2 776 13 150 16 164 –3 014Oct 15 795 18 065 –2 270 14 631 17 107 –2 476 13 626 16 337 –2 711Nov 15 188 18 144 –2 956 14 159 17 395 –3 236 13 224 16 217 –2 993Dec 14 638 18 115 –3 477 13 622 17 547 –3 925 12 860 16 262 –3 402
2002 Jan 15 316 17 956 –2 640 14 366 17 296 –2 930 13 417 16 348 –2 931Feb 15 383 17 971 –2 588 14 207 17 262 –3 055 13 344 16 352 –3 008Mar 15 228 18 131 –2 903 14 061 17 500 –3 439 13 159 16 537 –3 378Apr 16 428 18 749 –2 321 15 089 17 907 –2 818 13 832 16 794 –2 962May 17 293 18 739 –1 446 15 928 17 976 –2 048 14 872 16 710 –1 838Jun 15 467 18 202 –2 735 14 114 17 537 –3 423 13 151 16 406 –3 255
Jul 16 395 18 880 –2 485 15 289 18 070 –2 781 14 136 16 665 –2 529Aug 14 765 18 306 –3 541 13 738 17 655 –3 917 12 892 16 593 –3 701Sep 15 427 18 291 –2 864 14 234 17 445 –3 211 13 339 16 468 –3 129Oct 15 072 18 686 –3 614 13 862 17 937 –4 075 12 949 16 584 –3 635Nov 14 285 18 498 –4 213 13 296 17 686 –4 390 12 596 16 560 –3 964Dec 14 789 17 833 –3 044 13 473 17 165 –3 692 12 712 16 175 –3 463
2003 Jan 15 576† 18 740† –3 164† 14 239† 17 792† –3 553† 13 232† 16 607† –3 375†
Feb 14 813 18 465 –3 652 13 513 17 691 –4 178 12 687 16 691 –4 004
1 These are defined as ships, North Sea installations, aircraft, preciousstones and silver.
Source: Office for National Statistics: 020 7533 6064
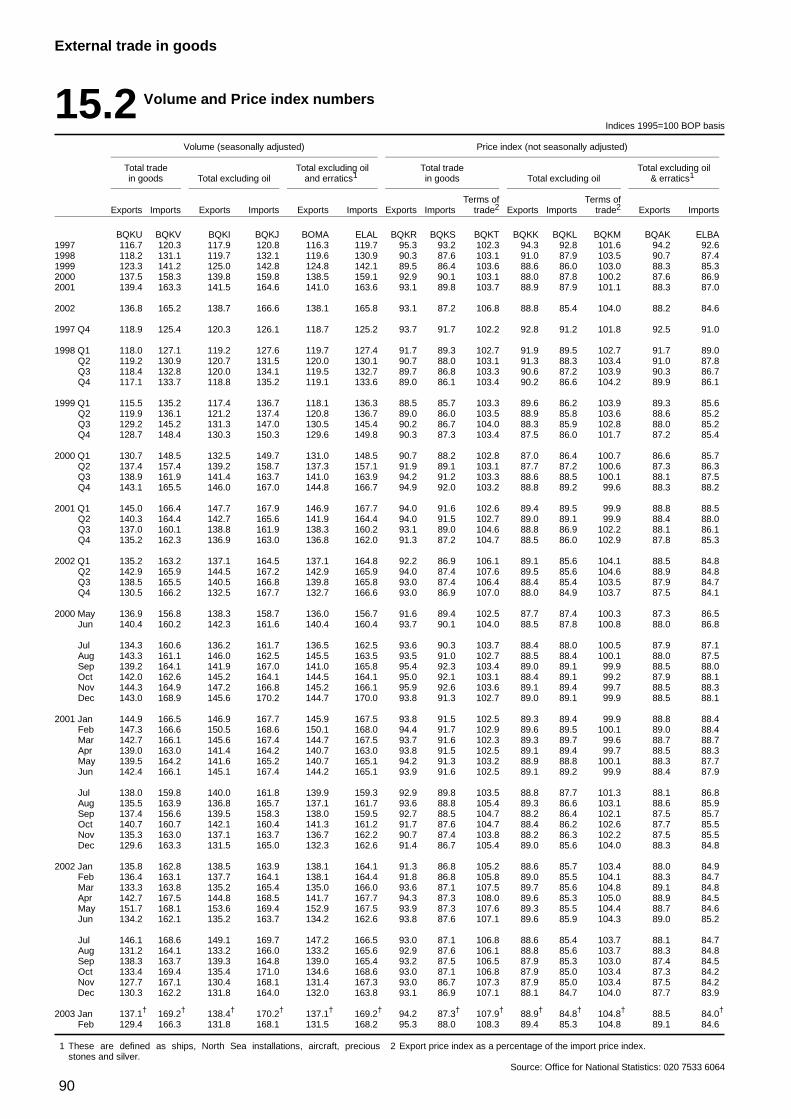
90
External trade in goods
15.2 Volume and Price index numbers
Indices 1995=100 BOP basis
Volume (seasonally adjusted) Price index (not seasonally adjusted)
Total trade Total excluding oil Total trade Total excluding oilin goods Total excluding oil and erratics1 in goods Total excluding oil & erratics1
Terms of Terms ofExports Imports Exports Imports Exports Imports Exports Imports trade2 Exports Imports trade2 Exports Imports
BQKU BQKV BQKI BQKJ BOMA ELAL BQKR BQKS BQKT BQKK BQKL BQKM BQAK ELBA1997 116.7 120.3 117.9 120.8 116.3 119.7 95.3 93.2 102.3 94.3 92.8 101.6 94.2 92.61998 118.2 131.1 119.7 132.1 119.6 130.9 90.3 87.6 103.1 91.0 87.9 103.5 90.7 87.41999 123.3 141.2 125.0 142.8 124.8 142.1 89.5 86.4 103.6 88.6 86.0 103.0 88.3 85.32000 137.5 158.3 139.8 159.8 138.5 159.1 92.9 90.1 103.1 88.0 87.8 100.2 87.6 86.92001 139.4 163.3 141.5 164.6 141.0 163.6 93.1 89.8 103.7 88.9 87.9 101.1 88.3 87.0
2002 136.8 165.2 138.7 166.6 138.1 165.8 93.1 87.2 106.8 88.8 85.4 104.0 88.2 84.6
1997 Q4 118.9 125.4 120.3 126.1 118.7 125.2 93.7 91.7 102.2 92.8 91.2 101.8 92.5 91.0
1998 Q1 118.0 127.1 119.2 127.6 119.7 127.4 91.7 89.3 102.7 91.9 89.5 102.7 91.7 89.0Q2 119.2 130.9 120.7 131.5 120.0 130.1 90.7 88.0 103.1 91.3 88.3 103.4 91.0 87.8Q3 118.4 132.8 120.0 134.1 119.5 132.7 89.7 86.8 103.3 90.6 87.2 103.9 90.3 86.7Q4 117.1 133.7 118.8 135.2 119.1 133.6 89.0 86.1 103.4 90.2 86.6 104.2 89.9 86.1
1999 Q1 115.5 135.2 117.4 136.7 118.1 136.3 88.5 85.7 103.3 89.6 86.2 103.9 89.3 85.6Q2 119.9 136.1 121.2 137.4 120.8 136.7 89.0 86.0 103.5 88.9 85.8 103.6 88.6 85.2Q3 129.2 145.2 131.3 147.0 130.5 145.4 90.2 86.7 104.0 88.3 85.9 102.8 88.0 85.2Q4 128.7 148.4 130.3 150.3 129.6 149.8 90.3 87.3 103.4 87.5 86.0 101.7 87.2 85.4
2000 Q1 130.7 148.5 132.5 149.7 131.0 148.5 90.7 88.2 102.8 87.0 86.4 100.7 86.6 85.7Q2 137.4 157.4 139.2 158.7 137.3 157.1 91.9 89.1 103.1 87.7 87.2 100.6 87.3 86.3Q3 138.9 161.9 141.4 163.7 141.0 163.9 94.2 91.2 103.3 88.6 88.5 100.1 88.1 87.5Q4 143.1 165.5 146.0 167.0 144.8 166.7 94.9 92.0 103.2 88.8 89.2 99.6 88.3 88.2
2001 Q1 145.0 166.4 147.7 167.9 146.9 167.7 94.0 91.6 102.6 89.4 89.5 99.9 88.8 88.5Q2 140.3 164.4 142.7 165.6 141.9 164.4 94.0 91.5 102.7 89.0 89.1 99.9 88.4 88.0Q3 137.0 160.1 138.8 161.9 138.3 160.2 93.1 89.0 104.6 88.8 86.9 102.2 88.1 86.1Q4 135.2 162.3 136.9 163.0 136.8 162.0 91.3 87.2 104.7 88.5 86.0 102.9 87.8 85.3
2002 Q1 135.2 163.2 137.1 164.5 137.1 164.8 92.2 86.9 106.1 89.1 85.6 104.1 88.5 84.8Q2 142.9 165.9 144.5 167.2 142.9 165.9 94.0 87.4 107.6 89.5 85.6 104.6 88.9 84.8Q3 138.5 165.5 140.5 166.8 139.8 165.8 93.0 87.4 106.4 88.4 85.4 103.5 87.9 84.7Q4 130.5 166.2 132.5 167.7 132.7 166.6 93.0 86.9 107.0 88.0 84.9 103.7 87.5 84.1
2000 May 136.9 156.8 138.3 158.7 136.0 156.7 91.6 89.4 102.5 87.7 87.4 100.3 87.3 86.5Jun 140.4 160.2 142.3 161.6 140.4 160.4 93.7 90.1 104.0 88.5 87.8 100.8 88.0 86.8
Jul 134.3 160.6 136.2 161.7 136.5 162.5 93.6 90.3 103.7 88.4 88.0 100.5 87.9 87.1Aug 143.3 161.1 146.0 162.5 145.5 163.5 93.5 91.0 102.7 88.5 88.4 100.1 88.0 87.5Sep 139.2 164.1 141.9 167.0 141.0 165.8 95.4 92.3 103.4 89.0 89.1 99.9 88.5 88.0Oct 142.0 162.6 145.2 164.1 144.5 164.1 95.0 92.1 103.1 88.4 89.1 99.2 87.9 88.1Nov 144.3 164.9 147.2 166.8 145.2 166.1 95.9 92.6 103.6 89.1 89.4 99.7 88.5 88.3Dec 143.0 168.9 145.6 170.2 144.7 170.0 93.8 91.3 102.7 89.0 89.1 99.9 88.5 88.1
2001 Jan 144.9 166.5 146.9 167.7 145.9 167.5 93.8 91.5 102.5 89.3 89.4 99.9 88.8 88.4Feb 147.3 166.6 150.5 168.6 150.1 168.0 94.4 91.7 102.9 89.6 89.5 100.1 89.0 88.4Mar 142.7 166.1 145.6 167.4 144.7 167.5 93.7 91.6 102.3 89.3 89.7 99.6 88.7 88.7Apr 139.0 163.0 141.4 164.2 140.7 163.0 93.8 91.5 102.5 89.1 89.4 99.7 88.5 88.3May 139.5 164.2 141.6 165.2 140.7 165.1 94.2 91.3 103.2 88.9 88.8 100.1 88.3 87.7Jun 142.4 166.1 145.1 167.4 144.2 165.1 93.9 91.6 102.5 89.1 89.2 99.9 88.4 87.9
Jul 138.0 159.8 140.0 161.8 139.9 159.3 92.9 89.8 103.5 88.8 87.7 101.3 88.1 86.8Aug 135.5 163.9 136.8 165.7 137.1 161.7 93.6 88.8 105.4 89.3 86.6 103.1 88.6 85.9Sep 137.4 156.6 139.5 158.3 138.0 159.5 92.7 88.5 104.7 88.2 86.4 102.1 87.5 85.7Oct 140.7 160.7 142.1 160.4 141.3 161.2 91.7 87.6 104.7 88.4 86.2 102.6 87.7 85.5Nov 135.3 163.0 137.1 163.7 136.7 162.2 90.7 87.4 103.8 88.2 86.3 102.2 87.5 85.5Dec 129.6 163.3 131.5 165.0 132.3 162.6 91.4 86.7 105.4 89.0 85.6 104.0 88.3 84.8
2002 Jan 135.8 162.8 138.5 163.9 138.1 164.1 91.3 86.8 105.2 88.6 85.7 103.4 88.0 84.9Feb 136.4 163.1 137.7 164.1 138.1 164.4 91.8 86.8 105.8 89.0 85.5 104.1 88.3 84.7Mar 133.3 163.8 135.2 165.4 135.0 166.0 93.6 87.1 107.5 89.7 85.6 104.8 89.1 84.8Apr 142.7 167.5 144.8 168.5 141.7 167.7 94.3 87.3 108.0 89.6 85.3 105.0 88.9 84.5May 151.7 168.1 153.6 169.4 152.9 167.5 93.9 87.3 107.6 89.3 85.5 104.4 88.7 84.6Jun 134.2 162.1 135.2 163.7 134.2 162.6 93.8 87.6 107.1 89.6 85.9 104.3 89.0 85.2
Jul 146.1 168.6 149.1 169.7 147.2 166.5 93.0 87.1 106.8 88.6 85.4 103.7 88.1 84.7Aug 131.2 164.1 133.2 166.0 133.2 165.6 92.9 87.6 106.1 88.8 85.6 103.7 88.3 84.8Sep 138.3 163.7 139.3 164.8 139.0 165.4 93.2 87.5 106.5 87.9 85.3 103.0 87.4 84.5Oct 133.4 169.4 135.4 171.0 134.6 168.6 93.0 87.1 106.8 87.9 85.0 103.4 87.3 84.2Nov 127.7 167.1 130.4 168.1 131.4 167.3 93.0 86.7 107.3 87.9 85.0 103.4 87.5 84.2Dec 130.3 162.2 131.8 164.0 132.0 163.8 93.1 86.9 107.1 88.1 84.7 104.0 87.7 83.9
2003 Jan 137.1† 169.2† 138.4† 170.2† 137.1† 169.2† 94.2 87.3† 107.9† 88.9† 84.8† 104.8† 88.5 84.0†
Feb 129.4 166.3 131.8 168.1 131.5 168.2 95.3 88.0 108.3 89.4 85.3 104.8 89.1 84.6
1 These are defined as ships, North Sea installations, aircraft, preciousstones and silver.
2 Export price index as a percentage of the import price index.
Source: Office for National Statistics: 020 7533 6064
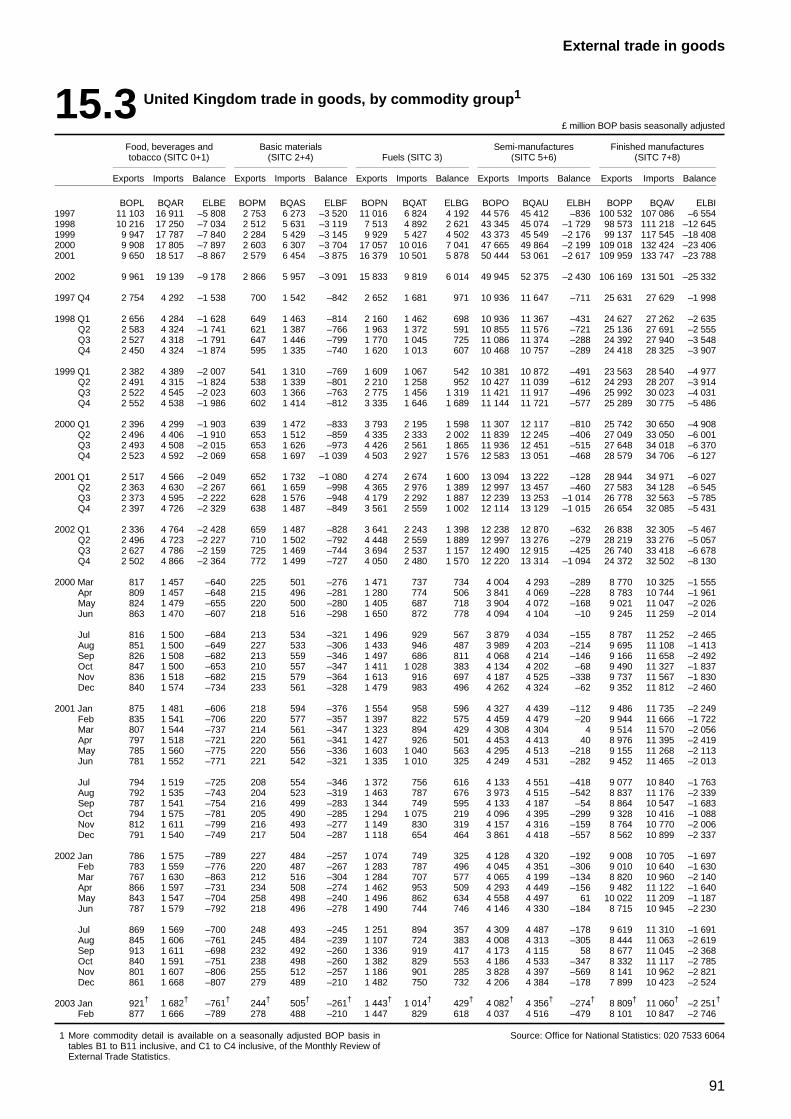
91
External trade in goods
15.3 United Kingdom trade in goods, by commodity group1
£ million BOP basis seasonally adjusted
Food, beverages and Basic materials Semi-manufactures Finished manufacturestobacco (SITC 0+1) (SITC 2+4) Fuels (SITC 3) (SITC 5+6) (SITC 7+8)
Exports Imports Balance Exports Imports Balance Exports Imports Balance Exports Imports Balance Exports Imports Balance
BOPL BQAR ELBE BOPM BQAS ELBF BOPN BQAT ELBG BOPO BQAU ELBH BOPP BQAV ELBI1997 11 103 16 911 –5 808 2 753 6 273 –3 520 11 016 6 824 4 192 44 576 45 412 –836 100 532 107 086 –6 5541998 10 216 17 250 –7 034 2 512 5 631 –3 119 7 513 4 892 2 621 43 345 45 074 –1 729 98 573 111 218 –12 6451999 9 947 17 787 –7 840 2 284 5 429 –3 145 9 929 5 427 4 502 43 373 45 549 –2 176 99 137 117 545 –18 4082000 9 908 17 805 –7 897 2 603 6 307 –3 704 17 057 10 016 7 041 47 665 49 864 –2 199 109 018 132 424 –23 4062001 9 650 18 517 –8 867 2 579 6 454 –3 875 16 379 10 501 5 878 50 444 53 061 –2 617 109 959 133 747 –23 788
2002 9 961 19 139 –9 178 2 866 5 957 –3 091 15 833 9 819 6 014 49 945 52 375 –2 430 106 169 131 501 –25 332
1997 Q4 2 754 4 292 –1 538 700 1 542 –842 2 652 1 681 971 10 936 11 647 –711 25 631 27 629 –1 998
1998 Q1 2 656 4 284 –1 628 649 1 463 –814 2 160 1 462 698 10 936 11 367 –431 24 627 27 262 –2 635Q2 2 583 4 324 –1 741 621 1 387 –766 1 963 1 372 591 10 855 11 576 –721 25 136 27 691 –2 555Q3 2 527 4 318 –1 791 647 1 446 –799 1 770 1 045 725 11 086 11 374 –288 24 392 27 940 –3 548Q4 2 450 4 324 –1 874 595 1 335 –740 1 620 1 013 607 10 468 10 757 –289 24 418 28 325 –3 907
1999 Q1 2 382 4 389 –2 007 541 1 310 –769 1 609 1 067 542 10 381 10 872 –491 23 563 28 540 –4 977Q2 2 491 4 315 –1 824 538 1 339 –801 2 210 1 258 952 10 427 11 039 –612 24 293 28 207 –3 914Q3 2 522 4 545 –2 023 603 1 366 –763 2 775 1 456 1 319 11 421 11 917 –496 25 992 30 023 –4 031Q4 2 552 4 538 –1 986 602 1 414 –812 3 335 1 646 1 689 11 144 11 721 –577 25 289 30 775 –5 486
2000 Q1 2 396 4 299 –1 903 639 1 472 –833 3 793 2 195 1 598 11 307 12 117 –810 25 742 30 650 –4 908Q2 2 496 4 406 –1 910 653 1 512 –859 4 335 2 333 2 002 11 839 12 245 –406 27 049 33 050 –6 001Q3 2 493 4 508 –2 015 653 1 626 –973 4 426 2 561 1 865 11 936 12 451 –515 27 648 34 018 –6 370Q4 2 523 4 592 –2 069 658 1 697 –1 039 4 503 2 927 1 576 12 583 13 051 –468 28 579 34 706 –6 127
2001 Q1 2 517 4 566 –2 049 652 1 732 –1 080 4 274 2 674 1 600 13 094 13 222 –128 28 944 34 971 –6 027Q2 2 363 4 630 –2 267 661 1 659 –998 4 365 2 976 1 389 12 997 13 457 –460 27 583 34 128 –6 545Q3 2 373 4 595 –2 222 628 1 576 –948 4 179 2 292 1 887 12 239 13 253 –1 014 26 778 32 563 –5 785Q4 2 397 4 726 –2 329 638 1 487 –849 3 561 2 559 1 002 12 114 13 129 –1 015 26 654 32 085 –5 431
2002 Q1 2 336 4 764 –2 428 659 1 487 –828 3 641 2 243 1 398 12 238 12 870 –632 26 838 32 305 –5 467Q2 2 496 4 723 –2 227 710 1 502 –792 4 448 2 559 1 889 12 997 13 276 –279 28 219 33 276 –5 057Q3 2 627 4 786 –2 159 725 1 469 –744 3 694 2 537 1 157 12 490 12 915 –425 26 740 33 418 –6 678Q4 2 502 4 866 –2 364 772 1 499 –727 4 050 2 480 1 570 12 220 13 314 –1 094 24 372 32 502 –8 130
2000 Mar 817 1 457 –640 225 501 –276 1 471 737 734 4 004 4 293 –289 8 770 10 325 –1 555Apr 809 1 457 –648 215 496 –281 1 280 774 506 3 841 4 069 –228 8 783 10 744 –1 961May 824 1 479 –655 220 500 –280 1 405 687 718 3 904 4 072 –168 9 021 11 047 –2 026Jun 863 1 470 –607 218 516 –298 1 650 872 778 4 094 4 104 –10 9 245 11 259 –2 014
Jul 816 1 500 –684 213 534 –321 1 496 929 567 3 879 4 034 –155 8 787 11 252 –2 465Aug 851 1 500 –649 227 533 –306 1 433 946 487 3 989 4 203 –214 9 695 11 108 –1 413Sep 826 1 508 –682 213 559 –346 1 497 686 811 4 068 4 214 –146 9 166 11 658 –2 492Oct 847 1 500 –653 210 557 –347 1 411 1 028 383 4 134 4 202 –68 9 490 11 327 –1 837Nov 836 1 518 –682 215 579 –364 1 613 916 697 4 187 4 525 –338 9 737 11 567 –1 830Dec 840 1 574 –734 233 561 –328 1 479 983 496 4 262 4 324 –62 9 352 11 812 –2 460
2001 Jan 875 1 481 –606 218 594 –376 1 554 958 596 4 327 4 439 –112 9 486 11 735 –2 249Feb 835 1 541 –706 220 577 –357 1 397 822 575 4 459 4 479 –20 9 944 11 666 –1 722Mar 807 1 544 –737 214 561 –347 1 323 894 429 4 308 4 304 4 9 514 11 570 –2 056Apr 797 1 518 –721 220 561 –341 1 427 926 501 4 453 4 413 40 8 976 11 395 –2 419May 785 1 560 –775 220 556 –336 1 603 1 040 563 4 295 4 513 –218 9 155 11 268 –2 113Jun 781 1 552 –771 221 542 –321 1 335 1 010 325 4 249 4 531 –282 9 452 11 465 –2 013
Jul 794 1 519 –725 208 554 –346 1 372 756 616 4 133 4 551 –418 9 077 10 840 –1 763Aug 792 1 535 –743 204 523 –319 1 463 787 676 3 973 4 515 –542 8 837 11 176 –2 339Sep 787 1 541 –754 216 499 –283 1 344 749 595 4 133 4 187 –54 8 864 10 547 –1 683Oct 794 1 575 –781 205 490 –285 1 294 1 075 219 4 096 4 395 –299 9 328 10 416 –1 088Nov 812 1 611 –799 216 493 –277 1 149 830 319 4 157 4 316 –159 8 764 10 770 –2 006Dec 791 1 540 –749 217 504 –287 1 118 654 464 3 861 4 418 –557 8 562 10 899 –2 337
2002 Jan 786 1 575 –789 227 484 –257 1 074 749 325 4 128 4 320 –192 9 008 10 705 –1 697Feb 783 1 559 –776 220 487 –267 1 283 787 496 4 045 4 351 –306 9 010 10 640 –1 630Mar 767 1 630 –863 212 516 –304 1 284 707 577 4 065 4 199 –134 8 820 10 960 –2 140Apr 866 1 597 –731 234 508 –274 1 462 953 509 4 293 4 449 –156 9 482 11 122 –1 640May 843 1 547 –704 258 498 –240 1 496 862 634 4 558 4 497 61 10 022 11 209 –1 187Jun 787 1 579 –792 218 496 –278 1 490 744 746 4 146 4 330 –184 8 715 10 945 –2 230
Jul 869 1 569 –700 248 493 –245 1 251 894 357 4 309 4 487 –178 9 619 11 310 –1 691Aug 845 1 606 –761 245 484 –239 1 107 724 383 4 008 4 313 –305 8 444 11 063 –2 619Sep 913 1 611 –698 232 492 –260 1 336 919 417 4 173 4 115 58 8 677 11 045 –2 368Oct 840 1 591 –751 238 498 –260 1 382 829 553 4 186 4 533 –347 8 332 11 117 –2 785Nov 801 1 607 –806 255 512 –257 1 186 901 285 3 828 4 397 –569 8 141 10 962 –2 821Dec 861 1 668 –807 279 489 –210 1 482 750 732 4 206 4 384 –178 7 899 10 423 –2 524
2003 Jan 921† 1 682† –761† 244† 505† –261† 1 443† 1 014† 429† 4 082† 4 356† –274† 8 809† 11 060† –2 251†
Feb 877 1 666 –789 278 488 –210 1 447 829 618 4 037 4 516 –479 8 101 10 847 –2 746
1 More commodity detail is available on a seasonally adjusted BOP basis intables B1 to B11 inclusive, and C1 to C4 inclusive, of the Monthly Review ofExternal Trade Statistics.
Source: Office for National Statistics: 020 7533 6064
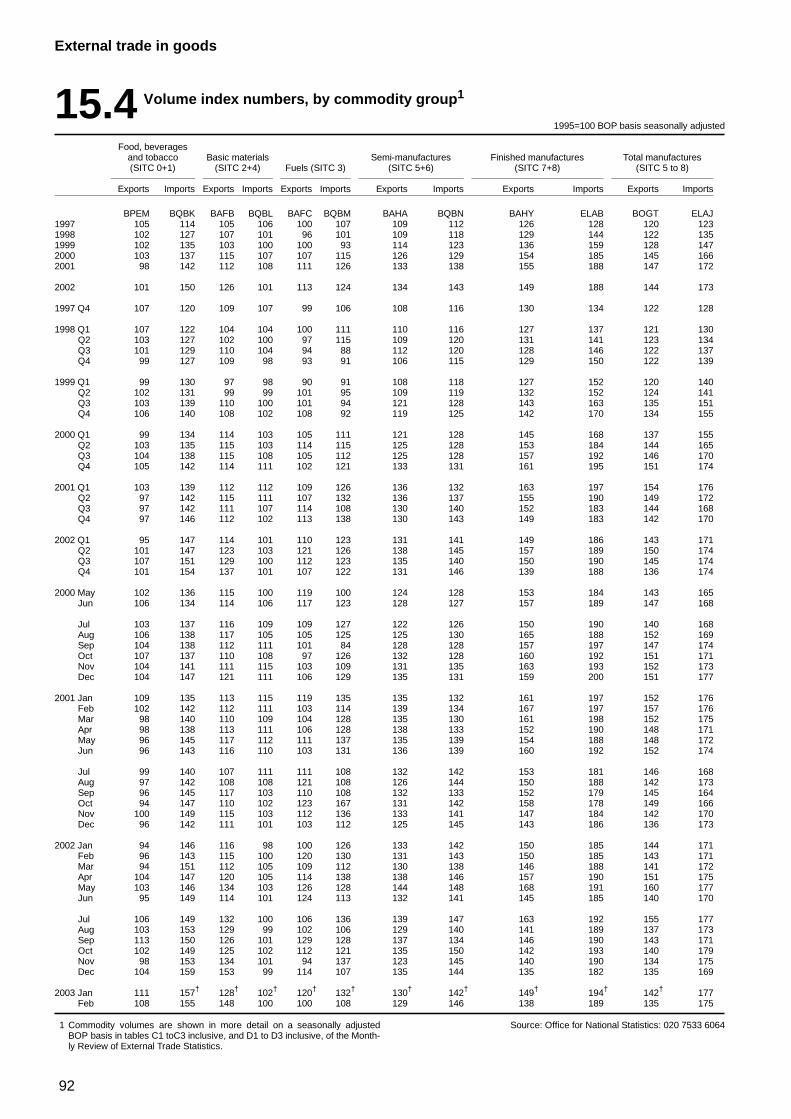
92
External trade in goods
15.4 Volume index numbers, by commodity group1
1995=100 BOP basis seasonally adjusted
Food, beveragesand tobacco Basic materials Semi-manufactures Finished manufactures Total manufactures(SITC 0+1) (SITC 2+4) Fuels (SITC 3) (SITC 5+6) (SITC 7+8) (SITC 5 to 8)
Exports Imports Exports Imports Exports Imports Exports Imports Exports Imports Exports Imports
BPEM BQBK BAFB BQBL BAFC BQBM BAHA BQBN BAHY ELAB BOGT ELAJ1997 105 114 105 106 100 107 109 112 126 128 120 1231998 102 127 107 101 96 101 109 118 129 144 122 1351999 102 135 103 100 100 93 114 123 136 159 128 1472000 103 137 115 107 107 115 126 129 154 185 145 1662001 98 142 112 108 111 126 133 138 155 188 147 172
2002 101 150 126 101 113 124 134 143 149 188 144 173
1997 Q4 107 120 109 107 99 106 108 116 130 134 122 128
1998 Q1 107 122 104 104 100 111 110 116 127 137 121 130Q2 103 127 102 100 97 115 109 120 131 141 123 134Q3 101 129 110 104 94 88 112 120 128 146 122 137Q4 99 127 109 98 93 91 106 115 129 150 122 139
1999 Q1 99 130 97 98 90 91 108 118 127 152 120 140Q2 102 131 99 99 101 95 109 119 132 152 124 141Q3 103 139 110 100 101 94 121 128 143 163 135 151Q4 106 140 108 102 108 92 119 125 142 170 134 155
2000 Q1 99 134 114 103 105 111 121 128 145 168 137 155Q2 103 135 115 103 114 115 125 128 153 184 144 165Q3 104 138 115 108 105 112 125 128 157 192 146 170Q4 105 142 114 111 102 121 133 131 161 195 151 174
2001 Q1 103 139 112 112 109 126 136 132 163 197 154 176Q2 97 142 115 111 107 132 136 137 155 190 149 172Q3 97 142 111 107 114 108 130 140 152 183 144 168Q4 97 146 112 102 113 138 130 143 149 183 142 170
2002 Q1 95 147 114 101 110 123 131 141 149 186 143 171Q2 101 147 123 103 121 126 138 145 157 189 150 174Q3 107 151 129 100 112 123 135 140 150 190 145 174Q4 101 154 137 101 107 122 131 146 139 188 136 174
2000 May 102 136 115 100 119 100 124 128 153 184 143 165Jun 106 134 114 106 117 123 128 127 157 189 147 168
Jul 103 137 116 109 109 127 122 126 150 190 140 168Aug 106 138 117 105 105 125 125 130 165 188 152 169Sep 104 138 112 111 101 84 128 128 157 197 147 174Oct 107 137 110 108 97 126 132 128 160 192 151 171Nov 104 141 111 115 103 109 131 135 163 193 152 173Dec 104 147 121 111 106 129 135 131 159 200 151 177
2001 Jan 109 135 113 115 119 135 135 132 161 197 152 176Feb 102 142 112 111 103 114 139 134 167 197 157 176Mar 98 140 110 109 104 128 135 130 161 198 152 175Apr 98 138 113 111 106 128 138 133 152 190 148 171May 96 145 117 112 111 137 135 139 154 188 148 172Jun 96 143 116 110 103 131 136 139 160 192 152 174
Jul 99 140 107 111 111 108 132 142 153 181 146 168Aug 97 142 108 108 121 108 126 144 150 188 142 173Sep 96 145 117 103 110 108 132 133 152 179 145 164Oct 94 147 110 102 123 167 131 142 158 178 149 166Nov 100 149 115 103 112 136 133 141 147 184 142 170Dec 96 142 111 101 103 112 125 145 143 186 136 173
2002 Jan 94 146 116 98 100 126 133 142 150 185 144 171Feb 96 143 115 100 120 130 131 143 150 185 143 171Mar 94 151 112 105 109 112 130 138 146 188 141 172Apr 104 147 120 105 114 138 138 146 157 190 151 175May 103 146 134 103 126 128 144 148 168 191 160 177Jun 95 149 114 101 124 113 132 141 145 185 140 170
Jul 106 149 132 100 106 136 139 147 163 192 155 177Aug 103 153 129 99 102 106 129 140 141 189 137 173Sep 113 150 126 101 129 128 137 134 146 190 143 171Oct 102 149 125 102 112 121 135 150 142 193 140 179Nov 98 153 134 101 94 137 123 145 140 190 134 175Dec 104 159 153 99 114 107 135 144 135 182 135 169
2003 Jan 111 157† 128† 102† 120† 132† 130† 142† 149† 194† 142† 177Feb 108 155 148 100 100 108 129 146 138 189 135 175
1 Commodity volumes are shown in more detail on a seasonally adjustedBOP basis in tables C1 toC3 inclusive, and D1 to D3 inclusive, of the Month-ly Review of External Trade Statistics.
Source: Office for National Statistics: 020 7533 6064
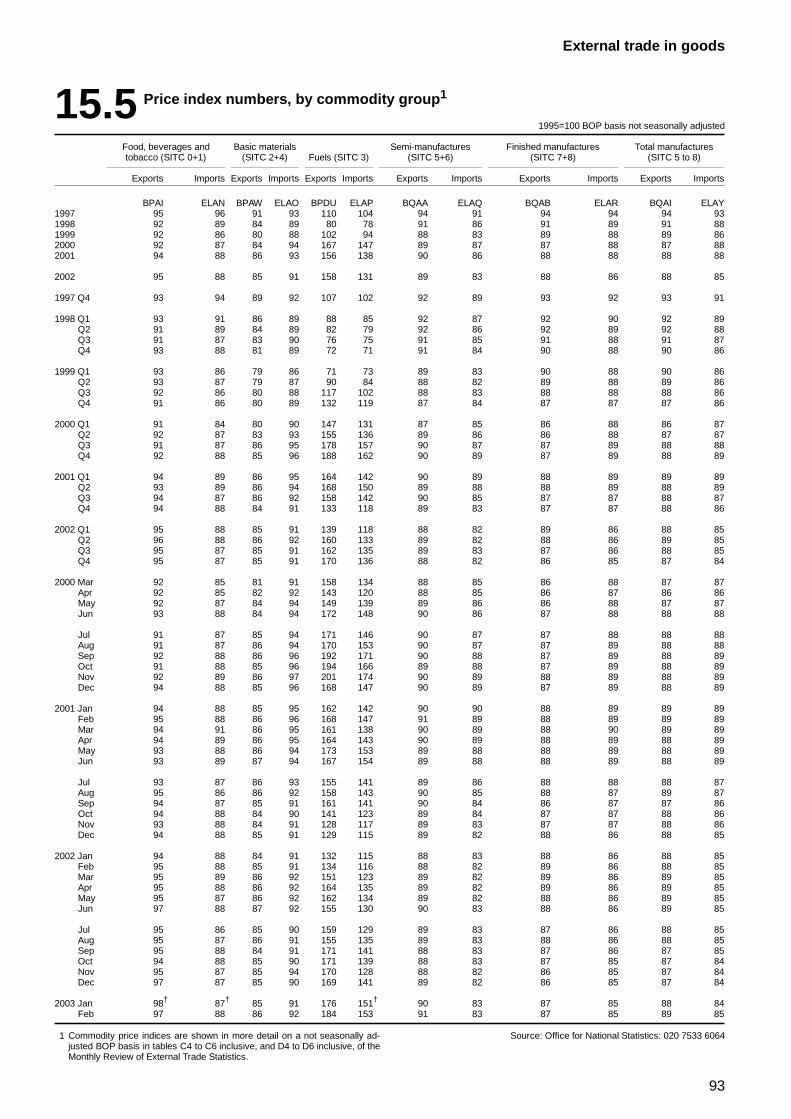
93
External trade in goods
15.5 Price index numbers, by commodity group1
1995=100 BOP basis not seasonally adjusted
Food, beverages and Basic materials Semi-manufactures Finished manufactures Total manufacturestobacco (SITC 0+1) (SITC 2+4) Fuels (SITC 3) (SITC 5+6) (SITC 7+8) (SITC 5 to 8)
Exports Imports Exports Imports Exports Imports Exports Imports Exports Imports Exports Imports
BPAI ELAN BPAW ELAO BPDU ELAP BQAA ELAQ BQAB ELAR BQAI ELAY1997 95 96 91 93 110 104 94 91 94 94 94 931998 92 89 84 89 80 78 91 86 91 89 91 881999 92 86 80 88 102 94 88 83 89 88 89 862000 92 87 84 94 167 147 89 87 87 88 87 882001 94 88 86 93 156 138 90 86 88 88 88 88
2002 95 88 85 91 158 131 89 83 88 86 88 85
1997 Q4 93 94 89 92 107 102 92 89 93 92 93 91
1998 Q1 93 91 86 89 88 85 92 87 92 90 92 89Q2 91 89 84 89 82 79 92 86 92 89 92 88Q3 91 87 83 90 76 75 91 85 91 88 91 87Q4 93 88 81 89 72 71 91 84 90 88 90 86
1999 Q1 93 86 79 86 71 73 89 83 90 88 90 86Q2 93 87 79 87 90 84 88 82 89 88 89 86Q3 92 86 80 88 117 102 88 83 88 88 88 86Q4 91 86 80 89 132 119 87 84 87 87 87 86
2000 Q1 91 84 80 90 147 131 87 85 86 88 86 87Q2 92 87 83 93 155 136 89 86 86 88 87 87Q3 91 87 86 95 178 157 90 87 87 89 88 88Q4 92 88 85 96 188 162 90 89 87 89 88 89
2001 Q1 94 89 86 95 164 142 90 89 88 89 89 89Q2 93 89 86 94 168 150 89 88 88 89 88 89Q3 94 87 86 92 158 142 90 85 87 87 88 87Q4 94 88 84 91 133 118 89 83 87 87 88 86
2002 Q1 95 88 85 91 139 118 88 82 89 86 88 85Q2 96 88 86 92 160 133 89 82 88 86 89 85Q3 95 87 85 91 162 135 89 83 87 86 88 85Q4 95 87 85 91 170 136 88 82 86 85 87 84
2000 Mar 92 85 81 91 158 134 88 85 86 88 87 87Apr 92 85 82 92 143 120 88 85 86 87 86 86May 92 87 84 94 149 139 89 86 86 88 87 87Jun 93 88 84 94 172 148 90 86 87 88 88 88
Jul 91 87 85 94 171 146 90 87 87 88 88 88Aug 91 87 86 94 170 153 90 87 87 89 88 88Sep 92 88 86 96 192 171 90 88 87 89 88 89Oct 91 88 85 96 194 166 89 88 87 89 88 89Nov 92 89 86 97 201 174 90 89 88 89 88 89Dec 94 88 85 96 168 147 90 89 87 89 88 89
2001 Jan 94 88 85 95 162 142 90 90 88 89 89 89Feb 95 88 86 96 168 147 91 89 88 89 89 89Mar 94 91 86 95 161 138 90 89 88 90 89 89Apr 94 89 86 95 164 143 90 89 88 89 88 89May 93 88 86 94 173 153 89 88 88 89 88 89Jun 93 89 87 94 167 154 89 88 88 89 88 89
Jul 93 87 86 93 155 141 89 86 88 88 88 87Aug 95 86 86 92 158 143 90 85 88 87 89 87Sep 94 87 85 91 161 141 90 84 86 87 87 86Oct 94 88 84 90 141 123 89 84 87 87 88 86Nov 93 88 84 91 128 117 89 83 87 87 88 86Dec 94 88 85 91 129 115 89 82 88 86 88 85
2002 Jan 94 88 84 91 132 115 88 83 88 86 88 85Feb 95 88 85 91 134 116 88 82 89 86 88 85Mar 95 89 86 92 151 123 89 82 89 86 89 85Apr 95 88 86 92 164 135 89 82 89 86 89 85May 95 87 86 92 162 134 89 82 88 86 89 85Jun 97 88 87 92 155 130 90 83 88 86 89 85
Jul 95 86 85 90 159 129 89 83 87 86 88 85Aug 95 87 86 91 155 135 89 83 88 86 88 85Sep 95 88 84 91 171 141 88 83 87 86 87 85Oct 94 88 85 90 171 139 88 83 87 85 87 84Nov 95 87 85 94 170 128 88 82 86 85 87 84Dec 97 87 85 90 169 141 89 82 86 85 87 84
2003 Jan 98† 87† 85 91 176 151† 90 83 87 85 88 84Feb 97 88 86 92 184 153 91 83 87 85 89 85
1 Commodity price indices are shown in more detail on a not seasonally ad-justed BOP basis in tables C4 to C6 inclusive, and D4 to D6 inclusive, of theMonthly Review of External Trade Statistics.
Source: Office for National Statistics: 020 7533 6064
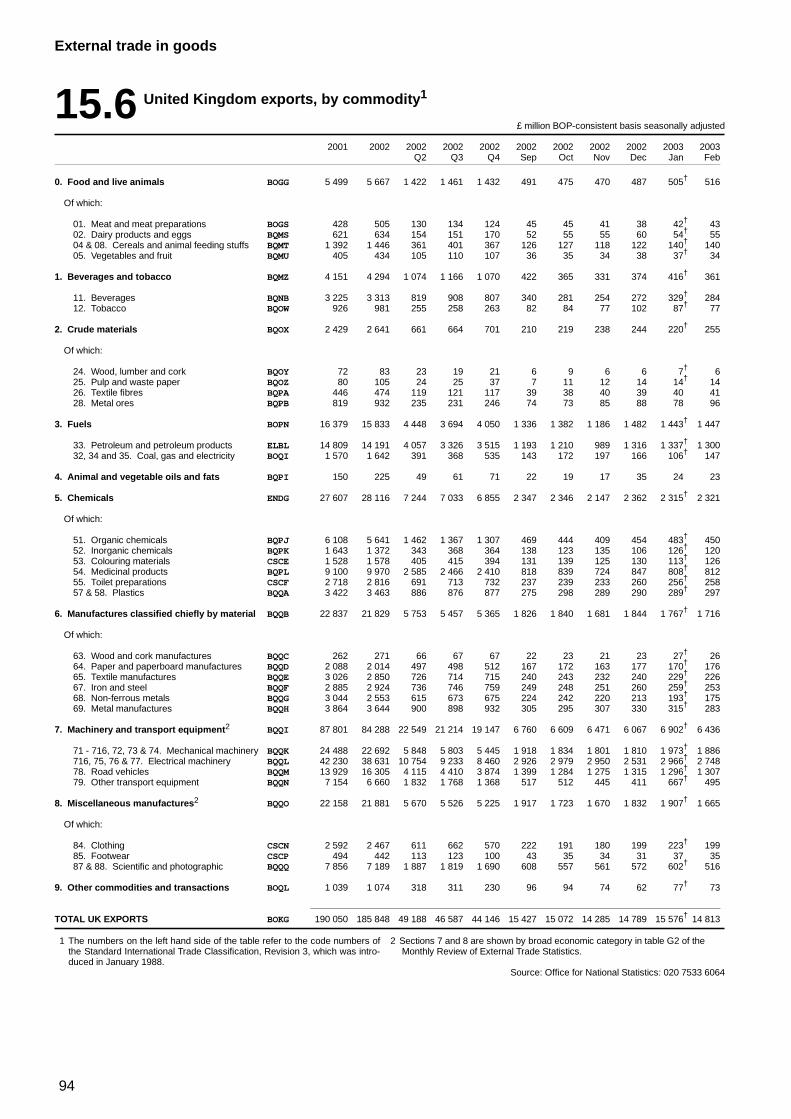
94
External trade in goods
15.6 United Kingdom exports, by commodity1
£ million BOP-consistent basis seasonally adjusted
2001 2002 2002 2002 2002 2002 2002 2002 2002 2003 2003Q2 Q3 Q4 Sep Oct Nov Dec Jan Feb
0. Food and live animals BOGG 5 499 5 667 1 422 1 461 1 432 491 475 470 487 505† 516
Of which:
01. Meat and meat preparations BOGS 428 505 130 134 124 45 45 41 38 42† 4302. Dairy products and eggs BQMS 621 634 154 151 170 52 55 55 60 54† 5504 & 08. Cereals and animal feeding stuffs BQMT 1 392 1 446 361 401 367 126 127 118 122 140† 14005. Vegetables and fruit BQMU 405 434 105 110 107 36 35 34 38 37† 34
1. Beverages and tobacco BQMZ 4 151 4 294 1 074 1 166 1 070 422 365 331 374 416† 361
11. Beverages BQNB 3 225 3 313 819 908 807 340 281 254 272 329† 28412. Tobacco BQOW 926 981 255 258 263 82 84 77 102 87† 77
2. Crude materials BQOX 2 429 2 641 661 664 701 210 219 238 244 220† 255
Of which:
24. Wood, lumber and cork BQOY 72 83 23 19 21 6 9 6 6 7† 625. Pulp and waste paper BQOZ 80 105 24 25 37 7 11 12 14 14† 1426. Textile fibres BQPA 446 474 119 121 117 39 38 40 39 40 4128. Metal ores BQPB 819 932 235 231 246 74 73 85 88 78 96
3. Fuels BOPN 16 379 15 833 4 448 3 694 4 050 1 336 1 382 1 186 1 482 1 443† 1 447
33. Petroleum and petroleum products ELBL 14 809 14 191 4 057 3 326 3 515 1 193 1 210 989 1 316 1 337† 1 30032, 34 and 35. Coal, gas and electricity BOQI 1 570 1 642 391 368 535 143 172 197 166 106† 147
4. Animal and vegetable oils and fats BQPI 150 225 49 61 71 22 19 17 35 24 23
5. Chemicals ENDG 27 607 28 116 7 244 7 033 6 855 2 347 2 346 2 147 2 362 2 315† 2 321
Of which:
51. Organic chemicals BQPJ 6 108 5 641 1 462 1 367 1 307 469 444 409 454 483† 45052. Inorganic chemicals BQPK 1 643 1 372 343 368 364 138 123 135 106 126† 12053. Colouring materials CSCE 1 528 1 578 405 415 394 131 139 125 130 113† 12654. Medicinal products BQPL 9 100 9 970 2 585 2 466 2 410 818 839 724 847 808† 81255. Toilet preparations CSCF 2 718 2 816 691 713 732 237 239 233 260 256† 25857 & 58. Plastics BQQA 3 422 3 463 886 876 877 275 298 289 290 289† 297
6. Manufactures classified chiefly by material BQQB 22 837 21 829 5 753 5 457 5 365 1 826 1 840 1 681 1 844 1 767† 1 716
Of which:
63. Wood and cork manufactures BQQC 262 271 66 67 67 22 23 21 23 27† 2664. Paper and paperboard manufactures BQQD 2 088 2 014 497 498 512 167 172 163 177 170† 17665. Textile manufactures BQQE 3 026 2 850 726 714 715 240 243 232 240 229† 22667. Iron and steel BQQF 2 885 2 924 736 746 759 249 248 251 260 259† 25368. Non-ferrous metals BQQG 3 044 2 553 615 673 675 224 242 220 213 193† 17569. Metal manufactures BQQH 3 864 3 644 900 898 932 305 295 307 330 315† 283
7. Machinery and transport equipment2 BQQI 87 801 84 288 22 549 21 214 19 147 6 760 6 609 6 471 6 067 6 902† 6 436
71 - 716, 72, 73 & 74. Mechanical machinery BQQK 24 488 22 692 5 848 5 803 5 445 1 918 1 834 1 801 1 810 1 973† 1 886716, 75, 76 & 77. Electrical machinery BQQL 42 230 38 631 10 754 9 233 8 460 2 926 2 979 2 950 2 531 2 966† 2 74878. Road vehicles BQQM 13 929 16 305 4 115 4 410 3 874 1 399 1 284 1 275 1 315 1 296† 1 30779. Other transport equipment BQQN 7 154 6 660 1 832 1 768 1 368 517 512 445 411 667† 495
8. Miscellaneous manufactures2 BQQO 22 158 21 881 5 670 5 526 5 225 1 917 1 723 1 670 1 832 1 907† 1 665
Of which:
84. Clothing CSCN 2 592 2 467 611 662 570 222 191 180 199 223† 19985. Footwear CSCP 494 442 113 123 100 43 35 34 31 37 3587 & 88. Scientific and photographic BQQQ 7 856 7 189 1 887 1 819 1 690 608 557 561 572 602† 516
9. Other commodities and transactions BOQL 1 039 1 074 318 311 230 96 94 74 62 77† 73
TOTAL UK EXPORTS BOKG 190 050 185 848 49 188 46 587 44 146 15 427 15 072 14 285 14 789 15 576† 14 813
1 The numbers on the left hand side of the table refer to the code numbers ofthe Standard International Trade Classification, Revision 3, which was intro-duced in January 1988.
2 Sections 7 and 8 are shown by broad economic category in table G2 of theMonthly Review of External Trade Statistics.
Source: Office for National Statistics: 020 7533 6064
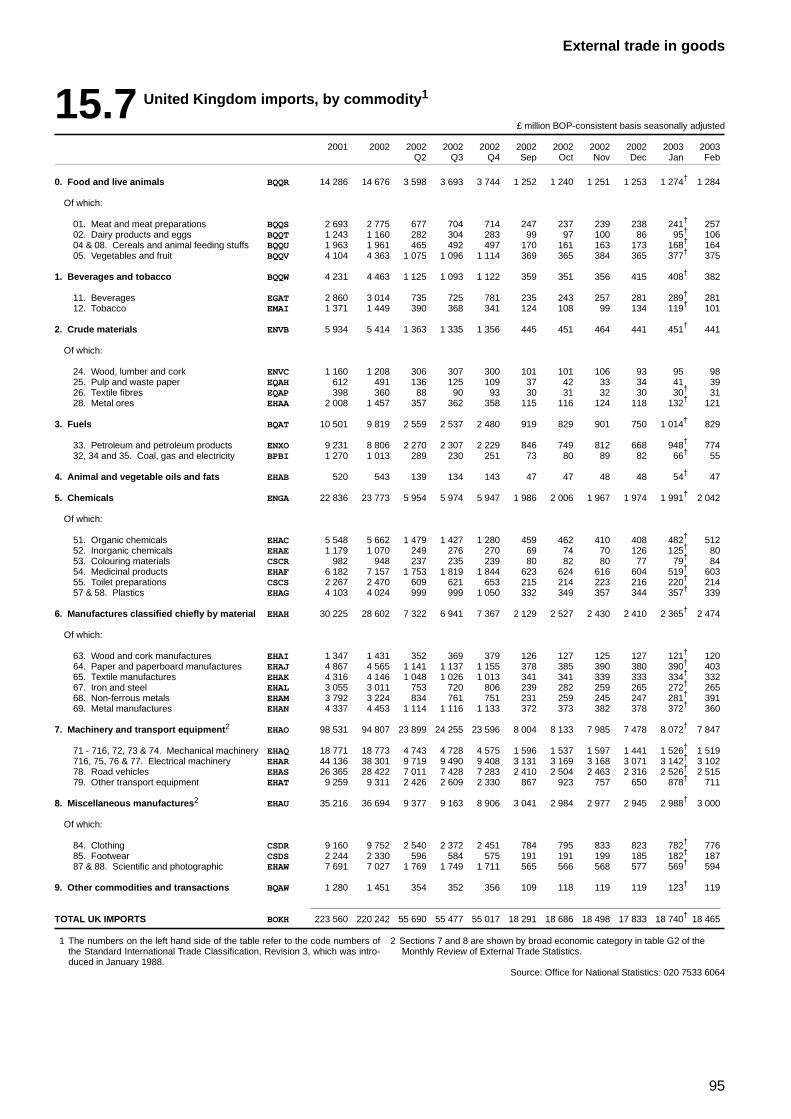
95
External trade in goods
15.7 United Kingdom imports, by commodity1
£ million BOP-consistent basis seasonally adjusted
2001 2002 2002 2002 2002 2002 2002 2002 2002 2003 2003Q2 Q3 Q4 Sep Oct Nov Dec Jan Feb
0. Food and live animals BQQR 14 286 14 676 3 598 3 693 3 744 1 252 1 240 1 251 1 253 1 274† 1 284
Of which:
01. Meat and meat preparations BQQS 2 693 2 775 677 704 714 247 237 239 238 241† 25702. Dairy products and eggs BQQT 1 243 1 160 282 304 283 99 97 100 86 95† 10604 & 08. Cereals and animal feeding stuffs BQQU 1 963 1 961 465 492 497 170 161 163 173 168† 16405. Vegetables and fruit BQQV 4 104 4 363 1 075 1 096 1 114 369 365 384 365 377† 375
1. Beverages and tobacco BQQW 4 231 4 463 1 125 1 093 1 122 359 351 356 415 408† 382
11. Beverages EGAT 2 860 3 014 735 725 781 235 243 257 281 289† 28112. Tobacco EMAI 1 371 1 449 390 368 341 124 108 99 134 119† 101
2. Crude materials ENVB 5 934 5 414 1 363 1 335 1 356 445 451 464 441 451† 441
Of which:
24. Wood, lumber and cork ENVC 1 160 1 208 306 307 300 101 101 106 93 95 9825. Pulp and waste paper EQAH 612 491 136 125 109 37 42 33 34 41 3926. Textile fibres EQAP 398 360 88 90 93 30 31 32 30 30† 3128. Metal ores EHAA 2 008 1 457 357 362 358 115 116 124 118 132† 121
3. Fuels BQAT 10 501 9 819 2 559 2 537 2 480 919 829 901 750 1 014† 829
33. Petroleum and petroleum products ENXO 9 231 8 806 2 270 2 307 2 229 846 749 812 668 948† 77432, 34 and 35. Coal, gas and electricity BPBI 1 270 1 013 289 230 251 73 80 89 82 66† 55
4. Animal and vegetable oils and fats EHAB 520 543 139 134 143 47 47 48 48 54† 47
5. Chemicals ENGA 22 836 23 773 5 954 5 974 5 947 1 986 2 006 1 967 1 974 1 991† 2 042
Of which:
51. Organic chemicals EHAC 5 548 5 662 1 479 1 427 1 280 459 462 410 408 482† 51252. Inorganic chemicals EHAE 1 179 1 070 249 276 270 69 74 70 126 125† 8053. Colouring materials CSCR 982 948 237 235 239 80 82 80 77 79† 8454. Medicinal products EHAF 6 182 7 157 1 753 1 819 1 844 623 624 616 604 519† 60355. Toilet preparations CSCS 2 267 2 470 609 621 653 215 214 223 216 220† 21457 & 58. Plastics EHAG 4 103 4 024 999 999 1 050 332 349 357 344 357† 339
6. Manufactures classified chiefly by material EHAH 30 225 28 602 7 322 6 941 7 367 2 129 2 527 2 430 2 410 2 365† 2 474
Of which:
63. Wood and cork manufactures EHAI 1 347 1 431 352 369 379 126 127 125 127 121† 12064. Paper and paperboard manufactures EHAJ 4 867 4 565 1 141 1 137 1 155 378 385 390 380 390† 40365. Textile manufactures EHAK 4 316 4 146 1 048 1 026 1 013 341 341 339 333 334† 33267. Iron and steel EHAL 3 055 3 011 753 720 806 239 282 259 265 272† 26568. Non-ferrous metals EHAM 3 792 3 224 834 761 751 231 259 245 247 281† 39169. Metal manufactures EHAN 4 337 4 453 1 114 1 116 1 133 372 373 382 378 372† 360
7. Machinery and transport equipment2 EHAO 98 531 94 807 23 899 24 255 23 596 8 004 8 133 7 985 7 478 8 072† 7 847
71 - 716, 72, 73 & 74. Mechanical machinery EHAQ 18 771 18 773 4 743 4 728 4 575 1 596 1 537 1 597 1 441 1 526† 1 519716, 75, 76 & 77. Electrical machinery EHAR 44 136 38 301 9 719 9 490 9 408 3 131 3 169 3 168 3 071 3 142† 3 10278. Road vehicles EHAS 26 365 28 422 7 011 7 428 7 283 2 410 2 504 2 463 2 316 2 526† 2 51579. Other transport equipment EHAT 9 259 9 311 2 426 2 609 2 330 867 923 757 650 878† 711
8. Miscellaneous manufactures2 EHAU 35 216 36 694 9 377 9 163 8 906 3 041 2 984 2 977 2 945 2 988† 3 000
Of which:
84. Clothing CSDR 9 160 9 752 2 540 2 372 2 451 784 795 833 823 782† 77685. Footwear CSDS 2 244 2 330 596 584 575 191 191 199 185 182† 18787 & 88. Scientific and photographic EHAW 7 691 7 027 1 769 1 749 1 711 565 566 568 577 569† 594
9. Other commodities and transactions BQAW 1 280 1 451 354 352 356 109 118 119 119 123† 119
TOTAL UK IMPORTS BOKH 223 560 220 242 55 690 55 477 55 017 18 291 18 686 18 498 17 833 18 740† 18 465
1 The numbers on the left hand side of the table refer to the code numbers ofthe Standard International Trade Classification, Revision 3, which was intro-duced in January 1988.
2 Sections 7 and 8 are shown by broad economic category in table G2 of theMonthly Review of External Trade Statistics.
Source: Office for National Statistics: 020 7533 6064
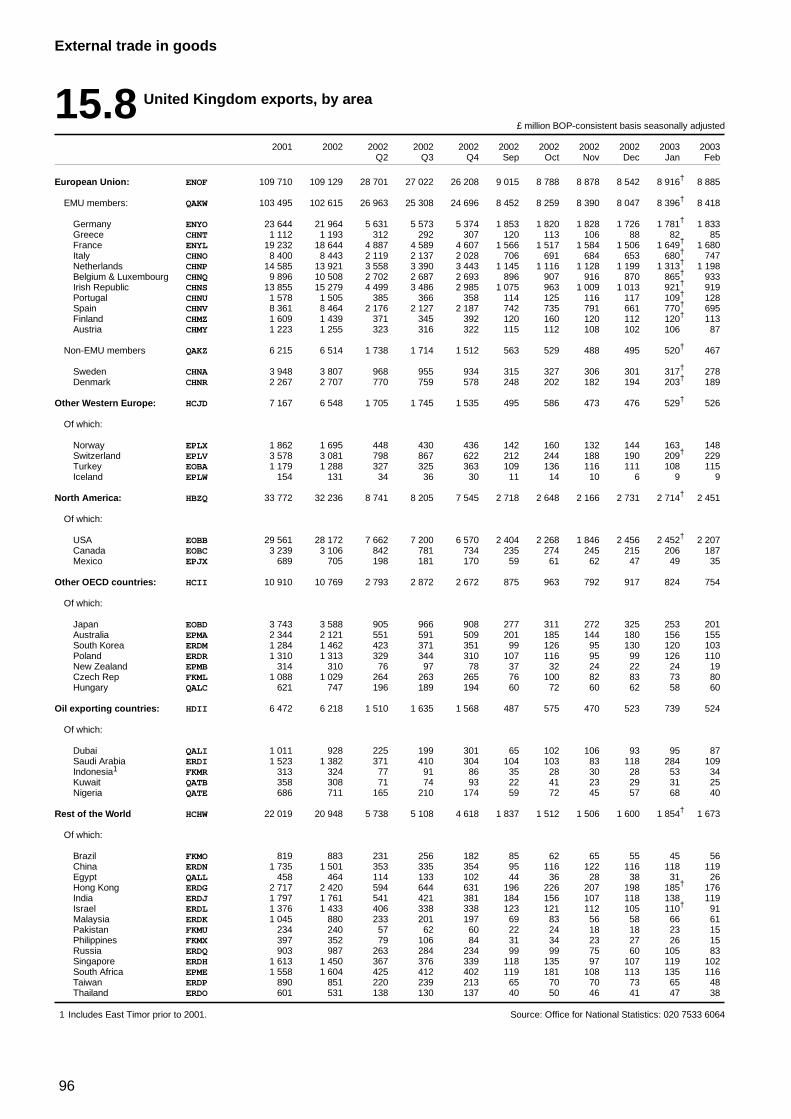
96
External trade in goods
15.8 United Kingdom exports, by area
£ million BOP-consistent basis seasonally adjusted
2001 2002 2002 2002 2002 2002 2002 2002 2002 2003 2003Q2 Q3 Q4 Sep Oct Nov Dec Jan Feb
European Union: ENOF 109 710 109 129 28 701 27 022 26 208 9 015 8 788 8 878 8 542 8 916† 8 885
EMU members: QAKW 103 495 102 615 26 963 25 308 24 696 8 452 8 259 8 390 8 047 8 396† 8 418
Germany ENYO 23 644 21 964 5 631 5 573 5 374 1 853 1 820 1 828 1 726 1 781† 1 833Greece CHNT 1 112 1 193 312 292 307 120 113 106 88 82 85France ENYL 19 232 18 644 4 887 4 589 4 607 1 566 1 517 1 584 1 506 1 649† 1 680Italy CHNO 8 400 8 443 2 119 2 137 2 028 706 691 684 653 680† 747Netherlands CHNP 14 585 13 921 3 558 3 390 3 443 1 145 1 116 1 128 1 199 1 313† 1 198Belgium & Luxembourg CHNQ 9 896 10 508 2 702 2 687 2 693 896 907 916 870 865† 933Irish Republic CHNS 13 855 15 279 4 499 3 486 2 985 1 075 963 1 009 1 013 921† 919Portugal CHNU 1 578 1 505 385 366 358 114 125 116 117 109† 128Spain CHNV 8 361 8 464 2 176 2 127 2 187 742 735 791 661 770† 695Finland CHMZ 1 609 1 439 371 345 392 120 160 120 112 120† 113Austria CHMY 1 223 1 255 323 316 322 115 112 108 102 106 87
Non-EMU members QAKZ 6 215 6 514 1 738 1 714 1 512 563 529 488 495 520† 467
Sweden CHNA 3 948 3 807 968 955 934 315 327 306 301 317† 278Denmark CHNR 2 267 2 707 770 759 578 248 202 182 194 203† 189
Other Western Europe: HCJD 7 167 6 548 1 705 1 745 1 535 495 586 473 476 529† 526
Of which:
Norway EPLX 1 862 1 695 448 430 436 142 160 132 144 163 148Switzerland EPLV 3 578 3 081 798 867 622 212 244 188 190 209† 229Turkey EOBA 1 179 1 288 327 325 363 109 136 116 111 108 115Iceland EPLW 154 131 34 36 30 11 14 10 6 9 9
North America: HBZQ 33 772 32 236 8 741 8 205 7 545 2 718 2 648 2 166 2 731 2 714† 2 451
Of which:
USA EOBB 29 561 28 172 7 662 7 200 6 570 2 404 2 268 1 846 2 456 2 452† 2 207Canada EOBC 3 239 3 106 842 781 734 235 274 245 215 206 187Mexico EPJX 689 705 198 181 170 59 61 62 47 49 35
Other OECD countries: HCII 10 910 10 769 2 793 2 872 2 672 875 963 792 917 824 754
Of which:
Japan EOBD 3 743 3 588 905 966 908 277 311 272 325 253 201Australia EPMA 2 344 2 121 551 591 509 201 185 144 180 156 155South Korea ERDM 1 284 1 462 423 371 351 99 126 95 130 120 103Poland ERDR 1 310 1 313 329 344 310 107 116 95 99 126 110New Zealand EPMB 314 310 76 97 78 37 32 24 22 24 19Czech Rep FKML 1 088 1 029 264 263 265 76 100 82 83 73 80Hungary QALC 621 747 196 189 194 60 72 60 62 58 60
Oil exporting countries: HDII 6 472 6 218 1 510 1 635 1 568 487 575 470 523 739 524
Of which:
Dubai QALI 1 011 928 225 199 301 65 102 106 93 95 87Saudi Arabia ERDI 1 523 1 382 371 410 304 104 103 83 118 284 109Indonesia1 FKMR 313 324 77 91 86 35 28 30 28 53 34Kuwait QATB 358 308 71 74 93 22 41 23 29 31 25Nigeria QATE 686 711 165 210 174 59 72 45 57 68 40
Rest of the World HCHW 22 019 20 948 5 738 5 108 4 618 1 837 1 512 1 506 1 600 1 854† 1 673
Of which:
Brazil FKMO 819 883 231 256 182 85 62 65 55 45 56China ERDN 1 735 1 501 353 335 354 95 116 122 116 118 119Egypt QALL 458 464 114 133 102 44 36 28 38 31 26Hong Kong ERDG 2 717 2 420 594 644 631 196 226 207 198 185† 176India ERDJ 1 797 1 761 541 421 381 184 156 107 118 138 119Israel ERDL 1 376 1 433 406 338 338 123 121 112 105 110† 91Malaysia ERDK 1 045 880 233 201 197 69 83 56 58 66 61Pakistan FKMU 234 240 57 62 60 22 24 18 18 23 15Philippines FKMX 397 352 79 106 84 31 34 23 27 26 15Russia ERDQ 903 987 263 284 234 99 99 75 60 105 83Singapore ERDH 1 613 1 450 367 376 339 118 135 97 107 119 102South Africa EPME 1 558 1 604 425 412 402 119 181 108 113 135 116Taiwan ERDP 890 851 220 239 213 65 70 70 73 65 48Thailand ERDO 601 531 138 130 137 40 50 46 41 47 38
1 Includes East Timor prior to 2001. Source: Office for National Statistics: 020 7533 6064
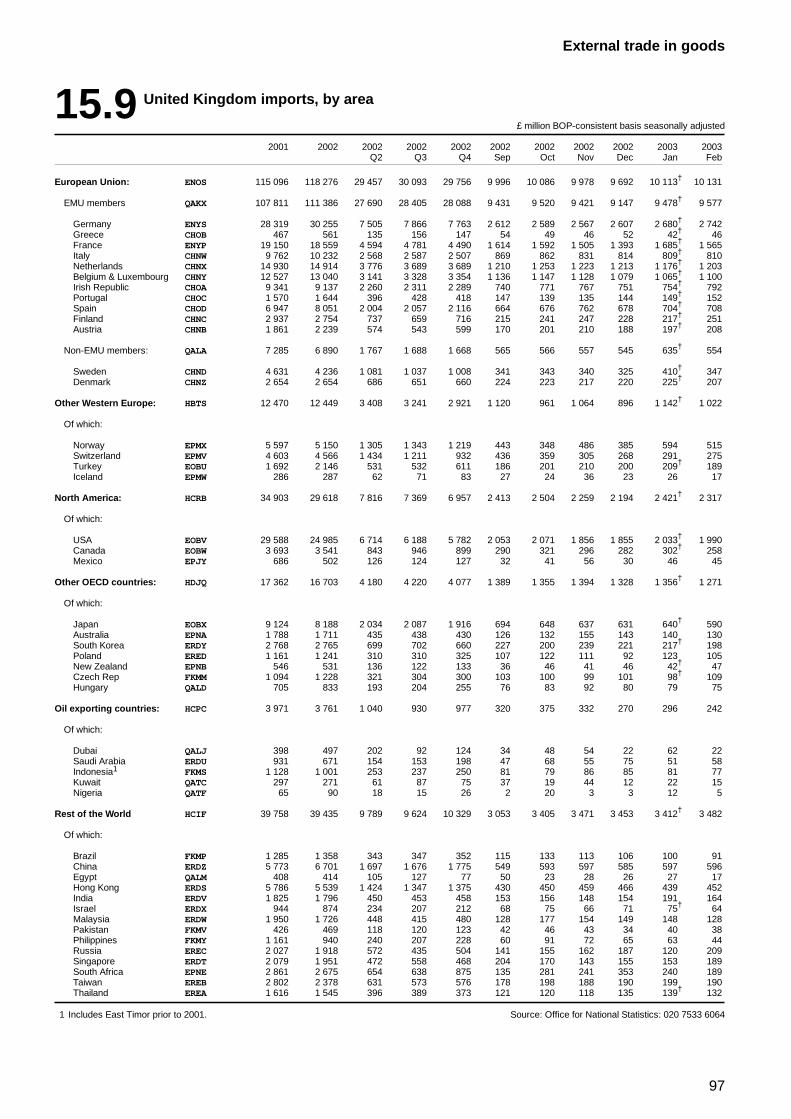
97
External trade in goods
15.9 United Kingdom imports, by area
£ million BOP-consistent basis seasonally adjusted
2001 2002 2002 2002 2002 2002 2002 2002 2002 2003 2003Q2 Q3 Q4 Sep Oct Nov Dec Jan Feb
European Union: ENOS 115 096 118 276 29 457 30 093 29 756 9 996 10 086 9 978 9 692 10 113† 10 131
EMU members QAKX 107 811 111 386 27 690 28 405 28 088 9 431 9 520 9 421 9 147 9 478† 9 577
Germany ENYS 28 319 30 255 7 505 7 866 7 763 2 612 2 589 2 567 2 607 2 680† 2 742Greece CHOB 467 561 135 156 147 54 49 46 52 42† 46France ENYP 19 150 18 559 4 594 4 781 4 490 1 614 1 592 1 505 1 393 1 685† 1 565Italy CHNW 9 762 10 232 2 568 2 587 2 507 869 862 831 814 809† 810Netherlands CHNX 14 930 14 914 3 776 3 689 3 689 1 210 1 253 1 223 1 213 1 176† 1 203Belgium & Luxembourg CHNY 12 527 13 040 3 141 3 328 3 354 1 136 1 147 1 128 1 079 1 065† 1 100Irish Republic CHOA 9 341 9 137 2 260 2 311 2 289 740 771 767 751 754† 792Portugal CHOC 1 570 1 644 396 428 418 147 139 135 144 149† 152Spain CHOD 6 947 8 051 2 004 2 057 2 116 664 676 762 678 704† 708Finland CHNC 2 937 2 754 737 659 716 215 241 247 228 217† 251Austria CHNB 1 861 2 239 574 543 599 170 201 210 188 197† 208
Non-EMU members: QALA 7 285 6 890 1 767 1 688 1 668 565 566 557 545 635† 554
Sweden CHND 4 631 4 236 1 081 1 037 1 008 341 343 340 325 410† 347Denmark CHNZ 2 654 2 654 686 651 660 224 223 217 220 225† 207
Other Western Europe: HBTS 12 470 12 449 3 408 3 241 2 921 1 120 961 1 064 896 1 142† 1 022
Of which:
Norway EPMX 5 597 5 150 1 305 1 343 1 219 443 348 486 385 594 515Switzerland EPMV 4 603 4 566 1 434 1 211 932 436 359 305 268 291 275Turkey EOBU 1 692 2 146 531 532 611 186 201 210 200 209† 189Iceland EPMW 286 287 62 71 83 27 24 36 23 26 17
North America: HCRB 34 903 29 618 7 816 7 369 6 957 2 413 2 504 2 259 2 194 2 421† 2 317
Of which:
USA EOBV 29 588 24 985 6 714 6 188 5 782 2 053 2 071 1 856 1 855 2 033† 1 990Canada EOBW 3 693 3 541 843 946 899 290 321 296 282 302† 258Mexico EPJY 686 502 126 124 127 32 41 56 30 46 45
Other OECD countries: HDJQ 17 362 16 703 4 180 4 220 4 077 1 389 1 355 1 394 1 328 1 356† 1 271
Of which:
Japan EOBX 9 124 8 188 2 034 2 087 1 916 694 648 637 631 640† 590Australia EPNA 1 788 1 711 435 438 430 126 132 155 143 140 130South Korea ERDY 2 768 2 765 699 702 660 227 200 239 221 217† 198Poland ERED 1 161 1 241 310 310 325 107 122 111 92 123 105New Zealand EPNB 546 531 136 122 133 36 46 41 46 42† 47Czech Rep FKMM 1 094 1 228 321 304 300 103 100 99 101 98† 109Hungary QALD 705 833 193 204 255 76 83 92 80 79 75
Oil exporting countries: HCPC 3 971 3 761 1 040 930 977 320 375 332 270 296 242
Of which:
Dubai QALJ 398 497 202 92 124 34 48 54 22 62 22Saudi Arabia ERDU 931 671 154 153 198 47 68 55 75 51 58Indonesia1 FKMS 1 128 1 001 253 237 250 81 79 86 85 81 77Kuwait QATC 297 271 61 87 75 37 19 44 12 22 15Nigeria QATF 65 90 18 15 26 2 20 3 3 12 5
Rest of the World HCIF 39 758 39 435 9 789 9 624 10 329 3 053 3 405 3 471 3 453 3 412† 3 482
Of which:
Brazil FKMP 1 285 1 358 343 347 352 115 133 113 106 100 91China ERDZ 5 773 6 701 1 697 1 676 1 775 549 593 597 585 597 596Egypt QALM 408 414 105 127 77 50 23 28 26 27 17Hong Kong ERDS 5 786 5 539 1 424 1 347 1 375 430 450 459 466 439 452India ERDV 1 825 1 796 450 453 458 153 156 148 154 191 164Israel ERDX 944 874 234 207 212 68 75 66 71 75† 64Malaysia ERDW 1 950 1 726 448 415 480 128 177 154 149 148 128Pakistan FKMV 426 469 118 120 123 42 46 43 34 40 38Philippines FKMY 1 161 940 240 207 228 60 91 72 65 63 44Russia EREC 2 027 1 918 572 435 504 141 155 162 187 120 209Singapore ERDT 2 079 1 951 472 558 468 204 170 143 155 153 189South Africa EPNE 2 861 2 675 654 638 875 135 281 241 353 240 189Taiwan EREB 2 802 2 378 631 573 576 178 198 188 190 199 190Thailand EREA 1 616 1 545 396 389 373 121 120 118 135 139† 132
1 Includes East Timor prior to 2001. Source: Office for National Statistics: 020 7533 6064
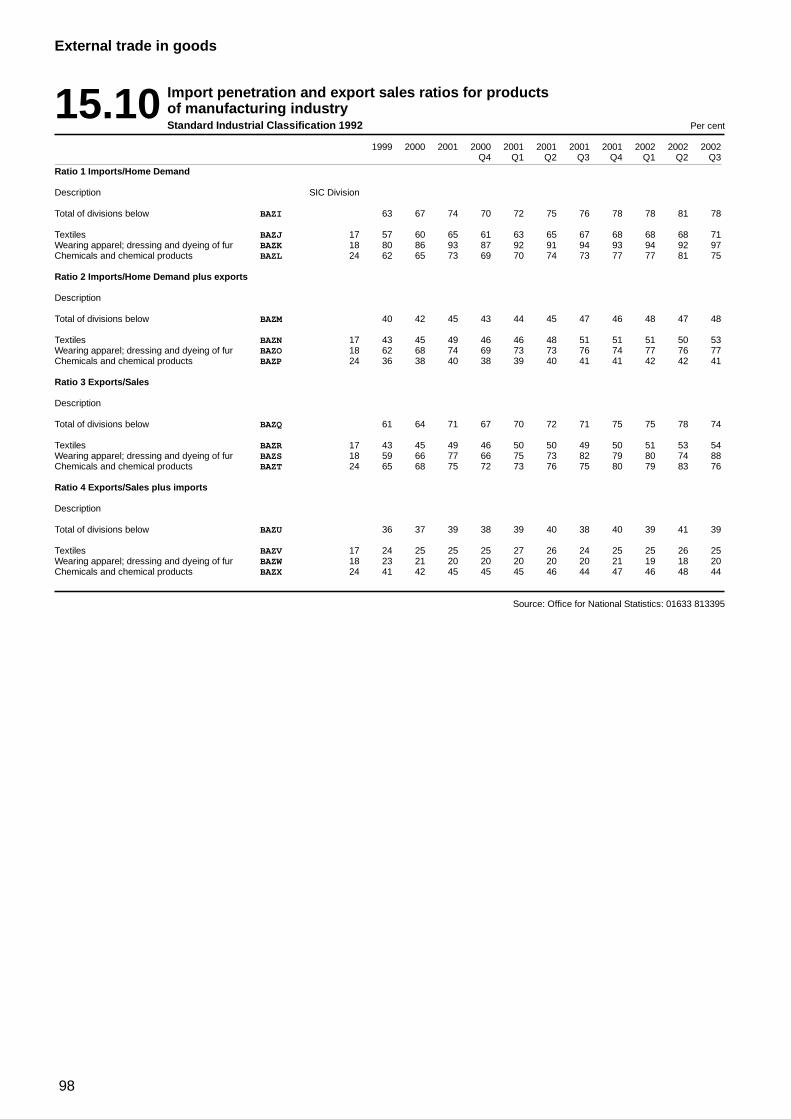
98
External trade in goods
15.10 Import penetration and export sales ratios for productsof manufacturing industryStandard Industrial Classification 1992 Per cent
1999 2000 2001 2000 2001 2001 2001 2001 2002 2002 2002Q4 Q1 Q2 Q3 Q4 Q1 Q2 Q3
Ratio 1 Imports/Home Demand
Description SIC Division
Total of divisions below BAZI 63 67 74 70 72 75 76 78 78 81 78
Textiles BAZJ 17 57 60 65 61 63 65 67 68 68 68 71Wearing apparel; dressing and dyeing of fur BAZK 18 80 86 93 87 92 91 94 93 94 92 97Chemicals and chemical products BAZL 24 62 65 73 69 70 74 73 77 77 81 75
Ratio 2 Imports/Home Demand plus exports
Description
Total of divisions below BAZM 40 42 45 43 44 45 47 46 48 47 48
Textiles BAZN 17 43 45 49 46 46 48 51 51 51 50 53Wearing apparel; dressing and dyeing of fur BAZO 18 62 68 74 69 73 73 76 74 77 76 77Chemicals and chemical products BAZP 24 36 38 40 38 39 40 41 41 42 42 41
Ratio 3 Exports/Sales
Description
Total of divisions below BAZQ 61 64 71 67 70 72 71 75 75 78 74
Textiles BAZR 17 43 45 49 46 50 50 49 50 51 53 54Wearing apparel; dressing and dyeing of fur BAZS 18 59 66 77 66 75 73 82 79 80 74 88Chemicals and chemical products BAZT 24 65 68 75 72 73 76 75 80 79 83 76
Ratio 4 Exports/Sales plus imports
Description
Total of divisions below BAZU 36 37 39 38 39 40 38 40 39 41 39
Textiles BAZV 17 24 25 25 25 27 26 24 25 25 26 25Wearing apparel; dressing and dyeing of fur BAZW 18 23 21 20 20 20 20 20 21 19 18 20Chemicals and chemical products BAZX 24 41 42 45 45 45 46 44 47 46 48 44
Source: Office for National Statistics: 01633 813395
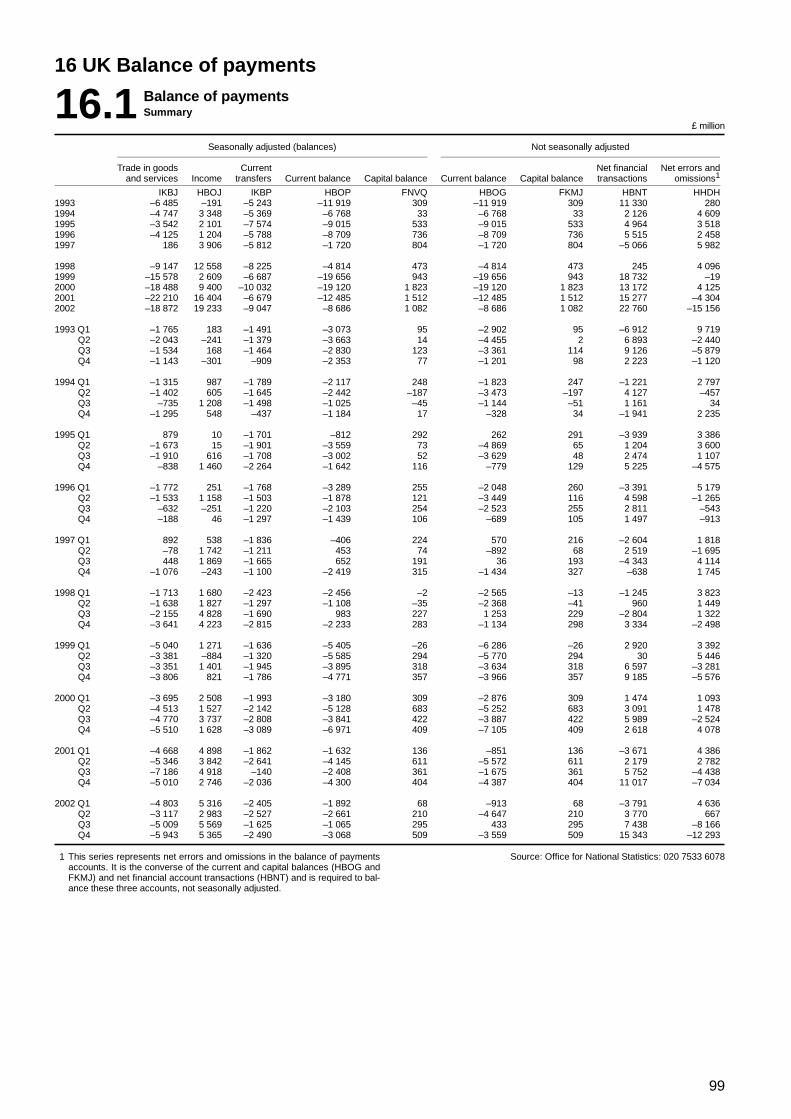
99
16 UK Balance of payments
16.1 Balance of paymentsSummary
£ million
Seasonally adjusted (balances) Not seasonally adjusted
Trade in goods Current Net financial Net errors andand services Income transfers Current balance Capital balance Current balance Capital balance transactions omissions1
IKBJ HBOJ IKBP HBOP FNVQ HBOG FKMJ HBNT HHDH1993 –6 485 –191 –5 243 –11 919 309 –11 919 309 11 330 2801994 –4 747 3 348 –5 369 –6 768 33 –6 768 33 2 126 4 6091995 –3 542 2 101 –7 574 –9 015 533 –9 015 533 4 964 3 5181996 –4 125 1 204 –5 788 –8 709 736 –8 709 736 5 515 2 4581997 186 3 906 –5 812 –1 720 804 –1 720 804 –5 066 5 982
1998 –9 147 12 558 –8 225 –4 814 473 –4 814 473 245 4 0961999 –15 578 2 609 –6 687 –19 656 943 –19 656 943 18 732 –192000 –18 488 9 400 –10 032 –19 120 1 823 –19 120 1 823 13 172 4 1252001 –22 210 16 404 –6 679 –12 485 1 512 –12 485 1 512 15 277 –4 3042002 –18 872 19 233 –9 047 –8 686 1 082 –8 686 1 082 22 760 –15 156
1993 Q1 –1 765 183 –1 491 –3 073 95 –2 902 95 –6 912 9 719Q2 –2 043 –241 –1 379 –3 663 14 –4 455 2 6 893 –2 440Q3 –1 534 168 –1 464 –2 830 123 –3 361 114 9 126 –5 879Q4 –1 143 –301 –909 –2 353 77 –1 201 98 2 223 –1 120
1994 Q1 –1 315 987 –1 789 –2 117 248 –1 823 247 –1 221 2 797Q2 –1 402 605 –1 645 –2 442 –187 –3 473 –197 4 127 –457Q3 –735 1 208 –1 498 –1 025 –45 –1 144 –51 1 161 34Q4 –1 295 548 –437 –1 184 17 –328 34 –1 941 2 235
1995 Q1 879 10 –1 701 –812 292 262 291 –3 939 3 386Q2 –1 673 15 –1 901 –3 559 73 –4 869 65 1 204 3 600Q3 –1 910 616 –1 708 –3 002 52 –3 629 48 2 474 1 107Q4 –838 1 460 –2 264 –1 642 116 –779 129 5 225 –4 575
1996 Q1 –1 772 251 –1 768 –3 289 255 –2 048 260 –3 391 5 179Q2 –1 533 1 158 –1 503 –1 878 121 –3 449 116 4 598 –1 265Q3 –632 –251 –1 220 –2 103 254 –2 523 255 2 811 –543Q4 –188 46 –1 297 –1 439 106 –689 105 1 497 –913
1997 Q1 892 538 –1 836 –406 224 570 216 –2 604 1 818Q2 –78 1 742 –1 211 453 74 –892 68 2 519 –1 695Q3 448 1 869 –1 665 652 191 36 193 –4 343 4 114Q4 –1 076 –243 –1 100 –2 419 315 –1 434 327 –638 1 745
1998 Q1 –1 713 1 680 –2 423 –2 456 –2 –2 565 –13 –1 245 3 823Q2 –1 638 1 827 –1 297 –1 108 –35 –2 368 –41 960 1 449Q3 –2 155 4 828 –1 690 983 227 1 253 229 –2 804 1 322Q4 –3 641 4 223 –2 815 –2 233 283 –1 134 298 3 334 –2 498
1999 Q1 –5 040 1 271 –1 636 –5 405 –26 –6 286 –26 2 920 3 392Q2 –3 381 –884 –1 320 –5 585 294 –5 770 294 30 5 446Q3 –3 351 1 401 –1 945 –3 895 318 –3 634 318 6 597 –3 281Q4 –3 806 821 –1 786 –4 771 357 –3 966 357 9 185 –5 576
2000 Q1 –3 695 2 508 –1 993 –3 180 309 –2 876 309 1 474 1 093Q2 –4 513 1 527 –2 142 –5 128 683 –5 252 683 3 091 1 478Q3 –4 770 3 737 –2 808 –3 841 422 –3 887 422 5 989 –2 524Q4 –5 510 1 628 –3 089 –6 971 409 –7 105 409 2 618 4 078
2001 Q1 –4 668 4 898 –1 862 –1 632 136 –851 136 –3 671 4 386Q2 –5 346 3 842 –2 641 –4 145 611 –5 572 611 2 179 2 782Q3 –7 186 4 918 –140 –2 408 361 –1 675 361 5 752 –4 438Q4 –5 010 2 746 –2 036 –4 300 404 –4 387 404 11 017 –7 034
2002 Q1 –4 803 5 316 –2 405 –1 892 68 –913 68 –3 791 4 636Q2 –3 117 2 983 –2 527 –2 661 210 –4 647 210 3 770 667Q3 –5 009 5 569 –1 625 –1 065 295 433 295 7 438 –8 166Q4 –5 943 5 365 –2 490 –3 068 509 –3 559 509 15 343 –12 293
1 This series represents net errors and omissions in the balance of paymentsaccounts. It is the converse of the current and capital balances (HBOG andFKMJ) and net financial account transactions (HBNT) and is required to bal-ance these three accounts, not seasonally adjusted.
Source: Office for National Statistics: 020 7533 6078
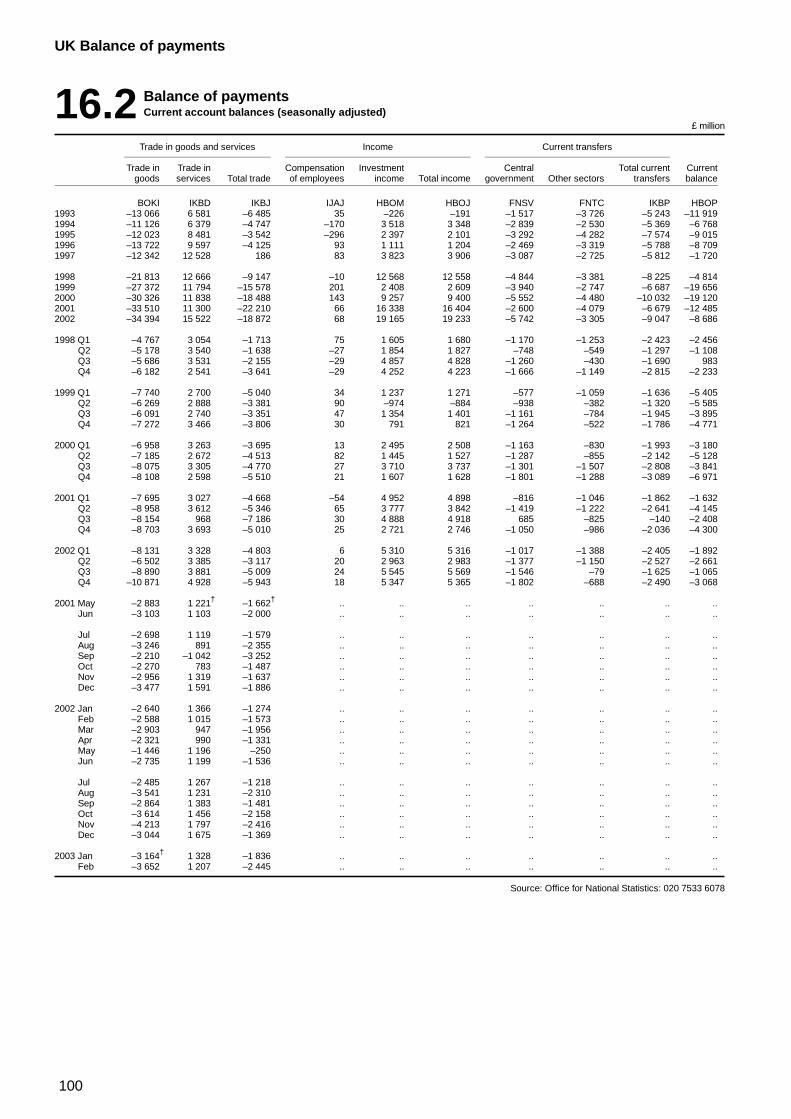
100
UK Balance of payments
16.2 Balance of paymentsCurrent account balances (seasonally adjusted)
£ million
Trade in goods and services Income Current transfers
Trade in Trade in Compensation Investment Central Total current Currentgoods services Total trade of employees income Total income government Other sectors transfers balance
BOKI IKBD IKBJ IJAJ HBOM HBOJ FNSV FNTC IKBP HBOP1993 –13 066 6 581 –6 485 35 –226 –191 –1 517 –3 726 –5 243 –11 9191994 –11 126 6 379 –4 747 –170 3 518 3 348 –2 839 –2 530 –5 369 –6 7681995 –12 023 8 481 –3 542 –296 2 397 2 101 –3 292 –4 282 –7 574 –9 0151996 –13 722 9 597 –4 125 93 1 111 1 204 –2 469 –3 319 –5 788 –8 7091997 –12 342 12 528 186 83 3 823 3 906 –3 087 –2 725 –5 812 –1 720
1998 –21 813 12 666 –9 147 –10 12 568 12 558 –4 844 –3 381 –8 225 –4 8141999 –27 372 11 794 –15 578 201 2 408 2 609 –3 940 –2 747 –6 687 –19 6562000 –30 326 11 838 –18 488 143 9 257 9 400 –5 552 –4 480 –10 032 –19 1202001 –33 510 11 300 –22 210 66 16 338 16 404 –2 600 –4 079 –6 679 –12 4852002 –34 394 15 522 –18 872 68 19 165 19 233 –5 742 –3 305 –9 047 –8 686
1998 Q1 –4 767 3 054 –1 713 75 1 605 1 680 –1 170 –1 253 –2 423 –2 456Q2 –5 178 3 540 –1 638 –27 1 854 1 827 –748 –549 –1 297 –1 108Q3 –5 686 3 531 –2 155 –29 4 857 4 828 –1 260 –430 –1 690 983Q4 –6 182 2 541 –3 641 –29 4 252 4 223 –1 666 –1 149 –2 815 –2 233
1999 Q1 –7 740 2 700 –5 040 34 1 237 1 271 –577 –1 059 –1 636 –5 405Q2 –6 269 2 888 –3 381 90 –974 –884 –938 –382 –1 320 –5 585Q3 –6 091 2 740 –3 351 47 1 354 1 401 –1 161 –784 –1 945 –3 895Q4 –7 272 3 466 –3 806 30 791 821 –1 264 –522 –1 786 –4 771
2000 Q1 –6 958 3 263 –3 695 13 2 495 2 508 –1 163 –830 –1 993 –3 180Q2 –7 185 2 672 –4 513 82 1 445 1 527 –1 287 –855 –2 142 –5 128Q3 –8 075 3 305 –4 770 27 3 710 3 737 –1 301 –1 507 –2 808 –3 841Q4 –8 108 2 598 –5 510 21 1 607 1 628 –1 801 –1 288 –3 089 –6 971
2001 Q1 –7 695 3 027 –4 668 –54 4 952 4 898 –816 –1 046 –1 862 –1 632Q2 –8 958 3 612 –5 346 65 3 777 3 842 –1 419 –1 222 –2 641 –4 145Q3 –8 154 968 –7 186 30 4 888 4 918 685 –825 –140 –2 408Q4 –8 703 3 693 –5 010 25 2 721 2 746 –1 050 –986 –2 036 –4 300
2002 Q1 –8 131 3 328 –4 803 6 5 310 5 316 –1 017 –1 388 –2 405 –1 892Q2 –6 502 3 385 –3 117 20 2 963 2 983 –1 377 –1 150 –2 527 –2 661Q3 –8 890 3 881 –5 009 24 5 545 5 569 –1 546 –79 –1 625 –1 065Q4 –10 871 4 928 –5 943 18 5 347 5 365 –1 802 –688 –2 490 –3 068
2001 May –2 883 1 221† –1 662† .. .. .. .. .. .. ..Jun –3 103 1 103 –2 000 .. .. .. .. .. .. ..
Jul –2 698 1 119 –1 579 .. .. .. .. .. .. ..Aug –3 246 891 –2 355 .. .. .. .. .. .. ..Sep –2 210 –1 042 –3 252 .. .. .. .. .. .. ..Oct –2 270 783 –1 487 .. .. .. .. .. .. ..Nov –2 956 1 319 –1 637 .. .. .. .. .. .. ..Dec –3 477 1 591 –1 886 .. .. .. .. .. .. ..
2002 Jan –2 640 1 366 –1 274 .. .. .. .. .. .. ..Feb –2 588 1 015 –1 573 .. .. .. .. .. .. ..Mar –2 903 947 –1 956 .. .. .. .. .. .. ..Apr –2 321 990 –1 331 .. .. .. .. .. .. ..May –1 446 1 196 –250 .. .. .. .. .. .. ..Jun –2 735 1 199 –1 536 .. .. .. .. .. .. ..
Jul –2 485 1 267 –1 218 .. .. .. .. .. .. ..Aug –3 541 1 231 –2 310 .. .. .. .. .. .. ..Sep –2 864 1 383 –1 481 .. .. .. .. .. .. ..Oct –3 614 1 456 –2 158 .. .. .. .. .. .. ..Nov –4 213 1 797 –2 416 .. .. .. .. .. .. ..Dec –3 044 1 675 –1 369 .. .. .. .. .. .. ..
2003 Jan –3 164† 1 328 –1 836 .. .. .. .. .. .. ..Feb –3 652 1 207 –2 445 .. .. .. .. .. .. ..
Source: Office for National Statistics: 020 7533 6078
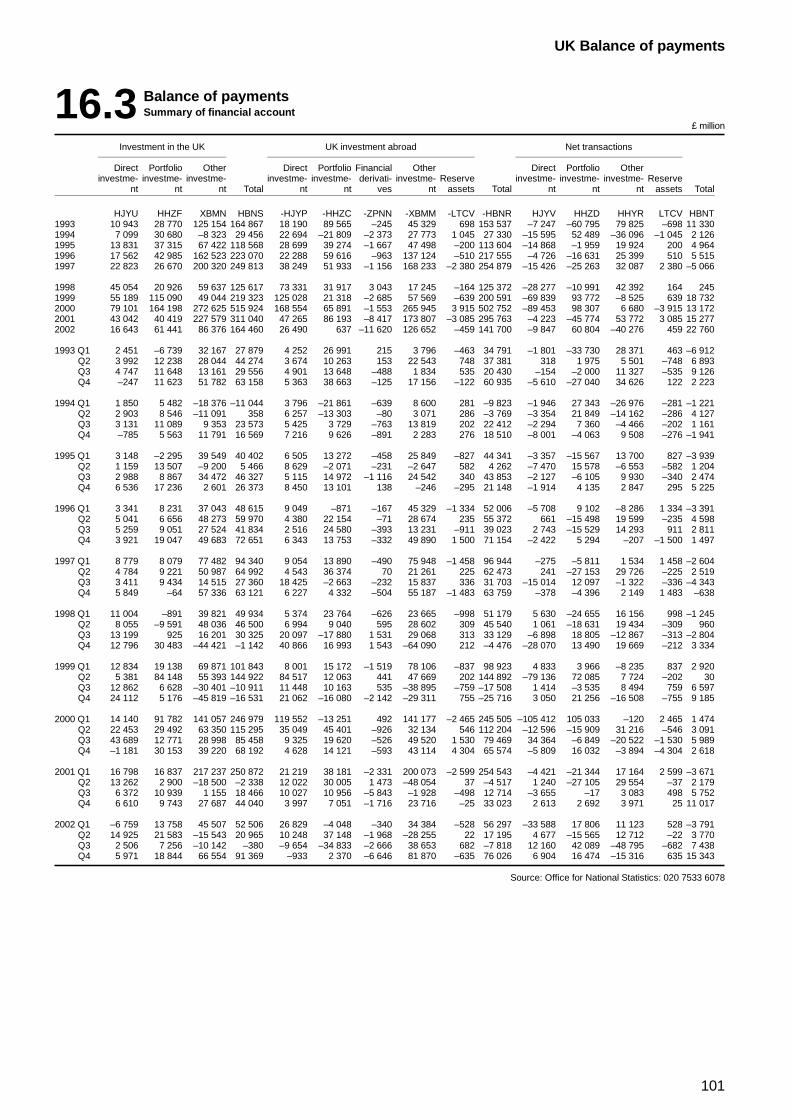
101
UK Balance of payments
16.3 Balance of paymentsSummary of financial account
£ million
Investment in the UK UK investment abroad Net transactions
Direct Portfolio Other Direct Portfolio Financial Other Direct Portfolio Otherinvestme- investme- investme- investme- investme- derivati- investme- Reserve investme- investme- investme- Reserve
nt nt nt Total nt nt ves nt assets Total nt nt nt assets Total
HJYU HHZF XBMN HBNS -HJYP -HHZC -ZPNN -XBMM -LTCV -HBNR HJYV HHZD HHYR LTCV HBNT1993 10 943 28 770 125 154 164 867 18 190 89 565 –245 45 329 698 153 537 –7 247 –60 795 79 825 –698 11 3301994 7 099 30 680 –8 323 29 456 22 694 –21 809 –2 373 27 773 1 045 27 330 –15 595 52 489 –36 096 –1 045 2 1261995 13 831 37 315 67 422 118 568 28 699 39 274 –1 667 47 498 –200 113 604 –14 868 –1 959 19 924 200 4 9641996 17 562 42 985 162 523 223 070 22 288 59 616 –963 137 124 –510 217 555 –4 726 –16 631 25 399 510 5 5151997 22 823 26 670 200 320 249 813 38 249 51 933 –1 156 168 233 –2 380 254 879 –15 426 –25 263 32 087 2 380 –5 066
1998 45 054 20 926 59 637 125 617 73 331 31 917 3 043 17 245 –164 125 372 –28 277 –10 991 42 392 164 2451999 55 189 115 090 49 044 219 323 125 028 21 318 –2 685 57 569 –639 200 591 –69 839 93 772 –8 525 639 18 7322000 79 101 164 198 272 625 515 924 168 554 65 891 –1 553 265 945 3 915 502 752 –89 453 98 307 6 680 –3 915 13 1722001 43 042 40 419 227 579 311 040 47 265 86 193 –8 417 173 807 –3 085 295 763 –4 223 –45 774 53 772 3 085 15 2772002 16 643 61 441 86 376 164 460 26 490 637 –11 620 126 652 –459 141 700 –9 847 60 804 –40 276 459 22 760
1993 Q1 2 451 –6 739 32 167 27 879 4 252 26 991 215 3 796 –463 34 791 –1 801 –33 730 28 371 463 –6 912Q2 3 992 12 238 28 044 44 274 3 674 10 263 153 22 543 748 37 381 318 1 975 5 501 –748 6 893Q3 4 747 11 648 13 161 29 556 4 901 13 648 –488 1 834 535 20 430 –154 –2 000 11 327 –535 9 126Q4 –247 11 623 51 782 63 158 5 363 38 663 –125 17 156 –122 60 935 –5 610 –27 040 34 626 122 2 223
1994 Q1 1 850 5 482 –18 376 –11 044 3 796 –21 861 –639 8 600 281 –9 823 –1 946 27 343 –26 976 –281 –1 221Q2 2 903 8 546 –11 091 358 6 257 –13 303 –80 3 071 286 –3 769 –3 354 21 849 –14 162 –286 4 127Q3 3 131 11 089 9 353 23 573 5 425 3 729 –763 13 819 202 22 412 –2 294 7 360 –4 466 –202 1 161Q4 –785 5 563 11 791 16 569 7 216 9 626 –891 2 283 276 18 510 –8 001 –4 063 9 508 –276 –1 941
1995 Q1 3 148 –2 295 39 549 40 402 6 505 13 272 –458 25 849 –827 44 341 –3 357 –15 567 13 700 827 –3 939Q2 1 159 13 507 –9 200 5 466 8 629 –2 071 –231 –2 647 582 4 262 –7 470 15 578 –6 553 –582 1 204Q3 2 988 8 867 34 472 46 327 5 115 14 972 –1 116 24 542 340 43 853 –2 127 –6 105 9 930 –340 2 474Q4 6 536 17 236 2 601 26 373 8 450 13 101 138 –246 –295 21 148 –1 914 4 135 2 847 295 5 225
1996 Q1 3 341 8 231 37 043 48 615 9 049 –871 –167 45 329 –1 334 52 006 –5 708 9 102 –8 286 1 334 –3 391Q2 5 041 6 656 48 273 59 970 4 380 22 154 –71 28 674 235 55 372 661 –15 498 19 599 –235 4 598Q3 5 259 9 051 27 524 41 834 2 516 24 580 –393 13 231 –911 39 023 2 743 –15 529 14 293 911 2 811Q4 3 921 19 047 49 683 72 651 6 343 13 753 –332 49 890 1 500 71 154 –2 422 5 294 –207 –1 500 1 497
1997 Q1 8 779 8 079 77 482 94 340 9 054 13 890 –490 75 948 –1 458 96 944 –275 –5 811 1 534 1 458 –2 604Q2 4 784 9 221 50 987 64 992 4 543 36 374 70 21 261 225 62 473 241 –27 153 29 726 –225 2 519Q3 3 411 9 434 14 515 27 360 18 425 –2 663 –232 15 837 336 31 703 –15 014 12 097 –1 322 –336 –4 343Q4 5 849 –64 57 336 63 121 6 227 4 332 –504 55 187 –1 483 63 759 –378 –4 396 2 149 1 483 –638
1998 Q1 11 004 –891 39 821 49 934 5 374 23 764 –626 23 665 –998 51 179 5 630 –24 655 16 156 998 –1 245Q2 8 055 –9 591 48 036 46 500 6 994 9 040 595 28 602 309 45 540 1 061 –18 631 19 434 –309 960Q3 13 199 925 16 201 30 325 20 097 –17 880 1 531 29 068 313 33 129 –6 898 18 805 –12 867 –313 –2 804Q4 12 796 30 483 –44 421 –1 142 40 866 16 993 1 543 –64 090 212 –4 476 –28 070 13 490 19 669 –212 3 334
1999 Q1 12 834 19 138 69 871 101 843 8 001 15 172 –1 519 78 106 –837 98 923 4 833 3 966 –8 235 837 2 920Q2 5 381 84 148 55 393 144 922 84 517 12 063 441 47 669 202 144 892 –79 136 72 085 7 724 –202 30Q3 12 862 6 628 –30 401 –10 911 11 448 10 163 535 –38 895 –759 –17 508 1 414 –3 535 8 494 759 6 597Q4 24 112 5 176 –45 819 –16 531 21 062 –16 080 –2 142 –29 311 755 –25 716 3 050 21 256 –16 508 –755 9 185
2000 Q1 14 140 91 782 141 057 246 979 119 552 –13 251 492 141 177 –2 465 245 505 –105 412 105 033 –120 2 465 1 474Q2 22 453 29 492 63 350 115 295 35 049 45 401 –926 32 134 546 112 204 –12 596 –15 909 31 216 –546 3 091Q3 43 689 12 771 28 998 85 458 9 325 19 620 –526 49 520 1 530 79 469 34 364 –6 849 –20 522 –1 530 5 989Q4 –1 181 30 153 39 220 68 192 4 628 14 121 –593 43 114 4 304 65 574 –5 809 16 032 –3 894 –4 304 2 618
2001 Q1 16 798 16 837 217 237 250 872 21 219 38 181 –2 331 200 073 –2 599 254 543 –4 421 –21 344 17 164 2 599 –3 671Q2 13 262 2 900 –18 500 –2 338 12 022 30 005 1 473 –48 054 37 –4 517 1 240 –27 105 29 554 –37 2 179Q3 6 372 10 939 1 155 18 466 10 027 10 956 –5 843 –1 928 –498 12 714 –3 655 –17 3 083 498 5 752Q4 6 610 9 743 27 687 44 040 3 997 7 051 –1 716 23 716 –25 33 023 2 613 2 692 3 971 25 11 017
2002 Q1 –6 759 13 758 45 507 52 506 26 829 –4 048 –340 34 384 –528 56 297 –33 588 17 806 11 123 528 –3 791Q2 14 925 21 583 –15 543 20 965 10 248 37 148 –1 968 –28 255 22 17 195 4 677 –15 565 12 712 –22 3 770Q3 2 506 7 256 –10 142 –380 –9 654 –34 833 –2 666 38 653 682 –7 818 12 160 42 089 –48 795 –682 7 438Q4 5 971 18 844 66 554 91 369 –933 2 370 –6 646 81 870 –635 76 026 6 904 16 474 –15 316 635 15 343
Source: Office for National Statistics: 020 7533 6078
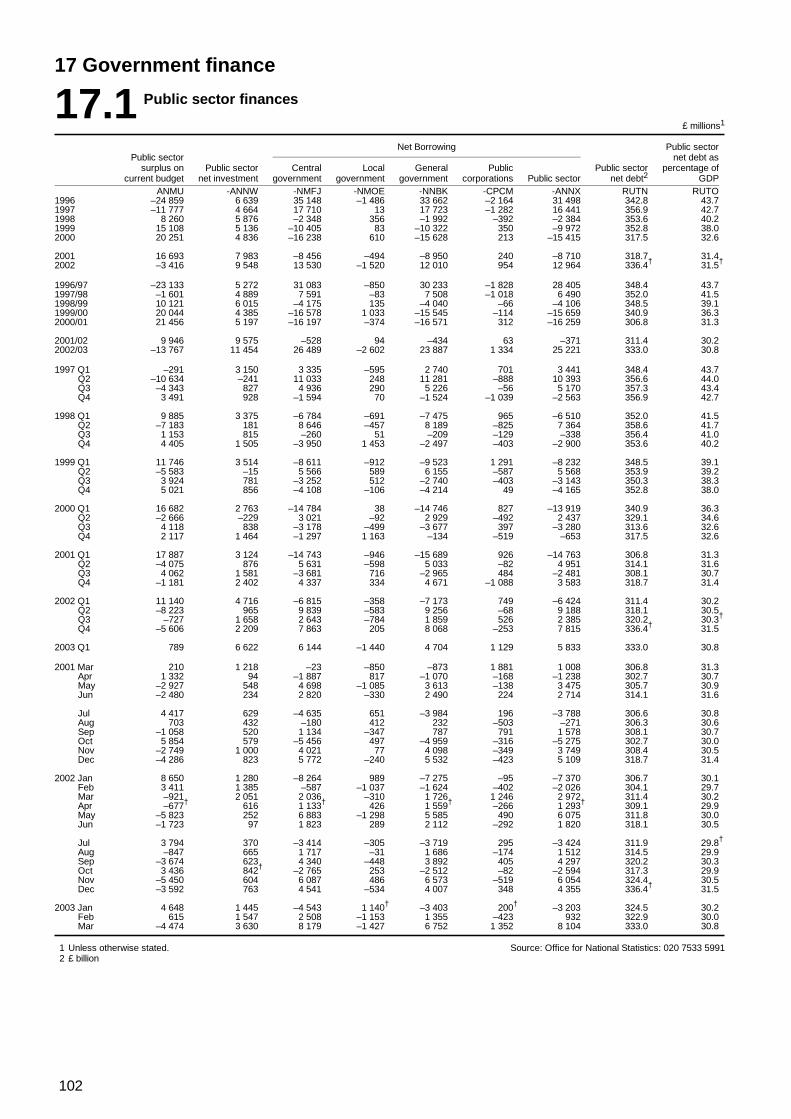
102
17 Government finance
17.1 Public sector finances
£ millions1
Net Borrowing Public sectorPublic sector net debt as
surplus on Public sector Central Local General Public Public sector percentage ofcurrent budget net investment government government government corporations Public sector net debt2 GDP
ANMU -ANNW -NMFJ -NMOE -NNBK -CPCM -ANNX RUTN RUTO1996 –24 859 6 639 35 148 –1 486 33 662 –2 164 31 498 342.8 43.71997 –11 777 4 664 17 710 13 17 723 –1 282 16 441 356.9 42.71998 8 260 5 876 –2 348 356 –1 992 –392 –2 384 353.6 40.21999 15 108 5 136 –10 405 83 –10 322 350 –9 972 352.8 38.02000 20 251 4 836 –16 238 610 –15 628 213 –15 415 317.5 32.6
2001 16 693 7 983 –8 456 –494 –8 950 240 –8 710 318.7 31.42002 –3 416 9 548 13 530 –1 520 12 010 954 12 964 336.4† 31.5†
1996/97 –23 133 5 272 31 083 –850 30 233 –1 828 28 405 348.4 43.71997/98 –1 601 4 889 7 591 –83 7 508 –1 018 6 490 352.0 41.51998/99 10 121 6 015 –4 175 135 –4 040 –66 –4 106 348.5 39.11999/00 20 044 4 385 –16 578 1 033 –15 545 –114 –15 659 340.9 36.32000/01 21 456 5 197 –16 197 –374 –16 571 312 –16 259 306.8 31.3
2001/02 9 946 9 575 –528 94 –434 63 –371 311.4 30.22002/03 –13 767 11 454 26 489 –2 602 23 887 1 334 25 221 333.0 30.8
1997 Q1 –291 3 150 3 335 –595 2 740 701 3 441 348.4 43.7Q2 –10 634 –241 11 033 248 11 281 –888 10 393 356.6 44.0Q3 –4 343 827 4 936 290 5 226 –56 5 170 357.3 43.4Q4 3 491 928 –1 594 70 –1 524 –1 039 –2 563 356.9 42.7
1998 Q1 9 885 3 375 –6 784 –691 –7 475 965 –6 510 352.0 41.5Q2 –7 183 181 8 646 –457 8 189 –825 7 364 358.6 41.7Q3 1 153 815 –260 51 –209 –129 –338 356.4 41.0Q4 4 405 1 505 –3 950 1 453 –2 497 –403 –2 900 353.6 40.2
1999 Q1 11 746 3 514 –8 611 –912 –9 523 1 291 –8 232 348.5 39.1Q2 –5 583 –15 5 566 589 6 155 –587 5 568 353.9 39.2Q3 3 924 781 –3 252 512 –2 740 –403 –3 143 350.3 38.3Q4 5 021 856 –4 108 –106 –4 214 49 –4 165 352.8 38.0
2000 Q1 16 682 2 763 –14 784 38 –14 746 827 –13 919 340.9 36.3Q2 –2 666 –229 3 021 –92 2 929 –492 2 437 329.1 34.6Q3 4 118 838 –3 178 –499 –3 677 397 –3 280 313.6 32.6Q4 2 117 1 464 –1 297 1 163 –134 –519 –653 317.5 32.6
2001 Q1 17 887 3 124 –14 743 –946 –15 689 926 –14 763 306.8 31.3Q2 –4 075 876 5 631 –598 5 033 –82 4 951 314.1 31.6Q3 4 062 1 581 –3 681 716 –2 965 484 –2 481 308.1 30.7Q4 –1 181 2 402 4 337 334 4 671 –1 088 3 583 318.7 31.4
2002 Q1 11 140 4 716 –6 815 –358 –7 173 749 –6 424 311.4 30.2Q2 –8 223 965 9 839 –583 9 256 –68 9 188 318.1 30.5Q3 –727 1 658 2 643 –784 1 859 526 2 385 320.2 30.3†
Q4 –5 606 2 209 7 863 205 8 068 –253 7 815 336.4† 31.5
2003 Q1 789 6 622 6 144 –1 440 4 704 1 129 5 833 333.0 30.8
2001 Mar 210 1 218 –23 –850 –873 1 881 1 008 306.8 31.3Apr 1 332 94 –1 887 817 –1 070 –168 –1 238 302.7 30.7May –2 927 548 4 698 –1 085 3 613 –138 3 475 305.7 30.9Jun –2 480 234 2 820 –330 2 490 224 2 714 314.1 31.6
Jul 4 417 629 –4 635 651 –3 984 196 –3 788 306.6 30.8Aug 703 432 –180 412 232 –503 –271 306.3 30.6Sep –1 058 520 1 134 –347 787 791 1 578 308.1 30.7Oct 5 854 579 –5 456 497 –4 959 –316 –5 275 302.7 30.0Nov –2 749 1 000 4 021 77 4 098 –349 3 749 308.4 30.5Dec –4 286 823 5 772 –240 5 532 –423 5 109 318.7 31.4
2002 Jan 8 650 1 280 –8 264 989 –7 275 –95 –7 370 306.7 30.1Feb 3 411 1 385 –587 –1 037 –1 624 –402 –2 026 304.1 29.7Mar –921 2 051 2 036 –310 1 726 1 246 2 972 311.4 30.2Apr –677† 616 1 133† 426 1 559† –266 1 293† 309.1 29.9May –5 823 252 6 883 –1 298 5 585 490 6 075 311.8 30.0Jun –1 723 97 1 823 289 2 112 –292 1 820 318.1 30.5
Jul 3 794 370 –3 414 –305 –3 719 295 –3 424 311.9 29.8†
Aug –847 665 1 717 –31 1 686 –174 1 512 314.5 29.9Sep –3 674 623 4 340 –448 3 892 405 4 297 320.2 30.3Oct 3 436 842† –2 765 253 –2 512 –82 –2 594 317.3 29.9Nov –5 450 604 6 087 486 6 573 –519 6 054 324.4 30.5Dec –3 592 763 4 541 –534 4 007 348 4 355 336.4† 31.5
2003 Jan 4 648 1 445 –4 543 1 140† –3 403 200† –3 203 324.5 30.2Feb 615 1 547 2 508 –1 153 1 355 –423 932 322.9 30.0Mar –4 474 3 630 8 179 –1 427 6 752 1 352 8 104 333.0 30.8
1 Unless otherwise stated.2 £ billion
Source: Office for National Statistics: 020 7533 5991
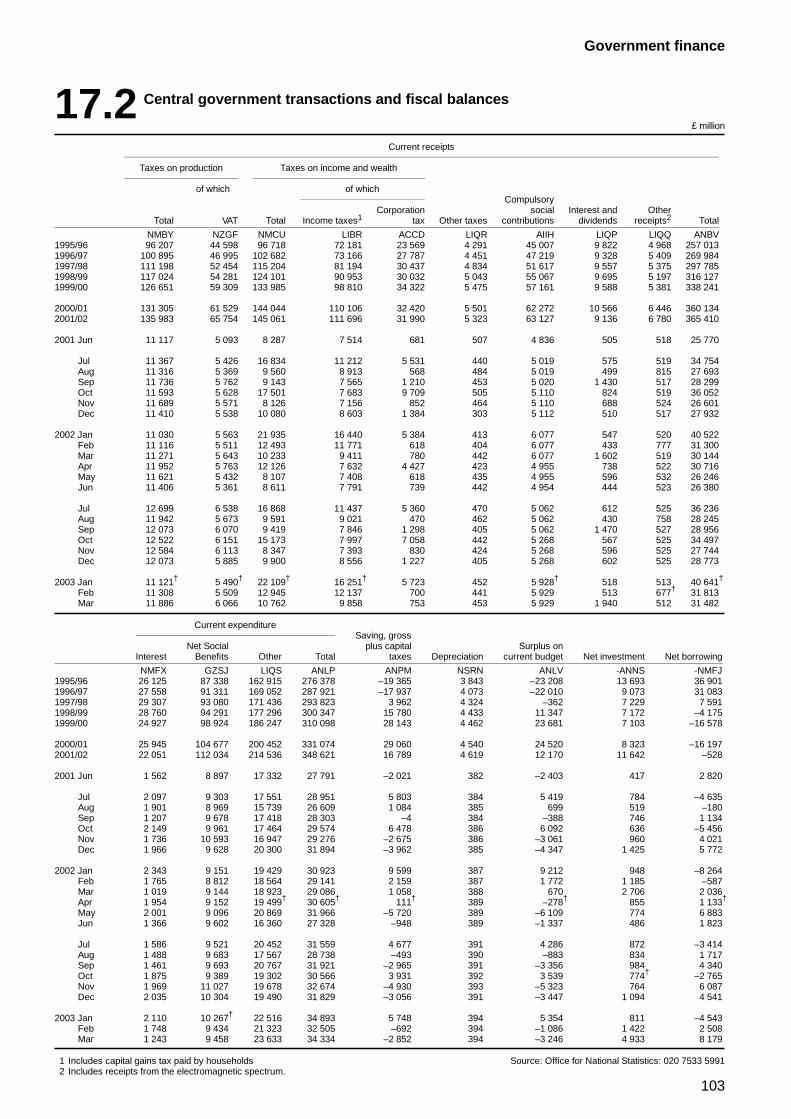
103
Government finance
17.2 Central government transactions and fiscal balances
£ million
Current receipts
Taxes on production Taxes on income and wealth
of which of whichCompulsory
Corporation social Interest and OtherTotal VAT Total Income taxes1 tax Other taxes contributions dividends receipts2 Total
NMBY NZGF NMCU LIBR ACCD LIQR AIIH LIQP LIQQ ANBV1995/96 96 207 44 598 96 718 72 181 23 569 4 291 45 007 9 822 4 968 257 0131996/97 100 895 46 995 102 682 73 166 27 787 4 451 47 219 9 328 5 409 269 9841997/98 111 198 52 454 115 204 81 194 30 437 4 834 51 617 9 557 5 375 297 7851998/99 117 024 54 281 124 101 90 953 30 032 5 043 55 067 9 695 5 197 316 1271999/00 126 651 59 309 133 985 98 810 34 322 5 475 57 161 9 588 5 381 338 241
2000/01 131 305 61 529 144 044 110 106 32 420 5 501 62 272 10 566 6 446 360 1342001/02 135 983 65 754 145 061 111 696 31 990 5 323 63 127 9 136 6 780 365 410
2001 Jun 11 117 5 093 8 287 7 514 681 507 4 836 505 518 25 770
Jul 11 367 5 426 16 834 11 212 5 531 440 5 019 575 519 34 754Aug 11 316 5 369 9 560 8 913 568 484 5 019 499 815 27 693Sep 11 736 5 762 9 143 7 565 1 210 453 5 020 1 430 517 28 299Oct 11 593 5 628 17 501 7 683 9 709 505 5 110 824 519 36 052Nov 11 689 5 571 8 126 7 156 852 464 5 110 688 524 26 601Dec 11 410 5 538 10 080 8 603 1 384 303 5 112 510 517 27 932
2002 Jan 11 030 5 563 21 935 16 440 5 384 413 6 077 547 520 40 522Feb 11 116 5 511 12 493 11 771 618 404 6 077 433 777 31 300Mar 11 271 5 643 10 233 9 411 780 442 6 077 1 602 519 30 144Apr 11 952 5 763 12 126 7 632 4 427 423 4 955 738 522 30 716May 11 621 5 432 8 107 7 408 618 435 4 955 596 532 26 246Jun 11 406 5 361 8 611 7 791 739 442 4 954 444 523 26 380
Jul 12 699 6 538 16 868 11 437 5 360 470 5 062 612 525 36 236Aug 11 942 5 673 9 591 9 021 470 462 5 062 430 758 28 245Sep 12 073 6 070 9 419 7 846 1 298 405 5 062 1 470 527 28 956Oct 12 522 6 151 15 173 7 997 7 058 442 5 268 567 525 34 497Nov 12 584 6 113 8 347 7 393 830 424 5 268 596 525 27 744Dec 12 073 5 885 9 900 8 556 1 227 405 5 268 602 525 28 773
2003 Jan 11 121† 5 490† 22 109† 16 251† 5 723 452 5 928† 518 513 40 641†
Feb 11 308 5 509 12 945 12 137 700 441 5 929 513 677† 31 813Mar 11 886 6 066 10 762 9 858 753 453 5 929 1 940 512 31 482
Current expenditureSaving, gross
Net Social plus capital Surplus onInterest Benefits Other Total taxes Depreciation current budget Net investment Net borrowing
NMFX GZSJ LIQS ANLP ANPM NSRN ANLV -ANNS -NMFJ1995/96 26 125 87 338 162 915 276 378 –19 365 3 843 –23 208 13 693 36 9011996/97 27 558 91 311 169 052 287 921 –17 937 4 073 –22 010 9 073 31 0831997/98 29 307 93 080 171 436 293 823 3 962 4 324 –362 7 229 7 5911998/99 28 760 94 291 177 296 300 347 15 780 4 433 11 347 7 172 –4 1751999/00 24 927 98 924 186 247 310 098 28 143 4 462 23 681 7 103 –16 578
2000/01 25 945 104 677 200 452 331 074 29 060 4 540 24 520 8 323 –16 1972001/02 22 051 112 034 214 536 348 621 16 789 4 619 12 170 11 642 –528
2001 Jun 1 562 8 897 17 332 27 791 –2 021 382 –2 403 417 2 820
Jul 2 097 9 303 17 551 28 951 5 803 384 5 419 784 –4 635Aug 1 901 8 969 15 739 26 609 1 084 385 699 519 –180Sep 1 207 9 678 17 418 28 303 –4 384 –388 746 1 134Oct 2 149 9 961 17 464 29 574 6 478 386 6 092 636 –5 456Nov 1 736 10 593 16 947 29 276 –2 675 386 –3 061 960 4 021Dec 1 966 9 628 20 300 31 894 –3 962 385 –4 347 1 425 5 772
2002 Jan 2 343 9 151 19 429 30 923 9 599 387 9 212 948 –8 264Feb 1 765 8 812 18 564 29 141 2 159 387 1 772 1 185 –587Mar 1 019 9 144 18 923 29 086 1 058 388 670 2 706 2 036Apr 1 954 9 152 19 499† 30 605† 111† 389 –278† 855 1 133†
May 2 001 9 096 20 869 31 966 –5 720 389 –6 109 774 6 883Jun 1 366 9 602 16 360 27 328 –948 389 –1 337 486 1 823
Jul 1 586 9 521 20 452 31 559 4 677 391 4 286 872 –3 414Aug 1 488 9 683 17 567 28 738 –493 390 –883 834 1 717Sep 1 461 9 693 20 767 31 921 –2 965 391 –3 356 984 4 340Oct 1 875 9 389 19 302 30 566 3 931 392 3 539 774† –2 765Nov 1 969 11 027 19 678 32 674 –4 930 393 –5 323 764 6 087Dec 2 035 10 304 19 490 31 829 –3 056 391 –3 447 1 094 4 541
2003 Jan 2 110 10 267† 22 516 34 893 5 748 394 5 354 811 –4 543Feb 1 748 9 434 21 323 32 505 –692 394 –1 086 1 422 2 508Mar 1 243 9 458 23 633 34 334 –2 852 394 –3 246 4 933 8 179
1 Includes capital gains tax paid by households2 Includes receipts from the electromagnetic spectrum.
Source: Office for National Statistics: 020 7533 5991
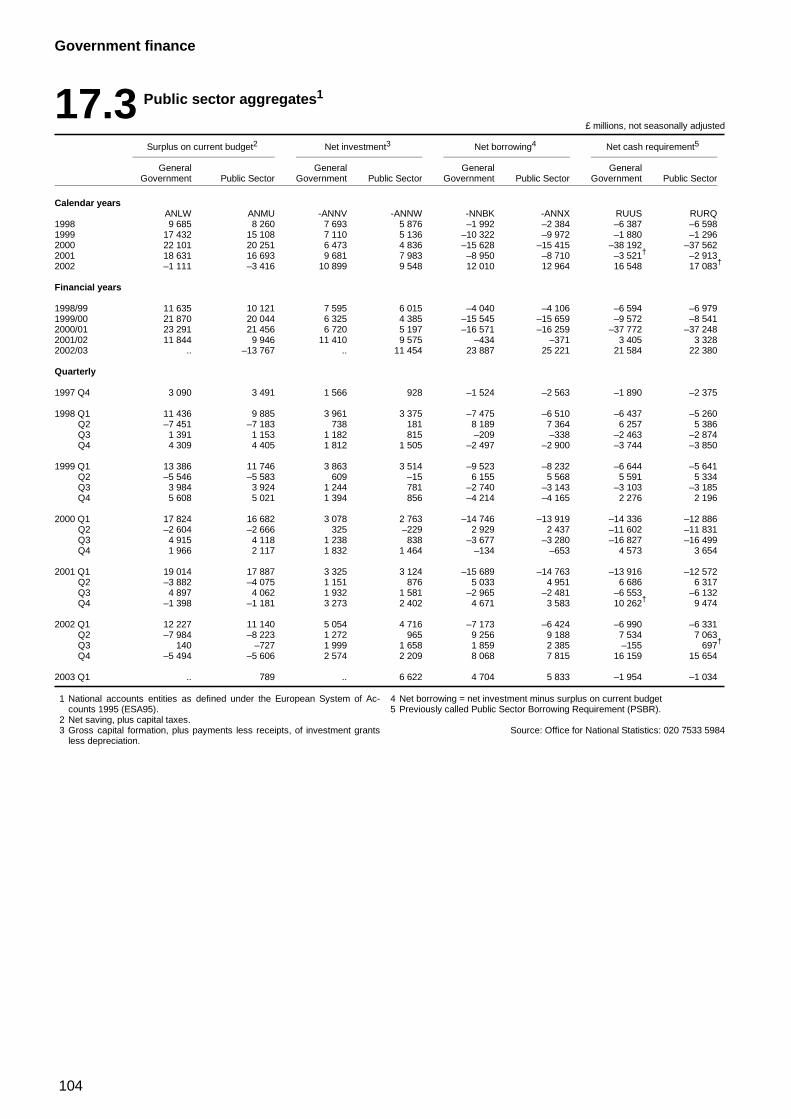
104
Government finance
17.3 Public sector aggregates1
£ millions, not seasonally adjusted
Surplus on current budget2 Net investment3 Net borrowing4 Net cash requirement5
General General General GeneralGovernment Public Sector Government Public Sector Government Public Sector Government Public Sector
Calendar yearsANLW ANMU -ANNV -ANNW -NNBK -ANNX RUUS RURQ
1998 9 685 8 260 7 693 5 876 –1 992 –2 384 –6 387 –6 5981999 17 432 15 108 7 110 5 136 –10 322 –9 972 –1 880 –1 2962000 22 101 20 251 6 473 4 836 –15 628 –15 415 –38 192 –37 5622001 18 631 16 693 9 681 7 983 –8 950 –8 710 –3 521† –2 9132002 –1 111 –3 416 10 899 9 548 12 010 12 964 16 548 17 083†
Financial years
1998/99 11 635 10 121 7 595 6 015 –4 040 –4 106 –6 594 –6 9791999/00 21 870 20 044 6 325 4 385 –15 545 –15 659 –9 572 –8 5412000/01 23 291 21 456 6 720 5 197 –16 571 –16 259 –37 772 –37 2482001/02 11 844 9 946 11 410 9 575 –434 –371 3 405 3 3282002/03 .. –13 767 .. 11 454 23 887 25 221 21 584 22 380
Quarterly
1997 Q4 3 090 3 491 1 566 928 –1 524 –2 563 –1 890 –2 375
1998 Q1 11 436 9 885 3 961 3 375 –7 475 –6 510 –6 437 –5 260Q2 –7 451 –7 183 738 181 8 189 7 364 6 257 5 386Q3 1 391 1 153 1 182 815 –209 –338 –2 463 –2 874Q4 4 309 4 405 1 812 1 505 –2 497 –2 900 –3 744 –3 850
1999 Q1 13 386 11 746 3 863 3 514 –9 523 –8 232 –6 644 –5 641Q2 –5 546 –5 583 609 –15 6 155 5 568 5 591 5 334Q3 3 984 3 924 1 244 781 –2 740 –3 143 –3 103 –3 185Q4 5 608 5 021 1 394 856 –4 214 –4 165 2 276 2 196
2000 Q1 17 824 16 682 3 078 2 763 –14 746 –13 919 –14 336 –12 886Q2 –2 604 –2 666 325 –229 2 929 2 437 –11 602 –11 831Q3 4 915 4 118 1 238 838 –3 677 –3 280 –16 827 –16 499Q4 1 966 2 117 1 832 1 464 –134 –653 4 573 3 654
2001 Q1 19 014 17 887 3 325 3 124 –15 689 –14 763 –13 916 –12 572Q2 –3 882 –4 075 1 151 876 5 033 4 951 6 686 6 317Q3 4 897 4 062 1 932 1 581 –2 965 –2 481 –6 553 –6 132Q4 –1 398 –1 181 3 273 2 402 4 671 3 583 10 262† 9 474
2002 Q1 12 227 11 140 5 054 4 716 –7 173 –6 424 –6 990 –6 331Q2 –7 984 –8 223 1 272 965 9 256 9 188 7 534 7 063Q3 140 –727 1 999 1 658 1 859 2 385 –155 697†
Q4 –5 494 –5 606 2 574 2 209 8 068 7 815 16 159 15 654
2003 Q1 .. 789 .. 6 622 4 704 5 833 –1 954 –1 034
1 National accounts entities as defined under the European System of Ac-counts 1995 (ESA95).
2 Net saving, plus capital taxes.3 Gross capital formation, plus payments less receipts, of investment grants
less depreciation.
4 Net borrowing = net investment minus surplus on current budget5 Previously called Public Sector Borrowing Requirement (PSBR).
Source: Office for National Statistics: 020 7533 5984
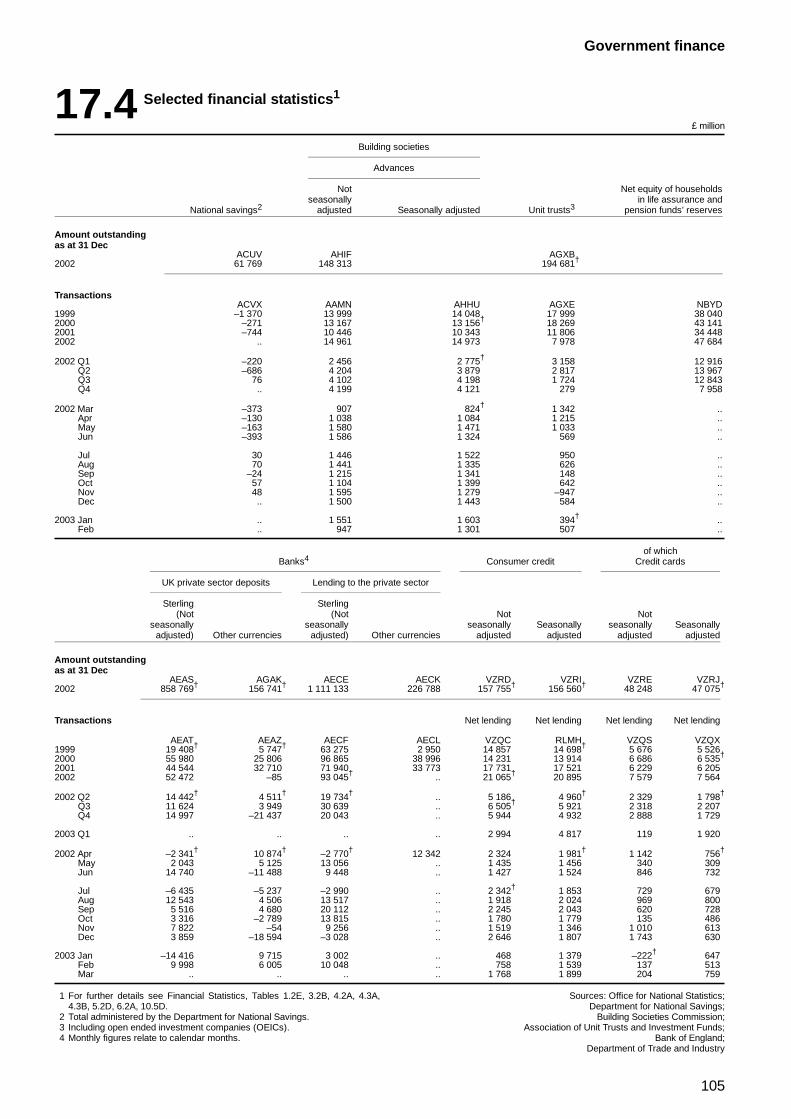
105
Government finance
17.4 Selected financial statistics1
£ million
Building societies
Advances
Not Net equity of householdsseasonally in life assurance and
National savings2 adjusted Seasonally adjusted Unit trusts3 pension funds’ reserves
Amount outstandingas at 31 Dec
ACUV AHIF AGXB2002 61 769 148 313 194 681†
TransactionsACVX AAMN AHHU AGXE NBYD
1999 –1 370 13 999 14 048 17 999 38 0402000 –271 13 167 13 156† 18 269 43 1412001 –744 10 446 10 343 11 806 34 4482002 .. 14 961 14 973 7 978 47 684
2002 Q1 –220 2 456 2 775† 3 158 12 916Q2 –686 4 204 3 879 2 817 13 967Q3 76 4 102 4 198 1 724 12 843Q4 .. 4 199 4 121 279 7 958
2002 Mar –373 907 824† 1 342 ..Apr –130 1 038 1 084 1 215 ..May –163 1 580 1 471 1 033 ..Jun –393 1 586 1 324 569 ..
Jul 30 1 446 1 522 950 ..Aug 70 1 441 1 335 626 ..Sep –24 1 215 1 341 148 ..Oct 57 1 104 1 399 642 ..Nov 48 1 595 1 279 –947 ..Dec .. 1 500 1 443 584 ..
2003 Jan .. 1 551 1 603 394† ..Feb .. 947 1 301 507 ..
of whichBanks4 Consumer credit Credit cards
UK private sector deposits Lending to the private sector
Sterling Sterling(Not (Not Not Not
seasonally seasonally seasonally Seasonally seasonally Seasonallyadjusted) Other currencies adjusted) Other currencies adjusted adjusted adjusted adjusted
Amount outstandingas at 31 Dec
AEAS AGAK AECE AECK VZRD VZRI VZRE VZRJ2002 858 769† 156 741† 1 111 133 226 788 157 755† 156 560† 48 248 47 075†
Transactions Net lending Net lending Net lending Net lending
AEAT AEAZ AECF AECL VZQC RLMH VZQS VZQX1999 19 408† 5 747† 63 275 2 950 14 857 14 698† 5 676 5 5262000 55 980 25 806 96 865 38 996 14 231 13 914 6 686 6 535†
2001 44 544 32 710 71 940 33 773 17 731 17 521 6 229 6 2052002 52 472 –85 93 045† .. 21 065† 20 895 7 579 7 564
2002 Q2 14 442† 4 511† 19 734† .. 5 186 4 960† 2 329 1 798†
Q3 11 624 3 949 30 639 .. 6 505† 5 921 2 318 2 207Q4 14 997 –21 437 20 043 .. 5 944 4 932 2 888 1 729
2003 Q1 .. .. .. .. 2 994 4 817 119 1 920
2002 Apr –2 341† 10 874† –2 770† 12 342 2 324 1 981† 1 142 756†
May 2 043 5 125 13 056 .. 1 435 1 456 340 309Jun 14 740 –11 488 9 448 .. 1 427 1 524 846 732
Jul –6 435 –5 237 –2 990 .. 2 342† 1 853 729 679Aug 12 543 4 506 13 517 .. 1 918 2 024 969 800Sep 5 516 4 680 20 112 .. 2 245 2 043 620 728Oct 3 316 –2 789 13 815 .. 1 780 1 779 135 486Nov 7 822 –54 9 256 .. 1 519 1 346 1 010 613Dec 3 859 –18 594 –3 028 .. 2 646 1 807 1 743 630
2003 Jan –14 416 9 715 3 002 .. 468 1 379 –222† 647Feb 9 998 6 005 10 048 .. 758 1 539 137 513Mar .. .. .. .. 1 768 1 899 204 759
1 For further details see Financial Statistics, Tables 1.2E, 3.2B, 4.2A, 4.3A,4.3B, 5.2D, 6.2A, 10.5D.
2 Total administered by the Department for National Savings.3 Including open ended investment companies (OEICs).4 Monthly figures relate to calendar months.
Sources: Office for National Statistics;Department for National Savings;
Building Societies Commission;Association of Unit Trusts and Investment Funds;
Bank of England;Department of Trade and Industry
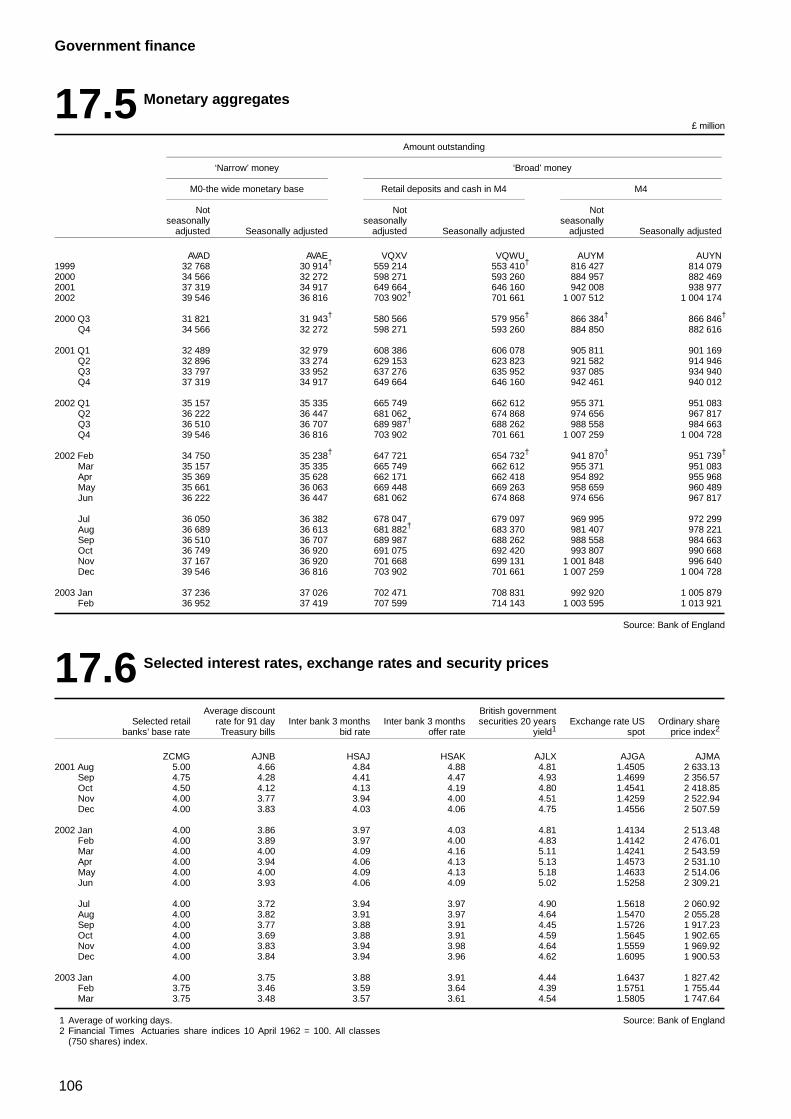
106
Government finance
17.5 Monetary aggregates
£ million
Amount outstanding
‘Narrow’ money ‘Broad’ money
M0-the wide monetary base Retail deposits and cash in M4 M4
Not Not Notseasonally seasonally seasonally
adjusted Seasonally adjusted adjusted Seasonally adjusted adjusted Seasonally adjusted
AVAD AVAE VQXV VQWU AUYM AUYN1999 32 768 30 914† 559 214 553 410† 816 427 814 0792000 34 566 32 272 598 271 593 260 884 957 882 4692001 37 319 34 917 649 664 646 160 942 008 938 9772002 39 546 36 816 703 902† 701 661 1 007 512 1 004 174
2000 Q3 31 821 31 943† 580 566 579 956† 866 384† 866 846†
Q4 34 566 32 272 598 271 593 260 884 850 882 616
2001 Q1 32 489 32 979 608 386 606 078 905 811 901 169Q2 32 896 33 274 629 153 623 823 921 582 914 946Q3 33 797 33 952 637 276 635 952 937 085 934 940Q4 37 319 34 917 649 664 646 160 942 461 940 012
2002 Q1 35 157 35 335 665 749 662 612 955 371 951 083Q2 36 222 36 447 681 062 674 868 974 656 967 817Q3 36 510 36 707 689 987† 688 262 988 558 984 663Q4 39 546 36 816 703 902 701 661 1 007 259 1 004 728
2002 Feb 34 750 35 238† 647 721 654 732† 941 870† 951 739†
Mar 35 157 35 335 665 749 662 612 955 371 951 083Apr 35 369 35 628 662 171 662 418 954 892 955 968May 35 661 36 063 669 448 669 263 958 659 960 489Jun 36 222 36 447 681 062 674 868 974 656 967 817
Jul 36 050 36 382 678 047 679 097 969 995 972 299Aug 36 689 36 613 681 882† 683 370 981 407 978 221Sep 36 510 36 707 689 987 688 262 988 558 984 663Oct 36 749 36 920 691 075 692 420 993 807 990 668Nov 37 167 36 920 701 668 699 131 1 001 848 996 640Dec 39 546 36 816 703 902 701 661 1 007 259 1 004 728
2003 Jan 37 236 37 026 702 471 708 831 992 920 1 005 879Feb 36 952 37 419 707 599 714 143 1 003 595 1 013 921
Source: Bank of England
17.6 Selected interest rates, exchange rates and security prices
Average discount British governmentSelected retail rate for 91 day Inter bank 3 months Inter bank 3 months securities 20 years Exchange rate US Ordinary share
banks’ base rate Treasury bills bid rate offer rate yield1 spot price index2
ZCMG AJNB HSAJ HSAK AJLX AJGA AJMA2001 Aug 5.00 4.66 4.84 4.88 4.81 1.4505 2 633.13
Sep 4.75 4.28 4.41 4.47 4.93 1.4699 2 356.57Oct 4.50 4.12 4.13 4.19 4.80 1.4541 2 418.85Nov 4.00 3.77 3.94 4.00 4.51 1.4259 2 522.94Dec 4.00 3.83 4.03 4.06 4.75 1.4556 2 507.59
2002 Jan 4.00 3.86 3.97 4.03 4.81 1.4134 2 513.48Feb 4.00 3.89 3.97 4.00 4.83 1.4142 2 476.01Mar 4.00 4.00 4.09 4.16 5.11 1.4241 2 543.59Apr 4.00 3.94 4.06 4.13 5.13 1.4573 2 531.10May 4.00 4.00 4.09 4.13 5.18 1.4633 2 514.06Jun 4.00 3.93 4.06 4.09 5.02 1.5258 2 309.21
Jul 4.00 3.72 3.94 3.97 4.90 1.5618 2 060.92Aug 4.00 3.82 3.91 3.97 4.64 1.5470 2 055.28Sep 4.00 3.77 3.88 3.91 4.45 1.5726 1 917.23Oct 4.00 3.69 3.88 3.91 4.59 1.5645 1 902.65Nov 4.00 3.83 3.94 3.98 4.64 1.5559 1 969.92Dec 4.00 3.84 3.94 3.96 4.62 1.6095 1 900.53
2003 Jan 4.00 3.75 3.88 3.91 4.44 1.6437 1 827.42Feb 3.75 3.46 3.59 3.64 4.39 1.5751 1 755.44Mar 3.75 3.48 3.57 3.61 4.54 1.5805 1 747.64
1 Average of working days.2 Financial Times Actuaries share indices 10 April 1962 = 100. All classes
(750 shares) index.
Source: Bank of England
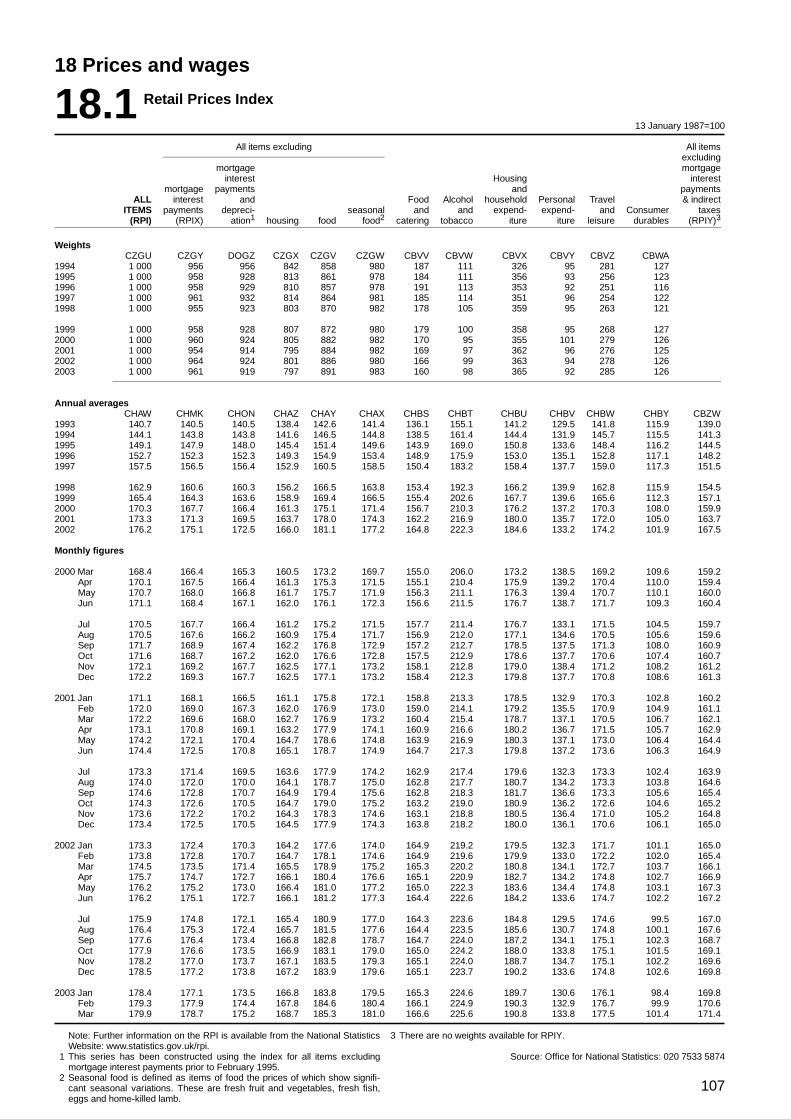
107
18 Prices and wages
18.1 Retail Prices Index
13 January 1987=100
All items excluding All itemsexcluding
mortgage mortgageinterest Housing interest
mortgage payments and paymentsALL interest and Food Alcohol household Personal Travel & indirect
ITEMS payments depreci- seasonal and and expend- expend- and Consumer taxes(RPI) (RPIX) ation1 housing food food2 catering tobacco iture iture leisure durables (RPIY)3
WeightsCZGU CZGY DOGZ CZGX CZGV CZGW CBVV CBVW CBVX CBVY CBVZ CBWA
1994 1 000 956 956 842 858 980 187 111 326 95 281 1271995 1 000 958 928 813 861 978 184 111 356 93 256 1231996 1 000 958 929 810 857 978 191 113 353 92 251 1161997 1 000 961 932 814 864 981 185 114 351 96 254 1221998 1 000 955 923 803 870 982 178 105 359 95 263 121
1999 1 000 958 928 807 872 980 179 100 358 95 268 1272000 1 000 960 924 805 882 982 170 95 355 101 279 1262001 1 000 954 914 795 884 982 169 97 362 96 276 1252002 1 000 964 924 801 886 980 166 99 363 94 278 1262003 1 000 961 919 797 891 983 160 98 365 92 285 126
Annual averagesCHAW CHMK CHON CHAZ CHAY CHAX CHBS CHBT CHBU CHBV CHBW CHBY CBZW
1993 140.7 140.5 140.5 138.4 142.6 141.4 136.1 155.1 141.2 129.5 141.8 115.9 139.01994 144.1 143.8 143.8 141.6 146.5 144.8 138.5 161.4 144.4 131.9 145.7 115.5 141.31995 149.1 147.9 148.0 145.4 151.4 149.6 143.9 169.0 150.8 133.6 148.4 116.2 144.51996 152.7 152.3 152.3 149.3 154.9 153.4 148.9 175.9 153.0 135.1 152.8 117.1 148.21997 157.5 156.5 156.4 152.9 160.5 158.5 150.4 183.2 158.4 137.7 159.0 117.3 151.5
1998 162.9 160.6 160.3 156.2 166.5 163.8 153.4 192.3 166.2 139.9 162.8 115.9 154.51999 165.4 164.3 163.6 158.9 169.4 166.5 155.4 202.6 167.7 139.6 165.6 112.3 157.12000 170.3 167.7 166.4 161.3 175.1 171.4 156.7 210.3 176.2 137.2 170.3 108.0 159.92001 173.3 171.3 169.5 163.7 178.0 174.3 162.2 216.9 180.0 135.7 172.0 105.0 163.72002 176.2 175.1 172.5 166.0 181.1 177.2 164.8 222.3 184.6 133.2 174.2 101.9 167.5
Monthly figures
2000 Mar 168.4 166.4 165.3 160.5 173.2 169.7 155.0 206.0 173.2 138.5 169.2 109.6 159.2Apr 170.1 167.5 166.4 161.3 175.3 171.5 155.1 210.4 175.9 139.2 170.4 110.0 159.4May 170.7 168.0 166.8 161.7 175.7 171.9 156.3 211.1 176.3 139.4 170.7 110.1 160.0Jun 171.1 168.4 167.1 162.0 176.1 172.3 156.6 211.5 176.7 138.7 171.7 109.3 160.4
Jul 170.5 167.7 166.4 161.2 175.2 171.5 157.7 211.4 176.7 133.1 171.5 104.5 159.7Aug 170.5 167.6 166.2 160.9 175.4 171.7 156.9 212.0 177.1 134.6 170.5 105.6 159.6Sep 171.7 168.9 167.4 162.2 176.8 172.9 157.2 212.7 178.5 137.5 171.3 108.0 160.9Oct 171.6 168.7 167.2 162.0 176.6 172.8 157.5 212.9 178.6 137.7 170.6 107.4 160.7Nov 172.1 169.2 167.7 162.5 177.1 173.2 158.1 212.8 179.0 138.4 171.2 108.2 161.2Dec 172.2 169.3 167.7 162.5 177.1 173.2 158.4 212.3 179.8 137.7 170.8 108.6 161.3
2001 Jan 171.1 168.1 166.5 161.1 175.8 172.1 158.8 213.3 178.5 132.9 170.3 102.8 160.2Feb 172.0 169.0 167.3 162.0 176.9 173.0 159.0 214.1 179.2 135.5 170.9 104.9 161.1Mar 172.2 169.6 168.0 162.7 176.9 173.2 160.4 215.4 178.7 137.1 170.5 106.7 162.1Apr 173.1 170.8 169.1 163.2 177.9 174.1 160.9 216.6 180.2 136.7 171.5 105.7 162.9May 174.2 172.1 170.4 164.7 178.6 174.8 163.9 216.9 180.3 137.1 173.0 106.4 164.4Jun 174.4 172.5 170.8 165.1 178.7 174.9 164.7 217.3 179.8 137.2 173.6 106.3 164.9
Jul 173.3 171.4 169.5 163.6 177.9 174.2 162.9 217.4 179.6 132.3 173.3 102.4 163.9Aug 174.0 172.0 170.0 164.1 178.7 175.0 162.8 217.7 180.7 134.2 173.3 103.8 164.6Sep 174.6 172.8 170.7 164.9 179.4 175.6 162.8 218.3 181.7 136.6 173.3 105.6 165.4Oct 174.3 172.6 170.5 164.7 179.0 175.2 163.2 219.0 180.9 136.2 172.6 104.6 165.2Nov 173.6 172.2 170.2 164.3 178.3 174.6 163.1 218.8 180.5 136.4 171.0 105.2 164.8Dec 173.4 172.5 170.5 164.5 177.9 174.3 163.8 218.2 180.0 136.1 170.6 106.1 165.0
2002 Jan 173.3 172.4 170.3 164.2 177.6 174.0 164.9 219.2 179.5 132.3 171.7 101.1 165.0Feb 173.8 172.8 170.7 164.7 178.1 174.6 164.9 219.6 179.9 133.0 172.2 102.0 165.4Mar 174.5 173.5 171.4 165.5 178.9 175.2 165.3 220.2 180.8 134.1 172.7 103.7 166.1Apr 175.7 174.7 172.7 166.1 180.4 176.6 165.1 220.9 182.7 134.2 174.8 102.7 166.9May 176.2 175.2 173.0 166.4 181.0 177.2 165.0 222.3 183.6 134.4 174.8 103.1 167.3Jun 176.2 175.1 172.7 166.1 181.2 177.3 164.4 222.6 184.2 133.6 174.7 102.2 167.2
Jul 175.9 174.8 172.1 165.4 180.9 177.0 164.3 223.6 184.8 129.5 174.6 99.5 167.0Aug 176.4 175.3 172.4 165.7 181.5 177.6 164.4 223.5 185.6 130.7 174.8 100.1 167.6Sep 177.6 176.4 173.4 166.8 182.8 178.7 164.7 224.0 187.2 134.1 175.1 102.3 168.7Oct 177.9 176.6 173.5 166.9 183.1 179.0 165.0 224.2 188.0 133.8 175.1 101.5 169.1Nov 178.2 177.0 173.7 167.1 183.5 179.3 165.1 224.0 188.7 134.7 175.1 102.2 169.6Dec 178.5 177.2 173.8 167.2 183.9 179.6 165.1 223.7 190.2 133.6 174.8 102.6 169.8
2003 Jan 178.4 177.1 173.5 166.8 183.8 179.5 165.3 224.6 189.7 130.6 176.1 98.4 169.8Feb 179.3 177.9 174.4 167.8 184.6 180.4 166.1 224.9 190.3 132.9 176.7 99.9 170.6Mar 179.9 178.7 175.2 168.7 185.3 181.0 166.6 225.6 190.8 133.8 177.5 101.4 171.4
Note: Further information on the RPI is available from the National StatisticsWebsite: www.statistics.gov.uk/rpi.
1 This series has been constructed using the index for all items excludingmortgage interest payments prior to February 1995.
2 Seasonal food is defined as items of food the prices of which show signifi-cant seasonal variations. These are fresh fruit and vegetables, fresh fish,eggs and home-killed lamb.
3 There are no weights available for RPIY.
Source: Office for National Statistics: 020 7533 5874
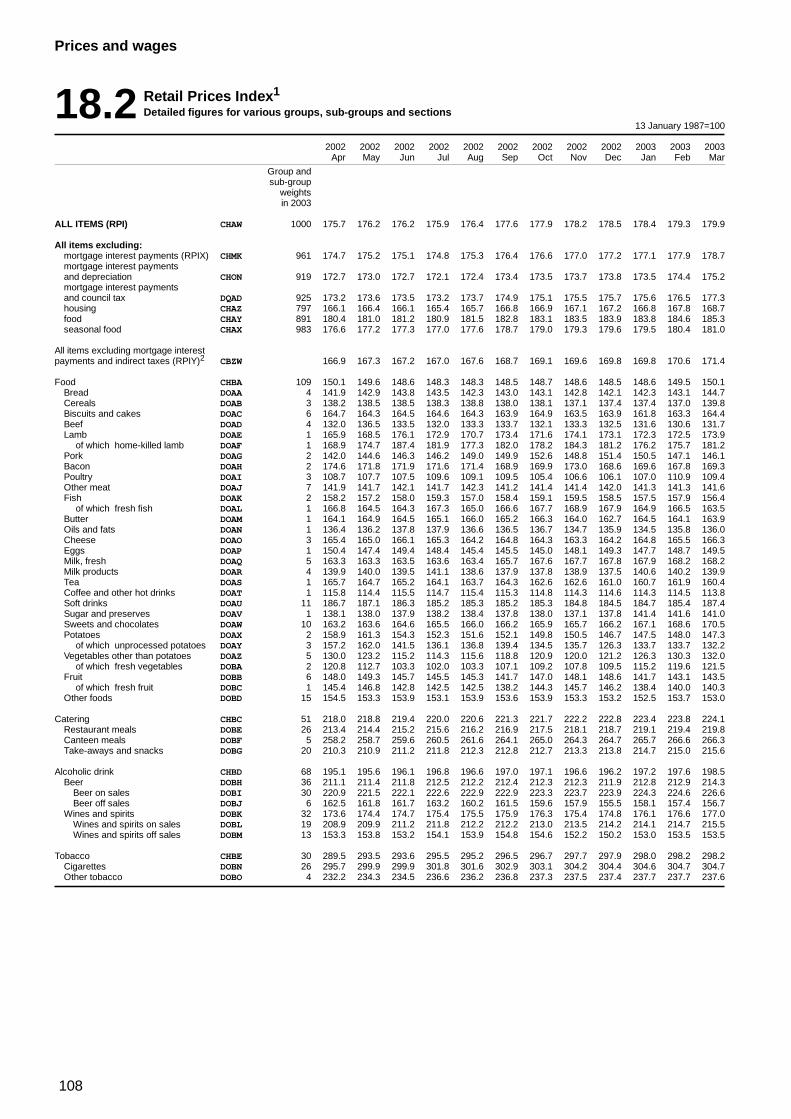
108
Prices and wages
18.2 Retail Prices Index1
Detailed figures for various groups, sub-groups and sections13 January 1987=100
2002 2002 2002 2002 2002 2002 2002 2002 2002 2003 2003 2003Apr May Jun Jul Aug Sep Oct Nov Dec Jan Feb Mar
Group andsub-group
weightsin 2003
ALL ITEMS (RPI) CHAW 1000 175.7 176.2 176.2 175.9 176.4 177.6 177.9 178.2 178.5 178.4 179.3 179.9
All items excluding:mortgage interest payments (RPIX) CHMK 961 174.7 175.2 175.1 174.8 175.3 176.4 176.6 177.0 177.2 177.1 177.9 178.7mortgage interest paymentsand depreciation CHON 919 172.7 173.0 172.7 172.1 172.4 173.4 173.5 173.7 173.8 173.5 174.4 175.2mortgage interest paymentsand council tax DQAD 925 173.2 173.6 173.5 173.2 173.7 174.9 175.1 175.5 175.7 175.6 176.5 177.3housing CHAZ 797 166.1 166.4 166.1 165.4 165.7 166.8 166.9 167.1 167.2 166.8 167.8 168.7food CHAY 891 180.4 181.0 181.2 180.9 181.5 182.8 183.1 183.5 183.9 183.8 184.6 185.3seasonal food CHAX 983 176.6 177.2 177.3 177.0 177.6 178.7 179.0 179.3 179.6 179.5 180.4 181.0
All items excluding mortgage interestpayments and indirect taxes (RPIY)2 CBZW 166.9 167.3 167.2 167.0 167.6 168.7 169.1 169.6 169.8 169.8 170.6 171.4
Food CHBA 109 150.1 149.6 148.6 148.3 148.3 148.5 148.7 148.6 148.5 148.6 149.5 150.1Bread DOAA 4 141.9 142.9 143.8 143.5 142.3 143.0 143.1 142.8 142.1 142.3 143.1 144.7Cereals DOAB 3 138.2 138.5 138.5 138.3 138.8 138.0 138.1 137.1 137.4 137.4 137.0 139.8Biscuits and cakes DOAC 6 164.7 164.3 164.5 164.6 164.3 163.9 164.9 163.5 163.9 161.8 163.3 164.4Beef DOAD 4 132.0 136.5 133.5 132.0 133.3 133.7 132.1 133.3 132.5 131.6 130.6 131.7Lamb DOAE 1 165.9 168.5 176.1 172.9 170.7 173.4 171.6 174.1 173.1 172.3 172.5 173.9
of which home-killed lamb DOAF 1 168.9 174.7 187.4 181.9 177.3 182.0 178.2 184.3 181.2 176.2 175.7 181.2Pork DOAG 2 142.0 144.6 146.3 146.2 149.0 149.9 152.6 148.8 151.4 150.5 147.1 146.1Bacon DOAH 2 174.6 171.8 171.9 171.6 171.4 168.9 169.9 173.0 168.6 169.6 167.8 169.3Poultry DOAI 3 108.7 107.7 107.5 109.6 109.1 109.5 105.4 106.6 106.1 107.0 110.9 109.4Other meat DOAJ 7 141.9 141.7 142.1 141.7 142.3 141.2 141.4 141.4 142.0 141.3 141.3 141.6Fish DOAK 2 158.2 157.2 158.0 159.3 157.0 158.4 159.1 159.5 158.5 157.5 157.9 156.4
of which fresh fish DOAL 1 166.8 164.5 164.3 167.3 165.0 166.6 167.7 168.9 167.9 164.9 166.5 163.5Butter DOAM 1 164.1 164.9 164.5 165.1 166.0 165.2 166.3 164.0 162.7 164.5 164.1 163.9Oils and fats DOAN 1 136.4 136.2 137.8 137.9 136.6 136.5 136.7 134.7 135.9 134.5 135.8 136.0Cheese DOAO 3 165.4 165.0 166.1 165.3 164.2 164.8 164.3 163.3 164.2 164.8 165.5 166.3Eggs DOAP 1 150.4 147.4 149.4 148.4 145.4 145.5 145.0 148.1 149.3 147.7 148.7 149.5Milk, fresh DOAQ 5 163.3 163.3 163.5 163.6 163.4 165.7 167.6 167.7 167.8 167.9 168.2 168.2Milk products DOAR 4 139.9 140.0 139.5 141.1 138.6 137.9 137.8 138.9 137.5 140.6 140.2 139.9Tea DOAS 1 165.7 164.7 165.2 164.1 163.7 164.3 162.6 162.6 161.0 160.7 161.9 160.4Coffee and other hot drinks DOAT 1 115.8 114.4 115.5 114.7 115.4 115.3 114.8 114.3 114.6 114.3 114.5 113.8Soft drinks DOAU 11 186.7 187.1 186.3 185.2 185.3 185.2 185.3 184.8 184.5 184.7 185.4 187.4Sugar and preserves DOAV 1 138.1 138.0 137.9 138.2 138.4 137.8 138.0 137.1 137.8 141.4 141.6 141.0Sweets and chocolates DOAW 10 163.2 163.6 164.6 165.5 166.0 166.2 165.9 165.7 166.2 167.1 168.6 170.5Potatoes DOAX 2 158.9 161.3 154.3 152.3 151.6 152.1 149.8 150.5 146.7 147.5 148.0 147.3
of which unprocessed potatoes DOAY 3 157.2 162.0 141.5 136.1 136.8 139.4 134.5 135.7 126.3 133.7 133.7 132.2Vegetables other than potatoes DOAZ 5 130.0 123.2 115.2 114.3 115.6 118.8 120.9 120.0 121.2 126.3 130.3 132.0
of which fresh vegetables DOBA 2 120.8 112.7 103.3 102.0 103.3 107.1 109.2 107.8 109.5 115.2 119.6 121.5Fruit DOBB 6 148.0 149.3 145.7 145.5 145.3 141.7 147.0 148.1 148.6 141.7 143.1 143.5
of which fresh fruit DOBC 1 145.4 146.8 142.8 142.5 142.5 138.2 144.3 145.7 146.2 138.4 140.0 140.3Other foods DOBD 15 154.5 153.3 153.9 153.1 153.9 153.6 153.9 153.3 153.2 152.5 153.7 153.0
Catering CHBC 51 218.0 218.8 219.4 220.0 220.6 221.3 221.7 222.2 222.8 223.4 223.8 224.1Restaurant meals DOBE 26 213.4 214.4 215.2 215.6 216.2 216.9 217.5 218.1 218.7 219.1 219.4 219.8Canteen meals DOBF 5 258.2 258.7 259.6 260.5 261.6 264.1 265.0 264.3 264.7 265.7 266.6 266.3Take-aways and snacks DOBG 20 210.3 210.9 211.2 211.8 212.3 212.8 212.7 213.3 213.8 214.7 215.0 215.6
Alcoholic drink CHBD 68 195.1 195.6 196.1 196.8 196.6 197.0 197.1 196.6 196.2 197.2 197.6 198.5Beer DOBH 36 211.1 211.4 211.8 212.5 212.2 212.4 212.3 212.3 211.9 212.8 212.9 214.3
Beer on sales DOBI 30 220.9 221.5 222.1 222.6 222.9 222.9 223.3 223.7 223.9 224.3 224.6 226.6Beer off sales DOBJ 6 162.5 161.8 161.7 163.2 160.2 161.5 159.6 157.9 155.5 158.1 157.4 156.7
Wines and spirits DOBK 32 173.6 174.4 174.7 175.4 175.5 175.9 176.3 175.4 174.8 176.1 176.6 177.0Wines and spirits on sales DOBL 19 208.9 209.9 211.2 211.8 212.2 212.2 213.0 213.5 214.2 214.1 214.7 215.5Wines and spirits off sales DOBM 13 153.3 153.8 153.2 154.1 153.9 154.8 154.6 152.2 150.2 153.0 153.5 153.5
Tobacco CHBE 30 289.5 293.5 293.6 295.5 295.2 296.5 296.7 297.7 297.9 298.0 298.2 298.2Cigarettes DOBN 26 295.7 299.9 299.9 301.8 301.6 302.9 303.1 304.2 304.4 304.6 304.7 304.7Other tobacco DOBO 4 232.2 234.3 234.5 236.6 236.2 236.8 237.3 237.5 237.4 237.7 237.7 237.6
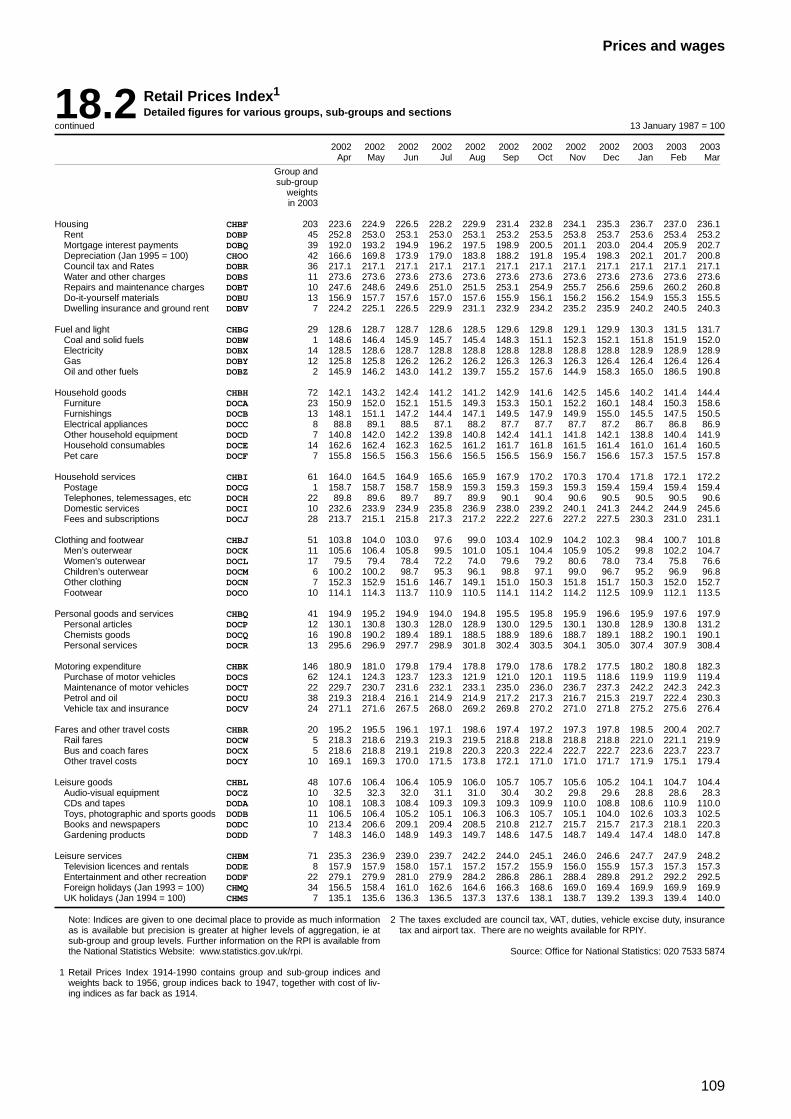
109
Prices and wages
18.2 Retail Prices Index1
Detailed figures for various groups, sub-groups and sectionscontinued 13 January 1987 = 100
2002 2002 2002 2002 2002 2002 2002 2002 2002 2003 2003 2003Apr May Jun Jul Aug Sep Oct Nov Dec Jan Feb Mar
Group andsub-group
weightsin 2003
Housing CHBF 203 223.6 224.9 226.5 228.2 229.9 231.4 232.8 234.1 235.3 236.7 237.0 236.1Rent DOBP 45 252.8 253.0 253.1 253.0 253.1 253.2 253.5 253.8 253.7 253.6 253.4 253.2Mortgage interest payments DOBQ 39 192.0 193.2 194.9 196.2 197.5 198.9 200.5 201.1 203.0 204.4 205.9 202.7Depreciation (Jan 1995 = 100) CHOO 42 166.6 169.8 173.9 179.0 183.8 188.2 191.8 195.4 198.3 202.1 201.7 200.8Council tax and Rates DOBR 36 217.1 217.1 217.1 217.1 217.1 217.1 217.1 217.1 217.1 217.1 217.1 217.1Water and other charges DOBS 11 273.6 273.6 273.6 273.6 273.6 273.6 273.6 273.6 273.6 273.6 273.6 273.6Repairs and maintenance charges DOBT 10 247.6 248.6 249.6 251.0 251.5 253.1 254.9 255.7 256.6 259.6 260.2 260.8Do-it-yourself materials DOBU 13 156.9 157.7 157.6 157.0 157.6 155.9 156.1 156.2 156.2 154.9 155.3 155.5Dwelling insurance and ground rent DOBV 7 224.2 225.1 226.5 229.9 231.1 232.9 234.2 235.2 235.9 240.2 240.5 240.3
Fuel and light CHBG 29 128.6 128.7 128.7 128.6 128.5 129.6 129.8 129.1 129.9 130.3 131.5 131.7Coal and solid fuels DOBW 1 148.6 146.4 145.9 145.7 145.4 148.3 151.1 152.3 152.1 151.8 151.9 152.0Electricity DOBX 14 128.5 128.6 128.7 128.8 128.8 128.8 128.8 128.8 128.8 128.9 128.9 128.9Gas DOBY 12 125.8 125.8 126.2 126.2 126.2 126.3 126.3 126.3 126.4 126.4 126.4 126.4Oil and other fuels DOBZ 2 145.9 146.2 143.0 141.2 139.7 155.2 157.6 144.9 158.3 165.0 186.5 190.8
Household goods CHBH 72 142.1 143.2 142.4 141.2 141.2 142.9 141.6 142.5 145.6 140.2 141.4 144.4Furniture DOCA 23 150.9 152.0 152.1 151.5 149.3 153.3 150.1 152.2 160.1 148.4 150.3 158.6Furnishings DOCB 13 148.1 151.1 147.2 144.4 147.1 149.5 147.9 149.9 155.0 145.5 147.5 150.5Electrical appliances DOCC 8 88.8 89.1 88.5 87.1 88.2 87.7 87.7 87.7 87.2 86.7 86.8 86.9Other household equipment DOCD 7 140.8 142.0 142.2 139.8 140.8 142.4 141.1 141.8 142.1 138.8 140.4 141.9Household consumables DOCE 14 162.6 162.4 162.3 162.5 161.2 161.7 161.8 161.5 161.4 161.0 161.4 160.5Pet care DOCF 7 155.8 156.5 156.3 156.6 156.5 156.5 156.9 156.7 156.6 157.3 157.5 157.8
Household services CHBI 61 164.0 164.5 164.9 165.6 165.9 167.9 170.2 170.3 170.4 171.8 172.1 172.2Postage DOCG 1 158.7 158.7 158.7 158.9 159.3 159.3 159.3 159.3 159.4 159.4 159.4 159.4Telephones, telemessages, etc DOCH 22 89.8 89.6 89.7 89.7 89.9 90.1 90.4 90.6 90.5 90.5 90.5 90.6Domestic services DOCI 10 232.6 233.9 234.9 235.8 236.9 238.0 239.2 240.1 241.3 244.2 244.9 245.6Fees and subscriptions DOCJ 28 213.7 215.1 215.8 217.3 217.2 222.2 227.6 227.2 227.5 230.3 231.0 231.1
Clothing and footwear CHBJ 51 103.8 104.0 103.0 97.6 99.0 103.4 102.9 104.2 102.3 98.4 100.7 101.8Men’s outerwear DOCK 11 105.6 106.4 105.8 99.5 101.0 105.1 104.4 105.9 105.2 99.8 102.2 104.7Women’s outerwear DOCL 17 79.5 79.4 78.4 72.2 74.0 79.6 79.2 80.6 78.0 73.4 75.8 76.6Children’s outerwear DOCM 6 100.2 100.2 98.7 95.3 96.1 98.8 97.1 99.0 96.7 95.2 96.9 96.8Other clothing DOCN 7 152.3 152.9 151.6 146.7 149.1 151.0 150.3 151.8 151.7 150.3 152.0 152.7Footwear DOCO 10 114.1 114.3 113.7 110.9 110.5 114.1 114.2 114.2 112.5 109.9 112.1 113.5
Personal goods and services CHBQ 41 194.9 195.2 194.9 194.0 194.8 195.5 195.8 195.9 196.6 195.9 197.6 197.9Personal articles DOCP 12 130.1 130.8 130.3 128.0 128.9 130.0 129.5 130.1 130.8 128.9 130.8 131.2Chemists goods DOCQ 16 190.8 190.2 189.4 189.1 188.5 188.9 189.6 188.7 189.1 188.2 190.1 190.1Personal services DOCR 13 295.6 296.9 297.7 298.9 301.8 302.4 303.5 304.1 305.0 307.4 307.9 308.4
Motoring expenditure CHBK 146 180.9 181.0 179.8 179.4 178.8 179.0 178.6 178.2 177.5 180.2 180.8 182.3Purchase of motor vehicles DOCS 62 124.1 124.3 123.7 123.3 121.9 121.0 120.1 119.5 118.6 119.9 119.9 119.4Maintenance of motor vehicles DOCT 22 229.7 230.7 231.6 232.1 233.1 235.0 236.0 236.7 237.3 242.2 242.3 242.3Petrol and oil DOCU 38 219.3 218.4 216.1 214.9 214.9 217.2 217.3 216.7 215.3 219.7 222.4 230.3Vehicle tax and insurance DOCV 24 271.1 271.6 267.5 268.0 269.2 269.8 270.2 271.0 271.8 275.2 275.6 276.4
Fares and other travel costs CHBR 20 195.2 195.5 196.1 197.1 198.6 197.4 197.2 197.3 197.8 198.5 200.4 202.7Rail fares DOCW 5 218.3 218.6 219.3 219.3 219.5 218.8 218.8 218.8 218.8 221.0 221.1 219.9Bus and coach fares DOCX 5 218.6 218.8 219.1 219.8 220.3 220.3 222.4 222.7 222.7 223.6 223.7 223.7Other travel costs DOCY 10 169.1 169.3 170.0 171.5 173.8 172.1 171.0 171.0 171.7 171.9 175.1 179.4
Leisure goods CHBL 48 107.6 106.4 106.4 105.9 106.0 105.7 105.7 105.6 105.2 104.1 104.7 104.4Audio-visual equipment DOCZ 10 32.5 32.3 32.0 31.1 31.0 30.4 30.2 29.8 29.6 28.8 28.6 28.3CDs and tapes DODA 10 108.1 108.3 108.4 109.3 109.3 109.3 109.9 110.0 108.8 108.6 110.9 110.0Toys, photographic and sports goods DODB 11 106.5 106.4 105.2 105.1 106.3 106.3 105.7 105.1 104.0 102.6 103.3 102.5Books and newspapers DODC 10 213.4 206.6 209.1 209.4 208.5 210.8 212.7 215.7 215.7 217.3 218.1 220.3Gardening products DODD 7 148.3 146.0 148.9 149.3 149.7 148.6 147.5 148.7 149.4 147.4 148.0 147.8
Leisure services CHBM 71 235.3 236.9 239.0 239.7 242.2 244.0 245.1 246.0 246.6 247.7 247.9 248.2Television licences and rentals DODE 8 157.9 157.9 158.0 157.1 157.2 157.2 155.9 156.0 155.9 157.3 157.3 157.3Entertainment and other recreation DODF 22 279.1 279.9 281.0 279.9 284.2 286.8 286.1 288.4 289.8 291.2 292.2 292.5Foreign holidays (Jan 1993 = 100) CHMQ 34 156.5 158.4 161.0 162.6 164.6 166.3 168.6 169.0 169.4 169.9 169.9 169.9UK holidays (Jan 1994 = 100) CHMS 7 135.1 135.6 136.3 136.5 137.3 137.6 138.1 138.7 139.2 139.3 139.4 140.0
Note: Indices are given to one decimal place to provide as much informationas is available but precision is greater at higher levels of aggregation, ie atsub-group and group levels. Further information on the RPI is available fromthe National Statistics Website: www.statistics.gov.uk/rpi.
1 Retail Prices Index 1914-1990 contains group and sub-group indices andweights back to 1956, group indices back to 1947, together with cost of liv-ing indices as far back as 1914.
2 The taxes excluded are council tax, VAT, duties, vehicle excise duty, insurancetax and airport tax. There are no weights available for RPIY.
Source: Office for National Statistics: 020 7533 5874
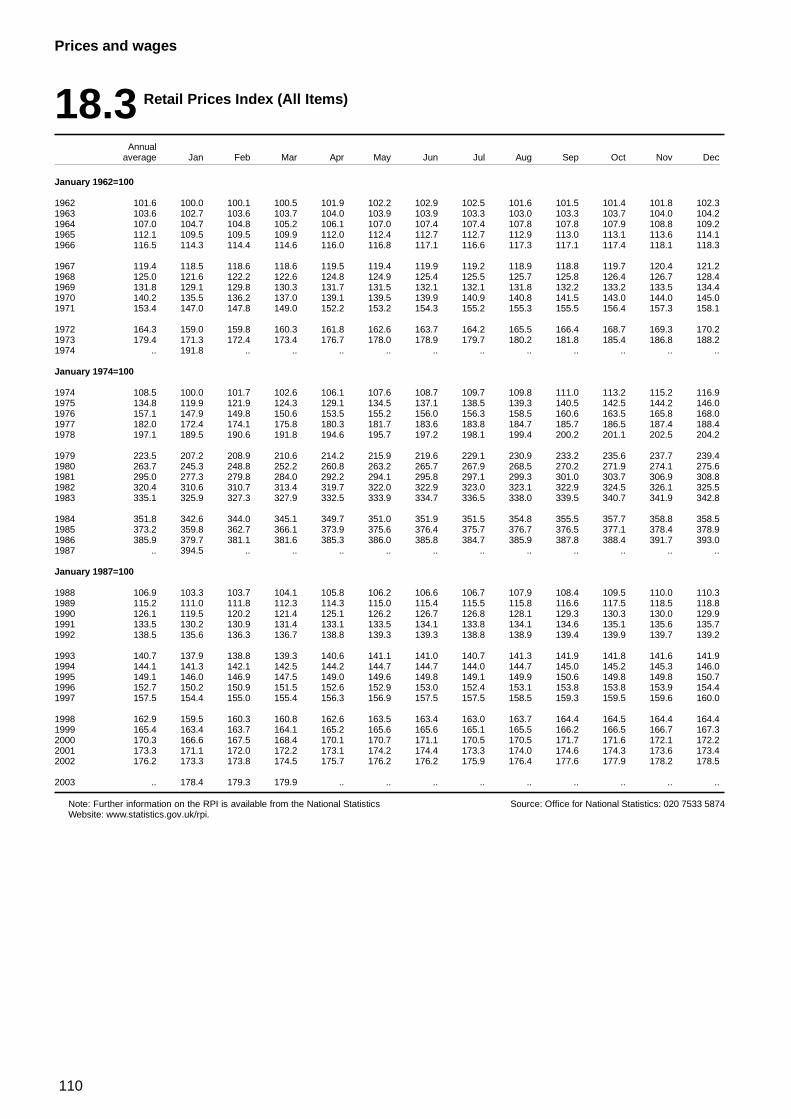
110
Prices and wages
18.3 Retail Prices Index (All Items)
Annualaverage Jan Feb Mar Apr May Jun Jul Aug Sep Oct Nov Dec
January 1962=100
1962 101.6 100.0 100.1 100.5 101.9 102.2 102.9 102.5 101.6 101.5 101.4 101.8 102.31963 103.6 102.7 103.6 103.7 104.0 103.9 103.9 103.3 103.0 103.3 103.7 104.0 104.21964 107.0 104.7 104.8 105.2 106.1 107.0 107.4 107.4 107.8 107.8 107.9 108.8 109.21965 112.1 109.5 109.5 109.9 112.0 112.4 112.7 112.7 112.9 113.0 113.1 113.6 114.11966 116.5 114.3 114.4 114.6 116.0 116.8 117.1 116.6 117.3 117.1 117.4 118.1 118.3
1967 119.4 118.5 118.6 118.6 119.5 119.4 119.9 119.2 118.9 118.8 119.7 120.4 121.21968 125.0 121.6 122.2 122.6 124.8 124.9 125.4 125.5 125.7 125.8 126.4 126.7 128.41969 131.8 129.1 129.8 130.3 131.7 131.5 132.1 132.1 131.8 132.2 133.2 133.5 134.41970 140.2 135.5 136.2 137.0 139.1 139.5 139.9 140.9 140.8 141.5 143.0 144.0 145.01971 153.4 147.0 147.8 149.0 152.2 153.2 154.3 155.2 155.3 155.5 156.4 157.3 158.1
1972 164.3 159.0 159.8 160.3 161.8 162.6 163.7 164.2 165.5 166.4 168.7 169.3 170.21973 179.4 171.3 172.4 173.4 176.7 178.0 178.9 179.7 180.2 181.8 185.4 186.8 188.21974 .. 191.8 .. .. .. .. .. .. .. .. .. .. ..
January 1974=100
1974 108.5 100.0 101.7 102.6 106.1 107.6 108.7 109.7 109.8 111.0 113.2 115.2 116.91975 134.8 119.9 121.9 124.3 129.1 134.5 137.1 138.5 139.3 140.5 142.5 144.2 146.01976 157.1 147.9 149.8 150.6 153.5 155.2 156.0 156.3 158.5 160.6 163.5 165.8 168.01977 182.0 172.4 174.1 175.8 180.3 181.7 183.6 183.8 184.7 185.7 186.5 187.4 188.41978 197.1 189.5 190.6 191.8 194.6 195.7 197.2 198.1 199.4 200.2 201.1 202.5 204.2
1979 223.5 207.2 208.9 210.6 214.2 215.9 219.6 229.1 230.9 233.2 235.6 237.7 239.41980 263.7 245.3 248.8 252.2 260.8 263.2 265.7 267.9 268.5 270.2 271.9 274.1 275.61981 295.0 277.3 279.8 284.0 292.2 294.1 295.8 297.1 299.3 301.0 303.7 306.9 308.81982 320.4 310.6 310.7 313.4 319.7 322.0 322.9 323.0 323.1 322.9 324.5 326.1 325.51983 335.1 325.9 327.3 327.9 332.5 333.9 334.7 336.5 338.0 339.5 340.7 341.9 342.8
1984 351.8 342.6 344.0 345.1 349.7 351.0 351.9 351.5 354.8 355.5 357.7 358.8 358.51985 373.2 359.8 362.7 366.1 373.9 375.6 376.4 375.7 376.7 376.5 377.1 378.4 378.91986 385.9 379.7 381.1 381.6 385.3 386.0 385.8 384.7 385.9 387.8 388.4 391.7 393.01987 .. 394.5 .. .. .. .. .. .. .. .. .. .. ..
January 1987=100
1988 106.9 103.3 103.7 104.1 105.8 106.2 106.6 106.7 107.9 108.4 109.5 110.0 110.31989 115.2 111.0 111.8 112.3 114.3 115.0 115.4 115.5 115.8 116.6 117.5 118.5 118.81990 126.1 119.5 120.2 121.4 125.1 126.2 126.7 126.8 128.1 129.3 130.3 130.0 129.91991 133.5 130.2 130.9 131.4 133.1 133.5 134.1 133.8 134.1 134.6 135.1 135.6 135.71992 138.5 135.6 136.3 136.7 138.8 139.3 139.3 138.8 138.9 139.4 139.9 139.7 139.2
1993 140.7 137.9 138.8 139.3 140.6 141.1 141.0 140.7 141.3 141.9 141.8 141.6 141.91994 144.1 141.3 142.1 142.5 144.2 144.7 144.7 144.0 144.7 145.0 145.2 145.3 146.01995 149.1 146.0 146.9 147.5 149.0 149.6 149.8 149.1 149.9 150.6 149.8 149.8 150.71996 152.7 150.2 150.9 151.5 152.6 152.9 153.0 152.4 153.1 153.8 153.8 153.9 154.41997 157.5 154.4 155.0 155.4 156.3 156.9 157.5 157.5 158.5 159.3 159.5 159.6 160.0
1998 162.9 159.5 160.3 160.8 162.6 163.5 163.4 163.0 163.7 164.4 164.5 164.4 164.41999 165.4 163.4 163.7 164.1 165.2 165.6 165.6 165.1 165.5 166.2 166.5 166.7 167.32000 170.3 166.6 167.5 168.4 170.1 170.7 171.1 170.5 170.5 171.7 171.6 172.1 172.22001 173.3 171.1 172.0 172.2 173.1 174.2 174.4 173.3 174.0 174.6 174.3 173.6 173.42002 176.2 173.3 173.8 174.5 175.7 176.2 176.2 175.9 176.4 177.6 177.9 178.2 178.5
2003 .. 178.4 179.3 179.9 .. .. .. .. .. .. .. .. ..
Note: Further information on the RPI is available from the National StatisticsWebsite: www.statistics.gov.uk/rpi.
Source: Office for National Statistics: 020 7533 5874
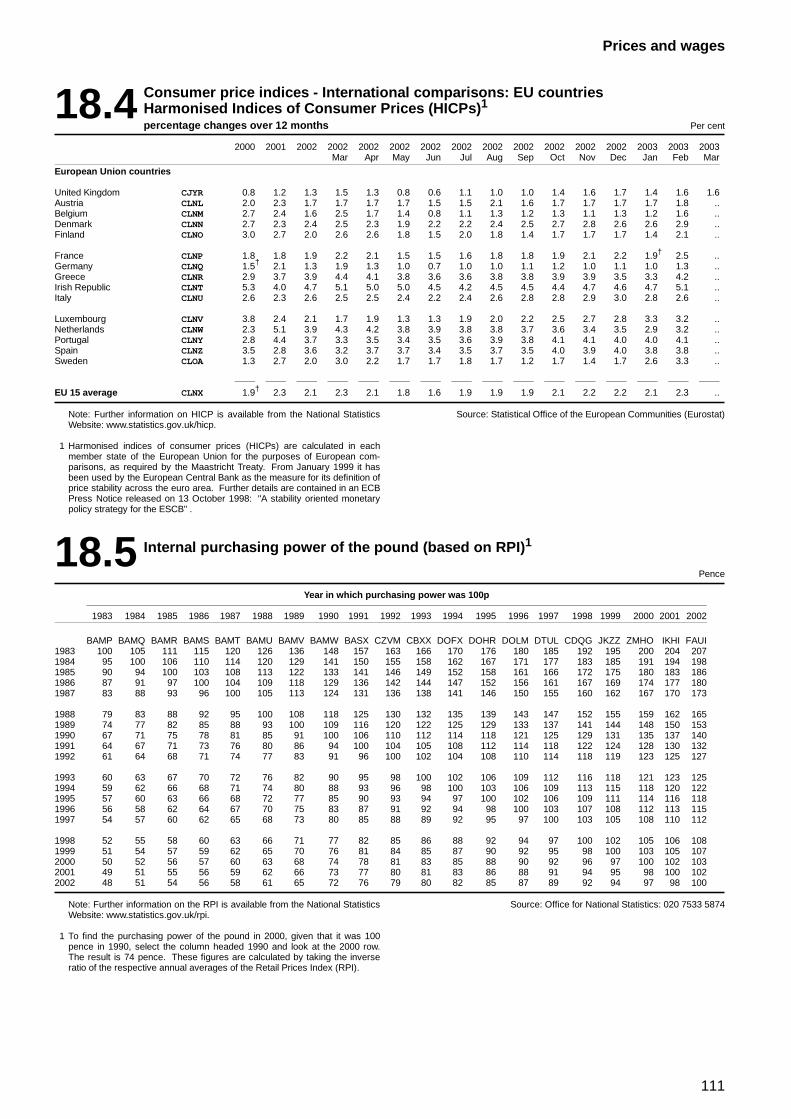
111
Prices and wages
18.4 Consumer price indices - International comparisons: EU countriesHarmonised Indices of Consumer Prices (HICPs)1percentage changes over 12 months Per cent
2000 2001 2002 2002 2002 2002 2002 2002 2002 2002 2002 2002 2002 2003 2003 2003Mar Apr May Jun Jul Aug Sep Oct Nov Dec Jan Feb Mar
European Union countries
United Kingdom CJYR 0.8 1.2 1.3 1.5 1.3 0.8 0.6 1.1 1.0 1.0 1.4 1.6 1.7 1.4 1.6 1.6Austria CLNL 2.0 2.3 1.7 1.7 1.7 1.7 1.5 1.5 2.1 1.6 1.7 1.7 1.7 1.7 1.8 ..Belgium CLNM 2.7 2.4 1.6 2.5 1.7 1.4 0.8 1.1 1.3 1.2 1.3 1.1 1.3 1.2 1.6 ..Denmark CLNN 2.7 2.3 2.4 2.5 2.3 1.9 2.2 2.2 2.4 2.5 2.7 2.8 2.6 2.6 2.9 ..Finland CLNO 3.0 2.7 2.0 2.6 2.6 1.8 1.5 2.0 1.8 1.4 1.7 1.7 1.7 1.4 2.1 ..
France CLNP 1.8 1.8 1.9 2.2 2.1 1.5 1.5 1.6 1.8 1.8 1.9 2.1 2.2 1.9† 2.5 ..Germany CLNQ 1.5† 2.1 1.3 1.9 1.3 1.0 0.7 1.0 1.0 1.1 1.2 1.0 1.1 1.0 1.3 ..Greece CLNR 2.9 3.7 3.9 4.4 4.1 3.8 3.6 3.6 3.8 3.8 3.9 3.9 3.5 3.3 4.2 ..Irish Republic CLNT 5.3 4.0 4.7 5.1 5.0 5.0 4.5 4.2 4.5 4.5 4.4 4.7 4.6 4.7 5.1 ..Italy CLNU 2.6 2.3 2.6 2.5 2.5 2.4 2.2 2.4 2.6 2.8 2.8 2.9 3.0 2.8 2.6 ..
Luxembourg CLNV 3.8 2.4 2.1 1.7 1.9 1.3 1.3 1.9 2.0 2.2 2.5 2.7 2.8 3.3 3.2 ..Netherlands CLNW 2.3 5.1 3.9 4.3 4.2 3.8 3.9 3.8 3.8 3.7 3.6 3.4 3.5 2.9 3.2 ..Portugal CLNY 2.8 4.4 3.7 3.3 3.5 3.4 3.5 3.6 3.9 3.8 4.1 4.1 4.0 4.0 4.1 ..Spain CLNZ 3.5 2.8 3.6 3.2 3.7 3.7 3.4 3.5 3.7 3.5 4.0 3.9 4.0 3.8 3.8 ..Sweden CLOA 1.3 2.7 2.0 3.0 2.2 1.7 1.7 1.8 1.7 1.2 1.7 1.4 1.7 2.6 3.3 ..
EU 15 average CLNX 1.9† 2.3 2.1 2.3 2.1 1.8 1.6 1.9 1.9 1.9 2.1 2.2 2.2 2.1 2.3 ..
Note: Further information on HICP is available from the National StatisticsWebsite: www.statistics.gov.uk/hicp.
1 Harmonised indices of consumer prices (HICPs) are calculated in eachmember state of the European Union for the purposes of European com-parisons, as required by the Maastricht Treaty. From January 1999 it hasbeen used by the European Central Bank as the measure for its definition ofprice stability across the euro area. Further details are contained in an ECBPress Notice released on 13 October 1998: "A stability oriented monetarypolicy strategy for the ESCB" .
Source: Statistical Office of the European Communities (Eurostat)
18.5 Internal purchasing power of the pound (based on RPI)1
Pence
Year in which purchasing power was 100p
1983 1984 1985 1986 1987 1988 1989 1990 1991 1992 1993 1994 1995 1996 1997 1998 1999 2000 2001 2002
BAMP BAMQ BAMR BAMS BAMT BAMU BAMV BAMW BASX CZVM CBXX DOFX DOHR DOLM DTUL CDQG JKZZ ZMHO IKHI FAUI1983 100 105 111 115 120 126 136 148 157 163 166 170 176 180 185 192 195 200 204 2071984 95 100 106 110 114 120 129 141 150 155 158 162 167 171 177 183 185 191 194 1981985 90 94 100 103 108 113 122 133 141 146 149 152 158 161 166 172 175 180 183 1861986 87 91 97 100 104 109 118 129 136 142 144 147 152 156 161 167 169 174 177 1801987 83 88 93 96 100 105 113 124 131 136 138 141 146 150 155 160 162 167 170 173
1988 79 83 88 92 95 100 108 118 125 130 132 135 139 143 147 152 155 159 162 1651989 74 77 82 85 88 93 100 109 116 120 122 125 129 133 137 141 144 148 150 1531990 67 71 75 78 81 85 91 100 106 110 112 114 118 121 125 129 131 135 137 1401991 64 67 71 73 76 80 86 94 100 104 105 108 112 114 118 122 124 128 130 1321992 61 64 68 71 74 77 83 91 96 100 102 104 108 110 114 118 119 123 125 127
1993 60 63 67 70 72 76 82 90 95 98 100 102 106 109 112 116 118 121 123 1251994 59 62 66 68 71 74 80 88 93 96 98 100 103 106 109 113 115 118 120 1221995 57 60 63 66 68 72 77 85 90 93 94 97 100 102 106 109 111 114 116 1181996 56 58 62 64 67 70 75 83 87 91 92 94 98 100 103 107 108 112 113 1151997 54 57 60 62 65 68 73 80 85 88 89 92 95 97 100 103 105 108 110 112
1998 52 55 58 60 63 66 71 77 82 85 86 88 92 94 97 100 102 105 106 1081999 51 54 57 59 62 65 70 76 81 84 85 87 90 92 95 98 100 103 105 1072000 50 52 56 57 60 63 68 74 78 81 83 85 88 90 92 96 97 100 102 1032001 49 51 55 56 59 62 66 73 77 80 81 83 86 88 91 94 95 98 100 1022002 48 51 54 56 58 61 65 72 76 79 80 82 85 87 89 92 94 97 98 100
Note: Further information on the RPI is available from the National StatisticsWebsite: www.statistics.gov.uk/rpi.
1 To find the purchasing power of the pound in 2000, given that it was 100pence in 1990, select the column headed 1990 and look at the 2000 row.The result is 74 pence. These figures are calculated by taking the inverseratio of the respective annual averages of the Retail Prices Index (RPI).
Source: Office for National Statistics: 020 7533 5874
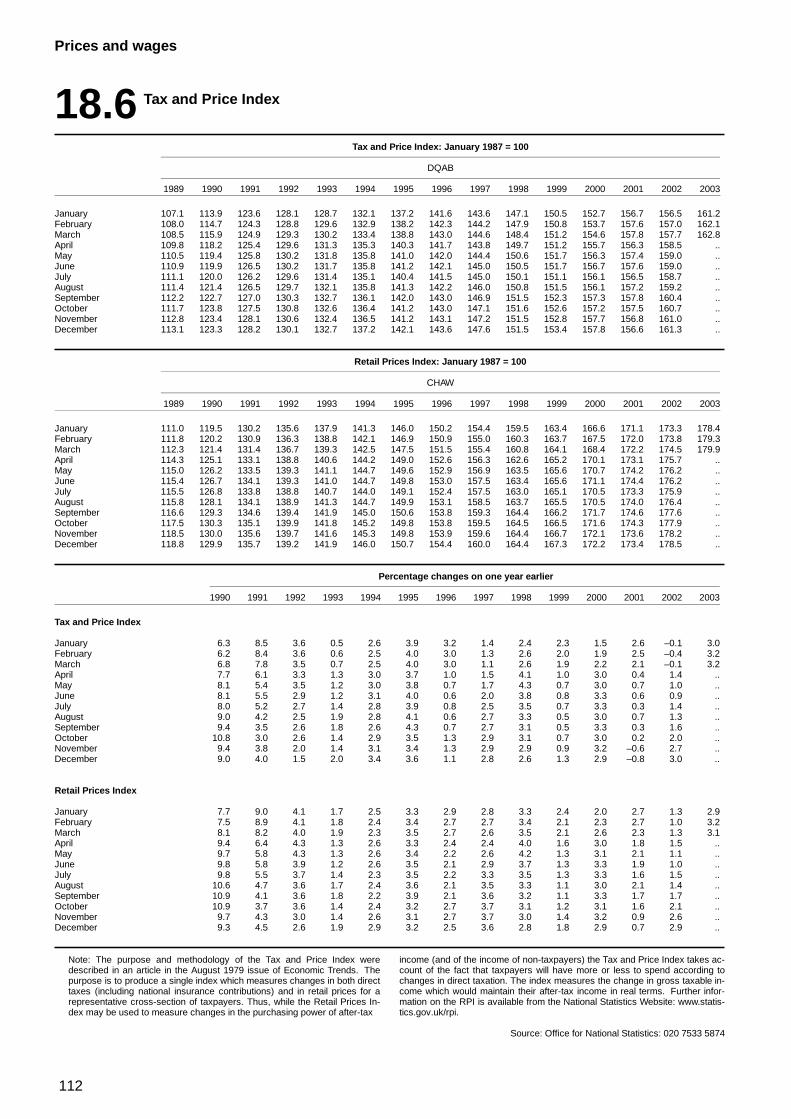
112
Prices and wages
18.6 Tax and Price Index
Tax and Price Index: January 1987 = 100
DQAB
1989 1990 1991 1992 1993 1994 1995 1996 1997 1998 1999 2000 2001 2002 2003
January 107.1 113.9 123.6 128.1 128.7 132.1 137.2 141.6 143.6 147.1 150.5 152.7 156.7 156.5 161.2February 108.0 114.7 124.3 128.8 129.6 132.9 138.2 142.3 144.2 147.9 150.8 153.7 157.6 157.0 162.1March 108.5 115.9 124.9 129.3 130.2 133.4 138.8 143.0 144.6 148.4 151.2 154.6 157.8 157.7 162.8April 109.8 118.2 125.4 129.6 131.3 135.3 140.3 141.7 143.8 149.7 151.2 155.7 156.3 158.5 ..May 110.5 119.4 125.8 130.2 131.8 135.8 141.0 142.0 144.4 150.6 151.7 156.3 157.4 159.0 ..June 110.9 119.9 126.5 130.2 131.7 135.8 141.2 142.1 145.0 150.5 151.7 156.7 157.6 159.0 ..July 111.1 120.0 126.2 129.6 131.4 135.1 140.4 141.5 145.0 150.1 151.1 156.1 156.5 158.7 ..August 111.4 121.4 126.5 129.7 132.1 135.8 141.3 142.2 146.0 150.8 151.5 156.1 157.2 159.2 ..September 112.2 122.7 127.0 130.3 132.7 136.1 142.0 143.0 146.9 151.5 152.3 157.3 157.8 160.4 ..October 111.7 123.8 127.5 130.8 132.6 136.4 141.2 143.0 147.1 151.6 152.6 157.2 157.5 160.7 ..November 112.8 123.4 128.1 130.6 132.4 136.5 141.2 143.1 147.2 151.5 152.8 157.7 156.8 161.0 ..December 113.1 123.3 128.2 130.1 132.7 137.2 142.1 143.6 147.6 151.5 153.4 157.8 156.6 161.3 ..
Retail Prices Index: January 1987 = 100
CHAW
1989 1990 1991 1992 1993 1994 1995 1996 1997 1998 1999 2000 2001 2002 2003
January 111.0 119.5 130.2 135.6 137.9 141.3 146.0 150.2 154.4 159.5 163.4 166.6 171.1 173.3 178.4February 111.8 120.2 130.9 136.3 138.8 142.1 146.9 150.9 155.0 160.3 163.7 167.5 172.0 173.8 179.3March 112.3 121.4 131.4 136.7 139.3 142.5 147.5 151.5 155.4 160.8 164.1 168.4 172.2 174.5 179.9April 114.3 125.1 133.1 138.8 140.6 144.2 149.0 152.6 156.3 162.6 165.2 170.1 173.1 175.7 ..May 115.0 126.2 133.5 139.3 141.1 144.7 149.6 152.9 156.9 163.5 165.6 170.7 174.2 176.2 ..June 115.4 126.7 134.1 139.3 141.0 144.7 149.8 153.0 157.5 163.4 165.6 171.1 174.4 176.2 ..July 115.5 126.8 133.8 138.8 140.7 144.0 149.1 152.4 157.5 163.0 165.1 170.5 173.3 175.9 ..August 115.8 128.1 134.1 138.9 141.3 144.7 149.9 153.1 158.5 163.7 165.5 170.5 174.0 176.4 ..September 116.6 129.3 134.6 139.4 141.9 145.0 150.6 153.8 159.3 164.4 166.2 171.7 174.6 177.6 ..October 117.5 130.3 135.1 139.9 141.8 145.2 149.8 153.8 159.5 164.5 166.5 171.6 174.3 177.9 ..November 118.5 130.0 135.6 139.7 141.6 145.3 149.8 153.9 159.6 164.4 166.7 172.1 173.6 178.2 ..December 118.8 129.9 135.7 139.2 141.9 146.0 150.7 154.4 160.0 164.4 167.3 172.2 173.4 178.5 ..
Percentage changes on one year earlier
1990 1991 1992 1993 1994 1995 1996 1997 1998 1999 2000 2001 2002 2003
Tax and Price Index
January 6.3 8.5 3.6 0.5 2.6 3.9 3.2 1.4 2.4 2.3 1.5 2.6 –0.1 3.0February 6.2 8.4 3.6 0.6 2.5 4.0 3.0 1.3 2.6 2.0 1.9 2.5 –0.4 3.2March 6.8 7.8 3.5 0.7 2.5 4.0 3.0 1.1 2.6 1.9 2.2 2.1 –0.1 3.2April 7.7 6.1 3.3 1.3 3.0 3.7 1.0 1.5 4.1 1.0 3.0 0.4 1.4 ..May 8.1 5.4 3.5 1.2 3.0 3.8 0.7 1.7 4.3 0.7 3.0 0.7 1.0 ..June 8.1 5.5 2.9 1.2 3.1 4.0 0.6 2.0 3.8 0.8 3.3 0.6 0.9 ..July 8.0 5.2 2.7 1.4 2.8 3.9 0.8 2.5 3.5 0.7 3.3 0.3 1.4 ..August 9.0 4.2 2.5 1.9 2.8 4.1 0.6 2.7 3.3 0.5 3.0 0.7 1.3 ..September 9.4 3.5 2.6 1.8 2.6 4.3 0.7 2.7 3.1 0.5 3.3 0.3 1.6 ..October 10.8 3.0 2.6 1.4 2.9 3.5 1.3 2.9 3.1 0.7 3.0 0.2 2.0 ..November 9.4 3.8 2.0 1.4 3.1 3.4 1.3 2.9 2.9 0.9 3.2 –0.6 2.7 ..December 9.0 4.0 1.5 2.0 3.4 3.6 1.1 2.8 2.6 1.3 2.9 –0.8 3.0 ..
Retail Prices Index
January 7.7 9.0 4.1 1.7 2.5 3.3 2.9 2.8 3.3 2.4 2.0 2.7 1.3 2.9February 7.5 8.9 4.1 1.8 2.4 3.4 2.7 2.7 3.4 2.1 2.3 2.7 1.0 3.2March 8.1 8.2 4.0 1.9 2.3 3.5 2.7 2.6 3.5 2.1 2.6 2.3 1.3 3.1April 9.4 6.4 4.3 1.3 2.6 3.3 2.4 2.4 4.0 1.6 3.0 1.8 1.5 ..May 9.7 5.8 4.3 1.3 2.6 3.4 2.2 2.6 4.2 1.3 3.1 2.1 1.1 ..June 9.8 5.8 3.9 1.2 2.6 3.5 2.1 2.9 3.7 1.3 3.3 1.9 1.0 ..July 9.8 5.5 3.7 1.4 2.3 3.5 2.2 3.3 3.5 1.3 3.3 1.6 1.5 ..August 10.6 4.7 3.6 1.7 2.4 3.6 2.1 3.5 3.3 1.1 3.0 2.1 1.4 ..September 10.9 4.1 3.6 1.8 2.2 3.9 2.1 3.6 3.2 1.1 3.3 1.7 1.7 ..October 10.9 3.7 3.6 1.4 2.4 3.2 2.7 3.7 3.1 1.2 3.1 1.6 2.1 ..November 9.7 4.3 3.0 1.4 2.6 3.1 2.7 3.7 3.0 1.4 3.2 0.9 2.6 ..December 9.3 4.5 2.6 1.9 2.9 3.2 2.5 3.6 2.8 1.8 2.9 0.7 2.9 ..
Note: The purpose and methodology of the Tax and Price Index weredescribed in an article in the August 1979 issue of Economic Trends. Thepurpose is to produce a single index which measures changes in both directtaxes (including national insurance contributions) and in retail prices for arepresentative cross-section of taxpayers. Thus, while the Retail Prices In-dex may be used to measure changes in the purchasing power of after-tax
income (and of the income of non-taxpayers) the Tax and Price Index takes ac-count of the fact that taxpayers will have more or less to spend according tochanges in direct taxation. The index measures the change in gross taxable in-come which would maintain their after-tax income in real terms. Further infor-mation on the RPI is available from the National Statistics Website: www.statis-tics.gov.uk/rpi.
Source: Office for National Statistics: 020 7533 5874
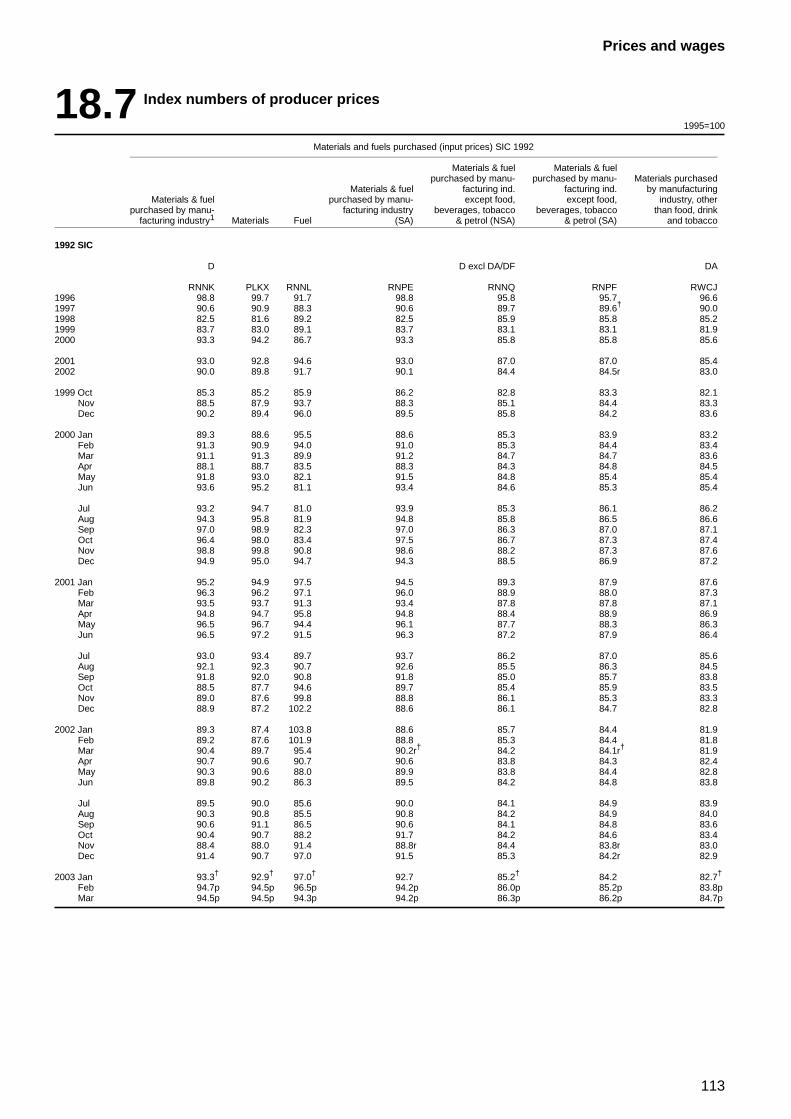
113
Prices and wages
18.7 Index numbers of producer prices
1995=100
Materials and fuels purchased (input prices) SIC 1992
Materials & fuel Materials & fuelpurchased by manu- purchased by manu- Materials purchased
Materials & fuel facturing ind. facturing ind. by manufacturingMaterials & fuel purchased by manu- except food, except food, industry, other
purchased by manu- facturing industry beverages, tobacco beverages, tobacco than food, drinkfacturing industry1 Materials Fuel (SA) & petrol (NSA) & petrol (SA) and tobacco
1992 SIC
D D excl DA/DF DA
RNNK PLKX RNNL RNPE RNNQ RNPF RWCJ1996 98.8 99.7 91.7 98.8 95.8 95.7 96.61997 90.6 90.9 88.3 90.6 89.7 89.6† 90.01998 82.5 81.6 89.2 82.5 85.9 85.8 85.21999 83.7 83.0 89.1 83.7 83.1 83.1 81.92000 93.3 94.2 86.7 93.3 85.8 85.8 85.6
2001 93.0 92.8 94.6 93.0 87.0 87.0 85.42002 90.0 89.8 91.7 90.1 84.4 84.5r 83.0
1999 Oct 85.3 85.2 85.9 86.2 82.8 83.3 82.1Nov 88.5 87.9 93.7 88.3 85.1 84.4 83.3Dec 90.2 89.4 96.0 89.5 85.8 84.2 83.6
2000 Jan 89.3 88.6 95.5 88.6 85.3 83.9 83.2Feb 91.3 90.9 94.0 91.0 85.3 84.4 83.4Mar 91.1 91.3 89.9 91.2 84.7 84.7 83.6Apr 88.1 88.7 83.5 88.3 84.3 84.8 84.5May 91.8 93.0 82.1 91.5 84.8 85.4 85.4Jun 93.6 95.2 81.1 93.4 84.6 85.3 85.4
Jul 93.2 94.7 81.0 93.9 85.3 86.1 86.2Aug 94.3 95.8 81.9 94.8 85.8 86.5 86.6Sep 97.0 98.9 82.3 97.0 86.3 87.0 87.1Oct 96.4 98.0 83.4 97.5 86.7 87.3 87.4Nov 98.8 99.8 90.8 98.6 88.2 87.3 87.6Dec 94.9 95.0 94.7 94.3 88.5 86.9 87.2
2001 Jan 95.2 94.9 97.5 94.5 89.3 87.9 87.6Feb 96.3 96.2 97.1 96.0 88.9 88.0 87.3Mar 93.5 93.7 91.3 93.4 87.8 87.8 87.1Apr 94.8 94.7 95.8 94.8 88.4 88.9 86.9May 96.5 96.7 94.4 96.1 87.7 88.3 86.3Jun 96.5 97.2 91.5 96.3 87.2 87.9 86.4
Jul 93.0 93.4 89.7 93.7 86.2 87.0 85.6Aug 92.1 92.3 90.7 92.6 85.5 86.3 84.5Sep 91.8 92.0 90.8 91.8 85.0 85.7 83.8Oct 88.5 87.7 94.6 89.7 85.4 85.9 83.5Nov 89.0 87.6 99.8 88.8 86.1 85.3 83.3Dec 88.9 87.2 102.2 88.6 86.1 84.7 82.8
2002 Jan 89.3 87.4 103.8 88.6 85.7 84.4 81.9Feb 89.2 87.6 101.9 88.8 85.3 84.4 81.8Mar 90.4 89.7 95.4 90.2r† 84.2 84.1r† 81.9Apr 90.7 90.6 90.7 90.6 83.8 84.3 82.4May 90.3 90.6 88.0 89.9 83.8 84.4 82.8Jun 89.8 90.2 86.3 89.5 84.2 84.8 83.8
Jul 89.5 90.0 85.6 90.0 84.1 84.9 83.9Aug 90.3 90.8 85.5 90.8 84.2 84.9 84.0Sep 90.6 91.1 86.5 90.6 84.1 84.8 83.6Oct 90.4 90.7 88.2 91.7 84.2 84.6 83.4Nov 88.4 88.0 91.4 88.8r 84.4 83.8r 83.0Dec 91.4 90.7 97.0 91.5 85.3 84.2r 82.9
2003 Jan 93.3† 92.9† 97.0† 92.7 85.2† 84.2 82.7†
Feb 94.7p 94.5p 96.5p 94.2p 86.0p 85.2p 83.8pMar 94.5p 94.5p 94.3p 94.2p 86.3p 86.2p 84.7p
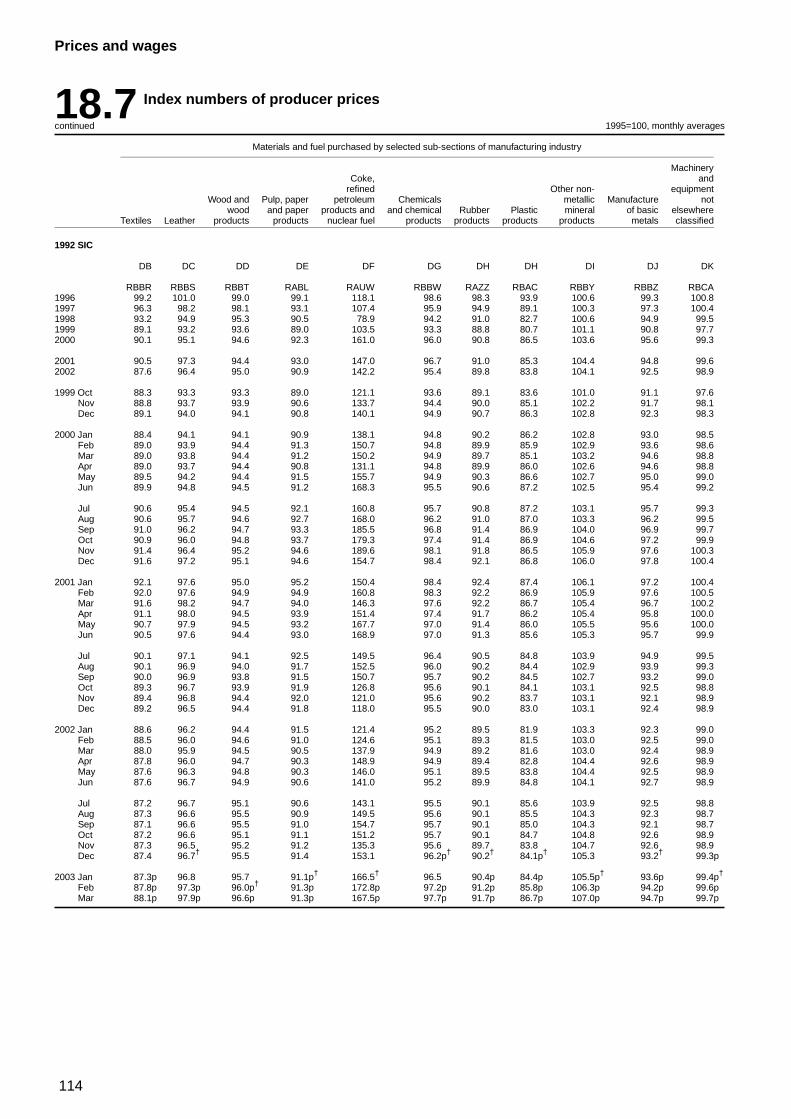
114
Prices and wages
18.7 Index numbers of producer prices
continued 1995=100, monthly averages
Materials and fuel purchased by selected sub-sections of manufacturing industry
MachineryCoke, and
refined Other non- equipmentWood and Pulp, paper petroleum Chemicals metallic Manufacture not
wood and paper products and and chemical Rubber Plastic mineral of basic elsewhereTextiles Leather products products nuclear fuel products products products products metals classified
1992 SIC
DB DC DD DE DF DG DH DH DI DJ DK
RBBR RBBS RBBT RABL RAUW RBBW RAZZ RBAC RBBY RBBZ RBCA1996 99.2 101.0 99.0 99.1 118.1 98.6 98.3 93.9 100.6 99.3 100.81997 96.3 98.2 98.1 93.1 107.4 95.9 94.9 89.1 100.3 97.3 100.41998 93.2 94.9 95.3 90.5 78.9 94.2 91.0 82.7 100.6 94.9 99.51999 89.1 93.2 93.6 89.0 103.5 93.3 88.8 80.7 101.1 90.8 97.72000 90.1 95.1 94.6 92.3 161.0 96.0 90.8 86.5 103.6 95.6 99.3
2001 90.5 97.3 94.4 93.0 147.0 96.7 91.0 85.3 104.4 94.8 99.62002 87.6 96.4 95.0 90.9 142.2 95.4 89.8 83.8 104.1 92.5 98.9
1999 Oct 88.3 93.3 93.3 89.0 121.1 93.6 89.1 83.6 101.0 91.1 97.6Nov 88.8 93.7 93.9 90.6 133.7 94.4 90.0 85.1 102.2 91.7 98.1Dec 89.1 94.0 94.1 90.8 140.1 94.9 90.7 86.3 102.8 92.3 98.3
2000 Jan 88.4 94.1 94.1 90.9 138.1 94.8 90.2 86.2 102.8 93.0 98.5Feb 89.0 93.9 94.4 91.3 150.7 94.8 89.9 85.9 102.9 93.6 98.6Mar 89.0 93.8 94.4 91.2 150.2 94.9 89.7 85.1 103.2 94.6 98.8Apr 89.0 93.7 94.4 90.8 131.1 94.8 89.9 86.0 102.6 94.6 98.8May 89.5 94.2 94.4 91.5 155.7 94.9 90.3 86.6 102.7 95.0 99.0Jun 89.9 94.8 94.5 91.2 168.3 95.5 90.6 87.2 102.5 95.4 99.2
Jul 90.6 95.4 94.5 92.1 160.8 95.7 90.8 87.2 103.1 95.7 99.3Aug 90.6 95.7 94.6 92.7 168.0 96.2 91.0 87.0 103.3 96.2 99.5Sep 91.0 96.2 94.7 93.3 185.5 96.8 91.4 86.9 104.0 96.9 99.7Oct 90.9 96.0 94.8 93.7 179.3 97.4 91.4 86.9 104.6 97.2 99.9Nov 91.4 96.4 95.2 94.6 189.6 98.1 91.8 86.5 105.9 97.6 100.3Dec 91.6 97.2 95.1 94.6 154.7 98.4 92.1 86.8 106.0 97.8 100.4
2001 Jan 92.1 97.6 95.0 95.2 150.4 98.4 92.4 87.4 106.1 97.2 100.4Feb 92.0 97.6 94.9 94.9 160.8 98.3 92.2 86.9 105.9 97.6 100.5Mar 91.6 98.2 94.7 94.0 146.3 97.6 92.2 86.7 105.4 96.7 100.2Apr 91.1 98.0 94.5 93.9 151.4 97.4 91.7 86.2 105.4 95.8 100.0May 90.7 97.9 94.5 93.2 167.7 97.0 91.4 86.0 105.5 95.6 100.0Jun 90.5 97.6 94.4 93.0 168.9 97.0 91.3 85.6 105.3 95.7 99.9
Jul 90.1 97.1 94.1 92.5 149.5 96.4 90.5 84.8 103.9 94.9 99.5Aug 90.1 96.9 94.0 91.7 152.5 96.0 90.2 84.4 102.9 93.9 99.3Sep 90.0 96.9 93.8 91.5 150.7 95.7 90.2 84.5 102.7 93.2 99.0Oct 89.3 96.7 93.9 91.9 126.8 95.6 90.1 84.1 103.1 92.5 98.8Nov 89.4 96.8 94.4 92.0 121.0 95.6 90.2 83.7 103.1 92.1 98.9Dec 89.2 96.5 94.4 91.8 118.0 95.5 90.0 83.0 103.1 92.4 98.9
2002 Jan 88.6 96.2 94.4 91.5 121.4 95.2 89.5 81.9 103.3 92.3 99.0Feb 88.5 96.0 94.6 91.0 124.6 95.1 89.3 81.5 103.0 92.5 99.0Mar 88.0 95.9 94.5 90.5 137.9 94.9 89.2 81.6 103.0 92.4 98.9Apr 87.8 96.0 94.7 90.3 148.9 94.9 89.4 82.8 104.4 92.6 98.9May 87.6 96.3 94.8 90.3 146.0 95.1 89.5 83.8 104.4 92.5 98.9Jun 87.6 96.7 94.9 90.6 141.0 95.2 89.9 84.8 104.1 92.7 98.9
Jul 87.2 96.7 95.1 90.6 143.1 95.5 90.1 85.6 103.9 92.5 98.8Aug 87.3 96.6 95.5 90.9 149.5 95.6 90.1 85.5 104.3 92.3 98.7Sep 87.1 96.6 95.5 91.0 154.7 95.7 90.1 85.0 104.3 92.1 98.7Oct 87.2 96.6 95.1 91.1 151.2 95.7 90.1 84.7 104.8 92.6 98.9Nov 87.3 96.5 95.2 91.2 135.3 95.6 89.7 83.8 104.7 92.6 98.9Dec 87.4 96.7† 95.5 91.4 153.1 96.2p† 90.2† 84.1p† 105.3 93.2† 99.3p
2003 Jan 87.3p 96.8 95.7 91.1p† 166.5† 96.5 90.4p 84.4p 105.5p† 93.6p 99.4p†
Feb 87.8p 97.3p 96.0p† 91.3p 172.8p 97.2p 91.2p 85.8p 106.3p 94.2p 99.6pMar 88.1p 97.9p 96.6p 91.3p 167.5p 97.7p 91.7p 86.7p 107.0p 94.7p 99.7p
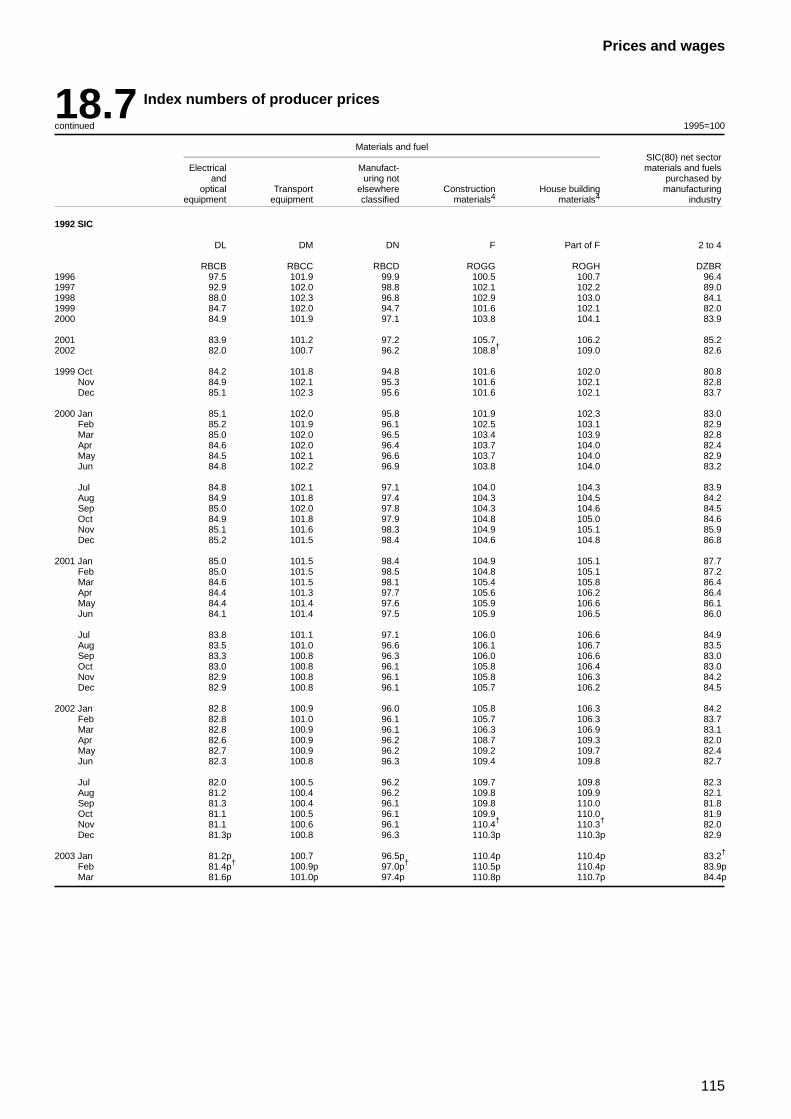
115
Prices and wages
18.7 Index numbers of producer prices
continued 1995=100
Materials and fuelSIC(80) net sector
Electrical Manufact- materials and fuelsand uring not purchased by
optical Transport elsewhere Construction House building manufacturingequipment equipment classified materials4 materials4 industry
1992 SIC
DL DM DN F Part of F 2 to 4
RBCB RBCC RBCD ROGG ROGH DZBR1996 97.5 101.9 99.9 100.5 100.7 96.41997 92.9 102.0 98.8 102.1 102.2 89.01998 88.0 102.3 96.8 102.9 103.0 84.11999 84.7 102.0 94.7 101.6 102.1 82.02000 84.9 101.9 97.1 103.8 104.1 83.9
2001 83.9 101.2 97.2 105.7 106.2 85.22002 82.0 100.7 96.2 108.8† 109.0 82.6
1999 Oct 84.2 101.8 94.8 101.6 102.0 80.8Nov 84.9 102.1 95.3 101.6 102.1 82.8Dec 85.1 102.3 95.6 101.6 102.1 83.7
2000 Jan 85.1 102.0 95.8 101.9 102.3 83.0Feb 85.2 101.9 96.1 102.5 103.1 82.9Mar 85.0 102.0 96.5 103.4 103.9 82.8Apr 84.6 102.0 96.4 103.7 104.0 82.4May 84.5 102.1 96.6 103.7 104.0 82.9Jun 84.8 102.2 96.9 103.8 104.0 83.2
Jul 84.8 102.1 97.1 104.0 104.3 83.9Aug 84.9 101.8 97.4 104.3 104.5 84.2Sep 85.0 102.0 97.8 104.3 104.6 84.5Oct 84.9 101.8 97.9 104.8 105.0 84.6Nov 85.1 101.6 98.3 104.9 105.1 85.9Dec 85.2 101.5 98.4 104.6 104.8 86.8
2001 Jan 85.0 101.5 98.4 104.9 105.1 87.7Feb 85.0 101.5 98.5 104.8 105.1 87.2Mar 84.6 101.5 98.1 105.4 105.8 86.4Apr 84.4 101.3 97.7 105.6 106.2 86.4May 84.4 101.4 97.6 105.9 106.6 86.1Jun 84.1 101.4 97.5 105.9 106.5 86.0
Jul 83.8 101.1 97.1 106.0 106.6 84.9Aug 83.5 101.0 96.6 106.1 106.7 83.5Sep 83.3 100.8 96.3 106.0 106.6 83.0Oct 83.0 100.8 96.1 105.8 106.4 83.0Nov 82.9 100.8 96.1 105.8 106.3 84.2Dec 82.9 100.8 96.1 105.7 106.2 84.5
2002 Jan 82.8 100.9 96.0 105.8 106.3 84.2Feb 82.8 101.0 96.1 105.7 106.3 83.7Mar 82.8 100.9 96.1 106.3 106.9 83.1Apr 82.6 100.9 96.2 108.7 109.3 82.0May 82.7 100.9 96.2 109.2 109.7 82.4Jun 82.3 100.8 96.3 109.4 109.8 82.7
Jul 82.0 100.5 96.2 109.7 109.8 82.3Aug 81.2 100.4 96.2 109.8 109.9 82.1Sep 81.3 100.4 96.1 109.8 110.0 81.8Oct 81.1 100.5 96.1 109.9 110.0 81.9Nov 81.1 100.6 96.1 110.4† 110.3† 82.0Dec 81.3p 100.8 96.3 110.3p 110.3p 82.9
2003 Jan 81.2p 100.7 96.5p 110.4p 110.4p 83.2†
Feb 81.4p† 100.9p 97.0p† 110.5p 110.4p 83.9pMar 81.6p 101.0p 97.4p 110.8p 110.7p 84.4p
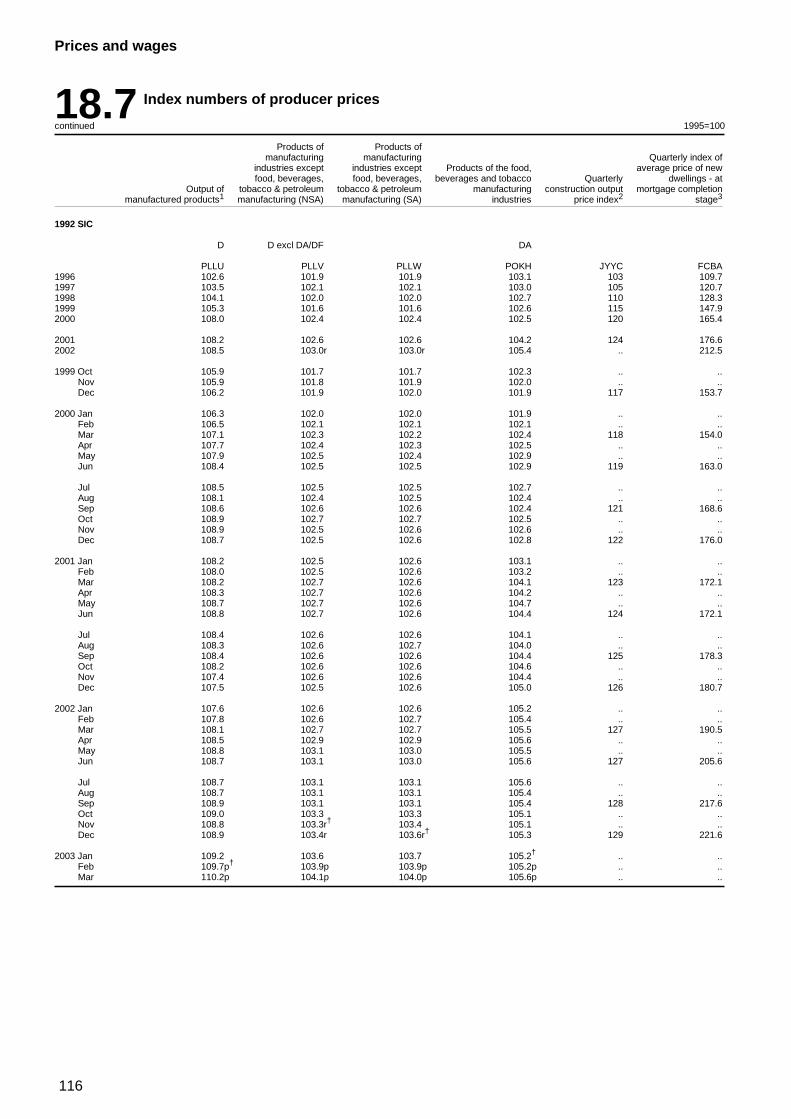
116
Prices and wages
18.7 Index numbers of producer prices
continued 1995=100
Products of Products ofmanufacturing manufacturing Quarterly index of
industries except industries except Products of the food, average price of newfood, beverages, food, beverages, beverages and tobacco Quarterly dwellings - at
Output of tobacco & petroleum tobacco & petroleum manufacturing construction output mortgage completionmanufactured products1 manufacturing (NSA) manufacturing (SA) industries price index2 stage3
1992 SIC
D D excl DA/DF DA
PLLU PLLV PLLW POKH JYYC FCBA1996 102.6 101.9 101.9 103.1 103 109.71997 103.5 102.1 102.1 103.0 105 120.71998 104.1 102.0 102.0 102.7 110 128.31999 105.3 101.6 101.6 102.6 115 147.92000 108.0 102.4 102.4 102.5 120 165.4
2001 108.2 102.6 102.6 104.2 124 176.62002 108.5 103.0r 103.0r 105.4 .. 212.5
1999 Oct 105.9 101.7 101.7 102.3 .. ..Nov 105.9 101.8 101.9 102.0 .. ..Dec 106.2 101.9 102.0 101.9 117 153.7
2000 Jan 106.3 102.0 102.0 101.9 .. ..Feb 106.5 102.1 102.1 102.1 .. ..Mar 107.1 102.3 102.2 102.4 118 154.0Apr 107.7 102.4 102.3 102.5 .. ..May 107.9 102.5 102.4 102.9 .. ..Jun 108.4 102.5 102.5 102.9 119 163.0
Jul 108.5 102.5 102.5 102.7 .. ..Aug 108.1 102.4 102.5 102.4 .. ..Sep 108.6 102.6 102.6 102.4 121 168.6Oct 108.9 102.7 102.7 102.5 .. ..Nov 108.9 102.5 102.6 102.6 .. ..Dec 108.7 102.5 102.6 102.8 122 176.0
2001 Jan 108.2 102.5 102.6 103.1 .. ..Feb 108.0 102.5 102.6 103.2 .. ..Mar 108.2 102.7 102.6 104.1 123 172.1Apr 108.3 102.7 102.6 104.2 .. ..May 108.7 102.7 102.6 104.7 .. ..Jun 108.8 102.7 102.6 104.4 124 172.1
Jul 108.4 102.6 102.6 104.1 .. ..Aug 108.3 102.6 102.7 104.0 .. ..Sep 108.4 102.6 102.6 104.4 125 178.3Oct 108.2 102.6 102.6 104.6 .. ..Nov 107.4 102.6 102.6 104.4 .. ..Dec 107.5 102.5 102.6 105.0 126 180.7
2002 Jan 107.6 102.6 102.6 105.2 .. ..Feb 107.8 102.6 102.7 105.4 .. ..Mar 108.1 102.7 102.7 105.5 127 190.5Apr 108.5 102.9 102.9 105.6 .. ..May 108.8 103.1 103.0 105.5 .. ..Jun 108.7 103.1 103.0 105.6 127 205.6
Jul 108.7 103.1 103.1 105.6 .. ..Aug 108.7 103.1 103.1 105.4 .. ..Sep 108.9 103.1 103.1 105.4 128 217.6Oct 109.0 103.3 103.3 105.1 .. ..Nov 108.8 103.3r† 103.4 105.1 .. ..Dec 108.9 103.4r 103.6r† 105.3 129 221.6
2003 Jan 109.2 103.6 103.7 105.2† .. ..Feb 109.7p† 103.9p 103.9p 105.2p .. ..Mar 110.2p 104.1p 104.0p 105.6p .. ..
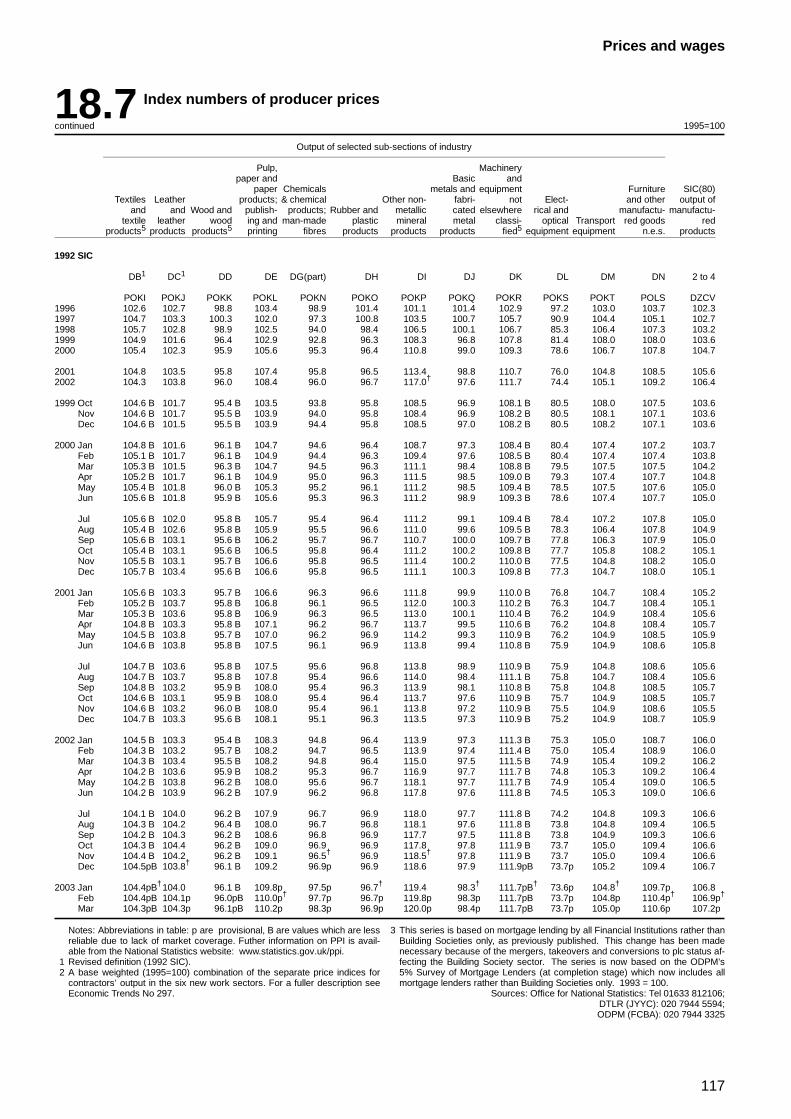
117
Prices and wages
18.7 Index numbers of producer prices
continued 1995=100
Output of selected sub-sections of industry
Pulp, Machinerypaper and Basic and
paper Chemicals metals and equipment Furniture SIC(80)Textiles Leather products; & chemical Other non- fabri- not Elect- and other output of
and and Wood and publish- products; Rubber and metallic cated elsewhere rical and manufactu- manufactu-textile leather wood ing and man-made plastic mineral metal classi- optical Transport red goods red
products5 products products5 printing fibres products products products fied5 equipment equipment n.e.s. products
1992 SIC
DB1 DC1 DD DE DG(part) DH DI DJ DK DL DM DN 2 to 4
POKI POKJ POKK POKL POKN POKO POKP POKQ POKR POKS POKT POLS DZCV1996 102.6 102.7 98.8 103.4 98.9 101.4 101.1 101.4 102.9 97.2 103.0 103.7 102.31997 104.7 103.3 100.3 102.0 97.3 100.8 103.5 100.7 105.7 90.9 104.4 105.1 102.71998 105.7 102.8 98.9 102.5 94.0 98.4 106.5 100.1 106.7 85.3 106.4 107.3 103.21999 104.9 101.6 96.4 102.9 92.8 96.3 108.3 96.8 107.8 81.4 108.0 108.0 103.62000 105.4 102.3 95.9 105.6 95.3 96.4 110.8 99.0 109.3 78.6 106.7 107.8 104.7
2001 104.8 103.5 95.8 107.4 95.8 96.5 113.4 98.8 110.7 76.0 104.8 108.5 105.62002 104.3 103.8 96.0 108.4 96.0 96.7 117.0† 97.6 111.7 74.4 105.1 109.2 106.4
1999 Oct 104.6 B 101.7 95.4 B 103.5 93.8 95.8 108.5 96.9 108.1 B 80.5 108.0 107.5 103.6Nov 104.6 B 101.7 95.5 B 103.9 94.0 95.8 108.4 96.9 108.2 B 80.5 108.1 107.1 103.6Dec 104.6 B 101.5 95.5 B 103.9 94.4 95.8 108.5 97.0 108.2 B 80.5 108.2 107.1 103.6
2000 Jan 104.8 B 101.6 96.1 B 104.7 94.6 96.4 108.7 97.3 108.4 B 80.4 107.4 107.2 103.7Feb 105.1 B 101.7 96.1 B 104.9 94.4 96.3 109.4 97.6 108.5 B 80.4 107.4 107.4 103.8Mar 105.3 B 101.5 96.3 B 104.7 94.5 96.3 111.1 98.4 108.8 B 79.5 107.5 107.5 104.2Apr 105.2 B 101.7 96.1 B 104.9 95.0 96.3 111.5 98.5 109.0 B 79.3 107.4 107.7 104.8May 105.4 B 101.8 96.0 B 105.3 95.2 96.1 111.2 98.5 109.4 B 78.5 107.5 107.6 105.0Jun 105.6 B 101.8 95.9 B 105.6 95.3 96.3 111.2 98.9 109.3 B 78.6 107.4 107.7 105.0
Jul 105.6 B 102.0 95.8 B 105.7 95.4 96.4 111.2 99.1 109.4 B 78.4 107.2 107.8 105.0Aug 105.4 B 102.6 95.8 B 105.9 95.5 96.6 111.0 99.6 109.5 B 78.3 106.4 107.8 104.9Sep 105.6 B 103.1 95.6 B 106.2 95.7 96.7 110.7 100.0 109.7 B 77.8 106.3 107.9 105.0Oct 105.4 B 103.1 95.6 B 106.5 95.8 96.4 111.2 100.2 109.8 B 77.7 105.8 108.2 105.1Nov 105.5 B 103.1 95.7 B 106.6 95.8 96.5 111.4 100.2 110.0 B 77.5 104.8 108.2 105.0Dec 105.7 B 103.4 95.6 B 106.6 95.8 96.5 111.1 100.3 109.8 B 77.3 104.7 108.0 105.1
2001 Jan 105.6 B 103.3 95.7 B 106.6 96.3 96.6 111.8 99.9 110.0 B 76.8 104.7 108.4 105.2Feb 105.2 B 103.7 95.8 B 106.8 96.1 96.5 112.0 100.3 110.2 B 76.3 104.7 108.4 105.1Mar 105.3 B 103.6 95.8 B 106.9 96.3 96.5 113.0 100.1 110.4 B 76.2 104.9 108.4 105.6Apr 104.8 B 103.3 95.8 B 107.1 96.2 96.7 113.7 99.5 110.6 B 76.2 104.8 108.4 105.7May 104.5 B 103.8 95.7 B 107.0 96.2 96.9 114.2 99.3 110.9 B 76.2 104.9 108.5 105.9Jun 104.6 B 103.8 95.8 B 107.5 96.1 96.9 113.8 99.4 110.8 B 75.9 104.9 108.6 105.8
Jul 104.7 B 103.6 95.8 B 107.5 95.6 96.8 113.8 98.9 110.9 B 75.9 104.8 108.6 105.6Aug 104.7 B 103.7 95.8 B 107.8 95.4 96.6 114.0 98.4 111.1 B 75.8 104.7 108.4 105.6Sep 104.8 B 103.2 95.9 B 108.0 95.4 96.3 113.9 98.1 110.8 B 75.8 104.8 108.5 105.7Oct 104.6 B 103.1 95.9 B 108.0 95.4 96.4 113.7 97.6 110.9 B 75.7 104.9 108.5 105.7Nov 104.6 B 103.2 96.0 B 108.0 95.4 96.1 113.8 97.2 110.9 B 75.5 104.9 108.6 105.5Dec 104.7 B 103.3 95.6 B 108.1 95.1 96.3 113.5 97.3 110.9 B 75.2 104.9 108.7 105.9
2002 Jan 104.5 B 103.3 95.4 B 108.3 94.8 96.4 113.9 97.3 111.3 B 75.3 105.0 108.7 106.0Feb 104.3 B 103.2 95.7 B 108.2 94.7 96.5 113.9 97.4 111.4 B 75.0 105.4 108.9 106.0Mar 104.3 B 103.4 95.5 B 108.2 94.8 96.4 115.0 97.5 111.5 B 74.9 105.4 109.2 106.2Apr 104.2 B 103.6 95.9 B 108.2 95.3 96.7 116.9 97.7 111.7 B 74.8 105.3 109.2 106.4May 104.2 B 103.8 96.2 B 108.0 95.6 96.7 118.1 97.7 111.7 B 74.9 105.4 109.0 106.5Jun 104.2 B 103.9 96.2 B 107.9 96.2 96.8 117.8 97.6 111.8 B 74.5 105.3 109.0 106.6
Jul 104.1 B 104.0 96.2 B 107.9 96.7 96.9 118.0 97.7 111.8 B 74.2 104.8 109.3 106.6Aug 104.3 B 104.2 96.4 B 108.0 96.7 96.8 118.1 97.6 111.8 B 73.8 104.8 109.4 106.5Sep 104.2 B 104.3 96.2 B 108.6 96.8 96.9 117.7 97.5 111.8 B 73.8 104.9 109.3 106.6Oct 104.3 B 104.4 96.2 B 109.0 96.9 96.9 117.8 97.8 111.9 B 73.7 105.0 109.4 106.6Nov 104.4 B 104.2 96.2 B 109.1 96.5† 96.9 118.5† 97.8 111.9 B 73.7 105.0 109.4 106.6Dec 104.5pB 103.8† 96.1 B 109.2 96.9p 96.9 118.6 97.9 111.9pB 73.7p 105.2 109.4 106.7
2003 Jan 104.4pB†104.0 96.1 B 109.8p 97.5p 96.7† 119.4 98.3† 111.7pB† 73.6p 104.8† 109.7p 106.8Feb 104.4pB 104.1p 96.0pB 110.0p† 97.7p 96.7p 119.8p 98.3p 111.7pB 73.7p 104.8p 110.4p† 106.9p†
Mar 104.3pB 104.3p 96.1pB 110.2p 98.3p 96.9p 120.0p 98.4p 111.7pB 73.7p 105.0p 110.6p 107.2p
Notes: Abbreviations in table: p are provisional, B are values which are lessreliable due to lack of market coverage. Futher information on PPI is avail-able from the National Statistics website: www.statistics.gov.uk/ppi.
1 Revised definition (1992 SIC).2 A base weighted (1995=100) combination of the separate price indices for
contractors’ output in the six new work sectors. For a fuller description seeEconomic Trends No 297.
3 This series is based on mortgage lending by all Financial Institutions rather thanBuilding Societies only, as previously published. This change has been madenecessary because of the mergers, takeovers and conversions to plc status af-fecting the Building Society sector. The series is now based on the ODPM’s5% Survey of Mortgage Lenders (at completion stage) which now includes allmortgage lenders rather than Building Societies only. 1993 = 100.
Sources: Office for National Statistics: Tel 01633 812106;DTLR (JYYC): 020 7944 5594;ODPM (FCBA): 020 7944 3325
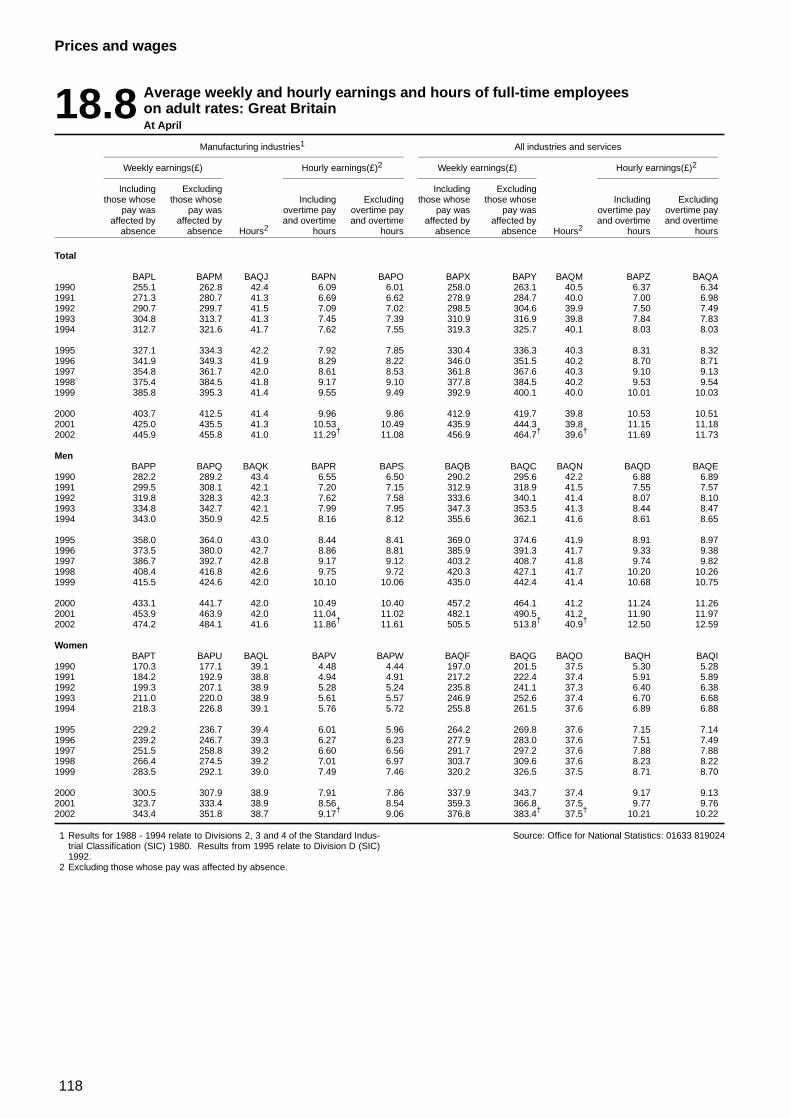
118
Prices and wages
18.8 Average weekly and hourly earnings and hours of full-time employeeson adult rates: Great BritainAt April
Manufacturing industries1 All industries and services
Weekly earnings(£) Hourly earnings(£)2 Weekly earnings(£) Hourly earnings(£)2
Including Excluding Including Excludingthose whose those whose Including Excluding those whose those whose Including Excluding
pay was pay was overtime pay overtime pay pay was pay was overtime pay overtime payaffected by affected by and overtime and overtime affected by affected by and overtime and overtime
absence absence Hours2 hours hours absence absence Hours2 hours hours
Total
BAPL BAPM BAQJ BAPN BAPO BAPX BAPY BAQM BAPZ BAQA1990 255.1 262.8 42.4 6.09 6.01 258.0 263.1 40.5 6.37 6.341991 271.3 280.7 41.3 6.69 6.62 278.9 284.7 40.0 7.00 6.981992 290.7 299.7 41.5 7.09 7.02 298.5 304.6 39.9 7.50 7.491993 304.8 313.7 41.3 7.45 7.39 310.9 316.9 39.8 7.84 7.831994 312.7 321.6 41.7 7.62 7.55 319.3 325.7 40.1 8.03 8.03
1995 327.1 334.3 42.2 7.92 7.85 330.4 336.3 40.3 8.31 8.321996 341.9 349.3 41.9 8.29 8.22 346.0 351.5 40.2 8.70 8.711997 354.8 361.7 42.0 8.61 8.53 361.8 367.6 40.3 9.10 9.131998 375.4 384.5 41.8 9.17 9.10 377.8 384.5 40.2 9.53 9.541999 385.8 395.3 41.4 9.55 9.49 392.9 400.1 40.0 10.01 10.03
2000 403.7 412.5 41.4 9.96 9.86 412.9 419.7 39.8 10.53 10.512001 425.0 435.5 41.3 10.53 10.49 435.9 444.3 39.8 11.15 11.182002 445.9 455.8 41.0 11.29† 11.08 456.9 464.7† 39.6† 11.69 11.73
MenBAPP BAPQ BAQK BAPR BAPS BAQB BAQC BAQN BAQD BAQE
1990 282.2 289.2 43.4 6.55 6.50 290.2 295.6 42.2 6.88 6.891991 299.5 308.1 42.1 7.20 7.15 312.9 318.9 41.5 7.55 7.571992 319.8 328.3 42.3 7.62 7.58 333.6 340.1 41.4 8.07 8.101993 334.8 342.7 42.1 7.99 7.95 347.3 353.5 41.3 8.44 8.471994 343.0 350.9 42.5 8.16 8.12 355.6 362.1 41.6 8.61 8.65
1995 358.0 364.0 43.0 8.44 8.41 369.0 374.6 41.9 8.91 8.971996 373.5 380.0 42.7 8.86 8.81 385.9 391.3 41.7 9.33 9.381997 386.7 392.7 42.8 9.17 9.12 403.2 408.7 41.8 9.74 9.821998 408.4 416.8 42.6 9.75 9.72 420.3 427.1 41.7 10.20 10.261999 415.5 424.6 42.0 10.10 10.06 435.0 442.4 41.4 10.68 10.75
2000 433.1 441.7 42.0 10.49 10.40 457.2 464.1 41.2 11.24 11.262001 453.9 463.9 42.0 11.04 11.02 482.1 490.5 41.2 11.90 11.972002 474.2 484.1 41.6 11.86† 11.61 505.5 513.8† 40.9† 12.50 12.59
WomenBAPT BAPU BAQL BAPV BAPW BAQF BAQG BAQO BAQH BAQI
1990 170.3 177.1 39.1 4.48 4.44 197.0 201.5 37.5 5.30 5.281991 184.2 192.9 38.8 4.94 4.91 217.2 222.4 37.4 5.91 5.891992 199.3 207.1 38.9 5.28 5.24 235.8 241.1 37.3 6.40 6.381993 211.0 220.0 38.9 5.61 5.57 246.9 252.6 37.4 6.70 6.681994 218.3 226.8 39.1 5.76 5.72 255.8 261.5 37.6 6.89 6.88
1995 229.2 236.7 39.4 6.01 5.96 264.2 269.8 37.6 7.15 7.141996 239.2 246.7 39.3 6.27 6.23 277.9 283.0 37.6 7.51 7.491997 251.5 258.8 39.2 6.60 6.56 291.7 297.2 37.6 7.88 7.881998 266.4 274.5 39.2 7.01 6.97 303.7 309.6 37.6 8.23 8.221999 283.5 292.1 39.0 7.49 7.46 320.2 326.5 37.5 8.71 8.70
2000 300.5 307.9 38.9 7.91 7.86 337.9 343.7 37.4 9.17 9.132001 323.7 333.4 38.9 8.56 8.54 359.3 366.8 37.5 9.77 9.762002 343.4 351.8 38.7 9.17† 9.06 376.8 383.4† 37.5† 10.21 10.22
1 Results for 1988 - 1994 relate to Divisions 2, 3 and 4 of the Standard Indus-trial Classification (SIC) 1980. Results from 1995 relate to Division D (SIC)1992.
2 Excluding those whose pay was affected by absence.
Source: Office for National Statistics: 01633 819024
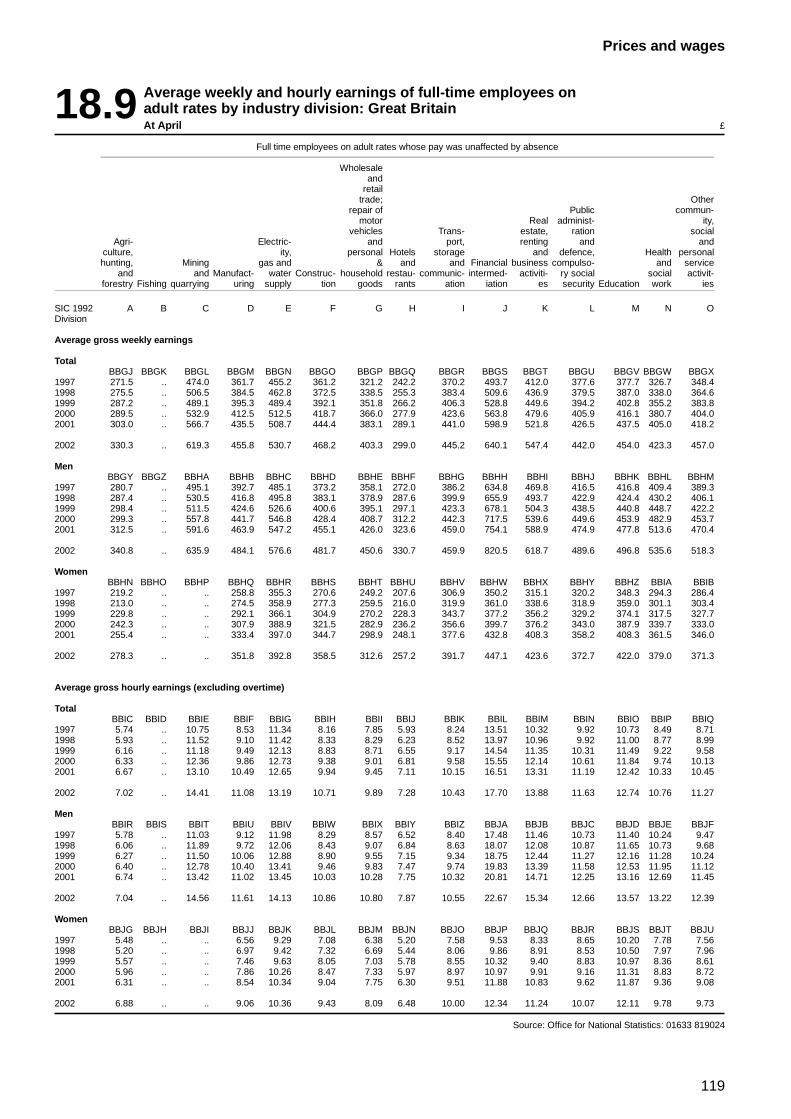
119
Prices and wages
18.9 Average weekly and hourly earnings of full-time employees onadult rates by industry division: Great BritainAt April £
Full time employees on adult rates whose pay was unaffected by absence
Wholesaleand
retailtrade; Other
repair of Public commun-motor Real administ- ity,
vehicles Trans- estate, ration socialAgri- Electric- and port, renting and and
culture, ity, personal Hotels storage and defence, Health personalhunting, Mining gas and & and and Financial business compulso- and service
and and Manufact- water Construc- household restau- communic- intermed- activiti- ry social social activit-forestry Fishing quarrying uring supply tion goods rants ation iation es security Education work ies
SIC 1992 A B C D E F G H I J K L M N ODivision
Average gross weekly earnings
TotalBBGJ BBGK BBGL BBGM BBGN BBGO BBGP BBGQ BBGR BBGS BBGT BBGU BBGV BBGW BBGX
1997 271.5 .. 474.0 361.7 455.2 361.2 321.2 242.2 370.2 493.7 412.0 377.6 377.7 326.7 348.41998 275.5 .. 506.5 384.5 462.8 372.5 338.5 255.3 383.4 509.6 436.9 379.5 387.0 338.0 364.61999 287.2 .. 489.1 395.3 489.4 392.1 351.8 266.2 406.3 528.8 449.6 394.2 402.8 355.2 383.82000 289.5 .. 532.9 412.5 512.5 418.7 366.0 277.9 423.6 563.8 479.6 405.9 416.1 380.7 404.02001 303.0 .. 566.7 435.5 508.7 444.4 383.1 289.1 441.0 598.9 521.8 426.5 437.5 405.0 418.2
2002 330.3 .. 619.3 455.8 530.7 468.2 403.3 299.0 445.2 640.1 547.4 442.0 454.0 423.3 457.0
MenBBGY BBGZ BBHA BBHB BBHC BBHD BBHE BBHF BBHG BBHH BBHI BBHJ BBHK BBHL BBHM
1997 280.7 .. 495.1 392.7 485.1 373.2 358.1 272.0 386.2 634.8 469.8 416.5 416.8 409.4 389.31998 287.4 .. 530.5 416.8 495.8 383.1 378.9 287.6 399.9 655.9 493.7 422.9 424.4 430.2 406.11999 298.4 .. 511.5 424.6 526.6 400.6 395.1 297.1 423.3 678.1 504.3 438.5 440.8 448.7 422.22000 299.3 .. 557.8 441.7 546.8 428.4 408.7 312.2 442.3 717.5 539.6 449.6 453.9 482.9 453.72001 312.5 .. 591.6 463.9 547.2 455.1 426.0 323.6 459.0 754.1 588.9 474.9 477.8 513.6 470.4
2002 340.8 .. 635.9 484.1 576.6 481.7 450.6 330.7 459.9 820.5 618.7 489.6 496.8 535.6 518.3
WomenBBHN BBHO BBHP BBHQ BBHR BBHS BBHT BBHU BBHV BBHW BBHX BBHY BBHZ BBIA BBIB
1997 219.2 .. .. 258.8 355.3 270.6 249.2 207.6 306.9 350.2 315.1 320.2 348.3 294.3 286.41998 213.0 .. .. 274.5 358.9 277.3 259.5 216.0 319.9 361.0 338.6 318.9 359.0 301.1 303.41999 229.8 .. .. 292.1 366.1 304.9 270.2 228.3 343.7 377.2 356.2 329.2 374.1 317.5 327.72000 242.3 .. .. 307.9 388.9 321.5 282.9 236.2 356.6 399.7 376.2 343.0 387.9 339.7 333.02001 255.4 .. .. 333.4 397.0 344.7 298.9 248.1 377.6 432.8 408.3 358.2 408.3 361.5 346.0
2002 278.3 .. .. 351.8 392.8 358.5 312.6 257.2 391.7 447.1 423.6 372.7 422.0 379.0 371.3
Average gross hourly earnings (excluding overtime)
TotalBBIC BBID BBIE BBIF BBIG BBIH BBII BBIJ BBIK BBIL BBIM BBIN BBIO BBIP BBIQ
1997 5.74 .. 10.75 8.53 11.34 8.16 7.85 5.93 8.24 13.51 10.32 9.92 10.73 8.49 8.711998 5.93 .. 11.52 9.10 11.42 8.33 8.29 6.23 8.52 13.97 10.96 9.92 11.00 8.77 8.991999 6.16 .. 11.18 9.49 12.13 8.83 8.71 6.55 9.17 14.54 11.35 10.31 11.49 9.22 9.582000 6.33 .. 12.36 9.86 12.73 9.38 9.01 6.81 9.58 15.55 12.14 10.61 11.84 9.74 10.132001 6.67 .. 13.10 10.49 12.65 9.94 9.45 7.11 10.15 16.51 13.31 11.19 12.42 10.33 10.45
2002 7.02 .. 14.41 11.08 13.19 10.71 9.89 7.28 10.43 17.70 13.88 11.63 12.74 10.76 11.27
MenBBIR BBIS BBIT BBIU BBIV BBIW BBIX BBIY BBIZ BBJA BBJB BBJC BBJD BBJE BBJF
1997 5.78 .. 11.03 9.12 11.98 8.29 8.57 6.52 8.40 17.48 11.46 10.73 11.40 10.24 9.471998 6.06 .. 11.89 9.72 12.06 8.43 9.07 6.84 8.63 18.07 12.08 10.87 11.65 10.73 9.681999 6.27 .. 11.50 10.06 12.88 8.90 9.55 7.15 9.34 18.75 12.44 11.27 12.16 11.28 10.242000 6.40 .. 12.78 10.40 13.41 9.46 9.83 7.47 9.74 19.83 13.39 11.58 12.53 11.95 11.122001 6.74 .. 13.42 11.02 13.45 10.03 10.28 7.75 10.32 20.81 14.71 12.25 13.16 12.69 11.45
2002 7.04 .. 14.56 11.61 14.13 10.86 10.80 7.87 10.55 22.67 15.34 12.66 13.57 13.22 12.39
WomenBBJG BBJH BBJI BBJJ BBJK BBJL BBJM BBJN BBJO BBJP BBJQ BBJR BBJS BBJT BBJU
1997 5.48 .. .. 6.56 9.29 7.08 6.38 5.20 7.58 9.53 8.33 8.65 10.20 7.78 7.561998 5.20 .. .. 6.97 9.42 7.32 6.69 5.44 8.06 9.86 8.91 8.53 10.50 7.97 7.961999 5.57 .. .. 7.46 9.63 8.05 7.03 5.78 8.55 10.32 9.40 8.83 10.97 8.36 8.612000 5.96 .. .. 7.86 10.26 8.47 7.33 5.97 8.97 10.97 9.91 9.16 11.31 8.83 8.722001 6.31 .. .. 8.54 10.34 9.04 7.75 6.30 9.51 11.88 10.83 9.62 11.87 9.36 9.08
2002 6.88 .. .. 9.06 10.36 9.43 8.09 6.48 10.00 12.34 11.24 10.07 12.11 9.78 9.73
Source: Office for National Statistics: 01633 819024
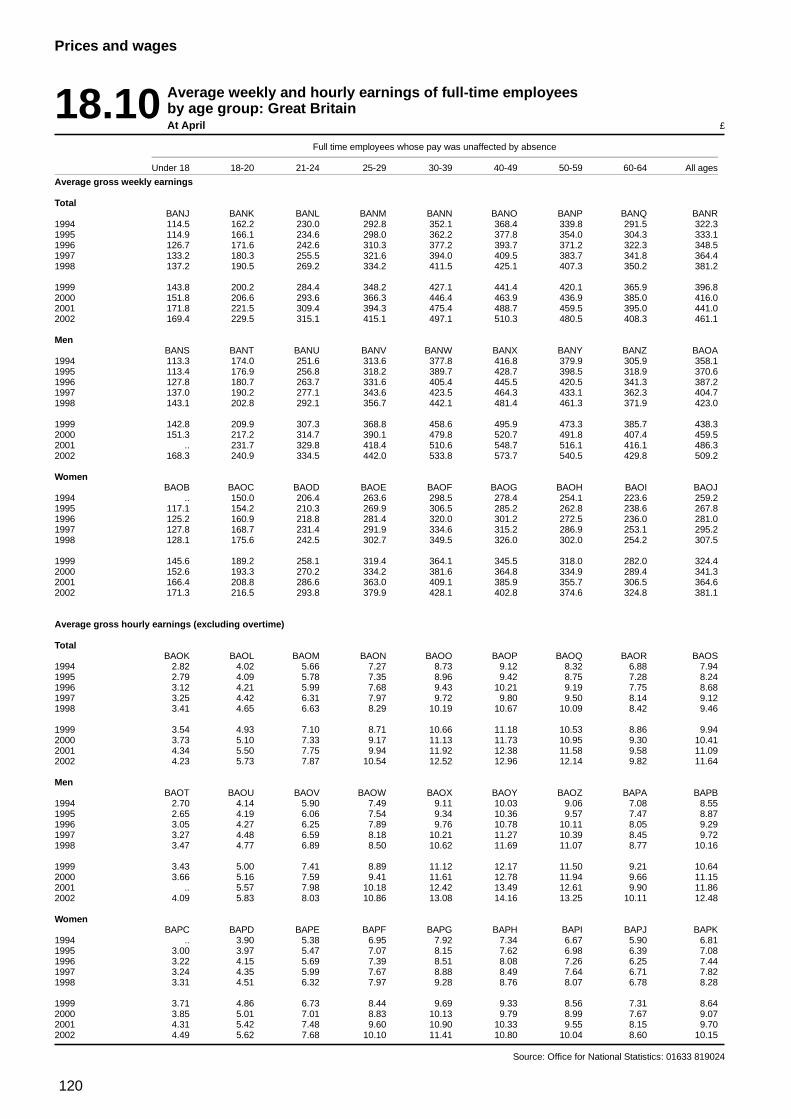
120
Prices and wages
18.10 Average weekly and hourly earnings of full-time employeesby age group: Great BritainAt April £
Full time employees whose pay was unaffected by absence
Under 18 18-20 21-24 25-29 30-39 40-49 50-59 60-64 All ages
Average gross weekly earnings
TotalBANJ BANK BANL BANM BANN BANO BANP BANQ BANR
1994 114.5 162.2 230.0 292.8 352.1 368.4 339.8 291.5 322.31995 114.9 166.1 234.6 298.0 362.2 377.8 354.0 304.3 333.11996 126.7 171.6 242.6 310.3 377.2 393.7 371.2 322.3 348.51997 133.2 180.3 255.5 321.6 394.0 409.5 383.7 341.8 364.41998 137.2 190.5 269.2 334.2 411.5 425.1 407.3 350.2 381.2
1999 143.8 200.2 284.4 348.2 427.1 441.4 420.1 365.9 396.82000 151.8 206.6 293.6 366.3 446.4 463.9 436.9 385.0 416.02001 171.8 221.5 309.4 394.3 475.4 488.7 459.5 395.0 441.02002 169.4 229.5 315.1 415.1 497.1 510.3 480.5 408.3 461.1
MenBANS BANT BANU BANV BANW BANX BANY BANZ BAOA
1994 113.3 174.0 251.6 313.6 377.8 416.8 379.9 305.9 358.11995 113.4 176.9 256.8 318.2 389.7 428.7 398.5 318.9 370.61996 127.8 180.7 263.7 331.6 405.4 445.5 420.5 341.3 387.21997 137.0 190.2 277.1 343.6 423.5 464.3 433.1 362.3 404.71998 143.1 202.8 292.1 356.7 442.1 481.4 461.3 371.9 423.0
1999 142.8 209.9 307.3 368.8 458.6 495.9 473.3 385.7 438.32000 151.3 217.2 314.7 390.1 479.8 520.7 491.8 407.4 459.52001 .. 231.7 329.8 418.4 510.6 548.7 516.1 416.1 486.32002 168.3 240.9 334.5 442.0 533.8 573.7 540.5 429.8 509.2
WomenBAOB BAOC BAOD BAOE BAOF BAOG BAOH BAOI BAOJ
1994 .. 150.0 206.4 263.6 298.5 278.4 254.1 223.6 259.21995 117.1 154.2 210.3 269.9 306.5 285.2 262.8 238.6 267.81996 125.2 160.9 218.8 281.4 320.0 301.2 272.5 236.0 281.01997 127.8 168.7 231.4 291.9 334.6 315.2 286.9 253.1 295.21998 128.1 175.6 242.5 302.7 349.5 326.0 302.0 254.2 307.5
1999 145.6 189.2 258.1 319.4 364.1 345.5 318.0 282.0 324.42000 152.6 193.3 270.2 334.2 381.6 364.8 334.9 289.4 341.32001 166.4 208.8 286.6 363.0 409.1 385.9 355.7 306.5 364.62002 171.3 216.5 293.8 379.9 428.1 402.8 374.6 324.8 381.1
Average gross hourly earnings (excluding overtime)
TotalBAOK BAOL BAOM BAON BAOO BAOP BAOQ BAOR BAOS
1994 2.82 4.02 5.66 7.27 8.73 9.12 8.32 6.88 7.941995 2.79 4.09 5.78 7.35 8.96 9.42 8.75 7.28 8.241996 3.12 4.21 5.99 7.68 9.43 10.21 9.19 7.75 8.681997 3.25 4.42 6.31 7.97 9.72 9.80 9.50 8.14 9.121998 3.41 4.65 6.63 8.29 10.19 10.67 10.09 8.42 9.46
1999 3.54 4.93 7.10 8.71 10.66 11.18 10.53 8.86 9.942000 3.73 5.10 7.33 9.17 11.13 11.73 10.95 9.30 10.412001 4.34 5.50 7.75 9.94 11.92 12.38 11.58 9.58 11.092002 4.23 5.73 7.87 10.54 12.52 12.96 12.14 9.82 11.64
MenBAOT BAOU BAOV BAOW BAOX BAOY BAOZ BAPA BAPB
1994 2.70 4.14 5.90 7.49 9.11 10.03 9.06 7.08 8.551995 2.65 4.19 6.06 7.54 9.34 10.36 9.57 7.47 8.871996 3.05 4.27 6.25 7.89 9.76 10.78 10.11 8.05 9.291997 3.27 4.48 6.59 8.18 10.21 11.27 10.39 8.45 9.721998 3.47 4.77 6.89 8.50 10.62 11.69 11.07 8.77 10.16
1999 3.43 5.00 7.41 8.89 11.12 12.17 11.50 9.21 10.642000 3.66 5.16 7.59 9.41 11.61 12.78 11.94 9.66 11.152001 .. 5.57 7.98 10.18 12.42 13.49 12.61 9.90 11.862002 4.09 5.83 8.03 10.86 13.08 14.16 13.25 10.11 12.48
WomenBAPC BAPD BAPE BAPF BAPG BAPH BAPI BAPJ BAPK
1994 .. 3.90 5.38 6.95 7.92 7.34 6.67 5.90 6.811995 3.00 3.97 5.47 7.07 8.15 7.62 6.98 6.39 7.081996 3.22 4.15 5.69 7.39 8.51 8.08 7.26 6.25 7.441997 3.24 4.35 5.99 7.67 8.88 8.49 7.64 6.71 7.821998 3.31 4.51 6.32 7.97 9.28 8.76 8.07 6.78 8.28
1999 3.71 4.86 6.73 8.44 9.69 9.33 8.56 7.31 8.642000 3.85 5.01 7.01 8.83 10.13 9.79 8.99 7.67 9.072001 4.31 5.42 7.48 9.60 10.90 10.33 9.55 8.15 9.702002 4.49 5.62 7.68 10.10 11.41 10.80 10.04 8.60 10.15
Source: Office for National Statistics: 01633 819024
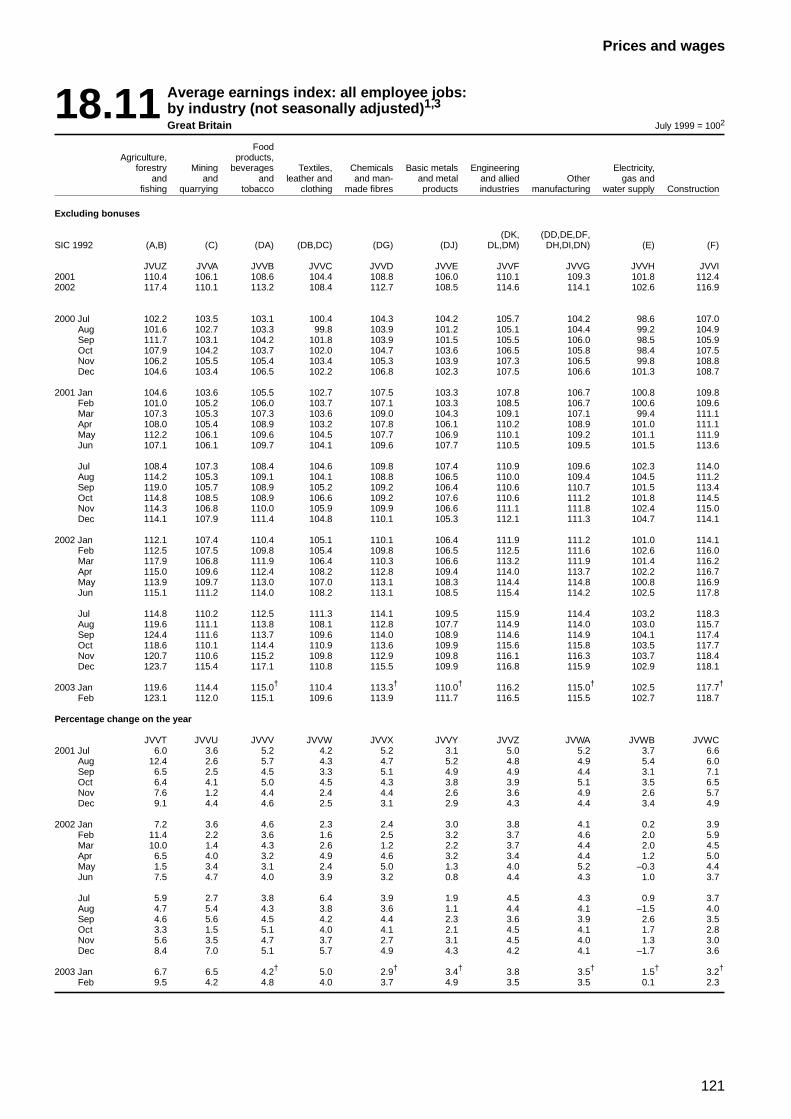
121
Prices and wages
18.11 Average earnings index: all employee jobs:by industry (not seasonally adjusted)1,3
Great Britain July 1999 = 1002
FoodAgriculture, products,
forestry Mining beverages Textiles, Chemicals Basic metals Engineering Electricity,and and and leather and and man- and metal and allied Other gas and
fishing quarrying tobacco clothing made fibres products industries manufacturing water supply Construction
Excluding bonuses
(DK, (DD,DE,DF,SIC 1992 (A,B) (C) (DA) (DB,DC) (DG) (DJ) DL,DM) DH,DI,DN) (E) (F)
JVUZ JVVA JVVB JVVC JVVD JVVE JVVF JVVG JVVH JVVI2001 110.4 106.1 108.6 104.4 108.8 106.0 110.1 109.3 101.8 112.42002 117.4 110.1 113.2 108.4 112.7 108.5 114.6 114.1 102.6 116.9
2000 Jul 102.2 103.5 103.1 100.4 104.3 104.2 105.7 104.2 98.6 107.0Aug 101.6 102.7 103.3 99.8 103.9 101.2 105.1 104.4 99.2 104.9Sep 111.7 103.1 104.2 101.8 103.9 101.5 105.5 106.0 98.5 105.9Oct 107.9 104.2 103.7 102.0 104.7 103.6 106.5 105.8 98.4 107.5Nov 106.2 105.5 105.4 103.4 105.3 103.9 107.3 106.5 99.8 108.8Dec 104.6 103.4 106.5 102.2 106.8 102.3 107.5 106.6 101.3 108.7
2001 Jan 104.6 103.6 105.5 102.7 107.5 103.3 107.8 106.7 100.8 109.8Feb 101.0 105.2 106.0 103.7 107.1 103.3 108.5 106.7 100.6 109.6Mar 107.3 105.3 107.3 103.6 109.0 104.3 109.1 107.1 99.4 111.1Apr 108.0 105.4 108.9 103.2 107.8 106.1 110.2 108.9 101.0 111.1May 112.2 106.1 109.6 104.5 107.7 106.9 110.1 109.2 101.1 111.9Jun 107.1 106.1 109.7 104.1 109.6 107.7 110.5 109.5 101.5 113.6
Jul 108.4 107.3 108.4 104.6 109.8 107.4 110.9 109.6 102.3 114.0Aug 114.2 105.3 109.1 104.1 108.8 106.5 110.0 109.4 104.5 111.2Sep 119.0 105.7 108.9 105.2 109.2 106.4 110.6 110.7 101.5 113.4Oct 114.8 108.5 108.9 106.6 109.2 107.6 110.6 111.2 101.8 114.5Nov 114.3 106.8 110.0 105.9 109.9 106.6 111.1 111.8 102.4 115.0Dec 114.1 107.9 111.4 104.8 110.1 105.3 112.1 111.3 104.7 114.1
2002 Jan 112.1 107.4 110.4 105.1 110.1 106.4 111.9 111.2 101.0 114.1Feb 112.5 107.5 109.8 105.4 109.8 106.5 112.5 111.6 102.6 116.0Mar 117.9 106.8 111.9 106.4 110.3 106.6 113.2 111.9 101.4 116.2Apr 115.0 109.6 112.4 108.2 112.8 109.4 114.0 113.7 102.2 116.7May 113.9 109.7 113.0 107.0 113.1 108.3 114.4 114.8 100.8 116.9Jun 115.1 111.2 114.0 108.2 113.1 108.5 115.4 114.2 102.5 117.8
Jul 114.8 110.2 112.5 111.3 114.1 109.5 115.9 114.4 103.2 118.3Aug 119.6 111.1 113.8 108.1 112.8 107.7 114.9 114.0 103.0 115.7Sep 124.4 111.6 113.7 109.6 114.0 108.9 114.6 114.9 104.1 117.4Oct 118.6 110.1 114.4 110.9 113.6 109.9 115.6 115.8 103.5 117.7Nov 120.7 110.6 115.2 109.8 112.9 109.8 116.1 116.3 103.7 118.4Dec 123.7 115.4 117.1 110.8 115.5 109.9 116.8 115.9 102.9 118.1
2003 Jan 119.6 114.4 115.0† 110.4 113.3† 110.0† 116.2 115.0† 102.5 117.7†
Feb 123.1 112.0 115.1 109.6 113.9 111.7 116.5 115.5 102.7 118.7
Percentage change on the year
JVVT JVVU JVVV JVVW JVVX JVVY JVVZ JVWA JVWB JVWC2001 Jul 6.0 3.6 5.2 4.2 5.2 3.1 5.0 5.2 3.7 6.6
Aug 12.4 2.6 5.7 4.3 4.7 5.2 4.8 4.9 5.4 6.0Sep 6.5 2.5 4.5 3.3 5.1 4.9 4.9 4.4 3.1 7.1Oct 6.4 4.1 5.0 4.5 4.3 3.8 3.9 5.1 3.5 6.5Nov 7.6 1.2 4.4 2.4 4.4 2.6 3.6 4.9 2.6 5.7Dec 9.1 4.4 4.6 2.5 3.1 2.9 4.3 4.4 3.4 4.9
2002 Jan 7.2 3.6 4.6 2.3 2.4 3.0 3.8 4.1 0.2 3.9Feb 11.4 2.2 3.6 1.6 2.5 3.2 3.7 4.6 2.0 5.9Mar 10.0 1.4 4.3 2.6 1.2 2.2 3.7 4.4 2.0 4.5Apr 6.5 4.0 3.2 4.9 4.6 3.2 3.4 4.4 1.2 5.0May 1.5 3.4 3.1 2.4 5.0 1.3 4.0 5.2 –0.3 4.4Jun 7.5 4.7 4.0 3.9 3.2 0.8 4.4 4.3 1.0 3.7
Jul 5.9 2.7 3.8 6.4 3.9 1.9 4.5 4.3 0.9 3.7Aug 4.7 5.4 4.3 3.8 3.6 1.1 4.4 4.1 –1.5 4.0Sep 4.6 5.6 4.5 4.2 4.4 2.3 3.6 3.9 2.6 3.5Oct 3.3 1.5 5.1 4.0 4.1 2.1 4.5 4.1 1.7 2.8Nov 5.6 3.5 4.7 3.7 2.7 3.1 4.5 4.0 1.3 3.0Dec 8.4 7.0 5.1 5.7 4.9 4.3 4.2 4.1 –1.7 3.6
2003 Jan 6.7 6.5 4.2† 5.0 2.9† 3.4† 3.8 3.5† 1.5† 3.2†
Feb 9.5 4.2 4.8 4.0 3.7 4.9 3.5 3.5 0.1 2.3
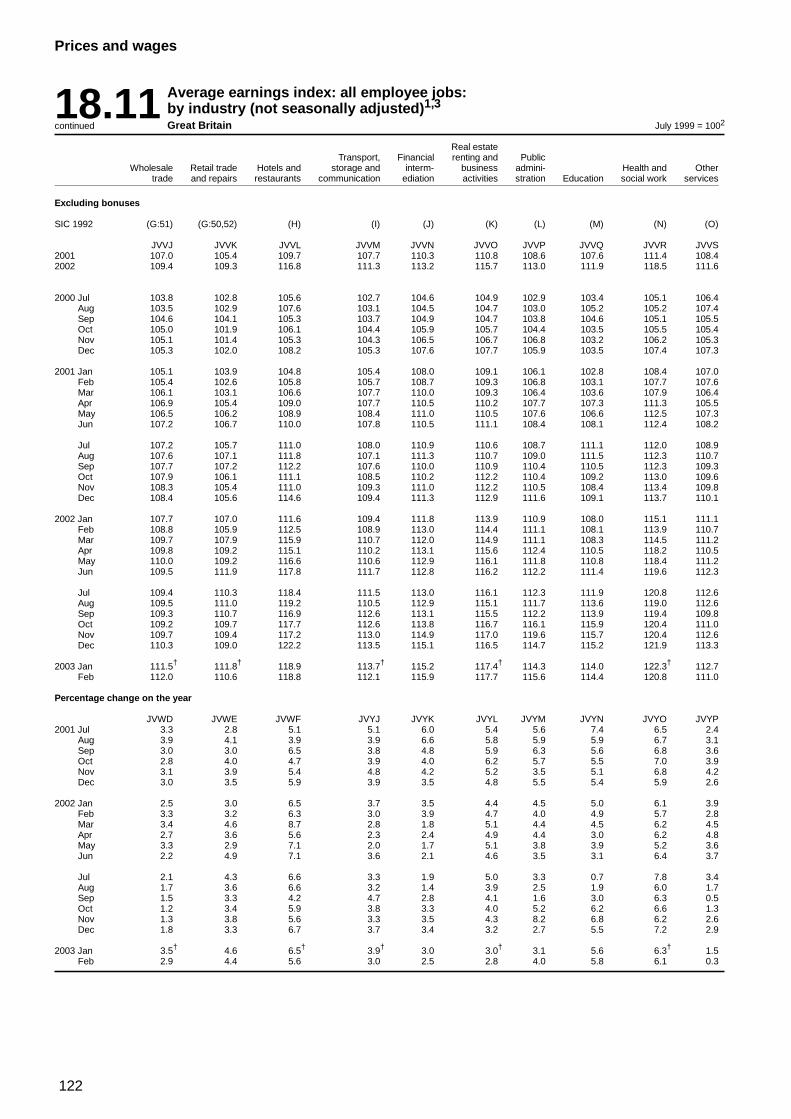
122
Prices and wages
18.11 Average earnings index: all employee jobs:by industry (not seasonally adjusted)1,3
Great Britaincontinued July 1999 = 1002
Real estateTransport, Financial renting and Public
Wholesale Retail trade Hotels and storage and interm- business admini- Health and Othertrade and repairs restaurants communication ediation activities stration Education social work services
Excluding bonuses
SIC 1992 (G:51) (G:50,52) (H) (I) (J) (K) (L) (M) (N) (O)
JVVJ JVVK JVVL JVVM JVVN JVVO JVVP JVVQ JVVR JVVS2001 107.0 105.4 109.7 107.7 110.3 110.8 108.6 107.6 111.4 108.42002 109.4 109.3 116.8 111.3 113.2 115.7 113.0 111.9 118.5 111.6
2000 Jul 103.8 102.8 105.6 102.7 104.6 104.9 102.9 103.4 105.1 106.4Aug 103.5 102.9 107.6 103.1 104.5 104.7 103.0 105.2 105.2 107.4Sep 104.6 104.1 105.3 103.7 104.9 104.7 103.8 104.6 105.1 105.5Oct 105.0 101.9 106.1 104.4 105.9 105.7 104.4 103.5 105.5 105.4Nov 105.1 101.4 105.3 104.3 106.5 106.7 106.8 103.2 106.2 105.3Dec 105.3 102.0 108.2 105.3 107.6 107.7 105.9 103.5 107.4 107.3
2001 Jan 105.1 103.9 104.8 105.4 108.0 109.1 106.1 102.8 108.4 107.0Feb 105.4 102.6 105.8 105.7 108.7 109.3 106.8 103.1 107.7 107.6Mar 106.1 103.1 106.6 107.7 110.0 109.3 106.4 103.6 107.9 106.4Apr 106.9 105.4 109.0 107.7 110.5 110.2 107.7 107.3 111.3 105.5May 106.5 106.2 108.9 108.4 111.0 110.5 107.6 106.6 112.5 107.3Jun 107.2 106.7 110.0 107.8 110.5 111.1 108.4 108.1 112.4 108.2
Jul 107.2 105.7 111.0 108.0 110.9 110.6 108.7 111.1 112.0 108.9Aug 107.6 107.1 111.8 107.1 111.3 110.7 109.0 111.5 112.3 110.7Sep 107.7 107.2 112.2 107.6 110.0 110.9 110.4 110.5 112.3 109.3Oct 107.9 106.1 111.1 108.5 110.2 112.2 110.4 109.2 113.0 109.6Nov 108.3 105.4 111.0 109.3 111.0 112.2 110.5 108.4 113.4 109.8Dec 108.4 105.6 114.6 109.4 111.3 112.9 111.6 109.1 113.7 110.1
2002 Jan 107.7 107.0 111.6 109.4 111.8 113.9 110.9 108.0 115.1 111.1Feb 108.8 105.9 112.5 108.9 113.0 114.4 111.1 108.1 113.9 110.7Mar 109.7 107.9 115.9 110.7 112.0 114.9 111.1 108.3 114.5 111.2Apr 109.8 109.2 115.1 110.2 113.1 115.6 112.4 110.5 118.2 110.5May 110.0 109.2 116.6 110.6 112.9 116.1 111.8 110.8 118.4 111.2Jun 109.5 111.9 117.8 111.7 112.8 116.2 112.2 111.4 119.6 112.3
Jul 109.4 110.3 118.4 111.5 113.0 116.1 112.3 111.9 120.8 112.6Aug 109.5 111.0 119.2 110.5 112.9 115.1 111.7 113.6 119.0 112.6Sep 109.3 110.7 116.9 112.6 113.1 115.5 112.2 113.9 119.4 109.8Oct 109.2 109.7 117.7 112.6 113.8 116.7 116.1 115.9 120.4 111.0Nov 109.7 109.4 117.2 113.0 114.9 117.0 119.6 115.7 120.4 112.6Dec 110.3 109.0 122.2 113.5 115.1 116.5 114.7 115.2 121.9 113.3
2003 Jan 111.5† 111.8† 118.9 113.7† 115.2 117.4† 114.3 114.0 122.3† 112.7Feb 112.0 110.6 118.8 112.1 115.9 117.7 115.6 114.4 120.8 111.0
Percentage change on the year
JVWD JVWE JVWF JVYJ JVYK JVYL JVYM JVYN JVYO JVYP2001 Jul 3.3 2.8 5.1 5.1 6.0 5.4 5.6 7.4 6.5 2.4
Aug 3.9 4.1 3.9 3.9 6.6 5.8 5.9 5.9 6.7 3.1Sep 3.0 3.0 6.5 3.8 4.8 5.9 6.3 5.6 6.8 3.6Oct 2.8 4.0 4.7 3.9 4.0 6.2 5.7 5.5 7.0 3.9Nov 3.1 3.9 5.4 4.8 4.2 5.2 3.5 5.1 6.8 4.2Dec 3.0 3.5 5.9 3.9 3.5 4.8 5.5 5.4 5.9 2.6
2002 Jan 2.5 3.0 6.5 3.7 3.5 4.4 4.5 5.0 6.1 3.9Feb 3.3 3.2 6.3 3.0 3.9 4.7 4.0 4.9 5.7 2.8Mar 3.4 4.6 8.7 2.8 1.8 5.1 4.4 4.5 6.2 4.5Apr 2.7 3.6 5.6 2.3 2.4 4.9 4.4 3.0 6.2 4.8May 3.3 2.9 7.1 2.0 1.7 5.1 3.8 3.9 5.2 3.6Jun 2.2 4.9 7.1 3.6 2.1 4.6 3.5 3.1 6.4 3.7
Jul 2.1 4.3 6.6 3.3 1.9 5.0 3.3 0.7 7.8 3.4Aug 1.7 3.6 6.6 3.2 1.4 3.9 2.5 1.9 6.0 1.7Sep 1.5 3.3 4.2 4.7 2.8 4.1 1.6 3.0 6.3 0.5Oct 1.2 3.4 5.9 3.8 3.3 4.0 5.2 6.2 6.6 1.3Nov 1.3 3.8 5.6 3.3 3.5 4.3 8.2 6.8 6.2 2.6Dec 1.8 3.3 6.7 3.7 3.4 3.2 2.7 5.5 7.2 2.9
2003 Jan 3.5† 4.6 6.5† 3.9† 3.0 3.0† 3.1 5.6 6.3† 1.5Feb 2.9 4.4 5.6 3.0 2.5 2.8 4.0 5.8 6.1 0.3
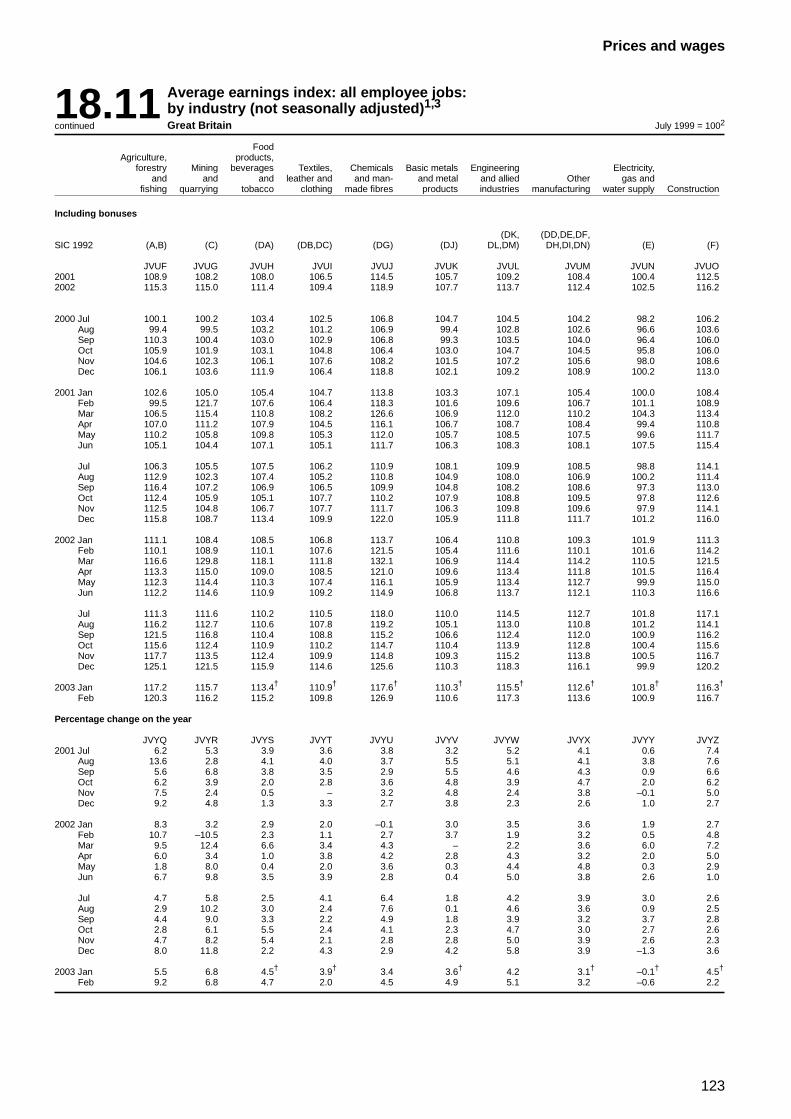
123
Prices and wages
18.11 Average earnings index: all employee jobs:by industry (not seasonally adjusted)1,3
Great Britaincontinued July 1999 = 1002
FoodAgriculture, products,
forestry Mining beverages Textiles, Chemicals Basic metals Engineering Electricity,and and and leather and and man- and metal and allied Other gas and
fishing quarrying tobacco clothing made fibres products industries manufacturing water supply Construction
Including bonuses
(DK, (DD,DE,DF,SIC 1992 (A,B) (C) (DA) (DB,DC) (DG) (DJ) DL,DM) DH,DI,DN) (E) (F)
JVUF JVUG JVUH JVUI JVUJ JVUK JVUL JVUM JVUN JVUO2001 108.9 108.2 108.0 106.5 114.5 105.7 109.2 108.4 100.4 112.52002 115.3 115.0 111.4 109.4 118.9 107.7 113.7 112.4 102.5 116.2
2000 Jul 100.1 100.2 103.4 102.5 106.8 104.7 104.5 104.2 98.2 106.2Aug 99.4 99.5 103.2 101.2 106.9 99.4 102.8 102.6 96.6 103.6Sep 110.3 100.4 103.0 102.9 106.8 99.3 103.5 104.0 96.4 106.0Oct 105.9 101.9 103.1 104.8 106.4 103.0 104.7 104.5 95.8 106.0Nov 104.6 102.3 106.1 107.6 108.2 101.5 107.2 105.6 98.0 108.6Dec 106.1 103.6 111.9 106.4 118.8 102.1 109.2 108.9 100.2 113.0
2001 Jan 102.6 105.0 105.4 104.7 113.8 103.3 107.1 105.4 100.0 108.4Feb 99.5 121.7 107.6 106.4 118.3 101.6 109.6 106.7 101.1 108.9Mar 106.5 115.4 110.8 108.2 126.6 106.9 112.0 110.2 104.3 113.4Apr 107.0 111.2 107.9 104.5 116.1 106.7 108.7 108.4 99.4 110.8May 110.2 105.8 109.8 105.3 112.0 105.7 108.5 107.5 99.6 111.7Jun 105.1 104.4 107.1 105.1 111.7 106.3 108.3 108.1 107.5 115.4
Jul 106.3 105.5 107.5 106.2 110.9 108.1 109.9 108.5 98.8 114.1Aug 112.9 102.3 107.4 105.2 110.8 104.9 108.0 106.9 100.2 111.4Sep 116.4 107.2 106.9 106.5 109.9 104.8 108.2 108.6 97.3 113.0Oct 112.4 105.9 105.1 107.7 110.2 107.9 108.8 109.5 97.8 112.6Nov 112.5 104.8 106.7 107.7 111.7 106.3 109.8 109.6 97.9 114.1Dec 115.8 108.7 113.4 109.9 122.0 105.9 111.8 111.7 101.2 116.0
2002 Jan 111.1 108.4 108.5 106.8 113.7 106.4 110.8 109.3 101.9 111.3Feb 110.1 108.9 110.1 107.6 121.5 105.4 111.6 110.1 101.6 114.2Mar 116.6 129.8 118.1 111.8 132.1 106.9 114.4 114.2 110.5 121.5Apr 113.3 115.0 109.0 108.5 121.0 109.6 113.4 111.8 101.5 116.4May 112.3 114.4 110.3 107.4 116.1 105.9 113.4 112.7 99.9 115.0Jun 112.2 114.6 110.9 109.2 114.9 106.8 113.7 112.1 110.3 116.6
Jul 111.3 111.6 110.2 110.5 118.0 110.0 114.5 112.7 101.8 117.1Aug 116.2 112.7 110.6 107.8 119.2 105.1 113.0 110.8 101.2 114.1Sep 121.5 116.8 110.4 108.8 115.2 106.6 112.4 112.0 100.9 116.2Oct 115.6 112.4 110.9 110.2 114.7 110.4 113.9 112.8 100.4 115.6Nov 117.7 113.5 112.4 109.9 114.8 109.3 115.2 113.8 100.5 116.7Dec 125.1 121.5 115.9 114.6 125.6 110.3 118.3 116.1 99.9 120.2
2003 Jan 117.2 115.7 113.4† 110.9† 117.6† 110.3† 115.5† 112.6† 101.8† 116.3†
Feb 120.3 116.2 115.2 109.8 126.9 110.6 117.3 113.6 100.9 116.7
Percentage change on the year
JVYQ JVYR JVYS JVYT JVYU JVYV JVYW JVYX JVYY JVYZ2001 Jul 6.2 5.3 3.9 3.6 3.8 3.2 5.2 4.1 0.6 7.4
Aug 13.6 2.8 4.1 4.0 3.7 5.5 5.1 4.1 3.8 7.6Sep 5.6 6.8 3.8 3.5 2.9 5.5 4.6 4.3 0.9 6.6Oct 6.2 3.9 2.0 2.8 3.6 4.8 3.9 4.7 2.0 6.2Nov 7.5 2.4 0.5 – 3.2 4.8 2.4 3.8 –0.1 5.0Dec 9.2 4.8 1.3 3.3 2.7 3.8 2.3 2.6 1.0 2.7
2002 Jan 8.3 3.2 2.9 2.0 –0.1 3.0 3.5 3.6 1.9 2.7Feb 10.7 –10.5 2.3 1.1 2.7 3.7 1.9 3.2 0.5 4.8Mar 9.5 12.4 6.6 3.4 4.3 – 2.2 3.6 6.0 7.2Apr 6.0 3.4 1.0 3.8 4.2 2.8 4.3 3.2 2.0 5.0May 1.8 8.0 0.4 2.0 3.6 0.3 4.4 4.8 0.3 2.9Jun 6.7 9.8 3.5 3.9 2.8 0.4 5.0 3.8 2.6 1.0
Jul 4.7 5.8 2.5 4.1 6.4 1.8 4.2 3.9 3.0 2.6Aug 2.9 10.2 3.0 2.4 7.6 0.1 4.6 3.6 0.9 2.5Sep 4.4 9.0 3.3 2.2 4.9 1.8 3.9 3.2 3.7 2.8Oct 2.8 6.1 5.5 2.4 4.1 2.3 4.7 3.0 2.7 2.6Nov 4.7 8.2 5.4 2.1 2.8 2.8 5.0 3.9 2.6 2.3Dec 8.0 11.8 2.2 4.3 2.9 4.2 5.8 3.9 –1.3 3.6
2003 Jan 5.5 6.8 4.5† 3.9† 3.4 3.6† 4.2 3.1† –0.1† 4.5†
Feb 9.2 6.8 4.7 2.0 4.5 4.9 5.1 3.2 –0.6 2.2
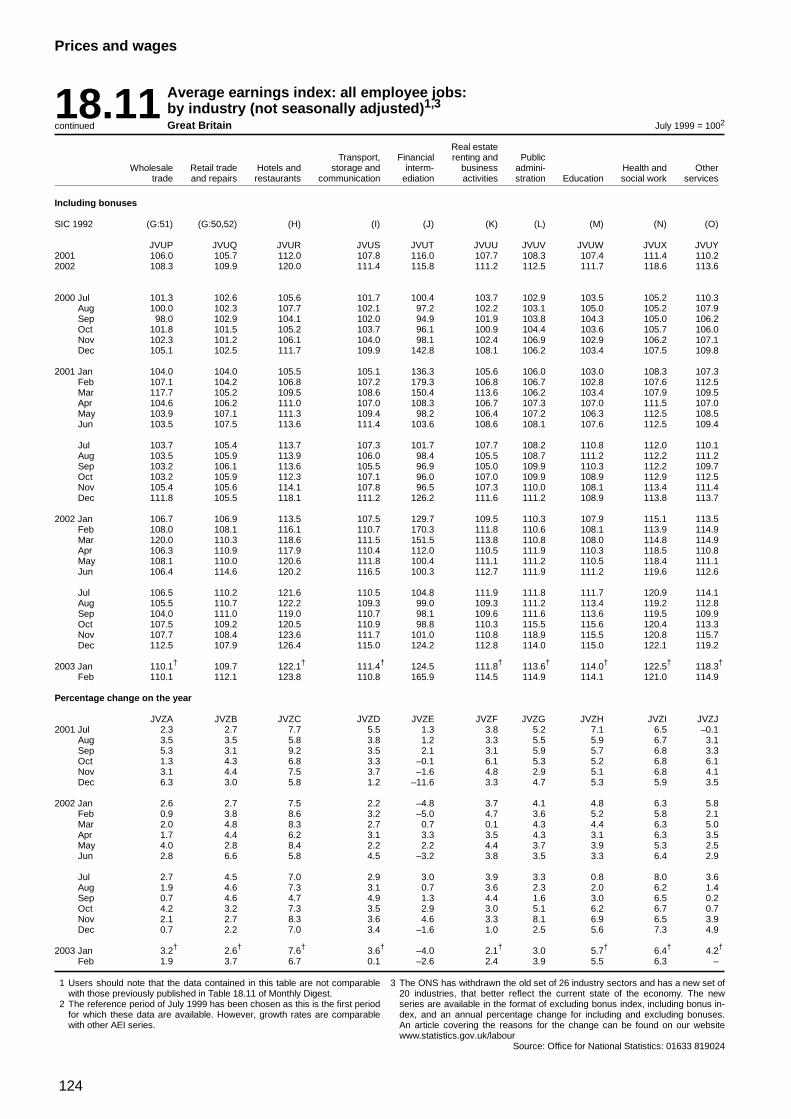
124
Prices and wages
18.11 Average earnings index: all employee jobs:by industry (not seasonally adjusted)1,3
Great Britaincontinued July 1999 = 1002
Real estateTransport, Financial renting and Public
Wholesale Retail trade Hotels and storage and interm- business admini- Health and Othertrade and repairs restaurants communication ediation activities stration Education social work services
Including bonuses
SIC 1992 (G:51) (G:50,52) (H) (I) (J) (K) (L) (M) (N) (O)
JVUP JVUQ JVUR JVUS JVUT JVUU JVUV JVUW JVUX JVUY2001 106.0 105.7 112.0 107.8 116.0 107.7 108.3 107.4 111.4 110.22002 108.3 109.9 120.0 111.4 115.8 111.2 112.5 111.7 118.6 113.6
2000 Jul 101.3 102.6 105.6 101.7 100.4 103.7 102.9 103.5 105.2 110.3Aug 100.0 102.3 107.7 102.1 97.2 102.2 103.1 105.0 105.2 107.9Sep 98.0 102.9 104.1 102.0 94.9 101.9 103.8 104.3 105.0 106.2Oct 101.8 101.5 105.2 103.7 96.1 100.9 104.4 103.6 105.7 106.0Nov 102.3 101.2 106.1 104.0 98.1 102.4 106.9 102.9 106.2 107.1Dec 105.1 102.5 111.7 109.9 142.8 108.1 106.2 103.4 107.5 109.8
2001 Jan 104.0 104.0 105.5 105.1 136.3 105.6 106.0 103.0 108.3 107.3Feb 107.1 104.2 106.8 107.2 179.3 106.8 106.7 102.8 107.6 112.5Mar 117.7 105.2 109.5 108.6 150.4 113.6 106.2 103.4 107.9 109.5Apr 104.6 106.2 111.0 107.0 108.3 106.7 107.3 107.0 111.5 107.0May 103.9 107.1 111.3 109.4 98.2 106.4 107.2 106.3 112.5 108.5Jun 103.5 107.5 113.6 111.4 103.6 108.6 108.1 107.6 112.5 109.4
Jul 103.7 105.4 113.7 107.3 101.7 107.7 108.2 110.8 112.0 110.1Aug 103.5 105.9 113.9 106.0 98.4 105.5 108.7 111.2 112.2 111.2Sep 103.2 106.1 113.6 105.5 96.9 105.0 109.9 110.3 112.2 109.7Oct 103.2 105.9 112.3 107.1 96.0 107.0 109.9 108.9 112.9 112.5Nov 105.4 105.6 114.1 107.8 96.5 107.3 110.0 108.1 113.4 111.4Dec 111.8 105.5 118.1 111.2 126.2 111.6 111.2 108.9 113.8 113.7
2002 Jan 106.7 106.9 113.5 107.5 129.7 109.5 110.3 107.9 115.1 113.5Feb 108.0 108.1 116.1 110.7 170.3 111.8 110.6 108.1 113.9 114.9Mar 120.0 110.3 118.6 111.5 151.5 113.8 110.8 108.0 114.8 114.9Apr 106.3 110.9 117.9 110.4 112.0 110.5 111.9 110.3 118.5 110.8May 108.1 110.0 120.6 111.8 100.4 111.1 111.2 110.5 118.4 111.1Jun 106.4 114.6 120.2 116.5 100.3 112.7 111.9 111.2 119.6 112.6
Jul 106.5 110.2 121.6 110.5 104.8 111.9 111.8 111.7 120.9 114.1Aug 105.5 110.7 122.2 109.3 99.0 109.3 111.2 113.4 119.2 112.8Sep 104.0 111.0 119.0 110.7 98.1 109.6 111.6 113.6 119.5 109.9Oct 107.5 109.2 120.5 110.9 98.8 110.3 115.5 115.6 120.4 113.3Nov 107.7 108.4 123.6 111.7 101.0 110.8 118.9 115.5 120.8 115.7Dec 112.5 107.9 126.4 115.0 124.2 112.8 114.0 115.0 122.1 119.2
2003 Jan 110.1† 109.7 122.1† 111.4† 124.5 111.8† 113.6† 114.0† 122.5† 118.3†
Feb 110.1 112.1 123.8 110.8 165.9 114.5 114.9 114.1 121.0 114.9
Percentage change on the year
JVZA JVZB JVZC JVZD JVZE JVZF JVZG JVZH JVZI JVZJ2001 Jul 2.3 2.7 7.7 5.5 1.3 3.8 5.2 7.1 6.5 –0.1
Aug 3.5 3.5 5.8 3.8 1.2 3.3 5.5 5.9 6.7 3.1Sep 5.3 3.1 9.2 3.5 2.1 3.1 5.9 5.7 6.8 3.3Oct 1.3 4.3 6.8 3.3 –0.1 6.1 5.3 5.2 6.8 6.1Nov 3.1 4.4 7.5 3.7 –1.6 4.8 2.9 5.1 6.8 4.1Dec 6.3 3.0 5.8 1.2 –11.6 3.3 4.7 5.3 5.9 3.5
2002 Jan 2.6 2.7 7.5 2.2 –4.8 3.7 4.1 4.8 6.3 5.8Feb 0.9 3.8 8.6 3.2 –5.0 4.7 3.6 5.2 5.8 2.1Mar 2.0 4.8 8.3 2.7 0.7 0.1 4.3 4.4 6.3 5.0Apr 1.7 4.4 6.2 3.1 3.3 3.5 4.3 3.1 6.3 3.5May 4.0 2.8 8.4 2.2 2.2 4.4 3.7 3.9 5.3 2.5Jun 2.8 6.6 5.8 4.5 –3.2 3.8 3.5 3.3 6.4 2.9
Jul 2.7 4.5 7.0 2.9 3.0 3.9 3.3 0.8 8.0 3.6Aug 1.9 4.6 7.3 3.1 0.7 3.6 2.3 2.0 6.2 1.4Sep 0.7 4.6 4.7 4.9 1.3 4.4 1.6 3.0 6.5 0.2Oct 4.2 3.2 7.3 3.5 2.9 3.0 5.1 6.2 6.7 0.7Nov 2.1 2.7 8.3 3.6 4.6 3.3 8.1 6.9 6.5 3.9Dec 0.7 2.2 7.0 3.4 –1.6 1.0 2.5 5.6 7.3 4.9
2003 Jan 3.2† 2.6† 7.6† 3.6† –4.0 2.1† 3.0 5.7† 6.4† 4.2†
Feb 1.9 3.7 6.7 0.1 –2.6 2.4 3.9 5.5 6.3 –
1 Users should note that the data contained in this table are not comparablewith those previously published in Table 18.11 of Monthly Digest.
2 The reference period of July 1999 has been chosen as this is the first periodfor which these data are available. However, growth rates are comparablewith other AEI series.
3 The ONS has withdrawn the old set of 26 industry sectors and has a new set of20 industries, that better reflect the current state of the economy. The newseries are available in the format of excluding bonus index, including bonus in-dex, and an annual percentage change for including and excluding bonuses.An article covering the reasons for the change can be found on our websitewww.statistics.gov.uk/labour
Source: Office for National Statistics: 01633 819024
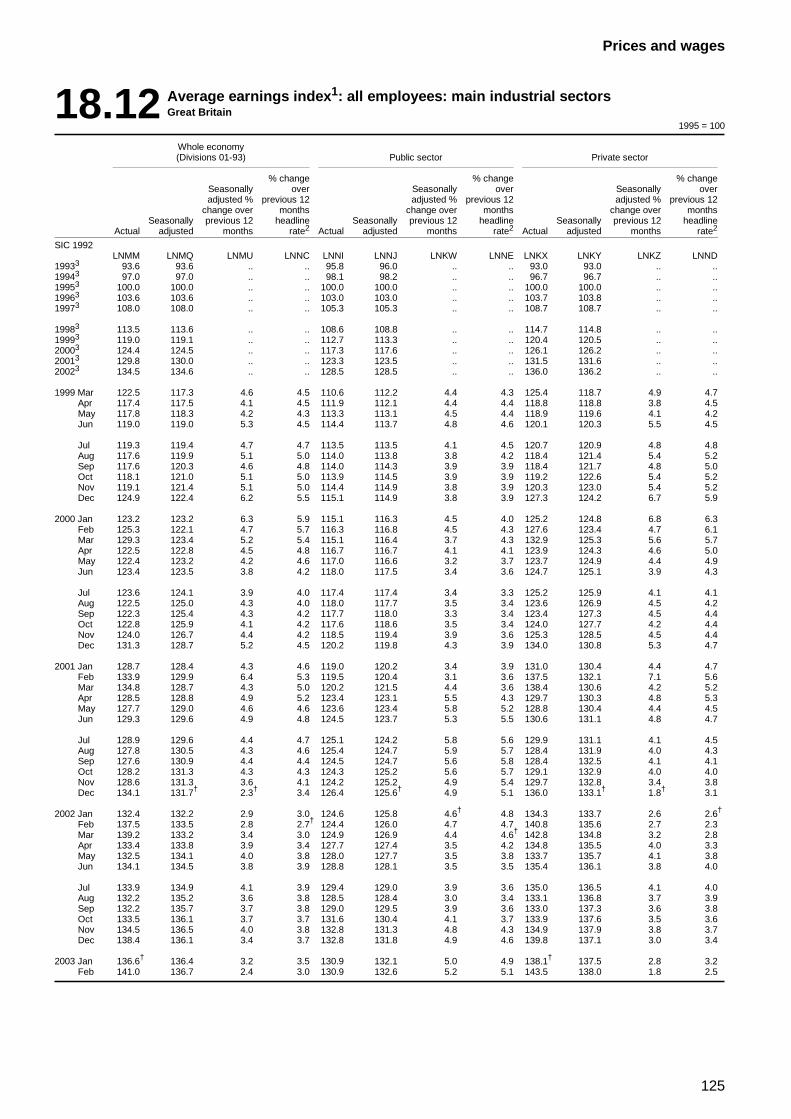
125
Prices and wages
18.12 Average earnings index1: all employees: main industrial sectorsGreat Britain
1995 = 100
Whole economy(Divisions 01-93) Public sector Private sector
% change % change % changeSeasonally over Seasonally over Seasonally overadjusted % previous 12 adjusted % previous 12 adjusted % previous 12
change over months change over months change over monthsSeasonally previous 12 headline Seasonally previous 12 headline Seasonally previous 12 headline
Actual adjusted months rate2 Actual adjusted months rate2 Actual adjusted months rate2
SIC 1992LNMM LNMQ LNMU LNNC LNNI LNNJ LNKW LNNE LNKX LNKY LNKZ LNND
19933 93.6 93.6 .. .. 95.8 96.0 .. .. 93.0 93.0 .. ..19943 97.0 97.0 .. .. 98.1 98.2 .. .. 96.7 96.7 .. ..19953 100.0 100.0 .. .. 100.0 100.0 .. .. 100.0 100.0 .. ..19963 103.6 103.6 .. .. 103.0 103.0 .. .. 103.7 103.8 .. ..19973 108.0 108.0 .. .. 105.3 105.3 .. .. 108.7 108.7 .. ..
19983 113.5 113.6 .. .. 108.6 108.8 .. .. 114.7 114.8 .. ..19993 119.0 119.1 .. .. 112.7 113.3 .. .. 120.4 120.5 .. ..20003 124.4 124.5 .. .. 117.3 117.6 .. .. 126.1 126.2 .. ..20013 129.8 130.0 .. .. 123.3 123.5 .. .. 131.5 131.6 .. ..20023 134.5 134.6 .. .. 128.5 128.5 .. .. 136.0 136.2 .. ..
1999 Mar 122.5 117.3 4.6 4.5 110.6 112.2 4.4 4.3 125.4 118.7 4.9 4.7Apr 117.4 117.5 4.1 4.5 111.9 112.1 4.4 4.4 118.8 118.8 3.8 4.5May 117.8 118.3 4.2 4.3 113.3 113.1 4.5 4.4 118.9 119.6 4.1 4.2Jun 119.0 119.0 5.3 4.5 114.4 113.7 4.8 4.6 120.1 120.3 5.5 4.5
Jul 119.3 119.4 4.7 4.7 113.5 113.5 4.1 4.5 120.7 120.9 4.8 4.8Aug 117.6 119.9 5.1 5.0 114.0 113.8 3.8 4.2 118.4 121.4 5.4 5.2Sep 117.6 120.3 4.6 4.8 114.0 114.3 3.9 3.9 118.4 121.7 4.8 5.0Oct 118.1 121.0 5.1 5.0 113.9 114.5 3.9 3.9 119.2 122.6 5.4 5.2Nov 119.1 121.4 5.1 5.0 114.4 114.9 3.8 3.9 120.3 123.0 5.4 5.2Dec 124.9 122.4 6.2 5.5 115.1 114.9 3.8 3.9 127.3 124.2 6.7 5.9
2000 Jan 123.2 123.2 6.3 5.9 115.1 116.3 4.5 4.0 125.2 124.8 6.8 6.3Feb 125.3 122.1 4.7 5.7 116.3 116.8 4.5 4.3 127.6 123.4 4.7 6.1Mar 129.3 123.4 5.2 5.4 115.1 116.4 3.7 4.3 132.9 125.3 5.6 5.7Apr 122.5 122.8 4.5 4.8 116.7 116.7 4.1 4.1 123.9 124.3 4.6 5.0May 122.4 123.2 4.2 4.6 117.0 116.6 3.2 3.7 123.7 124.9 4.4 4.9Jun 123.4 123.5 3.8 4.2 118.0 117.5 3.4 3.6 124.7 125.1 3.9 4.3
Jul 123.6 124.1 3.9 4.0 117.4 117.4 3.4 3.3 125.2 125.9 4.1 4.1Aug 122.5 125.0 4.3 4.0 118.0 117.7 3.5 3.4 123.6 126.9 4.5 4.2Sep 122.3 125.4 4.3 4.2 117.7 118.0 3.3 3.4 123.4 127.3 4.5 4.4Oct 122.8 125.9 4.1 4.2 117.6 118.6 3.5 3.4 124.0 127.7 4.2 4.4Nov 124.0 126.7 4.4 4.2 118.5 119.4 3.9 3.6 125.3 128.5 4.5 4.4Dec 131.3 128.7 5.2 4.5 120.2 119.8 4.3 3.9 134.0 130.8 5.3 4.7
2001 Jan 128.7 128.4 4.3 4.6 119.0 120.2 3.4 3.9 131.0 130.4 4.4 4.7Feb 133.9 129.9 6.4 5.3 119.5 120.4 3.1 3.6 137.5 132.1 7.1 5.6Mar 134.8 128.7 4.3 5.0 120.2 121.5 4.4 3.6 138.4 130.6 4.2 5.2Apr 128.5 128.8 4.9 5.2 123.4 123.1 5.5 4.3 129.7 130.3 4.8 5.3May 127.7 129.0 4.6 4.6 123.6 123.4 5.8 5.2 128.8 130.4 4.4 4.5Jun 129.3 129.6 4.9 4.8 124.5 123.7 5.3 5.5 130.6 131.1 4.8 4.7
Jul 128.9 129.6 4.4 4.7 125.1 124.2 5.8 5.6 129.9 131.1 4.1 4.5Aug 127.8 130.5 4.3 4.6 125.4 124.7 5.9 5.7 128.4 131.9 4.0 4.3Sep 127.6 130.9 4.4 4.4 124.5 124.7 5.6 5.8 128.4 132.5 4.1 4.1Oct 128.2 131.3 4.3 4.3 124.3 125.2 5.6 5.7 129.1 132.9 4.0 4.0Nov 128.6 131.3 3.6 4.1 124.2 125.2 4.9 5.4 129.7 132.8 3.4 3.8Dec 134.1 131.7† 2.3† 3.4 126.4 125.6† 4.9 5.1 136.0 133.1† 1.8† 3.1
2002 Jan 132.4 132.2 2.9 3.0 124.6 125.8 4.6† 4.8 134.3 133.7 2.6 2.6†
Feb 137.5 133.5 2.8 2.7† 124.4 126.0 4.7 4.7 140.8 135.6 2.7 2.3Mar 139.2 133.2 3.4 3.0 124.9 126.9 4.4 4.6† 142.8 134.8 3.2 2.8Apr 133.4 133.8 3.9 3.4 127.7 127.4 3.5 4.2 134.8 135.5 4.0 3.3May 132.5 134.1 4.0 3.8 128.0 127.7 3.5 3.8 133.7 135.7 4.1 3.8Jun 134.1 134.5 3.8 3.9 128.8 128.1 3.5 3.5 135.4 136.1 3.8 4.0
Jul 133.9 134.9 4.1 3.9 129.4 129.0 3.9 3.6 135.0 136.5 4.1 4.0Aug 132.2 135.2 3.6 3.8 128.5 128.4 3.0 3.4 133.1 136.8 3.7 3.9Sep 132.2 135.7 3.7 3.8 129.0 129.5 3.9 3.6 133.0 137.3 3.6 3.8Oct 133.5 136.1 3.7 3.7 131.6 130.4 4.1 3.7 133.9 137.6 3.5 3.6Nov 134.5 136.5 4.0 3.8 132.8 131.3 4.8 4.3 134.9 137.9 3.8 3.7Dec 138.4 136.1 3.4 3.7 132.8 131.8 4.9 4.6 139.8 137.1 3.0 3.4
2003 Jan 136.6† 136.4 3.2 3.5 130.9 132.1 5.0 4.9 138.1† 137.5 2.8 3.2Feb 141.0 136.7 2.4 3.0 130.9 132.6 5.2 5.1 143.5 138.0 1.8 2.5
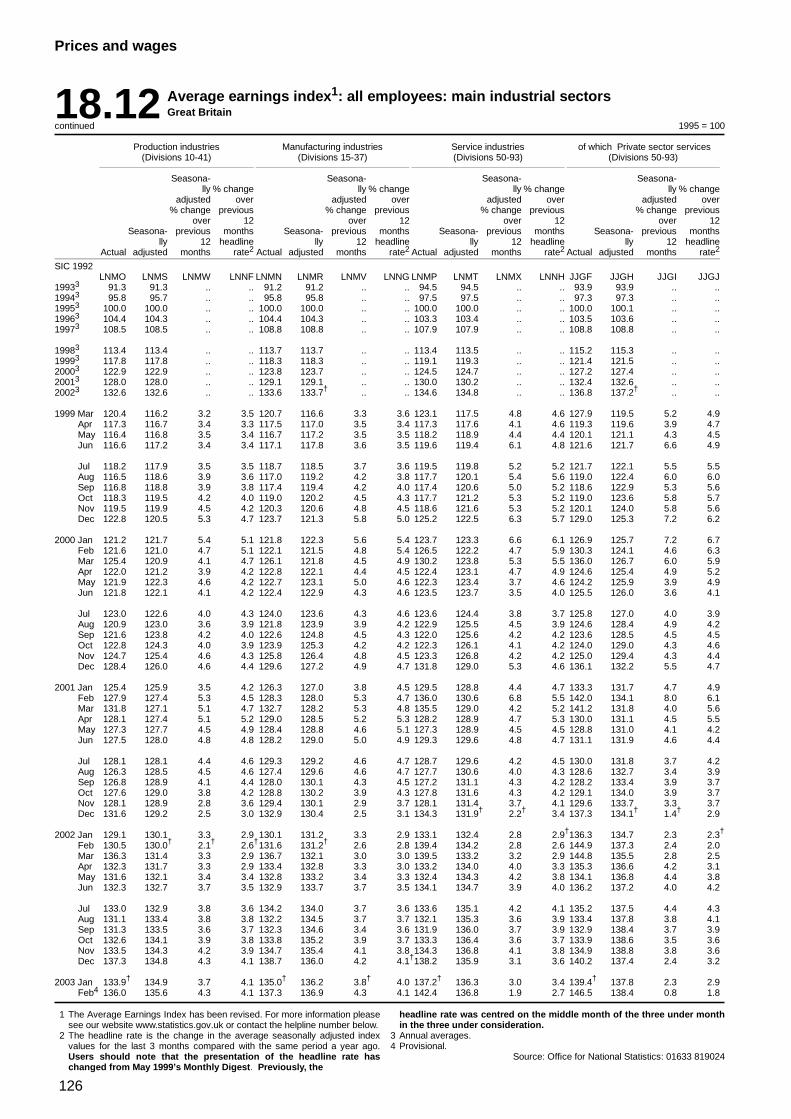
126
Prices and wages
18.12 Average earnings index1: all employees: main industrial sectorsGreat Britain
continued 1995 = 100
Production industries Manufacturing industries Service industries of which Private sector services(Divisions 10-41) (Divisions 15-37) (Divisions 50-93) (Divisions 50-93)
Seasona- Seasona- Seasona- Seasona-lly % change lly % change lly % change lly % change
adjusted over adjusted over adjusted over adjusted over% change previous % change previous % change previous % change previous
over 12 over 12 over 12 over 12Seasona- previous months Seasona- previous months Seasona- previous months Seasona- previous months
lly 12 headline lly 12 headline lly 12 headline lly 12 headlineActual adjusted months rate2 Actual adjusted months rate2 Actual adjusted months rate2 Actual adjusted months rate2
SIC 1992LNMO LNMS LNMW LNNF LNMN LNMR LNMV LNNG LNMP LNMT LNMX LNNH JJGF JJGH JJGI JJGJ
19933 91.3 91.3 .. .. 91.2 91.2 .. .. 94.5 94.5 .. .. 93.9 93.9 .. ..19943 95.8 95.7 .. .. 95.8 95.8 .. .. 97.5 97.5 .. .. 97.3 97.3 .. ..19953 100.0 100.0 .. .. 100.0 100.0 .. .. 100.0 100.0 .. .. 100.0 100.1 .. ..19963 104.4 104.3 .. .. 104.4 104.3 .. .. 103.3 103.4 .. .. 103.5 103.6 .. ..19973 108.5 108.5 .. .. 108.8 108.8 .. .. 107.9 107.9 .. .. 108.8 108.8 .. ..
19983 113.4 113.4 .. .. 113.7 113.7 .. .. 113.4 113.5 .. .. 115.2 115.3 .. ..19993 117.8 117.8 .. .. 118.3 118.3 .. .. 119.1 119.3 .. .. 121.4 121.5 .. ..20003 122.9 122.9 .. .. 123.8 123.7 .. .. 124.5 124.7 .. .. 127.2 127.4 .. ..20013 128.0 128.0 .. .. 129.1 129.1 .. .. 130.0 130.2 .. .. 132.4 132.6 .. ..20023 132.6 132.6 .. .. 133.6 133.7† .. .. 134.6 134.8 .. .. 136.8 137.2† .. ..
1999 Mar 120.4 116.2 3.2 3.5 120.7 116.6 3.3 3.6 123.1 117.5 4.8 4.6 127.9 119.5 5.2 4.9Apr 117.3 116.7 3.4 3.3 117.5 117.0 3.5 3.4 117.3 117.6 4.1 4.6 119.3 119.6 3.9 4.7May 116.4 116.8 3.5 3.4 116.7 117.2 3.5 3.5 118.2 118.9 4.4 4.4 120.1 121.1 4.3 4.5Jun 116.6 117.2 3.4 3.4 117.1 117.8 3.6 3.5 119.6 119.4 6.1 4.8 121.6 121.7 6.6 4.9
Jul 118.2 117.9 3.5 3.5 118.7 118.5 3.7 3.6 119.5 119.8 5.2 5.2 121.7 122.1 5.5 5.5Aug 116.5 118.6 3.9 3.6 117.0 119.2 4.2 3.8 117.7 120.1 5.4 5.6 119.0 122.4 6.0 6.0Sep 116.8 118.8 3.9 3.8 117.4 119.4 4.2 4.0 117.4 120.6 5.0 5.2 118.6 122.9 5.3 5.6Oct 118.3 119.5 4.2 4.0 119.0 120.2 4.5 4.3 117.7 121.2 5.3 5.2 119.0 123.6 5.8 5.7Nov 119.5 119.9 4.5 4.2 120.3 120.6 4.8 4.5 118.6 121.6 5.3 5.2 120.1 124.0 5.8 5.6Dec 122.8 120.5 5.3 4.7 123.7 121.3 5.8 5.0 125.2 122.5 6.3 5.7 129.0 125.3 7.2 6.2
2000 Jan 121.2 121.7 5.4 5.1 121.8 122.3 5.6 5.4 123.7 123.3 6.6 6.1 126.9 125.7 7.2 6.7Feb 121.6 121.0 4.7 5.1 122.1 121.5 4.8 5.4 126.5 122.2 4.7 5.9 130.3 124.1 4.6 6.3Mar 125.4 120.9 4.1 4.7 126.1 121.8 4.5 4.9 130.2 123.8 5.3 5.5 136.0 126.7 6.0 5.9Apr 122.0 121.2 3.9 4.2 122.8 122.1 4.4 4.5 122.4 123.1 4.7 4.9 124.6 125.4 4.9 5.2May 121.9 122.3 4.6 4.2 122.7 123.1 5.0 4.6 122.3 123.4 3.7 4.6 124.2 125.9 3.9 4.9Jun 121.8 122.1 4.1 4.2 122.4 122.9 4.3 4.6 123.5 123.7 3.5 4.0 125.5 126.0 3.6 4.1
Jul 123.0 122.6 4.0 4.3 124.0 123.6 4.3 4.6 123.6 124.4 3.8 3.7 125.8 127.0 4.0 3.9Aug 120.9 123.0 3.6 3.9 121.8 123.9 3.9 4.2 122.9 125.5 4.5 3.9 124.6 128.4 4.9 4.2Sep 121.6 123.8 4.2 4.0 122.6 124.8 4.5 4.3 122.0 125.6 4.2 4.2 123.6 128.5 4.5 4.5Oct 122.8 124.3 4.0 3.9 123.9 125.3 4.2 4.2 122.3 126.1 4.1 4.2 124.0 129.0 4.3 4.6Nov 124.7 125.4 4.6 4.3 125.8 126.4 4.8 4.5 123.3 126.8 4.2 4.2 125.0 129.4 4.3 4.4Dec 128.4 126.0 4.6 4.4 129.6 127.2 4.9 4.7 131.8 129.0 5.3 4.6 136.1 132.2 5.5 4.7
2001 Jan 125.4 125.9 3.5 4.2 126.3 127.0 3.8 4.5 129.5 128.8 4.4 4.7 133.3 131.7 4.7 4.9Feb 127.9 127.4 5.3 4.5 128.3 128.0 5.3 4.7 136.0 130.6 6.8 5.5 142.0 134.1 8.0 6.1Mar 131.8 127.1 5.1 4.7 132.7 128.2 5.3 4.8 135.5 129.0 4.2 5.2 141.2 131.8 4.0 5.6Apr 128.1 127.4 5.1 5.2 129.0 128.5 5.2 5.3 128.2 128.9 4.7 5.3 130.0 131.1 4.5 5.5May 127.3 127.7 4.5 4.9 128.4 128.8 4.6 5.1 127.3 128.9 4.5 4.5 128.8 131.0 4.1 4.2Jun 127.5 128.0 4.8 4.8 128.2 129.0 5.0 4.9 129.3 129.6 4.8 4.7 131.1 131.9 4.6 4.4
Jul 128.1 128.1 4.4 4.6 129.3 129.2 4.6 4.7 128.7 129.6 4.2 4.5 130.0 131.8 3.7 4.2Aug 126.3 128.5 4.5 4.6 127.4 129.6 4.6 4.7 127.7 130.6 4.0 4.3 128.6 132.7 3.4 3.9Sep 126.8 128.9 4.1 4.4 128.0 130.1 4.3 4.5 127.2 131.1 4.3 4.2 128.2 133.4 3.9 3.7Oct 127.6 129.0 3.8 4.2 128.8 130.2 3.9 4.3 127.8 131.6 4.3 4.2 129.1 134.0 3.9 3.7Nov 128.1 128.9 2.8 3.6 129.4 130.1 2.9 3.7 128.1 131.4 3.7 4.1 129.6 133.7 3.3 3.7Dec 131.6 129.2 2.5 3.0 132.9 130.4 2.5 3.1 134.3 131.9† 2.2† 3.4 137.3 134.1† 1.4† 2.9
2002 Jan 129.1 130.1 3.3 2.9 130.1 131.2 3.3 2.9 133.1 132.4 2.8 2.9†136.3 134.7 2.3 2.3†
Feb 130.5 130.0† 2.1† 2.6†131.6 131.2† 2.6 2.8 139.4 134.2 2.8 2.6 144.9 137.3 2.4 2.0Mar 136.3 131.4 3.3 2.9 136.7 132.1 3.0 3.0 139.5 133.2 3.2 2.9 144.8 135.5 2.8 2.5Apr 132.3 131.7 3.3 2.9 133.4 132.8 3.3 3.0 133.2 134.0 4.0 3.3 135.3 136.6 4.2 3.1May 131.6 132.1 3.4 3.4 132.8 133.2 3.4 3.3 132.4 134.3 4.2 3.8 134.1 136.8 4.4 3.8Jun 132.3 132.7 3.7 3.5 132.9 133.7 3.7 3.5 134.1 134.7 3.9 4.0 136.2 137.2 4.0 4.2
Jul 133.0 132.9 3.8 3.6 134.2 134.0 3.7 3.6 133.6 135.1 4.2 4.1 135.2 137.5 4.4 4.3Aug 131.1 133.4 3.8 3.8 132.2 134.5 3.7 3.7 132.1 135.3 3.6 3.9 133.4 137.8 3.8 4.1Sep 131.3 133.5 3.6 3.7 132.3 134.6 3.4 3.6 131.9 136.0 3.7 3.9 132.9 138.4 3.7 3.9Oct 132.6 134.1 3.9 3.8 133.8 135.2 3.9 3.7 133.3 136.4 3.6 3.7 133.9 138.6 3.5 3.6Nov 133.5 134.3 4.2 3.9 134.7 135.4 4.1 3.8 134.3 136.8 4.1 3.8 134.9 138.8 3.8 3.6Dec 137.3 134.8 4.3 4.1 138.7 136.0 4.2 4.1†138.2 135.9 3.1 3.6 140.2 137.4 2.4 3.2
2003 Jan 133.9† 134.9 3.7 4.1 135.0† 136.2 3.8† 4.0 137.2† 136.3 3.0 3.4 139.4† 137.8 2.3 2.9Feb4 136.0 135.6 4.3 4.1 137.3 136.9 4.3 4.1 142.4 136.8 1.9 2.7 146.5 138.4 0.8 1.8
1 The Average Earnings Index has been revised. For more information pleasesee our website www.statistics.gov.uk or contact the helpline number below.
2 The headline rate is the change in the average seasonally adjusted indexvalues for the last 3 months compared with the same period a year ago.Users should note that the presentation of the headline rate haschanged from May 1999’s Monthly Digest. Previously, the
headline rate was centred on the middle month of the three under monthin the three under consideration.
3 Annual averages.4 Provisional.
Source: Office for National Statistics: 01633 819024
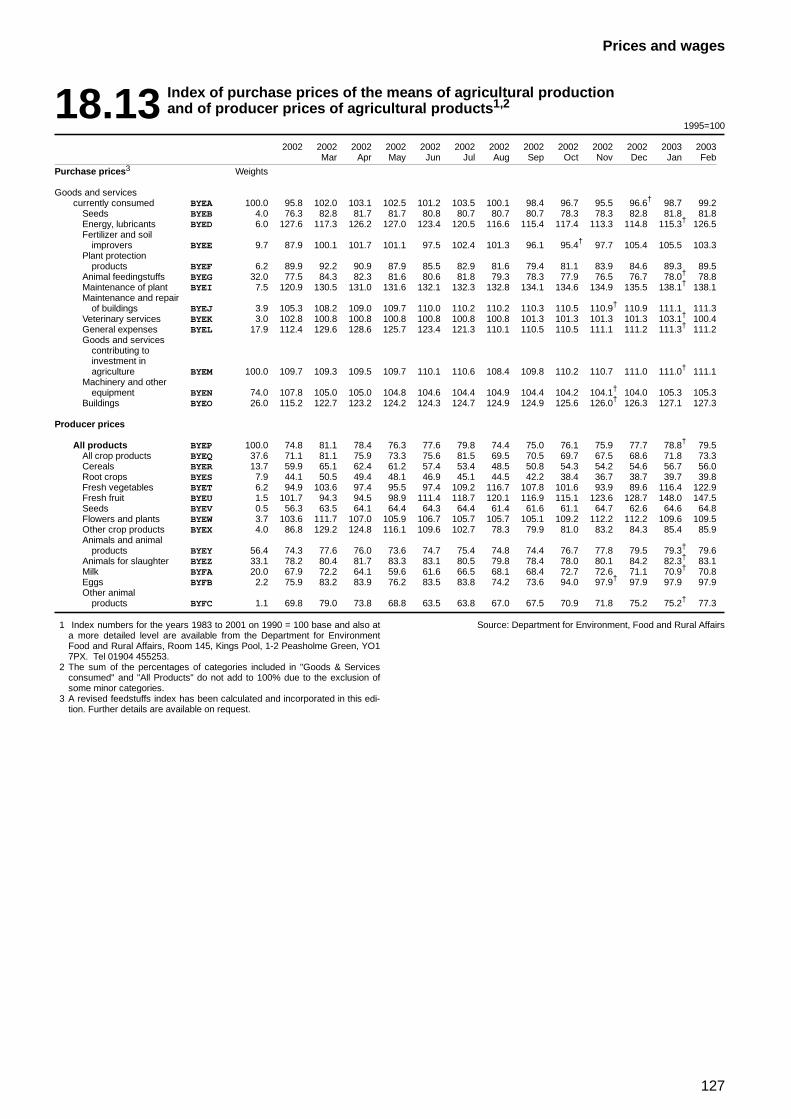
127
Prices and wages
18.13 Index of purchase prices of the means of agricultural productionand of producer prices of agricultural products1,2
1995=100
2002 2002 2002 2002 2002 2002 2002 2002 2002 2002 2002 2003 2003Mar Apr May Jun Jul Aug Sep Oct Nov Dec Jan Feb
Purchase prices3 Weights
Goods and servicescurrently consumed BYEA 100.0 95.8 102.0 103.1 102.5 101.2 103.5 100.1 98.4 96.7 95.5 96.6† 98.7 99.2
Seeds BYEB 4.0 76.3 82.8 81.7 81.7 80.8 80.7 80.7 80.7 78.3 78.3 82.8 81.8 81.8Energy, lubricants BYED 6.0 127.6 117.3 126.2 127.0 123.4 120.5 116.6 115.4 117.4 113.3 114.8 115.3† 126.5Fertilizer and soil
improvers BYEE 9.7 87.9 100.1 101.7 101.1 97.5 102.4 101.3 96.1 95.4† 97.7 105.4 105.5 103.3Plant protection
products BYEF 6.2 89.9 92.2 90.9 87.9 85.5 82.9 81.6 79.4 81.1 83.9 84.6 89.3 89.5Animal feedingstuffs BYEG 32.0 77.5 84.3 82.3 81.6 80.6 81.8 79.3 78.3 77.9 76.5 76.7 78.0† 78.8Maintenance of plant BYEI 7.5 120.9 130.5 131.0 131.6 132.1 132.3 132.8 134.1 134.6 134.9 135.5 138.1† 138.1Maintenance and repair
of buildings BYEJ 3.9 105.3 108.2 109.0 109.7 110.0 110.2 110.2 110.3 110.5 110.9† 110.9 111.1 111.3Veterinary services BYEK 3.0 102.8 100.8 100.8 100.8 100.8 100.8 100.8 101.3 101.3 101.3 101.3 103.1† 100.4General expenses BYEL 17.9 112.4 129.6 128.6 125.7 123.4 121.3 110.1 110.5 110.5 111.1 111.2 111.3† 111.2Goods and services
contributing toinvestment inagriculture BYEM 100.0 109.7 109.3 109.5 109.7 110.1 110.6 108.4 109.8 110.2 110.7 111.0 111.0† 111.1
Machinery and otherequipment BYEN 74.0 107.8 105.0 105.0 104.8 104.6 104.4 104.9 104.4 104.2 104.1† 104.0 105.3 105.3
Buildings BYEO 26.0 115.2 122.7 123.2 124.2 124.3 124.7 124.9 124.9 125.6 126.0† 126.3 127.1 127.3
Producer prices
All products BYEP 100.0 74.8 81.1 78.4 76.3 77.6 79.8 74.4 75.0 76.1 75.9 77.7 78.8† 79.5All crop products BYEQ 37.6 71.1 81.1 75.9 73.3 75.6 81.5 69.5 70.5 69.7 67.5 68.6 71.8 73.3Cereals BYER 13.7 59.9 65.1 62.4 61.2 57.4 53.4 48.5 50.8 54.3 54.2 54.6 56.7 56.0Root crops BYES 7.9 44.1 50.5 49.4 48.1 46.9 45.1 44.5 42.2 38.4 36.7 38.7 39.7 39.8Fresh vegetables BYET 6.2 94.9 103.6 97.4 95.5 97.4 109.2 116.7 107.8 101.6 93.9 89.6 116.4 122.9Fresh fruit BYEU 1.5 101.7 94.3 94.5 98.9 111.4 118.7 120.1 116.9 115.1 123.6 128.7 148.0 147.5Seeds BYEV 0.5 56.3 63.5 64.1 64.4 64.3 64.4 61.4 61.6 61.1 64.7 62.6 64.6 64.8Flowers and plants BYEW 3.7 103.6 111.7 107.0 105.9 106.7 105.7 105.7 105.1 109.2 112.2 112.2 109.6 109.5Other crop products BYEX 4.0 86.8 129.2 124.8 116.1 109.6 102.7 78.3 79.9 81.0 83.2 84.3 85.4 85.9Animals and animal
products BYEY 56.4 74.3 77.6 76.0 73.6 74.7 75.4 74.8 74.4 76.7 77.8 79.5 79.3† 79.6Animals for slaughter BYEZ 33.1 78.2 80.4 81.7 83.3 83.1 80.5 79.8 78.4 78.0 80.1 84.2 82.3† 83.1Milk BYFA 20.0 67.9 72.2 64.1 59.6 61.6 66.5 68.1 68.4 72.7 72.6 71.1 70.9† 70.8Eggs BYFB 2.2 75.9 83.2 83.9 76.2 83.5 83.8 74.2 73.6 94.0 97.9† 97.9 97.9 97.9Other animal
products BYFC 1.1 69.8 79.0 73.8 68.8 63.5 63.8 67.0 67.5 70.9 71.8 75.2 75.2† 77.3
1 Index numbers for the years 1983 to 2001 on 1990 = 100 base and also ata more detailed level are available from the Department for EnvironmentFood and Rural Affairs, Room 145, Kings Pool, 1-2 Peasholme Green, YO17PX. Tel 01904 455253.
2 The sum of the percentages of categories included in "Goods & Servicesconsumed" and "All Products" do not add to 100% due to the exclusion ofsome minor categories.
3 A revised feedstuffs index has been calculated and incorporated in this edi-tion. Further details are available on request.
Source: Department for Environment, Food and Rural Affairs
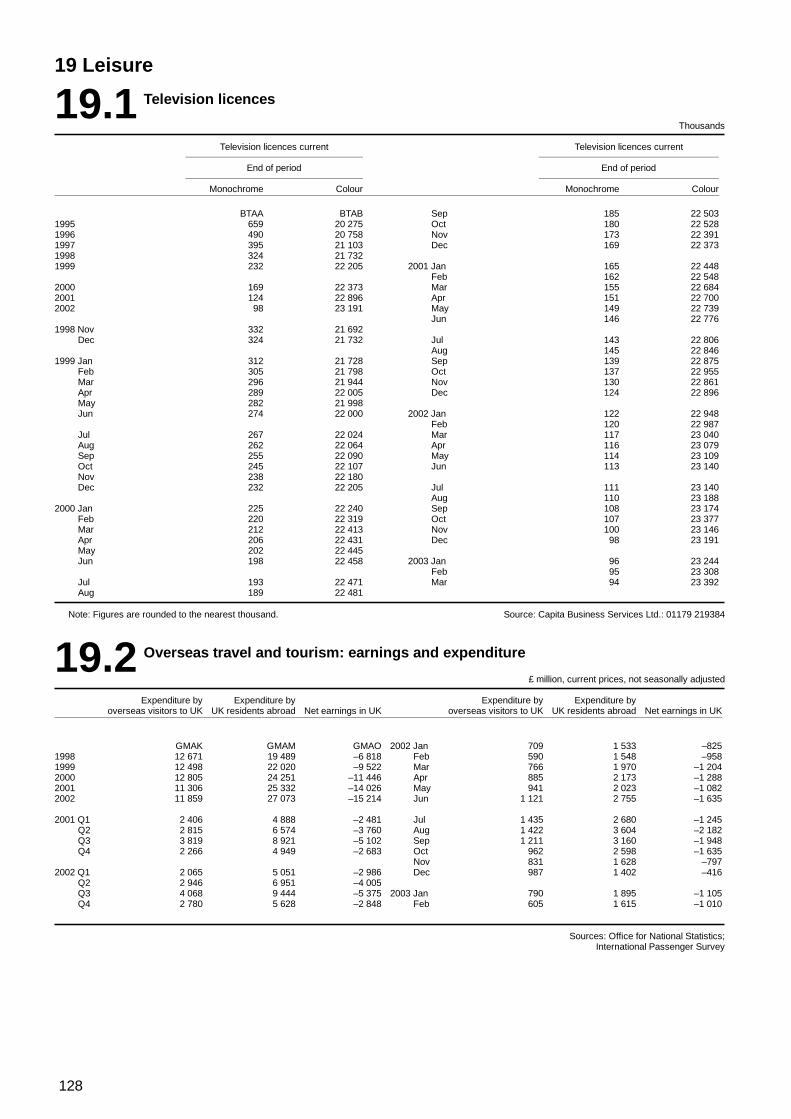
128
19 Leisure
19.1 Television licences
Thousands
Television licences current Television licences current
End of period End of period
Monochrome Colour Monochrome Colour
BTAA BTAB Sep 185 22 5031995 659 20 275 Oct 180 22 5281996 490 20 758 Nov 173 22 3911997 395 21 103 Dec 169 22 3731998 324 21 7321999 232 22 205 2001 Jan 165 22 448
Feb 162 22 5482000 169 22 373 Mar 155 22 6842001 124 22 896 Apr 151 22 7002002 98 23 191 May 149 22 739
Jun 146 22 7761998 Nov 332 21 692
Dec 324 21 732 Jul 143 22 806Aug 145 22 846
1999 Jan 312 21 728 Sep 139 22 875Feb 305 21 798 Oct 137 22 955Mar 296 21 944 Nov 130 22 861Apr 289 22 005 Dec 124 22 896May 282 21 998Jun 274 22 000 2002 Jan 122 22 948
Feb 120 22 987Jul 267 22 024 Mar 117 23 040Aug 262 22 064 Apr 116 23 079Sep 255 22 090 May 114 23 109Oct 245 22 107 Jun 113 23 140Nov 238 22 180Dec 232 22 205 Jul 111 23 140
Aug 110 23 1882000 Jan 225 22 240 Sep 108 23 174
Feb 220 22 319 Oct 107 23 377Mar 212 22 413 Nov 100 23 146Apr 206 22 431 Dec 98 23 191May 202 22 445Jun 198 22 458 2003 Jan 96 23 244
Feb 95 23 308Jul 193 22 471 Mar 94 23 392Aug 189 22 481
Note: Figures are rounded to the nearest thousand. Source: Capita Business Services Ltd.: 01179 219384
19.2 Overseas travel and tourism: earnings and expenditure
£ million, current prices, not seasonally adjusted
Expenditure by Expenditure by Expenditure by Expenditure byoverseas visitors to UK UK residents abroad Net earnings in UK overseas visitors to UK UK residents abroad Net earnings in UK
GMAK GMAM GMAO 2002 Jan 709 1 533 –8251998 12 671 19 489 –6 818 Feb 590 1 548 –9581999 12 498 22 020 –9 522 Mar 766 1 970 –1 2042000 12 805 24 251 –11 446 Apr 885 2 173 –1 2882001 11 306 25 332 –14 026 May 941 2 023 –1 0822002 11 859 27 073 –15 214 Jun 1 121 2 755 –1 635
2001 Q1 2 406 4 888 –2 481 Jul 1 435 2 680 –1 245Q2 2 815 6 574 –3 760 Aug 1 422 3 604 –2 182Q3 3 819 8 921 –5 102 Sep 1 211 3 160 –1 948Q4 2 266 4 949 –2 683 Oct 962 2 598 –1 635
Nov 831 1 628 –7972002 Q1 2 065 5 051 –2 986 Dec 987 1 402 –416
Q2 2 946 6 951 –4 005Q3 4 068 9 444 –5 375 2003 Jan 790 1 895 –1 105Q4 2 780 5 628 –2 848 Feb 605 1 615 –1 010
Sources: Office for National Statistics;International Passenger Survey
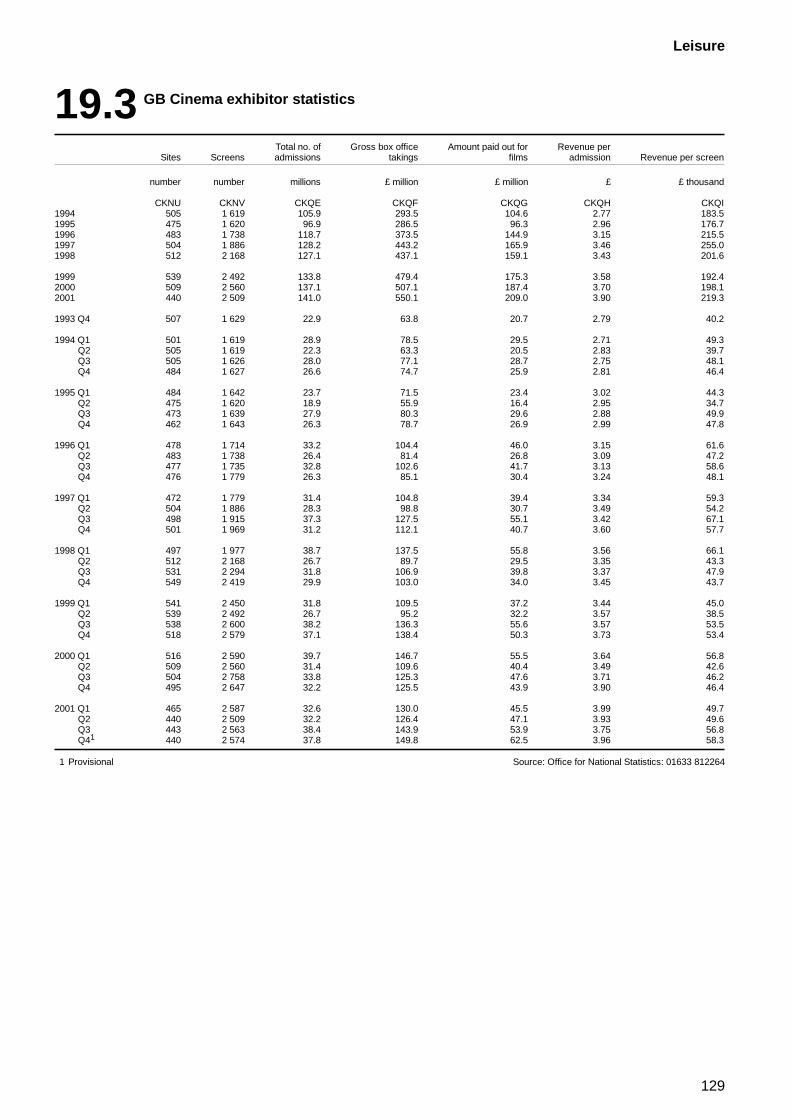
129
Leisure
19.3 GB Cinema exhibitor statistics
Total no. of Gross box office Amount paid out for Revenue perSites Screens admissions takings films admission Revenue per screen
number number millions £ million £ million £ £ thousand
CKNU CKNV CKQE CKQF CKQG CKQH CKQI1994 505 1 619 105.9 293.5 104.6 2.77 183.51995 475 1 620 96.9 286.5 96.3 2.96 176.71996 483 1 738 118.7 373.5 144.9 3.15 215.51997 504 1 886 128.2 443.2 165.9 3.46 255.01998 512 2 168 127.1 437.1 159.1 3.43 201.6
1999 539 2 492 133.8 479.4 175.3 3.58 192.42000 509 2 560 137.1 507.1 187.4 3.70 198.12001 440 2 509 141.0 550.1 209.0 3.90 219.3
1993 Q4 507 1 629 22.9 63.8 20.7 2.79 40.2
1994 Q1 501 1 619 28.9 78.5 29.5 2.71 49.3Q2 505 1 619 22.3 63.3 20.5 2.83 39.7Q3 505 1 626 28.0 77.1 28.7 2.75 48.1Q4 484 1 627 26.6 74.7 25.9 2.81 46.4
1995 Q1 484 1 642 23.7 71.5 23.4 3.02 44.3Q2 475 1 620 18.9 55.9 16.4 2.95 34.7Q3 473 1 639 27.9 80.3 29.6 2.88 49.9Q4 462 1 643 26.3 78.7 26.9 2.99 47.8
1996 Q1 478 1 714 33.2 104.4 46.0 3.15 61.6Q2 483 1 738 26.4 81.4 26.8 3.09 47.2Q3 477 1 735 32.8 102.6 41.7 3.13 58.6Q4 476 1 779 26.3 85.1 30.4 3.24 48.1
1997 Q1 472 1 779 31.4 104.8 39.4 3.34 59.3Q2 504 1 886 28.3 98.8 30.7 3.49 54.2Q3 498 1 915 37.3 127.5 55.1 3.42 67.1Q4 501 1 969 31.2 112.1 40.7 3.60 57.7
1998 Q1 497 1 977 38.7 137.5 55.8 3.56 66.1Q2 512 2 168 26.7 89.7 29.5 3.35 43.3Q3 531 2 294 31.8 106.9 39.8 3.37 47.9Q4 549 2 419 29.9 103.0 34.0 3.45 43.7
1999 Q1 541 2 450 31.8 109.5 37.2 3.44 45.0Q2 539 2 492 26.7 95.2 32.2 3.57 38.5Q3 538 2 600 38.2 136.3 55.6 3.57 53.5Q4 518 2 579 37.1 138.4 50.3 3.73 53.4
2000 Q1 516 2 590 39.7 146.7 55.5 3.64 56.8Q2 509 2 560 31.4 109.6 40.4 3.49 42.6Q3 504 2 758 33.8 125.3 47.6 3.71 46.2Q4 495 2 647 32.2 125.5 43.9 3.90 46.4
2001 Q1 465 2 587 32.6 130.0 45.5 3.99 49.7Q2 440 2 509 32.2 126.4 47.1 3.93 49.6Q3 443 2 563 38.4 143.9 53.9 3.75 56.8Q41 440 2 574 37.8 149.8 62.5 3.96 58.3
1 Provisional Source: Office for National Statistics: 01633 812264
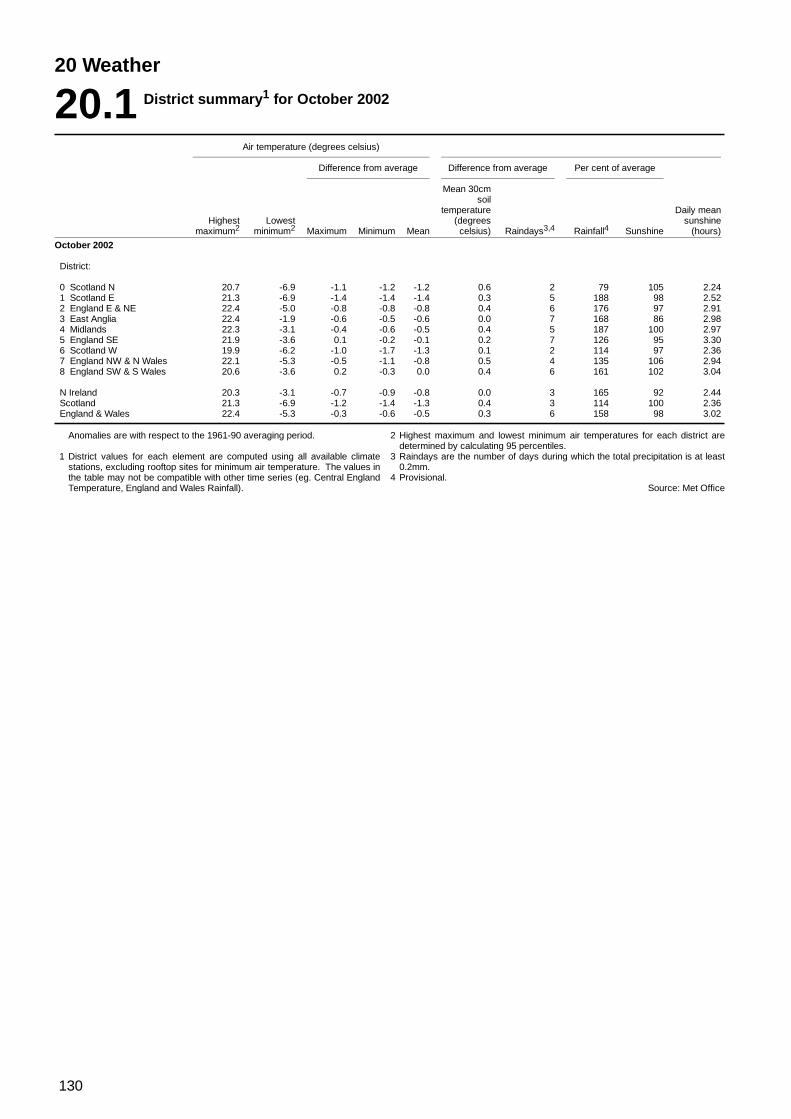
130
20 Weather
20.1 District summary1 for October 2002
Air temperature (degrees celsius)
Difference from average Difference from average Per cent of average
Mean 30cmsoil
temperature Daily meanHighest Lowest (degrees sunshine
maximum2 minimum2 Maximum Minimum Mean celsius) Raindays3,4 Rainfall4 Sunshine (hours)
October 2002
District:
0 Scotland N 20.7 -6.9 -1.1 -1.2 -1.2 0.6 2 79 105 2.241 Scotland E 21.3 -6.9 -1.4 -1.4 -1.4 0.3 5 188 98 2.522 England E & NE 22.4 -5.0 -0.8 -0.8 -0.8 0.4 6 176 97 2.913 East Anglia 22.4 -1.9 -0.6 -0.5 -0.6 0.0 7 168 86 2.984 Midlands 22.3 -3.1 -0.4 -0.6 -0.5 0.4 5 187 100 2.975 England SE 21.9 -3.6 0.1 -0.2 -0.1 0.2 7 126 95 3.306 Scotland W 19.9 -6.2 -1.0 -1.7 -1.3 0.1 2 114 97 2.367 England NW & N Wales 22.1 -5.3 -0.5 -1.1 -0.8 0.5 4 135 106 2.948 England SW & S Wales 20.6 -3.6 0.2 -0.3 0.0 0.4 6 161 102 3.04
N Ireland 20.3 -3.1 -0.7 -0.9 -0.8 0.0 3 165 92 2.44Scotland 21.3 -6.9 -1.2 -1.4 -1.3 0.4 3 114 100 2.36England & Wales 22.4 -5.3 -0.3 -0.6 -0.5 0.3 6 158 98 3.02
Anomalies are with respect to the 1961-90 averaging period.
1 District values for each element are computed using all available climatestations, excluding rooftop sites for minimum air temperature. The values inthe table may not be compatible with other time series (eg. Central EnglandTemperature, England and Wales Rainfall).
2 Highest maximum and lowest minimum air temperatures for each district aredetermined by calculating 95 percentiles.
3 Raindays are the number of days during which the total precipitation is at least0.2mm.
4 Provisional.Source: Met Office
IndexFigures indicate table numbers
Agricultural land, 6.1Agriculture, 6.1 - 6.3 employment, 3.3, 3.8 index of producer prices, 18.13 index of purchase prices, 18.13Agriculture and forestry, average earnings, 18.9Alcoholic drinks, 6.13 retail prices index, 18.1, 18.2 consumption expenditure, 1.8Aluminium, 10.3Animals and animal products, 6.3, 6.4, 6.8 price indices 18.14Average earnings index, 18.11 - 18.12Aviation, civil, 13.9, 13.11, 13.12
Bacon and ham, 6.8Balance of payments, 16.1 - 16.3Banking sector, private sector borrowing, 17.4 private sector deposits, 17.4Barley - see CerealsBeer, 6.13Beverages, 6.11Births registered, 2.3Boats, pleasure & sporting, 11.5Bricks, 12.3British Government securities, 20 years yield, 17.6Building block (concrete), 12.3Building materials and components, 12.3 producer price index, 18.7Building societies, deposits and advances, 17.4Buildings, agricultural price indices, 18.13Business investment, 1.11 - 1.15Butter, 6.10
Canned meat, 6.8Canvas, 11.4Capital expenditure - see Business investmentCarpets and rugs, 11.2Cars, Passenger - see Motor vehiclesCatering, 1.8Cattle, 6.3, 6.4 price index, 18.13Cement, 12.3Central government, net borrowing, 17.1 net cash requirement, 17.2, 17.3 financial transactions, 17.2Cereals, 6.1, 6.5 price index, 18.13Cheese, 6.10
Chemicals, 9.1 - 9.5 basic, 9.3 photographic, 9.5 producer price index, 18.7Child benefit, 4.1Chocolate and sugar confectionery, 6.11Cinema, 19.3Civil Service, staff employed, 3.4Cleaning preparations, 9.4Clothing, 11.1, 11.4 employment, 3.3Clothing and footwear, 1.8 producer price index, 18.7 retail price index, 18.1, 18.2Coal and coal-mining, 8.3, 8.4, 8.6Cocoa beans, 6.11Coffee, raw, 6.11Commercial vehicles - see Motor vehiclesCompound feedingstuffs, production, 6.6Compressors, 11.6Concrete, ready mixed, 12.3Confectionery, 6.11Construction, 12.1, 12.2 employment, 3.3Consumer credit, 17.4Consumers' expenditure, 1.7, 1.8Crime, 5.1, 5.2Crop areas, 6.1Crops harvested, 6.2
Dairy products, 6.10Deaths registered, 2.4Dental services, 4.4Distributive trades, average earnings, 18.11Domestic appliances, producer price index, 18.7Durable goods, 1.8 retail price index, 18.1, 18.2Dwellings, 12.4
Earnings, in manufacturing and other industries, 18.8 - 18.10 index of average earnings, 18.11 - 18.12Eggs, 6.10 price index, 18.14Electrical engineering, 10.4 - 10.7 producer price index, 18.7Electricity, 8.6 - 8.7Employment, 3.1 - 3.13 analysis by industry, 3.3 claimant count, 3.10, 3.11, 3.13 distribution of workforce, 3.2 unemployment, 3.1, 3.9, 3.12 vacancies, 3.14
Energy, 8.1 - 8.9Engineering industries, new orders, 10.7 orders on hand, 10.6 producer price index, 18.7 turnover, 10.4 volume index numbers of turnover, 10.5Essential oils, 9.4Exchange rates, sterling effective, 17.6 US Spot, 17.6Explosives, 9.5Exports, 15.1 - 15.6, 15.8 area analysis, 15.8 commodity groups, 15.3 - 15.6 sales ratios, 15.10 unit value index, 15.2, 15.5 value, 15.1 volume index, 15.2, 15.4
'Factory gate' prices - see producerprice indicesFamily allowances, 4.1Family credit, 4.2Family practitioner services, 4.4Fares, indices of stage bus services, 13.6Feedstuffs, 6.6 price index, 18.13Fertilisers, 9.1 price index, 18.13Fibre cement products, 12.3Financial services, 1.8Fish, 6.9Fixed capital formation, 1.10Flour, 6.5Flowers and plants, price index, 18.13Food, 6.7 - 6.11 employment, 3.3 producer price index, 18.7 retail price index, 18.1, 18.2Foreign trade - see Imports, exportsForestry - see Agriculture and forestryFreight train traffic, 13.8Fuel and light, 1.8, 1.9 retail price index, 18.1, 18.2Fuels, supply and use of, 8.2Fur, dressing and dying of, 11.4
Gas, 8.5, 8.7Glucose, 6.7Glues and gelatines, 9.5Goods and services, 1.2Gross fixed capital formation, 1.10Gross domestic product, 1.1, 1.2, 1.3, 1.4Gross national income, 1.1
131
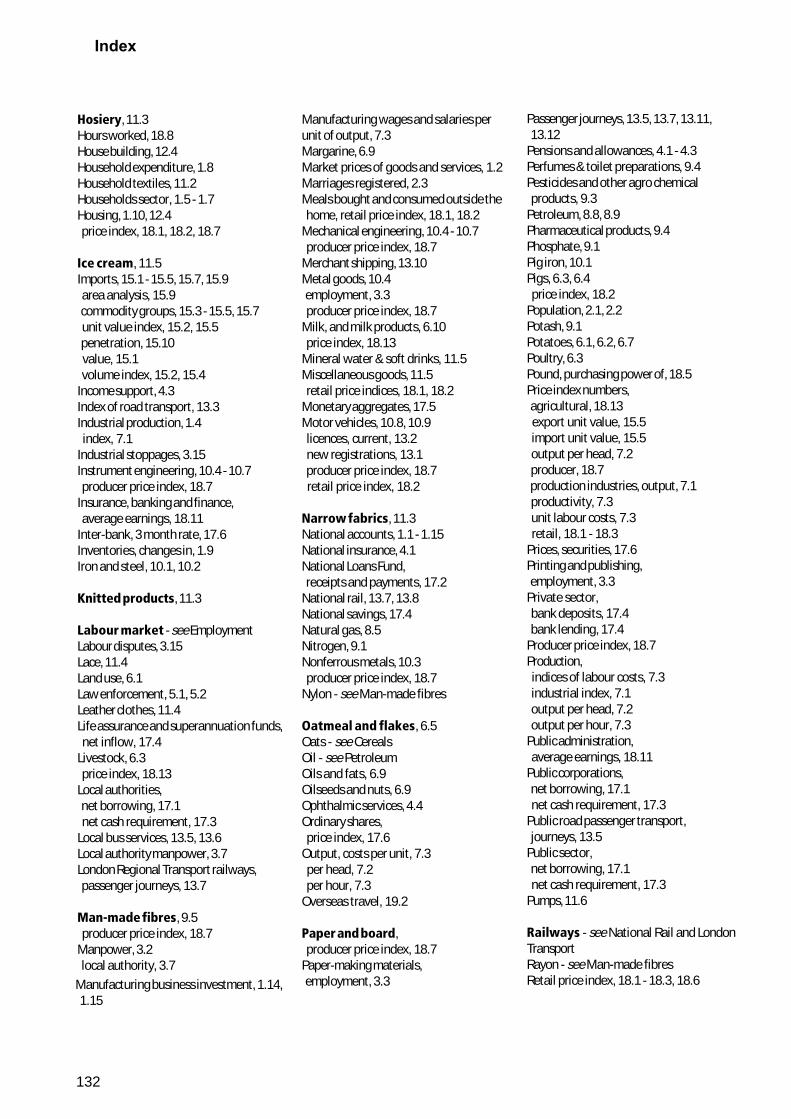
Hosiery, 11.3Hours worked, 18.8House building, 12.4Household expenditure, 1.8Household textiles, 11.2Households sector, 1.5 - 1.7Housing, 1.10, 12.4 price index, 18.1, 18.2, 18.7
Ice cream, 11.5Imports, 15.1 - 15.5, 15.7, 15.9 area analysis, 15.9 commodity groups, 15.3 - 15.5, 15.7 unit value index, 15.2, 15.5 penetration, 15.10 value, 15.1 volume index, 15.2, 15.4Income support, 4.3Index of road transport, 13.3Industrial production, 1.4 index, 7.1Industrial stoppages, 3.15Instrument engineering, 10.4 - 10.7 producer price index, 18.7Insurance, banking and finance, average earnings, 18.11Inter-bank, 3 month rate, 17.6Inventories, changes in, 1.9Iron and steel, 10.1, 10.2
Knitted products, 11.3
Labour market - see EmploymentLabour disputes, 3.15Lace, 11.4Land use, 6.1Law enforcement, 5.1, 5.2Leather clothes, 11.4Life assurance and superannuation funds, net inflow, 17.4Livestock, 6.3 price index, 18.13Local authorities, net borrowing, 17.1 net cash requirement, 17.3Local bus services, 13.5, 13.6Local authority manpower, 3.7London Regional Transport railways, passenger journeys, 13.7
Man-made fibres, 9.5 producer price index, 18.7Manpower, 3.2 local authority, 3.7
Manufacturing wages and salaries perunit of output, 7.3Margarine, 6.9Market prices of goods and services, 1.2Marriages registered, 2.3Meals bought and consumed outside the home, retail price index, 18.1, 18.2Mechanical engineering, 10.4 - 10.7 producer price index, 18.7Merchant shipping, 13.10Metal goods, 10.4 employment, 3.3 producer price index, 18.7Milk, and milk products, 6.10 price index, 18.13Mineral water & soft drinks, 11.5Miscellaneous goods, 11.5 retail price indices, 18.1, 18.2Monetary aggregates, 17.5Motor vehicles, 10.8, 10.9 licences, current, 13.2 new registrations, 13.1 producer price index, 18.7 retail price index, 18.2
Narrow fabrics, 11.3National accounts, 1.1 - 1.15National insurance, 4.1National Loans Fund, receipts and payments, 17.2National rail, 13.7, 13.8National savings, 17.4Natural gas, 8.5Nitrogen, 9.1Nonferrous metals, 10.3 producer price index, 18.7Nylon - see Man-made fibres
Oatmeal and flakes, 6.5Oats - see CerealsOil - see PetroleumOils and fats, 6.9Oilseeds and nuts, 6.9Ophthalmic services, 4.4Ordinary shares, price index, 17.6Output, costs per unit, 7.3 per head, 7.2 per hour, 7.3Overseas travel, 19.2
Paper and board, producer price index, 18.7Paper-making materials, employment, 3.3
Passenger journeys, 13.5, 13.7, 13.11, 13.12Pensions and allowances, 4.1 - 4.3Perfumes & toilet preparations, 9.4Pesticides and other agro chemical products, 9.3Petroleum, 8.8, 8.9Pharmaceutical products, 9.4Phosphate, 9.1Pig iron, 10.1Pigs, 6.3, 6.4 price index, 18.2Population, 2.1, 2.2Potash, 9.1Potatoes, 6.1, 6.2, 6.7Poultry, 6.3Pound, purchasing power of, 18.5Price index numbers, agricultural, 18.13 export unit value, 15.5 import unit value, 15.5 output per head, 7.2 producer, 18.7 production industries, output, 7.1 productivity, 7.3 unit labour costs, 7.3 retail, 18.1 - 18.3Prices, securities, 17.6Printing and publishing, employment, 3.3Private sector, bank deposits, 17.4 bank lending, 17.4Producer price index, 18.7Production, indices of labour costs, 7.3 industrial index, 7.1 output per head, 7.2 output per hour, 7.3Public administration, average earnings, 18.11Public corporations, net borrowing, 17.1 net cash requirement, 17.3Public road passenger transport, journeys, 13.5Public sector, net borrowing, 17.1 net cash requirement, 17.3Pumps, 11.6
Railways - see National Rail and LondonTransportRayon - see Man-made fibresRetail price index, 18.1 - 18.3, 18.6
132
Index
Manufacturing business investment, 1.14, 1.15
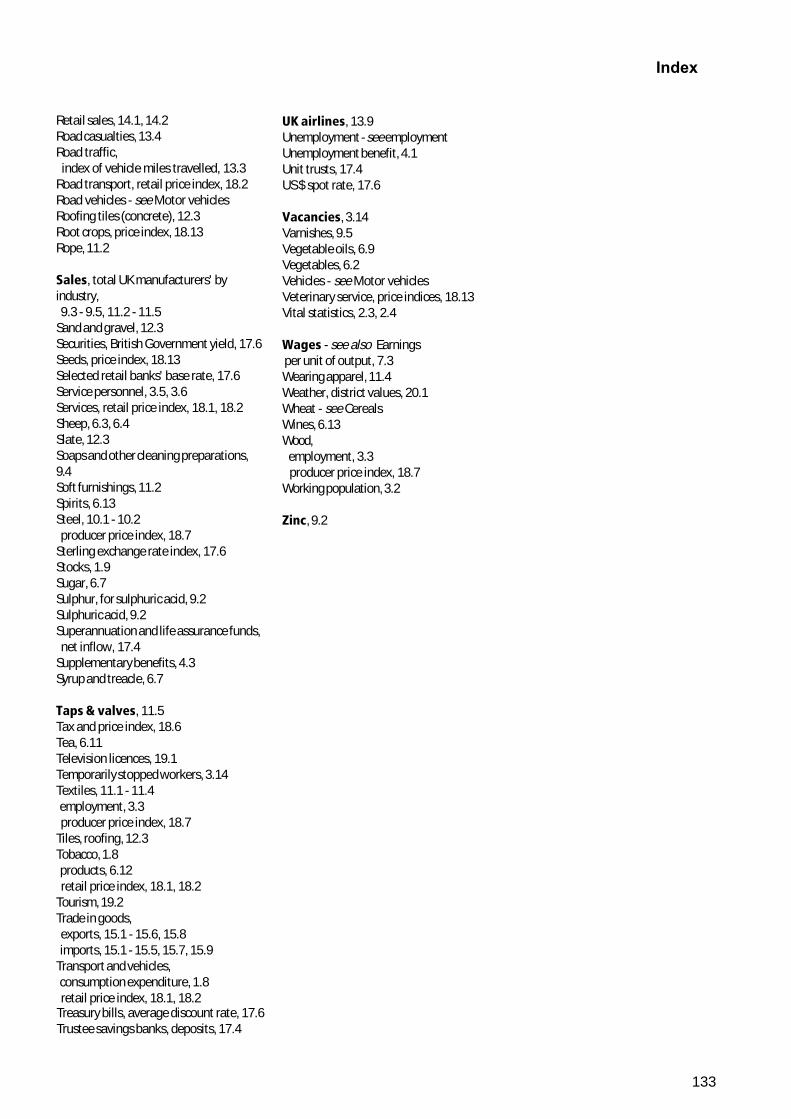
UK airlines, 13.9Unemployment - see employmentUnemployment benefit, 4.1Unit trusts, 17.4US $ spot rate, 17.6
Vacancies, 3.14Varnishes, 9.5Vegetable oils, 6.9Vegetables, 6.2Vehicles - see Motor vehiclesVeterinary service, price indices, 18.13Vital statistics, 2.3, 2.4
Wages - see also Earnings per unit of output, 7.3Wearing apparel, 11.4Weather, district values, 20.1Wheat - see CerealsWines, 6.13Wood, employment, 3.3 producer price index, 18.7Working population, 3.2
Zinc, 9.2
Retail sales, 14.1, 14.2Road casualties, 13.4Road traffic, index of vehicle miles travelled, 13.3Road transport, retail price index, 18.2Road vehicles - see Motor vehiclesRoofing tiles (concrete), 12.3Root crops, price index, 18.13Rope, 11.2
Sales, total UK manufacturers' byindustry, 9.3 - 9.5, 11.2 - 11.5Sand and gravel, 12.3Securities, British Government yield, 17.6Seeds, price index, 18.13Selected retail banks' base rate, 17.6Service personnel, 3.5, 3.6Services, retail price index, 18.1, 18.2Sheep, 6.3, 6.4Slate, 12.3Soaps and other cleaning preparations,9.4Soft furnishings, 11.2Spirits, 6.13Steel, 10.1 - 10.2 producer price index, 18.7Sterling exchange rate index, 17.6Stocks, 1.9Sugar, 6.7Sulphur, for sulphuric acid, 9.2Sulphuric acid, 9.2Superannuation and life assurance funds, net inflow, 17.4Supplementary benefits, 4.3Syrup and treacle, 6.7
Taps & valves, 11.5Tax and price index, 18.6Tea, 6.11Television licences, 19.1Temporarily stopped workers, 3.14Textiles, 11.1 - 11.4 employment, 3.3 producer price index, 18.7Tiles, roofing, 12.3Tobacco, 1.8 products, 6.12 retail price index, 18.1, 18.2Tourism, 19.2Trade in goods, exports, 15.1 - 15.6, 15.8 imports, 15.1 - 15.5, 15.7, 15.9Transport and vehicles, consumption expenditure, 1.8 retail price index, 18.1, 18.2
Index
133
Treasury bills, average discount rate, 17.6Trustee savings banks, deposits, 17.4
Monthly Digest Navigation Instructions
Overview
This PDF file of Monthly Digest has been created from the pages of the book. These brief instructions will help you find your way around the electronic
publication.
Navigation
The PDF file has a ‘bookmarks’ panel down the left hand side, which allows you to jump from one section to another. The main chapters have lower levels of
bookmarks enabling you to jump to the tables contained in each chapter. You can show and hide the bookmarks panel using the show/hide navigation buttons
on the Acrobat Reader toolbar at the top of the screen. Thumbnails (small replicas of the pages) are also available in the navigation pane. Clicking on a
thumbnail of a page will allow you to jump to that page. Similarly, clicking on the Contents table will permit you to skip to any chapter or individual table.
Searching
The first large binoculars (find) button at the top of the screen will do a simple search on a word in the current document. To see if the word appears again in
the publication click again on the binoculars button.
Spreadsheets
Clicking anywhere on a table number, table title or the main body of a table will launch an Excel file. A number of the tables in this pdf document are spread
over more than page. Efforts have been made to combine these into a single worksheet in each of the corresponding Excel files. Where this has not been
possible, as where units or periodicity differ from page to page, each page has been accorded its own separate worksheet within the same Excel file. The
worksheet tabs and the instructions appearing in red at the top of the affected tables indicate how each has been treated. To permit the data in the Excel
spreadsheets to be used in calculations, it has also been necessary to remove “flags” and footnote indicators from the numbers in the files.
In the event of differences between the data appearing in the Excel files and those presented in the corresponding pdf tables, the pdf versions are to be
regarded as definitive.
Index
Clicking on an index entry will take you automatically to the relevant table.
Screen Resolution
Adobe Acrobat works with any screen resolution. For this product 800x600 is acceptable, but 1024x768 works better if the monitor and graphics card will
support it. To change the view type to one which best suits your screen, use the View menu.
Other
If the text looks blurry on screen, this may be improved by visiting File Menu, Preferences, General and switching ‘Smooth Text and Monochrome images’ off.


![Monthly statistics 1/1994 [fre] ÉNERGIE](https://img.pdfslide.net/doc/110x75/6324c6f1e491bcb36c09fb2c/monthly-statistics-11994-fre-energie.jpg)