Embed Size (px)
Citation preview
APPAREL & TEXTILE
REPORT
2021 - 2022
FLEXIBLE TO DISEASE
TOWARDS SUSTAINABLE SUPPLY CHAIN

2
UPDATES ON INDUSTRY 10M.2021
INDUSTRY OUTLOOK 2021 - 2022
STOCK RECOMMENDATION
3
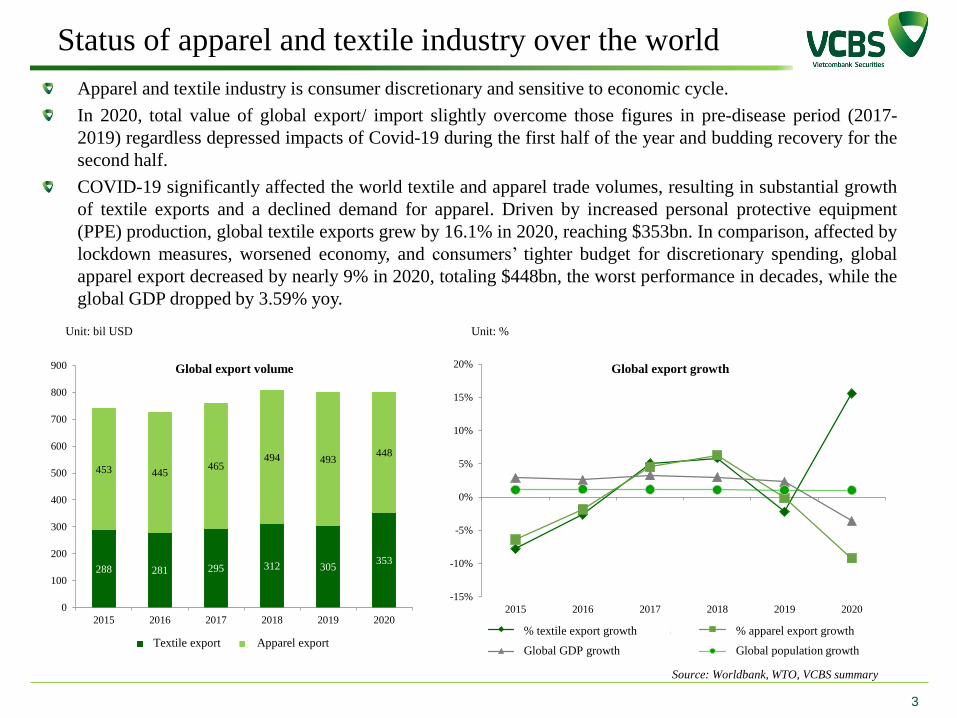
Apparel and textile industry is consumer discretionary and sensitive to economic cycle.
In 2020, total value of global export/ import slightly overcome those figures in pre-disease period (2017-
2019) regardless depressed impacts of Covid-19 during the first half of the year and budding recovery for the
second half.
COVID-19 significantly affected the world textile and apparel trade volumes, resulting in substantial growth
of textile exports and a declined demand for apparel. Driven by increased personal protective equipment
(PPE) production, global textile exports grew by 16.1% in 2020, reaching $353bn. In comparison, affected by
lockdown measures, worsened economy, and consumers’ tighter budget for discretionary spending, global
apparel export decreased by nearly 9% in 2020, totaling $448bn, the worst performance in decades, while the
global GDP dropped by 3.59% yoy.
Source: Worldbank, WTO, VCBS summary
Status of apparel and textile industry over the world
Unit: bil USD
-15%
-10%
-5%
0%
5%
10%
15%
20%
2015 2016 2017 2018 2019 2020
Global export growth
% tốc độ tăng trưởng KNXK dệt sợi % tốc độ tăng trưởng KNXK may mặc
Tốc độ tăng trưởng GDP toàn thế giới Tốc độ tăng dân số toàn thế giới
Unit: %
288 281 295 312 305353
453 445465
494 493448
0
100
200
300
400
500
600
700
800
900
2015 2016 2017 2018 2019 2020
Global export volume
KNXK dệt sợi TG KNXK may mặc TGTextile export Apparel export% textile export growth
Global GDP growth
% apparel export growth
Global population growth
4Source: WTO, VCBS summary
Status of global textile export/ import
Unit: bn USD, % Unit: bn USD, %
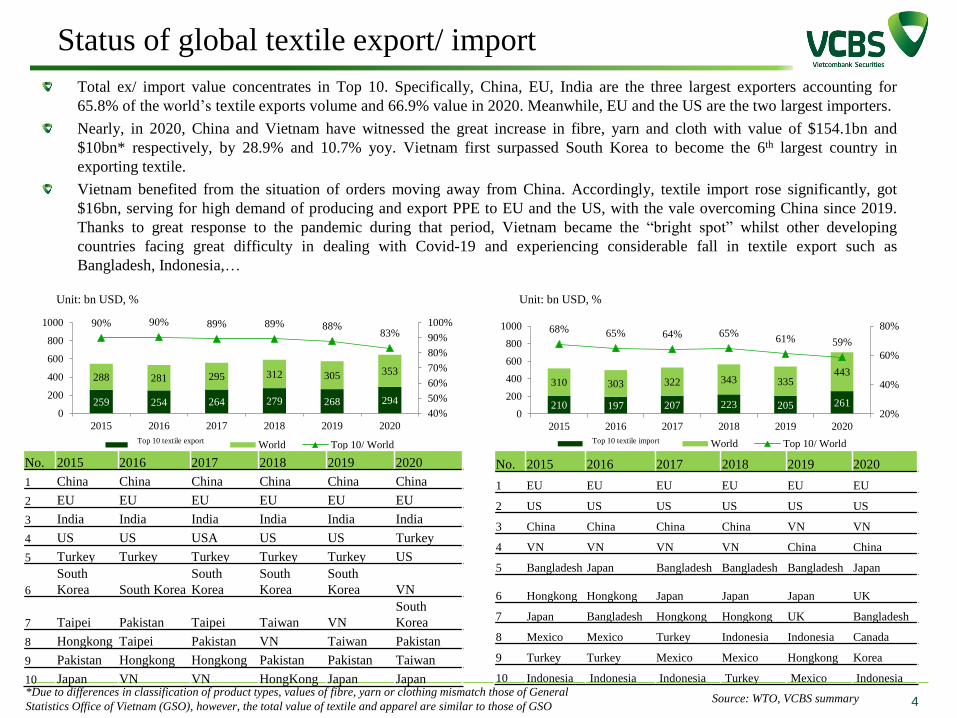
Total ex/ import value concentrates in Top 10. Specifically, China, EU, India are the three largest exporters accounting for
65.8% of the world’s textile exports volume and 66.9% value in 2020. Meanwhile, EU and the US are the two largest importers.
Nearly, in 2020, China and Vietnam have witnessed the great increase in fibre, yarn and cloth with value of $154.1bn and
$10bn* respectively, by 28.9% and 10.7% yoy. Vietnam first surpassed South Korea to become the 6th largest country in
exporting textile.
Vietnam benefited from the situation of orders moving away from China. Accordingly, textile import rose significantly, got
$16bn, serving for high demand of producing and export PPE to EU and the US, with the vale overcoming China since 2019.
Thanks to great response to the pandemic during that period, Vietnam became the “bright spot” whilst other developing
countries facing great difficulty in dealing with Covid-19 and experiencing considerable fall in textile export such as
Bangladesh, Indonesia,…
259 254 264 279 268 294
288 281 295 312 305 353
90% 90% 89% 89% 88%83%
40%
50%
60%
70%
80%
90%
100%
0
200
400
600
800
1000
2015 2016 2017 2018 2019 2020
Top 10 XK dệt sợi World Top 10/ World
210 197 207 223 205 261
310 303 322 343 335443
68% 65% 64% 65%61% 59%
20%
40%
60%
80%
0
200
400
600
800
1000
2015 2016 2017 2018 2019 2020
Top 10 NK dệt sợi World Top 10/ World
No. 2015 2016 2017 2018 2019 2020
1 China China China China China China
2 EU EU EU EU EU EU
3 India India India India India India
4 US US USA US US Turkey
5 Turkey Turkey Turkey Turkey Turkey US
6
South
Korea South Korea
South
Korea
South
Korea
South
Korea VN
7 Taipei Pakistan Taipei Taiwan VN
South
Korea
8 Hongkong Taipei Pakistan VN Taiwan Pakistan
9 Pakistan Hongkong Hongkong Pakistan Pakistan Taiwan
10 Japan VN VN HongKong Japan Japan
No. 2015 2016 2017 2018 2019 2020
1 EU EU EU EU EU EU
2 US US US US US US
3 China China China China VN VN
4 VN VN VN VN China China
5 Bangladesh Japan Bangladesh Bangladesh Bangladesh Japan
6 Hongkong Hongkong Japan Japan Japan UK
7 Japan Bangladesh Hongkong Hongkong UK Bangladesh
8 Mexico Mexico Turkey Indonesia Indonesia Canada
9 Turkey Turkey Mexico Mexico Hongkong Korea
10 Indonesia Indonesia Indonesia Turkey Mexico Indonesia
*Due to differences in classification of product types, values of fibre, yarn or clothing mismatch those of General
Statistics Office of Vietnam (GSO), however, the total value of textile and apparel are similar to those of GSO
Top 10 textile export Top 10 textile import
5
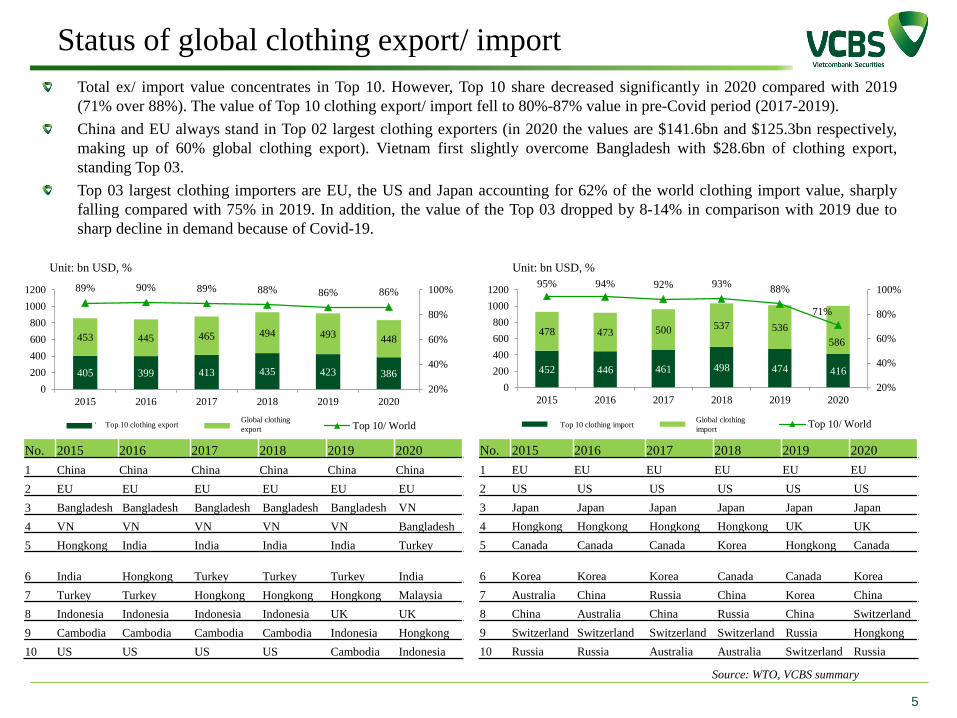
Total ex/ import value concentrates in Top 10. However, Top 10 share decreased significantly in 2020 compared with 2019
(71% over 88%). The value of Top 10 clothing export/ import fell to 80%-87% value in pre-Covid period (2017-2019).
China and EU always stand in Top 02 largest clothing exporters (in 2020 the values are $141.6bn and $125.3bn respectively,
making up of 60% global clothing export). Vietnam first slightly overcome Bangladesh with $28.6bn of clothing export,
standing Top 03.
Top 03 largest clothing importers are EU, the US and Japan accounting for 62% of the world clothing import value, sharply
falling compared with 75% in 2019. In addition, the value of the Top 03 dropped by 8-14% in comparison with 2019 due to
sharp decline in demand because of Covid-19.
Status of global clothing export/ import
405 399 413 435 423 386
453 445 465 494 493448
89% 90% 89% 88% 86% 86%
20%
40%
60%
80%
100%
0
200
400
600
800
1000
1200
2015 2016 2017 2018 2019 2020
Top 10 XK may mặc KNXK may mặc Top 10/ World
452 446 461 498 474 416
478 473 500 537 536
586
95% 94% 92% 93%88%
71%
20%
40%
60%
80%
100%
0
200
400
600
800
1000
1200
2015 2016 2017 2018 2019 2020
Top 10 NK may mặc KNNK may mặc Top 10/ World
No. 2015 2016 2017 2018 2019 2020
1 China China China China China China
2 EU EU EU EU EU EU
3 Bangladesh Bangladesh Bangladesh Bangladesh Bangladesh VN
4 VN VN VN VN VN Bangladesh
5 Hongkong India India India India Turkey
6 India Hongkong Turkey Turkey Turkey India
7 Turkey Turkey Hongkong Hongkong Hongkong Malaysia
8 Indonesia Indonesia Indonesia Indonesia UK UK
9 Cambodia Cambodia Cambodia Cambodia Indonesia Hongkong
10 US US US US Cambodia Indonesia
No. 2015 2016 2017 2018 2019 2020
1 EU EU EU EU EU EU
2 US US US US US US
3 Japan Japan Japan Japan Japan Japan
4 Hongkong Hongkong Hongkong Hongkong UK UK
5 Canada Canada Canada Korea Hongkong Canada
6 Korea Korea Korea Canada Canada Korea
7 Australia China Russia China Korea China
8 China Australia China Russia China Switzerland
9 Switzerland Switzerland Switzerland Switzerland Russia Hongkong
10 Russia Russia Australia Australia Switzerland Russia
Top 10 clothing export Top 10 clothing import
Source: WTO, VCBS summary
Unit: bn USD, % Unit: bn USD, %
Global clothing
export
Global clothing
import
6
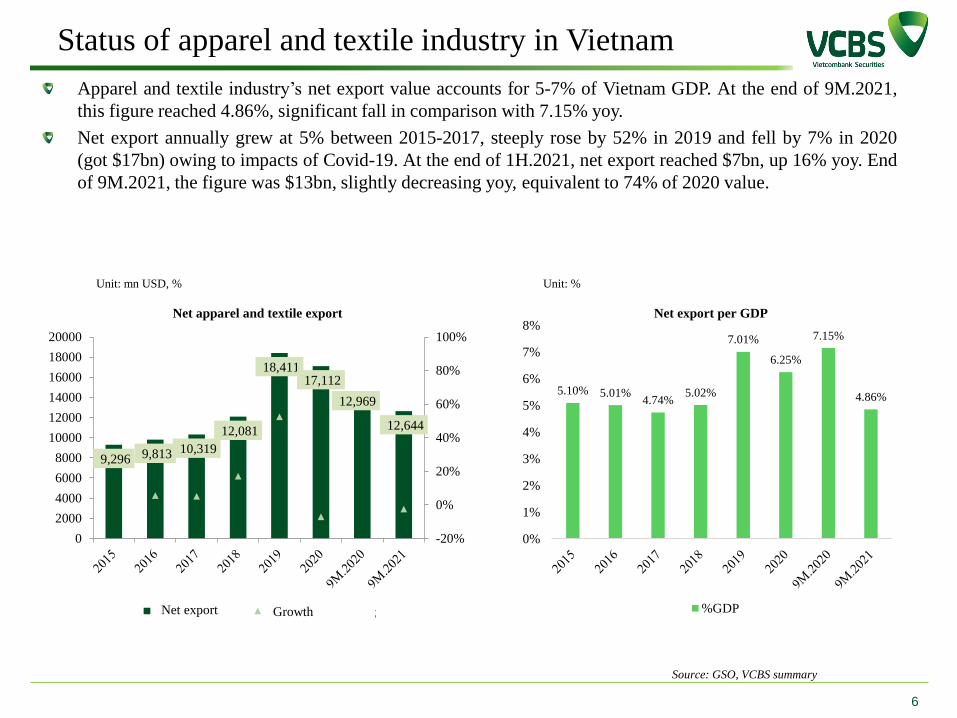
Apparel and textile industry’s net export value accounts for 5-7% of Vietnam GDP. At the end of 9M.2021,
this figure reached 4.86%, significant fall in comparison with 7.15% yoy.
Net export annually grew at 5% between 2015-2017, steeply rose by 52% in 2019 and fell by 7% in 2020
(got $17bn) owing to impacts of Covid-19. At the end of 1H.2021, net export reached $7bn, up 16% yoy. End
of 9M.2021, the figure was $13bn, slightly decreasing yoy, equivalent to 74% of 2020 value.
Source: GSO, VCBS summary
Status of apparel and textile industry in Vietnam
Unit: mn USD, % Unit: %
9,296 9,813 10,319
12,081
18,411 17,112
12,969
12,644
-20%
0%
20%
40%
60%
80%
100%
0
2000
4000
6000
8000
10000
12000
14000
16000
18000
20000
Net apparel and textile export
Xuất khẩu ròng % tốc độ tăng trưởng
5.10% 5.01%4.74%
5.02%
7.01%
6.25%
7.15%
4.86%
0%
1%
2%
3%
4%
5%
6%
7%
8%Net export per GDP
%GDPNet export Growth
7
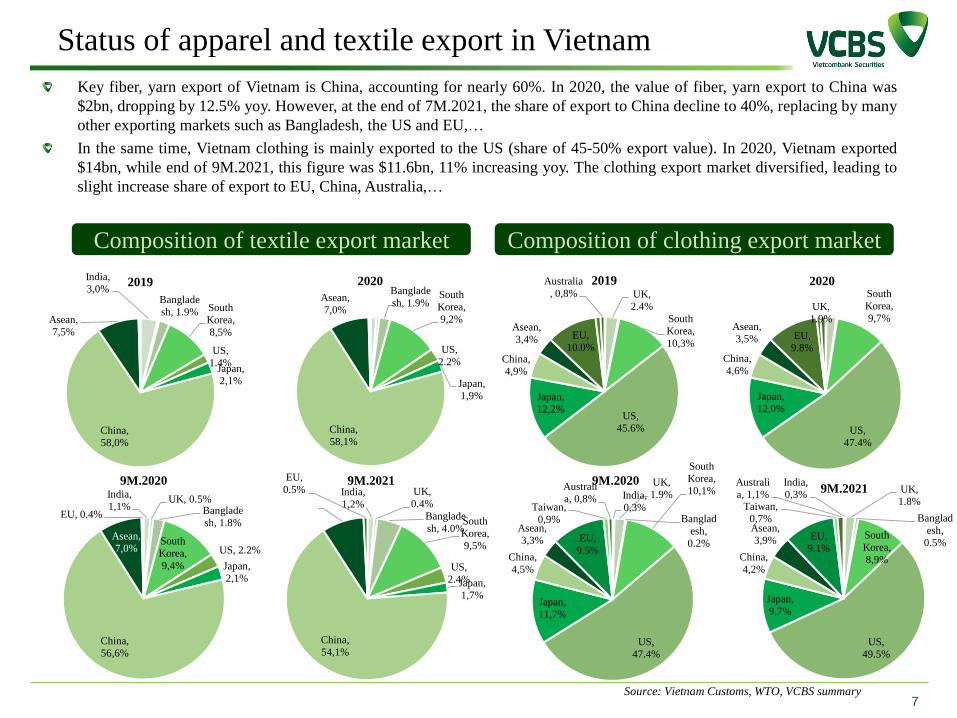
Key fiber, yarn export of Vietnam is China, accounting for nearly 60%. In 2020, the value of fiber, yarn export to China was
$2bn, dropping by 12.5% yoy. However, at the end of 7M.2021, the share of export to China decline to 40%, replacing by many
other exporting markets such as Bangladesh, the US and EU,…
In the same time, Vietnam clothing is mainly exported to the US (share of 45-50% export value). In 2020, Vietnam exported
$14bn, while end of 9M.2021, this figure was $11.6bn, 11% increasing yoy. The clothing export market diversified, leading to
slight increase share of export to EU, China, Australia,…
Source: Vietnam Customs, WTO, VCBS summary
Status of apparel and textile export in Vietnam
Composition of textile export market Composition of clothing export market
India,
3,0%Banglade
sh, 1.9% South
Korea,
8,5%
US,
1.4%Japan,
2,1%
China,
58,0%
Asean,
7,5%
2019Banglade
sh, 1.9%South
Korea,
9,2%
US,
2.2%
Japan,
1,9%
China,
58,1%
Asean,
7,0%
2020UK,
2.4%
South
Korea,
10,3%
US,
45.6%
Japan,
12,2%
China,
4,9%
Asean,
3,4% EU,
10.0%
Australia
, 0,8%
2019
UK,
1.9%
South
Korea,
9,7%
US,
47.4%
Japan,
12,0%
China,
4,6%
Asean,
3,5% EU,
9.8%
2020
India,
1,1%UK, 0.5%
Banglade
sh, 1.8%
South
Korea,
9,4%
US, 2.2%
Japan,
2,1%
China,
56,6%
Asean,
7,0%
EU, 0.4%
9M.2020India,
1,2%
UK,
0.4%
Banglade
sh, 4.0%South
Korea,
9,5%
US,
2.4%Japan,
1,7%
China,
54,1%
Asean,
6,7%
EU,
0.5%9M.2021
India,
0,3%
UK,
1.9%
Banglad
esh,
0.2%
South
Korea,
10,1%
US,
47.4%
Japan,
11,7%
China,
4,5%
Asean,
3,3% EU,
9.5%
Taiwan,
0,9%
Australi
a, 0,8%
9M.2020 India,
0,3%UK,
1.8%
Banglad
esh,
0.5%South
Korea,
8,9%
US,
49.5%
Japan,
9,7%
China,
4,2%
Asean,
3,9% EU,
9.1%
Taiwan,
0,7%
Australi
a, 1,1%9M.2021
8
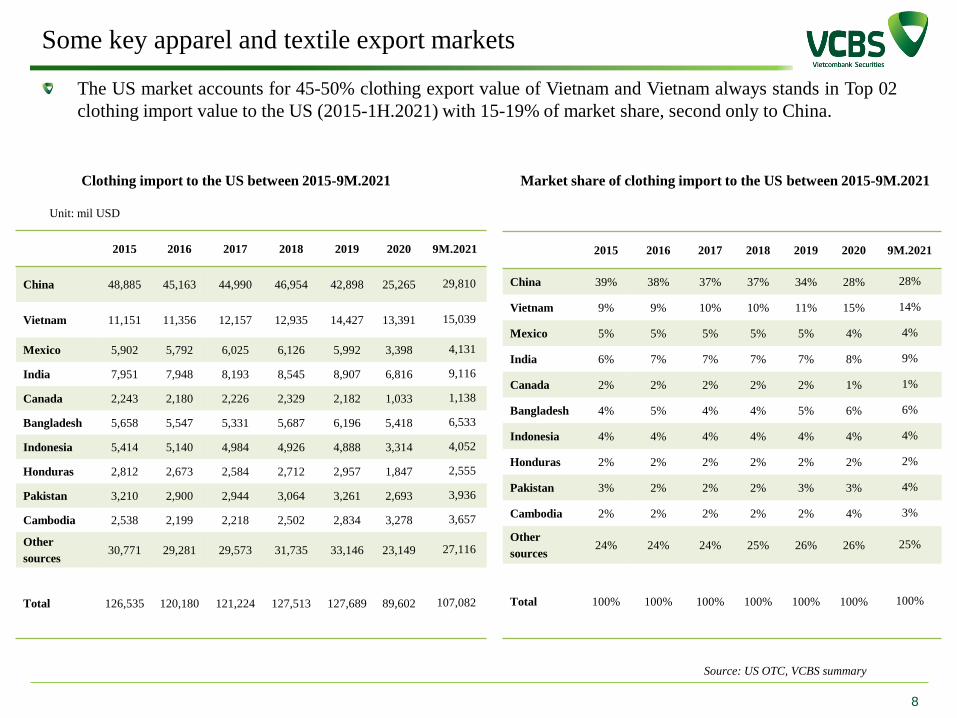
The US market accounts for 45-50% clothing export value of Vietnam and Vietnam always stands in Top 02
clothing import value to the US (2015-1H.2021) with 15-19% of market share, second only to China.
Source: US OTC, VCBS summary
Some key apparel and textile export markets
Clothing import to the US between 2015-9M.2021 Market share of clothing import to the US between 2015-9M.2021
Unit: mil USD
2015 2016 2017 2018 2019 2020 9M.2021
China 48,885 45,163 44,990 46,954 42,898 25,265 29,810
Vietnam 11,151 11,356 12,157 12,935 14,427 13,391 15,039
Mexico 5,902 5,792 6,025 6,126 5,992 3,398 4,131
India 7,951 7,948 8,193 8,545 8,907 6,816 9,116
Canada 2,243 2,180 2,226 2,329 2,182 1,033 1,138
Bangladesh 5,658 5,547 5,331 5,687 6,196 5,418 6,533
Indonesia 5,414 5,140 4,984 4,926 4,888 3,314 4,052
Honduras 2,812 2,673 2,584 2,712 2,957 1,847 2,555
Pakistan 3,210 2,900 2,944 3,064 3,261 2,693 3,936
Cambodia 2,538 2,199 2,218 2,502 2,834 3,278 3,657
Other
sources30,771 29,281 29,573 31,735 33,146 23,149 27,116
Total 126,535 120,180 121,224 127,513 127,689 89,602 107,082
2015 2016 2017 2018 2019 2020 9M.2021
China 39% 38% 37% 37% 34% 28% 28%
Vietnam 9% 9% 10% 10% 11% 15% 14%
Mexico 5% 5% 5% 5% 5% 4% 4%
India 6% 7% 7% 7% 7% 8% 9%
Canada 2% 2% 2% 2% 2% 1% 1%
Bangladesh 4% 5% 4% 4% 5% 6% 6%
Indonesia 4% 4% 4% 4% 4% 4% 4%
Honduras 2% 2% 2% 2% 2% 2% 2%
Pakistan 3% 2% 2% 2% 3% 3% 4%
Cambodia 2% 2% 2% 2% 2% 4% 3%
Other
sources24% 24% 24% 25% 26% 26% 25%
Total 100% 100% 100% 100% 100% 100% 100%
9
Source: Vietnam Customs, VCBS summary
Some signed Vietnam free-traded partnership agreements with other countries
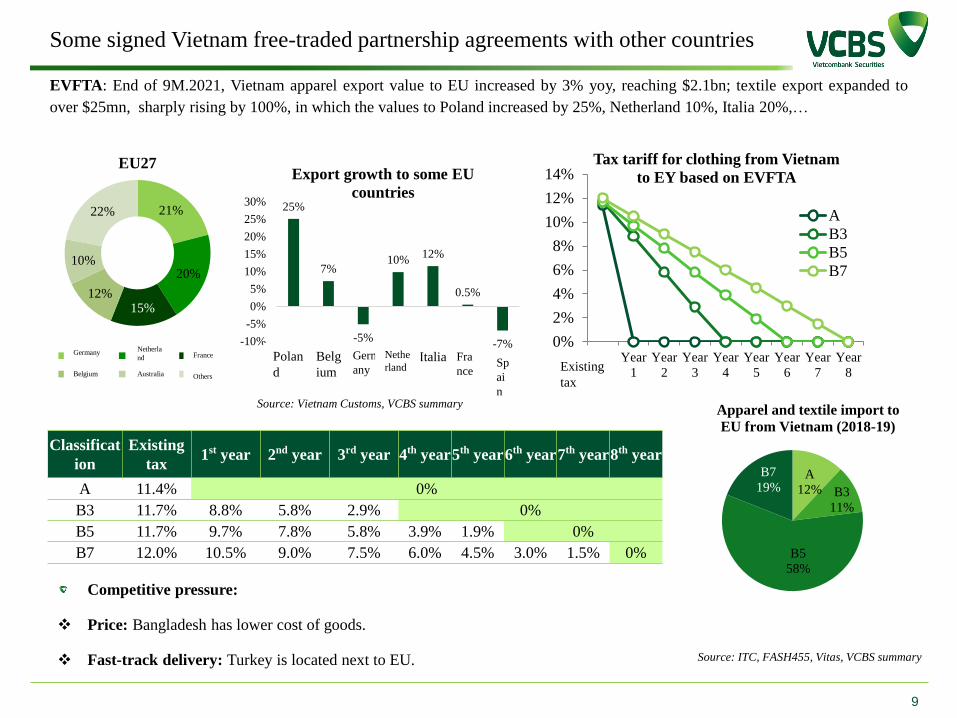
EVFTA: End of 9M.2021, Vietnam apparel export value to EU increased by 3% yoy, reaching $2.1bn; textile export expanded to
over $25mn, sharply rising by 100%, in which the values to Poland increased by 25%, Netherland 10%, Italia 20%,…
21%
20%
15%12%
10%
22%
EU27
Đức Hà Lan Pháp
Bỉ Úc Còn lại
Classificat
ion
Existing
tax1st year 2nd year 3rd year 4th year5th year6th year7th year8th year
A 11.4% 0%
B3 11.7% 8.8% 5.8% 2.9% 0%
B5 11.7% 9.7% 7.8% 5.8% 3.9% 1.9% 0%
B7 12.0% 10.5% 9.0% 7.5% 6.0% 4.5% 3.0% 1.5% 0%
0%
2%
4%
6%
8%
10%
12%
14%
Year
1
Year
2
Year
3
Year
4
Year
5
Year
6
Year
7
Year
8
Tax tariff for clothing from Vietnam
to EY based on EVFTA
A
B3
B5
B7
Existing
tax
Competitive pressure:
Price: Bangladesh has lower cost of goods.
Fast-track delivery: Turkey is located next to EU.
A
12% B3
11%
B5
58%
B7
19%
Apparel and textile import to
EU from Vietnam (2018-19)
Source: ITC, FASH455, Vitas, VCBS summary
Germany
Belgium
Netherla
nd
Australia
France
Others
25%
7%
-5%
10%12%
0.5%
-7%-10%
-5%
0%
5%
10%
15%
20%
25%
30%
Ba
LanBỉ Đức Hà
Lan
Italia Pháp Tây
Ban
Nha
Export growth to some EU
countries
Polan
d
Belg
ium
Germ
any
Nethe
rlandFra
nceSp
ai
n
10
Some signed free-traded partnership agreements
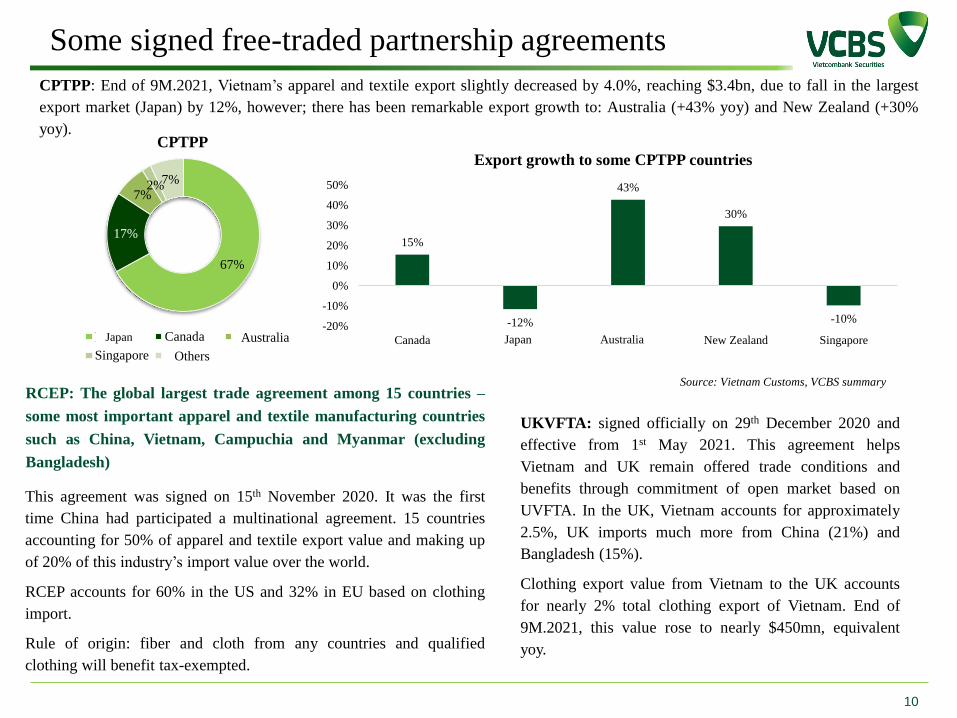
CPTPP: End of 9M.2021, Vietnam’s apparel and textile export slightly decreased by 4.0%, reaching $3.4bn, due to fall in the largest
export market (Japan) by 12%, however; there has been remarkable export growth to: Australia (+43% yoy) and New Zealand (+30%
yoy).
This agreement was signed on 15th November 2020. It was the first
time China had participated a multinational agreement. 15 countries
accounting for 50% of apparel and textile export value and making up
of 20% of this industry’s import value over the world.
RCEP accounts for 60% in the US and 32% in EU based on clothing
import.
Rule of origin: fiber and cloth from any countries and qualified
clothing will benefit tax-exempted.
RCEP: The global largest trade agreement among 15 countries –
some most important apparel and textile manufacturing countries
such as China, Vietnam, Campuchia and Myanmar (excluding
Bangladesh)
UKVFTA: signed officially on 29th December 2020 and
effective from 1st May 2021. This agreement helps
Vietnam and UK remain offered trade conditions and
benefits through commitment of open market based on
UVFTA. In the UK, Vietnam accounts for approximately
2.5%, UK imports much more from China (21%) and
Bangladesh (15%).
Clothing export value from Vietnam to the UK accounts
for nearly 2% total clothing export of Vietnam. End of
9M.2021, this value rose to nearly $450mn, equivalent
yoy.
67%
17%
7%2%7%
CPTPP
Nhật Canada Úc
Singapore Còn lại
Japan Australia
Others
Source: Vietnam Customs, VCBS summary
15%
-12%
43%
30%
-10%-20%
-10%
0%
10%
20%
30%
40%
50%
Canada Nhật Bản Úc New Zealand Singapore
Export growth to some CPTPP countries
AustraliaJapan
11
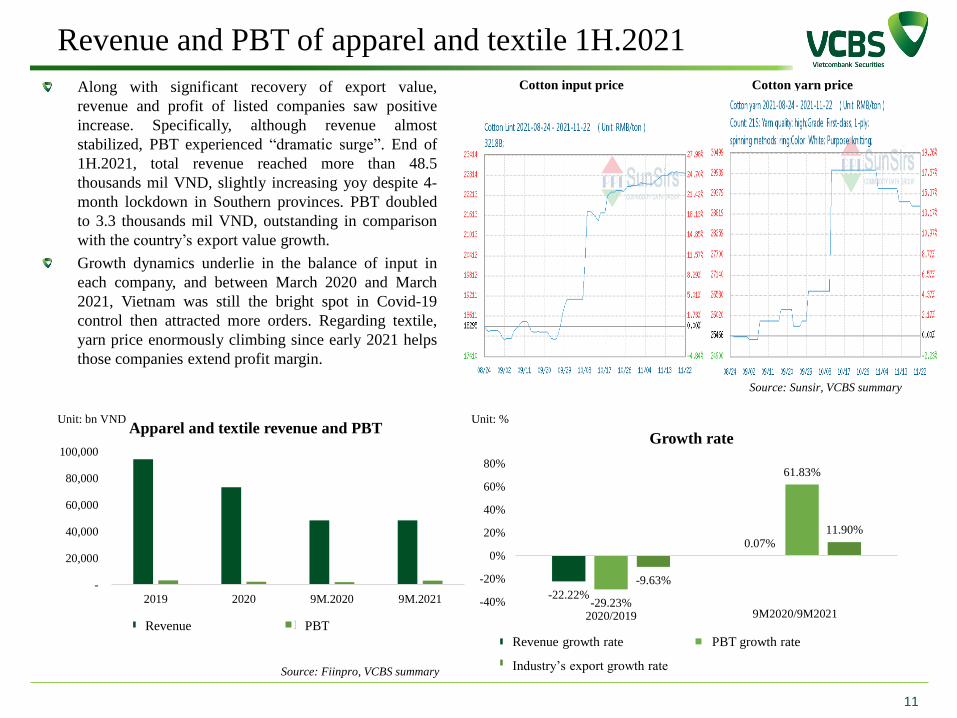
Along with significant recovery of export value,
revenue and profit of listed companies saw positive
increase. Specifically, although revenue almost
stabilized, PBT experienced “dramatic surge”. End of
1H.2021, total revenue reached more than 48.5
thousands mil VND, slightly increasing yoy despite 4-
month lockdown in Southern provinces. PBT doubled
to 3.3 thousands mil VND, outstanding in comparison
with the country’s export value growth.
Growth dynamics underlie in the balance of input in
each company, and between March 2020 and March
2021, Vietnam was still the bright spot in Covid-19
control then attracted more orders. Regarding textile,
yarn price enormously climbing since early 2021 helps
those companies extend profit margin.
Source: Fiinpro, VCBS summary
Revenue and PBT of apparel and textile 1H.2021
Unit: bn VND Unit: %
Cotton input price Cotton yarn price
Source: Sunsir, VCBS summary
-
20,000
40,000
60,000
80,000
100,000
2019 2020 9M.2020 9M.2021
Apparel and textile revenue and PBT
Doanh thu ngành dệt may LNTT ngành dệt may
-22.22%
0.07%
-29.23%
61.83%
-9.63%
11.90%
-40%
-20%
0%
20%
40%
60%
80%
2020/2019 1H.2021/1H.2020
Growth rate
Tốc độ tăng trưởng doanh thu Tốc độ tăng trưởng lợi nhuận
Tốc độ tăng trưởng xuất khẩu dệt may
Revenue PBT
Revenue growth rate
Industry’s export growth rate
PBT growth rate
9M2020/9M2021
12
UPDATES ON INDUSTRY 10M.2021
INDUSTRY OUTLOOK 2021 - 2022
STOCK RECOMMENDATION
13
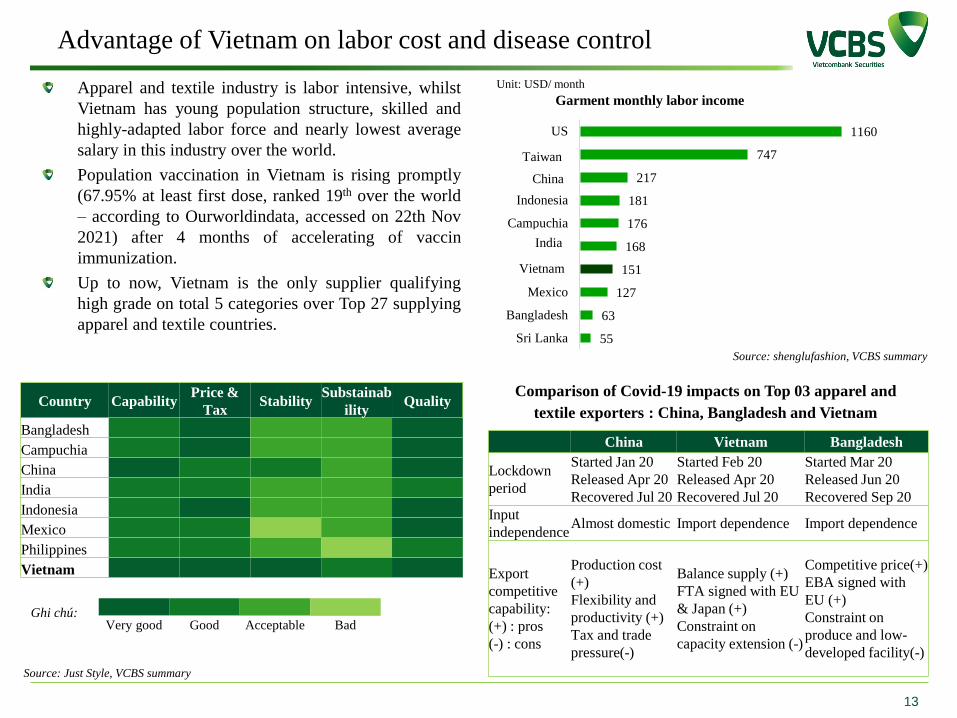
Apparel and textile industry is labor intensive, whilst
Vietnam has young population structure, skilled and
highly-adapted labor force and nearly lowest average
salary in this industry over the world.
Population vaccination in Vietnam is rising promptly
(67.95% at least first dose, ranked 19th over the world
– according to Ourworldindata, accessed on 22th Nov
2021) after 4 months of accelerating of vaccin
immunization.
Up to now, Vietnam is the only supplier qualifying
high grade on total 5 categories over Top 27 supplying
apparel and textile countries.
Advantage of Vietnam on labor cost and disease control
Country CapabilityPrice &
TaxStability
Substainab
ilityQuality
Bangladesh
Campuchia
China
India
Indonesia
Mexico
Philippines
Vietnam
Ghi chú:Very good Good Acceptable Bad
Comparison of Covid-19 impacts on Top 03 apparel and
textile exporters : China, Bangladesh and Vietnam
China Vietnam Bangladesh
Lockdown
period
Started Jan 20
Released Apr 20
Recovered Jul 20
Started Feb 20
Released Apr 20
Recovered Jul 20
Started Mar 20
Released Jun 20
Recovered Sep 20
Input
independenceAlmost domestic Import dependence Import dependence
Export
competitive
capability:
(+) : pros
(-) : cons
Production cost
(+)
Flexibility and
productivity (+)
Tax and trade
pressure(-)
Balance supply (+)
FTA signed with EU
& Japan (+)
Constraint on
capacity extension (-)
Competitive price(+)
EBA signed with
EU (+)
Constraint on
produce and low-
developed facility(-)
Source: Just Style, VCBS summary
1160
747
217
181
176
168
151
127
63
55
US
Đài Loan
Trung Quốc
Indonesia
Campuchia
Ấn Độ
Việt Nam
Mexico
Bangladesh
Sri Lanka
Garment monthly labor income
Unit: USD/ month
Source: shenglufashion, VCBS summary
Taiwan
China
India
Vietnam
14
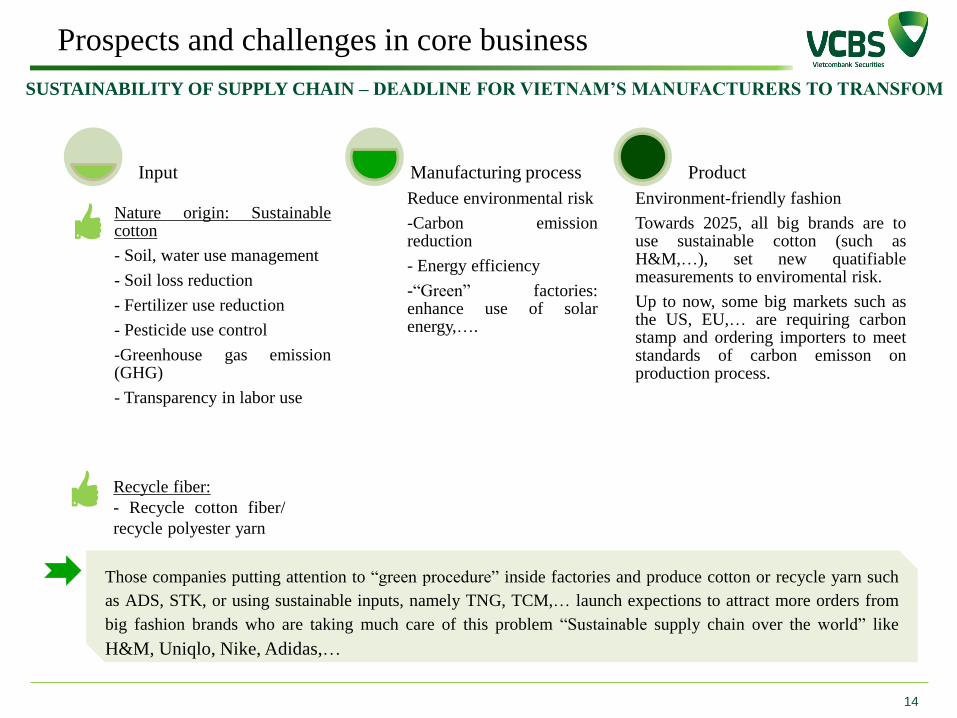
Prospects and challenges in core business
SUSTAINABILITY OF SUPPLY CHAIN – DEADLINE FOR VIETNAM’S MANUFACTURERS TO TRANSFOM
Nature origin: Sustainablecotton
- Soil, water use management
- Soil loss reduction
- Fertilizer use reduction
- Pesticide use control
-Greenhouse gas emission(GHG)
- Transparency in labor use
Input
Reduce environmental risk
-Carbon emissionreduction
- Energy efficiency
-“Green” factories:enhance use of solarenergy,….
Manufacturing process
Environment-friendly fashion
Towards 2025, all big brands are touse sustainable cotton (such asH&M,…), set new quatifiablemeasurements to enviromental risk.
Up to now, some big markets such asthe US, EU,… are requiring carbonstamp and ordering importers to meetstandards of carbon emisson onproduction process.
Product
Recycle fiber:
- Recycle cotton fiber/
recycle polyester yarn
Those companies putting attention to “green procedure” inside factories and produce cotton or recycle yarn such
as ADS, STK, or using sustainable inputs, namely TNG, TCM,… launch expections to attract more orders from
big fashion brands who are taking much care of this problem “Sustainable supply chain over the world” like
H&M, Uniqlo, Nike, Adidas,…
15
Prospects and challenges in core business
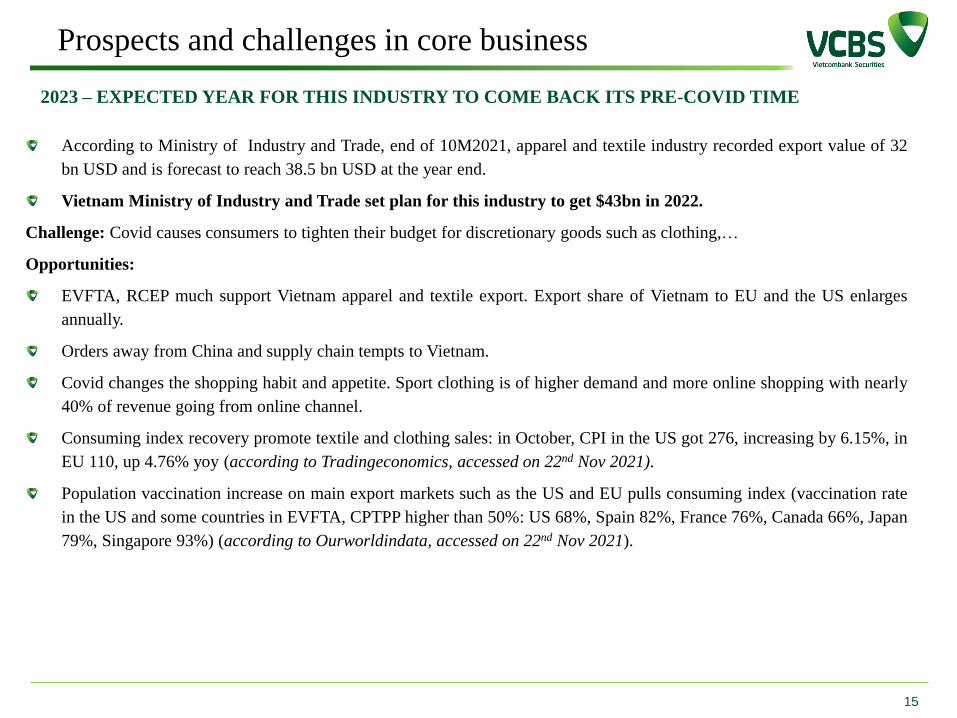
According to Ministry of Industry and Trade, end of 10M2021, apparel and textile industry recorded export value of 32
bn USD and is forecast to reach 38.5 bn USD at the year end.
Vietnam Ministry of Industry and Trade set plan for this industry to get $43bn in 2022.
Challenge: Covid causes consumers to tighten their budget for discretionary goods such as clothing,…
Opportunities:
EVFTA, RCEP much support Vietnam apparel and textile export. Export share of Vietnam to EU and the US enlarges
annually.
Orders away from China and supply chain tempts to Vietnam.
Covid changes the shopping habit and appetite. Sport clothing is of higher demand and more online shopping with nearly
40% of revenue going from online channel.
Consuming index recovery promote textile and clothing sales: in October, CPI in the US got 276, increasing by 6.15%, in
EU 110, up 4.76% yoy (according to Tradingeconomics, accessed on 22nd Nov 2021).
Population vaccination increase on main export markets such as the US and EU pulls consuming index (vaccination rate
in the US and some countries in EVFTA, CPTPP higher than 50%: US 68%, Spain 82%, France 76%, Canada 66%, Japan
79%, Singapore 93%) (according to Ourworldindata, accessed on 22nd Nov 2021).
2023 – EXPECTED YEAR FOR THIS INDUSTRY TO COME BACK ITS PRE-COVID TIME
16
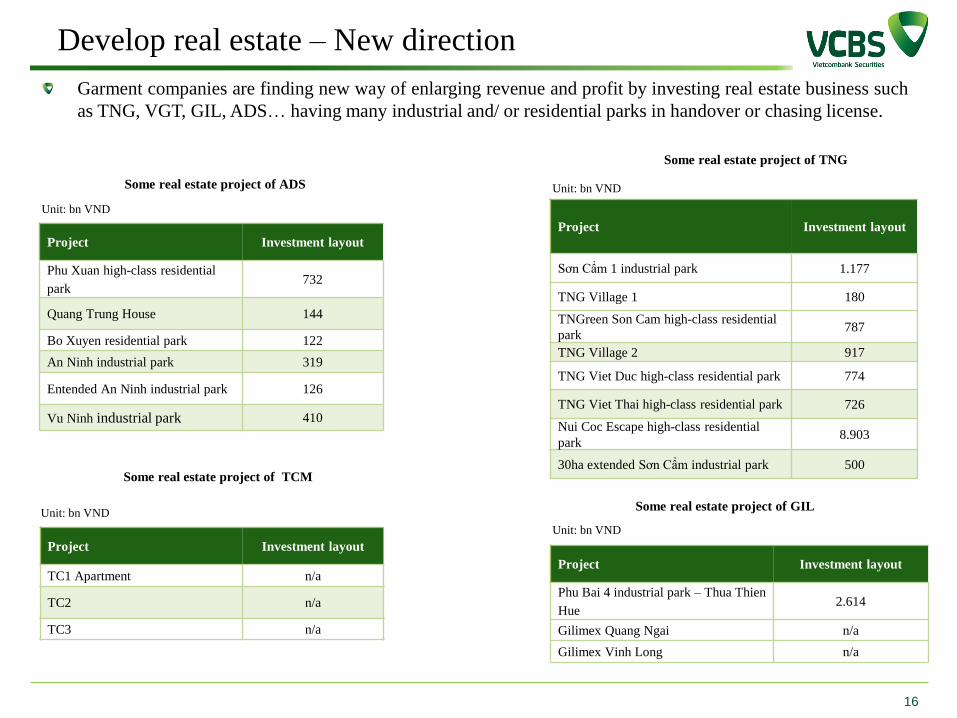
Garment companies are finding new way of enlarging revenue and profit by investing real estate business such
as TNG, VGT, GIL, ADS… having many industrial and/ or residential parks in handover or chasing license.
Develop real estate – New direction
Project Investment layout
Sơn Cẩm 1 industrial park 1.177
TNG Village 1 180
TNGreen Son Cam high-class residential
park787
TNG Village 2 917
TNG Viet Duc high-class residential park 774
TNG Viet Thai high-class residential park 726
Nui Coc Escape high-class residential
park8.903
30ha extended Sơn Cẩm industrial park 500
Project Investment layout
Phu Xuan high-class residential
park732
Quang Trung House 144
Bo Xuyen residential park 122
An Ninh industrial park 319
Entended An Ninh industrial park 126
Vu Ninh industrial park 410
Some real estate project of TNG
Some real estate project of ADS
Unit: bn VND
Project Investment layout
TC1 Apartment n/a
TC2 n/a
TC3 n/a
Some real estate project of TCM
Project Investment layout
Phu Bai 4 industrial park – Thua Thien
Hue2.614
Gilimex Quang Ngai n/a
Gilimex Vinh Long n/a
Some real estate project of GIL
Unit: bn VND
Unit: bn VND
Unit: bn VND

17
UPDATES ON INDUSTRY 10M.2021
INDUSTRY OUTLOOK 2021 - 2022
STOCK RECOMMENDATION
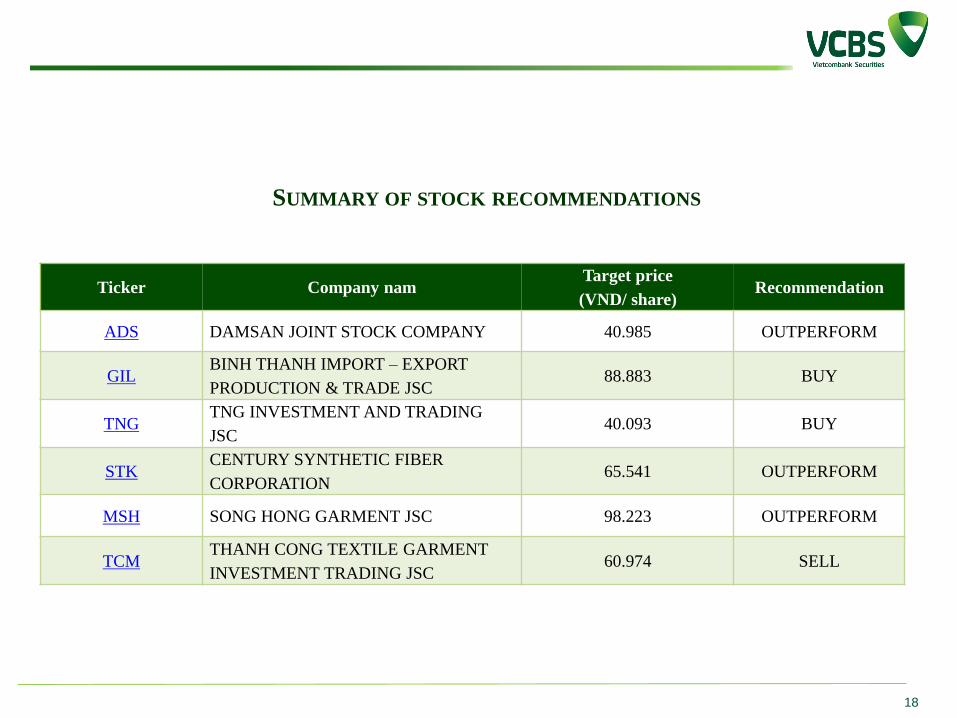
SUMMARY OF STOCK RECOMMENDATIONS
18
Ticker Company namTarget price
(VND/ share)Recommendation
ADS DAMSAN JOINT STOCK COMPANY 40.985 OUTPERFORM
GILBINH THANH IMPORT – EXPORT
PRODUCTION & TRADE JSC88.883 BUY
TNGTNG INVESTMENT AND TRADING
JSC40.093 BUY
STKCENTURY SYNTHETIC FIBER
CORPORATION65.541 OUTPERFORM
MSH SONG HONG GARMENT JSC 98.223 OUTPERFORM
TCMTHANH CONG TEXTILE GARMENT
INVESTMENT TRADING JSC60.974 SELL
750 800 850 900 950 1,000 1,050
9M.2020
9M.2021
Bán hàng hóa và thành phẩm
Cho thuê BĐS
BĐS
DAMSAN JOINT STOCK COMPANY – OVERVIEW
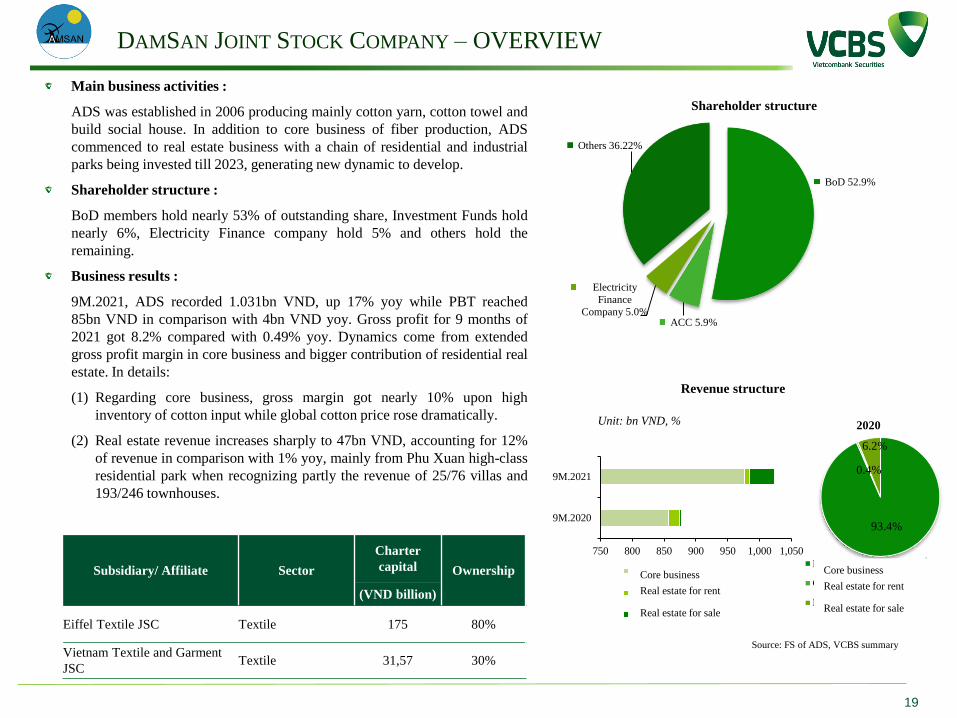
Source: FS of ADS, VCBS summary
Subsidiary/ Affiliate Sector
Charter
capital Ownership
(VND billion)
Eiffel Textile JSC Textile 175 80%
Vietnam Textile and Garment
JSCTextile 31,57 30%
19
Unit: bn VND, %
BoD 52.9%
ACC 5.9%
Electricity
Finance
Company 5.0%
Others 36.22%
Shareholder structure
93.4%
0.4%
6.2%
2020
Bán hàng hóa và thành phẩm
Cho thuê BĐS
BĐS
Revenue structure
Main business activities :
ADS was established in 2006 producing mainly cotton yarn, cotton towel and
build social house. In addition to core business of fiber production, ADS
commenced to real estate business with a chain of residential and industrial
parks being invested till 2023, generating new dynamic to develop.
Shareholder structure :
BoD members hold nearly 53% of outstanding share, Investment Funds hold
nearly 6%, Electricity Finance company hold 5% and others hold the
remaining.
Business results :
9M.2021, ADS recorded 1.031bn VND, up 17% yoy while PBT reached
85bn VND in comparison with 4bn VND yoy. Gross profit for 9 months of
2021 got 8.2% compared with 0.49% yoy. Dynamics come from extended
gross profit margin in core business and bigger contribution of residential real
estate. In details:
(1) Regarding core business, gross margin got nearly 10% upon high
inventory of cotton input while global cotton price rose dramatically.
(2) Real estate revenue increases sharply to 47bn VND, accounting for 12%
of revenue in comparison with 1% yoy, mainly from Phu Xuan high-class
residential park when recognizing partly the revenue of 25/76 villas and
193/246 townhouses.
Core business
Real estate for rent
Real estate for sale
Core business
Real estate for rent
Real estate for sale
DAMSAN JOINT STOCK COMPANY – PROSPECT
20
INVESTMENT CATALYSTS
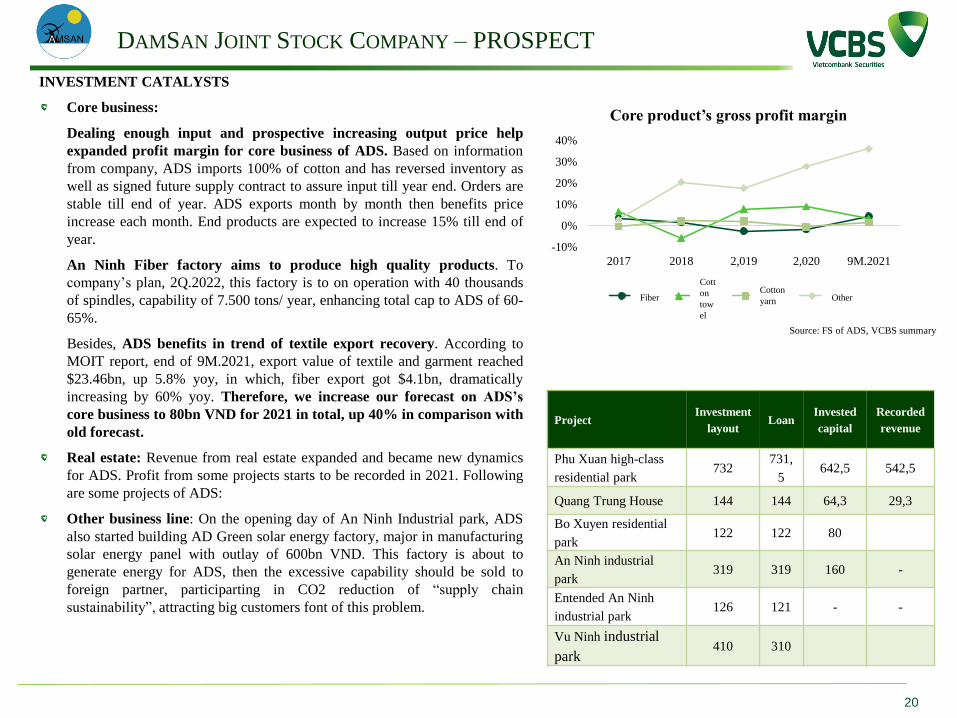
Core business:
Dealing enough input and prospective increasing output price help
expanded profit margin for core business of ADS. Based on information
from company, ADS imports 100% of cotton and has reversed inventory as
well as signed future supply contract to assure input till year end. Orders are
stable till end of year. ADS exports month by month then benefits price
increase each month. End products are expected to increase 15% till end of
year.
An Ninh Fiber factory aims to produce high quality products. To
company’s plan, 2Q.2022, this factory is to on operation with 40 thousands
of spindles, capability of 7.500 tons/ year, enhancing total cap to ADS of 60-
65%.
Besides, ADS benefits in trend of textile export recovery. According to
MOIT report, end of 9M.2021, export value of textile and garment reached
$23.46bn, up 5.8% yoy, in which, fiber export got $4.1bn, dramatically
increasing by 60% yoy. Therefore, we increase our forecast on ADS’s
core business to 80bn VND for 2021 in total, up 40% in comparison with
old forecast.
Real estate: Revenue from real estate expanded and became new dynamics
for ADS. Profit from some projects starts to be recorded in 2021. Following
are some projects of ADS:
Other business line: On the opening day of An Ninh Industrial park, ADS
also started building AD Green solar energy factory, major in manufacturing
solar energy panel with outlay of 600bn VND. This factory is about to
generate energy for ADS, then the excessive capability should be sold to
foreign partner, participarting in CO2 reduction of “supply chain
sustainability”, attracting big customers font of this problem.
Source: FS of ADS, VCBS summary
-10%
0%
10%
20%
30%
40%
2017 2018 2,019 2,020 9M.2021
Core product’s gross profit margin
Sợi Khăn Bông KhácFiber
Cott
on
tow
el
Cotton
yarn Other
ProjectInvestment
layoutLoan
Invested
capital
Recorded
revenue
Phu Xuan high-class
residential park732
731,
5642,5 542,5
Quang Trung House 144 144 64,3 29,3
Bo Xuyen residential
park122 122 80
An Ninh industrial
park319 319 160 -
Entended An Ninh
industrial park126 121 - -
Vu Ninh industrial
park410 310
21
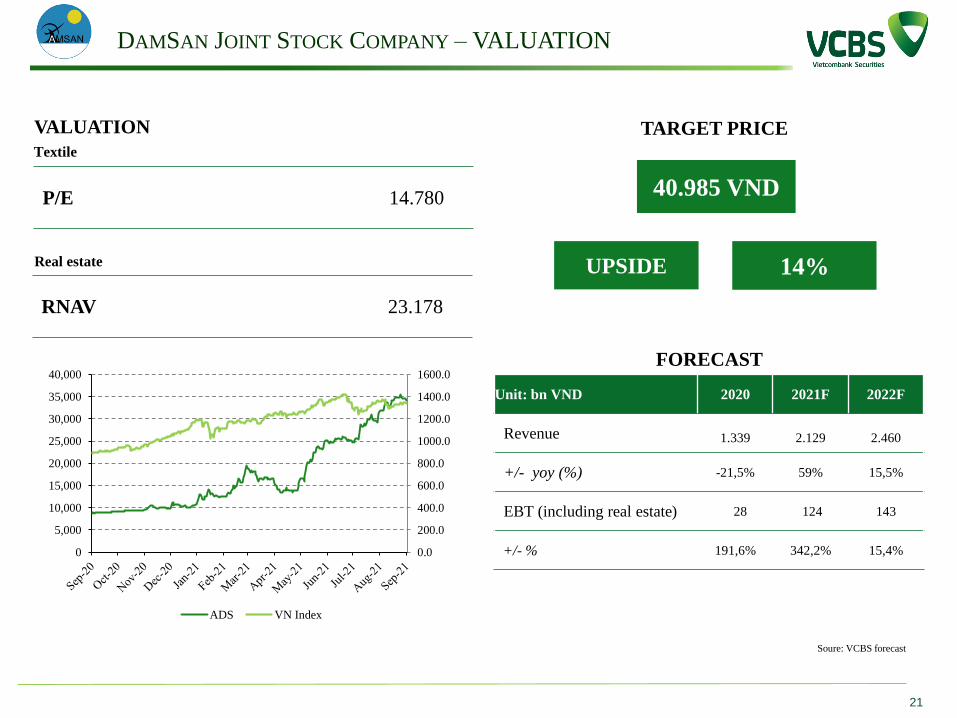
P/E 14.780
FORECAST
VALUATION
40.985 VND
TARGET PRICE
14%UPSIDE
Unit: bn VND 2020 2021F 2022F
Revenue 1.339 2.129 2.460
+/- yoy (%) -21,5% 59% 15,5%
EBT (including real estate) 28 124 143
+/- % 191,6% 342,2% 15,4%
Textile
Real estate
RNAV 23.178
DAMSAN JOINT STOCK COMPANY – VALUATION
0.0
200.0
400.0
600.0
800.0
1000.0
1200.0
1400.0
1600.0
0
5,000
10,000
15,000
20,000
25,000
30,000
35,000
40,000
ADS VN Index
Soure: VCBS forecast
BINH THANH IMPORT – EXPORT PRODUCTION & TRADE JSC
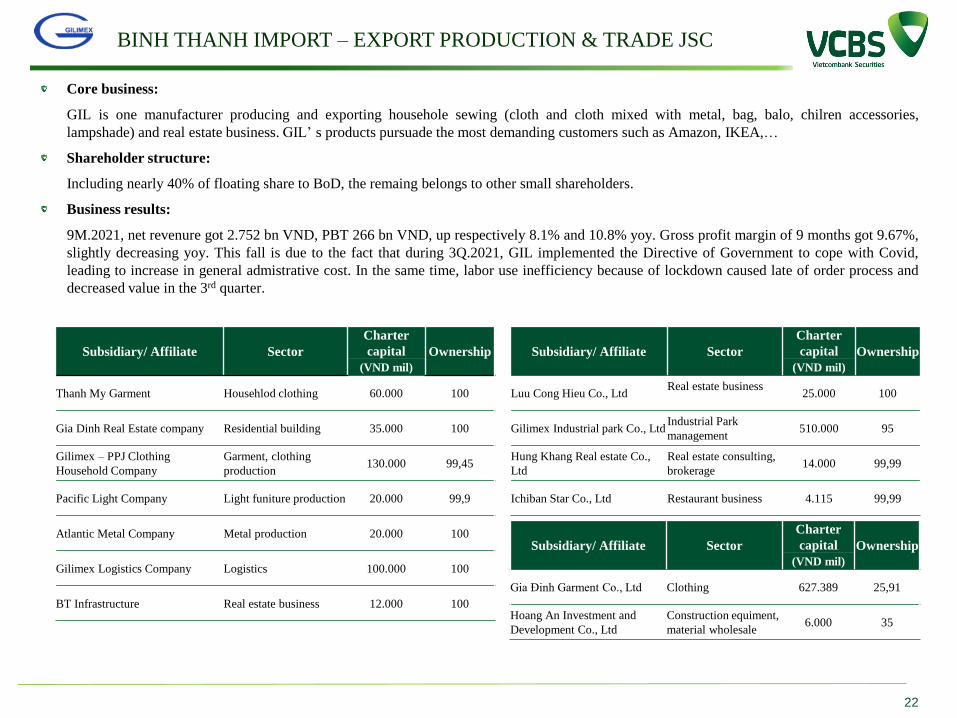
Core business:
GIL is one manufacturer producing and exporting househole sewing (cloth and cloth mixed with metal, bag, balo, chilren accessories,
lampshade) and real estate business. GIL’ s products pursuade the most demanding customers such as Amazon, IKEA,…
Shareholder structure:
Including nearly 40% of floating share to BoD, the remaing belongs to other small shareholders.
Business results:
9M.2021, net revenure got 2.752 bn VND, PBT 266 bn VND, up respectively 8.1% and 10.8% yoy. Gross profit margin of 9 months got 9.67%,
slightly decreasing yoy. This fall is due to the fact that during 3Q.2021, GIL implemented the Directive of Government to cope with Covid,
leading to increase in general admistrative cost. In the same time, labor use inefficiency because of lockdown caused late of order process and
decreased value in the 3rd quarter.
Subsidiary/ Affiliate Sector
Charter
capital Ownership
(VND mil)
Thanh My Garment Househlod clothing 60.000 100
Gia Dinh Real Estate company Residential building 35.000 100
Gilimex – PPJ Clothing
Household Company
Garment, clothing
production130.000 99,45
Pacific Light Company Light funiture production 20.000 99,9
Atlantic Metal Company Metal production 20.000 100
Gilimex Logistics Company Logistics 100.000 100
BT Infrastructure Real estate business 12.000 100
22
Subsidiary/ Affiliate Sector
Charter
capital Ownership
(VND mil)
Luu Cong Hieu Co., LtdReal estate business
25.000 100
Gilimex Industrial park Co., LtdIndustrial Park
management510.000 95
Hung Khang Real estate Co.,
Ltd
Real estate consulting,
brokerage14.000 99,99
Ichiban Star Co., Ltd Restaurant business 4.115 99,99
Subsidiary/ Affiliate Sector
Charter
capital Ownership
(VND mil)
Gia Đinh Garment Co., Ltd Clothing 627.389 25,91
Hoang An Investment and
Development Co., Ltd
Construction equiment,
material wholesale6.000 35
23
INVESTMENT CATALYSTS
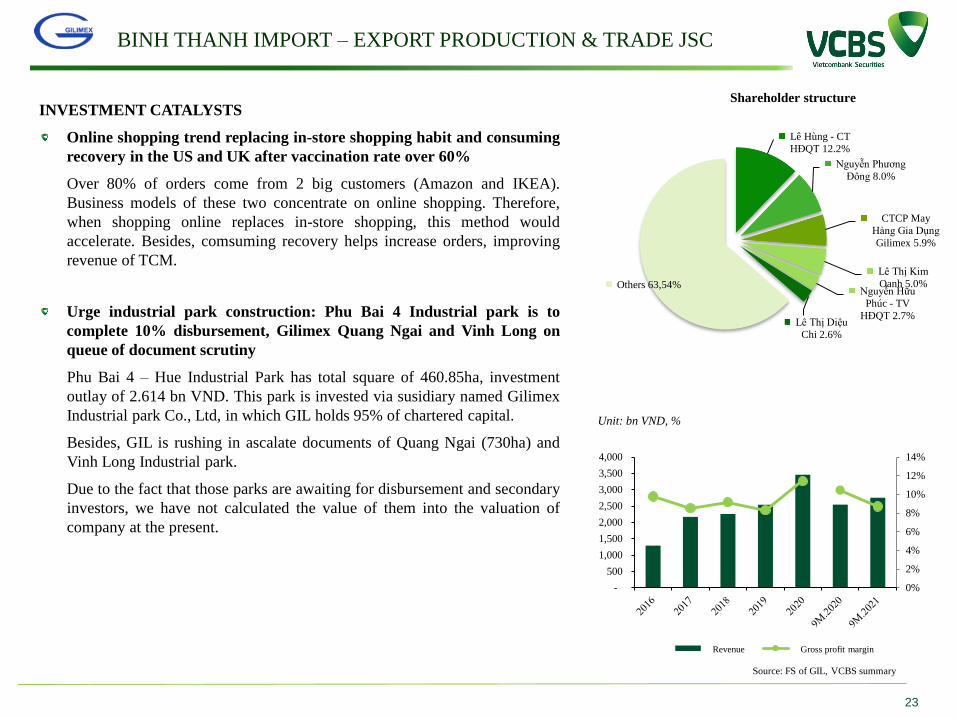
Online shopping trend replacing in-store shopping habit and consuming
recovery in the US and UK after vaccination rate over 60%
Over 80% of orders come from 2 big customers (Amazon and IKEA).
Business models of these two concentrate on online shopping. Therefore,
when shopping online replaces in-store shopping, this method would
accelerate. Besides, comsuming recovery helps increase orders, improving
revenue of TCM.
Urge industrial park construction: Phu Bai 4 Industrial park is to
complete 10% disbursement, Gilimex Quang Ngai and Vinh Long on
queue of document scrutiny
Phu Bai 4 – Hue Industrial Park has total square of 460.85ha, investment
outlay of 2.614 bn VND. This park is invested via susidiary named Gilimex
Industrial park Co., Ltd, in which GIL holds 95% of chartered capital.
Besides, GIL is rushing in ascalate documents of Quang Ngai (730ha) and
Vinh Long Industrial park.
Due to the fact that those parks are awaiting for disbursement and secondary
investors, we have not calculated the value of them into the valuation of
company at the present.
BINH THANH IMPORT – EXPORT PRODUCTION & TRADE JSC
Unit: bn VND, %
0%
2%
4%
6%
8%
10%
12%
14%
-
500
1,000
1,500
2,000
2,500
3,000
3,500
4,000
Doanh thu Biên LN ròng
Lê Hùng - CT
HĐQT 12.2%
Nguyễn Phương
Đông 8.0%
CTCP May
Hàng Gia Dụng
Gilimex 5.9%
Lê Thị Kim
Oanh 5.0%Nguyễn Hữu
Phúc - TV
HĐQT 2.7%Lê Thị Diệu
Chi 2.6%
Others 63,54%
Shareholder structure
Revenue Gross profit margin
Source: FS of GIL, VCBS summary
24
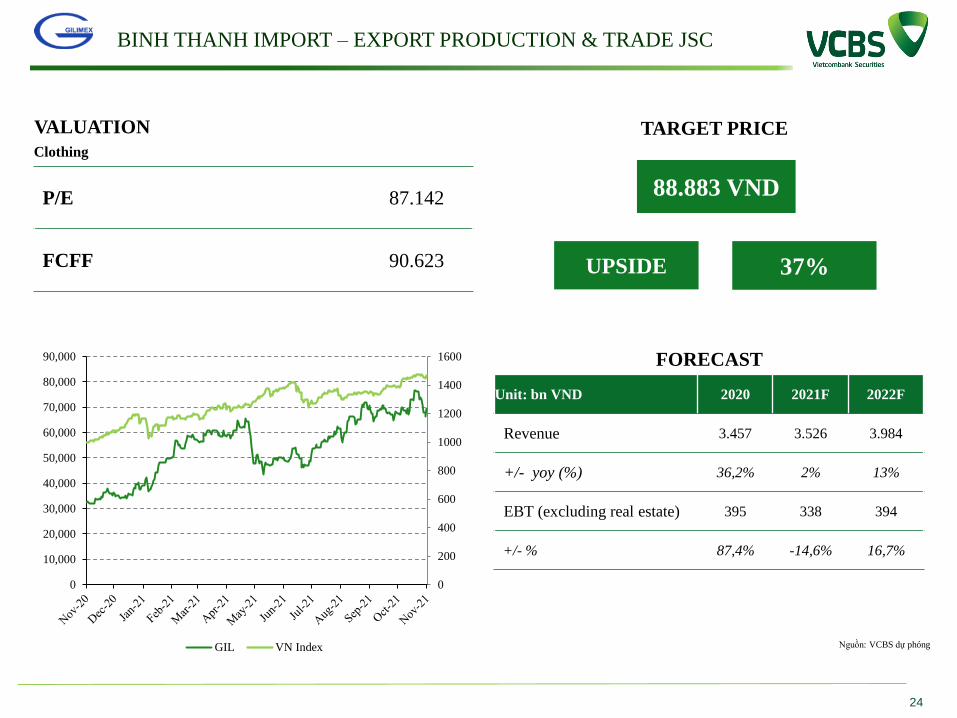
P/E 87.142
FCFF 90.623
FORECAST
VALUATION
88.883 VND
TARGET PRICE
37%UPSIDE
Unit: bn VND 2020 2021F 2022F
Revenue 3.457 3.526 3.984
+/- yoy (%) 36,2% 2% 13%
EBT (excluding real estate) 395 338 394
+/- % 87,4% -14,6% 16,7%
Nguồn: VCBS dự phóng
Clothing
0
200
400
600
800
1000
1200
1400
1600
0
10,000
20,000
30,000
40,000
50,000
60,000
70,000
80,000
90,000
GIL VN Index
BINH THANH IMPORT – EXPORT PRODUCTION & TRADE JSC
0.0%
1.0%
2.0%
3.0%
4.0%
5.0%
6.0%
7.0%
-
500
1,000
1,500
2,000
2,500
3,000
3,500
4,000
4,500
5,000
Doanh thu Biên LN ròng
TNG INVESTMENT AND TRADING JSC – OVERVIEW
25
Unit: bn VND, %
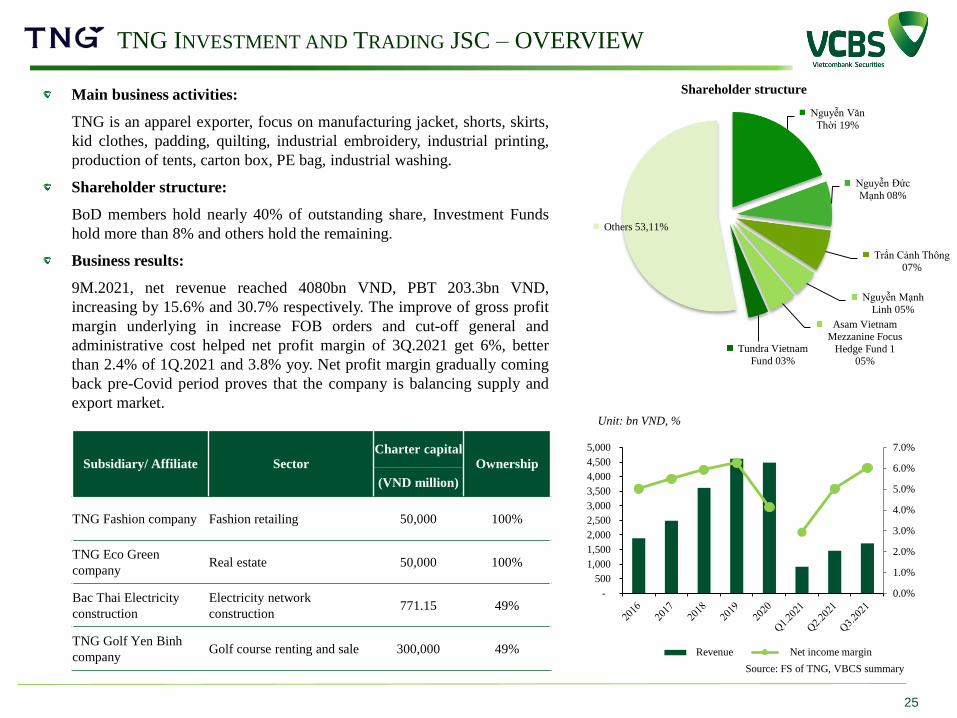
Main business activities:
TNG is an apparel exporter, focus on manufacturing jacket, shorts, skirts,
kid clothes, padding, quilting, industrial embroidery, industrial printing,
production of tents, carton box, PE bag, industrial washing.
Shareholder structure:
BoD members hold nearly 40% of outstanding share, Investment Funds
hold more than 8% and others hold the remaining.
Business results:
9M.2021, net revenue reached 4080bn VND, PBT 203.3bn VND,
increasing by 15.6% and 30.7% respectively. The improve of gross profit
margin underlying in increase FOB orders and cut-off general and
administrative cost helped net profit margin of 3Q.2021 get 6%, better
than 2.4% of 1Q.2021 and 3.8% yoy. Net profit margin gradually coming
back pre-Covid period proves that the company is balancing supply and
export market.
Subsidiary/ Affiliate SectorCharter capital
Ownership
(VND million)
TNG Fashion company Fashion retailing 50,000 100%
TNG Eco Green
companyReal estate 50,000 100%
Bac Thai Electricity
construction
Electricity network
construction771.15 49%
TNG Golf Yen Binh
companyGolf course renting and sale 300,000 49%
Nguyễn Văn
Thời 19%
Nguyễn Đức
Mạnh 08%
Trẩn Cảnh Thông
07%
Nguyễn Mạnh
Linh 05%
Asam Vietnam
Mezzanine Focus
Hedge Fund 105%
Tundra Vietnam
Fund 03%
Others 53,11%
Shareholder structure
Revenue Net income margin
Source: FS of TNG, VBCS summary
- 1,000 2,000 3,000 4,000 5,000
2018
2019
2020
1H.2021
TNG’s revenue structure
FOB CMT Bán sản phẩm thời trang BĐS
TNG INVESTMENT AND TRADING JSC – PROSPECT
26
Unit: bn VND
INVESTMENT CATALYSTS
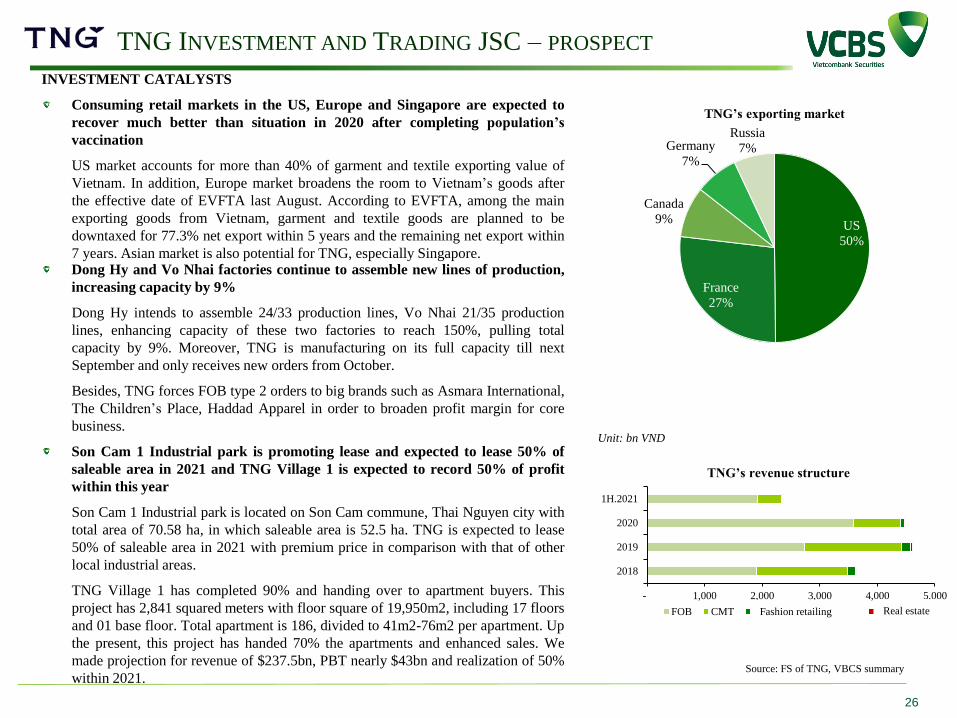
Consuming retail markets in the US, Europe and Singapore are expected to
recover much better than situation in 2020 after completing population’s
vaccination
US market accounts for more than 40% of garment and textile exporting value of
Vietnam. In addition, Europe market broadens the room to Vietnam’s goods after
the effective date of EVFTA last August. According to EVFTA, among the main
exporting goods from Vietnam, garment and textile goods are planned to be
downtaxed for 77.3% net export within 5 years and the remaining net export within
7 years. Asian market is also potential for TNG, especially Singapore.Dong Hy and Vo Nhai factories continue to assemble new lines of production,
increasing capacity by 9%
Dong Hy intends to assemble 24/33 production lines, Vo Nhai 21/35 production
lines, enhancing capacity of these two factories to reach 150%, pulling total
capacity by 9%. Moreover, TNG is manufacturing on its full capacity till next
September and only receives new orders from October.
Besides, TNG forces FOB type 2 orders to big brands such as Asmara International,
The Children’s Place, Haddad Apparel in order to broaden profit margin for core
business.
Son Cam 1 Industrial park is promoting lease and expected to lease 50% of
saleable area in 2021 and TNG Village 1 is expected to record 50% of profit
within this year
Son Cam 1 Industrial park is located on Son Cam commune, Thai Nguyen city with
total area of 70.58 ha, in which saleable area is 52.5 ha. TNG is expected to lease
50% of saleable area in 2021 with premium price in comparison with that of other
local industrial areas.
TNG Village 1 has completed 90% and handing over to apartment buyers. This
project has 2,841 squared meters with floor square of 19,950m2, including 17 floors
and 01 base floor. Total apartment is 186, divided to 41m2-76m2 per apartment. Up
the present, this project has handed 70% the apartments and enhanced sales. We
made projection for revenue of $237.5bn, PBT nearly $43bn and realization of 50%
within 2021.
US
50%
France
27%
Canada
9%
Germany
7%
Russia
7%
TNG’s exporting market
Fashion retailing Real estate
Source: FS of TNG, VBCS summary
27
FORECAST
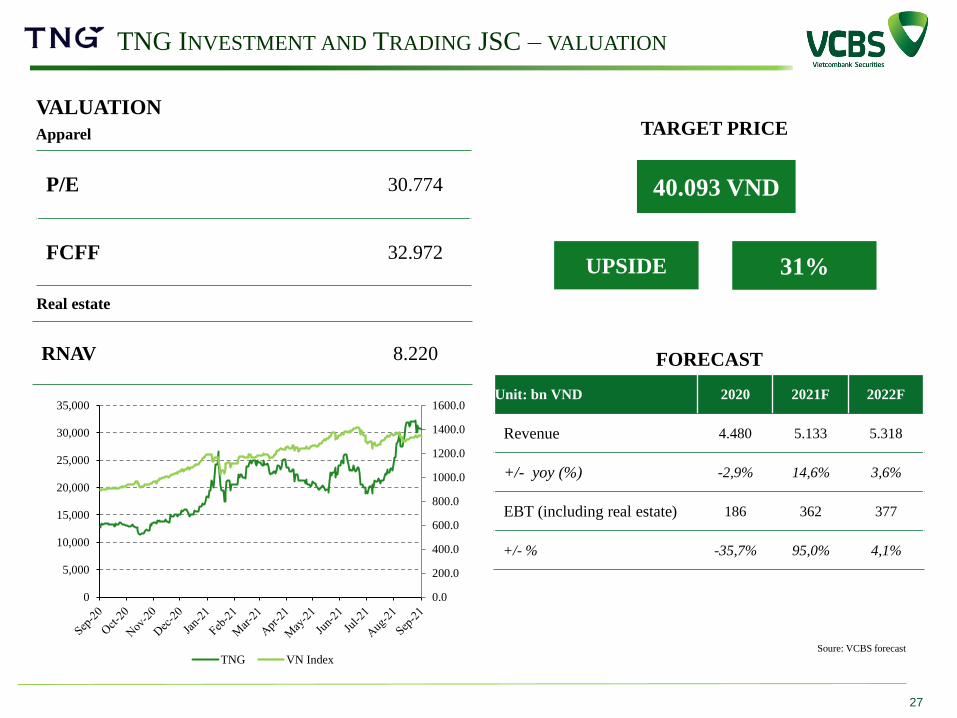
40.093 VND
TARGET PRICE
31%UPSIDE
Unit: bn VND 2020 2021F 2022F
Revenue 4.480 5.133 5.318
+/- yoy (%) -2,9% 14,6% 3,6%
EBT (including real estate) 186 362 377
+/- % -35,7% 95,0% 4,1%
RNAV 8.220
TNG INVESTMENT AND TRADING JSC – VALUATION
0.0
200.0
400.0
600.0
800.0
1000.0
1200.0
1400.0
1600.0
0
5,000
10,000
15,000
20,000
25,000
30,000
35,000
TNG VN Index
P/E 30.774
FCFF 32.972
VALUATION
Apparel
Real estate
Soure: VCBS forecast
CENTURY SYNTHETIC FIBER CORPORATION - OVERVIEW
Source: FS of STK, VBCS summary
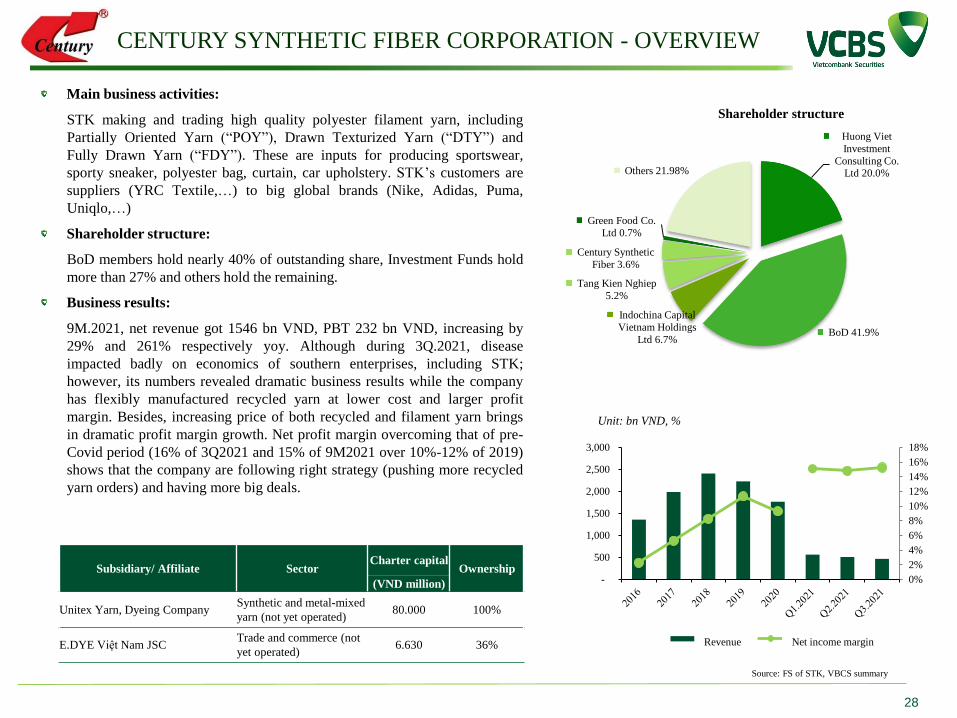
Main business activities:
STK making and trading high quality polyester filament yarn, including
Partially Oriented Yarn (“POY”), Drawn Texturized Yarn (“DTY”) and
Fully Drawn Yarn (“FDY”). These are inputs for producing sportswear,
sporty sneaker, polyester bag, curtain, car upholstery. STK’s customers are
suppliers (YRC Textile,…) to big global brands (Nike, Adidas, Puma,
Uniqlo,…)
Shareholder structure:
BoD members hold nearly 40% of outstanding share, Investment Funds hold
more than 27% and others hold the remaining.
Business results:
9M.2021, net revenue got 1546 bn VND, PBT 232 bn VND, increasing by
29% and 261% respectively yoy. Although during 3Q.2021, disease
impacted badly on economics of southern enterprises, including STK;
however, its numbers revealed dramatic business results while the company
has flexibly manufactured recycled yarn at lower cost and larger profit
margin. Besides, increasing price of both recycled and filament yarn brings
in dramatic profit margin growth. Net profit margin overcoming that of pre-
Covid period (16% of 3Q2021 and 15% of 9M2021 over 10%-12% of 2019)
shows that the company are following right strategy (pushing more recycled
yarn orders) and having more big deals.
Subsidiary/ Affiliate SectorCharter capital
Ownership
(VND million)
Unitex Yarn, Dyeing CompanySynthetic and metal-mixed
yarn (not yet operated)80.000 100%
E.DYE Việt Nam JSCTrade and commerce (not
yet operated)6.630 36%
28
Unit: bn VND, %
Huong Viet
Investment
Consulting Co. Ltd 20.0%
BoD 41.9%
Indochina Capital
Vietnam Holdings
Ltd 6.7%
Tang Kien Nghiep
5.2%
Century Synthetic
Fiber 3.6%
Green Food Co.
Ltd 0.7%
Others 21.98%
Shareholder structure
0%
2%
4%
6%
8%
10%
12%
14%
16%
18%
-
500
1,000
1,500
2,000
2,500
3,000
Doanh thu Biên LN ròngRevenue Net income margin
CENTURY SYNTHETIC FIBER CORPORATION - PROSPECT
Source: FS of STK, VBCS summary
29
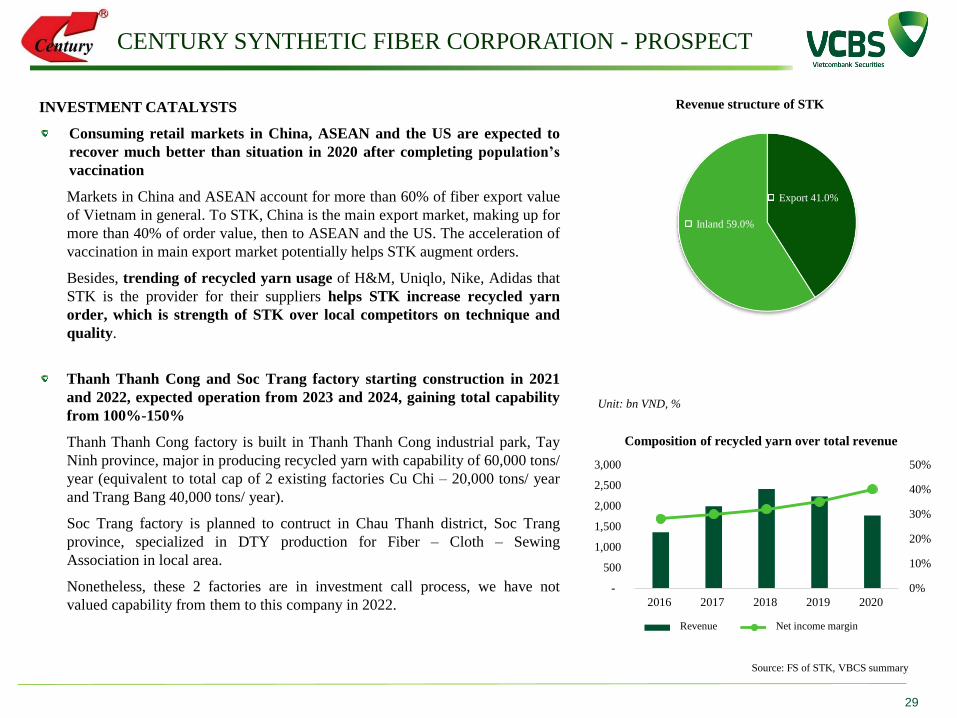
INVESTMENT CATALYSTS
Consuming retail markets in China, ASEAN and the US are expected to
recover much better than situation in 2020 after completing population’s
vaccination
Markets in China and ASEAN account for more than 60% of fiber export value
of Vietnam in general. To STK, China is the main export market, making up for
more than 40% of order value, then to ASEAN and the US. The acceleration of
vaccination in main export market potentially helps STK augment orders.
Besides, trending of recycled yarn usage of H&M, Uniqlo, Nike, Adidas that
STK is the provider for their suppliers helps STK increase recycled yarn
order, which is strength of STK over local competitors on technique and
quality.
Thanh Thanh Cong and Soc Trang factory starting construction in 2021
and 2022, expected operation from 2023 and 2024, gaining total capability
from 100%-150%
Thanh Thanh Cong factory is built in Thanh Thanh Cong industrial park, Tay
Ninh province, major in producing recycled yarn with capability of 60,000 tons/
year (equivalent to total cap of 2 existing factories Cu Chi – 20,000 tons/ year
and Trang Bang 40,000 tons/ year).
Soc Trang factory is planned to contruct in Chau Thanh district, Soc Trang
province, specialized in DTY production for Fiber – Cloth – Sewing
Association in local area.
Nonetheless, these 2 factories are in investment call process, we have not
valued capability from them to this company in 2022.
Unit: bn VND, %
Export 41.0%
Inland 59.0%
Revenue structure of STK
0%
10%
20%
30%
40%
50%
-
500
1,000
1,500
2,000
2,500
3,000
2016 2017 2018 2019 2020
Composition of recycled yarn over total revenue
Doanh thu Tỷ trọng DT sợi tái chếRevenue Net income margin
30
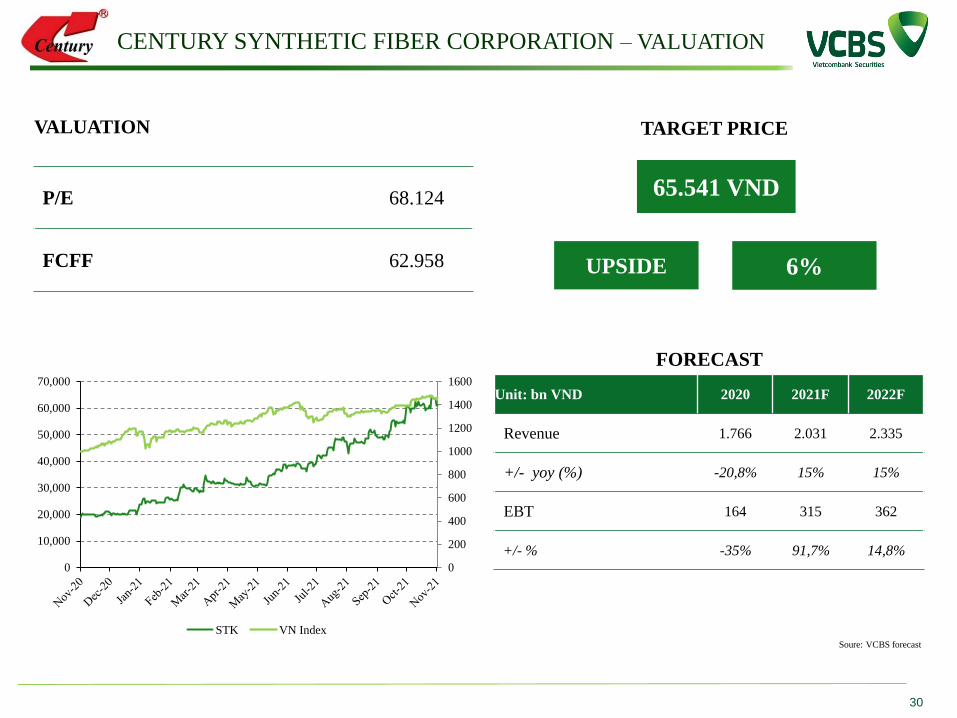
P/E 68.124
FCFF 62.958
FORECAST
VALUATION
65.541 VND
TARGET PRICE
6%UPSIDE
Unit: bn VND 2020 2021F 2022F
Revenue 1.766 2.031 2.335
+/- yoy (%) -20,8% 15% 15%
EBT 164 315 362
+/- % -35% 91,7% 14,8%
Soure: VCBS forecast
CENTURY SYNTHETIC FIBER CORPORATION – VALUATION
0
200
400
600
800
1000
1200
1400
1600
0
10,000
20,000
30,000
40,000
50,000
60,000
70,000
STK VN Index
0.0%
2.0%
4.0%
6.0%
8.0%
10.0%
12.0%
-
500
1,000
1,500
2,000
2,500
3,000
3,500
4,000
4,500
5,000
2016 2017 2018 2019 2020 9T.2021
Doanh thu Biên LN ròng
SONG HONG GARMENT JSC - OVERVIEW
Source: FS of MSH, VCBS summary
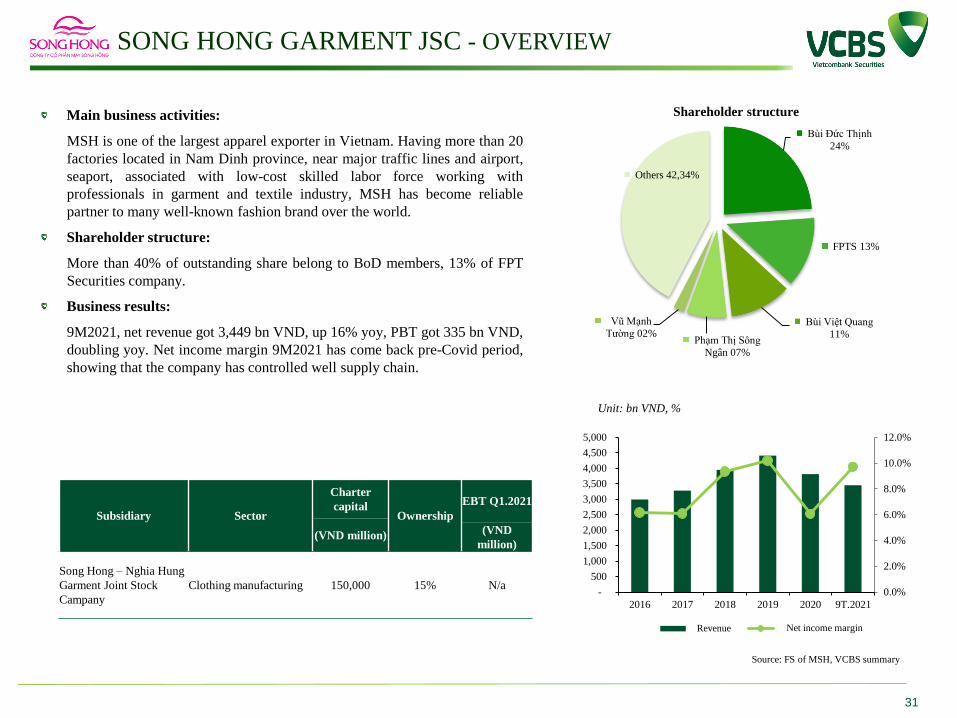
Main business activities:
MSH is one of the largest apparel exporter in Vietnam. Having more than 20
factories located in Nam Dinh province, near major traffic lines and airport,
seaport, associated with low-cost skilled labor force working with
professionals in garment and textile industry, MSH has become reliable
partner to many well-known fashion brand over the world.
Shareholder structure:
More than 40% of outstanding share belong to BoD members, 13% of FPT
Securities company.
Business results:
9M2021, net revenue got 3,449 bn VND, up 16% yoy, PBT got 335 bn VND,
doubling yoy. Net income margin 9M2021 has come back pre-Covid period,
showing that the company has controlled well supply chain.
Subsidiary Sector
Charter
capitalOwnership
EBT Q1.2021
(VND million) (VND
million)
Song Hong – Nghia Hung
Garment Joint Stock
Campany
Clothing manufacturing 150,000 15% N/a
31
Unit: bn VND, %
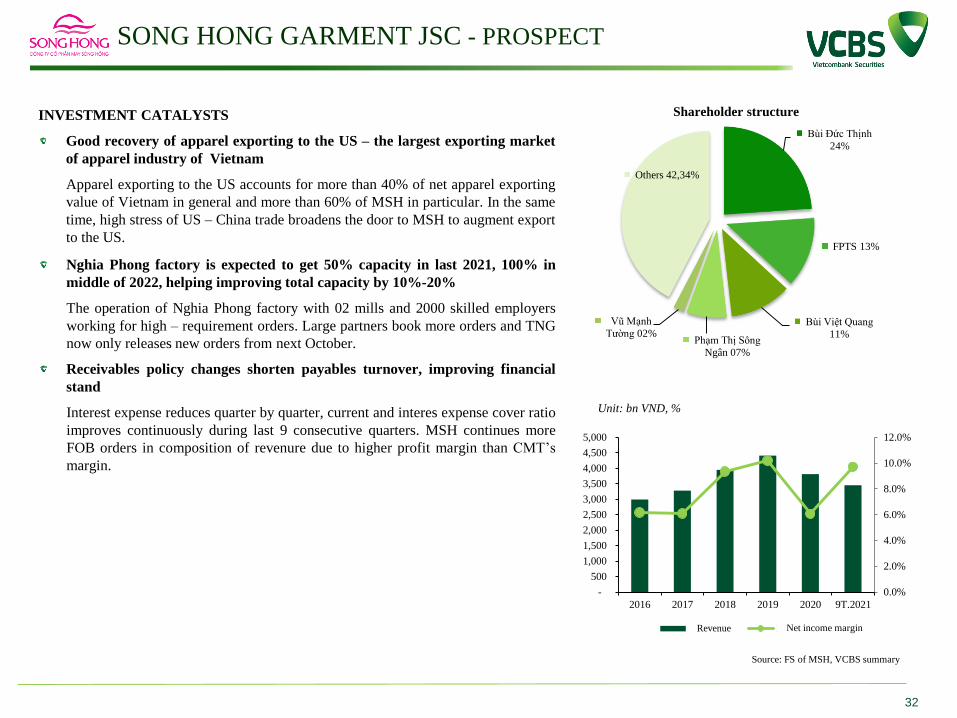
Bùi Đức Thịnh
24%
FPTS 13%
Bùi Việt Quang
11%Phạm Thị Sông
Ngân 07%
Vũ Mạnh
Tường 02%
Others 42,34%
Shareholder structure
Revenue Net income margin
SONG HONG GARMENT JSC - PROSPECT
32
INVESTMENT CATALYSTS
Good recovery of apparel exporting to the US – the largest exporting market
of apparel industry of Vietnam
Apparel exporting to the US accounts for more than 40% of net apparel exporting
value of Vietnam in general and more than 60% of MSH in particular. In the same
time, high stress of US – China trade broadens the door to MSH to augment export
to the US.
Nghia Phong factory is expected to get 50% capacity in last 2021, 100% in
middle of 2022, helping improving total capacity by 10%-20%
The operation of Nghia Phong factory with 02 mills and 2000 skilled employers
working for high – requirement orders. Large partners book more orders and TNG
now only releases new orders from next October.
Receivables policy changes shorten payables turnover, improving financial
stand
Interest expense reduces quarter by quarter, current and interes expense cover ratio
improves continuously during last 9 consecutive quarters. MSH continues more
FOB orders in composition of revenure due to higher profit margin than CMT’s
margin.
0.0%
2.0%
4.0%
6.0%
8.0%
10.0%
12.0%
-
500
1,000
1,500
2,000
2,500
3,000
3,500
4,000
4,500
5,000
2016 2017 2018 2019 2020 9T.2021
Doanh thu Biên LN ròng
Source: FS of MSH, VCBS summary
Unit: bn VND, %
Bùi Đức Thịnh
24%
FPTS 13%
Bùi Việt Quang
11%Phạm Thị Sông
Ngân 07%
Vũ Mạnh
Tường 02%
Others 42,34%
Shareholder structure
Revenue Net income margin
33
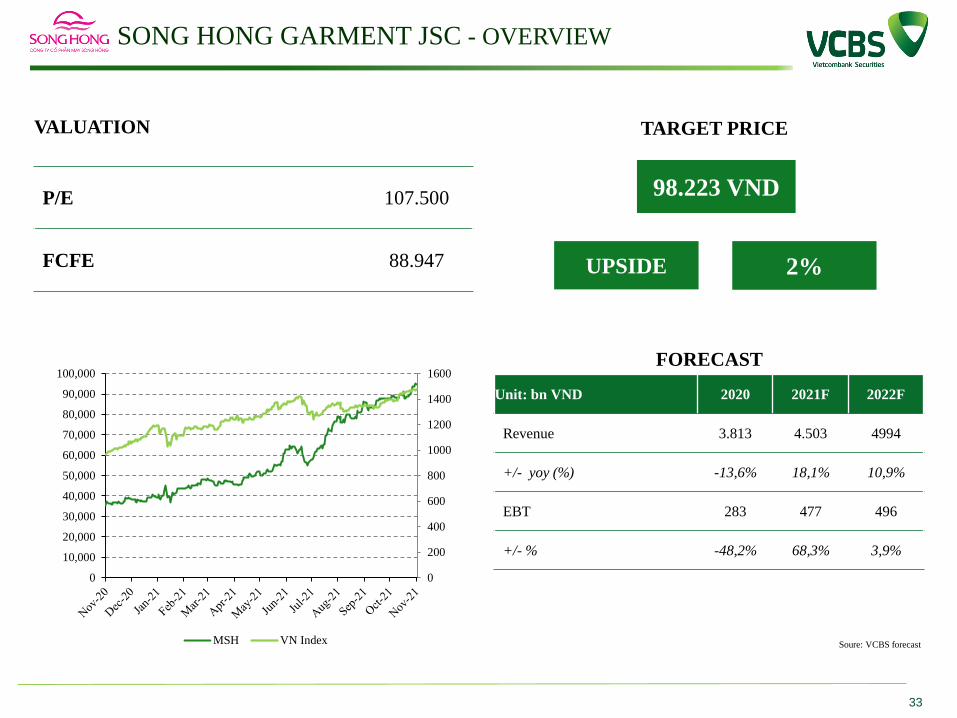
P/E 107.500
FCFE 88.947
FORECAST
VALUATION
98.223 VND
TARGET PRICE
2%UPSIDE
Unit: bn VND 2020 2021F 2022F
Revenue 3.813 4.503 4994
+/- yoy (%) -13,6% 18,1% 10,9%
EBT 283 477 496
+/- % -48,2% 68,3% 3,9%
SONG HONG GARMENT JSC - OVERVIEW
Soure: VCBS forecast
0
200
400
600
800
1000
1200
1400
1600
0
10,000
20,000
30,000
40,000
50,000
60,000
70,000
80,000
90,000
100,000
MSH VN Index
THANH CONG TEXTILE GARMENT INVESTMENT TRADING JSC
Source: FS of TCM, VCBS summary
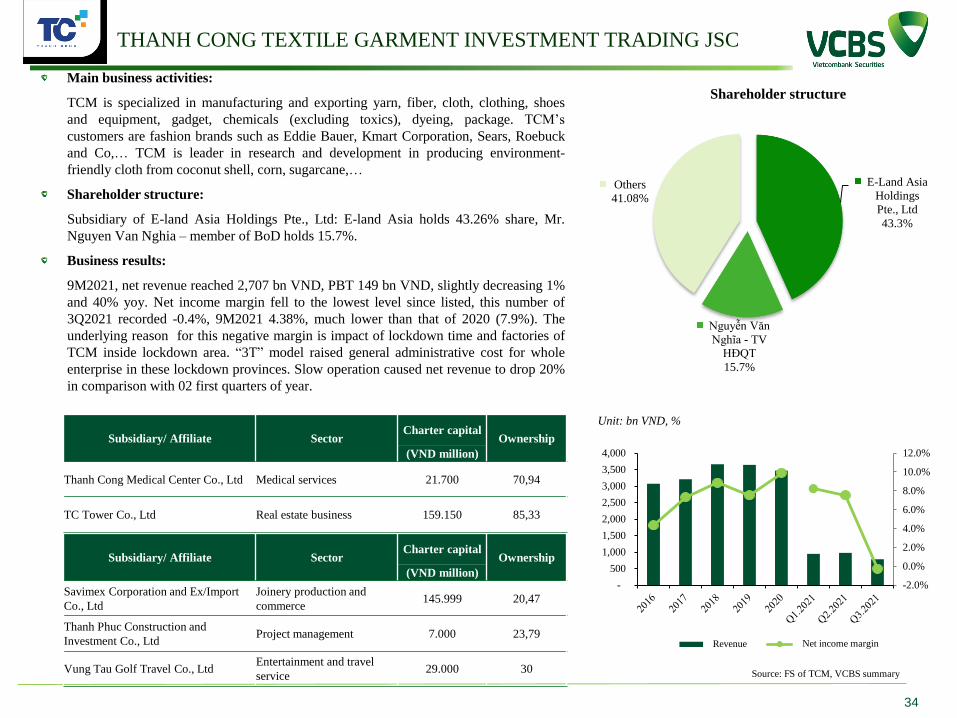
Main business activities:
TCM is specialized in manufacturing and exporting yarn, fiber, cloth, clothing, shoes
and equipment, gadget, chemicals (excluding toxics), dyeing, package. TCM’s
customers are fashion brands such as Eddie Bauer, Kmart Corporation, Sears, Roebuck
and Co,… TCM is leader in research and development in producing environment-
friendly cloth from coconut shell, corn, sugarcane,…
Shareholder structure:
Subsidiary of E-land Asia Holdings Pte., Ltd: E-land Asia holds 43.26% share, Mr.
Nguyen Van Nghia – member of BoD holds 15.7%.
Business results:
9M2021, net revenue reached 2,707 bn VND, PBT 149 bn VND, slightly decreasing 1%
and 40% yoy. Net income margin fell to the lowest level since listed, this number of
3Q2021 recorded -0.4%, 9M2021 4.38%, much lower than that of 2020 (7.9%). The
underlying reason for this negative margin is impact of lockdown time and factories of
TCM inside lockdown area. “3T” model raised general administrative cost for whole
enterprise in these lockdown provinces. Slow operation caused net revenue to drop 20%
in comparison with 02 first quarters of year.
Subsidiary/ Affiliate SectorCharter capital
Ownership
(VND million)
Thanh Cong Medical Center Co., Ltd Medical services 21.700 70,94
TC Tower Co., Ltd Real estate business 159.150 85,33
34
Unit: bn VND, %
-2.0%
0.0%
2.0%
4.0%
6.0%
8.0%
10.0%
12.0%
-
500
1,000
1,500
2,000
2,500
3,000
3,500
4,000
Doanh thu Biên LN ròng
Subsidiary/ Affiliate SectorCharter capital
Ownership
(VND million)
Savimex Corporation and Ex/Import
Co., Ltd
Joinery production and
commerce145.999 20,47
Thanh Phuc Construction and
Investment Co., LtdProject management 7.000 23,79
Vung Tau Golf Travel Co., LtdEntertainment and travel
service29.000 30
E-Land Asia
Holdings
Pte., Ltd
43.3%
Nguyễn Văn
Nghĩa - TV
HĐQT
15.7%
Others
41.08%
Shareholder structure
Revenue Net income margin
THANH CONG TEXTILE GARMENT INVESTMENT TRADING JSC
Source: FS of TCM, VCBS summary
35
INVESTMENT CATALYSTS
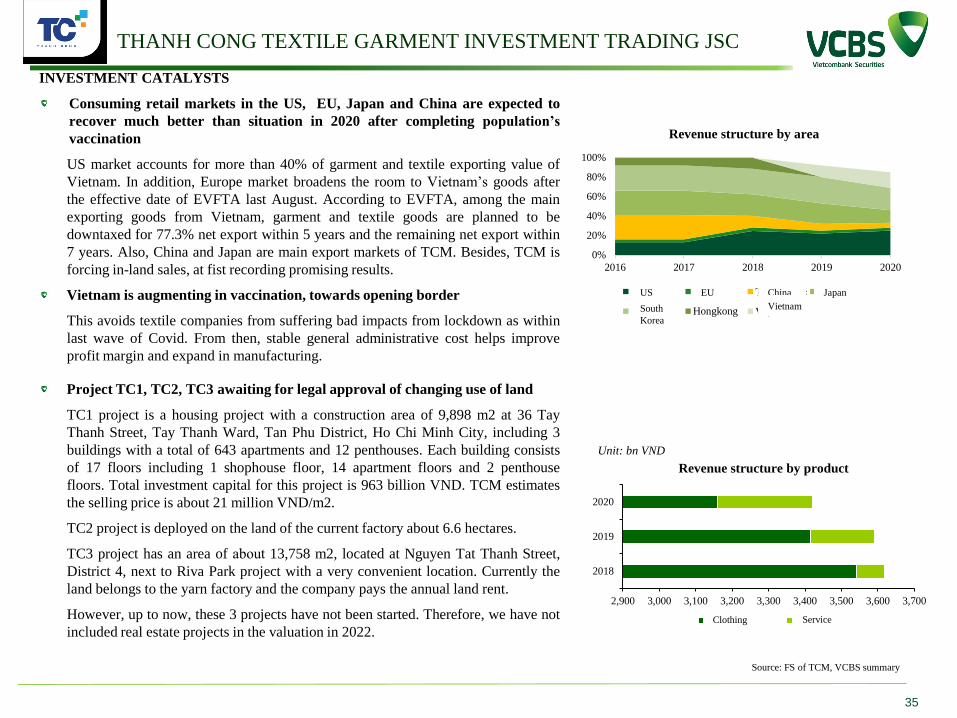
Consuming retail markets in the US, EU, Japan and China are expected to
recover much better than situation in 2020 after completing population’s
vaccination
US market accounts for more than 40% of garment and textile exporting value of
Vietnam. In addition, Europe market broadens the room to Vietnam’s goods after
the effective date of EVFTA last August. According to EVFTA, among the main
exporting goods from Vietnam, garment and textile goods are planned to be
downtaxed for 77.3% net export within 5 years and the remaining net export within
7 years. Also, China and Japan are main export markets of TCM. Besides, TCM is
forcing in-land sales, at fist recording promising results.
Vietnam is augmenting in vaccination, towards opening border
This avoids textile companies from suffering bad impacts from lockdown as within
last wave of Covid. From then, stable general administrative cost helps improve
profit margin and expand in manufacturing.
Project TC1, TC2, TC3 awaiting for legal approval of changing use of land
TC1 project is a housing project with a construction area of 9,898 m2 at 36 Tay
Thanh Street, Tay Thanh Ward, Tan Phu District, Ho Chi Minh City, including 3
buildings with a total of 643 apartments and 12 penthouses. Each building consists
of 17 floors including 1 shophouse floor, 14 apartment floors and 2 penthouse
floors. Total investment capital for this project is 963 billion VND. TCM estimates
the selling price is about 21 million VND/m2.
TC2 project is deployed on the land of the current factory about 6.6 hectares.
TC3 project has an area of about 13,758 m2, located at Nguyen Tat Thanh Street,
District 4, next to Riva Park project with a very convenient location. Currently the
land belongs to the yarn factory and the company pays the annual land rent.
However, up to now, these 3 projects have not been started. Therefore, we have not
included real estate projects in the valuation in 2022.
Unit: bn VND
0%
20%
40%
60%
80%
100%
2016 2017 2018 2019 2020
Revenue structure by area
Mỹ Châu Âu Trung Quốc Nhật Bản
Hàn Quốc Hongkong Việt Nam
2,900 3,000 3,100 3,200 3,300 3,400 3,500 3,600 3,700
2018
2019
2020
Revenue structure by product
Vải và may mặc Gia côngClothing Service
US
South
Korea
EU China Japan
Vietnam
36
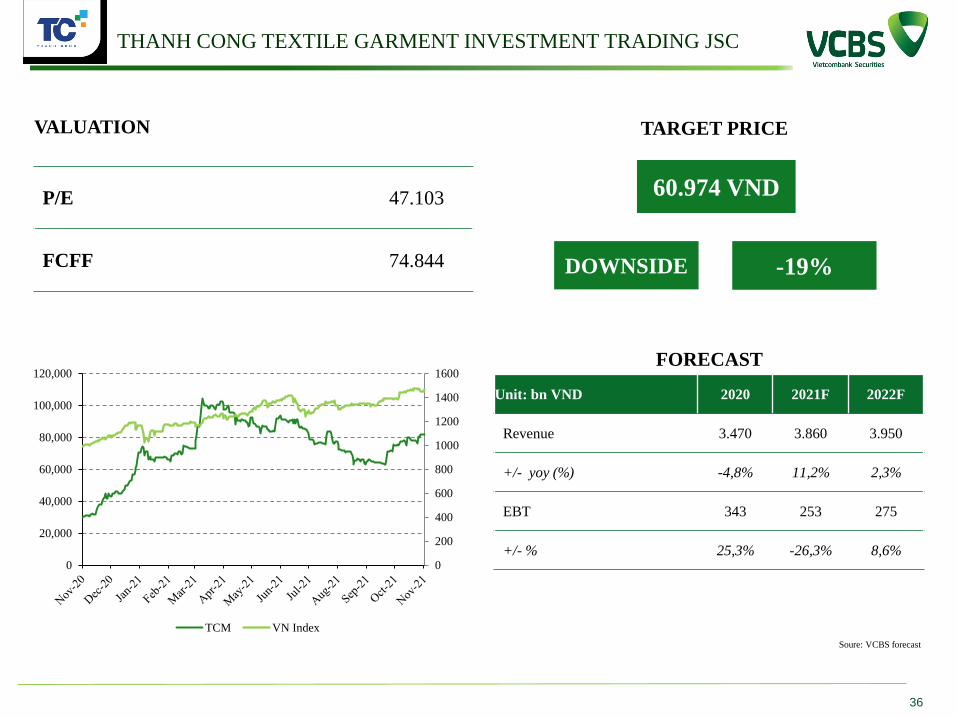
P/E 47.103
FCFF 74.844
FORECAST
VALUATION
60.974 VND
TARGET PRICE
-19%DOWNSIDE
Unit: bn VND 2020 2021F 2022F
Revenue 3.470 3.860 3.950
+/- yoy (%) -4,8% 11,2% 2,3%
EBT 343 253 275
+/- % 25,3% -26,3% 8,6%
Soure: VCBS forecast
0
200
400
600
800
1000
1200
1400
1600
0
20,000
40,000
60,000
80,000
100,000
120,000
TCM VN Index
THANH CONG TEXTILE GARMENT INVESTMENT TRADING JSC
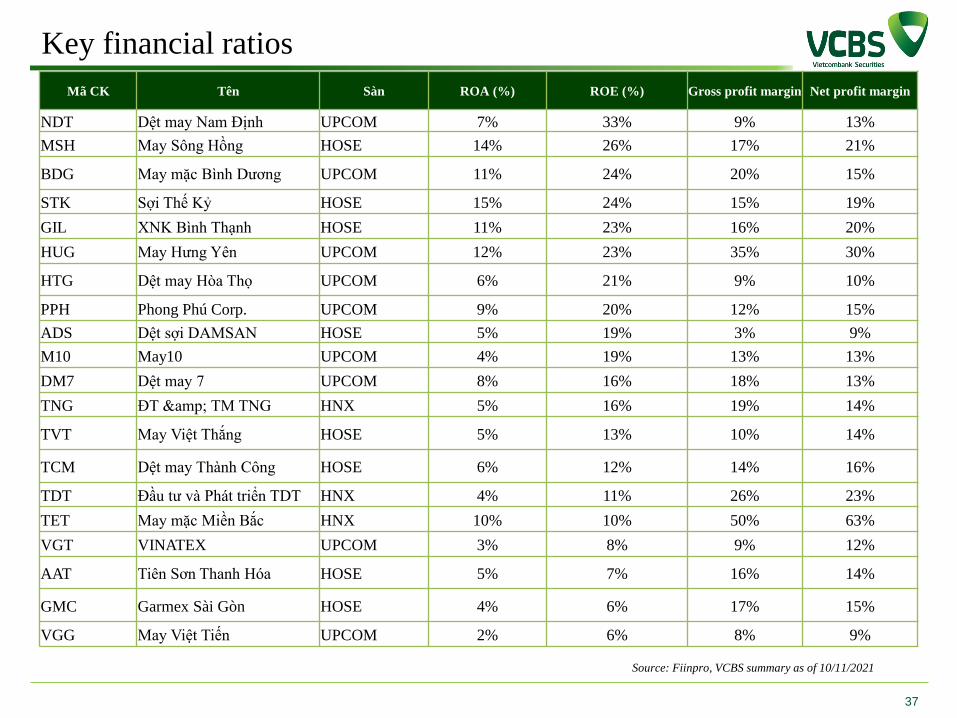
Key financial ratios
37
Source: Fiinpro, VCBS summary as of 10/11/2021
Mã CK Tên Sàn ROA (%) ROE (%) Gross profit margin Net profit margin
NDT Dệt may Nam Định UPCOM 7% 33% 9% 13%
MSH May Sông Hồng HOSE 14% 26% 17% 21%
BDG May mặc Bình Dương UPCOM 11% 24% 20% 15%
STK Sợi Thế Kỷ HOSE 15% 24% 15% 19%
GIL XNK Bình Thạnh HOSE 11% 23% 16% 20%
HUG May Hưng Yên UPCOM 12% 23% 35% 30%
HTG Dệt may Hòa Thọ UPCOM 6% 21% 9% 10%
PPH Phong Phú Corp. UPCOM 9% 20% 12% 15%
ADS Dệt sợi DAMSAN HOSE 5% 19% 3% 9%
M10 May10 UPCOM 4% 19% 13% 13%
DM7 Dệt may 7 UPCOM 8% 16% 18% 13%
TNG ĐT & TM TNG HNX 5% 16% 19% 14%
TVT May Việt Thắng HOSE 5% 13% 10% 14%
TCM Dệt may Thành Công HOSE 6% 12% 14% 16%
TDT Đầu tư và Phát triển TDT HNX 4% 11% 26% 23%
TET May mặc Miền Bắc HNX 10% 10% 50% 63%
VGT VINATEX UPCOM 3% 8% 9% 12%
AAT Tiên Sơn Thanh Hóa HOSE 5% 7% 16% 14%
GMC Garmex Sài Gòn HOSE 4% 6% 17% 15%
VGG May Việt Tiến UPCOM 2% 6% 8% 9%
38
This report is designed to provide updated information on macroeconomics, fixed-income, including bonds, interest rates, industries,
equity outlook and some other related. The VCBS analysts exert their best efforts to obtain the most accurate and timely information
available from various sources, including information pertaining to market prices, yields and rates. All information stated in the report
has been collected and assessed as carefully as possible.
It must be stressed that all opinions, judgments, estimations and projections in this report represent independent views of the analyst at
the date of publication. Therefore, this report should be best considered a reference and indicative only. It is not an offer or advice to
buy or sell or any actions related to any assets. VCBS and/or Departments of VCBS as well as any affiliate of VCBS or affiliate that
VCBS belongs to or is related to (thereafter, VCBS), provide no warranty or undertaking of any kind in respect to the information and
materials found on, or linked to the report and no obligation to update the information after the report was released. VCBS does not
bear any responsibility for the accuracy of the material posted or the information contained therein, or for any consequences arising
from its use, and does not invite or accept reliance being placed on any materials or information so provided.
This report may not be copied, reproduced, published or redistributed for any purpose without the written permission of an authorized
representative of VCBS. Please cite sources when quoting. Copyright 2012 Vietcombank Securities Company. All rights reserved.
CONTACTS
DISCLAIMER
Trần Minh Hoàng Lê Đức Quang, CFA Phùng Thị Quỳnh Liên
Head of Research
Teamlead, Equity Analysis
[email protected] Analyst