Embed Size (px)
Citation preview
International Journal of Geology, Earth and Environmental Sciences ISSN: 2277-2081 (Online) An Online International Journal Available at http://www.cibtech.org/jgee.htm 2012 Vol. 2 (2) May-August, pp.87-101/Onagh et al. Research Article
87
APPLICATION OF MULTIPLE LINEAR REGRESSION MODEL IN LANDSLIDE SUSCEPTIBILITY ZONATION MAPPING
THE CASE STUDY NARMAB BASIN IRAN *Mohammad Onagh, V.K. Kumra and Praveen Kumar Rai
Department of Geography Banaras Hindu University, Varanasi, India
ABSTRACT Landslide is a form of slope process which points to the transmission and downward movement of materials, such as soil and rock mass. Every year landslide takes a heavy death-toll and damage to property. It also becomes difficult to provide instant relief measure. For the present study, Narmab basin has been selected which is situated in the southern part of Minūdasht Township in Golestan province of Iran. The most affected villages are Nishak, Saran and Takht. The populations living in these villages suffer badly from the onslaught of landslide. Therefore, landslide susceptibility mapping is one of the important issues for urban and rural planning in Iran. In this study, layers are evaluated with the help of stability studies used to produce landslide susceptibility map by Multiple Linear Regression method. The parameters of slope, aspect, lithology, land cover, rainfall and distance from fault, distance from river, and distance from road were used as variables in the Multiple Linear Regression analysis. Ilwis 3.3 Academic, Arc GIS 9.3, Global Mapper 13.0 and Excel softwares have been used for zonation, and statistical analyses respectively. Finally, an overlay analysis is carried out by evaluating the layers obtained according to their accepted coefficient in final model. The result was validated using the Area under Curve (AUC) method and temporal data of landslide occurrences. The validation results showed satisfactory agreement between the susceptibility map and the existing data on landslide locations. As a result, the success rate of the model (79.7%) shows high prediction accuracy. The study area has been classified into five classes of relative landslide susceptibility, namely, Very Low, Low, Moderate, High, and Very High. Key Words: Iran, basin, Landslide Susceptibility Zonation, Multiple Linear Regression method, AUC INTRODUCTION Landslides are amongst the most damaging natural hazards in the mountainous terrain such as the Alborz. The study of landslides has drawn worldwide attention mainly due to increasing awareness of the socio-economic impacts of landslides (Aleotti and Chowdhury, 1999). For many natural and anthropogenic reasons, northern slopes of Alborz Mountain in Iran are at the risk of a number of small and large-scale landslides which take their heavy tolls in this area. For instance in Alborz mountain Iran, Manjil landslide in 1990, Abask landslide in 1993, Kiasar landslide in 1999, Karaj-Chalous road's landslide in 2007, Hezarcham landslide in 2007 are major landslides Nishak, Saran and Takht villages which are situated in Narmab basin, are destroyed completely or they face to the risk of landslide. Therefore, taking into account occurrence of landslides, and in order to mitigate the ensuing losses and consequences, landslide susceptibility is duly warranted; also landslide susceptibility mapping is one of the important issues for urban and rural planning in Iran. Landslide susceptibility Zonation (LSZ) relies on a rather complex knowledge of slope movements and their controlling parameters. The reliability of landslide susceptibility maps depends mostly on the amount and quality of available data, the working scale and the selection of the appropriate methodology of analysis and modeling. The process of creating these maps involves several qualitative or quantitative approaches (Soeters and van Westen, 1996, Aleotti and Chowdhury, 1999; Guzzetti et al., 1999). Qualitative methods depend on expert opinions. The most common types of qualitative method simply use landslide inventories to identify sites of similar geological and geomorphologic properties that are
International Journal of Geology, Earth and Environmental Sciences ISSN: 2277-2081 (Online) An Online International Journal Available at http://www.cibtech.org/jgee.htm 2012 Vol. 2 (2) May-August, pp.87-101/Onagh et al. Research Article
88
susceptible to failure. Some qualitative approaches, however, incorporate the idea of ranking and weighting, and may evolve to be semi-quantitative in nature. Examples are the use of the Analytic Hierarchy Process (AHP) of Saaty (1980) by Barredol et al., (2000) and Weighted Linear Combination (WLC) by Ayalew et al., (2004). AHP involves building a hierarchy of decision elements and then making comparisons between possible pairs in a matrix to give a weight for each element and also a consistency ratio. It is based on three principles: decomposition, comparative judgment and synthesis of priorities (Malczewski, 1999). WLC is a concept to combine maps of landslide-controlling parameters by applying a standardized score (primary-level weight) to each class of a certain parameter and a parameter weight (secondary-level weight) to the parameters themselves. Being partly subjective, results of these approaches vary depending upon the knowledge of experts. Hence, qualitative or semi-quantitative methods are often useful for regional studies (Soeters and van Westen, 1996; Guzzetti et al., 1999). Quantitative methods are particularly based on numerical expressions of the relationship between controlling parameters and landslides. There are two types of quantitative methods: deterministic and statistical (Aleotti and Chowdhury, 1999). Deterministic quantitative method depends on engineering principles of slope instability expressed in terms of parameter of safety. On account of the need for exhaustive data from individual slopes, these methods are often effective for mapping only smaller areas. Landslide susceptibility mapping using either multivariate or bivariate statistical approaches analyses the historical link between landslide-controlling parameters and the distribution of landslides sites (Guzzetti et al., 1999). Bivariate statistical analyses (BSA) involves compared of a landslide inventory map with maps of landslide influencing parameters in order to rank the corresponding classes according to their role in landslide formation. Ranking is normally carried out using landslide densities. A variety of multivariate statistical approaches (MSA) exist, but those commonly used to map landslide susceptibility include discriminant analyses and logistic regression. Stepwise discriminant analysis has been used by Carrara et al., (1991 and 2003) to classify stable and unstable slope-units in Italy. The method was also reported to be significant to define landslide susceptibility classes in the Spanish Eastern Pyrenees (Baeza and Corominas, 2001). Logistic regression has been applied for susceptibility mapping by a number of researchers including: (Guzzetti et al., 1999), Eshlaghi Frahani (2001), Die and Lee (2002), Ayalew and Yamagishi (2005), Chen and Wang (2007). Various methods have been introduced to LSZ, each of which has considered a number of factors. For instance, Pachauri et al., (1998) used geotechnical parameters, distance from the nearest major lineament, slope gradient, relative relief, lithology, vegetation, road density, and distance from the nearest ridge top and relative altitude for zonation of landslide. Later Lee (2001) considered factors like slope gradient, slope aspect, soil thickness, proximity to flood-way, land use, and vegetation cover for delineating landslide susceptibility zonation. In a very interesting study Ayalew et al., (2005) used factors like lithology, bed rock-slope relationship, lineaments, slope gradient, aspect, elevation and road network for landslide zonation. In a similar exercise Saha et al., (2005) applied factors like slope, aspect, relative relief, lithology, buffer zones along thrusts, faults and lineaments, the drainage density and land cover. Further, Rezaei Moghaddam et al (2007) considered parameters like lithology, elevation, slope gradient, lineaments and the distance from streams, vegetation, and land use for landslide zonation of Merek area of Iran. In this study, factors such as slope gradient, slope aspect, geology, land-use, precipitation, proximity to fault, proximity to river, proximity to road and altitude have been used for modeling and zonation. The scope of the study is to examine the long-term parameters and to define their relations to landslide occurrence in the studied area. The main goal of this study is assessment and appraisal of the Multiple Linear Regression method in landslide susceptibility zonation and validation of landslide susceptibility map with inventory map of study area. Study area The study area occupies about 218.53 Km2 in the East of Northern Alborz located in South Eastern part of Golestan province (Figure 1). The terrain is highly rugged with elevations ranging from about 150 to 2060 m above the mean sea level.
International Journal of Geology, Earth and Environmental Sciences ISSN: 2277-2081 (Online) An Online International Journal Available at http://www.cibtech.org/jgee.htm 2012 Vol. 2 (2) May-August, pp.87-101/Onagh et al. Research Article
89
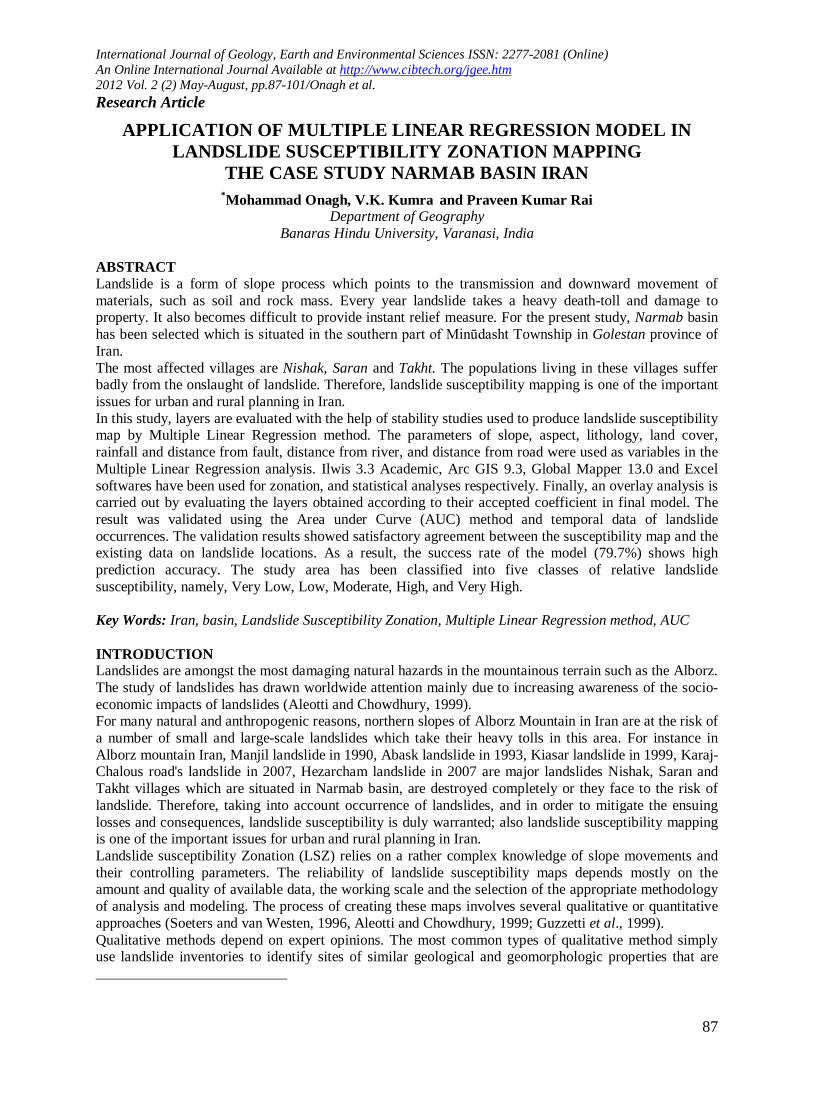
Figure 1: Location of the study area in Iran
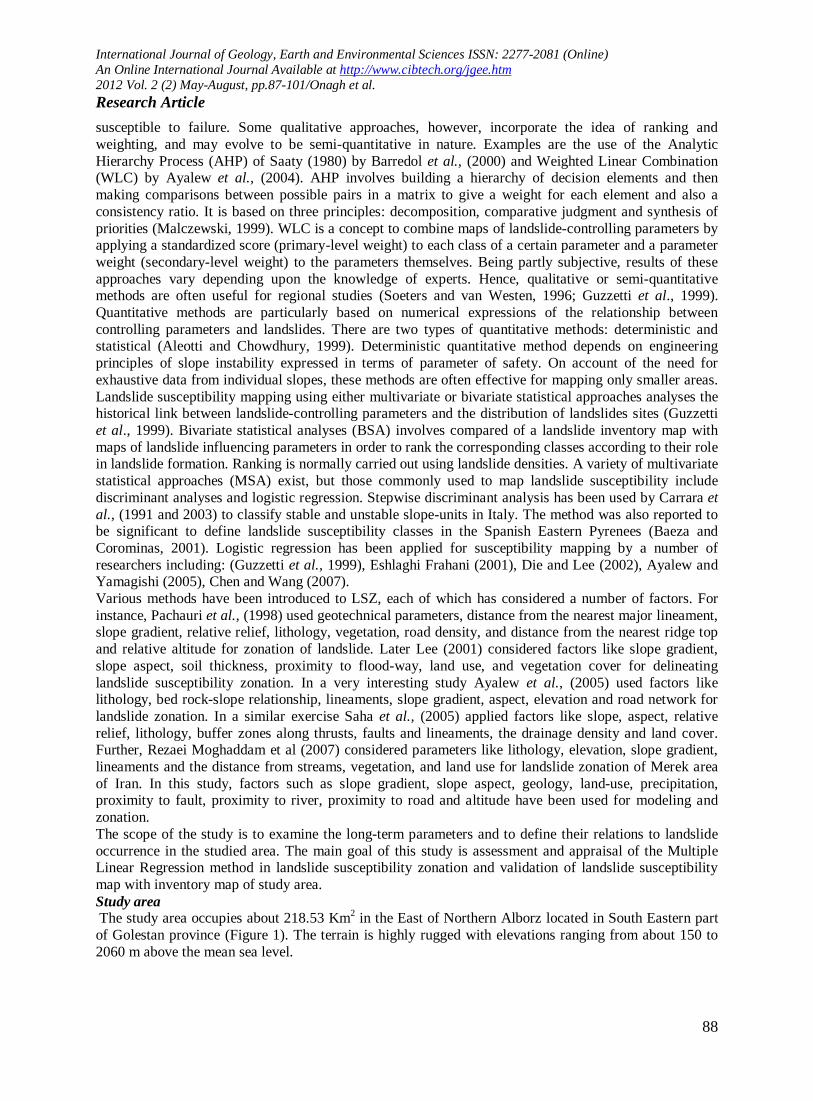
The Narmab River flows through the southern part of the study area and its tributaries constitute the drainage network in the area. Structurally, the region is complex due to presence of various thrusts, faults and intense deformations. The area has experienced numerous landslides of different dimensions causing damage to human life and property. MATERIALS AND METHODS Successful prediction of landslide occurrences and the preparation of a map showing landslide-prone areas call for collection of the relevant spatial data (Saha et al., 2005). A number of thematic maps (referred to as data layers in GIS) based on specific parameters or parameters which are related to the occurrence of landslides, viz. slope, aspect, lithology, distance to fault, distance to road, Distance from River, rainfall, and land cover have been generated (Figure 2). In this study, Ilwis v. 3.3 and Arc GIS 9.3 GIS and Global Mapper 13.0 GIS software’s were used to produce the layer maps that assist in production of landslide susceptibility maps. Google earth imagery and National Geographic Organization topographic maps on a scale of 1:50,000 of the study area were used to digitize landslide, land cover types, boundaries and other features such as buildings, roads, etc. The coordinates of important point for geo reference point like road conjunction points and landslide prone area were measured during the field surveys using Global Positioning Systems (GPS) technology.
International Journal of Geology, Earth and Environmental Sciences ISSN: 2277-2081 (Online) An Online International Journal Available at http://www.cibtech.org/jgee.htm 2012 Vol. 2 (2) May-August, pp.87-101/Onagh et al. Research Article
90
Figure 2: Pasposhteh1 Landslide (Source: Google)
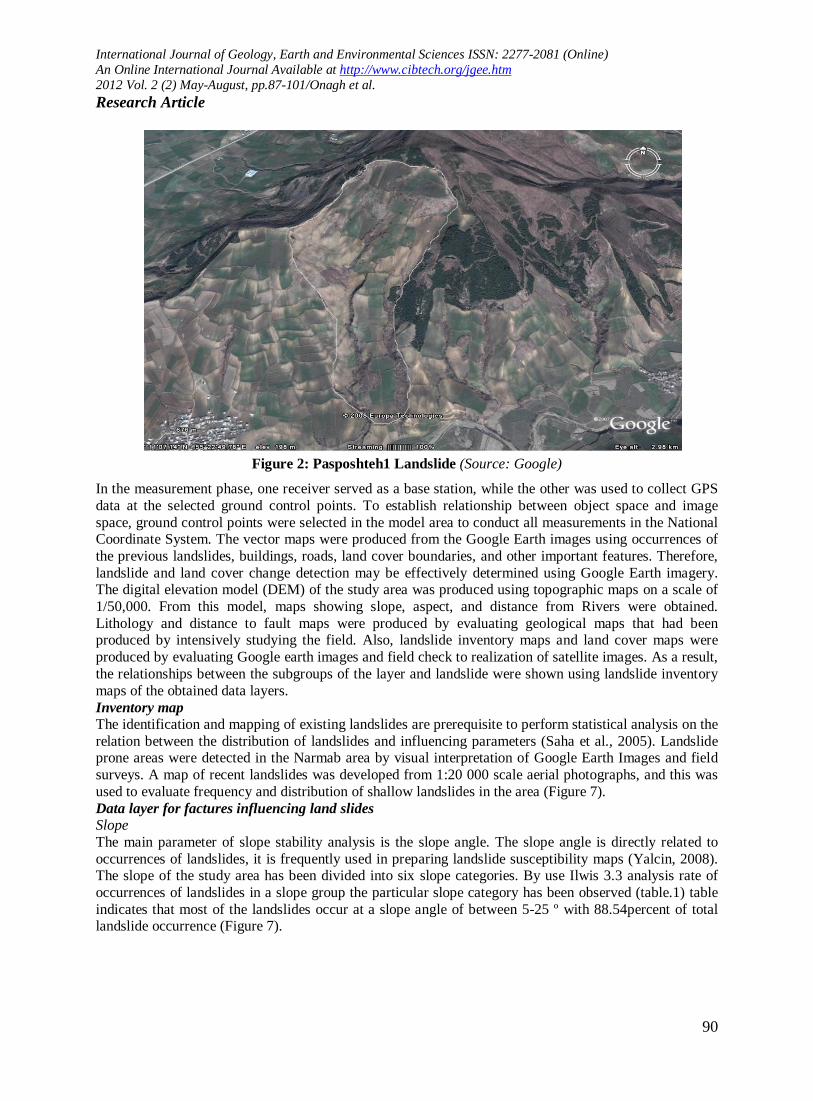
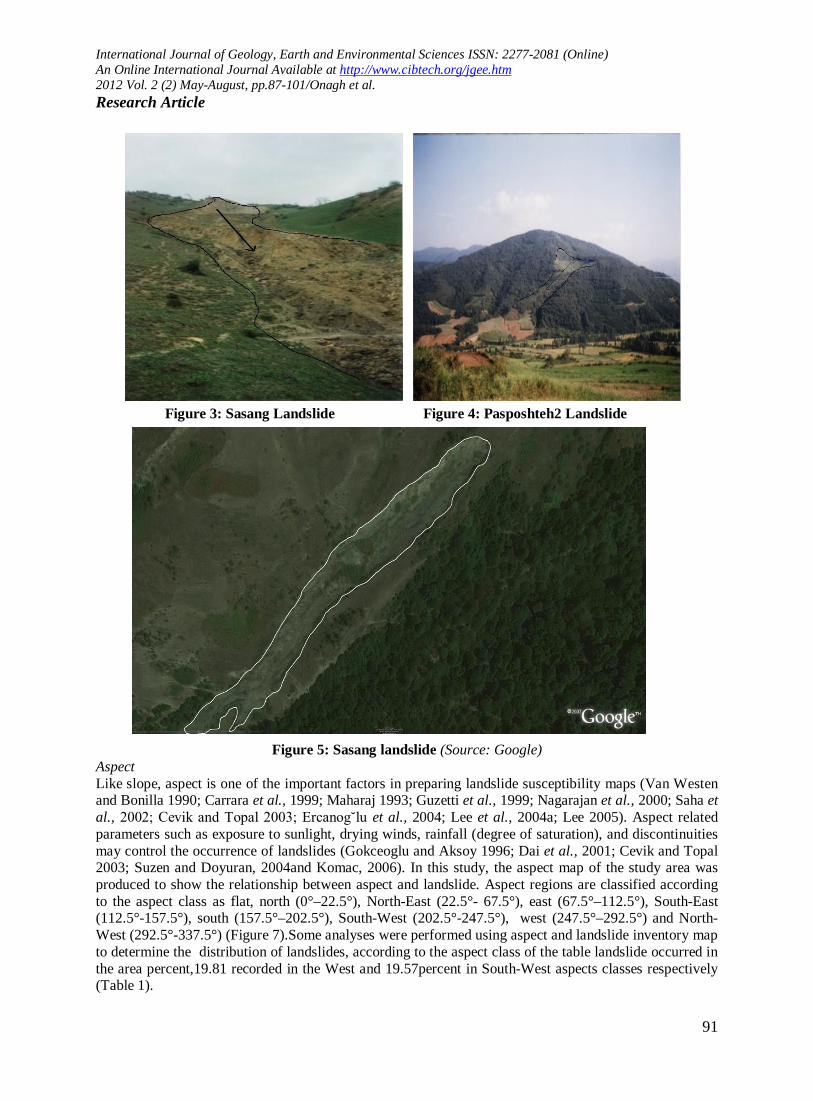
In the measurement phase, one receiver served as a base station, while the other was used to collect GPS data at the selected ground control points. To establish relationship between object space and image space, ground control points were selected in the model area to conduct all measurements in the National Coordinate System. The vector maps were produced from the Google Earth images using occurrences of the previous landslides, buildings, roads, land cover boundaries, and other important features. Therefore, landslide and land cover change detection may be effectively determined using Google Earth imagery. The digital elevation model (DEM) of the study area was produced using topographic maps on a scale of 1/50,000. From this model, maps showing slope, aspect, and distance from Rivers were obtained. Lithology and distance to fault maps were produced by evaluating geological maps that had been produced by intensively studying the field. Also, landslide inventory maps and land cover maps were produced by evaluating Google earth images and field check to realization of satellite images. As a result, the relationships between the subgroups of the layer and landslide were shown using landslide inventory maps of the obtained data layers. Inventory map The identification and mapping of existing landslides are prerequisite to perform statistical analysis on the relation between the distribution of landslides and influencing parameters (Saha et al., 2005). Landslide prone areas were detected in the Narmab area by visual interpretation of Google Earth Images and field surveys. A map of recent landslides was developed from 1:20 000 scale aerial photographs, and this was used to evaluate frequency and distribution of shallow landslides in the area (Figure 7). Data layer for factures influencing land slides Slope The main parameter of slope stability analysis is the slope angle. The slope angle is directly related to occurrences of landslides, it is frequently used in preparing landslide susceptibility maps (Yalcin, 2008). The slope of the study area has been divided into six slope categories. By use Ilwis 3.3 analysis rate of occurrences of landslides in a slope group the particular slope category has been observed (table.1) table indicates that most of the landslides occur at a slope angle of between 5-25 º with 88.54percent of total landslide occurrence (Figure 7).
International Journal of Geology, Earth and Environmental Sciences ISSN: 2277-2081 (Online) An Online International Journal Available at http://www.cibtech.org/jgee.htm 2012 Vol. 2 (2) May-August, pp.87-101/Onagh et al. Research Article
91
Figure 3: Sasang Landslide Figure 4: Pasposhteh2 Landslide
Figure 5: Sasang landslide (Source: Google) Aspect Like slope, aspect is one of the important factors in preparing landslide susceptibility maps (Van Westen and Bonilla 1990; Carrara et al., 1999; Maharaj 1993; Guzetti et al., 1999; Nagarajan et al., 2000; Saha et al., 2002; Cevik and Topal 2003; Ercanog˘lu et al., 2004; Lee et al., 2004a; Lee 2005). Aspect related parameters such as exposure to sunlight, drying winds, rainfall (degree of saturation), and discontinuities may control the occurrence of landslides (Gokceoglu and Aksoy 1996; Dai et al., 2001; Cevik and Topal 2003; Suzen and Doyuran, 2004and Komac, 2006). In this study, the aspect map of the study area was produced to show the relationship between aspect and landslide. Aspect regions are classified according to the aspect class as flat, north (0°–22.5°), North-East (22.5°- 67.5°), east (67.5°–112.5°), South-East (112.5°-157.5°), south (157.5°–202.5°), South-West (202.5°-247.5°), west (247.5°–292.5°) and North-West (292.5°-337.5°) (Figure 7).Some analyses were performed using aspect and landslide inventory map to determine the distribution of landslides, according to the aspect class of the table landslide occurred in the area percent,19.81 recorded in the West and 19.57percent in South-West aspects classes respectively (Table 1).
International Journal of Geology, Earth and Environmental Sciences ISSN: 2277-2081 (Online) An Online International Journal Available at http://www.cibtech.org/jgee.htm 2012 Vol. 2 (2) May-August, pp.87-101/Onagh et al. Research Article
92
Rainfall Rainfall is considered to be the most important landslide triggering parameter causing soil saturation and a rise in pore-water pressure. However, there are not many examples of the use of this parameter in stability zonation, probably due to the difficulty in collecting rainfall data for long periods over large areas. After interpolation between amounts of annual rainfall in the study area stations, the isohyets’ map created. Finally this map has been grouped into five classes to prepare the rainfall data layer (Figure 7). It was verified that approximately 34.37 percent of the landslides occurred in 850-900M class (Table 1).
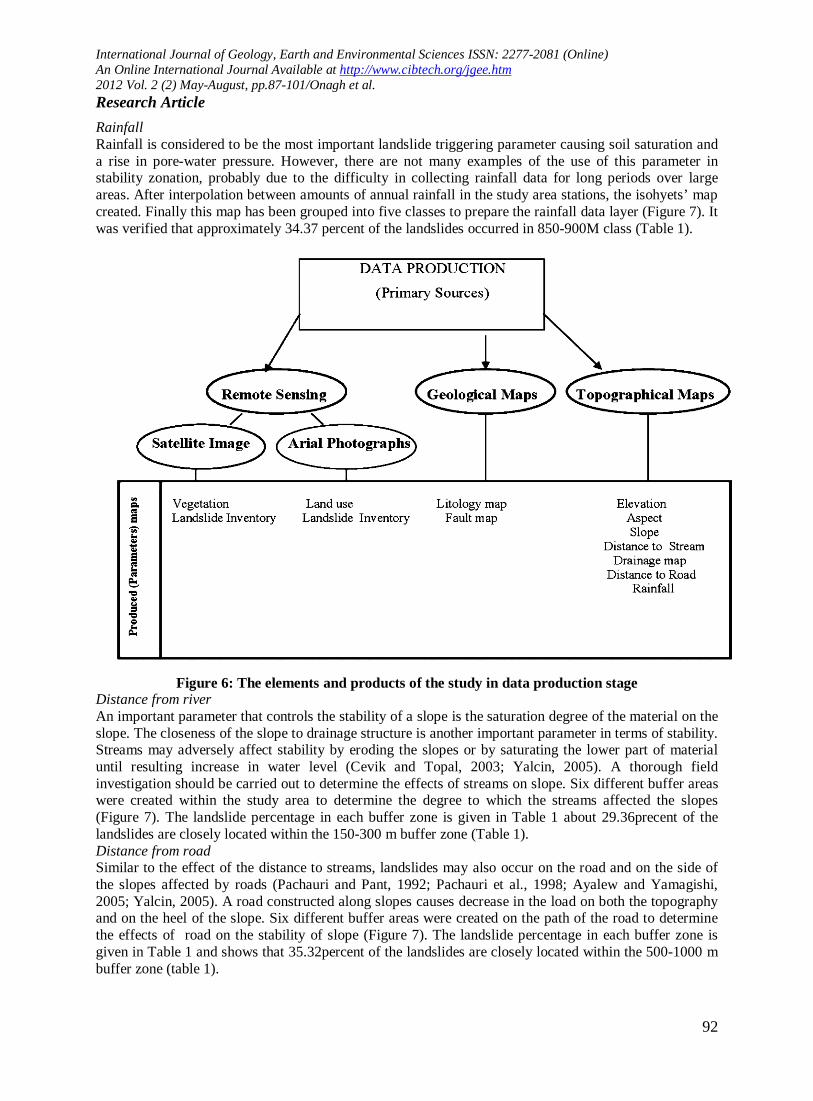
Figure 6: The elements and products of the study in data production stage Distance from river An important parameter that controls the stability of a slope is the saturation degree of the material on the slope. The closeness of the slope to drainage structure is another important parameter in terms of stability. Streams may adversely affect stability by eroding the slopes or by saturating the lower part of material until resulting increase in water level (Cevik and Topal, 2003; Yalcin, 2005). A thorough field investigation should be carried out to determine the effects of streams on slope. Six different buffer areas were created within the study area to determine the degree to which the streams affected the slopes (Figure 7). The landslide percentage in each buffer zone is given in Table 1 about 29.36precent of the landslides are closely located within the 150-300 m buffer zone (Table 1). Distance from road Similar to the effect of the distance to streams, landslides may also occur on the road and on the side of the slopes affected by roads (Pachauri and Pant, 1992; Pachauri et al., 1998; Ayalew and Yamagishi, 2005; Yalcin, 2005). A road constructed along slopes causes decrease in the load on both the topography and on the heel of the slope. Six different buffer areas were created on the path of the road to determine the effects of road on the stability of slope (Figure 7). The landslide percentage in each buffer zone is given in Table 1 and shows that 35.32percent of the landslides are closely located within the 500-1000 m buffer zone (table 1).
International Journal of Geology, Earth and Environmental Sciences ISSN: 2277-2081 (Online) An Online International Journal Available at http://www.cibtech.org/jgee.htm 2012 Vol. 2 (2) May-August, pp.87-101/Onagh et al. Research Article
93
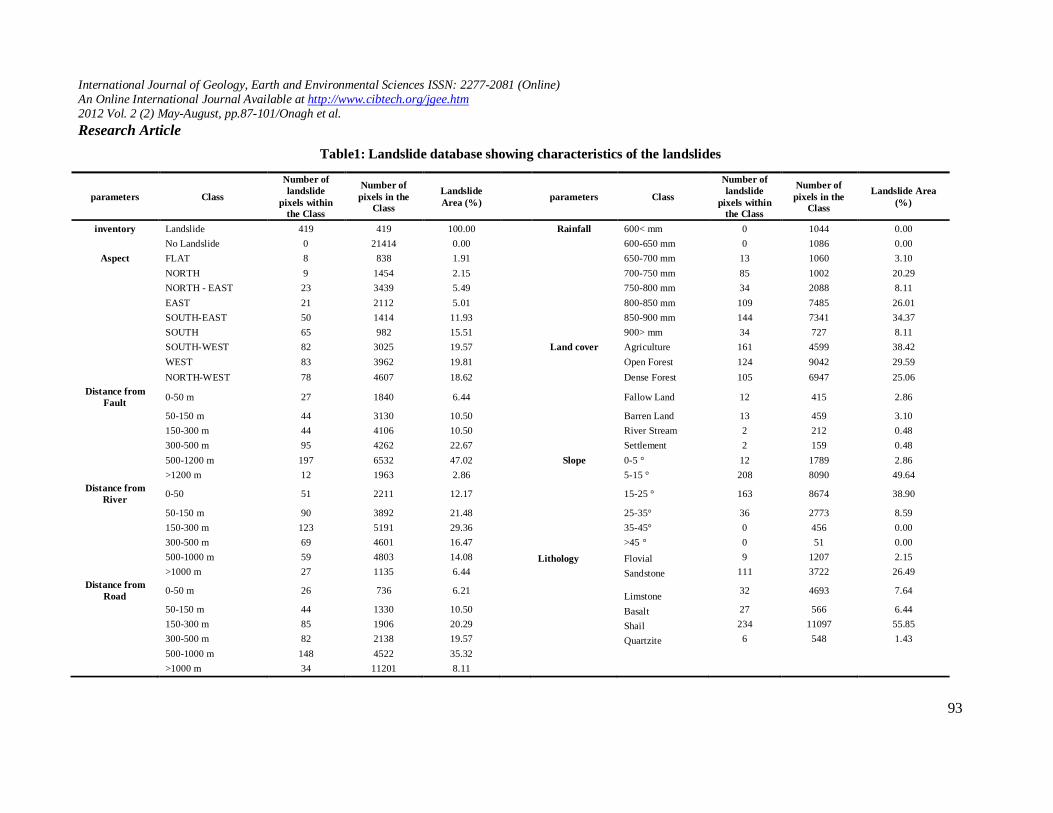
Table1: Landslide database showing characteristics of the landslides
parameters Class
Number of landslide
pixels within the Class
Number of pixels in the
Class
Landslide Area (%) parameters Class
Number of landslide
pixels within the Class
Number of pixels in the
Class
Landslide Area (%)
inventory Landslide 419 419 100.00 Rainfall 600< mm 0 1044 0.00 No Landslide 0 21414 0.00 600-650 mm 0 1086 0.00
Aspect FLAT 8 838 1.91 650-700 mm 13 1060 3.10 NORTH 9 1454 2.15 700-750 mm 85 1002 20.29 NORTH - EAST 23 3439 5.49 750-800 mm 34 2088 8.11 EAST 21 2112 5.01 800-850 mm 109 7485 26.01 SOUTH-EAST 50 1414 11.93 850-900 mm 144 7341 34.37 SOUTH 65 982 15.51 900> mm 34 727 8.11 SOUTH-WEST 82 3025 19.57 Land cover Agriculture 161 4599 38.42 WEST 83 3962 19.81 Open Forest 124 9042 29.59 NORTH-WEST 78 4607 18.62 Dense Forest 105 6947 25.06
Distance from Fault 0-50 m 27 1840 6.44 Fallow Land 12 415 2.86
50-150 m 44 3130 10.50 Barren Land 13 459 3.10 150-300 m 44 4106 10.50 River Stream 2 212 0.48 300-500 m 95 4262 22.67 Settlement 2 159 0.48 500-1200 m 197 6532 47.02 Slope 0-5 ° 12 1789 2.86 >1200 m 12 1963 2.86 5-15 ° 208 8090 49.64
Distance from River 0-50 51 2211 12.17 15-25 ° 163 8674 38.90
50-150 m 90 3892 21.48 25-35° 36 2773 8.59 150-300 m 123 5191 29.36 35-45° 0 456 0.00 300-500 m 69 4601 16.47 >45 ° 0 51 0.00 500-1000 m 59 4803 14.08 Lithology Flovial 9 1207 2.15 >1000 m 27 1135 6.44 Sandstone 111 3722 26.49
Distance from Road 0-50 m 26 736 6.21 Limstone 32 4693 7.64
50-150 m 44 1330 10.50 Basalt 27 566 6.44 150-300 m 85 1906 20.29 Shail 234 11097 55.85 300-500 m 82 2138 19.57 Quartzite 6 548 1.43 500-1000 m 148 4522 35.32 >1000 m 34 11201 8.11
International Journal of Geology, Earth and Environmental Sciences ISSN: 2277-2081 (Online) An Online International Journal Available at http://www.cibtech.org/jgee.htm 2012 Vol. 2 (2) May-August, pp.87-101/Onagh et al. Research Article
94
d c
b a
International Journal of Geology, Earth and Environmental Sciences ISSN: 2277-2081 (Online) An Online International Journal Available at http://www.cibtech.org/jgee.htm 2012 Vol. 2 (2) May-August, pp.87-101/Onagh et al. Research Article
95
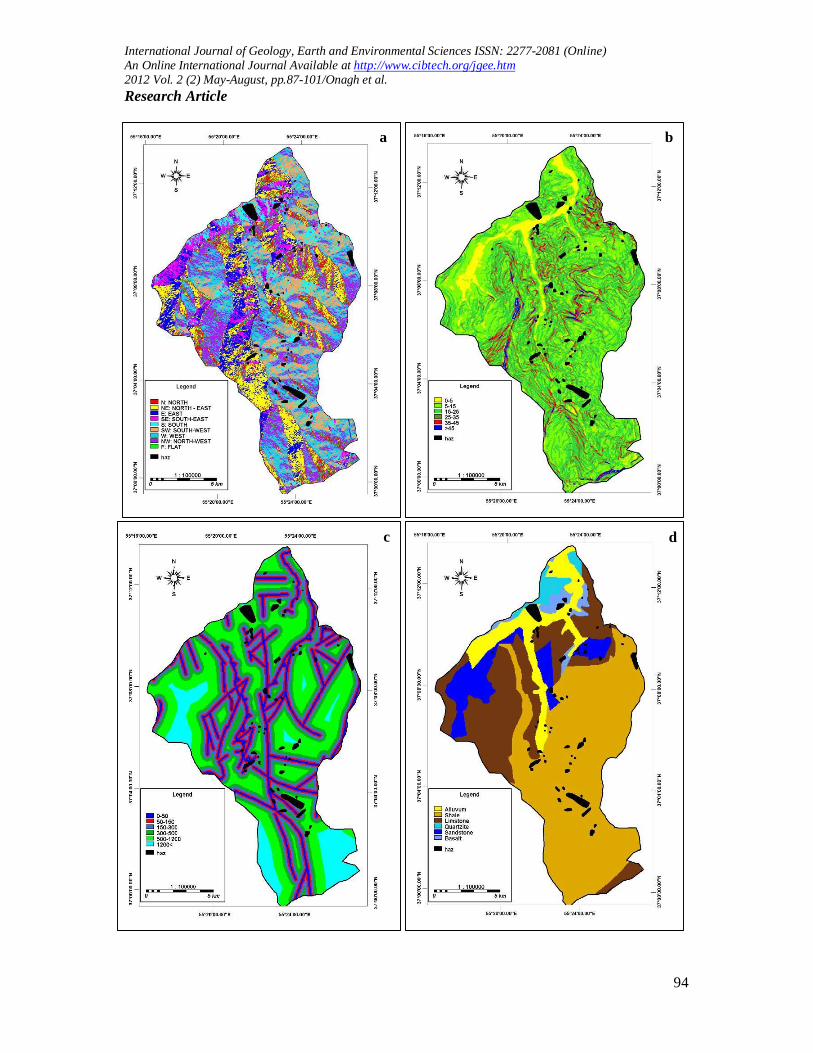
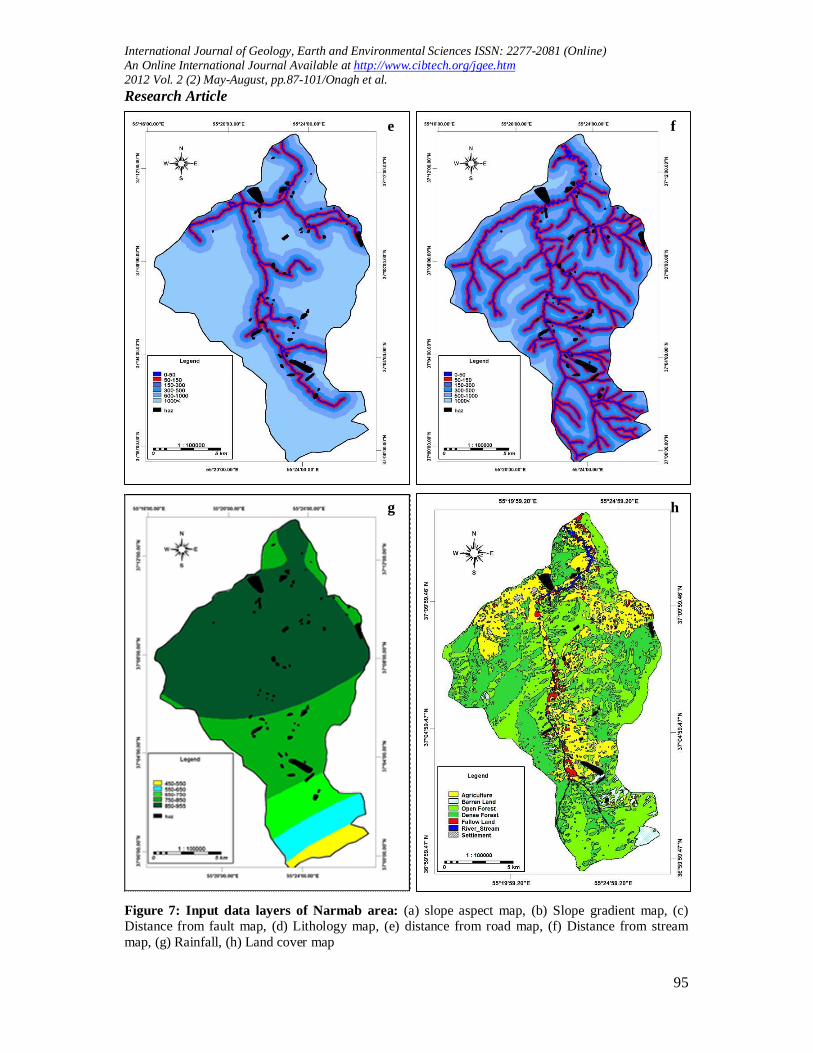
Figure 7: Input data layers of Narmab area: (a) slope aspect map, (b) Slope gradient map, (c) Distance from fault map, (d) Lithology map, (e) distance from road map, (f) Distance from stream map, (g) Rainfall, (h) Land cover map
e f
g h
International Journal of Geology, Earth and Environmental Sciences ISSN: 2277-2081 (Online) An Online International Journal Available at http://www.cibtech.org/jgee.htm 2012 Vol. 2 (2) May-August, pp.87-101/Onagh et al. Research Article
96
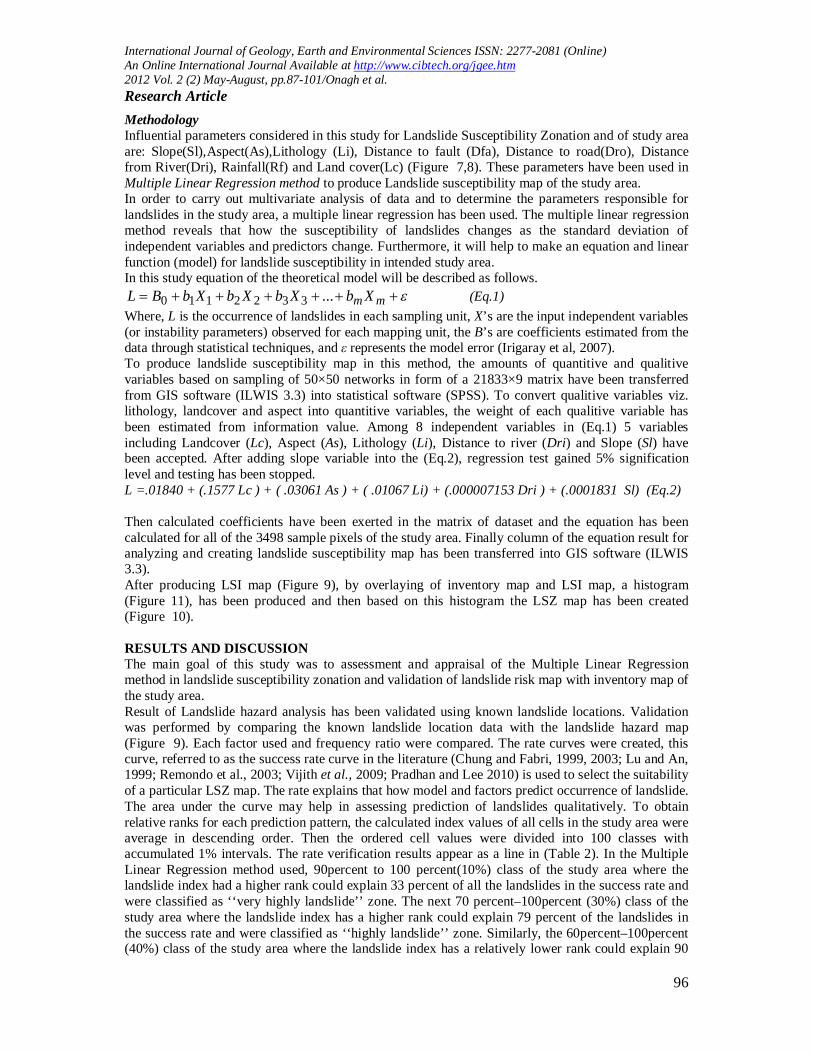
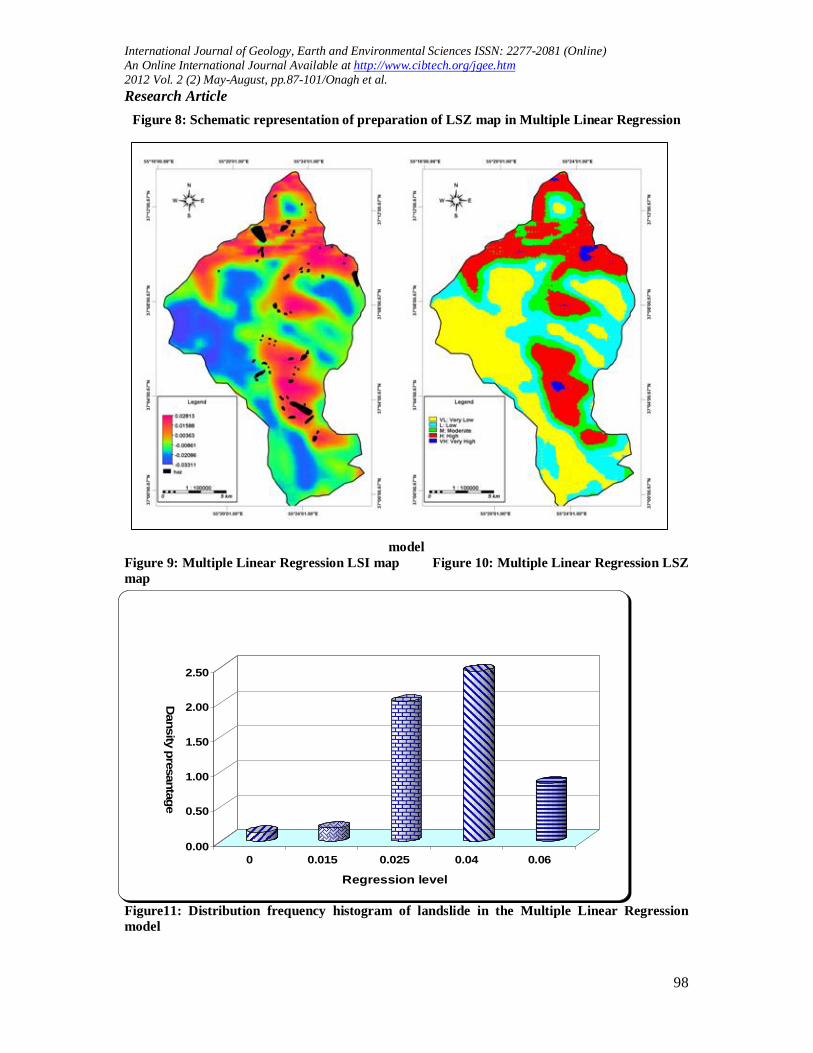
Methodology Influential parameters considered in this study for Landslide Susceptibility Zonation and of study area are: Slope(Sl),Aspect(As),Lithology (Li), Distance to fault (Dfa), Distance to road(Dro), Distance from River(Dri), Rainfall(Rf) and Land cover(Lc) (Figure 7,8). These parameters have been used in Multiple Linear Regression method to produce Landslide susceptibility map of the study area. In order to carry out multivariate analysis of data and to determine the parameters responsible for landslides in the study area, a multiple linear regression has been used. The multiple linear regression method reveals that how the susceptibility of landslides changes as the standard deviation of independent variables and predictors change. Furthermore, it will help to make an equation and linear function (model) for landslide susceptibility in intended study area. In this study equation of the theoretical model will be described as follows.
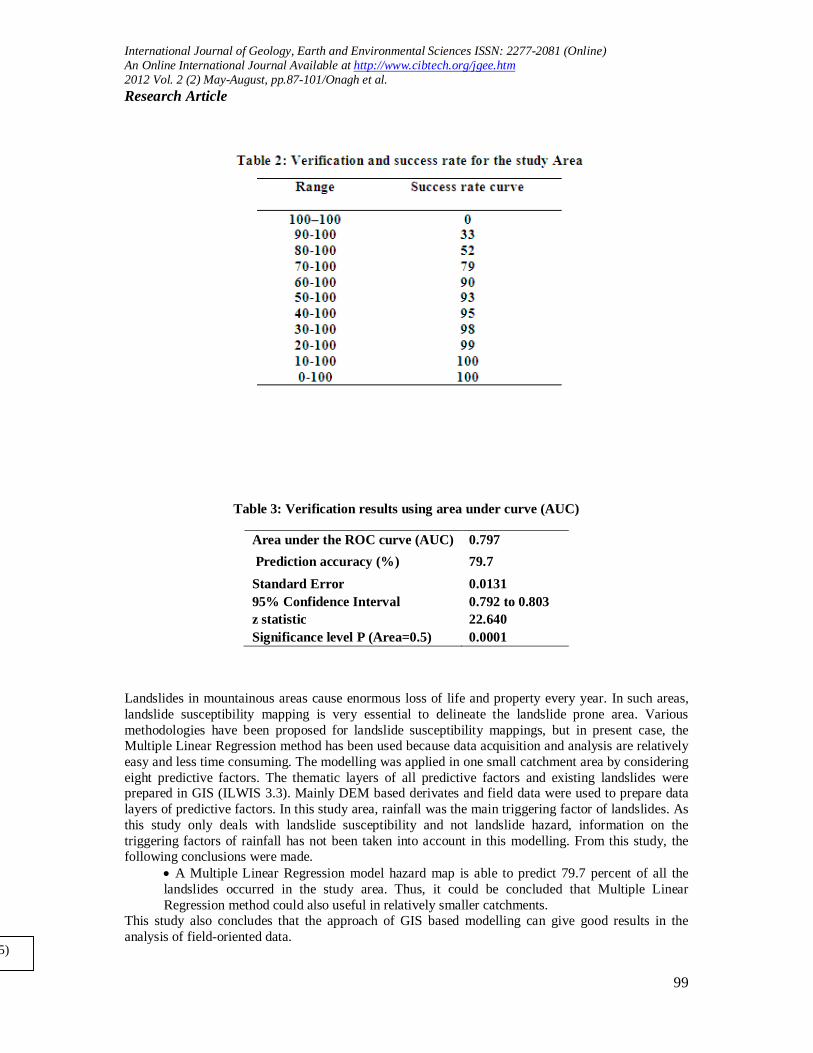
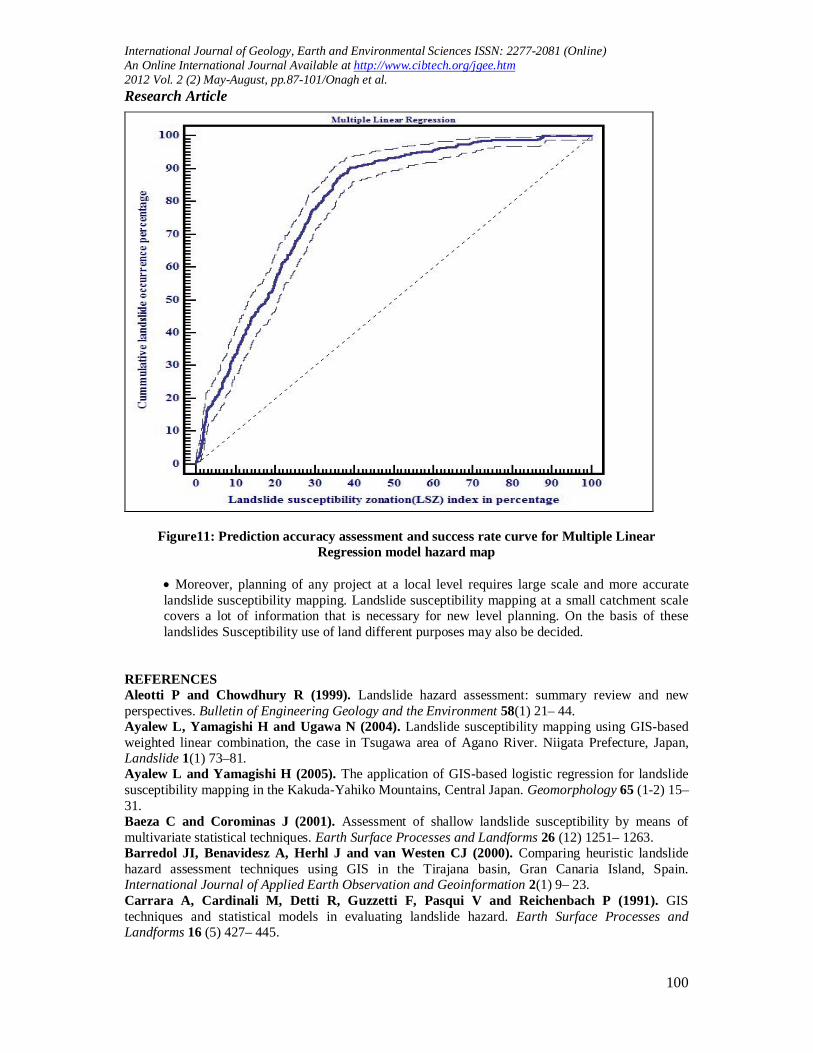
mm XbXbXbXbBL ...3322110 (Eq.1) Where, L is the occurrence of landslides in each sampling unit, X’s are the input independent variables (or instability parameters) observed for each mapping unit, the B’s are coefficients estimated from the data through statistical techniques, and ε represents the model error (Irigaray et al, 2007). To produce landslide susceptibility map in this method, the amounts of quantitive and qualitive variables based on sampling of 50×50 networks in form of a 21833×9 matrix have been transferred from GIS software (ILWIS 3.3) into statistical software (SPSS). To convert qualitive variables viz. lithology, landcover and aspect into quantitive variables, the weight of each qualitive variable has been estimated from information value. Among 8 independent variables in (Eq.1) 5 variables including Landcover (Lc), Aspect (As), Lithology (Li), Distance to river (Dri) and Slope (Sl) have been accepted. After adding slope variable into the (Eq.2), regression test gained 5% signification level and testing has been stopped. L =.01840 + (.1577 Lc ) + ( .03061 As ) + ( .01067 Li) + (.000007153 Dri ) + (.0001831 Sl) (Eq.2) Then calculated coefficients have been exerted in the matrix of dataset and the equation has been calculated for all of the 3498 sample pixels of the study area. Finally column of the equation result for analyzing and creating landslide susceptibility map has been transferred into GIS software (ILWIS 3.3). After producing LSI map (Figure 9), by overlaying of inventory map and LSI map, a histogram (Figure 11), has been produced and then based on this histogram the LSZ map has been created (Figure 10). RESULTS AND DISCUSSION The main goal of this study was to assessment and appraisal of the Multiple Linear Regression method in landslide susceptibility zonation and validation of landslide risk map with inventory map of the study area. Result of Landslide hazard analysis has been validated using known landslide locations. Validation was performed by comparing the known landslide location data with the landslide hazard map (Figure 9). Each factor used and frequency ratio were compared. The rate curves were created, this curve, referred to as the success rate curve in the literature (Chung and Fabri, 1999, 2003; Lu and An, 1999; Remondo et al., 2003; Vijith et al., 2009; Pradhan and Lee 2010) is used to select the suitability of a particular LSZ map. The rate explains that how model and factors predict occurrence of landslide. The area under the curve may help in assessing prediction of landslides qualitatively. To obtain relative ranks for each prediction pattern, the calculated index values of all cells in the study area were average in descending order. Then the ordered cell values were divided into 100 classes with accumulated 1% intervals. The rate verification results appear as a line in (Table 2). In the Multiple Linear Regression method used, 90percent to 100 percent(10%) class of the study area where the landslide index had a higher rank could explain 33 percent of all the landslides in the success rate and were classified as ‘‘very highly landslide’’ zone. The next 70 percent–100percent (30%) class of the study area where the landslide index has a higher rank could explain 79 percent of the landslides in the success rate and were classified as ‘‘highly landslide’’ zone. Similarly, the 60percent–100percent (40%) class of the study area where the landslide index has a relatively lower rank could explain 90
International Journal of Geology, Earth and Environmental Sciences ISSN: 2277-2081 (Online) An Online International Journal Available at http://www.cibtech.org/jgee.htm 2012 Vol. 2 (2) May-August, pp.87-101/Onagh et al. Research Article
97
percent of the landslides in the success rate and were classified as ‘‘moderately landslide’’ zone. Finally, the remaining 40percent–100percent (60%) class of the study area where the landslide index had a low rank could explain 95percentof the landslides were classified as ‘‘area with of landslide’’ zone. To compare the result quantitatively, the areas under the curve was recalculated as the total area is 1, which means perfect prediction accuracy. So, the area under a curve can be used to assess the prediction accuracy qualitatively. The area ratio calculated for Figure 11 was 0.797 and it may be imbedded that the prediction accuracy is 79.7 percent (Table 3).
Convert Feature to Raster
Resample as Uniform Pixel Size
Multiple Linear Regression
Score Factor Calculation &
Model Validation Test
Landslide Susceptibility Zonation
International Journal of Geology, Earth and Environmental Sciences ISSN: 2277-2081 (Online) An Online International Journal Available at http://www.cibtech.org/jgee.htm 2012 Vol. 2 (2) May-August, pp.87-101/Onagh et al. Research Article
98
0.00
0.50
1.00
1.50
2.00
2.50
Dansity presantage
0 0.015 0.025 0.04 0.06
Regression level
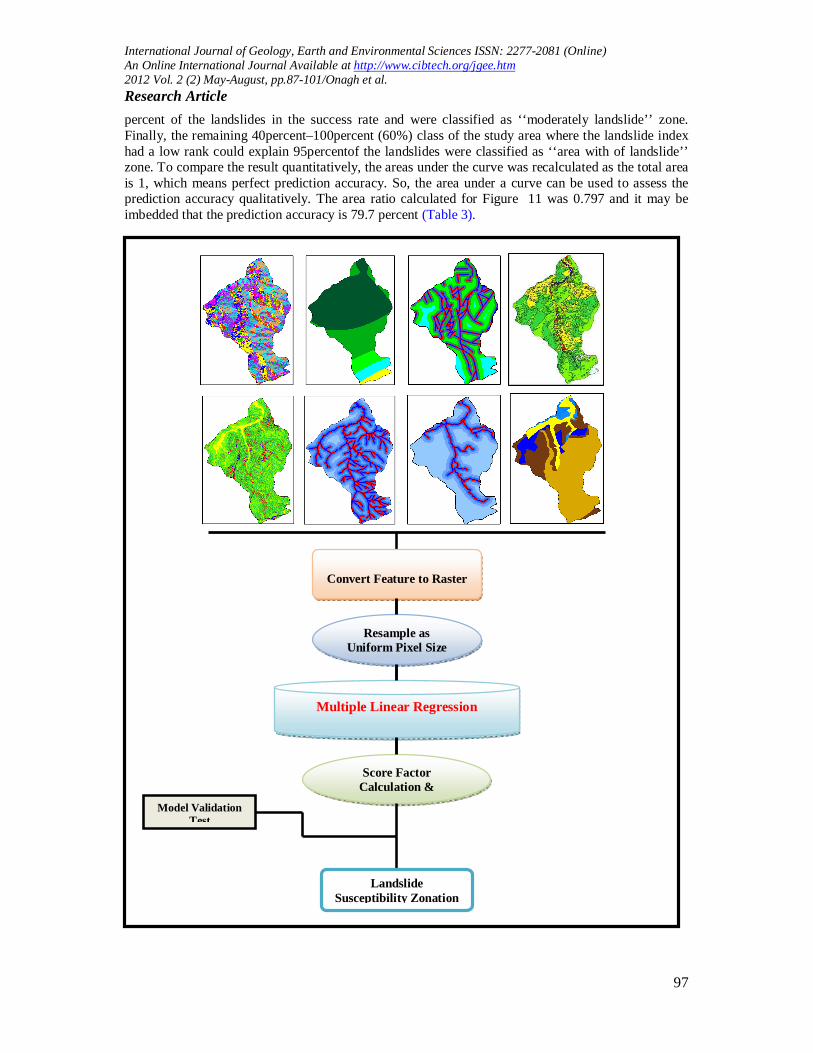
Figure 8: Schematic representation of preparation of LSZ map in Multiple Linear Regression
model Figure 9: Multiple Linear Regression LSI map Figure 10: Multiple Linear Regression LSZ map
Figure11: Distribution frequency histogram of landslide in the Multiple Linear Regression model
International Journal of Geology, Earth and Environmental Sciences ISSN: 2277-2081 (Online) An Online International Journal Available at http://www.cibtech.org/jgee.htm 2012 Vol. 2 (2) May-August, pp.87-101/Onagh et al. Research Article
99
Table 3: Verification results using area under curve (AUC) Landslides in mountainous areas cause enormous loss of life and property every year. In such areas, landslide susceptibility mapping is very essential to delineate the landslide prone area. Various methodologies have been proposed for landslide susceptibility mappings, but in present case, the Multiple Linear Regression method has been used because data acquisition and analysis are relatively easy and less time consuming. The modelling was applied in one small catchment area by considering eight predictive factors. The thematic layers of all predictive factors and existing landslides were prepared in GIS (ILWIS 3.3). Mainly DEM based derivates and field data were used to prepare data layers of predictive factors. In this study area, rainfall was the main triggering factor of landslides. As this study only deals with landslide susceptibility and not landslide hazard, information on the triggering factors of rainfall has not been taken into account in this modelling. From this study, the following conclusions were made.
A Multiple Linear Regression model hazard map is able to predict 79.7 percent of all the landslides occurred in the study area. Thus, it could be concluded that Multiple Linear Regression method could also useful in relatively smaller catchments.
This study also concludes that the approach of GIS based modelling can give good results in the analysis of field-oriented data.
Area under the ROC curve (AUC) 0.797 Prediction accuracy (%) 79.7 Standard Error 0.0131 95% Confidence Interval 0.792 to 0.803 z statistic 22.640 Significance level P (Area=0.5) 0.0001
Reference line (AUC = 0.5)
International Journal of Geology, Earth and Environmental Sciences ISSN: 2277-2081 (Online) An Online International Journal Available at http://www.cibtech.org/jgee.htm 2012 Vol. 2 (2) May-August, pp.87-101/Onagh et al. Research Article
100
Figure11: Prediction accuracy assessment and success rate curve for Multiple Linear Regression model hazard map
Moreover, planning of any project at a local level requires large scale and more accurate landslide susceptibility mapping. Landslide susceptibility mapping at a small catchment scale covers a lot of information that is necessary for new level planning. On the basis of these landslides Susceptibility use of land different purposes may also be decided.
REFERENCES Aleotti P and Chowdhury R (1999). Landslide hazard assessment: summary review and new perspectives. Bulletin of Engineering Geology and the Environment 58(1) 21– 44. Ayalew L, Yamagishi H and Ugawa N (2004). Landslide susceptibility mapping using GIS-based weighted linear combination, the case in Tsugawa area of Agano River. Niigata Prefecture, Japan, Landslide 1(1) 73–81. Ayalew L and Yamagishi H (2005). The application of GIS-based logistic regression for landslide susceptibility mapping in the Kakuda-Yahiko Mountains, Central Japan. Geomorphology 65 (1-2) 15–31. Baeza C and Corominas J (2001). Assessment of shallow landslide susceptibility by means of multivariate statistical techniques. Earth Surface Processes and Landforms 26 (12) 1251– 1263. Barredol JI, Benavidesz A, Herhl J and van Westen CJ (2000). Comparing heuristic landslide hazard assessment techniques using GIS in the Tirajana basin, Gran Canaria Island, Spain. International Journal of Applied Earth Observation and Geoinformation 2(1) 9– 23. Carrara A, Cardinali M, Detti R, Guzzetti F, Pasqui V and Reichenbach P (1991). GIS techniques and statistical models in evaluating landslide hazard. Earth Surface Processes and Landforms 16 (5) 427– 445.
International Journal of Geology, Earth and Environmental Sciences ISSN: 2277-2081 (Online) An Online International Journal Available at http://www.cibtech.org/jgee.htm 2012 Vol. 2 (2) May-August, pp.87-101/Onagh et al. Research Article
101
Carrara A, Crosta G and Frattini P (2003). Geomorphological and historical data in assessing landslide hazard. Earth Surface Processes and Landforms 28(10) 1125– 1142. Cevik E and Topal T (2003). GIS-based landslide susceptibility mapping for a problematic segment of the natural gas pipeline, Hendek (Turkey), Environmental Geology 44(8) 949–962. Chen Z and Wang J (2007), Landslide hazard mapping using logistic regression model in Mackenzie Valley, Canada, Natural Hazards 42(1) 75-89. Chung CF and Fabbri AG (1999). Probabilistic prediction models for landslide hazard mapping. Photogrammetric Engineering & Remote Sensing 65 (12) 1389–1399. Chung CF and Fabbri AG (2003). Validation of spatial prediction models for landslide hazard mapping. Natural Hazards 30 (3) 451–472. Demoulin A and Chung CF (2007). mapping landslide susceptibility from small datasets: A case study in the Pays de Herve (E Belgium). Geomorphology 89(3-4) 391–404. Eshlaghi Farahani A (2001). Natural slopes instability risk appraisal in Rudbar by statistical methods, unpublished M.A thesis on geological engineering, Trabiat Moalem University, Tehran. Irigaray C, Ferna´ndez T, El Hamdouni R and Chaco´n J (2007). Evaluation and validation of landslide-susceptibility maps obtained by a GIS matrix method: examples from the Betic Cordillera (southern Spain). Natural Hazards 41(1) 61–79. Lee S (2001). Statistical Analysis of landslide susceptibility at Yonging, Korea. Environmental Geology 40(9) 1095- 1113. Lu PF and An P (1999). A metric for spatial data layers in favorability mapping for geological events. IEEE Transactions in Geoscience and Remote Sensing 37 1194–1198. Malczewski J (1999), GIS and Multi-Criteria Decision Analysis. John Willey and Sons, New York 392. Pachauri AK, Gupta PV and Chander R (1998). Landslide zoning in a part of the Garhwal Himalayas. Environmental Geology 36(3-4) 325-334. Pradhan B, Lee S (2010). Delineation of landslide hazard areas on Penang Island, Malaysia, by using frequency ratio, logistic regression, and artificial neural network models. Environ Earth Science 60 (5)1037–1054. Rezaei Moghaddam MH, Khayyam M, Ahmadi M and Farajzadeh M (2007). Mapping Susceptibility Landslide by Using the Weight-of-evidence Model: A case study in Merek Valley, Iran. Journal of Applied Sciences 7(22) 3342-3355. Saaty TL (1980). The Analytical Hierarchy Process. McGraw Hill, New York, 350. Saha AK, Gupta RP, Arora MK, Sarkar I and Csaplovics E (2005). An approach for GIS-based statistical landslide susceptibility zonation - with a case study in the Himalayas. Landslides 2(1) 61–69. Soeters R and Van Westen CJ (1996). Slope instability recognition, analysis, and zonation, In: Turner, K.A., Schuster, R.L. (Eds.), Landslides: investigation and mitigation. Transport ResearchBoard Special Report (247) 129– 177. Vijith H, Rejith PG and Madhu G (2009). Using InfoVal Method and GIS Techniques for the Spatial Modelling of Landslide Susceptibility in the Upper Catchment of River Meenachil in Kerala. Journal of Indian Society for Remote Sensing 37(2) 241–250. Yalcin A (2005). An investigation on Ardesen (Rize) region on the basis of landslide susceptibility. PhD Thesis, Karadeniz Technical University, Trabzon, Turkey (in Turkish). Yalcin A (2008). GIS-based landslide susceptibility mapping using analytical hierarchy process and bivariate statistics in Ardesen (Turkey): Comparisons of results and confirmations. Catena 72(1) 1–12.


