Embed Size (px)
Citation preview
4
Application of the Software e-SAFES® (Based on SAFES Methodology)
to Control Disinfection in the Sugar Extraction from Sugar Beet (Beta vulgaris L.)
Marek Bennár1, 2 et al.* 1Universitat Politècnica de València
2Slovenská Poľnohospodárska Univerzita v Nitre 1Spain
2Slovakia
1. Introduction Microbial contamination during extraction is an important control point in the production of sugar. It is associated with significant losses of sugar, increased production of molasses and, ultimately, a decline in the quality of juice extraction. Three species of microorganisms are responsible for microbial contamination in the extraction. Bacillus stearothermofilus constitutes the bulk of microbial contamination and the main product of its metabolism is lactic acid. Its content in the raw juice is an indicator of infection rate and shows the losses of sugar (Baryga, 2006); Leuconostoc is another type of organism that metabolizes sucrose and produces glucose. Other types of microorganisms of Lactobacillus species synthesize glucose and form dextran which has a negative impact on the technological process. With the contamination, the purification of raw juice is less efficient, filtering is hampered, sediments cover the heating surface reducing heat transfer, crystallization becomes difficult, and finally sugar yield is reduced (Santos et al., 2000). Some problems have arisen regarding the addition of formaldehyde to foods to extend shelf life. Foods known to be contaminated include noodles, salted fish, tofu. In some places formaldehyde is still used illegally as a preservative in foods, which exposes people to formaldehyde ingestion (IARC Monographs, 2006). The current trend is to minimize the application of synthetic disinfectants that may adversely affect health. Consumption and contact with some unnatural disinfectants contaminated food is a health hazard. Consuming contaminated food causes abdominal pain, vomiting, diarrhea, unconsciousness, cancer or even death (Department of Health and Human Services, 2005). This is the case of formalin which use in food production is banned in some European Union countries. In fact, formalin * Ester Betoret1, Noelia Betoret1, Lucía Seguí1, Luis Mayor López1, David Arce1, Ignacio Blanquer1, Vicente Hernández1, Tatiana Bojňanská2 and Pedro Fito1
1Universitat Politècnica de València, Spain 2Slovenská Poľnohospodárska Univerzita v Nitre, Slovakia
Quality Control of Herbal Medicines and Related Areas
40
has still been found in some countries of EU. Thus, the use of new natural disinfectants has increased considerably in order to ensure safety and minimize possible adverse effects. Currently, numerous researches have improved theoretical understanding of sucrose extraction process. In the last decade, new tools for process engineering have allowed a more accurate simulation of the process, aimed not only to increase yields but also to the facilities design (Bennár, 2010). In recent years, a new systematic approach to food engineering systems (SAFES methodology) has been developed and applied to several food manufacture processes. Considering the different phases, components and aggregation states present in the food at certain stages of the process and applying the knowledge about its structure and the interactions between its components, the SAFES methodology makes possible to predict quality and safety attributes based on compositional and volumetric changes. However, available information is not always provided according to the SAFES methodology requirements for a better knowledge on food manufacture processes. Sometimes, when applying the SAFES methodology to a particular case of study, a lack of significant data became evident. In this case, the SAFES methodology could be a useful tool for planning future research (Barrera et al., 2007). The aim of this paper is to demonstrate the possibility of applying a natural disinfectant in the extraction process and the usefulness of the e-SAFES® V 0.4 software based on SAFES methodology on the control of the disinfecting process in an industrial line of sugar beet.
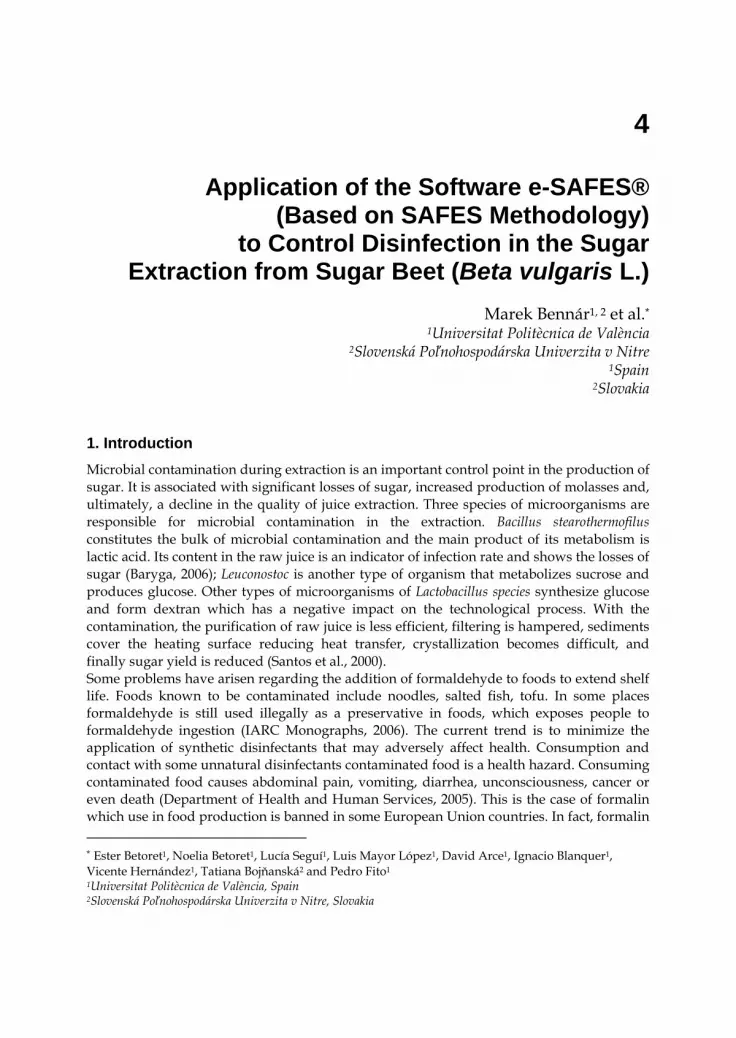
2. Materials and methods 2.1 Industrial plant The industrial plant for the production of sugar (Figure 1), owned by AGRANA Company, is located in Sereď (south-western of Slovakia) and its processing capacity is 3500 tons of sugar beet per day to produce 550 - 600 t of sugar per day during one campaign which is normally from middle of September till end of December.
Fig. 1. Industrial plant location
In the process to obtain sugar from sugar beet, the cossettes (sugar beet cut specifically) are fed into the extractor by means of a continuous scale. The continuous extractor DC12 is in
Application of the Software e-SAFES® (Based on SAFES Methodology) to Control Disinfection in the Sugar Extraction from Sugar Beet (Beta vulgaris L.)
41
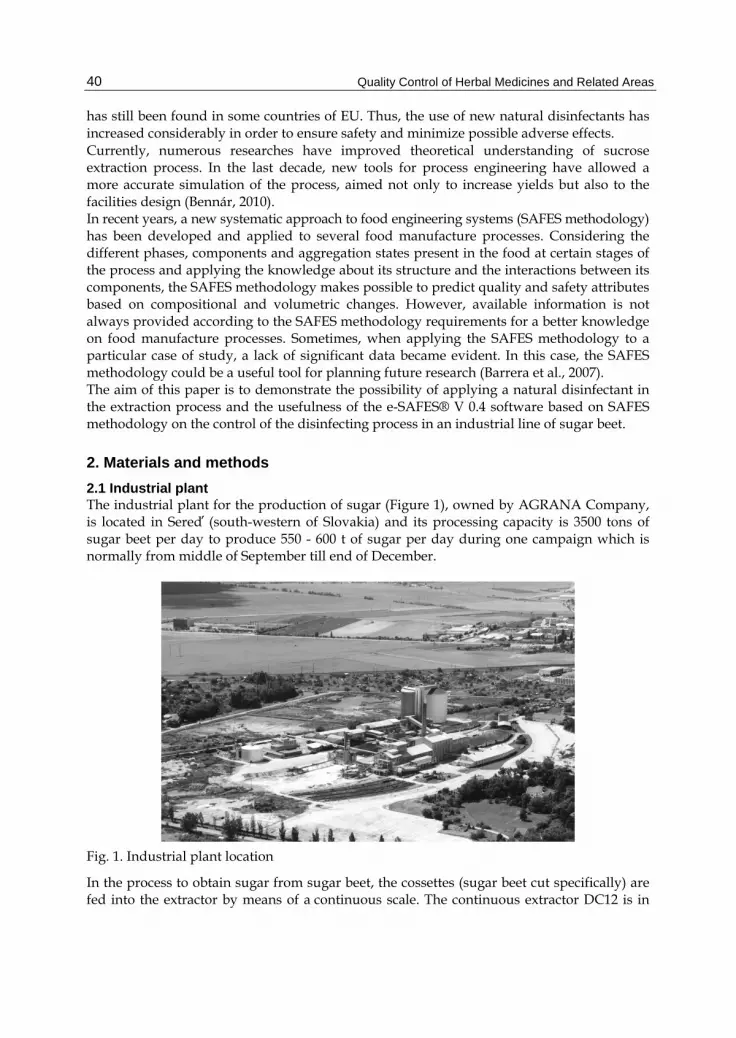
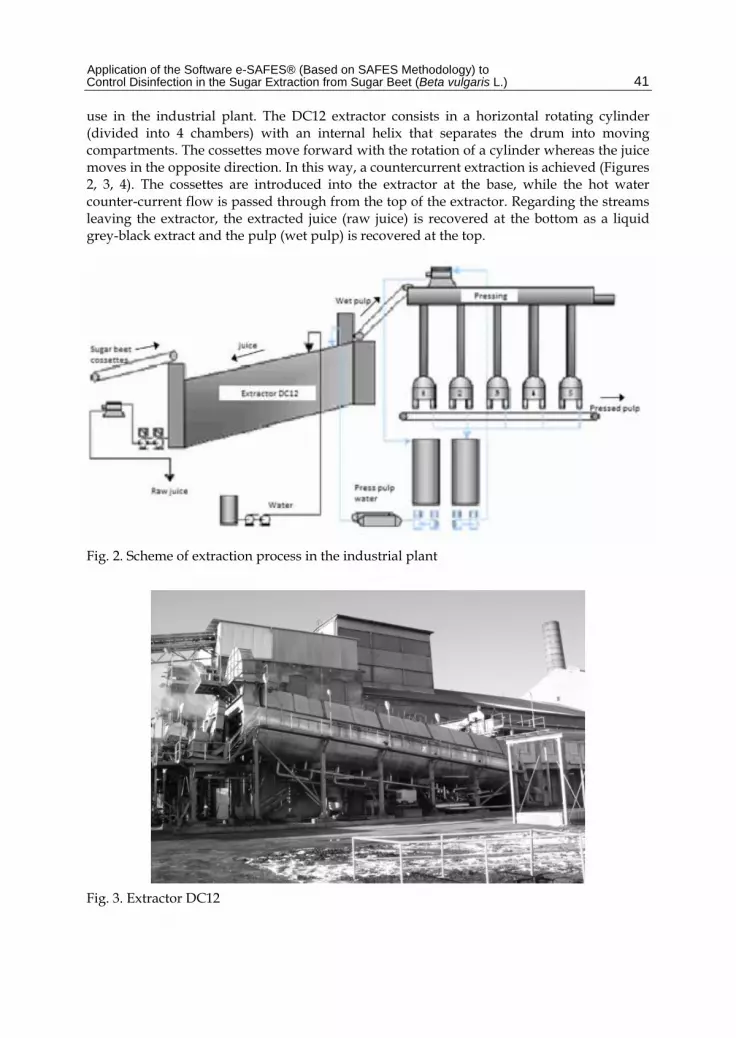
use in the industrial plant. The DC12 extractor consists in a horizontal rotating cylinder (divided into 4 chambers) with an internal helix that separates the drum into moving compartments. The cossettes move forward with the rotation of a cylinder whereas the juice moves in the opposite direction. In this way, a countercurrent extraction is achieved (Figures 2, 3, 4). The cossettes are introduced into the extractor at the base, while the hot water counter-current flow is passed through from the top of the extractor. Regarding the streams leaving the extractor, the extracted juice (raw juice) is recovered at the bottom as a liquid grey-black extract and the pulp (wet pulp) is recovered at the top.
Fig. 2. Scheme of extraction process in the industrial plant
Fig. 3. Extractor DC12
Quality Control of Herbal Medicines and Related Areas
42
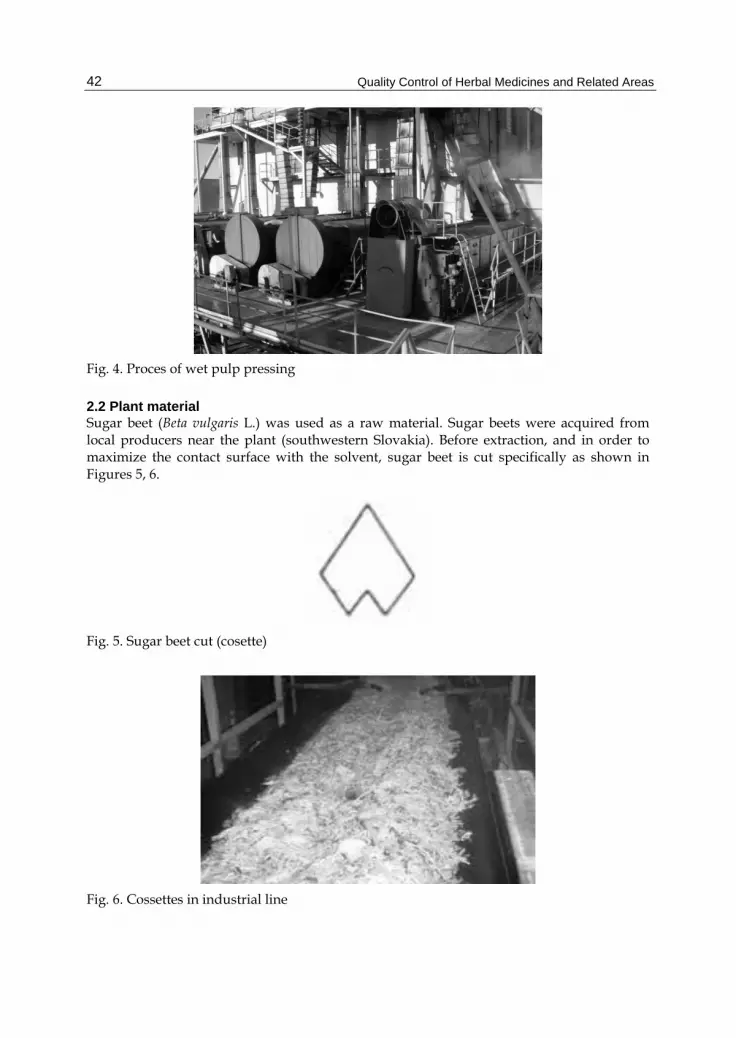
Fig. 4. Proces of wet pulp pressing
2.2 Plant material Sugar beet (Beta vulgaris L.) was used as a raw material. Sugar beets were acquired from local producers near the plant (southwestern Slovakia). Before extraction, and in order to maximize the contact surface with the solvent, sugar beet is cut specifically as shown in Figures 5, 6.
Fig. 5. Sugar beet cut (cosette)
Fig. 6. Cossettes in industrial line
Application of the Software e-SAFES® (Based on SAFES Methodology) to Control Disinfection in the Sugar Extraction from Sugar Beet (Beta vulgaris L.)
43
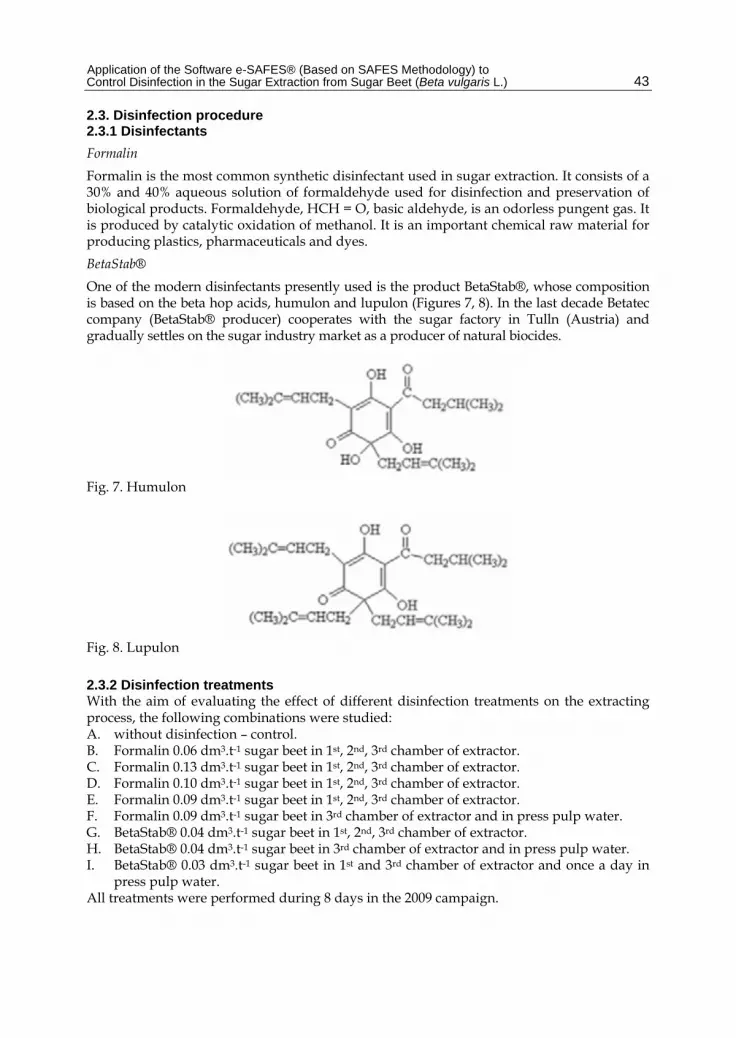
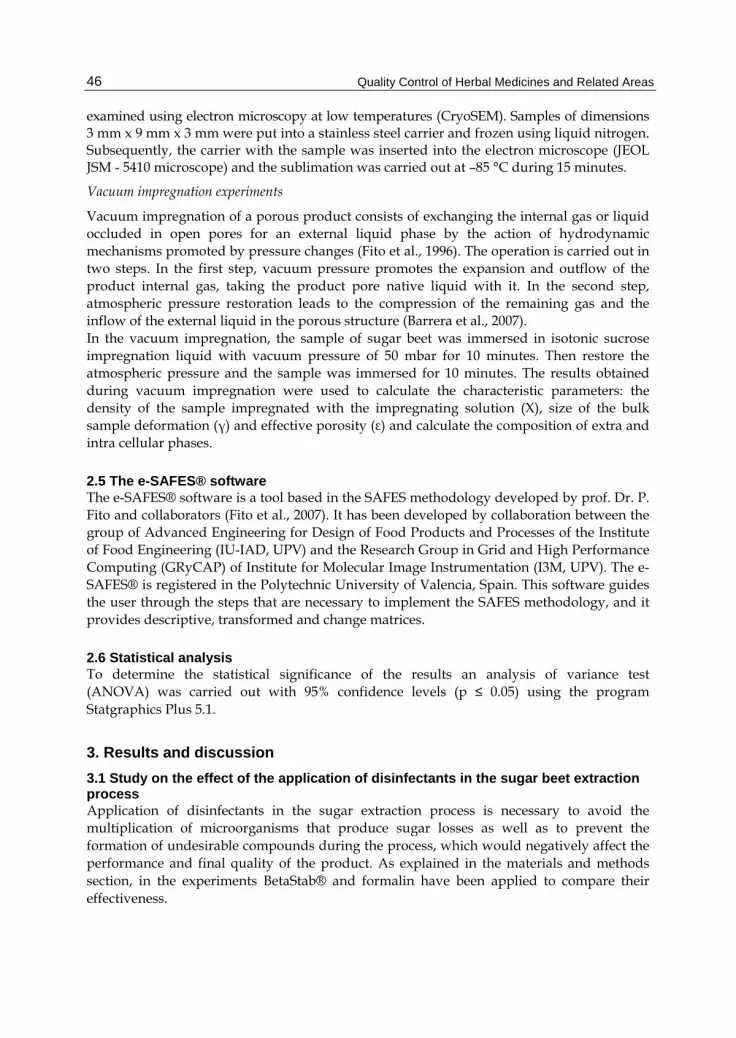
2.3. Disinfection procedure 2.3.1 Disinfectants Formalin Formalin is the most common synthetic disinfectant used in sugar extraction. It consists of a 30% and 40% aqueous solution of formaldehyde used for disinfection and preservation of biological products. Formaldehyde, HCH = O, basic aldehyde, is an odorless pungent gas. It is produced by catalytic oxidation of methanol. It is an important chemical raw material for producing plastics, pharmaceuticals and dyes. BetaStab® One of the modern disinfectants presently used is the product BetaStab®, whose composition is based on the beta hop acids, humulon and lupulon (Figures 7, 8). In the last decade Betatec company (BetaStab® producer) cooperates with the sugar factory in Tulln (Austria) and gradually settles on the sugar industry market as a producer of natural biocides.
Fig. 7. Humulon
Fig. 8. Lupulon
2.3.2 Disinfection treatments With the aim of evaluating the effect of different disinfection treatments on the extracting process, the following combinations were studied: A. without disinfection – control. B. Formalin 0.06 dm3.t-1 sugar beet in 1st, 2nd, 3rd chamber of extractor. C. Formalin 0.13 dm3.t-1 sugar beet in 1st, 2nd, 3rd chamber of extractor. D. Formalin 0.10 dm3.t-1 sugar beet in 1st, 2nd, 3rd chamber of extractor. E. Formalin 0.09 dm3.t-1 sugar beet in 1st, 2nd, 3rd chamber of extractor. F. Formalin 0.09 dm3.t-1 sugar beet in 3rd chamber of extractor and in press pulp water. G. BetaStab® 0.04 dm3.t-1 sugar beet in 1st, 2nd, 3rd chamber of extractor. H. BetaStab® 0.04 dm3.t-1 sugar beet in 3rd chamber of extractor and in press pulp water. I. BetaStab® 0.03 dm3.t-1 sugar beet in 1st and 3rd chamber of extractor and once a day in
press pulp water. All treatments were performed during 8 days in the 2009 campaign.

Quality Control of Herbal Medicines and Related Areas
44
2.3.3 Physico-chemical determinations Determination of lactic acid and glucose Lactic acid and glucose were determined by SelectTM biochemical analyzer YSI 2700. The measuring principle of this biochemical analyzer is the use of an enzyme sensor integrated into two platinum electrodes. The sensor applies the enzyme L-lactate dehydrogenase and isomerase to detect lactic acid and glucose, respectively. Determination of pH pH was determined by potentiometer with self-calibrating system (S20 pH Meter, METTLER TOLEDO SevenEasy) and able to work with automatic temperature compensation. As pH value was considered the average of two determinations on the same sample, when the difference between them was less than 0.1 units.
2.3.4 Theoretical predictions of sugar losses during the extraction process Sugar losses were calculated from different predictive models, as follows: 2.3.4.1 Krüger’s model (1957) Krüger's model predicts the sugar losses P1 (percentage on sugar beet) from a decrease in the pH of raw juice. The decrease ΔpH = 0.3 and under “normal value of pH = 6” of raw juice predicts losses of 0.025% on sugar beet.
P1 (%) = [(6 – pH)/0.3]· 0.025 (1)
2.3.4.2 van der Poel’s model (1975) The van der Poel’s model (equation 2) predicts the losses of sugar P2 (percentage on sugar beet) as a function of: mRJ = percentage of raw juice in sugar beet (w/w), mPP = percentage of press pulp water in sugar beet (w/w), wL, RJ = content of lactic acid in the raw juice (mg.dm-3), wL, PP = content of lactic acid in the press pulp water (mg.dm-3)
P2 (%) = [[(mRJ + mPP)] · [((wL, RJ - wL, PP) · 1.38) – 1.7]] / 70 (2)
2.3.4.3 Oikawa’s model (1993) The Oikawa’s model (equation 3) predicts the losses of sugar P3 (percentage on sugar beet) as a function of mRJ = percentage of raw juice in sugar beet (w/w), wL, RJ = content of lactic acid in the raw juice (mg.dm-3)
P3 (%) = mRJ · 2 · wL, RJ (3)
2.4 SAFES methodology According to the fuzzy knowledge of the sugar beet process provided by tradicional methodology, a new approach tackled in this work is to apply SAFES methodology to provide a simple control system of the disinfection process. The Systematic Approach to Food Engineering Systems (SAFES) has been recently developed and applied in modeling complex structured food systems using chemical, physical, biological and structural information of the product (Fito et al., 2007). The SAFES methodology is conceived to describe food considering its structural, thermodynamic and physic-chemical complexity in the simplest possible way detecting the

Application of the Software e-SAFES® (Based on SAFES Methodology) to Control Disinfection in the Sugar Extraction from Sugar Beet (Beta vulgaris L.)
45
changes that it can suffer as a result of a stage of changes. It is based on mathematic matrices designed to perform mass balances which include food components in different aggregation states in rows and food phases in columns (Bennár, 2008). The first step in the application of the SAFES methodology is the identification of those components, phases and aggregation states that are relevant to explaining changes in food properties along the process. After that, the process is divided into several stages of changes, according to the main expected changes in any component, phase or aggregation state and their relevance in the quality and safety attributes of the final product. The term “stage of changes” replaces the traditional concept of unit operation, which can be sub-divided into several stages of changes. Available data also conditions the selection of various stages of changes. Once different stages of changes are identified, appropriate information is compiled and employed in building descriptive matrices (Mn,n) of products involved in each stage of changes (n being the number of stages of the process, the first sub-index refers to the output in any particular stage, and the second sub-index refers to the mass of the product in any stage). Descriptive matrices should include not only compositional information, but also information on the main thermodynamic variables (volume, temperature and pressure). Then, matrices of changes (MCn,n-1) showing up the main changes taking place at each stage of changes are calculated by subtracting descriptive matrices of the outputs and inputs of that specific stage, both referred to the same basis of calculus. A descriptive matrix of a product at any stage referred to the basis of a product at a different stage (Mn-1,n) is called transformed matrix. Among different matrices of changes, the matrix of changes of the whole process, obtained from descriptive matrices of initial and final products, both referred to the same basis of calculus, shows the global changes suffered by the product during the entire process (Betoret et al., 2007). Application of the SAFES methodology is systematized, according to the steps listed below: 1. Define from the standpoint of structural biology the product being processed. 2. Describe the basic operations that make up the transformation process. 3. Define the phases, components and aggregation states that will display all relevant
changes in the properties of the final product without unduly complicating the description of the food.
4. Definition of the SAFES space of phases and components, which consists of the distribution of components and aggregation states in rows and subrows, the distribution of phases in columns and those cells that involve combinations of phase-component-aggregation state that are thermodynamically possible.
5. Identifying critical points and stages of changes in order to build the SAFES process diagram.
6. Building matrices: descriptive, transformed and matrix of change. For the construction of these matrices it is necessary to use experimental data obtained in the laboratory or referred to in the literature, and assume simplifying hypotheses to solve those situations where no data are available.
2.4.1 Experimental work needed to apply the SAFES methodology Electromicroscopy
In order to properly describe the structure of the product, samples of fresh sugar beet and those collected during the experimental extraction (30 and 60 minutes processed) were
Quality Control of Herbal Medicines and Related Areas
46
examined using electron microscopy at low temperatures (CryoSEM). Samples of dimensions 3 mm x 9 mm x 3 mm were put into a stainless steel carrier and frozen using liquid nitrogen. Subsequently, the carrier with the sample was inserted into the electron microscope (JEOL JSM - 5410 microscope) and the sublimation was carried out at –85 °C during 15 minutes.
Vacuum impregnation experiments
Vacuum impregnation of a porous product consists of exchanging the internal gas or liquid occluded in open pores for an external liquid phase by the action of hydrodynamic mechanisms promoted by pressure changes (Fito et al., 1996). The operation is carried out in two steps. In the first step, vacuum pressure promotes the expansion and outflow of the product internal gas, taking the product pore native liquid with it. In the second step, atmospheric pressure restoration leads to the compression of the remaining gas and the inflow of the external liquid in the porous structure (Barrera et al., 2007). In the vacuum impregnation, the sample of sugar beet was immersed in isotonic sucrose impregnation liquid with vacuum pressure of 50 mbar for 10 minutes. Then restore the atmospheric pressure and the sample was immersed for 10 minutes. The results obtained during vacuum impregnation were used to calculate the characteristic parameters: the density of the sample impregnated with the impregnating solution (X), size of the bulk sample deformation (γ) and effective porosity (ε) and calculate the composition of extra and intra cellular phases.
2.5 The e-SAFES® software The e-SAFES® software is a tool based in the SAFES methodology developed by prof. Dr. P. Fito and collaborators (Fito et al., 2007). It has been developed by collaboration between the group of Advanced Engineering for Design of Food Products and Processes of the Institute of Food Engineering (IU-IAD, UPV) and the Research Group in Grid and High Performance Computing (GRyCAP) of Institute for Molecular Image Instrumentation (I3M, UPV). The e-SAFES® is registered in the Polytechnic University of Valencia, Spain. This software guides the user through the steps that are necessary to implement the SAFES methodology, and it provides descriptive, transformed and change matrices.
2.6 Statistical analysis To determine the statistical significance of the results an analysis of variance test (ANOVA) was carried out with 95% confidence levels (p ≤ 0.05) using the program Statgraphics Plus 5.1.
3. Results and discussion 3.1 Study on the effect of the application of disinfectants in the sugar beet extraction process Application of disinfectants in the sugar extraction process is necessary to avoid the multiplication of microorganisms that produce sugar losses as well as to prevent the formation of undesirable compounds during the process, which would negatively affect the performance and final quality of the product. As explained in the materials and methods section, in the experiments BetaStab® and formalin have been applied to compare their effectiveness.
Application of the Software e-SAFES® (Based on SAFES Methodology) to Control Disinfection in the Sugar Extraction from Sugar Beet (Beta vulgaris L.)
47
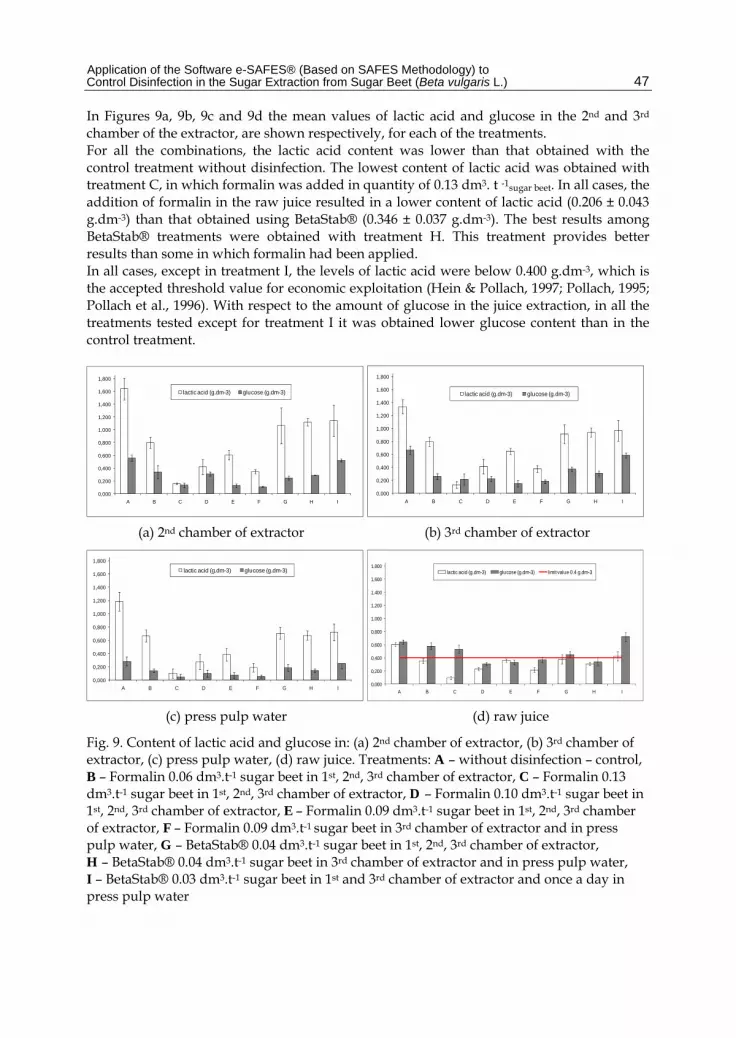
In Figures 9a, 9b, 9c and 9d the mean values of lactic acid and glucose in the 2nd and 3rd chamber of the extractor, are shown respectively, for each of the treatments. For all the combinations, the lactic acid content was lower than that obtained with the control treatment without disinfection. The lowest content of lactic acid was obtained with treatment C, in which formalin was added in quantity of 0.13 dm3. t -1sugar beet. In all cases, the addition of formalin in the raw juice resulted in a lower content of lactic acid (0.206 ± 0.043 g.dm-3) than that obtained using BetaStab® (0.346 ± 0.037 g.dm-3). The best results among BetaStab® treatments were obtained with treatment H. This treatment provides better results than some in which formalin had been applied. In all cases, except in treatment I, the levels of lactic acid were below 0.400 g.dm-3, which is the accepted threshold value for economic exploitation (Hein & Pollach, 1997; Pollach, 1995; Pollach et al., 1996). With respect to the amount of glucose in the juice extraction, in all the treatments tested except for treatment I it was obtained lower glucose content than in the control treatment.
0,000
0,200
0,400
0,600
0,800
1,000
1,200
1,400
1,600
1,800
A B C D E F G H I
lactic acid (g.dm-3) glucose (g.dm-3)
0,000
0,200
0,400
0,600
0,800
1,000
1,200
1,400
1,600
1,800
A B C D E F G H I
lactic acid (g.dm-3) glucose (g.dm-3)
(a) 2nd chamber of extractor (b) 3rd chamber of extractor
0,000
0,200
0,400
0,600
0,800
1,000
1,200
1,400
1,600
1,800
A B C D E F G H I
lactic acid (g.dm-3) glucose (g.dm-3)
0,000
0,200
0,400
0,600
0,800
1,000
1,200
1,400
1,600
1,800
A B C D E F G H I
lactic acid (g.dm-3) glucose (g.dm-3) limit value 0.4 g.dm-3
(c) press pulp water (d) raw juice
Fig. 9. Content of lactic acid and glucose in: (a) 2nd chamber of extractor, (b) 3rd chamber of extractor, (c) press pulp water, (d) raw juice. Treatments: A – without disinfection – control, B – Formalin 0.06 dm3.t-1 sugar beet in 1st, 2nd, 3rd chamber of extractor, C – Formalin 0.13 dm3.t-1 sugar beet in 1st, 2nd, 3rd chamber of extractor, D – Formalin 0.10 dm3.t-1 sugar beet in 1st, 2nd, 3rd chamber of extractor, E – Formalin 0.09 dm3.t-1 sugar beet in 1st, 2nd, 3rd chamber of extractor, F – Formalin 0.09 dm3.t-1 sugar beet in 3rd chamber of extractor and in press pulp water, G – BetaStab® 0.04 dm3.t-1 sugar beet in 1st, 2nd, 3rd chamber of extractor, H – BetaStab® 0.04 dm3.t-1 sugar beet in 3rd chamber of extractor and in press pulp water, I – BetaStab® 0.03 dm3.t-1 sugar beet in 1st and 3rd chamber of extractor and once a day in press pulp water
Quality Control of Herbal Medicines and Related Areas
48
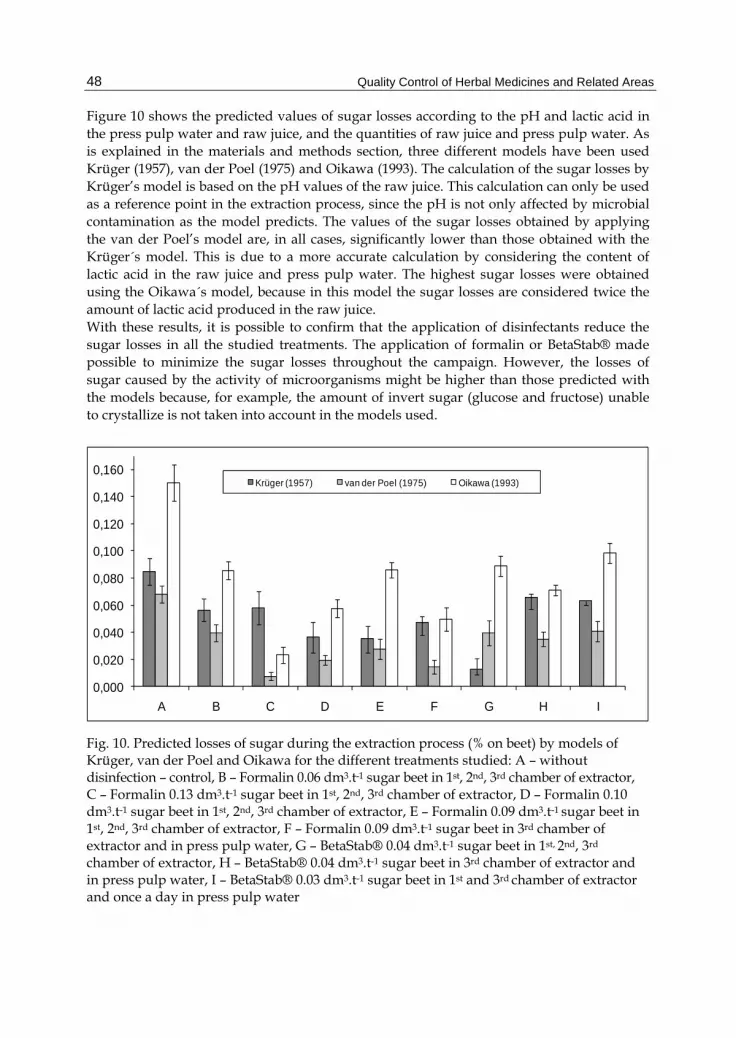
Figure 10 shows the predicted values of sugar losses according to the pH and lactic acid in the press pulp water and raw juice, and the quantities of raw juice and press pulp water. As is explained in the materials and methods section, three different models have been used Krüger (1957), van der Poel (1975) and Oikawa (1993). The calculation of the sugar losses by Krüger’s model is based on the pH values of the raw juice. This calculation can only be used as a reference point in the extraction process, since the pH is not only affected by microbial contamination as the model predicts. The values of the sugar losses obtained by applying the van der Poel’s model are, in all cases, significantly lower than those obtained with the Krüger´s model. This is due to a more accurate calculation by considering the content of lactic acid in the raw juice and press pulp water. The highest sugar losses were obtained using the Oikawa´s model, because in this model the sugar losses are considered twice the amount of lactic acid produced in the raw juice. With these results, it is possible to confirm that the application of disinfectants reduce the sugar losses in all the studied treatments. The application of formalin or BetaStab® made possible to minimize the sugar losses throughout the campaign. However, the losses of sugar caused by the activity of microorganisms might be higher than those predicted with the models because, for example, the amount of invert sugar (glucose and fructose) unable to crystallize is not taken into account in the models used.
0,000
0,020
0,040
0,060
0,080
0,100
0,120
0,140
0,160
A B C D E F G H I
Krüger (1957) van der Poel (1975) Oikawa (1993)
Fig. 10. Predicted losses of sugar during the extraction process (% on beet) by models of Krüger, van der Poel and Oikawa for the different treatments studied: A – without disinfection – control, B – Formalin 0.06 dm3.t-1 sugar beet in 1st, 2nd, 3rd chamber of extractor, C – Formalin 0.13 dm3.t-1 sugar beet in 1st, 2nd, 3rd chamber of extractor, D – Formalin 0.10 dm3.t-1 sugar beet in 1st, 2nd, 3rd chamber of extractor, E – Formalin 0.09 dm3.t-1 sugar beet in 1st, 2nd, 3rd chamber of extractor, F – Formalin 0.09 dm3.t-1 sugar beet in 3rd chamber of extractor and in press pulp water, G – BetaStab® 0.04 dm3.t-1 sugar beet in 1st, 2nd, 3rd chamber of extractor, H – BetaStab® 0.04 dm3.t-1 sugar beet in 3rd chamber of extractor and in press pulp water, I – BetaStab® 0.03 dm3.t-1 sugar beet in 1st and 3rd chamber of extractor and once a day in press pulp water
Application of the Software e-SAFES® (Based on SAFES Methodology) to Control Disinfection in the Sugar Extraction from Sugar Beet (Beta vulgaris L.)
49
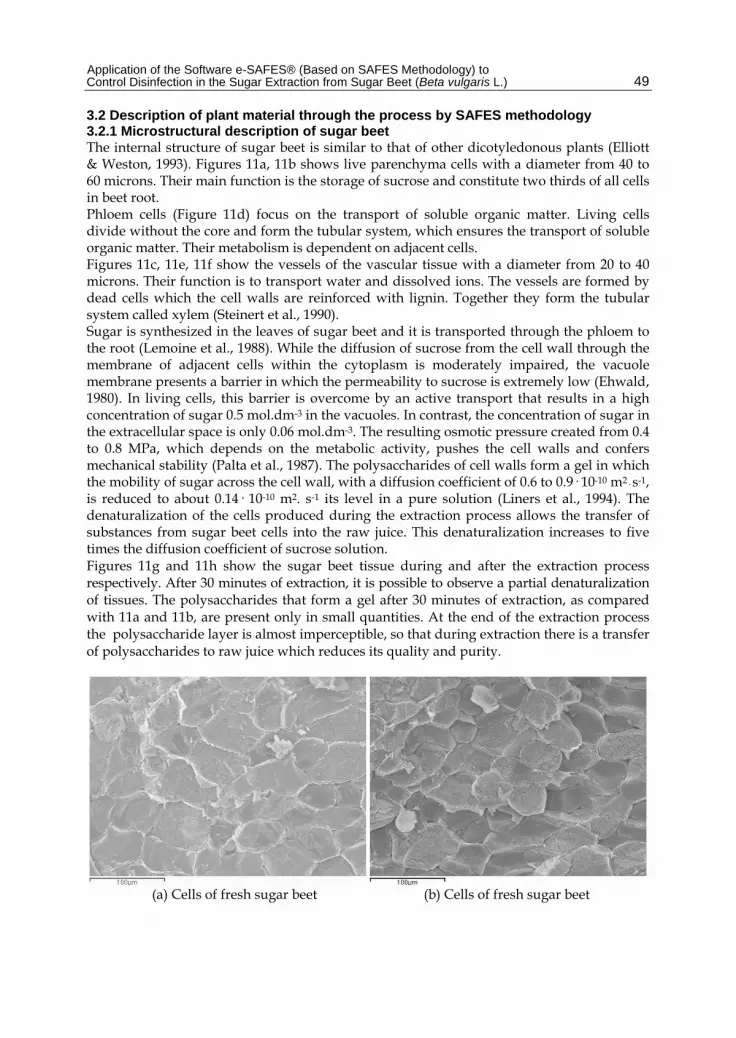
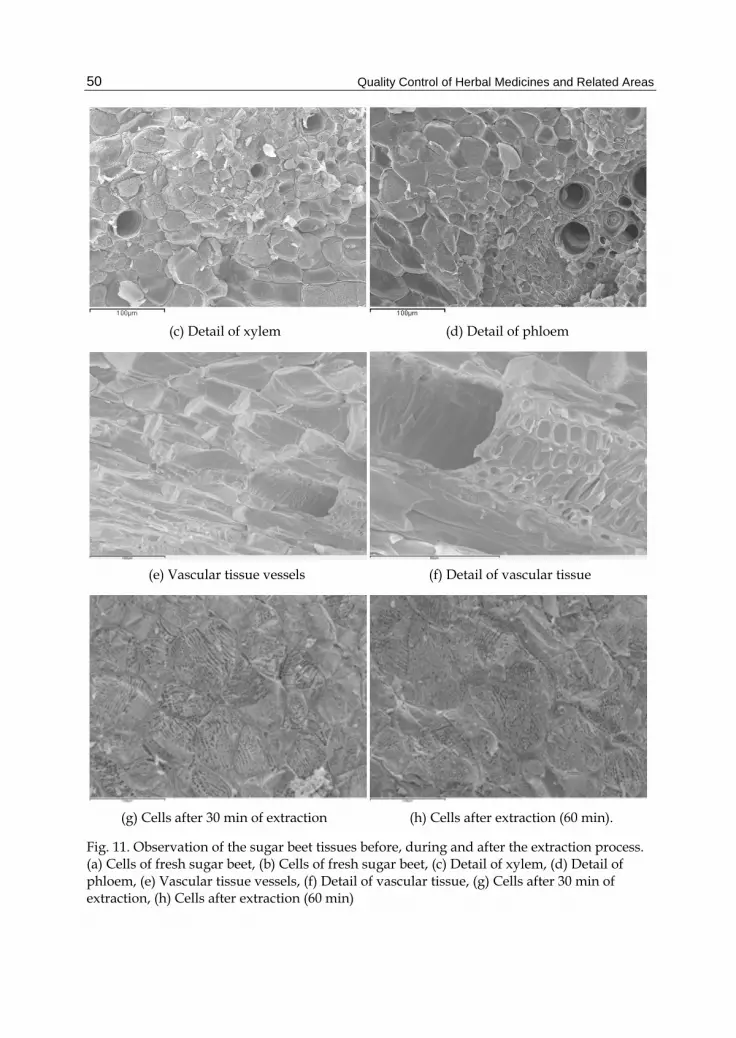
3.2 Description of plant material through the process by SAFES methodology 3.2.1 Microstructural description of sugar beet The internal structure of sugar beet is similar to that of other dicotyledonous plants (Elliott & Weston, 1993). Figures 11a, 11b shows live parenchyma cells with a diameter from 40 to 60 microns. Their main function is the storage of sucrose and constitute two thirds of all cells in beet root. Phloem cells (Figure 11d) focus on the transport of soluble organic matter. Living cells divide without the core and form the tubular system, which ensures the transport of soluble organic matter. Their metabolism is dependent on adjacent cells. Figures 11c, 11e, 11f show the vessels of the vascular tissue with a diameter from 20 to 40 microns. Their function is to transport water and dissolved ions. The vessels are formed by dead cells which the cell walls are reinforced with lignin. Together they form the tubular system called xylem (Steinert et al., 1990). Sugar is synthesized in the leaves of sugar beet and it is transported through the phloem to the root (Lemoine et al., 1988). While the diffusion of sucrose from the cell wall through the membrane of adjacent cells within the cytoplasm is moderately impaired, the vacuole membrane presents a barrier in which the permeability to sucrose is extremely low (Ehwald, 1980). In living cells, this barrier is overcome by an active transport that results in a high concentration of sugar 0.5 mol.dm-3 in the vacuoles. In contrast, the concentration of sugar in the extracellular space is only 0.06 mol.dm-3. The resulting osmotic pressure created from 0.4 to 0.8 MPa, which depends on the metabolic activity, pushes the cell walls and confers mechanical stability (Palta et al., 1987). The polysaccharides of cell walls form a gel in which the mobility of sugar across the cell wall, with a diffusion coefficient of 0.6 to 0.9· 10-10 m2· s-1, is reduced to about 0.14· 10-10 m2. s-1 its level in a pure solution (Liners et al., 1994). The denaturalization of the cells produced during the extraction process allows the transfer of substances from sugar beet cells into the raw juice. This denaturalization increases to five times the diffusion coefficient of sucrose solution. Figures 11g and 11h show the sugar beet tissue during and after the extraction process respectively. After 30 minutes of extraction, it is possible to observe a partial denaturalization of tissues. The polysaccharides that form a gel after 30 minutes of extraction, as compared with 11a and 11b, are present only in small quantities. At the end of the extraction process the polysaccharide layer is almost imperceptible, so that during extraction there is a transfer of polysaccharides to raw juice which reduces its quality and purity.
(a) Cells of fresh sugar beet (b) Cells of fresh sugar beet
Quality Control of Herbal Medicines and Related Areas
50
(c) Detail of xylem (d) Detail of phloem
(e) Vascular tissue vessels (f) Detail of vascular tissue
(g) Cells after 30 min of extraction (h) Cells after extraction (60 min).
Fig. 11. Observation of the sugar beet tissues before, during and after the extraction process. (a) Cells of fresh sugar beet, (b) Cells of fresh sugar beet, (c) Detail of xylem, (d) Detail of phloem, (e) Vascular tissue vessels, (f) Detail of vascular tissue, (g) Cells after 30 min of extraction, (h) Cells after extraction (60 min)
Application of the Software e-SAFES® (Based on SAFES Methodology) to Control Disinfection in the Sugar Extraction from Sugar Beet (Beta vulgaris L.)
51
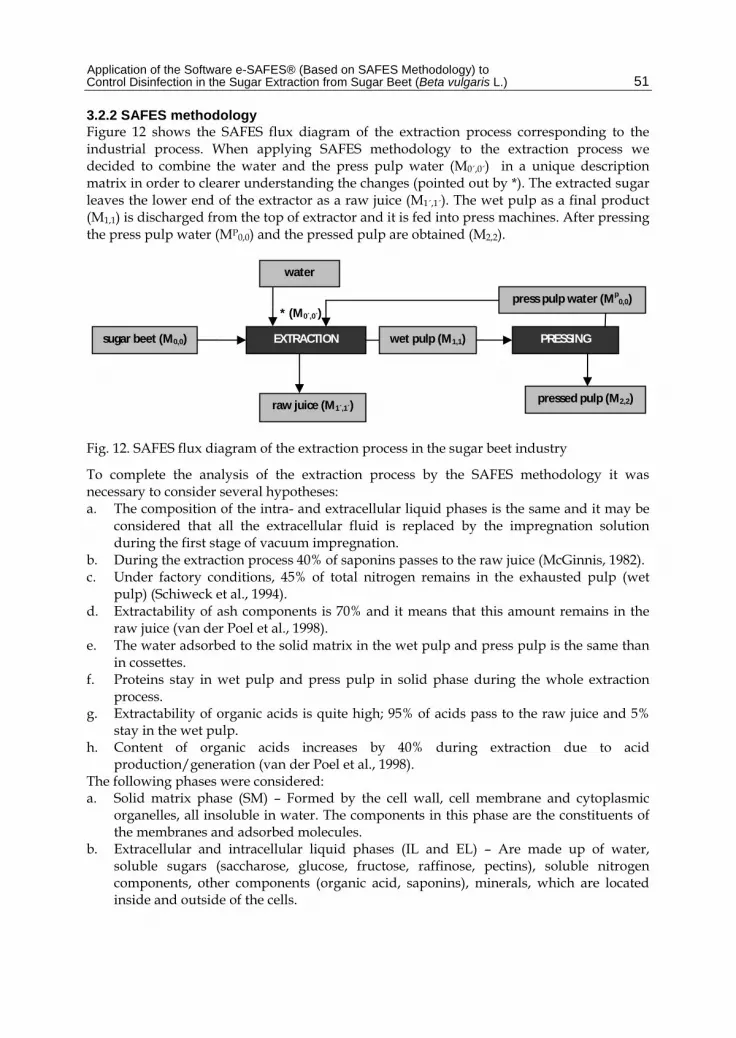
3.2.2 SAFES methodology Figure 12 shows the SAFES flux diagram of the extraction process corresponding to the industrial process. When applying SAFES methodology to the extraction process we decided to combine the water and the press pulp water (M0´,0´) in a unique description matrix in order to clearer understanding the changes (pointed out by *). The extracted sugar leaves the lower end of the extractor as a raw juice (M1´,1´). The wet pulp as a final product (M1,1) is discharged from the top of extractor and it is fed into press machines. After pressing the press pulp water (MP0,0) and the pressed pulp are obtained (M2,2).
Fig. 12. SAFES flux diagram of the extraction process in the sugar beet industry
To complete the analysis of the extraction process by the SAFES methodology it was necessary to consider several hypotheses: a. The composition of the intra- and extracellular liquid phases is the same and it may be
considered that all the extracellular fluid is replaced by the impregnation solution during the first stage of vacuum impregnation.
b. During the extraction process 40% of saponins passes to the raw juice (McGinnis, 1982). c. Under factory conditions, 45% of total nitrogen remains in the exhausted pulp (wet
pulp) (Schiweck et al., 1994). d. Extractability of ash components is 70% and it means that this amount remains in the
raw juice (van der Poel et al., 1998). e. The water adsorbed to the solid matrix in the wet pulp and press pulp is the same than
in cossettes. f. Proteins stay in wet pulp and press pulp in solid phase during the whole extraction
process. g. Extractability of organic acids is quite high; 95% of acids pass to the raw juice and 5%
stay in the wet pulp. h. Content of organic acids increases by 40% during extraction due to acid
production/generation (van der Poel et al., 1998). The following phases were considered: a. Solid matrix phase (SM) – Formed by the cell wall, cell membrane and cytoplasmic
organelles, all insoluble in water. The components in this phase are the constituents of the membranes and adsorbed molecules.
b. Extracellular and intracellular liquid phases (IL and EL) – Are made up of water, soluble sugars (saccharose, glucose, fructose, raffinose, pectins), soluble nitrogen components, other components (organic acid, saponins), minerals, which are located inside and outside of the cells.
water
raw juice (M1´,1´)
wet pulp (M1,1)
press pulp water (Mp0,0)
pressed pulp (M2,2)
EXTRACTION PRESSING
* (M0´,0´)
sugar beet (M0,0)

Quality Control of Herbal Medicines and Related Areas
52
c. Soluble solids in solid state (SSs) – Formed by soluble solids that have become solid as a result of crystallization.
d. Gas (G) - Gaseous components which are located mainly in the intercellular spaces. e. Whole food (WF) The components were considered: a. Water b. Insoluble solids - structural components of cells c. Sugars – saccharose, glucose, fructose, raffinose d. Nitrogen components – proteins, amino acids, nitrate, amides, nucleotides e. Other components – organic acids and saponins f. Minerals – K, Mg, Ca, Na, P, Cl, S The aggregation states considered in this work were gaseous (G), liquid (L), adsorbed (A), rubbery (R), vitreous (V) and crystalline (C). The thermodynamically possible combinations of phases-components-states of aggregation yields the SAFES space of phases and components.
3.3 Implementation of the e-SAFES® V 0.4 based on SAFES methodology as a tool to control disinfection in an industrial line of sugar beet The e-SAFES® software V 0.4 (Fig. 13) was used as a control tool for monitoring the application of disinfectants in the sugar extraction process (Figure 13).
Fig. 13. Initial window of the e-SAFES® software
The steps of the e-SAFES® program to apply the SAFES methodology and identify the changes that occur in the process are: 1. Add the phases, components and aggregation states for the specific product-process, so
that these will be available subsequently in the list to create a template or product. 2. Create template - choose phases and components for the template. 3. In the template defined by components, phases and aggregation states, introduce
equations or relationships required to fully define the template.
Application of the Software e-SAFES® (Based on SAFES Methodology) to Control Disinfection in the Sugar Extraction from Sugar Beet (Beta vulgaris L.)
53
4. Create product - Bibliographic and experimental values are introduced into the appropriate cells to obtain the descriptive matrix.
5. Get transformed matrices or matrices of changes by modification of the descriptive matrices.
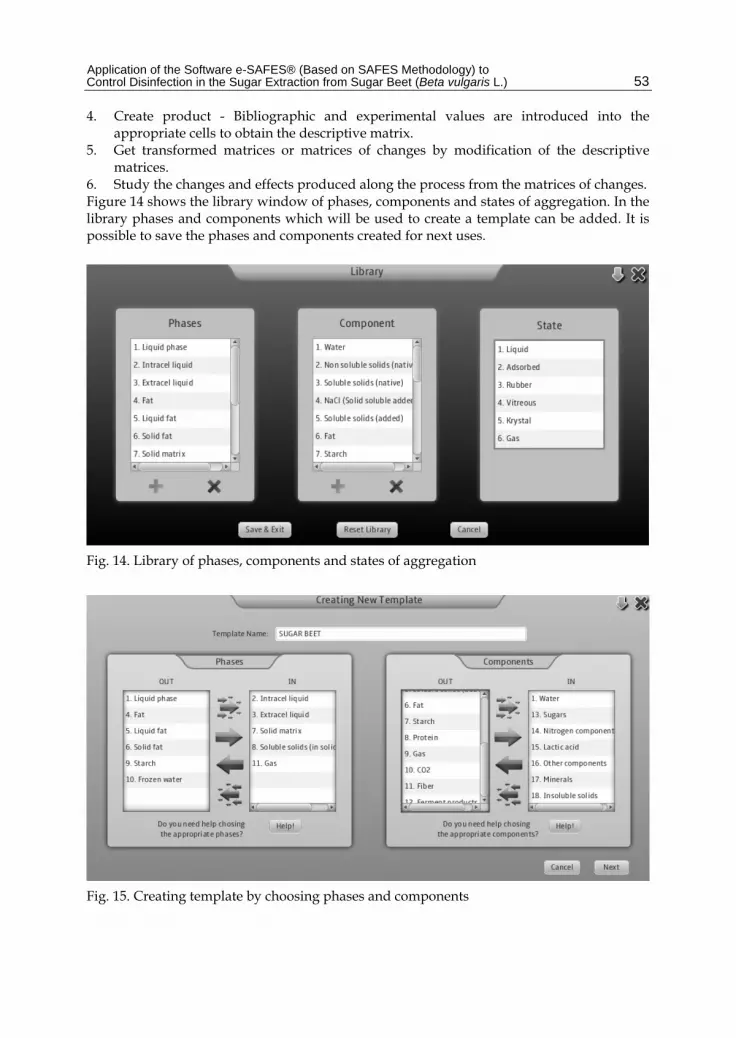
6. Study the changes and effects produced along the process from the matrices of changes. Figure 14 shows the library window of phases, components and states of aggregation. In the library phases and components which will be used to create a template can be added. It is possible to save the phases and components created for next uses.
Fig. 14. Library of phases, components and states of aggregation
Fig. 15. Creating template by choosing phases and components
Quality Control of Herbal Medicines and Related Areas
54
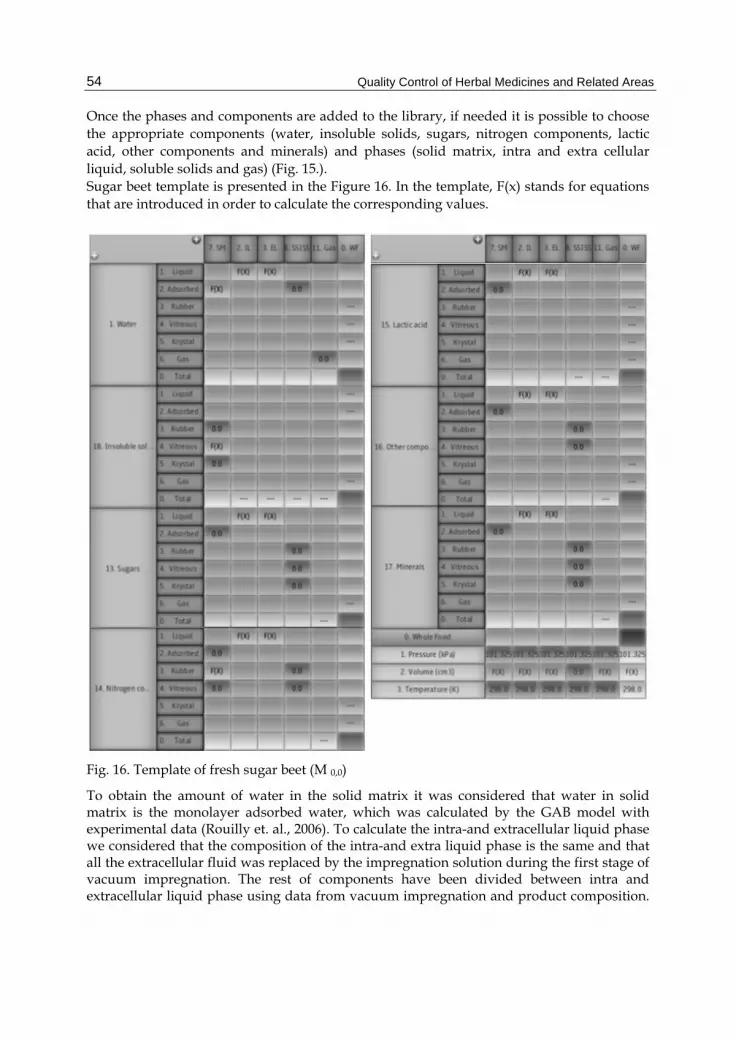
Once the phases and components are added to the library, if needed it is possible to choose the appropriate components (water, insoluble solids, sugars, nitrogen components, lactic acid, other components and minerals) and phases (solid matrix, intra and extra cellular liquid, soluble solids and gas) (Fig. 15.). Sugar beet template is presented in the Figure 16. In the template, F(x) stands for equations that are introduced in order to calculate the corresponding values.
Fig. 16. Template of fresh sugar beet (M 0,0)
To obtain the amount of water in the solid matrix it was considered that water in solid matrix is the monolayer adsorbed water, which was calculated by the GAB model with experimental data (Rouilly et. al., 2006). To calculate the intra-and extracellular liquid phase we considered that the composition of the intra-and extra liquid phase is the same and that all the extracellular fluid was replaced by the impregnation solution during the first stage of vacuum impregnation. The rest of components have been divided between intra and extracellular liquid phase using data from vacuum impregnation and product composition.
Application of the Software e-SAFES® (Based on SAFES Methodology) to Control Disinfection in the Sugar Extraction from Sugar Beet (Beta vulgaris L.)
55
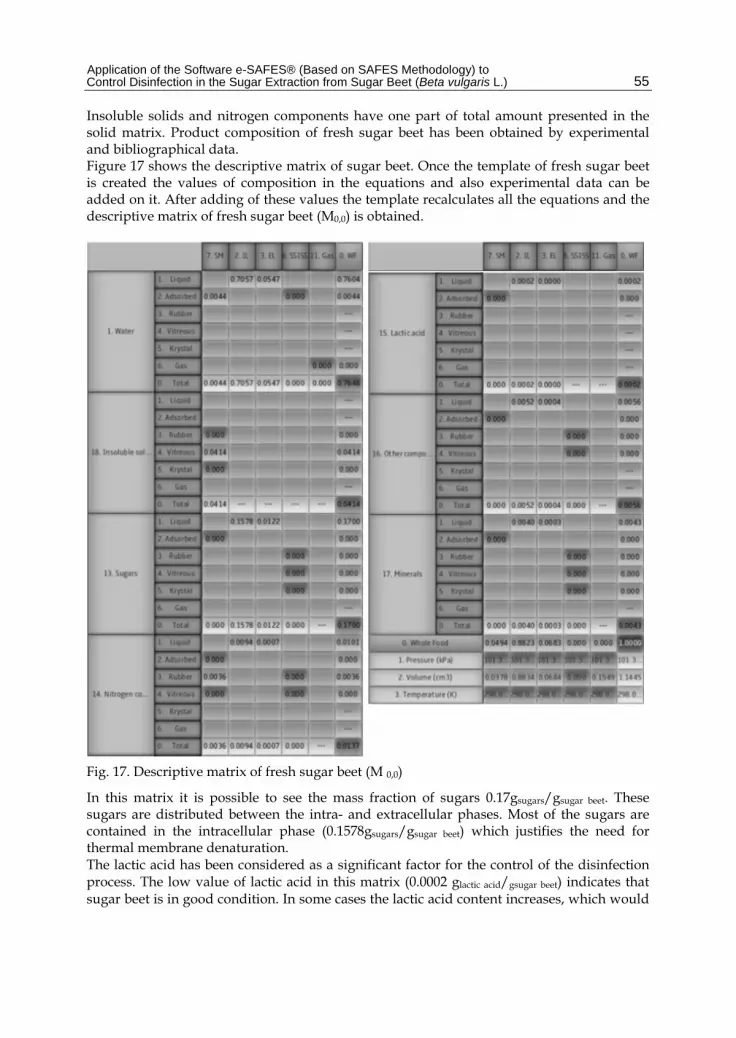
Insoluble solids and nitrogen components have one part of total amount presented in the solid matrix. Product composition of fresh sugar beet has been obtained by experimental and bibliographical data. Figure 17 shows the descriptive matrix of sugar beet. Once the template of fresh sugar beet is created the values of composition in the equations and also experimental data can be added on it. After adding of these values the template recalculates all the equations and the descriptive matrix of fresh sugar beet (M0,0) is obtained.
Fig. 17. Descriptive matrix of fresh sugar beet (M 0,0)
In this matrix it is possible to see the mass fraction of sugars 0.17gsugars/gsugar beet. These sugars are distributed between the intra- and extracellular phases. Most of the sugars are contained in the intracellular phase (0.1578gsugars/gsugar beet) which justifies the need for thermal membrane denaturation. The lactic acid has been considered as a significant factor for the control of the disinfection process. The low value of lactic acid in this matrix (0.0002 glactic acid/gsugar beet) indicates that sugar beet is in good condition. In some cases the lactic acid content increases, which would

Quality Control of Herbal Medicines and Related Areas
56
indicate poor storage (microbial contamination) or use of rotten sugar beet. The contents of other components (solid insoluble, nitrogen components, other components and minerals) tend to have very low variability. All descriptive matrices have been done using the same principles. A template was created for each stream of the process, which include the appropriate equations that allow calculating each product composition. In addition, experimental or bibliographical data were added to the corresponding template. Descriptive matrices of wet pulp (M2,2), water, press pulp water(MP0,0), water and press pulp water (M0´,0´), raw juice (M1´,1´) and pressed pulp (M2,2) were also obtained. Once the template is done, this can be used as a basic template to make the other ones. After that, it is possible to create the descriptive matrix (product) and modify product (Figure 18).
(a) Modify template (b) Create product
(c) Modify product
Fig. 18. Windows for specific operations with the aim to create new templates or products

Application of the Software e-SAFES® (Based on SAFES Methodology) to Control Disinfection in the Sugar Extraction from Sugar Beet (Beta vulgaris L.)
57
The e-SAFES® software also allows the creation of matrices of changes, which are useful to study the changes undergone by the product as a consequence of a single or multiple stages of changes (or unit operations). A matrix of changes is the result of substracting two descriptive matrices, for which one of them needs to be previously transformed, i.e. multiplied by a factor that relates the mass of the product before and after the operation being studied (Fig. 19, 20).
Fig. 19. Creating a Transformed Matrix
Fig. 20. Creating a Matrix of Changes
Figures 21, 22 and 23 show the matrices of changes of sugar beet MC1´,0 for each disinfection process. It is possible to detect a decrease in all components of the intracellular liquid phase. This indicates that each soluble component migrates from the cellular structure of cossettes because of cell membrane denaturation. Water content, together with soluble solids, decreases a 23.53%. Decreasing of soluble components is different, because of their different behavior in the extractor. The solubility of sugars is very high (the content of sugars have decreased in 93%), but for example solubility of saponins is less than 40%. This means that all components can leave the cells of sugar beet, but the amount of components which ends in the raw juice is different as it is possible to observe in the matrix of changes. The increasing of sugars in the raw juice is the aim of the extraction operation, but other components (nitrogen components, ash, etc) are also increasing which debase quality of raw juice. From the point of view of disinfection, the focus must be placed on the cell that displays the lactic acid content, which would increase as a consequence of microbial growth.
Quality Control of Herbal Medicines and Related Areas
58
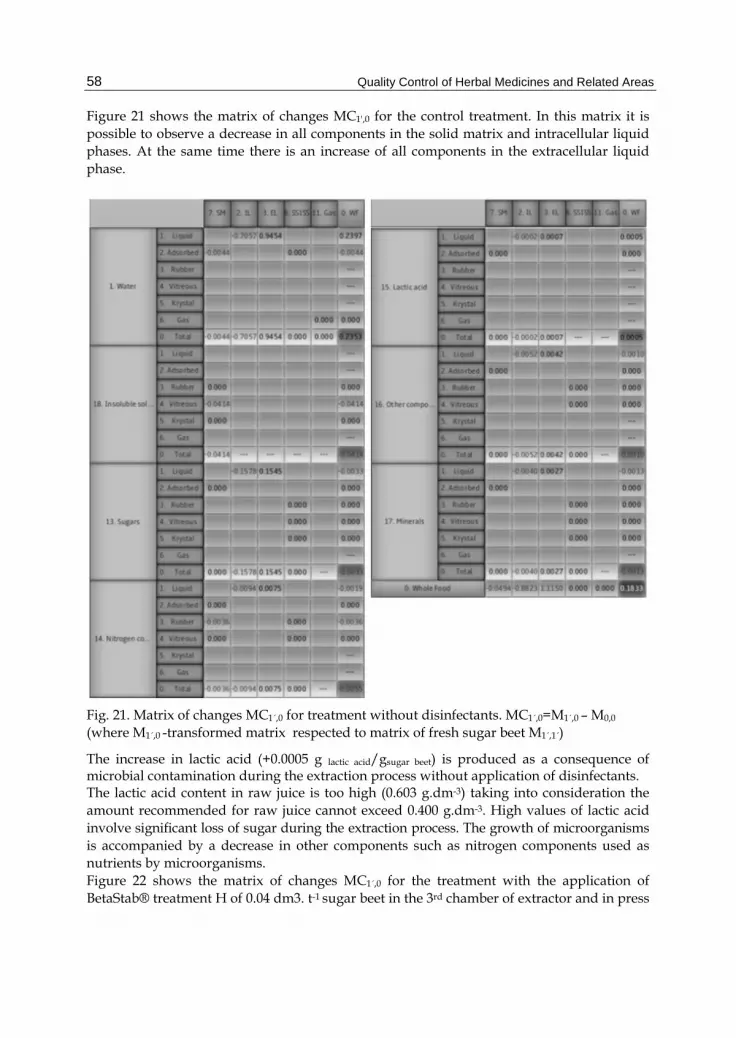
Figure 21 shows the matrix of changes MC1',0 for the control treatment. In this matrix it is possible to observe a decrease in all components in the solid matrix and intracellular liquid phases. At the same time there is an increase of all components in the extracellular liquid phase.
Fig. 21. Matrix of changes MC1´,0 for treatment without disinfectants. MC1´,0=M1´,0 – M0,0 (where M1´,0 -transformed matrix respected to matrix of fresh sugar beet M1´,1´)
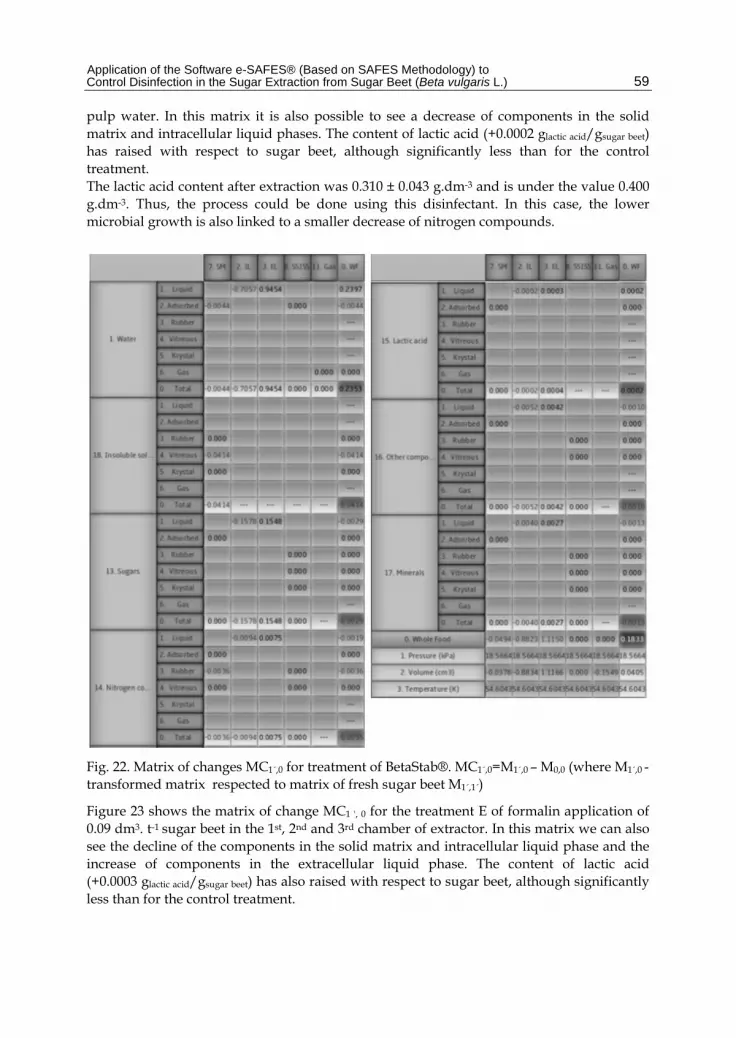
The increase in lactic acid (+0.0005 g lactic acid/gsugar beet) is produced as a consequence of microbial contamination during the extraction process without application of disinfectants. The lactic acid content in raw juice is too high (0.603 g.dm-3) taking into consideration the amount recommended for raw juice cannot exceed 0.400 g.dm-3. High values of lactic acid involve significant loss of sugar during the extraction process. The growth of microorganisms is accompanied by a decrease in other components such as nitrogen components used as nutrients by microorganisms. Figure 22 shows the matrix of changes MC1´,0 for the treatment with the application of BetaStab® treatment H of 0.04 dm3. t-1 sugar beet in the 3rd chamber of extractor and in press
Application of the Software e-SAFES® (Based on SAFES Methodology) to Control Disinfection in the Sugar Extraction from Sugar Beet (Beta vulgaris L.)
59
pulp water. In this matrix it is also possible to see a decrease of components in the solid matrix and intracellular liquid phases. The content of lactic acid (+0.0002 glactic acid/gsugar beet) has raised with respect to sugar beet, although significantly less than for the control treatment. The lactic acid content after extraction was 0.310 ± 0.043 g.dm-3 and is under the value 0.400 g.dm-3. Thus, the process could be done using this disinfectant. In this case, the lower microbial growth is also linked to a smaller decrease of nitrogen compounds.
Fig. 22. Matrix of changes MC1´,0 for treatment of BetaStab®. MC1´,0=M1´,0 – M0,0 (where M1´,0 -transformed matrix respected to matrix of fresh sugar beet M1´,1´)
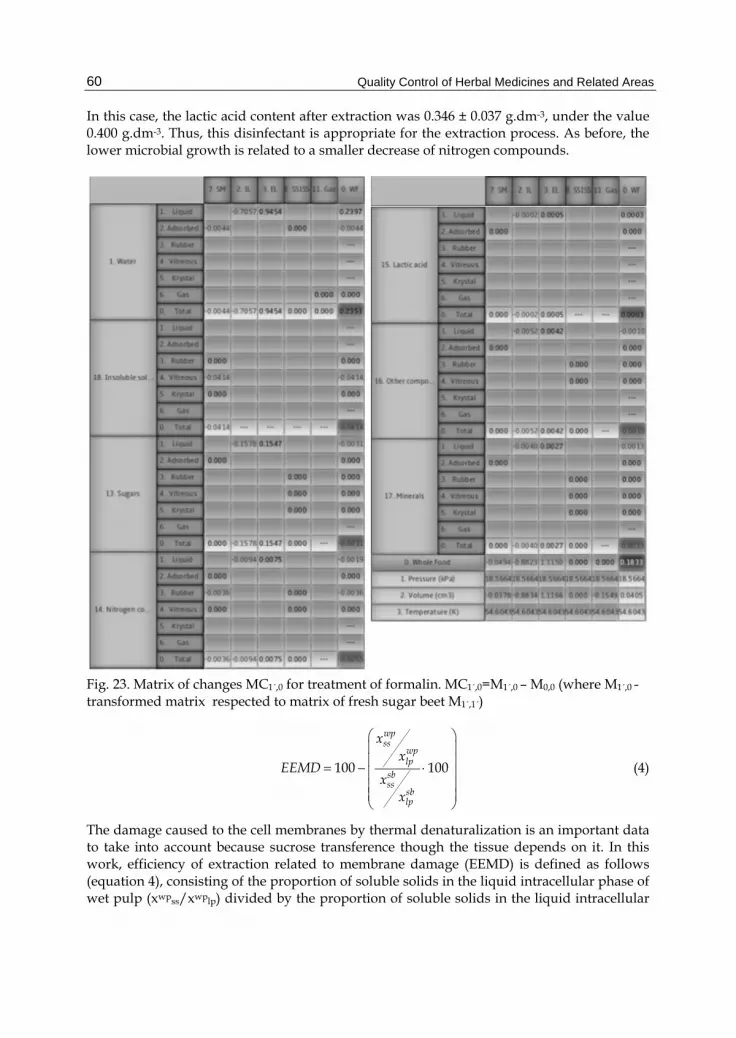
Figure 23 shows the matrix of change MC1 ', 0 for the treatment E of formalin application of 0.09 dm3. t-1 sugar beet in the 1st, 2nd and 3rd chamber of extractor. In this matrix we can also see the decline of the components in the solid matrix and intracellular liquid phase and the increase of components in the extracellular liquid phase. The content of lactic acid (+0.0003 glactic acid/gsugar beet) has also raised with respect to sugar beet, although significantly less than for the control treatment.
Quality Control of Herbal Medicines and Related Areas
60
In this case, the lactic acid content after extraction was 0.346 ± 0.037 g.dm-3, under the value 0.400 g.dm-3. Thus, this disinfectant is appropriate for the extraction process. As before, the lower microbial growth is related to a smaller decrease of nitrogen compounds.
Fig. 23. Matrix of changes MC1´,0 for treatment of formalin. MC1´,0=M1´,0 – M0,0 (where M1´,0 -transformed matrix respected to matrix of fresh sugar beet M1´,1´)
100 100
wpss
wplp
sbss
sblp
xx
EEMDx
x
⎛ ⎞⎜ ⎟⎜ ⎟= − ⋅⎜ ⎟⎜ ⎟⎜ ⎟⎝ ⎠
(4)
The damage caused to the cell membranes by thermal denaturalization is an important data to take into account because sucrose transference though the tissue depends on it. In this work, efficiency of extraction related to membrane damage (EEMD) is defined as follows (equation 4), consisting of the proportion of soluble solids in the liquid intracellular phase of wet pulp (xwpss/xwplp) divided by the proportion of soluble solids in the liquid intracellular
Application of the Software e-SAFES® (Based on SAFES Methodology) to Control Disinfection in the Sugar Extraction from Sugar Beet (Beta vulgaris L.)
61
phase in sugar beet (xsbss/xsblp). In our case, this parameter resulted in 85.43% of the cell membranes damaged by denaturation.
4. Conclusion The results show that the application of a new natural disinfectant (BetaStab®) for the extraction of sugar (sucrose) from sugar beet ensures acceptable results, as well as the application of formalin. The best solution for reducing microbial contamination in the extraction process must take into account the possibility that microorganisms develop resistance to disinfectants, so that rotation should be considered during all campaign. It has been demonstrated the usefulness of e-SAFES® tool for the detection of changes associated with the application of disinfectants in the manufacturing process. The simplicity of the interface with the user is an advantage in its application as a tool of control.
5. Acknowledgment The authors would like to acknowledge to the Ministry of Science and Innovation (Spain) for providing the financial support of the project AGL 2009-09905.
6. References Barrera, C.; Chenoll, C.; Andrés, A. & Fito, P. (2007). Application of safes (systematic
approach to food engineering systems) methodology to French fries manufacture. Journal Of Food Engineering, Vol.83, No.2, pp. 201-210, ISSN 0260-8774
Baryga, A. (2006). Vliv mikrobiologické čistoty bílého cukru na jeho využití v potravinářském průmyslu. Listy cukrovarnické a řeparské, Vol.122, No.12, pp. 341 – 343, ISSN 1210-3306
Bennár, M.; Betoret, E.; Betoret, N.; Bojňanská T. & Fito, P. (2008). Application of the SAFES (Systematic Approach to Food Engineering System) methodology to the extraction operation in sugar beet process. In: CD-ROM of Full Texts from 18th International Congress of Chemical and Process Engineering CHISA 2008, Praha: Process Engineering Publisher, ISBN 978-80-02-02047-9
Bennár, M. (2010). Optimization the yield increase of sugar in obtaining sucrose from sugar beet - doctoral thesis, Slovak University of Agriculture in Nitra, Slovakia.
Betoret, N.; Andrés, A.; Segui, L. & Fito, P. (2007). Application of safes (systematic approach to food engineering systems) methodology to dehydration of apple by combined methods. Journal Of Food Engineering, Vol.83, No.2, pp. 186-192, ISSN 0260-8774
Department of Health and Human Services, Public Health Service, National Toxicology Program (2005). Report on Carcinogens, 11th Edition, 31.3.2011. Available from: http://ntp.niehs.nih.gov/ntp/roc/eleventh/profiles/s089form.pdf.
Ehwald, R.; Kowallick, D.; Meshcheryakov, A. B.; & Kholodova, V. P. (1980). Sucrose Leakage from Isolated Parenchyma of Sugar Beet Roots, Journal of Experimental Botany, Vol.31, No.2, pp. 607-620, ISSN 1460-2431
Elliot, M. C. & Weston, G. D. (1993). In: van der Poel, P. W.; Schiweck, H. & Schwartz, T. (1998). Sugar Technology. Beet and Cane Manufacture. Berlin: Verlag Dr. Albert Bartens KG, 1120 p., ISBN 3-87040-065X.
Fito, P.; Andrés, A.; Chiralt, A.; Pardo, P. (1996) Coupling of hydrodynamic mechanism and deformation relaxation phenomena during vacuum teatments in solid porous food liquid systems. Journal Of Food Engineering, Vol.27, pp. 229-240, ISSN 0260-8774

Quality Control of Herbal Medicines and Related Areas
62
Fito, P.; Le Maguer, M.; Betoret, N. & Fito, P.J. (2007). Advanced food process engineering to model real foods and processes: The “SAFES” methodology. Journal Of Food Engineering, Vol.83, No.2, pp. 173-185, ISSN 0260-8774
Hein, W. & Pollach, G. (1997). In: van der Poel, P. W.; Schiweck, H. & Schwartz, T. (1998). Sugar Technology. Beet and Cane Manufacture. Berlin: Verlag Dr. Albert Bartens KG, 1120 p., ISBN 3-87040-065X.
IARC Monographs. (2006). Formaldehyde, 2-Butoxyethanol and 1-tert-Butoxypropan-2-ol, IARC Monographs on the Evaluation of Carcinogenic Risks to Humans 88, Lyon, France: International Agency for Research on Cancer, pp. 39–325, ISBN 92-832-1288-6.
Krűger, W. (1957). In: van der Poel, P. W.; Schiweck, H. & Schwartz, T. (1998). Sugar Technology. Beet and Cane Manufacture. Berlin: Verlag Dr. Albert Bartens KG, 1120 p., ISBN 3-87040-065X.
Lemoine, R.; Daie, J. & Wyse, R. (1988). Evidence for the Presence of a Sucrose Carrier in Immature Sugar Beet Tap Roots. Plant Physiology, Vol.86, pp. 575 – 580, ISSN 1532-2548.
Liners, F.; Gaspar, Th. & van Cutsem, P. (1994). Acetyl-and methyl-esterification of pectins of friable and compact sugarbeet calli: consequences for intercellular adhesion, Planta, Vol.192, No.4, pp. 545–556, ISSN 0032-0935.
McGinnis, R. A. (1982). Beet-Sugar Technology, 3. Ed., Beet Sugar Development Foundation, Fort Collins.
Oikawa et al. (1993). In: van der Poel, P. W.; Schiweck, H. & Schwartz, T. (1998). Sugar Technology. Beet and Cane Manufacture. Berlin: Verlag Dr. Albert Bartens KG, 1120 p., ISBN 3-87040-065X.
Palta, J. A.; Wyn-Jones, R. G. & Tomos, A. D. (1987). Leaf diffusive conductance and tap root cell turgor presure of sugar beet. Plant, Cell and Enviroment, Vol.10, No.9, pp. 735 – 740, ISSN 0140-7791
Pollach, G. (1995). In: van der Poel, P. W.; Schiweck, H. & Schwartz, T. (1998). Sugar Technology. Beet and Cane Manufacture. Berlin: Verlag Dr. Albert Bartens KG, 1120 p., ISBN 3-87040-065X.
Pollach, G. et al. (1996). In: van der Poel, P. W.; Schiweck, H. & Schwartz, T. (1998). Sugar Technology. Beet and Cane Manufacture. Berlin: Verlag Dr. Albert Bartens KG, 1120 p., ISBN 3-87040-065X.
Rouilly, A.; Jorda, J.; Rigal, L. (2006). Thermo-mechanical processing of sugar beet pulp. II. Thermal and rheological properties of thermoplastic SBP. Carbohydrate Polymers, Vol.66,No.1, pp. 117–125, ISSN 0144-8617.
Santos, M.; Teixeira, J. & Rodriguez, A. (2000). Production of dextranase, dextran and fructose from sucrose using Leuconostoc mesenteroides NRRL B512 (F). Biochemical Engineering Journal, Vol.4, No.3, pp. 177-188, ISSN 1369-703X
Schiweck, H.; Kozianowski, G.; Anderlei, J. & Burba, M., (1994). Errechnung der Dicksaft-Nichtzuckermasse aus Rübenanalysen—Vorschlag für eine Gleichung zur Bewertung der technischen Rübenqualität. Zuckerindustrie, Vol.119, pp. 268–282, ISSN 0344-8657
Steinert, P.; Galling, G.; Buttersack, C. & Buchholz, K. (1990). Die Ultrastruktur der Zuckerrübe während der industriellen Zuckergewinnung. Zuckerindustrie, Vol.115, No.10, pp. 840 – 851, ISSN 0344-8657.
van der Poel, P. W. (1975). In: van der Poel, P. W.; Schiweck, H. & Schwartz, T. (1998). Sugar Technology. Beet and Cane Manufacture. Berlin: Verlag Dr. Albert Bartens KG, 1120 p., ISBN 3-87040-065X.
van der Poel, P. W.; Schiweck, H. & Schwartz, T. (1998). Sugar Technology. Beet and Cane Manufacture. Berlin: Verlag Dr. Albert Bartens KG, 1120 p., ISBN 3-87040-065X.