Embed Size (px)
Citation preview
Application of Vertical Electrical Sounding (VES) Method with Resistivity Meter Based on Boost Converter to Estimate the Potential of Groundwater Aquifers in Karang Anyar of Tarakan City
Asta1* and Abdul Muis Prasetia2 1Civil Engineering Borneo Tarakan University, Indonesia 2Electrical Engineering Borneo Tarakan University, Indonesia
Abstract. Water catchment research has been done in Karang Anyar of Tarakan City with the aim to estimate the potential of groundwater aquifers. Groundwater is more widely used to meet the needs because of its better quality compared to surface water. The groundwater distribution is not only described vertically, to find horizontally can be seen through the deployment of geological formations that act as aquifers. Vertical Electrical Sounding method is one method that can be used to predict geological and hydrogeological conditions. Based on geoelectric exploration using a resistivity meter based on boost converter shows the presence of groundwater in a depth of 7.91- 44.33 meters with resistance of 27.22 Ωm and the estimated lithology is sand. According the research could determine that resources ground water in Karang Anyar village is prospectly
1 Introduction Geographically, Tarakan City is located between 117 ° 34'-117 ° 38 'east longitude and 3 ° 19'-3 ° 20' North Latitude with a total area of 657.33 km2. Due island, the city only has 38.2% of the land and the rest of the ocean. Most areas Tarakan City situated at an altitude of about > 25-100 above sea level, the city is also one of the drought-prone areas due to the need for water depending on rainfall.
Water is a very important necessity in everyday life, farming and livestock activities. During the dry season many dry agricultural lands makes agriculture is not maximal, so that new water resources are needed to fulfil the daily life of the community, including also for agricultural activities. The new source can be obtained from groundwater. Groundwater can be found in the sedimentary pore spaces and the weathered layers, in the folds and crevices of hard rock, the cracks zone and karst cave. Rock layers that can save and drain water are called aquifers [1]. Search on the potential presence of ground water for daily needs to be
* Corresponding author: [email protected]
© The Authors, published by EDP Sciences. This is an open access article distributed under the terms of the Creative Commons Attribution License 4.0 (http://creativecommons.org/licenses/by/4.0/).
MATEC Web of Conferences 331, 06001 (2020) https://doi.org/10.1051/matecconf/202033106001ICUDR 2019
done in order to determine whether or not the aquifer layer is present. Land surface investigation is an important first step in order to provide an idea of the location of the groundwater presence. Although groundwater cannot be directly observed through the earth's surface, can at least provide an idea of the location of the groundwater presence [2].
Identification of the constituent layers of the aquifer in the ground can be done through a method of geoelectric resistivity. This identification aims to determine the type of rock layers below the earth's surface with a depth information, thickness, and type of rock aquifer layer. Detection is based on the physical properties of rocks against the current that is injected into the ground, where each rock has a different resistance type. The working principle of geoelectric by measuring the resistivity to the flow of electric current into the rock through the current electrode, then the voltage can be received by the potential electrode. The potential difference between the electrodes is measured by a voltmeter and of the value of these measurements can be calculated resistance type [3].
In this study used Resistivity Measurement in vertical direction or Vertical Electrical Sounding (VES). This measurement is one of the resistivity geoelectric method to determine changes soil resistivity with depth that aims to study variations in resistivity of rock beneath the earth's surface vertically. This configuration is one of the configurations of the resistivity geoelectric method for depth investigation, so it is more suitable for use in this research because it can achieve more depth results compared to other configurations [4].
The resistivity data obtained in this study used a resistivity meter based on boost converter. The advantages offered by the boost converter in managing direct current and simple successfully applied to the resistivity meter design that has been done in previous research [5]. This resistivity survey will provide an overview of the subsurface resistivity distribution. certain resistivity values will be associated with certain geological conditions. To convert resistivity values into geologic form requires knowledge of the typical resistivity rates for each type of material and structure of the survey area. The existing data is processed using software with the aim interpolating subsurface resistivity value in one-dimensional.
2 Method Aquifer is a rock layer that serves as a water carrier or rock that has the arrangement of granules in such a way that it can drain the water. Instead the waterproof layer is a rock that can store ground water but cannot drain in significant amounts. While the rock layers that are not able to store and drain water is called aquifer. The distribution of ground water is not only described vertically, to know horizontally can be known through the spread of geological formations acting as aquifers. The condition of the aquifer layer is influenced by the nature of the rock especially the porosity and the permeability level.
To know the type of rock layers beneath the Earth's surface with the depth information, thickness, and type of aquifer lining rock can be done by knowing the resistivity beneath the surface of the earth through the measurement of resistance in the earth's surface. Earth resistivity associated with the type of mineral, fluid content and the degree of water saturation in the rock. The basic principle of the method of type resistivity is Ohm's Law, the resistance is obtained by measuring the potential difference and the current passed in a conductor [3]. The current (I) flowing on a medium is proportional to the measured potential (V) and inversely proportional to the medium resistance (R), or can be formulated as equation (1)
𝑅𝑅 = #$ (1)
the basic concept of rock resistivity measurement is modified from the measurement of resistance of a material sample in the laboratory
2
MATEC Web of Conferences 331, 06001 (2020) https://doi.org/10.1051/matecconf/202033106001ICUDR 2019
done in order to determine whether or not the aquifer layer is present. Land surface investigation is an important first step in order to provide an idea of the location of the groundwater presence. Although groundwater cannot be directly observed through the earth's surface, can at least provide an idea of the location of the groundwater presence [2].
Identification of the constituent layers of the aquifer in the ground can be done through a method of geoelectric resistivity. This identification aims to determine the type of rock layers below the earth's surface with a depth information, thickness, and type of rock aquifer layer. Detection is based on the physical properties of rocks against the current that is injected into the ground, where each rock has a different resistance type. The working principle of geoelectric by measuring the resistivity to the flow of electric current into the rock through the current electrode, then the voltage can be received by the potential electrode. The potential difference between the electrodes is measured by a voltmeter and of the value of these measurements can be calculated resistance type [3].
In this study used Resistivity Measurement in vertical direction or Vertical Electrical Sounding (VES). This measurement is one of the resistivity geoelectric method to determine changes soil resistivity with depth that aims to study variations in resistivity of rock beneath the earth's surface vertically. This configuration is one of the configurations of the resistivity geoelectric method for depth investigation, so it is more suitable for use in this research because it can achieve more depth results compared to other configurations [4].
The resistivity data obtained in this study used a resistivity meter based on boost converter. The advantages offered by the boost converter in managing direct current and simple successfully applied to the resistivity meter design that has been done in previous research [5]. This resistivity survey will provide an overview of the subsurface resistivity distribution. certain resistivity values will be associated with certain geological conditions. To convert resistivity values into geologic form requires knowledge of the typical resistivity rates for each type of material and structure of the survey area. The existing data is processed using software with the aim interpolating subsurface resistivity value in one-dimensional.
2 Method Aquifer is a rock layer that serves as a water carrier or rock that has the arrangement of granules in such a way that it can drain the water. Instead the waterproof layer is a rock that can store ground water but cannot drain in significant amounts. While the rock layers that are not able to store and drain water is called aquifer. The distribution of ground water is not only described vertically, to know horizontally can be known through the spread of geological formations acting as aquifers. The condition of the aquifer layer is influenced by the nature of the rock especially the porosity and the permeability level.
To know the type of rock layers beneath the Earth's surface with the depth information, thickness, and type of aquifer lining rock can be done by knowing the resistivity beneath the surface of the earth through the measurement of resistance in the earth's surface. Earth resistivity associated with the type of mineral, fluid content and the degree of water saturation in the rock. The basic principle of the method of type resistivity is Ohm's Law, the resistance is obtained by measuring the potential difference and the current passed in a conductor [3]. The current (I) flowing on a medium is proportional to the measured potential (V) and inversely proportional to the medium resistance (R), or can be formulated as equation (1)
𝑅𝑅 = #$ (1)
the basic concept of rock resistivity measurement is modified from the measurement of resistance of a material sample in the laboratory
𝑅𝑅 = 𝜌𝜌 &' (2)
with R = resistance (Ω), ρ = resistivity of material (Ωm), L = length (meters) and A = cross-sectional area (meters). combining equation (1) and equation (2) then obtained as equation (3):
𝜌𝜌 = #$. '& (3)
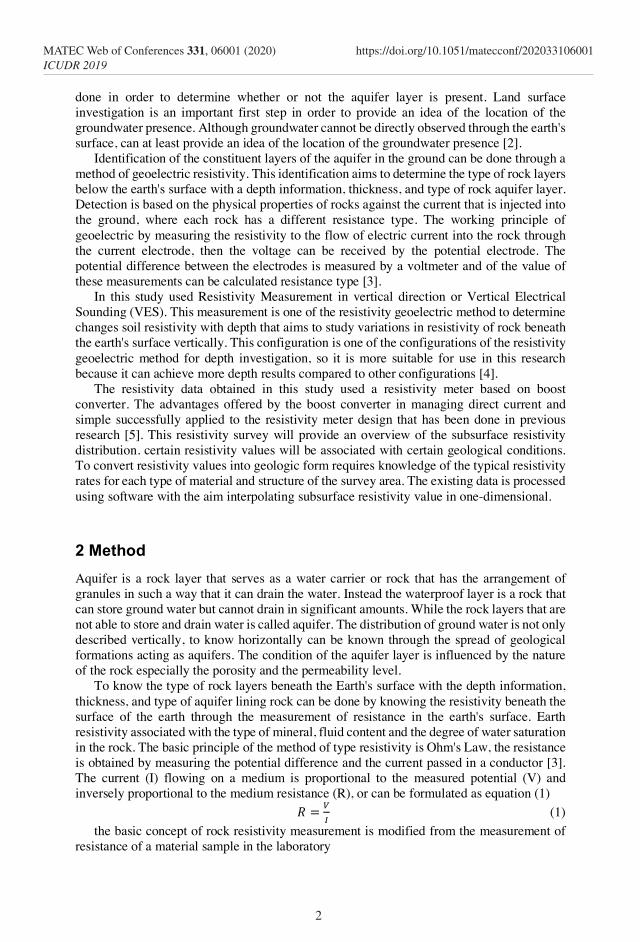
There are two types inquiry of resistance type, namely Horizontal Profiling (HP) and Vertical Electrical Sounding (VES) or depth investigation. VES is a one-dimensional resistivity measurement method to obtain subsurface resistivity variations vertically [4] The VES method utilizes the nature of propagation of an electric current injected into the ground through two current electrodes and then measured the potential difference between two voltage electrodes which are plugged into the surface. From the information of the value of the injected electrical current and the magnitude of the measured voltage, then can be calculated resistivity pseudo rocks. The measurement scheme with the VES Method is shown in Figure 1.
Fig. 1. Vertical Electrical Sounding Method
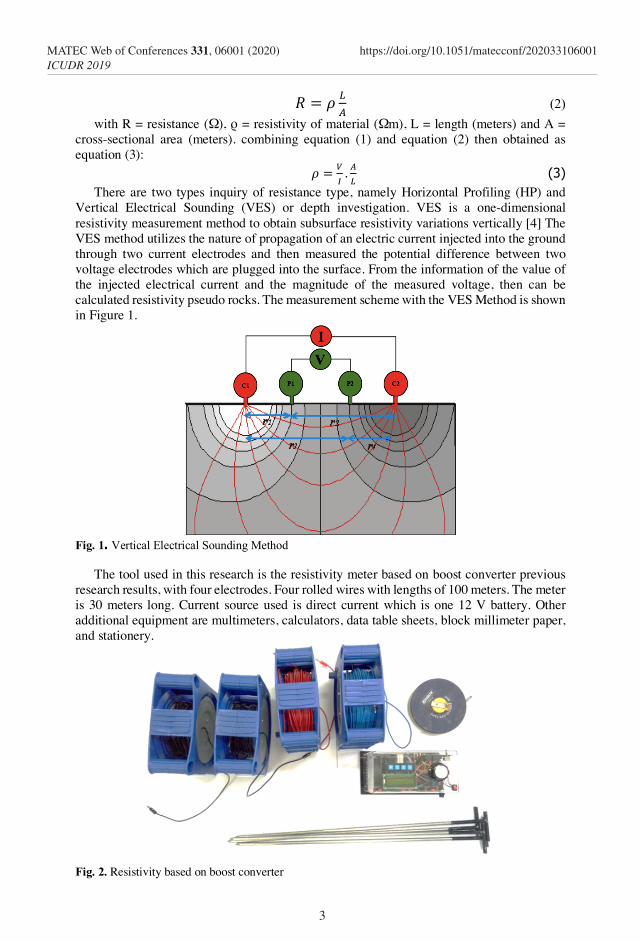
The tool used in this research is the resistivity meter based on boost converter previous research results, with four electrodes. Four rolled wires with lengths of 100 meters. The meter is 30 meters long. Current source used is direct current which is one 12 V battery. Other additional equipment are multimeters, calculators, data table sheets, block millimeter paper, and stationery.
Fig. 2. Resistivity based on boost converter
3
MATEC Web of Conferences 331, 06001 (2020) https://doi.org/10.1051/matecconf/202033106001ICUDR 2019
Specification resistivity meter based on boost converter output
- Injection : Controlled by microcontroller - Power supply : 12 Volts - Outgoing Voltage : 500 Volts - Power : 75 Watt - Current accuracy : 4 mA
Input - Voltage : 2.5 - 2000 mV - System readings : Digital - Voltage accuracy : 2.5 mV
This research is divided into three stages namely, preliminary stage, data collection phase,
and analysis phase. 1. Preliminary stage 2. Studying literature review becomes the basic process in conducting this research, in this
stage also performed the initial analysis. This analysis is a first step to illustrate the results of similar studies that have been done by previous researchers.
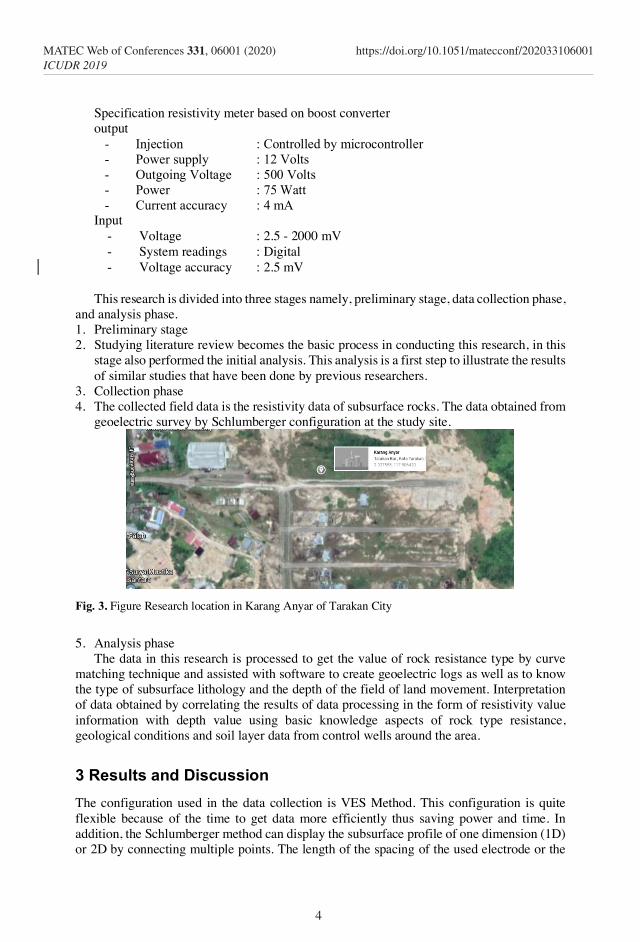
3. Collection phase 4. The collected field data is the resistivity data of subsurface rocks. The data obtained from
geoelectric survey by Schlumberger configuration at the study site.
Fig. 3. Figure Research location in Karang Anyar of Tarakan City
5. Analysis phase
The data in this research is processed to get the value of rock resistance type by curve matching technique and assisted with software to create geoelectric logs as well as to know the type of subsurface lithology and the depth of the field of land movement. Interpretation of data obtained by correlating the results of data processing in the form of resistivity value information with depth value using basic knowledge aspects of rock type resistance, geological conditions and soil layer data from control wells around the area.
3 Results and Discussion The configuration used in the data collection is VES Method. This configuration is quite flexible because of the time to get data more efficiently thus saving power and time. In addition, the Schlumberger method can display the subsurface profile of one dimension (1D) or 2D by connecting multiple points. The length of the spacing of the used electrode or the
4
MATEC Web of Conferences 331, 06001 (2020) https://doi.org/10.1051/matecconf/202033106001ICUDR 2019
Specification resistivity meter based on boost converter output
- Injection : Controlled by microcontroller - Power supply : 12 Volts - Outgoing Voltage : 500 Volts - Power : 75 Watt - Current accuracy : 4 mA
Input - Voltage : 2.5 - 2000 mV - System readings : Digital - Voltage accuracy : 2.5 mV
This research is divided into three stages namely, preliminary stage, data collection phase,
and analysis phase. 1. Preliminary stage 2. Studying literature review becomes the basic process in conducting this research, in this
stage also performed the initial analysis. This analysis is a first step to illustrate the results of similar studies that have been done by previous researchers.
3. Collection phase 4. The collected field data is the resistivity data of subsurface rocks. The data obtained from
geoelectric survey by Schlumberger configuration at the study site.
Fig. 3. Figure Research location in Karang Anyar of Tarakan City
5. Analysis phase
The data in this research is processed to get the value of rock resistance type by curve matching technique and assisted with software to create geoelectric logs as well as to know the type of subsurface lithology and the depth of the field of land movement. Interpretation of data obtained by correlating the results of data processing in the form of resistivity value information with depth value using basic knowledge aspects of rock type resistance, geological conditions and soil layer data from control wells around the area.
3 Results and Discussion The configuration used in the data collection is VES Method. This configuration is quite flexible because of the time to get data more efficiently thus saving power and time. In addition, the Schlumberger method can display the subsurface profile of one dimension (1D) or 2D by connecting multiple points. The length of the spacing of the used electrode or the
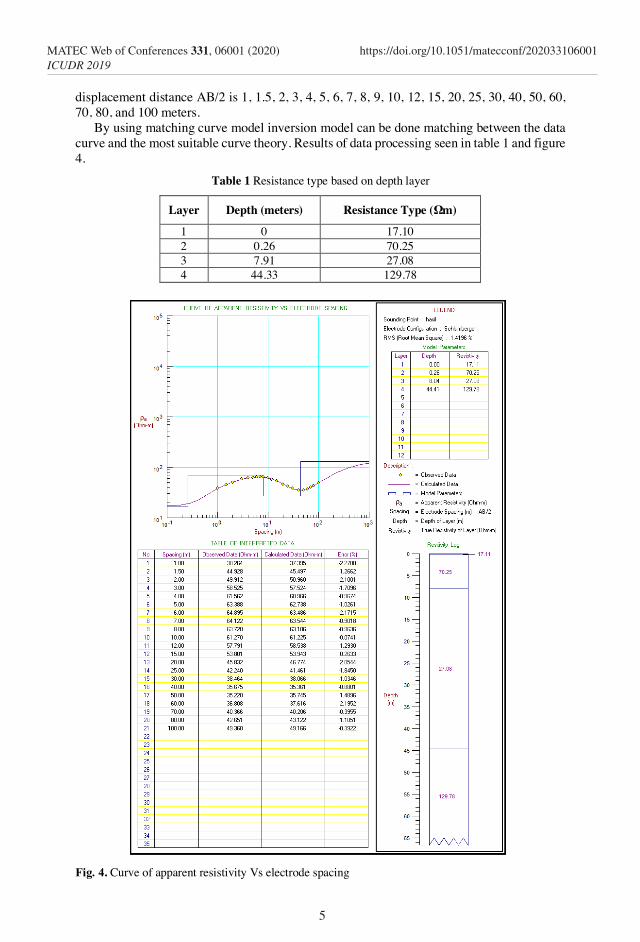
displacement distance AB/2 is 1, 1.5, 2, 3, 4, 5, 6, 7, 8, 9, 10, 12, 15, 20, 25, 30, 40, 50, 60, 70, 80, and 100 meters.
By using matching curve model inversion model can be done matching between the data curve and the most suitable curve theory. Results of data processing seen in table 1 and figure 4.
Table 1 Resistance type based on depth layer
Layer Depth (meters) Resistance Type (Ωm)
1 0 17.10 2 0.26 70.25 3 7.91 27.08 4 44.33 129.78
Fig. 4. Curve of apparent resistivity Vs electrode spacing
5
MATEC Web of Conferences 331, 06001 (2020) https://doi.org/10.1051/matecconf/202033106001ICUDR 2019
Results of one-dimensional data processing obtained resistivity value and depth. The
prediction of the coating is based on the value of resistivity that is processed and matched to the resistivity value of the previous literature or study. The results of data processing obtained curves and resistivity logs containing the resistivity value of each layer, layer thickness, and depth. The results of data processing can be known to a depth of ± 65 m with a variation of rock resistance value between 17.10 to 129.78 Ωm. The interpretation results are as follows: a. Layer 1 with a resistance value of type 17.10 Ωm predicted as top soil. b. Layer 2 with a resistance value of type 70.25 Ωm is predicted as a clay layer. c. Layer 3 with a resistance value of type 27.08 Ωm is predicted as a sand layer. d. Layer 4 with a resistance value of type 129.78 Ωm is predicted as a sandstone layer
The results of the interpretation show that most of the sub-surface structure of the research area is dominated by sedimentary rock types consisting of clay, sand, and sandstone. The aquifer layer is bounded by an impermeable layer in the form of clay for water to get trapped and collected in the aquifer layer. Aquifer that has a high potential to be taken as additional water for the community needs is at the 2nd layer.
4 Conclusions The results of the research of aquifer pattern mapping in the area of Karang Anyar Tarakan City can be concluded that the aquifer thickness of 36.42m with a depth of less than 44.33m. The variation of resistance type values in the study area ranged from 17.10 to 125.12 Ωm and located at a depth of ± 65 m. Areas with a large groundwater potential source at a depth of 7.91 - 44.33 m with a resistance type of 27.22 Ωm and the estimated lithology is sand, based on the analysis of the optimum available debit potential of 33,281.07 m3 / hr.
Reference 1. E. A. T. Winarni, Darsono, B. Legowo, Aplikasi Metode Geolistrik Resistivitas
Konfigurasi Schlumberger Untuk Identifikasi Akuifer Di Kecamatan Plupuh, Kabupaten Sragen, Jurnal Fisika Flux, Vol 11 No 2, 119 – 128 (2014)
2. A. P. Yuristina, S. Khumaedi, Pendugaan Persebaran Air Bawah Permukaan Metode Geolistrik Konfigurasi Wenner-Schlumberger Di Desa Tanggungarjo Kabupaten Grobogan, Unnes Physics Journal, Vol 4 No 1(2015)
3. S. K. Tama, Supriyadi, Struktur Bawah Permukaan Tanah Di Kota Lama Semarang Menggunakan Metode Geolistrik Resistivity Konfigurasi Schlumberger, Unnes Physics Journal, Vol 4 No 1(2015)
4. A. Muis, R. Aidil, R. Faizal, Penggunaan Resistivity Meter Berbasis Boost Converter untuk Identifikasi Batuan Dasar Pancang Pondasi Bangunan di Pulau Tarakan,Borne Engineering: Jurnal Teknik Sipil,Vol 2 No 2, 127-136 (2018).
6
MATEC Web of Conferences 331, 06001 (2020) https://doi.org/10.1051/matecconf/202033106001ICUDR 2019


