Embed Size (px)
Citation preview

INTERNATIONAL JOURNAL OF ENERGY RESEARCHInt. J. Energy Res. 2006; 30:659–670Published online 9 February 2006 in Wiley InterScience (www.interscience.wiley.com). DOI: 10.1002/er.1176
Assessment of the energy and exergy utilization efficienciesin the Turkish agricultural sector
Zafer Utlu1,z and Arif Hepbasli2,n,y
1Turkish Land Forces NCO Vocational College, 10110 Balikesir, Turkey2Department of Mechanical Engineering, Faculty of Engineering, Ege University, 35100 Bornova, Izmir, Turkey
SUMMARY
This study deals with evaluating the energy and exergy utilization efficiencies in the Turkish agriculturalsector over a 12-year period from 1990 to 2001. In the energy and exergy analyses, two main energysources, namely fuels and electricity, are taken into consideration, while the sectoral energy and exergyefficiencies are compared for this period. These main energy sources include diesel for tractors and othervehicles, and electricity for pumps. Overall energy utilization efficiencies are obtained to vary between 29.1and 41.1%, while overall exergy utilization efficiencies are found to range from 27.9 to 37.4% in theanalysed years, respectively. It may be concluded that the present technique proposed here may be used asa useful tool in analysing and evaluating the energy and exergy utilization efficiencies, identifying energyefficiency and/or energy conservation opportunities and dictating the energy strategies of countries.Copyright # 2005 John Wiley & Sons, Ltd.
KEY WORDS: agriculture; energy efficiency; exergy efficiency; energy utilization; energy resources; Turkey
1. INTRODUCTION
The exergy of an energy form or a substance is a measure of its usefulness or quality or potentialto cause change (Rosen and Dincer, 1997). Exergy is defined as the maximum work, which canbe produced by a system or a flow (Rosen and Scott, 2003). A true understanding of exergy andthe insights it can provide into the efficiency, environmental impact and sustainability of energysystems are required for the engineer or scientist working in the area of energy systems andthe environment.
Energy requirements in the agriculture are divided into two groups, namely direct andindirect. Direct energy is required to perform various tasks related to crop production processessuch as land preparation, irrigation, interculture, threshing, harvesting and transportation ofagricultural inputs and farm product (Singh, 2000). Direct energy is directly used at farms and
Received 27 April 2005Revised 13 July 2005
Accepted 8 August 2005Copyright # 2005 John Wiley & Sons, Ltd.
yE-mails: [email protected]; [email protected]: zafer [email protected]
nCorrespondence to: Arif Hepbasli, Department of Mechanical Engineering, Faculty of Engineering, Ege University,35100 Bornova, Izmir, Turkey.

on fields. Indirect energy, on the other hand, consists of the energy used in the manufacture,packaging and transport of fertilizers, pesticides and farm machinery (CAEEDAC, 2000;Kennedy, 2000). Indirect energy is not directly used on the farm, while its major items includefertilizers, seeds, machinery production and pesticides. Calculating energy input in theagricultural production is more difficult in comparison to the industry sector due to the highnumber of factors affecting agricultural production (Yaldiz et al., 1993). However, considerablestudies have been conducted in different countries on energy use in the agriculture (Kennedy,2000; Dincer et al., 2005).
The energy utilization of a country can be evaluated using exergy analysis to gain insights intoits efficiency (Rosen and Dincer, 1997). The studies conducted on the energy and exergy analysisof countries have been reviewed in more detail elsewhere (Utlu and Hepbasli, 2005). Theapproaches used to analyse energy utilization of countries or societies may be grouped into threetypes, namely Reistad’s approach, Wall’s approach and Sciubba’s approach. The first one wasapplied by Reistad (1975) to the U.S. in 1970, while the most comprehensive one in terms ofyears appears to be Ayres et al.’s (2003) analysis of the U.S. between 1900 and 1998. Theagriculture sector was singly investigated in the Wall’s and Scuiba’s approach. However, it wasevaluated within the residential sector in the Reistad’s approach. Besides this, Dincer et al.(2005) applied the Reistad’s approach by taking into account the Saudi Arabian agriculturesector separately. In the analysis, they used two main energy sources, viz. diesel for tractors andelectricity for pumps.
In Turkey, the agriculture sector keeps its absolute importance in the economy. Especially,after 1990s, its importance in the economy has raised since Turkey lost its position of self-sufficiency in agriculture and imported agriculture products. The present study is the firstattempt towards conducting an energy and exergy analysis of the Turkish agriculture sector. Itdiffers from the study conducted by Dincer et al. (2005) as follows: (i) All the vehicles (tractor,combine harvester, thresher and atomizer) used in the Turkish agriculture sector were classifiedaccording to their efficiencies, while there was only one vehicle (tractor) considered in the studyof Dincer et al., (ii) In the analysis of the electricity utilization, all electric motors used in theTurkish agriculture were taken into account in terms of efficiencies and capacities, while Dinceret al. (2005) considered only one type of electric motor with an efficiency of 70%, and (iii) Thisstudy also investigated exergy improvement potential over the period considered.
2. ANALYSIS
Some of the key aspects of thermodynamics in terms of energy and exergy balancesand efficiencies have been comprehensively given elsewhere (Dincer et al., 2005; Utlu andHepbasli, 2005).
Energy (first law) and exergy (second law) utilization efficiencies in %, e1 and e2, can bedefined as follows, respectively.
e1 ¼ ðEnergy in products=Total energy inputÞ 100 ð1Þ
e2 ¼ ðEnergy in products=Total energy inputÞ 100 ð2Þ
The energy and exergy efficiencies for heating, cooling, work production, and kinetic energyproduction processes are listed in Table I (Dincer et al., 2005).
Copyright # 2005 John Wiley & Sons, Ltd. Int. J. Energy Res. 2006; 30:659–670
Z. UTLU AND A. HEPBASLI660

Taking into account that the output of tractor is in the form of kinetic energy (shaft work),the exergy associated with shaft work (W) is given by (Dincer et al., 2005)
EW ¼W ð3Þ
Assuming that the fuel exergy grade function is ‘unity’, for fossil-fuelled and electric shaftwork production in tractor, the energy and exergy efficiencies are equal to each other as follows(Dincer et al., 2005):
e1;f ¼ e2;f ¼W=mfHf ð4Þ
The energy efficiency or pump efficiency is given by
e1e;p ¼Wreversible=Wactual ð5Þ
with
Wactual ¼ e1e *Qinput ð6Þ
Van Gool (1997) has also noted that maximum improvement in the exergy efficiency for aprocess or system is obviously achieved when the exergy loss or irreversibility (Exin�Exout) isminimized. Consequently, he suggested that it is useful to employ the concept of an exergetic‘improvement potential’ when analysing different processes or sectors of the economy. Thisimprovement potential, IP, is given by (Hammond and Stapleton, 2001).
IP ¼ ð1� e2ÞðExin � ExoutÞ ð7Þ
Table I. The energy and exergy efficiencies for heating, cooling, work production, and kinetic energyproduction processes.
Process Energy efficiency Exergy efficiency
Electrical heating e1e,h=Qp/We e2e;h ¼ ExQp=ExWe
e2e,h=[1�(T0/Tp)] Qp/We
e2e,h=[(1�(T0/Tp)] e1e,h
Fuel heating e1f,h=Qp/mfHf e2f ;h ¼ ExQp=mfefe2f,h=[(1�(T0/Tp)] Qp/(mfgfHf)e2f,h=[1�(T0/Tp)] e1f,h
Electrical cooling e1c,e=Qp/We e2c;e;h ¼ ExQp=ExWe
e2c,e,h=[(1�(T0/Tp)]Qp/We
e2c,e,h=[1�(T0/Tp)] e1c,e,hShaft work productionvia electricity
e1e,w=W/We e2e;w ¼ ExW=ExWe ¼W=We ¼ e1e;w
Shaft work production via fuel e1f,w=W/mfHf e2f,w=ExW/mfHf=W/(mfgfHf)= e1f,w/gfFuel-driven kineticenergy production
e1f,ke=msDkes/mfHf e2f,ke=msDkes/mfef=msDkes/(mfgfHf)= e1f,ke/gf,ke
Source: Dincer et al. (2005).
Note: Electric and fossil fuel heating processes are taken to generate product heat Qp at a constant temperature Tp, either
from electric energy We or fuel mass mf. Double subscripts indicate the processes in which the quantity represented by
the first subscript is produced by the quantity represented by the second; e.g. the double subscript h, e means heating
with electricity.
Copyright # 2005 John Wiley & Sons, Ltd. Int. J. Energy Res. 2006; 30:659–670
ENERGY AND EXERGY EFFICIENCIES IN TURKISH AGRICULTURE 661

The energy utilization efficiencies in the Turkish agricultural production is calculated for theperiod 1990–2001. In the calculation of the energy inputs, electricity and diesel oil were takeninto consideration. The data used in the study were collected from various statistical resourcessuch as the Statistical Yearbook of Turkey published by the State Institute of Statistics (SIS)under the Prime Ministry of the Republic of Turkey (SIS, 1981, 1992, 1997, 1998, 2002, 2003)and the Special Privatization Commission Reports by the State Planning Organization underthe Prime Ministry (SPO, 2001).
The values of total and agriculture sector energy and exergy consumptions from 1990 to 2001are determined in Table II. Of the total energy input, 36.5% was produced in 2001, while therest was met by imports (Hepbasli and Utlu, 2004a). In 2001, of Turkey’s total end use energy,37% was used by the industrial sector, followed by the residential–commercial sector, 35%, thetransportation sector, 20%, the agricultural sector, 5%, and the non-energy use, 3% (Utlu,2003; Utlu and Hepbasli, 2003).
Figure 1 illustrates material and energy flow in terms of output products in the Turkishagricultural sector. The agricultural sector is vital in the Turkish economy. The extent ofcultivated area is increasing in Turkey unlike in the developed countries. The extent of cultivatedarea was 16 million ha in 1950 and it reached 27.8 million ha in 1990. The distribution ofcultivated area and forest area from 1990 to 2001 according to the included area is given by SIS(1981, 1992, 1997, 1998, 2002, 2003) and SPO (2001). In 1990 and 2001, the total agriculturallands were 27.9 and 26.4 million ha, respectively, in Turkey. Of these, 67.3 and 68.4% were forthe sown area, 19.1 and 18.9% for the fallow area, 7.8 and 7.4% for the orchard and vineyardsarea, 2.3 and 3.1% for the vegetable area, and 3.1 and 2.3% for olives in the same years,respectively.
Fertilizer utilization increased in the agricultural production. N, P2O5 and K2O were takeninto account with the estimated values summarized in Table III. In the calculation of chemicalenergy input, any information that used individual fertilizer materials was not available;therefore, amounts of three main kinds of fertilizers (nitrogen, phosphorous and potassium)were used in the estimation (SIS, 1981, 1992, 1997, 1998, 2002, 2003; SPO, 2001). Since the
Table II. Energy and exergy inputs to the Turkish agriculture sector and Turkey’s total from 1990 to 2001.
Fuels (pJ) Electrical (pJ) Turkish agriculture sector (pJ) Turkey’s total input (pJ)
Year Energy Exergy Energy Exergy Energy Exergy Energy Exergy
1990 20.3 20.1 2.1 2.1 22.4 22.2 2236.3 2227.51991 20.4 20.2 2.6 2.6 23.0 22.8 2256.9 2246.41992 20.5 20.3 3.1 3.1 23.5 23.3 2379.4 2365.91993 25.2 24.9 3.6 3.6 28.8 28.5 2530.7 2511.31994 25.3 25.1 4.3 4.3 29.6 29.4 2513.8 2494.21995 25.8 25.6 5.4 5.4 31.3 31.0 2707.9 2683.71996 27.2 27.0 6.6 6.6 33.8 33.5 2936.5 2907.11997 28.2 27.9 7.2 7.2 35.5 35.2 3082.7 3047.11998 28.0 27.7 8.4 8.4 36.4 36.1 3186.6 3149.91999 28.7 28.4 9.4 9.4 38.2 37.8 3392.0 3380.72000 29.9 29.6 11.0 11.0 41.0 40.7 3527.3 3470.02001 28.6 28.4 11.5 11.5 40.2 39.9 3203.5 3139.1
Source: SIS (2002), Utlu and Hepbasli (2004a) and Hepbasli and Utlu (2004b).
Copyright # 2005 John Wiley & Sons, Ltd. Int. J. Energy Res. 2006; 30:659–670
Z. UTLU AND A. HEPBASLI662

largest energy input is in the form of nitrogen fertilizer, total energy input calculated bysummating the energy amounts of individual fertilizers was converted to energy equivalent.Total fertilizer energy input in the agricultural production was determined to be 412.6 pJ in 1990and obtained to be 381.2 pJ in 2001. Fertilized area has approximately the same value from 1990to 2001. However, the proportion of the area fertilized to the cultivated area changed from 0.79to 0.84 in the years analysed (SIS, 2002).
Crop and livestock production are carried out together in the majority of farm householdswith 72.7%. The share of the crop’s value in the total agricultural production value is 66.0%.
Waste
AGRICULTURESECTORSeed energy
Fuel
Human andanimal power
Fertilizer
Electric
Pesticides
Products
Figure 1. Material and energy flow in the Turkish agriculture sector.
Table III. Fertilizer energy utilization in the Turkish agriculture sector from 1990 to 2001.
Nitrogen Phosphorous Potassium Total fertilizer Area fertilized
Year 106 t Energy (pJ) 106 t Energy (pJ) 106 t Energy (pJ) 106 t Energy (pJ) 106 ha GJha�1
1990 5.7 367.8 3.7 43.9 0.12 0.9 9.5 412.6 17.5 23.61991 5.3 338.4 3.6 43.4 0.01 0.7 9.0 382.5 17.5 21.81992 5.7 369.8 3.9 46.2 0.12 0.9 9.7 416.9 18.2 23.01993 6.4 409.4 4.6 55.3 0.17 1.1 11.2 465.8 18.5 25.21994 4.8 308.6 2.6 31.2 0.11 0.001 7.5 339.8 17.9 19.11995 5.1 323.1 3.4 40.7 0.13 0.001 8.6 363.8 18.1 20.21996 5.5 351.8 3.4 40.6 0.14 0.001 9.0 392.4 18.4 21.31997 5.6 357.8 3.5 41.6 0.13 0.89 9.2 400.3 18.5 21.71998 6.7 427.7 4.1 49.4 0.18 1.19 11.0 478.2 18.4 26.01999 7.1 455.5 3.8 44.9 0.16 1.09 11.0 501.4 18.2 27.62000 6.6 422.7 3.7 44.2 0.16 1.1 10.4 468.0 18.3 25.52001 5.4 347.2 2.8 33.1 0.14 0.9 8.3 381.2 18.2 21.0
Source: Energy values are calculated by the authors, while other values are taken from SIS (1981, 1992, 1997, 1998, 2002,
2003) and SPO (2001).
Copyright # 2005 John Wiley & Sons, Ltd. Int. J. Energy Res. 2006; 30:659–670
ENERGY AND EXERGY EFFICIENCIES IN TURKISH AGRICULTURE 663

The major products in the Turkish agricultural sector are determined as cereals, pulses,fruit and vegetables, olive, tea, tobacco, sugar beet, cotton, oil seeds and tuber crops. Thereare 36 crops in the Turkish agricultural sector. These include wheat, rye, barley, oat, maize,rice, dry beans, lentils, chick-peas, sugar beet, tobacco, cotton, sunflower, seed cotton,pears, apples, figs, apricots, cherries, peaches, grapes, oranges, tangerines, grapefruits,lemons, nuts, tomatoes, cucumbers, peppers, eggplants, carrots, water melon/melons,onions, potatoes, olive and tea (SIS, 1981, 1992, 1997, 1998, 2002, 2003; SPO, 2001; Ozkanet al., 2004).
Turkey is also one of the most important producer countries of fresh fruit and vegetable with32.5 million tonnes. The Turkish fresh fruit production in the year 2001 was around 10.5 milliontonnes. Turkey’s share in the world’s fresh fruit production is 2.5%. Total vegetable productionin the world is nearly 628 million tonnes, of which 21.93 million tonnes is provided by Turkey(SIS, 2002).
Improvement in vehicle use in the Turkish agricultural sector is shown in Table IV. Asgiven in this table, mechanization in the Turkish agricultural sector has increased year-by-year; this is due to the technical development. The use of fossil and electric energyin this sector has increased in recent years; therefore, the problem associated with the energy usein the Turkish agriculture has grown. ‘‘The average animal power dropped from 28.04 to 17.08million kW in 1975 and 2000, respectively. The highest value in total human power was 8.32million kW in 1990, and the highest value for animal power was 30.62 million kW in 1980(Ozkan et al., 2004).’’
In the study period, the average power calculated for tractors increased from 29.5 to 44 kW.These data were given in terms of energy used in agriculture, and did not separate the energyused for personal purposes from the ones used for commercial purposes. Since there are no dataavailable for diesel consumption for machinery used in agriculture, the total diesel energy inputis calculated from the diesel consumption of tractors used during the examined period.Therefore, in the calculation it is assumed that a 40 kW tractor consumes 4.8 l diesel per hourwith a 50% loading capacity (Eren, 1991) and that its average use on the field is 720 ha (Ozkanet al., 2004).
Table IV. Development of agricultural equipment and machinery in the Turkish agriculture sector.
Year Tractor Combine harvester Thresher Atomizer Motor pump Total vehicle Tractor/103 ha
1990 692 454 11 741 134 470 95 111 302 138 692 695.3 24.91991 704 373 10 946 132 214 100 487 307 596 704 616.6 25.51992 725 933 11 114 132 475 102 899 320 066 726 179.5 26.31993 746 303 11 463 134 613 103 879 325 433 892 482.9 27.11994 757 505 11 649 137 508 106 149 325 816 1 012 811 27.41995 775 863 12 706 141 908 107 639 332 313 1 038 116 28.91996 806 203 11 993 143 603 105 656 332 620 1 067 455 29.91997 864 995 12 385 132 265 99 984 329 072 1 109 629 32.21998 902 513 12 564 134 778 98 623 334 504 1 148 478 33.51999 914 471 12 563 137 396 101 157 340 274 1 165 587 34.12000 941 835 12 578 139 512 98 924 343 902 1 192 849 35.72001 948 416 12 053 140 915 100 879 347 782 1 202 263 36.0
Source: SIS (1992, 1997, 1998, 2002) and SPO (2001).
Copyright # 2005 John Wiley & Sons, Ltd. Int. J. Energy Res. 2006; 30:659–670
Z. UTLU AND A. HEPBASLI664

3. RESULTS AND DISCUSSION
The agricultural sector consumers least energy in comparison with other sectors in Turkey.Diesel and electricity are used in this sector and the breakdown for the last 12 years is shown inTable II. The devices representing the agricultural sector are assumed as tractors, combineharvester, thresher, atomizer and motor pumps, which cover more than 90% of the total energyconsumption. These vehicle’s efficiencies and energy utilization values are shown in Table V.
Mean energy and exergy efficiencies are calculated by multiplying the energy used in each enduse by the corresponding efficiency for that end use, as given below
e1v;e;m ¼ ½ða1 *ea1Þ þ ða2 *ea2Þ þ ða3 *ea3Þ þ � � � þ ða7 *ea7Þ�=100 ð8Þ
e2v;e;m ¼ ½ða1 *ea1Þ þ ða2 *ea2Þ þ ða3 *ea3Þ þ � � � þ ða7 *ea7Þ�=100 ð9Þ
where the subscript ‘a1–7’ stands for a ratio of fuel and electric energy utilization of the material,while subscripts ‘v’, ‘e’ and ‘m’ stand for the vehicle, the electric and the weighted mean,respectively. Adding these values, the overall efficiency of the agricultural sector is obtained.
In calculating the overall energy and exergy efficiencies of the agricultural sector, the tractor,which runs on diesel, is assumed to be 28% efficient under part load conditions and the pump,which is driven by the electric motor to be 90% efficient for kinetic energy production as motorpump, centrifugal pump and deep-well turbine pump (Dincer et al., 2005), and to be 70%efficient for heating. It should be noted that the tractor and pump (for kinetic energyproduction) efficiencies are taken as similar to the energy efficiency of the fossil-fuelled andelectric shaft work production in tractor and electric pumps. The product temperature or thetemperature at the pump outlet Tp is assumed to be a room temperature of 258C. The energyefficiencies for the four modes of transportation (tractor, combine harvester, atomizer andthresher) and the values which are based on the U.S. and European devices are assumed torepresent the Turkish devices. Since vehicles generally are not operated at a full load, adistinction is made between the rated load (full load) and operating (part load) efficiencies
Table V. Energy utilization and efficiencies of fuelled vehicles and electric pumps in the Turkish agriculturesector (%).
e1 e2
Mode Full load Part load Full load Part loadEnergyterms
Exergyterms
Tractor 28 22 28 22 78.6 78.6Combine harvester 35 28 35 28 1.1 1.1Thresher 35 28 35 28 11.7 11.7Atomizer 28 26 28 26 8.6 8.6
Total fuel use 28.9 23.1 28.9 23.1 100 100
Electric pump for mechanical drive 90 90 90 90 80 80Electric pump for heating 70 70 2.9 2.9 20 20Total electricity use 83.0 86 72.6 72.6 100 100
Source: Hepbasli and Utlu (2004b) and Dincer et al. (2005).
Copyright # 2005 John Wiley & Sons, Ltd. Int. J. Energy Res. 2006; 30:659–670
ENERGY AND EXERGY EFFICIENCIES IN TURKISH AGRICULTURE 665

(Dincer et al., 2005). A weighted mean is obtained for the agricultural mode energy efficiencieswhere the weighting factor is the fraction of the total energy input which supplies eachtransportation mode.
The overall mean energy and exergy efficiencies of the agricultural sector are calculated usinga weighting factor with Equations (32) and (33), which is the fraction of the total energy inputsupplied to each device.
e1;ag ¼ ð fc *e1v;meanÞ þ ðec *e1e;meanÞ=ð fc þ ecÞ ð10Þ
e2;ag ¼ ð fc *e2v;meanÞ þ ðec *e2e;meanÞ=ð fc þ ecÞ ð11Þ
where the subscripts ‘ag’ and ‘c’ stand for the agriculture and the energy consumption,respectively, e and f denote electricity consumption and direct fuel use by the agriculture sectorin energy terms (pJ), respectively.
Figure 2 illustrates a variation of the overall mean energy and exergy efficiencies in theTurkish agricultural sector between 1990 and 2001. It is obvious from this figure that the energy
0
5
10
15
20
25
30
35
40
45
Years200120001999199819971996199519941993199219911990
Ove
rall
effi
cien
cies
(%
)
Energy Exergy
Figure 2. Variation of energy and exergy utilization efficiencies in the Turkish agriculture sector.
Copyright # 2005 John Wiley & Sons, Ltd. Int. J. Energy Res. 2006; 30:659–670
Z. UTLU AND A. HEPBASLI666
efficiencies in the years studied range from 29.1 to 41.1%, while the exergy efficiencies vary from27.9 to 37.4%. This sector shows considerably important and comparable losses of energy andexergy. In terms of exergy losses, this sector ranks rather differently, accounting for about53–62% of all exergy losses. The irreversibilities are mainly due to the mechanical work losses intractors and pumps. These two types of devices are very essential for improving the efficiency inthe agriculture sector. In order to minimize the irreversibilities in the tractors, the work outputfor the same energy input supplied from the fuel combustion should be increased. As for thepumps, the main cause is the pressure drop which should be eliminated.
By comparison, Dincer et al. (2005) reported that the overall exergy efficiencies in the SaudiArabian agricultural sector are slightly less than the corresponding energy efficiencies, e.g.74.2–69.2% for exergy efficiency and 74.9–74.6% for energy efficiency from 1990 to 2001.
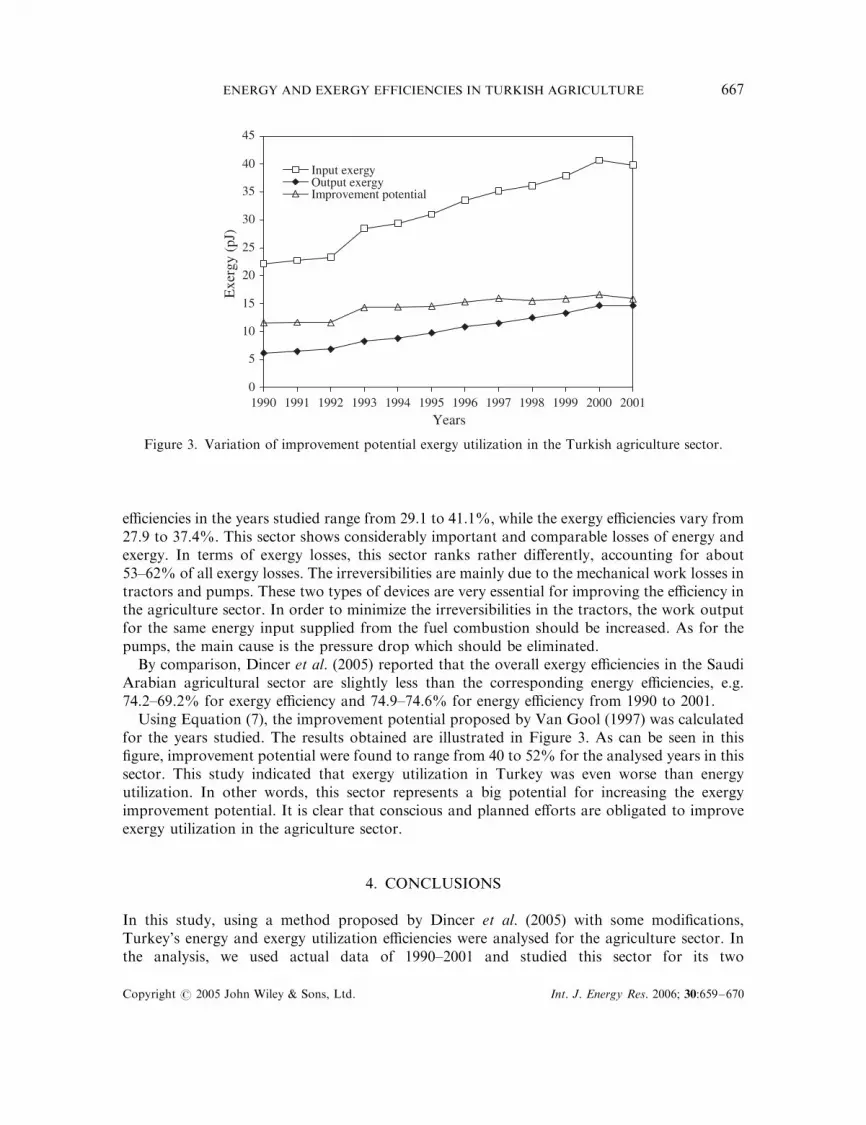
Using Equation (7), the improvement potential proposed by Van Gool (1997) was calculatedfor the years studied. The results obtained are illustrated in Figure 3. As can be seen in thisfigure, improvement potential were found to range from 40 to 52% for the analysed years in thissector. This study indicated that exergy utilization in Turkey was even worse than energyutilization. In other words, this sector represents a big potential for increasing the exergyimprovement potential. It is clear that conscious and planned efforts are obligated to improveexergy utilization in the agriculture sector.
4. CONCLUSIONS
In this study, using a method proposed by Dincer et al. (2005) with some modifications,Turkey’s energy and exergy utilization efficiencies were analysed for the agriculture sector. Inthe analysis, we used actual data of 1990–2001 and studied this sector for its two
0
5
10
15
20
25
30
35
40
45
1990 1991 1992 1993 1994 1995 1996 1997 1998 1999 2000 2001
Years
Exe
rgy
(pJ)
Input exergyOutput exergyImprovement potential
Figure 3. Variation of improvement potential exergy utilization in the Turkish agriculture sector.
Copyright # 2005 John Wiley & Sons, Ltd. Int. J. Energy Res. 2006; 30:659–670
ENERGY AND EXERGY EFFICIENCIES IN TURKISH AGRICULTURE 667

essential components, namely tractors and other vehicles using diesel and pumps consumingelectricity.
The main conclusions which may be drawn from the results of this study, are listed below:
(a) The values for total energy input and output increased over the period from 1990 to 2001.The energy input value rose from 0.8GJ ha�1 in 1990 to 1.52GJ ha�1 in 2001. It wasobserved that during the period studied, the share of human and animal power (animate)decreased from 31.6 to 13.2%, whereas mechanical and electrical power (inanimatepower) increased from 68.4 to 86.8%. This clearly indicates the improvement inmechanical and electrical power in the agricultural industry.
(b) Although the production area for the crops decreased from 27.9 to 26.4 million ha from1990 to 2001, the intensive input was not accompanied by the expected output increase.
(c) During the last 12 years, the increase in fuel-electric input, fertilizer and seed energy inputvalues is estimated to be about 1.9, 1.1 and 1.7 folds, respectively, although it has beenrealized as 650.4 and 772.9 pJ for by-product energy value.
(d) From 1990 to 2001, the overall exergy efficiency values ranging from 27.9 to 37.4%appear to be slightly less than the corresponding energy efficiencies varying from 29.1to 41.1%.
NOMENCLATURE
e =electricity consumption by the agriculture sector (kJ)E =energy (kJ)Ex =exergy (kJ)f =direct fuel use by the agriculture sector (kJ)H =higher heating value (kJ kg�1)IP =improvement potential (kJ)ke =kinetic energy (kJ kg�1)m =mass (kg)Q =heat transfer (kJ)T =temperature (K)W =shaft work, work (kJ)
Greek letters
g =exergy grade functione1 =energy (first law) efficiency (%)e2 =exergy (second law) efficiency (%)
Indices
0 =dead state or reference environmentag =agriculturalc =energy consumptione =electricalf =fuel
Copyright # 2005 John Wiley & Sons, Ltd. Int. J. Energy Res. 2006; 30:659–670
Z. UTLU AND A. HEPBASLI668

h =heatingin =inputke =kinetic energym =weighted meanout =outletp =productv =vehiclew =work
REFERENCES
Ayres RU, Ayres LW, Warr B. 2003. Exergy, power, and work in the US economy, 1900–1998. Energy 28:219–273.
CAEEDAC A. 2000. Descriptive analysis of energy consumption in agriculture and food sector in Canada. Final Report.Dincer I, Hussain MM, AL-Zaharnah I. 2005. Energy and exergy utilization in agricultural sector of Saudi Arabia.
Energy Policy 33(11):1461–1467.Eren Y. 1991. A study on utilization period of tractors in Turkey. 13th National Agricultural Mechanization Congress,
Konya, Turkey, 514–519 (in Turkish).Hammond GP, Stapleton AJ. 2001. Exergy analysis of the United Kingdom energy system. Proc IMechE Part A:
Journal of Power and Energy 215(2):141–162.Hepbasli A, Utlu Z. 2004a. Evaluating the energy utilization efficiency of Turkey’s renewable energy sources during
2001. Renewable and Sustainable Energy Reviews 8(3):237–255.Hepbasli A., Utlu Z. 2004b. Comparison of Turkey’s sectoral energy utilization efficiencies between 1990 and 2000:
Part 2. Residential–commercial and transportation sectors. Energy Sources 26:1345–1355.Kennedy S. 2000. Energy use in American agriculture. Sustainable Energy Term Paper.Ozkan B, Akcaoz H, Fert C. 2004. Energy input–output analysis in Turkish agriculture. Renewable Energy 29:
39–51.Reistad GM. 1975. Available energy conversion and utilization in the United States. ASME Journal of Engineering for
Power 97:429–434.Rosen MA, Dincer I. 1997. On exergy and environmental impact. International Journal of Energy Research 21:
643–654.Rosen MA, Scott DS. 2003. Entropy production and exergy destruction: Part I. Hierarchy of Earth’s major
constituencies. International Journal of Hydrogen Energy 28(12):1307–1313.Singh JM. 2000. On farm energy use pattern in different cropping systems in Haryana, India. Sustainable Energy
Systems and Management. Master of Science, International Institute of Management, University of Flensburg,Germany.
State Institute of Statistics (SIS). 1981. Statistical Yearbook of Turkey in 1981. Prime Ministry, Republic of Turkey:Ankara.
State Institute of Statistics (SIS). 1992. Statistical Yearbook of Turkey in 1991. Prime Ministry, Republic of Turkey:Ankara.
State Institute of Statistics (SIS). 1997. The Summary of Agricultural Statistics of Turkey in 1996. Prime Ministry,Republic of Turkey: Ankara.
State Institute of Statistics (SIS). 1998. The Summary of Agricultural Statistics of Turkey in 1997. Prime Ministry,Republic of Turkey: Ankara.
State Institute of Statistics (SIS). 2002. Statistical Yearbook of Turkey in 2000. Prime Ministry, Republic of Turkey:Ankara.
State Institute of Statistics (SIS). 2003. Statistical Yearbook of Turkey in 2002. Prime Ministry, Republic of Turkey:Ankara.
The State Planning Organization (SPO). 2001. Special Privatization Commission Reports. Prime Ministry, Republic ofTurkey: Ankara.
Utlu Z. 2003. Analysis of Turkey’s sectoral energy and exergy utilization efficiency by 2023. Ph.D. Thesis, Solar EnergyInstitute (Advisor: A. Hepbasli). Graduate School of Natural and Applied Sciences, Ege University, Izmir, Turkey(in Turkish).
Utlu Z, Hepbasli A. 2003. A study on the evaluation of energy utilization efficiency in the Turkish residential–commercial sector using energy and exergy analyses. Energy and Buildings 35(11):1145–1153.
Copyright # 2005 John Wiley & Sons, Ltd. Int. J. Energy Res. 2006; 30:659–670
ENERGY AND EXERGY EFFICIENCIES IN TURKISH AGRICULTURE 669

Utlu Z, Hepbasli A. 2004. Comparison of Turkey’s sectoral energy utilization efficiencies between 1990 and 2000: Part 1.Utility and industrial sectors. Energy Sources 26:1331–1344.
Utlu Z, Hepbasli A. 2005. A review on analyzing and evaluating the energy utilization efficiency of countries. Renewableand Sustainable Energy Reviews (in press).
Van Gool W. 1997. Energy policy: fairly tales and factualities. In Innovation and Technology-Strategies andPolicies, Soares ODD, Martins da Cruz A, Costa Pereira G, Soares IMRT, Reis AJPS (eds). Kluwer: Dordrecht;93–105.
Yaldiz O, Ozturk HH, Zeren Y, Bascetomcelik A. 1993. Energy usage in production of field crops inTurkey. 5th International Congress on Mechanization and Energy Use in Agriculture, Kusadasi, Turkey, 11–14October 1993.
Copyright # 2005 John Wiley & Sons, Ltd. Int. J. Energy Res. 2006; 30:659–670
Z. UTLU AND A. HEPBASLI670