Embed Size (px)
Citation preview

Atlanta Strategic Action Plan
Atlanta Strategic Action Plan September 2007 Draft

Atlanta Strategic Action Plan September 2007 Draft

Elected Officials
Shirley Franklin
Mayor
ATLANTA CITY COUNCIL
Lisa Borders
President of Council
DistrictCouncil Member
1Carla Smith
2Kwanza Hall
3Ivory Lee Young
4Cleta Winslow
5Natalyn Mosby Archibong
6Ann Fauver
7Charles Howard Shook
8Clair Muller
9Felicia Moore
10Clarence T. Martin
11Jim Maddox
12Joyce Shepard
PostAt Large
1Ceasar C. Mitchell
2Mary Norwood
3H. Lamar Willis
Department of Planning & Community Development
Steve Cover, AICP, Commissioner
Alice Wakefield, Director of Planning
Strategic Planning and Environment Division
www.atlantaga.gov/government/planning/burofplanning.aspx
iAtlanta Strategic Action Plan September 2007 Draft

1Introduction1
3Planning Process and Community Participation2
6Community Assessment3
6Quality Community Objectives6Development Patterns11Resource Conservation15Social and Economic Development20Governmental Relations23Areas Requiring Special Attention
23Areas of significant natural or cultural resources, particularly where these are likely tobe intruded upon or otherwise impacted by development
24Areas where rapid development or change of land uses is likely to occur
26Areas where the pace of development has and/or may outpace the availability ofcommunity facilities and services, including transportation
27Areas in need of redevelopment and/or significant improvement to aesthetics orattractiveness (including strip commercial corridors)
29Large abandoned structures or sites, including those that may be environmentallycontaminated
30Areas with significant infill development opportunities (scattered vacant sites)
32Areas of significant disinvestment, levels of poverty and/or unemployment substantiallyhigher than average levels for the community as a whole
34Plan Elements34Population60Economic Development92Housing137Natural and Cultural Resources186Community Facilities and Services246Intergovernmental Coordination250Transportation System295Urban Design300Land Use
330Community Agenda4
330Implementation Program330Short Term Work Program421Policies
ALand Use MapsA
BFact SheetsB
KCommunity Meeting CommentsC
September 2007 Draft Atlanta Strategic Action Plan
Contents

SPopulationD
ABResolutionsE
Atlanta Strategic Action Plan September 2007 Draft

September 2007 Draft Atlanta Strategic Action Plan
Contents

1 IntroductionThe development and adoption of a comprehensive plan document is a requirement for local governmentsmandated by The Georgia Planning Act of 1989. In addition, the Charter of the City of Atlanta mandatesthe preparation of a comprehensive development plan every 3 to 5 years (CDP) in Section 3-601 as follows:
The Mayor shall have a comprehensive development plan of the City of Atlanta prepared andmaintained to be used as a guide for the growth and development of the City and which willidentify its present and planned physical, social and economic development. This plan shall:
1) set forth the comprehensive development goals, policies and objectives for both the entireCity and for individual geographic areas and communities within the City,
2) in conformance with such development goals, objectives and policies, identify the generallocation, character, and extent of streets and thoroughfares, parks, recreation facilities, sites forpublic buildings and structures, City and privately-owned utilities, transportation systems andfacilities, housing, community facilities, future land use for all classifications, and such otherelements, features and policies as will provide for the improvement of the City over the next 15years.
Comprehensive planning is the foundation for quality growth management. The comprehensive plan bringstogether and addresses all aspects of community and economic functions with the objective of sustainingand improving these functions in the future. The comprehensive plan addresses, but is not limited to thefollowing issues of current concern for Atlanta: rapid population growth and suburban sprawl, environmentalprotection, affordable housing, lack of open space, transportation and quality of life.
In keeping with Georgia State law, the comprehensive plan for Atlanta follows the format for the Requirementsfor a Partial Update to the Local Comprehensive Plan.
Background
In May 2005, the Georgia State Department of Community Affairs (DCA) adopted new Standards andProcedures for Local Comprehensive Planning. These standards are significantly different from the previousguidelines in terms of format, process for submission, and the content required. As a result, there was aneed to produce an interim document called the Partial Update that would address only some of thecomponents under the new guidelines but serve as a bridge from the old comprehensive planning guidelinesto the new.
The City of Atlanta launched its planning process for the Partial Update under the new DCA guidelines inApril, 2007 with a new name for the plan. Formerly called the Comprehensive Development Plan (CDP),Atlanta’s comprehensive plan is now entitled the Atlanta Strategic Action Plan (ASAP). The ASAP is a majorupdate to the 2004-2019 Comprehensive Plan.
1Atlanta Strategic Action Plan September 2007 Draft

Unlike the full document, due in the fall of 2011, this major update follows the requirements for PartialUpdates developed by the Department of Community Affairs. This major update includes only some of therequired components of the full plan. The partial update includes:
I. Community AssessmentA Quality Community Objectives (QCO) assessmentAn analysis of Areas Requiring Special AttentionIdentification of Issues and OpportunitiesPlan Elements
II. Community Agenda/ Implementation ProgramPoliciesShort Term Work ProgramLand Use Map
September 2007 Draft Atlanta Strategic Action Plan2
Introduction1

2 Planning Process and Community ParticipationAs part of the planning process, Bureau of Planning staff worked with City of Atlanta Departments to obtaininformation on all of the plan components. In addition, a series of community meetings were held in tworounds. The NPUS were grouped into seven study areas. Each meeting included two or three study areas(see Map 2.1 ‘City of Atlanta Study Areas’). The first round of community meetings were held on April 30,May 3, and May 10, 2007 to brief the public on the differences between the new process versus the olderprocess as well as to solicit contributions from the community.
Below is a table that summarizes the differences between the old process and the new:
Table 2.1 Old CDP and New ASAP Planning ProcessNew ASAP processOld CDP process
Full updates every 5 yearsAnnual updates
Annual Short Term Work ProgramAnnual Short Term Work Program
Strong implementation strategy
Link ASAP with CIP and service delivery
Community involvement is more extensive andinclusive. Visioning process
Community involvement process
Focus groups/stakeholders
Based on a more holistic and strategic approach toproblem solving towards achieving the City’s Vision:
Based on the assessment of current conditions andproject lists
Quality Community Objectives
Areas Requiring Special Attention
Coordination with City Departments to implement visionand plan for growth
Ask for information from the City Departments
Annual update of Population and development
Incorporation of Transportation Plan, ProjectGreenspace, Beltline, Peachtree Corridor in to ASAP
At the community meetings, the attendees were asked to focus on the strengths of Atlanta as well as theelements that need improvement. They emphasized concerns such as transportation, park space, affordablehousing, acknowledgement of historic community areas, and economic development concerns. A summaryof the comments made during community meetings is included in the appendix.
3Atlanta Strategic Action Plan September 2007 Draft
As part of the partial update, communities were asked to evaluate and revise the existing land use map fortheir Neighborhood Planning Units (NPU). In order to facilitate this exercise, the Bureau of Planning staffprovided technical assistance to NPU and neighborhood leaders by hosting two Land Use Charrettes. TheseCharrettes served to educate the public about land use maps and its purpose, how to formulate policiesand make appropriate land use changes. Almost 70 requests to amend the Land Use map were submitted.The Bureau of Planning staff evaluated these requests and recommended approval to 44 of the requests.A public hearing was held for these land use amendments was held on September 10, 2007.
The second round of community meetings were held on July 17, 19 and 25, 2007. At these meetings thedraft document was presented and the attendees were asked to review and submit comments. In addition,the draft plan was posted on the Bureau of Planning website. A special citywide public hearing was heldon July 30, 2007 to hear public comment on the draft plan. After incorporating the public comments, therevised document was submitted to the Atlanta Regional Commission (ARC) and the Georgia Departmentof Community Affairs (DCA) for review. After the regional and State agencies have approved the draftdocument, the City of Atlanta will approve and adopt the document. This process was completed in the fallof 2007.
Comments and questions regarding the Atlanta Strategic Action Plan can be sent by mail to the City ofAtlanta Bureau of Planning City Hall South Building, 55 Trinity Ave. SW, S 3350, Atlanta, GA 30303-0310by phone 404-330-6145 and by email to [email protected]. Comments can also be made on-line.
The planning process for the full Atlanta Strategic Action Plan will kick off in early 2008 and conclude in thefall of 2009.
September 2007 Draft Atlanta Strategic Action Plan4
Planning Process and Community Participation2

ASAP Study Area Groups
Study Area NPU’s 1.Northwest – G,J,K,L 2.Northside – A,B,C,D 3.Northeast – E,F,M 4.Southwest – H,I,Q,R,P 5.Eastside – N,O,W 6.Intown South – T,V,S 7.Southside – X,Y,Z
2.Northside
1.Northwest 3.Northeast
6.Intown South
5.Eastside
4.Southwest
7.Southside
City of Atlanta Bureau of Planning
Map 2.1 City of Atlanta Study Areas
5Atlanta Strategic Action Plan September 2007 Draft

3 Community Assessment
Quality Community Objectives
The Georgia Department of Community Affairs has established statewide goals and associated QualityCommunity Objectives (QCO). Quality Community Objectives (QCOs) are "a statement of the developmentpatterns and options that will help Georgia preserve its unique cultural, natural and historic resources whilelooking to the future and growing to its fullest potential". As required in the Minimum Planning Standards,the City of Atlanta evaluated how these QCOs are being met in order to determine the "progress to date"towards creating a sustainable and livable community. As part of the evaluation, issues that should beaddressed in the Comprehensive Plan were identified. The State Planning goals are listed below.
Statewide Planning Goals
Economic Development Goal: To achieve a growing and balanced economy, consistent with the prudentmanagement of the state’s resources, that equitably benefits all segments of the population.
Natural and Cultural Resources Goal: To conserve and protect the environmental, natural and culturalresources of Georgia’s communities, regions and the state.
Community Facilities and Services Goal: To ensure the provision of community facilities and servicesthroughout the state to support efficient growth and development patterns that will protect and enhance thequality of life of Georgia’s residents.
Housing Goal: To ensure that all residents of the state have access to adequate and affordable housing.
Land Use and Transportation Goal: To ensure the coordination of land use planning and transportationplanning throughout the state in support of efficient growth and development patterns that will promotesustainable economic development, protection of natural resources and provision of adequate and affordablehousing.
Intergovernmental Coordination: To ensure the coordination of local planning efforts with local serviceproviders and authorities, with neighboring communities and with the state and regional plans and programs.
Development Patterns
Traditional Neighborhoods
Traditional neighborhood development patterns should be encouraged, including use ofmore humanscale development, compact development, mixing of uses within easy walking distance of oneanother, and facilitating pedestrian activity.
September 2007 Draft Atlanta Strategic Action Plan6
Community Assessment3

Historic neighborhoods throughout the City of Atlanta, from West End and Inman Park that developed atthe turn of the century to Morningside that developed before the 1950's, have a connected street pattern,small blocks, street lined streets, neighborhood serving commercial areas, community schools, sidewalksand streets that promote walking, biking and transit All of these are characteristics of Traditional NeighborhoodDevelopment (TND). Currently, there is no comprehensive implementation of the concept within the city.
Development standards in the City of Atlanta’s Zoning Resolution called for development patterns that werenot compatible with the characteristics of these traditional neighborhoods. Moreover, neighborhoodcommercial uses such as grocers and retailers have long since given way to supermarkets, malls and “bigbox” retailers, which do not fit the character of these traditional neighborhoods. In response to concernsover incompatible infill development, the City of Atlanta adopted several mixed-use smart growth zoningdistricts (i.e. Mixed Residential Commercial (MRC), Live Work (LW), Multi-family Residential (MR),Neighborhood Commercial (NC), and Special Public Interest (SPI) districts) that require development patternscompatible with those of Atlanta’s historic or traditional neighborhoods and also allow for a mix of uses builtin a pedestrian oriented manner. Moreover, the Neighborhood Commercial Zoning district limits the size ofcommercial uses in order to maintain a neighborhood scale. These traditional neighborhood standards areby right and in some cases require an administrative approval.
Tree lined streets are integral to the character of many neighborhoods. Trees moderate the temperature,absorb stormwater, clean the air, provide habitat, provide shade in the summer, buffer pedestrians frommoving traffic and beautify streets. The Tree Protection Ordinance establishes standards to promote thecity’s policy that “there shall be no net loss of trees” and that Atlanta “will continue to enjoy the benefitsprovided by its urban forest.” Planting of street trees is required in certain Quality of Life zoning districts.Moreover, the Tree Protection Ordinance requires tree planting. The City of Atlanta Parks Department, inpartnership with Trees Atlant,a has a tree planting program. Trees Atlanta also plants and maintains treesin the public right-of-way. Some of the tree plantings are funded in part with the tree recompense fund(check). In commercial areas with Community Improvement Districts (CIDs) - Downtown DID, MidtownMID, and Buckhead BCID- the CIDs provide maintenance to the trees and streetscape.
Walkability is one of the key features of traditional neighborhoods. Many of the commercial areas in traditionalneighborhoods, such as Little Five Points, Virginia Highlands, East Atlanta; the City’s main business districtssuch as Midtown and Downtown, as well as the mixed-use smart growth zoning districts and the areasaround public rail transit are walkable. In these areas errands can be made on foot. Although the City ofAtlanta has an extensive sidewalk network, many are in poor condition and some areas lack sidewalks.Sidewalk maintenance is the responsibility of the property owner where the sidewalk is located. As a result,many are not well maintained. The City of Atlanta has installed several streetscapes funded by bond andfederal sources. Several of the streetscape projects are public/private partnerships with the CIDs. TheCommunity Improvement Districts also have programs to maintain and clean public areas. The AtlantaPolice Department actively works to keep public areas safe for citizens and visitors. Business Watchprograms encourage business people to be alert to suspicious circumstances and to take crime preventionsteps.
Walking and biking to school are also attributed with traditional neighborhoods. In several neighborhoodsthroughout the City, students can walk safely to schools. However, lack of sidewalk connectivity, streetswith heavy traffic volumes and long distance, are all obstacles students face while walking to school. Biking
7Atlanta Strategic Action Plan September 2007 Draft

to school can be even more challenging. Limited bike lanes, traffic speed and volume are deterrents tobiking to school. The Police Department posts School Crossing Guards at selected crossings to promotechildren’s safety.
Sense of Place
Traditional downtown areas should be maintained as the focal point of the community or, for newerareas where this is not possible, the development of activity centers to serve as community focalpoints should be encouraged. These areas should be attractive, mixed-use, pedestrian-friendlyplaces where people choose to gather for shopping, dining, socializing, and entertainment.
A community’s “sense of place” is loosely defined as how a place identifies and distinguishes itself fromother places. These places foster a sense of uniqueness about that community. Sense of place can bemost easily created through a patterns, including a community’s historic buildings pattern, building andhome styles, the street network, the relationship of buildings to the street, street angle and direction, theplacement of railroads, and old trolley routes. In addition, the experience a place provides is defined by theinteraction of the built environment with the natural environment such as trees, streams, physical topography,and even weather patterns. Finally, the people in the community itself and cultural patterns are also integralin shaping a community’s sense of place. New York City’s massive skyscrapers, San Francisco’s Victorianhomes that line its hilly streets, and Miami’s busy waterfront and beaches are all features that create asense of place for those cities.
Part of Atlanta’s sense of place stems from its history. Unfortunately, some of Atlanta’s landmark buildingssuch as Union and Terminus stations, the Peachtree Arcade and the Lowes Grand; early skyscrapers suchas the Equitable; grand hotels, such as the Piedmont and the Henry Grady; as well as other commercialand residential buildings been demolished. In some cases they have been replaced with contemporarybuildings that lack a pedestrian scale and don't address the street, in other cases they have been replacedwith surface parking and vacant lots. This fragmented urban environment with a minimum of street levelactivity has led to a lack of "place" along with criticism by visitors that “there is no 'there' there”. Today,many historic buildings and districts are protected under the City’s Historic Preservation Ordinance.
Vibrant in-town neighborhoods, commercial districts, community events, and parks give the city its distinctfeel and identity. In an effort to create a more vibrant city, plans have been adopted for Downtown, Midtownand Buckhead. To implement these plans, developments are regulated by the quality of life zoning districts(NC, LW, MRC, MF, and 22 SPIs). They aim to improve the aesthetics of the built environment, maximizethe pedestrian experience, and encourage a compatible mix of residential and commercial uses. The Qualityof Life bond program is designed to encourage neighborhood livability, pedestrian mobility and generallyimprove the quality of life in Atlanta. The bond issue complements the zoning, and allows the City to leveragefunding with the Department of Transportation, Housing and Urban Development, and private funding toprovide many improvements to the City's greenspace and alternative transportation systems.
September 2007 Draft Atlanta Strategic Action Plan8
Community Assessment3

Transportation Alternatives
Alternatives to transportation by automobile, including mass transit, bicycle routes, and pedestrianfacilities, should be made available in each community. Greater use of alternate transportationshould be encouraged.
Taking tranist, walking and biking are all transportation modes that can be used in the City of Atlanta as analternative to driving. However, the ability to use transit, walk or bike varies throughout the City. The Cityof Atlanta provides public transportation by way of MARTA to the community. MARTA offers a mix of buses(local, express and shuttle services such as the Braves Shuttle; the Tourist Loop and Paratransit) and trainservices. In addition, Cobb Community Transit, Gwinnett County Transit, Georgia Regional TransportationAuthority express bus service and C-Tran provide bus service from surrounding counties to the City ofAtlanta. However, additional modes, frequency, and coverage are needed. The Beltline and the Peachtreestreetcar studies are proposing additional transit service.
The Mixed Residential Commercial (MRC) District regulations encourage new developments to provide agrid of connected streets to improve the street network and reduce congestion. An appropriate street gridcreates small blocks that encourage walking and disperses traffic over the street network. Articulation ofthe street grid is not always required by the land development code. The subdivision ordinance in particularneeds to be updated to require connecting streets. A connecting street network is pertinent for crimeprevention in allowing police to have access to the communities.
The City of Atlanta currently has an extensive network of sidewalks that make walking an alternative todriving. Rough pavement, missing links, and non-compliance with the Americans with Disabilities Act (ADA)limit the effectiveness of the sidewalk network for many users. The sidewalk network is being expandedthru implementation of the smart growth zoning districts and as a requirement in new developments.Sidewalks are also being built with bond funding for streetscapes and with public/private partnerships withthe CIDs.
The City’s ordinance stipulates that, “Before any building permit shall be issued for the construction of anystructure on property within any planned development-housing (PD-H) district or any zoning district whichpermits multifamily residential, commercial or industrial uses, the owner shall agree to construct or haveconstructed sidewalks…on all public streets within and abutting the property”. The ordinance requires allnew developments to install a minimum of 5’ and up to 15 feet of sidewalks in designated zoning areas ofthe city. Sidewalks are also required on both sides of existing and proposed streets within subdivisions.All new sidewalks are required to connect to existing wherever possible. Some conventional zoning districts(e.g. C series) do not currently require sidewalks concurrent with new development. Unfilled network gapsthat remain should be identified in a pedestrian master plan.
In September 1995, after adoption by the City Council, the Atlanta Commuter On-Street Bike Plan wassigned into law as a portion of the City’s Comprehensive Development Plan. The On-Street Bike Planestablished goals, policies and design criteria to create a network of safe and efficient bicycle routesthroughout the City of Atlanta. Reducing traffic congestion, improving air quality and providing Atlantanswith high quality transportation choices were priorities of the On-Street Bike Plan and remain critical policy
9Atlanta Strategic Action Plan September 2007 Draft

objectives in Atlanta today. Initial design work was completed by the Department of Public Works in 2005for the 1995 Commuter On-Street Bike Plan. Through an ongoing partnership with the Path Foundation,the City is building multi-use trails within communities.
The smart growth zoning ordinances allows shared parking arrangements. The City does not currently havea policy that addresses shared parking for commercial and retail developments but it is recommendedwherever possible. Currently a special permit is required for shared-use parking to reduce requirementsfor new spaces. Streamlining requirements would allow more new development to make shared parkingarrangements.
Regional Identity
Each region should promote and preserve a regional “identity”, or regional sense of place, definedin terms of traditional architecture, common economic linkages that bind the region together, orshared characteristics.
Transportation has been the engine of growth and development of the City of Atlanta and in turn the AtlantaRegion. The railroads, interstate highways and HJAIA are the threads that tie the economy of the regiontogether. At the same time congestion, urban sprawl, poor air quality and loss of open space that hasresulted due to the reliance of the automobile are some of the City's characteristics and that are often usedto describe the Atlanta Region.
The Chattahoochee River, the tree canopy, the gently rolling terrain are natural resources that define thecharacter of the region. Architectural styles and types in main streets and in historic neighborhoods, earlydevelopment patterns are common elements that many communities in the Atlanta Region share. Historicalevents, from settlement starting in the 1830s, the Civil War, cotton production and the bowl weevil, to theGreat Depression and the Civil Rights Movement, shape the Region’s collective history. Historic sites inAtlanta: the MLK birth home, the Herndon Home, Auburn Ave, the Atlanta Cyclorama, the Margaret MitchellHouse, the Wrens Nest and the Swan House, tell the story of significant events in the City’s history thatdraws visitors to the City. However, preserving the past has been a struggle. Historic buildings have beendemolished and replaced by new ones and parking lots. As a result, Atlanta has lost some of its uniquecharacteristics, leading some to describe the City as not having a strong sense of place.
Forward thinking, ambitious, business oriented, coalition building and boosterism are some of the intangibledefining features shared by the business and political leaders of the City of Atlanta. This approach andattitude has been a big factor in the growth and success of the City of Atlanta.
Infill Development
Communities should maximize the use of existing infrastructure and minimize the conversion ofundeveloped land at the urban periphery by encouraging development or redevelopment of sitescloser to the downtown or traditional urban core of the community.
September 2007 Draft Atlanta Strategic Action Plan10
Community Assessment3

Since 2000, approximately 39,000 net building permits have been issued in the City of Atlanta. The locationof many of these new units could be considered infill. The City of Atlanta has a very small amount of vacantand greenfield sites available for development. Most new development has occurred or will occur inunderutilized parcels of land, such as greyfields and brownfields. The City of Atlanta has a brownfieldredevelopment program that works to identify these sites.
To encourage infill development numerous plans have been approved for areas throughout the City.Redevelopment will be a primary focus for spurring economic development in portions of the City that areeither “built-out” or have experienced disinvestment and decline. The City of Atlanta’s New Century EconomicDevelopment Plan identified 14 separate areas within the City that have suffered social and economicdecline. Further, the City has placed emphasis on five of the 14 areas as economic development priorityareas: Simpson Road, Campbellton Road, Memorial Drive, Donald Lee Hollowell Parkway and the JonesboroRoad corridors.
The purpose of creating a redevelopment plan is to revitalize a neighborhood and establish a proactiveframework for its future growth. This is accomplished by identifying existing challenges, ways to overcomethem, and creating a long-term vision for positive change. In these plans, inventories are taken of the qualityof properties in those study areas and the potential for those areas to support redevelopment. Future landuse and zoning changes are recommended by parcel and projects are recommended that support thesechanges and facilitate redevelopment. The plan is then adopted into the City’s Comprehensive DevelopmentPlan (CDP) and targeted actions consistent with the plan are taken by various parties to implement planrecommendations. As stand-alone documents, redevelopment plans serve as long-term guides todecision-making and investment.
As the City’s population has increased, demand for additional housing has followed. Demolition of existinghomes and construction of new infill residential units has been a concern for many neighborhoods. At timesthese new houses are larger, taller and out of context with the neighboring homes and development pattern.In response to these issues, amendments to the Zoning Resolutions that address lot coverage, floor arearatios will be considered by City Council before the end of 2007.
Resource Conservation
Heritage Preservation
The traditional character of the community should bemaintained through preserving and revitalizinghistoric areas of the community, encouraging new development that is compatible with the traditionalfeatures of the community, and protecting other scenic or natural features that are important todefining the community’s character.
The City of Atlanta’s historic fabric is a diverse collection of buildings, structures, objects, sites, and districtwhich reflect all decades of the City’s past, embodies the wide variety of themes in the City’s history, andhas significance for all of the City’s residents, workers, and visitors. These historic resources are essentialin defining the City’s traditional character. The City’s traditional character is best described through thefollowing inventories and designations of historic resources.
11Atlanta Strategic Action Plan September 2007 Draft

The City’s Historic Preservation Zoning Ordinance of 1989 (Ordinance) establishes categories of protection:Landmark and Historic for districts and individual buildings/sites, and Conservation just for districts. Currently,57 buildings are designated as Landmark or Historic and 15 districts are designated as Landmark, Historicor Conservation.
The Atlanta Urban Design Commission (AUDC) has the responsibility for the protection of the City's historicresources and most other historic resource and historic preservation-related issues in which the City isinvolved. Each designated Landmark and Historic District has a set of customized design regulations toensure that alterations, additions, new construction, and site work are compatible with the existing historicresources in each district, while demolitions of contributing structures are reviewed using a standard set ofcriteria that are the same for each district. A standard set of design regulations that are based on the U.S.Secretary of the Interior’s Standards apply to the individual buildings/sites and the Conservation Districts.The demolition of individual Landmark Buildings/Sites are reviewed using the same standard criteria usedfor demolitions in Landmark and Historic Districts. The AUDC administers the Ordinance by issuingCertificates of Appropriateness as the first step in the building permits process for construction, renovation,or demolition are completed. This review and approval process is only required for districts and buildingsdesignated under the Ordinance, as well as in several Special Public Interest (SPI) districts. The AUDCalso provides comment or regulation as required by individual ordinances, such as the Subdivision Ordinance,and zoning applications (rezoning, variances, special use permits, etc.).
There are several issues and concerns regarding the City’s historic resources that could ultimately affectthe City’s traditional character. These issues and concerns fall into two categories: awareness/educationand implementation/enforcement.
Regarding awareness/education, there is a lack of research and information regarding a wide variety ofAtlanta's historic resources, such as the remnants of the City's rural past, remnants of the City's industrialpast, sites associated with the Civil Rights Movement, post-WWII neighborhoods, and abandoned cemeteries.Master and/or management plans are needed for some of the historic resources open to the public and/ormanaged by the City (parks, community centers, etc.). There is no ongoing and active education programfor the general public, elected officials, other government agencies, developers, neighborhoods, etc. abouthistoric resource protection and revitalization, preservation tools, or the role of historic preservation in theCity’s future. Not all development entities (public and private) are aware of historic preservation issues,potential historic resources and the support available to assist them.
Regarding implementation/enforcement, the number of neighborhoods and individual property ownersseeking listing in the National Register of Historic Places and designation by the City is expected to increasedue to: increased developmental pressures on historic intown neighborhoods, the recognition of designationas a revitalization tool; the various economic incentives which are available for designated properties; andthe effect the Beltline will have on the awareness of historic resources along its corridor. However, evenwith this increased interest in listing and protection, the City has limited resources to respond to theserequests, manage the subsequent processing of development-related applications for projects, enforce theregulations that come with designation under the Ordinance, and to directly assist with the improving orenhancing historic resources. Further, the City's current regulatory tools that protect designated historicresources do not address other problems that face non-designated historic areas and other areas withtraditional character.
September 2007 Draft Atlanta Strategic Action Plan12
Community Assessment3

Open Space Preservation
New development should be designed to minimize the amount of land consumed, and open spaceshould be set aside from development for use as public parks or as greenbelts/wildlife corridors.Compact development ordinances are one way of encouraging this type of open space preservation.
The 1993 Parks Open Space and Greenways Plan; the 2000 Atlanta Community Greenspace Program;and the 2002 Parks and Greenspace Task Force Report have all proposed policies and actions to addressgreenspace issues. Atlanta’s Project Greenspace, to be adopted in 2007, is building on prior planninginitiatives by defining a comprehensive strategy and action plan that can be implemented to develop aworld-class greenspace system for the future. All of these plans call for an increase in the amount ofgreenspace throughout the City. The Project Greenspace goal is to have 10.5 acres+ of parkland per 1,000residents.
The City of Atlanta has been purchasing greenspace under the Greenways Acquisition Project. This projectwas undertaken as part of settlement of an enforcement action against the City of Atlanta for violations ofthe Federal Water Pollution Control Act and the GeorgiaWater Quality Control Act. Specifically, the CombinedSewer Overflow (CSO) Consent Decree signed in 1998 requires the City to implement a $25 million programto acquire streamside buffers in the City of Atlanta and 14 counties in the Atlanta Region through March2007. Under this program, the City of Atlanta’s Department of Watershed purchased land and easementson 700 acres within the city limits and 1,187 acres outside of the city limits. Furthermore, the Parks OpportunityBond has allocated $35 million for park acquisitions.
The City of Atlanta has worked with conservation organizations such as the Trust for Public Land (TPL) theArthur M. Blank Foundation’s Inspiring Spaces Initiative and the Conservation Fund to preserve open space.The City of Atlanta has been working with TPL in the Chattahoochee River Land Protection Campaign. TheCity of Atlanta, BeltLine Inc and TPL are currently working to preserve land along the BetlLine. To date,almost 200 acres in the Westside Park (the former Bellwood Quarry), Four Corners Park in Peoplestown,and the new Boulevard Crossing Park, has been purchased. Redevelopment plans currently underway forthe Lakewood Fairgrounds and Fort McPherson will most likely include greenspace.
Some SPI districts require open space in multifamily residential uses and public space in commercial uses.To further protect open space, the City of Atlanta will adopt a Conservation Subdivision Ordinance in 2007to comply with the Metropolitan North Georgia Water Planning District’s Watershed Management Plan.
Environmental Protection
Environmentally sensitive areas should be protected from negative imprints of development,particularly when they are important for maintaining traditional character or quality of life of thecommunity or region. Whenever possible, the terrain, drainage, and vegetation of an area shouldbe preserved.
13Atlanta Strategic Action Plan September 2007 Draft

Natural resources provide important environmental benefits to the residents and visitors of the City of Atlantaand are essential to sustain plant and animal life. Project Greenspace identifies many of the City’s naturalresources and includes goals and strategies to protect them. Moreover, the City of Atlanta has regulationsto protect natural resources from the adverse impacts of development and human activities.
Atlanta’s tree canopy is consistently identified as an important key resource in the City’s quality of life.Chapter 158 (Vegetation) of the City of Atlanta Code of Ordinances set standards for tree protection. TheTree Protection Ordinance requires a permit for the direct or indirect removal or destruction of any treeshaving a diameter at breast height (DBH) of six inches or greater. Applicants are required to minimizeimpacts to trees on the site (particularly mature trees) and to plant trees to replace those destroyed. Theregulations provide for “recompense” to the tree trust fund based on the differences between the numberand total DBH of the trees removed or destroyed and number and total DBH of the trees replaced on thesite. This ordinance also includes minimum requirements for parking lot landscaping
Regulations to protect environmentally sensitive resources are set forth in Chapter 74 (Environment) of theCity of Atlanta Code of Ordinances. The Soil Erosion and Sedimentation Control article establishes standardsto control erosion and sedimentation impacts caused by land-disturbing activities on surface waters andother environmental resources within the City. Applicants are required to submit soil erosion and sedimentationcontrol plans that specify “best management practices” or measures to be used to control erosion andsedimentation pollution during all stages of the land-disturbing activity.
The Post Development Stormwater Management article sets standards to protect water resources fromdegradation caused by post-development stormwater runoff, including increases in stormwater rates andvolumes, post-construction soil erosion and sedimentation, stream channel erosion, and nonpoint sourcepollution. Applicants are required to submit a stormwater management plan detailing how post-developmentstormwater runoff will be controlled and managed in accordance with the requirements of the ordinance.Regulations require new development and redevelopment maintain a peak rate of stormwater dischargenot more than 70 percent of the pre-development peak discharge at all times during and after the developmentof the property.
The Flood Area Ordinance regulates and restricts land disturbance and construction within floodways andfloodplains. Atlanta’s floodplain regulations are more restrictive than many other municipal ordinances inthat they prohibit new construction within the 100-year floodplain. No fill or other encroachments that wouldimpede the ability to convey and discharge the water resulting from the 100-year flood are permitted withinthe floodway. Earth-disturbing activities within the designated floodplain must result in “no net loss” of existingflood volume or expansion of a flood hazard area as determined by engineering calculations.
The Riparian Buffer Ordinance has requirements for the establishment, protection, and maintenance ofnatural vegetative buffers along the city’s streams and rivers. Both perennial and intermittent streams arerequired to have a 75-foot buffer measured from the top of the stream bank. If a jurisdictional wetland ispresent, the buffer must include the wetland and extend at least 25 feet beyond the wetland edge.
Wetland Protection Regulations protect the environmental integrity of freshwater wetlands within the Cityof Atlanta. It does not impose any wetland protection requirements beyond the U.S. Army Corps of Engineers(USACOE) requirements under Section 404 of the Clean Water Act.
September 2007 Draft Atlanta Strategic Action Plan14
Community Assessment3

Social and Economic Development
Growth Preparedness
Each community should identify and put in place the pre-requisites for the type of growth it seeksto achieve. These might include infrastructure (roads, water, and sewer) to support new growth,appropriate training of the workforce, ordinances and regulations to manage growth as desired, orleadership capable of responding to growth opportunities andmanaging new growth when it occurs.
The City of Atlanta’s Code of Ordinances calls for the development of a Comprehensive Development Planto guide growth and development. The plan is also required by the Minimum Planning Standards for theCity to maintain its Qualified Local Government Status. Grant funding is often tied to this designation. Thetwenty year Comprehensive Plan, prepared every 3 to 5 years, contains comprehensive development goals,policies, and objectives for both the entire city and for individual geographic areas and communities withinthe city. The plan also incorporates information regarding transportation, parks and recreation, communityfacilities, housing, land use, policies and implementation strategies for a 15 year time frame. In addition,the plan is required to include a land use map to guide growth as well as goals and objectives based on theexisting and projected demographic and socioeconomic data. Twenty year demographic projections areprepared by the City of Atlanta's Bureau of Planning and are used by other departments and agenciesthroughout the City. The Capital Improvements Program is based on population projections as well as otherfactors. In addition to the Comprehensive Development Plan, corridor studies, Livable Center’s Initiative(LCI) studies and plans for specific geographic areas of the City have been adopted by the City of Atlanta.
Moreover, as called for in the Georgia Planning Act, the City of Atlanta prepares a Comprehensive Plan,Short TermWork Program and Capital Improvements Element according to theMinimumPlanning Standardsand the time frame required by the Georgia Department of Community Affairs.
The City of Atlanta has adopted the “New Century Economic Development Plan for the City of Atlanta"(updated July 14, 2005) which outlines the three primary components of the economy: HealthyNeighborhoods and Quality of Life, Economic Opportunity, and Physical Infrastructure”. As a result of this“umbrella” plan the City has been able to identify issues, opportunities and actions which will achieve thestated goals. The City’s strategy for growth is to achieve a balance in the preservation of existing single-familyneighborhoods and sensitive areas as well as providing opportunities for new development to accommodatepopulation and employment growth at major activity centers and along major corridors with appropriatedensity and mix of uses.
This plan also identified an action plan which includes Citywide focus on: target industries, businessrecruitment, retention, and expansion, the Beltline, the Downtown and Brand Atlanta Campaign, economicvitality in underserved areas, business climate, workforce housing, capital available for development, crimerate, public schools, and parks and greenspace. The City identified seven goals by 2009 based on theaction plan:
Create 60,000 new jobsCreate 24,000 new metro jobs related to the airport growth and expansionGrow property value in the City by $26B
15Atlanta Strategic Action Plan September 2007 Draft

Add 10,000 new workforce housing units by use of City incentivesDecrease the city’s crime rate to 5,600 crimes per 100,000 residentsIncrease the high school completion rate of Atlanta Public School students to 72%Add 1,900 acres of dedicated parks and greenspace
To this end, the City has undergone a variety of plans for LCI designated areas and corridor studies todetermine the best land use for underserved areas as well as when infrastructure projects support the plans.These studies recommend implementing zoning changes such as the Quality of Life District, NeighborhoodCommercial Zoning and SPI Zoning to create positive growth in the City. Each year the City updates theCapital Improvement Program is updated to support current and future growth based on these priorities.These initiatives provide the framework to foster and control development in the City.
Appropriate Businesses
The businesses and industries encouraged to develop or expand in a community should be suitablefor the community in terms of job skills required, long-term sustainability, linkages to other economicactivities in the region, impact on the resources of the area, and future prospects for expansion andcreation of higher-skilled job opportunities.
The Atlanta Development Authority (ADA) is a public authority created by the City of Atlanta to promote therevitalization and growth of the City through a comprehensive and centralized program focusing on communitydevelopment and redevelopment. It represents a consolidation of the City’s economic and communitydevelopment efforts in real estate, finance, marketing and employment, for the purpose of providing a focalpoint for improving Atlanta’s neighborhoods and the quality of life for all its citizens. The ADA has a varietyof incentives in place, including tax credits, tax abatements, Urban Enterprise Zones, and small businessassistance to name a few, which encourage additional business in the City. The ADA works with a varietyof economic development organizations to create development strategies for business development basedon the City’s strengths, assets, opportunities and weaknesses. Moreover, the Atlanta Development Authorityis actively pursuing incentives for relocation and expansion, promoting Atlanta as a great place to live,supporting the growth of small business, and creating a comprehensive program to drive retention andexpansion of existing business.
The City of Atlanta has a diverse employment base with no single industry and employer dominating themarket. Based on an evaluation of existing business types in our community, several target industries havebeen identified as the focus of our business retention and expansion plan. These industries are compatiblewith the City of Atlanta’s existing business patterns. The City of Atlanta has prioritized these criteria toevaluate target industries with the greatest potential for job creation: large cluster industries, significant neargrowth prospects and actions by the City that can make a positive impact. The following industries aretargeted for growth:
Transportation, logistics and distributionHotels, tourism, and entertainmentHealth servicesHigher education and bioscience
September 2007 Draft Atlanta Strategic Action Plan16
Community Assessment3

Other target industries that are identified for expansion are: retail, high tech communications, construction,music, film, and video production and financial institutions.
Employment Options
A range of job types should be provided in each community to meet the diverse needs of the localworkforce.
The City of Atlanta has a diverse economy with no sector dominating it. Public Administration andProfessional, Scientific, and Technical Services, the sectors with the largest share of jobs, have 12% and11% of employment respectively. However there has been an overall decline in the number of manufacturingand warehousing jobs. These are generally good paying jobs for skilled workers without a college education.The employment information from the US Census economic data shows that there were approximately425,000 jobs in the City of Atlanta in 2006 and an average of 21,000 jobs were created each quarter. Thevariety of jobs available in the City requires a wide range of educational and skill set requirements. Byfocusing on many target industries, the City of Atlanta will be able to ensure that a wide range of jobs fromtransportation and logistics to FIRE and managerial are available. The City is working on expanding bothhigh and low-skilled jobs in the City. The City of Atlanta’s economic development program has anentrepreneur and small businesses support program to promote the development of a smaller retail andservice business sectors. These businesses will provide job opportunities and will further diversify the localworkforce.
To enable City of Atlanta residents and businesses to participate in business development and make apositive impact on the greater picture of Atlanta as a prosperous city, the Atlanta Workforce DevelopmentAgency, which is a Bureau in the City of Atlanta government, administers employment and training programsunder theWorkforce Investment Act (WIA). Each local area has a Board of Directors and a physical locationor a “One-Stop-Center” which provides workforce development services which train people for jobs in thetarget industries as well as other areas. They partner with the state, community colleges, public schoolsand faith based organizations to coordinate workforce development efforts across the city.
Housing Choices
A range of size, cost, and density should be provided in each community to make it possible for allwho work in the community to also live in the community (thereby reducing commuting distances),to promote a mixture of income and age groups in each community, and a range of housing choiceto meet market needs.
A range of housing choices from cost, size, age and type are available in the City of Atlanta. Approximately57% housing units are single family homes (1-4 units) and 43% are multi-family homes (5+ units). Thenumber of multi-family homes is increasing. Between 2000 and 2006, 80% of the homes built weremulti-familyhomes. Most of these new multifamily units are located along major corridors and are located in the City’smajor employment centers – Downtown, Midtown and Buckhead. These residential developments aresupported by the land use policies to promote nodal development, to promote residential density nearavailable infrastructure, to develop transit station areas and to minimize urban sprawl.
17Atlanta Strategic Action Plan September 2007 Draft

The Land Use Map and Zoning Ordinances include many residential districts that allow for a variety ofhousing types and densities. The Land Use Map includes Single Family Residential to Very High DensityResidential land uses (describe the allowed densities). The Zoning Resolution contains many residentialzoning categories that allow for a range of densities from R-1 to RG-6 and MR-6. The minimum lot sizesrange from 2 acres, allowed in R-1 to 2,800 square foot lots allowed in R-4B. Many homes were built in theearly to mid 1900s, prior the City of Atlanta’s Zoning Ordinance of 1982; therefore the City recognizes manyof these small lots as lots of record and are therefore buildable lots. The density ranges allowed in theresidential zoning districts vary from one home per two acres in the R-1 district to XX allowed in the RG-6district (what is the max density).
Residential developments are encouraged to be compatible with their surrounding community. Followingthe same street pattern and street design is required in neighborhoods designated historic and encouragedin other neighborhoods and in SPI districts. A draft Residential Scale Ordinance is currently underconsideration to ensure that new construction is compatible with the scale of existing houses.
Numerous zoning classifications allow for multi-family development such as: R-G (Residential General)Districts, MRC and Commercial Zoning Districts (include units per acre). Moreover, the MRC zoning districts,allow for the combination of live-work mixed use developments. Examples of this type of developmentinclude: Atlantic Station and Glenwood Park. Loft developments have proven to be an attractive house typein older industrial corridors of the City of Atlanta such as Castleberry Hill, along Marietta Boulevard, and theFairlie Poplar District downtown. To encourage a diversity of housing types, somemulti-family andmixed-usezoning districts allow accessory units like garage apartments or mother-in-law units. These types of accessoryunits are common in many of the older neighborhoods. Allowing these accessory units in certain single-familyresidential districts will be considered.
Most new housing, particularly multi-family development, will be located in land that will be redeveloped.For example, City Hall East, the former Sears distribution facility, will be redeveloped into a mixed usedevelopment with xx housing units. Plans are underway for the redevelopment of the land along the BeltLine,the Lakewood Fairgrounds, and Fort McPherson. All of these redevelopments will include a range of housingtypes. However, there is some vacant land in the City of Atlanta. In 2004, 12% of the land in the City ofAtlanta was classified as vacant. The Fulton Atlanta Land-bank Authority is one depository for availableland for development
While there is a range in the price of housing in the City of Atlanta, there is a need for an increased availabilityof workforce and affordable housing. Former housing developments operated by the Atlanta HousingAuthority have been redeveloped into mixed income communities. This has resulted in a net loss of subsidizedhousing. Many of the new private housing units being built through out the City are not affordable to thosethat work in the City. Moreover, the increase in population has led to an increase demand in housing. As aresult the cost of the existing housing stock has also increased. These factors have resulted in housing thatis increasingly out of reach for the workforce and residents of the City of Atlanta.
As housing costs increase citywide, providing affordable housing is a challenge. Recent studies also suggesta need for affordable, workforce, and low-income housing. For example, salaries for police employeesgenerally do not sustain living in the City at the current prices of housing. There are several existing programs(through tax abatement programs, zoning bonus incentives, etc.) to address this issue. The Bureau of
September 2007 Draft Atlanta Strategic Action Plan18
Community Assessment3

Housing is working on an Inclusionary Zoning Ordinance to provide density bonuses for the construction ofworkforce housing. Several of the Tax Allocation Districts, including the Beltline TAD, call for the constructionof workforce housing units. Between 2004 and 2006, almost 4,000 affordable housing units were built.
The City of Atlanta is committed to the development of housing for all income levels. The City supports anumber of Community Development Corporations (CDC) who build affordable and low-income housingthrough various subsidies. In 2004, Mayor Shirley Franklin established a goal of creating 10,000 units ofaffordable workforce housing by 2009. To assist in accomplishing this endeavor, the City of Atlanta, theAtlanta Housing Authority and the Atlanta Development Authority, have partnered together to implement anew $75 million workforce housing initiative for persons and families who desire to reside in the City ofAtlanta. The single family mortgage assistance program is the first initiative that will be implemented.
The City of Atlanta does not have programs for households with special needs; however, housing programsfor rehabilitation of single-family homes for the elderly and housing to the homeless via the Gateway Centerare available. Other housing programs for households in Atlanta with special needs are provided by FultonCounty.
Educational Opportunities
Education and training opportunities should be readily available in each community to permitcommunity residents to improve their job skills, adapt technological advances and pursueentrepreneurial ambition.
Approximately 45 accredited colleges and universities are located in the City of Atlanta and the AtlantaRegion. Many top colleges and universities including Georgia State University, Georgia Institute ofTechnology, Spelman College, Morehouse College, Morehouse School of Medicine, Clark Atlanta, MorrisBrown College, American Intercontinental University, Art Institute of Atlanta, and the Savannah College ofArt and Design are located in the City of Atlanta. Georgia State University a public, four-year school offersa comprehensive selection of degrees and services. The colleges at the Atlanta University Center are aprivate, not-for profit four-year schools that offer a range of undergraduate and graduate programs. TheGeorgia Institute of Technology is a specialty/professional school with extensive facilities and technologyfocusing on science and engineering. The Savannah College of Art and Design, a recent addition to theCity, is a private, four-year school which focuses on the arts. There are also a variety of two-year schoolssuch as the Atlanta Technical College and Bauder College.
Atlanta’s educational system has formed a consortium called ARCHE (Atlanta Consortium for HigherEducation) which was created to expand opportunities, foster cultural diversity and provide students withaccess to a variety of programs within their school and through other participating schools. According to astudy by ARCHS, Atlanta ranks second nationally in the production of engineering and related technologygraduates and fourth in computer science degrees. With such a large concentration of colleges, universitiesand technical schools, and even private training programs, numerous resources are available for continuingeducation, executiveemployee training, and research and development opportunities.
19Atlanta Strategic Action Plan September 2007 Draft

The Atlanta Workforce Development Agency (AWDA), a Bureau of the City of Atlanta under the ExecutiveOffices of the Mayor, offers a wide variety of training opportunities for youth and adults to foster theireducational and professional development. The mission of the Atlanta Workforce Development Board(AWDB) is to promote a workforce development system that meets the needs of businesses, job seekers,and workers while ensuring that the City of Atlanta maintains a strong and vibrant economy.
The Atlanta One-Stop Center operated by AWDA seeks to provide quality workforce development servicesto Atlanta residents and the business community. The Atlanta One-Stop Center connects qualified jobseekers to employers, provides comprehensive assessments for residents seeking training or jobs andoffers its services and facility as "Your Only Stop" for continued workforce solutions. Workforce solutionsare delivered by a consortium of training providers, One-Stop partners, educational, community and faithbased organizations.
Governmental Relations
Local Self-determination
Communities should be allowed to develop and work toward achieving their own vision for thefuture.Where the state seeks to achieve particular objectives, state financial and technical assistanceshould be used as the incentive to encourage local government conformance to those objectives.
Community participation is integral to many of the activities undertaken by the City of Atlanta. The communityparticipation process is formalized in the City of Atlanta Municipal code. It sets up a process for neighborhoodplanning by creating Neighborhood Planning Units (NPUs) and spelling out their role. The NeighborhoodPlanning Units provide input into the development of the comprehensive plan and make recommendationsto the City of Atlanta on a wide range of topics including land use, zoning, transportation, open space andparks, community facilities and environmental quality. The 25 Neighborhood Planning Units meet everymonth and provide recommendations to the City of Atlanta on rezoning, subdivision and variance applications,Zoning Resolution Amendments, Comprehensive Plan amendments and other matters. Over the years, theNPUs have become very knowledgeable of the development process and regulations.
Community participation and community awareness are essential components to all of the planning effortsconducted by the City of Atlanta. Thru the community participation process, City of Atlanta staff reachesout to community members to ensure broad participation. Moreover, community members are involved indeveloping a vision, goals and recommendations for each of the plans by attending community meetings,participating advisory committees, by submitting comments among other methods. During the planningprocess, advisory boards are often created to allow for more extensive participation.
Regional Cooperation
Regional cooperation should be encouraged in setting priorities, identifying shared needs, andfinding collaborative solutions, particularly where it is critical to success of a venture, such asprotection of shared natural resources or development of a transportation network.
September 2007 Draft Atlanta Strategic Action Plan20
Community Assessment3

Many of the challenges facing the City of Atlanta are regional in nature. To address these complex issues,the City of Atlanta has been at the forefront of regional cooperation and planning. In 1947, the City of Atlantaalong the Fulton and Dekalb Counties created the Metropolitan Planning Commission, the predecessor ofthe Atlanta Regional Commission (ARC). The City of Atlanta is a member of the ARC, the 10 county regionalplanning and intergovernmental agency. The mayor and a city council member serve on the ARC Board.In addition, elected officials and city staff serve on the Environment and Land Use, Transportation and AirQuality, Land Use Coordinating and the Transportation Coordinating committees. The City of Atlantaparticipates in ARC’s transportation planning process that results in the adoption of the RegionalTransportation Plan and the Transportation Improvement Plan as well as other studies and initiatives.Moreover, the City of Atlanta works cooperatively with sixteen counties in the region by participating in theMetropolitan North GeorgiaWater Planning. The City of Atlanta Mayor is a member of the District GoverningBoard. The District establishes policy, creates plans and promotes intergovernmental coordination of allwater issues.
The City of Atlanta along Fulton County and the other nine cities in the County adopted a Service DeliveryStrategy (SDS) in 1999, in response to the 1997 Service Delivery Strategy Act. The SDS identifies servicearrangements for 54 services. The agreements were re-evaluated and adopted in 2005 at the time that alllocal governments were required to adopt new 10 year Comprehensive Plans. The City of Atlanta is currentlyworking with Dekalb County to update its Service Delivery Strategy.
Transportation has played a key role in the development of the City and region. The City of Atlanta hasplayed a leadership role in the development of key transportation infrastructure crucial to the success ofthe Atlanta Region. In 1968, the residents of Atlanta, joined residents in Dekalb and Fulton Counties, inapproving a referendum to designate a one cent sales tax to fund the Metropolitan Atlanta Regional TransitAuthority (MARTA). Revenue from the one cent sales tax provides 67% of MARTA’s annual budget. TheCity Council recently adopted legislation extending the one cent sales tax until 2047 to provide MARTA withthe ability to expand its operations. It is the ninth largest transit system in the nation and the only one thatdoesn’t receive state funding.
The City of Atlanta's Department of Aviation is responsible for the operation of the Hartsfield-Jackson AtlantaInternational Airport HJAIA. HJAIA is one of the key reasons many companies are located in the AtlantaRegion. The Airport is the principal airport serving Georgia and the Southeastern US. It has been the world’sbusiest passenger airport for many years and it is gaining importance in the transportation of air cargo andfreight. Currently it is one of the top 10 cargo airports in the US. The total annual, regional economic impactof the Airport is more than $18.7 billion.
The City of Atlanta is a leader in the arts. It provided funding for the Metro Atlanta Arts and Culture Coalition,a six county coalition to support arts and culture in the region. More recently, Mayor Shirley Franklin’s Artsand Culture Task Force is proposing the creation of the Cultural Investment Fund. The Cultural InvestmentFund will create a mechanism to provide funding to arts and cultural organization. Initially the fund will bebenefit arts and cultural organization in the City of Atlanta. Task Force members hope that it will become aregional funding source.
21Atlanta Strategic Action Plan September 2007 Draft

Atlanta Mayor Shirley Franklin, working with the United Way, has taken a leadership role in developing aregional approach to eliminate and prevent homelessness. In 2003, the Commission on Homelessnesspresented the Blueprint to End Homelessness in Atlanta in Ten Years. The plan serves as the frameworkfor the City of Atlanta, Clayton, Cobb, Dekalb, Douglas, Fulton, Gwinnett and Rockdale Counties to provideservice and address issues facing the homeless population.
The Atlanta Police department cooperates actively with Fulton County, MARTA, and other police departments;county sheriff and district attorney; State GBI and State Patrol; city schools, court, detention center, andtraffic engineers; Atlanta Fire and Rescue Department; Atlanta-Fulton County Emergency ManagementAgency; and emergency medical services in emergency management and law enforcement.
September 2007 Draft Atlanta Strategic Action Plan22
Community Assessment3

Areas Requiring Special Attention
Areas of significant natural or cultural resources, particularly where these arelikely to be intruded upon or otherwise impacted by development
Natural Resources
Chattahoochee River CorridorThick tree canopyRare birds, native to landscapePiedmont ParkFreedom ParkWater resources
Greenway corridorsStream buffersNancy CreekDrinking water sourcesCreek beds particularly along Peachtree Creek
Vistas and view sheds: The vista and viewsheds are most common in Northwest, West, Southwest,and extreme Southeast portions of the City. They are often found along old ferry or mill roads, andalong lesser developing former farm roads.
Other: old growth stands of trees, stone/boulder outcroppings, and dramatic exposed slopes wouldalso be natural resources requiring special attention. This would be combined with the "vistas andviewsheds" comment above or the comment on "areas that retain rural/agricultural landscape" in thecultural resources section.
Cultural Resources
Post WWII neighborhoods as well as post WWII commercial, industrial, and institutional architecture, whichlike the neighborhoods are much less understood and documented.
Properties along the BeltLine
Virginia Highlands, Morningside, Castleberry Hill and other National Register of Historic Places listed orpotentially listed neighborhoods experiencing substantial infill.
Areas that retain rural/agricultural landscape particularly Bolton Road, Campbellton Road, South FultonRoad,
LCI corridors, such as Bankhead Hwy, and MARTA stations as well as the economic priority areas.
Archeological and Civil War related sites as well as sites associated with the Civil Rights Movement.
23Atlanta Strategic Action Plan September 2007 Draft

Areas where rapid development or change of land uses is likely to occur
The following areas are expected to experience rapid development accompanied by changing land uses incoming years. In many of the areas, existing economic pressures are driving rapid growth and redevelop,while other areas have been targeted by planners and policy makers for land use changes coupled witheconomic development public investment incentives, which are expected to bring rapid development.
Areas where growth and land use changes are likely to occur are:
Economic Development Priority Areas
Campbelton RoadDonald Lee Hollowell ParkwayJonesboro RoadMemorial Drive CorridorSimpson RoadStadium neighborhoods:
MechanicsvillePeoplestownPittsburghSummerhill
Livable Centers Initiative Areas:
City Center LCI (2001)Greenbriar Mall LCI (2001)Memorial Drive Corridor LCI (2001)West End LCI (2001)Bolton/Moores Mill LCI (2002)Buckhead Village LCI (2002)HE Holmes MARTA LCI (2002)JSA/McGill LCI (2003)Midtown LCI (2004)Oakland City/Lakewood LCI (2004)Upper Westside LCI (2004)Bankhead MARTA LCI (2006)South Moreland (2007)West Lake MARTA LCI ( 2007)
Other areas currently where growth and land use changes are likely to occur:
Downtown, Midtown and Buckhead Business Districts: These areas have had high level of developmentactivity over the past several years. These three areas led the city in the number of residential housing
September 2007 Draft Atlanta Strategic Action Plan24
Community Assessment3

units permitted and in population growth. Growth and development will be directed to these areas inthe future.Near-core Neighborhoods: Neighborhoods near downtown and Atlanta’s inner core are currently andwill be the most attractive areas for infill development in the city. This process has already begun innorth and northeast Atlanta and the pattern is nowmoving both clockwise and counterclockwise, towardthe south and west, around the inner coreBeltLine Redevelopment Area: Areas concentrated around the Beltline will likely see both plannedand unplanned forms of rapid development and land use changes. There will be significant newresidential and mixed use development in south and west Atlanta, concentrated around the Beltline,on former industrial and commercial properties. Environmental remediation will challenge the economicsof new development in the short term. The areas most susceptible to change are at the intersectionof the Beltline with major through-city streets and near MARTA stations. Areas where developmentwill most likely occur are:
University AvenueWhite Street/Donnelly AvenueJefferson StreetHuff RoadOld Fourth Ward/City Hall East and south to DeKalb AvenueBill Kennedy WayEnglewood Avenue/Grant Circle
Peachtree Corridor: While this corridor is currently Atlanta’s economic center, there is still a vastamount of development potential from Brookwood to Fort McPherson in the south. This developmentactivity will be fueled by the Peachtree Taskforce recommendations for a street car to run along thefull corridor.Other Corridors:
Cheshire Bridge RoadMidtown West (Northside Drive Corridor & Georgia Tech Environs)Georgia State UniversitySouth Atlanta/Pryor RoadFort MacPhearsonNorthwest AtlantaBuckhead VillageDekalb Avenue CorridorDowntown “Gulch” between Five Points MARTA station and CNN CenterCentennial Park AreaIvan Allen BoulevardAtlantic StationHowell Mill Rd.Huff Road.Upper West SideMidtown: Spring Street & West Peachtree Street corridorsCastleberry Hill
25Atlanta Strategic Action Plan September 2007 Draft

Turner Field Parking LotsNPUs Q, P& R (Ben Hill & Niskey Lake)
Redevelopment of Industrial Areas
Atlanta has a large inventory of vacant and underutilized industrial properties, particularly along rail corridorssuch as the BeltLine. In many cases, development pressures are encouraging residential and mixed-useredevelopment of these sites. While overall this redevelopment is an encouraging sign, this phenomenonis contributing to a decrease in the City’s Industrial employment base. As these sites are re-zoned andconverted to residential uses, the City is quickly losing its already diminished inventory of largeindustrial-zoned sites. A concerted effort must be made to preserve industrial land within the city. Areaswith experiencing pressures to convert industrial land to other non-industrial uses include:
Industrial Properties adjacent to the Proposed BeltLine CorridorCheshire Bridge CorridorArmour Industrial YardNorthside Drive CorridorChattahoochee Industrial parkHuff Road CorridorHowell Mill Road CorridorEllsworth Industrial ParkMemorial Drive CorridorDekalb Avenue CorridorLarge Portions of NPU D, particularly adjacent to rail yards.
Areas where the pace of development has and/or may outpace the availabilityof community facilities and services, including transportation
Currently the needs of the existing population in many cases outpace the availability of community facilities,particularly transportation. All areas of Atlanta, the near-core neighborhoods most critically, will be strainedby the projected demographic growth. Northeast Atlanta will likely show signs of outpaced transportationfacilities first; however, south and west Atlanta have had less investment in infrastructure investment in thepast and will quickly show an acute lack of community facilities and services. The specific needs arediscussed below.
Transportation: Transportation facilities will be addressed in the Comprehensive Transportation Plan. Areaswith rapid growth such as Downtown, Midtown and Buckhead experience the worse congestion. Otherareas, such as NPU P, don’t have an extensive road network to handle increased demand. Road connectingEast-West are lacking. Transit service doesn’t meet the existing needs.
Sewer and Water: Some parts of the City use septic systems, mainly in SW Atlanta/NPU P. Sewer work iscurrently being undertaken by the Department of Watershed Management. However, some sewer and waterbasins might not be able to meet future demands.
September 2007 Draft Atlanta Strategic Action Plan26
Community Assessment3

Parks and Greenspace: Greenspace planning now being studied by Project Greenspace. Maintaining openspace and meeting park needs will be a challenge in Buckhead and areas that have been developed at thehighest density.
Other City Services and Municipal Government: Police, fire, and solid waste will be quickly stretched thinwithout expanded investment and planning – straining of services will extend into City operating departments
Areas in need of redevelopment and/or significant improvement to aestheticsor attractiveness (including strip commercial corridors)
Through its planning activities, the City of Atlanta has recognized many areas and corridors which couldbenefit from redevelopment and aesthetic improvements. These include both areas that are currentlyeconomically viable, yet are not reflective of a first-class urban environment; as well as areas that arecurrently economically depressed, yet have enormous potential for improvement through redevelopmentand public investment. All of these areas would benefit from special attention to encourage and manageimprovement.
Economic Development Priority Areas
The highest priority targets for redevelopment and improvement are the six Economic Development PriorityAreas that were identified in the City’s 2004 New Century Economic Development Plan, all of which exhibitnot only significant levels of poverty, unemployment and disinvestment, but also potential for improvementwith concerted public investment and economic development. The six areas meet the following criteriaidentified in the economic development plan:
1. Additional focus by the City and ADA will impact job creation, residential, and commercial developmentin the near-term
2. Significant developable area is available3. Supports affordable housing growth goals and mixed use communities4. Attracts goods and services for the existing revitalizing neighborhoods5. Enhances usage of transit infrastructure6. Aligns with employment centers7. Provides greenspace opportunities8. Can be implemented with planning tools and incentives
These areas and corridors are:
1. Campbelton Road2. Donald Lee Hollowell Parkway3. Jonesboro Road4. Memorial Drive Corridor5. Simpson Road6. Stadium neighborhoods
a. Mechanicsville
27Atlanta Strategic Action Plan September 2007 Draft
b. Peoplestownc. Pittsburghd. Summerhill
LCI Areas
14 areas within the City of Atlanta have been designated by the Atlanta Regional Commission as LivableCities Initiatives Study areas because of their potential to become vital & sustainable activity hubs whichsupport the City’s long term growth strategies. All these LCI areas have already been recognized as significantopportunities for redevelopment planning and implementation. They have all undergone extensive planningand public involvement processes, and provided with short and long term implementation plans. The LCIstatus qualifies these areas to access additional state and federal matching funds, allowing local funds tobe significantly leveraged. For this reason, the implementation of these plans should remain a priority forthe City of Atlanta. The areas are:
1. City Center LCI -(2001)2. Greenbriar Mall LCI-(2001)3. Memorial Drive Corridor LCI-(2001)4. West End LCI-(2001)5. Bolton/Moores Mill LCI-(2002)6. Buckhead Village LCI-(2002)7. HE Holmes MARTA LCI-(2002)8. JSA/McGill LCI-(2003)9. Midtown LCI-(2004)10. Oakland City/Lakewood LCI-(2004)11. Upper Westside LCI-(2004)12. Bankhead MARTA LCI-(2006)13. South Moreland-(2007)14. West Lake MARTA LCI-(2007)
As additional areas within the City are designated as LCI communities, they too shall be considered priorityareas for planning, implementation of capital projects, and redevelopment.
BeltLine Redevelopment Areas
Another great opportunity for redevelopment and improvement is defined in the BeltLine redevelopmentarea in which many properties have a high potential for redevelopment and aesthetic improvement. TheBeltLine project, as outlined in the 2005 Atlanta BeltLine Redevelopment Plan and defined by the AtlantaBeltLine Tax Allocation District and BeltLine Overlay zoning district, identifies long-term development /redevelopment strategies and short-term recommendations for public and private investment withconcentrations on improving and creating parks and trails, building transit and workforce housing, remediatingbrownfields, and preserving historical resources. It provides a framework for development over the next 25years along the Beltline, establishes preliminary standards for land use and zoning, and recommendstransportation improvement projects to facilitate future development / redevelopment.
September 2007 Draft Atlanta Strategic Action Plan28
Community Assessment3

Other Areas and Corridors
Several other areas and corridors have been identified by the City as significant planning opportunities forredevelopment and/or aesthetic improvement. Each of these have already undergone significant planningand public involvement to begin to identify future planning activities. These corridors and areas include:
1. Boulevard / Boulevard Drive Corridor2. Cascade Road Corridor3. Cheshire Bridge Road Corridor4. Cleveland Avenue Corridor5. Fort McPherson6. Howell Mill Road Corridor7. James Jackson Parkway / HE Holmes Drive Corridor8. Lakewood Fairgrounds9. Martin Luther King Jr. Drive Corridor10. Metropolitan Parkway Corridor11. Moreland Avenue Corridor12. Northside Drive Corridor13. Peachtree Road / Whitehall Street / Lee Street Corridor14. Piedmont Road Corridor15. Ponce de Leon Corridor
Other corridors with redevelopment opportunites are: Ben Mays Dr., Glenwood Ave, DeKalb Ave., JL LoweryBlvd., Hollywood Rd, Perry Blvd., Bolton Rd., Marietta Blvd. Marietta Rd., Flat Shoals Ave, Hosea WilliamsDr., McLendon Ave., Buford Hgwy., Peachtree Dunwoody Rd., Roswell Rd.
Large abandoned structures or sites, including those that may beenvironmentally contaminated
Large abandoned structures and sites that may be contaminated typify brownfields. Brownfields are propertiesthat are abandoned or underutilized because of actual or perceived contamination, which makes theirredevelopment difficult. Visual evidence of a brownfield site include old rail tracks, large old and vacantbuildings, abandoned machinery/equipment and/or large concrete slabs or paving. Through the City’sSustainable Brownfield Redevelopment Project, efforts are underway to compile a geographic databasethat will list, categorize and map the suspected brownfields throughout the City. This will be available to thepublic in the fall of 2007.
Areas/communities where there are brownfield sites require special attention because they pose a threatto the community in terms of safety, health, future investment. These sites represent economicallyunproductive real estate that produces negative returns since the presence of these sites leads todisinvestment throughout the community. Brownfield sites are especially difficult to redevelop into a productiveuse because of the potential environmental contamination, the extra cost of corrective action (clean-up orcaps) and legal ramifications that can arise. The State of Georgia Environmental Protection Department
29Atlanta Strategic Action Plan September 2007 Draft

(EPD) and the United States Environmental Protection Agency (EPA) have programs that offer grant fundingin order to provide incentives (and in some case legal protection) for the identification, assessment, andcorrective action for the subsequent redevelopment of these difficult sites.
The City is a recipient of EPA grant funding for the identification and assessment of brownfield sites citywide.The identification of these sites and the formation of a geographic database is a key component of thecurrent program. Once the sites have been identified the next step is to prioritize the sites such that thosethat pose the biggest threat to communities and have the best potential for successful redevelopment aregiven special attention.
Thus far, areas of the city that have been identified as requiring special attention due to large abandonedbuildings that may be contaminated are the old abandoned industrial sites along the rail segments thatmake up the BeltLine (see map). Other areas of the city that are being given special attention due to theirprevious varied industrial uses are the Mayor’s six priority areas, Donald Lee Hollowell Parkway, JonesboroRoad, Simpson Road, Martin Luther King, Jr. Drive, Campbellton Road and the Stadium Neighborhoods(see map).
Areas with significant infill development opportunities (scattered vacant sites)
The term infill has many definitions. Some times the word is used to define new construction on vacantparcels, others, it refers to new single family homes that replace existing ones. The new home may beinconsistent in size with the existing houses in the neighborhood.
The diminishing supply of land In the City of Atlanta, the high cost of building additional infrastructure, andthe social and economic costs of vacant and abandoned properties all contribute to an economic environmentwhich supports infill development. Infill development allows communities to maximize existing infrastructureand increase densities to levels that will support neighborhood amenities such as retail and transit. Infilldevelopment most be carefully managed to make sure that new infill development is consistent withneighborhood character and land use and development plans.
Areas with high levels of housing abandonment
Many single-family residential neighborhoods have seen a sharp increase in the abandonment and vandalismof homes and properties due to economic forces such as high foreclosure rates stemming from sub-primelending, mortgage fraud, and a thriving black-market for home-building materials such as copper, whichencourages theft and vandalism. Residential neighborhoods hit hardest by disinvestment and abandonmenttend to be located in the south and west sides of the city. This abandonment, however, creates opportunity,providing sites for infill development and reducing demand for green-field development. Areas especiallyimpacted by disinvestment with large inventories of vacant and abandoned properties include:
Polar RockSylvan HillsEnglish AvenueVine City
September 2007 Draft Atlanta Strategic Action Plan30
Community Assessment3

All of the City’s Economic Development Priority areas have large inventories of vacant and abandonedproperties suitable for infill development, including:
1. Campbellton Road2. Donald Lee Hollowell Parkway3. Jonesboro Road4. Memorial Drive Corridor5. Simpson Road6. Stadium neighborhoods:
MechanicsvillePeoplestownPittsburghSummerhill
BeltLine
Atlanta has a large inventory of vacant and underutilized industrial properties, particularly along rail corridorssuch as the BeltLine. These offer excellent opportunities for infill-development, although it is important toretain commercial and industrial uses in these areas to retain an employment base along the BeltLinecorridor and create transit accessible jobs throughout the city of Atlanta.
MARTA Station areas
Most MARTA stations outside the Downtown & Midtown core are surrounded by large MARTA-ownedsurface parking lots. Every station area has been part of an LCI study which supports the consolidation ofthe parking areas to allow for development of surface parking lots as part of a larger transit-orienteddevelopment.
Downtown and Midtown infill opportunities.
In Downtown, Midtown, Buckhead there has been significant infill development. These developments haveincluded a significant amount of highrise (more than 20 stories tall) residential developments, as well assome new hotels and office developments. All of these developments have included ground-floor accessoryretail. These areas still have large numbers of vacant lots and surface parking lots that could be developed.More specifically: Downtown south of Marietta Street, North of Underground, the site of the old World ofCoke, Peachtree Street between Ralph McGill and North Avenue, scattered lots around Centennial OlympicPark.
Older strip commercial shopping centers
Many older strip commercial shopping centers have the potential to consolidate parking and redevelopstreet-facing parking areas with infill development. Many of Atlanta’s traditional auto-oriented commercialcenters have recently been redeveloped in this way, most notably in the Lindbergh Area. Some potentialareas include:
31Atlanta Strategic Action Plan September 2007 Draft

Strip commercial shopping centers along Metropolitan ParkwayStrip commercial shopping centers along Roswell RoadStrip commercial shopping centers along Piedmont Avenue/RoadStrip commercial shopping centers along Marietta Blvd. near Bolton RoadStrip commercial shopping centers along West Paces Ferry Road near Northside ParkwayGreenbriar MallWest End Mall
Areas of significant disinvestment, levels of poverty and/or unemploymentsubstantially higher than average levels for the community as a whole
Economic Development Priority Areas
Mayor Franklin’s 2005New Century Economic Development Plan for the City of Atlanta identifies six priorityareas for economic development, all of which exhibit not only significant levels of poverty, unemploymentand disinvestment, but also the potential for the improvement with concerted public investment and economicdevelopment.
The six Economic Development Priority Areas identified in Plan are:
1. Campbellton Road2. Donald Lee Hollowell Parkway3. Jonesboro Road4. Memorial Drive Corridor5. Simpson Road6. Stadium neighborhoods
a. Mechanicsvilleb. Peoplestownc. Pittsburghd. Summerhill
Neighborhoods below the median household income
Thirteen of the City’s twenty-five Neighborhood Planning Units have median household incomes lower thatboth the 2000 citywide median household income of $34,770 and the 2005 median household income of$39, 752. These NPUS are:
1. Northeast: M2. Northwest: G, J, K, & L3. Southwest: H4. Intown South: S, T, V5. Eastside: O6. Southside: X, Y, Z
September 2007 Draft Atlanta Strategic Action Plan32
Community Assessment3

Areas of significant residential disinvestment, vacancy, and abandonment.
Many single-family residential neighborhoods have seen a sharp increase in the abandonment and vandalismof homes and properties due to economic forces such as high foreclosure rates stemming from sub-primelending, mortgage fraud, and a thriving black-market for home-building materials such as copper, whichencourages theft and vandalism. Residential neighborhoods hit hardest by disinvestment and abandonmentinclude:
1. Polar Rock2. Sylvan Hills3. English Avenue4. Vine City
Areas of significant commercial and industrial disinvestment, vacancy, and abandonment
Atlanta has a large inventory of vacant and underutilized industrial properties, particularly along rail corridorssuch as the BeltLine The demolition of these properties or their conversion to other non-industrial land-usesis leading to a decrease in the city’s industrial and employment base: the city is quickly losing its alreadydiminished inventory of large industrial-zoned sites.
A concerted effort must be made to preserve industrial land within the city. Areas with significant industrialdisinvestment include:
1. Industrial properties adjacent to the proposed BeltLine corridor2. Oakland City3. Capitol View4. Adair Park5. Chattahoochee Industrial district6. Memorial Drive Corridor7. DeKalb Avenue Corridor8. Jonesboro Road Corridor9. McDonough Boulevard Corridor10. Fulton Industrial Boulevard11. Atlanta Industrial Park
33Atlanta Strategic Action Plan September 2007 Draft

Plan Elements
Population
The Population Element provides the basis for the development of the Comprehensive Plan. The informationin the Population Element paints a picture of where the City of Atlanta has been, the way it is now andforecasts how it will be in the future. It includes an inventory and assessment of changes in the demographiccharacteristics, including population, race, age and income of the City of Atlanta. This information is criticalin determining existing and future service needs, land use development, infrastructure requirements, andhousing demand among others.
The City of Atlanta, the county seat for Fulton County and Georgia’s capital, is located at the center of the28 county Atlanta Metropolitan Statistical Area (MSA) and the 10 county Atlanta Regional Commission(ARC). Transportation has been the main engine of growth of the City and the surrounding cities and countiessince construction of the railroads in the 1830s. In the 20th century, transportation continued to be thecatalyst of growth of the City of Atlanta as well as the surrounding cities and counties with the constructionof Hartsfield-Jackson Airport, the interstate highway system and the rail network.
The transportation infrastructure is also the engine of job growth and creation. As a result of the transportationsystem, the City’s economy, along with that of the Region has prospered. This has created numerous jobswhich has resulted in an increase in the City's population. An effort to avoid transportation congestion inthe Atlanta Region is one the reasons often mentioned by some people that have recently moved to theCity of Atlanta from other areas in the Region.
Forecasting Sources and Methods
The City of Atlanta Department of Planning and Community Development Bureau of Planning uses a buildingpermit model to estimate population. Building permits issued for new housing units are a leading indicatorof population growth. This model was calibrated to the 1990 to 2000 US Census, but is different than theCensus Bureau’s Estimates (www.census.gov, click on estimates) and Atlanta Regional Commission’s(ARC) County Forecasts to 2030 found on their website (www.atlantaregional.com).
The 1990 and 2000 information is from Summary File 1 (100%) tables of the US Census. The net new unitswere obtained from the Bureau of Buildings KIVA permit tracking system and assigned to the correspondingcensus tract. The net new housing units reflect building unit creations minus demolitions. The net newhousing units are added to the previous year's housing units to get each new year's estimate of housingunits. From the total housing units are subtracted the number of vacant units to obtain households.Households times average household size yields total household population to which is added group quarterspopulation to get total population. Population gained thru annexations is also added.
The vacant housing units are estimated by assuming a vacancy rate and multiplying it times the total housingunits calculated above. The assumption is that the vacancy rates will remain at the 2000 level unless harddata indicates a change. A vacancy rate of 10.5% was used. However, with the current slump in the housingsector, this number might be too low. At some of the community meetings, residents expressed concern
September 2007 Draft Atlanta Strategic Action Plan34
Community Assessment3

over the large number of vacant new houses. The current average estimate of household size is 2.30persons per household. However, the household size varies from one census tract to the other. In the model,the household size is different in each census tract. Anecdotal evidence indicates that many that are movinginto the City are empty nesters and singles. As a result, the average household size may be smaller than2.3 persons.
The model assumes that there will be a gradual reduction in the number of permits issued reflecting theincreasing difficulty in obtaining permits and the decreasing availability of suitable land available fordevelopment and redevelopment. From 2000-2006 the actual number of net new housing units permittedwas used. From 2007 onwards, the average number of net new housing units was reduced to arrive witha new housing units for each year. The tract level growth was driven by the ARC forecasting model net unitchange after 2010.
This model will be updated and refined to establish a range of housing units that could be built under theland use policies to be determined by the Land Use Plan and the number of net new housing units permittedeach year. This is then a system with feedback loops. Over the next couple of years, this model will berefined as Bureau of Planning staff align the distribution of the population with the land use map policiesand land use plans for specific areas of the City of Atlanta such as Fort McPherson, Lakewood Fairgrounds,the Peachtree Corridor and the BeltLine.
Permitting Information
The number of housing permits issued is one of the main components of the permit driven model used todevelop population estimates and forecasts. Permitting information was obtained from the KIVA system,a permit tracking system used by the Bureau of Buildings in Department of Planning and CommunityDevelopment. Residential building permits are grouped in two categories: 1-4 units and 5+ units. 1 to 4 unitsincludes the number of residential permits issued for residential units in structures with 1 to 4 housing unitssuch as single family, duplex, triplex and quadruplex homes (described below as single family homes).Five untis or more includes the number of housing permits issued for residential units that are in a structurewith 5 or more housing units (described below as multi-family homes). Both of these equal the total newhousing units. The number of units demolished was subtracted from the total of new housing units to obtainthe net housing units.
The number of permits issued for new housing units, both single family (1-4 untis) and multi family (5+units) and the number of housing demolitions have increased steadily since 2000. In 2000, there were2,204 net new housing units permitted. In 2006, 8,593 net new housing permits were issued, an increaseof 290% (See Table 3.1 ‘City of Atlanta Building Permits and Demolitions from 2000-2006’). Since 2000,37,817 net new housing units have been permitted. The majority of the new units, 80%, are multi-familyresidential units.
Table 3.1 City of Atlanta Building Permits and Demolitions from 2000-2006Total2006200520042003200220012000City of
Atlanta
9,3632,1331,8941,6959808201,0877541-4 units
35,5058,0364,5377,8876,0844,3173,0161,6285+ units
35Atlanta Strategic Action Plan September 2007 Draft

Total2006200520042003200220012000City ofAtlanta
44,86810,1696,4319,5827,0645,1374,1032,382Total HousingUnits
-7,051-1,576-1,807-1,005-569-1,529-387-178Demolitions
37,8178,5934,6248,5776,4953,6083,7162,204Net HousingUnits
The distribution of the housing permits and demolitions issued are shown by NPU in the table below (seeTable 3.2 ‘City of Atlanta Building Permits and Demolitions from 2000 to 2006 by NPU’) and the maps below(see Map 3.1 ‘City of Altanta New Residential Housing of 1 to 4 Units - 2000 to 2006’ and Map 3.2 ‘City ofAltanta New Residential Housing Five Units or More - 2000 to 2006’).
Table 3.2 City of Atlanta Building Permits and Demolitions from 2000 to 2006 by NPUNet NewNew Housing5+ Units1 to 4
Housing UnitsDemolitionsHousingUnitsUnitsNPU
268-23450266436NPU A
6,324-9877,3116,775536NPU B
274-160434173261NPU C
2,006-4622,4681,624844NPU D
7,652-5748,2268,077149NPU E
772-5051,2771,092185NPU F
1,470-431,5131,016497NPU G
574-21595468127NPU H
1,733-301,7631,504259NPU I
336-149485163322NPU J
192-19638841347NPU K
1,219-2901,5091,305204NPU L
2,745-6893,4343,267167NPU M
1,845-4332,2781,637641NPU N
699-92791396395NPU O
2,363-222,3851,496889NPU P
617-56673428245NPU R
243-50293177116NPU S
738-231969827142NPU T
1,506-1,0352,5411,662879NPU V
1,665-3632,0281,170858NPU W
450-37487318169NPU X
September 2007 Draft Atlanta Strategic Action Plan36
Community Assessment3
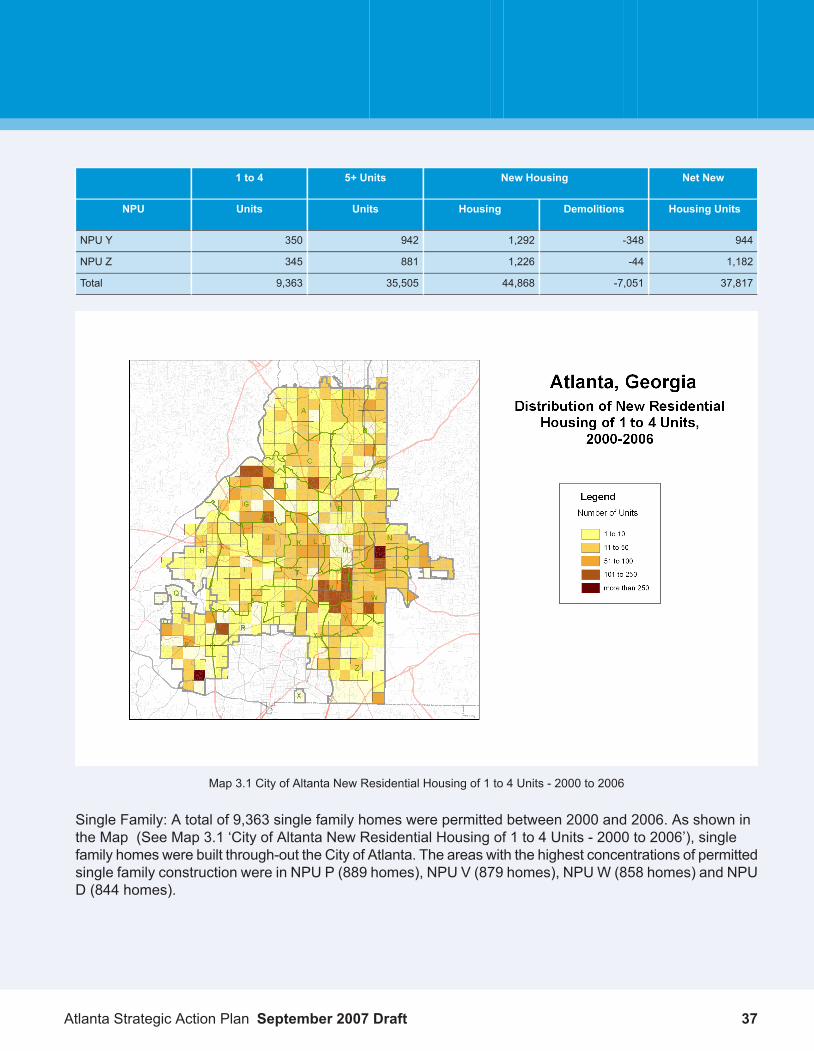
Net NewNew Housing5+ Units1 to 4
Housing UnitsDemolitionsHousingUnitsUnitsNPU
944-3481,292942350NPU Y
1,182-441,226881345NPU Z
37,817-7,05144,86835,5059,363Total
Map 3.1 City of Altanta New Residential Housing of 1 to 4 Units - 2000 to 2006
Single Family: A total of 9,363 single family homes were permitted between 2000 and 2006. As shown inthe Map (See Map 3.1 ‘City of Altanta New Residential Housing of 1 to 4 Units - 2000 to 2006’), singlefamily homes were built through-out the City of Atlanta. The areas with the highest concentrations of permittedsingle family construction were in NPU P (889 homes), NPU V (879 homes), NPUW (858 homes) and NPUD (844 homes).
37Atlanta Strategic Action Plan September 2007 Draft

Map 3.2 City of Altanta New Residential Housing Five Units or More - 2000 to 2006
Multi-Family: A total of 35,505 multi-family homes were permitted between 2000 and 2006. As shown in themap below, (See Map 3.2 ‘City of Altanta New Residential Housing Five Units or More - 2000 to 2006’)construction of multi-family homes was concentrated along the Peachtree Corridor in Downtown, Midtownand Buckhead and along the neighborhoods surrounding downtown. The areas with the highest concentrationof multi-family units were in Midtown - NPU E (8,077 homes), Buckhead -NPU B ( 6,775 homes ) andDowntown - NPU M ( 3,267 homes) .
September 2007 Draft Atlanta Strategic Action Plan38
Community Assessment3

Map 3.3 City of Altanta Residential Demolitions - 2000 to 2006
Demolitions: A total of 7,051 residential units were demolished between 2000 and 2006. Residential unitswere demolished through-out the City of Atlanta (See Map 3.3 ‘City of Altanta Residential Demolitions -2000 to 2006’). The NPUs with the highest number of demolitions are: NPU V (1,035 homes), NPU B (987homes), and NPU M (689 homes). In some parts of the City, public housing developments and agingapartment buildings were demolished.
Total Population
The City of Atlanta has an estimated 2007 population of almost half a million. It is the 35th largest city inthe US based on the 2005 USCensus population estimate. In 2005, the USCensus Bureau revised populationestimate for the City of Atlanta was 483,108, close to the City's population in the 1970s. Between 2005 and2006, the US Census estimated that the City's population grew by 9,928. In the 1990’s the City of Atlanta’spopulation started growing after several decades of decline.
39Atlanta Strategic Action Plan September 2007 Draft

City of Atlanta Population 1850-2035
0
100000
200000
300000
400000
500000
600000
700000
800000
900000
1800 1850 1900 1950 2000 2050
Year
Po
pu
lati
on
Figure 3.1 City of Atlanta Population 1850-2035
Between 1990 and 2000, the City of Atlanta added 22,457 residents, a growth rate of 5.7%, for a 2000population of 416,474 (see Figure 3.1 ‘City of Atlanta Population 1850-2035’). During this time, the populationgrew in some portions of the City and it declined in other areas ( in NPUs G, L, O, S, W & Y). Between 2000and 2005, the City’s population grew by an estimated 66,634 people, a 16% rate of growth. While all areasof the City grew, growth was concentrated in certain parts of the City, particularly Midtown and Buckhead.Based of the City of Atlanta’s population forecast, the City of Atlanta is expected to grow by almost 300,000by 2030 to a population of 782,952, an increase of 62% (See Table 3.3 ‘City of Atlanta Population andForecasts 1950-2035’).
Table 3.3 City of Atlanta Population and Forecasts 1950-2035
September 2007 Draft Atlanta Strategic Action Plan40
Community Assessment3

Growth RatePopulation ChangeYear
9.60%29,0261950
47.13%156,1411960
1.95%9,5181970
-14.48%-71,9511980
-7.29%-31,0051990
5.70%22,4572000
16.00%66,6342005
13.83%66,8002010
11.17%61,4482015
9.69%59,2622020
8.52%57,1692025
7.58%55,1662030
6.80%53,2482035
6.15%51,4132040
Population by Study Area & NPU
The City of Atlanta Bureau of Planning has created seven study areas for the development of the AtlantaStrategic Plan. Each of the 25 Neighborhood Planning Units are assigned to one of the Study Areas (seeChapter 2). Population and permitting information is presented by NPU and by Study Area. The informationfor each NPU represents the addition of the census tracts for each NPU. If a census tract was mainly inone NPU was assigned to that NPU. Since census tract boundaries do not follow NPU boundaries, thesefigures are estimates for the NPUs. The list of census tracts in each NPU is included in the PopulationAppendix.
Between 1990 and 2000, some parts of the City added population while others lost. Population growth wasconcentrated in the major employment centers. Buckhead (NPU B) added 6,689 residents, Midtown (NPUE) added 9,166 residents and Downtown added 5,148 residents. Popular intown neighborhoods also addedpopulation. Virginia Highlands/Morningside (NPU F) added 2,580 residents. Neighborhoods in Buckhead,NPU C, also added 1,619 residents. Southwest Atlanta, NPU P, added 1,626. On the other hand, someneighborhoods lost population. On the eastside, both NPU O (-3,287) and NPUW (-1,352) lost population.On the west side, NPU G (-2,380) and NPU L (-2,078) lost population.
Since 2000, the City of Atlanta has grown at a faster pace. Between 2000 and 2005, the population increasedby approximately 66,634 residents, an increase of 16%. All areas of the City grew (see Map 3.4 ‘City ofAtlanta Population Change 2000-2005’ and Table 3.4 ‘Change in the City of Atlanta Population by Study
41Atlanta Strategic Action Plan September 2007 Draft

Area and NPU between 1990 and 2035’) The North, Northeast and Southwest areas of the City led thegrowth. In the Northside, NPU B added 8,187 residents and NPU D increased by 3,244. In Northeast, NPUE ( Midtown) added 14,144 residents while NPU M (Downtown) added 2,893 residents. Southwest Atlantaalso experienced significant growth. Both NPU I & P added over 4,000 residents.
Map 3.4 City of Atlanta Population Change 2000-2005
Table 3.4 Change in the City of Atlanta Population by Study Area and NPU between 1990 and 20352030-20352025-20302020-20252015-20202010-20152005-20102000-20051990-20001990Study Area
7,8577,4648,8269,1179,65712,83813,13310,87063,964Northside
2,8033,4533,8283,2401,8646149061,34015,751ANPU
3,6552,7213,4814,3416,2398,9758,1876,68932,222B
6518539017213814377961,6199,382C
7474376168151,1742,8123,2441,2226,609D
14,51213,41415,06114,88820,08916,19218,18916,89462,031Northeast
7,5296,9197,7207,76010,52511,18914,1449,16626,035ENPU
September 2007 Draft Atlanta Strategic Action Plan42
Community Assessment3

2030-20352025-20302020-20252015-20202010-20152005-20102000-20051990-20001990Study Area
1,8221,7831,9332,1012,0281,4561,1532,58018,901F
5,1614,7125,4095,0277,5363,5462,8935,14817,095M
5,6626,3626,3246,4835,6165,4665,539-4,18352,821Northwest
1,2101,2271,0351,1871,7142,4482,888-2,38016,227GNPU
1,5261,8951,9451,85199574591913711,318J
1,6892,0212,1002,0681,44826721213817,170K
1,2371,2191,2441,3761,4582,0071,520-2,0788,106L
8,7449,8119,0619,8319,95112,17712,4133,28162,462Southwest
1,8932,5532,3162,2091,8611,0012,0111,01118,800HNPU
2,5083,0672,5412,5912,5742,9444,079-53823,924I
2,4622,4942,3612,8653,0527,3144,3021,6269,690P & Q
1,8811,6971,8422,1682,4659182,0221,18210,048R
6,0077,3715,7975,8876,1767,1574,063-1,12648,331Intown South
9701,4241,1581,022709430924-1,05815,376SNPU
2,2842,0622,2872,4873,1403,1399005718,165T
2,7533,8852,3512,3782,3273,5882,239-12514,790V
4,6503,7264,2605,2137,0146,7958,110-3,53351,932Eastside
1,2161,0759651,0591,8042,2053,2141,10612,959NNPU
1,3461,0751,1701,5292,2681,2921,895-3,28717,550O
2,0881,5752,1252,6262,9413,2993,001-1,35221,423W
5,8187,0187,8407,8422,9446,1765,18858052,150Southside
9751,4441,4421,1991816651,1071,15813,898XNPU
1,8421,9452,0382,6521,2262,4021,008-1,38112,123Y
3,0013,6294,3603,9921,5383,1093,07280326,129Z
53,24955,16657,16959,26161,44866,80066,63422,457394,017Citywide Total
Source: US Census and City of Atlanta DPCD
Table 3.5 City of Atlanta Population and Forecasts 1990-2035 by Study Area and NPU203520302025202020152010200520001990Study Area
143,725135,868128,404119,579110,462100,80487,96774,83463,964Northside
33,80030,99627,54323,71520,47418,61117,99717,09115,751ANPU
76,51072,85570,13466,65362,31256,07347,09838,91132,222B
15,74015,08914,23613,33512,61412,23311,79711,0019,382C
17,67516,92816,49115,87615,06113,88711,0757,8316,609D
191,270176,758163,344148,283133,395113,30697,11478,92562,031Northeast
100,98693,45686,53878,81871,05860,53449,34535,20126,035ENPU
43Atlanta Strategic Action Plan September 2007 Draft

203520302025202020152010200520001990Study Area
33,75731,93530,15228,21926,11824,09022,63421,48118,901F
56,52851,36746,65541,24636,21928,68225,13622,24317,095M
90,08984,42778,06671,74165,25959,64354,17748,63852,821Northwest
25,55724,34623,11922,08420,89719,18216,73513,84716,227GNPU
21,33119,80517,91015,96514,11413,11912,37411,45511,318J
27,11425,42523,40421,30419,23517,78717,52017,30817,170K
16,08714,85113,63212,38811,0139,5557,5486,0288,106L
137,731128,988119,176110,116100,28490,33378,15665,74362,462Southwest
33,65431,76129,20826,89224,68322,82321,82219,81118,800HNPU
43,69141,18238,11535,57432,98330,40927,46523,38623,924I
36,16433,70331,20928,84825,98322,93215,61811,3169,690P & Q
24,22222,34220,64418,80216,63414,17013,25211,23010,048R
89,66283,65576,28470,48764,60058,42451,26847,20548,331Intown South
20,95519,98518,56117,40316,38115,67215,24214,31815,376SNPU
34,52232,23830,17627,88825,40122,26119,12218,22218,165T
34,18531,43227,54725,19622,81820,49116,90414,66514,790V
88,16883,51879,79275,53170,31863,30456,50948,39951,932Eastside
25,60424,38723,31222,34621,28819,48417,27914,06512,959NNPU
24,83823,49322,41721,24719,71817,45016,15814,26317,550O
37,72635,63834,06231,93829,31226,37123,07220,07121,423W
95,55689,73882,72074,88067,03864,09357,91852,73052,150Southside
22,06921,09419,65018,20817,00916,82816,16315,05613,898XNPU
23,85422,01220,06718,02915,37714,15211,75010,74212,123Y
49,63346,63243,00338,64334,65133,11330,00426,93226,129Z
836,201782,952727,786670,617611,356549,908483,108416,474393,691Citywide Total
Growth between 2005 and 2010 is expected to mirror the growth between 2000 and 2005. The City ofAtlanta is forecasted to grow by almost 14%, equal to 66,800 new residents. Growth will be concentratedin the main employment centers: Buckhead, Midtown and Downtown as well as Southwest Atlanta. TheNortheast Study Area which includes Midtown will lead the City in population growth. NPU E is expectedto add 11,000 residents. In Downtown (NPU M), also in the Northeast Study area, 3,500 new residents areanticipated. The Northside Study Area, which includes NPU B, almost 9,000 residents are projected. In theSouthwest Study Area, NPU P will add over 7,000 residents (See Map 3.5 ‘City of Atlanta Population Change2005-2010’).
September 2007 Draft Atlanta Strategic Action Plan44
Community Assessment3

Map 3.5 City of Atlanta Population Change 2005-2010
Beyond 2010, the forecast models assigns population growth based of growth trends and some of theassumptions included in the ARC forecast model. With the Full Comprehensive Plan Update, the locationand extent of the population growth will be refined and tied to the Land Use Map. The population changesbetween 2005 and 2030 by census tract by total number and percent is shown in the map below (see Map3.6 ‘Projection of Population Change 2005-2030’).
45Atlanta Strategic Action Plan September 2007 Draft

POPU
LATI
ON
DIF
FER
ENC
EPE
RC
ENTA
GE
[M
appr
oduc
edth
roug
hC
ityof
Atla
nta,
Dep
artm
ento
fPla
nnin
gan
dC
omm
unity
Dev
elop
men
t,B
urea
uof
Plan
ning
GIS
,Sha
wn
G.B
row
n,Ju
ly19
,200
7
PROJE
CTIO
NOF
POPU
LATIO
NCH
AN
GE
PER
CEN
SU
STRACT:2005-2030
PROJE
CTIO
NOF
POPU
LATIO
NCH
AN
GE
PER
CEN
SU
STRACT:2005-2030
POPU
LATI
ON
DIF
FER
ENC
E<
1,00
0
1,00
1-5
,000
5,00
1-1
0,00
0
10,0
01-1
5,00
0
>15
,001
POPU
LATI
ON
PER
CEN
TAG
E<1
0%
11-3
0%
31-5
0%
51-7
5%
>76
%
CIT
YOFATLA
NTA
Map
3.6ProjectionofPopulationChange2005-2030
September 2007 Draft Atlanta Strategic Action Plan46
Community Assessment3

Age Distribution
The City of Atlanta is a young city. The average age of the city's residents is 34.7, younger than the 36.4average age of the US population. However, like the US population, the City of Atlanta population is aging.Since 2000, the average age has increased by 2.8 years from 31.9. The Atlanta population is aging fasterthan the US population. The average age of the US population has increase be 1.1 years since 2000.
The population is distributed into the following stages of life: Preschool 0-4, School Age 5-7, Family Forming18-44, Peak Earning 45-64, Younger Seniors 65-84 and Older Seniors 85 & Over. In 2005, 21% of thepopulation was under 17. NPU G in Northwest and NPU Z in the Southside have the highest percentagesof the population under 17, 37.8% and 35.8% respectively. Almost half of the population, 47.9%, is between18 and 44. NPU E and NPU B have the highest percentage of the 18-44 age group, 76.4% and 61.3%respectively. 21.5 % of the population is 45-64. NPU A has the highest percentage, at 31.6%, followed bythe NPUs in the Southwest Study Area, around 27%. Younger Seniors, those between 65-84 make up 8%of the population. NPUs A, B, J and I have the highest percentages of this group, ranging from 14.6% to11.4%. Older Seniors, those over 85, make up only 1.6% of the population. NPUs B & K have the highestpercentage of Older Seniors (See Table 3.6 ‘City of Atlanta 2005 Age Distribution by Study Area and NPU’and Map 3.7 ‘Percent Age by Census Tract in 2005’).
As mentioned earlier, the City's population is aging. Between 2005 and 2030, the percent of the populationunder 17 will be decreasing. As well as the percent of the population 18-44 and 45-64. The percent of thepopulation 65-85 will increase to 12.5% and the population over 85 will go up to 2.4%. This trend mayindicate that some of the people moving into the city are empty nesters/ retirees and that the population isaging in place and not moving to another area. If the population trends continue, the age distribution byNPU of the 2030 population is shown in Table 3.7 ‘City of Atlanta 2030 Age Distribution by Study Area andNPU’.
Table 3.6 City of Atlanta 2005 Age Distribution by Study Area and NPUAge Group
OlderYoungerPeakFamily
SeniorsSeniorsEarningFormingSchool AgePreschoolTotal
85 & Over65 - 8445 -6418 - 445 - 170 - 4PopulationStudy Area
Northside
2.70%11.83%31.67%32.48%15.55%5.78%17,997ANPU
4.77%11.41%21.46%50.39%7.52%4.44%47,098B
0.76%5.27%18.69%57.52%10.66%7.11%11,797C
0.76%5.59%18.11%61.31%9.22%5.01%11,075D
Northeast
0.74%3.26%14.56%76.40%3.10%1.94%49,345ENPU
1.16%5.45%21.93%60.61%6.67%4.18%22,634F
1.68%8.31%19.71%53.41%10.98%5.90%25,136M
Northwest
47Atlanta Strategic Action Plan September 2007 Draft

Age Group
1.07%8.57%19.43%33.08%26.80%11.07%16,735GNPU
1.98%12.06%22.75%36.61%19.65%6.96%12,374J
3.30%10.63%21.29%44.79%14.89%5.10%17,520K
1.40%7.44%22.31%43.11%17.19%8.55%7,548L
Southwest
0.85%7.82%21.88%38.04%22.42%9.00%21,822HNPU
1.83%14.65%27.57%34.07%16.19%5.68%27,465I
1.03%7.29%27.77%38.03%18.96%6.91%15,618P & Q
0.80%7.34%27.63%37.75%18.80%7.69%13,252R
Intown South
1.29%8.70%18.70%42.73%20.18%8.40%15,242SNPU
1.15%7.25%18.92%50.93%15.25%6.50%19,122T
1.13%7.48%20.76%37.86%23.58%9.18%16,904V
Eastside
0.85%4.27%22.07%59.59%8.72%4.50%17,275NNPU
1.43%10.62%22.90%40.10%18.04%6.91%16,159O
1.02%6.65%21.47%53.73%13.63%5.96%23,072W
Southside
2.34%9.80%23.32%40.04%18.22%6.27%16,164XNPU
0.54%5.65%18.87%46.39%20.23%8.32%11,750Y
0.43%5.18%20.81%37.81%25.55%10.21%30,004Z
1.62%8.01%21.51%47.94%14.65%6.27%483,108Citywide Total
September 2007 Draft Atlanta Strategic Action Plan48
Community Assessment3
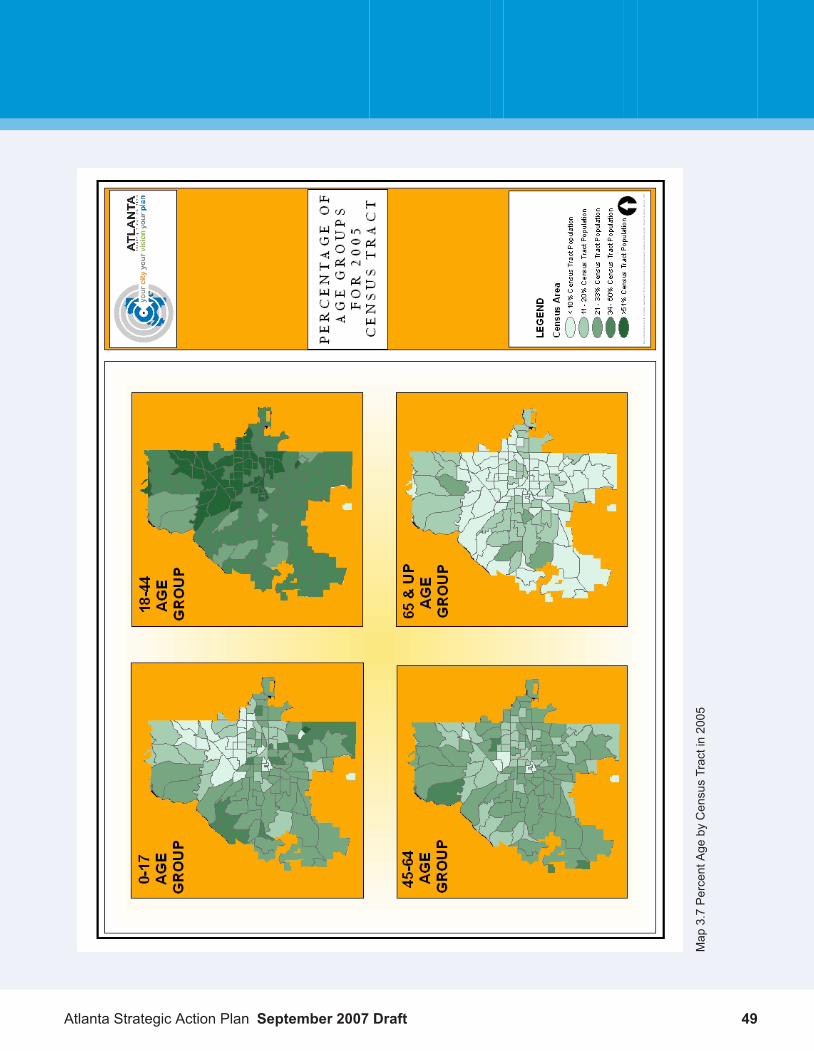
Map
3.7PercentAge
byCensusTractin2005
49Atlanta Strategic Action Plan September 2007 Draft
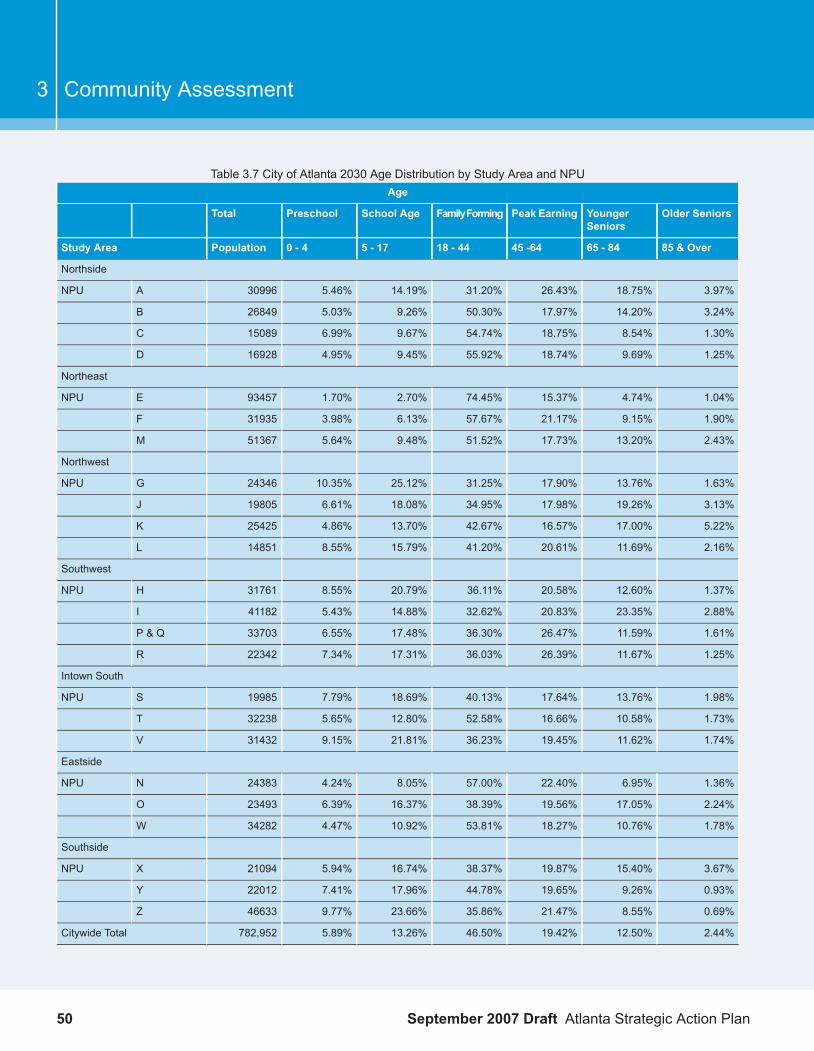
Table 3.7 City of Atlanta 2030 Age Distribution by Study Area and NPUAge
Older SeniorsYoungerSeniors
Peak EarningFamilyFormingSchool AgePreschoolTotal
85 & Over65 - 8445 -6418 - 445 - 170 - 4PopulationStudy Area
Northside
3.97%18.75%26.43%31.20%14.19%5.46%30996ANPU
3.24%14.20%17.97%50.30%9.26%5.03%26849B
1.30%8.54%18.75%54.74%9.67%6.99%15089C
1.25%9.69%18.74%55.92%9.45%4.95%16928D
Northeast
1.04%4.74%15.37%74.45%2.70%1.70%93457ENPU
1.90%9.15%21.17%57.67%6.13%3.98%31935F
2.43%13.20%17.73%51.52%9.48%5.64%51367M
Northwest
1.63%13.76%17.90%31.25%25.12%10.35%24346GNPU
3.13%19.26%17.98%34.95%18.08%6.61%19805J
5.22%17.00%16.57%42.67%13.70%4.86%25425K
2.16%11.69%20.61%41.20%15.79%8.55%14851L
Southwest
1.37%12.60%20.58%36.11%20.79%8.55%31761HNPU
2.88%23.35%20.83%32.62%14.88%5.43%41182I
1.61%11.59%26.47%36.30%17.48%6.55%33703P & Q
1.25%11.67%26.39%36.03%17.31%7.34%22342R
Intown South
1.98%13.76%17.64%40.13%18.69%7.79%19985SNPU
1.73%10.58%16.66%52.58%12.80%5.65%32238T
1.74%11.62%19.45%36.23%21.81%9.15%31432V
Eastside
1.36%6.95%22.40%57.00%8.05%4.24%24383NNPU
2.24%17.05%19.56%38.39%16.37%6.39%23493O
1.78%10.76%18.27%53.81%10.92%4.47%34282W
Southside
3.67%15.40%19.87%38.37%16.74%5.94%21094XNPU
0.93%9.26%19.65%44.78%17.96%7.41%22012Y
0.69%8.55%21.47%35.86%23.66%9.77%46633Z
2.44%12.50%19.42%46.50%13.26%5.89%782,952Citywide Total
September 2007 Draft Atlanta Strategic Action Plan50
Community Assessment3

Race and Ethnicity
The race and ethnic background information is based on decennial census figures for 2000 and the adjusted1990 Census figures which reflect 2000 categories. The forecast uses the 2005 American CommunitySurvey data to examine changes since 1990. The primary trend appears to be a "return to the mean" wherelocal race proportions gradually become closer to national shares. Population totals are controlled to abuilding permit driven set of forecasts for the City of Atlanta.
According to the American Community Survey, the 2005 racial and ethnic composition of the City of Atlantais 58.6% Black, 36.2% White, 2.02% Asian and 3.1% are other races or two or more races. Hispanic orLatino (any race) comprise 4.7% of the population (See Table 3.8 ‘City of Atlanta Forecast by Race- 1990to 2030’). The City of Atlanta racial composition is changing. The black population declined by 8,573 between1990 and 2000 (many of the NPUs that lost population between 1990 and 2000 are predominantly black).Between 2000 and 2005, the number of blacks increased by 27,633. However, as a percentage of thepopulation, the percent blacks decreased from 61.4% in 2000 to 58.6% in 2005. The number and thepercentage of whites increased between 1990 and 2000 from 31% to 33.2%. Between 2000 and 2005, thewhite population increased by 36,714 to 36.2%. Several of the census tract experiencing high growth arepredominantly white. If these growth trends continue, between 2025 and 2030, the percent white and percentblack will be almost the same.
Table 3.8 City of Atlanta Forecast by Race- 1990 to 2030Year
20302025202020152010200520001990
ForecastForecastForecastForecastForecastForecastCensusAdjustedCharacteristic
782,952727,786670,617611,356549,908483,108416,474394,017Total:
65,79655,75346,39137,74829,86822,65018,7207,525Hispanic or Latino:
782,952727,786670,617611,356549,908483,108416,474394,017Total Hispanic andNon-Hispanic:
364,061323,474284,301246,632210,558175,066138,352122,327White Alone
349,838345,515337,102324,387307,140283,322255,689264,262Black Alone
288398489556599614765563Am. In. & Al. Nat.
27,77523,59619,69416,08712,7919,7628,0463,498Asian alone
322299277252227200173164Nat. Haw.& P.I.
29,60424,45419,71015,39411,5338,0978,2723,203Some other race alone
11,06510,0509,0438,0477,0606,0465,1774,898Two or more races
51Atlanta Strategic Action Plan September 2007 Draft

Year
20302025202020152010200520001990
ForecastForecastForecastForecastForecastForecastCensusAdjustedCharacteristic
20302025202020152010200520001990
100.00%100.00%100.00%100.00%100.00%100.00%100.00%100.00%Total:
8.40%7.66%6.92%6.17%5.43%4.69%4.49%1.91%Hispanic or Latino:
100.00%100.00%100.00%100.00%100.00%100.00%100.00%100.00%Total Hispanic andNon-Hispanic:
46.50%44.45%42.39%40.34%38.29%36.24%33.22%31.05%White Alone
44.68%47.47%50.27%53.06%55.85%58.65%61.39%67.07%Black Alone
0.04%0.05%0.07%0.09%0.11%0.13%0.18%0.14%Am. In. & Al. Nat.
3.55%3.24%2.94%2.63%2.33%2.02%1.93%0.89%Asian alone
0.04%0.04%0.04%0.04%0.04%0.04%0.04%0.04%Nat. Haw.& P.I.
3.78%3.36%2.94%2.52%2.10%1.68%1.99%0.81%Some other race alone
1.41%1.38%1.35%1.32%1.28%1.25%1.24%1.24%Two or more races
In general, a census tract is either predominantly black or predominantly white. The Northside and Northeaststudy area are predominantly white, while the Northwest, Southwest, Intown South and Southside arepredominantly black. The Eastside Study Area is almost balanced between both black and white (See Map3.8 ‘Race and Ethnicity by Census Tract in 2005’ and Table 3.9 ‘City of Atlanta 2005 Population by Raceand Study Area and NPU’). The Asian population is concentrated around Georgia Tech in NPU E and inthe Northside and Northeast Study areas. The Asian population is expected to gradually increase over time.The Hispanic Population is concentrated in the Northside and Southside Study areas. Several apartmentbuildings along Piedmont Road were many Hispanics lived have been demolished so the location of theHispanic population may change in the future. The percent of the population that is Hispanic increased from1.9% in 1990 to 4.7% in 2005. However, the Hispanic population is anticipated to grow at a much slowerrate.
September 2007 Draft Atlanta Strategic Action Plan52
Community Assessment3

Map
3.8RaceandEthnicityby
CensusTractin2005
53Atlanta Strategic Action Plan September 2007 Draft

If the population growth and the changes in racial composition between 1990 and 2005 continue to 2030,then the racial composition of the City of Atlanta will be 45.8%White, 45.4% Black, 3.8% Asian, 4.8%Otherand 8.9% Hispanic (could be any race). See Table 3.10 ‘City of Atlanta 2030 Population by Race by StudyArea and NPU’ for the racial composition by Study Area and NPU.
Table 3.9 City of Atlanta 2005 Population by Race and Study Area and NPURace and Ethnicity
Hispanic(Any Race)
All OtherRaces
AsianAlone
BlackAlone
WhiteAloneStudy Area
8.92%5.08%2.88%9.87%82.17%Northside
3.1%2.6%2.1%2.6%92.7%ANPU
10.4%5.9%3.2%5.6%85.3%B
11.0%5.3%1.9%18.8%73.9%C
9.8%5.2%3.8%30.5%60.5%D
4.45%2.62%6.12%28.19%63.08%Northeast
3.6%2.3%10.3%14.6%72.8%ENPU
6.1%3.4%2.2%7.5%87.0%F
4.7%2.6%1.4%73.5%22.4%M
0.96%0.28%0.11%94.38%5.24%Northwest
0.8%0.2%0.1%95.2%4.5%GNPU
0.9%0.6%0.1%95.3%4.1%J
1.1%0.2%0.2%92.7%6.9%K
1.2%0.1%0.1%94.9%4.9%L
2.03%1.39%0.18%92.94%5.48%Southwest
3.0%1.9%0.3%92.9%4.9%HNPU
2.7%0.7%0.1%93.4%5.8%I
0.6%2.9%0.1%90.8%6.2%P & Q
0.7%0.4%0.1%94.6%4.8%R
1.27%0.56%1.51%92.06%5.87%Intown South
1.1%0.5%0.1%92.2%7.2%SNPU
1.0%0.5%0.5%94.2%4.8%T
1.7%0.6%4.0%89.5%5.9%V
4.79%2.71%0.88%53.86%42.55%Eastside
2.9%2.8%1.5%21.6%74.1%NNPU
3.4%1.1%0.2%84.3%14.4%O
7.2%3.8%0.9%56.7%38.7%W
7.30%2.89%2.23%81.23%13.64%Southside
8.5%4.4%3.9%74.7%17.1%XNPU
September 2007 Draft Atlanta Strategic Action Plan54
Community Assessment3

Race and Ethnicity
Hispanic(Any Race)
All OtherRaces
AsianAlone
BlackAlone
WhiteAloneStudy Area
11.1%3.6%1.3%75.3%19.8%Y
5.2%1.8%1.7%87.1%9.3%Z
4.52%2.43%2.33%58.89%36.35%Citywide Total
Table 3.10 City of Atlanta 2030 Population by Race by Study Area and NPURace and Ethnicity
Hispanic(Any Race)
All OtherRaces
AsianAlone
BlackAlone
WhiteAlone
Study Area
17.36%10.05%4.12%7.43%78.41%Northside
5.5%4.6%3.2%2.0%90.2%ANPU
21.2%12.2%4.7%4.3%78.8%B
19.6%9.7%2.8%13.2%74.3%C
20.6%10.9%4.8%25.8%58.5%D
9.05%5.32%10.50%22.96%61.23%Northeast
7.1%4.5%17.0%10.8%67.7%ENPU
14.1%7.4%3.3%6.1%83.2%F
9.4%5.6%3.2%55.5%35.7%M
1.93%0.55%0.15%73.06%26.23%Northwest
1.6%0.4%0.1%73.5%26.0%GNPU
1.8%1.1%0.1%73.8%25.0%J
2.2%0.4%0.3%71.8%27.5%K
2.3%0.3%0.1%73.5%26.1%L
3.86%3.13%0.25%71.74%24.87%Southwest
5.9%3.7%0.5%72.0%23.9%HNPU
5.7%1.4%0.2%72.2%26.2%I
1.2%6.3%0.2%70.0%23.5%P & Q
1.5%0.8%0.2%73.3%25.7%R
2.53%1.08%2.22%71.36%25.34%Intown South
2.0%0.9%0.1%71.6%27.4%SNPU
2.2%1.0%0.6%72.8%25.5%T
3.2%1.3%5.2%69.7%23.8%V
10.06%5.65%1.26%41.49%51.60%Eastside
5.8%5.6%2.2%17.7%74.5%NNPU
7.1%2.3%0.3%64.9%32.5%O
15.0%7.9%1.2%42.3%48.5%W
55Atlanta Strategic Action Plan September 2007 Draft

Race and Ethnicity
Hispanic(Any Race)
All OtherRaces
AsianAlone
BlackAlone
WhiteAlone
Study Area
14.36%5.56%3.03%63.12%28.30%Southside
16.7%8.6%5.6%58.0%27.8%XNPU
21.0%6.7%1.7%58.6%33.0%Y
10.2%3.6%2.5%67.6%26.3%Z
8.89%4.88%3.86%45.45%45.81%Citywide Total
Income
Income forecasts were driven with Per Capita Personal Income Trends from 1959 through 2005 from theU.S. Bureau of Economic Analysis (BEA) for Fulton County Trends are deemed to be very stable for income.Consumer Price Index numbers are from the U.S. Bureau of Labor Statistics and were trended from 1913through 2006, but only the past ten years were used to drive the forecasts because of better Federal Reservepolicies to control inflation. Obviously this is one of many possible alternatives and must be monitored andre-calibrated from time to time; particularly after the 2010 Census. Areas which have been substantiallyredeveloped or where there was been population growth have not had special adjustments because it isunknown how much the income in these areas has changed. The 2010 Census will provide information onthe change in income by census tract.
In 2005, the City of Atlanta median household income was $39,752. It was lower than the median incomefor the Atlanta Region of $54,066, the State of $45,604 and the Nation of $46,242. The median householdincome is for the City is forecasted to grow at a faster rate than the State and the Nation and by 2020 it isexpected to be higher (See Table 3.11 ‘2000-2030 Median Household Income’)
Table 3.11 2000-2030 Median Household Income2030202520202015201020052000
$98,221$85,050$72,555$62,169$62,014$46,242$41,994United States
$95,541$82,729$71,554$61,311$61,159$45,604$42,433Georgia
$129,299$111,960$96,450$82,643$70,360$52,465$47,321Fulton County
$108,678$94,105$73,079$62,617$53,311$39,752$34,770City of Atlanta
Although the City has experienced significant economic growth, the prosperity is not universal. Accordingto the American Community Survey, in 2005, 27% of the City's residents live in poverty. The medianhousehold income is lower in the Northwest ($22,634), Intown South ($20,527) and Southside ($26,823)Study areas. NPU G ($17,513) and NPU T ($17,224) had the lowest median household incomes (SeeTable 3.12 ‘City of Atlanta 2000-2030 Median Household Income by Study Area and NPU’ and Map 3.9‘Median Household Income by Census Tract in 2005’).
Table 3.12 City of Atlanta 2000-2030 Median Household Income by Study Area and NPU
September 2007 Draft Atlanta Strategic Action Plan56
Community Assessment3

Year
2030202520202015201020052000Study Area
$204,065$174,515$148,894$126,082$106,908$80,614$71,808Northside
$344,304$297,660$235,136$201,320$171,247$127,695$111,657ANPU
$189,956$164,415$143,922$122,881$104,282$77,350$67,386B
$145,765$125,172$122,443$104,167$88,493$65,672$57,146C
$87,222$75,870$76,250$65,940$56,675$42,998$39,028D
$107,414$93,681$90,344$78,248$68,726$51,879$45,502Northeast
$128,764$111,884$101,799$87,345$74,714$55,793$47,954ENPU
$141,216$121,752$126,516$107,894$92,363$69,577$61,172F
$54,159$47,044$45,517$39,563$34,700$26,216$23,071M
$50,774$43,960$41,255$35,260$30,145$22,634$19,954Northwest
$48,736$42,274$31,569$27,218$23,456$17,513$15,508GNPU
$59,305$51,413$50,076$42,911$36,550$27,219$23,777J
$52,769$45,767$47,475$40,495$33,985$25,258$21,894K
$40,393$34,894$35,867$31,041$27,087$20,009$17,189L
$84,792$73,367$75,440$64,496$54,804$40,567$34,493Southwest
$68,903$59,714$57,313$49,329$42,059$31,310$27,240HNPU
$90,481$78,434$80,200$68,725$58,576$43,394$36,938I
$92,418$79,577$85,742$72,831$61,748$47,579$40,258P & Q
$83,175$72,027$74,083$63,434$54,036$40,273$35,175R
$47,137$41,284$36,617$31,476$27,111$20,592$18,120Intown South
$49,182$42,644$35,594$30,861$26,819$20,367$17,989SNPU
$38,785$34,456$31,366$26,723$22,842$17,224$14,936T
$56,565$48,776$44,957$38,306$32,538$24,252$21,249V
$93,797$81,260$85,979$68,078$62,859$46,750$41,047Eastside
$118,155$102,579$107,488$73,744$79,386$59,337$52,265NNPU
$74,112$64,055$63,447$92,680$45,782$34,258$30,202O
$84,276$72,853$80,237$54,044$57,424$42,563$37,948W
$55,158$47,749$48,745$41,837$35,712$26,823$23,549Southside
$63,325$54,627$53,333$45,515$38,758$28,982$25,659XNPU
$45,603$39,496$40,459$34,605$29,493$21,841$18,993Y
$54,450$47,184$49,386$42,492$36,170$27,063$23,580Z
$108,678$94,105$73,079$62,617$53,311$39,752$34,770Citywide Total
57Atlanta Strategic Action Plan September 2007 Draft

Map
3.9MedianHouseholdIncomeby
CensusTractin2005
September 2007 Draft Atlanta Strategic Action Plan58
Community Assessment3

Table 3.13 City of Atlanta 1990 & 2000 Household Income Distribution20001990Category
%168,341%155,894Total
17.00%28,66926.40%41,132less than $9,999
7.30%12,2679.90%15,462$10,000 - $14,999
7.10%11,9449.40%14,626$15,000 - $19,999
12.90%21,67815.70%24,440$20,000 - $29,999
5.90%9,9725.80%9,040$30,000 - $34,999
4.90%8,2145.30%8,260$35,000 - $39,999
8.00%13,4907.20%11,261$40,000 - $49,999
6.70%11,3445.20%8,136$50,000 - $59,999
7.40%12,4754.90%7,619$60,000 - $74,999
7.60%12,8593.90%6,021$75,000 - $99,999
4.70%7,9062.00%3,111$100,000 - $124,999
2.70%4,4921.00%1,571$125,000 - $149,999
7.70%13,0313.30%5,215$150,000 and above
In 2005, the City of Atlanta per capita income was $33,590, higher than the U.S. per capita income of$25,035 as well as Georgia’s per capita income of $23,982. This may be due to the number of higher payingjobs in the City of Atlanta to the higher cost of living (See Table 3.14 ‘2000-2030 Per Capita Income’).
Table 3.14 2000-2030 Per Capita Income2030202520202015201020052000
$70,953$59,171$49,161$40,676$33,480$25,035$21,578United States
$67,969$56,682$47,093$38,965$32,072$23,982$21,154Georgia
$101,449$84,603$70,290$58,159$47,870$35,795$30,003Fulton County
$95,200$79,391$65,960$54,576$44,921$33,590$25,772City of Atlanta
59Atlanta Strategic Action Plan September 2007 Draft
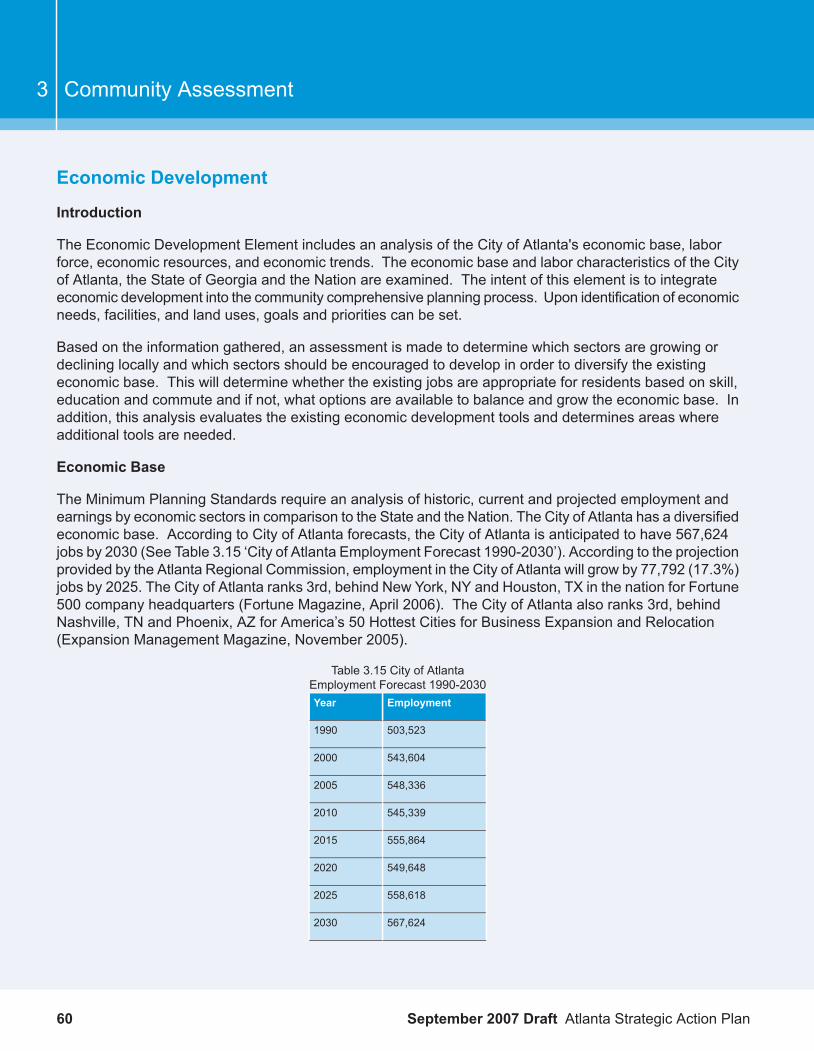
Economic Development
Introduction
The Economic Development Element includes an analysis of the City of Atlanta's economic base, laborforce, economic resources, and economic trends. The economic base and labor characteristics of the Cityof Atlanta, the State of Georgia and the Nation are examined. The intent of this element is to integrateeconomic development into the community comprehensive planning process. Upon identification of economicneeds, facilities, and land uses, goals and priorities can be set.
Based on the information gathered, an assessment is made to determine which sectors are growing ordeclining locally and which sectors should be encouraged to develop in order to diversify the existingeconomic base. This will determine whether the existing jobs are appropriate for residents based on skill,education and commute and if not, what options are available to balance and grow the economic base. Inaddition, this analysis evaluates the existing economic development tools and determines areas whereadditional tools are needed.
Economic Base
The Minimum Planning Standards require an analysis of historic, current and projected employment andearnings by economic sectors in comparison to the State and the Nation. The City of Atlanta has a diversifiedeconomic base. According to City of Atlanta forecasts, the City of Atlanta is anticipated to have 567,624jobs by 2030 (See Table 3.15 ‘City of Atlanta Employment Forecast 1990-2030’). According to the projectionprovided by the Atlanta Regional Commission, employment in the City of Atlanta will grow by 77,792 (17.3%)jobs by 2025. The City of Atlanta ranks 3rd, behind New York, NY and Houston, TX in the nation for Fortune500 company headquarters (Fortune Magazine, April 2006). The City of Atlanta also ranks 3rd, behindNashville, TN and Phoenix, AZ for America’s 50 Hottest Cities for Business Expansion and Relocation(Expansion Management Magazine, November 2005).
Table 3.15 City of AtlantaEmployment Forecast 1990-2030
EmploymentYear
503,5231990
543,6042000
548,3362005
545,3392010
555,8642015
549,6482020
558,6182025
567,6242030
September 2007 Draft Atlanta Strategic Action Plan60
Community Assessment3

The New Century Economic Development Plan for the City of Atlanta, developed in 2004 (Updated July2005), has set very aggressive goals for employment growth. The City of Atlanta anticipates that 60,000new jobs will be created by 2009. To achieve this goal, the City has identified several target industries,which are either existing large industry clusters or industries having significant near term growth prospects(See Figure 3.2 ‘Economic Development Plan - Target Industries’ ). Progress in these target industries canbe illustrated through the groundbreaking of the Georgia Institute of Technology based Technology EnterprisePark located in Downtown, which is a bioscience and technology research and development marketplacethat will house both emerging and established companies. This facility will also act as a catalyst forrevitalization in the surrounding area.
Figure 3.2 Economic Development Plan - Target Industries
Although Atlanta’s economy is diverse, it is more service-based than manufacturing-based. Historically,manufacturing provided a relatively large number of jobs. In 2000, employment in manufacturing sector was7.6% of total employment. By 2005, that percentage had decreased to 5.6%. The State of Georgia has amuch higher percentage of manufacturing jobs, 12.10%. For the City to enhance economic vitality there isgreat need to retain and attract manufacturing industries by having a land use policy that retains existingindustrial land uses and identifies land uses for future industrial use. Analysis needs to be completed todetermine possible locations for industrial use in the City as well as investigate a stronger citywide industrialpolicy.
Labor Force
61Atlanta Strategic Action Plan September 2007 Draft

The City of Atlanta has a higher unemployment rate than surrounding counties and the State of Georgia.The City is actively targeting areas which are underserved and working to promote training and job growthto increase employment. Expansion of the existing education and training programs provided by differentagencies to the under-skilled population in the City of Atlanta, especially for residents in underserved areasis needed. National studies have shown that income increases and poverty decreases as the educationalattainment increases. An educated worker will also have a variety of job options, thus making him/her lessvulnerable to changes in the economy.
The Atlanta Workforce Development Agency promotes Summer Youth Programs, a program that preparesHigh School graduates with the tools to find employment. This agency also provides youth developmentservices and job fairs as well as a variety of other employment services for people of all ages.
As baby boomers reach retirement age, a significant part of the City of Atlanta's workforce will be retiringin the near future. This aging workforce includes many highly skilled professionals. While their retirementmight result in a shortage of skilled employees, it will also create job opportunities to the college educatedworkforce. These retirees will, in turn, create a new labor pool which may be beneficial in other industrysectors. New programs should be investigated to assist this population.
The mean travel time to work in the City of Atlanta in 2005 was 26.6 minutes. This is higher than the 25.1minutes mean travel time to work in the nation. However, it is lower than the 31.1 minutes mean travel timeto work in the Atlanta Region. This indicates that large percentage of the workforce commutes into the Cityof Atlanta to work.
Economic Development Resources
The City of Atlanta has many economic development organizations. Coordination among these differenteconomic development agencies (the Department of Planning and Community Development, ADA, MACOC,DCA, Renewal Communities, the state's Economic Development agencies, etc.) and private entities willenhance opportunities for individuals and corporations to retain and attract businesses.
An example of a positive economic development tool is the small business seminars administered by theAtlanta Development Authority. The last seminar was held in January of 2007. $2 million dollars has beenmade available in the form of loans for entrepreneurs and small businesses that need financing. Theseseminars are designed to support the City’s Economic Development Goals of adding an average of 12,000jobs per year.
Major Initiatives
The City has a strategy to encourage infill and new development at major activity centers and along majorcorridors. To implement this strategy, the City of Atlanta has adopted 14 Livable Centers Initiatives studies,2 corridor studies, and 6 economic development priority areas (See Map 3.10 ‘Economic DevelopmentPriority Areas’).
September 2007 Draft Atlanta Strategic Action Plan62
Community Assessment3

Map 3.10 Economic Development Priority Areas
63Atlanta Strategic Action Plan September 2007 Draft

Other major projects, which are having positive impacts on the City’s economy include:
Atlantic Station: The project is open and near completion. The mixed-use development provides jobs,a variety of housing types, retail, restaurants and recreational activities in Midtown Atlanta. This wasa former steel mill and brownfield site.
City Hall East: The mixed-use redevelopment at City Hall East is expected to improve the quality oflife in surrounding neighborhoods, preserve historic structure resources, provide greenspace andpromote economic development.
Large Scale Cultural Public Facilities: The Georgia Aquarium, the World of Coke, and the expansionof the High Museum are important cultural institutions that are attracting new residents and touristsand enhancing the City's quality of life.
The Beltline: This project offers opportunities for development and redevelopment of many intownneighborhoods along the 22-mile of railroad corridors around the City's core. It is expected to promotesustainable economic development in the City as well as add much needed park space and transitoptions.
Fort McPherson: This 485 acre historic army base is scheduled to close in 2011. It is located adjacentto the Oakland and the Lakewood/McPherson MARTA station and near I-75/85. The McPhersonPlanning Local Redevelopment Authority is actively working toward creating a redevelopment planworking with a variety of local agencies and neighborhoods.
Lakewood Fairgrounds Redevelopment: This 132 acre site, located near MARTA and I-75/85, sevenhistoric structures, 4 which have been restored, a 15 acre lake and the Hi-fi Buys Amphitheater (stillin use) are located on the property.
Economic Base
In 2006, the City of Atlanta had an estimated 419,042 jobs. The number of jobs has increased since 2004,but it is still far less than the number of jobs in 2000. Between 2000 and 2006, 61,406 jobs were lost. Aneconomic recession in early 2000 and the terrorist attacks in 2001 resulted in the loss of jobs (see Table3.16 ‘Employment in the City of Atlanta between 2000 and 2005’).
Table 3.16 Employment in the City of Atlanta between 2000 and2005
Number of JobsYear
480,4482000
467,7572001
427,7852002
417,9672003
September 2007 Draft Atlanta Strategic Action Plan64
Community Assessment3

Number of JobsYear
413,8492004
415,6982005
419,0422006
Source: US Census, QWI, 2006 2nd qtr
The highest number are jobs is in the Public Administration sector. Atlanta has a large number of publicadministration jobs due the number of federal, state and local government offices located in the City.Professional, Scientific and Technical jobs is the second largest category. Universities, research institutionsand high tech industries located in the City are source of many of these jobs. Accommodations and Foodservices follows as the third largest employment sector. Many of the jobs are the result of the large conventionbusiness centered around Downtown ( Table 3.17 ‘Total Employment in the City of Atlanta in 2006’).
Table 3.17 Total Employment in the City of Atlanta in 2006PercentTotal EmploymentEmployment Sector
0.01%59Agriculture, Forestry, Fishing and Hunting
0.01%49Mining
0.30%1,247Utilities
2.36%9,908Construction
4.56%19,088Manufacturing
4.29%17,972Wholesale Trade
6.13%25,708Retail Trade
4.44%18,597Transportation and Warehousing
6.98%29,267Information
6.08%25,461Finance and Insurance
2.38%9,989Real Estate and Rental and Leasing
10.98%45,996Professional, Scientific, and Technical Services
2.46%10,302Management of Companies and Enterprises
6.55%27,443Administrative and Support and Waste Management andRemediation Services
7.37%30,864Educational Services
8.66%36,291Health Care and Social Assistance
1.73%7,250Arts, Entertainment, and Recreation
9.17%38,436Accommodation and Food Services
3.23%13,533Other Services (except Public Administration)
12.31%51,582Public Administration
100.00%419,042Total
65Atlanta Strategic Action Plan September 2007 Draft
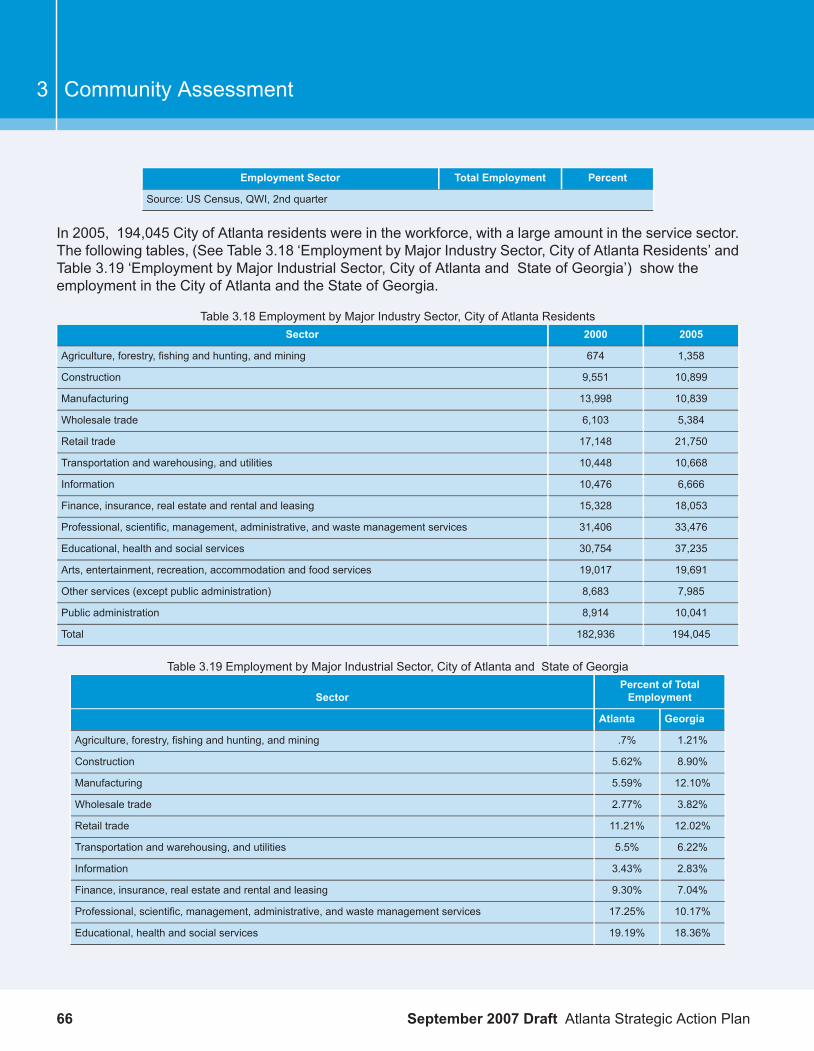
PercentTotal EmploymentEmployment Sector
Source: US Census, QWI, 2nd quarter
In 2005, 194,045 City of Atlanta residents were in the workforce, with a large amount in the service sector.The following tables, (See Table 3.18 ‘Employment by Major Industry Sector, City of Atlanta Residents’ andTable 3.19 ‘Employment by Major Industrial Sector, City of Atlanta and State of Georgia’) show theemployment in the City of Atlanta and the State of Georgia.
Table 3.18 Employment by Major Industry Sector, City of Atlanta Residents20052000Sector
1,358674Agriculture, forestry, fishing and hunting, and mining
10,8999,551Construction
10,83913,998Manufacturing
5,3846,103Wholesale trade
21,75017,148Retail trade
10,66810,448Transportation and warehousing, and utilities
6,66610,476Information
18,05315,328Finance, insurance, real estate and rental and leasing
33,47631,406Professional, scientific, management, administrative, and waste management services
37,23530,754Educational, health and social services
19,69119,017Arts, entertainment, recreation, accommodation and food services
7,9858,683Other services (except public administration)
10,0418,914Public administration
194,045182,936Total
Table 3.19 Employment by Major Industrial Sector, City of Atlanta and State of GeorgiaPercent of TotalEmploymentSector
GeorgiaAtlanta
1.21%.7%Agriculture, forestry, fishing and hunting, and mining
8.90%5.62%Construction
12.10%5.59%Manufacturing
3.82%2.77%Wholesale trade
12.02%11.21%Retail trade
6.22%5.5%Transportation and warehousing, and utilities
2.83%3.43%Information
7.04%9.30%Finance, insurance, real estate and rental and leasing
10.17%17.25%Professional, scientific, management, administrative, and waste management services
18.36%19.19%Educational, health and social services
September 2007 Draft Atlanta Strategic Action Plan66
Community Assessment3

Percent of TotalEmploymentSector
GeorgiaAtlanta
7.39%10.15%Arts, entertainment, recreation, accommodation and food services
4.69%4.12%Other services (except public administration)
5.25%5.17%Public administration
According to the Bureau of Census, the largest percentage of the City of Atlanta and Georgia residentsare in employed in Educational, health and social services jobs. The City of Atlanta lags behind the Stateof Georgia in the Construction and Manufacturing industry sectors. The City of Atlanta has a higherpercentage of Professional (Scientific, Management, Administrative, and Waste Management Services) aswell as Arts and Entertainment and FIRE. This illustrates the shrinking heavy/light industrial sectors of theCity. The City does not have a solid land use policy to retain this sector.
According to data provided by the Atlanta Regional Commission, the number of jobs increased by 10.2%(40,425) from 1990 to 2000. Between 2000 and 2005, the number of jobs fell by 12.7%. The ARC forecastindicate an 17.3 (77,792) increase in the number of jobs between 2005 and 2025. Compared to the Stateof Georgia, the projected employment growth rates are relative low ( See Table 3.20 ‘Projected Employmentby Major Industrial Sector, City of Atlanta, 2005-2025’ and Table 3.21 ‘Projected Employment Growth byMajor Industry Sector, City of Atlanta Compared with the State of Georgia, 2005-2025’). The City of Atlantahas a more aggressive growth goal than projected by Atlanta Regional Commission. As part of the NewCentury Economic Development Plan the City aims to create 60,000 new jobs, which equals a 14% overallgrowth rate and 3% annual growth rate.
Table 3.20 Projected Employment by Major Industrial Sector, City of Atlanta, 2005-2025% Change20252020201520102005Employment Sector
18.6%11,70411,19710,3659,5339,871Construction
-0.7%32,22032,10831,89931,68932,450Manufacturing
1.2%31,70731,44030,84630,25231,328Transportation, Communication and Utilities
-2.7%24,47524,74524,57924,41325,163Wholesale Trade
33.9%76,19571,08065,53559,98956,925Retail
5.8%36,63135,78534,88133,97634,636Finance, Insurance, and Real Estate
24.2%213,615205,355194,427183,498172,044Services
15.4%102,12998,72194,78390,84488,467Government
17.3%528,675510,431487,313464,194450,883Total
Table 3.21 Projected Employment Growth by Major Industry Sector, City of Atlanta Compared with the State of Georgia, 2005-2025Georgia State % ChangeAtlanta % Change
2015-20252005-20152015-20252005-2015Employment Sector
18.7%22.0%N/AN/AAgricultural
4.7%3.0%N/AN/AMining
67Atlanta Strategic Action Plan September 2007 Draft
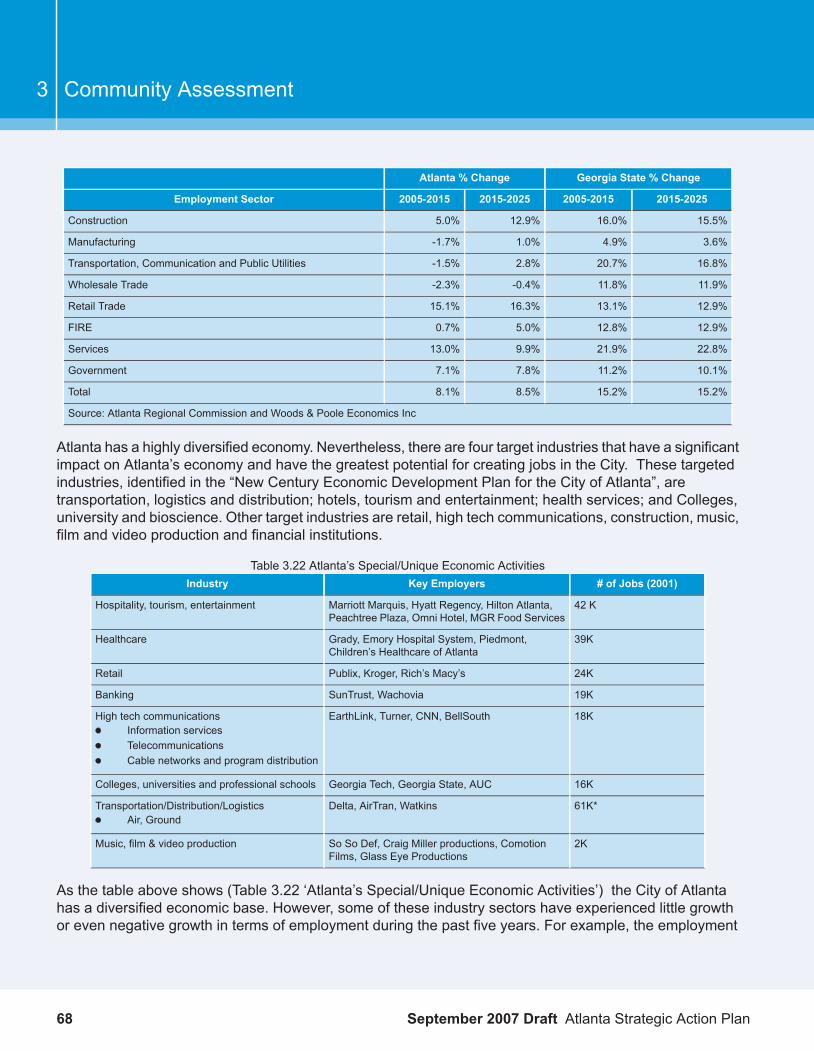
Georgia State % ChangeAtlanta % Change
2015-20252005-20152015-20252005-2015Employment Sector
15.5%16.0%12.9%5.0%Construction
3.6%4.9%1.0%-1.7%Manufacturing
16.8%20.7%2.8%-1.5%Transportation, Communication and Public Utilities
11.9%11.8%-0.4%-2.3%Wholesale Trade
12.9%13.1%16.3%15.1%Retail Trade
12.9%12.8%5.0%0.7%FIRE
22.8%21.9%9.9%13.0%Services
10.1%11.2%7.8%7.1%Government
15.2%15.2%8.5%8.1%Total
Source: Atlanta Regional Commission and Woods & Poole Economics Inc
Atlanta has a highly diversified economy. Nevertheless, there are four target industries that have a significantimpact on Atlanta’s economy and have the greatest potential for creating jobs in the City. These targetedindustries, identified in the “New Century Economic Development Plan for the City of Atlanta”, aretransportation, logistics and distribution; hotels, tourism and entertainment; health services; and Colleges,university and bioscience. Other target industries are retail, high tech communications, construction, music,film and video production and financial institutions.
Table 3.22 Atlanta’s Special/Unique Economic Activities# of Jobs (2001)Key EmployersIndustry
42 KMarriott Marquis, Hyatt Regency, Hilton Atlanta,Peachtree Plaza, Omni Hotel, MGR Food Services
Hospitality, tourism, entertainment
39KGrady, Emory Hospital System, Piedmont,Children’s Healthcare of Atlanta
Healthcare
24KPublix, Kroger, Rich’s Macy’sRetail
19KSunTrust, WachoviaBanking
18KEarthLink, Turner, CNN, BellSouthHigh tech communicationsInformation servicesTelecommunicationsCable networks and program distribution
16KGeorgia Tech, Georgia State, AUCColleges, universities and professional schools
61K*Delta, AirTran, WatkinsTransportation/Distribution/LogisticsAir, Ground
2KSo So Def, Craig Miller productions, ComotionFilms, Glass Eye Productions
Music, film & video production
As the table above shows (Table 3.22 ‘Atlanta’s Special/Unique Economic Activities’) the City of Atlantahas a diversified economic base. However, some of these industry sectors have experienced little growthor even negative growth in terms of employment during the past five years. For example, the employment
September 2007 Draft Atlanta Strategic Action Plan68
Community Assessment3

in FIRE sector has increased by 2005 (15%), and the employment in wholesale sector has decreased by791 (13%) (See Table 3.19 ‘Employment by Major Industrial Sector, City of Atlanta and State of Georgia’).Based on the projection for the next twenty years, the City will have an increase in jobs in most employmentsectors. The City needs to target retaining and strengthening these basic industry sectors to provide morejobs and revenues for the City. Among these sectors, wholesale trade and warehousing have least potentialfor growth and are not identified as target industries. However, these sectors provide good paying jobs forthe portion of the workforce without a high education attainment.
Except for the basic industry sectors, some other industry sectors are having the potential of either providinga great number of jobs for the City or turning from non-basic to basic sectors. These sectors includeeducational, health and social services, tourism and convention, and retail trade. In addition, universitiesand research institutions in the City are good resources for high-tech or bioscience related industries. Thereis need for the City to facilitate and promote the growth of these sectors in an effort to continue diversifyingthe economic base.
Labor Force
Employment by Occupation
Employment by occupation data is collected by the U.S. Census and shows the occupations of personsliving within the City, regardless of where they work. The total number of jobs held by Atlanta residentsincreased between 1989 and 2005, but the distribution of employment by occupation shifted toward morewhite-collar and highly skilled jobs as well as jobs related to transportation andmaterial moving. Administrationsupport positions provided the largest number of jobs in 1990, while professional and technical specialtypositions provided the largest number of jobs in 2000, followed by executive, administrative and managerialpositions. In 2005, the highese percentage of jobs were in executive, administrative and managerialoccupations. The largest increase was in jobs in transportation and material moving. The largest decreaseswere in precision craft/mechanical jobs and in administrative support jobs, while the largest percentagedecline was in farming, fishing and forestry (See Table 3.23 ‘Current and Historic Employment by Occupation,Atlanta Residents, 1989-2005’).
A comparison of the state and national distributions of employment by occupation shows that, comparedto the national work force, Atlanta residents are more likely to work in offices than in factories. More Atlantaworkers are employed as executives and professionals; fewer work in precision production and machineoperations (See Table 3.24 ‘Employment by Occupation Comparison, Atlanta, Georgia, and United States,1999’ and Table 3.25 ‘Employment by Occupation Comparison, Atlanta, Georgia, and United States, 2005’).
Table 3.23 Current and Historic Employment by Occupation, Atlanta Residents, 1989-2005Percent200519991989Occupation
4.5%181,036182,936175,126Total Occupations
41.0%76,16031,52022,362Executive, administrative, and managerial occupations
51.9%N/A42,68228,107Professional specialty occupations
31,245N/A6,262Technicians and related support occupations
6.2%44,22321,47820,215Sales occupations
69Atlanta Strategic Action Plan September 2007 Draft

Percent200519991989Occupation
-10.6%N/A25,38728,400Administrative support occupations, including clerical
N/AN/A2,281Private household occupations
9.4%N/A3,1502,880Protective service occupations
2.6%N/A26,81026,124Service occupations, except protective and household
-81.1%N/A4092,161Farming, forestry, and fishing occupations
-25.4%N/A8,94611,989Precision production, craft, and repair occupations
27.3%8,07811,0148,649Machine operators, assemblers, and inspectors
55.9%20,48311,5407,400Transportation and material moving occupations
N/AN/AN/A8,296Handlers, equipment cleaners, helpers, and laborers
Source: US Census
Table 3.24 Employment by Occupation Comparison, Atlanta, Georgia, and United States, 1999Percent Employed Residents-1999
U.SGeorgiaAtlantaOccupation
13.5%14.0%17.2%Executive, administrative, and managerial occupations
20.2%18.7%23.3%Professional specialty occupations
12.9%11.4%14.7%Sales occupations
2.0%2.0%1.7%Administrative support occupations, including clerical
11.2%11.6%11.7%Protective service occupations
15.4%15.1%13.9%Service occupations, except protective and household
0.7%0.6%0.2%Farming, forestry, and fishing occupations
9.4%10.8%6.0%Precision production, craft, and repair occupations
8.5%9.0%4.9%Machine operators, assemblers, and inspectors
6.1%6.6%6.3%Transportation and material moving occupations
Source: US Census
Table 3.25 Employment by Occupation Comparison, Atlanta, Georgia, and United States, 2005Percent Employed Residents-2005
U.SGeorgiaAtlantaOccupation
34.1%33.6%45.7%Executive, administrative, and managerial occupations
*%*%*%Professional specialty occupations
25.9%26.1%24.6%Sales occupations
*%*%*%Administrative support occupations, including clerical
*%*%*%Protective service occupations
16.3%14.7%16.8%Service occupations
.6%0.6%0.6%Farming, forestry, and fishing occupations
September 2007 Draft Atlanta Strategic Action Plan70
Community Assessment3

10%11.2%5.4%Precision production, craft, and repair occupations
*%*%*%Machine operators, assemblers, and inspectors
13.1%13.8%6.9%Transportation and material moving occupations
Source: US Census
Employment Status
The US Census defines the labor force to include persons sixteen years of age and older, both employedand unemployed, who are able to work. The percentage of Atlanta adults who were at working age increasedby approximately 10% between 1989 and 2005, and the number who were in the labor force increased by11% (See Table 3.26 ‘Current and Historic Employment Status, Atlanta, 1989-2005’). The percentage ofGeorgians aged 16 and over who were in the labor force increased from 62.7% in 1990 to 68.7% in 2005.The percentage of Atlanta adults who are in the labor force is higher than the state and national level ascompared to 1999 which showed almost the same as the national level and are slightly lower than statelevel. However, the City of Atlanta unemployment rate is much higher than state and national percent figuresSee Table 3.27 ‘Employment Status Comparison, Atlanta, Georgia and United Stated, 2005’). The Atlantalabor force is roughly one-half female (See Table 3.28 ‘Percent of Labor Force by Gender, Atlanta, Georgiaand United States, 1989,1999, 2005’).
Table 3.26 Current and Historic Employment Status, Atlanta, 1989-2005% Change200519991989Employment Category
10.8%312,115333,209308,805Population Aged 16 and Older
11.3%214,575212,817192,794Civilian Labor Force
6%68.7%63.9%62.7%Percent in Labor Force
10.77%194,045182,936175,126Employed
15.1%20,35229,88117,668Unemployed
.8%9.5%9.0%5.7%Percent Unemployed
-78.1%178440812In the Armed Forces
Source: US Census
Table 3.27 Employment Status Comparison, Atlanta, Georgia and United Stated,2005
U.S.GeorgiaAtlantaEmployment Status
63.39%65.00%68.7%Percent in Labor Force
6.9%7.4%9.5%Percent Unemployed
Source: US Census
Table 3.28 Percent of Labor Force by Gender, Atlanta, Georgiaand United States, 1989,1999, 2005
U.S.GeorgiaAtlanta2005
53.7%54%53.3%Male:
46.3%46%46.7%Female:
71Atlanta Strategic Action Plan September 2007 Draft

U.S.GeorgiaAtlanta2005
U.S.GeorgiaAtlanta1999
48.3%48.5%49.3%Male:
51.7%51.5%50.7%Female:
U.S.GeorgiaAtlanta1989
54.7%53.8%51.9%Male:
45.3%46.2%48.1%Female:
The City of Atlanta has a lower percentage of people who obtained a high school degree than both the Stateand the Nation (See Table 3.29 ‘Educational Attainment Comparison, Atlanta, Georgia and United States,2005 Population 25 and over ’ ). Even more concerning is that 17% of the population had less than a highschool degree which is lower than the State of Georgia but higher than the national average. In generalthe median earnings directly correlate to the level of educational attainment. Table Table 3.30 ‘EducationalAttainment Comparison, Atlanta, Georgia and United States, 2005 Median Earnings ’ illustrates that a collegeand graduate degree will significantly increase annual salaries. City of Atlanta residents with a bachelorsand graduate degrees will have a higher annual salary than their counterparts in the State and the Nation.
Table 3.29 Educational Attainment Comparison, Atlanta, Georgia and United States, 2005 Population 25and over
United StatesGeorgiaAtlantaEducational Attainment
15.9%17.2%17%Less than High School Graduate
29.6%29.6%21.8%High School Graduate
27.5%25.9%18.8%Some college or Associates Degree
17.2%17.6%25.3%Bachelor’s Degree
10%9.6%17.1%Graduate or Professional Degree
Table 3.30 Educational Attainment Comparison, Atlanta, Georgia and United States, 2005Median EarningsUnited StatesGeorgiaAtlantaEducational Attainment
$18,435$19,367$12,370Less than High School Graduate
$25,829$25,538$22,965High School Graduate
$31,566$31,653$30,260Some college or Associates Degree
$43,954$45,335$47,103Bachelor’s Degree
$57,585$54,563$62,025Graduate or Professional Degree
Although management, professional and related occupations in Atlanta ($51,710) exceed both the State($30,306) and the Nation ($46,246) women receive less pay in each category ( See Table 3.31 ‘Occupationby Sex and Median Earnings-Atlanta’, Table 3.33 ‘Occupation by Sex and Median Earnings-U. S. Nation’and Table 3.33 ‘Occupation by Sex and Median Earnings-U. S. Nation’). In contrast, occupations such asconstruction (Atlanta-$26,216) lag behind both the State ($28,281) and the Nation ($31,306). In this fieldwomen, make a very small percentage of the salary afforded to their male counterparts.
Table 3.31 Occupation by Sex and Median Earnings-Atlanta
September 2007 Draft Atlanta Strategic Action Plan72
Community Assessment3

MedianEarnings-Female
MedianEarnings-Male
Medianearnings
FemaleMaleTotalOccupations
$47,880$59,702$51,71045.6%54.%88,636Management, professional and related occupations
$14,493$20,902$17,00052.4%47.6%32,667Service occupations
$22,842$38,657$28,20358.4%41.6%47,649Sales and office Occupations
0$20,906$20,9060%100%1,192Farming, fishing, and forestry occupations
$11,275$27,060$26,2165%95%10,561Construction, extraction, maintenance, and repairoccupations
$17,481$22,436$21,15335%65%13,340Production, transportation, and material movingoccupations
Table 3.32 Occupation by Sex and Median Earnings-GeorgiaMedianEarnings-Female
MedianEarnings-Male
Medianearnings
FemaleMaleTotalOccupations
$25,293$35,037$30,30646%54.%4,185,729Management, professional and related occupations
$13,219$21,543$16,65656.4%43.6%615,462Service occupations
$23,470$35,560$26,90861.4%38.6%1,093,497Sales and office Occupations
$12,381$18,306$17,31017.2%82.8%26,909Farming, fishing, and forestry occupations
$23,283$28,563$28,2814.6%95.4%463,726Construction, extraction, maintenance, and repair occupations
$19,342$28,681$25,41826%74%578,222Production, transportation, and material moving occupations
Table 3.33 Occupation by Sex and Median Earnings-U. S. NationMedianEarnings-Female
MedianEarnings-Male
Medianearnings
FemaleMaleTotalOccupations
$35,555$57,385$46,24650.7%49.3%46,514,512Management, professional and related occupations
$12,920$20,735$15,91156.6%43.4%22,224,170Service occupations
$22,657$33,302$25,77163%37%35,352,046Sales and office Occupations
$10,792$17,351$15,89620.4%79.6%929,636Farming, fishing, and forestry occupations
$27,050$31,411$31,3063.6%96.4%13,630,934Construction, extraction, maintenance, and repair occupations
$19,401$31,154$26,65823.1%76.9%17,807,512Production, transportation, and material moving occupations
Unemployment Rates
Since 2002, there has been a trend of decreasing unemployment rates with the recovery of the nationaland local economies until and upturn in 2005. In 2005, the unemployment rate in Atlanta was 9.5% whichis the highest it had been since 1995. Compared to surrounding counties, the state and the nation, Atlantaalways has the highest unemployment rate, regardless of the economic condition.
Table 3.34 Historic and Current Unemployment Rates, Atlanta Compare with Surrounding Counties, Georgia, and United States,1995-2005
20052004200320022001200019991998199719961995Government
9.5%7.7%8.1%8.2%6.1%5.0%5.0%5.6%6.2%6.7%7.2%Atlanta
73Atlanta Strategic Action Plan September 2007 Draft

20052004200320022001200019991998199719961995Government
6.2%5.3%5.7%5.7%4.2%3.5%3.7%4.0%4.6%4.9%5.3%Fulton
6.1%5.3%5.5%5.6%4.1%3.3%3.7%4.1%4.4%4.4%4.8%DeKalb
4.7%4.2%4.3%4.5%3.3%2.8%2.4%2.6%2.9%3.0%3.6%Cobb
6.7%5.6%5.8%5.7%3.9%3.4%3.3%3.7%4.1%4.5%5.0%Clayton
5.5%4.6%4.7%4.8%4.0%3.5%3.8%4.2%4.5%4.6%4.8%Georgia
7.0%4.6%4.8%4.9%3.6%3.1%3.0%3.3%3.7%3.8%4.3%MSA
4.8%5.5%6.0%5.8%4.7%4.0%4.2%4.5%4.9%5.4%5.6%U.S.
Source: US Bureau of Labor
The City of Atlanta has had a higher rate of unemployment than the surrounding counties, the state ofGeorgia, and the nation for the last decade (See Table 3.34 ‘Historic and Current Unemployment Rates,Atlanta Compare with Surrounding Counties, Georgia, and United States, 1995-2005’). The City shouldfocus on training and job creation. Most of the unemployed are those who have less education and/or areliving in areas with poor accessibility to jobs located in the metro area. Creating entry-level jobs in retail,tourism and some transportation sectors will expand and provide opportunities for the unemployed. Asidentified in the New Century Economic Development Plan, some areas of the City are not served by retail.
With the diversified economic base, the City also needs to create a wide range of jobs that serve all segmentsof the population. Entry-level jobs to serve the under-skilled portion of the population are important. Inaddition, the City needs to equip and attract the labor force for high-skill level jobs, such as FIRE, information,telecommunication and bioscience. Since the City is home to several major universities, Atlanta shouldwork on retaining recent graduates of the many colleges and universities in Atlanta in order to have ahigh-skilled workforce. Moreover, the City needs to work with technical schools, work force developmentagencies, universities, collages to train and educate students to meet the needs of employers.
Almost half of the people living in poverty in Atlanta (45%) have less than a High School degree. This ismuch higher than in Georgia and the United States (See Table 3.29 ‘Educational Attainment Comparison,Atlanta, Georgia and United States, 2005 Population 25 and over ’). A low percentage of college graduatesare below the poverty level. Therefore, it is very important to stress education as a means of having accessto high paying jobs.
Table 3.35 Poverty Rate for the Population 25 Years and over for Whom Poverty Status is determined by Educational AttainmentLevel
United StatesGeorgiaAtlantaEducational Attainment
23.6%25.2%45.6%Less than High School Graduate
11.2%12.2%24.1%High School Graduate
7.7%8%17%Some college or Associates Degree
3.9%3.2%4.9%Bachelor’s Degree
2.9%2.4%3.7%Graduate or Professional Degree
September 2007 Draft Atlanta Strategic Action Plan74
Community Assessment3

Commuting Patterns
Despite the number of people working in the City being the greatest share of the total, there is a trend formore people commuting outside the City to their jobs. The number of people working in the City decreasedby almost 10 percent from 1989 to 1999 but there was an overall increase between 1989 to 2005 of 3.9percent. The number working outside the MSA has increased by more than 74 percent from 1989 to 2005(See Table 3.36 ‘Current and Historic Commuting Patterns, City of Atlanta, 1989-2005 ’).
From 1989 to 1999, the number of persons commuting to jobs inside the City of Atlanta decreased from117,553 to 106,145, although the total commuters living in the City increased from 171,185 to 178,970.During that period the data indicated that the job growth in certain sectors in the surrounding suburbs wasfaster than the City. These jobs included manufacturing, wholesale and retail. As noted in an earlier section,the City of Atlanta has lost much of its manufacturing/wholesale business and land use dedicated to thiscategory thus causing the workers with skill sets in those particular areas to search for work elsewhere. In1999, the percentage of population commuting to jobs more than 29 minutes increased by 3% (5,844)compared to 1990. This category increased 6.3 percent from 1989-2005 ( See Table 3.37 ‘Current andHistoric Travel Times, City of Atlanta, 1989-1999’). This indicates there is increased job-housing imbalancein the City. This commuting pattern reveals again that the City needs to create jobs for its residents andimprove job housing balance in the city.
The State of Georgia has a mean travel time to work of 27.2. minutes. With increased congestion and poorair quality, there has been an increase in workers that telecommunte and work from home. In 2005, therewere 145,988, approximately 4% of the workforce, in the State telecomuted. In comparison the City ofAtlanta, 8,813 workers or 5% or the workforce telecommuted ( See Table 3.37 ‘Current and Historic TravelTimes, City of Atlanta, 1989-1999’).
Table 3.36 Current and Historic Commuting Patterns, City of Atlanta, 1989-2005% Change200519991989Commuting Patterns
9.1%186,756178,970171,185Total:
9.1%186,756178,970171,185Living in an MSA/PMSA:
7%181,750175,996169,782Worked in MSA/PMSA of residence:
3.9%122,367106,145117,553Central City
13.7%59,38369,85152,229Remainder of this MSA/PMSA
74%3,9652,9742,281Worked outside MSA/PMSA of residence:
72%2,4081,8761,403Worked in a different MSA/PMSA:
67%1,5571,122928Central City
-8.5%435754475Remainder of different MSA/PMSA
-31%6061,098878Worked outside any MSA/PMSA
Source: US Census
75Atlanta Strategic Action Plan September 2007 Draft

There is a trend toward more people traveling for longer time periods to work. At the same time, due toincreased congestion and increase in mixed use developments, there was an almost 19% increase in peoplewith a less than five minute commute. This was the largest increase aside from the 90 or more minutes.There was also a significant increase of the number of people working from home (see Table 3.37 ‘Currentand Historic Travel Times, City of Atlanta, 1989-1999’).
Table 3.37 Current and Historic Travel Times, City of Atlanta, 1989-1999% Change200519991989Travel Time
3.41%177,942178,970172,063Total:
18.23%4,3773,1273,702Less than 5 minutes
34%16,71813,15112,4765 to 9 minutes
1.7%23,71022,14723,31810 to 14 minutes
-14.4%27,11130,03731,67215 to 19 minutes
.01%28,37128,75728,15920 to 24 minutes
6.3%10,55410,3729,88425 to 29 minutes
13.2%30,91626,82327,32030 to 34 minutes
.01%4,0764,2674,06435 to 39 minutes
7%4,5164,8594,22440 to 44 minutes
9%12,27111,50211,21545 to 59 minutes
4.6%9,89910,0619,46860 to 89 minutes
116.7%5,4247,1262,50390 or more minutes
117%8,8136,7414,058Worked at home
Source: US Census
Economic Resources
Economic Development Agencies
Our Community has different economic development agencies which target at different geographic areasor economic development elements.
1. Atlanta Development AuthorityThe Atlanta Development Authority forges partnerships with private and nonprofit interests (includingfinancial institutions, retailers, corporations, foundations, and universities) to plan and implementredevelopment and economic development projects and programs. This agency also promotes jobtraining and markets Atlanta to potential investors and employers.Fulton County Economic Development DepartmentThemission of the Economic Development Department is to market and promote Fulton County throughcomprehensive programs designed to promote the location of new and expanding business. Thesecomprehensive programs include: Marketing and Business Development, Expansion and Retention
September 2007 Draft Atlanta Strategic Action Plan76
Community Assessment3

of existing businesses, Small Business Development, and Financing and Development incentivesdesigned to encourage residential, commercial and industrial growth in Fulton County, thereby creatingjobs and expanding the tax base.
2. Dekalb County Economic Development DepartmentThe Dekalb County Economic Development Department markets Dekalb to the world through itsdatabase of investment opportunities and commercial and industrial properties. The Dekalb DevelopmentAuthority of Dekalb County works with growing companies to find financing alternatives for establishinga presence in Dekalb County.
3. Metro Atlanta Chamber of CommerceMetro Atlanta Chamber of Commerce is the business association of the metro Atlanta area. TheChamber’s focuses are improving quality of life and promoting economic growth. Its EconomicDevelopment Division is committed to creating a high-quality business environment in the metro areafor new and existing businesses. The Chamber's business recruitment team actively recruits newcompanies to relocate to the region by marketing to, and working directly with, corporate executivesand relocation consultants. The Chamber is committed to developing new business in targeted industryclusters, including Corporate Headquarters, Biosciences, Logistics/Transportation, Telecommunications,Computer Software & Services. Recently, the Chamber of Commerce has been working on the MetroAtlanta Quality Growth Task Force, which is a public-private venture to reach consensus on growthstrategies necessary to successfully accommodate the next 2.3 million people in the region.
4. Atlanta Neighborhood Development Partnership, Inc. (ANDP)The Atlanta Neighborhood Development Partnership, Inc. (ANDP) works with a dynamic network ofbusinesses and organizations to both advocate for and participate in the bricks and mortar buildingprocess for new affordable, mixed income housing and community revitalization. This strong networkencompasses lenders, for-profit and non-profit developers, public and private agencies, foundationsand community development corporations (CDCs) - all working for positive change at the neighborhoodlevel. Throughout its 12-year history, ANDP has been engaged in developing housing for people ofmoderate to low incomes. This dedicated, hard work has resulted in the building or renovation of morethan 7,800 housing units in the Atlanta Region. To implement the vision and to be a catalyst forsustainable communities, ANDP will:
a. Develop mixed income housing that includes very low, low-to-moderate and market rate housing;
b. Help build the capacity of community-based organizations;
c. Provide debt and equity capital for mixed income housing;
d. Advocate for public policies that promote healthy communities; and
e. Establish appropriate partnerships that are in alignment with the vision.
5. Georgia Department of Economic Development
77Atlanta Strategic Action Plan September 2007 Draft

The Georgia Department of Economic Development is responsible for administering many of the stateincentive programs as well as providing technical assistance to local governments, developmentauthorities, and private for-profit entities in the area of economic development. The RedevelopmentFund Project, Employment Incentive Program, and the Downtown Development Revolving Loan Fundare a few resources available through the department. There are many other resources offered throughthe Georgia Department of Economic Development for businesses to utilize.
6. Atlanta Regional Commission (ARC)The Atlanta Regional Commission is the regional planning and intergovernmental coordination agencyfor the 10-county Atlanta area. The agency is involved with the economic development/improvementof Atlanta. ARC has been very involved with revitalizing the weaker neighborhoods of Atlanta. Theagencies LCI program, workforce initiatives, and its long-range plans are vital to creating a thrivingAtlanta.
7. Georgia PowerGeorgia Power operates a full-service Community and Economic Development organization whichserves the entire State of Georgia. The purpose of this organization is to help new and existingcompanies expand in Georgia. Experienced leadership, leading edge technology, and targeted researchand management tools have all led to the success of the community and economic efforts.
Economic Development Programs/ Tools
Different economic development programs/tools are available in the City to attract businesses andemployment, provide affordable housing, and encourage economic development.
1. Atlanta Renewal CommunityEstablished by the 2000 Community Renewal Tax Relief Act, the Renewal Community Initiative allowsAtlanta to receive regulatory relief and tax breaks to help local businesses provide more jobs andpromote community revitalization in areas suffering from divestment and decline. This initiative hasreplaced the Empowerment Zone Program. Through this program, the City of Atlanta will utilize taxcredits, tax deductions, capital gains exclusions and bond financing to encourage public-privatecollaboration to generate economic development in 40 distressed communities. The details of theprogram are detailed below.
a. Tax Credits
i. Wage credits: Businesses who hire and retain Renewal Community residents are able toapply credits against their federal tax liability. Businesses operating in the new RenewalCommunity (RC) will receive up to a $1,500 credit for every newly hired or existing employeewho lives and works in the RC.
September 2007 Draft Atlanta Strategic Action Plan78
Community Assessment3

ii. Work Opportunity Credits: These credits provide businesses in Renewal Communities withup to $2,400 against their Federal tax liability for each employee hired from groups withhistorically high unemployment rates or other special employment needs, including youthwho live in the RC.
iii. Welfare to Work Credits: Businesses are offered a credit of up to $3,500 (in the first year ofemployment) and $5,000 (in the second year) for each newly hired long-term welfare recipient.
b. Tax Deductions
i. Commercial Revitalization Deductions: States with one or more RCs are permitted to deduct$12 million per RC per year, up to $10 million per project for commercial or industrial buildingsdeveloped in the RCs. A business can deduct up to $5 million in the year the building isplaced in service or deduct the full amount of eligible expenditures pro rata over 10 years.
ii. Section 179 Deductions: A qualified Renewal Community business is allowed under the taxcode to expense up to $35,000 of additional qualified property such as equipment andmachinery acquired each year during the period of the RC designation, 2002 through 2009.
iii. Environmental Cleanup Cost Deductions: Businesses are allowed to deduct qualified cleanupcosts accrued in Brownfields.
iv. Zero Percent Capital Gains Rate: This rate applies to an interest in, or property of, certainbusinesses operating in a Renewal Community, if the asset is acquired during the period ofthe RC designation and held for at least 5 years.
c. Bond FinancingQualified Zone Academy Bonds: These bonds allow state and local governments to matchno-interest loans with private funding sources to finance public school renovations and programs.Areas that are included in the designation are to become “renewal clusters” and receive priorityin their planning and economic development. Listed below are three identified clusters (Map 1).
i. Westside Renewal Cluster: Combines six communities linked by Ralph David AbernathyBlvd, Martin Luther King Jr. Dr, Joseph E. Lowery Blvd, Northside Dr. and Simpson Rd.Communities in this cluster include West End Historic District, Vine City/ Ashby St., SimpsonRd. Corridor, Greater Atlanta University Center Community, Northwest Atlanta, and EnglishAvenue. Includes the Old Fourth Ward Neighborhood, the Butler/ Auburn Community, andReynoldstown.
79Atlanta Strategic Action Plan September 2007 Draft

ii. Eastside Renewal Cluster: Includes the Old Fourth Ward neighborhood, the Butler/ AuburnCommunity, and Reynoldstown Neighborhood.
iii. Southside Renewal Cluster: Memorial Dr., Pryor Rd., Jonesboro Rd. and Metropolitan Pkwyare major commercial corridors connecting the neighborhoods in this Cluster. It includesMechanicsville, Pittsburgh, Jonesboro RoadCorridor, Capitol Homes/ Memorial Drive, ThomasHeights, and greater Southside.
2. Urban Enterprise Zones: An Urban Enterprise Zone (UEZ) designation is given to projects located indepressed areas wherein the City of Atlanta and Fulton County may abate ad valorem taxes on newdevelopment, rehabilitation and certain inventories in order to encourage private investment and toexpand the tax base. The City may also waive development impact fees associated with developmentwithin enterprise zones. There are six types of UEZs:
a. Housing Enterprise Zone (HEZ) – 57 active HEZ
b. Mixed-use Residential Commercial Enterprise Zone (MUR/CEZ) – 16 active MUR/CEZ
c. Commercial Enterprise Zone (CEZ) – 6 active CEZ
d. Industrial Enterprise Zone (IEZ) – 10 active IEZ
e. Mixed-use Commercial/Industrial Enterprise Zone (MUC/IEZ) – 4 active MUC/IEZ
f. Business Enterprise Zone (BEZ) – 1 active BEZ
3. Tax Allocation DistrictState authorized tax increment financing (TIF), or tax allocation financing, is a method of paying forpublic improvements within a designated redevelopment district through the increases in tax revenueresulting from the revitalization of that district. Tax allocation bonds are used to finance redevelopmentcosts within a tax allocation district and are issued on the basis of pledging the projected increase inad valorem tax revenues resulting from the proposed redevelopment of property within a tax allocationdistrict for the repayment of such bonds. The tax allocation increment is the amount obtained bymultiplying the total ad valorem property taxes levied on all taxable property within a tax allocationdistrict in any year by a fraction having a numerator equal to that year’s taxable value of all taxableproperty within the tax allocation district minus the tax allocation increment base, and a denominatorequal to that year’s taxable value of all taxable property within the tax allocation district. The incrementis positive if the tax allocation increment base is less than that year’s taxable value of all taxable propertyand negative if such base exceeds such taxable value.The process of tax increment financing begins when the City designates a blighted area as aredevelopment district. In order to create the district, under Georgia’s Redevelopment Powers Law(OCGA s 36-44-1 et. seq.), proposed redevelopment activities must be described in a redevelopmentplan that meets various requirements. There must be findings that the redevelopment area on thewhole has not been subject to growth and development through private enterprise and would not
September 2007 Draft Atlanta Strategic Action Plan80
Community Assessment3

reasonably be anticipated to be developed without the approval of the redevelopment plan. Theredevelopment plan must be adopted by the Mayor and City Council, with the formal consent of theAtlanta Board of Education and the Fulton County or DeKalb County Board of Commissioners.To date, the City has created six TAD’s districts: Westside, Atlantic Steel, Princeton Lakes, Perry/Bolton,Beltine and Eastside Tax Allocation districts; and is in the process of creating the four additional. TheAtlanta Development Authority (ADA) now serves at the Redevelopment Agent for the 6 TADs.
4. Urban Residential Finance Authority (URFA)URFA is a program initiated by the Atlanta Development Authority. This Citywide incentive is competitiveon application to URFA and provides municipal bond rate financing for affordable housing units.
5. Economic Development & Growth Enhancement Program (EDGE)This program was developed by the Federal Home Loan Bank of Atlanta (FHLBA) to help their bankmembers partner with community-based organizations to fund a variety of economic development andneighborhood enrichment initiatives.The EDGE program provides, through a competitive process, its member financial institutions with theability to write down the interest rate on a loan to the level deemed necessary to make an economicdevelopment project feasible. Practically, this means enhanced cash flow to secure or attract equityand repay debt. Local Initiatives Support Corporation (LISC) has participated in many of thesetransactions, providing technical assistance, recoverable grants, grants and low interest subordinateddebt to CDCs. For example, a community development corporation (CDC) is developing a retail stripto revitalize a commercial corridor in a low-income community. The project has $750,000 in developmentcosts. An FHLBA Member Bank can provide $500,000 at 7%. The interest rate however makes theproject infeasible since there is not enough cash to pay repay the debt. FHLBA provides a loan advanceto the member bank at a subsidized rate. The bank then makes a loan to the CDC at 3%, making thedeal viable. LISC partners provide a $150,000 secondmortgage. Local government provides a $100,000Community Development Block Grant (CDBG) deferred payment third mortgage, completing the project.
6. Community Improvement Districts (CID’s)A Community Improvement District (CID) is the most powerful public-private partnership today andhas been used successfully around the country to revitalize center cities. It is an effective tool forfinancing improvements that directly enhance property values by allowing property owners to determinehow funds are expended in their area. CID funds can augment existing services such as public safetyand they can also be used to leverage additional public and private funds. CID funds can be used toleverage such funds at a ratio of 4 to 1. The Georgia Constitution specifies that funds collected througha CID may be used for the following: water, public transportation, street and road construction andmaintenance, parks and recreational areas and facilities, storm water and sewage, parking, terminaland dock facilities, and others.The City of Atlanta has three Community Improvement Districts charging extra taxes to businesses tofund millions of dollars worth of localized projects and services. These include:
a. Downtown Improvement District (DID): The DID comprises a 200-block area of Downtown.Founded in 1995 by Central Atlanta Progress (CAP) and Downtown property owners, theDID is a public-private partnership that strives to create a livable environment for DowntownAtlanta and is governed by a Board of Directors of nine private and public sector leaders.
81Atlanta Strategic Action Plan September 2007 Draft

DID supports the operation of the Ambassador Force, a 63-person group dedicated tomaking Downtown safer and more hospitable, and the 13-member Clean Team, whichcleans the District’s sidewalks and removes graffiti. In 2003, the DIDsmission was expandedto include the development of capital projects to improve Downtown’s transportationinfrastructure. Imagine Downtown, sponsored by CAP, has numerous recommendationsthat will make Downtown Atlanta more attractive. Down CID is also managing 2 LCI’s inthe City including City Center LCI and JSA-McGill LCI.
b. Midtown Community Improvement District (MID): This district was created to offer enhancedsafety, maintenance and capital improvement projects in Midtown. The MID extends fromBrookwood Station on the north to Pine Street on the south, and from I-75/85 on the westto Piedmont Avenue on the east. MID has been served as an effective financing tool forlarge-scale, local public improvement programs including public safety, traffic improvements,transit initiatives, and streetscape enhancement. The estimated funding provided throughMID is about $80 million over the last six years.
c. Buckhead Community Improvement District (BCID): This district is more oriented towardphysical improvements. The BCID, which was approved in 1999, will use the $1.9 millionit has collected to obtain federal matching funds for intersection improvements, operate ashuttle system, and create safer crosswalks and sidewalks for pedestrians.
7. CDBG Grants/LoansThe Community Development Block Grant (CDBG) Program provides funds that can beused for housing, infrastructure, economic development and public service needs. Residentsof neighborhoods and local government officials should identify needs in their communityand create their own vision for revitalization. Grants for these revitalization efforts maythen be attained. The revitalization efforts need to principally benefit low- andmoderate-income residents.
8. Business Improvement Loan Fund (BILF)The BILF Program is sponsored by the City of Atlanta and the Atlanta DevelopmentAuthority. The BILF is designed to encourage the revitalization of targeted business districtsin the City of Atlanta and to support commercial and industrial development in other eligibleareas. Loans can be made for additions and/or improvements to commercial, industrialand mixed-use property; purchase of equipment and fixtures, that are part of the real estate;energy conservation designed to encourage the efficient use of energy resources forcommercial, industrial, or mixed-use facilities; acquisition of commercial, industrial andmixed-use properties; and inventory and office equipment in targeted Business ImprovementDistricts. Two (2) forms of financial assistance are available through the BusinessImprovement Loan Fund (BILF):
a. Direct Loans: The City may provide a direct loan for an eligible project in targeted BusinessImprovement Districts if the applicant is unable to obtain a market-rate loan for the financingneeded. The maximum loan amount is $50,000. The interest rate will be determined bythe project’s cash flow, and the loan must be repaid on a monthly basis (over a term not
September 2007 Draft Atlanta Strategic Action Plan82
Community Assessment3

to exceed 7 years). Loan funds (not exceeding $10,000 per applicant) may be used toacquire inventory and office equipment for eligible applicants located in targeted areas ofthe City where property renovation is not needed.
b. Loan Participants: The City may participate in larger loans (usually $50,000 or more)throughout Community Development Impact Areas (CDIA). Loans may be made to smallbusinesses to assist in meeting local injection requirements for SBA loans. No more than10% of the total financing for a project can be provided from the Business ImprovementLoan Fund. The interest rate will be determined by the project’s cash flow, and the repaymentterms may not exceed that of the longest participating lender (maximum 25 years).
9. EPA Brownfields GrantsEPA's Brownfields Program empowers states, communities, and other stakeholders ineconomic development to work together to prevent, assess, safely clean up, and sustainablyreuse brownfields. A brownfield site is real property, the expansion, redevelopment, orreuse of which may be complicated by the presence or potential presence of a hazardoussubstance, pollutant, or contaminant. On January 11, 2002, the President signed into lawthe Small Business Liability Relief and Brownfields Revitalization Act. Under the BrownfieldsLaw, EPA provides financial assistance to eligible applicants through four competitive grantprograms: assessment grants, revolving loan fund grants, cleanup grants, and job traininggrants.
10. Fulton Atlanta Land Bank AuthorityThe Fulton/Atlanta Land Bank Authority enables the City to put tax-delinquent propertiesback into productive use. The land bank authority possesses the power to give land togroups more quickly than bureaucratic and legal procedures allow for. The Fulton/AtlantaLand Bank Authority is the lead agency for all of the tax delinquent properties in the City.The authority reduces real estate legal costs and creates properties that are easier toinsure, as well as making it easier to assemble large blocks of land.
11. Livable Centers InitiativeThe livable Centers Initiative (LCI) Program has been created to plan and implementstrategies that link transportation improvements and land use strategies to create livablecenters that are consistent with the Atlanta Regional Commission’s Regional DevelopmentPlan. The program focuses on increasing residential development, creating a mix of uses,and improving connectivity in activity and town center development. The ultimate goals ofthis program are as follows: connect homes, shops and offices; enhance streetscape andsidewalks; emphasize the pedestrian; improve access to transit and other transportationoptions; and to expand housing options. The Atlanta Regional Commission has programmed$105 million to fund implementation of the projects. Currently, the City has 14 LCIdesignations.
12. Phoenix Fund
83Atlanta Strategic Action Plan September 2007 Draft

The Phoenix Fund assists small and medium-sized businesses with affordable loans. Itprovides financial assistance for the construction or renovation of privately-ownedcommercial buildings; equipment purchases needed to operate a business, and, in somecases, working capital. The Atlanta Development Authority will provide loans of $10,000 -$100,000 at a rate below prime as a way of creating and retaining jobs for low/moderateincome residents in the City of Atlanta.
13. Industrial Revenue BondsThe Atlanta Development Authority (ADA) issues taxable and tax-exempt industrial revenuebonds in the City of Atlanta. Tax-exempt bonds called Private Activity Bonds (PAB) canbe used to finance the acquisition, construction, improvement or modification of plants,factories, mills, sewage, solid waste facilities, machinery, equipment, or any other propertywhich an industrial concern might desire to acquire or lease in connection with the operationof such a facility anywhere within the City of Atlanta. ADA may issue Taxable Bonds fora wider variety of facilities, (i.e., warehouses, office buildings, industrial parks, nursinghomes, retail, hotels, and research and development). No facility may be financed by ADAunless it will increase or maintain permanent employment in the City of Atlanta. Financingmay be provided to construct, acquire, expand, modify, or renovate facilities.
14. Small Business Administration Loan (SBA)The SBA-504 Loan Program offers businesses a unique source for 90% financing. Loansare available through the Atlanta Local Development Company (ALDC), a private, nonprofitcorporation certified under the U.S. Small Business Administration 504 CertifiedDevelopment Corporation Program.
15. Opportunity ZonesOpportunity Zones were created to better utilize state statutes to further economicdevelopment, entrepreneurship, and increases in private sector investments through locallydriven partnerships. The program uses a “bottom up, locally driven” philosophy in orderto allow for innovative, multi-faceted policies, programs, and projects. For the less developedcensus block groups these new opportunities can be realized without the creation of newstate programs by efficiently using state statutes in existence. The statutes utilized includeThe Georgia Enterprise Zone Employment Act and The Georgia Business Expansion andSupport Act
16. Georgia Business Expansion and Support ActThis Act provides the following type of tax credit to encourage economic development:
a. Job Tax Credits: Job tax credits provide for a statewide job tax credit for a business orheadquarters of any such business engaged in manufacturing, warehousing and distribution,processing, telecommunications, tourism, or research and development industries that arelocated in a qualified census tract. Fulton County is considered a Tier 2 county, meaningcompanies in the City of Atlanta creating 15 or more jobs may receive a $2,500 tax credit
September 2007 Draft Atlanta Strategic Action Plan84
Community Assessment3

plus $500 from the Joint Authority’s participation. Atlanta companies located in lessdeveloped census tracts that create 5 or more jobs may receive credits of $3,500 plus $500from the Joint Authority participation.
b. Retraining Tax Credit: The retraining tax credit allows some employers to claim certaincosts of retraining employees to use new equipment, new technology, or new operatingsystems. The credit can be worth 50% of the direct costs of retraining, up to $500 peremployee per approved retraining program per year. The total credit amount cannot bemore than 50% of the taxpayer’s total state yearly income liability. Credits that are claimedbut not used can be carried forward for 10 years.
c. Headquarters Tax Credits: Companies establishing headquarters or relocating to Georgiamay be entitled to a tax credit under this program.
d. Investment Tax Credits: Investment Tax Credits may apply to taxpayers who have operateda manufacturing or telecommunications facility or manufacturing or telecommunicationssupport facility for the previous three years and meet specified criteria. The credit may beclaimed for a 10-year period, provided the qualified property remains in service throughoutthe period.
e. Child Care Credits:Employers who provide or sponsor child care for employees are eligibleto receive a tax credit of up to 75% of the employers’ direct costs. The credit cannot exceed50% of the taxpayer’s total state income tax liability for that taxable year.
f. Research & Development Tax Credits: A tax credit is allowed for research expenses forresearch conducted within Georgia for any business or headquarters of a business engagedin manufacturing, warehousing and distribution, processing, telecommunications, tourism,or research and development industries, assuming certain criteria are met. The credit shallbe 10% of the additional research expense over the base amount (not exceeding 50% ofthe business’s remaining Georgia net income tax liability after all other credits have beenapplied).
g. Small Business Growth Companies Tax Credits: A tax credits is granted to businesses thatengage in manufacturing, warehousing and distribution, processing, telecommunications,tourism, or research and development industries that have a net taxable income which is20% or more above the previous year. Other specified criteria apply.
h. Ports Activity Job Tax & Investment Tax Credits: Tax credits are eligible to businesses thatengage in manufacturing, warehousing and distribution, processing, telecommunications,tourism, or research and development that have increased their port traffic tonnage throughGeorgia ports by specified amounts. The job tax and investment tax credits for the City ofAtlanta is an additional $1,250 per job, or 5% investment tax credit, or 10% optionalinvestment tax credit
85Atlanta Strategic Action Plan September 2007 Draft

Education and Training Opportunities
Currently, the City has relatively limited resource for workforce education and training. There is a need toexpand the existing programs that agencies have to provide more training opportunities to the under-skilledpopulation in the City, especially for residents in underserved areas. AWDA, as the City’s workforce agency,is working on expanding their programs to meet the needs. There is also need for local NPU’s andneighborhood organizations to work on the community level to identify needs and develop strategies forworkforce training.
1. Atlanta Workforce Development Agency (AWDA)AWDA is a bureau of City of Atlanta under the executive offices of the mayor. AWDA provide innovativeemployment and job-training programs to the citizens of the City, strategize with business communitiesand economic development in job creation, and prepare the current and future workforce for theever-changing labor demands. They provide services to employers as well as job-training programsfor adult and youth, the following are some of the programs:
a. Summer Youth Employment Program: Provides job-training opportunities for Atlanta youthevery year.
b. Goodworks! Program: The Goodworks! Program teaches participants how to write aneffective resume, succeed in an interview, and how to handle themselves and others inthe workplace.
c. Computerized Training Program: This program was designed for individuals with a busyschedule that precludes them from taking typical training programs. In this programparticipants can take self-paced computerized courses in a wide variety of subjects, suchas math, writing, reading, office skills, customer service, security, healthcare and childcare.
d. First Source Employment Program: Any company that receives a contract from the City ofAtlanta worth $50,000 or more and employs 15 or more individuals must use the FirstSource Registry to fill at least 50% of all entry-level positions. The First Source Registrycontains City of Atlanta residents who have completed skill training funded by theWorkforceInvestment Act. The unemployed, laid off, veterans, people with disabilities, older workers,and young adults are also included.
e. BRU’s Customized Training: The Business Relations Unit (BRU) supplies companies withcustomized training services to retool, expand, or create its workforce. The training programis customized to best suit the needs of the company. It is useful to further train currentemployees or to train job seekers to give them the skills necessary to be hired.
2. Women's Economic Development Agency (WEDA)The Women’s Economic Development Agency, Inc. is a non-profit, 501(c) 3 corporation. WEDAprograms and services are made possible by grants and contributions from the U.S. Small BusinessAdministration, the City of Atlanta, the Atlanta Empowerment Zone Corporation, and the AtlantaOne-Stop Capital Shop and through the generous support of corporations, organizations and individuals.
September 2007 Draft Atlanta Strategic Action Plan86
Community Assessment3

WEDAassists women in achieving self-empowerment through economic development.WEDA programsand services will focus on entrepreneurial development through business ownership training andmentoring, and financial self-sufficiency through employability skills training and personal financialmanagement. Technical assistance, via one-on-one counseling, also will be made available for allWEDA program offerings.The programs offered by WEDA include the Business Fundamentals Series, the Business PlanningSeries, Technical Assistance, the Youth Economic Fundamentals Series and WEDA-By-Design.
3. The Atlanta Regional Workforce Board (ARWB)The Atlanta Regional Workforce Board (ARWB) at the Atlanta Regional Commission (ARC) offer avariety of free services through a system of one stop Career Resource Centers. Assistance is availableto individuals seeking employment, training and educational services, including advanced training forthose who need additional skills to become employed or return to work. Career Advisors can assistindividuals with financial aid planning including how to apply for PELL Grants, Hope scholarships andfinancial aid assistance to pay for training through the Workforce Investment Act (WIA).
4. Georgia Adult Education and Traininga. Quick Start: Quick Start is among the state’s primary incentives for recruitment of new jobs
to Georgia and retention of existing jobs. Quick Start develops and delivers a full range ofhigh quality customized training services at no cost to client companies.
b. Intellectual Capital Partnership Program (ICAPP): ICAPP is the economic developmentprogram of the University System of Georgia. Georgia businesses can contact ICAPP totap into the resources of Georgia’s 34 public colleges and universities for college-educatedemployees, access to the latest research, and access to business and operations advice.
Economic Trends
The City of Atlanta has been successful in attracting new businesses. From 2002 to 2005, the City attracted250 businesses, which range from professional and business services, education and health services,financial services, hospitality, hotel, retail, to transportation, distribution, andmanufacturing. These businesses,with a total equivalent real estate value of approximately $215.5 million, have brought 6,291 jobs to the City(See Table 3.38 ‘Recently Established Businesses, 2002-2005 Summary’). These diversified newcomersillustrate the economic trend in the City of Atlanta. Table 3.39 ‘Examples of Major Businesses Establishedin City of Atlanta, 2002-2005’ lists some of the major businesses established in the City during the pastthree years.
Table 3.38 Recently Established Businesses, 2002-2005 SummaryEquivalent Real Estate InvestmentEmployees# of BusinessYear
$9,014,1971109562002
$35,794,22635941332003
$147,510,458854332004
$23,262,649734282005
87Atlanta Strategic Action Plan September 2007 Draft

Equivalent Real Estate InvestmentEmployees# of BusinessYear
$215,581,5306291250Total
Table 3.39 Examples of Major Businesses Established in City of Atlanta, 2002-2005Equivalent RealEstate Investment
Type of OperationEmployeesMajor Businesses Established
2002
$360,000Warehouse/Distribution84Atlanta Home Depot Transit Facility
$368,000Division Headquarters43Grey Global Atlanta
$2,530,000National Headquarters117Internap Network Services corporation
$138,000Operations Center75NovaMed Eye Surgery Center - Perimeter, LLC
$230,000Division Headquarters70Parsons Corporation FAA Division
$92,800Retail40The Capital Grille
$304,200Retail40Urban Outfitters
2003
$11,700,000Retail405Bloomingdale's
$73,800Retail145Emeril's Atlanta
$540,500Operations Center300ER Solutions, Inc.
$615,000Retail50Filene's Basement
$2,700,000Operations Center230Level 3 Communications
$73,695Retail60New York Prime
$198,900Retail65Twist
$51,040Retail40Wolfgang Puck Express
2004
$14,500,000Operations Center100Airtran Airways - Maintenance Hangar
$87,500Retail50Au Pied de Cochon
$15,000,000Hotel34Hotel Indigo
$1,331,400Warehouse/Distribution200Hughes Supply Co.
$115,000,000Hotel300InterContinental Hotel
$69,000Branch Office30The Titus Group, Inc.
2005
$5,927,250Retail235IKEA North America
$206,250Manufacturing40Latex International Southeast
$115,000Regional Office20McCarthy Building Companies
$2,500,000National Headquarters31Novelis
$140,000Retail80Oceanaire Seafood Room
$12,000,000Regional Office100Savannah College of Art & Design
September 2007 Draft Atlanta Strategic Action Plan88
Community Assessment3

Equivalent RealEstate Investment
Type of OperationEmployeesMajor Businesses Established
$1,110,072Branch Office75Westwood College
ARC’s projection for the next 20 years has foreseen great population and employment growth (22% and17% respectively) in the City. To accommodate the new growth, the City’s strategy on development isfocusing on infill development, smart growth and sustainable development in appropriate areas, which isreflected in the following action plans:
The City has established 6 economic development priority areas and is in the process of developingmore detailed strategies on how to promote physical and economic development builds upon the areas’strengths and weaknesses.Under the lead of Atlanta Regional Commission, the City of Atlanta has been able to conduct and fundLCI studies for 14 activity and town centers, which promote higher density, mixed-use and transit-orienteddevelopment to accommodate population, household, and employment growth in the City. Currently,most of these LCI’s are just at the beginning of implementation. There is need for effectiveimplementation of these LCI action plans.As an important part of the City and the Region’s transportation system, corridors in the City are keyto mobility and connectivity. Major corridors including Northside Dr., Ponce De Leon Ave., MorelandAve., Martin Luther King Jr. Dr., Donald L. Hollowell Pkwy. have the potential to accommodatehigher-density, mixed-use development as well as provide multiple choices for movements along thesecorridors. Currently, studies have been completed for all these corridors and will be implemented stepby step based on the plan.Downtown, Midtown, and Buckhead are major employment centers in the City. The City is workingwith the CID’s on how to better utilize the advantages of these areas to attract businesses as well asresidents.Beltline is the top priority project in the City. The Tax Allocation District has been approved. This willimprove mobility, greenspace and workforce housing across the City.Other major projects either under planning, ongoing or just completed have a positive impact on theCity’s economy. These projects include Atlantic Station, City Hall East redevelopment, and Aquariumin Downtown.
Issues and Opportunities
Issues
1. Lack of Citywide policy for Industrial (Manufacturing) Development.2. Need to improve our marketing strategy to promote economic development.3. Overall vision for the use of land in the City is needed.4. Downtown does not provide a positive image to the visitor or resident.5. The permitting system in the City is hindering development/redevelopment and new businesses coming
to the City.6. Infrastructure investments are needed to remain competitive in business recruitment. Currently the
City’s resources are inadequate.
89Atlanta Strategic Action Plan September 2007 Draft

7. The City has a higher percentage of unemployment than in the region and the state.8. There is an imbalance of available jobs to match the education and training of citizens/workforce.9. The City has a high household poverty rate.10. There is a lack of affordable workforce housing.11. There is an aging workforce and aging population.12. The City relies too heavily on expanded airport employment as a mechanism for increasing jobs for
City residents.13. Better coordination, cooperation and support will be needed from both the public and private sections
to achieve economic development advances.14. The crime rate needs to be lowered.15. The City has a high homeless population.16. The school system needs to be improved.17. There is a lack of Code Enforcement for trash and other violations which adds to the overall poor
appearance in underserved neighborhoods which promotes crime.18. The Southern portion of the City suffers from disinvestment.19. The City is plagued by traffic congestion.
Opportunities
1. The City of Atlanta has a diversified economic base with several major target industries establishedas the focus of business recruitment and expansion.
2. The large number of colleges and universities make the City a leader in higher education, which alsoserves as an engine for economic development.
3. Major initiatives which address growth in the City have a positive impact on the City’s economy.4. Our community has established a strategy, which includes Quality of Life Zoning, to concentrate infill
and new development at major activity centers and along major corridors with proper density and mixof uses, which promote quality growth in the City.
5. There is a growing cooperation between public and private economic development agencies, groups,and practitioners to achieve balanced growth that maintains a high quality of life style and an appropriaterange of employment options.
6. New leadership in the Mayor’s office has provided positive support for the City’s economic developmentefforts.
7. Our community has a variety of existing tools, programs, and incentives provided by different agencies.New tools have been added recently and existing tools are in the process of revision to meet changingcommunity needs.
8. The building permit process is being evaluated to promote better business climate.9. Historic resources can be used to attract intown developers, homebuyers and businesses.10. Further park development will improve the livability of the City.
Specific Opportunities
1. The Beltline will add 1,400 acres of new greenspace, 33 miles of trails, a 22 mile loop of transit, 30,000new jobs, 45 neighborhoods will be connected and 5600+ workforce housing units will be added.
September 2007 Draft Atlanta Strategic Action Plan90
Community Assessment3

2. There are 15 LCI areas designated. Many studies have been completed and funds will be availablefor implementation.
3. There are three CIDs in the LCI designated areas.4. There are 6 approved TADs and four which have been approved by the City.5. The Urban Enterprise Zones attract developers to areas often ignored.6. The Lakewood Fairgrounds Redevelopment Site has 132 acres available with exceptional access to
the City Center, major roadways and historic resources.7. The Fort McPherson Redevelopment Site is 485 acres with exceptional access to the City Center,
major roadways and historic resources.8. Centennial Park has major attractions.9. The City has 15 Historic Districts and a multitude of individually listed properties.
91Atlanta Strategic Action Plan September 2007 Draft

Housing
Housing Types and Mix
From 1980 to 2000, the net number of housing units in Atlanta increased by 4.6%, going from 178,744 in1980 to 186,998 in 2000. As Table 3.40 ‘Unit Type, City of Atlanta, 1980 and 2000’ displays, the mostdramatic shift in terms of structure type between these decades was the increase in the number of units in50 or more unit structures, which increased by 78.8% and made up 6.6% more of the housing stock in 2000than in 1980. Additionally, a net loss of 7,083 units in 10 to 49 unit structures occurred within that timeperiod; such units made up 19.3% of the city’s housing stock in 1980 and 14.7% in 2000. As Table 3.41‘ Occupancy Status, City of Atlanta, 1980 to 2000’ shows, a decline in occupied units occurred between1980 and 1990; however, there was a net increase of 5,689 (3.4%) occupied units from 1980 to 2000.Further, although the 2000 occupancy rate of 90.0% represented an increase from that of 1990 (85.2%), itremained lower than the rate in 1980 of 90.9%.
From 1990 to 2000, the number of housing units in the Atlanta increased by 4,244, or 2.3%, from 182,754in 1990 to 186,998 in 2000. The number of occupied units increased from 155,752 to 168,242, growing by8.0% (12,490 units) over that time period. Owner-occupied units increased at the higher rate of 9.4% (or6,316 units), while renter-occupied units increased by 7.0% (or 6,174 units). As of 2000, the majority of theoccupied housing units in the city (56.3%) were renter-occupied, and the remainder (43.7%) owner-occupied,which did not represent a significant change from 1990.
Currently, most (80.5%) of owner-occupied units are single unit, detached structures, with single unit,attached structures composing the second largest group, at 6.2%, of owner-occupied housing stock. From1990 to 2000, the percentage of single unit, detached, owner-occupied units decreased the most, by 4.7%,although the number of units of this type increased by 1,928 units, with the percentage of duplexes alsodecreasing slightly. The net loss in single-family housing reflects both the increase in the supply of newsingle-family housing and the demolition of an even larger number of single-family units in the run-up to the1996 Olympics. The loss of duplex units reflects almost no new construction, demolition and the consolidationof subdivided units into single-family homes as many neighborhoods gentrify. The owner-occupied unittype showing the greatest increase in percentage was the 50 or more unit structure type, which more thantripled in number over the ten-year period, making up 1.6% (1,091 units) of owner-occupied housing stockin 1990 and 4.5% (3,320 units) in 2000. The primary dynamic at work here was the development of high-risecondominiums in Buckhead and Midtown. The percentage of owned single unit, attached structures(townhouses) and 20 to 49 and 10 to 19 unit structures also increased (by 1.2%, 0.7% and 0.6%, respectively),although less substantially than that of 50 or more unit structure. As of 2000, the largest percentage (23.2%)of renter-occupied housing stock saw an increase in the percentage of rental housing of 50 or more units,which made up 13.2% of the rental housing stock in 1990 and 23.2% (21,984 units) in 2000. Within thatten-year span, 5 to 9 and 10 to 19 unit structures decreased, both in number and in percentage of housingstock. These losses were due to both demolitions and condominium conversions.
In brief, the vast majority, over four-fifths, of owner occupied housing is single unit, detached homes, whilemost renters live in multi-unit structures, with the largest group, about one-quarter, living in buildings of 50or more units. Current trends indicate an increase in 50 or more unit structures for both owners and renters
September 2007 Draft Atlanta Strategic Action Plan92
Community Assessment3

and a decrease in the percentage of single unit, detached housing for owners and 3 to 19 unit structuresfor renters, as Table 3.42 ‘Unit Type by Tenure for Occupied Housing Units, City of Atlanta, 1990 and 2000’shows.
Table 3.40 Unit Type, City of Atlanta, 1980 and 2000200019901980Type of
HousingUnitPercentNumberPercentNumberPercentNumber
46.687,16545.983,79345.280,761Single Unit,UnattachedandDetached
4.27,8714.48,0886.411,361Duplex
7.714,3587.513,7698.515,1863 to 4 units
10.419,49614.326,13711.019,6715 to 9 units
14.727,45517.732,36519.334,53810 to 49 units
15.929,7238.615,7009.316,61950 or moreunits
0.59301.62,9020.3608Other*
100.0186,998100.0182,754100.0178,744Total Units
* Other includes 1980 “Manufactured housing, trailers, etc.” category, 1990 “Mobile home or trailer” and “Other” categories and 2000 “Mobilehome” and “Boat, RV, van, etc.” categories. Source: U.S. Census, 1980 and 2000
Table 3.41 Occupancy Status, City of Atlanta, 1980 to 2000200019901980Status
PercentNumberPercentNumberPercentNumber
90.0168,24285.2155,57290.9162,553Occupied
10.018,75614.827,0029.116,191Vacant
100.0186,998100.0182,754100.0178,744Total
Source: U.S. Census, 1980, 1990 and 2000
Table 3.42 Unit Type by Tenure for Occupied Housing Units, City of Atlanta, 1990 and 200020001990Type of Housing
UnitRenterOwnerRenterOwner
PercentNumberPercentNumberPercentNumberPercentNumber
16.715,82280.559,16415.413,64785.257,236Single unit, detached
2.52,3506.24,5552.72,3935.03,384Single unit, attached
6.05,6591.39846.45,6611.51,024Duplex
11.811,1481.61,14812.110,7381.28113 or 4 units
17.016,1311.61,16921.418,9531.49565 to 9 units
14.613,8762.01,43319.717,4841.492910 to 19 units
7.97,4781.81,3017.46,5371.168020 to 49 units
93Atlanta Strategic Action Plan September 2007 Draft

20001990Type of HousingUnit
RenterOwnerRenterOwner
PercentNumberPercentNumberPercentNumberPercentNumber
23.221,9844.53,32013.211,7211.61,09150 or more units
0.32550.53820.21640.5278Manufactured home*
0.1640191.51,2951.1770Other*
100.094,767100.073,475100.088,593100.067,159Total Occupied Units
Table 3.43 Vacancy Status, City of Atlanta, 1980 to 2000200019901980Status
PercentNumberPercentNumberPercentNumber
40.67,60957.815,61747.97,751For rent
19.83,71511.12,98110.41,680For sale only
10.01,872----9.71,574Rented or sold, notoccupied*
8.81,6521.43832.2356Seasonal, recreational oroccasional use*
.362--------Migrant workers*
20.53,84629.78,02129.84,830Other
100.018,756100.027,002100.016,191Total
*In 1980, “Seasonal, recreation or occasional use” and “Migrant workers” categories were collapsed. In 1990, “Rented or sold, not occupied” and“Migrant workers” categories were not used. Source: U.S. Census, 1980, 1990 and 2000
Table 3.44 Unit Type for Vacant Units, City of Atlanta, 1990 to 200020001990Unit Type
PercentNumberPercentNumber
25.74,81722.05,953Single unit, detached
2.44574.41,180Single unit, attached
6.51,2285.21,403Duplex
11.02,0628.22,2203 or 4 units
11.72,19623.16,2285 to 9 units
12.52,35018.04,86010 to 19 units
5.41,0176.91,87520 to 49 units
23.64,41910.72,88850 or more units
0.91730.499Mobile home or trailer*
0.2371.1296Other*
100.018,756100.027,002Total
*In 1990, categories included “Mobile home or trailer” and “Other.” In 2000, categories included “Mobile home” and “Boat, RV, van, etc.” Source:U.S. Census, 1990 and 2000
September 2007 Draft Atlanta Strategic Action Plan94
Community Assessment3

Physically Substandard Housing in 2003
The Census publishes data on both the number of households affected by three types of housing needs(cost burdened, overcrowding and lacking facilities) and some of the socioeconomic characteristics of thosehouseholds. Data on the fourth type of housing need, physically substandard housing, requires either localsurveys (which are quite expensive) or locally generated estimates.
In 1998, the Community Design Center of Atlanta prepared detailed estimates of the physically substandardhousing in Atlanta. These estimates were based on three contributing factors: housing code inspections,incomes in surrounding areas and assessed values. The estimates concluded that there were 43,527physically substandard units in the city.
Estimates for 2003 did not have as much underlying data as the 1998 estimates because housing codeinspections data were not available. Based on changes in appraised values between 1998 and 2003, the2003 estimates increased the cutoff between standard and substandard housing by the proportional increasein each structure type’s appraised value. This approach yielded the estimates summarized in Table 3.45‘Substandard Housing Stock, 1998 – 2003’, and they conclude that there were 37,196 substandard unitsin 2003.
Table 3.45 Substandard Housing Stock, 1998 – 2003Over 100units
33– 100units
16–32units
9–16 units5 – 8 unitsQuadsTriplexDuplexSingleFamily
TotalBldgs.
Year
3518521426231822811540495705027214435271998
419745923148017701228368518425077371962003
68-107-503-838-511-312-127-1866-2137-6331Change
Source: Estimates based on data from Fulton County Tax Assessor, 2004; DeKalb County Tax Assessor, 2004
These estimates should be considered general characterizations of the overall magnitude and compositionof the substandard stock and not exact measurements of the specific numbers of substandard units. Theestimates comport well with the other data assembled for this analysis. Specifically, the increases in thevalues of single-family units due to substantial increases in gentrification is reflected in the reduction ofsubstandard single family units by 2,137 and in the reduction of substandard duplex units by 1,866. In thefirst of these cases, increases in values among the lowest price units outpaced average single-family unitprice increases, producing a reduction in the number of estimated substandard single-family units. Similardynamics produced an estimate of fewer substandard duplex units, but in these cases, increases in priceswere accompanied by consolidation of duplex units into single family units as gentrification restored theseunits to their original single family use or as gentrification demolished the duplex units and replaced themwith new single family units.
95Atlanta Strategic Action Plan September 2007 Draft

The changes in other segments of the supply were also consistent with prior analysis. (i)There were 2,291fewer substandard units in 2003 in developments containing between three and 32 units. Dual dynamicsproduced these changes as well: There was an overall reduction of units in the 9-16 category as buildingswere demolished after physically declining into dilapidated condition or as units were demolished to makeway for newer, larger houses. Simultaneously, other units in close in neighborhoods in three to 32 unitdevelopments converted to condominiums or upgraded in both physical condition and rent.
The reduction in the number of physically substandard units is beneficial to larger public interests becausetax revenues on the increased values are greater and there are fewer threats to public health, safety andwelfare by physically substandard structures.
But the lower income people who are living in the units that were demolished or upgraded were forced tomove without compensation, and they were forced to seek affordable housing in a market that is consistentlysmaller and more expensive than it was the previous year.
Condition and OccupancyTable 3.46 Occupancy Status, City of Atlanta, 1980 to 2000
200019901980Status
PercentNumberPercentNumberPercentNumber
90.0168,24285.2155,57290.9162,553Occupied
10.018,75614.827,0029.116,191Vacant
100.0186,998100.0182,754100.0178,744Total
Table 3.47 Unit Type by Tenure for Occupied Housing Units, City of Atlanta, 1990 and 200020001990Type of Housing Unit
RenterOwnerRenterOwner
PercentNumberPercentNumberPercentNumberPercentNumber
16.715,82280.559,16415.413,64785.257,236Single unit, detached
2.52,3506.24,5552.72,3935.03,384Single unit, attached
6.05,6591.39846.45,6611.51,024Duplex
11.811,1481.61,14812.110,7381.28113 or 4 units
17.016,1311.61,16921.418,9531.49565 to 9 units
14.613,8762.01,43319.717,4841.492910 to 19 units
7.97,4781.81,3017.46,5371.168020 to 49 units
23.221,9844.53,32013.211,7211.61,09150 or more units
0.32550.53820.21640.5278Manufactured home*
0.1640191.51,2951.1770Other*
i Max Creighton and Larry Keating, Small Multifamily Rehabilitation: An Assessment of Affordable Apartment Developments in Atlanta,Community Design Center of Atlanta, April 2003. This analysis included a survey of physical conditions and concluded that approximatelyone-half the units in small rental developments were substandard, deteriorating and dilapidated.
September 2007 Draft Atlanta Strategic Action Plan96
Community Assessment3

20001990Type of Housing Unit
100.094,767100.073,475100.088,593100.067,159Total Occupied Units
Table 3.48 Vacancy Status, City of Atlanta, 1980 to 2000200019901980Status
PercentNumberPercentNumberPercentNumber
40.67,60957.815,61747.97,751For rent
19.83,71511.12,98110.41,680For sale only
10.01,872----9.71,574Rented or sold, not occupied*
8.81,6521.43832.2356Seasonal, recreational oroccasional use*
.362--------Migrant workers*
20.53,84629.78,02129.84,830Other
100.018,756100.027,002100.016,191Total
Table 3.49 Unit Type for Vacant Units, City of Atlanta, 1990 to 200020001990Unit Type
PercentNumberPercentNumber
25.74,81722.05,953Single unit, detached
2.44574.41,180Single unit, attached
6.51,2285.21,403Duplex
11.02,0628.22,2203 or 4 units
11.72,19623.16,2285 to 9 units
12.52,35018.04,86010 to 19 units
5.41,0176.91,87520 to 49 units
23.64,41910.72,88850 or more units
0.91730.499Mobile home or trailer*
0.2371.1296Other*
100.018,756100.027,002Total
*In 1990, categories included “Mobile home or trailer” and “Other.” In 2000, categories included “Mobile home” and “Boat, RV, van, etc.” Source:U.S. Census, 1990 and 2000
Physically Substandard Housing in 2003
The Census publishes data on both the number of households affected by three types of housing needs(cost burdened, overcrowding and lacking facilities) and some of the socioeconomic characteristics of thosehouseholds. Data on the fourth type of housing need, physically substandard housing, requires either localsurveys (which are quite expensive) or locally generated estimates.
97Atlanta Strategic Action Plan September 2007 Draft

In 1998, the Community Design Center of Atlanta prepared detailed estimates of the physically substandardhousing in Atlanta. These estimates were based on three contributing factors: housing code inspections,incomes in surrounding areas and assessed values. The estimates concluded that there were 43,527physically substandard units in the city.
Estimates for 2003 did not have as much underlying data as the 1998 estimates because housing codeinspections data were not available. Based on changes in appraised values between 1998 and 2003, the2003 estimates increased the cutoff between standard and substandard housing by the proportional increasein each structure type’s appraised value. This approach yielded the estimates summarized in Table 3.50‘Substandard Housing Stock, 1998 – 2003’, and they conclude that there were 37,196 substandard unitsin 2003.
Table 3.50 Substandard Housing Stock, 1998 – 2003Over 100units
33– 100units
16–32units
9–16 units5 – 8 unitsQuadsTriplexDuplexSingleFamily
TotalBldgs.
Year
3518521426231822811540495705027214435271998
419745923148017701228368518425077371962003
68-107-503-838-511-312-127-1866-2137-6331Change
Source: Estimates based on data from Fulton County Tax Assessor, 2004; DeKalb County Tax Assessor, 2004
These estimates should be considered general characterizations of the overall magnitude and compositionof the substandard stock and not exact measurements of the specific numbers of substandard units. Theestimates comport well with the other data assembled for this analysis. Specifically, the increases in thevalues of single-family units due to substantial increases in gentrification is reflected in the reduction ofsubstandard single family units by 2,137 and in the reduction of substandard duplex units by 1,866. In thefirst of these cases, increases in values among the lowest price units outpaced average single-family unitprice increases, producing a reduction in the number of estimated substandard single-family units. Similardynamics produced an estimate of fewer substandard duplex units, but in these cases, increases in priceswere accompanied by consolidation of duplex units into single family units as gentrification restored theseunits to their original single family use or as gentrification demolished the duplex units and replaced themwith new single family units.
The changes in other segments of the supply were also consistent with prior analysis.(ii) There were 2,291fewer substandard units in 2003 in developments containing between three and 32 units. Dual dynamicsproduced these changes as well: There was an overall reduction of units in the 9-16 category as buildingswere demolished after physically declining into dilapidated condition or as units were demolished to makeway for newer, larger houses. Simultaneously, other units in close in neighborhoods in three to 32 unitdevelopments converted to condominiums or upgraded in both physical condition and rent.
ii Max Creighton and Larry Keating, Small Multifamily Rehabilitation: An Assessment of Affordable Apartment Developments in Atlanta,Community Design Center of Atlanta, April 2003. This analysis included a survey of physical conditions and concluded that approximatelyone-half the units in small rental developments were substandard, deteriorating and dilapidated.
September 2007 Draft Atlanta Strategic Action Plan98
Community Assessment3

The reduction in the number of physically substandard units is beneficial to larger public interests becausetax revenues on the increased values are greater and there are fewer threats to public health, safety andwelfare by physically substandard structures.
But the lower income people who are living in the units that were demolished or upgraded were forced tomove without compensation, and they were forced to seek affordable housing in a market that is consistentlysmaller and more expensive than it was the previous year.
Cost of Housing
Residential sales in Atlanta expanded from 4,292 in 2000 to 7,570 in 2003 and contracted in 2004 to anannual rate of 6,078 as interest rates increased from record lows. Intensified gentrification geographicallyexpanded both new development patterns and sales of existing homes throughout the city. Where newdevelopment had previously focused along the Peachtree spine, along I-20 and MARTA from the West Endto East Lake, on the far southwest side and trailed sporadically after gentrifying neighborhoods. EveryNeighborhood Planning Unit save one had over 500 sales; eight NPUs had between 500 and 1,000 salesand 15 had over 1,000 sales. Buckhead and NPU-B led the way with 2,501 sales but the east sideneighborhoods in NPU-W, which includes Grant Park, Ormewood Park, East Atlanta and Boulevard Heights,also had over 2,000 sales (2,150)(iii)
Average annual sales prices reflected multiple different, thriving submarkets. Annual prices in 2000 rangedfrom an average of $869,573 in NPU-A to $56,872 in NPU-Y. Average sales prices over the nearly fiveyear period ranged from $1,040,629 in Northwest Atlanta (NPU-A) through $539,518 and $564,682 in NPUsB and C, respectively, to $82,695 in NPU-J and $87,180 in NPU-Z.
Reflecting the diversity of housing prices available in the city, there were 5,253 (19.3%) sales at less than$75,000, and 3,102 (11.4%) sales between $75,000 and $124,999. Forty-eight percent (13,196) of thesales were less than $200,000. Average sales prices in the city increased from $206,934 in 2000 to $246,732in 2004, a $39,798 (19.2%) increase. In 2004, Atlanta’s average sales price was 28.3% higher than theaverage sales price of existing units in the metro area (iv) Because average sales prices reflect both changesin prices and the composition of each year’s different sizes of units sold, changes in sales price per squarefoot is a more accurate guide to price changes. In 2000, the sales price per square foot in the City of Atlantawas $125.33. The price increased each year until in 2004 it was $169.10, a $43.77 increase. In percentageterms, the increase was 34.9%.
Prices increased every year in 23 of 24 Neighborhood Planning Units. The only NPU in which prices didnot increase annually was at the upper end of the market in NPU-E (Midtown, Ansley Park, SherwoodForest, Home Park and Georgia Tech) where oversupply caused prices to decline briefly in 2003.Nevertheless, square foot prices were $231.48 over the 4. 8-year period, 155.4% of the city average.
Of the 27,192 homes that changed hands, the largest single group (8,410/30%) was between 50 and 75years old. Up until very recently, new residential construction lagged behind sales in existing units in differentsectors of the city until a firm base of gentrification-induced increasing numbers of sales and increasing
iii Sales data supplied by the Tax Assessors of Fulton and DeKalb Countiesiv Georgia Multiple Listing Service. The average sale price of existing homes was $192,262 in 2004.
99Atlanta Strategic Action Plan September 2007 Draft

sales prices assured developers and their financial institutions that investments in developing new housingwere secure. During the last few years expanded gentrification has stimulated developer and investorconfidence throughout the city. Both the overall volume of new unit sales (7,733/28.4%) and the distributionthroughout the city confirm the vigorous establishment of thriving housing markets in every sector of thecity. Twenty-five of the 26 NPUs had over 100 new unit sales between 2000 and 2004. The only NPU thatdid not have 100 new unit sales was R (Southwest Atlanta), which had 80 new unit sales. In the centralcity, the leader in new unit sales was NPU-V – Peoplestown, Mechanicsville, Summerhill, Pittsburgh andAdair Park with 769 new unit sales. Sales of new units in NPU-V increased from 86 in 2000 to 189 in 2004(an annualized rate of 227).
The three neighborhoods of Peoplestown, Mechanicsville and Summerhill averaged 9.5 sales each year atan average price of $30,169 between 1989 and 1991 (v) For the past 4.8 years, the same figures are 139.0sales at an average price of $165,584.
New housing development (sales and rental) within the city increased by at least 114% between the 1980sand the first four years of this decade. Average annual additions to the stock from 1980 through the early1990’s were 1,710 units. Currently 3,683 new units are added each year (vi) The location and types of newdevelopment have changed as substantially as the volume. The 1980s witnessed (1) subdivision and infillin the northwest of the few difficult-to-develop lots that the initial wave of new construction passed over; (2)continued suburban development on the southwest side as the African American population built out thelast remaining expanse of undeveloped properties within the city; (3) sporadic and deeply subsidizedcompletion of a few decades old urban renewal properties east of the CBD; and (4) a modest number ofsmall infill developments in established gentrified neighborhoods. A much more diverse mix of geographicareas, economic classes and building types characterize development recently. Earlier data documentedthe nearly complete geographic dispersion of new residential construction throughout the city. Sites varyfrom the last remaining undeveloped parcel in an area, to former commercial, industrial or residential uses.Economic classes range from a few new units of public housing through a full range of rental and ownershiplevels to million dollar penthouses and mansions. Building types are equally diverse. Lofts have beendeveloped in former warehouses, factories, office buildings and built anew. As a suburban, Sunbelt city,in 1980 Atlanta had fewer than 15 townhouses. Now there are thousands. Similarly with high risecondominiums: from three or four with peeling paint in the 1980s to more than 30 currently. Low-risecondominium conversions have transformed at least 6,000 units of the existing rental stock. Cluster homes,townhomes, hospital conversions, above the store, new-urbanist-on-the street, accessory units and on thegolf course: there are multiple different types of units in the reviving mix.
Table 3.51 Trends of Housing Sales by Neighborhood Planning Units for Years 2000 – 2004 by Average Sales Price and SquareFootage
Number of SalesPrice / Square FootAverage Square FootageAverage Sales PriceNPU
1030232.204482$ 1,040,629A
2501209.982569$ 539,518B
v Larry Keating and Max Creighton, 1991, Olympic Impact Neighborhoods: Planning Assessments of Human Services, Housing andTransportation Issues, pp. 53, 69 and 117
vi Atlanta Regional Commission; Some estimates range as high as 5,000 new units per year since 2000. See David Pendered, “Housing Hot”Atlanta Journal Constitution, December 27, 2004: E1, 3
September 2007 Draft Atlanta Strategic Action Plan100
Community Assessment3

Number of SalesPrice / Square FootAverage Square FootageAverage Sales PriceNPU
1294213.182649$ 564,682C
772134.811248$ 168,294D
1261231.482211$ 511,812E
1659200.672005$ 402,313F
58395.61809$ 77,386G
63685.381136$ 96,959H
108196.811522$ 147,381I
116277.901062$ 82,695J
98691.141258$ 114,673K
64589.591009$ 90,358L
647146.341420$ 207,780M
1244150.081439$ 215,908N
1060139.881311$ 183,332O
734136.021319$ 179,469P
41282.101502$ 123,291R
106584.761285$ 108,928S
127699.951447$ 144,668T
1784103.701101$ 114,153V
2150132.661407$ 186,700W
117481.141268$ 102,887X
84798.221011$ 99,322Y
118981.861065$ 87,180Z
27192148.941564$ 232,930TOTAL
Source: Fulton County Board of Assessors (2005)
Cost-Burdened Households
Cost-Burdened Households and Housing Needs
In January 2004, the Georgia Department of Community Affairs (DCA) adopted the indices of housing needsthat the U.S. Department of Housing and Urban Development traditionally used to measure needs. DCA’sMinimum Standards and Procedures for Local Comprehensive Planning stipulate that needs consist of costburdened households (defined as those paying over 30% of income for housing), severely cost burdened(those paying over 50% of income for housing), overcrowded households (defined as housing over 1.01persons per habitable room) and households lacking complete plumbing and/or kitchen facilities. Physicallysubstandard housing is the fourth dimension of substandard housing situations that both governmentsrecognize as fundamental.
101Atlanta Strategic Action Plan September 2007 Draft

These measures disclose that in 2000, 54,612 City of Atlanta households had one or more of the first threetypes of housing needs, and that in 2003, 37,196 households lived in physically substandard housing(vii) Nearlyone-third (32.5%) of the households in the City of Atlanta are either cost burdened, overcrowded or live inunits that lack basic plumbing and kitchen facilities. This figure represents only those households havingless than 80 percent of the regional median income, which in 2000 was $50,400 for a family of four(viii) Thisanalysis will examine multiple additional socio-economic characteristics of households with housing needsafter more detailed assessment of the specific components of needs, but one characteristic is so pervasiveand fundamental to understanding the nature of the housing problem that it is briefly discussed here: Peoplewho have housing needs are poor.
Living in a substandard housing situation is primarily a consequence of low incomes: 1) All of the householdsdescribed in this analysis have low incomes (80% or less of area median incomes; $40,384 for a two personhousehold and $45,432 for a three person household); 2) 53.4% of households with one or more housingproblems have extremely low incomes (defined by U.S. HUD as 30% or less of area median income; in2000, this figure was $15,144 for a two person household and $17,037 for a three person household); 3)78.2% of households with one or more housing problems have very low incomes (defined as 50% or lessof area median income; in 2000, this figure was $25,240 for a two person household and $28,395 for athree person household); 4) For renters, 57.3% of those with a housing problem have extremely low incomesand 82.3% have very low incomes; 5) Comparable proportions for owners are 40.3% extremely low incomeand 63.8% very low income; 6) Relative to the City, 29.2% of all occupied households have at least onehousing need; 17.3% of owners and 44.2% of renters.
Table 3.52 Atlanta Housing Needs by Tenure, 2000TenureHousing Needs
RentersOwners
PercentNumberPercentNumber
87.636,70794.712,053Cost Burdened
47.619,92460.37,674Severely Cost Burdened
19.68,2217.8988Overcrowded
4.61,9324.0504Lacking Facilities
11.14,6315.1654Multiple Needs
100.041,880100.012,732Total Needs
Source: Georgia Tech City and Regional Planning Program estimates based on U.S. Census Public Use Micro Sample, 2000
Returning to the dissection of housing needs, the most extensive housing need is cost burdening. Fully48,760 of the households with housing needs are cost burdened – over seven-eighths (89.3%) of the total.
vii Measurement of the first three indices of needs are drawn from the U.S. Census. Incidence of physically substandard housing is estimatedusing multiple local data sources. The different bases for the two sets of measures render indeterminate the extent to which physicallysubstandard units are either cost burdened, overcrowded or lacking facilities (and vice versa).
viii The rationale behind not considering households with more than 80% of the regional median income as having housing needs is that peoplewith that level (and higher) of incomes have the fiscal resources to choose not to live in overcrowded, cost burdened or facility deficienthousing situations. A closer examination of the data reveals that there are almost no households with 80% of median or higher incomeswho are overcrowded or facility deficient. Slightly less than 4,000 owners (most of whom where relatively young) and 600 renters with higherincomes were cost burdened.
September 2007 Draft Atlanta Strategic Action Plan102
Community Assessment3

Three-quarters (75.3%) of cost-burdened households are renters. Relative to their own tenure group, rentersare far likelier to be cost burdened: 38.7% of renters versus 16.4% of owners are cost burdened. Thus,renters are more than twice as likely (2.36) to be cost burdened.
Severely cost burdened households pay 50% or more of their incomes for housing. There are 19,924severely cost burdened renter households and 7,674 owner households in the city. Over one-half (54.2%of the cost burdened renters and 63.7% of the cost burdened owners) are severely cost burdened.Seventy-two (72.2%) of cost burdened households are renters.
Overcrowding is the second most pervasive housing problem. Nine thousand two hundred nine (9,209)households have more than one person per habitable room(ix) Overcrowding is predominately a problem forrenters: 8,221 renters are overcrowded whereas 988 owner households are. Eight percent (8.7%) of allrenters and 1.3% of all owners are overcrowded.
Units lacking facilities is a measure of housing adequacy that derives frommid-twentieth century and earlierwhen indoor plumbing was not nearly as common as it is today. But, somewhat surprisingly, the incidenceof units lacking either a complete kitchen (hot and cold running water; sink; refrigerator and stove) or acomplete bathroom (hot and cold running water; water closet; bath or shower) is increasing in Atlanta. In2000, there were 2,436 such units, 1,932 of which were rented and 504 of which were owned. Illegalsubdivision of existing units and poverty are the most likely explanations for the increasing numbers of theseunits.
Turning from magnitude of housing needs to some of the socio-economic characteristics of the householdswith needs, the first attribute analyzed is income. Tables 8 and 9 disaggregate the incomes of householdswith housing needs by type of housing need. Within the population with housing needs, the poorest subgroupis also the most numerous. Cost burdened renters, who constitute two-thirds (67.2%) of those with housingneeds have the lowest incomes of the four subsets for which income is known at $13,012. Fully 39.0% or14,298 of cost burdened renters have incomes less than $10,000. The second poorest group is overcrowdedrenters, whose median income of $17,301 is less than one half of the City’s median. One third (33.3%/3,736)of this population has incomes of $10,000 or less.
Table 3.53 Household Income for Owner Households with One or More Housing Needs, Cost Burdened or Overcrowded, Atlanta,2000
OwnerHousehold Income
OvercrowdedCost BurdenedOne or More Housing Needs
PercentNumberPercentNumberPercentNumber
9.59412.21,46912.41,585Less than $5,000
8.48315.61,88115.51,968$5,000-9,999
5.25112.11,46412.11,535$10,000-14,999
11.111011.51,38711.61,471$15,000-19,999
ix The Census defines habitable rooms such that living rooms are habitable, but bathrooms, kitchens and dining areas are not.
103Atlanta Strategic Action Plan September 2007 Draft

OwnerHousehold Income
16.216011.81,42611.91,509$20,000-24,999
25.224920.02,41219.82,524$25,000-34,999
24.424116.72,01416.82,140$35,000-49,999
100.0988100.012,053100.012,732Total
-$24,875-$19,371-$19,344Median
Table 3.54 Household Income for Renter Households with One or More Housing Needs, Cost Burdened, or Overcrowded, Atlanta,2000RenterHousehold
Income
OvercrowdedCost BurdenedOne or More Housing Needs
NumberPercentNumberPercentNumberPercent
1,25917.46,37817.07,1209.5Less than $5,000
1,47721.67,92020.98,7538.4$5,000-9,999
83218.36,73216.87,0355.2$10,000-14,999
1,17915.55,69015.36,40811.1$15,000-19,999
96010.23,75310.54,39716.2$20,000-24,999
1,32312.04,41312.85,36125.2$25,000-34,999
1,1915.01,8216.72,80624.4$35,000-49,999
8,221100.036,707100.041,880100.0Total
$17,301-$13,012-$13,601-Median
Source: Georgia Tech City and Regional Planning Program estimates based on U.S. Census Public Use Micro Sample, 2000
The 2000 Census refined and expanded the categorization of race. Tables 10 and 11 present this data.The most significant features of this data are the higher proportions of each subcategory occupied by blackhouseholds. Where 34.7% of all households in Atlanta have housing needs, an overwhelming 42.2% areblack households. The comparable figure for whites is 24.1%. Where 46.1% of renter households live insocially substandard housing situations, 52.3% of black renter households do. The comparable figure forwhite renters is 36.2%. Where 20.0% of all owners have housing problems, 26.0% of black owners do.The comparable figure for whites is 13.7%. Overall, black households are 1.76 times more likely to havehousing needs. Within rental households, blacks are 1.44 times more likely to have housing problems. Forowners, black households are 1.89 times more likely than whites to have housing needs. Differences inincomes, adversely impact specific socio-economic factors, which are the product of historic discriminatorypatterns in education, housing and employment and continue to be a disadvantage to lower incomehouseholds.
Table 3.55 Race and Ethnicity for Owner Households with One or More Housing Needs, Cost Burdened or Overcrowded, Atlanta,2000
September 2007 Draft Atlanta Strategic Action Plan104
Community Assessment3

OwnerRace
OvercrowdedCost BurdenedOne or More Housing Needs
PercentNumberPercentNumberPercentNumber
Non-Hispanic
1.01033.9408632.54,134White
82.681659.37,14360.27,669Black
0.000.4530.453AmericanIndian /NativeAmerican
0.001.21431.1143Asian
0.000.000.00Pacific Islander
0.001.51791.4181Other
Hispanic
3.8382.42912.4301White
9.9981.0971.3162Black
0.000.000.00AmericanIndian/AlaskanNative
0.000.000.00Asian
0.000.000.00Pacific Islander
2.6260.5610.789Other
100.0988100.012,053100.012,732Total
Source: Georgia Tech City and Regional Planning Program estimates based on U.S. Census Public Use Micro Sample, 2000
Table 3.56 Race and Ethnicity for Renter Households with One or More Housing Needs, Cost Burdened, or Overcrowded, Atlanta,2000
RenterRace
OvercrowdedCost BurdenedOne or More Housing Needs
PercentNumberPercentNumberPercentNumber
Non-Hispanic
1.411426.99,86123.59,852White
79.36,51765.924,17467.028,043Black
0.000.2790.284American Indian /NativeAmerican
3.73071.55521.9796Asian
0.0000.00Pacific Islander
1.71371.96881.8754Other
Hispanic
5.54512.07242.61,103White
105Atlanta Strategic Action Plan September 2007 Draft
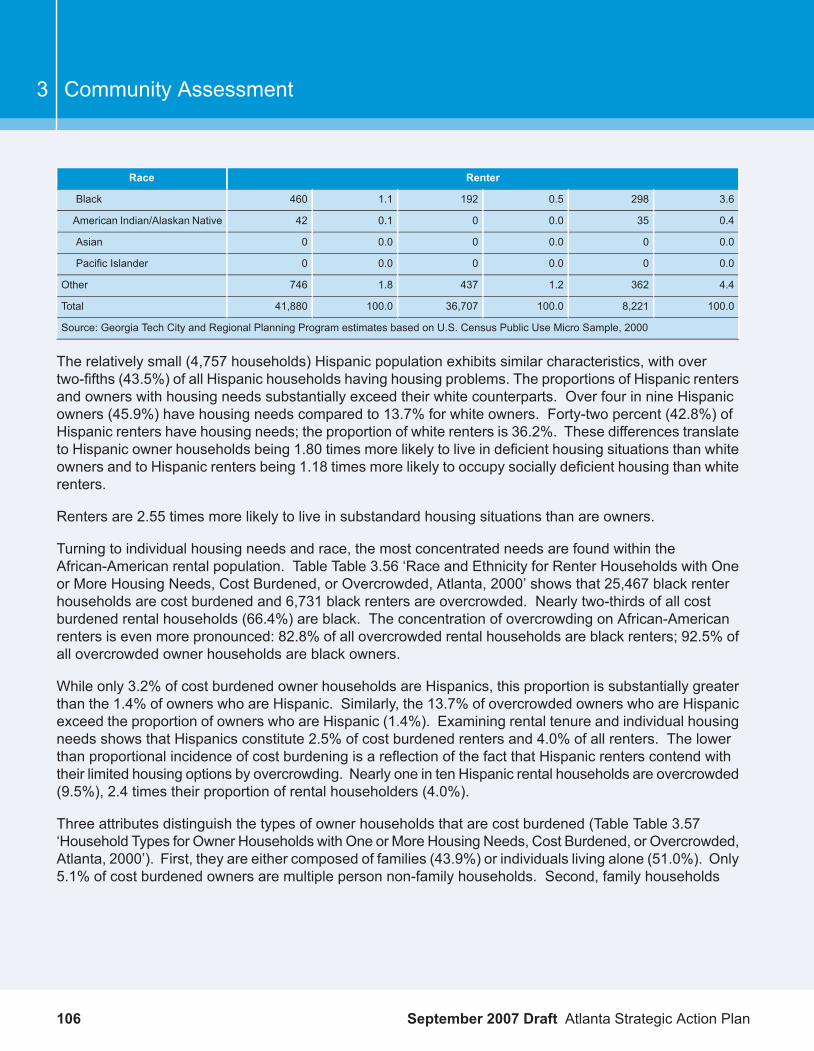
RenterRace
3.62980.51921.1460Black
0.4350.000.142American Indian/Alaskan Native
0.000.000.00Asian
0.000.000.00Pacific Islander
4.43621.24371.8746Other
100.08,221100.036,707100.041,880Total
Source: Georgia Tech City and Regional Planning Program estimates based on U.S. Census Public Use Micro Sample, 2000
The relatively small (4,757 households) Hispanic population exhibits similar characteristics, with overtwo-fifths (43.5%) of all Hispanic households having housing problems. The proportions of Hispanic rentersand owners with housing needs substantially exceed their white counterparts. Over four in nine Hispanicowners (45.9%) have housing needs compared to 13.7% for white owners. Forty-two percent (42.8%) ofHispanic renters have housing needs; the proportion of white renters is 36.2%. These differences translateto Hispanic owner households being 1.80 times more likely to live in deficient housing situations than whiteowners and to Hispanic renters being 1.18 times more likely to occupy socially deficient housing than whiterenters.
Renters are 2.55 times more likely to live in substandard housing situations than are owners.
Turning to individual housing needs and race, the most concentrated needs are found within theAfrican-American rental population. Table Table 3.56 ‘Race and Ethnicity for Renter Households with Oneor More Housing Needs, Cost Burdened, or Overcrowded, Atlanta, 2000’ shows that 25,467 black renterhouseholds are cost burdened and 6,731 black renters are overcrowded. Nearly two-thirds of all costburdened rental households (66.4%) are black. The concentration of overcrowding on African-Americanrenters is even more pronounced: 82.8% of all overcrowded rental households are black renters; 92.5% ofall overcrowded owner households are black owners.
While only 3.2% of cost burdened owner households are Hispanics, this proportion is substantially greaterthan the 1.4% of owners who are Hispanic. Similarly, the 13.7% of overcrowded owners who are Hispanicexceed the proportion of owners who are Hispanic (1.4%). Examining rental tenure and individual housingneeds shows that Hispanics constitute 2.5% of cost burdened renters and 4.0% of all renters. The lowerthan proportional incidence of cost burdening is a reflection of the fact that Hispanic renters contend withtheir limited housing options by overcrowding. Nearly one in ten Hispanic rental households are overcrowded(9.5%), 2.4 times their proportion of rental householders (4.0%).
Three attributes distinguish the types of owner households that are cost burdened (Table Table 3.57‘Household Types for Owner Households with One or More Housing Needs, Cost Burdened, or Overcrowded,Atlanta, 2000’). First, they are either composed of families (43.9%) or individuals living alone (51.0%). Only5.1% of cost burdened owners are multiple person non-family households. Second, family households
September 2007 Draft Atlanta Strategic Action Plan106
Community Assessment3

subdivide equally between married couple families (20.5%) and female householder families (20.5%). Third,single person households are composed of more female householders (3,712/30.8% of cost burdenedowners) than male householders (2,674/20.28%).
Table 3.57 Household Types for Owner Households with One or More Housing Needs, Cost Burdened, or Overcrowded, Atlanta,2000
OwnerHousehold Type
OvercrowdedCost BurdenedOne or More Housing Needs
PercentNumberPercentNumberPercentNumber
100.098843.95,29642.65,420Family
50.850220.52,46720.02,541Married Couple
2.4243.03612.9363Male Householder, ( No Wife)
46.846220.52,46819.82,516Female Householder, (NoHusband)
0.0056.16,75757.47,312Non-family
0.0022.22,67423.63,005Male Householder
0.0020.22,43021.52,743Living Alone
0.002.02442.1262Not Living Alone
0.0033.94,08333.84,307Female Householder
0.0030.83,71230.73,909Living Alone
0.003.13713.1398Not Living Alone
100.0988100.012,053100.012,732Total
Source: Georgia Tech City and Regional Planning Program estimates based on U.S. Census Public Use Micro Sample, 2000
Table 3.58 Household Types for Renter Households with One or More Housing Needs and for Cost Burdened and OvercrowdedHouseholds, Atlanta, 2000
Renter
OvercrowdedCost BurdenedOne or More Housing NeedsHousehold Type
PercentNumberPercentNumberPercentNumber
94.07,72538.614,17240.517,121Family
27.52,2597.82,8738.93,723Married Couple
7.76323.61,3223.81,606Male Householder, ( No Wife)
58.84,83427.29,97728.211,792Female Householder, ( No Husband)
6.049661.422,53559.124,759Non-family
3.327427.710,16427.111,364Male Householder
0.0023.08,45922.49,365Living Alone
3.32744.61,7054.81,999Not Living Alone
2.722233.712,37132.013,395Female Householder
0.0029.310,76227.811,631Living Alone
107Atlanta Strategic Action Plan September 2007 Draft

Renter
OvercrowdedCost BurdenedOne or More Housing NeedsHousehold Type
PercentNumberPercentNumberPercentNumber
2.72224.41,6094.21,764Not Living Alone
100.08,221100.036,707100.041,880Total
Source: Georgia Tech City and Regional Planning Program estimates based on U.S. Census Public Use Micro Sample, 2000
Table Table 3.58 ‘Household Types for Renter Households with One or More Housing Needs and for CostBurdened and Overcrowded Households, Atlanta, 2000’ above shows that similar attributes to those thatcharacterize cost burdened owners describe cost burdened renters: 1) they are either families (38.6%) orpeople living alone (52.3%); 2) cost burdened rental families are composed primarily of married couplefamilies and female householder families, but a much higher proportion of the rental groups are femalehouseholders (9,977/27.2%). Women living alone (10,762/29.3% of cost burdened renters) are morenumerous thanmen living alone (8,459/23.0%) and taken together, individuals are amajority of cost burdenedrental households (19,221/52.3%). In comparing cost burdened owners and renters, it is important to recallthat there are three times as many renters as owners (36,707/12.053).
Almost all overcrowded renter households are families (7,725/94.0), but there are twice as many femalehouseholder families (4,234/58.8% of overcrowded renters) than there are married couples (2,259/27.5%).
Household sizes of those with housing needs are instrumental factors in the design of successful housingpolicies and programs. Tables Table 3.63 ‘Employment Status of Persons 16 Years Old and Older in OwnerHouseholds with One or More Housing Needs, Cost Burdened or Overcrowded, Atlanta, 2000’ and Table3.64 ‘Employment Status of Persons 16 Years Old and Older in Renter Households with One or MoreHousing Needs, Cost Burdened or Overcrowded, Atlanta, 2000 ’ contain this data. The fact that singleindividuals constitute such substantial proportions of the household type data (Tables Table 3.61 ‘Age ofHouseholders for Owner Households with One or More Housing Needs, Cost Burdened, or Overcrowded,Atlanta 2000’ and Table 3.62 ‘Age of Householders for Renter Households with One or More Housing Needs,Cost Burdened, or Overcrowded, Atlanta 2000’) is reflected again in the fact that one half of both costburdened owners and renters are one-person households. For owners, the figures are 6,141 persons and50.9% of the total. For renters, comparable data are 19,223 and 52.4%.
Table 3.59 Household Size for Owner Households with One or More Housing Needs, Cost Burdened, or Overcrowded, Atlanta,2000OwnerHousehold Size
OvercrowdedCost BurdenedOne or More Housing Needs
PercentNumberPercentNumberPercentNumber
0.0050.96,14148.56,1751 person
2.82827.93,36526.53,3812 persons
9.19011.01,32110.51,3423 persons
11.81174.14974.25384 persons
35.23483.64355.26645 persons
September 2007 Draft Atlanta Strategic Action Plan108
Community Assessment3

13.81361.61892.12686 persons
27.22690.81052.9364More than 6
100.0988100.012,053100.012,732Total
-5.30-1.89-2.00Average
Source: Georgia Tech City and Regional Planning Program estimates based on U.S. Census Public Use Micro Sample, 2000
Table 3.60 Household Size for Renter Households with One or More Housing Needs, Cost Burdened, or Overcrowded, Atlanta,2000
RenterHousehold Size
OvercrowdedCost BurdenedOne or More Housing Needs
PercentNumberPercentNumberPercentNumber
0.0052.419,22346.019,2831 person
11.291720.47,51518.57,7592 persons
17.31,42512.54,59012.75,3123 persons
20.01,6416.22,2657.63,1934 persons
21.71,7814.81,7626.72,8155 persons
15.81,3012.38274.71,9686 persons
14.11,1561.45253.71,550More than 6
100.08,221100.036,707100.041,880Total
-4.56-2.02-2.38Average
Source: Georgia Tech City and Regional Planning Program estimates based on U.S. Census Public Use Micro Sample, 2000
The fact that the composition of cost burdened household sizes contains a majority of single individualsplus the fact that very few households exceed four persons means that average household sizes are low.For cost burdened owners, the average size is 1.89 persons. For cost burdened renters, the same figureis 2.02 persons. Both of these figures are substantially lower than the 2.30 average household size in theCity of Atlanta.
As one would expect, overcrowded households are substantially larger than other households. TablesTable 3.55 ‘Race and Ethnicity for Owner Households with One or More Housing Needs, Cost Burdenedor Overcrowded, Atlanta, 2000’ and Table 3.56 ‘Race and Ethnicity for Renter Households with One or MoreHousing Needs, Cost Burdened, or Overcrowded, Atlanta, 2000’ informed us that overcrowded owners are92.5% black and overcrowded renters are 82.9% black. We also know from Tables Table 3.57 ‘HouseholdTypes for Owner Households with One or More Housing Needs, Cost Burdened, or Overcrowded, Atlanta,2000’ and Table 3.58 ‘Household Types for Renter Households with One or More Housing Needs and forCost Burdened and Overcrowded Households, Atlanta, 2000’ that a majority of overcrowded householdsare families: 1) for owners, 50.8% are married couple families and 46.8% are female householder families;2) for renters, 27.5% are married couple families and 58.8% are female householder families. Tables Table3.59 ‘Household Size for Owner Households with One or More Housing Needs, Cost Burdened, orOvercrowded, Atlanta, 2000’ and Table 3.60 ‘Household Size for Renter Households with One or MoreHousing Needs, Cost Burdened, or Overcrowded, Atlanta, 2000’ add to our understanding of who is
109Atlanta Strategic Action Plan September 2007 Draft

overcrowded by supplementing this knowledge with household sizes. For the renters, the distribution isvery close to level. After the 917 two person households living in efficiency units, no household group hasfewer than 1,156 households (14.1% of the total) or more than 1,781 households (21.7%).
One clear conclusion from this analysis is that poverty (recall that median income for this group is $17,301)drives a range of household sizes from two to more than 6 into units that are too small for their families.The problem of overcrowding is not, as it was 30 or 40 years ago, a problem of very large families and alower income housing stock that is too small; instead, some low income households of almost every sizecannot find adequate housing that they can afford and choose to deal with that reality by squeezing intosmaller than adequate or overcrowded units.
On the ownership side, five, six and more than six person households account for over three-quarters(76.2%) of the overcrowded households. We know that this group is wholly composed of families (TableTable 3.61 ‘Age of Householders for Owner Households with One or More Housing Needs, Cost Burdened,or Overcrowded, Atlanta 2000’). One cannot be certain, but the social dynamics are very likely composedof multigenerational families who are effectively “doubling up” due to poverty and a smaller number of largersingle generational families. Forthcoming data regarding social security income (Tables Table 3.67 ‘SocialSecurity and Public Assistance Income for Owner Households with One or More Housing Needs, CostBurdened, or Overcrowded, Atlanta, 2000’ and Table 3.68 ‘Social Security and Public Assistance Incomefor Renter Households with One or More Housing Needs, Cost Burdened, or Overcrowded, Atlanta, 2000’)will support this interpretation.
The age of householders with housing needs varies by type of need. Tables Table 3.61 ‘Age of Householdersfor Owner Households with One or More Housing Needs, Cost Burdened, or Overcrowded, Atlanta 2000’and Table 3.62 ‘Age of Householders for Renter Households with One or More Housing Needs, CostBurdened, or Overcrowded, Atlanta 2000’ exhibit this data. No single group has amedian age of householderless than 30 years old. Most of the households with housing needs have householders who are maturemembers of the community. Overcrowded renters are the youngest group with a median age of 30.3 years.We know from the analysis of household types that 94.0% of overcrowded renters are families; Table Table3.62 ‘Age of Householders for Renter Households with One or More Housing Needs, Cost Burdened, orOvercrowded, Atlanta 2000’ reveals that the largest single group (39.2%) has householders between theages of 25 and 34. One quarter (25.1%) are younger and one-fifth (21.2%) are in the next older age category(35 to 44). But one-seventh (14.4%) are older than 45.
Table 3.61 Age of Householders for Owner Households with One or More Housing Needs, Cost Burdened, or Overcrowded, Atlanta2000
OwnerAge of Householders
OvercrowdedCost BurdenedOne or More Housing Needs
PercentNumberPercentNumberPercentNumber
0.002.12482.025924 and Under
33.032613.71,64615.11,92325 to 34
8.38215.71,89315.01,91535 to 44
20.720524.82,98724.43,10945 to 58
September 2007 Draft Atlanta Strategic Action Plan110
Community Assessment3

OwnerAge of Householders
38.037543.85,27943.45,52659 and Older
100.0988100.012,053100.012,732Total
49.9-54.5-54.2Median
Source: Georgia Tech City and Regional Planning Program estimates based on U.S. Census Public Use Micro Sample, 2000
Table 3.62 Age of Householders for Renter Households with One or More Housing Needs, Cost Burdened, or Overcrowded, Atlanta2000
RenterAge of Householders
OvercrowdedCost BurdenedOne or More Housing Needs
PercentNumberPercentNumberPercentNumber
25.12,06517.86,55219.18,02024 and Under
39.23,22328.410,43030.012,58425 to 34
21.21,74919.97,30120.18,39735 to 44
9.981315.75,76914.76,13645 to 58
4.537118.16,65516.16,74359 and Older
100.08,221100.136,707100.041,880Total
-30.3-35.9-35.4Median
Source: Georgia Tech City and Regional Planning Program estimates based on U.S. Census Public Use Micro Sample, 2000
Cost burdened renters are approximately five years older (when median age is used as the measure). But,the distribution of householder ages is much more even – i.e., there are substantial numbers and proportionswithin each age cohort. None of the categories has fewer than 5,769 households and none of the categoriescontains fewer than 15.7% of the total cost burdened renters. We know from Table Table 3.54 ‘HouseholdIncome for Renter Households with One or More Housing Needs, Cost Burdened, or Overcrowded, Atlanta,2000’ that this group is the poorest segment of the housing needs population with 57.9% being extremelylow income. We know from Table Table 3.52 ‘Atlanta Housing Needs by Tenure, 2000’ that they are alsoby far the largest group in the population with housing needs, constituting 36,707 households, over two-thirds(67.2%) of those with housing needs. We know from Table Table 3.54 ‘Household Income for RenterHouseholds with One or More Housing Needs, Cost Burdened, or Overcrowded, Atlanta, 2000’ that amajority (60.9%) are female householders, and Table Table 3.56 ‘Race and Ethnicity for Renter Householdswith One or More Housing Needs, Cost Burdened, or Overcrowded, Atlanta, 2000’ showed that 66.4% areblack. We now know that the householders are of many different ages and that one-half are older than 35.9years and one-half are younger.
Owners with housing needs are significantly older. Cost burdened owners have householders with a medianage of 54.5 years, and the largest group (5,279/43.8%) are 59 years old or older. Very few are under 24(248/2.1%). Mature householders also characterize overcrowded owners: the median age is 49.9 yearsand nearly two in five (376/38.1%) are over 59 years old. There are no overcrowded owners with young(under 24) householders.
111Atlanta Strategic Action Plan September 2007 Draft

Tables Table 3.63 ‘Employment Status of Persons 16 Years Old and Older in Owner Households with Oneor More Housing Needs, Cost Burdened or Overcrowded, Atlanta, 2000’ and Table 3.64 ‘Employment Statusof Persons 16 Years Old and Older in Renter Households with One or More Housing Needs, Cost Burdenedor Overcrowded, Atlanta, 2000 ’ describe the employment status of persons 16 years old and older inhouseholds with housing needs. Recalling that 43.8% of cost burdened owners had a householder 59 yearsold or older (Table Table 3.61 ‘Age of Householders for Owner Households with One or More HousingNeeds, Cost Burdened, or Overcrowded, Atlanta 2000’), the unemployment rate of cost burdened ownersof 9.4% overstates unemployment because some of the owners over age 59 are, in fact, retired and notactually in the labor force. Similarly, interpretations of the unemployment rate for overcrowded owners of12.7% should be tempered by the knowledge that 38.1% of the householders are 59 years old or older.
Table 3.63 Employment Status of Persons 16 Years Old and Older in Owner Households with One or More Housing Needs, CostBurdened or Overcrowded, Atlanta, 2000
OwnerWork Status
OvercrowdedCost BurdenedOne or More Housing Needs
PercentNumberPercentNumberPercentNumber
100.01,632100.09,469100.010,838In Labor Force
87.31,42590.68,58290.19,770Employed
12.72079.48879.91,068Unemployed
0.000.000.00Armed Forces
-1,910-10,376-11,995Not In Labor Force
Source: Georgia Tech City and Regional Planning Program estimates based on U.S. Census Public Use Micro Sample, 2000
Table 3.64 Employment Status of Persons 16 Years Old and Older in Renter Households with One or More Housing Needs, CostBurdened or Overcrowded, Atlanta, 2000
RenterWork Status
OvercrowdedCost BurdenedOne or More Housing Needs
PercentNumberPercentNumberPercentNumber
100.010,922100.030,382100.038,495In Labor Force
76.38,33785.225,90082.931,909Employed
23.72,58514.84,48217.16,586Unemployed
0.000.000.00Armed Forces
-8,537-22,084-28,538Not In Labor Force
Source: Georgia Tech City and Regional Planning Program estimates based on U.S. Census Public Use Micro Sample, 2000
Nearly one-fifth (18.1%/6,655) of the cost burdened renters had an older householder (59 or over), a factthat modifies the 14.8% unemployment rate for cost burdened renters.
Overcrowded renters have an unemployment rate of 23.7%, higher than any of the other three groupsidentified by one housing need. Only 4.5% of this group are 59 or older, so the unemployment rate for thosein the labor force would not be reduced substantially by the recognition that some of the over 59 demographiccannot work. We know that these households are large (Table Table 3.60 ‘Household Size for Renter
September 2007 Draft Atlanta Strategic Action Plan112
Community Assessment3

Households with One or More Housing Needs, Cost Burdened, or Overcrowded, Atlanta, 2000’) and theyare almost entirely families (Table Table 3.58 ‘Household Types for Renter Households with One or MoreHousing Needs and for Cost Burdened and Overcrowded Households, Atlanta, 2000’), so there will be anumber of 17 and 18 year olds who may still be in school. Nevertheless, the unemployment rate for personsin the labor force in overcrowded rental housing is at least in the high teens.
Viewed another way, most of the people with housing needs in the (broadly defined) labor force work for aliving. For cost burdened renters, 85.2% of persons over 16 are employed. For overcrowded owners,87.3% are. Ninety percent (90.6%) of persons over 16 in cost burdened owner housing are employed. Thecentral fact deriving from this data is that most households with housing needs have working members.We know that a primary cause of housing needs is low incomes (Tables Table 3.53 ‘Household Income forOwner Households with One or More Housing Needs, Cost Burdened or Overcrowded, Atlanta, 2000’ andTable 3.54 ‘Household Income for Renter Households with One or More Housing Needs, Cost Burdened,or Overcrowded, Atlanta, 2000’), and we now know that low incomes for the housing needs populationderive from low pay and not from low levels of labor force participation.
Tables Table 3.65 ‘Occupation of Employed Persons Age 16 and Over in Owner Households with One orMore Housing Needs, Cost Burdened, or Overcrowded, Atlanta, 2000’ and Table 3.66 ‘Occupation ofEmployed Persons Age 16 andOver in Renter Households with One or More Housing Needs, Cost Burdened,or Overcrowded, Atlanta, 2000’ describe the occupations of employed persons in households with housingneeds. The first conclusion is that each occupational category is represented, although farming, fishing,and forestry has predictably low numbers. Compared to the rest of the City of Atlanta, households withhousing needs have proportionally fewer employed numbers in management, professional and relatedoccupations (40.6% of the city versus 29.0% of owners with housing needs and 22.4% of renters withhousing needs), more members in services (16.4% in the city and 19.6% of owners with housing needsand 27.6% of renters with housing needs), slightly more than the city in sales and office occupations (25.6%in Atlanta, 31.5% for owners with housing needs and 28.5% for renters with housing needs) except forovercrowded renters, who have slightly fewer (21.8%), and more in construction, extraction andmaintenanceoccupations (6.0% of the city and 6.9% and 7.2%, respectively, for owners and renters with housing needs),except for cost burdened renters (5.8%). The proportion of employed persons in production, transportationand material moving occupations is 11.2% in the city, a figure that is essentially the same as cost burdenedowners (11.8%) and renters (11.1%) and just over one-half the comparable figure for overcrowded ownersand renters. So, a part of the explanation for the lower pay and lower incomes of households with housingneeds is greater than proportional representation in lower paid occupations and vice versa.
Table 3.65 Occupation of Employed Persons Age 16 and Over in Owner Households with One or More Housing Needs, CostBurdened, or Overcrowded, Atlanta, 2000
OwnerOccupation
OvercrowdedCost BurdenedOne or More Housing Needs
PercentNumberPercentNumberPercentNumber
5.68032.22,77129.02,833Management, Professional andRelated
33.647917.91,53319.61,914Services
31.144331.62,71131.53,079Sales and Office
113Atlanta Strategic Action Plan September 2007 Draft

OwnerOccupation
0.000.3270.327Farming, Fishing and Forestry
8.51216.65696.9674Construction, Extraction andMaintenance
21.230211.397112.71,243Production, Transportation andMaterials Moving
100.01,425100.08,582100.09,770Total
Source: Georgia Tech City and Regional Planning Program estimates based on U.S. Census Public Use Micro Sample, 2000
Table 3.66 Occupation of Employed Persons Age 16 and Over in Renter Households with One or More Housing Needs, CostBurdened, or Overcrowded, Atlanta, 2000
RenterOccupation
OvercrowdedCost BurdenedOne or More Housing Needs
PercentNumberPercentNumberPercentNumber
11.596225.96,71122.47,151Management, Professional andRelated
32.12,67426.16,77227.68,804Services
21.81,81530.77,94928.59,101Sales and Office
0.9740.4920.5155Farming, Fishing and Forestry
11.69635.81,4947.22,289Construction, Extraction andMaintenance
22.21.84911.12,88213.84,409Production, Transportation andMaterials Moving
100.08,337100.025,900100.031,909Total
Source: Georgia Tech City and Regional Planning Program estimates based on U.S. Census Public Use Micro Sample, 2000
Tables Table 3.67 ‘Social Security and Public Assistance Income for Owner Households with One or MoreHousing Needs, Cost Burdened, or Overcrowded, Atlanta, 2000’ and Table 3.68 ‘Social Security and PublicAssistance Income for Renter Households with One orMore Housing Needs, Cost Burdened, or Overcrowded,Atlanta, 2000’ examine the segment of the housing needs population that has members who draw socialsecurity income or public assistance income. The first conclusion that can be drawn from this data is thatnearly one-half (47.8%) of the owners with housing needs have a member drawing social security. Closerexamination of the data reveals that older owners account for most, but not all, of the housing needshouseholds with a member receiving social security. High proportions of both overcrowded and costburdened owners have members with social security income: 84.8% of overcrowded owners and 44.7% ofthe cost burdened owners. Table Table 3.65 ‘Occupation of Employed Persons Age 16 and Over in OwnerHouseholds with One or More Housing Needs, Cost Burdened, or Overcrowded, Atlanta, 2000’ pointed outthat both of these groups had high proportions of householders over 59 years of age (43.8% and 38.1% forcost burdened and overcrowded owner householders, respectively) so the figures in Table Table 3.67 ‘SocialSecurity and Public Assistance Income for Owner Households with One or More Housing Needs, CostBurdened, or Overcrowded, Atlanta, 2000’ are not completely unexpected. But, the proportion of overcrowdedowner households with a member being paid social security is twice the proportion with householders over
September 2007 Draft Atlanta Strategic Action Plan114
Community Assessment3

59 years old: 84.9% (Table Table 3.67 ‘Social Security and Public Assistance Income for Owner Householdswith One or More Housing Needs, Cost Burdened, or Overcrowded, Atlanta, 2000’) versus 38.0% (TableTable 3.61 ‘Age of Householders for Owner Households with One or More Housing Needs, Cost Burdened,or Overcrowded, Atlanta 2000’). The explanation for the difference is that many of the overcrowdedhouseholds contain an older member who is drawing social security but who is not the householder. Insimpler terms, a parent or grandparent who is not the owner of the house is the person receiving socialsecurity. Similar phenomena appear to be at work on a smaller scale for cost burdened owners.
Table 3.67 Social Security and Public Assistance Income for Owner Households with One or More HousingNeeds, Cost Burdened, or Overcrowded, Atlanta, 2000
OwnerIncome Source
OvercrowdedCost BurdenedOne or More Housing Needs
PercentNumberPercentNumberPercentNumber
84.883844.75,39247.86,082Social SecurityIncome
3.1313.44143.4434Public AssistanceIncome
Source: Georgia Tech City and Regional Planning Program estimates based on U.S. Census Public Use MicroSample, 2000
Table 3.68 Social Security and Public Assistance Income for Renter Households with One or MoreHousing Needs, Cost Burdened, or Overcrowded, Atlanta, 2000
RenterIncome Source
OvercrowdedCost BurdenedOne or More Housing Needs
PercentNumberPercentNumberPercentNumber
10.384420.17,38218.37,668Social SecurityIncome
27.72,27410.63,90913.85,763Public AssistanceIncome
Source: Georgia Tech City and Regional Planning Program estimates based on U.S. Census Public Use MicroSample, 2000
The City of Atlanta proportion of households with social security income is 20.6% and the number is 34,757.One-seventh (15.2%) of the households with social security income are cost burdened owners.
In the rental sector, receipt of social security income is equivalent to the overall city proportion for costburdened renters (20.1% versus 20.6%). Approximately one in ten (10.3%) overcrowded renter householdshave a member with social security income.
One household in 20 (5.5%/9,234 households) had a member receiving public assistance income in Atlantain 2000. Table Table 3.68 ‘Social Security and Public Assistance Income for Renter Households with Oneor More Housing Needs, Cost Burdened, or Overcrowded, Atlanta, 2000’ indicates that 42.3% of thesehouseholds were cost burdened renters (3,909/9,234). Viewed another way, one-tenth (10.6%) of costburdened renters and one-quarter (27.7%) of overcrowded renter households received public assistanceincome.
115Atlanta Strategic Action Plan September 2007 Draft

The type of housing occupied by people with housing needs defines much of the first set of alternatives inderiving remedial programs. In many cases, solving the housing problem without requiring people to relocatepreserves valuable connections to supporting community networks and facilities. Analyzing the type ofhousing occupied by the people with housing needs is therefore an instrumental part of understandinghousing needs and a prerequisite for designing effective housing programs. Tables Table 3.69 ‘Type ofHousing Unit Occupied by Owner Households with One or More Housing Needs, Cost Burdened, orOvercrowded, Atlanta, 2000’ and Table 3.70 ‘Type of Housing Unit Occupied by Renter Households withOne or More Housing Needs, Cost Burdened, or Overcrowded, Atlanta, 2000’ present this data.
Table 3.69 Type of Housing Unit Occupied by Owner Households with One or More Housing Needs, Cost Burdened, or Overcrowded,Atlanta, 2000
OwnersType of
Housing Unit
OvercrowdedCost BurdenedOne or More Housing Needs
PercentNumberPercentNumberPercentNumber
90.289177.79,36877.99,920Single unit detached
2.1216.07256.0762Single unit attached
0.002.63102.5322Duplex
0.001.92321.92403 or 4 units
0.000.1710.6715 to 9 units
0.003.03622.836210 to 19 units
0.001.51811.418120 to 49 units
2.8285.86975.670750 or more units
4.9480.91071.3167Manufactured home
0.000.000.00Boat, RV, van, etc.
100.0988100.012,053100.012,732Total
Source: Georgia Tech City and Regional Planning Program estimates based on U.S. Census Public Use Micro Sample, 2000
Table 3.70 Type of Housing Unit Occupied by Renter Households with One or More Housing Needs, Cost Burdened, or Overcrowded,Atlanta, 2000
RenterType of
Housing Unit
OvercrowdedCost BurdenedOne or More Housing Needs
PercentNumberPercentNumberPercentNumber
11.090516.05,86515.26,363Single unit detached
0.7562.48912.2917Single unit attached
10.58666.72,4547.43,099Duplex
14.01,15410.13,72210.84,5233 or 4 units
September 2007 Draft Atlanta Strategic Action Plan116
Community Assessment3

RenterType of
Housing Unit
20.91,71516.76,12817.57,3295 to 9 units
18.01,47914.95,47015.46,49110 to 19 units
7.25948.23,0098.03,35020 to 49 units
17.11,40324.89,09023.19,68450 or more units
0.6490.2580.284Manufactured home
0.000.1200.140Boat, RV, van, etc.
100.08,121100.036,707100.041,880Total
Source: Georgia Tech City and Regional Planning Program estimates based on U.S. Census Public Use Micro Sample, 2000
In the ownership sector, the predominant housing type is single family detached, with over three-quarters(9,368/77.7%) of cost burdened households and over 90% (90.2%) of overcrowded households living inthis type of housing. Much smaller numbers of cost burdened households live in other housing types. Theonly other housing types containing more than 600 cost burdened owner households are attached singlefamily (725 units/6.0% of owner occupied cost burdened) and larger developments of 50 or more units(697/5.8%).
Housing types on the rental side are much more disparate. No type of housing contains more than onequarter of the cost burdened renters, although at 9,090 units and 24.8% of the total cost burdened rentalunits, developments of 50 units or more come close. Seven other types of housing ranging from singlefamily detached to apartment developments of 20 to 49 units house the bulk (74.9%/27,539 households)of the remaining cost burdened renters. With the exception of the fewer than 100 households in manufacturedhomes and makeshift accommodations in boats, or RVs, etc., the number of each housing type ranges from891 to 6,128.
Overcrowded renters exhibit similar variations in their housing types. The largest concentration is not alarge concentration at 20.9% of overcrowded renters and 1,716 units in 5 to 9 unit developments. Ten to19 unit buildings (18.0%/1,479 units), 50 or more unit developments (17.1%/1,403 units) and 3 or 4 unitbuildings (14.0%/1,155 units) follow closely behind.
The implications for the policy of these distributions are significant. On the ownership side, the concentrationof both overcrowding and cost burdening in single family detached units is not a substantial barrier to dealingdirectly with the housing needs in situ either through loans and/or grant programs to rectify the deterioratingphysical quality problems induced by cost burdening or overcrowding or by restructuring mortgage financeto reduce the absolute burden of monthly payments. But, the fact that nearly three quarters of the costburdened renters (74.9%/27,539 units) are in developments of one to 49 units presents complex obstaclesto effective policy. The most significant of these are the dearth of private financing available to developmentscontaining fewer than 50 units and economies of scale for managing rental properties that conclude that50 units is the smallest size development that can be managed efficiently. Surmounting or circumnavigatingthese constraints will be addressed in the subsequent policy section.
117Atlanta Strategic Action Plan September 2007 Draft

Viewed from the preceding institutional perspectives, the fact that 9,090 units of cost burdened rental housingin developments of 50 or more units mean that these units are the most accessible block of rental housingneeds in the city. Because these developments meet or exceed industry minimums for effective managementand access to financing, devising effective policies is a more straightforward set of tasks. Once again, theseissues will be addressed in the policy section.
Special Housing Needs
Persons with Physical or Mental Disabilities
Needs for Persons with Mental Disabilities
The DHR provides services and treatment for persons with mental illness as well as those with mentalretardation and substance abuse. DHR Annual Report for 2004 reported that the population of personswith mental illness, mental retardation or with a substance abuse problem is continuing to increase. (x)
The City conducted a one-day survey documenting the unmet residential treatment and other supportivehousing needs of homeless persons. The majority of this group of persons earns less than $10,000 peryear and also needs a housing subsidy as well as supportive services in order to live in the community. (xi)
A review of the characteristics of those needing housing indicated a need to expand levels of care to theresidential continuum and to increase the capacity of existing and available services. (xii)
Current Programs and Strategies
The 811 Supportive Housing program for persons with disabilities provides funding to developers who buildhousing for disabled, low-income households. The program also provides rental assistance that can coverthe difference between the HUD-approved operating costs and the tenant’s contributions toward rent. Thissmall federal program supports 332 units statewide and, of these, 83 units of Supportive Housing for personswith Disabilities are in Fulton County. Most are in Atlanta.(xiii)
An important service provided by Georgia DHR and its non-profit contract agencies is community-basedresidential treatment and support services in conjunction with housing through the Medicaid waiver program.DHR provides a wide array of residential services that range from highly structured treatment programs,group homes with twenty-four hour support services to drop-in support services provided to consumersliving in their own homes. The DHR actively pursues a multi-path approach for federal, state, and localfunds for developing new residential and supportive housing opportunities
Section 8 Mainstream vouchers under the Mainstream Housing for Persons with Disabilities program aredesignated for people with disabilities and allow housing authorities and nonprofit disability organizationsto apply for vouchers with five year terms.(xiv) . AHA reports that it has requested Mainstream vouchers toserve persons with disabilities.
x Department of Mental Health, Mental Retardation, and Substance Abuse Services for the Comprehensive State Plan for 2000xi Consolidated Plan for the City of Atlanta – 2005 - 2009xii Ibidxiii Personal communication (via email) with Sue Barron, HUD (Atlanta Field Office) Department of Multifamily Housing. November 3, 2004xiv DHR Metro Regional Office information as relayed in the Consolidated Plan for the City of Atlanta – 2004-2009
September 2007 Draft Atlanta Strategic Action Plan118
Community Assessment3

Gaps and Priorities
Georgia Code 120-3-20 (Georgia Accessibility Code) requires that 5.0% of newly constructed multifamilyrental housing has to be accessible to persons with disabilities. But there is no systematic way for peoplewith disabilities to access these units.
A serious lack of wheel chair accessibility in affordable housing presents constant barriers for persons withdisabilities. A disabled individual earning less than $12,000 per year cannot afford to rent anywhere inAtlanta without a cost burden of over 50% of income and/or without a shared unit living arrangement. Thereis a need for additional rental subsidies and additional units of affordable housing, including barrier-freeunits. With the changing nature of health insurance coverage and the complex public system for screeningdisability services, the number of people without appropriate and necessary services also continues togrow. Atlanta will face several particularly challenging issues in the future, including two that directly relateto housing needs:
Long-term community-based residential services for persons with serious mental health problems wholose their eligibility for other programs, andLong-term residential services, for adults with mental disabilities whose parents or primarycommunity-based care givers are unavailable or unable to provide care.
The priority for serving people with mental disabilities is to support those who live in nursing homes andstate institutions and those who live with caregivers who are either elderly or in poor health. The 38 Atlantanursing homes that accept Medicare and Medicaid clients house 6,080 patients, half of whom receive alevel of care below state standards. (xv) To implement this priority, there needs to be an adequate supply ofhousing available to meet the needs of an estimated 3,000 individuals. Housing designed to meet the needsof inadequate state and nursing home care should be affordable, barrier-free, located near publictransportation and shopping, and available for long-term use.
Needs for Persons with Cognitive Disabilities
The Census estimated that 24,472 individuals, 6.4% of the Atlanta population, have a physical or sensory(visual and hearing) disability (xvi) and 4,540 individuals live in Atlanta with disabilities as a consequence ofbrain injury.(xvii). Due to the unique nature of a brain injury, individuals with this condition have very differentneeds for services and housing.
The largest group of individuals who sustain brain injuries are young males, ages 16-24 years. Many ofthese individuals, at the time of injury, were in school or just beginning to work. Over 65% of the personsserved by Brain Injury Services have incomes less than $12,000 and rely on SSI or other governmentalsupports.(xviii).
xv Personal interview with Susan Jamieson – Director - Atlanta Legal Aid – Atlanta Legal Aid Mental Health and Disability Law Project, March9, 2005
xvi 2000 Decennial Census: U.S. Department of Housing and Urban Development - PCT 69xvii Georgia Division of Mental Health, Developmental Disabilities and Addictive Disabilities (MHDDAD)xviii Consolidated Plan for the City of Atlanta – 2004-2009 p.36
119Atlanta Strategic Action Plan September 2007 Draft

Transitional living programs attempt to reduce the structure and supervision needed in carrying out activitiesof daily living and to increase an individual’s ability to function independently.
Current Programs and Strategies
Restore, a nonprofit organization based in Atlanta, provides long-term case management services andsupport to over 250 people with brain injuries every year. Restore does not support lower income persons(except those receiving accident insurance support). The independent waiver care program does providespecific resources to Medicaid eligible persons with brain injuries. These services are provided at homeand through personal care homes.
Gaps and Priorities
The twenty-four thousand persons have physical or sensory disabilities, and of these 2,951 with braininjuries, live on incomes of less than $1,000 per month.
Due to cognitive, physical and social deficits that can occur as a result of a brain injury, residential alternativesare needed to meet the needs of these individuals. A priority is to find alternatives to institutionalization,such as transitional living programs and group homes, which are accessible and provide the appropriatelevel of care. Persons wanting to remain in their homes could be provided apartment coaches or personalassistant care for safety and performance of adult daily living tasks. Model programs around the countryfor persons with brain injuries need to be studied and recommendations developed.
Needs for Persons with Physical or Sensory Disabilities
The Census estimated that 24,472 individuals, 6.4% of Atlanta population, have a physical or sensory (visualand hearing) disability.(xix).
Current Programs and Strategies
AHA have an unknown number of Section 8 vouchers under the Mainstream Housing for Persons withDisabilities program, which are designated for people with disabilities, and in 2004 requested additionalvouchers to serve the disabled population. This voucher program is also used for persons with mentaldisabilities.
Metro Fair Housing Inc. compiles and maintains a listing of accessible apartment complexes in the metroAtlanta area. These include: accessible building apartment entrances; curb cuts for wheelchairs; elevatorswith Braille; ramps with handrails; grab bars; wide doorways; low cabinets, sinks, and countertops; raisedtoilets, and other features. Newer apartment complexes built since 1991 meet Fair Housing standards butare often out of the price range for residents who have low-income jobs or depend on Social Security orSSI assistance payments. The Community Housing Resource Center also has an inventory of accessibleapartment buildings in cooperation with the Department of Community Affairs aging in place initiative.
xix 2000 Decennial Census: U.S. Department of Housing and Urban Development - PCT 69
September 2007 Draft Atlanta Strategic Action Plan120
Community Assessment3

AHA has approximately 1,100 people (xx) with self-reported disabilities on the waiting list for the Section 8housing subsidy. The Community Housing Resource Center is currently working to bring together groupsinterested in developing housing with services for people with significant physical disabilities.(xxi).
Gaps and Priorities
Independence for persons with disabilities often hinges on four key components: housing, transportation,employment and supportive services in the community. Without adequate affordable housing, independenceand self-sufficiency cannot be attained.
Housing on accessible public transportation routes is a significant issue for persons with disabilities. Personswith physical disabilities are more likely to depend on public transportation in order to maintain employmentand to meet daily needs.
Renters with disabilities also need financial assistance to make accessibility accommodations to theirhomes. Typically, renters must pay to have the accommodations made, and then must pay to return theresidence to its original state when they leave. These costs are often prohibitive for a disabled person withlimited income and financial resources.
Development of group housing options for persons with disabilities is constrained by the lack of affordableland. Likewise, housing options for other special needs groups, such as those with chemical sensitivitieswho may also need temporary emergency shelter, need to be address.
Most sales housing in the Atlanta area is designed for people who can climb steps and take care of theiryards. For those who are physically disabled and own their homes, more education and awareness isneeded on options for adapting a home and the financial resources that are available for renovationsnecessary to make homes accessible.
Elderly Needs
The elderly are a significant segment of Atlanta’s population. Over 10 percent of the City’s residents areover the age of 65. The great majority of Atlanta’s seniors aged 65 and over (14,594 seniors) live alone(82.1%), and nearly one-third (31.7%) was living below the poverty level in 2000. The 2000 census estimateda senior population (age 65 and over) living with a disability and living below the poverty level to be 5,118.Atlanta’s senior population that is poor made up nearly 10% (9.9%) of the city’s population living under thepoverty level in 2000.(xxii). Tables 22 and 23 from the earlier Housing Needs analysis define 6,082 seniorhomeowners with housing needs who receive Social Security. A higher number of senior renter households,7,668, receive Social Security and have housing needs. Cost burden is the greatest cause of housing need;89% for senior owners and 96% for senior renters. Affordable housing for this growing population group isa critical issue.
xx Community Design Center of Atlanta estimate, March 11, 2005xxi Community Housing Resource Center of Atlanta - Web Sitexxii Census 2000 Summary File 4 (SF 4) PCT 78 PCT 148
121Atlanta Strategic Action Plan September 2007 Draft

In 2000, the median income in Atlanta for households between ages 65 and 74 was $24,915 and $19,136for households aged 75 and older while, according to USHUD, the Area Median Income for all householdswas $63,100.(xxiii).
The City of Atlanta has prioritized households with less that 30% of Area Median Income ($13,250 for aone person household in 2000; $14,950 for that household in 2004) as the focus of housing subsidies. In2000, 31.7% of Atlanta seniors lived below the poverty level.
Current Programs and Strategies
The City has established five-year goals for expanded affordable housing assistance of 5,700 units forsenior households with incomes at or below 30% AMI and 7,600 units for senior households with incomesbetween 31% and 50% of AMI.(xxiv).
The primary source of dedicated affordable senior housing is HUD Section 202. There are 2,711 units ofSection 202 elderly housing in Fulton County,(xxv) most of which are in Atlanta. The Community HousingResource Center (CHRC) provides low interest loan and grant support to senior homeowners for repairswho qualify by income. The City also funds weatherization, emergency repair and roof repair to seniorhomeowners through CDBG.
There are 3,082 units in 17 high-rise developments owned by AHA that are designated for elderly or disabledpersons. AHA planning for senior high-rise developments and Grady Homes Redevelopment proposesan emphasis on small bedroom sized units with dedicated senior support services.
Georgia’s private nursing home providers provide 50,000 unit/beds for elderly persons, 40,000 of which arededicated to Medicaid recipients. (xxvi) State records show that seniors and disabled persons in nursing homesare frequently subject to understaffed nursing care levels, leaving over 10,000 of their residents withoutenough nurses and nurses' aides to care for them. State inspectors found that staffing had dropped belowstate minimum standards by 115 homes – nearly one of every three in Georgia –at least once since 1999.The staffing violations were found at least twice at 55 of those homes. The state rarely fines or punishesnursing homes for understaffing, and it does not require homes to document that they have added workersafter a spot check finds understaffing. As a result, some nursing homes show up repeatedly as staffingbelow the standard.(xxvii)
For persons wanting to remain in their own home and for elderly householders who cannot afford the costof housing or assisted living, there are programs available. The City’s Bureau of Housing has CDBG andHOME funded programs for a limited number of repairs: Community Housing Resource Center EmergencyRepair (major systems, roofs, access); Tool Bank (general repairs in NPU V); Project Extend of Wesley
xxiii 2000 Decennial Census; U.S. Department of Housing and Urban Developmentxxiv Consolidated Plan for the City of Atlanta – 2005 - 2009xxv Personal communication (via email) with Sue Barron, HUD (Atlanta Field Office) Department of Multifamily Housing. November 3, 2004xxvi Annual Report – Association of Private Nursing Home Providers 2004xxvii Carrie Teegardin, Atlanta Journal-Constitution, Short-staffed nursing homes don't have to prove they've added enough workers after spot
checks December 19, 2001
September 2007 Draft Atlanta Strategic Action Plan122
Community Assessment3

Senior Citizens (general repairs, chores and maintenance); Southeast Energy Weatherization (furnace/heater replacement); Southeast Energy Care and Conserve (plumbing and water line replacement). Theyare described in Section VII of the City of Atlanta 2004 Consolidated Plan.
Gaps and Priorities
The Atlanta Study Group on Assisted Living identified housing affordability as the greatest single issue forseniors living alone. An inadequate supply of services for those not qualified for Medicaid waiver personalassistance was also identified as a major need.
Strategies to help older adults remain as independent as possible should be encouraged, including onesconcerned with having sufficient income to be able to afford housing in the Atlanta area and remain here.Nursing home care should be considered a less desirable alternative to group home, assisted living/personalcare home care that are more integrated into the community and more frequently have better levels of care.
Needs for Persons with Substance Abuse-related Disabilities
The supply of housing dedicated to persons who are in recovery from alcohol or other drug abuse is limited.Substance abuse and physical and mental disabilities affect an estimated 2,912 people who are chronicallyhomeless in Atlanta.(xxviii).
A continuum of treatment and housing options, including emergency, transitional and permanent housing,with access to community services, employment and public transportation are essential to successfulcommunity reintegration. In addition, to address the diverse needs of recovering substance abusers, thesecomponents should include both large and small facilities, highly intensive and less intensive services,locations throughout the City and include reasonable costs and housing subsidies.
Atlanta lacks a “Rapid Response” support response that can intervene when individuals are at risk of relapsewhile waiting for residential treatment services. This 24/7-response service can include screening from ahot line and transportation to an assisted facility e.g. Grady Hospital.(xxix).
Current Programs and Strategies
Recovering substance abusers are eligible for very few specialized housing programs. As they recover,most are able to obtain employment that allows them to find private market or shared housing. The Divisionof Mental Health, Developmental Disabilities and Addictive Diseases Georgia Department of HumanResources provide preventative support and information primarily focused at children. Publicly supportedservices for alcohol and drug addictions in Atlanta are primarily the responsibility of Fulton and DeKalbCounties. What was once the only publicly supported extended stay detoxification program, Project Focus(40 – 100 residents), operated by Fulton County Human Services Department Office of Emergency andTransitional Housing, has not been refunded as of December 2004 due to budgetary constraints. Thisfacility has been partially replaced by the new 48-bed recovery facility, Hope House on Washington Street.
xxviii Dennis P. Culhane, Leonard Davis Institute of Health Economics University of Pennsylvania, Boston College Magazine, winter 2005, p.xxix Blueprint to End Homelessness in Atlanta in Ten Years, Commission on Homelessness, March 2003 p.33
123Atlanta Strategic Action Plan September 2007 Draft

A multi-path approach for federal, state, and local funds to develop and expand residential and supportivehousing opportunities similar to Project Focus is needed. Housing strategies for individuals recovering fromsubstance abuse include developing and expanding public-private partnerships with nonprofit organizations.Other strategies include assisting clients in developing shared housing options that meet their needs.
Gaps and Priorities
Access to available, affordable housing is essential to reintegration of recovering substance abusers intothe community in a drug-free lifestyle. Although a continuum of housing and residential treatment exists,there are significant gaps to be addressed:
Housing for 50 recovering substance abusers who speak only Spanish;Housing for 150 dually-diagnosed individuals;Permanent and transitional housing for 85 families with children and recovering parent(s) whose chronichealth problems limit their ability to work and earn enough income to support dependent children;(xxx)
Additional Independent living capacity similar to Young Adult Guidance Center is needed for 50recovering adolescents who cannot return home after treatment;(xxxi)
Persons with HIV/AIDS.
Needs for Persons with HIV/AIDS
The City of Atlanta is the entitlement grantee for the HOPWA program that covers the 28-county metropolitanAtlanta area. The Georgia Department of Human Resources estimates that the 28-county metropolitanAtlanta area had 9,068 diagnosed and reported HIV cases as of December 31, 2003. The majority ofdiagnosed cases (94%) were in 5 central metro area counties: Fulton, DeKalb, Gwinnett, Clayton, and Cobb;81% of the cases were reported in Fulton and DeKalb Counties(xxxii).
Approximately 68% of all cases reported in metro Atlanta were African American, 28% were white, and 4%were identified as Hispanic and/or other ethnic groups. Men represented 82% of all cases and 73% of allcases were over the age of 30.
The 2004 SuperNOFA applications developed by the metro Atlanta Tri-Jurisdictional Collaborative onHomelessness estimated that 10% of the estimated 6,529 homeless persons living on the streets, shelters,or transitional housing were infected with HIV.
Of the diagnosed and reported cases of people living with AIDS as of the end of 2003, 61% had beendiagnosed prior to 1999. Assuming that persons living with a diagnosis of AIDS for longer than 5 yearsrequire a higher level of services, it is projected that approximately 5,531 individuals with AIDS in themetropolitan Atlanta area are in need of assistance either through supportive housing facilities, rent subsidiesor short-term assistance to enable them to maintain appropriate housing and access services.
xxx Sister Love Substance Abuse Rehabilitation service need estimations 2004xxxi Young Adult Guidance Center Service applications – Community Design Center 2004xxxii Consolidated Plan for the City of Atlanta – 2005-2009 p. 31
September 2007 Draft Atlanta Strategic Action Plan124
Community Assessment3

Anecdotal information from AIDS service providers indicates that shelter options for homeless people livingwith HIV are not appropriate for many clients. For example, transgender individuals are not safe or welcomeat shelters for men or women. Further study is underway to assess the extent of need and adequacy ofexisting resources for homeless men and women living with HIV/AIDS(xxxiii).
The Fulton County Health Department reports a cumulative total of 844 HIV cases from 2000 through 2004.An incidence rate of 6.4 per 100,000 for new cases of HIV infection was reported in Atlanta as of 2004, upfrom the rate of 4.8 per 100,000 in 2000. There is a waiting list in Atlanta of over 100 households for rentalsubsidy through the Housing Opportunities for Persons with AIDS (HOPWA) Program administered by theMayor’s Office of Human Services.
Current Programs and Strategies
The federal HOPWA Program is an entitlement program that provides rental subsidies to families andindividuals living with AIDS whose condition leaves them unable to earn sufficient income to maintain theirhousing arrangement. The limited funding available was providing assistance to 345 households at theend of FY 2004.(xxxiv). Some emergency assistance is also available under this program. The Fulton CountyHealth Department provides non-residential casemanagement and clinic services for persons with HIV/AIDS.
Housing related supportive services including substance abuse recovery, mental health and legal services,home-delivered meals and furnishings to assist transitioning from homelessness will be provided forapproximately 700 persons in the metro area through the HOPWA program.
As the governmental entity responsible for development of the metro-wide Housing Opportunities for Personswith AIDS (HOPWA) program, the City of Atlanta coordinates with Fulton, DeKalb, Gwinnett, Clayton andCobb Counties and the City of Marietta. Local government representatives participate in the assessmentof housing and support service needs and long-range planning for the HOPWA program. The City alsocoordinates planning for the HOPWA program with the Metro Atlanta HIV Health Services Planning Council(Planning Council), which includes a broad range of organizations and individuals active in the HIV/AIDSarena in metro Atlanta. The Planning Council is responsible for planning and setting priorities for the allocationof RyanWhite program funds. The City of Atlanta works with local governments and the HOPWACommitteeof the Planning Council to review annual applications for HOPWA funding and staff recommendations forconsistency with HOPWA policies and priorities. The HOPWA Committee presents preliminaryrecommendations to a meeting of the full Planning Council for public comment and adoption ofrecommendations that are subsequently submitted for public review and comment in the City’s ConsolidatedPlan public hearings.
In partnership with Fulton County and the Planning Council, the City is conducting an HIV/AIDS housingand related services needs assessment update. The update is scheduled to be completed in August, 2005and will include input from members of the HIV/AIDS-affected community, AIDS housing and serviceproviders, representatives of metro area local governments, and other key informants to be identified. Needsassessment findings and recommendations should be incorporated into future HOPWA plans and priorities.
xxxiii Consolidated Plan for the City of Atlanta – 2005-2009 p. 3xxxiv Consolidated Plan for the City of Atlanta – 2004-2009 p. 14
125Atlanta Strategic Action Plan September 2007 Draft

Gaps and Priorities
HIV/AIDS supportive services are in constant need of reassessment as medical treatment advances andnew populations become at risk. HIV/AIDS remains a large and consuming issue for the 9,068 diagnosed(xxxv)
and reported cases in the Metro Atlanta area. HIV/AIDS is also intertwined with substance abuse as twentypercent of the total reported cases indicated intravenous drug use being the risk factor to their exposure.
As more effective treatments are developed for HIV/AIDS, persons who have the disease are living longer,but over time may be less able to earn sufficient income to remain self-supporting. An increasing need forshort-term and emergency assistance is also anticipated as those who are still able work experience periodsof disability and loss of income.
Homeless Needs
U.S. HUD now requires a ten-year plan to end chronic homelessness. The Regional Commission onHomelessness prepared this plan and is referenced throughout this section. Fulton and DeKalb Countiesand the City formed the Tri-Jurisdictional Collaboration to conduct the homeless census and apply for federalMcKinney funding annually, and support the establishment of a homeless management information system.
Several disparate estimates of the Atlanta homeless population have recently been developed using differentmethodologies. The 2005–2009 Consolidated Plan, relying on theBlueprint to End Homelessness, estimatesthe point-in-time number for homeless at 12,000 individuals. The Metro Atlanta Task Force for the Homeless,Inc. estimate of a point-in-time average night of 11,300 for 1995 and 16,351 (2005) was developed forMetropolitan Atlanta ContinuumCare planning for the U.S. Department of Housing and Urban Development(xxxvi).
The Homeless Task Force estimated the following subcategories of the special needs and the general(non-special needs) population who were homeless in 2004. This estimate was generated from a computermodel using 2002 poverty rates for Georgia. The Supportive Housing Program’s Continuum of Care GapsAnalysis subdivides the total homeless population into the categories used in the Task Force estimate.
Table 3.71 Percentage Distribution of the Homeless Population by Service Need, 2004TotalGPYQDVDVHIVDDSMICSAPopulation
100303101091037Single Men
1002231253131419Single Women
10045012015523Couples w/o children
100322115591026Total Individuals
10070011014410Men w/ Children
1006301201447Women w/ children
10065011514410Couples w/ Children
1006601151449Total Families
xxxv Consolidated Plan for the City of Atlanta – 2004-2009 p. 21xxxvi Jaret, Charles Adleman, Robert. Homelessness in Metro Atlanta, Research Atlanta, Inc. December 1997 had slightly lower estimates and
appears to have set the standard for the most recent estimates cited above.
September 2007 Draft Atlanta Strategic Action Plan126
Community Assessment3

TotalGPYQDVDVHIVDDSMICSAPopulation
Table 3.72 Key(VDV)Victims of Domestic Violence(CSA)Chronic Substance Abuse
(OD)Persons with Other Disabilities(SMI)Seriously Mentally Ill
(Y)Youth(DD)Dually Diagnosed
(GP)General Population(HIV)Persons with HIV/AIDS
These estimates generally correspond to the current literature on homelessness. Two-thirds of families donot have special needs characteristics – they are homeless due to economic or institutional circumstances.Approximately one-third of non-family individuals are homeless for similar reasons. Substance abuse affectsover one-third (37%) of single men but only 9% of families. Domestic violence affects one-quarter of singlewomen (25%), one-fifth (20%) of women with children and one-sixth (15%) of couples with children.
Serious mental illness afflicts 10% of single men, 14% of single women and relatively small proportions ofother sub groups of the homeless.(xxxvii) In March of 2003, Pathways Community Network, Inc. (PCNI) onbehalf of the Metro Atlanta Tri-Jurisdictional Collaborative on Homelessness, covering the City of Atlanta,Fulton County, and Dekalb County, conducted a homeless census and survey. This initiative provided bothcounts of the homeless and detailed information on the causes and nature of homelessness and theself-perceived needs of homeless persons. The survey phase of the homeless census interviewed 993persons, or nearly 15% of the total point-in-time homeless population within the Tri-Jurisdiction area. Surveysettings included a variety of shelter and transitional programs serving varied populations and a number ofsoup kitchens. Surveys were also conducted among homeless inmates in the municipal jail.
The table below , from the City’s 2004 “SuperNOFA” Exhibit 1 narrative, presents the adjusted census countof homeless persons for Atlanta utilized in Atlanta’s 2005 Consolidated Plan.
Table 3.73 Continuum of Care Homeless Population and Subpopulations Chart (HUD Table 1A)TotalUnshelteredShelteredPart 1: Homeless Population
TransitionalEmergency
4,8121,9281,1541,7301. Homeless Individuals
1672580622. Homeless Families with Children
6661003192472a. Persons in Homeless Families with Children
5,4782,0281,4731,977Total (lines 1 + 2a)
TotalUnshelteredShelteredPart 2: Homeless Subpopulation
5531883651. Chronically Homeless
4142. Seriously Mentally Ill
6903. Chronic Substance Abuse
xxxvii Homeless Task Force estimates adjusted by Community Design Center of Atlanta, March 2005
127Atlanta Strategic Action Plan September 2007 Draft

TotalUnshelteredShelteredPart 1: Homeless Population
3504. Veterans
3455. Persons with HIV/AIDS
356. Victims of Domestic Violence
227. Youth
One-third of the homeless survey respondents were female and two-thirds were male. Over 86% wereAfrican-American, 9.0%were non-HispanicWhite, 1.8%was Asian/Pacific Islander, 0.7%wasHispanic/Latino,and 2.0% were “other.”
Eighty-eight percent (88%) of the City’s point-in-time homeless population consists of single persons, while12% are persons in families. The 2003 homeless census and survey project found that homeless familiesare more likely than single persons to become homeless due to economic problems such as loss of job ortermination of benefits.
The over 107 organizations that provide homeless services are dependent on public support for 49% oftheir operating income. These providers anticipated a 15-40% decline (2003) as compared to 2002 levels(xxxviii).The Atlanta Tri-Jurisdictional Collaborative reported in 2002 that City homeless shelters, on one winter nightin 2002, served 2,267 people with 1,200 beds.
At Risk Populations
In addition to those persons and families who are already homeless, many households in the City of Atlantaare at risk of homelessness. The risk factor that is most easily measurable is housing cost burden. Costburdened households are defined as those paying over 30% of income for housing; severely cost burdenedhouseholds pay 50% or more of their incomes for housing. The preceding housing needs analysis concludedthat there were 12,053 cost burdened owners and 36,707 cost burdened renters in Atlanta. There were7,674 severely cost burdened owners and 19,924 severely cost burdened renters. The median income ofcost burdened owners was $19,371 and the comparable figure for renters was $13,012. All of the severelycost burdened households are at acute risk for homelessness in the immediate future, and many lessseverely cost burdened households could easily be pushed into homelessness by one large unexpectedexpense.
The 2004 SuperNOFA developed by the Metro-Atlanta Tri-Jurisdictional Collaborative on Homelessnessestimated that 10% of the 6,529 to 12,000 homeless persons estimated to be living on the street, in sheltersor in transitional housing are infected with AIDS. Anecdotal information from AIDS service providers indicatesthat shelter options for homeless people living with HIV are not appropriate for many clients.
The Fulton County Department of Human Resources (DHR) estimates that there were 75,985 adults (12.3%of 2000 Census adult population) and 3,249 adolescents (4.9% of 2000 Census adolescent population)needing substance abuse treatment(xxxix).
xxxviii Blueprint to End Homelessness in Atlanta in Ten Years, Commission on Homelessness, March 2003, p. 16xxxix City of Atlanta, U.S. Housing and Urban Development Consolidated Plan, 2005
September 2007 Draft Atlanta Strategic Action Plan128
Community Assessment3

Another group at risk for homelessness is youth aging out of foster care. In 2003, the Fulton CountyDepartment of Human Resources reported 281 youth between the ages of 6 and 18, and 74 youth over 18were residing in foster care, for a total of approximately 97 youth aging out of foster care and eventuallyrequiring affordable housing in order to avoid homelessness. A Jim Casey Youth Opportunities InitiativeStudy cited one in four children who “age out” of foster care become homeless.(xl).
Table 3.74 Homeless Facilities Components in Continuum of Care System – Emergency Shelters2004 All Beds2004 Year-Round
Units/BedsTarget PopulationGeo CodeHMISFacility NameProvider Name
SeasonalYr-roundIndivBeds
Fam.Beds
Fam.Units
BA
Current Inventory
05500SF130174CALPP EmergencyShelter
Alternate Life Paths
0757500SM130174NAtlanta BaptistRescue Mission
Atlanta BaptistRescue Mission
01082088*FC130174CMilton Ave. ShelterAtlanta City Mission
011236760FC130174CMy Sister’s HouseAtlanta Union Mission
10030830800SM130174CShepherd's InnAtlanta Union Mission
170017000SMW130174NShelter ProgramBlood N Fire
130013000SM130174CCentral Night ShelterCentral PresbyterianChurch
0303000SM130174CClifton Night ShelterClifton SanctuaryMinistries
070070FC130174CEllis Street ShelterCommunity Concerns
1401400SW130174CShearith IsraelShelter
CongregationShearith Israel
3003000SM130174NDruid Hills ShelterDruid HillsPresbyterian
0121200130174NFirst PresbyterianChurch Shelter
First PresbyterianChurch
015015000SM130174CJefferson PlaceFulton County
0505000SM130174NMen’s HousingGod's Favorite People
0412021*DVFC130174NPartnership AgainstDomestic Violence
Partnership AgainstDomestic Violence
7005020*SMF130174CRed Shield ColdWeather Program
Salvation Army
0362412*SMF130174CRed Shield ServicesEmergency
Salvation Army
030030*FC130174NSet Free SanctuaryShelter
Set Free MemorialDrive SanctuaryShelter
xl Jim Casey Youth Opportunities Initiative Study, LA Times Series on Aging Out, LA Times, December 2, 2000
129Atlanta Strategic Action Plan September 2007 Draft

2004 All Beds2004 Year-RoundUnits/Beds
Target PopulationGeo CodeHMISFacility NameProvider Name
04400SMW130174CMercy MobileMotel/Hotel*
St. Joseph's MercyCare Services
0202000SMW130174CSt. Jude's DetoxSt. Jude's RecoveryCenter
061261200SMW130174CPeachtree PineOverflow Shelter
Task Force for theHomeless
4404400SMW130174N***Zaban Night ShelterThe Temple - HebrewBenevolentCongregation
015015*M130174CTraveler's AidEmergency Shelter**
Traveler's Aid
558167818043320Subtotal
Under Development
0404000YMF130174CCovenant HouseCrisis Center
Covenant House
0454500SM130174P-3/05Emergency Shelter24/7 Gateway Center
0454500SM130174P-3/05Safe Haven24/7 Gateway Center
Table 3.75 Homeless Facilities Components in Continuum of Care System – Transitional Housing2004 All Beds2004 Year-Round
Units/BedsTarget PopulationGeo CodeHMISFacility NameProvider Name
SeasonalYr-roundIndivBeds
Fam.Beds
Fam. UnitsBA
Current Inventory
070155520FC130174CAchorAchor
0121200AIDSSM130174NAESM HouseAESM
0121200SM130174CSaint ThereseHouse
AftercareResidentialRehabilitationServices
06600SW130174CALPP GroupHome
Alternate Life Paths
0328248FC130174CIndependent LivingAlternate Life Paths
06600SW130174NLuke's PlaceAntioch UrbanMinistries
0202000SMW130174NMadison HouseAntioch UrbanMinistries
0181800AIDSSMW130174NMatthew’s PlaceAntioch UrbanMinistries
07700SW130174NRuth’s PlaceAntioch UrbanMinistries
034034*FC130174CMilton AvenueAtlanta City Mission
September 2007 Draft Atlanta Strategic Action Plan130
Community Assessment3

2004 All Beds2004 Year-RoundUnits/Beds
Target PopulationGeo CodeHMISFacility NameProvider Name
016616600SM130174NAtlanta RecoveryCenter
Atlanta RecoveryCenter
06600SM130174NSerenity HouseAtl.
Atlanta Step-UpSociety
016416400SM130174CCarpenter's HouseAtlanta UnionMission
0909000SM130174CFuqua HallAtlanta UnionMission
015230122*SW130174CMy Sister’s HousePersonalDevelopm’t
Atlanta UnionMission
040040*FC130174NBlood N FireTransitional
Blood N Fire
0606000SMW130174NBehavioral HealthResidence
Bright Beginnings
0240248FC130174NIndependentResidence
Bright Beginnings
03503512FC130174CTransition HousingBuckhead ChristianMinistry
0202000SM130174COdyssey IIITransitional
CommunityConcerns
0181800SM130174NCovenantCommunity
CovenantCommunity
0101000SM130174NTransitionalHousing
CovenantCommunity
08800YW130174CSecond ChanceFamilies First
0505000SM130174CJefferson PlaceTransitionalHousing
Fulton County
0121200SM130174CJefferson PlaceProject Focus
Fulton County
052052*FC130174CGenesisGenesis
0181800VETSMW130174NCrisis ResourceCenter
Georgia VietnamVeterans Alliance
0202000SM130174NTransitionalHousing
He’s Brought LifeMinistries
0191900SM130174CHOPE Thru DivineIntervention
HOPE Thru DivineIntervention
0101000SM130174CJoe’s PlaceClifton SanctuaryMinistries
06600SM130174NMen’s ProgramNew BeginningsRestoration
131Atlanta Strategic Action Plan September 2007 Draft

2004 All Beds2004 Year-RoundUnits/Beds
Target PopulationGeo CodeHMISFacility NameProvider Name
06600SW130174NWomen’s ProgramNew BeginningsRestoration
055055*FC130174CBoulevard HouseNicholas House
0262600SMW130174C881 Rock StreetQuest 35
06600SM130174CLeonard HouseMen’s Program
Quest 35
06600SW130174CLeonard HouseWomen’s Program
Quest 35
2004 All Beds2004 Year-RoundUnits/Beds
Target PopulationGeo CodeHMISFacility NameProvider Name
SeasonalYr-roundIndivBeds
Fam.Beds
Fam.Units
BA
Current Inventory
0808*FC130174NWomen +Children'sTransitional
Saint Mark's
019016525*SMW130174CTransitionalSalvation Army
06600SM130174CTransitional HouseSamaritan House
01376*AIDSSW130174NLoveHouseSisterLove
06600AIDSSMW130174NLegacy HouseSouthsideHealthcare
0202000AIDSSMW130174NLegacy VillageSouthsideHealthcare
0454500SM130174C95 RenaissancePkwy
St. Jude’s RecoveryCenter
01120112*FC130174CFamily CareCenter
St. Jude’s RecoveryCenter
0202000SM130174CStep-Down at 450Piedmont
St. Jude’s RecoveryCenter
0202000SW130174CWomen’s Programat 244 14th St.
St. Jude’s RecoveryCenter
0585800SMW130174NThe Open DoorThe Open DoorCommunity
0282800SM130174CTransition Housingat Peachtree Pine
Task Force for theHomeless
04004010FC130174CTransitionalHousing
Traveler's Aid
0121200SM130174CTrinity HouseTrinity CommunityMinistries
04400SM130174CTrinity LodgeTrinity CommunityMinistries
September 2007 Draft Atlanta Strategic Action Plan132
Community Assessment3
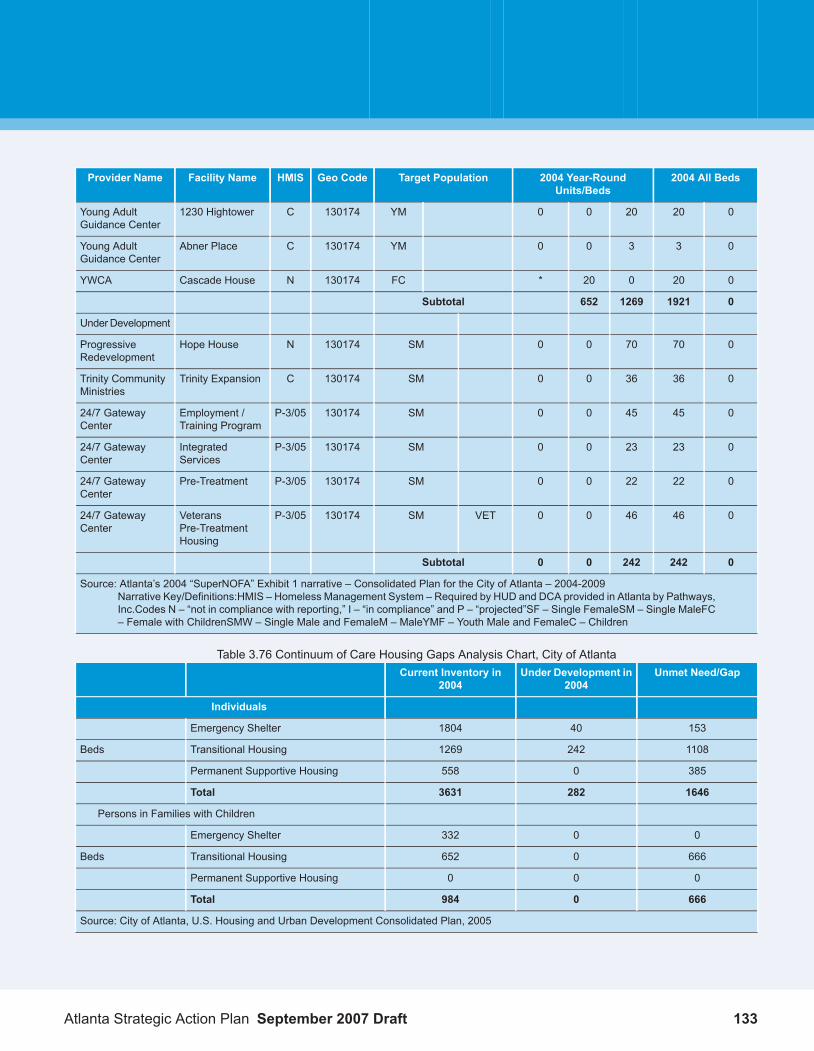
2004 All Beds2004 Year-RoundUnits/Beds
Target PopulationGeo CodeHMISFacility NameProvider Name
0202000YM130174C1230 HightowerYoung AdultGuidance Center
03300YM130174CAbner PlaceYoung AdultGuidance Center
020020*FC130174NCascade HouseYWCA
019211269652Subtotal
UnderDevelopment
0707000SM130174NHope HouseProgressiveRedevelopment
0363600SM130174CTrinity ExpansionTrinity CommunityMinistries
0454500SM130174P-3/05Employment /Training Program
24/7 GatewayCenter
0232300SM130174P-3/05IntegratedServices
24/7 GatewayCenter
0222200SM130174P-3/05Pre-Treatment24/7 GatewayCenter
0464600VETSM130174P-3/05VeteransPre-TreatmentHousing
24/7 GatewayCenter
024224200Subtotal
Source: Atlanta’s 2004 “SuperNOFA” Exhibit 1 narrative – Consolidated Plan for the City of Atlanta – 2004-2009Narrative Key/Definitions:HMIS – Homeless Management System – Required by HUD and DCA provided in Atlanta by Pathways,Inc.Codes N – “not in compliance with reporting,” I – “in compliance” and P – “projected”SF – Single FemaleSM – Single MaleFC– Female with ChildrenSMW – Single Male and FemaleM – MaleYMF – Youth Male and FemaleC – Children
Table 3.76 Continuum of Care Housing Gaps Analysis Chart, City of AtlantaUnmet Need/GapUnder Development in
2004Current Inventory in
2004
Individuals
153401804Emergency Shelter
11082421269Transitional HousingBeds
3850558Permanent Supportive Housing
16462823631Total
Persons in Families with Children
00332Emergency Shelter
6660652Transitional HousingBeds
000Permanent Supportive Housing
6660984Total
Source: City of Atlanta, U.S. Housing and Urban Development Consolidated Plan, 2005
133Atlanta Strategic Action Plan September 2007 Draft

Jobs-Housing Balance
Commuting Patterns of Resident and Nonresident Workforce
The table below compares the number of residents that live in Fulton County and are employed in Fultonand the 12 surrounding counties. Of the 717,702 employed residents that live in Fulton County, 265,870(37%) work in Fulton County while 42,910 (6%) residents are employed outside of the region. There are385,442 persons commuting to work in Fulton County and 119,572 of these are persons who live outsideof Fulton County.
Table 3.77 Resident and Nonresident Workforce of Fulton CountyNet Out-Migrationfrom Fulton County
Persons Employed in Fulton CountyEmployed Residents of Fulton County
Number of EmployedPersons
County of ResidenceNumber of EmployedPersons
County of Employment
16,3651,129Cherokee17,494Cherokee
30,5499,722Clayton40,271Clayton
67,02324,991Cobb92,014Cobb
7,905950Coweta8,855Coweta
80,68941,232DeKalb121,921DeKalb
13,0611,192Douglas14,253Douglas
13,1121,633Fayette14,745Fayette
9,6255,626Forsyth15,251Forsyth
0265,870Fulton265,870Fulton
36,52621,211Gwinnett57,737Gwinnett
13,203954Henry14,157Henry
7,304128Paulding7,432Paulding
4,221571Rockdale4,792Rockdale
299,583375,20913 County Area674,79213 County Area
32,67710,233External42,910External
332,260385,442Total Workers717,702Total Workers
Source: Atlanta Regional Commission 2004
Stated another way, 37.0% of Fulton County’s employed persons work inside the county and 63.0% commuteto work outside the county. Of the 385,442 employed persons in Fulton County, two-thirds (66.6%) arefrom Fulton County and one-third (33.4%) is from outside the country. While 119,572 people commute towork in Fulton County from outside the county, Fulton sends 451,832 residents to work outside the county.Thus, the net out migration from the county is 332,260.
If there were more affordable housing in the suburbs, the imbalance between outbound and inboundcommuters would be less.
September 2007 Draft Atlanta Strategic Action Plan134
Community Assessment3

Cost of Housing and Jobs-Housing Balance
David Sawicki, Aidan Poile and a team of City and Regional Planning students analyzed the relationshipsbetween jobs, wages and housing costs in the Atlanta 10 County Region in fall, 2003.(xli) Their findingsempirically confirm intuitive perceptions of job rich suburbs surrounding a central city populated by poorerpeople who live in cost burdened housing conditions. Specifically, they concluded:
For households earning less than $35,000, the 10-county region lacks approximately 185,000 affordableunits. For incomes above this level, the region has a surplus of over 95,000 units (i.e., households arepaying less than 30% of their income for housing, and “competing” with poorer households for more affordableunits). The region lacks enough housing for the poor. (xlii)
The focus of their research was on job centers and not political jurisdictions, so there is less data presentedfor cities and counties. But, one analysis summarizes the units needed to meet existing housing deficitsby jurisdiction. This analysis concludes that the City of Atlanta has a deficit of 81,257 units priced under$600 a month when incomes are compared to housing prices. Stated another way, the incomes of Atlantahouseholds are so low that there is a shortage of housing in the lowest price ranges. Specifically:
Table 3.78 Units Needed to Meet Existing Deficits, City of Atlanta,2000
Deficit (Units)Monthly Payment
3,068Less than $300
21,325$300 to $399
35,983$400 to $499
20,815$500 to $599
81,191Total
This interpretation of needs means that the 81,191 units constitute 24.5% of the region’s deficit for unitsunder $600.
Figure 1 describes the jobs housing ratio by census tract and is drawn from Fair Share Housing. The mapclearly shows much of the City of Atlanta to have less than 0.75 jobs per housing unit. Much of the areabelow Interstate 20 is in the two categories with the lowest jobs to housing ratios (housing rich in theterminology of the research team). The job rich areas are on the periphery, along the expressways outsidethe perimeter and across the northern portion of the region.
xli David Sawicki, Aidan Poile, Zarinah Boykin, Cassie Gorman, Lauren Jaynes, Ellen Mendelsohn, Irene Wong, David Zanaty. Fair ShareHousing in the Atlanta Region. Graduate Program in City and Regional Planning, Georgia Institute of Technology, December 2003
xlii Fair Share Housing, p. I-O
135Atlanta Strategic Action Plan September 2007 Draft

Issues and Opportunities
Issues
The availability of decent affordable housing has become scarce as living intown closer to the job markethas become increasingly desirable, the prices of residential real estate particularly new construction, hasrisen above threshold for what the National Housing and Urban Development (HUD) considers to beaffordable.
Historically the city's residential market consisted of mostly single family homes. It was until the last decade(1990s) that the housingmarket expanded significantly to include a variety of apartment complexes, townhomecommunities and both low and high rise condominiums. This has provided some variety in the city's housingmarket to meet residents's needs at all stages of life, but it still falls short of optimum. The city also lacksavailable housing for the Special Needs community.
As more residential options become available intown the gap between housing and major employmentcenters is closing. There is still a major disparity in the location of housing and the location of employmentcenters.
The City's ability to provide housing code enforcement is out-paced by the rate at which code violationsoccur therefore, substandard housing persists.
Given the impending increases in energy costs, the current housing market has not responded sufficientlytowards the production of energy efficient homes.
Opportunities
Efforts are underway and some programs are in place such as the UEZ’s, TAD’s, LCI’s, Quality of LifeDistricts, Opportunity Bonds and Inclusionary Zoning to maximize the number of affordable housing unitsproduced annually.
Through the Livable Centers initiative (LCI) transit oriented development has become a focus in the city'splanning efforts. This not only encourages residential development new transit stations, it encourages mixedincome residential, job creation and economic development. This helps close the gap between place ofwork and place of residence as well as provides a variety of housing for all sections of the community.
There are new policies in place to increase the level of response to housing code violations. Improvementsin the code enforcement process is imminent.
Efforts are underway to re-write the existing Housing Codes Ordinance of 1987 (as amended) to updateand incorporate changes in policy, court proceedings etc., for new and existing housing.
In the fall of 2007 their will be a new department of environment and sustainability. New policies and regulationwill emerge to address the creation of energy efficient housing units.
September 2007 Draft Atlanta Strategic Action Plan136
Community Assessment3

Natural and Cultural Resources
Environmental Planning Criteria
The City of Atlanta takes pride in the varied Natural Resources that lie within its boundaries. Whetherenjoying the vista that the Chattahoochee offers or making use of the many parks and trails that traversethe city, the City of Atlanta is abundant with Natural Resources that need protection. In this section of theStrategic Plan we will outline the existing Natural Resources as well as current policies used to protect them.
Georgia Department of Community Affairs's Minimum Planning Standards requires that the City of Atlantadevelop environmental planning criteria that deals with identifying and protecting all water supply watersheds,groundwater recharge areas, wetlands, river corridors and mountains. The following information attemptsto give an assessment of existing environmental planning components as well as describe efforts to protectthem throughout the future.
Protection of Water Supply Watersheds
Water Supply Watersheds
The Department of Natural Resources defines water supply watersheds as the areas of land that drain toa public drinking water supply intake. Water supply watersheds are subject to the Department of NaturalResources’ Rules for Environmental Planning Criteria. The City’s public drinking water supply intake islocated on the Chattahoochee River just north of Peachtree Creek. The portion of the City that falls withinthe boundaries of its water supply watershed is the Chattahoochee River drainage basin north of PeachtreeCreek.
Watershed Supply Watersheds are defined by DNR as water supply that drain into a public drinking watersupply intake. The City's drinking water supply is on the Chattahoochee just north of Peachtree Creek.
As Atlanta's primary drinking source, the Chattahoochee has always been high on the list of protection forthe City and State of Georgia. In 1973, the Georgia Assembly enacted the Metropolitan River ProtectionAct to place 2000-foot corridor along both banks of the river as well as its impoundments. At the sametime the Atlanta Regional Commission developed the Chattahoochee Corridor Plan. This act requires thatlocal governments implement the plan by issuing permits, monitoring land-distrubing activities around thecorridor, and by enforcing the act via the plan.
The Chattahoochee Corridor Plan, devised by the Atlanta Regional Commission, sets standards that mustbe met: Buffer Zone Standards, Vulnerability Standards, and Floodplain Standards. These standards wereestablished to minimize the effects of development along the river by utilizing the existing surrounding asa guide for development suitability.
With the Greenway Acquisition program, land adjacent all Water Supply Watersheds has the opportunityto be eligible for a conservation easement in order to control any development in and around the area. Thefollowing creeks have the opportunity to benefit from donated adjacent lands:
137Atlanta Strategic Action Plan September 2007 Draft

Peachtree CreekProcter CreekSouth RiverUtoy CreekSouth Utoy CreekNancy CreekIntrenchment Creek
September 2007 Draft Atlanta Strategic Action Plan138
Community Assessment3

Map 3.11 Atlanta's Watersheds
Table 3.79 Atlanta's Watershed Framework
139Atlanta Strategic Action Plan September 2007 Draft
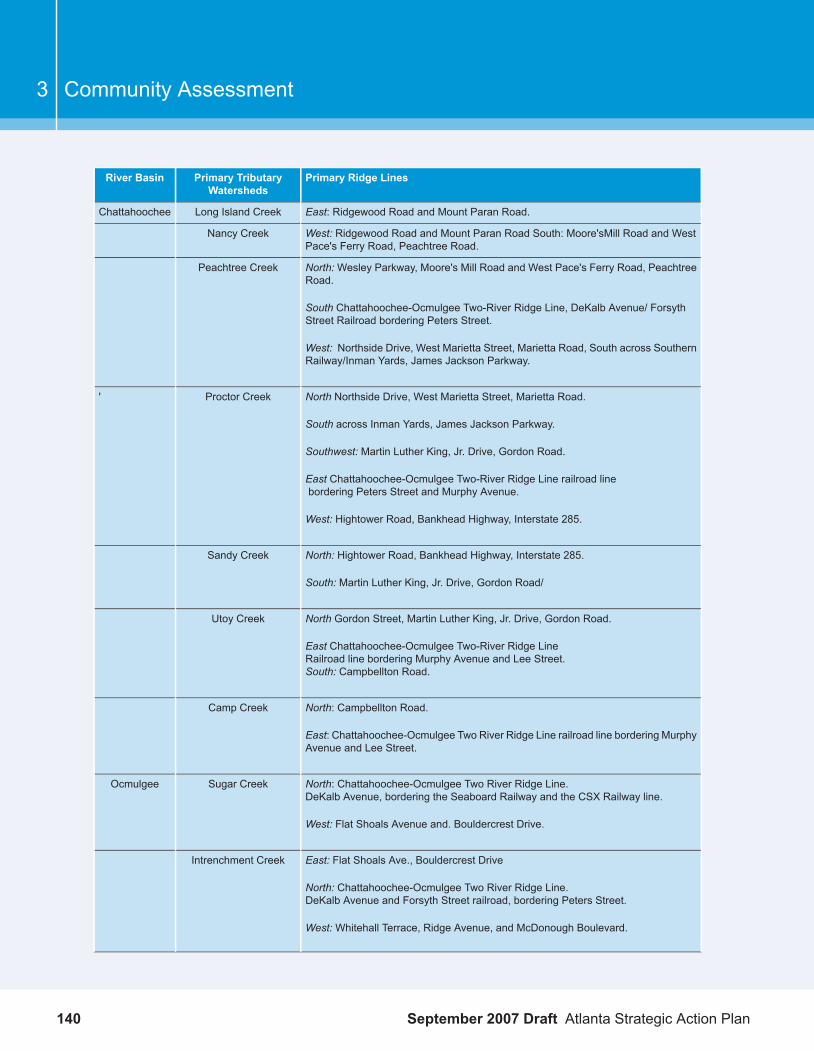
Primary Ridge LinesPrimary TributaryWatersheds
River Basin
East: Ridgewood Road and Mount Paran Road.Long Island CreekChattahoochee
West: Ridgewood Road and Mount Paran Road South: Moore'sMill Road and WestPace's Ferry Road, Peachtree Road.
Nancy Creek
North:Wesley Parkway, Moore's Mill Road and West Pace's Ferry Road, PeachtreeRoad.
Peachtree Creek
South Chattahoochee-Ocmulgee Two-River Ridge Line, DeKalb Avenue/ ForsythStreet Railroad bordering Peters Street.
West: Northside Drive, West Marietta Street, Marietta Road, South across SouthernRailway/Inman Yards, James Jackson Parkway.
North Northside Drive, West Marietta Street, Marietta Road.Proctor Creek'
South across Inman Yards, James Jackson Parkway.
Southwest: Martin Luther King, Jr. Drive, Gordon Road.
East Chattahoochee-Ocmulgee Two-River Ridge Line railroad linebordering Peters Street and Murphy Avenue.
West: Hightower Road, Bankhead Highway, Interstate 285.
North: Hightower Road, Bankhead Highway, Interstate 285.Sandy Creek
South: Martin Luther King, Jr. Drive, Gordon Road/
North Gordon Street, Martin Luther King, Jr. Drive, Gordon Road.Utoy Creek
East Chattahoochee-Ocmulgee Two-River Ridge LineRailroad line bordering Murphy Avenue and Lee Street.South: Campbellton Road.
North: Campbellton Road.Camp Creek
East: Chattahoochee-Ocmulgee Two River Ridge Line railroad line bordering MurphyAvenue and Lee Street.
North: Chattahoochee-Ocmulgee Two River Ridge Line.DeKalb Avenue, bordering the Seaboard Railway and the CSX Railway line.
Sugar CreekOcmulgee
West: Flat Shoals Avenue and. Bouldercrest Drive.
East: Flat Shoals Ave., Bouldercrest DriveIntrenchment Creek
North: Chattahoochee-Ocmulgee Two River Ridge Line.DeKalb Avenue and Forsyth Street railroad, bordering Peters Street.
West:Whitehall Terrace, Ridge Avenue, and McDonough Boulevard.
September 2007 Draft Atlanta Strategic Action Plan140
Community Assessment3

Primary Ridge LinesPrimary TributaryWatersheds
River Basin
East:Whitehall Terrace, Ridge Avenue, and McDonough Boulevard.South River
West: Chattahoochee-Ocmulgee to Two-River Ridge Line railroad line borderingMurphy Avenue and Lee Street.
On the West and North sides of the City, the Chattahoochee River is supplied by seven stream drainagebasins: Long Island Creek, Nancy Creek, Peachtree Creek, Proctor Creek, Sandy Creek, Utoy Creek, andCamp Creek basins. In the Southeast section of the City, three stream drainage basins supply the OcmulgeeRiver: Sugar Creek, Intrenchment Creek, and the South River.
Each stream drainage basin watershed is bounded by ridgelines and plateaus, which cradle floodplainvalleys where the headwaters of several tributary creeks originate in springs. These springwaters flow intothe principal creek, which finally flows through a streamway corridor and floodplain to supply the river.
From Atlanta’s earliest days, the network of its major arterial roads has followed the ridgeline networkbordering the river and stream basins. The relationship between Atlanta’s stream basin ridgeline systemand the roadway framework is shown by Table IV-1.
The two continental plates that comprise each river basin interface in the heart of the Central BusinessDistrict (CBD). This boundary runs along a ridge line which originates east of Atlanta, travels westward toenter the City along what is now DeKalb Avenue, crosses Woodruff Park to Forsyth Street, and then archesto the southwest, paralleling Spring Street and Peters Street.
The headwaters for several creeks in the Chattahoochee River Basin and the Ocmulgee River Basin originatewithin a fifteen-block radius of the "Five Points" intersection. Waters from these springs are currently routedto the storm sewer system that carries the water to the rivers via outfall pipes, which feed the creeks.
Since water supply watersheds directly into the City’s water supply intake, it is critical that they be protectedin order to ensure the adequate supply of water for Atlanta’s citizens.
Water supply watersheds in Atlanta are protected by ordinance. The ordinance regulates uses within aseven-mile radius up stream of any public drinking water supply intake, which would handle hazardousmaterials. Requirements include siting such uses on an impervious surface and having a spill and leakcollection system. In addition, Atlanta citizens have been concerned about and involved in the protectionof water supply watersheds through the formation of several community watershed groups. Their missionis to preserve and protect the integrity of the City’s streams. City officials work with these groups on aninformal basis.
The City of Atlanta may also consider the establishment of a water reuse program. According to EPA, waterrecycling has proven to be effective and successful in creating a new and reliable water supply, while notcompromising public health. Non-potable (not for drinking purposes) reuse is a widely accepted practice.However, in many parts of the United States, the uses of recycled water are expanding in order toaccommodate the needs of the environment and growing water supply demands. Advances in wastewater
141Atlanta Strategic Action Plan September 2007 Draft

treatment technology and health studies of indirect potable reuse have led many to predict that plannedindirect potable reuse will soon become more common. In the future, the City will be identifying otherpotential users of treated effluent for irrigation purposes.
Protection of Groundwater Recharge Areas
Groundwater recharge is the process by which precipitation infiltrates soil and rock to add to the volume ofwater that is stored in pores and other openings within them. Most of northern Georgia is underlain bycrystalline rocks with complex geologic character and with little or no porosity within the rocks themselves.Significant recharge areas in the crystalline rock terrain of northern Georgia are found in areas that havethick soils or saprolite, and which have relatively low (less than 8 percent) slopes. These conditions arenot present in the City. Groundwater recharge areas are subject to the Department of Natural Resources’Rules for Environmental Planning Criteria.
The City has passed and enforces ordinances which protect river corridors and wetlands. The City doesnot have any significant recharge areas or any mountains which required protection based on the Part Venvironmental criteria. The City has not passed ordinances to address these criteria. The City has notpassed an ordinance to protect water supply watersheds as outlined in the Part V criteria.
Groundwater recharge areas are subject to the Department of Natural Resources’ Rules for EnvironmentalPlanning Criteria. Recharge is the process by which precipitation infiltrates soil and rock to add to thevolume of water stored in pores and other openings within them. Most of northern Georgia is underlain bycrystalline rocks with complex geologic character and with little or no porosity within the rocks themselves.Significant recharge areas in the crystalline rock terrain of northern Georgia are found in areas that havethick soils or saprolite and relatively low (less than 8 percent) slopes. These conditions are not present inthe City.
Protection of River Corridors, Mountains & Wetlands
Protected Rivers
The Chattahoochee River Corridor is the Atlanta Region’s most significant natural feature. It is unrivaled inthe State for historic and cultural significance, and is rich in animal and plant diversity. These characteristicsmake reclaiming the corridor for environmental enhancement and public benefit desirable. Protected riversand their corridors are subject to the Department of Natural Resources’ Rules for Environmental PlanningCriteria. The Chattahoochee River Corridor is protected by the Metropolitan River Protection Act (MRPA),which is described in another section of this element of the CDP.
Proposed development threatens the Chattahoochee River Corridor north and south of Peachtree Creek.Invasive infrastructure and plants, as well as adverse types of land uses, have irreparably altered the naturalecology of the corridor south of Peachtree Creek.
Smaller streams need protection as well. The combination of volume and velocity of stormwater runoff fromimpervious surfaces in watersheds throughout the City, in conjunction with intense rainstorms, has causedsevere erosion of streambanks in many neighborhoods. Loss of property, trees, and soil are commonplace.Destruction of streambanks is both economically- and ecologically-damaging, and expensive to restore.
September 2007 Draft Atlanta Strategic Action Plan142
Community Assessment3

Pollution of the City's streams and creeks is most-frequently caused by non-point source pollution, such asfertilizer residue from lawns and parking lot and road oil that is washed into streams during a rainstorm.Point source discharges, such as the illegal dumping of hazardous or toxic materials into culverts or directlyinto streams is also occurring. Pollution of surface water is a critical health and safety problem, particularlyin City parks or near schools, where streams often attract young children.
Under current City ordinances, alterations of stream courseways are generally not allowed. In densedevelopment areas, it is sometimes necessary to augment a stream; however, this practice interrupts thenatural desired movement of the stream and may result in a higher stream velocity.
Greenway Acquisition Project
Under a Supplemental Environmental Program that was established by a federal consent decree, The Cityof Atlanta is investing $25 million in the purchase of property along selected portions of streams in MetroAtlanta that flow into the Chattahoochee and South Rivers. The Greenway Acquisition Project is intendedto improve water quality in Metro Atlanta streams and the Chattahoochee and South Rivers. The land willbe converted to and/or preserved as “greenways”, which are undeveloped and undisturbed corridors alongstream banks that serve as natural filters to trap sediment and other pollutants carried by stormwater beforethey reach the streams. The natural vegetation of greenways provides wildlife habitats and offer opportunitiesfor passive recreation. The City of Atlanta would like to create a protected greenway along the ChattahoocheeRiver from the northern City Limits at the National Park Service Recreational Area to the southern City Limitsat the Fulton County Airport.
Other relevant goals, regulations, and programs by the City, State, and National Park Service are focusedon further protecting and preserving the Chattahoochee River Corridor. These are identified and discussedbelow.
Metropolitan River Protection Act
The Metropolitan River Protection Act (MRPA) was signed into law by the Georgia General Assembly in1973 in response to growing concerns about protecting the Chattahoochee River. The Act established a2000-foot river corridor on both banks of the Chattahoochee River for the 48-mile stretch of the river betweenthe Buford Dam north of Atlanta and Peachtree Creek. In 1998, the Act was amended to extend theChattahoochee River Corridor by an additional 36 miles southward to the boundaries of the Atlanta Region.
The Act required the Atlanta Regional Commission (ARC) to adopt a Chattahoochee River Corridor Planto protect the land water resources of the Chattahoochee River Corridor, as well as procedures to implementthe Act and the Plan. It also gave ARC the authority to review development proposals for compliance withthe Plan, and to issue findings from these reviews. The Act empowered local governments within the Planboundaries to implement the Plan by allowing development proposals that are approved through ARC’sreviews; to monitor land-disturbing activities within the Corridor; and to enforce the requirements of the Actand the standards of the Plan. The Act specifies that any land-disturbing activity which occurs within theCorridor that is not in compliance with, or has not been certified under, the Plan is illegal.
143Atlanta Strategic Action Plan September 2007 Draft

ARC reviews proposed development projects for properties that are located within the Chattahoochee RiverCorridor according to its adopted Chattahoochee Corridor Plan. The Plan includes development principlesand standards that are intended to minimize the negative effects of development on the ChattahoocheeRiver. The suitability of specific types of development is gauged on a property’s existing topography, soils,and vegetation.
The law as it is applied to the Atlanta Region establishes a river protection corridor two thousand feet fromeither bank of the river below Buford Dam in Gwinnett County to the southern boundary of Fulton County.Development standards within the corridor include a fifty-foot natural vegetative buffer, a 150-foot impervioussurface setback along the bank of the Chattahoochee River, and a thirty-five-foot natural vegetative bufferon both banks of all flowing tributary streams in the Corridor. The MRPA also requires that local governmentsadopt tributary buffer ordinances for streams outside the 2000-foot River Corridor that drain into theChattahoochee River.
The Plan identifies three types of standards that must be met by a proposed development project. Theseare vulnerability standards, buffer zone standards, and floodplain standards. A height limit of 35 feet isimposed for all structures, other than bridges, above the existing gradeof the property. Development projectscan be as small as one lot, such as for a subdivision or the installation of a swimming pool on a residentialproperty, or as large as a major mixed-use development project.
The keys in determining whether or not a particular proposed development project must be subjected tothe MRPA review process is whether the project would increase the existing amounts of land disturbanceand impervious surface (or above any previously-approved amounts for that property) and whether it wouldaffect other standards. Additions to existingdevelopments which are located within the Chattahoochee RiverCorridor are also subject to MRPA review.
If a MRPA review for a proposed development project is required, the review process is governed by ARC’sMetropolitan River Protection Act Rules and Regulations. The local government accepts a completedMRPAreview application from the applicant and sends it to ARC for review of its consistency with the standardsof the Chattahoochee River Corridor Plan. ARC makes a “finding”, which it communicates to the localgovernment. In turn, the local government issues a “certificate” to the applicant. Thereafter, the localgovernment must monitor the development project and other land within the Corridor to ensure that nounauthorized land-disturbing activity occurs. The local government may then take action against violatorsand impose penalties of up to $1,000 per acre per day.
The City of Atlanta participates in the MRPA review process for properties that are located within its bordersalong the Chattahoochee River Corridor. This requirement is satisfied by the City of Atlanta Riparian BufferOrdinance (Chapter 79, Article VII of the City Code), and a summary of the provisions of the MetropolitanRiver Protection Act, asit affects local zoning, comprises Sec. 16-23.007 of the Atlanta Land DevelopmentCode of 1982 (Zoning Ordinance)
For the City of Atlanta, the Bureau of Planning within the Department of Planning and CommunityDevelopment manages the MRPA development review process. Applicants of proposed developmentprojects that are to be located within 2,000 feet of the Chattahoochee River are notified of the requiredMRPA review process. They are then given handouts with examples of situations which may be encountered
September 2007 Draft Atlanta Strategic Action Plan144
Community Assessment3

and the applicable regulations; steps in the MRPA review process; and an application for a MRPACertificate.Applicants are required to submit for review a site plan, erosion control plan, vegetation plan, grading plan,a list of land-disturbing activities that would occur, and an explanation of how sewage from the proposeddevelopment project would be treated. These are forwarded to the Atlanta Regional Commission (ARC)for its review, and a public hearing is held.
When all requirements are satisfied, the applicant is issued a MRPA Certificate, which is filed in the realestate records office of the Clerk of Superior Court in the county in which the property is located (eitherFulton or DeKalb County for properties that are located within the City of Atlanta). The enforcement ofgranted MRPA certificates is initiated by the City, forwarded to ARC, and ultimately carried out by the GeorgiaEnvironmental Protection Division (EPD).
The City of Atlanta processed two MRPA cases in 2003, and has received two MRPA applications in 2004through September. The two MRPA cases for 2003 were both approved—one for a new house, and theother for a guesthouse with a tennis court. The two MRPA cases for 2004 are still pending. They are for1) a proposed mixed residential development project on James Jackson Parkway and 2) shafts for seweragetunnel expansion at the R.M. Clayton Sewage Treatment Plant, on behalf of the City of Atlanta.
Metropolitan Atlanta Urban Watershed Initiative
Another program for the protection of City streams is the Metropolitan Atlanta Urban Watershed Initiative(MAUWI), which is a joint initiative by the City of Atlanta, Fulton County, and DeKalb County. Its overall goalis to determine the current conditions and uses of Atlanta’s urban streams, to assess the sizes and impactsof the different pollution sources, and to evaluate options for improving water quality. The outcome of MAUWIwas the MAUWI Watershed Management Guidance Document, which established a vision and goals thatare intended to guide the City and community groups in the care and development of the City’s watersheds.
The MAUWI Vision is “Healthy and aesthetically appealing streams for ourselves, our children, and ourdownstream neighbors, with a diverse and healthy aquatic life and habitat, supported by an educated andinvolved citizenry, government, and business community, and a future for flood-free neighborhoods.”
The goals that were established by MAUWI are as follows:
Reduce litter in streamsMeet water quality standards in streamsImprove water quality in streamsImprove stream habitatImplement cost-effective strategiesReduce flooding of human structuresIncrease health and diversity of aquatic lifeIncrease citizen, government, and business awareness of watershed pollution
Clean Water Atlanta Program
145Atlanta Strategic Action Plan September 2007 Draft
The CleanWater Atlanta Program includes five types of efforts: 1) professional management of the ConsentDecree Program; 2) the strategy to reduce flooding and pollution from stormwater by implementing astormwater utility; 3) the SSOConsent Decree compliance; 4) water quality monitoring; and 5) CSOConsentDecree compliance. Each of these efforts is described below.
1. Professional Management of Consent Decree Program
The Department of Watershed Management was created in 2002 to oversee the City’s new comprehensiveapproach to solving water issues. The DWM includes the City’s two water-related bureaus--WastewaterServices and Drinking Water--along with Engineering Services and the proposed Stormwater ManagementUtility. This organizational structure allows DWM to plan, design, construct, operate and maintain the City’sentire system of water and wastewatertreatment, pumping, collection and distribution, and proposedstormwater management facilities.
2. Strategy to Reduce Flooding and Pollution Caused by Stormwater
The City's goal is to implement a stormwater utility by the end of 2006. A stormwater utility will provide asteady and reliable source of revenue for reducing stormwater flooding and pollution and maximizing theuse of natural pollution-reduction methods such as greenspace and ponds.
3. SSO Consent Decree Compliance
The First Amended Consent Decree (FACD) addresses improvements in the City's sanitary sewer systemand requires the elimination of sanitary sewer overflows (SSOs). Under the FACD, the City is repairing,replacing or rehabilitating all 2,200 miles of sewer throughout the City and implementing long-term preventionand maintenance strategies under "Operation Clean Sewer." Operation Clean Sewer is an aggressiveapproach to inspecting, cleaning and relining the sewer system, and includes a full-scale greasemanagementprogram that was launched in January 2003. Operation Clean Sewer will allow the City to achieve all FACDobligations by 2012 – 2 years ahead of CD schedule.
4. Water Quality Monitoring
The City has partnered with the USGS and Southeast Waters to implement a comprehensive water qualitymonitoring plan. Forty stream sites will be monitored initially; twenty permanent sites will be monitored overthe next decade. In addition, the Long-Term Monitoring Program will help the City to track water qualityimprovements associated with Clean Water Atlanta.
5. CSO Consent Decree Compliance
The City has submitted and received regulatory authorization to implement the refined Combined SewerOverflow (CSO) Remediation Plan. The CSOPlan, which must be completed by November 2007, will enablethe City to achieve the highest water quality at the lowest cost within the shortest time frame. The City willachieve CD compliance using a combination of technologies: separation of two full basins (Greensferryand McDaniel) and one sub-basin (Stockade); eliminates two CSO facilities; and construct a tunnel storageand treatment system to capture and treat 99% of the sewage and 85% of the stormwater from the remainingcombined area.
September 2007 Draft Atlanta Strategic Action Plan146
Community Assessment3

Chattahoochee River Project
The Chattahoochee River Project is an effort to establish a river greenway park along the entireChattahoochee River Corridor in the City of Atlanta. The purpose of the project is to reclaim theChattahoochee River corridor and to conserve it as a sustainable resource.
--Various Protective Measures for City Streams, Stream Banks, and Creeks--
The City of Atlanta has identified six goals for the protection of City streams, stream banks, and creeks, asare listed below.
1. Achieve the water quality standards in City streams and creeks that are specified by the GeorgiaEnvironmental Protection Division.
2 Support and enforce the City's Erosion and Sedimentation Ordinance.
3 Continue to support the Citizen StreamMonitoring Program for education and training programs to monitor,report, and prevent stormwater runoff pollution and other sources of stream pollution.
4 Produce stream monitoring data profiles and watershed surveys on designated streams in the CitizenStream Monitoring Program.
5. Develop a mechanism for handling citizen calls and acting on citizen reports of pollution sources ofstreams and creeks.
6. Ongoing implementation of the long-term watershed monitoring program on an ongoing basis incoordination with the United States Geological Survey.
Although there has been some success in stabilizing stream banks with vegetative and structural techniques,one permanent solution to this costly problem is to reduce stormwater runoff from impervious surfacesCitywide and regionally in concert with more vigorous protection of natural floodplains. Requiring stormwaterto be retained in ponds or vaults either on-site or regionally, and installing infiltration areas in developmentprojects, are several policy options that the City should investigate. The City plans to implement a stormwatermanagement utility in 2006 to alleviate many of these issues. In 2004, the Atlanta City Council adopted anordinance to put further restrictions on the amount of stormwater that is required to be retained on developedsites. It also sets forth an ongoing operations andmaintenance requirement for all stormwater infrastructureto ensure performance. Education, policing, and the enforcement of existing regulations, as well as thedevelopment of new regulations, are needed to prevent or redirect the sources of stream pollution.
Citizen Stream Monitoring Program
The Georgia Environmental Protection Division (EPD) has provided the City with startup grants for thepurpose of initiating a citizens' education and awareness program for the prevention of non-point sourcepollution of our streams and creeks. Citizens learn to identify and report water pollution problems and collectdata on the stream that they are monitoring. The City is providing training, educational materials, andassistance in initiating stream-monitoring programs throughout the City.
147Atlanta Strategic Action Plan September 2007 Draft

Protected Mountains
No protected mountains have been identified within the Atlanta City Limits. The land area is located on thePiedmont Plateau, which is mostly comprised of underlying schist, biotite, gneiss, and other metamorphicrock. The remainder of the Piedmont Plateau is comprised of underlying Augen gneiss, hornblende gneiss,granite intrusions, and other igneous rocks. These rock formations have weathered thousands of years,interacting with various biological processes, to form the soils that are found in Atlanta.
Protection of Wetlands
“Freshwater wetlands” are defined by federal law as being those areas that are inundated or saturated bysurface or groundwater at a frequency and duration that is sufficient to support, and that under normalcircumstances do support, a prevalence of vegetation which is typically adapted for life in saturated soilconditions. Wetlands generally include swamps, marshes, bogs, and similar areas. According to the NationalWetlands Inventory that was conducted by the U.S. Fish and Wildlife Service, wetlands within Atlanta occurgenerally in the areas along the Chattahoochee River and along the City's major streams and creeks,although some non-stream corridor wetlands do exist in the City. Wetlands are subject to the Departmentof Natural Resources’ Rules for Environmental Planning Criteria.
Wetlands are areas inundated or saturated by surface water or groundwater at a frequency and durationsufficient to support a prevalence of vegetation adapted for life in saturated soil conditions. The wetlandsdelineated in Figure 3 are from the National Wetlands Inventory (NWI) maintained by the U.S. Fish andWildlife Service. Wetlands offer numerous environmental benefits, such as flood control, groundwaterrecharge, and provision of important wildlife habitat. They are protected through the City's Greenspaceprogram
The City of Atlanta's Greenspace plan, Project Greenspace, addresses wetlands through Greenspacegoals. Project Greenspace is a comprehensive plan and strategy for implementing a city-wide greenspacesystem for Atlanta. Goal 5 is to permanently protect environmentally sensitive lands such as floodplains,wetlands, and natural habitat areas. According to the Greenspace plan, there are 29.9 acres of wetlandswithin the City of Atlanta.
Currently, the U.S. Fish and Wildlife Service’s National Wetland Inventory Maps represent the best sourceof available information regarding the locations of wetlands in the City. As such, they indicate wetlandsareas that should be preserved.
The City of Atlanta has identified three main goals for wetlands protection and preservation. They are: 1)identify significant wetland resources, both on public and private land; 2) strengthen the protection of wetlandareas; and 3) continue to comply with the Federal wetlands program under section 404 of the Clean WaterAct.
Atlanta complies with the federal wetlands program under Section 404 of the Clean Water Act in order tomaintain and protect these natural resources. Developers are responsible for requesting a determinationof jurisdiction for any project that would result in altering over one acre of wetlands as required by the CleanWater Act. Atlanta does not allow land-disturbing activity within delineated wetlands jurisdictions except asis restricted by a permit that is issued by the U.S. Army Corps of Engineers.
September 2007 Draft Atlanta Strategic Action Plan148
Community Assessment3

The Georgia Department of Community Affairs has recommended a set of regulations to be included in theComprehensive Development Plan (CDP) that would protect the City’s wetlands in providing for the health,safety, and welfare of its citizens. Towards this end, the City has adopted a wetland protection ordinance,which is included in Appendix B of the CDP. This Ordinance requires coordination between the City andthe Army Corps of Engineers’ permitting processes.
Other Environmentally Sensitive Areas
Environmentally Sensitive Land
The environmentally sensitive land shown in Figure 3 is based on the “Greenspace Acquisition SupportSystem Report, 2002” funded by Trees Atlanta and the Turner Foundation, and prepared by the GeorgiaInstitute of Technology Center for GIS. The land areas shown are undeveloped areas (excluding existingcity parks and including some areas of golf courses and cemeteries) greater than five (5) acres in size thatexhibit high environmental and greenspace value in terms of:
Water Quality: based on proximity to water bodies, floodplains, and wetlands; and proximity to “priority”stream segments designated as part of the 1998 Consent Decree.
Forest Cover: based on canopy area percentage and the relative mix of evergreens and hardwoods.Greater canopy area and greater stand purity (either evergreen or hardwood) resulted in higher values.
Connectivity: based on proximity to existing parks, schools, cemeteries and the size of the parcel.
To provide a current inventory of environmentally sensitive land within the City, the Greenspace AcquisitionSupport System Report was updated by ATS, Inc. (a member of the consultant team) to identify and excludeareas that have been developed or are now protected as parks or greenways since the completion of thereport in 2002.
The proximity and/or environmental relationship of these land areas to the land areas that compose thecity’s drainage system (see Figure 2) represent a significant opportunity to expand Atlanta’s greenspace.
The City of Atlanta through its greenspace program has identified environmentally sensitive lands, describedAtlanta's drainage system, and identified steep slopes and wetlands.
Atlanta’s natural drainage system – the dendritic pattern of rivers and streams and the land forms associatedwith them – is an important feature of the Atlanta’s greenspace system. Figure 2 shows the resources thatcompose this system. These include the 100-year floodplain as delineated by FEMA; additional flat landareas (up to 2% in slope) next to the FEMA 100-year floodplain; 75-foot wide land buffers adjacent to the
149Atlanta Strategic Action Plan September 2007 Draft

edges of rivers, streams, and other water bodies; and steep slope areas (20% and greater in slope) adjacentto rivers and streams. As environmentally sensitive areas, these resources are subject to federal, state,and local development regulations. Together, they function as natural corridors for human recreation andwildlife habitat. Protecting and enhancing these resources should be one of the city’s primary goals to ensurea sustainable, interconnected greenspace system. Each of the land areas that compose Atlanta’s naturaldrainage system is described in greater detail below.
September 2007 Draft Atlanta Strategic Action Plan150
Community Assessment3

Picture 3.1 Atlanta's Environmentally Sensitive Lands
151Atlanta Strategic Action Plan September 2007 Draft

Map 3.12 Atlanta's Drainage System
September 2007 Draft Atlanta Strategic Action Plan152
Community Assessment3

Floodplains
Inventory of Existing Conditions
Floodplains serve three major purposes: 1) they provide natural water storage and conveyance; 2) theyenhance water quality maintenance; and 3) they are involved in groundwater recharge. However, they canhave adverse effects on development. Over the past ten years, the size of flooded areas has beenincreasing. This is a result of increased storm water runoff from developed areas into culverts and streams.The result has been considerable property damage. The effect on parks, for example, has included severestream bank erosion, loss of land and vegetation, and damage to ball courts and other facilities.
Development in floodplain areas is carefully monitored to protect the functional integrity of floodplains, aswell as the health, safety, and property of the City's residents. The Federal Emergency Management Agency(FEMA) has identified and mapped areas in Atlanta that are prone to flooding. These maps constitute theflood hazard district maps for the City and have been incorporated into and made a part of the City's officialzoning map, as is described in Section 16.02.004 of the City's zoning ordinance. By using the flood hazarddistrict maps and the City’s official zoning map, one can assess where particular types of development canand cannot be permitted.
Additional management of the 100-year floodplain is anticipated as flooding frequency increases due towatershed development. In addition, the City has identified six goals for floodplain areas, as are listedbelow.
1. Assist in and support the metropolitan watershed management guidelines which have been developedby the Atlanta Regional Commission--Metropolitan North Georgia Water Planning District in conjunctionwith all participating local governments.
2. Revise development standards to prevent the alteration of the size or shape of natural floodplains.
3. Adopt City regulations that prohibit alterations of the natural streamcourses according to professionalengineering recommendations.
4. Adopt City regulations that prohibit the development of impervious surfaces in floodplains.
5. Adopt City regulations for Citywide stormwater retention facilities in all new developments, includingparking lots and other paved areas, in order to reduce flooding of combined sewers, streets, and homes,as well as the erosion of streambanks.
6. Preserve, enhance, and expand the undeveloped floodplain along the Chattahoochee River as publicopen space.
153Atlanta Strategic Action Plan September 2007 Draft

The 100-Year Floodplain
The 100-year floodplain, as shown in Figure 2, is delineated by the Federal Emergency Management Agency(FEMA) to define land areas within communities that are eligible to participate in the National Flood InsuranceProgram (NFIP). In order to participate in the program, local governments must adopt ordinances and otherdevelopment regulations that minimize the risk to life and property and prevent increased flooding withinthe 100-year floodplain during flood events. NFIP makes flood insurance available to affected land ownersin participating communities.
FEMA mapping of the 100-year floodplain does not exist for all areas of Atlanta subject to periodic floodinundation. For developments proposed along watercourses for which FEMA mapping does not exist, thecity’s flood area regulations require engineering studies to be performed to determine the area whereinundation is likely to occur during the 100-year base flood.
The floodplain performs very important natural functions within the City of Atlanta, including temporarystorage of floodwaters, reduction in soil erosion, and maintenance of water quality. The linear nature of the100-year floodplain also provides important habitat corridors for the unobstructed movement of wildlife.Because these areas are flat, floodplains can also accommodate types of recreation and sports facilitiesthat are not severely impacted by frequent flooding (e.g. soccer, baseball, etc.).
There is a total of 4,091.61 acres of floodplains within the City Limits.
Flat Areas
Flat land areas up to 2% in slope and contiguous with the FEMA delineated 100-year floodplain are alsoshown in Figure 2. These flat areas, though un-delineated by FEMA, are likely subject to minor flooding.These areas could also include unmapped wetlands (see Figure 3). Like the FEMA delineated 100-yearfloodplain described above, flat land areas can contribute to Atlanta’s greenspace system by providingimportant wildlife habitat and accommodating recreation facilities. There is a total of 470.09 acres of flatareas in the City of Atlanta.
75-Foot Riparian Buffer
In an effort to protect and improve the quality of the city’s waterways, the City of Atlanta has adopted anordinance requiring a 75-foot riparian buffer to be maintained on both sides of each river, stream, and naturaldrainage channel. Unless a variance or exemption is granted, building activity of any kind cannot occurwithin this area. If properly maintained, buffer areas provide numerous environmental protection and resourcemanagement benefits, such as improved water quality and wildlife habitat. There is a total of 2,327.99 acresof 75-foot buffer within the City of Atlanta.
Steep Slopes
Slopes in Atlanta range from nearly level to 60 percent. The steeper slopes (greater than 15 percent) aregenerally located in the north, southwest, and southeast quadrants of the City. Some of these areas areheavily forested or covered with other forms of protective vegetation.
September 2007 Draft Atlanta Strategic Action Plan154
Community Assessment3

All of Atlanta is located within the Atlanta Plateau, and is part of the greater Georgia Piedmont Province ofthe Southern Piedmont Region of the United States. One of the most striking features of Atlanta is thevalley of the Chattahoochee River, which runs along its northwestern boundary. The valley ranges in depthfrom 150 to 400 feet and from two to five miles in width from rim to rim. Rolling to hilly and broad, smoothuplands characterize the general surface features of the City. The largest areas, with slopes of 15 percentor greater, are located in the north, southwest, and southeast quadrants of the City. Elevations in Atlantarange from 960 to 1,050 feet above sea level.
The presence of steep slopes in some areas of the City present challenges to protect the existing vegetationwhile allowing for development in appropriate areas.
Additional protection of slopes that are greater than 15 percent is anticipated as development pressure inthe City increases.
Slopes in Atlanta range from nearly level to 60 percent. The steeper slopes (greater than 15 percent) aregenerally located in the north, southwest, and southeast quadrants of the City. Some of these areas areheavily forested or covered with other forms of protective vegetation. There is a total of 2,356.68 acres ofsteep sloping land in the City of Atlanta.
Soil Types
The soils in Atlanta are generally red in color and, with the exception of soils that are located in floodplainareas, are well-drained. These soils were formed frommetamorphic and igneous rocks and range in texturefrom stony loams, gravelly-and-sandy loams, to clay loams. Six soil associations are found in Atlanta. Theyare grouped below into three categories according to type, location, and use limitations.
1. Nearly-level soils on bottomlands and low stream terraces. These include the following:
a. Congaree-Chewacla-Wickham. Drainage is moderately good along the Chattahoochee River are butsomewhat poor along small streams. Relief is mostly level or nearly level, although some slopes areundulating. These soils lie along the Chattahoochee River and along the City's larger streams and creeks.Because of the flooding hazard, the major soils in these associations have severe limitations if used forutility construction or residential, recreational, commercial or light industrial development. These areasshould be limited to suitable wildlife habitat and supporting hardwood stands.
b. Cecil-Floyd-Appling. Drainage ranges from good to excessive.
c. Floyd-Cecil-Madison. Deep to moderately-deep soils that are well-drained to somewhat excessivelydrained.
d. Appling-Cecil. Deep to moderately-deep soils that are well-drained to somewhat excessively drained. Inmost areas, limitations are slight for residential and park/recreational development and moderate becauseof clay for commercial and light industrial development, roads, and septic tank drainage fields. However,in the few areas where Louisburg soils predominate, depth to bedrock is very shallow, ranging from a fewinches to three feet in depth.
155Atlanta Strategic Action Plan September 2007 Draft
2. Gently-sloping and moderately-sloping soils of uplands. Soils in these associations are
located primarily along portions of the major stream banks.
3. Strongly-sloping and steep soils of uplands. These include the following:
a. Madison-Louisa. This soil type includes well-drained to excessively-drained soils.
b. Cecil-Lockhart. This soil type has drainage that is good to excessive in most places,
although it is excessive in some steep areas.
Much of the original topsoil in areas of the City has been eroded away, leaving red clay subsoil exposed insome areas. Along slopes of major stream banks development limitations are moderate for residential,park, and road constructions where slopes are less than 15 percent, and are severe for all uses whereslopes range from 15 to 40 percent. Development in these areas is also limited by adverse soil properties.
The City of Atlanta Erosion and Sedimentation Control Ordinance (Chapter 74, Article II of the City Code)provides legal authority to enforce soil erosion and sediment control measures for land-disturbing activitiesthat apply to all features of a particular site, including street and utility installations, drainage facilities andother temporary and permanent improvements. The City's ordinance also includes the statewide requirementthat at least twenty-five feet along stream banks remain as undisturbed vegetation. Additionally, the Cityrequires a seventy-five foot buffer protection along perennial and intermittent streams. These provisionsreduce the sediment load in area creeks and rivers.
The soils in Atlanta are generally red in color and, with the exception of soils that are located in floodplainareas, are well-drained. These soils were formed frommetamorphic and igneous rocks and range in texturefrom stony loams, gravelly-and-sandy loams, to clay loams. Six soil associations are found in Atlanta. Theyare grouped below into three categories according to type, location, and use limitations.
1. Nearly-level soils on bottomlands and low stream terraces.
2. Gently-sloping and moderately-sloping soils of uplands.
3. Strongly-sloping and steep soils of uplands.
Much of the original topsoil in areas of the City has been eroded away, leaving red clay subsoil exposed insome areas. Along slopes of major stream banks development limitations are moderate for residential,park, and road constructions where slopes are less than 15 percent, and are severe for all uses whereslopes range from 15 to 40 percent. Development in these areas is also limited by adverse soil properties.
The City of Atlanta Erosion and Sedimentation Control Ordinance (Chapter 74, Article II of the City Code)provides legal authority to enforce soil erosion and sediment control measures for land-disturbing activitiesthat apply to all features of a particular site, including street and utility installations, drainage facilities andother temporary and permanent improvements. The City's ordinance also includes the statewide requirement
September 2007 Draft Atlanta Strategic Action Plan156
Community Assessment3

that at least twenty-five feet along stream banks remain as undisturbed vegetation. Additionally, the Cityrequires a seventy-five foot buffer protection along perennial and intermittent streams. These provisionsreduce the sediment load in area creeks and rivers.
Plant & Animal Habitats
The list below identifies the sensitive plants and animals that are located within the Atlanta City Limits, alongwith a brief description of the habitats of each.
1. Plants. The six main types of sensitive plants that are located within the Atlanta City Limits include thefollowing:
a. Moccasin Flower and Pink Ladyslipper.
b. Golden Slipper and Yellow Ladyslipper--Primarily found in rich, moist, hardwood coves and forests.
c. Bay Star-vine, Climbing Magnolia, and Weld Jarsparilla--Typically found twining over understorytrees shrubs in rich, alluvial woods, and on lower slopes near streams.
d. Granite Stonecrop and Dwarf Stonecrop--Found growing among moss in partial shade under large,open-grown eastern red cedar (Juniperus virginians) trees on granite outcrops.
e. False Hellebore and Ozark Bunchflower--Found in moist, hardwood-dominated woods, usually insmall clumps on terraces along streams.
f. Piedmont Barren Strawberry--Found in rocky, acidic woods along streams with mountain laurel (Kalmialatifolia); also in drier, upland oak-hickory-pine woods.
2. Endangered Wildlife
"Endangered" species are those wildlife species which are in danger of extinction throughout a significantportion of its range. Four endangered species may live in the Atlanta Region, as are listed below.
a. The Indiana bat--A nocturnal insectivore, this bat lives in caves in the winter and may live outside cavesfrom April through October.
b. The red-cockaded woodpecker--Is endangered because it only nests in pine trees over sixty years old,which are infected with a fungus called red heart disease.
c. Peregrine falcons--Migrate long distances and usually live on cliffs over water, but in Atlanta they havenested on tall towers and buildings
d. Southern bald eagles--Usually live in inland waterways and estuaries, however they have been spottednesting in tall trees in undisturbed Piedmont wetlands and lakeshores.
157Atlanta Strategic Action Plan September 2007 Draft

Rare plants, animals, and natural habitats are particularly vulnerable to the effects of development andshould be recognized and protected to the extent that is possible. Loss in the diversity of wildlife and aquaticspecies due to contaminated and sediment-filled creeks and streams is a major environmental challengefor the City.
The City of Atlanta seeks to identify and protect natural plant and wildlife habitats and corridors, and toprotect endangered and rare species through the compliance with the various federal and state laws for theprotection of plant and animal habitats. The federal Endangered Species Act of 1973 and Georgia’s Rulesoffer protection for endangered species, for the Department of Natural Resources (DNR), beginning at391-4-13.02.
Development and prior agricultural use have interrupted Atlanta's natural wildlife corridors and destroyedmost of the old-growth forests that many animal species need in order to survive. Less desirable species,such as rodents and pigeons, are adaptable to stressful urban environments and have replaced many ofthe natural species that are found in the Piedmont plateau geographic region. Without measures to encouragediversity of wildlife, the City's wildlife will continue to be displaced.
Significant Natural Resources
The natural environment places certain opportunities and constraints on the way that land is utilized. Itencompasses many areas and resources that are vulnerable to the impacts of development and whichrequire protection by the community. For instance, soil characteristics, topography, and the frequency offlooding are just a few of the factors that affect where development can safely and feasibly be accommodated.Other areas such as wetlands, forest areas, and sensitive plant and animal habitats are also vulnerable tothe impacts of development. As the City and its surrounding areas continue to grow, the conservation ofenvironmentally-sensitive and ecologically-significant resources will become increasingly important. TheCity of Atlanta’s vision is to balance growth and economic development with protection of the naturalenvironment. This is to be done in conjunction with the Statewide goal for natural resources, which is toconserve and protect the environmental and natural resources of Georgia’s communities, regions, and theState. Environmental policies are directed at improving the City’s stewardship of its unique, fragileenvironmental resources. Atlanta’s goal is to respect these assets when creating policies for futuredevelopment.
The Natural Resources Section of the Natural and Cultural Resources Element is comprised of fifteensubsections representing fifteen types of natural resources that are found within the Atlanta City Limits.Each natural resource is discussed by presenting (i) an Inventory of Existing Conditions; (ii) an Assessmentof Current and Future Needs; and (iii) an Articulation of Community Goals and an Associated ImplementationProgram. An understanding of the existing conditions through an inventory can provide the foundation fordeveloping appropriate community programs through the planning process. This is done by assessing thecurrent and future needs of the City. For some of the natural resources, the various community programsthat are already in place are a result of an apparent extensive assessment that was conducted some timeago. The fifteen types of natural resources within the Atlanta City Limits that are to be discussed are listedbelow.
A. Public Water Supply Sources
September 2007 Draft Atlanta Strategic Action Plan158
Community Assessment3

B. Water Supply WatershedsC. Groundwater Recharge AreasD. WetlandsE. Protected MountainsF. Protected RiversG. Coastal ResourcesH. FloodplainsI. Soil TypesJ. Steep SlopesK. Prime Agricultural and Forest LandL. Plant and Animal HabitatsM. Major Park, Recreation, and Conservation AreasN. Scenic Views and SitesO. Air Quality
The land lying within the Atlanta City Limits is traversed with numerable streams, creeks, springs, andravines. Atlanta's geographic location is unique in several ways--it is one of the only cities to be located ona sub-continental divide, and it is one of the few metropolitan areas in the United States to be over onethousand feet in elevation. DeKalb Avenue, Spring Street, and Peter Street are on the ridge line whichdivides Atlanta's major drainage basins, the Chattahoochee River and the South River (the Ocmulgee River),which subsequently drain into the Gulf of Mexico and Atlantic Ocean, respectively.
Atlanta’s streams and drainage ways are potentially the City’s most valuable natural resources. Map IV-1illustrates the locations of the major streams that are located within the Atlanta City Limits.
The annual rainfall in Atlanta varies from 32 go 68 inches per year, with an average of 48 inches. Evaporationand transpiration account for approximately 30 inches of rainfall, resulting in about 18 inches annually thatare available for stream flow and percolation to groundwater.
Scenic Areas
The City has not identified to date any scenic views or sites requiring special management.
Prime Agricultural/ Forest Land
Prime agricultural and forest land refers to those areas in which the soils and topography are conducive togrowth. As a result of increased urbanization, neither of these land use types can be found in any greatquantity within the Atlanta City limits.
However, the remaining pockets of prime agricultural and forestland should be protected. The City needsto commit to implementation of an urban forestry program in order to address the escalating problem ofurban forest depletion. Further, trees in sidewalk planters have an average life span of only fifteen years,and even trees in park areas require special attention for the first three years.
159Atlanta Strategic Action Plan September 2007 Draft

Prime agricultural and forestland refers to those areas in which the soils and topography are conducive togrowth. As a result of increased urbanization, neither of these land use types can be found in any greatquantity within the Atlanta City limits. A network of community gardens are located throughout the City ofAtlanta. The Atlanta Community Gardens Coalition and the Atlanta Community Food Bank provides resourcesand expertise to community gardens. In addition, farmer's markets located throughout the City of Atlantaprovides the opportunity to residents to buy fresh produce.
The remaining pockets of prime agricultural and forestland should be protected. The City needs to committo implementation of an urban forestry program in order to addressing the escalating problem of urban forestdepletion. Further, trees in sidewalk planters have an average life span of only fifteen years, and even treesin park areas require special attention for the first three years.
The City is focused on protecting urban forest areas within the City as a legacy for future generations.Toward this end, various goals have been identified and programs have been developed, as are listedbelow.
1. Provide adequate City resources for the management of the urban forest.
2. Provide adequate City resources for the enforcement and implementation of the City of Atlanta TreeOrdinance.
3. Implement and enforce the parking lot landscape ordinance.
4. Implement and enforce the City of Atlanta Tree Ordinance. The City has recently adopted revisions toits Tree Ordinance. Protection of the urban forest, street trees, and landscape buffers to reduce stormwaterrunoff from impervious surfaces are key elements of the new tree ordinance.
5. Implement an up-to-date computerized tree maintenance program for parks and public rights- of-ways.
6. Develop an urban forest management plan for the City including planting, maintenance, protection,promotion, and staffing levels.
7. Expand the Bureau of Parks Forestry Division staff to implement and promote the urban forestmanagement plan.
8. Update the existing Arboricultural Specifications and Standards of Practice.
9. Develop a Citywide streetscape master plan, including tree planting details and prioritized streetscapeprojects.
10. Develop citywide streetscape specifications and standards as part of the above master plan.
11. Utilize the Georgia Greenspace Program and the City’s Greenway Acquisition Program to increase theamount of protected open space in the City.
12. Continue to review proposed development projects for their provision of adequate vegetative bufferingand their compliance with the City’s Tree Ordinance to preserve trees and to plant replacement trees.
September 2007 Draft Atlanta Strategic Action Plan160
Community Assessment3

13. Within the Special Public Interest (SPI) zoning districts in the central areas of the City, issue SpecialAdministrative Permits (SAPs) only after adequate provision has been indicated on developers’ site plansfor the planting of street trees adjacent to City streets, among other requirements.
14. Other strategies include strengthening legislation, policing, and enforcement Citywide.
Major Parks, Recreation, and Conservation Areas
Major Parks
The Atlanta City Limits contain approximately 3,200 acres of parkland, which represents 3.78 percent ofthe City’s total geographic area. Atlanta parkland comprises a wide variety of natural resource areas andenvironmental functions. Eighty-five percent of City parks are located along streams in floodplain andwetland areas, in areas with steep and rocky topography, or in other environmentally-sensitive areas. Partof the City park inventory includes four nature preserves. These are North Camp Creek, Cascade Springs,Daniel Johnson, and the Outdoor Activity Center. In addition to City holdings, the National Park Serviceoperates the Chattahoochee National Recreation Area that extends from Buford Dam in Gwinnett Countysouth to Peachtree Creek in the City of Atlanta.
The City’s Department of Parks, Recreation, and Cultural Affairs operates, maintains, monitors, and conductsassessments of the current and future needs of the parks, recreation, and conservation areas of the City.
The City has identified five goals for the protection and enhancement of the City’s parklands, which arelisted below. The City’s Department of Parks, Recreation, and Cultural Affairs identifies community goals,establishes programs, and prepares implementation programs for the parks, recreation, and conservationareas of the City.
1. Restrict development of wetlands to boardwalks, informational signage, and other recreational andeducational elements that protect and preserve the City’s natural resources.
2. Restrict development of floodplains to pathways, picnic areas, ballfields, golf courses, and other appropriaterecreational elements that protect and preserve the City’s natural resources.
3. Limit the use of maintenance chemicals that pollute water, air, and wildlife habitats.
4. Create a position in the Bureau of Parks, Forestry Division that would be responsible for protection andmaintenance of City streambanks and major riparian corridors that are located in parks and other publiclands, and to provide technical assistance for protection of all riparian corridors.
5. Investigate the feasibility and need for the use of greywater to irrigate recreational facilities such asballfields and golf courses.
Issues and Opportunities
161Atlanta Strategic Action Plan September 2007 Draft

Issue: The size of flooded areas has increased as a result of increased storm water runoff intoculverts and streams from developed areas.
Opportunities:
Assist in and support the metropolitan watershed management guidelines developed by the AtlantaRegional Commission in conjunction with participating local governments.
Revise development standards to prevent the alteration of the size or shape of natural floodplains.
Adopt City regulations that prohibit the alteration of the natural stream courses according to professionalengineering recommendations.
Adopt City regulations that prohibit the development of impervious surfaces in floodplains.
Adopt City regulations for citywide storm water retention facilities in all new developments including parkinglots and other paved surfaces, in order to reduce combined sewer flooding, streets, and homes as well asstream bank erosion.
Preserve, enhance and expand the undeveloped floodplain along the Chattahoochee River as public openspace.
Issue: Soil Types
Opportunities:
Continue to utilize the City of Atlanta Erosion and Sedimentation Control Ordinance to monitor and enforcesoil control measures for land disturbing activities including street and utility installation, drainage facilitiesand other temporary and permanent improvements.
Continue to enforce both state required and city required stream and river bank buffer requirements toreduce the sediment loads in creeks and rivers.
Monitor development in areas where the original top soil has eroded away, leaving red clay subsoil exposed.(such areas include slope ranging from 15 to 40 percent)
Issue: The presence of steep slopes in some areas of the City present challenges to protect existingvegetation while allowing development in appropriate areas.
Opportunities:
Maintain an inventory of steep slopes within the city (15% or greater) where steeper slopes exist such asthe north, southwest and southeast quadrants of Atlanta.
Provide additional protection for slopes that are greater than 15 percent as development pressure in thecity increases.
September 2007 Draft Atlanta Strategic Action Plan162
Community Assessment3

Issue: Protect the prime agricultural and forest land within the city.
Opportunities:
Though little prime agricultural and forest land exists within Atlanta due to increased urbanization, the cityshould commit to the implementation of an urban forestry program to address forestry depletion.
Provide adequate city resources for urban forestry management.
Provide adequate city resources for the enforcement of Atlanta’s Tree Ordinance.
Enforce the parking lot landscaping ordinance.
Implement and enforce the new amendments to the Tree ordinance which includes protection of the urbanforest.
Implement up-to-date computerized tree maintenance program.
Develop urban forest management plan for the City.
Expand Parks Bureau Forestry division to help implement urban forest management plan.
Update the existing Arboricultural Specifications and Standards of Practice.
Develop a citywide streetscape master plan to include tree planting details.
Use Georgia Greenspace Program and Atlanta Greenway Acquisition Program to increase the amount ofprotected open space in the city.
Issue SAPs for SPIs only after adequate provisions are made for planting of trees next to streets.
Issue: Protection of rare plants, wildlife and natural habitats.
Opportunities:
Develop city policies that require sensitivity to the 6 types of endangered plant life and 4 species ofendangered wildlife (birds) during the City’s development activities.
Continue compliance with State and Federal laws for the protection of plant and animal habitats.
Develop a program to increase awareness of Atlanta’s loss in diversity of wildlife and aquatic species dueto contamination and sediment –filled creeks and streams.
163Atlanta Strategic Action Plan September 2007 Draft
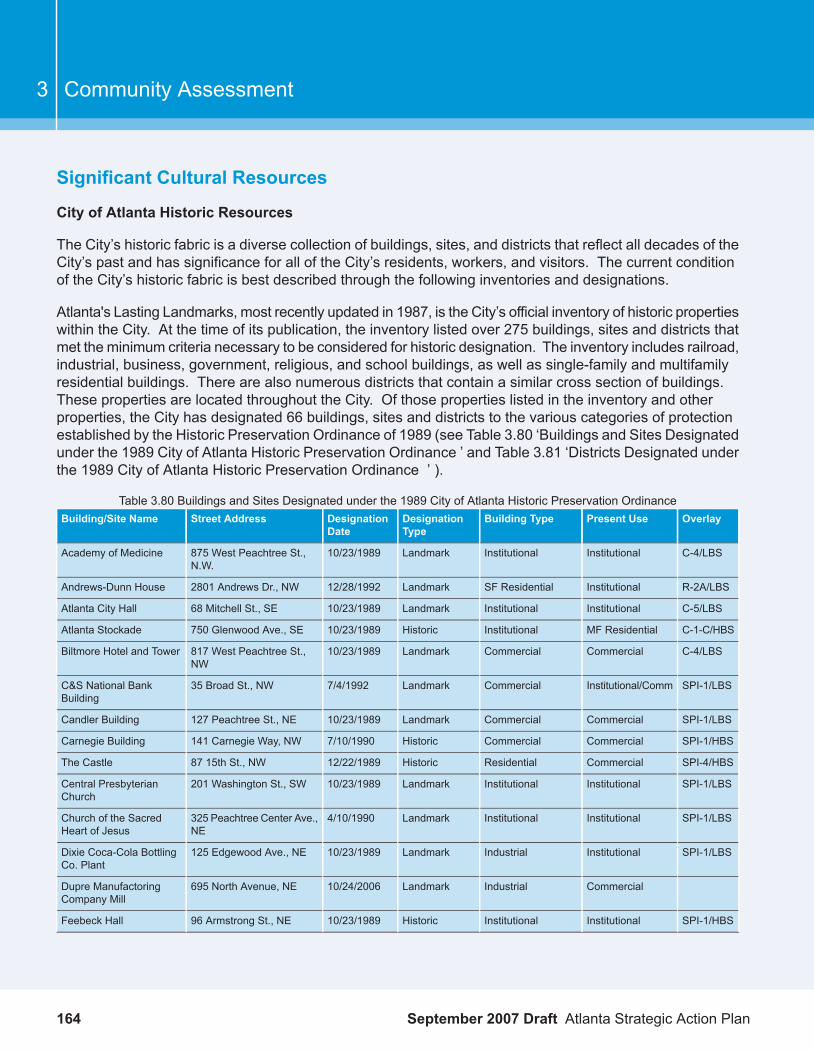
Significant Cultural Resources
City of Atlanta Historic Resources
The City’s historic fabric is a diverse collection of buildings, sites, and districts that reflect all decades of theCity’s past and has significance for all of the City’s residents, workers, and visitors. The current conditionof the City’s historic fabric is best described through the following inventories and designations.
Atlanta's Lasting Landmarks, most recently updated in 1987, is the City’s official inventory of historic propertieswithin the City. At the time of its publication, the inventory listed over 275 buildings, sites and districts thatmet the minimum criteria necessary to be considered for historic designation. The inventory includes railroad,industrial, business, government, religious, and school buildings, as well as single-family and multifamilyresidential buildings. There are also numerous districts that contain a similar cross section of buildings.These properties are located throughout the City. Of those properties listed in the inventory and otherproperties, the City has designated 66 buildings, sites and districts to the various categories of protectionestablished by the Historic Preservation Ordinance of 1989 (see Table 3.80 ‘Buildings and Sites Designatedunder the 1989 City of Atlanta Historic Preservation Ordinance ’ and Table 3.81 ‘Districts Designated underthe 1989 City of Atlanta Historic Preservation Ordinance ’ ).
Table 3.80 Buildings and Sites Designated under the 1989 City of Atlanta Historic Preservation OrdinanceOverlayPresent UseBuilding TypeDesignation
TypeDesignationDate
Street AddressBuilding/Site Name
C-4/LBSInstitutionalInstitutionalLandmark10/23/1989875 West Peachtree St.,N.W.
Academy of Medicine
R-2A/LBSInstitutionalSF ResidentialLandmark12/28/19922801 Andrews Dr., NWAndrews-Dunn House
C-5/LBSInstitutionalInstitutionalLandmark10/23/198968 Mitchell St., SEAtlanta City Hall
C-1-C/HBSMF ResidentialInstitutionalHistoric10/23/1989750 Glenwood Ave., SEAtlanta Stockade
C-4/LBSCommercialCommercialLandmark10/23/1989817 West Peachtree St.,NW
Biltmore Hotel and Tower
SPI-1/LBSInstitutional/CommCommercialLandmark7/4/199235 Broad St., NWC&S National BankBuilding
SPI-1/LBSCommercialCommercialLandmark10/23/1989127 Peachtree St., NECandler Building
SPI-1/HBSCommercialCommercialHistoric7/10/1990141 Carnegie Way, NWCarnegie Building
SPI-4/HBSCommercialResidentialHistoric12/22/198987 15th St., NWThe Castle
SPI-1/LBSInstitutionalInstitutionalLandmark10/23/1989201 Washington St., SWCentral PresbyterianChurch
SPI-1/LBSInstitutionalInstitutionalLandmark4/10/1990325 Peachtree Center Ave.,NE
Church of the SacredHeart of Jesus
SPI-1/LBSInstitutionalIndustrialLandmark10/23/1989125 Edgewood Ave., NEDixie Coca-Cola BottlingCo. Plant
CommercialIndustrialLandmark10/24/2006695 North Avenue, NEDupre ManufactoringCompany Mill
SPI-1/HBSInstitutionalInstitutionalHistoric10/23/198996 Armstrong St., NEFeebeck Hall
September 2007 Draft Atlanta Strategic Action Plan164
Community Assessment3

OverlayPresent UseBuilding TypeDesignationType
DesignationDate
Street AddressBuilding/Site Name
SPI-1/LBSInstitutionalInstitutionalLandmark10/23/1989115 Courtland St., NEFirst CongregationalChurch
SPI-1/LBSCommercialCommercialLandmark12/23/199184 Peachtree St., NWFlatiron Building
O-I/LBSInstitutionalInstitutionalLandmark10/14/1989643 Martin Luther King, Jr.Dr., SW
Fountain Hall
SPI-2/LBSCommercialCommercialLandmark10/23/1989660 Peachtree St., NWFox Theater
R-4/LBSSF ResidentialSF ResidentialLandmark10/14/1989132 East Lake Dr., SEGentry-McClinton House
SPI-1/LBSInstitutionalInstitutionalLandmark10/23/198936 Butler St., NEGeorgia Hall
naInstitutionalInstitutionalHonoraryLandmark
na206 Washington St., S.E.Georgia State Capitol
SPI-2/LBSCommercial/MFRes
Commercial/MFResLandmark6/13/1990659 Peachtree St., NEGeorgian Terrace Hotel
R-4/LBSInstitutionalSF ResidentialLandmark10/14/19892238 Perkerson Rd., SWGilbert, Jeremiah S.,House
O-I/LBSInstitutionalInstitutionalLandmark12/23/1991830 Westview Dr., SWGraves Hall
SPI-1/LBSInstitutionalCommercialLandmark12/23/199175 Poplar St., NWHaas-Howell Building
SPI-1/LBSCommercialCommercialLandmark12/23/199157 Forsyth St., NWHealey Building
O-I/LBSInstitutionalSF ResidentialLandmark10/14/1989587 University Pl., SWHerndon Home
MF ResidentialInstitutionalLandmark1/28/2004978 North Avenue, NEHighland School
SPI-1/LBSInstitutionalInstitutionalHistoric12/12/198955 Coca Cola Pl., NEHirsch Hall
SPI-1/LBSCommercialCommercialLandmark10/23/198945 Edgewood Ave., NEHurt Building
SPI-1/HBSMF ResidentialCommercialHistoric10/23/1989355 Peachtree St., NEImperial Hotel
C-1/LBSCommercialResidentialLandmark6/13/1990292 Moreland Ave., NEKriegshaber House
OfficeOffceLandmark10/10/2005384 Peachtree Street, NWMedical Arts Building
RG-3/LBSCommercialResidentialLandmark10/23/1989821 Piedmont Ave., NENicolson, William Perrin,House
SPI-1/LBSCommercialCommercialLandmark6/13/199023 Peachtree St., NEOlympia Building
SPI-2/LBSCommercialCommercialLandmark10/23/1989478 Peachtree St., NWOrr, W.W, DoctorsBuilding
SPI-3/LBSMF ResidentialMF ResidentialLandmark4/8/199281 Peachtree Pl. & 952Peachtree St., NW
Palmer House Apartments
C-4/LBSInstitutionalInstitutionalLandmark10/23/19891580 Peachtree St., NWPeachtree ChristianChurch
C-2/LBSCommercialSF ResidentialLandmark10/23/1989179 Ponce de Leon Ave.,NE
Peters, Edward C., House
SPI-10/LBSMF ResidentialMF ResidentialLandmark12/23/1991266 Eleventh St., NEPiedmont ParkApartments
SPI-2/LBSMF ResidentialMF ResidentialLandmark5/10/199375 Ponce de Leon Ave., NEPonce de LeonApartments
165Atlanta Strategic Action Plan September 2007 Draft

OverlayPresent UseBuilding TypeDesignationType
DesignationDate
Street AddressBuilding/Site Name
RG-3/HBSSF ResidentialSF ResidentialHistoric3/12/19902494 Peachtree Rd., NWRandolph-Lucas House
SPI-1/LBSCommercialCommercialLandmark10/23/1989134 Peachtree St., NWRhodes-Haverty Building
C-4/LBSInstitutionalInstitutionalLandmark10/23/19891516 Peachtree St., NWRhodes Memorial Hall
SPI-1/LBSMF Residential /Comm.
CommercialLandmark6/14/200082-86 Peachtree St. &111-115Martin Luther King,Jr. Dr., SW
M. Rich & Brothers &Company Bldng.
RG-3-C/LBSMF ResidentialInstitutionalLandmark10/10/1995745 Rosalia St., SERoosevelt High School
SPI-2/LBSCommercialSF ResidentialLandmark10/23/1989537 Peachtree St., NERose, Rufus M., House
C-4/LBSInstitutionalInstitutionalLandmark10/23/1989781 Peachtree St., NESt. Mark United MethodistChurch
SPI-1/HBSInstitutionalInstitutionalHistoric12/12/198962 Butler St., NESteiner Clinic
R-3/LBSSF ResidentialSF ResidentialLandmark2/16/2000505 Argonne Dr,, NWSpotswood Hall
R-3/LBSInstitutionalSF ResidentialLandmark10/14/19893099 Andrews Dr., NWSwan House
RG-4,C-4/LBSInstitutionalInstitutionalLandmark10/23/19891589 Peachtree St., NEThe Temple
SPI-1/LBSCommercialCommercialLandmark10/23/198910 Park Pl., NETen Park Place Building
R-5/LBSInstitutionalInstitutionalLandmark10/14/198945 Whitehouse Dr., SWWashington, Booker T.,High School
InstitutionalInstitutionalLandmark3/12/20021150 Peachtree Street, NEWimbish House
SPI-3/LBSMF ResidentialMF ResidentialLandmark10/23/1989979 Crescent Ave., NWWindsor HouseApartments
R-5/LBSInstitutionalResidentialLandmark10/14/19891050 Gordon St., SWWren's Nest
Table 3.81 Districts Designated under the 1989 City of Atlanta Historic Preservation OrdinanceDesignation TypeDesignation DateMajor StreetsDistrict Name
Historic8/9/1994Mayland, Elbert, Metropolitan, Tift, Allene,Catherine, Pearce, Brookline
Adair Park
Landmark6/19/1989Baltimore PlaceBaltimore Block
Conservation11/28/1994Huntington, Palisades, Wakefield, Brighton,Northwood, Montclair
Brookwood Hills
Landmark6/19/1989Berean, Tye, Estoria, Gaskill, Carrol, Wylie,Powell, Pearl, Savannah
Cabbagetown
Landmark3/16/2006Peters, Walker, Nelson, Fair, HaynesCastleberry Hill
Landmark6/19/1989, exp.1/25/2001
Ponce de Leon, S. Ponce de Leon, Fairview,Oakdale, Springdale, Lullwater
Druid Hills
Historic4/11/2000, exp.11/10/2003
Boulevard, Cherokee, Hill, Grant, Glenwood,Atlanta, Confederate, Woodward
Grant Park
Landmark12/23/1991Mitchell, ForsythHotel Row
Historic4/10/2002Euclid, Edgewood, Dekalb, Elizabeth, Austin,Sinclair, N. Highland, Lake
Inman Park
September 2007 Draft Atlanta Strategic Action Plan166
Community Assessment3

Designation TypeDesignation DateMajor StreetsDistrict Name
Landmark6/19/1989Auburn, Edgewood, Boulevard, Howell,Randolph, Irwin, J.W. Dobbs
Martin Luther King, Jr.
Landmark6/19/1989N/AOakland Cemetery
Historic11/10/2004Oakland, Avon, Peeples, Lawton, & DonnellyOakland City
Landmark6/19/1989N/AWashington Park
Historic12/7/1991, exp.8/19/2002
Oak, Holderness, Oglethorpe, Lawton,Peeples, Oglethorpe, Lucile, White
West End
Historic10/28/1994Whittier, Layton, Butler, ParrotWhittier Mill
In addition to the survey and designation work by the City, 168 historic resources in the City have beenlisted since 1966 by the Georgia Department of Natural Resources in the National Register of Historic Places(see Table 3.82 ‘National Register of Historic Places Listings in the City of Atlanta’). The National Registerof Historic Places is the country’s list of historic places worthy of preservation. Generally, properties needto be at least 50 years old, have physical integrity, and be significant for at least one of four broad criteriato be listed in the National Register of Historic Places. It includes buildings, districts, structures, sites andobjects.
The listing of 168 properties and districts does not include those historic resources that are consideredeligible for listing in the National Register of Historic Places. (Being listed or eligible for listing in the NationalRegister of Historic Places takes on added significance if such resources will be affected by a federalundertaking.) In addition, there are normally about 20 buildings and districts proposed for listing in theNational Register of Historic Places at any given time. However, many more, as yet undocumented, historicresources in the City that could be listed in the National Register of Historic Places.
The City’s historic fabric that is listed in the National Register of Historic Places is almost all buildings anddistricts, with the exception of one site and one object. There is a wide variety of building types represented:single-family houses, large office buildings, apartments, warehouses, religious buildings, etc. Most of thedistricts, however, are residential ones.
Over 60 pre-World War II neighborhoods in the City could also be considered eligible for the NationalRegister of Historic Places as potential historic districts. These neighborhoods were substantially developedbeforeWorld War II and are mostly located adjacent to or near the City’s CBD. A few of these neighborhoodsare located farther from the City’s CBD in what were considered in the past to be suburban areas, or insome cases, separate towns.
There are 19 park sites owned by the City and maintained by the Department of Parks and Recreation thathave major historic significance. In addition, there are many other parks that have more moderatesignificance, including many small, neighborhood parks. The parks’ significance includes history, landscapearchitecture, archeology, architecture, park design, and community planning.
167Atlanta Strategic Action Plan September 2007 Draft

There are also at least 39 properties for which facade easements have been donated to the non-profitorganization Easements Atlanta, Inc. (see Page ?). These historic properties have their facades protectedin perpetuity. To be considered for this program, the buildings must be eligible for or listed in the NationalRegister of Historic Places.
Table 3.82 National Register of Historic Places Listings in the City of AtlantaNationalType ofDate of
CountyOther NamesLandmarkListingListingAddress /Location
Resource Name
FultonN/ABuilding6/14/2001161 SpringStreet
161 Spring Street building
Building8/30/200661 16th Street,NE
61 16th Street Building
FultonN/ABuilding6/28/199663 - 69Mangum St.
63 Mangum Street IndustrialBuilding
FultonN/ABuilding12/19/1991705 PiedmontAve.
705 Piedmont AvenueApartments
FultonN/ABuilding4/30/1980875 W.Peachtree St.NE
Academy of Medicine
FultonDistrict6/2/2000Metropolitian,Mayland,
Adair Park Historic District
Allene,Brookline
FultonN/ABuilding3/18/1996832 Burchill St.SW
Adams, Jack and Helen, LustronHouse
Building7/14/20042420 AlstonDrive
Alston, Robert A., House
FultonN/ADistrict4/20/1979Ansley Parkand environs
Ansley Park Historic District
FultonN/ABuilding8/6/1998981 Ashby St.,N.W.
Ashby Street Car Barn
FultonN/ADistrict8/30/1982St. AugustineSt., St.
Atkins Park Historic District
Charles, andSt. Louis Pl.
FultonN/ABuilding3/26/1976215 DecaturSt.
Atlanta and West Point RailroadFreight Depot
FultonThe BiltmoreBuilding1/20/1980817 W.Peachtree St.
Atlanta Biltmore Hotel andBiltmore Apartments
FultonAtlanta Buggy WorksBuilding8/21/1992530 - 544Means St.
Atlanta Buggy Company andWarehouse--Hatcher Bros.Furniture Company
FultonN/ABuilding7/13/198368 Mitchell St.SW
Atlanta City Hall
September 2007 Draft Atlanta Strategic Action Plan168
Community Assessment3

NationalType ofDate of
CountyOther NamesLandmarkListingListingAddress /Location
Resource Name
FultonN/ABuilding7/28/1995512 Means St.Atlanta Spring and BedCompany--Block CandyCompany
FultonN/ABuilding6/25/1987760 GlenwoodAve.
Atlanta Stockade
FultonN/ADistrict7/12/1976Northside Dr.,Walnut St.,
Atlanta University Center HistoricDistrict
Fair St., RoachSt.
FultonN/ABuilding3/29/19781210 HemphillAve. NW
Atlanta Waterworks HemphillAvenue Station
FultonPeachtree Playhouse;Community Playhouse; LucilleKing Thomas Auditorium
Building1/31/19791150Peachtree St.NE
Atlanta Women's Club
FultonN/ABuilding6/3/19765,7,9,11,13,15,17,19Baltimore Pl.
Baltimore Block
FultonN/ABuilding1/8/1979142 - 150Mitchell St.
Bass Furniture Building
District6/23/2003Holmes St.,Antone St.,
Berkeley Park Historic District
BellemeadeAve., HowellMill Rd.
Building4/8/2005193 Joseph E.LoweryBoulevard
Brazeal, Dr. Brailsford R., House
FultonThe 750Building9/9/19821050 Ponce deLeon Ave.
Briarcliff Hotel
FultonN/ABuilding9/23/19931109 W.Peachtree St.
Brittain, Dr. Marion Luther, Sr.,House
FultonN/ADistrict1/24/1986E ofPeachtree-Dunwoody
Brookhaven Historic District
FultonN/ADistrict12/21/1979Off U.S. 19and GA 9
Brookwood Hills Historic District
FultonBurns Club of AtlantaBuilding12/1/1983988 Alloway Pl.SE
Burns Cottage
FultonN/ABuilding5/9/198323 Butler St.SE
Butler Street Colored MethodistEpiscopal Church
FultonN/ADistrict1/1/1976Carroll St.,Pearl St.,Memorial Dr.
Cabbagetown Historic District
FultonN/ABuilding8/24/1977127 PeachtreeSt. NE
Candler Building
169Atlanta Strategic Action Plan September 2007 Draft
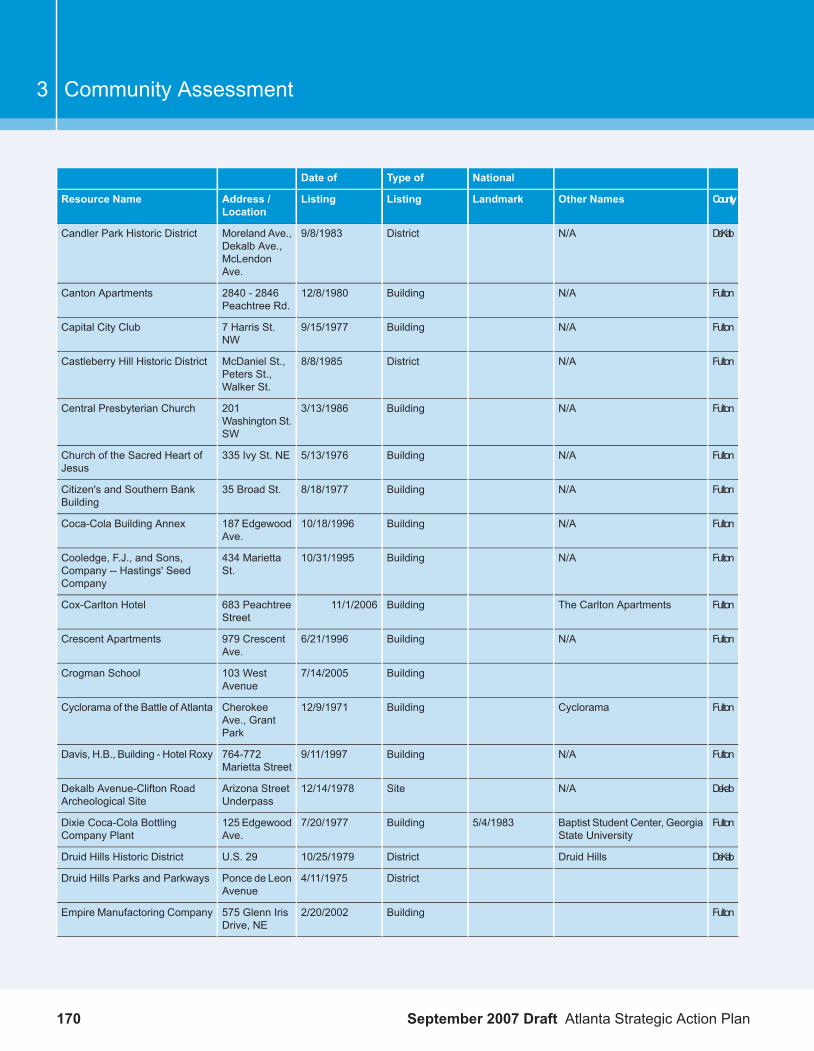
NationalType ofDate of
CountyOther NamesLandmarkListingListingAddress /Location
Resource Name
DeKalbN/ADistrict9/8/1983Moreland Ave.,Dekalb Ave.,
Candler Park Historic District
McLendonAve.
FultonN/ABuilding12/8/19802840 - 2846Peachtree Rd.
Canton Apartments
FultonN/ABuilding9/15/19777 Harris St.NW
Capital City Club
FultonN/ADistrict8/8/1985McDaniel St.,Peters St.,Walker St.
Castleberry Hill Historic District
FultonN/ABuilding3/13/1986201Washington St.SW
Central Presbyterian Church
FultonN/ABuilding5/13/1976335 Ivy St. NEChurch of the Sacred Heart ofJesus
FultonN/ABuilding8/18/197735 Broad St.Citizen's and Southern BankBuilding
FultonN/ABuilding10/18/1996187 EdgewoodAve.
Coca-Cola Building Annex
FultonN/ABuilding10/31/1995434 MariettaSt.
Cooledge, F.J., and Sons,Company -- Hastings' SeedCompany
FultonThe Carlton ApartmentsBuilding11/1/2006683 PeachtreeStreet
Cox-Carlton Hotel
FultonN/ABuilding6/21/1996979 CrescentAve.
Crescent Apartments
Building7/14/2005103 WestAvenue
Crogman School
FultonCycloramaBuilding12/9/1971CherokeeAve., GrantPark
Cyclorama of the Battle of Atlanta
FultonN/ABuilding9/11/1997764-772Marietta Street
Davis, H.B., Building - Hotel Roxy
DekalbN/ASite12/14/1978Arizona StreetUnderpass
Dekalb Avenue-Clifton RoadArcheological Site
FultonBaptist Student Center, GeorgiaState University
5/4/1983Building7/20/1977125 EdgewoodAve.
Dixie Coca-Cola BottlingCompany Plant
DeKalbDruid HillsDistrict10/25/1979U.S. 29Druid Hills Historic District
District4/11/1975Ponce de LeonAvenue
Druid Hills Parks and Parkways
FultonBuilding2/20/2002575 Glenn IrisDrive, NE
Empire Manufactoring Company
September 2007 Draft Atlanta Strategic Action Plan170
Community Assessment3

NationalType ofDate of
CountyOther NamesLandmarkListingListingAddress /Location
Resource Name
FultonGeorgia Savings Bank Building;Flatiron Building
Building3/26/197674 PeachtreeSt.
English - American Building
FultonN/ABuilding3/18/19961692 BrewerBlvd. SE
Epting, Thomas andRae, LustronHouse
FultonN/ADistrict9/9/1982Broad St.,Fairlie St.,Luckie St.
Fairlie - Poplar Historic District
FultonN/ABuilding2/12/198030 North Ave.Fire Station No. 11
FultonFirst Church; United Church ofChrist
Building1/19/1979105 CourtlandSt. NE
First Congregational Church
FultonN/ABuilding5/10/1984699 Ponce deLeon Ave.
Ford Motor Company AssemblyPlant
FultonCivilian Employee's QuartersBuilding2/25/1975Bldng. No.532, FortMcPherson
FORSCOM Command SergeantMajor's Quarters -- FortMcPherson
FultonFox Theatre Historic District5/11/1976Building5/17/1974600 PeachtreeSt.
Fox Theatre
FultonN/ADistrict10/7/1978Peachtree St.and Ponce deLeon Ave.
Fox Theatre Historic District
FultonN/ABuilding8/6/199875 JohnWesley DobbsAve., N.E.
Freeman Ford Building
FultonN/ABuilding9/18/1980160 Pryor St.SW
Fulton County Courthouse
FultonN/ADistrict8/17/1987Delmont Dr.,Brentwood Dr.,Peachtree Rd.
Garden Hills Historic District
Fulton1325 Apartments (1926-74);Reid House (1974-78)
Building1/29/19791325 - 1327Peachtree St.NE
Garrison Apartments
DeKalbN/ABuilding5/2/1985132 E. LakeDr. SE
Gentry, William T., House
FultonN/ADistrict8/25/1978225 North Ave.Georgia Institute of TechnologyHistoric District
FultonN/A11/7/1973Building12/9/1971Capitol SquareGeorgia State Capitol
FultonGilbert HouseBuilding4/17/19802238Perkerson Rd.SW
Gilbert, Jeremiah S., House
FultonOld Grady Hospital; GeorgiaHall
Building8/13/198136 Butler St.SE
Grady Hospital
FultonN/ADistrict7/20/1979CherokeeAve.,
Grant Park Historic District
171Atlanta Strategic Action Plan September 2007 Draft

NationalType ofDate of
CountyOther NamesLandmarkListingListingAddress /Location
Resource Name
Boulevard,Stanley
FultonN/ADistrict3/17/1986WoodwardAve., Hill St.
Grant Park North Historic District
FultonStandard Federal SavingsBuilding; Prudential Building
Building1/8/197944 Broad St.NW
Grant, W.D., Building
FultonN/ABuilding10/27/2004881 MemorialDrive
Great Atlantic and Pacific TeaCompany
FultonPayne-Griffith HouseBuilding5/12/1999650BonaventureAve., N.E.
Griffith School of Music
FultonN/ABuilding6/7/197415th St., W ofJunction withPiedmont Ave.
Habersham Memorial Hall
FultonThe Wren's Nest; Snap BeanFarm
12/19/1962Building10/15/19661050 GordonSt. SW
Harris, Joel Chandler, House
FultonN/ABuilding8/12/197757 Forsyth St.Healey Building
Fulton2/16/2000Building2/16/2000587 UniversityPlace, SW
Herndon Home
FultonNinth Ward School Building; J.S. Candler Public School
Building11/1/2006978 NorthAvenue, NE
Highland School
FultonState Street AcademyApartments
District7/26/19891031 State St.NW
Home Park School
FultonN/ADistrict7/20/1989205 - 235Mitchell St.
Hotel Row Historic District
District7/25/2003West MariettaSt., Howell Mill
Howell Interlocking HistoricDistrict
Rd., LoweryAve.
FultonKnight Park Historic DistrictDistrict4/17/1997W. MariettaSt., Rice St.,
Howell Station Historic District
Baylor St.,Herndon St.
FultonHowell - Kilpatrick HouseBuilding1/11/1991400 W. PacesFerry Rd. NW
Howell, Mrs. George Arthur, Jr.,House
FultonN/ABuilding4/13/197745 EdgewoodAve. NE
Hurt Building
FultonN/ABuilding3/31/1983355 PeachtreeSt.
Imperial Hotel
FultonN/ADistrict7/23/1973I-485, DekalbAve., LakeAve.
Inman Park Historic District (incl.boundary increase)
FultonBoundary Expanded 10/13/03,See Also: Kriegshaber House
District6/5/1986N. Highland,Seminole,
Inman Park-Moreland HistoricDistrict (incl. boundary increase)
September 2007 Draft Atlanta Strategic Action Plan172
Community Assessment3
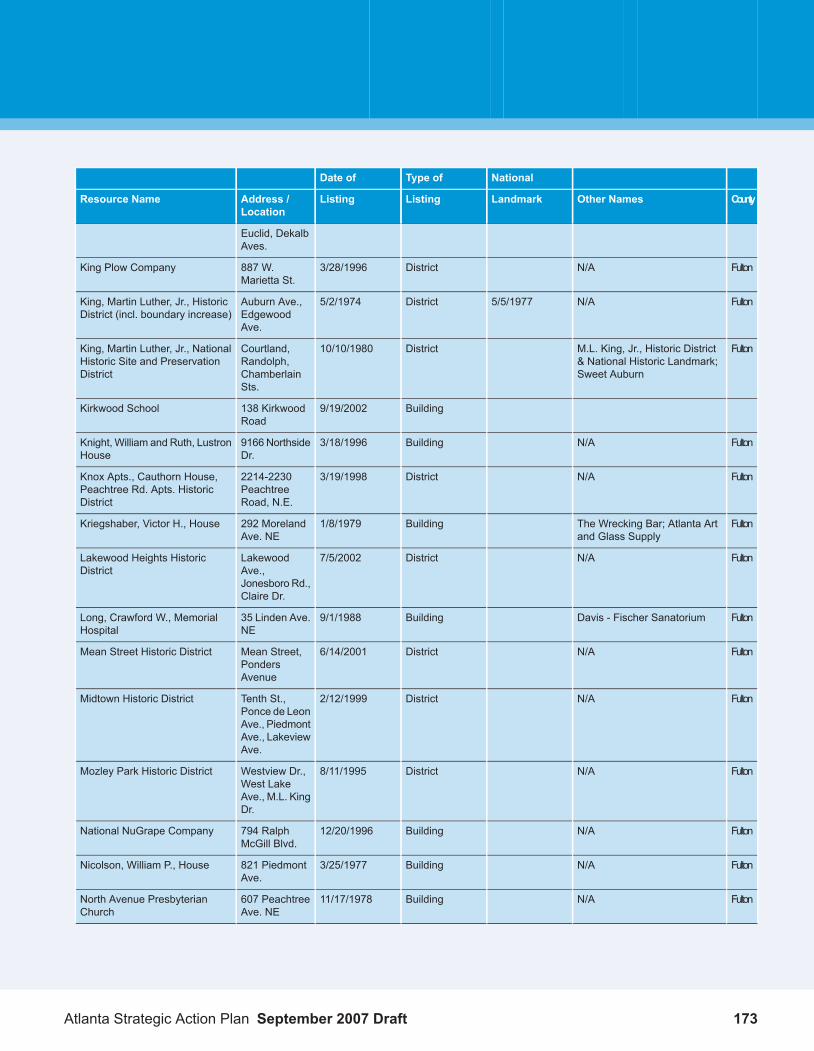
NationalType ofDate of
CountyOther NamesLandmarkListingListingAddress /Location
Resource Name
Euclid, DekalbAves.
FultonN/ADistrict3/28/1996887 W.Marietta St.
King Plow Company
FultonN/A5/5/1977District5/2/1974Auburn Ave.,EdgewoodAve.
King, Martin Luther, Jr., HistoricDistrict (incl. boundary increase)
FultonM.L. King, Jr., Historic District& National Historic Landmark;Sweet Auburn
District10/10/1980Courtland,Randolph,ChamberlainSts.
King, Martin Luther, Jr., NationalHistoric Site and PreservationDistrict
Building9/19/2002138 KirkwoodRoad
Kirkwood School
FultonN/ABuilding3/18/19969166NorthsideDr.
Knight, William and Ruth, LustronHouse
FultonN/ADistrict3/19/19982214-2230PeachtreeRoad, N.E.
Knox Apts., Cauthorn House,Peachtree Rd. Apts. HistoricDistrict
FultonThe Wrecking Bar; Atlanta Artand Glass Supply
Building1/8/1979292 MorelandAve. NE
Kriegshaber, Victor H., House
FultonN/ADistrict7/5/2002LakewoodAve.,
Lakewood Heights HistoricDistrict
Jonesboro Rd.,Claire Dr.
FultonDavis - Fischer SanatoriumBuilding9/1/198835 Linden Ave.NE
Long, Crawford W., MemorialHospital
FultonN/ADistrict6/14/2001Mean Street,PondersAvenue
Mean Street Historic District
FultonN/ADistrict2/12/1999Tenth St.,Ponce de Leon
Midtown Historic District
Ave., PiedmontAve., LakeviewAve.
FultonN/ADistrict8/11/1995Westview Dr.,West Lake
Mozley Park Historic District
Ave., M.L. KingDr.
FultonN/ABuilding12/20/1996794 RalphMcGill Blvd.
National NuGrape Company
FultonN/ABuilding3/25/1977821 PiedmontAve.
Nicolson, William P., House
FultonN/ABuilding11/17/1978607 PeachtreeAve. NE
North Avenue PresbyterianChurch
173Atlanta Strategic Action Plan September 2007 Draft

NationalType ofDate of
CountyOther NamesLandmarkListingListingAddress /Location
Resource Name
FultonN/ADistrict4/28/1976248 OaklandAve. SE
Oakland Cemetery
FultonDistrict4/11/2003Oakland Drive,Avon St.,
Oakland City Historic District
Richland Dr.,Donnally St.
FultonN/ABuilding5/2/1975228 - 250Auburn Ave.NE
Odd Fellows Building andAuditorium
FultonGeorgia Tech Chi Phi HouseBuilding6/17/1982720 Fowler St.NW
Omega Chapter of the Chi PhiFraternity
FultonRed Seal Shoe FactoryBuilding9/29/199516 WilliamHolmes
Orr, J.K., Shoe Company
Borders, Sr.Ave
FultonBuilding10/27/2004952 PeachtreeSt. and 93Peachtree Pl.
Palmer House and Phelan HouseApartments
FultonN/ABuilding5/9/1997793 ParkStreet, S.W.
Park Street Methodist EpiscopalChurch, South
FultonN/ABuilding5/17/19841580Peachtree St.NW
Peachtree Christian Church
FultonN/ADistrict12/8/1980Peachtree,Habersham,
Peachtree Heights Park HistoricDistrict
and WesleyRds.
FultonN/ADistrict6/5/1986E. PacesFerry,
Peachtree Highlands HistoricDistrict
Piedmont Rd.,Highland Dr.
FultonBrookwood StationBuilding9/14/19761688Peachtree St.NW
Peachtree Southern RailwayStation
FultonN/ABuilding1/20/1972179 Ponce deLeon Ave.
Peters, Edward C., House
FultonBuilding10/28/2003266 11thStreet, NE
Piedmont Park Apartments
FultonGrounds of Cotton States andInternational Exposition
District5/13/197610th St.,Piedmont Rd.
Piedmont Park Historic District
District6/14/2006McDaniel,Metropolitan,University
Pittsburgh Historic District
FultonN/ABuilding1/6/198090 Fairlie St.SW
Retail Credit Company HomeOffice Building
September 2007 Draft Atlanta Strategic Action Plan174
Community Assessment3

NationalType ofDate of
CountyOther NamesLandmarkListingListingAddress /Location
Resource Name
FultonN/ADistrict4/3/2003Flat ShoalsRd., Wylie St.,
Reynoldstown Historic District
Kirkwood Ave.,Chester Ave.
FultonN/ABuilding3/1/19741516Peachtree St.
Rhodes Memorial Hall
FultonN/ABuilding1/19/1979134 PeachtreeSt. NW
Rhodes-Haverty Building
FultonN/ABuilding5/24/19901824 PiedmontAve. NE
Rock Spring Presbyterian Church
FultonJ.W. Elliot AntiquesBuilding9/20/1977537 PeachtreeSt.
Rose, Rufus M., House
FultonPioneer Neon BuildingBuilding2/22/1996330 - 346Marietta St.
Selig Company Building
FultonN/ABuilding12/12/197648 Hunter St.SW
Shrine of the ImmaculateConception
FultonN/ABuilding11/20/19703099 AndrewsDr. NW
Smith, Tullie, House
DeKalbN/ABuilding6/28/1982520 OakdaleRd. NE
Smith-Benning House
FultonN/ABuilding12/1/197851 Ivy St. NESouthern Bell TelephoneCompany Building
FultonToshiba Building; GarnettStation Place
Building8/10/1988236 Forsyth St.SW
Southern Belting CompanyBuilding
Building8/21/2002593 Glen IrisDrive
Southern Dairies
District7/16/2002539 JohnStreet, NW
Southern Railroad North YardsHistoric District
Building2/5/2002555 ArgonneAvenue, NE
Spotswood Hall
FultonN/ABuilding6/13/19861041 W.Peachtree St.
St. Andrews Apartments
FultonSt. Mark United MethodistChurch
Building11/2/1987781 PeachtreeSt.
St. Mark Methodist Church
FultonOriginal Fort McPhersonDistrict11/5/1974NE corner ofFortMcPherson
Staff Row and Old Post Area --Fort McPherson
FultonStewart Avenue UnitedMethodist Church
Building3/2/1989867 StewartAve. SW
Stewart Avenue MethodistEpiscopal Church, South
FultonFairchild Hall12/2/1974Building12/2/1974Morris BrownCollegeCampus
Stone Hall, Atlanta University
175Atlanta Strategic Action Plan September 2007 Draft

NationalType ofDate of
CountyOther NamesLandmarkListingListingAddress /Location
Resource Name
FultonN/ABuilding9/13/19773099 AndrewsDr. NW
Swan House
FultonN/A12/8/1976District12/8/1976Auburn Ave.Sweet Auburn Historic District
FultonTechwoodDistrict6/29/1976North Ave.,Parker St.,Williams St.
Techwood Homes HistoricDistrict
FultonN/ABuilding9/9/19821589Peachtree St.
Temple, The
FultonN/AStructure6/19/1973CycloramaBuilding /Grant Park
Texas, The
FultonN/ABuilding12/8/1980105 W. PacesFerry Rd.
Thornton, Albert E., House
Fulton10 Pryor Street BuildingBuilding2/23/198410 Pryor St. /10 Park PlaceSouth
Thorton Building
FultonN/ABuilding12/12/1976125 W. WesleyRd. NW
Tompkins, Henry B., House
FultonAtlanta Brush CompanyBuilding9/18/199719 HilliardStreet, S.E.
Trio Steam Laundry
FultonN/ABuilding9/9/1999650 Glen IrisDrive, S.E.
Troy Peerless Luandry Building
FultonN/ABuilding12/8/19803418PinestreamRd. NW
Trygveson
FultonN/ABuilding7/15/1982679 Durant Pl.NE
Tyree Building
FultonOld Post OfficeBuilding5/2/197476 Forsyth St.U.S. Post Office and Courthouse
Building2/10/200677 Forsyth St.U.S. Post Office, Federal Annex
FultonUnderground Atlanta; See Also:Western and Atlantic RR ZeroMilepost
District7/24/1980M.L. King Jr.Dr., CentralAve.,Peachtree St.
Underground Atlanta HistoricDistrict
FultonTheMurray Company / "MurrayMill"
Building9/10/1979Foster St.VanWinkle, E., Gin and MachineWorks
FultonHollywood; Newcastle; RubenGarland House
Building6/8/1988801 W. PacesFerry Rd.
Villa Lamar
Fulton/DekalbDistrict5/10/1998Virginia Ave.,N. Highland
Virginia-Highland Historic District
Ave.,AmsterdamAve., MonroeDr.
September 2007 Draft Atlanta Strategic Action Plan176
Community Assessment3

NationalType ofDate of
CountyOther NamesLandmarkListingListingAddress /Location
Resource Name
FultonBuilding12/4/2004535 LuckieStreet
Wallace Branch, Ann, CarnegieLibrary
FultonDistrict2/28/2000Ashby St.,MLK, Jr. Dr.,
Washington Park Historic District
Simpson,Ashby Ter.
FultonN/ABuilding3/18/198645WhitehouseDr. SW
Washington, Booker T., HighSchool
FultonN/ADistrict2/25/1999Ralph D.AbernathyBlvrd, S.W.
West End Historic District
FultonN/AObject9/19/1977Central Ave.,between Wall
Western and Atlantic RailroadZero Milepost
St. andRailroad Ave.
FultonBuilding11/8/2000820 RalphMcGillBoulevard
Western Electric CompanyBuilding
FultonBuilding2/9/2001426 MariettaStreet, NW
Westinghouse Electric CompanyBuilding
FultonDistrict9/13/2001Off of BoltonRoad
Whittier Mill Historic District
FultonThe Wilson HouseBuilding2/15/1980501 FairburnRd. SW
Wilson, Judge William, House
FultonBuilding5/10/20052626BrookwoodDrive, NE
Winship, Georgia and EmilyHouse
FultonWitham - Clark HouseBuilding12/22/19782922 AndrewsDr. NW
Witham, Stuart, House
FultonH.R. Butler SchoolBuilding1/24/198089 Yonge St.Yonge Street School
DekalbN/ABuilding9/30/1997810 FlatShoals Road,S.E.
Zuber-Jarrell House
Proposed / Uncompleted National Register Historic District Nominations
Candler Park Historic DistrictAmendment
Kirkwood Historic District
Poncey-Highlands
South Atlanta
Addressmappingaddress
Proposed National RegisterHistoric Buildings
Buildingx167 PeachtreeStreet
167 PeachtreeStreet
165-167 Peachtree Street
177Atlanta Strategic Action Plan September 2007 Draft

NationalType ofDate of
CountyOther NamesLandmarkListingListingAddress /Location
Resource Name
Building193 Joseph E.LoweryBoulevard
Brazeal, Dr. Brailsford R., House
Buildingx329 DecaturStreet
Bremen Steel Company
2230-50 Cheshire Bridge Road2230-50CheshireBridge Road
Cheshire Bridge RoadApartments
Buildingx505 WhitehallStreet
Chevrolet Motor Company
Buildingx1885 WalthallDrive, NW
1885 WalthallDrive, NW
Copeland, William, House
x1332 EuclidAvenue and
1332 EuclidAvenue and
Goldsboro Apartments
542-548542-548GoldsboroAvenue
GoldsboroAvenue
xMetropolitanAvenue, SE
Gordon, John B., ElemetarySchool
Buildingx290 MartinLuther King, Jr.Drive, SE
Southern Spring Bed Company
Buildingx176 PeachtreeStreet
Winecoff Hotel
488 Glenn Street, SW488 GlennStreet, SW
General Electric CompanyWarehouse (Toby Sexton TireCompany)
Table 3.83 Easements Atlanta PropertiesProperty AddressProperty Name
70 Fairlie Street, NW70 Fairlie Street
90 Fairlie Street NW90 Fairlie
2855 Peachtree Road NWAlhambra, The
1080 Euclid Avenue NEBass Lofts
150 5th StreetBiltmore Tower
512 Means Street NWBlock Candy
63 Mangum Street SWBottle Works, The
19 Hilliard Street SWBrushworks
530 Means Street NWCarriage Works
2840 Peachtree RoadCrestwood
326 Nelson StreetDeer Lofts
September 2007 Draft Atlanta Strategic Action Plan178
Community Assessment3

Property AddressProperty Name
510 Edgewood Avenue SEEdgewood Lofts
79, 85/87 Poplar Street; 87/89 Fairlie StreetFairlie Poplar Lofts
75 John Wesley Dobbs Avenue NEFreeman Ford Lofts
170 Boulevard Avenue SEFulton Bag and Cotton Mill
172 Haynes Street NWGE Lofts
426 Marietta Street NWGiant Lofts, The
120 Marietta Street NWGlenn Building
75 Poplar Street NWHaas Howell Building
161 Spring StreetHampton Inn and Suites
434 Marietta Street NWHastings Seed
57 Forsyth Street NWHealey Building
768 Marietta Street NWHotel Roxy
138 Kirkwood Road NEKirkwood Lofts
1610 Ponce de Leon Avenue NELullwater
205 Auburn Avenue NEOddfellows Building
826 Peachtree StreetPeachtree Manor
690 Piedmont Avenue NEPiedmont and Third
342 Marietta Street NWPioneer Neon Lofts
427 Moreland AvenuePoint Center
745 Rosalia Street SERoosevelt High School
729 Edgewood Avenue NESchoolhouse Lofts
555 Argonne DriveSpotswood Hall
92 Luckie Street NWStandard Building
659 Auburn Avenue NEStudioPlex
244 Peters StreetSwift & Company Lofts
828 Ralph McGill BoulevardTelephone Factory Lofts
75 Marietta StreetWalton Place
589 Auburn Avenue NEWigwam Condominiums
32 Peachtree StreetWilliam Oliver Building
Current Activities
Survey and Identification of Historic Resources
In July 2000, the Urban Design Commission began the Comprehensive Historic Resource Survey (CHRS)for the entire City. A comprehensive survey was last completed in the late 1980s and culminated in thepublishing of Atlanta’s Lasting Landmarks in 1987. The current goals of the CHRS are:
179Atlanta Strategic Action Plan September 2007 Draft

1. Produce tools that are valuable for current and future preservation work using formats that are responsiveand accessible to multiple audiences.
2. Be as comprehensive as possible in its coverage and include all relevant periods of history andprehistory; major historical events, trends, and people; and architecture and landscape resources.
3. Be, as much as possible, inclusive in its process, responsive in its procedures, and up-to-date in itstechnologies.
4. Uncover and address questions of significance, boundaries, coverage, and National Register of HistoricPlaces (and other) systems that have not been previously explored even if they cannot be fully resolvedwithin the terms of the CHRS.
The CHRS would synthesize all survey efforts since 1987. Initially, the UDC expected this effort to take anestimated 3-4 years to complete. The UDC will provide the overall project management, with the bulk ofthe survey, identification, research, and ‘document’ work being done by consultants and graduate historicpreservation students. At this time, the UDC Staff time allocated to the CHRS has been greatly reduced.The Staff’s historic resource survey efforts related to the Beltline have been its only contribution to the CHRSthis past year.
During the summer and fall of 2005, the Atlanta Urban Design Commission, in conjunction with graduatestudents from the Georgia State University Heritage Preservation program, studied the proposed Beltlineproject and its potential impact on historic resources. The study was performed in cooperation with theCity’s redevelopment plan, developed by the firms of EDAW and Urban Collage. The historic analysisproject included archival research about the historical development of the area and a field survey of historicresources along the proposed Beltline path. The area of the study followed the Tax Allocation District (TAD)boundary, as well as immediately adjacent properties. There were several keys findings of this initial Beltlineresearch:
The Beltline was developed in the period from 1871 to 1905 as a railroad bypass around the City,It had a notable influence on Atlanta’s later development, particularly early-to-mid 20th century,1002 resources were surveyed, of which 848 were considered historic,Historic resources are roughly equally distributed along all portions of the Beltline, andMany of the proposed redevelopment nodes have historic resources.
Local and National Nomination of Historic Resources
The Historic Preservation Ordinance of 1989 establishes several categories of designation for both districtsand individual buildings/sites in the City: Landmark; Historic; and, for districts only, Conservation. (A listingof designated properties are listed above.) Regarding designation under the City’s Historic PreservationOrdinance, in 2006 the Urban Design Commission expects: 1) requests to work with a few neighborhoodswho are interested in becoming designated under the historic preservation ordinance, and 2) to nominateindividual buildings whose owners have prepared the required designation report and seek to utilize theCity's economic incentives for historic properties.
It is expected that the number of neighborhoods and individual property owners seeking listing in the NationalRegister of Historic Places and designation by the City will increase due to:
September 2007 Draft Atlanta Strategic Action Plan180
Community Assessment3

increased developmental pressures on historic intown neighborhoods,recognition of designation as a revitalization tool,the various economic incentives which are available for designated properties; andthe effect the Beltline will have on the awareness of historic resources along its corridor.
The Urban Design Commission’s National Register of Historic Places nomination work is limited to supplyinglimited technical assistance to requests for such nominations. There is no proactive program for localdesignations. A listing of properties in the National Register of Historic Places can be found under “Analysisof Data and Information.” The Urban Design Commission's current staff will be unable respond as it has inthe past to the increased number of property owners or neighborhoods seeking designation by the City orlisting in the National Register of Historic Places. Even with additional staff, it is anticipated that the increasingdemand for designation by the City and listing activities will exceed the Urban Design Commission resources.
Review and Regulation of Historic Resources
The Urban Design Commission issues Certificates of Appropriateness before building permits for construction,renovation, or demolition are completed. This review and approval process is required for designateddistricts and buildings, as well as in several Special Public Interest (SPI) districts. The Urban DesignCommission also provides advice or regulation as required by individual ordinances, such as the SubdivisionOrdinance, and zoning applications (rezoning, variances, special use permits, etc.) involving historicresources. Further, it reviews and comments on projects that involve City capital funds, property (includingparks), right-of-way or air rights, or public art.
The Section 106 process required by the National Historic Preservation Act of 1966, as amended, isundertaken by the Urban Design Commission when directed by other City agencies, particularly theDepartment of Planning and Community Development. The Section 106 must be completed for all Cityprojects that have any federal involvement, such as funding, licensing, or other assistance. For morecomplicated or larger projects, the City may find it necessary to enter into a programmatic agreement withthe State Historic Preservation Office, the Advisory Council on Historic Preservation (in some cases), theinvolved federal agency and other concerned parties. These programmatic agreements provide the processand procedures that guide the project. At this time, the City is party to programmatic agreements for theSummerhill Urban Redevelopment Area, the Fulton Bag and Cotton Mill project, In Rem EmergencyDemolitions, and the North Yards Business Park.
The City is currently working with the State Historic Preservation Division to develop a City-side ProgrammaticAgreement that will cover all U.S. Housing and Urban Development funded projects, as well as potentiallyother federal programs the City participates in.
The Urban Design Commission staff will be unable to properly respond to the resulting number and complexityof requests for Certificates of Appropriateness if additional properties come under the Urban DesignCommission's regulation. The number of regulatory actions completed by the Commission and Staff hasgone from 126 in 1995 to 556 in 2005. Even with additional staff, it is anticipated that the increasing demandfor and complexity of Certificates of Appropriateness will exceed the Urban Design Commission resources.
181Atlanta Strategic Action Plan September 2007 Draft

The Economic Review Panel is used inappropriately. It should be convened only for the purpose of assessingthe reasonable economic return argument for the complete demolition of contributing structures inCity-designated districts.
Section 106 reviews by the staff under the current programmatic agreements will reveal the strengths andweaknesses of those agreements andmay necessitate further changes or amendments to avoid unnecessarydelays in City projects. This experience was used in developing the proposed Citywide ProgrammaticAgreement, now under development with the State Historic Preservation Division.
There is no legislation that ensures archeological sites and Civil War trenches are not destroyed.
Long-term and sustainable strategies do not exist that would help prevent the demolition of abandonedand/or deteriorated (but salvageable) residential structures in City-designated districts.
Economic Incentives
Another integral part of the City’s historic preservation program has been the adoption of various ordinancesto establish economic incentives. These economic incentives include the transfer of development rights,the Landmark Historic Property Tax Abatement Program, the City/County Housing Enterprise Zone TaxAbatement Program, and the development impact fee waiver. Additionally, the Rehabilitated HistoricProperty Tax Abatement Program, the State Income Tax Program, and the Federal Tax Credit Programare available through the Historic Preservation Division, Georgia Department of Natural Resources. Privately,facade easements can be donated to Easements Atlanta, a local non-profit, private corporation. (A listingof easements currently held by Easements Atlanta, Inc. is included above).
While the City has an innovative array of economic incentives, several issues require additional attention.The tax assessment “freezes” currently available must be evaluated regarding: 1) ease of application; 2)possibility of freezing the assessment of City-designated Landmark buildings with regards to Fulton Countytaxes; and 3) historic properties being assessed at their designated level of land use. Economic incentivesset out in the Atlanta Comprehensive Historic Preservation Program, such as mortgage guarantees and arevolving loan fund, need to be evaluated as to their viability for the City. In addition, there is minimaltechnical support by the City for property owners applying for the tax abatements for designated propertiesas provided for by State and City law.
The City must determine if it is feasible in the future, with adequate funding and staffing, to provide “bricksand mortar” funding for the rehabilitation of historic commercial and residential buildings. Any such historicrehabilitation or facade programmust address: 1) identifying and assisting potential applicants; 2) providingincentives for applicants to participate; 3) assuring that design and construction work meets appropriatestandards; 4) creating economies of scale; and 5) once properties are rehabilitated, assuring they aremaintained.
Public Outreach and Interpretation
September 2007 Draft Atlanta Strategic Action Plan182
Community Assessment3

Every year, representatives of the Urban Design Commission make presentations to neighborhoods andneighborhood planning units, civic and professional associations, and classes at all educational levels fromelementary to graduate school. These presentations cover a variety of topics, including Atlanta’s history,its historic buildings and districts, the operations of the Urban Design Commission, past historic preservationprojects, and historic designation types / procedures.
There is minimal information regarding the City's historic resources for visitors and residents alike, especiallyguides for foreign tourists and those interested in the Civil Rights movement in Atlanta. While the FreedomWalk brochure, the National Park Service interpretation of the M. L. King Jr. Birth Home and the AtlantaPreservation Center's tours of Sweet Auburn provide ample information for that area, few of Atlanta's otherhistoric resources can offer anything comparable.
Those seeking information and walking / driving tours dealing with the City’s historic resources will increaseas Atlanta’s tourism industry continues to grow, heritage tourism receives more attention locally, olderneighborhoods are revitalized, and the general public becomes more aware of the benefits of working, living,or visiting Atlanta’s Downtown and other areas containing historic resources.
Operations and Information Technology
The Urban Design Commission staff continues to work on building its geographic information system capacityand increasing the amount of historic resource information available electronically. This includes addingmaps, text, downloadable application materials, and pictures to the web site, digitizing current and formerdesignation boundaries and sites, digitizing other historic resource–related information maintained by otherpublic and non-profit agencies, and integrating into the City’s local area network.
Buildings Worth Saving Committee
The Atlanta Preservation Center’s Buildings Worth Saving Committee, working together with the UrbanDesign Commission, normally offers two workshops regarding the economic incentives available to theowners of historic property. “The Bottom Line” workshop focuses on income-generating properties, while“Live in a Landmark” focuses on owner-occupied residential property. The Georgia Institute of Real Estatehas accredited these workshops for continuing education. A second component of the Buildings WorthSaving Committee is to publish a list of endangered buildings each year.
Awards of Excellence
The Urban Design Commission conducts an annual event to recognize outstanding projects, programs,individuals and organizations that have significantly contributed to the preservation of Atlanta's physicalheritage or the enhancement of our urban environment.
Additional Programs and Projects Needed
Taking into account the anticipated future conditions, and existing programs and projects, the followingadditional programs and projects are needed, but could not be initiated or sustained by current or anticipatedfuture levels of staff and funding for the Urban Design Commission:
183Atlanta Strategic Action Plan September 2007 Draft

1. Strategies and programs for the preservation of existing residential properties in historic districts, aswell as for the design of appropriate in-fill construction in such districts.
2. Walking Tours for specific areas and Bus Tours for more far-reaching areas covering topics such asthe Civil War and the Civil Rights movement. A better line of communication between the historicpreservation groups and the Atlanta Convention and Visitor Bureau is needed to assist in thedevelopment of additional tours and the capability to deliver, describe and promote such tours in anumber of foreign languages.
3. Historic Resource Education Units in every school in Atlanta, including a unit on historic resources withworkshops to train teachers in the application and utilization of the historic resources unit. Ultimately,a "preservation camp" program might be established for the summer months.
4. Layman’s Guide regarding the implementation of the Historic Preservation Ordinance, including themost commonly asked questions regarding historic districts.
5. A pattern book outlining compatible infill development in undesignated neighborhoods.
6. Comprehensive revision of the City’s zoning code to reflect current City policies, priorities, and changingapproaches to construction and development in the City.
Issues and Opportunities
Awareness and Education
Issues:
Not all of the City’s historic resources worthy of protection have not been identified and researched.
Not all of the City’s historic resources have not been mapped or compared to areas of future developmentor areas that are targeted for development by the City (See “Areas Requiring Special Attention” below).
Master and/or management plans are needed for some of the historic resources open to the public and/ormanaged by the City (parks, community centers, etc.)
There is no ongoing and active education program for the general public, elected officials, other governmentagencies, developers, neighborhoods, etc. about historic resource protection and revitalization, preservationtools, or the role of historic preservation in the City’s future.
Not all development entities (public and private) are aware of historic preservation issues, potential historicresources and the support available to assist them.
The condition of some historic resources is endangered and / or declining.
September 2007 Draft Atlanta Strategic Action Plan184
Community Assessment3

Some development is diminishing the historic integrity of neighborhoods, commercial areas, and individualproperties.
Some new development is not compatible with historic, but unprotected neighborhoods and commercialareas.
Rural areas within the City are not protected against incompatible development patterns.
Implementation / Enforcement
Issues:
The City has limited resources (financial, staff, etc.) to respond to requests for the protection of historicresources and to manage the subsequent processing of development-related applications for projects.
Further improvement needed in the enforcement of regulations that protect historic resources.
The City’s current regulatory tools to protect historic resources provide outdated or inadequate solutions tosome of the development circumstances that exist in the City.
Historic resources are not thoroughly considered in all of the City’s development-related decisions or majorprojects.
The City has limited programs to directly assist with the improving or enhancing historic resources.
The City has no program to promote the City’s historic resources and their value to the City’s future to thegeneral public, potential developers, or other interested parties.
185Atlanta Strategic Action Plan September 2007 Draft

Community Facilities and Services
Water Supply and Treatment
The City of Atlanta’s water supply and treatment system is owned and operated by the City of Atlanta. Itserves a population of more than 1.2 million people, including approximately 646,000 residents and 565,000employees. In 2006 the City’s average daily water production was 113 million gallons per day.
1. Service Area
The geographic area served by the City of Atlanta’s water treatment and distribution system covers an areagreater than 650 square miles. It includes the City of Atlanta, and all local governments and jurisdictionsin Fulton County south of the Chattahoochee River, with the exception of East Point and College Park.Hartsfield-Jackson Airport and Fort McPherson are also included in the City’s service area. Within this areathe City of Atlanta provides water on a wholesale basis to the cities of Fairburn, Hapeville and Union City.Coweta, Clayton and Fayette counties are also wholesale customers. The boundaries for the City of Atlanta’sretail service area are the boundaries for the City of Atlanta and unicorporated Fulton County prior to Fairburnand Union City’s November 2006 annexations. As such, a portion of Fairburn and Union City now lie withinthe retail area served by the City of Atlanta. The City also provides water to Fulton County north of theChattahoochee River. The City’s service area is shown in Map Map 3.13 ‘City of Atlanta Water Treatmentand Distribution Service Area’.
2. Water Supply Facilities
The City of Atlanta’s water supply and treatment system consists of multiple facilities and an extensivenetwork of water mains. Key to this system are two intake structures, two raw water pumping stations, threereservoirs, three treatment plants, fifteen pump stations, 12 storage tanks, five major administrative facilitiesand approximately 2,700 miles of water mains and pipes. The locations of these facilities are shown inMap Map 3.14 ‘City of Atlanta Water Treatment Facilities’.
September 2007 Draft Atlanta Strategic Action Plan186
Community Assessment3

#Y
#Y
#Y
Jonesboro Rd
D E K A L BD E K A L B
Decatur
Doraville
Chamblee
Clarkston
AvondaleEstates
Pine
§̈¦285§̈¦75
§̈¦285
C L A Y T O NC L A Y T O N
F U L T O NF U L T O N
C O B BC O B B
G W I NG W I N
Roswell
!(400
ATLANTAHemphill WTP
Hartsfield-JacksonAirport
Sandy Springs
Chattahoochee R
iver
Flint River
South R
iver
C O W E T AC O W E T AF A Y E T T EF A Y E T T E
D O U G L A SD O U G L A S
Chattahoochee WTP
Atlanta-Fulton County WTP
§̈¦75
§̈¦85
§̈¦85
§̈¦20
H E N R YH E N R Y
P A U L D I N GP A U L D I N G
Alpharetta
East Point
Fairburn
Union City
Forest Park
CollegePark
Palmetto
RiverdaleMorrow
Hapeville
Lake City
JonesboroPalmetto
Water Service Area
City of Atlanta
City Boundary
Water Treatment Plant!.
Map 3.13 City of Atlanta Water Treatment and Distribution Service Area
187Atlanta Strategic Action Plan September 2007 Draft

18
3
87
6
14
9
11
3
S Central Ave
CHAMBLEE
DORAVILLE
FULTON
DEKALB
CLAYTON
1913
146
81016
12
2311
117
25222
24
521
815
20
6
4
10
12
RefNo. Water Treatment Facilities
Administrative Facilities
1 Chattahoochee WTP 2 Hemphill WTP3 Atlanta-Fulton County WTP 4 Atlanta-Fulton County Intake
5 Adamsville6 Dilbeck7 Dupree8 Hartsfield-Jackson9 Long Island Creek10 Mt. Paran11 Northside12 Peachtree-Dunwoody13 Roswell Road14 Sandy Springs15 Welcome All Road16 West Wieuca
5 Adamsville17 Casey's Hill7 Dupree8 Hartsfield-Jackson18 Jett Ferry11 Northside19 Pitts Road14 Sandy Springs20 Stonewall
21 City Hall22 14th Street Water Administration Building23 Chastain Substation24 Pipe Yard Maintenance and Storage Facility25 Waterworks Lodge
Pump Stations
Tanks
Map 3.14 City of Atlanta Water Treatment Facilities
September 2007 Draft Atlanta Strategic Action Plan188
Community Assessment3

The Chattahoochee River Intake operates pursuant to a withdrawal permit of 180 mgd from the GeorgiaEnvironmental Protection Division (EPD) and is the source off water for the Chattahoochee and HemphillWater Treatment Plants (WTPs). Water from the intake flows to the Chattahoochee Raw Water PumpingStation from which it is pumped to the Hemphill WTP reservoirs or the Chattahoochee WTP. TheChattahoochee WTP has a maximum permitted treatment capacity of 64.9 million gallons per day (mgd).The two raw water reservoirs located at the Hemphill Water Treatment Plant have a total capacity ofapproximately 550 million gallons. Water flows from the raw water reservoirs to the Hemphill Water TreatmentPlant which has a permitted maximum treatment capacity of 136.5 mgd.
The Atlanta-Fulton County Water Treatment Plant (AFCWTP) is a joint venture plant owned by the City ofAtlanta and Fulton County. The facility is managed by the Atlanta-Fulton County Water ResourcesCommission. The City of Atlanta and Fulton County jointly own the land and the facility on a fifty-fifty basis.Each entity is entitled to 50% of the total supply of water treated by the plant at any time or fifty percent ofthe capacity, whichever is greater.
The AFCWTP intake operates pursuant to a withdrawal permit of 90 mgd from the Environmental ProtectionDivision (EPD). This water withdrawal permit is anticipated to be increased to 135 mgd and is the sourceoff water for the Atlanta-Fulton County Water Treatment Plant. The raw water is pumped from theChattahoochee River to the raw water reservoir which has capacity of approximately 1 billion gallons. Fromthe reservoir the water flows to the AFCWTP, which has a permitted capacity 90 mgd. Ultimately, this plantis anticipated to be expanded to 155 mgd.
3 . Water Distribution System
The City of Atlanta’s water distribution system consists of fifteen storage tanks, twelve pump stations andapproximately 2,700 miles of water mains. The City of Atlanta owns and operates the distribution systemwithin the City of Atlanta, including the portion of the City that lies within Dekalb County, and within theportion of unincorporated Fulton County which is located south of the Chattahoochee River.
The City’s distribution system includes the pipelines required to service the City’s retail customers up to theedge of the right-of-way where ownership of the pipeline transfers to others. It should also be noted thatthe City uses its distribution system to deliver water to its wholesale water customers.
The water lines in the City’s system range in age from one year to over seventy-five years and have diameterranging from two to seventy-two inches. Nearly all of the pipes are constructed of cast iron or ductile iron.The older pipes are cast iron, with the installation of ductile iron pipe starting in the 1960’s.
The distribution system storage tanks and pump stations serve to dampen instantaneous water demandand pressure fluctuations in the service area. The pump stations allow water to be pumped up hill andensure that there is adequate pressure throughout the water system. Amajority of the pump stations operateon standby status to be utilized during peak demand or in the event service from the Atlanta-Fulton CountyWTP is interrupted.
189Atlanta Strategic Action Plan September 2007 Draft

The storage tanks provide backup water during peak demand or when there is a loss of pressure in thesystem. Elevated storage tanks are used to maintain pressure in the distribution system for general waterdelivery and fire flow protection . Overall, the distribution system has approximately forty-two (42) milliongallons of storage (excluding storage at the water treatment facilities).
In addition to its treatment plants and pump stations, the Department of Watershed Management utilizesmultiple permanent and temporary facilities to support its water, wastewater and soon-to-be stormwaterfunctions. The department faces considerable space shortages and maintenance facilities for both its waterand wastewater operations are needed. To resolve these issues the Department of Watershed Management(DWM) has proposed the construction of an administration and maintenance building. Such relocationwould resolve space constraints, improve communication, facilitate the alignment of like services, andimprove overall efficiency.
4. City of Atlanta Growth and Development and Water Supply
Level of Service and Adequacy of Facilities to Meet Future Needs
The level of service provided by the City’s drinking water system is good. The water treatment plants haveadequate capacity, water is routinely distributed throughout the distribution system to the City’s customers,and the City’s drinking water meets all water quality standards.
In 2006 the City produced an average of approximately 113 million gallons per day (mgd) of drinking water.By 2030 the City anticipates that up to 149 mgd will be needed on an average daily basis with peak demandreaching upwards of 239 mgd. This figure is based upon the assumption that a 10 percent reduction inper capita water usage based on water conservation will be achieved by 2030.
To meet these water supply needs the City has proposed the conversion of the Bellwood Quarry into a rawwater reservoir. This reservoir is anticipated to provide over two billion gallons of raw water storage. Thedevelopment of such a reservoir in conjunction with maintaining the ability to withdraw 180 mgd at thePeachtree intake, increasing the AFCWTP permit to allow a withdrawal of 135 mgd, and supplementing theCity of Atlanta’s water supply with a portion of the 53 mgd of wholesale water to be made available to FultonCounty from Cobb County (as outlined in the 2003 Metropolitan North Georgia Water Planning District WaterSupply and Water Conservation Management Plan), is anticipated to meet the City’s water supply needsthrough 2030 and beyond.
Although the City of Atlanta’s water treatment supply and distribution facilities currently meet system demands,significant capital improvements are needed to ensure the ongoing delivery of water throughout the servicearea and to develop and maintain the system to meet future demands. These needs include:
The ongoing replacement of infrastructure that has reached its useful service life,
The upgrading and/or replacement of existing water mains, pump stations, and tanks to provideadditional water to growing areas and to extend water service into areas where service has previouslynot been provide,
September 2007 Draft Atlanta Strategic Action Plan190
Community Assessment3

The ongoing installation and replacement of water meters to ensure that all customers pay a fair pricefor the water they receive, and that fees for water are collected,
The upgrading and replacement of equipment and systems to maintain and improve system operabilityand efficiency, and
The implementation of the security measures necessary to comply with the national homeland securityguidelines
The Capital Improvement Projects necessary to meet the projected needs from now through 2017 areincluded in the Short Term Work Program.
The Department of Watershed Management is currently developing a Watershed Master Plan. This planwill be based upon the 2006 ARC population projections which are being utilized in the Population andEconomic Development Elements of the Atlanta Strategic Action Plan, the MNGWPD Water Supply andWater Conservation Management Plan, and the State Water Plan. As the Watershed Master Plan isdeveloped additional review of the ASAP elements will be performed to identify needs which may be differentfrom those identified to date.
The Ability of Water Infrastructure to Direct Development Patterns
Because the development of communities is dependent on the availability of water, and because the costof developing the infrastructure necessary to deliver water is high, the financial requirements for developingnew infrastructure is likely to direct the development patterns of a community, e.g. development occursaround existing infrastructure.
For development to occur sufficient water must be available and water treatment plant capacity must besufficient to deliver water of appropriate quality, quantity and pressure. In addition, the infrastructurenecessary to deliver water to the locations where new development is desired must be put in place.Unfortunately, it is not easy to predict the ideal size of the facilities needed (bigger is necessarily better) norare the land and easements necessary to construct the needed infrastructure easy to obtain. Furthermore,once the infrastructure is built there it will remain, and thus, by its very size and location impacting thedevelopment patterns of the community.
Improving Infrastructure Efficiency to Accommodate Future Development
As noted above, the delivery of water is key to development; however the ability to deliver water requiresthe construction of the water infrastructure prior to the facilities it will serve. Further complicating the issueis the fact that projections of growth and development are dynamic, frequently changing significantly overa few short years. Yet, the lifetimes of water facilities and pipelines are long, frequently ranging from 30 to100 years. As such the sizing and locating of water system infrastructure, is both an art and a science, thatcan best be improved by improving both the accuracy of the growth projections and the analysis that isperformed to project the improvements needed to the system.
The Influence of Service Areas and Levels of Service on Future Development
191Atlanta Strategic Action Plan September 2007 Draft

The level of water service provided to a community is fundamental to the enjoyment of living in the communityand the development of the community. Without water, growth can not occur and routine activity ceases toexist. The quantity and pressure of the water must be adequate to meet day-to-day needs, including fireprotection, and the quality of the water provided must protect health and should be aesthetically pleasing.Providing water of sufficient quantity and quality at an appropriate pressure is key to customer satisfaction,and fundamental to future development.
At the same time, providing water is a long-term proposition. As such, it is important that service areas bemaintained. Water infrastructure is expensive and is built well before the facilities it will serve are in place.The up-front costs are high and take many years to recover If water providers can not be certain that theirservice area will remain, the financial basis for constructing the system is at risk. In addition, the planningand ongoing analysis which helps to ensure that the system constructed will operate efficiently can notoccur.
The Impact of Service Area and Level of Service on Natural and Cultural Resources
Regardless of the service area, there are several primary ways in which providing water impacts naturaland cultural resources. With respect to natural resources, the amount of water withdrawn from the watersource is of key importance along with the quantity and quality of the water returned to the system. Withrespect to cultural resources the primary concerns include the ability to supply water to the cultural resourceand the ability to minimize the nuisances associated with the construction of pipelines and distributionfacilities, e.g. disruption of traffic, construction runoff control, construction noise, etc. Issues associated withconstruction are common to all forms of development, and are routinely handled through various regulatory,permitting, and enforcement processes.
The quantity of water available throughout the State of Georgia is currently of concern. This situation iscertainly no different for the City of Atlanta and the entire Atlanta Region. Fundamental to the City ofAtlanta’s development plans is the 180 mgd currently specified in the City’s current permit for the PeachtreeCreek water intake and the 135 mgd water withdrawal rate currently proposed for the intake at the AFCWTP.In addition, the MNGWPD Water Supply Plan identities that an additional 53 mgd will be supplied to FultonCounty through wholesale purchases (The City of Atlanta is included in Fulton County in the MNGWPDPlans.) To date, alternate methods of supplying this water have not been identified, however, alternatemethods which are more efficient may be identified in the future.
With respect to returning water to the basin from which it is withdrawn, the City of Atlanta is a leader. Since1984 the Three Rivers Tunnel has been in place. This tunnel provides the mechanism for returning waterto the Chattahoochee River that is withdrawn from the Chattahoochee River and used in the Flint River andSouth River Basins. In addition, the density of the City of Atlanta, and the small number of septic tankslocated within the City Limits (the City has a no new septic tank policy) results in a lower than normal rateof consumptive use.
Directing Development Patterns through Water Facilities
September 2007 Draft Atlanta Strategic Action Plan192
Community Assessment3

Because water facilities and pipelines are designed for lifetimes of 30 to 100 years, and because they areconstructed before the development they serve, the location of the water supply pipelines will dictate wheredevelopment can occur. As such, the sitting and development of the water supply system should be closelytied to the land use and development patterns desired by the jurisdiction. Within the financial constraintsof the jurisdiction, it is the desired development pattern that drives the development of the water supplysystem, not the other way around.
Issues and Opportunities
1. Providing Water
Issue: Ensure integrity of Chattahoochee Raw Water Intake
Opportunity: Streambank renovation and protection is required to ensure the Integrity of theChattahoochee RawWater Intake. Continue to support the City's Clean Water Atlanta Programwhich provides funding to resolve this problem.
Issue: Eliminate pressure and supply problems
Opportunity: Improvements to water supply and pressure are required in select areas of theCity's service area--predominately S. Fulton, in the vicinity of the Hartsfield Airport, and in thehospital corridor around I-285 and Peachtree-Dunwoody Road. Continue to support the City'sClean Water Atlanta Program which provides funding for the problem areas that have beenidentified to date.
Issue: Replace City's aging distribution system
Opportunity: Continue to support the City's CleanWater Atlanta Program which provides fundingfor this program.
Issue: Providing emergency or redundant water supplies
Opportunity: Investigate with other jurisdictions the potential of providing emergency backupservices.
Issue: Facility security
Opportunity: Continue to support the development of the security upgrades and emergencyplanning required to protect the City's utility systems. DWM has a dedicated staff member todirect the City's effort and the City has implemented a Security Surcharge rate to provide fundingof security projects.
Issue: Access Pipelines
Opportunities: Continue to support the acquisition and documentation of easements.
193Atlanta Strategic Action Plan September 2007 Draft

Improve interdepartmental communication to facilitate the development of linear corridors (sewereasements, bikeways, pathways, animal migration routes, etc.) that provide pipeline access,greenspace, recreational opportunities, alternative transportation modes, and animal habitatand migration pathways.
2. Treating Water
Issue: Maintain high quality treatment at cost-effective rate
Opportunity: Ongoing improvements to the City'sWater Treatment Plants are required to ensurehigh quality treatment at a cost-effective rate. Continue to support the City's CleanWater AtlantaProgram which provides funding for the projects to achieve this objective.
Issue: Develop additional raw water storage
Opportunity: Develop the Bellwood Quarry to meet the City's collective raw water storage,greenspace, recreational and development needs. Upgrade the raw water system to serve theBellwood Quarry and to allow the Bellwood Quarry to serve the ChattahoocheeWater TreatmentPlant.
3. Maximizing Water Revenue
Issue: Increase water revenue
Opportunity: The City's WTP and distribution system have been designed to service Fairburn,Union City and Hapeville and to provide significant quantities of water to Fayette, Coweta andClayton County. Improve Interjurisdictional Communication and Coordination to facilitate themaximum sale of water to these wholesale customers.
Issue: Improve water revenue collection
Opportunity: DWM has increased staff to address problem accounts, has acquired a newcustomer information/billing system and is executing an extensive meter replacement programwhich includes the installation of an automated meter reading system. The meter replacementprogram and the automated meter reading system will increase the quantity of water billed (oldmeters read low) and will greatly improve the accuracy of customers' bills.
4. Improving Customer Service
Issue: Minimize inconvenience and negative business impacts to City residents and employers
September 2007 Draft Atlanta Strategic Action Plan194
Community Assessment3

Opportunity: Improve interdepartmental coordination of transportation & utility projects (water,wastewater, stormwater, gas, electric, telephone, roadways, pathways, railroads, linear avenuesfor animal migration) Improved coordination has the potential to reduce inconvenience andnegative business impacts and decrease project costs.
Issue: Quick response to customer complaints
Opportunity: Continue to support DWM's budget to provide the staff necessary to managecustomer complaints including the staff necessary to man the call center, investigate complaintsand field crews to address field problems.
Issue: Reducing meter installation time
Opportunity: The Department has revised its procedures to reduce the wait time required toreceive meter installation. Implementation of the customer information system, which will trackmeter installation requests and promote follow-up will bring further improvement.
5. Providing Cost-Effective Services
Issue: Development of integrated permit management system with management functioncapability
Opportunity: A permit management systemwhich is capable of scheduling and tracking permitting,inspection, and ongoing compliance requirements (e.g. erosion & sedimentation controlinspections) is needed. Kiva is unable to manage the inspection data in a fashion that allowsefficient scheduling, tracking and monitoring. Build upon the development of computerapplications that are currently underway (GIS, Customer Information Billing System, Maximo,Hansen, Project Scheduling) to develop a permit tracking system that meets customer and Cityneeds.
Issue: Additional space needed to support required staffing level
Opportunity: Complete the DWMAdministration andMaintenance Facility. This facility is currentlyfunded under the Clean Water Atlanta Program and will provide the space necessary to hirethe additional staff required to perform DWM functions and to consolidate the City's water andwastewater operations for improved performance.
Issue: Development of document management system
Opportunity Complete the development of a DWM document management system, takingadvantage of the lessons learned and building upon the development of computer applicationsthat are currently used by DWM (GIS, Customer Information Billing System, Maximo, Hansen,Project Scheduling).
195Atlanta Strategic Action Plan September 2007 Draft

6. Educating the Public
Issue: Ongoing public education needed
Opportunity: Continue to provide public education with respect to water supply, conservation,treatment and project issues. Coordinate the City's public education efforts to maximize theimpact of its public education efforts.
Continue to participate in the MNGWPD public education program and take advantage of theresources it has to offer.
7. Coordinating with Neighboring Jurisdictions
Issue: Renegotiation of agreements
Opportunity: Expand the City's interaction with its wholesale partners to include discussions offuture water supply and to renegotiate expired agreements or out-of-date requirements includedin current agreements. (See "Increase Water Revenue" above.)
Sewerage System and Wastewater Treatment
Service Area
The City of Atlanta’s wastewater treatment and collection system serves a geographic area of approximately225 square-miles, including the City of Atlanta, as well as portions of Fulton, Dekalb and Clayton counties,and the cities of College Park, Hapeville, East Point and Sandy Springs. The City of Atlanta’s service areais divided into three individual service areas, each of which is served by one of the City’s three permittedwater reclamation centers (WRCs) (See Map 3.15 ‘City of Atlanta Wastewater Treatment Service Area’).
The jurisdictions that are served directly by the City of Atlanta’s wastewater treatment facilities are knownas interjurisdictional (IJ) partners as they pay for a portion of the facility and collection system costs. (Itshould be noted that although a portion of the wastewater flow from Sandy Springs is treated at the City'sWRCs, Sandy Springs is served directly through Fulton County and is not an IJ partner with the City.)Similarly, the wastewater services associated with the flow from the City of Atlanta to the Camp CreekWastewater Treatment Plant and the R.L. Sutton Wastewater Treatment Plant are provided to the City byFulton County. In this case the City of Atlanta is an IJ partner with Fulton County as the City of Atlanta paysa portion of Fulton and Dekalb County’s wastewater treatment facility and collection system costs.
September 2007 Draft Atlanta Strategic Action Plan196
Community Assessment3

197Atlanta Strategic Action Plan September 2007 Draft

Map 3.15 City of Atlanta Wastewater Treatment Service Area
1
3
4
6
7
8
9
10
11
1213
14
15
16
17
18
19
202
FULTONFULTON
21
Nancy C
reek
Tunnel
Three Rivers Tunnel
§̈¦75§̈¦85
§̈¦20
§̈¦75§̈¦85
§̈¦285
!(400
Hartsfield-JacksonAirport
Sandy Springs
COBBCOBB
DEKALBDEKALB
CLAYTONCLAYTON
2223
24
25
East Point
Forest Park
College Park
Decatur
D
Chamblee
Hapeville
CSO Facilities
6789
10112
121314151617181920
1234
Miscellaneous Structures21 Proctor Creek Diversion Structure
NOTE: For CSO Basins and facilities,see Figures 3.6 and 3.7
Bell South PSBolton Road PSCascade Road PSFlint River PSHanover West PSHighlands PSNancy Creek Tunnel PSNiskey Lake 1 PSNiskey Lake 2 PSNorthside Drive PSPaul Avenue PSPhillip PSRebel Forrest PSRivermeade PSSouth River PSWoodward Way PS
Intrenchment Creek WRCR.M. Clayton WRCSouth River WRCUtoy Creek WRC
Pump Stations
Water Reclamation Centers
222324
25
City HallCity Hall EastJames Walker Sewer Constructionand Maintenance Facility (Englewood)Liddell Drive Facility
Administrative Facilities
Atlanta-Camp Creek WWTPService Area
R.M. Clayton WRC Service Area
South River WRC Service Area
Utoy Creek WRC Service Area
Atlanta-R.L. Sutton WWTPService Area
Map 3.16 City of Atlanta Wastewater System Facilities
September 2007 Draft Atlanta Strategic Action Plan198
Community Assessment3

Wastewater System
The City of Atlanta’s wastewater collection and treatment system consists of multiple facilities and anextensive network of pipelines and tunnels. Key to this system are four water reclamation centers (WRCs),six permitted combined sewer overflow (CSO) facilities, sixteen pump stations, four administrative facilitiesand approximately 2,126 miles of water mains and pipes (See Map 3.16 ‘City of Atlanta Wastewater SystemFacilities’ ). The City owns and operates three permitted water reclamation centers – the RM ClaytonWRC,the Utoy Creek WRC and the South River WRC. See Table 3.84 ‘City of Atlanta Water ReclamationCenters- Summary of Capacity’ for a summary of their design capacity.
Table 3.84 City of Atlanta Water Reclamation Centers- Summary of CapacityPeak Hourly
Hydraulic Capacity(mgd)
Maximum Monthly Capacity (mgd)Average Annual Daily Flow(mgd)
Water Reclamation Centers
240122103R.M. Clayton
904436Utoy Creek
855443South River
R. M. Clayton WRC
The RM Clayton Water Reclamation Center is located in northwest Atlanta. The facility provides tertiarytreatment which includes the removal of both biological and chemical impurities and is designed to treat anaverage daily annual flow of 103 million gallons per day (mgd). The RM Clayton WRC discharges to theChattahoochee River.
South River/Intrenchment Creek WRC System
The South River WRC is located in southeast Atlanta. The South River WRC receives wastewater fromthe Intrenchment CreekWRC as well as directly from the surrounding area. The South River facility providestertiary treatment that includes the removal of both biological and chemical impurities and is designed totreat an average daily annual daily flow of 43 mgd. The South River WRC discharges to the ChattahoocheeRiver via the Three Rivers Tunnel.
The Intrenchment Creek WRC is located in Dekalb County. The Intrenchment Creek WRC receiveswastewater from the northern portion of the South River wastewater service area. The Intrenchment CreekWRC is designed to provide primary treatment and partial secondary treatment for an average annual dailyflow of 23 mgd. Treated effluent from the Intrenchment Creek WRC is conveyed to the South River WRCvia the Intrenchment Creek force main. Since the Intrenchment Creek WRC does not discharge to a riveror stream, but rather to the South River WRC, the Intrenchment Creek WRC is permitted as part of theSouth River WRC system.
199Atlanta Strategic Action Plan September 2007 Draft

Utoy Creek WRC
The Utoy Creek WRC is located in south Fulton County. In addition to treating flow from the Utoy Creekservice area, the Utoy Creek WRC can also receive wastewater from a portion of the RM Clayton servicearea via the diversion structure. The Utoy Creek WRC provides tertiary treatment that includes the removalof both biological and chemical impurities, and is designed to treat an average annual daily flow of 43 mgd.The Utoy Creek WRC discharges to the Chattahoochee River.
Wastewater Collection System
The City’s wastewater collection system consists of separate sanitary sewer systems and combined sewersystems. Where separate sanitary sewer systems exist, the sanitary sewers collect wastewater from homes,businesses, and industrial facilities and convey the wastewater to a water reclamation center. In thissituation, stormwater (e.g. water from rainfall events, over-watering of lawns, car washing, etc.) is collectedin stormwater pipes, which discharge the water into the closest receiving stream. In the case of combinedsewer systems, wastewater is collected in the same pipe as the stormwater. Identical to a separate sanitarysewer system, during dry weather conditions and low-flow wet weather conditions, the flow is conveyed toa wastewater reclamation facility for treatment. During some wet weather events, however, the flow ofstormwater into the pipes is sufficiently large that a portion of the stormwater and wastewater mixture isdiverted to a Combined Sewer Overflow (CSO) facility. Approximately 19 square miles, in the denselypopulated center of the City, contains combined sewers. This area is shown in Figures 1 and 3. Theremaining area of the City has separate wastewater and stormwater collection systems. (Insert Figure3.4)
The City of Atlanta’s wastewater collection system is comprised of approximately 2,126 miles of pipe. Ofthe City’s 2,126 miles of collection system piping, it is estimated that there are 86 miles of combined sewers,1,610 miles of separate sanitary sewers (exclusive of sewer lines serving the Hartsfield-Jackson Airport)430 miles of service laterals in public rights-of-way and 8 miles of force main. The collection system isconstructed of a variety of materials and ranges in size from 8 inch diameter pipe to large 11-foot diameterbrick and concrete arch sewers constructed as part of the combined sewer system.
The City of Atlanta owns and maintains the collection system located within Atlanta’s city limits includingthe portion of the City that lies within Dekalb County. The City owns the trunk lines (the major collection andtransmission pipelines) and in general owns the laterals up to the edge of the right-of-way. At the edge ofright-of-way, ownership of the lateral transfers to others, typically the property owner. The City’s collectionsystem is used to convey wastewater from the City’s IJ partners to the City’s treatment plants.
As noted above, the City’s wastewater collection system contains 16 pump stations (excluding those thatare located at the WRCs). The City’s largest wastewater pump stations--Phillip Lee, Bolton Road, and FlintRiver have average daily flows of approximately 23, 18, and 6.5 million gallons respectively. The RebelForest Pump Station has the capacity to pump slightly over one mgd at its peak pumping rate. The remainderof the pump stations have average daily flows of less than 1 mgd. Figure 2 shows the location of the Cityof Atlanta’s wastewater pumping facilities.
September 2007 Draft Atlanta Strategic Action Plan200
Community Assessment3

CSO Facilities
The City currently owns and operates six permitted CSO facilities and two regulators (see Table 3.85 ‘Cityof Atlanta CSO Facilities’ and Map 3.17 ‘City of Atlanta CSO’). The CSO facilities are grouped into the EastArea CSO Facilities and theWest Area CSO Facilities. TheWest Area CSOs are those CSO’s that dischargeinto creeks which are part of the Chattahoochee Basin. These CSO’s include the Clear Creek, Greensferry,North Avenue, and Tanyard Creek CSO’s. The East Area CSOs are those CSO’s which discharge intocreeks which are part of the Ocmulgee River Basin. The East Area CSO’s include the McDaniel, CusterAvenue and Intrenchment Creek CSOs as well as the Confederate and Boulevard regulators. Unlike mostother CSO systems in the United States, where combined sewer overflows discharge directly to the receivingstreams, all CSOs in the City currently receive some form of treatment. Table 4 summarizes generalinformation regarding these facilities.
All of the CSO’s are similar in nature. During routine operation incoming flow passes through the CSOenroute to a water reclamation center. If during wet weather conditions the capacity of one of the downstreaminterceptor is reached, the flow is diverted through the associated CSO treatment process which includesscreening and/or disinfection depending on the quantity of flow.
201Atlanta Strategic Action Plan September 2007 Draft
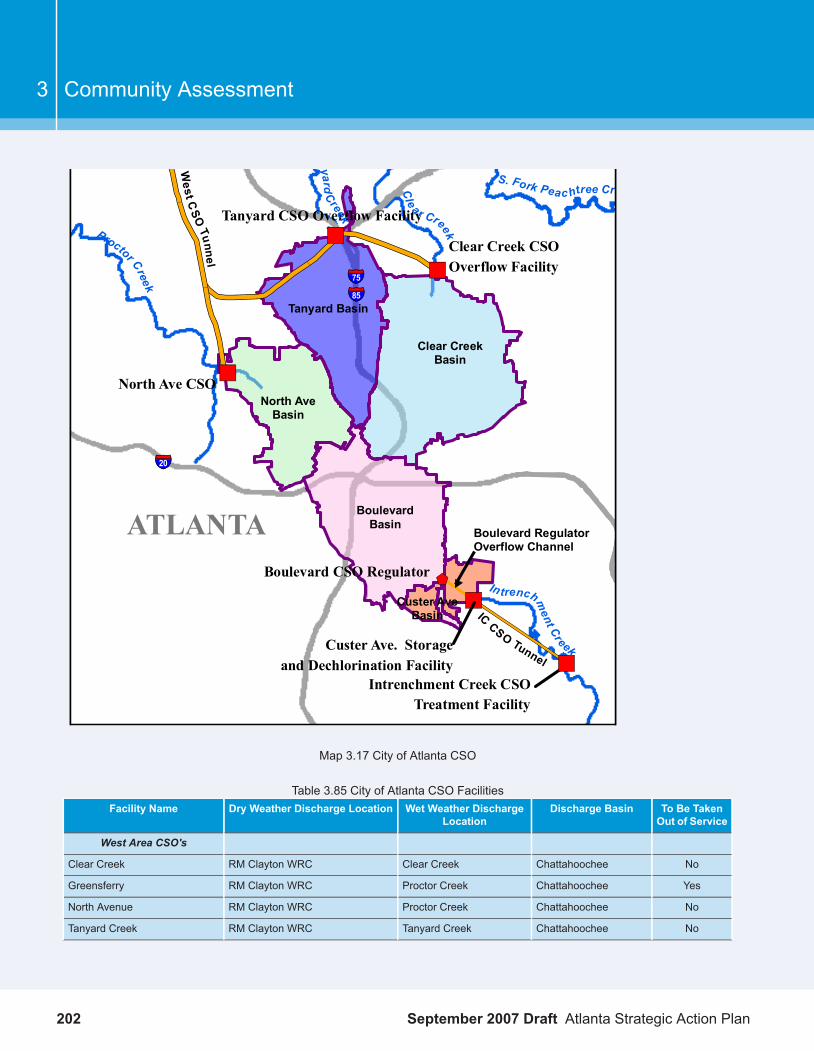
Tanyard CSO Overflow Facility
Clear Creek CSOOverflow Facility
North Ave CSO
ATLANTA
Custer Ave. Storageand Dechlorination Facility
Intrenchment Creek CSOTreatment Facility
ICCSO Tunnel
Tanyard Basin
Clear CreekBasin
BoulevardBasin
North AveBasin
Custer AveBasin
$+
�)
Proctor Creek
S. Fork Peac htree Cre
�)
�)
�)
West C
SOTunne l
Boulevard CSO Regulator
�
Cle a r Creek
In trenchment Creek
�)
ya rdCreek
���20
Boulevard RegulatorOverflow Channel
���85���75
Map 3.17 City of Atlanta CSO
Table 3.85 City of Atlanta CSO FacilitiesTo Be TakenOut of Service
Discharge BasinWet Weather DischargeLocation
Dry Weather Discharge LocationFacility Name
West Area CSO's
NoChattahoocheeClear CreekRM Clayton WRCClear Creek
YesChattahoocheeProctor CreekRM Clayton WRCGreensferry
NoChattahoocheeProctor CreekRM Clayton WRCNorth Avenue
NoChattahoocheeTanyard CreekRM Clayton WRCTanyard Creek
September 2007 Draft Atlanta Strategic Action Plan202
Community Assessment3

To Be TakenOut of Service
Discharge BasinWet Weather DischargeLocation
Dry Weather Discharge LocationFacility Name
East Area CSO's
YesOcmulgeeSouth RiverSouth River WRCMcDaniel Street
NoOcmulgeeIntrenchment CreekIntrenchment Creek WRCCuster Avenue
NoOcmulgeeIntrenchment CreekIntrenchment Creek WRCIntrenchment
East Area Regulator's
NoOcmulgeeCuster Avenue CSOIntrenchment Creek WRCBoulevard
YesOcmulgeeCuster Avenue CSOIntrenchment Creek WRCConfederate
West Area CSOs
The West Area CSO facilities are comprised of the Clear Creek, Greensferry, North Avenue, and TanyardCreek CSO’s. The Clear Creek and Tanyard CSO’s dry weather flow is directed to the RM Clayton WRC.Discharge from the Clear Creek CSO is to Clear Creek via an open channel. Discharge from the TanyardCSO is to Tanyard Creek via a concrete discharge channel that is approximately 0.8 miles long.
In the case of the North Avenue CSO and the Greensferry CSO, the downstream interceptors lead to theDiversion Structure which, depending on its operational setting, directs flow to either the RM Clayton and/orthe Utoy Creek WRC. Discharge from the Greensferry CSO is to Proctor Creek, and discharge from theNorth Avenue CSO is to a tributary of Proctor Creek via a 600-foot concrete culvert.
East Area CSOs
The East Area CSO facilities are comprised of the McDaniel Street, Custer Avenue and Intrenchment CreekCSO facilities and the Boulevard and Confederate CSO regulators.
McDaniel Street CSO Facility
The McDaniel Street CSO differs from the City’s other CSO facilities in that grit is removed from dry weatherflow and the CSO facility includes a 6 million gallon underground storage basin. During routine operationgrit is removed before the flow is diverted into an interceptor that conveys the flow to the South River WRC.During wet weather flow, flow which exceeds the capacity of the interceptor is disinfected and screened atthe CSO facility prior to capture and storage in the storage basin. Once the storm event passes, the storedflow is then returned to the sanitary system and conveyed to the South River WRC for further treatment.Flow that exceeds the storage capacity is disinfected and discharged to the North Branch of the South River.
Intrenchment Creek CSO System
The remainder of the East Area CSO facilities, i.e. the Custer Avenue and Intrenchment Creek CSOs andthe Boulevard and Confederate CSO regulators, function as a system. The Boulevard and the ConfederateAvenue regulators are similar to a CSO facility in that during dry weather, and low-flow wet-weather conditions,wastewater and stormwater that is collected in the combined sewer is conveyed directly to a WRC, in thiscase the Intrenchment Creek WRC. During wet weather when the capacity of the combined sewer at a
203Atlanta Strategic Action Plan September 2007 Draft

regulator is reached, the regulator diverts the flow to a concrete channel that conveys the flow to the CusterAvenue CSO. At the Custer Avenue CSO the flow is screened and routed into the 34 million gallonIntrenchment Creek CSO Tunnel which conveys the flow to the Intrenchment Creek CSO. If the tunnelstorage capacity is reached, excess flow is disinfected and diverted from the Custer Avenue CSO toIntrenchment Creek. At the terminal end of the Intrenchment Creek CSO Tunnel, the flow is pumped fromthe tunnel. During dry weather conditions flow that is pumped from the CSO tunnel is routed to theIntrenchment Creek WRC for treatment. During wet weather conditions the flow is directed to theIntrenchment Creek CSO where, depending on the level of flow, wastewater is screened, physically andchemically treated, and/or disinfected prior to being discharged to Intrenchment Creek.
CSO Abatement Improvement Plan
The City is currently in the process of completing a major CSO abatement improvement plan. As part ofthis plan, additional pipelines will be laid in the East CSO area such that the combined sewers in theGreensferry and McDaniel basins, and the Stockade sub-basin, will be separated. Thereafter, thesebasins/sub-basins will have separate sanitary sewers and stormdrains. Once this is accomplished theGreensferry and McDaniel CSOs and the Confederate Regulator will be taken out of service. As a result,the number of permitted CSO overflow points will be reduced from six to four and the flow passing throughthe Custer Avenue and Intrenchment Creek CSOs will be reduced. In the West Area CSO area, flow fromthe North Avenue and Tanyard Creek CSO facilities will be discharged into the newly constructed WestAreas CSO storage tunnel which will convey the flow to the West Area CSO treatment plant. The WestArea CSO treatment plant will provide a higher level of treatment for the combined stormwater/ wastewaterthan is currently provided. In addition, the storage provided by the tunnel will significantly increases thequantity of flow that receives full treatment (See Map 3.17 ‘City of Atlanta CSO’).
Administrative Facilities
In addition to its water reclamation centers and pump stations, the Department of Watershed Managementutilizesmultiple permanent and temporary facilities to support its water, wastewater and soon-to-be stormwaterfunctions. The department faces considerable space shortages and maintenance facilities for both its waterand wastewater operations are needed. To resolve these issues the Department of Watershed Management(DWM) has proposed the construction of an administration and maintenance building. Such relocationwould resolve space constraints, improve communication, facilitate the alignment of like services, andimprove overall efficiency.
City of Atlanta Growth and Development and Wastewater Services
Level of Service and Adequacy of Facilities to Meet Future Needs
The level of service provided by the City’s wastewater treatment and collection system ranges from goodto poor. The wastewater reclamation centers have adequate capacity, the water discharged from thesefacilities routinely meet the facilities discharge requirements, and an extensive CSO AbatementImplementation Plan is well underway. Although wastewater is routinely conveyed from the City’s customersto theWRCs, sanitary sewer overflows (SSOs) do occur, portions of the collection system need rehabilitation,and other portions of the collection system are capacity limited. To address both current and future needs
September 2007 Draft Atlanta Strategic Action Plan204
Community Assessment3
the City is currently involved in the extensive capital improvement program outlined in the Short Term WorkPlan presented in Table 4.7 ‘City of Atlanta 2008 - 2012 SHORT TERM WORK PROGRAM - WastewaterCollection and Treatment’. This plan is intended to address the City’s long-term planning needs through2017.
In addition, the Department of Watershed Management is currently developing a Watershed Master Plan.Should additional needs be identified which are not address by the projects that have been identified todate, these projects will be added to the Watershed Master Plan. As the Watershed Management Plan isdeveloped, additional review of the CDP elements will be performed to capture needs which may be differentfrom those identified to date.
The Ability of Wastewater Infrastructure to Direct Development Patterns
New development is dependent on the availability of both sewer capacity and wastewater treatment plantcapacity. If the portion of the wastewater system to which the new development is to be connected iscapacity limited, or if there is not adequate treatment plant capacity, development can not occur until theseproblems are resolved. As such, sewer capacity and wastewater treatment plant capacity can drivedevelopment patterns.
Improving Wastewater Infrastructure Efficiency to Accommodate Future Development
Within the City’s wastewater collection and treatment system, the primary component of the system thathas the potential to be improved such that the efficiency of the system can accommodate future developmentis the Water Reclamation Centers. As the water reclamation centers reach their design capacity and/or asregulatory changes occur, modifications to the treatment processes will be required to maintain the plantswithin their discharge limits.
To eliminate sanitary sewer overflows (SSOs) and as growth and development occur, the capacity of pumpstations and collection lines may need to be increased. Capacity issues throughout the City’s wastewatercollection system are being addressed as part of its Sewer System Evaluation and Survey (SSES),Rehabilitation and Relief Projects.
The Influence of Service Areas and Levels of Service on Future Development
Provisions for wastewater services is fundamental to development. Due to the extensive network ofwastewater pipelines available throughout the City, the ability to connect to the wastewater collection systemis generally not an issue. As noted above, however, there are capacity issues. These issues are currentlybeing addressed as part of the City’s Clean Water Atlanta Program.
Providing wastewater service is a long-term proposition. As such, it is important that service areas remainintact. Wastewater infrastructure is expensive and is built well before the facilities it will serve. The up-frontcosts are high and take many years to recover. In order to incur such risk, wastewater collection andtreatment service providers need to know that they have a stable service area. Without such assurance
205Atlanta Strategic Action Plan September 2007 Draft

the financial viability of such organizations is at risk. Furthermore, the long-term planning and constructionnecessary to ensure that wastewater systems are expanded to align with the long-term development plansonly makes sense if jurisdictions can plan for a continuing service area.
The Impact of Service Area and Level of Service on Natural and Cultural Resources
Regardless of the service area, there are several ways in which wastewater collection and treatment facilitieshave the potential to impact natural and cultural resources. With respect to natural resources, the primaryconcern is the quantity and quality of the treated wastewater which is returned to receiving rivers andstreams. Environmental impacts associated with wastewater spills and overflows are also of concern. Withrespect to cultural resources the primary concern is the ability to supply wastewater services at the specificlocation of the cultural resource. As noted above, due to the extensive network of wastewater pipelinesavailable throughout the City, the ability to connect to the wastewater collection system is generally not anissue.
Throughout the state the quantity and quality of water in Georgia’s rivers and streams is of concern. Thissituation is certainly no different for the City of Atlanta and the entire Atlanta Region. With respect toreturning water to the basin from which it is withdrawn, the City of Atlanta is a leader. Since 1984 the ThreeRivers Tunnel has been in place. This tunnel provides a mechanism for returning to the ChattahoocheeRiver, water that is withdrawn from the Chattahoochee River and used in the Flint River and South RiverBasins. In addition, the density of the City of Atlanta and the small number of septic tanks located withinthe City minimize the consumptive use of water.
Each of the City’s WRCs is operated under a National Pollution Discharge Elimination System (NPDES)permit. These permits include numerous operating requirements and specify the discharge limits for theCity’s WRCs. In addition to specifying discharge limits for the plants, these permits include specificrequirements for reporting spills and addressing the causes of such spills. The City’s high level ofenvironmental performance is demonstrated by both its compliance record and its receipt of numerousawards for the performance of its Water Reclamation Centers.
Directing Development Patterns through Wastewater Facilities
For development to occur, wastewater collection lines and the treatment facilities must have adequatecapacity to receive the wastewater generated by the new development. As such, the planning anddevelopment of wastewater systems should be closely coordinated with land use and the desired developmentpatterns. The more accurately the location and quantity of wastewater demand are determined, the moreefficiently the wastewater system can be designed and constructed, and the less frequently the wastewatersystem will constrain development. Within the financial constraints of the service provider, the desireddevelopment pattern within the service area should drive the development of the wastewater supply system,not the other way around.
September 2007 Draft Atlanta Strategic Action Plan206
Community Assessment3

Issues and Opportunities
1. Achieving Environmental Compliance
Issue: Meet Consent Order requirements and deadlines
Opportunity: Continue the City's Clean Water Atlanta Program. The program includes theprojects and funding to address the Consent Order issues. The projects developed to complywith the Consent Order requirements address important wastewater issues, and have beenvalue-engineered to be cost effective within the constraints of the Consent Orders.
Issue: Eliminate sewer spills
Opportunity: Continue to support the Clean Water Atlanta program and DWM's operationalbudget. The projects identified to date that are required to achieve these objectives through2017 are included in these programs.
Issue: Eliminate capacity issues
Opportunity: Continue to support the Clean Water Atlanta program and DWM's operationalbudget. The projects identified to date that are required to achieve these objectives through2017 are included in these programs.
Issue: Provide security
Opportunity: Continue to support the development of the security upgrades and emergencyplanning required to protect the City's utility systems. DWM has a dedicated staff member todirect the City's effort and the City has implemented a Security Surcharge rate to provide fundingof security projects.
2. Providing Wastewater Treatment
Issue: Maintain high quality treatment at cost-effective rate
Opportunity: Continue to support the Clean Water Atlanta program and DWM's operationalbudget. The projects identified to date that are required to achieve this objective are includedin these programs.
Issue: Maintain Industrial Pretreatment Program
Opportunity: Continue support of the City's Industrial Pretreatment Program.
Issue: Maintain Grease Management Program
Opportunity: Continue support of the City's Grease Management Program.
207Atlanta Strategic Action Plan September 2007 Draft

3. Providing Wastewater Collection and Storage
Issue: Provide storage for the CSO system
Opportunity: Continue to support the Clean Water Atlanta program and DWM's operationalbudget. The projects identified to date that are required to achieve this objective through 2017are included in these programs.
Issue: Replace aging collection system
Opportunity: Continue to support the City's collection system rehabilitation and relief program.The City's Clean Water Atlanta Program and DWM budget includes the projects and funding toaddress this issue through 2014.
Issue: Maintain pump station capacity
Opportunity: Continue to support the Clean Water Atlanta program and DWM's operationalbudget. The projects identified to date that are required to achieve this objective through 2017are included in these programs.
Issue: Protect pipelines
Opportunity: Streambank restoration and protection is required to protect pipes which are locatedin close vicinity of streambanks. (This includes many wastewater pipelines.) Support anddevelop DWM's streambank restoration group that is developing practices and implementingprojects to facilitate streambank protection and restoration.
Issue: Access Pipelines
Opportunity: Continue to support the acquisition and documentation of easements.
Opportunity: Improve interdepartmental communication to facilitate the development of linearcorridors (sewer easements, bikeways, pathways, animal migration routes, etc.) that providepipeline access, greenspace, recreational opportunities, alternative transportation modes, andanimal habitat and migration pathways.
4. Maximizing Revenue Collection
Issue: Maximize wastewater revenue collection
Opportunity: Continue the development of DWM processes to incorporate the collection of capitaland operating costs associated with the collection system. (To date such collections haveapplied to a limited number of pipelines.)
September 2007 Draft Atlanta Strategic Action Plan208
Community Assessment3

5. Improving Customer Service
Issue: Minimize inconvenience and negative business impacts to City residents and employers
Opportunity Improve interdepartmental coordination of transportation & utility projects (water,wastewater, stormwater, gas, electric, telephone, roadways, pathways, railroads, etc.). Improvedcoordination has the potential to reduce inconvenience and negative business impacts anddecrease project costs.
Issue: Quick response to customer complaints
Opportunity Continue to support DWM's budget to provide the staff necessary to managecustomer complaints including the staff necessary to man the call center, investigate complaintsand field crews to address field problems.
Issue: Streamline permitting processes
Opportunity Facilitate the development of a streamlined inter-department permitting process bylinking the development of the process with the development of a permit management systemthat is capable of scheduling and tracking permit, inspection, and compliance requirements.
6. Providing Cost-Effective Services
Issue: Additional space needed to support required staffing level
Opportunity: Complete the DWMAdministration andMaintenance Facility. This facility is currentlyfunded under the Clean Water Atlanta Program and will provide the space necessary to hirethe additional staff required to perform DWM functions and to consolidate the City's water andwastewater operations for improved performance.
Issue: Development of in-house work crews
Opportunity: The current DWM budget provides for the development of an in-house work crews.Expansion of this program as quickly as possible (subject to the hiring of qualified personneland the implementation of training for existing personnel) will reduce construction costs.
Issue: Development of integrated permit management system with management functioncapability
Opportunity: A permit management systemwhich is capable of scheduling and tracking permitting,inspection, and ongoing compliance requirements (e.g. erosion & sedimentation controlinspections) is needed. Kiva is unable to manage the inspection data in a fashion that allowsefficient scheduling, tracking and monitoring. Build upon the development of computer
209Atlanta Strategic Action Plan September 2007 Draft

applications that are currently underway (GIS, Customer Information Billing System, Maximo,Hansen, Project Scheduling) to develop a permit tracking system that meets customer and Cityneeds.
Issue: Development of document management system
Opportunity: Complete the development of a DWM document management system, takingadvantage of the lessons learned and building upon the development of computer applicationsthat are currently used by DWM (GIS, Customer Information Billing System, Maximo, Hansen,Project Scheduling).
7. Educating the Public
Issue: Ongoing public education needed
Opportunity: Continue to provide public education with respect to wastewater collection, treatmentand project issues. Coordinate the City's public education efforts to maximize the impact of itspublic education efforts.
Opportunity: Continue to participate in the MNGWPD public education program and takeadvantage of the resources it has to offer.
8. Supporting AHA Projects
Issue: Need for AHA Project funding
Opportunity: Where wastewater systems require replacement in AHA Housing developmentareas funding of the wastewater portion of the work is provided as part of the DWM's wastewaterprojects.
9. Coordinating with Neighboring Jurisdictions
Issue: Ongoing coordination and communication with the City's Interjurisdictional Partners
Opportunity: Expand the number of issues discussed as DWM continues to meet on a regularbasis with the City's Interjurisdictional Partners.
Opportunity: Continue to participate in the MNGWPD and take advantage of the resources ithas to offer.
Fire Protection
The Atlanta Fire Department will include information regarding its services and facilities in the Final Draft.
September 2007 Draft Atlanta Strategic Action Plan210
Community Assessment3

Map 3.18 City of Atlanta Fire Stations
211Atlanta Strategic Action Plan September 2007 Draft

Issues and Opportunities
Staffing
Issue: Lack of sufficient human resources has been identified as one of the critical issues for the AtlantaFire Department (AFD). The department is lacking in personnel for various areas in the department includingbut not limited to the specialist officers, administrative staff, researchers and fire fighters.
Ideally there should be four firefighters on each truck deployed to respond to a fire call. It is acceptable toallow a truck with at least three firefighters to respond to a fire call. The shortage of firefighters has forcedtrucks to go out with only two firefighters on board. It is not acceptable to have one driver and only one otherfirefighter to respond to a fire call.
Response time specification is four firefighters on the scene within 300 seconds. The lack of firefightersaffects the response time. With less than four firefighters on a truck, the response time criterion, of fourfirefighters in less than 300 seconds, is not met with the arrival of the first truck. This puts the departmentat increased risk of not meeting the response time.
The shortage of Specialist Officers affects the AFD’s ability to conduct the annual inspection of commercialbuildings. Given the number of inspectors on staff (six) and the ever increasing number of commercialbuildings in the City, this is not feasible; resulting in buildings not being inspected for several years.
Research staff is also deficient, putting the preparation and filing process for accreditation in jeopardy.
Opportunity: The opportunity here is for the city to prioritize funding that would allow sufficient staffing in allareas of the department. The budget must include provisions for the recruitment, training, and retention ofmore fire officers and supportive personnel in the fire department.
Salaries and Compensation
Issue: Atlanta firefighters’ salaries and compensation are not competitive with other municipalities withinthe Metropolitan Atlanta area. In addition to ranking close to the bottom in terms of starting pay, the cost ofliving (real estate) within the City is above the other municipalities resulting in less disposable income forAtlanta firefighters relative to other municipalities.
Then there is the issue of City firefighters not able to afford to live within the City. This is a growing problemfor Atlanta’s workforce.
Opportunity: The Opportunity then is to develop a recruitment and retention strategy. Establish a morecompetitive compensation package that would attract more firefighters to AFD as well as allow City firefightersto live and work within the City.
September 2007 Draft Atlanta Strategic Action Plan212
Community Assessment3

Fire Stations, Facilities & Equipment Maintenance
Issue: There are a number of fire stations that are in disrepair and require severe renovation and/orreplacement. The equipment is described as aging and needs enhancement (The Mayor’s New CenturyEconomic Development Plan 2004). Radio equipment is failing and the coordination system needsimprovement. There is a need for investment in acquiring and installing the Advanced Life Support (ALS)systems on more fire engines. Currently the AFD has basic life support equipment on its trucks. In all of theAtlanta Fire Department, only six trucks are equipped with advanced life support (ALS) equipment. Thereare no provisions in the 2006 budget for acquiring the ALS equipment.
The lack in number of Fire Stations is evident in the Fire Department’s inability to reach areas of the Citywithin the required response time (See figure x). Also, new developing areas of the city, ie, office parks andresidential subdivisions, increases the demand on fire protective services, and thus have to be looked at interms of increasing AFD’s capacity accordingly in order to services these areas.
Opportunity: the Opportunity is for the City to budget for the building of additional fire stations. More firestations spatially distributed about the City will shorten actual response times and increase AFD’s ability toalways arrive to a scene within the required response time; and increase AFD’s capacity to service newlydeveloping areas. Priority must be placed on investment for the the purchase of up to date ALS equipmentto enhance the effectiveness of the AFD in saving lives. The issue of aging equipment is being addressedby an apparatus-leasing program.
Accreditation
Issue: In 2002 the Commission on Fire Accreditation International completed its site review of the department’saccreditation application and forwarded a favorable recommendation and awarded Accreditation to AFDon March 23, 2002. After gaining this “World Class” status and being the 34th fire service entity to be socommended in the country, this accreditation status is up for renewal in 2006. The maintenance of thisaccreditation depends on the resolution of the issues discuss above.
The fire department needs research staff (Department of Assessment and Planning) to start preparingthe application documents in 2006.The number of fire fighter per truck has to improve to the optimal 4 firefighters per fire truck.Inspectors are needed to inspect the growing number of commercial buildingsEquipment and facilities needs to be up to standard
Accreditation status (along with other criteria) affects the fire department’s ISO score. A good ISO scoreresults in lower fire insurance rates for Atlanta residents and businesses. Atlanta Fire Department hasgained an ISO rating of Class 1 (up from Class 2 in 2003), which is the highest and best rating possible.With renewal of accreditation and ISO rating impending, the current staffing and equipment situation maylikely jeopardize the good standing the department was able to gain in the past year. And in the case forthe ISO rating, will likely result in increased insurance rates for residents and businesses.
213Atlanta Strategic Action Plan September 2007 Draft

A Public Safety Headquarter Complex
Opportunity: A new facility is proposed to house the Headquarters for both the Police and Fire departments.This represents a great opportunity for better coordination and communication between agencies. It alsoprovides a centralized location that maximizes agglomeration economies in cost and service efficiency.
In keeping with the Quality Community Objectives, consideration should be made to utilize or redevelopexisting building stock (greyfield site), redevelop a brownfield site, and incorporate green-building principlesto maximize energy efficiency,
Public Safety
Introduction
The Police Department, Department of Fire/Rescue, Department of Corrections, and EmergencyManagementAgency are responsible for the maintenance and effective delivery of public safety services to the citizensand business community of the City.
Public safety policies focus on engaging the whole community in building and sustaining a safe, fear-freeenvironment. The City's policies embrace crime reduction; community policing; the reduction of responsetime for emergency vehicles; creating more public/private community safety partnerships; and bettercoordinating public safety efforts. Projects include the creation of and improvements to fire, police andemergencymanagement facilities and communication systems. Atlanta Police Department programs includeCOBRA, FACE 5, Weed & Seed, and participation in downtown's Interagency Law Enforcement Group(ILE) and numerous citizen initiatives.
The City of Atlanta Police Department (APD) provides services to City residents, businesses and visitorscitywide The Police Department provides service in all areas not policed by another law enforcement agencysuch as the Georgia State University Police or MARTA police. APD works with these agencies on issuesof mutual concern.
The City continues its emphasis on crime reduction, combining aggressive crime-fighting strategies andproblem-solving capabilities, and other crime-fighting initiatives to prevent crime and improve the quality ofthe life in the City. The Police Department performs at a high level of service in responding to calls forservice, arresting criminals, and solving crimes. (Figure 17-1 shows the level of crime from 2002 to 2006;)“Part I Crimes” are the major crime categories identified by the FBI. Part I Crimes have been steadilydecreasing, 2005 and 2006 had the lowest crime totals since 1969 (See Figure 3.3 ‘City of Atlanta 2002-2006Part I Crimes’) . The Department still plans to improve its service delivery strategies.
September 2007 Draft Atlanta Strategic Action Plan214
Community Assessment3

Number of Part I Crimes
49,45046,722
41,10738,609 39,779
0
10000
20000
30000
40000
50000
60000
2002 2003 2004 2005 2006
Year
Nu
mb
er o
f C
rim
es
Figure 3.3 City of Atlanta 2002-2006 Part I Crimes
Facilities
Services are managed and supported through City Hall East headquarters, six patrol precincts, mini-precincts,the training facility, airport, and other facilities. Each precinct is responsible for a police patrol zone (SeeTable 3.86 ‘Atlanta Police Department Precincts’ and Map 3.19 ‘Atlanta Police Zones and Beats’ ). Twelvemini-precincts are located throughout the City.
A major project for the Department, working with the Fire/Rescue Department, is to build a new headquartersbuilding near City Hall, a 911 Center, and an annex for support services. This project is expected to becomplete and to be occupied by the end of 2008.
Table 3.86 Atlanta Police Department PrecinctsPhoneLocationStreet AddressZone
404-799-2488Zone One Precinct2315 Bankhead Hwy NW1
404-658-6274Zone One Mini676 Fair St SW1
404-658-6486Zone One Investigative Unit612 Magnolia St. NW1
404-848-7231Zone Two Precinct3120 Maple Dr. NW2
404-467-8061Zone Two Mini3393 Lenox Rd2
404-658-6636Zone Two Investigative Unit3129 Maple Dr. NW2
215Atlanta Strategic Action Plan September 2007 Draft
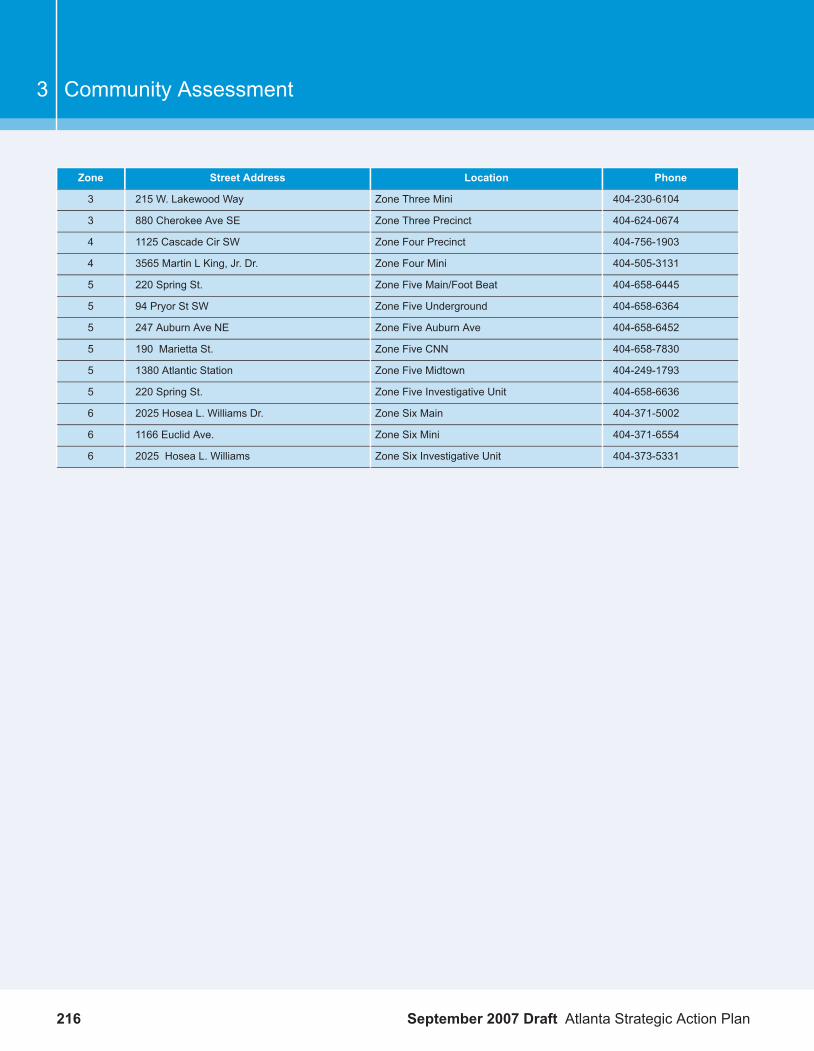
PhoneLocationStreet AddressZone
404-230-6104Zone Three Mini215 W. Lakewood Way3
404-624-0674Zone Three Precinct880 Cherokee Ave SE3
404-756-1903Zone Four Precinct1125 Cascade Cir SW4
404-505-3131Zone Four Mini3565 Martin L King, Jr. Dr.4
404-658-6445Zone Five Main/Foot Beat220 Spring St.5
404-658-6364Zone Five Underground94 Pryor St SW5
404-658-6452Zone Five Auburn Ave247 Auburn Ave NE5
404-658-7830Zone Five CNN190 Marietta St.5
404-249-1793Zone Five Midtown1380 Atlantic Station5
404-658-6636Zone Five Investigative Unit220 Spring St.5
404-371-5002Zone Six Main2025 Hosea L. Williams Dr.6
404-371-6554Zone Six Mini1166 Euclid Ave.6
404-373-5331Zone Six Investigative Unit2025 Hosea L. Williams6
September 2007 Draft Atlanta Strategic Action Plan216
Community Assessment3

0
202
209
409
410
411
207
413
201
203
310
050
407
206
106
208
309
102
108
307
110
104
609
408
403
204
406
109
608
611
304
601
501
306
607
605
602
305
405
402
210
610
105
412
504
303
308
103
302
107
603
205
604506
401 301
404
606
510 511111
502
508
505
101509
503
507
606
GA 40
0 SB
GA 40
0 NB
ARTHUR LANGFORD PW
CAMP CREEK PW MAIN
ST
LEE S
T
ROSW
ELL R
D
PEAC
HTRE
E RD
JONESBORO RD SE
FULTON INDUSTRIAL BL
CAMPBELLTON RD
ROOSEVELT HW
MCDONOUGH BL
14TH ST
BOLTO
N RD JAMES JACKSON PW
MARTA
NORTHSIDE PW
DOGW
OOD
DR
CROWN RD
NORT
HSID
E DR
NW
CASCADE RD
SYLV
AN R
D
DELO
WE D
R
CAMPBELLTON RD
VIRGINIA AV
DODSON DRLA
KE FO
RRES
T DR
MOORES MILL RD
MARIETTA BLVD
HEADLAND DR
CHILD
RESS
DR
NORTHSIDE DR NW
CENTRAL AV
GLENWOOD AVBEN HILL RD
REBEL TL
CLEVELAND AV SE
BEEC
HER R
D
ROXBORO RD
NORTHLAND DR
BEECHER ST
LENOX RD
atlantaztlantaATLANTA POLICE ZONES AND BEATS
InterstatesOther Limited AccessState RouteArterial RoadsRampsRailroad POLICE BEATS
POLICE ZONESZONE
123456
Map 3.19 Atlanta Police Zones and Beats
Programs and Initiatives
1. Crime Reduction
217Atlanta Strategic Action Plan September 2007 Draft

1. COBRA: The command staff of the Atlanta Police Department gathers weekly to review crimestatistics, identify problems, and plot strategies. COBRA is the backbone of APD's crime-fightingefforts. Central strategic direction of the Department is stronger, with specific responsibilities,clear performance measures, and strict accountability. This process is possible because recenttechnological improvements have made crime data much more quickly available and thorough.Analysis of the data has become much more efficient through automating the tabulation andmapping processes. Having top command staff, patrol commanders, investigation commanders,and crime analysts together for the discussion promotes cooperative and effective solutions toproblems.Gun Reduction Strategy: Weapons-related violence remains a serious concern. Accordingly,the Department is participating in a multi-faceted approach to reduce gun violence by decreasingjuvenile demand for guns and/or decreasing the supply of guns to youth. In conjunction with theU.S. Bureau of Alcohol, Tobacco and Firearms (ATF), the department seeks to systematicallytrace every gun confiscated in order to identify patterns and high-risk dealers and to increaseenforcement. The Department has implemented a street-level interdiction project, targetingenforcement of laws that prohibit carrying of firearms by juveniles and convicted felons in orderto reduce violent crime in the City. The project targets any type of firearm violation, with ATFtracking the weapon to find its source. Through the FACE 5 program, repeat offenders face anadditional five years in Federal prison. The Department is also developing a “safe storagecampaign” to encourage gun owners to properly store weapons and keep them safe.Gang Strategy: The Gangs Unit was formed to investigate and prevent gang violence. TheDepartment works actively with the Bureau of Alcohol, Tobacco and Firearms (BATF), FBI, stateand local jurisdictions to reduce gang activity. Within the Department, Field Investigation Teamsand the Intelligence Unit continue to cooperate closely in areas of gang activity.
2. Community Policing
Community policing is spearheaded by the Atlanta Police Department, but requires that other City governmentand community resources be directed at many of the underlying causes of crime and violence. It is acollaborative effort. Components within the Police Department include citizen advisory councils, foot patrols,“park and walk,” bicycle patrols, police security inspectors, mini precincts, Project Safe Neighborhood,OperationWeed and Seed, and zone level community outreach programs. In support of community policing,the Department is developing and communicating better information on communities and their problemsthrough technological innovations.
The APD has researched the City’s communities with Limited English Proficiency (LEP) and found asignificant population of Spanish-speaking residents and visitors who speak English poorly. The newlyappointed Hispanic Liaison officer meets with the community to resolve issues. Information and forms thatare critical to a citizen are being translated into Spanish, and the Department is seeking funding to supportin-house Spanish translators.
September 2007 Draft Atlanta Strategic Action Plan218
Community Assessment3

The Police Department operates the Citizen’s Police Academy to provide positive interaction betweencommunity leaders and the police, and to educate them about the crime issues, how the police are trainedand directed to reduce crime, and what the community can do to prevent crime. The curriculum for theprogram also includes demonstrations by specialized patrol units such as the helicopter, motorcycle, mountedpatrol and K-9 units.
The Police Department actively works to keep public areas safe for citizens and visitors. The Departmentmaintains a strong program of Neighborhood and Business watches. These programs keep the businessesand residents focused on the safety of the area. Business Watch programs encourage business people tobe alert to suspicious circumstances and to take crime prevention steps.
3. Initiatives to Address the Needs and Challenges of Atlanta Youths I
The Atlanta Police Department, in partnership with the community and other social service providers, offersAtlanta’s youths alternatives to violence, drug usage, and other criminal activities as well as initiatives aimedat helping youths to make good life choices.
Expansion of the Police Athletic League (PAL) program has included not only athletics, but also academicand life skill initiatives.
The Department continues its truant efforts to reduce the likelihood of juveniles becoming crime victims orperpetrators and to reinforce the schools’ efforts at education. The Field Operations Division (FOD)commander assigns one officer to a truant detail in each police zone. The truancy program includes thecooperative efforts of the Atlanta Police Department, the Atlanta Public Schools, MARTA, Juvenile Courtand the Atlanta Housing Authority.
The Department enforces the curfew ordinance for children under sixteen, to protect the children andreinforce the role of the parents.
4. Maintain Police Visibility Downtown
Police visibility tends to reduce the community perceptions of fear and crime. The Atlanta Police Departmentwill maintain the visibility of police officers downtown.
COMNET: is a radio communications network between the Atlanta Police Department (APD) andprivate security agencies. The scope of participation now includes college and university policedepartments, federal law enforcement agencies, and the Downtown Improvement District (DID)Ambassadors. This project enhances the safety of Central Business District streets by enablingparticipants to communicate directly with the Atlanta Police. Currently COMNET is operating throughoutthe city and has grown from ninety members in 1995 to over one hundred eighty members.Downtown Improvement District (DID): Through the DID, non-residential downtown building ownerspay a special property tax assessment for additional security through the Ambassador program,overseen by a board of property owners with City participation, and a contract with the City guaranteeingthe existing level of police service.
5. Aggressive Recruiting to Fill Vacancies
219Atlanta Strategic Action Plan September 2007 Draft
At the end of 2006, the Atlanta Police Department had 1,699 police officers in all ranks, a 15% increasesince 1999. The Department also experienced a spike in attrition, losing 10.1%, in contrast with 7 to 7.5%in earlier years. In 2007, the Department will continue to fill its vacant police officer positions.
6. Enhance the Quality of Police Service Through the Improvement in Technology
CJIS (Criminal Justice Information System): The City’s Department of Information Technology (DIT)is replacing CJIS, formerly the cornerstone for sharing crucial information about all types of incidentsbetween police, corrections, and Municipal Court. It provided the ability to track an incident from theinitial call through completion of the court action at the City level.Automated Fingerprinting Identification System: The Police and Corrections Departments are upgradingtheir Automated Fingerprint Identification System (AFIS) to provide better electronic storage offingerprints. It searches local and national records. With this automation, it is anticipated that all of theCity's arrestees will be fingerprinted, increasing the chances of identifying a wanted person when heor she is brought to the jail on unrelated charges. The system will aid in the solution of many otherwiseunsolvable crimes.Crime lab: The Police Department has created a Crime Lab to supplement the services of the GeorgiaState Crime Lab, which suffers from underfunding and backlogs of evidence. Currently, the APDCrimeLab analyzes suspected marijuana and conducts certain ballistics tests. As funding becomes availablefor staff, training, and equipment, the lab will add the testing of other suspected drugs, a wider rangeof ballistics tests, and similar services. More timely information for investigators will lead to moresuccessful investigative outcomes.Laptop Computers: The Police Department is replacing the software that officers use in their patrolcars to write incident and accident reports. The new ICIS software not only supports incident andaccident reporting, but also supports production of citations electronically and provides for themanagement of the investigation of cases. Besides saving officers time in report writing, the laptopcomputers also provide better controls for a higher quality of information, support faster electronicprocessing of reports, and reduce paper handling.Computerized Mapping: Computerized mapping has significantly improved the department’s ability toelectronically map and analyze crime data, for more effective deployment of resources and analysisof crime patterns. The Department will continue to develop its crime analysis capabilities to providebetter information to officers, investigators and managers.Networking: The Department has created a Web page to share information with other agencies andthe community, and will continue to expand the available information through the Internet and internalnetworks.
The Department has electronically networked all police facilities via the City’s Wide Area Network (WAN).This connection enables police employees with the correct security codes to inquire into a variety of databasesin support of ongoing investigations.
7. Develop Partnerships with Other Agencies
The Department continues to maintain and increase its partnerships with other agencies, in law enforcement,public safety, criminal justice, and social services.
September 2007 Draft Atlanta Strategic Action Plan220
Community Assessment3

The Department participates in numerous interagency task forces targeted on particular problems. Continuedcooperation between federal, state, and other law enforcement agencies, such as a joint task force betweenthe DEA, FBI, Customs, ATF, and APD is essential to effective law enforcement.
The Department has established a partnership with the Midtown Improvement District. Midtown has createda supplemental police patrol, hiring off duty police officers.
8. Vehicles for Hire Regulation
The Division of Taxicabs and Vehicles for Hire is a component of the Atlanta Police Department. It enforcesthe Vehicle for Hire Ordinance to ensure safe, courteous, and professional service for the visitors to theCity, as well as for residents. The operation of the Division consists of three distinct but interdependentfunctions:
Licensing and permitting of the industry's companies, vehicles, and drivers.Enforcement of City ordinances governing vehicles for hire service delivery.Providing a liaison between providers of services and users.
The Division issues permits and routinely inspects the taxicabs and horse-drawn carriages for compliancewith City ordinances regarding inspections, insurance, and operator permit validity.
City of Atlanta Growth and Development and Police Services
Level of Service and Adequacy of Facilities to Meet Future Needs
The priorities of the Atlanta Police Department will be to reduce crime, to expand its Community PolicingInitiatives, and to further develop technological tools in support of policing. Resources, however, are notexpected to rise at the same rate as needed; therefore, the requirement for cooperation between the publicand private sectors will intensify, a move consistent with the Community Policing Philosophy. Moreover,the Department will continue to experience extremely competitive recruiting efforts in US law enforcement.In addition, development and implementation of strategies to address special events and diverse internationaland cultural issues will have an impact on the Department’s resources.
Three patrol precincts need to be refurbished or rebuilt. They are listed in the CIP but exceed APD’s fundingallotment. The Training Academy needs a new facility, including a driving track. While listed in the CIP, thisproject exceeds the funding available. The motorized fleet needs significant additions to replace worn-outequipment. Budget requests are ongoing. Desktop and in-car laptop computers need replacement. Somenew laptops are standing by for new software.
The Department provides for the maintenance of its facilities and has a strategy in place for the location ofreplacement facilities.
The Police Department answers a large volume of calls from the public promptly and effectively and hasreduced crime to historically low levels. Improvement is always possible by providing more patrol officers,investigators, support staff, and technology to further reduce crime and the fear of crime.
221Atlanta Strategic Action Plan September 2007 Draft

Improving Infrastructure Efficiency to Accommodate Future Development
The Police Department needs to evaluate major new developments for their impact on police workload:calls for service and crimes. Developments such as Atlantic Station and annexations increase the demandon police services.
The Influence of Service Areas and Levels of Service on Future Development
The Atlanta Police Department will experience changes brought about by developments in society, in theeconomy, and in technology. The City’s population growth and the booming development of some areaspose new challenges for the police force. The Police Department needs to evaluate major new developmentsfor their impact on police workload: calls for service and crimes. For example, developments such as AtlanticStation and annexations increase the demand on police services. Increase in traffic congestion also hasan impact on police services.
The Police Department generally is not involved in evaluation of existing development patterns and proposedmajor new developments. It would be helpful to crime reduction if the police perspective were included.APD’s Community Services Unit has offered to work with Zoning and Building to promote crime-reducingdesigns. The Department has acquired the City's 2030 forecasts and will use them in making long-rangeplans.
Directing Development Patterns through Police Services
While abandoned structures provide opportunities for redevelopment, they also harbor narcotics dealing,prostitution, and other crimes. Police officers work actively with Zoning and Building inspectors to secureor demolish abandoned structures.
Social and economic patterns have enormous impact on crime rates and fear of crime. The Departmentworks with community leaders and with other agencies that have responsibility in education, housing,homelessness, child welfare, drug treatment, and other social services to help individuals solve problemsthat may otherwise result in criminality. The Community Services Unit and the Weed and Seed Projectwork with communities to strengthen the social ties that discourage criminals from operating there.
The Police Department actively works to keep public areas safe for citizens and visitors. Business Watchprograms encourage business people to be alert to suspicious circumstances and to take crime preventionsteps.
Issues and Opportunities
1. Facilities, Equipment, & TechnologyIssue: Three patrol precincts need to be rebuilt. They are listed in the CIP but exceed APD’sfunding allotment. The Training Academy needs a new facility, including a driving track andrefurbishment of the Firing Range. While listed in the CIP, these projects exceed the fundingavailable. The access road to the Firing Range has been in bad need of repair for three years;while funded, the responsible City agencies have not taken action. Desktop computers need
September 2007 Draft Atlanta Strategic Action Plan222
Community Assessment3

replacement. Opportunity: The new public safety headquarters is in the design stage, foroccupancy in 2008. Field reporting software is being replaced. Investigative case managementsoftware is being implemented. Funding has come through in the budget to replace worn-outequipment in the motorized fleet. Possibilities are being investigated for generating citationselectronically.
2. Coordination between other first responders & Collaboration among other agencies.Issue: APD coordinates and works well with Fire and Rescue, EMS, and neighboring lawenforcement agencies. The issue is with the communication system. There is a need forup-to-date communication equipment. Opportunity: The opportunity here is to implement theinteroperable radio communications and the incident command system. Better coordination willoccur as APD gets these system improvements. UASI grant and other Homeland Securityinitiatives support these efforts.
3. Officer Recruitment, Retention, and CompensationIssue: Recruitment and retention of sworn employees is problematic, due in part to competitionwith other employers. Improvements in pay and benefits are needed. Funding is needed for thetraining and for career incentives. Opportunity: The Department has planned a career ladderfor the development and retention of sworn employees and needs a similar ladder for civilianemployees. The Department is evaluating its recruitment plan to improve its effectiveness.
4. Crime and the Community’s Perception of CrimeIssue: According to the City’s Citizens' Satisfaction Survey, residents feel safe in their homesand neighborhoods even at night. They feel as safe in the Downtown, but the survey did notask the question about being Downtown after dark. Opportunity: Crime has decreased recently,resulting in 2005 and 2006 having the lowest level of Part I crime since 1969. Further reductionswill be more difficult.
Parks and Recreation
The Department of Parks, Recreation and Cultural Affairs (DPRCA) calls itself the “Heart and Soul of theCity.” The Department of Watershed Management aspires to be “Best-in-Class.” The Department of PublicWorks manages the city’s skeleton of streets and roads. They all impact and are responsible for segmentsof the City’s Green Infrastructure.
The City’s creeks and drainage ways not only transport storm water they impact the water quality. Waterrunning off of the City’s streets and parking lots carry oils and debris that can be mitigated if filtered throughsoil and vegetation. The same flood plains mitigate many environmental stressors created by urbandevelopment. At the same time these lands can be used as greenway trails, providing opportunities foralternative modes of transportation that reduce our dependence upon automobiles. Nodes of recreationfacilities can make natural areas come alive and greatly improve the quality of life in adjacent neighborhoods.Near by parks accessible via attractive side walks encourage walking, which is critically important forimproved public health.
223Atlanta Strategic Action Plan September 2007 Draft

Parks and Greenspace
Parks, greenspace, and recreation are essential to individual well being and the healthy development of acity. Together they create a dynamic system that supports the environmental, cultural, and economicfunctions of the city. These services impact a variety of concerns: public health, individual well being,community cohesion, environmental sustainability, and economic vitality. They are interrelated andinterdependent.
Management of these resources and services is complex. Currently they are fragmented with portions fallingunder the jurisdiction of Parks, Recreation, and Cultural Affairs (RPCA), Public Works, WatershedManagement, and Planning and Community Development Departments. In addition the ProcurementDepartment is responsible for the City’s Real Estate. PRCA is responsible for management of park sitesand street trees. Public Works manages the City’s streets. Watershed Management is responsible for theCity’s water, wastewater and sanitary sewer services and function using a watershed management. Planningand Community Development coordinates multi-use trails, subdivision reviews, and administers the City’sTree Ordinance.
Currently the City is engaged in a review process, Project Greenspace, to create a framework of policiesand strategies for managing its green infrastructure through 2030. The initiative is charged with positioningthe City for development of a world class open space system that connects people to parks, recreationalfacilities, plazas, streetscapes, greenways, and sensitive lands.
Between January 1, 2005 and January 1, 2007 the City grew its park and greenspace system from 4,155to 4,482 acres, adding 322 acres.
Parks Facilities
As of the end of 2006 the Atlanta parks system consisted of 3,681 acres of developed and protected sensitivelands within the City limits. The Office of Parks in the Department of Parks, Recreation and Cultural Affairs(DPRCA) currently manages 345 sites. However, only 147 sites have any type of improvement. Parkimprovements range from Adamsville Park with a 100,000 square foot recreation center to sites with nomore than a bench or trail. Parks are categorized into nine separate classifications based on the types ofresources and facilities present within each. Parks classification are shown in Table 3.87 ‘City of AtlantaParks by Type’.
Table 3.87 City of Atlanta Parks by TypeDescriptionPark TypeNumber
Regional parks are major park sites that draw a significant portion of users from both the communityand the entire City. They generally contain facilities that generate revenue, like the Chastain ArtsCenter.
Regional9
Community parks support organized programming with staff. They typically contain such facilitiesas recreation centers, pools, large picnic shelters, or programmed athletic complexes. A smallfee for the use of some of these facilities may be charged in order to partially offset operatingcosts.
Community24
Community centers are stand-alone facilities leased to a community service organization providingsocial services.
Community Center3
September 2007 Draft Atlanta Strategic Action Plan224
Community Assessment3

DescriptionPark TypeNumber
Neighborhood Parks serve local informal recreational needs. Typical amenities include picnicshelters (small to medium for family gatherings), open fields for informal sports and recreationactivities; play grounds/tot lots, basketball and tennis courts, and wooded natural areas. Generallyneighborhood parks are not staffed.
Neighborhood67
Nature preserves are primarily natural areas with amenities that facilitate environmentalinterpretation.
Nature Preserve12
Conservation parks are areas managed for environmental protection purposes. Conservationparks are publicly accessible.
Conservation24
Block parks are small park sites containing limited amenities such as a play grounds and tot lots.Block29
Garden spots are very small landscaped areas – typically traffic islands. These areas generallydo not have amenities.
Garden Spot170
Special Facility: Special facilities are sites within the park inventory that contain facilities nottypically associated with parks. The Historic Oakland Cemetery is one example of a special facility.
Special Facility6
Other Parks and Open Spaces
Other types of parks and open spaces not under the city’s direct control make significant contributions tothe overall viability of Atlanta’s greenspace system. Currently these facilities total 2,596 acres. These typesof parks and open spaces include:
1. National Park Service (NPS) sites – 16.24 acres: NPS sites offer recreational and historic value toAtlanta’s greenspace system. Several NPS sites are located within or adjacent to the City of Atlanta.These include sites like the Martin Luther King, Jr. National Historic Site and the Chattahoochee RiverNational Recreation Area (located just over the northwest boundary of the City).
2. State and Dekalb County Parks – 20.22 acres: There are relatively few park resources of this typewithin the City. Centennial Olympic Park is managed by the State of Georgia and is an example of asignificant park resource located adjacent to the downtown.
3. Greenways (consent decree acquisitions) 638.6 acres: These include acquisitions along river andstream corridors made per the 1998 Combined Sewer Overflow Consent Decree. They typically haverestricted public access.
4. Golf Courses (privately owned) 91.3 acres: Private golf courses, such as the Ansley and Druid Hill golfcourses, offer a recreational amenity on large tracts of land maintained in a park-like setting. Therefore,golf courses are important components of Atlanta’s existing greenspace system.
5. Cemeteries - 560 acres: Atlanta has several very large cemeteries within its borders, like WestviewCemetery. Similar to golf courses, cemeteries maintain large areas of land in a park-like setting.
6. Atlanta Public Schools – 911 acres: The recreational facilities and undeveloped land found at manypublic school sites make Atlanta’s public schools a potentially important component of the city’sgreenspace system. Furthermore, the many school sites abandoned as part of the school district’sconsolidation efforts could provide future greenspace opportunities.
7. K-12 Private Schools – 396 acres: Private school sites are similar to public school sites. The City wouldneed to partner individually with these institutions to benefit from the facilities and potential greenspacethey provide.Colleges and Universities: Thoughmany of the city’s colleges and universities are adjacent to downtownand quite urban in character, they do offer open spaces and facilities within their campuses. Colleges
225Atlanta Strategic Action Plan September 2007 Draft

and universities are shown in Figure 1 to illustrate how these resources may connect to the largergreenspace system.
Recreation Facilities
There are 33 recreation centers, 15 centers do not have a gym, 2 have a gym and natatorium, 15 have agym and one or more activities, five indoor and 17 outdoor pools, two arts and crafts center, five tenniscenters and other special recreational facilities, such as J. A. White Junior Training Golf Course, SouthsideSports Complex, and Lake Allatoona Resident Camp.
In addition to these facilities, there are several joint use facilities. Several schools use city parks for theirphysical education programs. These include Benteen Elementary, Cleveland Avenue Elementary, DunbarElementary Kennedy Middle School and Turner Middle School. Moreover, five community facilities are majorjoint-use facilities: Dunbar (NPU-V), Georgia Hill (NPU-W), M. L. King (NPU-M), JFK (NPU-L) and RosaleFann Community Center (NPU-Z) John Burdine (NPU-Y). JFK is administered by the Atlanta School System;the other five are administered by the City's Department of Parks Recreation and Cultural Affairs.
Recreation Programs DPRCA Facilities
Program development areas administered by the Office of Recreation include aquatics, athletics, tennis,special populations, and coaches' certification. The Aquatics Division operates indoor and outdoor pools,provides instructional programs in swimming, and has developed the City's youth competitive swim team,the Atlanta Dolphins. The Athletics Division operates the City's adult league plan in football, flag football,basketball and softball and youth team programs. The Special Population Division offers programs forsenior citizens and for persons who are both physically and mentally disabled. This division also conductsoutdoor camping programs and operates Camp Best Friends at Lake Allatoona. The new Coaches'Certification Program is taking the lead in providing training to youth coaches.
During the summer, the Office focuses on Camp Best Friends, a youth day-camp program, serving overthree thousand young people. The summer-camp program, offers children age six through 16 a variety ofeducational, recreational and cultural activities.
Special Event Sites
The DPRCA has several special event facilities (see map). Some special facilities such as the ChastainPark Amphitheater, the Cyclorama, and the Civic Center draw visitors from the Atlanta Region, thus providingservice to the region as well as the City.
No park in the City is adequately equipped to hold major outdoor special events. In parks that regularlyhost events, temporary structures and facilities such as stages, lighting posts and electrical supply outletsmust be rebuilt and disassembled for every event. Parks not originally designed or planned for holdingspecial events attract thousands of visitors. These events sometimes have had a major detrimental impacton the environmental health of the parks and have increased park maintenance costs.
September 2007 Draft Atlanta Strategic Action Plan226
Community Assessment3

In 2002, a mayoral-appointed Special Events Task Force made significant changes to the City’s OutdoorFestival ordinance. The new ordinance was adopted by City Council in 2002. The ordinance revised therules and raised fees for festival organizers.
Special Events make a significant contribution to the City’s economic vitality. The City loses millions ofdollars because it does not have an appropriate site to host events major events. The 25 acre MillenniumPark in Chicago is estimated to have generated over 1 billion dollars in residential development over a 10year period. The redevelopment of Fort McPhearson presents a unique opportunity to create such a site.In Atlanta signature park developments such as Centennial Olympic, Piedmont, and Freedom Parks havegreatly increased the value of adjacent land.
Parks Funding
The following have been identified as potential funding sources for the City of Atlanta’s Greenspace Program:
Park Impact FeesQuality of Life BondsGeorgia DOT’s Wetland Mitigation Banking ProgramGeneral FundGrantsDonationsAtlanta/Fulton Land Bank AuthorityLand and Water Conservation FundsPark Improvement FundTransportation Enhancement MoniesCommunity Development Block Grants (CDBG)FoundationsTax Allocation Districts (TAD)The Parks and Greenspace Opportunity Bond
The City is aggressively pursuing funding from sources such as: state grants, non-profit foundations, itsQuality of Life Bond program, and Tax Allocation Districts (TADs). The BeltLine TAD promises to createover 1000 acres of new parks and 22 miles of new trails. The largest single acquisition is the BellwoodQuarry. The most recent acquisition is the 22 acre Boulevard Crossing Park. The Parks and GreenspaceOpportunity Bond will provide $35 million to acquire land for new parks, $30 million to develop recreationfacilities in those parks, and $40 million to rehabilitate existing recreation facilities.
Mayor Franklin’s 2006 budget increased Parks and Recreation funding for the third straight year, this timeby $2.6 million. The adopted 2007 budget increased the DPRCA budget by another 10%. This is a continuingeffort to increase general fund support for Parks and Recreation by over $10 million during the last yearsof Mayor Franklin’s administration. These funds will be used to help DPRCA meet concrete, improvedoperation and maintenance standards for parks, recreation and cultural affairs programs and to reachdetermined standards for better parks.
227Atlanta Strategic Action Plan September 2007 Draft

Several financing trends of the last decade promise to play important roles in shaping the financialmanagement of parks in the future. These include: leasing of major facilities, joint-use of facilities, andprivate sector support. The City has successfully leased such as the City golf courses and the Civic CenterConvention Hall. Joint-use of facilities is not a new idea, but is being resurrected as even more attractiveto potential project partners as the price of real estate in Atlanta rises.
Park Impact Fees
Park impact fees are an important method of offsetting the effect of new developments on mandated cityservices. The current impact fees structure is out dated, therefore the City is advertising for a review andrevision of this program.
Partners
The following organizations provide both funding and in-kind services toward maintenance and improvementof the parks:
1. Park Pride: Park Pride, Inc. is a nonprofit, volunteer organization established in 1986 to build civic andcorporate support for City of Atlanta parks. The organization works to preserve, enhance, and promoteparks and green spaces and to encourage acquisition and development of new parks and greenspaces. Park Pride Atlanta oversees the "Adopt-A-Park" program, in which corporate sponsors andneighborhood, civic, youth, and senior groups assume responsibility for park maintenance andimprovements. This system is key to the success of small parks, which are valued by communitiesbut are expensive and difficult for the City of Atlanta to maintain.
2. Path Foundation: The PATH Foundation is a nonprofit organization formed in 1991 to design, capitalizeand build the greenway trails system proposed by the City. PATH has worked with the Mayor's GreenRibbon Committee and the Bureau of Planning in developing the City of Atlanta Greenway Trail CorridorPlan.
3. Piedmont Park Conservancy: The Piedmont Park Conservancy is a nonprofit organization workingwith the City of Atlanta and neighborhood and civic associations to develop a strategy for privateinvestment in the expansion and revitalization of Piedmont Park. This effort is an example of apublic-private partnership for investment in parks Citywide.
4. Freedom Park Conservancy: In 1997, CAUTION, Inc., the nonprofit neighborhood organizationresponsible for the re-design of Freedom Parkway, was re-incorporated as the Freedom ParkConservancy/CAUTION, Inc.
5. Grant Park Conservancy: The Grant Park Conservancy is committed to the restoration, beautificationand preservation of historic Grant Park. The Grant Park Conservancy is a non-profit volunteerorganization that raises funds independently, and organizes volunteer work groups. The purpose isto work in tandem with the City of Atlanta Office of Parks with regard to the implementation of theMaster Plan (adopted by the City Council of Atlanta in May 1998). The Conservancy works within theparameters of the Master Plan.
September 2007 Draft Atlanta Strategic Action Plan228
Community Assessment3

6. Olmsted Linear Park Alliance: The Olmsted Linear Park Alliance is working with the Office of Parks toimplement a master plan for all sections of the Olmsted Linear Park. To date, the Alliance has raisedfunds for the renovation of r the Oak Grove section and the Shadyside and Dellwood sections.
7. Chastain Park Conservancy: The The Chastain Park Conservancy was founded in the fall of 2003.The Conservancy has a Memorandum of Understanding with the City of Atlanta Parks Department.Its mission is to restore, enhance, maintain and preserve Chastain Park, organizing volunteers anddonations. The CPC also works closely with the community, City departments, the nearest NPUs (Aand B), and 11 different venue operators The Conservancy is currently undertaking a master plan forChastain Park.
8. Historic Oakland Foundation: The Historic Oakland Foundation Inc. was founded to cultivate resourcesto assist the City of Atlanta in the preservation, restoration and beautification of Historic OaklandCemetery and to promote it as a local cultural resource and as an historic site of national importance.
9. Little Five Points Business Association: The Association is responsible for the maintenance of theFindley Plaza in Little Five Points.
Park and Recreation Plans
A number of prior plans and initiatives have addressed greenspace issues in the City of Atlanta, sponsoredby the City of Atlanta, Park Pride, and other partners. These plans and initiatives have addressed greenspaceissues and proposed policies and actions to address these issues. These plans have resulted in somesignificant accomplishments. They all support an overarching goal to develop a world-class greenspacesystem as an essential component of Atlanta’s quality of life, economic vitality, and aspirations to be aleading national and international city.
1. Project Greenspace: Atlanta’s Project Greenspace is building on prior planning initiatives. ProjectGreenspace is a comprehensive plan and strategy – for implementing a city-wide greenspace systemfor Atlanta. The Plan establishes an overall framework, direction and action steps for growing andmanaging the City of Atlanta’s greenspace system. Project Greenspace identifies a potential greenspacenetwork of five greenways and a multi-pronged strategy to developing a greenspace network in themost densely development portions of City of Atlanta. Project Greenspace is organized into broadstrategic directions and associated strategies (identified numerically) under three major categories:
a. Growing the Greenspace System
b. Managing the Greenspace System
c. Building Capacity
2. Parks, Open Space and Greenways Plan (1993): The 1993 Parks, Open Space and Greenways Planwas prepared by the City of Atlanta Department of Planning and Development and Department ofParks and Recreation in conjunction with the Mayor’s Green Ribbon Committee, a citizen advisory
229Atlanta Strategic Action Plan September 2007 Draft

group appointed by Mayor Maynard Jackson in 1990 to facilitate the parks planning process. The planestablished planning policies intended to guide the development of park, open space, and recreationalfacilities over a 15-year period. As a comprehensive, citywide assessment of Atlanta’s park and openspace (greenspace) resources, the Parks, Open Space and Greenways Plan is the predecessor toAtlanta’s Project Greenspace.
3. Georgia Community Greenspace Program: The Georgia Greenspace Program was established by theGeorgia General Assembly in 2000 to encourage eligible counties to initiate community greenspaceprograms. It defines greenspace as “permanently protected land and water, including agricultural andforestry land, that is in its undeveloped, natural state or that has been developed only to the extentconsistent with, or is restored to be consistent with, one or more listed goals for natural resourceprotection or informal recreation.” The Georgia Greenspace Trust Fund was established in conjunctionwith this program to assist local governments in carrying out strategies for acquiring and permanentlyprotecting land. To qualify for grant funds from this source, local governments were required to set agoal of setting aside at least 20% of the jurisdiction as open and connected greenspace.In 2000 Atlanta City Council adopted aGreenspace Program concept plan and application for submissionto Fulton and Dekalb Counties and the Georgia Department of Natural Resources. The concept planestablished a goal to protect a minimum of 20% of the City’s land area as open greenspace that canbe used for informal recreation and natural resource protection. Types of land targeted by the plan toachieve the 20% goal included floodplain and wetlands; greenways; existing nature preserves andother existing passive parks; new parkland; and vacant/undeveloped land.
4. Parks Atlanta Rescue Coalition 9-1-1 (2001) / 2005 Atlanta Park System Agenda: The Parks AtlantaRescue Coalition 9-1-1 (9 goals, 1 visionary mayor, and 1 great city, or PARC 9-1-1) was formed in2001 by a partnership of neighborhood, civic, and environmental organizations, led by Park Pride, toencourage Atlanta's next administration to create a world-class park system. PARC 9-1-1 assertedthat “Atlanta lags behind other American cities in every measure of park acreage, and the parks wedo have are unsafe and poorly maintained.” It called on the next mayor to endorse a bold new visionfor Atlanta’s parks. In anticipation of the next round of city elections, Park Pride reviewed and updatedPARC 9-1-1 in 2005. However, the review found that most of the original nine points were unfulfilled.In response, Park Pride and its partners issued the 2005 Atlanta Park System Agenda.
5. 2002 Parks and Greenspace Task Force Report: In 2002 the Mayor appointed a Parks and GreenspaceTask Force to make recommendations to improve existing parks and increase park acreage within theCity. The Task Force’s report, issued in November 2002, identified four major themes:
a. The City must improve the maintenance and safety of existing parks.
b. The City must dramatically increase the amount of its park space.
c. The City must provide special recreation parks and special events venues to reduce the stresson existing parks.
d. The City must improve management of the Department of Parks, Recreation and Cultural Affairs.
September 2007 Draft Atlanta Strategic Action Plan230
Community Assessment3
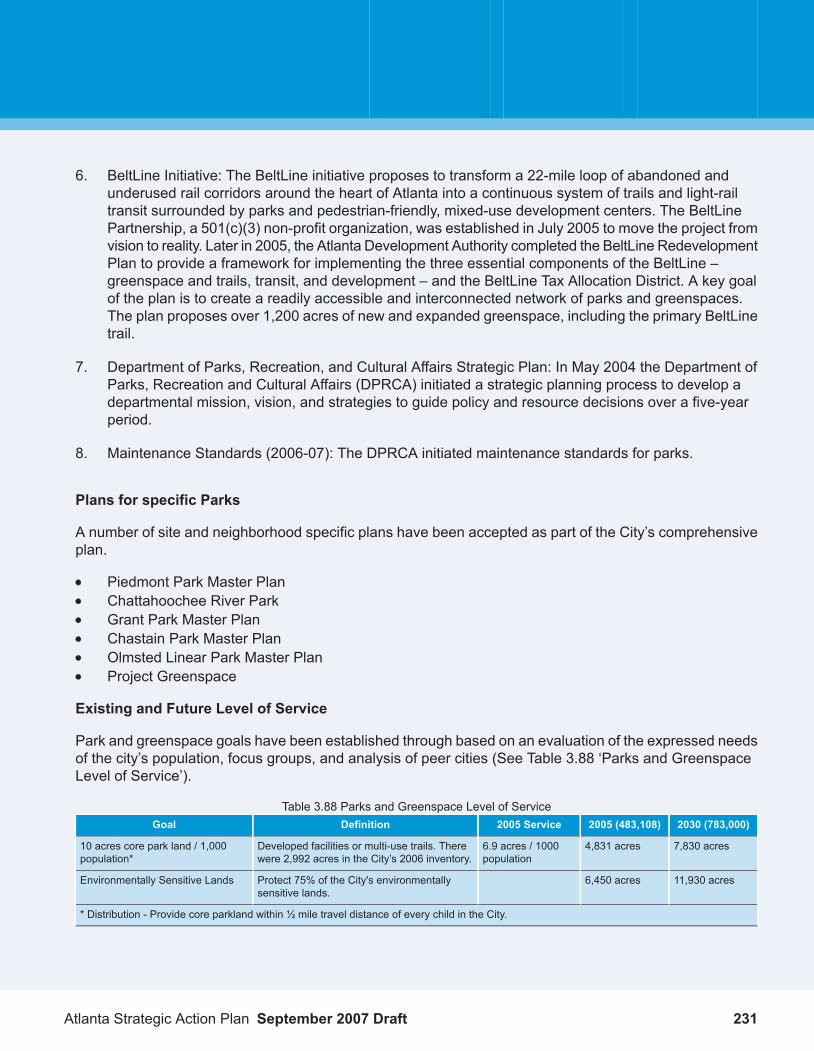
6. BeltLine Initiative: The BeltLine initiative proposes to transform a 22-mile loop of abandoned andunderused rail corridors around the heart of Atlanta into a continuous system of trails and light-railtransit surrounded by parks and pedestrian-friendly, mixed-use development centers. The BeltLinePartnership, a 501(c)(3) non-profit organization, was established in July 2005 to move the project fromvision to reality. Later in 2005, the Atlanta Development Authority completed the BeltLine RedevelopmentPlan to provide a framework for implementing the three essential components of the BeltLine –greenspace and trails, transit, and development – and the BeltLine Tax Allocation District. A key goalof the plan is to create a readily accessible and interconnected network of parks and greenspaces.The plan proposes over 1,200 acres of new and expanded greenspace, including the primary BeltLinetrail.
7. Department of Parks, Recreation, and Cultural Affairs Strategic Plan: In May 2004 the Department ofParks, Recreation and Cultural Affairs (DPRCA) initiated a strategic planning process to develop adepartmental mission, vision, and strategies to guide policy and resource decisions over a five-yearperiod.
8. Maintenance Standards (2006-07): The DPRCA initiated maintenance standards for parks.
Plans for specific Parks
A number of site and neighborhood specific plans have been accepted as part of the City’s comprehensiveplan.
Piedmont Park Master PlanChattahoochee River ParkGrant Park Master PlanChastain Park Master PlanOlmsted Linear Park Master PlanProject Greenspace
Existing and Future Level of Service
Park and greenspace goals have been established through based on an evaluation of the expressed needsof the city’s population, focus groups, and analysis of peer cities (See Table 3.88 ‘Parks and GreenspaceLevel of Service’).
Table 3.88 Parks and Greenspace Level of Service2030 (783,000)2005 (483,108)2005 ServiceDefinitionGoal
7,830 acres4,831 acres6.9 acres / 1000population
Developed facilities or multi-use trails. Therewere 2,992 acres in the City’s 2006 inventory.
10 acres core park land / 1,000population*
11,930 acres6,450 acresProtect 75% of the City's environmentallysensitive lands.
Environmentally Sensitive Lands
* Distribution - Provide core parkland within ½ mile travel distance of every child in the City.
231Atlanta Strategic Action Plan September 2007 Draft

A goal of 10 acres of core park land per 1000 population has been established. As of the end of 2006 thecity’s inventory was 1,839 acres short of this goal. Unless the city develops more aggressive tools forobtaining this land there will be larger unmet needs as the city’s population grows.The useful life of parksand recreation facilities varies widely. As a rule of thumb parks should have a major renovation every 20 to30 years.
In response to the 2001 Georgia Community Greenspace Program, the City adopted a general goal toprotect 20% of its land area as greenspace. In the beginning of 2007 the City contained 85,384.5 acres,twenty percent amounts to 17,077 acres. The goal of protecting these acres is to be met with greenspaceprotected as parks, multi-use trails, watershed greenways, and easements. Because it is an urban citystreetscapes, public squares, and plazas are also considered to be critical components of Atlanta’s greeninfrastructure.
As part of Project Greenspace, a statistical valid survey was conducted to assist in determining the level ofservice provided by recreational programs. The City's community recreation center system have overlappingservice areas which increases maintenance and programming costs. In addition, significant gaps exist inservice softball, football, track and field, and baseball.. Soccer programs are being developed. The TennisDivision operates five tennis centers and offers adult and youth instructional programs.
A study of park access found that only 50% of Atlanta’s residents live within the .5 mile travel distance of apark entrance. This over states access because some neighborhoods have inadequate sidewalks and nobikeway facilities to their parks. Children may not have suitable routes in which to bike or walk to the facility.Neighborhood residents may not be able to walk to a park.
City of Atlanta's Growth and Development and Green Infrastructure
The Ability of Green Infrastructure to Direct Development Patterns
Parks often serve as a focus for community life. Property adjacent to parks is more valuable. When parksare visible and accessible they shape the image and form of the community.
Improving Infrastructure Efficiency to Accommodate Future Development
Study existing parks for acquisition, street, and trail developments that expand access by adjacentneighborhoods. Encourage the multiple-use of lands examples include: multi-use trails along sewer linesand the use of watershed management lands for outdoor recreation.
The Influence of Service Areas and Levels of Service on Future Development
Service areas are shaped by the street network and park entry points. Parks have been shown to have apositive impact upon public health, community involvement, and economic vitality. Their distribution andvisibility have been shown to influence the location and quality of development.
The Impact of Service Area and Level of Service on Natural and Cultural Resources
September 2007 Draft Atlanta Strategic Action Plan232
Community Assessment3

The implementation of a green infrastructure strategy that provides for the access, appreciation, andprotection of sensitive land, such as flood plains, creates opportunities for improving the quality of the city’snatural environment and providing outdoor recreation.
Directing Development Patterns through Green Infrastructure
Development patterns that make parks accessible and visible result in more desirable communities.Appropriate distribution of facilities through out the community improves the city’s competitive advantagein attracting businesses and provides a high standard of living for its residents.
Issues and Opportunities
Issues
1. Atlanta lacks sufficient acreage of parkland and other greenspaces.2. Atlanta’s park infrastructure requires continuous renovation and redevelopment. A dedicated funding
source that allows systematic management is needed.3. The City’s green infrastructure is a system that provides many benefits for Atlanta’s citizens. These
need to be evaluated as part of development decisions.4. Greenspace is a major contributor to Atlanta’s economy.5. Population growth is magnifying the need to address park and greenspace issues.6. Development and redevelopment pressures provide the opportunity to “grow” Atlanta’s greenspace.7. The city’s internal operational and management processes related to greenspace need to be
strengthened and better coordinated. Environmental resources would benefit from a comprehensiveapproach to planning and management.
8. Funding for Atlanta’s parks and greenspaces needs to be significantly increased.9. Apply urban design standards related to greenspace visibility and access to projects receiving city
incentives.10. There is a lack of resources for planning, acquisition, development, and management of the City’s
Park system.11. The lack of side walks and in many areas their poor condition limit access to greenspace.
Opportunities
1. Expanded access to core park land- With GIS technology the City will be able to map networkconnectivity to Core Parkland access points. This can be used to determine park access by demographicsegment and provide analysis of acquisitions that increase access to existing facilities.
2. Public participation in resolution of parks and public open space issues- The City helps fund Park Pride,an auxiliary non-profit organization that coordinates volunteer and advocacy projects within the parksystem. These activities need to be publicized and expanded to support other public spaces.
233Atlanta Strategic Action Plan September 2007 Draft

3. Adoption of long range master and management plans for each park site- There should be a CouncilAdopted Park Master Plan for each park site. These plans will guide the pursuit of funding, projectcoordination of small projects, and generate project lists for the capital improvement budget. Parkmaster plans developed as a collaborative effort between site stake holders and park staff lead toincreased communication and understanding of the issues and opportunities related to that site. Localstake holders have a known contact within Park Pride and Office of Park Design. The master plan canbe used to guide incremental development so that one element does not preclude future neededopportunities. It is also serves as a tool to leverage funding requests. Having illustrated plans framedand hung in Recreation Centers help keep the City’s long term needs for park improvements in focusand directed.
4. Protection of sensitive lands such as flood plains, wet lands, steep slopes, views, historic and culturalsites- Development of a sensitive areas / connectivity map that can be referenced as part of zoningand development reviews to identify opportunities and encourage the creation of a city wide openspace system.
5. There is a need for a Special Events Park site- Major outdoor festivals are popular and the demandfor such events continues to grow. These venues have been shown to have tremendous positiveeconomic impacts both in the support of the hospitality industry and as a stimulus for redevelopment.The coordinators often see potential events find other locations when their organizers learn that Atlantadoes not have a suitable site for their event. City is looking for such a venue. One promising locationis in Fort McPherson.
6. Fort McPherson parade ground could be the location for a some special events.
7. Creation of an Open Space incentives program- Review zoning and development codes for opportunitiesto encourage the creation of public open space and protection of sensitive lands as part of thedevelopment process.
8. Planning resources for management and coordination of opportunities to create parks, open space,and greenways as part of the development process are needed- Staff resources are needed to workwith developers during the concept stage of proposed projects. Establish standard policies andprocedures that provide for a systematic review of project submittals and result in the capture of openspace opportunities.
9. Track land set aside as open space or commonly owned land as part of conditional zoning- Requirethe submission of a digital boundary survey that is compatible with the City’s GIS system for all landdesignated as open space. Include management contacts. Provide for periodic reports as to the land’scondition and staff review of such reports.
10. Development of Multi-use trails- In 1993 the City adopted a multi-use trail master plan. The City needsa dedicated trails coordinator to leverage funding and manage specific trail alignments.
September 2007 Draft Atlanta Strategic Action Plan234
Community Assessment3

11. Common source of shared data- The City currently is increasing its ability to use available technologysuch as GIS/CAD to reduce duplication of effort and to enhance services to residents. Capital investmentin technology is essential.
12. Tracking of city owned real estate- GISmapping of city owned real estate with linked data would greatlyenhance the ability to manage these properties.
13. Protection of water quality thru the acquisition of wide stream buffers that could be used for multi-usetrails and other outdoor recreation activities.
Storwater Management
The City of Atlanta's stormwater system is owned by the City of Atlanta. It serves the entire population ofAtlanta, as well as employees that work within the City and individuals that pass through Atlanta.
1. Service Area
The City of Atlanta's stormwater service area is the City of Atlanta, which includes a geographic area ofapproximately 132 square miles. Although the City's stormwater service area includes the entire City ofAtlanta, the City of Atlanta is not responsible for the entire stormwater system within Atlanta’s city limits.Rather, the majority of the stormwater system is owned by private citizens.
2. Stormwater Facilities
From a practical sense, stormwater management can be thought of as managing water which runs off ofthe land. Using this broad definition, the stormwater system is synonymous with the system that is used tomanage surface water. Within the City of Atlanta this system includes portions of ten drainage basin,including the land and all of the structures constructed on the land. It includes all water bodies andwaterways. It also includes the structures and piping used to convey and manage this water. Of thesecomponents, the City of Atlanta is responsible for only those components of the system that are owned bythe City; that are located within City's right-of-way; or, which have been constructed by others, dedicatedto the City and accepted by the City. These components are estimated to comprise less than five percentof the total stormwater system.
Portions of the City are served by a combined sewer system (e.g. a system that manages both stormwaterand wastewater flow). In general, the City of Atlanta considers its combined sewer system to be a part ofits wastewater system. (For further information on the combined sewer area and the associated facilitiessee Section 3.3.5.2 of this document.)
3. Level of Service and Adequacy of Facilities to Meet Future Needs
Currently there are numerous functions being performed throughout the City that apply to stormwatermanagement. Such functions include:
Land use planning
235Atlanta Strategic Action Plan September 2007 Draft

The development and enforcement of site development requirementsThe development and enforcement of erosion and sedimentation control requirementsRiver and stream monitoringImplementation of the CSO ProgramStreet sweeping, andOutfall monitoring
At the present time, however, the City does not have a program to address stormwater management in anintegrated fashion that facilitates development while promoting the protection of the City’s watersheds. Itdoes not have a dedicated funding source for maintaining the City’s existing infrastructure, developing newstormwater infrastructure and ensuring that the City stays on top of the ever-increasing stormwater compliancerequirements.
To address this need, the City is currently in the process of developing a Stormwater Implementation Plan.The purpose of this project is to define the resources necessary for the City to implement a StormwaterManagement Program and to establish a designated funding mechanism for the program. At a minimum,it is anticipated that the Stormwater Management Program will ensure that the City’s existing infrastructureis properly maintained, that stormwater compliance requirements are met, and that the City will move forwardat a limited pace to develop an integrated program that addresses stormwater management and watershedprotection. Development of the Stormwater Implementation Plan, including the adoption of a dedicatedfunding source, is scheduled to be completed by the end of 2008.
4. The Ability of Stormwater Infrastructure to Direct Development Patterns
There are numerous ways that stormwater infrastructure can be used to facilitate development and resolveproblems associated with development. In general, however, stormwater infrastructure is not a good toolfor directing development patterns. Rather, the desired pattern of development should be determined andthe mechanism(s) for managing the stormwater resulting from such development should be identified andimplemented.
5. Improving Infrastructure Efficiency to Accommodate Future Development
Stormwater infrastructure can be used in many ways to facilitate development. It can be used to facilitateflow, impede flow, store flow, or treat flow. Regardless of how the infrastructure is used, it is important thatthe stormwater management system be looked at as a whole. Components of the stormwater system thatare not typically considered to be stormwater infrastructure, (i.e. land surfaces, rooftops, streets, watercoursesand water bodies) should be considered, as well as the impact of changing various components of thesystem. Increasing the size of a culvert to prevent upstream ponding may be a bad solution if it causes theerosion of a streambank below.
It should be noted that stormwater management includes more that managing stormwater flow. It includesland use planning and the definition and enforcement of development requirements. It includes facilitatinginfiltration and finding ways to prevent the contamination of surface water flow. Such programs are part
September 2007 Draft Atlanta Strategic Action Plan236
Community Assessment3

and parcel of effective stormwater management, and are most productive when considered as a whole inconjunction with the desired patterns of development and the management of the stormwater which willresult from such development.
6. The Influence of Service Areas and Levels of Service on Future Development
Successful stormwater management is key to developing a safe, healthy, comfortable, convenient andaesthetic environment. As such, the level of stormwater services provided has tremendous potential toimpact the quality of development. The extent to which land use planning, site development, and stormwaterprograms are thoughtfully developed, integrated, executed and enforced, will directly impact the degree towhich negative stormwater effects are mitigated, reduced, controlled, and eliminated.
Stormwater impacts begin with small localized effects and coalesce into large effects that affect entire riverbasins. As such, the effects of stormwater runoff from upstream areas that are located outside of a stormwaterservice area can not be separated from the effect of stormwater impacts that are generated within the servicearea. Coordination across service area boundaries-- especially jurisdictional boundaries that crosswatersheds--is needed to maximize the benefit of stormwater programs. In some cases, without suchcoordination, significant results can not be achieved regardless of the efforts of the downstream entity.
7. The Impact of Service Area and Level of Service on Natural and Cultural Resources
Stormwater is a natural resource and impacts natural resources. Stormwater feeds Atlanta’s rivers andstreams. It waters the earth and nourishes plants and animals. It is fundamental to habitats and has thepotential to provide tremendous aesthetic beauty and recreational value. Stormwater also erodes soil andtransports pollutants. It roars through rivers and streams eroding banks and changing watercourses. Itponds in inconvenient places and causes flooding. For these reasons, stormwater management programs,depending on the level of service provided, have considerable potential to protect natural resources.
The impacts of stormwater on cultural resources are the same as the impacts of stormwater on naturalresources with the exception that concerns regarding cultural resources are generally directed towardprotecting the specific site at which the cultural resource is located. If the cultural resource is a public facility,removing stormwater to prevent unsafe or inconvenient conditions is also of concern.
8. Directing Development Patterns through Stormwater Management
Successful stormwater management is vital to successful development and the long-term success ofdevelopment depends on successfully managing stormwater. As such, the vision for development and thestormwater management programs necessary to achieve such development should consider as a whole.
Issues and Opportunities
1. Balancing Needs
Issue: Determining City priorities and policy with respect to stormwater management
237Atlanta Strategic Action Plan September 2007 Draft

Opportunity: The primary issues associated with stormwater management are reducingstormwater runoff, preventing soil erosion and stormwater contamination, and maintaining anddeveloping the stormwater system so as to prevent stormwater damage and flooding. Theseare extremely difficult and expensive issues to address. The issue is further complicated bythe fact that less than 5% of the stormwater system within the City is in the public domain. Policydiscussions of the cost, benefit, and timing of developing the City's stormwater managementprogram are required to move forward in a significant manner beyond the level of activity outlinedin the City's current ordinances.
2. Obtaining Stormwater Funding
Issue: Lack of funding
Opportunity: Develop a dedicated stormwater management program funding source
Developing a Stormwater Management Program
Issue: Develop a stormwater management program from the ground up
Opportunity: Development of the program from the ground up allows the program to build uponthe knowledge gained from other programs, and to wrap together the required components ofthe program. Currently there is no funding for program development.
3. Achieving Regulatory Compliance
Issue: There are significant federal, state, and local compliance requirements associated withthe City's stormwater system, including MNGWPD requirements associated with maintainingthe City's permits.
Opportunity: Support the development of the City staff and systems necessary to cost-effectivelycomply with regulatory requirements
Issue: MNGWPDRequirement--Ongoing development of floodplain maps (10% of service areaper year)
Opportunity: Build upon the development of DWM's current GIS system.
Issue: MNGWPD Requirement-- Develop developer/contractor certification program
Opportunity: Build upon the DWM's current in-house training programs.
Issue: MNGWPDRequirement--Develop Compliance, Violation and Enforcement Action trackingand reporting for stream buffer, floodplain management, post development stormwatermanagement, etc.
September 2007 Draft Atlanta Strategic Action Plan238
Community Assessment3

Opportunity: A permit management systemwhich is capable of scheduling and tracking permitting,inspection, and ongoing compliance requirements (e.g. erosion & sedimentation controlinspections) is needed. Kiva is unable to manage the inspection data in a fashion that allowsefficient scheduling, tracking and monitoring. Build upon the development of computerapplications that are currently underway (GIS, Customer Information Billing System, Maximo,Hansen, Project Scheduling) to develop a permit tracking system that meets customer and Cityneeds.
4. Inspecting & Constructing Stormwater Facilities
Issue: Maintenance of the City's stormwater system (including pipelines resulting from CSOseparation)
Opportunity: At a minimum DWM is required to maintain the City's existing structures includingthe new stormwater system that results from the sewer separation of the CSO area. Supportthe development of additional in house construction crews to address this work in a cost-effectivemanner.
Issue: Implementation of select stormwater facility construction projects
Opportunity: The regulations and the City's approach to stormwater management, includingthe amount of available funding, will dictate the timing and extent to which the City will bedesigning and constructing stormwater management projects.
Issue: Streambank restoration & protection
Opportunity: Streambank restoration and protection is required to prevent erosion, protectexisting facilities, including stormwater facilities. Support the development of DWM's streambankrestoration group that is developing practices and implementing projects to facilitate streambankprotection and restoration.
5. Improving Customer Service
Issue: Minimize inconvenience and negative business impacts to City residents and employers
Opportunity: Improve interdepartmental coordination of transportation & utility projects (water,wastewater, stormwater, gas, electric, telephone, roadways, pathways, railroads, linear avenuesfor animal migration) Improved coordination has the potential to reduce inconvenience andnegative business impacts and decrease project costs.
Issue: Quick response to customer complaints
Opportunity: Continue to support DWM's budget to provide the staff necessary to managecustomer complaints including the staff necessary to man the call center, investigate complaintsand field crews to address field problems.
239Atlanta Strategic Action Plan September 2007 Draft

Issue: Streamline permitting processes
Opportunity: Facilitate the development of a streamlined inter-department permitting processby linking the development of the process with the development of a permit management systemthat is capable of tracking permitting, inspection, and ongoing compliance requirements.
6. Providing Cost-Effective Services
Issue: Development of document management system
Opportunity: Complete the development of a DWM document management system, takingadvantage of the lessons learned and building upon the development of computer applicationsthat are currently used by DWM (GIS, Customer Information Billing System, Maximo, Hansen,Project Scheduling).
7. Educating the Public
Issue: Ongoing public education needed
Opportunity: Increase public awareness of the options and costs associated with the developmentof a stormwater management program including the fact that less than 5% of the stormwatersystem in the City is in the public domain. Coordinate the City's public education efforts tomaximize the impact of its public education efforts.
Opportunity: Continue to participate in the MNGWPD public education program and takeadvantage of the resources it has to offer.
8. Coordinating with Neighboring Jurisdictions
Issue: Ongoing coordination and communication with neighboring jurisdictions
Opportunity: Continue to participate in the MNGWPD and take advantage of the resources ithas to offer.
Solid Waste Management Facilities
Introduction
This section includes background information about the City of Atlanta’s solid waste collection and treatmentsystem including information on the solid waste services, solid waste generation, waste reduction, collectionsystem, solid waste disposal and land use considerations.
September 2007 Draft Atlanta Strategic Action Plan240
Community Assessment3

The Office of Solid Waste Services (SWS) in the Department of Public Works responsible for the collectionand disposal of solid waste within the City of Atlanta. SWS also provides a wide range of other solid wastemanagement services that include yard waste collection, recycling, City building collection, bulky wastecollection, street sweeping, street basket collection, removal of illegal signage, vacant lot and right-of-way(ROW) cleaning, dead animal removal, illegal dumping cleanup, and assistance with citywide emergencyoperations. SWS also oversees post-closure/monitoring operations of the City’s four landfills. (Include amap of City of Atlanta solid waste facilities)
The City of Atlanta’s Comprehensive Solid Waste Management Plan (SWMP), adopted by the City Councilin December 2005, serves as the City’s action plan for managing the City’s solid waste. The SWMP is arequirement of the State of Georgia’s Department of Community Affairs (DCA) and was initiated by theGeorgia Comprehensive Solid Waste Management Act of 1990. The SWMP addresses the City of Atlanta’swaste stream, waste reduction, collection, disposal, land limitations, and education and public involvement.The SWMP document covers a 10-year planning period from 2005-2014.
Solid Waste Services
The City of Atlanta collects residential single- and multi-family solid waste within the City of Atlanta citylimits, an area of 131.6 square miles. The SWS also collects waste from City buildings and facilities, someC&D debris, yard trimmings from residents and City owned properties; and performs various beautificationservices. The City services approximately 87,000 single-family units and 33,600 multi-family units weekly.
Private hauling companies also collect solid waste from residential multi-family units. They serviceapproximately 63,762 multi-family residences in the City of Atlanta. It is estimated that approximately 36,422tons of solid waste were collected. The private companies provide some residential recycling to multi-familyunits.
In the City of Atlanta, commercial solid waste is collected by private hauling companies and includescommercial non-residential solid waste, some institutional solid waste, and industrial-sector solid waste.These private hauling companies are not required to provide the City with tonnage information for wastecollected from the commercial sector.
Solid Waste Generation
The amount of solid waste generated in the City of Atlanta is expected to increase by 35% from 764,607tons in 2005 to 1,033,282 tons in 2015 as the population and the number of employees increase. The Cityof Atlanta generated approximately 189,508 tons of residential (single family and multi-family) solid wastein 2003. The residential waste generation rate in the City of Atlanta was 2.4 pounds per capita per day. Forthe planning period of 2004 through 2015, the residential waste-generation rate is expected to remain fairlysteady, not fluctuating significantly. The amount of residential solid waste disposed has also decreasedsteadily since 2001 which indicates an increase in source reduction and/or recycling. The composition ofthe waste stream is shown in table Table 3.89 ‘City of Atlanta Solid Waste Composition in 2004’.
Table 3.89 City of Atlanta Solid WasteComposition in 2004
241Atlanta Strategic Action Plan September 2007 Draft

CommercialResidentialType
40.237.9Paper
15.217Plastic
3.64.8Glass
5.54.9Metal
26.628.8Organic
3.72.9Inorganic
5.83.8C&D
In 2003, the City of Atlanta disposed of approximately 359,555 tons of commercial, institutional, and industrialsolid waste. Based on employment of 445,559 the commercial, institutional, and industrial solid wastegeneration rate in the City of Atlanta for 2003 was approximately 4.4 pounds per employee per day. For theplanning period, the commercial waste per employee generation rate is expected to remain fairly steadyand not fluctuate significantly.
On average between 7 and 8 thousand tons of residential solid waste from single- andmulti-family residencesserviced by the City were collected for recycling. Residential recycling data from private waste companieswere not available. The estimated residential recycling rate in the City of Atlanta for 2003 was approximately0.09 pound per capita per day. This rate is presumably higher because some residents may utilize drop-offcenters or other mechanisms for recycling. In 2003, the City collected approximately 88 tons of tires forrecycling. In 1996, the City began collecting yard trimmings separately from residential refuse. The yardtrimmings are collected bi-weekly and taken to a chipping, grinding, and staging area at the William B.Hartsfield Solid Waste Reduction Plant. The City collects approximately 40,000 tons of yard waste a year.Yard trimmings are sold for reuse as boiler fuel to various mills.
Construction and Demolition (C&D) debris is collected by both private haulers and the City of Atlanta andis disposed of in private C&D landfills. The City of Atlanta uses private dedicated C&D landfills for C&Ddisposal. No C&D recycling program currently exists. In 2003, the City of Atlanta collected 45,521 tons ofC&D debris. In 2003, private haulers collected approximately 49,820 tons of C&D debris in the City anddelivered the debris to four private C&D landfills
In 2003, approximately 118,725 tons of sludge were generated from City-owned wastewater treatmentfacilities. Of this amount, approximately 46,984 tons were sent to Live Oak Landfill for disposal. The remaining71,741 tons were incinerated and the ash was sent to a brick facility for recycling as an amendment in themanufacturing of bricks.
Waste Reduction
The Georgia Comprehensive Solid Waste Management Act (O.C.G.A. §12-8-20) set forth the State’s wastereduction goal, which requires a 25 percent per capita reduction rate in the amount of solid waste beingdisposed, from a 1992 baseline year. There has been an 11 percent decrease in the per capita disposal ofall waste in the City of Atlanta since 1992. If only the waste disposed from just the City of Atlanta collections
September 2007 Draft Atlanta Strategic Action Plan242
Community Assessment3

is calculated, the per capita disposal reduction from 1992 is actually 25 percent, which meets the State’sreduction goal. If sludge disposal were removed from the analysis, the per capita reduction increases to 36percent.
Source reduction of solid waste is any action taken to prevent the generation of the waste in the first place.Over the past 5 years, the City has promoted source reduction by promoting backyard composting,disseminating educational material and providing educational programs. Reuse is another way to reducethe waste stream. The concept behind reuse/recovery of items before they become solid waste is to reuseitems by repairing them, donating them to charity and community groups, or selling them, all of which reduceswaste. Several non-profit and for-profit organizations collect or accept items for reuse.
The City of Atlanta provides curbside recycling service to approximately 87,000 single family residents. Inaddition, the City of Atlanta currently operates three drop-off centers for recyclable items. Between 7 and8 thousand tons are collected every year. Recyclables are processed at a Materials Recovery Facility (MRF).The operator, Dreamsan, has established markets for all materials and has extended term agreements withbuyers for each of these markets. The City of Atlanta requires owners of any multi-family dwelling to providecontainers for the collection of recyclables and to provide for their collection. The amounts of recyclingtonnages collected by these companies, however, were not available.
To meet the State of Georgia’s 25 percent per-capita reduction rate of the amount of solid waste beingreceived at disposal facilities, the City has proposed the following new programs to help achieve the City’s10-year planning goals as well as the State’s solid waste reduction goal. These programs have beencategorized as either source reduction, reuse/recovery, recycling, or special items programs.
Waste Reduction Programs:Pay-As-You-ThrowJunk Mail ReductionFinancial Incentives
Reuse/Recovery Programs:Don’t Dispose – DonateMetro Atlanta Waste Exchange
Recycling Programs:Curbside Collection Program (Enhanced Program)Drop-Off Centers (Enhanced Program)City and Commercial Multi-Family Recycling (Enhanced Program)Commercial Business Recycling (Enhanced Program)Sales Tax Incentives (New Program)C&D Recycling (New Program)Tire Recycling (Enhanced Program)Conversion of Hartsfield Solid Waste Reduction Plant to Environmental Education Center andPark (New Program)Backyard Composting (Enhanced Program)Yard Trimmings Pay-As-You-Throw (PAYT) Program (New Program)
243Atlanta Strategic Action Plan September 2007 Draft

Amnesty Days andHousehold Hazardous Waste Events (New Program).
Collection System
As mentioned above, both the City of Atlanta and private haulers provide garbage collection in the City.SWS currently collects residential garbage, yard trimmings, garbage from City-owned buildings and facilities,some C&D debris, and performs various city beautification services (street sweeping, signage removal,etc.). The City contracts with a private company to provide curbside recycling collection. Private haulerscollect commercial and industrial solid waste, C&D debris, and some multi-family residential garbage in theCity. The City provides weekly semi-automated cart and dumpster refuse collection to roughly 120,600residential units. This includes approximately 95,400 single-family and multi-family dwelling units that receivecart collection and 25,200 multi-family dwelling units that receive dumpster service in the City. The City alsocollects residential bulky waste items. The City operates from four substations located throughout the City(see map).
The City believes that its current waste collection services are adequate for the present and future needsof the community; however, the City also believes that several operational efficiency improvements areneeded. The following are proposed garbage collection programs under consideration by the City.
Garbage Collection Programs:Education and Compliance – Curbside GarbageSet-Out Limits (New Program),Collection Productivity and Operational Efficiency (New Program),Fleet Maintenance (Enhanced Program),Commercial Collection (New Program)Improved Overall Route Balance (New Program)
Yard Trimmings Collection Programs:Increased Frequency of Yard Trimmings Pickup (New Program),Education and Compliance – Yard Trimmings Set-Out Limits (New Program)
Non-Traditional Collection Services ProgramIllegal Dumping/Littering Programs:
Expand Illegal Dumping/Littering Program (Enhanced Program)
Solid Waste Disposal
The current disposal program being used by the City is adequate for the 10-year planning period and meetsthe State’s required assurance for 10-year disposal capacity. However, the City understands that its currentdisposal program is a short-term solution, and that future disposal options must be evaluated and consideredfor the long term management of the City’s solid waste. This section also includes a contingency strategyfor the interim disposal of the City’s solid waste in the event that the primary disposal option becomesinterrupted.
September 2007 Draft Atlanta Strategic Action Plan244
Community Assessment3

The City now has short-term, renewable contracts with privately owned landfills for waste disposal. Thecontracts consist of 1-year term contracts, with up to five 1-year renewals. Due to the location of theselandfills, the City is using local transfer stations to minimize hauling distance and cost. A transfer station isa facility with a designated receiving area where waste collection vehicles deliver the collected waste. Thewaste is often compacted, then loaded into larger vehicles for shipment to a final disposal site, which istypically a landfill.
Since 2005, the City is using Advanced Disposal Services’ Welcome All Transfer Station in College Park,and Republic Services of Georgia’s United Waste Service, Inc., Lee Industrial Transfer Station in Austell.Twenty percent of the waste is processed at the Welcome All Transfer Station and then sent to the EaglePoint Landfill, in Ball Ground (Forsyth County). The remaining 80 percent of the City’s collected solid wastegoes to the Republic Services’ United Waste Service, Inc. Lee Industrial Transfer Station, in Austell. Thenit is sent to the Pine Ridge landfill in Griffin (Butts County). The City has written commitments from theowners of the disposal facilities certifying sufficient capacity for the City of Atlanta’s solid waste over the10-year planning period. Long term disposal options are:
Combustion Waste-To-Energy SolutionsMass Burn Combustion (New Program)Refuse-Derived Fuel (New Program)Regional LandfillsUse of Transfer Stations to Support Regional Disposal FacilitiesEco-Industrial Park
Land Use Considerations
Solid waste disposal facilities and other solid waste handling facilities should be located where they haveminimum adverse effects on the community and the environment. When considering the location of all solidwaste handling facilities including landfills, the following will be considered, according to state planningguidelines: floodplains, wetlands, and groundwater recharge areas. The City will also consider other criteriasuch as water supply watersheds, fault zones, seismic impact zones, and unstable areas (karst areas).The City of Atlanta or a private entity will consider land use and zoning restrictions, historic sites,archaeological sites, location of surface water intakes, airport safety restrictions, parks and nature preserves,scenic views, rare, threatened, and endangered species, and Chattahoochee River protection criteria. Inorder for EPD to issue or renew a permit for a solid waste handling facility or facility expansion in the Cityof Atlanta, the facility must be consistent with this Comprehensive SWMP. In addition to the proceduresoutlined in the City of Atlanta solid waste permitting and zoning regulations, the City and private entity willfollow the established siting process described in the SWMP.
Over time, the availability of sites suitable for solid waste handling facilities in the City of Atlanta will decline.Therefore, the City will need to manage the existing facilities wisely and protect large-scale industrial areasfrom encroachment by residential or community facilities, which are typically not compatible with solid wastehandling facilities. As Atlanta continues to grow in population, and therefore, experience an increase in theamount of solid waste generated, the City will need to efficiently utilize the existing solid waste handlingfacilities, implement new technologies that will enhance environmental controls and capacities, and continueto implement recycling programs which help to achieve waste reduction goals.
245Atlanta Strategic Action Plan September 2007 Draft

Issues and Opportunities
Intergovernmental Coordination
The Intergovernmental Coordination Element provides local governments an opportunity to inventory existingintergovernmental coordination mechanisms and processes with other local governments and governmentalentities that can have profound impacts on the success of implementing the local government’scomprehensive plan. The purpose of this element is to assess the adequacy and suitability of existingcoordination mechanism to serve the current and future needs of the community and articulate goals andformulate a strategy for effective implementation of community policies and objectives that, in many casesinvolve multiple governmental entities.
Adjacent Local Governments
Atlanta is the most populous city in Georgia and home to a diverse citizenry. Located in north centralGeorgia, Atlanta is positioned in the central portion of Fulton County with a small, eastern portion of the citylocated in western Dekalb county. It joins Palmetto, Fairburn, Union City, College Park, Hapeville, EastPoint, Roswell, Mountain Park, Alpharetta, Sandy Springs, Milton, and Johns Creek. Amongst Dekalb’smajor cities are Decatur, Stone Mountain, and Lithonia.
Independent Special Authorities and Districts
1. Advisory Committee On International RelationsThe Advisory Committee on International Relations seeks to establish a more meaningful dialoguebetween various international groups and the City's elected officials.
2. Atlanta Conventions and Visitors Bureau (ACVB)Established in 1913, ACVB is a private, nonprofit organization created exclusively to market metroAtlanta and Georgia as a premier convention, meeting and leisure destination in the regional, nationaland international marketplace and to favorably impact the Atlanta economy through conventions andtourism.
3. Atlanta Coordinating Responsible Authority (ACoRA)ACoRA administers the City's remaining Title XX funds for the purpose of assisting communitydevelopment corporations and other public and private sector organizations in providing economic,social welfare and administrative services to facilitate the revitalization of Renewal Community (RC)neighborhoods.
4. Atlanta Development Authority (ADA)ADA provides the mechanism for consistent policies regarding development within the City of Atlanta.
5. Atlanta Housing AuthorityThe Housing Authority is organized under Georgia law to develop, acquire, lease and operate affordablehousing for low-income families. Today, AHA is the largest housing agency in Georgia and one of thelargest in the nation, serving approximately 50,000 people.
6. Atlanta Planning Advisory Board (APAB)APAB serves to advise the City on city-wide issues, goals and objectives relative, but not limited to theComprehensive Development Plan, land use, zoning transportation, environmental quality, license
September 2007 Draft Atlanta Strategic Action Plan246
Community Assessment3

review, parks and open spaces. APAB also advises the City on matters relating to citizen organizationsand participation in the planning process.
7. Eastside TAD Advisory BoardProvides economic incentives necessary to encourage private and public development in order togenerate necessary growth in Downtown jobs and residents. The desired result is an attractive, bustling24-hour downtown.
8. MARTA Board of DirectorsTheMARTABoard of Directors exists for purposes of planning, designing, leasing, purchasing, acquiring,holding, owning, constructing, improving, administering and operating a rapid transit system within theAtlanta metropolitan area.
9. Urban Design CommissionThe Urban Design Commission holds public hearings for Council nominations for designation ofbuildings, sites and districts. The Commission also regulates the City's historic preservation regulationsand decisions regarding applications for certifications of appropriateness.
10. Zoning Review Board (ZRB)The ZRB conducts public hearings on amendments to the zoning ordinance of the City and onapplications.
School Boards
The City and Atlanta Public Schools are developing an information-technology strategy to increase accessto computers, appropriate training, and resources to prepare central city youths to work and play in the 21st
Century. The City has received an $8.1 grant to develop a series of community technology centers, wherecitizens can access the Internet and receive training. The City established the Mayor’s Office of CommunityTechnology (MOCT) in 2000 and appointed a blue ribbon committee of top corporate and educationalleaders to assist with the planning. MOCT conducted a community needs and resources assessment. Theresources assessment afforded the City the opportunity to study best practices and develop a program thatstrengthens what already exists in the community and fills the void of what is needed. MOCT opened itsfirst technology center in June 0f 2000. By the end of the year five centers were in operation. Fifteen centersnow exist, where more than 12,000 students have trained.
Independent Development Authorities and Districts
Community Improvement Districts (CID)
A CID is a geographic area whose property owners establish a Board of Directors who vote to assessadditional property tax dollars to accelerate transportation and infrastructure improvement projects. CIDsare comprised of private properties usually zoned for non-residential uses. A CID is a private businessorganization, not a government entity.
A CID is created when a simple majority of the commercial property owners agree to establish the district.This simple majority must also represent at least 75% of the taxable value of the commercial property locatedwithin the proposed CID. The Tax Commissioner must certify that these requirements are satisfied and theCounty must approve legislation authorizing the CID.
247Atlanta Strategic Action Plan September 2007 Draft

The resolution establishing the CID includes a provision for a board of directors and the services to beprovided. Specific joint planning or service agreements are entered into on a case by case basis. Atlantahas three Community Improvement Districts: Central Atlanta Progress (Downtown), Midtown Alliance, andthe Buckhead Community Improvement District.
1. Central Atlanta Progress/ Atlanta Downtown Improvement DistrictCentral Atlanta Progress, founded in 1941, is a private, not-for-profit corporation that strives to createa robust economic climate for Downtown Atlanta. With a Board of Directors of Downtown's top businessleaders, CAP is funded through the investment of businesses and institutions. The Atlanta DowntownImprovement District, founded in 1995 by CAP, is a public-private partnership that strives to create alivable environment for Downtown Atlanta. With a Board of Directors of nine private and public-sectorleaders, ADID is funded through a community improvement district within which commercial propertyowners pay special assessments. Together, Central Atlanta Progress and the Atlanta DowntownImprovement District are committed to a Downtown for the diverse Atlanta community and all ofDowntown's property owners, employees, residents, students and visitors.
2. Midtown AllianceThe mission of the Midtown Alliance is to improve and sustain the quality of life for those who live work,and play in Midtown Atlanta. The Alliance accomplishes this goal through a comprehensive approachto planning and development that includes initiatives to enhance public safety, improve the physicalenvironment, and strengthen the urban amenities which give Midtown Atlanta its unique character.
Its vision concerning the future direction of Midtown includes a project known as Blueprint Midtownwhich envisions a vital, vibrant city center inspired by what people want in an urban community. Itspurpose is to make sure that projects adhere to the following components: balanced blend of residential,retail, office& mixed-use properties, plenty of greenspace, multiple transit options, unique, welcoming& thoroughly pedestrian streetscape environment.
3. Buckhead Community Improvement DistrictThe Buckhead CID is a taxation entity of local government created pursuant to the Georgia Constitution,Article 9, Section 7, the Atlanta Community Improvement District Act, 1991 Ga. L. 3653, as amendedand Atlanta City Council Resolution 99-R-1154, July 6, 1999. Pursuant to its authority under Georgialaw, the Buckhead CID receives three mils of the assessed value of property in property tax revenuefrom non-residential property located within its district boundaries.
Federal, State, or Regional Programs
1. Atlanta Regional Commission (ARC)The ARC is the regional planning and intergovernmental coordination agency for the 10 county areaincluding Cherokee, Clayton, Cobb, Dekalb, Douglas, Fayette, Fulton, Gwinnett, Henry and Rockdalecounties, as well as the City of Atlanta. For 60 years, ARC and its predecessor agencies have helpedto focus the region's leadership, attention and resources on key issues of regional consequence.
September 2007 Draft Atlanta Strategic Action Plan248
Community Assessment3
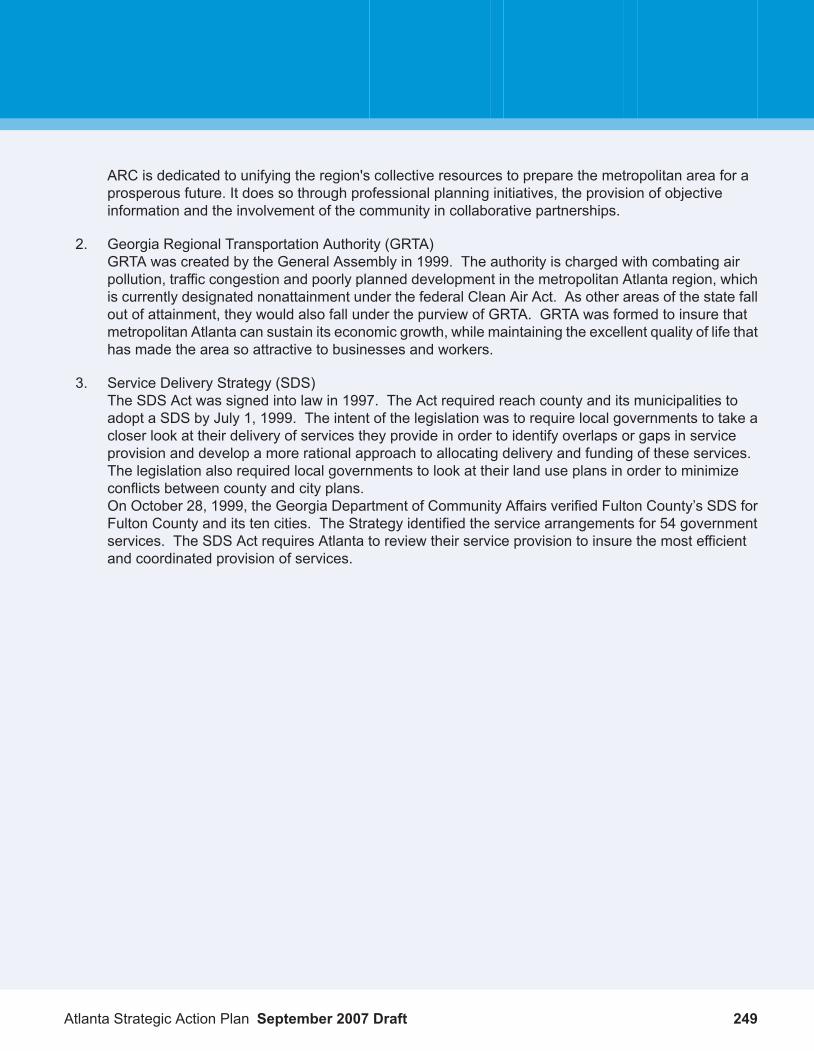
ARC is dedicated to unifying the region's collective resources to prepare the metropolitan area for aprosperous future. It does so through professional planning initiatives, the provision of objectiveinformation and the involvement of the community in collaborative partnerships.
2. Georgia Regional Transportation Authority (GRTA)GRTA was created by the General Assembly in 1999. The authority is charged with combating airpollution, traffic congestion and poorly planned development in the metropolitan Atlanta region, whichis currently designated nonattainment under the federal Clean Air Act. As other areas of the state fallout of attainment, they would also fall under the purview of GRTA. GRTA was formed to insure thatmetropolitan Atlanta can sustain its economic growth, while maintaining the excellent quality of life thathas made the area so attractive to businesses and workers.
3. Service Delivery Strategy (SDS)The SDS Act was signed into law in 1997. The Act required reach county and its municipalities toadopt a SDS by July 1, 1999. The intent of the legislation was to require local governments to take acloser look at their delivery of services they provide in order to identify overlaps or gaps in serviceprovision and develop a more rational approach to allocating delivery and funding of these services.The legislation also required local governments to look at their land use plans in order to minimizeconflicts between county and city plans.On October 28, 1999, the Georgia Department of Community Affairs verified Fulton County’s SDS forFulton County and its ten cities. The Strategy identified the service arrangements for 54 governmentservices. The SDS Act requires Atlanta to review their service provision to insure the most efficientand coordinated provision of services.
249Atlanta Strategic Action Plan September 2007 Draft

Transportation System
Introduction
The transportation network has shaped Atlanta’s growth and development since the first train departedMarthasville for Marietta in 1842. As the home to Hartsfield-Jackson Atlanta International Airport, the heartof the MARTA system, convergence point of three interstate highways, and a major railroad hub, Atlanta isa nexus of global commerce and the urban core of a very automobile dependent metropolitan area thatdoes not attain national clean air standards due in large part to vehicle emissions.
Expressway construction in the region drove the loss of residents to the suburbs through the 1990’s. Nowaccess to transit and walkable communities undergirds rapid population growth in the City of Atlanta. It isAtlanta’s vision to be a leader in the region for forging efficient, effective, and affordable transportationsystems that promote quality of life.
Travel ways traversing Atlanta serve thousands of special events visitors, tourists, conventioneers, morethan half a million residents, and more than a quarter million suburban commuters – who hold three out ofevery five jobs located in the City. Road, rail, and trail corridors provide circulation to, from, within, andthrough the City of Atlanta for the movement of people and goods. Safe and efficient transportationinfrastructure is key to the continuing growth of the hospitality and logistics industry clusters targeted in theCity’s New Century Economic Development Plan for strong employment growth.
Development patterns have created a mismatch between transportation and land use, leaving underutilizedfacility capacity in some parts of the system and creating traffic congestion where land use intensity hasoutpaced the transportation system in others. The City of Atlanta embraces two interrelated principles forimproving the integration between transportation and land use: focusing transportation investments (especiallytransit) on links between high density land uses and focusing high density land use in centers and corridorswith transit, pedestrian, and bicycle transportation capacity.
The Transportation Element evaluates the adequacy of system components for serving the multimodalneeds of the community throughout the planning period. It frames issues and opportunities for more detailedanalysis in the City of Atlanta’s initial Comprehensive Transportation Plan (CTP). It begins with an Overviewsection that looks at the transportation system as a holistic continuum of facilities from those that providethe highest levels of access (sidewalks, parking facilities, local streets) to those that provide the highestlevels of mobility (expressways, high speed intercity rail, aviation). Then it continues with sections thatexamine individual transportation modes and planning considerations, as described below.
1. Road Network
Facilities to accommodate the circulation and storage of vehicles include roads, bridges, traffic controldevices (signs, signals, pavement markings), parking decks, surface lots, and on-street parking spaces.This section evaluates level of service for vehicles as the volume to capacity ratio along corridors andcontrolled delay at intersections. It examines accessmanagement techniques such as driveway consolidationon commercial strips and ways to articulate a fine-grained/small-block street grid network for efficient traffic
September 2007 Draft Atlanta Strategic Action Plan250
Community Assessment3
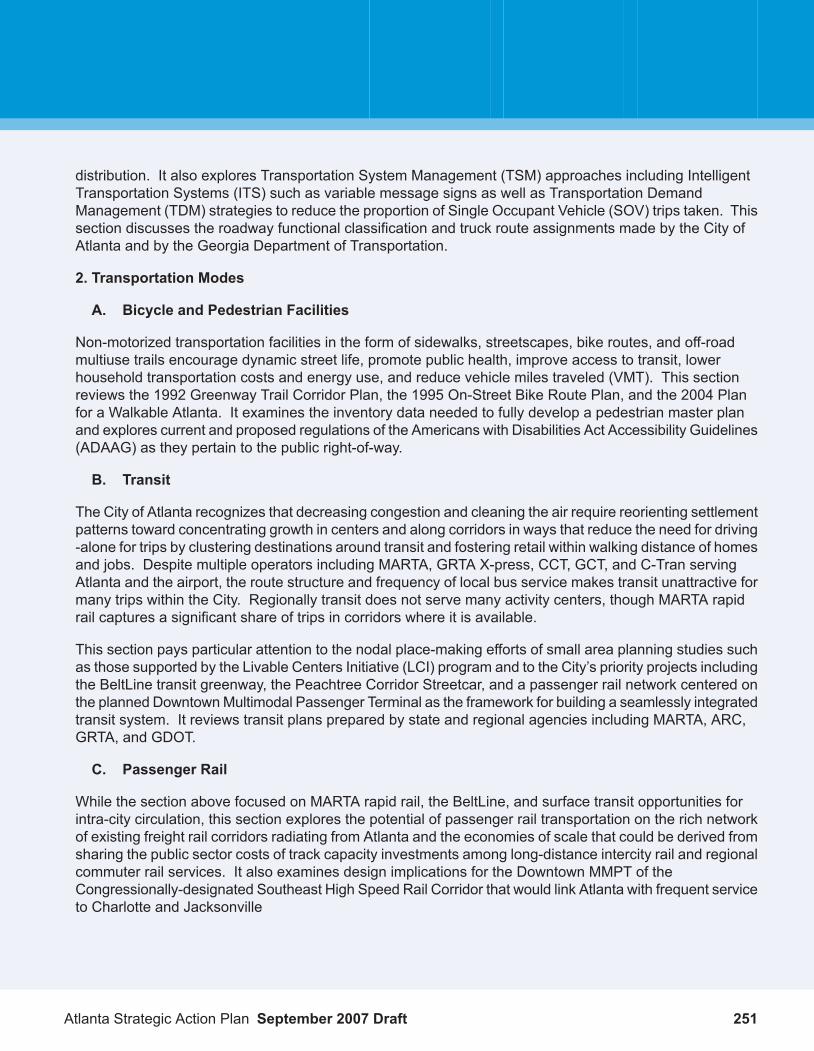
distribution. It also explores Transportation System Management (TSM) approaches including IntelligentTransportation Systems (ITS) such as variable message signs as well as Transportation DemandManagement (TDM) strategies to reduce the proportion of Single Occupant Vehicle (SOV) trips taken. Thissection discusses the roadway functional classification and truck route assignments made by the City ofAtlanta and by the Georgia Department of Transportation.
2. Transportation Modes
A. Bicycle and Pedestrian Facilities
Non-motorized transportation facilities in the form of sidewalks, streetscapes, bike routes, and off-roadmultiuse trails encourage dynamic street life, promote public health, improve access to transit, lowerhousehold transportation costs and energy use, and reduce vehicle miles traveled (VMT). This sectionreviews the 1992 Greenway Trail Corridor Plan, the 1995 On-Street Bike Route Plan, and the 2004 Planfor a Walkable Atlanta. It examines the inventory data needed to fully develop a pedestrian master planand explores current and proposed regulations of the Americans with Disabilities Act Accessibility Guidelines(ADAAG) as they pertain to the public right-of-way.
B. Transit
The City of Atlanta recognizes that decreasing congestion and cleaning the air require reorienting settlementpatterns toward concentrating growth in centers and along corridors in ways that reduce the need for driving-alone for trips by clustering destinations around transit and fostering retail within walking distance of homesand jobs. Despite multiple operators including MARTA, GRTA X-press, CCT, GCT, and C-Tran servingAtlanta and the airport, the route structure and frequency of local bus service makes transit unattractive formany trips within the City. Regionally transit does not serve many activity centers, though MARTA rapidrail captures a significant share of trips in corridors where it is available.
This section pays particular attention to the nodal place-making efforts of small area planning studies suchas those supported by the Livable Centers Initiative (LCI) program and to the City’s priority projects includingthe BeltLine transit greenway, the Peachtree Corridor Streetcar, and a passenger rail network centered onthe planned DowntownMultimodal Passenger Terminal as the framework for building a seamlessly integratedtransit system. It reviews transit plans prepared by state and regional agencies including MARTA, ARC,GRTA, and GDOT.
C. Passenger Rail
While the section above focused on MARTA rapid rail, the BeltLine, and surface transit opportunities forintra-city circulation, this section explores the potential of passenger rail transportation on the rich networkof existing freight rail corridors radiating from Atlanta and the economies of scale that could be derived fromsharing the public sector costs of track capacity investments among long-distance intercity rail and regionalcommuter rail services. It also examines design implications for the Downtown MMPT of theCongressionally-designated Southeast High Speed Rail Corridor that would link Atlanta with frequent serviceto Charlotte and Jacksonville
251Atlanta Strategic Action Plan September 2007 Draft

3. Parking
Although the City is working to create a more pedestrian-oriented environment and encourage alternativemodes of transit, parking remains an essential element of an economically vibrant area. The City of Atlantacurrently provides for off-street parking permits, temporary parking permits, and review of the consistencyof parking facilities with code requirements as part of development review for compliance with the City’sZoning Ordinance. Even as efforts to support alternatives to Single Occupancy Vehicle (SOV) travel moveforward, parking will continue to be a major component of most new development. This section discussesthe SPI and QOL parking requirements as well as the parking meter program. It also explores a possibleparking authority.
4. Railroads, Trucking and Airports
A. Railroads
This section looks at the movement of freight by both trucks and trains within and through the City of Atlantaand considers the ARC Regional Freight Mobility Study underway in 2007 as well as the SRTA proposalfor Truck-Only Toll lanes and the GDOT/CSX capacity study. It provides additional detail on air cargofacilities at H-JAIA and future expansion needs.
B. Airport
This section reviews the Hartsfield-Jackson Development Program (H-JDP) which grew from the airportMaster Plan completed in 2000 to meet passenger and cargo aviation needs through 2020. It also exploresairport ground transportation needs including transit access to the new I-75 side Maynard H. JacksonInternational Terminal ticketing and baggage claim area at Concourse E. Additional elements of the H-JDPinclude the fifth runway completed in 2006, the CONRAC Consolidated Rental-car Agency Facility underconstruction west of I-85 with a new non-sterile Automated People Mover (APM) connection to the maindomestic terminal, remodeling of the Central Passenger Terminal Complex, airfield improvements, and apotential new domestic South Passenger Complex.
5. Transportation and Land Use
6. Transportation Planning
A. Planning and Implementation of Transportation Projects
Transportation projects follow discrete steps of concept refinement, agency coordination, environmentalclearance, detailed design, ROW plan certification, and ROW acquisition prior to start of construction. Thetransition from “planning” to “implementation” involves the iterative process of completing sufficient designto make accurate cost estimates in order to request and “program” funds. This section describes the rolesand responsibilities of City departments and partner agencies in the transportation project lifecycle.
September 2007 Draft Atlanta Strategic Action Plan252
Community Assessment3

B. Funding Transportation Projects
This section analyzes existing and potential sources of funding for transportation system investments at thelocal, regional, state, and federal levels. It explores innovative public-private partnership financing techniquesand outlines the appropriateness of each possible funding category for capital costs of constructing variousproject types and meeting ongoing operating and maintenance needs.
C. Equity, Efficiency, and Environmental Quality
With more than 20% of City of Atlanta residents living below the poverty line, affordable transportationoptions including the ability for households to reduce their vehicle ownership cost burden while reachingjob opportunities are paramount. This section outlines concerns for economic justice and sustainability thatinform the City’s commitment to development of mobility alternatives that reduce the household dependenceon the car and reducing emissions that lead to poor air quality. It also examines the effects of pollutedrunoff from transportation-related pervious surfaces on the watershed system.
D. City of Atlanta Comprehensive Transportation Plan (CTP)
The Comprehensive Transportation Plan (CTP), also known as the Connect Atlanta Plan, will create a visionand implementation plan to address the City’s 21st century transportation needs of a growing populationand densification of residential and commercial development as well as increasing employment.
Road Network
Introduction
Cars, trucks, taxis, vans, transit buses and high occupancy vehicles share the network of roads, bridgesand traffic control devices. The City of Atlanta’s mature street system has a well-established grid networkthat facilitates access, supports mobility, and mitigates peak-hour congestion by providing multiple routechoices. Articulating this grid network in newly developing parts of the City is fundamental to avoidingsuburban-style gridlock on overloaded arterial roads. Even as efforts to support alternatives to SingleOccupancy Vehicle (SOV) travel move forward, parking will continue to be a major component of most newdevelopment. An urban response to the Region’s expected 50% growth over the next 25 years to 2030 isshaped by three key strategies with regard to the road network: leverage development to minimize SOVmode share, optimize the existing network, and extend the street grid.
Transportation System Management (TSM) is a set of tools used by the City and its transportation planningpartners to optimize safety and efficiency through traffic flow improvements without adding roadwaythrough-lanes. Transportation Demand Management (TDM) is a set of tools used to encourage use ofmeans other than driving alone, especially by commuters to major employment centers. Ironically, largeamounts of parking are required for an activity center to reach a level of development density sufficient tosupport high quality transit.
253Atlanta Strategic Action Plan September 2007 Draft

“Intelligent Transportation System” (ITS) technology applications include installing communications fiberalong a travel corridor in conjunction with signal upgrade projects to enhance traffic flow. ITS corridorprojects present the City an important opportunity for coordination with MARTA to provide signal priority forbus routes on arterials.
1. Roadway System and Jurisdictional Responsibilities
There are approximately 1,500 miles of surface streets and more than 900 signalized intersections. TheManual of Uniform Traffic Control Devices (MUTCD), a key publication of the Federal Highway Administration(FHWA) last updated in 2003, sets national standards for the application of traffic signals, regulatory andwarning signs, changeable electronic message signs, and pavement markings.
The FHWA in cooperation with a task force of the American Association of State Highway and TransportationOfficials (AASHTO) produces A Policy on Geometric Design of Highways and Streets, also known as the“AASHTOGreen Book” addressing features such as sight distance, access management, operating speed,and intersection design that seek to provide positive guidance for drivers through roadway design (Theskyline of Atlanta is featured on the cover of the latest (2001) edition of the AASHTO Green Book).
The Department of Public Works (DPW) is responsible for construction andmaintenance of roads and rights-of-way, operation of the street system,including the installation andmaintenance of roadway lighting, traffic signals,traffic signs, pedestrian crossings and pavement markings. Atlanta’sroadway system is under the control of the City, with the exception of StateRoutes and all railroad bridges, which are controlled and maintained byGDOT (see Table 3.90 ‘National Highway System and State Routes in theCity of Atlanta’)
Table 3.90 National Highway System and State Routes in the City of AtlantaTo (S/W)From (N/E)State RouteUS HighwayStreet Name
City Limits (South)Northside DrSR 3US 19, 41Metropolitan Pkwy
DLHollowell Pkwy14th StSR 3US 19, 41Northside Dr
North AveDLHollowell PkwySR 3, 8US 19, 41, 78, 278Northside Dr
Metropolitan PkwyNorth AveSR 3, 8US 19, 29, 41Northside Dr
City Limits (West)Northside DrSR 8US 78, 278DLHollowell Pkwy
Northside DrPiedmont AveSR 8US 29, 78, 278North Ave
North AvePonce de LeonAve
SR 8US 29, 78, 278Piedmont Ave
North AvePonce de LeonAve
SR 8US 29, 78, 278Juniper St
September 2007 Draft Atlanta Strategic Action Plan254
Community Assessment3
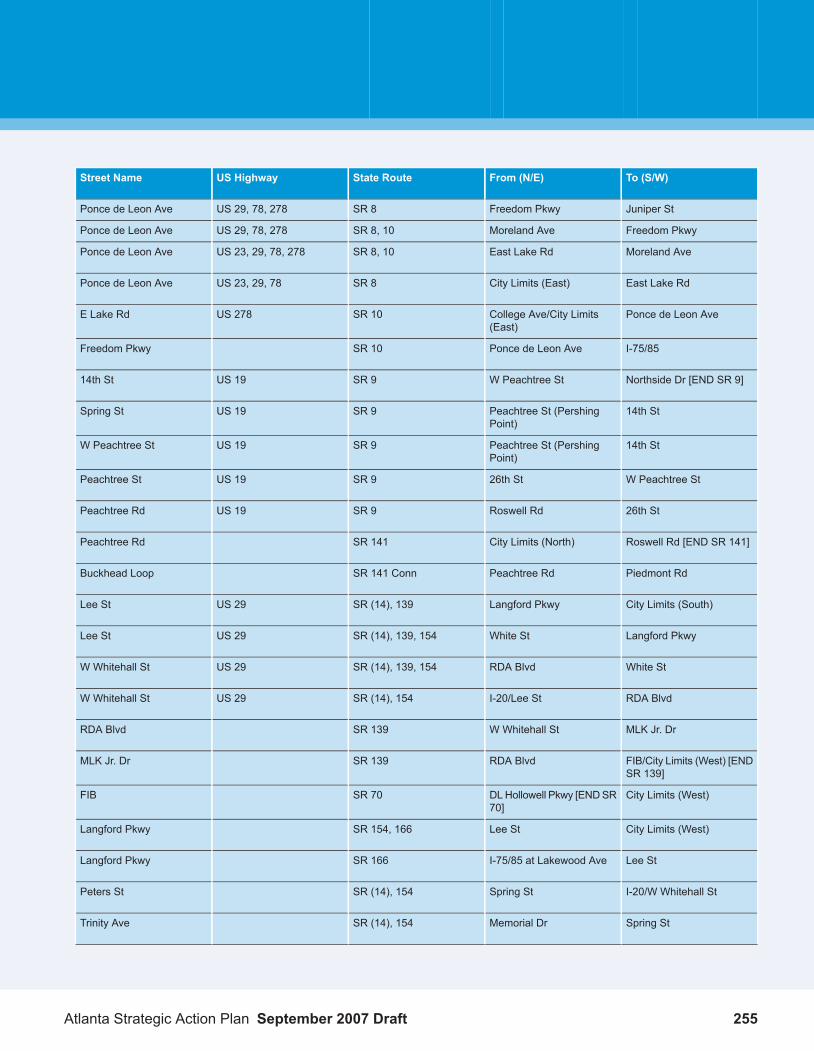
To (S/W)From (N/E)State RouteUS HighwayStreet Name
Juniper StFreedom PkwySR 8US 29, 78, 278Ponce de Leon Ave
Freedom PkwyMoreland AveSR 8, 10US 29, 78, 278Ponce de Leon Ave
Moreland AveEast Lake RdSR 8, 10US 23, 29, 78, 278Ponce de Leon Ave
East Lake RdCity Limits (East)SR 8US 23, 29, 78Ponce de Leon Ave
Ponce de Leon AveCollege Ave/City Limits(East)
SR 10US 278E Lake Rd
I-75/85Ponce de Leon AveSR 10Freedom Pkwy
Northside Dr [END SR 9]W Peachtree StSR 9US 1914th St
14th StPeachtree St (PershingPoint)
SR 9US 19Spring St
14th StPeachtree St (PershingPoint)
SR 9US 19W Peachtree St
W Peachtree St26th StSR 9US 19Peachtree St
26th StRoswell RdSR 9US 19Peachtree Rd
Roswell Rd [END SR 141]City Limits (North)SR 141Peachtree Rd
Piedmont RdPeachtree RdSR 141 ConnBuckhead Loop
City Limits (South)Langford PkwySR (14), 139US 29Lee St
Langford PkwyWhite StSR (14), 139, 154US 29Lee St
White StRDA BlvdSR (14), 139, 154US 29W Whitehall St
RDA BlvdI-20/Lee StSR (14), 154US 29W Whitehall St
MLK Jr. DrW Whitehall StSR 139RDA Blvd
FIB/City Limits (West) [ENDSR 139]
RDA BlvdSR 139MLK Jr. Dr
City Limits (West)DLHollowell Pkwy [ENDSR70]
SR 70FIB
City Limits (West)Lee StSR 154, 166Langford Pkwy
Lee StI-75/85 at Lakewood AveSR 166Langford Pkwy
I-20/W Whitehall StSpring StSR (14), 154Peters St
Spring StMemorial DrSR (14), 154Trinity Ave
255Atlanta Strategic Action Plan September 2007 Draft

To (S/W)From (N/E)State RouteUS HighwayStreet Name
Trinity AveCity Limits (East)SR (14), 154Memorial Dr
Peachtree/W Peachtree[END SR 13]
City Limits (North)SR 13Buford Hwy
City Limits (South)Ponce de Leon AveSR 42US 23Moreland Ave
Ponce de Leon AveCity Limits (North)SR 42Briarcliff Rd
Freedom PkwyMoreland AveSR 42 ConnE Freedom Pkwy
MLK Jr. DrDL Hollowell PkwySR 280HE Holmes Dr
DL Hollowell PkwyCity Limits/ChattahoocheeSR 280James Jackson Pkwy
City Limits (South)McDonough BlvdSR 54Jonesboro Rd
Jonesboro RdMoreland AveSR 42 SpurMcDonough Blvd
University Ave/Hank AaronDr
Jonesboro RdSR 54McDonough Blvd
I-75/85McDonough Blvd/HankAaron Dr
SR 54University Ave
Jonesboro RdMcDonough BlvdSR 54 ConnSawtell Ave
Peachtree RdCheshire Bridge RdSR 236Lindbergh Dr
Cheshire Bridge RdCity Limits (East)SR 236LaVista Rd
Cheshire BridgeRd/Piedmont Cir
Roswell RdSR 237Piedmont Rd
Boulevard/I-20City Limits (East)SR 260Glenwood Ave
Roadway Volumes and Levels of Service
The following map indicates the volume of automobile traffic on each of the City’s roadways classified as“collector” and above (see Map 3.20 ‘Total Daily Roadway Volume’). The data on which the maps are basedare output from the Atlanta Regional Commission’s regional travel demand model, not actual traffic counts.
September 2007 Draft Atlanta Strategic Action Plan256
Community Assessment3

Map 3.20 Total Daily Roadway Volume
257Atlanta Strategic Action Plan September 2007 Draft

September 2007 Draft Atlanta Strategic Action Plan258
Community Assessment3

Map 3.21 City of Atlanta Congestion
The maps depict current (2005) and future (2030) automobile traffic roadway levels of service (LOS) (SeeMap 3.21 ‘City of Atlanta Congestion’). LOS indicates the level of traffic volume on a particular roadway ascompared to its capacity. Capacity is measured in terms of the number of travel lanes provided on a particularroadway segment.
Roadway Level of Service is defined in another “green book,” the Highway Capacity Manual, produced bythe Transportation Research Board (TRB) of the National Academy of Sciences, through the NationalCooperative Highway Research Program (NCHRP), most recently in 2000 (HCM 2000). Generally LOS-Fmeans a V/C ratio greater than 1.0 i.e. with demand volume in excess of facility capacity.
Functional Classification
Differences in function between routes classified as arterial, collector, or local street can be used intransportation planning to prioritize capital projects and also in development review, such as to determinebuilding setbacks or driveway requirements. Every public road in the United States has a designation inthe National Functional Classification (NFC) hierarchy established by FHWA.
Principal arterials carry long distance, through-travel movements, and serve major trip generators,such as airports or regional retail. Principal arterials are interstates and other expressways, importantsurface streets within or state routes between large cities.Minor arterials still emphasize mobility, but they carry shorter trips, and serve lesser trip generators.Arterials are surface streets of medium importance in large cities.Collectors provide more access to property than do the arterials to which they funnel traffic fromresidential areas Collectors are the connecting streets in an urban grid.Local roads primarily provide land access. Residential streets are local streets.
In addition to the above subcategories, functional class designation makes a further distinction betweenrural roads and those that lie along or within an urban/urbanized area boundary as defined in Title 23 of theUnited States Code based on population density. The federal-aid urbanized area boundary for the AtlantaRegion is adjusted subsequent to each decennial census. Up to 35% of statewide road mileage may havean NFC of collector or higher that makes a road eligible for federal-aid, usually under the SurfaceTransportation Program (STP) as a corridor of regional significance. Urban collectors and arterials can bemore densely spaced than rural collectors and arterials.
State DOT’s report standardized usage statistics by functional class that figure into national funding allocationformulas. It should be noted that the City of Atlanta intends to revaluate it current roadway functional classassignments and system in mid-2006.
See Map 3.22 ‘City of Atlanta Roadway Functional Classification’ depicting the functional classification ofeach roadway within the City of Atlanta .
259Atlanta Strategic Action Plan September 2007 Draft

Map 3.22 City of Atlanta Roadway Functional Classification
2. Bridges
September 2007 Draft Atlanta Strategic Action Plan260
Community Assessment3
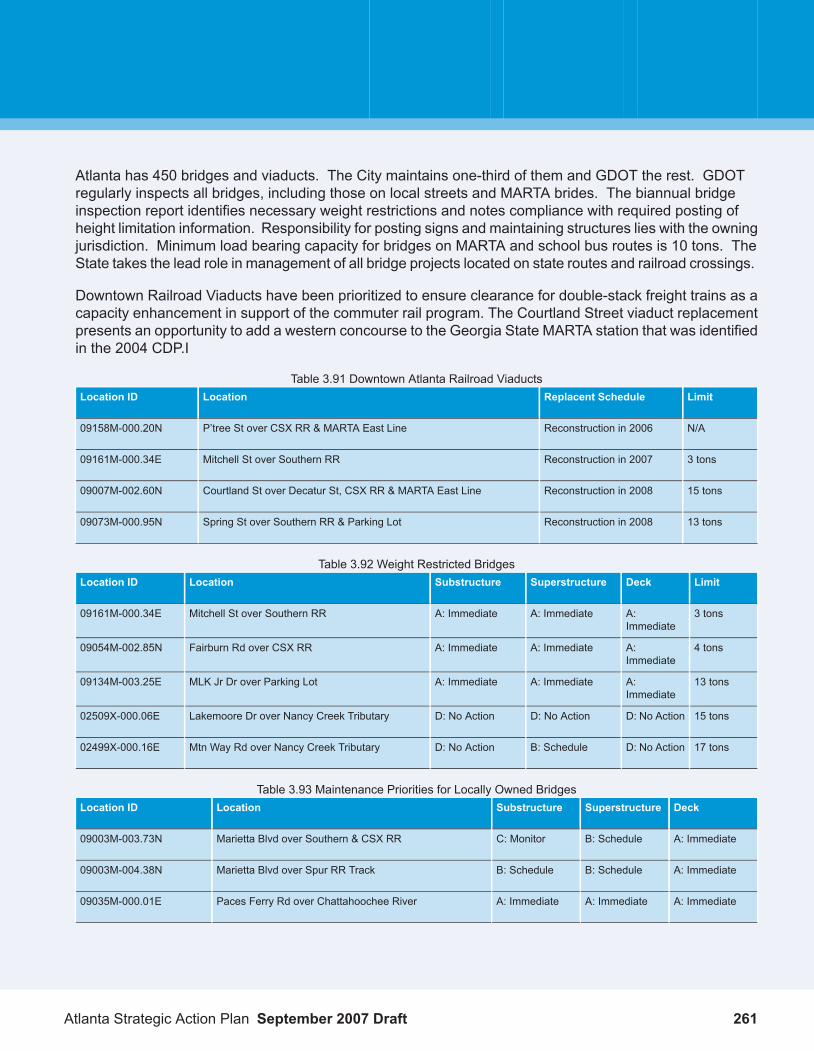
Atlanta has 450 bridges and viaducts. The City maintains one-third of them and GDOT the rest. GDOTregularly inspects all bridges, including those on local streets and MARTA brides. The biannual bridgeinspection report identifies necessary weight restrictions and notes compliance with required posting ofheight limitation information. Responsibility for posting signs and maintaining structures lies with the owningjurisdiction. Minimum load bearing capacity for bridges on MARTA and school bus routes is 10 tons. TheState takes the lead role in management of all bridge projects located on state routes and railroad crossings.
Downtown Railroad Viaducts have been prioritized to ensure clearance for double-stack freight trains as acapacity enhancement in support of the commuter rail program. The Courtland Street viaduct replacementpresents an opportunity to add a western concourse to the Georgia State MARTA station that was identifiedin the 2004 CDP.I
Table 3.91 Downtown Atlanta Railroad ViaductsLimitReplacent ScheduleLocationLocation ID
N/AReconstruction in 2006P’tree St over CSX RR & MARTA East Line09158M-000.20N
3 tonsReconstruction in 2007Mitchell St over Southern RR09161M-000.34E
15 tonsReconstruction in 2008Courtland St over Decatur St, CSX RR & MARTA East Line09007M-002.60N
13 tonsReconstruction in 2008Spring St over Southern RR & Parking Lot09073M-000.95N
Table 3.92 Weight Restricted BridgesLimitDeckSuperstructureSubstructureLocationLocation ID
3 tonsA:Immediate
A: ImmediateA: ImmediateMitchell St over Southern RR09161M-000.34E
4 tonsA:Immediate
A: ImmediateA: ImmediateFairburn Rd over CSX RR09054M-002.85N
13 tonsA:Immediate
A: ImmediateA: ImmediateMLK Jr Dr over Parking Lot09134M-003.25E
15 tonsD: No ActionD: No ActionD: No ActionLakemoore Dr over Nancy Creek Tributary02509X-000.06E
17 tonsD: No ActionB: ScheduleD: No ActionMtn Way Rd over Nancy Creek Tributary02499X-000.16E
Table 3.93 Maintenance Priorities for Locally Owned BridgesDeckSuperstructureSubstructureLocationLocation ID
A: ImmediateB: ScheduleC: MonitorMarietta Blvd over Southern & CSX RR09003M-003.73N
A: ImmediateB: ScheduleB: ScheduleMarietta Blvd over Spur RR Track09003M-004.38N
A: ImmediateA: ImmediateA: ImmediatePaces Ferry Rd over Chattahoochee River09035M-000.01E
261Atlanta Strategic Action Plan September 2007 Draft

DeckSuperstructureSubstructureLocationLocation ID
A: ImmediateA: ImmediateB: ScheduleTechwood Dr over Southern RR & M-916109073M-000.60N
C: MonitorA: ImmediateD: No ActionBrowns Mill Rd over South River09085M-003.11N
D: No ActionD: No ActionA: ImmediateVirginia Ave over Flint River09095M-001.34E
A: ImmediateA: ImmediateB: ScheduleWhitehall St over Spring St09124M-004.60N
A: ImmediateA: ImmediateA: ImmediateMLK Jr Dr over Southern RR & Mangum St09134M-002.92E
A: ImmediateA: ImmediateA: ImmediateMitchell St over Abandoned RR09161M-000.25E
A: ImmediateA: ImmediateA: ImmediateEdgewood Ave over NE Belt Line09184M-001.42E
D: No ActionA: ImmediateB: ScheduleCollier Rd over Peachtree Creek Tributary09205M-000.10E
C: MonitorA: ImmediateD: No ActionPowers Ferry Rd over Nancy Creek09243M-001.04N
A: ImmediateC: MonitorD: No ActionWieuca Rd over Nancy Creek09244M-001.80N
B: ScheduleD: No ActionA: ImmediatePark Dr over NE Belt Line00647X-000.02E
A: ImmediateD: No ActionB: ScheduleMarietta Blvd over CSX RR Spur00716X-000.92S
D: No ActionD: No ActionA: ImmediateKerry Cir over Proctor Creek00747X-000-10S
C: MonitorA: ImmediateD: No ActionPryor St over CSX RR02044X-000.40S
D: No ActionB: ScheduleA: ImmediateAdams Dr over South Utoy Creek02992X-000.66S
The following bridges are closed to vehicular traffic:
Bankhead Ave. over CSX and Southern RR (closed since 1993)Nelson St. over Southern RR and Parking Lot (closed since 1993)
Both of the above bridges have been identified in adopted plans as connections in a network of bicycle andpedestrian facilities. The Bankhead Avenue bridge would link Georgia Tech and Midtown west to theBeltLine. The Castleberry Hill Neighborhood Master Plan seeks to preserve the Nelson Street bridge thatpasses between wings of the historic Norfolk-Southern building downtown (a potential condo conversion)as a non-motorized facility and it could also serve as a possible streetcar link between the western side ofthe MMPT and the Trinity Street government district.
Transportation Modes
1. Bicycle Transportation
September 2007 Draft Atlanta Strategic Action Plan262
Community Assessment3

An inviting environment for non-motorized travel along transportation corridors and on fine-grained blocksin mixed-use nodes is essential to providing land access at the origin and destination ends of every trip. Itis the hallmark of a connected urban fabric and it is fundamental to reducing growth in vehicle miles traveled(VMT). A robust non-motorized transportation network in tandem with additional open space can enhancecommunity life, improve public health, address the current obesity epidemic, improve air quality, lowerhousehold transportation costs, stimulate economic development, and reduce vehicle miles traveled.
Trails
The City of Atlanta Greenway Trail Corridor Plan was developed through a Citywide, volunteer-sponsored,public participation process in 1991-92. The purpose of the Plan was to evaluate and identify future locationsfor parks and multi-use trails. The City and the PATH Foundation published the final plan in October 1992(see Map 3.23 ‘Parks Open Space and Greenway Plan’) .
The Greenway Trail Corridor Plan became part of the larger Atlanta Parks, Open Space, and GreenwaysPlan in 1993 and implementation has continued jointly with the PATH Foundation. The Path Foundationhas been building Greenways Trails throughout the City of Atlanta and the rest of the Atlanta Region sincethe early 1990s. The three mile trail around Chastain park, the Freedom Park trail that connects to its StoneMountain Trail, the Norhwest Atlanta and Peachtree Battle Trail, the West Side and the Lionel Hamptontrail total 15 miles of trails. Path Foundation has an additional 18 miles under development.
263Atlanta Strategic Action Plan September 2007 Draft

September 2007 Draft Atlanta Strategic Action Plan264
Community Assessment3

Map 3.23 Parks Open Space and Greenway Plan
The 1993 Greenway Plan anticipated the trails and transit elements of the Atlanta BeltLine with a two-phased“Cultural Ring” described in its narrative and project lists. The first phase imagined tourist-oriented transitalong a tighter loop of two rail-trails: the Piedmont Trail on the NE BeltLine and the Arts District Trail, whichcombined the NW BeltLine with the Marietta Street rail corridor, where several active freight rail lines runtogether. A second phase added transit to the SE and SW BeltLine corridors alongside the envisionedGrant Park and West End Trails for a transit greenway loop all around the historic railroad Circle Line.
This concept of a Cultural Ring loop concept with transit supportive land use and pedestrian-oriented urbandesign trails has been further refined in the BeltLine Transit Greenway concept. The approval of the BeltLineTax Allocation District Number, in 2005, provides funding with property taxes collected 2006 through 2030for the construction of multi-use trails, transit, parks, and other amenities (see Map 3.24 ‘Beltline ConceptMap’)
265Atlanta Strategic Action Plan September 2007 Draft

Map 3.24 Beltline Concept Map
September 2007 Draft Atlanta Strategic Action Plan266
Community Assessment3

267Atlanta Strategic Action Plan September 2007 Draft

Map 3.25 On Street Bike Plan
On-Street Bike Plan
The Atlanta Commuter On-Street Bike Plan seeks to develop a safe transportation network geared towardmoving commuter cyclists through the City. It was developed in 1995 by the Bureau of Planning and theMayor’s Bicycle Planning Committee, which included representatives from local bicycle organizations,NPU’s, the Department of Public Works, the Georgia DOT, the PATH Foundation, and the Atlanta RegionalCommission (See Map 3.25 ‘On Street Bike Plan’).
The Commuter On-Street Bike Plan calls for designated bicycle routes including bike lanes, bike shoulders,wide curb lanes, and shared travel lanes to be installed on existing streets, some of which may requirewidening the road right-of-way. Currently, there are approximately 11 miles of on street bike lanes.
Table 3.94 On Street Bicycle LanesCommentsProject NameMilesStreet limitStreet Name
Existing bike lane in placeAnsley Park0.7fr Peachtree St to FifteethSt
Peachtree Circle
Existing bike lane (variesfrom 2 to 4 ft)
Collier Drive2.5fr Bolton Rd to HightowerRd
Collier Drive
Sections alreadydesignated as Bike lanes
Downtown Loop0.9fr Argonne Ave to Fowler StFifth Street
Existing 5 ft bike laneEdgewood/McClendon0.2fr Krog St to Euclid AveEdgewood Avenue
Existing 4 ft bike laneHabersham Road1.6fr W. Paces Ferry toPeachtree Battle Ave
Habersham Road
Existing 2 to 5 ft bike lanePaces Ferry Road1.6fr Chattahoochee River toWest Paces Ferry
Paces Ferry Road
Existing bike lane fromPeachtree Rd. to DellwoodDr.
Peachtree Battle Avenue3.2fr Peachtree St to MooresMill Rd
Peachtree Battle Drive
The 1995 Plan also identifies policies, implementation strategies, design standards, and other related bicycleinformation. Preliminary design work including recommendations for alternative routings to maintain continuitywhere proposed links may be found unfeasible was completed in 2005.
The City supports bicycle advocacy organizations such as the Atlanta Bicycle Campaign, Sopo BicycleCooperative, and Georgia Bikes! that promote coordinated planning and safety awareness.
Bikes on Transit
Bicycles are welcome on all MARTA trains at all times. MARTA is the nation’s largest transit agency thathas a universal bicycle access policy. Bicycle racks are provided on all MARTA, Clayton County C-Tran,Cobb Community Transit, and Gwinnett County Transit buses. Bike racks are not provided on GRTA’sover-the-road X-press coaches, which makes it difficult for City residents to use the reverse commute routesthat take passengers to remote park-and-ride lots beyond walking distance of employment opportunities.
September 2007 Draft Atlanta Strategic Action Plan268
Community Assessment3

2. Pedestrian Transportation
The City of Atlanta has an extensive sidewalk network. Connected, continuous, and accessible sidewalkswith fully functional crosswalks can enhance both walking and transit use as viable transportation options.Pedestrian friendly amenities include wide sidewalks, street trees, wayfinding signage, paving material,benches, waste receptacles, pedestrian lighting as well as shelter at transit stops and retail opportunities.Standards in many districts of the zoning code address building and entryway orientation to the street andrequire pedestrian improvements with all new residential and commercial construction projects. The Cityof Atlanta staff works closely with pedestrian advocacy organizations including PEDS.
Following the approval of the 1994 capital improvements bond, in 1996 the City developed a program forthe construction of 140 miles of new sidewalks to address pedestrian safety hazards and to provideconnectivity to activities and transportation facilities. In November of 2000, the voters of the City of Atlantaapproved a referendum for a five-year $150 million “Quality of Life Improvements” General Obligation Bondprogram providing funds to implement almost 1,000 sidewalk, streetscape, crosswalk, activity center, andtraffic calming projects, intersection improvements, and public plazas and greenspace.
Plan for a Walkable Atlanta
In January 2004, Mayor Shirley Franklin appointed 12 community stakeholders to the Walkable AtlantaTask Force, charging members with developing:
1. A clearly articulated vision of what Atlanta will look and feel like when it is a “walkable city” – and thebenefits that residents, commuters, visitors and businesses will receive from a more walkable city.
2. A comprehensive set of policy recommendations dealing with street design, street safety, sidewalkdesign and sidewalk maintenance.
3. Implementation strategies including funding, and a suggested timetable.4. A set of measurements that can be used to gauge progress toward making Atlanta a walkable city.
The Plan for aWalkable Atlanta released on September 14, 2004 presented more than 50 strategies framedaround the following vision:
In Atlanta, walking is a natural part of a vibrant community life that encourages active living andenhances the City’s appeal to residents, businesses and visitors. The pedestrian infrastructureis seamlessly integrated into the transportation system, and the walking experience is inviting,enriching and safe.
Highlighted from the list of strategies were “Long-Term Priority” strategies as well as short-term “Big Wins”for reaching the following five key goals:
1. Adopt transportation principles, street design guidelines andmeasurement tools that encourage walking,cycling and use of public transit, to reduce traffic.
2. Eliminate procedural barriers to a walkable environment by providing adequate staffing, facilitatingcollaboration among City departments and implementing objective and equitable systems for prioritizingprojects.
269Atlanta Strategic Action Plan September 2007 Draft

3. Eliminate physical barriers to a walkable environment by building and maintaining a functional andaesthetically pleasing pedestrian infrastructure.
4. Strengthen and enforce traffic laws that protect pedestrians.5. Improve the relationship between the pedestrian and the built environment by implementing new zoning,
enforcing existing guidelines and encouraging development that provides walkable destinations.
The Plan for a Walkable Atlanta echoes many of the same recommendations provided in 1997 by theAtlanta-Fulton Pedestrian Safety Task Force:
(2004) Discontinue use of automobile-only level of service measures in centers(1997) Expand the Level of Service system beyond motor vehicles(2004) Develop a city-wide pedestrian master plan(1997) Develop a Pedestrian Master Plan(2004) Establish a proactive system for monitoring and repairing sidewalks(1997) Establish a sidewalk maintenance tracking system(2004) Ensure that police officers enforce crosswalk laws and speed limits(1997) Prioritize traffic safety in community policing(2004) Rezone C1, C2, C3 and RG along corridors to NC, MRC and MR districts(1997) Change codes to require sidewalks and streetscapes and encourage walking with pedestrianscale land use
3. Public Transportation
The Metropolitan Atlanta Rapid Transit Authority (MARTA) , the 9th largest transit system in the country,operates 556 buses on 118 local routes totaling 986 route miles, 110 Lift Vans for paratransit and small busroutes, and 338 rail cars between the 38 stations of a 48-mile heavy rail transit (HRT) a.k.a. rapid rail network(See Map 3.26 ‘MARTA Rail Stations’) Created by an act of the General Assembly in 1965 and fundedwith a 1% sales tax following a 1971 referendum successful in the City of Atanta, Fulton and DeKalb Counties,MARTA celebrated 25 years of rapid rail service on June 30, 2004.
TheMARTA rail rapid transit system has stations that directly serve many of the regions largest trip attractors,such as events at the Georgia World Congress Center complex with Philips Arena and the Georgia Dome,jobs and flights at Hartsfield-Jackson Airport, and the major employment/activity centers Buckhead, Midtown,and Downtown. MARTA achieved its daily record of 1.3 million passengers on August 2 during the 1996Centennial Olympic Games. In 2006, MARTA had an average of 451,064 weekday riders and over 138million riders for the year. MARTA bus and rail provides approximately 450,000 unlinked (i.e. one-way)trips and takes as many as 200,000 cars off the roads each day. Fortunately, its trunk line design capacityhas the capability to multiply that patronage number many times. Transit-oriented development aroundstations and system expansion are effective means to boost ridership figures.
September 2007 Draft Atlanta Strategic Action Plan270
Community Assessment3

Map 3.26 MARTA Rail Stations
271Atlanta Strategic Action Plan September 2007 Draft

MARTA, the backbone of the regional transit system, represents a $4 billion public investment net presentvalue ($8 billion replacement cost). MARTA is the only transit agency in the US that does not receive fundingfrom state government. MARTA’s two largest revenue sources are sales tax and fare Revenue. The twocombined make up 86% or $434 million of total revenue. Sales tax provides 67% of MARTA’s total revenueand fare revenue provides 20% of the total. The reliance on sales tax results in a revenue stream thatfluctuates with the economy. Sales tax revenue declined in 2002-2004. As a result, MARTA cut back services.Since the end of 2004, sale tax revenue has been increasing. In the Spring of 2006, Dekalb County andthe City of Atlanta approved extending the 1% sales tax. As authorized by the MARTA Law, a full onepercent sales tax has been extended to 2047 with all three jurisdictions (Atlanta and Dekalb and FultonCounties) having ratified the 12th amendment to the Rapid Transit Contract and Assistance Agreement(RTCAA) in Spring 2007. This agreement extends the full 1% sales tax until 2047 and ½% until 2056. Justas importantly this piece of legislation adds 4 key future planning components - the Beltline, Lindbergh toEmory (Central DeKalb Branch/C-Loop), I-20 East/South DeKalb BRT (Downtown to Mall at StoneCrest)and the West Line (BRT from HE Holmes to FIB and HRT from HE Holmes to I-285 and MLK) to theReferendum System/Engineering Report.
To meet future travel demand, several planning studies have been undertaken by MARTA to identify futureexpansion in key corridors (See Map 3.27 ‘Planned Transit Service’) . Studies in the City of Atlanta include:
West Line CorridorI-20 East Corridor StudyBeltLine Corridor StudyC-Loop Corridor Study
September 2007 Draft Atlanta Strategic Action Plan272
Community Assessment3

Map 3.27 Planned Transit Service
Infill MARTA Stations
273Atlanta Strategic Action Plan September 2007 Draft
Themodern “rail rapid transit” generation of heavy rail transit systems in Atlanta, Toronto, Miami, Washington,and the San Francisco Bay Area combine the direct access to dense employment centers traditionallyprovided by urban “metro” subways with the higher speeds, longer distances between stations, andpark-and-ride features of suburban commuter rail. This compromise system design supports intense nodaldevelopment in rail-served activity centers, but the length of gaps between stations causes discontinuitiesin the urban fabric. Expansion of transit system access through line extensions to suburban destinationshave reinforced the commuter orientation of rapid transit systems constructed in the late 20th century.
As they mature and as their central cities revitalize, two of the rail rapid transit systems comparable toMARTA have already turned to also adding “infill” stations between existing stations on operating lines toexpand access. After initial system construction in the 1960’s Bay Area Rapid Transit (BART) built its firstinfill station in the 1980’s at Montgomery, in an emerging quarter of downtown San Francisco. BART hasstudies underway for infill stations on several of its rapid transit lines. In September 2004, the WashingtonMetropolitan Area Transit Authority (WMATA) opened its first infill station at New York Ave. on the MetroRed Line at its intersection with the Metropolitan Branch Trail bicycle and pedestrian greenway, betweenDC’s Union Station and the Rhode Island Ave. Station.
While their ridership is far lower than that of MARTA’s, other transit services also serve the City of Atlanta.Cobb Community Transit (CCT), Gwinnett County Transit (GCT), and GRTA Xpress provide commuter busservice. Clayton County Transit (C-Tran) serves the airport. As a result of the Region’s population growth,increased traffic congestion, and added service frequency, patronage has risen over the past couple ofyears. Continued increases in ridership are expected. Atlanta is also served by numerous shuttle services.Typically, they are privately funded and serve specialty service areas and riders. Examples include the TechTrolley, The Buc, and the “Free Ride” linking MARTA Arts Center and Atlantic Station.
Transit Planning
Combinedmonetary and travel time costs often make driving more attractive to those travelers with a choicebetween driving and taking transit. For some, transit is the only option available, but for many people andplaces in the region, and for many trip purposes even within the City of Atlanta, transit is no choice at all.Considering this, the City seeks to enhance and expand its network of fixed guide-way and dedicatedright-of-way based systems. Transit vehicles – buses – operating in mixed traffic with stops close togetherare slow and unattractive to users. Inadequate bus service frequency requires a user to rely on a schedulefor most MARTA bus routes.
The City of Atlanta’s top transportation priorities – a transit greenway along the BeltLine and a regionalnetwork of commuter rail followed by intercity passenger service along existing freight rail corridors, centeredon a Multimodal Station located Downtown between Five Points and Philips Arena – do not address alltransit needs, but rather they lay the framework for organizing a network of seamless connections acrossmodes and between activity centers of various scales from neighborhood retail node to the Central BusinessDistrict. Introducing modern streetcar and/or light rail service along a few of City’s major corridors – primarilyPeachtree – is also being considered. Introducing bus rapid transit (BRT) service is a means by which toincrementally evolve the City’s transit network towards the use of modern streetcar and light rail technologies- more attractive and effective transit choices.
September 2007 Draft Atlanta Strategic Action Plan274
Community Assessment3

4. Regional Commuter Rail
The Georgia Department of Transportation released the Metropolitan North Georgia Commuter Rail Planin 1995, which identified three corridors as Phase One priorities (Senoia, Bremen, and Athens), and threePhase Two priorities (Canton, Gainesville, Madison). Upgrading the rail corridor to Macon via Lovejoy andGriffin emerged as a priority in order to create a trunk line for service to South Georgia and Florida in the1997 Intercity Rail Plan. The Georgia Rail Passenger Program (GRPP) divided responsibilities for commuterrail among the Georgia Rail Passenger Authority (GRPA-Operations), GDOT (Construction), GRTA (StationArea Planning) coordinated by a Program Management Team (PMT) in a 1999 Interagency Memorandum.The GRPP established rail service linking Atlanta to Athens and Macon (via Griffin) as implementationpriorities. Construction of the Lovejoy Commuter rail has been stalled over the past few years by the StateLegislature, the GDOT board and funding.
Implementing commuter rail also relies on the construction of the Multi-modal Passenger Terminal (MMPT)in downtown Atlanta. The MMPT is to be situated in an area known as “The Gulch” located immediately tothe west of the Five Points MARTA station. The initial phases of the MMPT include a small terminal building,platforms to accommodate initial rail service, underground connections to the Five Points MARTA station,and a small number of bus bays located at street level.
Implementing passenger commuter and intercity rail on corridors shared with freight trains will require notonly upgrades to the capacity of those tracks, but also a passenger train technology that meets strict FederalRailroad Administration (FRA) requirements for withstanding a collision. As the commuter rail program wasdeveloped through the 1990’s, only locomotives with trailing passenger coaches could meet this requirement.However, FRA-compliant designs of the alternative Diesel Multiple Unit (DMU) transit technology becameavailable in 2003.
The more rapid acceleration characteristics and the more flexible fleet deployment capability offered byDMUs open the opportunity to improve upon the limited peak flow service currently proposed for the commuterrail corridors. One possible application of DMU technology would be a continuous rapid transit alignmentproviding 3-4 or more trains per hour linking Jackson International Terminal’s Automated People Mover atthe Jackson Terminal transportation service center to Atlantic Station and Emory/CDC with connections toMARTA at East Point and Philips Arena, as well as to the BeltLine at Armour and Adair Park/MurphyCrossing.
5. Passenger Rail
Currently there remains only a single intercity passenger rail route with a stop in Atlanta – at the BrookwoodStation on Peachtree Street north of Pershing Point – from the rich heritage of train connections thatconverged on the elegant downtown train stations, the east-west oriented Union Station and the north-southoriented Terminal Station, and which established Atlanta as the transportation hub for the Southeast in the19th and early 20th centuries. Amtrak trains 19 and 20 provide daily service once each way through Atlantabetween New Orleans and New York along the route of the “Southern Crescent.”
275Atlanta Strategic Action Plan September 2007 Draft

Fast passenger trains linking airports and major cities with relatively few stops in between will be a growingcomponent of an interconnected transportation network carrying business and leisure travelers betweenurban centers. As demonstrated in the Northeast Corridor of the US, rail travel is particularly competitivefor medium-haul trips of a few hundred miles that are increasingly uneconomic for airlines to provide. Atlantais well positioned to resume a central role in a network of high speed and other intercity passenger railsharing existing corridors with commuter and freight trains.
Investment in the capacity of common carrier railroad lines that now carry freight trains can create economiesof scale because different classes of passenger trains – local, regional, express, intercity, and high-speedrail – can share the same corridors through scheduling, unlike roads where separate facilities are neededfor each functional class. Investments in existing freight railroad rights-of-way can support passenger trainsof up to 79 mph without affecting the equipment used on freight trains sharing the tracks. Upgrading freightrail operations to world-class, real-time signaling and dispatching systems would enable passenger trainsto travel safely on a shared network at the much higher speeds that can be achieved by the high-speedAccelerail family of train technologies. Superelevation – raising the track a few inches on the outside of acurve – increases passenger comfort at high-speeds, but can be dangerous for slow-moving freight trains,so one recent engineering approach gets the needed tilt movement from the body of the trains instead ofthe tracks.
Although, there are no funding programs to support rail infrastructure for intercity passenger servicecomparable to the federal support available for air traffic and interstates, states have petitioned Congressto designate multi-state High Speed Rail corridors in anticipation of a future dedicated funding program fortrain routes that promise to relieve growing congestion on highways and airways. High-speed rail corridordesignation can help advance projects such as separations of at-grade road crossings and serves to focuspublic and private rail planning efforts. HSR corridor study efforts have been financed by economicdevelopment organizations along each route.
West of Atlantic Station, the Amtrak Crescent train passes through Bremen, Anniston and Birmingham alongthe Norfolk-Southern (NS) line that has been designated a segment of the Gulf Coast High Speed Rail(GCHSR) Corridor. East through Armour Yard, Amtrak follows part of the South East High Speed Rail(SEHSR) Corridor along the NS line to Gainesville, Greenville, Charlotte and Greensboro. Another part ofthe SEHSR Corridor follows the NS line to Lovejoy, Griffin, and Macon proposed in the Georgia RailPassenger Program (GRPP) for both commuter rail and intercity rail to Savannah and Florida. In October2004, Georgia Rail Consultants released promising passenger projections and cost estimates for scenariosof 2 to 6 daily trains on the SEHSR between Charlotte, NC and Macon, GA.
Notably absent from the trellis of designated High Speed Rail corridors is the spoke northwest from theAtlanta hub toward Chattanooga and Nashville. CSX leases the state-owned Western & Atlantic rail linethrough Marietta and Cartersville that was the favored alignment for train service through Atlanta betweenChicago and Miami considered in the early 1990’s. However, the NS line through Austell and Rome offersan alternative route with fewer curves for a high speed rail corridor to the northwest of Atlanta that couldserve existing communities instead of bypassing them with construction of a new rail line along a highway.
September 2007 Draft Atlanta Strategic Action Plan276
Community Assessment3

In the late 1990’s the Federal Railroad Administration (FRA) sponsored a multi-city competition to select aproject to demonstrate the commercial viability of magnetic levitation, a train technology that travels over200 mph on an exclusive purpose-built guideway. ARC proposed a maglev project alignment following theI-75 North interstate. The capital cost estimated for the H-JAIA to Chattanooga Airport proposal that wasa runner-up in the FRA contest would build all seven trunk lines of the commuter rail program and the firstphases of the GRPP’s intercity lines.
6. Intercity Bus Service
Greyhound buses connect the City of Atlanta with other cities in Georgia and with surrounding states. Sevenbus lines that radiate in all directions. The main Greyhound bus terminal is located in a temporary facilityin Downtown Atlanta that was built in 1996. Greyhound is interested in relocating to a permanent facility ator near the proposed multi-modal station.
Parking
1. Parking
Although the City is working to create a more pedestrian-oriented environment and encourage alternativemodes of transit, parking remains an essential element of an economically vibrant area. The City of Atlantacurrently provides for off-street parking permits, temporary parking permits, and review of the consistencyof parking facilities with code requirements as part of development review for compliance with the City’sZoning Ordinance. Even as efforts to support alternatives to Single Occupancy Vehicle (SOV) travel moveforward, parking will continue to be a major component of most new development.
Conventional zoning which covers most of the City’s land area prioritizes vehicle storage and circulation tothe detriment of the pedestrian environment with parking lots separating buildings from the street andminimum parking standards that require each development to provide the capacity for peak demandinternally.
The progressive Special Public Interest (SPI) and Quality of Life Zoning (QOL) districts restore pedestriansto prominence in the public realm along street frontages and mitigate the negative impacts of parking . Thisis accomplished by moving parking behind street-front buildings or into structures shared amongcomplementary uses to reduce the number of spaces left unused for large parts of the day.The SPI andQOL zoning districts also have the benefit of placing maximum limitations on the number of parking spacesthat may be provided for a particular development; a practice preferable to the traditional approach ofmandating minimum parking space requirements for an urban setting. Road access and parking availabilityare tools that can be used to shape quality urban development. Shared parking arrangements betweenprivate land owners and parking structures accessible to the public can limit the amount of space devotedto parking that sits empty most of the day.
MARTA Stations in the City of Atlanta that provide park-and-ride lots include West End, Oakland City, andLakewood on the South Line; Vine City, Ashby, West Lake, and H. E. Holmes on the West Line; Lindberghand Lenox on the North Line; and Inman Park, Candler Park, and East Lake on the East Line. The Greenbriar
277Atlanta Strategic Action Plan September 2007 Draft

park-and-ride lot also serves as a transfer point between several local and express MARTA bus routes inSouthwest Atlanta. MARTA Stations do not provide patron parking in the Buckhead, Midtown, and Downtownbusiness districts, or at the Airport.
In Special Public Interest (SPI) zoning districts 1, 2, and 13 Downtown, there are currently no parkingminimum or maximum requirements for commercial development around the Five Points, Arena, Garnett,Georgia State, Peachtree Center, Civic Center, and North Avenue stations. In SPI-20 around GreenbriarMall (a potential MARTA extension), SPI-11 around the Vine City and Ashby Stations, SPI-16 around theMidtown and Arts Center stations, and SPI-15 at Lindbergh, a parking maximum of 2.5 spaces may beincluded in a development for every 1,000 square feet of office space.
SPI-12 around the Buckhead and Lenox stations overlays the underlying zoning of each parcel that dictatesminimum parking requirements with a parking maximum of 2.75 spaces per 1,000 square feet of office.SPI-7 addresses the Candler Park neighborhood rather than the MARTA station. SPI districts affecting theWest End (SPI-21) and King Memorial (SPI-22) station areas were adopted in 2005.
Even in SPI districts, the rules typically require developers in Atlanta to provide one parking space perbedroom in residential developments. By comparison, Portland allows only 6 parking spaces for every 10residential units. As an incentive to reduce car ownership and to underscore the full cost of parking, SanFrancisco prohibits multifamily housing from bundling parking spaces with residential units, requiring aseparate monthly fee to be charged for each space.
As the core areas of the City develop, parking will become more expensive while the number of surfacelots declines and the demand for parking increases. In 2000, the Downtown TMA found approximately 300parking facilities with 78,000 spaces, of which half are open to the general public, within the area boundedby North Avenue, Boulevard, I-20, and Northside Drive.
The future of parking Downtown is being studied by Central Atlanta Progress (CAP). A Downtown ParkingManagement Study (TIP project AT-223) is programmed for $175,000 in FY 2006 with 80% federal fundsfrom the Congestion Mitigation and Air Quality (CMAQ) program matched by 20% from CAP and the TMA.The Downtown Parking Management Study is expected to explore the feasibility of a municipal parkingauthority that might own and operate shared, public-use parking structures. Municipal parking structuresmay also be appropriate in neighborhood commercial districts in addition to the core business areas.
The Midtown Alliance addressed policies, location, design, and ratios of parking in structures with theBlueprint Midtown plan completed in 1997. The Midtown Parking and Transit Plan of December 2000identified 42,000 spaces in structures, another 1,800 on-street parking spaces, and up to 2,000 spaces inaccessory parking lots. The plan recommended implementation of on-street parking with meters to stimulateturnover during the day and discourage on-street commuter parking. Demand was forecast to surpassparking supply in Midtown after 2010.
2. Parking Meter Program
September 2007 Draft Atlanta Strategic Action Plan278
Community Assessment3

On-street parking provides convenient access to business appointments and to street-level retail thatenhances the urban environment, but it is generally inappropriate for all-day commuter parking in activitycenters. Metered, on street parking is provided in certain retail and commercial areas of the City in order toincentivize turnover of the spaces. This frequent turnover acts to support ground level retail establishmentsfronting the City commercial corridors and areas.
The Quality of Life Bond program funded the recent installation of several hundred parking meters on streetsin commercial and mixed-use areas. Parking meter rates were set at $2 per hour by the Atlanta City Council,and are payable in coin, citywide. It may be appropriate to consider a differentiated fee schedule thatestablishes lower parking meter rates on neighborhood commercial streets to support street level retaildistricts.
While the City recently made a significant investment in its parking meters, continued upgrading of thisinfrastructure is imperative. The technology selected for Atlanta’s current parking meter program does notallow payment by credit card or any medium other than silver money. Regional smart card initiatives presentan opportunity to expand on-street parking customer options in the future. MARTA is installing the BreezeCard integrated transit pass system through 2006 and the SRTA is exploring ways that its Cruise Cardprogram can evolve into a consolidated transportation service payment instrument for transit, tolls, andparking.
3. Potential Municipal Parking Authority
A downtown focused Public Parking Authority Function Feasibility Study, completed in 1995, consideredmunicipal parking decks as a marketing tool for stimulating economic development, as a policy tool for theCity to assert control over parking issues, and as a potential revenue source. The feasibility study madethe following recommendations.
The Downtown Development Authority (now a part of ADA) should assume the functions andresponsibilities of a special-purpose parking authority, including.
Own parking facilities through acquisition or constructionContract with private firms for servicesIssue bonds and obtain other financingPromote Minority & Female Business Enterprises (MBE & FBE)
A City Parking Advisory Committee composed entirely of City personnel should be appointed to establishparking policies and make recommendations to the DDA regarding their implementation.An advisory Downtown Parking Commission including City staff and business/civic representativesshould be appointed to make recommendations regarding parking policies and issues.
Georgia Law governing the authority to develop, acquire and operate municipal parking facilities is addressedin Title 36 Chapters 42, 43, 44, and 61.
If restricted from the general fund, revenue generated from municipal parking operations in excess ofconstruction debt service and operations costs could also be targeted toward accelerating streetscapeimprovements and creating a local circulator transit system.
279Atlanta Strategic Action Plan September 2007 Draft
Railroads, Trucking, Port Facilities and Airports
Introduction
Trucks, trains, and aircraft keep goods and people moving through Atlanta’s economy. Cargo transportincludes truck and tractor-trailers belonging to national, long haul freight carriers, freight forwarders,independent haulers, and courier/ mail services. Freight warehousing, transshipment between markets,and delivery for local consumption all support thousands of regional jobs. The net effect on manufacturers,freight forwarders, trucking companies, customs agents, etc. of each additional ton of international cargogoing through Hartsfield-Jackson is another job in the local economy. Although, trains still offer the betterdeal for commodity long hauls, growth in heavy truck traffic continues to outpace rail volumes.
The New Century Economic Development Plan adopted by the Atlanta Development Authority in December2004, identifies transportation, logistics, and distribution as one of four target industries with the greatestpotential for job creation. Freight logistics and air passenger transportation employed more than 60,000 in2001. The Atlanta Logistics Innovation Council organized by the Metro Atlanta Chamber of Commerceseeks to increase regional logistics industry jobs from 84,000 to 100,000 by 2010, to increase domestic andinternational air cargo, and to establish a global center of excellence for innovation in logistics with theplanned Transportation Research Center at Georgia Tech.
1. Railroads
The City of Atlanta started and grew around the railroads. It has an extensive rail network that plays a majorrole in the movement of freight through out the City, Region and State (see Map 3.28 ‘Rail Road Lines andYards’). General merchandise trains, unit trains carrying freight and intermodal trains with containers andtrailers move thru the system. The City of Atlanta is served by two private railroads: CSX and NorfolkSouthern. Both companies operate large intermodal facilities inside the City which were integral to thestreamlining of operations through the 1990’s that led to abandoning some of the Belt Lines around Downtownand Midtown. CSX Transportation (CSXT) and Norfolk Southern (NS) operate rail yards in the City of Atlanta.The yards are used to disconnect and connect trains for local delivery and pick up and to hold loaded andempty trains and cars, among other uses.
CSXT operates Tilford Yard and Howells Yard. Tilford Yard handles more than 40 trains per day. HowellsYard, a bulk terminal in the Chattahoochee Industrial district, transfers bulk goods to trucks for localdistribution. It also receives coal trains for Georgia Power. CSX Intermodal operates Hulsey Yard a"piggyback" rail to truck transfer facility in Cabbagetown. Hulsey Yard, which ranks 7th in terms of freightvolume for CSX, handles more than 500 trucks and 16 trains per day. It is operated in conjunction with theCSX terminal in Fairburn.
Norfolk Southern operates Inman Yard, an intermodal facility in the Chattahoochee Industrial district andArmour yard. Inman Yard is the largest of the company’s 33 intermodal yards. Norfolk Southern trainsexchange containers and trailers with trucks at the intermodal Inman Yard in Northwest Atlanta. A majorNS train classification facility is located in Austell. Between 80-110 trains a day move through NorfolkSouthern’s Atlanta yards. Norfolk Southern also operates the Pegram Yard between Mechanicsville andPittsburg neighborhoods in the Intown South study area.
September 2007 Draft Atlanta Strategic Action Plan280
Community Assessment3

Map 3.28 Rail Road Lines and Yards
2. Aviation
281Atlanta Strategic Action Plan September 2007 Draft

The Hartsfield-Jackson Atlanta International Airport (H-JAIA),"the world’s busiest passenger airport", is oneof the main economic engines of the Atlanta Region. H-JAIA, with two outer runways that typically handlearrivals, two inner runways for departures, and a midfield terminal complex now with 176 gates, containedwithin a 3,750 acre footprint is the result of a 1966 airport master plan. The central passenger terminalcomplex includes about 31,000 public parking spaces, the 1.2 million sq ft landside terminal, and 3.7 millionsq ft of concourses T, A, B, C, D, and E-International.
The Atlanta airport marked 75 years since its 1925 beginnings as a dirt racetrack with a new Master Planin 2000, to be the largest public works project in Georgia history at an estimated cost over $6 billion. In the1970’s, the City of Atlanta pursued a multi-pronged strategy to secure future airport expansion optionsincluding both planning for on-site expansion contingent on adding a fifth runway and exurban landacquisitions for a potential second airport. Pursuing the former has increased the size of the airport to just4,700 acres (1,518 hectares), still tiny in comparison with other airports such as Dallas-Ft. Worth that has18,000 acres.
The Hartsfield-Jackson Development Plan (H-JDP) provides sufficient aviation capacity to meet forecastdemand through 2020. Should air travel demand someday require a second airport, the City-owned propertyin Paulding County could be integrated with an intercity rail line, whereas the land bought in Dawson Countyand found environmentally unsuitable for airport use is a potential inter-jurisdictional Transfer of DevelopmentRights (TDR) sending area.
H-JAIA has been the world’s busiest airport every year since 1998 and since 2005 the busiest for both thenumber of flights and passenger, surpassing 80 million passengers enplaned in 2000 – ten million morethan Chicago O’Hare. It had 976,446 take-offs and landings and 85 million passengers in 2006, and morethan 120 million anticipated in 2017. Daily aircraft operations are expected to rise from a 1995 baseline of2,066 to more than 3,400 by 2015. With 976,447 take-offs and landings in 2006. Atlanta is directly linkedby air to more than 30 countries and to over 200 cities, by the 32 airlines serving domestic and internationalpassengers and 16 airlines transporting cargo.
The passenger terminal complex measures 130 acres (52.6 hectares), or 5.7 million square feet. TheComplex includes the Terminal Building, Concourses T, A, B, C, D, and E. Within these Concourses are148 domestic and 28 international gates. International Concourse E opened in 1994 with Federal InspectionService capacity to process 6,000 arriving international passengers per hour.
The 900,000 sq ft transportation mall that connects all concourses with the terminal houses a very efficientunderground, automated people mover (APM) consisting of eight 4-car rubber-tired trains operating on a3.5-mile loop guideway. This $163 million “sterile” APM that stays within the secure parts of the airport hasa capacity of 128,000 passengers per hour.
Ground Transportation
September 2007 Draft Atlanta Strategic Action Plan282
Community Assessment3

The Airport is well served by ground transportation infrastructure. It is located immediately adjacent to threeInterstate Highways (75, 85, and 285) and heavy rail transit service connects directly to the main terminal.The Metropolitan Atlanta Rapid Transit Authority (MARTA) Airport rail station is located on the west-end ofthe terminal building between the north and south baggage claim areas. The Clayton County transit system(C-Tran) provides frequent bus service.
Thirty Airport shuttle services offer door-to-door reservations for transportation covering the AtlantaMetropolitan Area and bordering states. Vans carrying 7 to 10 passengers depart every 15 minutes.Hartsfield-Jackson taxi stand is located within the Ground Transportation Center. Hartsfield-Jackson Airporthas 11 rental car companies with free shuttle service to and from the Airport.
Hartsfield-Jackson AIA Development Program
In the coming years, H-JAIA will give its current facilities a face-lift as well as construct additional facilitiesto accommodate growing traffic demands and provide its passengers with a world class traveling experience.This program will assure that Hartsfield-Jackson maintains its global leadership role. The future plans areidentified in its 2000 Master Plan.
To define a new vision for Hartsfield-Jackson through 2015 and beyond, a new Master Plan was developedas a "working document" to meet future air travel growth and remain compliant with the aviation industry,taking into consideration the Airport's impact on the environment and the economy of the surroundingcommunities and the southeastern region. Created to respond to changing market conditions and globalopportunities, the Master Plan's flexibility allows H-JAIA to identify critical needs and respond quickly to thedemands of the growing aviation industry.
The Master Plan, now in implementation as the Hartsfield-Jackson Development Plan (H-JDP), identifiesseveral key projects, which are:
Fifth Runway over I-285Maynard Holbrook Jackson International TerminalConsolidated Rent-a-Car (CONRAC) facility west of I-85Automated People Mover systemCentral Passenger Terminal Complex renovations at existing terminalSouth Passenger Complex – new gates south of existing terminalAirfield ImprovementsSupport Facilities
Runway 10/28 (Fifth Runway): In order to meet the increased demand for air travel and reduce currentdelays, the need to build the new 9,000 foot Fifth Runway (Runway 10/28) was identified and it becameparamount that construction be completed as soon as practical. The $1.28 billion runway started operationsin May 2006.
283Atlanta Strategic Action Plan September 2007 Draft

Maynard Holbrook Jackson, Jr. International Terminal (MHJIT) – "Atlanta’s global gateway to the world:The expansion of Concourse E and the construction of the Maynard Holbrook Jackson (East International)Terminal will add international gates, check-in counters, parking, expand the transportation system to accessthe terminal. Enhanced international passenger customer service
Consolidated Rental Agency Complex (CONRAC): The new $480 million Consolidated Rental Car Facility(CONRAC) will be located south of Camp Creek Parkway and west of Interstate 85. The facility willaccommodate the ten rental car companies (with room for expansion in the future) and will provide forapproximately 8,700 ready and return spaces. Additionally, this project will include accommodations forcustomer service centers, storage and minor maintenance areas, wash lane facilities and vehicle fuelingpositions to support the quick turn around operation used by the rental car agencies.
Automated People Mover (APM) System: To accommodate passengers to and from the Central PassengerTerminal Complex (CPTC) and the new CONRAC Facility, a new Automated People Mover System (APM)will be built. This APM will be similar to the one already in operation at the Airport. The APM track will beelevated over I-85 and U.S. Hwy 29 and will have three stops including one near the Georgia InternationalConvention Center. A new four-lane airport access road will connect the airport roadway system to theCONRAC Facility. This roadway provides the vehicular access and egress to the facility. The roadway willinclude a vehicular bridge that will cross Interstate 85, U.S. Hwy 29, CSX Railroad and the MARTA tracks.
Central Passenger Terminal Complex (CPTC): The Central Passenger Terminal Complex will undergo $500million of enhancements. This will include: upgrades to curbside services, security checkpoints, ticketcounters, interior finishes, concessions, baggage, make-up facilities, baggage claim areas, verticaltransportation, moving sidewalks and expansion of existing concourses.
South Passenger Complex: A new complex with 29 domestic gates will be built south of the existing airfieldto accommodate expected demand by 2012.
Other Airfield Improvements: The plan features approximately $400 million in other airfield improvements.Include: a runway extension to accommodate international flights, and construction of taxiways .
Support Facilities: Expansion of support facilities such as flight kitchens, ground service equipmentmaintenance facilities, airport support facilities, aircraft maintenance, and cargo facilities will be needed asairport operations increase. Support facilities will be constructed based on demand throughout the 2000-2015timeframe at an approximate cost of $637 million.
Future and Potential Airport Transit Access
On the east side of the airport, right-of-way for an Automated People Mover (APM) has been preservedalong the former Aviation Boulevard that will link Jackson Terminal across I-75 to the Norfolk-Southern “S”Line that diverges from CSX and the MARTA South Line at East Point. That rail corridor forms the routeof GDOT’s Lovejoy-Macon commuter rail line and has been suggested as the route of a MARTA heavy railbranch or “regional rail” service.
September 2007 Draft Atlanta Strategic Action Plan284
Community Assessment3

On the west side of the airport, an extension of the existing MARTA South Line from its current AirportStation terminus at the Central Passenger Terminal Complex to the planned South Gate Complex wasoriginally considered in fiscally unconstrained drafts of the latest Regional Transportation Plan (RTP), butwas ultimately eliminated from the Mobility 2030 RTP adopted by the Atlanta Regional Commission inDecember 2004.
An Automated People Mover (APM) is being designed to connect the existing terminal to a new ConsolidatedRent-A-Car (CONRAC) facility in College Park. This APM crosses I-85 and a CSX rail corridor that hasbeen considered by GDOT for commuter rail service to Senoia via Peachtree City and intercity rail serviceto Montgomery via Newnan. The Georgia Rail Passenger Program identifies commuter rail stationopportunities adjacent to both the College Park and East Point MARTA stations on this line. Adding atransfer station on the APM could provide a relocation opportunity for the College Park commuter rail stationsite that would improve access to CONRAC.
3. Air Cargo
H-JAIA has three main air cargo complexes: North, Midfield, South, and a Perishables Complex with a totalon-airport air cargo warehouse space measures two million square feet. Cargo processed atHartsfield-Jackson Atlanta International Airport (H-JAIA) grew from 317,000 metric tons in 1995 to 738,180metric tons in 2006, making Atlanta 10th in the nation for airfreight shipments. The international cargocomponent captured most of the growth, increasing from 86,000 metric tons in 1995 to 390,000 metric tonsin 2006. At 46 cents per 1,000 pounds of landed weight, Hartsfield-Jackson has the country’s lowest landingfees out of 479 commercial airports. The $30 million South Cargo facility built in 1999 has room for nine747’s at once and 1.5 million square feet of cargo warehouse space gives Atlanta an edge over traditionalinternational gateway airports Chicago-O’Hare, New York-JFK, and Miami.
Delta Air Lines and FedEx account for more than half of Atlanta’s air cargo and Korean Air and UPS eachaccount for about 5%. H-JAIA is served by 16 cargo only carriers. China’s Cathay Pacific introduced threedirect cargo flights weekly between Atlanta and Hong Kong in 2005. In February 2005Mayor Shirley Franklinand Aviation General Manager Ben DeCosta kicked off the 10-year Cargo Master Plan for Hartsfield-JacksonAtlanta International Airport to attract more carriers and allow H-JAIA to become a top-five national cargoairport and an international center in the logistics industry.
The City is determined to maximize Hartsfield-Jackson as a major air cargo facility while maintainingcompatibility with surrounding communities. Trucks and tractor-trailers of national long-haul freight carriers,freight forwarders, independent haulers, and couriers need dependable surface access to the airport includingdedicated truck routes. Truck terminals should be sited in environmentally acceptable locations such asnear highway interchanges or in the Hartsfield-Jackson noise zone.
4. Trucking
Numerous trucking firms serve the City of Atlanta, including some with terminals inside the City limits. TheDepartment of Public Works exercises regulatory control over truck loading and routing. The challengesof accommodating trucks include providing wide-radius intersections at appropriate locations andmaintaining
285Atlanta Strategic Action Plan September 2007 Draft

durable pavements under heavy loads. In 2004, intersections with large volumes of heavy trucks wereidentified and have been prioritized for the replacement of broken traffic signal loop detectors with video orinfrared vehicle detection for traffic signal control.
Industrial development has been targeted in the purpose-built Atlanta Industrial Park on D. L. HollowellParkway (formerly Bankhead Highway) at I-285 and Southside Industrial Park east of the airport. NorthwestAtlanta’s transportation and warehousing driven Marietta Boulevard and Chattahoochee/Ellsworth industrialdistricts provide a large employment base in the area around the rail yards.
The Atlanta Regional Commission (ARC) convenes amonthly Freight Advisory Task Force of freight planningstakeholders in government and industry that has been meeting since 2003. At the end of 2005 ARClaunched a comprehensive regional freight study that will inventory and assess regional goods movementneeds.
The Georgia State Road and Tollway Authority (SRTA) operates State Route 400, the only existing toll roadin Georgia. In June 2004 SRTA launched a High Occupancy Toll (HOT) Lanes and Truck Only Toll (TOT)Facilities Study (the “HOT and TOT Study”) to assess the ability of these concepts to relieve congestion,enhance safety, and improve efficiency on metro Atlanta’s road. Facilities restricted to commercial vehiclesare currently operational in Boston and New Orleans.
The 2004 Bolton Moores Mill LCI Supplemental Traffic and Circulation Study recommends truck accessimprovement from the northwest Atlanta rail yards (Inman and Tilford) to I-285 to relieve truck congestionon community streets. Activity center and corridor studies present opportunities to consider the impacts oftruck routes on neighborhoods and to re-evaluate truck route designations.
Transportation and Land Use Connection
The sprawling development pattern of the Atlanta region has resulted in a mismatch between transportationand land use; this has impacted the City of Atlanta itself by creating traffic congestion where the intensityof land use has outgrown the transportation system in some areas while leaving underutilized transportationfacilities in other areas.
The City of Atlanta experiences significant traffic congestion at a number of locations. Most of the significantcongestion occurs north of downtown in this includes areas such as Midtown and Buckhead. Congestionimpacts highways such as I-75, I-85 and Georgia 400 as well as a number of arterial roadways includingPeachtree Street/Road, West Peachtree Street, Northside Drive, Piedmont Road, Lindbergh Drive andLaVista and Briarcliff Roads. Much of the congestion occurs in areas of high employment; the majority ofworkers in these areas drive alone to work from other parts of the region, commuters from outside of Atlantahold three out of five jobs in the city. At the same time, some areas served by transit do not have highenough density to sustain high ridership. The largely industrial area of the city to the northwest of downtownaround Huff Road, Howell Mill Road and Marietta Boulevard also experiences significant congestion as thearea has seen significant redevelopment from industrial to high density residential and mixed use projectswithout any comparable increase in road capacity. Parts of southwest Atlanta don’t have an extensive streetnetwork to support recent increase in development.
September 2007 Draft Atlanta Strategic Action Plan286
Community Assessment3

The existing land use pattern favors the automobile over mass transit and pedestrian and bicycle facilities.Land use and zoning ordinances that encouraged the separation of different land uses have contributed byprioritizing the circulation and parking of vehicles with negative impacts for pedestrians and bicyclists. Thelack of connectivity in the street network in some parts of the city has also contributed to congestion. Theongoing sprawl in the region favors the reliance on single occupancy vehicles, increases commuting distancesand results in large amounts of land being used for roadways and parking. In the core business areas thereare many surface parking lots and a lack of shared use parking structures. These problems are reinforcedby zoning requirements for minimum parking standards for each development project.
The city has embraced two principles for improving transportation and land use integration: Focusingtransportation investment (especially transit) on links between high density land uses and focusing highdensity land use in centers and corridors with transit, pedestrian, and bicycle transportation capacity.
The use of Special Public Interest (SPI) and Quality of Life (QOL) districts in zoning is an attempt to reduceparking and make neighborhoods more pedestrian oriented. In these districts, there are maximum parkingrequirements as opposed to the minimum parking standards outlined above. Land uses that encourage amore compact urban form will help to reduce vehicle miles traveled and could also contribute to reducingcongestion. In the Mixed Residential Commercial (MRC) district; regulations encourage new developmentsto provide a grid of connected streets to improve the street network and reduce congestion.
Transportation Planning
1. Planning and Implementation of Transportation Projects
The Department of Public Works (DPW) has primary responsibility for implementation of City-sponsoredand City funded transportation projects through the Office of Transportation, while the Georgia Departmentof Transportation (GDOT) in coordination with the City, manages projects on state routes, including Interstatesand the National Highway System (NHS), and those utilizing federal funding sources.
For City of Atlanta transportation projects Public Works and the Department of Planning & CommunityDevelopment (DPCD) share responsibility for programming, which is the process of evaluating and prioritizingprojects, estimating costs, identifying funding, and scheduling the implementation (design and construction)phases. Many transportation projects originate from nominations by City Council, NPU’s, and neighborhoodsor as concepts identified through Livable Centers Initiative studies and corridor studies.
The Atlanta Regional Commission (ARC) as the official Metropolitan Planning Organization (MPO) producesa Regional Transportation Plan (RTP) listing 25 years of projects that can be afforded with anticipatedfunding within the Region’s motor vehicle emissions budget. Project implementation phases by fiscal yearare listed for the current and next five years in the Transportation Improvement Program (TIP) accordingto the various project eligibility and local matching requirements of multiple federal funding programs. TheARC Board adopted the Mobility 2030 RTP including the FY 2005-2010 TIP in December 2004 and updatedthat TIP in June 2005. ARC expects to adopt the FY 2006 – 2011 TIP in February 2005.
287Atlanta Strategic Action Plan September 2007 Draft

Projects that include funding through Federal-Aid or State-Aid must follow the Georgia DOT’s PlanDevelopment Process (PDP), which outlines the reviews and document approvals needed at each stepfrom concept report and alternatives evaluation through construction contract award. Project Managementincludes development of a series of increasingly detailed designs, right-of-way plans, construction plans,and bid documents. Whether the local government sponsor will assume lead responsibility for design,construction, or the entire project is established in each Project Management Agreement (PMA) with theDOT.
The National Environmental Policy Act of 1969 (NEPA) requires a public involvement process and approvalof a final environmental document for projects involving federal funds. The PDP requires that the CategoricalExclusion (CE), Finding of No Significant Impact (FONSI), or Record of Decision (ROD) on a FinalEnvironmental Impact Statement (FEIS) or equivalent GEPA documentation be approved before completingfinal plans.
Capital projects in study areas designated under the ARC’s Livable Centers Initiative are eligible for LCIimplementation funding. The City of Atlanta also applies for federal funding for large projects where theadded value of leveraged matching funds is expected to outweigh the administrative burden added by thePDP.
GDOT maintains a six-year Construction Work Program (CWP) of projects scheduled in the current andnext five fiscal years for at least one of the three major elements: Preliminary Engineering, Right-of-WayAcquisition, or Construction. The three-year State Transportation Improvement Program (STIP) is a list ofprojects in the current and next two fiscal years that is constrained to anticipated program revenues.
The project tables in the CDP are intended to represent a master list of all identified transportation projectseligible for further consideration as being consistent with City goals. The first track-able identification numberis currently assigned when a project is entered into an implementation database, and an unrelated projectID is assigned with each new database entered at DPW, GDOT, and ARC.
The Bureau of Planning (BOP) within DPCD annually submits to the state Department of Community Affairs(DCA) a Short-TermWork Program (STWP), which is required to list projects and programs to be undertakenduring the current and next four years. The annual STWP submission allows the City to remain qualifiedto collect development impact fees. Each year the BOP also submits to DCA a separately produced five-yearCapital Improvement Program (CIP) that is required to list projects for which funding sources have beenidentified.
2. Funding Transportation Projects
Funding for transportation projects is provided through local, state, and federal programs. The onlysemi-regional transportation funding source currently available for new projects is the half of the MARTAsales tax collected in Atlanta, Fulton and DeKalb that is available for transit capital expenses.
Federal Funding Sources
September 2007 Draft Atlanta Strategic Action Plan288
Community Assessment3

The United States Department of Transportation (USDOT) includes agencies that set standards and oftenprovide project funding for every transportation mode: Federal Aviation Administration (FAA), FederalHighway Administration (FHWA), Federal Motor Carrier Safety Administration (FMCSA), Federal RailroadAdministration (FRA), Federal Transit Administration (FTA), Maritime Administration (MARAD), NationalHighway Traffic Safety Administration (NHTSA), and others.
Grants offered through the Federal Highway Administration and the Federal Transit Administration havevarying program-specific requirements for local matching funds that may be met by private contributions orstate dollars as well as municipal funds. Most FHWA and FTA programs require a 20% local match, but inpractice localities that can provide a 50% match are more successful in obtaining major transit capitalinvestment dollars from FTA’s New Starts program.
Formal application for federal funding from the MPOAllocation of the FHWASurface Transportation Program(STP-Q23) is made through the ARC’s Transportation Improvement Program (TIP). Another federal program,Transportation Enhancements (TE) is awarded at the discretion of GDOT Board Members following anapplication cycle every two years. The FHWA Congestion Mitigation/Air Quality (CMAQ-Q40) programprovides funds that can be used for the first 3 years of operating a new transit service such as GRTA’sX-press commuter over the road coaches. STP and CMAQ along with National Highway System (NHS-Q05)funds can be flexed to transit.
State Funding Sources
Georgia’s transportation funding flows primarily from the state motor fuel tax, which is restricted to spendingon roads and bridges and is lower than in any state but Alaska. GDOT’s internal process of allocatingavailable state funds to projects is neither open nor transparent, but the 2005 Congestion Mitigation TaskForce recommends a set of project evaluation criteria shared by ARC, GRTA, SRTA and GDOT.
In addition to the state per gallon motor fuel tax, there is also a 4% “second” motor fuel tax assessed onthe retail price of the purchase. Only 3% is dedicated to GDOT and the other 1% sales tax on motor fuelis deposited into the state general fund. Dedicating that 1% revenue instead to statewide paratransitoperations could provide for improved service to the elderly and mobility impaired in communities acrossGeorgia.
Regional Funding Sources
Two promising and complementary ideas for regional transportation funding sources are 1) a regional motorfuel tax that could be used to leverage federal funds for transit capital investments, and 2) a sales taxextended beyond Fulton and DeKalb Counties made available for the operating subsidy of regional transitoperations that would incorporate rather than duplicate the half of the 1%MARTA tax available for operations.
Local Funding
The City of Atlanta’s largest source of local funds is the Quality of Life Bond Program, followed byTransportation Impact Fees, and other allocations. Parking revenue represents a growth opportunity asdevelopment densities increase in commercial areas and it should be dedicated to funding transportation
289Atlanta Strategic Action Plan September 2007 Draft

alternatives such as circulator transit. Tax increment financing and special benefit assessments provideways to capture some of the increased land value created by improved access to fund transportationimprovements.
3. Equity, Efficiency and Environmental Quality
Equity
In regional and state forums (ARC, MACOC, GRTA, GDOT, GRPA, SRTA, and DCA) the City stands forequity in rebalancing transportation and land use policies and funding to expand transportation choices andto enhance the travel experience for the full income range of the City residetns. The City seeks toaggressively develop viable and equitable mobility alternatives that reduce the stresses of singulardependency on the car.
Efficiency
The City of Atlanta aims to establish integrated, multi-modal transportation systems that move people andgoods in an efficient and environmentally sensitive manner. Emphasis is on creating alternatives to thesingle occupancy vehicle (SOV) mode of travel by increasing bicycle and pedestrian linkages that supportpedestrian-oriented retail and mass transit patronage. Effective transportation planning helps families raisetheir standard of living by expanding employment options accessible without a car and by allowing householdsto save money in owning andmaintaining fewer vehicles. Completing and enhancing the City’s grid networkof streets, in conjunction with traffic signal optimization and neighborhood traffic management, providesmultiple route choices to mitigate congestion of private vehicles making the majority of trips.
Environmental Quality
Impervious concrete and asphalt surfaces prevent the covered land area from filtering oil and gas runofffrom storm water, which exacerbates water quality and flooding issues. The abundance of land devoted toparking drives its cost down, which undermines transit’s competitiveness. Combined monetary and traveltime costs often make driving more attractive to travelers with a choice of transit, but for many people andplaces in the region, and for many trip purposes within the City of Atlanta, transit is no choice at all.
The Georgia Regional Transportation Authority was endowed at its creation with the prerogative to restrictregional transportation funds only to those areas and projects that would break the sprawl cycle’s relentlessgrowth in per capita rates of Vehicle Miles Traveled (VMT). However, to date there has been neither a testof local government permission (e.g. rezoning, building permit issuance, etc.) for a Development of RegionalImpact (DRI) over an unfavorable recommendation by GRTA, nor a challenge mounted by GRTA to anyiteration of ARC’s Transportation Improvement Program (TIP).
4. City of Atlanta Comprehensive Transportation Plan (CTP)
The Comprehensive Transportation Plan (CTP), also known as the Connect Atlanta Plan, will create a visionand implementation plan to address the City’s 21st century transportation needs of a growing populationand densification of residential and commercial development as well as increasing employment.
September 2007 Draft Atlanta Strategic Action Plan290
Community Assessment3

The Connect Atlanta Plan will meet regional planning requirements for coordination with other jurisdictionsand will address the need for cost-effective street, traffic, transit, freight, bicycle, and pedestrian improvements.The plan will promote a balanced multi-modal transportation system that enhances transportation choicesfor residents, employees, visitors, and firms doing business in Atlanta, making it more convenient to walk,bicycle, take transit, and to reduce reliance on the automobile. The Plan will be coordinated with the City’scomprehensive development plan, also known as The Atlanta Strategic Action Plan, to ensure the integrationof land use and transportation initiatives.
The Connect Atlanta Plan will allow the City to announce to the Region, State, and beyond, its intent andstrategy for becoming a leader in developing a world class transportation system – with special emphasison the transit component. The plan will support neighborhood livability and economic development.
A challenge for the Connect Atlanta Plan lies in effectively integrating the accommodation of commutertraffic moving into and out of the City, with the provision of transportation modes necessary to circulatewithin the City. Currently there a number of transit initiatives under consideration within the City and Region,including; the Beltline, Commuter Rail, Peachtree Corridor Streetcar, various Bus Rapid Transit (BRT)alignments, MARTA’s system optimization study, etc. The Plan seeks to integrate these initiatives into aneffective transit system.
Issues and Opportunities
Road Network
There is insufficient connectivity between pedestrian, bicycle, transit, and road facilities in the City ofAtlanta.Atlanta’s major roadway corridors suffer from unattractive utility clutter, excessive signage, and poorurban design.Roadway capacity additions cause an increase in driving and congestion.Resiliency and connectivity within road networks are lacking in parts of Atlanta.Right-of-way constraints limit flexibility to adjust the design or operation of roadways in the City ofAtlanta.We have a high traffic incident rate, increasing congestion and gridlock.Parts of the transportation infrastructure have exceeded their expected lifetimes reducing systemefficiency and creating potentially unsafe travel conditions.Car-sharing programs increase the utility of transit and permit valuable urban land to be convertedfrom parking to dense development. The City of Atlanta should consider a car-sharing partnership toreduce fleet maintenance costs and to build critical mass for a citywide car-sharing program.The Atlanta Region’s reliance on personal automobiles consumes valuable urban land for roadwaysand parking facilities.Atlanta’s current transportation systems contribute to air and water pollution.Current transportation systems do not use gas and energy efficiently.Taxpayers are frustrated as more and more money is spent to expand roadways while traffic congestionremains unchanged.
291Atlanta Strategic Action Plan September 2007 Draft

Transportation Modes
Bicycle Facilities
Bicycle and pedestrian facility planning, construction, and maintenance are cost effective investmentsfor expanding transportation choices.The City of Atlanta does not have an adequate network of sidewalks, bicycle lanes, and trails – thosethat exist are not well linked.On-street bicycle lanes or shared-use signage and off-road multiuse trail facilities can serve bothcommuter cyclists and recreational users.Greater education and enforcement are needed to improve safety for cyclists, pedestrians, andmotoristsalike.Bicycle parking provisions are inadequate in Atlanta.
Pedestrian Facilities
Pedestrian crosswalks are insufficient; investments in pedestrian amenities and safety features arenot adequate.Sidewalks are not currently provided with all new development.
Public Transportation
There are few attractive alternatives to using a car to get around within the City and the Region.Atlanta needs a seamlessly integrated public transportation network with various modes, technologiesand classes of transit service along railroad corridors and multimodal streets connecting livable activitycenters.Existing railroad corridors present opportunities for both regional commuter rail and local circulatortransit service.A Multimodal Passenger Terminal (MMPT) will link the City, state, region, and beyond and set thestage for intense mixed-use development in the railroad “gulch” area of downtown.Transit Level of Service (LOS) is inadequate and the coverage is insufficient.There is a lack of activities located within easy walking distance of some transit stops. Many MARTArail stations are underutilized and underdeveloped.Streetcars, arterial bus rapid transit, and enhanced bus service will attract more riders and boost urbandevelopment.The Proctor Creek Rail Line should serve more of the MARTA East Line.Making seamless transit network connections by adding “infill” MARTA stations at strategic locationscan promote economic development and foster a continuous urban fabric across Atlanta’s core toaccommodate density.The Regional Transportation Plan and Transportation Improvement Program could provide furtherfinancial support to transit by transferring more highway funds from federal programs designated asflexible.Preserving and fully-funding MARTA should be a top priority. The current funding structure starvesthe core transit system of operating support.
September 2007 Draft Atlanta Strategic Action Plan292
Community Assessment3

Major transit expansion projects must compete nationally for scarce New Starts funding from theFederal Transit Administration (FTA).The value added to real-estate surrounding rail stations should be captured to support transit systemenhancements.
Commuter Rail
The existing New Orleans – New York Amtrak Crescent route could function better with a new Atlantastation along its current alignment. Rerouting it to serve the MMPT in downtown Atlanta would requireusing the NE BeltLine.Adding north-south passenger platforms at the Philips Arena MARTA Station to the design of the MMPTwould allow it to accommodate the proposed Southeast High-Speed Rail (SEHSR) corridor extensionfrom Charlotte.GDOT’s Atlanta-Chattanooga Corridor Study presents an opportunity to consider high-speed rail alongan existing Norfolk-Southern line through northwest Georgia.
Parking
Electronic parking meters connected to a central computer would allow rates to be adjusted periodicallyand to accept non-cash payments.There is too much off-street surface lot parking in the core business districts and busy activity centers.There is a lack of shared-use parking structures and initiatives to create such.Parking revenue is a potential source of innovative financing for both the capital investment andoperations of new transit initiatives as well as streetscapes.
Railroad, Trucking and Airport
Railroads and Trucking
Development around truck-rail freight intermodal yards in the City of Atlanta hampers truck access andrestricts facility expansion opportunities.Designated truck routes in Atlanta should be reconsidered in light of recent study recommendations.A study by the State Road and Tollway Authority (SRTA) indicates that truck only toll (TOT) laneswould provide greater congestion mitigation than HOV lanes or high-occupancy toll (HOT) lanes alone.
Airport
Aviation access is essential to the top two target growth industries identified in the New CenturyEconomic Development Plan (EDP).Build out of the Hartsfield-Jackson Atlanta International Airport Development Plan (H-JDP) createsopportunities for additional landside connections to an expanded regional transit network.Growth in air cargo volume at H-JAIA will help establish Atlanta as a center for logistics industry jobsand research.
Transportation and Land Use
293Atlanta Strategic Action Plan September 2007 Draft

The regional land use planning structure is not integrated within a larger transportation network builtaround transit, but instead one built around expressways.
Transportation Planning
The City of Atlanta does not have a comprehensive transportation study that includes non-motorized.transportation, transit, vehicle traffic and parking, both local and regional.Our community does not offer equitable and affordable access to mobility.Allocation of state and federal transportation money on the basis of where people live withoutconsideration for where they work creates an undue burden on City of Atlanta local resources to meetRegional needs.Georgia’s state gas tax rate is lower than all states except Alaska and the limited revenue isconstitutionally restricted to spending on roads and bridges, but a new Regional gas tax could providemore revenue and be more flexible.The City of Atlanta 2000 Quality of Life Bond Program provides local funding only for projects that werespecifically listed in the successful 1999 referendum.Transportation Impact Fees, the other primary local funding source, produce less than $2 millionannually.Expanding the area of the City covered by a Community Improvement District (CID) would providemore resources to facilitate implementation of transit service and transportation capital projects inAtlanta's business centers.Transportation projects do not move from concept to implementation in the most expeditious manner.There should be better coordination between Planning and Public Works.The City of Atlanta does not have a consolidated database of all the transportation projects that areor should be listed in the CDP.Projects receiving state or federal funding must follow GDOT’s Plan Development Process (PDP),which adds many steps of documentation and review beyond what is required for an entirely locallyfunded project.
September 2007 Draft Atlanta Strategic Action Plan294
Community Assessment3

Urban Design
Introduction
The term "urban design" refers to the physical form and organization of elements in the urban environment.The arrangement of physical elements in our communities has wide implications beyond aesthetics. Urbandesign is about weaving together all of our neighborhoods into places that connect us with each other andour life activities. Physical relationships between elements such as residences, streets, parks, historic andcultural resources, businesses, and mass transportation facilities affect the social structure of a communityand communicate a value and role for each of these elements within the community.
Urban design can enhance the function and beauty of communities with careful consideration of site location,building form, visual characteristics, and relationships between each community element. The design ofpublic spaces and the hierarchy between public, semi-public, and private space are also critical aspects ofurban design which determine how people interact with and experience the urban environment. Atlanta’spolicies embrace concepts of new urbanism and smart growth, which focus on neighborhood cohesiveness,defined mixed-used centers, historic preservation and environmental conservation. The goal for urbandesign in Atlanta is to improve the quality and productivity of the lives of all Atlantan's by creating a humaneand enjoyable place to live, work, shop, recreate, grow and raise children.
Urban Design Elements
Seven physical elements, more than any others, characterize the urban form of Atlanta.
1. Tree Canopy: Atlanta is covered with a heavy canopy of mature forests. These trees soften harshbuilding and pavement surfaces and make in-town living pleasant during the hot summer months byproviding shade, reducing radiant heating, and improving the visual qualities of the urban landscape.Atlanta is often called "the City of trees."
2. Neighborhoods: There are a total of 230 distinct neighborhoods in Atlanta. These neighborhoods havea wide variety of architectural styles and serve every economic level. Many of the most attractive andpopular neighborhoods exist within blocks of towering commercial high-rises, yet are protected frominvasive development by strict zoning codes, land use policies and, in some cases, existing buffers.
3. Peachtree Street Spine: Peachtree Street, Atlanta's best-known and most-coveted business address,extends along Atlanta's dominant north-south ridgeline. Peachtree Street is the spine of a linearcommercial district that begins Downtown, just north of I-20 and runs north, through Midtown, toBuckhead at the northern City limits.
4. Major Travel Corridors: The City has several major transportation corridors (i.e. Peachtree Street,Piedmont Avenue, Moreland Avenue, Cheshire Bridge Road, Pryor Road, Northside Drive, Howell MillRoad, Ponce De Leon Avenue, North Avenue, Dekalb Avenue, Memorial Drive, Metropolitan Parkway,etc.), which have developed into fragmented, suburban-style commercial strips with no relation tonearby residential neighborhoods. The creation of new smart growth zoning districts coupled withtoday’s development pressures offers the opportunity to create pedestrian-friendly, sustainablemixed-useenvironments that combine commercial and residential uses in a balanced manner which also servesto link the surrounding neighborhoods to one another.
295Atlanta Strategic Action Plan September 2007 Draft

5. Nodal Development : High-density nodal development is encouraged around the Metropolitan AtlantaRapid Transit Authority (MARTA) rail stations. This nodal development is particularly evidenced bythe skyscrapers that are clustered around MARTA rail stations located Downtown, along PeachtreeStreet and along the Lindbergh and Lenox stations. On a smaller scale, nodes created aroundcommercial intersections are opportunities to focus and enhance retail and mixed-use developmentserving nearby neighborhoods.
6. Transit and Railroads: Historically, transportation has been a vital component in the development ofAtlanta. Railroads became the framework for the City’s early development, with Downtown servingas the original railroad hub with a railroad network that to this day circles the central area and extendsout from Downtown to surrounding counties and neighboring states. The City’s development was alsoimpacted during the 1970’s and 1980’s with the construction of the MARTA transit system. Today, thecontinued expansion of the MARTA transit system and the focus on alternative transit modes, as wellas the construction of the proposed multi-modal station, combined with the concentration of higherdensity development within the City, offer the opportunity to link Atlanta’s neighborhoods with majoractivity centers (i.e. the Cultural Ring: Downtown, King Center, Studio Plex, Carter Center, FreedomPark, Botanical Garden, Lindbergh, Woodruff Arts Center, Atlantic Station, King Plow, Georgia Tech,Historic West Side Village, Atlanta Clark University Center, West End, Pryor Road, Grant Park, EastAtlanta Village, etc.).
7. BeltLine: The BeltLine project is a major planning initiative for the City of Atlanta. With the Cityexperiencing population growth, the Beltline will be a catalyst for economic and community developmentthroughout the City. It is comprised of 22 miles of historic rail segments that encircle the urban core.The concept provides a unique opportunity to bring together neighborhood revitalization and newdevelopment organized around a corridor of transit, trails, open space and public art. The Beltline alsorepresents an opportunity to enhance the City’s quality of life by preserving and revitalizing existingneighborhoods, fostering mixed-use developments at select locations, promoting improved air qualityand reducing dependency on the automobile.The city recognizes that new development will be attracted to the BeltLine area and that the orientationand character of that growth should encourage pedestrian and transit-oriented uses and activities sothat the BeltLine has the most positive impact on communities. To this end, the Atlanta DevelopmentAuthority completed the Atlanta BeltLine Redevelopment Plan in 2005 and with the support of theAtlanta City Council, Fulton County Commission and Atlanta Public School Board, created Tax AllocationDistrict #6 – BeltLine. In anticipation of the BeltLine TAD funds that will be used to invest in landacquisition, multi-use trails, greenspace, transit, workforce housing and Atlanta Public Schools projects,developer infrastructure, primarily for environmental brownfield cleanup, or to jump-start developmentin historically underdeveloped areas, implementation of the BeltLine is one of the urban design goals.
8. Creeks, Watersheds, Forests and Landforms: Deriving from a range of citizen and traditional planninginitiatives, the City is responding to an ever-heightening emphasis on its natural setting, both the assetsit represents and the threats it faces. Any set of urban design strategies must include, and even beginwith, the natural pre-urbanized environment and seek to conserve and reestablish complementary andmutually supportive development futures for the environment’s sustainability and peoples quality oflife. These can mean:a. Reintroducing healthy creek, greenway and riparian tendrils into the urban fabric in a manner
complementary to single-family, low-density or mixed-use and high-density environs;b. Protecting or extending upland forest ecosystems;
September 2007 Draft Atlanta Strategic Action Plan296
Community Assessment3

c. Continued strengthening and maturing of the tree conservation program;d. Rearranging zoning, subdivision, transportation and utility corridor standards and designs in
support of the urban naturalization strategies;e. Overall, enhancing the environmental and green space response to the growing citizen emphasis
on quality of life issues.
Urban Design Considerations
Several factors will influence urban design in Atlanta as we move through the 21st century. Those factorsare as follows:
1. Expanding central role of Atlanta in the region: Atlanta gives the region a sense of place and history.It also provides a central place with which all may identify and which unifies the region. As the AtlantaRegion continues to grow, people will be looking for more convenient and central locations for theirbusinesses and residences. Urban design issues that will need to be addressed for Atlanta to attractpositive growth include: reestablishing downtown as a regional center, maintaining and strengtheningexisting neighborhoods, advancing urban design that engenders a safe environment, and preservingAtlanta's historic and cultural resources. In addition, the design of major cultural and other buildingsand infrastructure, where appropriate, should be of the highest quality.
2. Expanding global role of Atlanta: If Atlanta's urban design is to be world class, Downtown, Midtownand Buckhead should be designed with spaces for public art and parks for cultural events. Streetscapeswill also need to be improved, the visual clutter of signage and utilities in our public spaces will needto be controlled, and these elements of the public realm will need to be knit together by a cohesivenetwork of usable public space and sidewalk oriented buildings.
3. Increased dependence on multi-modal transportation: Atlanta must look for alternatives to automobiletransportation as roadways are widened past their optimum capacity, air quality problems from emissionsare escalating, and highways are expanding to the point of fracturing our communities. Urban designissues that will need to be addressed include the emphasis of pedestrian and bicycle transportationthroughout the City, encouraging development around transit facilities, and limiting parking lot expansionin areas where alternate transportation facilities are planned or provided.
4. Increased demand for pedestrian and bicycle facilities: Street improvements need to include pedestrianand bicycle facilities. Sidewalks need to be wider to accommodate pedestrian traffic, lighting needsto promote pedestrian safety and comfort, lighting fixtures and street furniture need to be coordinated,on-street parking needs to be encouraged to buffer pedestrians from traffic and support sidewalk-orientedretail, street trees need to cool and define a pedestrian zone, buildings need to be oriented towardsthe sidewalk, and signage needs to be coordinated to minimize visual blight. Bicycle lanes need tobe provided on designated bicycle routes.
5. Increased demand for parks, open space and greenways: Parks and open space contribute to thequality of life by protecting and enhancing neighborhoods and historic places, linking neighborhoodsand commercial districts, providing opportunities for social interaction, and promoting the physical andthe mental well-being of all citizens. There is a need to increase the abundance, quality, usability and
297Atlanta Strategic Action Plan September 2007 Draft

accessibility of parks, plazas and public open spaces; create more opportunities for pedestrianmovement; highlight the visual quality and beauty of Atlanta; secure irreplaceable historic heritage andcultural life; and protect the man-made environment.
6. Greater emphasis on security in urban design: Crime prevention may be increased through carefuldesign of the built environment. Strategies as advocated through “CPTED,” Crime Prevention ThroughEnvironmental Design, are creative design solutions that may be implemented to increase public safetyalong streets. These design techniques include creating high visibility spaces that clearly define thepublic and private realm, and are based upon the following design strategies: natural access control(keeping potential intruders under observation), natural surveillance (decreasing the crime opportunity),and territorial reinforcement (developing a sense of ownership).
Issues and Opportunities
Issues
Atlanta's urban form is missing several elements that could improve the quality of life for Atlantan's and helpto attract visitors.
1. Public Space: Many of Atlanta's public spaces have given priority to automobiles and lack appropriatepedestrian or bicycle-oriented spaces.
2. Surface Parking Lots: Acres of uninterrupted surface parking Downtown and in other areas create aninhumane, environmentally unsound and visually disruptive condition. These desolate areas of pavementbreak the continuity of development, disrupting the urban fabric and discouraging pedestrian activity.
3. Visual Clutter: Visual clutter from billboards, signage, and overhead utilities creates unsafe conditionson our roads and deteriorates the quality of life in Atlanta's neighborhoods.
4. Parks, boulevards, fountains and public art are often missing elements in Atlanta's urban form.5. Public Safety: Many of Atlanta's real and perceived public safety problems are adversely affected by
poor urban design. Public spaces that are not visible and accessible for informal policing by residents,workers, and visitors; and a lack of legitimate street life are undesirable.
6. Suburban Sprawl: The sprawling urban form of the Atlanta region could be remedied for the regionwith a vibrant Downtown-Midtown city center as well as many other towns and activity centers in theregion to refocus development energy.
Opportunities
The following represent opportunities for Atlanta:
1. Tree Canopy: A mature tree canopy enhances the image of Atlanta, ameliorates the climate, andmitigates environmental problems in Atlanta.
2. Neighborhood Identity: A strong sense of neighborhood identity exists in Atlanta and should becapitalized on in any urban design plans. Many of the most successful neighborhoods are focusedaround parks.
September 2007 Draft Atlanta Strategic Action Plan298
Community Assessment3

3. Surface Parking Lots: The inordinate amount of surface parking in Downtown, Midtown and alongmajor corridors is currently a negative attribute for these areas, but it could be seen as an opportunityfor new mixed-use and residential developments in the near future. Many of the recent mixed usedevelopments around Centennial Olympic Park and Georgia Tech were surface parking lots.
4. Transportation: The expanding MARTA system, and pedestrian and bicycle facilities providetransportation alternatives to the automobile. As these systems expand so do the transportationpossibilities.
5. Historic Districts: Existing historic districts provide a continuity with Atlanta's past that contributes tothe image, unique character and architectural heritage of Atlanta.
6. Beltline: comprised of 22 miles of historic rail segments that encircle the urban core. The Beltlinerepresents the opportunity for new transit, trails and parks linking together 45 city neighborhoods.
7. Population growth: as Atlanta’s population continues to grow there are opportunities for infill and newdevelopment as well as redevelopment and revitalization of existing neighborhoods.
299Atlanta Strategic Action Plan September 2007 Draft
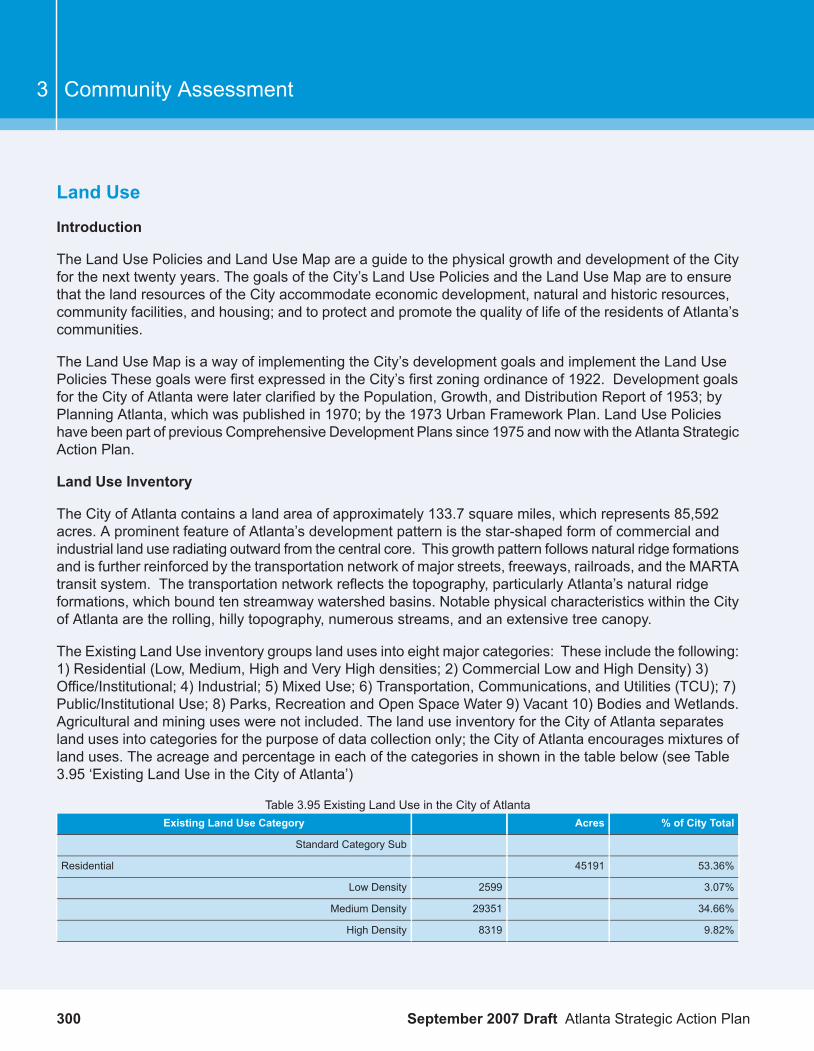
Land Use
Introduction
The Land Use Policies and Land Use Map are a guide to the physical growth and development of the Cityfor the next twenty years. The goals of the City’s Land Use Policies and the Land Use Map are to ensurethat the land resources of the City accommodate economic development, natural and historic resources,community facilities, and housing; and to protect and promote the quality of life of the residents of Atlanta’scommunities.
The Land Use Map is a way of implementing the City’s development goals and implement the Land UsePolicies These goals were first expressed in the City’s first zoning ordinance of 1922. Development goalsfor the City of Atlanta were later clarified by the Population, Growth, and Distribution Report of 1953; byPlanning Atlanta, which was published in 1970; by the 1973 Urban Framework Plan. Land Use Policieshave been part of previous Comprehensive Development Plans since 1975 and nowwith the Atlanta StrategicAction Plan.
Land Use Inventory
The City of Atlanta contains a land area of approximately 133.7 square miles, which represents 85,592acres. A prominent feature of Atlanta’s development pattern is the star-shaped form of commercial andindustrial land use radiating outward from the central core. This growth pattern follows natural ridge formationsand is further reinforced by the transportation network of major streets, freeways, railroads, and the MARTAtransit system. The transportation network reflects the topography, particularly Atlanta’s natural ridgeformations, which bound ten streamway watershed basins. Notable physical characteristics within the Cityof Atlanta are the rolling, hilly topography, numerous streams, and an extensive tree canopy.
The Existing Land Use inventory groups land uses into eight major categories: These include the following:1) Residential (Low, Medium, High and Very High densities; 2) Commercial Low and High Density) 3)Office/Institutional; 4) Industrial; 5) Mixed Use; 6) Transportation, Communications, and Utilities (TCU); 7)Public/Institutional Use; 8) Parks, Recreation and Open Space Water 9) Vacant 10) Bodies and Wetlands.Agricultural and mining uses were not included. The land use inventory for the City of Atlanta separatesland uses into categories for the purpose of data collection only; the City of Atlanta encourages mixtures ofland uses. The acreage and percentage in each of the categories in shown in the table below (see Table3.95 ‘Existing Land Use in the City of Atlanta’)
Table 3.95 Existing Land Use in the City of Atlanta% of City TotalAcresExisting Land Use Category
Standard Category Sub
53.36%45191Residential
3.07%2599Low Density
34.66%29351Medium Density
9.82%8319High Density
September 2007 Draft Atlanta Strategic Action Plan300
Community Assessment3
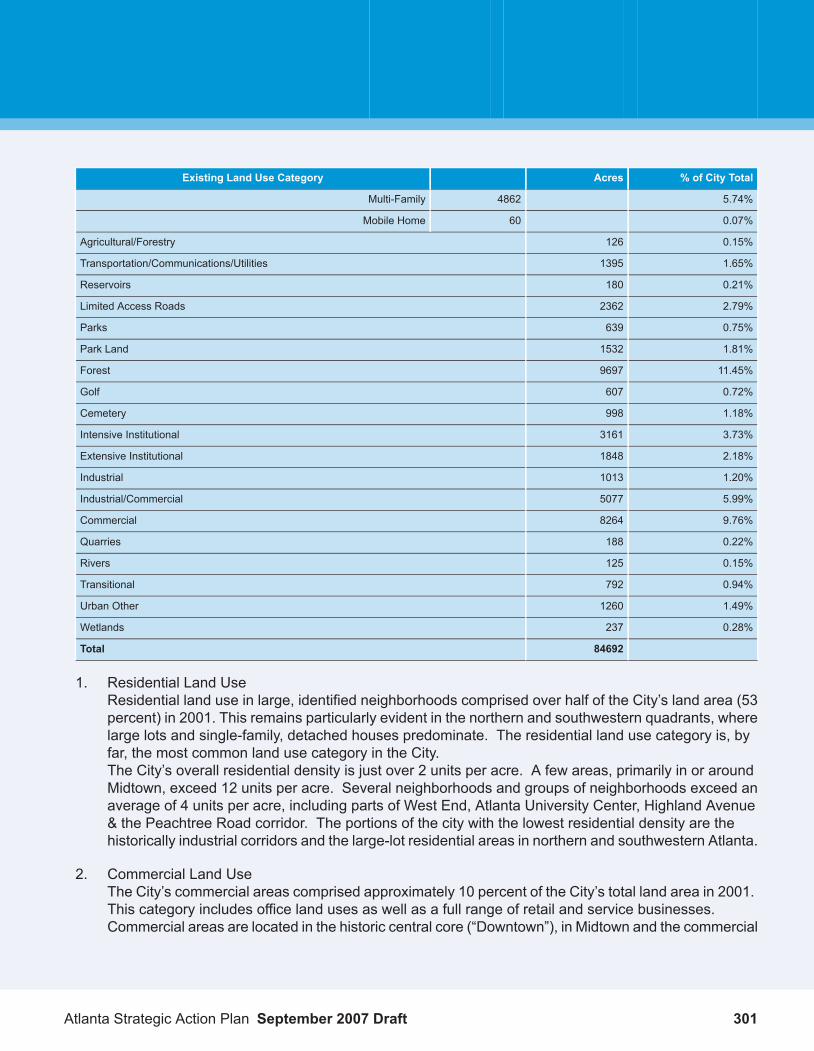
% of City TotalAcresExisting Land Use Category
5.74%4862Multi-Family
0.07%60Mobile Home
0.15%126Agricultural/Forestry
1.65%1395Transportation/Communications/Utilities
0.21%180Reservoirs
2.79%2362Limited Access Roads
0.75%639Parks
1.81%1532Park Land
11.45%9697Forest
0.72%607Golf
1.18%998Cemetery
3.73%3161Intensive Institutional
2.18%1848Extensive Institutional
1.20%1013Industrial
5.99%5077Industrial/Commercial
9.76%8264Commercial
0.22%188Quarries
0.15%125Rivers
0.94%792Transitional
1.49%1260Urban Other
0.28%237Wetlands
84692Total
1. Residential Land UseResidential land use in large, identified neighborhoods comprised over half of the City’s land area (53percent) in 2001. This remains particularly evident in the northern and southwestern quadrants, wherelarge lots and single-family, detached houses predominate. The residential land use category is, byfar, the most common land use category in the City.The City’s overall residential density is just over 2 units per acre. A few areas, primarily in or aroundMidtown, exceed 12 units per acre. Several neighborhoods and groups of neighborhoods exceed anaverage of 4 units per acre, including parts of West End, Atlanta University Center, Highland Avenue& the Peachtree Road corridor. The portions of the city with the lowest residential density are thehistorically industrial corridors and the large-lot residential areas in northern and southwestern Atlanta.
2. Commercial Land UseThe City’s commercial areas comprised approximately 10 percent of the City’s total land area in 2001.This category includes office land uses as well as a full range of retail and service businesses.Commercial areas are located in the historic central core (“Downtown”), in Midtown and the commercial
301Atlanta Strategic Action Plan September 2007 Draft

area of northeast Atlanta (“Buckhead”) and along major arterials, primarily Peachtree Road, PiedmontRoad, Cheshire Bridge Road, Martin Luther King, Jr. Drive, Bankhead Highway, Ponce de Leon Avenue,Campbellton Road, and Jonesboro Road.
3. Industrial Land UseAbout 7 percent of the City’s land area in 2001 was committed to light and heavy industrial uses. Theindustrial areas of the City were mainly concentrated in the northwestern part of the City, between theChattahoochee River and Fulton Industrial Boulevard, and along the Southern Railway and SeaboardCoast Line Railroad, which extend through the northeastern corridor. On the south side, industriesare located along the Central of Georgia railway, the Atlanta and West Point railway, the Southernrailway, Zip Industrial Boulevard, and South River Industrial Boulevard.
4. Transportation, Communications & Utilities (TCU) Land UseThis land use includes roads and utility easements (open land that are devoted to electrical andtelecommunications equipment), as well as transportation-related facilities, including theHartsfield-Jackson Atlanta International Airport , the proposed BeltLine, MARTA stations and relatedfacilities. About 4.5 percent of the City’s total area in 2001 was committed to transportation,communications, and utilities. The City’s historic role as a regional hub, together with the developmentof Hartsfield-Jackson Airport after 1970, account for the proportion of land use that is devoted for thesepurposes.
5. Public/ Institutional Land UseApproximately 6 percent of the City’s land area in 2001 was used for institutional uses. Examples ofthese uses are churches, government facilities, colleges, hospitals, medical offices, and cemeteries.
6. Parks, Recreation & Conservation Land UseApproximately 4 percent of the City’s land area in 2001 was committed to open space uses such asrecreation facilities, parks, golf courses, cemeteries, and floodplains.
7. Vacant and Transitional LandThis category is comprised of undeveloped, wooded land, vacant, platted residential lots and propertiesthat have been cleared of buildings and structures. In 2001, this category comprised 2.9% of the totalland area in the City.
8. Water Bodies, Wetlands & QuarriesThis category, which includes rivers, lakes, and streams, comprised 14.2% of the total land area in theCity in 2001.
Future Land Use Map
The Future Land Use Map is a guide for growth and development. Each parcel of land in the City of Atlantahas land use designation. The land use designations have occurred over a period of time through officialCity policy in consideration of several factors; including existing land use conditions, projected land use andreal estate trends, citizen input, petitions by NPUs and CIDs, studies such as LCIs and redevelopment plans
September 2007 Draft Atlanta Strategic Action Plan302
Community Assessment3

and professional recommendations. The land use designation for a particular parcel of land represents theCity’s official policy for the recommended future development of that parcel. It may or may not coincidewith the actual zoning or use of that parcel as it has been developed. The City considers these land usedesignations when reviewing rezoning requests. The land use designations are portrayed on the land usemaps for each of the twenty-four neighborhood planning units (NPUs).
Fifteen land use designations are recognized and portrayed on the City’s land use maps. They are:
1. Single Family Residential: This residential designation consists entirely of detached single family homeswith one house per lot, with a maximum height of 35 feet.
2. Low Density Residential: This residential designation consists primarily of detached single familyhomes. Building height primarily is up to 3 stories.
3. Medium Density Residential: This residential category consists of the residential uses allowed in singlefamily and low density residential as well as duplex, triplex, quadruplex and townhomes and multi-familyunits such as apartments, condos and lofts. Building heights are primarily up to 4 stories.
4. High Density Residential: This residential category includes residential uses included in single family,low density and medium density residential as well as attached residential developments such asapartments, condos. Building height are up to 12 stories.
5. Very High Density Residential: This residential category includes residential uses included in singlefamily, low density, medium density and high density residential as well as attached residentialdevelopments up to 13+ stories and greater than 72 units/ acre.
6. Low Density Commercial: This land use category includes commercial uses such as retail, restaurants,services, etc. Building height up to 3 stories is typical.
7. High Density Commercial: This land use category includes commercial uses such as retail, restaurants,office, services etc at a higher intensity and height than the Low Density Commercial land use. Buildingheight over 3 stories is typical.
8. Industrial: This land use category allows for industrial uses such as warehousing, distribution,transportation, manufacturing, refining, production, construction, truck and rail terminals, industrialparks and related support services and rehabilitation of industrial buildings to residential uses.
9. Office/ Institutional/ Residential: This land use category allows office, institutional uses and residentialuses. Examples are multi-family housing, clinics, and colleges.
10. Mixed Use: This land use category allows for a mix of uses such as commercial, office, hotels andresidential, except for industrial uses.
303Atlanta Strategic Action Plan September 2007 Draft

11. Open Space: This land use category includes land for active and/or passive recreational uses andopen space. This includes public open space owned by the City of Atlanta or other government. Itincludes parks, nature preserves, golf courses, recreation centers, playgrounds, etc.
12. Private Open Space: This land use category includes land for active or passive open space that isprivately owned. This includes land with a conservation easement, private golf courses or open spaceowned by a private entity such as a residential subdivision.
13. Transportation, Communications and Utilities: This land use includes transportation uses such asairports, transportation corridors such as the BeltLine, MARTA stations, communication facilities, andutilities.
14. Community Facilities: This land use categories includes public facilities such as public schools, firestations, health centers, senior centers, libraries etc.
15. Business Park: This land use category allows for office and light industrial type uses such aswarehousing and distribution.
The acres in each of the Land Use designations of the Future Land Use Map are shown in Table 3.96‘Future Land Use Map Designations by Acre’. Residential land uses account for 68% of the uses.Non-residential uses (commercial, office, industrial and mixed use) equal to 25% of the land uses. Openspace includes 5.6% of the uses and TCU is 0.55.
Table 3.96 Future Land Use Map Designations by AcrePercentAcresLand Use
52.9%45,146Single Family Residential
8.4%7,172Low Density Residential
5.3%4,560Medium Density Residential
1.6%1,400High Density Residential
0.3%252Very High Density Residential
4.3%3,638Low Density Commercial
2.9%2,455High Density Commercial
8.5%7,282Industrial
3.8%3,217Office/ Institutional/ Residential
5.8%4,972Mixed Use
5.6%4,766Open Space
0.5%416Transportation, Communications and Utilities
85,276Total
September 2007 Draft Atlanta Strategic Action Plan304
Community Assessment3
As part of developing the Atlanta Strategic Action Plan, the Neighborhood Planning Units were asked torecommend changes to the Future Land Use Map. In addition, two Land Use Charettes were held to workwith NPUs and neighborhoods to identify potential changes to the Future Land Use Map. These changeswill be evaluated by the Bureau of Planning staff for approval or denial. These changes will be included inthe September 10th CDP Public Hearing. Approved Land Use changes will be incorporated when the ASAPand the Future Land Use Plan are approved by City Council in October/ November 2007.
Land Use Development Patterns
The residential land use pattern is expected to remain similar to what has existed in recent years.Single-family areas are expected to remain as the City’s predominant land use. Construction of multi-familyhousing (5 or more units) has dramatically increased. Since 2000, 80% of the permitted housing units havebeen multi-family homes. Construction of higher-density housing developments should continue to occurin parts of Downtown, Midtown and Buckhead, in older industrial areas, and on infill housing sites in existingneighborhoods and corridors. It is anticipated that residential uses that are located in airport noise zoneswill continue to be replaced by industrial and commercial uses. Specialty housing for senior citizens areexpected to continue to be developed in response to the aging of the City’s population.
The high-density commercial corridor that stretches alongside Interstates 75/85, from one end of Downtownto the other, from Interstate 20 to the Brookwood Interchange, should continue to be the largest and mostdense commercial area. The Peachtree Corridor, the Buckhead Village and the Buckhead/Lenox MARTAStation Special Public Interest District (SPI-12) commercial core is expected to continue to develop andintensify. New office and residential development have taken place particularly in Downtown, near CentennialOlympic Park, Midtown and in Buckhead.
The Neighborhood Commercial Zoning District is intended to preserve existing neighborhood commercialareas, as well as to enhance the appearance and pedestrian amenity of neighborhood-scale commercialestablishments and activities. This designation has been applied to the new Historic Westside Village,Virginia Highlands, West End, East Atlanta Village and Little Five Points, among others.
Changes in Industrial Land Use reflect changes in industrial businesses, employment and industry needs.Older buildings with low ceiling heights, the high cost of land, development, rental rates and the cost ofbusiness have led to the loss of industrial uses. Over the past several years, industrial uses have beenredeveloped to other uses. Recent examples are the redevelopment of the former Atlantic Steel industrialsite, to the mixed use Atlanta Station. The Northyards Business Park at North Avenue and Northside Driveincorporated industrial railroad buildings. Along the rail corridors in the Chattahoochee Industrial district andMarietta Boulevard, industrial land uses have been converted to residential and mixed use developments.
Since 2002, approximately 1,040 acres (14% of industrially designated land) has been re-designated fromindustrial to another land use. Some of the re-designations were recommended in the Westside LCI andthe Bolton/Moores Mill LCI. Since 2000, 10% (950 acres) of all industrial zoning have been re-zoned toanother zoning category. The redevelopment of industrial land to other uses is creating land use conflictsbetween the new use and the existing industrial uses.
305Atlanta Strategic Action Plan September 2007 Draft

Industrial uses are an essential part of the City’s economy. In 2005, 64,000 jobs were in the industrial sector.This sector pays higher wages than average. Construction, manufacturing, wholesale transportation andwarehousing jobs and services are all need for the growth and prosperity of the City. In addition, a healthymix of industrial uses are needed to stay competitive. Therefore, the policy that promoted the redevelopmentof industrial uses to other uses is being changes to promote the redevelopment of industrial uses to newindustrial uses. A more comprehensive Industrial Policy will be developed over the next year. To addressthe loss of industrial uses and to retain industrial sector, cities through out the US have created IndustrialPolicies (Minneapolis – 2006, New York – 2005, Portland OR – 2003, and Los Angeles – 2007)
Industrial land uses are expected to grow in the areas that are adjacent to Hartsfield-Atlanta InternationalAirport where residential uses are being phased out due to the presence of excess airport noise. Proximityto I-75, I-285 and Airport Road and the airport’s three cargo complexes make this a good location forwarehousing of air drayage. Empire Industrial Sites, the Southeast Industrial Park and Southside IndustrialPark are located in this study area. Almost half of the businesses are transportation and warehousing.Industrial facilities are newer in this area than in other study areas.
The City of Atlanta Zoning Resolution
The City of Atlanta Zoning Ordinance of 1982, as amended, identifies specific allowable zoning districtswithin the City (see Table 3.97 ‘City of Atlanta Zoning Districts’). Each parcel of land in the City currentlylies within a specific zoning district, as is shown on the Zoning Maps that are maintained by the Bureau ofPlanning. When a parcel of land lies within a particular zoning district, it is said to be “zoned” according tothat zoning district. The City’s zoning districts include seventeen types of residential zoning districts, elevenquality of life zoning districts (eight mixed residential districts and three mixed commercial districts), a livework zoning district, an office and institutional zoning district, six commercial zoning districts, six neighborhoodcommercial zoning districts, two industrial zoning districts, eighteen special public interest districts (SPIs),three types of planned development zoning districts, nine landmark districts, and eight historic districts.
“Historic district zones” may be established as “overlay zones” for the purpose of recognizing official historiczones and requiring that special standards be applied to any development-related activity which is proposedfor an existing historic structure or for vacant land which lies within an official historic area. Such propertiesthus receive special protection due to their historic statuses. The Urban Design Commission engages in aformal review of any development-related proposals for properties that are located within these historicdistrict zones.
Similarly, some SPI districts are overlay zones that add to, rather than supplant, the underlying zoning ofthe property. SPI districts are established for areas of the City that have unique, significant characteristicsand thus merit regulation on an individual basis.
Table 3.97 City of Atlanta Zoning DistrictsDescriptionDistrict
Community businessC-1
Commercial serviceC-2
Commercial-residentialC-3
September 2007 Draft Atlanta Strategic Action Plan306
Community Assessment3

DescriptionDistrict
Central area commercial-residentialC-4
Central business district supportC-5
Historic building or siteHBS
West End historic districtHD-20G
Adair Park historic districtHD-20I
Whittier Mill historic districtHD-20J
Grant Park historic districtHD-20K
Inman Park historic districtHD-20L
Oakland City historic districtHD-20M
Atkins Park historic districtHD-20O
Light industrialI-1
Heavy industrialI-2
Landmark building or siteLBS
Cabbagetown landmark districtLD-20A
Druid Hills landmark districtLD-20B
Martin Luther King, Jr. landmark districtLD-20C
Washington Park landmark districtLD-20D
Oakland Cemetery landmark districtLD-20E
Baltimore Block landmark districtLD-20F
Hotel Row landmark districtLD-20H
Castleberry Hill landmark districtLD-20N
Live-WorkLW
Multi-family residential, maximum floor area ratio of 0.162MR-1
Multi-family residential, maximum floor area ratio of 0.348MR-2
Multi-family residential, maximum floor area ratio of 0.696MR-3
Multi-family residential, maximum floor area ratio of 1.49MR-4A
Multi-family residential (townhouses), maximum floor area ratio of 1.49MR-4B
Multi-family residential, maximum floor area ratio of 3.2MR-5A
Multi-family residential next to single-family districts, maximum FAR of 3.2MR-5B
Multi-family residential, maximum floor area ratio of 6.4MR-6
Mixed residential and commercial, maximum floor area ratio of 1.696MRC-1
Mixed residential and commercial, maximum floor area ratio of 3.196MRC-2
Mixed residential and commercial, maximum floor area ratio of 7.2MRC-3
Neighborhood commercialNC
Little Five Points Neighborhood CommercialNC-1
307Atlanta Strategic Action Plan September 2007 Draft

DescriptionDistrict
East Atlanta Neighborhood CommercialNC-2
Kirkwood Neighborhood CommercialNC-3
Cheshire Bridge North Neighborhood CommercialNC-4
Cheshire Bridge South Neighborhood CommercialNC-5
Office-InstitutionalO-I
Planned housing development (single-family or multi-family)PD-H
Mixed-use planned developmentPD-MU
Office-commercial planned developmentPD-OC
Single-family residential, minimum lot size 2 acresR-1
Single-family residential, minimum lot size 1 acreR-2
Single-family residential, minimum lot size 0.69 acresR-2A
Single-family residential, minimum lot size 0.64 acresR-2B
Single-family residential, minimum lot size 0.41 acresR-3
Single-family residential, minimum lot size 0.31 acresR-3A
Single-family residential, minimum lot size 0.21 acresR-4
Single-family residential, minimum lot size 0.17 acresR-4A
Single-family residential, minimum lot size 0.06 acresR-4B
Two-family residential, minimum lot size 0.17 acresR-5
General (multi-family) residential, maximum floor area ratio of 0.162RG-1
General (multi-family) residential, maximum floor area ratio of 0.348RG-2
General (multi-family) residential, maximum floor area ratio of 0.696RG-3
General (multi-family) residential, maximum floor area ratio of 1.49RG-4
General (multi-family) residential, maximum floor area ratio of 3.2RG-5
General (multi-family) residential, maximum floor area ratio of 6.4RG-6
Residential with limited commercial, maximum floor area ratio of 0.348R-LC
Special Public Interest District: Central CoreSPI-1
Special Public Interest District: North AvenueSPI-2
Special Public Interest District: Inman ParkSPI-5
Special Public Interest District: Poncey-HighlandSPI-6
Special Public Interest District: Candler ParkSPI-7
Special Public Interest District: Home ParkSPI-8
Special Public Interest District: Buckhead Commercial CoreSPI-9
Special Public Interest District: Vine City and Ashby StationSPI-11
Special Public Interest District: Buckhead/Lenox StationSPI-12
Special Public Interest District: Centennial Olympic ParkSPI-13
September 2007 Draft Atlanta Strategic Action Plan308
Community Assessment3

DescriptionDistrict
Special Public Interest District: Berkeley ParkSPI-14
Special Public Interest District: Lindbergh Transit Station AreaSPI-15
Special Public Interest District: MidtownSPI-16
Special Public Interest District: Piedmont AvenueSPI-17
Special Public Interest District: MechanicsvilleSPI-18
Special Public Interest District: Buckhead Peachtree CorridorSPI-19
Special Public Interest District: GreenbriarSPI-20
Special Public Interest District: Historic West End/Adair ParkSPI-21
Special Public Interest District: Memorial Drive/Oakland CemeterySPI-22
The Land Use Map Designations and Zoning Districts
Each land use designation is more generalized than any individual zoning district and is considered to becompatible with several zoning districts. As a result, many more zoning classifications exist than do landuse designations. This is because zoning is a more specific means of regulating property than a land usedesignation. The land use maps and policies guide the land use pattern of the city in a general fashion,while the zoning districts impose specific controls and permissions on property.
Residential development in Atlanta is regulated through a Land Use Intensity System (LUI System), whichwas incorporated into the zoning ordinance in 1989. The LUI System incorporates floor area ratios (FARs)to control the bulk of multi-family residential development in relation to gross lot size.
The “unit density” of some low- and medium density residential development is regulated by minimum andmaximum of dwelling units per acre. These controls are imposed on property, if considered appropriate,when the CDP land use map designation of the property is changed.
Each land use designation has several corresponding zoning designations (see Table 3.98 ‘Land UseDesignation and Compatible Zoning Districts’ and Figure 3.4 ‘Relationship Between Land Use Designationsand Zoning Classification’). The mixed-use land use designation is unusual in that it imposes a specificcontrol on property: it requires that 20 percent (20%) of the total square footage of a proposed developmentfor a property with a mixed use designation be residential. The table shows the correspondence betweenland use designations, zoning categories, floor area ratios, and residential units per acre. Table 20-4 furtherillustrates the correspondence. Some zoning districts, notably the SPI and historic districts, are not includedin these tables because the correspondence between these districts and the land use designations isdetermined on a case-by-case basis, by Bureau of Planning staff.
Table 3.98 Land Use Designation and Compatible Zoning DistrictsF.A.R. LimitsAllowedUnits per
AcreCompatible Zoning
DistrictsLand Use Designation
VariesOPEN SPACE
N/AN/AR-1 to R-4,PD-HSINGLE-FAMILY RESIDENTIAL
0-8R-1 to R-4,LOW-DENSITY RESIDENTIAL
309Atlanta Strategic Action Plan September 2007 Draft

F.A.R. LimitsAllowedUnits perAcre
Compatible ZoningDistricts
Land Use Designation
0.0 - 0.3480-16RG-1 & RG-2, MR-1 & MR-2
0-32PD-H
0-16R-1 to R-5MEDIUM-DENSITY RESIDENTIAL
0.0 - 0.6960-29RG-1 to RG-2, MR-1 & MR-2
0-64RG-3, MR-3, PD-H
0.0 to 1.49N/AR-1 to R-5HIGH-DENSITY RESIDENTIAL
RG-1 to RG-4, MR-1 toMR-4,
PD-H
0.0 – 6.40N/AR-1 to R-5VERY-HIGH DENSITY RESIDENTIAL
RG-1 to RG-6, MR-1 toMR-6
PD-H
Established by ZoningDistrict Regulations
R-1 to R-5, RG-1 to RG-3,R-LC, MR-1 to MR-4, O-I,
LOW-DENSITY COMMERCIAL
LW, NC, C-1 & C-2, MRC-1& MRC-2, PD-H, PD-OC
Established by ZoningDistrict Regulations
R-1 to R-5, RG-1 to RG-6,R-LC, MR-1 to MR-6, O-I,
HIGH-DENSITY COMMERCIAL
LW, NC, C-1 to C-5, MRC-1to MRC-3, PD-H, PD-MU,PD-OC
Established by ZoningDistrict Regulations
N/ALW, I-1, I-2, PD- BPINDUSTRIAL
Established by ZoningDistrict Regulations
R-1 to R-5OFFICE/ INSTITUTIONAL/ RESIDENTIAL
N/ARG-1 to RG-6, MR-1 toMR-6
O-I
Established by ZoningDistrict Regulations
N/AAll districts except forIndustrial uses
MIXED-USE
September 2007 Draft Atlanta Strategic Action Plan310
Community Assessment3

Zon
ing
Cla
ssif
icat
ion
Lan
d U
se
Des
igna
tion
R-1
R-2
R-3
R-3A
R-4
R-4A
R-4B
R-5
RG-1
RG-2
RG-3
RG-4
RG-5
RG-6
RL-C
MR-1
MR-2
MR-3
MR-4 A & B
MR-5 A & B
MR-6
O-I
LW
NC
C-1
C-2
C-3
C-4
C-5
MRC-1
MRC-2
MRC-3
I-1
I-2
PD-H
PD-OC
PD-MU
PD-BP
Ope
n Sp
ace
Sin
gle-
Fam
ily
Low
-Den
sity
R
esid
enti
al
Med
ium
-D
ensi
ty
Res
iden
tial
Hig
h-D
ensi
ty
Res
iden
tial
Ver
y H
igh
-D
ensi
ty
Res
iden
tial
Low
-Den
sity
C
omm
erci
al
Hig
h-D
ensi
ty
Com
mer
cial
Indu
stri
al
Off
ice/
In
stit
utio
nal
Off
ice/
In
stit
utio
nal/
R
esid
enti
al
Mix
ed-U
se
Bus
ines
s P
ark
NO
TE
S:
Shad
ed a
reas
rep
rese
nt c
ompa
tible
zon
ing
clas
sifi
catio
ns.
Non
-sha
ded
area
s re
pres
ent z
onin
g cl
assi
fica
tion
s th
at a
re n
ot c
ompa
tible
wit
h la
nd u
se d
esig
natio
ns.
Sour
ce:
Cit
y of
Atla
nta
Bur
eau
of P
lann
ing.
Figure3.4RelationshipBetweenLand
Use
Designations
andZoning
Classification
311Atlanta Strategic Action Plan September 2007 Draft
Changing the Land Use Designation of a Property
A close correlation exists between the Land Use Plan and the City’s zoning maps. Four times a year,amendments are made to the Land Use Plan so that zoning changes correspond with the Land Use Plan.These amendments are made in order to comply with the landmark case of Moore vs. Maloney, in which afederal court ruled in 1985 that zoning changes must be consistent with the Land Use Map. Prior to thecourt ruling, the land use plan was amended annually to correspond to zoning changes.
The amendments are commonly referred to as “CDP Amendments”, and require the submission of a formalCDP Amendment application and hearing, in a similar fashion to an application for a zoning change to aproperty. The quarterly CDP hearings are conducted in the Atlanta City Hall Council Chambers by theCommunity Development/Human Resources Committee (CD/HR Committee).
A property owner may petition the City of Atlanta to officially change the land use designation on thatproperty. This is called a “CDP amendment” or “CDP land use map amendment”. This usually occurs whena property owner seeks to rezone a property to a zoning classification that is not currently allowed underthe existing land use designation of the property. In that situation, the property owner must also requestthat the land use designation of the property be changed in addition to changing the zoning classificationof the property.
For example, the “Single-Family Residential” land use designation allows only the zoning districts of R-1,R-2, R-3, R-4, R-5, and PD-H. If a property owner were to seek a zoning classification of C-1, then a requestfor a “CDP land use map amendment” must also be filed along with the rezoning application, in order toinitiate the process of changing the land use map designation of the property to Low-Density Commercial.
While it is most common for a CDP land use amendment to be requested in conjunction with a rezoningapplication, occasionally a neighborhood group might request it, or it might be sponsored by the City Councilitself. Such an application would typically be filed with the Bureau of Planning for the purpose of seekinga change in the land use designations of several adjacent or nearby properties in order to encourage thedevelopment of certain types of land use patterns. Changes in land use designations are also made as aresult of redevelopment plan and studies. As part of the Atlanta Strategic Action Plan, NPUs submittedrecommended changes to the land use map.
CDP land use map amendments are reviewed in a similar fashion to that of zoning cases, and then areheard in public hearings that are conducted by the Community Development/Human Resources Committeeof the City Council. These public hearings are held on a quarterly basis. The full City Council makes thefinal decisions on the CDP land use map amendments.
Community Plans
The City of Atlanta has conducted Redevelopment Plans, Livable Centers Initiative Plans, Corridor Plans,Small Area Plans, Citywide plans and studies, and Empowerment Zone Plans. Plans in collaboration withother agencies have also been created and adopted. Moreover, Economic Development Priority Areas havebeen identified in the NewCentury Economic Development Plan. Moreover, Atlanta Renewal Communities,
September 2007 Draft Atlanta Strategic Action Plan312
Community Assessment3

have been identified under HUD's Renewal Community program. These plans, studies, corridors, priorityareas and communities that have been approved by the Atlanta City Council are incorporated into theAtlanta Strategic Action Plan, as well as the recommendations and policies
1. Redevelopment Plans - Adopted Redevelopment plans and StudiesThe city has completed and adopted 24 redevelopment plans, ten of which are in support of TaxAllocation districts. Approved Plans, with date of approval, include:
a. BeltLine Redevelopment Plan 2005The Atlanta BeltLine Redevelopment Plan was completed and adopted by the city in 2005, andsubsequently led to the formation of Atlanta BeltLine Tax Allocation District and Zoning Overlaydistrict. The plan identifies long-term development/re-development strategies and short-termrecommendations for public and private investment, with concentrations on improving and creatingparks and trails, building transit and workforce housing, remediating brownfields, and preservinghistorical resources. It also provides a framework for development over the next 25 years alongthe Beltline, establishes preliminary standards for land use and zoning policies, and recommendstransportation improvement projects to facilitate future development and redevelopment. Mostproperties in the BeltLine Redevelopment area have a high potential for redevelopment andaesthetic improvement.
b. Butler/ Auburn Redevelopment Plan 1994, Updated 2005The study area is roughly bound by Boulevard to the east, Dekalb Avenue to the south, PeachtreeStreet/J.W. Dobbs/I-75/85 to the west and Freedom Parkway to the north. The RedevelopmentPlan Update addresses the issues and strategies contained in the 1994 CRP, particularly updatingand re-conceiving catalytic projects, drafting zoning adjustments, and creating an overarchingmarketing or branding strategy. The plan includes very detailed financial redevelopment studiesas well as general planning recommendations. The Butler/Auburn area is an Empowerment Zoneand contains historic and Landmark buildings.
c. Campbellton/ Cascade Corridors Redevelopment Plan 2006The Cascade Avenue corridor runs fromWillis Mill Road to Langhorn Street, including the CascadeHeights commercial node on one end, and the Kroger Citi-Center shopping center on the other.The Campbellton West corridor includes the portion of Campbellton Road west of I-285 from thecity limits to Barge Road. The Campbellton East corridor includes the portion of CampbelltonRoad between Greenbriar Mall and Fort McPherson, from Maxwell Drive to Oakland Drive. Theplan has been adopted. The Campbellton Road Corridor was designated as an EconomicDevelopment Priority Area in 2005. The Corridor is located in the Campbellton TAD. The landuse changes have been adopted and the projects have been incorporated into the CDP.
d. Castleberry Hill Redevelopment Plan 2000The study area is located on the southwestern edge of downtown Atlanta and south of the PhilipsArena, Georgia Dome, and Georgia World Congress Center in NPU M. The plan consists ofwell-defined programs and projects intended to fulfill the neighborhoods objectives, including theformation of a community development corporation (CDC), the preservation of the Historic Districtthrough design guidelines and zoning, the establishment of pedestrian-friendly streetscapes,
313Atlanta Strategic Action Plan September 2007 Draft
promoting neighborhood oriented retail and employment opportunities addressing a variety oftransportation and parking concerns, reinstating a regular neighborhood clean-up program,reducing crime and improving safety through neighborhood watch and resident-businesspartnerships, and the construction of a park, greenway and community center.
e. DL Hollowell Parkway (aka Bankhead Hwy) Redevelopment Plan 2004The study area includes 5.3 miles from Bankhead MARTA Station to the City limits. The area isclose to the major employment centers such as the Atlanta Industrial Park and the ChattahoocheeIndustrial Park. The major activity nodes include the Bankhead MARTA Station, Grove Park,Hollywood Road, Center Hill Neighborhood, James Jackson Parkway and Woodmere. The landuse and zoning have been adopted and incorporated into the CDP. The area is in the BeltlineTAD and the Hollowell TAD. The D.L. Hollowell Parkway Corridor was designated as an EconomicDevelopment Priority Area in 2005.
f. English Avenue Redevelopment Plan 1998, Updated 2006The English Avenue neighborhood (397 acres) is bound by the Norfolk Southern rail corridor tothe east and north, Joseph E. Lowery Boulevard to the west and Simpson Street to the south.The extended study area also includes a portion to the north of the study area, extending toMarietta Street. It is in close proximity to the downtown business district and the Georgia Aquarium.It is located in NPU L, Council District 3 and the City of Atlanta Westside TAD and RenewalCommunity. This plan builds upon the previously adopted Community Redevelopment Plan (1998).Since the development and adoption of the 1998 plan, increased speculation in English Avenuehas been generated due to a resurgence of development and growth in the area.The plan hasbeen adopted and the projects have been incorporated into the CDP.
g. Jonesboro Road Redevelopment Plan 1998, Updated 2006The study area includes approximately six miles fromMcDonough Boulevard to the Fulton/ClaytonCounty Line. The corridor has a mix of newer, well-kept retail business juxtaposed against olderstrip centers. The Southside Industrial Park is a major employment center in the area.Hartsfield-Jackson is close by. The activity nodes are the BeltLine, Lakewood Heights, HarperRoad, Cleveland Avenue, Hutchens Road and I-285. The plan has been adopted. The land usechanges have been adopted and the projects have been incorporated into the CDP. The Corridoris located in the North End and BeltLine TAD. The Jonesboro Road Corridor was designated asan Economic Development Priority Area in 2005.
h. Mechanicsville Redevelopment Plan 2004This neighborhood plan is one of the four redevelopment plans incorporated into the StadiumNeighborhoods TAD Redevelopment Plan (2006) and Economic Priority Area. The plan andprojects projects have been adopted and incorporated into the CDP. This plan was the basis fora special Public Interest District: SPI-18 zoning was created in 2003 and amended in 2006.
i. Memorial Drive-MLK Drive Area Revitalization Study 2001
September 2007 Draft Atlanta Strategic Action Plan314
Community Assessment3

This study analyzed the underutilized properties along both corridors, encompassing 2.2 milesfrom I-75/85 to Boulevard corridor. The corridor is close to the Downtown Employment Centerand has a mix of land uses. The plan lead to recommendations which include proposed mixed-usedevelopment areas that satisfy the need for more retail, cultural and neighborhood services, whilestill preserving the scale and character of adjacent neighborhoods.The study was conducted concurrently with the Empowerment Zone neighborhood master plansThe plan has been adopted. The land use and zoning have been adopted. SPI-22 zoning hasbeen approved for the study area and the projects have been incorporated into the CDP. Thisstudy area was designated by the Atlanta Regional Commission as a “grandfathered” LivableCommunities Initiative area in 2002. A portion o the Memorial Drive Corridor was designated asan economic Development Priority Area in 2005. The area is partially in the Beltline TAD.
j. Metropolitan Parkway Redevelopment PlanSee Stewart Avenue Redevelopment Plan below.
k. Old Fourth Ward Neighborhood Development Plan 1989 & Old Fourth Ward CommunityRedevelopment Plan 1994The 1989 Neighborhood redevelopment plan concentrates primarily on housing and historicpreservation issues in the neighborhood. The 1994 Community Redevelopment Plan was createdto support the designation of the Old Fourth Ward Urban Redevelopment Area. The primarypurpose of the Plan is to present the vision of the Old Fourth Ward community as a rejuvenated,economically and socially diverse community, endowed with opportunities to live, work and playin a safe and livable intown environment. Both of these plans were created prior to theimplementation of the Freedom Parkway Road project and prior to the conception of the BeltLineinitiative, both of which completely alter the transportation, land-use and economic context of theneighborhood.
l. Peoplestown Redevelopment Plan 1996, Updated 2006This neighborhood plan is one of the four redevelopment plans incorporated into the StadiumNeighborhoods TAD Redevelopment Plan (2006) and Economic Priority Area. The plan andprojects have been adopted and incorporated into the CDP. This neighborhood is located in theBeltline TAD.
m. Pittsburgh Redevelopment Plan 2001, Updated 2006This plan helped to develop a long-term community-wide vision and policy for the PittsburghNeighborhood. The plan generated 27 redevelopment projects, a land use plan, civic andtransportation improvements as well as a rezoning plan. This effort will help protect existingneighborhood residents and will bring investment back into this once-thriving community. Theplan has been adopted and the projects have been incorporated into the CDP. This neighborhoodis located in the Beltline TAD This neighborhood plan is one of the four redevelopment plansincorporated into the Stadium Neighborhoods TAD Redevelopment Plan (2006) and EconomicPriority Area.
n. Reynoldstown Redevelopment Plan 2000
315Atlanta Strategic Action Plan September 2007 Draft

Reynoldstown is situated south of Memorial Drive to I-20 with Moreland Avenue to the east, PearlStreet to the west and the Southern Railroad to the north all contained within NPU N. TheNeighborhood Master Plan goals include occupying/ utilizing all vacant lots with land uses thataddress the needs of the community, restoring a pedestrian friendly environment, improving streetconditions, renovate and expanding existing housing stock, community and commercial facilities,creating a safe and drug free community, and improving parks and open space. Adopted January2001.
o. Simpson Road Redevelopment Plan 1995, Updated 2006The study area includes 4.2 miles of Simpon Road/Avenue from H.E. Holmes Boulevard toNorthside Drive. The major employers in and surrounding the study area include Coca-Cola,Turner Entertainment, Cartoon Network, Custom Services, HJR Russell and the GWCC. Majoractivity nodes include: Joseph E. Lowery Boulevard, Beltline, Chappell Road andWestlake Avenue.The plan has been adopted, and its recommended land use changes have been adopted and theprojects have been incorporated into the CDP. The corridor is partially located in the BeltlineTAD. The Simpson Road Corridor was designated as an Economic Development Priority Area in2005.
p. Southside Redevelopment PlanThe Southside Redevelopment Plan includes all of the neighborhoods in NPU Y. The Planidentifies residential and commercial implementation projects along Pryor Rd, Jonesboro Rd, andMcDonough Blvd corridors and streetscape improvements such as Pryor Rd, and the LakewoodTown Center area and Lakewood Avenue. Adopted July 2000.
q. Stewart Avenue (renamed Metropolitan Parkway) Redevelopment Plan
r. Summer Hill Redevelopment Plan 1993, Updated 2006This neighborhood plan is one of the four redevelopment plans incorporated into the StadiumNeighborhoods TAD Redevelopment Plan (2006) and Economic Priority Area The plan andprojects have been adopted and incorporated into the CDP.
s. Vine City Redevelopment Plan 2004The Vine City Neighborhood study includes Simpson Street to the north, Northside Drive to theeast, Martin Luther King Jr. Drive to the south, and Lowery Boulevard to the west. The Vine Cityneighborhood is surrounded by the following neighborhoods: English Avenue to the north,Washington Park to the west, Ashview Heights to the south-west, Atlanta University to the south,Castleberry Hills to the southeast, and Downtown to the east. The redevelopment plan highlightskey development projects for new/ rehabilitated and preserved housing, mixed-use and institutionaldevelopment and infrastructure improvements building on the strengths and opportunities of thecommunity. Through the planning process, 29 projects were further defined and an illustrativeplan was generated to illustrate the potential 20-year build-out. The major activity nodes areSimpson Road and J.E. Lowry, Carter Street Park, Northside Drive, Vine City Park and Elm Street.The plan has been adopted. The land use and zoning changes have been implemented, andthe plan’s recommended projects have been incorporated into the CDP.
September 2007 Draft Atlanta Strategic Action Plan316
Community Assessment3

2. Tax Allocation District Redevelopment PlansThe city has completed and adopted ten redevelopment plans in support of the formation of TaxAllocation Districts. These plans include:
a. Atlantic Steel Redevelopment (TAD) 1999b. BeltLine Redevelopment Plan (TAD) 2005c. Campbellton Road Redevelopment Plan (TAD) 2007d. DL Hollowell Parkway (AKA Bankhead Hwy) Redevelopment Plan (TAD) 2004e. Eastside Atlanta Redevelopment Plan (TAD) 2003f. Metropolitan Parkway Redevelopment Plan (TAD) 2006g. Perry Bolton Redevelopment Plan (TAD) 2002h. Princeton Lakes Redevelopment Plan (TAD) 2002i. Stadium Neighborhoods Redevelopment Plan (TAD) 2006
This TAD redevelopment plan encompasses four neighborhoods located around the Turner Fieldsouth of Downtown Atlanta.i. Summerhill (2006)ii. Peoplestown (2006)iii. Mechanicsville (2004)iv. Pittsburgh (2006)
j. Westside Redevelopment Plan (TAD) 19983. Plans and Studies in Progress
Plans that are currently underway or pending adoption include:a. Old Fourth Ward Master Plan, 2007-
The Bureau of Planning is currently in the initial stages undertaking a Master Plan process for theOld FourthWard Neighborhood, which has recently been expanded to include what was previouslyknown as the Bedford Pines Neighborhoods. Rapid redevelopment in the area, combined withthe completion of Freedom Parkway and BeltLine planning and development activities havenecessitated a new master plan for the neighborhood. The plan is expected to be completed inSpring of 2008.
b. Cleveland Avenue Corridor Redevelopment Plan , 2007-The Bureau of Planning is currently in the initial stages of conducting a corridor study of theCleveland Avenue Corridor from Jonesboro road to the Atlanta City Limits. It is intended that thisstudy can be combined with a similar study of the East Point portion of the corridor, to create ajoint corridor study to be submitted to the Atlanta Regional Commission for consideration fordesignation as an LCI area. The plan is expected to be completed in Spring of 2008
Livable Centers Initiative Plans
The City is also involved with the Livable Centers Initiative (LCI) Program, sponsored by the Atlanta RegionalCommission. The primary focus of the program is to encourage mass transit-oriented, pedestrian-friendlymixed-income residential development, as well as mixed-use developments and improve the connectivityat the activity and town center level as an alternative to standard suburban or strip type developments. This
317Atlanta Strategic Action Plan September 2007 Draft
program awards $5 million over five years with $3 million already awarded for planning studies. 500 milliondollars has been made available for project and plan implementation (transportation). The City, partneredwith other organizations, is developing the following Livable Centers plans and proposed implementationstrategies:
1. Adopted plans and Studies
a. Bankhead MARTA LCI 2005The study area is located 2 miles west of Midtown, centered at the terminus of MARTA’s ProctorCreek Rail line at Donald Lee Hallowell Parkway and Gray Street, just north of Maddox Park. Itincludes a one half mile radius around the rail station and contains 738 acres. The activity nodesare located along D. L. Hollowell Parkway. Emphases should be given to the preservation ofhistoric neighborhoods: Grove Park and English Avenue. The plan was adopted. The land usewas adopted and the projects have been incorporated into the CDP.
b. Bolton Road/Moore’s Mill’ LCI 2002This study area is located at the intersection of Marietta Boulevard and Bolton Road. It alsoincludes a larger area to ensure that the connectivity between major users and activities withinthe area is considered. This activity center includes a variety of industrial, commercial andresidential developments. The focus of the study is to encourage the expansion and redevelopmentof this area into a mixed-use development node. The major components of this proposed activitycenter include theMoore’s Mill shopping center and immediate areas as focal point. A supplementalStudy, the Bolton/Moore’s Mill Transportation Plan (2002) followed the Bolton-Moore’s Mill LCI.This study examined the area’s transportation issues in greater detail. Both plans have beenadopted. A five year update for this plan is underway. Project Implementation: Bolton RoadIntersection Improvement (Marietta Boulevard)-$1,000,000.
c. Buckhead Village LCI 2001The Buckhead Transportation Management Association (TMA) worked to bring consensus amongvarious community groups and business organizations in the Buckhead area by assemblingprevious study information and utilizing a visual preference survey. In addition to focusing on LCIgoals, issues of connectivity and housing availability in the study area received emphasis. Theplan has been adopted and the projects have been incorporated into the CDP. ProjectImplementation: SR-141 (Peachtree Road)Multimodal Corridor Enhancements Project -$3,717,463.
d. City Center LCI 2001This study area includes the corridors along Decatur and Marietta Streets, Auburn Avenue andEdgewood Avenue, as well as three MARTA stations (King Memorial, Georgia State and FivePoints). This activity center study will focus on increasing connectivity among lower incomeneighborhoods, the Downtown employment center and transit stations. In addition, the study willconcentrate on infill development and redevelopment opportunities within the study area. Theplan has been adopted and the projects have been incorporated into the CDP.
e. Greenbriar Mall LCI 2000
September 2007 Draft Atlanta Strategic Action Plan318
Community Assessment3

This existing older suburban mall area offers opportunities to transform auto-oriented centers tomore transit and pedestrian friendly environment. The plan will be a model for older suburbanstrip centers or malls throughout the region to determine needs and incentives for redevelopment.The plan has been adopted. The land use and zoning has been adopted and the projects havebeen incorporated into the CDP. Project Implementation: Greenbrier Parkway PedestrianImprovements (Langford Parkway to I-285)-$1,908,000, BargeRoad/Campbellton Road IntersectionImprovements-$280,000, Langford Parkway (At Campbellton Road)-$0, Headland Street PedestrianImprovements (Greenbrier Parkway to City limits)-$0.
f. Hamilton E. Holmes MARTA Station Area LCI 2002Hamilton E. Holmes MARTA Station is located in southwest Atlanta. The area is 495.5 acres.The activity center proper is located along Martin Luther King, Jr. Drive, between Linwood Streetand HE Holmes Drive. The plan will be to create a mixed-use nodal development around thestation. The station is to become a gateway to the neighborhood and business district. The planhas been adopted. The land use has been partially adopted through the MLK Jr. Dr. Study. Afive year update for this project is currently underway.
g. JSA-McGill LCI 2003Central Atlanta Progress and the Atlanta Downtown Improvement District will conduct this studyto focus on the east-west corridor in north Downtown Atlanta that includes the plannedimprovements to the Jones Avenue, Simpson Street and Alexander Street corridor and the RalphMcGill Boulevard corridor. This vital corridor will experience great change with the plannedconstruction of the Georgia Aquarium and adjacent World of Coca-Cola project. The LCI studywill recommend best-practice solutions for integrating existing, proposed and future developmentinto the corridor’s physical and social infrastructure. The study will propose creative solutions forlinking this growth with the rest of Downtown Atlanta and the area’s roadway and transit facilities.This study will maximize the potential of the Civic Center MARTA station and transform thesurrounding community into a true Transit-Oriented Development. East-west circulation, connectivityand compatibility will also be considered from the I-75/85 Downtown Connector west to theproposed Georgia Aquarium and World of Coca-Cola sites. The plan has been adopted and theprojects have been incorporated into the CDP.
h. Midtown LCI 2001Midtown is a two square mile, high-density corridor with Peachtree Street as is core. Within a1-mile radius of Midtown’s core, there are over 58,000 employees and 27,000 residents makingit among the most dense activity centers in the region. The Midtown study, referred to as BlueprintMidtown, focused on the area from Piedmont Avenue on the east to I-75 on the west and then onthe north and south where I-75/85 crosses Peachtree Street. This plan was adopted in 1997 andmet all the criteria set forth in the Livable Centers Initiatives. Rather than fund a repetitive planningstudy, ARC reviewed the planning process and the results and granted Blueprint Midtowngrandfathered status. The plan was adopted and the projects have been incorporated into theCDP. The plan has been adopted.
i. Moreland Avenue Corridor LCI 2007 (Grandfathered)
319Atlanta Strategic Action Plan September 2007 Draft

This study was originally carried out as a joint City of Atlanta/Georgia Department of Transportationproject, subsequently submitted to the Atlanta Regional Commission for consideration as a“grandfathered” LCI area. The study examined three contiguous and overlapping study areas onAtlanta’s east side: Ponce de Leon Ave, Moreland Ave. and Moreland LCI. The activity nodesinclude: Moreland Ave at Euclid/McLendon Ave., Edgewood Retail, Wylie Street, Memorial Driveat I-20 and Edgewood at Hurt Street. The plan was adopted and the projects have beenincorporated into the CDP. In 2007, the Atlanta Regional Commission granted both corridorsdesignation as Livable Centers Initiative areas.
j. Oakland City Lakewood LCI 2004The study area is located in the southwest quadrant of the City just north of the City of East Point.The study area contains two MARTA Stations, Lakewood/ Fort Macpherson and Oakland. Thearea highlights include retail nodes along Lee Street and the Murphy Avenue Industrial Corridor.The area also includes a wide variety of historic resources. The plan has been adopted and theprojects have been incorporated into the CDP.
k. Ponce de Leon Avenue Corridor LCI 2007 (Grandfathered)This study was originally carried out as a joint City of Atlanta/Georgia Department of Transportationproject, subsequently submitted to the Atlanta Regional Commission for consideration as a“grandfathered” LCI area. The study examined three contiguous and overlapping study areas onAtlanta’s east side: Ponce de Leon Ave, Moreland Ave, and Moreland LCI. The activity nodesinclude: Moreland Ave at Euclid/McLendon Ave, Edgewood Retail, Wylie Street, Memorial Driveat I-20 and Edgewood at Hurt Street. The plan was adopted and the projects have beenincorporated into the CDP. In 2007, the Atlanta Regional Commission granted both corridorsdesignation as Livable Communities Initiative areas.
l. West End Station LCI 2000Study area incorporates the mixed-use community surrounding theWest End MARTA rail Station.The area has many opportunities for redevelopment including the Candler warehouse area. Thestudy determines opportunities for transit oriented development (TOD) and other needs in thearea to create a more thriving urban community.The plan has been adopted. The land use andzoning has been adopted and the projects have been incorporated into the CDP. ProjectImplementation: Ralph David Abernathy Boulevard (Ashby to Lee) Pedestrian and IntersectionImprovements- $1,268,000, Lowery Boulevard (AKA Ashby Street) Pedestrian Improvement-$627,250.
m. Upper Westside LCI 2004
n. The study area is bound by Northside Drive to the east, Bankhead Hwy to the south, MariettaStreet to the west and Culpepper Street to the north. The study area encompasses 1,400 acres.The thriving major corridor in the area is Northside Drive. The Activity Nodes in the area includeHuff Design, Marietta/Howell Mill/Main Street, Howell Station/ Knight Park, English Avenue,Antioch, and Downtown Atlanta. The plan has been adopted. The land use has been adoptedand the projects have been incorporated into the CDP.
September 2007 Draft Atlanta Strategic Action Plan320
Community Assessment3

2. LCI Plans and Studies in Progress
a. Westlake MARTA Station LCI 2006The study area is focused around the Westlake MARTA Station. The study encompasses 650acres and lies in a portion of 7 neighborhoods. The study focuses on transit alternatives,appropriate density and historic preservation. The activity nodes are: Simpson Road and WestLake Avenue, MLK Jr. Drive and Westview Cemetery, R. D. Abernathy Blvd. and Lucile Avenue,and the West Lake MARTA Station. The plan was completed in December 2006. It is currentlygoing through the legislative process. The City filed a pre-qualification application in the amountof $3.9 million dollars to fund a project recommended by the plan.
b. South Moreland Avenue Corridor LCI (2007)The South Moreland Study focuses on the area from I-20 to Constitution Avenue, including thearea ¼mile from the centerline of the corridor. The corridor is connected to I-20 with easy accessto I-285 and I-675. Moreland Avenue is a major collector with rapid growth taking place in manyforms, including infill residential construction, demolition and rebuilding commercial space, andnew mixed-use that will have a significant impact on the character on the corridor. The plan isscheduled for completion in March 2008.
3. Other LCI Initiatives
a. Peachtree Corridor Workforce Housing StudyIn 2002, the ARC/LCI program funded a workforce housing study for Downtown, Midtown andBuckhead spearheaded by sister organizations Central Atlanta Progress, the Buckhead ActionCommittee and the Midtown Alliance to address the need for affordable “workforce housing” alongthe Peachtree corridor from Downtown, through Midtown to Buckhead. The study maderecommendations on the mechanisms that could be used to effectively build housing affordableto many of the employees in these very dense and high land cost areas.
b. SMARTAQ (Strategies for Metropolitan Atlanta‘s Regional Transportation and Air QualityThis initiative also focuses on LCI studiess to find out how LCI plans have furthered the land useand transportation planning in the study areas and how LCI funded transportation investmentsmight be evaluated. West End LCI along with Perimeter Center and the City of Marietta LCI’s arethe study areas recommended to perform a detailed review of expected transportation choicesand other impacts.
c. Regional Affordable Homeownership Task ForceThe Greenbriar community along with Norcross and the City of Marietta has been chosen as apilot community of the Regional Affordable Homeownership Task Force.
4. 2007 LCI Pre-Qualification ApplicationThe Atlanta Regional Commission (ARC) has accepted applications for 2007/2008 LCI implementationprojects. These recommendations will be evaluated and awarded in the Fall of 2007. The City ofAtlanta submitted and application for a streetscape/bike/pedestrian project along RDA Boulevard and
321Atlanta Strategic Action Plan September 2007 Draft

MLK Jr. Drive as recommended in the Westlake MARTA Station LCI Study. The project budget is $3.9million.
Corridor Plans
The following corridors, which generally include a road and transportation facilities and properties within ¼mile, have all been the subject of planning efforts which have been adopted by the city.
1. Corridor Redevelopment Plans (for details see “Redevelopment Plans” Section above):
2. Campbelton/-Cascade Corridors Redevelopment Plan 2006a.b. Cleveland Avenue Corridor Study (Underway 2007)c. DL Hollowell Parkway (AKA Bankhead Hwy) Corridor Redevelopment Plan 2004d. Jonesboro Road Corridor Redevelopment Plan 1998, Updated 2006e. Memorial Drive-MLK Drive Area Revitalization Study 2001f. Metropolitan Parkway Redevelopment Plang. Simpson Road Corridor Redevelopment Plan 1995, Updated 2006h. Stewart Avenue (renamed Metropolitan Parkway) Redevelopment Plan
3. LCI Corridor Plans (for details see “Livable Centers Initiative Plans” Section above)4. a. JSA-McGill LCI 2003a.
b. South Moreland LCI (Currently Underway 2007-) and Moreland Avenue Corridor LCI 2007(Grandfathered)
c. Ponce de Leon Avenue CorridorLCI 2007 (Grandfathered)3. Other Adopted Corridor Plans
a. Cheshire Bridge Road Study 1999This comprehensive study addressed transportation, marketing, urban design, environment andland use concerns in the area. Recommendations include a number of transportation andstreetscape improvements which are currently funded and underway.
b. Martin Luther King Jr. Drive Corridor Study 2005The MLK Drive Corridor study included a land use analysis and future traffic impact analysis todevelop recommendations for future land uses, and road and intersection improvements.
c. Northside Drive Corridor Plan 2005The future transportation function of Northside Drive from I-75 to I-20 was studied using theregional transportation model. Demographic and market pressures were the primary drivers ofchange, and different transportation improvement scenarios were analyzed to determine appropriateand effective recommendations to accommodate future travel demand and urban growth.
d. Ponce de Leon Boulevard/Moreland Avenue Corridor Study 2005The purpose for the Ponce/ Moreland Avenue Corridor Study, is to arrive at a set of practicalrecommendations for improved coordination of all types of transportation through the area andto identify potential enhancements to non-motorized modes of movement including access totransit, pedestrian and bicycle friendly infrastructure, and incentives for increased mixed use/mixed
September 2007 Draft Atlanta Strategic Action Plan322
Community Assessment3

income development along the corridor. Both corridors have been experiencing a surge of currentand proposed construction of large developments. The study will recommend land uses, ingressand egress to adjacent developments, improvements to intersections and traffic signals and otherroad improvements, which will address the safety and efficiency of the corridor. The plan wasadopted by the city in 2005. In 2007, the Atlanta Regional Commission granted both corridorsdesignation as Livable Centers Initiative areas.
Other Small Area Plans
The following plans have all been adopted by the city of Atlanta and incorporated into the ComprehensiveDevelopment Plan.
1. East Atlanta Village Plan 2000This was a comprehensive commercial revitalization plan promoting neighborhood commercialdevelopment. Study recommendations include streetscape and transportation improvements.
2. Home Park Master Plan 2003The greater Home Park Master Plan was completed in August 2002 and adopted in 2003. The masterplan aims to champion development that enhances the multi-faceted character of Home Park, networkthe community with internal and external linkages that enable convenient, but controlled, access toamenities and services, and add green space for public gathering and recreation.
3. Lindbergh Transportation Urban Design Plan 2000The Lindbergh Transit Station Area Development Study (TSADS) reflects, current development activityand provides a framework for future growth. The City of Atlanta is also in the process of creating anew Special Public Interest zoning district for the Lindbergh area that will direct future development insuch a way that encourages the creation of the vibrant, pedestrian and transit-oriented urbanneighborhoods recommended in the proposed TSADS update. Adopted July 2001.
4. North Highland Avenue Transportation and Parking Study 1999This study focused on the transportation, parking and pedestrian issues along North Highland Avenueto preserve and enhance the unique character of the adjacent neighborhoods.
5. NPU S Comprehensive Plan 2002This framework plan will examine the entire NPU, identifying the major issues and devising a strategyfor enhancing residential uses and major corridors. Adopted 2002.
6. NPU X Comprehensive Plan 2005This framework plan will examine the entire NPU, identifying the major issues and devising a strategyfor enhancing residential uses and major corridors. Adopted 2005.
7. Northwest Atlanta Framework Plan 2000
323Atlanta Strategic Action Plan September 2007 Draft

The Plan for Council District 9 examines the entire area with a focus on its major corridors: BankheadHighway, Bolton Road, Marietta Boulevard, and Hollywood Road. corridors along with the ChattahoocheeAve. area. The study identifies a vision for revitalizing these corridors and prepares recommendationsto guide residential infill development, stimulate commercial revitalization, enhance access to commercialopportunities, and improve the overall connectivity within the area. Adopted 2000.
8. Southwest Atlanta Framework Plan 2000This plan, which includes NPUs H, I, P, & R, identifies implementation projects for commercialrevitalization, infill housing guidelines, intersection improvements, streetscape improvements andenhanced environmental protection. Projects recommend from this study include the Cascade/Ben E.Mays streetscape, Greenbriar Mall Livable Community Initiative study and Campbellton Road Study.
9. District 2 Rail Corridor Study 2001The purpose of this inventory and assessment was to examine the large parcels of undeveloped and/orunderdeveloped industrial zoned properties along the Norfolk Southern rail corridor within the City ofAtlanta Council District Two. This information is intended for use by interested parties, including theRailroad Territory Task Force of NPU M and N, a group of residents, businesses, property ownersand elected officials in the Assessment Area. It provides information that supports efforts to developa vision and strategy for the long-term development of industrial properties along the rail corridor.
City Wide Plans and Studies
1. Adopted plans and Studies
a. Parks Open Space and Greenways Plan 1994This was the first update of the City’s Parks Master Plan undertaken since 1968. This plan wasa major element of the City’s build-up to the 1996 Olympics.
2. Plans and Studies in Progress
a. Atlanta Comprehensive Transportation Plan, Underway, Completion Expected Fall 2008The City of Atlanta Comprehensive Transportation Plan will support the City’s comprehensivedevelopment plan update (Atlanta Strategic Action Plan) by addressing connections between landuse and transportation, giving explicit consideration to the ability of recommendations to supportlocal and regional land use plans, and examining land use linkages, connectivity, and accessmanagement. The Plan will commence in the summer of 2007 and is expected to lastapproximately 1 year.
b. Project Greenspace, Underway, Completion Expected Fall 2007Project Greenspace is a long-term plan for growing and managing Atlanta's greenspace system.The plan will create a vision and framework for a world-class greenspace system that connectspeople with great public spaces, nature preserves, parks, plazas, and streetscapes. The plan
September 2007 Draft Atlanta Strategic Action Plan324
Community Assessment3

will leverage the City’s phenomenal economic growth to create a connected system of naturepreserves, parks, plazas, and streetscapes while creating regulatory incentives that preserve theurban tree canopy.
c. City of Atlanta Brownfield Program 2005, OngoingThe City of Atlanta was awarded two community-wide U.S. Environmental Protection AgencyBrownfield Assessment Pilot grants in 2005 to assess properties thought to be contaminated byhazardous substances or petroleum. Brownfields are properties that are abandoned or underutilizedbecause of actual or perceived contamination, which makes their redevelopment difficult.
This project builds upon the work conducted in a previous brownfield pilot programwhich the City completed in 2004. The City’s goals in this project are to build uponthe current momentum in the City to revitalize neighborhoods, redevelop underutilizedproperties, address environmental justice concerns, and create new greenspace.The City plans to utilize grant resources on properties with the greatest potential forreuse/redevelopment and that have broad-based community support.
Economic Development Priority Areas
The highest priority targets for redevelopment and improvement are the six Economic Development PriorityAreas that were identified in the City’s 2004 New Century Economic Development Plan, all of which exhibitnot only significant levels of poverty, unemployment and disinvestment, but also the potential for theimprovement with concerted public investment and economic development. The six areas all meet thefollowing criteria identified in the economic development plan:
Additional focus by the City and ADA will impact job creation, residential, and commercial developmentin the near-termSignificant developable area is availableSupports affordable housing growth goals and mixed use communitiesAttracts goods and services for the existing revitalizing neighborhoodsEnhances the usage of existing transit infrastructureAligns with employment centersProvides greenspace opportunitiesCan be implemented with tools and incentives
These Economic Development Priority areas are:
1. Campbellton Road Corridor2. Donald Lee Hollowell Parkway Corridor3. Jonesboro Road Corridor4. Memorial Drive Corridor5. Simpson Road Corridor6. Stadium neighborhoods
325Atlanta Strategic Action Plan September 2007 Draft

7. Mechanicsville8. Peoplestown9. Pittsburgh10. Summerhill
Empowerment Zone Plans
The following plans all fall within designated Empowerment Zone areas:
1. Butler-Auburn Redevelopment Plan2. Castleberry Hill Redevelopment Plan3. English Avenue Redevelopment Plan4. Mechanicsville Corridor Redevelopment Plan5. Memorial Drive Corridor LCI6. Memorial Drive-MLK Drive Area Revitalization Study/LCI7. Old Fourth Ward Redevelopment Plan8. Peoplestown Redevelopment Plan9. Pittsburgh Redevelopment Plan10. Reynoldstown Redevelopment Plan11. Southside Redevelopment Plan12. Summerhill Urban Redevelopment Plan13. Vine City Redevelopment Plan
Atlanta Renewal Communities
Atlanta was recently designated as a Renewal Community by the Department of Housing and UrbanDevelopment presenting an opportunity to stimulate job growth, promote economic development and createaffordable housing in the distressed areas of Atlanta’s Empowerment Zone and Linkage Communities.
Renewal Community Initiative Highlights:
Encourage public/private collaborations to generate economic development in 40 distressed communitiesaround the country.
Include $17 billion in tax incentives. Low Income Housing Credits and New Market Tax Credits
Areas included in the designation are to become renewal clusters (3)
The City of Atlanta will facilitate in attracting new business and providing employment opportunities forRenewal Community residents through Wage Credits, Work Opportunity Credits, Welfare to Work Credits,tax deductions (i.e. Commercial Revitalization Deductions, Section 179 Deductions, Environmental CleanupCost Deductions), capital gains exclusions (i.e. Zero Percent Capital Gains Rate), and bond financing (i.e.Qualified Zone Academy Bonds). Renewal Communities include:
September 2007 Draft Atlanta Strategic Action Plan326
Community Assessment3

1. Westside Renewal ClusterCombines six communities linked by Ralph David Abernathy Blvd, Martin Luther King Jr. Dr, JosephE. Lowery Blvd, Northside Dr. and Simpson Rd. Communities in this cluster include West End HistoricDistrict, Vine City/ Ashby St., Simpson Rd. Corridor, Greater Atlanta University Center Community,Northwest Atlanta, and English Avenue.
2. Eastside Renewal ClusterIncludes the Old Fourth Ward neighborhood, the Butler/ Auburn community, and Reynoldstown.
3. Southside Renewal ClusterMemorial Dr., Pryor Rd., Jonesboro Rd. and Metropolitan Pkwy are major commercial corridorsconnecting the neighborhoods in this Cluster. It includes Mechanicsville, Pittsburgh, Jonesboro RoadCorridor, Capitol Homes/ Memorial Drive, Thomas Heights, and greater Southside.
Collaborations with Other Agencies
The city is also actively involved in the adoption and implementation of planning studies initiated by otheragencies.
1. Midtown Alliance - Midtown Blueprinta. Midtown SPI, Midtown CID – completed, streetscape implementation underway
2. Downtown Plan – Central Atlanta Progressa. Downtown SPI - completedb. Downtown/Old 4th Ward Corridor LCI – completed, implementation will be Underway this year
3. Buckhead Coalition
a. Buckhead Village Urban Design Guidelinesb. Buckhead CID (BATMA)c. Buckhead LCI - completed
Atlanta University Center – University Center Development Corporation
Master Plan and Community Revitalization – completed, implementation underway
Atlantic Steel Design Framework – GDOT, EPA, GRTA, Atlantic Station LLC, ADA
Tax Allocation District - adopted17th Street Bridge – design completed
Historic Westside Village – Atlanta Development Authority
Master Plan and implementation - construction underway
Atlanta Housing Authority collaborations:
327Atlanta Strategic Action Plan September 2007 Draft

Centennial Place Hope VI – implementationEast Lake Revitalization - implementationCarver Hope VI –implementationHarris Homes Hope VI implementationWest Highland Hope VI Revitalization implementationKimberley Homes Hope V Revitalization –implementationCapitol Homes Hope VI – applicationMcDaniel Glenn Hope VI-implementationGrady Homes Hope VI-implementationUniversity Homes Hope VI- implementation
Issues and Opportunities
1. Infill and Design
a. Not all neighborhoods have design guidelines to ensure appropriate new and infill developmentthat complements the character of the community.
b. Some new subdivisions do not follow the same platting pattern as existing neighborhoods,particularly in the street layout, orientation and design.
c. Older homes are being replaced with newer homes that are incompatible in scale, height, massing,size and design.
d. Major roadways are developed with unattractive suburban/auto oriented typee. Development regulations allow suburban type development in the City.f. The city is still rebuilding from the urban disinvestment of the 1970’s and 1980’s. Some parts of
the city still have a significant amount of blight.2. Mix of Land Uses
a. There is inadequate mix of uses (like corner groceries or drugstores) within neighborhoods.b. There are not enough neighborhood centers to serve adjacent neighborhoods.c. In some cases there is not enough transition between land uses.d. Industrial uses are being lost and redeveloped for non-industrial uses.e. Some industrial buildings are obsolete.f. Residential and mixed use developments in industrial areas are creating land use conflicts.
3. Approval and Permitting Process
a. Developers complain about local development approval process, especially for innovative projects.b. At times there is neighborhood opposition to new/innovative or higher density developments.
4. Transportation
a. Development patterns do not create a pedestrian oriented environment.b. In some cases major centers and corridors do not have enough density to support transit.c. Land Use and transportation policies need to be coordinated in order to compliment each other.
September 2007 Draft Atlanta Strategic Action Plan328
Community Assessment3

d. There is too much land dedicated to parking or other paved areas, particularly in Downtown andMidtown.
e. Parts of the City are spread out and only accessible by car.5. Open Space
a. Public space/open space is not incorporated into new developments, particularly in Downtown,Midtown and Buckhead.
b. Public spaces sometimes are not designed for gathering and social interaction.c. Some of the remaining greenfields are being developedd. New developments in greenfields clear cut trees prior to development.
6. Housinga. There is a lack of housing, particularly workforce housing, at employment centers.b. Land Use policies do not promote affordable housing throughout the City.c. Some of the affordable housing stock is being lost.
329Atlanta Strategic Action Plan September 2007 Draft

4 Community Agenda
Implementation Program
Short Term Work Program
In order to maintain Qualified Local Government (QLG) status under the Georgia Planning Act, localgovernments must have an approved and adopted Short Term Work Program (STWP) for implementationof their Comprehensive Plan. The STWP is a key implementation tool which reflects those activities andstrategies the City of Atlanta proposes to implement over the next five years. The City of Atlanta updatesthe STWP annually.
The STWP contains a list of the major actions to be undertaken by the City to implement the comprehensiveplan recommendations. These actions include a description of community and economic developmentinitiatives or programs, major capital improvements or infrastructure expansions, regulatory measures orland development regulations to be adopted or amended. This list of actions is also supplemented withinformation regarding each project's time frame, party responsible for implementation, estimated projectcosts, funding sources, council districts and NPUs. The sections in the Short Term Work Program is thealmost the same as the plan elements. These are: Economic Development, Housing, Natural and CulturalResources, Community Facilities, Transportation, and Land Use. In addition, each NPU was given theopportunity to included projects to be added in the STWP.
Economic Development
September 2007 Draft Atlanta Strategic Action Plan330
Community Agenda4

Table4.1City
ofAtlanta2008
-2012SHORTTE
RMWORKPROGRAM-EconomicDevelopment
NPU
CD
Responsible
Party
Cos
tX1
000
Fund
ing
Source
Com
pletion
year
Current,n
ewin
2007
orprop
osed
Descriptio
nNam
eProg
ram
M,L
2,3
ADA
80,000
TAD
Bonds
ongoing
current
3rdbond
issue
WestsideTA
D1
D9
ADA
t/b/d
TAD
Bonds
ongoing
current
3rdbond
issue
AtlanticSteelTA
D2
M,W
1,2,5
ADA
t/b/d
TAD
Bonds
ongoing
current
2ndbond
issue
EastsideTA
D3
ADA
t/b/d
TAD
Bonds
ongoing
current
1stbondissue
PerryBoltonTA
D4
Vary
Vary
ADA/COA
TBD
Property
Tax
Increm
ent
ongoing
current
ObtainapprovalfromAPS
andFultonCounty;
operationalize
Com
mercialRevitalization
TADSforT
urnerF
ield
area,M
etropolitan,
5
Hollowelland
Cam
pbellton
Road
Vary
Vary
ADA/COA
n/a
General
Fund
ongoing
current
Establishpre-qualified
areas
andprogramefficiencies
Urban
EnterpriseZone
program
6
Vary
ADA/COA
t/b/d
General
Fund
2007
proposed
Update%tocompetewith
surroundingjurisdictions
FreeportExemptionfor
companies
who
ship
inventoryoutofstate
7
n/a
Stateof
Georgia
2007
proposed
Securedesignation
OpportunityZone
designationforindustrial
parksinthecity
8
t/b/d
General
Fund
ongoing
current
Grantsforcorporate
relocations
EconomicOpportunity
Fund
9
City-wide
N/A
COA
500
CDBG
ongoing
current
Issueas
approved
byADA
CreditR
eviewCom
mittee
Smallbusinessloan
programs
10
ADA
1,500
Renew
alCommunity
ongoing
proposed
Securedesignation
RCsm
allbusinessloan
fund
11
ADA
n/a
n/a
ongoing
current
Issueas
approved
byADA
board
501c3bonds
12
?new
Implem
ent
URFA
SingleFamilyBo
nds
13
2008
current
Makegrantsandmonitor
Hom
elessOpportunity
Program
14
ongoing
current
AAHOPMortgage
Assistance
15
2011
new
Implem
ent
OpportunityBonds
MortgageAssistance
16
331Atlanta Strategic Action Plan September 2007 Draft

NPU
CD
Responsible
Party
Cos
tX1
000
Fund
ing
Source
Com
pletion
year
Current,n
ewin
2007
orprop
osed
Descriptio
nNam
eProg
ram
2011
new
Implem
ent
Purchase/Rehabilitation
Program
17
2011
new
Implem
ent
Hom
eBuilderIncentive
Program
18
ongoing
current
URFA
Multifam
ilyBonds
19
ongoing
new
HOMEMultifam
ilyLoan
Program
20
2011
new
Multifam
ilyLoan
Program
-Opp
Bonds
21
2011
new
EnterpriseLand
Assem
blageFund
Managem
ent
22
2011
new
DirectLand
Acquisition
Fund
23
2011
new
CHDPLoan
Program
Managem
ent
24
ongoing
current
MonitorsallU
RFA
projects
Multifam
ilyBond
Com
plianceprogram
25
Z1,12
ADA
General
Fund
2008
current
Sellrem
aining
land
Southside
IndustrialPark
26
L3
ADA,
Private
RC,
Private,
2007
current
Sellrem
aining
land
Historic
WestsideVillage
27
TAD
Bonds
R11
ADA,
Private
current
Sellrem
aining
land
Cascade
Park(Kings
Ridge)
28
September 2007 Draft Atlanta Strategic Action Plan332
Community Agenda4

Hou
sing
Table4.2City
ofAtlanta2008
-2012SHORTTE
RMWORKPROGRAM-H
ousing
CD
NPU
CIP
#Fu
nding
Source
COST
x1000
Responsible
Party
Completion
Year
Initiation
Year
Descriptio
nProject
Prog
ram
MHOME
82BOH
2008
Rehabilitationofahistoric4-unit
apartmentbuilding
371Irw
inStreet
Rehabilitation
1
VHOME
91BOH
2008
Rehab
ofavacant10-unitapartm
ent
buildingforaffordablehousing.
924Washington
Street
2
All
HOME
250
URFA
/ADA
On-going
Dow
npaym
entassistanceforfirst-time
homebuyers
AtlantaAffordable
Hom
eownership
Program
(AAHOP)
3
All
Hom
e/ADDI
150
URFA
/ADA
On-going
Dow
npaym
entassistanceup
to$15,000
availabletohomebuyerswithin80%of
area
medianincome.
American
Dream
Dow
npayment
Initiative(ADDI)
4
LURFA
8000
ADA
2006
Acquisition,rehabilitiation,ornew
constructionofaffordableunits
URFA
TaxExempt
Bonds
5
LVCHTF
475
ADA
On-going
Houisng
inVine
City
andEn
glishAvenue
Fund
6
All
VCHTF
1000
ADA
On-going
Fundsavailableform
ulti-family
developm
ent
URFA
MultiFamily
Hom
es
All
HOBP
22000
ADA
2009
Governm
entsupportive
housing
Housing
Opportunities
BondforP
ermanent
Supportive
Housing
7
All
CDBG
100
BOH
On-going
Conductquiettitleactions,acquireand
inventoryabandonedparcelsforthe
productionofaffordablehousing.
Atlanta/FultonCounty
Landbank
8
SHOME
200
BOH
2007
Topurchase
3-4vacantandabandoned
housingunits/properties
Com
munity
Alliance
ofMetropolitian
Parkw
ay(CAMP)
9
All
CDBG
900
BOH
2009
Emergencyhomerepair
Com
munity
Housing
ResourceCenter
10
MHOME
200.3
BOH
2010
Toacquire
andrehabilitateapproximately
10units
forco-op
housing.
Co-OpDevelopment
11
LHOME
603
BOH
2010
Acquisition
of37
vacantpropertiesalong
LindsayStreetandconnectingstreetsin
EnglishAvenue
LindsayStreet
Corridor(2003)
12
ordertorehabilitate/constructaffordable
single-familyhouses
forsaletofirst-time
homebuyers.
MHOME
388
BOH
2010
Acquisitionandrehabilitationof3vacant
structures
withintheHDDC
Historic
District
Housing
Development
(HDDC)
13
neighborhood
forsaleand/orleaseat
333Atlanta Strategic Action Plan September 2007 Draft

CD
NPU
CIP
#Fu
nding
Source
COST
x1000
Responsible
Party
Completion
Year
Initiation
Year
Descriptio
nProject
Prog
ram
affordableprices
and/orrentalratesfor
eligiblelow/moderateincomepersons.
G,I,L,
S,V,Y,
Z
CDBG
200
BOH
2009
Acquisitionofland
onwhich
toconstruct
21single-familydetached
homes
forsale
toqualified
first-timehomebuyers.
HabitatforHum
anity
14
All
CDBG
104
BOH
2009
Dow
npaymentassistanceforlow
income
newhomeowners.
AccessIDA
Dow
npayment
Assistance
15
All
CDBG
200
BOH
On-going
Efforts
necessarytoachievecomplaince
ofcode.
Housing
Code
Inspection
16
All
CDBG
220
BOH
Ongoing
Inremdemolition
ofhazadorous
housing.
Dem
olition
/Relocation
17
All
CDBG
350
BOH
Ongoing
Energyefficiencyimprovem
entsfor
homeowners.
Housing
Weatherization
18
Metro
CDBG
45BOH
Ongoing
Fairhousingenforcem
ent.
JointVentureinFair
Housing
19
MCDBG
300
BOH
2010
Com
munity
resource
services
centerfor
theindigent,disadvantaged,and
low-incomeindividuals.
MLK
,Sr.Com
munity
ResourceServices
Center
20
HOME
250
BOH
2010
Toacquire
2-3vacantlotstobuild
affordablehousingunits
Morehouse
Housing
21
MCDBG
50BOH
2008
Fundingisrecommendedtosupporta
programintheZone
4policeprecinctto
NeighborhoodFresh
Start
22
purchase
andrenovate1-2former
crack/illegaldrug
homes
thatareseized
bytheFultonCountyDistrictAttorney’s
office.
All
HOME
4,800
BOH
On-going
Grantsandloanstolow/m
oderate
incomehomeownerstobringtheir
houses
uptocode.
OwnerO
ccupied
Rehabilitation
23
All
CDBG
300
BOH
2008
Emergencyhomerepair,home
maintenance
forlow
-income,elderly,
handicappedhomeowners.
ProjectExtend
24
VCDBG
75BOH
2007
Hom
erepairforlow
income
elderly/disabled
Toolbank
25
LHOME
200
BOH
2005
Acquisitionof3-4lotsforhousing.
TylerP
lace
Vine
City
Com
munity
RevitalizationProject
26
MCDBG
163.3
BOH
On-going
Seniorcitizendevelopm
entofhousing.
Valena
Henderson
Village
27
September 2007 Draft Atlanta Strategic Action Plan334
Community Agenda4

CD
NPU
CIP
#Fu
nding
Source
COST
x1000
Responsible
Party
Completion
Year
Initiation
Year
Descriptio
nProject
Prog
ram
All
CDBG
150
DWM
2008
Roofforseniorhigh
rise.
Brannon
TowersRoof
Replacement
28
All
CDBG
150
BOH
2008
Plumbing
andwaterlinerepairs
forlow
incomehomeowners.
CaveandConserve
29
All
Sect.105/
EDI
3200
BOH
2010
Acquisition
anddevlopmentofresidential
/com
mercial.
Mechanicsville
Redevelopment
30
All
CDBG/
HOME
2128
OHS
On-going
Loanstorehabandconstructrental
developm
ent.
MultiFamily
Housing
Development
31
All
CDBG
240
ADA/
URFA
2010
Shelterrenovationforabusedwom
enandchildren.
PartnershipAgainst
Dom
estic
Violence
32
All
HOME
1500
BOH
2010
Loanstorehabandconstructaffordable
rentalhousing.
URFA
MultFam
ilyRentalH
ousing
33
All
CDBG
100
BOH
2009
Roofingforlow
incomehomeowners.
SoutheastEnergy
Assistance
Residentail
34
All
HOME
604
BOH
2009
Dow
npaymentsforlow
incomeHabitat
homeowners.
HabitatforHum
anity
Dow
npayment
Assistance
35
All
CDBG
600
DWM
2009
Lateralsew
errepairs
forlow
income
homeowners.
SoutheastEnergy
Sew
ersandDrain
36
All
HOME
700
BOH
On-going
10%ofHOMEfundsforhousing
capital
projectsforC
ommunity
Housing
DevelopmentO
rganizations.
CHDOCapital
ProjectsEastside
37
All
HOME
200
BOH
On-going
5%operatingsupportforCHDOs.
CHDOOperating
Support
38
145
2007
HOPWAProgram
:FederalGrants
/Entitlem
ents
AID
Athens,HP-59
39
280
2007
HOPWAProgram
:FederalGrants
/Entitlem
ents
AIDSLegalProject,
HP-15
40
415
2007
HOPWAProgram
:FederalGrants
/Entitlem
ents
JerusalemHouse
ScatteredSite
Housing,H
P-56
41
276
2007
HOPWAProgram
:FederalGrants
/Entitlem
ents
JerusalemHouse
Wom
enandChildren,
HP-30
42
101
2007
HOPWAProgram
:FederalGrants
/Entitlem
ents
Furniture
Bank-HOPW
A,HP-17
43
120
2007
HOPWAProgram
:FederalGrants
/Entitlem
ents
HopeHouse,H
P-58
44
335Atlanta Strategic Action Plan September 2007 Draft

CD
NPU
CIP
#Fu
nding
Source
COST
x1000
Responsible
Party
Completion
Year
Initiation
Year
Descriptio
nProject
Prog
ram
181
2007
HOPWAProgram
:FederalGrants
/Entitlem
ents
HousemateMatch
-HOPWA,H
P-26
45
261
2007
HOPWAProgram
:FederalGrants
/Entitlem
ents
Living
Room,H
P-36
46
459
2007
HOPWAProgram
:FederalGrants
/Entitlem
ents
Matthew
sPlace,
HP-22
47
502
2007
HOPWAProgram
:FederalGrants
/Entitlem
ents
OurCom
mon
Welfare
Housing
DeK
alb
HP-09
48
132
2007
HOPWAProgram
:FederalGrants
/Entitlem
ents
OurCom
mon
Welfare
Housing
FultonHP-53
49
127
2007
HOPWAProgram
:FederalGrants
/Entitlem
ents
PositveImpact,
HP-07
50
330
2007
HOPWAProgram
:FederalGrants
/Entitlem
ents
Southside
Legacy
House,H
P-37
51
546
2007
HOPWAProgram
:FederalGrants
/Entitlem
ents
Southside
Legacy
Village,H
P-29
52
601
2007
HOPWAProgram
:FederalGrants
/Entitlem
ents
Edgew
ood
Operations,H
P-49
53
496
2007
HOPWAProgram
:FederalGrants
/Entitlem
ents
EdgewoodSu
pportive
Services,HP-01
54
All
CDBG
2006
75DPCD
2007
Provide
lowtomoderate-income
individualswith
creditandbusiness
ACCION
55
advisoryservices
they
need
tobuild
orsupporttheirsm
allbusinesses.
All
CDBG
2007
75DPCD
TBD
Provide
lowtomoderate-income
individualswith
creditandbusiness
ACCION
56
advisoryservices
they
need
tobuild
orsupporttheirsm
allbusinesses.
All
HOME
2006
250
DPCD
2009
Dow
npaym
entassistanceup
to$15,000
availabletohomebuyerswithin80%of
thearea
medianincome.
ADDI(2006)
57
All
HOME
2007
75.3
DPCD
TBD
Dow
npaym
entassistanceup
to$15,000
availabletohomebuyerswithin80%of
thearea
medianincome.
ADDI
58
MHOME
2006
92.5
DPCD
2008
Constructionof4-unitrentalproperty
locatedintheold4thWard.
BeaconofHope520
BoulevardApts
59
XHOME
1998
250.9
DPCD
2008
Rehab
5to7singlefamily
residential
structures
CAMPSuperblock
60
September 2007 Draft Atlanta Strategic Action Plan336
Community Agenda4

CD
NPU
CIP
#Fu
nding
Source
COST
x1000
Responsible
Party
Completion
Year
Initiation
Year
Descriptio
nProject
Prog
ram
XHOME
1999
200
DPCD
2008
Acquire,rehab,and/orconstructa
minimum
ofsixsinglefamily
residential
structures
CAMPSuperblock
Phase
III61
XHOME
2000
200
DPCD
2008
Acquiringandrehabaminimum
offive
singlefamily
residentialstructures
CAMPSuperblock
Phase
IV62
XHOME
2004
200
DPCD
2008
Acquisitionandrehabilitationoffour(4)
vacantsingle-fam
ilyunits
onBelmont
Avenue
inCapitolViewcommunity
CAMPCapitolView
Estates
63
SHOME
2006
200
DPCD
2008
Acquisitiontoproduceaffordable
townhouses(Oakland
City)
CAMPTuckerRow
e64
MCDBG
2007
839
DPCD
TBD
Providesdirectrepairservices
to180
verylowincomeanddisabled
residents
CHRCHom
eRepair
65
LHOME
1997
139
DPCD
2008
Acquiringandrehabaminimum
of6
residentialproperties
EnglishAvenue
ProctorStreet
66
MHOME
1996
666.1
DPCD
2008
Acquisitionof10
residentialproperties
forrentalopportunitiesforlow
tomoderateincomehouseholds
HDDCRehabilitation
ofTenhomes
67
MHOME
1997
364.8
DPCD
2008
AcquisitionofAuburnAvenue
Warehouse
propertyforthe
developm
ent
ofamixed
incomerentaldevelopm
ent
HDDCRehabilitation
68
MHOME
1997
384.5
DPCD
2008
Acquisitionof5residentialproperties
for
rentalopportunitiesforlow
tomoderate
incomehouseholds
HDDCRehabilitation
Project
69
MHOME
2000
495
DPCD
2008
Acquisitionof5vacantresidential
propertiesforhom
eownershipand/or
HDDCRehab
Year
2000
Program
70
rentalopportunitiesforlow
tomoderate
incomehouseholds.Twopropertiesfor
willbe
forhom
eownership;three
propertieswillbe
forrental.
MHOME
2002
388
DPCD
2008
Acquisitionandrehabilitationof3vacant
structures
withintheHDDC
HDDCRehab
Year
2002
Program
71
neighborhood
forsaleand/orleaseat
affordableprices
and/orrentalratesfor
eligiblelow/moderateincomepersons
S,L,V
CDBG
2006
200
2007
Acquisitionof28
propertiesand
constructionof28
single-familydetached
homes
HabitatforHum
anity
72
337Atlanta Strategic Action Plan September 2007 Draft

CD
NPU
CIP
#Fu
nding
Source
COST
x1000
Responsible
Party
Completion
Year
Initiation
Year
Descriptio
nProject
Prog
ram
J,L,
Y,Z,X
HOME
2007
360
DPCD
TBD
Dow
npaymentassistanceforfirst
homebuyers
HabitatforHum
anity
DPA
73
All
HOME
2007
500
DPCD
TBD
Multi-family
developm
entw
ithatotalof
78one-bedroomunits
forseniorsage62
andolder.
MarcusStreetSenior
Residences
74
All
CDBG
2006
300
DPCD
2007
Emergencyhomerepair,home
maintenance
forlow
-incomeelderly
ProjectExtend
75
handicappedhomeownersenabling
elderly/handicapped
toreside
intheir
homes,notmoveintoinstitutionalized
settings
All
CDBG
2007
473.7
DPCD
TBD
Providesmajorandminorhomerepairs
andmaintenance
tolow-incomeseniors
anddisabled
adulthom
eowners.
ProjectExtend
WesleyCom
munities
76
NHOME
1999
50DPCD
2008
Acquisitionof6houses
Reynoldstow
nSingle
Family
Hom
eownership
77
VHOME
2006
200
DPCD
2008
Constructaffordabletownhom
esMechanicsville
neighborhood
Sum
mechBlock
85Townhom
es78
OHOME
1997
215.9
DPCD
2008
Theacquiring
andrehabofaminimum
of12
houses
TylerP
lace
CDC's
Hom
eownershipPart
II
79
OHOME
2001
392.6
DPCD
2008
Acquisitionofaminimum
of12
houses
TylerP
lace
CDC's
Hom
eownershipPart
III
80
LHOME
2004
200
DPCD
2007
Fundingisrecommendedtopartiallyfund
theacquisition
of3-4lotsprimarily
onElmStreetintheVine
City
neighborhood.
TylerP
lace
Vine
City
Com
munity
RevitalizationProject
81
Table4.3City
ofAtlanta2008
-2012SHORTTE
RMWORKPROGRAM-H
ousing:C
ommunity
DevelopmentB
lock
Grants
CD
NPU
CIP
#Fu
nding
Source
COST
x1000
Responsible
Party
Completion
Year
Initiation
Year
Descriptio
nProject
Prog
ram
all
all
N/A
28OHS
CDBG/
Intergovt.
Fund
2008
AdultDay
Care
Services
1
all
All
N/A
20OHS
CDBG
2008
AHAElderly
Services
2
all
all
N/A
81OHS
CDBG
2008
AlternateLifePath
3
all
all
N/A
25OHS
CDBG
2008
AtlantaChildren's
Shelter
4
September 2007 Draft Atlanta Strategic Action Plan338
Community Agenda4
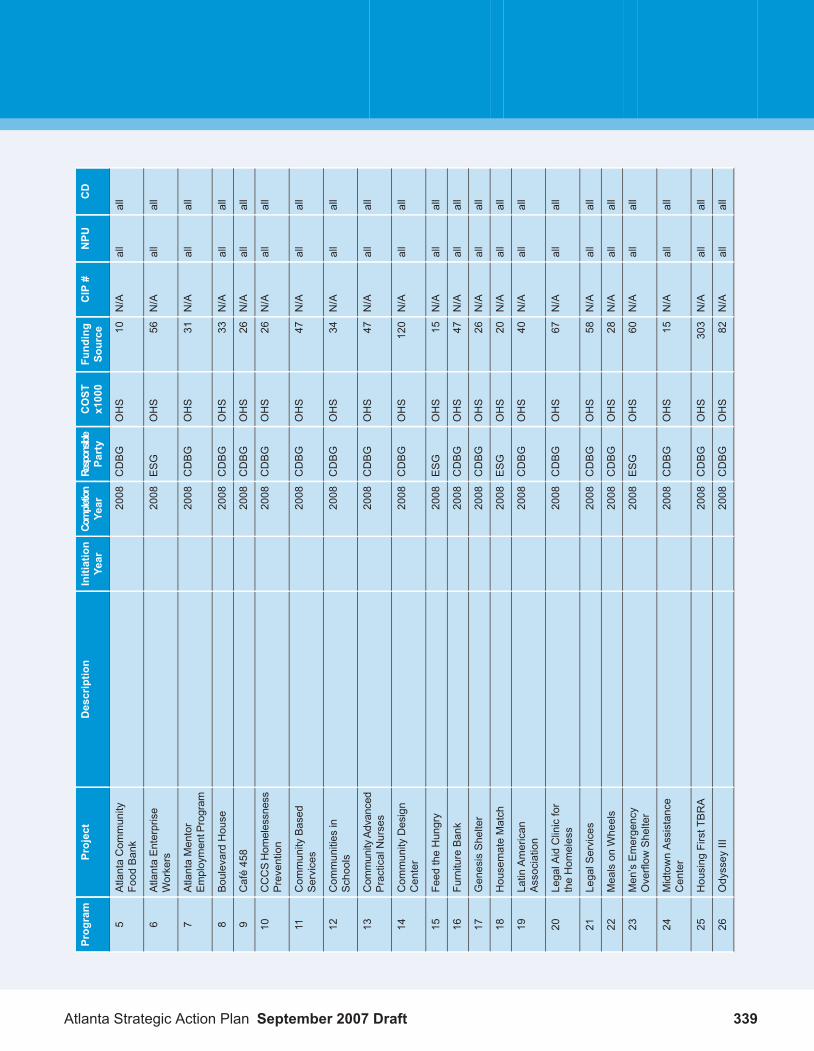
CD
NPU
CIP
#Fu
nding
Source
COST
x1000
Responsible
Party
Completion
Year
Initiation
Year
Descriptio
nProject
Prog
ram
all
all
N/A
10OHS
CDBG
2008
AtlantaCom
munity
Food
Bank
5
all
all
N/A
56OHS
ESG
2008
AtlantaEnterprise
Workers
6
all
all
N/A
31OHS
CDBG
2008
AtlantaMentor
EmploymentProgram
7
all
all
N/A
33OHS
CDBG
2008
BoulevardHouse
8
all
all
N/A
26OHS
CDBG
2008
Café458
9
all
all
N/A
26OHS
CDBG
2008
CCCSHom
elessness
Prevention
10
all
all
N/A
47OHS
CDBG
2008
Com
munity
Based
Services
11
all
all
N/A
34OHS
CDBG
2008
Com
munities
inSchools
12
all
all
N/A
47OHS
CDBG
2008
Com
munityAd
vanced
PracticalNurses
13
all
all
N/A
120
OHS
CDBG
2008
Com
munity
Design
Center
14
all
all
N/A
15OHS
ESG
2008
Feed
theHungry
15
all
all
N/A
47OHS
CDBG
2008
FurnitureBank
16
all
all
N/A
26OHS
CDBG
2008
GenesisShelter
17
all
all
N/A
20OHS
ESG
2008
HousemateMatch
18
all
all
N/A
40OHS
CDBG
2008
Latin
American
Association
19
all
all
N/A
67OHS
CDBG
2008
LegalAidClinicfor
theHom
eless
20
all
all
N/A
58OHS
CDBG
2008
LegalServices
21
all
all
N/A
28OHS
CDBG
2008
Mealson
Wheels
22
all
all
N/A
60OHS
ESG
2008
Men’sEmergency
Overflow
Shelter
23
all
all
N/A
15OHS
CDBG
2008
MidtownAssistance
Center
24
all
all
N/A
303
OHS
CDBG
2008
Housing
FirstTBRA
25
all
all
N/A
82OHS
CDBG
2008
Odyssey
III26
339Atlanta Strategic Action Plan September 2007 Draft

CD
NPU
CIP
#Fu
nding
Source
COST
x1000
Responsible
Party
Completion
Year
Initiation
Year
Descriptio
nProject
Prog
ram
all
all
N/A
20OHS
CDBG
2008
PartnershipAgainst
Dom
estic
Violence
27
all
all
N/A
53OHS
CDBG
2008
PredatoryMortgage
Defense
28
all
all
N/A
68OHS
CDBG
2008
ProjectConnect
29
all
all
N/A
55OHS
CDBG
2008
Sam
aritanHouse
30
all
all
N/A
12OHS
CDBG
2008
Shearith
Israel
31
all
all
N/A
5OHS
CDBG
2008
Steps
toKeepOne’s
Hom
e32
all
all
N/A
10OHS
CDBG
2008
Task
Forceon
the
Hom
elessHotline
33
all
all
N/A
15OHS
CDBG
2008
Task
Forceforthe
Hom
elessOutreach
34
all
all
N/A
28OHS
CDBG
2008
TheAtlanta
CollaborativeKitchen
35
all
all
N/A
28OHS
CDBG
2008
TheRenew
alProject
36
all
all
N/A
7OHS
CDBG
2008
TransitionHouse
37
all
all
N/A
62OHS
CDBG
2008
Traveler’sAid
Resettlement
38
all
all
N/A
72OHS
CDBG
2008
Traveler’sAid
TransitionalH
ousing
39
all
all
N/A
20OHS
CDBG
2008
Trinity
House
40
all
all
N/A
66OHS
CDBG
2008
WesleySenior
Citizens
Program
41
all
all
N/A
76OHS
CDBG
2008
YoungAdult
GuidanceCenter
42
all
all
N/A
14OHS
CDBG
2008
Cascade
House
43
all
all
N/A
30OHS
CDBG
2008
Clean
StreetTeam
44
all
all
N/A
16OHS
CDBG
2008
CovenantC
ommunity
45
all
all
N/A
6OHS
ESG
2008
Men'sEmergency
Shelter
46
all
all
N/A
41OHS
CDBG
2008
NightHospitalityat
Clifton
47
all
all
N/A
4OHS
CDBG
2008
Northside
Shephard
Center
48
September 2007 Draft Atlanta Strategic Action Plan340
Community Agenda4

CD
NPU
CIP
#Fu
nding
Source
COST
x1000
Responsible
Party
Completion
Year
Initiation
Year
Descriptio
nProject
Prog
ram
all
all
N/A
18OHS
CDBG
2008
PathwaysCom
munity
Network
49
all
all
N/A
22OHS
CDBG
2008
SW
YMCA
50
341Atlanta Strategic Action Plan September 2007 Draft

Naturalan
dCulturalR
esou
rces
Table4.4City
ofAtlanta2008
-2012SHORTTE
RMWORKPROGRAM-N
aturalResources
NPU
Cou
ncil
District
WBS#
Fund
ing
Source*
Cos
t(x
$1,000)
Respo
nsible
Party
Com
pletion
Year
Initiation
Year
ProjectN
ame
All
All
N/A
Budget
DWM
2020
<2007
WaterConservationProgram
1
All
All
See
Wastewater
Section
WSRB
See
Wastewater
Section
DWM
2017
<2007
Clean
WaterAtlantaProgram
2
All
All
N/A
Budget
Budget
DWM
2007
2007
Watershed
MonitoringProgram
(U.S.GeologicalSurvey)
3
All
All
05.09.006&
05.09.007
WSRB
See
Wastewater
Section
DWM
2008
2001
Greenway
AcquisitionProject
4
All
All
N/A
Budget
Budget
DWM
2020
<2007
SoilErosion
&SedimentationControl
Inspection
5
All
All
N/A
Budget
Budget
DWM,D
PW,
DPRCA
2020
<2007
Site
DevelopmentR
eview
6
All
N/A
Budget
Budget
DWM
2020
<2007
MunicipalSeparateStorm
Sew
erSystem(MS4)PermitProgram
7
All
All
N/A
Budget
Budget
DWM
2008
2006
Stream
BankBiorevetmentP
rogram
8
All
All
N/A
Budget
Budget
DWM
2020
<2007
Public
EducationProgram
--Water
Resources
Protection
9
All
All
N/A
Budget
Budget
DWM
2008
2006
Watershed
ProtectionPlan
10
Budget
Budget
DWM
2009
2006
LandscapingforW
atershed
Protection
11
All
All
N/A
Budget
$566
DWM
2009
2008
City
HallSouthGreen
Roof--Phase
212
All
All
N/A
Bond&Budget
$1,231
DWM
2008
2007
StormwaterManagem
entImplentation
Program
13
All
All
N/A
Budget
Budget
DWM
2005
2005
DevelopmentofE
lementarySchool
Curriculum
14
All
All
N/A
Budget
Budget
DWM
2007
2006
DevelopmentofE
lementarySchool
Curriculum
--TeacherT
raining
15
All
All
07.03.001
WSRB
See
Wastewater
Section
DWM
2007
2001
Watershed
MonitoringProgram
(w/
U.S.GeologicalSurvey)
16
September 2007 Draft Atlanta Strategic Action Plan342
Community Agenda4

Table4.5City
ofAtlanta2008
-2012SHORTTE
RMWORKPROGRAM-H
istoric
Resources
CD
NPU
CIP
#Respo
nsible
Party
Fund
ingSo
urce
COST (x
1,000)
Com
pletion
Year
Initiation
Year
Descriptio
nProg
ram
all
all
n/a
DPCD/A
UDC
GeneralFund
2016
2007
Co-manage"City-wideProgram
matic
Agreement"forF
ederalSection106Review
ofHUDProgram
s
1
all
all
n/a
AUDC
GeneralFund
2016
2007
FacilitateNeighborhood-Based
Local
DesignationEfforts
2
all
all
n/a
AUDC
GeneralFund
2016
2007
ReviseExistingLocalDistrictRegulations,per
NeighborhoodRequest
3
all
all
n/a
AUDC
GeneralFund
2016
2007
FacilitateNeighborhood-Based
National
RegisterofH
istoric
PlacesNom
inations
4
all
all
n/a
AUDC/B
eltline,
Inc.
GeneralFund/Beltline
TAD
2016
2007
IntegrateHistoric
PreservationintoBeltline,
LakewoodFairgrounds,and
Ft.M
cPherson
RedevelopmentE
fforts
5
all
all
n/a
AUDC
GeneralFund
22008
2007
Upgrade
andexpand
AUDCresources
avaiableon
website(s)
6
all
all
n/a
AUDC
GeneralFund
2007
2007
UpdateandFinalizeHistoric
ResourceData
forC
ityPermittingSystemandGIS
7
all
all
n/a
AUDC
GeneralFund,G
rants,
&Private
300
2009
2007
UpdateCitywideSu
rvey
and"Atlanta'sLasting
Landmarks"
8
343Atlanta Strategic Action Plan September 2007 Draft

Com
mun
ityFa
cilitiesan
dSe
rvices
Table4.6City
ofAtlanta2008
-2012SHORTTE
RMWORKPROGRAM-W
aterSupplyandTreatment
NPU
Cou
ncil
District
WBS#
Fund
ing
Source*
Cos
t(x
$1,000)
Respo
nsible
Party
Com
pletion
Year
Initiation
Year
ProjectN
ame
A,B
,C,D
,E,F,
G,H
,I,J,K
,L,M
,1,2,3,4,5,
6,7,8,9,10,
11,12
08.04.011
WSRB
$1,500
DWM
2/4/08
2/11/2002
CivilEngineering&
FieldInspectionServices
1
N,O
,P,R
,S,T,
V,W,X
,Y,Z
P,R
1198.03.011
WSRB
$28,593
DWM
1/21/10
8/2/2004
FairburnRoadPum
pStation&WaterMains
2
P11
98.03.013
WSRB
$44,525
DWM
2/21/10
8/2/2004
Kow
etaRoadPum
pStation&WaterMains
3
C,D
,E,K
,L2,3,7,8,11
98.08.029
WSRB
$4,023
DWM
9/10/09
1/26/2004
Hem
phillReservoir#1
EmbankmentR
epair
4
C9
98.08.033
WSRB
$11,190
DWM
4/11/08
9/17/2004
RiverIntake
Erosion
ControlImprovem
ents
5
A,B
,C,D
,E,F,
G,H
,I,J,K
,L,M
,1,2,3,4,5,
6,7,8,9,10,
11,12
98.99.001
WSRB
$4,402
DWM
12/31/07
1/1/2005
Reserve
forA
ppropriations
-WaterConsentOrder
6
N,O
,P,R
,S,T,
V,W,X
,Y,Z
A,B
,C,D
,E,F,
G,H
,I,J,K
,L,M
,1,2,3,4,5,
6,7,8,9,10,
11,12
08.02.005
WSRB
$75,000
DWM
12/3/16
1/13/2004
New
WaterMeterInstallation-S
mallM
eter-
AnnualC
ontract
7
N,O
,P,R
,S,T,
V,W,X
,Y,Z
A,B
,C,D
,E,F,
G,H
,I,J,K
,L,M
,1,2,3,4,5,
6,7,8,9,10,
11,12
08.02.009
WSRB
$1,263
DWM
7/20/08
8/2/2004
BackFlow
Preventors/Flow
meters-A
nnual
Contract
8
N,O
,P,R
,S,T,
V,W,X
,Y,Z
Outside
City
Limits
Outside
City
Limits
98.02.951
WSRB
$33,500
DWM
6/30/07
1/1/2004
NorthAreaTreatmentP
lant-P
hase
2.5
9
C,E
8,9
98.03.017
WSRB
$16,884
DWM
1/7/10
4/4/2005
Hem
phillFinished
WaterPum
pStationUpgrade
-DesignPhase
10
A,C
,D8,9
98.08.034
WSRB
$4,763
DWM
1/21/09
11/1/2005
WaterTank
Painting&StructuralRepair
11
C8
98.08.039
WSRB
$1,154
DWM
7/13/10
8/2/2004
SoilR
emediation&Site
Closure
12
A,B
,C,D
,E,F,
G,H
,I,J,K
,L,M
,1,2,3,4,5,
6,7,8,9,10,
11,12
98.08.047
WSRB
$28,200
DWM
10/16/07
8/2/2004
Hom
elandSecurity
13
N,O
,P,R
,S,T,
V,W,X
,Y,Z
A,B
,C,D
,E,F,
G,H
,I,J,K
,L,M
,1,2,3,4,5,
6,7,8,9,10,
11,12
98.99.003
WSRB
$6,385
DWM
12/31/14
1/1/2005
Reserve
forA
ppropriations
-RegulatoryorContract
Com
pliance
14
N,O
,P,R
,S,T,
V,W,X
,Y,Z
07.05.009
WSRB
$37,500
DWM
1/15/12
2/6/2006
BellwoodQuarry
15
September 2007 Draft Atlanta Strategic Action Plan344
Community Agenda4
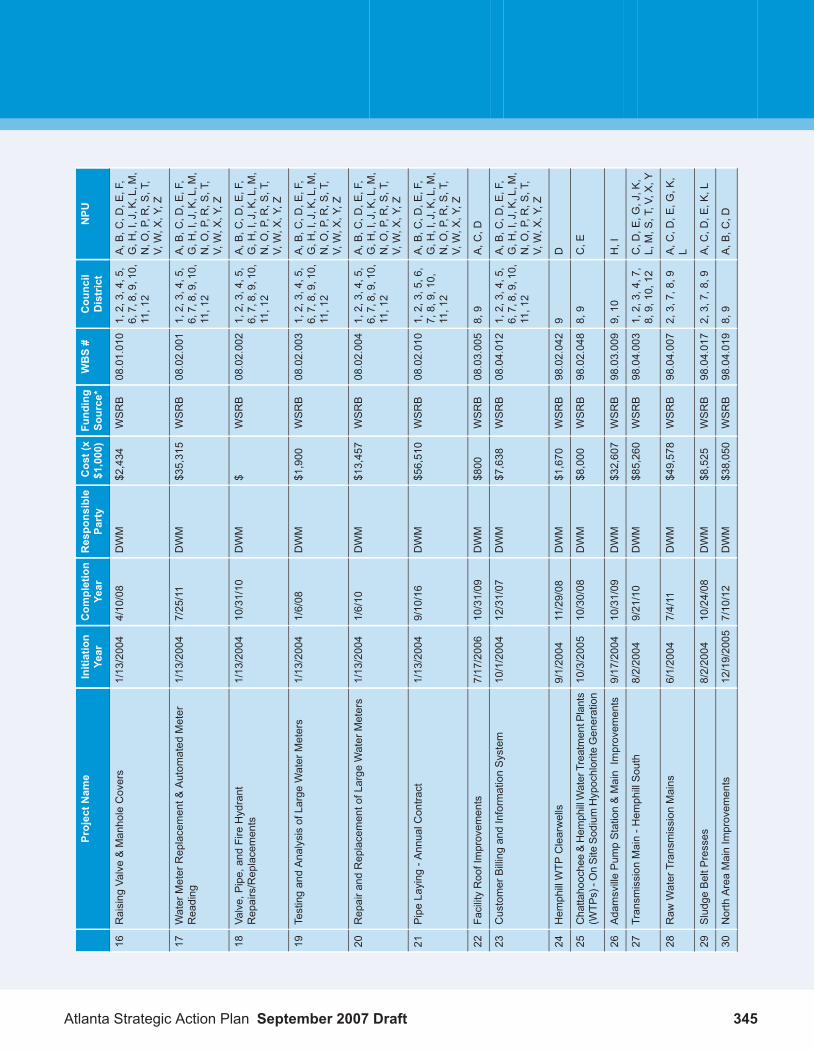
NPU
Cou
ncil
District
WBS#
Fund
ing
Source*
Cos
t(x
$1,000)
Respo
nsible
Party
Com
pletion
Year
Initiation
Year
ProjectN
ame
A,B
,C,D
,E,F,
G,H
,I,J,K
,L,M
,1,2,3,4,5,
6,7,8,9,10,
11,12
08.01.010
WSRB
$2,434
DWM
4/10/08
1/13/2004
Raising
Valve&ManholeCovers
16
N,O
,P,R
,S,T,
V,W,X
,Y,Z
A,B
,C,D
,E,F,
G,H
,I,J,K
,L,M
,1,2,3,4,5,
6,7,8,9,10,
11,12
08.02.001
WSRB
$35,315
DWM
7/25/11
1/13/2004
WaterMeterReplacement&
Autom
ated
Meter
Reading
17
N,O
,P,R
,S,T,
V,W,X
,Y,Z
A,B
,C,D
,E,F,
G,H
,I,J,K
,L,M
,1,2,3,4,5,
6,7,8,9,10,
11,12
08.02.002
WSRB
$DWM
10/31/10
1/13/2004
Valve,Pipe,andFireHydrant
Repairs/Replacements
18
N,O
,P,R
,S,T,
V,W,X
,Y,Z
A,B
,C,D
,E,F,
G,H
,I,J,K
,L,M
,1,2,3,4,5,
6,7,8,9,10,
11,12
08.02.003
WSRB
$1,900
DWM
1/6/08
1/13/2004
TestingandAnalysisofLargeWaterMeters
19
N,O
,P,R
,S,T,
V,W,X
,Y,Z
A,B
,C,D
,E,F,
G,H
,I,J,K
,L,M
,1,2,3,4,5,
6,7,8,9,10,
11,12
08.02.004
WSRB
$13,457
DWM
1/6/10
1/13/2004
Repairand
ReplacementofLarge
WaterMeters
20
N,O
,P,R
,S,T,
V,W,X
,Y,Z
A,B
,C,D
,E,F,
G,H
,I,J,K
,L,M
,1,2,3,5,6,
7,8,9,10,
11,12
08.02.010
WSRB
$56,510
DWM
9/10/16
1/13/2004
PipeLaying
-AnnualC
ontract
21
N,O
,P,R
,S,T,
V,W,X
,Y,Z
A,C
,D8,9
08.03.005
WSRB
$800
DWM
10/31/09
7/17/2006
FacilityRoofImprovem
ents
22
A,B
,C,D
,E,F,
G,H
,I,J,K
,L,M
,1,2,3,4,5,
6,7,8,9,10,
11,12
08.04.012
WSRB
$7,638
DWM
12/31/07
10/1/2004
CustomerBillingandInformationSystem
23
N,O
,P,R
,S,T,
V,W,X
,Y,Z
D9
98.02.042
WSRB
$1,670
DWM
11/29/08
9/1/2004
Hem
phillWTP
Clearwells
24
C,E
8,9
98.02.048
WSRB
$8,000
DWM
10/30/08
10/3/2005
Chattahoochee&Hem
phillWaterTreatmentPlants
(WTP
s)-O
nSiteSo
dium
Hypochlorite
Generation
25
H,I
9,10
98.03.009
WSRB
$32,607
DWM
10/31/09
9/17/2004
AdamsvillePum
pStation&MainImprovem
ents
26
C,D
,E,G
,J,K
,L,M,S
,T,V,X
,Y1,2,3,4,7,
8,9,10,12
98.04.003
WSRB
$85,260
DWM
9/21/10
8/2/2004
Transm
ission
Main-H
emphillSouth
27
A,C
,D,E
,G,K
,L
2,3,7,8,9
98.04.007
WSRB
$49,578
DWM
7/4/11
6/1/2004
Raw
WaterTransm
ission
Mains
28
A,C
,D,E
,K,L
2,3,7,8,9
98.04.017
WSRB
$8,525
DWM
10/24/08
8/2/2004
SludgeBeltP
resses
29
A,B
,C,D
8,9
98.04.019
WSRB
$38,050
DWM
7/10/12
12/19/2005
NorthAreaMainImprovem
ents
30
345Atlanta Strategic Action Plan September 2007 Draft

NPU
Cou
ncil
District
WBS#
Fund
ing
Source*
Cos
t(x
$1,000)
Respo
nsible
Party
Com
pletion
Year
Initiation
Year
ProjectN
ame
A,B
,C,D
,E,F,
G,H
,I,J,K
,L,M
,1,2,3,4,5,
6,7,8,9,10,
11,12
98.04.024
WSRB
$793
DWM
12/31/07
9/17/2004
DistributionSystemHydraulicModelUpdate
31
N,O
,P,R
,S,T,
V,W,X
,Y,Z
F6
98.04.030
WSRB
$24,846
DWM
1/31/09
1/26/2005
WaterMainReplacement-VirginiaHighlands
32
C,E
,F,M
2,3,6
98.04.031
WSRB
$30,655
DWM
4/12/09
1/17/2005
WaterMainReplacement-GATech
Midtownand
BedfordPines
Area
33
E,L,M
,T2,3,4,5
98.04.101
WSRB
$21,005
DWM
11/27/09
1/3/2006
EnglishAvenue,V
ineCity,B
ankheadWaterMain
Replacement
34
M,N
2,5,6
98.04.102
WSRB
$20,943
DWM
8/21/10
2/6/2006
OldFourthWard,Inman
ParkAreaWaterMain
ReplacementP
rogram
35
E,F
2,6
98.04.103
WSRB
$11,959
DWM
4/14/11
8/18/2008
WaterMainReplacementP
rogram
:Piedm
ont
HeightsandAnsleyParkArea
36
N,O
,V,W
,Y1,2,5,6
98.04.104
WSRB
$29,189
DWM
9/28/12
8/18/2008
WaterMainReplacementP
rogram
:Edgew
ood-Kirkwood-Sum
erhillArea
37
S,T,V,X
,Y1,2,4,12
98.04.105
WSRB
$26,853
DWM
9/27/13
8/17/2009
WaterMainReplacementP
rogram
:CapitalView
andLakewoodHeightsArea
38
A,B
,C,D
,G,I,J,
K,R
,S,T
3,4,7,8,9,
10,11
98.04.106
WSRB
$23,334
DWM
9/19/14
8/16/2010
WaterMainReplacementP
rogram
:Cascade
HeightsandFloridaHeights
39
E,M
,V,W
1,2,3,5,6
98.05.003
WSRB
$3,451
DWM
4/13/10
1/2/2007
Dow
ntow
nElevatedStorage
Tanks
40
H,I,P,R
,S,T,V,
X4,9,10,11,
1298.08.024
WSRB
$36,553
DWM
5/18/10
8/2/2004
South-W
estM
ainImprovem
ents
41
A,C
,D8,9
98.08.031
WSRB
$5,788
DWM
4/23/09
8/2/2004
WaterLaboratory
&WaterWorks
Lodge
Renovation
42
A,C
,D,E
,K,L
2,3,7,8,9
98.08.037
WSRB
$15,000
DWM
5/7/09
8/2/2004
Autom
ationofHem
phill&Chattahoochee
TreatmentP
lants
43
A,C
,D,E
,K,L
2,3,7,8,9
98.08.038
WSRB
$1,699
DWM
5/23/09
8/2/2004
ElectricalSwitchgearR
eplacement
44
A,C
,D8,9
98.08.041
WSRB
$9,439
DWM
3/19/10
8/2/2004
ChattahoocheePlantVarious
Improvem
ents
45
C,D
,E,K
,L2,3,7,8,10
98.08.042
WSRB
$6,792
DWM
9/10/09
8/2/2004
Hem
phillPlantVarious
Improvem
ents
46
A,B
,C,D
,E,F,
G,H
,I,J,K
,L,M
,1,2,3,4,5,
6,7,8,9,10,
11,12
98.08.045
WSRB
$1,836
DWM
6/30/07
8/2/2004
AssetManagem
entS
ystem
47
N,O
,P,R
,S,T,
V,W,X
,Y,Z
A,C
,D8,9
98.08.048
WSRB
$3,884
DWM
8/28/10
1/3/2006
WaterSystemPlantMaintenance
Building
48
A,B
,C,D
,E,F,
G,H
,I,J,K
,L,M
,1,2,3,4,5,
6,7,8,9,10,
11,12
98.10.001
WSRB
$2,000
DWM
11/20/09
9/17/2004
MOMSPlanDevelopment&
Implem
entation
49
September 2007 Draft Atlanta Strategic Action Plan346
Community Agenda4

NPU
Cou
ncil
District
WBS#
Fund
ing
Source*
Cos
t(x
$1,000)
Respo
nsible
Party
Com
pletion
Year
Initiation
Year
ProjectN
ame
N,O
,P,R
,S,T,
V,W,X
,Y,Z
A,B
,C,D
,E,F,
G,H
,I,J,K
,L,M
,1,2,3,4,5,
6,7,8,9,10,
11,12
98.99.002
WSRB
$20,222
DWM
12/31/14
1/1/2005
Reserve
forA
ppropriations
-SystemRenew
alor
OperationalR
eliability
50
N,O
,P,R
,S,T,
V,W,X
,Y,Z
A,B
,C,D
,E,F,
G,H
,I,J,K
,L,M
,1,2,3,4,5,
6,7,8,9,10,
11,12
98.08.049
WSRB
$3,485
DWM
7/4/06
9/17/2004
WaterSystemLeakageAuditandUnderground
VoidDetection
52
N,O
,P,R
,S,T,
V,W,X
,Y,Z
C,E
8,9
98.02.034
WSRB
$33,129
DWM
2/1/06
4/2/2001
Hem
phill&ChattahoocheeWTP
Improvem
ents
53
A,B
,C,H
,I8
98.08.028
WSRB
$2,648
DWM
3/24/07
7/1/2003
Northside
&AdamsvillePum
pStation-I&Cand
ElectricalRenovations
54
E7
98.04.040
WSRB
$999
DWM
8/31/05
6/10/2005
Emergency:WaterMainReplacementand
Building
Repairalong
PeachtreeRd
55
347Atlanta Strategic Action Plan September 2007 Draft

Table4.7City
ofAtlanta2008
-2012SHORTTE
RMWORKPROGRAM-W
astewaterCollectionandTreatment
NPU
Cou
ncilDistrict
WBS#
Fund
ing
Source*
Cos
t(x
$1,000)
Respo
nsible
Party
Com
pletion
Year
Initiation
Year
ProjectN
ame
A,B
,C,D
,E,F,G
,H,I,
J,K,L,M
,N,O
,P,R
,S,
T,V,W,X
,Y,Z
1,2,3,4,5,6,7,
8,9,10,11,12
05.09.006
WSRB
$25,000
DWM
9/30/07
4/29/1998
Greenway
Acquistion-Land
Acquisition
1
A,B
,C,D
,E,F,G
,H,I,
J,K,L,M
,N,O
,P,R
,S,
T,V,W,X
,Y,Z
1,2,3,4,5,6,7,
8,9,10,11,12
05.09.007
WSRB
$7,034
DWM
8/24/07
4/27/2001
Greenway
Acquisition-
ConsultantServices
2
A,C
,D,E
,G,J,K
,L,T
2,3,4,6,7,8,9
05.13.001
WSRB
$241,749
DWM
9/7/08
4/2/2001
WestA
reaCSOStorage
TunnelandPu
mping
Station
3
V,W,Y,Z
1,2,5
05.14.001
WSRB
$42,058
DWM
6/29/07
4/2/2001
CusterA
venueStorage
&DechlorinationFacility
4
A,C
,D8,9
05.15.001
WSRB
$55,423
DWM
3/31/08
9/13/2001
WestA
reaCSOTreatment
Plant
5
W,Y,Z
1,5
05.16.001
WSRB
$35,243
DWM
5/31/07
9/13/2001
Intrenchm
entC
reek
CSO
TreatmentP
lant
6
I,J,K,L,M
,S,T,V,X
2,3,4,9,10,12
05.17.400
WSRB
$113,196
DWM
2/29/08
10/1/2001
GreensferryCom
bined
Sew
erSeparation
7
K,L,M
,S,T,V,X
,Y1,2,3,4,5,12
05.18.100
WSRB
$109,024
DWM
2/29/08
10/1/2001
McD
anielC
ombinedSew
erSeparation
8
M,N
,O,V,W
,Y1,2,5,6
05.18.201
WSRB
$89,873
DWM
2/29/08
10/1/2001
StockadeCom
binedSew
erSeparation-P
hase
29
W,Y,Z
105.25.001
WSRB
$6,500
DWM
12/30/10
1/2/2007
Intrenchm
entC
reek
WRC
Capacity
Expansion
10
A,B
,C,D
,E,F,G
,H,I,
J,K,L,M
,N,O
,P,R
,S,
T,V,W,X
,Y,Z
1,2,3,4,5,6,7,
8,9,10,11,12
05.96.001
WSRB
$21,300
DWM
12/31/09
9/1/2004
CSOCostS
haringProjects
11
A,B
,C,D
,E,F,G
,H,I,
J,K,L,M
,N,O
,P,R
,S,
T,V,W,X
,Y,Z
2,3,4,5,6,7,8,
9,10,11,12
05.97.001
WSRB
$50,000
DWM
12/31/11
9/1/2004
CSOInterim
ReliefP
rojects
12
A,B
,C,D
,E,F,G
,H,I,
J,K,L,M
,N,O
,P,R
,S,
T,V,W,X
,Y,Z
1,2,3,4,5,6,7,
8,9,10,11,12
08.01.092
WSRB
$7,025
DWM
5/27/08
4/1/2001
CSO
ProgramManagem
ent
Services
13
C,D
,G,H
,Y,Z
903.06.903
WSRB
$8,808
DWM
12/2/09
6/1/2005
Pum
pStation2003
Improvem
ents(BR,P
L,PA
,RF)
14
A,B
,C,D
,E,F,G
,H,I,
J,K,L,M
,N,O
,P,R
,S,
T,V,W,X
,Y,Z
1,2,3,4,5,6,7,
8,9,10,11,12
04.16.200
WSRB
$100,902
DWM
11/30/08
4/25/2004
Sew
erGroup
1-
Rehabilitation
15
September 2007 Draft Atlanta Strategic Action Plan348
Community Agenda4

NPU
Cou
ncilDistrict
WBS#
Fund
ing
Source*
Cos
t(x
$1,000)
Respo
nsible
Party
Com
pletion
Year
Initiation
Year
ProjectN
ame
Outside
City
Limits
Outside
City
Limits
04.16.356
WSRB
$12,210
DWM
11/29/07
8/2/2004
FultonCountyCam
pCreek
Reserve
Capacity
16
A,B
,C,D
,E,F,G
,H,I,
J,K,L,M
,N,O
,P,R
,S,
T,V,W,X
,Y,Z
1,2,3,4,5,6,7,
8,9,10,11,12
04.17.200
WSRB
$128,864
DWM
5/1/09
1/1/2006
Sew
erGroup
2-
Rehabilitation
17
D,G
,H9
04.17.320
WSRB
$7,683
DWM
5/6/08
8/2/2004
Riverside
OutfallCapacity
Relief
18
A,B
,C,D
,E,F,G
,H,I,
J,K,L,M
,N,O
,P,R
,S,
T,V,W,X
,Y,Z
1,2,3,4,5,6,7,
8,9,10,11,12
04.18.001
WSRB
$4,646
DWM
2/16/08
4/13/2005
Sew
erGroup
3-S
SES
ContractA
19
A,B
,C,D
,E,F,G
,H,I,
J,K,L,M
,N,O
,P,R
,S,
T,V,W,X
,Y,Z
1,2,3,4,5,6,7,
8,9,10,11,12
04.18.002
WSRB
$4,646
DWM
7/17/08
4/13/2005
Sew
erGroup
3-S
SES
ContractB
20
A,B
,C,D
,E,F,G
,H,I,
J,K,L,M
,N,O
,P,R
,S,
T,V,W,X
,Y,Z
1,2,3,4,5,6,7,
8,9,10,11,12
04.18.003
WSRB
$4,646
DWM
7/18/08
4/13/2005
Sew
erGroup
3-S
SES
ContractC
21
A,B
,C,D
,E,F,G
,H,I,
J,K,L,M
,N,O
,P,R
,S,
T,V,W,X
,Y,Z
1,2,3,4,5,6,7,
8,9,10,11,12
04.18.004
WSRB
$4,646
DWM
5/20/08
4/13/2005
Sew
erGroup
3-S
SES
ContractD
22
A,B
,C,D
,E,F,G
,H,I,
J,K,L,M
,N,O
,P,R
,S,
T,V,W,X
,Y,Z
1,2,3,4,5,6,7,
8,9,10,11,12
04.18.200
WSRB
$82,728
DWM
10/23/10
1/25/2006
Sew
erGroup
3-
Rehabilitation
23
A,B
,C,D
,E,F,G
,H,I,
J,K,L,M
,N,O
,P,R
,S,
T,V,W,X
,Y,Z
1,2,3,4,5,6,7,
8,9,10,11,12
04.19.001
WSRB
$4,090
DWM
8/7/09
4/13/2005
Sew
erGroup
4-S
SES
ContractA
24
A,B
,C,D
,E,F,G
,H,I,
J,K,L,M
,N,O
,P,R
,S,
T,V,W,X
,Y,Z
1,2,3,4,5,6,7,
8,9,10,11,12
04.19.002
WSRB
$4,090
DWM
3/14/09
4/13/2005
Sew
erGroup
4-S
SES
ContractB
25
A,B
,C,D
,E,F,G
,H,I,
J,K,L,M
,N,O
,P,R
,S,
T,V,W,X
,Y,Z
1,2,3,4,5,6,7,
8,9,10,11,12
04.19.003
WSRB
$4,090
DWM
4/9/09
4/13/2005
Sew
erGroup
4-S
SES
ContractC
26
A,B
,C,D
,E,F,G
,H,I,
J,K,L,M
,N,O
,P,R
,S,
T,V,W,X
,Y,Z
1,2,3,4,5,6,7,
8,9,10,11,12
04.19.004
WSRB
$4,090
DWM
12/16/08
4/13/2005
Sew
erGroup
4-S
SES
ContractD
27
A,B
,C,D
,E,F,G
,H,I,
J,K,L,M
,N,O
,P,R
,S,
T,V,W,X
,Y,Z
1,2,3,4,5,6,7,
8,9,10,11,12
04.19.200
WSRB
$69,768
DWM
6/3/11
7/1/2008
Sew
erGroup
4-
Rehabilitation
28
A,B
,C,D
,E,F,G
,H,I,
J,K,L,M
,N,O
,P,R
,S,
T,V,W,X
,Y,Z
1,2,3,4,5,6,7,
8,9,10,11,12
04.20.001
WSRB
$5,328
DWM
9/30/10
7/18/2008
Sew
erGroup
5-S
SES
ContractA
29
349Atlanta Strategic Action Plan September 2007 Draft
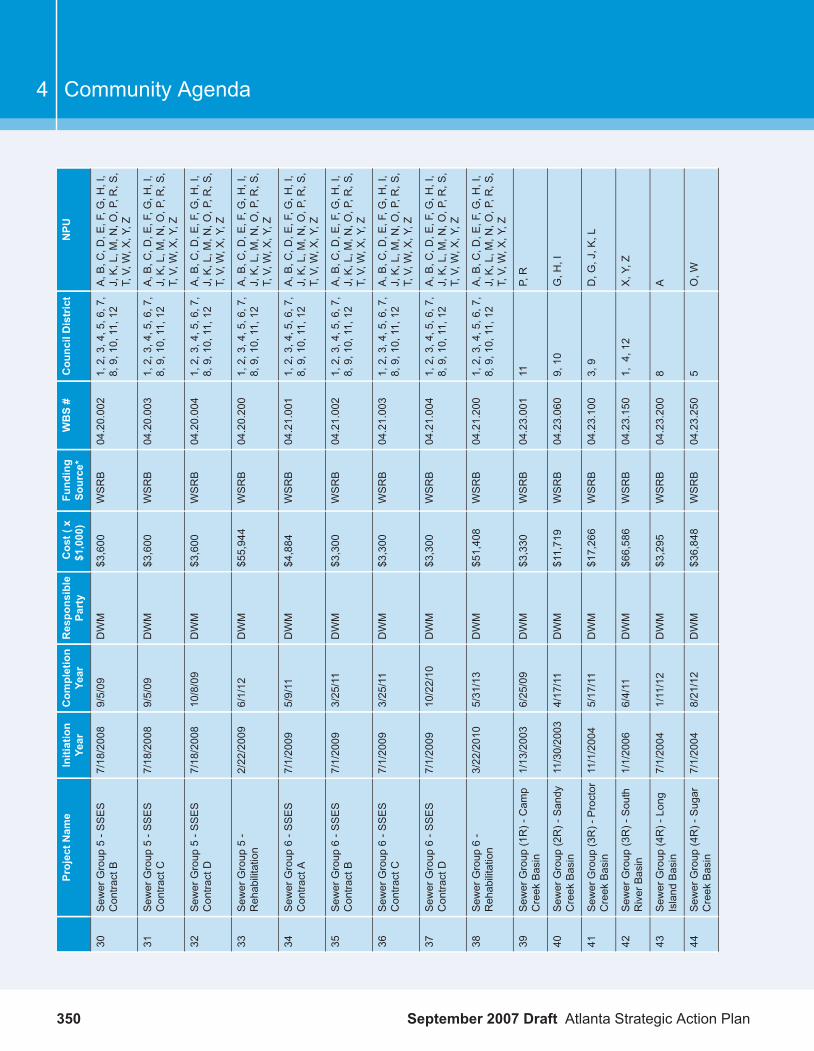
NPU
Cou
ncilDistrict
WBS#
Fund
ing
Source*
Cos
t(x
$1,000)
Respo
nsible
Party
Com
pletion
Year
Initiation
Year
ProjectN
ame
A,B
,C,D
,E,F,G
,H,I,
J,K,L,M
,N,O
,P,R
,S,
T,V,W,X
,Y,Z
1,2,3,4,5,6,7,
8,9,10,11,12
04.20.002
WSRB
$3,600
DWM
9/5/09
7/18/2008
Sew
erGroup
5-S
SES
ContractB
30
A,B
,C,D
,E,F,G
,H,I,
J,K,L,M
,N,O
,P,R
,S,
T,V,W,X
,Y,Z
1,2,3,4,5,6,7,
8,9,10,11,12
04.20.003
WSRB
$3,600
DWM
9/5/09
7/18/2008
Sew
erGroup
5-S
SES
ContractC
31
A,B
,C,D
,E,F,G
,H,I,
J,K,L,M
,N,O
,P,R
,S,
T,V,W,X
,Y,Z
1,2,3,4,5,6,7,
8,9,10,11,12
04.20.004
WSRB
$3,600
DWM
10/8/09
7/18/2008
Sew
erGroup
5-S
SES
ContractD
32
A,B
,C,D
,E,F,G
,H,I,
J,K,L,M
,N,O
,P,R
,S,
T,V,W,X
,Y,Z
1,2,3,4,5,6,7,
8,9,10,11,12
04.20.200
WSRB
$55,944
DWM
6/1/12
2/22/2009
Sew
erGroup
5-
Rehabilitation
33
A,B
,C,D
,E,F,G
,H,I,
J,K,L,M
,N,O
,P,R
,S,
T,V,W,X
,Y,Z
1,2,3,4,5,6,7,
8,9,10,11,12
04.21.001
WSRB
$4,884
DWM
5/9/11
7/1/2009
Sew
erGroup
6-S
SES
ContractA
34
A,B
,C,D
,E,F,G
,H,I,
J,K,L,M
,N,O
,P,R
,S,
T,V,W,X
,Y,Z
1,2,3,4,5,6,7,
8,9,10,11,12
04.21.002
WSRB
$3,300
DWM
3/25/11
7/1/2009
Sew
erGroup
6-S
SES
ContractB
35
A,B
,C,D
,E,F,G
,H,I,
J,K,L,M
,N,O
,P,R
,S,
T,V,W,X
,Y,Z
1,2,3,4,5,6,7,
8,9,10,11,12
04.21.003
WSRB
$3,300
DWM
3/25/11
7/1/2009
Sew
erGroup
6-S
SES
ContractC
36
A,B
,C,D
,E,F,G
,H,I,
J,K,L,M
,N,O
,P,R
,S,
T,V,W,X
,Y,Z
1,2,3,4,5,6,7,
8,9,10,11,12
04.21.004
WSRB
$3,300
DWM
10/22/10
7/1/2009
Sew
erGroup
6-S
SES
ContractD
37
A,B
,C,D
,E,F,G
,H,I,
J,K,L,M
,N,O
,P,R
,S,
T,V,W,X
,Y,Z
1,2,3,4,5,6,7,
8,9,10,11,12
04.21.200
WSRB
$51,408
DWM
5/31/13
3/22/2010
Sew
erGroup
6-
Rehabilitation
38
P,R
1104.23.001
WSRB
$3,330
DWM
6/25/09
1/13/2003
Sew
erGroup
(1R)-
Cam
pCreek
Basin
39
G,H
,I9,10
04.23.060
WSRB
$11,719
DWM
4/17/11
11/30/2003
Sew
erGroup
(2R)-
Sandy
Creek
Basin
40
D,G
,J,K
,L3,9
04.23.100
WSRB
$17,266
DWM
5/17/11
11/1/2004
Sew
erGroup
(3R)-Proctor
Creek
Basin
41
X,Y,Z
1,4,12
04.23.150
WSRB
$66,586
DWM
6/4/11
1/1/2006
Sew
erGroup
(3R)-
South
RiverBasin
42
A8
04.23.200
WSRB
$3,295
DWM
1/11/12
7/1/2004
Sew
erGroup
(4R)-
Long
Island
Basin
43
O,W
504.23.250
WSRB
$36,848
DWM
8/21/12
7/1/2004
Sew
erGroup
(4R)-
Sugar
Creek
Basin
44
September 2007 Draft Atlanta Strategic Action Plan350
Community Agenda4

NPU
Cou
ncilDistrict
WBS#
Fund
ing
Source*
Cos
t(x
$1,000)
Respo
nsible
Party
Com
pletion
Year
Initiation
Year
ProjectN
ame
A,B
,C7,8,9
04.23.300
WSRB
$5,496
DWM
10/19/11
4/1/2005
Sew
erGroup
(5R)-
Nancy
Creek
Basin
45
A,B
,C,D
,E,F,G
,N2,6,7,8,9
04.23.350
WSRB
$56,758
DWM
11/19/12
3/15/2005
Sew
erGroup
(5R)-
PeachtreeCreek
Basin
46
E,F,M,N
2,6
04.23.400
WSRB
$69,840
DWM
3/1/13
3/1/2006
Sew
erGroup
(6R)-
Clear
Creek
CSOBasin
47
W,Y
104.23.450
WSRB
$60,100
DWM
10/7/12
1/1/2007
Sew
erGroup
(6R)-
Custer
AveCSOBasin
48
K,L,M
,T2,3,4,8
04.23.500
WSRB
$46,560
DWM
10/7/12
1/1/2007
Sew
erGroup
(6R)-
North
AveCSOBasin
49
D,E
,M2,7,8
04.23.550
WSRB
$60,100
DWM
12/30/12
1/1/2006
SewerGroup
(6R)-Tanyard
AveCSOBasin
50
H,I,P,R
,S,T
4,10,11,12
04.23.600
WSRB
$82,136
DWM
9/30/12
3/31/2004
Sew
erGroup
(6R)-
Utoy
Creek
Basin
51
A,B
,C,D
,E,F,G
,H,I,
J,K,L,M
,N,O
,P,R
,S,
T,V,W,X
,Y,Z
1,2,3,4,5,6,7,
8,9,10,11,12
04.96.001
WSRB
$10,956
DWM
12/31/09
9/1/2004
SSO-C
ostS
haringRelief
Projects
52
E,K
,L,M
,T2,3,4,8
05.92.004
WSRB
$49,116
DWM
3/4/12
8/25/2002
RockandVine
Streets
Sew
erProject
53
V,W,Y,Z
1,2,4,5
05.92.006
WSRB
$675
DWM
10/23/10
1/1/2003
BoulevardTrunkOutflow
Managem
ent
54
E,F,M
,N,O
,W1,2,5,6,7
05.94.002
WSRB
$85,714
DWM
12/12/12
5/1/2007
ButlerS
treet/
HighlandAveTrunkRelief
Phase
II&III
55
A,B
,C,D
,E,F,G
,H,I,
J,K,L,M
,N,O
,P,R
,S,
T,V,W,X
,Y,Z
1,2,3,4,5,6,7,
8,9,10,11,12
08.01.002
WSRB
$39,270
DWM
6/22/15
8/2/2004
LargeDiameterSew
erRehabilitation-A
nnual
Contract
56
A,B
,C,D
,E,F,G
,H,I,
J,K,L,M
,N,O
,P,R
,S,
T,V,W,X
,Y,Z
1,2,3,4,5,6,7,
8,9,10,11,12
08.01.003
WSRB
$42,000
DWM
3/4/18
8/2/2004
LargeDiameterClean,Find
andFixContract-A
nnual
Contract
57
A,B
,C,D
,E,F,G
,H,I,
J,K,L,M
,N,O
,P,R
,S,
T,V,W,X
,Y,Z
1,2,3,4,5,6,7,
8,9,10,11,12
08.01.004
WSRB
$11,777
DWM
10/23/15
10/11/2003
Flow
Monitoringand
Inspections
58
A,B
,C,D
,E,F,G
,H,I,
J,K,L,M
,N,O
,P,R
,S,
T,V,W,X
,Y,Z
1,2,3,4,5,6,7,
8,9,10,11,12
08.01.006
WSRB
$17,250
DWM
4/19/15
9/12/2005
PipelineAssessment,CCTV
InspectionandCleaning-
AnnualC
ontract
59
A,B
,C,D
,E,F,G
,H,I,
J,K,L,M
,N,O
,P,R
,S,
T,V,W,X
,Y,Z
1,2,3,4,5,6,7,
8,9,10,11,12
08.01.007
WSRB
$6,050
DWM
6/4/18
11/9/2005
ROW
Clearing-A
nnual
Contract
60
351Atlanta Strategic Action Plan September 2007 Draft

NPU
Cou
ncilDistrict
WBS#
Fund
ing
Source*
Cos
t(x
$1,000)
Respo
nsible
Party
Com
pletion
Year
Initiation
Year
ProjectN
ame
A,B
,C,D
,E,F,G
,H,I,
J,K,L,M
,N,O
,P,R
,S,
T,V,W,X
,Y,Z
1,2,3,4,5,6,7,
8,9,10,11,12
08.01.018
WSRB
$28,484
DWM
8/2/09
6/13/2005
SmallD
iameterSew
erRehabilitation:Pipe
Bursting
-AnnualC
ontract
61
A,B
,C,D
,E,F,G
,H,I,
J,K,L,M
,N,O
,P,R
,S,
T,V,W,X
,Y,Z
1,2,3,4,5,6,7,
8,9,10,11,12
08.01.019
WSRB
$25,442
DWM
8/2/09
6/13/2005
SmallD
iameterSew
erRehabilitation:
CIPP-
AnnualC
ontract
62
A,B
,C,D
,E,F,G
,H,I,
J,K,L,M
,N,O
,P,R
,S,
T,V,W,X
,Y,Z
1,2,3,4,5,6,7,
8,9,10,11,12
08.01.091
WSRB
$83,547
DWM
5/27/08
4/1/2001
Program
Managem
ent
Services(SSO)
63
A,B
,C,D
,E,F,G
,H,I,
J,K,L,M
,N,O
,P,R
,S,
T,V,W,X
,Y,Z
1,2,3,4,5,6,7,
8,9,10,11,12
08.01.093
WSRB
$28,908
DWM
6/27/08
5/1/2007
Supplem
entalProgram
Managem
entS
ervices
64
A,B
,C,D
,E,F,G
,H,I,
J,K,L,M
,N,O
,P,R
,S,
T,V,W,X
,Y,Z
1,2,3,4,5,6,7,
8,9,10,11,12
08.99.001
WSRB
$2,060
DWM
9/27/07
8/2/2004
ConstructionManagem
ent
Services
65
A,B
,C,D
,E,F,G
,H,I,
J,K,L,M
,N,O
,P,R
,S,
T,V,W,X
,Y,Z
1,2,3,4,5,6,7,
8,9,10,11,12
99.02.006
WSRB
$62,570
DWM
12/31/14
1/1/2005
Reserve
forA
ppropriations
-FirstA
mendedConsent
Decree(SSO)
66
Z1,12
02.14.040
WSRB
$1,100
DWM
4/1/09
4/2/2007
SouthRiverEnergySystem
ReliabilityImprovem
ents
67
A,C
,D8,9
02.17.900
WSRB
$26,023
DWM
12/26/08
8/2/2004
RMClayton
-Com
pliance
Upgrades
68
A,C
,D8,9
02.17.940
WSRB
$5,057
DWM
8/29/07
11/15/2004
RMClayton
-GritRem
oval
69
Z1,12
02.18.910
WSRB
$1,750
DWM
12/4/10
10/1/2006
SouthRiverWRCPrim
ary
ClarifierR
eplacement
70
W,Y,Z
102.20.902
WSRB
$812
DWM
2/20/08
9/1/2006
Intrenchm
entC
reek
WRC
GeneralImprovem
ents
71
Outside
City
Limits
Outside
City
Limits
03.05.002
WSRB
$14,850
DWM
2/1/13
1/1/2009
FlintR
iverPum
pStation
Replacement
72
A,B
,C,D
,E,F,G
,H,I,
J,K,L,M
,N,O
,P,R
,S,
T,V,W,X
,Y,Z
1,2,3,4,5,6,7,
8,9,10,11,12
05.28.001
WSRB
$4,323
DWM
9/4/09
8/21/2001
Watershed
MasterP
lan
73
A,B
,C,D
,E,F,G
,H,I,
J,K,L,M
,N,O
,P,R
,S,
T,V,W,X
,Y,Z
1,2,3,4,5,6,7,
8,9,10,11,12
07.03.001
WSRB
$8,583
DWM
11/7/07
6/29/2001
Watershed
Monitoring
Program
74
A,B
,C,D
,E,F,G
,H,I,
J,K,L,M
,N,O
,P,R
,S,
T,V,W,X
,Y,Z
1,2,3,4,5,6,7,
8,9,10,11,12
07.79.001
WSRB
$39,218
DWM
11/29/07
9/1/2002
Bio-SolidsManagem
ent
Services
75
September 2007 Draft Atlanta Strategic Action Plan352
Community Agenda4

NPU
Cou
ncilDistrict
WBS#
Fund
ing
Source*
Cos
t(x
$1,000)
Respo
nsible
Party
Com
pletion
Year
Initiation
Year
ProjectN
ame
Y,Z
1,12
09.02.902
WSRB
$3,175
DWM
3/27/09
5/2/2005
FlintR
iverForceMain
Phase
II76
Y,Z
1,12
09.02.903
WSRB
$12,000
DWM
9/3/09
6/1/2007
FlintR
iverForceMain
Phase
III77
A,B
,C,D
,E,F,G
,H,I,
J,K,L,M
,N,O
,P,R
,S,
T,V,W,X
,Y,Z
1,2,3,4,5,6,7,
8,9,10,11,12
99.02.007
WSRB
$4,207
DWM
12/31/09
1/1/2005
Reserve
forA
ppropriations
-RegulatoryorContract
Com
pliance
78
H,I,P,R
1002.15.004
WSRB
$1,962
DWM
10/18/08
3/1/2006
UtoyCreek
-Maintenance
BuildingImprovem
ents
79
A,C
,D8,9
02.17.020
WSRB
$2,836
DWM
8/1/08
8/1/2001
RMClayton
-Landscaping
Improvem
ents
80
A,C
,D8,9
02.17.050
WSRB
$5,413
DWM
8/28/09
8/2/2004
RMClayton
-Prim
aryArea
Upgrades
81
Z1,12
02.18.901
WSRB
$4,622
DWM
12/3/10
2/1/2006
SouthRiver-S
mallC
apital
Projects
82
Z1,12
02.18.903
WSRB
$1,750
DWM
8/1/08
8/2/2004
SouthRiverWRCEffluent
Pum
ping
StationUpgrade
83
Z1,2,12
02.18.904
WSRB
$877
DWM
5/31/08
10/11/2004
SouthRiver-U
pgrade
ofSolidsHandlingat
Headw
orks
84
H,I,P,R
1002.19.004
WSRB
$2,070
DWM
12/3/10
3/15/2006
UtoyCreek
-SmallC
apital
Projects
85
W,Z
102.20.900
WSRB
$1,677
DWM
12/3/10
2/1/2006
Intrenchm
entC
reek
-Small
CapitalProjects
86
A,H
,I,P,R
,S10,11
03.03.050
WSRB
$2,931
DWM
1/15/10
3/1/2007
SmallPSUpgrades
(Highlands,N
iskeyLake
1&2,andCascade
Road)
87
D,G
903.06.905
WSRB
$2,000
DWM
12/3/10
2/16/2006
Pum
pStation-B
arScreen
Replacement(BR&PL)
88
M,N
,V,W
1,2,3,4,5
05.96.016
WSRB
$1,500
DWM
9/21/07
8/1/2006
AHA-C
apital
RedevelopmentP
hase
389
M,N
,V,W
1,2,5
05.96.017
WSRB
$5,800
DWM
2/17/08
8/1/2006
AHA-G
rady
RedevelopmentP
hase
190
M,N
,V,W
1,2,5
05.96.018
WSRB
$912
DWM
10/31/07
4/2/2007
AHA-G
rady
RedevelopmentP
hase
291
V2
05.96.019
WSRB
$11,500
DWM
11/30/08
4/7/2008
AHA-M
cDanielG
lenn
Hom
esPhase
192
353Atlanta Strategic Action Plan September 2007 Draft

NPU
Cou
ncilDistrict
WBS#
Fund
ing
Source*
Cos
t(x
$1,000)
Respo
nsible
Party
Com
pletion
Year
Initiation
Year
ProjectN
ame
A,B
,C,D
,E,F,G
,H,I,
J,K,L,M
,N,O
,P,R
,S,
T,V,W,X
,Y,Z
1,2,3,4,5,6,7,
8,9,10,11,12
07.05.003
WSRB
$32,500
DWM
5/18/10
12/31/2004
DWMAdm
inistrationand
Maintenance
Building
(University)
93
H,I,P,R
1007.05.008
WSRB
$995
DWM
2/18/09
12/1/2005
TemporaryFieldOffice
Facilities
94
A,B
,C,D
,E,F,G
,H,I,
J,K,L,M
,N,O
,P,R
,S,
T,V,W,X
,Y,Z
1,2,3,4,5,6,7,
8,9,10,11,12
07.06.001
WSRB
$496
DWM
8/16/09
9/17/2004
Docum
entM
anagem
ent
System-F
easibilityStudy
95
A,B
,C,D
,E,F,G
,H,I,
J,K,L,M
,N,O
,P,R
,S,
T,V,W,X
,Y,Z
1,2,3,4,5,6,7,
8,9,10,11,12
08.01.012
WSRB
$46,021
DWM
4/30/18
8/2/2004
SanitarySew
ersRepair-
AnnualC
ontract
96
A,B
,C,D
,E,F,G
,H,I,
J,K,L,M
,N,O
,P,R
,S,
T,V,W,X
,Y,Z
1,2,3,4,5,6,7,
8,9,10,11,12
08.01.013
WSRB
$2,200
DWM
6/21/16
1/3/2005
Repairand
Replace
Roofing
-AnnualC
ontract
97
A,B
,C,D
,E,F,G
,H,I,
J,K,L,M
,N,O
,P,R
,S,
T,V,W,X
,Y,Z
1,2,3,4,5,6,7,
8,9,10,11,12
08.04.008
WSRB
$4,200
DWM
1/21/09
7/5/2004
Surveying
andMapping
Services-A
nnualC
ontract
98
A,B
,C,D
,E,F,G
,H,I,
J,K,L,M
,N,O
,P,R
,S,
T,V,W,X
,Y,Z
1,2,3,4,5,6,7,
8,9,10,11,12
99.02.008
WSRB
$17,678
DWM
12/31/14
1/1/2005
Reserve
forA
ppropriations
-SystemRenew
alor
OperationalR
eliability
99
New
Projects
CapitalImprovem
ent
A,C
,D8,9
02.17.910
WSRB
$15,842
DWM
11/24/08
11/21/2006
RMClayton--D
igesterC
over
Replacement
100
Com
pleted
Projects
CapitalImprovem
ent
C,D
,E2,6,7,8
05.04.003
WSRB
$500
DWM
6/25/06
5/2/2000
TanyardWestA
rea
DisinfectionFacility
101
A,C
,D8,9
05.19.001
WSRB
$5,517
DWM
2/1/06
1/7/2002
CSODechlorinationWest
102
C8
04.01.001
WSRB
$246
DWM
12/16/05
11/1/2004
Woodw
ardWay
/Northside
Sew
erImprovem
ent
103
P,R
1104.16.357
WSRB
$1,375
DWM
12/31/05
8/2/2004
Cam
pCreek
Outfall
Capacity
Relief-Phase
1(PrincetonLakes)
104
September 2007 Draft Atlanta Strategic Action Plan354
Community Agenda4
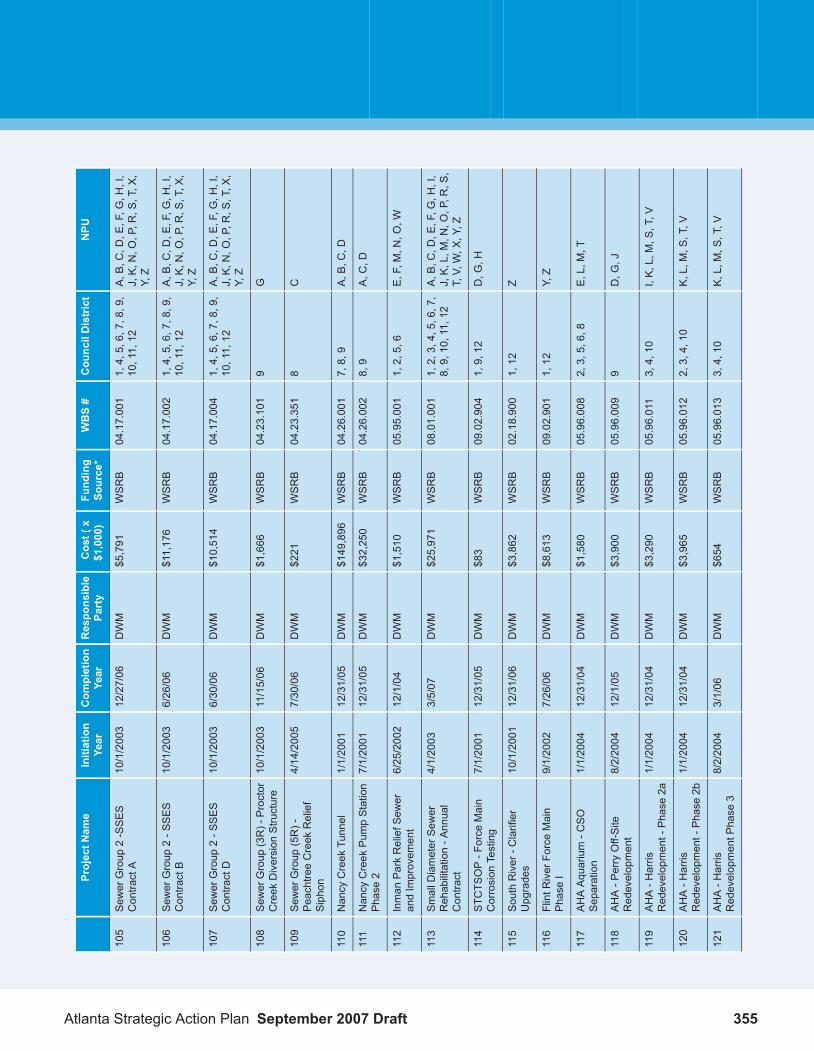
NPU
Cou
ncilDistrict
WBS#
Fund
ing
Source*
Cos
t(x
$1,000)
Respo
nsible
Party
Com
pletion
Year
Initiation
Year
ProjectN
ame
A,B
,C,D
,E,F,G
,H,I,
J,K,N
,O,P,R
,S,T,X
,Y,Z
1,4,5,6,7,8,9,
10,11,12
04.17.001
WSRB
$5,791
DWM
12/27/06
10/1/2003
Sew
erGroup
2-SSES
ContractA
105
A,B
,C,D
,E,F,G
,H,I,
J,K,N
,O,P,R
,S,T,X
,Y,Z
1,4,5,6,7,8,9,
10,11,12
04.17.002
WSRB
$11,176
DWM
6/26/06
10/1/2003
Sew
erGroup
2-S
SES
ContractB
106
A,B
,C,D
,E,F,G
,H,I,
J,K,N
,O,P,R
,S,T,X
,Y,Z
1,4,5,6,7,8,9,
10,11,12
04.17.004
WSRB
$10,514
DWM
6/30/06
10/1/2003
Sew
erGroup
2-S
SES
ContractD
107
G9
04.23.101
WSRB
$1,666
DWM
11/15/06
10/1/2003
Sew
erGroup
(3R)-Proctor
Creek
Diversion
Structure
108
C8
04.23.351
WSRB
$221
DWM
7/30/06
4/14/2005
Sew
erGroup
(5R)-
PeachtreeCreek
Relief
Siphon
109
A,B
,C,D
7,8,9
04.26.001
WSRB
$149,896
DWM
12/31/05
1/1/2001
Nancy
Creek
Tunnel
110
A,C
,D8,9
04.26.002
WSRB
$32,250
DWM
12/31/05
7/1/2001
Nancy
Creek
Pum
pStation
Phase
2111
E,F,M
,N,O
,W1,2,5,6
05.95.001
WSRB
$1,510
DWM
12/1/04
6/25/2002
Inman
ParkReliefS
ewer
andImprovem
ent
112
A,B
,C,D
,E,F,G
,H,I,
J,K,L,M
,N,O
,P,R
,S,
T,V,W,X
,Y,Z
1,2,3,4,5,6,7,
8,9,10,11,12
08.01.001
WSRB
$25,971
DWM
3/5/07
4/1/2003
SmallD
iameterSew
erRehabilitation-A
nnual
Contract
113
D,G
,H1,9,12
09.02.904
WSRB
$83
DWM
12/31/05
7/1/2001
STC
TSOP-F
orce
Main
Corrosion
Testing
114
Z1,12
02.18.900
WSRB
$3,862
DWM
12/31/06
10/1/2001
SouthRiver-C
larifier
Upgrades
115
Y,Z
1,12
09.02.901
WSRB
$8,613
DWM
7/26/06
9/1/2002
FlintR
iverForceMain
Phase
I116
E,L,M
,T2,3,5,6,8
05.96.008
WSRB
$1,580
DWM
12/31/04
1/1/2004
AHAAquarium-C
SO
Separation
117
D,G
,J9
05.96.009
WSRB
$3,900
DWM
12/1/05
8/2/2004
AHA-P
erryOff-Site
Redevelopment
118
I,K,L,M
,S,T,V
3,4,10
05.96.011
WSRB
$3,290
DWM
12/31/04
1/1/2004
AHA-H
arris
Redevelopment-Phase
2a119
K,L,M
,S,T,V
2,3,4,10
05.96.012
WSRB
$3,965
DWM
12/31/04
1/1/2004
AHA-H
arris
Redevelopment-Phase
2b120
K,L,M
,S,T,V
3,4,10
05.96.013
WSRB
$654
DWM
3/1/06
8/2/2004
AHA-H
arris
RedevelopmentP
hase
3121
355Atlanta Strategic Action Plan September 2007 Draft

NPU
Cou
ncilDistrict
WBS#
Fund
ing
Source*
Cos
t(x
$1,000)
Respo
nsible
Party
Com
pletion
Year
Initiation
Year
ProjectN
ame
M,N
,V,W
1,2,3,4,5
05.96.014
WSRB
$1,334
DWM
12/31/04
1/1/2004
AHA-C
apital
RedevelopmentP
hase
1122
M,N
,V,W
1,2,3,4,5
05.96.015
WSRB
$4,035
DWM
12/31/05
1/1/2005
AHA-C
apital
RedevelopmentP
hase
2123
September 2007 Draft Atlanta Strategic Action Plan356
Community Agenda4

Table4.8City
ofAtlanta2008
-2012-S
HORTTE
RMWORKPROGRAM-S
WMPImplem
entationPlan
NPU
Cou
ncil
District
WBS
#Fu
ndingSo
urce*
Cos
t(x
$1,000)
Respo
nsible
Party
Com
pletion
Year
Initiation
Year
ProjectN
ame
Section2:WasteDisposalStream
Analysis
SolidWaste
Reserve
Fund
(SWRF)
$50
SWS/P
rivate
2014
2005
CollectBe
tterD
atatoAn
alyzeandManage
Com
mericalandC&DWaste
1 Section3:WasteReductionElement
GeneralFund
$135
SWS/G
eneral
Services
2014
2005
City
ofAtlantaRecyclingProgram
s2
SWRF
$100
SWS/R
ecycling
Contractor
2014
2005
CurbsideRecyclingCollectionProgram
3
SWRF
$209
SWS/P
rivate
2014
2005
DropOffCenters
4
SWRF
$750
SWS/P
rivate
2014
2005
City
andCom
mericalMulti-Family
Recycling
5
SWRF
$100
SWS/P
rivate
2014
2006
Com
mericalBusinessRecycling
6
SWRF
$10
SWS/R
ecycling
Vendors
2014
2005
TireRecycling
7
SWRF
$4,800
SWS
2014
2005
ResidentialYardTrimmings
Curbside
CollectionProgram
8
SWRF
$240
SWS
2014
2005
WhiteGoods
Recycling
9
SWRF
$100
SWS
2009
2006
Pay-As-You-ThrowGarbage
andYard
Trimmings
Evaluation
10
SWRF
$174
SWS
2014
2010
Pay-As-You-ThrowGarbage
andYard
Trimmings
PotientalImplem
entation
11
SWRF
$70
SWS
2006
2006
FinancialIncentives
12
SWRF
$100
SWS
2006
2005
Metro-AtlantaWasteExchangeEvaluation
13
SWRF
$74
SWS
2014
2007
Metro-AtlantaWasteExchangePotiental
Implem
tation
14
SWRF
$100
SWS/P
rivate
2014
2006
C&DRecycling
15
GeneralFund/
Grants
$50
SWS/D
PRC/
DPCD
2007
2006
ConversionofHartsfieldSolidWaste
ReductionPlanttoEnvironm
ental
EducationCenterand
ParkEvaluation
16
GeneralFund/
Grants
$250
SWS/D
PRC/
DPCD
2014
2008
ConversionofHartsfieldSolidWaste
ReductionPlanttoEnvironm
ental
17
EducationCenterand
ParkPotiental
Implem
entation
SWRF
$150
SWS
2014
2005
AmnestyDaysandHouseholdHazardous
WasteEvents
18
357Atlanta Strategic Action Plan September 2007 Draft

NPU
Cou
ncil
District
WBS
#Fu
ndingSo
urce*
Cos
t(x
$1,000)
Respo
nsible
Party
Com
pletion
Year
Initiation
Year
ProjectN
ame
SWRF
$13,400
SWS
2014
2005
City
ofAtlantaCollectionOperations
19
SWRF
$1,900
SWS
2014
2005
City-OwnedBuildings
andFacilities
Collection
20
SWRF
$6,200
SWS
2014
2005
City
BeautificationandCom
mon
Good
Services
21
SWRF
$101
SWS
2014
2005
EducationandCom
plianceon
St-OutLimits
forS
olidWaste&YardTrimmings
22
SWRF
$500
SWS
2007
2005
CollectionProductivity
andOperational
Efficientcy
23
SWRF
$8,700
SWS
2014
2005
Fleetm
aintenance
24
SWRF
$275
SWS
2006
2005
Com
mericalCollection
25
SWRF
$50
SWS
2006
2006
Improved
OverallRouteBalance
26
SWRF
$398
SWS
2006
2005
IncreasedFrequencyofYardTrimmings
Pickup
27
SWRF
$1,300
SWS
2014
2005
Expand
IllegalDum
pang
/LitteringProgram
28 Section4:DisposalElement
SWRF
$1,000
SWS
2014
2005
MonitoringandPost-C
losureActivities
atExsiting
landfills
29
SWRF
$7,000
SWS
2009
2005
Contracted
DisposaltoLnadfillsvia
TransfreStations
30
SWRF
$5,000
SWS
2014
2005
Non-IncineratedSludgeDisposalto
Landfills
31
SWRF
$50
SWS
2014
2006
Continue
EvaluatingInnovativeand
SustainableDisposalTechnologies
32
SWRF
$100
SWS
2006
2006
MassBurnCom
bustion
33
SWRF
$100
SWS
2006
2006
Refuse-Derived
Fuel
34
SWRF
$100
SWS
2006
2006
ReginalLandfills
35
SWRF
$100
SWS
2006
2006
Use
ofTransferStations
toSupport
RegionalD
isposalFacilities
36
SWRF
$100
SWS
2006
2006
Eco-IndustrialPark
37 Section5:Land
LimitationElement
GeneralFund
Ongoing
SWS/D
PCD
2014
2005
Enforcem
entofN
aturalEn
vironm
entaland
Land
Use
Limitations
andOtherRegulatory
38
RequirementsforS
olidWasteFacility
Siting
September 2007 Draft Atlanta Strategic Action Plan358
Community Agenda4

NPU
Cou
ncil
District
WBS
#Fu
ndingSo
urce*
Cos
t(x
$1,000)
Respo
nsible
Party
Com
pletion
Year
Initiation
Year
ProjectN
ame
GeneralFund
Ongoing
SWS/D
PCD
2014
2005
AccountforDisproportionateEn
vironm
ental
Impacts
39
GeneralFund
Ongoing
SWS/D
PCD
2014
2005
EstablishConsistency
with
Com
prehensive
SWMP
40 Section6:EducationandPublic
Involvem
entE
lement
SWRF
$800
SWS
2014
SWEET
41
SWRF
$800
SWS
2014
2005
TrashTroopers
42
SWRF
$85
SWS
2014
2005
Partnershipswith
OtherOrganizations
43
SWRF
$1,100
SWS
2014
2005
Public
OutreachProgram
s44
SWRF
$104
SWS
2014
2005
EducationalM
aterials
45
359Atlanta Strategic Action Plan September 2007 Draft

Table4.9CITYOFAT
LANTA
2008-2012SHORTTE
RMWORKPROGRAM-F
ireDepartment
NPU
CD
CIP
#Fu
ndingSo
urce
Cos
tx1000
Respo
nsible
Party
Com
pletionYe
arInitiationYe
arDescriptio
nProject
Num
ber
M2
AFD
-05-0001
4149
AFD
71ElliotStreet
Relocatethis
building.
Thereisa
FireStation1
1
proposalby
the
Departmentof
Transportationto
connectthe
TechwoodDrive
viaducttoI-20.
This
proposed
extension
willgo
almostover
thetopofthis
building.
W N5
AFD
-05-0002
3600
AFD
09/30/2007
447FlatShoals
Blvd.,S
ERelocateandrebuild
firestationdueto
FireStation13
2
condition
ofcurrent
building(verypoor).
O5
AFD
-05-0003
3600
AFD
09/01/2007
2007
Oakview
,SE
Relocateandrebuild
firestationdueto
FireStation18
3
condition
ofcurrent
building(verypoor).
G J9
AFD
-05-0004
3780
AFD
04/01/2009
817HollywoodRd.,
NE
Relocateandrebuild
firestationdueto
FireStation22
4
condition
ofcurrent
building(poor).This
facilityistoooldand
smalltofunctionas
afirestation.
Itwouldnotbe
feasibletobuild
alargerfacilityon
the
property.
C D E
8AFD
-05-0005
3780
AFD
04/01/2009
817HollywoodRd.,
NE
Relocateandrebuild
firestationdueto
FireStation23
5
condition
ofcurrent
building(poor).This
facilityistoooldand
smalltofunctionas
afirestation.
It
September 2007 Draft Atlanta Strategic Action Plan360
Community Agenda4

NPU
CD
CIP
#Fu
ndingSo
urce
Cos
tx1000
Respo
nsible
Party
Com
pletionYe
arInitiationYe
arDescriptio
nProject
Num
ber
wouldnotbe
feasibletobuild
alargerfacilityon
the
property.
R S11
AFD
-05-0006
4959
AFD
2349
BenjaminE.
MaysDr.,SW
Relocateandrebuild
firestationdueto
FireStation25
6
condition
ofcurrent
building(poor).
A C T
8AFD
-05-0007
4149
AFD
2970
How
ellM
illRd.,N
WRelocateandrebuild
firestationdueto
FireStation26
7
condition
ofcurrent
building(poor)and
toosm
allforfuture
apparatus.
Re-locationwill
includebetter
response
time.
A T8
AFD
-05-0008
4959
AFD
4260
Northside
Dr.,
NW
Relocateandrebuild
firestationdueto
FireStation27
8
condition
ofcurrent
building(poor).
D G9
AFD
-05-0009
3600
AFD
09/30/2007
4260
Northside
Dr.,
NW
Relocateandrebuild
firestationdueto
FireStation28
9
condition
ofcurrent
building(poor).
G H I
12AFD
-05-0010
6426
AFD
10Cleveland
Ave.,
SW
Relocateandrebuild
firestationdueto
FireStation30
10
condition
ofcurrent
building(poor).
P11
AFD
-05-0011
6425
AFD
09/30/2005
2406
FairburnRd.,
SW
Relocateandrebuild
firestationdueto
FireStation31
11
condition
ofcurrent
(poor)building.
361Atlanta Strategic Action Plan September 2007 Draft

NPU
CD
CIP
#Fu
ndingSo
urce
Cos
tx1000
Respo
nsible
Party
Com
pletionYe
arInitiationYe
arDescriptio
nProject
Num
ber
T4
AFD
-05-0012
4149
AFD
04/01/2009
2406
FairburnRd.,
SW
Relocateandrebuild
firestationdueto
FireStation7
12
condition
ofcurrent
(poor)building.
G H I
10AFD
-05-0013
6425
AFD
2501
MLK
.Jr.D
r.SW
Relocateandrebuild
firestationdueto
FireStation9
13
condition
ofcurrent
building.
City-
Wide
City-
Wide
AFD
-05-0014
0AFD
Relocateandrebuild
FireHeadquarters
Fire-Rescue
Adm
inistration
14
duetocondition
ofcurrentbuildingand
expansionof
services.
City-
Wide
4
AFD
-05-0015
1300
AFD
770Oak
St.,SW
Relocateandrebuild
facilityandbreathing
Fire-Rescue
RepairS
hop
15
apparatusshop
due
tocondition
ofcurrentbuilding.
C D E
City-
Wide
8 7
AFD
-05-0016
4959
AFD
Peachtree
Street/Peachtree
Battle
Avenue
Add
firestationto
improveresponse
coverage
Peachtree
Street-Peachtree
Battle
Avenue
AreaFireStation
16
City-
Wide
City-
Wide
AFD
-05-0017
500
AFD
Peachtree
Street/Peachtree
Battle
Avenue
Add
firestationto
improveresponse
coverage
Training
Academy
17
City-
Wide
City-
Wide
AFD
-05-0018
4000
AFD
Relocateandrebuild
Fire-Rescue
Training
Academy,
18
Training
Academy
Classroom
/duetocondition
ofAdm
inistration
Building
currentbuildingand
expansionof
services.
September 2007 Draft Atlanta Strategic Action Plan362
Community Agenda4

NPU
CD
CIP
#Fu
ndingSo
urce
Cos
tx1000
Respo
nsible
Party
Com
pletionYe
arInitiationYe
arDescriptio
nProject
Num
ber
City-
Wide
City-
Wide
AFD
-05-0019
3500
AFD
Relocateandrebuild
Fire-Rescue
Training
AcademyLand
Procurement
19
Training
Academy
duetocondition
ofcurrentbuildingand
expansionof
services.
City-
Wide
AFD
-05-0020
4500
AFD
Relocateandrebuild
FireTraining
Facility
Training
Academy,Tower
20
duetocondition
ofcurrentbuilding.
Building/D
river
Training
Course
E2
AFD
-07-0001
3600
AFD
09/30/2007
New
FireStation11
AtlanticStationFire
Station
NPUE,C
ouncil
District2
FireStation11
21
X12
AFD
-07-0002
3780
AFD
04/01/2009
ReplacementFire
Station20
Built1926,Very
PoorC
ondition
NPUX,C
ouncil
District12
FireStation20
22
Table4.10
City
ofAtlanta2008
-2012SHORTTE
RMWORKPROGRAM-P
oliceDepartment
NPU
CD
CIP
#Fu
nding
Cos
tx1000
Respo
nsible
Party
Com
pletionYe
arInitiation
Year
Descriptio
nProject
Num
ber
City-
Wide
City-
Wide
APD-05-0002
610.755
APD
03/01/2006
Thisprojectw
illcreateanew
3000
sq.ft.K9facilityon
the
K-9Facility-New
Bldg.&Renovations
1
existingland
utilizedby
the
mounted
patrol
1001
CherokeeAvenue
Interiorand
Exterior
Renovations
toexisting
buildings
City-
Wide
City-
Wide
APD-05-0003
120-396
APD
Thisprojectw
illreplacethe
existingtargetsystem
and
FiringRange
2
repairtheexistingfenceline
toincrease
security.
M2
APD-05-0004
44500
APD
12/30/2008
1/1/2006
Thisprojectw
ouldcreatea
newfacilitytoreplacethe
PoliceHeadquarters
3
currentofficesatCity
Hall
East.
*PROPOSEDREQUESTE
DFU
NDING
363Atlanta Strategic Action Plan September 2007 Draft

NPU
CD
CIP
#Fu
nding
Cos
tx1000
Respo
nsible
Party
Com
pletionYe
arInitiation
Year
Descriptio
nProject
Num
ber
City-
Wide
City-
Wide
APD-05-0005
200-400
APD
Study
allofthe
City
Police
DepartmentP
recinct
*Couldbe
funded
bythe
AtlantaPoliceFoundation
PrecinctFacility
Study
4
City-
Wide
City-
Wide
APD-05-0012
42APD
03/01/2006
180So
uthsideIndustrialPkw
yInteriorand
Exterior
Renovations
Training
Academy/
SOSPrecinct
Facility-Renovations
5
City-
Wide
City-
Wide
APD-05-0013
6700
APD
180So
uthsideIndustrialPkw
yInteriorand
Exterior
Renovations
EVOCDriving
Course
6
City-
Wide
City-
Wide
APD-05-0014
1700
APD
Zone
2Precinct=
departm
ent's
#2priority
Requestreflectsbuilding
costsonly.
Land
acquisition
needed.
*PROPOSEDREQUESTE
DFU
NDING
Zone
2-R
eplace
PrecinctB
uilding
7
n/a
n/a
APD-05-0015
46APD
03/01/2006
880CherokeeAvenue
Interiorand
Exterior
Renovations
andHVA
Crepairs/
1500
Key
Road
Interiorand
Exterior
Renovations
androofrepairs/
Emergencypowergenerators
&lightsatthepatrolprecincts
Zone
3/Firing
Range
/Emergency
Pow
er-Renovations
8
S11
APD-05-0016
1700
APD
Estimated
costfor
constructiononly.
Land
Zone
4-R
eplace
PrecinctB
uilding
9
acquisition
wouldaddtocost.
APDassumes
city-owned
land
atJohn
A.W
hitePark
couldbe
used.
*PROPOSEDREQUESTE
DFU
NDING
M City-
Wide
6 City-
Wide
APD-05-0020
300
APD
Thisprojectw
illcreatea
securestorage/parking
facility
forlarge
APDvehicles.
City
HallEast:
Parking
Facility
Replacement&
UsefulSignage
10
City-
Wide
City-
Wide
APD-06-0002
76-255
APD
Thisprojectw
illcreateanew
crimelabfacilityandlessen
Crim
eLab
11
ourrelianceon
theGBIC
rime
Labfortestingofevidence.
APD-06-0004
1700
APD
Thisprojectw
illcreateanew
Zone
6precinctthatwillallow
Zone
6Precinct
12
September 2007 Draft Atlanta Strategic Action Plan364
Community Agenda4

NPU
CD
CIP
#Fu
nding
Cos
tx1000
Respo
nsible
Party
Com
pletionYe
arInitiation
Year
Descriptio
nProject
Num
ber
theCity
todiscontinue
rental
paym
entsforuse
offacilities.
Locationtobe
determined
TBD
TBD
300
APD
Thisprojectw
illcreatea
hangarinside
thecityfora
HelicopterH
anger
13
morecentralized
deployment
oftheHelicopterS
quad.
TBD
TBD
100
APD
Thisprojectw
illallowforthe
purchase
ofaspecialized
crimepreventionvehicle.
Crim
ePrevention
Van
14
M2
40APD
1/1/2007
1/1/2007
Thisprojectw
illallow
upgraded
facilitiesinthe
WorkArea
Renovation
15
CentralR
ecords
and
Identificationunits
workareas.
Z12
180
Purchase180
Southside
Ind.
16
365Atlanta Strategic Action Plan September 2007 Draft

Table4.11
City
ofAtlanta2008-2012SHORTTE
RMWORKPROGRAM-D
epartmentofC
orrections
NPU
CD
CIP
#Fu
ndingSo
urce
Cos
tx1000
Respo
nsible
Party
Com
pletionYe
arInitiationYe
arDescriptio
nProject
Num
ber
City-
Wide
City-
Wide
DOC-2005-0001
750
DOC
Tofurther
accommodatethe
Enhancement
ofLawLibrary
1
federalcontract
allowingfederal
inmates
theabilityto
access
legal
materialforthe
purposeofself
representationand
case
research.
City-
Wide
City-
Wide
DOC-2005-0002
10DOC
07/01/2005
Replace
theliningof
thecoolingtowerto
CoolingTower
2
improvetheair
quality
andextend
thelifeexpectancy
oftheheatingand
airconditioning
system
.2005
GOBond
Funded
project
ProjectCom
pleted
City-
Wide
City-
Wide
DOC-2005-0003
60DOC
Toupgradethe
vehiclesally
port
Replacement
ofSallyPort
Doors
3
doorstoensure
securitytolaw
enforcem
ent
agencies
transporting
inmates
toandfromthejail.
Nofundingidentified
atthistim
e
City-
Wide
City-
Wide
DOC-2005-0004
80DOC
Toincrease
the
overallsecurity
ofClosedCircuit
Television
System
4
thefederal
detaineeshoused
withintheCity’s
detentioncenter.
ProjectCom
pleted
City-
Wide
City-
Wide
DOC-2005-0005
50DOC
Toreconstructthe
flooringsurface
for
Upgrade
/Expansion
ofLaundry
5
installationof
commercialwashers
anddryersso
asto
meetthe
manufacturer’s
specifications.
September 2007 Draft Atlanta Strategic Action Plan366
Community Agenda4

NPU
CD
CIP
#Fu
ndingSo
urce
Cos
tx1000
Respo
nsible
Party
Com
pletionYe
arInitiationYe
arDescriptio
nProject
Num
ber
Nofundingidentified
atthistim
e
City-
Wide
City-
Wide
DOC-2006-0001
134.461
DOC
Toreconstructthe
flooringsurface
for
Various
Renovations
6
installationof
&Upgrades
Projects
commercialwashers
anddryersso
asto
meetthe
manufacturer’s
specifications.
Nofundingidentified
atthistim
e
367Atlanta Strategic Action Plan September 2007 Draft

Table4.12
City
ofAtlanta2008-2012SHORTTE
RMWORKPROGRAM-D
epartmentofP
arks,R
ecreation,andCulturalAffairs
NPU
CD
CIP
#Fu
nding
Source
Cos
tx1000
Respo
nsible
Party
Com
pletion
Year
Initiation
Year
Descriptio
nProject
Num
ber
M2
DPRCA-05-0001
1000
DPRCA
06/01/2005
Improveandinstall
ADAseatingandsafety
CivicCenter
Improvem
ents
1
screen
atthedrop
oftheAuditorium
1C49
773001
N12D099992AK
CIVIC
CEN
TER$194,801.73
M2
DPRCA-05-0002
200
DPRCA
12/01/2008
Installa
security
system
andlighting
CivicCenterS
ecurity
SystemsandLighting
Improvem
ents
2
improvem
entsatCivic
Centerpremises.
Y1
DPRCA-05-0003
1180
DPRCA
04/15/2007
Installa
security
system
andlighting
SouthBendPark-
CulturalC
enter
3
improvem
entsatCivic
Centerpremises.
City-
Wide
City-
Wide
DPRCA-05-0007
100
DPRCA
06/15/2007
Installationofbackflow
preventerson
allthe
facilitiesas
required.
BackflowReplacement
andRepairsinVarious
parks
4
C8
DPRCA-05-0009
100
DPRCA
01/01/2008
Totalrenovationto
Clubhouse.
BitsyGrantClubHouse
Improvem
ents
5
City-
Wide
City-
Wide
DPRCA-05-0014
40DPRCA
12/31/2006
HVA
Csystem
sin
facilitiesarereaching
FacilitiesAssessm
ent
HVA
C6
theendoftheirlife
cycles
anda
comprehensive
evaluationisbeing
plannedforneeded
replacem
entand
repairs
M2
DPRCA-05-0017
254
DPRCA
09/15/2007
Existingfacilitytobe
completelyrenovated
J.D.S
imsRecreation
CenterImprovem
ents
7
toserveas
acultural
artcenter.
N5
DPRCA-05-0019
254
DPRCA
06/01/2008
Replace
oldwaterlines
throughoutthefacility.
Lang
CarsonBuilding
Improvem
ents
8
X E6
DPRCA-05-0023
175
DPRCA
12/15/2006
Replace
oldwaterlines
throughoutthefacility.
Piedm
ontP
arkTennis
CenterR
enovations
9
City-
Wide
City-
Wide
DPRCA-05-0025
75DPRCA
09/01/2007
Repairand
Replace
FireAlarm
Systemsat
Various
Facilities
PI200675,000
Replace
andRepairFire
Alarm
Systems
10
September 2007 Draft Atlanta Strategic Action Plan368
Community Agenda4

NPU
CD
CIP
#Fu
nding
Source
Cos
tx1000
Respo
nsible
Party
Com
pletion
Year
Initiation
Year
Descriptio
nProject
Num
ber
City-
Wide
City-
Wide
DPRCA-05-0027
300
DPRCA
09/01/2007
Replace
and/orrepair
roofsatvarious
facilities.
RoofR
epairsand
Replacementsat
Various
Parks
11
Z1
DPRCA-05-0030
200
DPRCA
05/15/2007
Totalrenovationto
interioroffacility.
Workisunderway.
Thom
asville
Recreation
CenterImprovem
ents
12
B7
DPRCA-05-0035
150
DPRCA
09/15/2007
Replace
sportslighting
attenniscourts
FrankieAllenPark
TennisSports
Lighting
13
City-
Wide
City-
Wide
DPRCA-05-0039
100
DPRCA
02/15/2007
OBF2006
100,000
SignReplacementsin
Various
Parks
14
DPRCA-05-0042
100
DPRCA
12/15/2007
Site
andam
enity
improvem
ents
throughoutthepark.
BallFieldupgrade,
resurface
tennisand
ButlerP
ark
Improvem
ents
15
basketballcourtsand
drainage
improvem
ents.
O5
DPRCA-05-0043
250
DPRCA
03/31/2007
BuildaBoundless
Playgroundtoreplace
theoldplayground.
CoanParkPlayground
Replacement
16
DPRCA-05-0044
250
DPRCA
12/31/2008
Improvedrainage,
reestablishwalking
DeerwoodParkSite
Improvem
entsand
Development
17
pathintheparkand
installlandscaping.
M2
DPRCA-05-0047
150
DPRCA
06/15/2007
Replace
theold
playground
J.D.S
imsPlayground
Replacement
18
V4
DPRCA-05-0050
75DPRCA
06/15/2007
Replace
old
playground.
PhoenixIIPark
Playground
Replacement
19
V4
DPRCA-05-0053
203
DPRCA
06/15/2007
ExistingBasketball
courtroof/coverisin
AdairIIBasketballCourt
CoverandSite
Improvem
ents
20
badcondition
and
needstobe
replaced.
Drainage
improvem
entsand
landscapingtobe
done
throughoutthepark.
DPRCA-05-0056
150
DPRCA
01/01/2007
Buildanewentrance
tothefacility.
AdamsvilleSite
Improvem
ents
21
369Atlanta Strategic Action Plan September 2007 Draft

NPU
CD
CIP
#Fu
nding
Source
Cos
tx1000
Respo
nsible
Party
Com
pletion
Year
Initiation
Year
Descriptio
nProject
Num
ber
DPRCA-05-0057
101
DPRCA
06/15/2007
Com
pleterepairand
resurfacing
ofthe
courts
AndersonParkTennis
CourtImprovem
ents
22
DPRCA-05-0063
75DPRCA
12/15/2006
Picnicshelteratm
aster
grilltobe
rebuilt.
ChastainPark
RestorationofPicnic
Shelters
23
H10
DPRCA-05-0064
250
DPRCA
03/15/2008
Com
pleterenovationof
ballfields,concessions,
CollierP
arkSite
Improvem
ents
24
bleachers,tennisand
basketballcourts,and
relatedsite
improvem
ents
City-
Wide
City-
Wide
DPRCA-05-0069
200
DPRCA
07/15/2007
Replace
andrepair
fencinginvarious
parks.
FencingRepairsand
Replacementsin
Various
Parks
25
S4
DPRCA-05-0084
25DPRCA
09/01/2008
Landscaping.
Oakland
City
ParkSite
Improvem
ents
26
City-
Wide
City-
Wide
DPRCA-05-0087
300
DPRCA
07/01/2007
Repairand
replace
drainage
andpipes,
SiteandErosionControl
Improvem
entsinVarious
Parks
27
build
retainingwalls,
installlandscaping
tocontrolerosion
and
drainage
problemsin
various
parks.
Z12
DPRCA-05-0088
335
DPRCA
06/15/2008
Convert6existing
tenniscourtsintoa
soccerfield.
SouthsideTennisCourts
ConversiontoSoccer
Field
28
A8
DPRCA-05-0093
2500
DPRCA
06/15/2007
Fundraisingefforts
underway
byChastian
ChastainPark
SwimmingPool
29
ParkConservancy
tofund
therenovationof
thisfacility.
Buildnewpooland
bathhousefacilitieson
existingsite.
DPRCA-05-0094
600
DPRCA
12/15/2007
Com
pleterenovations
ofthebathhouseand
thepool.
Anderson
ParkPo
oland
BathHouse
Improvem
ents
30
Z1
DPRCA-05-0099
76DPRCA
04/15/2007
Interiorrenovations
and
drainage
improvem
ents
outsidethebathhouse
CDBG2005
76,125
Thom
asville
PoolBath
House
Renovations
31
September 2007 Draft Atlanta Strategic Action Plan370
Community Agenda4

NPU
CD
CIP
#Fu
nding
Source
Cos
tx1000
Respo
nsible
Party
Com
pletion
Year
Initiation
Year
Descriptio
nProject
Num
ber
M2
DPRCA-06-0001
300
DPRCA
03/01/2006
Thisprojectproposes
toinstalla
uptodate
CivicCenterF
ireAlarm
Systems
32
firealarmsystem
inthe
facility.
Y12
DPRCA-06-0002
294
DPRCA
07/01/2007
Com
pleterenovationof
exteriorand
interiorof
ArthurLangford
RecreationCenter
Improvem
ents
33
thefacilityandasenior
citizensactivity
room
.
City-
Wide
City-
Wide
DPRCA-06-0003
5500
DPRCA
09/01/2007
Com
pleterenovationof
exteriorand
interiorof
BallfieldRenovations
atVarious
Parks
34
thefacilityandasenior
citizensactivity
room
.
Y1
DPRCA-06-0004
300
DPRCA
11/01/2007
Extensive
interior
renovations
areneeded
KnightP
arkBuilding
Renovations
35
toconvertintoa
community
meeting
space.
N6
DPRCA-06-0005
300
DPRCA
09/01/2007
Com
pleteinterior
renovationandsewer
linereplacem
ent.
CandlerParkGolfC
lub
House
Improvem
ents
36
N6
DPRCA-06-0006
925
DPRCA
11/15/2009
Storm
drainage,
naturalizationof
CandlerPark-S
torm
Drainange
Improvem
ents
37
concretechanneland
drainage
system
&waterquality
improvem
entsinthe
creek
M2
DPRCA-06-0007
1000
DPRCA
09/15/2008
Designofre-buildingof
theparkinprocess.
DanielL.S
tanton
Park
38
V4
DPRCA-06-0008
1200
DPRCA
09/01/2006
Thebuildingisoldand
ingreatneedofinterior
renovations.
Makeimprovem
entsfor
code
andaccessibility
DunbarC
ommunity
Center-
Renovation
39
compliancethroughout
thebuilding.
477
WindsorStreet.
Improvem
entstothe
exteriorofthe
building
andtothesitebeing
planned.
X12
DPRCA-06-0009
150
DPRCA
01/01/2008
Replace
existing
equipm
entand
install
newplayground.
EmmaMillican
Park
Playground
Improvem
ents
40
371Atlanta Strategic Action Plan September 2007 Draft
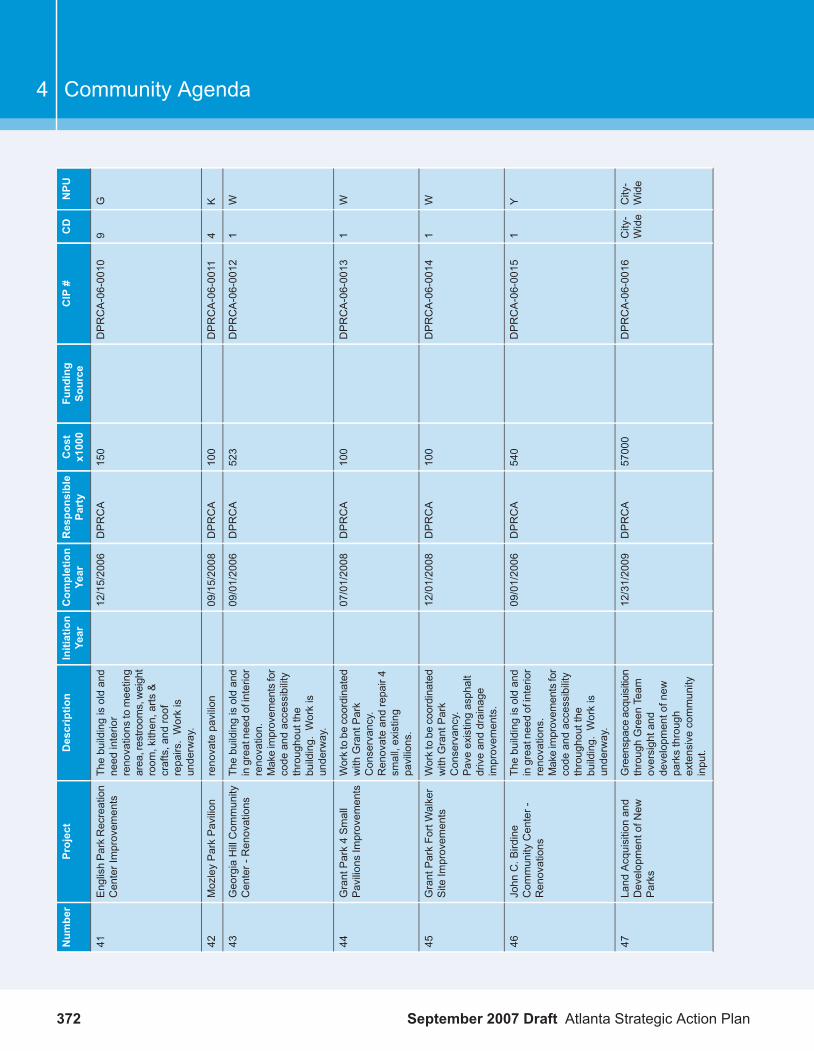
NPU
CD
CIP
#Fu
nding
Source
Cos
tx1000
Respo
nsible
Party
Com
pletion
Year
Initiation
Year
Descriptio
nProject
Num
ber
G9
DPRCA-06-0010
150
DPRCA
12/15/2006
Thebuildingisoldand
need
interior
EnglishParkRecreation
CenterImprovem
ents
41
renovations
tomeeting
area,restroom
s,weight
room
,kithen,arts
&crafts,and
roof
repairs.Workis
underway.
K4
DPRCA-06-0011
100
DPRCA
09/15/2008
renovatepavilion
MozleyParkPavilion
42
W1
DPRCA-06-0012
523
DPRCA
09/01/2006
Thebuildingisoldand
ingreatneedofinterior
renovation.
Makeimprovem
entsfor
code
andaccessibility
GeorgiaHillCom
munity
Center-
Renovations
43
throughoutthe
building.
Workis
underway.
W1
DPRCA-06-0013
100
DPRCA
07/01/2008
Worktobe
coordinated
with
GrantPark
Conservancy.
Renovateandrepair4
small,existing
pavilions.
GrantPark4Small
PavilionsImprovem
ents
44
W1
DPRCA-06-0014
100
DPRCA
12/01/2008
Worktobe
coordinated
with
GrantPark
Conservancy.
Paveexistingasphalt
driveanddrainage
improvem
ents.
GrantParkFortWalker
Site
Improvem
ents
45
Y1
DPRCA-06-0015
540
DPRCA
09/01/2006
Thebuildingisoldand
ingreatneedofinterior
renovations.
Makeimprovem
entsfor
code
andaccessibility
John
C.B
irdine
Com
munity
Center-
Renovations
46
throughoutthe
building.
Workis
underway.
City-
Wide
City-
Wide
DPRCA-06-0016
57000
DPRCA
12/31/2009
Greenspaceacquisition
throughGreen
Team
Land
Acquisitionand
DevelopmentofN
ewParks
47
oversightand
developm
entofnew
parksthrough
extensivecommunity
input.
September 2007 Draft Atlanta Strategic Action Plan372
Community Agenda4

NPU
CD
CIP
#Fu
nding
Source
Cos
tx1000
Respo
nsible
Party
Com
pletion
Year
Initiation
Year
Descriptio
nProject
Num
ber
N5
DPRCA-06-0017
100
DPRCA
03/01/2007
Replace
existing
railroadtieswallat
Lang
Carson-R
eplace
Retaining
Wallat
BasketballC
ourts
48
coveredbasketball
courtand
replace
existingbleachers.
M2
DPRCA-06-0018
1700
DPRCA
04/01/2007
Thebuildingwas
built
in1970's.P
ooland
MLKingNatatorium
49
deck
needstobe
resurfaced,newroof,
lockerroom
renovations,fitness
room
,paintthewhole
facilityetc.
Workisunderway.
X12
DPRCA-06-0019
203
DPRCA
06/01/2007
Totalinterior
renovations
andporch
addition.
Perkerson
Park
RecreationCenter
Improvem
ents
50
X12
DPRCA-06-0020
300
DPRCA
06/15/2008
Establishwalking
trails
andcleanup
onthe
Perkerson
ParkSite
Improvem
ents
51
bank
toconnecttoball
fieldandtrack.
G H T Z B Y F V
9 10 4 12 7 1 6
DPRCA-06-0021
2000
DPRCA
12/01/2009
ADWilliams,
Adamsville,Cleopas
Johnson,Cleveland,
Empire,N
agouchi,
PryorTucker,S
hady
Valley,Southbend,
SunkenGardan,
Wilson
Mill,W
indsor
Playground
Improvem
entsat
Various
Parks
52
R Y N A W B S K E V P Z
1 2 6 4 3 11 7 8 12
DPRCA-06-0022
12000
DPRCA
12/01/2008
Adams,Arthur
Langford,C
andler,
Chastain,GardenHills,
Grant,JAWhite,
Maddox,Mozley,
Oakland
City,P
ittman,
Piedm
ont,Rosa
Burney(Dunbar),
Southbend,Tucson,
Thom
asville
PoolR
enovations
and
Improvem
entsat16
OutdoorPools
53
V5
DPRCA-06-0023
150
DPRCA
04/01/2007
Replace
andrepair
existingplayground
Raw
sonWashington
ParkPlayground
Improvem
ents
54
andaddressdrainage
problem.(Requestfor
fundingsubm
itted
to
373Atlanta Strategic Action Plan September 2007 Draft
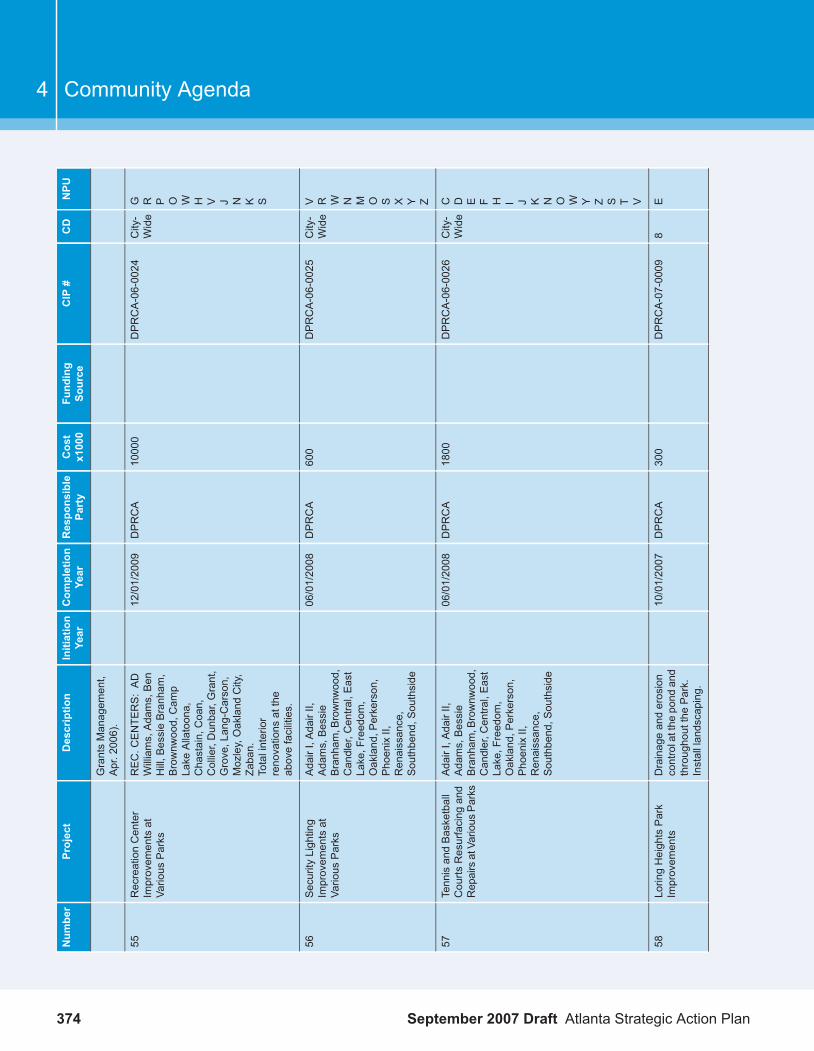
NPU
CD
CIP
#Fu
nding
Source
Cos
tx1000
Respo
nsible
Party
Com
pletion
Year
Initiation
Year
Descriptio
nProject
Num
ber
GrantsManagem
ent,
Apr.2006).
G R P O W H V J N K S
City-
Wide
DPRCA-06-0024
10000
DPRCA
12/01/2009
REC.C
ENTE
RS:AD
Williams,Adams,Ben
Hill,B
essieBranham
,Brownw
ood,Cam
pLake
Allatoona,
Chastain,Coan,
Collier,Dunbar,Grant,
Grove,Lang-Carson,
Mozley,Oakland
City,
Zaban.
Totalinterior
renovations
atthe
abovefacilities.
RecreationCenter
Improvem
entsat
Various
Parks
55
V R W N M O S X Y Z
City-
Wide
DPRCA-06-0025
600
DPRCA
06/01/2008
AdairI,AdairII,
Adams,Bessie
Branham
,Brownw
ood,
Candler,C
entral,East
Lake,Freedom
,Oakland,P
erkerson,
PhoenixII,
Renaissance,
Southbend,S
outhside
Security
Lighting
Improvem
entsat
Various
Parks
56
C D E F H I J K N O W Y Z S T V
City-
Wide
DPRCA-06-0026
1800
DPRCA
06/01/2008
AdairI,AdairII,
Adams,Bessie
Branham
,Brownw
ood,
Candler,C
entral,East
Lake,Freedom
,Oakland,P
erkerson,
PhoenixII,
Renaissance,
Southbend,S
outhside
TennisandBasketball
Courts
Resurfacing
and
RepairsatVarious
Parks
57
E8
DPRCA-07-0009
300
DPRCA
10/01/2007
Drainageanderosion
controlatthe
pond
and
throughoutthePark.
Installlandscaping.
LoringHeightsPark
Improvem
ents
58
September 2007 Draft Atlanta Strategic Action Plan374
Community Agenda4

NPU
CD
CIP
#Fu
nding
Source
Cos
tx1000
Respo
nsible
Party
Com
pletion
Year
Initiation
Year
Descriptio
nProject
Num
ber
A8
DPRCA-2005-0003
200
DPRCA
12/15/2007
Phase
1Partial
renovationof
whole
ChastainArts
Center
Renovations
59
facility.Thebuilding
was
builtin1909.In
spite
ofthetheperiodic
repairs
itisnow
necessarytocontinue
majoroverallrepairs.
Replacementof
existingroofand
renovations
torestroom
stobe
done
underP
hase
2.
9G
PK050
Adopt-A-Park
P.I.,OBF
300
DPRCA
2009
2005
A.D.W
illiamsPark
60
4V
PK100
Adopt-A-Park
P.I.C
DBG
250
DPRCA
2016
2005
AdairIP
ark
61
4V
PK101
Adopt-A-Park,
P.I.,CDBG
300
DPRCA
2016
2005
AdairIIPark
62
11R
PK002
P.I.,OBF
1,250
DPRCA
2009
2005
AdamsPark
Improvem
ents
63
10H
PK210
G.O.,PI
450
DPRCA
2009
2005
AdamsvilleRecreation
Center
64
notin
city
not
in city
PK171
PVT.,OBF
2500
DPRCA
2016
2010
AllatoonaResident
Cabins
65
3J
PK004
CDBG,O
BF
1,100
DPRCA
2008
2010
AndersonPark
Improvem
ents
66
1Y
PK024
CDBG,O
BF
1,200
DPRCA
2016
2005
ArthurLangfordPark
Improvem
ents
67
12Y
PK024
DPRCA
2007
2010
ArthurLangfordPark
NaturalAreaExpansion
68
12Y
PK024
CDBG
300
DPRCA
2008
2005
ArthurLangford
RecreationCenter
Improvem
ents
69
3L
PK209
50DPRCA
2008
2015
Ashby
StreetGarden
Park
70
2M
PK140
GO,O
BF
100,000
DPRCA
2009
2005
AtlantaCivicCenter
improvem
entsand
Development
71
4S
PK201
P.I.,PVT
1500
DPRCA
2016
2010
AtlantaMem
orialPark
72
375Atlanta Strategic Action Plan September 2007 Draft

NPU
CD
CIP
#Fu
nding
Source
Cos
tx1000
Respo
nsible
Party
Com
pletion
Year
Initiation
Year
Descriptio
nProject
Num
ber
9PK236
CDBG
120
DPRCA
2009
2010
BarbaraAnn
McC
oyPark
73
11I
PK160
Adopt-A-Park
P.I.
50DPRCA
2008
2010
BeaverB
rook
Park
74
11-Jan
all
P.I.
10DPRCA
2008
2010
BeecherCirclePark
75
11P
PK027
BeltLineInc,
DPCD,
DPRCA
1.2B
2031
2005
Beltline
76
5O
PK149
CDBG&G.O.
I.F.
6000
DPRCA
2016
Dropped
2007
Ben
HillNatatorium
77
8C
PK072
OBF
500
DPRCA
2008
2010
BessieBranham
Park
Improvem
ents
78
12Z
PK055
PVT.,OBF
1000
DPRCA
2008
2005
BitsyGrantTennis
CenterImprovem
ents
79
QOL,PVT
500
2015
2005
BrownsmillImps
80
5O
TBD
100
DPRCA
2010
2010
Brownw
oodPark
81
2M
PK056
OBF
270
DPRCA
2008
2005
Brownw
oodPark
RecreationCenterand
82
basketballcourt
Improvem
ents
5N
ETA
D100
DPRCA
2008
2005
ButlerP
ark
83
6N
PK185
QOL,PVT
100
DPRCA,
DPCD
2010
2010
CabbagetownPark,
KirkwoodTyeProject
84
11I,R
PK157
OBF,P.I.,
Adopt-A-Park,
EPD
1,280
DPRCA
2009
2005
CandlerPark,stream
naturalization,ballfield
andmultipurpose
court
Imps.
85
9J
PK077
P.I.
186
DPRCA
2010
2010
Cascade
Springs
Nature
Preserve
86
2M
PK006
CDBG/P
VT
700
DPRCA
2008
2005
CenterH
illPark
Development
87
8A
PK186
TBD
750
DPRCA
2016
2010
CentralParksiteand
landscape
improvem
ents
88
8A
PK011
TRUST
150
DPRCA
2009
2005
ChastainAmphitheatre
89
8A
PK241
OBF.&PVT
6000
DPRCA
2009
2010
ChastainPool
Improvem
ents
90
September 2007 Draft Atlanta Strategic Action Plan376
Community Agenda4
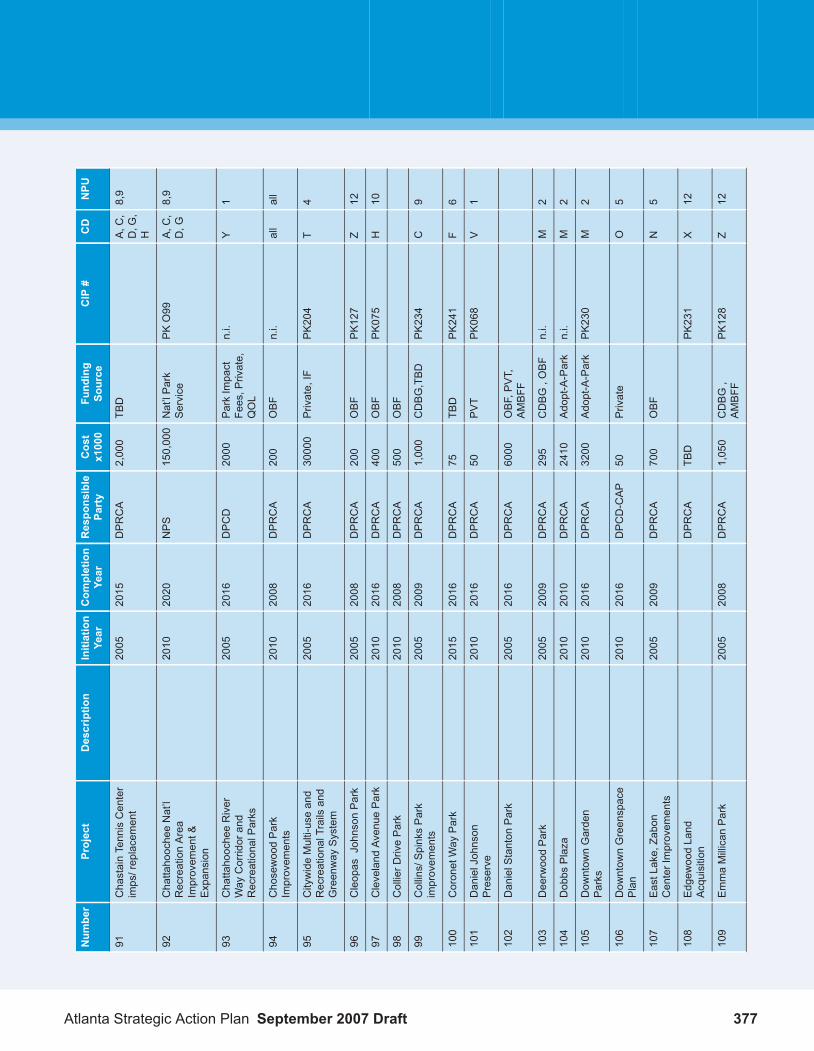
NPU
CD
CIP
#Fu
nding
Source
Cos
tx1000
Respo
nsible
Party
Com
pletion
Year
Initiation
Year
Descriptio
nProject
Num
ber
8,9
A,C
,D,G
,H
TBD
2,000
DPRCA
2015
2005
ChastainTennisCenter
imps/replacement
91
8,9
A,C
,D,G
PKO99
Nat’lPark
Service
150,000
NPS
2020
2010
ChattahoocheeNat’l
RecreationArea
92
Improvem
ent&
Expansion
1Y
n.i.
ParkImpact
Fees,P
rivate,
QOL
2000
DPCD
2016
2005
ChattahoocheeRiver
Way
Corridorand
RecreationalParks
93
all
all
n.i.
OBF
200
DPRCA
2008
2010
ChosewoodPark
Improvem
ents
94
4T
PK204
Private,IF
30000
DPRCA
2016
2005
CitywideMulti-useand
RecreationalTrails
and
Greenway
System
95
12Z
PK127
OBF
200
DPRCA
2008
2005
Cleopas
JohnsonPark
96
10H
PK075
OBF
400
DPRCA
2016
2010
Cleveland
Avenue
Park
97
OBF
500
DPRCA
2008
2010
CollierD
rivePark
98
9C
PK234
CDBG,TBD
1,000
DPRCA
2009
2005
Collins/SpinksPark
improvem
ents
99
6F
PK241
TBD
75DPRCA
2016
2015
CoronetWay
Park
100
1V
PK068
PVT
50DPRCA
2016
2010
DanielJohnson
Preserve
101
OBF,PVT,
AMBFF
6000
DPRCA
2016
2005
DanielStanton
Park
102
2M
n.i.
CDBG,O
BF
295
DPRCA
2009
2005
DeerwoodPark
103
2M
n.i.
Adopt-A-Park
2410
DPRCA
2010
2010
Dobbs
Plaza
104
2M
PK230
Adopt-A-Park
3200
DPRCA
2016
2010
Dow
ntow
nGarden
Parks
105
5O
Private
50DPCD-CAP
2016
2010
Dow
ntow
nGreenspace
Plan
106
5N
OBF
700
DPRCA
2009
2005
EastLake,Zabon
CenterImprovem
ents
107
12X
PK231
TBD
DPRCA
Edgew
oodLand
Acquisition
108
12Z
PK128
CDBG,
AMBFF
1,050
DPRCA
2008
2005
EmmaMillican
Park
109
377Atlanta Strategic Action Plan September 2007 Draft

NPU
CD
CIP
#Fu
nding
Source
Cos
tx1000
Respo
nsible
Party
Com
pletion
Year
Initiation
Year
Descriptio
nProject
Num
ber
OBF
175
DPRCA
2008
2005
EmpirePark
110
5W
CDBG,O
BF
350
DPRCA
2008
2005
EnglishPark
111
7B
PK052
TBD
DPRCA
FlatShoalsSE/C
lifton
SEBeautification
112
2N
n.i.
OBF,PVT
500
DPRCA
2009
2005
FrankieAllenPark
113
7B
PK007
Private,DOT,
IF1000
DPRCA
2016
2005
FreedomPark
Development
114
12X
PK076
Adopt-A-Park
50DPRCA
2016
2005
GardenHills
115
6N
PK188
CDBG
190
DPRCA
2010
2005
GilbertH
ouse
Improvem
ents
116
1W
PK019
Adopt-A-Park,
50DPRCA
2010
2005
GoldsboroPark
117
10h
OBF&
PVT
1,000
DPRCA
2016
2005
GrantPark
Improvem
ents
118
9J
PK087
IF200
DPRCA
2020
2005
Green
Property
119
10I
PK170
OBF
1,000
DPRCA
2009
2010
Grove
Park
120
4T
PK189
OBF
150
DPRCA
2016
2005
HarwellH
eights
121
10I
n.i.
OBF,CDBG
100
DPRCA
2016
2005
How
ellPark-W
estE
nd122
2M
PK232
OBF,PVT
250
DPRCA
2014
2005
IsabelleGates
Webster
123
3L
PK190
CDBG,
400
DPRCA
2016
2010
J.D.S
imsPark
124
11S
PK048
OBF
350
DPRCA
2008
2010
J.F.Kennedy
Park
125
11S
PK048
OBF,TB
D850
DPRCA
2010
2005
John
A.W
hitePark
Improvem
ents
126
5O
QOL,TB
D200
DPCD,
DPRCA
2009
2005
Kings
Ridge
Acquisition
andImprovem
ents
127
5N
PVT
TBD
DPRCA,
DPCD,A
DA
2010
2010
LakewoodPark
Restoration
128
5N
PK008
CDBG
300
DPRCA
2006
2010
Lang
CarsonRecreation
CenterImprovem
ents
129
6F
PK070
TBD
250
DPRCA
2016
2010
Lang
CarsonSecurity
Lights&Improvem
ents
130
10,11
IOBF
100
DPRCA
2016
2005
LenoxWildwoodPark&
Improvem
ents
131
2N
PVT,QOL
1,925
DPRCA
2010
2005
LionelHam
pton
Park
132
September 2007 Draft Atlanta Strategic Action Plan378
Community Agenda4

NPU
CD
CIP
#Fu
nding
Source
Cos
tx1000
Respo
nsible
Party
Com
pletion
Year
Initiation
Year
Descriptio
nProject
Num
ber
3K
PK029
30DPRCA
2009
2010
LittleFive
PointsPark
(FinleyPark)
133
2M
PK185
OBF
1,000
DPRCA
2010
2005
MaddoxPa
rkExpansion
&Improvem
ents
134
7E
PK130
Adopt-A-Park
150
DPRCA
2010
2005
MargaretM
itchellPark
135
11S
PK243
TBD
25DPRCA
2007
2010
McC
latcheyPark
136
11P
PK156
TBD
300
DPRCA
2010
2005
McG
heeTennisCenter
137
5W
TBD
600
DPRCA
2012
2010
MelvinDrivePark
138
3K
PK079
TBD
DPRCA
Montvallo/Fayetteville
RoadLand
Acquisition
139
6F
IF,Q
OL,PVT
200
DPDNC,
DPRCA,
DPW
2010
2005
Morningside
Nature
Preserve
140
6F
OBF
1,250
DPRCA
2009
2010
MozleyPark
141
8,9
D,G
n.i.
TBD
DPRCA
2010
2010
Natatorium(Midtown
newsite)
142
OBF
28,000
DPRCA
2010
2005
New
Parks
Development
143
2M
n.i.
TrustFund&
PVT
3600
DPRCA
2010
2010
Oakland
Cem
etery
Improvem
ents
144
6N
CDBG
825
DPRCA
2010
2005
OldFourthWardParks
145
6F
PK197
PVT
2,000
DPRCA,
private
2010
2005
Olmsted
LinearParks
146
PVT
50DPRCA
2008
2005
OrmePark
147
20DPCD
2010
2005
ParkImpactFee
ScheduleUpdate
148
OBF
35,000
Continuing
2005
ParkLand
Acquistion
City
Wide
149
2,5,8
E,F,
Mn.i.
QOL
700
DPCD
2008
2005
Parks,OpenSp
ace,and
GreenwaysPlan
Update
150
2,5,8
E,F,
Mn.i.
Capital
ProjectsFund,
PVT
50000
DPW
2010
2005
PeachtreeCreek/C
lear
Creek
Stormwater
Managem
entP
roject
151
(Ponce
deLeon
Springs
Park,CivicCenterP
ark,
Piedm
ontP
ark
expansion)
379Atlanta Strategic Action Plan September 2007 Draft

NPU
CD
CIP
#Fu
nding
Source
Cos
tx1000
Respo
nsible
Party
Com
pletion
Year
Initiation
Year
Descriptio
nProject
Num
ber
7B
PK064
OBF,PVT
300
DPRCA
2008
2005
PeachtreeHillsPark
imps
152
12X
PK039
CDBG,O
BF
600
DPRCA
2016
2005
Perkerson
Park
Improvem
ents
153
1V
PK164
CDBG,O
BF
150
DPRCA
2008
2005
PhoenixIIPark
154
1W
PK165
Adopt-A-Park
20DPRCA
2016
2010
PhoenixParkIII
155
2V
PK041
CDBG,O
BF,
PVT
2,500
DPRCA
2009
2005
Phoenix/D
unbarP
ark/
ROSABIRNEYPA
RK
Improvem
ents
156
6E,F
n.i.
Piedm
ontP
ark
Conservancy,
PVT
72,000
DPRCA
2009
2005
Piedm
ontP
arkMaster
PlanImplem
entation
157
2M
PK214
PVT,QOL
50DPRCA
2006
2010
Piedm
ont-A
uburnPark
158
4V
PK174
CDBG,O
BF
1,200
DPRCA
2016
2005
Pittman
Park
159
all
all
n.i.
CDBG,OBF
2,300
DPRCA
2006
2010
Playscape
Replacementsat
Various
Parks
160
2V
PK107
ETA
D,C
DBG
500
DPRCA
2016
2005
Raw
sonWashington
Park
161
5W
PK034
TBD
35000
DPRCA
2016
2010
Bellw
oodQuarry?
RegionalPark
--Westside--
NorthwestC
ommunity
Park
162
DPCD
2020
2010
RegionalPark:Atlanta
inDeK
alb
163
11R,P
DPCD
2020
2010
RegionalPark:Ben
Hill
Area
164
7,8
A,B
DPCD
2020
2010
RegionalPark:
NortheastAtlanta
165
5M,O
PVT
200
DPRCA
2020
2005
Riverside
166
9D
PK225
CDBG
55DPRCA
22010
RoseCirclePlaylot
167
4T
PK214
PVT
30DPRCA
2016
2010
Sandtow
nTriangle
168
11P
PK158
OBF
150
DPRCA
2008
2010
SEAtlantaBallfield/
TrackImprovem
ents
169
10H
PK093
OBF
400
DPRCA
2008
2010
Shady
ValleyPark
170
6B
PK202
CDBG
50DPRCA
2016
2010
SouthAtlantaPark
171
September 2007 Draft Atlanta Strategic Action Plan380
Community Agenda4

NPU
CD
CIP
#Fu
nding
Source
Cos
tx1000
Respo
nsible
Party
Com
pletion
Year
Initiation
Year
Descriptio
nProject
Num
ber
1Y
PK067
UPA
RR,O
BF
2,000
DPRCA
2008
2005
SouthBendPark
172
12Y
PK044
OBF,CDBG
700
DPRCA
2008
2005
Southside
Park
173
12Z
PK213
TBD
135
DPRCA
2009
2010
Stone
Hogan
Park
174
11P
PK045
CDBG
600
DPRCA
2008
2005
Thom
asville
Park
175
1Z
PK116
TBD
400
DPRCA
2009
2005
Tucson
TrailPark
176
11P
PK203
OBF
150
DPRCA
2016
2005
UnderwoodHills
177
9D
GG
2005
VenetianHills/Oakland
City
Parks
&Open
Space
178
4S
GG
400
DPRCA,
DPCD
2008
2005
Vine
City
Parks
&Open
Space
179
5O
PK205
OBF,TB
D185
DPRCA
2010
2005
WalkerP
ark
180
3K
PK080
CDBG,TBD
1500
DPRCA
2008
2005
WashingtonPark
Improvem
ents
181
2M
n.i.
CDBG
190
DPRCA
2005
WaterTowerPark
182
9I
PVT
50DPRCA
2010
2005
Waterford
Property
183
5O
PK012
OBF,TB
D500
DPRCA
2008
2005
WesleyCoanPark
Improvem
ents
184
4T
PK206
OBF,TB
D200
DPRCA
2008
2005
WestE
ndPark
185
10I
PK109
OBF
300
DPRCA
2008
2005
WestM
anorPark
186
9D
n.i.
IF,C
apital
ProjectsFund,
PVT
2000
DPRCA
2010
2005
WhittierMillPark
Development
187
2M
n.i.
Adopt-A-Park
108
DPRCA
2006
2010
Willoughby
Way/R
alph
McG
illPark
188
10H
PK051
OBF
525
DPRCA
2016
2010
Wilson
MillPark
189
2,4
Vn.i.
OBF
100
DPRCA
2008
2010
WindsorStreetPlaylot
Renovations
190
7E
n.i.
P.I.,PVT
50DPRCA
2009
2005
WinnPark
Improvem
ents
191
1W
PK211
Adopt-A-Park
5DPRCA
2016
2010
WoodlandGardenPark
192
Table4.13
CITYOFAT
LANTA
2008-2012SHORTTE
RMWORKPROGRAM-D
epartmentofP
arks
Recreationa
andCulturalAffairs
381Atlanta Strategic Action Plan September 2007 Draft

CD
NPU
CIP
#Responsible
Party
Funding
Source
COST
x1,000
Com
pletion
Year
InitiationYear
Program
Description
Project
Parks
StrategicPlan
1
All
All
NA
DPRCA
General
Fund
170
Contiuing
Project
2005
ARTS
Cool
2
All
All
NA
DPRCA
Prom
otion
and
Tourism
400
Contiuing
Project
2005
AtlantaJazz
Festival
3
All
All
NA
DPRCA
Prom
otion
and
Tourism
600
Contiuing
Project
2005
ContractsforA
rtsFunding
4
All
All
NA
DPRCA
Chastian
Art
3Contiuing
Project
2005
Exhibition
Program
satCity
Gallery-C
hastain
5
Center
Trust
All
All
NA
DPRCA
General
Fund
40Contiuing
Project
2005
Exhibition
Program
satCity
Gallery-C
HE
6
All
All
NA
DPRCA
Foundation
2Contiuing
Project
2005
NationalArts
Program
7
All
All
NA
DPRCA
General
Fund
40Contiuing
Project
2005
YouthArts
Program
8
NA
NA
NA
CITYWIDE
G2000
Continuing
Project
2007
StrategicPerformance
measurementsystem
COGNOS
9
thatimplem
entsbusiness
intellig
ence
andbalanced
scorecarding
methodology.
September 2007 Draft Atlanta Strategic Action Plan382
Community Agenda4
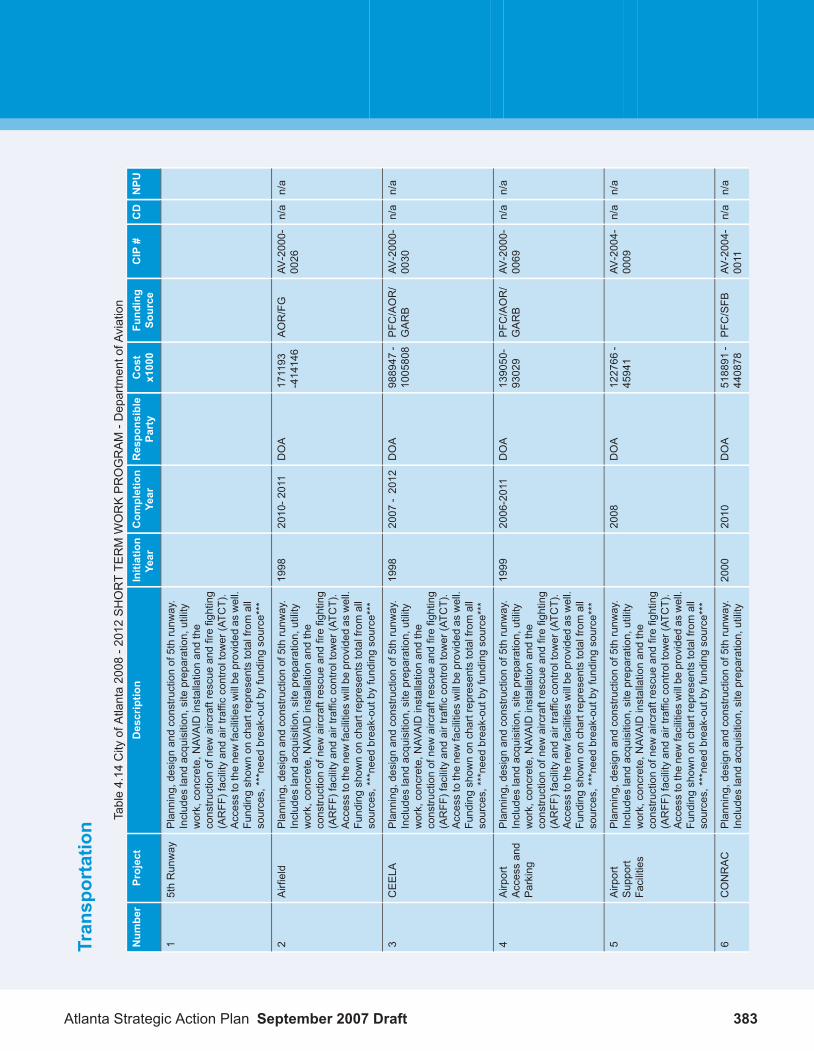
Tran
sportatio
nTable4.14
City
ofAtlanta2008
-2012SHORTTE
RMWORKPROGRAM-D
epartmentofA
viation
NPU
CD
CIP
#Fu
nding
Source
Cos
tx1000
Respo
nsible
Party
Com
pletion
Year
Initiation
Year
Descriptio
nProject
Num
ber
Planning,design
andconstructionof5thrunw
ay.
Includes
land
acquisition,site
preparation,utility
5thRunway
1
work,concrete,N
AVAID
installationandthe
constructionofnewaircraftrescue
andfirefighting
(ARFF
)facilityandairtrafficcontroltow
er(ATC
T).
Accesstothenewfacilitieswillbe
provided
aswell.
Fundingshow
non
chartrepresentstotalfromall
sources,***needbreak-outbyfundingsource***
n/a
n/a
AV-2000-
0026
AOR/FG
171193
-414146
DOA
2010-2011
1998
Planning,design
andconstructionof5thrunw
ay.
Includes
land
acquisition,site
preparation,utility
Airfield
2
work,concrete,N
AVAID
installationandthe
constructionofnewaircraftrescue
andfirefighting
(ARFF
)facilityandairtrafficcontroltow
er(ATC
T).
Accesstothenewfacilitieswillbe
provided
aswell.
Fundingshow
non
chartrepresentstotalfromall
sources,***needbreak-outbyfundingsource***
n/a
n/a
AV-2000-
0030
PFC
/AOR/
GARB
988947
-1005808
DOA
2007
-2012
1998
Planning,design
andconstructionof5thrunw
ay.
Includes
land
acquisition,site
preparation,utility
CEELA
3
work,concrete,N
AVAID
installationandthe
constructionofnewaircraftrescue
andfirefighting
(ARFF
)facilityandairtrafficcontroltow
er(ATC
T).
Accesstothenewfacilitieswillbe
provided
aswell.
Fundingshow
non
chartrepresentstotalfromall
sources,***needbreak-outbyfundingsource***
n/a
n/a
AV-2000-
0069
PFC
/AOR/
GARB
139050-
93029
DOA
2006-2011
1999
Planning,design
andconstructionof5thrunw
ay.
Includes
land
acquisition,site
preparation,utility
Airport
Accessand
Parking
4
work,concrete,N
AVAID
installationandthe
constructionofnewaircraftrescue
andfirefighting
(ARFF
)facilityandairtrafficcontroltow
er(ATC
T).
Accesstothenewfacilitieswillbe
provided
aswell.
Fundingshow
non
chartrepresentstotalfromall
sources,***needbreak-outbyfundingsource***
n/a
n/a
AV-2004-
0009
122766
-45941
DOA
2008
Planning,design
andconstructionof5thrunw
ay.
Includes
land
acquisition,site
preparation,utility
Airport
Support
Facilities
5
work,concrete,N
AVAID
installationandthe
constructionofnewaircraftrescue
andfirefighting
(ARFF
)facilityandairtrafficcontroltow
er(ATC
T).
Accesstothenewfacilitieswillbe
provided
aswell.
Fundingshow
non
chartrepresentstotalfromall
sources,***needbreak-outbyfundingsource***
n/a
n/a
AV-2004-
0011
PFC
/SFB
518891
-440878
DOA
2010
2000
Planning,design
andconstructionof5thrunw
ay.
Includes
land
acquisition,site
preparation,utility
CONRAC
6
383Atlanta Strategic Action Plan September 2007 Draft

NPU
CD
CIP
#Fu
nding
Source
Cos
tx1000
Respo
nsible
Party
Com
pletion
Year
Initiation
Year
Descriptio
nProject
Num
ber
work,concrete,N
AVAID
installationandthe
constructionofnewaircraftrescue
andfirefighting
(ARFF
)facilityandairtrafficcontroltow
er(ATC
T).
Accesstothenewfacilitieswillbe
provided
aswell.
Fundingshow
non
chartrepresentstotalfromall
sources,***needbreak-outbyfundingsource***
n/a
n/a
SFB
160713
DOA
2013
2005
Thisprojectprovidesforthe
maintenance
and
expansionofexistingfacilities.
Thisincludes
the
AirCargo
7
followingprojects:U
SAPHSQuarantineFacility
Upgrades,AirCargo
Com
plex
Expansion
Program
,andCargo
Facilities(BuildingC).
n/a
n/a
AOR/SFB
45941
DOA
2010
1999
Thisprojectprovidesforthe
maintenance
and
expansionofexistingfacilities.
Thisincludes
the
Airport
Support
Facilities
8
followingprojects:U
SAPHSQuarantineFacility
Upgrades,AirCargo
Com
plex
Expansion
Program
,andCargo
Facilities(BuildingC).
n/a
n/a
AOR/ARB
318868
DOA
2011
1999
Inordertomaintainahigh
levelofcustomer
satisfaction,thiselem
entprovidesforthe
renovation
Terminal
Facility
9
andexpansionofexistingfacilities.
Itincludes
the
followingprojects:A
PMreplacem
entofautom
atic
traincontrolequipment,existingterminalplanning,
design,&
construction,terminalrestroom
upgrades,
concourseTCosmeticupgrades,C
oncourse
Acosm
eticupgrades,C
oncourse
Cexpansion,
Concourse
Dexpansion,MUFIDSPhase
II,centralized
passengerpagingsystem
,signage
and
graphics
additions,and
exteriorlandscaping
program.
n/a
n/a
AOR/ARB
48526
DOA
2010
1999
Thisprojectincludesthemaintenance,replacement,
andexpansionofHVA
C,plumbing
andelectrical
Utilities
10
system
sforthe
CentralPassengerTerminal
Com
plex.Fuelsystem
s,waterandsewer,and
telecommunications
arealso
included.The
listof
projectsincluded
areTerminalHVA
CUpgrades,
Centralplantequipm
entreplacement,airport
maintenance
programneedsassessment,andfuel
maintenance.
n/a
n/a
AOR/FG
209615
DOA
2012
2000
Thisprojectprovidesforrenovationandexpansion
offacilitiesandprogramsthroughwhich
Environm
ent
11
environm
entalissuesaremitigated.
These
programsincludeaspecialm
aterialshandling
building,stormwatermanagem
entalleviationplan,
noisemitigation,land
acquisition
andnoise
insulation.
September 2007 Draft Atlanta Strategic Action Plan384
Community Agenda4

NPU
CD
CIP
#Fu
nding
Source
Cos
tx1000
Respo
nsible
Party
Com
pletion
Year
Initiation
Year
Descriptio
nProject
Num
ber
n/a
n/a
PFC
/GARB
1790382
DOA
2013
2003
Thisprojectw
illincludetheplanning,design,and
constructionofanewsouthpassengercom
plex.
SouthGate
Com
plex
12
Thisprojectisanticipated
toincludeland
acquisition,
sitepreparationandenvironm
entalassessm
entsas
wellasconstructionofconcourses,apron,and
anAPMsystem
thatwillprovideconnectiontothe
existingterminalandthenewseriesofconcourses.
Table4.15
City
ofAtlanta2008
-2012SHORTTE
RMWORKPROGRAM-D
epartmentofP
ubilc
Works
CD
NPU
CIP
#Fu
nding
Cos
tx1000
Respo
nsible
Party
Com
pletion
Year
Initiation
Year
Descriptio
nProject
Prog
ram
DPW-
05-0002
QOL,TIF,
CDBG
DPW
Jun-07
Oct-06
10thStreetStreetscapes
1
06DPW-
05-0003
QOL
$4,795
DPW
Jun-08
Oct-07
Streetscapeimprovem
entson
14thStfromW
PeachtreeSt
toPiedm
ontA
v.
14thStreetStreetscape
2
02DPW-
05-0004
QOL
$5,900
DPW
Jun-08
Oct-07
TurnlanesfromSpringStreet
toWestP
eachtreeStreet.
14thStreetTurnLanes
3
11DPW-
06-0001
QOL
$692
DPW
Not
available
Not
available
Replacementofexistingbridge
structure.
AdamsDriveBridge
Repairs
4
05DPW-
05-0021
QOL
$1,000
DPW
Not
available
Not
Available
Traffic
calmingmeasures
throughoutAnsleyPark
neighborhood.
AnsleyParkTraffic
Calming
5
05DPW-
06-0004
STP
Enh,
TIF,QOL
$54,563
DPW
From
AlstonDriveto
Glenw
oodAvenue
AshburtonAvenue
6
03DPW-
05-0028
CID,S
tBnd
$30
DPW
Apr-07
Mar-07
Evaluationongoingform
inor
traffic&pedestriansafety
improvem
entsatintersection.
Ashby
StreetandSimpson
Street
7
03,04
DPW-
05-0029
CID,S
tBnd
$1,084
DPW
Jun-09
Jun-08
Partofthe
Westend
LCIfrom
Ralph
DavidAbernathy
Drive
toI-20.
Ashby
StreetStreetscape
8
02DPW-
06-0005
TIF
$47
DPW
2008
2008
From
10thStreetto14thStreet
AtlanticDrive
9
09DPW-
06-0006
QOL
$67,000
DPW
Jul-08
Aug-07
Thisproject,also
associated
with
AT-AR224A
andC,w
illAtlanticStationTC
MNB
Off-Ram
p,WilliamsStreet
Rel.
10
relocateWilliamsStreetand
thenorthboundofframpfrom
theDow
ntow
nConnector
(I-75/85)at14thStreetinorder
toaccommodatethenew17th
StreetBridge.
385Atlanta Strategic Action Plan September 2007 Draft

CD
NPU
CIP
#Fu
nding
Cos
tx1000
Respo
nsible
Party
Com
pletion
Year
Initiation
Year
Descriptio
nProject
Prog
ram
02DPW-
06-0007
CMAQ,
QOL,TIF
$25
DPW
Sep-07
Aug-07
Bulboutsatthetwoexisting
pedestriancrossingsatHogue
StreetandatHow
ellStreet.
AuburnAvenue
11
11DPW-
05-0033
CMAQ,
TE$404
DPW
Jun-09
Oct-08
Improvem
enttothe
intersectionofBarge
and
Barge
Roadat
Cam
pbelltonRoad
12
Cam
bellton
Roads,including
agateway
entranceatthe
intersection.
12DPW-
06-0009
QOL
$350
DPW
Nov-07
Aug-07
From
DillAvenue
toErin
Avenue
Beatie
Avenue
13
11DPW-
05-0039
CID,S
tBnd,LCI
$48
DPW
Sep-08
Aug-08
From
Cam
pbelltonRoadto
Cul-de-sac
BentC
reek
Way
14
02DPW-
05-0578
QOL
$1,900
DPW
May-08
Sep-07
Thisprojectw
illrealignthe
intersectionofBeverlyRd.,
BeverlyRoad/Peachtree
StreetIntersection
Improvem
ents
15
PeachtreeSt.andWest
PeachtreeSt.
City-
wide
DPW-
05-0040
QOL
$670
DPW
Feb-08
Aug-06
Installingsignageand
pavementm
arking
for
BicycleSignage
Fifteen
YearProjects
16
on-streetbicycleroutes
previouslyadoptedby
theCity
ofAtlanta.
City-
wide
DPW-
05-0041
$310
DPW
Feb-08
Aug-06
Installingsignageand
pavementm
arking
for
BicycleSignage
Five
Year
Projects
17
on-streetbicycleroutes
previouslyadoptedby
theCity
ofAtlanta.
09DPW-
05-0044
PIF,
PATH
,$53
DPW
Dec-07
Jun-07
TBD
BohlerR
oadandDeFoors
FerryRoad
18
CMAQ,
TE,1C28
-574001,
N12F03
559985
09DPW-
05-0048
QOL
$607
DPW
Aug-06
Aug-06
From
DLHollowellParkw
ayto
MooresMillRoad
BoltonRoad
19
09DPW-
05-0051
QOL
$53
DPW
May-09
May-08
IntersectionImprovem
entsto
beincluded
with
BoltonRoad
Streetscapeproject.
BoltonRoadandMarietta
Road
20
09DPW-
05-0052
TIF,LC
I$53
DPW
May-09
May-08
Providesrightturnlane.
Improvem
entincludedwith
BoltonRoadandPaul
Avenue
21
BoltonRoadStreetscape
project.
September 2007 Draft Atlanta Strategic Action Plan386
Community Agenda4

CD
NPU
CIP
#Fu
nding
Cos
tx1000
Respo
nsible
Party
Com
pletion
Year
Initiation
Year
Descriptio
nProject
Prog
ram
09DPW-
05-0056
QOL
$300
DPW
May-09
May-08
BoltonRoad/Hollywood
Road/MainStreet
BoltonRoad/Hollywood
RoadPlaza
22
09DPW-
06/0068
QOL
$750
DPW
May-09
May-08
Bolton/Marietta
Intersection
23
09DPW-
05-0057
STP
Enh,
TIF
$1,270
DPW
May-09
May-08
StreetscapeImprovem
entson
BoltonRoadfromMoore’sMill
Bolton/MooresMill
Streetscape
24
RoadtoJames
Jackson
Parkw
ay
City-
wide
DPW-
05-0067
Local
$2,000
DPW
Jul-08
Oct-07
Maintenaceprogramforcity
bridges.
Bridge
Refurbishingand
StabilizationProgram
25
07DPW-
05-0072
LCI,St
Bnd
$1,191
DPW
Oct-08
Apr-08
BuckheadMartaStation
BuckheadPedestrian
Bridge/Plaza
26
07&
08DPW-
05-0073
QOL
$2,000
DPW
Not
Available
Not
Available
From
PeachtreeRoadto
RoswellR
oad;60%,C
D7;
40%,C
D8.
BuckheadTriangle
Park/Reconfiguration
27
02DPW-
05-0079
QOL
$100
DPW
7/29/2011
9/28/2009
Replacementofbridge
over
CSXRailroad.City
ofAtlanta
ButlerS
treetBridge
Right-of-W
ayAcquisition
28
willfund
right-of-w
ayandutilitiy
relocations
only.
Engineering
andconstructionareby
GDOT.
09DPW-
06-0011
QOL
$38
DPW
From
ParrottAvenue
toDead
End
ButlerW
ay29
10DPW-
06-0012
Local
$10,394
DPW
Not
Available
Not
Available
Thisprojectw
illwiden
Cam
pbeltonHighw
ay(SR166)
Cam
pbelltonHighw
ay-S
R166
30
fromEnonRoadtoEastBarge
Roadfromtwotofourlanes.It
isintended
torelieve
congestionintheLakewood
Freeway,I-285W,Fulton
IndustrialBoulevardandCam
pCreek
Parkw
aycorridors.
11DPW-
06-0013
QOL
$248
DPW
Feb-08
Aug-07
Installand
upgradetraffic
signals;Link
system
tothe
Cam
pbelltonRoad
31
ATCCviaexistingandnew
copper-wire
communications;
Develop
system
-timingand
integrationplansforcorridor
07DPW-
06-0014
QOL
$34
DPW
From
WestR
oxboroRoadto
1022
CanterR
oad
CanterR
oad
32
02DPW-
06-0015
QOL
$96
DPW
Sep-08
Jul-08
From
NorthHighlandAvenue
toSinclairD
rive
CarmelAvenue
33
387Atlanta Strategic Action Plan September 2007 Draft

CD
NPU
CIP
#Fu
nding
Cos
tx1000
Respo
nsible
Party
Com
pletion
Year
Initiation
Year
Descriptio
nProject
Prog
ram
09DPW-
06-0016
QOL
$36
DPW
From
Marietta
RoadtoAlma
Street
CarrollDrive
34
07DPW-
06-0017
StB
nd,
Local
$40
DPW
From
ClubDrivetoPeachtree
Dunwoody
Road
CarterD
rive
35
10DPW-
05-0093
QOL
$89
DPW
Oct-07
Aug-07
CD10
-50%
;CD11
-50%
.Cascade
Roadand
LynhurstDrive
36
11DPW-
06-0019
STP,
Local
$885
DPW
Jul-08
Jan-08
StreetscapeImprovem
entsin
business
district:on
Cascade
Cascade/MaysVillage
CenterP
hase
237
RoadfromBeechertoBE
Mays;on
BEMaysfrom
Cascade
toBeecherand
BeecherfromCascade
toBE
Mays.
11DPW-
06-0020
QOL,LC
I$489
DPW
Nov-07
Jul-07
StreetscapeImprovem
entson
Cascade
RoadfromVenetian
Cascade/MaysVillage
CenterP
hase
338
DrivetoBeecher,between
phase1andphase2.
02DPW-
05-0097
QOL
$4,088
DPW
Not
Available
Not
Available
RehabilitationoftheCentral
Avenue
bridge
overtheCSX
CentralAvenueBridge
39
Railroad
andMARTA
rail.The
projectw
illrunfromAlabama
StreettoWallStreet.
08DPW-
06-0021
QOL
$328
DPW
May-06
Not
Available
Greenway
andParkNodes
alongtheentirelengthofthe
ChattahoocheeRiverWay
CorridorandRecreational
Parks,CD9
40
riverwithintheCity,initial
focuson
trailconstructionon
RMClayton
AtlantaWater
TreatmentS
iteandStanding
PeachtreeSite
andproperty
acquistioninCouncilDistrict
9.CD8-25%
;CD9-75%
06DPW-
05-0101
LCI,QOL
$1,130
DPW
May-07
Nov-06
Phase
1:Streetscape
improvem
entsfromPiedm
ont
AvetoManchesterS
t.
Cheshire
Bridge
Road
Streetscape,phase1
41
06DPW-
06-0023
QOL
$14,257
DPW
Not
Available
Not
Available
Addition
ofleftturnlaneson
Cheshire
Bridge
Roadat
LindburghDrive.
Cheshire
Bridge
Road/LindburghDrive
42
various
DPW-
05-0106
QOL
$1,394
DPW
Jan-07
Jun-06
Improvem
entstopedestrian
environm
entaroundselected
City
ofAtlantaSchools
Sidew
alks,P
hase
243
schoolsintheCity
ofAtlanta
byconstructing/reconstructing
sidewalks
inthevicinityof
schools.
September 2007 Draft Atlanta Strategic Action Plan388
Community Agenda4

CD
NPU
CIP
#Fu
nding
Cos
tx1000
Respo
nsible
Party
Com
pletion
Year
Initiation
Year
Descriptio
nProject
Prog
ram
12DPW-
05-0107
QOL
$248
DPW
Nov-08
Feb-08
Installand
upgradetraffic
signals;Link
system
tothe
Cleveland
Avenue
44
ATCCviaexistingandnew
copper-wire
communications;
Develop
system
-timingand
integrationplansforcorridor
08DPW
-05-0113
QOL
$440
DPW
Jun-07
Jan-08
Constructionofsidewalks
onCollierR
oadfromHow
ellM
illRoadtoPeachtreeRoad.
CollierR
oadSidew
alk
45
02DPW-
05-0118
QOL
$1,195
DPW
Not
Available
Not
Available
Replacementofbridge
over
CSXRailroad.City
ofAtlanta
CourtlandStreetBridge
46
willfund
right-of-w
ayandutilitiy
relocations
only.
Engineering
andconstructionareby
GDOT.
01DPW-
05-0121
STP
Enh,
TIF
$164
DPW
Jul-2010
Jan-08
Replace
existingcrossw
alks
with
internationalcrosswalks
atarterialand
collectorstreets.
CrosswalkInstallation,
CouncilDistrict1
47
10DPW-
05-0122
QOL
$164
DPW
Jul-2010
Jan-08
Replace
existingcrossw
alks
with
internationalcrosswalks
atarterialand
collectorstreets.
CrosswalkInstallation,
CouncilDistrict10
48
11DPW-
05-0123
QOL
$164
DPW
Jul-2010
Jan-08
Replace
existingcrossw
alks
with
internationalcrosswalks
atarterialand
collectorstreets.
CrosswalkInstallation,
CouncilDistrict11
49
12DPW-
05-0124
OffSys
Br,QOL,
StB
nd
$164
DPW
Jul-2010
Jan-08
Replace
existingcrossw
alks
with
internationalcrosswalks
atarterialand
collectorstreets.
CrosswalkInstallation,
CouncilDistrict12
50
03DPW-
05-0126
QOL
$164
DPW
Jul-2010
Jan-08
Replace
existingcrossw
alks
with
internationalcrosswalks
atarterialand
collectorstreets.
CrosswalkInstallation,
CouncilDistrict3
51
04DPW-
05-0127
QOL,LC
I$164
DPW
Jul-2010
Jan-08
Replace
existingcrossw
alks
with
internationalcrosswalks
atarterialand
collectorstreets.
CrosswalkInstallation,
CouncilDistrict4
52
05DPW-
05-0128
QOL
$164
DPW
Jul-2010
Jan-08
Replace
existingcrossw
alks
with
internationalcrosswalks
atarterialand
collectorstreets.
CrosswalkInstallation,
CouncilDistrict5
53
06DPW-
05-0129
Local,
STPPg
m,
State
$274
DPW
Jul-2010
Jan-08
Replace
existingcrossw
alks
with
internationalcrosswalks
atarterialand
collectorstreets.
CrosswalkInstallation,
CouncilDistrict6
54
07DPW-
05-0130
QOL
$164
DPW
Jul-2010
Jan-08
Replace
existingcrossw
alks
with
internationalcrosswalks
atarterialand
collectorstreets.
CrosswalkInstallation,
CouncilDistrict7
55
389Atlanta Strategic Action Plan September 2007 Draft

CD
NPU
CIP
#Fu
nding
Cos
tx1000
Respo
nsible
Party
Com
pletion
Year
Initiation
Year
Descriptio
nProject
Prog
ram
08DPW-
05-0131
QOL
$164
DPW
Jul-2010
Jan-08
Replace
existingcrossw
alks
with
internationalcrosswalks
atarterialand
collectorstreets.
CrosswalkInstallation,
CouncilDistrict8
56
09DPW-
05-0132
LCI
$164
DPW
Jul-2010
Jan-08
Replace
existingcrossw
alks
with
internationalcrosswalks
atarterialand
collectorstreets.
CrosswalkInstallation,
CouncilDistrict9
57
03DPW-
05-0136
QOL
$12,227
DPW
Jun-09
Jan-08
Upgrade
roadway
tocurrent
standards,fromProctorCreek
toeastofCSXrailroadbridge.
D.L.H
ollowellParkw
ay(formerlyBankhead
Highw
ay)-
US78/278,SR
8-A
58
02DPW-
06-0025
QOL,On
Sys
Br,St
Bnd
$2,412
DPW
Not
Available
Not
Available
Replacementofa
substandard
bridge
onD.L.H
ollowell
Parkw
ay(US78/278)overthe
D.L.H
ollowellParkw
ay(formerlyBankhead
Highw
ay)-
US78/278,SR
8-B
59
CSXRailroad
nearMean
Street.The
projectw
illwiden
thecurrently
narrow
travel
laneson
thebridge.
09DPW-
06-0026
TIF,
CMAQ
$24,393
DPW
Not
Available
Not
Available
Widen
road
to4lanesfrom
HarwellR
oadtoH.E.H
olmes
D.L.H
ollowellParkw
ay(formerlyBankhead
60
Drive.
COAisresponsiblefor
Highw
ay)-
US78/278,SR
8-C
ROW
andutilities.Estimated
ROW
costis$14.5M
02DPW-
06-0027
QOL,On
Sys
Br,St
Bnd
$39
DPW
Apr-07
Apr-07
From
GlenIrisDrivetoNorth
AngierA
venue
DallasStreet
61
05DPW-
05-0139
QOL
$1,370
DPW
Dec-07
Jun-07
DecaturStreetfromPe
achtree
toJesseHillJr.D
rive
DecaturStreetStreetscape
Improvem
ents
62
09,03
DPW-
05-0145
QOL
$277
DPW
Jul-08
Oct-07
Installand
upgradetraffic
signals;Link
system
tothe
DonaldLeeHollowell
Parkw
ay63
ATCCviaexistingandnew
copperwire
communications;
Develop
system
-timingand
integrationplansforcorridor.
02DPW-
05-0146
QOL
$3,061
DPW
Not
Available
Not
Available
ElementsoftheWayfinding
Signage
Systemwillinclude:
DonaldLeeHollowell
Parkw
ay64
maps,signsandkiosks
atkey
streetcornerswithinthecore
ofDow
ntow
nandMidtown.
09DPW-
05-0148
QOL
$2,000
DPW
Aug-07
Jul-06
From
James
JacksonPa
rkway
toNorthside
Drive,CD3-
60%,C
D9-40%
.
Dow
ntow
n&Midtown
AtlantaWayfinding
65
September 2007 Draft Atlanta Strategic Action Plan390
Community Agenda4

CD
NPU
CIP
#Fu
nding
Cos
tx1000
Respo
nsible
Party
Com
pletion
Year
Initiation
Year
Descriptio
nProject
Prog
ram
02DPW-
05-0149
QOL
$4,375
DPW
Oct-07
Jan-07
Thisprojectw
illimplem
ent
streetscapeandsafety
improvem
entsrecommended
intheCity
Center
LivabilityProjectLC
IStudy
onMarietta
StreetandCentennial
OlympicPark.
Dow
ntow
nAtlanta
Pedestrian
Corridor
Improvem
ents
66
02DPW-
05-0151
QOL
$175
DPW
Not
Applicable
Not
Applicable
Develop
andimplem
ent
parkingmanagem
entactivities
Dow
ntow
nParking
Managem
entP
rogram
67
andstrategies,suchas
variableparkingcharges,an
area-wideparkingcash-out
program,a
parkingandtransit
informationprogram,and
preferentialparking
forcarand
vanpoolpatrons.
05DPW-
05-0155
QOL
$1,078
DPW
Dec-08
Jun-08
Streetscapeimprovem
ents.
ThisisPhase
IIoftheEAV
EastA
tlantaVillage
Streetscape
Improvem
ents,P
hase
2
68
Streetscapes.P
hase
Iwas
funded
totally
with
QOLBond
money.
02DPW-
06-0028
QOL
$91
DPW
May-08
Apr-08
From
BoulevardtoDeadEnd
EastA
venue
69
07DPW-
05-0157
QOL
$1,250
DPW
Aug-07
Aug-06
Sidew
alkandpedestrian
improvem
entson
E.W
esley
EastW
esleyRoad
Streetscape
70
fromPe
achtreeSttoPiedmont
Ave.
02DPW-
05-0159
Local,
LCI,TIF
$500
DPW
Jul-07
Mar-07
From
ButlerS
treettoHurt
Plaza:CD2-50%
,CD5-
50%.
Edgew
oodAvenue
71
06DPW-
06-0029
QOL,
CID,TE
$29
DPW
Mar-07
Mar-07
From
DeK
albAvenue
toMcLendonAvenue
Elmira
Place
72
10DPW-
05-0168
QOL
$750
DPW
Not
Available
Not
Available
Installationofsidewalks,
crossw
alks
andbike
lanes
FairburnRoad-B
73
alongFairburnRoadfromMLK
Jr.D
rivetoStone
Road.
02DPW-
05-0171
QOL
$995
DPW
Nov-08
Jun-08
Phase
3improvem
entson
Walton,NassauandSpring
Streets.
Fairlie-PoplarS
treetscapes
74
06DPW-
05-0174
QOL
$350
DPW
Nov-07
Sep-07
MansfieldAvenue
toDruid
Place
FelderStreet
75
391Atlanta Strategic Action Plan September 2007 Draft

CD
NPU
CIP
#Fu
nding
Cos
tx1000
Respo
nsible
Party
Com
pletion
Year
Initiation
Year
Descriptio
nProject
Prog
ram
05DPW-
06-0030
TIF,LC
I,QOL
$316
DPW
Nov-07
Aug-07
From
PearlStreettoChester
Avenue
FieldStreet
76
09DPW-
05-0176
StB
nd,
QOL
$328
DPW
Nov-07
Jun-07
From
SaintJames
Avenue
toSp
ringStreet:Projectestim
ate
is$299,000.00.
FirstS
treet
77
01DPW-
05-0188
QOL
$450
DPW
Nov-07
Sep-07
From
Troy
StreettoDeadEnd
FreemontS
treet
78
11DPW-
05-0193
$374
DPW
Nov-07
Sep-07
From
Childress
DrivetoDead
End
GlenEchoDrive
79
01DPW-
05-0196
QOL
$162
DPW
Oct-07
Jan-07
From
BoulevardtoI-20:
CD1
-40%
,CD5-60%
Glenw
oodAvenue
80
05DPW-
05-0199
QOL
$180
DPW
Jan-07
Jun-07
AtlantaHousing
Authority
Grady
Hom
es81
07DPW-
06-0031
QOL
$25
DPW
Aug-08
Jul-08
From
PeachtreeRoadto
BuckheadAvenue
Grandview
Avenue
82
11DPW-
05-0205
QOL
$2,380
DPW
Oct-09
Oct-08
Implem
entationofstreetscape
improvem
entsalong
GreenbriarP
arkw
ayImprovem
ents
83
GreenbriarP
arkw
ayfrom
LangfordParkw
aytoI-285
West.Improvem
entsinclude
sidewalks,pedestrian
ligting,
streetfurnitureandtrees.
City-
wide
DPW-
06-0032
QOL,
CMAQ
$4,629
DPW
Sep-08
Feb-06
Prim
arygreenw
aytrailsystem
throughouttheCity
asdefined
Greenway
TrailProjects
84
intheCDPandassociated
secondarytrails
with
improvem
entsanticipated
into
each
councildistricts.
03,09,
10DPW-
06-0069
QOL
$8,726
DPW
Not
available
Not
available
Widen
H.E.H
olmes
Drivefrom
2to4lanesfromI-20westto
H.E
.Holmes
Drive-S
R280
85
D.L.H
ollowellParkw
ay.City
responsibleforR
OW.ROW
estim
ate$2,475,000.
04DPW-
05-0216
QOL
$1,400
DPW
Dec-07
Jun-08
Harris
Hom
esStreetscapes:
LoweryBlvd,Peeples
St.,
Baldw
inSt.,Westview
Harris
Hom
esStreetscapes:Low
eryBlvd
86
11DPW-
05-0220
QOL
$350
DPW
Jun-09
Oct-08
Constructionofsidewalks,
pedestrianam
manities,
HeadlandStreetfrom
GreenbriarP
arkw
ayto
AtlantaCity
Limits
87
lighting,crossingsand
landscapingfromGreenbriar
Parkw
aytoAtlantaCity
Limits.
September 2007 Draft Atlanta Strategic Action Plan392
Community Agenda4

CD
NPU
CIP
#Fu
nding
Cos
tx1000
Respo
nsible
Party
Com
pletion
Year
Initiation
Year
Descriptio
nProject
Prog
ram
03DPW-
05-0221
QOL
$100
DPW
Dec-07
Jun-07
AtlantaHousing
Authority
Herndon
Hom
es88
City-
wide
DPW-
05-0608
QOL
$1,500
DPW
Not
Available
Not
Available
Thisprojectprovides
necessarymaintenance
tothe
HillStreetOperations
Facility
89
existingfacility,such
asreplacingtheexistingroofand
repairing
theelectricalsystem
09DPW-
05-0230
QOL
$610
DPW
Nov-07
Jul-07
Installationofsidewalks
onHollywoodRd.fromBo
ltonRd.
HollywoodRoadSidewalks
90
toSpringstreet.P
roject
connectswith
AT-ARBP024,
BoltonRoadSidew
alks.
09DPW-
05-0227
CID,S
tBnd
$881
DPW
Jul-07
Nov-06
Streetscapeimprovem
entsat
theintersections
ofHollywood
HollywoodRoad
Streetscapes
91
RdatBoltonRd,PerryBlvd
andHollowellPkw
y.
09DPW-
05-0237
QOL
$3,150
DPW
Jan-08
Jan-07
Thisprojectw
illupgrade
How
ellM
illRd.from
How
ellM
illRoad
IntersectionImprovem
ents
92
ChattahoochieAve.to
Bellemeade
Ave.by
widening
narrow
lanesandadding
turn
lanes.
10DPW-
05-0244
QOL
$24,870
DPW
Not
available
Not
available
Reconfigurationofinterchange
ramps
atI-285
southandI-20
west.
I-285
SouthtoI-20West,
Ram
pGeometry
93
09DPW-
06-0034
QOL
$35,701
DPW
Not
available
Not
available
I-285
Westand
D.L.H
ollowell
Parkw
ay(US78/278)
I-285
West@
US
78/278-SR8-D
.L.
94
Interchange.Theprojectalso
HollowellParkw
ay(formerlyBankheadHw
includes
anassociated
four
lane
collector-distributor
system
runningfromI-20West
to BoltonRoad(SR70).
08DPW-
06-0035
QOL
$111,652
DPW
Not
available
Not
available
Reconstructionoftheoff-ram
pfromI-75southbound
toI-85
I-75SBTO
I-85NB
FlyoverB
ridge
95
northbound.Theexistingramp
forces
motoriststomakea
sharpturningmovem
entand
hasresultedinnumerous
vehicles
losing
controlor
flippingover.
08DPW-
06-0036
$33,081
DPW
Not
available
Not
available
ThereconstructionoftheI-85
NorthandMonroeDrive
I-85@
MonroeSlipRam
ps96
393Atlanta Strategic Action Plan September 2007 Draft

CD
NPU
CIP
#Fu
nding
Cos
tx1000
Respo
nsible
Party
Com
pletion
Year
Initiation
Year
Descriptio
nProject
Prog
ram
interchange.Itwillrelocatethe
on-and
off-ram
pstoMonroe
Drive.
City-
wide
DPW-
06-0037
QOL
$1,000
DPW
Jan-08
Jan-07
Retime,synchronize,replace
downloop
detectors,andadd
IntersectionTimingand
Loop
DetectorInstallation
97
crossw
alks
andpedestrian
phasingwhererelevantto115
signalized
intersections
City
wide.Approximately370loop
detectorshave
been
identified
asnotfunctioning
alongCMS
corridors.
09DPW-
05-0262
QOL
$10,765
DPW
Not
available
Not
available
Widen
theJames
Jackson
Parkw
ay(SR280)bridge
over
James
JacksonParkw
ay-
SR280-A
98
theChattahoocheeRiverfrom
twotofourlanes.Itwillwiden
theapproaches
tothebridge
andspan
therailroadas
well.
09DPW-
05-0263
OnSys
Br,QOL,
StB
nd
$1,765
DPW
Not
available
Not
available
Widen
theJames
Jackson
Parkw
ay(SR280)bridge
over
theChattahoocheeRiverfrom
James
JacksonParkw
ay-
SR280-B
99
twotofourlanes.Itwillwiden
theapproaches
tothebridge
andspan
therailroadas
well.
02DPW-
06-0038
StB
nd,
STP
Pgm
$1,588
DPW
Not
available
Not
available
ButlerS
treettravelsunderthe
CSXRailroad
bridge.This
JesseHillJrDr(Butler
Street)B
ridge
100
projectw
illrehabilitatethe
underpass.
02,03
DPW-
05-0270
QOL
$7,208
DPW
Jul-07
Feb-07
Thisprojectw
illreroutetraffic
bypermanently
closing
Jones/Simpson/Alexander
StreetCorridor
Improvem
ents
101
segm
entsofJones,Simpson
andAlexanderStreetsand
combining
them
intoasingle
roadway
betweenNorthside
DriveandWestP
eachtree
Street.
12DPW
-05-0273
CMAQ,
TIF
$172
DPW
Not
Available
Not
Available
Jonesboro/Hutchinsto
Jonesboro/Macedonia
JonesboroSchoolD
rive
Plaza/SchoolD
rive
Macedonia
102
01DPW-
05-0274
QOL
$445
DPW
Not
Available
Not
Available
Jonesboro/
McD
onough/Gannon
Jonesboro-
McD
onough
Plaza
103
September 2007 Draft Atlanta Strategic Action Plan394
Community Agenda4

CD
NPU
CIP
#Fu
nding
Cos
tx1000
Respo
nsible
Party
Com
pletion
Year
Initiation
Year
Descriptio
nProject
Prog
ram
01DPW-
05-0282
CID,LCI
$1,245
DPW
Jul-08
Jan-08
Streetscapeboundedby
Jonesboro/Lakewood/
Clair/Shoen
LakewoodHeightsTown
Center
104
11DPW-
05-0284
LCI,QOL
$3,000
DPW
Not
available
Not
available
RedesignofCam
pbellton
RoadatMt.Gilead
Road
Langford
Parkw
ay-SR154/166at
Cam
pbelltonRoad
105
intersection.
Landscapingand
signagefora
gateway
into
area
istobe
included
inthe
design.
04DPW-
05-0289
QOL
$200
DPW
Jan-07
Sep-06
Constructionofsidewalks
onLawtonStreetfromOglethorpe
AvetoLucileAvenue.
LawtonRoadSidew
alks
106
04DPW-
05-0291
QOL
$30
DPW
Nov-07
Jul-07
Evaluationongoingform
inor
traffic&pedestriansafety
improvem
entsatintersection.
LeeStreetandYorke
Avenue
107
07DPW-
06-0039
QOL
$9,984
DPW
Not
Available
Not
Available
ThewideningofLenoxRoad
fromFerncliffRoadto
LenoxRoadWidening
108
CanterburyRoadfromtwoto
fourlanes.Itisdesigned
torelieve
abottleneckbetween
theLenoxMallareaandI-85
North.Itw
illalso
willprovide
analternateroutetothe
congestedSR400corridor.
07DPW
-06-0040
QOL
$1,462
DPW
Jan-07
Feb-05
Streetscapeandtrafficcalming
devicesalongLindberghDrive
LindberghDrive
Streetscape
109
fromPeachtreeRoadto
Piedm
ontA
ve.
02DPW-
05-0295
QOL
$3,125
DPW
Jun-08
Oct-07
NorthAvenue
fromTech
Parkw
aytoPiedm
ontR
oad;
Linden
St/P
once
DeLeon
AveIntersection
Improvem
ents
110
Ponce
DeLeon
Avenue
from
SpringStreettoMyrtle
Street
andLinden
Avenue
from
SpringStreettoPeachtree
Street.C
orridorleveland
individualintersection
improvem
entswillbe
applied.
10DPW-
06-0041
QOL
$413
DPW
Sep-07
Dec-06
Greenway
system
with
large
ParkNodes
betweenRalph
LionelHam
pton
Park
111
DavidAbernathy
andPeyton
Road
10DPW-
05-0302
QOL
$4,350
DPW
Not
available
Not
available
Improvem
entofthe
intersections
atM.L.K
ingJr.
M.L.K
ing,Jr.D
rive-
SR139
112
395Atlanta Strategic Action Plan September 2007 Draft

CD
NPU
CIP
#Fu
nding
Cos
tx1000
Respo
nsible
Party
Com
pletion
Year
Initiation
Year
Descriptio
nProject
Prog
ram
Drive(SR139)andH.E.
Holmes
DriveandBarfield
Avenue.Includedare
continuous
turnlanesbetween
thetwointersections.
03DPW-
05-0305
QOL
$100
DPW
Jan-08
Jun-07
AtlantaHousing
Authority
Magnolia
Park
113
06DPW-
06-0042
QOL
$662
DPW
Nov-07
Sep-07
Highpriorityforcouncilperson.
Thisisan
alleyw
ayperL.
MaidenLane
114
Jeter,partiallypavedperB
illy
Mitchell.
Itisroughly10
feet
wideinsomesections,and
provides
access
totherearof
thepropertiesthatabutit.
09DPW-
05-0310
QOL
$1,600
DPW
Jul-09
Jul-08
Sidew
alks
andpedestrian
improvem
entsalongMarietta
Marietta
Boulevard
Streetscapes
115
BlvdfromWMarietta
SttoCity
limit/River.
10DPW-
05-0318
$1,485
DPW
Oct-07
Jan-07
From
FairburnRoadtoWest
Lake
Drive
Martin
LutherKingJr.,
Drive
116
04DPW-
05-0321
QOL
$668
DPW
Not
Available
Not
Available
From
Westlake
Avenue
toAnderson
Martin
LutherKingJr.,
Drive/Ralph
David
117
Abernathy
Boulevard/W
estviewDriv
05DPW-
05-0333
QOL
$120
DPW
Oct-07
Aug-07
From
PearlStreettoOakland
Avenue
Mem
orialD
rive
118
05DPW-
05-0338
QOL
$400
DPW
Nov-07
May-07
From
MorelandAvenue
toCandlerRoad
Mem
orialD
rive(SR154)
119
05DPW-
06-0071
QOL
$400
DPW
Aug-07
Jul-07
From
CapitalAvenueto
Oakland
Avenue:C
D1-10%
,CD5-90%
.
Mem
orialD
riveParks
120
01DPW-
06-0070
QOL
$86
DPW
Aug-07
Jul-07
From
CapitalAvenueto
Oakland
Avenue:C
D1-10%
,CD5-90%
.
Mem
orialD
riveParks
121
12DPW-
05-0342
QOL
$358
DPW
Mar-08
Apr-07
PartofM
etropolitan
Parkw
aystreetscapeAproject.
Metropolitan
Parkw
ayand
Cleveland
Avenue
122
12DPW-
05-0343
NatlH
wy
Sys,S
tBnd
$54
DPW
Mar-08
Apr-07
PartofM
etropolitan
Parkw
aystreetscapeBproject.
Metropolitan
Parkw
ayand
ManfordRoad
123
September 2007 Draft Atlanta Strategic Action Plan396
Community Agenda4

CD
NPU
CIP
#Fu
nding
Cos
tx1000
Respo
nsible
Party
Com
pletion
Year
Initiation
Year
Descriptio
nProject
Prog
ram
12,04
DPW-
05-0344
QOL
$1,079
DPW
Mar-08
Apr-07
Phase
1Cleveland
Ave.
Intersection
DecknerAve.toCasplan
(1side
ofthestreetonly)
Gatew
ayfeature/M
onum
ent
atRDAIntersection
StreetscapeImprovem
entsfro
RDAtoShelton(BothSides
ofStreet)
Metropolitan
Parkw
ay/StewartAvenue-
A
124
12/04
DPW-
05-0344
QOL
$1,079
DPW
Mar-08
Apr-07
Phase
2:Sidew
alks
andped
imp'tsat
Unive.A
veInterstn
StreetscapeImprovem
ents
fromDecknertoUniversity
(BothSides
ofStreet)
StreetscapeImprovem
ents
fromFairSt.toCasplan
(on
Metropolitan
Parkw
ay/StewartAvenue-
B
125
theeastside.Alsoon
westside
ifbudgetallows)
06,02
DPW-
05-0345
QOL
$2,000
DPW
Dec-07
Dec-07
Thisprojectw
illaddtraffic
signalsthefollowing
MidtownAtlantaSignaland
IntersectionImprovem
ents
126
intersections:P
eachtree
Street,JuniperStreetand
Piedm
ontA
veat8thStreet
(phase
I).Phase
IIintersections
areSp
ringStreet
andWestP
eachtreeStreetat
12thStreet.
06DPW-
05-0348
QOL
$300
DPW
Jul-08
Apr-08
OakdaleRoadtoColvinStreet
MillerAvenue
127
03DPW-
05-0351
QOL
$155
DPW
Mar-006
Jan-06
Locations
tobe
determined
MiscellaneousTB
DSidew
alks
CD3
128
02DPW-
05-0352
QOL
$15,100
DPW
Not
available
Not
available
Thisprojectw
illreplacethe
MitchellStreetbridge
overthe
SouthernRailroad.
MitchellStreet
129
06DPW-
05-0356
QOL
$115
DPW
Nov-07
Jun-07
Installand
upgradetraffic
signals;Link
signalsystem
toMorelandAvenue
130
theAT
CCviafiberoptic
communications;D
evelop
signal-timingplansforcorridor
05DPW-
05-0358
QOL
$169
DPW
Jul-09
Nov-08
From
NorthAvenue
toI-20:CD
2-24%
,CD5-52%
,CD6-
24%.
MorelandAvenue
North
131
397Atlanta Strategic Action Plan September 2007 Draft

CD
NPU
CIP
#Fu
nding
Cos
tx1000
Respo
nsible
Party
Com
pletion
Year
Initiation
Year
Descriptio
nProject
Prog
ram
01DPW-
05-0359
QOL
$506
DPW
Jul-09
Nov-08
From
I-20toI-285:CD1-
80%,C
D5-20%
.MorelandAvenue
South
132
02DPW-
06-0043
QOL
$38
DPW
Mar-07
Mar-07
From
BoulevardtoNorth
AngierA
venue
MorganStreet
133
04DPW-
05-0362
QOL
$200
DPW
Nov-06
Jul-06
From
I-20toLakewood
Freeway
MurphyAvenue
134
DPW
135
11DPW-
05-0366
QOL
$600
DPW
Nov-07
Jul-07
ButnerR
oadtoDeadEnd
NiskeyLake
Road
136
02DPW-
06-0045
QOL
$25
DPW
Apr-07
Apr-07
From
NorthAvenue
toDallas
Street
NorthAngierA
venue
137
03DPW-
05-0369
QOL
$30
DPW
May-07
Mar-07
Evaluationongoingform
inor
traffic&pedestriansafety
improvem
entsatintersection.
NorthAvenue
andAshby
Street
138
02DPW-
05-0370
QOL
$54
DPW
Feb-09
Dec-07
Projectcancelledas
improvem
entstobe
completed
byMidtownCID.
NorthAvenue
andWest
PeachtreeStreet
139
City-
wide
DPW-
06-0068
LCI,CID
$4,750
DPW
Acquisitionordesign
and
constructionofnewSolid
NorthAvenue
Facility
Relocation
140
Wastefacilitiesandtransfer
stations.Fundspreviously
awardedforthe
Chester
Avenue
Facilitywillbe
utilized
forthisproject
04DPW-
05-0376
QOL
$203
DPW
Jan-08
Aug-07
From
I-75toFairStreet,C
D3
-70%
,CD4-30%
Northside
Drive
141
03,08
DPW-
05-0377
TIF,LC
I$4,928
DPW
Not
Available
Not
Available
Theimprovem
entoftraffic
signaltim
ingon
Northside
Northside
Drive-U
S41/SR3
142
Drive(US41/SR3)fromI-20
WesttoI-75North.
Intersections
included
onthe
signaltim
ingimprovem
ent
includeMcD
aniel,Fair,
Mitchell,Simpson,and
M.L.
King,Jr.D
r.
02,03
DPW-
05-0378
QOL
$10,546
DPW
Not
Available
Not
Available
Intersectiongeom
etry
upgrades
alongNorthside
Driveat10thand14thStreets.
Northside
Drive-U
S41/SR3-A
143
DPW-
05-0379
QOL
$5,000
DPW
Not
Available
Not
Available
Thisprojectw
illupgrade
Northside
Drivefrom14thSt
Northside
Drive-U
S41/SR3-B
144
September 2007 Draft Atlanta Strategic Action Plan398
Community Agenda4

CD
NPU
CIP
#Fu
nding
Cos
tx1000
Respo
nsible
Party
Com
pletion
Year
Initiation
Year
Descriptio
nProject
Prog
ram
toTrabertA
veby
improving
pavement
08DPW-
05-0383
QOL
$8,050
DPW
Not
Available
Not
Available
Theconstructionofarailroad
overpass
attheCSXRailroad
Northside
Drive-U
S41/SR3Bridge
145
andNorthside
Drive(US
41/SR3).
08DPW-
05-0383
OnSys
Br,QOL,
StB
nd
$2,674
DPW
Not
Available
Not
Available
Improvem
entstotheNorthside
Drivebridge
overtheNorfolk
SouthernRailroad.
Northside
DriveBridge
146
03DPW-
05-0385
QOL
$309
DPW
Not
Available
Not
Available
From
I-75toFairStreet,C
D3
-70%
,CD4-30%
.Northside
DriveTravel
Way,C
D3
147
04DPW-
05-0384
QOL
$193
DPW
Not
Available
Not
Available
From
I-75toFairStreet,C
D3
-70%
,CD4-30%
.Northside
DriveTravel
Way,C
D4
148
08DPW-
05-0386
TIF,LC
I$6,898
DPW
Not
available
Not
available
Thisprojectw
illwiden
the
Northside
Parkway
bridge
over
Northside
Parkw
ay-U
S41/SR3-A
149
theChattahoocheeRiverand
theapproaches
tothebridge.
Theroadway
willtransition
fromeightlanes
tosixlanesbetweenPaces
MillRoadandtheapproach
tothebridge.
08DPW-
05-0386
StB
nd,
NatlH
wy
Sys
$10,302
DPW
Not
available
Not
available
Thisprojectw
illwiden
the
Northside
Parkway
bridge
over
theChattahoocheeRiverand
Northside
Parkw
ay-U
S41/SR3-B
150
theapproaches
tothebridge.
Theroadway
willtransition
fromeightlanes
tosixlanesbetween
Paces
MillRoadandthe
approach
tothebridge.
02DPW-
05-0396
NatlH
wy
Sys,S
tBnd
$5,842
DPW
Not
available
Not
available
Streetscapeimprovem
ents
fromDecaturStreettoRalph
McG
illBoulevard
PeachtreeCenterA
venue
151
07DPW-
06-0047
$1,290
DPW
Oct-06
Feb-05
StreetscapeandTraffic
CalmingfromPeachtreeRoad
toLingberghDrive
PeachtreeHillsRoad
Improvem
ents
152
08DPW
05-0402
QOL
$179
DPW
Sep-09
Apr-09
CD7-50%
;CD8-50%
.Per
Council's
request,residents
PeachtreeRoadand
PeachtreeBattle
Road
153
areinterested
intrafficcalming
measuresatthisintersection.
399Atlanta Strategic Action Plan September 2007 Draft
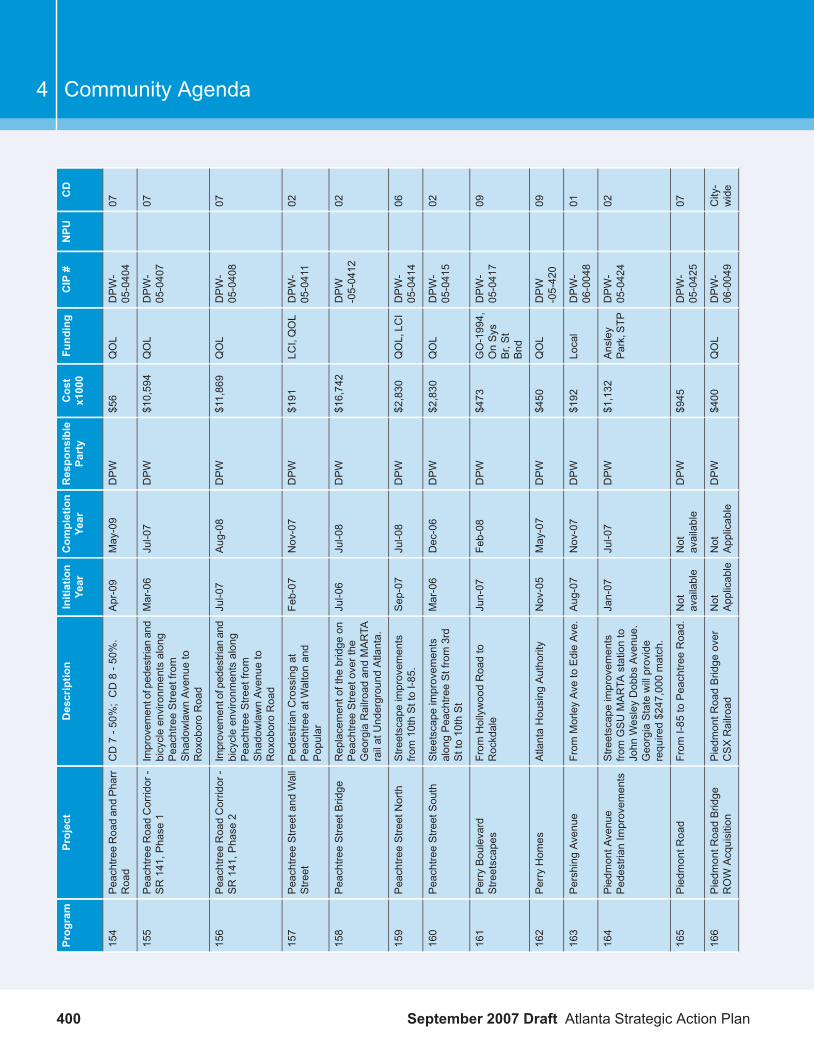
CD
NPU
CIP
#Fu
nding
Cos
tx1000
Respo
nsible
Party
Com
pletion
Year
Initiation
Year
Descriptio
nProject
Prog
ram
07DPW-
05-0404
QOL
$56
DPW
May-09
Apr-09
CD7-50%
;CD8-50%
.Pe
achtreeRoadandPh
arr
Road
154
07DPW-
05-0407
QOL
$10,594
DPW
Jul-07
Mar-06
Improvem
entofpedestrian
and
bicycleenvironm
entsalong
PeachtreeRoadCorridor-
SR141,Phase
1155
PeachtreeStreetfrom
ShadowlawnAvenue
toRoxoboroRoad
07DPW-
05-0408
QOL
$11,869
DPW
Aug-08
Jul-07
Improvem
entofpedestrian
and
bicycleenvironm
entsalong
PeachtreeRoadCorridor-
SR141,Phase
2156
PeachtreeStreetfrom
ShadowlawnAvenue
toRoxoboroRoad
02DPW-
05-0411
LCI,QOL
$191
DPW
Nov-07
Feb-07
Pedestrian
Crossingat
PeachtreeatWaltonand
Popular
PeachtreeStreetandWall
Street
157
02DPW
-05-0412
$16,742
DPW
Jul-08
Jul-06
Replacementofthe
bridge
onPeachtreeStreetoverthe
PeachtreeStreetBridge
158
GeorgiaRailroad
andMARTA
railatUnderground
Atlanta.
06DPW-
05-0414
QOL,LC
I$2,830
DPW
Jul-08
Sep-07
Streetscapeimprovem
ents
from10thSttoI-85.
PeachtreeStreetNorth
159
02DPW-
05-0415
QOL
$2,830
DPW
Dec-06
Mar-06
Steetscapeimprovem
ents
alongPeachtreeStfrom3rd
Stto10thSt
PeachtreeStreetSouth
160
09DPW-
05-0417
GO-1994,
OnSys
$473
DPW
Feb-08
Jun-07
From
HollywoodRoadto
Rockdale
PerryBoulevard
Streetscapes
161
Br,St
Bnd
09DPW
-05-420
QOL
$450
DPW
May-07
Nov-05
AtlantaHousing
Authority
PerryHom
es162
01DPW-
06-0048
Local
$192
DPW
Nov-07
Aug-07
From
MorleyAvetoEdieAve.
PershingAvenue
163
02DPW-
05-0424
Ansley
Park,STP
$1,132
DPW
Jul-07
Jan-07
Streetscapeimprovem
ents
fromGSUMARTA
stationto
Piedm
ontA
venue
Pedestrian
Improvem
ents
164
John
WesleyDobbs
Avenue.
GeorgiaStatewillprovide
required$247,000
match.
07DPW-
05-0425
$945
DPW
Not
available
Not
available
From
I-85toPeachtreeRoad.
Piedm
ontR
oad
165
City-
wide
DPW-
06-0049
QOL
$400
DPW
Not
Applicable
Not
Applicable
Piedm
ontR
oadBridge
over
CSXRailroad
Piedm
ontR
oadBridge
ROW
Acquisition
166
September 2007 Draft Atlanta Strategic Action Plan400
Community Agenda4

CD
NPU
CIP
#Fu
nding
Cos
tx1000
Respo
nsible
Party
Com
pletion
Year
Initiation
Year
Descriptio
nProject
Prog
ram
07DPW-
06-0050
QOL
$11,779
DPW
Not
Available
Not
Available
Theadditionofturnlanesand
medianimprovem
entson
Piedm
ontR
oadTurn
Lanes
167
Piedm
ontR
oadfromSidney
MarcusBoulevard/Morosgo
DrivetoGarsonRoad.The
project
isdesigned
toimprovetraffic
flowinandaround
theMARTA
LindbergTransitC
enter.
05DPW-
06-0051
QOL
$35
DPW
Apr-07
Apr-07
From
BouldercrestD
riveto
BouldercrestD
rive
PiperCircle
168
08DPW-
06-0052
QOL
$320
DPW
Nov-07
Aug-07
From
WestW
esleyRoadto
Nancy
Creek
Road
PlymstockLane
169
06DPW
-05-0428
QOL
$252
DPW
Jul-09
Nov-08
From
I-75/85
toMoreland
Avenue,C
D2-60%
,CD6-
40%.
Ponce
deLeon
Avenue
170
06DPW-
05-0434
QOL
$27
DPW
Apr-09
Nov-08
CD2-50%
;CD6-50%
.Based
onCouncilrequest,
Ponce
deLeon
Avenue
andMorelandAvenue
171
recommendadding
LTsignal
forS
Bapproach.
02DPW-
05-0435
QOL
$27
DPW
Apr-09
Nov-08
CD2-50%
;CD6-50%
.Based
onCouncilrequest,
Ponce
deLeon
Avenue
andMorelandAvenue
172
recommendadding
LTsignal
forS
Bapproach.
08DPW-
05-0437
QOL
$1,469
DPW
Jun-08
Oct-07
Replacementofbridge
over
Nancy
Creek.
Pow
ersFerryRoadBridge
Replacement
173
12DPW-
05-0438
QOL
$54
DPW
Sep-07
Apr-07
Partof00G
O-0839and
00GO-0840,PryorRoad
streetscapeproject.
PryorR
oadandAm
alDrive
174
12DPW
-05-0439
CID,
CMAQ
$27
DPW
Sep-07
Apr-07
CD1-50%
;CD12
-50%
.Partof00G
O-0839and
PryorRoadandJoyland
Street
175
00GO-0840,PryorRoad
streetscapes
project.
01DPW
-05-0440
QOL
$27
DPW
Sep-07
Apr-07
CD1-50%
;CD12
-50%
.Partof00G
O-0839and
PryorRoadandJoyland
Street
176
00GO-0840,PryorRoad
streetscapes
project.
01DPW
-05-0441
QOL
$27
DPW
Sep-07
Apr-07
CD1-50%
;CD12
-50%
.Partof00G
O-0839and
PryorRoadandManford
Road
177
00GO-0840,PryorRoad
streetscapes
project.
401Atlanta Strategic Action Plan September 2007 Draft

CD
NPU
CIP
#Fu
nding
Cos
tx1000
Respo
nsible
Party
Com
pletion
Year
Initiation
Year
Descriptio
nProject
Prog
ram
12DPW-
05-0442
$27
DPW
Sep-07
Apr-07
CD1-50%
;CD12
-50%
.Partof00G
O-0839and
PryorRoadandMoury
Drive
178
00GO-0840,PryorRoad
streetscapes
project.
12,04
DPW-
05-0443
QOL,TE
$1,146
DPW
Sep-07
Apr-07
Sidew
alks
andpedestrian
improvem
entsfromsouthof
University
AvetoPryorCircle.
PryorRoadStreetscape
179
02DPW-
05-0445
QOL
$13,466
DPW
Feb-2011
Jun-09
Thisprojectw
illrehabilitatethe
PryorStreetbridge
overthe
PryorStreetBridge
180
CSX
Railroad
andMAR
TArail.
Theprojectw
illrunfrom
Alabam
aStreettoWallStreet.
COAresponsibleforrightof
way
($9,510,000).
04DPW-
05-0448
STP,
State
$30
DPW
Jun-09
Jun-08
PartofR
alph
DavidAbernathy
BoulevardStreetscape.
Ralph
DavidAbernathy
BoulevardandLeeStreet
181
04DPW-
05-0449
$1,259
DPW
Jun-09
Jun-08
From
Metropolitan
Parkw
ayto
Longhorn
Ralph
DavidAbernathy
BoulevardStreetscapes
182
03DPW
-05-0452
QOL
$1,968
DPW
Dec-07
Oct-07
NearM
orris
BrownCollege
Reconstructionof
Retaining
WallonMartin
LutherKingJr.D
rive
183
City-
wide
DPW-
05-0454
$2,256
DPW
Jun-08
Jun-06
Installingsignageand
pavementm
arking
for
Restriping
andGeometric
Modifications
184
on-streetbicycleroutes
previouslyadoptedby
theCity
ofAtlanta.
03DPW-
05-0471
LCI,CID
$30
DPW
May-07
Apr-07
Evaluationongoingform
inor
traffic&pedestriansafety
improvem
entsatintersection.
Simpson
RoadandSu
nset
Avenue
185
03DPW-
05-0472
NatlH
wy
Sys,S
tBnd
$1,890
DPW
May-09
May-08
From
Northside
DrivetoWest
Lake
Avenue.
Simpson
Road
Streetscapes
186
DPW-
06-0069
$33,000
DPW
TheNorthAvefacilityneedsto
berelocatedwithinthenext
SolidWasteFacility
Upgrade
187
twoyears.Dem
olition
and
reconstructionoftheHill
Street
Fundspreviously
awardedforthe
currentH
illStreetfacilitywillbe
utilized
for
thisproject.
September 2007 Draft Atlanta Strategic Action Plan402
Community Agenda4

CD
NPU
CIP
#Fu
nding
Cos
tx1000
Respo
nsible
Party
Com
pletion
Year
Initiation
Year
Descriptio
nProject
Prog
ram
01DPW-
06-0057
QOL
$657
DPW
Oct-07
Jan-07
Greenway
Trailfrom
LakewoodAvenue
toHarper
Road
SouthBendPark
Greenway
188
01DPW-
06-0060
OnSys
Br,St
Bnd
$549
DPW
Oct-07
Jan-06
Greenway
andtrailsystem
inCouncilDistricts1and12
onalltributarieson
themainstem
SouthtownTrail/South
RiverGreenway
CD1
189
ontheSouthRiverfrom
DeK
albCountylinetoI-75/85,
andtrails
fromCSXRailroad
southtoSouthside
Park.75%
12DPW
-06-0059
QOL,CID
$1,648
DPW
Sep-08
Jan-06
Greenway
andtrailsystem
inCouncilDistricts1and12
onSouthtownTrail/South
RiverGreenway
CD12
190
alltributarieson
themainstem
ontheSouthRiverfrom
DeK
albCountylinetoI-75/85,
andtrails
fromCSXRailroad
southtoSouthside
Park.
CD
1-25%
,CD12
-75%
.
03DPW
-05-0475
CID,S
tBnd
$239
DPW
Nov-07
Sep-07
From
WhitakerS
treettoDead
End
SpainPlace
191
06DPW-
05-0476
QOL
$100
DPW
Dec-09
Jan-07
Fundingfor3rdBo
ndIssuance
Speed
Hum
psfromNew
Requests,CD06
192
10DPW
-05-0477
QOL
$72
DPW
Dec-09
Jan-07
Fundingfor3rdBo
ndIssuance
Speed
Hum
psfromNew
Requests,CD10
193
11DPW-
05-0478
StB
nd,
CID
$46
DPW
Dec-09
Jan-07
Fundingfor3rdBo
ndIssuance
Speed
Hum
psfromNew
Requests,CD11
194
02DPW-
05-0501
QOL
$8,057
DPW
Not
available
Not
available
RehabilitationoftheSpring
Streetbridge
overtheCSX
SpringStreet-A
195
Railroad.Inconjunctionwith
AT-086B.
02DPW-
05-0502
$17,225
DPW
Not
available
Not
available
Thisprojectw
illreplacethe
SpringStreetbridge
overthe
SpringStreet-B
196
SouthernRailroad.In
conjunctionwith
AT-086A.
02DPW-
05-0503
LCI
$8,593
DPW
Not
available
Not
available
Streetscapeimprovem
ents
alongSpringStfromPineSt
toPeachtreeSt.
SpringStreet-C
197
08DPW-
06-0061
CMAQ
$22,470
DPW
Not
available
Not
available
New
access
rampfromI-85
southbound
toSR400
SR400@
I-285
North
198
northboundandfromSR400
southbound
toI-85northbound
403Atlanta Strategic Action Plan September 2007 Draft

CD
NPU
CIP
#Fu
nding
Cos
tx1000
Respo
nsible
Party
Com
pletion
Year
Initiation
Year
Descriptio
nProject
Prog
ram
andasixlane
collector-
distributorsystem
runningfrom
justsouthofI-85/SR400
interchangetojustsouthof
NorthDruidHillsRoad(SR
42).
12DPW-
05-0507
OnSys
Br,St
Bnd
$300
DPW
Nov-07
Aug-07
From
HardenRoadtoPryor
Road
St.John'sAvenue
199
12DPW-
05-0508
$58
DPW
Nov-07
Aug-07
From
St.JohnsAvenue
toDeadEnd
St.John'sCircle
200
11DPW-
05-0512
Interstate
Maint,S
tBnd
$1,500
DPW
Mar-07
Sep-07
Ben
EMays/Beecher/Cascade/W
illis
MilltoCascade/DeLow
e
SW
AtlantaSidew
alk
Program
:Cascade
Rd,
Ben
E.M
ays
201
03DPW
-05-0515
CMAQ,
TIF
$1,956
DPW
Not
available
Not
available
Thisprojectw
illimprovethe
TechwoodDrivebridge
over
TechwoodDriveBridge
202
theCSXandNorfolkSouthern
Railroads.
11DPW-
05-0516
OnSys
Br,St
Bnd
$600
DPW
Aug-08
Apr-08
From
ButnerRoadtodead
end
(approximately0.25
miles).
TellRoad
203
05DPW-
05-0528
CID,LCI
$355
DPW
Jun-08
Jan-07
Evaluations
underway
for
AtlantaPublic
Schoolswithin
thisCouncilDistrict(5)
Traffic
CalmingMeasures
CD05
204
01DPW-
05-0521
LCI,QOL
$249
DPW
Jun-08
Jan-07
Evaluations
underway
for
AtlantaPublic
Schoolswithin
thisCouncilDistrict(1)
Traffic
CalmingMeasures,
CD01
205
02DPW-
05-0525
QOL
$276
DPW
Jun-08
Jan-07
Evaluations
underway
for
AtlantaPublic
Schoolswithin
thisCouncilDistrict(2)
Traffic
CalmingMeasures,
CD02
206
03DPW
-05-0526
OnSys
Br,St
Bnd
$242
DPW
Jun-08
Jan-07
Evaluations
underway
for
AtlantaPublic
Schoolswithin
thisCouncilDistrict(3)
Traffic
CalmingMeasures,
CD03
207
04DPW-
05-0527
NatlH
wy
Sys,S
tBnd
$123
DPW
Jun-08
Jan-07
Evaluations
underway
for
AtlantaPublic
Schoolswithin
thisCouncilDistrict(4)
Traffic
CalmingMeasures,
CD04
208
06DPW-
05-0529
LCI,QOL,
StB
nd$191
DPW
Jun-08
Jan-07
Evaluations
underway
for
AtlantaPublic
Schoolswithin
thisCouncilDistrict(6)
Traffic
CalmingMeasures,
CD06
209
September 2007 Draft Atlanta Strategic Action Plan404
Community Agenda4

CD
NPU
CIP
#Fu
nding
Cos
tx1000
Respo
nsible
Party
Com
pletion
Year
Initiation
Year
Descriptio
nProject
Prog
ram
07DPW-
05-0530
QOL
$96
DPW
Jun-08
Jan-07
Proposed
medianon
Lakeview
Avenue
betweenPeachtree
RoadandParksideDrive.
Traffic
CalmingMeasures,
CD07
210
08DPW-
05-0531
QOL
$163
DPW
Jun-08
Jan-07
Evaluations
underway
for
AtlantaPublic
Schoolswithin
thisCouncilDistrict(8)
Traffic
CalmingMeasures,
CD08
211
09DPW-
05-0520
$241
DPW
Jun-08
Jan-07
Evaluations
underway
for
AtlantaPublic
Schoolswithin
thisCouncilDistrict(9)
Traffic
CalmingMeasures,
CD09
212
10DPW
-05-0522
QOL
$143
DPW
Jun-08
Jan-07
Evaluations
underway
for
AtlantaPublic
Schoolswithin
thisCouncilDistrict(10)
Traffic
CalmingMeasures,
CD10
213
11DPW
-05-0523
QOL
$236
DPW
Jun-08
Jan-07
Evaluations
underway
for
AtlantaPublic
Schoolswithin
thisCouncilDistrict(11)
Traffic
CalmingMeasures,
CD11
214
12DPW
-05-0524
QOL
$33
DPW
Jun-08
Jan-07
Evaluations
underway
for
AtlantaPublic
Schoolswithin
thisCouncilDistrict(12)
Traffic
CalmingMeasures,
CD12
215
City-
wide
DPW-
05-0532
QOL,
Q40
$5,054
DPW
Sep-08
Sep-05
Mem
orialD
riveReversible
Lane
System(from
Pearl
StreettoCandlerRoad,CD5)
Traffic
Signals&
Com
munications
216
11DPW-
06-0062
QOL
$414
DPW
Oct-07
Nov-05
Parkupgrades
includingtrails
tobe
provided
onarecent
TrailD
evelopmentfor
Greenbriarand
Kingsbridge
communities
217
purchase
property-adjacent
toKingsridge
subdivision.
04DPW-
05-0534
TIF,
CMAQ
$521
DPW
Nov-07
Aug-07
From
Peeples
StreettoLee
Street
TuckerAvenue
218
05DPW-
05-0536
$275
DPW
Nov-07
Aug-07
From
Mem
orialDrivetoGaskill
Street
TyeStreet
219
04DPW-
06-0063
QOL,
Q40
$16,400
DPW
Not
available
Not
available
Widen
from2to4lanes
betweenMcD
onough
Blvd.
andMetropolitan
Pkw
y.
University
Avenue
Widening
220
05DPW-
06-0066
QOL
$41
DPW
From
1stS
treettoHardee
Avenue
WesleyAvenue
221
04and
12DPW
-05-0589
AnlBnd,
OnSys
$1,197
DPW
Mar-09
Jun-08
The12'w
idemulti-usetrailis
proposed
tobe
4.2mile
long,
WestE
ndRailM
ulti-Use
Trail
222
Br,St
whereitbegins
andends
atBnd,
GO-1994
thesw
ofAtlanta'sCBD.It
proposes
toconvertthe
abandonedCSXrightofway
405Atlanta Strategic Action Plan September 2007 Draft

CD
NPU
CIP
#Fu
nding
Cos
tx1000
Respo
nsible
Party
Com
pletion
Year
Initiation
Year
Descriptio
nProject
Prog
ram
betweenSimpson
Rd,RDA,M
LKingJrDr.,PryorRd.
08DPW
-05-0593
QOL
$556
DPW
Nov-06
Jan-06
Constructionofsidewalks
onWestP
aces
FerryRoadand
WestP
aces
FerryRoad
223
Paces
FerryRoadfrom
PeachtreeRoadtotheAtlanta
citylim
itsatthe
ChattahoocheeRiver.
02DPW
-05-0594
QOL,
CMAQ
$4,012
DPW
Sep-08
Dec-07
Streetscapeimprovem
ents
from12thStreettoPeachtree.
WestP
eachtreeStreet
Streetscape-N
orth
224
02DPW-
05-0595
QOL,
TIF
$4,012
DPW
Dec-06
Feb-06
Streetscapeimprovem
ents
fromNorthAvenue
to12th
Street.
WestP
eachtreeStreet
Streetscape-S
outh
225
06DPW-
06-0067
NatlH
wy
Sys,S
tBnd
$453
DPW
Sep-08
Jun-06
WildwoodUrban
Forest
propertyacquisition
and
developm
ent,(roughly
WildwoodUrban
Forest
226
betweenCheshire
Bridge
RoadandLenoxRoad)
City-
wide
DPW-
05-0609
Interstate
Maint,
$1,000
DPW
Not
Available
Not
Available
SolidWaste-Cascade
Rd
landfillm
ethane
system
Cascade
RoadLandfill
Methane
System
Rem
ediation
227
NatlH
wy
remediationrequiredtomeet
EPDregulation
Sys,S
tBnd
City-
wide
DPW-
06-0018
QOL
$500
DPW
Not
Available
Not
Available
SolidWaste-Cascade
Road
landfillretaining
wall/slope
Cascade
RoadLandfill
retainingwallrem
ediation
228
remediationrequiredtomeet
EPDregulation
City-
wide
DPW-
06-0024
QOL
$920
DPW
Not
Available
Not
Available
Upgrading
andmaintenance
totheexistingChesterAvenue
ChesterAvenue
Facility
Upgrade
229
facilityincludingrepairing
HVA
Csystem
,and
repairing
thebuildings
electricaland
plum
bing
system
s
City-
wide
DPW-
05-0612
QOL
$300
DPW
Not
Available
Not
Available
SolidWaste-E.C
onfederate
Rdlandfillm
ethane
system
E.C
onfederateRdLandfill
methane
remediation
230
remediationrequiredtomeet
EPDregulation
City-
wide
DPW-
05-0613
QOL
$2,000
DPW
Not
Available
Not
Available
SolidWaste-G
unClublandfill
methane
system
remediation
Gun
ClubLandfillm
ethane
system
remediation
231
requiredtomeetE
PD
regulation
September 2007 Draft Atlanta Strategic Action Plan406
Community Agenda4

CD
NPU
CIP
#Fu
nding
Cos
tx1000
Respo
nsible
Party
Com
pletion
Year
Initiation
Year
Descriptio
nProject
Prog
ram
City-
wide
DPW
-05-0615
CID,S
tBnd
$6,000
DPW
Not
Available
Not
Available
SolidWaste-Key
Roadlandfill
methane
system
remediation
Key
Roadlandfillm
ethane
system
remediation
232
requiredtomeetE
PD
regulation
City-
wide
DPW-
05-0618
QOL
$525
DPW
Not
Available
Not
Available
MaddoxParkStationfacility
improvem
ents/renovations
MaddoxParkStation
renovations
233
City-
wide
DPW-
05-0617
QOL
$12,000
DPW
Not
Available
Not
Available
New
Maintenance
Garage
Constructionat1540
Northside
New
Maintenance
Garage
(1540Northside
Drive)
facility
234
Drive(LiddellStation)to
replacecurrentfacility
City-
wide
DPW
-05-0616
QOL
$750
DPW
Not
Available
Not
Available
LakewoodStationfacility
renovations
LakewoodStationfacility
renovations
235
1,12
Z,W
ARC/City
$120
City-B
OP
2008
2007
Prepareastudyforthe
South
MorelandCorridorincluding
Study
forS
outhMoreland
Avenue
236
Land
Use,Transportation,
Econom
icDevelopment,Urban
Design,andHousing
recommendations.
10I
N/A
N/A
City-BOP
2007
2007
Fullfillthe5YearUpdate
requirementsforA
RC.
H.E.H
olmes
LCI5
Year
Update
237
12X,Z
City
$40,000
City-BOP
2008
2007
Prepareastudyforthe
Cleveland
Avenue
Corridor
Study
forthe
Cleveland
Avenue
Corridorwith
the
City
ofEastP
oint
238
includingLand
Use,
Transportation,Economic
Development,Urban
Design,
andHousing
recommendations.
9D
N/A
N/A
City-BOP
2007
2007
Fulfillthe5YearUpdate
requirementsforA
RC.
Bolton/MooresMill/LCI5
YearUpdate
239
3,4,10
J,K,T,I
ARC/
City
$3,922,
659
City-BOP/
DPW
2008/2009
2007
ApplicationtoARCfor
StreetscapeandPedestrian
Improvem
ents
WestLake-Streetscape
Improvem
ent
240
4T
ARC/
City
$1,268
City-BOP/
DPW
2009
2004
Prelim
inaryDesignand
Construction
RDABlvd-Streetscape
Improvem
ent
241
4T
ARC/
City
$627
City-BOP/
DPW
2010
2004
Prelim
inaryDesignand
Construction
LoweryBlvd-Streetscape
Improvem
ent
242
4T
ARC/
City
$1,000
City-BOP/
DPW
2010
2003
Prelim
inaryDesignand
Construction
Harris
Hom
es-Streetscape
Improvem
ent
243
11P,R
ARC/
City
$1,908
City-BOP/
DPW
2010
2004
Prelim
inaryDesignand
Construction
GreenbriarP
kwy
-StreetscapeImprovem
ent
244
407Atlanta Strategic Action Plan September 2007 Draft

CD
NPU
CIP
#Fu
nding
Cos
tx1000
Respo
nsible
Party
Com
pletion
Year
Initiation
Year
Descriptio
nProject
Prog
ram
11R
ARC/
City
$250
City-BOP/
DPW
2010
2004
Prelim
inaryDesignand
Construction
HeadlandDrive
-StreetscapeImprovem
ent
245
11P
ARC/
City
$280
City-BOP/
DPW
2010
2003
Prelim
inaryDesignand
Construction
Barge
Road-Intersection
Imp
246
9D,C
ARC/
City
$1,000
City-BOP/
DPW
2009
2003
Prelim
inaryDesignand
Construction
BoltonIntersection-
Improvem
ent
247
11R,P
ARC/
City
$150
City-BOP/
DPW
TBD
2004
Prelim
inaryDesign
LangfordPkw
yandGB
Pkw
yInt.Improvem
ent
248
3J,L,M
ARC/
City
$750
City-BOP/
DPW
2009
2003
Prelim
inaryDesignand
Construction
Simpson
Rd-Streetscape
Improvem
ent
249
September 2007 Draft Atlanta Strategic Action Plan408
Community Agenda4
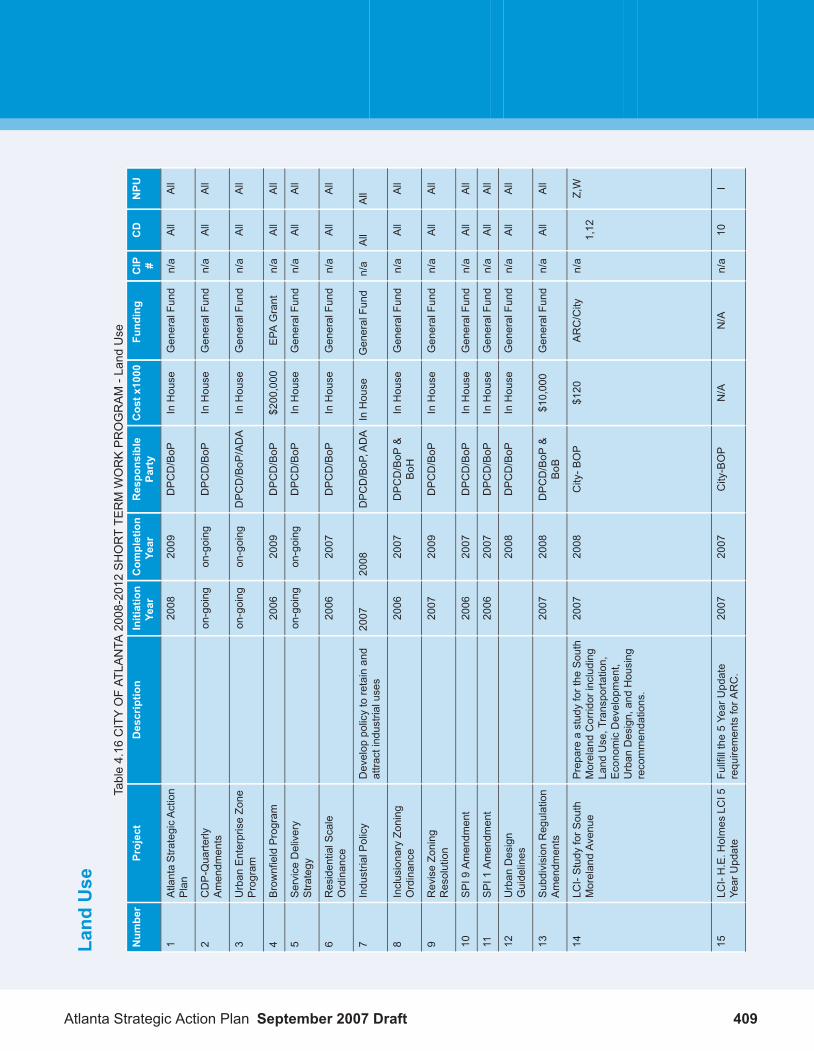
Land
Use
Table4.16
CITYOFAT
LANTA
2008-2012SHORTTE
RMWORKPROGRAM-LandUse
NPU
CD
CIP #
Fund
ing
Cos
tx1000
Respo
nsible
Party
Com
pletion
Year
Initiation
Year
Descriptio
nProject
Num
ber
All
All
n/a
GeneralFund
InHouse
DPCD/BoP
2009
2008
AtlantaStrategicAction
Plan
1
All
All
n/a
GeneralFund
InHouse
DPCD/BoP
on-going
on-going
CDP-Quarterly
Amendm
ents
2
All
All
n/a
GeneralFund
InHouse
DPCD/BoP
/ADA
on-going
on-going
Urban
EnterpriseZone
Program
3
All
All
n/a
EPA
Grant
$200,000
DPCD/BoP
2009
2006
BrownfieldProgram
4
All
All
n/a
GeneralFund
InHouse
DPCD/BoP
on-going
on-going
Service
Delivery
Strategy
5
All
All
n/a
GeneralFund
InHouse
DPCD/BoP
2007
2006
ResidentialScale
Ordinance
6
All
All
n/a
GeneralFund
InHouse
DPC
D/BoP,ADA
2008
2007
Develop
policytoretainand
attractindustrialuses
IndustrialPolicy
7
All
All
n/a
GeneralFund
InHouse
DPCD/BoP
&BoH
2007
2006
InclusionaryZoning
Ordinance
8
All
All
n/a
GeneralFund
InHouse
DPCD/BoP
2009
2007
ReviseZoning
Resolution
9
All
All
n/a
GeneralFund
InHouse
DPCD/BoP
2007
2006
SPI9
Amendm
ent
10
All
All
n/a
GeneralFund
InHouse
DPCD/BoP
2007
2006
SPI1
Amendm
ent
11
All
All
n/a
GeneralFund
InHouse
DPCD/BoP
2008
Urban
Design
Guidelines
12
All
All
n/a
GeneralFund
$10,000
DPCD/BoP
&BoB
2008
2007
Subdivision
Regulation
Amendm
ents
13
Z,W
1,12
n/a
ARC/City
$120
City-B
OP
2008
2007
Prepareastudyforthe
South
MorelandCorridorincluding
LCI-Study
forS
outh
MorelandAvenue
14
Land
Use,Transportation,
EconomicDevelopment,
Urban
Design,andHousing
recommendations.
I10
n/a
N/A
N/A
City-BOP
2007
2007
Fullfillthe5YearUpdate
requirementsforA
RC.
LCI-H.E.H
olmes
LCI5
YearUpdate
15
409Atlanta Strategic Action Plan September 2007 Draft

NPU
CD
CIP #
Fund
ing
Cos
tx1000
Respo
nsible
Party
Com
pletion
Year
Initiation
Year
Descriptio
nProject
Num
ber
X,Z
12n/a
City
$40,000
City-BOP
2008
2007
Prepareastudyforthe
Cleveland
Avenue
Corridor
LCI-Study
forthe
Cleveland
Avenue
16
includingLand
Use,
Corridorwith
theCity
ofEastP
oint
Transportation,Economic
Development,Urban
Design,
andHousing
recommendations.
D9
n/a
N/A
N/A
City-BOP
2007
2007
Fullfillthe5YearUpdate
requirementsforA
RC.
LCI-Bolton/Moores
Mill/LCI5
YearUpdate
17
n/a
ARC/City
GDOT
NA
City-BOP
on-going
2000
Seekfunding&coordinate
with
operatingdepartm
entsto
LivableCenters
Initiative(LCI)Program
Adm
inistration
18
implem
entLCIplanprojects.
Coordinate&supportC
ID's
onplan
implem
entation.
All
All
n/a
City-QOL#2
$700
City-BOP
2007
2006
Fram
eworkforthe
strategic
actionplan
andpoliciesfor
greenspace
intheCity.
ProjectGreenspace
19
O5
n/a
Private
50DPCD-CAP
2016
2010
Dow
ntow
nGreenspace
Plan
20
n/a
NA
NA
City-BOP
on-going
2006
Continuing
updates
Multi-useTrailM
aster
Plan
21
n/a
20DPCD
2010
2005
ParkImpactFee
ScheduleUpdate
22
n/a
City/other
partners
NA
City-BOP
on-going
0n-going
Seekfundingandcoordinate
w/operatingdepartm
entsto
Smallareastudy
implem
entation
23
implem
entplanprojects.
InteractiveGIS
mapsofstudy
areasLinked
tospecific
studies
All
All
n/a
GeneralFund
160
2007
2006
Createacentralized
enterprise-levelrepositoryof
GIS
DataRepository
24CoA
GIS
dataforuse
throughout
thecitygovernment.
GeneralFund
50CoA
2007
2006
Develop
information
technology
infrastructureand
Public
Accessto
GeographicInformation
25
computerapplications
toprovideandsupportaccessby
thepublictogeographic
informationrelatedto
governmentbusiness,
operations,facilitiesand
services
September 2007 Draft Atlanta Strategic Action Plan410
Community Agenda4

NPU
CD
CIP #
Fund
ing
Cos
tx1000
Respo
nsible
Party
Com
pletion
Year
Initiation
Year
Descriptio
nProject
Num
ber
GeneralFund
40CoA
2008
2006
Integrateandvalidatethe
various
sourcesofland
Land
Information
System
26
informationinthecity
governmentand
providea
singlereliableinterface
for
accessingalllandinformation
GeneralFund
80CoA
2008
2007
Develop
amasterdatabaseof
geo-referenced
addressesto
MasterA
ddress
Repository
27
serveas
areliablesource
ofaddressvalidationand
geo-coding
B,C
,D,E
,n/a
GeneralFund
InHouse
CoA
2007
2006
Develop
andadoptzoning
regulations
toguideand
BeltLineOverlay
28
F,G,
developareasintheBeltLine
OverlayDistrict
H,I,J,
K,L,
M,N
,O,S
,T,W,
V,X&
Y B,C
,D,E
,TA
DBeltineInc./CoA
2008
2007
Land
useplanswillbe
developedforthe
BeltLine
SubAreas
Beltline
Sub
AreaPlans
28
F,G,
H,I,J,
K,L,
M,N
,O,S
,T,W,
V,X&
Y All
All
n/a
GeneralFund
Inhouse
CoA
2008
2007
Conservation
Subdivision
29
O5
n/a
Generalfund
Inhouse
CoA
2009
2008
Mem
orialDriveCorridor
Study
30
All
All
n/a
GeneralFund
in-house
CoA
2009
2008
Createlow,m
edium
andhigh
density
mixed
useandactivity
nodes
31
411Atlanta Strategic Action Plan September 2007 Draft
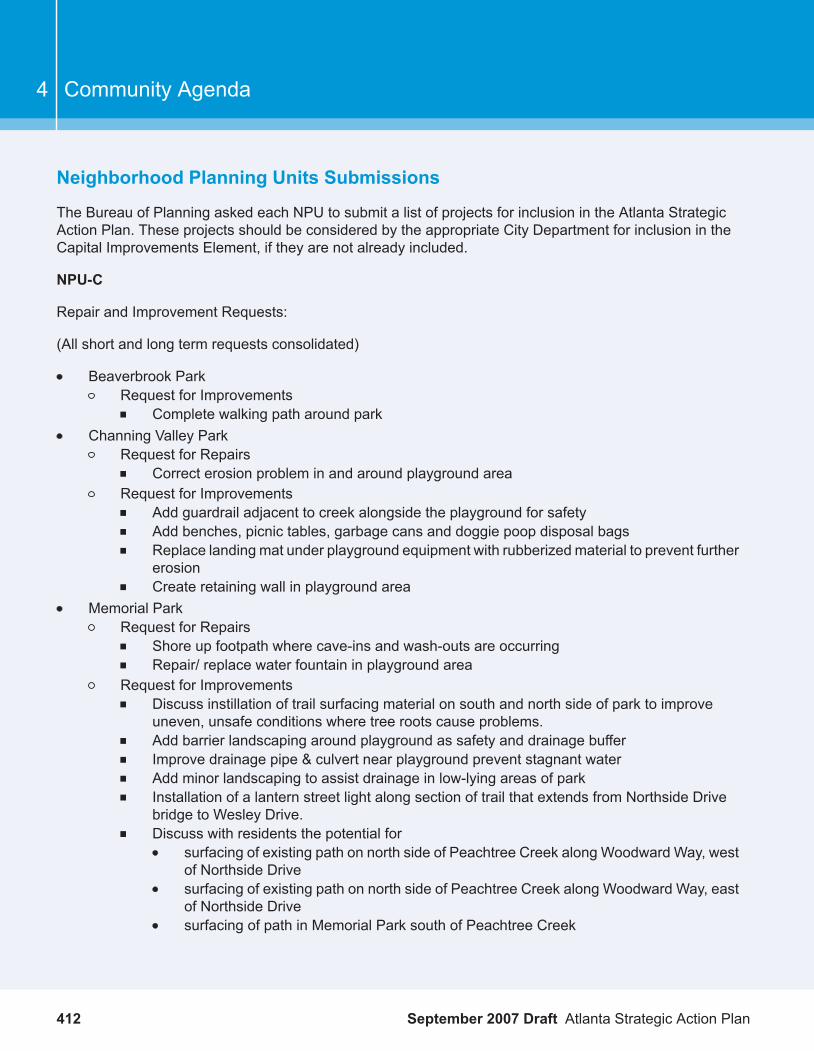
Neighborhood Planning Units Submissions
The Bureau of Planning asked each NPU to submit a list of projects for inclusion in the Atlanta StrategicAction Plan. These projects should be considered by the appropriate City Department for inclusion in theCapital Improvements Element, if they are not already included.
NPU-C
Repair and Improvement Requests:
(All short and long term requests consolidated)
Beaverbrook ParkRequest for Improvements
Complete walking path around parkChanning Valley Park
Request for RepairsCorrect erosion problem in and around playground area
Request for ImprovementsAdd guardrail adjacent to creek alongside the playground for safetyAdd benches, picnic tables, garbage cans and doggie poop disposal bagsReplace landing mat under playground equipment with rubberized material to prevent furthererosionCreate retaining wall in playground area
Memorial ParkRequest for Repairs
Shore up footpath where cave-ins and wash-outs are occurringRepair/ replace water fountain in playground area
Request for ImprovementsDiscuss instillation of trail surfacing material on south and north side of park to improveuneven, unsafe conditions where tree roots cause problems.Add barrier landscaping around playground as safety and drainage bufferImprove drainage pipe & culvert near playground prevent stagnant waterAdd minor landscaping to assist drainage in low-lying areas of parkInstallation of a lantern street light along section of trail that extends from Northside Drivebridge to Wesley Drive.Discuss with residents the potential for
surfacing of existing path on north side of Peachtree Creek along Woodward Way, westof Northside Drivesurfacing of existing path on north side of Peachtree Creek along Woodward Way, eastof Northside Drivesurfacing of path in Memorial Park south of Peachtree Creek
September 2007 Draft Atlanta Strategic Action Plan412
Community Agenda4

Consider adding a swimming pool as an amenity to the Bitsy Grant TennisCenter and Bobby Jones Golf Course facilities of Atlanta Memorial Park east of NorthsideDrive.
Peachtree Battle ParkRequest for Improvements
Add wooden bench at bus stop near PATH entrance at Peachtree Battle Northside Drintersection (SE comer)Renovate "sundial" area in the park median and area near the ravine East of WoodwardWay.Add five ( 5 ) garbage cans to park median areaAdd granite curbing along inside park median between E.' Rivers school and Habersham forerosion and parking controlRenovate bus stop area at Peachtree Rd/ Peachtree Battle intersection
Tanvard Creek ParkRequest for Repairs
Repair eroded trail and install covered walkway connecting Tanyard Creek Park with ArdmorePark under CSX RR bridgeAnchor bench that has fallen over in the meadow side of the parkRepair or replace curbing on Walthall Drive to prevent over-washing stormwater and erosionin the parkShore up bridge abutment on downstream side of bridge.Repair/ replace non-functioning water fountain near bridgeReset bench in playground area of park that has tilted forwardFill two large potholes in meadow
Request for ImprovementsAdd more garbage cansCover exposed tree roots at either end of bridge over Tanyard Creek with bark chips orsimilar material to improve pedestrian safetyAdd concrete pad below last step on stairway from Walthall Drive to Tanyard Creelc bridgeto improve safetySpread bark chips along dirt footpath on south side of park to fill in uneven spotsInstall drinking fountain in park near Dellwood Rd entranceInstall dog poop bag holder & garbage can in park near Dellwood Rd entranceInstall signs instructing owners to clean up poopConstruct BeltLine/ PATH trail of pervious materials, locate it along edge of park with trailwidth no wider than 10'Create sand volleyball court in south side of park
Acquisition Requests
Colonial Park (proposed new park at north end of Colonial Homes property)Provide funds: if necessary, to acquire new park land from developer
413Atlanta Strategic Action Plan September 2007 Draft

NPU-F
Encourage pedestrian mobility by completing sidewalks through the NPU and upgrading and addingcrosswalks. Encourage safe and responsible driving patterns throughout the NPU throughimplementation of traffic calming measures and enforcement of speed limits.Implement theMorningside-Lenox Park portion of the four-neighborhood Traffic Calming Plan (submittedby the City of Atlanta to ARC in May 2004). Specific streets are North Rock Springs Road, JohnsonRoad, East Rock Springs Road, North Morningside Drive, North highland Avenue, Lenox Road andEast Rock Springs Road.Continue the improvements already identified and included in the Cheshire Bridge Corridor Study,including but not limited to the intersection at LaVista and general streetscape improvements alongthe whole corridor.Connect existing sidewalks along Lenox Road and Cheshire Bridge Road by constructing and connectingsidewalks along Lenox Road between Cheshire Bridge and the CSX railroad crossing.Construct sidewalks on the south side of Lindbergh from I-85 to Cheshire Bridge Road.Complete the Highland Corridor streetscape and traffic improvement plan. Specific nodes are VirginiaAvenue and North Highland Avenue; St. Charles segment of North Highland Avenue, University Driveand North Highland Avenue; Amsterdam Avenue and North Highland Avenue.Complete sidewalks on Monroe Drive from Montgomery Ferry to Armour Drive and from Rock Springsto Ansley Villas.Complete transportation master plan and implement recommendations along Monroe Drive and theother collector and arterial streets.Re-stripe all crosswalks and upgrade signage.Synchronize all traffic lights to encourage driving the posted speed.
NPU-O
TRANSPORTATION PROJECTS
Priority
Complete replacement of signal system at Rocky Ford Road and College Avenue.Complete replacement of signal system at Rocky Ford Road and Dekalb Avenue.
Re-engineering of signals, turn lanes, and through traffic at Rocky Ford Road and it’s intersectionswith Dekalb Avenue and College Avenue.
Installation of four way signals at the intersection of Memorial Drive and Howard Street S.E.
Install sidewalks along Norwood Avenue from Hosea Williams Drive to Lanes Lane (Including bothsides at Branham Park).
Abandonment of the western side of the divided road Woodbine Avenue between Hosea WilliamsDrive and Wade Avenue N.E. for conversion to mixed use bicycle / walking / skating PATH connectingCoan and Gilliam Parks and their two existing PATH segments.
September 2007 Draft Atlanta Strategic Action Plan414
Community Agenda4

Sidewalks
Install, repair, and replace sidewalks on both sides of Memorial Drive from (currently intermittent andin poor repair with many missing segments).Replace sidewalk on the north side of Wade Avenue fronting Gilliam Park.Install sidewalks the length of Hillcrest Street.Install sidewalks on Sisson Avenue from Wisteria Way to Hillcrest Street.Install sidewalks along Wisteria Way between Rocky Ford Road and city limits.Install sidewalks and curbs the length of Bixby StreetInstall sidewalks along Norwood Avenue from Hosea Williams Drive to Lanes Lane.Install sidewalks along Rocky Ford Road between Lanes Lane and Delano Drive.Install sidewalks along Delano Drive between Rocky Ford Road and Martha, especially between RockyFord Road and Hillcrest.Install and replace sidewalks along Kirkwood Road between Warlick and Emery Place (the side walkstarts and stops several times).Install sidewalks on Kirkwood Road from Emery Place to College Avenue.Install sidewalks on Mellrich Avenue.Repair sidewalks along Memorial Drive from Dixie Street S.E. to Wyman Street.Repair sidewalks along Memorial Drive from Clifton Street to Clay Street.Repair sidewalks along Memorial Drive from Douglas Street to Watson Circle.Repair sidewalks along Norwood Avenue from Fowler to College Avenue.Repair sidewalks along Kirkwood Road from Delano Drive to Emery Place.Repair sidewalks along Rocky Ford Road from Lanes Lane to Fowler Street.Repair sidewalks along Dunwoody Street from Kirkwood Road to Norwood Avenue.
Traffic Control
Complete replacement of signal system at Rocky Ford Road and College Avenue.Complete replacement of signal system at Rocky Ford Road and Dekalb Avenue.Re-engineering of signals, turn lanes, and through traffic at Rocky Ford Road and it’s intersectionswith Dekalb Avenue and College Avenue.Installation of four way signals at the intersection of Memorial Drive and Howard Street S.E.Re-engineering of the intersections of Memorial Drive with Howard Street S.E. and South HowardStreet.Four way stop signs at all four corners of Bessie Branham Park (Kirkwood Road at both Delano Driveand at Ridgedale Road, Norwood Avenue at both Delano Drive and at Ridgedale Road).Installation of signals at College Avenue and Park Place.Installation of signals at College Avenue and Murray Hill Avenue.Add west bound left turn signal from Dekalb Avenue onto Rocky FordInstallation of four way signals at the intersection of Hosea Williams and Oakview Road N.E.Add eastbound left turn lane and signal at Rocky Ford Road and College Avenue.Four way stop at Bates and Delano Drive.
415Atlanta Strategic Action Plan September 2007 Draft

Install four way stop signs at the intersection of Anniston Avenue and Woodbine Avenue, adjacent tothe new playground.Install four way stop signs at the intersection of Sisson Avenue and Wisteria Way.
Traffic Calming
Install “neckdown” traffic calming device on Norwood Avenue between Delano Drive and RidgedaleRoad.Raised crosswalks across Kirkwood Road at both Delano Drive and Ridgedale Road.Install bulb-outs alongWyman Street S.E. at intersections between HoseaWilliams Drive and MemorialDrive.Install additional traffic calming as necessary on Wyman Street S.E. between Hosea Williams Driveand Memorial Drive.Install traffic calming along Howard Street S.E. between Memorial Drive and Hosea Williams Drive.Install traffic calming along Rocky Ford Road between Lanes Lane and College Avenue.Install traffic calming along Clifton Street S.E.Install traffic calming along Clay Street S.E.Install traffic calming along Mellrich Avenue from Wisteria Way to Delano Drive.Install traffic calming on Warren Street N.E. between Hosea Williams Drive and Trotti Street.
Streets
Initiate and complete Phase II Kirkwood Business District Streetscape.Install College Avenue streetscape from Howard Street N.E. to Park Place.Install greenspace median on Hosea Williams Drive from Anniston Avenue to 1st Avenue.Re-engineer Memorial Drive to a consistent three lane roadway.Re-pave both sides of Oakview Road N.E. from the intersection of Hosea Williams Drive to city limits.
Bicycles
Abandonment of the western side of the divided road Woodbine Avenue between Hosea WilliamsDrive and Wade Avenue N.E. for conversion to mixed use bicycle / walking / skating PATH connectingCoan and Gilliam Parks and their two existing PATH segments.Construction of a mixed use PATH spur connecting the end of Arizona Avenue with the Gilliam ParkPATH spur.Bicycle lanes on Arizona Avenue (both sides) from the proposed PATH spur to Dekalb Avenue.Bicycle lanes on La France Street (both sides) from Arizona Avenue to Whitefoord Avenue N.E.Bicycle lanes on College Avenue from Rocky Ford Road to Howard Avenue N.E.Construction of a PATH trail from the intersection of College Avenue and Howard Street N.E. to RogersStreet N.E.Completion of the Eastside Trolley Route of PATH as originally envisioned.
Other
September 2007 Draft Atlanta Strategic Action Plan416
Community Agenda4

Signage identifying the Kirkwood neighborhood at the major points of entry into the community includingCollege Avenue at Park Place, Rocky Ford Road at College and Dekalb Avenues, Hosea WilliamsDrive at Anniston and 1st Avenues, Memorial Drive at Wyman, Clifton, and Clay Streets. Also at I- 20and Maynard Terrace.
GREENSPACE PROJECTS
Priority
Gilliam Park: Replacement of collapsed culvert under PATH trail that drains park of storm water, toaddress chronic flooding with most rains.Gilliam Park: Construct two 20’ X 20’ picnic shelters, one for each half of park.Coan Park: Day light stream that runs through the park.Branham Park: Install sidewalks on Norwood Avenue between Ridgedale Road and Delano Drive.Branham Park: Installation of playground water fountain, entrance gate, and column.Eastside Greenway Park: Purchase land for connection between Dekalb Senior Center and park.Eastside Greenway Park: Restoration of the stream
Branham Park
Install sidewalks on Norwood Avenue between Ridgedale Road and Delano Drive.Four way stop signs at all four corners of Bessie Branham Park (Kirkwood Road at both Delano Driveand at Ridgedale Road, Norwood Avenue at both Delano Drive and Ridgedale Road).Install raised crosswalks across Kirkwood Road at both Delano Drive and Ridgedale Road.Install “neckdown” traffic calming device on Norwood Avenue between Delano Drive and RidgedaleRoad.Re-construction of the “Urban Treehouse” structure at the end of it’s service life.Installation of two “doggie bag dispensers”.Installation of standard adjustable rotating grills.Resurfacing tennis and basketball courtsNew Air conditioning units for the Recreation CenterReplacement of trees surrounding playground.Water fountain at playgroundGate and columns for playground entranceBike racksRepairing lighting of ball field and score boardRefurbishment of the ball fieldLight System around perimeter of parkMaster plansRestoration of Stone memorialsLow fencing or bollards along Norwood to prevent parking in the grassTrash Receptacles
417Atlanta Strategic Action Plan September 2007 Draft

Gilliam Park
Replace sidewalk on the north side of Wade Avenue fronting Gilliam Park.Replacement of collapsed culvert under PATH trail that drains park of storm water to correct floodingwith most rains.Construct two 20’ X 20’ picnic shelters, one for each half of park.Install lighting along PATH trail from Rogers Street N.E. to HoseaWilliams Drive andWoodbine Avenue.Installation of two “doggie bag dispensers”.“Porch Swing” along PATH trail in the next 5 years.Replacement of retaining wallWidening of upper portion of Woodbine for parkingBike racksAbandonment of the western side of the divided road Woodbine Avenue between Hosea WilliamsDrive andWade Avenue N.E. for conversion to mixed use bicycle / walking / skating PATH connectingCoan and Gilliam Parks and their two existing PATH segments.Construction of a mixed use PATH spur connecting the end of Arizona Avenue with the Gilliam ParkPATH spur.Installation of standard adjustable rotating grills.Repave parking lotExpansion of Gilliam Park with land acquisition of adjacent Coan Middle School PropertyTrash ReceptaclesMaster plan
Coan Park
Install lighting along PATH trail fromWoodbine Avenue and Hosea Williams Drive toWoodbine Avenueand Anniston Avenue.Installation of two “doggie bag dispensers”.Day light stream that runs through the parkBike racksWater featureRefurbishment of picnic gazebosReplacement of sidewalk along AnnistonInstallation of standard adjustable rotating grills.Master PlanRepair interactive musical sculptureTrash ReceptaclesResurfacing of tennis and basketball courts
Eastside Greenway Park
Senior fitness/nature trailPurchase land for connection between Dekalb Senior Center and TEG
September 2007 Draft Atlanta Strategic Action Plan418
Community Agenda4

Restoration of the streamTrail DesignPedestrian bridge at the end of RogersConverting deeded streets to park into entrywaysAcquire greenspace along Eastern portion of the Pullman Yard for connection to the Eastside GreenwayParkTrash Receptacles
Bicycles
Bicycle lanes on Arizona Avenue (both sides) from the proposed PATH spur to Dekalb Avenue.Bicycle lanes on La France Street (both sides) from Arizona Avenue to Whitefoord Avenue N.E.PATH connection between Rogers/LaFrance and College Ave. using the deeded street along thetrack
Rocky Ford Creek Watershed Greenspace and Trail
Acquisition of 25’ to 75’ of stream buffer each side of Rocky Ford Creek from Memorial Drive northincluding the NW branch at Wisteria Way and Rocky Ford Road and the NE branch at Wisteria Wayand Murray Hill Avenue.Restoration of Rocky Ford Creek.Restoration of stream embankments and unbuildable slopes from Memorial Drive to Hosea WilliamsDrive including removal of all invasive species and erosion control based on installation of native plantspecies.Creation of a green median in the boulevard width street of Delano Drive between Sisson Avenue andRocky Ford Road.
Miscellaneous
Neighborhood swimming pool.Placement of a dog park in Kirkwood.Creation of green median from 2nd Ave. to Kirkwood Road and from Warren Street to Hardee Street.
NPU-P
Existing projects in current CIP but have not yet been built (in order of priority):
Sidewalks installed on Fairburn Road from Garrison Drive to city limits at Camp Creek Parkway.Replace bridge at Fairburn Road and north CampCreek just before Deerwood Academy so the structurewill accommodate the weight of school buses and fire trucks.New firehouse or extensive renovations for Station #31 on Fairburn Road and maintain a station in theexact location/ vicinity.
New projects submitted in 2004 (in order of priority):
419Atlanta Strategic Action Plan September 2007 Draft

Sidewalks installed on Barge Road from Campbellton to Stone Road.Widen and improve Tell Road (including improving the Fairburn and Tell Road intersection and fixingmultiple storm drains on Tell Road).Widen and improve Fairburn Road from Cmapbellton Road to city limits at camp Creek Parkway.Intersection improvement at Fairburn and Campbellton Roads.Bell Hill Recreation Center improvements; Add classrooms andmeeting space to accommodate 400-500persons, add a natatorium.
New projects submitted in 2005 (in order of priority):
Sidewalks installed on camp Ground to Rux Road (for the Fickett School).Sidewalks installed on County Line Road between Campbellton Road and Rio Grande
New projects submitted in 2006 (in order of priority):
Deerwood Park Improvements: additional parking and additional ingress/ egressMelvin Drive Park Improvements: rebuild the community meeting facility that was torn down severalyears ago
New projects submitted in 2007 (in order of priority):
Pave Tell Road past intersection of Butner Road and Niskey Lake Road south of Butner Road.Resurface Heritage Valley subdivision (excluding Hertiage Valley Road) and Welcome All Road fromFairburn Road to Camp Creek Parkway.
NPU-S
Develop Walking Trails within the NPU.Provide a Senior Facility.Implement recommendations for Oakland City portion of Lee Street-Lakewood LCI plan.Increase funding for CDC activities to benefit from city funding opportunities or available HOME funds.Install and improve sidewalks throughout the NPU-S neighborhoods including fromOakland city stationto neighborhoods and Campbellton Road.Develop streetscapes within the Cascade/Beecher commercial node.
September 2007 Draft Atlanta Strategic Action Plan420
Community Agenda4

Policies
Economic Development
Housing
The City, through its principle policy documents (Comprehensive Development Plan and Consolidated Plan)has sought to address objectives that relate to an assortment of Federal requirements and local needs.The City is transforming itself into the vision created by the Atlanta Renaissance Program; created after theOlympics to insure that the development activity within the City would remain strong, beyond the Games.The vision consists of revitalized, sustainable, urban village communities, populated with mixed-incomehouseholds within the city’s redevelopment areas.
The Atlanta Renaissance Program has been successful in targeting resources to implement a comprehensive,focused economic development and neighborhood revitalization program that has begun to attractmixed-income City residents.
In promoting housing opportunities, the City of Atlanta is committed to fairness toward all of its citizens andneighborhoods. As the City strives to preserve and revitalize its neighborhoods, it is committed to educatingthe public regarding fair-share housing. Fairshare housing is a policy that encourages proportionate andequitable distribution of a range of housing choices and types, including low-income housing throughoutthe City. Housing choices also include conventional, public, publicly assisted and special needs housing.The City’s goal in this regard is to encourage the development and preservation of mixed-income residentialareas.
General Housing Policies
1. Promote opportunities for mixed-income housing developments throughout the City.2. Maintain, rehabilitate and replace the existing housing stock where appropriate.3. Increase opportunities for home ownership for low and moderate-income residents.4. Promote housing affordability in order to minimize the number of households that must pay more than
30 percent of their income in rent or mortgage payments.5. Promote the creation of new housing in appropriate locations.6. Increase public, private funds to help construct, acquire and rehabilitate housing.7. Promote full implementation of all fair housing laws.8. Promote a wide range of housing types to meet different housing needs and income levels within the
BeltLine Corridors and along major employment centers: Downtown, Midtown and Buckhead.
Low/Moderate Housing Policies
421Atlanta Strategic Action Plan September 2007 Draft

The following policies legislate federally (CDBG, HOME, HOPWA etc.) financed housing projects. Thepolicies support the Consolidated Plan, which is based on the needs of defined population groups(low/moderate income individuals, homeless persons, public housing tenants, etc.). The Policies establishpriorities based largely on the conditions and needs of the City’s housing stock. The Consolidated Plan’shousing priorities are as follows:
1. Assist “special needs” persons living in substandard apartments and rental units by making low or nocost acquisition and rehabilitation loans available.
2. Assist extremely low, and very low-income homeowners living in substandard single- family units bymaking rehabilitation loans and grants available.
3. Assist very low and low-income persons with home ownership by making acquisition and rehabilitationloans available to individuals.
4. Promote new housing development through in-fill housing construction.5. Aggressively enforce Housing Code and Demolition to remove slum and blight.6. Encourage development of alternative forms of ownership, including cooperatives, mutual housing and
lease purchase programs.7. Support housing opportunities for persons with special needs.8. Develop a program to provide equal access to credit and fair housing opportunities for low to
moderate-income people.
These policies set priorities addressing the most serious problems with existing housing stock.
Community Facilities
Atlanta Police Department
1. To reduce crime and the fear of crime, including domestic violence, gun related crimes and youthcrimes.
2. To further expand the Department’s community policing efforts.3. To address the needs and challenges of Atlanta youths.4. To maintain police visibility downtown.5. To enhance service through improvement in technology.6. To recruit aggressively to fill vacant positions.7. To develop working partnerships with other agencies.8. To properly regulate the City’s vehicles for hire.
Parks and Recreation
Parks, Open Space and Greenways
Through its planning efforts the City has established policies for Parks, Open Space, and Greenways.
1. Meet or surpass a goal of 10 acres of core parkland per 1,000 persons by the year 2020.2. Unify the City by developing multi-use greenway trails.
September 2007 Draft Atlanta Strategic Action Plan422
Community Agenda4

3. Preserve, enhance, and expand the undeveloped flood plain as public open space.4. Permanently protect 20% of the City’s land area with an emphasis on sensitive lands such as flood
plains, wet lands, and public open spaces.5. Create a special events venue.6. Acquire neighborhood park sites, meeting the City’s adopted park design standards. Acquisitions will
focus on sections of the City that are currently underserved.7. Provide core park sites within a .5 mile travel distance for every child.8. Provide incentives for the development of community open spaces within development projects.9. Evaluate existing park sites against the park planning guidelines.10. Protect Atlanta’s tree canopy through appropriate policies and procedures.11. Establish measurements and reporting for public open space within projects receiving city funding or
incentives.
Policies: Maintenance and Management
1. Maximize efficiency of staff and management by providing needed job training.2. Ensure the efficient maintenance of existing park land and facilities by providing an adequate dedicated
revenue stream.3. Increase staff and equipment as new park land and facilities are acquired to ensure efficient
maintenance.4. Maximize efficient utility of park components by adopting uniform standards for play equipment and
park furniture.5. Utilize Park Planning Guidelines in the design of all parks and public open spaces.6. Clearly post park rules and regulations in all parks.7. Produce park management plans that include staffing, maintenance schedules, equipment, training,
quality control, and annual cost.8. Locate new block, neighborhood, and community parks only in areas that are highly visible from
surrounding residential streets.9. Include park rules and regulations as part of the City's law enforcement code, so that police may enforce
observance of these regulations.10. Utilize greenway trails to increase activity and visibility in parks and neighborhoods.11. As part of police training, educate all police on park regulations, as specified in the City Code, so that
they will know to enforce such regulations.12. Include cleanup costs in the fees charged for special events.13. Close parks with security problems after dark. When parks are open at night, provide adequate lighting
and park personnel. House caretakers on site where appropriate.
Policies: Funding
1. Finance parkland acquisition by acquiring large tracts of open space and sell appropriate residentialhome sites to overlook a centralized park. Use the resulting revenues to pay for the open spaceacquisition.
2. Utilize conservation easements for greenway acquisition.
423Atlanta Strategic Action Plan September 2007 Draft
3. Use special taxes and districts such as community improvement districts (CIDs), special tax districts(STDs), and tax allocation districts (TADs) to increase the quantity and improve the maintenance ofparks and public open space.
4. Utilize the existing Planned Development (PD) zoning regulations as a means to maximize public openspace potential.
5. Pursue city objectives to acquire and manage land adjacent to streams for both water quality and outdoor recreation.
Natural and Cultural Resources
Natural Resources
Cultural Resources
Since the early 1970’s, it has been the policy of the City to delegate to the Urban Design Commission theresponsibility for the protection of the City's historic resources and most other historic resource and historicpreservation-related issues. The City’s current policies regarding historic resources are embodied in severaldocuments.
Policies of the Comprehensive Historic Preservation Program
The current preservation policies for the protection of historic resources in the City are based on The AtlantaComprehensive Historic Preservation Program, adopted in 1988. This program incorporates eight technicalpapers as appendices. The program document and the following eight supporting technical papers arehereby incorporated by reference into this Comprehensive Development Plan:
1. Freilich, Robert H. and Terri A. Muren, Growth Management and Historic Preservation.2. Howard, J. Myrick, Using a Revolving Fund for Downtown Preservation: Recommendations for Atlanta.3. Howell, Joseph T., Creative Financing Techniques to Facilitate the Renovation of Historic Properties
in Atlanta.4. Petersen, John E. and Susan G. Robinson, The Effectiveness and Fiscal Impact on Tax Incentives for
Historic Preservation: A Reconnaissance for the City of Atlanta.5. Roddewig, Richard J., Economic Incentives for Historic Preservation in Atlanta.6. Williamson, Frederick C., Atlanta and Historic Preservation.7. Winter, Nore' V., The Atlanta System of Definitions and Criteria for Designating Historic Preservation
Resources.8. Winter, Nore' V., Design Guidelines for Historic Districts in the City of Atlanta.
Policies of the Historic Preservation Ordinance
This ordinance, adopted by City Council and signed by the Mayor in 1989, establishes and outlines theCity’s historic preservation program. The ordinance delineates the responsibilities of the Urban DesignCommission and its staff, as well as outlines its procedures. The policies of the City of Atlanta HistoricPreservation Ordinance are:
September 2007 Draft Atlanta Strategic Action Plan424
Community Agenda4

1. Effect and accomplish the protection, enhancement and perpetuation of such buildings, sites anddistricts, which represent or reflect special elements of the City's cultural, social, economic andarchitectural history.
2. Safeguard the City's historic aesthetic and cultural heritage, as embodied and reflected in such buildings,sites and districts.
3. Stabilize and improve property values of such buildings, sites and districts.
4. Foster civic pride in the beauty and noble accomplishments of the past.
5. Protect and enhance the City's attractions to tourists and visitors and thereby support and stimulatebusiness and industry.
6. Strengthen the economy of the City.
7. Promote the use of such buildings, sites and districts for the education, pleasure and general welfareof the people of the City.
8. Promote attention to sound design principles in areas of new development and redevelopment.
9. Raise the level of community understanding and expectation for quality in the built environment.
10. Implement the City's comprehensive development plan.
Historic Resource-related Policies of the Parks, Open Space, and Greenways Plan
The Atlanta Parks, Open Space and Greenways Plan, adopted by City Council in December of 1993,includes the following policies regarding historic resources:
1. Protect archeological sites, such as Civil War trenches, from artifact hunters.
2. Promote the recognition of the Civil War battlefield on Copenhill, in Freedom Park, as a nationalbattlefield site.
3. Promote the portion of Freedom Park that lays west of Moreland Avenue as a national park that linksthe Carter Presidential Center with the Copenhill Civil War battlefield and the Martin Luther King Jr.National Historic Site.
4. Support the expansion and improvement of the M. L. King Jr. National Historic Site.
5. Promote the redevelopment of the linear parks in the Druid Hills Neighborhood consistent with theOlmsted Park Master Plan.
425Atlanta Strategic Action Plan September 2007 Draft

6. Develop historic rail corridors, such as the CSX line from Washington Park to I-75/85, as historicgreenway trails. Remnants of abandoned rail corridors should be preserved and their formertransportation function memorialized by developing them into multi-use trails.
7. Encourage festivals that use significant sites to highlight the history of the neighborhood.
Supporting Policies
The following preservation policies apply to the historic resources in the City and how City agencies dealwith these historic resources:
1. Utilize economic incentives to encourage historic preservation.
2. Utilize the Zoning Code to support preservation policies.
3. Incorporate historic resource opportunities into the open space framework plan.
4. Develop mechanisms for supporting historic resource-sensitive development along the Beltline corridor.
5. Promote historic sites and corridors in order to enhance their economic benefits.
6. Generate additional support for historic resources through educational programs.
7. Promote the development of Master Plans for all historic parks that will protect the resources and guidethe enhancement of their appearance and recreational potential.
8. Adopt suitable legislation to prevent the further destruction of any parks containing Civil War trenchesor archaeological sites.
9. Develop historic transportation corridors, abandoned railroad and trolley lines similar to the Beltline foruse as heritage corridor greenways and promote use of these corridors during cultural festivals.
10. Change the current historic preservation regulations regarding non-contributing buildings in LandmarkDistricts to eliminate the need for the review of their demolition.
11. Regularly update the City’s official inventory of historic resources.
12. Improve the nomination and regulation processes provided for by the Historic Preservation Ordinance.
13. Expand working relations with other groups and agencies responsible for Atlanta's historic resources,including the Atlanta Preservation Center, the Georgia Trust for Historic Preservation, the AtlantaHistory Center, the State of Georgia Division of Historic Preservation, the National Park Service, andcitizen-based advocacy groups.
September 2007 Draft Atlanta Strategic Action Plan426
Community Agenda4

Revision of the existing policies may be required in the future to:
1. Meet the City's future needs;
2. Ensure that the Historic Preservation Ordinance operates efficiently and in an equitable manner; and
3. ully maximize the contribution that historic resources can make in educating the public, stabilizingresidential neighborhoods, revitalizing community and commercial areas, and stimulating tourism."
Transportation
Transportation Goals
Beyond the subject specific goals articulated below, the following concepts are overarching principles thatguide City transportation planning :
1. Enhance accessibility and mobility within City
2. Support regional access and connectivity
3. Create an affordable and walkable city
4. Link development to transportation infrastructure
5. Exceed standards for air, water, and environmental quality
6. Maintain and optimize existing transportation infrastructure
7. Ensure a balanced multi-modal transportation approach
8. Link transportation strategies to jobs, land use, recreational, and environmental systems
9. Identify funding, and other resources, to realize priorities
Aviation Policies
1. Maximize Hartsfield-Jackson Atlanta International Airport (H-JAIA) as a major air carrier hub andinternational service facility.
2. Maintain compatibility of H-JAIA with the surrounding community.
3. Ensure customer satisfaction and service by accepting only reasonably achievable flight departureschedules from air carriers so that the airport is not faced with unnecessary passenger congestion.
427Atlanta Strategic Action Plan September 2007 Draft

4. Support long-term expansion of existing airport facilities and construction of new facilities toaccommodate future demand.
5. Protect the traveling public and airport workers from environmentally detrimental agents or conditions.
6. Maintain a safe and secure airport
7. Support economic vitality
8. Deliver quality customer service
9. Assure environmental responsibility
Bicycle and Pedestrian Facilities Policies
Bicycle Facilities
1. Increase bicycle ridership as a viable mode of transportation by providing a network of on-streetbikeways that is accessible to all neighborhoods and serves residents, commuters and visitors.
2. Include on-street bicycle facilities with resurfacing, reconstruction, and capacity-adding roadway projectson all arterials and collectors.
3. Promote bicycle safety, education and awareness, and sponsor and engage in community bicycleprograms for children and adults.
4. Provide efficient and effective maintenance of all on-street bike facilities, thereby providing optimalcommuting and recreational opportunities.
5. Promote the provision of pedestrian and bicycle transportation facilities in redevelopments and newmixed use, commercial and residential developments.
6. Develop a system of multi-use recreational trails within the open space and greenways system, foruse by all ages.
Pedestrian Facilities
1. Require sidewalks for all new development and sidewalk repair for new construction.
2. Incorporate sidewalks into design plans for all transportation improvements when feasible and providepedestrian crossing signals.
3. Reduce vehicular travel speeds city-wide and re-time traffic signals to slow traffic in support of pedestriancrossing needs and safety.
September 2007 Draft Atlanta Strategic Action Plan428
Community Agenda4

4. Rebuild intersections in high pedestrian traffic areas to reduce crossing distances and improve visualquality; install ADA accessible refuge islands where feasible.
5. Discourage pedestrian bridges and tunnels, except over limited access/grade separated highways,railway corridors and other public rights-of-way where pedestrians are prohibited, to emphasizepedestrian safety and encourage pedestrian activity at the street level.
6. Minimize the number of curb cuts and encourage the use of private alleys or drives to access parkingand loading areas
7. Encourage curb cut consolidation to minimize pedestrian and automobile conflicts
Centers, Corridors, and Transit
Mass Transit
1. Encourage and support further expansion of MARTA rail and bus systems.
2. Support the accessibility of transit to city residents at a reasonable cost.
3. Develop a grid of frequent surface transit including streetcars, arterial BRT, and enhanced bus services.
4. Increase the exposure and accessibility of MARTA rail stations through improved signage, additionalentrances, and connecting non-motorized facilities..
5. Establish mixed-use zoning around all transit stations addressing minimum development density,maximum parking, bicycle and pedestrian facilities requirements, and urban design guidelines.
6. Promote transit investments oriented to development of walkable communities around station nodesover transit in highway corridors that require a vehicle to access.
Driving and Parking
Surface Streets
1. Support the efficient movement of traffic with sensitivity to all modes of transportation and neighborhoodintegrity.
2. Support pedestrian activity as a preferred mode of transportation in densely developed areas withaccommodation for the handicapped.
3. Support on-street metered parking where feasible.
4. Use traffic signalization improvements and intersection improvements to slow traffic and improve thesafety and quality of the pedestrian environment.
429Atlanta Strategic Action Plan September 2007 Draft

5. Assure compatibility of freight operations with existing neighborhoods and streets.
6. Promote the paving of all city streets to control dust pollution and reduce city maintenance costs.
7. Promote and plan for greater street connectivity in major travel corridors.
8. Promote street repaving and expand street cleaning program to improve traffic operations and safety,and enhance the visual environment.
Limited Access Highways
1. Support essential highway improvements, which would improve safety, relieve traffic on City streetsand contain provisions for neighborhood protection.
2. Support provisions for high occupancy vehicles (HOV) in freeway design.
3. Support the installation of Changeable Message Signs on all highways.
4. Support projects to reconnect city streets across highways.
Parking Facilities
1. Encourage additional on-street parking throughout Downtown, Midtown and other centers as appropriate.
2. Encourage the redevelopment of surface parking lots into higher-density, mixed-use developments.
3. Encourage mixed-use developments with shared parking amongst the different uses.
4. Encourage the construction of parking decks with retail/commercial, office, or residential uses at theground level.
5. Encourage participation in Transportation Management Associations to encourage alternative modesof travel, promote shared parking, and reduce traffic congestion and the demand for parking.
6. Limit off-street parking ratios for certain uses within transit station areas.
7. Consider requiring the cost of parking to be unbundled from rent and charged separately in activitycenters.
8. Reduce parking requirements for developments providing car sharing.
September 2007 Draft Atlanta Strategic Action Plan430
Community Agenda4

Equity, Efficiency, and Environmental Quality
Transportation Equity Policies
1. Weigh costs vs. benefits in public decisions, including qualitative assessment of benefits and burdensor projects and impacts to directly impacted populations as well as secondary impacts.
2. Give advantage to projects serving City residents rather than commuters coming into the City such asbetter sidewalks and bike paths, improving local bus headways, neighborhood parking programs, andinstalling pedestrian signals.
3. Spread the cost of transportation services across all beneficiaries.
Transportation Efficiency Policies
1. Collect data on all transportation systems and facilities in the City in order to measure multi-modal levelof service (MM-LOS), to create improved infrastructure management systems, and to guide investmentdecisions.
2. Improve linkage and transparency of infrastructure spending decisions with land use decisions anddevelopment permission
3. Use Intelligent Transportation Systems (ITS) and congestion management strategies to improve trafficflow on the arterial network in the City without adding roadway capacity
4. Promote an improved understanding of the full costs of the different development types and locations,including identifying economic factors, considering infrastructure costs, and identifying service costs(police, fire, sanitation, etc).
Transportation Environmental Impact Policies
1. Provide alternatives to automobile dependency, such as prioritizing transit, as the first step to achievingair quality.
2. Mitigate polluted runoff from impervious surfaces such as roadways and parking lots through sewersystemmodernization, stormwater retention; encourage conservation and reduced water consumptionin new development.
3. Identify historical sites and sensitive environmental areas such as wetlands, parks, urban forests, andhabitats for protection.
431Atlanta Strategic Action Plan September 2007 Draft

4. Provide incentives for development in areas with existing infrastructure; discourage greenfielddevelopment.
5. Convert all City vehicles to clean fuel systems.
Funding Transportation Projects
1. Seek and utilize a broad range of federal, state, regional, and local funding sources and financingmechanisms to plan, design, construct, operate, and maintain an effective and safe multimodaltransportation network within the City and the Region.
2. Support capitalization of a State Infrastructure Bank (SIB) to fund multimodal transportation projects.
3. Increase the proportion of the MARTA 1-cent sales tax that can be used for transit operations andexpand the participating jurisdictions.
4. Promote a referendum on a regional gas tax eligible for spending on transit and other local priorities
5. Study viability of joint public-private partnerships to expand rail capacity in and around Atlanta for themovement of people and goods.
6. Add requirements for construction of sidewalks and bicycle facilities with new development in all zoningdistricts.
7. Consider the use of parking fees, congestion pricing, and tolls to support public transit system operationsand to discourage SOV driving.
8. Revisit the impact fee ordinance and realign it to provide more resources for financing public projectsto mitigate the impacts of new development.
9. Establish area-specific benefit districts to accumulate development impact fees, tax increment financing,parking fees, grant funds, and community improvement district funds, to implement larger scale capitalprojects with greater impacts than incremental improvements.
10. Replace unpredictable special assessments for neighborhood sidewalk maintenance with an annualsidewalk fee collected with property tax assessments.
11. Support public investments in privately owned common carrier freight rail corridors to create expandedcapacity for shared use with passenger trains.
September 2007 Draft Atlanta Strategic Action Plan432
Community Agenda4

Goods Movement
1. Maintain and improve accessibility and connectivity for in-city and through-city freight traffic, providedthat the City’s residents and businesses are not unreasonably impacted by freight-related traffic, noise,or air pollution
2. Encourage seamless integration of freight movement across modes
3. Review appropriateness of existing designated heavy vehicle routes and disseminate updated truckmap to the freight industry and the public
4. Create a maintenance and improvement program for designated truck thoroughfares
5. Ensure sufficient capacity on access roads for Hartsfield-Jackson Atlanta International Airport includingthe potential for dedicated truck-only routes for air cargo
6. Support grade separation projects and initiatives for railroad crossing safety enhancements.
7. Ensure that locations of inter-modal terminals and truck-related facilities are environmentally acceptable.
8. Encourage industrial expansion in purpose-built industrial parks that are more efficient to serve bytruck than linear industrial development scattered along rail lines.
High Speed, Intercity, and Regional Commuter Rail
1. Support development of intercity and regional commuter rail and bus service centered on the downtownMulti-modal Passenger Terminal (MMPT) as the primary hub.
2. Serve the New Orleans – New York Amtrak Crescent on its current route along the Southern Railroad,potentially with a secondary hub station at 17th St. or Armour Yard.
3. Encourage implementation of north-south passenger rail alignments by adding platforms on the westernside of the MMPT build-out design near Philips Arena.
4. Link Atlanta to cities across the Southeast and Gulf Coast with a network of High Speed Rail in existingfreight corridors.
Implementing Transportation Projects
1. Maintain all capital project status information in a comprehensive interdepartmental database.
2. Make information available to the community through the Internet on project location, design, schedules,budgets, and public involvement opportunities.
433Atlanta Strategic Action Plan September 2007 Draft

Urban Design
The vision for Atlanta is a City that is a humane and enjoyable place to live, work, play, grow and raisechildren. The following policies are grouped under eight major goals designed to realize that vision. Thesegoals are:
1. Preservation of neighborhoods.2. Preservation of cultural, historic and natural resources.3. Strengthening of Downtown Atlanta as a regional center.4. Expansion of Atlanta’s role as an international city.5. Encouraging pedestrian, bicycle, and mass transportation.6. Providing opportunities for human association.7. Enhancing the visual quality of Atlanta.8. Implementing the BeltLine
1. Neighborhood Preservation
Atlanta's greatest pride is found in its neighborhoods. They are not simply places to live, but communitiesfor building friendship and mutual support. Safe parks, good schools, historic architectural character andvital neighborhood commercial districts create stable neighborhoods. Urban design supports these elementsby enhancing them individually and improving their relationship with one another. Policies to promote thisgoal are as follows:
a. Preserve the boundaries and architectural character of Atlanta's existing neighborhoods.b. Create stable neighborhoods by protecting and enhancing their historic character and enhancing
neighborhood parks, schools and commercial areas.c. Discourage land speculation and disinvestment that lead to neighborhood buy-outs, demolition of
significant buildings (historic or otherwise) or land vacancy (including surface parking lots).d. Protect and preserve existing boundaries between neighborhoods and commercial areas.e. Provide primarily single-family neighborhoods with nodal commercial areas, which are of such a size,
that all uses are within convenient walking distance of one another.f. Protect existing neighborhood-oriented commercial areas from uses and building forms, which are
incompatible with the scale, character and needs of the adjacent primarily single-family neighborhoods.g. Prevent encroachment of incompatible commercial uses andminimize commercial parking into residential
neighborhoods.h. Promote the nodal form of commercial and multi-family development to relieve development pressure
on existing neighborhoods and to avoid development or expansion of strip commercial areas.i. Place reasonable controls on the development of larger scale highway-oriented retail, service, office
and dining uses which are intended to serve larger areas of the City than a single neighborhood or asmall group of neighborhoods.
j. Alleviate development pressure on existing neighborhoods by placing reasonable controls on thedevelopment and expansion of strip commercial areas within primarily single-family neighborhoods.
September 2007 Draft Atlanta Strategic Action Plan434
Community Agenda4

k. Create new neighborhood commercial nodes, in areas so indicated in the Comprehensive DevelopmentPlan, which are pedestrian-oriented and provide uses, which primarily serve adjacent neighborhoods.
l. Discourage the development of gated communities or those otherwise physically and symbolicallyseparated from the surrounding urban social and physical fabric.
m. Integrate new developments into the existing urban fabric, providing connectivity into and expansionof the existing street grid system.
n. Encourage multi-family and neighborhood-oriented commercial development that is built up to thepublic sidewalk or respects historic setbacks, faces the public sidewalk, and has entrances to groundfloor units directly accessible to the public sidewalk.
o. Encourage the development of multi-family housing within commercial areas.p. Discourage invasive or insensitive road projects and the land speculation that surrounds them. Minimize
negative impacts of road projects on neighborhoods and encourage an interconnected street systemto provide a variety of route choices and lessen pressure to widen arterial and collector streets.
2. Preservation of Cultural, Historic and Natural Resources
Cultural, historic and natural resources preservation and enhancement have become a priority that is woventhroughout the City's development policies. Inclusion of these resources in the daily experience enrichesthe lives of all citizens and generates economic activity and investment in protected areas. Policies topromote this goal are as follows:
a. Preserve and protect the city’s historic buildings and sites.b. Preserve historic, cultural and natural resources by integrating them into new and existing developments,
parks, greenways and special-event sites while protecting their distinctive qualities.c. Discourage land speculation and disinvestment that lead to neighborhood buy-outs, demolition of
significant buildings (historic or otherwise) or land vacancy (including surface parking lots).d. Encourage infill and rehabilitation development within traditionally commercial areas that include
proportionately significant residential uses.e. Improve the quality of air and water through provisions for the planting of trees, greenspace protection,
bicycle parking and alternative fuel vehicle parking.f. Associate future development, both type and intensity, with environmentally sustainable locations and
infrastructure.g. Conservation Area Boundaries policies:
Adopt conservation-area boundaries with guidelines and regulations to minimize the impact ofadjacent development.Support the principle of maintaining neighborhoods and conservation-area boundaries throughthe use of natural and man-made features, which act as barriers and buffers to protect areas thatthe City has identified for conservation, protection or preservation.Support the use of transition areas as a buffering device where natural or man-made buffers donot exist.
435Atlanta Strategic Action Plan September 2007 Draft
3. Strengthening of Downtown Atlanta as a regional center.
Atlanta provides a central place with which the region identifies and which unifies the region. The proposedDowntown parks, plazas and streetscapes will become spaces where people of the region gather to sharecommon experiences and special events. Increased housing Downtown will benefit the existing Downtownneighborhood and continue to promote vitality and safety at all hours. Support for an improved pedestrianenvironment throughout the City is growing as Atlanta strives to be a world-class city. Policies to promotethis goal are as follows:
a. Develop Atlanta as the central, unifying place for the region.b. Encourage a compatible mixture of residential, commercial, entertainment, cultural and recreational
uses in Downtown that creates a vital and safe community at all hours.c. Encourage a greater intensity of land use in Downtown through the revitalization of underutilized
buildings and the use of upper-story space, and the redevelopment of vacant lots and surface parkinglots.
d. Promote high density housing in Downtown to continue to strengthen and revitalize Downtown as acomplete and sustainable community.
e. Provide a range of housing types and prices to meet different housing needs.4. Expansion of Atlanta’s role as an international city
Atlanta's vision of its role in the 21st century includes expanding its role as an international city. Policiesto promote this goal are as follows:
a. Preserve and enhance Atlanta’s sense of place and heritage expressed through its built environment.b. Aspire for award-winning architectural design in all buildings, parks, plazas and streetscapes.c. Encourage preservation and creation of existing and new signature streets that define the city's identity.d. Promote the continued use of environmentally-friendly “green” building techniques.e. Promote the use of public art on the exterior of buildings and in parks, plazas and streetscapes.f. Enhance all modes of transportation by providing more opportunities for pedestrian, bicycle and transit
usage and enhancing street grid connectivity.g. Expand way-finding signage to improve access, identification and connectivity within the City, and
create a memorable experience that enhances Atlanta’s business, cultural and historic attractions.h. Implement the BeltLine as a cultural ring, emerald necklace and a multi-modal transportation system
to weave the City's urban fabric.5. Encouraging pedestrian, bicycle, and mass transportation.
A vision for the future of Atlanta includes improving the pedestrian environment and encouraging the useof mass transit and alternative modes of transportation, and reducing the dependency on the automobile.Policies to promote this goal are as follows:
a. Promote multi-modal transportation, including rail, bus, airplane, bicycle and pedestrian modes.
September 2007 Draft Atlanta Strategic Action Plan436
Community Agenda4

b. Elevate the status of the pedestrian by creating safe, enjoyable, accessible and usable parks,streetscapes and greenways.
c. Develop a system of greenways throughout the City to connect all major parks, stream corridors, andpublic spaces.
d. Develop a system of multi-use trails to link greenways and parks and streetscapes. Multi-use trailsshould be paved concrete and minimum of 12 feet in width.
e. Provide for a pedestrian-scale environment on streets and sidewalks.f. Facilitate development of a pedestrian system with sidewalks, street lights, and street trees.g. Provide sidewalks along all public streets consisting of two zones: a street furniture and tree planting
zone located adjacent to the curb, and a pedestrian clear zone.Street Furniture Zone – a minimum width of five feet. Said zone is reserved for the placement ofstreet trees and street furniture including utility poles, waste receptacles, fire hydrants, trafficsigns, traffic control boxes, newspaper vending boxes, transit shelters, bicycle racks, benchesand similar elements in a manner that does not obstruct pedestrian access or motorist visibility.Pedestrian Clear Zone – a minimum width of six feet along local streets and 10 feet alongarterials/collector streets. Said zone is reserved for pedestrian circulation and passage and shallconsist of continuous hardscape that is unobstructed by any permanent objects for a minimumheight of eight feet.
h. Ensure pedestrian-oriented building forms with articulated facades and pedestrian entrances accessiblefrom adjacent sidewalks.
i. Reserve the space between the building and the sidewalk for pedestrian related uses.j. Promote public safety through the provision of pedestrian-oriented street-level active uses accessible
from adjacent sidewalks.k. Encourage street-level retail activities adjacent to the sidewalk in commercial nodes and along major
corridors, and ensure that nearby residents have pedestrian access to such uses.l. Encourage mixed-use developments with residential uses to promote walkable communities.m. Control and limit strip-commercial development along arterial roads oriented solely to the automobile.n. Facilitate safe and convenient bicycle usage by providing multi-use trails and designated bicycle lanes.o. Prohibit pedestrian bridges and tunnels, except over limited access/grade separate highways, railway
corridors and other public rights-of-way where pedestrians are prohibited, to emphasize pedestriansafety and encourage pedestrian activity at the street-level.
p. Facilitate safe, pleasant and convenient pedestrian circulation and access management:Encourage a grid of connected streets to improve access and reduce congestion.Encourage creation of pedestrian scale block sizes to enhance circulation and connectivity.Minimize the number of curb cuts and encourage the use of private alleys or drives to accessparking and loading areas.Limit the width of curb cuts to ensure safe pedestrian movement.Minimize conflicts between pedestrians and vehicles by encouraging curb cut consolidation andshared driveways.Reduce vehicular congestion by encouraging a smooth, uninterrupted and low-speed flow oftraffic.
437Atlanta Strategic Action Plan September 2007 Draft

q. Establish maximum parking requirements, encourage shared parking and alternative modes oftransportation.
r. Maximize opportunities for on-street parking.s. Encourage the use of MARTA through the location of mixed-use development and regional entertainment
and cultural facilities around MARTA rail stations.6. Providing opportunities for human association
The growth and change that Atlanta has experienced has attracted many newcomers, and has created acity of strangers. Urban design efforts are therefore aimed towards providing greater opportunities forhuman association. Pedestrian-friendly streetscapes, parks, greenways and plazas encourage socialengagement by providing opportunities for interaction during recreation, special events and daily activities.Policies to promote this goal are as follows:
a. Promote socialization and neighboring by knitting the City together with pedestrian and bicycle corridorsand by providing a range of recreational, cultural and special event opportunities throughout the City.
b. Promote a mix of land uses in Downtown that create a vital and safe community at all hours.c. Encourage a built environment that fosters mixed-uses where people can live, work, meet and play.d. Maximize opportunities for pedestrian amenities, including parks, plazas, greenways and public art.e. Provide safe and sufficient pedestrian-accessible streetscapes, parks, plazas and greenways for active
and passive enjoyment.7. Enhancing the visual quality of Atlanta
The visual quality of Atlanta affects all other goals. Visual quality helps to preserve and strengthenneighborhoods and civic identity, it contributes to Atlanta's image as an international city, it enhances thepedestrian and vehicular environment, it promotes economic development and stability, and attracts visitorsto Atlanta. Policies to promote this goal are as follows:
a. Create a more beautiful city by enhancing the visual quality of all public spaces.b. Enhance the visual quality and beauty of the City through landscaping, varied building and streetscape
materials, placement of overhead utilities underground, a clearer and less obtrusive system of signage,greater sensitivity to building scale.
c. Preserve high points were the city skyline can be viewed and enjoyed.d. Encourage the creation of visual focal points along corridors, parks and plazas.e. Improve the aesthetics of street and built environments.f. Promote visual continuity and an enhanced street environment with street trees and street lights.g. Promote landscaping in parking lots, landscaped sidewalk areas and landscaped buffers as a means
of lessening the negative visual impacts of strip development.h. Encourage site development that creates visual continuity and interest along streets and sidewalks by
placing building facades and storefronts adjacent to sidewalks and locating parking to the rear ofbuildings.
i. Emphasize gateways with the use of architecture, landscaping and or public art.
September 2007 Draft Atlanta Strategic Action Plan438
Community Agenda4

j. Preserve Atlanta’s tree canopy and encourage on-site tree replacement as part of any new development.Create spaces appropriate and adequate for large shade trees.
k. Encourage the underground placement of overhead wires along parade routes, visually and historicallyimportant streets, such as Peachtree Street and Auburn Avenue, and key retail areas, such asDowntown, Midtown, Buckhead and West End.
l. Establish an Urban Design Policy document as a framework for infill and new development to createpedestrian-friendly buildings, streets, streetscapes, and parks and plazas.
m. Provide citywide streetscape standards to promote pedestrian safety and connectivity, efficiency ofmaintenance, continuity and beauty of design, and handicapped accessibility.
n. Standardize the location and design of street signs and methods for promoting continuity in streetnames and street identity.
8. Implementing the BeltLine
Policies to promote this goal in the area directly zoned with the BeltLine Overlay Zoning and in other areasof the City adjacent to but not directly controlled by the BeltLine Overlay Zoning are as follows:
a. Preserve a continuous corridor along the BeltLine route of sufficient dimension for the implementationof transit, multi-use trails and greenspace;
b. Preserve opportunities for connecting trails that reach out beyond the BeltLine to create a broad networkof trails throughout the City;
c. Encourage a grid of smaller blocks and connected streets to improve access to the BeltLine, reducecongestion, and further the urban character of the area;
d. Preserve the historic physical character of the industrial districts that follow the BeltLine by promotingadaptive re-use of historic structures and encouraging new construction to be consistent with the size,scale and/or character of those buildings;
e. Promote opportunities for parks, open space, and cultural and institutional buildings in the BeltLinedistrict;
f. Encourage opportunities for public art and promote the concept of a cultural ring to unify the city'scultural institutions.
g. Ensure that new construction is compatible with the scale and character of adjacent single familyneighborhoods;
h. Create new mixed use and commercial nodes at BeltLine station areas that are pedestrian andtransit-oriented;
i. Maximize air and water quality, including that which supports the planting of trees, greenspace andwatershed protection, and bicycle parking.
Land Use
Current land use policies for the City of Atlanta are grouped in the discussion below by three categories.These are:
1. Citywide Land Use Policies
439Atlanta Strategic Action Plan September 2007 Draft
2. Specific Types of Land Use Policies; and3. Land Use Policies for Neighborhood Planning Units (NPUs).
Land use policies are also included in the Urban Design Element. The Urban Design Element outlinesurban design policies for new and infill development in the City in order to ensure that all future developmentis compatible with a pedestrian-oriented urban environment and to eliminate development that disrupts andis incompatible with the City’s urban fabric. The urban design policies emphasize the quality of the streetenvironment, public space, and flexibility of development.
At the same time, the City’s land use policies reflect the principles of “New Urbanism” by promoting improvedland use planning for neighborhoods. “New Urbanism” reflects the public’s desire to live in neighborhoodsthat offer a wide range of services and activities in small-scale mixed-use environments that provide a senseof intimacy as well as convenience. The principles of New Urbanism are included at the end of this section,prior to the NPU Policies.
ARC’s Regional Development Plan Land Use Policies
These land use policies build on and further define the Regional Land Use Policies that were identified inEnvision6. These are listed below.
Developed Area Policies
1. Promote sustainable economic growth in all areas of the region.2. Encourage development within principal transportation corridors, the Central Business District, activity
centers, and town centers.3. Increase opportunities for mixed-use development, transit-oriented development, infill and
redevelopment.4. At strategic regional locations, plan and retain industrial and freight land uses.5. Design transportation infrastructure to protect the context of adjoining development and provide a
sense of place appropriate for our communities.6. Promote the reclamation of Brownfield development sites.
Housing and Neighborhood Policies
7. Protect the character and integrity of existing neighborhoods, while also meeting the needs ofcommunities.
8. Encourage a variety of home styles, densities and price ranges in locations that are accessible to jobsand services to ensure housing for individuals and families of all incomes and age groups.
9. Promote new communities that feature greenspace and neighborhood parks, pedestrian scale, supporttransportation options and provide an appropriate mix of uses and housing types.
10. Promote sustainable and energy efficient development.
Open Space and Preservation
September 2007 Draft Atlanta Strategic Action Plan440
Community Agenda4

11. Protect environmentally-sensitive areas including wetlands, floodplains, small water supply watersheds,rivers and stream corridors.
12. Increase the amount, quality, connectivity and accessibility of greenspace.13. Provide strategies to preserve and enhance historic resources.14. Through regional infrastructure planning, discourage growth in undeveloped areas
Coordination Policies
15. Assist local governments to adopt growth management strategies that make more efficient use ofexisting infrastructure.
16. Inform and involve the public in planning at regional, local and neighborhood levels.17. Coordinate local policies and regulations to support Regional Policies.18. Encourage the development of state and regional growth management policy.
Citywide Land Use Policies
The following eight general land use policies have been identified as Citywide guides for future development,and are directed toward the achievement desired land use patterns:
1. Preserve single-family detached residential neighborhoods against encroachment by non-residentialor incompatibly scaled residential development.
2. Control and limit strip commercial development.3. Encourage nodal land use patterns and mixed-use development around certain public transit stations
and selected major transportation intersections.4. Encourage medium-, high-, or very high-density residential development, particularly in areas that are
designated for nodal development, and other selected areas.5. Promote the efficient use of land in order to minimize sprawl.6. Retain industrial land uses.7. Enhance the pedestrian infrastructure.8. Encourage the dispersal of social service agencies throughout the City, including residential facilities
for elderly persons, mentally- and physically-disabled persons, and persons who are undergoingrehabilitation
Specific Land Use Policies
Specific types of land use policies have been identified for carrying out the City’s general land use policies.They describe implementation measures in greater detail than do general policies. The ten Specific Typesof Land Use Policies are:
1. Promote Neighborhood Conservation2. Encourage Nodal Development3. Discourage Strip Commercial Development4. Promote Residential Density Near Available Infrastructure5. Promote Appropriate for Urban Areas and Minimize Urban Sprawl
441Atlanta Strategic Action Plan September 2007 Draft

6. Develop Transit Station Areas7. Retain Industrial Land Uses8. Enhance the Pedestrian System9. Promote Interjurisdictional Land Use Compatibility10. Plan Land Use Transition Areas
Sub policies for each of the specific land use policies are detailed below.
1. Promote Neighborhood Conservationa. Discourage neighborhood buyouts, except where they are a matter of City policy. Wherever it is
appropriate, planned developments resulting from neighborhood buyouts should be of sufficientsize to provide adequate land for the new use and should minimize the likely impacts on adjacentland uses, on the nearby transportation system, and on City utility systems.
b. Strengthen the regulations for MARTA transit-station areas and for buffers (natural and man-made)in order to reduce the impacts of the heights and masses of high-density land uses on adjacentlow-density residential uses.
c. Discourage land speculation and disinvestment activities that lead to neighborhood buyouts, tothe demolition of significant buildings (historic or otherwise), or which result in buildings or landbecoming vacant.
d. Encourage new housing development that is compatible with the character of existingneighborhoods. “Character of neighborhoods” is defined by attributes of the platting pattern,including the layout of streets and blocks, the shapes and sizes of lots, the natural topography,and the presence of mature trees.
e. Encourage residential zoning categories that accomplish the following: (a) describe the variousresidential development patterns and densities which exist in the City; (b) accurately reflect theexisting platting pattern of neighborhoods; and (c) contain adequate controls to preserve thecharacter-defining elements of neighborhoods.
f. Ensure that the sizes and scales of new homes are commensurate with lot sizes in order toensure the presence of adequate open space, permeable surfaces, and tree cover on each lot.
g. Encourage the development of infill housing at appropriate densities in sparsely developed areas.h. Offer economic incentives to builders and developers in order to assist them in the construction
of new low- and moderate-income housing throughout the City.i. Reduce homebuilding costs by adopting appropriate infrastructure construction requirements
that are consistent with the protection of the public health and safety.j. Maintain the boundaries of existing single-family neighborhoods in order to prevent encroachment
by nonresidential or incompatibly scaled residential land uses.2. Promote Nodal Development
a. Promote nodal development at all existing and proposed development nodes, including expresswayinterchanges.
b. Promote the concentration of different types of public service uses, such as those that are relatedto health, education, day care, and libraries.
c. Minimize the construction and existence of parking facilities near transit stations which currentlyfeature parking facilities in order to encourage the use of the rapid transit system and in order to
September 2007 Draft Atlanta Strategic Action Plan442
Community Agenda4
provide land for the development of high-density uses (residential, office and retail) in areasimmediately around the station.
d. Promote pedestrian systems within nodal development areas; and extend these systems outwardto adjacent activity centers.
e. Promote retail development in nodal development areas through zoning and other incentives.These areas include Fairlie-Poplar, West End, Upper Downtown, Midtown, and Greenbriar.
f. Expand residential use by emphasizing mixed-use development and by replacing demolishedresidential units with new residential units in nodal development areas.
g. Limit development densities to levels that can be accommodated by transportation and infrastructuresystems.
h. Incorporate transitional use districts into the planning and design of development nodes.3. Discourage Strip Commercial Development
a. Encourage coordinated, planned development activity and discourage the continuation andexpansion of strip commercial areas.
b. Promote the installation of appropriate and sufficient landscaping in parking lots, landscapedsidewalk areas, and landscaped buffers as a means of lessening the negative visual impacts ofstrip development.
c. Promote the development of a mix of land uses (primarily commercial and residential) alongcommercial strips so that traffic generation peaks at different times during the day.
d. Limit the lengths of strip development along arterial roads.e. Encourage all strip commercial developments to include alternative parking options that do not
create urban heat islands, i.e. parking decks4. Promote Residential Density Near Available Infrastructure.
The City assigns high priority to the development of affordable housing for households of all incomelevels, especially those having low or moderate incomes. These policy recommendations have beenprepared to insure that new housing is supported by sufficient infrastructure; is not isolated from retailand other housing-related facilities and amenities; it is in proximity to employment centers and doesnot adversely impact existing neighborhoods.a. Encourage the development of very high-density uses in nodal development areas around certain
transit stations, as is specified in the Urban Framework Plan.b. Encourage the development of high-density housing along major arterial routes that have transit
service available to MARTA stations. Assure that adjacent neighborhoods are not adverselyimpacted and that development guidelines for the area are followed.
c. Encourage the development of low- and medium-density multifamily residential uses on vacantor under-utilized tracts wherever they are compatible with surrounding uses
5. Promote development appropriate for urban areas
a. Minimize urban sprawl and sprawl type developments.
b. Encourage residential infill development that is compatible with existing residential uses in orderto take advantage of existing community facilities and infrastructure.
c. Encourage appropriate neighborhood commercial uses as components of existing and futureresidential development.
443Atlanta Strategic Action Plan September 2007 Draft

d. Promote the safe and orderly flow of traffic through the City by improving planned connectionsbetween proposed and existing streets, in conjunction with new development, and encourage theprovision of local rather than arterial street access to residential subdivisions.
e. Ensure that adequate recreational facilities, parks, and multi-purpose open spaces are availablein conjunction with new land development.
6. Develop Transit Station AreasThe City of Atlanta is committed to the development of mixed uses around MARTA transit stations inan effort to minimize urban sprawl, to reduce traffic congestion, to provide efficiency in public services,and to encourage the development of self-contained living and working environments. Mixed-usedevelopment should be promoted around all MARTA transit stations as well.
7. Retain Industrial Land UsesMany industrial buildings within industrial areas of the City, including heavy manufacturing facilitiesand warehouses, were constructed decades ago when traditional types of industrial activities weremore prominent. Changes in technology have caused these buildings to become obsolete for someindustrial uses. As a result, many of them have been vacant or partially vacant. However, a significantnumber of these buildings are still structurally sound, thus they are physically suitable for adaptivereuse. Now, due to changes in the real estate market and business trends, such buildings haverenewed economic potential. In order to stimulate the reuse of these industrial buildings and to retainindustrial uses the City has established the following four sub-policies:a. Promote the adaptive reuse or redevelopment of vacant, underutilized, obsolete, or
structurally-deteriorated industrial and commercial properties in order to increase the possibilitiesfor introducing modern industrial uses to increase the compatibility of these areas with thesurrounding land uses.
b. Provide landscaped or architectural buffers in order to minimize potentially adverse impacts ofexisting and proposed industrial uses on residential areas. Ensure that light industrial areas areredeveloped only after a Phase II Environmental Assessment has taken place and after anyrequired remediation measures, have been completed.
c. Encourage the redevelopment of underused industrial areas which have sufficient existing streetand utility infrastructure rather than the expansion of development in areas that are undeservedby streets and utility connections.
d. Maintain industrial land uses by discouraging encroachment of incompatible land uses in industrialareas, encouraging redevelopment of obsolete industrial buildings to new industrial uses insteadof a non-industrial uses.
e. Discourage the conversion of industrial land uses to non industrial land uses.8. Enhance the Pedestrian System
The City of Atlanta seeks to encourage increased pedestrian travel as an alternative to short trips thatwould otherwise be made by automobile. In order to foster such activity, land uses need to be situatedin such a manner that pedestrian access to them becomes attractive.a. Encourage street-level retail activities in order to maximize the use of streets by pedestrians.b. Ensure that sidewalks are constructed on and around properties for which new development is
planned.c. Design and signalize street intersections for the safe and convenient crossing by pedestrians.
September 2007 Draft Atlanta Strategic Action Plan444
Community Agenda4

d. Ensure that new construction meets Federal, State, and local handicapped accessibility guidelines.e. Coordinate with the Public Works and Arborist Departments to maintain all sidewalks that may
come under disrepair due to tree roots and construction.9. Promote Inter-jurisdictional Land Use Compatibility
The following sub-policy promotes the development of land uses within the City of Atlanta that wouldbe compatible with those of adjacent and nearby jurisdictions.a. Promote coordinated planning efforts with neighboring jurisdictions (local governments).
10. Plan Land Use Transition AreasWhere land use classifications exist which permit the occurrence of development having incompatiblecharacteristics, such as incompatible height, density, scale, appearance, or character, they may beseparated by representatives of other land use classifications which permit the occurrence of certaintypes of development that have intermediate characteristics, and which may act as transitional landuse areas. The positioning of such “transitional land uses” is a highly desirable land use practice forprotecting sensitive areas, and it is to be encouraged wherever it is possible.
Principles of New Urbanism
Below are the principles for New Urbanism established by the Congress for New Urbanism. These are notCity of Atlanta policies. However, they reflect many of the concepts that City of Atlanta would like to achieve.
The region: Metropolis, city, and town
1. Metropolitan regions are finite places with geographic boundaries derived from topography, watersheds,coastlines, farmlands, regional parks, and river basins. The metropolis is made of multiple centers thatare cities, towns, and villages, each with its own identifiable center and edges.
2. The metropolitan region is a fundamental economic unit of the contemporary world. Governmentalcooperation, public policy, physical planning, and economic strategies must reflect this new reality.
3. Themetropolis has a necessary and fragile relationship to its agrarian hinterland and natural landscapes.The relationship is environmental, economic, and cultural. Farmland and nature are as important tothe metropolis as the garden is to the house.
4. Development patterns should not blur or eradicate the edges of the metropolis. Infill development withinexisting urban areas conserves environmental resources, economic investment, and social fabric,whilereclaimingmarginal and abandoned areas. Metropolitan regions should develop strategies to encouragesuch infill development over peripheralexpansion.
5. Where appropriate, new development contiguous to urban boundaries should be organized asneighborhoods and districts, and be integrated with the existing urban pattern. Noncontiguousdevelopment should be organized as towns and villages with their own urban edges, and planned fora jobs/housing balance, not as bedroom suburbs.
6. The development and redevelopment of towns and cities should respect historical patterns, precedents,and boundaries.
445Atlanta Strategic Action Plan September 2007 Draft

7. Cities and towns should bring into proximity a broad spectrum of public and private uses to support aregional economy that benefits people of all incomes. Affordable housing should be distributedthroughout the region to match job opportunities and to avoid concentrations of poverty.
8. The physical organization of the region should be supported by a framework of transportationalternatives. Transit, pedestrian, and bicycle systems should maximize access and mobility throughoutthe region while reducing dependence upon the automobile.
9. Revenues and resources can be shared more cooperatively among the municipalities and centerswithin regions to avoid destructive competition for tax base and to promote rational coordination oftransportation, recreation, public services, housing, and community institutions.
The neighborhood, the district, and the corridor
1. The neighborhood, the district, and the corridor are the essential elements of development andredevelopment in the metropolis. They form identifiable areas that encourage citizens to takeresponsibility for their maintenance and evolution.
2. Neighborhoods should be compact, pedestrian-friendly, and mixed-use. Districts generally emphasizea special single use, and should follow the principles of neighborhood design when possible. Corridorsare regional connectors of neighborhoods and districts; they range from boulevards and rail lines torivers and parkways.
3. Many activities of daily living should occur within walking distance, allowing independence to thosewho do not drive, especially the elderly and the young. Interconnected networks of streets should bedesigned to encourage walking, reduce the number and length of automobile trips, and conserveenergy.
4. Within neighborhoods, a broad range of housing types and price levels can bring people of diverseages, races, and incomes into daily interaction, strengthening the personal and civic bonds essentialto an authentic community.
5. Transit corridors, when properly planned and coordinated, can help organize metropolitan structureand revitalize urban centers. In contrast, highway corridors should not displace investment from existingcenters.
6. Appropriate building densities and land uses should be within walking distance of transit stops, permittingpublic transit to become a viable alternative to the automobile.
7. Concentrations of civic, institutional, and commercial activity should be embedded in neighborhoodsand districts, not isolated in remote, single-use complexes. Schools should be sized and located toenable children to walk or bicycle to them.
8. The economic health and harmonious evolution of neighborhoods, districts, and corridors can beimproved through graphic urban design codes that serve as predictable guides for change.
9. A range of parks, from tot-lots and village greens to ballfields and community gardens, should bedistributed within neighborhoods. Conservation areas and open lands should be used to define andconnect different neighborhoods and districts.
The block, the street, and the building
1. A primary task of all urban architecture and landscape design is the physical definition of streets andpublic spaces as places of shared use.
September 2007 Draft Atlanta Strategic Action Plan446
Community Agenda4

2. Individual architectural projects should be seamlessly linked to their surroundings. This issue transcendsstyle.
3. The revitalization of urban places depends on safety and security. The design of streets and buildingsshould reinforce safe environments, but not at the expense of accessibility and openness.
4. In the contemporary metropolis, development must adequately accommodate automobiles. It shoulddo so in ways that respect the pedestrian and the form of public space.
5. Streets and squares should be safe, comfortable, and interesting to the pedestrian. Properly configured,they encourage walking and enable neighbors to know each other and protect their communities.
6. Architecture and landscape design should grow from local climate, topography, history, and buildingpractice.
7. Civic buildings and public gathering places require important sites to reinforce community identity andthe culture of democracy. They deserve distinctive form, because their role is different from that ofother buildings and places that constitute the fabric of the city.
8. All buildings should provide their inhabitants with a clear sense of location, weather and time. Naturalmethods of heating and cooling can be more resource-efficient than mechanical systems.
9. Preservation and renewal of historic buildings, districts, and landscapes affirm the continuity andevolution of urban society.
NPU Policies
Land Use Policies for the Neighborhood Planning Units (NPU)
In addition to the preceding citywide land use policies, individual land use policies have been establishedfor each Neighborhood Planning Units (NPU’s). As part of the development of the ASAP, each NPU wasasked to submit amendments/revisions to the NPU policies. These policies have not been reviewed byBureau of Planning staff yet. Prior to the next draft, BoP staff will review these and recommended approvalor denial of these for inclusion in the ASAP. The NPU policies are listed below.
NPU A
A-1 Reserve the single-family character of NPU ‘A’, including the following neighborhoods: Paces, MountParan-Northside, Chastain Park, Tuxedo Park, Moores Mill, Margaret Mitchell, Randall Mill, andWest PacesFerry-Northside.
A-2 Maintain the boundaries of the I-75/West Paces Ferry commercial node. Incorporate pedestrianamenities and encourage street-level retail uses in order to maximize pedestrian activity. Treat low- andmedium-density residential areas as buffers for surrounding single-family neighborhoods. Maintain theexisting scale of the structures in the commercial district.
A-3 Preserve the single family residential character of the neighborhoods surrounding Chastain Park, aunique single-family residential and historic area, as well as the only significant park and green space inNorth Atlanta. Maintain the boundaries of the Roswell Road commercial area as a medium density corridor.Maintain the maximum allowable density of the Chastain Park Civic Association neighborhoods at the currentR-3 zoning. Recognize the historic Sardis Church and the Georgia Power substation as the established
447Atlanta Strategic Action Plan September 2007 Draft

buffers between Roswell Road commercial area and the single-family residential areas surrounding ChastainPark. Preserve the current residential zoning of all gateway streets from Roswell Road to Chastain Park,including West Wieuca, Interlochen, Laurel Forest, Le Brun, and Powers Ferry Roads.
A-4 Limit the development of office-institutional uses to the northwest quadrant of the I-75/Mount ParanRoad/I-75 Interchange and prevent the development of additional commercial use property in this area.
A-5 Preserve the single-family residential character of existing neighborhoods surrounding the I-75/MooresMill Road Interchange.
A-6 Protect the environment and preserve the character of the Paces neighborhood west of Nancy Creekby promoting single-family residential development having a maximum density of 0.5 units per acre.
A-7 Limit multi-family uses on Northside Parkway from the Cobb County Line to Moores Mill Road.
A-8 Preserve the existing zoning boundaries of the Paces Civic Association neighborhood.
A-9 Maintain the existing zoning boundaries of the Randall Mill neighborhood in which the Paces WestTown Homes and the Longcourte cluster housing development serve as the transitional use between theoffice/commercial center and the one-acre, single family housing along West Paces Ferry Road, EastBeechwood Drive and Randall Mill Road.
A-10 Establish a broader scope Chastain Park Trust or amend the existing Chastain Park AmphitheatreTrust- to be funded, in part, by additional event-based impact fees- for the additional purpose of mitigatingevent-related costs (park and adjacent neighborhood infrastructures, noise, traffic, safety and waste issuesfrom more than 60 concerts in a six-month season) as well as supporting the full implementation of theChastain Park Master Plan.
A-11 Prevent the further degradation of the residential neighborhoods in NPU-A by opposing the conversionof residential properties to non-residential uses, except in those very limited situations where such conversionis required by applicable law due to the existing, established non-residential use of all surrounding property.
A-12 Maintain the historic and residential character of West Paces Ferry Road.
A-13 Ensure that all development and redevelopment within NPU-A occurs only with due regard to: (i)the safety of our citizens and visitors; and (ii) the maintenance of our environmental ecosystems.
A-14 Encourage the development of a trailhead at the Northeast Corner of Mount Paran Road and NorthsideParkway so as to facilitate the extension of the Silver Comet Trail into this area.
A-15 Preserve the existing residential and historic character of the Tuxedo Park Civic Association, andmaintain the existing zoning boundaries with a maximum density of R-3 zoning. Preserve the woodlandand park-like character of Tuxedo Park. Prevent the creation of new subdivided lots on land that istopographically challenged. Preserve the current residential zoning of all gateway streets from RoswellRoad to Tuxedo Park and South Tuxedo Park including Blackland Road, Karland Drive and Lakeland Drive.Preserve the historical and residential character of Blackland Road.
September 2007 Draft Atlanta Strategic Action Plan448
Community Agenda4

NPU B
B-1 Implement minimum standards for “open” space and “green space” in lieu of “open space” only.Minimum standards should be based on square feet of development in all categories except single familyresidential (R-1 through R-5).
B-2 Preserve the historic integrity of the Brookhaven, Garden Hills, Peachtree Heights East, PeachtreePark, and Tuxedo Park neighborhoods, as well as the West Paces Ferry Road commercial district.
B-3 Maintain the Southern Railroad and MARTA tracks as the firm boundary of the Lenox MARTA Stationdevelopment node. Discourage nonresidential uses on the southern boundary of the Pine Hills neighborhood.
B-4 Maintain the CSX Railroad and MARTA tracks as the firm southern boundary of the Lenox stationdevelopment node. Permit no residential uses to encroach upon the Pine Hill neighborhood south of thisboundary. Maintain current CDP zoning and land-use densities in Pine Hill (single family and multi-family).Protect single-family uses in the interior of the neighborhood and limit multi-family uses to those propertieshaving frontage along Lenox Road.
B-5 Maintain residential-only uses along both sides of the Roxboro Road corridor from Peachtree Roadto East Paces Ferry Road. Permit only low-density development (O-8 U/A) on lots on the east side ofRoxboro Road and medium-density development on the west side of Roxboro. Maintain the existing usesand densities along the Peachtree Road corridor from Roxboro Road to the DeKalb County Line. Permitno nonresidential use to encroach upon Ridgedale Park or Brookhaven neighborhoods.
B-6 Maintain Lenox Road/Phipps Boulevard (also know as the Buckhead Loop/ Wieuca Road Connector)as the firm boundary between residential land use north of the boundary and mixed-use land use south ofthe boundary. Permit no non-residential uses to encroach upon the single-family uses of the North Buckheadneighborhood north of Lenox Road. also know as the Buckhead Loop/Phipps Boulevard/Wieuca RoadConnector.
B-7 Within the capacity of the existing sewer, transportation, and storm water systems, permit developmentof high-density residential and mixed-uses development in the development nodes that are associated withthe Buckhead, Lenox, and Lindbergh MARTA stations. Encourage development that is located in designatedmixed-use districts to consist of residential and commercial (office and /or retail) uses that have a ratio ofat least 1:1 with development to be phased so that residential space is developed in advance or concurrentwith, an equivalent amount of commercial (office and retail) space.
B-8 Contain strip commercial use along Peachtree, Piedmont and Roswell Roads. Promote theredevelopment of existing commercial strips along these corridors so as to enable the reduction of curbcuts and turn-lanes, as well as the improvement and consolidation of points of automobile access to thedevelopment and the utilizing of Neighborhood Commercial Zoning. Maintain existing land use along andexisting land uses and densities along the Roswell Road corridor. Protect the integrity of R-LC(Residential-Limited Commercial) Districts on East Paces Ferry Road, east of the Buckhead Village andwest of Piedmont Road, East Shadowlawn, Pharr Road at Hardman Court, Hardman Court, Lookout Place,
449Atlanta Strategic Action Plan September 2007 Draft

Grandview Avenue, North Fulton Drive and Piedmont Road between Pharr Road and East Wesley Roadfrom encroaching by commercial zoning districts. Encourage pedestrian connectivity and bicycle lanesalong all major connections.
B-9 Implement Special Public Interest (SPI) District regulations that are contained in the study entitled “AVision for Buckhead Village” using recommendations by the Buckhead Action Committee in the “BuckheadAction Plan” related to transportation, pedestrian safety and appeal, and street scapes. Maintain the diversityof low-density commercial uses and promote a mix of multi-family residential housing types in the samebuilding, with parking included within the Buckhead Village. Maintain high-density commercial and residentialuses north of Buckhead Village along the Peachtree corridor; promote transitional zones between residentialneighborhoods using mid and low-rise mixed-use development. Encourage all development in the areacovered in the “Buckhead Action Plan” to be in accordance with the guidelines set forth in the final adoptedversion of the “Buckhead Action Plan” by incorporating appropriate elements into the CDP.
B-10 Support and promote the Buckhead Action Committee’s Livable Centers Initiative.
B-11 Implement requirement that all infrastructure and development criteria for a proposed project shallbe evaluated in the context of existing development, as well as currently approved/permitted developmentwhich has not yet been constructed.
B-12 Revise SPI regulations and CDP to promote moderately priced housing units in transition zonesbetween single-family residential and higher-density uses
B-13 Promote the LEED principles within commercial developments or sustainable construction including:
Emphasis on use of public transportation
Emphasis on alternative power sources
Emphasis on water re-use or grey water
Emphasis on recycled and reclaimed materials for construction
Emphasis on heat island mitigation through use of green roofs.
NPU C
C-1 Maintain, but do not expand (either geographically or by permitting change to more intense land usedesignations) land use classifications [as shown on the CDP Land Use Map for NPU-C dated 12-10-03(“2003 Map)]for the commercial development node at Howell Mill Road and Northside Parkway, includingexisting low and medium density designations surrounding it as buffers for single family neighborhoods.
C-2 Protect existing single family land uses throughout the NPU. As part of this policy prohibit commercialand multi-family encroachment in all single family land use designations shown (or subsequently added to)the 2003 map. This prohibition includes, but is not limited to, the following single family areas: 1) north of
September 2007 Draft Atlanta Strategic Action Plan450
Community Agenda4

the intersection of Howell Mill Road and Collier Road to the intersection of Howell Mill Road and GreendaleRoad; 2) eastward and northeastward from the intersection of Howell Mill Road and Collier Road to theintersection of Collier Road and Anjaco Drive; and 3) eastward and northeastward from the intersection ofMoores Mill Road and the right of way of Seaboard Railroad to West Paces Ferry Road.
C-3 Provide landscaped or architectural buffers that are of sufficient scale and depth between diverseland uses in order to minimize higher-density impacts on single-family residential areas.
C-4 Do not expand geographically the non-single family residential land use designations as shown onthe 2003Map, in order to prevent expansion of the non-single family designations into single family residentialdesignated areas of NPU-C. This includes the commercial and industrial designations which lie along andadjacent to the Peachtree Road, Collier Road/Howell Mill and Bolton Road/Moores Mill corridors.
C-5 Encourage the redevelopment of the retail districts in the Howell Mill/Collier Road and the BoltonRoad/MooresMill areas into pedestrian friendly and attractive retail areas serving surrounding neighborhoods,rather than a larger service area. Comprehensive master planning should be undertaken for these areasin order to encourage unified, rather than parcel, planning and projects.
C-6 Maintain the single family residential character of properties surrounding the Moores Mill Interchangeon Interstate 75.
NPU D
D-1 Protect the single-family and low-density residential areas in NPU-D, including the followingneighborhoods: Underwood Hills Park, Bolton, Riverside, Whittier Mill Village, Hills Park, and Berkeley Park.
D-2 Restrict commercial and further multi-family development on the East Side of DeFoor Avenue.Encourage residential land use on the west side of DeFoor Avenue as the industrial uses become obsolete.
D-3 Maintain low-density residential land use in the area of the Berkeley Park Neighborhood that lies betweenHowell Mill Road and Northside Drive, pending clarification of MARTA’s plans for the Northwest Line andthe proposed Northside Station.
D-4 Preserve the historic and single-family integrity of the Whittier Mill Village Historic District.
D-5 Introduce a transitional buffer zone between single-family uses and industrial uses to help to protectthe Whittier Mill Historic District from adjacent development.
D-6 Encourage the re-designation of properties that are in proximity to the Whittier Mill site and theChattahoochee River from industrial to open space to enable the development of a recreation andconservation district within the Chattahoochee River Corridor and floodplain.
D-7 Review the industrially-classified properties to determine the potential for vacant and underutilized tobe reclassified to residential
451Atlanta Strategic Action Plan September 2007 Draft

D-8 Where industrial uses are to remain, provide landscaped or architectural buffers to minimize theirimpacts on residential areas.
D-9 Encourage the addition of a second roadway through Riverside to handle industrial and by-pass traffic.
D-10 Encourage the development of James Jackson into a major commercial corridor I the NW quadrant.
D-11 Encourage the utilization of undeveloped land along the Chattahoochee River for a park and biketrail.
D-12 Encourage the re-zoning of the Riverside area from R-4A to R-4.
D-13 Support the creation of neighborhood commercial zones within the Riverside community.
D-14 Support improvements to Bolton Road with the addition of sidewalks and other streetscapemeasures.
NPU E
E-1 Maintain Tenth Street as the boundary between the Georgia Tech campus and the Home ParkNeighborhood.
E-2 Promote the development of housing and accessory commercial uses in the Upper Midtown area inaccordance with density, height, and design guidelines that serve to protect the character of Piedmont Parkand adjoining residential neighborhoods. The Upper Midtown area is bounded by Fourteenth Street on thewest. Promote low-rise, high-density residential development in the portion of the Upper Midtown area thatis bounded by Piedmont Park, Tenth Street, and Piedmont Avenue; and mid-rise, high-density residentialdevelopment along the western frontage of Piedmont Avenue (North of 10th Street). Promote residentialdevelopment elsewhere in the Upper Midtown area at densities, heights, and scale that increase fromPiedmont Avenue to Juniper Street. Protect views of and from Piedmont Park and Downtown Atlantathrough design guidelines relating to setbacks and the orientation of buildings.
E-3 Promote medium-density residential use (17-29 units/acre) in the area that is bounded by PiedmontAvenue, Westminster Drive, and the Southern Railroad.
E-4 Preserve the historic integrity of the Ansley Park, Brookwood Hills, Georgia Tech, Midtown, Morningside,Brookwood, and Piedmont Park neighborhoods.
E-5 Encourage mixed-use nodal development that is centered on the MARTA stations which are locatedwithin the Peachtree Road corridor. Promote the use of the Midtown Development Guidelines.
E-6 Encourage street-level retail uses in order to maximize pedestrian activity and facilitate the developmentof a pedestrian system.
E-7 Provide mixed-use development (with residential space at a 1:1 ratio with non-residential) in the areathat is located west of the Southern Railroad between City Hall East (formerly known as “the Sears site”)on Ponce de Leon Avenue andMidtown Plaza. Maintain the low-density residential (0-8-units/acre) characterof the Midtown neighborhood along St. Charles Avenue and Greenwood Avenue.
September 2007 Draft Atlanta Strategic Action Plan452
Community Agenda4

E-8 Preserve the single-family and low-density residential character of the Ansley Park, Sherwood Forest,Brookwood Hills, Ardmore, Loring Heights, Midtown, Brookwood, and Home Park neighborhoods.
E-9 Protect the residential character of the Inwood Circle neighborhood.
E-10 Support the long-range use of the Southern Railroad right-of-way that exists between Ansley Malland Ford Factory Square for open space usage. Secure this right-of-way if or when the railroad use isabandoned.
E-11 Provide landscaped or architectural buffers between diverse land uses in order to minimize impactson residential areas.
NPU F
F-1 Restrict industrial uses along Cheshire Bridge Road and retain only those industrial uses that arecompatible with surrounding development patterns along the Norfolk Southern Railroad right-of-way, DutchValley Road and Cheshire Bridge/Lindridge Road area. Provide landscaped or architectural buffers tominimize the potential impacts on residential areas.
F-2 Protect the historic integrity and single-family character of Virginia-Highland, Atkin Park,Morningside-Lenox Park, Piedmont Heights and Lindridge Martin Manor neighborhoods and the low densityresidential character of the St. Charles-Greenwood neighborhoods.
F-3 Consolidate strip commercial uses in order to create unified development having a minimum numberof curb cuts. Discourage the occurrence of further strip development on Ponce de Leon Avenue, MonroeDrive, Piedmont Avenue, and Cheshire Bridge Road.
F-4 Contain the small commercial districts along North Highland Avenue and Virginia Avenue withinexisting boundaries. Discourage uses having parking requirements that would adversely impact adjacentsingle-family and low-density residential neighborhoods.
F-5 Encourage neighborhood commercial uses on Cheshire Bridge Road by downzoning them from C-2to C-1.
F-6 Discourage the rezoning of existing residential property to commercial zoning.
F-7 Encourage new mixed-use and pedestrian oriented development along Cheshire Bridge road.
F-8 Discourage high density residential uses in areas designated as Low Density Commercial in the LandUse Map.
NPU G
G-1 Preserve the single-family and low-density residential character of the Scotts Crossing, Lincoln Homes,Almond Park, and Carey Park neighborhoods.
G-2 Prevent the encroachment of industrial and commercial uses into residential areas.
453Atlanta Strategic Action Plan September 2007 Draft

G-3 Contain strip commercial uses along Bankhead Highway. Consolidate strip commercial uses so asto create a unified development having a minimum number of curb cuts and turn lanes.
G-4 Retain industrials uses, and provide landscaped or architectural buffers to minimize their potentialimpacts on adjacent residential areas.
NPU H
H-1 Preserve the single-family residential character of NPU-H, including the Carroll Heights, FairburnHeights, Adamsville, and Bolder Park Neighborhoods.
H-2 Encourage infill development that is compatible with surrounding uses.
H-3 Support unified development of the Adamsville commercial area and its associated community facilitieswithout encroaching into adjacent residential areas.
H-4 Encourage the development of office-institutional uses along Martin Luther King Jr. Drive from theAdamsville commercial area to the existing commercial use at the I-285 interchange without encroachinginto adjacent residential areas.
H-5 Maintain the boundaries of commercial, industrial, and institutional uses without encroaching intolow-density residential areas.
H-6 Consolidate strip commercial uses in order to create a unified development having a minimum numberof curb cuts and turn lanes.
H-7 Retain industrial uses. Provide landscaped or architectural buffers to minimize their potential impactson adjacent residential areas.
H-8 Preserve, protect, and maintain floodplain areas in their natural states.
H-9 Support Fulton County in the acquisition of a clear zone for the Fulton County/Brown Field Airport,which is located at the northern end of the Carroll Heights neighborhood, as is depicted on the land usemap for NPU-H.
NPU I
I-1 Preserve the single-family residential character of NPU-I, including the Collier Heights, Westhaven,Peyton Forest, Chalet Woods, Florida Heights, Westwood Terrace, Beecher Hills, Audubon Forest, CascadeHeights, and West Manor neighborhoods.
I-2 Encourage infill development that is compatible with surrounding areas.
I-3 Consolidate strip commercial uses in order to create a unified development having a minimum numberof curb cuts and turn lanes.
September 2007 Draft Atlanta Strategic Action Plan454
Community Agenda4

I-4 Support redevelopment and unification of commercial and multifamily uses along Martin Luther KingJr. Drive and Bankhead Highway without encroachment into adjacent low density and single-family residentialareas.
I-5 Encourage concentrated, high-intensity mixed-use development in the Hightower /Hamilton E. HolmesStation development node.
I-6 Support expansion of the Cascade Springs Nature Preserve in order to protect its integrity.
I-7 Protect the integrity of all Greenways’ within NPU ~ I.
I-8 Build environmental friendly subdivisions.
I-9 Minimize clear cutting when building new subdivision.
I-10 Protect, preserve and maintain our waterways ~ maintain the 75 foot buffer zone; no encroachment.
I-11 Build green whenever possible.
NPU J
J-1 Preserve the single-family and low-density residential character of the Grove Park, West Lake, DixieHills, and Center Hill neighborhoods.
J-2 Encourage medium-density commercial and residential uses in proximity to the Bankhead MARTAStation.
J-3 Consolidate strip commercial uses in order to create a unified development having a minimum numberof curb cuts and turn lanes.
NPU K
K-1 Preserve the single-family and low-density residential character of the following neighborhoods: HunterHills, Mozley Park, Knight Park/Howell Station, Bankhead, Westin Heights, and Washington Park HistoricDistrict.
K-2 Provide landscaped and/architectural buffers between commercial/industrial and residential uses.
K-3 Prevent encroachment of commercial uses into residential areas , and prevent other zoning designationswhich would allow greater densities in currently designated single family and low density residential areas.
K-4 Clearly illustrate the borders of Mozley Park, Maddox Park, Washington Park, Knight Park (and theproposed quarry park) as permanent protected green space on the City of Atlanta’s Map of Neighborhoods.
K-5 Support the redevelopment/revitalization of neighborhood commercial nodes with a focus onmixed-usedevelopments which serve nearby neighborhoods.
455Atlanta Strategic Action Plan September 2007 Draft
K-6 Support the creation of Neighborhood Commercial Nodes around commercial intersections with afocus on retail and mixed-use development serving nearby neighborhoods in NPU-K.
K-7 Encourage and support the rezoning of all I-2 property to a mixed-use classification as deemedappropriate by residents of NPU-K.
K-8 Preserve and protect currently designated green spaces, neighborhood parks and play lots.
NPU L
L-1 Preserve the low-density residential character of the English Avenue and Vine City neighborhoods.
L-2 Preserve the historic integrity of the Vine City neighborhood.
L-3 Consolidate strip commercial uses in order to create a unified development having a minimum numberof curb cuts and turn lanes.
L-4 Maintain the boundaries of commercial, industrial, and institutional uses without encroachment intolow-density residential areas.
L-5 Encourage concentrated, high-intensity, mixed-use development in the Ashby Street Station AreaDevelopment Node.
L-6 Encourage mixed-use development on property that is located between the Vine City Station, MartinLuther King Jr. Drive, and Northside Drive.
NPU M
M-1 Encourage high-density mixed-use development in the commercial areas that are associated withthe Civic Center and Civic Center MARTA Station. Residential uses that are associated with these areasshould be provided at a 1:1 ratio with nonresidential uses.
M-2 Promote the preservation of Castleberry Hill as a loft housing residential use within a commercialdistrict.
M-3 Promote a low-density mixed-used (commercial, office, entertainment, and residential) developmentpattern along Auburn and Edgewood Avenues in the Butler Street/Auburn Avenue neighborhood.
M-4 Preserve the historic integrity of the Fairlie-Poplar, Sweet Auburn, Old Fourth Ward, Terminus, andGrady Memorial neighborhoods, as well as the Castleberry Hill National Register District and the BaltimoreBlock and Martin Luther King Jr. landmark districts.
M-5 Promote the highest density of development in the Central Business District around the MARTAtransit stations: Garnett, Five Points, Dome/GWCC/Philips Arena/CNN Center, Georgia State, PeachtreeCenter, and Civic Center.
September 2007 Draft Atlanta Strategic Action Plan456
Community Agenda4

M-7 Encourage street-level retail uses in order to maximize pedestrian activity and to facilitate vibrant andactive pubic spaces that link neighborhoods with Downtown.
M-8 Promote and expand low- and medium-density residential uses in the Old Fourth Ward neighborhood,emphasizing increased single-family home-ownership.
M-9 Encourage the reuse or redevelopment of vacant, under-utilized, obsolescent, and/or structurallydeteriorated industrial and commercial properties that are associated with the historic railroad corridorsbordering the Butler Street/Auburn Avenue and Old Fourth Ward neighborhoods. Promote mixed-usedevelopments that would increase compatibility with the surrounding residential land uses while generatingmodern industries, businesses, and employment opportunities for center-city residents.
M-10 Control the development of businesses, such as liquor stores, labor pools, and adult entertainmentestablishments as well as social service providers to ameliorate their concentration within the City Centerand encourage their geographic distribution throughout the entire city .
NPU N
N-1 Encourage development in Inman Park consistent with and in support of the specific guidelinesestablished by the Inman Park Historic Designation Regulation adopted by the Atlanta City Council as anordinance entitled 20J, Inman Park Historical District, and the applicable policy statements contained in theDistrict 2 Railroad Corridor Study.
N-2 Maintain the Little Five Points Neighborhood Commercial District (NC-1) boundaries to prevent theencroachment of non-residential uses into surrounding residentially zoned areas.
N-3 Prohibit the expansion of industrial and commercial uses along DeKalb Avenue through Inman Parkand prohibit the expansion of commercial uses at Hurt & Edgewood, at Austin & Elizabeth, at N. Highland& Bernina, at Highland & Colquitt and at Waddell & Edgewood into the existing surrounding residentiallyzoned areas.
N-4 Encourage non-invasive, community sensitive mixed use, development and/or re-development offormerly industrial and commercial property along the DeKalb Avenue corridor through Inman Park, enhancingand encouraging compatibility with the “small-town/downtown” character of the neighborhood.
N-5 Promote the re-zoning of commercial properties along DeKalb Avenue (from Clifton Road east toRidgecrest) to Neighborhood Commercial in order to encourage destination-oriented and pedestrian-friendlyactivity through mixed-use development.
N-6 Maintain all of Poncey-Highland's existing LowDensity Residential zoning designations, and specifically,maintain all Single-Family zoning designations.
N-7 Encourage the redevelopment of the southeast corner of North Highland and North Avenues inaccordance with the Neighborhood Commercial District zoning classification, preserving the existingcommercial building at 599 North Highland Avenue.
457Atlanta Strategic Action Plan September 2007 Draft

N-8 Evaluate, promote & support development of a neighborhood sensitive parking garage within theboundaries of Little Five Points, NC-1, complying with the design guidelines established and included in theNC-1 Ordinance.
N-9 Maintain the Bass Playing Field as open space used for community recreation.
N-10 Discourage “park for hire” surface parking lots within the Inman Park Historic District to insureagainst unsightly and incompatible development.
N-11 Discourage the development of new surface parking lots within the Poncey-Highland neighborhooddistrict.
N-12 Encourage the use of existing neighborhood alleys for parking access to private homes, trash pickupand utility lines. Where and when appropriate, encourage and support such expanded use.
N-13 Encourage that watershed and drainage impacts are afforded equal importance as land use planningand development decisions and other planning functions, such as transportation. Request that thisconsideration take place well before the construction permit stage.
N-14 Encourage the continued development of vacant infill lots in Cabbagetown as single-family andduplex residences compatible in scale and character with the existing fabric of the neighborhood.
N-15 Encourage the development of the Memorial Drive edge of Cabbagetown in keeping with thecommercial nature of the area and in conjunction with the overall vision of the Memorial Drive/MLK DriveRevitalization Plan adopted by City Council 10/1/01 (01-R-0921).
N-16 Encourage development on Memorial Drive between Boulevard and Pearl Street in a mixed-useurban pattern with housing and retail uses and with a maximum building height of 2-3 stories in keepingwith the scale of adjacent residences.
N-17 Encourage development along Carroll Street in Cabbagetown with shops at street level and residentialabove through the continued renovation of mixed-use buildings, the construction of new infill buildings andthe development of the parking area immediately west of Carroll Street, currently owned by Fulton Bag andMill Lofts.
N-18 Encourage redevelopment of the block containing the existing truck yard (Memorial, Estoria, Tye,Pearl and Gaskill Streets) in accordance with the adopted Memorial Drive/MLK Drive Revitalization Planwith particular attention to the context of new development with the adjacent residential structures and thepossibility of extending Chastain Street to provide additional access and sites for residential development.
N-19 Encourage the redevelopment of Pearl Street as an internal neighborhood street of single-familyand duplex housing. New development should be accomplished with sensitivity to both the scale andcharacter of existing single family and duplex structures.
N-20 Encourage and facilitate development within Reynoldstown that is consistent with principals andpolicies outlined in the Reynoldstown Master Plan, adopted by City Council January 16, 2001.
September 2007 Draft Atlanta Strategic Action Plan458
Community Agenda4

N-21 Encourage the development of affordable housing as a high priority in Reynoldstown
N-22 Limit Commercial Zoning to the C-1 classification to eliminate commercial development out of scalewith the Reynoldstown neighborhood.
N-23 Limit development of mixed-use project to parcels zoned for such use.
N-24 Encourage buffering of existing and new residential developments in the Reynoldstown area frommore intensive non-residential development.
N-25 Support mixed-income developments in Reynoldstown.
NPU O
O-1 Preserve the single family and low density residential character of NPU-O.
O-2 Promote transportation oriented development to include:
a.) Promote alternative transportation initiatives.
b.) Discourage the widening of roadways.
O-3 Promote installation of underground utilities.
O-4 Provide landscaped architectural and noise pollution buffers to minimize the impact of non residentialand mixed uses on residential areas.
O-5 Preserve and maintain all watershed buffers at a minimum 75 feet.
O-6 Prevent encroachment of commercial and other uses into single family
and low density residential areas.
O-7 Reject administrative subdivides of parcels less than 10,000 square feet, including lots of record.
O-9 Discourage spot zoning
O-10 Kirkwood Land Use Policies
1. Promote mixed use residential-low density commercial uses of the western side of Rogers Street NE(90-206 Rogers Street NE).
2. Promote the use of 225 Rogers Street NE as greenspace, historical site, and mixed use low densitycommercial and residential.
a. Promote preservation of the original Pratt-Pullman structures as a historical site in the northerlyportion.
459Atlanta Strategic Action Plan September 2007 Draft

b. Promote mixed residential - light commercial uses in the southerly portion of 225 Rogers StreetNE exclusive of greenspace.
c. Promote greenspace use of the eastern margin of 225 Rogers Street NE containing 75’ streambuffer and mixed use path.
3. Promote single family residential uses from 1758-1770 Wade Avenue.
4. Promote higher density commercial and residential uses in the Memorial Drive Corridor from EastsideDrive to Howard Street SE.
a. Promote high density commercial uses of the Renaissance Plaza Shopping Center (“Wayfield’s”)site including 1511- 1655 Memorial Drive and extending south to I-20.
b. Promote very high density residential uses of the area bounded by 1675-1685 Memorial Drive,Maynard Terrace, Clifton Street, and I-20.
c. Promote mixed use residential - low density commercial uses from 1460-1648 Memorial Drive.d. Promote medium density commercial uses from 1674-1770 and 1828-1950 Memorial Drive.e. Promote single family residential use of 1800-1820 Memorial Drive.
5. Preserve single family residential uses in the Memorial Drive Corridor from Howard Street SE to 1stAvenue.
6. Promote medium density commercial uses of the Eastlake MARTA Station Commercial District fromLeland Terrace and Park Place to Clifford Avenue and College Avenue with a maximum height of 3-4stories.
7. Promote low density commercial uses of College Avenue from Rocky Ford Road to Howard Street NE.
8. Inclusion of 2023 Oakview Road SE within NC-3 District and uses.
9. Promote preservation of the following historical structures and sites:
a. Pratt-Pullman Yard original industrial structures, 225 Rogers St. NEb. Bailey’s Hardware, 2161 College Avenuec. Kirkwood School, 138 Kirkwood Roadd. Turner Monumental AME Church, 66 Howard Street, NEe. Israel Baptist Church, 2071 Hosea Williams Drivef. Pentocostal Church of God, 110 Howard Street NEg. Ingram Temple Church of God in Christ, 1953 Hosea Williams Driveh. Fleming Hardware and General Store, 260 Howard Street NEi. Crim High School, 256 Clifton Street SEj. Ice House, 239 Locust Streetk. Clay Family Cemetery, Clifton Street NE
10. Preservation for public park and greenspace uses of the following:
a. Bessie Branham Park, 2051 Delano Drive
September 2007 Draft Atlanta Strategic Action Plan460
Community Agenda4

b. Gilliam Park, 1650 Wade Avenuec. Wesley Coan Park, 1530 Woodbine Avenue, SEd. Eastside Greenway Park, 1807 Dixie Streete. Dekalb Memorial Park, 353 Wilkinson Drivef. Oakview Park, the median of Oakview Road from it’s origin to Rockyg. Ford Road and from Hosea Williams Drive to city limits.h. The Eastside Trolley PATH mixed use trail
11. Implementation of the Kirkwood 2006 CDP Streets, Traffic, and Sidewalks submissions.
12. Implementation of the Kirkwood 2006 CDP Parks and Greenspaces submissions.
O-11 East Lake Land Use Policies
1. Promote mixed use residential and low density commercial uses of the parcels bounded by CottageGrove Avenue S.E., Third Avenue S.E., and Memorial Drive from 2410 to 2450 Memorial Drive.
2. Promote mixed use residential and low density commercial uses in the Memorial Drive Corridor from2411 to 2451 Memorial Drive.
3. Promote mixed use residential and low density commercial uses in the Memorial Drive Corridor from2454 to 2496 Memorial Drive.
4. Promote mixed use residential and low density commercial uses of the parcels comprising theintersection of 2nd Avenue and Hosea Williams Drive including 2358 to 2380 Hosea Williams Drive,2343 to 2373 Hosea Williams Drive, and 50 Second Avenue S.E.
5. Promote mixed use residential and low density commercial uses in the Candler Road Corridor from177 to 367 Candler Road and including 2876 to 2889 Memorial Drive (at Candler Road and MemorialDrive).
6. Preserve current single family residential uses in the Memorial Drive Corridor from 1st Ave SE toCandler Road SE.
7. Promote preservation of the following historical structures and sites:
8. Victorian Residential Structure at 2348 Hosea L Williams Drive (1910)
a. Commercial Structure at SE Corner of 2nd Ave and Hosea L Williams Drive (1935)b. Zaban Community Center, 241 Daniel Ave. SE, East Lake Parkc. 246 Daniel Ave SE (1898 & 1894), Possible Home of Bobby Jones (Charles Watts Meadors
Boarding House)d. 227 East Lake Drive, Scott Hudson Home (Funeral Home, 1924).e. 226 East Lake Drive, Second Shepard Home (1920)f. 236 East Lake Drive, First Shepard Home (1914)
461Atlanta Strategic Action Plan September 2007 Draft

g. 2594 Alston Drive, Dr. Sterling Home (1907)h. 2806 Alston Drive, Bailey Home (1931). First cinderblock home in Atlanta.i. 2704 Alston Drive (1912)j. 2724 Alston Drive, Senkbelt Home (1916)k. 2740 Alston Drive, Watts Gunnl. 2542 Alston Drive (1907)m. 2820 Alston Drive, Fulbright Home (1907)n. 2811 Alston Drive (1910)o. 245 3rd Ave SE, Flanagan Home (1917)p. 2641 Pharr Rd NE (1915)q. 132 East Lake; William T. Gentry House, Inventor of Pay Phone (1910)r. 2720 Memorial Drive; Gentry’s Daughters Home (1912)s. 2740 Memorial Drive; Gentry’s Daughters Home (1910)t. 98 Candler Rd (1900)u. 2898 Salmon Avenue (1924)v. Commercial structure at SE Corner of 2nd Avenue and Hosea Williams Drivew. 249 Club Place (1913)x. 112 East Lake (1925)
8. Preservation for public park and greenspace uses of the following:
a. East Lake Park, including opposing the sale or division of any section of that park.b. Willow Wood Green Space @ North end of intersection of Willow Wood Circle and Roseclair
Drive.c. Promote, expand, and preserve mixed use path connections to other greenspaces and parks in
the area.
O-12 Edgewood Land Use Policies will be based on the “JOINT NPU-O LAND USE POLICIES” above.
NPU P
P-1 Preserve the single-family residential character of NPU P, including the neighborhoods of NiskeyLake, Kings Forest, Heritage Valley, and Ben Hill.
P-2 Encourage residential infill development that is compatible with adjacent development.
P-3 Maintain the boundaries of existing commercial districts, and prevent the encroachment of commercialuses into residential areas.
P-4 Support unified development of the Ben Hill commercial area and its associated community facilities.
P-5 Support the reuse of the existing rock quarry, as is identified in the reclamation plan.
NPU R
September 2007 Draft Atlanta Strategic Action Plan462
Community Agenda4

R-1 Preserve the single-family residential areas of NPU-R, including the Adams Park and SouthwestAtlanta neighborhoods.
R-2 Encourage residential infill development that is compatible with adjacent development.
R-3 Support unified development of the Campbellton Road commercial corridor, including Greenbriar Malland Campbellton Plaza, without encroaching into adjacent residential areas.
R-4 Consolidate strip-commercial uses in order to create a unified development having a minimum numberof curb cuts and turn lanes.
R-5 Support unified development in the Greenbriar commercial area, with an emphasis on concentratedmixed-use development.
R-6 Restrict uses in the industrial land use category to allow business parks only. Such business parksshall include complementary groupings of office, warehousing, distribution, and light manufacturing uses,provided that such light manufacturing activity is limited to the processing or assembly of completed partsor components into finished or semi-finished products. Such uses shall not involve any hazardous materialsor excessive noise, odor, vibration, or other negative impacts. Further, such uses shall exist in a park-likesetting and shall be situated in such a manner as to preclude the occurrence of any adverse impacts onany nearby residential uses.
NPU S
S-1 Preserve the single-family and low-density residential character of the Venetian Hills and OaklandCity neighborhoods.
S-2 Preserve the historic integrity of the Oakland City neighborhood.
S-3 Prevent the encroachment of commercial uses into adjacent single-family and low-density residentialneighborhoods.
S-4 Create opportunities for commercial property owners and merchants to improve their propertiesthrough a uniform and coordinated method that links the character, design standards, and historic natureof the community.
S-5 Install and improve sidewalks throughout the NPU-S neighborhoods including from Oakland CityStation to neighborhoods and Campbellton Road.
S-6 Encourage the rezoning of properties within the NPU that are currently incompatible with residentialuses to a more compatible zoning district.
S-7 Encourage the development of a Neighborhood Commercial Zoning District for the Cascade/Beechercommercial node to promote new high quality retail services to the area.
S-8 Encourage the adoption of local design standards that would enhance the identity of the retailcommunity.
463Atlanta Strategic Action Plan September 2007 Draft

S-9 Improve the pedestrian access by developing and improving sidewalks and streetscapes within theCascade/Beecher commercial node.
S-10 Encourage Mixed-use, economic development attracting more commerce into NPU S.
S-11 Support the development of infill housing that is consistent with the lot coverage, floor-to-area ratio,building height, and wall/fence height of nearby home.
NPU-T
T-1 Preserve the single-family and low-density character of the Westview, Just Us, Ashview Heights, andWest End neighborhoods.
T-2 Promote the orderly expansion of Atlanta University Center and preserve the historic character of theWest End neighborhood.
T-3 Support the expansion of Atlanta University Center colleges in accordance with a master plan to beapproved by the City of Atlanta.
T-4 Encourage the development of concentrated, high-intensity mixed use development in the West EndStation Area Development Node.
T-5 Support the development of street-level retail uses along Ralph D. Abernathy Drive from Lee Streetto Ashby Street.
T-6 Consolidate strip commercial uses in order to create a unified development having a minimum numberof curb cuts and turn lanes.
T-7 Promote medium density residential (0-16 units/acre) development of the Brown High School site ina manner that preserves the historic integrity of the West End neighborhood.
T-8 Promote the residential quality of neighborhoods and foster and assist citizens with homeowneracquisition, rehabilitation/renovation, and sales of real property.
T-9 Support the unified development of the Abernathy commercial district, extending into the Cascadecommercial district to Donnelly Street, without encroaching into adjacent residential areas.
T-10 Support the finalization of redevelopment plans for the Sears Building and the Candler Warehouse.
NPU V
V-1 Preserve and promote the low-density residential character of the Adair Park, Pittsburg, Mechanicsville(south of Georgia Avenue), Summerhill (south of Georgia Avenue), and Peoplestown neighborhoods byencouraging a mix of incomes and housing types in the redevelopment of NPU-V.
September 2007 Draft Atlanta Strategic Action Plan464
Community Agenda4

V-2 Encourage mixed-use and neighborhood commercial development activities in the Georgia Avenue,Ralph David Abernathy Boulevard, Atlanta Avenue, and McDaniel Street (as were proposed in the respectiveneighborhood redevelopment plans) areas in order to reestablish the historical small-town ambiance ofthese areas.
V-3 Retain industrial uses that are compatible with their surrounding development patterns. Providelandscape or architectural buffers in order to minimize their impacts on residential areas.
V-4 Promote and expand low-density mixed-use (commercial, residential, office, and office) developmentpatterns that are compatible with the surrounding residential areas and are located along major transportationroutes.
V-5 Promotemixed-use and commercial development on Capitol Avenue in order to create a vital connectionto the Downtown area.
V-6 Encourage the environmental rehabilitation and reuse or redevelopment of the Candler Warehouse.Promote light industrial, loft housing, and/or office usage of this property.
V-7 Maintain the land-use boundaries that were identified in the redevelopment plan for NPU-V in orderto minimize the adverse effects of special events parking on neighborhoods.
V-8 Promote increased MARTA access to Turner Field (also known as Braves Stadium) in order to reducethe continued need for parking in NPU-V neighborhoods and to enhance the further development of thecommunity.
NPU W
W-1 Preserve the single-family and low-density character of the Ormewood Park, East Atlanta, WoodlandHills, Custer Avenue, McDonough, Guice, Benteen, Boulevard Heights, and Grant Park neighborhoods.
W-2 Preserve the historic integrity of the Grant Park neighborhood and the Oakland Cemetery HistoricDistrict.
W-3 Promote low-density residential development of the Hoke Smith High School property in a mannerthat preserves the historic integrity of the Grant Park neighborhood.
W-4 Encourage mixed use development along the Memorial Drive and Moreland Avenue corridors.Consolidate strip- commercial uses in order to create a unified development pattern having a minimumnumber of curb cuts and turn lanes.
W-5 Maintain the boundaries of the existing commercial uses along Hill Street from I-20 to MemorialDrive. Prevent the encroachment of these uses into adjacent residential areas.
W-6 Support the development of a limited access road from I-20 to the CSX landport facility betweenMemorial Drive and Boulevard. Minimize the adverse impacts of the CSX landport facility on adjacentresidential areas.
465Atlanta Strategic Action Plan September 2007 Draft

W-7 Support and promote the continued commercial revitalization efforts for the East Atlanta businessdistrict.
W-8 Encourage and foster the revitalization of NPU-W by annually reviewing the City’s NPU-W 15-yearRecommended Land Use Map.
W-9 Promote the redevelopment of the Williams Brothers/Blue Circle property north of Glenwood Avenueand east of Boulevard as a mixed housing/retail commercial area. Promote this area as a viable locationfor major grocery and anchor stores, with supporting smaller retail/restaurant businesses. These newcommercial uses should serve to provide an appropriate transition from commercial to adjacent residentialareas.
W-10 Support the adoptive reuse of the facilities comprising the former John B. Gordon School, JohnSlaton School, and Anne E. West School for residential and neighborhood-oriented commercial purposes,and preserve the historically significant components of the structures.
W-11 Encourage the preservation and promote the use of the Entrenchment Creek floodplain as openspace and the site of a 25-acre park and adjacent PDH housing.
W-12 Support a restriction on the siting of impound lots, landfills, municipal trash transfer stations andother similar facilities in NPU-W
NPU X
X-1 Preserve the single-family character of the Capitol View, Capitol Manor, Sylvan Hills, Perkerson andHammond Park neighborhoods.
X-2 Preserve the historic integrity of the Capitol View neighborhood.
X-3 Support unified development in the Cleveland Avenue/I-75 and the Lakewood Freeway/I-75/85/Langford Parkway Interchange areas, with emphasis on concentrated mixed-use development.
X-4 Consolidate strip commercial uses in order to create a unified development having a minimum numberof curb cuts and turn lanes.
X-5 Maintain the boundaries of industrial uses on Murphy Avenue and prevent industrial encroachmentinto adjacent single-family residential areas.
X-6 Encourage the creation and development of a Master Plan for NPU-X.
X-7 Encourage the support of Perkerson Park.
X-8 Encourage and promote low density commercial and neighborhood commercial land uses at thefollowing intersections: Avon at Murphy, Dill Avenue at Murphy, Deckner at Murphy, Birch at Deckner,Lakewood at Murphy and Metropolitan Parkway west side immediately north of Casplan, across from theAtlanta Metropolitan College.
September 2007 Draft Atlanta Strategic Action Plan466
Community Agenda4

NPU Y
Y-1 Preserve the single-family and low-density residential character of the Chosewood Park, High Point,Joyland, Betmar LaVilla, South Atlanta, and Lakewood Heights neighborhoods.
Y-2 Promote the redevelopment of the Lakewood Fairgrounds property as an entertainment/sports center.Preserve the historic fairground buildings.
Y-3 Consolidate strip commercial uses to create a unified development pattern having a minimum numberof curb cuts and turn lanes.
NPU Z
Z-1 Preserve the single-family and low-density residential character of the Thomasville, Norwood Manor,Leila Valley, Rebel Forest, Polar Rock, Lakewood, Orchard Knob, and Pennington Park neighborhoods.
Z-2 Promote the industrial and low-density commercial development of property that is located betweenI-285 and the City Limits that is impacted by airport noise.
Z-3 Promote industrial development east of the existing residential uses on Forest Park Road.
Z-4 Promote commercial development at the I-75/Cleveland Avenue Interchange.
Z-5 Preserve floodplain areas along South River, William’s Creek, and Poole Creek as open space.
Z-6 Consolidate strip commercial uses to create a unified development pattern having a minimum numberof curb cuts and turn lanes.
Z-7 Retain industrial uses. Provide landscaped or architectural buffers in order to minimize the impactsof industrial uses on residential areas.
467Atlanta Strategic Action Plan September 2007 Draft

September 2007 Draft Atlanta Strategic Action Plan468
Community Agenda4

Appendix A Land Use Maps
AAtlanta Strategic Action Plan September 2007 Draft

Appendix B Fact Sheets
Fact Sheet #1
TheTheTheThe
AAAAtlantatlantatlantatlanta S S S Strategictrategictrategictrategic A A A Actionctionctionction P P P Planlanlanlan ASAPASAPASAPASAP
Partial UpdatePartial UpdatePartial UpdatePartial Update
What is What is What is What is the ASAP?ASAP?ASAP?ASAP? Starting this year, the City of Atlanta’s Comprehensive Development Plan (CDP) will be renamed the Atlanta Strategic Action Plan (ASAP)Atlanta Strategic Action Plan (ASAP)Atlanta Strategic Action Plan (ASAP)Atlanta Strategic Action Plan (ASAP). The Atlanta Strategic Action Plan will guide the growth and development of the City, set forth development goals, policies and objectives for the City and its neighborhoods, while framing the future for a successful and prosperous Atlanta. Why a Partial Update?Why a Partial Update?Why a Partial Update?Why a Partial Update? The Bureau of Planning is launching a Partial UpdatePartial UpdatePartial UpdatePartial Update of the 2007 Comprehensive Plan. The State planning agency, the Georgia Department of Community Affairs (DCA), is requiring that the City of Atlanta only adopt a Partial UPartial UPartial UPartial Updatepdatepdatepdate of the 2007 Comprehensive Plan. The full update for the new ASAP will begin later this year. It will be completed and submitted to the Georgia DCA in October, 2009. What does the Partial Update consist of?What does the Partial Update consist of?What does the Partial Update consist of?What does the Partial Update consist of? The Atlanta Strategic Action Plan includes three components: (1) Community Assessment, (2) Community Participation and (3) Community Agenda. The Plan will address the following topics:
• An assessment of the State’s Quality Community Objectives (QCO),
• An analysis of Areas Requiring Special Attention,
• Seven Plan Elements o Population o Economic Development o Housing o Community Facilities o Natural and Cultural Resources o Transportation and o Land Use
• An Implementation Program, and
• The City’s future Land Use Map.
September 2007 Draft Atlanta Strategic Action PlanB
Fact SheetsB
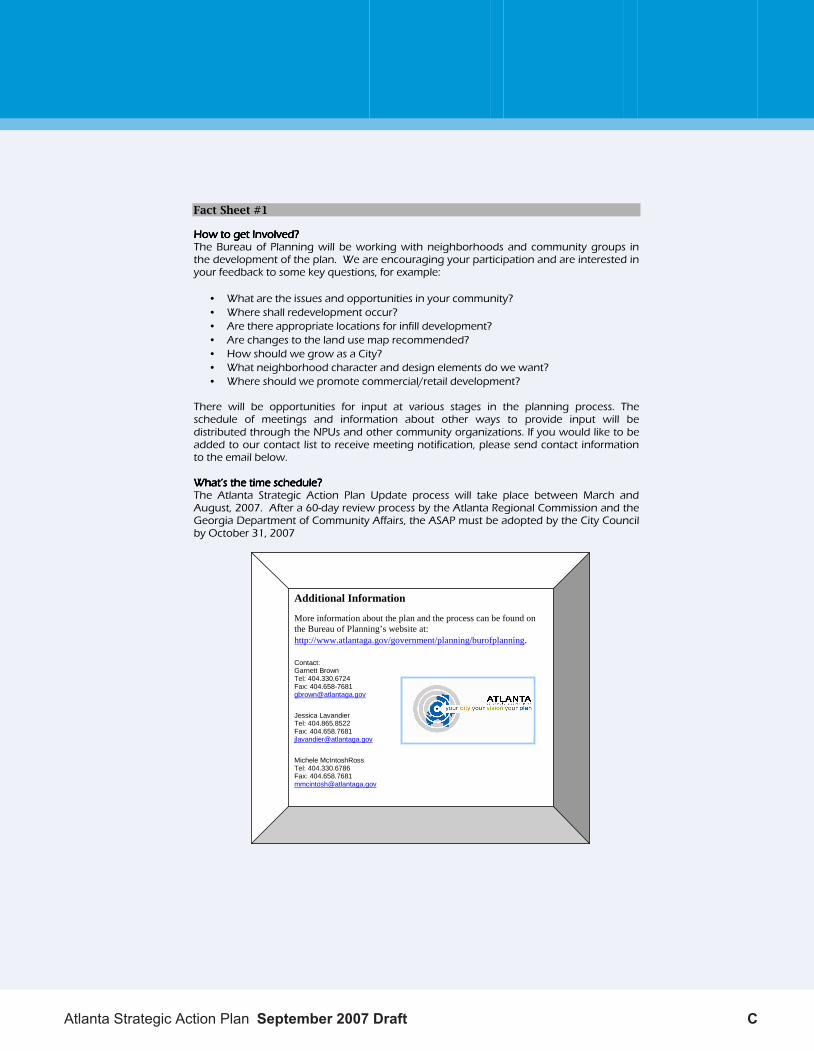
Fact Sheet #1
HowHowHowHow to get Involved?to get Involved?to get Involved?to get Involved? The Bureau of Planning will be working with neighborhoods and community groups in the development of the plan. We are encouraging your participation and are interested in your feedback to some key questions, for example:
• What are the issues and opportunities in your community?
• Where shall redevelopment occur?
• Are there appropriate locations for infill development?
• Are changes to the land use map recommended?
• How should we grow as a City?
• What neighborhood character and design elements do we want?
• Where should we promote commercial/retail development? There will be opportunities for input at various stages in the planning process. The schedule of meetings and information about other ways to provide input will be distributed through the NPUs and other community organizations. If you would like to be added to our contact list to receive meeting notification, please send contact information to the email below. What’s the time schedule?What’s the time schedule?What’s the time schedule?What’s the time schedule? The Atlanta Strategic Action Plan Update process will take place between March and August, 2007. After a 60-day review process by the Atlanta Regional Commission and the Georgia Department of Community Affairs, the ASAP must be adopted by the City Council by October 31, 2007
Additional Information More information about the plan and the process can be found on the Bureau of Planning’s website at: http://www.atlantaga.gov/government/planning/burofplanning.
Contact: Garnett Brown Tel: 404.330.6724 Fax: 404.658-7681 [email protected]
Jessica Lavandier Tel: 404.865.8522 Fax: 404.658.7681 [email protected]
Michele McIntoshRoss Tel: 404.330.6786 Fax: 404.658.7681 [email protected]
CAtlanta Strategic Action Plan September 2007 Draft

Fact Sheet #2 – Population
1
TheTheTheThe
AAAAtlantatlantatlantatlanta S S S Strategictrategictrategictrategic A A A Actionctionctionction P P P Planlanlanlan ASAPASAPASAPASAP
Partial UpdatePartial UpdatePartial UpdatePartial Update
Population Population Population Population Forecasting Sources and Methodsorecasting Sources and Methodsorecasting Sources and Methodsorecasting Sources and Methods
The City of Atlanta Department of Planning and Community Development Bureau of Planning developed 2005-2030 population forecasts using a building permit model. Building permits issued for new housing units are a leading indicator of population growth. This model was calibrated to the 1990 to 2000 US Census. The net new units were obtained from the Bureau of Buildings KIVA permit tracking system and assigned to the corresponding census tract. The net new housing units reflect building unit creations minus demolitions. The net new housing units are added to the previous year's housing units to get each new year's estimate of housing units. From the total housing units are subtracted the number of vacant units to obtain households. Households times average household size yields total household population to which is added group quarters population to get total population. Population gained thru annexations is also added.
The model assumes that there will be a gradual reduction in the number of permits issued reflecting the increasing difficulty in obtaining permits and the decreasing availability of suitable land available for development and redevelopment. From 2000-2006 the actual number of net new housing units permitted was used. From 2007 onwards, the average number of net new housing units was reduced to arrive with new housing units for each year. The tract level growth was driven by the Atlanta Regional Commission forecasting model net unit change after 2010.
Total PopulationTotal PopulationTotal PopulationTotal Population
The City of Atlanta has an estimated 2007 population of almost half a million. It is the 35th largest city in the US based on the 2005 US Census population estimate. In 2005, the US Census Bureau revised population estimate for the City of Atlanta was 483,108, close to the City's population in the 1970s. In
the 1990’s, the City of Atlanta’s population started increasing after several decades of decline. Between 1990 and 2000, the City of Atlanta added 22,457 residents, a growth rate of 5.7%, for a 2000 population of 416,474. Between 2000 and 2005, the City’s population grew by an estimated 66,634 people, a 16% rate of growth. While all areas of the City grew, growth was concentrated in certain parts of the City, particularly Midtown and Buckhead. Based of the City of Atlanta’s population forecast, the City of Atlanta is expected to add almost 300,000 residents by 2030 to a population of 782,952, an increase of
62% (see charts and maps below).
City of Atlanta Population 1850-2035
0
100,000
200,000
300,000
400,000
500,000
600,000
700,000
800,000
900,000
1800 1850 1900 1950 2000 2050
Year
Po
pu
lati
on
September 2007 Draft Atlanta Strategic Action PlanD
Fact SheetsB
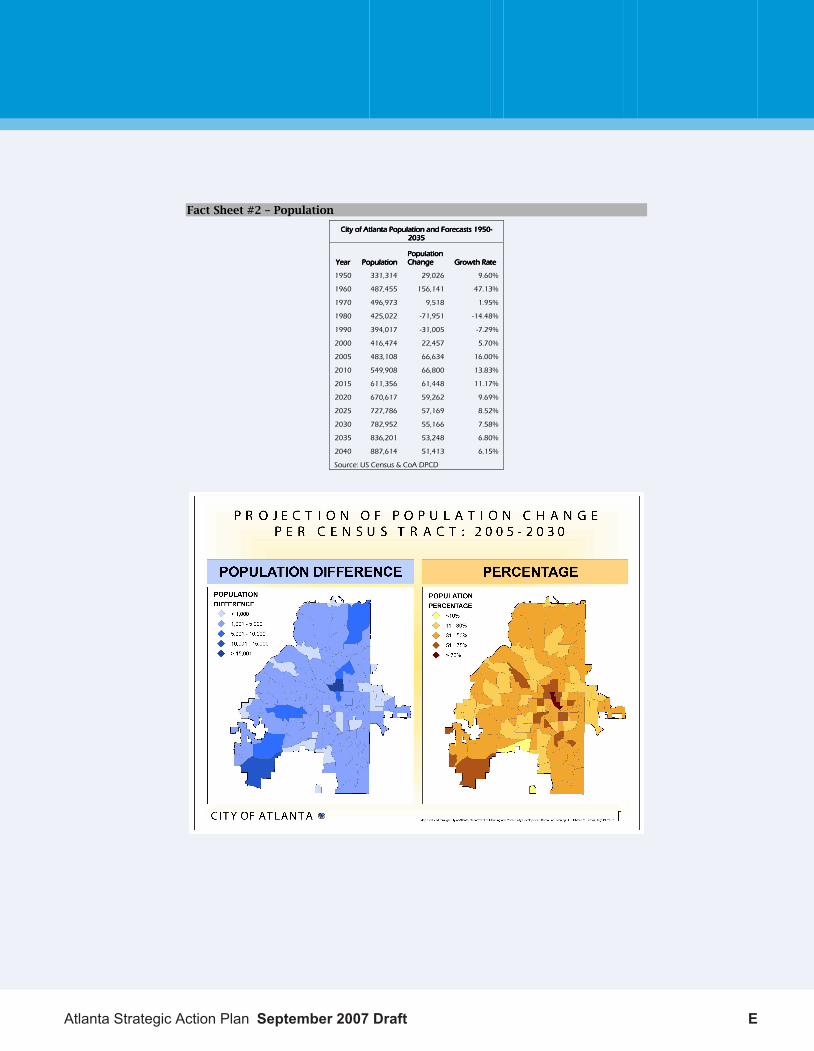
Fact Sheet #2 – Population
City of Atlanta Population and Forecasts 1950City of Atlanta Population and Forecasts 1950City of Atlanta Population and Forecasts 1950City of Atlanta Population and Forecasts 1950----2035203520352035
YearYearYearYear PopulationPopulationPopulationPopulation Population Population Population Population ChangeChangeChangeChange Growth RateGrowth RateGrowth RateGrowth Rate
1950 331,314 29,026 9.60%
1960 487,455 156,141 47.13%
1970 496,973 9,518 1.95%
1980 425,022 -71,951 -14.48%
1990 394,017 -31,005 -7.29%
2000 416,474 22,457 5.70%
2005 483,108 66,634 16.00%
2010 549,908 66,800 13.83%
2015 611,356 61,448 11.17%
2020 670,617 59,262 9.69%
2025 727,786 57,169 8.52%
2030 782,952 55,166 7.58%
2035 836,201 53,248 6.80%
2040 887,614 51,413 6.15%
Source: US Census & CoA DPCD
EAtlanta Strategic Action Plan September 2007 Draft

Fact Sheet #2 – Population
Age DistributionAge DistributionAge DistributionAge Distribution
The City of Atlanta is a young city. The average age of the city's residents is 34.7, younger than the 36.4 average age of the US population. Almost half of the population is between 18 and 44 years old. However, like the US population, the City of Atlanta population is aging. The population is distributed into the following stages of life: Preschool 0-4, School Age 5-7, Family Forming 18-44, Peak Earning 45-64, Younger Seniors 65-84 and Older Seniors 85 & over. Between 2005 and 2030, the percent of the population under 17 will be decreasing. Percent of population 18-44 and 45-64 will also be decreasing. The percent of the population 65-85 will increase to 12.5% and the population over 85 will go up to 2.4%. This trend may indicate that some of the people moving into the city are empty nesters/ retirees and that the population is aging in place and not moving to another area. The distribution of the population by age is shown in the map below.
September 2007 Draft Atlanta Strategic Action PlanF
Fact SheetsB

Fact Sheet #2 – Population
1
Race and EthnicityRace and EthnicityRace and EthnicityRace and Ethnicity According to the American Community Survey, the 2005 racial and ethnic composition of the City of Atlanta is 58.6% Black, 36.2% White, 2.02% Asian and 3.1% are other races or two or more races. Hispanic or Latino (any race) comprises 4.7% of the population. The City of Atlanta racial composition is changing. The black population declined by 8,573 between 1990 and 2000. Between 2000 and 2005, the number of blacks increased by 27,633. However, as a percentage of the population, the percent black decreased from 61.4% in 2000 to 58.6% in 2005. The number and the percentage of whites increased between 1990 and 2000 from 31% to 33.2%. Between 2000 and 2005, the white population increased to 36.2% of the population. If these growth trends continue, between 2025 and 2030, the percent of the population that is white and black will be almost the same. The racial composition of the census tracts in the City of Atlanta are shown in the map below.
For additional information see the Population Chapter of the Atlanta Strategic Action Plan at http://www.atlantaga.gov/government/planning/asap.aspx or contact Jessica Lavandier at 404-865-8522.
GAtlanta Strategic Action Plan September 2007 Draft

Fact Sheet #3 – The Industrial Sector
TheTheTheThe
AAAAtlantatlantatlantatlanta S S S Strategictrategictrategictrategic A A A Actionctionctionction P P P Planlanlanlan ASAPASAPASAPASAP
Partial UpdatePartial UpdatePartial UpdatePartial Update
The Industrial Sector The Industrial Sector The Industrial Sector The Industrial Sector ---- Jobs Jobs Jobs Jobs The industrial sector is an essential component of the City of Atlanta’s economic base. Not only does the industrial sector fuel the growth and development of the City and provides needed services and goods to the City’s residents, visitors and workers, it also provides high paying jobs to the City’s workforce. Moreover, the property taxes collected from industrial uses may off set the cost of providing services to non-industrial uses. Rail access via the CSX & Norfolk Southern’s extensive rail network, high train frequency, the Interstate System with three Interstates through downtown, air cargo facilities at Hartsfield Jackson Atlanta International Airport (HJAIA) and proximity to the Port of Savannah make the City of Atlanta and the Atlanta Region the distribution hub for the Southeastern US. In 2006, almost 64,000 jobs, equal to 15% of all jobs in the City of Atlanta, were in the industrial sector. The numbers of jobs in each of the components of the industrial sector are: construction: 9,716 jobs, manufacturing: 19,372 jobs, wholesale: 18,114 jobs and transportation and warehousing: 18,383 jobs. Moreover, almost 20% or the resident workforce (approximately 38,000 city residents) are employed in the industrial sector. The number of residents employed in each industry is: construction: 10,899, manufacturing: 10,839 wholesale: 5,384 and transportation and warehousing: 10,668. Jobs in the industrial sector pay higher than the average monthly salary of all of the employment sectors. The average monthly salary for industrial sector jobs is $5,463. It is higher than the citywide average of $4,895. Within the industrial sector, the average monthly salaries are: construction: $4,697, manufacturing: $7,457, wholesale: $ 6,607 and transportation and warehousing: $3,092. Industrial Sector Industrial Sector Industrial Sector Industrial Sector ---- Issues Issues Issues Issues Industrial business and uses face obstacles in the City of Atlanta. Some of these are:
• Older buildings, many with low ceiling height that do not meet today’s needs; • Small parcel sizes – 2.6 avg; • High costs of land, development/redevelopment, cost of doing business and high rental rates; • Safety and security concerns from employers; • Loss of industrial businesses - a healthy mix of industrial uses are needed to stay competitive; • Lack of places to eat and shop for employees; • Transportation network does not meet current needs;
– Road conditions and geometry are difficult for trucks (Bolton Rd., Howell Mill Rd.) – Not in proximity to MARTA
• Industrial land needed for Operational Departments; • Issues with the Community (no vote at NPU, no advocate for Industrial users, image problem); • Changing Land Use :conflicts with residential uses and loss of industrial land uses.
Industrial Industrial Industrial Industrial LanLanLanLand Use and Zoningd Use and Zoningd Use and Zoningd Use and Zoning Industrially zoned land is concentrated along the rail corridors, in Northwest Atlanta, along the proposed BeltLine and south of downtown, and along the cargo entrance at HJAIA in Southeast Atlanta. Ten percent, or 8,776 acres, of the City’s land is zoned industrial. However, since 2000, 10% or 950 acres of industrially zoned land, has been rezoned to other uses (see map below).
September 2007 Draft Atlanta Strategic Action PlanH
Fact SheetsB

Fact Sheet #3 – The Industrial Sector
Approximately 7,246 acres, or 8.5% of all land, are designated as Industrial in the Land Use Map. Since 2002, 1,040 acres, or 14%, have been re-designated from Industrial to another use (see map below). Once an industrially zoned parcel is not designated as industrial, the parcel can be rezoned for non-industrial uses. Some of the re-designations are the result of various plans such as the Westside LCI and the Bolton/Moores Mill LCI.
IAtlanta Strategic Action Plan September 2007 Draft

Fact Sheet #3 – The Industrial Sector
Initiatives to Preserve Industrial UsesInitiatives to Preserve Industrial UsesInitiatives to Preserve Industrial UsesInitiatives to Preserve Industrial Uses In an effort to retain industrial uses, the City of Atlanta and the Atlanta Development Authority are undertaking several initiatives to develop an Industrial Policy. These are: Land Use and Zoning
• Strengthening the Land Use Policies in the Comprehensive Plan (ASAP).
• Considering a moratorium on land use changes on parcels designated Industrial.
• Limiting changes on parcels designated as Industrial in the Land Use Map.
• Re-evaluating previous changes to land use map and UEZ sites.
• Creating a Business Park Land Use category.
• Developing urban design guidelines for industrial uses that include buffers and transitional uses. Annexation/Acquisition of Industrial land:
• Evaluating annexation of industrially zoned property: Honor Farm, Fulton Industrial Boulevard, closed City landfills, Georgia Power Plant McDonough.
Operating Departments:
• Evaluate co-locating City facilities with other industrial uses
• Adopting design guidelines/standards for the City’s facilities.
September 2007 Draft Atlanta Strategic Action PlanJ
Fact SheetsB

Appendix C Community Meeting CommentsApril 30, 2007
The April 30, 2007 Community Meeting was held at the Rosel Fann Recreation Center at 365 ClevelandAve. The meeting was held for the Eastside (NPUs N. O &W), Intown South (NPUs T,V & S) and Southside(NPUs X, Y & Z) study areas. Approximately 34 people attended the meeting. The comments from themeeting are listed below.
Economic Development
Concern over the loss of industrial base. Industrial sector provides good jobs for those without a collegeeducation.
Housing
Concern over the loss of housing stock and affordable housing.New mixed income communities don’t have enough housing for low income/displaced residents.
Community Facilities
Construction of housing outpaces availability of infrastructureDon’t wait for development to build infrastructureCost of land is increasing, hard to buy land
Historic Resources
Show recent designated buildings on map Excelsior Mill, Telephone factory, Ford Factory, Troy Perless.Could you show potential historic buildings on the map?Worried about the demolition of older homes, often replaced with larger homesList historic landmarks (cemeteries) to educate communityDevelop policy to document historic sites – city and state should work together to catalog sites.
Transportation
Need to preserve/set aside land for future R-O-W.Zoning recommendations don’t address accessibility. Need more access curbs, particularly mid-block.Traffic calming: use 4 way stops, flashing yellow lights, traffic lights should be set to calm traffic.The City has neglected its rail road.Traffic lights seem to favor east/west movement over north/south.Need better planning for the disabled
Planning process
When does the input from residents get implemented?
KAtlanta Strategic Action Plan September 2007 Draft

Why do new plans when current needs aren’t addressed?Is BoP adequately staffed to do the comprehensive plan?Are there plans to train community members?
Maps
Is the historic resources building on line?Could BoP mail site maps along with Land Use maps to NPUs
May 3, 2007
The May 3, 2007 Community Meeting was held at the Peachtree Hill Recreation Center at 308 PeachtreeHills Road. The meeting was held for the Northside (NPUs A, B, C & D) and Northeast (NPUs E, F & M)study areas. Approximately 17 people attended the meeting. The comments made at the meeting aresummarized below.
Natural Resources
Code enforcement needs to be increased to monitor erosion control. Should have bigger fines andstronger/aggressive enforcement.Is a stormwater utility being considered?
Community Facilities
Should have separate funding source for parks. Funds are available for planning but not forimplementation.Many neighborhoods have submitted plans with previous CDPs, however, the plans are not implementedand the projects don’t move forward.
Transportation
Bicycle facilities conflict with traffic calming measures.City of Atlanta needs a better mass transit system.Impact fee delivery area should be established so that impact fee funds are spent in area where impactfees are collected.Concerned over streets being narrowed.
Land Use
Need to protect single family neighborhoods.
Planning process
Will the ASAP include NPU plans?How will NPUs provide input in the planning process?
September 2007 Draft Atlanta Strategic Action PlanL
Community Meeting CommentsC

May 10, 2007
TheMay 10, 2007 Community Meeting was held at the Adamsville Recreation Center at 3201 Martin LutherKing Jr. Dr. The meeting was held for the Northwest (NPUs G, J, K & L) and Southwest (NPUs H, I, P, Q& R) study areas. Approximately 33 people attended the meeting. The comments made at the meeting arebelow.
Housing
What is the difference between affordable and workforce housing?It is difficult for a single person to find reasonably priced housing.Rent for apartments are as high as cost of a home.
Natural Resources
Concern over the loss of tree canopy. Why are sites cleared cut for development while homeownershave difficulty obtaining a permit for removing trees on their parcel?The Tree Ordinance should protect tree canopy from development process. Minimum amount of treesnecessary for development should be removed instead of removing all trees from a site that will bedeveloped.Need conservation subdivision.
Community Facilities
City of Atlanta seems to be interested in purchasing parks along Beltline and along streams (WatershedMgmt) and not interested in purchasing land next to an existing park.
Transportation
What is the process of obtaining traffic calming funds?Traffic calming/street humps make vibrations of MARTA buses worse. Should have smaller MARTAbuses.Do citizens have to pay for speed humps?Why is CoA not focusing on Marietta st./Blvd/Perry/Hollywood Rd?
Land Use
Concerned that ZRB overturns decisions of NPUs
Planning process
What happens to LCI plans, how are they incorporated?How can one obtain a copy of the recommendations?
July 17, 2007
MAtlanta Strategic Action Plan September 2007 Draft

The July 17, 2007 Community Meeting was held at the Rosel Fann Recreation Center at 365 ClevelandAve. The meeting was held for the Eastside (NPUs N. O &W), Intown South (NPUs T,V & S) and Southside(NPUs X, Y & Z) study areas. Approximately 31 people attended the meeting. The comments from themeeting are listed below.
Transportation
Transportation in the city is not world class
Housing
Speculative new housing is boarded up when it is not sold. This creates public safety concern.Could a moratorium be placed on permitting new housing until the existing vacant new homes aresold?Quality of new construction appears to be poor.Affordable HousingQuality of newly-build homes in Southeast AtlantaFew new affordable housing units being builtHousing costsHousing costs seem to be inflatedNeed for design standards for multifamilyCode enforcement of homes that are in neglectVacant housingDefinition of sustainability
Aging Population
Assistance for older residents living in historic neighborhoodsSenior housingNew developments not designed for needs of seniorsSenior Tax abatementNeed incentives to build senior housingConcern over seniors being pushed out of AHA
Economic Development
Jobs/EmploymentsNeed Jobs for Students with DebtHigh drop out rateNeed jobs for a changing populationTrain students to be better citizens
Development
September 2007 Draft Atlanta Strategic Action PlanN
Community Meeting CommentsC

Building code overhaulPre-purchase agreements before developers buildWest End needs updated design standards, in kind doesn't match existing materialsConcerned that Lakewood buildings not protected in RFPImprove fire code
Historic Preservation
Historic ResourcesNew housing sticks out in West EndCan overlays be done instead of historic designations?
Greenspace
Need Funding for greenspace
July 19, 2007
The July 19, 2007 Community Meeting was held at the Peachtree Hill Recreation Center at 308 PeachtreeHills Road. The meeting was held for the Northside (NPUs A, B, C & D) and Northeast (NPUs E, F & M)study areas. Approximately 11 people attended the meeting. The comments made at the meeting aresummarized below.
Population
Low income citizens dispersed to other areas where there is lack of transportation/GradyExplanation of how population numbers were derived on website?
Transportation/Transit
Problem with the suburban buses that crowd downtown streets when staging before dropping or pickingup passengersWho’s really paying for MARTA?
Greenspace
Problems with COA & GA Power cutting down trees-we need a reason whyWho do you call to stop this and is it against the lawDifferentiate between Open Space and GreespaceInitiative to connect developers to greenspaceGreenspace needs its own category
Land Use
Definition of single-family neighborhood
OAtlanta Strategic Action Plan September 2007 Draft

Are we going to implement trust fund of SPI-16?Need to develop several mixed use districts
Housing
Closing of Roosevelt & Palmer HousesSenior housing priority over those with disabilitiesBedford Pines has 722 units of affordable housing74 Section 8 properties near the Old Fourth Ward districtLack of senior housing
Public Participation
City Council wants to hear from citizens—communication makes a difference
Community Facilities/Solid Waste
Who is doing the oversight?Waste Storage facilitiesTransfer stations (future of)Recycling for multifamily units
July 25, 2007
The July 25, 2007 Community Meeting was held at the Adamsville Recreation Center at 3201 Martin LutherKing Jr. Dr. The meeting was held for the Northwest (NPUs G, J, K & L) and Southwest (NPUs H, I, P, Q& R) study areas. Approximately 24 people attended the meeting. The comments made at the meeting arebelow.
World Class City:
We have 3 research universities – add institutions to that list, AUC counts too.
Land Use
Industrial Land Use Policy – has it been identified?We need to have a spine and not give up our industrial line.In the FLUM, we need more residential land use categories. We need to be able to set densities above17 units per acre.C4and C5 needs to be gone.If the FLUM doesn’t reflect existing uses, should we make requests for changes? How can we have aFLUM that doesn’t reflect existing uses?
Housing:
September 2007 Draft Atlanta Strategic Action PlanP
Community Meeting CommentsC

We have no affordable housing policy. How can you plan without a policy? We see so much housing goingup, who are these houses for? Why are they not affordable? Where do you plan to put this affordablehousing? We’re filled up, every nook and cranny.
Define “affordable”, because $100,000 isn’t affordable for me or my neighbors.We need a citywide discussion of residential housing density. WE need to put it where WE want it.These new homes going up will last for 10 years. Then what?What is the residential scale ordinance?Westlake neighborhood is being destroyed. We need to renovate existing houses before we createnew affordable housing. Homes are just sitting vacant.Why aren’t we building out of brick? It lasts longer.
Population:
What number are we actually shooting for? It will determine densities.
Process:
It’s OUR city, we need to take the data and present it to council. YOU’RE currently taking that dataaway from us and determining the plan by yourselves.You've taken the pride of authorship. A few people are making all the plans.Redo the ASAP each year, take a particular section and redo it. Parks year one, Transportation yeartwo, etc. And use the neighborhoods, not consultants.
Development:
If we give away density, as an incentive, we’re not considering the increase use of that infrastructure.If its too hard for a developer to build somewhere, let them leave. They don’t need any incentives.We need traffic studies required for new development. Our roads are of poor construction andinfrastructure is bad. The weight of the vehicles is too much.Developers need to work with Public Works to get appropriate permits.Development is driven by population forecast. Are we doing anything to lower our population forecastsand slow down development?
Subdivisions:
Subdivisions are being built, the streets flood, and nothing is done.We shouldn’t give out new permits until what is wrong is fixed.R4 zoning is a problem for subdivisions. They clear cut the trees and create run off. We need a wayto make sure developers can develop only a certain percentage of the site.Add tree replacement to the plan, but still they won’t mature for another 10+ years.When do developers have to meet with the community? I didn’t get a chance to approve my neighborslot addition.We need to look at building permits more. Houses are being built in flooded areas. Its only fair tocitizens.
QAtlanta Strategic Action Plan September 2007 Draft

Parks:
Designate new areas for open space to save our trees. Protect from development.
Community Facilities:
Why isn’t health included? Medical facilities?
September 2007 Draft Atlanta Strategic Action PlanR
Community Meeting CommentsC

Appendix D Population
Table D.1 Census Tracts Included in each NPUCensus TractsNPU
97.00, 98.00, 99.00, 102.06 and 102.07NPU A
93.00, 94.01, 94.02, 95.00, 96.00 and 100.00NPU B
89.01 and 90.00NPU C
88.00 and 89.02NPU D
4.00, 5.00, 6.00, 10.00, 11.00, 12.00, 13.00, & 91.00NPU E
1.00, 2.00, 14.00, 15.00, 92.00, & 201.00NPU F
86.01, 86.02, 87.01, & 87.02NPU G
78.05, 78.06, 78.07, 78.08, & 82.02NPU H
79.00, 80.00, 81.01, 81.02 & 82.01NPU I
83.01, 83.02 & 85.00NPU J
7.00, 23.00, 24.00, 40.00 & 84.00NPU K
8.00, 22.00, 25.00 & 26.00NPU L
17.00, 18.00, 19.00, 21.00, 27.00, 28.00, 29.00, 33.00, 35.00 & 36.00NPU M
16.00, 30.00, 31.00, 32.00, 202.00, 203.00 & 204.00NPU N
8.00, 22.00, 25.00 & 26.00NPU O
77.02, 78.02 &103.03NPU P
76.02 & 77.01NPU R
61.00, 62.00, 66.02, & 76.01NPU S
37.00, 38.00, 39.00, 41.00, 42.00, 43.00 & 60.00NPU T
44.00, 46.00, 48.00, 55.01, 56.00, 57.00, 58.00 & 63.00NPU V
49.99, 50.00, 52.00, 53.00, 69.00 & 209.00NPU W
65.00, 66.01, 74.00, 75.00 & 108.00NPU X
52.02, 64.00, 67.00 & 68.01NPU Y
68.02, 70.01, 70.02, 71.00, 72.00 & 73.00NPU Z
Table D.2 City of Atlanta 2000-2035 Population Forecasts by Census Tract20352030202520202015201020052000Share inCensus
PopulationPopulationPopulationPopulationPopulationPopulationPopulationPopulationAtlantaTract
6,9556,3985,7665,1524,5094,4054,2964,153100.00%1.00
7,0286,7756,3796,0715,8975,7255,6435,448100.00%2.00
4,1823,8453,4883,2502,8312,3782,0001,670100.00%4.00
14,55713,52012,87911,90910,6999,1557,1463,705100.00%5.00
5,1134,6954,1713,9323,5233,2433,1672,707100.00%6.00
SAtlanta Strategic Action Plan September 2007 Draft

20352030202520202015201020052000Share inCensus
PopulationPopulationPopulationPopulationPopulationPopulationPopulationPopulationAtlantaTract
5,2514,9924,7664,4643,9973,4333,4873,551100.00%7.00
5,8845,6465,4025,0724,7594,5883,2421,564100.00%8.00
41,00437,26133,63729,55425,51820,18115,9219,223100.00%10.00
6,8986,4346,3626,1475,4544,4203,3652,569100.00%11.00
10,2639,8069,3958,8448,6787,9836,0114,195100.00%12.00
5,9115,6035,1354,5954,5384,2984,1933,897100.00%13.00
2,9532,8602,8332,7962,6272,4252,3372,130100.00%14.00
5,4585,3025,1995,0984,8664,4894,4124,206100.00%15.00
2,9642,7382,6412,5212,2201,7881,6481,390100.00%16.00
6,1965,8345,3244,6574,4474,1373,4082,506100.00%17.00
5,2775,0804,9734,7424,5364,0523,8333,553100.00%18.00
6,5975,8185,2824,7084,0452,8042,2732,121100.00%19.00
9,2768,1107,0505,9054,5662,5681,7451,573100.00%21.00
3,3382,9252,6482,3451,8821,2121,1631,105100.00%22.00
4,5844,2813,8693,5933,2112,9782,8352,714100.00%23.00
4,2163,9673,6653,2263,0252,8892,7272,467100.00%24.00
4,1473,8093,4493,1092,7182,2621,7641,981100.00%25.00
2,7192,4722,1321,8621,6541,4941,3791,378100.00%26.00
3,9173,3772,8312,1611,541776684587100.00%27.00
6,6526,0965,5324,6134,0693,4883,0552,859100.00%28.00
4,6154,2143,9733,7003,3922,8572,0671,333100.00%29.00
4,9454,8134,7464,6194,5574,3823,2281,968100.00%30.00
3,4723,2933,0562,8452,6662,4992,1631,626100.00%31.00
3,5503,2933,0752,8582,6322,3121,9481,498100.00%32.00
5,0324,5244,1563,7563,1382,3262,8102,499100.00%33.00
6,1775,6884,9674,4914,0783,5803,6783,710100.00%35.00
2,7902,6272,5662,5142,4072,0951,5821,502100.00%36.00
2,4772,3132,0891,8701,6841,5501,5131,432100.00%37.00
3,5623,3883,1442,8702,6882,7342,4702,273100.00%38.00
4,2143,9213,5703,1502,7502,5802,5292,426100.00%39.00
5,0614,7064,3113,8953,5103,2143,2043,166100.00%40.00
4,3794,1433,7913,4003,2653,1342,9552,565100.00%41.00
6,3285,7285,3594,8924,1483,1792,8162,493100.00%42.00
7,5376,9926,9196,7176,1584,5172,3802,770100.00%43.00
September 2007 Draft Atlanta Strategic Action PlanT
PopulationD

20352030202520202015201020052000Share inCensus
PopulationPopulationPopulationPopulationPopulationPopulationPopulationPopulationAtlantaTract
4,0143,7123,4443,1502,7992,3801,9571,717100.00%44.00
2,3202,1642,0341,8851,7261,5361,4851,156100.00%46.00
6,3065,4833,3673,1282,8932,5692,0282,259100.00%48.00
5,8045,1834,6784,0493,1692,5131,8092,041100.00%49.00
3,6133,3553,1232,8762,5812,1832,0291,921100.00%50.00
6,9156,5406,2675,8735,4364,7664,1403,475100.00%52.00
4,3314,1994,1384,0953,9683,6933,3892,892100.00%53.00
5,7615,3134,8544,2743,7543,4513,0332,368100.00%55.01
4,4033,9763,6243,2972,8612,2671,5421,229100.00%55.02
2,9682,8502,7072,5552,4662,3722,0391,674100.00%56.00
3,8453,6303,4803,2553,0482,8121,7521,382100.00%57.00
4,1103,8443,5493,2212,8672,6662,3432,230100.00%58.00
6,0255,7535,3034,9894,7084,5664,4594,263100.00%60.00
6,3716,0455,4865,1044,8094,6444,5344,326100.00%61.00
3,4263,1422,7982,4422,0871,8561,7491,614100.00%62.00
4,8614,4354,1133,7283,2662,7052,2681,879100.00%63.00
5,3985,0244,5483,9243,4353,3663,1892,972100.00%64.00
6,4586,2025,7545,4035,1945,1374,9274,674100.00%65.00
4,4594,1363,7263,2402,7722,6842,5812,425100.00%66.01
2,6602,4442,1651,8901,6251,4941,4711,405100.00%66.02
8,7888,2717,7627,2296,7086,2404,7643,893100.00%67.00
5,2654,7414,1333,5802,3742,2792,2542,648100.00%68.01
3,5363,2572,9182,4552,0512,0101,9691,896100.00%68.02
8,0257,6007,2386,7366,1615,7384,6343,302100.00%69.00
8,4227,9327,3566,7295,9505,6505,2574,971100.00%70.01
8,1407,6677,0116,3785,8975,5515,0524,584100.00%70.02
8,5097,8477,1886,0255,0904,8304,0863,923100.00%71.00
6,6046,2235,6865,1334,7784,6854,3134,162100.00%72.00
14,42313,70612,84311,92310,88610,3889,3287,396100.00%73.00
5,6455,4025,0114,5454,1934,2384,1864,158100.00%74.00
5,5075,3545,1605,0214,8514,7694,4703,79999.08%75.00
8,4988,3538,1137,9667,8617,6797,4896,973100.00%76.01
4,9864,6224,2593,8663,4973,0803,0132,848100.00%76.02
19,13217,61916,28914,84313,08611,00210,1598,32896.33%77.01
UAtlanta Strategic Action Plan September 2007 Draft

20352030202520202015201020052000Share inCensus
PopulationPopulationPopulationPopulationPopulationPopulationPopulationPopulationAtlantaTract
21,17019,89718,67217,59316,09014,3139,0697,14691.75%77.02
8,7798,1897,6007,0376,4575,7084,2032,46036.90%78.02
3,7483,6033,4083,2673,1782,9652,8492,60062.41%78.05
8,9368,5077,8337,3296,7676,4026,0285,24199.95%78.06
6,8186,3535,7475,2144,7654,1813,9923,610100.00%78.07
6,4076,0775,6595,1904,7524,5834,3664,016100.00%78.08
10,1349,5248,8508,2047,5606,9616,1194,24597.34%79.00
8,0867,7207,1126,7186,3686,0925,9885,728100.00%80.00
2,4332,2041,9441,6651,3751,1761,1571,121100.00%81.01
14,20113,20312,20711,21410,1328,9018,1396,579100.00%81.02
8,8368,5318,0027,7727,5497,2806,0625,713100.00%82.01
7,7457,2226,5615,8925,2214,6914,5874,344100.00%82.02
7,0126,5105,8085,1134,4924,2534,0843,844100.00%83.01
5,5385,0764,5484,0193,5733,1433,0052,813100.00%83.02
8,0017,4786,7936,1255,4935,2735,2665,410100.00%84.00
8,7808,2197,5546,8346,0485,7235,2854,798100.00%85.00
9,2678,9238,5388,0107,7027,2926,4315,811100.00%86.01
7,9087,3496,8886,7296,0945,0614,5263,625100.00%86.02
2,4452,2792,1191,9301,7531,559975326100.00%87.01
5,9365,7955,5745,4155,3485,2704,8034,085100.00%87.02
9,8989,2988,9368,4197,7206,8685,0902,972100.00%88.00
8,8638,6968,4768,2988,0877,9127,7777,399100.00%89.01
7,7777,6307,5567,4577,3417,0195,9844,859100.00%89.02
6,8786,3935,7605,0374,5274,3214,0203,602100.00%90.00
13,05712,29311,47110,5869,8188,8767,5437,235100.00%91.00
8,9528,3447,7747,0116,2765,4944,4014,055100.00%92.00
7,7597,4647,1236,8086,5306,1665,3454,751100.00%93.00
11,26110,59810,3059,9119,2107,8716,9686,078100.00%94.01
7,5037,3587,2246,9666,6096,2354,5704,172100.00%94.02
12,47311,99311,76411,44810,7969,6268,7447,539100.00%95.00
17,68916,90816,16415,37114,57713,47511,5208,564100.00%96.00
9,0598,1737,1095,7824,6594,2184,1203,930100.00%97.00
13,36612,41711,20010,0279,1418,4108,0747,62498.84%98.00
9,8358,9437,8876,6465,5064,8434,7074,491100.00%99.00
September 2007 Draft Atlanta Strategic Action PlanV
PopulationD

20352030202520202015201020052000Share inCensus
PopulationPopulationPopulationPopulationPopulationPopulationPopulationPopulationAtlantaTract
19,67418,38617,40816,00314,44712,5619,8147,67491.44%100.00
1501481471451431401371330.99%101.01
17161514131111110.22%102.06
1,5211,4471,3321,2461,1561,1291,0851,03510.40%102.07
6,2155,6174,9364,2193,4372,9112,3461,71029.25%103.03
1051019692518879540.90%113.01
2,4122,2552,2002,0901,9441,5511,5451,48974.72%201.00
3,0562,9042,7892,6862,5312,1752,2802,198100.00%202.00
4,6404,4584,2444,1504,0303,7873,5973,257100.00%203.00
2,9722,8832,7572,6642,6462,5372,4112,124100.00%204.00
4,6614,5204,3584,1834,0683,8933,5663,203100.00%205.00
3,8723,7423,6123,5153,4763,1902,8472,167100.00%206.00
4,6124,3294,1483,9123,5943,1112,8572,619100.00%207.00
5,0504,7394,4344,1213,7223,2333,0592,714100.00%208.01
6,6446,1625,8655,5174,8594,0233,8293,560100.00%208.02
9,0378,7608,6198,3087,9977,4777,0726,440100.00%209.00
444444440.00%224.03
836,201782,952727,786670,617611,356549,908483,108416,474Total:
Table D.3 City of Atlanta 2000-2035 Population Forecast Change by Census Tract30-3525-3020-2515-2010-1505-1000-05%Hsg.Units
PopulationPopulationPopulationPopulationPopulationPopulationPopulationShare inCensus
ChangeChangeChangeChangeChangeChangeChangeAtlantaTract
556632614643103109143100.00%1.00
25339630817417282195100.00%2.00
337357238420452378330100.00%4.00
1,0376419691,2111,5432,0093,441100.00%5.00
41952423840928076460100.00%6.00
259226301468563-54-64100.00%7.00
2382433313131701,3471,678100.00%8.00
3,7433,6244,0834,0365,3384,2606,698100.00%10.00
464712156931,0341,055796100.00%11.00
4564125511666951,9721,816100.00%12.00
30846854057240105296100.00%13.00
93273717020288207100.00%14.00
WAtlanta Strategic Action Plan September 2007 Draft

30-3525-3020-2515-2010-1505-1000-05%Hsg.Units
PopulationPopulationPopulationPopulationPopulationPopulationPopulationShare inCensus
ChangeChangeChangeChangeChangeChangeChangeAtlantaTract
15510410123237678206100.00%15.00
22697119301432140258100.00%16.00
362510667209310728902100.00%17.00
197106231206484219280100.00%18.00
7795365746631,241530152100.00%19.00
1,1661,0601,1461,3381,998823172100.00%21.00
4142763034646704858100.00%22.00
303412276382233143121100.00%23.00
249302440201136161260100.00%24.00
338359340391457497-217100.00%25.00
2473402702081601151100.00%26.00
5395466716207659297100.00%27.00
556564919544581433196100.00%28.00
401241274308535789734100.00%29.00
13267127621751,1541,260100.00%30.00
179237211179168336537100.00%31.00
257218217225321364450100.00%32.00
508368400619812-484311100.00%33.00
489721476413498-98-32100.00%35.00
163615210731251380100.00%36.00
1642232191861343781100.00%37.00
175244274181-45264197100.00%38.00
29335142039917051103100.00%39.00
3553954163852961038100.00%40.00
236352391136130180390100.00%41.00
600369467744969363323100.00%42.00
545732025601,6412,138-390100.00%43.00
302268293351419423240100.00%44.00
15613015015919052329100.00%46.00
8232,116239235324541-231100.00%48.00
621505629880656704-232100.00%49.00
258232247295398155108100.00%50.00
375273394437671626665100.00%52.00
September 2007 Draft Atlanta Strategic Action PlanX
PopulationD

30-3525-3020-2515-2010-1505-1000-05%Hsg.Units
PopulationPopulationPopulationPopulationPopulationPopulationPopulationShare inCensus
ChangeChangeChangeChangeChangeChangeChangeAtlantaTract
1326243127275304497100.00%53.00
448460579521302418665100.00%55.01
427352327436594724313100.00%55.02
1181431528894333365100.00%56.00
2151502252072351,060370100.00%57.00
266295328354201323113100.00%58.00
272450314281142108196100.00%60.00
326559382295165110208100.00%61.00
284345356355231107135100.00%62.00
426322385463561437389100.00%63.00
37447662448969177217100.00%64.00
25644835220956210253100.00%65.00
32341048646788103156100.00%66.01
2162792752651312366100.00%66.02
5175095335214691,475871100.00%67.00
5246085531,2069425-394100.00%68.01
280339463404414173100.00%68.02
4253635015754231,1051,332100.00%69.00
490576627779300393286100.00%70.01
472656633481346499468100.00%70.02
6626591,163934260744163100.00%71.00
38153755335692373151100.00%72.00
7168639201,0374991,0601,932100.00%73.00
243392466352-455228100.00%74.00
1531941391708129967199.08%75.00
145240146106182190516100.00%76.01
36436339336941766165100.00%76.02
1,5131,3301,4461,7582,0848431,83196.33%77.01
1,2731,2241,0801,5031,7775,2441,92391.75%77.02
5905895635807491,5041,74336.90%78.02
1451961408921311624962.41%78.05
42967450456236537478799.95%78.06
465606534448584189382100.00%78.07
YAtlanta Strategic Action Plan September 2007 Draft

30-3525-3020-2515-2010-1505-1000-05%Hsg.Units
PopulationPopulationPopulationPopulationPopulationPopulationPopulationShare inCensus
ChangeChangeChangeChangeChangeChangeChangeAtlantaTract
330417470438169218350100.00%78.08
6106746466455988431,87497.34%79.00
366608394350276104260100.00%80.00
2292612782902001936100.00%81.01
9999959931,0831,2317611,560100.00%81.02
3055292302232691,218349100.00%82.01
523661669671530104243100.00%82.02
502702695620240169240100.00%83.01
463527530446430138192100.00%83.02
5236856686322207-144100.00%84.00
561665720785326438487100.00%85.00
344385528308410860620100.00%86.01
5584611596351,033535901100.00%86.02
166160189177193585649100.00%87.01
1422211596778468718100.00%87.02
6003625176998521,7772,118100.00%88.00
167219178211175136378100.00%89.01
14775991163221,0351,125100.00%89.02
484634722510206301418100.00%90.00
7648228857689421,333308100.00%91.00
6075707637367821,093346100.00%92.00
295342314278365821594100.00%93.00
6632933957001,339904890100.00%94.01
1461332583583741,665398100.00%94.02
4802293166521,1718821,205100.00%95.00
7827447937941,1021,9552,956100.00%96.00
8871,0641,3271,12344199190100.00%97.00
9501,2171,17388573133645098.84%98.00
8921,0571,2411,140664135216100.00%99.00
1,2889791,4041,5571,8862,7472,14091.44%100.00
21123340.99%101.01
12111000.22%102.06
74114869027435010.40%102.07
September 2007 Draft Atlanta Strategic Action PlanZ
PopulationD

30-3525-3020-2515-2010-1505-1000-05%Hsg.Units
PopulationPopulationPopulationPopulationPopulationPopulationPopulationShare inCensus
ChangeChangeChangeChangeChangeChangeChangeAtlantaTract
59868171878252556663629.25%103.03
45341-379250.90%113.01
1575511014639365674.72%201.00
152115103154356-10582100.00%202.00
18221494119244190340100.00%203.00
891279318109126287100.00%204.00
140162176115175328363100.00%205.00
1301309839286343680100.00%206.00
283182236318483254238100.00%207.00
311305313399489174345100.00%208.01
482297348659836194269100.00%208.02
277141310311520405632100.00%209.00
00000000.00%224.03
53,24955,16657,16959,26161,44866,80066,634Total:
836,201782,952727,786670,617611,356549,908483,108TotalPopulation
6.80%7.58%8.52%9.69%11.17%13.83%16.00%% growth
AAAtlanta Strategic Action Plan September 2007 Draft

Appendix E Resolutions
September 2007 Draft Atlanta Strategic Action PlanAB
ResolutionsE

ACAtlanta Strategic Action Plan September 2007 Draft

Atlanta Strategic Action Plan
Atlanta Strategic Action Plan September 2007 Draft