Embed Size (px)
Citation preview
Universiteit Gent
Faculty of Sciences
Dept. of Plant Biotechnology and Bioinformatics
KU Leuven
Faculty of Bioscience Engineering
Centre of Microbial and Plant Genetics
Network-based identification of driver pathways in
clonal systems
Netwerk-gebaseerde identificatie van causale moleculaire processenin klonale systemen
Bram Weytjens
Promotors:
Prof. Kathleen Marchal, Universiteit Gent
Prof. Jos Vanderleyden, KU Leuven
Members of the examination board:Prof. Aurelien CarlierProf. Bart DevreeseProf. Jan FostierProf. Jan MichielsProf. Luc De RaedtDr. Jimmy Van den EyndenDr. Lieven Verbeke
Dissertation presented in partialfulfillment of the requirements forthe degrees of:Doctor of Science: Bioinformatics,andDoctor of Bioscience EngineeringAcademic year 2017-2018

©2017 Universiteit Gent and KU Leuven, Science, Engineering & Techology
Uitgegeven in eigen beheer, Bram Weytjens, Wijshagen
Alle rechten voorbehouden. Niets uit deze uitgave mag worden verveelvoudigd,
opgeslagen in een geautomatiseerd gegevensbestand of openbaar gemaakt, in enige
vorm of op enige wijze, hetzij elektronisch, mechanisch, door printouts, kopieen,
of op welke andere manier dan ook, zonder voorafgaande schriftelijke toestem-
ming van de uitgever.
All Rights Reserved. No part of this book may be reproduced or utilized in any
form or by any means, electronic or mechanical, including photocopying, record-
ing, or by any information storage and retrieval system, without permission in
writing from the publisher.


Dankwoord
”No man is an island”
-John Donne-
Biologische netwerken opstellen, data klaarmaken voor analyse, computerprogramma’s
ontwikkelen om de data met behulp van voorgenoemde netwerken te analyseren,...
het was een uitdaging. Ik ben blij dat ik tevreden kan terugkijken op dit project
en dat er concrete toepassingen zijn gepubliceerd die bruikbaar zijn in de praktijk.
Maar ik had dit nooit alleen kunnen bereiken. Hier wil ik iedereen bedanken die
mij de afgelopen jaren op gelijk welke manier heeft gesteund.
Ik weet nog toen, nu al ongeveer 6 jaar geleden, professor Vanderleyden een
project over biologische netwerken kwam voorstellen voor de masterproeven. Het
project had weinig tot geen succes omdat biologie noch programmeren echt goed
aan bod kwamen tijdens de opleiding burgerlijk ingenieur chemie. Maar gezien
mijn interesse in biologie was dat project mij op het lijf geschreven en zo kwam
ik terecht bij de groep van professor Kathleen Marchal en was Dries De Maeyer
mijn opzichter tijdens mijn master thesis. Dries, jij moet gedacht hebben: ‘Wat
gooien ze hier nu binnen?’ Een student die nog nooit van de ‘map‘ of ‘filter‘ func-
ties heeft gehoord en denkt dat ‘Python‘ gewoon de Engelse benaming is voor een
slangensoort. Maar je hebt je daar niet bij neergelegd en legde mij met plezier,
gevraagd of ongevraagd, alle technische details van zowat alles wat op ons com-
puterscherm verscheen haarfijn uit. Hoewel ik 90% van de tijd vooral overdonderd
was door de hoeveelheid informatie die je mij gaf, heeft het er toch toe geleid dat
ik vandaag kan zeggen dat ik kan programmeren. Bedankt, Dries! Zonder jouw
officieuze programmeerlessen was dit project mij nooit gelukt.
Geen doctoraat zonder promotoren. Bedankt Kathleen voor het gegeven ver-
trouwen en de kans om dit doctoraat uit te voeren. Het over-en-weer mailen van
nieuwe versies van papers zal mij nog lang bij blijven. We zouden toch eens moe-
ten navragen of ”versie 109” een record is voor een wetenschappelijke paper. Ook
bedankt professor Vanderleyden om de rol van promotor aan KU Leuven op jou te
nemen.
ii
Bio-informatica is een zeer interdisciplinair veld. Dit werk zou dus niet tot
stand zijn gekomen zonder de samenwerkingen met collega’s uit aanverwante vel-
den. Bedankt Toon S, Sergio P-T, Pieter A, Dries VD en alle anderen voor jullie
interesse, enthousiasme en vaak uitgebreide wetenschappelijke discussies.
Verder wil ik nog mijn beide partner instituten, UGent en KU Leuven, bedan-
ken voor het gebruik van hun faciliteiten en iedereen die betrokken is bij het NA-
TAR project, onder leiding van prof. Kevin Verstrepen, voor het delen van ideeen
en resultaten tijdens de NATAR meetings en de financiering van dit project.
De boog kan niet altijd gespannen staan. Gelukkig kan ik altijd op mijn vrien-
den rekenen wanneer het tijd is om te ontspannen. Of het nu gaat om een rustig
avondje gezelschapsspelletjes spelen, stijldansen in Bree, op cafe gaan, knotsgekke
vakanties met ’de mannen van Peer’ of ons eigen bier brouwen in de kelder. Het
zijn stuk voor stuk leuke momenten met geweldige vrienden. Merci allemaal! En
Peter en Jo: ooit maken we dat geweldige bier waar we nu al drie jaar naartoe
werken.
Natuurlijk mag mijn (schoon)familie hier niet ontbreken. Mama, papa: bedankt
voor de steun op alle vlakken de voorbije jaren. Het is dankzij de kansen, de raad en
de hulp die ik altijd van jullie gekregen heb dat ik hier ben geraakt. Geert: bedankt
voor de leuke momenten en onze seizoensgebonden avonden ”Game of Thrones”
kijken. Miet en Dominique: bedankt om regelmatig als babysit te fungeren zodat
ik de tijd had om aan dit doctoraat te werken.
Tijdens mijn doctoraat heb ik afscheid moeten nemen van mijn nonkel, Jan
Weytjens, die altijd een bijzondere interesse in mijn studies en doctoraat had. Jam-
mer genoeg kan je vandaag niet meer op mijn verdediging aanwezig zijn maar
bedankt voor alle telefoontjes en gesprekken. Jij wist mij altijd op te beuren als
mij iets tegen stak.
Schat, schattebout, liefie, lieveke, kleine. Als er iemand heeft te klagen over
dit doctoraat dan ben jij dat wel. De afgelopen jaren waren voor ons uitzonderlijk
druk en spannend: trouwen, huisje kopen, een praktijk voor jou opbouwen, de
komst van onze lieve schat Elise en dat allemaal terwijl ik vaak nog tot 11 uur ’s
avonds moest doorwerken. En als er papers binnen moesten zat ik soms tot een
gat in de nacht voor mijn computer zodat je in het weekend hoegenaamd ook niks
meer aan mij had omdat het dan tijd was om te slapen. Bedankt, schat! Om ook
in periodes die voor ons allebei druk waren, een steun voor mij te zijn waarop ik
altijd kan terugvallen. Ik ben nu al benieuwd naar ons volgende avontuur.
Gent, oktober 2017
Bram Weytjens


Abstract
Highly ethanol-tolerant bacteria for the production of biofuels, bacterial patho-
genes which are resistant to antibiotics and cancer cells are examples of pheno-
types that are of importance to society and are currently being studied. In order to
better understand these phenotypes and their underlying genotype-phenotype rela-
tionships it is now commonplace to investigate DNA and expression profiles using
next generation sequencing (NGS) and microarray techniques. These techniques
generate large amounts of omics data which result in lists of genes that have mu-
tations or expression profiles which potentially contribute to a specific phenotype
under research. These lists often include a multitude of genes and are troublesome
to verify manually as performing literature studies and wet-lab experiments for a
large number of genes is very time and resources consuming. Therefore, (computa-
tional) methods are required which can narrow these gene lists down by removing
generally abundant false positives from these lists and can ideally provide addi-
tional information on the relationships between the selected genes.
Other high-throughput techniques such as yeast two-hybrid (Y2H), ChIP-Seq
and Chip-Chip but also a myriad of small-scale experiments and predictive com-
putational methods have generated a treasure of interactomics data over the last
decade and a lot of it is now publicly available. By combining this data into a bio-
logical interaction network, which contains all molecular pathways that an organ-
ism can utilize and thus is the equivalent of the blueprint of an organism, it is pos-
sible to integrate the omics data obtained from experiments with these biological
interaction networks. Biological interaction networks are key to the computational
methods presented in this thesis as they enables methods to account for important
relations between genes (and gene products). Doing so it is possible to not only
identify interesting genes but also to uncover molecular processes important to the
phenotype.
As the best way to analyze omics data from an interesting phenotype varies
widely based on the experimental setup and the available data, multiple methods
were developed and applied in the context of this thesis.
vi ENGLISH SUMMARY
In a first approach, an existing method (PheNetic) was applied to a consortium
of three bacterial species that together are able to efficiently degrade a herbicide
but none of the species are able to efficiently degrade the herbicide on their own.
For each of the species expression data (RNA-seq) was generated for the consor-
tium and the species in isolation. PheNetic identified molecular pathways which
were differentially expressed and likely contribute to a cross-feeding mechanism
between the species in the consortium.
Having obtained proof-of-concept, PheNetic was adapted to cope with experi-
mental evolution datasets in which, in addition to expression data, genomics data
was available. Two publicly available datasets were analyzed: Amikacin resistance
in E. coli and coexisting ecotypes in E.coli. The results allowed to identify both
well-known and newly found molecular pathways involved in these phenotypes.
Experimental evolution sometimes generates datasets consisting of mutator
phenotypes which have high mutation rates. These datasets are hard to analyze due
to the large amount of noise (most mutations have no effect on the phenotype). To
this end IAMBEE was developed. IAMBEE is able to analyze genomic datasets
from evolution experiments even if they contain mutator phenotypes. IAMBEE
was tested using an E. coli evolution experiment in which cells were exposed to
increasing concentrations of ethanol. Part of the results were validated in the wet-
lab.
In addition to methods for analysis of causal mutations and mechanisms in bac-
teria, a method for the identification of causal molecular pathways in cancer was
developed. As bacteria and cancerous cells are both clonal, they can be treated
similar in this context. The big differences are the amount of data available (many
more samples are available in cancer) and the fact that cancer is a complex and
heterogenic phenotype. Therefore we developed SSA-ME, which makes use of
the concept that a causal molecular pathway often has at most one mutation in a
cancerous cell (mutual exclusivity). However, enforcing this criterion is computa-
tionally hard. SSA-ME is designed to cope with this problem and searches for mu-
tual exclusive patterns in relatively large datasets. SSA-ME was tested on cancer
data from the TCGA PAN-cancer project. From the results we could, in addition
to already known molecular pathways and mutated genes, predict the involvement
of a few rarely mutated genes.
Nederlandse samenvatting
–Summary in Dutch–
Bacterien die in hogere concentraties ethanol kunnen leven voor de productie van
biobrandstoffen, bacteriele pathogen die resistent zijn tegen antibiotica en kanker-
cellen zijn voorbeelden van fenotypes die van belang zijn voor onze maatschap-
pij en die momenteel worden bestudeerd. Om deze fenotypes en hun onderlig-
gende genotype-fenotype relatie beter te begrijpen bestudeert men tegenwoordig
het DNA en de expressieprofielen die worden verkregen door middel van next-
generation sequencing (NGS) en microarray technieken. Deze technieken genere-
ren grote hoeveelheden omics data hetgeen resulteert in een lijst van genen met in-
teressante mutaties of expressieprofielen die potentieel bijdragen aan het fenotype.
Deze lijsten bevatten vaak zeer veel genen. Het is problematisch om deze genen
manueel te verifieren omdat literatuurstudies en laboratoriumexperimenten voor
een groot aantal genen veel tijd en middelen vergt. Daarom zijn (computationele)
methodes nodig die deze genlijsten kunnen reduceren door, meestal abundante,
vals positieve genen te verwijderen. In het ideale geval rapporteren deze methoden
ook de relaties tussen de geselecteerde genen.
Andere hoge doorvoer technieken zoals yeast two-hybrid (Y2H), ChIP-Seq en
Chip-chip maar ook veel experimenten op kleine schaal en predictieve computa-
tionele methodes hebben het afgelopen decennium een schat aan interactomics
data gegenereerd. Door deze data te combineren tot een biologisch interactienet-
werk, dat alle moleculaire paden bevat die een bepaald organisme kan gebruiken
en dus de blauwdruk van dat organisme voorstelt, is het mogelijk om omics data
uit experimenten met zulk biologisch interactienetwerk te combineren. Biologi-
sche interactienetwerken staan centraal in de computationele methodes die in deze
thesis worden voorgesteld omdat ze toelaten om belangrijke relaties tussen genen
(en genproducten) in rekening te brengen. Zo doende is het mogelijk om niet enkel
interessante genen te identificeren maar ook om moleculaire processen die belang-
rijk zijn voor een fenotype in kaart te brengen.
De beste manier om omics data van een interessant fenotype te analyseren
hangt af van de experimentele opstelling en de beschikbare data. Daarom werden
verschillende methodes ontwikkeld en toegepast binnen deze thesis.
viii NEDERLANDSE SAMENVATTING
Vooreerst werd een bestaande methode (PheNetic) toegepast op een consor-
tium van drie bacteriele soorten die samen in staat zijn om een herbicide efficient
af te breken maar waarvan geen enkele soort het herbicide op zichzelf efficient kan
afbreken. Voor elke soort werd er expressiedata (RNA-seq) gegenereerd voor zo-
wel het consortium als de soort in isolatie. Hieruit bleek dat PheNetic moleculaire
paden kan identificeren die differentieel geexpresseerd zijn en wellicht bijdragen
tot een cross-feeding mechanisme tussen de soorten in het consortium.
Na het verkrijgen van proof-of-concept werd PheNetic aangepast om experi-
mentele evolutie datasets waarin behalve expressiedata ook genomische data aan-
wezig is, te analyseren. Twee publiek beschikbare datasets werden geanalyseerd:
Amikacine resistentie in E. coli en coexisterende ecotypes in E. coli. Uit de resul-
taten konden reeds beschreven maar ook nieuwe moleculaire paden die belangrijk
zijn voor deze fenotypes worden geıdentificeerd.
Experimentele evolutie genereert soms datasets die bestaan uit mutator feno-
types die hoge mutatiesnelheden hebben. Deze datasets zijn moeilijk om te ana-
lyseren omdat er veel ruis in zit (de meeste mutaties hebben geen effect op het
fenotype). Hiervoor werd IAMBEE ontwikkeld. IAMBEE kan genomische data-
sets van evolutie-experimenten analyseren, zelfs als ze mutator fenotypes bevatten.
IAMBEE werd getest op een E. coli evolutie-experiment waarin cellen werden
blootgesteld aan stijgende ethanol concentraties. Een deel van de resultaten werd
gevalideerd in het laboratorium.
Naast methoden om causale mutaties en mechanismen in bacterien te analyse-
ren, werd ook een methode ontwikkeld om causale moleculaire paden in kanker te
identificeren. Omdat bacteriele cellen en kankercellen beiden klonaal zijn, kunnen
ze in deze context als gelijkaardig worden behandeld. De grote verschillen zijn de
hoeveelheid data die typisch beschikbaar is (veel meer monsters in kanker) en het
feit dat kanker een complex en heterogeen fenotype is. Hiervoor werd SSA-ME
ontwikkeld. SSA-ME maakt gebruik van het concept dat een causaal moleculair
pad slechts een mutatie heeft in een kankercel (mutuele exclusiviteit). Het toepas-
sen van dit criterium is echter computationeel moeilijk. SSA-ME is ontworpen om
om te gaan met dit probleem en zo mutueel exclusieve patronen in relatief grote
datasets te vinden. SSA-ME was getest op kankerdata van het TCGA PAN-kanker
project. De resultaten lieten toe om, naast reeds gekende moleculaire mechanis-
men en gemuteerde genen, de betrokkenheid van enkele genen te voorspellen die
slechts zelden gemuteerd zijn in kankerpatienten.


Table of contents
List of figures xix
List of tables xxiii
1 Introduction 1-1
1.1 The central dogma of molecular biology . . . . . . . . . . . . . . 1-2
1.2 Omics data . . . . . . . . . . . . . . . . . . . . . . . . . . . . . 1-3
1.3 Evolution experiments . . . . . . . . . . . . . . . . . . . . . . . 1-6
1.4 Cancer . . . . . . . . . . . . . . . . . . . . . . . . . . . . . . . . 1-7
1.5 Biological interaction networks . . . . . . . . . . . . . . . . . . . 1-8
1.6 Network-based methods . . . . . . . . . . . . . . . . . . . . . . 1-13
2 Scientific problem and aim 2-1
2.1 Scientific problem . . . . . . . . . . . . . . . . . . . . . . . . . . 2-1
2.2 Aim . . . . . . . . . . . . . . . . . . . . . . . . . . . . . . . . . 2-6
3 Overview of the proposed methods 3-1
4 Uncovering interspecies interactions from RNA-seq data 4-1
4.1 Introduction . . . . . . . . . . . . . . . . . . . . . . . . . . . . . 4-1
4.2 Paper . . . . . . . . . . . . . . . . . . . . . . . . . . . . . . . . 4-2
xii TABLE OF CONTENTS
4.2.1 Abstract . . . . . . . . . . . . . . . . . . . . . . . . . . . 4-2
4.2.2 Introduction . . . . . . . . . . . . . . . . . . . . . . . . . 4-2
4.2.3 Results . . . . . . . . . . . . . . . . . . . . . . . . . . . 4-5
4.2.3.1 Linuron and 3,4-DCA degradation performance
of consortium and monoculture biofilms . . . . 4-5
4.2.3.2 Overall analysis and validation of RNA-seq data 4-6
4.2.3.3 Transcriptional responses in Variovorax sp. WDL1
when grown in consortium conditions . . . . . . 4-8
4.2.3.4 Transcriptional responses elicited in C. testos-
teroni WDL7 when grown in consortium biofilms 4-11
4.2.4 Discussion . . . . . . . . . . . . . . . . . . . . . . . . . 4-13
4.2.4.1 Co-culturing of strains modulates additional metabolic
pathways in the linuron-degrading consortium . 4-13
4.2.4.2 Co-culturing of consortium strains triggers a stress
response in WDL1 . . . . . . . . . . . . . . . . 4-15
4.2.4.3 Potential involvement of cell-to-cell interactions
in shaping the linuron degrading consortium . . 4-15
4.2.5 Conclusion . . . . . . . . . . . . . . . . . . . . . . . . . 4-16
4.2.6 Experimental procedures . . . . . . . . . . . . . . . . . . 4-17
4.2.6.1 Bacteria, media and biofilm growth conditions . 4-17
4.2.6.2 Determination of differential gene expression val-
ues . . . . . . . . . . . . . . . . . . . . . . . . 4-17
4.2.6.3 Differential gene expression analysis . . . . . . 4-18
4.2.7 Acknowledgements . . . . . . . . . . . . . . . . . . . . . 4-19
4.2.8 Supplementary figures and tables . . . . . . . . . . . . . 4-20
5 Prioritization of driver genes and pathways from eQTL data 5-1
5.1 Introduction . . . . . . . . . . . . . . . . . . . . . . . . . . . . . 5-1
TABLE OF CONTENTS xiii
5.2 Paper . . . . . . . . . . . . . . . . . . . . . . . . . . . . . . . . 5-2
5.2.1 Abstract . . . . . . . . . . . . . . . . . . . . . . . . . . . 5-2
5.2.2 Introduction . . . . . . . . . . . . . . . . . . . . . . . . . 5-2
5.2.3 Materials and Methods . . . . . . . . . . . . . . . . . . . 5-4
5.2.3.1 Network-based eQTL method . . . . . . . . . . 5-4
5.2.3.2 Construction of probabilistic networks . . . . . 5-4
5.2.3.3 Pathfinding in probabilistic networks . . . . . . 5-5
5.2.3.4 Inference of the optimal subnetwork by combin-
ing the data from all evolved lines . . . . . . . . 5-5
5.2.3.5 Driver gene prioritization . . . . . . . . . . . . 5-7
5.2.3.6 Parameter settings . . . . . . . . . . . . . . . . 5-7
5.2.3.7 Data sets . . . . . . . . . . . . . . . . . . . . . 5-8
5.2.3.8 Genome-wide interaction networks . . . . . . . 5-9
5.2.4 Results . . . . . . . . . . . . . . . . . . . . . . . . . . . 5-11
5.2.4.1 Method overview . . . . . . . . . . . . . . . . 5-11
5.2.4.2 Performance of network-based eQTL method on
a semi-synthetic data set . . . . . . . . . . . . . 5-12
5.2.4.3 Unveiling the molecular mechanisms underly-
ing Amikacin resistance . . . . . . . . . . . . . 5-14
5.2.4.4 Unveiling the molecular mechanisms of coexist-
ing ecotypes in glucose-limited minimal medium 5-16
5.2.5 Discussion . . . . . . . . . . . . . . . . . . . . . . . . . 5-19
5.2.6 Acknowledgements . . . . . . . . . . . . . . . . . . . . . 5-21
5.2.7 Supplementary Figures . . . . . . . . . . . . . . . . . . . 5-22
6 Ranking of driver genes and pathways from genomics data 6-1
6.1 Introduction . . . . . . . . . . . . . . . . . . . . . . . . . . . . . 6-1
xiv TABLE OF CONTENTS
6.2 Paper . . . . . . . . . . . . . . . . . . . . . . . . . . . . . . . . 6-2
6.2.1 Abstract . . . . . . . . . . . . . . . . . . . . . . . . . . . 6-2
6.2.2 Introduction . . . . . . . . . . . . . . . . . . . . . . . . . 6-2
6.2.3 Results . . . . . . . . . . . . . . . . . . . . . . . . . . . 6-4
6.2.4 Ethanol tolerant populations display a hypermutator phe-
notype . . . . . . . . . . . . . . . . . . . . . . . . . . . . 6-4
6.2.5 Exploiting parallel evolution to identify adaptive pathways 6-6
6.2.5.1 Validation of IAMBEE using synthetic data . . 6-7
6.2.5.2 Network-based analysis unravels adaptive path-
ways for high ethanol tolerance . . . . . . . . . 6-9
6.2.5.3 The fatty acids biosynthesis pathway is selected
exclusively for initial adaptation . . . . . . . . 6-11
6.2.5.4 Pathways involved in both initial and consecu-
tive adaptation . . . . . . . . . . . . . . . . . . 6-12
6.2.5.5 Pathways exclusively involved in the second adap-
tation step . . . . . . . . . . . . . . . . . . . . 6-16
6.2.5.6 Indications for epistasis at the pathway level . . 6-16
6.2.5.7 Comparison with per gene mutation frequency
approach . . . . . . . . . . . . . . . . . . . . . 6-17
6.2.6 Discussion . . . . . . . . . . . . . . . . . . . . . . . . . 6-21
6.2.7 Conclusions . . . . . . . . . . . . . . . . . . . . . . . . . 6-22
6.2.8 Materials and Methods . . . . . . . . . . . . . . . . . . . 6-23
6.2.8.1 Data acquisition . . . . . . . . . . . . . . . . . 6-23
6.2.8.2 Functional impact scores and frequency of mu-
tations . . . . . . . . . . . . . . . . . . . . . . 6-23
6.2.8.3 Genome-wide interaction network . . . . . . . 6-23
6.2.8.4 Construction of the probabilistic
genome-wide interaction network . . . . . . . . 6-24
TABLE OF CONTENTS xv
6.2.9 IAMBEE . . . . . . . . . . . . . . . . . . . . . . . . . . 6-24
6.2.9.1 Calculation of relevance scores . . . . . . . . . 6-24
6.2.9.2 Pathfinding between mutated genes . . . . . . . 6-27
6.2.9.3 Subnetwork inference and prioritization of molec-
ular pathways . . . . . . . . . . . . . . . . . . 6-28
6.2.9.4 Parameter setting . . . . . . . . . . . . . . . . 6-29
6.2.9.5 Validation of IAMBEE features . . . . . . . . . 6-30
6.2.10 Acknowledgments . . . . . . . . . . . . . . . . . . . . . 6-30
6.2.11 Availability of data and material . . . . . . . . . . . . . . 6-30
6.2.12 Competing interests . . . . . . . . . . . . . . . . . . . . 6-30
6.2.13 Supplementary methods . . . . . . . . . . . . . . . . . . 6-31
6.2.13.1 Synthetic data . . . . . . . . . . . . . . . . . . 6-31
6.2.13.2 Using synthetic data to validate IAMBEE features6-32
6.2.14 Supplementary figures . . . . . . . . . . . . . . . . . . . 6-33
7 Mutual exclusivity to detect cancer driver genes 7-1
7.1 Introduction . . . . . . . . . . . . . . . . . . . . . . . . . . . . . 7-1
7.2 Paper . . . . . . . . . . . . . . . . . . . . . . . . . . . . . . . . 7-2
7.2.1 Abstract . . . . . . . . . . . . . . . . . . . . . . . . . . . 7-2
7.2.2 Introduction . . . . . . . . . . . . . . . . . . . . . . . . . 7-2
7.2.3 Results . . . . . . . . . . . . . . . . . . . . . . . . . . . 7-4
7.2.3.1 SSA-ME implementation . . . . . . . . . . . . 7-4
7.2.3.2 Performance on simulated data . . . . . . . . . 7-6
7.2.3.3 Analysis of TCGA data . . . . . . . . . . . . . 7-8
7.2.3.4 Comparison with other methods . . . . . . . . . 7-13
7.2.4 Discussion . . . . . . . . . . . . . . . . . . . . . . . . . 7-15
xvi TABLE OF CONTENTS
7.2.5 Materials and Methods . . . . . . . . . . . . . . . . . . . 7-16
7.2.5.1 SSA-ME . . . . . . . . . . . . . . . . . . . . . 7-16
7.2.5.2 Simulated data . . . . . . . . . . . . . . . . . . 7-20
7.2.5.3 TCGA Data . . . . . . . . . . . . . . . . . . . 7-21
7.2.5.4 Patterns of mutual exclusivity . . . . . . . . . . 7-22
7.2.6 Acknowledgements . . . . . . . . . . . . . . . . . . . . . 7-22
7.2.7 Additional Information . . . . . . . . . . . . . . . . . . . 7-22
7.2.8 Availability of materials and data . . . . . . . . . . . . . 7-22
7.2.9 Supplementary results . . . . . . . . . . . . . . . . . . . 7-23
7.2.9.1 Comparison with MEMo . . . . . . . . . . . . 7-23
7.2.9.2 Literature-based evidence for predicted cancer
drivers in the breast cancer dataset . . . . . . . 7-24
7.2.10 Supplementary figures and tables . . . . . . . . . . . . . 7-27
7.3 Critical reflections and future work . . . . . . . . . . . . . . . . . 7-33
8 Overall conclusions and perspectives 8-1
8.1 Conclusions . . . . . . . . . . . . . . . . . . . . . . . . . . . . . 8-1
8.2 Limitations . . . . . . . . . . . . . . . . . . . . . . . . . . . . . 8-4
8.3 Perspectives . . . . . . . . . . . . . . . . . . . . . . . . . . . . . 8-5
A Additions to chapter 4 A-1
A.1 Additional results . . . . . . . . . . . . . . . . . . . . . . . . . . A-1
A.1.1 Transcriptional responses in Variovorax sp. WDL1 when
grown in consortium conditions . . . . . . . . . . . . . . A-1
A.1.2 Transcriptional responses elicited in C. testosteroni WDL7
when grown in consortium biofilms . . . . . . . . . . . . A-3
A.2 Additional discussion . . . . . . . . . . . . . . . . . . . . . . . . A-3
TABLE OF CONTENTS xvii
A.2.1 Semi-synthetic benchmarking set . . . . . . . . . . . . . A-3
A.3 Additional experimental procedures . . . . . . . . . . . . . . . . A-4
A.3.0.1 Draft genome sequence of the consortium mem-
bers . . . . . . . . . . . . . . . . . . . . . . . A-4
A.3.0.2 RNA extraction, library preparation and sequenc-
ing . . . . . . . . . . . . . . . . . . . . . . . . A-5
A.3.0.3 Verification of differential transcription using tran-
scriptional gene fusions . . . . . . . . . . . . . A-6
A.3.0.4 Nucleotide sequence accession numbers . . . . A-6
A.4 Additional figures and tables . . . . . . . . . . . . . . . . . . . . A-6
B Additions to chapter 6 B-1
B.1 Additional results . . . . . . . . . . . . . . . . . . . . . . . . . . B-1
B.1.1 Hypothetical ethanol tolerance related pathways . . . . . B-1
B.1.2 Transcription and translation . . . . . . . . . . . . . . . . B-1
B.1.3 Osmotic stress response . . . . . . . . . . . . . . . . . . B-2
B.1.4 Amino acid biosynthesis . . . . . . . . . . . . . . . . . . B-2
B.1.5 DNA damage and repair . . . . . . . . . . . . . . . . . . B-3
B.1.6 Protein stress . . . . . . . . . . . . . . . . . . . . . . . . B-3
B.1.7 Acid stress response . . . . . . . . . . . . . . . . . . . . B-4
B.1.8 Pyrroloquinoline quinone biosynthesis . . . . . . . . . . . B-4
B.1.9 Biofilm formation . . . . . . . . . . . . . . . . . . . . . B-4
B.2 Additional methods . . . . . . . . . . . . . . . . . . . . . . . . . B-5
B.2.1 Experimental evolution . . . . . . . . . . . . . . . . . . . B-5
B.2.2 Sequencing and mutation calling . . . . . . . . . . . . . . B-5
B.2.3 Mapping of mutations to genes . . . . . . . . . . . . . . . B-6

xviii TABLE OF CONTENTS
B.3 Additional figures . . . . . . . . . . . . . . . . . . . . . . . . . . B-7
C Additions to chapter 7 C-1
C.1 Literature-based evidence for frequently
predicted cancer drivers in the
TCGA PAN-cancer datasets . . . . . . . . . . . . . . . . . . . . C-1
List of figures
1.1 Genome sequencing cost per human genome over time. . . . . . . 1-2
1.2 Evolution experiment. . . . . . . . . . . . . . . . . . . . . . . . . 1-7
1.3 Multi-layered physical biological interaction network . . . . . . . 1-10
2.1 Clonal interference. . . . . . . . . . . . . . . . . . . . . . . . . . 2-3
2.2 Visual representation of a consistently mutated pathway. . . . . . 2-4
3.1 General overview of computational methods used in chapters 4, 5
and 6. . . . . . . . . . . . . . . . . . . . . . . . . . . . . . . . . 3-3
4.1 Overview of linuron degradation by the triple-species consortium. 4-4
4.2 Time lapse effluent concentrations of metabolites. . . . . . . . . . 4-5
4.3 Average percentages of retained and discarded RNA-seq read pairs. 4-7
4.4 Rarefaction curves. . . . . . . . . . . . . . . . . . . . . . . . . . 4-8
4.5 KEGG orthology based functional categorization of CDSs. . . . . 4-9
4.6 Molecular pathways differentially expressed between consortium
and monoculture conditions for WDL1 as inferred by PheNetic. . 4-10
4.7 Molecular pathways differentially expressed between consortium
and monoculture conditions for WDL7 as inferred by PheNetic. . 4-11
S4.1 RNA-seq data validation. . . . . . . . . . . . . . . . . . . . . . . 4-20
S4.2 Phenetic inferred map of porphyrin metabolism . . . . . . . . . . 4-21
xx LIST OF FIGURES
5.1 Overview of the network-based eQTL method. . . . . . . . . . . 5-12
5.2 Performance assessment of the network-based eQTL method on
the semi-synthetic data set based on data from 100 randomizations. 5-13
5.3 Visualization of subnetworks inferred from the Amikacin resis-
tance data set. . . . . . . . . . . . . . . . . . . . . . . . . . . . . 5-15
5.4 Visualization of subnetworks inferred from the coexisting eco-
types data set. . . . . . . . . . . . . . . . . . . . . . . . . . . . . 5-17
S5.1 PCA analysis of transcriptomics data of the coexisting ecotypes
data set as obtained from Le Gac et al. (Le Gac, et al. 2012). . . . 5-22
S5.2 Mapping of the inferred subnetwork from all four lines of the
Amikacin resistance data set to the oxidative phosphorylation from
KEGG pathways. . . . . . . . . . . . . . . . . . . . . . . . . . . 5-23
S5.3 Mapping of the inferred subnetwork from the coexisting ecotypes
data set to the TCA cycle from KEGG pathways. . . . . . . . . . 5-23
S5.4 Mapping of the inferred subnetwork from the coexisting ecotypes
data set to the pentose phosphate pathway from KEGG pathways. 5-24
6.1 Set-up of the experiment, data acquisition and workflow of adap-
tive pathway identification. . . . . . . . . . . . . . . . . . . . . . 6-5
6.2 Calculation of the relevance scores for each mutation by IAMBEE. 6-8
6.3 Subnetwork consisting of multiple connected components inferred
by analyzing the mutation data observed in all 16 populations dur-
ing the initial selective sweep. . . . . . . . . . . . . . . . . . . . 6-10
6.4 Subnetwork consisting of multiple connected components inferred
by analyzing the mutation data observed in all 16 populations dur-
ing the second selective sweep. . . . . . . . . . . . . . . . . . . . 6-11
6.5 Effect of fab mutations on the percentage of unsaturated fatty acids
in the plasma membrane. . . . . . . . . . . . . . . . . . . . . . . 6-14
6.6 Effect of acrB deletion on growth under high ethanol stress. . . . . 6-15
6.7 Comparison of the output generated by IAMBEE with the per gene
mutation frequency approach. . . . . . . . . . . . . . . . . . . . 6-18
S6.1 Ethanol tolerance profiles of HT populations. . . . . . . . . . . . 6-33
LIST OF FIGURES xxi
S6.2 Synthetic data analysis results. . . . . . . . . . . . . . . . . . . . 6-34
S6.3 Growth advantage of a ∆acrB mutant under ethanol stress increases
with the concentration of the stress. . . . . . . . . . . . . . . . . 6-35
S6.4 fabA mutation in HT13 does not affect the shift in percentage un-
saturated fatty acids in response to ethanol. . . . . . . . . . . . . 6-36
S6.5 Frequency-based approach for the initial selective sweep. . . . . . 6-37
S6.6 Frequency-based approach for the second selective sweep. . . . . 6-38
S6.7 Degree to which pathways identified in the two distinct ethanol
sweeps overlap. . . . . . . . . . . . . . . . . . . . . . . . . . . . 6-39
7.1 Overview of SSA-ME. . . . . . . . . . . . . . . . . . . . . . . . 7-5
7.2 Performance on Simulated Data. . . . . . . . . . . . . . . . . . . 7-7
7.3 Application of SSA-ME on TGCA Breast Cancer dataset. . . . . . 7-10
7.4 Mutual exclusivity pattern for EPHA2. . . . . . . . . . . . . . . . 7-11
7.5 Analysis of selected genes. . . . . . . . . . . . . . . . . . . . . . 7-12
7.6 Comparison between SSA-ME and related methods. . . . . . . . . 7-14
7.7 Pseudocode of SSA-ME algorithm. . . . . . . . . . . . . . . . . . 7-17
7.8 Calculation of MES and corresponding rMES scores for three dif-
ferent small subnetworks. . . . . . . . . . . . . . . . . . . . . . . 7-19
S7.1 Robustness of the predictions with respect to the used reference
network. . . . . . . . . . . . . . . . . . . . . . . . . . . . . . . . 7-27
S7.2 Differences in mutual exclusivity scores of small subnetworks de-
rived from respectively real and randomized datasets. . . . . . . . 7-28
S7.3 Comparison between SSA-ME and MEMo. . . . . . . . . . . . . 7-29
S7.4 Mutual exclusivity patterns of selected genes. . . . . . . . . . . . 7-30
9 Pseudocode for MES calculation. . . . . . . . . . . . . . . . . . . 7-34
A1 Phenetic inferred map of part of the pentose phosphate pathway. . A-7
xxii LIST OF FIGURES
A2 Phenetic inferred map of interconversion glutamate family. . . . . A-7
A3 Phenetic inferred map of part of the phenylalanine metabolism. . . A-8
A4 Phenetic inferred map of part of the cysteine/methionine metabolism.A-8
A5 Phenetic inferred map of part of the pyrimidine metabolism. . . . A-9
A6 Phenetic inferred map of multiple parts of the purine metabolism. A-10
A7 Phenetic inferred map of part of the porphyrin metabolism . . . . A-11
B1 Mutational profile of all mutations from the 16 evolved populations. B-7
B2 Lineage tracking of HT1-9 populations show common predecessor. B-7
List of tables
4.1 Summary of sequencing results and read alignment of the different
RNA-seq libraries. . . . . . . . . . . . . . . . . . . . . . . . . . 4-6
4.2 Log2-fold change values for genes belonging to discussed molec-
ular pathways. . . . . . . . . . . . . . . . . . . . . . . . . . . . . 4-12
S4.1 Calculated scaling factors for genes of WDL1 and WDL7 . . . . . 4-21
5.1 Data sets used to compile the Escherichia coli genome-wide inter-
action networks. . . . . . . . . . . . . . . . . . . . . . . . . . . . 5-10
5.2 Selected mutated genes prioritized as driver genes. . . . . . . . . 5-19
6.1 Comparison between IAMBEE and the commonly used frequency-
based approach. . . . . . . . . . . . . . . . . . . . . . . . . . . . 6-19
6.2 Percentage of paths found at the end of the pathfinding step . . . . 6-27
S7.1 Ranked genes for BRCA . . . . . . . . . . . . . . . . . . . . . . 7-31
S7.2 Ranked genes for BRCA . . . . . . . . . . . . . . . . . . . . . . 7-32
A1 Summary of draft genome sequencing results. . . . . . . . . . . . A-6


Abbreviations
A
AMK Amikacin
C
COLOMBOS Collection of Microarrays for Bacterial Organisms
ChIP-Seq Chromatin immunoprecipitation-sequencing
Chip-Chip Chromatin immunoprecipitation-on-chip
cDNA complementary DNA
CDS Coding DNA Sequence
CoMEt Combinations of Mutually Exclusive Alterations
CGC Cancer Gene Census
CNA Copy Number Alteration
D
DDBJ DNA Data Bank of Japan
d-DNNF Deterministic Decomposable Negation Normal Form
xxvi ABBREVIATIONS
E
eQTL expression Quantitative Trait Loci
G
GEO Gene Expression Omnibus
GO Gene Ontology
H
HT High tolerant
HINT High-quality INTeractomes
HPRD Human Protein Reference Database
I
IAMBEE Identification of Adaptive Mutations in Bacterial Evo-
lution Experiments
INDEL INnsertion or DELetion
ICGC International Cancer Genome Consortium
K
KEGG Kyoto Encyclopedia of Genes and Genomes
KO Knock-out
ABBREVIATIONS xxvii
KAAS KEGG automatic annotation server
L
LIMMA Linear Models for Microarray and RNA-seq Data
M
MMR Methyl-directed Mismatch Repair
MuSiC Mutational Significance in Cancer genomes
MEMo Mutually Exclusive Modules in cancer
MutSig Mutational Significance
MutSigCV Mutational Significance CoVariates
MES Mutual Exclusivity Score
mRNA messenger RNA
MPIDB Microbial Protein Interaction DataBase
miRNA MicroRNA
N
NCBI National Center for Biotechnology Information
NER Nucleotide Excision Repair
NCG Network of Cancer Genes
NGS Next-Generation Sequencing
NMR Nuclear Magnetic Resonance
P
PPV Positive Predictive Value
xxviii ABBREVIATIONS
PCR Polymerase Chain Reaction
PCA Principal Component Analysis
PP Protein-protein
Q
qRT-PCR quantitative Real Time-PCR
QTL Quantitative Trait Loci
R
ROC Receiver Operating Characteristic
RAST Rapid Annotation using Subsystem Technology
rMES ranked Mutual Exclusivity Score
RNA-seq RNA sequencing
S
SSA-ME Small Subnetwork Analysis with reinforced learning
to detect driver genes using Mutual Exclusivity
sRNA small RNA
SRA Sequence Read Archive
SNP Single Nucleotide Polymorphism
SIFT Sorting Intolerant From Tolerant
T
TAP Tandem Affinity Purification
TCA cycle TriCarboxylic Acid cycle
ABBREVIATIONS xxix
TCGA The Cancer Genome Atlas
TSG Tumor Suppressor Gene
tRNA transfer RNA
U
Y2H Yeast two-Hybrid
W
WGS Whole genome sequencing
WES Whole exome sequencing

1Introduction
In the last decade high-throughput techniques which generate large quantities of
omics data have become commonplace as their costs continued to drop [1]. One
example is that through Next-generation sequencing (NGS) technologies, the cost
of sequencing a human genome, which refers to the DNA molecules in a human
cell, has dropped from roughly $100 million in 2001 to nearly $1200 in 2015
(Figure 1.1). The availability and integration of this omics data has revolutionized
a multitude of fields in biology as it lead to a significant increase in our knowledge
of systems biology, especially in model oragnisms [2, 3]. But in order to analyze
this ever-increasing stream of omics data, further efforts in data curation and multi-
omics data integration are needed [4, 5]. This thesis contributes to the latter by
the development of methods which integrate interactomics data, in the form of a
biological interaction network, with genomics and/or transcriptomics data in order
to elucidate the genotype-phenotype relationship underlying a specific phenotype
under research [6–8]. This chapter serves as an introduction to some important
concept used in this thesis.
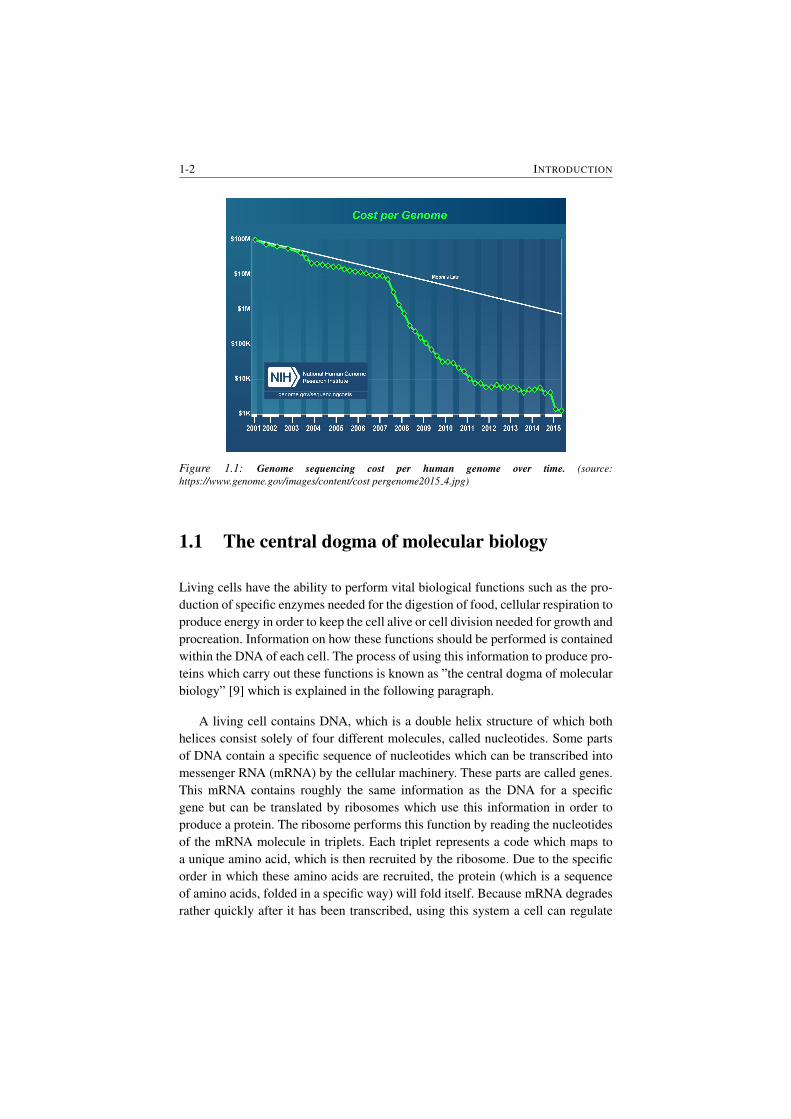
1-2 INTRODUCTION
Figure 1.1: Genome sequencing cost per human genome over time. (source:
https://www.genome.gov/images/content/cost pergenome2015 4.jpg)
1.1 The central dogma of molecular biology
Living cells have the ability to perform vital biological functions such as the pro-
duction of specific enzymes needed for the digestion of food, cellular respiration to
produce energy in order to keep the cell alive or cell division needed for growth and
procreation. Information on how these functions should be performed is contained
within the DNA of each cell. The process of using this information to produce pro-
teins which carry out these functions is known as ”the central dogma of molecular
biology” [9] which is explained in the following paragraph.
A living cell contains DNA, which is a double helix structure of which both
helices consist solely of four different molecules, called nucleotides. Some parts
of DNA contain a specific sequence of nucleotides which can be transcribed into
messenger RNA (mRNA) by the cellular machinery. These parts are called genes.
This mRNA contains roughly the same information as the DNA for a specific
gene but can be translated by ribosomes which use this information in order to
produce a protein. The ribosome performs this function by reading the nucleotides
of the mRNA molecule in triplets. Each triplet represents a code which maps to
a unique amino acid, which is then recruited by the ribosome. Due to the specific
order in which these amino acids are recruited, the protein (which is a sequence
of amino acids, folded in a specific way) will fold itself. Because mRNA degrades
rather quickly after it has been transcribed, using this system a cell can regulate
CHAPTER 1 1-3
the production of specific proteins and as such react to sudden changes in the
environment.
The specific nucleotide sequence of the DNA of an organism is called its
genotype and is closely related to the observable traits of the organisms, which
together are called the organism’s phenotype. Variation in the genotypes of indi-
viduals leads to different proteins being produced and thus to distinct phenotypes
between individuals. For example eye colors in humans is largely determined by
the alteration of a single nucleotide in several genes [10]. Likewise, a mutation in
the DNA of a cell can cause some cellular functions to behave differently or even
fail.
As an organism’s environment plays an important role in determining how a
cell should behave, the phenotype cannot be fully predicted by only looking at the
organism’s genotype but it does play a large role in determining the phenotype. A
lot of research, including the research presented in this thesis, tries to identify this
genotype-phenotype relationship for a specific trait by looking at how mutations
in genes vary with the observed phenotype of an organism [11].
1.2 Omics data
The term ”omics” refers to a field of study in biology. Multiple types of omics data
exist. Examples include genomics (the study of genomes), lipidomics (the study of
lipids), proteomics (the study of proteins) and transcriptomics (the study of RNA).
This thesis focuses only on genomics and transcriptomics as those are the omics
data sources most commonly generated when trying to disentangle the genotype-
phenotype relationship and these data sources were used to develop the proposed
methods.
Genomics data
Genomics data refers to data generated about an organisms’s genome and is thus
used to determine the genotype of an organism (the nucleotide sequence of its
DNA). Knowing the genotype of an organism under research is of primordial im-
portance when investigating the relationship between an organisms genotype and
its phenotype.
Gathering information on the genotype of an organism is called DNA sequenc-
ing. This was performed for the first time in 1970 by Ray Wu at Cornell university
who partially sequenced DNA from bacteriophage λ and 186 DNA [12]. This was
1-4 INTRODUCTION
later improved so any DNA sequence could be sequenced. It was Frederick Sanger
who, in 1977, adopted the sequencing strategy from Wu to create a more rapid
way of sequencing DNA [13] which has been the dominant method for DNA se-
quencing for some time. In fact, the first human genome was sequenced using
Sanger sequencing during the human genome project which started in 1990 and
was completed in 2003 [14]. Modern efforts which require at least large parts of
multiple genomes to be sequenced, such as cancer genome analysis, would have
been impossible using Sanger sequencing because it would take up too much time
and would be too costly.
Today NGS technologies such as Illumina sequencing and Roche 454 sequenc-
ing are used to generate genomics data [15, 16]. The primary advantage of using
these methods as compared to the previously used Sanger sequencing is that they
are able to produce large amounts of data in small amounts of time with low costs.
In general the genome of an organism is first fragmented using enzymes or son-
ication. These (single stranded) fragments are then immobilized and amplified to
create a large concentration of the same fragment in a fixed place. In order to read
the sequence of every fragment, one specific nucleotide is added to it at a time and
it is detected which complementary nucleotide is added where each time. Because
of the large concentration of identical fragments, the signal is strong enough for
detection [17]. Using this technique the sequence of all fragments can be deter-
mined in parallel which greatly contributes to the amount of data one can generate
in a given time.
The result is the sequence of all fragments which constitute the entire genome.
These sequences are called ”reads”. As the order of the reads is undefined, the
organism’s genome cannot be directly reconstructed from these reads. When no
reference genome is available for the organism under research, specific software is
used to assemble the reads (put them in the right order), reconstructing the genome
[18]. This genome is then normally annotated which means that the positions of
genes are determined and their function is inferred based on information from
other (closely related) species. Alternatively, when a reference genome is already
available, the reads are aligned to the reference genome in order to infer their
identity [19].
Often one is interested in the mutations which occurred in the genome during
an event, for example before and after an adaptive sweep. This is done by compar-
ing the genome of an evolved organism to the genome of the organism from which
it evolved (see the section on evolution experiments). These variants can be SNP’s
(single nucleotide polymorphisms), small INDEL’s (INSertions or DELetions of
a few base pairs) or larger genomic rearrangements such as translocations or the
loss/duplication of large parts of a chromosome. Multiple computational methods
CHAPTER 1 1-5
are available for variant calling [20–22].
But one is not always interested in sequencing the entire genome, known as
whole genome sequencing (WGS). In higher eukaryotes a large fraction of the
genome consists of non-coding DNA, which is not translated into proteins. For a
lot of studies, just looking at the parts of the genome which are expressed and thus
translated into proteins is adequate. This part of the genome is referred to as the
”exome” and sequencing only this part is referred to as whole exome sequencing
(WES) [23–25]. However, non-coding DNA can play a role in the functioning of an
organism as some is transcribed into RNA (but not further translated into proteins)
and this RNA can perform other functions such as inhibiting the translation of other
RNA molecules (RNA interference) or help with the recruitment of amino acids
to the ribosomes (tRNA). When screening patients for specific genetic diseases
an even more concise way of genome sequencing is used in which only one or a
couple of specific genes are sequenced and screened for variants known to cause
disease, as is done when screening for Huntington’s disease [26].
Transcriptomics data
Transcriptomics data refers to the number of mRNA molecules that an organism
produces for every gene. As mRNA is translated into proteins by the ribosomes
in the cell, mRNA is assumed to be a proxy for the number of proteins produced.
Transcriptomics data can thus shed light on the activity of cellular processes. Tran-
scriptomics data are particularly valuable when it is generated together with ge-
nomics data for two distinct but related cases (for example before and after a bac-
teria gains resistance to a specific drug). In such a case it is possible to link the
identified mutations to changes in gene expression allowing to identify the mu-
tation(s) responsible for changes in the expression profiles of genes belonging to
a specific cellular mechanism (this is called eQTL mapping). Two popular tech-
niques exist for the generation of transcriptomics data: RNA microarrays [27] and
RNA-seq [28]. Both techniques are able to quantify the amount of mRNA tran-
scribed for every gene in the genome.
A microarray is a solid plate with a large number of microscopic spots. Each
of these spots contains single stranded DNA probes for a specific gene. By sub-
merging the microarray into a pool of single stranded cDNA strains (obtained from
the RNA sample under research), hybridization occurs. The probes are designed
such that a hybridization event produces an optical result (usually a green or red
fluorescent signal) which can be measured. Due to noise and nonlinear charac-
teristics of the optical signals, it is nontrivial to convert the optical signals to a
measure which quantifies the amount of mRNA present in the sample [29,30] and
to determine which genes have different expression levels when comparing the re-
1-6 INTRODUCTION
sults from microarrays of the same organism or strain in two different conditions
(which is known as differential expression analysis). Therefore, statistical software
is available to solve these issues. Examples of such software include LIMMA [31]
and MAANOVA [32].
RNA-seq uses NGS technologies to sequence cDNA, obtained from RNA, in-
stead of the genome. The experimental procedure is thus very similar to genome
sequencing. The difference resides in the fact that when performing RNA-seq one
is also interested in the quantity of mRNA molecules in the sample instead of only
the sequence. Therefore, the resulting reads are mapped to the genome and the
number of reads which map to each gene are counted [33]. Because read counts
cannot be readily used to compare different samples and thorough statistical anal-
ysis is needed to decide which genes are differentially expressed in differential
expression analysis, statistical software packages to analyze RNA-seq data are
available. They include DeSeq2 [34] and TopHat/Cufflinks [35].
1.3 Evolution experiments
Often phenotypes are studied because they are useful in economic applications (for
example ethanol resistance for the production of alcoholic beverages or biofuels).
In order to study such acquired phenotypes it can be required to study organisms
under very specific conditions during multiple generations to assess the relation-
ship between the phenotype and the mutations which arise during adaptation to
these conditions. This is impractical to do in nature as it is often impossible to
find these conditions, let alone in combination with a suitable organism to study.
Therefore, when studying such a phenotype, evolution experiments are widely
used [36–38]. While it is possible to conduct evolution experiments in sexual re-
producing organisms [39], bacteria are often used due to their short generation
times (only about 20 minutes for E. coli) which allows to study more generations
in the same time frame. Therefore, the evolution experiments described in this sec-
tion apply to bacteria. Evolution experiments usually start with an ancestral strain
which is exposed to a specific environment. Natural selection favors mutations
that confer a benefit in the chosen condition leading to improved phenotypes [40].
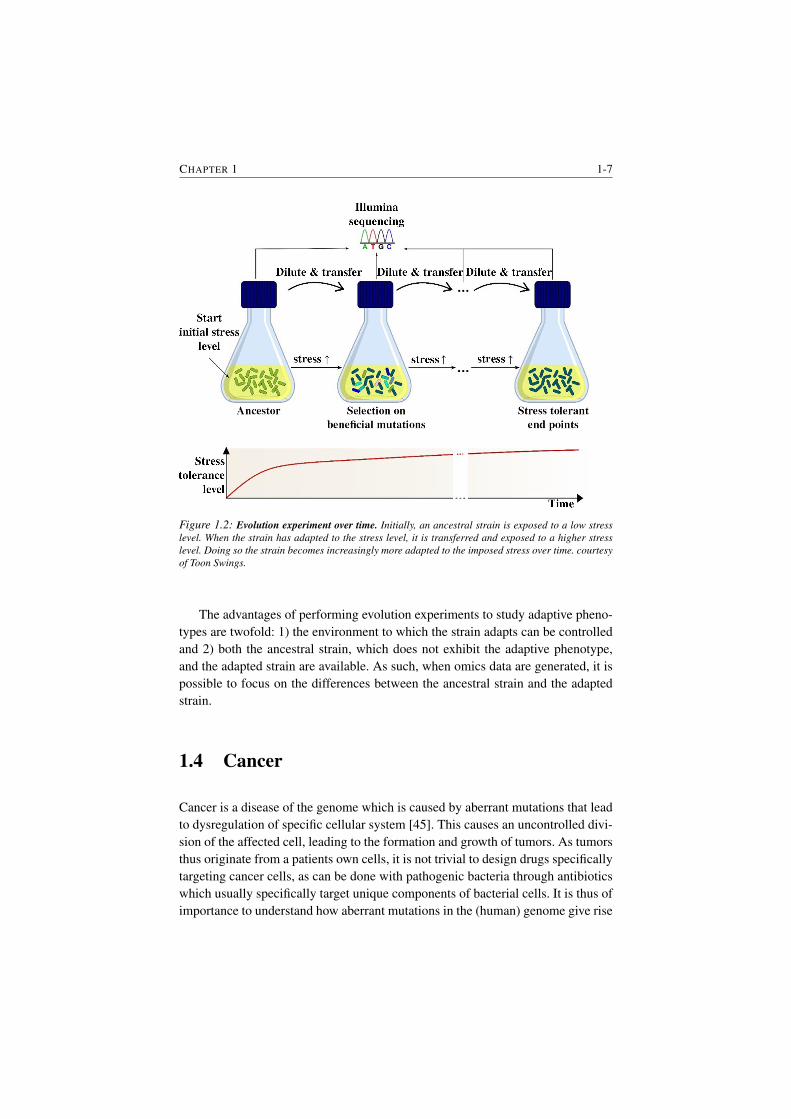
The environment can be static [41, 42] or gradually increasing in intensity over
time [43, 44] (Figure 1.2).
CHAPTER 1 1-7
Figure 1.2: Evolution experiment over time. Initially, an ancestral strain is exposed to a low stress
level. When the strain has adapted to the stress level, it is transferred and exposed to a higher stress
level. Doing so the strain becomes increasingly more adapted to the imposed stress over time. courtesy
of Toon Swings.
The advantages of performing evolution experiments to study adaptive pheno-
types are twofold: 1) the environment to which the strain adapts can be controlled
and 2) both the ancestral strain, which does not exhibit the adaptive phenotype,
and the adapted strain are available. As such, when omics data are generated, it is
possible to focus on the differences between the ancestral strain and the adapted
strain.
1.4 Cancer
Cancer is a disease of the genome which is caused by aberrant mutations that lead
to dysregulation of specific cellular system [45]. This causes an uncontrolled divi-
sion of the affected cell, leading to the formation and growth of tumors. As tumors
thus originate from a patients own cells, it is not trivial to design drugs specifically
targeting cancer cells, as can be done with pathogenic bacteria through antibiotics
which usually specifically target unique components of bacterial cells. It is thus of
importance to understand how aberrant mutations in the (human) genome give rise
1-8 INTRODUCTION
to cancer in order to identify druggable targets for specific cases [46, 47]. Cancer
research is further complicated by the observation that cancer is a very heteroge-
neous disease, even within cancers with identical primary sites. In this respect it is
known that for example within different gastric and breast cancers, amongst oth-
ers, there exist multiple subtypes each with their own genetic cause, survival rate
and response to treatments [48, 49]. This means that knowing the primary site of
a tumor is not enough to propose an appropriate treatment and treatment should
most likely be based on the genomes of the patient’s cancer cells.
Like bacteria, cancer cells have clonal evolutionary properties [50]. In general,
tumor progression is controlled by a series of somatic mutations which are ac-
quired during a person’s life and that each individually give the cell an increased
rate of clonal expansion [51] as these mutations promote uncontrolled divisions.
Cells with higher clonal expansion rates will overgrow others and become domi-
nant, forming tumors. Patients which have mutations in their germline (inherited
mutations) that contribute to the onset of cancer will typically have higher chances
to develop cancer as fewer somatic mutations are needed. Mutations which con-
tribute to healthy cells becoming cancerous can arise in two types of genes: onco-
genes and tumor suppressor genes (TSG). Oncogenes are genes which in normal
circumstances promote cell growth and division while TSG’s are genes involved
in mechanisms which counter-act spurious growth such as apoptosis and cell cy-
cle checkpoints [52]. Mutations in oncogenes can lead to an abundance of growth
promoting signals while mutations in TSG’s can disrupt the cell’s control mecha-
nisms [53].
As both technical and ethical problems prohibit the use of evolution experi-
ments to study human cancer, efforts are being made to collect genomics data from
multiple patients with similar cancer. Results of such analyses are often stored in
(partly) publicly available databases [54]. The most prominent examples are The
Cancer Genome Atlas (TCGA) [55] and the International Cancer Genome Consor-
tium (ICGC) [56]. Because genomics data from both cancerous tissue and healthy
tissue are usually available, it is possible to focus analysis on somatic mutations.
1.5 Biological interaction networks
Networks are currently used in a myriad of disciplines ranging from social net-
works in business [57] and social sciences [58] to neural networks in machine
learning [59]. All these networks have in common that they consist of nodes which
represent entities and edges which represent interactions between these entities.
Edges can be either directed (the interaction is only valid in one direction) or undi-
CHAPTER 1 1-9
rected (the interaction is valid in both directions). In biological networks nodes
represent genes and/or gene products (such as proteins or RNA) and edges repre-
sent the interactions between these nodes.
Biological networks are seldom homogeneous as different types of interac-
tions are usually present. This is important as different types of interactions have
different properties, are discovered using different techniques and are gathered in
different databases (see below). More advanced network-based methods also take
into account interaction types while analyzing data. Therefore, biological interac-
tion networks are usually multi-layered [60, 61].
The different layers can be subdivided in two groups: physical interactions and
functional interactions. Physical interactions are derived from experiments which
prove direct physical interactions between genes/gene products. Genes/gene prod-
ucts involved in functional interactions are not proven to physically interact with
each other but are associated with each other in other ways. Examples of func-
tional interactions include co-expression when genes share expression profiles in
multiple environments [62, 63], predicted interactions in a species by inferring
them from known interactions in related species based on phylogeny [64] and text-
mined interactions [65,66]. As in physical interaction networks the mechanisms of
the interactions are clear and to avoid overconnecting the interaction network, we
focus only on physical interaction networks in the context of this thesis (Figure
1.3).
The interactomics data required to construct a biological physical interaction
network are maintained within a plethora of databases. Usually each database fo-
cuses on a specific layer. An important aspect to consider when consulting an in-
teraction database is how the data are curated as each database has its own cura-
tion rules [67]. Curation can be high-throughput or literature curated. Literature
curated resources contain a large number of small-scale experiments while high-
throughput resources contain large-scale experiments. Literature-curated resources
are mostly used when benchmarking data mining technologies as the superior reli-
ability of literature curated resources is generally assumed [68]. Another important
aspect of an interaction is its reliability. This expresses how likely it is that an in-
teraction exists in reality and is dependent on the experimental technique(s) used
to infer the interaction. Note that even if two databases are both literature curated
they can have different curation rules and therefore contain different interactions
and/or assign different reliabilities to the same interactions. Because of this, efforts
such as IMEx, which integrates different databases using identical curation rules,
have been made [69].
1-10 INTRODUCTION
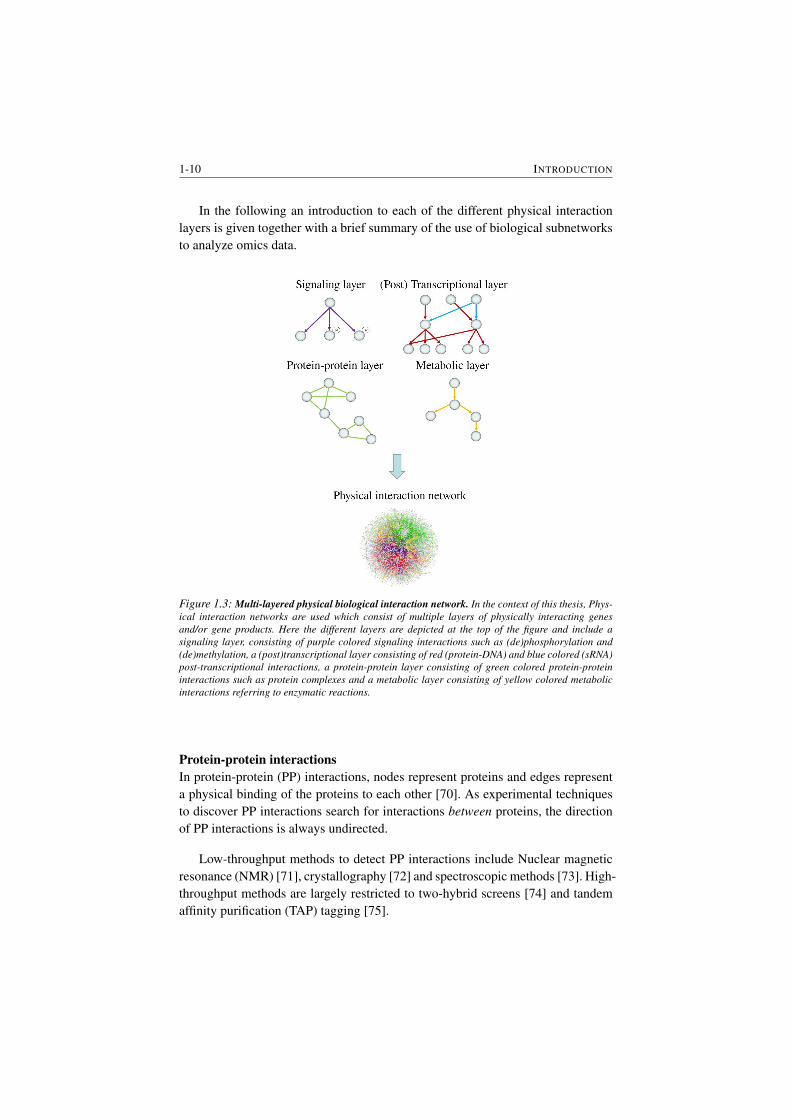
In the following an introduction to each of the different physical interaction
layers is given together with a brief summary of the use of biological subnetworks
to analyze omics data.
Figure 1.3: Multi-layered physical biological interaction network. In the context of this thesis, Phys-
ical interaction networks are used which consist of multiple layers of physically interacting genes
and/or gene products. Here the different layers are depicted at the top of the figure and include a
signaling layer, consisting of purple colored signaling interactions such as (de)phosphorylation and
(de)methylation, a (post)transcriptional layer consisting of red (protein-DNA) and blue colored (sRNA)
post-transcriptional interactions, a protein-protein layer consisting of green colored protein-protein
interactions such as protein complexes and a metabolic layer consisting of yellow colored metabolic
interactions referring to enzymatic reactions.
Protein-protein interactions
In protein-protein (PP) interactions, nodes represent proteins and edges represent
a physical binding of the proteins to each other [70]. As experimental techniques
to discover PP interactions search for interactions between proteins, the direction
of PP interactions is always undirected.
Low-throughput methods to detect PP interactions include Nuclear magnetic
resonance (NMR) [71], crystallography [72] and spectroscopic methods [73]. High-
throughput methods are largely restricted to two-hybrid screens [74] and tandem
affinity purification (TAP) tagging [75].
CHAPTER 1 1-11
Protein-protein interactions are available in several databases [76] ranging from
organism or taxonomic group-specific databases such as the Human Protein Refer-
ence Database (HPRD) [77] and the microbial protein interaction database (MPI-
DB) [78] which focus on humans and microbes respectively, to databases which
contain PP interactions for a large number of organisms such as BioGRID [79]
and String [64]. Even efforts which enable users to query multiple PP interaction
databases simultaneously have been made (e.g. PSICQUIC [80]).
(Post)Transcriptional interactions
(Post)Transcriptional interactions regulate gene expression in cells. In transcrip-
tional interactions the source node of the interaction is a regulator and the end
node is a target gene of that regulator [81]. Transcriptional interactions are there-
fore directed. These interactions regulate translation after transcription and thus
involve interfering with mRNA. These are interactions between molecules (such
as miRNA or sRNA) and the mRNA of a target gene [82] and are also directed.
Transcriptional interactions are mainly obtained using ChiP-chip [83] or ChIP-
seq [84, 85] experimental techniques. But integrating interaction data from multi-
ple Chip experiments does not take the experimental conditions into account. This
leads to situations where it is not clear whether different regulators controlling the
same gene need to act together to perform a specific regulatory function [86]. Be-
cause of this and technical limitations of Chip-chip and ChiP-seq techniques [87],
methods have been developed that use expression data together with interaction
data in order to infer transcriptional interactions [88, 89].
Databases that contain (post)transcriptional interactions include species-spe-
cific databases such as RegulonDB for E. coli K-12 [90] and regulatory networks
based on ENCODE data for human [91]. Also less specific databases exist such as
animalTFDB [92] and RegPrecise which focuses on reconstructing transcription
factor regulons in prokaryotes [93].
Metabolic interactions
Metabolic interactions represent the metabolism of a cell. Nodes represent en-
zymes and edges represent the interactions they catalyze. Metabolic interactions
are therefore directed.
In recent times, metabolic interactions for a specific organism are not neces-
sarily derived from experiments but rather from hight-throughput genomics data
[94, 95]. In general, the genome of the organism is assembled and annotated as to
identify genes which code for enzymes [96, 97]. Using highly curated metabolic
1-12 INTRODUCTION
interactions known from past experiments [98], these genes are then mapped to
metabolic interactions. Software tools such as metaSHARK [99] provide an auto-
mated way of inferring metabolic interactions from genomics data.
Multiple databases provide metabolic interaction data. Examples are KEGG
[100], BRENDA [101] and MetaCyc [102].
Signaling interactions
Signaling interactions control essential cellular processes and mediate quick re-
sponse to changing environments. Examples include post-translational modifica-
tion of proteins (e.g. (de)phosphorylation [103] and (de) acetylation [104]) and
receptor pathways in which a receptor binds to specific molecules and passes the
signal down to other cellular processes [105]. The source nodes in signaling inter-
actions are proteins such as kinases, acetylation agents or members of a receptor
pathway and the target nodes are the targets of these proteins. the edges are di-
rected.
To study modifications of a single protein, experimental techniques include
chromatographic purification or antibody precipitation to obtain samples of, for ex-
ample, phosphorylated or acetylated proteins [106]. The use of mass-spectrometry
methods allows to assess the presence of multiple (de)phosphorylated or (de)acety-
lated proteins at the same time at different points in time, making it possible
to investigate post-translational modification after the pertubation of the environ-
ment [107].
Databases which contain signaling interactions include KEGG [100] (small
number of signaling interactions for a large number of organisms) and SPIKE
[108] (multiple signaling pathways specific for human).
Weighted interaction networks
An important aspect for many network-based methods is the concept of a weighted
interaction network. In a weighted interaction network each node or edge has a
weight assigned to it. This weight can reflect multiple features of the node or
edge. Because experimental techniques to infer interactions vary with respect to
their accuracy and some edges might have been inferred by multiple experimen-
tal techniques, it is not uncommon to assign a weight to the edges which reflects
the probability that the interaction is present in the organism [64]. Alternatively,
some network-based methods have problems with nodes which have a large num-
ber of edges. Most biological networks exhibit a scale-free property with respect
to the distribution of the number of interactions each node has [109]. This means
CHAPTER 1 1-13
that there are many nodes with few interactions but few nodes with a very large
number of interactions. Nodes with a very large number of interactions are called
”hubs” and can overconnect the network. Therefore, some network-based meth-
ods weight the network based on the network’s topology to mitigate the effects of
such hubs [6, 110]. Weights are used by methods as a priori information thereby
decreasing the odds of a node/edge to show up in the solution if it has a low weight
and vice versa [110–112].
1.6 Network-based methods
Currently, biological interaction networks are often used in combination with omics
data. How the biological interaction network is used and which data are integrated
with the network largely depends on the the research question. Applications in-
clude hypothesis generation about a protein’s or gene’s function [113, 114], motif
detection, [115] inference of interactions between genes [116], prioritization of
gene lists [117] and inference of subnetworks of the interaction network which
are involved in a specific phenotype or which are active when exposed to a spe-
cific environment [6,111,118]. In this thesis, the focus is on subnetwork inference
methods and prioritization of gene lists.
The most naive approach would be to identify the most interesting genes from
omics data (e.g. mutated genes or genes with high expression values) and map
them to the network to see if a subset of them are connected in the network. Sub-
sequent GO enrichment analysis of the connected components [119] could then
help to identify the molecular pathways from the set of interesting genes. A more
advanced way of doing this would be to first weight the interaction network by
assigning scores to the nodes or the edges based on the omics data (e.g. log-fold
changes or functional impact scores of mutations). Subnetworks are then inferred
by simply selecting the parts of the network which have highest score. These ap-
proaches are commonly referred to as ”guilt-by-association” as the premise is that
genes which are associated with each other in the network will have similar func-
tion [120, 121].
Another approach is to propagate the information over the network, thereby
using the network’s topology and in some cases the direction of the edges to dif-
fuse the data through the network. An important added value of diffusion methods
as opposed to simply mapping the data to the network is that intermediate nodes,
which were not measured or do not show clearly in the data due to technical limita-
tions or their biological properties, can be recovered in this way. Examples include
diffusion kernel-on-graphs [122–124].
1-14 INTRODUCTION
The network-based methods developed in the context of this thesis explicitly
search for biologically relevant paths which are subsequently used to infer the
subnetwork of the interaction network that represents the interesting part of the
network, given the data. A path is simply a series of consecutive nodes and edges.
When searching for paths the directions and types of the interactions are taken into
account. For example a path between a mutation and a differentially expressed
gene must end with a regulatory edge towards the differentially expressed gene.
Based on the experimental data, these paths are then assigned a score. Finally an
optimization function is utilized to select the subset of paths which make up the
best subnetwork [6, 8, 111, 125].
Network visualization
Visual inspection of (sub)networks is primordial to interpret the results of network-
based methods. To this end multiple software platforms are available such as cy-
toscape [126], Osprey [127] and BioLayout Express3D [128]. Some of these plat-
forms offer functionality to analyze network properties or to perform enrichment
analyses [119, 129, 130].
2Scientific problem and aim
The methods proposed in this thesis are designed to help analyze data from omics
experiments. We address the need for methods capable of analyzing different ex-
perimental design and that can cope with large amounts of data, possibly contain-
ing a lot of noise. The focus is specifically on the interpretation of genomics and/or
transcriptomics data from clonal systems as the analysis of omics data from clonal
systems poses additional challenges in comparison with sexual reproducing organ-
isms. This chapter first focuses on these additional challenges as it discusses the
scientific problem and secondly gives an overview of the developed methods and
explains their aims.
2.1 Scientific problem
Search for molecular pathways
NGS sequencing enabled rapid characterization of genetic variance between mul-
tiple individuals of the same species. Correlating this genetic variation to specific
phenotypes or molecular traits using statistical methods, respectively GWAS [131]
and eQTL mapping [132], offers potential for the identification and/or prioritiza-
tion of alleles underlying important properties [133] or diseases [134]. GWAS/e-
QTL approaches assume, however, that individuals who have similar phenotypes,
2-2 SCIENTIFIC PROBLEM AND AIM
have similar alleles and that enough samples are available to prove correlation.
The assumption that individuals who have similar phenotypes (because for ex-
ample they are gathered from parallel evolution experiments in which the condi-
tions were identical), have similar alleles is embodied in the fact that traditionally
these methods search for recurrently mutated genes. This is a narrow definition of
parallelism as mutations in genes belonging to the same molecular pathway can
equally well confer the same phenotype [41, 135, 136]. This is especially true for
clonal systems which reproduce asexual and therefore DNA exchange between
individuals is minimal. Because of this, when a population of clones adapts to a
specific environment, individual clones in the population will evolve and adapt
independently of each other. This means that when a clone obtains a beneficial
mutation, that mutation cannot spread to the offspring of other clones and as such
another beneficial mutation in another clone can lead to the formation of subpopu-
lations which have similar phenotypes but different genotypes. This phenomenon
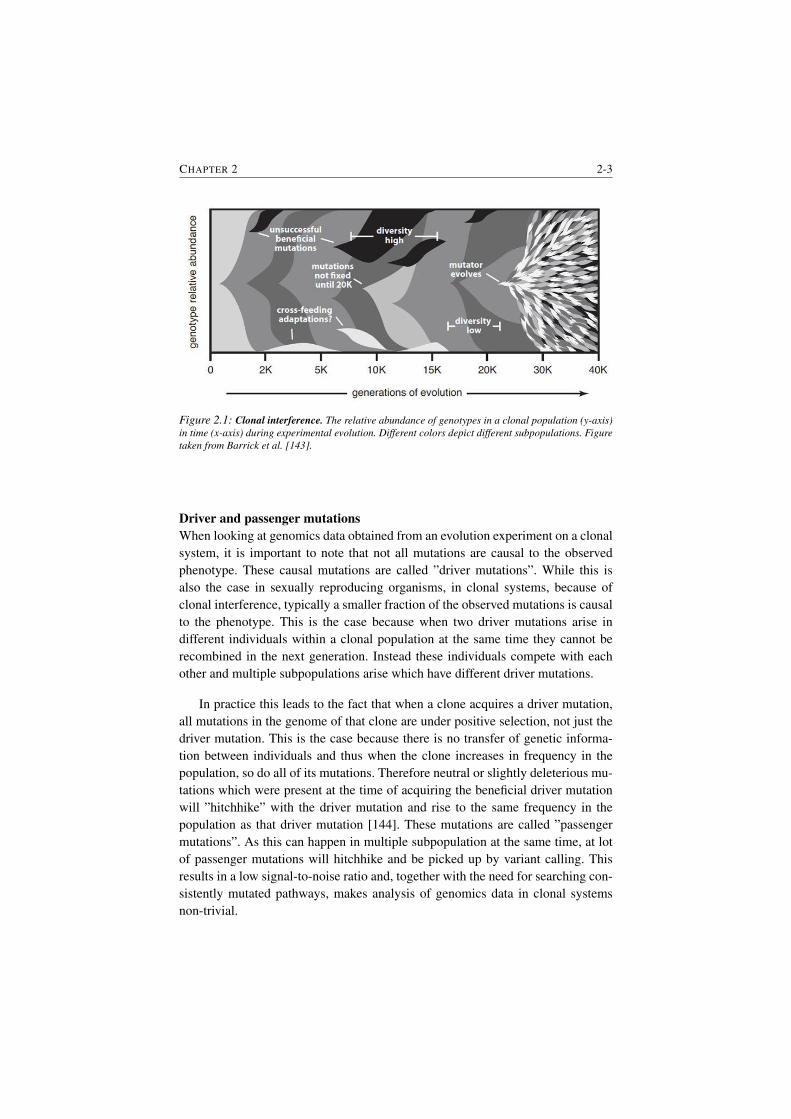
is known as clonal interference [137, 138](Figure 2.1). As such, when collect-
ing clones from end points in parallel evolution experiments (which have similar
phenotypes) the chance of them having identical mutations is lower than would
be expected for sexual reproducing organisms. As such, searching for recurrently
mutated genes, as is often done [139, 140], might not be adequate. Having access
to a large amount of independently evolved samples with similar phenotypes could
offset this problem but in reality usually only few samples are available.
This, together with the fact that experiments which exploit sexual reproduc-
tion in order to increase the observed mutation frequency in causal genes, such
as bulked or pooled segregant analysis [141, 142] is not possible, calls for another
strategy to perform genotype-phenotype mapping in clonal systems. As stated ear-
lier, genes belonging to the same molecular pathway can also confer the same
phenotype. That is why in this thesis methods are proposed to search for molecu-
lar pathways which are recurrently mutated in parallel evolved clonal populations
(Figure 2.2) instead of consistently mutated genes [41, 135, 136]. In order to do
this, it is needed to integrate interactomics data with the obtained genomics (and
possible transcriptomics) data in the form of an interaction network which contains
data on how the biomolecules within a cell interact with each other.
CHAPTER 2 2-3
Figure 2.1: Clonal interference. The relative abundance of genotypes in a clonal population (y-axis)
in time (x-axis) during experimental evolution. Different colors depict different subpopulations. Figure
taken from Barrick et al. [143].
Driver and passenger mutations
When looking at genomics data obtained from an evolution experiment on a clonal
system, it is important to note that not all mutations are causal to the observed
phenotype. These causal mutations are called ”driver mutations”. While this is
also the case in sexually reproducing organisms, in clonal systems, because of
clonal interference, typically a smaller fraction of the observed mutations is causal
to the phenotype. This is the case because when two driver mutations arise in
different individuals within a clonal population at the same time they cannot be
recombined in the next generation. Instead these individuals compete with each
other and multiple subpopulations arise which have different driver mutations.
In practice this leads to the fact that when a clone acquires a driver mutation,
all mutations in the genome of that clone are under positive selection, not just the
driver mutation. This is the case because there is no transfer of genetic informa-
tion between individuals and thus when the clone increases in frequency in the
population, so do all of its mutations. Therefore neutral or slightly deleterious mu-
tations which were present at the time of acquiring the beneficial driver mutation
will ”hitchhike” with the driver mutation and rise to the same frequency in the
population as that driver mutation [144]. These mutations are called ”passenger
mutations”. As this can happen in multiple subpopulation at the same time, at lot
of passenger mutations will hitchhike and be picked up by variant calling. This
results in a low signal-to-noise ratio and, together with the need for searching con-
sistently mutated pathways, makes analysis of genomics data in clonal systems
non-trivial.
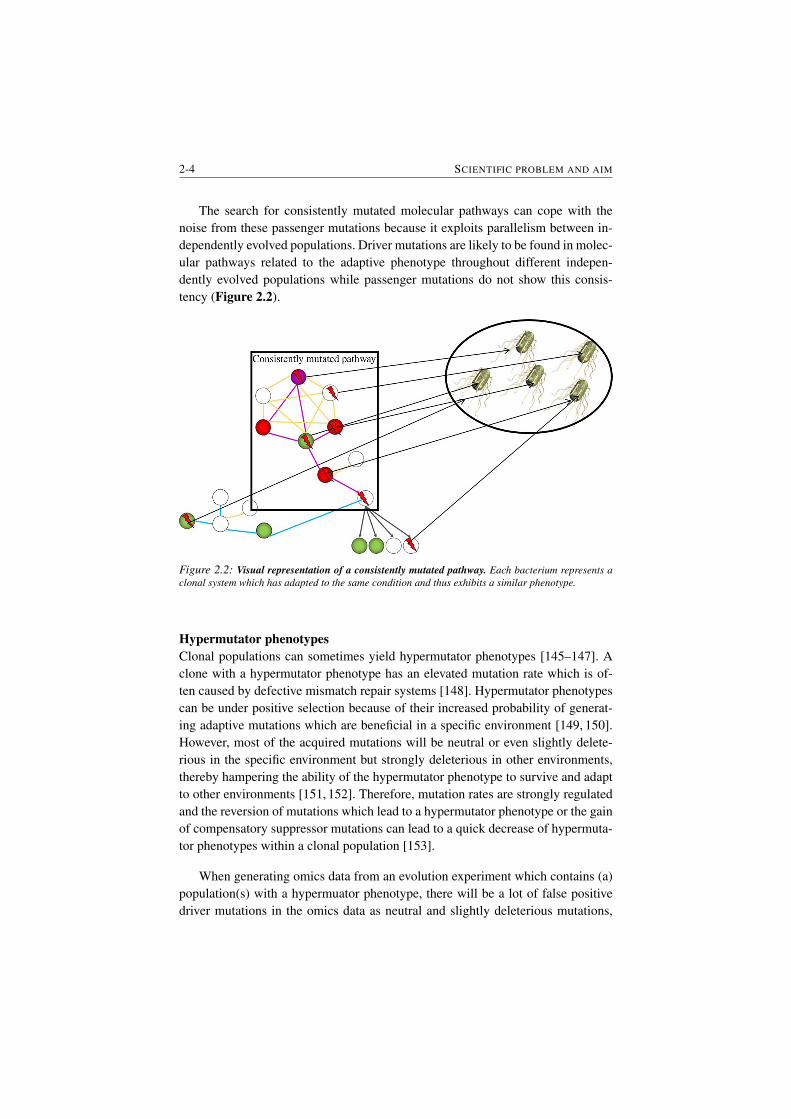
2-4 SCIENTIFIC PROBLEM AND AIM
The search for consistently mutated molecular pathways can cope with the
noise from these passenger mutations because it exploits parallelism between in-
dependently evolved populations. Driver mutations are likely to be found in molec-
ular pathways related to the adaptive phenotype throughout different indepen-
dently evolved populations while passenger mutations do not show this consis-
tency (Figure 2.2).
Figure 2.2: Visual representation of a consistently mutated pathway. Each bacterium represents a
clonal system which has adapted to the same condition and thus exhibits a similar phenotype.
Hypermutator phenotypes
Clonal populations can sometimes yield hypermutator phenotypes [145–147]. A
clone with a hypermutator phenotype has an elevated mutation rate which is of-
ten caused by defective mismatch repair systems [148]. Hypermutator phenotypes
can be under positive selection because of their increased probability of generat-
ing adaptive mutations which are beneficial in a specific environment [149, 150].
However, most of the acquired mutations will be neutral or even slightly delete-
rious in the specific environment but strongly deleterious in other environments,
thereby hampering the ability of the hypermutator phenotype to survive and adapt
to other environments [151, 152]. Therefore, mutation rates are strongly regulated
and the reversion of mutations which lead to a hypermutator phenotype or the gain
of compensatory suppressor mutations can lead to a quick decrease of hypermuta-
tor phenotypes within a clonal population [153].
When generating omics data from an evolution experiment which contains (a)
population(s) with a hypermuator phenotype, there will be a lot of false positive
driver mutations in the omics data as neutral and slightly deleterious mutations,
CHAPTER 2 2-5
which are prominently present in hypermutator phenotypes, will show up in the
data. This makes datasets containing hypermutator phenotypes very hard to ana-
lyze, often resulting in the deletion of hypermutator phenotypes from the data or
the inability to analyze the dataset entirely.
The case for cancer
Some cancer genome databases contain up to 2000 patients for one specific cancer
type at the time of writing. Because these amounts of data are available for some
types of cancer (in bacteria there are usually only between 1 and 20 samples), it
is possible to perform GWAS studies [154–156]. However, GWAS studies tend
to identify common alleles with low penetrance and are ill-equipped to identify
causal mutations which are rare. In addition, the mechanisms underlying the iden-
tified mutations are often unclear [157]. Therefore, novel analysis techniques are
warranted.
As statistical association analysis techniques such as GWAS use no prior knowl-
edge, the incorporation of prior knowledge in the form of interactomics data (which
is abundantly present for human) has potential. Network-based methods are able
to account for known interactions between genes when analyzing genomics data,
leading to the possible identification of (rare) mutations in which the underlying
mechanisms are more clear [8].
Wet-lab mutations testing
Because epistasis between mutations occurs often [158,159] during evolution, wet-
lab testing of a list of interesting mutations is not trivial. As every mutation can
potentially influence another mutation, simply testing the mutations one-by-one
in the ancestral background will likely only lead to the explanation of part of the
phenotype. In principle, every possible combination of identified mutations should
be tested in the ancestral background until a minimal set which explains the phe-
notype completely is found [160]. But this quickly becomes infeasible as even
with as few as 4 genes, there are 15 possible combinations to test and this number
rises quickly with the number of mutations identified. Therefore, methods which
prioritize mutations based on how likely it is that they contribute to the observed
phenotype can be very useful as a guidance for which genes and combinations of
genes should be tested first.
2-6 SCIENTIFIC PROBLEM AND AIM
2.2 Aim
The aim of this thesis is to provide computational methods which can help re-
searchers to interpret large genomics and/or transcriptomics datasets. This inter-
pretation includes the use of biological interaction networks to prioritize mutated
or differentially expressed genes and the inference of the subnetwork of the bio-
logical interaction network which explains the data best. These results will provide
researchers in the wet-lab with additional insights into the molecular mechanisms
of the phenotype under study and provide a starting point for further experiments.
Additionally the results can also be used for hypothesis generation.
More specifically, the aim is to provide methods which are able to analyze
experiments from four different experimental designs which each have their own
available data and data gathering strategies. In brief, computational methods for
the analysis of data from experiments with bacteria were developed and/or tested
for the analysis of 1) expression data, 2) genomics data coupled with expression
data and 3) only genomics data from hypermutator phenotypes. The fourth exper-
imental design refers to the analysis of a large amount of genomic profiles from
cancer patients. A more in-depth overview of the different experimental designs
treated in this thesis, together with the specific strategies utilized to tackle them, is
provided in the following chapter.
3Overview of the proposed methods
In order to achieve the aim, in this thesis three different network-based methods
were developed and one existing method was tested. Each addresses a specific
experimental design in which different data are available. Each method is unique
in that it capitalizes on specific biological insights and/or available data while si-
multaneously dealing with the specific problems of the experimental design. The
remainder of the thesis largely consists of the scientific papers of these methods.
This chapter is meant to give readers a general overview of the methods and the
experimental designs for which they were developed but also to provide insight
into the relationships between the different methods.
In chapter 4 subnetwork inference was tested on a transcriptomics dataset us-
ing the network-based method PheNetic, which existed prior to this thesis. The
method was applied in the context of an ecological study: a consortium of bacteria
which occur together in nature is able to degrade the herbicide linuron efficiently
while its constituents grown in isolation are not. In this system it was unclear
which carbon source(s) support the growth of the primary linuron degrader and
how the synergistic interactions between the constituents of the consortium are
established. In order to gain insight in these mechanisms, RNA-seq data was gen-
erated for both the consortium grown in the presence of linuron as well as for each
of its constituents which were grown in isolation and in the presence of linuron
or a hydrolysis product of linuron. To this end, differential expression analysis
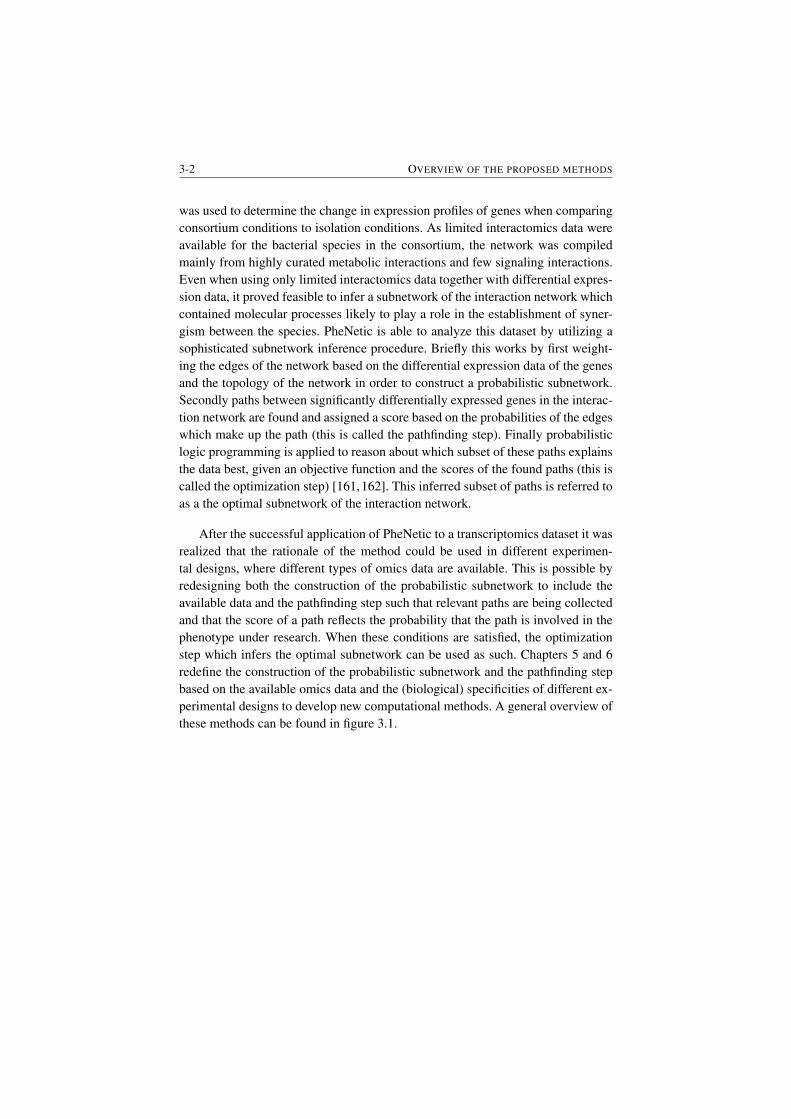
3-2 OVERVIEW OF THE PROPOSED METHODS
was used to determine the change in expression profiles of genes when comparing
consortium conditions to isolation conditions. As limited interactomics data were
available for the bacterial species in the consortium, the network was compiled
mainly from highly curated metabolic interactions and few signaling interactions.
Even when using only limited interactomics data together with differential expres-
sion data, it proved feasible to infer a subnetwork of the interaction network which
contained molecular processes likely to play a role in the establishment of syner-
gism between the species. PheNetic is able to analyze this dataset by utilizing a
sophisticated subnetwork inference procedure. Briefly this works by first weight-
ing the edges of the network based on the differential expression data of the genes
and the topology of the network in order to construct a probabilistic subnetwork.
Secondly paths between significantly differentially expressed genes in the interac-
tion network are found and assigned a score based on the probabilities of the edges
which make up the path (this is called the pathfinding step). Finally probabilistic
logic programming is applied to reason about which subset of these paths explains
the data best, given an objective function and the scores of the found paths (this is
called the optimization step) [161,162]. This inferred subset of paths is referred to
as a the optimal subnetwork of the interaction network.
After the successful application of PheNetic to a transcriptomics dataset it was
realized that the rationale of the method could be used in different experimen-
tal designs, where different types of omics data are available. This is possible by
redesigning both the construction of the probabilistic subnetwork to include the
available data and the pathfinding step such that relevant paths are being collected
and that the score of a path reflects the probability that the path is involved in the
phenotype under research. When these conditions are satisfied, the optimization
step which infers the optimal subnetwork can be used as such. Chapters 5 and 6
redefine the construction of the probabilistic subnetwork and the pathfinding step
based on the available omics data and the (biological) specificities of different ex-
perimental designs to develop new computational methods. A general overview of
these methods can be found in figure 3.1.
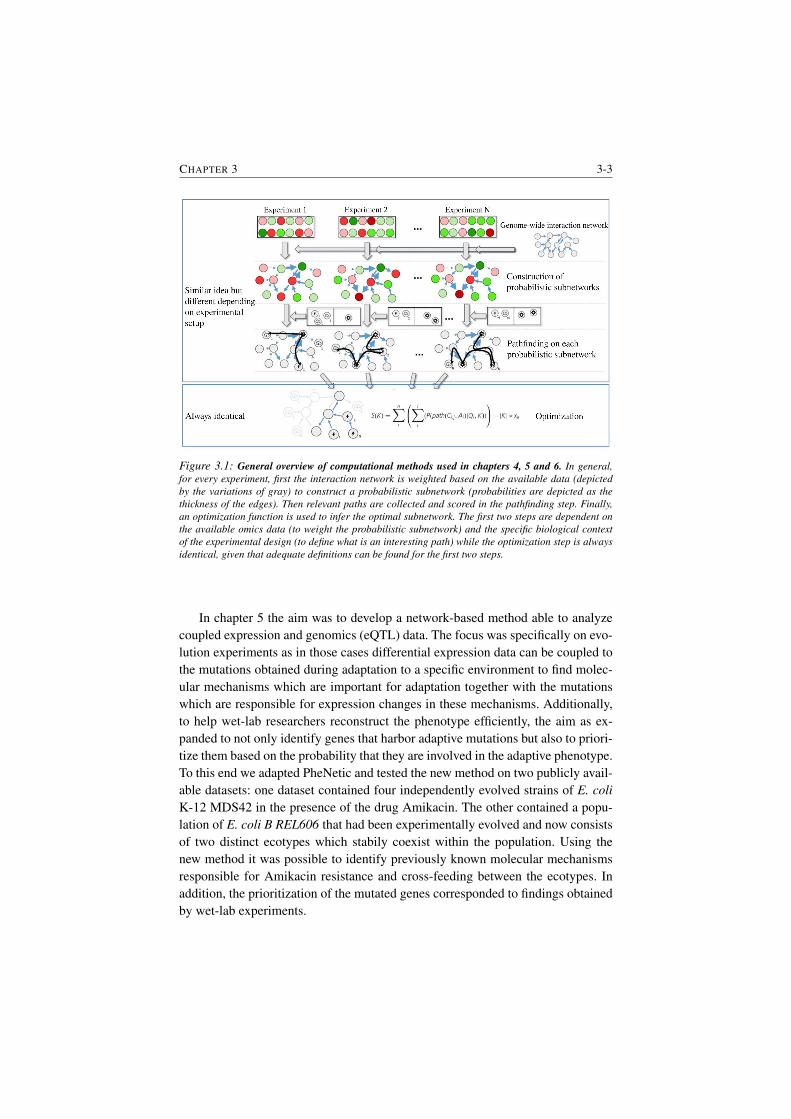
CHAPTER 3 3-3
Figure 3.1: General overview of computational methods used in chapters 4, 5 and 6. In general,
for every experiment, first the interaction network is weighted based on the available data (depicted
by the variations of gray) to construct a probabilistic subnetwork (probabilities are depicted as the
thickness of the edges). Then relevant paths are collected and scored in the pathfinding step. Finally,
an optimization function is used to infer the optimal subnetwork. The first two steps are dependent on
the available omics data (to weight the probabilistic subnetwork) and the specific biological context
of the experimental design (to define what is an interesting path) while the optimization step is always
identical, given that adequate definitions can be found for the first two steps.
In chapter 5 the aim was to develop a network-based method able to analyze
coupled expression and genomics (eQTL) data. The focus was specifically on evo-
lution experiments as in those cases differential expression data can be coupled to
the mutations obtained during adaptation to a specific environment to find molec-
ular mechanisms which are important for adaptation together with the mutations
which are responsible for expression changes in these mechanisms. Additionally,
to help wet-lab researchers reconstruct the phenotype efficiently, the aim as ex-
panded to not only identify genes that harbor adaptive mutations but also to priori-
tize them based on the probability that they are involved in the adaptive phenotype.
To this end we adapted PheNetic and tested the new method on two publicly avail-
able datasets: one dataset contained four independently evolved strains of E. coli
K-12 MDS42 in the presence of the drug Amikacin. The other contained a popu-
lation of E. coli B REL606 that had been experimentally evolved and now consists
of two distinct ecotypes which stabily coexist within the population. Using the
new method it was possible to identify previously known molecular mechanisms
responsible for Amikacin resistance and cross-feeding between the ecotypes. In
addition, the prioritization of the mutated genes corresponded to findings obtained
by wet-lab experiments.
3-4 OVERVIEW OF THE PROPOSED METHODS
In chapter 6 a network-based method named IAMBEE was developed. This
method is able to analyze genomics data without having access to coupled expres-
sion data. The ability to analyze genomics data in isolation is useful as the cost
of performing RNA-seq (which has to be performed at least in triplicate in order
to generate reliable results) can be prohibitively large, especially for experiments
including a large number of parallel samples and/or the sequencing of multiple
time points throughout evolution. Additionally, the method deals with hypermuta-
tor phenotypes which are frequently observed in evolution experiments [163,164].
Datasets including hypermutators are especially hard to analyze, often leading to
the exclusion of hypermutators from the dataset or the inability to analyze the
dataset at all. By using a specific experimental design and incorporating additional
data, the method successfully analyzed a dataset consisting of 16 independently
evolved E. coli K-12 MG1655 populations, all of which developed a hypermutator
phenotype, in the presence of an increasing ethanol concentration.
In chapter 7 a network-based method named SSA-ME was developed to ana-
lyze cancer datasets. The big difference in cancer datasets as compared to micro-
bial datasets is the amount of data. In cancer, datasets of several hundred individ-
uals exist while for bacteria there are usually a lot less samples. As such, different
biological properties which require the availability of a large number of samples
in order to observe them, can be utilized. One such property is mutual exclusivity
in cancer. Mutual exclusivity refers to the observation that once a biological path-
way involved in oncogenesis has obtained a causal mutation in one of its genes,
a second mutation in that pathway will not confer any fitness advantage anymore
and will thus not be fixated [165, 166]. Finding such patterns in large datasets is,
however, a complex problem as simply testing for all possible combinations of
genes is computationally intractable. Therefore, an adaptation of the PheNetic al-
gorithm was not adequate and a completely different network-based method was
developed to find patterns of mutually exclusive mutations in large cancer datasets.
The method was applied to multiple cancer datasets from the TCGA PAN-cancer
project [124] and was able to identify known oncogenic pathways and propose
newly found genes which were rarely mutated.
4Uncovering interspecies interactions
from RNA-seq data
4.1 Introduction
This chapter presents the analysis of a consortium of three species which together
degrade linuron in an efficient way but cannot in isolation. To gain insight into
which interactions between the constituents of the consortium can explain this ob-
servation, RNA-seq data was generated for the consortium and for each of the
constituents grown in isolation. After performing differential RNA-seq analysis,
PheNetic was used to analyze the differential expression data between consortium
and isolation conditions for the two most interesting species. together with pre-
vious work [6], this chapter represents the proof-of-concept of the network-based
methods described in the rest of this thesis.
PA and BW analyzed the data, interpreted the results and wrote the manuscript.
PA performed the biological experiments, BW performed the differential RNA-
seq analysis and applied PheNetic. RDM, KM and DS conceptualized the study,
designed the experiments, discussed the results and edited the manuscript.
4-2 UNCOVERING INTERSPECIES INTERACTIONS FROM RNA-SEQ DATA
4.2 Paper
Interspecies interactions during linuron mineraliza-tionAlbers, P.†, Weytjens, B.†, De Mot, R., Marchal, K. and Springael, K.(2017). Interspecies interactionsduring linuron mineralization. tbd, Submitted.
† these authors contributed equally to this paper
4.2.1 Abstract
The proteobacteria Variovorax sp. WDL1, Comamonas testosteroni WDL7 and
Hyphomicrobium sulfonivorans WDL6 compose a triple-species consortium that
synergistically degrades and grows on the phenylurea herbicide linuron. To ac-
quire a better insight in the interactions between the consortium members and the
underlying molecular mechanisms, we compared the transcriptomes of the key
biodegrading strains WDL7 and WDL1 grown as biofilms in either isolation or
consortium conditions by differential RNA-seq analysis. Differentially expressed
pathways and cellular systems were inferred using the network-based algorithm
PheNetic. Co- culturing affected mainly metabolism in WDL1. Significantly en-
hanced expression of hylA encoding linuron hydrolase was observed. Moreover,
differential expression of several pathways involved in carbohydrate, amino acid,
nitrogen and sulfur metabolism was observed indicating that WDL1 gains carbon
and energy from linuron indirectly by consuming excretion products from WDL7
and/or WDL6. Moreover, in consortium conditions WDL1 showed a pronounced
stress response and overexpression of cell-to-cell interaction systems such as quo-
rum sensing, contact-dependent inhibition and Type VI secretion. Since the latter
two systems can mediate interference competition, it prompts the question if syn-
ergistic linuron degradation is the result of true adaptive cooperation or rather a
facultative interaction between bacteria that coincidentally occupy complementary
metabolic niches.
4.2.2 Introduction
Mineralization of organic xenobiotic compounds is often performed by microbial
consortia by means of metabolic association in which one organism in the consor-
tium converts the organic xenobiotic into metabolites that are degraded by other
consortium members [167]. Further degradation of downstream metabolites can
enhance the initial degradation step resulting in an overall increased efficiency of
mineralization of the organic xenobiotic in which case the metabolic association
between consortium members is called synergistic. Members of organic xenobi-
CHAPTER 4 4-3
otic degrading consortia are often heterotrophic organisms that also feed singly
on compounds other than the organic xenobiotic. Therefore, it is not always clear
whether metabolic association between consortium members is a beneficial inter-
action that has evolved by cooperative adaptation, at least in part because of this
purpose [168], or rather represents a facultative interaction between species that
coincidentally occupy complementary metabolic niches. In fact, the evolution of
cooperative traits is estimated to be rare in the microbial world [169]. The rare
examples of cooperation among bacteria show that the involved bacteria typically
have developed specialized molecular mechanisms necessary for synergistic func-
tioning of the consortium, such as co-aggregration or bacterial signaling [170,171].
The identification of such molecular mechanisms can therefore be indicative of the
evolution of cooperation between bacterial consortium members.
A consortium that synergistically degrades an organic xenobiotic compound
has been described for mineralisation of the widely used phenylurea herbicide lin-
uron [172]. The consortium was enriched from an orchard soil with a history of
linuron treatment and originally consisted of five to six species with functional
redundancy. The consortium can be reduced to three partners, i.e. strains Variovo-
rax sp. WDL1, Comamonas testosteroni WDL7 and Hyphomicrobium sulfonivo-
rans WDL6, that together provide all steps of the catabolic pathway for linuron
mineralisation [172]. Metabolic association, i.e., the exchange of linuron metabo-
lites, has been identified as the major driver for synergistic linuron degradation by
the consortium. Variovorax sp. WDL1 hydrolyzes linuron into 3,4-dichloroaniline
(3,4-DCA) and N,O-dimethylhydroxylamine (N,O-DMHA) using the phenylurea
hydrolase HylA [172, 173]. Although WDL1 contains dca and ccd clusters en-
coding for the further degradation of 3,4-DCA to 3-oxoadipate via a chlorocate-
chol intermediate, 3,4-DCA is degraded inefficiently by WDL1. Instead, 3,4-DCA
and N,O-DMHA are excreted by WDL1 and used as carbon and energy source
by WDL7 and WDL6, respectively [172]. An overview of linuron degradation
by the consortium is depicted in Figure 4.1. When the consortium is grown as
a biofilm on linuron as the sole carbon, nitrogen and energy source, the removal
of 3,4-DCA by WDL7 increases the rate of linuron hydrolysis by strain WDL1
whereas N,O-DMHA degradation by WDL6 has no effect on linuron hydrolysis.
Therefore, WDL7 is considered to act as a mutualistic partner of WDL1 whereas
WDL6 is suggested to have a rather commensal role [174]. The metabolic inter-
action between the three strains is further reflected in their close co-localization
when grown as biofilms on linuron [174]. Conservation of species composition of
linuron-degrading consortia as suggested by the isolation of such consortia from
geographically separated and physico- chemically different soils [174] and from
molecular ecology studies [167, 174, 175], underlines the ecological relevance of
this multi-species bacterial organization. Although metabolic association during
linuron degradation appears the major driving force of the consortium composition
and functionality, we do not know whether other interactions underlie the synergis-
tic degradation of linuron. For instance, it is not yet clear which carbon source(s)
support the growth of the primary linuron degrader strain WDL1 in the consortium.
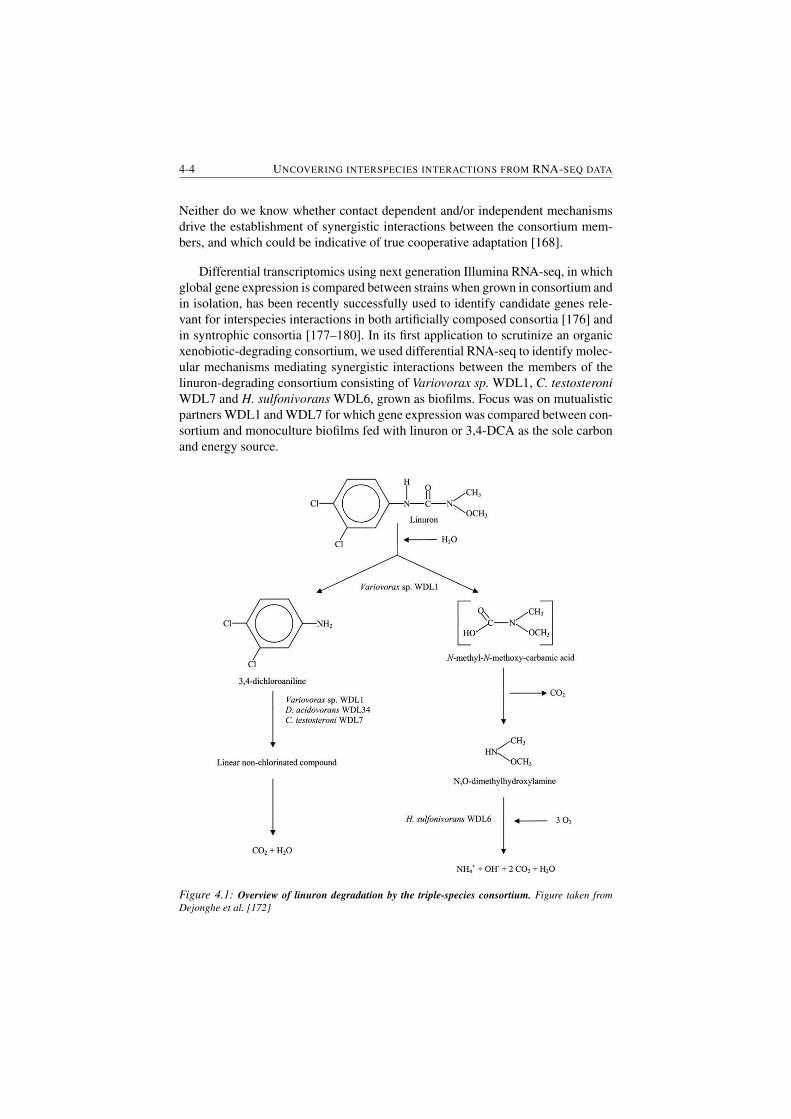
4-4 UNCOVERING INTERSPECIES INTERACTIONS FROM RNA-SEQ DATA
Neither do we know whether contact dependent and/or independent mechanisms
drive the establishment of synergistic interactions between the consortium mem-
bers, and which could be indicative of true cooperative adaptation [168].
Differential transcriptomics using next generation Illumina RNA-seq, in which
global gene expression is compared between strains when grown in consortium and
in isolation, has been recently successfully used to identify candidate genes rele-
vant for interspecies interactions in both artificially composed consortia [176] and
in syntrophic consortia [177–180]. In its first application to scrutinize an organic
xenobiotic-degrading consortium, we used differential RNA-seq to identify molec-
ular mechanisms mediating synergistic interactions between the members of the
linuron-degrading consortium consisting of Variovorax sp. WDL1, C. testosteroni
WDL7 and H. sulfonivorans WDL6, grown as biofilms. Focus was on mutualistic
partners WDL1 and WDL7 for which gene expression was compared between con-
sortium and monoculture biofilms fed with linuron or 3,4-DCA as the sole carbon
and energy source.
Figure 4.1: Overview of linuron degradation by the triple-species consortium. Figure taken from
Dejonghe et al. [172]
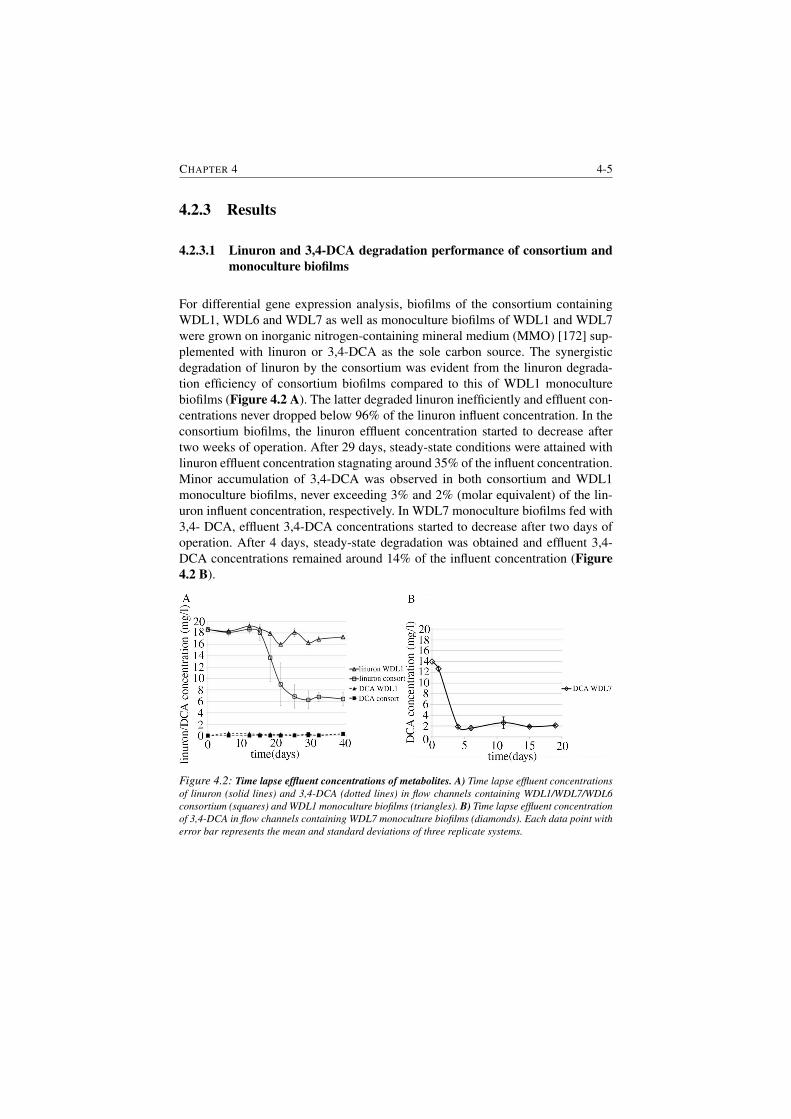
CHAPTER 4 4-5
4.2.3 Results
4.2.3.1 Linuron and 3,4-DCA degradation performance of consortium and
monoculture biofilms
For differential gene expression analysis, biofilms of the consortium containing
WDL1, WDL6 and WDL7 as well as monoculture biofilms of WDL1 and WDL7
were grown on inorganic nitrogen-containing mineral medium (MMO) [172] sup-
plemented with linuron or 3,4-DCA as the sole carbon source. The synergistic
degradation of linuron by the consortium was evident from the linuron degrada-
tion efficiency of consortium biofilms compared to this of WDL1 monoculture
biofilms (Figure 4.2 A). The latter degraded linuron inefficiently and effluent con-
centrations never dropped below 96% of the linuron influent concentration. In the
consortium biofilms, the linuron effluent concentration started to decrease after
two weeks of operation. After 29 days, steady-state conditions were attained with
linuron effluent concentration stagnating around 35% of the influent concentration.
Minor accumulation of 3,4-DCA was observed in both consortium and WDL1
monoculture biofilms, never exceeding 3% and 2% (molar equivalent) of the lin-
uron influent concentration, respectively. In WDL7 monoculture biofilms fed with
3,4- DCA, effluent 3,4-DCA concentrations started to decrease after two days of
operation. After 4 days, steady-state degradation was obtained and effluent 3,4-
DCA concentrations remained around 14% of the influent concentration (Figure
4.2 B).
Figure 4.2: Time lapse effluent concentrations of metabolites. A) Time lapse effluent concentrations
of linuron (solid lines) and 3,4-DCA (dotted lines) in flow channels containing WDL1/WDL7/WDL6
consortium (squares) and WDL1 monoculture biofilms (triangles). B) Time lapse effluent concentration
of 3,4-DCA in flow channels containing WDL7 monoculture biofilms (diamonds). Each data point with
error bar represents the mean and standard deviations of three replicate systems.
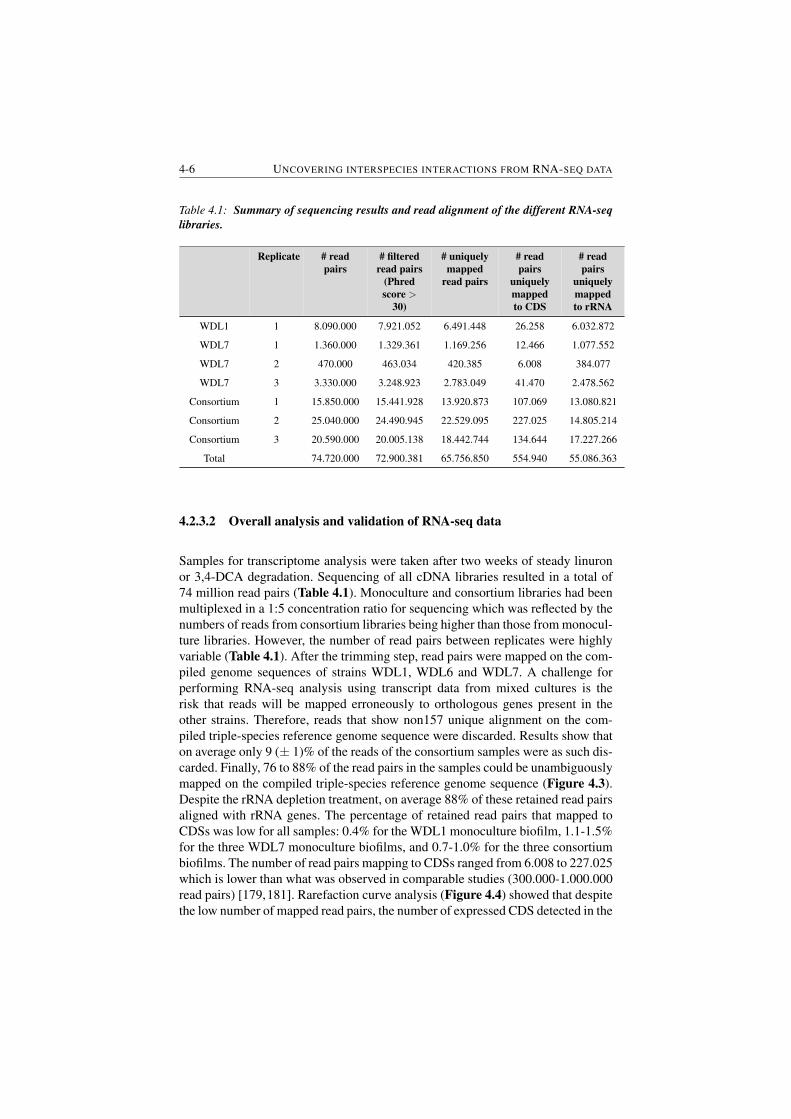
4-6 UNCOVERING INTERSPECIES INTERACTIONS FROM RNA-SEQ DATA
Table 4.1: Summary of sequencing results and read alignment of the different RNA-seq
libraries.
Replicate # read
pairs
# filtered
read pairs
(Phred
score >
30)
# uniquely
mapped
read pairs
# read
pairs
uniquely
mapped
to CDS
# read
pairs
uniquely
mapped
to rRNA
WDL1 1 8.090.000 7.921.052 6.491.448 26.258 6.032.872
WDL7 1 1.360.000 1.329.361 1.169.256 12.466 1.077.552
WDL7 2 470.000 463.034 420.385 6.008 384.077
WDL7 3 3.330.000 3.248.923 2.783.049 41.470 2.478.562
Consortium 1 15.850.000 15.441.928 13.920.873 107.069 13.080.821
Consortium 2 25.040.000 24.490.945 22.529.095 227.025 14.805.214
Consortium 3 20.590.000 20.005.138 18.442.744 134.644 17.227.266
Total 74.720.000 72.900.381 65.756.850 554.940 55.086.363
4.2.3.2 Overall analysis and validation of RNA-seq data
Samples for transcriptome analysis were taken after two weeks of steady linuron
or 3,4-DCA degradation. Sequencing of all cDNA libraries resulted in a total of
74 million read pairs (Table 4.1). Monoculture and consortium libraries had been
multiplexed in a 1:5 concentration ratio for sequencing which was reflected by the
numbers of reads from consortium libraries being higher than those from monocul-
ture libraries. However, the number of read pairs between replicates were highly
variable (Table 4.1). After the trimming step, read pairs were mapped on the com-
piled genome sequences of strains WDL1, WDL6 and WDL7. A challenge for
performing RNA-seq analysis using transcript data from mixed cultures is the
risk that reads will be mapped erroneously to orthologous genes present in the
other strains. Therefore, reads that show non157 unique alignment on the com-
piled triple-species reference genome sequence were discarded. Results show that
on average only 9 (± 1)% of the reads of the consortium samples were as such dis-
carded. Finally, 76 to 88% of the read pairs in the samples could be unambiguously
mapped on the compiled triple-species reference genome sequence (Figure 4.3).
Despite the rRNA depletion treatment, on average 88% of these retained read pairs
aligned with rRNA genes. The percentage of retained read pairs that mapped to
CDSs was low for all samples: 0.4% for the WDL1 monoculture biofilm, 1.1-1.5%
for the three WDL7 monoculture biofilms, and 0.7-1.0% for the three consortium
biofilms. The number of read pairs mapping to CDSs ranged from 6.008 to 227.025
which is lower than what was observed in comparable studies (300.000-1.000.000
read pairs) [179,181]. Rarefaction curve analysis (Figure 4.4) showed that despite
the low number of mapped read pairs, the number of expressed CDS detected in the
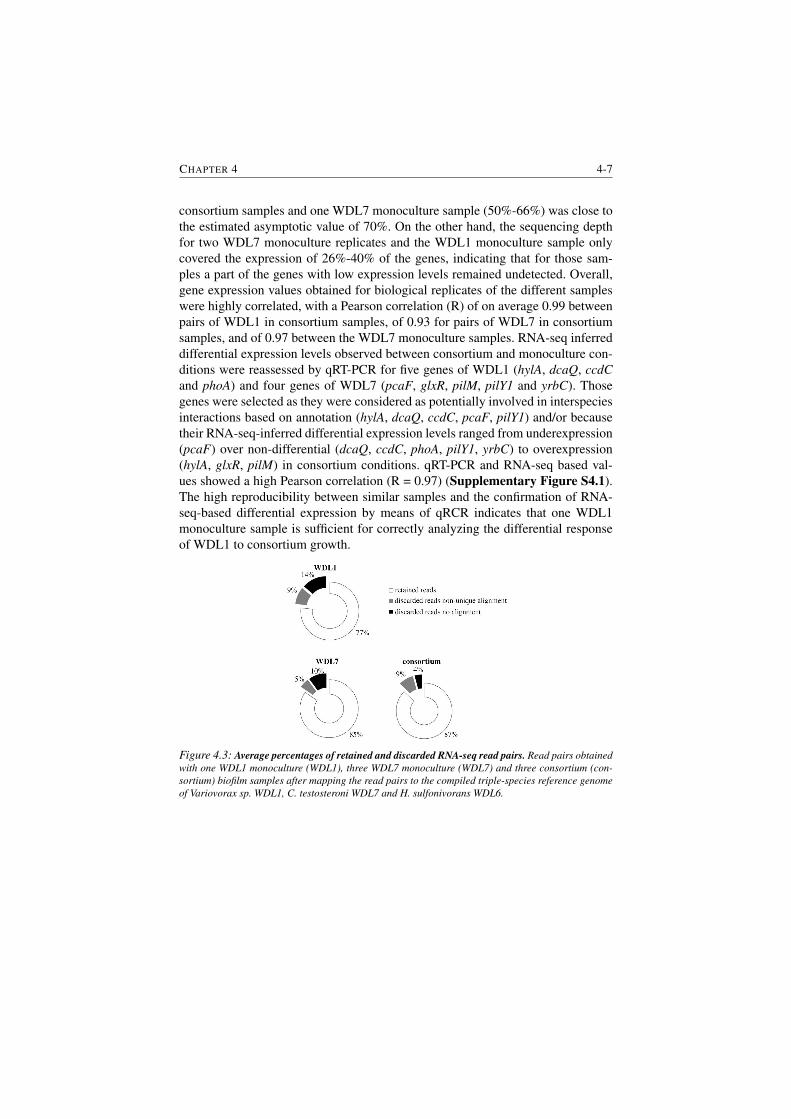
CHAPTER 4 4-7
consortium samples and one WDL7 monoculture sample (50%-66%) was close to
the estimated asymptotic value of 70%. On the other hand, the sequencing depth
for two WDL7 monoculture replicates and the WDL1 monoculture sample only
covered the expression of 26%-40% of the genes, indicating that for those sam-
ples a part of the genes with low expression levels remained undetected. Overall,
gene expression values obtained for biological replicates of the different samples
were highly correlated, with a Pearson correlation (R) of on average 0.99 between
pairs of WDL1 in consortium samples, of 0.93 for pairs of WDL7 in consortium
samples, and of 0.97 between the WDL7 monoculture samples. RNA-seq inferred
differential expression levels observed between consortium and monoculture con-
ditions were reassessed by qRT-PCR for five genes of WDL1 (hylA, dcaQ, ccdC
and phoA) and four genes of WDL7 (pcaF, glxR, pilM, pilY1 and yrbC). Those
genes were selected as they were considered as potentially involved in interspecies
interactions based on annotation (hylA, dcaQ, ccdC, pcaF, pilY1) and/or because
their RNA-seq-inferred differential expression levels ranged from underexpression
(pcaF) over non-differential (dcaQ, ccdC, phoA, pilY1, yrbC) to overexpression
(hylA, glxR, pilM) in consortium conditions. qRT-PCR and RNA-seq based val-
ues showed a high Pearson correlation (R = 0.97) (Supplementary Figure S4.1).
The high reproducibility between similar samples and the confirmation of RNA-
seq-based differential expression by means of qRCR indicates that one WDL1
monoculture sample is sufficient for correctly analyzing the differential response
of WDL1 to consortium growth.
Figure 4.3: Average percentages of retained and discarded RNA-seq read pairs. Read pairs obtained
with one WDL1 monoculture (WDL1), three WDL7 monoculture (WDL7) and three consortium (con-
sortium) biofilm samples after mapping the read pairs to the compiled triple-species reference genome
of Variovorax sp. WDL1, C. testosteroni WDL7 and H. sulfonivorans WDL6.
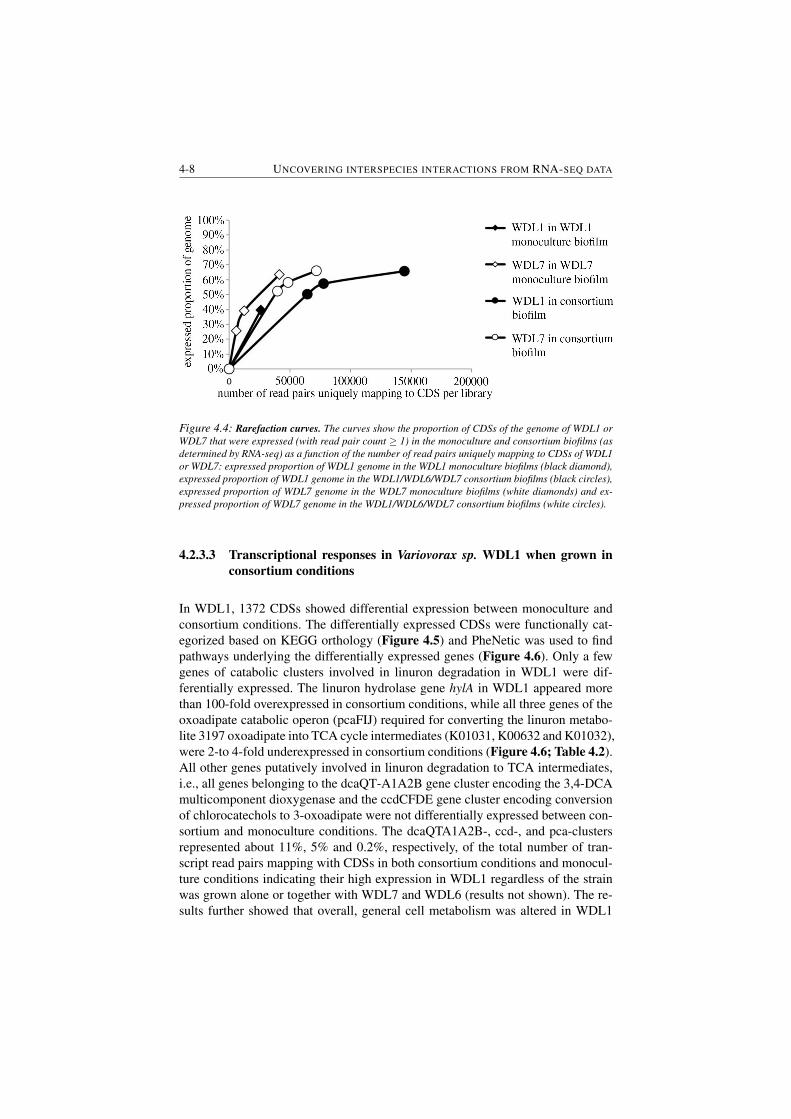
4-8 UNCOVERING INTERSPECIES INTERACTIONS FROM RNA-SEQ DATA
Figure 4.4: Rarefaction curves. The curves show the proportion of CDSs of the genome of WDL1 or
WDL7 that were expressed (with read pair count ≥ 1) in the monoculture and consortium biofilms (as
determined by RNA-seq) as a function of the number of read pairs uniquely mapping to CDSs of WDL1
or WDL7: expressed proportion of WDL1 genome in the WDL1 monoculture biofilms (black diamond),
expressed proportion of WDL1 genome in the WDL1/WDL6/WDL7 consortium biofilms (black circles),
expressed proportion of WDL7 genome in the WDL7 monoculture biofilms (white diamonds) and ex-
pressed proportion of WDL7 genome in the WDL1/WDL6/WDL7 consortium biofilms (white circles).
4.2.3.3 Transcriptional responses in Variovorax sp. WDL1 when grown in
consortium conditions
In WDL1, 1372 CDSs showed differential expression between monoculture and
consortium conditions. The differentially expressed CDSs were functionally cat-
egorized based on KEGG orthology (Figure 4.5) and PheNetic was used to find
pathways underlying the differentially expressed genes (Figure 4.6). Only a few
genes of catabolic clusters involved in linuron degradation in WDL1 were dif-
ferentially expressed. The linuron hydrolase gene hylA in WDL1 appeared more
than 100-fold overexpressed in consortium conditions, while all three genes of the
oxoadipate catabolic operon (pcaFIJ) required for converting the linuron metabo-
lite 3197 oxoadipate into TCA cycle intermediates (K01031, K00632 and K01032),
were 2-to 4-fold underexpressed in consortium conditions (Figure 4.6; Table 4.2).
All other genes putatively involved in linuron degradation to TCA intermediates,
i.e., all genes belonging to the dcaQT-A1A2B gene cluster encoding the 3,4-DCA
multicomponent dioxygenase and the ccdCFDE gene cluster encoding conversion
of chlorocatechols to 3-oxoadipate were not differentially expressed between con-
sortium and monoculture conditions. The dcaQTA1A2B-, ccd-, and pca-clusters
represented about 11%, 5% and 0.2%, respectively, of the total number of tran-
script read pairs mapping with CDSs in both consortium conditions and monocul-
ture conditions indicating their high expression in WDL1 regardless of the strain
was grown alone or together with WDL7 and WDL6 (results not shown). The re-
sults further showed that overall, general cell metabolism was altered in WDL1
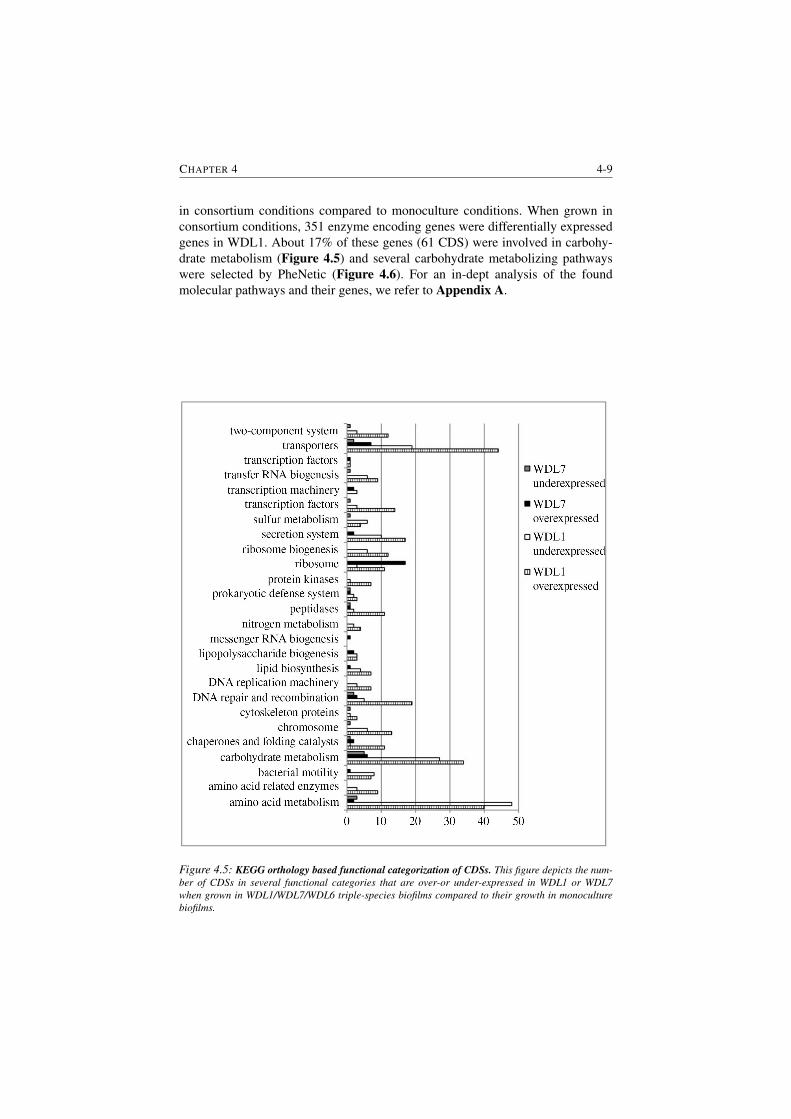
CHAPTER 4 4-9
in consortium conditions compared to monoculture conditions. When grown in
consortium conditions, 351 enzyme encoding genes were differentially expressed
genes in WDL1. About 17% of these genes (61 CDS) were involved in carbohy-
drate metabolism (Figure 4.5) and several carbohydrate metabolizing pathways
were selected by PheNetic (Figure 4.6). For an in-dept analysis of the found
molecular pathways and their genes, we refer to Appendix A.
Figure 4.5: KEGG orthology based functional categorization of CDSs. This figure depicts the num-
ber of CDSs in several functional categories that are over-or under-expressed in WDL1 or WDL7
when grown in WDL1/WDL7/WDL6 triple-species biofilms compared to their growth in monoculture
biofilms.
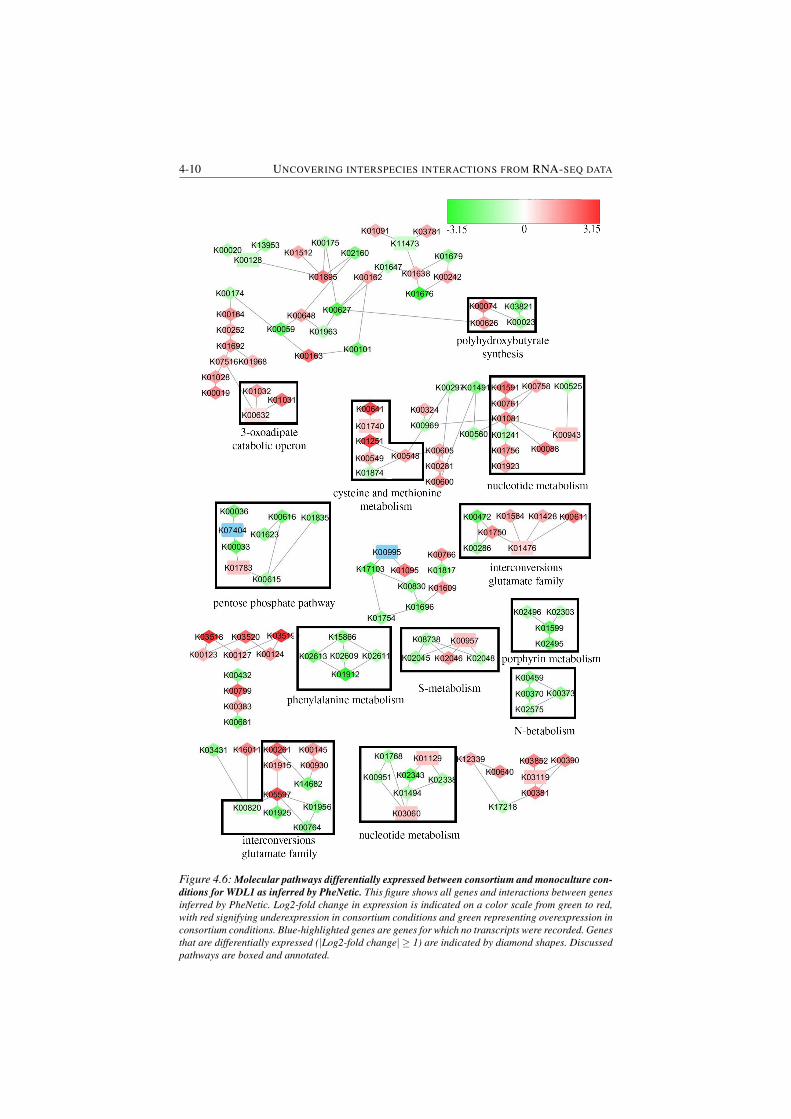
4-10 UNCOVERING INTERSPECIES INTERACTIONS FROM RNA-SEQ DATA
Figure 4.6: Molecular pathways differentially expressed between consortium and monoculture con-
ditions for WDL1 as inferred by PheNetic. This figure shows all genes and interactions between genes
inferred by PheNetic. Log2-fold change in expression is indicated on a color scale from green to red,
with red signifying underexpression in consortium conditions and green representing overexpression in
consortium conditions. Blue-highlighted genes are genes for which no transcripts were recorded. Genes
that are differentially expressed (|Log2-fold change| ≥ 1) are indicated by diamond shapes. Discussed
pathways are boxed and annotated.
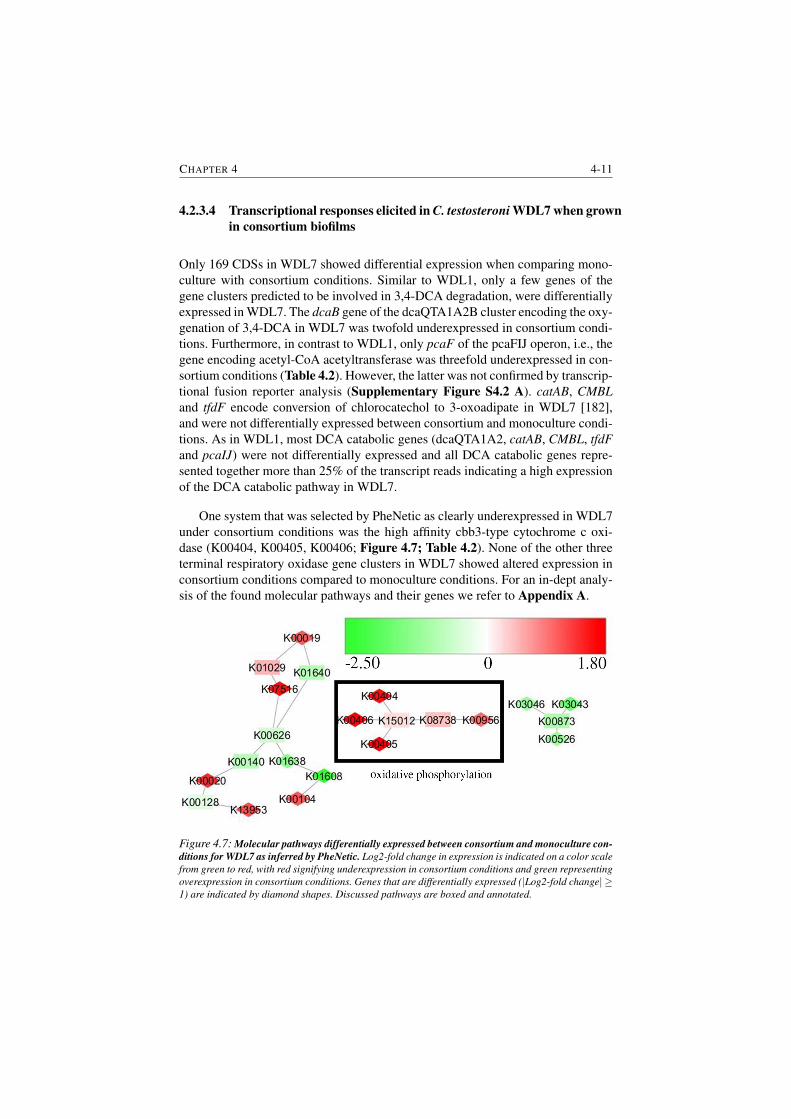
CHAPTER 4 4-11
4.2.3.4 Transcriptional responses elicited in C. testosteroni WDL7 when grown
in consortium biofilms
Only 169 CDSs in WDL7 showed differential expression when comparing mono-
culture with consortium conditions. Similar to WDL1, only a few genes of the
gene clusters predicted to be involved in 3,4-DCA degradation, were differentially
expressed in WDL7. The dcaB gene of the dcaQTA1A2B cluster encoding the oxy-
genation of 3,4-DCA in WDL7 was twofold underexpressed in consortium condi-
tions. Furthermore, in contrast to WDL1, only pcaF of the pcaFIJ operon, i.e., the
gene encoding acetyl-CoA acetyltransferase was threefold underexpressed in con-
sortium conditions (Table 4.2). However, the latter was not confirmed by transcrip-
tional fusion reporter analysis (Supplementary Figure S4.2 A). catAB, CMBL
and tfdF encode conversion of chlorocatechol to 3-oxoadipate in WDL7 [182],
and were not differentially expressed between consortium and monoculture condi-
tions. As in WDL1, most DCA catabolic genes (dcaQTA1A2, catAB, CMBL, tfdF
and pcaIJ) were not differentially expressed and all DCA catabolic genes repre-
sented together more than 25% of the transcript reads indicating a high expression
of the DCA catabolic pathway in WDL7.
One system that was selected by PheNetic as clearly underexpressed in WDL7
under consortium conditions was the high affinity cbb3-type cytochrome c oxi-
dase (K00404, K00405, K00406; Figure 4.7; Table 4.2). None of the other three
terminal respiratory oxidase gene clusters in WDL7 showed altered expression in
consortium conditions compared to monoculture conditions. For an in-dept analy-
sis of the found molecular pathways and their genes we refer to Appendix A.
Figure 4.7: Molecular pathways differentially expressed between consortium and monoculture con-
ditions for WDL7 as inferred by PheNetic. Log2-fold change in expression is indicated on a color scale
from green to red, with red signifying underexpression in consortium conditions and green representing
overexpression in consortium conditions. Genes that are differentially expressed (|Log2-fold change| ≥1) are indicated by diamond shapes. Discussed pathways are boxed and annotated.
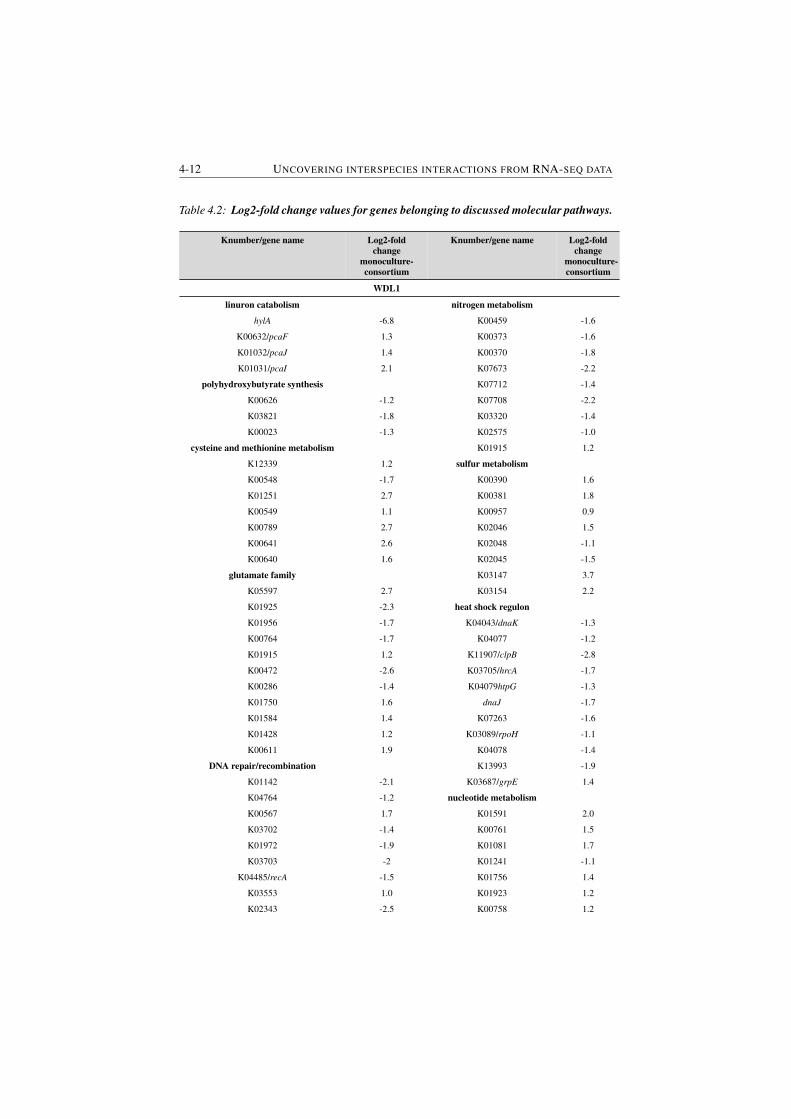
4-12 UNCOVERING INTERSPECIES INTERACTIONS FROM RNA-SEQ DATA
Table 4.2: Log2-fold change values for genes belonging to discussed molecular pathways.
Knumber/gene name Log2-fold
change
monoculture-
consortium
Knumber/gene name Log2-fold
change
monoculture-
consortium
WDL1
linuron catabolism nitrogen metabolism
hylA -6.8 K00459 -1.6
K00632/pcaF 1.3 K00373 -1.6
K01032/pcaJ 1.4 K00370 -1.8
K01031/pcaI 2.1 K07673 -2.2
polyhydroxybutyrate synthesis K07712 -1.4
K00626 -1.2 K07708 -2.2
K03821 -1.8 K03320 -1.4
K00023 -1.3 K02575 -1.0
cysteine and methionine metabolism K01915 1.2
K12339 1.2 sulfur metabolism
K00548 -1.7 K00390 1.6
K01251 2.7 K00381 1.8
K00549 1.1 K00957 0.9
K00789 2.7 K02046 1.5
K00641 2.6 K02048 -1.1
K00640 1.6 K02045 -1.5
glutamate family K03147 3.7
K05597 2.7 K03154 2.2
K01925 -2.3 heat shock regulon
K01956 -1.7 K04043/dnaK -1.3
K00764 -1.7 K04077 -1.2
K01915 1.2 K11907/clpB -2.8
K00472 -2.6 K03705/hrcA -1.7
K00286 -1.4 K04079htpG -1.3
K01750 1.6 dnaJ -1.7
K01584 1.4 K07263 -1.6
K01428 1.2 K03089/rpoH -1.1
K00611 1.9 K04078 -1.4
DNA repair/recombination K13993 -1.9
K01142 -2.1 K03687/grpE 1.4
K04764 -1.2 nucleotide metabolism
K00567 1.7 K01591 2.0
K03702 -1.4 K00761 1.5
K01972 -1.9 K01081 1.7
K03703 -2 K01241 -1.1
K04485/recA -1.5 K01756 1.4
K03553 1.0 K01923 1.2
K02343 -2.5 K00758 1.2
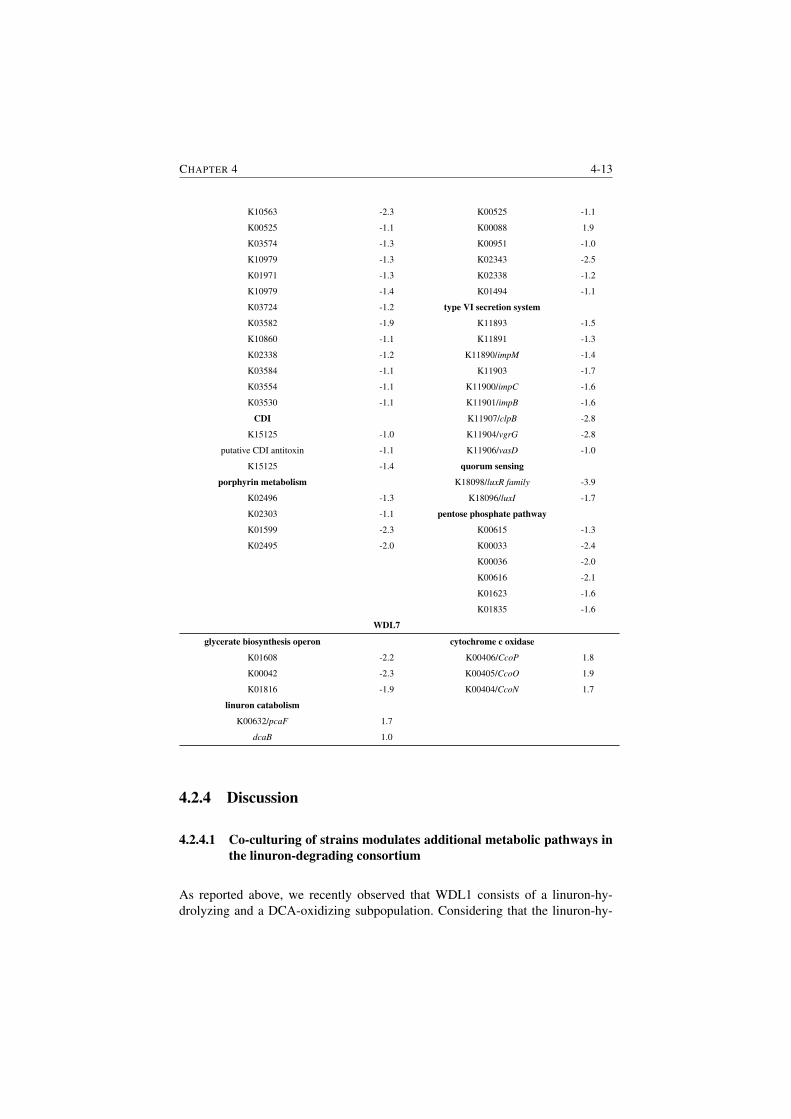
CHAPTER 4 4-13
K10563 -2.3 K00525 -1.1
K00525 -1.1 K00088 1.9
K03574 -1.3 K00951 -1.0
K10979 -1.3 K02343 -2.5
K01971 -1.3 K02338 -1.2
K10979 -1.4 K01494 -1.1
K03724 -1.2 type VI secretion system
K03582 -1.9 K11893 -1.5
K10860 -1.1 K11891 -1.3
K02338 -1.2 K11890/impM -1.4
K03584 -1.1 K11903 -1.7
K03554 -1.1 K11900/impC -1.6
K03530 -1.1 K11901/impB -1.6
CDI K11907/clpB -2.8
K15125 -1.0 K11904/vgrG -2.8
putative CDI antitoxin -1.1 K11906/vasD -1.0
K15125 -1.4 quorum sensing
porphyrin metabolism K18098/luxR family -3.9
K02496 -1.3 K18096/luxI -1.7
K02303 -1.1 pentose phosphate pathway
K01599 -2.3 K00615 -1.3
K02495 -2.0 K00033 -2.4
K00036 -2.0
K00616 -2.1
K01623 -1.6
K01835 -1.6
WDL7
glycerate biosynthesis operon cytochrome c oxidase
K01608 -2.2 K00406/CcoP 1.8
K00042 -2.3 K00405/CcoO 1.9
K01816 -1.9 K00404/CcoN 1.7
linuron catabolism
K00632/pcaF 1.7
dcaB 1.0
4.2.4 Discussion
4.2.4.1 Co-culturing of strains modulates additional metabolic pathways in
the linuron-degrading consortium
As reported above, we recently observed that WDL1 consists of a linuron-hy-
drolyzing and a DCA-oxidizing subpopulation. Considering that the linuron-hy-
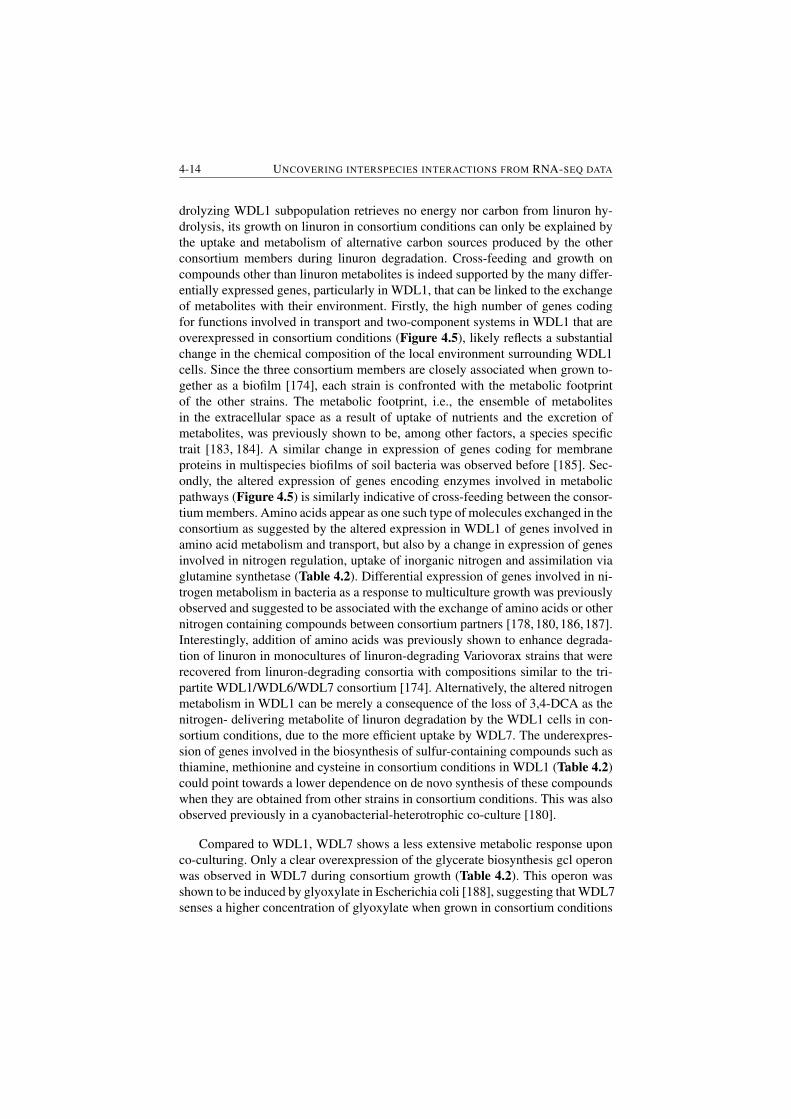
4-14 UNCOVERING INTERSPECIES INTERACTIONS FROM RNA-SEQ DATA
drolyzing WDL1 subpopulation retrieves no energy nor carbon from linuron hy-
drolysis, its growth on linuron in consortium conditions can only be explained by
the uptake and metabolism of alternative carbon sources produced by the other
consortium members during linuron degradation. Cross-feeding and growth on
compounds other than linuron metabolites is indeed supported by the many differ-
entially expressed genes, particularly in WDL1, that can be linked to the exchange
of metabolites with their environment. Firstly, the high number of genes coding
for functions involved in transport and two-component systems in WDL1 that are
overexpressed in consortium conditions (Figure 4.5), likely reflects a substantial
change in the chemical composition of the local environment surrounding WDL1
cells. Since the three consortium members are closely associated when grown to-
gether as a biofilm [174], each strain is confronted with the metabolic footprint
of the other strains. The metabolic footprint, i.e., the ensemble of metabolites
in the extracellular space as a result of uptake of nutrients and the excretion of
metabolites, was previously shown to be, among other factors, a species specific
trait [183, 184]. A similar change in expression of genes coding for membrane
proteins in multispecies biofilms of soil bacteria was observed before [185]. Sec-
ondly, the altered expression of genes encoding enzymes involved in metabolic
pathways (Figure 4.5) is similarly indicative of cross-feeding between the consor-
tium members. Amino acids appear as one such type of molecules exchanged in the
consortium as suggested by the altered expression in WDL1 of genes involved in
amino acid metabolism and transport, but also by a change in expression of genes
involved in nitrogen regulation, uptake of inorganic nitrogen and assimilation via
glutamine synthetase (Table 4.2). Differential expression of genes involved in ni-
trogen metabolism in bacteria as a response to multiculture growth was previously
observed and suggested to be associated with the exchange of amino acids or other
nitrogen containing compounds between consortium partners [178,180,186,187].
Interestingly, addition of amino acids was previously shown to enhance degrada-
tion of linuron in monocultures of linuron-degrading Variovorax strains that were
recovered from linuron-degrading consortia with compositions similar to the tri-
partite WDL1/WDL6/WDL7 consortium [174]. Alternatively, the altered nitrogen
metabolism in WDL1 can be merely a consequence of the loss of 3,4-DCA as the
nitrogen- delivering metabolite of linuron degradation by the WDL1 cells in con-
sortium conditions, due to the more efficient uptake by WDL7. The underexpres-
sion of genes involved in the biosynthesis of sulfur-containing compounds such as
thiamine, methionine and cysteine in consortium conditions in WDL1 (Table 4.2)
could point towards a lower dependence on de novo synthesis of these compounds
when they are obtained from other strains in consortium conditions. This was also
observed previously in a cyanobacterial-heterotrophic co-culture [180].
Compared to WDL1, WDL7 shows a less extensive metabolic response upon
co-culturing. Only a clear overexpression of the glycerate biosynthesis gcl operon
was observed in WDL7 during consortium growth (Table 4.2). This operon was
shown to be induced by glyoxylate in Escherichia coli [188], suggesting that WDL7
senses a higher concentration of glyoxylate when grown in consortium conditions
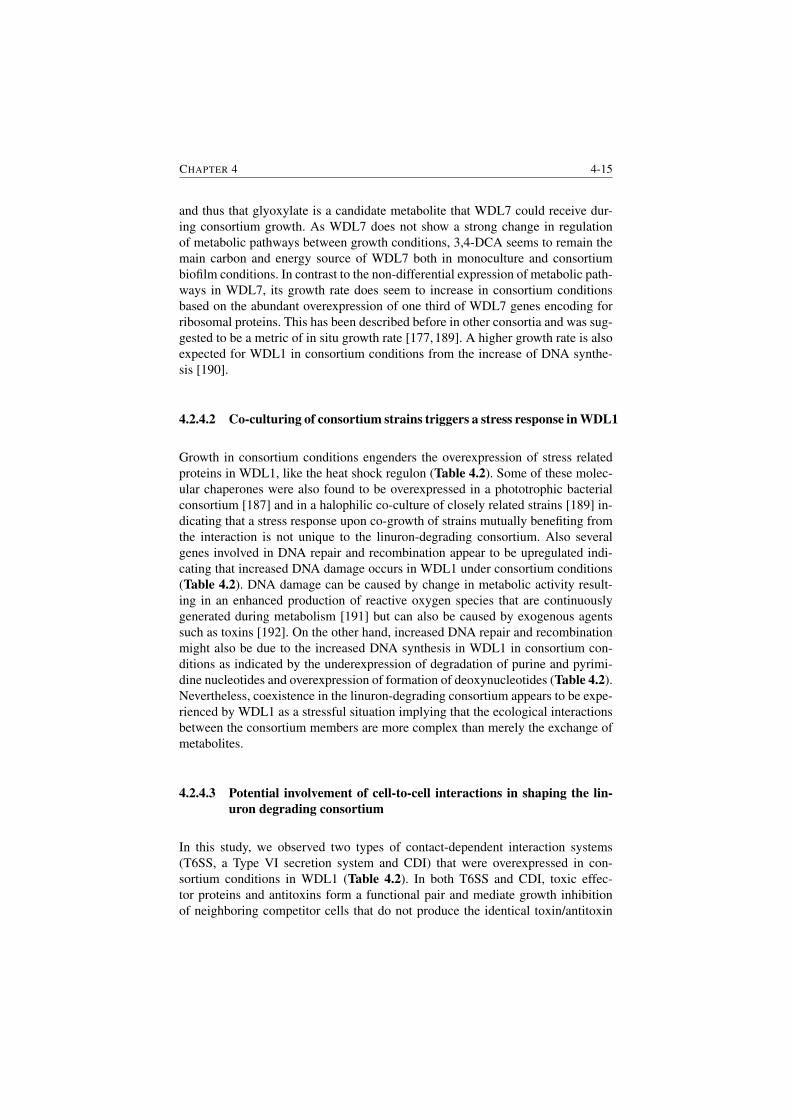
CHAPTER 4 4-15
and thus that glyoxylate is a candidate metabolite that WDL7 could receive dur-
ing consortium growth. As WDL7 does not show a strong change in regulation
of metabolic pathways between growth conditions, 3,4-DCA seems to remain the
main carbon and energy source of WDL7 both in monoculture and consortium
biofilm conditions. In contrast to the non-differential expression of metabolic path-
ways in WDL7, its growth rate does seem to increase in consortium conditions
based on the abundant overexpression of one third of WDL7 genes encoding for
ribosomal proteins. This has been described before in other consortia and was sug-
gested to be a metric of in situ growth rate [177,189]. A higher growth rate is also
expected for WDL1 in consortium conditions from the increase of DNA synthe-
sis [190].
4.2.4.2 Co-culturing of consortium strains triggers a stress response in WDL1
Growth in consortium conditions engenders the overexpression of stress related
proteins in WDL1, like the heat shock regulon (Table 4.2). Some of these molec-
ular chaperones were also found to be overexpressed in a phototrophic bacterial
consortium [187] and in a halophilic co-culture of closely related strains [189] in-
dicating that a stress response upon co-growth of strains mutually benefiting from
the interaction is not unique to the linuron-degrading consortium. Also several
genes involved in DNA repair and recombination appear to be upregulated indi-
cating that increased DNA damage occurs in WDL1 under consortium conditions
(Table 4.2). DNA damage can be caused by change in metabolic activity result-
ing in an enhanced production of reactive oxygen species that are continuously
generated during metabolism [191] but can also be caused by exogenous agents
such as toxins [192]. On the other hand, increased DNA repair and recombination
might also be due to the increased DNA synthesis in WDL1 in consortium con-
ditions as indicated by the underexpression of degradation of purine and pyrimi-
dine nucleotides and overexpression of formation of deoxynucleotides (Table 4.2).
Nevertheless, coexistence in the linuron-degrading consortium appears to be expe-
rienced by WDL1 as a stressful situation implying that the ecological interactions
between the consortium members are more complex than merely the exchange of
metabolites.
4.2.4.3 Potential involvement of cell-to-cell interactions in shaping the lin-
uron degrading consortium
In this study, we observed two types of contact-dependent interaction systems
(T6SS, a Type VI secretion system and CDI) that were overexpressed in con-
sortium conditions in WDL1 (Table 4.2). In both T6SS and CDI, toxic effec-
tor proteins and antitoxins form a functional pair and mediate growth inhibition
of neighboring competitor cells that do not produce the identical toxin/antitoxin
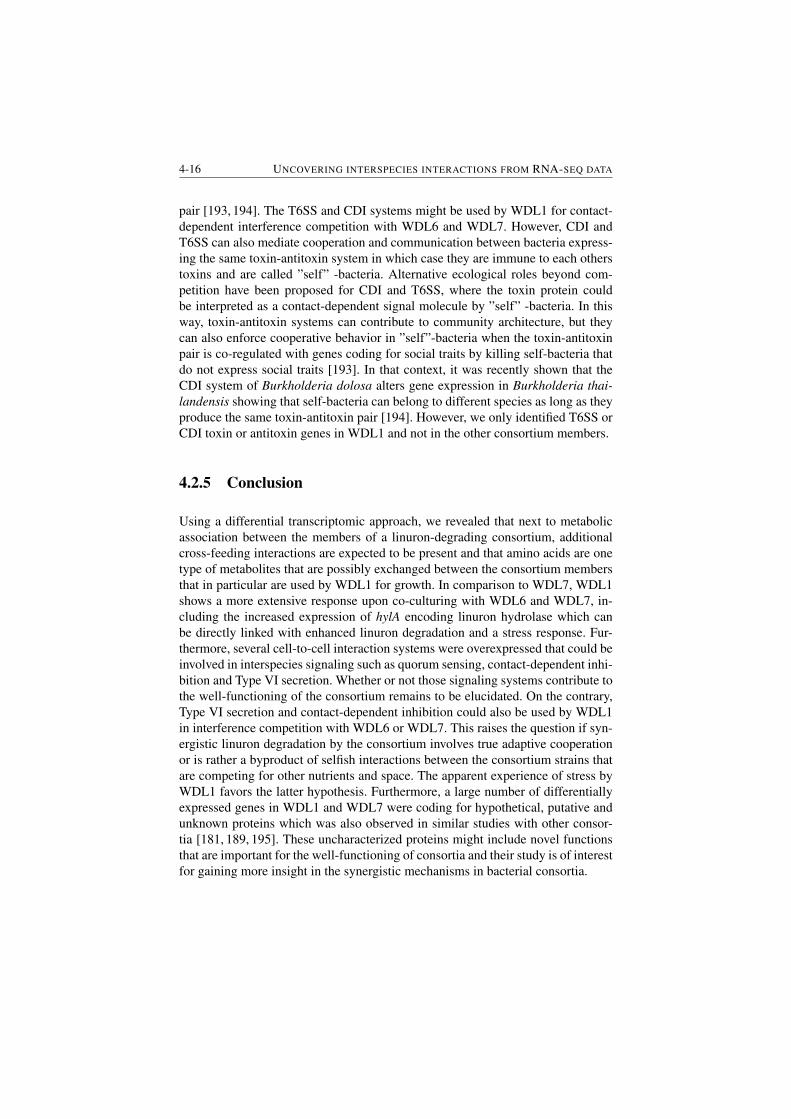
4-16 UNCOVERING INTERSPECIES INTERACTIONS FROM RNA-SEQ DATA
pair [193, 194]. The T6SS and CDI systems might be used by WDL1 for contact-
dependent interference competition with WDL6 and WDL7. However, CDI and
T6SS can also mediate cooperation and communication between bacteria express-
ing the same toxin-antitoxin system in which case they are immune to each others
toxins and are called ”self” -bacteria. Alternative ecological roles beyond com-
petition have been proposed for CDI and T6SS, where the toxin protein could
be interpreted as a contact-dependent signal molecule by ”self” -bacteria. In this
way, toxin-antitoxin systems can contribute to community architecture, but they
can also enforce cooperative behavior in ”self”-bacteria when the toxin-antitoxin
pair is co-regulated with genes coding for social traits by killing self-bacteria that
do not express social traits [193]. In that context, it was recently shown that the
CDI system of Burkholderia dolosa alters gene expression in Burkholderia thai-
landensis showing that self-bacteria can belong to different species as long as they
produce the same toxin-antitoxin pair [194]. However, we only identified T6SS or
CDI toxin or antitoxin genes in WDL1 and not in the other consortium members.
4.2.5 Conclusion
Using a differential transcriptomic approach, we revealed that next to metabolic
association between the members of a linuron-degrading consortium, additional
cross-feeding interactions are expected to be present and that amino acids are one
type of metabolites that are possibly exchanged between the consortium members
that in particular are used by WDL1 for growth. In comparison to WDL7, WDL1
shows a more extensive response upon co-culturing with WDL6 and WDL7, in-
cluding the increased expression of hylA encoding linuron hydrolase which can
be directly linked with enhanced linuron degradation and a stress response. Fur-
thermore, several cell-to-cell interaction systems were overexpressed that could be
involved in interspecies signaling such as quorum sensing, contact-dependent inhi-
bition and Type VI secretion. Whether or not those signaling systems contribute to
the well-functioning of the consortium remains to be elucidated. On the contrary,
Type VI secretion and contact-dependent inhibition could also be used by WDL1
in interference competition with WDL6 or WDL7. This raises the question if syn-
ergistic linuron degradation by the consortium involves true adaptive cooperation
or is rather a byproduct of selfish interactions between the consortium strains that
are competing for other nutrients and space. The apparent experience of stress by
WDL1 favors the latter hypothesis. Furthermore, a large number of differentially
expressed genes in WDL1 and WDL7 were coding for hypothetical, putative and
unknown proteins which was also observed in similar studies with other consor-
tia [181, 189, 195]. These uncharacterized proteins might include novel functions
that are important for the well-functioning of consortia and their study is of interest
for gaining more insight in the synergistic mechanisms in bacterial consortia.
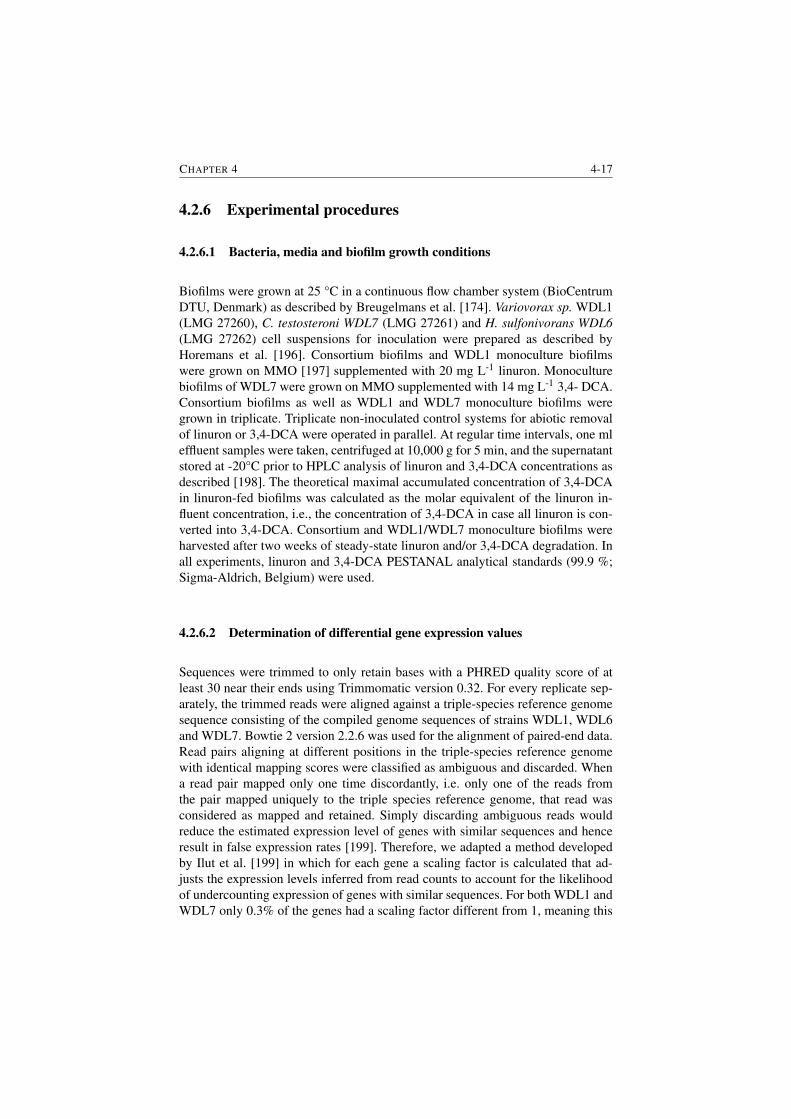
CHAPTER 4 4-17
4.2.6 Experimental procedures
4.2.6.1 Bacteria, media and biofilm growth conditions
Biofilms were grown at 25 °C in a continuous flow chamber system (BioCentrum
DTU, Denmark) as described by Breugelmans et al. [174]. Variovorax sp. WDL1
(LMG 27260), C. testosteroni WDL7 (LMG 27261) and H. sulfonivorans WDL6
(LMG 27262) cell suspensions for inoculation were prepared as described by
Horemans et al. [196]. Consortium biofilms and WDL1 monoculture biofilms
were grown on MMO [197] supplemented with 20 mg L-1 linuron. Monoculture
biofilms of WDL7 were grown on MMO supplemented with 14 mg L-1 3,4- DCA.
Consortium biofilms as well as WDL1 and WDL7 monoculture biofilms were
grown in triplicate. Triplicate non-inoculated control systems for abiotic removal
of linuron or 3,4-DCA were operated in parallel. At regular time intervals, one ml
effluent samples were taken, centrifuged at 10,000 g for 5 min, and the supernatant
stored at -20°C prior to HPLC analysis of linuron and 3,4-DCA concentrations as
described [198]. The theoretical maximal accumulated concentration of 3,4-DCA
in linuron-fed biofilms was calculated as the molar equivalent of the linuron in-
fluent concentration, i.e., the concentration of 3,4-DCA in case all linuron is con-
verted into 3,4-DCA. Consortium and WDL1/WDL7 monoculture biofilms were
harvested after two weeks of steady-state linuron and/or 3,4-DCA degradation. In
all experiments, linuron and 3,4-DCA PESTANAL analytical standards (99.9 %;
Sigma-Aldrich, Belgium) were used.
4.2.6.2 Determination of differential gene expression values
Sequences were trimmed to only retain bases with a PHRED quality score of at
least 30 near their ends using Trimmomatic version 0.32. For every replicate sep-
arately, the trimmed reads were aligned against a triple-species reference genome
sequence consisting of the compiled genome sequences of strains WDL1, WDL6
and WDL7. Bowtie 2 version 2.2.6 was used for the alignment of paired-end data.
Read pairs aligning at different positions in the triple-species reference genome
with identical mapping scores were classified as ambiguous and discarded. When
a read pair mapped only one time discordantly, i.e. only one of the reads from
the pair mapped uniquely to the triple species reference genome, that read was
considered as mapped and retained. Simply discarding ambiguous reads would
reduce the estimated expression level of genes with similar sequences and hence
result in false expression rates [199]. Therefore, we adapted a method developed
by Ilut et al. [199] in which for each gene a scaling factor is calculated that ad-
justs the expression levels inferred from read counts to account for the likelihood
of undercounting expression of genes with similar sequences. For both WDL1 and
WDL7 only 0.3% of the genes had a scaling factor different from 1, meaning this
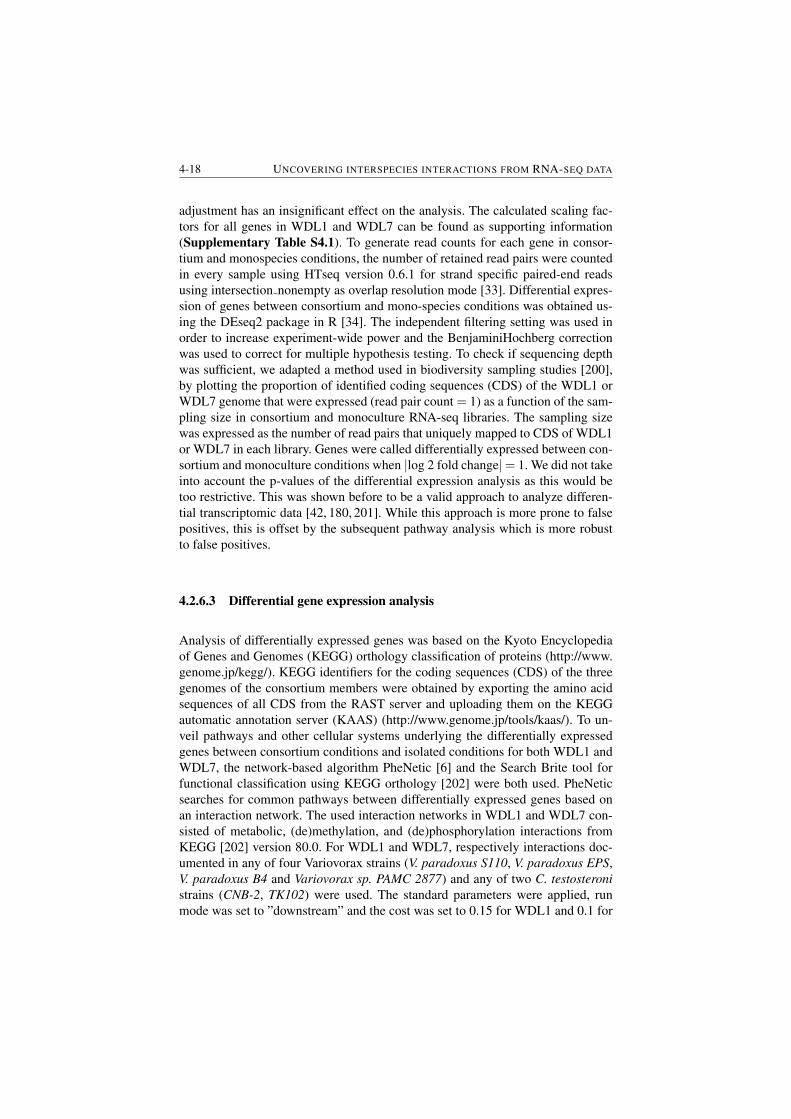
4-18 UNCOVERING INTERSPECIES INTERACTIONS FROM RNA-SEQ DATA
adjustment has an insignificant effect on the analysis. The calculated scaling fac-
tors for all genes in WDL1 and WDL7 can be found as supporting information
(Supplementary Table S4.1). To generate read counts for each gene in consor-
tium and monospecies conditions, the number of retained read pairs were counted
in every sample using HTseq version 0.6.1 for strand specific paired-end reads
using intersection nonempty as overlap resolution mode [33]. Differential expres-
sion of genes between consortium and mono-species conditions was obtained us-
ing the DEseq2 package in R [34]. The independent filtering setting was used in
order to increase experiment-wide power and the BenjaminiHochberg correction
was used to correct for multiple hypothesis testing. To check if sequencing depth
was sufficient, we adapted a method used in biodiversity sampling studies [200],
by plotting the proportion of identified coding sequences (CDS) of the WDL1 or
WDL7 genome that were expressed (read pair count = 1) as a function of the sam-
pling size in consortium and monoculture RNA-seq libraries. The sampling size
was expressed as the number of read pairs that uniquely mapped to CDS of WDL1
or WDL7 in each library. Genes were called differentially expressed between con-
sortium and monoculture conditions when |log 2 fold change|= 1. We did not take
into account the p-values of the differential expression analysis as this would be
too restrictive. This was shown before to be a valid approach to analyze differen-
tial transcriptomic data [42, 180, 201]. While this approach is more prone to false
positives, this is offset by the subsequent pathway analysis which is more robust
to false positives.
4.2.6.3 Differential gene expression analysis
Analysis of differentially expressed genes was based on the Kyoto Encyclopedia
of Genes and Genomes (KEGG) orthology classification of proteins (http://www.
genome.jp/kegg/). KEGG identifiers for the coding sequences (CDS) of the three
genomes of the consortium members were obtained by exporting the amino acid
sequences of all CDS from the RAST server and uploading them on the KEGG
automatic annotation server (KAAS) (http://www.genome.jp/tools/kaas/). To un-
veil pathways and other cellular systems underlying the differentially expressed
genes between consortium conditions and isolated conditions for both WDL1 and
WDL7, the network-based algorithm PheNetic [6] and the Search Brite tool for
functional classification using KEGG orthology [202] were both used. PheNetic
searches for common pathways between differentially expressed genes based on
an interaction network. The used interaction networks in WDL1 and WDL7 con-
sisted of metabolic, (de)methylation, and (de)phosphorylation interactions from
KEGG [202] version 80.0. For WDL1 and WDL7, respectively interactions doc-
umented in any of four Variovorax strains (V. paradoxus S110, V. paradoxus EPS,
V. paradoxus B4 and Variovorax sp. PAMC 2877) and any of two C. testosteroni
strains (CNB-2, TK102) were used. The standard parameters were applied, run
mode was set to ”downstream” and the cost was set to 0.15 for WDL1 and 0.1 for
CHAPTER 4 4-19
WDL7. These costs were determined by running a sweep over the cost parameter.
In order to avoid selecting noise, identified pathways consisting of at most three
genes were discarded The subsystem tool from RAST [203] was used to look
for additional genes with no KEGG identifier that could be linked with the dif-
ferentially expressed pathways and other cellular systems. The RNA-seq derived
expression of four genes of WDL1 (hylA, dcaQ, catA and phoA) and five genes
of WDL7 (pcaF, glxR, pilM, pilY1 and yrbC) were validated by real time quan-
titative PCR (qRT-PCR). For detailed information, see Supporting Experimental
Procedures.
For information on draft genome sequencing of the consortium members, RNA
extraction and library prep an how differential transcription was verified, we refer
to the Additional experimental procedures in Appendix A
4.2.7 Acknowledgements
This work was funded by IWT (Innovation by Science and Technology) project
SB/101628, by KU
Leuven project OT/10/030, FWO project n°G.0371.06 and the Inter-University
Attraction Pole (IUAP) ”µ-manager” of the Belgian Science Policy (BELSPO,
P7/25). We thank A. Sanchez, B. Horemans, B. zturk and V. Nolla Ardevol for
advice and assistance. The authors declare no competing interests.
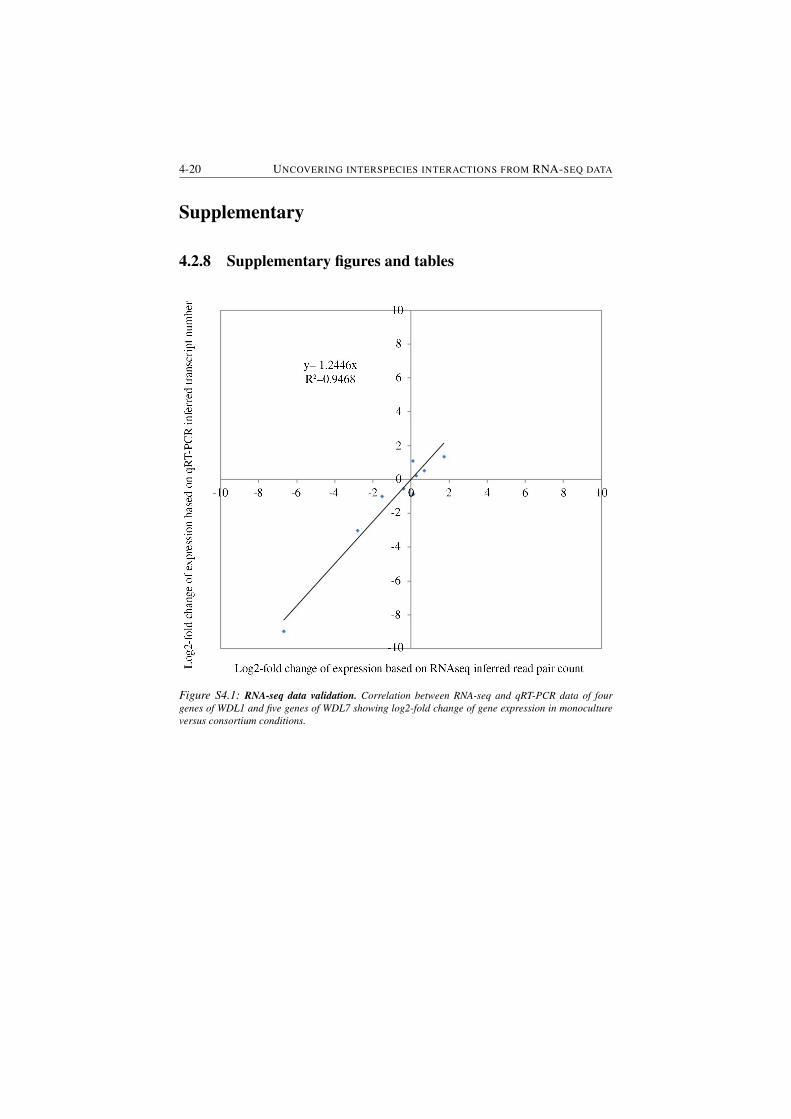
4-20 UNCOVERING INTERSPECIES INTERACTIONS FROM RNA-SEQ DATA
Supplementary
4.2.8 Supplementary figures and tables
Figure S4.1: RNA-seq data validation. Correlation between RNA-seq and qRT-PCR data of four
genes of WDL1 and five genes of WDL7 showing log2-fold change of gene expression in monoculture
versus consortium conditions.
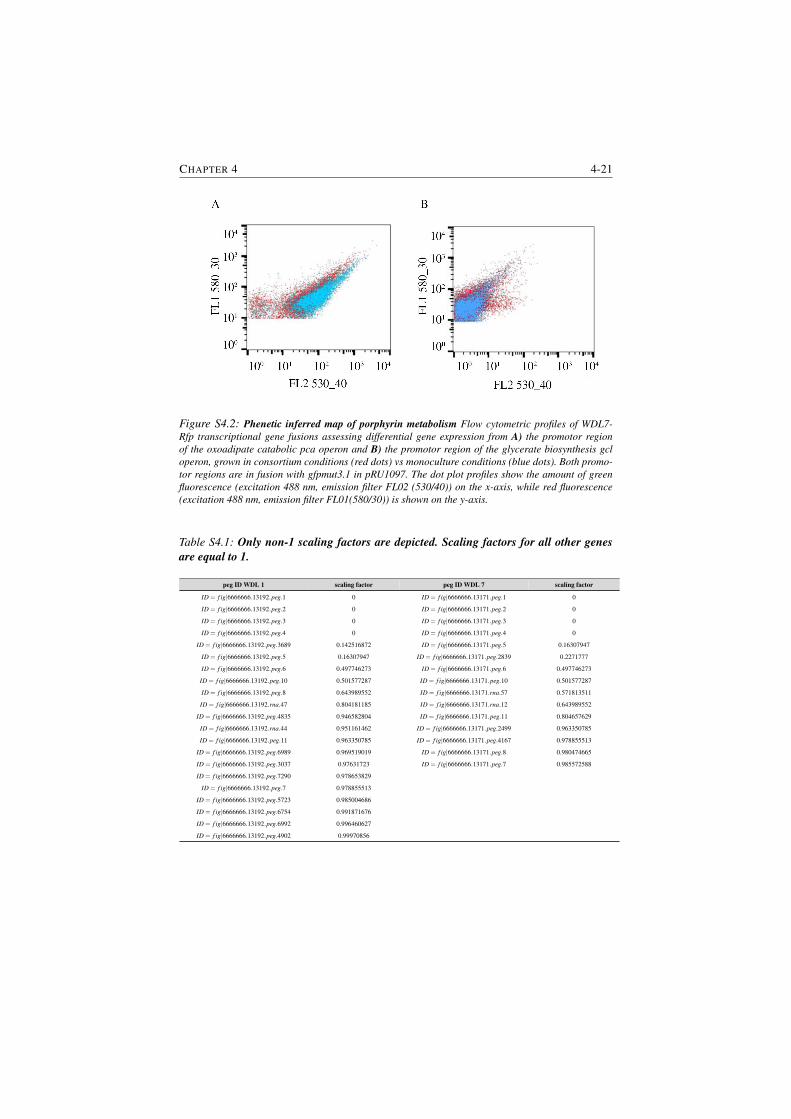
CHAPTER 4 4-21
Figure S4.2: Phenetic inferred map of porphyrin metabolism Flow cytometric profiles of WDL7-
Rfp transcriptional gene fusions assessing differential gene expression from A) the promotor region
of the oxoadipate catabolic pca operon and B) the promotor region of the glycerate biosynthesis gcl
operon, grown in consortium conditions (red dots) vs monoculture conditions (blue dots). Both promo-
tor regions are in fusion with gfpmut3.1 in pRU1097. The dot plot profiles show the amount of green
fluorescence (excitation 488 nm, emission filter FL02 (530/40)) on the x-axis, while red fluorescence
(excitation 488 nm, emission filter FL01(580/30)) is shown on the y-axis.
Table S4.1: Only non-1 scaling factors are depicted. Scaling factors for all other genes
are equal to 1.
peg ID WDL 1 scaling factor peg ID WDL 7 scaling factor
ID = f ig|6666666.13192.peg.1 0 ID = f ig|6666666.13171.peg.1 0
ID = f ig|6666666.13192.peg.2 0 ID = f ig|6666666.13171.peg.2 0
ID = f ig|6666666.13192.peg.3 0 ID = f ig|6666666.13171.peg.3 0
ID = f ig|6666666.13192.peg.4 0 ID = f ig|6666666.13171.peg.4 0
ID = f ig|6666666.13192.peg.3689 0.142516872 ID = f ig|6666666.13171.peg.5 0.16307947
ID = f ig|6666666.13192.peg.5 0.16307947 ID = f ig|6666666.13171.peg.2839 0.2271777
ID = f ig|6666666.13192.peg.6 0.497746273 ID = f ig|6666666.13171.peg.6 0.497746273
ID = f ig|6666666.13192.peg.10 0.501577287 ID = f ig|6666666.13171.peg.10 0.501577287
ID = f ig|6666666.13192.peg.8 0.643989552 ID = f ig|6666666.13171.rna.57 0.571813511
ID = f ig|6666666.13192.rna.47 0.804181185 ID = f ig|6666666.13171.rna.12 0.643989552
ID = f ig|6666666.13192.peg.4835 0.946582804 ID = f ig|6666666.13171.peg.11 0.804657629
ID = f ig|6666666.13192.rna.44 0.951161462 ID = f ig|6666666.13171.peg.2499 0.963350785
ID = f ig|6666666.13192.peg.11 0.963350785 ID = f ig|6666666.13171.peg.4167 0.978855513
ID = f ig|6666666.13192.peg.6989 0.969519019 ID = f ig|6666666.13171.peg.8 0.980474665
ID = f ig|6666666.13192.peg.3037 0.97631723 ID = f ig|6666666.13171.peg.7 0.985572588
ID = f ig|6666666.13192.peg.7290 0.978653829
ID = f ig|6666666.13192.peg.7 0.978855513
ID = f ig|6666666.13192.peg.5723 0.985004686
ID = f ig|6666666.13192.peg.6754 0.991871676
ID = f ig|6666666.13192.peg.6992 0.996460627
ID = f ig|6666666.13192.peg.4902 0.99970856

5Prioritization of driver genes and
pathways from eQTL data
5.1 Introduction
In this chapter an adaptation of the network-based method PheNetic, which was
used in the previous chapter, is presented. This adapted version is specifically de-
signed to analyze differential expression data together with genomics data (eQTL
data). As such the method uses a biological interaction network to uncover which
mutated genes lead to significant changes in the expression profile of molecular
pathways. On top of the identification of causal mutated genes and molecular path-
ways, the method also ranks the observed mutation based on their likelihood to be
causal to the phenotype. By testing the method on two publicly available datasets
which had previously been analyzed using literature research and wet-lab exper-
iments, it was possible to automatically reconstruct the results and propose new
causal mutations.
DDM and BW conceptualized the study, developed the method, analyzed the
data, interpreted the results and wrote the manuscript. LDR and KM conceptual-
ized the study, discussed the results and edited the manuscript.
5-2 PRIORITIZATION OF DRIVER GENES AND PATHWAYS FROM EQTL DATA
5.2 Paper
Network-based analysis of eQTL data to prioritizedriver mutationsDe Maeyer, D.†, Weytjens, B.†,De Raedt, L., Marchal, K. (2016). Network-based analysis of eQTL
data to prioritize driver mutations. Genome biology and evolution, 8(3): 481-494.† these authors contributed equally to this paper
5.2.1 Abstract
In clonal systems, interpreting driver genes in terms of molecular networks helps
understanding how these drivers elicit an adaptive phenotype. Obtaining such a
network-based understanding depends on the correct identification of driver genes.
In clonal systems, independent evolved lines can acquire a similar adaptive phe-
notype by affecting the same molecular pathways, a phenomenon referred to as
parallelism at the molecular pathway level. This implies that successful driver
identification depends on interpreting mutated genes in terms of molecular net-
works. Driver identification and obtaining a network-based understanding of the
adaptive phenotype are thus confounded problems that ideally should be solved si-
multaneously. In this study, a network-based eQTL method is presented that solves
both the driver identification and the network-based interpretation problem. As in-
put the method uses coupled genotype-expression phenotype data (eQTL data) of
independently evolved lines with similar adaptive phenotypes and an organism-
specific genome-wide interaction network. The search for mutational consistency
at pathway level is defined as a subnetwork inference problem, which consists of
inferring a subnetwork from the genome-wide interaction network that best con-
nects the genes containing mutations to differentially expressed genes. Based on
their connectivity with the differentially expressed genes, mutated genes are pri-
oritized as driver genes. Based on semi-synthetic data and two publicly available
data sets, we illustrate the potential of the network-based eQTL method to priori-
tize driver genes and to gain insights in the molecular mechanisms underlying an
adaptive phenotype.
5.2.2 Introduction
Because of their short generation times, large population sizes and quasi clonal be-
havior, experimental evolution of micro-organisms offers great potential for trait
selection and testing evolutionary theory [204, 205]. Evolution experiments start
from a single clone propagated for many generations under a predefined condi-
CHAPTER 5 5-3
tional set up, defined as the selection regime. As the organisms propagate they
gradually accumulate genetic variation (SNPs, INDELs, etc.). Some of this varia-
tion will cause a clonal fitness increase and a concomitant selective sweep, which
ultimately increases population fitness. The acquired genetic variation can be iden-
tified in the evolved lines of the population through sequencing. Genes containing
mutations that are fixed in the population, that reach a high frequency in the pop-
ulation, or of which the origin coincides with an increase in fitness [135,136,206]
are pinpointed as likely drivers, where a driver in this context is defined as any
gene carrying adaptive mutations, that in isolation or in combination with other
drivers can elict a fitness increase and concomittant clonal expansion. In most evo-
lution studies however, a mechanistic understanding of how the selected driver
mutations elicit the adaptive phenotype is still lacking. Such a mechanistic inter-
pretation depends on correctly identifying and interpreting driver genes in terms
of the genome-wide interaction network of the organism of interest in order to find
the molecular pathways that drive the observed adaptive phenotype. The identifi-
cation of the driver genes is in itself not trivial because during a selection sweep,
passenger mutations, i.e. mutations that do not contribute to the phenotype, are
likely to hitchhike to fixation along with driver mutations [150]. Furthermore, be-
cause under strong selection pressures hyper mutators frequently arise [153, 207],
the ratio of driver genes to passenger genes can become low, further complicating
the identification of driver genes. To identify driver genes, one can exploit paral-
lelism of mutations at the gene/nucleotide level. Genes observed to be recurrently
mutated in independently evolved lines with a similar phenotype are more likely to
be drivers [41,136]. However, independently evolved lines can also acquire similar
adaptive phenotypes by mutations in different genes that affect the same molecu-
lar pathways [41, 135, 136], rather than by sharing exactly the same mutations or
mutated genes. Identifying driver genes underlying an observed phenotype thus
requires identifying mutational parallelism between independently evolved lines
at the molecular pathway level [208–211]. In other words, driver gene identifi-
cation and acquiring a network-based understanding of the adaptive phenotype
are confounded problems that have to be solved simultaneously. In this study, we
illustrate how a network-based method in combination with coupled genotype-
expression phenotype data (eQTL data) of parallel evolved lines can aid in simul-
taneously prioritizing driver genes and providing a network-based interpretation of
the molecular mechanisms underlying the evolved adaptive traits. To this purpose
the network-based eQTL method uses an organism-specific genome-wide interac-
tion network, compiled from publicly available interactomics data [60,61] to drive
the search for mutational consistency at the pathway level. By generating a semi-
synthetic experimental evolution benchmark, the ability of the method to prioritize
driver genes is demonstrated. To illustrate the performance of both driver gene
prioritization and network-based interpretation of the data in a real setting, the
method is applied to eQTL data obtained from two previously described evolution
experiments in Escherichia coli. The first data set aims at identifying the adaptive
pathways that gave rise to improved Amikacin resistance in four independently
evolved lines [201]. The second data set focuses on unveiling the molecular in-
5-4 PRIORITIZATION OF DRIVER GENES AND PATHWAYS FROM EQTL DATA
teractions between two distinct ecotypes that evolved from a common ancestor
in the long term evolution experiment of Lenski et al. [212]. For both data sets
the method prioritizes driver genes that contribute to the adaptive phenotypes and
unveils their molecular modes of action.
5.2.3 Materials and Methods
5.2.3.1 Network-based eQTL method
The eQTL analysis method is based on the probabilistic logical querying lan-
guage ProbLog [213]. To simultaneously prioritize driver genes and unveil adap-
tive molecular pathways, elicited by these driver mutations, the driver gene iden-
tification problem is reformulated as a decision theoretic subnetwork inference
problem [161] over multiple probabilistic networks Qi, derived from the genome-
wide interaction network G. The method consists of three steps (Figure 5.1):
5.2.3.2 Construction of probabilistic networks
For each of the parallel evolved lines i of an evolution experiment, the genome-
wide directed interaction network G is converted into a probabilistic network Qi
by assigning to each edge a weight that reflects the probability the edge is play-
ing a role under the assessed condition, given the differential expression data as
depicted in Figure 5.1 A. To this end, per node the probability is calculated that
an expression value at least as extreme as the one associated with that node would
be observed by chance, given the null hypothesis that the expression value of the
gene which corresponds to the node is not significantly differentially expressed, is
true. Calculation is performed using a two-tailed p-test assuming that the log2 fold
changes follow a normal distribution N(µ,σ ) [214,215]. By standardizing this dis-
tribution to N(0,1) this probability can be calculated for any differential expression
value Dgene using Equation 5.1 in which Zgene corresponds to the standard score
associated with Dgene.
Pgene =
{
P(X > Zgene)+P(X <−Zgene) i f Zgene > 0
P(X < Zgene)+P(X >−Zgene) i f Zgene < 0GivenN(0,1) (5.1)
As in the network-based eQTL method the edges, not the nodes, are weighted,
the value Pgene is propagated to the edges that terminate in it. A high value for
the probability that a specific edge is involved in a specific experimental condi-
tion is assigned to edges that terminate in highly differentially expressed genes.
CHAPTER 5 5-5
Therefore, 1-Pend gene will be assigned to all edges. Using the cumulative normal
distribution of N(µ,σ ) which is written as φ(µ,σ), this can be simplified as shown
in Equation 5.2.
Pedge = (|0.5−φ(µ,σ) ∗ (Dendgene)|)∗2 (5.2)
Where Dend gene is the differential expression data of the end gene of the inter-
action. If no differential expression data is available for Dend gene, Pedge is set to
0.5.
5.2.3.3 Pathfinding in probabilistic networks
Each probabilistic network Qi allows for determining the probability of connect-
edness between a gene Ci,j, from a set of genes Ci, and a gene set Ai, defined as
P(path(Ci,j,Ai)|Qi). This probability of connectedness expresses how likely it is
that there exists a path that connects the gene Ci,j to any gene in the gene set Ai,
in the probabilistic network Qi. A path between two nodes is a sequence of con-
secutive edges from the genome-wide interaction network that connects these two
nodes and for which all edges are directed in the same direction. The probability
of such a path is simply the product of the probabilities of the edges it contains.
In the proposed eQTL setting each gene Ci,j is defined as significantly differen-
tially expressed in evolved line i and gene set Ai is the set of mutated genes ob-
tained from evolved line i. A path connects a significantly differentially expressed
gene to genes mutated in the same evolved line. The rationale behind this is that
the significantly differentially expressed genes are effects of mutations and thus
connect to the “causal” mutations through the probabilistic network. The proba-
bility of connectedness P(path(Ci,j,Ai)|Qi) represents the probability with which
the differential expression of Ci,j can be induced by the set of mutations, given
the probabilistic interaction network Qi and quantifies which mutations are most
likely to cause the differential expression of Ci,j.
5.2.3.4 Inference of the optimal subnetwork by combining the data from all
evolved lines
Identifying driver mutations from a set of independent end points with the same
phenotype corresponds to inferring a single subnetwork Koptimal over all indepen-
dent end points that best connects the significantly differentially expressed genes
Ci,j and the set of mutations Ai for all end points together as depicted in Figure
5.1 C. A subnetwork K of a network G is defined as a subset of the edges in G
together with the nodes occurring in the selected edges. Note that a subnetwork
5-6 PRIORITIZATION OF DRIVER GENES AND PATHWAYS FROM EQTL DATA
in this context can thus consist of any number of disconnected parts of the orig-
inal network G. For each subnetwork K from G the probability of connectedness
changes to P(path(Ci,j,Ai )|Qi,K) as paths that are valid in Qi are not necessarily
valid in a subnetwork K. Therefore, the probability of connectedness changes to
P(path(Ci,j,Ai)|Qi,K) when working with subnetworks K, denoting that the edges
along the path have to be present in both Qi and K. Each subnetwork K should
be scored based on the sum of probabilities that there exists a path between each
significantly differentially expressed gene Ci,j in Ci and the list of mutated genes
Ai, for each independently evolved line i, out of a total of n independently evolved
lines as described in Equation 5.3. Between different end points it is expected
that the same adaptive pathways are triggered (parallel evolution). Also, within
every end point separately, multiple paths are expected to be found in regions with
many significantly differentially expressed genes that are likely to be important for
the phenotype. Therefore, paths between driver genes selected from different end
points and their respective sets of differentially expressed genes should overlap in
the optimal subnetwork. By restricting the size of the network through a cost based
on the number of edges |K| in the subnetwork the method will preferentially select
these overlapping paths. This edge cost can be modulated using the cost factor xe.
Koptimal is defined as the subnetwork that has the maximum possible value of the
score function S(K):
S(K) =n
∑i
(l
∑j
(P(path(Ci, j,Ai)|Qi,K)))−|K| ∗ xe (5.3)
Computing the probability that there exists a path between two nodes in a
probabilistic network is known as the two-terminal reliability problem, which is
NP-hard. This explains why there is no known efficient exact inference algorithm
and why we employ an approximation algorithm to compute P(path(Ci,j,Ai)|Qi).This probability is approximated by using only the N most likely paths of maxi-
mal length l between the differentially expressed gene Ci,j and any mutated gene
of Ai [162, 213]. The resulting paths (for all Ci) are then represented as a Boolean
formula (as in probabilistic logic programming languages [213]): each path cor-
responds to a conjunction of the edges that are present in the path, and a set of
such paths corresponds to the disjunction of the conjunctions corresponding to
these paths. This formula is then compiled into an equivalent deterministic De-
composable Negation Normal Form (d-DNNF) using knowledge compilation tech-
niques [216]. The advantage of the d-DNNF is that it contains the same informa-
tion as the original set of paths and that it can efficiently be evaluated in polynomial
time for each subnetwork K [217]. Selecting such a subnetwork K corresponds to
setting all edges not in K to false when evaluating the d-DNNFs. The optimal sub-
network Koptimal is determined by sampling different subnetworks K from G by
performing a random-restart hill climbing optimization as outlined in [161]. Note
that, as Koptimal is a subset of G, Koptimal is not necessarily connected.
CHAPTER 5 5-7
5.2.3.5 Driver gene prioritization
Because subnetworks obtained using a higher edge are more enriched in driver
genes than subnetworks obtained using a low edge cost (higher PPV, more strin-
gent conditions) and subnetworks detected at high edge costs are in general con-
tained within the ones retrieved at lower edge costs, mutated genes are prioritized
based on the highest edge cost for which they are still selected (i.e. ranks of mu-
tated genes are based on the most stringent condition under which they are still
selected). The reason for this is that mutated genes that are detected at the high-
est edge cost (most stringent parameter) represent the most pronounced signals in
the data. Mutated genes that represent weaker signals (mutations that explain less
of the expression data) are only retrieved at less stringent edge parameter costs.
To this end, for each data set multiple optimal subnetworks are inferred using a
gradually decreasing edge cost, i.e. a parameter sweep over the edge cost. Mutated
genes that are retrieved using a high edge cost are strongly connected to the expres-
sion phenotype and thus receive the lowest (best) rank. Note that this prioritization
strategy can result in assigning identical ranks to different mutated genes. These
prioritized mutated genes, together with the inferred subnetworks are visualized
by depicting the union of all edges and nodes present in the different inferred sub-
networks.
5.2.3.6 Parameter settings
To infer subnetworks the maximum length of a path is set to four edges based on
both biological [218, 219] and computational considerations. To approximate the
probability of connectedness P(path(Ci,j,Ai|Qi,K) the 20-best paths were used
that connect each differentially expressed gene Ci,j to the set of mutated genes Ai.
The edge cost parameter determines the size of the inferred subnetwork and forces
the selection of overlapping paths. The behavior of the edge cost is characterized
on a semi-synthetic data set as indicated in the result section. As described in
the driver gene prioritization paragraph, a parameter sweep of the edge cost was
performed in order to prioritize the mutated genes. As lower edge costs do not
affect ranks of genes prioritized at higher edge costs, the choice of the lower bound
on the edge cost does not interfere with the results of the highest ranked genes. For
convenience and visualization purposes we choose a cut-off on the sweep at a cost
that corresponds to finding a network of no more than 120 nodes. Conversely,
when setting the conditions too stringent i.e. very high edge cost, subnetworks can
no longer be inferred. Therefore, as smallest edge cost we chose the most stringent
value at which a subnetwork could be inferred. This resulted in a parameter sweep
of the edge cost from 1.75 to 0.25 for the AMK resistance data set and from 0.975
to 0.025 for the co-existence ecotypes data set. The edge cost sweep was performed
with a step size of 0.025. Note that the upper limit of the edge cost in the sweep
corresponds to the value for which no subnetwork was inferred anymore.
5-8 PRIORITIZATION OF DRIVER GENES AND PATHWAYS FROM EQTL DATA
5.2.3.7 Data sets
Semi-synthetic benchmarking set
The semi-synthetic benchmark data set was based on data published by Stincone
et al. (publicly available from Gene Expression Omnibus under accession number
GSE13361) assessing for 27 E. coli K-12 MG1655 single gene knock-out strains
involved in acid resistance, the expression profiles relative to a wild type E. coli
K-12 MG1655 [220]. Levels of differential expression of single gene knock-out
strains (27 strains) with respect to the reference were obtained from COLOM-
BOS [221]. As no repeats were available for the different experiments, and thus
no relevant p-values were available, significantly differentially expressed genes
were determined as genes having a log2 fold expression change larger than 2. For
each KO strain, the knocked out gene was considered a known driver gene and the
measured levels of differential expression as the corresponding expression pheno-
type. Five of those strains, namely phoH, cadB, ycaD, spy, yjbJ and grxA, were
discarded for benchmarking, because these genes only have incoming interactions
in the genome-wide interaction network or, in the case of yjbJ, are not present in
the interaction network. In addition the experiment corresponding to the hns KO
strain was removed as the COLOMBOS database did not contain the appropriate
data. For each of the remaining 20 strains the presence of passenger genes was
mimicked by randomly selecting a nucleotide position in the reference genome
and mapping this position to a gene. Passenger mutations had to obey following
conditions: 1) randomly selected genes did not belong to the set of driver genes
and 2) they were connected in the genome-wide interaction network with outgo-
ing interactions. The number of passenger mutations assigned to each data set was
selected from a binomial distribution with n, the total number of selected muta-
tions, being equal to 9 and p, the chance of adding a passenger mutation, being
equal to 0.5. On average this mimics an addition of 5 passenger mutations with a
standard deviation of 1.5 for each of the 20 strains in each data set. This way the
total number of mutated genes in the semi-synthetic data set is of the same order
of magnitude as the number of passenger mutations per driver mutation observed
in real data sets [41, 201, 206].
AMK resistance data set
The genomic data for the four amikacin resistant strains was obtained from Suzuki
et al [201]. Raw sequencing data was available at the DDBJ Sequence Read Archive
under accession number PRJDB2980. Only the Illumina reads were used. The data
of the four Amikacin resistant lines was mapped to the ancestral E. coli K-12
MDS42 strain using bowtie2 [19]. SNPs and small INDELs were called using free-
bayes [222] while large INDELs were called using Pindel [20]. This resulted in a
total of 59 mutations throughout the four strains. These mutations were mapped
to genes as follows: mutations within the coding region of a gene were mapped
to the encoded gene, mutations in intergenic regions were mapped to the closest
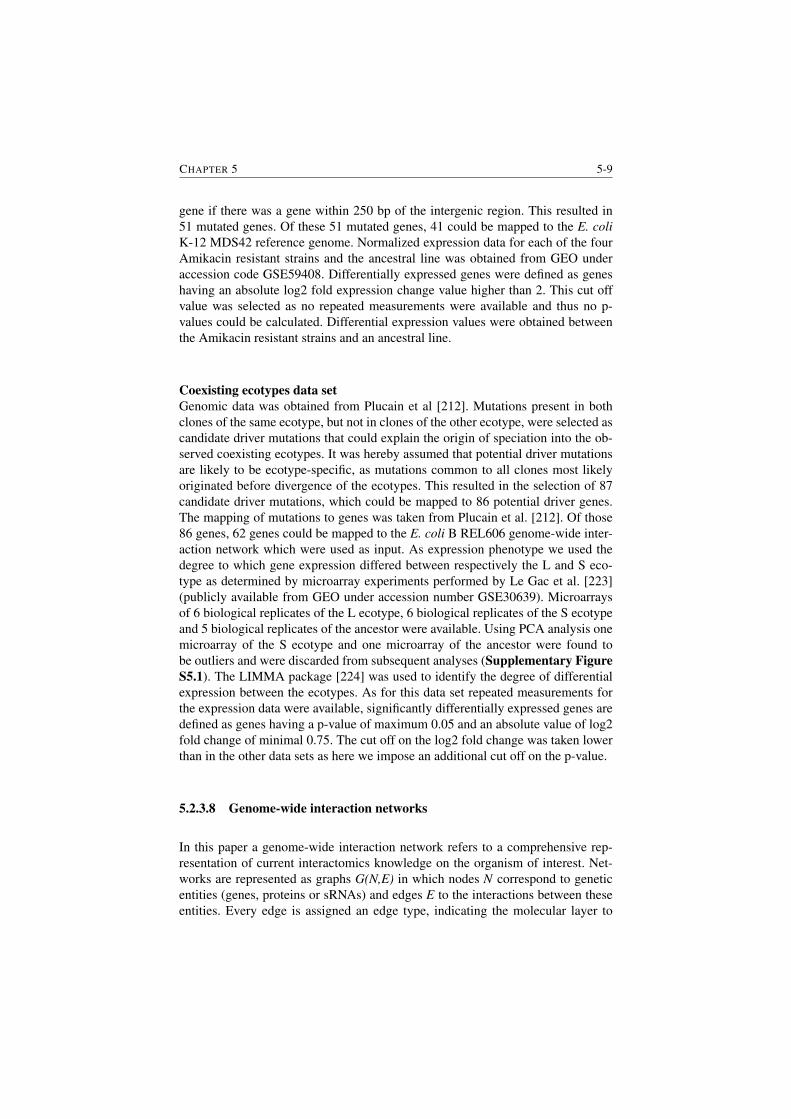
CHAPTER 5 5-9
gene if there was a gene within 250 bp of the intergenic region. This resulted in
51 mutated genes. Of these 51 mutated genes, 41 could be mapped to the E. coli
K-12 MDS42 reference genome. Normalized expression data for each of the four
Amikacin resistant strains and the ancestral line was obtained from GEO under
accession code GSE59408. Differentially expressed genes were defined as genes
having an absolute log2 fold expression change value higher than 2. This cut off
value was selected as no repeated measurements were available and thus no p-
values could be calculated. Differential expression values were obtained between
the Amikacin resistant strains and an ancestral line.
Coexisting ecotypes data set
Genomic data was obtained from Plucain et al [212]. Mutations present in both
clones of the same ecotype, but not in clones of the other ecotype, were selected as
candidate driver mutations that could explain the origin of speciation into the ob-
served coexisting ecotypes. It was hereby assumed that potential driver mutations
are likely to be ecotype-specific, as mutations common to all clones most likely
originated before divergence of the ecotypes. This resulted in the selection of 87
candidate driver mutations, which could be mapped to 86 potential driver genes.
The mapping of mutations to genes was taken from Plucain et al. [212]. Of those
86 genes, 62 genes could be mapped to the E. coli B REL606 genome-wide inter-
action network which were used as input. As expression phenotype we used the
degree to which gene expression differed between respectively the L and S eco-
type as determined by microarray experiments performed by Le Gac et al. [223]
(publicly available from GEO under accession number GSE30639). Microarrays
of 6 biological replicates of the L ecotype, 6 biological replicates of the S ecotype
and 5 biological replicates of the ancestor were available. Using PCA analysis one
microarray of the S ecotype and one microarray of the ancestor were found to
be outliers and were discarded from subsequent analyses (Supplementary Figure
S5.1). The LIMMA package [224] was used to identify the degree of differential
expression between the ecotypes. As for this data set repeated measurements for
the expression data were available, significantly differentially expressed genes are
defined as genes having a p-value of maximum 0.05 and an absolute value of log2
fold change of minimal 0.75. The cut off on the log2 fold change was taken lower
than in the other data sets as here we impose an additional cut off on the p-value.
5.2.3.8 Genome-wide interaction networks
In this paper a genome-wide interaction network refers to a comprehensive rep-
resentation of current interactomics knowledge on the organism of interest. Net-
works are represented as graphs G(N,E) in which nodes N correspond to genetic
entities (genes, proteins or sRNAs) and edges E to the interactions between these
entities. Every edge is assigned an edge type, indicating the molecular layer to
5-10 PRIORITIZATION OF DRIVER GENES AND PATHWAYS FROM EQTL DATA
which the interaction represented by the edge belongs (e.g. protein-DNA, protein-
protein, metabolic or signaling interactions). Depending on its type and provided
the proper information is available, an edge will be added as a single directed inter-
action (e.g. protein-DNA interactions, sRNA-DNA, kinase-target, etc.) or two di-
rected interactions (protein-protein interactions, undirected metabolic interactions,
etc.).
Table 5.1: Data sets used to compile the Escherichia coli genome-wide interaction net-
works.
interaction type E. coli K12 MG1655 E. coli B REL606 E. coli K12 MDS42a
Protein-protein 2737 27282 2534
Protein-DNA 4492 3415 3890
Sigma 727 1225 592
Metabolic 2798 5146 2530
(de)Phosphorylation 44 38 44
Srna 213 2 171
Size (edges) 11011 12554 9761
Size (nodes) 2732 2643 2422
a The E. coli K12 MDS42 network was derived from the E. coli K12 MG1655 network by deleting all
edges connecting genes that do not exist in E. coli K12 MDS42.
An overview of the genome-wide interaction networks used in this study for
the three different E. coli strains: E. coli K-12 MDS42, E. coli B REL606 and E.
coli K-12 MG1655 is given in Table 5.1. To compile these networks metabolic
interactions and (de)phosphorylation interactions were derived from KEGG [225]
version 72.1, protein-DNA, sigma interactions and sRNA-DNA interactions from
RegulonDB version 8.6 [90] and high-confidence physical protein-protein interac-
tions from String [226] version 10. Interactions involving RpoD, the primary sigma
factor, were removed from these interaction networks as RpoD regulates over half
of the genes in the interaction network.
CHAPTER 5 5-11
5.2.4 Results
5.2.4.1 Method overview
A network-based eQTL method was devised to simultaneously prioritize driver
genes and unveil molecular pathways involved in the adaptive phenotype. As in-
put the method requires a genome-wide interaction network of the organism of
interest and coupled genotype-expression phenotype (eQTL) data for a set of in-
dependently evolved lines (strains/populations) with similar phenotypes (Figure
5.1). The expression phenotype is defined as the level of differential expression of
every gene between an evolved line and a reference. To prioritize driver genes, all
genes from the end points carrying allelic variants (hereafter referred to as mutated
genes) will be assessed for their ability to explain the adaptive expression pheno-
type. Hereto the method infers from the genome-wide interaction network the sub-
network that best connects the mutated genes in each of the evolved lines to the set
of significantly differentially expressed genes in the corresponding evolved lines,
assuming that 1) the expression phenotype is at least partially a consequence of the
driver mutations and 2) the adaptive molecular pathways, but not necessarily the
driver genes, are to some extent similar, resulting in parallelism at the molecular
pathway level.
An overview of the proposed network-based eQTL method is given in Figure
5.1. The method consists of three steps (see 5.2.3). In a first step (Figure 5.1 A)
the genome-wide interaction network is for each evolved line separately converted
into a condition-specific probabilistic network using the expression data of the cor-
responding evolved line. These condition-specific probabilistic networks are sub-
sequently, in a second step (Figure 5.1 B), used to find all paths between mutated
and significantly differentially expressed genes for each evolved line separately. A
path is here defined as a sequence of consecutive edges in the genome-wide inter-
action network. These paths represent possible molecular mechanisms by which
mutations could induce the observed pattern of differential expression. In the third
step (Figure 5.1 C) all these paths are analyzed together to find the optimal sub-
network, which aims at selecting the subnetwork of the genome-wide interaction
network that captures the molecular mechanisms that drive the adaptive phenotype
common to all evolved lines. The optimization enforces the selected subnetwork
to have two properties. First, it selects the subnetwork that contains the most likely
paths that explain the connection between the mutated and differential expressed
genes. Second, it enforces the network to contain parallel molecular pathways be-
tween the different evolved lines. The optimal subnetwork thus contains the molec-
ular mechanisms likely to drive adaptation. Possible driver mutations which occur
in the optimal subnetwork are prioritized based on the strength of their connectiv-
ity with downstream effects and their involvement in parallel molecular pathways
(see 5.2.3).
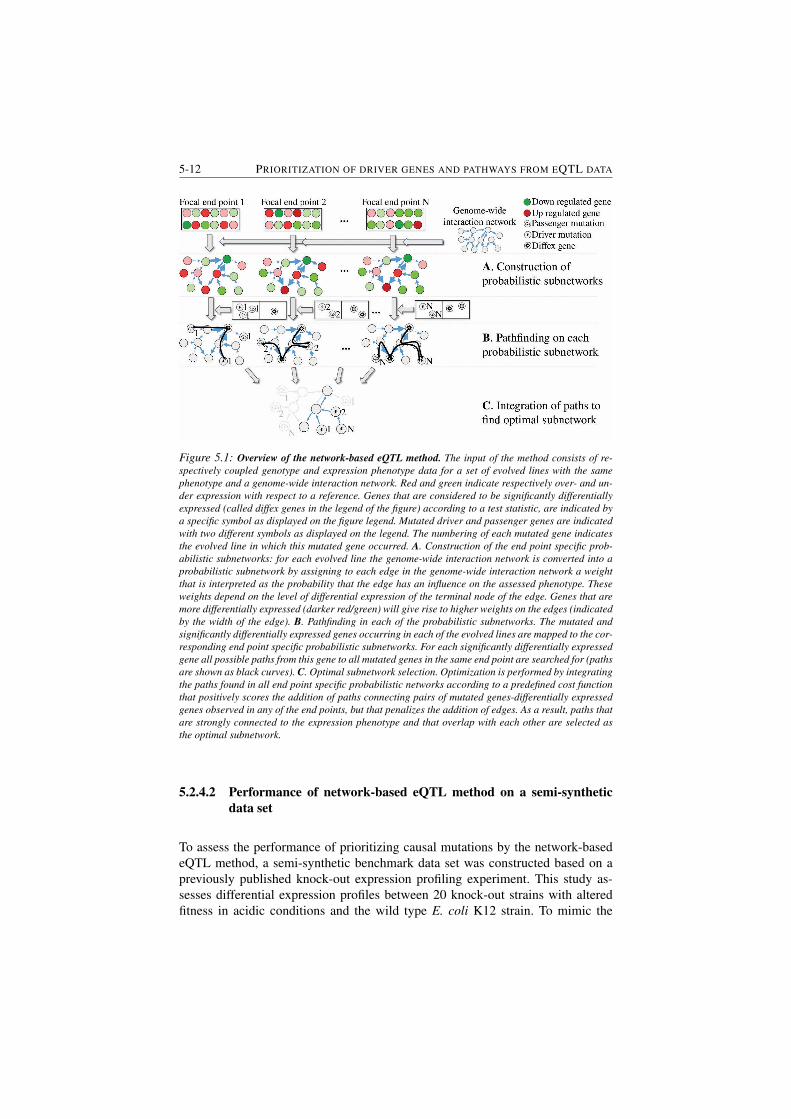
5-12 PRIORITIZATION OF DRIVER GENES AND PATHWAYS FROM EQTL DATA
Figure 5.1: Overview of the network-based eQTL method. The input of the method consists of re-
spectively coupled genotype and expression phenotype data for a set of evolved lines with the same
phenotype and a genome-wide interaction network. Red and green indicate respectively over- and un-
der expression with respect to a reference. Genes that are considered to be significantly differentially
expressed (called diffex genes in the legend of the figure) according to a test statistic, are indicated by
a specific symbol as displayed on the figure legend. Mutated driver and passenger genes are indicated
with two different symbols as displayed on the legend. The numbering of each mutated gene indicates
the evolved line in which this mutated gene occurred. A. Construction of the end point specific prob-
abilistic subnetworks: for each evolved line the genome-wide interaction network is converted into a
probabilistic subnetwork by assigning to each edge in the genome-wide interaction network a weight
that is interpreted as the probability that the edge has an influence on the assessed phenotype. These
weights depend on the level of differential expression of the terminal node of the edge. Genes that are
more differentially expressed (darker red/green) will give rise to higher weights on the edges (indicated
by the width of the edge). B. Pathfinding in each of the probabilistic subnetworks. The mutated and
significantly differentially expressed genes occurring in each of the evolved lines are mapped to the cor-
responding end point specific probabilistic subnetworks. For each significantly differentially expressed
gene all possible paths from this gene to all mutated genes in the same end point are searched for (paths
are shown as black curves). C. Optimal subnetwork selection. Optimization is performed by integrating
the paths found in all end point specific probabilistic networks according to a predefined cost function
that positively scores the addition of paths connecting pairs of mutated genes-differentially expressed
genes observed in any of the end points, but that penalizes the addition of edges. As a result, paths that
are strongly connected to the expression phenotype and that overlap with each other are selected as
the optimal subnetwork.
5.2.4.2 Performance of network-based eQTL method on a semi-synthetic
data set
To assess the performance of prioritizing causal mutations by the network-based
eQTL method, a semi-synthetic benchmark data set was constructed based on a
previously published knock-out expression profiling experiment. This study as-
sesses differential expression profiles between 20 knock-out strains with altered
fitness in acidic conditions and the wild type E. coli K12 strain. To mimic the
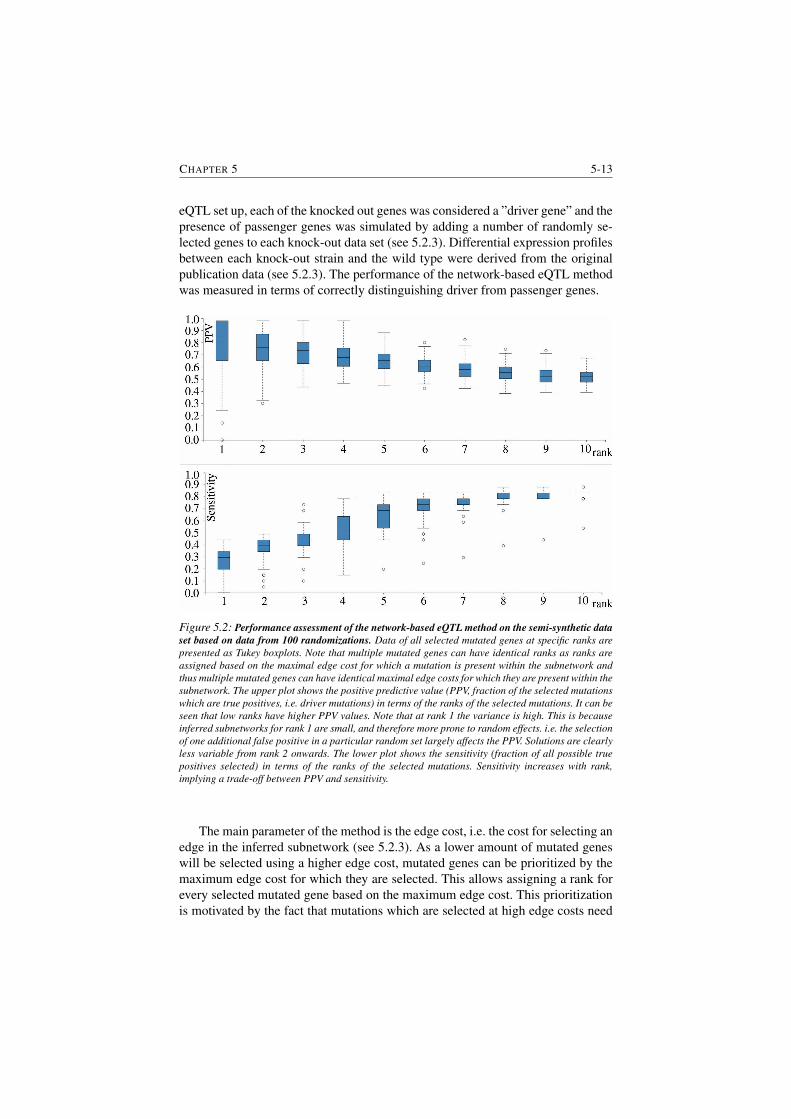
CHAPTER 5 5-13
eQTL set up, each of the knocked out genes was considered a ”driver gene” and the
presence of passenger genes was simulated by adding a number of randomly se-
lected genes to each knock-out data set (see 5.2.3). Differential expression profiles
between each knock-out strain and the wild type were derived from the original
publication data (see 5.2.3). The performance of the network-based eQTL method
was measured in terms of correctly distinguishing driver from passenger genes.
Figure 5.2: Performance assessment of the network-based eQTL method on the semi-synthetic data
set based on data from 100 randomizations. Data of all selected mutated genes at specific ranks are
presented as Tukey boxplots. Note that multiple mutated genes can have identical ranks as ranks are
assigned based on the maximal edge cost for which a mutation is present within the subnetwork and
thus multiple mutated genes can have identical maximal edge costs for which they are present within the
subnetwork. The upper plot shows the positive predictive value (PPV, fraction of the selected mutations
which are true positives, i.e. driver mutations) in terms of the ranks of the selected mutations. It can be
seen that low ranks have higher PPV values. Note that at rank 1 the variance is high. This is because
inferred subnetworks for rank 1 are small, and therefore more prone to random effects. i.e. the selection
of one additional false positive in a particular random set largely affects the PPV. Solutions are clearly
less variable from rank 2 onwards. The lower plot shows the sensitivity (fraction of all possible true
positives selected) in terms of the ranks of the selected mutations. Sensitivity increases with rank,
implying a trade-off between PPV and sensitivity.
The main parameter of the method is the edge cost, i.e. the cost for selecting an
edge in the inferred subnetwork (see 5.2.3). As a lower amount of mutated genes
will be selected using a higher edge cost, mutated genes can be prioritized by the
maximum edge cost for which they are selected. This allows assigning a rank for
every selected mutated gene based on the maximum edge cost. This prioritization
is motivated by the fact that mutations which are selected at high edge costs need
5-14 PRIORITIZATION OF DRIVER GENES AND PATHWAYS FROM EQTL DATA
to be better connected to the expression and/or have a higher degree of parallelism
with other mutations than mutations which are selected at lower edge costs. This
reasoning was tested by analyzing the semi-synthetic data set for a wide range
of edge costs (see 5.2.3 for specific parameter settings). As can be seen in Fig-
ure 5.2, the positive predictive value (PPV) is high for low ranks and decreases
for higher ranks, meaning mutated genes having low ranks are likely to be driver
genes. Furthermore the sensitivity clearly increases with increasing rank, leading
to a trade-off between selecting few passenger mutations and selecting many driver
mutations. Even for high ranks, results are still better than a random selection of
genes as this would correspond to a PPV of 0.2 (on average for every driver gene,
4 passenger genes were added).
5.2.4.3 Unveiling the molecular mechanisms underlying Amikacin resistance
We applied the eQTL analysis on the eQTL data set from the study of Suzuki et
al. [201]. In this study four independent E. coli MDS 42 lines were grown in the
presence of the aminoglycoside antibiotic until all four strains attained increased
Amikacin resistance compared to the parental strains. The network-based eQTL
method was applied using the genome-wide interaction network of E. coli MDS 42
and the data of the 4 parallel evolved strains (see 5.2.3). Out of 41 mutated genes,
we prioritized 12 as potential drivers based on their association with the expression
data (Table 5.2). The inferred adaptive pathways containing those prioritized genes
are visualized in Figure 5.3.
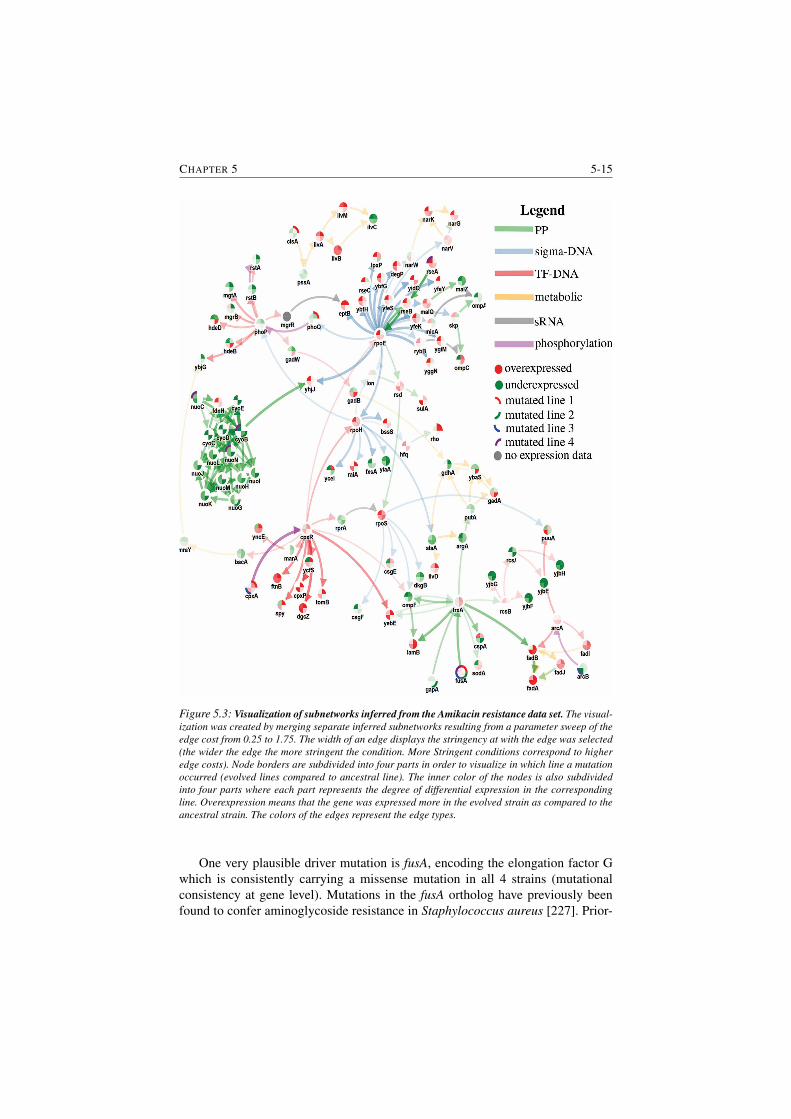
CHAPTER 5 5-15
Figure 5.3: Visualization of subnetworks inferred from the Amikacin resistance data set. The visual-
ization was created by merging separate inferred subnetworks resulting from a parameter sweep of the
edge cost from 0.25 to 1.75. The width of an edge displays the stringency at with the edge was selected
(the wider the edge the more stringent the condition. More Stringent conditions correspond to higher
edge costs). Node borders are subdivided into four parts in order to visualize in which line a mutation
occurred (evolved lines compared to ancestral line). The inner color of the nodes is also subdivided
into four parts where each part represents the degree of differential expression in the corresponding
line. Overexpression means that the gene was expressed more in the evolved strain as compared to the
ancestral strain. The colors of the edges represent the edge types.
One very plausible driver mutation is fusA, encoding the elongation factor G
which is consistently carrying a missense mutation in all 4 strains (mutational
consistency at gene level). Mutations in the fusA ortholog have previously been
found to confer aminoglycoside resistance in Staphylococcus aureus [227]. Prior-
5-16 PRIORITIZATION OF DRIVER GENES AND PATHWAYS FROM EQTL DATA
itized genes that are also plausible candidate drivers are those that are consistently
mutated at pathway level. Examples of those are the highly prioritized genes cyoB,
nuoG, nuoN and nuoC, affected in lines 2 and/or 4 by nonsense or frameshift muta-
tions. These genes are members of the electron transport chain which are known to
down regulate the protein complexes to which they belong (NADH dehydrogenase
or terminal oxidase, see Supplementary Figure S5.2) implying an involvement of
the electron transport chain in the adaptive phenotype. cpxA is another likely driver
as it shows mutational consistency at gene level in two lines (lines 1 and 3). cpxA
is a sensor kinase that is known to regulate the cpx response in conjunction with
the transcription factor cpxR. The mutations in cpxA seem to result in lines 1 and
3 in an activation of the cpx response with the targets of cpxR being overexpressed
compared to the ancestral strain. This increased cpx response has previously been
found to have an effect on the electron transfer chain [228]. These results are con-
sistent with what is described in the original paper of Suzuki et al. [201] and are
in line with the knowledge that Amikacin uptake is dependent on proton-motive
force [229]. Our results confirm these previous findings although the different lines
seem to be triggered through two different molecular systems, either by directly
affecting the electron transfer chain or through mutations in cpxA. In addition to
genes associated with the proton motive force, the method prioritizes additional
genes, such as rseA explain a large part of the expression phenotype and therefore
receive a high rank. However, as a mutation in the anti-sigma factor which inhibits
rpoE leads to large effects on the expression phenotype and other independently
evolved lines do not show effects in molecular pathways associated with rseA or
rpoE, we would need more data to completely rule out the rseA mutation in line 4
being a false positive.
5.2.4.4 Unveiling the molecular mechanisms of coexisting ecotypes in glucose-
limited minimal medium
A second test case consisted of transcriptomics data and genomics data, described
respectively by Plucain et al. [212] and Le Gac et al. [223]. These data sets pro-
vide the molecular characterization at generation 6500 of Ara-2, one of the 12
populations that were evolved in the E. coli long term evolution experiment in glu-
cose minimal medium [36, 143]. By this time the ancestral line had diverged into
two distinct, stable ecotypes [223]. Associated studies by Rozen et al. [230–232]
showed that the L ecotype grows faster on glucose, but secretes byproducts that
S can exploit, implying a cross-feeding mechanism between the L and S ecotypes
that can explain their stable coexistence. Plucain et al. experimentally identified a
minimal set of mutations. Two S-specific mutations in respectively arcA and gntR
and one in spoT, shared by both the L and S strains that when reintroduced together
in the ancestral strain were sufficient to mimic the evolved S ecotype in invading
and stably coexisting with the L ecotype. However, the fitness level of this recon-
structed S ecotype was lower than the fitness level of the evolved S ecotype [212],
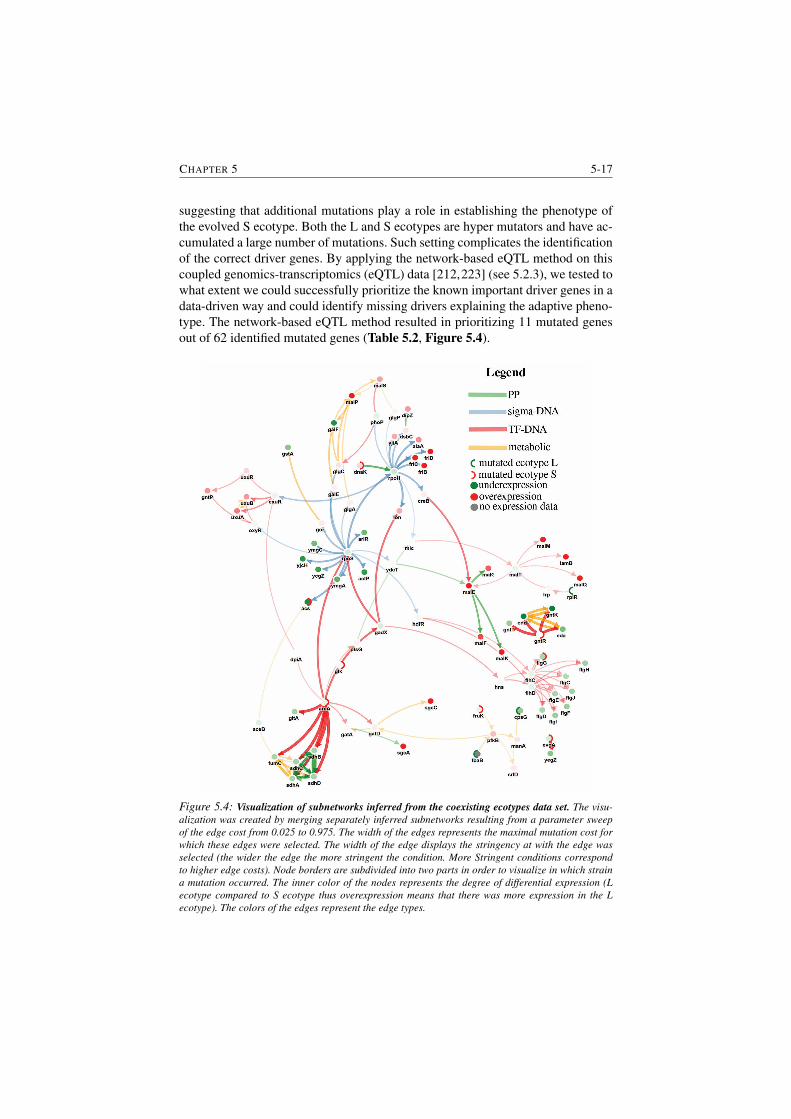
CHAPTER 5 5-17
suggesting that additional mutations play a role in establishing the phenotype of
the evolved S ecotype. Both the L and S ecotypes are hyper mutators and have ac-
cumulated a large number of mutations. Such setting complicates the identification
of the correct driver genes. By applying the network-based eQTL method on this
coupled genomics-transcriptomics (eQTL) data [212,223] (see 5.2.3), we tested to
what extent we could successfully prioritize the known important driver genes in a
data-driven way and could identify missing drivers explaining the adaptive pheno-
type. The network-based eQTL method resulted in prioritizing 11 mutated genes
out of 62 identified mutated genes (Table 5.2, Figure 5.4).
Figure 5.4: Visualization of subnetworks inferred from the coexisting ecotypes data set. The visu-
alization was created by merging separately inferred subnetworks resulting from a parameter sweep
of the edge cost from 0.025 to 0.975. The width of the edges represents the maximal mutation cost for
which these edges were selected. The width of the edge displays the stringency at with the edge was
selected (the wider the edge the more stringent the condition. More Stringent conditions correspond
to higher edge costs). Node borders are subdivided into two parts in order to visualize in which strain
a mutation occurred. The inner color of the nodes represents the degree of differential expression (L
ecotype compared to S ecotype thus overexpression means that there was more expression in the L
ecotype). The colors of the edges represent the edge types.
5-18 PRIORITIZATION OF DRIVER GENES AND PATHWAYS FROM EQTL DATA
Given the available data, we could only focus on identifying drivers that orig-
inated after the divergence between both ecotypes. Using this input data we were
able to successfully prioritize the driver genes originally identified by Plucain
et al., which are arcA and gntR, but not spoT as this mutation was present be-
fore the divergence of the two ecotypes. The selected subnetwork (Figure 5.4)
shows that, consistent with the prioritized mutations in arcA and gntR, the TCA
cycle and the Entner-Doudoroff pathway are up-regulated in S as compared to
L. (Supplementary Figure S5.3 and Supplementary Figure S5.4). Figure 5.4
shows how the S-specific mutation in gntR is responsible for the observed up reg-
ulation of the Entner-Doudoroff pathway (gntT, gntK, edd, eda). As gntT is a glu-
conate transmembrane transporter protein, the inferred subnetwork provides an
explanation of one of the previously described mechanisms of the cross-feeding
phenotype [231] in which the gluconate released by the L ecotype is metabo-
lized by the S ecotype. The S-specific mutation in the arcA gene relates to the
S-specific up regulation of the TCA cycle (gltA, fumC, sdhC, sdhD, sdhA, sdhB).
ArcA was previously found to be repetitively mutated in strains of fast switching
phenotypes [233], meaning that the S ecotype could have a fast switching pheno-
type.Besides the already previously prioritized adaptive alleles, the method could
prioritize several additional mutated genes. acs, carrying an S-specific mutation in
a cis binding site element known to promote acs expression [234] was prioritized.
Consistently, the network shows how acs is highly up-regulated in the S-strain as
compared to the L strain. acs is an extracellular acetate scavenger involved in the
conversion of acetate to acetyl coenzyme which implies that, in addition to glu-
conate, acetate might also be (partly) responsible for the cross feeding phenotype
between L and S. Acetate consumption has previously been linked to the origin
of cross-feeding phenotypes in experimental evolution [150,206]. Interestingly an
intergenic mutation associated to dnaK in the S ecotype appears highly priori-
tized (Table 5.2). Overexpression of the gene dnaK, a heat shock chaperone, has
previously been found to mitigate the effect of deleterious mutations in hyper mu-
tators [235]. Although in our network this mutation does not lead to significantly
higher expression levels of dnaK, the mutation could indirectly interfere with e.g.
the stability of the mRNA and as such affect protein expression [236], hereby pro-
tecting both hyper mutator strains. For the S ecotype the molecular mechanism
involved in triggering the coexistence phenotype are clear, the mechanism of the
L ecotype in the coexistence phenotype is, given the available data, less obvious.
However, the uxuA and uxuB genes are more pronouncedly expressed in the L
strain than in the S strain. Both genes are involved in catalyzing the reaction of D-
fructuronate to 2-dehydro-3-deoxy-D-gluconate, which could play an important
role in gluconate cross-feeding.
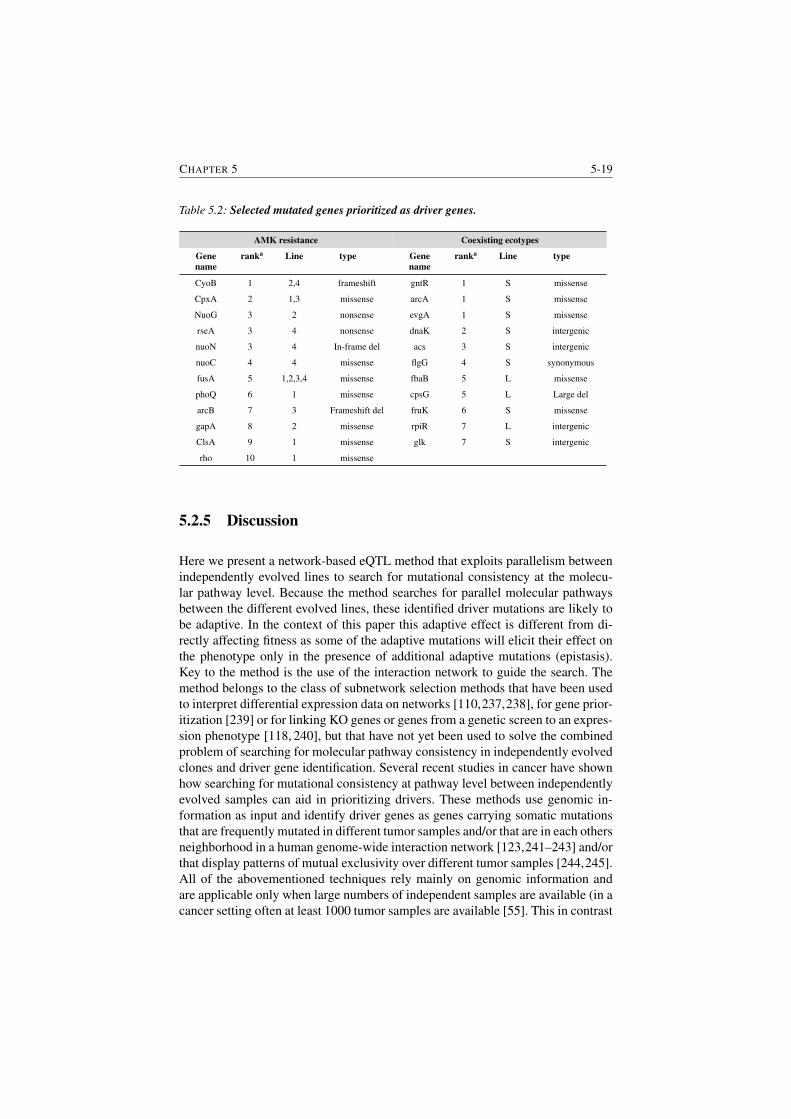
CHAPTER 5 5-19
Table 5.2: Selected mutated genes prioritized as driver genes.
AMK resistance Coexisting ecotypes
Gene
name
ranka Line type Gene
name
ranka Line type
CyoB 1 2,4 frameshift gntR 1 S missense
CpxA 2 1,3 missense arcA 1 S missense
NuoG 3 2 nonsense evgA 1 S missense
rseA 3 4 nonsense dnaK 2 S intergenic
nuoN 3 4 In-frame del acs 3 S intergenic
nuoC 4 4 missense flgG 4 S synonymous
fusA 5 1,2,3,4 missense fbaB 5 L missense
phoQ 6 1 missense cpsG 5 L Large del
arcB 7 3 Frameshift del fruK 6 S missense
gapA 8 2 missense rpiR 7 L intergenic
ClsA 9 1 missense glk 7 S intergenic
rho 10 1 missense
5.2.5 Discussion
Here we present a network-based eQTL method that exploits parallelism between
independently evolved lines to search for mutational consistency at the molecu-
lar pathway level. Because the method searches for parallel molecular pathways
between the different evolved lines, these identified driver mutations are likely to
be adaptive. In the context of this paper this adaptive effect is different from di-
rectly affecting fitness as some of the adaptive mutations will elicit their effect on
the phenotype only in the presence of additional adaptive mutations (epistasis).
Key to the method is the use of the interaction network to guide the search. The
method belongs to the class of subnetwork selection methods that have been used
to interpret differential expression data on networks [110,237,238], for gene prior-
itization [239] or for linking KO genes or genes from a genetic screen to an expres-
sion phenotype [118, 240], but that have not yet been used to solve the combined
problem of searching for molecular pathway consistency in independently evolved
clones and driver gene identification. Several recent studies in cancer have shown
how searching for mutational consistency at pathway level between independently
evolved samples can aid in prioritizing drivers. These methods use genomic in-
formation as input and identify driver genes as genes carrying somatic mutations
that are frequently mutated in different tumor samples and/or that are in each others
neighborhood in a human genome-wide interaction network [123,241–243] and/or
that display patterns of mutual exclusivity over different tumor samples [244,245].
All of the abovementioned techniques rely mainly on genomic information and
are applicable only when large numbers of independent samples are available (in a
cancer setting often at least 1000 tumor samples are available [55]. This in contrast
5-20 PRIORITIZATION OF DRIVER GENES AND PATHWAYS FROM EQTL DATA
to evolution experiments in micro-organisms which contain too few independently
evolved samples (clones) to directly apply the abovementioned data-driven meth-
ods that mainly rely on genotype data. Therefore, we combine molecular profiling
data (expression data) with genomic data to increase the signal of mutational con-
sistency at the molecular pathway level. This compensates partly for the number of
evolved samples usually available in studies on microbial clonal systems. Because
of the eQTL setting drivers that affect expression are more likely to be identified.
Based on the few eQTL studies that have been performed it appears that at least in
microbes adaptive mutations often result in a sometimes marginal but significant
expression response compared to their (immediate) ancestor [246, 247]. Further-
more, In contrast to the statistical and diffusion based methods used in cancer re-
search, we have developed a method that can more explicitly exploit prior informa-
tion to drive the search for drivers. To that end our method relies on a probabilistic
subnetwork selection technique that in a first pathfinding step uses an explicit path
definition to find paths in a weighted (by expression data) and annotated proba-
bilistic subnetwork. This allows integrating prior and/or condition specific data on
the biological process of interest to steer the search towards specific parts of the
genome-wide interaction network by exploiting the directionality of the network
and the properties of the edges to define biologically relevant paths and by assign-
ing prior weights to the edges of the network that are likely to be active under the
assessed conditions. The optimization function actively searches for overlap in the
selected subnetworks allowing to detect mutational consistency at molecular path-
way level, despite even a low number of independently evolved lines. The required
overlap between paths can be tuned using the edge cost parameter. Driver muta-
tions exhibit a high degree of mutational consistency at the molecular pathway
level. Therefore, using a high edge cost, which forces the selection of subnetworks
with a large overlap between paths over the different evolved lines, leads to fewer
false positives amongst the identified driver mutations. On the semi-synthetic data
set it was illustrated how a sweep on the edge cost parameter can be used to suc-
cessfully prioritize the most likely candidate drivers. Using two biological data
sets, the potential of applying the method on eQTL data for studying the molec-
ular mechanisms underlying adaptive traits was illustrated. From a large number
of potential mutations the method was able to select previously identified driver
mutations. In addition to this, potential driver mutations could be identified and
verified with literature. The potential of the method to distinguish passengers from
driver mutations was also shown on mutator phenotypes, where a large amount of
passenger mutations are present but where the method was able to rank the previ-
ously identified driver genes as highly likely to be driver genes. It is important to
note that even if few mutations are available, it is often not clear which of those
are the drivers (as is illustrated in the case of the Amikacin resistance) and which
are potentiating mutations. Microbial systems are not guaranteed to display mu-
tational consistency at gene level, solely relying on mutational consistency of the
same mutation in independent lines to identify drivers might fail. Because of this,
the experimental identification of drivers is tedious as it requires reintroducing all
possible individual driver mutations and, in case of complex phenotypes, their pos-
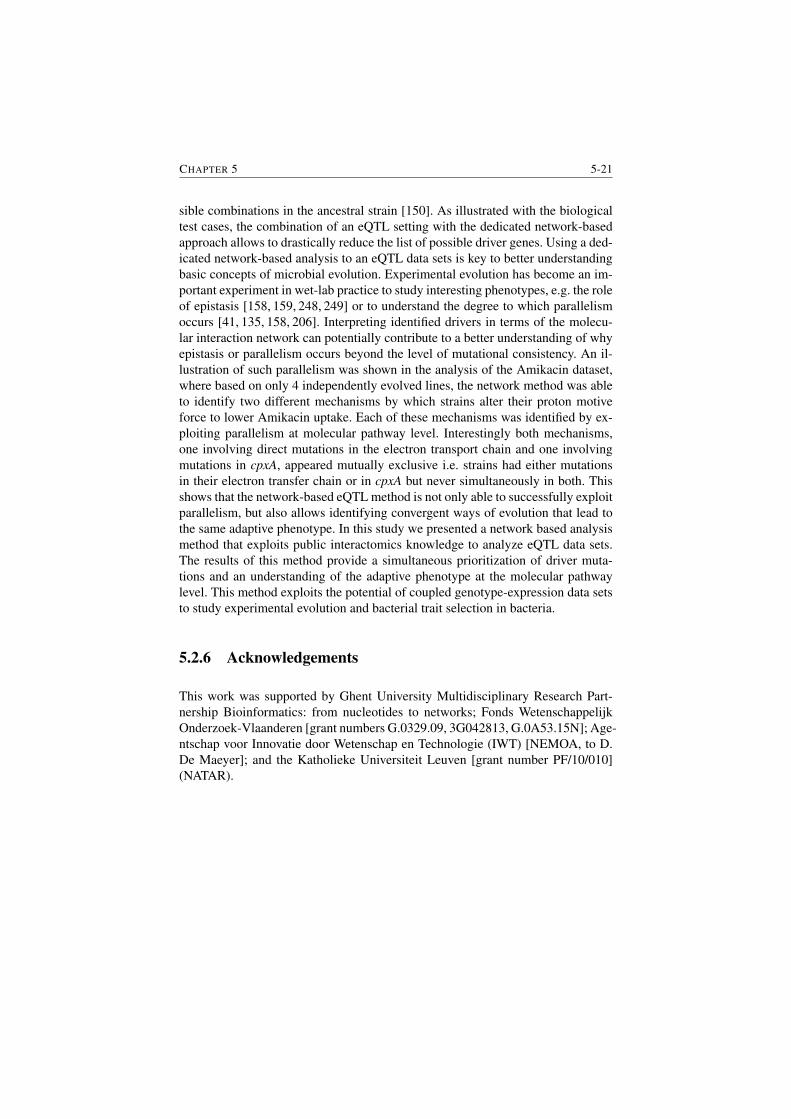
CHAPTER 5 5-21
sible combinations in the ancestral strain [150]. As illustrated with the biological
test cases, the combination of an eQTL setting with the dedicated network-based
approach allows to drastically reduce the list of possible driver genes. Using a ded-
icated network-based analysis to an eQTL data sets is key to better understanding
basic concepts of microbial evolution. Experimental evolution has become an im-
portant experiment in wet-lab practice to study interesting phenotypes, e.g. the role
of epistasis [158, 159, 248, 249] or to understand the degree to which parallelism
occurs [41, 135, 158, 206]. Interpreting identified drivers in terms of the molecu-
lar interaction network can potentially contribute to a better understanding of why
epistasis or parallelism occurs beyond the level of mutational consistency. An il-
lustration of such parallelism was shown in the analysis of the Amikacin dataset,
where based on only 4 independently evolved lines, the network method was able
to identify two different mechanisms by which strains alter their proton motive
force to lower Amikacin uptake. Each of these mechanisms was identified by ex-
ploiting parallelism at molecular pathway level. Interestingly both mechanisms,
one involving direct mutations in the electron transport chain and one involving
mutations in cpxA, appeared mutually exclusive i.e. strains had either mutations
in their electron transfer chain or in cpxA but never simultaneously in both. This
shows that the network-based eQTL method is not only able to successfully exploit
parallelism, but also allows identifying convergent ways of evolution that lead to
the same adaptive phenotype. In this study we presented a network based analysis
method that exploits public interactomics knowledge to analyze eQTL data sets.
The results of this method provide a simultaneous prioritization of driver muta-
tions and an understanding of the adaptive phenotype at the molecular pathway
level. This method exploits the potential of coupled genotype-expression data sets
to study experimental evolution and bacterial trait selection in bacteria.
5.2.6 Acknowledgements
This work was supported by Ghent University Multidisciplinary Research Part-
nership Bioinformatics: from nucleotides to networks; Fonds Wetenschappelijk
Onderzoek-Vlaanderen [grant numbers G.0329.09, 3G042813, G.0A53.15N]; Age-
ntschap voor Innovatie door Wetenschap en Technologie (IWT) [NEMOA, to D.
De Maeyer]; and the Katholieke Universiteit Leuven [grant number PF/10/010]
(NATAR).
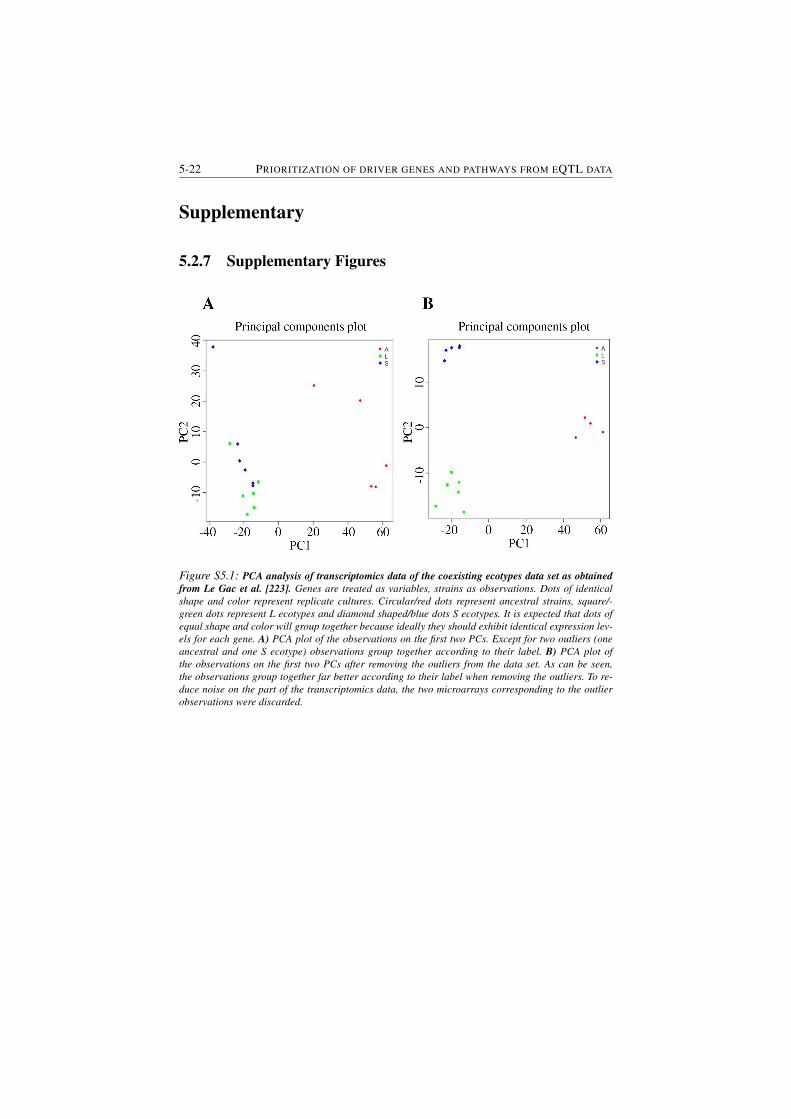
5-22 PRIORITIZATION OF DRIVER GENES AND PATHWAYS FROM EQTL DATA
Supplementary
5.2.7 Supplementary Figures
Figure S5.1: PCA analysis of transcriptomics data of the coexisting ecotypes data set as obtained
from Le Gac et al. [223]. Genes are treated as variables, strains as observations. Dots of identical
shape and color represent replicate cultures. Circular/red dots represent ancestral strains, square/-
green dots represent L ecotypes and diamond shaped/blue dots S ecotypes. It is expected that dots of
equal shape and color will group together because ideally they should exhibit identical expression lev-
els for each gene. A) PCA plot of the observations on the first two PCs. Except for two outliers (one
ancestral and one S ecotype) observations group together according to their label. B) PCA plot of
the observations on the first two PCs after removing the outliers from the data set. As can be seen,
the observations group together far better according to their label when removing the outliers. To re-
duce noise on the part of the transcriptomics data, the two microarrays corresponding to the outlier
observations were discarded.
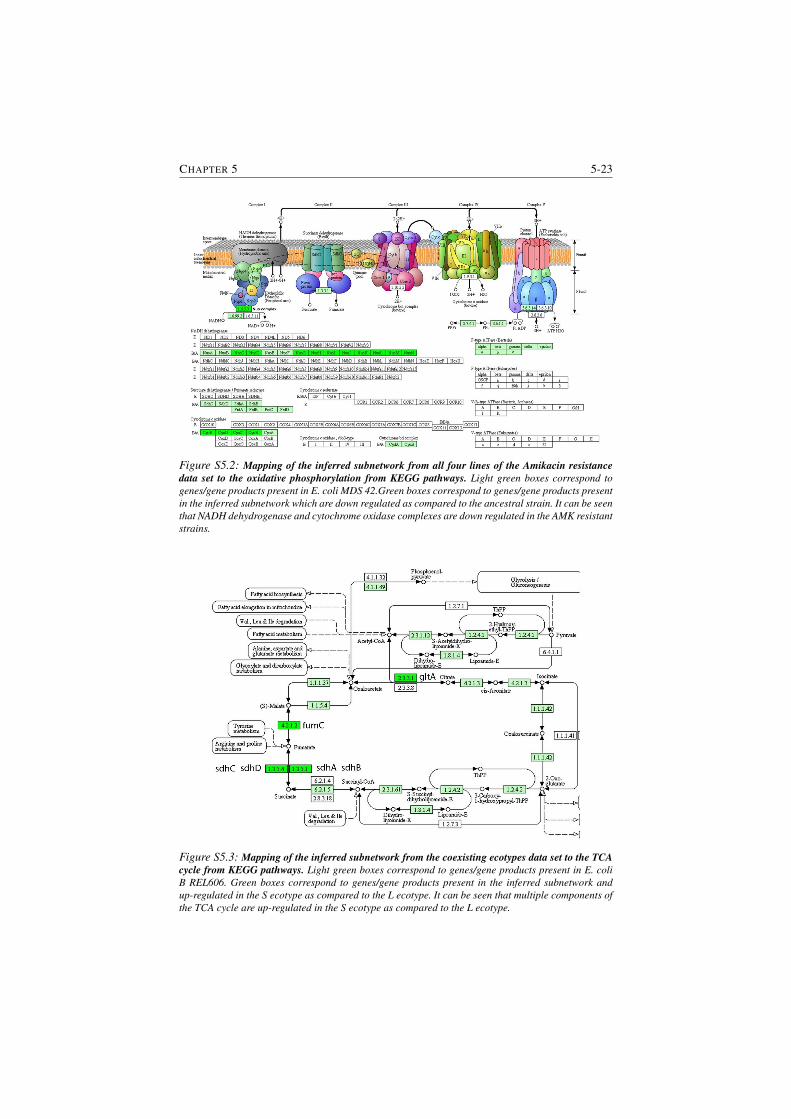
CHAPTER 5 5-23
Figure S5.2: Mapping of the inferred subnetwork from all four lines of the Amikacin resistance
data set to the oxidative phosphorylation from KEGG pathways. Light green boxes correspond to
genes/gene products present in E. coli MDS 42.Green boxes correspond to genes/gene products present
in the inferred subnetwork which are down regulated as compared to the ancestral strain. It can be seen
that NADH dehydrogenase and cytochrome oxidase complexes are down regulated in the AMK resistant
strains.
Figure S5.3: Mapping of the inferred subnetwork from the coexisting ecotypes data set to the TCA
cycle from KEGG pathways. Light green boxes correspond to genes/gene products present in E. coli
B REL606. Green boxes correspond to genes/gene products present in the inferred subnetwork and
up-regulated in the S ecotype as compared to the L ecotype. It can be seen that multiple components of
the TCA cycle are up-regulated in the S ecotype as compared to the L ecotype.
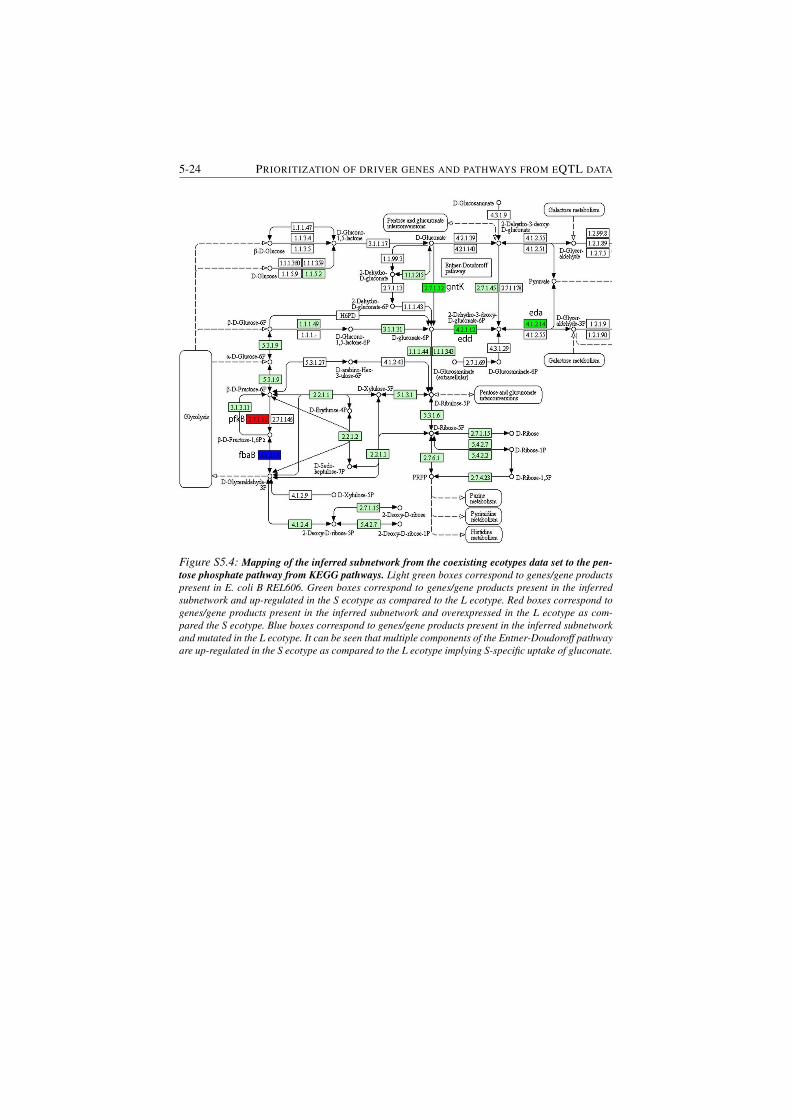
5-24 PRIORITIZATION OF DRIVER GENES AND PATHWAYS FROM EQTL DATA
Figure S5.4: Mapping of the inferred subnetwork from the coexisting ecotypes data set to the pen-
tose phosphate pathway from KEGG pathways. Light green boxes correspond to genes/gene products
present in E. coli B REL606. Green boxes correspond to genes/gene products present in the inferred
subnetwork and up-regulated in the S ecotype as compared to the L ecotype. Red boxes correspond to
genes/gene products present in the inferred subnetwork and overexpressed in the L ecotype as com-
pared the S ecotype. Blue boxes correspond to genes/gene products present in the inferred subnetwork
and mutated in the L ecotype. It can be seen that multiple components of the Entner-Doudoroff pathway
are up-regulated in the S ecotype as compared to the L ecotype implying S-specific uptake of gluconate.
6Ranking of driver genes and pathways
from genomics data
6.1 Introduction
This chapter describes IAMBEE, a network-based method which was specifically
designed for use with evolution experiments in which genomics data is available
before and after an adaptive sweep. In such an experimental set-up, data on the
increase in frequency of every mutation during the adaptive sweep is available. By
combining this data with information about the functional effects of each mutation
and correcting for possible samples which exhibit a mutation rate which is much
higher than the other samples, IAMBEE can prioritize molecular pathways which
harbor adaptive mutations. It is shown that IAMBEE can lead to additional insights
in the acquisition of a specific trait. For example, in this chapter mutual exclusiv-
ity of mutations on the level of molecular pathways was found in an evolution
experiment in which E. coli was exposed to ethanol.
TS and BW conceptualized the study, analyzed and interpreted the results and
wrote the manuscript. TS designed and performed the biological experiments, BW
designed IAMBEE and used it to analyze the sequence data. CB helped in per-
forming the biological experiments. NV, JM and KM conceptualized the study,
designed the experiments, discussed the results and edited the manuscript.
6-2 RANKING OF DRIVER GENES AND PATHWAYS FROM GENOMICS DATA
6.2 Paper
Network-Based Identification of Adaptive Pathwaysin Evolved Ethanol-Tolerant Bacterial PopulationsSwings, T.†, Weytjens, B.†, Schalck, T., Bonte, C., Verstraeten, N., Michiels, J.§ and Marchal, K.§
(2017). Network-based identification of adaptive pathways in evolved ethanol-tolerant bacterial popu-lations. Molecular Biology and Evolution, msx228.
† these authors contributed equally to this paper§ these authors contributed equally to this paper
6.2.1 Abstract
Efficient production of ethanol for use as a renewable fuel requires organisms with
a high level of ethanol tolerance. However, this trait is complex and increased tol-
erance therefore requires mutations in multiple genes and pathways. Here, we use
experimental evolution for a system-level analysis of adaptation of Escherichia
coli to high ethanol stress. As adaptation to extreme stress often results in complex
mutational datasets consisting of both causal and non-causal passenger mutations,
identifying the true adaptive mutations in these settings is not trivial. Therefore, we
developed a novel method named IAMBEE (Identification of Adaptive Mutations
in Bacterial Evolution Experiments). IAMBEE exploits the temporal profile of
the acquisition of mutations during evolution in combination with the functional
implications of each mutation at the protein level. These data are mapped to a
genome-wide interaction network to search for adaptive mutations at the level
of pathways. The 16 evolved populations in our dataset together harbored 2286
mutated genes with 4470 unique mutations. Analysis by IAMBEE significantly
reduced this number and resulted in identification of 90 mutated genes and 345
unique mutations that are most likely to be adaptive. Moreover, IAMBEE not only
enabled the identification of previously known pathways involved in ethanol toler-
ance, but also identified novel systems such as the AcrAB-TolC efflux pump and
fatty acids biosynthesis and even allowed to gain insight into the temporal profile
of adaptation to ethanol stress. Moreover, this method offers a solid framework for
identifying the molecular underpinnings of other complex traits as well.
6.2.2 Introduction
Experimental evolution offers great potential to gain insights into the molecular
mechanisms that contribute to the acquisition of complex traits [149, 205, 250].
Previously, experimental evolution has been used not only to study the mecha-
nisms underlying clinically [251–253] or industrially relevant phenotypes [254],
CHAPTER 6 6-3
but also to improve key industrial traits for the production of advanced evolution-
ary engineered strains [254]. Laboratory evolution experiments usually start from
a single clone that is cultivated for prolonged periods of time in predefined con-
ditions. During this period of time, natural selection favors mutations that confer
a benefit in the chosen condition leading to improved phenotypes [40]. Fitness is
tracked over time and clones displaying increased fitness are genotyped to identify
the underlying mutations [255]. While some phenotypes are established by only
one or just a few mutations, complex traits often lead to complex mutational pro-
files, severely complicating identification of the causal adaptive mutations [256].
In this study, we used experimental evolution to study high ethanol tolerance
in the bacterium Escherichia coli. Usually, microbial ethanol production capacity
is severely limited by the toxic effect of ethanol itself. Therefore, higher ethanol
tolerance and increased ethanol production are inherently linked [257, 258]. Even
though understanding and improving this trait is vital for strain engineering, it
has been challenging to fully elucidate the underlying mechanisms. Previous stud-
ies have identified single genes [259,260] as well as epistatically interacting genes
[261] involved in higher ethanol tolerance. However, tolerance to ethanol is clearly
a complex trait established by the interaction of multiple genes and pathways
[259–263] and a broad understanding of ethanol tolerance in E. coli is currently
lacking. Moreover, in a previous study we found that hypermutation drives evolu-
tion under severe stress, such as ethanol stress, to enable adaptation of at least some
individuals to avoid extinction [44]. An increased mutation rate was found in all
high ethanol tolerant populations and resulted in a higher ratio of passenger versus
adaptive mutations, leading to an extremely complex mutational profile. Conse-
quently, this increased complexity impedes the ability to statistically distinguish
between true adaptive mutations and passenger mutations.
In most studies, this distinction between adaptive and passenger mutations is
based on identifying mutations or mutated genes that recurrently emerge in inde-
pendent evolutionary lines [139, 264–268]. This narrow definition of parallelism
assumes that only frequently mutated genes contribute to an adaptive phenotype.
However, in populations that evolve independently, there is no guarantee that ex-
actly the same mutation or even the same mutated gene is responsible for the ob-
served adaptive phenotype. Affecting the same pathway through different and not
necessarily frequently mutated genes might equally well induce the same adap-
tive phenotype [41, 135, 136]. Rather than identifying recurrent mutations, one
can search for consistently mutated molecular pathways, assuming that adaptive
mutations will hit the same adaptive pathways in independently evolved popula-
tions, while passenger mutations will be spread randomly over the genome. Ap-
proaches that search for consistent changes in molecular pathways are typically
network-based and have been applied successfully, mainly in the context of cancer
genomics [8, 124, 269, 270] but not yet for the mapping of genotypes to complex
traits in clonal micro-organisms such as bacteria.
6-4 RANKING OF DRIVER GENES AND PATHWAYS FROM GENOMICS DATA
To cope with the specificities of clonal evolution experiments that aim to study
complex traits, we developed a novel network-based method, IAMBEE. IAMBEE
exploits the information gained from the trajectory of individual mutations along
the evolution experiment to reduce the complexity of identifying adaptive path-
ways/genes. Our experimental set-up combined with this unique network-based
approach resulted in the identification of several adaptive pathways that conferred
ethanol resistance in E. coli. The role of the 30S ribosomal subunit pathway [271,
272] as well as the osmotic stress response pathway (ompR/envZ) [273, 274] were
confirmed. In addition, newly predicted molecular mechanisms such as the mul-
tidrug efflux pump AcrAB-TolC and the fatty acid biosynthesis pathway were ex-
perimentally validated. These results demonstrate the value of IAMBEE to analyze
complex mutational datasets including even datasets resulting from a hypermuta-
tor phenotype, to obtain a comprehensive overview of the pathways and its specific
mutated components involved in the establishment of the trait.
6.2.3 Results
6.2.4 Ethanol tolerant populations display a hypermutator phe-
notype
We set up an evolution experiment in which 16 independent E. coli populations
were experimentally evolved under increasing ethanol concentrations (Figure 6.1).
Changes in ethanol tolerance due to accumulation of beneficial mutations were
tracked in time to obtain a fitness trajectory for each population (Supplementary
Figure S6.1). These trajectories show remarkable selective sweeps between 5%
and 6% ethanol tolerance (further referred to as the initial selective sweep) and
from 6% to 6.5% ethanol tolerance (further referred to as the second selective
sweep). Populations were sampled right before and right after each increase in
ethanol tolerance and were subjected to pooled sequencing. Primary analysis of the
data showed that each of the ethanol tolerant populations evolved a hypermutation
phenotype. In depth study of this observation led to the conclusion that near-lethal
conditions require rapid adaptation of at least some individuals to avoid extinc-
tion of the population [44]. Hypermutation considerably facilitates rapid adapta-
tion by increasing the mutational supply rate thereby increasing the probability to
acquire a beneficial mutation [44, 249, 275]. While hypermutation enables adapta-
tion, it also leads to complex mutational profiles with multiple mutations in random
genes [140], further impeding identification of causal mutations. In our dataset of
16 evolved populations a total of 2286 mutated genes, containing 4470 unique
mutations were detected. To identify causal mutation despite this complexity, we
developed a method that overcomes the limitations of only identifying recurrent
mutations.
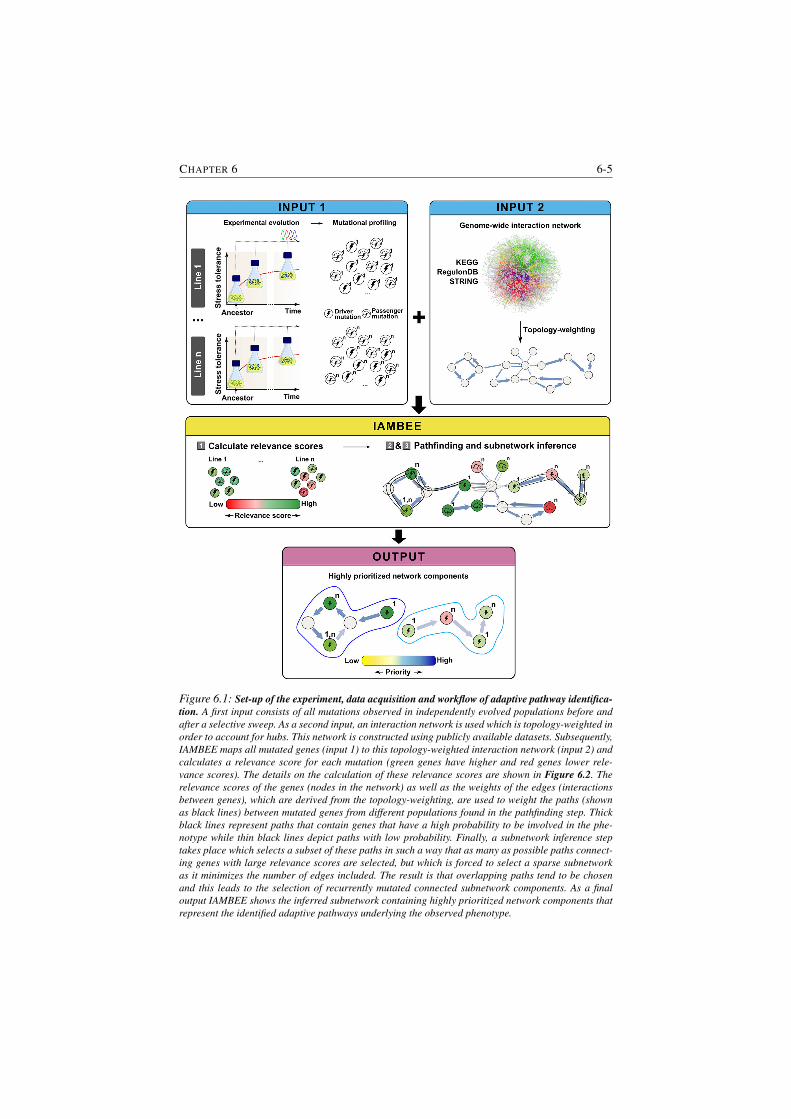
CHAPTER 6 6-5
Figure 6.1: Set-up of the experiment, data acquisition and workflow of adaptive pathway identifica-
tion. A first input consists of all mutations observed in independently evolved populations before and
after a selective sweep. As a second input, an interaction network is used which is topology-weighted in
order to account for hubs. This network is constructed using publicly available datasets. Subsequently,
IAMBEE maps all mutated genes (input 1) to this topology-weighted interaction network (input 2) and
calculates a relevance score for each mutation (green genes have higher and red genes lower rele-
vance scores). The details on the calculation of these relevance scores are shown in Figure 6.2. The
relevance scores of the genes (nodes in the network) as well as the weights of the edges (interactions
between genes), which are derived from the topology-weighting, are used to weight the paths (shown
as black lines) between mutated genes from different populations found in the pathfinding step. Thick
black lines represent paths that contain genes that have a high probability to be involved in the phe-
notype while thin black lines depict paths with low probability. Finally, a subnetwork inference step
takes place which selects a subset of these paths in such a way that as many as possible paths connect-
ing genes with large relevance scores are selected, but which is forced to select a sparse subnetwork
as it minimizes the number of edges included. The result is that overlapping paths tend to be chosen
and this leads to the selection of recurrently mutated connected subnetwork components. As a final
output IAMBEE shows the inferred subnetwork containing highly prioritized network components that
represent the identified adaptive pathways underlying the observed phenotype.
6-6 RANKING OF DRIVER GENES AND PATHWAYS FROM GENOMICS DATA
6.2.5 Exploiting parallel evolution to identify adaptive path-
ways
To distinguish between adaptive and passenger mutations and to identify pathways
underlying complex traits we have developed IAMBEE, which integrates prior in-
formation on gene interactions (i.e. an interaction network) with the specificities
of the experimental design. Key to the concept of IAMBEE is the use of multiple
independently evolved populations to search for recurrently mutated molecular
pathways. This search is driven by the interaction network and based on a decision
theoretic subnetwork inference problem [6, 7]. However, given the high mutation
rate and the relatively low number of indpedently evolved populations, additional
information in the form of functional impact scores of the individual mutations
is needed to drive the analysis. We hereby assume a priori that not all mutations
are equally likely to be involved in the adaptive phenotype. Mutations that in-
crease in frequency during a selective sweep and/or that have a functional impact
on the protein in which they occur, are more likely to be involved in the pheno-
type. Figure 6.1 gives a conceptual overview of IAMBEE. The input consists of
called mutations from multiple, independently evolved populations and a genome-
wide interaction network of the organism of interest. After topology-weighting the
interaction network to downweight the effect of hubs on the final solution (see
Materials and Methods), IAMBEE proceeds in three steps (Figure 6.1): 1) the rel-
evance score is calculated for each mutated gene in each population. The relevance
score consists of three components. The first component describes the change in
frequency of the mutation during a selective sweep in the population. Mutations
that increase in frequency during a selective sweep are more likely to be adaptive
than mutations that decrease in frequency. However, not necessarily all adaptive
mutations will increase in frequency during a sweep (e.g. potentiating mutations)
and conversely passenger mutations that hitchhike with driver mutations will also
increase in frequency [144]. Therefore, the frequency change component is com-
plemented with a second component: the functional impact score. The functional
impact score reflects the effect of the mutation on the function of the protein. Mu-
tations that are likely to alter a proteins function are more likely to be adaptive. A
last component of a mutations relevance score relates to the mutation rate of the
population in which the mutation occurs: we assume that mutations that originate
from populations with a significantly higher mutation rate than the other popula-
tions should contribute relatively less to the final solution as they contain a larger
number of passenger mutations (more noise) and a mutation of such a line should
thus exhibit a stronger signal in order to be selected. A detailed overview of the
calculation of the relevance scores by IAMBEE is shown in Figure 6.2 and is de-
scribed in Materials and Methods. 2) The pathfinding step embodies the search for
paths, which are defined as consecutive sets of edges connecting mutated genes
from different populations, on the topology-weighted interaction network. These
paths are weighted based on the relevance scores of the involved mutations and the
weights of the edges involved in the path. The weight of a path reflects the degree
CHAPTER 6 6-7
of belief that the path is involved in the adaptive phenotype. 3) Subnetwork infer-
ence (optimization strategy) is subsequently used to select a subset of the paths
found during the pathfinding step. This subset is selected such that a maximum
number of mutated genes with high relevance scores are included but a minimal
number of edges is selected. This means that overlapping paths are more easily
selected as they share edges, which reflects the search for molecular pathways that
are consistently mutated throughout independently evolved populations. The re-
sulting subset of paths makes up a subnetwork that consists of multiple connected
components which are parts of molecular pathways. For a more detailed explana-
tion of these steps, we refer to the methods section.
6.2.5.1 Validation of IAMBEE using synthetic data
To validate and characterize IAMBEE, we generated 100 synthetic datasets, each
with randomly selected adaptive and passenger mutations (Supplementary meth-
ods). Running IAMBEE on one of these datasets with a specific parameter setting
resulted in a subnetwork containing prioritized mutated genes. Every synthetic
dataset was run with 50 different parameter settings ranging from settings which
result in small subnetworks to settings which result in larger subnetworks. As in
this synthetic setting the true adaptive mutations (true positives) are known, we
used PPV (the ratio of true positives to the total number of prioritized mutations)
and sensitivity (the number of true positives to the total number of true positives in
the dataset) as performance criteria. Results showed that, as expected for a method
that makes relevant non-random predictions, small subnetworks have a high PPV
at the expense of a lower sensitivity and subnetworks (of any size) rarely have both
low sensitivity and PPV (Supplementary Figure S6.2). This indicates that users
should start exploring small solutions when identifying candidates for experimen-
tal validation while progressing to larger solutions allows gaining a more complete
pathway level insight into the adaptive phenotype but risks identifying false pos-
itives. This information is also included in the output of IAMBEE where more
opaque edges represent edges which are involved in both small and large solutions
(high PPV) while less opaque edges are only involved in small solutions (lower
PPV) (Figure 6.3, Figure 6.4).
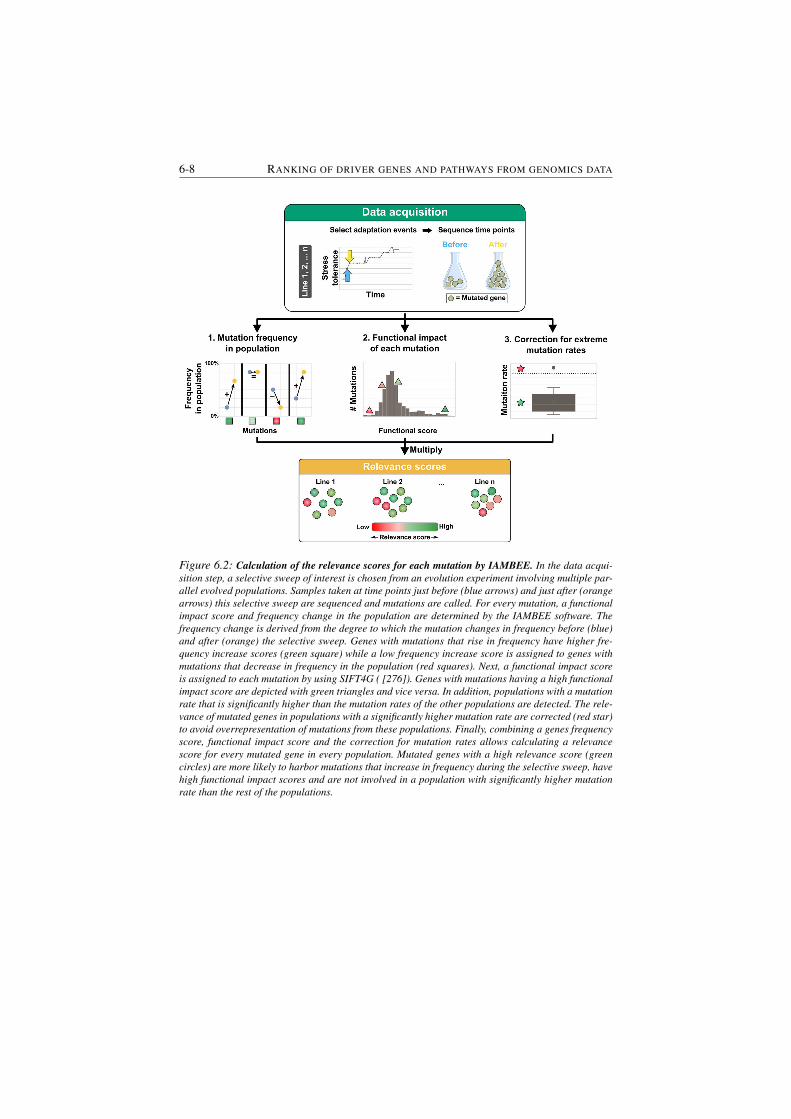
6-8 RANKING OF DRIVER GENES AND PATHWAYS FROM GENOMICS DATA
Figure 6.2: Calculation of the relevance scores for each mutation by IAMBEE. In the data acqui-
sition step, a selective sweep of interest is chosen from an evolution experiment involving multiple par-
allel evolved populations. Samples taken at time points just before (blue arrows) and just after (orange
arrows) this selective sweep are sequenced and mutations are called. For every mutation, a functional
impact score and frequency change in the population are determined by the IAMBEE software. The
frequency change is derived from the degree to which the mutation changes in frequency before (blue)
and after (orange) the selective sweep. Genes with mutations that rise in frequency have higher fre-
quency increase scores (green square) while a low frequency increase score is assigned to genes with
mutations that decrease in frequency in the population (red squares). Next, a functional impact score
is assigned to each mutation by using SIFT4G ( [276]). Genes with mutations having a high functional
impact score are depicted with green triangles and vice versa. In addition, populations with a mutation
rate that is significantly higher than the mutation rates of the other populations are detected. The rele-
vance of mutated genes in populations with a significantly higher mutation rate are corrected (red star)
to avoid overrepresentation of mutations from these populations. Finally, combining a genes frequency
score, functional impact score and the correction for mutation rates allows calculating a relevance
score for every mutated gene in every population. Mutated genes with a high relevance score (green
circles) are more likely to harbor mutations that increase in frequency during the selective sweep, have
high functional impact scores and are not involved in a population with significantly higher mutation
rate than the rest of the populations.
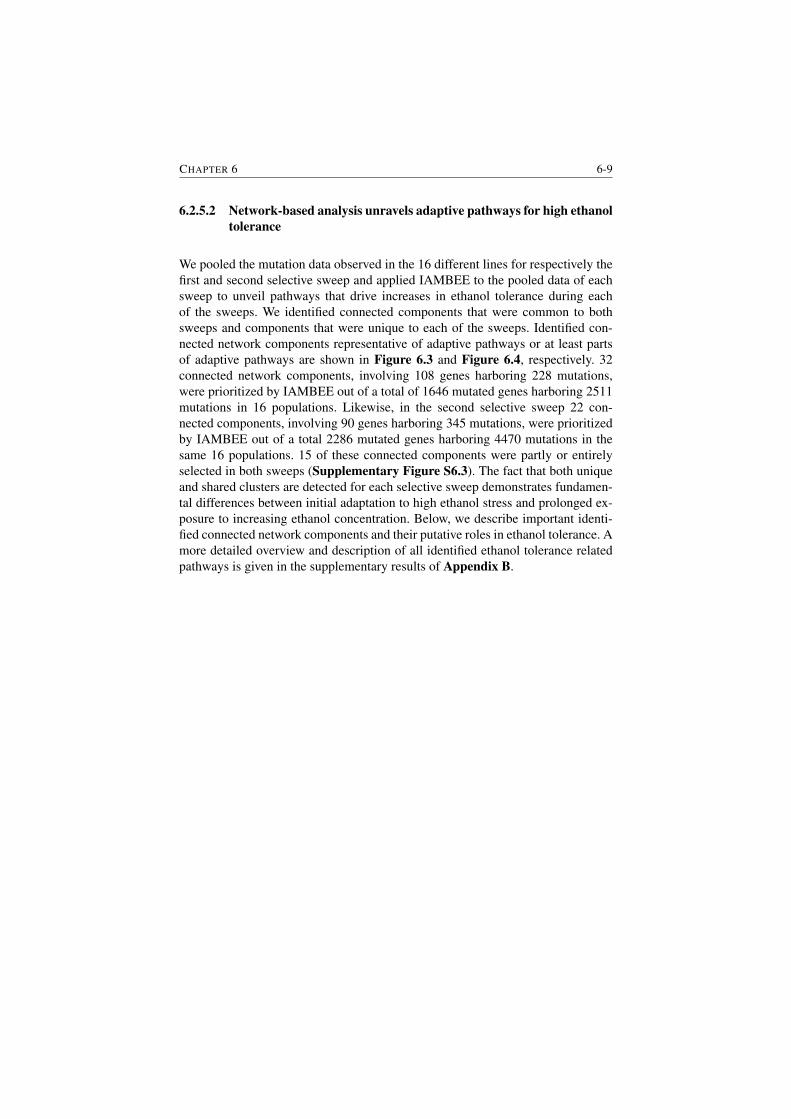
CHAPTER 6 6-9
6.2.5.2 Network-based analysis unravels adaptive pathways for high ethanol
tolerance
We pooled the mutation data observed in the 16 different lines for respectively the
first and second selective sweep and applied IAMBEE to the pooled data of each
sweep to unveil pathways that drive increases in ethanol tolerance during each
of the sweeps. We identified connected components that were common to both
sweeps and components that were unique to each of the sweeps. Identified con-
nected network components representative of adaptive pathways or at least parts
of adaptive pathways are shown in Figure 6.3 and Figure 6.4, respectively. 32
connected network components, involving 108 genes harboring 228 mutations,
were prioritized by IAMBEE out of a total of 1646 mutated genes harboring 2511
mutations in 16 populations. Likewise, in the second selective sweep 22 con-
nected components, involving 90 genes harboring 345 mutations, were prioritized
by IAMBEE out of a total 2286 mutated genes harboring 4470 mutations in the
same 16 populations. 15 of these connected components were partly or entirely
selected in both sweeps (Supplementary Figure S6.3). The fact that both unique
and shared clusters are detected for each selective sweep demonstrates fundamen-
tal differences between initial adaptation to high ethanol stress and prolonged ex-
posure to increasing ethanol concentration. Below, we describe important identi-
fied connected network components and their putative roles in ethanol tolerance. A
more detailed overview and description of all identified ethanol tolerance related
pathways is given in the supplementary results of Appendix B.
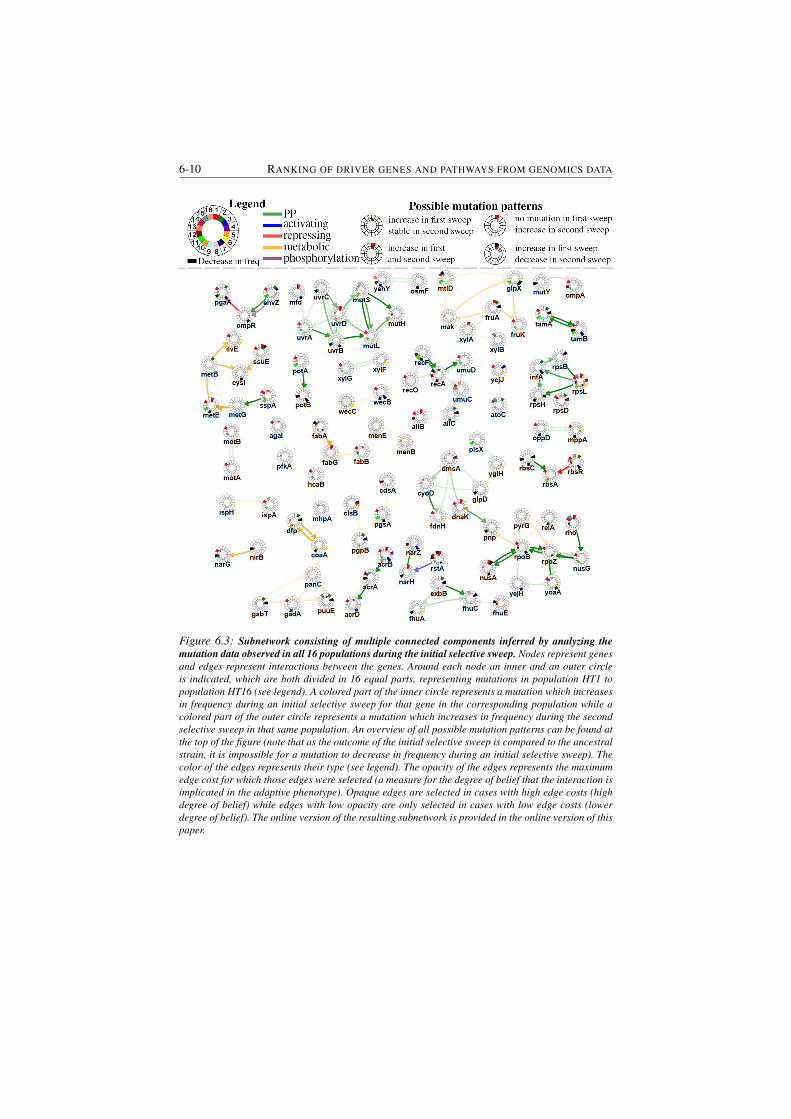
6-10 RANKING OF DRIVER GENES AND PATHWAYS FROM GENOMICS DATA
Figure 6.3: Subnetwork consisting of multiple connected components inferred by analyzing the
mutation data observed in all 16 populations during the initial selective sweep. Nodes represent genes
and edges represent interactions between the genes. Around each node an inner and an outer circle
is indicated, which are both divided in 16 equal parts, representing mutations in population HT1 to
population HT16 (see legend). A colored part of the inner circle represents a mutation which increases
in frequency during an initial selective sweep for that gene in the corresponding population while a
colored part of the outer circle represents a mutation which increases in frequency during the second
selective sweep in that same population. An overview of all possible mutation patterns can be found at
the top of the figure (note that as the outcome of the initial selective sweep is compared to the ancestral
strain, it is impossible for a mutation to decrease in frequency during an initial selective sweep). The
color of the edges represents their type (see legend). The opacity of the edges represents the maximum
edge cost for which those edges were selected (a measure for the degree of belief that the interaction is
implicated in the adaptive phenotype). Opaque edges are selected in cases with high edge costs (high
degree of belief) while edges with low opacity are only selected in cases with low edge costs (lower
degree of belief). The online version of the resulting subnetwork is provided in the online version of this
paper.
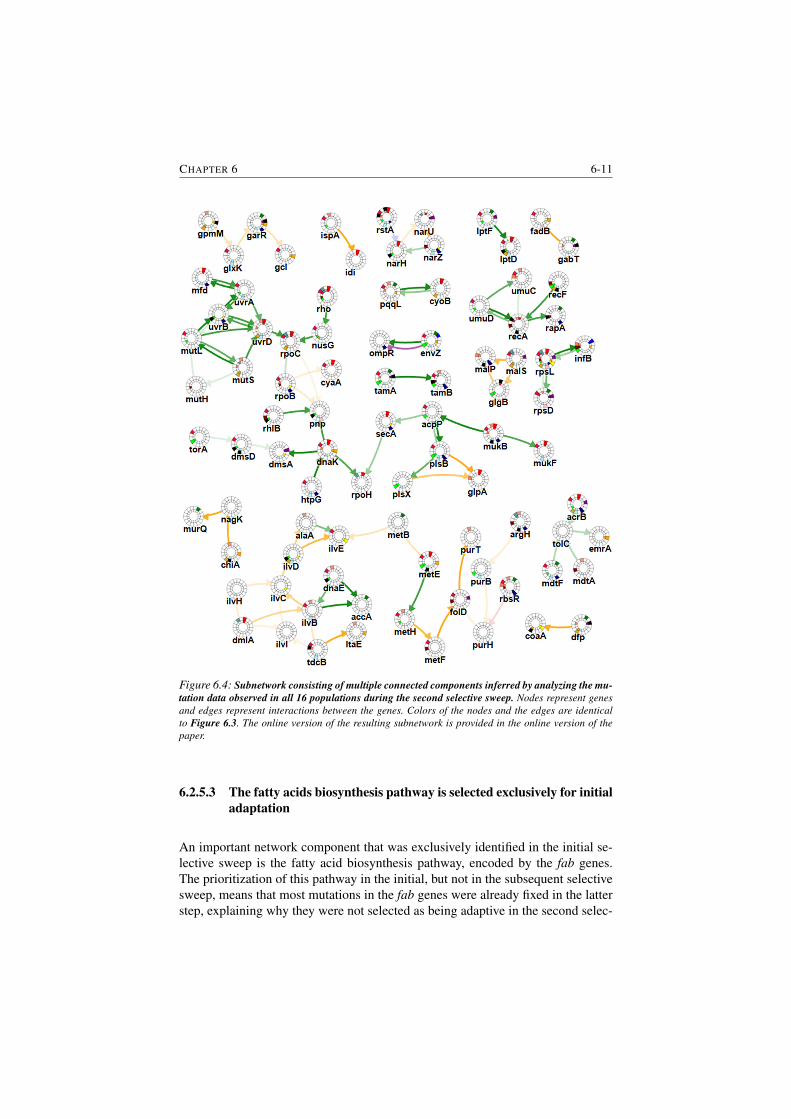
CHAPTER 6 6-11
Figure 6.4: Subnetwork consisting of multiple connected components inferred by analyzing the mu-
tation data observed in all 16 populations during the second selective sweep. Nodes represent genes
and edges represent interactions between the genes. Colors of the nodes and the edges are identical
to Figure 6.3. The online version of the resulting subnetwork is provided in the online version of the
paper.
6.2.5.3 The fatty acids biosynthesis pathway is selected exclusively for initial
adaptation
An important network component that was exclusively identified in the initial se-
lective sweep is the fatty acid biosynthesis pathway, encoded by the fab genes.
The prioritization of this pathway in the initial, but not in the subsequent selective
sweep, means that most mutations in the fab genes were already fixed in the latter
step, explaining why they were not selected as being adaptive in the second selec-
6-12 RANKING OF DRIVER GENES AND PATHWAYS FROM GENOMICS DATA
tive sweep. This early fixation of fab mutations indicates that changing the fatty
acid composition in the membrane is an initial adaptation strategy, but does not suf-
fice to confer resistance to higher concentrations of ethanol. Both fabA and fabB
accumulated mutations in different parallel populations. The amount of unsatu-
rated fatty acids eventually present in the membrane depends on the competition
for intermediates at the FabA branch point in the pathway [277–279]. Mutations in
either the fabA gene itself or in genes downstream (e.g. fabB or fabG) can perma-
nently change the ratio saturated versus unsaturated fatty acids thereby changing
the fluidity of the membrane. Changes in membrane composition, such as the ratio
of saturated versus unsaturated fatty acids, have previously been reported to affect
ethanol tolerance [280, 281] although mutations in the fab genes have not been
associated with ethanol resistance in the past.
To validate whether mutations in the fab genes affect membrane composition,
we compared fatty acid content of selected strains harboring these mutations with
that of the wild type (Figure 6.5). When exposed to 5% ethanol, the percentage
unsaturated fatty acids in wild-type cells increases 2-fold (Figure 6.5a). This ob-
servation corroborates previous results showing ethanol-induced inhibition of sat-
urated fatty acid synthesis [280]. The percentage unsaturated fatty acids in the
absence of ethanol in the two mutant populations harboring a fabA (HT15) and a
fabB (HT12) mutation equals that of the wild-type ancestor. However, in the mu-
tant populations subjected to 5% ethanol the percentage unsaturated fatty acids
also increases, but not to the same extent as for the wild type (Figure 6.5b). This
difference suggests a direct effect of the identified fab mutations on the ethanol-
induced shift in saturated versus unsaturated fatty acids ratio. Increased propor-
tions of unsaturated fatty acids fluidizes the membrane. Mutations in the fab genes
possibly counteract this shift to become more tolerant against ethanol by maintain-
ing structural rigidity of the membrane.
6.2.5.4 Pathways involved in both initial and consecutive adaptation
Several highly prioritized pathways conferring tolerance to ethanol were identified
in both the initial and second sweep. When a pathway is selected in both sweeps,
typically only few genes are prioritized in the initial sweep, whereas newly ac-
quired mutations are prioritized in the second sweep (Figure 6.3, Figure 6.4).
Multidrug efflux pumps
One network component of particular interest is linked to multidrug efflux
complexes. The genes acrA, acrB and acrD, encoding the AcrAB-TolC and the
AcrAD-TolC multidrug efflux pump were found to be frequently mutated during
the initial selective sweep. Multidrug efflux pumps usually consist of three parts:
an inner-membrane transporter, such as AcrB, a membrane fusion protein such as
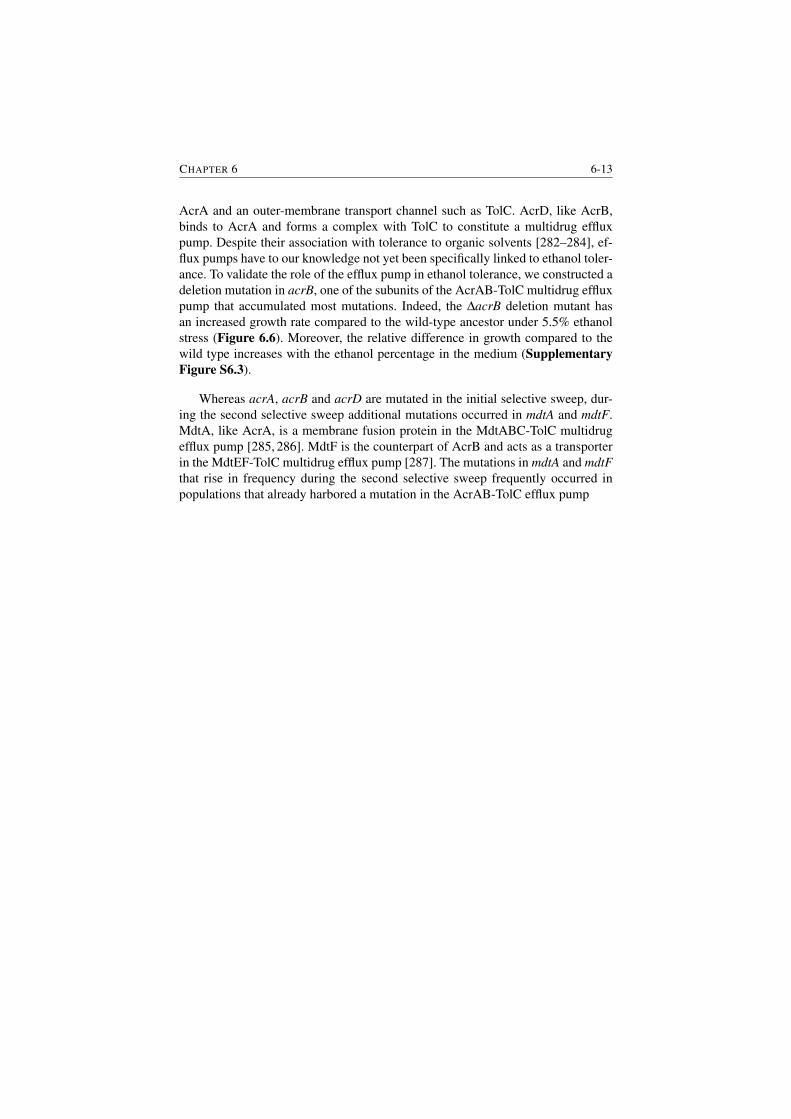
CHAPTER 6 6-13
AcrA and an outer-membrane transport channel such as TolC. AcrD, like AcrB,
binds to AcrA and forms a complex with TolC to constitute a multidrug efflux
pump. Despite their association with tolerance to organic solvents [282–284], ef-
flux pumps have to our knowledge not yet been specifically linked to ethanol toler-
ance. To validate the role of the efflux pump in ethanol tolerance, we constructed a
deletion mutation in acrB, one of the subunits of the AcrAB-TolC multidrug efflux
pump that accumulated most mutations. Indeed, the ∆acrB deletion mutant has
an increased growth rate compared to the wild-type ancestor under 5.5% ethanol
stress (Figure 6.6). Moreover, the relative difference in growth compared to the
wild type increases with the ethanol percentage in the medium (Supplementary
Figure S6.3).
Whereas acrA, acrB and acrD are mutated in the initial selective sweep, dur-
ing the second selective sweep additional mutations occurred in mdtA and mdtF.
MdtA, like AcrA, is a membrane fusion protein in the MdtABC-TolC multidrug
efflux pump [285, 286]. MdtF is the counterpart of AcrB and acts as a transporter
in the MdtEF-TolC multidrug efflux pump [287]. The mutations in mdtA and mdtF
that rise in frequency during the second selective sweep frequently occurred in
populations that already harbored a mutation in the AcrAB-TolC efflux pump
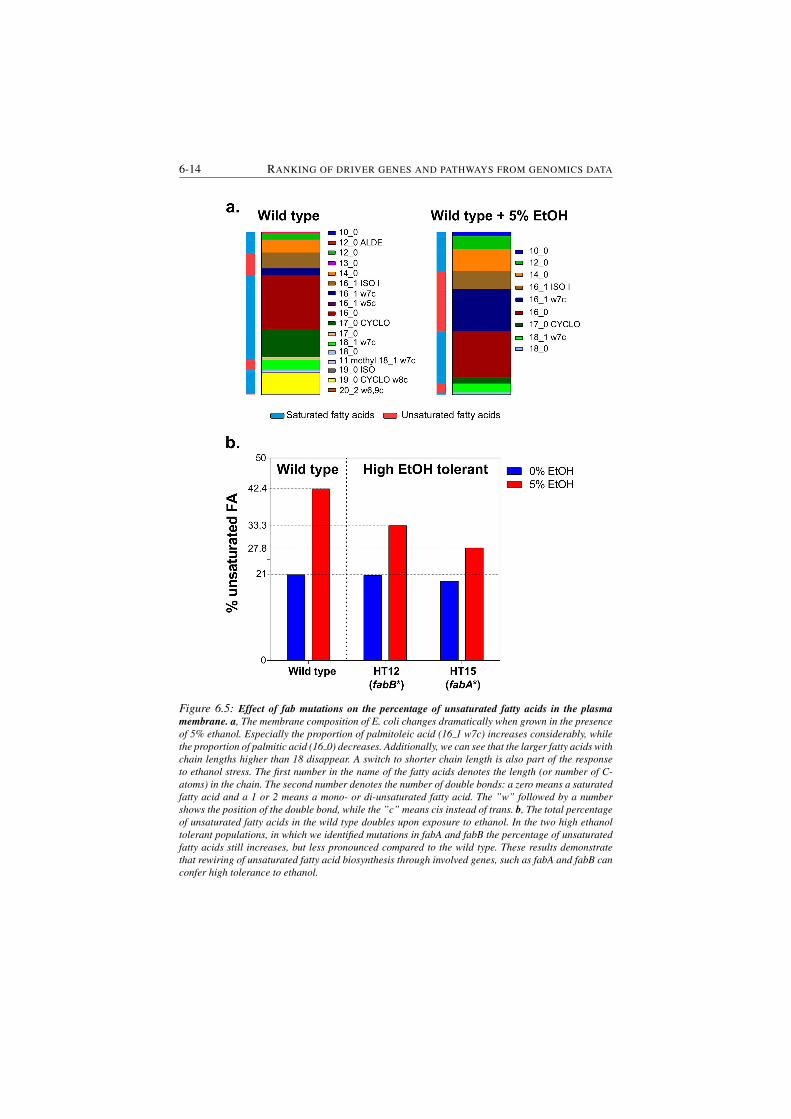
6-14 RANKING OF DRIVER GENES AND PATHWAYS FROM GENOMICS DATA
Figure 6.5: Effect of fab mutations on the percentage of unsaturated fatty acids in the plasma
membrane. a, The membrane composition of E. coli changes dramatically when grown in the presence
of 5% ethanol. Especially the proportion of palmitoleic acid (16 1 w7c) increases considerably, while
the proportion of palmitic acid (16 0) decreases. Additionally, we can see that the larger fatty acids with
chain lengths higher than 18 disappear. A switch to shorter chain length is also part of the response
to ethanol stress. The first number in the name of the fatty acids denotes the length (or number of C-
atoms) in the chain. The second number denotes the number of double bonds: a zero means a saturated
fatty acid and a 1 or 2 means a mono- or di-unsaturated fatty acid. The ”w” followed by a number
shows the position of the double bond, while the ”c” means cis instead of trans. b, The total percentage
of unsaturated fatty acids in the wild type doubles upon exposure to ethanol. In the two high ethanol
tolerant populations, in which we identified mutations in fabA and fabB the percentage of unsaturated
fatty acids still increases, but less pronounced compared to the wild type. These results demonstrate
that rewiring of unsaturated fatty acid biosynthesis through involved genes, such as fabA and fabB can
confer high tolerance to ethanol.
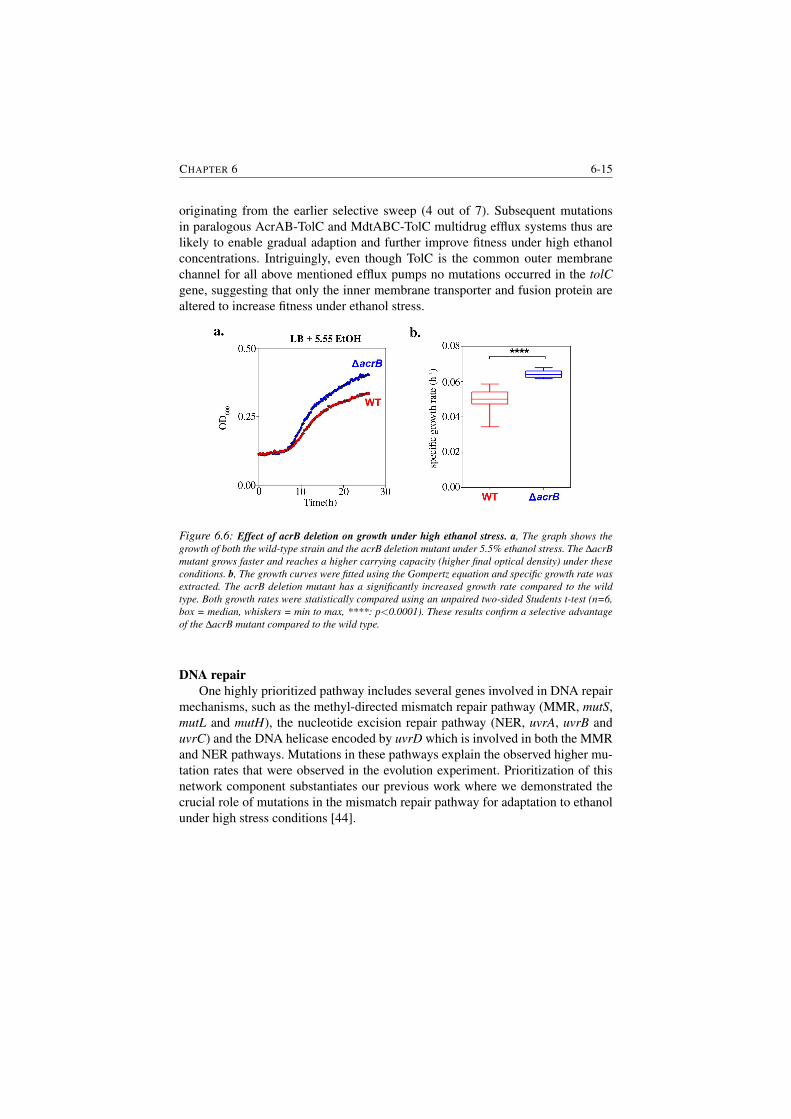
CHAPTER 6 6-15
originating from the earlier selective sweep (4 out of 7). Subsequent mutations
in paralogous AcrAB-TolC and MdtABC-TolC multidrug efflux systems thus are
likely to enable gradual adaption and further improve fitness under high ethanol
concentrations. Intriguingly, even though TolC is the common outer membrane
channel for all above mentioned efflux pumps no mutations occurred in the tolC
gene, suggesting that only the inner membrane transporter and fusion protein are
altered to increase fitness under ethanol stress.
Figure 6.6: Effect of acrB deletion on growth under high ethanol stress. a, The graph shows the
growth of both the wild-type strain and the acrB deletion mutant under 5.5% ethanol stress. The ∆acrB
mutant grows faster and reaches a higher carrying capacity (higher final optical density) under these
conditions. b, The growth curves were fitted using the Gompertz equation and specific growth rate was
extracted. The acrB deletion mutant has a significantly increased growth rate compared to the wild
type. Both growth rates were statistically compared using an unpaired two-sided Students t-test (n=6,
box = median, whiskers = min to max, ****: p<0.0001). These results confirm a selective advantage
of the ∆acrB mutant compared to the wild type.
DNA repair
One highly prioritized pathway includes several genes involved in DNA repair
mechanisms, such as the methyl-directed mismatch repair pathway (MMR, mutS,
mutL and mutH), the nucleotide excision repair pathway (NER, uvrA, uvrB and
uvrC) and the DNA helicase encoded by uvrD which is involved in both the MMR
and NER pathways. Mutations in these pathways explain the observed higher mu-
tation rates that were observed in the evolution experiment. Prioritization of this
network component substantiates our previous work where we demonstrated the
crucial role of mutations in the mismatch repair pathway for adaptation to ethanol
under high stress conditions [44].
6-16 RANKING OF DRIVER GENES AND PATHWAYS FROM GENOMICS DATA
6.2.5.5 Pathways exclusively involved in the second adaptation step
One smaller network component that was exclusively, but highly, prioritized in the
second selective sweep consist of two genes fadB and gabT. FadB plays a role in
fatty acid oxidation and is regulated by FadR [288]. Interestingly, a fadR deletion
mutant was also recently found to increase organic solvent tolerance [289] pointing
to a similar process.
Several additional identified pathways that have never been linked to ethanol
tolerance before, but that might influence this trait are discussed in Appendix B.
In conclusion, we state that IAMBEE is able to detect previously known as well
as new adaptive pathways. The identified adaptive pathways in ethanol tolerance
might serve as a basis for future strain improvement efforts.
6.2.5.6 Indications for epistasis at the pathway level
Remarkably, adaptive mutations in the fatty acid pathways tend to occur in a mu-
tual exclusive way: 8 populations have mutations in fadB-gabT, 9 populations have
mutations in the fabA-B system, 2 populations (HT13 and HT14) have mutations
in both pathways and only 1 population (HT3) has no mutations in either of the
respective pathways. Strikingly, this would imply negative epistasis at the pathway
level, i.e. a mutation in either pathway increases ethanol resistance but mutations
in both mechanisms do not lead to a greater increase in resistance. The incom-
plete pattern of mutual exclusivity in HT14 can be explained by the fact that both
the mutation in fabA (present in 50% of population) and fadB (present in 12% of
population) are not fixated in the population. Therefore, it is possible that these
mutations exist in different subpopulations. As was the case in the co-occurrence
of mutations in the acrAB-tolC/fab pathway, the incomplete pattern of mutual ex-
clusivity in HT13 could be explained by the fact that the fabA mutation is situated
towards the end of the fabA protein (7 amino acids near the end), which makes
it likely that this mutation is not functionally relevant. Indeed, by determining the
membrane composition we confirmed that the percentage of unsaturated fatty acids
in absence and in response to 5% ethanol did not differ from the wild-type strain,
suggesting that this particular mutation does not contribute to higher ethanol stress
by changing the membrane composition (Supplementary Figure S6.4).
Additionally, mutations in the AcrAB-TolC efflux pump tend to co-occur with
mutations in the previously mentioned fab pathway. From the 10 populations which
have a mutation in acrAB-tolC and the 9 populations which have a mutation in the
fab pathway, 8 populations overlap. According to the mutational trajectories, mu-
tations in both pathways arise during the same selective sweep (5%-6%) in 7 popu-
lations. Only in one population (HT10), the mutation in acrAB-tolC was obtained
late during the second selective sweep, following an earlier mutation in the fab
CHAPTER 6 6-17
pathway. Only population HT13 had a fabA mutation but not a mutation in acrAB-
tolC. Again, this specific mutation in fabA is located at 7 amino acid residues near
the end of the FabA protein (Supplementary Figure S6.4).
6.2.5.7 Comparison with per gene mutation frequency approach
To show the value of the network-based approach of IAMBEE, we compared our
results with those obtained by a frequency-based approach which ranks genes
based on the number of populations in which they were mutated (Figure 6.7, Sup-
plementary file available in supplementary data of the originally published online
version of this paper). Although our method does not explicitly search for genes
that are recurrently mutated across populations, it also prioritizes most of the fre-
quently mutated genes which are associated with ethanol resistance (e.g. rpsL and
envZ). We subsequently tested whether mapping the frequently mutated genes (136
and 153 for respectively the first and the second selective sweep) to the genome-
wide interaction network also allowed identifying adaptive pathways. Connected
components identified in this way show (Supplementary Figure S6.5 and Supple-
mentary Figure S6.6) that adaptive pathways which were identified by IAMBEE,
such as the fatty acid biosynthesis pathway, fadB-gabT and acrAB-tolC, are largely
or completely missed. This can be explained by the fact that these pathways are
composed of genes that are not necessarily frequently mutated (e.g. some con-
necting genes were only found mutated in one or two populations). By exploiting
all mutated genes over the network using information from mutational trajectories
and functional impact scores IAMBEE can, in contrast to the frequency-based ap-
proach, extract adaptive pathways consisting of less frequently mutated but highly
connected genes (Table 6.1). However, as IAMBEE is network-based it is possible
that some genes are missed because they are not present in the network (e.g. marC
and tqsA [283,290]). Nevertheless, this does not outweigh the benefit of IAMBEE
to retrieve more complete pathways and to be able to reason about the temporal
aspects of mutation acquisition, which is not possible by simply assuming that the
most frequently mutated genes are the only driver genes.
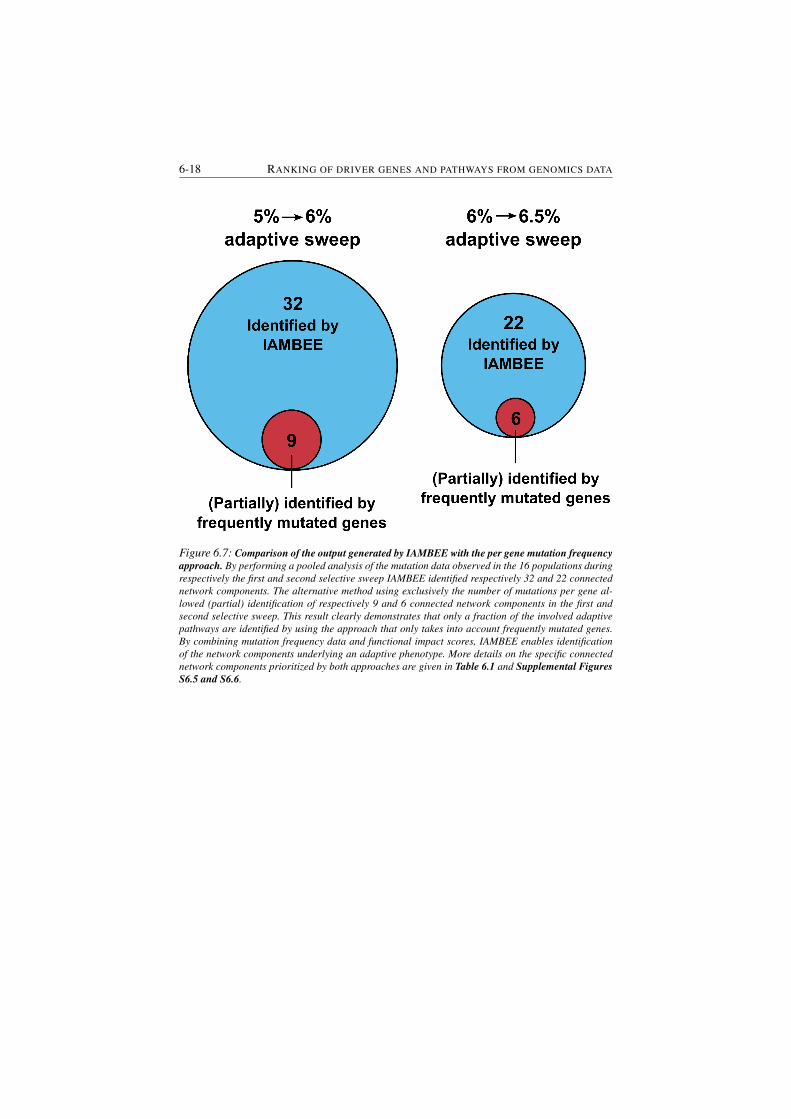
6-18 RANKING OF DRIVER GENES AND PATHWAYS FROM GENOMICS DATA
Figure 6.7: Comparison of the output generated by IAMBEE with the per gene mutation frequency
approach. By performing a pooled analysis of the mutation data observed in the 16 populations during
respectively the first and second selective sweep IAMBEE identified respectively 32 and 22 connected
network components. The alternative method using exclusively the number of mutations per gene al-
lowed (partial) identification of respectively 9 and 6 connected network components in the first and
second selective sweep. This result clearly demonstrates that only a fraction of the involved adaptive
pathways are identified by using the approach that only takes into account frequently mutated genes.
By combining mutation frequency data and functional impact scores, IAMBEE enables identification
of the network components underlying an adaptive phenotype. More details on the specific connected
network components prioritized by both approaches are given in Table 6.1 and Supplemental Figures
S6.5 and S6.6.
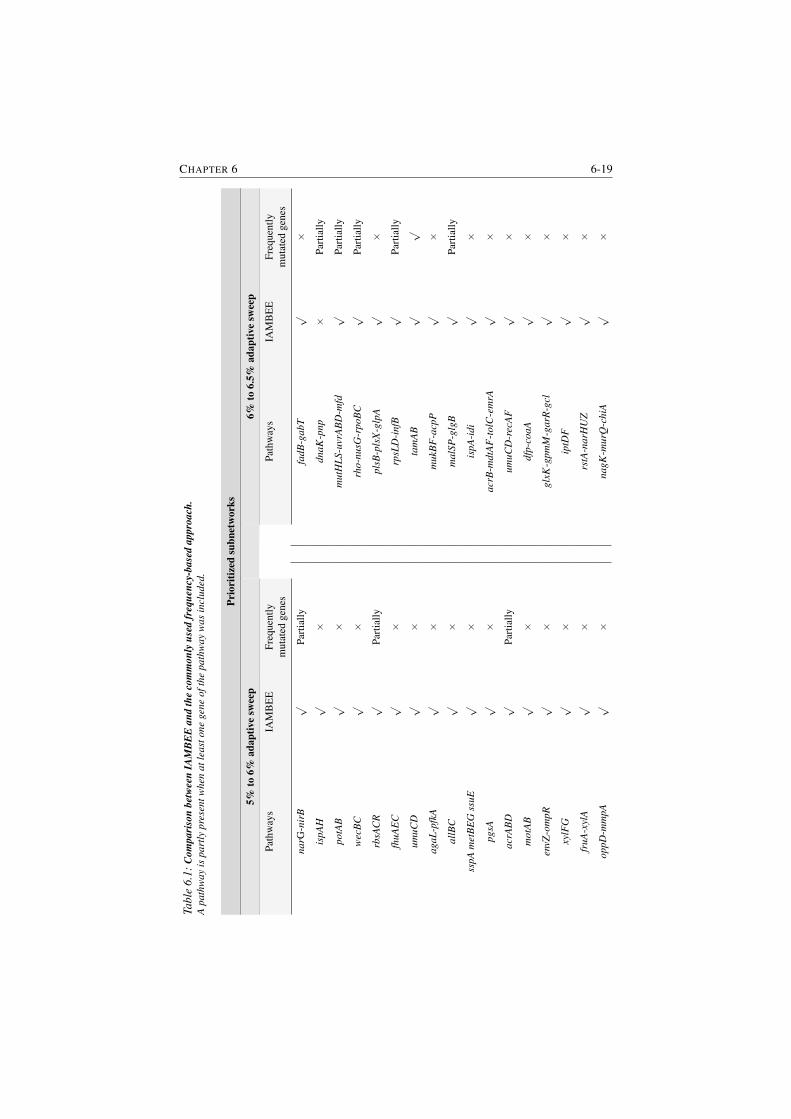
CHAPTER 6 6-19
Ta
ble
6.1
:C
om
pa
riso
nb
etw
een
IAM
BE
Ea
nd
the
com
mo
nly
use
dfr
equ
ency
-ba
sed
ap
pro
ach
.
Ap
ath
wa
yis
pa
rtly
pre
sen
tw
hen
at
lea
sto
ne
gen
eo
fth
ep
ath
wa
yw
as
incl
ud
ed.
Pri
ori
tize
dsu
bn
etw
ork
s
5%
to6
%a
da
pti
ve
swee
p6
%to
6.5
%a
da
pti
ve
swee
p
Pat
hw
ays
IAM
BE
EF
req
uen
tly
mu
tate
dg
enes
Pat
hw
ays
IAM
BE
EF
req
uen
tly
mu
tate
dg
enes
na
rG-n
irB
√P
arti
ally
fad
B-g
ab
T√
×is
pA
H√
×d
na
K-p
np
×P
arti
ally
po
tAB
√×
mu
tHL
S-u
vrA
BD
-mfd
√P
arti
ally
wec
BC
√×
rho
-nu
sG-r
po
BC
√P
arti
ally
rbsA
CR
√P
arti
ally
pls
B-p
lsX
-glp
A√
×fh
uA
EC
√×
rpsL
D-i
nfB
√P
arti
ally
um
uC
D√
×ta
mA
B√
√
ag
aL
-pfk
A√
×m
ukB
F-a
cpP
√×
all
BC
√×
ma
lSP
-glg
B√
Par
tial
ly
ssp
Am
etB
EG
ssu
E√
×is
pA
-id
i√
×p
gsA
√×
acr
B-m
dtA
F-t
olC
-em
rA√
×a
crA
BD
√P
arti
ally
um
uC
D-r
ecA
F√
×m
otA
B√
×d
fp-c
oa
A√
×en
vZ-o
mp
R√
×g
lxK
-gp
mM
-ga
rR-g
cl√
×xy
lFG
√×
iptD
F√
×fr
uA
-xyl
A√
×rs
tA-n
arH
UZ
√×
op
pD
-mm
pA
√×
nag
K-m
urQ
-ch
iA√
×
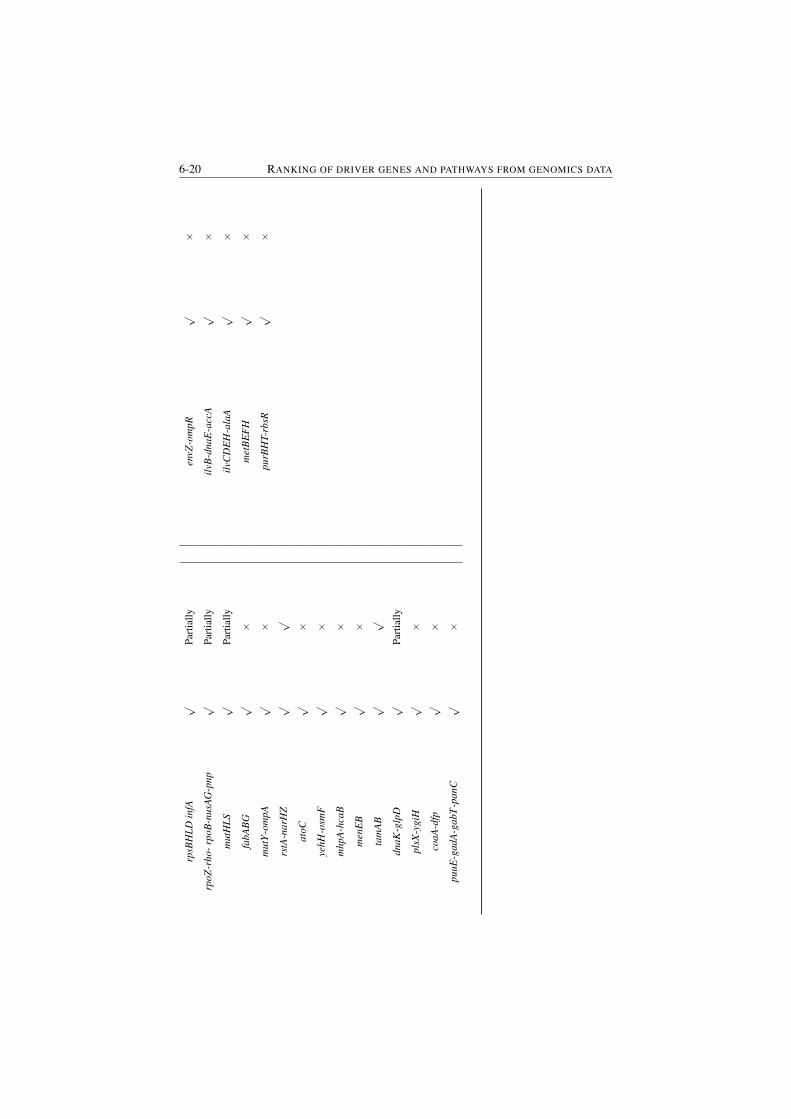
6-20 RANKING OF DRIVER GENES AND PATHWAYS FROM GENOMICS DATA
rpsB
HL
Din
fA√
Par
tial
lyen
vZ-o
mp
R√
×rp
oZ
-rh
o-
rpo
B-n
usA
G-p
np
√P
arti
ally
ilvB
-dn
aE
-acc
A√
×m
utH
LS
√P
arti
ally
ilvC
DE
H-a
laA
√×
fab
AB
G√
×m
etB
EF
H√
×m
utY
-om
pA
√×
pu
rBH
T-r
bsR
√×
rstA
-na
rHZ
√√
ato
C√
×ye
hH
-osm
F√
×m
hp
A-h
caB
√×
men
EB
√×
tam
AB
√√
dn
aK
-glp
D√
Par
tial
ly
pls
X-y
giH
√×
coa
A-d
fp√
×p
uu
E-g
ad
A-g
ab
T-p
an
C√
×
CHAPTER 6 6-21
6.2.6 Discussion
Evolution experiments have been successfully used to identify the role of specific
genes in an adaptive phenotype [201, 252]. However, genetic data derived from
parallel evolution experiments is usually interpreted by looking at the mutation
frequencies of the individual genes. Especially when dealing with complex traits,
these studies do not necessarily yield insight into the complex interactions of the
genes that contribute to the adaptive phenotype. Key to unraveling the genetic
mechanisms underlying high ethanol tolerance is the development of a dedicated
analysis method. IAMBEE is unique in prioritizing adaptive mutations by combin-
ing information on each individual mutation inferred from functional impact scores
and relative frequency increases during a selective sweep, with information on the
interactions between genes (a genome-wide interaction network). Using our newly
developed method, we were able to prioritize multiple pathways that were recur-
rently mutated in different independent high ethanol tolerant populations. Among
the highly prioritized pathways, those related to translation, anti-termination and
amino acid metabolism were previously associated with high ethanol tolerance.
Recovering these well-known pathways confirms the ability of IAMBEE to iden-
tify true adaptive pathways.
On top of those well-known systems, we identified a yet undescribed role for
multidrug efflux pumps in the continuous adaptation to high ethanol stress and
the role of fatty acid metabolism in allowing the cell to cope with the toxic ef-
fects of ethanol on the membrane [291]. Related to the latter mechanism, binding
and penetration of ethanol into the lipid bilayer increases membrane fluidity [292],
thereby inducing secondary effects, such as osmotic stress [293–295]. Response
to osmotic stress has previously been shown to induce alterations of the mem-
brane composition including cis-to-trans isomerization of unsaturated fatty-acids
as a short-term response [278] and alteration of the ratio of saturated versus unsatu-
rated fatty acids as a long-term response [280,281]. Both changes to the membrane
composition can result in denser packing of the fatty acids thereby increasing the
rigidity of the membrane which enables the cell to withstand the toxic effect of
ethanol [261, 292]. Although there has been confusion about the effect of unsat-
urated fatty acids on ethanol tolerance [280, 281, 296], we provide evidence that
tempering the shift to higher ratios of unsaturated fatty acids confers higher resis-
tance to ethanol (Figure 6.5). We could indeed show that mutations in representa-
tive genes of the fab pathway resulted in increased ethanol tolerance by affecting
the ratio of saturated versus unsaturated fatty acids.
As IAMBEE is designed to be used in combination with a dedicated experi-
mental set-up, which includes sequencing of the evolving populations before and
after a selective sweep, it is possible to gain insight in the temporal profile of adap-
tation. Using this unique feature of the method we found that mutations in the fatty
acid biosynthesis pathway occur early in the evolutionary trajectory of ethanol re-
6-22 RANKING OF DRIVER GENES AND PATHWAYS FROM GENOMICS DATA
sistance in E. coli while mutations in other pathways have less strict temporal con-
straints. In this context, we also found that mutations in respectively the pathway
for fatty acid biosynthesis (fabA, fabG and fabB) and a pathway involved in fatty
acid oxidation (gabT, fadB) were mutually exclusive while having high coverage
(15 out of the 16 populations had a mutation in either pathway). This implies that
fatty acids play a pivotal role in ethanol tolerance, but that either a mutation in one
of the two pathways does not lead to a significant increase in fitness if a mutation
in the other pathway is already present (negative epistasis) or that having a mu-
tation simultaneously in both pathways is lethal (synthetic lethality as an extreme
form of negative epistasis). In contrast, mutations in the fatty acid biosynthesis
pathway (fabA,fabG and fadB) and the AcrAB-tolC efflux pump (acrA and acrB)
significantly co-occur, suggesting positive epistasis between these pathways.
When compared to a naive approach which is based on recurrence of mutations
across experiments at the level of individual genes, it is obvious that IAMBEE
offers not only the advantage of being able to identify adaptive mutations which
are not frequently mutated but also to interpret adaptive mutations and epistasis
at the level of pathways. As such, IAMBEE is very useful and meets the need for
adequate tools to analyze highly complex mutational datasets.
6.2.7 Conclusions
Experimental evolution can readily yield insight in complex traits assuming low
complexity of the resulting mutational profiles. However, in the case of complex
traits and especially when hypermutation arises, evolution experiments often lead
to complex mutational profiles with high rates of passenger mutations that are
difficult to interpret. Traditionally, adaptive genes are identified by counting the
number of mutations per gene across independently evolved populations. While
this approach is valid in some datasets, in complex mutational profiles it neglects
less frequently mutated genes, resulting in the inability to generate a broad under-
standing of the adaptive phenotype. Therefore, we developed IAMBEE, a method
that exploits the interaction network, combined with information from mutational
trajectories and functional impact scores, to identify adaptive genes and pathways
from complex mutational datasets. By applying IAMBEE to an evolution exper-
iment consisting of 16 independently evolved E. coli populations subjected to
increasing ethanol concentrations, pathways that were previously linked to high
ethanol resistance as well as novel pathways, which were experimentally validated,
could be identified. In conclusion, IAMBEE is a powerful tool that successfully al-
lows to generate a broader understanding of (complex) traits that could not be fully
elucidated so far.
CHAPTER 6 6-23
6.2.8 Materials and Methods
6.2.8.1 Data acquisition
6.2.8.2 Functional impact scores and frequency of mutations
To calculate functional impact scores for each mutation we used SIFT scores which
were calculated using the SIFT4G annotator version 2.2 with the E. coli (GCA -
000005845.1.21) database [276]. Note that while SIFT scores were used in this pa-
per, any functional impact score measure can be inserted in IAMBEE. As IAMBEE
tries to identify the causal molecular pathways which lie at the basis of a selective
sweep, mutations which decrease in frequency during a selective sweep are not
taken into account. Therefore, we have to determine when a mutation ”decreases”
in frequency. As the precision of frequency calling of mutations is finite, the naive
way of viewing all mutations with a negative frequency increase as ”decreasing” is
not valid. This would discard too many mutations which remained stable or, most
of the time, were fixed previously in the population. As these mutations could be
potentiating mutations, we do not want to discard them. Because of this, and the
specifications of the CLC variant caller (a required significance of 1%), we viewed
all mutations with a decrease in frequency of at least 2% as decreasing. All muta-
tions in both selective sweeps, together with their SIFT scores and their increase
in frequency during the selective sweep are given in Supplemental file 1 which is
available in the online version of this paper.
6.2.8.3 Genome-wide interaction network
We used a directed genome-wide interaction network of E. coli K-12 MG1655
compiled from (de)-methylation, (de)phosphorylation and metabolic interactions
from KEGG version 80 [100,225], protein-DNA, sigma factor binding and sRNA-
DNA interactions from regulonDB version 9.2 [297] and protein-protein interac-
tions from STRING version 10 (RRID:SCR 005223) [64]. To reduce the num-
ber of false positive interactions in the interaction network, only direct (physi-
cal) associations with a score of at least 0.8 were retained from STRING. Interac-
tions involving the primary sigma factor RpoD were removed as RpoD regulates
over half of the genes in the interaction network. Furthermore, self-edges were
deleted. The final genome-wide interaction network contains 2678 nodes (genes)
and 14702 edges (interactions between genes/sRNAs), representing about 63% of
E. coli K-12 genes. This interaction network is supplied together with IAMBEE at
http://bioinformatics.intec.ugent.be/IAMBEE.
6-24 RANKING OF DRIVER GENES AND PATHWAYS FROM GENOMICS DATA
6.2.8.4 Construction of the probabilistic
genome-wide interaction network
IAMBEE is guided by a directed genome-wide interaction network with the nodes
representing genes and the edges representing interactions between these genes. A
topology-based weighting of the genome-wide interaction network was performed
to reduce the effect of hubs in the subsequent analysis steps: a power law distri-
bution [298] was estimated based on the out-degrees of the nodes in the interac-
tion network. Next, a sigmoidal function was constructed using as inflection point
the out-degree that corresponded to the 90th percentile. This leads to following
topology-based weighting of each edge between node i and node j [6]:
weight(i, j) =1
1+ e
out degree(i)-inflection pointinflection point
6
(6.1)
This sigmoidal function is utilized to mainly down-weight interactions orig-
inating from large hubs while avoiding to penalize interactions involving nodes
with low out-degrees. The value 6, which together with the inflection point value
dictates the slope of the sigmoidal, was chosen as such because it led to good re-
sults when used with multiple bacterial interaction networks (results not shown).
As bacterial interaction networks tend to follow similar scale-free distributions it
is expected that this sigmoidal will perform well on other bacterial interaction net-
works as well.
For the materials and methods on the used experimental evolution setup, the
sequencing and mutation calling and the mapping of mutations to genes we refer
to Appendix B.2.
6.2.9 IAMBEE
6.2.9.1 Calculation of relevance scores
Not all mutations are equally likely to be involved in the adaptive phenotype.
Therefore, a relevance score was assigned to each mutation based on its estimated
functional impact on the coding/promoter sequence and based on its relative in-
crease in frequency in the population during a fitness increase. The functional
impact score reflects how likely a mutation causes a functional change in the re-
sulting protein(s). Here it is based on the degree of conservation of amino acid
residues in sequence alignments from closely related sequences using the SIFT
algorithm (RRID:SCR 012813) ( [276, 299, 300]). To derive frequency increases,
for each population the adaptive trajectory (e.g. fitness profile) is used to delin-
CHAPTER 6 6-25
eate selective sweeps (sudden jumps in fitness or an increase in adaptation towards
the experimental conditions). The frequency increase of a mutation is equal to the
difference of its frequency in the population just after and just before the sweep.
To assess the relative importance of a mutations frequency increase or functional
impact score, we first estimate both the distribution functions, based on the fre-
quency increase/impact score of all mutations from all evolved populations. As
neither the functional impact score distribution, nor the frequency increase distri-
bution is expected to follow any known mathematical distribution, the distributions
are estimated using a nonparametric cumulative distribution function (MathWorks
2017). As synonymous mutations would skew the distribution of the functional im-
pact scores towards low functional impact scores, which could result in assigning
relatively high relevance scores to mutations with poor functional impact scores,
synonymous mutations are removed from the data when estimating the functional
impact distribution function. Note that because some synonymous mutations do
have relevant functional impact scores they are not discarded but only ignored
when estimating the functional impact distribution. While the functional impact
distribution function is estimated using all mutation data from all evolved popu-
lations, the frequency increase distribution is estimated on a per-population basis
as the population dynamics can differ between populations. This means that one
functional impact distribution is estimated, while the number of frequency increase
distributions is equal to the number of parallel evolved populations are estimated.
Based on these distributions a relevance score is calculated for each mutated gene
in each population as follows:
relevance(S,n) = (1− eCDFf un(Functional score(S,n)))
× eCDFf req,n(Frequency increase(S,n))(6.2)
with eCDF f un(Functional score(S,n)) the value of the cumulative distribution func-
tion of the functional impact scores for the mutation in gene S in population n with
the most deleterious functional impact score (note the 1−eCDF f un(Functional -
score(S,n)). This is needed as we use SIFT scores which are low when the mutation
is deleterious.), eCDF f req,n(Frequency increase(S,n)) the value of the cumulative
distribution function in population n of the frequency increases for the mutation in
gene S in that population with the highest frequency increase. relevance(S,n) is a
value between 0 (gene S is unlikely to be relevant towards adaptation in popula-
tion n) and 1 (gene S is very likely to be relevant towards adaptation in population
n). Genes without mutations are assigned the mean functional impact score and
frequency increase when calculating their relevance.
Furthermore, if the dataset contains populations with a mutation rate which is
significantly higher than the mutation rates of the other populations, the search for
paths in the pathfinding step (see following paragraph) would be skewed towards
this population (Table 6.2). In order to reduce the impact of this feature without
completely discarding these populations, a correction factor for each population is
6-26 RANKING OF DRIVER GENES AND PATHWAYS FROM GENOMICS DATA
calculated. To detect populations with significantly higher rates we use the modi-
fied z-score for outlier detection ( [301]) as follows:
modified Z-score(n) =0.6745× (mutations(n)−median(n1, . . . ,ni))
MAD(n)
MAD(n) = median(|mutations(n)−median(n1, . . . ,ni)|)
(6.3)
with mutations(n) the number of mutations in population n, median(n1, . . . ,ni) the
median number of mutations in a population and MAD(n) the mean absolute devi-
ation of population n. Note that in the original publication the modified Z-score is
defined as the absolute value of the measure used in this paper. We intentionally left
out the absolute value to avoid down weighting populations with few mutations.
Populations with a significantly higher mutation rate are defined as populations
having a modified Z-score of at least 3.5 [301]. From this modified Z score a pop-
ulation specific correction factor is calculated, based on a parameter p which sets
the upper limit for the correction factor. In our analysis we set this to 3 to have an
upper limit of 0.85 but based on how a user would like to deal with populations
having significantly higher mutation rates, the factor can be anywhere between 0
and 3,5:
correction(n) =
{
pmodified Z-score(n)
if modified Z-score(n) ≥ 3.5
1 else(6.4)
Due to the modified Z score, the correction factor intrinsically assigns a lower
value to outlier populations when the study contains a larger number of indepen-
dent populations, hereby largely removing populations with high mutation rates
to reduce noise when a large number of independent populations is present while
largely retaining them, as in that case they will be needed to exploit parallelism, if
only few populations are present. The relevance score and the correction factor are
integrated into a single score for every mutated gene in every population. This is
implemented as follows:
corrected relevance(S,n) = relevance(S,n)× correction(n) (6.5)
With S a mutated gene in population n
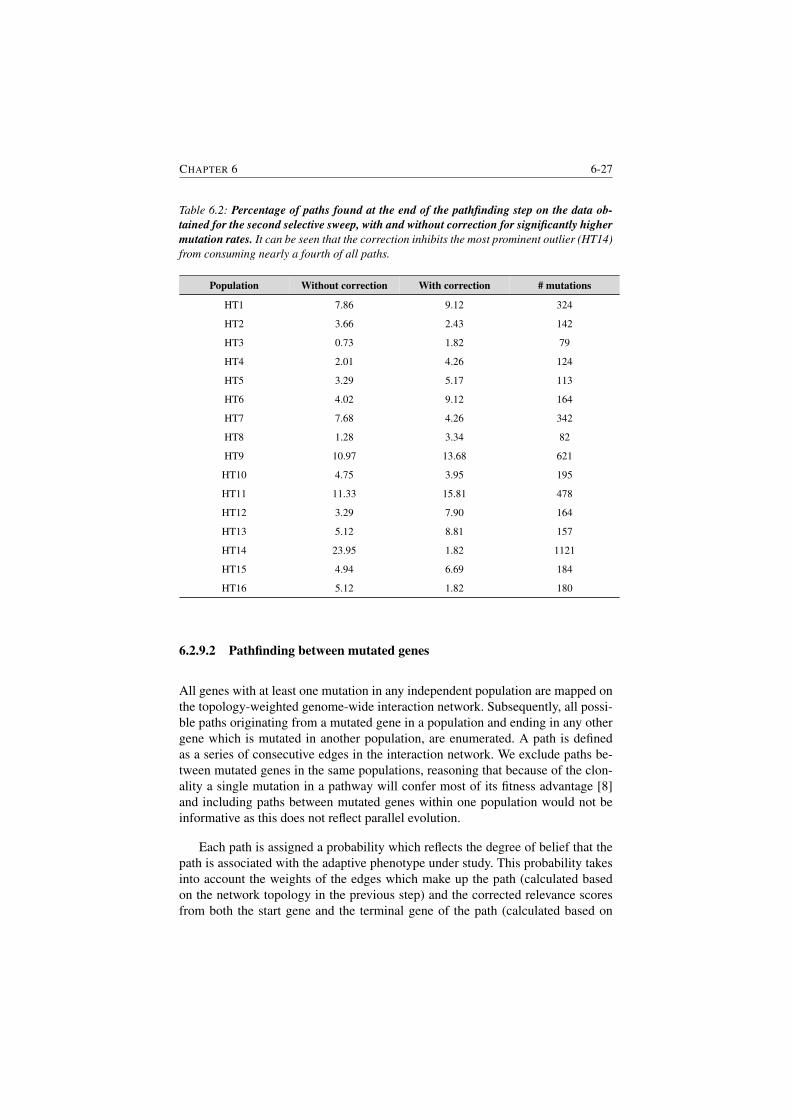
CHAPTER 6 6-27
Table 6.2: Percentage of paths found at the end of the pathfinding step on the data ob-
tained for the second selective sweep, with and without correction for significantly higher
mutation rates. It can be seen that the correction inhibits the most prominent outlier (HT14)
from consuming nearly a fourth of all paths.
Population Without correction With correction # mutations
HT1 7.86 9.12 324
HT2 3.66 2.43 142
HT3 0.73 1.82 79
HT4 2.01 4.26 124
HT5 3.29 5.17 113
HT6 4.02 9.12 164
HT7 7.68 4.26 342
HT8 1.28 3.34 82
HT9 10.97 13.68 621
HT10 4.75 3.95 195
HT11 11.33 15.81 478
HT12 3.29 7.90 164
HT13 5.12 8.81 157
HT14 23.95 1.82 1121
HT15 4.94 6.69 184
HT16 5.12 1.82 180
6.2.9.2 Pathfinding between mutated genes
All genes with at least one mutation in any independent population are mapped on
the topology-weighted genome-wide interaction network. Subsequently, all possi-
ble paths originating from a mutated gene in a population and ending in any other
gene which is mutated in another population, are enumerated. A path is defined
as a series of consecutive edges in the interaction network. We exclude paths be-
tween mutated genes in the same populations, reasoning that because of the clon-
ality a single mutation in a pathway will confer most of its fitness advantage [8]
and including paths between mutated genes within one population would not be
informative as this does not reflect parallel evolution.
Each path is assigned a probability which reflects the degree of belief that the
path is associated with the adaptive phenotype under study. This probability takes
into account the weights of the edges which make up the path (calculated based
on the network topology in the previous step) and the corrected relevance scores
from both the start gene and the terminal gene of the path (calculated based on

6-28 RANKING OF DRIVER GENES AND PATHWAYS FROM GENOMICS DATA
the frequency increase and the functional impact score of both genes in the data
preparation step). Only the relevance scores of the start gene and the terminal gene
are considered because whether or not intermediate genes are mutated should not
be taken into account. If they were taken into account, even one passenger mu-
tation in the middle of an interesting molecular pathway would severely decrease
the probability of every found path in that molecular pathway. This leads to the
following equation for the probability of a path:
probability(S,n,E,m)(S 6=E,n6=m) = ∏(i, j)∈P
weight(i, j)× relevance(S,n)
× relevance(E,m)
(6.6)
with (S,n,E,m) the path which starts in gene S, which is mutated in population n
and terminates in gene E, which is mutated in population m. P is the collection of
edges which make up the path and (i,j) is the edge from node i to node j.
Enumerating all possible paths is computationally expensive and leads to a pro-
hibitively large computational cost in the subsequent subnetwork inference step.
Therefore, the following heuristics are used:
1. Based on biological considerations [218, 219] the maximum path length is
set to four.
2. From all possible paths originating from a mutated gene in a specific popu-
lation, only the 25 paths with highest probabilities are retained.
6.2.9.3 Subnetwork inference and prioritization of molecular pathways
The final step of the analysis is the inference of a subnetwork containing the molec-
ular pathways responsible for the adaptive phenotype. This subnetwork consists of
a subset of the paths selected in the previous step. This subset of paths is obtained
by optimizing the following function:
S(K) = ∑n∈R
( ∑S∈Qn
(P(path(mutS,n,mutall)|probabilities,K)))−|K|× xe (6.7)
Where S(K) is the score of the selected subnetwork and needs to be maximized, |K|is the number of edges selected, xe is the imposed cost for each edge, R is the col-
lection of strains, Qn the collection of mutated genes in n and P(path(mutS,n,mutall))
CHAPTER 6 6-29
| probabilities,K) is the probability that there exists a path between a mutated gene
S in population n and any other mutated gene in any other population, given the
degrees of belief (probabilities) of all found paths in the pathfinding Step and the
selected subnetwork K. The calculation of this term is a generalization of the two-
terminal reliability problem [302,303] and the implementation of the search for the
highest scoring subnetwork, according to this optimization function is explained in
chapter 5 of this thesis as the exact same strategy was used. Note that the optimal
subnetwork, which is the selected subnetwork with the highest score S(K), is not
necessarily a connected graph.
As the complexity of this problem inhibits a deterministic solution, a greedy
hill-climbing heuristic is used in which the previously found paths get sampled
pseudo-randomly based on the overlap the paths have with each other: Overlapping
paths are more likely to be sampled together. As this procedure is probabilistic in
nature, the procedure is repeated 20 times and the best solution with respect to the
optimization score S(K) is used as the solution.
The xe parameter is an important parameter as it incentives IAMBEE to pri-
marily select overlapping paths with high probabilities because doing so a single
edge can be used multiple times while the cost for selecting this edge only has
to be paid once. This is biologically relevant as molecular mechanisms in which
multiple (partly) overlapping paths with high probabilities are found, are likely
mechanisms of interest for a specific selective sweep.
Setting the xe parameter is not trivial as its optimal value is dataset specific.
If xe is set too high the subnetwork will be small and multiple causal molecular
pathways are likely missed. Conversely if xe is set too low the subnetwork will be
too large and of little practical use as the fraction of false positives in the solution
increases (Figure 6.2). Therefore, instead of calculating the optimal subnetwork
for one specific cost, we perform a parameter sweep over the xe parameter and
summarize the results in the form of a network, which is obtained by taking the
union of all found optimal subnetworks and where the edges are prioritized based
on the maximum edge cost for which they are still included in an optimal sub-
network. This means that edges with a high priority (visualized in the output as
opaque edges) get selected even when the edge cost xe is high. This is useful as
the PPV (positive predictive value) of a subset of opaque edges is higher (Syn-
thetic data in Subsection 6.2.5.1) and thus a good starting point for experimental
validation.
6.2.9.4 Parameter setting
The parameters of IAMBEE were set as follows for both jumps in ethanol toler-
ance: The path length was kept at the default value of 4 and the maximum number
of paths between every pair of mutated genes was kept at the default value of 25.
6-30 RANKING OF DRIVER GENES AND PATHWAYS FROM GENOMICS DATA
The sweep over the edge cost parameter xe was set from 0.1 to 1.5 in steps of 0.025
and the maximum size for an optimal subnetwork to be accepted was set to 80 (in
terms of nodes) in order to keep the resulting subnetwork small enough to interpret
manually.
6.2.9.5 Validation of IAMBEE features
To show the importance of the different features of IAMBEE, which include mu-
tation frequencies, functional scores, a correction factor for populations with ex-
treme mutation rates and the use of an interaction network, the method was ad-
justed several times to exclude one feature each time. Each of these adjusted ver-
sions of IAMBEE was applied to the synthetic dataset. PPV and sensitivity plots
were constructed (Supplemental Figure S6.2) and demonstrated that each feature
led to an increase in performance. The results are discussed in Supplemental
Methods.
6.2.10 Acknowledgments
We thank S. Xie for providing the E. coli SX4 ancestor strains.
6.2.11 Availability of data and material
The genome sequencing dataset generated and analyzed during the current study
are available in the SRA repository of NCBI, PRJNA380734 (https://www.ncbi.
nlm.nih.gov/bioproject/380734). IAMBEE is can be found at http://bioinformatics.
intec.ugent.be/IAMBEE.
6.2.12 Competing interests
The authors declare no competing financial interests. The funding sources were
not involved in study design, data collection and interpretation, or the decision to
submit the work for publication.
CHAPTER 6 6-31
Supplementary
6.2.13 Supplementary methods
6.2.13.1 Synthetic data
As complete and reliable gene sets of causal mutations for complex traits are rarely
available and previous methods do not advocate the analysis of experimental evo-
lution data in complex traits from clonal organisms, we used synthetic datasets to
illustrate that IAMBEE can identify causal mutated genes and mechanisms. For
the construction of the synthetic datasets, the same E. coli MG1655 genome-wide
interaction network as used in the analysis of the ethanol tolerance dataset was
used. Each synthetic dataset was constructed by randomly choosing a number of
populations between 5 and 30 to simulate a wide range of possible evolution ex-
periments with different amounts of data. In order to make sure that IAMBEE
will have to deal with hypermutators in at least some datasets, each population
has a 15% chance of being a hypermutator. Each normal population has a random
number of mutated genes between 5 and 40 [289] while each hypermutator popu-
lation harbors a random number of mutated genes between 100 and 200 [41]. The
causal mechanisms are determined by randomly sampling a gene together with all
of its outgoing interactions from the interaction network. Isolated genes are with-
held. The union of all genes involved in the sampled interactions is labeled as the
causal mechanism. As the complexity of traits vary, for each dataset 1 to 5 causal
mechanisms are present. For every causal mechanism, every population has a 50%
chance to have a mutation in a random gene from that causal mechanism with the
additional constraint that parallel evolution is, at least to some extent, present and
thus every causal mechanism has at least two mutations from two different popu-
lations. For obvious reasons, every population is forced to have at least one causal
mutation. To determine the frequency increase and the functional impact score
data for each mutated gene in every population in a synthetic dataset, we sample
from respectively the frequency increase data and the functional impact score data
of the mutations implicated in the used E. coli MG1655 ethanol tolerance dataset
in the main paper. As the used mutation rates for a synthetic data are based on
non-synonymous mutations, we only sample from non-synonymous mutations in
the ethanol tolerance dataset. Because the ethanol tolerance dataset is dominated
by passenger mutations, we randomly sample from all mutations when setting the
frequency increase and functional impact score for the synthetic passenger muta-
tions. When setting these values for the synthetic adaptive mutations, we sample
only from the mutations which are amongst the 20% highest frequency increase/-
functional impact score. 100 such synthetic datasets were created and analyzed
with identical settings as the E. coli MG1655 ethanol tolerance experiment, using
a parameter sweep over the edge cost parameter from 0.05 to 2.45 in steps of 0.05.
6-32 RANKING OF DRIVER GENES AND PATHWAYS FROM GENOMICS DATA
The results are depicted in Supplementary Figure S6.7.
6.2.13.2 Using synthetic data to validate IAMBEE features
In order to validate and disentangle the contribution of the different features of
IAMBEE (mutation frequency, functional data, correction factor and the network)
we performed the same analysis on the synthetic data with different versions of
IAMBEE, each time leaving out one feature. Note that in the case of leaving out
the network, subnetworks are not inferred but instead the genes were ranked based
on their relevance scores and e.g. a solution of size 5 for a specific synthetic dataset
consists of the 5 highest ranked genes in that synthetic dataset. These results are
depicted in Supplementary figure S6.2. As can be seen, in general PPV and sen-
sitivity are both higher in the original version of IAMBEE. This means that the
resulting subnetworks of the original version will overall contain a higher pro-
portion of adaptive mutations and that the original version is more likely to find
(nearly) all adaptive mutations. This is especially true for the relatively smaller
subnetworks which is important as the prioritization of interactions is based on the
assumption that mutations found in small subnetworks are more likely to be adap-
tive mutations. From the plots of PPV in terms of sensitivity it can be seen that few
subnetworks have both low sensitivity and low PPV (which are bad solutions) in
the original version of IAMBEE while other versions generate more bad solutions.
These results indicate that, even in simple synthetic datasets where adaptive mu-
tations are guaranteed to have high scores for frequency increase and functional
impact score, all features of IAMBEE contribute to better results.
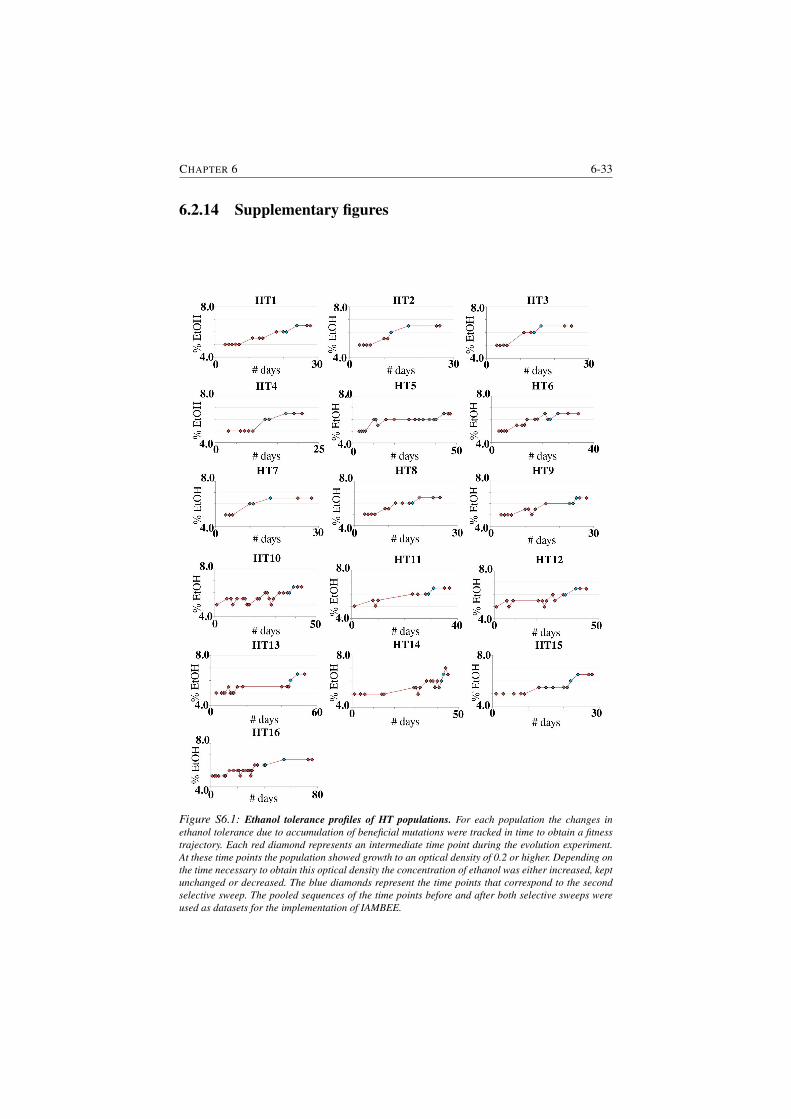
CHAPTER 6 6-33
6.2.14 Supplementary figures
Figure S6.1: Ethanol tolerance profiles of HT populations. For each population the changes in
ethanol tolerance due to accumulation of beneficial mutations were tracked in time to obtain a fitness
trajectory. Each red diamond represents an intermediate time point during the evolution experiment.
At these time points the population showed growth to an optical density of 0.2 or higher. Depending on
the time necessary to obtain this optical density the concentration of ethanol was either increased, kept
unchanged or decreased. The blue diamonds represent the time points that correspond to the second
selective sweep. The pooled sequences of the time points before and after both selective sweeps were
used as datasets for the implementation of IAMBEE.
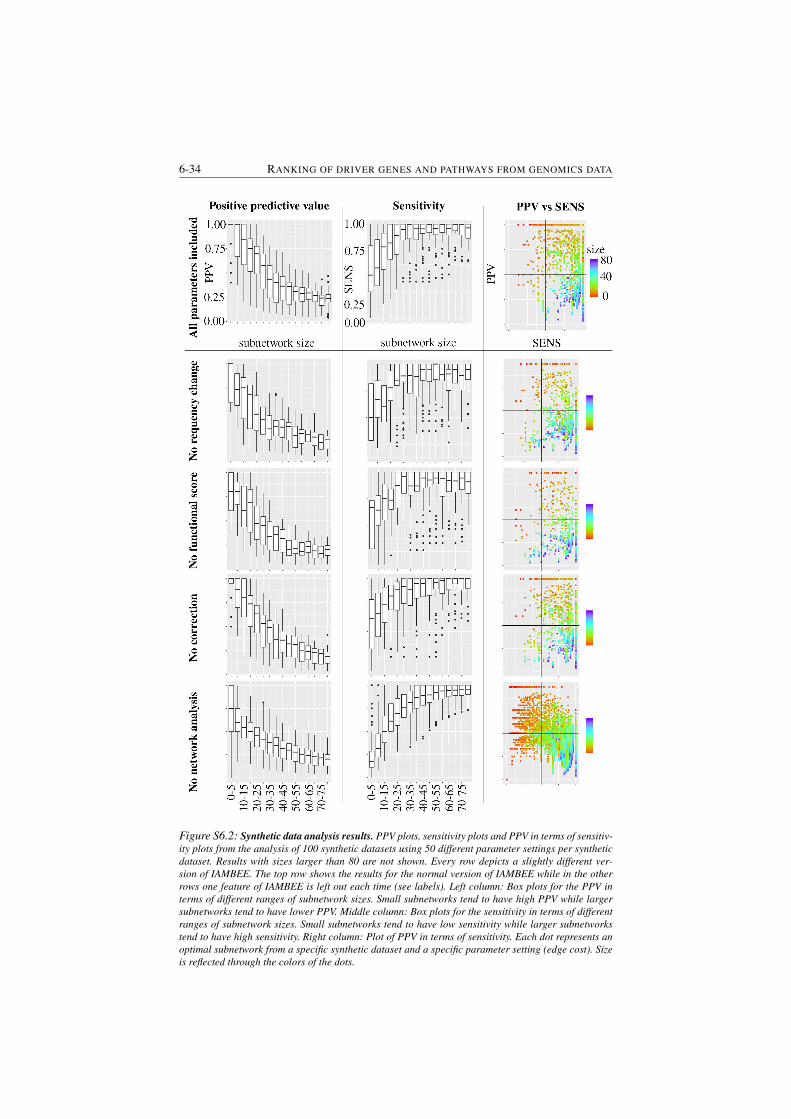
6-34 RANKING OF DRIVER GENES AND PATHWAYS FROM GENOMICS DATA
Figure S6.2: Synthetic data analysis results. PPV plots, sensitivity plots and PPV in terms of sensitiv-
ity plots from the analysis of 100 synthetic datasets using 50 different parameter settings per synthetic
dataset. Results with sizes larger than 80 are not shown. Every row depicts a slightly different ver-
sion of IAMBEE. The top row shows the results for the normal version of IAMBEE while in the other
rows one feature of IAMBEE is left out each time (see labels). Left column: Box plots for the PPV in
terms of different ranges of subnetwork sizes. Small subnetworks tend to have high PPV while larger
subnetworks tend to have lower PPV. Middle column: Box plots for the sensitivity in terms of different
ranges of subnetwork sizes. Small subnetworks tend to have low sensitivity while larger subnetworks
tend to have high sensitivity. Right column: Plot of PPV in terms of sensitivity. Each dot represents an
optimal subnetwork from a specific synthetic dataset and a specific parameter setting (edge cost). Size
is reflected through the colors of the dots.
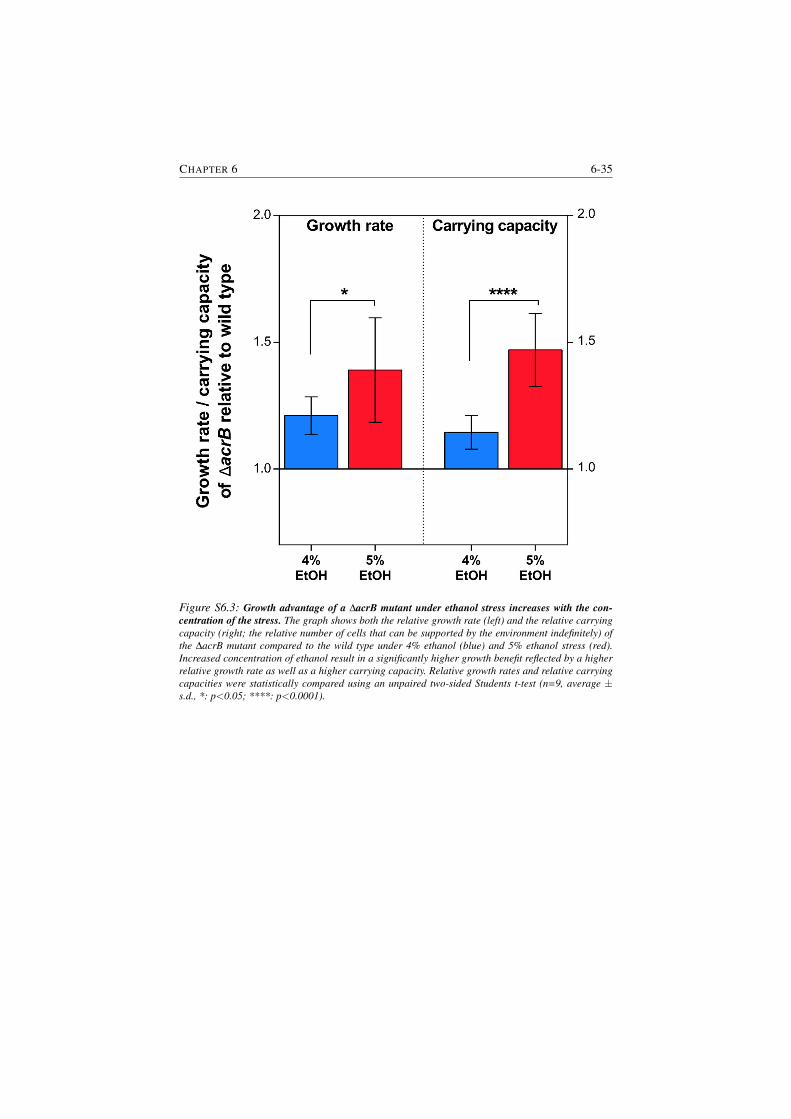
CHAPTER 6 6-35
Figure S6.3: Growth advantage of a ∆acrB mutant under ethanol stress increases with the con-
centration of the stress. The graph shows both the relative growth rate (left) and the relative carrying
capacity (right; the relative number of cells that can be supported by the environment indefinitely) of
the ∆acrB mutant compared to the wild type under 4% ethanol (blue) and 5% ethanol stress (red).
Increased concentration of ethanol result in a significantly higher growth benefit reflected by a higher
relative growth rate as well as a higher carrying capacity. Relative growth rates and relative carrying
capacities were statistically compared using an unpaired two-sided Students t-test (n=9, average ±s.d., *: p<0.05; ****: p<0.0001).
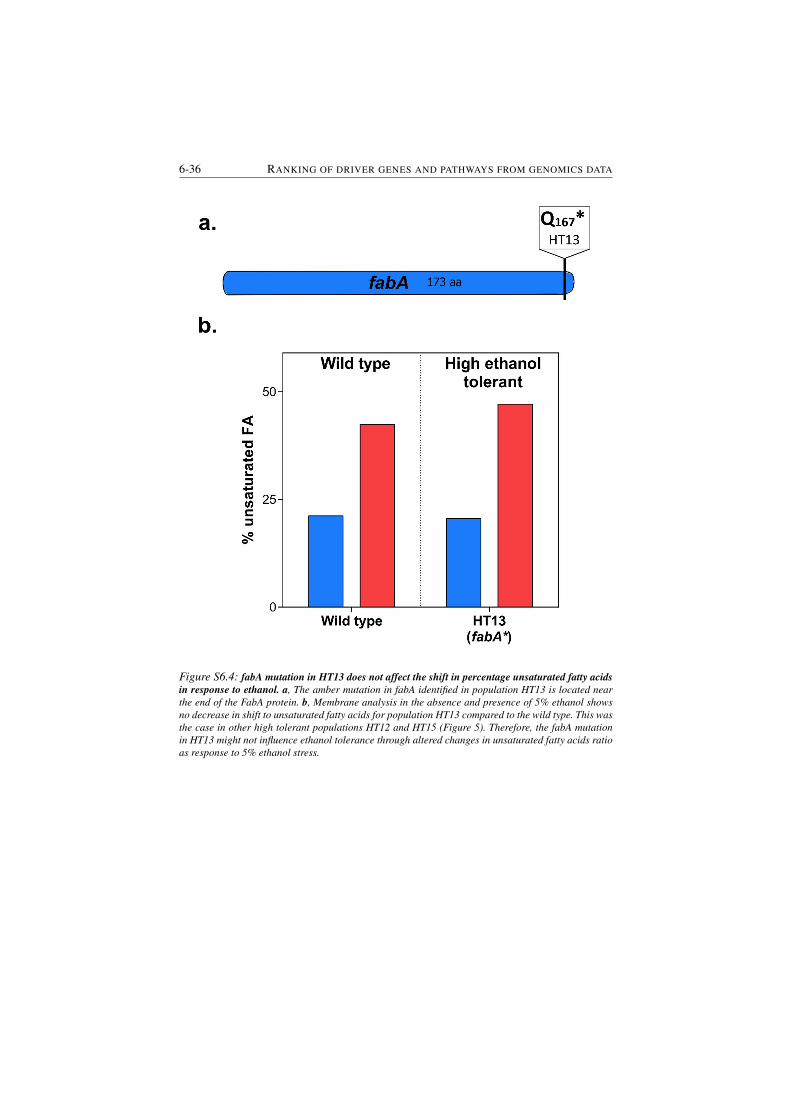
6-36 RANKING OF DRIVER GENES AND PATHWAYS FROM GENOMICS DATA
Figure S6.4: fabA mutation in HT13 does not affect the shift in percentage unsaturated fatty acids
in response to ethanol. a, The amber mutation in fabA identified in population HT13 is located near
the end of the FabA protein. b, Membrane analysis in the absence and presence of 5% ethanol shows
no decrease in shift to unsaturated fatty acids for population HT13 compared to the wild type. This was
the case in other high tolerant populations HT12 and HT15 (Figure 5). Therefore, the fabA mutation
in HT13 might not influence ethanol tolerance through altered changes in unsaturated fatty acids ratio
as response to 5% ethanol stress.
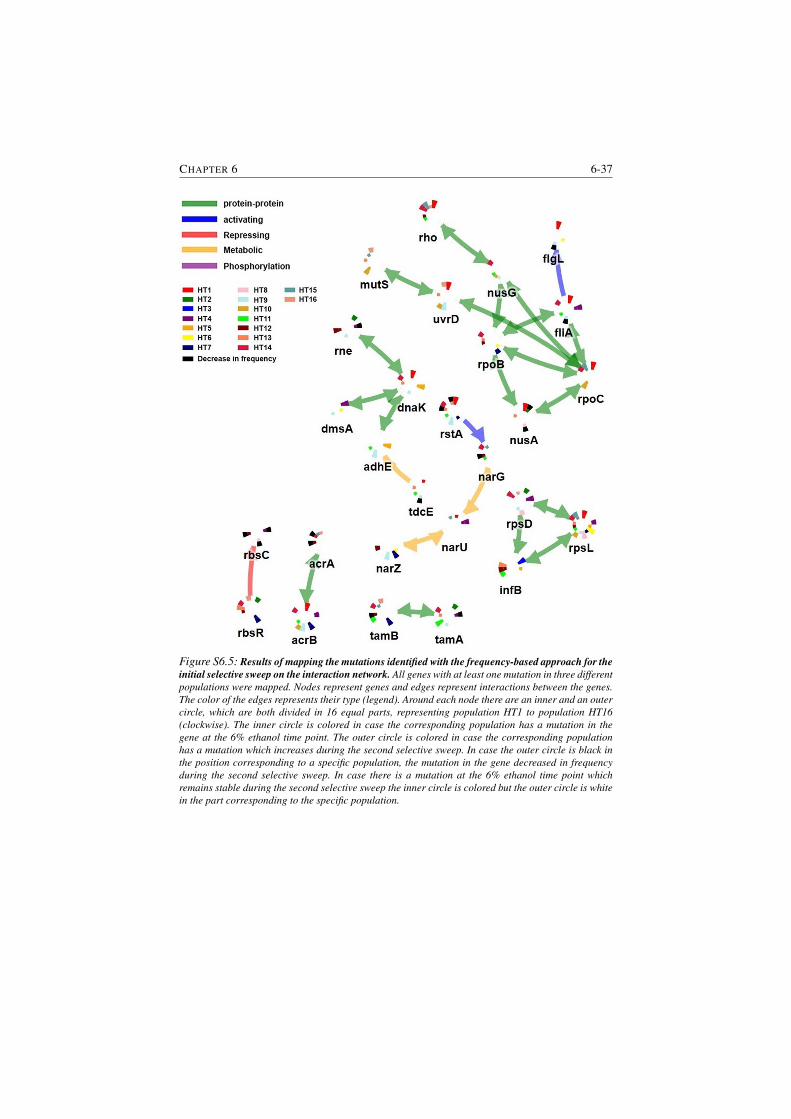
CHAPTER 6 6-37
Figure S6.5: Results of mapping the mutations identified with the frequency-based approach for the
initial selective sweep on the interaction network. All genes with at least one mutation in three different
populations were mapped. Nodes represent genes and edges represent interactions between the genes.
The color of the edges represents their type (legend). Around each node there are an inner and an outer
circle, which are both divided in 16 equal parts, representing population HT1 to population HT16
(clockwise). The inner circle is colored in case the corresponding population has a mutation in the
gene at the 6% ethanol time point. The outer circle is colored in case the corresponding population
has a mutation which increases during the second selective sweep. In case the outer circle is black in
the position corresponding to a specific population, the mutation in the gene decreased in frequency
during the second selective sweep. In case there is a mutation at the 6% ethanol time point which
remains stable during the second selective sweep the inner circle is colored but the outer circle is white
in the part corresponding to the specific population.
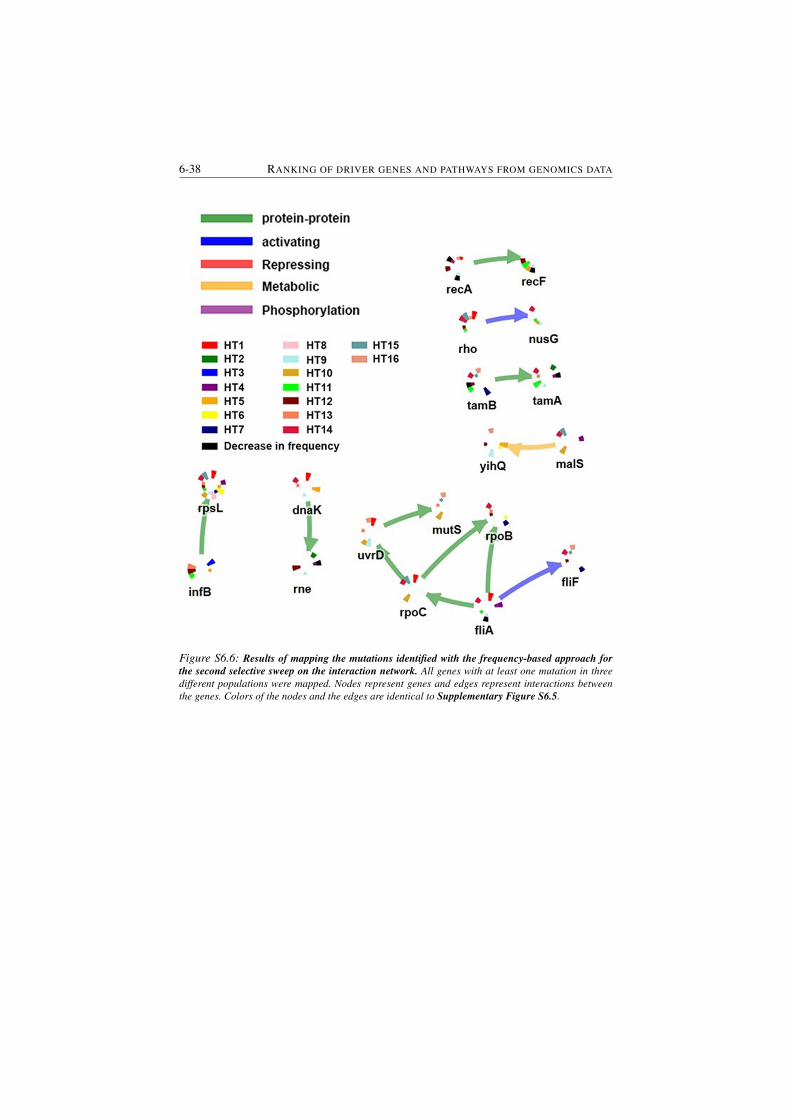
6-38 RANKING OF DRIVER GENES AND PATHWAYS FROM GENOMICS DATA
Figure S6.6: Results of mapping the mutations identified with the frequency-based approach for
the second selective sweep on the interaction network. All genes with at least one mutation in three
different populations were mapped. Nodes represent genes and edges represent interactions between
the genes. Colors of the nodes and the edges are identical to Supplementary Figure S6.5.
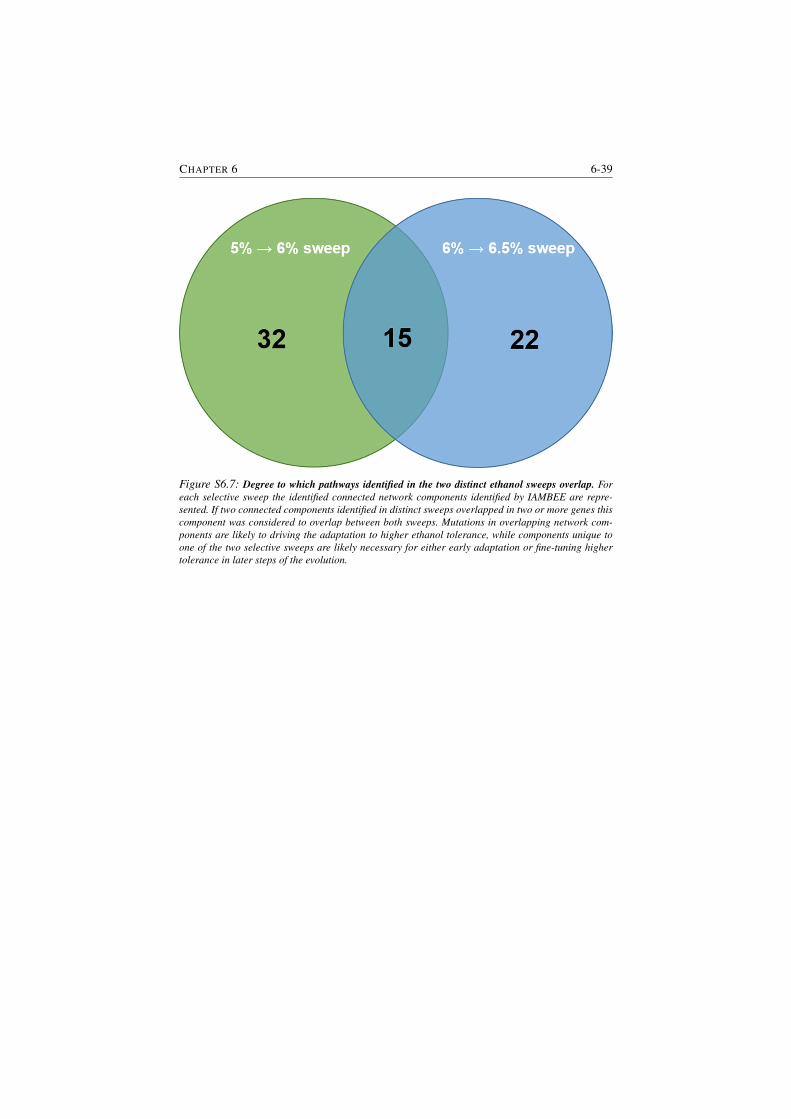
CHAPTER 6 6-39
Figure S6.7: Degree to which pathways identified in the two distinct ethanol sweeps overlap. For
each selective sweep the identified connected network components identified by IAMBEE are repre-
sented. If two connected components identified in distinct sweeps overlapped in two or more genes this
component was considered to overlap between both sweeps. Mutations in overlapping network com-
ponents are likely to driving the adaptation to higher ethanol tolerance, while components unique to
one of the two selective sweeps are likely necessary for either early adaptation or fine-tuning higher
tolerance in later steps of the evolution.

7Mutual exclusivity to detect cancer
driver genes
7.1 Introduction
This chapter presents the development of SSA-ME, a network-based method which
can analyze large genomic datasets in the context of cancer. SSA-ME uses the con-
cept of mutual exclusivity to patterns of mutual exclusive mutated genes within
the dataset. As mutual exclusivity is computationally expensive to calculate, SSA-
ME uses a biological interaction network and a reinforcement learning heuristic
to restrict the search space and produce an approximate but adequate result within
reasonable time. SSA-ME was tested on all cancer datasets belonging to PAN-
cancer [55] and was able to predict the involvement of a couple of rarely mutated
genes.
SPT, BW, DDM and KM conceived the study. SPT, BW and DDM devel-
oped the SSA framework. SPT and BW developed, tested and analyzed the perfor-
mance of the SSA application to mutual exclusivity. SPT, BW and KM wrote the
manuscript. All authors reviewed the manuscript.
7-2 MUTUAL EXCLUSIVITY TO DETECT CANCER DRIVER GENES
7.2 Paper
SSA-ME Detection of cancer driver genes using mu-tual exclusivity by small subnetwork analysisPulido-Tamayo, S.†, Weytjens, B.†, De Maeyer, D., Marchal, K. (2016). SSA-ME Detection of cancerdriver genes using mutual exclusivity by small subnetwork analysis. Scientific Reports, 6: 36257.
† these authors contributed equally to this paper
7.2.1 Abstract
Because of its clonal evolution a tumor rarely contains multiple genomic alter-
ations in the same pathway as disrupting the pathway by one gene often is suf-
ficient to confer the complete fitness advantage. As a result, many cancer driver
genes display mutual exclusivity across tumors. However, searching for mutually
exclusive gene sets requires analyzing all possible combinations of genes, leading
to a problem which is typically too computationally complex to be solved with-
out a stringent a priori filtering, restricting the mutations included in the analysis.
To overcome this problem, we present SSA-ME, a network-based method to de-
tect cancer driver genes based on independently scoring small subnetworks for
mutual exclusivity using a reinforcement learning approach. Because of the al-
gorithmic efficiency, no stringent upfront filtering is required. Analysis of TCGA
cancer datasets illustrates the added value of SSA-ME: well-known recurrently
mutated but also rarely mutated drivers are prioritized. We show that using mu-
tual exclusivity to detect cancer driver genes is complementary to state-of-the-art
approaches. This framework, in which a large number of small subnetworks are
being analyzed in order to solve a computationally complex problem (SSA), can
be generically applied to any problem in which local neighborhoods in a network
hold useful information.
7.2.2 Introduction
Because of internationally coordinated efforts such as TCGA [55, 304] and ICGC
[56], a vast number of cancer datasets are publicly available. Using these datasets
to identify mutations and pathways driving cancer phenotypes has become an ac-
tive field of research [165, 245, 305, 306].
Efforts to search for driver genes in cancer tend to use single-gene tests, e.g.
identification of significantly mutated genes based on background mutation rates
(MutSigCV [264], MuSiC [265]), identification of genes which are enriched in
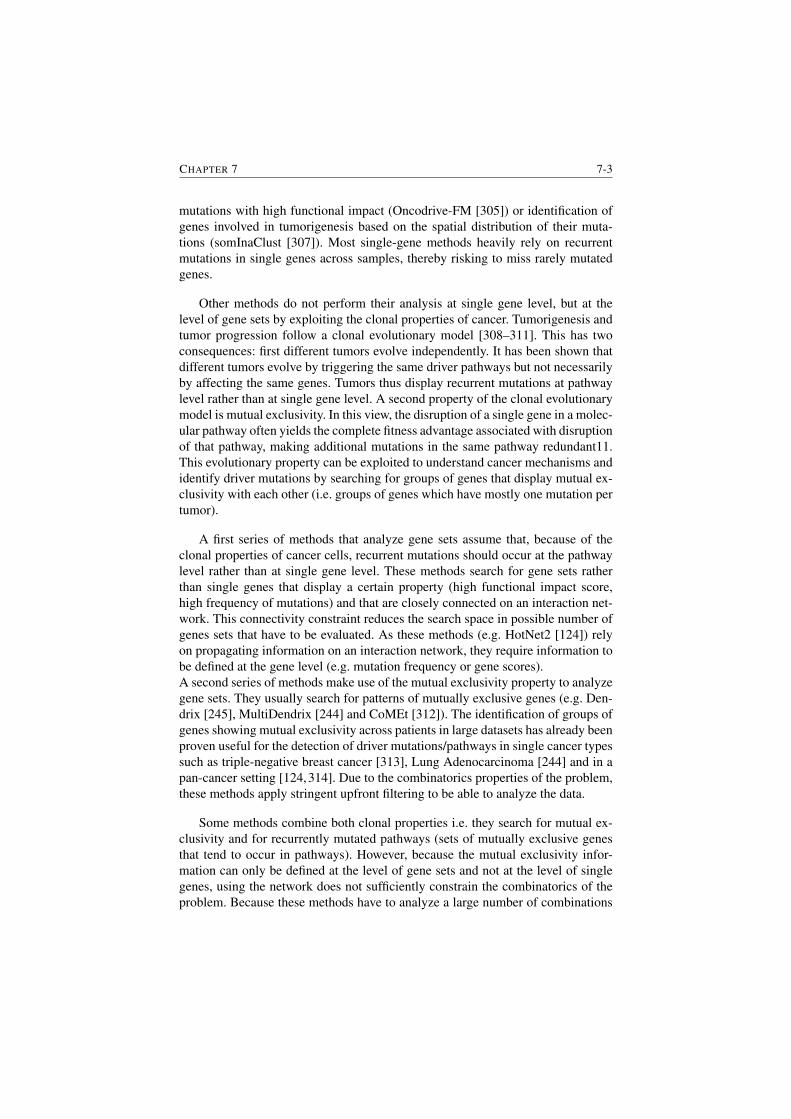
CHAPTER 7 7-3
mutations with high functional impact (Oncodrive-FM [305]) or identification of
genes involved in tumorigenesis based on the spatial distribution of their muta-
tions (somInaClust [307]). Most single-gene methods heavily rely on recurrent
mutations in single genes across samples, thereby risking to miss rarely mutated
genes.
Other methods do not perform their analysis at single gene level, but at the
level of gene sets by exploiting the clonal properties of cancer. Tumorigenesis and
tumor progression follow a clonal evolutionary model [308–311]. This has two
consequences: first different tumors evolve independently. It has been shown that
different tumors evolve by triggering the same driver pathways but not necessarily
by affecting the same genes. Tumors thus display recurrent mutations at pathway
level rather than at single gene level. A second property of the clonal evolutionary
model is mutual exclusivity. In this view, the disruption of a single gene in a molec-
ular pathway often yields the complete fitness advantage associated with disruption
of that pathway, making additional mutations in the same pathway redundant11.
This evolutionary property can be exploited to understand cancer mechanisms and
identify driver mutations by searching for groups of genes that display mutual ex-
clusivity with each other (i.e. groups of genes which have mostly one mutation per
tumor).
A first series of methods that analyze gene sets assume that, because of the
clonal properties of cancer cells, recurrent mutations should occur at the pathway
level rather than at single gene level. These methods search for gene sets rather
than single genes that display a certain property (high functional impact score,
high frequency of mutations) and that are closely connected on an interaction net-
work. This connectivity constraint reduces the search space in possible number of
genes sets that have to be evaluated. As these methods (e.g. HotNet2 [124]) rely
on propagating information on an interaction network, they require information to
be defined at the gene level (e.g. mutation frequency or gene scores).
A second series of methods make use of the mutual exclusivity property to analyze
gene sets. They usually search for patterns of mutually exclusive genes (e.g. Den-
drix [245], MultiDendrix [244] and CoMEt [312]). The identification of groups of
genes showing mutual exclusivity across patients in large datasets has already been
proven useful for the detection of driver mutations/pathways in single cancer types
such as triple-negative breast cancer [313], Lung Adenocarcinoma [244] and in a
pan-cancer setting [124,314]. Due to the combinatorics properties of the problem,
these methods apply stringent upfront filtering to be able to analyze the data.
Some methods combine both clonal properties i.e. they search for mutual ex-
clusivity and for recurrently mutated pathways (sets of mutually exclusive genes
that tend to occur in pathways). However, because the mutual exclusivity infor-
mation can only be defined at the level of gene sets and not at the level of single
genes, using the network does not sufficiently constrain the combinatorics of the
problem. Because these methods have to analyze a large number of combinations
7-4 MUTUAL EXCLUSIVITY TO DETECT CANCER DRIVER GENES
of genes, the problem typically gets computationally too complex to be solved.
Consequently, these methods use upfront filtering to reduce this computational
complexity, thereby reducing the number of genes to analyze. Doing so, methods
as MEMo [165] and mutex [269] filter upfront based on mutational frequency and
are thus unable to take into account rarely mutated genes.
In order to provide a framework to assess mutual exclusivity while incorporat-
ing biological pathway information without the need for stringent upfront filtering,
we developed SSA-ME (Small Subnetwork Analysis with reinforcement learn-
ing to detect driver genes using Mutual Exclusivity). SSA-ME is a computational
tool that searches for genes that show mutual exclusivity and that are closely con-
nected on an interaction network to prioritize drivers. It uses a novel methodology
named Small Subnetwork Analysis with reinforcement learning (SSA) that divides
a complex problem, i.e. finding driver genes that exhibit mutual exclusivity, into
many simpler ones by calculating measures for mutual exclusivity in many small
subnetworks. By solving these simpler problems iteratively, each time biasing the
search space based on results of previous iterations, SSA-ME can prioritize poten-
tial driver genes with linear algorithmic complexity. This, in principle, allows it to
process large input datasets in short computational times and therefore, in contrast
to previous approaches, requires little upfront filtering.
To assess the performance of SSA-ME we analyzed each of the 12 TCGA
Pan-Cancer tumor types [314]. Despite adding many more mutations to the input,
we could prioritize well-known drivers that are found to be recurrently mutated in
different tumors. However, in addition to prior findings we could prioritize several
genes that displayed mutual exclusivity and pathway connectivity with well-known
drivers, but that were rarely mutated in the different tumors and were missed by
other methods that search for mutual exclusivity.
7.2.3 Results
7.2.3.1 SSA-ME implementation
To identify cancer driver genes, we developed SSA-ME, a method that searches
for small subnetworks of the interaction network containing mutated genes that
show mutual exclusivity. SSA-ME approaches the complex problem of detecting
driver genes by solving many independent and less complex sub-problems. In each
sub-problem the method scores a set of genes which are close to each other in the
interaction network for mutual exclusivity. SSA-ME scores many of these small
subnetworks for their potential to contain genes exhibiting mutual exclusivity. Us-
ing these small subnetwork scores in a reinforcement learning framework allows
prioritizing individual genes that are likely involved in the cancer phenotype.
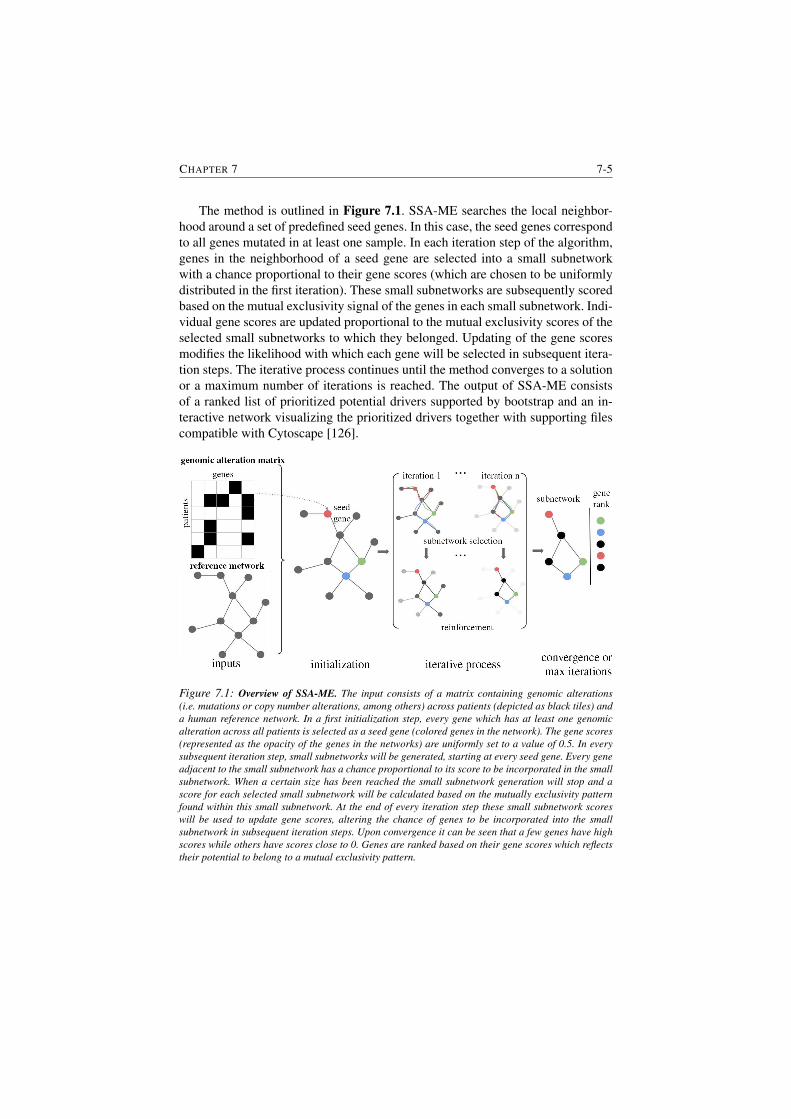
CHAPTER 7 7-5
The method is outlined in Figure 7.1. SSA-ME searches the local neighbor-
hood around a set of predefined seed genes. In this case, the seed genes correspond
to all genes mutated in at least one sample. In each iteration step of the algorithm,
genes in the neighborhood of a seed gene are selected into a small subnetwork
with a chance proportional to their gene scores (which are chosen to be uniformly
distributed in the first iteration). These small subnetworks are subsequently scored
based on the mutual exclusivity signal of the genes in each small subnetwork. Indi-
vidual gene scores are updated proportional to the mutual exclusivity scores of the
selected small subnetworks to which they belonged. Updating of the gene scores
modifies the likelihood with which each gene will be selected in subsequent itera-
tion steps. The iterative process continues until the method converges to a solution
or a maximum number of iterations is reached. The output of SSA-ME consists
of a ranked list of prioritized potential drivers supported by bootstrap and an in-
teractive network visualizing the prioritized drivers together with supporting files
compatible with Cytoscape [126].
Figure 7.1: Overview of SSA-ME. The input consists of a matrix containing genomic alterations
(i.e. mutations or copy number alterations, among others) across patients (depicted as black tiles) and
a human reference network. In a first initialization step, every gene which has at least one genomic
alteration across all patients is selected as a seed gene (colored genes in the network). The gene scores
(represented as the opacity of the genes in the networks) are uniformly set to a value of 0.5. In every
subsequent iteration step, small subnetworks will be generated, starting at every seed gene. Every gene
adjacent to the small subnetwork has a chance proportional to its score to be incorporated in the small
subnetwork. When a certain size has been reached the small subnetwork generation will stop and a
score for each selected small subnetwork will be calculated based on the mutually exclusivity pattern
found within this small subnetwork. At the end of every iteration step these small subnetwork scores
will be used to update gene scores, altering the chance of genes to be incorporated into the small
subnetwork in subsequent iteration steps. Upon convergence it can be seen that a few genes have high
scores while others have scores close to 0. Genes are ranked based on their gene scores which reflects
their potential to belong to a mutual exclusivity pattern.
7-6 MUTUAL EXCLUSIVITY TO DETECT CANCER DRIVER GENES
7.2.3.2 Performance on simulated data
To evaluate the robustness of the method with respect to the used reference net-
work, we applied SSA-ME on a simulated dataset in combination with a high
quality human reference network and underconnected/overconnected versions of
this reference network (with respectively 10%, 25% and 50% of the network edges
being deleted or added). Per network, 100 simulations were performed. Each sim-
ulated dataset contained a target gene set of mutually exclusive genes consisting
of maximally 20 genes that are connected on the reference network and that were
mutated in 30% of the samples (see Materials and Methods).
Applying SSA-ME on each simulated dataset resulted in a ranked gene list.
The top x% of the gene list were considered as driver genes. Performance was
evaluated by plotting the sensitivity versus the specificity where the sensitivity
is defined as the percentage of genes belonging to the target gene set that was
retrieved amongst the x% highest ranked genes and the specificity is defined as the
proportion of genes not present in the target gene set that were correctly classified
as non-drivers. The results are shown in Figure 7.2 A for the highest ranked genes
as this is the range that is of biological relevance (correctly identifying positives).
The full ROC plot and the sensitivity/PPV plots can be found in Supplementary
Figure S7.1.
(Figure 7.2 A) indicates that the best performance is obtained using the refer-
ence network without added or deleted edges, as for the same relative increase in
sensitivity less false positives are predicted (lower relative increase in 1-sensitivity).
The method shows in general a high resilience of the results to using an overcon-
nected network. In this case the method is capable of successfully prioritizing most
of the genes in the mutually exclusive gene set with a low number of false positives
(which is the range we envisage when only showing the values of the 1-specificty
between 0 and 0.01). With an underconnected network the maximal sensitivity that
can be reached will get restricted as some of the genes that show mutual exclusivity
can no longer be connected in the network.
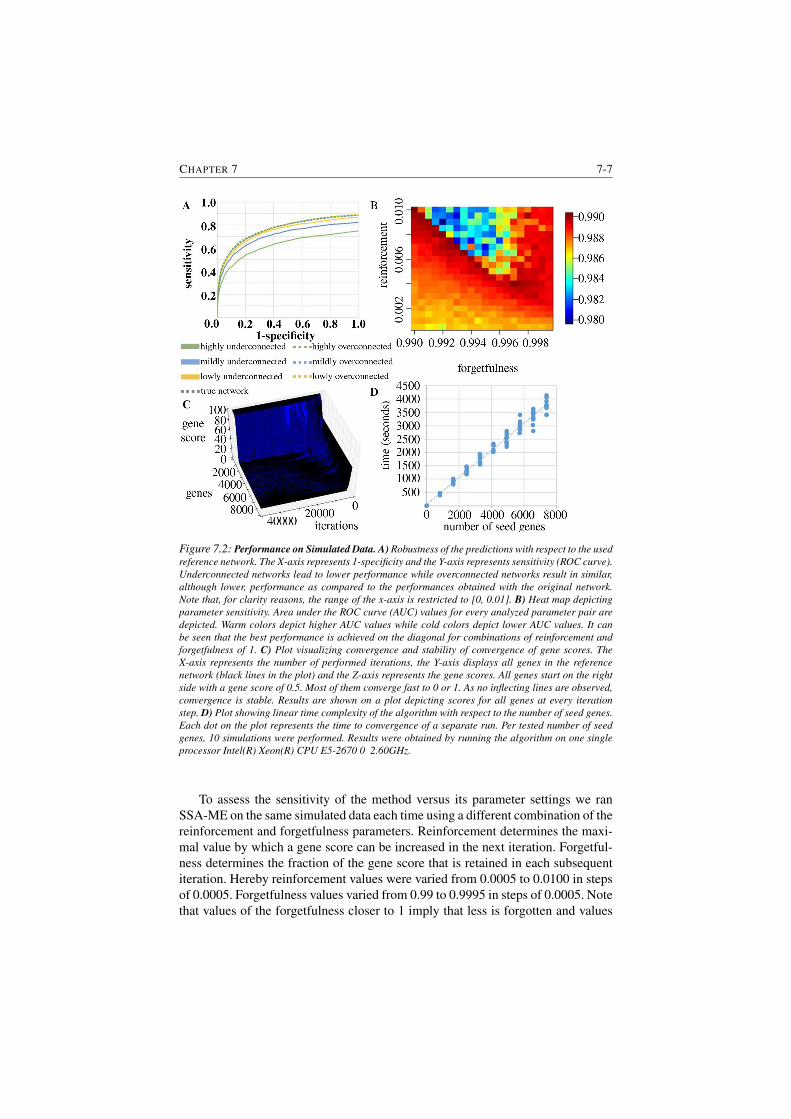
CHAPTER 7 7-7
Figure 7.2: Performance on Simulated Data. A) Robustness of the predictions with respect to the used
reference network. The X-axis represents 1-specificity and the Y-axis represents sensitivity (ROC curve).
Underconnected networks lead to lower performance while overconnected networks result in similar,
although lower, performance as compared to the performances obtained with the original network.
Note that, for clarity reasons, the range of the x-axis is restricted to [0, 0.01]. B) Heat map depicting
parameter sensitivity. Area under the ROC curve (AUC) values for every analyzed parameter pair are
depicted. Warm colors depict higher AUC values while cold colors depict lower AUC values. It can
be seen that the best performance is achieved on the diagonal for combinations of reinforcement and
forgetfulness of 1. C) Plot visualizing convergence and stability of convergence of gene scores. The
X-axis represents the number of performed iterations, the Y-axis displays all genes in the reference
network (black lines in the plot) and the Z-axis represents the gene scores. All genes start on the right
side with a gene score of 0.5. Most of them converge fast to 0 or 1. As no inflecting lines are observed,
convergence is stable. Results are shown on a plot depicting scores for all genes at every iteration
step. D) Plot showing linear time complexity of the algorithm with respect to the number of seed genes.
Each dot on the plot represents the time to convergence of a separate run. Per tested number of seed
genes, 10 simulations were performed. Results were obtained by running the algorithm on one single
processor Intel(R) Xeon(R) CPU E5-2670 0 2.60GHz.
To assess the sensitivity of the method versus its parameter settings we ran
SSA-ME on the same simulated data each time using a different combination of the
reinforcement and forgetfulness parameters. Reinforcement determines the maxi-
mal value by which a gene score can be increased in the next iteration. Forgetful-
ness determines the fraction of the gene score that is retained in each subsequent
iteration. Hereby reinforcement values were varied from 0.0005 to 0.0100 in steps
of 0.0005. Forgetfulness values varied from 0.99 to 0.9995 in steps of 0.0005. Note
that values of the forgetfulness closer to 1 imply that less is forgotten and values
7-8 MUTUAL EXCLUSIVITY TO DETECT CANCER DRIVER GENES
of reinforcement are consistently lower than the ones of the forgetfulness to en-
sure that only true positives will be reinforced. For each parameter combination
10 simulated datasets were analyzed. The performance per parameter combination
was assessed using the mean value of the area under the ROC curve (Figure 7.2
B). In general, a low performance is obtained if the forgetfulness is relatively low
compared to the reinforcement. In those settings false positives might become re-
inforced relatively more than some weak or isolated true positives. However, when
the forgetfulness is close to 1, the performance is more robust to the choice of the
reinforcement value. Alternatively, when the forgetfulness is too high compared
to the reinforcement, true positives retain too little gene score which results in a
more random selection of nodes, hence incorporating more false positives. Best
performances were obtained on the diagonal where the sum of the values of r and
f is close to one: r+f = 1. In most cases, a combination where the sum of the rein-
forcement and the forgetfulness is higher than one results in lower performances
because then again the reinforcement becomes relatively high compared to the
forgetfulness, resulting in relatively more false positives.
To show that the method converges to a stable solution, we ran it on one sim-
ulated dataset for 50.000 iterations. Figure 7.2 C shows that the method exhibits
a consistent behavior, i.e. after a gene obtains a high gene score, it will remain
consistently high or vice versa. Furthermore, this figure shows that the algorithm
converges, provided a sufficient number of iterations have been performed.
To analyze its complexity with respect to the number of seed genes, we ran
SSA-ME on 10 different simulated datasets, each time using an increasing num-
ber of seed genes (ranging from 1 to 8000 genes). Datasets contained incremen-
tally more added seed genes. Seed genes were added gradually according to the
frequency with which they were found mutated in the different tumor samples,
hereby assuming that the most frequently mutated genes are the ones that in a real
setting would also be prioritized as the most promising seeds. These runs were
repeated on 10 different simulated datasets. Results are visualized in Figure 7.2 D
and clearly show the linear complexity of the algorithm with respect to the number
of seed genes.
7.2.3.3 Analysis of TCGA data
To test the biological relevance of SSA-ME, we applied it to each of the Pan-
Cancer TCGA cancer datasets [314]. In this section we primarily focus on the well-
studied Breast cancer dataset as a benchmark but also show the most interesting
results of the Pan-Cancer analysis. All remaining Pan-Cancer TCGA results can
be found in the online version of this paper.
For the analysis we used a high quality human interaction network (see Mate-
rials and Methods). As seed genes we used all genes carrying at least one somatic
CHAPTER 7 7-9
mutation or copy number alteration in any of the samples. After running SSA-ME,
genes were prioritized as putative drivers based on their ranks by using a cut-off on
the ranked list. This cut-off was chosen to provide a good trade-off between sensi-
tivity and precision (i.e. an adequate positive predictive value (PPV) based on the
genes present in the Cancer Gene Census (CGC) [315] as true positives) (Figure
7.3 A). Note that the PPV represents a lower boundary on the actual number of
true positive predictions as all genes not present in the CGC are regarded as false
positives. This is particularly true in this analysis because CGC defines known
cancer genes merely based on their somatic mutational load: This excludes genes
implicated in cancer based on expression values, epigenetics, germline variants
and amplifications/deletions if it is deemed that the amplification/deletion cannot
be attributed to a single or a few genes with a sufficient amount of evidence [315].
In the breast cancer dataset, we identified 34 potential driver genes. Figure 7.3
B displays these genes in the form of an interaction network where the nodes are
genes and the edges are interactions connecting them. Because of the nature of
the method this prioritized gene list contains putative drivers, but also linker genes
that connect genes showing mutual exclusivity but that are not mutated themselves
in any of the breast cancer samples. These linker genes are therefore not drivers
within the available tumor samples, but have driver potential as they were found to
connect drivers through the network.
Most of the prioritized genes (26 out of 34) have previously been mentioned in
catalogues of genes implicated in cancer (CGC, NCG or the most relevant Malac-
ard) (Supplementary Table S7.1). 2 genes of 26 (CDC42 and BCL2L1) were se-
lected as linker genes (i.e. did not display alterations in the breast cancer dataset).
CDC42 is a candidate cancer driver according to NCG and is also listed in the
Breast cancer malacard. BCL2L1 is mainly associated with colorectal cancer and
lung cancer [316–318] through gene expression changes and is also selected as a
driver mutation in other TCGA datasets (see below). This confirms the driver po-
tential of the identified linker genes. Amongst the prioritized genes, 9 are rarely
altered (in ¡ 1% of the samples, at most 10 alterations in the breast cancer dataset,
i.e. BCL2L1, CDC42, DDX5, AKT1, VAV2, EPHA2, CRK, UFD1L, NGFR and
APC), indicating our method is able to also prioritize genes with few genomic al-
terations. For genes with such low mutational load it is impossible to statistically
or visually prove mutual exclusivity. These rarely mutated genes are retrieved by
SSA-ME, despite having few mutations, when they exhibit at least partial mutual
exclusivity with the surrounding genes in the network. If these surrounding genes
exhibit sufficient mutual exclusivity with each other, the rarely mutated gene is
selected based on its association with that pattern of mutual exclusivity. The fact
that of the 10 rarely mutated genes, 5 (BCL2L1, CDC42, DDX5, AKT1 and APC)
are listed in cancer gene databases indicates such association-based selection is
useful.
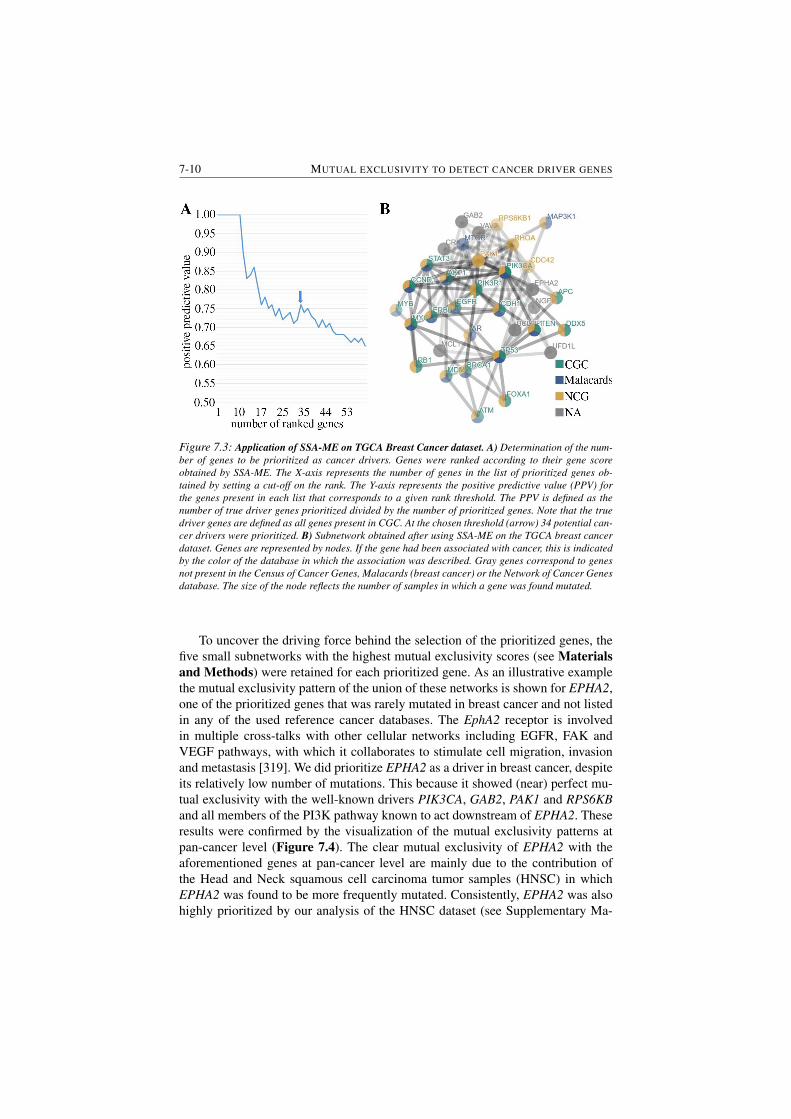
7-10 MUTUAL EXCLUSIVITY TO DETECT CANCER DRIVER GENES
Figure 7.3: Application of SSA-ME on TGCA Breast Cancer dataset. A) Determination of the num-
ber of genes to be prioritized as cancer drivers. Genes were ranked according to their gene score
obtained by SSA-ME. The X-axis represents the number of genes in the list of prioritized genes ob-
tained by setting a cut-off on the rank. The Y-axis represents the positive predictive value (PPV) for
the genes present in each list that corresponds to a given rank threshold. The PPV is defined as the
number of true driver genes prioritized divided by the number of prioritized genes. Note that the true
driver genes are defined as all genes present in CGC. At the chosen threshold (arrow) 34 potential can-
cer drivers were prioritized. B) Subnetwork obtained after using SSA-ME on the TGCA breast cancer
dataset. Genes are represented by nodes. If the gene had been associated with cancer, this is indicated
by the color of the database in which the association was described. Gray genes correspond to genes
not present in the Census of Cancer Genes, Malacards (breast cancer) or the Network of Cancer Genes
database. The size of the node reflects the number of samples in which a gene was found mutated.
To uncover the driving force behind the selection of the prioritized genes, the
five small subnetworks with the highest mutual exclusivity scores (see Materials
and Methods) were retained for each prioritized gene. As an illustrative example
the mutual exclusivity pattern of the union of these networks is shown for EPHA2,
one of the prioritized genes that was rarely mutated in breast cancer and not listed
in any of the used reference cancer databases. The EphA2 receptor is involved
in multiple cross-talks with other cellular networks including EGFR, FAK and
VEGF pathways, with which it collaborates to stimulate cell migration, invasion
and metastasis [319]. We did prioritize EPHA2 as a driver in breast cancer, despite
its relatively low number of mutations. This because it showed (near) perfect mu-
tual exclusivity with the well-known drivers PIK3CA, GAB2, PAK1 and RPS6KB
and all members of the PI3K pathway known to act downstream of EPHA2. These
results were confirmed by the visualization of the mutual exclusivity patterns at
pan-cancer level (Figure 7.4). The clear mutual exclusivity of EPHA2 with the
aforementioned genes at pan-cancer level are mainly due to the contribution of
the Head and Neck squamous cell carcinoma tumor samples (HNSC) in which
EPHA2 was found to be more frequently mutated. Consistently, EPHA2 was also
highly prioritized by our analysis of the HNSC dataset (see Supplementary Ma-
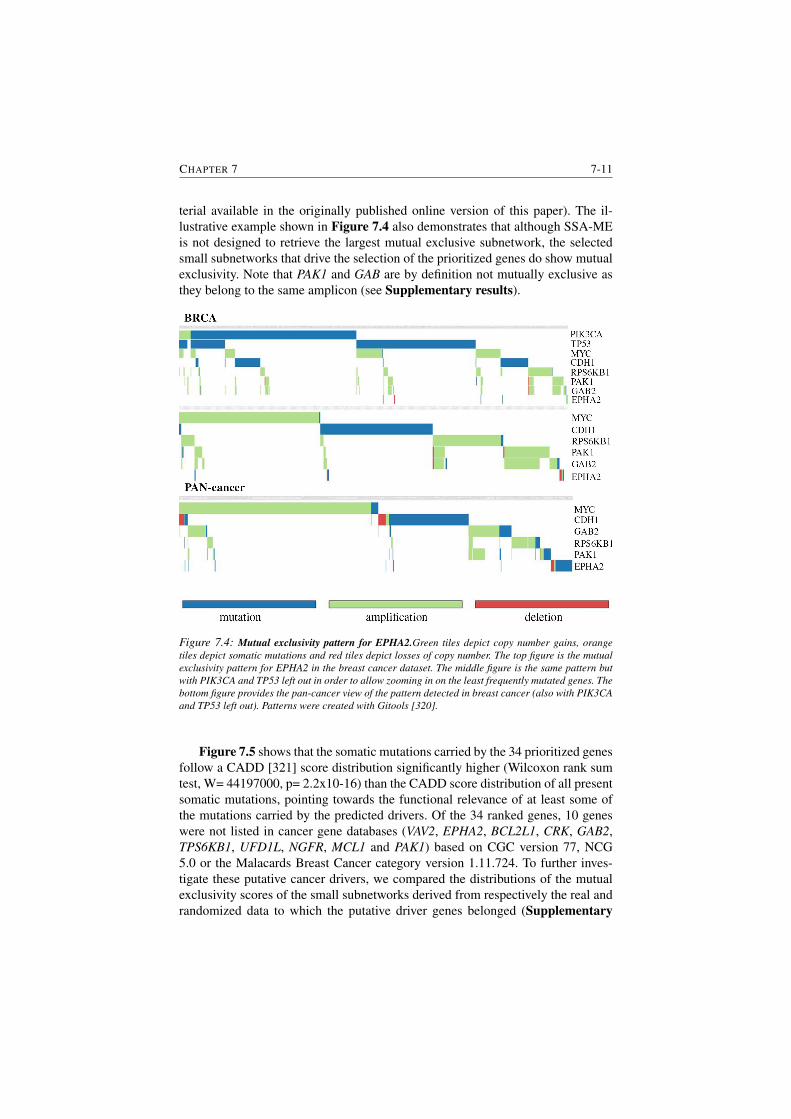
CHAPTER 7 7-11
terial available in the originally published online version of this paper). The il-
lustrative example shown in Figure 7.4 also demonstrates that although SSA-ME
is not designed to retrieve the largest mutual exclusive subnetwork, the selected
small subnetworks that drive the selection of the prioritized genes do show mutual
exclusivity. Note that PAK1 and GAB are by definition not mutually exclusive as
they belong to the same amplicon (see Supplementary results).
Figure 7.4: Mutual exclusivity pattern for EPHA2.Green tiles depict copy number gains, orange
tiles depict somatic mutations and red tiles depict losses of copy number. The top figure is the mutual
exclusivity pattern for EPHA2 in the breast cancer dataset. The middle figure is the same pattern but
with PIK3CA and TP53 left out in order to allow zooming in on the least frequently mutated genes. The
bottom figure provides the pan-cancer view of the pattern detected in breast cancer (also with PIK3CA
and TP53 left out). Patterns were created with Gitools [320].
Figure 7.5 shows that the somatic mutations carried by the 34 prioritized genes
follow a CADD [321] score distribution significantly higher (Wilcoxon rank sum
test, W= 44197000, p= 2.2x10⁻¹⁶) than the CADD score distribution of all present
somatic mutations, pointing towards the functional relevance of at least some of
the mutations carried by the predicted drivers. Of the 34 ranked genes, 10 genes
were not listed in cancer gene databases (VAV2, EPHA2, BCL2L1, CRK, GAB2,
TPS6KB1, UFD1L, NGFR, MCL1 and PAK1) based on CGC version 77, NCG
5.0 or the Malacards Breast Cancer category version 1.11.724. To further inves-
tigate these putative cancer drivers, we compared the distributions of the mutual
exclusivity scores of the small subnetworks derived from respectively the real and
randomized data to which the putative driver genes belonged (Supplementary
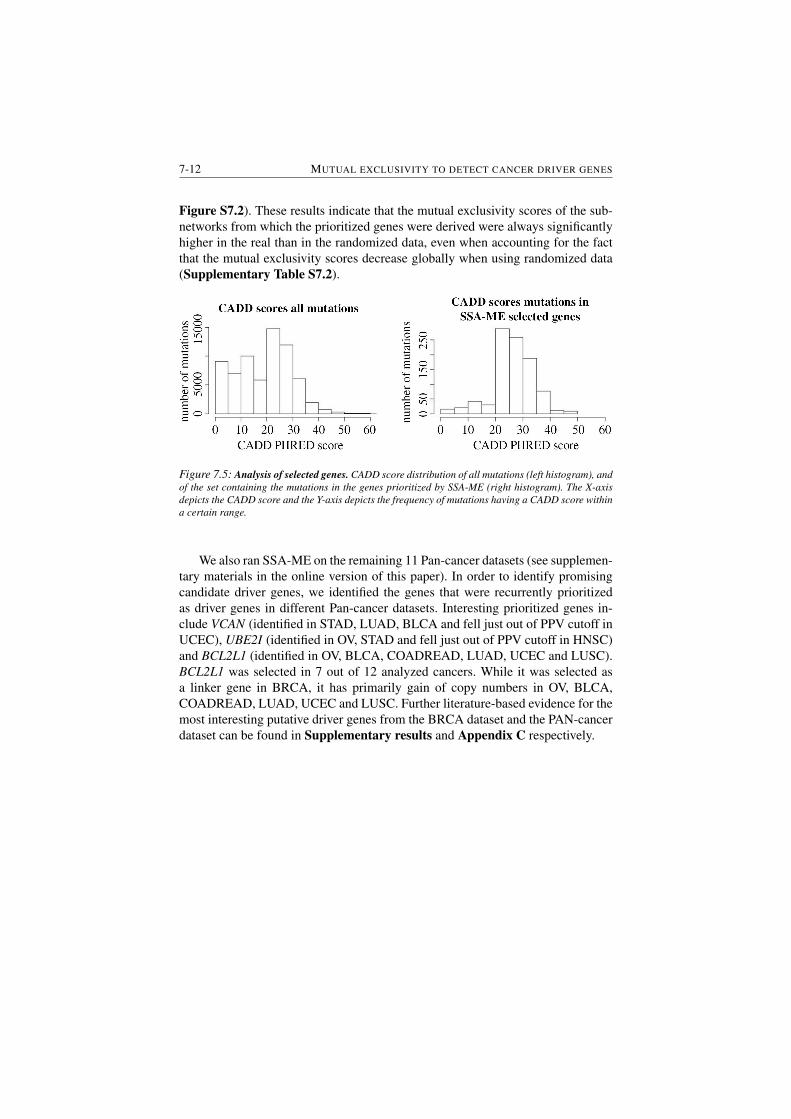
7-12 MUTUAL EXCLUSIVITY TO DETECT CANCER DRIVER GENES
Figure S7.2). These results indicate that the mutual exclusivity scores of the sub-
networks from which the prioritized genes were derived were always significantly
higher in the real than in the randomized data, even when accounting for the fact
that the mutual exclusivity scores decrease globally when using randomized data
(Supplementary Table S7.2).
Figure 7.5: Analysis of selected genes. CADD score distribution of all mutations (left histogram), and
of the set containing the mutations in the genes prioritized by SSA-ME (right histogram). The X-axis
depicts the CADD score and the Y-axis depicts the frequency of mutations having a CADD score within
a certain range.
We also ran SSA-ME on the remaining 11 Pan-cancer datasets (see supplemen-
tary materials in the online version of this paper). In order to identify promising
candidate driver genes, we identified the genes that were recurrently prioritized
as driver genes in different Pan-cancer datasets. Interesting prioritized genes in-
clude VCAN (identified in STAD, LUAD, BLCA and fell just out of PPV cutoff in
UCEC), UBE2I (identified in OV, STAD and fell just out of PPV cutoff in HNSC)
and BCL2L1 (identified in OV, BLCA, COADREAD, LUAD, UCEC and LUSC).
BCL2L1 was selected in 7 out of 12 analyzed cancers. While it was selected as
a linker gene in BRCA, it has primarily gain of copy numbers in OV, BLCA,
COADREAD, LUAD, UCEC and LUSC. Further literature-based evidence for the
most interesting putative driver genes from the BRCA dataset and the PAN-cancer
dataset can be found in Supplementary results and Appendix C respectively.
CHAPTER 7 7-13
7.2.3.4 Comparison with other methods
To compare SSA-ME to other methods, we obtained the results of MutSigCV
[264], MutSig2CV [322], Mutex [269] and Oncodrive-FM [305] when run on
the TCGA Breast cancer data. MutSigCV and MutSig2CV are representatives of
single-gene prioritization methods that test whether a gene is mutated more than
expected by chance. Oncodrive-FM prioritizes by searching for genes that are en-
riched in mutations with a high functional impact. Mutex searches for mutual ex-
clusivity modules using a reference network.
We used the positive predictive value using genes mentioned in CGC as true
positives to compare the performance of the different methods to each other. These
results are depicted in Figure 7.6 A. From this it can be seen that SSA-ME per-
forms about equally well as its competitors given the evaluation criteria. In all
cases the methods will be penalized for finding relevant novel predictions not
present in CGC. As the known drivers might be biased towards unknown prop-
erties (e.g. mutational recurrence) it is hard to predict which methods will be af-
fected most by false negatives in CGC. The relative under/over performance of
certain methods over other methods should therefore be interpreted with care.
Figure 7.6 B shows to what extent the different methods prioritize the same
genes. For each method we selected from the top 61 ranked genes (61 is the num-
ber of genes ranked by SSA-ME after bootstrapping on the top 100 ranked genes
prior to bootstrapping) only those present in CGC and we show their overlap. We
used genes present in CGC to reduce the number of false positives for this anal-
ysis. As expected, the more similar the concept of two methods, the more similar
their results. The single gene methods MutSigCV and Mutsig2CV are comparable
and SSA-ME shows the highest relative overlap with Mutex as both methods are
network-based and use mutual exclusivity. However, in general SSA-ME selects
several known cancer genes that were not selected by any of the other methods
(58% of genes selected by SSA-ME), indicating the complementary of SSA-ME
to the other methods in selecting drivers. The complementarity with single gene
methods is understandable given that SSA-ME uses different properties (mutual
exclusivity of a gene set rather than frequency-based properties of single genes).
Part of the difference between SSA-ME and Mutex can be explained by the dif-
ference in filtering (we can find more genes as we do not need to apply a stringent
criteria). Remaining differences might relate also to the fact that Mutex uses, as an
integral part of the method, a directed signaling network different from the inter-
action network used by SSA-ME. Note that the genes selected by SSA-ME show
a very low number of mutations in some genes. For example, of the 18 genes se-
lected only by SSA-ME, 7 genes contained less than five mutations compared to
just one of the 19 genes selected only by MutSig2CV and MutSigCV together.
This indicates that SSA-ME is complementary to the other methods in finding
rarely mutated driver genes.
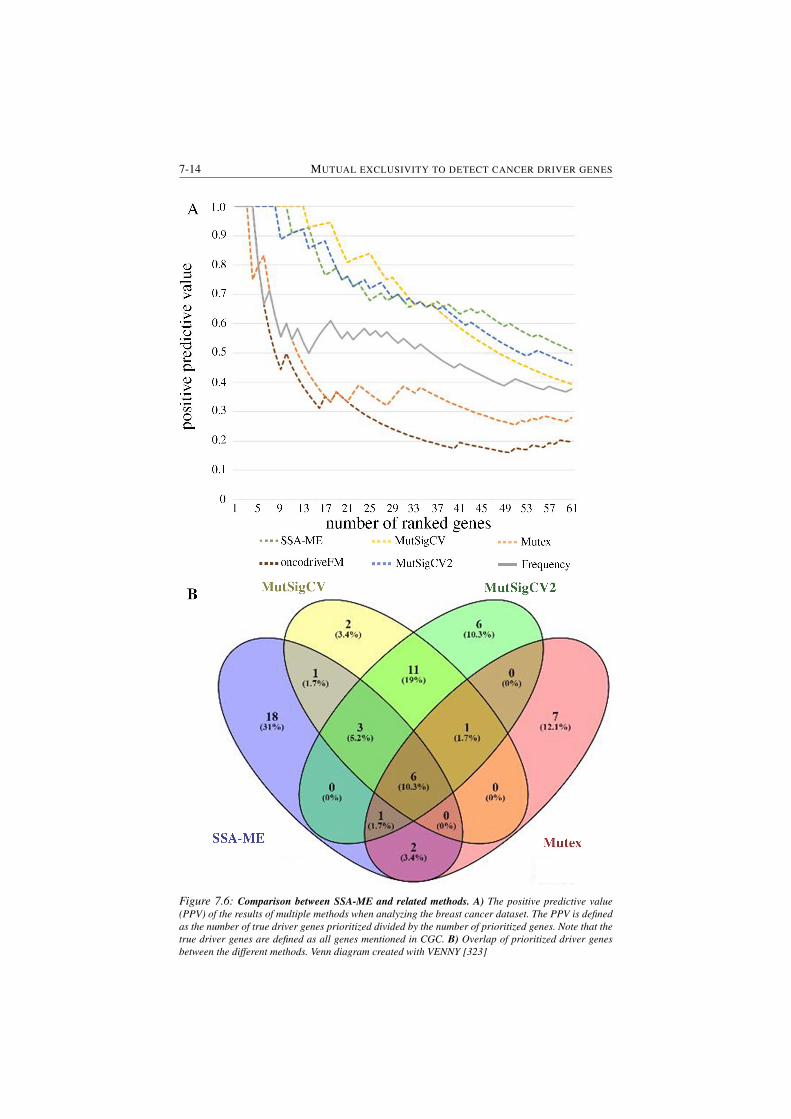
7-14 MUTUAL EXCLUSIVITY TO DETECT CANCER DRIVER GENES
Figure 7.6: Comparison between SSA-ME and related methods. A) The positive predictive value
(PPV) of the results of multiple methods when analyzing the breast cancer dataset. The PPV is defined
as the number of true driver genes prioritized divided by the number of prioritized genes. Note that the
true driver genes are defined as all genes mentioned in CGC. B) Overlap of prioritized driver genes
between the different methods. Venn diagram created with VENNY [323]
CHAPTER 7 7-15
A widely used method that is conceptually most similar to SSA-ME is MEMo
as it also uses mutual exclusivity over an interaction network. However, we were
not able to run MEMo on the used datasets so we could not directly include it in the
comparison described above. In order to compare the results with MEMo, we ran
SSA-ME on the 2012 TCGA BRCA data using the same criteria to filter the input
data as was used in the original MEMo publication. It can be shown that we are
able to find largely the same results in this case. The main advantage of SSA-ME
compared to MEMo is that SSA-ME can be run on larger, much less stringently
upfront filtered, datasets. The result of this comparison is in Supplementary Notes.
7.2.4 Discussion
We introduce SSA-ME, a tool for prioritizing cancer driver genes using mutual
exclusivity with SSA (Small Subnetwork Analysis). SSA is a small subnetwork
analysis technique with reinforcement learning which solves a complex combi-
natorial search problem over an interaction network by calculating, in this case,
measures for mutual exclusivity in many small subnetworks. The framework can
be generically applied to any problem in which local neighborhoods in a network
hold useful information.
Here we applied SSA to prioritize cancer driver genes that are in each others
neighborhood in the interaction network and at the same time display mutual ex-
clusivity across different tumor samples (referred to as SSA-ME). To overcome
the inherent high algorithmic complexity posed by its combinatorial nature, the
problem of identifying drivers is iteratively solved and in each iteration multiple
small subnetworks are independently analyzed for mutual exclusivity. All results
of these small subnetwork analyses are used in subsequent steps to bias the search
space. The advantage of splitting the complex problem into multiple less complex
problems, is that SSA-ME is not restricted by the number of mutated genes in the
input data. By circumventing the stringent filtering strategy that is required by most
other methods to evaluate mutual exclusivity, SSA-ME can identify drivers that are
rarely mutated. These mutations are normally lost when an upfront filtering is used
based on the mutation frequency across samples.
When prioritizing drivers by searching for closely connected genes on an in-
teraction network that exhibit mutual exclusivity, the incompleteness of the inter-
action network might lead to an underestimation of the number of potential driver
genes. Missing edges in the interaction network could refrain the method from
connecting some driver genes. Given we search for small subnetworks, our method
shows resilience towards incomplete or underconnected networks as was shown by
the simulated data and was able to find drivers even when mutual exclusivity had
been heavily disrupted.
The search for small subnetworks comes at the expense of never explicitly
7-16 MUTUAL EXCLUSIVITY TO DETECT CANCER DRIVER GENES
searching for the largest patterns of mutual exclusivity. Such largest patterns of
mutual exclusivity can only be approximated by merging small subnetworks with
high scores to which a prioritized gene belongs. They provide a good approxima-
tion but there is no guarantee that all genes within such pattern are mutual exclusive
with each other.
The performance of SSA-ME in terms of a positive predictive value based on
known genes associated with cancer was comparable to widely used methods. An
important observation is the fact that, while the SSA-ME and the other driver iden-
tification methods share some findings, SSA-ME was also able to prioritize a large
number of genes not found by any other method, indicating the complementarity
between SSA-ME and the other methods. In contrast to the single-gene methods,
SSA-ME relies also on the use of the interaction network and mutual exclusivity.
As compared to MEMo and Mutex, which use an interaction network and mu-
tual exclusivity, SSA-ME is the only method that can deal with a large number of
input mutations and is therefore able to use mutual exclusivity to drive the gene
prioritization.
7.2.5 Materials and Methods
7.2.5.1 SSA-ME
Small Subnetwork Analysis with reinforcement learning to detect driver genes us-
ing Mutual Exclusivity (SSA-ME) is an algorithm that uses an interaction network
to detect driver genes by exploiting mutual exclusivity in cancer. To accomplish
this, SSA-ME performs two independent functions in an iterative manner: small
subnetwork selection/scoring and reinforcement learning. Each gene (node) in the
interaction network is initialized with a uniform gene score. Then, iteratively: start-
ing from a set of seed genes, small subnetworks are selected favoring genes with
high gene scores. Each selected small subnetwork is then scored based on how well
the genes composing the small subnetwork exhibit mutual exclusivity. Genes that
consistently belong to small subnetworks with high mutually exclusivity scores
are more likely to be selected in subsequent iterations. This will lead to high gene
scores for genes which are involved in local gene sets showing mutual exclusivity,
and therefore are possible drivers. The pseudocode describing the algorithm can
be found in Figure 7.7.
Initialization
The algorithm is initialized by giving each gene (node) an initial gene score of 0.5.
A static list of seed genes is defined that contains genes which are possibly driver
mutations. Any type of biologically relevant filtering can be used to generate such
gene list. In the context of this paper, seed genes are defined as all genes that were
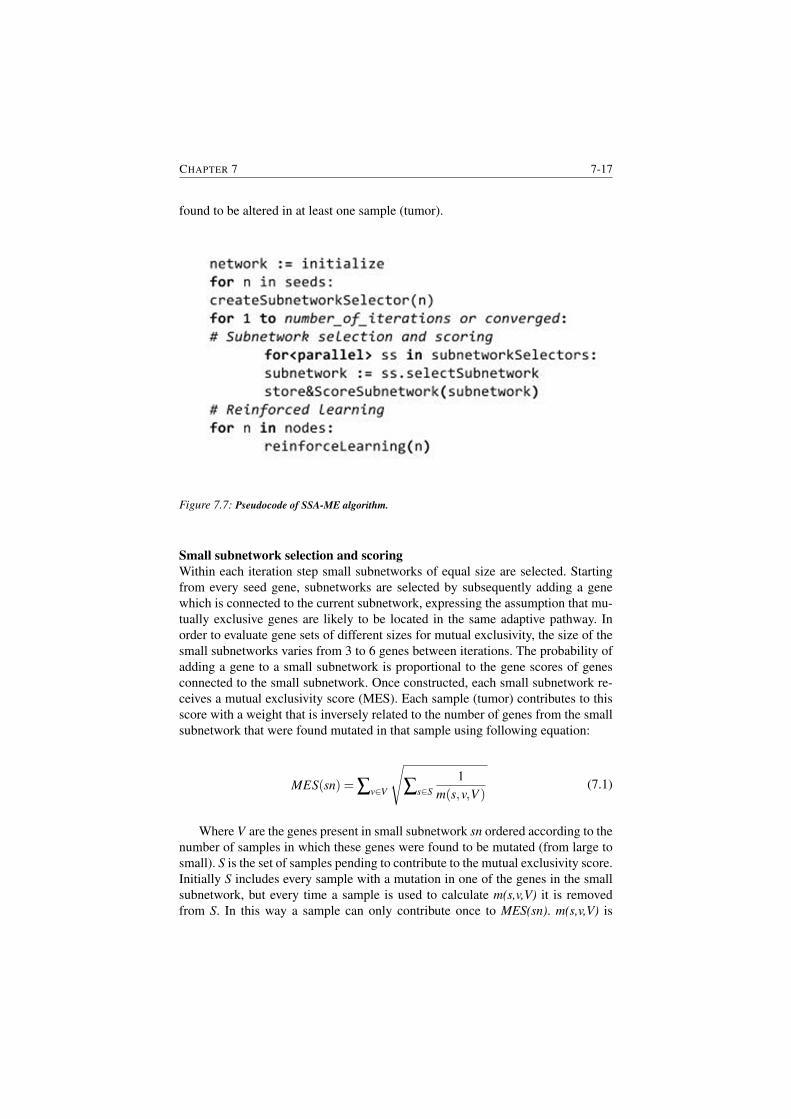
CHAPTER 7 7-17
found to be altered in at least one sample (tumor).
Figure 7.7: Pseudocode of SSA-ME algorithm.
Small subnetwork selection and scoring
Within each iteration step small subnetworks of equal size are selected. Starting
from every seed gene, subnetworks are selected by subsequently adding a gene
which is connected to the current subnetwork, expressing the assumption that mu-
tually exclusive genes are likely to be located in the same adaptive pathway. In
order to evaluate gene sets of different sizes for mutual exclusivity, the size of the
small subnetworks varies from 3 to 6 genes between iterations. The probability of
adding a gene to a small subnetwork is proportional to the gene scores of genes
connected to the small subnetwork. Once constructed, each small subnetwork re-
ceives a mutual exclusivity score (MES). Each sample (tumor) contributes to this
score with a weight that is inversely related to the number of genes from the small
subnetwork that were found mutated in that sample using following equation:
MES(sn) = ∑v∈V
√
∑s∈S
1
m(s,v,V )(7.1)
Where V are the genes present in small subnetwork sn ordered according to the
number of samples in which these genes were found to be mutated (from large to
small). S is the set of samples pending to contribute to the mutual exclusivity score.
Initially S includes every sample with a mutation in one of the genes in the small
subnetwork, but every time a sample is used to calculate m(s,v,V) it is removed
from S. In this way a sample can only contribute once to MES(sn). m(s,v,V) is
7-18 MUTUAL EXCLUSIVITY TO DETECT CANCER DRIVER GENES
the number of genes in V which are mutated in sample s with the restriction that
sample s must have a mutation in v, otherwise sample s is not yet used to calculate
m(s,v,V). m(s,v,V) will be equal to 1 if the genes in patient s are all members of a
perfect mutual exclusive pattern and |V | if all genes in s are also mutated in all other
samples. The square root allows giving relatively higher mutual exclusivity scores
to small subnetworks for which each gene is mutated in approximately the same
number of samples (Figure 7.8). When an unambiguous ordering of the samples
is not possible due to an identical number of mutated genes in multiple patients,
MES(sn) is calculated for every possible ordering and the resulting MES(sn) is
taken as the mean of these results. Next, the MES are ranked from highest to
lowest and their ranks are divided by the maximum rank (Figure 7.8). We end up
with a ranked MES (rMES) between zero and one where zero refers to the small
subnetwork having the least evidence for mutual exclusivity and one refers to the
small subnetwork having the most evidence for mutual exclusivity.
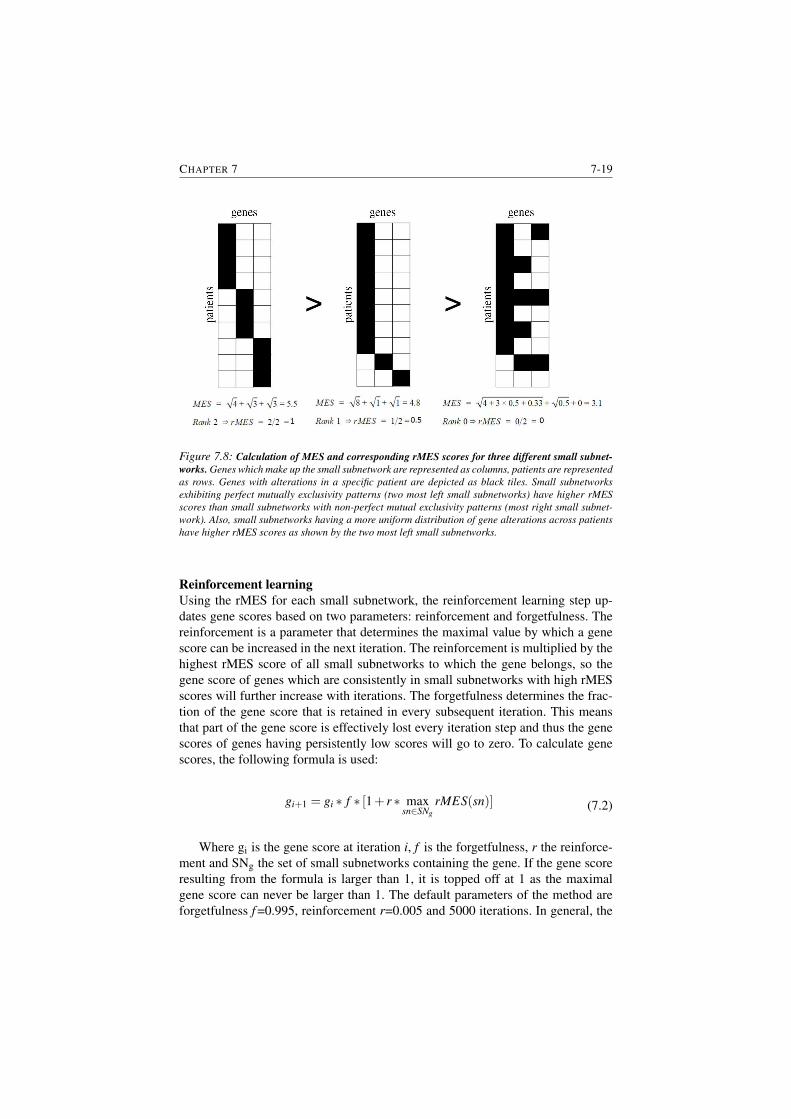
CHAPTER 7 7-19
Figure 7.8: Calculation of MES and corresponding rMES scores for three different small subnet-
works. Genes which make up the small subnetwork are represented as columns, patients are represented
as rows. Genes with alterations in a specific patient are depicted as black tiles. Small subnetworks
exhibiting perfect mutually exclusivity patterns (two most left small subnetworks) have higher rMES
scores than small subnetworks with non-perfect mutual exclusivity patterns (most right small subnet-
work). Also, small subnetworks having a more uniform distribution of gene alterations across patients
have higher rMES scores as shown by the two most left small subnetworks.
Reinforcement learning
Using the rMES for each small subnetwork, the reinforcement learning step up-
dates gene scores based on two parameters: reinforcement and forgetfulness. The
reinforcement is a parameter that determines the maximal value by which a gene
score can be increased in the next iteration. The reinforcement is multiplied by the
highest rMES score of all small subnetworks to which the gene belongs, so the
gene score of genes which are consistently in small subnetworks with high rMES
scores will further increase with iterations. The forgetfulness determines the frac-
tion of the gene score that is retained in every subsequent iteration. This means
that part of the gene score is effectively lost every iteration step and thus the gene
scores of genes having persistently low scores will go to zero. To calculate gene
scores, the following formula is used:
gi+1 = gi ∗ f ∗ [1+ r ∗ maxsn∈SNg
rMES(sn)] (7.2)
Where gi is the gene score at iteration i, f is the forgetfulness, r the reinforce-
ment and SNg the set of small subnetworks containing the gene. If the gene score
resulting from the formula is larger than 1, it is topped off at 1 as the maximal
gene score can never be larger than 1. The default parameters of the method are
forgetfulness f =0.995, reinforcement r=0.005 and 5000 iterations. In general, the
7-20 MUTUAL EXCLUSIVITY TO DETECT CANCER DRIVER GENES
sum of forgetfulness and reinforcement should be close to 1 and the reinforcement
should be small (smaller than 0.01). This because small values for forgetfulness
or large values for reinforcement would make the algorithm prone to stochastic
effects. Note that genes which are not part of any small subnetwork are assigned a
value of zero for max rMES(sn).
In a final step we assign a rank to each gene that reflects the possibility of it
being a driver gene. Hereto we exploit the fact that driver genes that exhibit mutual
exclusivity tend to have a consistent increase in their gene score between iterations
over time. Genes are ranked according to the maximal gene score they reach and
in case of ties are based on how fast their score converges.
Bootstrapping
In order to eliminate predicted driver mutations which are likely artefacts of spe-
cific samples in the data, we perform a bootstrap analysis. Here, we randomly sam-
ple with replacement an equal number of tumor samples as in the original dataset
and run SSA-ME on this new dataset. Each bootstrap dataset will contain some
duplicate samples but will also lack some samples from the original dataset. For
each dataset we generate and evaluate 1000 bootstrap datasets. We then evaluate
these results by assessing at which minimal rank threshold (the rank threshold is
the highest (worst) rank still considered in the calculation of the bootstrap support
across all bootstrap results) a gene can attain a bootstrap support of 95% (selected
in at least 95% of bootstrap results). We do this by gradually increasing the rank
threshold. The final rank of the genes is based on the order in which this 95% boot-
strap support is attained by the genes, the highest ranked gene being the gene which
attained a bootstrap support of 95% using the most strict minimal rank threshold.
7.2.5.2 Simulated data
To assess the performance of SSA-ME we used simulated data. The set of true pos-
itive driver genes was defined first by creating a target gene set of mutual exclusive
genes which in biological terms corresponds to a driver pathway. The target gene
set was generated using a random walker with restart (5% restart chance) to se-
lect genes from the local network neighborhood of a randomly selected gene until
20 interactions have been visited in a high quality human reference network. This
high quality human reference network was composed of HINT [324] version 3,
Interactome (HI-II-14) [325] and Reactome [326] interaction data.
To mimic real tumor data, we counted the number of mutated genes present
in each tumor sample in the TCGA 2012 study and assigned an equal number of
alterations to random genes, thus conserving the distribution of mutated genes per
sample. We added mutually exclusive mutations to genes present in the target gene
set in 30 % of the samples. Each sample had 5% chance to also be mutated in any
CHAPTER 7 7-21
of the other genes belonging to the mutually exclusivity gene set as we allowed for
non-perfect mutual exclusivity module.
To evaluate the robustness of the method with respect to the used reference net-
work, multiple simulated datasets were analyzed for different degrees of connect-
edness in the high quality human reference network: highly underconnected (50%
of the edges were deleted from the reference network), mildly underconnected
(25% of the edges deleted), lowly underconnected (10% edges deleted), origi-
nal network (i.e. the high quality human reference network), lowly overconnected
(10% additional random edges added to the reference network), mildly overcon-
nected (25% additional edges) and highly overconnected (50% additional edges).
We generated 100 different simulated datasets per network and ran SSA-ME. Per-
formance was measured by receiver operating characteristic (ROC) curves.
To assess parameter sensitivity, we tested the effect of using different parame-
ter combinations on the performance. This included 400 simulations for all com-
binations of reinforcement r (from 0.0005 to 0.0100 in steps of 0.0005) and forget-
fulness f (from 0.99 to 0.9995 in steps of 0.0005). Performance for each parameter
combination was measured using the area under the curve (AUC).
7.2.5.3 TCGA Data
TCGA data was downloaded from GDAC Firehose [327–329]. We used somatic
mutations annotated by MutatorAssesor [330] together with copy number alter-
ations (CNAs) inferred with GISTIC [331]. We removed samples containing more
than 500 genomic alterations to avoid taking into account hypermutator samples.
In our analysis only copy number altered genes in samples with high-level thresh-
olds (threshold 2 in GISTIC) for amplifications/deletions and for which copy num-
ber alteration showed a positive correlation (q < 0.05) with expression data were
used. Prioritization results were obtained by running SSA-ME on a non-stringently
filtered input set, consisting of all genes having at least one genetic alteration (mu-
tation or amplification/deletion) in the dataset. As a high quality human reference
network we compiled information data from HINT [324] version 3, Interactome
(HI-II-14) [325] and Reactome [326]. Results for MutSigCV and MutSig2CV
were downloaded from GDAC Firehose [332, 333]. Results for Mutex were taken
from supplementary of the original paper [269]. Results for Oncodrive-FM were
obtained by running Oncodrive-FM using default settings and functional impact
scores (SIFT [334], mutation assessor [330] and PolyPhen2 [335]).
7-22 MUTUAL EXCLUSIVITY TO DETECT CANCER DRIVER GENES
7.2.5.4 Patterns of mutual exclusivity
SSA-ME searches for small subnetworks that display a high degree of mutual ex-
clusivity. To visualize the patterns of mutual exclusivity for any prioritized gene,
SSA-ME selects the five best subnetworks (with highest MES score) to which that
prioritized gene belongs. In many cases the five best small subnetworks to which
the prioritized gene belongs, overlap and thus the union of these genes is used as
a pattern of mutual exclusivity with the prioritized gene. However, as we do not
explicitly impose the constraint that within such a union there should be mutual
exclusivity, there is no guarantee that all genes within the retrieved pattern are mu-
tually exclusive. It is perfectly possible that such a union consist of two separate
patterns of mutual exclusivity, each involving the prioritized gene.
7.2.6 Acknowledgements
The authors would like to thank Lieven Verbeke for the useful comments and dis-
cussions.
Funding: Ghent University Multidisciplinary Research Partnership Bioinformat-
ics: from nucleotides to networks; Fonds Wetenschappelijk Onderzoek-Vlaanderen
(FWO) [G.0329.09, 3G042813, G.0A53.15N]; Agentschap voor Innovatie door
Wetenschap en Technologie (IWT) [NEMOA and the personal fellowship of Dries
de Maeyer]; Katholieke Universiteit Leuven [PF/10/010] (NATAR)
7.2.7 Additional Information
The authors declare no competing financial interests.
7.2.8 Availability of materials and data
SSA-ME software is available at https://github.com/spulido99/SSA. CADD scores
version 1.3 were downloaded from http://cadd.gs.washington.edu/. The TCGA
Pan-Cancer datasets are publicly available at https://gdac.broadinstitute.org/.
CHAPTER 7 7-23
Supplementary
7.2.9 Supplementary results
7.2.9.1 Comparison with MEMo
In order to compare the results of SSA-ME with those of MEMo, a method that
searches for mutual exclusivity patterns using an interaction network, we obtained
the results from MEMo on the TCGA 2012 breast cancer dataset [304] and ran
SSA-ME on the same TCGA 2012 dataset, which was obtained directly from the
TCGA breast cancer analysis portal. To maximize comparability between our re-
sults and those of MEMo, we reproduced to the best possible extent the filtering
approach and network of the original MEMo study to run SSA-ME.
The used network is a non-curated network consisting of Reactome [326], Pan-
ther [336], KEGG [337], INOH [338] and interactions from non-curated sources
like high-throughput derived proteinprotein interactions, gene co-expression, pro-
tein domain interaction, GO annotations, and text-mined protein interactions [339].
The genetic alteration data was prepared according to the description in the origi-
nal paper, i.e. only retaining genes that were altered in at least ten samples.
Just like Mutex, MEMo is primarily designed to detect patterns of mutual ex-
clusivity but does not explicitly extract drivers. To compare the results of MEMo
with these of SSA-ME and because of the high similarity of the mutual exclu-
sivity patterns detected by MEMo in the original paper (patterns consisting of
maximally 8 genes that varied in most cases in no more than one gene), we col-
lapsed the 23 genes of all patterns found by MEMo and depicted them as a network
(Supplementary Figure S7.3 A). The subnetwork obtained by SSA-ME consisted
of 33 genes (applying a FDR cutoff, as described in the main text) of which 18
were also found in the MEMo network (Supplementary Figure S7.3 B). 5 genes
retrieved by MEMo were not detected by SSA-ME: 3 genes (NBN, CHECK2 and
MDM4) because they were no longer present in the filtered list we used as input,
whereas they must have been present in the original input of MEMo: in contrast
to what has been described in the original TGCA paper we found these genes to
be mutated in less than 2 samples and therefore removed them from our analysis,
the score of ATM just fell below the chosen threshold of the ranked list of SSA-
ME (ATM ranked 36 whereas with the chosen cut-off we only retained the 33 top
ranked genes) and ATK3 was truly missed in our analysis as the small subnetworks
to which it belonged never received consistently high scores during subsequent it-
eration steps.
On the other hand, we found 10 additional genes that were not retrieved by
MEMo. Some of these additional genes had previously been associated to breast
7-24 MUTUAL EXCLUSIVITY TO DETECT CANCER DRIVER GENES
cancer (AR and ESR1) or to cancer in general (MUC4 and CCDN1). The reason
why we detect more genes than MEMo is partially due to the choice of the cut-
off, but also because of the inherent differences in selection criteria between the
methods: MEMo searches for patterns of mutual exclusivity in which all genes
need to be mutually exclusive which each other (have to pass a permutation test)
whereas the mutual exclusivity criteria of SSA-ME are less stringent. Also, our
method does not require stringent filtering which leaves the possibility of selecting
rarely mutated genes.
These results thus show that SSA-ME is able to reproduce largely the same
results as MEMo, provided the same input data are used. Genes that are highly
ranked by MEMo are also highly ranked by SSA-ME.
7.2.9.2 Literature-based evidence for predicted cancer drivers in the breast
cancer dataset
Of the 34 ranked genes, 8 genes were not listed in cancer gene databases (MCL1,
GAB2, RPS6KB1, CRK, NGFR, EPHA2, VAV2 and UFD1L) based on CGC ver-
sion 77, NCG 5.0 or the Malacards Breast Cancer category version 1.11.724. These
genes are discussed below. Some of these are well known cancer drivers not re-
ported in CGC, because they contain CNVs rather than somatic mutations. For
selected genes which are not listed in cancer gene databases, for which the muta-
tions are mainly SNPs and which have at least 20 SNPs in all pan-cancer datasets
combined (to ensure the pattern can be visually convincing), we show the uncov-
ered mutual exclusivity profiles (EPHA2 and VAV2 showed).
MCL1 was found frequently (64 times) amplified in the dataset. MCL1 is in-
volved in apoptosis modulation and signaling [340]. Its alterations by CNVs have
been reported in literature before [341]. It has been associated with a number of
cancers because of its involvement in the regulation of apoptosis versus cell sur-
vival [342].
Both GAB2 and PAK1 were frequently amplified (respectively 58 and 61 times)
in the TCGA breast cancer dataset. Both genes belong to the same amplicon as the
well-known breast cancer driver CCND1 [343], which was in concordance also
frequently amplified. However, because it cannot be excluded that more genes in
the same amplicon are causal to cancer and because CCND1, GAB2, and PAK1
each show a strong mutual exclusivity with a subset of selected genes closely re-
lated in the network, each of them might act independently from one another as
a true driver. Whereas both CCND1, a regulatory protein involved in mitosis, and
PAK1, a protein belonging to the family of serine/threonine p21-activating kinases
that are involved in cytoskeleton reorganization and nuclear signaling, have been
reported in at least one of the cancer related databases, GAB2 is not. GAB2 was
prioritized because of its mutual exclusivity and close network connectivity with
CHAPTER 7 7-25
amongst others PIK3CA, PTEN and EPHA2 (Figure 7.4). GAB2 is a scaffolding
adapter protein that transduces cellular signals between receptors (tyrosine kinase
receptors) and intracellular downstream effectors (PI3K, SpH2) and is required
for efficient ErbB2-driven mammary tumorigenesis and metastatic spread by act-
ing downstream of ErbB2 [321, 344]. Interestingly, it was also shown that a focal
amplification of GAB2 independently of CCND1 in breast tumors contributes to
diverse oncogenic phenotypes in breast cancer by activating, amongst others, the
PI3K pathway, further confirming the role of GAB2 as primary driver in breast
cancer [345].
RPS6KB1 was found to be frequently (77 times) amplified in the TCGA breast
cancer dataset. RPS6KB1, encoding a ribosomal S6 kinase 1 (S6K1) is a member
of the frequently mutated PI3K pathway and has been reported to be involved in
cell proliferation and protein translation. A link between the S6K1 function and
cancer was suggested by the finding that RPS6KB1 resided in the chromosomal
region 17q22-17q23 and was often amplified in lung and breast cancers [346,347].
Other genes we prioritized were not listed in cancer gene databases but were
previously associated with cancer because of their expression behavior expression.
The signaling adaptor protein Crk has been shown to play an important role in
various human cancers. In the used breast cancer dataset CRK only had one SNP.
The CRK family proteins all act as molecular bridges between tyrosine kinases and
their substrates and modulate the specificity and stoichiometry of signaling pro-
cesses. Evidence suggests that cellular Crk proteins are overexpressed in human
tumors and that expression levels correlate with aggressive and malignant behav-
ior of cancer cells [348]. Using RNAi-mediated knockdown, Fathers et al. [349]
have shown in their study that CRK is required for cell migration and invasion of
metastatic breast cancer cells in vitro and for metastatic growth in vivo. However,
a mechanistic understanding of Crk proteins in cancer progression in vivo is still
lacking, partly because of the highly pleiotropic nature of Crk signaling [350].
NGFR (nerve growth factor receptor). It had 1 SNP in the BRCA dataset.
NGFR inactivates p53 by promoting its MDM2-mediated ubiquitin dependent pro-
teolysis and by directly binding to its central DNA binding domain and preventing
DNA-binding activity. Biologically, cancer cells hijack the negative feedback reg-
ulation of p53 by NGFR to their growth advantage, as down regulation of NGFR
induces p53-dependent apoptosis and cell growth arrest as well as suppressed tu-
mor growth [351]. Overexpression of NGFR has been observed in many metastatic
cancers and promotes tumor migration and invasion [352–354].
The EphA2 receptor is involved in multiple cross-talks with other cellular net-
works including EGFR, FAK and VEGF pathways, with which it collaborates to
stimulate cell migration, invasion and metastasis [355]. It had 7 mutations in the
BRCA dataset (3 SNPs, 1 amplification and 3 deletions). While its overexpression
7-26 MUTUAL EXCLUSIVITY TO DETECT CANCER DRIVER GENES
has been correlated to stem-like properties of cells and tumor malignancy as for
instance in colon cancer, less information is available on the role of EPHA2 as
a driver gene. We did prioritize EPHA2 as a driver in breast cancer, despite its
relatively low number of mutations. This because it showed (near) perfect mutual
exclusivity with, amongst others, the well-known drivers PIK3CA, PTEN, GAB2
and RP6KB1, and all members of the PI3K pathway known to act downstream of
EPHA2. A recent study shows that rare SNPs in receptor tyrosine kinases, amongst
which EPHA2, can be associated with negative outcome. This further points to-
wards the clinical relevance of these less frequently mutated drivers [356]. See
(Figure 7.4) for the retrieved mutual exclusivity pattern of EPHA2 in BRCA and
in all pan-cancer datasets.
VAV2 was also prioritized in the breast cancer dataset but rarely mutated (only
2 mutations in BRCA). VAV2 is a gene involved in altering cell shape and mi-
gration and has previously been associated with metastasis in breast cancer [304].
It was prioritized because of its association with PIK3CA and ERBB2, a signal-
ing subnetwork that was shown in literature to be involved in ovarian tumor cell
migration and growth through activation of PI3K in HER2 ovarian tumors. This
activation leads to the recruitment of actin and actinin to ERBB2, which then colo-
calizes with the VAV2 guanine nucleotide exchange factor to induce Rac1 and
Ras signaling and the concomitant activation of ovarian tumor cell migration and
growth [357]. See (Supplementary Figure S7.4) for the retrieved mutual exclu-
sivity pattern of VAV2.
UFD1L was prioritized in BRCA but has only 1 SNP. As there is only limited
evidence to support the involvement of UFD1L in tumorigenesis [358] we cannot
rule out UFD1L is a false positive.
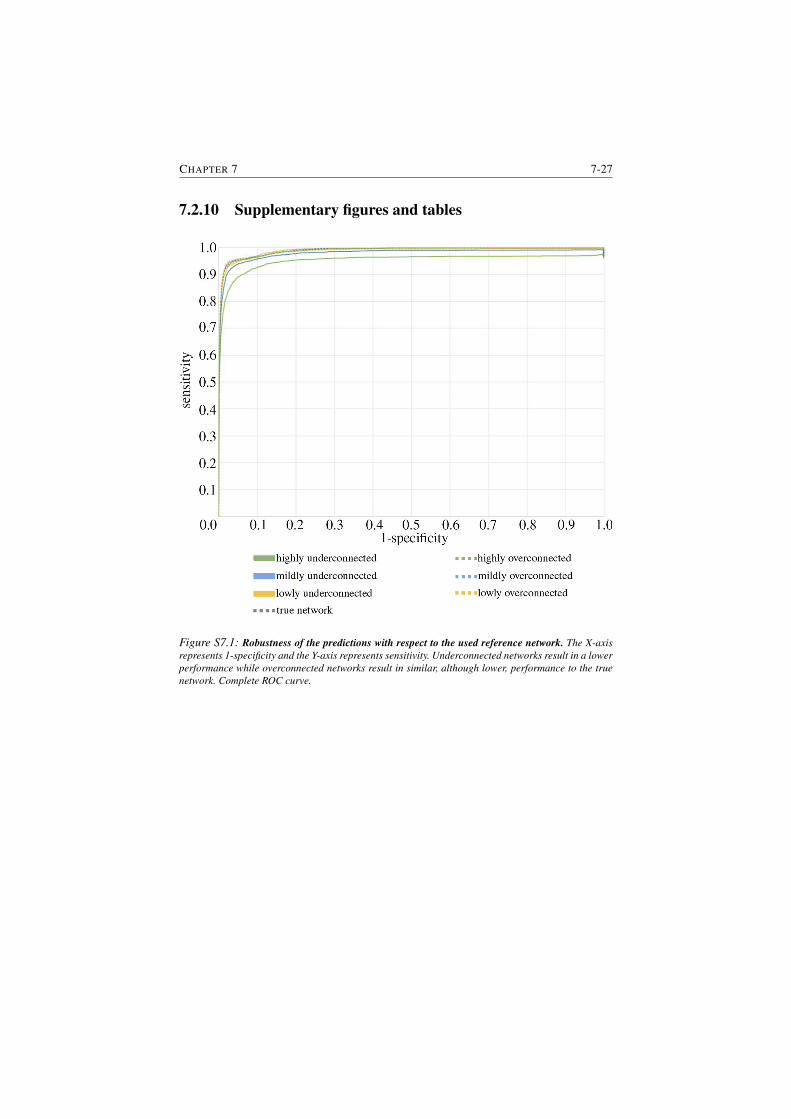
CHAPTER 7 7-27
7.2.10 Supplementary figures and tables
Figure S7.1: Robustness of the predictions with respect to the used reference network. The X-axis
represents 1-specificity and the Y-axis represents sensitivity. Underconnected networks result in a lower
performance while overconnected networks result in similar, although lower, performance to the true
network. Complete ROC curve.
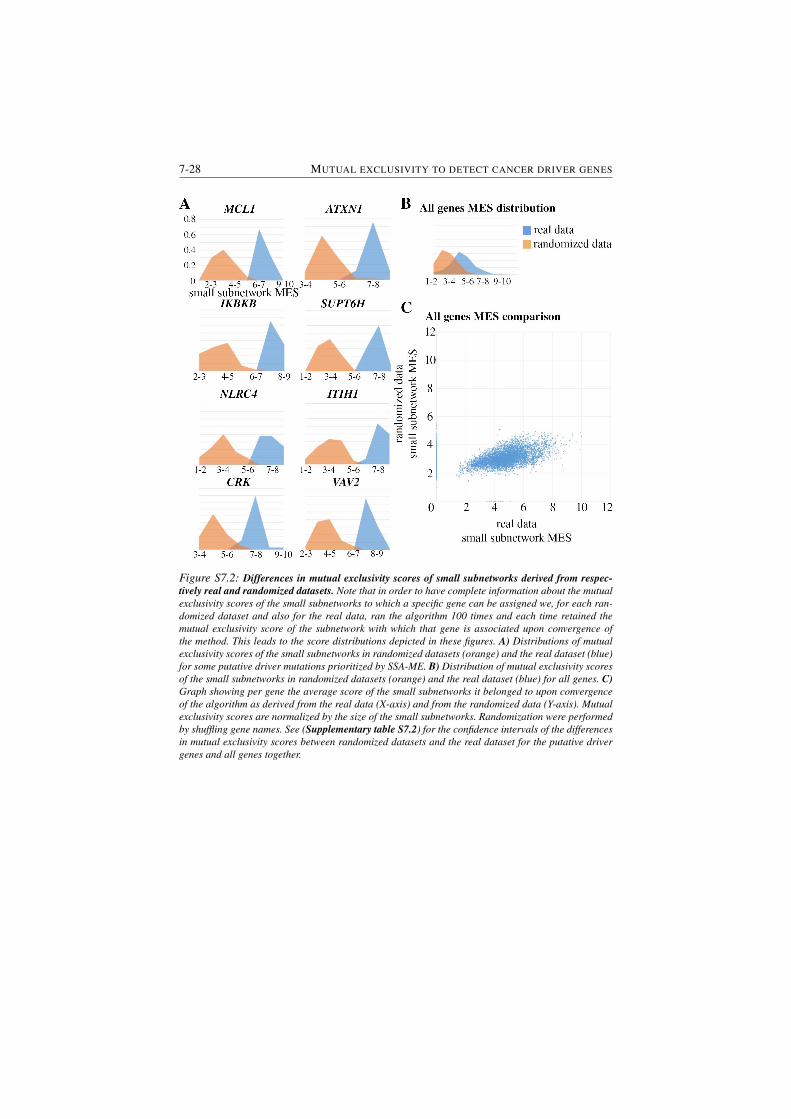
7-28 MUTUAL EXCLUSIVITY TO DETECT CANCER DRIVER GENES
Figure S7.2: Differences in mutual exclusivity scores of small subnetworks derived from respec-
tively real and randomized datasets. Note that in order to have complete information about the mutual
exclusivity scores of the small subnetworks to which a specific gene can be assigned we, for each ran-
domized dataset and also for the real data, ran the algorithm 100 times and each time retained the
mutual exclusivity score of the subnetwork with which that gene is associated upon convergence of
the method. This leads to the score distributions depicted in these figures. A) Distributions of mutual
exclusivity scores of the small subnetworks in randomized datasets (orange) and the real dataset (blue)
for some putative driver mutations prioritized by SSA-ME. B) Distribution of mutual exclusivity scores
of the small subnetworks in randomized datasets (orange) and the real dataset (blue) for all genes. C)
Graph showing per gene the average score of the small subnetworks it belonged to upon convergence
of the algorithm as derived from the real data (X-axis) and from the randomized data (Y-axis). Mutual
exclusivity scores are normalized by the size of the small subnetworks. Randomization were performed
by shuffling gene names. See (Supplementary table S7.2) for the confidence intervals of the differences
in mutual exclusivity scores between randomized datasets and the real dataset for the putative driver
genes and all genes together.
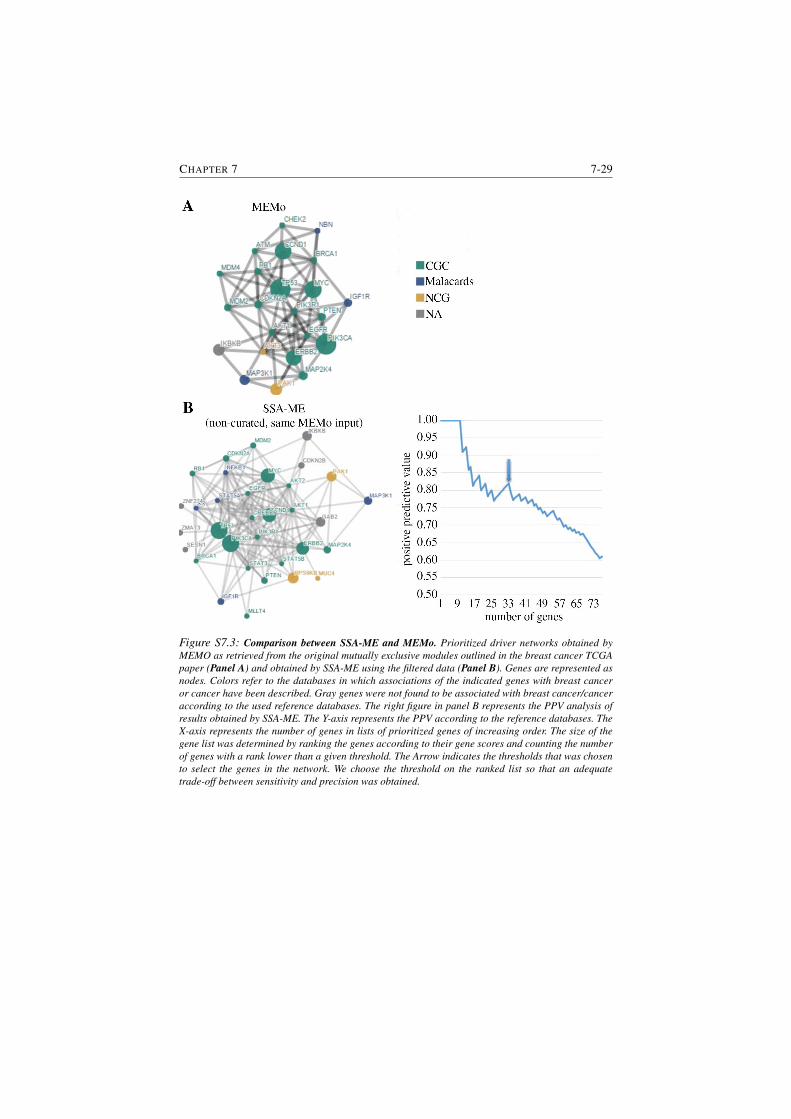
CHAPTER 7 7-29
Figure S7.3: Comparison between SSA-ME and MEMo. Prioritized driver networks obtained by
MEMO as retrieved from the original mutually exclusive modules outlined in the breast cancer TCGA
paper (Panel A) and obtained by SSA-ME using the filtered data (Panel B). Genes are represented as
nodes. Colors refer to the databases in which associations of the indicated genes with breast cancer
or cancer have been described. Gray genes were not found to be associated with breast cancer/cancer
according to the used reference databases. The right figure in panel B represents the PPV analysis of
results obtained by SSA-ME. The Y-axis represents the PPV according to the reference databases. The
X-axis represents the number of genes in lists of prioritized genes of increasing order. The size of the
gene list was determined by ranking the genes according to their gene scores and counting the number
of genes with a rank lower than a given threshold. The Arrow indicates the thresholds that was chosen
to select the genes in the network. We choose the threshold on the ranked list so that an adequate
trade-off between sensitivity and precision was obtained.
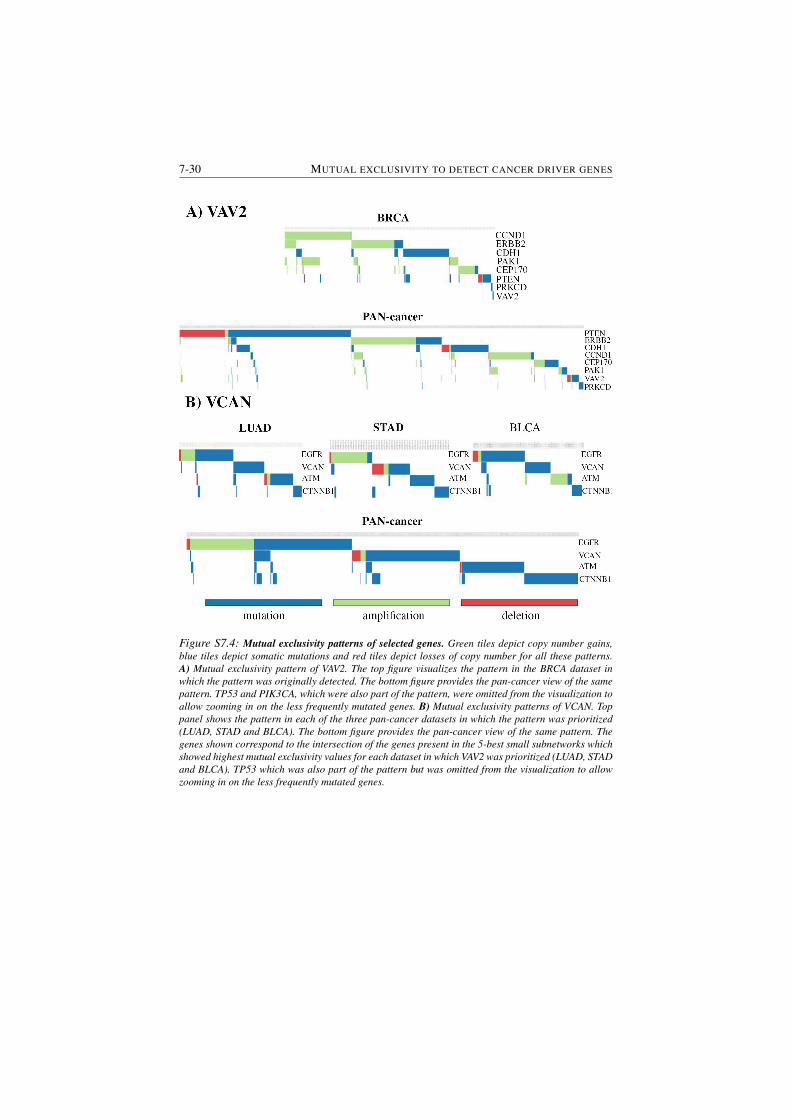
7-30 MUTUAL EXCLUSIVITY TO DETECT CANCER DRIVER GENES
Figure S7.4: Mutual exclusivity patterns of selected genes. Green tiles depict copy number gains,
blue tiles depict somatic mutations and red tiles depict losses of copy number for all these patterns.
A) Mutual exclusivity pattern of VAV2. The top figure visualizes the pattern in the BRCA dataset in
which the pattern was originally detected. The bottom figure provides the pan-cancer view of the same
pattern. TP53 and PIK3CA, which were also part of the pattern, were omitted from the visualization to
allow zooming in on the less frequently mutated genes. B) Mutual exclusivity patterns of VCAN. Top
panel shows the pattern in each of the three pan-cancer datasets in which the pattern was prioritized
(LUAD, STAD and BLCA). The bottom figure provides the pan-cancer view of the same pattern. The
genes shown correspond to the intersection of the genes present in the 5-best small subnetworks which
showed highest mutual exclusivity values for each dataset in which VAV2 was prioritized (LUAD, STAD
and BLCA). TP53 which was also part of the pattern but was omitted from the visualization to allow
zooming in on the less frequently mutated genes.
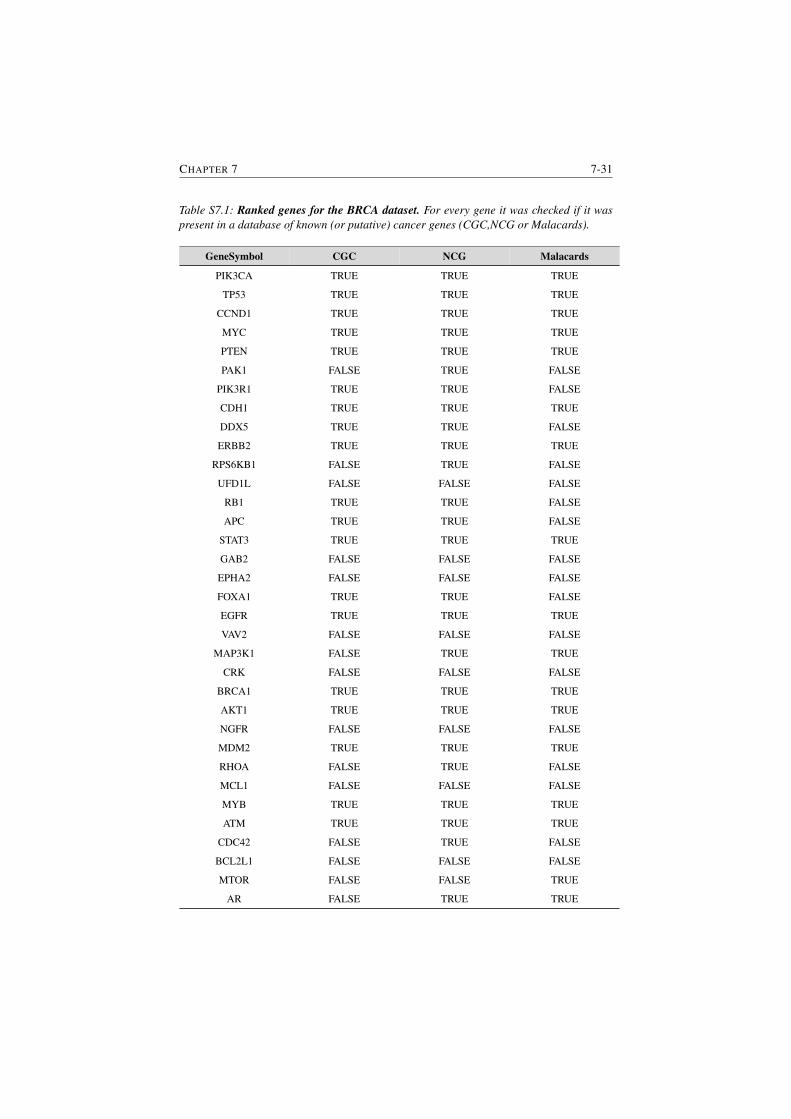
CHAPTER 7 7-31
Table S7.1: Ranked genes for the BRCA dataset. For every gene it was checked if it was
present in a database of known (or putative) cancer genes (CGC,NCG or Malacards).
GeneSymbol CGC NCG Malacards
PIK3CA TRUE TRUE TRUE
TP53 TRUE TRUE TRUE
CCND1 TRUE TRUE TRUE
MYC TRUE TRUE TRUE
PTEN TRUE TRUE TRUE
PAK1 FALSE TRUE FALSE
PIK3R1 TRUE TRUE FALSE
CDH1 TRUE TRUE TRUE
DDX5 TRUE TRUE FALSE
ERBB2 TRUE TRUE TRUE
RPS6KB1 FALSE TRUE FALSE
UFD1L FALSE FALSE FALSE
RB1 TRUE TRUE FALSE
APC TRUE TRUE FALSE
STAT3 TRUE TRUE TRUE
GAB2 FALSE FALSE FALSE
EPHA2 FALSE FALSE FALSE
FOXA1 TRUE TRUE FALSE
EGFR TRUE TRUE TRUE
VAV2 FALSE FALSE FALSE
MAP3K1 FALSE TRUE TRUE
CRK FALSE FALSE FALSE
BRCA1 TRUE TRUE TRUE
AKT1 TRUE TRUE TRUE
NGFR FALSE FALSE FALSE
MDM2 TRUE TRUE TRUE
RHOA FALSE TRUE FALSE
MCL1 FALSE FALSE FALSE
MYB TRUE TRUE TRUE
ATM TRUE TRUE TRUE
CDC42 FALSE TRUE FALSE
BCL2L1 FALSE FALSE FALSE
MTOR FALSE FALSE TRUE
AR FALSE TRUE TRUE
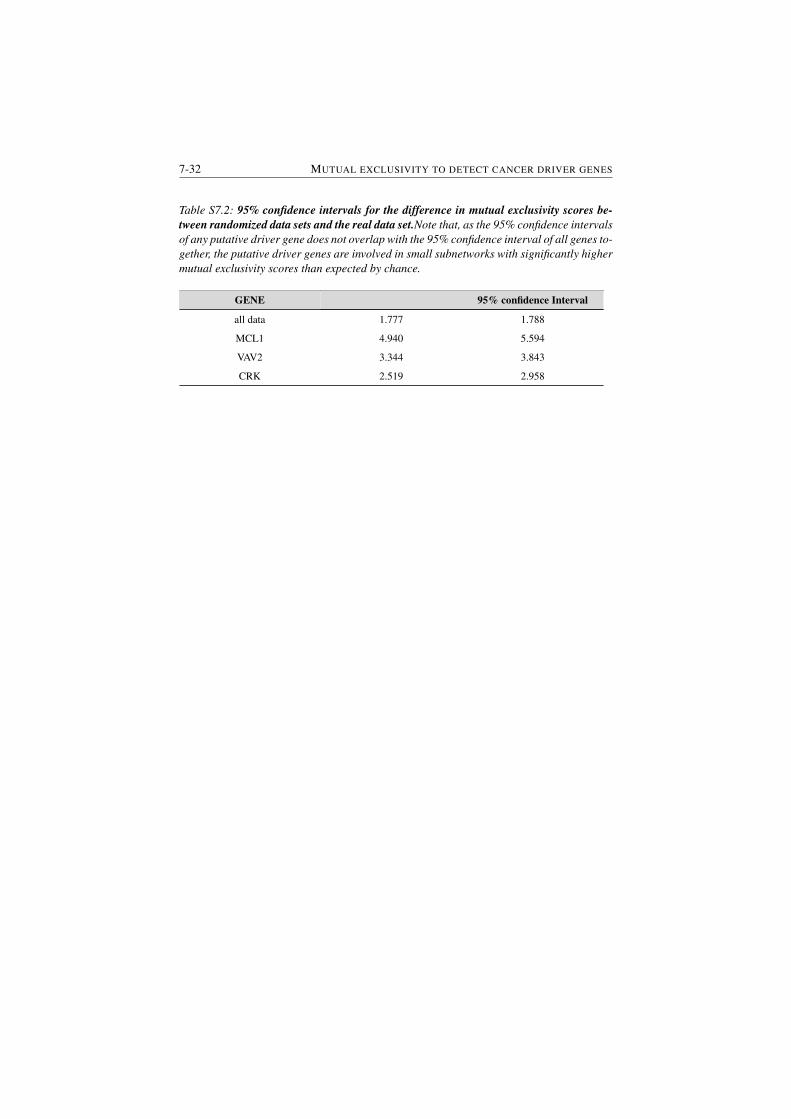
7-32 MUTUAL EXCLUSIVITY TO DETECT CANCER DRIVER GENES
Table S7.2: 95% confidence intervals for the difference in mutual exclusivity scores be-
tween randomized data sets and the real data set.Note that, as the 95% confidence intervals
of any putative driver gene does not overlap with the 95% confidence interval of all genes to-
gether, the putative driver genes are involved in small subnetworks with significantly higher
mutual exclusivity scores than expected by chance.
GENE 95% confidence Interval
all data 1.777 1.788
MCL1 4.940 5.594
VAV2 3.344 3.843
CRK 2.519 2.958
CHAPTER 7 7-33
7.3 Critical reflections and future work
The above manuscript shows that a method which uses an interaction network to
find sets of genes that are mutually exclusive in a (large) population of cancer
patients is useful and that an objective function to uncover such gene sets, that
trades of mutual exclusivity and coverage, is adequate to fulfill this task.
While the proposed method has proven its value, after publication algorithm
was reassessed and certain aspects were identified which could be improved. As
this would benefit the general applicability of the method and possibly allow the
method to analyze larger datasets with higher accuracy and precision, these as-
pects are being re-implemented at the time of writing in the form of a new algo-
rithm which nevertheless adheres to the same foundations as SSA-ME, being the
trade-off between mutual exclusivity and coverage. This section enumerates and
discusses these aspects.
In order to solve the highly combinatorial problem of finding sets of genes
which exhibit mutual exclusivity, SSA-ME uses a reinforcement learning approach
based on the ideas of ant colony optimization which were originally applied to
solve the traveling salesman problem, which is also a combinatorial problem [359,
360]. As explained in the manuscript, this involves a multitude of agents which
traverse the network in multiple rounds and in each round decide which edges to
take based on a dynamic gene score which is assigned to the nodes. At the end
of each round the gene scores are updated based on the extent to which the node
was part of an important gene set (based on an objective function). After some
time the agents only visit the ”important” parts of the network and the involved
genes will have high gene scores and are thus prioritized. While this method works
in all cases analyzed in the manuscript, It is based on a complex heuristic that
propagates the effects through the network. For this heuristic it is hard to prove
convergence (when one group of genes has high gene scores while the other has
very low). Furthermore the results might be sensitive to the initial values of the
edges. This means that for some specific datasets the method might not converge
(in final time) to a solution or extensive testing of the initial values of the edges
has to be done in order to find a satisfactory solution. Furthermore, this strategy of
exploring the search space does not guarantee to find the most optimal gene sets
as it is prone to local optima. A possible alternative to explore the search space
would be to enumerate and evaluate all possible paths of a fixed length against
an objective function using a random walk approach and subsequently check the
nodes which occur in a large number of high scoring gene sets for larger interesting
gene sets as such an approach would exhaustively check the network for gene sets
of a fixed size and does not rely on convergence. Such an approach is currently
under development and preliminary results show an increase in PPV in comparison
with other methods when analyzing large populations and populations for which
germline mutations are available.
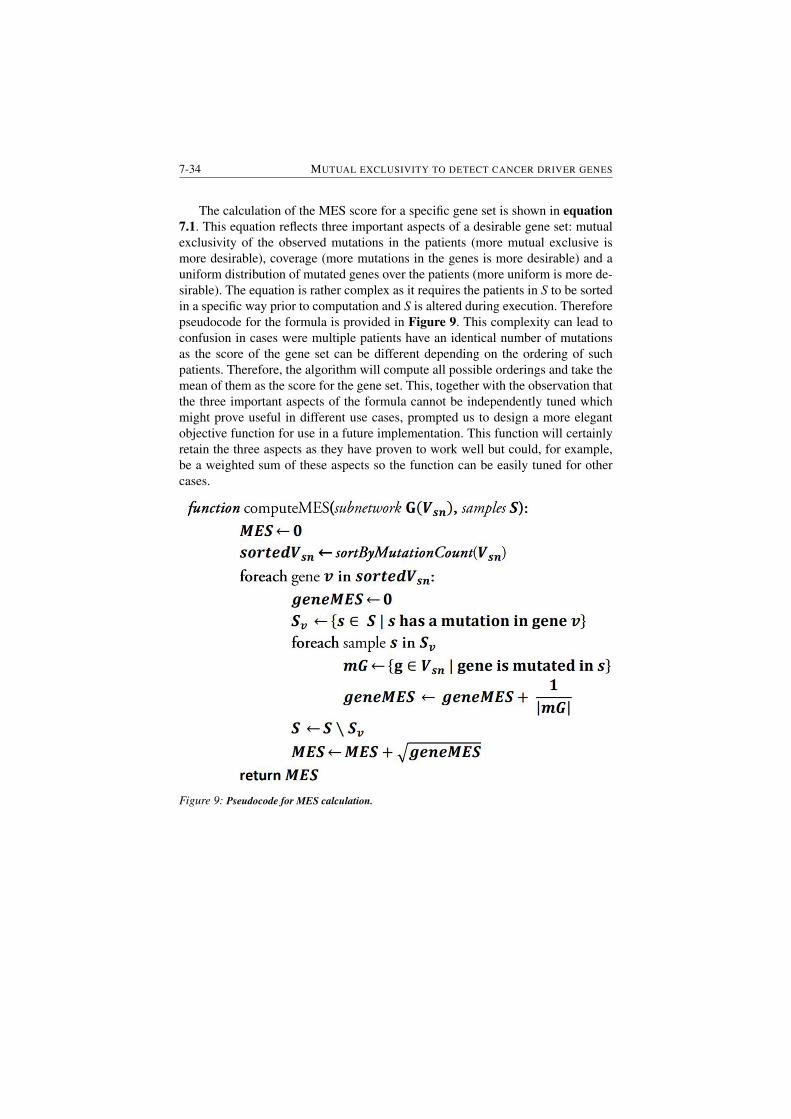
7-34 MUTUAL EXCLUSIVITY TO DETECT CANCER DRIVER GENES
The calculation of the MES score for a specific gene set is shown in equation
7.1. This equation reflects three important aspects of a desirable gene set: mutual
exclusivity of the observed mutations in the patients (more mutual exclusive is
more desirable), coverage (more mutations in the genes is more desirable) and a
uniform distribution of mutated genes over the patients (more uniform is more de-
sirable). The equation is rather complex as it requires the patients in S to be sorted
in a specific way prior to computation and S is altered during execution. Therefore
pseudocode for the formula is provided in Figure 9. This complexity can lead to
confusion in cases were multiple patients have an identical number of mutations
as the score of the gene set can be different depending on the ordering of such
patients. Therefore, the algorithm will compute all possible orderings and take the
mean of them as the score for the gene set. This, together with the observation that
the three important aspects of the formula cannot be independently tuned which
might prove useful in different use cases, prompted us to design a more elegant
objective function for use in a future implementation. This function will certainly
retain the three aspects as they have proven to work well but could, for example,
be a weighted sum of these aspects so the function can be easily tuned for other
cases.
Figure 9: Pseudocode for MES calculation.
8Overall conclusions and perspectives
8.1 Conclusions
This thesis embodies work done over the past four years. During this time the aim
was to develop three subnetwork inference methods which could cope with the
analysis of omics data from different experimental designs. Each of these methods
uses the (biological) specificities of the experimental design at hand together with
an interaction network of the organism under research to infer a subnetwork of
the interaction network which explains the observed omics data. All three were
successfully tested and validated on publicly available or in-house data.
In chapter 4 it was shown that an in-house subnetwork inference method, Phe-
Netic [6,162], could be applied to differential expression datasets, even in the con-
text of a naturally occurring multi-species consortium. This consortium consisted
of three bacterial species which together were capable to efficiently degrade the
herbicide linuron but could not do so efficiently in isolation. Therefore, RNA-seq
data was generated for the bacteria degrading linuron in consortium conditions and
in isolation. By performing differential expression analysis, using PheNetic, multi-
ple metabolic pathways which were likely involved in the studied mechanism were
uncovered. Having obtained this proof-of-concept, it was realized that the method
could be adapted for use in different experimental designs.
8-2 OVERALL CONCLUSIONS AND PERSPECTIVES
The network-based method developed in chapter 4 roughly consists of three
steps: first the network is weighted based on the available data, then a pathfinding
step in which paths between differentially expressed genes are gathered, based on
a biologically motivated definition, is performed. The edges of the network are
weighted based on 1) differential expression data which is obtained from measur-
ing expression data for a population in two different conditions and 2) the topol-
ogy of the network. The found paths are given probabilities based on the weights of
their edges. Finally, an optimization step in which the method reasons about which
is the optimal subnetwork is performed. The optimal subnetwork is found by opti-
mizing an objective function using the paths found in the pathfinding step. In order
to achieve the aim of analyzing experiments with different experimental designs,
in chapters 5 and 6 the network weighting and pathfinding steps are adapted to
incorporate the available data and biological specificities of these datasets. The
results are methods which respectively can be used with expression data coupled
with genomics data from evolution experiments and with solely genomics data
from evolution experiments which include hypermutator phenotypes. The follow-
ing two paragraphs briefly explain how the method was altered to allow analysis
of these experiments.
In chapter 5 two evolution experiments were analyzed: one in which four pop-
ulations of an E. coli strain were evolved to resist the drug Amikacin and one in
which a population of an E. coli strain diverged into two stably co-existing eco-
types during an evolution experiment in conditions with an elevated citrate con-
centration. In order to cope with these experimental designs, the method’s path
definition was adapted to analyze differential expression data coupled with ge-
nomics data. This was done by changing the pathfinding step to now search for
all paths which start in a mutated gene and end in any significantly differentially
expressed gene, keeping into account that a path should always go downstream
(the mutation should be the cause and the differentially expressed gene the ef-
fect). In addition, the aim was to also allow ranking of the mutated genes as this
is of importance when designing follow-up experiments in the lab. Ranking was
based on how strongly a mutated gene is connected to the expression data, and
thus how likely it is that it explains part of the phenotype. By performing a pa-
rameter sweep of the edge cost in the optimization function, optimal subnetworks
were identified for very stringent settings (only selecting very small subnetworks)
to very relaxed settings (selecting large subnetworks). We reasoned that mutated
genes which were identified in stringent settings as well as relaxed settings were
more strongly connected to the differential expression data than mutated genes
which were only selected in relaxed settings. The resulting method was effec-
tive in reconstructing the relevant molecular processes and in the prioritization
of mutated genes in two publicly available datasets. The method is available at
http://bioinformatics.intec.ugent.be/phenetic/#/index.
In chapter 6 a very specifically designed evolution experiment was analyzed:
16 different populations of a strain of E. coli were independently evolved in the
CHAPTER 8 8-3
presence of increasing concentrations of ethanol. The ethanol tolerance of these
populations, in terms of in what concentration of ethanol they could still grow,
was constantly assessed and the populations were sequenced before and after each
adaptive sweep (when a population significantly increases its tolerance). There
was, however, no expression data available because it was both costly and possibly
useless as all these populations had developed a mutator phenotype. By thoroughly
redesigning the pathfinding step, such challenging datasets consisting only of mu-
tation data and containing a lot of hypermutator phenotypes, were addressed. As
in this case the expression data could not be used to weight the interaction network
and drive the search for paths, a solution was found in the incorporation of addi-
tional data in the form of functional impact data (the predicted effect a mutation
has on the protein it encodes) and frequency increase (the increase in frequency
of a specific mutation during an adaptive sweep). This requires the sequencing of
clonal populations before and after an adaptive event, as was done, in order to de-
rive the frequency increase. On top of that, the definition of a biologically valid
path was changed to ”any path starting in a gene which is mutated in a population
and ending in any gene which is mutated in another population” because clusters
of mutations within a population are not interesting but molecular pathways which
are mutated in several populations are. This method, called IAMBEE, prioritized
several interesting mutated genes and gave insight in the molecular mechanisms
involved. It even allowed to generate a hypothesis about epistasis on the level of
molecular pathways. The most promising of these mutations were validated in the
wet-lab. IAMBEE is available at http://bioinformatics.intec.ugent.be/IAMBEE.
In chapter 7 we proposed a network-based method for the identification of
molecular pathways that lie at the basis of certain cancer types. This was done by
looking for patterns of mutations in molecular pathways which are mutually exclu-
sive (have at most one mutation in a cancerous cell) as it is known that molecular
pathways causal to cancer often exhibit this pattern. But while the network-based
methods derived from PheNetic perform well on datasets from (clonal) evolution
experiments, they could not be used directly to search for patterns of mutual ex-
clusivity in human cancer datasets. This is the case because mutual exclusivity is a
property of gene sets, not of individual genes and it is thus impossible to combine
the different found paths during the optimization step as the path scores do not hold
when combining them. As such, in the case of mutual exclusivity the combination
of two paths, which are both very mutual exclusive by themselves, is not neces-
sarily mutual exclusive. Instead, a multi-agent system using a heuristic approach
in the domain of reinforcement learning, called SSA-ME was developed. SSA-
ME was applied to all 12 cancer datasets in the TCGA PAN-cancer project [124]
and was able to recover important molecular pathways involved in cancer while
simultaneously predicting few rarely mutated possible cancer genes. As SSA-ME
was built modular and the specificities for mutual exclusivity are just an objective
function, SSA-ME can be used in different settings where subnetworks need to be
inferred based on a metric which is a property of a set. SSA-ME is available at
github (https://github.com/spulido99/SSA).
8-4 OVERALL CONCLUSIONS AND PERSPECTIVES
The successful development of these methods shows that network-based meth-
ods are useful to analyze omics data in multiple experimental designs, but that no
one general method exists which is suitable in all cases. The method needs to ex-
ploit the data as well as the underlying biological mechanisms of the specific ex-
periment. It is therefore important that these methods are designed modular such
that specific parts can easily be adapted and additional functionality easily added.
In this thesis the most common experimental designs in evolution experiments as
well as genomics data in cancer were addressed.
8.2 Limitations
Interaction networks
While the developed methods performed well in the datasets presented in chapters
4 through 7, the availability of interactomics data for the organism is a prerequisite
for any network-based method to function properly. This limitation was clear in
chapter 4, where no complete interaction network could be constructed for Vari-
ovorax paradoxus WDL1 or Comamonas testosteroni WDL7. In order to construct
an interaction network, metabolic interactions of closely related organisms were
used but no transcriptional interactions and only a very limited amount of signal-
ing interactions could be recovered. However, for model organisms such as human,
Escherichia coli, Bacillus subtilis and Arabidopsis thaliana high quality interac-
tion networks are available. Therefore, when planning (evolution) experiments in
which the specific organism is not of primordial importance (for example when
the mode of action of resistance to a specific compound is studied in gram nega-
tive bacteria one could design the experiment using Escherichia coli) one should
opt for the use of a model organism. Luckily this is already common practice as the
wealth of information generated for model organisms in the past, such as gene and
GO annotation, are indispensable when analyzing experimental results in general.
For the study of naturally occurring organisms/populations on the other hand,
there is no choice and network-based analysis might be limited. As shown in
chapter 3, when working with organisms that have not been sequenced yet, the
genome can be assembled and annotated [97, 361] prior to reconstructing a net-
work. This network will be limited as regulatory and signaling interactions are
typically species-specific and cannot be inferred from mapping annotated genes
to curated interaction pathways, except when such interactions are available for a
closely related species. On top of that, specific metabolic interactions (such as for
example the catabolism of xenobiotics) will be missing. It was shown that even
with this limited (largely metabolic) network, network-based analysis could be
performed on omics data and yields interesting but possibly incomplete results.
CHAPTER 8 8-5
Comparison between different subnetwork inference methods
A multitude of subnetwork inference methods, which are usable in a variety of ex-
perimental designs, are now available but there is no consensus on which method-
ologies work best. This has three main reasons: 1) it is hard to compare differ-
ent subnetwork inference method due to the lack of a proper benchmark dataset,
2) subnetwork inference methods are often developed for a specific experimental
design or at least for use with specific input data and 3) the results of subnet-
work inference methods are dependent on the provided interaction network. Some
methods might be more robust towards more noisy, overconnected networks while
others may perform better in slightly underconnected networks which lack some
interactions. As interaction networks continue to grow, it is thus hard to propose a
benchmark interaction network.
It is possible that two subnetwork inference methods generate different subnet-
works when run on the same data set. Because of the reasons mentioned above it is
often hard to tell which of the methods performs best. Therefore, subnetwork infer-
ence methods are rarely compared to each other. Validation is performed by either
reconstructing the results of a small-scale experiments [118,311,362], by studying
well-known mechanisms so results can be easily compared to literature [312, 363]
and/or by using synthetic data [7].
Use of network-based methods
While it is shown that network-based methods can effectively analyze large omics
datasets in multiple experimental designs, it is important to emphasize that these
results should be used to guide further research, not replace it. Critical analysis
of the results is still needed as false positives are likely to be amongst the results.
However, in large and often complicated clonal omics datasets these methods can
significantly reduce the time and resources needed to analyze the results and in
some cases (as with hypermutators) analysis would be near-impossible without
the help of network-based methods.
8.3 Perspectives
Non-coding part of genomes
All networks used in this thesis use protein coding genes as nodes. This means
that information on non-coding entities such as long non-coding RNA and miRNA
cannot be used as it cannot be mapped to any gene. However, in principle this data
could be added to the networks, provided that information regarding the position
of these components in the genome and interactions between these components
and genes (as it is known that these entities often have gene regulatory properties
[364]) is known. As this data is becoming available with the construction of on-
8-6 OVERALL CONCLUSIONS AND PERSPECTIVES
line databases such as lncrnadb [365] it can now be readily added to these networks
and used provided whole-genome sequencing data is generated for the dataset to
be analyzed.
Networks in multi-organisms studies
Efforts such as the study of the human gut [366, 367] and other bacterial ecol-
ogy studies [368, 369] have been made in order to elucidate interactions between
multiple species in bacterial communities. In these, often large, communities of
species 16S rRNA is traditionally used to characterize the constituents of these
communities [370]. This data can then be used to correlate the presence/abun-
dance of taxonomic groups to clinical factors [371]. As these communities can
be very complex, containing up to 5000 unique genes [372], more recently meta-
transcriptomics studies have been performed on these communities in order to
gain a deeper understanding of these systems and how their constituents inter-
act [373, 374]. combining omics data such as RNA-seq data of the entire com-
munity with an interaction network might help to further uncover the functional
characteristics of such communities. As in practice it is impossible to readily have
interaction networks available for all identified (possibly unknown) species in a
community sample, a representation of the community would most likely be as-
sembled through functional annotation of the identified genes in the community to-
gether with known consensus pathways in the identified higher taxonomic groups.
In the past, using this reasoning only a limited number of network representations
to study metagenomics datasets have been proposed [375]. However, as a cell is
a closed system, metabolites and signaling molecules must be exchanged between
cells through the environment, using diffusion or active transport mechanisms to
expel or obtain them. This implies that a meta-interaction network should explic-
itly model the interactomes of the taxonomic groups separately, together with the
environment in which chemical interactions can occur [376, 377]. This makes the
assembly of a meta-interaction network challenging but once available, they can
be integrated with the network-based approaches presented here in the context of
bacterial datasets through minimal adaptation of the methods. The incorporation of
these meta-interaction networks in network-based methods is the logical next step
to expand the methods to new experimental designs and more complex biological
systems.
Increasing the resolution of interaction networks
Traditionally, the nodes of a biological interaction network represent genes/gene
products and the edges represent the interactions between these nodes [109]. This
implies that all data must be mapped to genes/gene products for use in the inter-
action network. The drawback of this approach is that only genes, not individual
mutations, can be selected. However, it would be interesting if one could pinpoint
the part of the gene (for example a causal mutation or a region in which causal
mutations occur) in which mutations can be responsible for some phenotype. For
CHAPTER 8 8-7
example in human cancer a specific BRAF mutation was correlated to a specific
drug treatment while other mutations in the same gene were not [378]. A possi-
bility for assessing such effects would be to expand the network representation by
duplicating the nodes which correspond to genes in which different ”subclasses” of
mutations can be identified (for example when multiple mutational hotspots [307]
can be identified within one gene or when a significant number of mutations of
specific types are found within one gene). Doing so, network-based methods could
select one specific ”subclass” of mutations in that gene.
From static to dynamic networks
Most available network-based methods, including the ones proposed in this thesis,
use static interaction networks [111, 124, 269, 362]. Static refers to the fact that
these networks are compiled a priori from available interactomics data and are not
changed during analysis. It is however known that mutations can cause interac-
tion networks to ”rewire”, as is required for evolution [379–381]. This rewiring
can potentially create interactions which are important to explain the observed
phenotype, leading to the inability of network-based methods which utilize static
interaction networks to explain the phenotype. A possible solution is to abandon
static interaction networks and allow the networks to be dynamic by encouraging
the method to infer new interactions while analyzing the data. A possible way
to achieve this would be to a priori propose a set of possible (and potentially
weighted) new interactions based on the data, for example by looking at muta-
tions within promotor regions or the DNA-binding domains of transcription fac-
tors. Given the data, a network-based method can then decide whether one or more
of the proposed interactions contributes significantly to an explanation of the data,
possibly inferring the existence of the new interaction.
Condition/tissue-specific interaction networks
Interaction networks are commonly compiled from publicly available databases
which gather interactomics data for specific organisms in different conditions,
and from different tissue types in case of multicellular organisms such as hu-
man [64, 80, 90, 100]. By merging this data without keeping into account in which
conditions/from which tissues the interactions were obtained, valuable information
is discarded and the resulting network will potentially be overconnected. This is
particularly true when investigating human cells, which are differentiated to use a
specific subset of molecular pathways. In the past efforts have been made to con-
struct condition-dependent and tissue-dependent interaction networks [382–385].
However, most network-based methods still do not use condition-dependent or
tissue-dependent interaction networks. As more experiments are being performed
and more condition/tissue-specific interaction data becomes available it will be-
come interesting to use them.
It can be concluded that network-based methods, although they have their
8-8 OVERALL CONCLUSIONS AND PERSPECTIVES
limitations, are useful in clonal systems to analyze a multitude of different ex-
perimental designs involving different types of input data. This thesis specifi-
cally illustrated its use to discover differentially expressed molecular pathways
between two conditions, to perform genotype-phenotype mapping in evolution
experiments and to find patterns of mutual exclusive mutated genes in cancer
genomes. It is expected that over the years to come these methods will be fur-
ther expanded to include additional types of data such as proteomics and methyla-
tion data. Also, the networks and perhaps network representations will most likely
expand as more data concerning non-coding elements and molecular interactions
will become available. As more heterogeneous data will be incorporated in these
methods, it is my opinion that network-based methods will have to employ more
explicit biological reasoning when searching the interaction network as to assure
that the found mechanisms make biological sense and can be explained in a mech-
anistic manner.
Curriculum Vitae
Personalia
Name Bram Weytjens
Date of birth September 16, 1990
Place of birth Genk
Nationality Belgian
E-mail [email protected]
Education
11/2013-10/2017 joint PhD in bioinformatics and bioengineering
Thesis:”Network-based identification of driver pathways in
clonal systems”
Promotors: Prof.Dr. Kathleen Marchal & Prof. Dr. Ir. Jozef
Vanderleyden
Centre of Microbial and Plant Genetics & Department of
Plant Biotechnology and Bioinformatics
UGent,Gent,Belgium & KU Leuven,Leuven, Belgium
09/2011-06/2013 Master of Engineering: Chemical Technology
Thesis:”PheNEtic2:subnetwork inference in physical
8-10 CURRICULUM VITAE
interaction networks by using E. coli single mutants
differential expression data”
Promotor: Prof. Dr. Ir. Jozef Vanderleyden
KU Leuven, Leuven, Belgium
09/2010-06/2016 Bachelor in biology
Thesis:”Screening for aluminium tolerant yeast
strains by fermentation; isolation of segregants & Further
characterization of gene Dnmt-1 in Schistocera gregaria”
Promotor: Prof. Dr. Johan Thevelein & Prof. Dr. Liliane
Schoofs
KU Leuven, Leuven, Belgium
09/2008-06/2011 Bachelor of Engineering Technology
KU Leuven, Leuven, Belgium
Publication list
Swings T†, Weytjens, B†, Schalck T, Bonte C, Verstraeten N, Marchal K.§, Michiels
J.§ 2017. Network-Based Identification of Adaptive Pathways in Evolved Ethanol-
Tolerant Bacterial Populations. Molecular Biology and Evolution, msx228.† these authors contributed equally to this paper§ these authors contributed equally to this paper
Albers P†, Weytjens B†, De Mot R, Marchal K, Springael D. 2017. Molecular
processes underlying synergistic linuron mineralization in a triple-species bacte-
rial consortium biofilm revealed by differential transcriptomics. Submitted to Mi-
crobiologyOpen.† these authors contributed equally to this paper
Babaki B, Van Daele D, Weytjens B, Guns T. A Branch-and-Cut Algorithm for
Constrained Graph Clustering. Paper presented at data science meets optimisation
CEC/CPAIOR (2017), Padova, Italy
CURRICULUM VITAE 8-11
De Maeyer D†, Weytjens B†, De Raedt L, Marchal K. 2016. Network-Based Anal-
ysis of eQTL Data to Prioritize Driver Mutations. Genome Biology and Evolution
8 (3). Doi: 10.1093/gbe/evw010†These authors contributed equally to this work
Pulido-Tamayo S†,Weytjens B†, De Maeyer D, Marachal K. 2016. SSA-ME De-
tection of cancer driver genes using mutual exclusivity by small subnetwork anal-
ysis. Scientific reports, 6.†These authors contributed equally to this work
Gerits E, Blommaert E, Lippell A, ONeill A J, Weytjens B, De Maeyer D, Car-
olina Fierro A, Marchal K, Marchand A, Chaltin P, Spincemaille P, De Brucker
K, Thevissen K, Cammue B.P.A, Swings T, Liebens V, Fauvart M, Verstraeten N,
Michiels J. 2016. Elucidation of the Mode of Action of a New Antibacterial Com-
pound Active against Staphylococcus aureus and Pseudomonas aeruginosa. PloS
one, 11(5), e0155139.
De Maeyer D, Weytjens B, Renkens J, De Raedt L, Marchal K. 2015. PheNetic:
network-based interpretation of molecular profiling data. Nucleic acids research,
gkv347.
Awards
First place in the Flemish Biology Olympiad 2008
Oral presentations at conferences
Automatic identification of causal mechanisms underlying experimentally evolved
populations. Weytjens B (Presented). EMBL: new model systems for linking evo-
lution and ecology. Heidelberg, Germany. May 10 2016.
8-12 CURRICULUM VITAE
Automatic identification of causal mechanisms underlying experimentally evolved
populations. Weytjens B (Presented). SETAC - iEOS environmental omics & epi-
genetics. Ghent, Belgium. September 12 2016.
Poster presentations at conferences
Automatic identification of causal mechanisms underlying experimentally evolved
populations. Weytjens B (presented), De Maeyer D, Vanderschaeve S. EMBL:
New approaches and concepts in microbiology. Heidelberg, Germany. October 13
2015.
Computational reasoning on genomics and transcriptomics data using interaction
networks. Weytjens B (presented), De Maeyer D, De Raedt L, Marchal K. BIG
N2N annual symposium. Ghent (zwijnaarde). May 21 2015. Poster: Automatic
identification of causal mechanisms underlying experimentally
PheNetic: Omics Interpretation Using Interaction Networks. De Maeyer D, Weytjens B
(presented), Renkens J, De Raedt L, Marchal K. 22nd Annual International Con-
ference on Intelligent Systems for Molecular Biology (ISMB). Boston, Ma. July
13 2014.
Attendance of symposia and conferences
SETAC - iEOS environmental omics & epigenetics. Ghent, Belgium. September
12 2016.
BIG N2N annual symposium. Ghent (zwijnaarde). May 19 2016.
EMBL: new model systems for linking evolution and ecology. Heidelberg, Ger-
many. May 10 2016.
BIG N2N annual symposium. Ghent (zwijnaarde). May 21 2015.
CURRICULUM VITAE 8-13
EMBL: New approaches and concepts in microbiology. Heidelberg, Germany. Oc-
tober 13 2015.
22nd Annual International Conference on Intelligent Systems for Molecular Biol-
ogy (ISMB). Boston, Ma. July 13 2014.
Courses and training followed
Sollicitatiegesprek (KU Leuven human resources). January 13 2017.
FLAMES summer school in statistics. Writing packages in R. September 5- Septem-
ber 9 2016.
FLAMES summer school in statistics. Multilevel analysis. September 5- Septem-
ber 9 2016.
Multi-Agent Systems (B-KUL-H02H4A). Second semester of academic year 2014-
2015.
Introductie leidinggeven voor doctorandi (KU Leuven human resources). May 29
2015.
Summerschool of microbial evolution: theory, simulation and experiment. May 6
May 7 2015.
Time and self management (KU Leuven human resources). May 19 2014.

8-14 CURRICULUM VITAE
Involvement in educational activities
Assisting at exercise sessions on principal component analysis, data clustering and
cluster validation at UGent first semester of academic year 2015-2016 and second
semester of academic year 2016-2017.
Chaired a session at the Microbial Evolution: theory, simulation and experiment
summer school. May 6- May 7 2015.
Thesis supervision of master thesis of Shauni Doms (Master Bioinformatics and
systems biology at UGent) title:” Het vinden van mutaties onder positieve selectie
door biologisch netwerk analyse”. September 2015 - June 2016.
Thesis Supervision of master thesis of Steven Vanderschaeve (Master Bioinformat-
ics and systems biology at UGent) titled: ”Netwerk-gebaseerde data-analyse voor
identificatie van antibiotica resistentie mechanismen in Escherichia coli”. Septem-
ber 2014 - June 2015.
AAdditions to chapter 4
A.1 Additional results
A.1.1 Transcriptional responses in Variovorax sp. WDL1 when
grown in consortium conditions
Genes involved in polyhydroxybutyrate (PHB) synthesis from acetoacetyl-CoA
(K03821, K00626 and K00023) were overexpressed in consortium conditions as
well as a large fraction of the genes determining the anabolic pentose phosphate
pathway (K00615, K01623, K00616, K01835, K00036 and K00033) including
genes encoding the conversion of -D-glucose-6P to D-ribulose-5P and of D217
glyceraldehyde-3P to D-ribulose-5P and/or D-ribose-5P (Additional Figure A1).
Another important fraction (88 CDS) of the enzyme encoding genes that were dif-
ferentially expressed, were involved in amino acid metabolism and PheNetic se-
lected several differentially expressed pathways related to amino acid metabolism.
Genes encoding interconversion reactions between molecules of the glutamate
family were differentially expressed (Additional Figure A2). Similarly, genes
involved in the degradation of phenylacetate to acetyl-CoA in the phenylalanine
metabolism were largely overexpressed in consortium conditions (Additional Fig-
ure A3. Moreover, in cysteine and methionine metabolism, several genes that were
involved in cycling of the central metabolite S- adenosylmethionine (K01251,
A-2 APPENDIX A
K00548, K00549, K00789) and genes involved in cysteine synthesis (K12339,
K00640) were underexpressed in consortium conditions (Additional Figure A4.
The differential expression of several genes encoding transporters involved in the
uptake of amino acid and carbohydrate molecules was also indicative of a metabolic
response upon co-culturing. Most of the transporters are members of the ATP-
binding cassette (ABC) superfamily. Changes in general cell metabolism were fur-
ther suggested by altered expression in pathways involved in sulfur and nitrogen
transport and metabolism. Pathways involved in sulfur transport and metabolism
were underexpressed in consortium conditions such as the synthesis of the sulfur
containing metabolite thiamine (K03147, K0315-4) as well as an operon spanning
three genes (K00390, K00381, K00957) involved in assimilatory sulfate reduc-
tion. Differentially expressed genes associated with nitrogen metabolism included
genes involved in ammonium and nitrate/nitrite transport (K03320, K02575), as-
similation of inorganic nitrogen via glutamine synthetase (K00370, K00373 and
K01915) and several nitrogen regulatory and sensor proteins (K07673, K07712
and K07708).
Also DNA metabolism appeared to be affected. Increased DNA synthesis in WDL1
when grown in consortium conditions is suggested by the underexpression of
degradation of purine and pyrimidine nucleotides (K00758, K01081), and overex-
pression of formation of deoxynucleotides (K02343, K02338, K01494, K00525).
See Additional Figure A5 and Additional Figure A6. In accordance with the sug-
gested increased DNA synthesis of WDL1, 20 genes involved in different mecha-
nisms of DNA repair and recombination were overexpressed (Figure 4.5 in chap-
ter 4). Also, a part of the porphyrin metabolism was selected by PheNetic. Addi-
tional manual analysis showed that genes involved in heme production (K01599,
K02495, K02492 and K01698) were overexpressed in consortium conditions. See
Additional Figure A7.
Besides the metabolic pathways that were mainly identified by Phenetic, additional
cellular systems were found to be differentially expressed between growth condi-
tions in WDL1 (Figure 4.5 in chapter 4). Several of those systems are related to
cell-to-cell interactions. These included overexpression under consortium condi-
tions of eight out of thirteen genes coding for a type VI secretion system (T6SS),
two genes that encode a toxin/antitoxin pair participating in systems mediating
contact- dependent inhibition (CDI), a gene encoding a putative adhesin and genes
encoding a putative quorum sensing circuit (Figure 4.5 in chapter 4). Interest-
ingly, the latter are located just downstream of linuron hydrolase encoding gene
hylA and encode a LuxR-type transcriptional regulator (K18098) and LuxI-type
acyl-homoserine lactone (AHL) synthase (K18096).
Another set of genes with altered expression are associated with stress response
indicating that WDL1 experiences cellular stress in consortium conditions. rpoH
and hrcA were overexpressed in consortium compared to monoculture conditions.
rpoH encodes sigma factor s32 which controls genes involved in heat shock re-
ADDITIONS TO CHAPTER 4 A-3
sponse and protein homeostasis. Genes encoding chaperones DnaK, DnaJ, GroEL,
GroES, HtpG and ClpB and a zinc protease were all overexpressed, whereas grpE
was underexpressed. The log2-fold change values of all genes mentioned in this
paragraph can be found in Table 4.2 in chapter 4
A.1.2 Transcriptional responses elicited in C. testosteroni WDL7
when grown in consortium biofilms
Another operon that was strongly affected in WDL7 in consortium conditions was
the glycerate biosynthesis operon (gcl; K01608, K00042, K01816). This operon
is involved in the conversion of glyoxylate to glycerate and showed clear over-
expression in consortium versus monoculture conditions. Its overexpression in
consortium conditions was confirmed by transcriptional fusion reporter analysis
(Supplementary Figure S4.2 B in chapter 4). Furthermore, seventeen out of 53
genes coding for ribosomal proteins in WDL7 were overexpressed in consortium
conditions. Nearly one third of the genes belonging to an unknown prophage ele-
ment were underexpressed. In contrast to WDL1, no differentially expressed genes
involved in cell-to-cell interaction were identified in WDL7 while overexpression
was observed for only one gene that is related to stress (dnaK, log2-fold change
of -1.3) and underexpression for one gene related to DNA repair and recombina-
tion (K01247, log2-fold change of 1.1). The log2-fold change values of all genes
mentioned in this paragraph can be found in Table 4.2 in chapter 4
A.2 Additional discussion
A.2.1 Semi-synthetic benchmarking set
The WDL1 hylA gene encoding linuron hydrolase showed strong overexpression
in consortium conditions. The higher expression of hylA per cell in WDL1 under
consortium conditions is remarkable but can be at least partially explained by re-
cent observations that (i) WDL1 consists of two subpopulations, one carrying hylA
and lacking the 3,4-DCA downstream pathway and one that carries only the 3,4-
DCA pathway, and (ii) the linuron-hydrolyzing WDL1 subpopulation becomes
more abundant (up to 10 fold) when grown in consortium conditions than when
grown in monoculture, as shown by qPCR targeting hylA and the dca gene cluster
in other identically operated biofilm experiments (P. Albers, unpublished results).
Regardless of the dynamics of the linuron-hydrolyzing WDL1 subpopulation, the
overall higher abundance of hylA transcripts in consortium conditions suggests an
increased production of HylA, which can obviously be linked with the enhanced
degradation of linuron in consortium biofilms. The pcaFIJ operon consisting of
A-4 APPENDIX A
three genes encoding the last steps in linuron conversion to TCA cycle intermedi-
ates, was underexpressed in WDL1 in consortium conditions. As in Sinorhizobium
meliloti, the pca operon of WDL1 is preceded by a regulatory gene that encodes an
IclR-type regulator which upon interaction with 3-oxoadipate results in induction
of the sinorhizobial pca operon [387]. This suggests that the pca operon in WDL1
is also inducible by 3-oxoadipate and that underexpression is possibly due to less
3-oxoadipate being used by WDL1 cells during consortium growth. On the other
hand, it could be speculated that a lower expression of the pca operon in WDL1 is a
consequence of catabolic repression by metabolic waste products or nutrients sup-
plied by the other strains [388]. Regarding the linuron catabolic genes in WDL7,
dcaB was the only gene of the dca operon of WDL7 that was slightly underex-
pressed in consortium condition. Other genes of the linuron catabolic operons of
WDL7 were all highly but not differentially expressed, supporting the assumption
that 3,4- DCA is a major carbon source for WDL7, not alone in monoculture, but
also in consortium biofilm conditions [172]. This observation further confirms that
there is metabolic association between WDL1 and WDL7 during linuron degrada-
tion.
A.3 Additional experimental procedures
A.3.0.1 Draft genome sequence of the consortium members
Cell cultures of strains WDL1, WDL6 and WDL7 for sequencing were prepared
as follows. WDL1 was plated from a cryoculture and grown on R2A [389] sup-
plemented with 20 mg L-1 linuron for 4 days at 25°C. WDL6 was plated and
grown on MMO agar plates supplemented with 1% (vol/vol) methanol [197] for
6 days at 25C; WDL7 was plated and grown on Luria-Bertani (LB) agar [390]
overnight at 25°C. A smear of colonies of WDL1, WDL6 and a colony of WDL7
was inoculated in R2B supplemented with 20 mg L-1 linuron, in liquid MMO
supplemented with 1% (vol/vol) methanol and in LB, respectively and cultures
were grown for 4 days, 4 days and overnight, respectively until exponential phase.
Genomic DNA was extracted from the cultures using the Puregene Core kit A (Qi-
agen) following the manufacturers instructions. A paired-end library (90 bp reads
with an insert length of 500 bp) of WDL6 genomic DNA was sequenced by BGI
Tech Solutions (Hong Kong) using the Illumina Hi-seq platform resulting into 418
MB of sequence information. Sequencing of the WDL7 and WDL1 genomes was
performed by Baseclear (The Netherlands) using Illumina Hi-seq based on 75 cy-
cle paired-ended reads with an insert length of 400 bp resulting in a total of 751
MB of WDL7 and 300 MB of WDL1 genomic sequence information. Nucleotides
with a PHRED quality score < 20 were trimmed from the end of raw reads and
trimmed reads with a length < 10 were discarded using the FASTX-Toolkit-0.0.12
software (http://hannonlab.cshl.edu/fastx toolkit/). Draft genome sequences were
ADDITIONS TO CHAPTER 4 A-5
obtained by assembling the trimmed paired-end reads into contigs using Velvet
(version 1.2.01) with an optimized k-mer length of 41, 51 and 41 for WDL1,
WDL6 and WDL7, respectively and a minimal contig length of 100 bp [391].
The draft genomes were annotated using the web-based RAST server [203]. The
PHAST web server was used to identify prophages in the bacterial genomes [392].
Undetected or erroneously annotated linuron catabolic genes were identified and
reannotated manually. The details of the draft genome assemblies are summarized
in Additional Table A1.
A.3.0.2 RNA extraction, library preparation and sequencing
Biofilm cells were flushed out of the flow chambers by injecting and pipetting up
and down (10 times) 1 mL of ice cold RNase-stop solution (5% water-saturated
phenol/95% ethanol mixture diluted (1:5 v/v) in deionized water). The cells were
snap frozen in liquid nitrogen and stored at -80°C. After thawing on ice, biofilm
biomass was pelleted by centrifugation at 15,000 g for 2 min at 4°C and total RNA
was extracted using the SV total RNA Isolation kit (Promega) with minor modifi-
cations. Briefly, the pellet was resuspended in 100 L lysis buffer containing 50 mg
mL-1 chicken egg white lysozyme (Sigma-Aldrich) and incubated for 4 minutes at
room temperature. Further extraction was performed according to the manufactur-
ers instructions, except that after washing and dissolving in RNase-free water, the
nucleic acid extract was treated twice with TURBO DNase using a TURBO DNA-
free kit (Ambion). Lack of DNA contamination was verified by conventional PCR
targeting the 16S rRNA gene of WDL1 and WDL7 as described in Supporting Ex-
perimental Procedures. rRNA was removed from the RNA extracts through sub-
tractive hybridization using the MICROBExpressTM kit (Ambion) according to
the manufacturers protocol. The rRNA-depleted RNA was dissolved in nuclease-
free water. RNA quality and concentration were estimated by spectrophotometry
(NanoDrop) and gel electrophoresis (Experion, Bio-Rad) before and after rRNA
depletion.
1.0 -1.5 ng of rRNA-depleted RNA was used to construct RNAseq libraries using
the ScriptSeqTMv2 RNAseq Library Preparation kit (Epicentre) for three consor-
tium biofilms, three WDL7 monoculture biofilms and one WDL1 monoculture
biofilm. Only one WDL1 biofilm RNA extract was used since insufficient RNA
was extracted from the other two WDL1 monoculture biofilm samples. Index reads
were added to the libraries using the Scriptseq Index PCR Primers (Epicentre) and
the barcoded libraries were PCR amplified according to the manufacturers instruc-
tions. The Agencourt AMPure XP system (Beckman Coulter) was used to purify
both the 3-terminal-tagged cDNA and the final RNAseq library. Size distribution
of the libraries was assessed by agarose gel electrophoresis. Library cDNA con-
centrations were quantified using a QubitTM fluorometer (Invitrogen) and adjusted
to 2 nM. Since WDL6 represents about 10% of the total biovolume in consortium
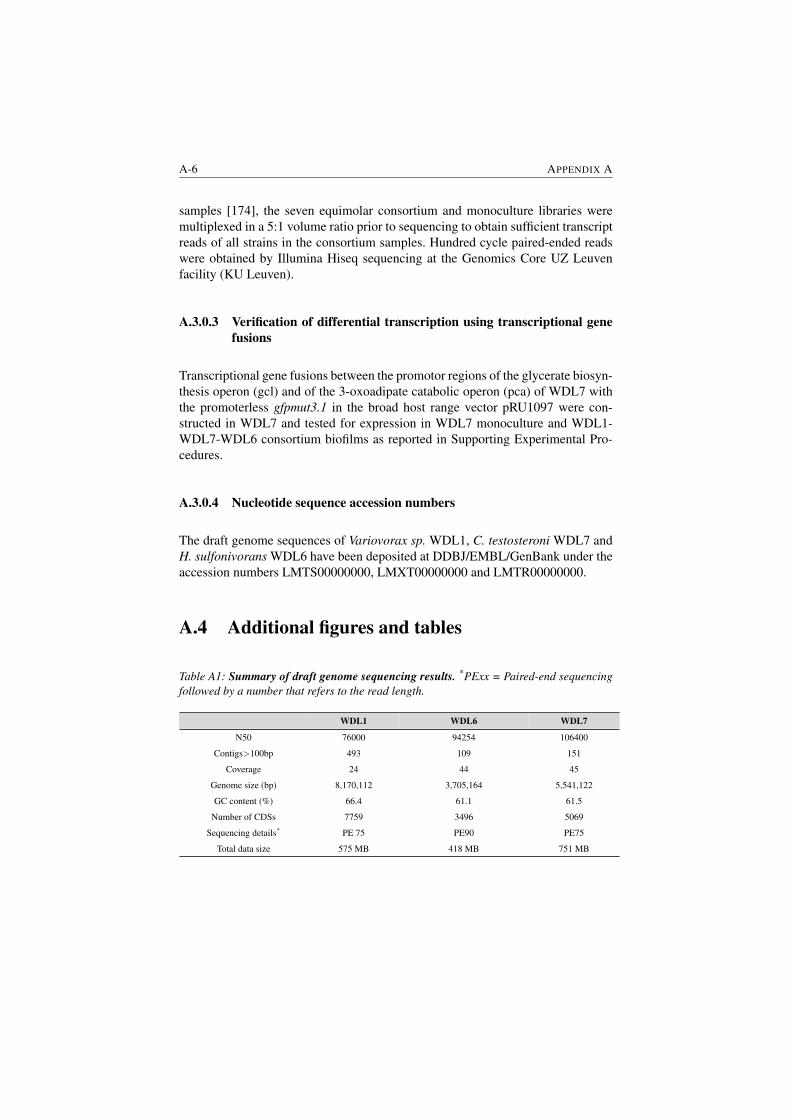
A-6 APPENDIX A
samples [174], the seven equimolar consortium and monoculture libraries were
multiplexed in a 5:1 volume ratio prior to sequencing to obtain sufficient transcript
reads of all strains in the consortium samples. Hundred cycle paired-ended reads
were obtained by Illumina Hiseq sequencing at the Genomics Core UZ Leuven
facility (KU Leuven).
A.3.0.3 Verification of differential transcription using transcriptional gene
fusions
Transcriptional gene fusions between the promotor regions of the glycerate biosyn-
thesis operon (gcl) and of the 3-oxoadipate catabolic operon (pca) of WDL7 with
the promoterless gfpmut3.1 in the broad host range vector pRU1097 were con-
structed in WDL7 and tested for expression in WDL7 monoculture and WDL1-
WDL7-WDL6 consortium biofilms as reported in Supporting Experimental Pro-
cedures.
A.3.0.4 Nucleotide sequence accession numbers
The draft genome sequences of Variovorax sp. WDL1, C. testosteroni WDL7 and
H. sulfonivorans WDL6 have been deposited at DDBJ/EMBL/GenBank under the
accession numbers LMTS00000000, LMXT00000000 and LMTR00000000.
A.4 Additional figures and tables
Table A1: Summary of draft genome sequencing results. *PExx = Paired-end sequencing
followed by a number that refers to the read length.
WDL1 WDL6 WDL7
N50 76000 94254 106400
Contigs>100bp 493 109 151
Coverage 24 44 45
Genome size (bp) 8,170,112 3,705,164 5,541,122
GC content (%) 66.4 61.1 61.5
Number of CDSs 7759 3496 5069
Sequencing details* PE 75 PE90 PE75
Total data size 575 MB 418 MB 751 MB
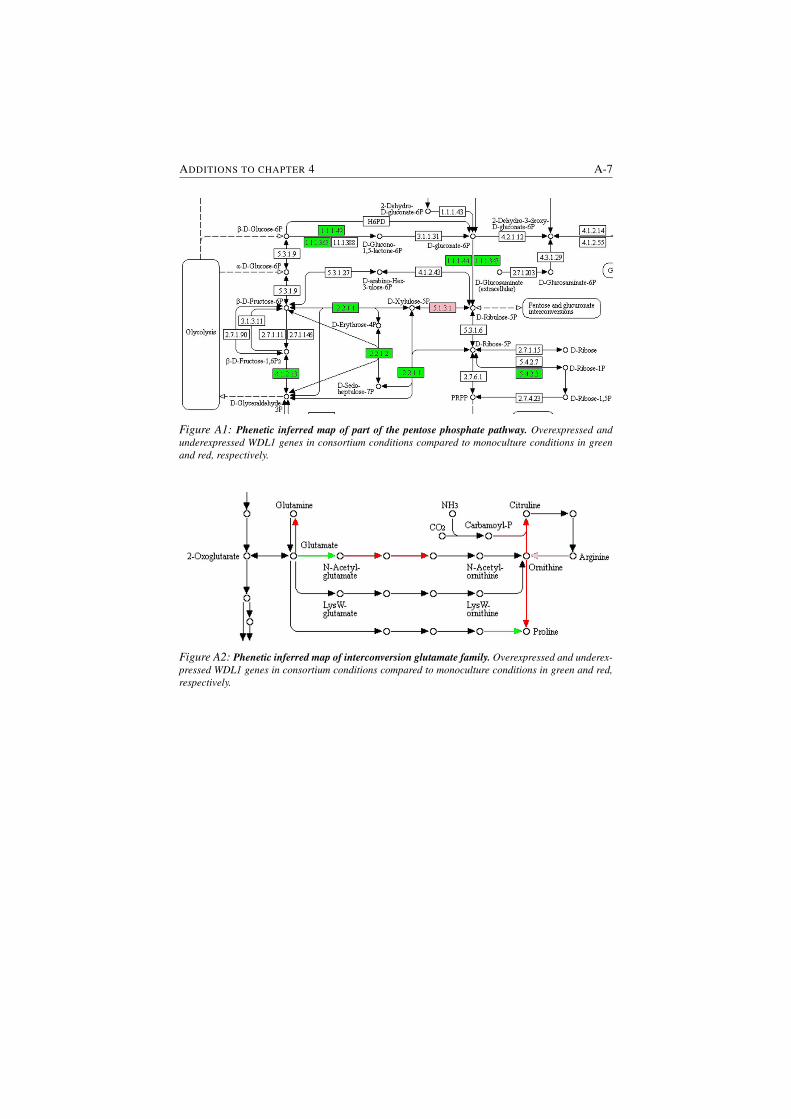
ADDITIONS TO CHAPTER 4 A-7
Figure A1: Phenetic inferred map of part of the pentose phosphate pathway. Overexpressed and
underexpressed WDL1 genes in consortium conditions compared to monoculture conditions in green
and red, respectively.
Figure A2: Phenetic inferred map of interconversion glutamate family. Overexpressed and underex-
pressed WDL1 genes in consortium conditions compared to monoculture conditions in green and red,
respectively.
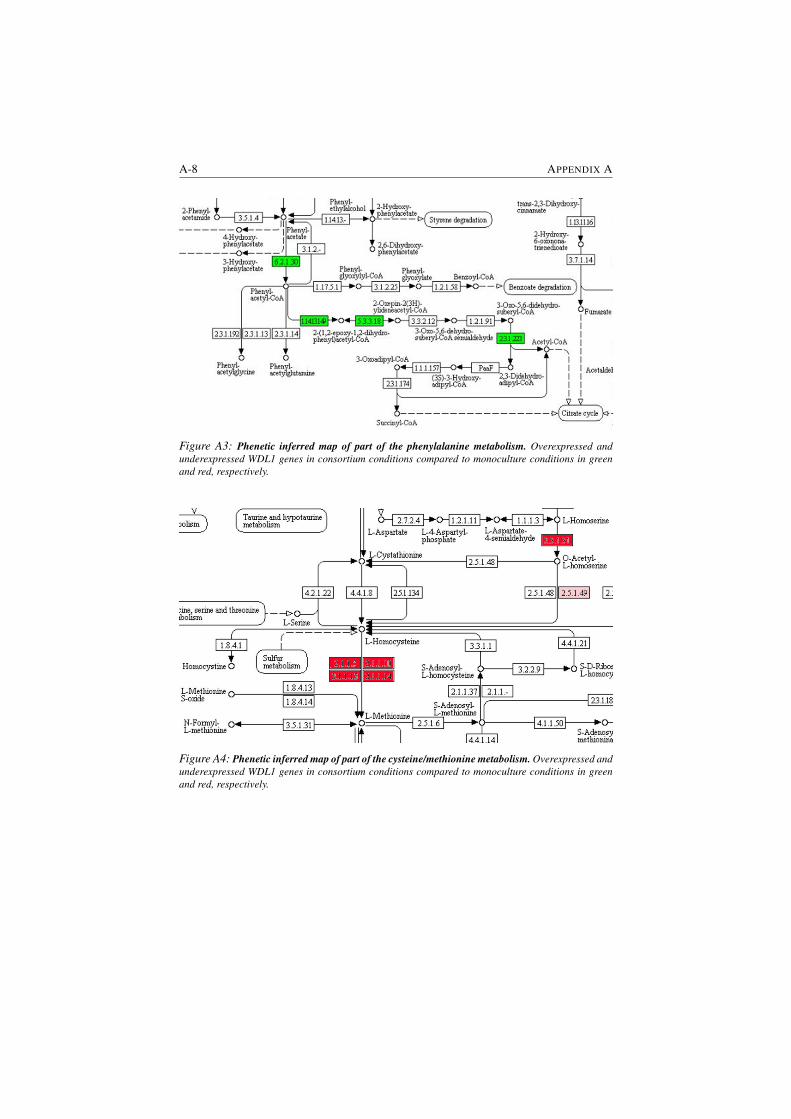
A-8 APPENDIX A
Figure A3: Phenetic inferred map of part of the phenylalanine metabolism. Overexpressed and
underexpressed WDL1 genes in consortium conditions compared to monoculture conditions in green
and red, respectively.
Figure A4: Phenetic inferred map of part of the cysteine/methionine metabolism. Overexpressed and
underexpressed WDL1 genes in consortium conditions compared to monoculture conditions in green
and red, respectively.
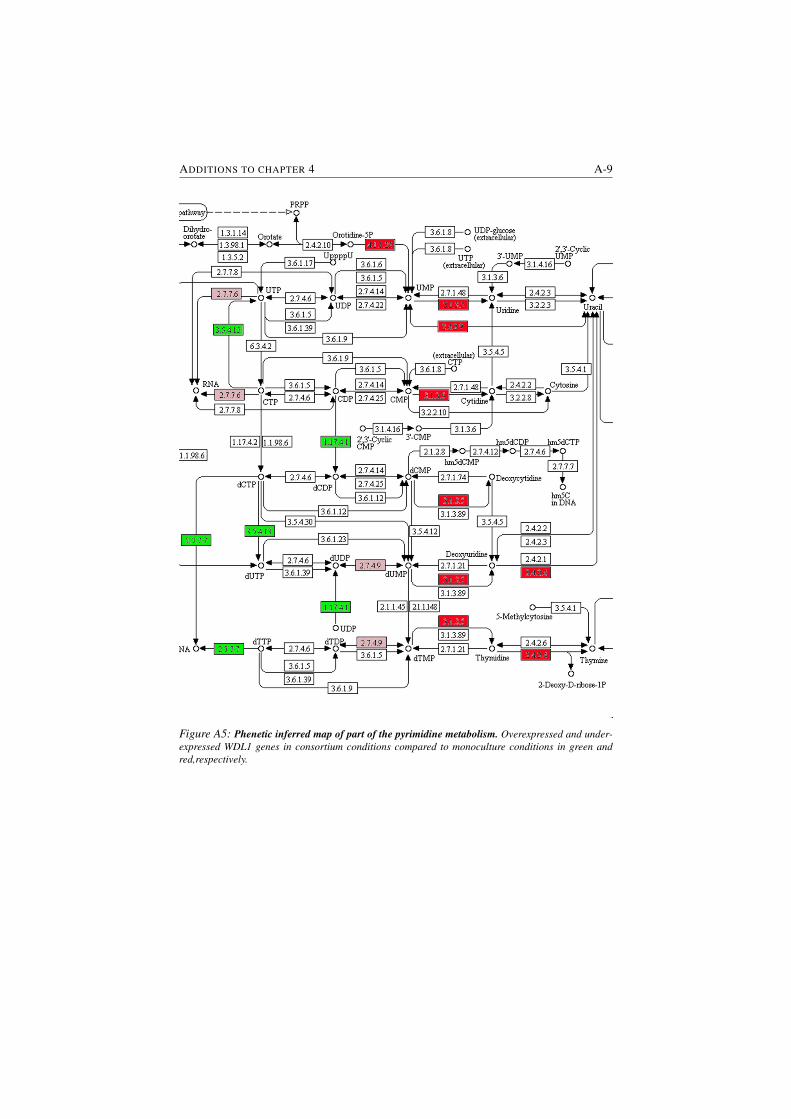
ADDITIONS TO CHAPTER 4 A-9
Figure A5: Phenetic inferred map of part of the pyrimidine metabolism. Overexpressed and under-
expressed WDL1 genes in consortium conditions compared to monoculture conditions in green and
red,respectively.
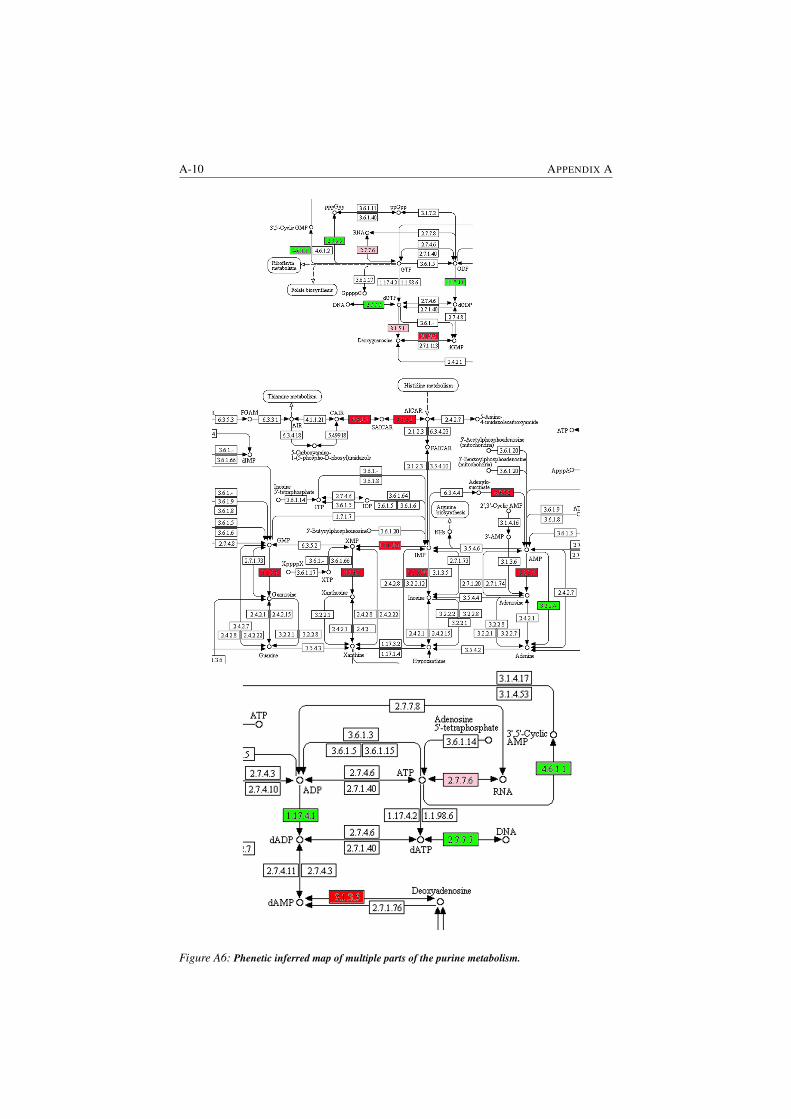
A-10 APPENDIX A
Figure A6: Phenetic inferred map of multiple parts of the purine metabolism.
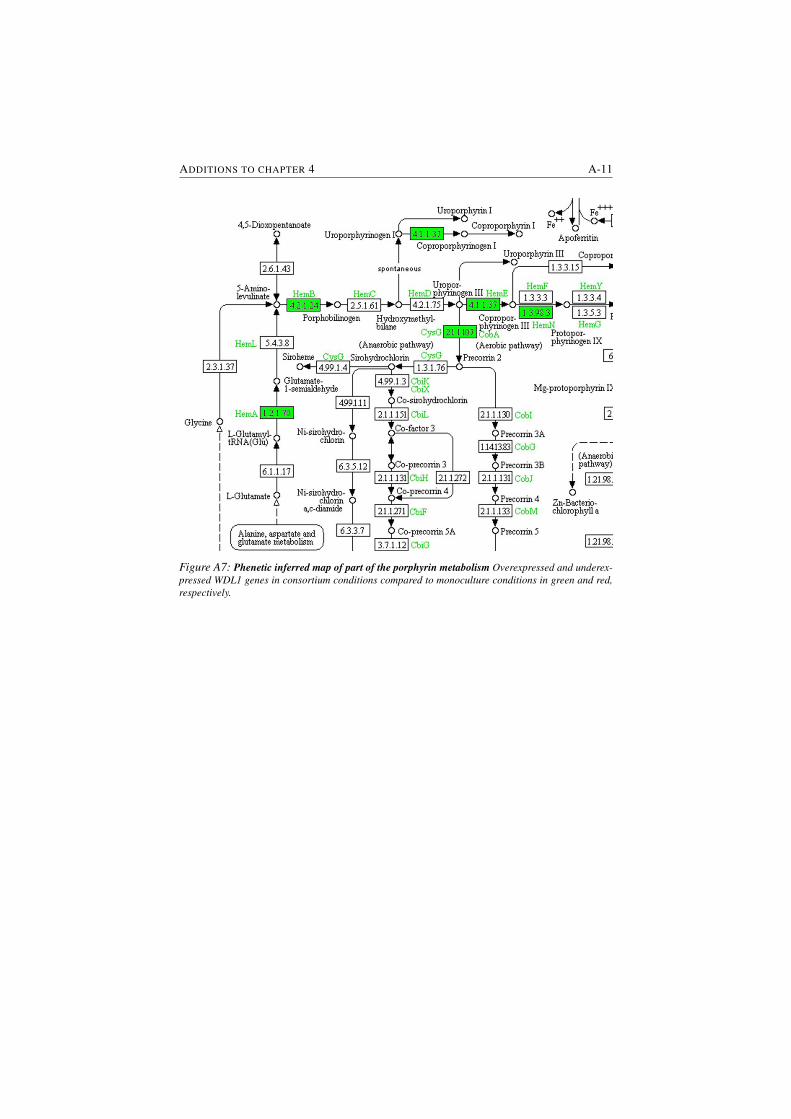
ADDITIONS TO CHAPTER 4 A-11
Figure A7: Phenetic inferred map of part of the porphyrin metabolism Overexpressed and underex-
pressed WDL1 genes in consortium conditions compared to monoculture conditions in green and red,
respectively.

BAdditions to chapter 6
B.1 Additional results
B.1.1 Hypothetical ethanol tolerance related pathways
Our analysis was able to select several molecular pathways that were previously
linked to the response to ethanol stress and to increasing ethanol tolerance. These
results show the potential of IAMBEE to comprehensively analyze complex mu-
tational datasets and select molecular pathways that are involved in the trait of in-
terest. Additionally, IAMBEE selected few molecular pathway that were not pre-
viously directly linked to ethanol tolerance, but that could hypothetically play a
role. These pathways are important, as they can provide new routes to genetically
engineer higher ethanol tolerance in industrially relevant strains. In what follows
we will shortly discuss some of these newly identified pathways and their possible
role in ethanol tolerance.
B.1.2 Transcription and translation
Other highly prioritized pathways are linked to transcription and translation. We
found a frequently mutated connected network component containing several well-
B-2 APPENDIX B
known genes involved in transcription termination and anti-termination (rho, nusG
and nusA). Additionally, we found a frequently mutated subnetwork containing
translation-linked genes encoding for 30S ribosomal subunit proteins (rpsL, rpsD,
rpsB and rpsH) and the protein chain initiation factor infB. Selection of these path-
ways further corroborates earlier results that demonstrate early ethanol-induced
transcription termination and ethanol-induced translational misreading during pro-
tein synthesis. Mutations in genes involved in transcription or translation might
confer higher ethanol tolerance through compensation for these toxic effects [393–
395].
Remarkably, we observed co-occurrence of mutations prioritized in transcription
(anti-) termination factors, such as rho, nusA and nusG and ribosomal genes, such
as rpsB, rpsD, rpsL and rpsH. These are consistently observed in the same popula-
tions and follow the same trajectories, suggesting that they are dependent on each
other in driving the observed tolerance towards ethanol (Figure 6.4, Figure 6.5 in
chapter 6). This observation suggests an epistatic interaction that corresponds to
previous findings of Freddolino et al. who showed that mutations in rpsL increase
ethanol tolerance in a mutant rho background [396] and Haft et al. who demon-
strated the role in ethanol tolerance of epistatic interactions between a mutation in
rho and rpsQ [393].
B.1.3 Osmotic stress response
Of note, also the envZ-ompR two-component system that regulates outer mem-
brane porin genes in response to changes in extracellular osmotic pressure was
prioritized [273, 274]. Ethanol increases membrane fluidity, thereby causing leak-
age and osmotic stress as shown by Goodarzi et al. [260]. Mutations in envZ and
ompR suggest adaptations to the increased osmotic stress under high ethanol con-
ditions.
B.1.4 Amino acid biosynthesis
Finally, several of the prioritized pathways and genes are involved in amino acid
biosynthesis, such as isoleucine and valine biosynthesis (ilvD, ilvC, ilvB, ilvE, ilvI,
tdcB), alanine and phenylalanine biosynthesis (ilvE, alaA), methionine biosynthe-
sis (metE, metB, metH), biosynthesis of tetrahydrofolic acid, which is a precur-
sor in the metabolism of amino acids (folD, purH), a gene involved in arginine
biosynthesis (argH), and a gene involved in threonine and glycine biosynthesis
(itaE) [397]. A role of amino acid biosynthesis and transport in tolerance towards
ethanol stress has previously been suggested in yeast, because of impaired deliv-
ery of amino acids into the cell as a result of membrane functions being disrupted
by ethanol [398, 399]. Our results are also in line with those of Horinouchi et al.
ADDITIONS TO CHAPTER 6 B-3
(2015) [400] who observed in their adapted ethanol tolerant strains upregulation
of several genes involved in amino acid biosynthesis. They attributed the upregu-
lation of amino acid biosynthesis genes to a significant decrease in expression of
genes related to the tricarboxylic acid (TCA) cycle and consequently of precursors
in amino acid biosynthesis [400].
B.1.5 DNA damage and repair
A molecular pathway of particular interest is the pathway containing genes in-
volved in DNA damage and repair, such as umuC, umuD, recF and recA. Both
UmuC and UmuD are subunits of the error-prone polymerase PolV, which is spe-
cialized in trans-lesion synthesis [401]. This polymerase has a LexA binding motif
in its promoter region and is consequently regulated by the SOS response [402].
Upon DNA damage, RecA binds to the single stranded DNA gap and induces
cleavage of the LexA repressor, resulting in activation of SOS genes necessary for
repair of the damaged DNA [403]. The selection of these genes strongly suggest
that ethanol causes DNA lesions and adaptation might occur through mutations in
genes involved in the repair. Interestingly, the rapA gene was also linked to this
pathway. RapA is an RNA polymerase recycling factor that enables recycling of
stalled RNA polymerases [404]. The selection of this gene further corroborates
the role of mutations found in rho, nusA and nusG, transcription termination or
anti-termination factors as described above.
B.1.6 Protein stress
Another interesting pathway contains genes involved in protein stress and protein
misfolding, such as dnaK, htpG and rpoH. Both DnaK (Hsp70) and HtpG (Hsp90
family) are chaperones involved in folding polypeptide chains and rescue of mis-
folded proteins [405,406]. They also interact with RpoH, the alternative sigma fac-
tor σ32, to control the heat shock response in response to temperature and increase
in misfolded proteins in E. coli [407]. Interestingly, overexpression of GroESL, an-
other chaperone system, was recently linked to increased viability upon exposure
to various organic solvents, such as ethanol and butanol [408]. Finally, the selec-
tion of this pathway substantiates the role of mutations found in rpsL rpsD, rpsB
and rpsH that possibly increase accuracy of translation by ribosomes as previously
discussed.
B-4 APPENDIX B
B.1.7 Acid stress response
The resulting pathways also include one that contains rstA, which encodes for a
transcriptional regulator. RstA is involved in many biological processes, such as
acid tolerance [409]. Upregulation of genes involved in the acid stress response in
response to ethanol stress was previously reported [259, 260].
B.1.8 Pyrroloquinoline quinone biosynthesis
A rather peculiar pathway that was selected contains genes cyoB and pqqL. Little
is known on the function of PqqL. Interestingly, pqqL from E. coli was able to
complement pqqE and pqqF mutants from Methylobacterium organophilum [410].
The pqqEF genes are required for pyrroloquinoline quinone (PQQ) biosynthesis
in Methylobacterium extorquens [411]. PQQ on his turn is a prosthetic group that
is required for many bacterial dehydrogenases, including alcohol dehydrogenases
[411, 412]. Hypothetically, pqqL might also play a role in PQQ cofactor synthesis
that is required for the function of alcohol dehydrogenases in E. coli. Goodarzi et
al. (2010) previously discovered ethanol degradation through adhE as an adaptive
strategy to high ethanol stress [260]. The mutated pqqL might confer a similar
resistance mechanism by activating an alcohol dehydrogenase through its PQQ
cofactor. Alternatively, it was found that PqqL interacts with proteins involved in
ribosome biogenesis, which might suggest an additional role in translation [413].
B.1.9 Biofilm formation
A final molecular pathway of particular interest contains the tamAB genes. Both
genes are frequently mutated in different parallel populations and mutations rise
in frequency in the initial selective sweep as well as in the second selective sweep.
TamA and TamB are components of a translocation and assembly complex. TamA
is the outer membrane protein while TamB is the inner membrane protein. The
complex is involved in secretion of the adhesin protein Ag43 [414]. Ag43 is in-
volved in biofilm formation by promoting cell-to-cell aggregation [415, 416]. Ex-
posure to stress conditions promotes to activation of biofilm formation, possibly
to decrease exposure to the stress and increase the chances to survive [417]. Alter-
ing the biofilm formation capabilities through mutations in the tamAB genes might
confer higher resistance to the ethanol stress.
ADDITIONS TO CHAPTER 6 B-5
B.2 Additional methods
B.2.1 Experimental evolution
We used a set of 16 parallel evolved E. coli populations. Of these highly ethanol-
tolerant populations, 7 originated from our previously conducted evolution exper-
iment [44]) and we initiated a new experiment using the same workflow to add
an additional 9 populations to the final dataset. All populations acquired a hyper-
mutator phenotype, which is necessary to enable evolution under near-lethal stress
conditions [44]). For ease of reading, we renamed al populations HT1-16 (High
Tolerance). In brief, all parallel populations originated from the same ancestral
strains SX4 and SX25. We used lysogeny broth (LB) supplemented with 5% (v/v)
ethanol as primary stress conditions to initiate the evolution experiment. We main-
tained growth in exponential phase in each population. As parameters to monitor
evolution, we used both the optical density (A595nm) and the time to reach a spe-
cific optical density, typical for exponential growth. When a population reached
exponential phase (A595nm around 0.2) within 24 hours, we transferred it to fresh
LB medium that was supplemented with an additional 0.5% (v/v) ethanol. If the
population needed more than 24 hours but less than 14 days to reach exponential
growth, we transferred it to fresh medium with the same percentage of ethanol. In
case the strain did not grow within 14 days, we revived the sample from the pre-
vious time point from the -80C stock and used it to restart the evolving population
in fresh medium with a 0.5% reduced ethanol concentration. Upon each transfer
to fresh medium, a sample was stored in a -80C glycerol stock for further analysis.
Based on the adaptation trajectories of these populations (Figure S6.1 in chapter
6) we decided to analyze both the selective sweep from 5% to 6% ethanol and
the selective sweep from 6% to 6.5% ethanol in order to also gain insight into the
temporal aspects of the adaptive pathways.
B.2.2 Sequencing and mutation calling
High-quality genomic DNA from overnight cultures of the ancestor and interme-
diate points of evolved populations was isolated (DNeasy Blood & Tissue kit, Qi-
agen). 100 bp paired-end sequencing libraries with an average insert size of 200
bp were prepared at GeneCore (EMBL, Heidelberg) and used for massive par-
allel sequencing with the Illumina HiSeq2000. We used CLC Genomics Work-
bench version 7.6 (https://www.qiagenbioinformatics.com) (RRID:SCR 011853)
for analysis of the sequences. Following quality assessment of the raw data, reads
were trimmed using quality scores of the individual bases (quality limit = 0.01;
maximum number of ambiguous bases = 2). Reads shorter than 15 bases were dis-
carded from the set. We used the CLC Assembly Cell 4.0 algorithm to map the
B-6 APPENDIX B
trimmed reads to the E. coli MG1655 reference genome (NC 000913.1) yielding
a minimal coverage of 150x (mismatch cost = 2; insertion cost = 3; deletion cost
= 3; length fraction = 0.8; similarity fraction = 0.8). Mutations were called using
the CLC Low Frequency Variant Detector (required significance = 1%; minimum
coverage = 10; minimum frequency = 10%). Finally, the mutations in the SX4
compared to the MG1655 reference genome were discarded.
B.2.3 Mapping of mutations to genes
The mapped mutations were checked for anomalies. Around position 570000-
580000 (DLP12 prophage) and position 1600000-1700000 (Qin prophage) we
found a very large number of mutations (Additional Figure B1 a). As the call-
ing of mutations in these prophage regions is likely erroneous, mutations in and
between prophage-related genes (i.e. aaaD, exoD, nohD, nohB, nohQ, rrrD, rzpD,
yecD, yfdL and ylcH) were filtered out (Additional Figure B1 b). There was also
a bias towards mutations in HT4, HT3, HT8, HT2, HT5 and HT9. In these popula-
tions 204 identical SNVs or INDELS were detected while these mutations did not
occur in one of the other populations. These populations originated from the new
evolution experiment. As opposed to the populations that we previously reported
on [44], these new populations were all initiated from a single ancestral popula-
tion. As these mutations are not independent from each other (Additional Figure
B2), we removed them from the analysis. Lastly, the lacZ gene shows a high num-
ber of mutations throughout the experiments but this was due to a known insertion
element ( [44, 252, 418]), which CLC did not call correctly. As such, mutations in
the lacZ gene were also discarded.
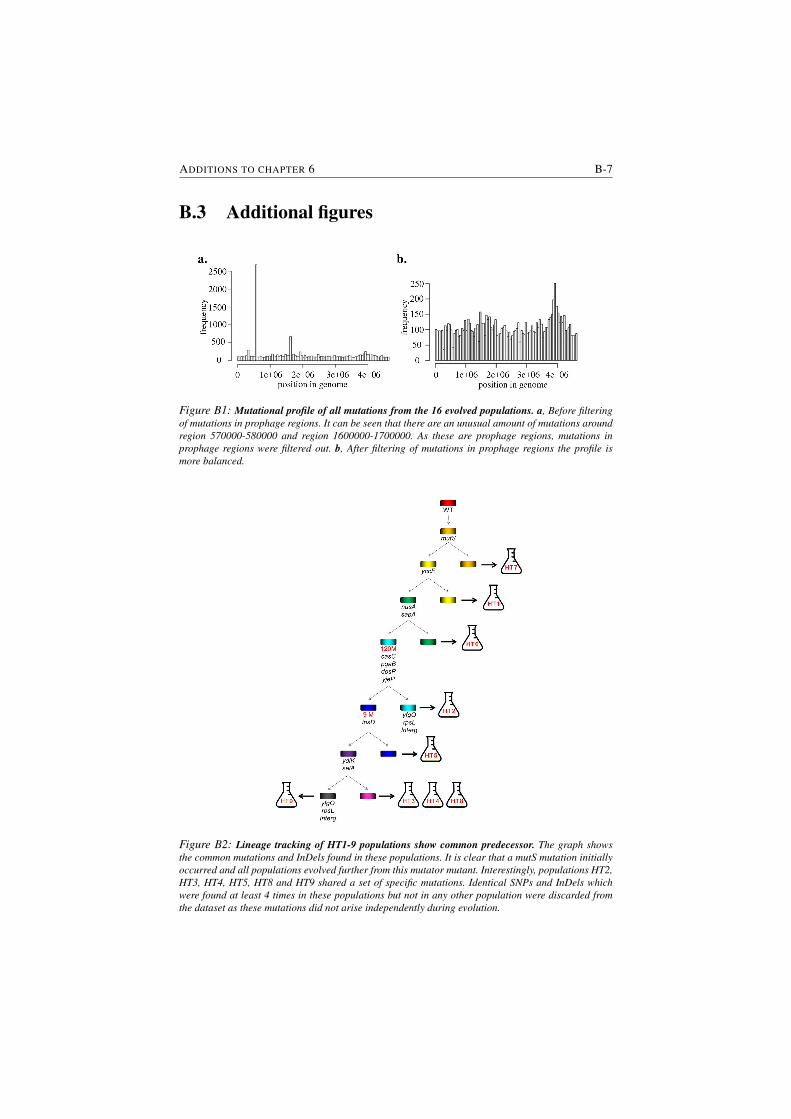
ADDITIONS TO CHAPTER 6 B-7
B.3 Additional figures
Figure B1: Mutational profile of all mutations from the 16 evolved populations. a, Before filtering
of mutations in prophage regions. It can be seen that there are an unusual amount of mutations around
region 570000-580000 and region 1600000-1700000. As these are prophage regions, mutations in
prophage regions were filtered out. b, After filtering of mutations in prophage regions the profile is
more balanced.
Figure B2: Lineage tracking of HT1-9 populations show common predecessor. The graph shows
the common mutations and InDels found in these populations. It is clear that a mutS mutation initially
occurred and all populations evolved further from this mutator mutant. Interestingly, populations HT2,
HT3, HT4, HT5, HT8 and HT9 shared a set of specific mutations. Identical SNPs and InDels which
were found at least 4 times in these populations but not in any other population were discarded from
the dataset as these mutations did not arise independently during evolution.

CAdditions to chapter 7
C.1 Literature-based evidence for frequently
predicted cancer drivers in the
TCGA PAN-cancer datasets
We also analyzed data from BLCA, COADREAD, GBM, HNSC, KIRC, LAML,
LUAD, LUSC, OV, UCEC and STAD datasets. These results can be found in the
online version of the paper presented in chapter 7. All datasets used for these anal-
yses were downloaded from GDAC firehose. Here we only focus on a detailed
description of genes that were prioritized recurrently in these datasets and that
were not yet mentioned as drivers in the used cancer gene reference databases.
Versican (VCAN) was selected in three out of twelve different pan-cancer datasets
(LUAD STAD, BLCA) and fell just below the PPV cutoff value in UCEC. VCAN
is a major component of the extracellular matrix (EM) involved in cell adhesion,
proliferation, migration and angiogenesis. Increased VCAN expression has been
observed in a wide range of malignant
tumors and has been associated with both cancer relapse and poor patient outcomes
[419–421]. Despite its well documented role in triggering tumor proliferation [422,
423], VCAN itself is not frequently mutated (mutations in 215 samples on a total of
C-2 APPENDIX C
5986 samples in the used pan-cancer datasets). In the LUAD dataset, VCAN was
interacting and mutual exclusive with EGFR, BCL9 and CTNNB1 (b1 catenin).
CTNNB1 is a well-known driver gene that plays a central molecule in the wnt
pathway and that is involved in the transcriptional regulation of VCAN [424]. The
uncovered mutual exclusivity pattern can be seen in Supplementary figure S7.4
in chapter 7.
BCL2L1 (BCL2 like 1, BCLX, BCLXL), belongs together with Mcl-1 to the Bcl2
family. BCL2L1 is an anti-apoptotic gene that has just like MCL1 has been ob-
served to be amplified in a variety of cancers. This is in accordance with our find-
ings where BCL2L1 was selected as a potential driver gene in 66% of the pan-
cancer datasets (OV, BLCA, COADREAD, LUAD, UCEC and LUSC) in which it
mostly had gains of copy number. Overexpression of anti-apoptotic Bcl-2 proteins
in cancers tilts the apoptosis signaling pathway towards cell survival. BCL2L1 is,
next to its role in promoting cancer cell survival by suppressing apoptosis, also
involved in promoting metastasis in a way that is independent of the anti-apoptotic
activity [341].
UBE2I Was prioritized in the ovarium (OV) and in the stomach adenocarcinoma
(STAD) pan-cancer datasets (as a linker gene). The ubiquitin-conjugating enzyme
9 (Ubc9), the sole conjugating enzyme for sumoylation, regulates protein function
and plays an important role in sumoylation-mediated cellular pathways. Sumoy-
lation plays a key role in DNA repair and tumorigenesis. Indeed, overexpress-
ing Ubc9 has been shown to contribute to EOC progression and cell proliferation
through the PI3K/Akt pathway [425]. In addition, the SUMO pathway mediated
by Ubc9 was shown to critically contribute to the transformed phenotype of KRAS
mutant cells [418]. UBE2I was prioritized in OV because of its association with
TP53 and RNF144B. The latter protein is an E3 ubiquitin-protein ligase that ac-
cepts ubiquitin from the E2 ubiquitin-conjugating enzymes UBE2L3 and UBE2L6
and then directly transfers the ubiquitin to targeted substrates, thereby promoting
their degradation. It induces apoptosis via a p53/TP53-dependent mechanism and
affects cell death by affecting the ubiquitin-dependent stability of BAX, a pro-
apoptotic protein [426].
References
[1] Jason A Reuter, Damek V Spacek, and Michael P Snyder. High-throughput sequenc-
ing technologies. Molecular cell, 58(4):586–597, 2015.
[2] Hui Ge, Albertha JM Walhout, and Marc Vidal. Integrating omicinformation: a
bridge between genomics and systems biology. TRENDS in Genetics, 19(10):551–
560, 2003.
[3] Andrew R Joyce and Bernhard Ø Palsson. The model organism as a system: inte-
grating’omics’ data sets. Nature reviews. Molecular cell biology, 7(3):198, 2006.
[4] Bernhard Palsson and Karsten Zengler. The challenges of integrating multi-omic
data sets. Nature chemical biology, 6(11):787, 2010.
[5] David Gomez-Cabrero, Imad Abugessaisa, Dieter Maier, Andrew Teschendorff,
Matthias Merkenschlager, Andreas Gisel, Esteban Ballestar, Erik Bongcam-Rudloff,
Ana Conesa, and Jesper Tegner. Data integration in the era of omics: current and
future challenges. BMC systems biology, 8(2):I1, 2014.
[6] Dries De Maeyer, Bram Weytjens, Joris Renkens, Luc De Raedt, and Kathleen Mar-
chal. PheNetic: network-based interpretation of molecular profiling data. Nucleic
acids research, page gkv347, 2015.
[7] Dries De Maeyer, Bram Weytjens, Luc De Raedt, and Kathleen Marchal. Network-
based analysis of eqtl data to prioritize driver mutations. Genome biology and evo-
lution, 8(3):481–494, 2016.
[8] Sergio Pulido-Tamayo, Bram Weytjens, Dries De Maeyer, and Kathleen Marchal.
SSA-ME Detection of cancer driver genes using mutual exclusivity by small subnet-
work analysis. Scientific reports, 6, 2016.
[9] Francis Crick. Central dogma of molecular biology. Nature, 227(5258):561–563,
1970.
[10] Fan Liu, Kate van Duijn, Johannes R Vingerling, Albert Hofman, Andre G Uitter-
linden, A Cecile JW Janssens, and Manfred Kayser. Eye color and the prediction of
complex phenotypes from genotypes. Current Biology, 19(5):R192–R193, 2009.
[11] Stephen J Chanock, Teri Manolio, Michael Boehnke, Eric Boerwinkle, David J
Hunter, Gilles Thomas, Joel N Hirschhorn, Goncalo Abecasis, David Altshuler,
Joan E Bailey-Wilson, et al. Replicating genotype–phenotype associations. Nature,
447(7145):655–660, 2007.
[12] Ray Wu. Nucleotide sequence analysis of DNA: I. Partial sequence of the cohesive
ends of bacteriophage λ and 186 DNA. Journal of molecular biology, 51(3):501–
521, 1970.
2 REFERENCES
[13] F Sanger, S Nicklen, and AR Coulson. DNA sequencing with chain-terminating
inhibitors. Proc. Natl. Acad. Sci. USA, 74:5463–5467, 1977.
[14] Mark P Sawicki, Ghassan Samara, Michael Hurwitz, and Edward Passaro. Human
genome project. The American journal of surgery, 165(2):258–264, 1993.
[15] Michael L Metzker. Sequencing technologiesthe next generation. Nature reviews
genetics, 11(1):31–46, 2010.
[16] Chengwei Luo, Despina Tsementzi, Nikos Kyrpides, Timothy Read, and Konstanti-
nos T Konstantinidis. Direct comparisons of Illumina vs. Roche 454 sequencing
technologies on the same microbial community DNA sample. PloS one, 7(2):e30087,
2012.
[17] Sara Goodwin, John D McPherson, and W Richard McCombie. Coming of age:
ten years of next-generation sequencing technologies. Nature Reviews Genetics,
17(6):333–351, 2016.
[18] Phillip EC Compeau, Pavel A Pevzner, and Glenn Tesler. How to apply de Bruijn
graphs to genome assembly. Nature biotechnology, 29(11):987–991, 2011.
[19] Ben Langmead and Steven L Salzberg. Fast gapped-read alignment with Bowtie 2.
Nature methods, 9(4):357–359, 2012.
[20] Kai Ye, Marcel H Schulz, Quan Long, Rolf Apweiler, and Zemin Ning. Pindel: a
pattern growth approach to detect break points of large deletions and medium sized
insertions from paired-end short reads. Bioinformatics, 25(21):2865–2871, 2009.
[21] Petr Danecek, Adam Auton, Goncalo Abecasis, Cornelis A Albers, Eric Banks,
Mark A DePristo, Robert E Handsaker, Gerton Lunter, Gabor T Marth, Stephen T
Sherry, et al. The variant call format and VCFtools. Bioinformatics, 27(15):2156–
2158, 2011.
[22] Mark A DePristo, Eric Banks, Ryan Poplin, Kiran V Garimella, Jared R Maguire,
Christopher Hartl, Anthony A Philippakis, Guillermo Del Angel, Manuel A Rivas,
Matt Hanna, et al. A framework for variation discovery and genotyping using next-
generation DNA sequencing data. Nature genetics, 43(5):491–498, 2011.
[23] Stephan J Sanders, Michael T Murtha, Abha R Gupta, John D Murdoch, Melanie J
Raubeson, A Jeremy Willsey, A Gulhan Ercan-Sencicek, Nicholas M DiLullo, Neel-
roop N Parikshak, Jason L Stein, et al. De novo mutations revealed by whole exome
sequencing are strongly associated with autism. Nature, 485(7397):237, 2012.
[24] Kaya Bilguvar, Ali Kemal Ozturk, Angeliki Louvi, Kenneth Y Kwan, Murim Choi,
Burak Tatli, Dilek Yalnizoglu, Beyhan Tuysuz, Ahmet Okay Caglayan, Sarenur
Gokben, et al. Whole exome sequencing identifies recessive WDR62 mutations in
severe brain malformations. Nature, 467(7312):207, 2010.
[25] Hubing Shi, Gatien Moriceau, Xiangju Kong, Mi-Kyung Lee, Hane Lee, Richard C
Koya, Charles Ng, Thinle Chodon, Richard A Scolyer, Kimberly B Dahlman, et al.
Melanoma whole exome sequencing identifies V600EB-RAF amplification-mediated
acquired B-RAF inhibitor resistance. Nature communications, 3:724, 2012.
[26] Francis O Walker. Huntington’s disease. The Lancet, 369(9557):218–228, 2007.
[27] Haichun Gao, Zamin K Yang, Terry J Gentry, Liyou Wu, Christopher W Schadt, and
Jizhong Zhou. Microarray-based analysis of microbial community RNAs by whole-
community RNA amplification. Applied and environmental microbiology, 73(2):563–
571, 2007.
REFERENCES 3
[28] Zhong Wang, Mark Gerstein, and Michael Snyder. RNA-Seq: a revolutionary tool
for transcriptomics. Nature reviews genetics, 10(1):57–63, 2009.
[29] Latha Ramdas, Kevin R Coombes, Keith Baggerly, Lynne Abruzzo, W Edward
Highsmith, Tammy Krogmann, Stanley R Hamilton, and Wei Zhang. Sources
of nonlinearity in cDNA microarray expression measurements. Genome Biology,
2(11):research0047–1, 2001.
[30] Y Tu, G Stolovitzky, and U Klein. Quantitative noise analysis for gene expres-
sion microarray experiments. Proceedings of the National Academy of Sciences,
99(22):14031–14036, 2002.
[31] Gordon Smyth. Limma: linear models for microarray data. Bioinformatics and
computational biology solutions using R and Bioconductor, pages 397–420, 2005.
[32] Hao Wu, M Kathleen Kerr, Xiangqin Cui, and Gary A Churchill. MAANOVA: a
software package for the analysis of spotted cDNA microarray experiments. In The
analysis of gene expression data, pages 313–341. Springer, 2003.
[33] Simon Anders, Paul Theodor Pyl, and Wolfgang Huber. HTSeqa Python frame-
work to work with high-throughput sequencing data. Bioinformatics, 31(2):166–169,
2015.
[34] Michael I Love, Wolfgang Huber, and Simon Anders. Moderated estimation of fold
change and dispersion for RNA-seq data with DESeq2. Genome biology, 15(12):550,
2014.
[35] Cole Trapnell, Adam Roberts, Loyal Goff, Geo Pertea, Daehwan Kim, David R Kel-
ley, Harold Pimentel, Steven L Salzberg, John L Rinn, and Lior Pachter. Differential
gene and transcript expression analysis of RNA-seq experiments with TopHat and
Cufflinks. Nature protocols, 7(3):562–578, 2012.
[36] Richard E Lenski, Michael R Rose, Suzanne C Simpson, and Scott C Tadler. Long-
term experimental evolution in Escherichia coli. I. Adaptation and divergence during
2,000 generations. The American Naturalist, 138(6):1315–1341, 1991.
[37] Michael Georg Hoesl, Stefan Oehm, Patrick Durkin, Elise Darmon, Lauri Peil, Hans-
Rudolf Aerni, Juri Rappsilber, Jesse Rinehart, David Leach, Dieter Soll, et al. Chem-
ical evolution of a bacterial proteome. Angewandte Chemie International Edition,
54(34):10030–10034, 2015.
[38] Bram Van den Bergh, Joran E Michiels, and Jan Michiels. Experimental Evolution
of Escherichia coli Persister Levels Using Cyclic Antibiotic Treatments. Bacterial
Persistence: Methods and Protocols, pages 131–143, 2016.
[39] Molly K Burke, Joseph P Dunham, Parvin Shahrestani, Kevin R Thornton, Michael R
Rose, and Anthony D Long. Genome-wide analysis of a long-term evolution experi-
ment with Drosophila. Nature, 467(7315):587, 2010.
[40] Martin Dragosits and Diethard Mattanovich. Adaptive laboratory evolution–
principles and applications for biotechnology. Microbial cell factories, 12(1):64,
2013.
[41] Olivier Tenaillon, Alejandra Rodrıguez-Verdugo, Rebecca L Gaut, Pamela McDon-
ald, Albert F Bennett, Anthony D Long, and Brandon S Gaut. The molecular diver-
sity of adaptive convergence. Science, 335(6067):457–461, 2012.
4 REFERENCES
[42] Takaaki Horinouchi, Kuniyasu Tamaoka, Chikara Furusawa, Naoaki Ono, Shingo
Suzuki, Takashi Hirasawa, Tetsuya Yomo, and Hiroshi Shimizu. Transcriptome
analysis of parallel-evolved Escherichia coli strains under ethanol stress. BMC ge-
nomics, 11(1):579, 2010.
[43] James D Winkler, Carlos Garcia, Michelle Olson, Emily Callaway, and Katy C
Kao. Evolved osmotolerant Escherichia coli mutants frequently exhibit defective N-
acetylglucosamine catabolism and point mutations in cell shape-regulating protein
MreB. Applied and environmental microbiology, 80(12):3729–3740, 2014.
[44] Toon Swings, Bram Van den Bergh, Sander Wuyts, Eline Oeyen, Karin Voordeckers,
Kevin J Verstrepen, Maarten Fauvart, Natalie Verstraeten, and Jan Michiels. Adaptive
tuning of mutation rates allows fast response to lethal stress in Escherichia coli.
eLife, 6:e22939, 2017.
[45] Charles J Vaske, Stephen C Benz, J Zachary Sanborn, Dent Earl, Christopher Szeto,
Jingchun Zhu, David Haussler, and Joshua M Stuart. Inference of patient-specific
pathway activities from multi-dimensional cancer genomics data using PARADIGM.
Bioinformatics, 26(12):i237–i245, 2010.
[46] Elina Zorde Khvalevsky, Racheli Gabai, Itzhak Haim Rachmut, Elad Horwitz, Zivia
Brunschwig, Ariel Orbach, Adva Shemi, Talia Golan, Abraham J Domb, Eylon
Yavin, et al. Mutant KRAS is a druggable target for pancreatic cancer. Proceed-
ings of the National Academy of Sciences, 110(51):20723–20728, 2013.
[47] Alberto Ocana and Atanasio Pandiella. Identifying breast cancer druggable onco-
genic alterations: lessons learned and future targeted options. Clinical Cancer Re-
search, 14(4):961–970, 2008.
[48] Manish A Shah and Jaffer A Ajani. Gastric canceran enigmatic and heterogeneous
disease. Jama, 303(17):1753–1754, 2010.
[49] K David Voduc, Maggie CU Cheang, Scott Tyldesley, Karen Gelmon, Torsten O
Nielsen, and Hagen Kennecke. Breast cancer subtypes and the risk of local and
regional relapse. Journal of Clinical Oncology, 28(10):1684–1691, 2010.
[50] Mel Greaves and Carlo C Maley. Clonal evolution in cancer. Nature, 481(7381):306,
2012.
[51] Ivana Bozic, Tibor Antal, Hisashi Ohtsuki, Hannah Carter, Dewey Kim, Sining Chen,
Rachel Karchin, Kenneth W Kinzler, Bert Vogelstein, and Martin A Nowak. Accu-
mulation of driver and passenger mutations during tumor progression. Proceedings
of the National Academy of Sciences, 107(43):18545–18550, 2010.
[52] Robert Weinberg. Tumor suppressor genes. Neuron, 11(2):191–196, 1993.
[53] Douglas Hanahan and Robert A Weinberg. The hallmarks of cancer. cell, 100(1):57–
70, 2000.
[54] Athanasia Pavlopoulou, Demetrios A Spandidos, and Ioannis Michalopoulos. Hu-
man cancer databases (Review). Oncology reports, 33(1):3–18, 2015.
[55] John N Weinstein, Eric A Collisson, Gordon B Mills, Kenna R Mills Shaw, Brad A
Ozenberger, Kyle Ellrott, Ilya Shmulevich, Chris Sander, Joshua M Stuart, Cancer
Genome Atlas Research Network, et al. The cancer genome atlas pan-cancer anal-
ysis project. Nature genetics, 45(10):1113–1120, 2013.
REFERENCES 5
[56] Thomas J Hudson, Warwick Anderson, Axel Aretz, Anna D Barker, Cindy Bell,
Rosa R Bernabe, MK Bhan, Fabien Calvo, Iiro Eerola, Daniela S Gerhard, et al.
International network of cancer genome projects. Nature, 464(7291):993–998, 2010.
[57] Ronald S Burt, Martin Kilduff, and Stefano Tasselli. Social network analysis: Foun-
dations and frontiers on advantage. Annual review of psychology, 64:527–547,
2013.
[58] Stephen P Borgatti, Ajay Mehra, Daniel J Brass, and Giuseppe Labianca. Network
analysis in the social sciences. science, 323(5916):892–895, 2009.
[59] Jurgen Schmidhuber. Deep learning in neural networks: An overview. Neural net-
works, 61:85–117, 2015.
[60] Lore Cloots and Kathleen Marchal. Network-based functional modeling of ge-
nomics, transcriptomics and metabolism in bacteria. Current opinion in microbi-
ology, 14(5):599–607, 2011.
[61] Aminael Sanchez-Rodrıguez, Lore Cloots, and Kathleen Marchal. Omics derived
networks in bacteria. Current Bioinformatics, 8(4):489–495, 2013.
[62] Patrik Dhaeseleer, Shoudan Liang, and Roland Somogyi. Genetic network inference:
from co-expression clustering to reverse engineering. Bioinformatics, 16(8):707–
726, 2000.
[63] Arun K Ramani, Zhihua Li, G Traver Hart, Mark W Carlson, Daniel R Boutz,
and Edward M Marcotte. A map of human protein interactions derived from co-
expression of human mRNAs and their orthologs. Molecular systems biology,
4(1):180, 2008.
[64] Damian Szklarczyk, Andrea Franceschini, Stefan Wyder, Kristoffer Forslund, Da-
vide Heller, Jaime Huerta-Cepas Milan Simonovic, Alexander Roth, Alberto Santos,
Kalliopi P. Tsafou, Michael Kuhn, Peer Bork, and Lars J. Jensen Christian von Mer-
ing. STRING v10: proteinprotein interaction networks, integrated over the tree of
life. Nucleic Acid Research, 2015.
[65] Robert Hoffmann, Martin Krallinger, Eduardo Andres, Javier Tamames, Christian
Blaschke, and Alfonso Valencia. Text mining for metabolic pathways, signaling cas-
cades, and protein networks. Sci STKE, 283:e21, 2005.
[66] Sofie Van Landeghem, Filip Ginter, Yves Van de Peer, and Tapio Salakoski. EVEX:
a PubMed-scale resource for homology-based generalization of text mining predic-
tions. In Proceedings of BioNLP 2011 workshop, pages 28–37. Association for Com-
putational Linguistics, 2011.
[67] Tomas Klingstrom and Dariusz Plewczynski. Protein–protein interaction and path-
way databases, a graphical review. Briefings in bioinformatics, 12(6):702–713,
2011.
[68] Michael E Cusick, Haiyuan Yu, Alex Smolyar, Kavitha Venkatesan, Anne-Ruxandra
Carvunis, Nicolas Simonis, Jean-Francois Rual, Heather Borick, Pascal Braun,
Matija Dreze, et al. Literature-curated protein interaction datasets. Nature meth-
ods, 6(1):39–46, 2009.
[69] Sandra Orchard, Samuel Kerrien, Sara Abbani, Bruno Aranda, Jignesh Bhate, Shelby
Bidwell, Alan Bridge, Leonardo Briganti, Fiona SL Brinkman, Gianni Cesareni,
et al. Protein interaction data curation: the International Molecular Exchange
(IMEx) consortium. Nature methods, 9(4):345–350, 2012.
6 REFERENCES
[70] Soon-Hyung Yook, Zoltan N Oltvai, and Albert-Laszlo Barabasi. Functional and
topological characterization of protein interaction networks. Proteomics, 4(4):928–
942, 2004.
[71] Erik RP Zuiderweg. Mapping protein- protein interactions in solution by NMR spec-
troscopy. Biochemistry, 41(1):1–7, 2002.
[72] SH Sleigh, PR Seavers, AJ Wilkinson, JE Ladbury, and JRH Tame. Crystallographic
and calorimetric analysis of peptide binding to OppA protein. Journal of molecular
biology, 291(2):393–415, 1999.
[73] Tord Berggard, Sara Linse, and Peter James. Methods for the detection and analysis
of protein–protein interactions. Proteomics, 7(16):2833–2842, 2007.
[74] Stanley Fields and Rolf Sternglanz. The two-hybrid system: an assay for protein-
protein interactions. Trends in Genetics, 10(8):286–292, 1994.
[75] Mike P Williamson and Michael J Sutcliffe. Protein–protein interactions, 2010.
[76] Orland Gonzalez. Protein–Protein Interaction Databases. In Encyclopedia of Sys-
tems Biology, pages 1786–1790. Springer, 2013.
[77] Baolin Liu and Bo Hu. HPRD: a high performance RDF database. International
Journal of Parallel, Emergent and Distributed Systems, 25(2):123–133, 2010.
[78] Johannes Goll, Seesandra V Rajagopala, Shen C Shiau, Hank Wu, Brian T Lamb,
and Peter Uetz. MPIDB: the microbial protein interaction database. Bioinformatics,
24(15):1743–1744, 2008.
[79] Andrew Chatr-Aryamontri, Bobby-Joe Breitkreutz, Rose Oughtred, Lorrie Boucher,
Sven Heinicke, Daici Chen, Chris Stark, Ashton Breitkreutz, Nadine Kolas, Lara
O’donnell, et al. The BioGRID interaction database: 2015 update. Nucleic acids
research, 43(D1):D470–D478, 2015.
[80] Bruno Aranda, Hagen Blankenburg, Samuel Kerrien, Fiona SL Brinkman, Arnaud
Ceol, Emilie Chautard, Jose M Dana, Javier De Las Rivas, Marine Dumousseau, Eu-
genia Galeota, et al. PSICQUIC and PSISCORE: accessing and scoring molecular
interactions. Nature methods, 8(7):528–529, 2011.
[81] Denis Thieffry, Araceli M Huerta, Ernesto Perez-Rueda, and Julio Collado-Vides.
From specific gene regulation to genomic networks: a global analysis of transcrip-
tional regulation in Escherichia coli. Bioessays, 20(5):433–440, 1998.
[82] Gerd Anders, Sebastian D Mackowiak, Marvin Jens, Jonas Maaskola, Andreas
Kuntzagk, Nikolaus Rajewsky, Markus Landthaler, and Christoph Dieterich. do-
RiNA: a database of RNA interactions in post-transcriptional regulation. Nucleic
acids research, 40(D1):D180–D186, 2012.
[83] Michael J Buck and Jason D Lieb. ChIP-chip: considerations for the design, anal-
ysis, and application of genome-wide chromatin immunoprecipitation experiments.
Genomics, 83(3):349–360, 2004.
[84] Terrence S Furey. ChIP–seq and beyond: new and improved methodologies to detect
and characterize protein–DNA interactions. Nature Reviews Genetics, 13(12):840–
852, 2012.
[85] Dominic Schmidt, Michael D Wilson, Christiana Spyrou, Gordon D Brown, James
Hadfield, and Duncan T Odom. ChIP-seq: using high-throughput sequencing to
discover protein–DNA interactions. Methods, 48(3):240–248, 2009.
REFERENCES 7
[86] S Balaji, M Madan Babu, Lakshminarayan M Iyer, Nicholas M Luscombe, and L Ar-
avind. Comprehensive analysis of combinatorial regulation using the transcriptional
regulatory network of yeast. Journal of molecular biology, 360(1):213–227, 2006.
[87] Jason Ernst, Qasim K Beg, Krin A Kay, Gabor Balazsi, Zoltan N Oltvai, and Ziv
Bar-Joseph. A semi-supervised method for predicting transcription factor–gene in-
teractions in Escherichia coli. PLoS Comput Biol, 4(3):e1000044, 2008.
[88] Karen Lemmens, Tijl De Bie, Thomas Dhollander, Sigrid C De Keersmaecker,
Inge M Thijs, Geert Schoofs, Ami De Weerdt, Bart De Moor, Jos Vanderleyden, Julio
Collado-Vides, et al. DISTILLER: a data integration framework to reveal condition
dependency of complex regulons in Escherichia coli. Genome biology, 10(3):R27,
2009.
[89] Riet De Smet and Kathleen Marchal. Advantages and limitations of current network
inference methods. Nature Reviews Microbiology, 8(10):717–729, 2010.
[90] Heladia Salgado, Martin Peralta-Gil, Socorro Gama-Castro, Alberto Santos-
Zavaleta, Luis Muniz-Rascado, Jair S Garcıa-Sotelo, Verena Weiss, Hilda Solano-
Lira, Irma Martınez-Flores, Alejandra Medina-Rivera, et al. RegulonDB v8. 0: omics
data sets, evolutionary conservation, regulatory phrases, cross-validated gold stan-
dards and more. Nucleic acids research, 41(D1):D203–D213, 2013.
[91] Mark B Gerstein, Anshul Kundaje, Manoj Hariharan, Stephen G Landt, Koon-Kiu
Yan, Chao Cheng, Xinmeng Jasmine Mu, Ekta Khurana, Joel Rozowsky, Roger
Alexander, et al. Architecture of the human regulatory network derived from EN-
CODE data. Nature, 489(7414):91–100, 2012.
[92] Hong-Mei Zhang, Hu Chen, Wei Liu, Hui Liu, Jing Gong, Huili Wang, and An-Yuan
Guo. AnimalTFDB: a comprehensive animal transcription factor database. Nucleic
acids research, 40(D1):D144–D149, 2012.
[93] Pavel S Novichkov, Olga N Laikova, Elena S Novichkova, Mikhail S Gelfand,
Adam P Arkin, Inna Dubchak, and Dmitry A Rodionov. RegPrecise: a database
of curated genomic inferences of transcriptional regulatory interactions in prokary-
otes. Nucleic acids research, 38(suppl 1):D111–D118, 2010.
[94] You-Kwan Oh, Bernhard O Palsson, Sung M Park, Christophe H Schilling, and Rad-
hakrishnan Mahadevan. Genome-scale reconstruction of metabolic network in Bacil-
lus subtilis based on high-throughput phenotyping and gene essentiality data. Journal
of Biological Chemistry, 282(39):28791–28799, 2007.
[95] John W Pinney, Martin W Shirley, Glenn A McConkey, and David R Westhead.
metaSHARK: software for automated metabolic network prediction from DNA se-
quence and its application to the genomes of Plasmodium falciparum and Eimeria
tenella. Nucleic acids research, 33(4):1399–1409, 2005.
[96] Ross Overbeek, Robert Olson, Gordon D Pusch, Gary J Olsen, James J Davis, Terry
Disz, Robert A Edwards, Svetlana Gerdes, Bruce Parrello, Maulik Shukla, et al. The
SEED and the Rapid Annotation of microbial genomes using Subsystems Technology
(RAST). Nucleic acids research, 42(D1):D206–D214, 2014.
[97] Yuki Moriya, Masumi Itoh, Shujiro Okuda, Akiyasu C Yoshizawa, and Minoru Kane-
hisa. KAAS: an automatic genome annotation and pathway reconstruction server.
Nucleic acids research, 35(suppl 2):W182–W185, 2007.
8 REFERENCES
[98] Shujiro Okuda, Takuji Yamada, Masami Hamajima, Masumi Itoh, Toshiaki
Katayama, Peer Bork, Susumu Goto, and Minoru Kanehisa. KEGG Atlas map-
ping for global analysis of metabolic pathways. Nucleic acids research, 36(suppl
2):W423–W426, 2008.
[99] Peter D Karp, Suzanne M Paley, Markus Krummenacker, Mario Latendresse,
Joseph M Dale, Thomas J Lee, Pallavi Kaipa, Fred Gilham, Aaron Spaulding, Liviu
Popescu, et al. Pathway Tools version 13.0: integrated software for pathway/genome
informatics and systems biology. Briefings in bioinformatics, 11(1):40–79, 2010.
[100] Minoru Kanehisa, Yoko Sato, Masayuki Kawashima, Miho Furumichi, and Mao Tan-
abe. KEGG as a reference resource for gene and protein annotation. Nucleic Acid
Research, 2016.
[101] Ida Schomburg, Antje Chang, and Dietmar Schomburg. BRENDA, enzyme data and
metabolic information. Nucleic acids research, 30(1):47–49, 2002.
[102] Ron Caspi, Richard Billington, Luciana Ferrer, Hartmut Foerster, Carol A Fulcher,
Ingrid M Keseler, Anamika Kothari, Markus Krummenacker, Mario Latendresse,
Lukas A Mueller, et al. The MetaCyc database of metabolic pathways and enzymes
and the BioCyc collection of pathway/genome databases. Nucleic acids research,
44(D1):D471–D480, 2016.
[103] Kun Ping Lu, Yih-Cherng Liou, and Xiao Zhen Zhou. Pinning down proline-directed
phosphorylation signaling. Trends in cell biology, 12(4):164–172, 2002.
[104] Wangsen Cao, Clare Bao, Elizaveta Padalko, and Charles J Lowenstein. Acetylation
of mitogen-activated protein kinase phosphatase-1 inhibits Toll-like receptor signal-
ing. Journal of Experimental Medicine, 205(6):1491–1503, 2008.
[105] Gregory M Barton and Ruslan Medzhitov. Toll-like receptor signaling pathways.
Science, 300(5625):1524–1525, 2003.
[106] Matthias Mann and Ole N Jensen. Proteomic analysis of post-translational modifi-
cations. Nature biotechnology, 21(3):255–261, 2003.
[107] Jesper V Olsen, Blagoy Blagoev, Florian Gnad, Boris Macek, Chanchal Kumar, Peter
Mortensen, and Matthias Mann. Global, in vivo, and site-specific phosphorylation
dynamics in signaling networks. Cell, 127(3):635–648, 2006.
[108] Arnon Paz, Zippora Brownstein, Yaara Ber, Shani Bialik, Eyal David, Dorit Sagir,
Igor Ulitsky, Ran Elkon, Adi Kimchi, Karen B Avraham, et al. SPIKE: a database
of highly curated human signaling pathways. Nucleic acids research, 39(suppl -
1):D793–D799, 2011.
[109] Albert-Laszlo Barabasi and Zoltan N Oltvai. Network biology: understanding the
cell’s functional organization. Nature reviews genetics, 5(2):101–113, 2004.
[110] Enrico Glaab, Anaıs Baudot, Natalio Krasnogor, Reinhard Schneider, and Alfonso
Valencia. EnrichNet: network-based gene set enrichment analysis. Bioinformatics,
28(18):i451–i457, 2012.
[111] Omer Basha, Shoval Tirman, Amir Eluk, and Esti Yeger-Lotem. ResponseNet2. 0:
revealing signaling and regulatory pathways connecting your proteins and genesnow
with human data. Nucleic acids research, 41(W1):W198–W203, 2013.
[112] Lieven PC Verbeke, Lore Cloots, Piet Demeester, Jan Fostier, and Kathleen Marchal.
EPSILON: an eQTL prioritization framework using similarity measures derived from
local networks. Bioinformatics, 29(10):1308–1316, 2013.
REFERENCES 9
[113] Roded Sharan, Igor Ulitsky, and Ron Shamir. Network-based prediction of protein
function. Molecular systems biology, 3(1):88, 2007.
[114] Ulrich Stelzl, Uwe Worm, Maciej Lalowski, Christian Haenig, Felix H Brembeck,
Heike Goehler, Martin Stroedicke, Martina Zenkner, Anke Schoenherr, Susanne
Koeppen, et al. A human protein-protein interaction network: a resource for an-
notating the proteome. Cell, 122(6):957–968, 2005.
[115] Falk Schreiber and Henning Schwobbermeyer. MAVisto: a tool for the exploration
of network motifs. Bioinformatics, 21(17):3572–3574, 2005.
[116] Roded Sharan and Trey Ideker. Modeling cellular machinery through biological
network comparison. Nature biotechnology, 24(4):427–433, 2006.
[117] David Warde-Farley, Sylva L Donaldson, Ovi Comes, Khalid Zuberi, Rashad
Badrawi, Pauline Chao, Max Franz, Chris Grouios, Farzana Kazi, Christian Tannus
Lopes, et al. The GeneMANIA prediction server: biological network integration for
gene prioritization and predicting gene function. Nucleic acids research, 38(suppl
2):W214–W220, 2010.
[118] Oved Ourfali, Tomer Shlomi, Trey Ideker, Eytan Ruppin, and Roded Sharan. SPINE:
a framework for signaling-regulatory pathway inference from cause-effect experi-
ments. Bioinformatics, 23(13):i359–i366, 2007.
[119] Steven Maere, Karel Heymans, and Martin Kuiper. BiNGO: a Cytoscape plugin to
assess overrepresentation of gene ontology categories in biological networks. Bioin-
formatics, 21(16):3448–3449, 2005.
[120] Stephen Oliver. Proteomics: guilt-by-association goes global. Nature,
403(6770):601–603, 2000.
[121] David Altshuler, Mark Daly, and Leonid Kruglyak. Guilt by association. Nature
genetics, 26(2):135–138, 2000.
[122] Francois Fouss, Kevin Francoisse, Luh Yen, Alain Pirotte, and Marco Saerens. An
experimental investigation of kernels on graphs for collaborative recommendation
and semisupervised classification. Neural networks, 31:53–72, 2012.
[123] Lieven PC Verbeke, Jimmy Van den Eynden, Ana Carolina Fierro, Piet Demeester,
Jan Fostier, and Kathleen Marchal. Pathway relevance ranking for tumor samples
through network-based data integration. PloS one, 10(7):e0133503, 2015.
[124] Mark DM Leiserson, Fabio Vandin, Hsin-Ta Wu, Jason R Dobson, Jonathan V
Eldridge, Jacob L Thomas, Alexandra Papoutsaki, Younhun Kim, Beifang Niu,
Michael McLellan, et al. Pan-cancer network analysis identifies combinations of
rare somatic mutations across pathways and protein complexes. Nature genetics,
47(2):106–114, 2015.
[125] Chen-Hsiang Yeang, Trey Ideker, and Tommi Jaakkola. Physical network models.
Journal of computational biology, 11(2-3):243–262, 2004.
[126] Paul Shannon, Andrew Markiel, Owen Ozier, Nitin S Baliga, Jonathan T Wang,
Daniel Ramage, Nada Amin, Benno Schwikowski, and Trey Ideker. Cytoscape: a
software environment for integrated models of biomolecular interaction networks.
Genome research, 13(11):2498–2504, 2003.
[127] Bobby-Joe Breitkreutz, Chris Stark, and Mike Tyers. Osprey: a network visualization
system. Genome biology, 4(3):R22, 2003.
10 REFERENCES
[128] Athanasios Theocharidis, Stjin Van Dongen, Anton J Enright, and Tom C Freeman.
Network visualization and analysis of gene expression data using BioLayout Ex-
press3D. Nature protocols, 4(10):1535–1550, 2009.
[129] Gabriela Bindea, Bernhard Mlecnik, Hubert Hackl, Pornpimol Charoentong, Marie
Tosolini, Amos Kirilovsky, Wolf-Herman Fridman, Zlatko Trajanoski, Jerome Ga-
lon, et al. ClueGO: a Cytoscape plug-in to decipher functionally grouped gene on-
tology and pathway annotation networks. Bioinformatics, 25(8):1091–1093, 2009.
[130] Jason Montojo, Khalid Zuberi, Harold Rodriguez, Farzana Kazi, George Wright,
Sylva L Donaldson, Quaid Morris, and Gary D Bader. GeneMANIA Cytoscape plu-
gin: fast gene function predictions on the desktop. Bioinformatics, 26(22):2927–
2928, 2010.
[131] William S Bush and Jason H Moore. Genome-wide association studies. PLoS Com-
put Biol, 8(12):e1002822, 2012.
[132] Jacob J Michaelson, Salvatore Loguercio, and Andreas Beyer. Detection and in-
terpretation of expression quantitative trait loci (eQTL). Methods, 48(3):265–276,
2009.
[133] Xinwei Chen, Christine A Hackett, Rients E Niks, Peter E Hedley, Clare Booth,
Arnis Druka, Thierry C Marcel, Anton Vels, Micha Bayer, Iain Milne, et al. An eQTL
analysis of partial resistance to Puccinia hordei in barley. PLoS One, 5(1):e8598,
2010.
[134] Shuang-Xia Zhao, Wei Liu, Ming Zhan, Zhi-Yi Song, Shao-Ying Yang, Li-Qiong
Xue, Chun-Ming Pan, Zhao-Hui Gu, Bing-Li Liu, Hai-Ning Wang, et al. A refined
study of FCRL genes from a genome-wide association study for Graves disease. PloS
one, 8(3):e57758, 2013.
[135] Daniel J Kvitek and Gavin Sherlock. Whole genome, whole population sequencing
reveals that loss of signaling networks is the major adaptive strategy in a constant
environment. PLoS Genet, 9(11):e1003972, 2013.
[136] Jungeui Hong and David Gresham. Molecular specificity, convergence and con-
straint shape adaptive evolution in nutrient-poor environments. PLoS Genet,
10(1):e1004041, 2014.
[137] J Arjan GM de Visser and Daniel E Rozen. Clonal interference and the periodic
selection of new beneficial mutations in Escherichia coli. Genetics, 172(4):2093–
2100, 2006.
[138] Katy C Kao and Gavin Sherlock. Molecular characterization of clonal interference
during adaptive evolution in asexual populations of Saccharomyces cerevisiae. Na-
ture genetics, 40(12):1499, 2008.
[139] Troy G Hammerstrom, Kathryn Beabout, Thomas P Clements, Gerda Saxer, and
Yousif Shamoo. Acinetobacter baumannii Repeatedly Evolves a Hypermutator Phe-
notype in Response to Tigecycline That Effectively Surveys Evolutionary Trajectories
to Resistance. PloS one, 10(10):e0140489, 2015.
[140] Robert Woods, Dominique Schneider, Cynthia L Winkworth, Margaret A Riley, and
Richard E Lenski. Tests of parallel molecular evolution in a long-term experi-
ment with Escherichia coli. Proceedings of the National Academy of Sciences,
103(24):9107–9112, 2006.
REFERENCES 11
[141] Paul M Magwene, John H Willis, and John K Kelly. The statistics of bulk seg-
regant analysis using next generation sequencing. PLoS computational biology,
7(11):e1002255, 2011.
[142] Jurgen Claesen, Lieven Clement, Ziv Shkedy, Maria R Foulquie-Moreno, and
Tomasz Burzykowski. Simultaneous mapping of multiple gene loci with pooled seg-
regants. PLoS One, 8(2):e55133, 2013.
[143] Jeffrey E Barrick, Dong Su Yu, Sung Ho Yoon, Haeyoung Jeong, Tae Kwang
Oh, Dominique Schneider, Richard E Lenski, and Jihyun F Kim. Genome evo-
lution and adaptation in a long-term experiment with Escherichia coli. Nature,
461(7268):1243–1247, 2009.
[144] Gregory I Lang, Daniel P Rice, Mark J Hickman, Erica Sodergren, George M We-
instock, David Botstein, and Michael M Desai. Pervasive genetic hitchhiking and
clonal interference in 40 evolving yeast populations. Nature, 500(7464):571, 2013.
[145] Lucinda Notley-McRobb, Shona Seeto, and Thomas Ferenci. Enrichment and elim-
ination of mutY mutators in Escherichia coli populations. Genetics, 162(3):1055–
1062, 2002.
[146] Lucinda Notley-McRobb, Rachel Pinto, Shona Seeto, and Thomas Ferenci. Regula-
tion of mutY and nature of mutator mutations in Escherichia coli populations under
nutrient limitation. Journal of bacteriology, 184(3):739–745, 2002.
[147] Jeffrey E Barrick and Richard E Lenski. Genome-wide mutational diversity in an
evolving population of Escherichia coli. In Cold Spring Harbor symposia on quanti-
tative biology, pages sqb–2009. Cold Spring Harbor Laboratory Press, 2009.
[148] Erick Denamur and Ivan Matic. Evolution of mutation rates in bacteria. Molecular
microbiology, 60(4):820–827, 2006.
[149] Michael J Wiser, Noah Ribeck, and Richard E Lenski. Long-term dynamics of adap-
tation in asexual populations. Science, 342(6164):1364–1367, 2013.
[150] Jeffrey E Barrick and Richard E Lenski. Genome dynamics during experimental
evolution. Nature Reviews Genetics, 14(12):827–839, 2013.
[151] Antoine Giraud, Miroslav Radman, Ivan Matic, and Francois Taddei. The rise and
fall of mutator bacteria. Current opinion in microbiology, 4(5):582–585, 2001.
[152] Adam Eyre-Walker and Peter D Keightley. The distribution of fitness effects of new
mutations. Nature reviews. Genetics, 8(8):610, 2007.
[153] Sebastien Wielgoss, Jeffrey E Barrick, Olivier Tenaillon, Michael J Wiser, W James
Dittmar, Stephane Cruveiller, Beatrice Chane-Woon-Ming, Claudine Medigue,
Richard E Lenski, and Dominique Schneider. Mutation rate dynamics in a bacte-
rial population reflect tension between adaptation and genetic load. Proceedings of
the National Academy of Sciences, 110(1):222–227, 2013.
[154] Gilles Thomas, Kevin B Jacobs, Meredith Yeager, Peter Kraft, Sholom Wacholder,
Nick Orr, Kai Yu, Nilanjan Chatterjee, Robert Welch, Amy Hutchinson, et al. Mul-
tiple loci identified in a genome-wide association study of prostate cancer. Nature
genetics, 40(3):310–315, 2008.
[155] Paul DP Pharoah, Ya-Yu Tsai, Susan J Ramus, Catherine M Phelan, Ellen L Goode,
Kate Lawrenson, Melissa Buckley, Brooke L Fridley, Jonathan P Tyrer, Howard
Shen, et al. GWAS meta-analysis and replication identifies three new susceptibil-
ity loci for ovarian cancer. Nature genetics, 45(4):362–370, 2013.
12 REFERENCES
[156] David J Hunter, Peter Kraft, Kevin B Jacobs, David G Cox, Meredith Yeager, Susan E
Hankinson, Sholom Wacholder, Zhaoming Wang, Robert Welch, Amy Hutchinson,
et al. A genome-wide association study identifies alleles in FGFR2 associated with
risk of sporadic postmenopausal breast cancer. Nature genetics, 39(7):870–874,
2007.
[157] John S Witte. Genome-wide association studies and beyond. Annual review of public
health, 31:9–20, 2010.
[158] Aisha I Khan, Duy M Dinh, Dominique Schneider, Richard E Lenski, and Tim F
Cooper. Negative epistasis between beneficial mutations in an evolving bacterial
population. Science, 332(6034):1193–1196, 2011.
[159] Hsin-Hung Chou, Hsuan-Chao Chiu, Nigel F Delaney, Daniel Segre, and Christo-
pher J Marx. Diminishing returns epistasis among beneficial mutations decelerates
adaptation. Science, 332(6034):1190–1192, 2011.
[160] K Al-Saktawi, M McLaughlin, M Klugmann, A Schneider, JA Barrie, MC McCul-
loch, P Montague, D Kirkham, K-A Nave, and IR Griffiths. Genetic background
determines phenotypic severity of the Plp rumpshaker mutation. Journal of neuro-
science research, 72(1):12–24, 2003.
[161] Guy Van den Broeck, Ingo Thon, Martijn Van Otterlo, and Luc De Raedt. DT-
ProbLog: A decision-theoretic probabilistic Prolog. In Proceedings of the twenty-
fourth AAAI conference on artificial intelligence, pages 1217–1222. AAAI Press,
2010.
[162] Dries De Maeyer, Joris Renkens, Lore Cloots, Luc De Raedt, and Kathleen Mar-
chal. PheNetic: network-based interpretation of unstructured gene lists in E. coli.
Molecular BioSystems, 9(7):1594–1603, 2013.
[163] Paul D Sniegowski, Philip J Gerrish, and Richard E Lenski. Evolution of high muta-
tion rates in experimental populations of E. coli. Nature, 387(6634):703, 1997.
[164] Aaron C Shaver, Peter G Dombrowski, Joseph Y Sweeney, Tania Treis, Renata M
Zappala, and Paul D Sniegowski. Fitness evolution and the rise of mutator alleles in
experimental Escherichia coli populations. Genetics, 162(2):557–566, 2002.
[165] Giovanni Ciriello, Ethan Cerami, Chris Sander, and Nikolaus Schultz. Mutual exclu-
sivity analysis identifies oncogenic network modules. Genome research, 22(2):398–
406, 2012.
[166] Maria A Svensson, Christopher J LaFargue, Theresa Y MacDonald, Dorothee
Pflueger, Naoki Kitabayashi, Ashley M Santa-Cruz, Karl E Garsha, Ubaradka G
Sathyanarayana, Janice P Riley, Chol S Yun, et al. Testing mutual exclusivity of
ETS rearranged prostate cancer. Laboratory investigation, 91(3):404–412, 2011.
[167] Benjamin Horemans, Karolien Bers, Erick Ruiz Romero, Eva Pose Juan, Vincent
Dunon, Rene De Mot, and Dirk Springael. Functional redundancy of linuron degra-
dation in microbial communities in agricultural soil and biopurification systems. Ap-
plied and environmental microbiology, 82(9):2843–2853, 2016.
[168] Stuart A West, Ashleigh S Griffin, and Andy Gardner. Social semantics: altruism,
cooperation, mutualism, strong reciprocity and group selection. Journal of evolu-
tionary biology, 20(2):415–432, 2007.
[169] Kevin R Foster and Thomas Bell. Competition, not cooperation, dominates inter-
actions among culturable microbial species. Current biology, 22(19):1845–1850,
2012.
REFERENCES 13
[170] Alexander H Rickard, Robert J Palmer, David S Blehert, Shawn R Campagna, Mar-
tin F Semmelhack, Paul G Egland, Bonnie L Bassler, and Paul E Kolenbrander.
Autoinducer 2: a concentration-dependent signal for mutualistic bacterial biofilm
growth. Molecular microbiology, 60(6):1446–1456, 2006.
[171] Takefumi Shimoyama, Souichiro Kato, Shun’ichi Ishii, and Kazuya Watanabe. Flag-
ellum mediates symbiosis. Science, 323(5921):1574–1574, 2009.
[172] Winnie Dejonghe, Ellen Berteloot, Johan Goris, Nico Boon, Katrien Crul, Siska
Maertens, Monica Hofte, Paul De Vos, Willy Verstraete, and Eva M Top. Synergistic
degradation of linuron by a bacterial consortium and isolation of a single linuron-
degrading Variovorax strain. Applied and Environmental Microbiology, 69(3):1532–
1541, 2003.
[173] Karolien Bers, I Batisson, Paul Proost, R Wattiez, Rene De Mot, and Dirk Springael.
HylA, an alternative hydrolase for initiation of catabolism of the phenylurea her-
bicide linuron in Variovorax sp. strains. Applied and environmental microbiology,
79(17):5258–5263, 2013.
[174] Philip Breugelmans, Kim Bundvig Barken, Tim Tolker-Nielsen, Johan Hofkens,
Winnie Dejonghe, and Dirk Springael. Architecture and spatial organization in a
triple-species bacterial biofilm synergistically degrading the phenylurea herbicide
linuron. FEMS microbiology ecology, 64(2):271–282, 2008.
[175] Simone Dealtry, Eman H Nour, Peter N Holmsgaard, Guo-Chun Ding, Viola We-
ichelt, Vincent Dunon, Holger Heuer, Lars H Hansen, Søren J Sørensen, Dirk
Springael, et al. Exploring the complex response to linuron of bacterial communities
from biopurification systems by means of cultivation-independent methods. FEMS
microbiology ecology, 92(2):fiv157, 2016.
[176] Paolina Garbeva, Mark W Silby, Jos M Raaijmakers, Stuart B Levy, and Wi-
etse De Boer. Transcriptional and antagonistic responses of Pseudomonas fluo-
rescens Pf0-1 to phylogenetically different bacterial competitors. The ISME journal,
5(6):973–985, 2011.
[177] Jose Perez, Alex Buchanan, Brett Mellbye, Rebecca Ferrell, Jeffrey H Chang, Frank
Chaplen, Peter J Bottomley, Daniel J Arp, and Luis A Sayavedra-Soto. Interac-
tions of Nitrosomonas europaea and Nitrobacter winogradskyi grown in co-culture.
Archives of microbiology, 197(1):79–89, 2015.
[178] Vera Tai, Ian T Paulsen, Katherine Phillippy, D Aaron Johnson, and Brian Palenik.
Whole-genome microarray analyses of Synechococcus–Vibrio interactions. Environ-
mental microbiology, 11(10):2698–2709, 2009.
[179] Adam Z Rosenthal, Eric G Matson, Avigdor Eldar, and Jared R Leadbetter. RNA-
seq reveals cooperative metabolic interactions between two termite-gut spirochete
species in co-culture. The ISME journal, 5(7):1133–1142, 2011.
[180] Alexander S Beliaev, Margie F Romine, Margrethe Serres, Hans C Bernstein,
Bryan E Linggi, Lye M Markillie, Nancy G Isern, William B Chrisler, Leo A Kucek,
Eric A Hill, et al. Inference of interactions in cyanobacterial–heterotrophic co-
cultures via transcriptome sequencing. The ISME journal, 8(11):2243–2255, 2014.
[181] Jorge Frias-Lopez and Ana Duran-Pinedo. Effect of periodontal pathogens on the
metatranscriptome of a healthy multispecies biofilm model. Journal of bacteriology,
194(8):2082–2095, 2012.
14 REFERENCES
[182] Yichao Wu, Anee Mohanty, Wu Siang Chia, and Bin Cao. Influence of 3-
Chloroaniline on the Biofilm Lifestyle of Comamonas testosteroni and its Implica-
tions on Bioaugmentation. Applied and environmental microbiology, 82(14):4401–
4409, 2016.
[183] Douglas B Kell, Marie Brown, Hazel M Davey, Warwick B Dunn, Irena Spasic, and
Stephen G Oliver. Metabolic footprinting and systems biology: the medium is the
message. Nature Reviews Microbiology, 3(7):557–565, 2005.
[184] Tony L Palama, I Canard, Gilles JP Rautureau, C Mirande, S Chatellier, and
Benedicte Elena-Herrmann. Identification of bacterial species by untargeted NMR
spectroscopy of the exo-metabolome. Analyst, 141(15):4558–4561, 2016.
[185] Dawei Ren. Synergistic interactions in multispecies biofilms. PhD thesis, University
of Copenhagen, Unpublished.
[186] Daniel Cerqueda-Garcıa, Leon P Martınez-Castilla, Luisa I Falcon, and Luis Delaye.
Metabolic analysis of Chlorobium chlorochromatii CaD3 reveals clues of the sym-
biosis in Chlorochromatium aggregatum. The ISME journal, 8(5):991–998, 2014.
[187] Roland Wenter, Katharina Hutz, Dorte Dibbern, Tao Li, Veronika Reisinger, Matthias
Ploscher, Lutz Eichacker, Brian Eddie, Thomas Hanson, Donald A Bryant, et al.
Expression-based identification of genetic determinants of the bacterial symbio-
sis Chlorochromatium aggregatum. Environmental microbiology, 12(8):2259–2276,
2010.
[188] Jun Teramoto, Yoko Yamanishi, El-Shimy H Magdy, Akiko Hasegawa, Ayako Kori,
Masahiro Nakajima, Fumihito Arai, Toshio Fukuda, and Akira Ishihama. Single live-
bacterial cell assay of promoter activity and regulation. Genes to cells, 15(11):1111–
1122, 2010.
[189] Pedro Gonzalez-Torres, Leszek P Pryszcz, Fernando Santos, Manuel Martınez-
Garcıa, Toni Gabaldon, and Josefa Anton. Interactions between closely related bac-
terial strains are revealed by deep transcriptome sequencing. Applied and environ-
mental microbiology, 81(24):8445–8456, 2015.
[190] CB Ward and DA Glaser. Correlation between rate of cell growth and rate of DNA
synthesis in Escherichia coli B/r. Proceedings of the National Academy of Sciences,
68(5):1061–1064, 1971.
[191] Darja Zgur-Bertok. DNA damage repair and bacterial pathogens. PLoS Pathog,
9(11):e1003711, 2013.
[192] Daniel J Dwyer, Michael A Kohanski, Boris Hayete, and James J Collins. Gyrase
inhibitors induce an oxidative damage cellular death pathway in Escherichia coli.
Molecular systems biology, 3(1):91, 2007.
[193] Alistair B Russell, S Brook Peterson, and Joseph D Mougous. Type VI secretion
system effectors: poisons with a purpose. Nature reviews microbiology, 12(2):137–
148, 2014.
[194] Erin C Garcia, Andrew I Perault, Sara A Marlatt, and Peggy A Cotter. Interbacte-
rial signaling via Burkholderia contact-dependent growth inhibition system proteins.
Proceedings of the National Academy of Sciences, 113(29):8296–8301, 2016.
[195] Nikole E Kimes, Mario Lopez-Perez, Eva Auso, Rohit Ghai, and Francisco
Rodriguez-Valera. RNA sequencing provides evidence for functional variability
between naturally co-existing Alteromonas macleodii lineages. BMC genomics,
15(1):938, 2014.
REFERENCES 15
[196] Benjamin Horemans, Erik Smolders, and Dirk Springael. Carbon source utilization
profiles suggest additional metabolic interactions in a synergistic linuron-degrading
bacterial consortium. FEMS microbiology ecology, 84(1):24–34, 2013.
[197] Nico Boon, Johan Goris, Paul De Vos, Willy Verstraete, and Eva M Top. Genetic
Diversity among 3-Chloroaniline-and Aniline-Degrading Strains of theComamon-
adaceae. Applied and environmental microbiology, 67(3):1107–1115, 2001.
[198] Benjamin Horemans, Johan Hofkens, Erik Smolders, and Dirk Springael. Biofilm
formation of a bacterial consortium on linuron at micropollutant concentrations in
continuous flow chambers and the impact of dissolved organic matter. FEMS micro-
biology ecology, 88(1):184–194, 2014.
[199] Daniel C Ilut, Jeremy E Coate, Amelia K Luciano, Thomas G Owens, Gregory D
May, Andrew Farmer, and Jeff J Doyle. A comparative transcriptomic study of an
allotetraploid and its diploid progenitors illustrates the unique advantages and chal-
lenges of RNA-seq in plant species. American journal of botany, 99(2):383–396,
2012.
[200] Robert K Colwell, Anne Chao, Nicholas J Gotelli, Shang-Yi Lin, Chang Xuan Mao,
Robin L Chazdon, and John T Longino. Models and estimators linking individual-
based and sample-based rarefaction, extrapolation and comparison of assemblages.
Journal of plant ecology, 5(1):3–21, 2012.
[201] Shingo Suzuki, Takaaki Horinouchi, and Chikara Furusawa. Prediction of antibiotic
resistance by gene expression profiles. Nature communications, 5, 2014.
[202] Minoru Kanehisa, Susumu Goto, Yoko Sato, Miho Furumichi, and Mao Tanabe.
KEGG for integration and interpretation of large-scale molecular data sets. Nu-
cleic acids research, 40(D1):D109–D114, 2012.
[203] Ramy K Aziz, Daniela Bartels, Aaron A Best, Matthew DeJongh, Terrence Disz,
Robert A Edwards, Kevin Formsma, Svetlana Gerdes, Elizabeth M Glass, Michael
Kubal, et al. The RAST Server: rapid annotations using subsystems technology. BMC
genomics, 9(1):75, 2008.
[204] Jeremy R Dettman, Nicolas Rodrigue, Anita H Melnyk, Alex Wong, Susan F Bailey,
and Rees Kassen. Evolutionary insight from whole-genome sequencing of experi-
mentally evolved microbes. Molecular ecology, 21(9):2058–2077, 2012.
[205] Tadeusz J Kawecki, Richard E Lenski, Dieter Ebert, Brian Hollis, Isabelle Olivieri,
and Michael C Whitlock. Experimental evolution. Trends in ecology & evolution,
27(10):547–560, 2012.
[206] Matthew D Herron and Michael Doebeli. Parallel evolutionary dynamics of adaptive
diversification in Escherichia coli. PLoS Biol, 11(2):e1001490, 2013.
[207] Patricia L Foster. Stress-induced mutagenesis in bacteria. Critical reviews in bio-
chemistry and molecular biology, 42(5):373–397, 2007.
[208] Li Ding, Michael C Wendl, Joshua F McMichael, and Benjamin J Raphael. Expand-
ing the computational toolbox for mining cancer genomes. Nature Reviews Genetics,
15(8):556–570, 2014.
[209] Gregory I Lang and Michael M Desai. The spectrum of adaptive mutations in exper-
imental evolution. Genomics, 104(6):412–416, 2014.
16 REFERENCES
[210] Jimmy Lin, Christine M Gan, Xiaosong Zhang, Sian Jones, Tobias Sjoblom, Laura D
Wood, D Williams Parsons, Nickolas Papadopoulos, Kenneth W Kinzler, Bert Vogel-
stein, et al. A multidimensional analysis of genes mutated in breast and colorectal
cancers. Genome research, 17(9):000–000, 2007.
[211] Laura D Wood, D Williams Parsons, Sian Jones, Jimmy Lin, Tobias Sjoblom,
Rebecca J Leary, Dong Shen, Simina M Boca, Thomas Barber, Janine Ptak,
et al. The genomic landscapes of human breast and colorectal cancers. Science,
318(5853):1108–1113, 2007.
[212] Jessica Plucain, Thomas Hindre, Mickael Le Gac, Olivier Tenaillon, Stephane Cru-
veiller, Claudine Medigue, Nicholas Leiby, William R Harcombe, Christopher J
Marx, Richard E Lenski, et al. Epistasis and allele specificity in the emergence
of a stable polymorphism in Escherichia coli. Science, 343(6177):1366–1369, 2014.
[213] Luc De Raedt, Angelika Kimmig, and Hannu Toivonen. ProbLog: A Probabilistic
Prolog and Its Application in Link Discovery. In IJCAI, volume 7, pages 2462–2467,
2007.
[214] Jianxing Feng, Clifford A Meyer, Qian Wang, Jun S Liu, X Shirley Liu, and Yong
Zhang. GFOLD: a generalized fold change for ranking differentially expressed genes
from RNA-seq data. Bioinformatics, 28(21):2782–2788, 2012.
[215] Yudi Pawitan, Stefan Michiels, Serge Koscielny, Arief Gusnanto, and Alexander
Ploner. False discovery rate, sensitivity and sample size for microarray studies.
Bioinformatics, 21(13):3017–3024, 2005.
[216] Adnan Darwiche and Pierre Marquis. A knowledge compilation map. Journal of
Artificial Intelligence Research, 17(1):229–264, 2002.
[217] Adnan Darwiche and Pierre Marquis. A perspective on knowledge compilation. In
IJCAI, volume 1, pages 175–182, 2001.
[218] Anthony Gitter, Judith Klein-Seetharaman, Anupam Gupta, and Ziv Bar-Joseph. Dis-
covering pathways by orienting edges in protein interaction networks. Nucleic Acids
Res, 2011.
[219] Saket Navlakha, Anthony Gitter, and Ziv Bar-Joseph. A Network-based Approach
for Predicting Missing Pathway Interactions. PLOS Computational Biology, 2012.
[220] Anna Stincone, Nazish Daudi, Ayesha S Rahman, Philipp Antczak, Ian Henderson,
Jeffrey Cole, Matthew D Johnson, Peter Lund, and Francesco Falciani. A systems
biology approach sheds new light on Escherichia coli acid resistance. Nucleic acids
research, 39(17):7512–7528, 2011.
[221] Kristof Engelen, Qiang Fu, Pieter Meysman, Aminael Sanchez-Rodrıguez, Riet
De Smet, Karen Lemmens, Ana Carolina Fierro, and Kathleen Marchal. COLOM-
BOS: access port for cross-platform bacterial expression compendia. PLoS One,
6(7):e20938, 2011.
[222] Erik Garrison and Gabor Marth. Haplotype-based variant detection from short-read
sequencing. arXiv preprint arXiv:1207.3907, 2012.
[223] Mickael Le Gac, Jessica Plucain, Thomas Hindre, Richard E Lenski, and Dominique
Schneider. Ecological and evolutionary dynamics of coexisting lineages during a
long-term experiment with Escherichia coli. Proceedings of the National Academy
of Sciences, 109(24):9487–9492, 2012.
REFERENCES 17
[224] Gordon K Smyth et al. Linear models and empirical bayes methods for assessing
differential expression in microarray experiments. Stat Appl Genet Mol Biol, 3(1):3,
2004.
[225] Minoru Kanehisa, Susumu Goto, Yoko Sato, Masayuki Kawashima, Miho Furu-
michi, and Mao Tanabe. Data, information, knowledge and principle: back to
metabolism in KEGG. Nucleic Acid Research, 2014.
[226] Lars J Jensen, Michael Kuhn, Manuel Stark, Samuel Chaffron, Chris Creevey, Jean
Muller, Tobias Doerks, Philippe Julien, Alexander Roth, Milan Simonovic, et al.
STRING 8a global view on proteins and their functional interactions in 630 organ-
isms. Nucleic acids research, 37(suppl 1):D412–D416, 2009.
[227] Tobias Norstrom, Jonas Lannergard, and Diarmaid Hughes. Genetic and pheno-
typic identification of fusidic acid-resistant mutants with the small-colony-variant
phenotype in Staphylococcus aureus. Antimicrobial agents and chemotherapy,
51(12):4438–4446, 2007.
[228] Tracy L Raivio, Shannon KD Leblanc, and Nancy L Price. The Escherichia coli Cpx
envelope stress response regulates genes of diverse function that impact antibiotic
resistance and membrane integrity. Journal of bacteriology, 195(12):2755–2767,
2013.
[229] Kyle R Allison, Mark P Brynildsen, and James J Collins. Metabolite-enabled eradi-
cation of bacterial persisters by aminoglycosides. Nature, 473(7346):216–220, 2011.
[230] Daniel E Rozen and Richard E Lenski. Long-term experimental evolution in Es-
cherichia coli. VIII. Dynamics of a balanced polymorphism. The American Natural-
ist, 155(1):24–35, 2000.
[231] Daniel E Rozen, Dominique Schneider, and Richard E Lenski. Long-term experi-
mental evolution in Escherichia coli. XIII. Phylogenetic history of a balanced poly-
morphism. Journal of Molecular Evolution, 61(2):171–180, 2005.
[232] Daniel E Rozen, Nadege Philippe, J Arjan de Visser, Richard E Lenski, and Do-
minique Schneider. Death and cannibalism in a seasonal environment facilitate bac-
terial coexistence. Ecology letters, 12(1):34–44, 2009.
[233] Gregory W Luli and WILLIAM R Strohl. Comparison of growth, acetate production,
and acetate inhibition of Escherichia coli strains in batch and fed-batch fermenta-
tions. Applied and environmental microbiology, 56(4):1004–1011, 1990.
[234] Christine M Beatty, Douglas F Browning, Stephen JW Busby, and Alan J Wolfe.
Cyclic AMP receptor protein-dependent activation of the Escherichia coli acsP2 pro-
moter by a synergistic class III mechanism. Journal of bacteriology, 185(17):5148–
5157, 2003.
[235] Sophie Maisnier-Patin, John R Roth, Asa Fredriksson, Thomas Nystrom, Otto G
Berg, and Dan I Andersson. Genomic buffering mitigates the effects of deleterious
mutations in bacteria. Nature genetics, 37(12):1376–1379, 2005.
[236] Darren J Burgess. RNA stability: remember your driver. Nature Reviews Genetics,
13(2):72–73, 2012.
[237] Andrey Alexeyenko, Woojoo Lee, Maria Pernemalm, Justin Guegan, Philippe
Dessen, Vladimir Lazar, Janne Lehtio, and Yudi Pawitan. Network enrichment anal-
ysis: extension of gene-set enrichment analysis to gene networks. BMC bioinformat-
ics, 13(1):226, 2012.
18 REFERENCES
[238] Haisu Ma, Eric E Schadt, Lee M Kaplan, and Hongyu Zhao. COSINE: COndition-
SpecIfic sub-NEtwork identification using a global optimization method. Bioinfor-
matics, 27(9):1290–1298, 2011.
[239] Minghong Fang, Xiaohua Hu, Tingting He, Yan Wang, Junmin Zhao, Xianjun Shen,
and Jie Yuan. Prioritizing disease-causing genes based on network diffusion and
rank concordance. In Bioinformatics and Biomedicine (BIBM), 2014 IEEE Interna-
tional Conference on, pages 242–247. IEEE, 2014.
[240] Alex Lan, Ilan Y Smoly, Guy Rapaport, Susan Lindquist, Ernest Fraenkel, and Esti
Yeger-Lotem. ResponseNet: revealing signaling and regulatory networks linking
genetic and transcriptomic screening data. Nucleic acids research, page gkr359,
2011.
[241] Sepideh Babaei, Marc Hulsman, Marcel Reinders, and Jeroen de Ridder. Detect-
ing recurrent gene mutation in interaction network context using multi-scale graph
diffusion. BMC bioinformatics, 14(1):29, 2013.
[242] Matan Hofree, John P Shen, Hannah Carter, Andrew Gross, and Trey Ideker.
Network-based stratification of tumor mutations. Nature methods, 10(11):1108–
1115, 2013.
[243] Fabio Vandin, Eli Upfal, and Benjamin J Raphael. Algorithms for detecting signifi-
cantly mutated pathways in cancer. Journal of Computational Biology, 18(3):507–
522, 2011.
[244] Mark DM Leiserson, Dima Blokh, Roded Sharan, and Benjamin J Raphael. Simul-
taneous identification of multiple driver pathways in cancer. PLoS Comput Biol,
9(5):e1003054, 2013.
[245] Fabio Vandin, Eli Upfal, and Benjamin J Raphael. De novo discovery of mutated
driver pathways in cancer. Genome research, 22(2):375–385, 2012.
[246] Sean Michael Carroll and Christopher J Marx. Evolution after introduction of a novel
metabolic pathway consistently leads to restoration of wild-type physiology. PLoS
Genet, 9(4):e1003427, 2013.
[247] Alejandra Rodrıguez-Verdugo, Olivier Tenaillon, and Brandon S Gaut. First-step
mutations during adaptation restore the expression of hundreds of genes. Molecular
biology and evolution, 33(1):25–39, 2016.
[248] Daniel J Kvitek and Gavin Sherlock. Reciprocal sign epistasis between frequently
experimentally evolved adaptive mutations causes a rugged fitness landscape. PLoS
Genet, 7(4):e1002056, 2011.
[249] Robert J Woods, Jeffrey E Barrick, Tim F Cooper, Utpala Shrestha, Mark R Kauth,
and Richard E Lenski. Second-order selection for evolvability in a large Escherichia
coli population. Science, 331(6023):1433–1436, 2011.
[250] JT Anderson, MR Wagner, CA Rushworth, KVSK Prasad, and T Mitchell-Olds.
The evolution of quantitative traits in complex environments. Heredity, 112(1):4–
12, 2014.
[251] Hans P Steenackers, Ilse Parijs, Kevin R Foster, and Jozef Vanderleyden. Experi-
mental evolution in biofilm populations. FEMS microbiology reviews, page fuw002,
2016.
REFERENCES 19
[252] Bram Van den Bergh, Joran E Michiels, Tom Wenseleers, Etthel M Windels, Pieter-
jan Vanden Boer, Donaat Kestemont, Luc De Meester, Kevin J Verstrepen, Na-
talie Verstraeten, Maarten Fauvart, et al. Frequency of antibiotic application drives
rapid evolutionary adaptation of Escherichia coli persistence. Nature microbiology,
1:16020, 2016.
[253] Adam C Palmer and Roy Kishony. Understanding, predicting and manipulating the
genotypic evolution of antibiotic resistance. Nature Reviews Genetics, 14(4):243–
248, 2013.
[254] James D Winkler and Katy C Kao. Recent advances in the evolutionary engineering
of industrial biocatalysts. Genomics, 104(6):406–411, 2014.
[255] Christian Schlotterer, R Kofler, E Versace, R Tobler, and SU Franssen. Combining
experimental evolution with next-generation sequencing: a powerful tool to study
adaptation from standing genetic variation. Heredity, 114(5):431–440, 2015.
[256] Adam Eyre-Walker. Genetic architecture of a complex trait and its implications for
fitness and genome-wide association studies. Proceedings of the National Academy
of Sciences, 107(suppl 1):1752–1756, 2010.
[257] Sutticha Na-Ranong Thammasittirong, Thanawan Thirasaktana, Anon Thammasit-
tirong, and Malee Srisodsuk. Improvement of ethanol production by ethanol-tolerant
Saccharomyces cerevisiae UVNR56. SpringerPlus, 2(1):583, 2013.
[258] Sarah Huffer, Christine M Roche, Harvey W Blanch, and Douglas S Clark. Es-
cherichia coli for biofuel production: bridging the gap from promise to practice.
Trends in biotechnology, 30(10):538–545, 2012.
[259] Ramon Gonzalez, Han Tao, JE Purvis, SW York, KT Shanmugam, and LO Ingram.
Gene array-based identification of changes that contribute to ethanol tolerance in
ethanologenic Escherichia coli: comparison of KO11 (parent) to LY01 (resistant mu-
tant). Biotechnology progress, 19(2):612–623, 2003.
[260] Hani Goodarzi, Bryson D Bennett, Sasan Amini, Marshall L Reaves, Alison K
Hottes, Joshua D Rabinowitz, and Saeed Tavazoie. Regulatory and metabolic
rewiring during laboratory evolution of ethanol tolerance in E. coli. Molecular Sys-
tems Biology, 6(1):378, 2010.
[261] Sergios A Nicolaou, Stefan M Gaida, and Eleftherios T Papoutsakis. Exploring the
combinatorial genomic space in Escherichia coli for ethanol tolerance. Biotechnol-
ogy journal, 7(11):1337–1345, 2012.
[262] Steve Swinnen, Kristien Schaerlaekens, Thiago Pais, Jurgen Claesen, Georg Hub-
mann, Yudi Yang, Mekonnen Demeke, Marıa R Foulquie-Moreno, Annelies
Goovaerts, Kris Souvereyns, et al. Identification of novel causative genes deter-
mining the complex trait of high ethanol tolerance in yeast using pooled-segregant
whole-genome sequence analysis. Genome research, 22(5):975–984, 2012.
[263] Felix H Lam, Adel Ghaderi, Gerald R Fink, and Gregory Stephanopoulos. Engineer-
ing alcohol tolerance in yeast. Science, 346(6205):71–75, 2014.
[264] Michael S Lawrence, Petar Stojanov, Paz Polak, Gregory V Kryukov, Kristian Cibul-
skis, Andrey Sivachenko, Scott L Carter, Chip Stewart, Craig H Mermel, Steven A
Roberts, et al. Mutational heterogeneity in cancer and the search for new cancer-
associated genes. Nature, 499(7457):214–218, 2013.
20 REFERENCES
[265] Nathan D Dees, Qunyuan Zhang, Cyriac Kandoth, Michael C Wendl, William
Schierding, Daniel C Koboldt, Thomas B Mooney, Matthew B Callaway, David
Dooling, Elaine R Mardis, et al. MuSiC: identifying mutational significance in can-
cer genomes. Genome research, 22(8):1589–1598, 2012.
[266] David Tamborero, Abel Gonzalez-Perez, and Nuria Lopez-Bigas. OncodriveCLUST:
exploiting the positional clustering of somatic mutations to identify cancer genes.
Bioinformatics, 29(18):2238–2244, 2013.
[267] Peter E Chen and B Jesse Shapiro. The advent of genome-wide association studies
for bacteria. Current opinion in microbiology, 25:17–24, 2015.
[268] Timothy D Read and Ruth C Massey. Characterizing the genetic basis of bacterial
phenotypes using genome-wide association studies: a new direction for bacteriology.
Genome medicine, 6(11):109, 2014.
[269] Ozgun Babur, Mithat Gonen, Bulent Arman Aksoy, Nikolaus Schultz, Giovanni
Ciriello, Chris Sander, and Emek Demir. Systematic identification of cancer driv-
ing signaling pathways based on mutual exclusivity of genomic alterations. Genome
biology, 16(1):45, 2015.
[270] Thanh Le Van, Matthijs van Leeuwen, Ana Carolina Fierro, Dries De Maeyer, Jimmy
Van den Eynden, Lieven Verbeke, Luc De Raedt, Kathleen Marchal, and Siegfried
Nijssen. Simultaneous discovery of cancer subtypes and subtype features by molec-
ular data integration. Bioinformatics, 32(17):i445–i454, 2016.
[271] Ruben AT Mars, Karoline Mendonca, Emma L Denham, and Jan Maarten van Dijl.
The reduction in small ribosomal subunit abundance in ethanol-stressed cells of
Bacillus subtilis is mediated by a SigB-dependent antisense RNA. Biochimica et
Biophysica Acta (BBA)-Molecular Cell Research, 1853(10):2553–2559, 2015.
[272] Toshihiro Suzuki, Kohei Seta, Chiaki Nishikawa, Eri Hara, Toshiya Shigeno, and
Toshiaki Nakajima-Kambe. Improved ethanol tolerance and ethanol production
from glycerol in a streptomycin-resistant Klebsiella variicola mutant obtained by
ribosome engineering. Bioresource technology, 176:156–162, 2015.
[273] Sheng Jian Cai and Masayori Inouye. EnvZ-OmpR interaction and osmoregulation
in Escherichia coli. Journal of Biological Chemistry, 277(27):24155–24161, 2002.
[274] Heather J Quinn, Andrew DS Cameron, and Charles J Dorman. Bacterial reg-
ulon evolution: distinct responses and roles for the identical OmpR proteins of
Salmonella Typhimurium and Escherichia coli in the acid stress response. PLoS
Genet, 10(3):e1004215, 2014.
[275] Francois Taddei, Miroslav Radman, J Maynard-Smith, Bruno Toupance, et al. Role
of mutator alleles in adaptive evolution. Nature, 387(6634):700, 1997.
[276] Robert Vaser, Swarnaseetha Adusumalli, Sim Ngak Leng, Mile Sikic, and Pauline C
Ng. SIFT missense predictions for genomes. Nature protocols, 11(1):1, 2016.
[277] Richard J Heath and Charles O Rock. Roles of the FabA and FabZ β -hydroxyacyl-
acyl carrier protein dehydratases in Escherichia coli fatty acid biosynthesis. Journal
of Biological Chemistry, 271(44):27795–27801, 1996.
[278] Burkhard Loffeld and Heribert Keweloh. cis/trans isomerization of unsaturated fatty
acids as possible control mechanism of membrane fluidity inPseudomonas putida P8.
Lipids, 31(8):811–815, 1996.
REFERENCES 21
[279] Yong-Mei Zhang and Charles O Rock. Membrane lipid homeostasis in bacteria.
Nature Reviews Microbiology, 6(3):222–233, 2008.
[280] Thomas M Buttke and Lonnie O’Neal Ingram. Ethanol-induced changes in lipid
composition of Escherichia coli: inhibition of saturated fatty acid synthesis in vitro.
Archives of biochemistry and biophysics, 203(2):565–571, 1980.
[281] Lian Hua Luo, Pil-Soo Seo, Jeong-Woo Seo, Sun-Yeon Heo, Dae-Hyuk Kim, and
Chul Ho Kim. Improved ethanol tolerance in Escherichia coli by changing the cel-
lular fatty acids composition through genetic manipulation. Biotechnology letters,
31(12):1867, 2009.
[282] David G White, John D Goldman, Bruce Demple, and Stuart B Levy. Role of the
acrAB locus in organic solvent tolerance mediated by expression of marA, soxS, or
robA in Escherichia coli. Journal of bacteriology, 179(19):6122–6126, 1997.
[283] Shota Atsumi, Tung-Yun Wu, Iara MP Machado, Wei-Chih Huang, Pao-Yang Chen,
Matteo Pellegrini, and James C Liao. Evolution, genomic analysis, and recon-
struction of isobutanol tolerance in Escherichia coli. Molecular systems biology,
6(1):449, 2010.
[284] Amanda C Bernardi, Claudia S Gai, Jingnan Lu, Anthony J Sinskey, and Christo-
pher J Brigham. Experimental evolution and gene knockout studies reveal AcrA-
mediated isobutanol tolerance in Ralstonia eutropha. Journal of bioscience and bio-
engineering, 122(1):64–69, 2016.
[285] M Ines Borges-Walmsley, Jeremy Beauchamp, Sharon M Kelly, Kornelia Jumel,
Denise Candlish, Stephen E Harding, Nicholas C Price, and Adrian R Walmsley.
Identification of oligomerization and drug-binding domains of the membrane fusion
protein EmrA. Journal of Biological Chemistry, 278(15):12903–12912, 2003.
[286] Satoshi Nagakubo, Kunihiko Nishino, Takahiro Hirata, and Akihito Yamaguchi. The
putative response regulator BaeR stimulates multidrug resistance of Escherichia
coli via a novel multidrug exporter system, MdtABC. Journal of bacteriology,
184(15):4161–4167, 2002.
[287] Kunihiko Nishino and Akihito Yamaguchi. EvgA of the two-component signal trans-
duction system modulates production of the YhiUV multidrug transporter in Es-
cherichia coli. Journal of bacteriology, 184(8):2319–2323, 2002.
[288] Concetta C DiRusso, Tamra L Heimert, and Amy K Metzger. Characterization of
FadR, a global transcriptional regulator of fatty acid metabolism in Escherichia coli.
Interaction with the fadB promoter is prevented by long chain fatty acyl coenzyme A.
Journal of Biological Chemistry, 267(12):8685–8691, 1992.
[289] Hye Yun Oh, Jae Ok Lee, and Ok Bin Kim. Increase of organic solvent tolerance
of Escherichia coli by the deletion of two regulator genes, fadR and marR. Applied
microbiology and biotechnology, 96(6):1619–1627, 2012.
[290] Jeremy J Minty, Ann A Lesnefsky, Fengming Lin, Yu Chen, Ted A Zaroff, Artur B
Veloso, Bin Xie, Catie A McConnell, Rebecca J Ward, Donald R Schwartz, et al.
Evolution combined with genomic study elucidates genetic bases of isobutanol toler-
ance in Escherichia coli. Microbial cell factories, 10(1):18, 2011.
[291] Kenneth Michael Dombek and LO Ingram. Effects of ethanol on the Escherichia coli
plasma membrane. Journal of bacteriology, 157(1):233–239, 1984.
22 REFERENCES
[292] Juan L Ramos, Estrella Duque, Marıa-Trinidad Gallegos, Patricia Godoy, Marıa Is-
abel Ramos-Gonzalez, Antonia Rojas, Wilson Teran, and Ana Segura. Mechanisms
of solvent tolerance in gram-negative bacteria. Annual Reviews in Microbiology,
56(1):743–768, 2002.
[293] Lonnie O’Neal Ingram and Thomas M Buttke. Effects of alcohols on micro-
organisms. Advances in microbial physiology, 25:253–300, 1985.
[294] Lonnie O Ingram. Ethanol tolerance in bacteria. Critical reviews in biotechnology,
9(4):305–319, 1989.
[295] Sarah Huffer, Melinda E Clark, Jonathan C Ning, Harvey W Blanch, and Douglas S
Clark. Role of alcohols in growth, lipid composition, and membrane fluidity of yeasts,
bacteria, and archaea. Applied and environmental microbiology, 77(18):6400–6408,
2011.
[296] Juan M Vanegas, Maria F Contreras, Roland Faller, and Marjorie L Longo. Role of
unsaturated lipid and ergosterol in ethanol tolerance of model yeast biomembranes.
Biophysical journal, 102(3):507–516, 2012.
[297] Socorro Gama-Castro, Heladia Salgado, Alberto Santos-Zavaleta, Daniela Ledezma-
Tejeida, Luis Muiz-Rascado Jair Santiago Garca-Sotelo, Kevin Alquicira-Hernndez,
Irma Martnez-Flores, Lucia Pannier Jaime Abraham Castro-Mondragn, Alejandra
Medina-Rivera, Hilda Solano-Lira, Csar Bonavides-Martnez Ernesto Prez-Rueda,
Shirley Alquicira-Hernndez, Liliana Porrn-Sotelo, Alejandra Lpez-Fuentes Anas-
tasia Hernndez-Koutoucheva, Vctor Del Moral-Chvez, Fabio Rinaldi, and Julio
Collado-Vides. high-level integration of gene regulation, coexpression, motif clus-
tering and beyond. Nucleic Acid Research, 2016.
[298] Albert-Lszl Barabsi and Rka Albert. Emergence of scaling in random networks.
Science, 1999.
[299] Pauline C Ng and Steven Henikoff. Predicting deleterious amino acid substitutions.
Genome research, 11(5):863–874, 2001.
[300] Prateek Kumar, Steven Henikoff, and Pauline C Ng. Predicting the effects of cod-
ing non-synonymous variants on protein function using the SIFT algorithm. Nature
protocols, 4(7):1073–1081, 2009.
[301] Boris Iglewicz and David Caster Hoaglin. How to detect and handle outliers. ASQC
Quality Press, 1993.
[302] Luigi Fratta and Ugo Montanari. A Boolean algebra method for computing the ter-
minal reliability in a communication network. IEEE Transactions on Circuit Theory,
1973.
[303] Jason L. Cook and Jose Emmanuel Ramirez-Marquez. Two-terminal reliability anal-
yses for a mobile ad hoc wireless network. Reliability Engineering & System Safety,
2007.
[304] Cancer Genome Atlas Network et al. Comprehensive molecular portraits of human
breast tumors. Nature, 490(7418):61, 2012.
[305] Abel Gonzalez-Perez and Nuria Lopez-Bigas. Functional impact bias reveals cancer
drivers. Nucleic acids research, page gks743, 2012.
[306] Sam Ng, Eric A Collisson, Artem Sokolov, Theodore Goldstein, Abel Gonzalez-
Perez, Nuria Lopez-Bigas, Christopher Benz, David Haussler, and Joshua M Stu-
art. PARADIGM-SHIFT predicts the function of mutations in multiple cancers using
pathway impact analysis. Bioinformatics, 28(18):i640–i646, 2012.
REFERENCES 23
[307] Jimmy Van den Eynden, Ana Carolina Fierro, Lieven PC Verbeke, and Kathleen Mar-
chal. SomInaClust: detection of cancer genes based on somatic mutation patterns of
inactivation and clustering. BMC bioinformatics, 16(1):125, 2015.
[308] Ludmil B Alexandrov, Serena Nik-Zainal, David C Wedge, Samuel AJR Aparicio,
Sam Behjati, Andrew V Biankin, Graham R Bignell, Niccolo Bolli, Ake Borg, Anne-
Lise Børresen-Dale, et al. Signatures of mutational processes in human cancer. Na-
ture, 500(7463):415–421, 2013.
[309] William C Hahn and Robert A Weinberg. Modelling the molecular circuitry of can-
cer. Nature Reviews Cancer, 2(5):331–341, 2002.
[310] Bert Vogelstein, Nickolas Papadopoulos, Victor E Velculescu, Shibin Zhou,
Luis A Diaz, and Kenneth W Kinzler. Cancer genome landscapes. science,
339(6127):1546–1558, 2013.
[311] Chen-Hsiang Yeang, Frank McCormick, and Arnold Levine. Combinatorial patterns
of somatic gene mutations in cancer. The FASEB Journal, 22(8):2605–2622, 2008.
[312] Mark DM Leiserson, Hsin-Ta Wu, Fabio Vandin, and Benjamin J Raphael. CoMEt:
a statistical approach to identify combinations of mutually exclusive alterations in
cancer. Genome biology, 16(1):160, 2015.
[313] Sohrab P Shah, Andrew Roth, Rodrigo Goya, Arusha Oloumi, Gavin Ha, Yongjun
Zhao, Gulisa Turashvili, Jiarui Ding, Kane Tse, Gholamreza Haffari, et al. The clonal
and mutational evolution spectrum of primary triple-negative breast cancers. Nature,
486(7403):395–399, 2012.
[314] Cyriac Kandoth, Michael D McLellan, Fabio Vandin, Kai Ye, Beifang Niu, Charles
Lu, Mingchao Xie, Qunyuan Zhang, Joshua F McMichael, Matthew A Wycza-
lkowski, et al. Mutational landscape and significance across 12 major cancer types.
Nature, 502(7471):333–339, 2013.
[315] P Andrew Futreal, Lachlan Coin, Mhairi Marshall, Thomas Down, Timothy Hub-
bard, Richard Wooster, Nazneen Rahman, and Michael R Stratton. A census of hu-
man cancer genes. Nature Reviews Cancer, 4(3):177–183, 2004.
[316] Anke H Sillars-Hardebol, Beatriz Carvalho, Jeroen AM Belien, Meike de Wit,
Pien M Delis-van Diemen, Marianne Tijssen, Mark A van de Wiel, Fredrik Ponten,
Remond JA Fijneman, and Gerrit A Meijer. BCL2L1 has a functional role in col-
orectal cancer and its protein expression is associated with chromosome 20q gain.
The Journal of pathology, 226(3):442–450, 2012.
[317] YH Kim, L Girard, CP Giacomini, P Wang, T Hernandez-Boussard, R Tibshirani,
JD Minna, and JR Pollack. Combined microarray analysis of small cell lung cancer
reveals altered apoptotic balance and distinct expression signatures of MYC family
gene amplification. Oncogene, 25(1):130–138, 2006.
[318] Yu-Ting Chou, Chih-Chan Lee, Shih-Hsin Hsiao, Sey-En Lin, Sheng-Chieh Lin,
Chih-Hung Chung, Chi-Hsiu Chung, Yu-Rong Kao, Yuan-Hung Wang, Chien-Tsun
Chen, et al. The emerging role of SOX2 in cell proliferation and survival and its
crosstalk with oncogenic signaling in lung cancer. Stem cells, 31(12):2607–2619,
2013.
[319] Mariangela De Robertis, Luisa Loiacono, Caterina Fusilli, Maria Luana Poeta, Tom-
maso Mazza, Massimo Sanchez, Luigi Marchionni, Emanuela Signori, Giuseppe
Lamorte, Angelo Luigi Vescovi, et al. Dysregulation of EGFR pathway in EphA2
24 REFERENCES
cell subpopulation significantly associates with poor prognosis in colorectal cancer.
Clinical Cancer Research, 23(1):159–170, 2017.
[320] Christian Perez-Llamas and Nuria Lopez-Bigas. Gitools: analysis and visualisation
of genomic data using interactive heat-maps. PloS one, 6(5):e19541, 2011.
[321] Martin Kircher, Daniela M Witten, Preti Jain, Brian J O’roak, Gregory M Cooper,
and Jay Shendure. A general framework for estimating the relative pathogenicity of
human genetic variants. Nature genetics, 46(3):310–315, 2014.
[322] Michael S Lawrence, Petar Stojanov, Craig H Mermel, James T Robinson, Levi A
Garraway, Todd R Golub, Matthew Meyerson, Stacey B Gabriel, Eric S Lander, and
Gad Getz. Discovery and saturation analysis of cancer genes across 21 tumour types.
Nature, 505(7484):495–501, 2014.
[323] Juan Carlos Oliveros. Venny. An interactive tool for comparing lists with Venn’s
diagrams, 2007-2015.
[324] Jishnu Das and Haiyuan Yu. HINT: High-quality protein interactomes and their
applications in understanding human disease. BMC systems biology, 6(1):92, 2012.
[325] Thomas Rolland, Murat Tasan, Benoit Charloteaux, Samuel J Pevzner, Quan Zhong,
Nidhi Sahni, Song Yi, Irma Lemmens, Celia Fontanillo, Roberto Mosca, et al. A
proteome-scale map of the human interactome network. Cell, 159(5):1212–1226,
2014.
[326] David Croft, Antonio Fabregat Mundo, Robin Haw, Marija Milacic, Joel Weiser,
Guanming Wu, Michael Caudy, Phani Garapati, Marc Gillespie, Maulik R Kamdar,
et al. The Reactome pathway knowledgebase. Nucleic acids research, 42(D1):D472–
D477, 2014.
[327] Broad Institute of MIT and Harvard. road Institute TCGA Genome Data Analysis
Center: Correlations between copy number and mRNA expression, 2015.
[328] Broad Institute of MIT and Harvard. Broad Institute TCGA Genome Data Analysis
Center: SNP6 Copy number analysis (GISTIC2), 2015.
[329] Broad Institute of MIT and Harvard. Broad Institute TCGA Genome Data Analysis
Center (2016): Mutation Assessor, 2016.
[330] Boris Reva, Yevgeniy Antipin, and Chris Sander. Predicting the functional impact
of protein mutations: application to cancer genomics. Nucleic acids research, page
gkr407, 2011.
[331] Craig H Mermel, Steven E Schumacher, Barbara Hill, Matthew L Meyerson, Rameen
Beroukhim, and Gad Getz. GISTIC2. 0 facilitates sensitive and confident localization
of the targets of focal somatic copy-number alteration in human cancers. Genome
biology, 12(4):R41, 2011.
[332] Broad Institute of MIT and Harvard. Broad Institute TCGA Genome Data Analysis
Center: Mutation Analysis (MutSigCV v0.9), 2015.
[333] Broad Institute of MIT and Harvard. Broad Institute TCGA Genome Data Analysis
Center: Mutation Analysis (MutSig 2CV v3.1), 2015.
[334] Ngak-Leng Sim, Prateek Kumar, Jing Hu, Steven Henikoff, Georg Schneider, and
Pauline C Ng. SIFT web server: predicting effects of amino acid substitutions on
proteins. Nucleic acids research, 40(W1):W452–W457, 2012.
REFERENCES 25
[335] Ivan A Adzhubei, Steffen Schmidt, Leonid Peshkin, Vasily E Ramensky, Anna
Gerasimova, Peer Bork, Alexey S Kondrashov, and Shamil R Sunyaev. A method
and server for predicting damaging missense mutations. Nature methods, 7(4):248–
249, 2010.
[336] Huaiyu Mi, Qing Dong, Anushya Muruganujan, Pascale Gaudet, Suzanna Lewis,
and Paul D Thomas. PANTHER version 7: improved phylogenetic trees, orthologs
and collaboration with the Gene Ontology Consortium. Nucleic acids research, page
gkp1019, 2009.
[337] Minoru Kanehisa, Michihiro Araki, Susumu Goto, Masahiro Hattori, Mika Hi-
rakawa, Masumi Itoh, Toshiaki Katayama, Shuichi Kawashima, Shujiro Okuda,
Toshiaki Tokimatsu, et al. KEGG for linking genomes to life and the environment.
Nucleic acids research, 36(suppl 1):D480–D484, 2008.
[338] Satoko Yamamoto, Noriko Sakai, Hiromi Nakamura, Hiroshi Fukagawa, Ken
Fukuda, and Toshihisa Takagi. INOH: ontology-based highly structured database
of signal transduction pathways. Database, 2011:bar052, 2011.
[339] Guanming Wu, Xin Feng, and Lincoln Stein. A human functional protein interaction
network and its application to cancer data analysis. Genome biology, 11(5):R53,
2010.
[340] Felix Ruckert, Gihan Dawelbait, Christof Winter, Arndt Hartmann, Axel Denz,
Ole Ammerpohl, Michael Schroeder, Hans Konrad Schackert, Bence Sipos, Gunter
Kloppel, et al. Examination of apoptosis signaling in pancreatic cancer by compu-
tational signal transduction analysis. PloS one, 5(8):e12243, 2010.
[341] Soyoung Choi, Zhengming Chen, Laura H Tang, Yuanzhang Fang, Sandra J Shin,
Nicole C Panarelli, Yao-Tseng Chen, Yi Li, Xuejun Jiang, and Yi-Chieh Nancy Du.
Bcl-xL promotes metastasis independent of its anti-apoptotic activity. Nature com-
munications, 7, 2016.
[342] Franziska Ertel, Mai Nguyen, Anne Roulston, and Gordon C Shore. Programming
cancer cells for high expression levels of Mcl1. EMBO reports, 14(4):328–336, 2013.
[343] Ldia Hernandez, Sarah Hsu, Ben Davidson, Michael J. Birrer, Elise C. Kohn, and
Christina M. Annunziata. Activation of NF-kappaB signaling by inhibitor of NF-
kappaB kinase beta increases aggressiveness of ovarian cancer. Cancer Research,
2010.
[344] Chen-Bo Ding, Wei-Na Yu, Ji-Hong Feng, and Jun-Min Luo. Structure and function
of Gab2 and its role in cancer (Review). Molecular medicine reports, 12(3):4007–
4014, 2015.
[345] M Bocanegra, A Bergamaschi, YH Kim, MA Miller, AB Rajput, J Kao, A Langerød,
W Han, D-Y Noh, SS Jeffrey, et al. Focal amplification and oncogene dependency
of GAB2 in breast cancer. Oncogene, 29(5):774–779, 2010.
[346] Gerold Bepler and Angelika Koehler. Multiple chromosomal aberrations and 11p
allelotyping in lung cancer cell lines. Cancer genetics and cytogenetics, 84(1):39–
45, 1995.
[347] Outi Monni, Maarit Barlund, Spyro Mousses, Juha Kononen, Guido Sauter, Mervi
Heiskanen, Paulina Paavola, Kristiina Avela, Yidong Chen, Michael L Bittner, et al.
Comprehensive copy number and gene expression profiling of the 17q23 ampli-
con in human breast cancer. Proceedings of the National Academy of Sciences,
98(10):5711–5716, 2001.
26 REFERENCES
[348] Ganapathy Sriram and Raymond B Birge. Emerging roles for crk in human cancer.
Genes & cancer, 1(11):1132–1139, 2010.
[349] Kelly E Fathers, Emily S Bell, Charles V Rajadurai, Sean Cory, Hong Zhao, Anna
Mourskaia, Dongmei Zuo, Jason Madore, Anie Monast, Anne-Marie Mes-Masson,
et al. Crk adaptor proteins act as key signaling integrators for breast tumorigenesis.
Breast Cancer Research, 14(3):R74, 2012.
[350] Emily S Bell and Morag Park. Models of crk adaptor proteins in cancer. Genes &
cancer, 3(5-6):341–352, 2012.
[351] Xiang Zhou, Qian Hao, Peng Liao, Shiwen Luo, Minhong Zhang, Guohui Hu, Hong-
bing Liu, Yiwei Zhang, Bo Cao, Melody Baddoo, et al. Nerve growth factor receptor
negates the tumor suppressor p53 as a feedback regulator. Elife, 5:e15099, 2016.
[352] Alexander D Boiko, Olga V Razorenova, Matt van de Rijn, Susan M Swetter,
Denise L Johnson, Daphne P Ly, Paris D Butler, George P Yang, Benzion Joshua,
Michael J Kaplan, et al. Human melanoma-initiating cells express neural crest nerve
growth factor receptor CD271. Nature, 466(7302):133–137, 2010.
[353] Gianluca Civenni, Anne Walter, Nikita Kobert, Daniela Mihic-Probst, Marie Zipser,
Benedetta Belloni, Burkhardt Seifert, Holger Moch, Reinhard Dummer, Maries
van den Broek, et al. Human CD271-positive melanoma stem cells associated with
metastasis establish tumor heterogeneity and long-term growth. Cancer research,
71(8):3098–3109, 2011.
[354] Angela LM Johnston, Xueqing Lun, Jennifer J Rahn, Abdelhamid Liacini, Limei
Wang, Mark G Hamilton, Ian F Parney, Barbara L Hempstead, Stephen M Robbins,
Peter A Forsyth, et al. The p75 neurotrophin receptor is a central regulator of glioma
invasion. PLoS Biol, 5(8):e212, 2007.
[355] Mariangela De Robertis, Luisa Loiacono, Caterina Fusilli, Maria Luana Poeta, Tom-
maso Mazza, Massimo Sanchez, Luigi Marchionni, Emanuela Signori, Giuseppe
Lamorte, Angelo Luigi Vescovi, et al. Dysregulation of EGFR pathway in EphA2
cell subpopulation significantly associates with poor prognosis in colorectal cancer.
Clinical Cancer Research, 23(1):159–170, 2017.
[356] Sarah Keppler, Susann Weiβbach, Christian Langer, Stefan Knop, Jordan Pischi-
marov, Miriam Kull, Thorsten Stuhmer, Torsten Steinbrunn, Ralf Bargou, Hermann
Einsele, et al. Rare SNPs in receptor tyrosine kinases are negative outcome predic-
tors in multiple myeloma. Oncotarget, 7(25):38762, 2016.
[357] Lilly YW Bourguignon, Hongbo Zhu, Bo Zhou, Falko Diedrich, Patrick A Singleton,
and Mien-Chie Hung. Hyaluronan promotes CD44v3-Vav2 interaction with Grb2-
p185HER2 and induces Rac1 and Ras signaling during ovarian tumor cell migration
and growth. Journal of Biological Chemistry, 276(52):48679–48692, 2001.
[358] Marco Ranzani, Stefano Annunziato, David J Adams, and Eugenio Montini. Can-
cer gene discovery: exploiting insertional mutagenesis. Molecular Cancer Research,
11(10):1141–1158, 2013.
[359] M Dorigo and Luca Maria Gambardella. Ant-Q: a reinforcement learning approach
to combinatorial optimization. Universite Libre de Bruxelles, Belgium, 1995.
[360] Marco Dorigo and Luca Maria Gambardella. Ant colony system: a cooperative learn-
ing approach to the traveling salesman problem. IEEE Transactions on evolutionary
computation, 1(1):53–66, 1997.
REFERENCES 27
[361] David Hernandez, Patrice Francois, Laurent Farinelli, Magne Østeras, and Jacques
Schrenzel. De novo bacterial genome sequencing: millions of very short reads as-
sembled on a desktop computer. Genome research, 18(5):802–809, 2008.
[362] Silpa Suthram, Andreas Beyer, Richard M Karp, Yonina Eldar, and Trey Ideker.
eQED: an efficient method for interpreting eQTL associations using protein net-
works. Molecular systems biology, 4(1):162, 2008.
[363] Esti Yeger-Lotem, Laura Riva, Linhui Julie Su, Aaron D Gitler, Anil G Cashikar,
Oliver D King, Pavan K Auluck, Melissa L Geddie, Julie S Valastyan, David R
Karger, et al. Bridging high-throughput genetic and transcriptional data reveals cel-
lular responses to alpha-synuclein toxicity. Nature genetics, 41(3):316–323, 2009.
[364] John S Mattick and Igor V Makunin. Non-coding RNA. Human molecular genetics,
15(suppl 1):R17–R29, 2006.
[365] Xiu Cheng Quek, Daniel W Thomson, Jesper LV Maag, Nenad Bartonicek, Bethany
Signal, Michael B Clark, Brian S Gloss, and Marcel E Dinger. lncRNAdb v2. 0:
expanding the reference database for functional long noncoding RNAs. Nucleic acids
research, 43(D1):D168–D173, 2014.
[366] Peter J Turnbaugh, Ruth E Ley, Micah Hamady, Claire Fraser-Liggett, Rob Knight,
and Jeffrey I Gordon. The human microbiome project: exploring the microbial part
of ourselves in a changing world. Nature, 449(7164):804, 2007.
[367] Ettje F Tigchelaar, Alexandra Zhernakova, Jackie AM Dekens, Gerben Hermes, Ag-
nieszka Baranska, Zlatan Mujagic, Morris A Swertz, Angelica M Munoz, Patrick
Deelen, Maria C Cenit, et al. Cohort profile: LifeLines DEEP, a prospective, gen-
eral population cohort study in the northern Netherlands: study design and baseline
characteristics. BMJ open, 5(8):e006772, 2015.
[368] Luana Martins Perin, Maria Luisa Savo Sardaro, Luıs Augusto Nero, Erasmo Ne-
viani, and Monica Gatti. Bacterial ecology of artisanal Minas cheeses assessed
by culture-dependent and-independent methods. Food Microbiology, 65:160–169,
2017.
[369] Eduardo Medina, Ilenys M Perez-Dıaz, Fred Breidt, Janet Hayes, Wendy Franco,
Natasha Butz, and Marıa Andrea Azcarate-Peril. Bacterial Ecology of Fermented
Cucumber Rising pH Spoilage as Determined by Nonculture-Based Methods. Journal
of food science, 81(1):M121–M129, 2016.
[370] David M Ward, Roland Weller, and Mary M Bateson. 16S rRNA sequences reveal nu-
merous uncultured microorganisms in a natural community. Nature, 345(6270):63,
1990.
[371] Gwen Falony, Marie Joossens, Sara Vieira-Silva, Jun Wang, Youssef Darzi, Karo-
line Faust, Alexander Kurilshikov, Marc Jan Bonder, Mireia Valles-Colomer, Doris
Vandeputte, et al. Population-level analysis of gut microbiome variation. Science,
352(6285):560–564, 2016.
[372] Human Microbiome Project Consortium et al. A framework for human microbiome
research. Nature, 486(7402):215–221, 2012.
[373] Jorge Frias-Lopez, Yanmei Shi, Gene W Tyson, Maureen L Coleman, Stephan C
Schuster, Sallie W Chisholm, and Edward F DeLong. Microbial community gene ex-
pression in ocean surface waters. Proceedings of the National Academy of Sciences,
105(10):3805–3810, 2008.
28 REFERENCES
[374] Jack A Gilbert, Dawn Field, Ying Huang, Robert A Edwards, Weizhong Li, Paul
Gilna, and Ian Joint. Detection of large numbers of novel sequences in the meta-
transcriptomes of complex marine microbial communities. Handbook of Molecular
Microbial Ecology II: Metagenomics in Different Habitats, pages 277–286, 2011.
[375] Bo Liu and Mihai Pop. MetaPath: identifying differentially abundant metabolic path-
ways in metagenomic datasets. In BMC proceedings, volume 5, page S9. BioMed
Central, 2011.
[376] Olga V Kalinina, Oliver Wichmann, Gordana Apic, and Robert B Russell.
ProtChemSI: a network of protein–chemical structural interactions. Nucleic acids
research, 40(D1):D549–D553, 2012.
[377] Damian Szklarczyk, Alberto Santos, Christian von Mering, Lars Juhl Jensen, Peer
Bork, and Michael Kuhn. STITCH 5: augmenting protein–chemical interaction net-
works with tissue and affinity data. Nucleic acids research, 44(D1):D380–D384,
2016.
[378] David B Solit, Levi A Garraway, Christine A Pratilas, Ayana Sawai, Gad Getz, An-
drea Basso, Qing Ye, Jose M Lobo, Yuhong She, Iman Osman, et al. BRAF mutation
predicts sensitivity to MEK inhibition. Nature, 439(7074):358–362, 2006.
[379] Jinho Kim, Inhae Kim, Seong Kyu Han, James U Bowie, and Sanguk Kim. Network
rewiring is an important mechanism of gene essentiality change. Scientific reports,
2:900, 2012.
[380] Sourav Bandyopadhyay, Monika Mehta, Dwight Kuo, Min-Kyung Sung, Ryan
Chuang, Eric J Jaehnig, Bernd Bodenmiller, Katherine Licon, Wilbert Copeland,
Michael Shales, et al. Rewiring of genetic networks in response to DNA damage.
Science, 330(6009):1385–1389, 2010.
[381] Hunter B Fraser, Aaron E Hirsh, Lars M Steinmetz, Curt Scharfe, and Mar-
cus W Feldman. Evolutionary rate in the protein interaction network. Science,
296(5568):750–752, 2002.
[382] Omer Basha, Dvir Flom, Ruth Barshir, Ilan Smoly, Shoval Tirman, and Esti Yeger-
Lotem. MyProteinNet: build up-to-date protein interaction networks for organisms,
tissues and user-defined contexts. Nucleic acids research, 43(W1):W258–W263,
2015.
[383] Edward L Huttlin, Mark P Jedrychowski, Joshua E Elias, Tapasree Goswami, Ramin
Rad, Sean A Beausoleil, Judit Villen, Wilhelm Haas, Mathew E Sowa, and Steven P
Gygi. A tissue-specific atlas of mouse protein phosphorylation and expression. Cell,
143(7):1174–1189, 2010.
[384] Casey S Greene, Arjun Krishnan, Aaron K Wong, Emanuela Ricciotti, Rene A Ze-
laya, Daniel S Himmelstein, Ran Zhang, Boris M Hartmann, Elena Zaslavsky, Stu-
art C Sealfon, et al. Understanding multicellular function and disease with human
tissue-specific networks. Nature genetics, 47(6):569–576, 2015.
[385] Yuanfang Guan, Dmitriy Gorenshteyn, Margit Burmeister, Aaron K Wong, John C
Schimenti, Mary Ann Handel, Carol J Bult, Matthew A Hibbs, and Olga G Troy-
anskaya. Tissue-specific functional networks for prioritizing phenotype and disease
genes. PLoS Comput Biol, 8(9):e1002694, 2012.
[386] JE Krol, JT Penrod, H McCaslin, LM Rogers, H Yano, AD Stancik, W Dejonghe,
CJ Brown, RE Parales, Stefan Wuertz, et al. Role of IncP-1β plasmids pWDL7::
REFERENCES 29
rfp and pNB8c in chloroaniline catabolism as determined by genomic and functional
analyses. Applied and environmental microbiology, 78(3):828–838, 2012.
[387] Allyson M MacLean, Gordon MacPherson, Punita Aneja, and Turlough M Finan.
Characterization of the β -ketoadipate pathway in Sinorhizobium meliloti. Applied
and environmental microbiology, 72(8):5403–5413, 2006.
[388] Fenja S Bleichrodt, Rita Fischer, and Ulrike C Gerischer. The β -ketoadipate pathway
of Acinetobacter baylyi undergoes carbon catabolite repression, cross-regulation
and vertical regulation, and is affected by Crc. Microbiology, 156(5):1313–1322,
2010.
[389] D J Reasoner and EE Geldreich. A new medium for the enumeration and subculture
of bacteria from potable water. Applied and environmental microbiology, 49(1):1–7,
1985.
[390] Joseph Sambrook, Edward F Fritsch, Tom Maniatis, et al. Molecular cloning: a
laboratory manual. Cold spring harbor laboratory press, 1989.
[391] Daniel R Zerbino and Ewan Birney. Velvet: algorithms for de novo short read as-
sembly using de Bruijn graphs. Genome research, 18(5):821–829, 2008.
[392] You Zhou, Yongjie Liang, Karlene H Lynch, Jonathan J Dennis, and David S Wishart.
PHAST: a fast phage search tool. Nucleic acids research, page gkr485, 2011.
[393] Rembrandt JF Haft, David H Keating, Tyler Schwaegler, Michael S Schwalbach,
Jeffrey Vinokur, Mary Tremaine, Jason M Peters, Matthew V Kotlajich, Edward L
Pohlmann, Irene M Ong, et al. Correcting direct effects of ethanol on translation
and transcription machinery confers ethanol tolerance in bacteria. Proceedings of
the National Academy of Sciences, 111(25):E2576–E2585, 2014.
[394] Christopher M Burns and John P Richardson. NusG is required to overcome a kinetic
limitation to Rho function at an intragenic terminator. Proceedings of the National
Academy of Sciences, 92(11):4738–4742, 1995.
[395] Zvi Pasman and Peter H von Hippel. Regulation of rho-dependent transcription
termination by NusG is specific to the Escherichia coli elongation complex. Bio-
chemistry, 39(18):5573–5585, 2000.
[396] Peter L Freddolino, Hani Goodarzi, and Saeed Tavazoie. Fitness landscape trans-
formation through a single amino acid change in the Rho terminator. PLoS Genet,
8(5):e1002744, 2012.
[397] Ingrid M Keseler, Amanda Mackie, Martin Peralta-Gil, Alberto Santos-Zavaleta, So-
corro Gama-Castro, Cesar Bonavides-Martınez, Carol Fulcher, Araceli M Huerta,
Anamika Kothari, Markus Krummenacker, et al. EcoCyc: fusing model organism
databases with systems biology. Nucleic acids research, 41(D1):D605–D612, 2013.
[398] Katsunori Yoshikawa, Tadamasa Tanaka, Chikara Furusawa, Keisuke Nagahisa,
Takashi Hirasawa, and Hiroshi Shimizu. Comprehensive phenotypic analysis for
identification of genes affecting growth under ethanol stress in Saccharomyces cere-
visiae. FEMS yeast research, 9(1):32–44, 2009.
[399] Dragana Stanley, Ajith Bandara, Sarah Fraser, PJ Chambers, and Grant A Stan-
ley. The ethanol stress response and ethanol tolerance of Saccharomyces cerevisiae.
Journal of applied microbiology, 109(1):13–24, 2010.
30 REFERENCES
[400] Takaaki Horinouchi, Shingo Suzuki, Takashi Hirasawa, Naoaki Ono, Tetsuya Yomo,
Hiroshi Shimizu, and Chikara Furusawa. Phenotypic convergence in bacterial adap-
tive evolution to ethanol stress. BMC Evolutionary Biology, 15(1):180, 2015.
[401] Nina Bacher Reuven, Gali Arad, Ayelet Maor-Shoshani, and Zvi Livneh. The muta-
genesis protein UmuC is a DNA polymerase activated by UmuD, RecA, and SSB
and is specialized for translesion replication. Journal of Biological Chemistry,
274(45):31763–31766, 1999.
[402] Andrew Robinson, John P McDonald, Victor EA Caldas, Meghna Patel, Elizabeth A
Wood, Christiaan M Punter, Harshad Ghodke, Michael M Cox, Roger Woodgate,
Myron F Goodman, et al. Regulation of mutagenic DNA polymerase V activation in
space and time. PLoS Genet, 11(8):e1005482, 2015.
[403] Anbu K Adikesavan, Panagiotis Katsonis, David C Marciano, Rhonald Lua,
Christophe Herman, and Olivier Lichtarge. Separation of recombination and SOS
response in Escherichia coli RecA suggests LexA interaction sites. PLoS Genet,
7(9):e1002244, 2011.
[404] Maxim V Sukhodolets, Julio E Cabrera, Huijun Zhi, and Ding Jun Jin. RapA, a bac-
terial homolog of SWI2/SNF2, stimulates RNA polymerase recycling in transcription.
Genes & development, 15(24):3330–3341, 2001.
[405] Bernd Bukau and Arthur L Horwich. The Hsp70 and Hsp60 chaperone machines.
Cell, 92(3):351–366, 1998.
[406] Jeffrey G Thomas and Francois Baneyx. ClpB and HtpG facilitate de novo protein
folding in stressed Escherichia coli cells. Molecular microbiology, 36(6):1360–1370,
2000.
[407] Florence Arsene, Toshifumi Tomoyasu, and Bernd Bukau. The heat shock response
of Escherichia coli. International journal of food microbiology, 55(1):3–9, 2000.
[408] Kyle A Zingaro and Eleftherios Terry Papoutsakis. Toward a semisynthetic stress
response system to engineer microbial solvent tolerance. Mbio, 3(5):e00308–12,
2012.
[409] Hiroshi Ogasawara, Akiko Hasegawa, Emi Kanda, Takenori Miki, Kaneyoshi Ya-
mamoto, and Akira Ishihama. Genomic SELEX search for target promoters un-
der the control of the PhoQP-RstBA signal relay cascade. Journal of bacteriology,
189(13):4791–4799, 2007.
[410] E Turlin, F Gasser, and F Biville. Sequence and functional analysis of an Escherichia
coli DNA fragment able to complement pqqE and pqqF mutants from Methylobac-
terium organophilum. Biochimie, 78(10):822–831, 1996.
[411] Amy L Springer, Roopa Ramamoorthi, and Mary E Lidstrom. Characterization and
nucleotide sequence of pqqE and pqqF in Methylobacterium extorquens AM1. Jour-
nal of bacteriology, 178(7):2154–2157, 1996.
[412] Ronnie Machielsen, Agustinus R Uria, Serve WM Kengen, and John van der Oost.
Production and characterization of a thermostable alcohol dehydrogenase that be-
longs to the aldo-keto reductase superfamily. Applied and environmental microbiol-
ogy, 72(1):233–238, 2006.
[413] Alla Gagarinova, Geordie Stewart, Bahram Samanfar, Sadhna Phanse, Carl A White,
Hiroyuki Aoki, Viktor Deineko, Natalia Beloglazova, Alexander F Yakunin, Ashkan
REFERENCES 31
Golshani, et al. Systematic Genetic Screens Reveal the Dynamic Global Functional
Organization of the Bacterial Translation Machinery. Cell Reports, 17(3):904–916,
2016.
[414] Joel Selkrig, Khedidja Mosbahi, Chaille T Webb, Matthew J Belousoff, Andrew J
Perry, Timothy J Wells, Faye Morris, Denisse L Leyton, Makrina Totsika, Minh-Duy
Phan, et al. Discovery of an archetypal protein transport system in bacterial outer
membranes. Nature structural & molecular biology, 19(5):506–510, 2012.
[415] Kristian Kjærgaard, Mark A Schembri, Henrik Hasman, and Per Klemm. Anti-
gen 43 from Escherichia coli induces inter-and intraspecies cell aggregation and
changes in colony morphology of Pseudomonas fluorescens. Journal of bacteriology,
182r(17):4789–4796, 2000.
[416] Per Klemm, Louise Hjerrild, Morten Gjermansen, and Mark A Schembri. Structure-
function analysis of the self-recognizing antigen 43 autotransporter protein from Es-
cherichia coli. Molecular microbiology, 51(1):283–296, 2004.
[417] Paolo Landini. Cross-talk mechanisms in biofilm formation and responses to envi-
ronmental and physiological stress in Escherichia coli. Research in microbiology,
160(4):259–266, 2009.
[418] Bing Yu, Stephen Swatkoski, Alesia Holly, Liam C Lee, Valentin Giroux, Chih-Shia
Lee, Dennis Hsu, Jordan L Smith, Garmen Yuen, Junqiu Yue, et al. Oncogenesis
driven by the Ras/Raf pathway requires the SUMO E2 ligase Ubc9. Proceedings of
the National Academy of Sciences, 112(14):E1724–E1733, 2015.
[419] William Weidong Du, Ling Fang, Xiangling Yang, Wang Sheng, Bing L Yang, Arun
Seth, Yaou Zhang, Burton B Yang, and Albert J Yee. The role of versican in modu-
lating breast cancer cell self-renewal. Molecular Cancer Research, 11(5):443–455,
2013.
[420] William Weidong Du, Weining Yang, and Albert J Yee. Roles of versican in cancer
biologytumorigenesis, progression and metastasis. Histol Histopathol, 28(6):701–
713, 2013.
[421] Andrew J Sakko, Carmela Ricciardelli, Keiko Mayne, Wayne D Tilley, Richard G
LeBaron, and David J Horsfall. Versican accumulation in human prostatic fibroblast
cultures is enhanced by prostate cancer cell-derived transforming growth factor β1.
Cancer research, 61(3):926–930, 2001.
[422] Kanda Fanhchaksai, Futoshi Okada, Naoko Nagai, Peraphan Pothacharoen, Prachya
Kongtawelert, Sonoko Hatano, Shinji Makino, Tomoyuki Nakamura, and Hideto
Watanabe. Host stromal versican is essential for cancer-associated fibroblast func-
tion to inhibit cancer growth. International Journal of Cancer, 138(3):630–641, 2016.
[423] Nidhi Gupta, Rehan Khan, Raman Kumar, Lalit Kumar, and Alpana Sharma.
Versican and its associated molecules: Potential diagnostic markers for multiple
myeloma. Clinica Chimica Acta, 442:119–124, 2015.
[424] Kohichi Takada, Di Zhu, Gregory H Bird, Kumar Sukhdeo, Jian-Jun Zhao, Mala
Mani, Madeleine Lemieux, Daniel E Carrasco, Jeremy Ryan, David Horst, et al. Tar-
geted disruption of the BCL9/β -catenin complex inhibits oncogenic Wnt signaling.
Science translational medicine, 4(148):148ra117–148ra117, 2012.
[425] Mei Dong, Xiaoyan Pang, Yang Xu, Fang Wen, and Yi Zhang. Ubiquitin-conjugating
enzyme 9 promotes epithelial ovarian cancer cell proliferation in vitro. International
journal of molecular sciences, 14(6):11061–11071, 2013.

32 REFERENCES
[426] Giovanni Benard, Albert Neutzner, Guihong Peng, Chunxin Wang, Ferenc Livak,
Richard J Youle, and Mariusz Karbowski. IBRDC2, an IBR-type E3 ubiquitin lig-
ase, is a regulatory factor for Bax and apoptosis activation. The EMBO journal,
29(8):1458–1471, 2010.