Embed Size (px)
Citation preview

Carbon monoxide secretion into ophthalmic venous blood of a crossbreed of wild boar and pig during light and nocturnal phase of day
Marek Koziorowski 1, Stanisława Stefańczyk-Krzymowska2, Anna Tabęcka-
Łonczyńska1, Przemysław Gilun2 and Marian Kamiński3
1Department of Animal Physiology and Reproduction, University of Rzeszow, 35-959
Rzeszów, Poland 2Department of Local Physiological Regulation, Institute of Animal Reproduction and Food
Research of the Polish Academy of Sciences, 10-747 Olsztyn, Poland 3 Chemical Faculty, Gdańsk University of Technology, 80-233 Gdańsk, Poland
Running title: Carbon monoxide secretion into ophthalmic venous blood
Key words: carbon monoxide, eye, circadian rhythm
Total number of words: 2772
Subject area: Endocrinology
Corresponding author: Marek Koziorowski, ul. Rejtana 16C, Rzeszów 35-959, Poland;
e-mail: [email protected]; Tel.: (17) 872 32 57; Fax: (17) 872 32 61.

2
Introduction
In both human and other animal tissues, two isoforms of heme oxygenase (HO); inducible
(HO-1), and constitutive (HO-2) break the rings of the heme to produce carbon monoxide
(CO), ferrous iron and biliverdin/bilirubin (Tenhunen et al. 1968; Maines, 1988; Ortiz de
Montellano, 1998). Functional HO-2 was found in the neurons of the cortex, hypothalamus,
thalamus and cerebellum (Vincent et al. 1994, Maines, 2000). It was documented, that CO as
a gaseous transmitter was synthesized rapidly following neural depolarization, and HO-2 was
activated during neuronal stimulation by phosphorylation by casein kinase-2 (Boehning et al.
2009).
In the eye, bright light stimulated HO in the retina and red blood cells to produce CO
(Kutty et al. 1995). High level of HO-1 mRNA and immunocytochemically localized HO-2
was found in the photoreceptors, amacrine, and both bipolar and ganglion cells of the retina in
the turtle, as well as in the ganglion and amacrine cells of the inner retina in rats (Cao et al.
2000). Stimulation of the retina, in combination with CO and nitric oxide (NO) application,
dramatically increased cGMP synthesis in the retina in comparison to NO or CO application
alone (Cao et al. 2000). Moreover, HO-1 appeared to be involved in the regulation of
intraocular pressure via CO production (Prifitera et al. 2007). HO-1 was also upregulated in
central retinal artery occlusion (Goldenberg-Cohen et al. 2008). CO has been found to be a
very important vasodilator (Pannen & Bauer, 1998; Kozma et al. 1999; Wu & Wang, 2005;
Abraham & Kappas 2008). When CO diffuses into the vascular smooth muscle cells, it elicits
vasodilatation by increasing cGMP production, and consequently it hyperpolarizes the muscle
cells by opening potassium channels (Furchgott & Jothianandan, 1991; Christodoulides et al.
1995; Morita & Kourembana, 1995). Furthermore, bath perfusion of tissues with exogenous
CO produced an increase in potassium current and hyperpolarized resting membrane potential
(Rich et al 1994). CO also induced vasodilatation as well as NO release (Thorup et al. 1999).
The presence and distribution of both isoforms of HO has been demonstrated using
immunohistochemical methods in the epithelium of the seromucous glands, endothelium of
human nasal mucosa and in erythrocytes (Andersson et al. 2000; Lo et al. 2005).
In 1996, Dan A. Oren published an inspirational hypothesis on humoral
phototransduction. This paper assumed that the information of light intensity might be
transmitted from the retina to the brain, not only by neural pathway, as generally accepted, but
also by a humoral pathway. CO and NO could be transported with venous blood and
transferred by counter current mechanism to the arterial blood in the area of the
perihypophyseal vascular complex. If CO and NO were transferred to the arterial blood in the

3
area of the perihypophyseal vascular complex then they could influence some of the neural
centres of the brain (Oren,1996). According to our knowledge, this concept has never been
studied. There is also lack of information on the relationship between the phase of the day and
CO production in the eye as well as the concentration of CO in venous blood flowing out of
the eye.
The present study was designed to determine whether the secretion of CO into the
venous blood flowing out from the eye differed between the light phase and nocturnal phase
during the long day of the summertime. The concentration of CO in venous blood flowing out
from the nasal cavity, where HO is expressed but photoreceptors are not present, was utilized
as a control.
Methods
Basic statements
All the procedures were carried out in compliance with Polish legal regulations (act of 21
January 2005), which determine the terms and conditions for performing experiments on
animals and in accordance with the protocol of the Local Ethics Commission for Animal
Experiments in Lublin No 8/2007. Mature males of crossbreed wild boar and pig (12 months
of age, body mass ~ 100-120kg, n=8) were used in the study. The animals were housed in an
experimental farm (Physiology and Reproduction of Animals Department, Rzeszów
University). The experiments were performed during the long daylight season (June). During
the collection of blood samples the animals were kept in individual cages in rooms with
natural illumination and ad libitum access to water and food.
Surgical procedures and blood samples collection
Five hours before the collection of blood samples, the animals were premedicated with
atropine (0.05 mg kg-1 I.M; Biowet, Gorzów Wielkopolski, Poland) and azaperone (Stresnil 2
mg kg-1 I.M; Jansen Pharmaceutica, Beerse, Belgium). General anaesthesia was induced with
thiopental sodium (Thiopental, Sandoz GmbH, Austria). Two silastic catheters (o.d., 2.4 mm;
i.d., 1.8 mm) were inserted into the dorsal nasal vein. The first catheter was directed into the
proximal part of the nasal vein to collect nasal venous blood. The second one was inserted in
the opposite direction. This catheter passed through the angularis oculi vein ending in the
venous ophthalmic sinus. Placing a catheter in the venous ophthalmic sinus allowed for the
collection of venous blood flowing out of the eye (Fig. 1). Blood samples (10 ml) were
collected from the nasal vein and venous ophthalmic sinus for two consecutive days, every

4
four hours during the day (4.00, 8.00 and 12.00 a.m. and 4.00, 8.00 and 10.00 p.m.) and every
two hours during the night (12.00 p.m., 2.00 a.m.). Simultaneously systemic arterial blood
samples were collected every eight hours during the day, whereas systemic venous blood
samples were collected every eight hours during the day and night from each animal.
Analysis of trace levels of CO in blood samples
1. Principles of the procedure for preparation of gaseous components and determination of
CO
Determination of CO concentrations in blood samples was performed at the Chemical
Faculty, Gdansk University of Technology. A standard addition method was used. Analytical
procedure was based on coupling of Head Space (HS) analytical technique (extraction of CO
from blood sample to gas phase) with the column gas chromatography technique using packed
column for separation of gaseous sample components (molecular sieve 5A, 80-100 mesh,
activated at 350oC). Trace concentrations of CO were determined as concentrations of
methane (CH4) using Flame Ionization Detector (FID) after stechiometric CO to CH4 catalytic
conversion in the packed micro-reactor (Raney Nickel) located between the outlet of the
column and the inlet of the FID detector (Col-/5A/-GC-/CO-CH4/-FID). Application of the
5A molecular sieve column ensures the separation of CO and oxygen (O2), and thus
eliminates the possible influence of O2 on determination of trace amounts of CO.
Chromatographic conditions during determination of the trace amounts of CO in blood
samples is presented in table 1. Detailed description of the procedure for CO/CO2/CH4/O2
separation as well as determination of trace amounts of CO in gas samples was presented
earlier (Kamiński et al. 2003).
2. Preparation of samples for CO determination
Five cm3 of blood was introduced into each of the two tightly sealed 16 cm3 HS vials filled
with helium, using a syringe with an injection needle. Simultaneously, the excess of helium
was removed to keep the atmospheric pressure in the vial. Then 0.5 cm3 of standard CO
mixture in helium (600 ppm [v/v]) was added to one of the vials. To equilibrate CO
concentrations between the liquid (blood) and gas phase, both vials were kept for 30 min at
37oC. Next, 5 cm3 of the gas sample was taken from each vial using a gas-tight syringe
(ensuring a constant pressure in a vial) and transferred into two tightly sealed 16 cm3 HS vials
filled with pure air. Prepared gas samples (0.5 cm3) were analyzed by gas chromatography
coupled to flame ionization detection after CO methanization (Col-/5A/-GC-/CO-CH4/-FID).

5
3 Calculation of the results
Concentration of CO (nmol/ml) in the blood samples was calculated using the following
formula:
)12(1)2(
AAwALV
AAwAwVwCxC
−⋅⋅⋅−⋅
=
Cx – concentration of CO in the blood sample
Cw – concentration of CO in the standard mixture added to HS vial containing the
sample studied
VL – volume of the liquid sample (blood) introduced into a HS vial
Vw – volume of the standard gas mixture introduced into a HS vial
A1 – CO peak area for the blood sample studied
A2 – CO peak area for the blood sample with the standard addition
Aw – CO peak area for the standard mixture
4 Statistical analysis
All the data are presented as means ± SEM. The concentration of CO in venous blood flowing
out from the eye and from the nasal area obtained during the morning, afternoon and night
(Figs 2 and 4) was compared between the vessels and between experimental periods using a
nonparametric Mann-Whitney t-test. The venous outflow of CO from the eye and nasal area
during the light phase of the long day (Fig. 3) was analysed by determining the total area
under respective curves. These data were also compared with nonparametric Mann-Whitney t-
test. All analyses were performed with the use of Prism GraphPad Software San Diego, CA.
Results
The concentration (mean ± SEM) of CO in venous blood flowing out of the eye (collected
from the ophthalmic sinus) averaged 3.32±0.71 nmol ml-1 and 3.43±0.8 nmol ml-1 in the
morning and afternoon, respectively. The data also did not differ between periods of sample
collection (Fig. 2). CO concentration in venous blood flowing out from the nasal cavity
averaged 0.75±0.06 nmol ml-1 and 1.03±0.22 nmol ml-1 in the morning and afternoon,
respectively, and these values did not differ. In both periods, CO concentration in venous
blood flowing out from the eye was significantly higher than that in nasal venous blood
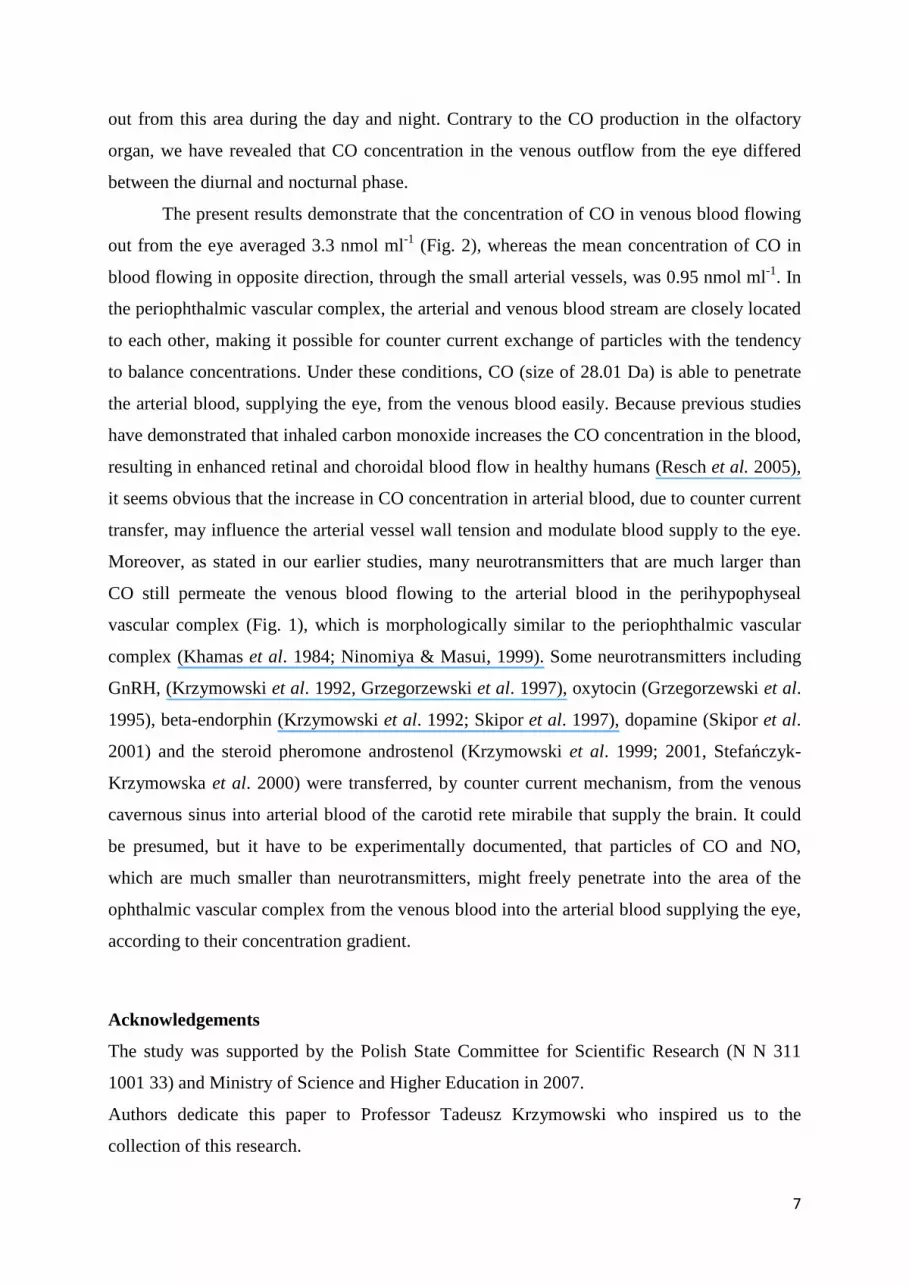
during the morning (P<0.001) and the afternoon (P<0.05). The mean (± SEM) area under the
curve of CO concentration during the day in venous blood flowing out from the eye was

6
significantly higher than that of CO concentration in the nasal venous blood (P<0.01) (Fig. 3).
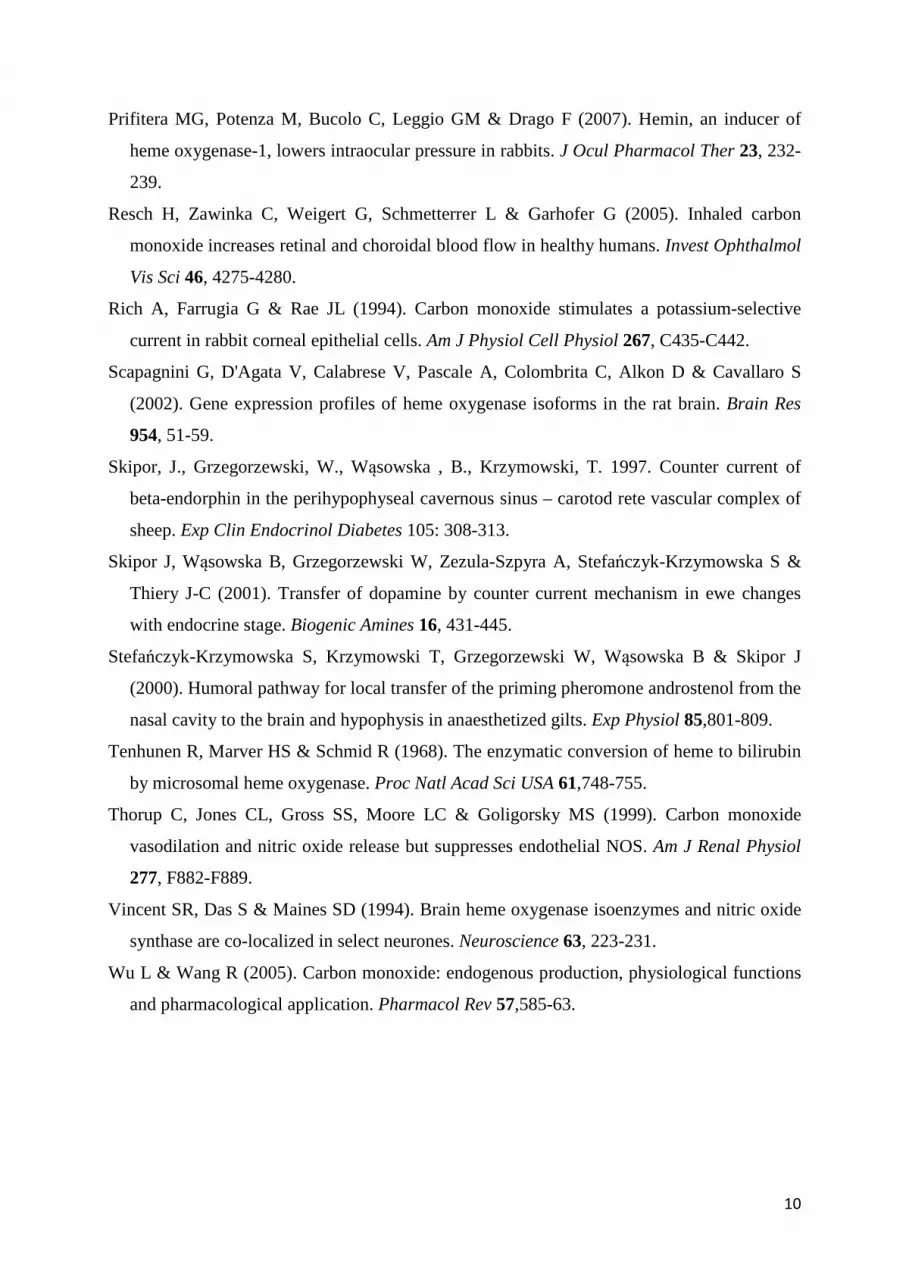
The mean CO concentration in venous blood flowing out from the eye and nasal area during
the night is presented in Fig. 4. It averaged 0.89±0.12 nmol ml-1 and 0.86±0.2 nmol ml-1 in
venous blood flowing out from the eye and nose, respectively, and the values did not differ
between vessels. The mean concentrations of CO in systemic arterial blood during the day
averaged 1.3±0.34 nmol ml-1, with venous systemic blood averaging 1.24±0.75 nmol ml-1 and
1.26±0.69 nmol ml-1 during the day and night, respectively. The data did not differ between
the vessels examined or time periods.
The above results demonstrated that the following occurred: 1) during the long light-
day season, CO was produced in the eye and concentrations in ophthalmic venous blood was
significantly higher than CO concentration in venous blood flowing out from the nasal cavity;
2) CO concentration in venous blood flowing out from the eye during the night was threefold
lower than concentrations taken during the day, and did not differ from nasal venous blood;
and 3) CO concentration in venous outflow from the nasal cavity did not differ between the
diurnal and nocturnal phase of the day and did not differ from CO concentration in the
systemic venous and arterial blood.
Discussion
Daily measurement of CO concentration in venous blood flowing out in physiological
conditions from the eye and nose was performed for the first time in the present study. CO is
produced in many tissues, including the eye, which is based on the immunohistochemical
localization of HO-1 and HO-2 (Tenhunen et al. 1968; Maines, 1988; 2000; Vincent at al.
1994; Kutty et al. 1995; Ortiz de Montellano, 1998; Cao et al. 2000). This study was
conducted during the entire day (in the morning and afternoon) and during the short night. It
should be emphasized that blood samples were collected in physiological conditions without
making the animal uneasy. The catheters inserted earlier into the dorsal nasal vein and into the
angularis oculi vein enabled us to repeatedly collect blood samples from the sinus ophthalmic
(venous outflow from the eye) and from the nasal vein (venous outflow from nasal area)
during the diurnal and nocturnal phase of two consecutive days. The concentration of CO in
venous blood flowing out from the area of the nasal cavity, which was at the level similar to
that in systemic venous and arterial blood, was accepted as a control. The localisation of both
isoforms of HO in the human olfactory organ (Andersson et al. 2000; Lo et al. 2005)
suggested that CO may be produced in this area. However, the olfactory organ is not sensitive
to light, and our study demonstrated constant concentration of CO in venous blood flowing
7
out from this area during the day and night. Contrary to the CO production in the olfactory
organ, we have revealed that CO concentration in the venous outflow from the eye differed
between the diurnal and nocturnal phase.
The present results demonstrate that the concentration of CO in venous blood flowing
out from the eye averaged 3.3 nmol ml-1 (Fig. 2), whereas the mean concentration of CO in
blood flowing in opposite direction, through the small arterial vessels, was 0.95 nmol ml-1. In
the periophthalmic vascular complex, the arterial and venous blood stream are closely located
to each other, making it possible for counter current exchange of particles with the tendency
to balance concentrations. Under these conditions, CO (size of 28.01 Da) is able to penetrate
the arterial blood, supplying the eye, from the venous blood easily. Because previous studies
have demonstrated that inhaled carbon monoxide increases the CO concentration in the blood,
resulting in enhanced retinal and choroidal blood flow in healthy humans (Resch et al. 2005),
it seems obvious that the increase in CO concentration in arterial blood, due to counter current
transfer, may influence the arterial vessel wall tension and modulate blood supply to the eye.
Moreover, as stated in our earlier studies, many neurotransmitters that are much larger than
CO still permeate the venous blood flowing to the arterial blood in the perihypophyseal
vascular complex (Fig. 1), which is morphologically similar to the periophthalmic vascular
complex (Khamas et al. 1984; Ninomiya & Masui, 1999). Some neurotransmitters including
GnRH, (Krzymowski et al. 1992, Grzegorzewski et al. 1997), oxytocin (Grzegorzewski et al.
1995), beta-endorphin (Krzymowski et al. 1992; Skipor et al. 1997), dopamine (Skipor et al.
2001) and the steroid pheromone androstenol (Krzymowski et al. 1999; 2001, Stefańczyk-
Krzymowska et al. 2000) were transferred, by counter current mechanism, from the venous
cavernous sinus into arterial blood of the carotid rete mirabile that supply the brain. It could
be presumed, but it have to be experimentally documented, that particles of CO and NO,
which are much smaller than neurotransmitters, might freely penetrate into the area of the
ophthalmic vascular complex from the venous blood into the arterial blood supplying the eye,
according to their concentration gradient.
Acknowledgements
The study was supported by the Polish State Committee for Scientific Research (N N 311
1001 33) and Ministry of Science and Higher Education in 2007.
Authors dedicate this paper to Professor Tadeusz Krzymowski who inspired us to the
collection of this research.

8
References
Abraham NG & Kappas A (2008). Pharmacological and clinical aspects of heme oxygenase.
Pharmacol Rev 60, 79-127.
Abraham NG, Lin JH, Schwartzman ML, Levere RD & Shibahara S (1988). The
physiological significance of heme oxygenase. Int J Biochem 20, 543-558.
Andersson JA, Uddman R & Cardell LO (2000). Carbon monoxide is endogenously produced
in the human nose and paranasal sinuses. J Allergy Clin Immunol 105, 269-273.
Boehning D, Moon S, Sharma S, Hurt K, Hester L, Ronnett G, Shugar D & Snyder S (2009).
Carbon monoxide neurotransmission activated by CK2 phosphorylation of heme
oxygenase-2. Neuron 40, 129-137.
Cao L, Blute TA & Eldred WD (2000). Localization of heme oxygenase-2 and modulation of
cGMP levels by carbon monoxide and/or nitric oxide in the retina. Vis Neurosci 17, 319-
329.
Christodoulides N, Durante W, Kroll MH & Shafer AI (1995). Vascular smoothmuscle cell
heme oxygenase generate guanyl cyclase stimulatory carbonmonoxide. Circulation 91,
2306-2309.
Furchgott RF & Jothianandan D (1991). Endothelium-dependent and independent
vasodilatation involving cyclic GMP: relaxation induced by nitric oxide, carbon monoxide
and light. Blood Vessels 28, 52-61.
Goldenberg-Cohen N, Dadon S, Bat-Chen S, Kramer M, Hasanreisoglu M, Eldar M,
Weinberger D & Bahar I (2008). Molecular and histological changes following central
retinal artery occlusion in a mouse model. Exp Eye Res 87, 327-333.
Grzegorzewski W, Skipor J, Wąsowska B & Krzymowski T (1995). Counter current transfer
of oxytocin from the venous blood of the perihypophyseal cavernous sinus to the arterial
blood of carotid rete supplying the hypophysis and brain depends on the phase of the
estrous cycle in pig. Biol Reprod 52, 139-144.
Kamiński M, Kartanowicz R, Jastrzębski D & Kamiński MM (2003). Determination of
Carbon Monoxide, Methane, and Carbon Dioxide in Refinery Hydrogen Gases and Air by
Gas Chromatograph. J Chromatogr A 989, 277-283.
Khamas WA, Ghoshal NG & Bal SH (1984). Histomorphologic structure of the carotid rete-
cavernus sinos complex and its functional importance in sheep (ovis aries). Am J Vet Res
45, 156-158.

9
Kozma F, Johnson RA, Zhang F, Yu C, Tong X & Nasjletti A (1999). Contribution of
endogenous carbon monoxide to regulation of diameter in resistance vessels. Am J Physiol
276, R1087-R1094.
Krzymowski T, Grzegorzewski W, Stefańczyk-Krzymowska S, Skipor J & Wąsowska B
(1999). Humoral pathway for transfer of the boar pheromone, androstenol, from the nasal
mucosa to the brain and hypophysis of gilts. Therigenology 52, 1225-1240.
Krzymowski T, Skipor J & Grzegorzewski W (1992). Cavernous sinus and carotid rete of
sheep and sows as a possible place for countercurrent exchange of some neuropeptides and
steroid hormone. Anim Reprod Sci 29, 225-240.
Krzymowski T, Stefańczyk-Krzymowska S, Grzegorzewski W, Skipor J & Wąsowska B
(2001). A possible humoral pathway for the priming action of the male pheromone
androstenol on female pig. In: Chemical Signals in Vertebrates, 9 edn, ed Marchlewska-
Koj et al., pp 117-123. Kluwer Academic/Plenum Publishers, New York.
Kutty R.K, Kutty G, Wiggert B, Chader G.J, Darrow RM & Organisciak DT (1995).
Induction of heme oxygenase 1 in the retina by intense visible light: suppression by the
antioxidant dimetylthiourea. Proc Natl Acad Sci USA 92,1177-1181.
Lo S, Palma SD, Pitkin L & McCombe AW (2005). Localisation of heme oxygenase isoforms
in allergic human nasal mucosa. Eur Arch Otorhinolaryngol 262, 595-598.
Maines MD (2000). The heme oxygenase system and its function in the brain. Cell Mol Biol
46, 573-585.
Maines MD (1988). Heme oxygenase: function, multiplicity, regulatory mechanisms and
clinical applications. FASEB J 2, 2557-2568.
Morita T & Kourembana S (1995). Endothelial cell expression of vasoconstrictors and growth
factors in regulated by smooth muscle cell-derived carbon monoxide. J Clin Invest 96,
2676-2682.
Ninomiya H & Masui M (1999). Vasculature of the orbital rete in the Japanese deer (Cervus
Nippon). Vet Ophthalmol 2, 107-112.
Oren DA (1996). Humoral phototransduction: blood is messenger. Neuroscientist 2, 207-210.
Ortiz de Montellano PR (1998). Heme oxygenase mechanism: evidence for an electrophilic,
ferric peroxide species. Acc Chem Res 31, 543-549.
Pannen BH & Bauer M (1998). Differential regulation of hepatic arterial and portal venous
vascular resistance by nitric oxide and carbon monoxide in rats. Life Sci 62,2025-2033.
10
Prifitera MG, Potenza M, Bucolo C, Leggio GM & Drago F (2007). Hemin, an inducer of
heme oxygenase-1, lowers intraocular pressure in rabbits. J Ocul Pharmacol Ther 23, 232-
239.
Resch H, Zawinka C, Weigert G, Schmetterrer L & Garhofer G (2005). Inhaled carbon
monoxide increases retinal and choroidal blood flow in healthy humans. Invest Ophthalmol
Vis Sci 46, 4275-4280.
Rich A, Farrugia G & Rae JL (1994). Carbon monoxide stimulates a potassium-selective
current in rabbit corneal epithelial cells. Am J Physiol Cell Physiol 267, C435-C442.
Scapagnini G, D'Agata V, Calabrese V, Pascale A, Colombrita C, Alkon D & Cavallaro S
(2002). Gene expression profiles of heme oxygenase isoforms in the rat brain. Brain Res
954, 51-59.
Skipor, J., Grzegorzewski, W., Wąsowska , B., Krzymowski, T. 1997. Counter current of
beta-endorphin in the perihypophyseal cavernous sinus – carotod rete vascular complex of
sheep. Exp Clin Endocrinol Diabetes 105: 308-313.
Skipor J, Wąsowska B, Grzegorzewski W, Zezula-Szpyra A, Stefańczyk-Krzymowska S &
Thiery J-C (2001). Transfer of dopamine by counter current mechanism in ewe changes
with endocrine stage. Biogenic Amines 16, 431-445.
Stefańczyk-Krzymowska S, Krzymowski T, Grzegorzewski W, Wąsowska B & Skipor J
(2000). Humoral pathway for local transfer of the priming pheromone androstenol from the
nasal cavity to the brain and hypophysis in anaesthetized gilts. Exp Physiol 85,801-809.
Tenhunen R, Marver HS & Schmid R (1968). The enzymatic conversion of heme to bilirubin
by microsomal heme oxygenase. Proc Natl Acad Sci USA 61,748-755.
Thorup C, Jones CL, Gross SS, Moore LC & Goligorsky MS (1999). Carbon monoxide
vasodilation and nitric oxide release but suppresses endothelial NOS. Am J Renal Physiol
277, F882-F889.
Vincent SR, Das S & Maines SD (1994). Brain heme oxygenase isoenzymes and nitric oxide
synthase are co-localized in select neurones. Neuroscience 63, 223-231.
Wu L & Wang R (2005). Carbon monoxide: endogenous production, physiological functions
and pharmacological application. Pharmacol Rev 57,585-63.

11
Table 1. Chromatographic conditions during determination of trace amounts of CO in blood
samples
Gas chromatograph Agilent 6890
Column
2m x 2.1 mm inner diameter GC
column packed with molecular sieve
5A (80-100 mesh)
Detector FID (280 oC) with Raney Ni -
methanizer
Carrier helium; 10 cm3 min-1
Oven temperature 130oC
Injection port split-less; 100oC
Sample volume 0.5 cm3
Limit of detection (LOD) 0.5 ppm (v/v) CO

12
Figures and figure legends
Figure 1. Simplified scheme of the experiment with ophthalmic and nasal venous blood
collection and arterial blood supply of the eye and venous blood effluent. 1/ maxillary artery;
2-3/ branches of the epidural rete mirabile; 4/ external ophthalmic artery; 5/ epidural rete
mirabile in the cavernous sinus; 6/ intercavernous sinus; 7/ carotis interna artery; 8/
anastomotic branch with epidural rete mirabile; 9/ emissary vein of the foramen
orbitorotundum; 10/ ophthalmic venous sinus and rete mirabile external ophthalmic artery;
11/ ophthalmic vein; 12/ ophthalmic externa artery; 13/ ciliares vein; 14/ circle of Willis; 15/
to jugular vein.
13
Figure 2. Mean (± SEM) concentration of carbon monoxide in venous blood outflow from the
eye and nasal area during light phase of the long day. A – morning, B – afternoon. * P<0.05;
*** P<0.001.
Figure 3. Mean (± SEM) area under curve (AUC) of carbon monoxide concentration in
venous outflow from the eye and nasal area during entire light phase of the long day. **
P<0.01.

14
Figure 4. Mean (± SEM) concentration of carbon monoxide in venous blood outflow from the
eye and nasal area during nocturnal phase of the long day.