Embed Size (px)
Citation preview

Finance Department
Finance Department Faculty Publications
University of Nebraska - Lincoln Year
Changes in CEO compensation structure
and the impact on firm performance
following CEO turnover
David W. Blackwell∗ Donna M. Dudney†
Kathleen A. Farrell‡
∗Texas A&M University, [email protected]†University of Nebraska–Lincoln, [email protected]‡University of Nebraska–Lincoln, [email protected]
This paper is posted at DigitalCommons@University of Nebraska - Lincoln.
http://digitalcommons.unl.edu/financefacpub/14

315
Published in Review of Quantitative Finance and Accounting 29 (2007), pp. 315–338; doi: 10.1007/s11156-007-0034-y Copyright © 2007 Springer Science+Business Media, LLC. Used by permission.
Published online August 24, 2007.
Changes in CEO compensation structure and the impact on firm performance
following CEO turnover
David W. BlackwellDepartment of Finance, Mays Business School, Texas A&M University, 4218 TAMU,
College Station, TX 77845-4218, USA; [email protected]
Donna M. DudneyDepartment of Finance, University of Nebraska–Lincoln,
Lincoln, NE 68588-0490, USA; [email protected]
Kathleen A. FarrellDepartment of Finance, University of Nebraska–Lincoln,
Lincoln, NE 68588-0490, USA; [email protected] (Corresponding author)
Abstract We document changes in compensation structure following CEO turnover and relate them to future performance. Compared to outgoing CEOs, incoming CEOs derive a significantly greater percentage of their compensation from option grants and new stock grants. The voluntary turnover sample shows similar changes in compensation structure while the forced turnover sample results suggest that new stock grants drive the significant increase in incentive compensation following turnover. Post-turnover performance is positively associated with new stock grants as a percentage of total compensation in the full sample and when analyzing forced and voluntary turnovers separately. We find limited evidence that future operating income is positively associ-ated with option grants following forced turnover. Post-turnover improvement in op-erating income is positively associated with an increase in new stock grants for the in-coming relative to the outgoing CEO.
The authors appreciate the comments and suggestions on a much earlier version of the paper titled “Changes in CEO compensation and firm performance following CEO turnover” received from George Benston, Jeff Coles, Richard DeFusco, David Denis, Jenny Gaver, Paul Irvine, Steve Jones, Ed Kane, Steve Kane, Scott Lee, Kevin Murphy, Jeff Netter, Bob Pavlik, Robert Peevey, Annette Poulsen, Carolyn Reichert, Oliver Rui, Terry Sebora, Jerry Strawser, Patrick A. Traichal, George Tsetsekos, Jerold B. War-ner, Ron Warren, Peter Xu, Zaher Zantout, Marc Zenner, seminar participants at University of Geor-gia, Drake University, Emory University, University of Arizona, University of Baltimore, University of Houston, and University of Nebraska–Lincoln. We also thank participants at the following conferences for their comments: the 1994 Financial Management Association, the 1994 Southern Finance Association, the 1995 Utah Winter Finance Conference, and the 1995 Southwestern Finance Association. We appreci-ate the research assistance of Ron Harris at Emory University. We are responsible for all errors.

316 Bl a c k w e l l, Du D n e y, & Fa r r e l l i n Re v. Qu a n t. F i n. & ac c t g 29 (2007)
Keywords: executive compensation, CEO turnover, compensation structure, firm performance
1 Introduction
A primary mechanism for controlling conflicts of interest between managers and shareholders is the ability of the board of directors to effect management changes. 1 In addition, executive turnover provides an opportunity for boards of directors to mod-ify the structure of compensation. If boards are effective in their selection of incoming CEOs and provide appropriate incentive compensation, then we should see improve-ment in operating performance following CEO turnover. The purpose of this paper is to examine the compensation packages of newly appointed CEOs to identify com-pensation components associated with future firm performance and also to identify changes in compensation that are associated with improved performance after CEO turnover. We also compare the compensation structure of the outgoing CEO to that of the incoming CEO around forced and voluntary CEO turnover.
The related compensation literature is extensive (e.g., Murphy 1999). First, a sub-stantial amount of literature focuses on the sensitivity of compensation to firm perfor-mance (e.g., Murphy 1985; Jensen and Murphy 1990; Crawford et al. 1995). In general, these studies find a significantly positive relation between compensation and perfor-mance. Compensation research also focuses on compensation structure as a function of certain firm characteristics. Smith and Watts (1992) and Gaver and Gaver (1993) find that growth firms pay significantly higher levels of cash compensation to their executives and have a significantly higher incidence of stock option plans than non-growth firms.
Additional research relates firm performance to compensation structure and to changes in firm performance surrounding executive turnover. For example, Meh-ran (1995) finds a positive relation between firm performance and the percentage of a manager’s compensation that is equity based. Studying CEO turnovers from 1985 to 1988, Denis and Denis (1995) find that industry-adjusted operating income increases significantly in the years following CEO replacement. They find significant differences in this effect, however, between samples of forced resignations and normal retire-ments. The forced resignations are characterized by significant improvements in op-erating income following turnover whereas the sample of normal retirements exhibits only small post-turnover improvements in operating income. Huson et al. (2004) also find that post turnover performance improvements tend to be in those firms that hire CEOs from outside the firm.
Our paper complements these earlier works on executive compensation and firm performance by examining the changes in compensation structure around turnover within the same firm thereby implicitly controlling for firm-specific characteristics and further relating compensation structure to future firm performance. When ana-lyzing the relation between managerial equity ownership and firm performance, Core and Larcker (2002) assume that firms choose optimal managerial equity incentives when they contract but transaction costs prohibit continuous re-contracting. Drawing
1 Several studies examine the poor performance hypothesis, which states that effective corporate boards replace CEOs when firm performance is poor. Coughlan and Schmidt (1985), Warner et al. (1988), Weisbach (1988), and Blackwell et al. (1994) find that the probability of a CEO change is in-versely related to the firm’s performance.

ceO c O m p e n s a t i O n a n D F i r m p e r F O r m a n c e F O l l O w i n g ceO t u r n O v e r 317
on Core and Larcker’s assumption, we argue that boards are likely to move to optimal executive compensation designs when they contract with the incoming CEO. Turn-over is a time when a board is required to contract with the incoming CEO and the transaction cost associated with the contracting is unavoidable.
We begin by examining changes in the structure of CEO compensation surround-ing 125 turnovers that occur from 1982 to 1991. Overall, we find that, compared to outgoing CEOs, incoming CEOs derive a significantly greater percentage of their to-tal compensation from new stock options granted and new stock grants. Total equity-based incentive compensation as a percentage of total compensation is significantly greater for incoming CEOs relative to the outgoing CEOs. 2 These results tend to hold even when differentiating between voluntary and forced turnover or when control-ling for the age of the incoming and outgoing CEO. Thus, firms appear to load up in-coming CEOs with new option and stock grants in an attempt to increase total equity-based compensation for the incoming CEO.
Next we analyze the association between post turnover performance and compen-sation structure. Our results suggest that new stock grants as a percentage of total compensation are positively related to future performance. The positive relation be-tween new stock grants and future performance is documented in both the full sam-ple and the voluntary and forced turnover subsamples. We also find a positive re-lation between option grants and future operating income for the forced turnover subsample. Analyzing changes in compensation structure, we also document evi-dence that increases in new stock grants are associated with improved operating in-come after turnover. In general, these results suggest that firm performance improve-ments following CEO turnover are associated with greater CEO stock grants.
Much of the focus in new CEO compensation contracts is on options which may result from their favorable accounting treatment during our sample period. Our re-sults suggest that restricted stock grants align the interests of managers and share-holders more effectively than stock options. Our evidence appears consistent with re-cent anecdotal evidence provided by Microsoft, when it announced that it would no longer issue stock options but will make employees eligible to receive awards of re-stricted shares that vest over 5 years (see Guth and Lublin 2003, p. A1).
In the next section of the paper, we describe the sample and the data. In Section 3 we analyze changes in compensation structure around turnover. Section 4 provides a discussion of results associated with changes in CEO compensation and future per-formance. Section 5 summarizes and concludes.
2 The sample and data
2.1 The sample
We choose a sample of firms that experience turnover prior to the implementation of the Omnibus Budget Reconciliation Act (OBRA) of 1993 which took effect on January
2 We also analyze total stockholdings in place of new stock grants since total stockholdings pro-vide incentives although they are not part of the current compensation package. When we measure the percentages of total compensation based on salary and bonus, total stockholdings and option grants our results differ. Total CEO stockholdings are significantly higher for the outgoing CEO relative to the incoming CEO. Option grants remain significantly greater for the incoming CEO rel-ative to the outgoing CEO but total incentives become significantly lower for the incoming CEO relative to the outgoing CEO.

318 Bl a c k w e l l, Du D n e y, & Fa r r e l l i n Re v. Qu a n t. F i n. & ac c t g 29 (2007)
1, 1994. The legislation capped the corporate tax deductibility of top management com-pensation at $1 million per executive unless it qualified as substantially performance based. Since the legislation exempted qualified performance based compensation, some argued that firms would modify the structure of executive compensation plans (see Rose and Wolfram (2002); Perry and Zenner (2001) for a more thorough discussion of the regulation). The evidence, however, is mixed on the effect of the legislation on com-pensation. Perry and Zenner (2001), for example, find evidence consistent with the Act increasing the pay–performance sensitivity of executive compensation for firms affected by the legislation. Alternatively, Rose and Wolfram (2002) find little evidence that the deductibility cap had a significant effect on overall executive compensation levels or growth rates at firms likely affected by the legislation. We avoid the potential problems associated with a shift in compensation structure after the implementation of OBRA of 1993 by choosing a sample of firms with CEO turnover prior to 1993 and measuring our compensation variables prior to the implementation of the Act.
The initial sample is derived from 1,431 firms that have appeared in the Forbes An-nual Survey of Compensation (hereafter, Forbes) in the 12 years, 1981–1992. 3 We elimi-nate from the sample 182 firms that experienced no turnover during 1981–1992 and another 368 that experienced no turnover but left the sample because of merger, ac-quisition, liquidation, bankruptcy, and other restructuring. Next we eliminate 294 regulated financial services firms (SIC 6021-6799) and public utilities (SIC 4911-4932). 4 To avoid including interim CEOs in the sample, we require 2 years of data for the same CEO, eliminating 114 firms. Due to missing proxy statements or incomplete firm performance data on the Compustat Industrial or Full Coverage files, we lose 254 firms. Of the 219 firms experiencing 249 CEO turnovers during the sample period, we eliminate an additional 58 turnovers because we were unable to determine the reason for the turnover. We exclude additional observations because of incomplete compen-sation data. Therefore, the samples we analyze range from 100 to 121 turnovers, de-pending on the specific analysis performed.
2.2 Identifying CEO turnover
To identify turnover, we record the name of each firm’s CEO for each year in the Forbes survey. For firms entering the survey after 1981 or leaving the survey be-fore 1992, we obtain the CEO name from proxy statements for all subsequent or prior years. We use the firm’s proxies and Forbes to gather information regarding the CEO’s age, tenure with the firm, and tenure as CEO. The transition year is the fiscal year of the turnover.
3 Murphy and Zimmerman (1993) note that sample selections based on the Forbes 500 may bias a sam-ple toward large, surviving, and growing firms. In an attempt to address this bias, we allow firms to enter or exit the panel over time. In addition, arguably we could choose a sample of turnovers after the passage of OBRA of 1993 to avoid the possibility of firms adjusting compensation structure due to the legislation. We did not choose this sample period since it would reduce the time horizon avail-able for turnover. Since we require compensation data 1 year after turnover and firm performance data 2 and 3 years after turnover, our turnover sample period would be much shorter (1994–1999) and still may capture the effect of the legislation as more firms approach the $1 million salary cap.
4 We define regulated industries similarly to Fama and French (1986) and DeFusco et al. (1991). We analyze only industrial firms to economize on data collection costs without unduly limiting the gen-eralizability of our results. Smith and Watts (1992) and Gaver and Gaver (1993) argue that regulated firms have systematically different compensation schemes because regulation restricts the invest-ment opportunity set.

ceO c O m p e n s a t i O n a n D F i r m p e r F O r m a n c e F O l l O w i n g ceO t u r n O v e r 319
2.3 Classifying forced and voluntary CEO turnover
Our scheme for classifying turnovers as forced or voluntary is based on that of Gilson (1989), Weisbach (1988), and Parrino (1997) and incorporates elements of each. We classify as forced turnovers all CEO changes other than those arising from retire-ment, normal management succession, death, illness, or those involving the CEO’s departure for a prestigious position elsewhere. We initially assume a voluntary retire-ment for any departing CEO at least 64 years old unless we later uncover information suggesting the departure is performance-related.
We consult the Wall Street Journal (WSJ), Wall Street Journal Index (WSJI), or both for turnover reasons. First, we checked the WSJI, which in some cases provides an un-ambiguous reason for the CEO’s departure. If, however, the WSJI-reason is unclear or if no reason is mentioned, we consult the full WSJ article. We also consult the full ar-ticle for reported retirements, resignations, or normal management successions to de-termine whether these reasons are associated with poor firm performance. We read the full WSJ article for 85% of the turnover sample. Voluntary turnovers account for 92 (76%) of the turnovers in the sample. Twenty-nine (24%) turnovers are forced. 5
2.4 Compensation and firm level data
From corporate proxy statements we gather information on salary, bonus, exec-utive stock option grants, and CEO stock holdings. We collect data for the 4 years surrounding the turnover: 1 year before the transition year, the transition year, and 2 years after the transition year. We require complete data for all compensation vari-ables in order for the turnover observation to remain in the final sample. We adjust all compensation data for inflation, using the Consumer Price Index (CPI) to convert the values to 1986 dollars.
Because proxy statements during our sample period frequently aggregate salary and bonus under the heading total cash compensation, we report the combined salary and bonus figures. We value stock options granted using the Black-Scholes model un-der a set of assumptions similar to those of Murphy (1985). We focus our analysis of options on the market value of options granted because of the high cost of collecting information on the CEOs entire portfolio of options. 6 When determining CEO stock holdings, we include shares held in trust for children, shares held by immediate fam-ily members, restricted stock, stock savings plans, and dual-class common stock and thereby exclude exercisable options.
Given our focus is on the incentive components of the executive compensation package, we focus our analysis on changes in stockholdings in an attempt to cap-ture the value of restricted stock grants. We assume that stock held prior to a particu-lar year represents accumulated wealth, not current compensation. While total stock-holdings certainly provide an incentive to CEOs, only the addition to stockholdings represents stock compensation for a particular year. We do, however, attempt to ad-dress this concern by controlling for total stockholdings held by the incoming CEO in our regression analysis. To proxy restricted stock grants, we look at additions to
5 For comparison, Huson et al. (2001) define 20% of their CEO turnovers as forced departures over the sample period 1983–1994. Denis and Denis (1995) classify between 18% and 21% of top execu-tive changes as forced depending on the data restrictions applied.
6 Our approach is similar to Gaver and Gaver (1995) and Collins et al. (1995).

320 Bl a c k w e l l, Du D n e y, & Fa r r e l l i n Re v. Qu a n t. F i n. & ac c t g 29 (2007)
the number of shares held by a CEO. 7 For turnovers where the replacement CEO is an insider, the increase in the number of shares is calculated by averaging the an-nual increases in stockholdings in the 2 years following the turnover. The increase in the number of shares for turnovers where the replacement CEO is an outsider is cal-culated in a similar manner, but also includes initial stockholdings in the year of the turnover in the calculation, as these stockholdings are likely to be in the form of new restricted grants. To separate the impact of share price from share grants, we hold the stock price constant by valuing the increase in the number of shares at the stock price as of the year prior to the turnover year for our restricted stock grant measure. 8
Our analysis focuses on percentages of compensation since percentages better cap-ture the composition of the pay package. The percentage of compensation also effec-tively controls for systematic differences in the level of pay due to differences in firm size. Therefore, we require a calculation of total compensation which is simply the sum of the salary and bonus, value of options granted, and the value of new stock grants. All remaining firm level data is obtained from Compustat or CRSP.
3 Compensation changes following CEO turnover
3.1 Changes in CEO compensation around turnover
Tables 1–3 provide percentages of various components of compensation surround-ing turnover for the outgoing and incoming CEO (years −1 and +1). We ignore the transition year. The transition year compensation data may include partial year sala-ries for incoming CEOs or salaries for the individual when they held a post other than CEO. In comparing the mean and median compensation data, Tables 1–3 indicate that the compensation data are skewed. The discussion and statistical tests will, therefore, focus on medians.
3.1.1 Structural changes for the overall sample In Table 1, we report comparisons of changes in compensation structure around
CEO turnover. In Table 1, we document that incoming CEOs receive significantly larger median stock grants (16.7%) than the outgoing CEO (3.2%) and significantly higher option grants (15.7%) than the outgoing CEO (7.4%). As a result, total incen-tives are a significantly higher percentage of total compensation (and salary and bo-nus a significantly lower percentage) for the incoming CEO relative to the outgoing CEO. Thus, the composition of the pay package changes following CEO turnover, with incoming CEOs receiving a significantly higher percentage of compensation in the form of new stock grants and option grants. 9
7 We estimate restricted grants by analyzing changes in the number of shares held during a given time period. If the number of shares held by a CEO decreased during the fiscal year, stock grants were assumed to be zero for that year.
8 We do not use number of shares granted in our analysis since our focus is on percentages of total compensation which requires us to value the individual compensation components.
9 We also analyzed changes in compensation structure using total CEO stockholdings in place of our proxy for the value of restricted stock grants. Total CEO stockholdings are significantly higher for the outgoing CEO relative to the incoming CEO. Option grants remain significantly greater for the incoming CEO relative to the outgoing CEO but total incentives become significantly lower for the incoming CEO relative to the outgoing CEO. These results are likely driven by the difference in firm tenure between the incoming and outgoing CEO. The incoming CEO has an average firm tenure of 20.8 years (median is 23). The average firm tenure for the outgoing CEO is 29.7 years (median is 33).

ceO c O m p e n s a t i O n a n D F i r m p e r F O r m a n c e F O l l O w i n g ceO t u r n O v e r 321
3.1.2 Structural changes in compensation after voluntary and forced CEO turnover Table 2 shows compensation structure data for forced and voluntary turnovers in
our sample. Median salary and bonus as a percentage of total compensation is signif-icantly lower for the incoming CEO relative to the outgoing CEO in both the volun-tary and forced turnover samples. Consistent with the full sample results, new stock grants is significantly higher for replacement CEOs in both the voluntary and forced samples. New stock grants as a percentage of total compensation rise more dramati-cally following forced turnover than voluntary turnover.
In the voluntary turnover sample, the percentage of compensation from option grants for the incoming CEOs is significantly greater than that of the outgoing CEOs. The percentage of compensation from option grants is higher for the incoming CEOs compared to the outgoing CEOs in the forced turnover sample, but the difference is
Table 1. Descriptive statistics: comparison of changes in compensation structure around CEO turnovers
Percentages of total compensation
Mean Median Maximum Minimum SD Equality of medians (%) (%) (%) (%) (%) test statistica
Salary and bonus Outgoing 70.54 74.78 100.00 6.62 25.63 4.8852 (0.000)** Incoming 54.64 54.35 100.00 4.08 23.86
New stock grants Outgoing 17.04 3.19 93.38 0.00 24.32 4.7043 (0.000)** Incoming 25.80 16.65 95.92 0.00 24.28
Option grants Outgoing 12.42 7.36 55.31 0.00 15.05 3.5253 (0.000)** Incoming 19.56 15.69 87.72 0.00 18.18
Total incentives Outgoing 29.46 25.22 93.38 0.00 25.63 4.8852 (0.000)** Incoming 45.36 45.65 95.92 0.00 23.86
Descriptive statistics are for a sample of 121 CEO turnovers occurring between 1982 and 1990. Compensation for the outgoing CEO is measured as of the fiscal year prior to the turnover year. Compensation for the incoming CEO is measured as of the fiscal year following the turnover year. All compensation components are adjusted for inflation and are reported in 1986 dollars. The value of new stock grant compensation for insiders is the average annual increase in stockholdings for the incoming CEO (calculated using the the 2 years following the turnover and valued at the stock price as of the year prior to the turnover). The value of new stock grant compensation for outsiders is calculated in a similar manner, but includes intial stockholdings in the year of the turnover. Option values are the Black-Scholes values of options granted during the fiscal year, calculated under a set of assumptions similar to Murphy (1985). Total incentive compensation is the sum of CEO stockholdings (as calculated above) and CEO option grants. Total compensation is the sum of salary and bonus, CEO stockholdings and CEO option grants.
aThe Wilcoxon/Mann–Whitney (non-parametric) test is used to test the equality of the compensation component medians at t = −1 (the year prior to the CEO turnover) and t = +1 (the year following the CEO turnover). Tests on the equality of the means of the compensation components were also conducted, with similar results. The number in parenthesis is the p-value associated with that test statistic.
** Significant at the 5% level

322 Bl a c k w e l l, Du D n e y, & Fa r r e l l i n Re v. Qu a n t. F i n. & ac c t g 29 (2007)
Table 2. Descriptive statistics: comparison of changes in compensation structure for forced versus voluntary turnovers
Mean Median Maximum Minimum SD Equality of medians (%) (%) (%) (%) (%) test statistica
Panel A: Percentages of total compensation for voluntary turnovers
Salary and bonus Outgoing 69.07 74.32 100.00 6.62 26.80 3.7082 (0.000)** Incoming 55.39 57.05 100.00 4.08 22.79
New stock grants Outgoing 18.93 4.25 93.38 0.00 25.39 3.4438 (0.001)** Incoming 24.62 16.66 95.92 0.00 23.49
Option grants Outgoing 12.00 6.72 55.31 0.00 15.18 3.7026 (0.000)** Incoming 19.99 15.86 66.87 0.00 17.24
Total incentives Outgoing 30.93 25.68 93.38 0.00 26.80 3.7082 (0.000)** Incoming 44.61 42.95 95.92 0.00 22.79
Panel B: Percentages of total compensation for forced turnovers
Salary and bonus Outgoing 75.19 76.07 100.00 6.73 21.26 3.2347 (0.001)** Incoming 52.26 52.00 100.00 6.33 27.28
New stock grants Outgoing 11.07 1.07 93.27 0.00 19.75 3.4057 (0.001)** Incoming 29.54 16.05 91.80 0.00 26.74
Option grants Outgoing 13.73 9.98 43.57 0.00 14.80 0.7620 (0.446) Incoming 18.20 14.39 87.72 0.00 21.18
Total incentives Outgoing 24.81 23.93 93.27 0.00 21.26 3.2347 (0.001)** Incoming 47.74 48.00 93.67 0.00 27.28
Descriptive statistics are for a sample of 92 voluntary and 29 forced CEO turnovers occurring between 1982 and 1990. In 76 of the 92 voluntary turnovers, the outgoing CEO was over 60. In 13 of the voluntary turnovers, the incoming CEO was over 60. In 13 of the 29 forced turnovers, the outgoing CEO’s were over age 60. Two of the incoming CEO’s were over 60 in the forced turnover sample. Compensation for the outgoing CEO is measured as of the fiscal year prior to the turnover year. Compensation for the incoming CEO is measured as of the fiscal year following the turnover year. All compensation components are adjusted for inflation and are reported in 1986 dollars. The value of new stock grant compensation for insiders is the average annual increase in stockholdings for the incoming CEO (calculated using the 2 years following the turnover and valued at the stock price as of the year prior to the turnover). The value of new stock grant compensation for outsiders is calcuated in a similar manner, but includes initial stockholdings in the year of the turnover. Option values are the Black-Scholes values of options granted during the fiscal year, calcuated under a set of assumptions similar to Murphy (1985). Total incentive compensation is the sum of CEO stockholdings and CEO option grants. Total compensation is the sum of salary and bonus, CEO stockholdings and CEO option grants.
a The Wilcoxon/Mann–Whitney (non-parametric) test is ued to test the equality of the compensation component medians at t = −1 (the year prior to the CEO turnover) and t = +1 (the year following the CEO turnover). Tests on the equality of the means of the compensation components were also conducted, with similar results. The number in parenthesis is the p-value associated with that test statistic.
** Significant at the 5% level

ceO c O m p e n s a t i O n a n D F i r m p e r F O r m a n c e F O l l O w i n g ceO t u r n O v e r 323
not significant. Overall, the median percentage of compensation received in the form of new stock and option grants is very similar for the incoming CEOs independent of whether the CEO follows a forced or voluntary turnover.
Total incentives as a percentage of total compensation are significantly higher for incoming CEOs relative to the outgoing CEOs in both the voluntary and forced sam-ples. In the forced sample, median total incentives as a percentage of total compen-sation appear to rise more dramatically for the incoming CEO (48%) relative to the outgoing CEO (23.9%) than in the voluntary sample (where the comparable percent-ages are 43 and 25.7). Therefore, as noted for the full sample, the structure of equity-based compensation appears to change around CEO turnover, where incoming CEOs are loaded up with incentive compensation independent of the type of turnover. 10 Changes in the percentage of incentive compensation are more pronounced following forced turnovers.
An alternative approach to analyzing the compensation structure is to partition the turnover sample based on inside versus outside replacement. One hundred and fifteen of the turnovers result in inside replacement and ninety four of these turn-overs are voluntary turnovers. Not surprisingly, the descriptive statistics for insiders tend to mimic the full sample and are very similar to the voluntary turnover sample. In the outside replacement sample, the descriptive statistics for the incoming and out-going CEO are not significantly different from each other. However, the outside re-placement sample has only 10 observations (one voluntary and nine forced), so the small sample size of outside replacements makes it difficult to draw meaningful in-ferences regarding compensation structure changes around turnover for outside CEO replacements.
3.1.3 Structural changes in compensation controlling for CEO age around turnover One potential criticism of our analysis is that an incoming CEO is likely to be of a
different age than the outgoing CEO. The structure of compensation is likely to dif-fer for CEOs of different ages due to the horizon problem. The horizon problem hy-pothesis predicts that CEOs nearing retirement will forgo valuable capital investment expenditures because incentive plans based on accounting data will penalize current CEOs and reward only their successors. A means to overcome the horizon problem is to use more stock-based compensation for older CEOs to provide long-term incen-tives. If outgoing CEOs are older and have optimal compensation plans, we expect to observe a decrease in equity-based compensation for the incoming CEO.
We compare compensation structure between incoming and outgoing CEOs who are close in age. We rank the turnovers based on the absolute value of the difference in age between the outgoing and incoming CEO. We then divide the sample into quartiles based on the age difference. Table 3 shows descriptive statistics for the sam-ple of turnovers in the lowest quartile (i.e. the quartile containing turnovers with the
10 We also analyzed changes in compensation structure for forced and voluntary turnover using total CEO stockholdings in place of our proxy for the value of restricted stock grants. The results for each subsample are very similar to the full sample results discussed in footnote 9. Note also that 9 of the 30 forced turnovers resulted in an outside replacement, while only 1 of the 95 voluntary turnovers re-sulted in an outside replacement which will likely impact total stockholdings due to shorter firm ten-ures for outside replacements. The average firm tenure for the incoming CEO is 22.8 years in the vol-untary departure sample and 14.3 years in the forced departure sample. The average firm tenure for the outgoing CEO is 31.4 years (voluntary sample) and 24.2 years (forced sample).

324 Bl a c k w e l l, Du D n e y, & Fa r r e l l i n Re v. Qu a n t. F i n. & ac c t g 29 (2007)
smallest age difference). This quartile includes turnovers where the incoming CEO is within 5 years of age of the outgoing CEO. Within the age-based sample, the outgo-ing CEO is 1.94 years older than the incoming CEO, on average, and 24 of the 32 turn-overs were voluntary. In addition, 29 outgoing CEOs were replaced by inside CEOs while three outgoing CEOs were replaced by outside CEOs. Consistent with the full sample results, new stock grants and option grants increase significantly and salary and bonus decrease significantly between incoming and outgoing CEOs as shown in Table 3. Therefore, changes in compensation structure in the overall sample are not attributable to horizon problems as these changes persist even when we control for differences in age between the incoming and outgoing CEO.
Table 3. Descriptive statistics: comparison of changes in compensation structure around CEO turnovers
Percentages of total compensation
Mean Median Maximum Minimum SD Equality of medians (%) (%) (%) (%) (%) test statistica
Salary and bonus Outgoing 68.42 73.10 100.00 6.62 27.51 2.5444 (0.011)** Incoming 53.39 51.85 100.00 20.97 20.30
New stock grants Outgoing 19.33 6.87 93.38 0.00 25.92 1.9134 (0.056)* Incoming 26.99 23.24 75.55 0.00 21.57
Option grants Outgoing 12.24 7.65 55.31 0.00 14.59 2.0745 (0.038)** Incoming 19.62 17.90 54.44 0.00 15.83
Total incentives Outgoing 31.58 26.90 93.38 0.00 27.51 2.5444 (0.011)** Incoming 46.61 48.15 79.03 0.00 20.30
Sample controlled for age—includes only turnovers where age difference between incoming and outgoing CEO is 5 years or less
This sample was derived by ranking all turnovers by the age difference between the outgoing and incoming CEO. The total turnover sample was then divided into quartiles based upon the age difference ranking. Descriptive statistics are for the 32 turnovers in the lowest quartile (i.e. the quartile containing turnovers with the smallest age difference). Of these 32 turnovers, 9 were forced turnovers and 23 were voluntary. Compensation for the outgoing CEO is measured as of the fiscal year prior to the turnover year. Compensation for the incoming CEO is measured as of the fiscal year following the turnover year. All compensation components are adjusted for inflation and are reported in 1986 dollars. The value of new stock grant compensation is the average annual increase in stockholdings for the incoming CEO (calculated using the the 2 years following the turnover and valued at the stock price as of the year prior to the turnover). The value of new stock grant compensation for outsiders is calculated in a similar manner, but includes intial stockholdings in the year of the turnover. Option values are the Black-Scholes values of options granted during the fiscal year, calculated under a set of assumptions similar to Murphy (1985). Total incentive compensation is the sum of CEO stockholdings and CEO option grants. Total compensation is the sum of salary and bonus, CEO stockholdings (as calculated above) and CEO option grants.
a The Wilcoxon/Mann–Whitney (non-parametric) test is used to test the equality of the compensation component medians at t = −1 (the year prior to the CEO turnover) and t = +1 (the year following the CEO turnover). Tests on the equality of the means of the compensation components were also conducted, with similar results. The number in parenthesis is the p-value associated with that test statistic.
* Significant at the 10% level** Significant at the 5% level

ceO c O m p e n s a t i O n a n D F i r m p e r F O r m a n c e F O l l O w i n g ceO t u r n O v e r 325
3.2 Summary of changes in CEO compensation around turnover
We find that the salary and bonus as a percentage of compensation of the incom-ing CEO is significantly lower than the outgoing CEO for the full sample of turnovers and for both turnover subsamples. Compared to pre-turnover levels, new stock grants and the value of options granted increase significantly for the full sample and follow-ing voluntary and forced departure. Our results do not change when we control for age differences between the incoming and outgoing CEO. The composition of incen-tives from options and new stock grants changes after turnover.
4 Relating compensation structure and firm performance
4.1 Method
Given the change in compensation structure following CEO turnover discussed in the previous section, we now investigate whether there is an association between the structural change in compensation and future firm performance. Our approach is to first analyze the relation between compensation structure of the incoming CEO in year one (+1) and future firm performance in years two (+2) and three (+3). We also analyze changes in the compensation of the incoming CEO relative to the out-going CEO and measure the associated changes in firm performance pre- and post-turnover. Given previous research, our analysis of the relation between the compen-sation package and future performance holds constant firm size, total stockholdings of the incoming CEO, firm leverage, firm growth opportunities, and business risk. 11 We also control for the type of turnover that preceded the structural change in com-pensation and the age of the incoming CEO. Our research design is similar to that of Mehran (1995).
The initial regression model is as follows:
Firm performance following CEO turnover = f (percentage of restricted stock compensation, percentage
of option compensation, and control variables) (1)
Next, we focus on the change in equity-based compensation between the incom-ing CEO and the outgoing CEO. Equation 2 (below) specifies the relation between firm performance changes around turnover as a function of changes in the structure of incentive compensation of the incoming CEO relative to the outgoing CEO. In both specifications, we omit the percentage of fixed compensation to avoid a singular ma-trix of independent variables.
Change in firm performance surrounding CEO turnover = f (change in percentage of restricted stock compensation, change in percentage of
option compensation, and control variables) (2)
11 See Smith and Watts (1992), Gaver and Gaver (1993), Mehran (1995), and Yermack (1995) among others.

326 Bl a c k w e l l, Du D n e y, & Fa r r e l l i n Re v. Qu a n t. F i n. & ac c t g 29 (2007)
4.2 Dependent variable
The dependent variable is specified using both accounting and market-based measures of performance. Accounting measures of performance provide informa-tion to the board regarding the performance of the CEO. Hermalin and Weisbach’s (1998) model of endogenously chosen boards of directors predicts that accounting measures of performance are better predictors of management turnover than stock-price performance. The implication is that accounting measures capture the perfor-mance of current management. Therefore, we expect CEOs with more incentive com-patible compensation packages to produce better accounting measures of future firm performance.
We examine two measures of firm performance. Following Denis and Denis (1995), we use operating income before depreciation, defined as sales minus cost of goods sold and selling, general, and administrative expenses and scaled by total assets. 12 Following Mehran (1995), we use Tobin’s Q as a proxy for a market-based measure of firm performance. We construct the proxy using the Chung and Pruitt (1994) method. Under this method, the approximate Tobin’s Q is calculated by adding the firm’s mar-ket value of equity, the liquidating value of the firm’s outstanding preferred stock, the value of the firm’s short-term liabilities net of its short-term assets, and the book value of the firm’s long-term debt. This sum is then divided by the book value of the firm’s assets. 13 We calculate firm performance measures two (+2) and three (+3) years from the turnover year (year 0). 14
We industry adjust the performance measures by subtracting the median of firms in the same 2-digit Standard Industrial Classification (SIC). Typically, industry-ad-justed performance measures are used to capture relative performance evaluation in either compensation contracts or the threat of turnover. Since our analysis focuses on the association between compensation structure and future performance, it is not ob-vious that relative performance is the theoretically appropriate metric. Therefore, fol-lowing Denis and Denis (1995), we initially present regression results for unadjusted and industry-adjusted performance measures and then continue with industry-ad-justed performance measures. Our results are qualitatively the same using unadjusted measures of performance unless otherwise noted in the paper.
A potential problem associated with market-based measures of future firm perfor-mance for our purposes is that to the extent that compensation structure changes are expected to result in improved performance; the market-based measure should cap-
12 Using this performance measure eliminates the typical type of ‘big bath,’ which may affect account-ing measures of performance that rely on net income. Most ‘baths’ involve write offs that impact net income but not operating income. As a robustness check, we also measure accounting perfor-mance using return on assets (ROA) measured as net income divided by total assets (e.g., Black-well et al. 1994; Mehran 1995). The ROA results are qualitatively the same as the operating income results unless otherwise noted. All of the ROA results are available from the authors.
13 We use this method because the Manufacturing Sector Master File data used to compute the tradi-tional Tobin’s Q is available only through 1987. Chung and Pruitt (1994) found no significant differ-ences between the Tobin’s Q calculated using the traditional and the approximation methods. Barn-hart and Rosenstein (1998) also used the Chung and Pruitt method for approximating Tobin’s Q.
14 Allgood and Farrell (2000) document that approximately 26% of CEOs turn over within the first 3 years of CEO tenure. Since we control for the same CEO remaining in office 3 years after turn-over, we do not extend our performance analysis beyond 3 years since we would lose additional sample firms.
ceO c O m p e n s a t i O n a n D F i r m p e r F O r m a n c e F O l l O w i n g ceO t u r n O v e r 327
ture this effect contemporaneously. For example, Hermalin and Weisbach (1998) con-tend that stock returns reflect both the performance of current management and the expectation of future performance, conditional on management changes. One could argue that stock returns also reflect the expected benefits from incentive effects of compensation contracts. Alternatively, Hermalin and Weisbach contend that account-ing earnings are a function of the performance of current management only (and pos-sibly that of CEOs in prior years). Given the backward-looking nature of an account-ing measure of performance, it may take a year or two before accounting measures reflect the decisions of the incoming CEO.
Table 4 presents descriptive statistics for the dependent variables and all of the control variables used in our regression analysis.
4.3 Independent variables
The independent variables in our analysis measure compensation structure. We focus on equity-based compensation in the model specifications. We define two vari-ables, the proportion of stock options as a percentage of total pay and the proportion of new stock grants as a percentage of pay (salary and bonus as a percentage of total pay is the excluded variable). We calculate these variables for the incoming CEO in the first full year following turnover. The descriptive statistics for these variables are contained in Tables 1 and 2, for the full sample and the forced and voluntary subsam-ples, respectively. We also calculate the change in the proportion of stock options and new stock grants for the incoming CEO relative to the outgoing CEO.
4.4 Control variables
One of the most well documented empirical regularities in the executive compen-sation literature is the positive relation between executive compensation and firm size (e.g., Murphy 1985; Jensen and Murphy 1990; Chung and Pruitt 1996). We include to-tal assets to account for differences in firm size and we specify our variable as the natural logarithm of total assets, consistent with Murphy (1995), Yermack (1995), and Mehran (1995), among others.
A CEO’s total stockholdings likely provide incentives to influence future firm per-formance. Given our focus is on the incentives provided by the current compensation package, we attempt to control for the effect of a CEO’s initial stockholdings. The in-coming CEO’s total stockholdings value is computed using the number of shares held and the stock price per share as of the end of the fiscal year following the turnover year.
Many studies have found a positive association between stock options and growth opportunities (e.g., Smith and Watts 1992; Gaver and Gaver 1993; Mehran 1995). Al-ternatively, Yermack (1995) and Bizjack et al. (1993) find a negative relation between stock-based incentives and growth opportunities. One complicating factor is that some studies proxy for growth opportunities using Tobin’s Q (as used in Smith and Watts 1992; Gaver and Gaver 1993; Yermack, 1995). Mehran (1995), however, uses R&D to sales. We do not use Tobin’s Q to measure growth options since it is our proxy for firm performance. We do not use R&D to sales because of missing data. Therefore, we specify a proxy that captures the value of the firm’s assets in place as an alternative to measuring growth options. Consistent with Mehran (1995), we measure assets in place as the ratio of inventory plus gross plant and equipment to total assets. Mehran

328 Bl a c k w e l l, Du D n e y, & Fa r r e l l i n Re v. Qu a n t. F i n. & ac c t g 29 (2007)
documents a negative relation between Tobin’s Q and assets in place but a positive re-lation between ROA and assets in place, although neither relation is significant.
Yermack (1995) hypothesizes that incentives provided by stock option awards will decrease as financial leverage increases due to the increased agency costs of debt. However, he finds no significant relation between financial leverage and incentives from stock option awards. Mehran (1995) finds no relation between financial leverage and the percentage of equity-based compensation. Lewellen et al. (1987), however,
Table 4. Descriptive statistics for regression variables
Mean Median Maximum Minimum SD Observations
Dependent variables Unadjusted performance measures OIBDA 2 years after turnover 0.1597 0.1560 0.4470 0.0120 0.0732 120 OIBDA 3 years after turnover 0.1575 0.1510 0.5640 −0.0250 0.0789 117 Tobin’s Q 2 years after turnover 1.0393 0.7880 6.7360 0.2450 0.8816 109 Tobin’s Q 3 years after turnover 1.0743 0.8590 6.7010 −0.2530 0.8882 107Adjusted performance measures OIBDA 2 years after turnover 0.0527 0.0418 0.3270 −0.1080 0.0734 120 OIBDA 3 years after turnover 0.0501 0.0390 0.4510 −0.0780 0.0767 117 Tobin’s Q 2 years after turnover 0.2266 0.0330 5.9040 −1.2200 0.8257 109 Tobin’s Q 3 years after turnover 0.2271 0.0645 5.9005 −1.1420 0.8462 107
Independent variables Total stockholdings (in millions) 2.8082 0.8984 82.8252 0.0000 8.3439 121 Assets-in-place 0.8639 0.8285 1.9370 0.0940 0.3263 118 LT debt/assets 0.1788 0.1665 0.4990 0.0000 0.1142 118 Ln(assets) 7.9391 7.8735 11.2250 5.3190 1.2450 118 Standard deviation of OIBDA 0.5162 0.1585 10.7920 0.0240 1.3315 117 Incoming CEO age 0.1240 0.0000 1.0000 0.0000 0.3309 121 Forced turnover 0.2397 0.0000 1.0000 0.0000 0.4287 121
OIBDA = Operating income before depreciation and amortization, for the second and third fiscal years following the turnover, respectively.
Tobin’s Q = [market value of equity + liquidating value of outstanding preferred stock + book value of short-term liabilities net of short-term assets + book value of long-term debt]/book value of assets, calculated for the second and third years following the turnover
Industry-adjusted performance measures were computed by subtracting the median performance measure for the industry (based on 2-digit SIC codes) from the performance measure for the turnover firm
Total stockholdings = Value of total stockholdings, calculated as the number of shares times the stock price, both in the year following the turnover
Assets-in-place = (Inventory + gross property, plant and equipment)/total assets, calculated for the year following the turnover
LT debt/assets = Long-term debt/total assets, calculated for the year following the turnoverLn(assets) = Natural log of total assets, calculated for the year following the turnoverStandard deviation of OIBDA = Standard deviation of unadjusted operating income before depreciation
and amortization, calculated over the 5-year period beginning 1 year prior to the turnover and ending 3 years following the turnover
Incoming CEO age = Dummy variable equal to 1 if the incoming CEO is over age 60, 0 otherwiseForced turnover = Dummy variable equal to 1 if outgoing CEO departure was forced; 0 if outgoing
CEO departure was voluntary

ceO c O m p e n s a t i O n a n D F i r m p e r F O r m a n c e F O l l O w i n g ceO t u r n O v e r 329
find a positive relation between stock related compensation and leverage. To control for potential agency costs of debt, we specify the ratio of long-term debt to total assets as a proxy for leverage following Mehran (1995).
Business risk may also impact the structure of the compensation package and ex-pected firm performance. For example, Lewellen et al. (1987) find a positive relation between stock related compensation and the monthly stock return variance. They ar-gue, however, that the predicted relation is an empirical question. Similar to Mehran (1995), we measure business risk as the standard deviation of the percentage change in operating income measured with annual data from 1 year prior to turnover to 3 years after. 15
Despite the results shown in Table 3 that indicate compensation structure changes after turnover are independent of the age of the incoming and outgoing CEO, we con-trol for CEO age in the regressions to account for the horizon problem of the incom-ing CEO. We specify the age variable as an indicator variable equal to one if the firm’s incoming CEO is older than 60 years of age. We use an indicator variable since we do not expect the relation to be necessarily linearly related to age. 16
Our final control variable relates to the type of turnover. Specifically, we control for whether the incoming CEO entered office following a forced turnover. Denis and Denis (1995) find that industry-adjusted operating income increases significantly in the years following CEO replacement but these performance changes vary depend-ing on whether the turnover is forced or voluntary. The firms that force turnover are characterized by large, statistically significant decreases in operating income prior to the CEO change, and significant improvement after. In the subsample of normal re-tirements they do not observe significant performance declines before turnover, but they do document a small post-turnover improvement in performance. 17 In addition, forced turnovers are characterized by slightly different structural changes in compen-sation. Therefore, we control for forced turnover by specifying an indicator variable equal to one if the firm experienced a forced turnover in the transition year, and zero otherwise. As an alternative method of capturing differences between forced and vol-untary turnovers, we partition the sample between forced and voluntary turnover and estimate our regressions separately for each subsample.
4.5 Results
Table 5 shows our estimates of Equation 1. The specification in Table 5, columns 1 through 4 shows the regression results using operating income and Tobin’s Q as the firm performance measures, unadjusted for industry performance. The specification in columns 5 through 8 includes the industry-adjusted performance variables. In general, Table 5 shows that the percentage of new stock grants in year +1 for the incoming CEO is positively related to firm performance in years +2 and +3, regardless of the perfor-
15 Mehran (1995) measures the standard deviation over a 10-year horizon. However, for the early turnovers in the sample, we do not have sufficient Compustat data to capture a 10-year horizon.
16 Our approach is similar to Parrino (1997) who argues that the likelihood of voluntary turnover ap-pears to increase once a CEO reaches the age of 60, but does not increase linearly beyond the age of 60. We argue that the horizon problem is likely to become relevant as a CEO approaches retire-ment and would seem to increase once a CEO reaches the age of 60.
17 Also using operating income as the proxy for performance, Huson et al. (2004) find that perfor-mance improvements after CEO turnover tend to be in those firms that hire the incoming CEO from outside the firm.

330 Bl a c k w e l l, Du D n e y, & Fa r r e l l i n Re v. Qu a n t. F i n. & ac c t g 29 (2007)
Tabl
e 5.
Rel
atio
nshi
p be
twee
n co
mpe
nsat
ion
stru
ctur
e fo
llow
ing
CEO
turn
over
s an
d fu
ture
per
form
ance
D
epen
dent
var
iabl
e: n
on-in
dust
ry-a
djus
ted
perf
orm
ance
mea
sure
s
D
epen
dent
var
iabl
e: in
dust
ry-a
djus
ted
perf
orm
ance
mea
sure
s
OIB
DA
OIB
DA
To
bin’
s Q
Tob
in’s
Q
OIB
DA
O
IBD
A
T
obin
’s Q
T
obin
’s Q
In
depe
nden
t var
iabl
es
(+2)
(+
3)
(+2)
(+
3)
(+2)
(+
3)
(+2)
(+
3)
Inte
rcep
t 0.
2171
**
0.21
76**
2.
2357
**
2.26
11**
0
.128
4**
0.12
46**
`1
.773
4**
1.89
91**
(5.1
99)
(4.
660)
(4
.235
) (4
.245
) (3
.070
) (2
.799
) (3
.581
) (3
.730
)
%N
ew s
tock
gra
nts
0.06
20**
0.
0921
**
0.9
172*
* 1.
1465
**
0.07
64**
0.11
58**
0.
6805
**
0.89
78**
(2.2
63)
(3.
005)
(2
.647
) (3
.330
) (2
.782
) (3
.963
) (2
.093
) (2
.728
)
%O
ptio
ns
0.04
67
0.02
38
−0.1
905
−0.0
954
0.06
01
0.04
71
−0.2
982
−0.1
499
(1
.190
) (0
.542
) −
(0.3
74)
−(0
.190
) (1
.528
) (1
.126
) −
(0.6
24)
−(0
.312
)
Tota
l sto
ckho
ldin
gs
0.00
15**
0.
0011
0.
0134
0.
0075
0.
0013
* 0.
0007
0.
0138
0.
0077
(2.0
59)
(1.3
69)
(1.4
36)
(0.8
16)
(1.7
55)
(0.8
43)
(1.5
84)
(0.8
78)
Ass
ets-
in-p
lace
−0
.005
2
−0.0
094
−0.3
639
−0.4
289
−0.0
257
−0.0
180
−0.2
970
−0.2
990
−(
0.26
1)
−(0
.423
) −
(1.3
89)
−(1
.627
) −
(1.2
90)
−(0
.852
) −
(1.2
08)
−(1
.186
)
LT d
ebt/
asse
ts
−0.0
640
−0
.069
8 −1
.552
1**
−1.5
780*
* −0
.126
3**
−0.1
387*
* −1
.037
4 −1
.303
0*
−(
1.11
5)
−(1
.088
) −
(2.0
96)
−(2.
079)
−
(2.1
96)
−(2
.266
) −
(1.4
93)
−(1
.795
)
Ln(a
sset
s)
−0.0
065
−0
.096
2 −0
.092
0 −0
.006
1 −0
.008
1 −0
.151
3**
−0.1
700*
* −0
.006
9
−(1.
175)
−
(1.1
26)
−(1
.363
) −
(1.2
69)
−(1
.107
)
−(1.
378)
−
(2.2
84)
−(2
.453
)
SD o
f OIB
DA
−0
.021
1**
−0.0
166*
* −0
.080
5 −0
.112
5**
−0.0
160*
* −0
.011
4**
−0.0
605
−0.0
729
−(4.
657)
−
(3.2
71)
−(1
.426
) −
(2.0
27)
−(3
.514
) −
(2.3
48)
−(1
.144
) −(
1.37
3)
Inco
min
g C
EO a
ge
−0.0
357*
−0
.034
3 −0
.223
1 −0
.227
7 −0
.042
2**
−0.0
308
−0.1
841
−0.2
040
−(1.
881)
−
(1.6
15)
−(0
.879
) −
(0.9
12)
−(2
.219
) −
(1.5
20)
−(0
.773
) −(
0.85
4)
Forc
ed tu
rnov
er
−0.0
110
−0
.014
7 −0
.070
3 −0
.077
4 −0
.009
9 −0
.005
8 −0
.068
7 −0
.019
7
−(0.
773)
−
(0.9
22)
−(0
.389
) −
(0.4
33)
−(0
.690
) −
(0.3
79)
−(0
.406
) −
(0.1
15)
Adj
uste
d R
2 (%
) 22
.595
17
.214
19
.189
23
.063
23
.056
20
.493
18
.897
22
.518
F-St
atis
tic
4.76
24**
3.
6800
**
3.84
94**
4.
5306
**
4.86
20**
4.
3221
**
3.79
60**
4.
4229
**
0.
0000
0
.000
5 0
.000
3 0
.000
1 0
.000
0 0
.000
1 0
.000
4 0
.000
1

ceO c O m p e n s a t i O n a n D F i r m p e r F O r m a n c e F O l l O w i n g ceO t u r n O v e r 331
Tabl
e 5
(con
tinue
d).
Sam
ple
size
= V
arie
s fr
om 1
07 to
117
turn
over
s de
pend
ing
on th
e pe
rfor
man
ce m
easu
re u
sed
OIB
DA
= O
pera
ting
inco
me
befo
re d
epre
ciat
ion
and
amor
tizat
ion,
for t
he s
econ
d an
d th
ird
fisca
l yea
rs fo
llow
ing
the
turn
over
, res
pect
ivel
y To
bin’
s Q =
[mar
ket v
alue
of e
quity
+ li
quid
atin
g va
lue
of o
utst
andi
ng p
refe
rred
stoc
k +
book
val
ue o
f sho
rt-te
rm li
abili
ties n
et o
f sho
rt-te
rm a
sset
s +
book
val
ue o
f lo
ng-te
rm d
ebt]/
book
val
ue o
f ass
ets,
cal
cula
ted
for t
he s
econ
d an
d th
ird
fisca
l yea
rs fo
llow
ing
the
turn
over
In
dust
ry-a
djus
ted
perf
orm
ance
mea
sure
s w
ere
com
pute
d by
sub
trac
ting
the
med
ian
perf
orm
ance
mea
sure
for
the
indu
stry
(bas
ed o
n 2-
digi
t SIC
cod
es) f
rom
the
perf
orm
ance
mea
sure
for t
he tu
rnov
er fi
rm
%N
ew s
tock
gra
nts
= C
EO s
tock
hold
ings
div
ided
by
the
tota
l val
ue o
f com
pens
atio
n in
the
year
follo
win
g th
e tu
rnov
er, w
here
CEO
sto
ckho
ldin
gs fo
r in
side
rs is
th
e av
erag
e an
nual
incr
ease
in st
ockh
oldi
ngs f
or th
e in
com
ing
CEO
(cal
cula
ted
usin
g th
e th
e 2
year
s fol
low
ing
the
turn
over
and
val
ued
at th
e st
ock
pric
e as
of t
he
year
pri
or to
the
turn
over
). Th
e va
lue
of C
EO s
tock
com
pens
atio
n fo
r out
side
rs is
cal
cula
ted
in a
sim
ilar m
anne
r, bu
t inc
lude
s in
itial
sto
ckho
ldin
gs in
the
year
of
the
turn
over
. Tot
al v
alue
of c
ompe
nsat
ion
is d
efine
d as
the
valu
e of
sala
ry, b
onus
and
opt
ions
gra
nted
to th
e C
EO in
the
year
follo
win
g th
e tu
rnov
er, p
lus t
he C
EO
stoc
khol
ding
s as
defi
ned
in th
e pr
evio
us s
ente
nce
%O
ptio
ns =
dol
lar v
alue
of o
ptio
ns g
rant
ed in
the
year
follo
win
g th
e tu
rnov
er, d
ivid
ed b
y th
e to
tal v
alue
of c
ompe
nsat
ion
in th
e ye
ar fo
llow
ing
the
turn
over
. The
va
lue
of o
ptio
ns g
rant
ed is
cal
cula
ted
usin
g th
e Bl
ack-
Scho
les
form
ula
unde
r a s
et o
f ass
umpt
ions
sim
ilar t
o M
urph
y (1
985)
To
tal s
tock
hold
ings
= V
alue
of t
otal
sto
ckho
ldin
gs, c
alcu
late
d as
the
num
ber o
f sha
res
times
the
stoc
k pr
ice,
bot
h in
the
year
follo
win
g th
e tu
rnov
er
Ass
ets-
in-p
lace
= (I
nven
tory
+ g
ross
pro
pert
y, p
lant
and
equ
ipm
ent)/
tota
l ass
ets,
cal
cula
ted
for t
he y
ear f
ollo
win
g th
e tu
rnov
erLT
deb
t/as
sets
= L
ong-
term
deb
t/to
tal a
sset
s, c
alcu
late
d fo
r the
yea
r fol
low
ing
the
turn
over
Ln(a
sset
s) =
Nat
ural
log
of to
tal a
sset
s, c
alcu
late
d fo
r the
yea
r fol
low
ing
the
turn
over
Stan
dard
Dev
iatio
n of
OIB
DA
= S
tand
ard
devi
atio
n of
una
djus
ted
oper
atin
g in
com
e be
fore
dep
reci
atio
n an
d am
ortiz
atio
n, c
alcu
late
d ov
er t
he 5
-yea
r pe
riod
be
ginn
ing
1 ye
ar p
rior
to th
e tu
rnov
er a
nd e
ndin
g 3
year
s fo
llow
ing
the
turn
over
In
com
ing
CEO
age
= D
umm
y va
riab
le e
qual
to 1
if th
e in
com
ing
CEO
is o
ver a
ge 6
0, 0
oth
erw
ise
Forc
ed tu
rnov
er =
Dum
my
vari
able
equ
al to
1 if
out
goin
g C
EO d
epar
ture
was
forc
ed; 0
if o
utgo
ing
CEO
dep
artu
re w
as v
olun
tary
The
num
bers
in p
aren
thes
is a
re t-
stat
istic
s**
Sig
nific
ant a
t the
5%
leve
l* S
igni
fican
t at t
he 1
0% le
vel

332 Bl a c k w e l l, Du D n e y, & Fa r r e l l i n Re v. Qu a n t. F i n. & ac c t g 29 (2007)
mance measure. In results not shown using return on assets as the firm performance measure, the results for new stock grants are qualitatively the same. We also find a posi-tive relation between the percentage of stock options and return on assets in year +3.
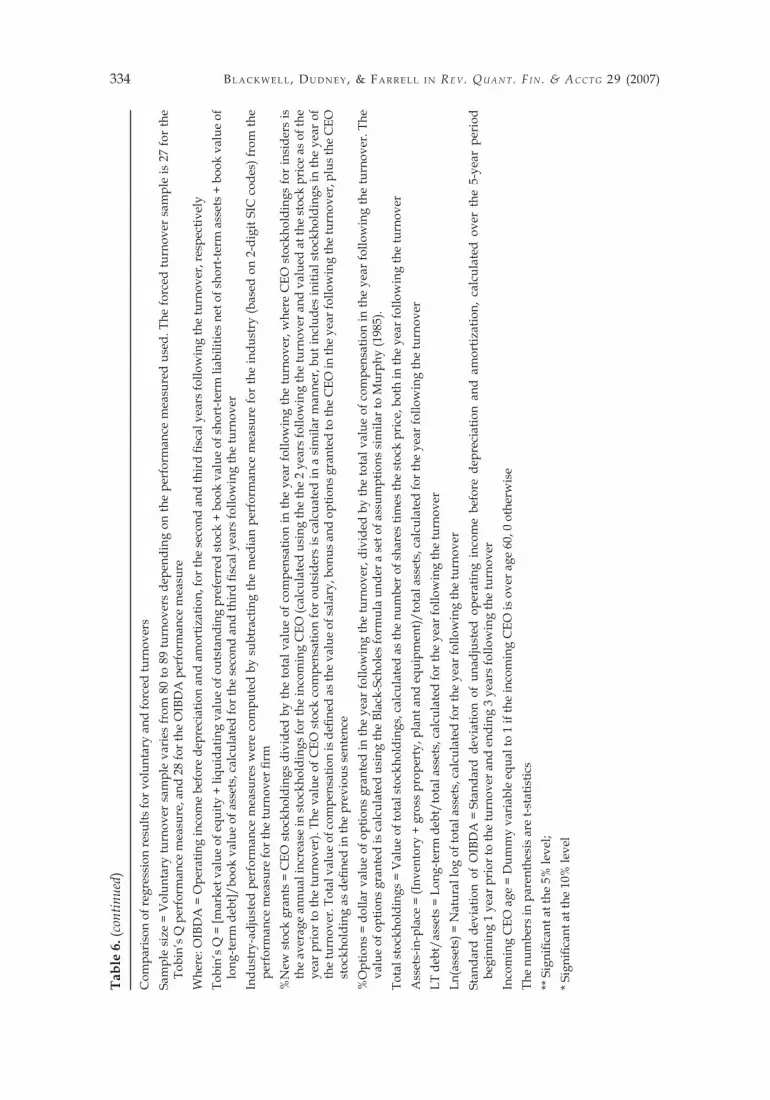
Although the coefficient on the forced turnover indicator variable is not significantly different from zero in any of the model specifications shown in Table 5, we estimate Equation 1 separately for the forced and voluntary subsamples (see Table 6). It appears that the positive relation between the percentage of compensation derived from new stock grants and industry-adjusted operating income in the full sample (Table 5) per-sists for both subsamples of turnovers (see Table 6). The positive and significant rela-tion between the percentage of compensation derived from new stock grants and in-dustry adjusted Tobin’s Q documented in Table 5 only persists for the forced turnover sample as shown in Table 6. We also document a positive relation between percentage of compensation derived from option grants and industry-adjusted operating income in year +3 and for results not shown, for ROA in year +3 in the forced turnover sample. 18
In Table 6, we also report a negative relation between total stockholdings of the in-coming CEO and future firm performance following forced turnover. Upon further analysis, this result appears to be driven by outside replacements. As noted by De-nis and Denis (1995), firms tend to improve operating income following forced turn-over. Also, incoming CEOs that are appointed from outside the firm, have on aver-age, lower total stockholdings relative to inside replacements.
4.6 Changes in CEO compensation and performance
To determine the compensation changes associated with the improvements in firm performance, we regress changes in firm performance (calculated as the average 2-year performance of the incoming CEO relative to the performance of the outgoing CEO in the last full year in office) on changes in the incoming CEOs compensation package rel-ative to the outgoing CEO. To calculate the changes in compensation we determine the total value of the outgoing and incoming CEOs compensation as the sum of salary and bonus, the Black-Scholes value of options granted, and the increase in the value of stockholdings (our proxy for restricted stock grants). Then we calculate the percentage of each of these components using total compensation as the denominator. Finally, we calculate the change in these percentages by subtracting the outgoing CEO compensa-tion percentage from the incoming CEO compensation percentage.
As shown in Table 7, for the full sample we find that a change in new stock grants is positively related to changes in both industry and non-industry adjusted operating income. Since the type of turnover may impact the change in performance, we parti-tion the data between forced and voluntary turnover and find that the voluntary turn-over sample more closely mimics the full sample, exhibiting a significant positive re-lation between new stock grants and changes in operating performance independent of whether performance is industry-adjusted or unadjusted. The coefficient on the change in new stock grants variable is not significant in the forced turnover sample.
18 If we partition the sample between inside and outside replacements, the inside replacement results more closely mimic those of the full sample as reported in Table 5. The outside replacement re-sults are more difficult to interpret given the small sample sizes. The positive relation between new stock grants and future firm performance tends to be more similar to the forced turnover results re-ported in Table 6. The only notable difference is size of the coefficients and that a positive relation between new stock grants and ROA in year +2 is not significant in the outside replacement sample. We also find a negative relation between option grants and future firm performance.

ceO c O m p e n s a t i O n a n D F i r m p e r F O r m a n c e F O l l O w i n g ceO t u r n O v e r 333
Tabl
e 6.
Rel
atio
nshi
p be
twee
n co
mpe
nsat
ion
stru
ctur
e fo
llow
ing
CEO
turn
over
s an
d fu
ture
per
form
ance
D
epen
dent
var
iabl
e: in
dust
ry-a
djus
ted
perf
orm
ance
mea
sure
s
Dep
ende
nt v
aria
ble:
indu
stry
-adj
uste
d pe
rfor
man
ce m
easu
res
for v
olun
tary
turn
over
sam
ple
for f
orce
d tu
rnov
er s
ampl
e
OIB
DA
OIB
DA
To
bin’
s Q
Tob
in’s
Q
OIB
DA
O
IBD
A
T
obin
’s Q
T
obin
’s Q
In
depe
nden
t var
iabl
es
(+2)
(+
3)
(+2)
(+
3)
(+2)
(+
3)
(+2)
(+
3)
Inte
rcep
t 0.
1265
**
0.10
84**
1.
7481
**
1.73
68**
0.
1390
0.
1930
4.
0697
* 4.
3325
**
(2
.825
) (2
.357
) (4
.039
) (3
.869
) (1
.064
) (1
.383
) (1
.955
) (2
.141
)
%N
ew s
tock
gra
nts
0.06
63**
0
.084
7**
0.28
67
0.46
67
0.18
16**
0.
2935
**
2.86
43**
3.
0915
**
(2
.039
) (2
.536
) (0
.894
) (1
.414
) (2
.530
) (3
.829
) (2
.641
) (2
.934
)
%O
ptio
ns
0.02
93
0.00
36
−0.3
906
−0.2
408
0.14
80
0.16
42*
−0.2
535
−0
.370
3
(0.6
49)
(0.0
77)
−(0
.861
) −
(0.5
21)
(1.5
99)
(1.6
60)
−(0.
174)
−
(0.2
62)
Tota
l sto
ckho
ldin
gs
0.00
17**
0.
0012
0.
0148
**
0.01
17
−0.0
063*
−0
.009
5**
−0.0
644
−0.0
919*
(2.2
13)
(1.5
53)
(2.0
34)
(1.5
84)
−(
1.94
4)
−(2
.729
) −
(1.3
07)
−(1.
916)
Ass
ets-
in-p
lace
−0
.037
5*
−0.0
246
−0.4
755*
* −0
.421
2*
0.00
72
0.01
50
0.43
80
0.33
98
−(
1.73
1)
−(1
.107
) −
(2.1
20)
−(1
.812
) (0
.120
) (0
.234
) (0
.487
) (0
.389
)
LT d
ebt/
asse
ts
−0.1
162*
−0
.081
0
−1.0
333
−0.9
418
−0.0
685
−0.1
192
0.72
84
0.37
88
−(
1.73
2)
−(1.
176)
−
(1.5
71)
−(1
.339
) −
(0.4
64)
−(0
.755
) (0
.281
) (0
.150
)
Ln(a
sset
s)
−0.0
039
−0
.004
8
−0.1
147*
* −0
.129
2**
−0.0
173
−0.0
268
−0
.623
4*
−0.6
442*
*
−(0.
688)
−(
0.81
7)
−(2
.045
) −
(2.1
76)
−(0
.857
) −(
1.24
8)
−(1.
893)
−
(2.0
13)
SD o
f OIB
DA
−0
.016
2**
−0.0
115*
* −0
.050
1 −0
.078
9*
−0.0
223
−0.0
374
−0.5
611
−0.3
186
−(
3.57
9)
−(2
.481
) −
(1.1
62)
−(1
.806
) −
(0.9
80)
−(1
.539
) −
(1.4
16)
−(0
.828
)
Inco
min
g C
EO a
ge
−0.0
364*
−0
.027
1 −0
.159
5 −0
.184
1 −0
.061
3 −0
.005
4 0.
6803
0.
3940
−(1.
898)
−
(1.3
75)
−(0
.798
) −
(0.9
11)
−(0
.659
) −
(0.0
55)
(0.4
90)
(0.2
92)
Adj
uste
d R
2 (%
) 26
.271
17
.546
25
.525
25
.394
19
.925
39
.535
19
.715
28
.877
F-St
atis
tic
4.91
95**
3.
3408
**
4.47
02**
4.
3613
**
1.83
98
3.20
67**
1.
7981
2.
3195
*
0.00
01
0.00
24
0.0
002
0.0
003
0.1
314
0.0
176
0.1
435
0.0
659
334 Bl a c k w e l l, Du D n e y, & Fa r r e l l i n Re v. Qu a n t. F i n. & ac c t g 29 (2007)
Tabl
e 6.
(con
tinue
d)
Com
pari
son
of re
gres
sion
resu
lts fo
r vol
unta
ry a
nd fo
rced
turn
over
sSa
mpl
e si
ze =
Vol
unta
ry tu
rnov
er s
ampl
e va
ries
from
80
to 8
9 tu
rnov
ers
depe
ndin
g on
the
perf
orm
ance
mea
sure
d us
ed. T
he fo
rced
turn
over
sam
ple
is 2
7 fo
r th
e To
bin’
s Q
per
form
ance
mea
sure
, and
28
for t
he O
IBD
A p
erfo
rman
ce m
easu
re
Whe
re: O
IBD
A =
Ope
ratin
g in
com
e be
fore
dep
reci
atio
n an
d am
ortiz
atio
n, fo
r the
sec
ond
and
thir
d fis
cal y
ears
follo
win
g th
e tu
rnov
er, r
espe
ctiv
ely
Tobi
n’s Q
= [m
arke
t val
ue o
f equ
ity +
liqu
idat
ing
valu
e of
out
stan
ding
pre
ferr
ed st
ock
+ bo
ok v
alue
of s
hort
-term
liab
ilitie
s net
of s
hort
-term
ass
ets
+ bo
ok v
alue
of
long
-term
deb
t]/bo
ok v
alue
of a
sset
s, c
alcu
late
d fo
r the
sec
ond
and
thir
d fis
cal y
ears
follo
win
g th
e tu
rnov
er
Indu
stry
-adj
uste
d pe
rfor
man
ce m
easu
res
wer
e co
mpu
ted
by s
ubtr
actin
g th
e m
edia
n pe
rfor
man
ce m
easu
re fo
r th
e in
dust
ry (b
ased
on
2-di
git S
IC c
odes
) fro
m th
e pe
rfor
man
ce m
easu
re fo
r the
turn
over
firm
%
New
sto
ck g
rant
s =
CEO
sto
ckho
ldin
gs d
ivid
ed b
y th
e to
tal v
alue
of c
ompe
nsat
ion
in th
e ye
ar fo
llow
ing
the
turn
over
, whe
re C
EO s
tock
hold
ings
for
insi
ders
is
the
aver
age
annu
al in
crea
se in
stoc
khol
ding
s for
the
inco
min
g C
EO (c
alcu
late
d us
ing
the
the
2 ye
ars f
ollo
win
g th
e tu
rnov
er a
nd v
alue
d at
the
stoc
k pr
ice
as o
f the
ye
ar p
rior
to th
e tu
rnov
er).
The
valu
e of
CEO
sto
ck c
ompe
nsat
ion
for o
utsi
ders
is c
alcu
ated
in a
sim
ilar m
anne
r, bu
t inc
lude
s in
itial
sto
ckho
ldin
gs in
the
year
of
the
turn
over
. Tot
al v
alue
of c
ompe
nsat
ion
is d
efine
d as
the
valu
e of
sala
ry, b
onus
and
opt
ions
gra
nted
to th
e C
EO in
the
year
follo
win
g th
e tu
rnov
er, p
lus t
he C
EO
stoc
khol
ding
as
defin
ed in
the
prev
ious
sen
tenc
e %
Opt
ions
= d
olla
r val
ue o
f opt
ions
gra
nted
in th
e ye
ar fo
llow
ing
the
turn
over
, div
ided
by
the
tota
l val
ue o
f com
pens
atio
n in
the
year
follo
win
g th
e tu
rnov
er. T
he
valu
e of
opt
ions
gra
nted
is c
alcu
late
d us
ing
the
Blac
k-Sc
hole
s fo
rmul
a un
der a
set
of a
ssum
ptio
ns s
imila
r to
Mur
phy
(198
5).
Tota
l sto
ckho
ldin
gs =
Val
ue o
f tot
al s
tock
hold
ings
, cal
cula
ted
as th
e nu
mbe
r of s
hare
s tim
es th
e st
ock
pric
e, b
oth
in th
e ye
ar fo
llow
ing
the
turn
over
A
sset
s-in
-pla
ce =
(Inv
ento
ry +
gro
ss p
rope
rty,
pla
nt a
nd e
quip
men
t)/to
tal a
sset
s, c
alcu
late
d fo
r the
yea
r fol
low
ing
the
turn
over
LT d
ebt/
asse
ts =
Lon
g-te
rm d
ebt/
tota
l ass
ets,
cal
cula
ted
for t
he y
ear f
ollo
win
g th
e tu
rnov
erLn
(ass
ets)
= N
atur
al lo
g of
tota
l ass
ets,
cal
cula
ted
for t
he y
ear f
ollo
win
g th
e tu
rnov
erSt
anda
rd d
evia
tion
of O
IBD
A =
Sta
ndar
d de
viat
ion
of u
nadj
uste
d op
erat
ing
inco
me
befo
re d
epre
ciat
ion
and
amor
tizat
ion,
cal
cula
ted
over
the
5-y
ear
peri
od
begi
nnin
g 1
year
pri
or to
the
turn
over
and
end
ing
3 ye
ars
follo
win
g th
e tu
rnov
er
Inco
min
g C
EO a
ge =
Dum
my
vari
able
equ
al to
1 if
the
inco
min
g C
EO is
ove
r age
60,
0 o
ther
wis
eTh
e nu
mbe
rs in
par
enth
esis
are
t-st
atis
tics
** S
igni
fican
t at t
he 5
% le
vel;
* Sig
nific
ant a
t the
10%
leve
l

ceO c O m p e n s a t i O n a n D F i r m p e r F O r m a n c e F O l l O w i n g ceO t u r n O v e r 335
Tabl
e 7.
Rel
atio
nshi
p be
twee
n ch
ange
s in
com
pens
atio
n st
ruct
ure
follo
win
g C
EO tu
rnov
ers
and
chan
ges
in p
erfo
rman
ce
D
epen
dent
var
iabl
e: c
hang
e in
per
form
ance
mea
sure
s
Dep
ende
nt v
aria
ble:
cha
nge
in p
erfo
rman
ce m
easu
res
(non
-indu
stry
-adj
uste
d)
(in
dust
ry-a
djus
ted)
Inde
pend
ent v
aria
bles
C
hang
e in
OIB
DA
Cha
nge
in T
obin
’s Q
C
hang
e in
OIB
DA
Cha
nge
in T
obin
’s Q
Inte
rcep
t −0
.003
7
0.21
22**
0.
0079
0.
0333
−(0.
489)
(3
.082
) (1
.030
) (0
.486
)
New
–old
% n
ew s
tock
gra
nts
0.03
75*
0.09
15
0.05
09**
0.
0883
(1.8
58)
(0.5
05)
(2.4
90)
(0.4
89)
New
–old
% o
ptio
ns
0.00
21
−0.1
613
0.00
79
−0.0
995
(0
.071
) −
(0.6
13)
(0.2
69)
−(0
.379
)
New
–old
chg
. in
tota
l sto
ckho
ldin
gs
−0.0
0003
0.
0015
9 −0
.000
08
0.00
058
−(
0.10
4)
(0.6
53)
−(0
.274
) (0
.241
)
Cha
nge
in a
sset
s-in
-pla
ce
−0.0
336
−0.
3589
−0
.098
7**
−0.1
981
−(
0.77
9)
−(0.
922)
−
(2.2
57)
−(0
.511
)
Cha
nge
in L
T de
bt/a
sset
s −0
.090
2
−0.3
466
−0
.053
5 −0
.373
8
−(1.
632)
−(
0.56
5)
−(0
.956
) −
(0.6
11)
Cha
nge
in L
nAss
ets
−0.0
530*
* −0
.370
8
−0.0
686*
* −0
.420
3*
−(
2.12
0)
−(1.
609)
−
(2.7
11)
−(1
.830
)
Forc
ed tu
rnov
er
0.02
84**
−0
.124
1 0.
0157
−0
.001
5
(2.1
39)
−(1
.041
) (1
.165
) −
(0.0
13)
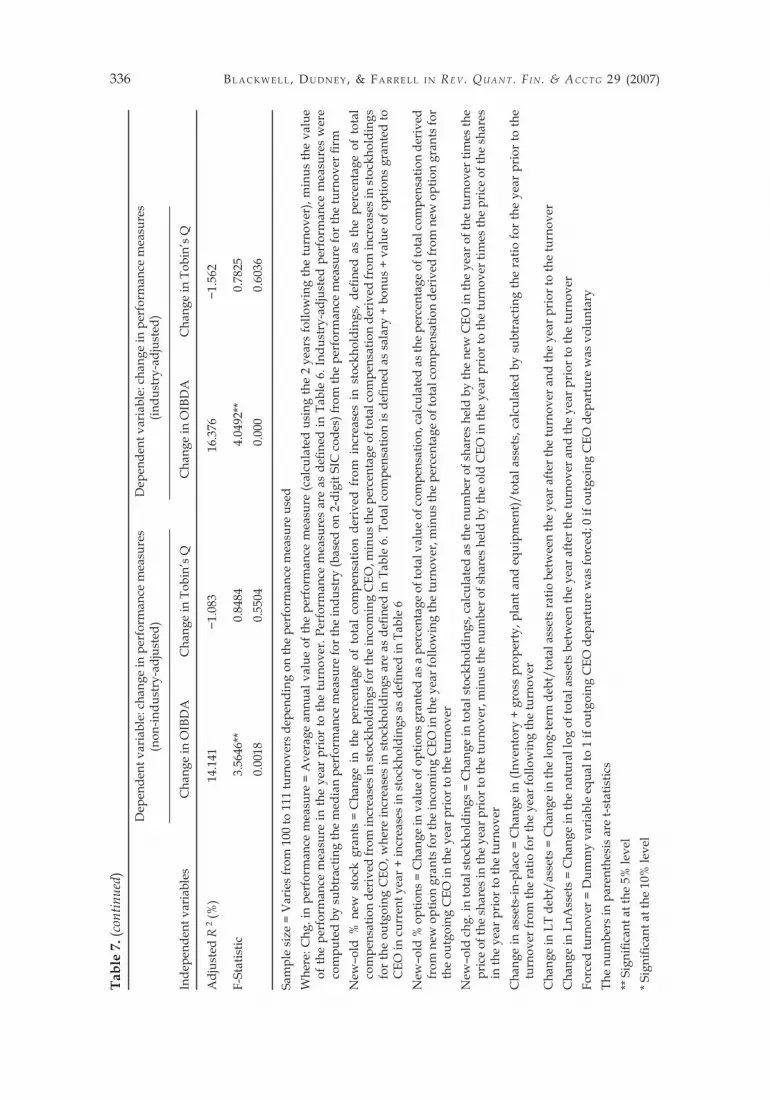
336 Bl a c k w e l l, Du D n e y, & Fa r r e l l i n Re v. Qu a n t. F i n. & ac c t g 29 (2007)
Tabl
e 7.
(con
tinue
d)
Dep
ende
nt v
aria
ble:
cha
nge
in p
erfo
rman
ce m
easu
res
D
epen
dent
var
iabl
e: c
hang
e in
per
form
ance
mea
sure
s
(n
on-in
dust
ry-a
djus
ted)
(indu
stry
-adj
uste
d)
Inde
pend
ent v
aria
bles
C
hang
e in
OIB
DA
Cha
nge
in T
obin
’s Q
C
hang
e in
OIB
DA
Cha
nge
in T
obin
’s Q
Adj
uste
d R
2 (%
) 14
.141
−1
.083
16
.376
−1
.562
F-St
atis
tic
3.56
46**
0.
8484
4.
0492
**
0.78
25
0.
0018
0
.550
4 0
.000
0
.603
6
Sam
ple
size
= V
arie
s fr
om 1
00 to
111
turn
over
s de
pend
ing
on th
e pe
rfor
man
ce m
easu
re u
sed
Whe
re: C
hg. i
n pe
rfor
man
ce m
easu
re =
Ave
rage
ann
ual v
alue
of t
he p
erfo
rman
ce m
easu
re (c
alcu
late
d us
ing
the
2 ye
ars
follo
win
g th
e tu
rnov
er),
min
us th
e va
lue
of th
e pe
rfor
man
ce m
easu
re in
the
year
pri
or to
the
turn
over
. Per
form
ance
mea
sure
s ar
e as
defi
ned
in T
able
6. I
ndus
try-
adju
sted
per
form
ance
mea
sure
s w
ere
com
pute
d by
sub
trac
ting
the
med
ian
perf
orm
ance
mea
sure
for t
he in
dust
ry (b
ased
on
2-di
git S
IC c
odes
) fro
m th
e pe
rfor
man
ce m
easu
re fo
r the
turn
over
firm
N
ew–o
ld %
new
sto
ck g
rant
s =
Cha
nge
in t
he p
erce
ntag
e of
tot
al c
ompe
nsat
ion
deri
ved
from
inc
reas
es i
n st
ockh
oldi
ngs,
defi
ned
as t
he p
erce
ntag
e of
tot
al
com
pens
atio
n de
rive
d fr
om in
crea
ses i
n st
ockh
oldi
ngs f
or th
e in
com
ing
CEO
, min
us th
e pe
rcen
tage
of t
otal
com
pens
atio
n de
rive
d fr
om in
crea
ses i
n st
ockh
oldi
ngs
for
the
outg
oing
CEO
, whe
re in
crea
ses
in s
tock
hold
ings
are
as
defin
ed in
Tab
le 6
. Tot
al c
ompe
nsat
ion
is d
efine
d as
sal
ary
+ bo
nus
+ va
lue
of o
ptio
ns g
rant
ed to
C
EO in
cur
rent
yea
r + in
crea
ses
in s
tock
hold
ings
as
defin
ed in
Tab
le 6
N
ew–o
ld %
opt
ions
= C
hang
e in
val
ue o
f opt
ions
gra
nted
as a
per
cent
age
of to
tal v
alue
of c
ompe
nsat
ion,
calc
ulat
ed a
s the
per
cent
age
of to
tal c
ompe
nsat
ion
deri
ved
from
new
opt
ion
gran
ts fo
r the
inco
min
g C
EO in
the
year
follo
win
g th
e tu
rnov
er, m
inus
the
perc
enta
ge o
f tot
al c
ompe
nsat
ion
deri
ved
from
new
opt
ion
gran
ts fo
r th
e ou
tgoi
ng C
EO in
the
year
pri
or to
the
turn
over
N
ew–o
ld c
hg. i
n to
tal s
tock
hold
ings
= C
hang
e in
tota
l sto
ckho
ldin
gs, c
alcu
late
d as
the
num
ber o
f sha
res
held
by
the
new
CEO
in th
e ye
ar o
f the
turn
over
tim
es th
e pr
ice
of th
e sh
ares
in th
e ye
ar p
rior
to th
e tu
rnov
er, m
inus
the
num
ber o
f sha
res h
eld
by th
e ol
d C
EO in
the
year
pri
or to
the
turn
over
tim
es th
e pr
ice
of th
e sh
ares
in
the
year
pri
or to
the
turn
over
C
hang
e in
ass
ets-
in-p
lace
= C
hang
e in
(Inv
ento
ry +
gro
ss p
rope
rty,
pla
nt a
nd e
quip
men
t)/to
tal a
sset
s, c
alcu
late
d by
sub
trac
ting
the
ratio
for
the
year
pri
or to
the
turn
over
from
the
ratio
for t
he y
ear f
ollo
win
g th
e tu
rnov
er
Cha
nge
in L
T de
bt/a
sset
s =
Cha
nge
in th
e lo
ng-te
rm d
ebt/
tota
l ass
ets
ratio
bet
wee
n th
e ye
ar a
fter t
he tu
rnov
er a
nd th
e ye
ar p
rior
to th
e tu
rnov
er
Cha
nge
in L
nAss
ets
= C
hang
e in
the
natu
ral l
og o
f tot
al a
sset
s be
twee
n th
e ye
ar a
fter t
he tu
rnov
er a
nd th
e ye
ar p
rior
to th
e tu
rnov
er
Forc
ed tu
rnov
er =
Dum
my
vari
able
equ
al to
1 if
out
goin
g C
EO d
epar
ture
was
forc
ed; 0
if o
utgo
ing
CEO
dep
artu
re w
as v
olun
tary
The
num
bers
in p
aren
thes
is a
re t-
stat
istic
s**
Sig
nific
ant a
t the
5%
leve
l* S
igni
fican
t at t
he 1
0% le
vel

ceO c O m p e n s a t i O n a n D F i r m p e r F O r m a n c e F O l l O w i n g ceO t u r n O v e r 337
This result holds for ROA as an alternative proxy for accounting performance. We also partition the data between inside and outside replacements. Similarly, we find a significant positive relation between new stock grants and changes in operating per-formance and ROA independent of whether performance is industry-adjusted or un-adjusted for the sample of inside replacements. Our sample size for outside replace-ments is too small to perform a similar regression.
Taken together, these results suggest that performance improvements as mea-sured using accounting data following CEO turnover are associated with greater CEO stock grants especially following voluntary turnover. This result appears consistent with Core and Larcker (2002) who find that for a sample of firms that are required to increase the level of managerial equity ownership due to the adoption of ‘target own-ership plans’ experience improvements in firm performance.
5 Summary and conclusions
We study changes in CEO compensation surrounding CEO turnover to determine whether changes in compensation structure are associated with future performance. Incoming CEOs following forced and voluntary turnover have significantly higher new stock and option grants as a percent of total compensation than their predeces-sors. We also document a positive relation between the percentage of compensation in the form of new stock grants for the incoming CEO and future firm performance. Finally, we find that increases in new stock grants for the incoming CEO relative to the outgoing CEO are associated with increases in operating income after turnover.
The overall implication is that although incoming CEOs have been loaded up with options (as noted by Hall and Liebman (1998) who show that option compensation has increased monotonically since the early 1980s), from an incentive compatibility perspective, stock grants appear more strongly associated with future firm perfor-mance (post-turnover performance improvement). Greater stock grants appear to pro-vide “greater” incentives to CEOs to improve future performance than option grants.
References
Allgood, S., & Farrell, K. A. (2000). The effect of CEO tenure on the relation between firm perfor-mance and turnover. The Journal of Financial Research, 23, 373–390.
Barnhart, S. W., & Rosenstein, S. (1998). Board composition, managerial ownership, and firm performance: An empirical analysis. The Financial Review, 33, 1–16.
Bizjack, J., Brickley, J. A., & Coles, J. L. (1993). Stock-based incentive compensation and invest-ment behavior. Journal of Accounting and Economics, 16, 349–372.
Blackwell, D. W., Brickley, J. A., & Weisbach, M. (1994). Accounting information and internal performance evaluation: Evidence from Texas banks. Journal of Accounting and Economics, 17, 331–358.
Chung, K. H., & Pruitt, S. W. (1994). A simple approximation of Tobin’s Q. Financial Manage-ment, 23, 70–74.
Chung, K. H., & Pruitt, S. W. (1996). Executive ownership, corporate value, and executive com-pensation: A unifying framework. Journal of Banking and Finance, 20, 1135–1159.
Collins, M. C., Blackwell, D. W., & Sinkey, J. F. (1995). The relationship between corporate com-pensation policies and investment opportunities: Empirical evidence for large bank holding companies. Financial Management, 24(3), 40–53.
Core, J. E., & Larcker, D. F. (2002). Performance consequences of mandatory increases in execu-tive stock ownership. Journal of Financial Economics, 64, 317–340.

338 Bl a c k w e l l, Du D n e y, & Fa r r e l l i n Re v. Qu a n t. F i n. & ac c t g 29 (2007)
Coughlan, A. T., & Schmidt, R. M. (1985). Executive compensation, management turnover, and firm performance: An empirical investigation. Journal of Accounting and Economics, 7, 43–66.
Crawford, A. J., Ezzell, J. R., & Miles, J. A. (1995). Bank CEO pay–performance relations and the effects of deregulation. Journal of Business, 68, 231–256.
Denis, D. J., & Denis, D. K. (1995). Performance changes following top management dismissals. Journal of Finance, 50, 1029–1057.
DeFusco, R. A., Zorn, T. S., & Johnson, R. R. (1991). The association between executive stock op-tion plans and managerial decision making. Financial Management, 20, 36–43.
Fama, E. F., & French, K. R. (1986). Common factors in the serial correlation of stock returns. CRSP Working Paper No. 200.
Gaver, J., & Gaver, K. (1993). Additional evidence on the association between the investment opportunity set and corporate financing, dividend and compensation policies. Journal of Ac-counting and Economics, 16, 125–160.
Gaver, J., & Gaver, K. (1995). Compensation policy and the investment opportunity set. Finan-cial Management, 24(1), 19–32.
Gilson, S. C. (1989). Management turnover and financial distress. Journal of Financial Economics, 25, 241–262.
Guth, R. A., & Lublin, J. S. (2003). Microsoft ushers out era of options. Wall Street Journal, July 9, pp. A1, A10.
Hall, B., & Liebman, J. (1998). Are CEOS really paid like bureaucrats? Quarterly Journal of Eco-nomics, 113, 653–691.
Hermalin, B. E., & Weisbach, M. S. (1998). Endogenously chosen boards of directors and their monitoring of the CEO. The American Economic Review, 88, 96–118.
Huson, M. R., Malatesta, P. H., & Parrino, R. (2004). Managerial succession and firm perfor-mance. Journal of Financial Economics, 74, 237–275.
Huson, M. R., Parrino, R., & Starks, L. (2001). Internal monitoring mechanisms and CEO turn-over: A long-term perspective. Journal of Finance, 56, 2265–2297.
Jensen, M., & Murphy, K. J. (1990). Performance pay and top-management incentives. Journal of Political Economy, 98, 225–264.
Lewellen, W. G., Loderer, C., & Martin, K. (1987). Executive compensation and executive incen-tive problems: An empirical analysis. Journal of Accounting and Economics, 9, 287–310.
Mehran, H. (1995). Executive compensation structure, ownership, and firm performance. Journal of Financial Economics, 38, 163–184.
Murphy, K. (1985). Corporate performance and managerial remuneration: An empirical analy-sis. Journal of Accounting and Economics, 7, 11–42.
Murphy, K. (1995). Politics, economics, and executive compensation. University of Cincinnati Law Review, 63, 713–748.
Murphy, K. (1999). Executive compensation. In O. Ashenfelter & D. Card (Eds.), Handbook of la-bor economics (Vol. 3). New York: Elsevier Science (Chap. 38).
Murphy, K., & Zimmerman, J. L. (1993). Financial performance surrounding CEO turnover. Journal of Accounting and Economics, 16, 273–315.
Parrino, R. (1997). CEO turnover and outside succession: A cross-sectional analysis. Journal of Fi-nancial Economics, 46, 165–197.
Perry, T., & Zenner, M. (2001). Pay for performance? Government regulation and the structure of compensation contracts. Journal of Financial Economics, 62(3), 453–488.
Rose, N. L., & Wolfram, C. (2002). Regulating executive pay: Using the tax code to influence CEO compensation. Journal of Labor Economics, 20(2), S138–S176.
Smith, C., & Watts, R. (1992). The investment opportunity set and corporate financing, dividend and compensation policies. Journal of Financial Economics, 32, 263–292.
Warner, J. B., Watts, R. L., & Wruck, K. (1988). Stock prices and top management changes. Jour-nal of Financial Economics, 20, 461–492.
Weisbach, M. S. (1988). Outside directors and CEO turnover. Journal of Financial Economics, 20, 431–460.
Yermack, D. (1995). Do corporations award CEO stock options effectively? Journal of Financial Economics, 39, 237–269.


![The political economy of CEO compensation [International Bernheim workshop on Fair CEO Compensation, Louvain-la-Neuve, 2012]](https://img.pdfslide.net/doc/110x75/631e3c784da51fc4a3038233/the-political-economy-of-ceo-compensation-international-bernheim-workshop-on-fair.jpg)


