Embed Size (px)
Citation preview
CHAPTER 10
PUBLIC TRANSPORT PLAN

THE EMERGENCY STUDY ON URBAN TRANSPORT IN BUJUMBURA FINAL REPORT, FEBRUARY 2008 CHAPTER 10 PUBLIC TRANSPORT PLAN
10-1
CHAPTER 10 PUBLIC TRANSPORT PLAN
10-1 IMPROVEMENT POLICY
There are some public transport modes in Bujumbura, the bus transport can be identified as main public transport system from the view of huge occupancy rate among current traffic volume. Therefore, the improvement of public transport shall be discussed about development of bus transport mainly.
According to the results of bus passenger interview, biggest complain is “expensive” which occupied 54% of the total answer, and second biggest is “not enough bus route”, thus sum of those answers reaches 79%.
From the result, the required bus services would be known, which are;
(1) reasonable fare and; (2) increase routes complying with the public movement and future demand.
In order to satisfy with requirement the following policies for its improvement are proposed they are as follows;
Providing required service network with stable operation system, complying with future urban expansion and development
As it is recognized from the passenger’s interview, there is some insufficient service frequency and route, in addition there is a fact that passenger’s convenient is not considered on the operations. These situations make low efficiency in economic activities and it also creates bad circumstances on bus financial management. In order to improve these situations, the stable operation system with re-structuring of the bus network shall be introduced and it shall comply with future urban expansion and population increase.
Clarifying assignments to both public (OTRACO) and private transporters
In Burundi, there are currently two sorts of bus operators which are OTRACO (public) and private transporters. The OTRACO uses comparatively large-size bus in its operation and the private transporters use mini bus which is categorized into the mini ban with 18 seats.
The OTRACO has a roll of the national transporter so that its operation shall cover not only at population dense areas but also at isolated areas. Although the OTRACO is one of the organization under the MTPT, the financial balance of the OTRACO shall be taken to be surplus or even, because it has been identified as the independent organization. If the
THE EMERGENCY STUDY ON URBAN TRANSPORT IN BUJUMBURA FINAL REPORT, FEBRUARY 2008 CHAPTER 10 PUBLIC TRANSPORT PLAN
10-2
OTRACO is given the assignment to operations on isolated areas only, the OTRACO never attain the financial independent, and the Government gives it financial support continuously; its support never be ended. Hence the OTRACO shall seek the service routes which can give some profits to the OTRACO, and they are considered to be routes on population dense and urbanized areas. It is supposed that they would cover financial loss being made from depopulation areas.
As the figure on Chapter 2 is shown, the services by the private transporters are distributed to all communes with exception of Buterere. Currently there are some routes operated by both the OTRACO and the private transporters, and however no serious conflict between the OTRACO and the private transporters is being made because of little service frequency of the OTRACO.
When the OTRACO increase their service on the area, there will be expanding conflicts between two operators; the clear assignments to both the OTRACO and the private transporters needs to be necessary.
The OTRACO is expected to provide the punctual service on its operation at the principal arterial roads in consideration of the importance of economic development. Because the securing smooth and reliable operation on the principal arterial roads is considered to be essential for the development. Moreover, the services by the OTRACO shall be carried out by larger sized bus in order to obtain efficiency on transport. This enlargement of bus might also bring sub benefit of stopping global warming. The service on isolated areas from the present network shall also be carried out by the OTRACO so as to remove the gaps of the living standard among the communes. By giving those assignments, the main frame of city bus network is organized.
Although the OTRACO will act an important role on the public transportation, still there are some backlogs for completion of the network, which is the service on roads with lower level from the principal arterial roads. As it is mentioned in Chapter 2 that there is some development of the NMT, the transportation with short distance has been covered by the NMT currently. The mini bus shall concentrate to the transportation with middle distance which is on arterial and feeder roads.
Contribution to traffic congestion by the improvement programme
In Bujumbura, present condition of traffic congestion is not serious, however as it is mentioned on Chapter 4, at some point (section) traffic volume has been over-flow and it result that service level on the sections are very low. When it is at 2017, over- flow points will be increased, especially at CBD and radial roads from CBD. Considering current dominated ratio
THE EMERGENCY STUDY ON URBAN TRANSPORT IN BUJUMBURA FINAL REPORT, FEBRUARY 2008 CHAPTER 10 PUBLIC TRANSPORT PLAN
10-3
by mini bus (10-50%), mini bus shall be compiled to large size bus; it will contribute to ease traffic congestion.
Minimizing social impacts by the improvement programme
When the frame of the city transport is drastically changed as discussed above, there will be some social impact which is the giving pressure to the private transporters. It is supposed that the services at the principal arterial roads give the profit so that the service on the principal arterial roads is also important to the private transporters. When the main actor of the service is changed to the OTRACO, the programme shall prepare the mitigation measure to the private transporters. The following mitigation measures can be imaged, as follows;
For Employees (Drivers and Conductors);
- Re-employment by the OTRACO (in accordance with needs of increase of operators)
For Owners;
- Urging of participation of investment to the OTRACO
Introducing clear assignments for each traffic modes (Taxi, Bike Taxi, Bicycle Taxi)
In Bujumbura, there are some traffic modes other than bus, which are Taxi, Bicycle Taxi. Those are being used and operated complying with several demands by users; no control is given to their operation. It sometime creates conflicts between the modes and normal traffic and pedestrian walks.
In order to avoid conflict between the modes, some controls and regulations shall be introduced, and by those the assignment to each traffic modes shall be clarified.
10-2 BUS NETWORK IMPROVEMENT PLAN
(1) Planning Flow
Planning flow of the bus network improvement is as follows;
THE EMERGENCY STUDY ON URBAN TRANSPORT IN BUJUMBURA FINAL REPORT, FEBRUARY 2008 CHAPTER 10 PUBLIC TRANSPORT PLAN
10-4
Figure 10.2.1 Planning Flow of Bus Network Improvement
The numbers of passenger of the bus network in 2017 can be estimated by following procedures;
Analysis of existing bus network by both the OTRACO and Private Transporters
Urban Planning / Population Forecast/ Road Network Plan
Future Passengers Volume Forecast/OD
Bus Network/Route Plan
Service Distribution Plan
THE EMERGENCY STUDY ON URBAN TRANSPORT IN BUJUMBURA FINAL REPORT, FEBRUARY 2008 CHAPTER 10 PUBLIC TRANSPORT PLAN
10-5
Figure 10.2.2 Demand Estimate Process
(2) Existing Bus Network
Existing bus network in Bujumbura by the OTRACO and the private transporters are shown in Figure 10.2.3 and 10.2.4
Generating/Attracting Bus Passenger Volume by Zone at year of 2007
Population by Zone at year of 2007
Generating/Attracting Bus Traffic Volume per capita by Zone at year of 2007
Generating/Attracting Bus Traffic Volume per capita by Zone at year of 2017
Forecast of Growth Ratio (2017/2007) of Bus Passenger
Record of Registered Number of Bus & Mini Bus for year of 2001-2007
Record of Population for year of 2001-2007
Population of Bujumbura by Zone at year of 2017
Generating/Attracting Bus Traffic Volume per capita by Zone at year of 2017
Future Bus OD Matrix Table
THE EMERGENCY STUDY ON URBAN TRANSPORT IN BUJUMBURA FINAL REPORT, FEBRUARY 2008 CHAPTER 10 PUBLIC TRANSPORT PLAN
10-6
Figure 10.2.3 Existing OTRACO Bus Network
THE EMERGENCY STUDY ON URBAN TRANSPORT IN BUJUMBURA FINAL REPORT, FEBRUARY 2008 CHAPTER 10 PUBLIC TRANSPORT PLAN
10-7
Figure 10.2.4 Existing Private Transporters (Bus) Network
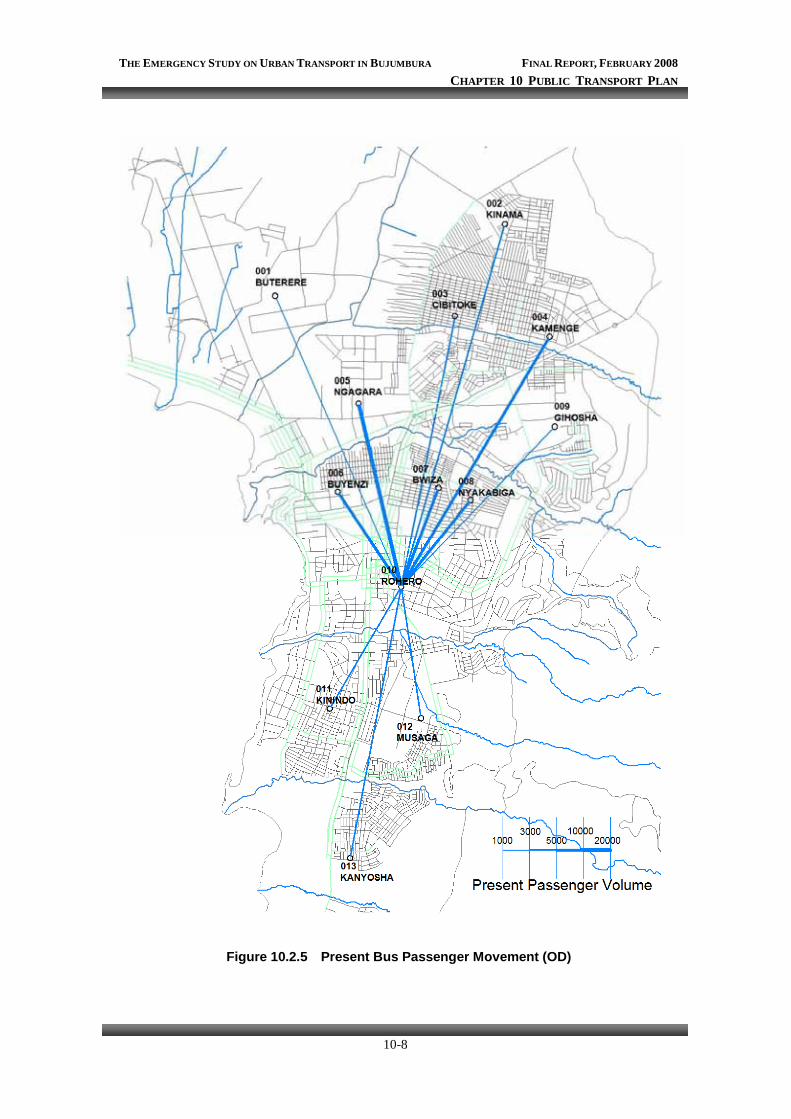
Figure 10.2.4 and 10.2.5 show present daily passenger’s movement.
THE EMERGENCY STUDY ON URBAN TRANSPORT IN BUJUMBURA FINAL REPORT, FEBRUARY 2008 CHAPTER 10 PUBLIC TRANSPORT PLAN
10-8
Figure 10.2.5 Present Bus Passenger Movement (OD)
THE EMERGENCY STUDY ON URBAN TRANSPORT IN BUJUMBURA FINAL REPORT, FEBRUARY 2008 CHAPTER 10 PUBLIC TRANSPORT PLAN
10-9
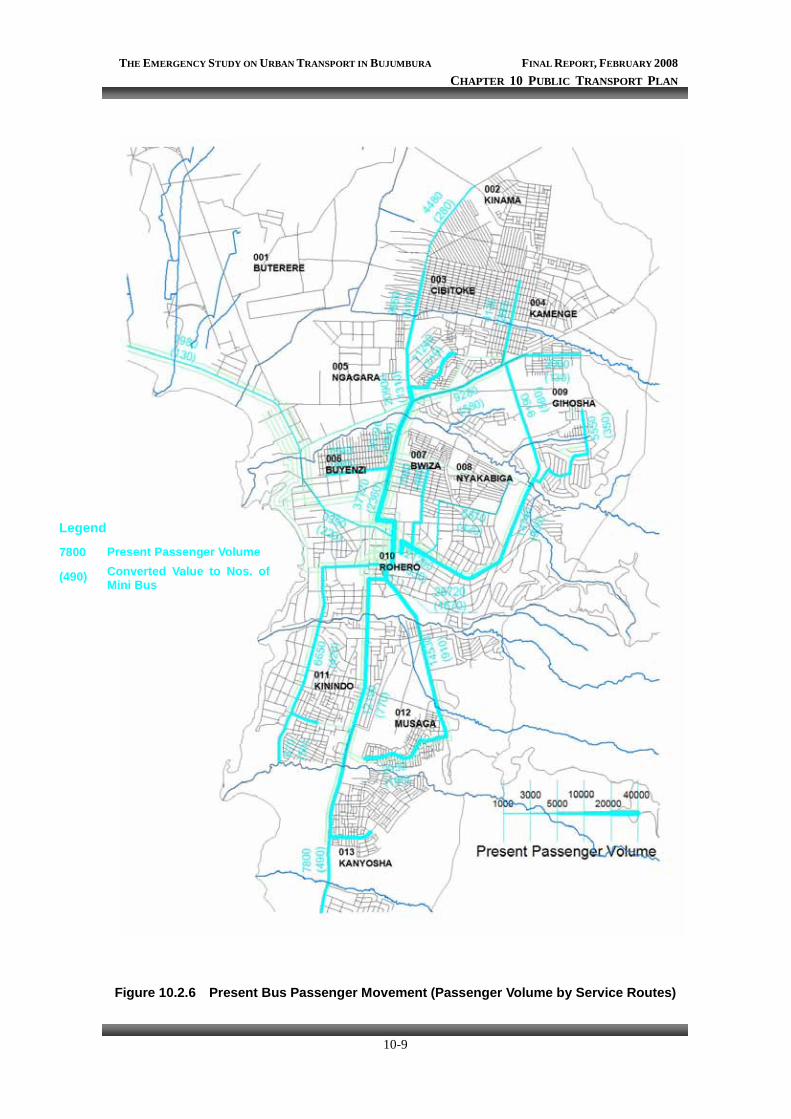
Figure 10.2.6 Present Bus Passenger Movement (Passenger Volume by Service Routes)
Legend
7800 Present Passenger Volume
(490) Converted Value to Nos. of Mini Bus
THE EMERGENCY STUDY ON URBAN TRANSPORT IN BUJUMBURA FINAL REPORT, FEBRUARY 2008 CHAPTER 10 PUBLIC TRANSPORT PLAN
10-10
As Figures 10.2.3 shows that the OTRACO network is organized from the jumping-off point where is the RA at the joining point of RN4 and RN5, and this setting of the jumping – off point is because that the RA is nearest landmark point from OTRACO head quarter.
However, the passengers is attracted at centre of CBD as the Figure 10.2.4 and 10.2.5 are shown, by this; it can be known that current OTRACO’s bus network dose not comply with passengers’ demand.
On the other hand, the private transporters’ network is organized from centre of CBD; complying with passengers’ demand.
The current bus network by both the OTRACO and the private transporters covers all of communes in Bujumbura with exception of Buterere. Buterere can be identified as lowest income level commune; the peoples at the area dose not afford to pay bus fare when the peoples need to move from the commune. The peoples rely on cheaper transport mode such as bicycle taxi and motor-bike taxi.
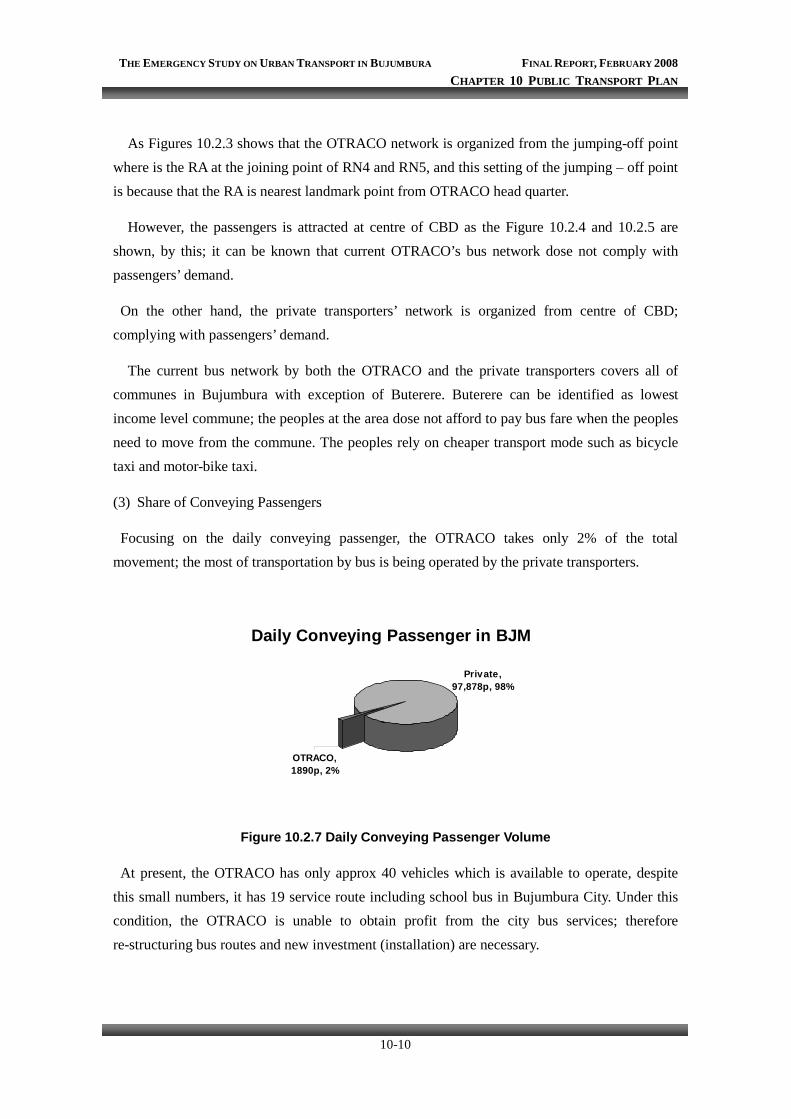
(3) Share of Conveying Passengers
Focusing on the daily conveying passenger, the OTRACO takes only 2% of the total movement; the most of transportation by bus is being operated by the private transporters.
Daily Conveying Passenger in BJM
Private,97,878p, 98%
OTRACO,1890p, 2%
Figure 10.2.7 Daily Conveying Passenger Volume
At present, the OTRACO has only approx 40 vehicles which is available to operate, despite this small numbers, it has 19 service route including school bus in Bujumbura City. Under this condition, the OTRACO is unable to obtain profit from the city bus services; therefore re-structuring bus routes and new investment (installation) are necessary.
THE EMERGENCY STUDY ON URBAN TRANSPORT IN BUJUMBURA FINAL REPORT, FEBRUARY 2008 CHAPTER 10 PUBLIC TRANSPORT PLAN
10-11
10-3 BUS OPERATION PLAN
In this paragraph, the improvement programmes of OTRACO’s service are mainly discussed. As problems of OTRACO’s service are identified in previous paragraph, the programme needs to create a measurement for the problems,
(1) Future Demands Forecast
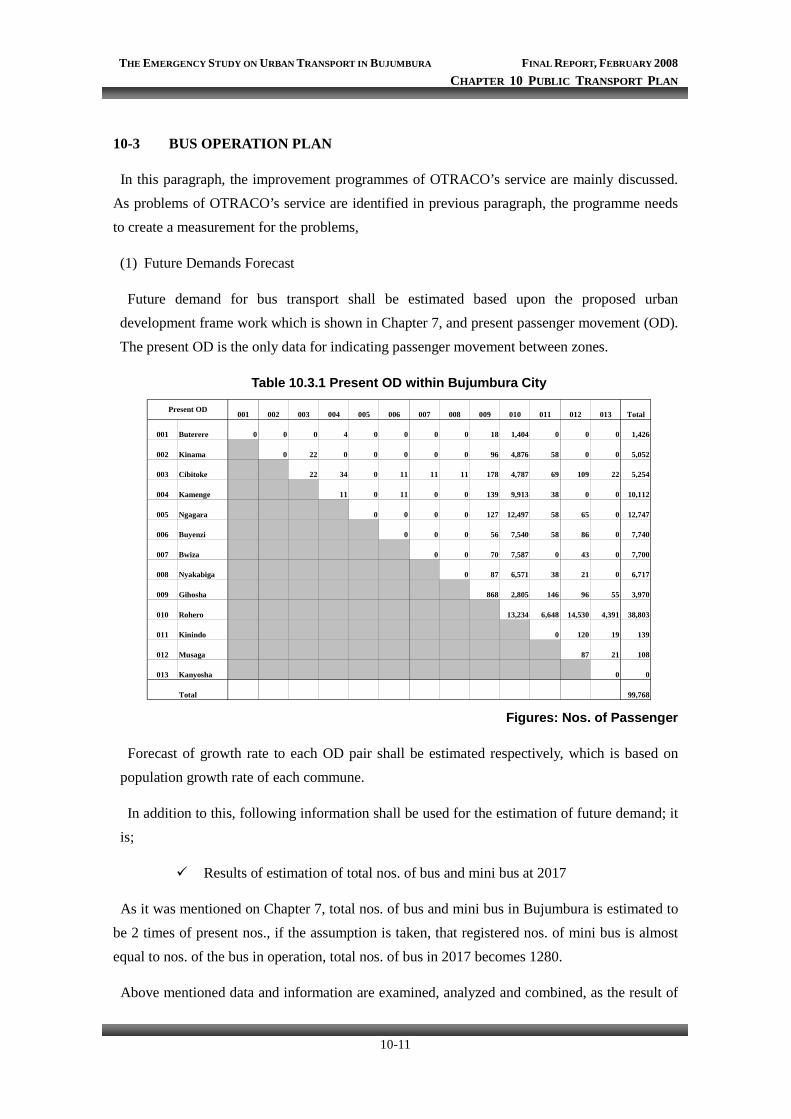
Future demand for bus transport shall be estimated based upon the proposed urban development frame work which is shown in Chapter 7, and present passenger movement (OD). The present OD is the only data for indicating passenger movement between zones.
Table 10.3.1 Present OD within Bujumbura City
001 002 003 004 005 006 007 008 009 010 011 012 013 Total
001 Buterere 0 0 0 4 0 0 0 0 18 1,404 0 0 0 1,426
002 Kinama 0 22 0 0 0 0 0 96 4,876 58 0 0 5,052
003 Cibitoke 22 34 0 11 11 11 178 4,787 69 109 22 5,254
004 Kamenge 11 0 11 0 0 139 9,913 38 0 0 10,112
005 Ngagara 0 0 0 0 127 12,497 58 65 0 12,747
006 Buyenzi 0 0 0 56 7,540 58 86 0 7,740
007 Bwiza 0 0 70 7,587 0 43 0 7,700
008 Nyakabiga 0 87 6,571 38 21 0 6,717
009 Gihosha 868 2,805 146 96 55 3,970
010 Rohero 13,234 6,648 14,530 4,391 38,803
011 Kinindo 0 120 19 139
012 Musaga 87 21 108
013 Kanyosha 0 0
99,768
Present OD
Total Figures: Nos. of Passenger
Forecast of growth rate to each OD pair shall be estimated respectively, which is based on population growth rate of each commune.
In addition to this, following information shall be used for the estimation of future demand; it is;
Results of estimation of total nos. of bus and mini bus at 2017
As it was mentioned on Chapter 7, total nos. of bus and mini bus in Bujumbura is estimated to be 2 times of present nos., if the assumption is taken, that registered nos. of mini bus is almost equal to nos. of the bus in operation, total nos. of bus in 2017 becomes 1280.
Above mentioned data and information are examined, analyzed and combined, as the result of
THE EMERGENCY STUDY ON URBAN TRANSPORT IN BUJUMBURA FINAL REPORT, FEBRUARY 2008 CHAPTER 10 PUBLIC TRANSPORT PLAN
10-12
it, the future OD is formulated as follows;
Table 10.3.2 Future (2017) OD within Bujumbura City
001 002 003 004 005 006 007 008 009 010 011 012 013
1.8 1.5 1.0 1.0 1.1 1.0 1.0 1.0 1.5 1.3 1.4 1.3 2.6
001 Buterere 1.8 0 0 0 6 0 0 0 0 30 2,176 0 0 0 2,212
002 Kinama 1.5 0 0 28 0 0 0 0 0 144 6,826 84 0 0 7,082
003 Cibitoke 1.0 0 0 22 34 0 11 11 11 223 11,010 83 125 40 11,569
004 Kamenge 1.0 0 0 0 11 0 11 0 0 174 11,400 46 0 0 11,641
005 Ngagara 1.1 0 0 0 0 0 0 0 0 165 14,996 73 78 0 15,312
006 Buyenzi 1.0 0 0 0 0 0 0 0 0 70 8,671 70 99 0 8,910
007 Bwiza 1.0 0 0 0 0 0 0 0 0 88 8,725 0 49 0 8,862
008 Nyakabiga 1.0 0 0 0 0 0 0 0 0 109 7,557 46 24 0 7,735
009 Gihosha 1.5 0 0 0 0 0 0 0 0 1,302 8,427 212 134 113 10,188
010 Rohero 1.3 0 0 0 0 0 0 0 0 0 21,204 8,975 23,389 8,562 62,130
011 Kinindo 1.4 0 0 0 0 0 0 0 0 0 0 0 162 38 200
012 Musaga 1.3 0 0 0 0 0 0 0 0 0 0 0 113 41 154
013 Kanyosha 2.6 0 0 0 0 0 0 0 0 0 0 0 0 0 0
145,995
GrowthRateBujumbura Total
Total
THE EMERGENCY STUDY ON URBAN TRANSPORT IN BUJUMBURA FINAL REPORT, FEBRUARY 2008 CHAPTER 10 PUBLIC TRANSPORT PLAN
10-13
Figure 10.3.1 Future Passenger Movement (2017) OD
THE EMERGENCY STUDY ON URBAN TRANSPORT IN BUJUMBURA FINAL REPORT, FEBRUARY 2008 CHAPTER 10 PUBLIC TRANSPORT PLAN
10-14
(2) Future Bus Network Plan
The population of Bujumbura will be increased on southern and northern area of the city, the increasing population is expected to come from outside of Bujumbura, and this population is also expected to be bus passenger.
The road network in the city will be improved by developing of north – south axis and inner and outer ring roads. This development will help the traffic flow to be smoothly, especially at CBD.
The future bus network shall be proposed in consideration of this road network improvement and future passenger’s movement. In addition, the circulation route shall also be proposed in order the bus operation to be easily. The following Figure shows the proposed bus network in 2017.
THE EMERGENCY STUDY ON URBAN TRANSPORT IN BUJUMBURA FINAL REPORT, FEBRUARY 2008 CHAPTER 10 PUBLIC TRANSPORT PLAN
10-15
Figure 10.3.2 Proposed Bus Network in 2017
Legend Principal Arterial Route
Arterial Route
Secondary Arterial Route
7220 Distributed Nos. of Passenger
THE EMERGENCY STUDY ON URBAN TRANSPORT IN BUJUMBURA FINAL REPORT, FEBRUARY 2008 CHAPTER 10 PUBLIC TRANSPORT PLAN
10-16
(3) Service Distribution Scenario
The several scenarios can be introduced for re- distribution of future volume of passengers to the OTRACO and the private transporters, they are as follows;
1) Scenario A
This scenario is drawn to maintain current situation that the OTRACO takes 2% of total passengers; the OTRACO will not require significant investment and the re-structuring. However, this plan will not contribute to both ease of traffic congestion and improvement of bus service standard. The service route and its passenger becomes that as shown in Figure 10.3.2(All colour lines are serviced by the private transporters).
2) Scenario B
This scenario is drawn from the view of minimizing social impact, that the OTRACO takes a part of increasing passengers and the private transporters take same nos. of current passengers on main routes.
The OTRACO is planned to concentrates on main routes and the routes on areas without public transport service at present. The other service routes, which are operated by both the OTRACO and the private transporters, will be operated by the private transporters only. This plan will not disturb existing operation right of the private transporters, however at the section where the traffic volume has already been over-flow, the traffic congestion become more serious. The re-distribution of the service becomes that as shown in Figure 10.3.3
THE EMERGENCY STUDY ON URBAN TRANSPORT IN BUJUMBURA FINAL REPORT, FEBRUARY 2008 CHAPTER 10 PUBLIC TRANSPORT PLAN
10-17
Figure 10.3.3 Re- Distribution of Future Bus Passenger (Scenario B)
Legend
OTRACO
7800 Future Passenger Volume
(490) Converted Value to Nos. of Large Bus
Private
7800 Future Passenger Volume
(490) Converted Value to Nos. of Mini Bus
THE EMERGENCY STUDY ON URBAN TRANSPORT IN BUJUMBURA FINAL REPORT, FEBRUARY 2008 CHAPTER 10 PUBLIC TRANSPORT PLAN
10-18
3) Scenario C
This scenario is drawn from the view of minimizing traffic congestion that the OTRACO takes a part of passengers on North-South Axis and other arterial route; and private transporters take parts of other routes where the traffic congestion is not expected to occur.
There will be some sections where road’s capacity is expected to meet shortage, and those
sections are located on North-South Axis and RN7. Off-course there will have road
improvements such as road widening, however on both, there will also have a difficulty of road
expansion due to the limitation of land, so the improvement is not supposed to be carried out
smoothly and timely, and when the implementation is done, traffic congestion become serous as
well due to setting of traffic control even if it occurs only during the construction. In order to
ease traffic congestion, the type of bus to be introduced on the route shall be large and the buses
shall be installed and operated by the OTRACO.
Figure 10.3.4 Expected Congestion Points
Based on this consideration, those sections shall be mainly operated by OTRACO with large size bus. However, on the other hand, this will become disturbance and deprivation of existing mini bus service, so the conflict between improvement and private transporters
X
X
X
XX: Congestion Point
THE EMERGENCY STUDY ON URBAN TRANSPORT IN BUJUMBURA FINAL REPORT, FEBRUARY 2008 CHAPTER 10 PUBLIC TRANSPORT PLAN
10-19
might be there.
The re-distribution of the service becomes that as shown in Figure 10.3.5
THE EMERGENCY STUDY ON URBAN TRANSPORT IN BUJUMBURA FINAL REPORT, FEBRUARY 2008 CHAPTER 10 PUBLIC TRANSPORT PLAN
10-20
Figure 10.3.5 Re- Distribution of Future Bus Passenger (Scenario C)
There is another understanding to above, that the OTRACO services principal arterial,
Legend
OTRACO
7800 Future Passenger Volume
(490) Converted Value to Nos. of Large Bus
Private
7800 Future Passenger Volume
(490) Converted Value to Nos. of Mini Bus
THE EMERGENCY STUDY ON URBAN TRANSPORT IN BUJUMBURA FINAL REPORT, FEBRUARY 2008 CHAPTER 10 PUBLIC TRANSPORT PLAN
10-21
arterial routes and the private transporters service feeder routes, but considering city size that Bujumbura is very small, the service on feeder routes become less than 5km each; that is range of NMT, mini bus is too big to operate the routes.
(3) Evaluation of Scenarios
In order to select the scenario, the evaluation shall be carried out from several aspects such as nos. of new installation of large sized bus, its cost, positive effect on traffic congestion and social impact.
1) Investments
By execution of the programme, new installation of bus will be required for the scenario B and C. Nos. of bus to be installed is calculated based on the route operation plan. This route operation plan will be in accordance with the distribution of future passenger nos. which is shown in Figure 10.3.2
Main consideration of the route operation plan is as follows;
Covering all communes in the city
Considering of road condition (pavement condition width, nos. of lanes, available space for facility)
Easiness and effectives of operation (distance from the base, circulation route)
Follow figures show the route operation plan by the programme;
THE EMERGENCY STUDY ON URBAN TRANSPORT IN BUJUMBURA FINAL REPORT, FEBRUARY 2008 CHAPTER 10 PUBLIC TRANSPORT PLAN
10-22
Figure 10.3.6 Route Operation Plan (Scenario B)
Legend
OTRACO Route
O1 OTRACO Route No.
Private Transporters Route
M1 Private Transporters Route No.
THE EMERGENCY STUDY ON URBAN TRANSPORT IN BUJUMBURA FINAL REPORT, FEBRUARY 2008 CHAPTER 10 PUBLIC TRANSPORT PLAN
10-23
Figure 10.3.7 Route Operation Plan (Scenario C)
The required nos. of bus can be estimated in consideration of peak demands with some
Legend
OTRACO Route
O1 OTRACO Route No.
Private Transporters Route
M1 Private Transporters Route No.
THE EMERGENCY STUDY ON URBAN TRANSPORT IN BUJUMBURA FINAL REPORT, FEBRUARY 2008 CHAPTER 10 PUBLIC TRANSPORT PLAN
10-24
assumption on operation, when the average operation ratio is assumed to be 65%, total required nos. of bus for both the Scenario B and C are as follows;
Table 10.3.3 Required Nos. of OTRACO’s Bus by Scenario B
N TO1 OTRACO 62 270 14 19 15 22 8 0.40 0.08 0.480 10 65 15O2 OTRACO 62 120 14 9 15 10 7 0.35 0.08 0.430 4 65 6O3 OTRACO 62 20 14 1 15 2 10 0.50 0.08 0.580 0 65 0O4 OTRACO 62 80 14 6 15 7 11 0.55 0.08 0.630 4 65 6O5 OTRACO 62 90 14 6 15 7 7 0.35 0.08 0.430 3 65 5O6 OTRACO 62 20 14 1 15 2 11 0.55 0.08 0.630 1 65 2O7 OTRACO 62 10 14 1 15 1 9 0.45 0.08 0.530 0 65 0O8 OTRACO 62 30 14 2 15 2 10 0.50 0.08 0.580 1 65 2
Sub-Total 640 23 36
(N x T)' OperationRatio (%)
NecessaryNos of Bus
ServiceLength(km)
NecessaryTime for
Journey (hr)
WaitingTime(hr) at
Starting Point
Total Timefor 1
operation (hr)
ServiceHours(hr)
HourlyNos of
Bus
PeakRatio (%)
Nos atPeakHourLine No. Executive
AgencyNos. ofSeats
ServiceFrequency
Table 10.3.4 Required Nos. of OTRACO’s Bus by Scenario C
N TO1 OTRACO 62 310 14 22 15 25 8 0.40 0.08 0.480 12 65 18O2 OTRACO 62 90 14 6 15 7 7 0.35 0.08 0.430 3 65 5O3 OTRACO 62 90 14 6 15 7 10 0.50 0.08 0.580 4 65 6O4 OTRACO 62 200 14 14 15 16 11 0.55 0.08 0.630 10 65 15O5 OTRACO 62 120 14 9 15 10 7 0.35 0.08 0.430 4 65 6O6 OTRACO 62 250 14 18 15 21 11 0.55 0.08 0.630 12 65 18O7 OTRACO 62 50 14 4 15 4 9 0.45 0.08 0.530 2 65 3O8 OTRACO 62 30 14 2 15 2 10 0.50 0.08 0.580 1 65 2
Sub-Total 1,140 48 73
Line No. ExecutiveAgency
Nos. ofSeats
ServiceFrequency
ServiceHours(hr)
HourlyNos of
Bus
PeakRatio (%)
WaitingTime(hr) at
Starting Point(N x T)'
Nos atPeakHour
ServiceLength(km)
NecessaryTime for
Journey (hr)
Total Timefor 1
operation (hr)OperationRatio (%)
NecessaryNos of Bus
2) Contribution to ease of traffic congestion
Required nos. of bus by large-sized bus for conveying per hundred passengers becomes 1.8 units, and the same case by minibus become 6.25 units. The difference of the nos. is 4.45. When it is considered by pcu, the difference becomes 7.1 (6.25x2-1.8x3). This difference can be said that the large sized bus creates huge contribution of increase of road capacity; this also can be said of ease of traffic congestion.
When above-mentioned consideration is applied to the Scenario B and C, total deduction of pcu on whole road network becomes 46,846 and 103,189, respectively, comparing to the Scenario A.
Table 10.3.5 Evaluations of Scenario
Scenario Nos. of New
Installation of Large size Bus
New Installation Cost (USD)
Deduction of PCU Social Impacts Evaluation
(Rank)
A 0 Nil Nil 3
B 36 46,846 Small 2
C 73 103,187 Large 1
As Table 10.3.3 shows that the positive impact on traffic congestion is proportional to an increase
THE EMERGENCY STUDY ON URBAN TRANSPORT IN BUJUMBURA FINAL REPORT, FEBRUARY 2008 CHAPTER 10 PUBLIC TRANSPORT PLAN
10-25
in the numbers and investment (new installation cost). In addition, considering 10 years of terms, the
amount of the investment and nos. of the new installation, the Scenario C is judged to be most
effective and feasible so that the Scenario C is selected.
In case of that Scenario C is selected, some mitigation for the social impact shall be considered. For
example, following mitigation can be introduced, they are;
・ Re-employment of current mini bus drivers by OTRACO in accordance with nos. of
large-sized bus as it increase
・ Urging current bus owner for participating in OTRACO’s capital
THE EMERGENCY STUDY ON URBAN TRANSPORT IN BUJUMBURA FINAL REPORT, FEBRUARY 2008 CHAPTER 10 PUBLIC TRANSPORT PLAN
10-26
10-4 BUS TERMINAL IMPROVEMENT PLAN
As explained on 10-2 and 10-3, the bus network improvement will contribute to several development in the future, however, the bus network improvement is not meant be only re-structuring bus route, the connection point between same and different modes is required to be improved as well.
In Bujumbura, the permanent bus terminal is only located in front of the central market, and it is observed to be a shortage of capacity. Most mini bus wait until its seats become full, this situation is one of cause of traffic congestion around the market area. In addition, no proper traffic control is being given such as restriction of parking and stopping area to each transport mode, no flag man is being assigned so every vehicle stops and starts as they like, it cerates a dangerous situation with high probability that the traffic accident occurs.
Moreover, long distance buses also use this bus terminal for its departure and arrival, and its point is difficult to find out and identify, this makes passengers to have inconvenience.
Observing above, drastic improvement of bus terminal is very necessary with assumption of its re-location.
(1) Basic Concept of Bus Terminal Improvement Plan
1) Isolation from traffic generating and attracting point (Contribution to ease of traffic congestion)
As the biggest problem in Bujumbura is pointed out that most of traffic concentrates to the CBD. Considering the domination of traffic capacity by mini bus, the existing bus terminal is the biggest generating and attracting traffic point in the CBD, and it locates real centre of the CBD. When it is removed from this real centre of CBD, it will contribute to ease of traffic congestion significantly. By this, the economic activities are supposed to be accelerated. Hence, relocation of the existing bus terminal shall be considered in the improvement.
2) Clear assignment complying with sort of journey
As it is pointed out at beginning oh this paragraph, city transport and long distance transport bus uses same bus terminal. It is creating a conflict of that mini bus disturbs long distance bus’s arrival and departure. In general, terminal of long distance buses requires some facilities which are box office, transporters’ office, kiosk and filling point, and however due to the limitation of space, such facilities has not been provided at the current
THE EMERGENCY STUDY ON URBAN TRANSPORT IN BUJUMBURA FINAL REPORT, FEBRUARY 2008 CHAPTER 10 PUBLIC TRANSPORT PLAN
10-27
bus terminal; there is no back-up for long distance trip. It can be known from the example at big cites that long distance bus terminal is normally designed to be located outer side of CBD, this is because that long distance buses which is normally large-size is designed to not to enter city centre with consideration of ease of traffic congestion, and this give a benefit that the long distance bus is possible to operate according to the time table..
Hence, bus terminal for long distance and inner city transport shall be provided, separately, complying with sort of journeys, even in Bujumbura.
By above consideration, the MTPT has started to conduct feasibility study for establishing new long distance bus terminal, entrusting to his relevant organization “SIP”.
The SIP has achieved the interim report. In the report, there are some descriptions as conclusion of their consideration and analysis, they are as follows;
When the long distance bus terminal is designed at CBD area, this will be in accordance with bus passengers’ intention; however, there is no available space for the bus terminal.
In Bujumbura, there is the road network consisting of only primary and secondary arterial roads, but their condition is that the network need to have periodic maintenance, there is some sewerage system along the roads but the storm water drainage system has problem due to lack of maintenance, by this there are some deterioration on carriageway and shoulder. Hence it is judged that there will be necessity of improvement of road network at city centre with consideration of widening, first, followed to it, the improvement shall be carried out to whole city so as the traffic flow to be smoothly. With consideration of above, candidate locations for the bus terminal are selected to be at
Carama in Kinama commune along RN9 and at Nyabaranda in Kanyosha commune along RN 3.
THE EMERGENCY STUDY ON URBAN TRANSPORT IN BUJUMBURA FINAL REPORT, FEBRUARY 2008 CHAPTER 10 PUBLIC TRANSPORT PLAN
10-28
Figure 10.4.1 Candidate Locations for Long Distance Transport Bus Terminals
CARAMA SITE
NYABARANDA SITE
RN3
RN7
RN1
RN9 RN5
RN4 CARAMA SITE
CARAMA SITE
CARAMA SITE
NYABARANDA SITE NYABARANDA SITE NYABARANDA SITE
THE EMERGENCY STUDY ON URBAN TRANSPORT IN BUJUMBURA FINAL REPORT, FEBRUARY 2008 CHAPTER 10 PUBLIC TRANSPORT PLAN
10-29
The JST accept and respect this SIP’s plan, and based on it the Bus terminal improvement plan
shall be formulated.
3) Passenger’s Convenience
As mentioned above, there will be a necessity of new establishment of bus terminals and they will be given specific assignment complying with sorts of journey. With regard to inner city transport, the bus terminal shall be planed in consideration of passenger’s convenience. The candidate locations shall be selected in view of available range of NMT from real city centre, public facilities and existing landmarks.
(2) Expected Function
In the beginning, it is necessary to identify expected bus terminal function; generally following expected functions has been identified from several past desk studies, they are as follows;
・ Traffic Connecting Function: Boarding and alighting of public transport mode ( bus, bike taxi, taxi), changing between modes
・ Amenity Space Function: Meeting and waiting
・ Economic Activity Function: Commercial facilities
Besides, the bus terminal consists of following spaces:
・ Traffic Space: Traffic space is sum of necessary spaces by each traffic mode; space for traffic processing, this traffic space consists of 1) walkway 2) carriageway 3) boarding and alighting space for bus and taxis 4) parking space 5) public transport modes pooling space
・ Environmental Space: Environmental space consists of walkway and green buffer zone with some free space, the free space will contribute to terminal composition with some composure.
(3) Planning Flow of Bus Terminal
The following shows planning flow of the terminal and it has been introduced and authorized by Ministry of Land Transport and Infrastructure, Japan.
THE EMERGENCY STUDY ON URBAN TRANSPORT IN BUJUMBURA FINAL REPORT, FEBRUARY 2008 CHAPTER 10 PUBLIC TRANSPORT PLAN
10-30
Source: Standard Guideline for Terminal Planning, Ministry of Land Transport &
Infrastructure, Japan Figure 10.4.2 Planning Flow for Terminal
Nos. of Passenger for Terminal
Estimation of Area of Standard Traffic Space
Estimation of Area to be provided to secure environmental space
Estimation of Area of Standard Terminal
Facilities Layout Planning ・Traffic Space &
Environmental Space Layout in consideration of Local Specific Features
・Consideration of
Possibility of Space to be Three Dimensional
Evaluation
Finalizing of Area of Terminal
Consideration of Layout of Traffic Space ・Consideration of
Facilities Layout (Consideration of Facilities to be introduced)
・Consideration of Traffic
Process - Traffic Stream Line - Traffic Safety - Processing of in and
out
Consideration of Layout of Environmental Space ・Fulfilment Condition of
Function of Environmental Space (Optimum Ratio of Environmental Space)
・Consideration of Facility
Layout - Consideration of
Facilities to be introduced
- Layout of Facilities Consideration of Enlarge of Standard Terminal Area
No.
Yes
THE EMERGENCY STUDY ON URBAN TRANSPORT IN BUJUMBURA FINAL REPORT, FEBRUARY 2008 CHAPTER 10 PUBLIC TRANSPORT PLAN
10-31
For the estimation of area of terminal space, the method of KONAMI is being commonly used in Japan, the method of KONAMI is the formula which sum up of each space based on their forecasted value. It has been said that the result of the KONAMI is more close to actual terminal situation. By this method of KONAMI, necessary area of bus terminal for inner city transport shall be estimated, as follows;
Table 10.4.1 Method of KONAMI Traffic Connecting Function
Calculation Remarks
Pedestrian
(Sp)
Sp (sq.m)=P/(SxV)xlp. Normal Case Sp(sq.m) =0.76pxlp
Where:
P: Nos of Pedestrian (In &Out; Peak average for 10 min, P/sec)
S: Average Pedestrian Density (P/sq.m)
V: Average Walking Speed (m/sec)
lp: Average Walking Distance in the Terminal (m):15m
Sp=22,786 sq.m
Total Passenger
(2017)=146,000
Peak=0.15
T=14 hour
Nos. of Pedestrian (10
min)=146,000/14x1.15/
6=1,999p
Bus
(Sb)
Sb
(sq.m)=[Nb/45+Nb/20]x45+[0.76x40Nb/3600xlp]+[Nb/20+13]+600
Where:
Nb: Nos. of Arrived Buses for peak 1hour
Sb=1,478
Nos of
Bus=146,000/14x1.15/5
5=218
Taxi
(St)
St (sq.m)=T/600/10x20x2+20T+600=20.3T+600
T: Nos. of Parking Taxis for peak10 min
St=702
T=5 (Assumption)
Private
Vehicle
(So)
So (sq.m)=No/600/10x20+No/2x15/10x35
Where:
No: Nos. of Boarding &Alighting Car Passenger for peak 10 min
So=131
T=5 (Assumption)
Public
(S2)
S1=Sp+Sb+St+So S1=25,097
S2=(0.2-0.3)S1
S2(sq.m)=0.2x(Sp+Sb+St+So)=5,019
Total Area
(S)
S(sq.m)=S1+S2
S=25,097+5,095=30,117 (sq.m)
Required
No. of Bus
Berth
No. of bus passengers at Bus terminal/peak hour=
146,000/14x1.15=11,993 pax/peak hour
Required No. of Buses=11,993/(60x0.7)=286 buses/peak hour
Required No. of Bus berth= 286x(60/5)=57.2----- 58 bus berth
THE EMERGENCY STUDY ON URBAN TRANSPORT IN BUJUMBURA FINAL REPORT, FEBRUARY 2008 CHAPTER 10 PUBLIC TRANSPORT PLAN
10-32
As shown in Table 10.4.1, required area for the bus terminal obtains approx 30,200 sq.m
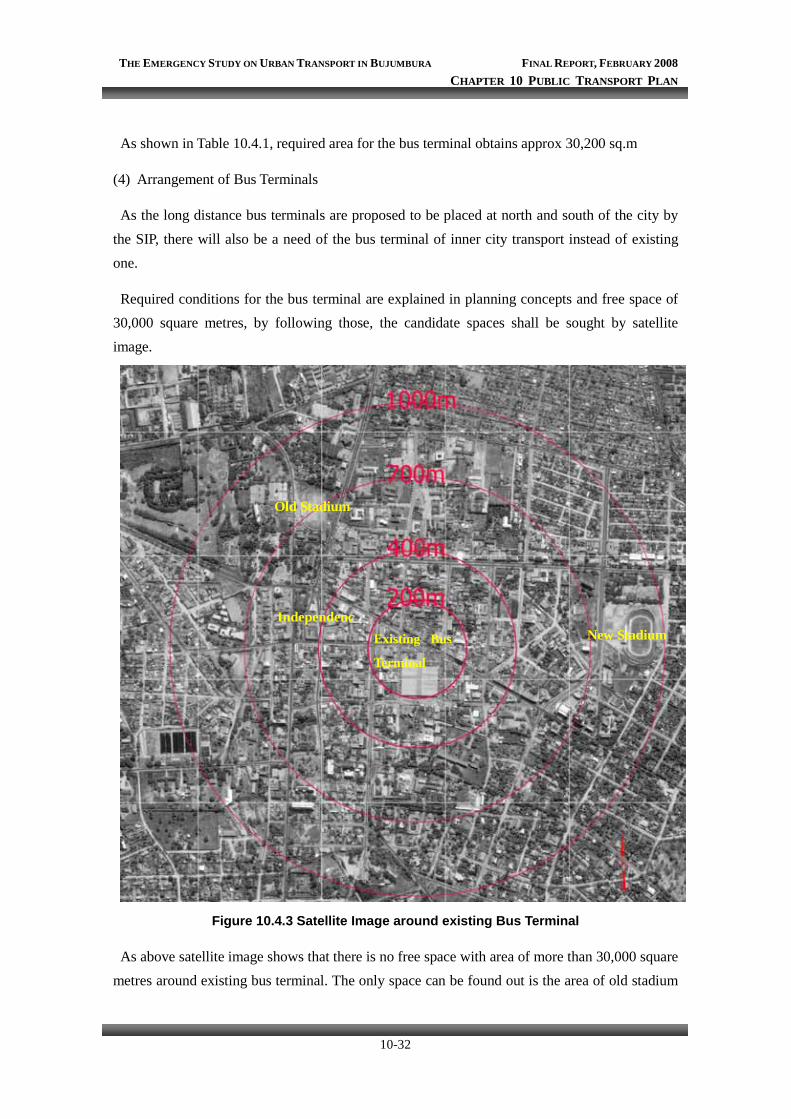
(4) Arrangement of Bus Terminals
As the long distance bus terminals are proposed to be placed at north and south of the city by the SIP, there will also be a need of the bus terminal of inner city transport instead of existing one.
Required conditions for the bus terminal are explained in planning concepts and free space of 30,000 square metres, by following those, the candidate spaces shall be sought by satellite image.
Figure 10.4.3 Satellite Image around existing Bus Terminal
As above satellite image shows that there is no free space with area of more than 30,000 square metres around existing bus terminal. The only space can be found out is the area of old stadium
Existing Bus
Terminal
Old Stadium
IndependencNew Stadium
THE EMERGENCY STUDY ON URBAN TRANSPORT IN BUJUMBURA FINAL REPORT, FEBRUARY 2008 CHAPTER 10 PUBLIC TRANSPORT PLAN
10-33
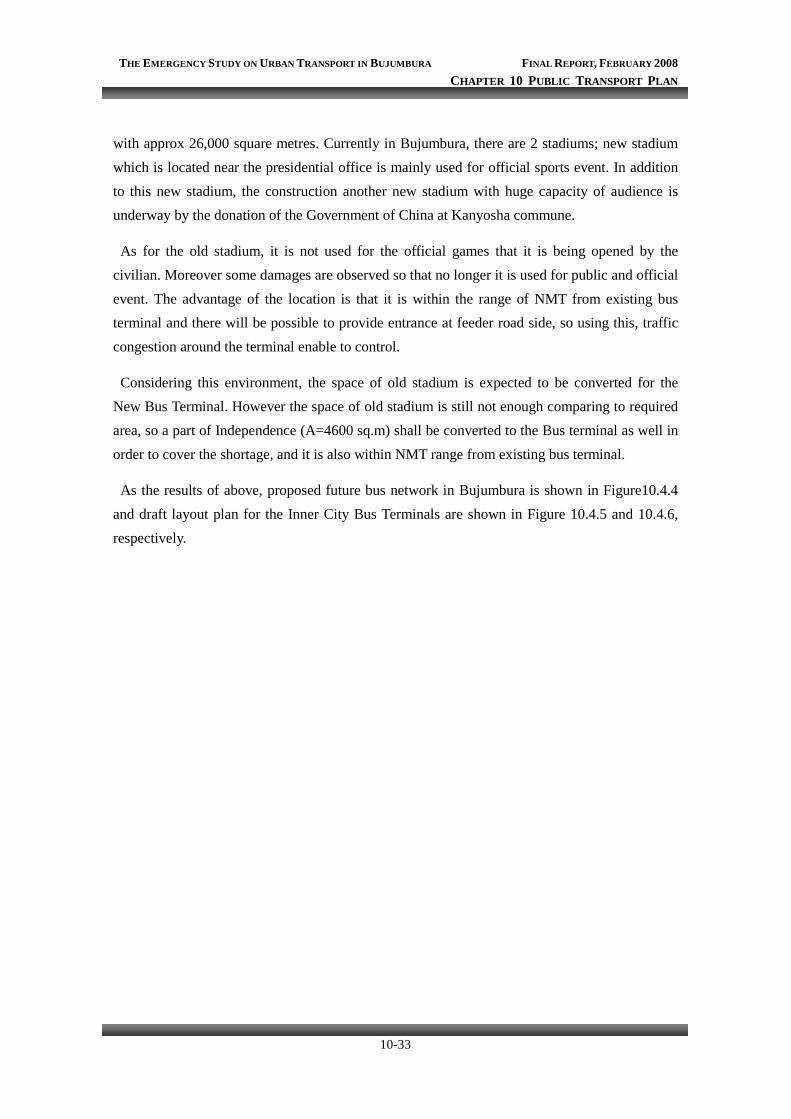
with approx 26,000 square metres. Currently in Bujumbura, there are 2 stadiums; new stadium which is located near the presidential office is mainly used for official sports event. In addition to this new stadium, the construction another new stadium with huge capacity of audience is underway by the donation of the Government of China at Kanyosha commune.
As for the old stadium, it is not used for the official games that it is being opened by the civilian. Moreover some damages are observed so that no longer it is used for public and official event. The advantage of the location is that it is within the range of NMT from existing bus terminal and there will be possible to provide entrance at feeder road side, so using this, traffic congestion around the terminal enable to control.
Considering this environment, the space of old stadium is expected to be converted for the New Bus Terminal. However the space of old stadium is still not enough comparing to required area, so a part of Independence (A=4600 sq.m) shall be converted to the Bus terminal as well in order to cover the shortage, and it is also within NMT range from existing bus terminal.
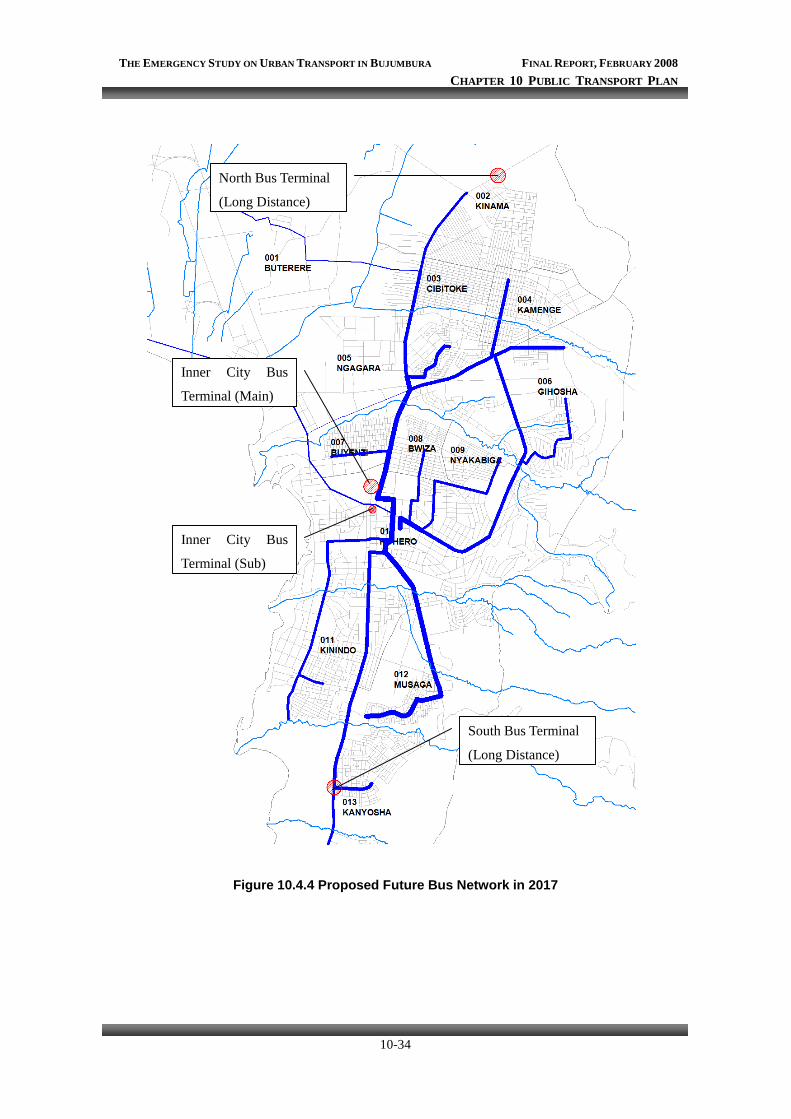
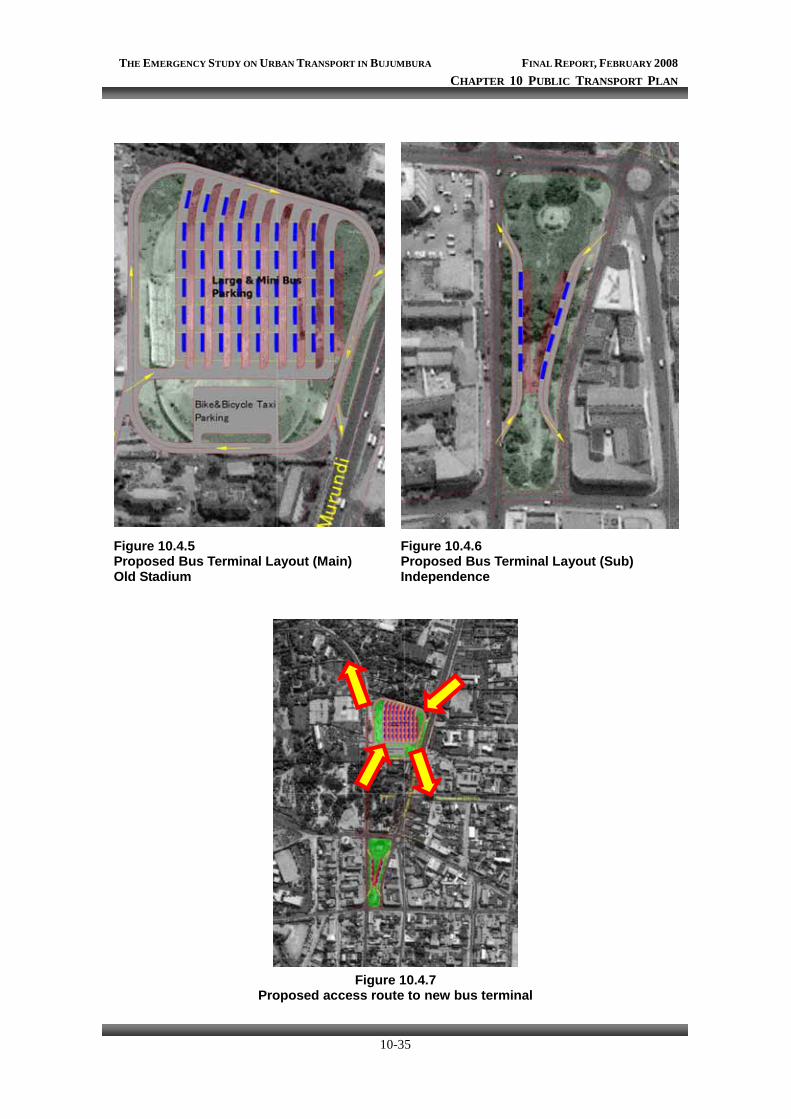
As the results of above, proposed future bus network in Bujumbura is shown in Figure10.4.4 and draft layout plan for the Inner City Bus Terminals are shown in Figure 10.4.5 and 10.4.6, respectively.
THE EMERGENCY STUDY ON URBAN TRANSPORT IN BUJUMBURA FINAL REPORT, FEBRUARY 2008 CHAPTER 10 PUBLIC TRANSPORT PLAN
10-34
Figure 10.4.4 Proposed Future Bus Network in 2017
North Bus Terminal
(Long Distance)
Inner City Bus
Terminal (Main)
Inner City Bus
Terminal (Sub)
South Bus Terminal
(Long Distance)
THE EMERGENCY STUDY ON URBAN TRANSPORT IN BUJUMBURA FINAL REPORT, FEBRUARY 2008 CHAPTER 10 PUBLIC TRANSPORT PLAN
10-35
Figure 10.4.5 Proposed Bus Terminal Layout (Main) Old Stadium
Figure 10.4.6 Proposed Bus Terminal Layout (Sub) Independence
Figure 10.4.7
Proposed access route to new bus terminal
THE EMERGENCY STUDY ON URBAN TRANSPORT IN BUJUMBURA FINAL REPORT, FEBRUARY 2008 CHAPTER 10 PUBLIC TRANSPORT PLAN
10-36
10-5 OTHER PUBLIC TRANSPORT
(1) Review of Current Situation
There are some transport modes other than bus, which are Taxi, Bike Taxi Bicycle Taxi and Walking. It seems that those modes are being used respectively depend on objective and user, the following Table 10.5.1 shows the identification of assignments for each mode by physical observation.
Table 10.5.1 Assumed Assignments to each Transport Modes
Mode Main User (Passenger) Assignment Remarks
Taxi Middle Income Layer On Demand Use,
Middle or Long Trip
(Available to operate for all
weather condition)
Fare is not fixed; based on the
negotiation between Taxi
Driver and Passenger. In
normal case , the fare for
within the city is 2000- 3000
FBu
Bike Taxi Middle –Low Income
Layer
Male
On Demand Use,
Short or Middle Trip,
Passenger in hurry.
(Available to operate under
the fine weather condition)
Cheaper than taxi, fare is also
based on the negotiation. In
normal case, the fare for
within the city is 500 FBu.
Bicycle
Taxi
Low Income Layer On Demand Use,
Short Trip,
Mainly, its operation can be
seen at suburb area.
(Available to operate under
the fine weather condition)
Cheaper than bicycle taxi,
fare is also based on the
negotiation. In normal case,
the fare for within the city is
100-300 FBu.
Walking Low Income Layer On Demand Use,
(Available to operate for all
weather condition)
Free of charge
In addition to above, there is also observation of behaviors of each transport modes; it will help
to identify current situation and problems;
1) Taxi Taxi drivers drive around in their cars to pick up customers or they are standing besides
THE EMERGENCY STUDY ON URBAN TRANSPORT IN BUJUMBURA FINAL REPORT, FEBRUARY 2008 CHAPTER 10 PUBLIC TRANSPORT PLAN
10-37
their parked cars to advertise themselves at anywhere they like to be, it makes the normal traffic to be interfered by them and to be difficult to negotiate to the feeder roads. The driving capabilities of these drivers are often not very high and they sometimes have their cars falling apart. Usually the taxis behave normally very unpredictable.
2) Bike Taxi The Bike Taxi drivers will try to get as much passengers as possible. In order to obtain
that, they will stop anywhere necessary to pick up passenger. They tend to ignore the traffic rules completely and will even drive over the walkway if it is possible and faster to the destination.
When Bike Taxis drive on the carriageway at peak hours, they tends to run between the vehicles so as themselves not to stop by traffic congestion, which result them to run in slalom.
3) Bicycle Taxi Because the Bicycle Taxis and pedestrians are using the same space (walkways) without
decent separation, the Bicycle Taxis are making noises all the time to get the space they need for their transportation. This results in slalom around all pedestrians. Especially around bus stops this is dangerous, because pedestrians do not pay any attention to the bicycle. The bicycles are manoeuvrable, more than the tricycles, which also use the walkway for transportation.
4) Pedestrians Pedestrians are using the walkways as if there are no other users on the walkways. They
don’t watch out for possible other users, like taxis, motorbike or cyclists. If necessary, they cross the walkways without even looking around for safety. This unexpected movement of the pedestrians makes it very hard for cyclists to manoeuvre around on the walkways.
Above behaviors creates dangerous situation with high probability that the traffic accident occurs.
As for the case of Kampala City, Uganda, bike and bicycle taxis are not allowed make their service on major roads; their service can be made on feeder roads only, and mini bus and/or large bus make their services on major road, it results that the passengers are forced to change the transport mode when they arrive at junction with major road, but at least it contributes ease of traffic congestion on major roads and drop in the number of traffic accidents.
THE EMERGENCY STUDY ON URBAN TRANSPORT IN BUJUMBURA FINAL REPORT, FEBRUARY 2008 CHAPTER 10 PUBLIC TRANSPORT PLAN
10-38
Photo: Bike Taxis are looking for passenger at feeder roads side of junction, Kampala City, UGANDA
Figure 10.5.1 Public Transportation Assignments in Kampala City
(2) Basic Concept for the Improvement Plan
1) Contribution of ease of Traffic Congestion
The promotion of use of Taxi, Bike Taxi, Bicycle Taxi and Waking is believed to contribute to ease of traffic congestion. However, in terms of motor bike, there is an observation in Asian countries that due to the regulation with aiming to control vehicle numbers, vehicles are given some condition when they run on main road, thus the number of motor bike is being increased, and therefore it result the motor bike become main actor of cause of creating traffic congestion due that their driving behaviours are not regulated. The same phenomenon can be predicted in Bujumbura if no control is given to the motor bike. As for the Taxi, it has been a cause of traffic congestion in Bujumbura as mentioned above. The bicycle and pedestrian is some times a cause of traffic congestion when they overflow in the carriage way.
THE EMERGENCY STUDY ON URBAN TRANSPORT IN BUJUMBURA FINAL REPORT, FEBRUARY 2008 CHAPTER 10 PUBLIC TRANSPORT PLAN
10-39
So as to improve and avoid the situations mentioned above, some limitation to their service shall be introduced.
2) Increase and Enhance Safety
As mentioned above, there is some violation of traffic safety by them; it is because of lack of proper facilities and regulations. The plan shall consider appropriate arrangements of necessary facility and regulation with paying attention of no disturbance of growth of economic activities.
(3) Arrangement for Service limitation to the Modes
To comply with mentioned concepts and referring to the idea in Kampala, the following limitation to the Public Transport Modes (Specification) shall be proposed, as shown in Table 10.5.2.
Table 10.5.2 Service Limitation to each Transport Mode
Mode Service Limitation (Specification) Remarks
Taxi No Limitation
Bike Taxi All area with exception of North-South Axis Red coloured section in
Figure 10.5.2 is not
available to service
Bicycle Taxi Arterial &Feeder roads only Red and blue coloured
section in Figure 10.5.2 is
not available to service
Walking No Limitation
.By this limitation, the public transport modes with 2 wheels will not be possible to use the North – South Axis, and however still they will have some alternative route to their destinations but the travelling time become more than the present. Hence passenger who seeks efficiency will choose mass transit system (OTRACO bus) even if they will need to have transit.
In addition, the transport mode which has no particular destination is possible to remove from the North-South Axis, thus the efficiency of road transport on the Axis is expected to increase and it result to contribute to have road safety and ease of traffic congestion.
(4) Arrangements of Facility
When the specification of the service is introduced, there will be a need of improvement of transit point between the modes. Therefore, the pool space for the modes which is assigned to feeder side, and the facility for the passenger who look for boarding of next transport mode shall
THE EMERGENCY STUDY ON URBAN TRANSPORT IN BUJUMBURA FINAL REPORT, FEBRUARY 2008 CHAPTER 10 PUBLIC TRANSPORT PLAN
10-40
be provided. The following Figure 10.5.2 and 10.5.3 show the arrangement of mentioned facility and its standard layout.
Figure 10.5.2 Public Transport Mode Assignment and Facility Plan
Legend
Road Class Available Service
North-South Axis
Bus, Taxi, Walking
Principal Arterial
Bus, Taxi, Bike Taxi, Walking
Arterial All Transport Mode
Feeder All Transport Mode
Legend
X Taxi Pool Space
X Pool Space Type –A (Bike & Bicycle Taxi)
x Pool Space Type –B (Bicycle Taxi)
X
x
X
X
X
x
x
X
X X
X
X
x
X
X
THE EMERGENCY STUDY ON URBAN TRANSPORT IN BUJUMBURA FINAL REPORT, FEBRUARY 2008 CHAPTER 10 PUBLIC TRANSPORT PLAN
10-41
Figure 10.5.3 Standard Layout of Bike and Bicycle Taxi Pool
Figure 10.5.4 Bus Bay Shelter
Type -A
Type –B
THE EMERGENCY STUDY ON URBAN TRANSPORT IN BUJUMBURA FINAL REPORT, FEBRUARY 2008 CHAPTER 10 PUBLIC TRANSPORT PLAN
10-42
(5) Arrangements of Regulation and Domestic Rule
In order to contribute ease of traffic congestion and enhance of road safety, not only clarifying assignments to each traffic mode but also need of establishment of the regulation and the domestic rule, because every traffic mode are being operated by private owner and his employee, it is difficult to control each operator without it.
As the pooling spaces are proposed above, the legal no stopping and parking areas shall be introduced together with them. For example, there is currently some observation of uncontrolled parking by the taxi at centre market area, parking taxis block the traffic flow, it is resulting to cause traffic congestion. The area where people and goods are being concentrated, parking control is essential, and this should be monitored by each Taxi Organization together with Police.
CHAPTER 11
TRAFFIC MANAGEMENT PLAN

THE EMERGENCY STUDY ON URBAN TRANSPORT IN BUJUMBURA FINAL REPORT, FEBRUARY 2008 CHAPTER 11 TRAFFIC MANAGEMENT PLAN
11-1
CHAPTER 11 TRAFFIC MANAGEMENT PLAN
11-1 PARKING FACILITIES AND CONTROL
11-1-1 Introduction
On-street parking often causes the reduction of road carriageway capacity for traffic vehicle flow. On the other hand, the road space serves and meets the public and commercial parking demand. Therefore, the adequate measure for car parks shall be established according to the road use condition and demands.
11-1-2 Existing Parking Conditions
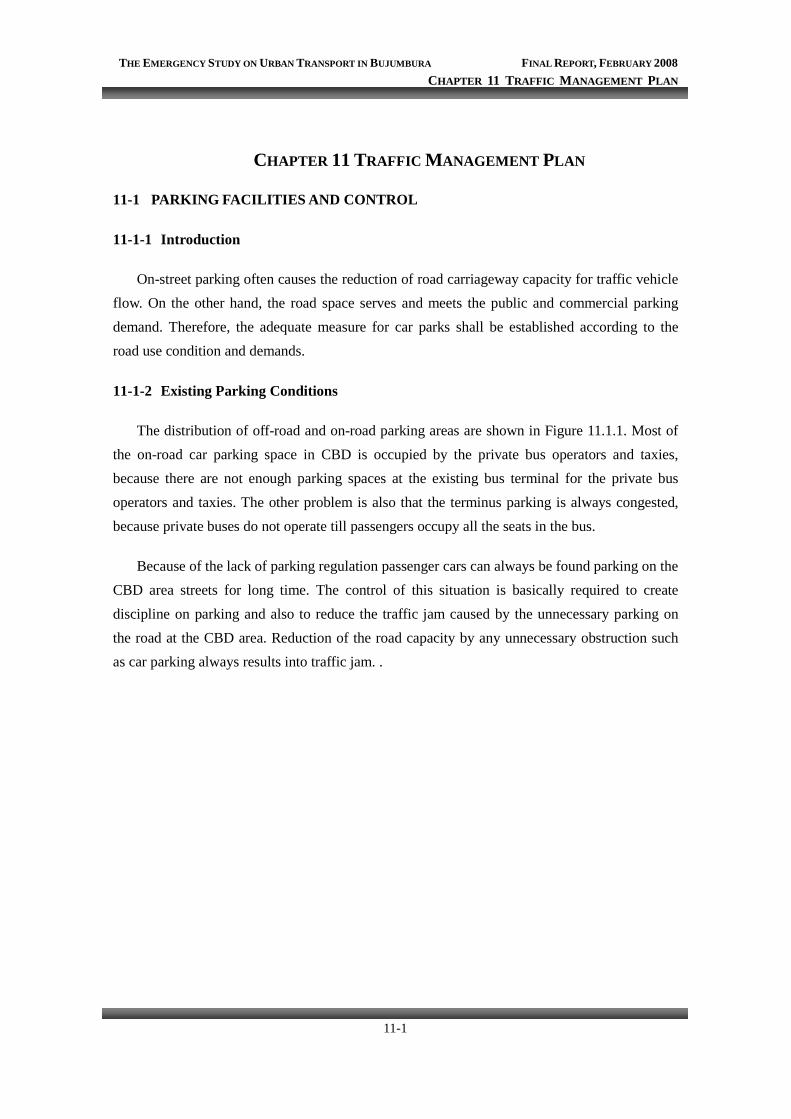
The distribution of off-road and on-road parking areas are shown in Figure 11.1.1. Most of the on-road car parking space in CBD is occupied by the private bus operators and taxies, because there are not enough parking spaces at the existing bus terminal for the private bus operators and taxies. The other problem is also that the terminus parking is always congested, because private buses do not operate till passengers occupy all the seats in the bus.
Because of the lack of parking regulation passenger cars can always be found parking on the CBD area streets for long time. The control of this situation is basically required to create discipline on parking and also to reduce the traffic jam caused by the unnecessary parking on the road at the CBD area. Reduction of the road capacity by any unnecessary obstruction such as car parking always results into traffic jam. .
THE EMERGENCY STUDY ON URBAN TRANSPORT IN BUJUMBURA FINAL REPORT, FEBRUARY 2008 CHAPTER 11 TRAFFIC MANAGEMENT PLAN
11-2
Existing Roadside Parking Area
Existing Roadside and center median Parking Area
Figure 11.1.1 Parking Condition in Bujumbura CBD
11-1-3 Basic Policy
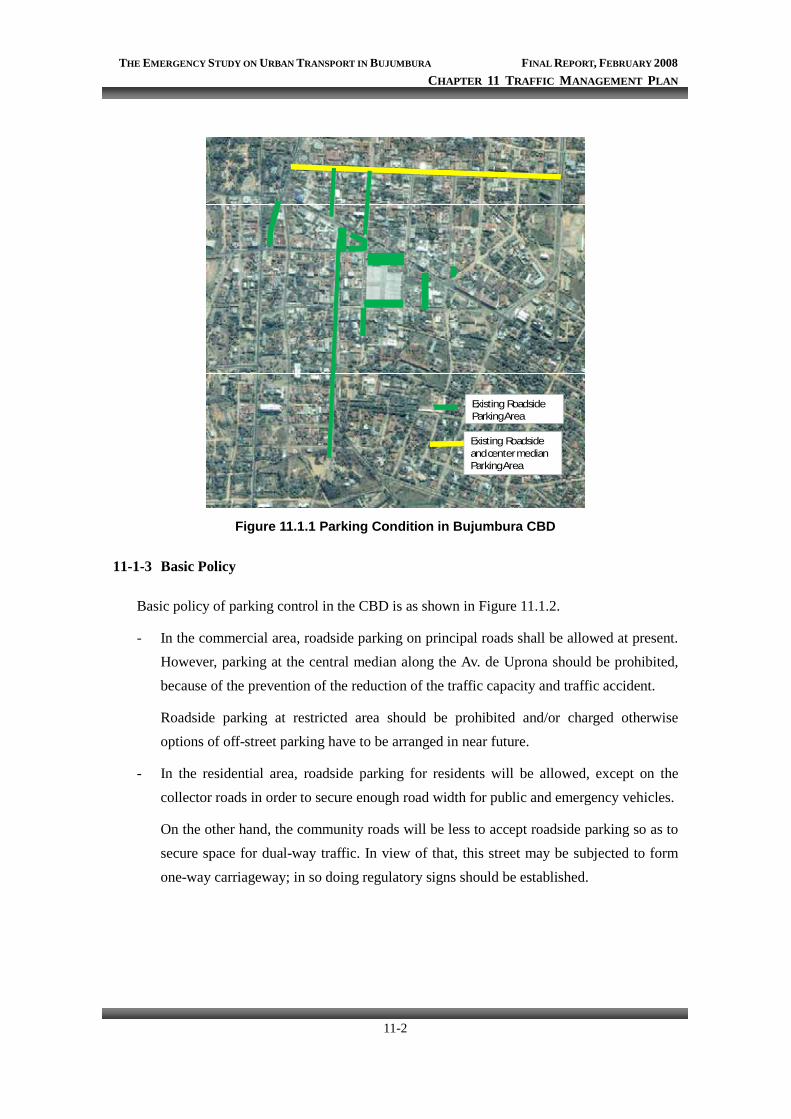
Basic policy of parking control in the CBD is as shown in Figure 11.1.2.
- In the commercial area, roadside parking on principal roads shall be allowed at present. However, parking at the central median along the Av. de Uprona should be prohibited, because of the prevention of the reduction of the traffic capacity and traffic accident.
Roadside parking at restricted area should be prohibited and/or charged otherwise options of off-street parking have to be arranged in near future.
- In the residential area, roadside parking for residents will be allowed, except on the collector roads in order to secure enough road width for public and emergency vehicles.
On the other hand, the community roads will be less to accept roadside parking so as to secure space for dual-way traffic. In view of that, this street may be subjected to form one-way carriageway; in so doing regulatory signs should be established.
THE EMERGENCY STUDY ON URBAN TRANSPORT IN BUJUMBURA FINAL REPORT, FEBRUARY 2008 CHAPTER 11 TRAFFIC MANAGEMENT PLAN
11-3
Prohibited Parking Area
Accepted Parking Area
Figure 11.1.2 Parking Control Policy in the CBD
11-1-4 Countermeasures
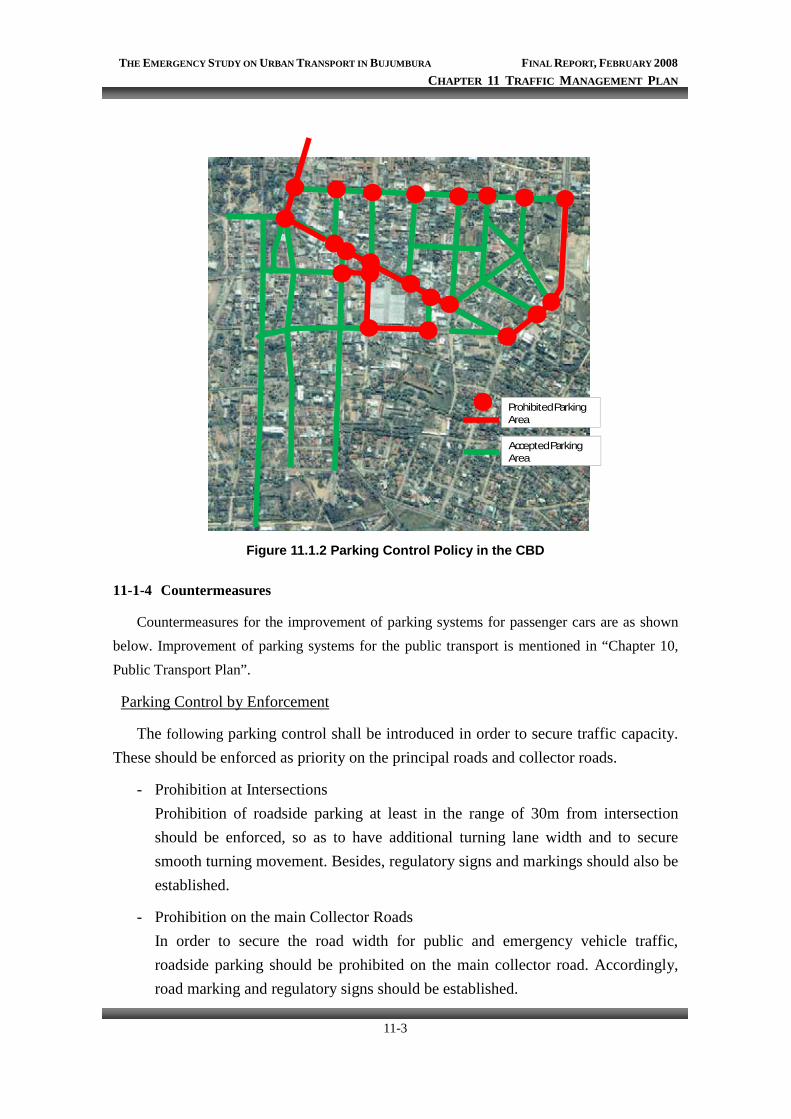
Countermeasures for the improvement of parking systems for passenger cars are as shown below. Improvement of parking systems for the public transport is mentioned in “Chapter 10, Public Transport Plan”.
Parking Control by Enforcement
The following parking control shall be introduced in order to secure traffic capacity. These should be enforced as priority on the principal roads and collector roads.
- Prohibition at Intersections Prohibition of roadside parking at least in the range of 30m from intersection should be enforced, so as to have additional turning lane width and to secure smooth turning movement. Besides, regulatory signs and markings should also be established.
- Prohibition on the main Collector Roads In order to secure the road width for public and emergency vehicle traffic, roadside parking should be prohibited on the main collector road. Accordingly, road marking and regulatory signs should be established.
THE EMERGENCY STUDY ON URBAN TRANSPORT IN BUJUMBURA FINAL REPORT, FEBRUARY 2008 CHAPTER 11 TRAFFIC MANAGEMENT PLAN
11-4
Improvement of Car Parks
The following measures for improvement of car parks should be conceived. These measures should be considered to meet parking demand and road geometry, detailed plan should be evaluated in the next stage of study.
- Widening of Car Parks and Introduction of parking charge system To shorten blocking the carriageway by parking maneuver, roadside parking strip should be widened around the commercial facilities where the parking demand is greater. Besides, regulatory signs and markings should also be established as well as introduction of parking charge system by new private enterprises
Elimination of On-street Parking
In future, on-street parking shall be eliminated to secure traffic capacity.
Following off-street parking facilities should be developed prior to the prohibition of the roadside parking in the future.
a) Introduction of Multi-storied Car Parking Building
As for the type of the parking facilities, the multi-storied car parking is recommended from the view point of the construction cost and land acquisition. For the off-street parking facilities, the dilapidated buildings and/or vacant lot in the Figure 11.1.3 are recommendable.
These parking garages would function more effectively if higher parking fee is charged on roadside parking in the nearby area.
THE EMERGENCY STUDY ON URBAN TRANSPORT IN BUJUMBURA FINAL REPORT, FEBRUARY 2008 CHAPTER 11 TRAFFIC MANAGEMENT PLAN
11-5
Multi-storied Parking
200m
400m
600m
800m
Off-set Parking
Bus Terminal
Figure 11.1.3 Recommendable Location of the Off-street Car Parking Facilities in CBD
b) Establishment of new Building Code
Considering the existing substandard buildings and the expected future chronic shortage of parking spaces and auto parking infringing on road traffic and pedestrian ways, it will be necessary to make new attachment of Parking Code to the Building Codes for the preservation of individual properties, especially in the CBD. The size of the parking spaces within each property should be carefully determined depending upon the total space and the purpose of usage for each building.
11-2 TRAFFIC DEMAND MANAGEMENT
One of the effective countermeasures to improve traffic conditions in Bujumbura CBD is the first the implementation of introduction of new parking policies and measures. However,
THE EMERGENCY STUDY ON URBAN TRANSPORT IN BUJUMBURA FINAL REPORT, FEBRUARY 2008 CHAPTER 11 TRAFFIC MANAGEMENT PLAN
11-6
this measure will not be the final permanent solution to traffic congestion in CBD.
As per the recommendation the fundamental measures to mitigate the traffic problems is the introduction of various countermeasures, such as traffic demand management to Bujumbura CBD.
Based on the typical measures of traffic demand management implemented elsewhere in the world, the followings are the recommendable measures to Bujumbura CBD considering the traffic characteristics and features of the Study Area.
(1) Introduction of New Parking Policies and Measures
- Introduction of the Parking Fees collection System: Minimizing of the time of parking in CBD area
- Development of multi-storied parking buildings
(2) Shifting to Public Transport from Private Vehicles
Existing main problems on transport in Bujumbura CBD is an increase of private vehicles which is an outcome of the improvement of their living environment. Almost all private cars carry few to none passengers excluding driver while moving around the CBD. This situation invite the need of more number of private passenger cars rapidly to meet the traffic demand, the phenomenon which results into traffic congestion due to the excess traffic in CBD area roads than the designated capacity.
The Solution for the reduction of number of private cars in CBD area road is to change/shift the traffic modes from private car to public transport during weekdays.
By establishing the stable and comfortable bus operation system through the introduction of new large-sized buses in Bujumbura, existing passengers who uses private cars can possibly change the mind and use public transport for their daily movement in the city.
(3) Restriction of the vehicles entering CBD
One of the solutions for the reduction of the traffic volume in CBD is restriction of the vehicles to enter CBD at peak hours. Heavy vehicles should be restricted to enter CBD to prevent traffic overcrowding. On the other hand for example, passenger cars having passengers less than two can also be restricted to enter CBD as well for the same reason said above.
(4) Introduction of Park and Bus Ride System
Introduction of park and bus ride system is effective, so it is necessary to have secure and
THE EMERGENCY STUDY ON URBAN TRANSPORT IN BUJUMBURA FINAL REPORT, FEBRUARY 2008 CHAPTER 11 TRAFFIC MANAGEMENT PLAN
11-7
convenient parking spaces close to public transport stations/terminals/stops.
(5) Introduction of Staggered Working Hours
The peak hour during which big number of car trips are attracted to CBD in Bujumbura city
occurs three times a day particularly at morning time when going to the offices, at lunch time and
during the evening time when going back home. High concentration is especially observed at lunch
time causing serious traffic jams in and around the CBD which in most cases bring about the delay
of people taking lunch at home. If staggered working hours will be introduced into the CBD, the
traffic volume at the peak hour will be decreased. But some of the difficulties associated with the
staggering of working hours are: loss in customer contact, and inconvenience to private motorists
transporting family members to work, school or shop, etc. It is necessary to gain public acceptance
prior to the implementation of the staggering working hours.

CHAPTER 12
FINANCING PLAN

THE EMERGENCY STUDY ON URBAN TRANSPORT IN BUJUMBURA FINAL REPORT, FEBRUARY 2008 CHAPTER 12 FINANCING PLAN
12-1
CHAPTER 12 FINANCING PLAN
12-1 FUND ALLOCATION FOR IMPROVEMENT PLAN
12-1-1 Road Sector
Considering the budget needed for a road investment activity and infrastructure maintenance on the future road network and public transport improvement discussed in the previous chapters 9 and 10, the cost estimate of the related activities as well as the fund allocation will be examined from a viewpoint of the categorization of the respective projects. In case of economic analysis, community road construction (stone pavement project) cost is not included; however, this cost is included in financial plan
This project consists of both the improvement of road and public transport facilities. The funds for the development of the above said project will largely depend on the allocation of fund from the central government in which part of the fund is provided by the international organizations or through some bilateral aid. The division and allocation of the budget is done according to the roles of each ministry. There are two ministries which differ in roles related in this study namely the Ministry of Public Works and Equipment (MTPE) responsible for the classified road infrastructure development and management while the Ministry of Transport, Post and Telecommunication (MTPT) is in charge of road transport delivery services and mobility.
In addition to the above, since cost estimate consists of investment cost and maintenance and operation cost, it will be important to examine a budget scale of each investment activity.
The World Bank (WB) has been studied and recommended to maintain road by the Burundian Government. The following paragraphs (in italic) are cited for the purpose of this study from the WB report relating to road development in Burundi.
(1) Macroeconomic context
Despite different country circumstances in each case, regional and international comparisons demonstrate Burundi’s need to significantly scale up the level of infrastructure spending in order to achieve and maintain growth and competitiveness. The justification for Burundi to scale up its infrastructure spending is particularly strong since it faces the continuing need to catch up on investment and maintenance of infrastructure destroyed during the war, and to overcome the lag in introducing reforms.
Table 12.1.1 provides a breakdown of the shares of investment and O & M spending by sector of Burundi’s public expenditures in infrastructure. First, O & M expenses in electricity, water supply & sanitation account for a large share of public spending. While there have been no major expansions of the road network in the period analyzed, most of the rehabilitation expenditures on existing roads are considered as new investments. These expenditures are then entered into the development budget and thus counted as investments. The definition of O & M
THE EMERGENCY STUDY ON URBAN TRANSPORT IN BUJUMBURA FINAL REPORT, FEBRUARY 2008 CHAPTER 12 FINANCING PLAN
12-2
expenditures for roads covers essentially the routine maintenance carried out with resources channeled through maintenance fund.
Table 12.1.1 Public Expenditure by Infrastructure Sector GDP Share (%) 2002 2003 2004 2005 2006 Total Spending 2.37 2.24 3.14 2.94 3.30 Electricity (total) 1.64 1.43 1.93 1.73 1.91 Road (total) 0.03 0.11 0.37 0.40 0.67 (Investment) (0.01) (0.07) (0.32) (0.37) (0.64) (O & M) (0.02) (0.05) (0.05) (0.03) (0.03) Water & Sanitation (Total) 0.71 0.69 0.84 0.81 0.72
Source: “Burundi Infrastructure Public Expenditure Review”, the World Bank
In the regional context, Burundi’s infrastructure spending as percentage of GDP ranges far below that of at least those neighboring countries, which have enjoyed a degree of recent economic and political stability, such as Rwanda 5.2%, Uganda 6.2%, Tanzania 6.1% and Kenya 6.0%.
Burundi needs to undertake major efforts to rebuild and improve its infrastructure, but at 3.3% of GDP in 2006, the level of infrastructure spending has remained for below regional and international comparators and does not appear sufficient to support the country’s ambitious growth and poverty reduction goals. Regional and international comparisons demonstrate Burundi’s need to significantly scale up the level of infrastructure spending in order to achieve and maintain growth and competitiveness. If there are any lessons to be drawn from the regional experience, Burundi’s infrastructure expenditures should be at least in the 5%-8% range of GDP in the next 10-15 years to be commensurate with the government’s economic development objectives.
(2) Investment plan in short-term period
The government’s efforts to move towards such a framework have recently been demonstrated by the presentation to the development partners of a strategic document “Programme d’Actions Prioritaire de mise en oeuvre du CSLP 2007-2010”(May 2007) as the basis for both its own budget process and the development partners’ future contributions. It places the overall sectoral investment plans into the macroeconomic and budgetary context and attempts to define priorities commensurate to the country’s growth objectives. It comprises analyses and policy orientations addressing economic challenges, investment needs, financing requirements, and the implementation strategy. The government recognizes that in principle investments are programmed to take full account of resource constraints, including those posed by external financing availability (including constraints on debt financing), absorption capacity, and the need to ensure stable macroeconomics conditions. Investments must therefore focus on a relatively limited number of key programs, in order to facilitate prioritization, resource planning, monitoring and management. These priorities are reflected in the expected action plan summarized in Table 12.1.2.
Although Road sector in the whole investment is accounted for about 12% in the CSLP
THE EMERGENCY STUDY ON URBAN TRANSPORT IN BUJUMBURA FINAL REPORT, FEBRUARY 2008 CHAPTER 12 FINANCING PLAN
12-3
2007-2010, it shows that the amount of investment in Infrastructure is the largest, and occupies 55% of the infrastructure investment.
Table 12.1.2 Public Investment Program for Poverty Reduction in Burundi (2007 – 2010)
(US$ millions) Sector Programmed
financing Needs Total % of total
Governance and security Support to economic growth and development Infrastructure
-Housing -Roads -Transport -Telecom and post -Information -Energy
Education Health and VIH/SIDA Other social expenditures
208.0 167.1 20.0 105.4 - - - 10.5 65.7 87.4 121.4
65.9 131.4 26.0 49.6 5.3 13.3 7.5 40.9 61.4 75.3 58.1
273.9 298.5 46.0 155.0 5.3 13.3 7.5 51.4 127.1 162.7 179.5
20.7% 22.6% 3.5% 11.7% 0.4% 1.0% 0.6% 3.9% 9.6% 12.3% 13.6%
Total 785.5 534.7 1,320.2 100.0% Source: Programme d’Actions Prioritaire de mise en oeuvre du CSLP 2007-2010. Table Ronde des Partenaires, Bujumbura, 24-25 mai 2007
The GoB recently published a program of investment priorities in infrastructure in the period 2007-2010 as shown in Table 12.1.3. This four years program recognizes that US$ 355 millions have to be allocated to reduce the shortage of infrastructure. A half of the budget is allocated in transport (roads) and the rest in water and energy.
Table 12.1.3 Investment needs in infrastructure Electricity Transport ICT Water Total US$ millions 71.4 181.5 13.3 89.3 355.5 % 20.1% 51.1% 3.7% 25.1% 100.0%
Source: “Overcoming Obstacles to Growth in Burundi; The role of Infrastructure”, the World Bank
(3) Investment scale for the Project
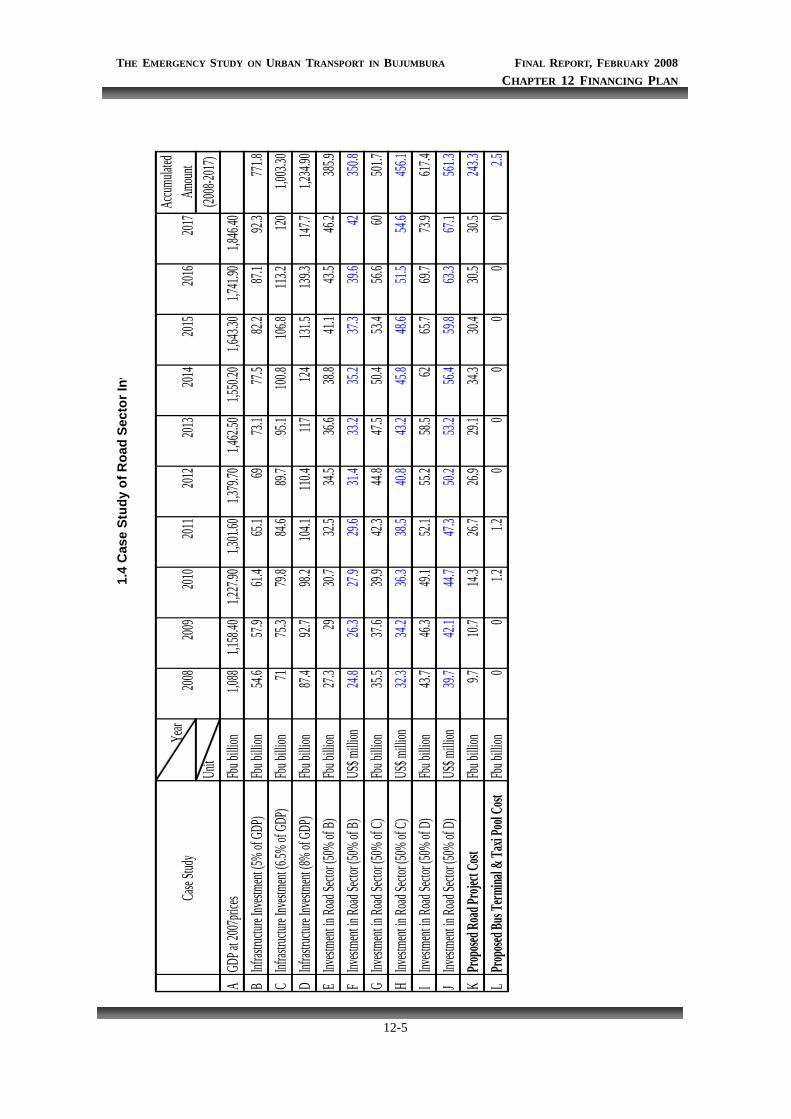
According to the recommendation of the World Bank, the proposed project in this study made the trial calculation of the total Infrastructure investment framework required when the range of GDP’s Infrastructure investment scale occupied range becomes 5%-8%.
In addition, the premise of trial calculation is as follows. The estimated price will be taken as a fix-price in the 2007 fiscal year. The rate of increase of GDP is taken as 6% of an annual rate till 2017. Use of 5%, 6.5%, and 8% (three cases) of the GDP’s occupied Infrastructure investment
THE EMERGENCY STUDY ON URBAN TRANSPORT IN BUJUMBURA FINAL REPORT, FEBRUARY 2008 CHAPTER 12 FINANCING PLAN
12-4
scale. The investment scale to road Sector is based on 50% of the investment in Infrastructure. Community road construction (stone pavement projects: FBu 94.2 billion) should be
included for the sake of budgetary purpose, although this cost is excluded in economic analysis for the sake of public transport project.
The result of the above investment scale to road sector by the above mentioned precondition is shown in table 12.1.4.
The result indicates that when the infrastructure investment ratio of 5% of GDP is assumed the total project cost will come up to about 70% of the cost of road sector investment. On the other hand when the maximum ratio of Infrastructure investment scale of about 8% (which is the maximum in this case) of GDP is assumed the project ratio become about 40%. However if the above calculation will be applied (by using investment ratio in the range of 5%, 6.5% and 8%) during the period of execution of this project the largest amount of project cost will be realized in 2014 whereby the ratio of investment for the road sector will occupy more than 50% at an investment scale of 8% of GDP. Therefore investment scale of 8% is suitable if we consider the GDP ratio when based on the investment scale by year. In this case, peak amount of investment in 2014 is accounted for 60% of BEI of PTPC in 2007, the ratio occupied by the road sector from total project cost (2008 – 2017) by 2017 will become 40%, and if local road improvement and maintenance is taken into consideration, it will be presumed that 8% will be a suitable scale.
THE EMERGENCY STUDY ON URBAN TRANSPORT IN BUJUMBURA FINAL REPORT, FEBRUARY 2008 CHAPTER 12 FINANCING PLAN
12-5
1.4
Cas
e St
udy
of R
oad
Sect
or In
v
Ye
ar Ac
cumula
tedAm
o unt
Unit
(2008-
2017)
AGD
P at 2
007pri
cesFb
u billi
on 1,0
881,1
58.40
1,227.
901,3
01.60
1,379.
701,4
62.50
1,550.
201,6
43.30
1,741.
901,8
46.40
BInf
rastru
cture I
nvestm
ent (5
% of
GDP)
Fbu b
illion
54.6
57.9
61.4
65.1
6973.
177.
582.
287.
192.
3771
.8C
Infras
tructu
re Inve
stment
(6.5%
of GD
P)Fb
u billi
on 71
75.3
79.8
84.6
89.7
95.1
100.8
106.8
113.2
1201,0
03.30
DInf
rastru
cture I
nvestm
ent (8
% of
GDP)
Fbu b
illion
87.4
92.7
98.2
104.1
110.4
117124
131.5
139.3
147.7
1,234.
90E
Invest
ment
in Ro
ad Sec
tor (5
0% of
B)Fb
u billi
on 27.
329
30.7
32.5
34.5
36.6
38.8
41.1
43.5
46.2
385.9
FInv
estme
nt in
Road
Sector
(50%
of B)
US$ m
illion
24.8
26.3
27.9
29.6
31.4
33.2
35.2
37.3
39.6
42350
.8G
Invest
ment
in Ro
ad Sec
tor (5
0% of
C)Fb
u billi
on 35.
537.
639.
942.
344.
847.
550.
453.
456.
660
501.7
HInv
estme
nt in
Road
Sector
(50%
of C)
US$ m
illion
32.3
34.2
36.3
38.5
40.8
43.2
45.8
48.6
51.5
54.6
456.1
IInv
estme
nt in
Road
Sector
(50%
of D)
Fbu b
illion
43.7
46.3
49.1
52.1
55.2
58.5
6265.
769.
773.
9617
.4J
Invest
ment
in Ro
ad Sec
tor (5
0% of
D)US
$ milli
on39.
742.
144.
747.
350.
253.
256.
459.
863.
367.
1561
.3K
Prop
osed R
oad Pr
oject
Cost
Fbu b
illion
9.710.
714.
326.
726.
929.
134.
330.
430.
530.
5243
.3L
Prop
osed B
us Te
rmina
l & Ta
xi Po
ol Cost
Fb
u billi
on 0
01.2
1.20
00
00
02.5
2014
2015
2016
2017
2010
2011
2012
2013
Case
Study
2008
2009
THE EMERGENCY STUDY ON URBAN TRANSPORT IN BUJUMBURA FINAL REPORT, FEBRUARY 2008 CHAPTER 12 FINANCING PLAN
12-6
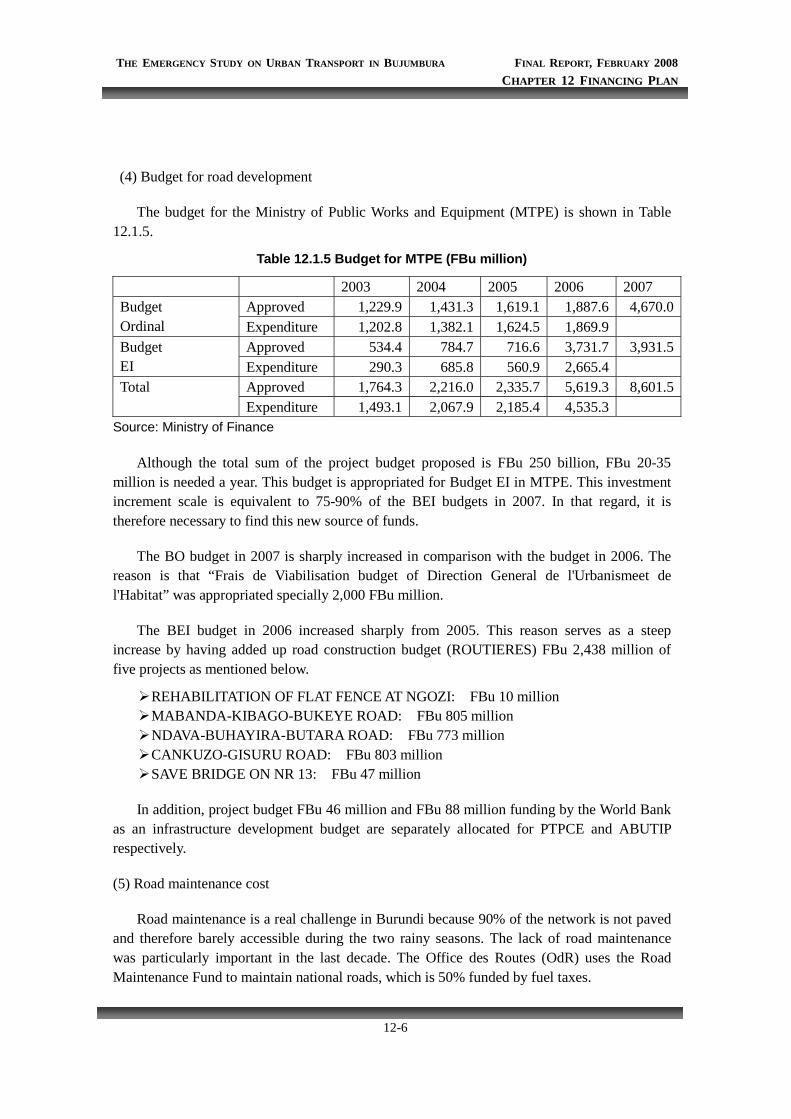
(4) Budget for road development
The budget for the Ministry of Public Works and Equipment (MTPE) is shown in Table 12.1.5.
Table 12.1.5 Budget for MTPE (FBu million)
2003 2004 2005 2006 2007 Approved 1,229.9 1,431.3 1,619.1 1,887.6 4,670.0 Budget
Ordinal Expenditure 1,202.8 1,382.1 1,624.5 1,869.9 Approved 534.4 784.7 716.6 3,731.7 3,931.5 Budget
EI Expenditure 290.3 685.8 560.9 2,665.4 Approved 1,764.3 2,216.0 2,335.7 5,619.3 8,601.5 Total Expenditure 1,493.1 2,067.9 2,185.4 4,535.3
Source: Ministry of Finance
Although the total sum of the project budget proposed is FBu 250 billion, FBu 20-35 million is needed a year. This budget is appropriated for Budget EI in MTPE. This investment increment scale is equivalent to 75-90% of the BEI budgets in 2007. In that regard, it is therefore necessary to find this new source of funds.
The BO budget in 2007 is sharply increased in comparison with the budget in 2006. The reason is that “Frais de Viabilisation budget of Direction General de l'Urbanismeet de l'Habitat” was appropriated specially 2,000 FBu million.
The BEI budget in 2006 increased sharply from 2005. This reason serves as a steep increase by having added up road construction budget (ROUTIERES) FBu 2,438 million of five projects as mentioned below.
REHABILITATION OF FLAT FENCE AT NGOZI: FBu 10 million MABANDA-KIBAGO-BUKEYE ROAD: FBu 805 million NDAVA-BUHAYIRA-BUTARA ROAD: FBu 773 million CANKUZO-GISURU ROAD: FBu 803 million SAVE BRIDGE ON NR 13: FBu 47 million
In addition, project budget FBu 46 million and FBu 88 million funding by the World Bank as an infrastructure development budget are separately allocated for PTPCE and ABUTIP respectively.
(5) Road maintenance cost
Road maintenance is a real challenge in Burundi because 90% of the network is not paved and therefore barely accessible during the two rainy seasons. The lack of road maintenance was particularly important in the last decade. The Office des Routes (OdR) uses the Road Maintenance Fund to maintain national roads, which is 50% funded by fuel taxes.
THE EMERGENCY STUDY ON URBAN TRANSPORT IN BUJUMBURA FINAL REPORT, FEBRUARY 2008 CHAPTER 12 FINANCING PLAN
12-7
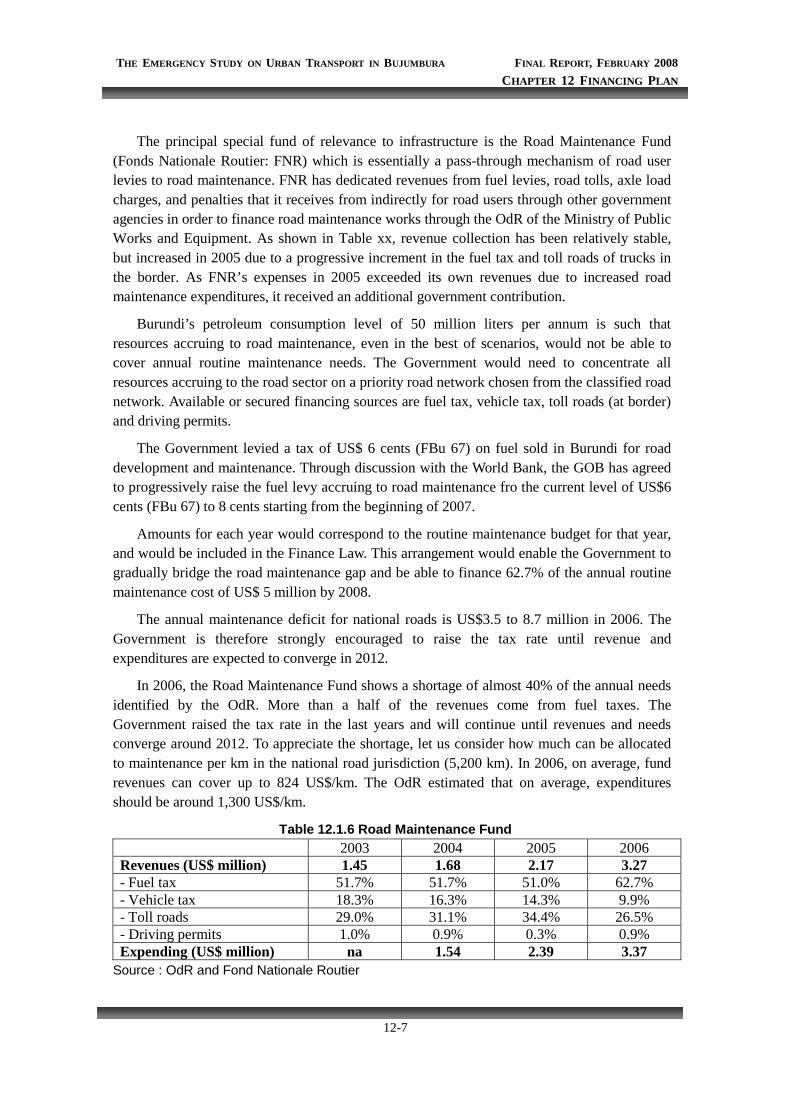
The principal special fund of relevance to infrastructure is the Road Maintenance Fund (Fonds Nationale Routier: FNR) which is essentially a pass-through mechanism of road user levies to road maintenance. FNR has dedicated revenues from fuel levies, road tolls, axle load charges, and penalties that it receives from indirectly for road users through other government agencies in order to finance road maintenance works through the OdR of the Ministry of Public Works and Equipment. As shown in Table xx, revenue collection has been relatively stable, but increased in 2005 due to a progressive increment in the fuel tax and toll roads of trucks in the border. As FNR’s expenses in 2005 exceeded its own revenues due to increased road maintenance expenditures, it received an additional government contribution.
Burundi’s petroleum consumption level of 50 million liters per annum is such that resources accruing to road maintenance, even in the best of scenarios, would not be able to cover annual routine maintenance needs. The Government would need to concentrate all resources accruing to the road sector on a priority road network chosen from the classified road network. Available or secured financing sources are fuel tax, vehicle tax, toll roads (at border) and driving permits.
The Government levied a tax of US$ 6 cents (FBu 67) on fuel sold in Burundi for road development and maintenance. Through discussion with the World Bank, the GOB has agreed to progressively raise the fuel levy accruing to road maintenance fro the current level of US$6 cents (FBu 67) to 8 cents starting from the beginning of 2007.
Amounts for each year would correspond to the routine maintenance budget for that year, and would be included in the Finance Law. This arrangement would enable the Government to gradually bridge the road maintenance gap and be able to finance 62.7% of the annual routine maintenance cost of US$ 5 million by 2008.
The annual maintenance deficit for national roads is US$3.5 to 8.7 million in 2006. The Government is therefore strongly encouraged to raise the tax rate until revenue and expenditures are expected to converge in 2012.
In 2006, the Road Maintenance Fund shows a shortage of almost 40% of the annual needs identified by the OdR. More than a half of the revenues come from fuel taxes. The Government raised the tax rate in the last years and will continue until revenues and needs converge around 2012. To appreciate the shortage, let us consider how much can be allocated to maintenance per km in the national road jurisdiction (5,200 km). In 2006, on average, fund revenues can cover up to 824 US$/km. The OdR estimated that on average, expenditures should be around 1,300 US$/km.
Table 12.1.6 Road Maintenance Fund 2003 2004 2005 2006 Revenues (US$ million) 1.45 1.68 2.17 3.27 - Fuel tax 51.7% 51.7% 51.0% 62.7% - Vehicle tax 18.3% 16.3% 14.3% 9.9% - Toll roads 29.0% 31.1% 34.4% 26.5% - Driving permits 1.0% 0.9% 0.3% 0.9% Expending (US$ million) na 1.54 2.39 3.37
Source : OdR and Fond Nationale Routier
THE EMERGENCY STUDY ON URBAN TRANSPORT IN BUJUMBURA FINAL REPORT, FEBRUARY 2008 CHAPTER 12 FINANCING PLAN
12-8
(6) Newly required O/M budget for this project
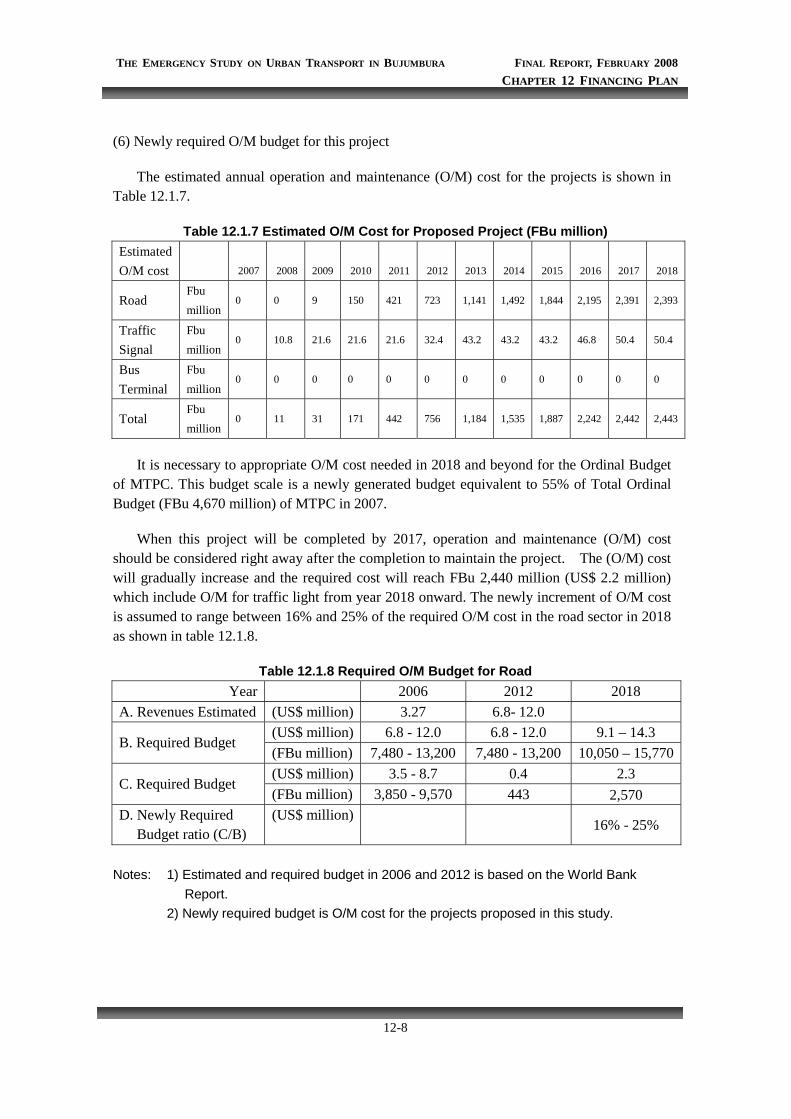
The estimated annual operation and maintenance (O/M) cost for the projects is shown in Table 12.1.7.
Table 12.1.7 Estimated O/M Cost for Proposed Project (FBu million) Estimated O/M cost 2007 2008 2009 2010 2011 2012 2013 2014 2015 2016 2017 2018
Road Fbu million
0 0 9 150 421 723 1,141 1,492 1,844 2,195 2,391 2,393
Traffic Signal
Fbu million
0 10.8 21.6 21.6 21.6 32.4 43.2 43.2 43.2 46.8 50.4 50.4
Bus Terminal
Fbu million
0 0 0 0 0 0 0 0 0 0 0 0
Total Fbu million
0 11 31 171 442 756 1,184 1,535 1,887 2,242 2,442 2,443
It is necessary to appropriate O/M cost needed in 2018 and beyond for the Ordinal Budget of MTPC. This budget scale is a newly generated budget equivalent to 55% of Total Ordinal Budget (FBu 4,670 million) of MTPC in 2007.
When this project will be completed by 2017, operation and maintenance (O/M) cost should be considered right away after the completion to maintain the project. The (O/M) cost will gradually increase and the required cost will reach FBu 2,440 million (US$ 2.2 million) which include O/M for traffic light from year 2018 onward. The newly increment of O/M cost is assumed to range between 16% and 25% of the required O/M cost in the road sector in 2018 as shown in table 12.1.8.
Table 12.1.8 Required O/M Budget for Road Year 2006 2012 2018
A. Revenues Estimated (US$ million) 3.27 6.8- 12.0 (US$ million) 6.8 - 12.0 6.8 - 12.0 9.1 – 14.3
B. Required Budget (FBu million) 7,480 - 13,200 7,480 - 13,200 10,050 – 15,770(US$ million) 3.5 - 8.7 0.4 2.3
C. Required Budget (FBu million) 3,850 - 9,570 443 2,570
D. Newly Required Budget ratio (C/B)
(US$ million)
16% - 25%
Notes: 1) Estimated and required budget in 2006 and 2012 is based on the World Bank
Report. 2) Newly required budget is O/M cost for the projects proposed in this study.
THE EMERGENCY STUDY ON URBAN TRANSPORT IN BUJUMBURA FINAL REPORT, FEBRUARY 2008 CHAPTER 12 FINANCING PLAN
12-9
12-1-2 Public Transport Sector
(1) Budget for public transport
OTRACO is taking charge of Public transport under the jurisdiction of MTPT. The budget for MTPT is shown in Table12.1.9.
The 2004 and 2005 BEI is sharply increased from that of year 2003 for the reason that the bus procurement budget for OTRACO was added up. However the BEI in 2006 was mostly accounted for the land acquisition expense for Parking. In addition, the subsidy to OTRACO is appropriated for BO, and occupies about 50% of BO per annum.
Table 12.1.9 Budget and Actual Expenditure for MTPT (FBu million) 2003 2004 2005 2006 2007
Approved 252.2 272.8 436.6 533.1 597.1Budget Ordinal Expenditure 249.9 272.8 436.6 530.9
Approved 5.9 403.0 333.0 410.5 889.7Budget EI Expenditure 5.9 403.0 333.0 380.8
Approved 258.1 675.8 769.6 943.6 1,486.2Total Expenditure 255.8 675.8 769.6 943.6
Source: Ministry of Finance
(2) Financial analysis of OTRACO
1) Annual Income and Expenditure
The annual income and expenditure of OTRACO is shown in Table 12.1.10
Although many of incomes of OTRACO are the fees from passengers, currently subsidy from the central government (MTPT) is accounted for about 30% of annual income. Annual income in 2003 is relatively higher that the preceding year, because annual income of that year included subsidy from the Government for bus fleet procurement. In addition, the expense of the bus fleet procurement is also covered with the BEI budget of MTPT, and it has not become self-dependent in management.
Table 12.1.10 OTRACO Annual Income and Expenditure (FBu million)
Year A. Annual Income (*1)
B. Annual
Expenditure C.
Balance Subsidy
2003 1,332.8 1,322.8 10.0 (549.8) 2004 1,176.3 1,167.8 8.5 (154.4) 2005 909.3 1,026.6 - 117.3 (201.8) 2006 1,005.6 1,263.9 - 258.3 (270.2) 2007 1,577.4 (*2) (289.7)
Source: Dept. of Financial Service, OTRACO Notes; 1) Annual income includes subsidy from the central government and others. 2) Annual income in 2007 is budget, not actual.
THE EMERGENCY STUDY ON URBAN TRANSPORT IN BUJUMBURA FINAL REPORT, FEBRUARY 2008 CHAPTER 12 FINANCING PLAN
12-10
2) Precondition of Assumption
According to the public transport implementation schedule (Chapter 14-1-3); OTRACO investment plan is as follows.
Table 12.1.11 Investment Plan Year 2010 2011 2012 2015
Fleet type Unit price (US$)
Nos. Fbu million
Nos. Fbu million
Nos. Fbu million
Nos. Fbu million
Bus (60 seats) 81,000 22 1,960 22 1,960 9 802 37 3,297 Bus (40 seats) 67,000 23 1,695 32 2,358 Bus (30 seats) 39,000 6 257 14 601 Total 28 2,217 45 3,655 55 3,761 38 3,297 Accumulated 28 2,217 73 5,872 128 9,633 165 12,930
Note; Exchange rate is US$1 equivalent to Fbu 1,100.
Based on the above OTRACO investment plan (Bus fleet purchasing plan) and the budget planning in 2007, Income and Expense are presumed according to the budget document item of OTRACO.
The presumed conditions are as follows.
a) Price is shown as the market price in 2007. b) The present tariff of FBu220 per person is applied as bus passengers’ tariff rate in
future. c) Bus passengers increases according to GRDP per one person of Bujumbura. d) An account item is presumed according to the budget for fiscal 2007 document of
OTRACO. e) Although OTRACO has not added up the depreciation expense of a bus fleet now, the
depreciation cost is indispensable in a corporate management, so that depreciation cost is appropriately considered at 12 years period.
f) Subsidy injected to OTRACO remains the same amount as 2007
3) The presumed method and Financial Forecast
The management index of OTRACO by improvement plan in Chapter 16-2 is shown in Table 12.1.12.
THE EMERGENCY STUDY ON URBAN TRANSPORT IN BUJUMBURA FINAL REPORT, FEBRUARY 2008 CHAPTER 12 FINANCING PLAN
12-11
Table 12.1.12 Management Index of OTRACO Management Index 2007 2013 2016 Number of staff 98 No. 298 No. 372 No. Bus (100 seats) 8 Unit 5 Unit 2 Unit 214,000 km 133,750 km 53,500 km Bus (60 seats) 4 Unit 59 Unit 97 Unit 54,000 km 2,065,000 km 3,395,000 km Bus (40 seats) 25 Unit 80 Unit 80 Unit 805,000 km 3,600,000 km 3,600,000 km Bus (30 seats) Unit 20 Unit 20 Unit km 1,135,250 km 1,107,500 km Total Number of Bus 37 Unit 164 Unit 199 Unit Total Operating Distance 1,073,000 Km 6,934,000 Km 8,156,000 Km
The presumed method of financial forecast is as follows
a) Income
Income consists of i) Operating receipts ii) Other operating receipts iii) Operating subsidy and iv) Subsidy for equipment.
Among these, since operating receipts is closely linked with an operation schedule, the trial calculation is made in consideration of the total operation distance of bus fleets in 2007 (1,098,000 km). Other operating receipts are presumed from an income trend of its activity. In case of insufficiency, subsidy is considered as the supplementation from the government.
b) Expenses
The main items of account for the budget item of OTRACO are shown in table 12.1.13. Expenses item consists of i) Variable costs, ii) Fixed costs, iii) Administration expenses, iv) Investment costs, v) Contingency and vi) Equipment purchasing costs.
Among these, although variable costs consists of fuel cost, cost of tyres, etc. among the major cost items, it is presumed based on a bus fleet schedule. In addition, the fuel consumption is also considered according to the size of a fleet, and decrease in fuel consumption by new bus is also taken into account.
A fixed cost means staff salary costs. The financial forecast is made based on the increase in staffs (drivers), etc. in consideration of increasing of bus fleets and maintaining the present salary level.
Other expense(s) are presumed from the present condition and a future operation schedule.
THE EMERGENCY STUDY ON URBAN TRANSPORT IN BUJUMBURA FINAL REPORT, FEBRUARY 2008 CHAPTER 12 FINANCING PLAN
12-12
Table 12.1.13 Major Account Items of OTRACO Budget INCOME Major Account Items A. Operating Receipts Urban Receipts
Interurban Receipts Scholarly and Public subscription Receipts Regional Receipts Punctual Operating Receipts Permanent Operating Receipts
B. Other Operating Receipts Garage and technical control Registration Sale of vehicle damaged Station renting Sale of used materials and stock, etc.
C. Operating Subsidy Subsidy from the Government D. Subsidy for Equipment Subsidy from the Government EXPENSES A. Variable Costs Diesel oil purchase
Gas, petrol Spare parts Pneumatic Bus ticket purchase, etc.
B1. Fixed Costs Staff costs Other staff costs (Work permit for foreigners, Doctor Fees,
Work uniform, Balance sheet bonus or pay, Staff mess and Restoration, Staff training cost, Optical and pharmaceutical costs, etc.)
B2. Administration Expenses Water and Electricity Maintenance and repairing of office Equipment Publicity costs Building maintenance (administrative office painting) Office supplies, etc.
C. Investment Costs Computer Equipment purchase Van Purchase Motorbike purchase Enclosing building and Station Rehabilitation Garage Equipment purchase, etc.
D. Contingency Extra budget E. Equipment Purchasing Budget (BEI) of Ministry of Transport
c) Financial Forecast
The result of financial forecast was made by using the account items shown in the above Table 12.1.13. This financial forecast does not included bus fleet purchasing cost as per investment plan because equipment purchasing costs is fully covered by BEI of the Ministry of
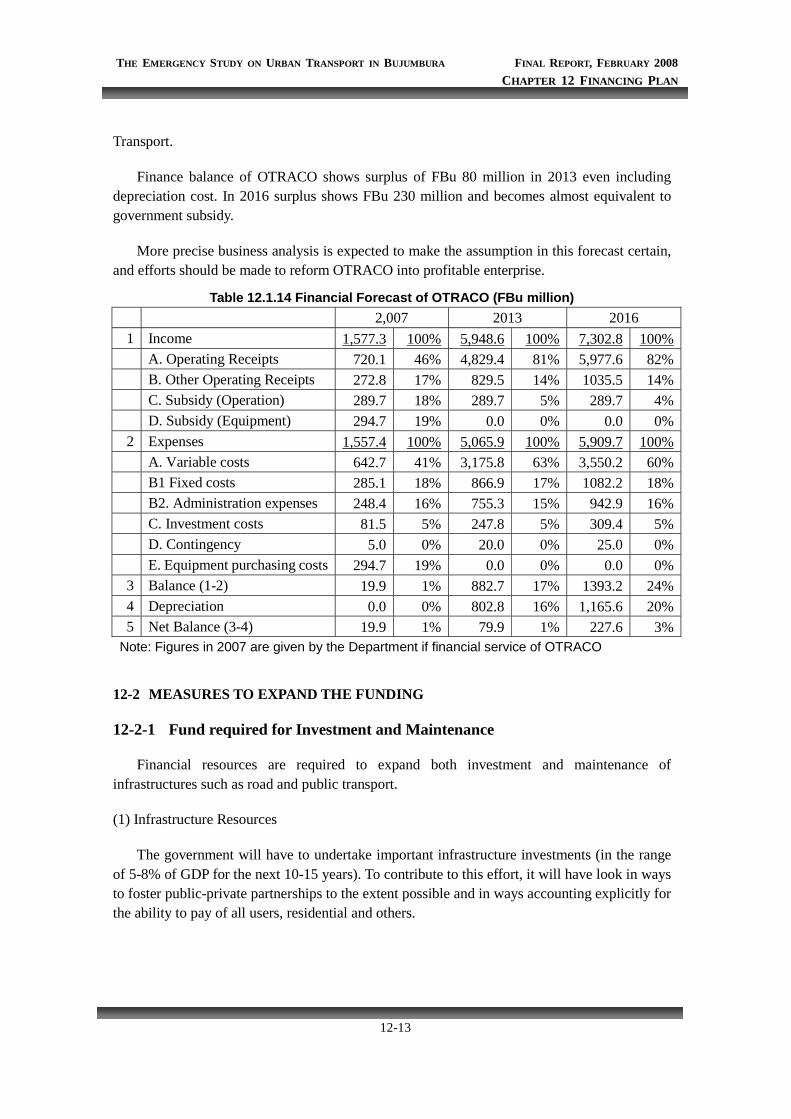
THE EMERGENCY STUDY ON URBAN TRANSPORT IN BUJUMBURA FINAL REPORT, FEBRUARY 2008 CHAPTER 12 FINANCING PLAN
12-13
Transport.
Finance balance of OTRACO shows surplus of FBu 80 million in 2013 even including depreciation cost. In 2016 surplus shows FBu 230 million and becomes almost equivalent to government subsidy.
More precise business analysis is expected to make the assumption in this forecast certain, and efforts should be made to reform OTRACO into profitable enterprise.
Table 12.1.14 Financial Forecast of OTRACO (FBu million) 2,007 2013 2016
1 Income 1,577.3 100% 5,948.6 100% 7,302.8 100% A. Operating Receipts 720.1 46% 4,829.4 81% 5,977.6 82% B. Other Operating Receipts 272.8 17% 829.5 14% 1035.5 14% C. Subsidy (Operation) 289.7 18% 289.7 5% 289.7 4% D. Subsidy (Equipment) 294.7 19% 0.0 0% 0.0 0%
2 Expenses 1,557.4 100% 5,065.9 100% 5,909.7 100% A. Variable costs 642.7 41% 3,175.8 63% 3,550.2 60% B1 Fixed costs 285.1 18% 866.9 17% 1082.2 18% B2. Administration expenses 248.4 16% 755.3 15% 942.9 16% C. Investment costs 81.5 5% 247.8 5% 309.4 5% D. Contingency 5.0 0% 20.0 0% 25.0 0% E. Equipment purchasing costs 294.7 19% 0.0 0% 0.0 0%
3 Balance (1-2) 19.9 1% 882.7 17% 1393.2 24%4 Depreciation 0.0 0% 802.8 16% 1,165.6 20%5 Net Balance (3-4) 19.9 1% 79.9 1% 227.6 3%
Note: Figures in 2007 are given by the Department if financial service of OTRACO
12-2 MEASURES TO EXPAND THE FUNDING
12-2-1 Fund required for Investment and Maintenance
Financial resources are required to expand both investment and maintenance of infrastructures such as road and public transport.
(1) Infrastructure Resources
The government will have to undertake important infrastructure investments (in the range of 5-8% of GDP for the next 10-15 years). To contribute to this effort, it will have look in ways to foster public-private partnerships to the extent possible and in ways accounting explicitly for the ability to pay of all users, residential and others.
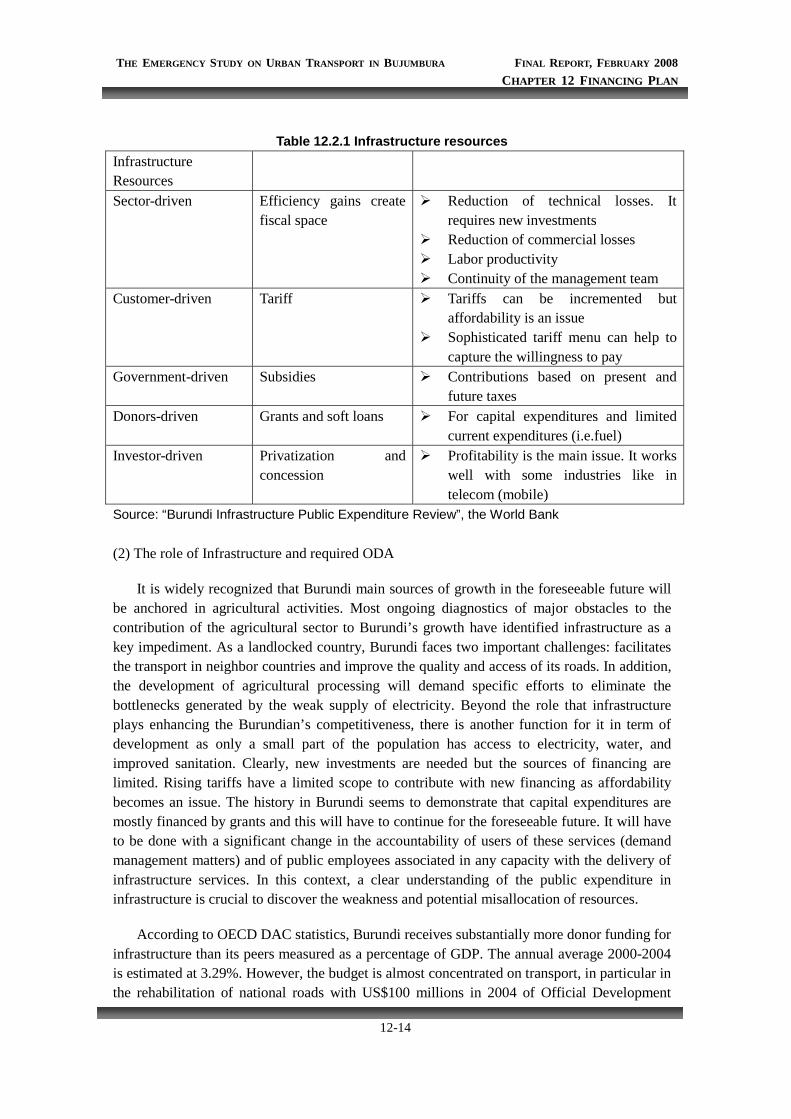
THE EMERGENCY STUDY ON URBAN TRANSPORT IN BUJUMBURA FINAL REPORT, FEBRUARY 2008 CHAPTER 12 FINANCING PLAN
12-14
Table 12.2.1 Infrastructure resources Infrastructure Resources
Sector-driven Efficiency gains create fiscal space
Reduction of technical losses. It requires new investments
Reduction of commercial losses Labor productivity Continuity of the management team
Customer-driven Tariff Tariffs can be incremented but affordability is an issue
Sophisticated tariff menu can help to capture the willingness to pay
Government-driven Subsidies Contributions based on present and future taxes
Donors-driven Grants and soft loans For capital expenditures and limited current expenditures (i.e.fuel)
Investor-driven Privatization and concession
Profitability is the main issue. It works well with some industries like in telecom (mobile)
Source: “Burundi Infrastructure Public Expenditure Review”, the World Bank (2) The role of Infrastructure and required ODA
It is widely recognized that Burundi main sources of growth in the foreseeable future will be anchored in agricultural activities. Most ongoing diagnostics of major obstacles to the contribution of the agricultural sector to Burundi’s growth have identified infrastructure as a key impediment. As a landlocked country, Burundi faces two important challenges: facilitates the transport in neighbor countries and improve the quality and access of its roads. In addition, the development of agricultural processing will demand specific efforts to eliminate the bottlenecks generated by the weak supply of electricity. Beyond the role that infrastructure plays enhancing the Burundian’s competitiveness, there is another function for it in term of development as only a small part of the population has access to electricity, water, and improved sanitation. Clearly, new investments are needed but the sources of financing are limited. Rising tariffs have a limited scope to contribute with new financing as affordability becomes an issue. The history in Burundi seems to demonstrate that capital expenditures are mostly financed by grants and this will have to continue for the foreseeable future. It will have to be done with a significant change in the accountability of users of these services (demand management matters) and of public employees associated in any capacity with the delivery of infrastructure services. In this context, a clear understanding of the public expenditure in infrastructure is crucial to discover the weakness and potential misallocation of resources.
According to OECD DAC statistics, Burundi receives substantially more donor funding for infrastructure than its peers measured as a percentage of GDP. The annual average 2000-2004 is estimated at 3.29%. However, the budget is almost concentrated on transport, in particular in the rehabilitation of national roads with US$100 millions in 2004 of Official Development
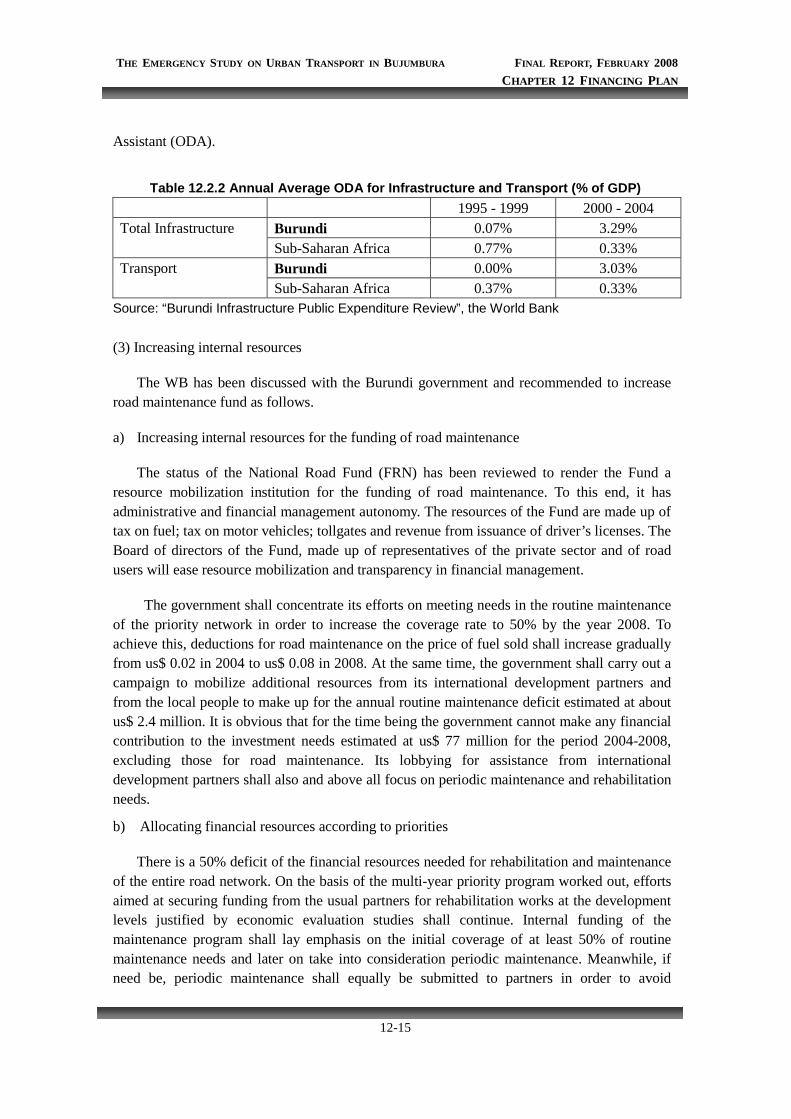
THE EMERGENCY STUDY ON URBAN TRANSPORT IN BUJUMBURA FINAL REPORT, FEBRUARY 2008 CHAPTER 12 FINANCING PLAN
12-15
Assistant (ODA).
Table 12.2.2 Annual Average ODA for Infrastructure and Transport (% of GDP)
1995 - 1999 2000 - 2004 Burundi 0.07% 3.29% Total Infrastructure Sub-Saharan Africa 0.77% 0.33% Burundi 0.00% 3.03% Transport Sub-Saharan Africa 0.37% 0.33%
Source: “Burundi Infrastructure Public Expenditure Review”, the World Bank (3) Increasing internal resources
The WB has been discussed with the Burundi government and recommended to increase road maintenance fund as follows.
a) Increasing internal resources for the funding of road maintenance
The status of the National Road Fund (FRN) has been reviewed to render the Fund a resource mobilization institution for the funding of road maintenance. To this end, it has administrative and financial management autonomy. The resources of the Fund are made up of tax on fuel; tax on motor vehicles; tollgates and revenue from issuance of driver’s licenses. The Board of directors of the Fund, made up of representatives of the private sector and of road users will ease resource mobilization and transparency in financial management.
The government shall concentrate its efforts on meeting needs in the routine maintenance of the priority network in order to increase the coverage rate to 50% by the year 2008. To achieve this, deductions for road maintenance on the price of fuel sold shall increase gradually from us$ 0.02 in 2004 to us$ 0.08 in 2008. At the same time, the government shall carry out a campaign to mobilize additional resources from its international development partners and from the local people to make up for the annual routine maintenance deficit estimated at about us$ 2.4 million. It is obvious that for the time being the government cannot make any financial contribution to the investment needs estimated at us$ 77 million for the period 2004-2008, excluding those for road maintenance. Its lobbying for assistance from international development partners shall also and above all focus on periodic maintenance and rehabilitation needs.
b) Allocating financial resources according to priorities
There is a 50% deficit of the financial resources needed for rehabilitation and maintenance of the entire road network. On the basis of the multi-year priority program worked out, efforts aimed at securing funding from the usual partners for rehabilitation works at the development levels justified by economic evaluation studies shall continue. Internal funding of the maintenance program shall lay emphasis on the initial coverage of at least 50% of routine maintenance needs and later on take into consideration periodic maintenance. Meanwhile, if need be, periodic maintenance shall equally be submitted to partners in order to avoid

THE EMERGENCY STUDY ON URBAN TRANSPORT IN BUJUMBURA FINAL REPORT, FEBRUARY 2008 CHAPTER 12 FINANCING PLAN
12-16
premature deterioration of the existing infrastructure. The working out of the routine maintenance program shall take into account the financial resources available or likely to be mobilized according to the prioritization criteria mentioned above.
For the period 2004-2008, the priority program shall concern: the rehabilitation of 162km of paved road of the listed network, 472km of provincial roads and 148km of council roads of the listed network as well as the surfacing of 104km. Each year, the maintenance program shall cover 1,500km including 600km of national roads, 700km of provincial roads and 200km of council roads, for three years. The program shall be financed by funds from the IDA and the European Union.
CHAPTER 13
INITIAL ENVIRONMENTAL
EXAMINATIONS

THE EMERGENCY STUDY ON URBAN TRANSPORT IN BUJUMBURA FINAL REPORT, FEBRUARY 2008 CHAPTER 13 INITIAL ENVIRONMENTAL EXAMINATIONS
13-1
CHAPTER 13 INITIAL ENVIRONMENTAL EXAMINATIONS
13-1 ENVIRONMENTAL SCOPE OF EACH PLAN
13-1-1 Brief Description
The Initial Environmental Examination (IEE) is carried out as a part of the Master Plan. The Environmental scope in the IEE is the first step to identify the environmental impacts and social considerations of the plans in the Master Plan. The plans are categorized into eight road improvement plans and three public transport plans from environmental points of view, and develop the scope of the environmental impacts. The plans that are likely to have minimal or little adverse impacts on the environment and society, such as the road maintenance plan and bus operation plan, are not included in this scope. The details of each plan are presented in CHAPTER 9 and CHAPTER 10.
Road Improvement Plan: (1) Development of North-South Axis (N-S Axis) (2) Development of Ring Road (Ring Road) (3) Forming Road Network (Road Network) (4) Development of City Plan Roads in Northern Area (City Plan N) (5) Development of City Plan Roads in Southern Area (City Plan S) (6) Stone Pavement Project to Improve Living Environment (Stone Pavement) (7) Intersection Improvement (Intersection) (8) Traffic Flow Control (Traffic Flow)
Public Transport Plan: (1) Bus Network Improvement Plan (Bus Network) (2) Bus Terminal Development Plan (Bus Terminal) (3) Other Public Transport Plan (Other Public)
The results of the Environmental Scope are summarized in Table 13.1.1 and 13.1.2. The details are presented in Appendix.
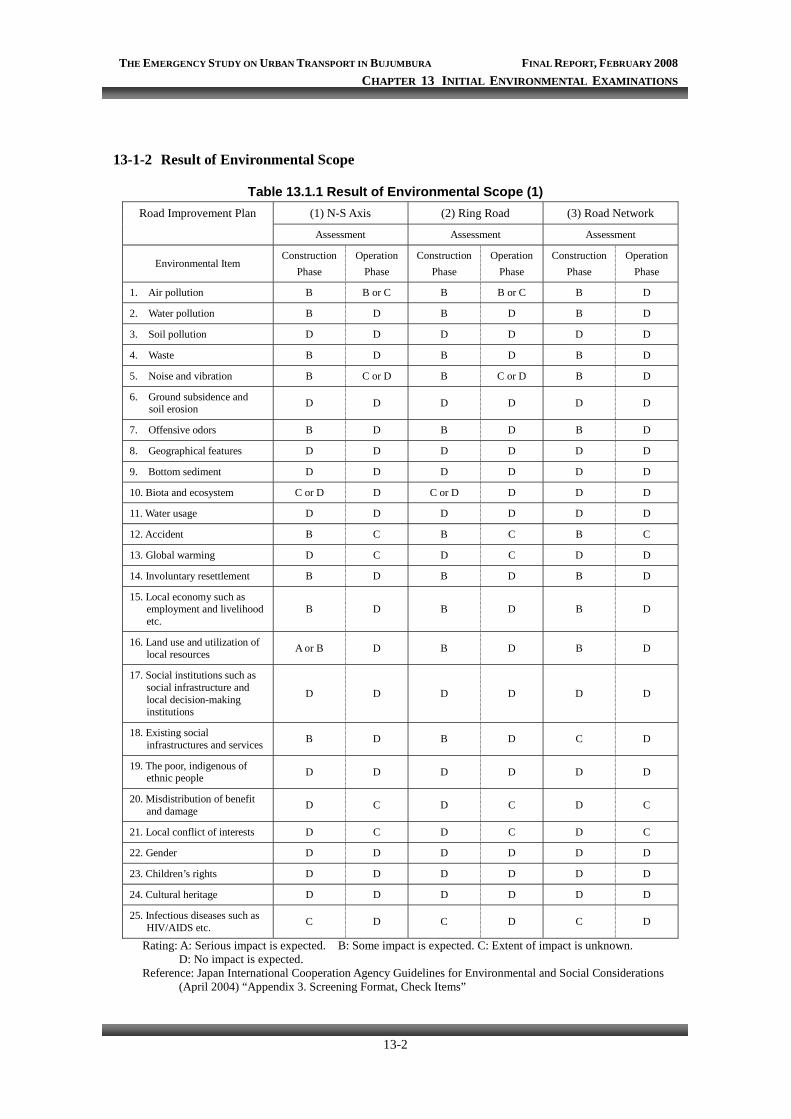
THE EMERGENCY STUDY ON URBAN TRANSPORT IN BUJUMBURA FINAL REPORT, FEBRUARY 2008 CHAPTER 13 INITIAL ENVIRONMENTAL EXAMINATIONS
13-2
13-1-2 Result of Environmental Scope
Table 13.1.1 Result of Environmental Scope (1) Road Improvement Plan (1) N-S Axis (2) Ring Road (3) Road Network
Assessment Assessment Assessment
Environmental Item Construction
Phase Operation
Phase Construction
Phase Operation
Phase Construction
Phase Operation
Phase
1. Air pollution B B or C B B or C B D
2. Water pollution B D B D B D
3. Soil pollution D D D D D D
4. Waste B D B D B D
5. Noise and vibration B C or D B C or D B D
6. Ground subsidence and soil erosion D D D D D D
7. Offensive odors B D B D B D
8. Geographical features D D D D D D
9. Bottom sediment D D D D D D
10. Biota and ecosystem C or D D C or D D D D
11. Water usage D D D D D D
12. Accident B C B C B C
13. Global warming D C D C D D
14. Involuntary resettlement B D B D B D
15. Local economy such as employment and livelihood etc.
B D B D B D
16. Land use and utilization of local resources A or B D B D B D
17. Social institutions such as social infrastructure and local decision-making institutions
D D D D D D
18. Existing social infrastructures and services B D B D C D
19. The poor, indigenous of ethnic people D D D D D D
20. Misdistribution of benefit and damage D C D C D C
21. Local conflict of interests D C D C D C
22. Gender D D D D D D
23. Children’s rights D D D D D D
24. Cultural heritage D D D D D D
25. Infectious diseases such as HIV/AIDS etc. C D C D C D
Rating: A: Serious impact is expected. B: Some impact is expected. C: Extent of impact is unknown. D: No impact is expected.
Reference: Japan International Cooperation Agency Guidelines for Environmental and Social Considerations (April 2004) “Appendix 3. Screening Format, Check Items”
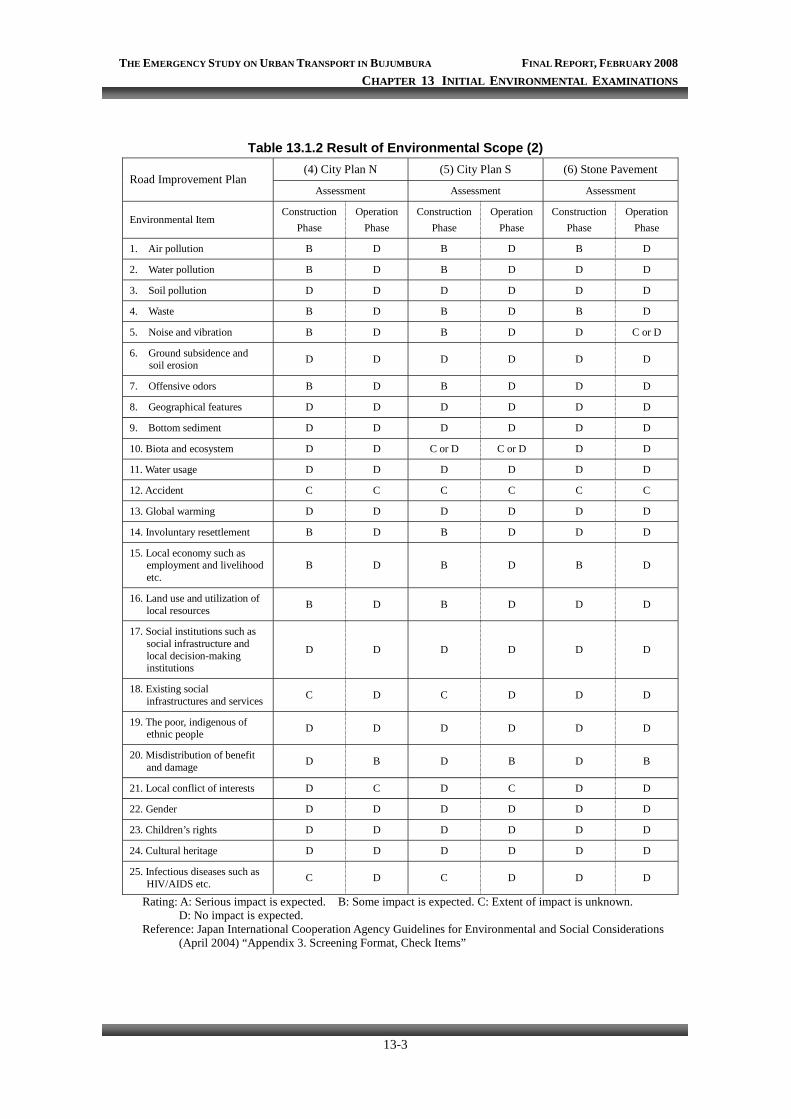
THE EMERGENCY STUDY ON URBAN TRANSPORT IN BUJUMBURA FINAL REPORT, FEBRUARY 2008 CHAPTER 13 INITIAL ENVIRONMENTAL EXAMINATIONS
13-3
Table 13.1.2 Result of Environmental Scope (2) (4) City Plan N (5) City Plan S (6) Stone Pavement
Road Improvement Plan Assessment Assessment Assessment
Environmental Item Construction
Phase Operation
Phase Construction
Phase Operation
Phase Construction
Phase Operation
Phase
1. Air pollution B D B D B D
2. Water pollution B D B D D D
3. Soil pollution D D D D D D
4. Waste B D B D B D
5. Noise and vibration B D B D D C or D
6. Ground subsidence and soil erosion D D D D D D
7. Offensive odors B D B D D D
8. Geographical features D D D D D D
9. Bottom sediment D D D D D D
10. Biota and ecosystem D D C or D C or D D D
11. Water usage D D D D D D
12. Accident C C C C C C
13. Global warming D D D D D D
14. Involuntary resettlement B D B D D D
15. Local economy such as employment and livelihood etc.
B D B D B D
16. Land use and utilization of local resources B D B D D D
17. Social institutions such as social infrastructure and local decision-making institutions
D D D D D D
18. Existing social infrastructures and services C D C D D D
19. The poor, indigenous of ethnic people D D D D D D
20. Misdistribution of benefit and damage D B D B D B
21. Local conflict of interests D C D C D D
22. Gender D D D D D D
23. Children’s rights D D D D D D
24. Cultural heritage D D D D D D
25. Infectious diseases such as HIV/AIDS etc. C D C D D D
Rating: A: Serious impact is expected. B: Some impact is expected. C: Extent of impact is unknown. D: No impact is expected.
Reference: Japan International Cooperation Agency Guidelines for Environmental and Social Considerations (April 2004) “Appendix 3. Screening Format, Check Items”
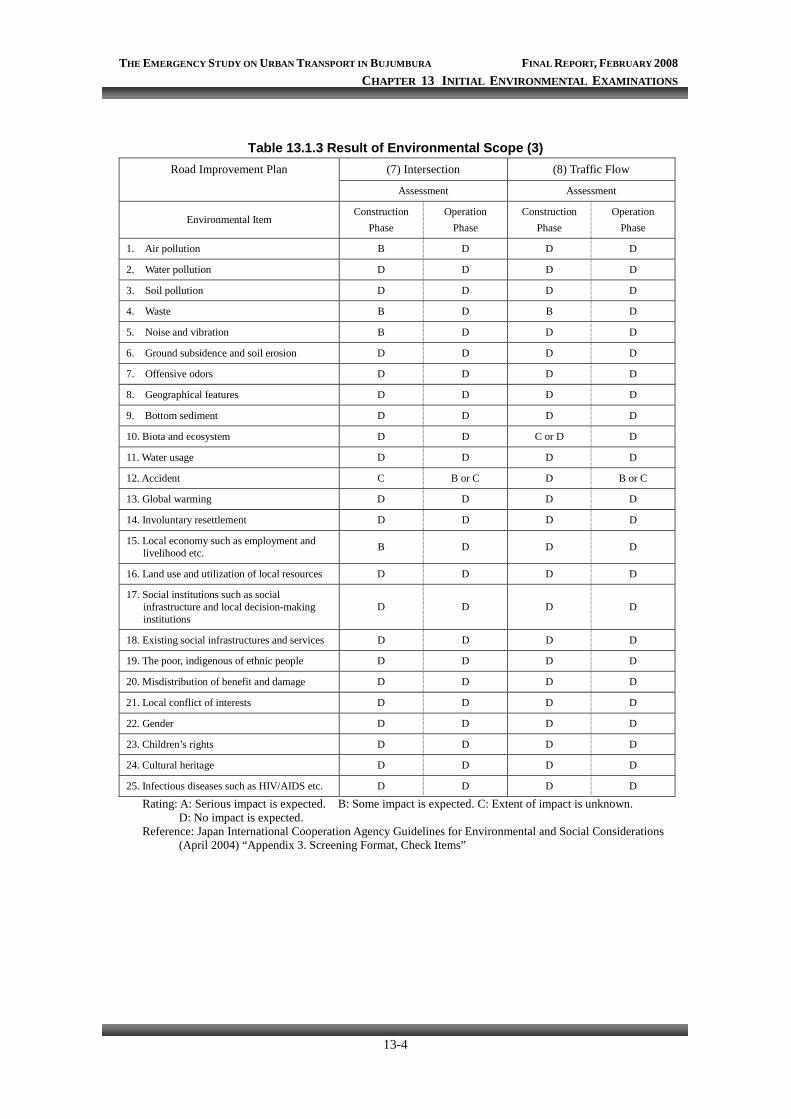
THE EMERGENCY STUDY ON URBAN TRANSPORT IN BUJUMBURA FINAL REPORT, FEBRUARY 2008 CHAPTER 13 INITIAL ENVIRONMENTAL EXAMINATIONS
13-4
Table 13.1.3 Result of Environmental Scope (3) Road Improvement Plan (7) Intersection (8) Traffic Flow
Assessment Assessment
Environmental Item Construction
Phase Operation
Phase Construction
Phase Operation
Phase
1. Air pollution B D D D
2. Water pollution D D D D
3. Soil pollution D D D D
4. Waste B D B D
5. Noise and vibration B D D D
6. Ground subsidence and soil erosion D D D D
7. Offensive odors D D D D
8. Geographical features D D D D
9. Bottom sediment D D D D
10. Biota and ecosystem D D C or D D
11. Water usage D D D D
12. Accident C B or C D B or C
13. Global warming D D D D
14. Involuntary resettlement D D D D
15. Local economy such as employment and livelihood etc. B D D D
16. Land use and utilization of local resources D D D D
17. Social institutions such as social infrastructure and local decision-making institutions
D D D D
18. Existing social infrastructures and services D D D D
19. The poor, indigenous of ethnic people D D D D
20. Misdistribution of benefit and damage D D D D
21. Local conflict of interests D D D D
22. Gender D D D D
23. Children’s rights D D D D
24. Cultural heritage D D D D
25. Infectious diseases such as HIV/AIDS etc. D D D D
Rating: A: Serious impact is expected. B: Some impact is expected. C: Extent of impact is unknown. D: No impact is expected.
Reference: Japan International Cooperation Agency Guidelines for Environmental and Social Considerations (April 2004) “Appendix 3. Screening Format, Check Items”
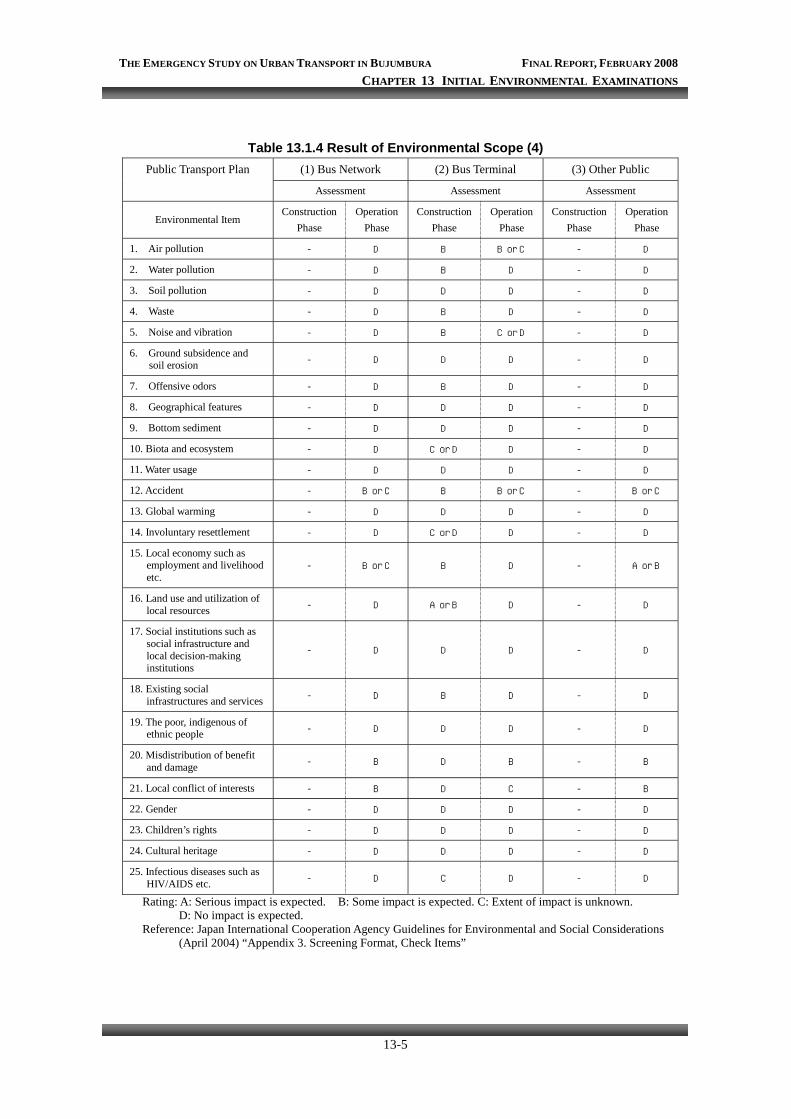
THE EMERGENCY STUDY ON URBAN TRANSPORT IN BUJUMBURA FINAL REPORT, FEBRUARY 2008 CHAPTER 13 INITIAL ENVIRONMENTAL EXAMINATIONS
13-5
Table 13.1.4 Result of Environmental Scope (4) Public Transport Plan (1) Bus Network (2) Bus Terminal (3) Other Public
Assessment Assessment Assessment
Environmental Item Construction
Phase Operation
Phase Construction
Phase Operation
Phase Construction
Phase Operation
Phase
1. Air pollution - D B B or C - D
2. Water pollution - D B D - D
3. Soil pollution - D D D - D
4. Waste - D B D - D
5. Noise and vibration - D B C or D - D
6. Ground subsidence and soil erosion - D D D - D
7. Offensive odors - D B D - D
8. Geographical features - D D D - D
9. Bottom sediment - D D D - D
10. Biota and ecosystem - D C or D D - D
11. Water usage - D D D - D
12. Accident - B or C B B or C - B or C
13. Global warming - D D D - D
14. Involuntary resettlement - D C or D D - D
15. Local economy such as employment and livelihood etc.
- B or C B D - A or B
16. Land use and utilization of local resources - D A or B D - D
17. Social institutions such as social infrastructure and local decision-making institutions
- D D D - D
18. Existing social infrastructures and services - D B D - D
19. The poor, indigenous of ethnic people - D D D - D
20. Misdistribution of benefit and damage - B D B - B
21. Local conflict of interests - B D C - B
22. Gender - D D D - D
23. Children’s rights - D D D - D
24. Cultural heritage - D D D - D
25. Infectious diseases such as HIV/AIDS etc. - D C D - D
Rating: A: Serious impact is expected. B: Some impact is expected. C: Extent of impact is unknown. D: No impact is expected.
Reference: Japan International Cooperation Agency Guidelines for Environmental and Social Considerations (April 2004) “Appendix 3. Screening Format, Check Items”
THE EMERGENCY STUDY ON URBAN TRANSPORT IN BUJUMBURA FINAL REPORT, FEBRUARY 2008 CHAPTER 13 INITIAL ENVIRONMENTAL EXAMINATIONS
13-6
13-2 EXPECTED ENVIRONMENTAL IMPACTS AND MITIGATION
13-2-1 Road Improvement Plan
(1) Air pollution and greenhouse gas emission
Impact:
The air quality data of Bujumbura are not available. However, the air pollution will not be serious because large scale pollutant sources including mobile pollutants such as vehicles do not exist in and around Bujumbura.
During construction phase, convey of construction materials, heavy equipment operation and earthworks will generate harmful dust. Operation of heavy equipment and asphalt plant will generate exhaust gas. These dust and exhaust gas caused by construction works are unavoidable to some degree.
During operation phase, the traffic volume will increase especially in North-South Axis road and Ring road. The exhaust gas from increased traffic may deteriorate the air pollution to a significant level. The greenhouse gases emitted from the vehicles will also increase. However, the total volume of the greenhouse gases will be of local level and it will have little impact on global warming. Moreover, the road improvement plans will improve the efficiency of the mobility of each vehicle.
Mitigation:
The contractor should keep their construction equipments and asphalt plant in proper condition to avoid the imperfect combustion. If the residents and pedestrians complain about the dust, the preventive measures such as water spraying to reduce the dust should be carried out.
The air quality should be monitored in the future. If the air pollution level reach a significant level for example in excess of WHO guideline (NO2: 40µg/m3 annual mean, Particulate Matter 10: 20µg/m3 annual mean), the preparation of the regulations on fuel quality, imported old cars and emission gas control will be necessary.
(2) Water pollution
Impact:
The water quality data of Bujumbura are not available. However, the water contamination in the rivers and Lake Tanganyika will not be serious because large scale pollutant sources do not
THE EMERGENCY STUDY ON URBAN TRANSPORT IN BUJUMBURA FINAL REPORT, FEBRUARY 2008 CHAPTER 13 INITIAL ENVIRONMENTAL EXAMINATIONS
13-7
exist in and around Bujumbura.
During construction phase, earthworks will generate turbid water. The turbid water caused by construction works is unavoidable to some degree. In construction works near Lake Tanganyika, the turbid water will flow into Lake Tanganyika directly and may have impact on the aquatic life. Spilling oil and gas from the construction equipments are also water pollution sources.
Mitigation:
The contractor should keep their construction equipments in proper condition to avoid accidental leaking of the oil and gas. In construction works near Lake Tanganyika, the Consultants’ supervising team and the Contractor should monitor and control the turbid water as necessary.
(3) Waste
Impact:
The overlay works of the existing paved road will be conducted after tearing up the old pavement. The torn up pavement will become the construction waste. Other construction waste such as surplus soil, fragments of construction materials and garbage from construction workers will be also generated as waste.
Mitigation:
The Contractor should consider the proper reuse and disposal plan, and manage the construction wastes. The Consultants’ supervising team should monitor the waste disposal.
(4) Noise and vibration
Impact:
During construction phase, heavy equipment operation and asphalt plant will generate noise and vibration. These noise and vibration caused by construction works is unavoidable to some degree.
During operation phase, the traffic volume will increase especially in North-South Axis road and Ring road. The level of the noise and vibration caused by increased traffic will increase. The noise and vibration level is related to the traffic volume, distance from the carriageway and road surface condition. Because North-South Axis road and Ring road will have the sidewalk and utility space enough to reduce the noise level, the actual noise level at the road edge will be less
THE EMERGENCY STUDY ON URBAN TRANSPORT IN BUJUMBURA FINAL REPORT, FEBRUARY 2008 CHAPTER 13 INITIAL ENVIRONMENTAL EXAMINATIONS
13-8
than a significant level for example in excess of WHO guideline (70dB, 24 hours in industrial, commercial and traffic areas).
Mitigation:
To mitigate the nuisance from noise and vibration, the Consultant during construction planning should consider the proper execution scheme. The construction works during night time should be avoided in residential areas. The Contractor should keep their construction equipments and asphalt plant in proper condition. If the residents complain about noise and vibration, the supervising Engineer and the Contractors should reconsider the construction method.
The noise along roadsides should be monitored in the future. If the noise level reach a significant level, the preparation of the regulations on noise control will be necessary.
(5) Flora and fauna
Impact:
The natural vegetation of Bujumbura is wooden grassland. But, most of the areas of Bujumbura city are developed well as build-up zones and agricultural fields; there is little natural vegetation area except little areas in the lakeside and mountain side.
There are well-grown roadside trees along the several parts of North-South Axis road and Ring road, which create the good scenery and shaded areas for rest. The widening works of the roads and installation of signals may affect the trees. The construction of City Plan Roads in southern area has potential impacts on the groves and lakeside ecosystem.
Mitigation:
To mitigate the impact on the roadside trees and groves, the Consultant during road design should consider the flexible cross-section and proper alignment. The ecological survey on the side of the City Plan Roads should be conducted prior to the basic design.
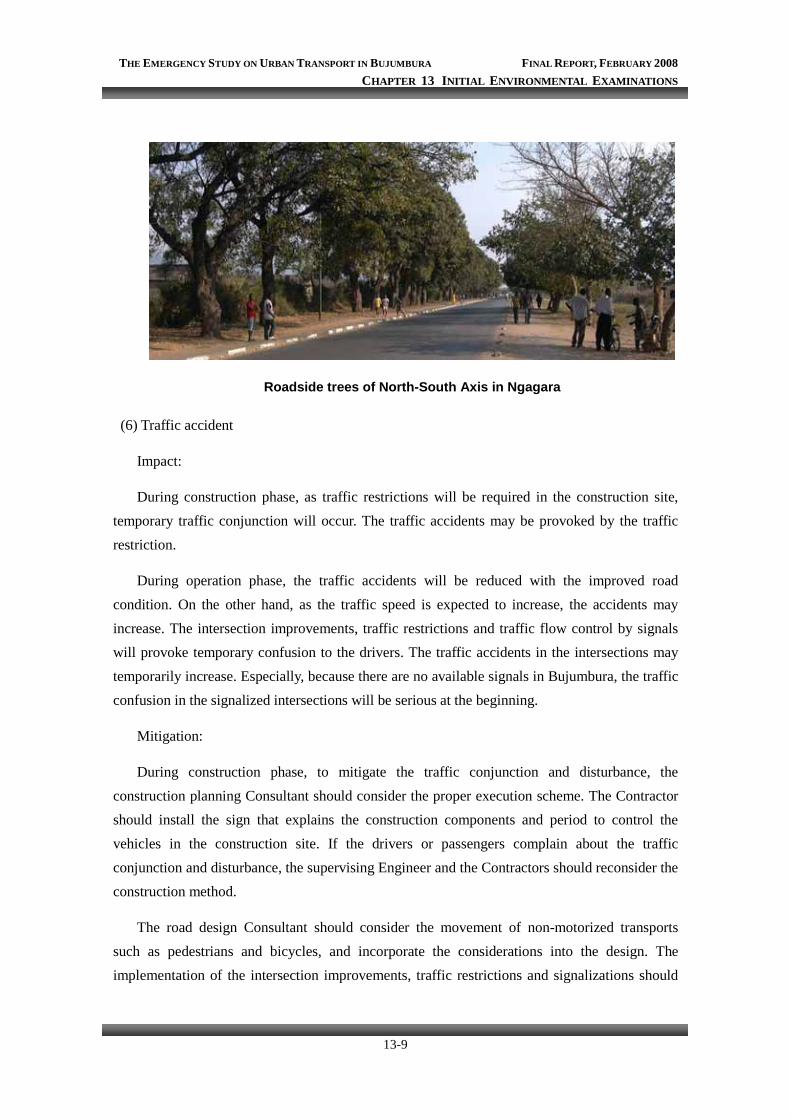
THE EMERGENCY STUDY ON URBAN TRANSPORT IN BUJUMBURA FINAL REPORT, FEBRUARY 2008 CHAPTER 13 INITIAL ENVIRONMENTAL EXAMINATIONS
13-9
Roadside trees of North-South Axis in Ngagara
(6) Traffic accident
Impact:
During construction phase, as traffic restrictions will be required in the construction site, temporary traffic conjunction will occur. The traffic accidents may be provoked by the traffic restriction.
During operation phase, the traffic accidents will be reduced with the improved road condition. On the other hand, as the traffic speed is expected to increase, the accidents may increase. The intersection improvements, traffic restrictions and traffic flow control by signals will provoke temporary confusion to the drivers. The traffic accidents in the intersections may temporarily increase. Especially, because there are no available signals in Bujumbura, the traffic confusion in the signalized intersections will be serious at the beginning.
Mitigation:
During construction phase, to mitigate the traffic conjunction and disturbance, the construction planning Consultant should consider the proper execution scheme. The Contractor should install the sign that explains the construction components and period to control the vehicles in the construction site. If the drivers or passengers complain about the traffic conjunction and disturbance, the supervising Engineer and the Contractors should reconsider the construction method.
The road design Consultant should consider the movement of non-motorized transports such as pedestrians and bicycles, and incorporate the considerations into the design. The implementation of the intersection improvements, traffic restrictions and signalizations should
THE EMERGENCY STUDY ON URBAN TRANSPORT IN BUJUMBURA FINAL REPORT, FEBRUARY 2008 CHAPTER 13 INITIAL ENVIRONMENTAL EXAMINATIONS
13-10
be closely informed to the local people in advance by the brochure, sign, mass media, police officers and driving schools. Police should be put in the intersection and roads, and guide the drivers and pedestrians till the traffic confusion settle down.
(7) Involuntary resettlement and land acquisition
Methodology:
The houses and buildings affected by the Road Improvement Plans are identified by using the satellite images. In new roads construction plan, the number of the houses and buildings affected by the temporary road alignment was counted. Therefore, in the earlier planning stage such as the Feasibility Study, the land surveys to identify the actual houses and buildings affected by the plan should be conducted.
Impact:
In some plan, the land acquisition for the occupation of the right of way will be required prior to the construction works. The people living in or owning the land in/along the roads will lose the residential or agricultural land, houses and facilities. Part of the affected people will be necessary to resettle to other place or prepare new living base. The improvement of North-South Axis road and Ring road may require the significantly sized land acquisitions of the build-up areas depending on the road design. The new road construction in City Plan Roads will require the significantly sized land acquisitions of agricultural land.
The numbers of houses and buildings affected by each plan were estimated as shown in Table 13.2.1. Because there are little illegal houses except for small temporary shops in the existing right of way, the illegal houses and buildings were not included in the numbers.
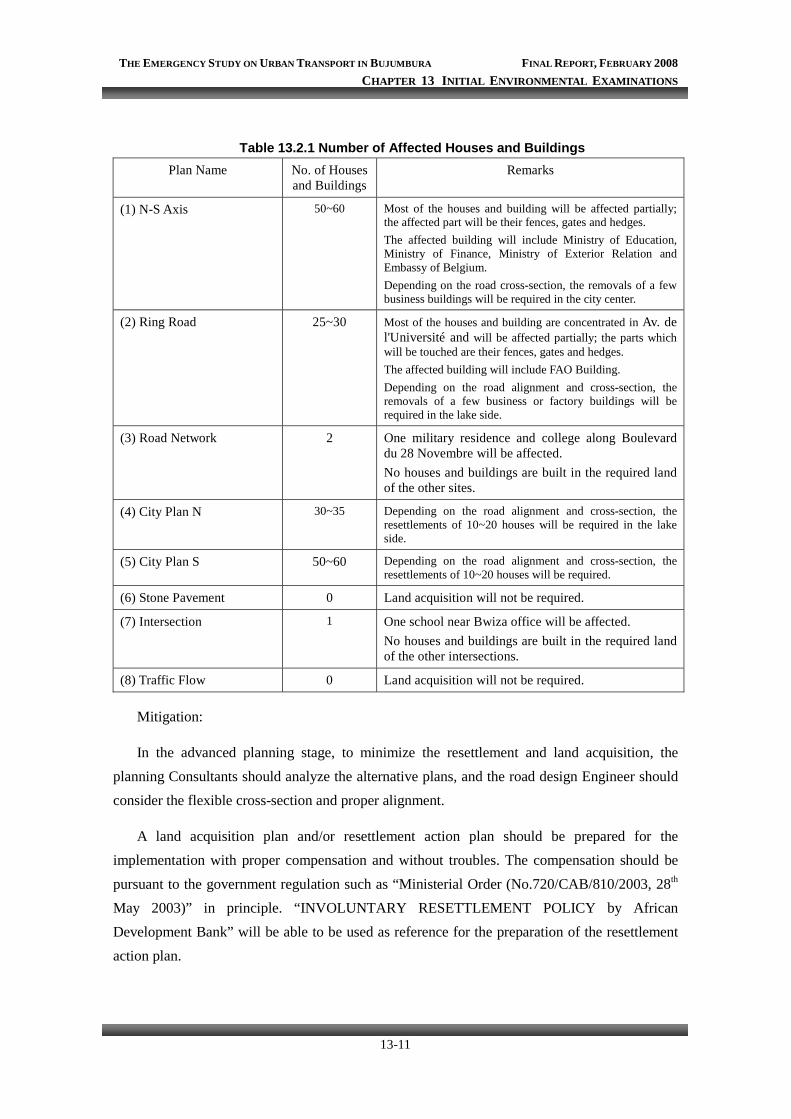
THE EMERGENCY STUDY ON URBAN TRANSPORT IN BUJUMBURA FINAL REPORT, FEBRUARY 2008 CHAPTER 13 INITIAL ENVIRONMENTAL EXAMINATIONS
13-11
Table 13.2.1 Number of Affected Houses and Buildings Plan Name No. of Houses
and BuildingsRemarks
(1) N-S Axis 50~60 Most of the houses and building will be affected partially; the affected part will be their fences, gates and hedges. The affected building will include Ministry of Education, Ministry of Finance, Ministry of Exterior Relation and Embassy of Belgium. Depending on the road cross-section, the removals of a few business buildings will be required in the city center.
(2) Ring Road 25~30 Most of the houses and building are concentrated in Av. de l'Université and will be affected partially; the parts which will be touched are their fences, gates and hedges. The affected building will include FAO Building. Depending on the road alignment and cross-section, the removals of a few business or factory buildings will be required in the lake side.
(3) Road Network 2 One military residence and college along Boulevard du 28 Novembre will be affected. No houses and buildings are built in the required land of the other sites.
(4) City Plan N 30~35 Depending on the road alignment and cross-section, the resettlements of 10~20 houses will be required in the lake side.
(5) City Plan S 50~60 Depending on the road alignment and cross-section, the resettlements of 10~20 houses will be required.
(6) Stone Pavement 0 Land acquisition will not be required.
(7) Intersection 1 One school near Bwiza office will be affected. No houses and buildings are built in the required land of the other intersections.
(8) Traffic Flow 0 Land acquisition will not be required.
Mitigation:
In the advanced planning stage, to minimize the resettlement and land acquisition, the planning Consultants should analyze the alternative plans, and the road design Engineer should consider the flexible cross-section and proper alignment.
A land acquisition plan and/or resettlement action plan should be prepared for the implementation with proper compensation and without troubles. The compensation should be pursuant to the government regulation such as “Ministerial Order (No.720/CAB/810/2003, 28th May 2003)” in principle. “INVOLUNTARY RESETTLEMENT POLICY by African Development Bank” will be able to be used as reference for the preparation of the resettlement action plan.
THE EMERGENCY STUDY ON URBAN TRANSPORT IN BUJUMBURA FINAL REPORT, FEBRUARY 2008 CHAPTER 13 INITIAL ENVIRONMENTAL EXAMINATIONS
13-12
(8) Employment opportunities
Impact:
During construction phase, the opportunity for employment on construction works will be increased. Because Bujumbura city has many kinds of employment, the increased opportunity for employment will have little negative impacts on the local condition of employment. During the construction of City Plan Roads, the local residents along the construction site will hope to be employed in the construction works.
Mitigation:
To implement the construction works smoothly, the Contractor should employ the residents as the temporary workers on the priority bases as necessary.
(9) Existing infrastructures and services
Impact:
There are water pipes, electric cables and/or telephone lines along most part of existing road. The widening works of the roads may require the relocation of the facilities. During construction phase, the facilities may be accidentally damaged.
Mitigation:
The road design and construction planning Consultant should collect information on the facilities from the related organizations such as REGIDESO, SETEMU and/or ONATEL, and consider the proper replacement plan as necessary. During construction works, the Consultants’ supervising team and the Contractor should study carefully the buried facilities to avoid the accidental destructions.
(10) Commercial activities
Impact:
During operation phase, the lands along the improved roads will increase in value especially in North-South Axis road and Ring road. The impact on the land value will be unavoidable to some degree. The main commercial zones and business areas of Bujumbura city have been developed along both sides of North-South Axis in Rohero. Following the increased traffic volume, the commercial zones and business areas may further build up along both sides.
THE EMERGENCY STUDY ON URBAN TRANSPORT IN BUJUMBURA FINAL REPORT, FEBRUARY 2008 CHAPTER 13 INITIAL ENVIRONMENTAL EXAMINATIONS
13-13
Mitigation:
Bujumbura city Government should monitor the land value and illegal land deals, and prepare the proper city plan or land use regulations as necessary.
(11) Local communities
Impact:
The road developments, such as City Plan Roads and Stone Pavement Projects especially in the rural areas, have potentially uneven distribution of the benefit. Before the construction, some residents may lose their land for occupation of the right of way. On the other hand, during operation phase, the residents living along the improved road will easily access the public transportation system. The land use of the improved road side may change. The uneven distribution and change of the land use may cause conflict in the local community.
Mitigation:
In the advanced planning stage, the components of the plan should be disclosed to the residents. To mitigate the uneven distribution, the proponents of the plan should reflect the opinions from the residents into the plan. The commune government should monitor the attitude of the local residents from the planning stage and hold the stakeholder meetings as necessary.
(12) Infectious diseases
Impact:
During construction phase, the construction worker may spread infectious diseases such as HIV/AIDS.
Mitigation:
To prevent the spread of infectious diseases, a sentence on the countermeasures should be added in the conditions of Contract to be signed by the Contractor. The Contractor should prepare the educational program to the worker as necessary.
13-2-2 Public Transport Plan
(1) Impacts during construction phase
The impacts of the bus terminals during construction phase such as air pollution, construction waste, noise and vibration, accident and existing infrastructures will be similar to those of the road improvement plans. These impacts and mitigations are presented in
THE EMERGENCY STUDY ON URBAN TRANSPORT IN BUJUMBURA FINAL REPORT, FEBRUARY 2008 CHAPTER 13 INITIAL ENVIRONMENTAL EXAMINATIONS
13-14
CHAPTER 13-2-1.
(2) Flora
Impact:
There are several trees in the proposed Bus Centre site. The construction works may require the cut down of those trees.
Mitigation:
Trees create the good scenery and shaded areas for rest. To maintain these advantages, the Bus Centre Architect should consider the use of these trees in the design.
(3) Traffic accident
Impact:
During operation phase, the traffic volume including motorbikes, bicycles and pedestrians near the bus terminals will increase. Traffic conjunction may occur around the Bus Centre. Traffic accidents may be increased in the roads served by the new bus network and near the bus terminals. The improvement of the public transport system will provoke temporary confusion to the drivers and user.
Mitigation:
The local people should be closely informed in advance about the implementation of the improvement of the public transport system by brochure, sign, mass media, police officers and the driving schools. OTRACO should conduct the safety education and training to the bus drivers. Police should be put in the roads and guide the drivers and pedestrians till the traffic confusion settle down.
(4) Local employment opportunities
Impact:
In the Bus Network Improvement Plan, the existing operation rights of the private bus transporters will be respected. However, the Plan mentions that the clarification of the roll between OTRACO and the private transporters shall be required and the services on same route by both transporters shall be united in the future. These improvements of the bus network may decrease the future opportunity on employment as private bus drivers. In the Other Public
THE EMERGENCY STUDY ON URBAN TRANSPORT IN BUJUMBURA FINAL REPORT, FEBRUARY 2008 CHAPTER 13 INITIAL ENVIRONMENTAL EXAMINATIONS
13-15
Transport Plan, the traffic methods such as the taxis, motorbike taxis and bicycle taxis are controlled and restricted. These managements of the private transport system may also decrease the future opportunity on employment as private transporters.
Mitigation:
In the advanced planning stage, the proponents of the plans should conduct baseline surveys on the private transporters and reflect the results in the plan. The proponents should have a series of the discussions on the actual implementation with the interested parties and individuals, and must essentially obtain their agreements. To mitigate the loss of the employment as private drivers, OTRACO should employ the affected divers as necessary.
(5) Land acquisition and land utilization
Impact:
The construction of the Bus Centre will require the significantly sized land acquisitions in the city center. The proposed Bus Centre site is at FFB stadium at present. The construction of the Bus Centre will lose the function as a stadium entirely. There is Prince Louis Rwagasore stadium in the urban area and a new stadium is under construction in Kanyosha commune as well. The loss of FFB stadium will not cause a fatal impact on the present users. However, the proposed bus terminal construction site is a prime location in Bujumbura and also very valuable to other public utilities. The land acquisitions for the proposed two bus terminal will not have serious concern, because the two sites are blank spaces at present. During operation phase, the lands near the bus terminals will increase in value especially in the Bus Centre. The impact on the land value will be unavoidable to some degree.
Mitigation:
In the advanced planning stage, the proponents of the plan should explain the importance of the Bus Centre to the interested parties and local people, and must obtain their agreements. The concerned authority should prepare the division plan of the function of FFB stadium before the demolition works. To prevent the excess build-up around the Bus Centre, Bujumbura city government should prepare the proper city plan or land use regulations as necessary.
(6) Local communities and groups
Impact:
The Bus Network Improvement Plan has potentially a matter on uneven distribution of benefit and damage between OTRACO and private bus transporters. The implementation of the
THE EMERGENCY STUDY ON URBAN TRANSPORT IN BUJUMBURA FINAL REPORT, FEBRUARY 2008 CHAPTER 13 INITIAL ENVIRONMENTAL EXAMINATIONS
13-16
plan may cause conflict on the bus routes between both transporters. The Other Public Transport Plan also has potentially a matter on uneven distribution of benefit and damage between bus and taxi transporters including motorbike taxi and bicycle taxi. The implementation of the plan may cause conflict on the passenger transport route between both transporters.
Mitigation:
In the advanced planning stage, the proponents of the plans should conduct baseline surveys on the private transporters and users, and reflect the results in the plan. The proponents should have a series of the discussions on the actual implementation with the interested parties, individuals and users in a public place, and must essentially obtain their agreements. After the implementation, the proponents should monitor the effects and attitude of the transporters and users, and review the plans. The road administrator should consider the movement of the motorbike taxis and bicycle taxis and incorporate the considerations into the road designs.
13-3 CONCLUSION AND RECOMMENDATION
Burundi has the environmental impact assessment (EIA) system mentioned in the environmental code. The following plans that have potentially negative impacts should be conducted by the EIA in the advanced planning stage such as the Feasibility Study.
Road Improvement Plan: Development of North-South Axis Development of Ring Road Development of City Plan Roads in Northern Area Development of City Plan Roads in Southern Area Traffic Flow Control
Public Transport Plan: Bus Network Improvement Plan Bus Terminal Development Plan
The Other Public Transport Plan and Long Term Plan in the Public Transport Plan will be related to various groups and people, and have impacts on many aspects. The concept of Strategic Impact Assessment should be included in these plans.
The guidelines on EIA are not prepared yet in Burundi. EIA guidelines prepared by
international donor such as “INTEGRATED ENVIRONMENTAL AND SOCIAL IMPACT ASSESSMENT GUIDELINES” and “Strategic Impact Assessment Guidelines” by African Development Bank will be able to be used as reference for the EIA.
THE EMERGENCY STUDY ON URBAN TRANSPORT IN BUJUMBURA FINAL REPORT, FEBRUARY 2008 CHAPTER 13 INITIAL ENVIRONMENTAL EXAMINATIONS
13-17
The town development strategy in the Master Plan mentions that Buterere commune located in the northern part and Kanyosha commune located in the southern part will absorb mainly the increasing population in the future, which is the basic frame work in the Master Plan. This strategy should be disclosed to public and discussed in many fields.
The community-based development in the Master Plan recommends fishery activity as the job creation opportunity. Because introduction of foreign fish species will have potentially serious impacts on the ecosystem in Lake Tanganyika, for example the ecological issue caused by Nile Perch (Lates niloticus) in Lake Victoria, the experts on fishery and ecosystem should guide the activity at the first step.

CHAPTER 14
EVALUATION OF
IMPROVEMENT PLAN

THE EMERGENCY STUDY ON URBAN TRANSPORT IN BUJUMBURA FINAL REPORT, FEBRUARY 2008 CHAPTER 14 EVALUATION OF IMPROVEMENT PLAN
14-1
CHAPTER 14 EVALUATION OF IMPROVEMENT PLAN
14-1 EVALUATION PROCEDURE
14-1-1 General
This chapter aims to evaluate the proposed project in this master plan from viewpoints of economic and financial aspects based on the various foreseeable assumptions. The projects to be evaluated mainly consist of North-South Traffic Axis Strengthening Projects, Ring Road Development Project, Missing Link Development Project, City Plan Development Projects (Northern and Southern Areas).
In general, various impacts, whether quantifiable or not, can be expected when public transport system is improved. For instance those impacts along the abovementioned road are such as reduction of road traffic congestion and increase in travel speed, improvement of services for public transport users, decrease in noise/air pollutions and traffic accidents, business reform for traditional public transport operators/employees and related/dependent business societies, etc.
Evaluation methods are applied for the economic cash flow analysis based on ‘benefit-cost’ analysis. The analysis is done comparatively on both of the so called ‘social benefits’ derived by the project in the regional economy and the ‘social costs’ necessary for the project’s implementation.
Project analysis allows the users to assess the physical, functional and economic benefit derived from planned project alternatives (With Project) by comparison against a base case (Without Project).
14-1-2 Indicators of Economic Analysis
For economic analysis, evaluation indicators are normally demonstrated by the Economic Internal Rate of Return (IRR), Net Present Value (NPV), and Benefit-Cost Ratio (B/C) to which mentioned below shall be referred.
a) The Economic Internal Rate of Return (EIRR): The internal rate of return of a project is defined as that discount rate which equates the present values of the project’s benefits and costs, so that the net present value is zero. The decision rule for the EIRR criterion is: accept the project if EIRR is greater than or equal to relevant discount rate; reject if otherwise. In the case of competing projects, select the project with the highest EIRR.
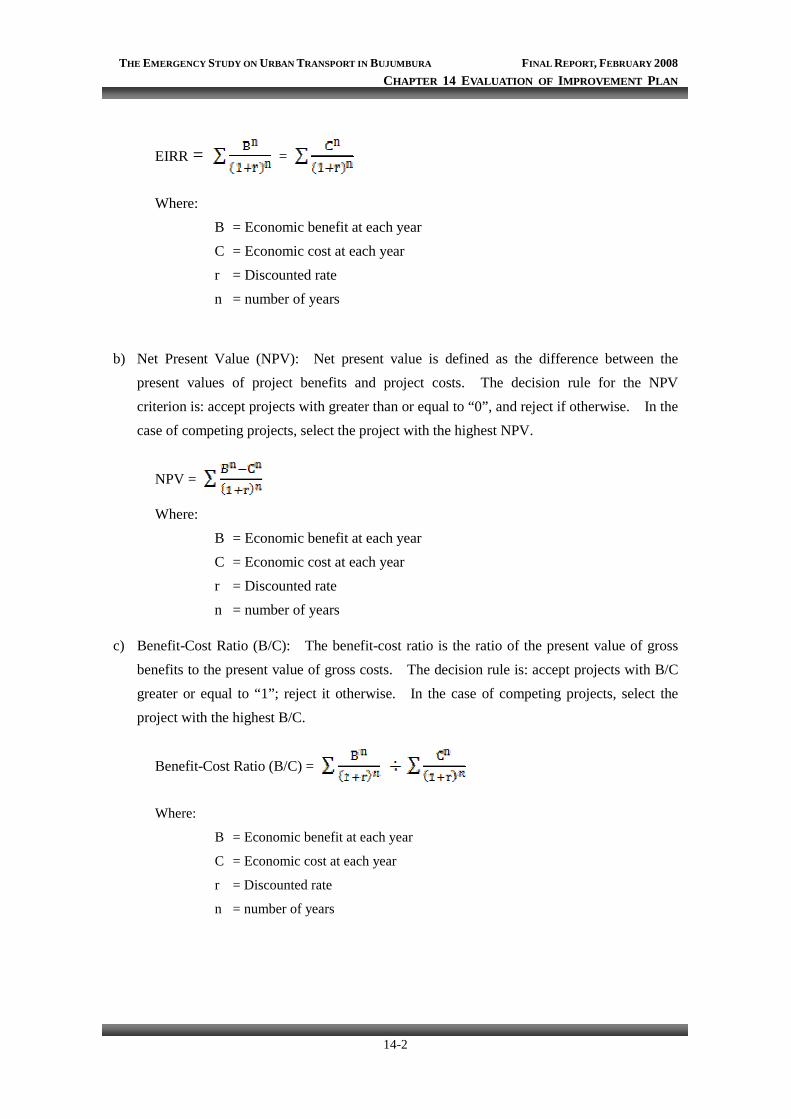
THE EMERGENCY STUDY ON URBAN TRANSPORT IN BUJUMBURA FINAL REPORT, FEBRUARY 2008 CHAPTER 14 EVALUATION OF IMPROVEMENT PLAN
14-2
EIRR = =
Where: B = Economic benefit at each year C = Economic cost at each year r = Discounted rate n = number of years
b) Net Present Value (NPV): Net present value is defined as the difference between the present values of project benefits and project costs. The decision rule for the NPV criterion is: accept projects with greater than or equal to “0”, and reject if otherwise. In the case of competing projects, select the project with the highest NPV.
NPV =
Where: B = Economic benefit at each year C = Economic cost at each year r = Discounted rate n = number of years
c) Benefit-Cost Ratio (B/C): The benefit-cost ratio is the ratio of the present value of gross benefits to the present value of gross costs. The decision rule is: accept projects with B/C greater or equal to “1”; reject it otherwise. In the case of competing projects, select the project with the highest B/C.
Benefit-Cost Ratio (B/C) =
Where:
B = Economic benefit at each year
C = Economic cost at each year
r = Discounted rate
n = number of years
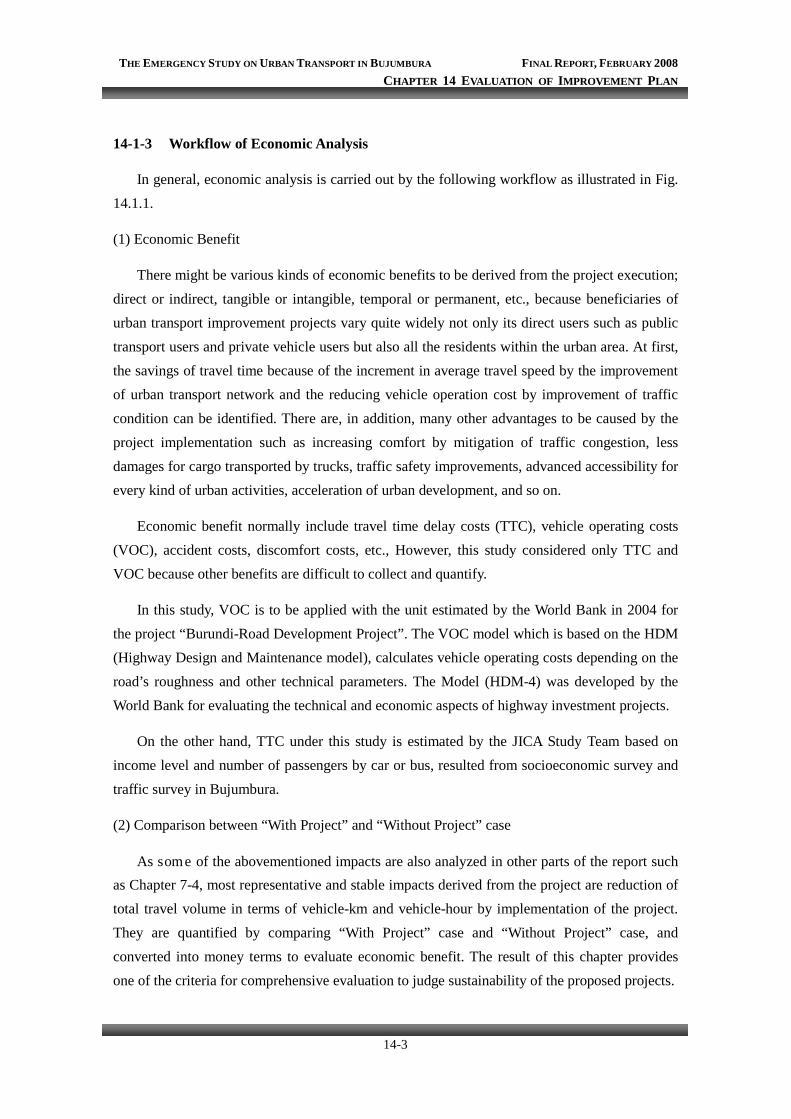
THE EMERGENCY STUDY ON URBAN TRANSPORT IN BUJUMBURA FINAL REPORT, FEBRUARY 2008 CHAPTER 14 EVALUATION OF IMPROVEMENT PLAN
14-3
14-1-3 Workflow of Economic Analysis
In general, economic analysis is carried out by the following workflow as illustrated in Fig. 14.1.1.
(1) Economic Benefit
There might be various kinds of economic benefits to be derived from the project execution; direct or indirect, tangible or intangible, temporal or permanent, etc., because beneficiaries of urban transport improvement projects vary quite widely not only its direct users such as public transport users and private vehicle users but also all the residents within the urban area. At first, the savings of travel time because of the increment in average travel speed by the improvement of urban transport network and the reducing vehicle operation cost by improvement of traffic condition can be identified. There are, in addition, many other advantages to be caused by the project implementation such as increasing comfort by mitigation of traffic congestion, less damages for cargo transported by trucks, traffic safety improvements, advanced accessibility for every kind of urban activities, acceleration of urban development, and so on.
Economic benefit normally include travel time delay costs (TTC), vehicle operating costs (VOC), accident costs, discomfort costs, etc., However, this study considered only TTC and VOC because other benefits are difficult to collect and quantify.
In this study, VOC is to be applied with the unit estimated by the World Bank in 2004 for the project “Burundi-Road Development Project”. The VOC model which is based on the HDM (Highway Design and Maintenance model), calculates vehicle operating costs depending on the road’s roughness and other technical parameters. The Model (HDM-4) was developed by the World Bank for evaluating the technical and economic aspects of highway investment projects.
On the other hand, TTC under this study is estimated by the JICA Study Team based on income level and number of passengers by car or bus, resulted from socioeconomic survey and traffic survey in Bujumbura.
(2) Comparison between “With Project” and “Without Project” case
As some of the abovementioned impacts are also analyzed in other parts of the report such as Chapter 7-4, most representative and stable impacts derived from the project are reduction of total travel volume in terms of vehicle-km and vehicle-hour by implementation of the project. They are quantified by comparing “With Project” case and “Without Project” case, and converted into money terms to evaluate economic benefit. The result of this chapter provides one of the criteria for comprehensive evaluation to judge sustainability of the proposed projects.
THE EMERGENCY STUDY ON URBAN TRANSPORT IN BUJUMBURA FINAL REPORT, FEBRUARY 2008 CHAPTER 14 EVALUATION OF IMPROVEMENT PLAN
14-4
(3) Project Cost for Economic Analysis
The project costs consist of road improvement investment costs planned in Chapter 9 and operation and maintenance (O/M) costs. The O/M costs contain three pillars which are O/M cost for road, traffic signal and public transport.
The cost and benefit in the economic analysis are calculated in terms of the economic price, while the cost and revenue in the financial analysis are measured by the market price.
For this purpose, generally, the following major items are to be considered.
*Examination of cost of brake down for tax deduction,
*Exclusion of both import duty and value added taxes on goods and service,
*Portion of unskilled labor cost and unemployment rate
THE EMERGENCY STUDY ON URBAN TRANSPORT IN BUJUMBURA FINAL REPORT, FEBRUARY 2008 CHAPTER 14 EVALUATION OF IMPROVEMENT PLAN
14-5
Figure 14.1.1 Workflow of Economic Analysis
14-2 ECONOMIC ANALYSIS
14-2-1 General conditions
Economic analysis is made based on the following conditions.
(1) Improvement Target Year
In this analysis, the present condition is as of 2007 and the preparation for the project will start from 2008 and all the necessary preparation for the investments of the infrastructure and bus operation are expected to be completed by the end of 2017. The public transportation system will be in full-scale operation from 2018.
Economic Benefit Present
Network
Master Plan Financial
Cost of
Project
World Bank
Road Project
Unit Cost
VOC/TTC
Improvement
Network in 2017
Traffic Assignment
Without
Project
With
Project
Benefit
Savings in VOC/TTC
Economic Cost
of Project
Cash Flow Analysis
Evaluation Indices
NPV, B/C Ratio, EIRR
Road
Maintenance Cost
O/M Cost of
Traffic Signal
O/M Cost of Bus
Operation
Comparison
THE EMERGENCY STUDY ON URBAN TRANSPORT IN BUJUMBURA FINAL REPORT, FEBRUARY 2008 CHAPTER 14 EVALUATION OF IMPROVEMENT PLAN
14-6
(2) Project Life
Economic analysis can be used to estimate the economic or engineering viability of investment projects by considering the structural performance of pavements, life cycle predictions of highway deterioration, effects of road work and costs, road user costs and benefits, as well as economic comparisons of project alternatives.
Generally, the life of concrete pavement is more than 20 years, while the life of asphalt pavement is around 10 years. Despite of the fact said above, a 25-year analysis period was selected because it would be appropriate for reflecting long-term cost effect as one or more rehabilitation strategies should be taken.
(3) Discount Rate
Economic costs and benefits throughout the project life periods are compared by a discount cash flow analysis. This study selected 12% as an average discount rate to be used in the analysis, which is commonly used in road sector analysis for African countries by the World Bank as a social discount rate.
(4) GRDP
Bujumbura has much greater productivity per inhabitant compared to that of other provinces
In accordance with “the IMF Country Report, No.05/329, September 2004”, GDP growth rate in Burundi is forecasted to reach 5% until 2024. Thus GRDP in Bujumbura is assumed to be 6.7% during the project life.
(5) Price
Economic cost and benefit are shown as the constant price in 2007.
(6) Exchange Rate
Exchange Rate of US$1.00 is equivalent to Burundi francs (FBu) 1,100 in 2007
14-2-2 Economic Benefit
Economic benefits are estimated by the estimated traffic improved value such as Vehicle-km and Vehicle-hour, derived from comparison between “Without” and “With” project case, and unit of VOC and TTC respectively.
The VOC and TTC are assumed by the following assumptions.
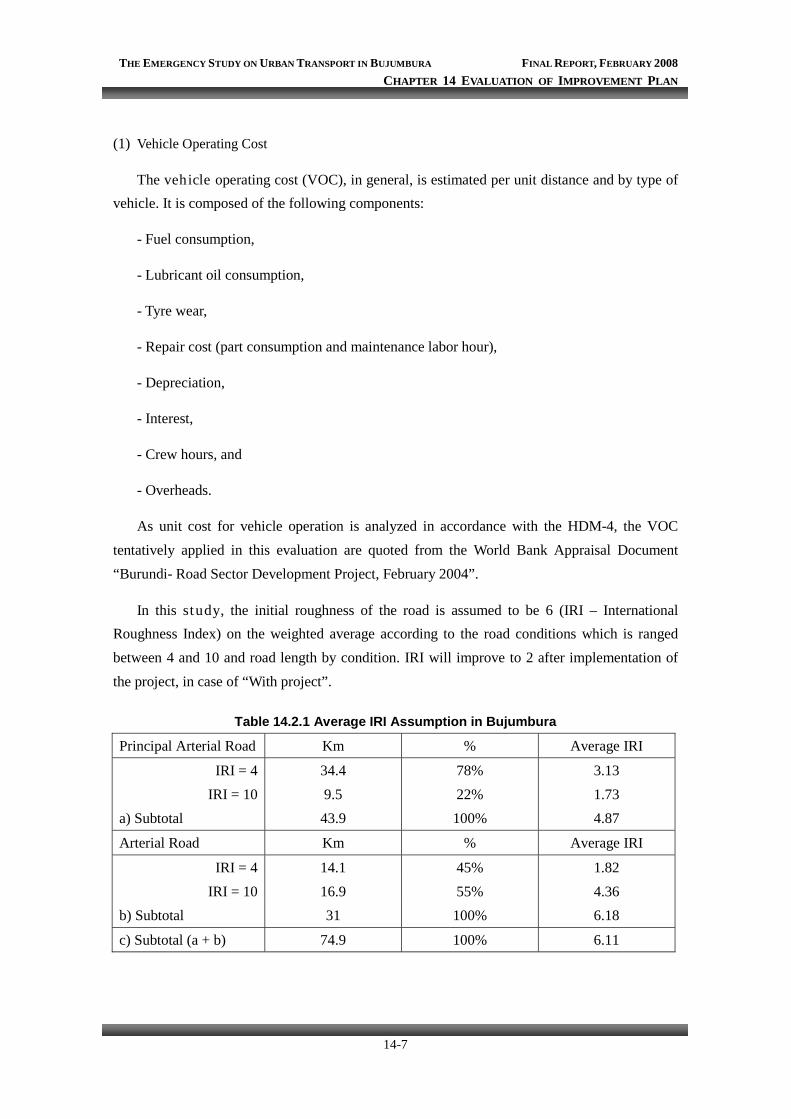
THE EMERGENCY STUDY ON URBAN TRANSPORT IN BUJUMBURA FINAL REPORT, FEBRUARY 2008 CHAPTER 14 EVALUATION OF IMPROVEMENT PLAN
14-7
(1) Vehicle Operating Cost
The vehicle operating cost (VOC), in general, is estimated per unit distance and by type of vehicle. It is composed of the following components:
- Fuel consumption,
- Lubricant oil consumption,
- Tyre wear,
- Repair cost (part consumption and maintenance labor hour),
- Depreciation,
- Interest,
- Crew hours, and
- Overheads.
As unit cost for vehicle operation is analyzed in accordance with the HDM-4, the VOC tentatively applied in this evaluation are quoted from the World Bank Appraisal Document “Burundi- Road Sector Development Project, February 2004”.
In this study, the initial roughness of the road is assumed to be 6 (IRI – International Roughness Index) on the weighted average according to the road conditions which is ranged between 4 and 10 and road length by condition. IRI will improve to 2 after implementation of the project, in case of “With project”.
Table 14.2.1 Average IRI Assumption in Bujumbura
Principal Arterial Road Km % Average IRI
IRI = 4 34.4 78% 3.13 IRI = 10 9.5 22% 1.73
a) Subtotal 43.9 100% 4.87
Arterial Road Km % Average IRI
IRI = 4 14.1 45% 1.82 IRI = 10 16.9 55% 4.36
b) Subtotal 31 100% 6.18
c) Subtotal (a + b) 74.9 100% 6.11
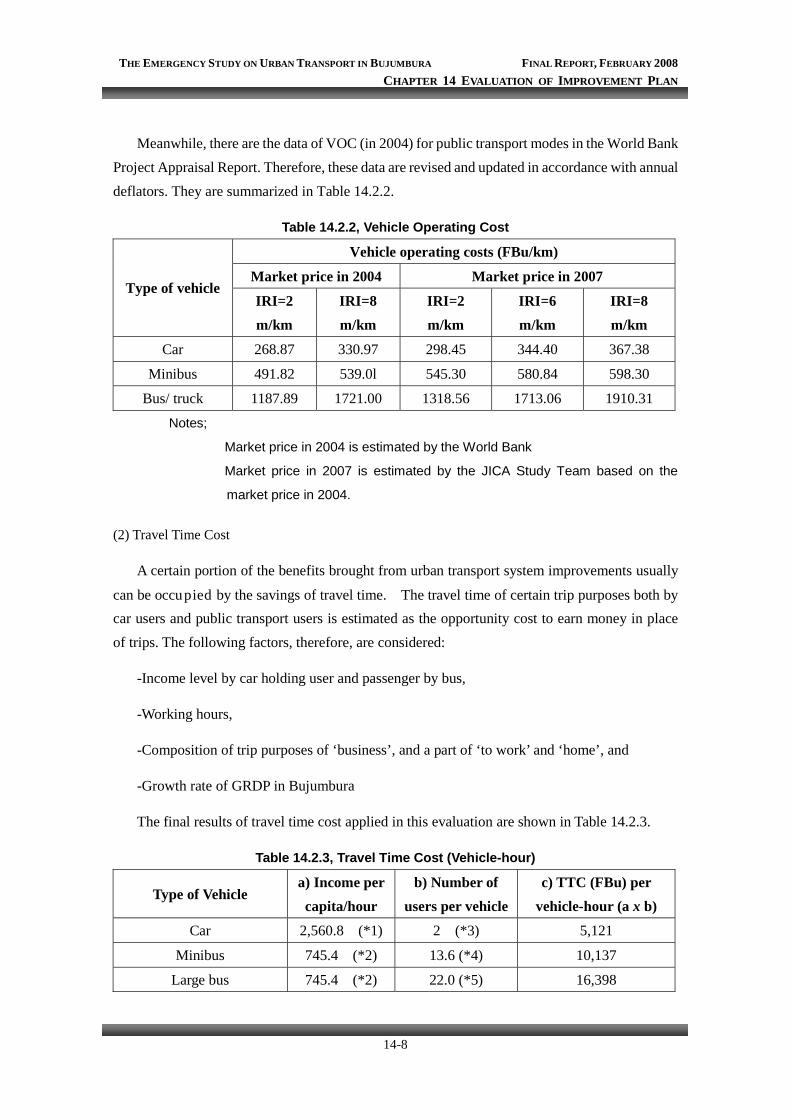
THE EMERGENCY STUDY ON URBAN TRANSPORT IN BUJUMBURA FINAL REPORT, FEBRUARY 2008 CHAPTER 14 EVALUATION OF IMPROVEMENT PLAN
14-8
Meanwhile, there are the data of VOC (in 2004) for public transport modes in the World Bank Project Appraisal Report. Therefore, these data are revised and updated in accordance with annual deflators. They are summarized in Table 14.2.2.
Table 14.2.2, Vehicle Operating Cost
Vehicle operating costs (FBu/km)
Market price in 2004 Market price in 2007 Type of vehicle
IRI=2 m/km
IRI=8 m/km
IRI=2 m/km
IRI=6 m/km
IRI=8 m/km
Car 268.87 330.97 298.45 344.40 367.38
Minibus 491.82 539.0l 545.30 580.84 598.30
Bus/ truck 1187.89 1721.00 1318.56 1713.06 1910.31
Notes;
Market price in 2004 is estimated by the World Bank
Market price in 2007 is estimated by the JICA Study Team based on the
market price in 2004.
(2) Travel Time Cost
A certain portion of the benefits brought from urban transport system improvements usually
can be occupied by the savings of travel time. The travel time of certain trip purposes both by car users and public transport users is estimated as the opportunity cost to earn money in place of trips. The following factors, therefore, are considered:
-Income level by car holding user and passenger by bus,
-Working hours,
-Composition of trip purposes of ‘business’, and a part of ‘to work’ and ‘home’, and
-Growth rate of GRDP in Bujumbura
The final results of travel time cost applied in this evaluation are shown in Table 14.2.3.
Table 14.2.3, Travel Time Cost (Vehicle-hour)
Type of Vehicle a) Income per capita/hour
b) Number of users per vehicle
c) TTC (FBu) per vehicle-hour (a x b)
Car 2,560.8 (*1) 2 (*3) 5,121
Minibus 745.4 (*2) 13.6 (*4) 10,137
Large bus 745.4 (*2) 22.0 (*5) 16,398
THE EMERGENCY STUDY ON URBAN TRANSPORT IN BUJUMBURA FINAL REPORT, FEBRUARY 2008 CHAPTER 14 EVALUATION OF IMPROVEMENT PLAN
14-9
Notes; (*1) Income per capita/hour for car is calculated by income level according to the community
survey which was conducted in May and June 2007 under this study. Household income (901,410FBu) per month/2 earners/176hours.
(*2) Income per capita/hour for minibus and large bus is calculated as household income (263,380FBu)/2 earners/176hours.
(*3) Number of users for car is assumed by household income earned by two persons.
(*4) Number of users for minibus is estimated by capacity of 14 passengers and occupancy ratio of 85% based on the traffic survey.
(*5) Number of users for large bus is estimated by capacity of 40 passengers and occupancy ratio of 55% based on the data of OTRACO.
(3) Estimated Traffic Improved Value between “Without” and “With”
The summary results of assigned traffic volume for economic evaluation, “Without” and “With project” networks both in 2007 and 2017 are summarized in Table 14.2.4.
As can be seen in the results below, the differences between “Without” and “With” cases are not so significant in the ratio of “without”/”With” in 2017, because the impacts of the improvement of roads are relatively small in comparison with the total amount of whole traffic assignment volumes.
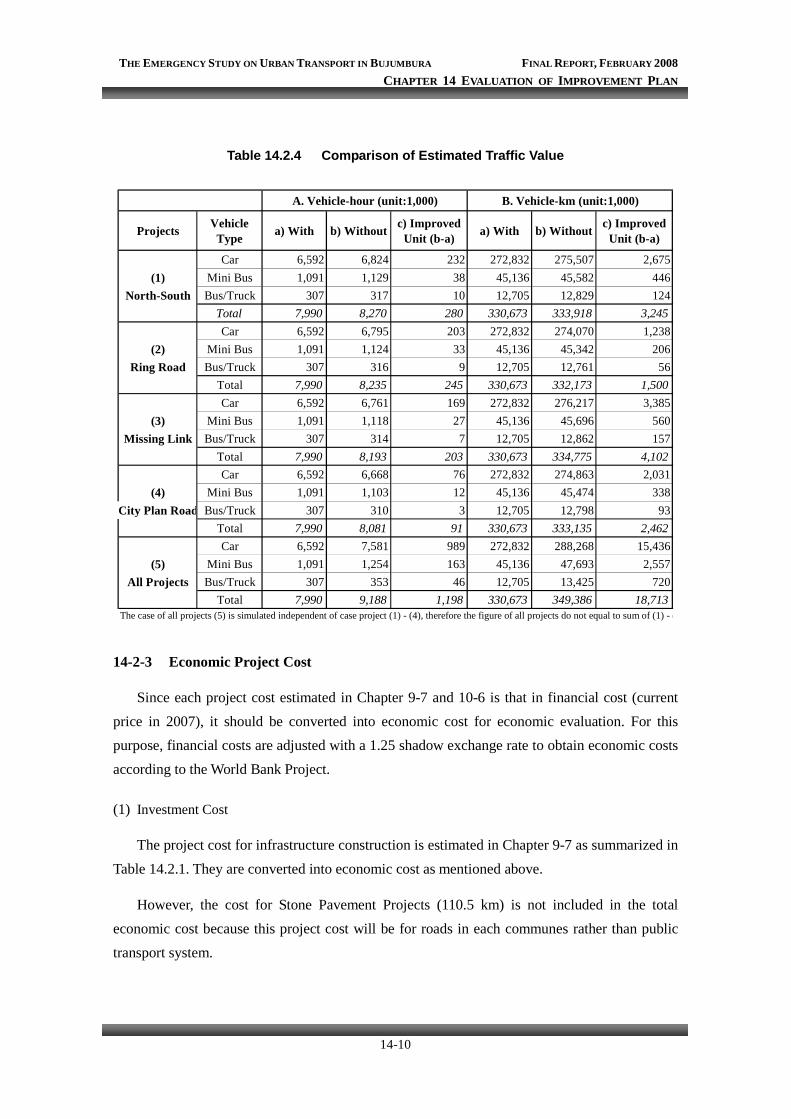
THE EMERGENCY STUDY ON URBAN TRANSPORT IN BUJUMBURA FINAL REPORT, FEBRUARY 2008 CHAPTER 14 EVALUATION OF IMPROVEMENT PLAN
14-10
Table 14.2.4 Comparison of Estimated Traffic Value
A. Vehicle-hour (unit:1,000) B. Vehicle-km (unit:1,000)
Projects VehicleType a) With b) Without c) Improved
Unit (b-a) a) With b) Without c) ImprovedUnit (b-a)
Car 6,592 6,824 232 272,832 275,507 2,675(1) Mini Bus 1,091 1,129 38 45,136 45,582 446
North-South Bus/Truck 307 317 10 12,705 12,829 124Total 7,990 8,270 280 330,673 333,918 3,245Car 6,592 6,795 203 272,832 274,070 1,238
(2) Mini Bus 1,091 1,124 33 45,136 45,342 206Ring Road Bus/Truck 307 316 9 12,705 12,761 56
Total 7,990 8,235 245 330,673 332,173 1,500Car 6,592 6,761 169 272,832 276,217 3,385
(3) Mini Bus 1,091 1,118 27 45,136 45,696 560Missing Link Bus/Truck 307 314 7 12,705 12,862 157
Total 7,990 8,193 203 330,673 334,775 4,102Car 6,592 6,668 76 272,832 274,863 2,031
(4) Mini Bus 1,091 1,103 12 45,136 45,474 338City Plan Road Bus/Truck 307 310 3 12,705 12,798 93
Total 7,990 8,081 91 330,673 333,135 2,462Car 6,592 7,581 989 272,832 288,268 15,436
(5) Mini Bus 1,091 1,254 163 45,136 47,693 2,557All Projects Bus/Truck 307 353 46 12,705 13,425 720
Total 7,990 9,188 1,198 330,673 349,386 18,713The case of all projects (5) is simulated independent of case project (1) - (4), therefore the figure of all projects do not equal to sum of (1) - (
14-2-3 Economic Project Cost
Since each project cost estimated in Chapter 9-7 and 10-6 is that in financial cost (current price in 2007), it should be converted into economic cost for economic evaluation. For this purpose, financial costs are adjusted with a 1.25 shadow exchange rate to obtain economic costs according to the World Bank Project.
(1) Investment Cost
The project cost for infrastructure construction is estimated in Chapter 9-7 as summarized in Table 14.2.1. They are converted into economic cost as mentioned above.
However, the cost for Stone Pavement Projects (110.5 km) is not included in the total economic cost because this project cost will be for roads in each communes rather than public transport system.
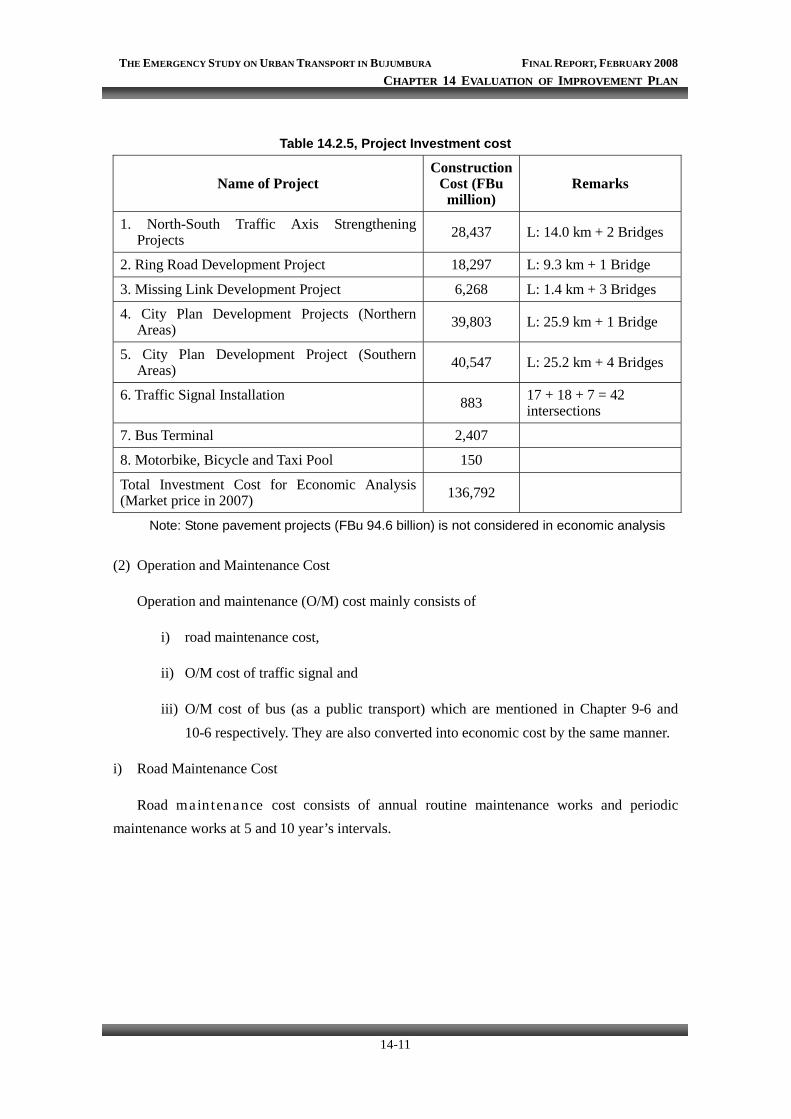
THE EMERGENCY STUDY ON URBAN TRANSPORT IN BUJUMBURA FINAL REPORT, FEBRUARY 2008 CHAPTER 14 EVALUATION OF IMPROVEMENT PLAN
14-11
Table 14.2.5, Project Investment cost
Name of Project Construction
Cost (FBu million)
Remarks
1. North-South Traffic Axis Strengthening Projects 28,437 L: 14.0 km + 2 Bridges
2. Ring Road Development Project 18,297 L: 9.3 km + 1 Bridge
3. Missing Link Development Project 6,268 L: 1.4 km + 3 Bridges
4. City Plan Development Projects (Northern Areas) 39,803 L: 25.9 km + 1 Bridge
5. City Plan Development Project (Southern Areas) 40,547 L: 25.2 km + 4 Bridges
6. Traffic Signal Installation 883 17 + 18 + 7 = 42 intersections
7. Bus Terminal 2,407
8. Motorbike, Bicycle and Taxi Pool 150
Total Investment Cost for Economic Analysis (Market price in 2007) 136,792
Note: Stone pavement projects (FBu 94.6 billion) is not considered in economic analysis
(2) Operation and Maintenance Cost
Operation and maintenance (O/M) cost mainly consists of
i) road maintenance cost,
ii) O/M cost of traffic signal and
iii) O/M cost of bus (as a public transport) which are mentioned in Chapter 9-6 and 10-6 respectively. They are also converted into economic cost by the same manner.
i) Road Maintenance Cost
Road maintenance cost consists of annual routine maintenance works and periodic maintenance works at 5 and 10 year’s intervals.
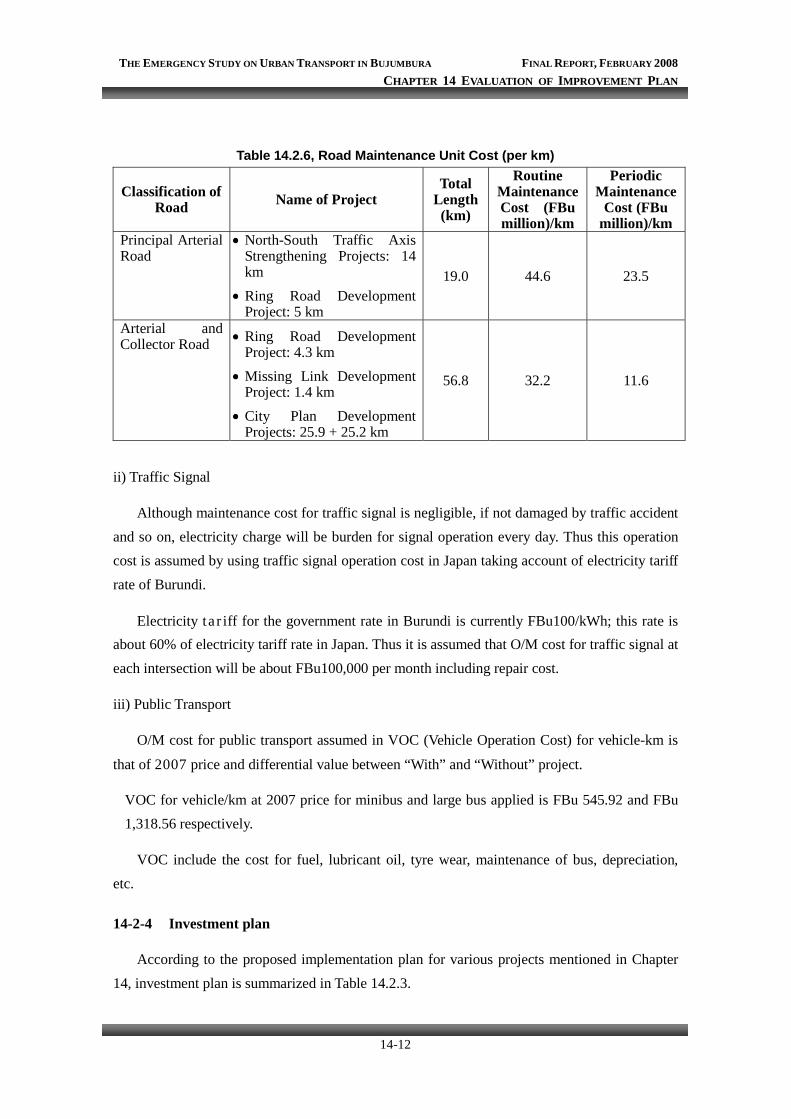
THE EMERGENCY STUDY ON URBAN TRANSPORT IN BUJUMBURA FINAL REPORT, FEBRUARY 2008 CHAPTER 14 EVALUATION OF IMPROVEMENT PLAN
14-12
Table 14.2.6, Road Maintenance Unit Cost (per km)
Classification of Road Name of Project
Total Length (km)
Routine Maintenance Cost (FBu million)/km
Periodic Maintenance
Cost (FBu million)/km
Principal Arterial Road
North-South Traffic Axis Strengthening Projects: 14 km
Ring Road Development Project: 5 km
19.0 44.6 23.5
Arterial and Collector Road Ring Road Development
Project: 4.3 km Missing Link Development Project: 1.4 km
City Plan Development Projects: 25.9 + 25.2 km
56.8 32.2 11.6
ii) Traffic Signal
Although maintenance cost for traffic signal is negligible, if not damaged by traffic accident and so on, electricity charge will be burden for signal operation every day. Thus this operation cost is assumed by using traffic signal operation cost in Japan taking account of electricity tariff rate of Burundi.
Electricity tariff for the government rate in Burundi is currently FBu100/kWh; this rate is about 60% of electricity tariff rate in Japan. Thus it is assumed that O/M cost for traffic signal at each intersection will be about FBu100,000 per month including repair cost.
iii) Public Transport
O/M cost for public transport assumed in VOC (Vehicle Operation Cost) for vehicle-km is
that of 2007 price and differential value between “With” and “Without” project.
VOC for vehicle/km at 2007 price for minibus and large bus applied is FBu 545.92 and FBu 1,318.56 respectively.
VOC include the cost for fuel, lubricant oil, tyre wear, maintenance of bus, depreciation, etc.
14-2-4 Investment plan
According to the proposed implementation plan for various projects mentioned in Chapter 14, investment plan is summarized in Table 14.2.3.
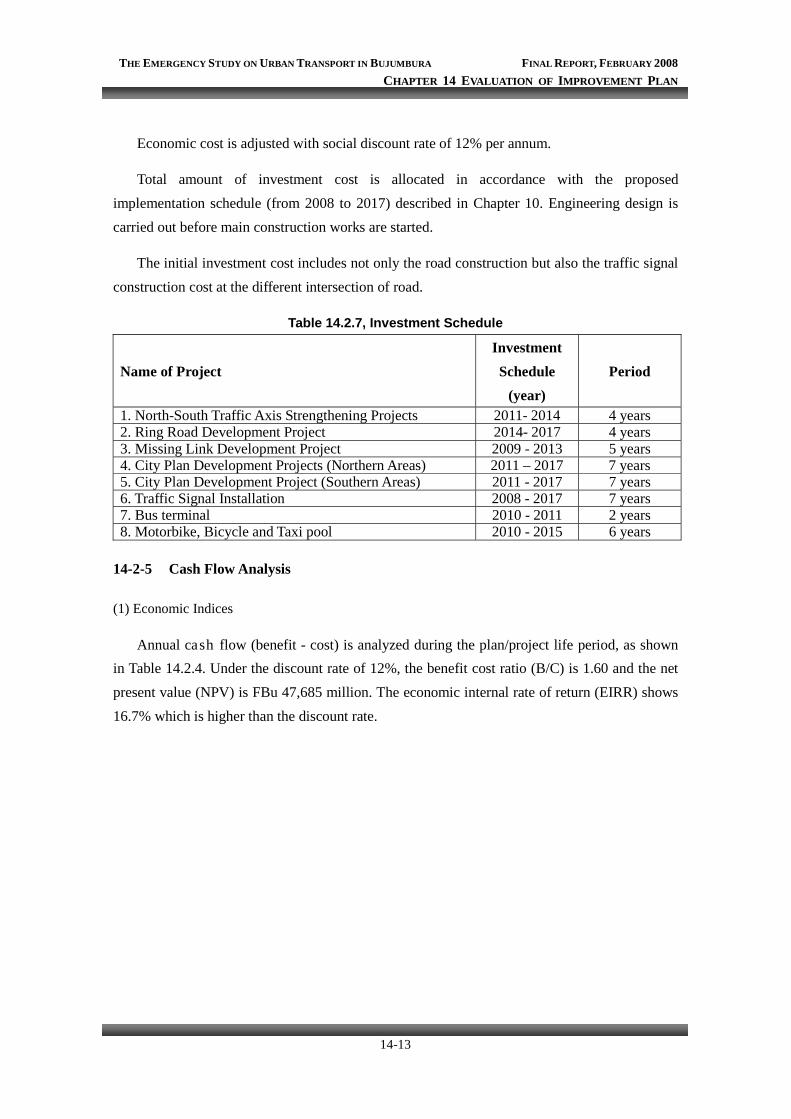
THE EMERGENCY STUDY ON URBAN TRANSPORT IN BUJUMBURA FINAL REPORT, FEBRUARY 2008 CHAPTER 14 EVALUATION OF IMPROVEMENT PLAN
14-13
Economic cost is adjusted with social discount rate of 12% per annum.
Total amount of investment cost is allocated in accordance with the proposed implementation schedule (from 2008 to 2017) described in Chapter 10. Engineering design is carried out before main construction works are started.
The initial investment cost includes not only the road construction but also the traffic signal construction cost at the different intersection of road.
Table 14.2.7, Investment Schedule
Name of Project Investment Schedule
(year) Period
1. North-South Traffic Axis Strengthening Projects 2011- 2014 4 years 2. Ring Road Development Project 2014- 2017 4 years 3. Missing Link Development Project 2009 - 2013 5 years 4. City Plan Development Projects (Northern Areas) 2011 – 2017 7 years 5. City Plan Development Project (Southern Areas) 2011 - 2017 7 years 6. Traffic Signal Installation 2008 - 2017 7 years 7. Bus terminal 2010 - 2011 2 years 8. Motorbike, Bicycle and Taxi pool 2010 - 2015 6 years
14-2-5 Cash Flow Analysis
(1) Economic Indices
Annual cash flow (benefit - cost) is analyzed during the plan/project life period, as shown in Table 14.2.4. Under the discount rate of 12%, the benefit cost ratio (B/C) is 1.60 and the net present value (NPV) is FBu 47,685 million. The economic internal rate of return (EIRR) shows 16.7% which is higher than the discount rate.
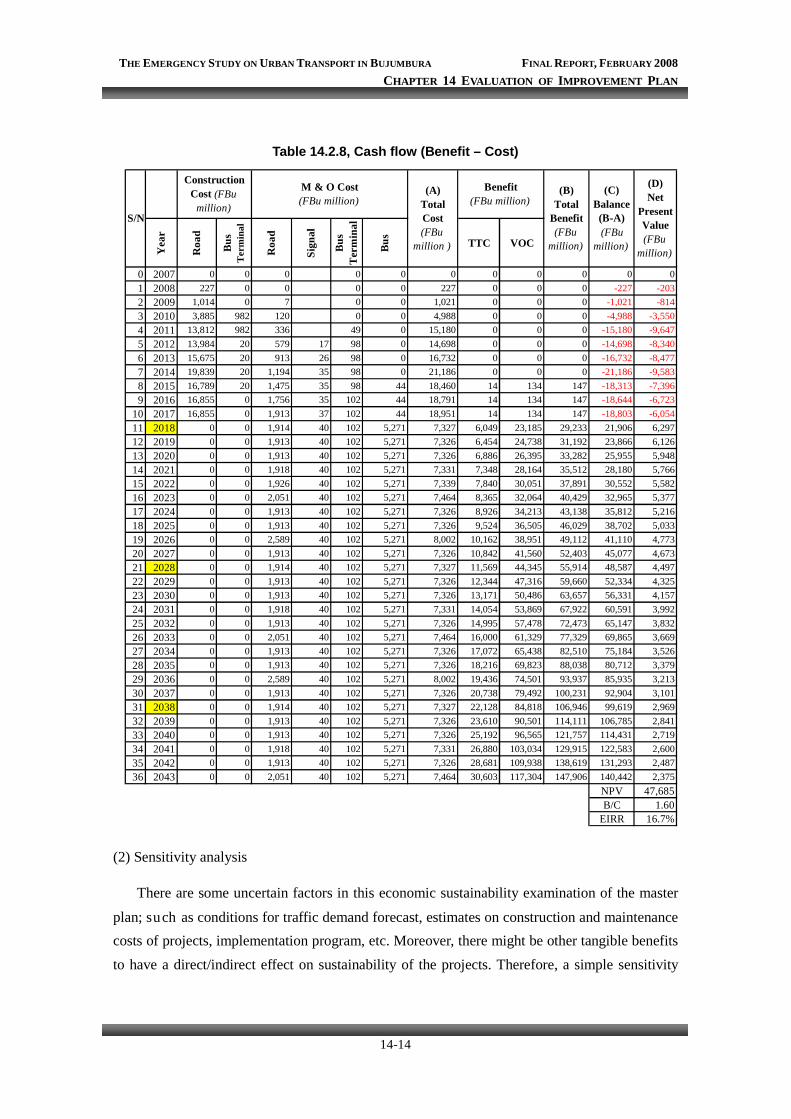
THE EMERGENCY STUDY ON URBAN TRANSPORT IN BUJUMBURA FINAL REPORT, FEBRUARY 2008 CHAPTER 14 EVALUATION OF IMPROVEMENT PLAN
14-14
Table 14.2.8, Cash flow (Benefit – Cost) Y
ear
Roa
d
Bus
Ter
min
al
Roa
d
Sign
al
Bus
Ter
min
al
Bus TTC VOC
0 2007 0 0 0 0 0 0 0 0 0 0 01 2008 227 0 0 0 0 227 0 0 0 -227 -2032 2009 1,014 0 7 0 0 1,021 0 0 0 -1,021 -8143 2010 3,885 982 120 0 0 4,988 0 0 0 -4,988 -3,5504 2011 13,812 982 336 49 0 15,180 0 0 0 -15,180 -9,6475 2012 13,984 20 579 17 98 0 14,698 0 0 0 -14,698 -8,3406 2013 15,675 20 913 26 98 0 16,732 0 0 0 -16,732 -8,4777 2014 19,839 20 1,194 35 98 0 21,186 0 0 0 -21,186 -9,5838 2015 16,789 20 1,475 35 98 44 18,460 14 134 147 -18,313 -7,3969 2016 16,855 0 1,756 35 102 44 18,791 14 134 147 -18,644 -6,723
10 2017 16,855 0 1,913 37 102 44 18,951 14 134 147 -18,803 -6,05411 2018 0 0 1,914 40 102 5,271 7,327 6,049 23,185 29,233 21,906 6,29712 2019 0 0 1,913 40 102 5,271 7,326 6,454 24,738 31,192 23,866 6,12613 2020 0 0 1,913 40 102 5,271 7,326 6,886 26,395 33,282 25,955 5,94814 2021 0 0 1,918 40 102 5,271 7,331 7,348 28,164 35,512 28,180 5,76615 2022 0 0 1,926 40 102 5,271 7,339 7,840 30,051 37,891 30,552 5,58216 2023 0 0 2,051 40 102 5,271 7,464 8,365 32,064 40,429 32,965 5,37717 2024 0 0 1,913 40 102 5,271 7,326 8,926 34,213 43,138 35,812 5,21618 2025 0 0 1,913 40 102 5,271 7,326 9,524 36,505 46,029 38,702 5,03319 2026 0 0 2,589 40 102 5,271 8,002 10,162 38,951 49,112 41,110 4,77320 2027 0 0 1,913 40 102 5,271 7,326 10,842 41,560 52,403 45,077 4,67321 2028 0 0 1,914 40 102 5,271 7,327 11,569 44,345 55,914 48,587 4,49722 2029 0 0 1,913 40 102 5,271 7,326 12,344 47,316 59,660 52,334 4,32523 2030 0 0 1,913 40 102 5,271 7,326 13,171 50,486 63,657 56,331 4,15724 2031 0 0 1,918 40 102 5,271 7,331 14,054 53,869 67,922 60,591 3,99225 2032 0 0 1,913 40 102 5,271 7,326 14,995 57,478 72,473 65,147 3,83226 2033 0 0 2,051 40 102 5,271 7,464 16,000 61,329 77,329 69,865 3,66927 2034 0 0 1,913 40 102 5,271 7,326 17,072 65,438 82,510 75,184 3,52628 2035 0 0 1,913 40 102 5,271 7,326 18,216 69,823 88,038 80,712 3,37929 2036 0 0 2,589 40 102 5,271 8,002 19,436 74,501 93,937 85,935 3,21330 2037 0 0 1,913 40 102 5,271 7,326 20,738 79,492 100,231 92,904 3,10131 2038 0 0 1,914 40 102 5,271 7,327 22,128 84,818 106,946 99,619 2,96932 2039 0 0 1,913 40 102 5,271 7,326 23,610 90,501 114,111 106,785 2,84133 2040 0 0 1,913 40 102 5,271 7,326 25,192 96,565 121,757 114,431 2,71934 2041 0 0 1,918 40 102 5,271 7,331 26,880 103,034 129,915 122,583 2,60035 2042 0 0 1,913 40 102 5,271 7,326 28,681 109,938 138,619 131,293 2,48736 2043 0 0 2,051 40 102 5,271 7,464 30,603 117,304 147,906 140,442 2,375
NPV 47,685B/C 1.60
EIRR 16.7%
S/N
ConstructionCost (FBu
million)(C)
Balance(B-A) (FBu
million)
(B)Total
Benefit(FBu
million)
M & O Cost(FBu million)
(A)TotalCost(FBu
million )
Benefit(FBu million)
(D)Net
PresentValue(FBu
million)
(2) Sensitivity analysis
There are some uncertain factors in this economic sustainability examination of the master
plan; such as conditions for traffic demand forecast, estimates on construction and maintenance costs of projects, implementation program, etc. Moreover, there might be other tangible benefits to have a direct/indirect effect on sustainability of the projects. Therefore, a simple sensitivity
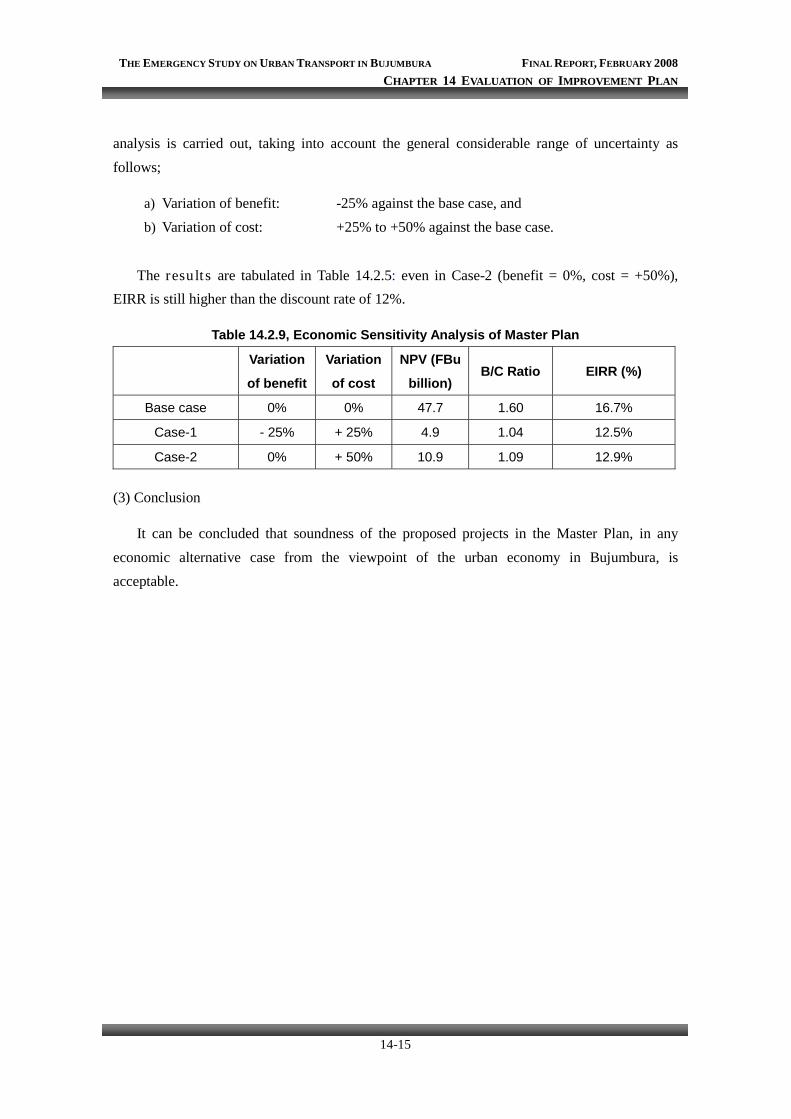
THE EMERGENCY STUDY ON URBAN TRANSPORT IN BUJUMBURA FINAL REPORT, FEBRUARY 2008 CHAPTER 14 EVALUATION OF IMPROVEMENT PLAN
14-15
analysis is carried out, taking into account the general considerable range of uncertainty as follows;
a) Variation of benefit: -25% against the base case, and b) Variation of cost: +25% to +50% against the base case.
The results are tabulated in Table 14.2.5: even in Case-2 (benefit = 0%, cost = +50%), EIRR is still higher than the discount rate of 12%.
Table 14.2.9, Economic Sensitivity Analysis of Master Plan
Variation
of benefit
Variation
of cost
NPV (FBu
billion) B/C Ratio EIRR (%)
Base case 0% 0% 47.7 1.60 16.7%
Case-1 - 25% + 25% 4.9 1.04 12.5%
Case-2 0% + 50% 10.9 1.09 12.9%
(3) Conclusion
It can be concluded that soundness of the proposed projects in the Master Plan, in any economic alternative case from the viewpoint of the urban economy in Bujumbura, is acceptable.

CHAPTER 15
IMPLEMENTATION PLAN

THE EMERGENCY STUDY ON URBAN TRANSPORT IN BUJUMBURA FINAL REPORT, FEBRUARY 2008 CHAPTER 15 IMPLEMENTATION PLAN
15-1
CHAPTER 15 IMPLEMENTATION PLAN
15-1 IMPLEMENTATION PROGRAM
15-1-1 Implementation Framework
The implementation plan for the improvements proposed in Chapter 9 shall be compiled. In this, upon comparing the order of priority of each project, the schedule shall be studied from the most urgent projects over the next 10 years according to the short term, medium term and long term. Here, the short term refers to next three years, the medium term refers to three years after short term, and the long term is the period of 10 years from now. The priority was set on comparing the following items. However, regarding the community roads, no particular consideration of priority shall be set because each community should take the initiative in examining road planning.
・Contribution for Urgent Problems ・Adjustment for Related Project (specially, EU road rehabilitation) ・Setup for implementation projects (Land acquisition, agreement in project site, etc) ・Available Cost for Investment ・Efficiency (Cost per unit traffic volume)
Moreover, important notice for implementation of projects shall be written finally.
15-1-2 Road Improvement Implementation Schedule
(1) Priority of Projects a) Contribution for Urgent Problems
The major urban problems facing Bujumbura city are, in terms of land use, the concentration of people and things into the central area of Rohero, the single point concentration of radial roads in line with this, and the localized traffic congestion that this imparts in the city centre. In particular, at the major intersections in the city, congestion of peak hours causes an impact on various urban activities and raises the risk of traffic accidents. Fundamental solutions to these problems are the construction of a ring road to disperse the traffic concentrating to the city centre, the inducement of appropriate land use in the future, and the advance of investment into development of support roads for this purpose; however, none of these measures provide immediate solutions to the urgent problems. In this respect, it is considered that improving bottleneck intersections and enforcing traffic controls in order to mitigate some of the traffic congestion around the inner city intersections is the best possible response to the urgent
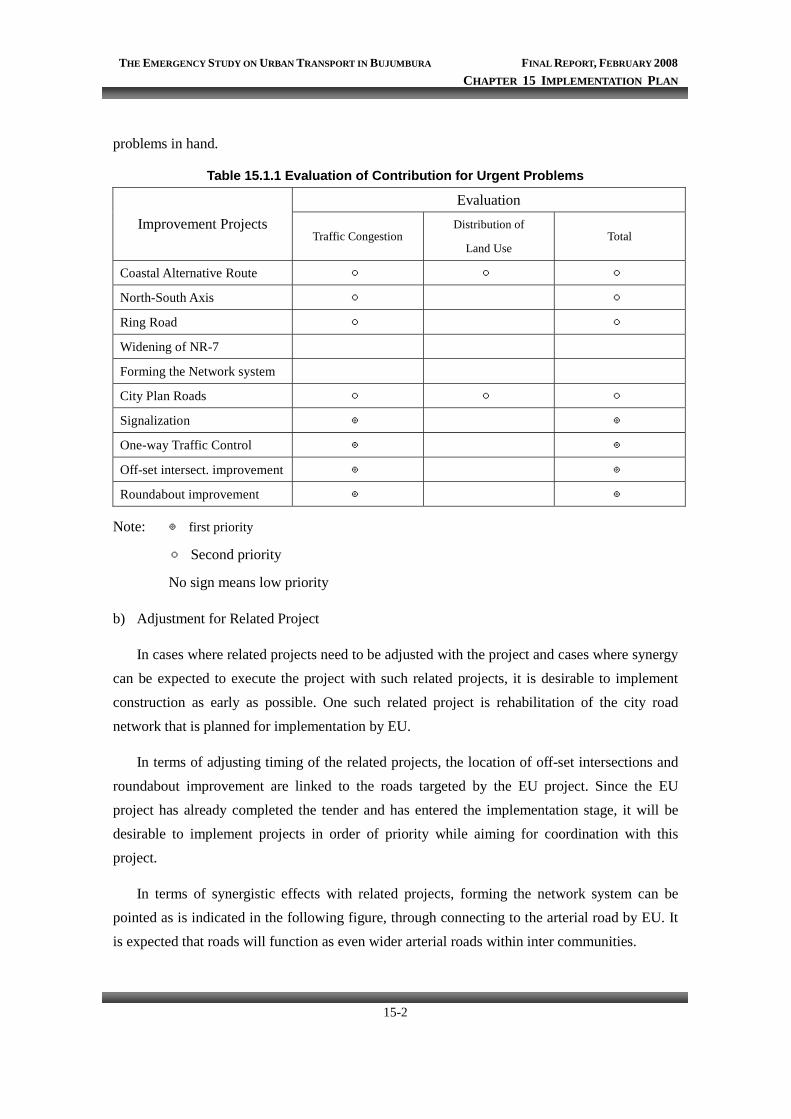
THE EMERGENCY STUDY ON URBAN TRANSPORT IN BUJUMBURA FINAL REPORT, FEBRUARY 2008 CHAPTER 15 IMPLEMENTATION PLAN
15-2
problems in hand.
Table 15.1.1 Evaluation of Contribution for Urgent Problems
Evaluation Improvement Projects
Traffic Congestion Distribution of
Land Use Total
Coastal Alternative Route ○ ○ ○
North-South Axis ○ ○
Ring Road ○ ○
Widening of NR-7
Forming the Network system
City Plan Roads ○ ○ ○
Signalization ◎ ◎
One-way Traffic Control ◎ ◎
Off-set intersect. improvement ◎ ◎
Roundabout improvement ◎ ◎
Note: ◎ first priority
○ Second priority
No sign means low priority
b) Adjustment for Related Project
In cases where related projects need to be adjusted with the project and cases where synergy can be expected to execute the project with such related projects, it is desirable to implement construction as early as possible. One such related project is rehabilitation of the city road network that is planned for implementation by EU.
In terms of adjusting timing of the related projects, the location of off-set intersections and roundabout improvement are linked to the roads targeted by the EU project. Since the EU project has already completed the tender and has entered the implementation stage, it will be desirable to implement projects in order of priority while aiming for coordination with this project.
In terms of synergistic effects with related projects, forming the network system can be pointed as is indicated in the following figure, through connecting to the arterial road by EU. It is expected that roads will function as even wider arterial roads within inter communities.
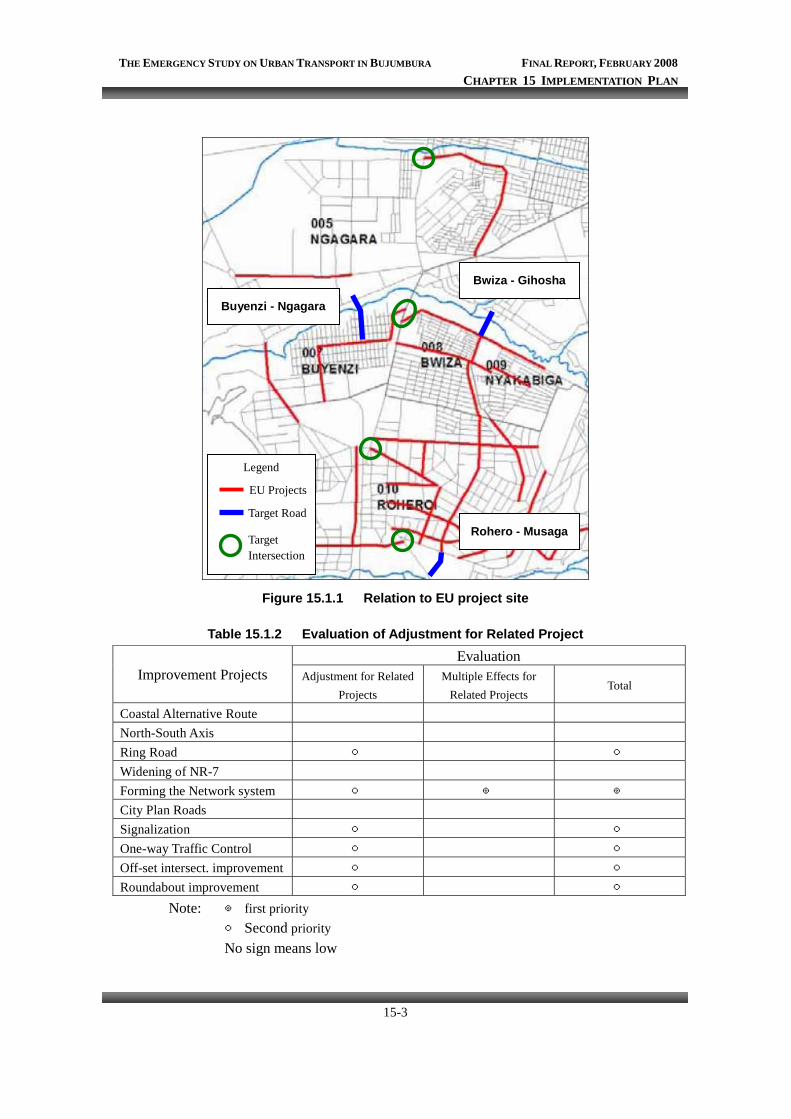
THE EMERGENCY STUDY ON URBAN TRANSPORT IN BUJUMBURA FINAL REPORT, FEBRUARY 2008 CHAPTER 15 IMPLEMENTATION PLAN
15-3
Figure 15.1.1 Relation to EU project site
Table 15.1.2 Evaluation of Adjustment for Related Project Evaluation
Improvement Projects Adjustment for Related Projects
Multiple Effects for Related Projects
Total
Coastal Alternative Route North-South Axis Ring Road ○ ○ Widening of NR-7 Forming the Network system ○ ◎ ◎ City Plan Roads Signalization ○ ○ One-way Traffic Control ○ ○ Off-set intersect. improvement ○ ○ Roundabout improvement ○ ○
Note: ◎ first priority ○ Second priority No sign means low
Buyenzi - Ngagara
Bwiza - Gihosha
Rohero - Musaga
EU Projects
Target Road
Legend
Target Intersection
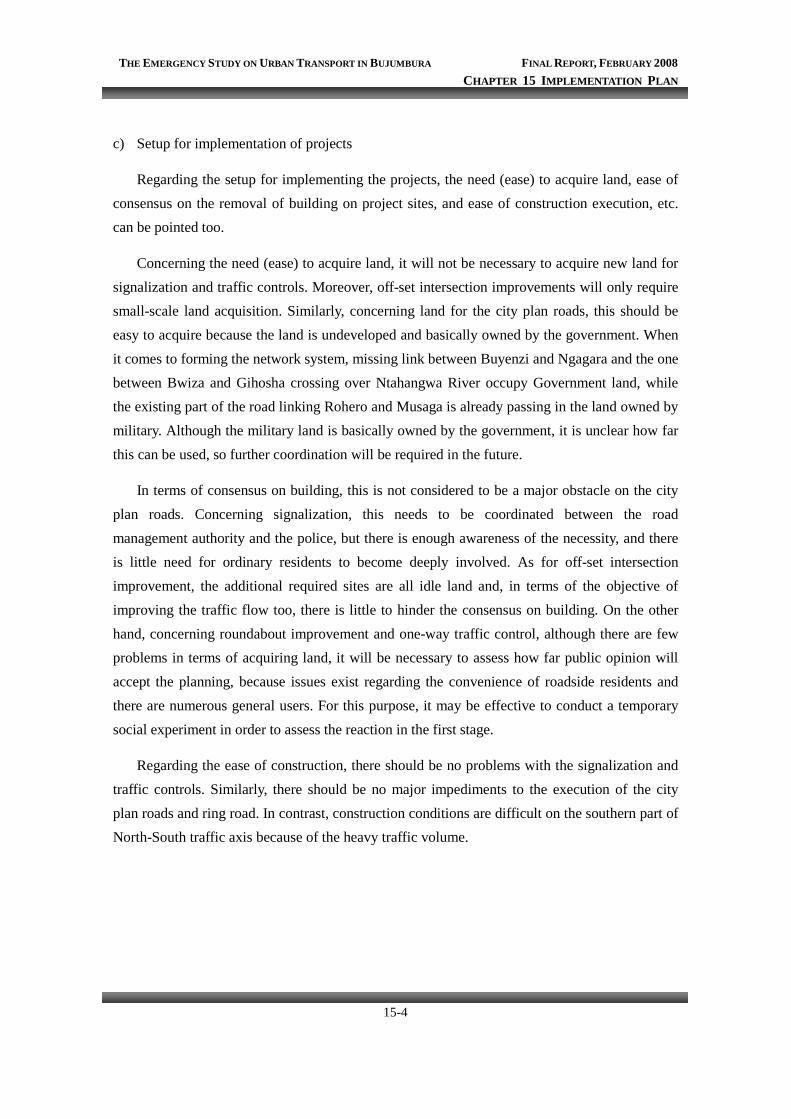
THE EMERGENCY STUDY ON URBAN TRANSPORT IN BUJUMBURA FINAL REPORT, FEBRUARY 2008 CHAPTER 15 IMPLEMENTATION PLAN
15-4
c) Setup for implementation of projects
Regarding the setup for implementing the projects, the need (ease) to acquire land, ease of consensus on the removal of building on project sites, and ease of construction execution, etc. can be pointed too.
Concerning the need (ease) to acquire land, it will not be necessary to acquire new land for signalization and traffic controls. Moreover, off-set intersection improvements will only require small-scale land acquisition. Similarly, concerning land for the city plan roads, this should be easy to acquire because the land is undeveloped and basically owned by the government. When it comes to forming the network system, missing link between Buyenzi and Ngagara and the one between Bwiza and Gihosha crossing over Ntahangwa River occupy Government land, while the existing part of the road linking Rohero and Musaga is already passing in the land owned by military. Although the military land is basically owned by the government, it is unclear how far this can be used, so further coordination will be required in the future.
In terms of consensus on building, this is not considered to be a major obstacle on the city plan roads. Concerning signalization, this needs to be coordinated between the road management authority and the police, but there is enough awareness of the necessity, and there is little need for ordinary residents to become deeply involved. As for off-set intersection improvement, the additional required sites are all idle land and, in terms of the objective of improving the traffic flow too, there is little to hinder the consensus on building. On the other hand, concerning roundabout improvement and one-way traffic control, although there are few problems in terms of acquiring land, it will be necessary to assess how far public opinion will accept the planning, because issues exist regarding the convenience of roadside residents and there are numerous general users. For this purpose, it may be effective to conduct a temporary social experiment in order to assess the reaction in the first stage.
Regarding the ease of construction, there should be no problems with the signalization and traffic controls. Similarly, there should be no major impediments to the execution of the city plan roads and ring road. In contrast, construction conditions are difficult on the southern part of North-South traffic axis because of the heavy traffic volume.
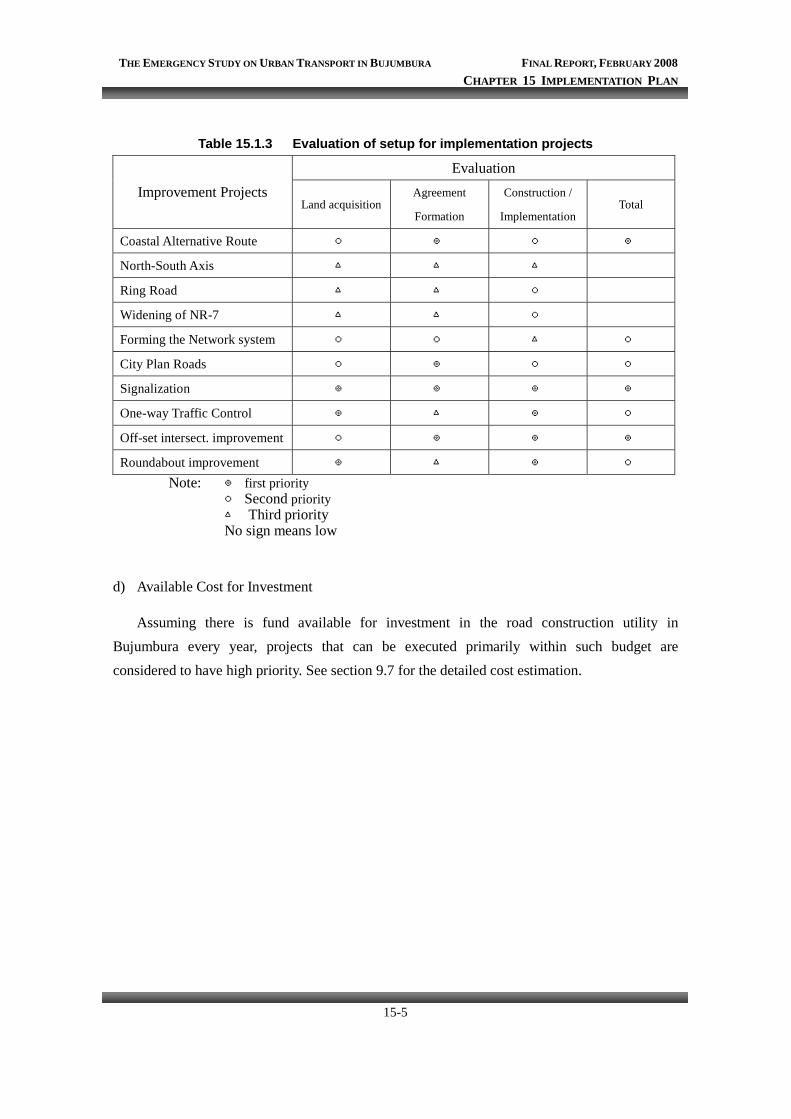
THE EMERGENCY STUDY ON URBAN TRANSPORT IN BUJUMBURA FINAL REPORT, FEBRUARY 2008 CHAPTER 15 IMPLEMENTATION PLAN
15-5
Table 15.1.3 Evaluation of setup for implementation projects
Evaluation Improvement Projects
Land acquisitionAgreement
Formation
Construction /
Implementation Total
Coastal Alternative Route ○ ◎ ○ ◎
North-South Axis △ △ △
Ring Road △ △ ○
Widening of NR-7 △ △ ○
Forming the Network system ○ ○ △ ○
City Plan Roads ○ ◎ ○ ○
Signalization ◎ ◎ ◎ ◎
One-way Traffic Control ◎ △ ◎ ○
Off-set intersect. improvement ○ ◎ ◎ ◎
Roundabout improvement ◎ △ ◎ ○ Note: ◎ first priority
○ Second priority △ Third priority No sign means low
d) Available Cost for Investment
Assuming there is fund available for investment in the road construction utility in Bujumbura every year, projects that can be executed primarily within such budget are considered to have high priority. See section 9.7 for the detailed cost estimation.
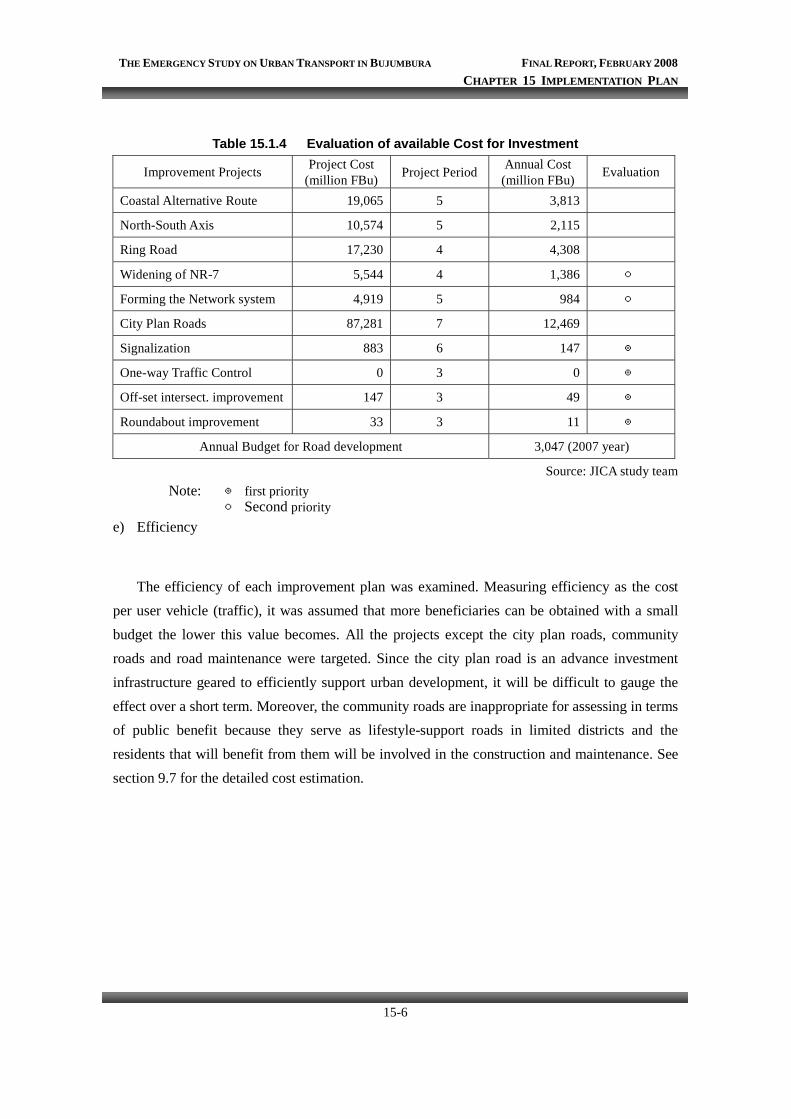
THE EMERGENCY STUDY ON URBAN TRANSPORT IN BUJUMBURA FINAL REPORT, FEBRUARY 2008 CHAPTER 15 IMPLEMENTATION PLAN
15-6
Table 15.1.4 Evaluation of available Cost for Investment
Improvement Projects Project Cost (million FBu) Project Period Annual Cost
(million FBu) Evaluation
Coastal Alternative Route 19,065 5 3,813
North-South Axis 10,574 5 2,115
Ring Road 17,230 4 4,308
Widening of NR-7 5,544 4 1,386 ○
Forming the Network system 4,919 5 984 ○
City Plan Roads 87,281 7 12,469
Signalization 883 6 147 ◎
One-way Traffic Control 0 3 0 ◎
Off-set intersect. improvement 147 3 49 ◎
Roundabout improvement 33 3 11 ◎
Annual Budget for Road development 3,047 (2007 year)
Source: JICA study team Note: ◎ first priority
○ Second priority e) Efficiency
The efficiency of each improvement plan was examined. Measuring efficiency as the cost per user vehicle (traffic), it was assumed that more beneficiaries can be obtained with a small budget the lower this value becomes. All the projects except the city plan roads, community roads and road maintenance were targeted. Since the city plan road is an advance investment infrastructure geared to efficiently support urban development, it will be difficult to gauge the effect over a short term. Moreover, the community roads are inappropriate for assessing in terms of public benefit because they serve as lifestyle-support roads in limited districts and the residents that will benefit from them will be involved in the construction and maintenance. See section 9.7 for the detailed cost estimation.
THE EMERGENCY STUDY ON URBAN TRANSPORT IN BUJUMBURA FINAL REPORT, FEBRUARY 2008 CHAPTER 15 IMPLEMENTATION PLAN
15-7
Table 15.1.5 Evaluation of Efficiency
Improvement Projects Average Traffic
Volume*km (pcu ・km/ day)
Project Cost (million FBu)
Cost per pcu・km
(1000FBu / pcu・km)Evaluation
Coastal Alternative Route 59,000 19,065 323
North-South Axis 69,000 10,574 153
Ring Road 87,000 17,230 198
Widening of NR-7 16,000 5,544 347
Forming the Network system 10,000 4,919 491
City Plan Roads 27,000 87,281 3,233
Signalization 34,000 883 26 ○
One-way Traffic Control 13,000 0 0 ◎
Off-set intersect. improvement 7,000 147 21 ○
Roundabout improvement 13,000 33 3 ◎
Source: JICA study team Note: ◎ first priority
○ Second priority
(2) Results of Examination
Upon conducting all assessment of each project based on the above contents, the following conclusions were obtained. As a result, signalization, one-way traffic control, and intersection improvements (off-set intersection improvement, roundabout improvement) had better be required in the short term, i.e. they should be started and completed within the next three years. However, concerning signalization, this will not target all the main intersections in the city; rather signals will initially be installed at intersections that already have heavy traffic, while signalization at the other intersections will be implemented over the medium term and long term according to the increasing traffic volume in future. Also, in parallel with this, it is desirable to start program on the road maintenance as early as possible in the short term. Since rehabilitation will be implemented on many arterial roads in the Bujumbura city under the EU project, it is desirable to take this opportunity to complete building of road maintenance program and to implement ongoing maintenance after that.
THE EMERGENCY STUDY ON URBAN TRANSPORT IN BUJUMBURA FINAL REPORT, FEBRUARY 2008 CHAPTER 15 IMPLEMENTATION PLAN
15-8
Table 15.1.6 Evaluation of each improvement projects
Evaluation Items Improvement Projects Urgent
Problems
Related
Project Setup
Available
Cost Efficiency Total
Coastal Alternative Route ○ ◎ 3
North-South Axis ○ 1
Ring Road ○ ○ 2
Widening of NR-7 ○ 1
Forming the Network system ◎ ○ ○ 4
City Plan Roads ○ ○ 2
Signalization ◎ ○ ◎ ◎ ○ 8
One-way Traffic Control ◎ ○ ○ ◎ ◎ 8
Off-set intersect. improvement ○ ○ ◎ ◎ ○ 7
Roundabout improvement ◎ ○ ○ ◎ ◎ 8
Score: ◎=2 points, ○=1 point
The following figure for the project schedule shows the start, execution period and service period for each project. Moreover, the planned required budget in each year according to this schedule is also indicated. The budget for the community road and one-way traffic control is not shown here because it is included in the Road Office budget.
Table 15.1.7 Implementation Schedule
Year Improvement menu
08 09 10 11 12 13 14 15 16 17 Coastal Alternative Route North-South Axis Ring Road Widening of NR-7 Forming the Network system City Plan Roads Community Road Signalization One-way Traffic Control Off-set intersection improvement Roundabout improvement Road Maintenance
Definition of Term Short Term Medium Term Long Term
THE EMERGENCY STUDY ON URBAN TRANSPORT IN BUJUMBURA FINAL REPORT, FEBRUARY 2008 CHAPTER 15 IMPLEMENTATION PLAN
15-9
Table 15.1.8 Road Development Cost during Project Period (million FBu)
Year Improvement projects
08 09 10 11 12 13 14 15 16 17
Coastal Alternative Route 3813 3813 3813 3813 3813
North-South Axis 2115 2115 2115 2115 2115
Ring Road 4307 4307 4307 4307
Widening of NR-7 1386 1386 1386 1386
Forming the Network
system
984 984 984 984 984
City Plan Roads 12469 12469 12469 12469 12469 12469 12469
Community Road - - - - - - - - - -
Signalization 141 141
214 214
82 82
One-way Traffic Control - - - - - - - - - -
Off-set intersection
improvement
49 49 49
Roundabout improvement 11 11 11
Sub-Total 201 1185 4867 17265 17479 19594 24090 20277 20359 20359
Road Maintenance 7071 7601 7615 7645 8043 8424 8810 9150 9581 9977
7272 8787 12471 24910 25523 28018 32900 29940 29940 30337
Total Annual average: 22,958 million FBu (14,567 million FBu) except maintenance cost
It is not added up as Road Office Budget
(3) For the implementation of projects
The important notices for implementation of projects are shown as follows.
a) Adjustment for EU Projects
The EU projects are being implemented on major arterial roads in the Bujumbura city. Many of the projects being proposed in this study are linked in some way or other to the EU projects. Although there is no overlapping of construction, there are examples where project sites connected at intersections and cases where roads targeted by the EU projects are included as part of traffic controls. Accordingly, it will be necessary to conduct alignment and adjustment with the EU projects in terms of the following points:
THE EMERGENCY STUDY ON URBAN TRANSPORT IN BUJUMBURA FINAL REPORT, FEBRUARY 2008 CHAPTER 15 IMPLEMENTATION PLAN
15-10
・ Confirmation of connection location at intersections; ・ Cross-sectional conformity and continuity of bicycle and pedestrian at points that will
be consecutively developed with EU projects; and
・ Execution period in each project.
b) Implementation of a Social Experiment
Concerning signalization, one-way traffic control and roundabout improvement, since these are programs that entail changing traffic controls, although there will be little problem regarding the acquisition of land, the conditions of road use will undergo major change for users. Accordingly, in order to obtain social consensus, it is desirable to implement a social experiment over a restricted area prior to the full-scale implementation in order to analyze the reaction of users and the effects of the project, and then to expand the area to the planning scale.
c) Packaging of Short-Term Projects
Concerning roundabout improvement and off-set intersection improvement, as a rule it will be necessary to install signals after the improvement. Accordingly, it will be effective to package intersection improvement, signalization and one-way traffic control as short-term projects with the social experiment.
15-1-3 Public Transport Implementation schedule
(1) Priority of Projects
1) Contribution for Public Transport Problems
The major public transport problems facing Bujumbura city are, lack of enough bus parking space and intermixed traffic modes such as OTRACO, private minibus, motor bike taxi, bicycle taxi and taxi. This situation causes traffic congestion and decreases the public transport services.
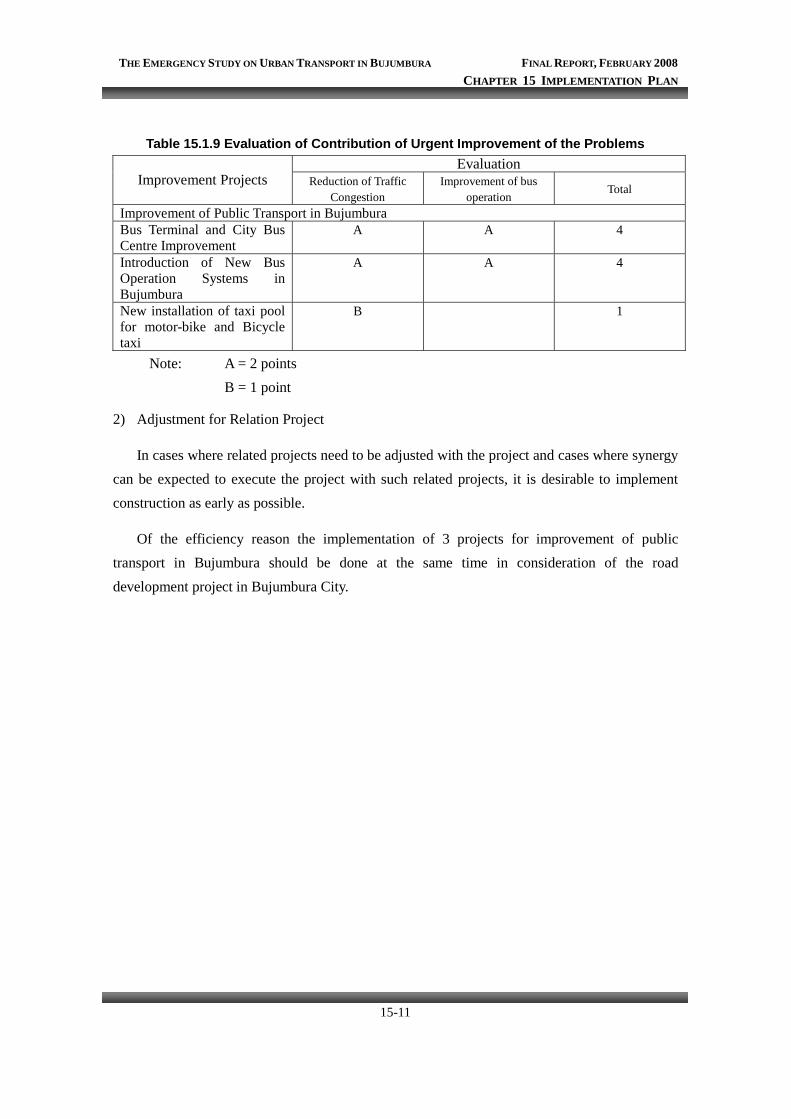
THE EMERGENCY STUDY ON URBAN TRANSPORT IN BUJUMBURA FINAL REPORT, FEBRUARY 2008 CHAPTER 15 IMPLEMENTATION PLAN
15-11
Table 15.1.9 Evaluation of Contribution of Urgent Improvement of the Problems Evaluation
Improvement Projects Reduction of Traffic Congestion
Improvement of bus operation
Total
Improvement of Public Transport in Bujumbura Bus Terminal and City Bus Centre Improvement
A A 4
Introduction of New Bus Operation Systems in Bujumbura
A A 4
New installation of taxi pool for motor-bike and Bicycle taxi
B 1
Note: A = 2 points B = 1 point
2) Adjustment for Relation Project
In cases where related projects need to be adjusted with the project and cases where synergy can be expected to execute the project with such related projects, it is desirable to implement construction as early as possible.
Of the efficiency reason the implementation of 3 projects for improvement of public transport in Bujumbura should be done at the same time in consideration of the road development project in Bujumbura City.
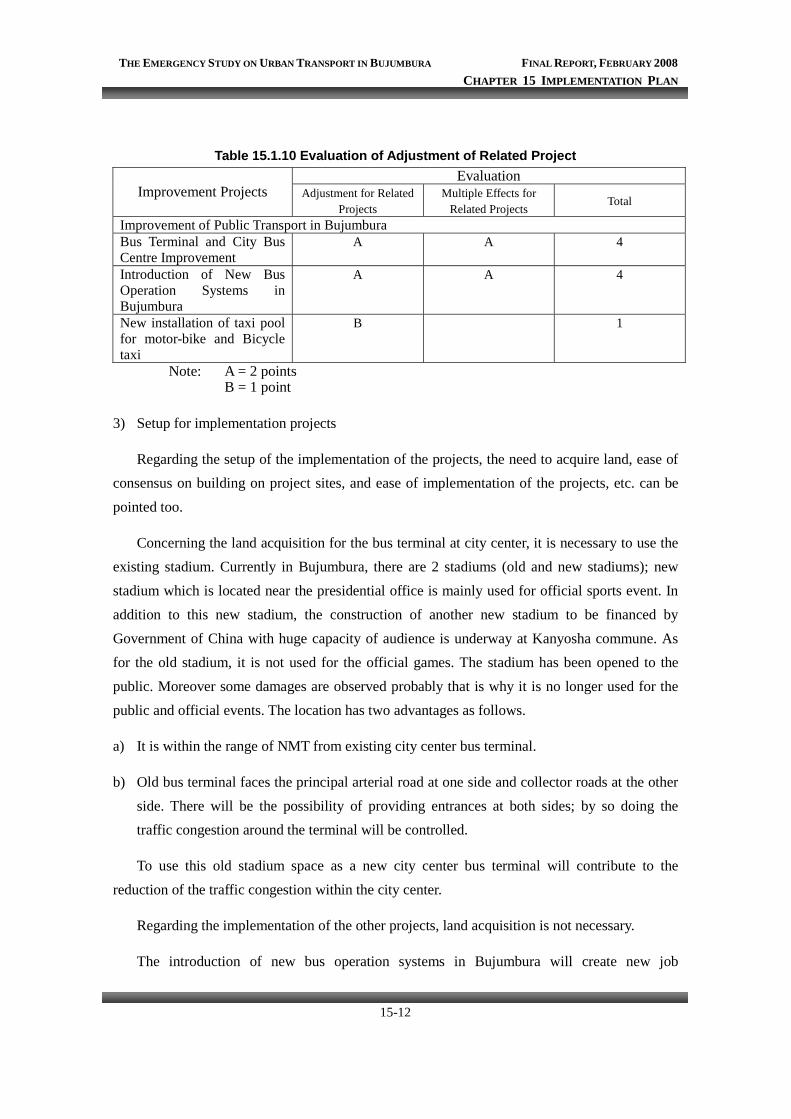
THE EMERGENCY STUDY ON URBAN TRANSPORT IN BUJUMBURA FINAL REPORT, FEBRUARY 2008 CHAPTER 15 IMPLEMENTATION PLAN
15-12
Table 15.1.10 Evaluation of Adjustment of Related Project Evaluation
Improvement Projects Adjustment for Related Projects
Multiple Effects for Related Projects
Total
Improvement of Public Transport in Bujumbura Bus Terminal and City Bus Centre Improvement
A A 4
Introduction of New Bus Operation Systems in Bujumbura
A A 4
New installation of taxi pool for motor-bike and Bicycle taxi
B 1
Note: A = 2 points B = 1 point
3) Setup for implementation projects
Regarding the setup of the implementation of the projects, the need to acquire land, ease of consensus on building on project sites, and ease of implementation of the projects, etc. can be pointed too.
Concerning the land acquisition for the bus terminal at city center, it is necessary to use the existing stadium. Currently in Bujumbura, there are 2 stadiums (old and new stadiums); new stadium which is located near the presidential office is mainly used for official sports event. In addition to this new stadium, the construction of another new stadium to be financed by Government of China with huge capacity of audience is underway at Kanyosha commune. As for the old stadium, it is not used for the official games. The stadium has been opened to the public. Moreover some damages are observed probably that is why it is no longer used for the public and official events. The location has two advantages as follows.
a) It is within the range of NMT from existing city center bus terminal.
b) Old bus terminal faces the principal arterial road at one side and collector roads at the other side. There will be the possibility of providing entrances at both sides; by so doing the traffic congestion around the terminal will be controlled.
To use this old stadium space as a new city center bus terminal will contribute to the reduction of the traffic congestion within the city center.
Regarding the implementation of the other projects, land acquisition is not necessary.
The introduction of new bus operation systems in Bujumbura will create new job
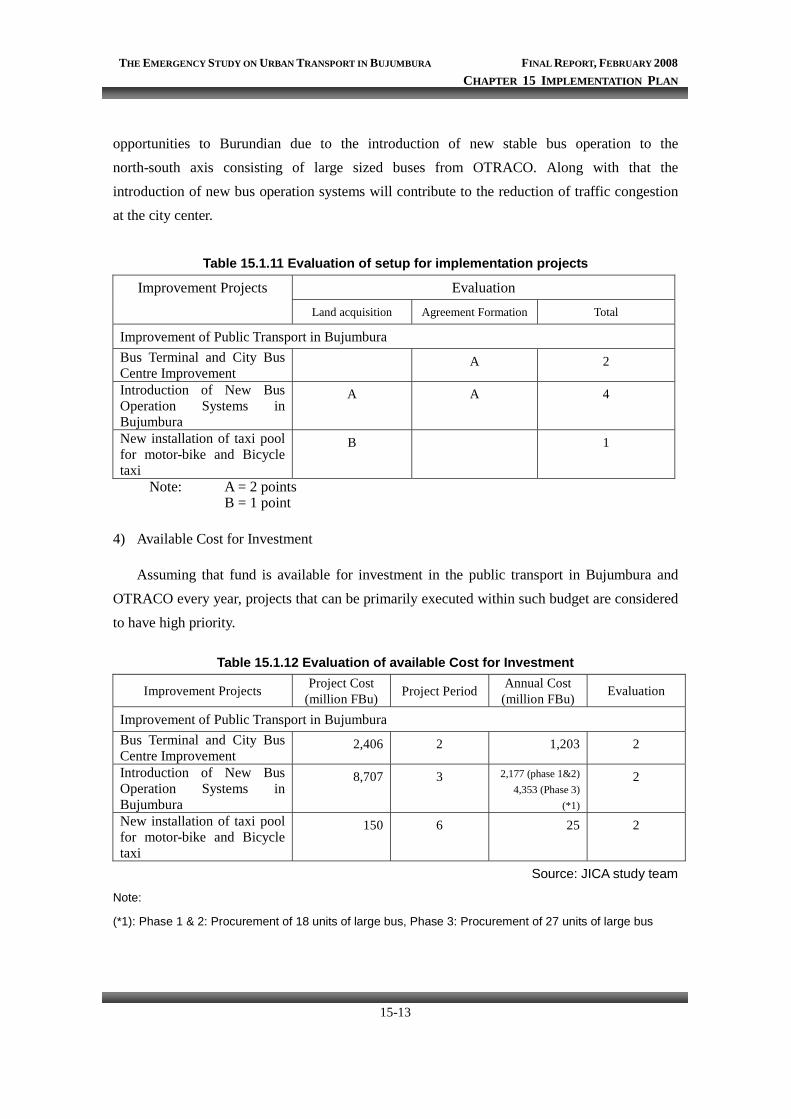
THE EMERGENCY STUDY ON URBAN TRANSPORT IN BUJUMBURA FINAL REPORT, FEBRUARY 2008 CHAPTER 15 IMPLEMENTATION PLAN
15-13
opportunities to Burundian due to the introduction of new stable bus operation to the north-south axis consisting of large sized buses from OTRACO. Along with that the introduction of new bus operation systems will contribute to the reduction of traffic congestion at the city center.
Table 15.1.11 Evaluation of setup for implementation projects
Evaluation Improvement Projects
Land acquisition Agreement Formation Total
Improvement of Public Transport in Bujumbura Bus Terminal and City Bus Centre Improvement
A 2
Introduction of New Bus Operation Systems in Bujumbura
A A 4
New installation of taxi pool for motor-bike and Bicycle taxi
B 1
Note: A = 2 points B = 1 point
4) Available Cost for Investment
Assuming that fund is available for investment in the public transport in Bujumbura and OTRACO every year, projects that can be primarily executed within such budget are considered to have high priority.
Table 15.1.12 Evaluation of available Cost for Investment
Improvement Projects Project Cost (million FBu) Project Period Annual Cost
(million FBu) Evaluation
Improvement of Public Transport in Bujumbura Bus Terminal and City Bus Centre Improvement
2,406 2 1,203 2
Introduction of New Bus Operation Systems in Bujumbura
8,707 3 2,177 (phase 1&2) 4,353 (Phase 3)
(*1)
2
New installation of taxi pool for motor-bike and Bicycle taxi
150 6 25 2
Source: JICA study team
Note:
(*1): Phase 1 & 2: Procurement of 18 units of large bus, Phase 3: Procurement of 27 units of large bus
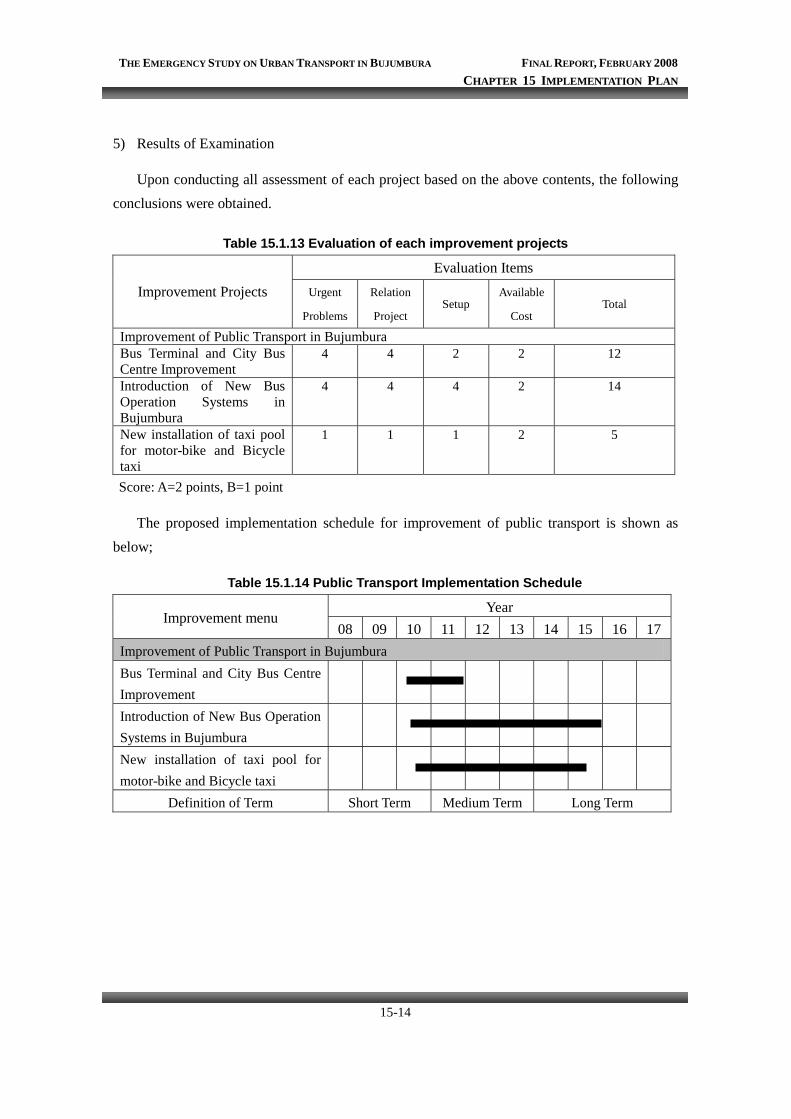
THE EMERGENCY STUDY ON URBAN TRANSPORT IN BUJUMBURA FINAL REPORT, FEBRUARY 2008 CHAPTER 15 IMPLEMENTATION PLAN
15-14
5) Results of Examination
Upon conducting all assessment of each project based on the above contents, the following conclusions were obtained.
Table 15.1.13 Evaluation of each improvement projects
Evaluation Items Improvement Projects Urgent
Problems
Relation
Project Setup
Available
Cost Total
Improvement of Public Transport in Bujumbura Bus Terminal and City Bus Centre Improvement
4 4 2 2 12
Introduction of New Bus Operation Systems in Bujumbura
4 4 4 2 14
New installation of taxi pool for motor-bike and Bicycle taxi
1 1 1 2 5
Score: A=2 points, B=1 point
The proposed implementation schedule for improvement of public transport is shown as below;
Table 15.1.14 Public Transport Implementation Schedule
Year Improvement menu
08 09 10 11 12 13 14 15 16 17 Improvement of Public Transport in Bujumbura Bus Terminal and City Bus Centre Improvement
Introduction of New Bus Operation Systems in Bujumbura
New installation of taxi pool for motor-bike and Bicycle taxi
Definition of Term Short Term Medium Term Long Term
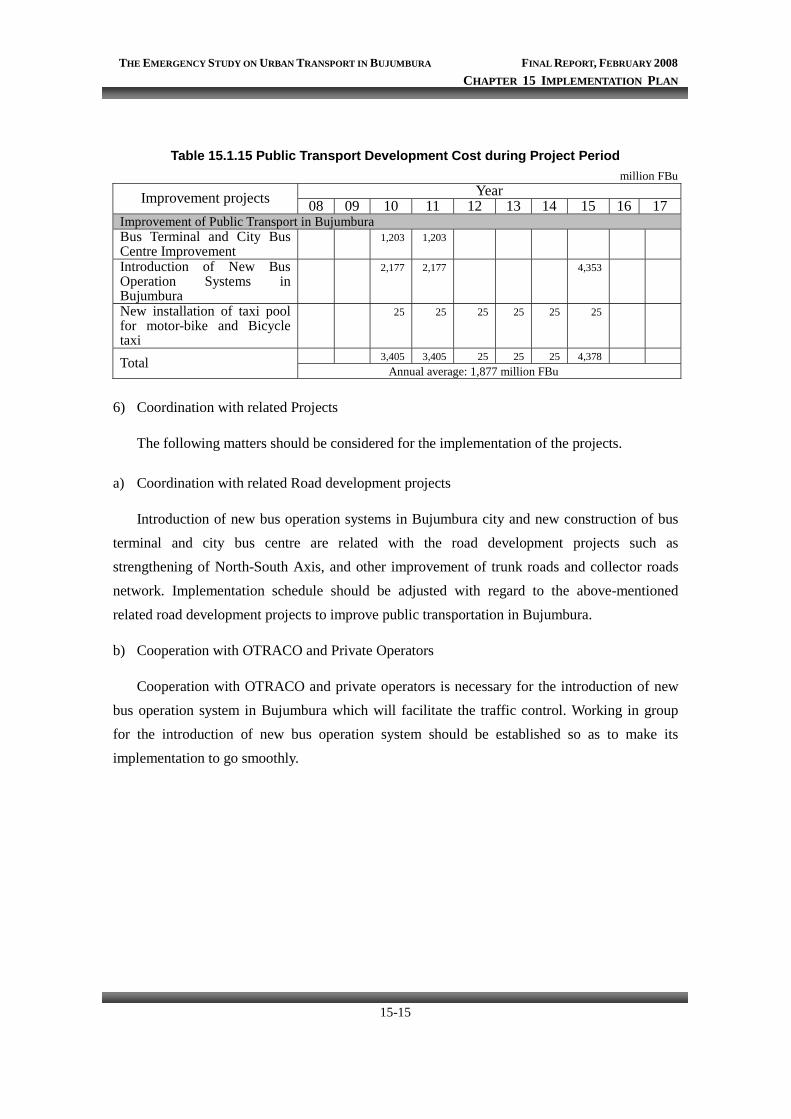
THE EMERGENCY STUDY ON URBAN TRANSPORT IN BUJUMBURA FINAL REPORT, FEBRUARY 2008 CHAPTER 15 IMPLEMENTATION PLAN
15-15
Table 15.1.15 Public Transport Development Cost during Project Period million FBu
Year Improvement projects 08 09 10 11 12 13 14 15 16 17 Improvement of Public Transport in Bujumbura Bus Terminal and City Bus Centre Improvement
1,203 1,203
Introduction of New Bus Operation Systems in Bujumbura
2,177 2,177 4,353
New installation of taxi pool for motor-bike and Bicycle taxi
25 25 25 25 25 25
3,405 3,405 25 25 25 4,378 Total Annual average: 1,877 million FBu
6) Coordination with related Projects
The following matters should be considered for the implementation of the projects.
a) Coordination with related Road development projects
Introduction of new bus operation systems in Bujumbura city and new construction of bus terminal and city bus centre are related with the road development projects such as strengthening of North-South Axis, and other improvement of trunk roads and collector roads network. Implementation schedule should be adjusted with regard to the above-mentioned related road development projects to improve public transportation in Bujumbura.
b) Cooperation with OTRACO and Private Operators
Cooperation with OTRACO and private operators is necessary for the introduction of new bus operation system in Bujumbura which will facilitate the traffic control. Working in group for the introduction of new bus operation system should be established so as to make its implementation to go smoothly.
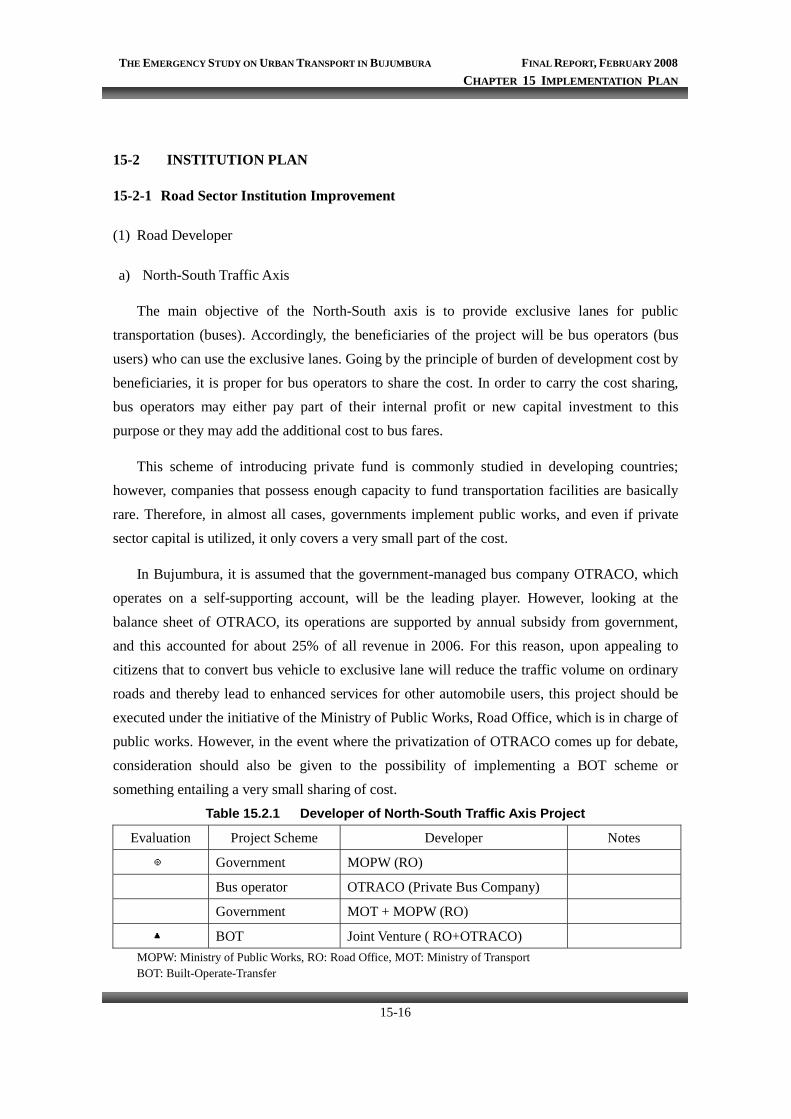
THE EMERGENCY STUDY ON URBAN TRANSPORT IN BUJUMBURA FINAL REPORT, FEBRUARY 2008 CHAPTER 15 IMPLEMENTATION PLAN
15-16
15-2 INSTITUTION PLAN
15-2-1 Road Sector Institution Improvement
(1) Road Developer
a) North-South Traffic Axis
The main objective of the North-South axis is to provide exclusive lanes for public transportation (buses). Accordingly, the beneficiaries of the project will be bus operators (bus users) who can use the exclusive lanes. Going by the principle of burden of development cost by beneficiaries, it is proper for bus operators to share the cost. In order to carry the cost sharing, bus operators may either pay part of their internal profit or new capital investment to this purpose or they may add the additional cost to bus fares.
This scheme of introducing private fund is commonly studied in developing countries; however, companies that possess enough capacity to fund transportation facilities are basically rare. Therefore, in almost all cases, governments implement public works, and even if private sector capital is utilized, it only covers a very small part of the cost.
In Bujumbura, it is assumed that the government-managed bus company OTRACO, which operates on a self-supporting account, will be the leading player. However, looking at the balance sheet of OTRACO, its operations are supported by annual subsidy from government, and this accounted for about 25% of all revenue in 2006. For this reason, upon appealing to citizens that to convert bus vehicle to exclusive lane will reduce the traffic volume on ordinary roads and thereby lead to enhanced services for other automobile users, this project should be executed under the initiative of the Ministry of Public Works, Road Office, which is in charge of public works. However, in the event where the privatization of OTRACO comes up for debate, consideration should also be given to the possibility of implementing a BOT scheme or something entailing a very small sharing of cost.
Table 15.2.1 Developer of North-South Traffic Axis Project
Evaluation Project Scheme Developer Notes
◎ Government MOPW (RO)
Bus operator OTRACO (Private Bus Company)
Government MOT + MOPW (RO)
▲ BOT Joint Venture ( RO+OTRACO) MOPW: Ministry of Public Works, RO: Road Office, MOT: Ministry of Transport
BOT: Built-Operate-Transfer
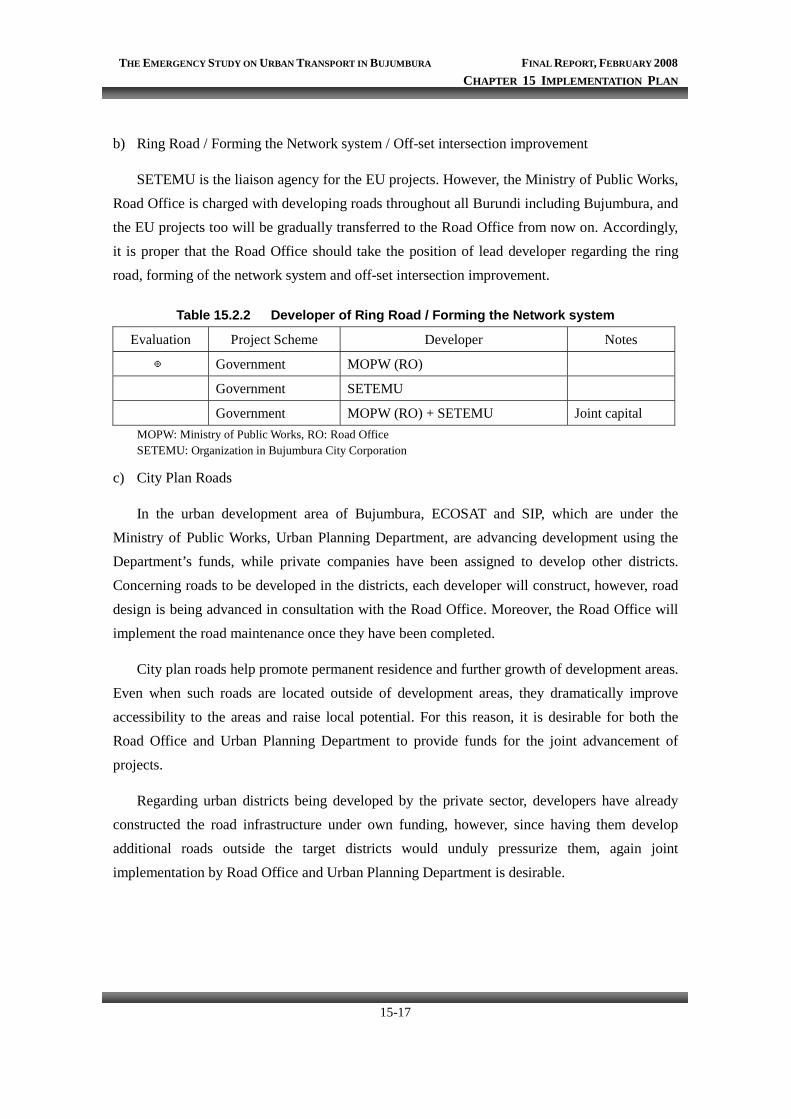
THE EMERGENCY STUDY ON URBAN TRANSPORT IN BUJUMBURA FINAL REPORT, FEBRUARY 2008 CHAPTER 15 IMPLEMENTATION PLAN
15-17
b) Ring Road / Forming the Network system / Off-set intersection improvement
SETEMU is the liaison agency for the EU projects. However, the Ministry of Public Works, Road Office is charged with developing roads throughout all Burundi including Bujumbura, and the EU projects too will be gradually transferred to the Road Office from now on. Accordingly, it is proper that the Road Office should take the position of lead developer regarding the ring road, forming of the network system and off-set intersection improvement.
Table 15.2.2 Developer of Ring Road / Forming the Network system
Evaluation Project Scheme Developer Notes
◎ Government MOPW (RO)
Government SETEMU
Government MOPW (RO) + SETEMU Joint capital MOPW: Ministry of Public Works, RO: Road Office SETEMU: Organization in Bujumbura City Corporation
c) City Plan Roads
In the urban development area of Bujumbura, ECOSAT and SIP, which are under the Ministry of Public Works, Urban Planning Department, are advancing development using the Department’s funds, while private companies have been assigned to develop other districts. Concerning roads to be developed in the districts, each developer will construct, however, road design is being advanced in consultation with the Road Office. Moreover, the Road Office will implement the road maintenance once they have been completed.
City plan roads help promote permanent residence and further growth of development areas. Even when such roads are located outside of development areas, they dramatically improve accessibility to the areas and raise local potential. For this reason, it is desirable for both the Road Office and Urban Planning Department to provide funds for the joint advancement of projects.
Regarding urban districts being developed by the private sector, developers have already constructed the road infrastructure under own funding, however, since having them develop additional roads outside the target districts would unduly pressurize them, again joint implementation by Road Office and Urban Planning Department is desirable.
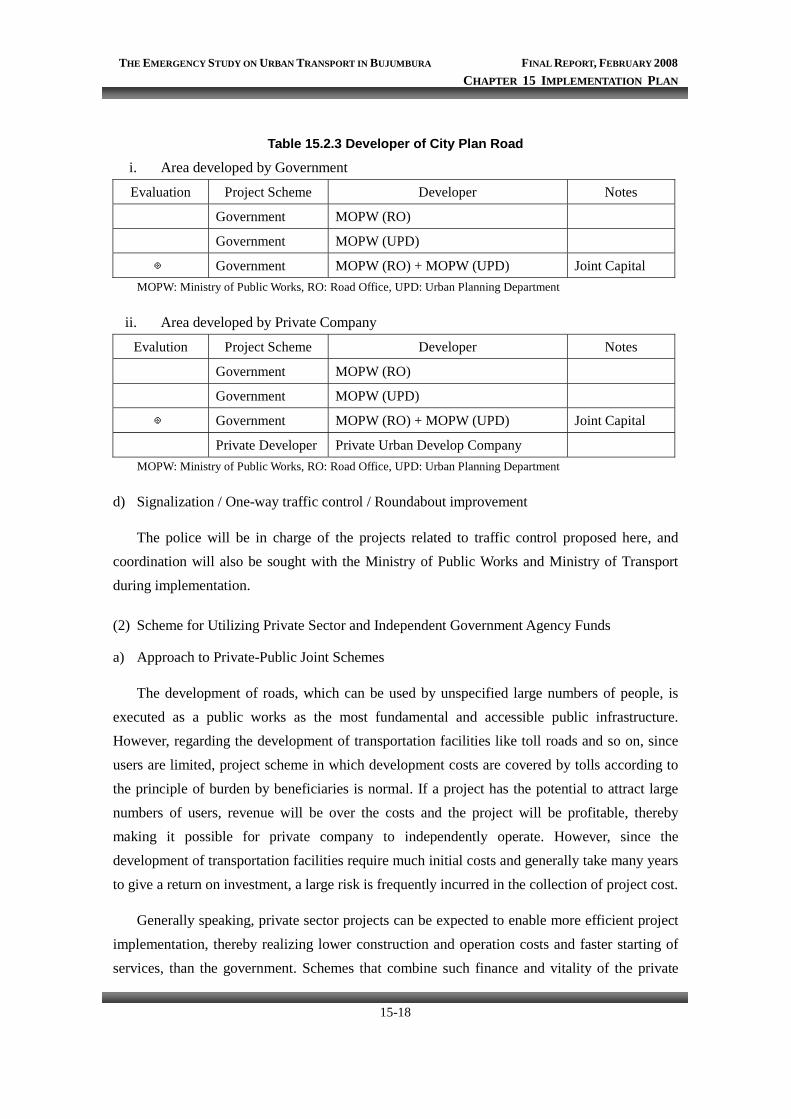
THE EMERGENCY STUDY ON URBAN TRANSPORT IN BUJUMBURA FINAL REPORT, FEBRUARY 2008 CHAPTER 15 IMPLEMENTATION PLAN
15-18
Table 15.2.3 Developer of City Plan Road
i. Area developed by Government
Evaluation Project Scheme Developer Notes
Government MOPW (RO)
Government MOPW (UPD)
◎ Government MOPW (RO) + MOPW (UPD) Joint Capital MOPW: Ministry of Public Works, RO: Road Office, UPD: Urban Planning Department
ii. Area developed by Private Company
Evalution Project Scheme Developer Notes
Government MOPW (RO)
Government MOPW (UPD)
◎ Government MOPW (RO) + MOPW (UPD) Joint Capital
Private Developer Private Urban Develop Company MOPW: Ministry of Public Works, RO: Road Office, UPD: Urban Planning Department
d) Signalization / One-way traffic control / Roundabout improvement
The police will be in charge of the projects related to traffic control proposed here, and coordination will also be sought with the Ministry of Public Works and Ministry of Transport during implementation.
(2) Scheme for Utilizing Private Sector and Independent Government Agency Funds
a) Approach to Private-Public Joint Schemes
The development of roads, which can be used by unspecified large numbers of people, is executed as a public works as the most fundamental and accessible public infrastructure. However, regarding the development of transportation facilities like toll roads and so on, since users are limited, project scheme in which development costs are covered by tolls according to the principle of burden by beneficiaries is normal. If a project has the potential to attract large numbers of users, revenue will be over the costs and the project will be profitable, thereby making it possible for private company to independently operate. However, since the development of transportation facilities require much initial costs and generally take many years to give a return on investment, a large risk is frequently incurred in the collection of project cost.
Generally speaking, private sector projects can be expected to enable more efficient project implementation, thereby realizing lower construction and operation costs and faster starting of services, than the government. Schemes that combine such finance and vitality of the private
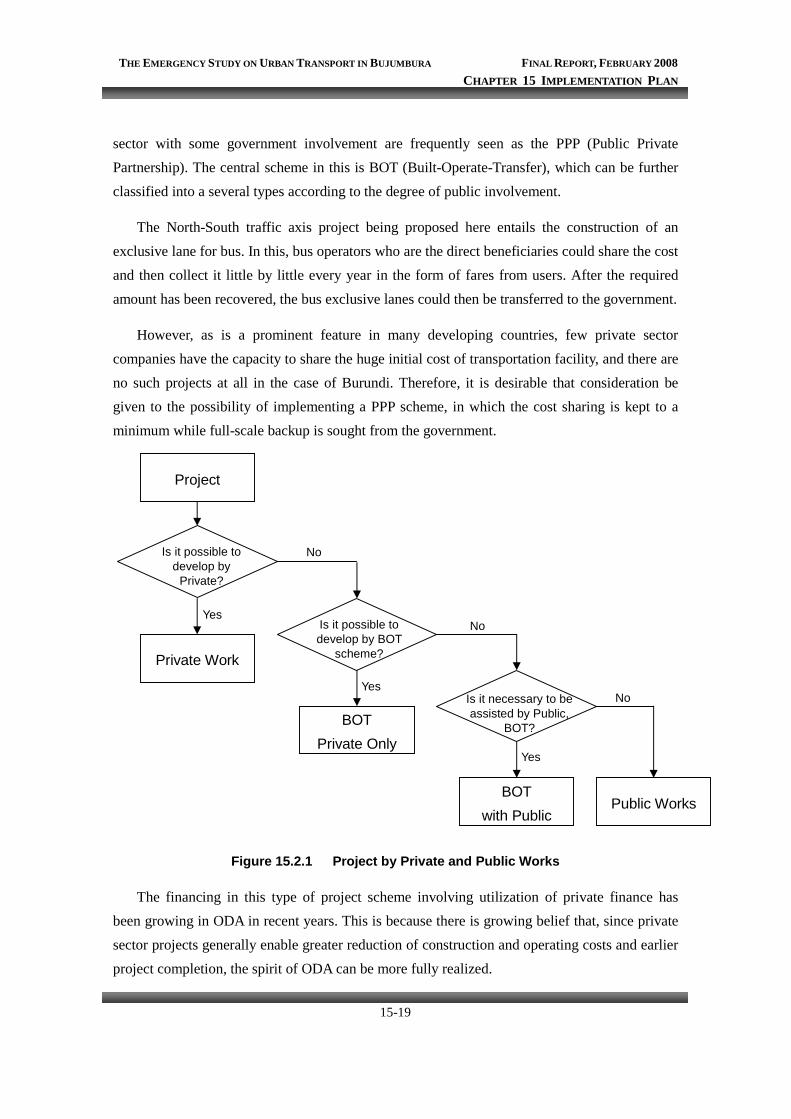
THE EMERGENCY STUDY ON URBAN TRANSPORT IN BUJUMBURA FINAL REPORT, FEBRUARY 2008 CHAPTER 15 IMPLEMENTATION PLAN
15-19
sector with some government involvement are frequently seen as the PPP (Public Private Partnership). The central scheme in this is BOT (Built-Operate-Transfer), which can be further classified into a several types according to the degree of public involvement.
The North-South traffic axis project being proposed here entails the construction of an exclusive lane for bus. In this, bus operators who are the direct beneficiaries could share the cost and then collect it little by little every year in the form of fares from users. After the required amount has been recovered, the bus exclusive lanes could then be transferred to the government.
However, as is a prominent feature in many developing countries, few private sector companies have the capacity to share the huge initial cost of transportation facility, and there are no such projects at all in the case of Burundi. Therefore, it is desirable that consideration be given to the possibility of implementing a PPP scheme, in which the cost sharing is kept to a minimum while full-scale backup is sought from the government.
Figure 15.2.1 Project by Private and Public Works
The financing in this type of project scheme involving utilization of private finance has been growing in ODA in recent years. This is because there is growing belief that, since private sector projects generally enable greater reduction of construction and operating costs and earlier project completion, the spirit of ODA can be more fully realized.
Project
Private Work
Is it possible to develop by
Private?
Is it possible to develop by BOT
scheme?
Is it necessary to be assisted by Public,
BOT? BOT Private Only
BOT with Public
Public Works
Yes
Yes
Yes
No
No
No
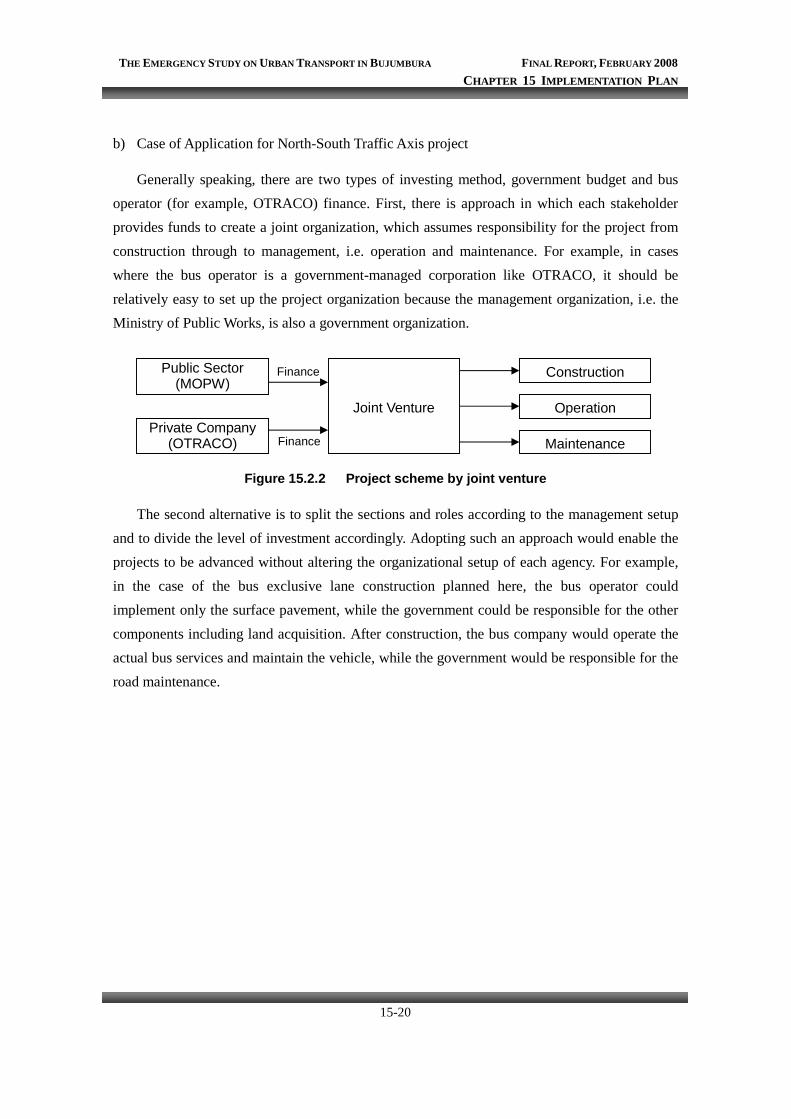
THE EMERGENCY STUDY ON URBAN TRANSPORT IN BUJUMBURA FINAL REPORT, FEBRUARY 2008 CHAPTER 15 IMPLEMENTATION PLAN
15-20
b) Case of Application for North-South Traffic Axis project
Generally speaking, there are two types of investing method, government budget and bus operator (for example, OTRACO) finance. First, there is approach in which each stakeholder provides funds to create a joint organization, which assumes responsibility for the project from construction through to management, i.e. operation and maintenance. For example, in cases where the bus operator is a government-managed corporation like OTRACO, it should be relatively easy to set up the project organization because the management organization, i.e. the Ministry of Public Works, is also a government organization.
Figure 15.2.2 Project scheme by joint venture
The second alternative is to split the sections and roles according to the management setup and to divide the level of investment accordingly. Adopting such an approach would enable the projects to be advanced without altering the organizational setup of each agency. For example, in the case of the bus exclusive lane construction planned here, the bus operator could implement only the surface pavement, while the government could be responsible for the other components including land acquisition. After construction, the bus company would operate the actual bus services and maintain the vehicle, while the government would be responsible for the road maintenance.
Public Sector (MOPW)
Private Company (OTRACO)
Joint Venture
Finance
Finance
Construction
Operation
Maintenance
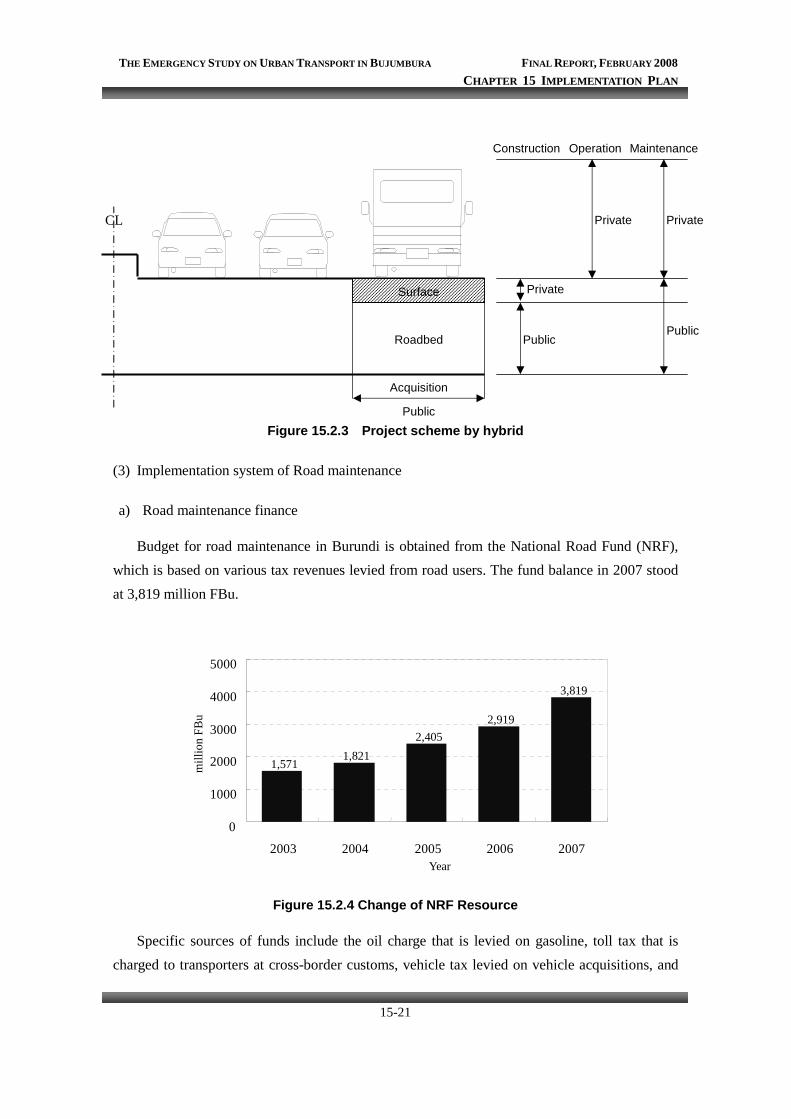
THE EMERGENCY STUDY ON URBAN TRANSPORT IN BUJUMBURA FINAL REPORT, FEBRUARY 2008 CHAPTER 15 IMPLEMENTATION PLAN
15-21
Figure 15.2.3 Project scheme by hybrid
(3) Implementation system of Road maintenance
a) Road maintenance finance
Budget for road maintenance in Burundi is obtained from the National Road Fund (NRF), which is based on various tax revenues levied from road users. The fund balance in 2007 stood at 3,819 million FBu.
Figure 15.2.4 Change of NRF Resource
Specific sources of funds include the oil charge that is levied on gasoline, toll tax that is charged to transporters at cross-border customs, vehicle tax levied on vehicle acquisitions, and
1,5711,821
2,4052,919
3,819
0
1000
2000
3000
4000
5000
2003 2004 2005 2006 2007
mill
ion
FBu
CL
Public
Surface
Roadbed
Acquisition
Public
Private
Private
Construction Operation Maintenance
Private
Public
Year
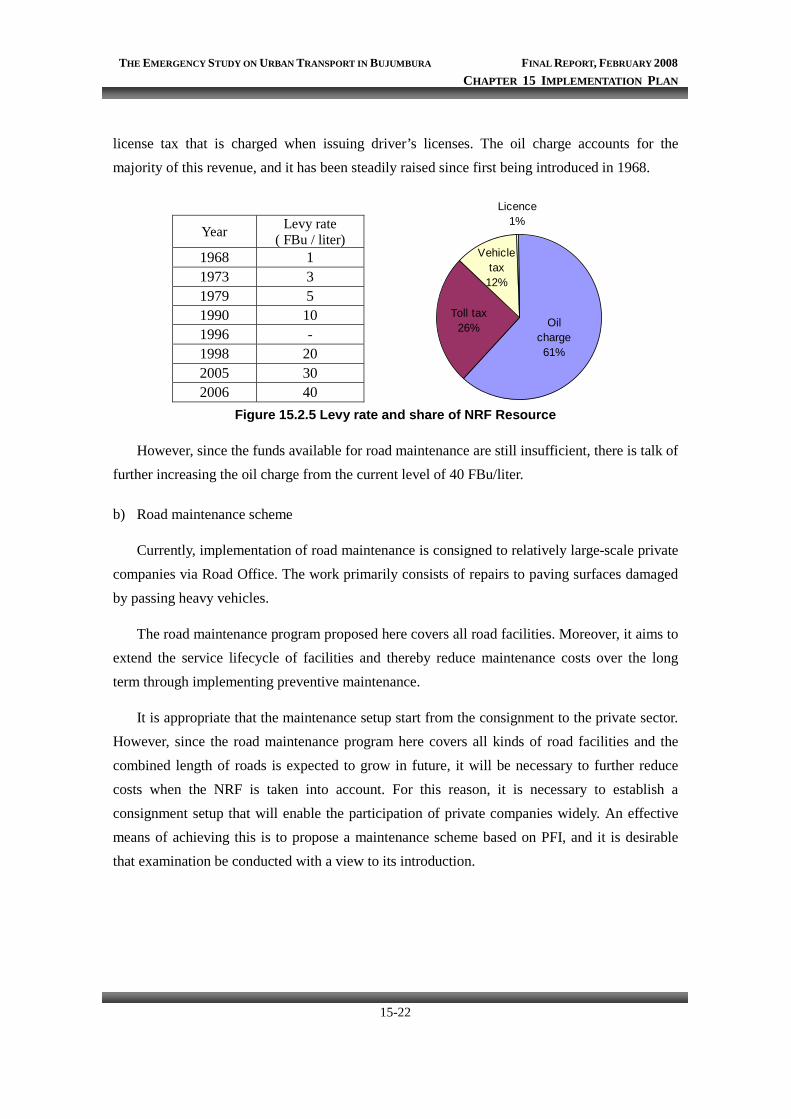
THE EMERGENCY STUDY ON URBAN TRANSPORT IN BUJUMBURA FINAL REPORT, FEBRUARY 2008 CHAPTER 15 IMPLEMENTATION PLAN
15-22
license tax that is charged when issuing driver’s licenses. The oil charge accounts for the majority of this revenue, and it has been steadily raised since first being introduced in 1968.
Year Levy rate ( FBu / liter)
1968 1 1973 3 1979 5 1990 10 1996 - 1998 20 2005 30 2006 40
Figure 15.2.5 Levy rate and share of NRF Resource
However, since the funds available for road maintenance are still insufficient, there is talk of further increasing the oil charge from the current level of 40 FBu/liter.
b) Road maintenance scheme
Currently, implementation of road maintenance is consigned to relatively large-scale private companies via Road Office. The work primarily consists of repairs to paving surfaces damaged by passing heavy vehicles.
The road maintenance program proposed here covers all road facilities. Moreover, it aims to extend the service lifecycle of facilities and thereby reduce maintenance costs over the long term through implementing preventive maintenance.
It is appropriate that the maintenance setup start from the consignment to the private sector. However, since the road maintenance program here covers all kinds of road facilities and the combined length of roads is expected to grow in future, it will be necessary to further reduce costs when the NRF is taken into account. For this reason, it is necessary to establish a consignment setup that will enable the participation of private companies widely. An effective means of achieving this is to propose a maintenance scheme based on PFI, and it is desirable that examination be conducted with a view to its introduction.
Licence1%
Vehicletax
12%
Toll tax26% Oil
charge61%
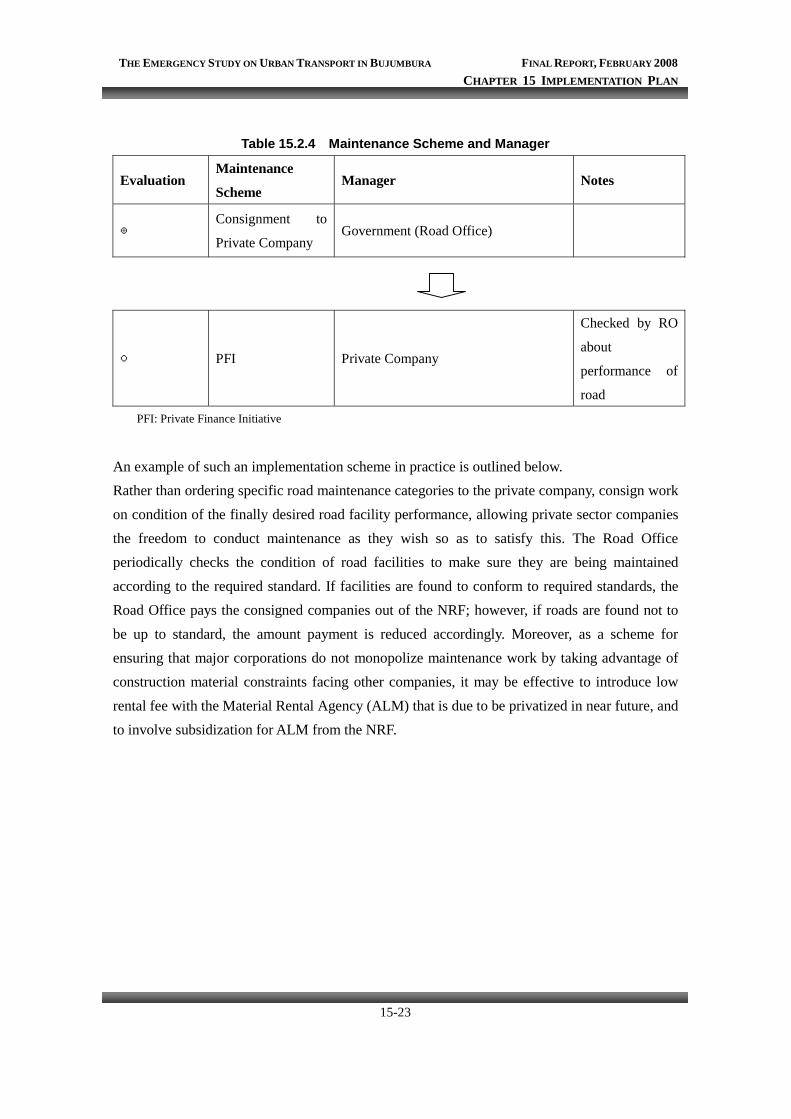
THE EMERGENCY STUDY ON URBAN TRANSPORT IN BUJUMBURA FINAL REPORT, FEBRUARY 2008 CHAPTER 15 IMPLEMENTATION PLAN
15-23
Table 15.2.4 Maintenance Scheme and Manager
Evaluation Maintenance
Scheme Manager Notes
◎ Consignment to
Private Company Government (Road Office)
○ PFI Private Company
Checked by RO
about
performance of
road
PFI: Private Finance Initiative
An example of such an implementation scheme in practice is outlined below. Rather than ordering specific road maintenance categories to the private company, consign work on condition of the finally desired road facility performance, allowing private sector companies the freedom to conduct maintenance as they wish so as to satisfy this. The Road Office periodically checks the condition of road facilities to make sure they are being maintained according to the required standard. If facilities are found to conform to required standards, the Road Office pays the consigned companies out of the NRF; however, if roads are found not to be up to standard, the amount payment is reduced accordingly. Moreover, as a scheme for ensuring that major corporations do not monopolize maintenance work by taking advantage of construction material constraints facing other companies, it may be effective to introduce low rental fee with the Material Rental Agency (ALM) that is due to be privatized in near future, and to involve subsidization for ALM from the NRF.
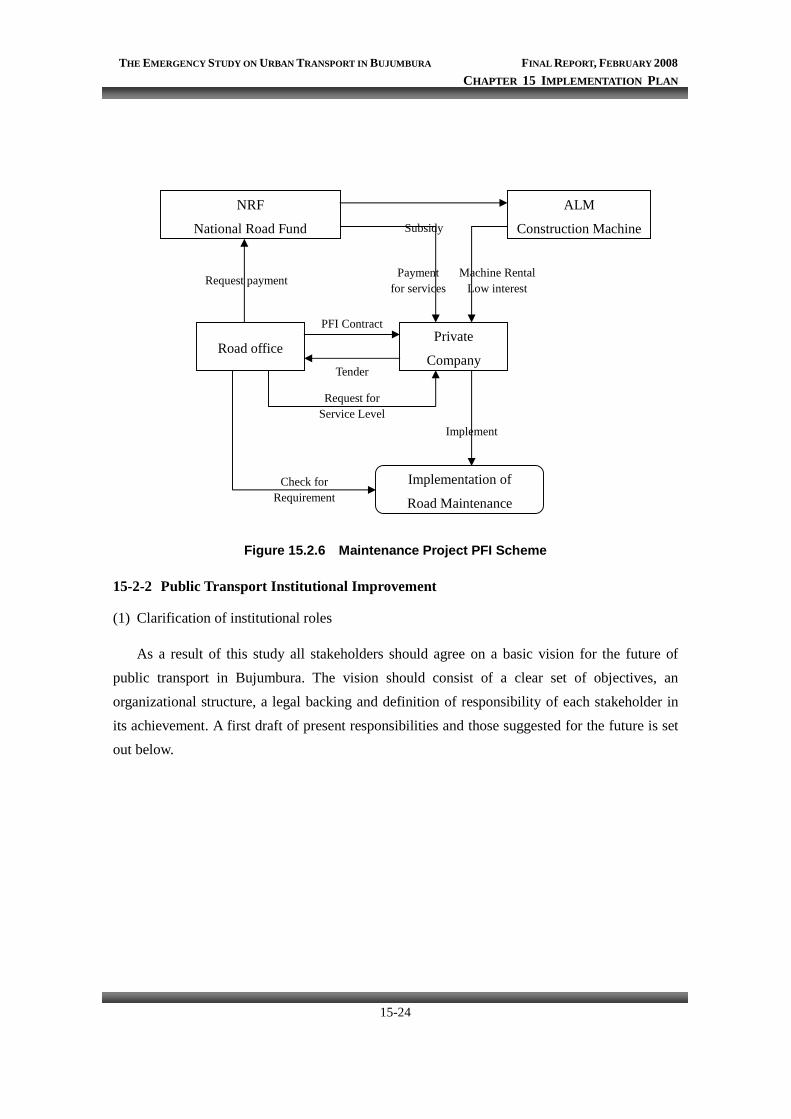
THE EMERGENCY STUDY ON URBAN TRANSPORT IN BUJUMBURA FINAL REPORT, FEBRUARY 2008 CHAPTER 15 IMPLEMENTATION PLAN
15-24
Figure 15.2.6 Maintenance Project PFI Scheme
15-2-2 Public Transport Institutional Improvement
(1) Clarification of institutional roles
As a result of this study all stakeholders should agree on a basic vision for the future of public transport in Bujumbura. The vision should consist of a clear set of objectives, an organizational structure, a legal backing and definition of responsibility of each stakeholder in its achievement. A first draft of present responsibilities and those suggested for the future is set out below.
Road office Private
Company
NRF
National Road Fund
ALM
Construction Machine
Implementation of
Road Maintenance
Tender
PFI Contract
Implement
Request for Service Level
Check for Requirement
Payment for services
Request payment
Subsidy
Machine RentalLow interest
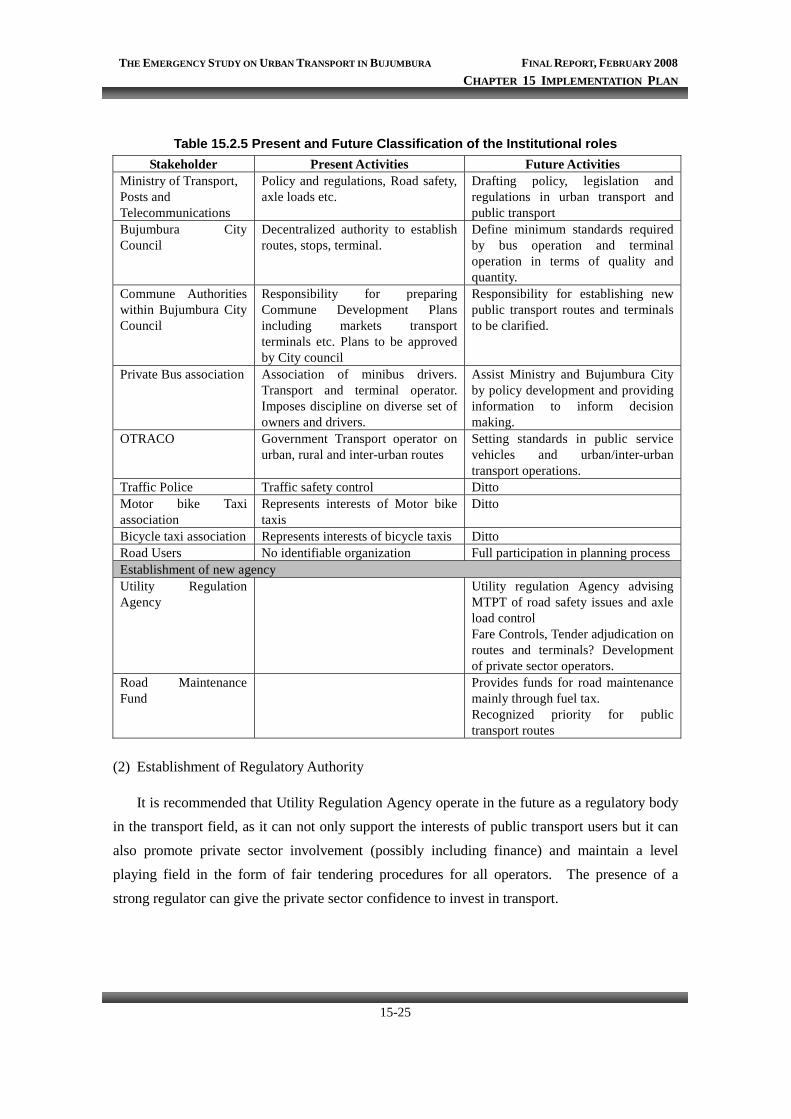
THE EMERGENCY STUDY ON URBAN TRANSPORT IN BUJUMBURA FINAL REPORT, FEBRUARY 2008 CHAPTER 15 IMPLEMENTATION PLAN
15-25
Table 15.2.5 Present and Future Classification of the Institutional roles Stakeholder Present Activities Future Activities
Ministry of Transport, Posts and Telecommunications
Policy and regulations, Road safety, axle loads etc.
Drafting policy, legislation and regulations in urban transport and public transport
Bujumbura City Council
Decentralized authority to establish routes, stops, terminal.
Define minimum standards required by bus operation and terminal operation in terms of quality and quantity.
Commune Authorities within Bujumbura City Council
Responsibility for preparing Commune Development Plans including markets transport terminals etc. Plans to be approved by City council
Responsibility for establishing new public transport routes and terminals to be clarified.
Private Bus association Association of minibus drivers. Transport and terminal operator. Imposes discipline on diverse set of owners and drivers.
Assist Ministry and Bujumbura City by policy development and providing information to inform decision making.
OTRACO Government Transport operator on urban, rural and inter-urban routes
Setting standards in public service vehicles and urban/inter-urban transport operations.
Traffic Police Traffic safety control Ditto Motor bike Taxi association
Represents interests of Motor bike taxis
Ditto
Bicycle taxi association Represents interests of bicycle taxis Ditto Road Users No identifiable organization Full participation in planning process Establishment of new agency Utility Regulation Agency
Utility regulation Agency advising MTPT of road safety issues and axle load control Fare Controls, Tender adjudication on routes and terminals? Development of private sector operators.
Road Maintenance Fund
Provides funds for road maintenance mainly through fuel tax. Recognized priority for public transport routes
(2) Establishment of Regulatory Authority
It is recommended that Utility Regulation Agency operate in the future as a regulatory body in the transport field, as it can not only support the interests of public transport users but it can also promote private sector involvement (possibly including finance) and maintain a level playing field in the form of fair tendering procedures for all operators. The presence of a strong regulator can give the private sector confidence to invest in transport.
THE EMERGENCY STUDY ON URBAN TRANSPORT IN BUJUMBURA FINAL REPORT, FEBRUARY 2008 CHAPTER 15 IMPLEMENTATION PLAN
15-26
(3) Public Transport Management and Transport Planning Expertise
Occasional consultancy studies are no substitute for a permanent supply of high quality advice to be obtained by in post officials who understand the technical issues at stake as well as the local cultural and political aspects of implementing solutions to the problem of urban public transport. It is thus suggested that a capacity building plan be agreed and put into operation as an integral part of the implementation of the project. Both the public and private sectors should participate and the activities of the training plan should be real in that relate to building consensus on the way forward and implementation of the project. It should involve expatriate support and local coordination with as wide participation as possible.
(4) Improvement of Bus terminal Operation
The principle of competitive tendering for the management of terminals should be established perhaps after improvements of city bus terminals. These bus terminals have to be operated in a way that allows a wide variety of operators to use it and to encourage its use as a passenger interchange. In this respect, ideally, the terminus manager should not be an operator but must be able to fairly adjudicate between operators. It is in the interest of passengers that all operators use the same terminus although pricing mechanisms should be used to eliminate the use of the terminus as a parking facility.
15-3 RECOMMENDATIONS FOR IMPLEMENTATION PLAN
(1) Utilization of Private fund
The road budget for all of Burundi is approximately 3,000 million FBu per annum. In Burundi, where roads are underdeveloped, there is still not enough capability to conduct adequate road development without assistance from foreign donors, etc. The government should make every effort to reduce expense through making the maximum possible use of private sector finance. PPP (Public Private Partnership) schemes utilizing BOT and so on are frequently examined in the development of transportation facilities in other developing countries. As was indicated in the preceding section, concerning development of bus exclusive lanes, there is room to consider a project scheme whereby the private companies that will benefit from the development share a part of the cost and there is a clear division of roles and risks between the public and private sectors. Since the participation of private sector in public works basically leads to more efficiency, the governments of various countries are actively promoting PPP in their ODA activities in recent years.
THE EMERGENCY STUDY ON URBAN TRANSPORT IN BUJUMBURA FINAL REPORT, FEBRUARY 2008 CHAPTER 15 IMPLEMENTATION PLAN
15-27
Moreover, concerning road tolls for which direct users pay tolls for use in addition to the private operators, it may be possible to utilize this approach to pay for the crossing sections over the river that are to be newly developed.
(2) Budget Position for Road development and maintenance
The road maintenance budget in Burundi is obtained from NRF. These funds are obtained from the percentage of taxes that are levied on gasoline and driver’s licenses. Since the road maintenance program proposed here aims to conduct preventive maintenance for keeping roads in good condition, it will be necessary to realize more stable maintenance expenses than ever before.
Moreover, the number of registered vehicles in Burundi is increasing at a rapid rate and if this continues, it will cause further traffic congestion and higher road maintenance costs. Therefore, it is important to make sure new sources of revenue are obtained in order to expand the present sources of fund.
・ A Part of business tax that transporters pay to Bujumbura city council currently is transferred to NRF. Until now SETEMU has carried out the construction and maintenance of roads in Bujumbura city utilizing part of this tax, however, in recent years, it has come to specialize more in electricity and sewage works, while the Road Office has taken over almost all road maintenance.
・ At the same time, measures should be taken to deal with illegal parking, which is one of the factors behind road congestion in the Bujumbura city. In addition to the strengthening of check and penalties, it is desirable to promote the construction of public parking. Also, a system of transferring part of the revenue obtained from parking will be established.
・ Concerning the policy on parking, it is recommended that consideration be given to legislation, etc. requiring facilities developers to provide parking according to the demand of parking that can be expected. Within this, it will also be desirable to build a system for subsidizing part of the costs of this from the NRF.
(3) Formulation of Road Maintenance Register System
In order to implement periodic road maintenance, it is necessary to have a system for stocking the contents of everyday monitoring and to implement this over the total road network of Bujumbura. Towards this end, it is effective to have a road maintenance register system that contains basic data (length, width, structures, traffic volume, etc.), past maintenance histories
THE EMERGENCY STUDY ON URBAN TRANSPORT IN BUJUMBURA FINAL REPORT, FEBRUARY 2008 CHAPTER 15 IMPLEMENTATION PLAN
15-28
and current road conditions and can be referred to and renewed at any time. First of all, it is seemed to be appropriate to begin with the road network of Bujumbura city.


