Embed Size (px)
Citation preview

Colloids and Surfaces A: Physicochem. Eng. Aspects 241 (2004) 351–372
Characterisation of irregular spatial structures by parallel setsand integral geometric measures
C.H. Arnsa, M.A. Knackstedta, K.R. Meckeb,c,∗a Department of Applied Mathematics, Research School of Physical Sciences and Engineering, Australian National University,
Canberra 0200, ACT, Australiab MPI für Metallforschung, Heisenbergstr. 3, D-70569 Stuttgart, Germany
c Institut für Theoretische und Angewandte Physik, Universität Stuttgart, Pfaffenwaldring 57, D-70569 Stuttgart, Germany
Abstract
A new method of characterising the morphology of disordered systems is presented based on the evolution of a family of integral geometricmeasures during erosion and dilation operations. The method is used to determine the accuracy of model reconstructions of random systems.It is shown that the use of erosion/dilation operations on the original image leads to an accurate discrimination of morphology. We considerthe morphology of an experimental system and use the method to optimally match a reconstructed model morphology.© 2004 Elsevier B.V. All rights reserved.
PACS:05.40–a; 81.05.Rm; 02.40.–k
Keywords:Porous media; Morphology; Euler number; Minkowski functional
1. Introduction
How do we characterize the structure of a complex ma-terial? This question is both of fundamental interest and iscrucial to the understanding of many industrially importantprocesses. The statistical characterization and modeling ofdisordered microstructures is a central problem in severalapplied fields. Accurate modeling relies on the availabilityof good microstructural models, which in turn relies onaccurate statistical characterization. To date the toolkit usedto quantify forms has been primarily those of the statis-tical physicist and engineer. Complete characterization ofthe effective morphology however requires knowledge ofan infinite set ofn-point statistical correlation functions.When attempting to reconstruct complex morphologies,only lower-order morphological information is available;common methods[1] are based on matching the first twomoments (volume fraction and two-point correlation func-tion) of the binary phase function to a random model. It iswidely recognised that although the two-point correlationfunction of a reference and a reconstructed system is in good
∗ Corresponding author. Fax:+61 2 6125 0732.E-mail address:[email protected] (K.R. Mecke).
agreement, this does not ensure that the structures of the twosystems will match well and attempts to reconstruct mate-rials from experimentally measured two-point informationhave not been very successful[2,3]. The same problem hasbeen encountered at the atomic scale in characterising andcomparing amorphous atomic glasses, where two-pointcorrelation functions are recognized to give poor structuralsignatures. Two-point information is non-unique and doesnot capture many important features of the microstructure.Higher order correlation functions immediately come tomind if one wants to go beyond the two-point correlationfunction. However, there is a conceptual problem sincen-point functions (n ≥ 3) depend on 3(n− 1)− 3 parameterseven for isotropic and homogeneous point distributions.Already for the three-point correlation function we arenot aware of a study where its dependence on all threeparameters was estimated.
Other useful characterizations of microstructure includethe chord-length distribution function[4,5] (and the relatedlineal-path function[6–8]) and the pore size distributionfunction [9]. However reconstructions of experimental datasets based on these characterisations have been shown togive a poor representation of the connectivity of the systems[10]. Functions that may provide more complete informa-
0927-7757/$ – see front matter © 2004 Elsevier B.V. All rights reserved.doi:10.1016/j.colsurfa.2004.04.034

352 C.H. Arns et al. / Colloids and Surfaces A: Physicochem. Eng. Aspects 241 (2004) 351–372
tion about connectivity[11] are unfortunately too complexto incorporate into reconstruction schemes[10]. Incorpo-ration of three- and four-point information may lead to abetter estimation of structure, but their measurement is verycomplex and it is not clear how to incorporate the informa-tion within reconstruction algorithms. There is a need forstatistical measures which include higher-order correlations,but are fast and reliable for characterizing the morphologyof a structure. Statistical measures which are sensitive to themorphology of structures have been extensively investigatedin other fields such as image analysis and pattern recogni-tion [4,12,13,16,17]. Integral geometry provides a suitablefamily of morphological descriptors, the Minkowski func-tionals (MFs). These measures embody information fromevery order of the correlation functions, are numericallyrobust even for small samples, are independent of statisticalassumptions on the distribution of phases, and yield globalas well as local morphological information. The MFs areadditive measures allowing one to calculate these measureseffectively by simply summing over local contributions[14,15]. The MFs characterize not only the connectivity,but the shape and content of spatial figures. In three dimen-sions the functionals are related to the familiar measuresof volume fraction, surface area, integral mean curvatureand Euler characteristic. The morphological measures areuseful order parameters to describe spatial patterns quanti-tatively and provide for a comparison between experimentand theory. In particular, MFs have been used to distinguishquantitatively between the turbulent and regular Turing pat-terns from chemical reaction-diffusion systems[18] and toshow that the hole distribution in thin films are inconsistentwith the concept of spinodal decomposition, but consistentwith a nucleation scenario[19]. In both cases the concept oflevel contours of concentration were used to threshold thesystem. MFs have also been used to discriminate betweendifferent cosmological models of the early universe[20]. Inthis cases, the MFs of parallel bodies of a point pattern (aconvex set) was considered. The point pattern was dilated toobtain detailed morphological information where the paral-lel distanceε was used as the diagnostic parameter. For ap-plications to disordered and porous media, we additionallyapply erosion/dilation procedures[21]. Since the function-als are numerically robust against short-scale spatial irreg-ularities in the coverage, which may arise via the variationof the thickness of the erosion/dilation, the scale-dependentmorphological features of this coverage may then be ex-plored by varying the thickness of the erosion/dilation. Insuch a way, we obtain scale-dependent integral informationon higher-order correlations of the distribution of pores inaddition to structure functions of the material.
In the current work, we measure the evolution of theMinkowski functions (Mfs) during erosion and dilation op-erations on complex non-convex morphologies. It is shownthat this gives a discriminating signature of structure. Fur-ther, we consider a range of disordered morphologies: (1)particle based models: models based on random Poisson dis-
tributed overlapping spheroids (Boolean models); (2) mod-els based on level-cuts of Gaussian random fields; and (3)models based on Voronoi tesselations of Poisson distributedpoints. We use the method to determine the accuracy ofmodel reconstructions of random systems. It is shown thatthe use of parallel bodies and Mfs leads to a very accuratediscrimination of morphology. We consider the morphologyof an experimental system and use the method to optimallymatch a reconstructed model morphology.
The plan of the paper is as follows. In Section 2, wereview concepts in mathematical morphology, and give thetheoretical predictions for the MFs for parallel sets of convexbodies. We then describe the computational algorithm forcalculating MFs, generating the parallel body morphologiesand define the model microstructures. In the final section,we compare the Mfs for the range of model morphologiesand compare to Mfs measured on experimental images.
2. Mathematical morphology
Since Minkowski functionals are not well-known amongphysicists as morphological measures for spatial patterns,we compile in this section some pertinent facts from imageanalysis[12], mathematical morphology[4], and integral ge-ometry [13,16,17]. A prominent member of this family ofmorphological measures is the Euler-characteristic describ-ing the topology, i.e. the connectivity of spatial patterns.
2.1. Minkowski functionals
The Minkowski functionals derive from the theory of con-vex sets. They generalize curvature integrals over smoothsurfaces to the case of surfaces with singular edges and cor-ners. Such irregularities arise always when spatial data arediscretized because a digitial image consists of a union ofcubic voxels intersecting at edges and corners.
Let K be a convex body in the three-dimensional Eu-clidean spaceR3, with regular boundary∂K ∈ C2 and prin-cipal radii of curvatureR1 andR2. The surface areaF of Kis given by
F(K) =∫∂K
df =∫S2R1R2 dσ, (1)
since the area element df on ∂K is related with the areaelement dσ of the spherical image ofK under the Gaussianmap by df = R1R2 dσ. The convex bodyKε ofK is definedas the set of points with distances toK smaller thanε, i.e.
Kε = ∪x∈KBε(x). (2)
The radii of curvature of∂Kε areR1+ ε andR2+ ε. There-fore, one finds for the area of the parallel body
F(ε;K)= F(Kε) =∫S2(R1+ ε)(R2+ ε)dσ
= F(K)+ 2 ·H(K) · ε+G(K) · ε2, (3)

C.H. Arns et al. / Colloids and Surfaces A: Physicochem. Eng. Aspects 241 (2004) 351–372 353
where
H(K) = 1
2
∫∂K
(1
R1+ 1
R2
)df, (4)
is the integral mean curvature and
G(K) =∫∂K
1
R1R2df, (5)
is the integral Gaussian curvature of∂K. If V denotes thevolume ofK andV(ε) that ofKε, we have
V(ε;K)= V(K)+∫ ε
0Fε′ dε
′ = V(K)+ F(K) · ε
+H(K) · ε2+(
4
3π
)ε3, (6)
which is known as Steiner’s formula.More generally, Steiner’s formula for convex bodies in
d-dimensional Euclidean spaceRd may be written as
V(ε;K) =d∑ν=0
(d
ν
)ωνVν(K)ε
ν, (7)
whereby the Minkowski functionalsVν(K), ν = 0, . . . , dare defined andων = πν/2/(1 + ν/2) denotes theν-dimensional volume of a unit-sphere, e.g.ω0 = 1,ω1 = 2,ω2 = π, andω3 = 4π/3. In d = 3 we find by comparison
V0(K)= V(K), 6V1(K) = F(K),3πV2(K) = H(K),V3(K)= G(K)
4π= χ(K), (8)
with the constantχ(K) = 1 denoting the Euler characteristicof a convex bodyK. The expression ((7)) for V(ε;K) allowsus to extend the definition of the functionalVν to any convexbody without requiring regularity of∂K; in particular im-portant for digital images as considered in the following. Forexample, let us take a cubeK(3)a in R3 with edge lengtha.Its parallel volumeV(ε;K(3)a ) may be found by inspection,
V(ε;K(3)a ) = a3+ 6a2ε+ 12a
(1
4π
)ε2+ 8
(4
24π
)ε3
(9)
yielding the Minkowski functionals
Vν(K(3)a ) = a3−ν. (10)
The ε-terms are the contributions from the rectangularprisms on the faces ofK(3), from the cylindrical sectorson its edges and from the spherical sectors located on itscorners. Furthermore, Steiner’s formula also yields theMinkowski functionals for lower dimensional ‘improper’convex bodies embedded inRd , such as points, straight linesegments, squares etc. For example, in the case of a squareK(2)a of edge lengtha in R3 which occur as boundaries of
voxels in digitised images, one finds
V(ε;K(2)a ) = 2a2ε+ 2aπε2+(
4
3π
)ε3, (11)
and thus
V0(K(2)a ) = V(K(2)a ) = 0,
V1(K(2)a ) =
F(K(2)a )
6= a2
3, (12)
V2(K(2)a ) =
H(K(2)a )
3π= 2
3a,
V3(K(2)a ) =
G(K(2)a )
4π= χ(K(2)a ) = 1.
We note that the two-dimensional square enters here asa quader with vanishing height; therefore its ‘content’F(K
(2)a ) = 2a2 is twice the area of a two-dimensional
square with edge lengtha. If a→ 0, the square degeneratesinto a pointK(0) with the Euler characteristicχ(K(0)) = 1andVν(K(0)) = 0, ν = 0, . . . , d − 1.
Let us now list some common general properties of thefunctionalsVν : K→ R. Here,K denotes the class of closedbounded convex subsets ofRd .
2.1.1. AdditivityIf K ∈ K is dissected by a planar cut into two convex
parts such thatK = K1 ∪K2, K1,K2 ∈ K, then
Vν(K1 ∪K2) = Vν(K1)+ Vν(K2)− Vν(K1 ∩K2) , (13)
holds for eachν = 0, . . . , d. This relation is easily verified ifK = Q is a quader of edge lengthsa, a, and 2a which is cutinto two cubesK(3)1 andK(3)2 of edge lengtha. For instance,
the surface area 10a2 of Q = K(3)1 ∪ K(3)2 is obtained by
adding up the surface areas of the cubes(2 · (6a2)) andsubtracting the content(2a2) of the intersectional squareK(2)a = K(3)1 ∩K(3)2 .
2.1.2. Motion invarianceLet G be the group of motions (translations and rotations)
in Rd . The transitive action ofg ∈ G onK ∈ K is denotedby gK. Then
Vν(gK) = Vν(K), ν = 0, . . . , d, (14)
i.e. the Minkowski functionals of a body are independent ofits location in space.
2.1.3. ContinuityIf Kn → K for n → ∞, Kn,K ∈ K (with convergence
defined in terms of the Hausdorff metric for sets), then
Vν(Kn)→ Vν(K), ν = 0, . . . , d. (15)
Intuitively, this continuity property expresses the fact thatan approximation of a convex body (an image) by convexpolyhedraKn (digitised data), for example, also yields anapproximation ofVν(K) by Vν(Kn).
So far, we only considered the Minkowski functionalsrestricted to the classK of convex bodies such as voxels of

354 C.H. Arns et al. / Colloids and Surfaces A: Physicochem. Eng. Aspects 241 (2004) 351–372
a binary image. Since we want to apply these measures toinvestigate the spatial pattern of digitized data as describedat the beginning, the definition of the Minkowski functionalsmust be extended to non-convex sets such as the union ofvoxelsK(3). This extension may be achieved in the followingway [22]. Let R denote the class of subsets ofRd whichcan be represented as a finite union of convex sets fromK,i.e. A ∈ R if and only if A = ∪Ni=1Ki, N < ∞, Ki ∈ K.The classR also includes the empty set∅. In the first step,the Euler characteristic is introduced by
χ(A) =
1, A ∈ K, A ≡ ∅,0, A = ∅. (16)
and extended toR via additivity
χ(A ∪ B) = χ(A)+ χ(B)− χ(A ∩ B) (17)
for anyA,B ∈ R. In particular,
χ(∪Ni=1Ki)=∑i
χ(Ki)−∑i<j
χ(Ki ∩Kj)+ · · ·
+ (−1)N+1χ(K1 ∩K2 ∩ · · · ∩KN), (18)
which follows fromEq. (13)by induction. The right handside ofEq. (18)only involves convex sets and may be appliedtogether withEq. (16)to computeχ(A) for anyA ∈ R. Wealso note thatχ : R→ Z is motion invariant and it can beshown to agree with the Euler characteristic as defined inalgebraic topology.
As a second step of the extension, the Minkowski func-tionals are defined forA ∈ R by
Vν(A) = 1
ων
∫χ(A ∩ Eν)dµ(Eν), (19)
andVd(A) = χ(A). Here,Eν is aν-dimensional plane inRd .The integral runs over all positions (induced by translationsand rotations) ofEν, weighted with the so-called kinematicaldensitydµ(Eν) ([22,13]) which is related to the invariantHaar measure on the group of motionsG and is normalizedsuch that for ad-dimensional ballBr with radiusr,Vν(Br) =(ωd/ων)r
d−ν.In the case of convexA ∈ K, the Eq. (19) reproduce
the Minkowski functionals obtained previously fromV(ε;A)[23]. According to their definition (Eq. (19)), the Minkowskifunctionals onR inherit from the Euler characteristic theproperty of additivity, i.e.
Vν(∪Ni=1Ki)=∑i
Vν(Ki)−∑i<j
Vν(Ki ∩Kj)+ · · ·
+ (−1)N+1Vν(K1 ∩ · · · ∩KN), (20)
as well as motion invariance. These features together withtheir ‘conditional continuity’ (theVν are continuous whenrestricted toK) specify the Minkowski functionals as a dis-tinguished family of geometrical and topological descrip-tors: There is a remarkable theorem[22] which asserts that
any additive, motion invariant and conditionally continuousfunctionalF on subsetsA ⊂ Rd, A ∈ R, is a linear combi-nation of thed + 1 Minkowski functionals,
F(A) =d∑ν=0
cνVν(A), (21)
with real coefficientscν independent ofA. Important con-sequences of this theorem are, for instance, the ‘principalkinematical formulae’, which may be written concisely inthe form∫GMν(A ∩ gB)dg =
ν∑β=0
(ν
β
)Mν−β(B)Mβ(A) (22)
with Mν(A) = (ωd−ν/ωd)Vν(A). The integral is performedwith respect to the invariant Haar measure dg of G and runsover all motions of the setB, withA,B ∈ R. Equation ((22))describes the factorization of the Minkowski functionals ofthe intersectionA ∩ B of two bodies if one integrates overthe motions, i.e. translations and rotations ofB. In the caseB = Bε(x) andA = K ∈ K the kinematical formula forν = d reproduces Steiner’s formula ((7))∫Rdχ(K ∩ Bε(x))ddx = V(ε;K). (23)
The kinematic formulae are useful mathematical tools instereology and stochastic geometry. The Minkowski func-tionals can be calculated efficiently for any given coveragewithout requiring statistical assumptions about the underly-ing point set. However, when the latter constitutes a realiza-tion of a random spatial process (which is the case in modelsfor porous media) then one faces a difficult inverse problem:to infer the statistics of random geometrical patterns from agenerally limited amount of data. It turns out that the meanvalues of the Minkowski functionals provide unbiased stere-ological estimators[24]. Moreover, these mean values canbe calculated exactly for the classical Boolean model[25],where grains of arbitrary shape are randomly distributed inRd according to a Poisson distribution, which is often em-ployed as a reference model. For convenience, we recall theresult for these mean values for randomly distributed over-lapping discs in two dimensions (seeFig. 3):
V0(r) = 1− e−πr2ρ,
V1(r) = πrρe−πr2ρ, (24)
V2(r) = πρ(1− πr2ρ)e−πr2ρ,with the number densityρ of discs [25]. The applicationof these Minkowski functionals in statistical physics andcosmology are reviewed by[15,17] and[26], respectively.
2.2. Morphology of discretized sets
We consider a two-component medium filling a cubic vol-umeV = L3. A digitized set of either component can be

C.H. Arns et al. / Colloids and Surfaces A: Physicochem. Eng. Aspects 241 (2004) 351–372 355
described by a collection of voxels or compact (closed andbounded) convex sets. The three general properties that afunctional should possess in order to be a morphologicalmeasure have been proposed to be additivity, motion invari-ance and continuity[14,15]. In three dimensional space ex-amples of such measures include volume and surface areaof a domain. In two dimensions they include the boundarylength and area. A remarkable theorem in integral geome-try is the completeness of the Minkowski functionals[22].The theorem asserts that any additive, continuous and mo-tion invariant functionalV(A) on subsetsA ⊂ Rd is a linearcombination of thed + 1 Minkowski functionals
V(A) =d∑ν=0
cνVν(A), (25)
with real coefficientscν independent ofA. The Minkowskifunctionals in three dimensions are related to familiar mor-phological quantities. For instance,
V0 = V, 6V1 = S, 3πV2 = C, V3 = χ, (26)
with the surface areaS and integral mean curvatureC ofthe surface exposed by a coverage with volumeV and Eu-ler characteristicχ. Thed+1 Minkowski functionals there-fore are the complete set of morphological measures. Thecontinuity of the functionalsVν allows the definition of in-tegrals of the curvature function to be evaluated for surfaceswith singular edges; i.e, the Minkowski functionals general-ize curvatures as differential geometric quantities to singularedges[20,18]. Therefore it is straightforward to apply thenotion of morphological measures to patterns consisting ofindividual lattice grains (voxel-based images).
Let us consider a three-dimensional cubic lattice+(3) ≡aZ3, wherea denotes the lattice constant. At each pointx(3)i ∈ Z3 one can fix a three-dimensional cubeKi (voxel) of
edge lengtha with x(3)i as midpoint, wherei = 1, . . . L3 nu-merates the lattice sites inside a cubic window of sizeL. LetE(ν) ⊂ +(3) denote aν-dimensional planar sublattice, i.e. aν-dimensional hyper-plane cuttingΛ(3). The Euler charac-teristic χ can be defined byχ(Ki) = 1, χ(∅) = 0 and fornon-empty intersectionsχ(∩iKi) = 1. Sinceχ is an additivefunctional one obtains for the union∪Ni=1Ki of N voxels
χ
(N⋃i=1
Ki
)= χ
(N−1⋃i=1
Ki
)+ χ(KN)− χ
(N−1⋃i=1
Ki ∩KN)
=∑i
χ(Ki)−∑i<j
χ(Ki ∩Kj)+ · · ·
+ (−1)N+1χ(K1 ∩K2 ∩ · · · ∩KN). (27)
Generally, the statistics of a heterogeneous media in a do-mainΩ with volume|Ω| is specified by a sequence of cor-relation functionsρ(n)(r1, . . . , rn) of the voxelsKi withthe homogeneous densityρ ≡ ρ(1)(r1) (porosity). The Eu-ler characteristic embodies information from every ordern
of the correlation functionsρ(n)(r1, . . . , rn) due to its de-pendence on multiple intersections of voxels. The simplemeasure ofχ on a disordered medium[27,28] only givesone higher order information at the local scale (scale ofthe voxel). By applying erosion/dilation operations one canprobe larger distances ofρ(n). We note that this functionalχcoincides with the Euler characteristic of algebraic topology.
The normalized Minkowski functionalsvν(A) =Vν(A)/L
3 of a structureA = ∪Ni=1Ki on a three-dimensionalcubic lattice of sizeL3 can be defined by[20,15]
vν(A) = lν(3ν
)L3
∑Eν
χ(A ∩ Eν), (28)
and forν = 0,1,2 andv3(A) = l3χ(A)/L3. Here,l denotesa dimensionless scaling factor which takes into account thesize of typical homogeneous domains of the structureAwithrespect to the lattice constanta. For the examples consid-ered in this paperl = 10 was used as an convenient nor-malization of the functionalsvν. The sum runs over all po-sitions (induced by lattice translations and rotations) of theν-dimensional hyper-planesEν.
Obviously, the Minkowski measures inherit the depen-dence on thenth order correlation functionsρ(n)(r1, . . . , rn)for the Euler characteristicχ. Therefore, one obtains for themean values of the MFs:
vν =∞∑n=1
(−1)n+1
n!
n∏i=1
∑ri∈Ω
vν
[n⋂i=1
Ki
]ρ(n)(r1, . . . , rn)
(29)
where the voxelKi is centered atri. If the density corre-lation functionsρ(n)(r1, . . . , rn) were independent of posi-tion, the integrals inEq. (29)could be performed using thefundamental kinematic formula yielding analytic mean val-ues forvν(ρ) which depend only on the porosityρ [15].But this is not the case for most physical applications andthe Minkowski functionals depend in an integral way on theshort-range behaviour of all correlation functionsρ(n).
From definition (28), it is clear that the Minkowski func-tionals inherit additivity fromχ and that they are relatedto familiar geometric quantities of the structureA, namelythe numberv0(A) of voxels normalized by the total num-ber of lattice sitesL3, the normalized number 6v1(A)/l ofboundary plaquettes (pairs of neighbored black and whitevoxels), and the normalized signed number 12v2(A)/l
2 ofedges where concave (convex) edges are counted as negative(positive). In particular, for aj-dimensional cubeK(j) =∩23−ji=1 Ki with centerx(j) generated by the intersection of
23−j neighbored lattice cubesKi (voxels) one obtains
vν(K(j)) = ν!j!
6(ν + j − 3)!
lν
L3, 3− j ≤ ν ≤ 3, (30)
andvν(K(j)) = 0 for 0≤ ν < 3− j. One should note, thatK(j) is not a voxelK but part of its boundary∂K and thatthe midpointsx(j) are not lattice points onA, except forx(3).

356 C.H. Arns et al. / Colloids and Surfaces A: Physicochem. Eng. Aspects 241 (2004) 351–372
Repeating the definition (28) and using Morses theoremin successive dimensions one obtains the decomposition ofthe morphological measuresvν in terms of edge and cornercontributions[20,15]
vν(A) =3∑
µ=3−ν
(−1)3−ν+µν!µ!
3!(ν + µ− 3)!
∑x (µ)
χ(A ∩ x(µ)), (31)
where the sum runs of all midpointsx (µ) of theµ-dimen-sional boundary cubesK(µ), i.e. of the plaquettes, edges,and corners of voxelsKi. For all voxel-based images, onemust specify the local neighborhood of the voxels. Since onemust consider topologically closed sets, voxels may be con-nected only by a single point. For voxel-based images thisleads to some ambiguity in the measure. On a square lattice,diagonally connected pixels have only one point in common— in the absence of a preferred connectivity of either phase,the interface can be considered to be curved equally towardeither medium. For example, consider the configuration con-sisting of diagonal cells on a square lattice (Fig. 1). Theprobability of either phase being connected depends on thephysics of the situation. In the presence of strongly preferredconnectivity of one phase the neighborhood will have eightneighbors (a pixel is connected to nearest and next-nearestneighbors) for the phase of preferred connectivity, and fourneighbors (only nearest neighbor connections) for the otherphase. This leads to a duality of these measures. Similarlyon a cubic lattice one may have six or twenty six neighborsdepending on the absence or presence of preferred connec-tivity. The connectivity of either phase can be varied contin-uously by defining the probabilitya of a common edge tobe connected in one phase and probabilityb = 1− a in theother phase[29]. If neither phase has preferred connectivitywe seta = b = 1/2.
2.3. Parallel bodies
We define the parallel body
Aε = x; d(A, x) ≤ ε , (32)
Fig. 1. Configuration resulting in an ambiguous geometry on a square lattice. The ambiguity at the central vertex can be resolved in two ways: (a) theconfiguration is continuous in the white phase, or (b) continuous in the black phase.
of a structureA as the set of all pointsx with dis-tances d(A, x) less than ε to A. Here, d(A, x) =Min (|x− y|; y ∈ A) denotes the minimal Euclidean dis-tance where|x| is the standard norm in ad-dimensionalEuclidean space. Changingε corresponds to dilationε > 0and erosionε < 0 of the spatial structure. For nega-tive values ofε the parallel body is defined formally byAε<0 = x; d(Ac, x) ≤ εc, i.e. as the complement set of allpoints with distances less thanε to the complementAc ofA. Alternatively, one may define the parallel body
Aε = ∪x∈ABε(x) (33)
by the union of all spheresBε(x) of radiusε and centersx ∈A inside ofA. Forε < 0 the parallel body is given by the setof all centersx so that the unionA = ∪x∈AεBε(x) equalsA.Mathematically, the erosion/dilation operators can also beintroduced in terms of Minkowski addition and subtractionoperators. The Minkowski additionC = A⊕ B of two setsA and B consists of all pointsc = a + b which can bewritten as a sum of pointsa ∈ A andb ∈ B contained inAandB. A dilation AE of a setA by a structural elementEcan then be written asAE = X ⊕ E(ε), whereε notes thecharacteristic size of the structuring element. If we take asthe structuring element ad-dimensional sphere of radiusε,and grow the radius of the sphere to run through all possibleradii until the structure becomes a one-phase medium, wecan write this as an operationAε = A ⊕ εB with a unitsphereBmultiplied by the actual dilation radius. Analogousto the Minkowski addition of two sets one may define theMinkowski subtractionA B consisting of all pointsc sothat to each pointb ∈ B one can find the pointsa ∈ Awith c = a − b. If no such points exists, the subtractionAB = ∅ is empty. In other words, the difference is givenby A B = x ∈ Rd, x ⊕ B ⊂ A or, alternatively, bythe Minkowski additionA B = (Ac ⊕ (−B))c with thecomplementAc where−B denotes the inverted set.
One should note that dilation and erosion cannot be ex-changed, i.e. that(Aε)−ε¬ = A which is clearly visible inFig. 2. Although the Minkowski addition is commutative,associative and distributive with the union∪ as second op-

C.H. Arns et al. / Colloids and Surfaces A: Physicochem. Eng. Aspects 241 (2004) 351–372 357
Fig. 2. Illustration of the differences in the erosion/dilation operation on a convex set and a non-convex set. In (a) we start from a collection of convexshapes (point pattern) and dilate first toφ(r − ε) we obtain the black pattern and then further toφ(r) = 0.5 where we obtain the grey pattern. In (b)beginning from the non-convex (grey) pattern atφ(r) = 0.5, we obtain a different morphology atφ(r − ε). Enhanced connectivity between overlappingsphere centers is one obvious qualitative difference. Domain size is 512× 512, with r = 46.5 andε = 15.5 in pixel units. The black phase on the leftside has a fraction ofφ = 0.134 and 34 components (periodic boundaries). In contrast, the black phase on the right side has a fraction ofφ = 0.156and 20 components.
eration, i.e.(A ∪ B)⊕ C = (A⊕ C) ∪ (B⊕ C), these rela-tions do not hold for intersections∩ but only a monotonicrelation(A∩B)⊕C ⊂ (A⊕C)∩ (B⊕C). The equality isvalid, if A∪B andC are convex grains. Also one finds thatA B ≡ A⊕ (−B) and that(A B)⊕ B ⊂ A is only ansubset ofA. Measuring the Minkowski functionsvν(ε) of abody one obtains detailed morphological information withε used as a diagnostic parameter. For a convex bodyK ind-dimensional Euclidean space thed-dimensional volumev0(ε) of its parallel bodyKε is given by the MFs. UsingSteiners formula[13,22]
V(Kε) = V(K ⊕ Bdε ) =d∑ν=0
(d
ν
)ωνVν(K)ε
ν, (34)
with ω0 = 1, ω1 = 2, ω2 = π, andω3 = 4π/3 one findsa polynomial inε where the coefficients are given by thelocal MFsVν(K) of the grainK. In general, one finds forthe Minkowski functionals of the parallel bodyKε
Vν(Kε) =d−ν∑µ=0
(d − νµ
)ων+µων
Vν+µ(K)εµ. (35)
Thus, if one knows the MFsvν(K) = vν(ε = 0) of a con-vex structureK, one knows the MFsvν(ε) for arbitraryε,and conversely, if one measures the parallel volumev0(ε)
of a convex shapeK, for instance, one can infer its MFsvν(K). This is not the case for irregular non-convex shapesA. In this case, the Minkowski functionsvν(ε) of the par-allel bodyAε contains more information about the spatialstructure than just the MFsvν(A) = vν(ε = 0) at zero di-lation. In particular, applyingEq. (29), contributions fromevery ordern are contributing for distances≤ ε. The par-allel body includes all points of distance less thanε to Awhich depends in turn on non-local properties ofA such asnarrow throats or bottle necks. This is illustrated inFig. 2.Thus, the parallel surface∂Aε contains spatial informationabout the embedding of the surface∂A in space in addition
to the MFs of the grainsA. Parallel bodies may thereforebe used to describe the morphology of irregular, non-convexpatterns beyond the additive MFs. One should keep in mindthatvν(ε) is not unique and still depends on the shape ofK
so that often the notationvν(ε;A) is used. In particular, oneshould note thatvν(ε;Aε′) ≡ vν(ε+ ε′;A).
2.4. Minkowski functionals of dilated point patterns
In order to demonstrate the utility of the method weconsider first a more simple case than two-phase media,namely point patterns. The discriminative power of thecomparison of experimentally measured point patterns withtheoretical models for the distribution of the points dependschiefly on the statistical measure used. In the experimentalphysics community the most frequently used measure wasand still is the two-point correlation function of a pointprocess such as the distribution of galaxies, holes in thinliquid films, or molecule positions of simple liquids[15].However, two-point correlation functions are poor dis-criminators of morphological features. Indeed, completelydifferent spatial patterns and point distributions could dis-play the same two–point correlation function, i.e. no directconclusions about the morphology of the structure can bedrawn from an analysis with these two–point measures[30].
Higher–order correlation functions immediately come tomind if one wants to go beyond the two–point correla-tion function. However, there is a conceptual problem sincen–point functions (n ≥ 3) depend on 3(n− 1)− 3 parame-ters even for isotropic and homogeneous point distributions.Already for the three-point correlation function we are notaware of a study where its dependence on all three param-eters was estimated. Integral information is required. Thismay be accomplished, e.g. for the three-point function byaveraging over the shape of triangles, or by considering the(factorial) moments of counts in cells.

358 C.H. Arns et al. / Colloids and Surfaces A: Physicochem. Eng. Aspects 241 (2004) 351–372
For the construction of statistical methods, sensitive to themorphology of a structure, additivity is a promising heuris-tic principle which can guide us to define useful measures.Additivity yields robust, local decomposable measures dueto Eq. (13). The mathematical discipline of integral geom-etry supplies us with a suitable family of such descriptors,namely the Minkowski functionals. These measures embodyinformation from every order of the correlation functions, arenumerically robust even for small samples, and yield globalas well as local morphological information. The Minkowskifunctionals are additive measures which allows us to cal-culate them efficiently by summing up their local contri-butions although they depend on all orders of correlationfunctions.
Efforts to go beyond the two-point correlation functioncomprise the consideration of higher-order correlations, voidprobability functions[31], andJ-functions[26]. However,statistical measures which are sensitive to the morphologyof point patterns have been not widely investigated. Of thoseapproaches which focus on global aspects of a density dis-tribution, the use of topological descriptors appears to beamong the most effective with respect to the comparison oftheoretical models and experimental observations. In partic-ular, the possibility to probe the topology of spatial struc-tures by employing the Euler characteristic or the genus of aspatial structure seems to be promising. But the full morpho-logical specification of spatial patterns requires topologicalas well as geometrical descriptors to characterize not onlythe connectivity but also the content and shape of point pat-terns. Integral geometry supplies a suitable family of suchdescriptors, namely the Minkowski functionalsVν.
In order to apply the Minkowski functionals to pointpatterns each point is decorated by a d-dimensional sphereof radiusr (seeFig. 2). The scale-dependent morphologicalfeaturesVν(r) of this coverage may then be explored byvarying the radius of the sphere. Calculating the Minkowskifunctionals for a given covering we obtain a quantitativecharacterization of the scale-dependent morphology of theunderlying spatial point process, which generalizes thespherical contact probabilityHs(r) = V0(r), i.e. the voidprobability function. Let us be more precise. Consider a setof points xi/i = 1, . . . , N which represent the structurein d-dimensional Euclidean spaceRd . In order to studythe global features of this point set, we introduce a col-lection of neighborhoods by covering each point with ad-dimensional sphereBr(xi) = x ∈ Rd/‖x−xi‖ ≤ r. Forany chosen value of the radiusr, the union of these spheresspecifies an ensemble of clusters, where two disks are saidto belong to the same cluster if they are connected by achain of intersecting disks. By employing the Minkowskifunctionals to measure content (area), shape (boundarylength), and connectivity (Euler characteristic) of the cov-eringB(r) = ∪Ni=1Br(xi) under variation ofr, we arrive ata quantitative operational definition for the scale-dependentmorphological characteristics of the underlying spatial pointprocess.
The correlation functionρ(x1, x2) is only a second-orderproperty of a point process. Thus, two processes havingthe same intensityλ and correlation functionρ(x1, x2) mayshow very different morphology. Let us consider, for in-stance, the cellular process of Baddeley and Silverman[30]shown inFig. 3 for two dimensions.
Here, a unit square is divided intoN2 cells of edge length1/N. In each cell,n points are distributed randomly andindependent wheren is a random number: with probabil-ity 1/10, we choosen = 0, but n = 1 with probability8/9 andn = 10 with probability 1/90. Thus, the intensityof this homogeneous point process equalsρ = 1 and thetwo-point correlation function isρ(x1, x2) = 1. In Fig. 3,a realization of this process is shown withN = 20 and atotal number of 420 points, as well as a Poisson processwith the same number of randomly and independently dis-tributed points. By visual inspection, the set of points givenby Baddeley and Silverman distribution shows a more reg-ular structure. Very dense clusters can be seen in this pro-cess whereas larger voids can only be found in the Poissondistribution. Nevertheless, both point distributions exhibitthe same two-point characteristics. Although the two-pointcorrelation functions are identical, the Minkowski function-als of these two processes which are shown inFig. 3 ex-hibit clear differences due to correlations of higher-orders.The Minkowski functionals for the Baddeley-Silverman pro-cess are larger at smallr than for the Poisson distributiondue to the more regular structure where fewer disks of ra-dius r overlap. At intermediate radii a more pronouncednetwork of connected (overlapping) disks are formed forthe Baddeley-Silverman process indicated by the more neg-ative Euler characteristic at its minimum value. At larger, the Poisson process shows more large voids yielding amore negative Euler characteristic of randomly distributedpoints.
In the general case, where the statistics of a point setin a d-dimensional domainΩ ⊂ Rd with content|Ω| isspecified by a sequence of density correlation functionsρn(x1, . . . , xn)|n = 1,2, . . . , the mean valuesVν(r) =〈 1ΩVν[B(r)]〉 for the augmented coverage per unit volume
are obtained from the additivity relation (13) in the form
Vν(r)=∞∑n=1
(−1)n+1
n!Ω
∫· · ·∫Ω
dx1 . . .dxn ρn(x1, . . . , xn)
×Vν[∩ni=1Br(xi)]. (36)
Obviously, the Minkowski functionals embody in-formation from every ordern of the n–point densitiesρn(x1, . . . , xn). If the product densitiesρn(x1, . . . , xn) =ρn were independent of position (Poisson distribution ofdensityρ = N/|Ω|), the integrals inEq. (36)can be per-formed using the fundamental kinematic formula ((22)). ForPoisson distributed spheresBr of radiusr one obtains themean values of the Minkowski functionals per unit volumegiven byEq. (24)for discs in two dimensions.

C.H. Arns et al. / Colloids and Surfaces A: Physicochem. Eng. Aspects 241 (2004) 351–372 359
0 0.5 1 1.5
r ρ1/2
-0.4
-0.2
0
0.2
0.4
0.6
0.8
1
Vν(r
) / N
π(r/
L)2-
ν
ν=0 (area)ν=1 (perimeter)ν=2 (Euler)
0 0.2 0.4 0.6 0.8
r ρ1/2
0
1
2
3
mν(
r)
ν=0 (area)ν=1 (perimeter)ν=2 (Euler)
Fig. 3. The importance of higher-order correlations may be illustrated by two different point distributions: randomly distributed points (Poisson process,left) and points given by the model of Baddeley and Silverman (right) [30]. In both cases 420 points are shown in a unit square which exhibit thesame two-point correlation function ρ(x1, x2) = 1. Nevertheless, the Minkowski functionals Vν(r) under dilation of the points are clearly different forthe Silverman–Baddeley process (lines) and Poisson distributed points (circles; thin lines are analytical results given by Eq. (24)). The deviation due tohigher correlations is even more pronounced visible in the local Minkowski functionals mν(r) defined by the Eq. (37) and Eq. (38). At small scales r,i.e. for radii of the disks which are attached at each point the morphological functionals of the Silverman–Baddeley process are larger than for randomlydistributed points indicating a more regular structure compared to the Poisson process. These correlations are not visible in the two-point correlationfunction since k(2)(x1, x2) = 0 for both processes (see Eq. (38).
It is straightforward to show that the functions read
V0(r) = 1− e−ρm0
V1(r) = m1e−ρm0
V2(r) = (m2 − m21ρ)e
−ρm0
V3(r) = (m3 − 3m1m2ρ + m31ρ
2)e−ρm0 . (37)
with the averaged local Minkowski functionals
mν[r; k(n)] =[ωd−νωd
Vν(K)−∞∑n=2
(−1)n
n!ρ
n∏i=2
∫K
dgiVν(K
n⋂i=2
Kgi
)k(n)(x1, x2, . . . , xn)
], (38)
in terms of connected correlation functions, i.e. centered cu-mulants k(n)(x1, . . . , xn). A Poisson distribution of grainshas vanishing cumulants k(n) = 0 and one recovers mν[ρ] =Mν(K) and, in particular, Eq. (24) for random distributeddiscs in two dimensions. Obviously, the Minkowski func-tionals embody information from every order n of the cor-relations. Instead of plotting the functions Vν(r) one may
use Eq. (37) to calculate mν(r) = mν(r)/Mν(K) which aremore sensitive to differences in the morphology of struc-tures. In Fig. 3 one can observe huge deviations of mν(r)for the Baddeley-Silverman process from the Poisson valuemν(r) = 1 (curve with circles) although the two-point cor-relation functions are identical.
Such a morphological analysis of point patterns has beensuccessfully been applied to such diverse fields as the dis-tribution of galaxies [26,32–35], holes in thin liquid films[36,19,17], or molecule positions of simple liquids [15]. Ageneralization of the procedure described here for point pat-terns leads immediately to the change of morphology duringan erosion/dilation process of an arbitrary spatial structure.The functional dependence of the Minkowski functionalson the erosion distance ε may be used to characterize spa-tial structures in real space beyond the two-point correlationfunction using additivity as a heuristic principle to reduce thehuge amount of information quantified in n-point functions.
3. Computational aspects
In this section we describe the algorithms implemented tocalculate the Minkowski functions, to generate the parallel

360 C.H. Arns et al. / Colloids and Surfaces A: Physicochem. Eng. Aspects 241 (2004) 351–372
body morphologies and describe the generation of differentmodel morphologies.
3.1. Algorithm to calculate the MFs
As discussed above, the MFs can be obtained directlyfrom an image made up of discrete voxels. For example, thevolume fraction of a phase is trivially obtained by dividingthe number of voxels of that phase by the total number ofvoxels. The other functionals are obtained by consideringthe interface associated with the vertices of each voxel orthe Voronoi cell of the lattice. Applying Eq. (31) we obtainvν for each vertex on the image. Since each vertex of thelattice is shared by eight neighboring cubes there are there-fore 28 = 256 possible configurations. Symmetries are usedto reduce the 256 configurations to the 22 isotropic config-urations. The resultant MFs for the 22 configurations aregiven elsewhere for general a [29,20,27]. The global mea-sure vν(A) is evaluated by counting the contribution to theglobal measure at each voxel during a single sweep throughthe lattice.
3.2. Erosion/dilation algorithm
A direct implementation of Equation ((33)) is computa-tionally very inefficient as it requires one to place spheresof different size along all voxels at the interface at eacherosion/dilation step. Our algorithm instead utilizes thedefinition given by Eq. (32) using an Euclidean DistanceMap (EDM), i.e. a mapping giving the Euclidean distance(1,√
2,√
3, 2, etc.) of each voxel in either phase to its near-est interface. From the EDM, the erosion/dilation is triviallyimplemented by stepping through the different Euclideandistances from the interface.
In previous work [37], approximations to the EDM havebeen employed due to the large computational overheadsassociated with calculating the map. We have developedfast algorithms for calculating the EDM exactly. The algo-rithm is similar to one published previously by Saito [38]with extensions to include periodic boundary conditions.The exact EDM for each voxel is calculated by grow-ing (discretised) spheres at each voxel xi until it reachesan interfacial voxel on A and returns the correspondingEuclidean distance d. We define the digital sphere of ra-dius r by all voxels radiating from the central voxel thatare separated by a Euclidean distance d < r with thesphere center defined as the center of the voxel. The al-gorithm speed is dramatically accelerated by noting thatthe Euclidean distance to A from any voxel xj neighbor-ing voxel xi will be given by ‖d(A, xi) − d(A, xj)‖ ≤ 1.One need not step through all possible radii for eachvoxel, but instead one can use d(A, xj) = d(A, xi) − 1as an initial guess. We increment d(A, xj) by a min-imum of 0.1 at each step and generate the equivalentdigitized sphere for that radius with an upper limit ofr = 50. This gives up to 400 different radii, for which the
Minkowski functions are evaluated. We compute the Mfson a minimum lattice size of 1283 for a minimum of 50realizations.
3.3. Generation of model media
The models we consider in this paper can be looselyseparated into three different classes: Boolean, Gaussian,and Voronoi models. The first class we consider is basedon Poisson distributed overlapping oblate and prolatespheroids, so-called Boolean models [16,17,31]. A specialcase of this model is based on identical overlapping spheres(IOS). We also consider Poisson distributed polydispersemixtures and spheroid packs that are fully oriented. Ex-amples of some of these Boolean models are given inFig. 4.
The internal interfaces of composite materials can be mod-eled alternatively by iso-surfaces of a stationary Gaussianrandom field (GRF) y(r) [39–41]. Correlations in the fieldare governed by the field-field correlation function g(r) =<y(0)y(r) > which can be specified. A useful form for g(r)is [5,40,42,43]
g(r) = e−r/ξ − (rc/ξ)e−r/rc1− (rc/ξ)
sin2πr/d
2πr/d, (39)
characterized by a correlation length ξ, domain scale d anda cut-off scale rc. A simple method for generating randomfields [44] is to sum N sinusoids with random phase andwave-vector
y(r) =√
2
N
N∑i=1
cos (kiki · r +Φi). (40)
where Φi is a uniform deviate on [0, 2π) and ki is uniformlydistributed on a unit sphere. The magnitude of the wavevectors ki are distributed on [0,∞) with a spectral densityrelated to g(r) by a Fourier transform.
In the original scheme due to Cahn [44], one associatesthe interface between two distinct phases with a singleiso-surface of y(r). Following Berk [45], one can define acomposite with phase 1 occupying the region where α ≤y(r) ≤ β and phase 2 occupying the remainder. The statisticsof the material are completely determined by the specifica-tion of the level-cut parameters and the function g(r). Thevolume fraction of phase 1 is given by p = pβ−pα, where:
pγ = 1√2π
∫ γ
−∞e−t
2/2dt, γ = α, β. (41)
Berk showed that the two-point correlation function is givenby
p(2)(r) = p2 + 1√2π
∫ g(r)
0
dt√1− t2 ×
[exp
(− α2
1+ t)
− 2exp
(−α
2 − 2αβ + β2
2(1− t2))+ exp
(− β2
1+ t)], (42)

C.H. Arns et al. / Colloids and Surfaces A: Physicochem. Eng. Aspects 241 (2004) 351–372 361
Fig. 4. Examples of Boolean models. From left to right: overlapping spheres of radius r = 12, overlapping spheroids randomly oriented and overlappingspheroids, fully aligned, both with r = 12. The volume fraction of either phase is φ = 0.50.
Fig. 5. Examples of Gaussian models for volume fractions of φ = 0.5. From left to right 1-level-cut (c = 0), 2-level-cuts (c = 1) and the intersectionset of two 2-level-cut fields.
with g(r) defined by Eq. (39) so that the specific surfaceSv = −4∂p(2)(0)/∂r reads:
Sv = p2 +√
2
2π(e−12α2 + e−12β2
)
√4π2
6d2+ 1
2rcε. (43)
A concise way of expressing the level cut field [5] is todefine a variable c where
pα = c
2− c
2p, pβ = c
2+(
1− c2
)p. (44)
Setting c = 0 and c = 1 corresponds to the one- andtwo-level cut models. Other models considered can beformed from intersection and union sets of n primary GRFmodels [5]. Examples of GRF models are given in Fig. 5.
The third class of morphologies, random cellular solids[46] are constructed using a Voronoi tessellation. In this
Fig. 6. The interface of the Voronoi closed-cell foam model at φ = 0.50 and the open-cell foam model at φ = 0.10.
model one subdivides space randomly into convex polyhe-dra by scattering Poisson points to a given density and con-structing the bisecting plane between each pair of points.From the tiles formed by the intersections of the bisectingplanes between a given Poisson point and its neighbor, weconstruct convex polyhedra. Within each polyhedra, everypoint is closer to the given Poisson point than to any other.The resultant structure is similar to that of a closed-cell foamor random honeycomb. By thickening the walls (generatingparallel bodies) of the polyhedra using the EDM, we probea large range of phase fractions. To form an open-cell foamnetwork of low coordination number, we considered the tri-secting planes of the Poisson points. By using the EDM, wegrow a network of connected cylinders which particularlyat phase fractions below 10% may be a good description offoam. Examples of the Voronoi structures are given in Fig. 6.

362 C.H. Arns et al. / Colloids and Surfaces A: Physicochem. Eng. Aspects 241 (2004) 351–372
4. Morphological analysis
To illustrate the method we consider the evolution of theMfs vν(ε) for the different model media beginning from animage A (ε = 0) at the symmetric phase fraction of φ = 0.5.In order to introduce a common scale we always consider themorphological measures vν(φ) as function of the porosityφ = v0(ε) with 0 < φ < 1 instead of ε with the possiblerange −∞ < ε <∞.
Results for the particle-based models are given in Fig. 7where we define φ as the phase fraction of particles andchoose the particles to have preferred connectivity. We con-sider first the differences in the measures for the two sys-tems illustrated in Fig. 2; the erosion/dilation operation ona Poisson point pattern A = xi shown in Fig. 2(a) and theoperation on the IOS model A = ∪iB(xi) at φ = 0.5 shownin Fig. 2(b). For φ > 0.5 the configurations of the two pro-cesses are identical; differences are only due to numericaldiscretization effects and the use of different EDMs for thetwo stochastic processes. But direct comparison for φ < 0.5shows distinct features, especially in the topological mea-sure v3(ε). It has been shown previously [47] that a negativevalue of v3 is indicative of the bicontinuity of the phases.For the Poisson point pattern one finds v3 > 0 for φ < 0.20in close agreement with the percolation threshold of the IOSmodel. In contrast, v3 remains negative for smaller values ofφ for the data set eroded off A = xi with φ = 50%. Thisreflects the structure noted in Fig. 2 where interconnectionsbetween overlapping spheres is enhanced.
Previously, we have calculated the MFs for a range ofparticle-based models at different porosity φ [27,28]. Onlyvery small differences between measures were observed foroverlapping grains such as uniform and random spheroidpacks. Similarly, the Mfs vν(ε) are similar for φ > 0.5because the dilated configurations (∪iKi)ε can still be re-sembled by overlapping convex bodies ∪i(Ki)ε (see theprevious discussion of the distributive Minkowski addition).In contrast the Mfs vν(ε) for uniform sphere packs have adistinct signature to spheroids with a distribution of radii forφ < 0.5 as illustrated in Fig. 7. Preferential alignment haslittle effect on the measures, however, measuring the Mfsalong different axes would clearly allow one to distinguishisotropic systems from those preferentially aligned.
The curves for different GRF models are given in Fig. 8.The 1-level cut model is symmetric around φ = 0.5 for v1.The asymmetry for the two other measures is due to ourchoice of preferred connectivity of one phase. For the twocut models we define φ as the fraction of the phase whereα ≤ y(r) ≤ β and choose this phase to have preferredconnectivity. The curves for different GRF models exhibitdistinct behavior and coincide only for very small or largeporosity φ since the morphology of the remaining holes for|ε| >> 1 are similar. The difference in v1 for the models ismainly due to the different surface area at the initial porosityφ = 0.5. One should note particularly the pronounced peakin the connectivity v3(φ) at φ ≈ 0.21 for the two-level-cut
Fig. 7. Boolean models: Minkowski functionals for a Poisson point patternand for the random grain model at φ = 0.5. The ‘point process’ andIOS have exactly the same particle centres for each of the realizations,and therefore have the same Poisson density at φ = 0.5. For φ > 0.5processes are identical; for φ < 0.5 the processes show distinct features.A distinct signature is also observed for φ < 0.5 when compareing theMfs for the IOS model to more general spheroidal grain models.
model which indicates a net-like structure, i.e. a connectedskeleton when the initial configuration is eroded. For allthree models one finds that the eroded configuration with ex-tremal connectivity exhibits almost a minimal surface (van-ishing integral mean curvature v2).
The curves for the Voronoi models are given in Fig. 9.Here, the porosity φ describes the fraction of the facet-phasewhich has preferred connectivity. Construction of theVoronoi models A = ∪i(Ai)ρ is defined by parallel bodies

C.H. Arns et al. / Colloids and Surfaces A: Physicochem. Eng. Aspects 241 (2004) 351–372 363
Fig. 8. Gaussian models: Minkowski functionals of erosion/dilation op-erations over phase fraction for GRF models having kernel g(r) as inEq. (39) with rc = 2, ξ = 4, d = 3 in pixels on a 1283 grid. The ero-sion/dilation operations are started at an initial fraction of φ = 0.5. Themodels are shown in Fig. 5.
(Ai)ρ of radius ρ to a set of two-dimensional polyhedraAi = Pi (facet model) and one-dimensional lines Ai = Li(cylinder model), respectively. It is instructive to comparethe MFs vν(ρ) for the original model Aρ = ∪i(Ai)ρ to theMfs vν(ε) = vν((Aρ)ε) based on erosion and dilation fromthe Voronoi models at radius ρ with φ = v0(ρ) = 50%.
For the variation in φ = v0(ρ) of the original facet modelAρ, the connected polyhedra phase always percolates, andthe other phase is made up of disconnected inclusions.Therefore, the system remains convex v3(ρ) > 0 for all φ.
Fig. 9. Voronoi models: morphological measures (MFs and Mfs) overphase fraction for Voronoi closed-cell (facet) and open-cell foam (cylinder)models. Compared are the densification process against the erosion/dilationprocess started at an initial fraction of φ = 0.5. The Voronoi cells aregenerated by 100 seeds periodically mapped on a 2003 lattice. See alsoFig. 6.
Accordingly, the connectivity v3(ε) = v3((Aρ)ε) for thedilated configurations (ε > 0) with φ = v0((Aρ)ε) > 0.5 ispositive too which is shown in Figure 9. In contrast, the be-havior of v3(ε) for the erosion (ε < 0) of the facet phase Aρwith φ = 50% exhibits a negative value at φ ! 15% imply-ing a bicontinuous system at quite substantial facet phasefractions. This bicontinuity is due to the formation of holesin the facet phase and continuity of the nodes where thefacets edges meet and is a consequence of the non-convex

364 C.H. Arns et al. / Colloids and Surfaces A: Physicochem. Eng. Aspects 241 (2004) 351–372
shape of the original structure. The curves for the Voronoicylinder model does not differ significantly indicating thatthe open-cell foam model maintains a convex-like structure.
4.1. Discrimination of model composites
To illustrate the powerful discrimination of morphologywhich comes from measuring the Mfs of parallel bodies wefollow Roberts [5] and select two model images and attemptto match a range of model morphologies by matching firstand second order statistical properties with the image. Thismethod was used in [5] to illustrate the relatively strong sig-nature provided by the chord distribution function (CDF).We illustrate the strong discrimination which is possiblewhen using Mfs for these systems.
In [5], GRF systems were considered; the single cutmodel N(c=)0 and the symmetric two-cut model N(c=)1(Berk’s original model [45]). Other models consideredcan be formed from any number n of intersection In andunion Un sets of the GRF models. One then considers aspecific GRF model with known statistical properties asthe “experimental” data set. Reconstructions are generatedby matching the volume fractions and by minimizing thedifference in the two-point correlation functions
Ep(2) =∑Mi=1[p(2)fit (ri)− p(2)exp(ri)]2∑Mi=1[p(2)fit (ri)− p2
exp]2. (45)
where M is the number of experimental points to be fitted.Numerical integration is used to find the best fit p(2)(r) fora number of different GRF models. The minimization al-gorithm defines rc, ξ and d for each model. All the mod-els are able to provide an excellent fit to the data based onmatching the two-point information. In [5] the CDF is usedto attempt to better discriminate the best matching modelmorphology. We use the Mfs vν(ε) to measure the best mor-phological fit to the data. In the first case, the experimentaldata set was based on a symmetric two-cut model (N1) atφ = 20% obtained from the field-field correlation function[5]:
g(r) = e(−r/D0)2; ρ(k) = D3
0
(4π)2/3e(kD0/2)2 (46)
with D0 = 2µm. Attempts to match the experimental data setwere made for models N0, N1, U
21 , I
21 . The resultant values
of rc, ξ and d for four different models are given in Table Iof [5].
We show in Fig. 10, the Mfs for the parallel sets of eachmodel morphology and the original experimental data set.As in the examples discussed previously we consider themorphological measures vν(φ) as a function of the porosityφ = v0(ε) with 0 < φ < 1. The dependence of the volumefraction v0(ε) on the dilation-erosion parameter ε is shownin Fig. 11.
In Table 1, we quantify the error in the measure of theMFs for the different model morphologies by employing a
Fig. 10. Reconstruction of an experimental Gaussian model (N1):Minkowski functionals of the erosion/dilation process for the experimen-tal data set (circles) and the corresponding Mfs for the matching modeldata sets defined in Table I of [58]. In contrast to fits based on porosityversus erosion radius or the chord distribution function, the use of theMfs clearly illustrates the best model fit.
Table 1Integral error of the Minkowski measures over fraction (Eq. (47)) for themodels defined in Table I of [5]
M E1 E2 E3 Eρ1 Eρ2z
N0 .096 7.6 1.48 .25 .62N1 2.5 · 10−4 0.0074 .0019 .04 .11I2
1 .023 .35 1.11 .20 .48U2
1 .121 1.60 .082 .02 .15
The last two columns show the error in the CDF from [5].

C.H. Arns et al. / Colloids and Surfaces A: Physicochem. Eng. Aspects 241 (2004) 351–372 365
Fig. 11. Erosion/dilation radius over fraction for the models given inTables I (left) and II (right) of [5]. Porosity is matched well by all modelsfor different radius ε in contrast to the strong discrimination observedwhen consider the Mfs in Fig. 9.
relative least squares error:
Ei =∫ 1
0 (Evi(φ))2dφ∫ 1
0 (vi(φ))2 dφ
. (47)
Since the porosity values are not identical for all r (Fig. 11)linear interpolation is used to do the resampling. We alsoshow in Table 1 the errors Eρ1 and Eρ2 in the chord distri-bution function (CDF) measure from [5]. We observe thatthe MFs provide a far stronger signature of morphology thanthe CDF. While the CDF does discriminate between somemodels, it is impossible to choose between modelN1 and U1as the best reconstruction for the two-level cut model. Forall four measures of the Mfs the actual model morphologyis more than two orders of magnitudemore accurate thanany other. It is important to note that we could discriminatemorphology from one- or two-dimensional information (v1and v2) as readily as from v3. Therefore the method can
Fig. 12. Reconstruction of an experimental Gaussian model (N0):Minkowski functionals of the erosion/dilation process for the experimen-tal data set and the corresponding Mfs for the matching model data setsdefined in Table II of [5].
be used to discriminate morphology from two-dimensionalmicrographs of the material or from 1D chord length mea-surements.
In the second case the experimentalimage was a 1-levelcut model (N0) and attempts to match this data set were madefor models N0, U
20 , I
20 . Again the Mfs give a very strong
signature of morphology and allow one to discriminate thecorrect morphology (see Fig. 12 and Table 2).
The Mfs appear to provide a strong signature of compos-ite morphology and hence may provide a method for select-ing an accurate reconstruction of a disordered material. In

366 C.H. Arns et al. / Colloids and Surfaces A: Physicochem. Eng. Aspects 241 (2004) 351–372
Table 2Integral error of the Minkowski measures over fraction (Eq. (47)) for themodels given in Table II of [5]
M E1 E2 E3 Eρ1 Eρ2
N0 6.74 · 10−5 5.30 · 10−4 .00118 .001 .003I2
0 6.73 · 10−3 .0231 .056 .137 .036U2
0 3.77 · 10−3 .0376 .078 .008 .127
the next section we attempt to do this for an experimentaltomographic image.
4.2. Morphology of experimental data sets
To study the properties of a random medium it is importantto have an accurate model of the microstructure. If the phys-ical mechanisms responsible for the generation of the mi-crostructure are poorly known or difficult to model, a statis-tical reconstruction may be necessary. In this section we usethe Mfs to attempt to optimally reconstruct 3D experimentalimages of a termite nest and Fontainebleau sandstone.
Fig. 13. The binary interface of the termite nest after segmentation at a resolution of 1 mm. The total image size is 65× 65× 33. High resolution colourimage can be seen at http://anusf.anu.edu.au/∼sjr.
Fig. 14. (a) Two-point correlation function of the experimental data set and the best fits for the three models. (b) Correlation function measured alongthe three axes and averaged (Sr).
Modern imaging techniques are emerging which al-low scientists and engineers to observe complex materialmorphologies in 3D in a minimal amount of time (e.g.X-ray CT, laser confocal microscopy). Tomographic im-ages of two-phase materials are grey-scale images, usuallywith a bimodal population apparent. Quantitative inves-tigation of the geometry of the phase space requires avoxel-by-voxel determination of the phase type, a processknown as segmentation. A simple thresholding based onmatching a predetermined bulk measurement (phase frac-tion) is often used to segment a tomographic image. Inpractice this may not be a reasonable method due to thepeak overlap in the intensity histogram or to uncertaintyabout the agreement between a bulk measurement and ameasurement on a smaller subvolume. For these reasons,to segment the original tomographic image we apply anedge-finding (kriging-based) algorithm [48]. The imagesare also corrected for noise by re-identifying the phase typeof all isolated grain and void voxel clusters. These isolatedvoxels have a strong effect on many of the morphologicalmeasures.

C.H. Arns et al. / Colloids and Surfaces A: Physicochem. Eng. Aspects 241 (2004) 351–372 367
Table 3Parameters of the matching models Nc, with c ∈ [0, 1] being the levelcut parameter, for the termite nest in mm
Model rc[mm] ξ[mm] d[mm] Ep(2)
IOS 3.271 − − 5.9 · 10−3
N0 2.641 2.668 13.2 1.4 · 10−2
N.01 2.724 2.732 13.31 1.4 · 10−2
N.125 3.280 3.291 14.79 1.1 · 10−2
N.25 3.710 3.754 16.06 8.2 · 10−3
N.5 4.308 4.359 18.00 5.2 · 10−3
N.75 4.547 4.659 19.48 4.7 · 10−3
N.875 4.606 4.704 19.92 4.8 · 10−3
N1 4.640 4.690 20.1 4.8 · 10−3
The original tomographic data set image has resolution at 1mm per voxel.For the IOS model, the equivalent sphere radius is in the rc column.
4.2.1. Termite nestThe segmented image had a porosity of 46%. We do not
have an independent porosity measure of the sample. InFig. 13, we show the resultant binary image of the termitenest at 1mmresolution.
The morphology of the termite nest is reminiscent of thestructure of the GRF fields. The GRF model is therefore anatural choice for describing the morphology of this system.We first attempt to match the simple GRF models (N0 andN1) and the IOS model to this structure to ascertain whichmodel gives the most realistic representation. As in the pre-vious section, we match p(2) to determine r0 for the IOSmodel and d, ξ and rc for the GRF models.
The p(2) for the experimental image and the model fits areshown in Fig. 14(a) . From visual inspection of Fig. 13 onemight expect an oscillatory correlation function indicatinga regular domain size d. The experimental p(2) exhibits noapparent domain size. We plot in Fig. 14(b) the correlationfunction along the three axes. We note that the deviation isquite strong indicating either anisotropy or more probably,poor sampling due to the small size of the image. We there-fore choose to fit the model p(2)(r) out to r = 11 mm. Asbefore, based on p(2)(r) data alone one cannot discriminatebetween the goodness of the model fits. Values of r0 for theIOS model, and d, ξ and rc are summarized in Table 3 alongwith the error E(p(2)).
Since the volume fraction of the GRF models is a func-tion of both α and β there is a continuum of choices whichcorrespond to a given volume fraction. Any combination of(α, β) in Berk’s model can be used to generate a structurewith the same φ as the experimental data set. We thereforematch the morphology of the experimental image to asym-metric (α ≡ β) GRF models with a range of c as definedby Eq. (44). In Table 3 the values of d, ξ and rc that bestmatch the experimental image are summarized along withthe error estimate E(p(2)).
We first consider the match of the Mfs vi(ε) to the ex-perimental data set for the IOS model and the one- andtwo-level-cut GRF models (N0 andN1) in Fig. 15. The corre-sponding error estimates defined by Eq. (47) are reported inTable 4. The measure clearly discriminates the GRF models
Fig. 15. Termite nest: Minkowski functionals of the erosion/dilation pro-cess over fraction. Note, that here no scaling factor is applied (l = 1)to honour the natural length scale of the experimental data set. The Mfsclearly discriminate the GRF which is not possible using conventionaltwo-point statistical measures (see Fig. 13).
as the best model for the termite nest. It is difficult to dis-cern which of the two simple GRF models gives the best fitto the experimental image.
In Table 4 we summarise the error in the Mfs for the rangeof assymetric GRF models. The best fit is for the asymmet-ric two-level-cut model with small c, c ∈ [0.01, 0.125]. Un-fortunately the discrimination of the fit is not comparable tothat seen for our model systems. We believe this is primarilydue to the limited size of the experimental data set.

368 C.H. Arns et al. / Colloids and Surfaces A: Physicochem. Eng. Aspects 241 (2004) 351–372
Table 4Integral error of the Mfs for the models of the tomographic image of thetermite mound calculated according to Eq. (47)
Model E1 E2 E3
IOS .0172 .536 .911N0 .00589 .117 .288N.01 .00301 .0740 .196N.125 .00253 .0428 .202N.25 .00377 .0506 .305N.5 .00466 .0549 .395N.75 .00479 .0569 .392N.875 .00475 .0565 .397N1 .00482 .0573 .450
For the microstructural parameters of the models see Table 3.
4.2.2. Fontainebleau sandstoneThe Fontainebleau images were obtained from 4.52 mm
diameter cylindrical core samples extracted from 4 blockswith bulk porosity φ = 7.5, 13, 15, 22%. A 2.91 mm lengthof each core was imaged [49–51]. The reconstructed imageshave a resolution of 5.7 µm resulting in 795 × 795 × 512imaged sections. From the original cylindrical plug, we ex-tract a 4803 cubic subset for analysis corresponding to avolume of 20.5 mm3. The images were thresholded usinga kriging-based thresholding method [48] to give a binarypore-solid image [52,53].
In another paper [54,55,28], we derived three differ-ent Boolean reconstructions of the Fontainebleau samples.
Fig. 16. Fontainebleau sandstone, sample fb7.5: Minkowski functionals over fraction (φ0 = 8.29%).
These models are a monodisperse sphere model recon-structed on the basis of the 2-point correlation function(IOSC), a model based on two different ellipsoids recon-structed using effective grain shapes (ROS(2)), and a modelusing a distribution of different sphere sizes derived usingthe covering sphere map [56]. The ROS(2) model gave anexcellent match to the global Minkowski measures of thesandstone samples. Here the three different Boolean en-sembles (IOSC, ROS(2), and OSC) and a fourth stochasticmodel for Fontainebleau sandstone, based on a Gaus-sian reconstruction given by five intersecting one-level-cutGaussian models [5], are compared for the accuracy ofreconstruction by evaluating the Mfs. The Gaussian ker-nel used for the intersection reconstruction is given bythe Fourier transform pair g(x) and ρ(k) = −F ′(k)/(4πk)with
g(x) = e−x/ξ(1+ x/ξ) sin 2πx/d
2πx/d(48)
F(k) = d
2π
(tan −1c− + tan −1c+ + c+
1+ c2+
c−1+ c2−
),
(49)
c± = ξ(
2π
d± k
), (50)
where ξ = 51.9 µm and d = 272 µm [5]. To preserve thevariability of the data and allow a direct comparison to the

C.H. Arns et al. / Colloids and Surfaces A: Physicochem. Eng. Aspects 241 (2004) 351–372 369
Fig. 17. Fontainebleau sandstone, sample fb13: Minkowski functionals over fraction (φ0 = 12.9%).
Fig. 18. Fontainebleau sandstone, sample fb15: Minkowski functionals over fraction (φ0 = 17.7%).

370 C.H. Arns et al. / Colloids and Surfaces A: Physicochem. Eng. Aspects 241 (2004) 351–372
Fig. 19. Fontainebleau sandstone, sample fb22: Minkowski functionals over fraction (φ0 = 21.0%).
Fontainebleau sandstone samples, all reconstructions weregenerated at the same resolution and domain size; the 4803
(20.3 mm3) Fontainebleau samples are used.The comparison of the Mf data from the tomographic im-
ages to the reconstructions is given in Figs. 16–19. Largejumps are observed in the Mf data for some morphologies,particularly near the original image porosity φ0. These jumpsare due primarily to discretisation effects. Unlike the ter-mite nest, which has limited size, the Fontainebleau sand-stone exhibits much greater detail. While homogeneous, wehave resolution limitations leading to discretisation errorsin ε. All images contain features on the scale of a smallnumber of voxels. When one erodes/dilates by a small ε,the step size is large and the effect on the morphologicalmeasures is large. Discretisation errors in ε therefore hap-pen for all images; less so if feature sizes are $ voxelsize.
We note peaks around the original image and reconstruc-tion porosity (φ0), particularly for the Boolean models. Forstructures made up of particles, the erosion of the particlefraction creates peaks in the Mfs and particular v3. This ef-fect is particularly pronounced for spheres. At ε = r, where
r is the radius of the spheres, only dense clusters of parti-cles are not eroded, i.e. a system of dilute spheres wouldbe completely eroded. Such a strong contribution at ε = rwould be expected for every sphere size (see also [56]). Thisis also observed in Figs. 16–19, showing one peak for thesingle particle matches, and two peaks for the two-particlereconstructions. For more irregular particles, the 2-spheroidmatches, the peaks become less pronounced. The same ap-plies to the OSC model, where a continuous distribution ofsphere sizes is present and this effect is smeared out.
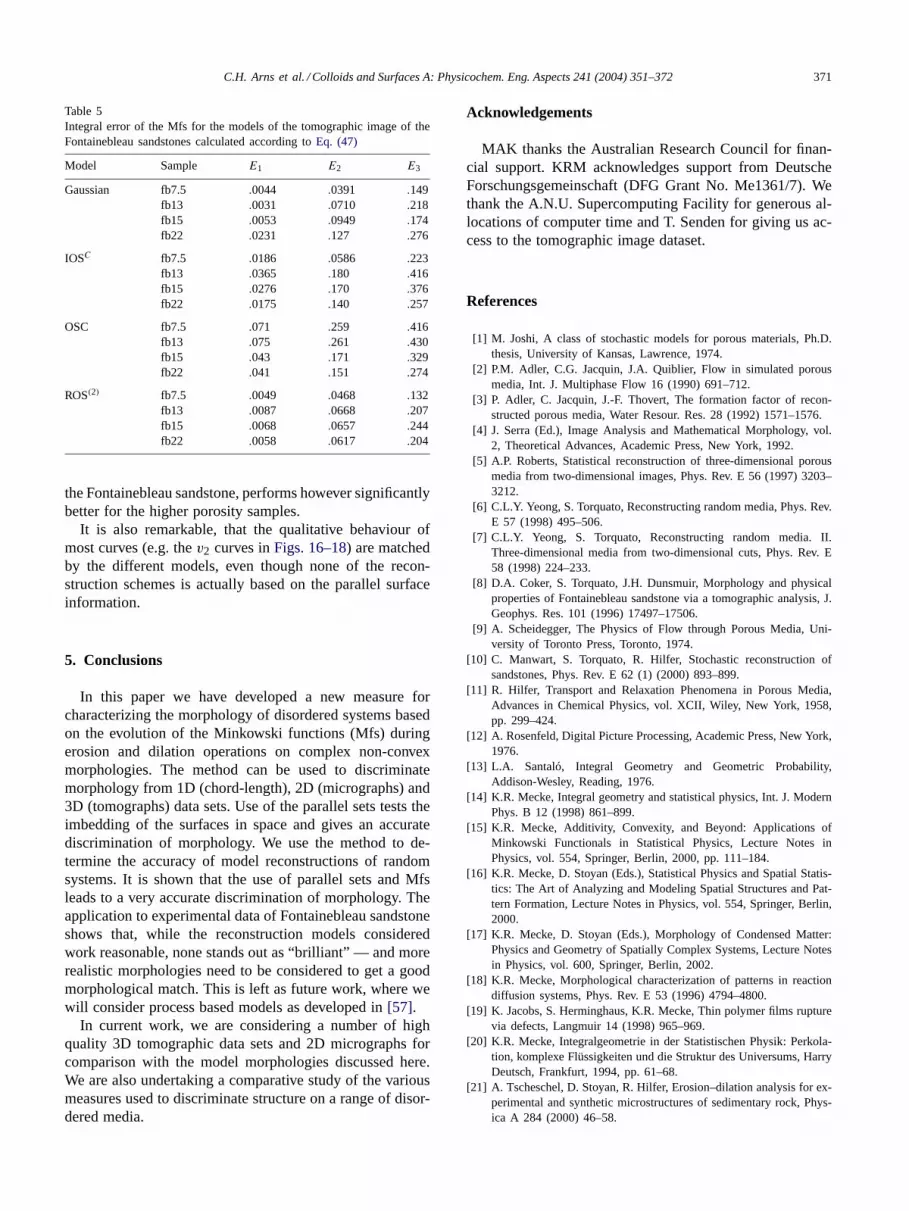
The integral error of the Mfs (Eq. (47)) for the four mod-els is given in Table 5. We note that the Gaussian andROS(2) models do best while IOSC and OSC perform poorly.It is surprising that despite the large errors in the Mfs ofthe Boolean reconstructions due to the peaks at φ0 andφ → 1 the ROS(2) model is still good. Note however, thatthe Boolean models were matched individually to the fourFontainebleau sandstone samples. The Gaussian model ofreference [5] was matched to a single sample at φ = 15.4%of Fontainebleau sandstone from another study. Thus, thereconstruction using the Gaussian scheme does remarkablywell. The OSC model gives the worst match to the Mfs of
C.H. Arns et al. / Colloids and Surfaces A: Physicochem. Eng. Aspects 241 (2004) 351–372 371
Table 5Integral error of the Mfs for the models of the tomographic image of theFontainebleau sandstones calculated according to Eq. (47)
Model Sample E1 E2 E3
Gaussian fb7.5 .0044 .0391 .149fb13 .0031 .0710 .218fb15 .0053 .0949 .174fb22 .0231 .127 .276
IOSC fb7.5 .0186 .0586 .223fb13 .0365 .180 .416fb15 .0276 .170 .376fb22 .0175 .140 .257
OSC fb7.5 .071 .259 .416fb13 .075 .261 .430fb15 .043 .171 .329fb22 .041 .151 .274
ROS(2) fb7.5 .0049 .0468 .132fb13 .0087 .0668 .207fb15 .0068 .0657 .244fb22 .0058 .0617 .204
the Fontainebleau sandstone, performs however significantlybetter for the higher porosity samples.
It is also remarkable, that the qualitative behaviour ofmost curves (e.g. the v2 curves in Figs. 16–18) are matchedby the different models, even though none of the recon-struction schemes is actually based on the parallel surfaceinformation.
5. Conclusions
In this paper we have developed a new measure forcharacterizing the morphology of disordered systems basedon the evolution of the Minkowski functions (Mfs) duringerosion and dilation operations on complex non-convexmorphologies. The method can be used to discriminatemorphology from 1D (chord-length), 2D (micrographs) and3D (tomographs) data sets. Use of the parallel sets tests theimbedding of the surfaces in space and gives an accuratediscrimination of morphology. We use the method to de-termine the accuracy of model reconstructions of randomsystems. It is shown that the use of parallel sets and Mfsleads to a very accurate discrimination of morphology. Theapplication to experimental data of Fontainebleau sandstoneshows that, while the reconstruction models consideredwork reasonable, none stands out as “brilliant” — and morerealistic morphologies need to be considered to get a goodmorphological match. This is left as future work, where wewill consider process based models as developed in [57].
In current work, we are considering a number of highquality 3D tomographic data sets and 2D micrographs forcomparison with the model morphologies discussed here.We are also undertaking a comparative study of the variousmeasures used to discriminate structure on a range of disor-dered media.
Acknowledgements
MAK thanks the Australian Research Council for finan-cial support. KRM acknowledges support from DeutscheForschungsgemeinschaft (DFG Grant No. Me1361/7). Wethank the A.N.U. Supercomputing Facility for generous al-locations of computer time and T. Senden for giving us ac-cess to the tomographic image dataset.
References
[1] M. Joshi, A class of stochastic models for porous materials, Ph.D.thesis, University of Kansas, Lawrence, 1974.
[2] P.M. Adler, C.G. Jacquin, J.A. Quiblier, Flow in simulated porousmedia, Int. J. Multiphase Flow 16 (1990) 691–712.
[3] P. Adler, C. Jacquin, J.-F. Thovert, The formation factor of recon-structed porous media, Water Resour. Res. 28 (1992) 1571–1576.
[4] J. Serra (Ed.), Image Analysis and Mathematical Morphology, vol.2, Theoretical Advances, Academic Press, New York, 1992.
[5] A.P. Roberts, Statistical reconstruction of three-dimensional porousmedia from two-dimensional images, Phys. Rev. E 56 (1997) 3203–3212.
[6] C.L.Y. Yeong, S. Torquato, Reconstructing random media, Phys. Rev.E 57 (1998) 495–506.
[7] C.L.Y. Yeong, S. Torquato, Reconstructing random media. II.Three-dimensional media from two-dimensional cuts, Phys. Rev. E58 (1998) 224–233.
[8] D.A. Coker, S. Torquato, J.H. Dunsmuir, Morphology and physicalproperties of Fontainebleau sandstone via a tomographic analysis, J.Geophys. Res. 101 (1996) 17497–17506.
[9] A. Scheidegger, The Physics of Flow through Porous Media, Uni-versity of Toronto Press, Toronto, 1974.
[10] C. Manwart, S. Torquato, R. Hilfer, Stochastic reconstruction ofsandstones, Phys. Rev. E 62 (1) (2000) 893–899.
[11] R. Hilfer, Transport and Relaxation Phenomena in Porous Media,Advances in Chemical Physics, vol. XCII, Wiley, New York, 1958,pp. 299–424.
[12] A. Rosenfeld, Digital Picture Processing, Academic Press, New York,1976.
[13] L.A. Santaló, Integral Geometry and Geometric Probability,Addison-Wesley, Reading, 1976.
[14] K.R. Mecke, Integral geometry and statistical physics, Int. J. ModernPhys. B 12 (1998) 861–899.
[15] K.R. Mecke, Additivity, Convexity, and Beyond: Applications ofMinkowski Functionals in Statistical Physics, Lecture Notes inPhysics, vol. 554, Springer, Berlin, 2000, pp. 111–184.
[16] K.R. Mecke, D. Stoyan (Eds.), Statistical Physics and Spatial Statis-tics: The Art of Analyzing and Modeling Spatial Structures and Pat-tern Formation, Lecture Notes in Physics, vol. 554, Springer, Berlin,2000.
[17] K.R. Mecke, D. Stoyan (Eds.), Morphology of Condensed Matter:Physics and Geometry of Spatially Complex Systems, Lecture Notesin Physics, vol. 600, Springer, Berlin, 2002.
[18] K.R. Mecke, Morphological characterization of patterns in reactiondiffusion systems, Phys. Rev. E 53 (1996) 4794–4800.
[19] K. Jacobs, S. Herminghaus, K.R. Mecke, Thin polymer films rupturevia defects, Langmuir 14 (1998) 965–969.
[20] K.R. Mecke, Integralgeometrie in der Statistischen Physik: Perkola-tion, komplexe Flüssigkeiten und die Struktur des Universums, HarryDeutsch, Frankfurt, 1994, pp. 61–68.
[21] A. Tscheschel, D. Stoyan, R. Hilfer, Erosion–dilation analysis for ex-perimental and synthetic microstructures of sedimentary rock, Phys-ica A 284 (2000) 46–58.

372 C.H. Arns et al. / Colloids and Surfaces A: Physicochem. Eng. Aspects 241 (2004) 351–372
[22] H. Hadwiger, Vorlesungenüber Inhalt, Oberfläche und Isoperimetrie,Springer, Berlin, 1957.
[23] R.E. Miles, Adv. Appl. Prob. 7 (1975) 818.[24] W. Weil, Convexity and its Applications, , Ch. Stereology, Birkhäuser,
1983.[25] K.R. Mecke, H. Wagner, Euler characteristic and related measures
for random geometric sets, J. Stat. Phys. 64 (1991) 843.[26] M. Kerscher, Statistical analysis of large-scale structures in the uni-
verse, in: K.R. Mecke, D.Stoyan (Eds.), Statistical Physics and Spa-tial Statistics: The Art of Analyzing and Modeling Spatial Structuresand Pattern Formation, Lecture Notes in Physics, vol. 554, Springer,Berlin, 2000, pp. 36–71.
[27] C.H. Arns, M.A. Knackstedt, W.V. Pinczewski, K.R. Mecke,Euler-Poincarè characteristics of classes of disordered media, Phys.Rev. E 63 (2001) 031112:1–13.
[28] C.H. Arns, M.A. Knackstedt, K. Mecke, Characterising the mor-phology of disordered materials, Lecture Notes in Physics, vol. 600,Springer, Berlin, 2002, pp. 40–78 .
[29] S.T. Hyde, I.S. Barnes, B.W. Ninham, Curvature energy of surfactantinterfaces confined to the plaquettes of a cubic lattice, Langmuir 6(1990) 1055–1062.
[30] A.J. Baddeley, B.W. Silverman, A cautionary example on the useof second-order methods for analyzing point patterns, Biometrics 40(1089–1094).
[31] D. Stoyan, W.S. Kendall, J. Mecke, Stochastic Geometry and itsApplications, Wiley, Chichester, 1995.
[32] M. Kerscher, K. Mecke, P. Schücker, et.al., Non-Gaussian morphol-ogy on large scales: Minkowski functionals of the REFLEX clustercatalogue, Astron. Astrophys. 377 (2001) 1–16.
[33] M. Kerscher, K. Mecke, J. Schmalzing, C. Beisbart, T. Buchert,H. Wagner, Morphological fluctuations of large–scale structure: thePSCz survey, Astron. Astrophys. 373 (2001) 1–11.
[34] K. Mecke, T. Buchert, H. Wagner, Robust morphological measure forlarge scale structure in the universe, Astron. Astrophys. 288 (1994)697–704.
[35] M. Krüger, K.R. Mecke, Morphometry of spherical point patterns,in preparation for Astron. Astrophys.
[36] S. Herminghaus, K. Jacobs, K. Mecke, J. Bischof, A. Frey, M.Ibn-Elhaj, S. Schlagowski, Spinodal dewetting in liquid crystal andliquid metal films, Science 282 (1998) 916–919.
[37] G. Borgefors, Distance transformations in digital images, Comput.Vis. Graphics Image Process. 34 (1986) 344–371.
[38] T. Saito, J.-I. Toriwaki, New algorithms for Euclidean distance trans-formation of an n-dimensional digitized picture with applications,Pattern Recognit. 27 (11) (1994) 1551–1565.
[39] J. Quiblier, A new three-dimensional modeling technique for studyingporous media, J. Colloid Interface Sci. 98 (1984) 84–102.
[40] M. Teubner, R. Strey, Origin of the scattering peak in microemulsions,J. Chem. Phys. 87 (1987) 3195–3200.
[41] N.F. Berk, Scattering properties of the leveled-wave model of randommorphologies, Phys. Rev. A 44 (1991) 5069–5079.
[42] S. Marcelja, Localized random wave description of continuous mi-croemulsions, J. Phys. Chem. 94 (1990) 7259–7261.
[43] A.P. Roberts, M. Knackstedt, Structure–property correlations inmodel composite materials, Phys. Rev. E 54 (1996) 2313–2328.
[44] J.W. Cahn, Phase separation by spinodal decomposition in isotropicsystems, J. Chem. Phys. 42 (1965) 93–99.
[45] N.F. Berk, Scattering properties of a model bicontinuous structurewith a well defined length scale, Phys. Rev. Lett. 58 (1987) 2718–2721.
[46] L. Gibson, M. Ashby, Cellular Solids: Structure and Properties,Pergamon Press, Oxford, 1988.
[47] K. Mecke, Morphology of spatial patterns: porous media, spinodaldecomposition and dissipative structures, Acta Phys. Polonica B 28(1997) 1747–1781.
[48] W. Oh, W.B. Lindquist, Image thresholding by indicator kriging,IEEE Trans. Pattern Anal. Mach. Intell. 21 (1999) 590–602.
[49] B.P. Flannery, H.W. Deckman, W.G. Roberge, K.L. D’Amico,Three-dimensional X-ray microtomography, Science 237 (1987)1439–1444.
[50] J.H. Dunsmuir, S.R. Ferguson, K.L. D’Amico, Design and operationof an imaging X-ray detector for microtomography, IOP Conf. Ser.121 (1991) 257–261.
[51] P. Spanne, J.F. Thovert, C.J. Jacquin, W.B. Lindquist, K.W. Jones,P.M. Adler, Synchotron computed microtomography of porous me-dia: topology and transports, Phys. Rev. Lett. 73 (1994) 2001–2004.
[52] W.B. Lindquist, A. Venkatarangan, Investigating 3D geometry ofporous media from high resolution images, PCEA 25 (1999) 593–599.
[53] W.B. Lindquist, A. Venkatarangan, J. Dunsmuir, T.F. Wong, Poreand throat size distributions measured from synchrotron X-ray tomo-graphic images of Fontainebleau sandstones, J. Geophys. Res. 105B(2000) 21509–21527.
[54] C.H. Arns, M.A. Knackstedt, K. Mecke, Reconstructing complexmaterials via effective grain shapes, Phys. Rev. Lett. 91 (2003)215506.
[55] C.H. Arns, The influence of morphology on physical propertiesof reservoir rocks, Ph.D. thesis, University of New South Wales,2002.
[56] J.-F. Thovert, F. Yousefian, P. Spanne, C.G. Jacquin, P.M. Adler,Grain reconstruction of porous media: Application to a low-porosityFontainebleau sandstone, Phys. Rev. E 63 (2001) 061307.
[57] P.E. Øren, S. Bakke, Process based reconstruction of sandstonesand prediction of transport properties, Transp. Porous Media 46 (2)(2002) 311–343.
[58] N. Roberts, M. Reed, G. Nesbitt, Estimation of the connectivity ofa synthetic porous medium, J. Microsc. 187 (1997) 110–118.


![[files indowebster com]-irregular verb - menhook](https://img.pdfslide.net/doc/110x75/63137e995cba183dbf071fa9/files-indowebster-com-irregular-verb-menhook.jpg)


