Embed Size (px)
Citation preview
Published March 31, 2022
Report No. 1030259
Find out what’s new at SAO
by scanning this code with
your smartphone’s camera
Financial Statements and Federal Single
Audit Report
City of Edmonds For the period January 1, 2020 through December 31, 2020
Insurance Building, P.O. Box 40021 Olympia, Washington 98504-0021 (564) 999-0950 [email protected]
Office of the Washington State Auditor
Pat McCarthy
March 31, 2022
Mayor and City Council
City of Edmonds
Edmonds, Washington
Report on Financial Statements and Federal Single Audit
Please find attached our report on the City of Edmonds financial statements and compliance with
federal laws and regulations.
We are issuing this report in order to provide information on the City’s financial condition.
Sincerely,
Pat McCarthy, State Auditor
Olympia, WA
Americans with Disabilities
In accordance with the Americans with Disabilities Act, we will make this document available in
alternative formats. For more information, please contact our Office at (564) 999-0950, TDD
Relay at (800) 833-6388, or email our webmaster at [email protected].
Office of the Washington State Auditor sao.wa.gov
TABLE OF CONTENTS
Schedule of Findings and Questioned Costs ................................................................................... 4
Schedule of Federal Award Findings and Questioned Costs .......................................................... 6
Independent Auditor's Report on Internal Control Over Financial Reporting and on Compliance
and Other Matters Based on an Audit of Financial Statements Performed in Accordance with
Government Auditing Standards................................................................................................... 12
Independent Auditor's Report on Compliance for Each Major Federal Program and Report on
Internal Control Over Compliance in Accordance With the Uniform Guidance ......................... 14
Independent Auditor's Report on the Financial Statements .......................................................... 17
Financial Section ........................................................................................................................... 20
Corrective Action Plan for Findings Reported Under Uniform Guidance ..................................100
About the State Auditor's Office ..................................................................................................101
Page 3
Office of the Washington State Auditor sao.wa.gov
SCHEDULE OF FINDINGS AND QUESTIONED COSTS
City of Edmonds
January 1, 2020 through December 31, 2020
SECTION I – SUMMARY OF AUDITOR’S RESULTS
The results of our audit of the City of Edmonds are summarized below in accordance with Title 2
U.S. Code of Federal Regulations (CFR) Part 200, Uniform Administrative Requirements, Cost
Principles, and Audit Requirements for Federal Awards (Uniform Guidance).
Financial Statements
We issued an unmodified opinion on the fair presentation of the financial statements of the
governmental activities, the business-type activities, each major fund and the aggregate discretely
presented component units and remaining fund information in accordance with accounting
principles generally accepted in the United States of America (GAAP).
Internal Control over Financial Reporting:
Significant Deficiencies: We reported no deficiencies in the design or operation of internal
control over financial reporting that we consider to be significant deficiencies.
Material Weaknesses: We identified no deficiencies that we consider to be material
weaknesses.
We noted no instances of noncompliance that were material to the financial statements of the City.
Federal Awards
Internal Control over Major Programs:
Significant Deficiencies: We reported no deficiencies in the design or operation of internal
control over major federal programs that we consider to be significant deficiencies.
Material Weaknesses: We identified deficiencies that we consider to be material
weaknesses.
We issued an adverse opinion on the City’s compliance with requirements applicable to its major
federal program.
We reported findings that are required to be disclosed in accordance with 2 CFR 200.516(a).
Page 4
Office of the Washington State Auditor sao.wa.gov
Identification of Major Federal Programs
The following program was selected as a major program in our audit of compliance in accordance
with the Uniform Guidance.
CFDA No. Program or Cluster Title
21.019 COVID-19 – Coronavirus Relief Fund
The dollar threshold used to distinguish between Type A and Type B programs, as prescribed by
the Uniform Guidance, was $750,000.
The City did not qualify as a low-risk auditee under the Uniform Guidance.
SECTION II – FINANCIAL STATEMENT FINDINGS
None reported.
SECTION III – FEDERAL AWARD FINDINGS AND QUESTIONED
COSTS
See Finding 2020-001.
Page 5
Office of the Washington State Auditor sao.wa.gov
SCHEDULE OF FEDERAL AWARD FINDINGS AND
QUESTIONED COSTS
City of Edmonds
January 1, 2020 through December 31, 2020
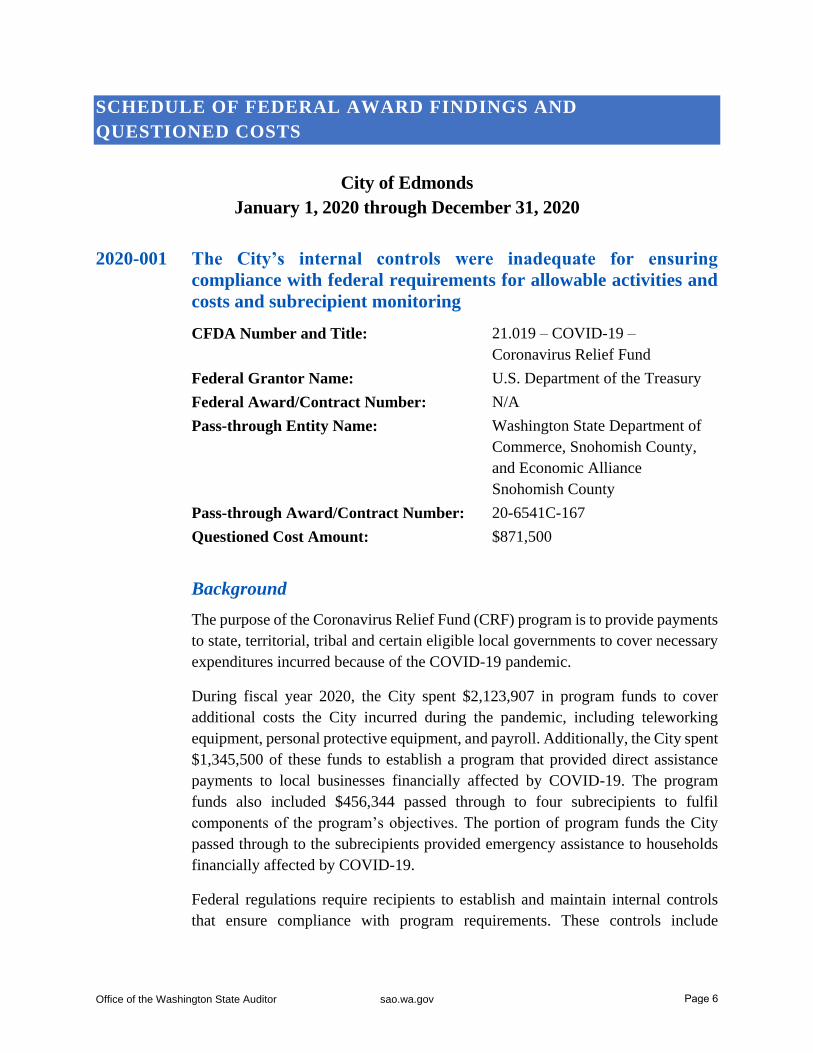
2020-001 The City’s internal controls were inadequate for ensuring
compliance with federal requirements for allowable activities and
costs and subrecipient monitoring
CFDA Number and Title: 21.019 – COVID-19 –
Coronavirus Relief Fund
Federal Grantor Name: U.S. Department of the Treasury
Federal Award/Contract Number: N/A
Pass-through Entity Name: Washington State Department of
Commerce, Snohomish County,
and Economic Alliance
Snohomish County
Pass-through Award/Contract Number: 20-6541C-167
Questioned Cost Amount: $871,500
Background
The purpose of the Coronavirus Relief Fund (CRF) program is to provide payments
to state, territorial, tribal and certain eligible local governments to cover necessary
expenditures incurred because of the COVID-19 pandemic.
During fiscal year 2020, the City spent $2,123,907 in program funds to cover
additional costs the City incurred during the pandemic, including teleworking
equipment, personal protective equipment, and payroll. Additionally, the City spent
$1,345,500 of these funds to establish a program that provided direct assistance
payments to local businesses financially affected by COVID-19. The program
funds also included $456,344 passed through to four subrecipients to fulfil
components of the program’s objectives. The portion of program funds the City
passed through to the subrecipients provided emergency assistance to households
financially affected by COVID-19.
Federal regulations require recipients to establish and maintain internal controls
that ensure compliance with program requirements. These controls include
Page 6
Office of the Washington State Auditor sao.wa.gov
understanding program requirements and monitoring the effectiveness of
established controls.
Activities Allowed/Allowable Costs
For the CRF program, the costs that recipients submit for federal reimbursement
must have been necessary for responding to the COVID-19 pandemic and not
previously included in budgets prior to March 27, 2020. All costs recipients charge
to the CRF program must comply with program requirements and be supported by
proper documentation demonstrating costs are specifically related to COVID-19
activities.
Subrecipient Monitoring
Whenever the City passes on federal funding to subrecipients, federal regulations
require the City to clearly identify the subaward contract as a federal award and
include all applicable program requirements. Further, the City must monitor its
subrecipients to ensure they comply with the terms and conditions of the federal
award. To determine the appropriate level of monitoring, the City must evaluate
each subrecipient’s risk of noncompliance with federal requirements. For this
award, monitoring would include verifying the subrecipients only provided
assistance to participants who met eligibility requirements and claimed
reimbursement for allowable costs.
Description of Condition
Activities Allowed/Allowable Costs
The City established four eligibility criteria for local businesses to receive
assistance payments, but it did not have a process for verifying that businesses met
all of these criteria. For one of the criteria, City employees relied on each business’
application and self-attestation without verifying the information was accurate to
ensure businesses were eligible to receive assistance payments.
Subrecipient Monitoring
The City contracted with four local nonprofit organizations to administer housing
assistance programs and distribute food to food-insecure individuals and
households in Edmonds. The City did not include all required elements in the
subawards and did not perform risk assessments or monitor each subrecipient for
compliance with program requirements, as federal regulations require.
We consider these deficiencies in internal controls to be material weaknesses,
which led to material noncompliance. These issues were not reported as a finding
in the prior audit.
Page 7
Office of the Washington State Auditor sao.wa.gov
Cause of Condition
Many businesses and people experienced sudden financial hardship due to the
COVID-19 pandemic. In an effort to help preserve its local economy, the City acted
quickly by providing assistance payments to businesses and passing funds to
nonprofit organizations it had worked with in the past for other programs. However,
the CRF program was a new type of federal funding for the City, and it had not
previously used federal funds to provide direct assistance payments to local
businesses or passed funding through to subrecipients.
As such, City employees lacked adequate experience and needed training to know
they should have independently verified each business met all eligibility criteria
before awarding assistance. Further, City employees were not aware of all federal
requirements involved when passing funding through to subrecipients.
Effect of Condition and Questioned Costs
Activities Allowed/Allowable Costs
Without obtaining documentation from business grant applicants to verify they met
all eligibility criteria, the City cannot ensure business relief grant costs were
allowable. During the audit, we gave the City the opportunity to obtain
documentation from businesses to support their eligibility. In January 2022, the
City hired a contractor to request and review supporting documentation from the
172 businesses that received CRF funds. We reviewed the information the
contractor obtained and found the following:
Eight businesses did not respond to the City’s request for financial
information or, after some communication, did not provide financial
information. These businesses received a total of $62,000.
Twenty-nine businesses did not meet the City’s eligibility criteria, based on
the information they provided. These businesses received a total of
$235,500.
An additional 74 businesses that received a total of $574,000 in direct business
grants provided tax returns, quarterly reports, profit and loss statements or other
financial information that showed a loss in revenues for the respective period.
However, based on the information provided, we could not confirm a
year-over-year business/revenue loss of at least 30 percent in April or May 2020,
which the City’s eligibility criteria required.
We also could not confirm the expenditures the City charged to the program were
allowable for these businesses. As such, we are questioning these costs.
Page 8
Office of the Washington State Auditor sao.wa.gov
Subrecipient Monitoring
The City did not include all required information in the four subrecipient contracts,
such as the subrecipient’s unique entity identifier, federal award date, name of
federal awarding agency, pass-through entity, contact information for awarding
official of the pass-through entity, and the program’s CFDA number and name.
Without this information, the subrecipient is at an increased risk of not knowing the
award comes from a federal program. This also increases the risk the subrecipient
would not know it needs to comply with specific program requirements, which
could potentially lead to spending funds for unallowable purposes.
Further, without performing risk assessments and adequately monitoring
subrecipients, the City cannot ensure it is performing the proper level of monitoring
and that subrecipients are complying with program requirements. Because the City
did not perform risk assessments and monitor the four subrecipients, we gave the
City the opportunity to perform monitoring during the audit and verify if
subrecipients complied with the terms and conditions of the subaward. In early
2022, the City hired a contractor to perform risk assessments and review three of
the subrecipients to verify they only provided assistance to eligible participants and
complied with program requirements. The City found the subrecipients did not have
adequate support demonstrating participant eligibility. As a result, we are
considering the costs the City passed through to subrecipients, totaling $456,344,
to be unsupported payments.
Recommendation
We recommend the City:
Provide adequate training to staff responsible for administering federal
programs
Dedicate the necessary time and resources to staying updated on program
guidance and ensuring compliance with all program requirements
Verify that beneficiaries of public funds meet all of the City’s eligibility
criteria before awarding funds
Include all required elements in subaward agreements, assess subrecipients’
risk, and monitor them accordingly to verify they are complying with the
terms and conditions of the award and only providing funds to eligible
participants
Page 9
Office of the Washington State Auditor sao.wa.gov
City’s Response
The City of Edmonds appreciates the opportunity to respond to the Washington State
Auditor’s Office’s (SAO) conclusions. The City is committed to establishing and
following effective internal controls for administering federal grants and for compliance
with federal uniform guidance for grant administration, and to monitor any transactions
with subrecipients to ensure compliance with federal requirements.
During 2020 the City endeavored to distribute Coronavirus Relief Funds as
expeditiously as possible into the community where support was most needed due to the
devastating impact on residents and businesses because of the COVID-19 pandemic.
We worked very hard to distribute these funds quickly and efficiently, which we believe
had a very significant, positive impact on our community.
In our attempts to get the grant money into the community as quickly as possible, the
City relied in part upon business’s self-certification of our eligibility requirements under
penalty of perjury. After distributing the CARES funds we became aware that some of
the businesses to whom grants had been awarded did not meet the eligibility
requirements. When we learned this we performed our own internal audit to determine
the number of businesses that were not eligible. After reviewing our audit results, the
SAO determined that 29 businesses who did not meet our grant requirements
nevertheless submitted applications and received grants totaling $235,500. Another 8
businesses have not responded to our requests for documentation; those businesses
received grants totaling $62,000. The City is exploring various remedies that may be
available and appropriate, including but not limited to civil suits and criminal
prosecution, to recover this $297,500 in grant funds or otherwise hold wrongdoers
accountable for their actions.
The remaining questioned costs of $574,000 are from 74 businesses who were able to
supply documentation of losses that they incurred on an annual basis, but were unable
to supply information specific to April or May of 2020. Because these businesses were
able to show proof of COVID-related income losses, we are not intending to pursue
legal action in these cases at this time.
The City acted in good faith to quickly deliver aid and assistance to our residents,
following the guidance and direction available at the time from the Department of
Treasury and the Department of Commerce. Overall, City staff administered this highly
complex and time sensitive program in a professional manner while dealing with
emergency circumstances. We acknowledge that this does not relieve the City of the
necessity to ensure that assistance payments are distributed only to those who meet our
eligibility requirements. The City will also provide training to ensure that subrecipients
are evaluated and monitored sufficiently to ensure eligibility and to reduce any risk of
Page 10
Office of the Washington State Auditor sao.wa.gov
noncompliance. We are planning to add additional staff to provide better monitoring of
the distribution of future grants funds, and we will provide staff with the time, resources,
and training necessary to avoid these errors from occurring again.
Auditor’s Remarks
We appreciate the City’s commitment to resolving this finding and thank the City for its
cooperation and assistance during the audit. We will review the corrective action taken
during the next regular audit.
Applicable Laws and Regulations
Title 2 U.S. Code of Federal Regulations (CFR) Part 200, Uniform Administrative
Requirements, Cost Principles, and Audit Requirements for Federal Awards (Uniform
Guidance), section 516, Audit findings, establishes reporting requirements for audit
findings.
Title 2 CFR Part 200, Uniform Guidance, section 303, Internal controls, describes the
requirements for auditees to maintain internal controls over federal programs and
comply with federal program requirements.
Title 2 CFR Part 200, Uniform Guidance, section 332, Requirements for pass-through
entities, establishes subrecipient monitoring and management requirements for pass
through entities.
The American Institute of Certified Public Accountants defines significant deficiencies
and material weaknesses in its Codification of Statements on Auditing Standards, section
935, Compliance Audits, paragraph 11.
Title 42 U.S. Code of Federal Regulations (CFR) Part 801, Coronavirus Relief Fund
establishes allowable costs of the program.
2 CFR Part 200, Subpart E, cost principles do not apply to the Coronavirus Relief Fund.
Therefore, auditors refer to guidance and FAQs from the U.S. Department of the
Treasury and the pass-through agency, the Washington State Department of Commerce,
as the criteria when testing the allowability of costs under the Fund. Guidance and FAQs
from both the U.S. Department of the Treasury and the Washington State Department
of Commerce can be found at: https://www.commerce.wa.gov/serving-
communities/local-government/covid-resiliency-grants/. These documents speak to the
grantors’ expectation that local governments obtain documentation that supports how
businesses met eligibility criteria.
Page 11
Office of the Washington State Auditor sao.wa.gov
INDEPENDENT AUDITOR’S REPORT
Report on Internal Control over Financial Reporting and on Compliance and Other
Matters Based on an Audit of Financial Statements Performed in Accordance with
Government Auditing Standards
City of Edmonds
January 1, 2020 through December 31, 2020
Mayor and City Council
City of Edmonds
Edmonds, Washington
We have audited, in accordance with auditing standards generally accepted in the United States of
America and the standards applicable to financial audits contained in Government Auditing
Standards, issued by the Comptroller General of the United States, the financial statements of the
governmental activities, the business-type activities, each major fund and the aggregate discretely
presented component units and remaining fund information of the City of Edmonds, as of and for
the year ended December 31, 2020, and the related notes to the financial statements, which
collectively comprise the City’s basic financial statements, and have issued our report thereon
dated June 30, 2021.
As discussed in Note 2 to the financial statements, during the year ended December 31, 2020, the
City implemented Governmental Accounting Standards Board Statement No. 84, Fiduciary
Activities and Statement No. 88, Certain Disclosures Related to Debt, including Direct Borrowings
and Direct Placements.
As discussed in Note 17 to the 2020 financial statements, the full extent of the COVID-19
pandemic’s direct or indirect financial impact on the City is unknown.
INTERNAL CONTROL OVER FINANCIAL REPORTING
In planning and performing our audit of the financial statements, we considered the City’s internal
control over financial reporting (internal control) to determine the audit procedures that are
appropriate in the circumstances for the purpose of expressing our opinions on the financial
statements, but not for the purpose of expressing an opinion on the effectiveness of the City’s
internal control. Accordingly, we do not express an opinion on the effectiveness of the City’s
internal control.
A deficiency in internal control exists when the design or operation of a control does not allow
management or employees, in the normal course of performing their assigned functions, to prevent,
Page 12
Office of the Washington State Auditor sao.wa.gov
or detect and correct, misstatements on a timely basis. A material weakness is a deficiency, or a
combination of deficiencies, in internal control such that there is a reasonable possibility that a
material misstatement of the City’s financial statements will not be prevented, or detected and
corrected on a timely basis. A significant deficiency is a deficiency, or a combination of
deficiencies, in internal control that is less severe than a material weakness, yet important enough
to merit attention by those charged with governance.
Our consideration of internal control was for the limited purpose described in the first paragraph
of this section and was not designed to identify all deficiencies in internal control that might be
material weaknesses or significant deficiencies. Given these limitations, during our audit we did
not identify any deficiencies in internal control that we consider to be material weaknesses.
However, material weaknesses may exist that have not been identified.
COMPLIANCE AND OTHER MATTERS
As part of obtaining reasonable assurance about whether the City’s financial statements are free
from material misstatement, we performed tests of the City’s compliance with certain provisions
of laws, regulations, contracts and grant agreements, noncompliance with which could have a
direct and material effect on the determination of financial statement amounts. However, providing
an opinion on compliance with those provisions was not an objective of our audit, and accordingly,
we do not express such an opinion.
The results of our tests disclosed no instances of noncompliance or other matters that are required
to be reported under Government Auditing Standards.
PURPOSE OF THIS REPORT
The purpose of this report is solely to describe the scope of our testing of internal control and
compliance and the results of that testing, and not to provide an opinion on the effectiveness of the
City’s internal control or on compliance. This report is an integral part of an audit performed in
accordance with Government Auditing Standards in considering the City’s internal control and
compliance. Accordingly, this communication is not suitable for any other purpose. However, this
report is a matter of public record and its distribution is not limited. It also serves to disseminate
information to the public as a reporting tool to help citizens assess government operations.
Pat McCarthy, State Auditor
Olympia, WA
June 30, 2021
Page 13
Office of the Washington State Auditor sao.wa.gov
INDEPENDENT AUDITOR’S REPORT
Report on Compliance for Each Major Federal Program and Report on Internal
Control over Compliance in Accordance with the Uniform Guidance
City of Edmonds
January 1, 2020 through December 31, 2020
Mayor and City Council
City of Edmonds
Edmonds, Washington
REPORT ON COMPLIANCE FOR EACH MAJOR FEDERAL
PROGRAM
We have audited the compliance of the City of Edmonds, with the types of compliance
requirements described in the U.S. Office of Management and Budget (OMB) Compliance
Supplement that could have a direct and material effect on each of the City’s major federal
programs for the year ended December 31, 2020. The City’s major federal programs are identified
in the accompanying Schedule of Findings and Questioned Costs.
Management’s Responsibility
Management is responsible for compliance with federal statutes, regulations, and the terms and
conditions of its federal awards applicable to its federal programs.
Auditor’s Responsibility
Our responsibility is to express an opinion on compliance for each of the City’s major federal
programs based on our audit of the types of compliance requirements referred to above. We
conducted our audit of compliance in accordance with auditing standards generally accepted in the
United States of America; the standards applicable to financial audits contained in Government
Auditing Standards, issued by the Comptroller General of the United States; and the audit
requirements of Title 2 U.S. Code of Federal Regulations Part 200, Uniform Administrative
Requirements, Cost Principles, and Audit Requirements for Federal Awards (Uniform Guidance).
Those standards and the Uniform Guidance require that we plan and perform the audit to obtain
reasonable assurance about whether noncompliance with the types of compliance requirements
referred to above that could have a direct and material effect on a major federal program occurred.
An audit includes examining, on a test basis, evidence about the City’s compliance with those
requirements and performing such other procedures as we considered necessary in the
circumstances.
Page 14
Office of the Washington State Auditor sao.wa.gov
We believe that our audit provides a reasonable basis for our adverse opinion on compliance for
each major federal program. Our audit does not provide a legal determination on the City’s
compliance.
Basis for Adverse Opinion on 21.019 - Coronavirus Relief Fund
As described in Finding 2020-01 in the accompanying Schedule of Federal Award Findings and
Questioned Costs, the City did not comply with requirements regarding 21.019 - Coronavirus
Relief Fund for Activities Allowed or Unallowed, Allowable Costs/Cost Principles and
Subrecipient Monitoring. Compliance with such requirements is necessary, in our opinion, for the
City to comply with the requirements applicable to that program.
Adverse Opinion on 21.019 - Coronavirus Relief Fund
In our opinion, because of the significance of the matter described in the Basis for Adverse Opinion
paragraph, the City did not comply, in all material respects, with the types of compliance
requirements referred to above that could have a direct and material effect on 21.019 – Coronavirus
Relief Fund for the year ended December 31, 2020.
City’s Response to Findings
The City’s response to the noncompliance findings identified in our audit is described in the
accompanying Schedule of Federal Award Findings and Questioned Costs. The City’s response
was not subjected to the auditing procedures applied in the audit of compliance and, accordingly,
we express no opinion on the response.
REPORT ON INTERNAL CONTROL OVER COMPLIANCE
Management of the City is responsible for establishing and maintaining effective internal control
over compliance with the types of compliance requirements referred to above. In planning and
performing our audit of compliance, we considered the City’s internal control over compliance
with the types of requirements that could have a direct and material effect on each major federal
program in order to determine the auditing procedures that are appropriate in the circumstances
for the purpose of expressing an opinion on compliance for each major federal program and to test
and report on internal control over compliance in accordance with the Uniform Guidance, but not
for the purpose of expressing an opinion on the effectiveness of internal control over compliance.
Accordingly, we do not express an opinion on the effectiveness of the City’s internal control over
compliance.
A deficiency in internal control over compliance exists when the design or operation of a control
over compliance does not allow management or employees, in the normal course of performing
their assigned functions, to prevent, or detect and correct, noncompliance with a type of
Page 15
Office of the Washington State Auditor sao.wa.gov
compliance requirement of a federal program on a timely basis. A material weakness in internal
control over compliance is a deficiency, or combination of deficiencies, in internal control over
compliance, such that there is a reasonable possibility that material noncompliance with a type of
compliance requirement of a federal program will not be prevented, or detected and corrected, on
a timely basis. A significant deficiency in internal control over compliance is a deficiency, or a
combination of deficiencies, in internal control over compliance with a type of compliance
requirement of a federal program that is less severe than a material weakness in internal control
over compliance, yet important enough to merit attention by those charged with governance.
Our consideration of internal control over compliance was for the limited purpose described in the
first paragraph of this section and was not designed to identify all deficiencies in internal control
over compliance that might be material weaknesses or significant deficiencies and therefore,
material weaknesses or significant deficiencies may exist that were not identified. We identified
certain deficiencies in internal control over compliance, as described in the accompanying
Schedule of Federal Award Findings and Questioned Costs as Finding 2020-001 that we consider
to be a material weakness.
City’s Response to Findings
The City’s response to the internal control over compliance findings identified in our audit is
described in the accompanying Schedule of Federal Award Findings and Questioned Costs. The
City’s response was not subjected to the auditing procedures applied in the audit of compliance
and, accordingly, we express no opinion on the response.
Purpose of this Report
The purpose of this report on internal control over compliance is solely to describe the scope of
our testing of internal control over compliance and the results of that testing based on the
requirements of the Uniform Guidance. Accordingly, this report is not suitable for any other
purpose. However, this report is a matter of public record and its distribution is not limited. It also
serves to disseminate information to the public as a reporting tool to help citizens assess
government operations.
Pat McCarthy, State Auditor
Olympia, WA
March 29, 2022
Page 16
Office of the Washington State Auditor sao.wa.gov
INDEPENDENT AUDITOR’S REPORT
Report on the Financial Statements
City of Edmonds
January 1, 2020 through December 31, 2020
Mayor and City Council
City of Edmonds
Edmonds, Washington
REPORT ON THE FINANCIAL STATEMENTS
We have audited the accompanying financial statements of the governmental activities, the
business-type activities, each major fund and the aggregate discretely presented component units
and remaining fund information of the City of Edmonds, as of and for the year ended
December 31, 2020, and the related notes to the financial statements, which collectively comprise
the City’s basic financial statements as listed on page 20.
Management’s Responsibility for the Financial Statements
Management is responsible for the preparation and fair presentation of these financial statements
in accordance with accounting principles generally accepted in the United States of America; this
includes the design, implementation, and maintenance of internal control relevant to the
preparation and fair presentation of financial statements that are free from material misstatement,
whether due to fraud or error.
Auditor’s Responsibility
Our responsibility is to express opinions on these financial statements based on our audit. We
conducted our audit in accordance with auditing standards generally accepted in the United States
of America and the standards applicable to financial audits contained in Government Auditing
Standards, issued by the Comptroller General of the United States. Those standards require that
we plan and perform the audit to obtain reasonable assurance about whether the financial
statements are free from material misstatement.
An audit involves performing procedures to obtain audit evidence about the amounts and
disclosures in the financial statements. The procedures selected depend on the auditor’s judgment,
including the assessment of the risks of material misstatement of the financial statements, whether
due to fraud or error. In making those risk assessments, the auditor considers internal control
relevant to the City’s preparation and fair presentation of the financial statements in order to design
audit procedures that are appropriate in the circumstances, but not for the purpose of expressing
Page 17
Office of the Washington State Auditor sao.wa.gov
an opinion on the effectiveness of the City’s internal control. Accordingly, we express no such
opinion. An audit also includes evaluating the appropriateness of accounting policies used and the
reasonableness of significant accounting estimates made by management, as well as evaluating the
overall presentation of the financial statements.
We believe that the audit evidence we have obtained is sufficient and appropriate to provide a basis
for our audit opinions.
Opinions
In our opinion, the financial statements referred to above present fairly, in all material respects,
the respective financial position of the governmental activities, the business-type activities, each
major fund and the aggregate discretely presented component units and remaining fund
information of the City of Edmonds, as of December 31, 2020, and the respective changes in
financial position and, where applicable, cash flows thereof, and the budgetary comparison for the
General fund, for the year then ended in accordance with accounting principles generally accepted
in the United States of America.
Matters of Emphasis
As discussed in Note 2 to the financial statements, in 2020, the City adopted new accounting
guidance, Governmental Accounting Standards Board Statement No. 84, Fiduciary Activities and
Statement No. 88, Certain Disclosures Related to Debt, including Direct Borrowings and Direct
Placements. Our opinion is not modified with respect to this matter.
As discussed in Note 17 to the 2020 financial statements, the full extent of the COVID-19
pandemic’s direct or indirect financial impact on the City is unknown. Our opinion is not modified
with respect to this matter.
Other Matters
Required Supplementary Information
Accounting principles generally accepted in the United States of America require that the
management’s discussion and analysis and required supplementary information listed on page 20
be presented to supplement the basic financial statements. Such information, although not a part
of the basic financial statements, is required by the Governmental Accounting Standards Board
who considers it to be an essential part of financial reporting for placing the basic financial
statements in an appropriate operational, economic or historical context. We have applied certain
limited procedures to the required supplementary information in accordance with auditing
standards generally accepted in the United States of America, which consisted of inquiries of
management about the methods of preparing the information and comparing the information for
consistency with management’s responses to our inquiries, the basic financial statements, and
Page 18
Office of the Washington State Auditor sao.wa.gov
other knowledge we obtained during our audit of the basic financial statements. We do not express
an opinion or provide any assurance on the information because the limited procedures do not
provide us with sufficient evidence to express an opinion or provide any assurance.
Supplementary and Other Information
Our audit was conducted for the purpose of forming opinions on the financial statements that
collectively comprise the City’s basic financial statements as a whole. The accompanying
Schedule of Expenditures of Federal Awards is presented for purposes of additional analysis as
required by Title 2 U.S. Code of Federal Regulations (CFR) Part 200, Uniform Administrative
Requirements, Cost Principles, and Audit Requirements for Federal Awards (Uniform
Guidance).This schedule is not a required part of the basic financial statements. Such information
is the responsibility of management and was derived from and relates directly to the underlying
accounting and other records used to prepare the basic financial statements. The information has
been subjected to the auditing procedures applied in the audit of the basic financial statements and
certain additional procedures, including comparing and reconciling such information directly to
the underlying accounting and other records used to prepare the basic financial statements or to
the basic financial statements themselves, and other additional procedures in accordance with
auditing standards generally accepted in the United States of America. In our opinion, the
information is fairly stated, in all material respects, in relation to the basic financial statements
taken as a whole.
OTHER REPORTING REQUIRED BY GOVERNMENT AUDITING
STANDARDS
In accordance with Government Auditing Standards, we have also issued our report dated
June 30, 2021 on our consideration of the City’s internal control over financial reporting and on
our tests of its compliance with certain provisions of laws, regulations, contracts and grant
agreements and other matters. The purpose of that report is to describe the scope of our testing of
internal control over financial reporting and compliance and the results of that testing, and not to
provide an opinion on internal control over financial reporting or on compliance. That report is an
integral part of an audit performed in accordance with Government Auditing Standards in
considering the City’s internal control over financial reporting and compliance.
Pat McCarthy, State Auditor
Olympia, WA
June 30, 2021
Page 19
Office of the Washington State Auditor sao.wa.gov
FINANCIAL SECTION
City of Edmonds
January 1, 2020 through December 31, 2020
REQUIRED SUPPLEMENTARY INFORMATION
Management’s Discussion and Analysis – 2020
BASIC FINANCIAL STATEMENTS
Statement of Net Position – 2020
Statement of Activities – 2020
Balance Sheet – Governmental Funds – 2020
Reconciliation of the Balance Sheet to the Statement of Net Position – Governmental
Funds – 2020
Statement of Revenues, Expenditures and Changes in Fund Balances – Governmental
Funds – 2020
Reconciliation of the Statement of Revenues, Expenditures, and Changes in Fund
Balances of Government Funds to the Statement of Activities – 2020
Statement of Revenues, Expenditures, and Changes in Fund Balances – Budget and
Actual – General Fund – 2020
Statement of Net Position – Proprietary Funds – 2020
Statement of Revenues, Expenses and Changes in Net Position – Proprietary Funds –
2020
Statement of Cash Flows – Proprietary Funds – 2020
Statement of Fiduciary Net Position – 2020
Statement of Changes in Fiduciary Net Position – 2020
Notes to the Financial Statements – 2020
REQUIRED SUPPLEMENTARY INFORMATION
Firemen’s Pension Fund Other Post-Employment Benefits – Schedule of Changes in Total
OPEB Liability and Related Ratios – 2020
Firemen’s Pension Fund – Schedule of Changes in the City’s Net Pension Liability and
Related Ratios – 2020
Firemen’s Pension Fund – Schedule of City Contributions – 2020
Schedules of Proportionate Share of the Net Pension Liability – PERS 1, PERS 2/3,
LEOFF 1, LEOFF 2 – 2020
Schedule of Employer Contributions – PERS 1, PERS 2/3, LEOFF 1, LEOFF 2 – 2020
Page 20
Office of the Washington State Auditor sao.wa.gov
SUPPLEMENTARY AND OTHER INFORMATION
Schedule of Expenditures of Federal Awards – 2020
Notes to the Schedule of Expenditures of Federal Awards – 2020
Page 21
MANAGEMENT’S DISCUSSION AND ANALYSIS The Management’s Discussion and Analysis section of this provides an overview of the City’s financial activities for the year ended December 31, 2020. The purpose is to highlight significant financial issues, major financial activities and resulting changes in the financial position and economic factors affecting the City. The reader is encouraged to consider the information presented here in conjunction with the information furnished in the Letter of Transmittal, the City’s financial statements and the accompanying notes following the financial information. Financial Highlights
The regional, national and global economies were impacted significantly in 2020 by the pandemic brought on by the COVID-19 virus. While some industries were devastated – travel/tourism and in-person entertainment such as concerts and sporting events, for example – the City’s revenue performance remained surprisingly strong in 2020. In the General Fund Taxes, Licenses and Permits, and Charges for Services decreased by only $1,139,116 compared to 2019, a 3.0% decrease, and assessed property values in the City increased by 7.7 percent over 2019.
The assets and deferred outflows of resources of the City of Edmonds exceeded its liabilities and
deferred inflows at fiscal year-end by $198.3 million (net position), an increase of $12.2 million over 2019. Of this amount, $144.6 million is a net investment in capital assets. The unrestricted net position totals $34.2 million and may be used to meet the city’s ongoing obligations to citizens and creditors. In addition, the restricted net position totals $19.5 million and is earmarked for debt service, capital projects and special revenue funds.
The City's total net position improved by $12.2 million in 2020. Governmental activities increased
by $2.7 million and business-type activities increased by $9.5 million, mostly the result of a bond issuance in late 2020.
Governmental funds reported a combined ending fund balance of $34.5 million; a $1.6 million
reduction from the prior year. Of this amount, $14.4 million is unassigned and available to fund ongoing activities. The committed fund balance category totals $3.1 million and the assigned fund balance category totals $2 million. The 2020 unassigned fund balance equals 25.9% of 2020 general fund expenditures.
Overview of the Financial Statements This discussion and analysis is intended to serve as an introduction to the City of Edmonds basic financial statements. The basic financial statements are comprised of three components: 1) government-wide financial statements, 2) fund financial statements, and 3) notes to the financial statements. Other supplementary information contained in the report is intended to furnish additional detail to support the basic financial statements. Using this Annual Financial Report This annual report consists of a series of financial statements and notes to those statements. These statements are organized so the reader can understand the City of Edmonds as a financial whole or as an entire operating entity. The statements then proceed to provide an increasingly detailed look at specific financial conditions. Government-wide Financial Statements The government-wide financial statements are designed to provide readers with a broad overview of the city’s financial position in a manner like that of the private-sector business. These statements are reported on the full accrual basis of accounting. Under the full accrual basis, certain revenues and expenses are reported that will not affect the cash flows until future periods. The focus of the Statement of Net Position is designed to be similar to bottom-line results for the City and its governmental and business-type activities. This statement presents all of the City’s assets, deferred outflows of resources, liabilities, and deferred inflows of resources, with the residual reported as net position. Over time, increases or decreases in net position may be one indicator of improvement or deterioration in the City’s overall financial health. The Statement of Activities presents both the gross and net cost of various functions, including both
Page 22
governmental and business-type activities, which are supported by the City’s general tax and other revenues. This is intended to summarize and simplify the reader’s analysis of the cost of various governmental services and/or subsidy to various business-type activities. The revenue generated by the specific functions (charges for services, grants, and contributions) is compared to the expenses for those functions to show how much each function either supports itself or relies on taxes and other general funding sources for support. All activity on this statement is reported on the accrual basis of accounting, requiring that revenues are reported when they are earned and expenses are reported when they are incurred, regardless of when cash is received or disbursed. Governmental activities of the City include general government (executive, finance, legal, human resources, and court), public safety, utilities and environment, transportation, economic environment, mental and physical health, and culture and recreation. The City’s business-type activities include water, sewer, and storm utilities. Governmental activities are primarily supported by taxes, charges for services, and grants while business-type activities are self-supporting through user fees and charges. The City also includes as a discretely presented component unit the Edmonds Public Facilities District (PFD), a performing arts center in Edmonds, and the PFD’s blended component unit, the Edmonds Center for the Arts, a non-profit established to collect donations and manage the operations for the PFD. Although legally separate, the PFD is important because the City provides financial support and oversight responsibilities connected to the activities of the board. Fund Financial Statements The annual financial report includes fund financial statements in addition to the government-wide statements. While the government-wide statements present the City’s finances based on the type of activity, general government versus business-type, the fund financial statements are presented by fund type, such as the general fund, special revenue funds, and proprietary funds. A fund is a fiscal and accounting entity with a self-balancing set of accounts used to account for specific activities or meet certain objectives. Funds are often set up in accordance with special regulations, restrictions or limitations. The City of Edmonds, like other state and local governments, uses fund accounting to ensure and show compliance with finance-related legal requirements. The City presents three categories of funds: governmental funds, proprietary funds, and fiduciary funds. Governmental funds account for essentially the same functions reported as governmental activities in the government-wide financial statements. Most of the City’s basic services are reported in the governmental funds. These statements, however, focus on cash and other assets that can readily be converted to available resources, as well as any balances remaining at year-end. Such information is useful in determining which financial resources are available in the near future to finance City programs. Readers may better understand the long-term impact of the government’s near-term financing decisions by comparing the information presented for the governmental funds with similar information presented for governmental activities in the government-wide financial statements. The Governmental Funds’ Balance Sheet and the Governmental Funds’ Statement of Revenues, Expenditures, and Changes in Fund Balances provide a reconciliation to facilitate the comparison. Information for the major governmental funds is presented separately in the Governmental Fund Balance Sheet and in the Governmental Fund’s Statement of Revenues, Expenditures, and Changes in Fund Balances; information for the non-major funds is presented in the aggregate. The City’s main operating fund is the General Fund. However, the City maintains many accounts and seven sub-funds within the General Fund. The remaining governmental funds are combined into a single column labeled non-major governmental funds. Individual fund data for each of the non-major governmental funds can be found in combining statements later in the report. The City maintains control over its operating funds through the adoption of an annual budget. Budgets are adopted at the fund level and accordance with state law. A budgetary comparison is presented for the General Fund as part of the basic financial statements. The basic governmental fund financial statements can be found after the government-wide statements of this report. Proprietary funds account for services for which the City charges outside customers and other City
Page 23
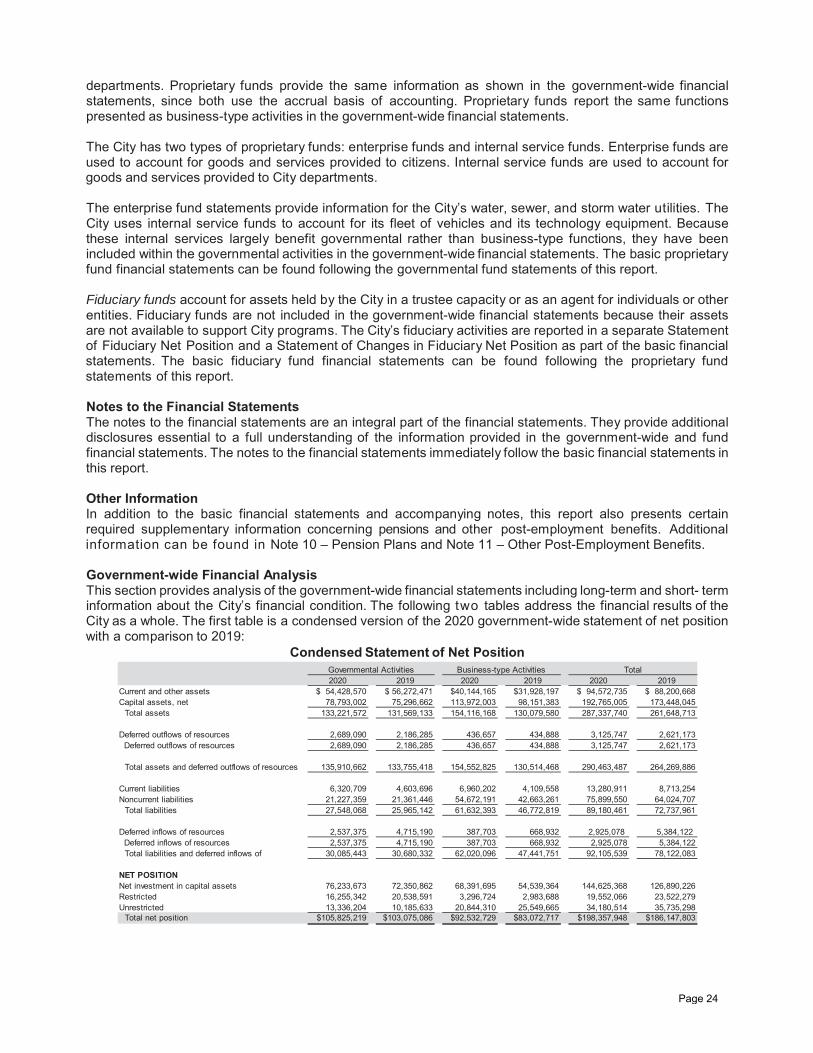
departments. Proprietary funds provide the same information as shown in the government-wide financial statements, since both use the accrual basis of accounting. Proprietary funds report the same functions presented as business-type activities in the government-wide financial statements. The City has two types of proprietary funds: enterprise funds and internal service funds. Enterprise funds are used to account for goods and services provided to citizens. Internal service funds are used to account for goods and services provided to City departments. The enterprise fund statements provide information for the City’s water, sewer, and storm water utilities. The City uses internal service funds to account for its fleet of vehicles and its technology equipment. Because these internal services largely benefit governmental rather than business-type functions, they have been included within the governmental activities in the government-wide financial statements. The basic proprietary fund financial statements can be found following the governmental fund statements of this report. Fiduciary funds account for assets held by the City in a trustee capacity or as an agent for individuals or other entities. Fiduciary funds are not included in the government-wide financial statements because their assets are not available to support City programs. The City’s fiduciary activities are reported in a separate Statement of Fiduciary Net Position and a Statement of Changes in Fiduciary Net Position as part of the basic financial statements. The basic fiduciary fund financial statements can be found following the proprietary fund statements of this report. Notes to the Financial Statements The notes to the financial statements are an integral part of the financial statements. They provide additional disclosures essential to a full understanding of the information provided in the government-wide and fund financial statements. The notes to the financial statements immediately follow the basic financial statements in this report. Other Information In addition to the basic financial statements and accompanying notes, this report also presents certain required supplementary information concerning pensions and other post-employment benefits. Additional information can be found in Note 10 – Pension Plans and Note 11 – Other Post-Employment Benefits. Government-wide Financial Analysis This section provides analysis of the government-wide financial statements including long-term and short- term information about the City’s financial condition. The following two tables address the financial results of the City as a whole. The first table is a condensed version of the 2020 government-wide statement of net position with a comparison to 2019:
Condensed Statement of Net Position
2020 2019 2020 2019 2020 2019Current and other assets $ 54,428,570 $ 56,272,471 $40,144,165 $31,928,197 $ 94,572,735 $ 88,200,668 Capital assets, net 78,793,002 75,296,662 113,972,003 98,151,383 192,765,005 173,448,045
Total assets 133,221,572 131,569,133 154,116,168 130,079,580 287,337,740 261,648,713
Deferred outflows of resources 2,689,090 2,186,285 436,657 434,888 3,125,747 2,621,173 Deferred outflows of resources 2,689,090 2,186,285 436,657 434,888 3,125,747 2,621,173
Total assets and deferred outflows of resources 135,910,662 133,755,418 154,552,825 130,514,468 290,463,487 264,269,886
Current liabilities 6,320,709 4,603,696 6,960,202 4,109,558 13,280,911 8,713,254 Noncurrent liabilities 21,227,359 21,361,446 54,672,191 42,663,261 75,899,550 64,024,707
Total liabilities 27,548,068 25,965,142 61,632,393 46,772,819 89,180,461 72,737,961
Deferred inflows of resources 2,537,375 4,715,190 387,703 668,932 2,925,078 5,384,122 Deferred inflows of resources 2,537,375 4,715,190 387,703 668,932 2,925,078 5,384,122
Total liabilities and deferred inflows of 30,085,443 30,680,332 62,020,096 47,441,751 92,105,539 78,122,083
NET POSITIONNet investment in capital assets 76,233,673 72,350,862 68,391,695 54,539,364 144,625,368 126,890,226 Restricted 16,255,342 20,538,591 3,296,724 2,983,688 19,552,066 23,522,279 Unrestricted 13,336,204 10,185,633 20,844,310 25,549,665 34,180,514 35,735,298
Total net position $105,825,219 $103,075,086 $92,532,729 $83,072,717 $198,357,948 $186,147,803
Governmental Activities Business-type Activities Total
Page 24
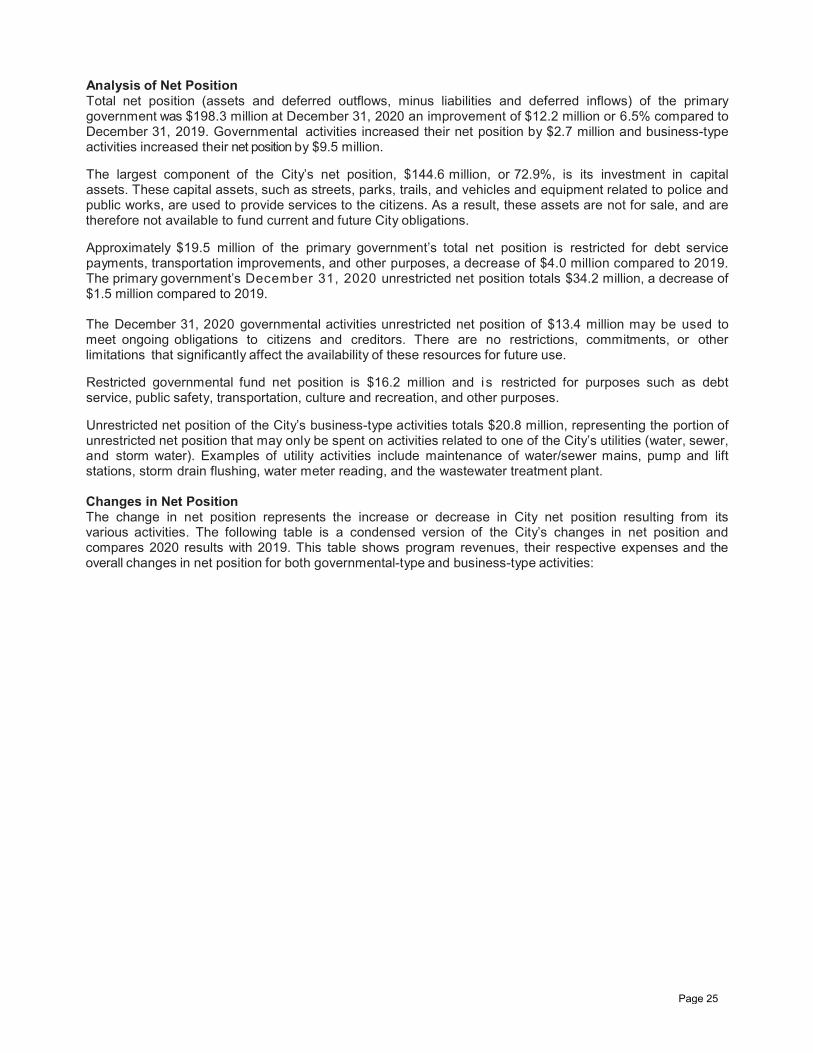
Analysis of Net Position Total net position (assets and deferred outflows, minus liabilities and deferred inflows) of the primary government was $198.3 million at December 31, 2020 an improvement of $12.2 million or 6.5% compared to December 31, 2019. Governmental activities increased their net position by $2.7 million and business-type activities increased their net position by $9.5 million. The largest component of the City’s net position, $144.6 million, or 72.9%, is its investment in capital assets. These capital assets, such as streets, parks, trails, and vehicles and equipment related to police and public works, are used to provide services to the citizens. As a result, these assets are not for sale, and are therefore not available to fund current and future City obligations. Approximately $19.5 million of the primary government’s total net position is restricted for debt service payments, transportation improvements, and other purposes, a decrease of $4.0 million compared to 2019. The primary government’s December 31, 2020 unrestricted net position totals $34.2 million, a decrease of $1.5 million compared to 2019. The December 31, 2020 governmental activities unrestricted net position of $13.4 million may be used to meet ongoing obligations to citizens and creditors. There are no restrictions, commitments, or other limitations that significantly affect the availability of these resources for future use. Restricted governmental fund net position is $16.2 million and i s restricted for purposes such as debt service, public safety, transportation, culture and recreation, and other purposes. Unrestricted net position of the City’s business-type activities totals $20.8 million, representing the portion of unrestricted net position that may only be spent on activities related to one of the City’s utilities (water, sewer, and storm water). Examples of utility activities include maintenance of water/sewer mains, pump and lift stations, storm drain flushing, water meter reading, and the wastewater treatment plant. Changes in Net Position The change in net position represents the increase or decrease in City net position resulting from its various activities. The following table is a condensed version of the City’s changes in net position and compares 2020 results with 2019. This table shows program revenues, their respective expenses and the overall changes in net position for both governmental-type and business-type activities:
Page 25
Changes in Net Position
2020 2019 2020 2019 2020 2019REVENUESProgram revenues:
Charges for services $ 12,634,784 $ 13,372,648 $27,280,123 $25,983,491 $ 39,914,907 $ 39,356,139 Operating grants and contributions 2,619,351 633,296 25,297 34,198 2,644,648 667,494 Capital grants and contributions 2,158,357 1,796,082 5,511,256 1,457,600 7,669,613 3,253,682
General revenues:Property taxes 14,599,185 14,386,149 - - 14,599,185 14,386,149 Sales taxes 9,397,119 9,477,813 - - 9,397,119 9,477,813 Interfund utility taxes 2,359,529 2,450,254 - - 2,359,529 2,450,254 Utility taxes 4,133,662 4,242,835 - - 4,133,662 4,242,835 Excise taxes 6,248,492 5,690,723 - - 6,248,492 5,690,723 Interest and investment earnings 691,210 1,468,251 165,842 363,547 857,052 1,831,798 Miscellaneous 552,738 274,840 3,544 - 556,282 274,840 Gains on disposition of assets 273,183 23,386 - - 273,183 23,386
Total revenues 55,667,610 53,816,277 32,986,062 27,838,836 88,653,672 81,655,113
EXPENSESGovernmental activities:
General government 16,103,089 13,458,742 - - 16,103,089 13,458,742 Public safety 25,261,314 26,060,416 - - 25,261,314 26,060,416 Utilities and environment 229,528 201,958 - - 229,528 201,958 Transportation 4,885,398 7,185,216 - - 4,885,398 7,185,216 Economic environment 1,461,200 1,640,845 - - 1,461,200 1,640,845 Mental and physical health 147,957 166,750 - - 147,957 166,750 Culture and recreation 4,682,914 5,405,494 - - 4,682,914 5,405,494 Interest on long-term debt 146,808 48,910 - - 146,808 48,910
Business-Type activities:Sewer Fund - - 10,930,526 12,068,583 10,930,526 12,068,583 Storm Fund - - 5,021,779 4,374,384 5,021,779 4,374,384 Water Fund - - 7,573,014 8,164,665 7,573,014 8,164,665
Total expenses 52,918,208 54,168,331 23,525,319 24,607,632 76,443,527 78,775,963 Excess (deficiency) before transfers 2,749,402 (352,054) 9,460,743 3,231,204 12,210,145 2,879,150
Transfers 731 11,984 (731) (11,984) - - Increase (decrease) in net position 2,750,133 (340,070) 9,460,012 3,219,220 12,210,145 2,879,150 Net position - beginning 103,075,086 103,415,154 83,072,717 79,853,497 186,147,803 183,268,651 Net position - ending $105,825,219 $103,075,084 $92,532,729 $83,072,717 $198,357,948 $186,147,801
Governmental Activities Business-type Activities Total
Analysis of the Changes in Net Position Net position of the primary government increased by $12.2 million, mostly due to the sale of $13.9 million of Climate Bonds in the Sewer Fund. Total government-wide revenues of the primary government increased by $7.0 million or 8.5% and total expenses decreased by $2.3 million or 3.0% over the prior year. These changes are discussed in more detail below. Governmental Activities: The table above shows the net position for Governmental activities increased by $2.7 million. This increase is the result of an increase in total revenues combined with a reduction of total expenses in 2020. Governmental activity expenditures decreased by $1.3 million or 2.3% and Governmental activity revenues increased by $1.8 million, or 3.4% from 2019 levels. The expenditure decrease is due to severe pandemic-related cutbacks, primarily in public safety, transportation, and cultural services expenditures in the City. The decreased spending was matched with an increase to general revenues. The increase in revenues is from over $2 million in Federal CARES funds appropriations and other related funds received from Snohomish County, which the City used to provide assistance to local individuals, businesses, and other organizations. Below are additional significant changes to revenues for 2020:
Page 26
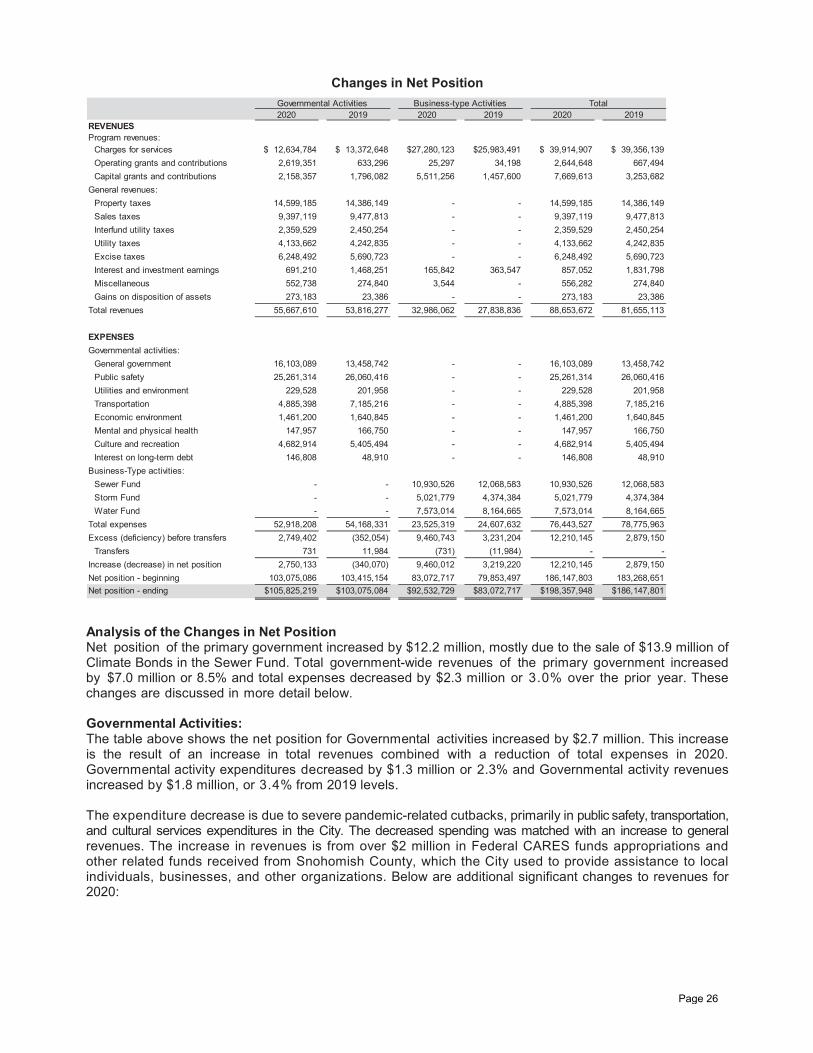
As a result of record low interest rates, Interest and Investment Earnings decreased by $777,756, or47.02%.Property tax revenue increased $248,154, or 1.7%.Sales tax collections decreased by $72,347, or 0.8%.Excise taxes increased by $561,016 or 9.9%.
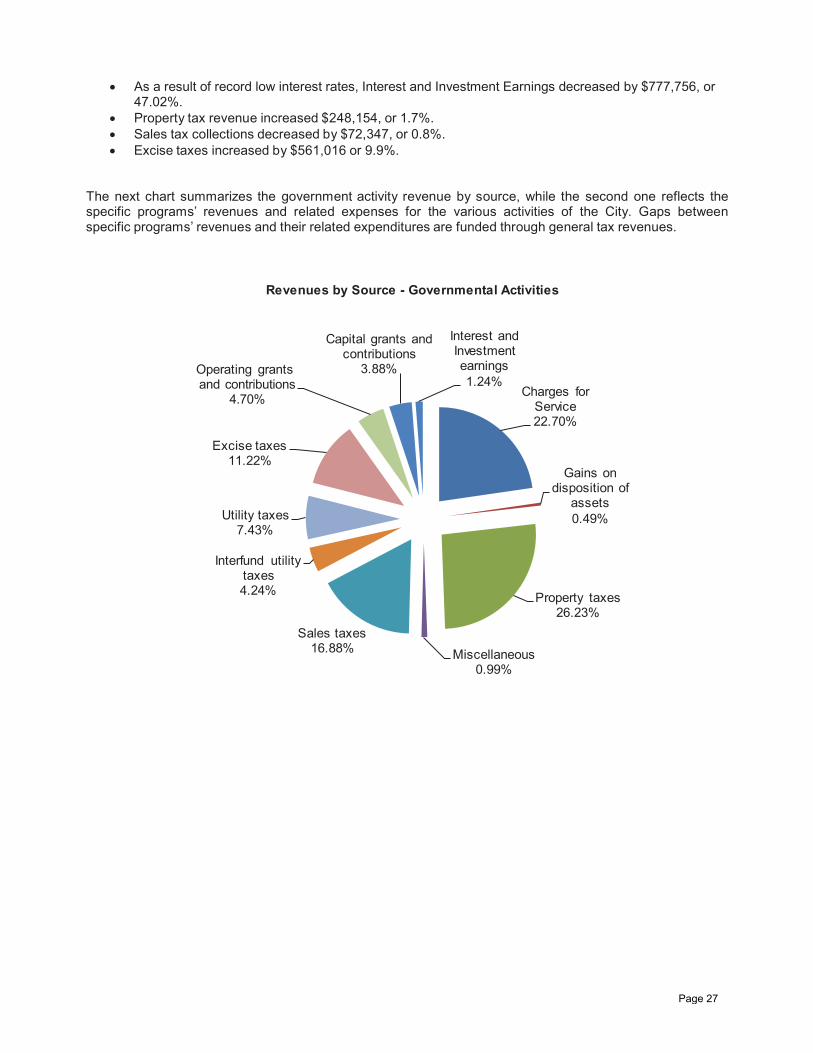
The next chart summarizes the government activity revenue by source, while the second one reflects the specific programs’ revenues and related expenses for the various activities of the City. Gaps between specific programs’ revenues and their related expenditures are funded through general tax revenues.
Charges for Service22.70%
Gains on disposition of
assets0.49%
Property taxes26.23%
Miscellaneous0.99%
Sales taxes16.88%
Interfund utility taxes4.24%
Utility taxes7.43%
Excise taxes11.22%
Operating grants and contributions
4.7 %
Capital grants and contributions
3.88%
Interest and Investment earnings1.24%
Revenues by Source - Governmental Activities
Page 27
$16,103,089
$25,261,314
$229,528
$4,885,398
$1,461,200
$147,957
$4,682,914
$6,641,160
$3,749,544
$125
$1,818,388
$3,217,476
$157,393
$1,828,406
$0 $5,000,000 $10,000,000 $15,000,000 $20,000,000 $25,000,000 $30,000,000
General government
Public safety
Utilities and environment
Transportation
Economic environment
Mental and physicalhealth
Culture and recreation
Expenses and Program Revenues - Governmental Activities
Program Revenues Expenses
Business-type Activities:
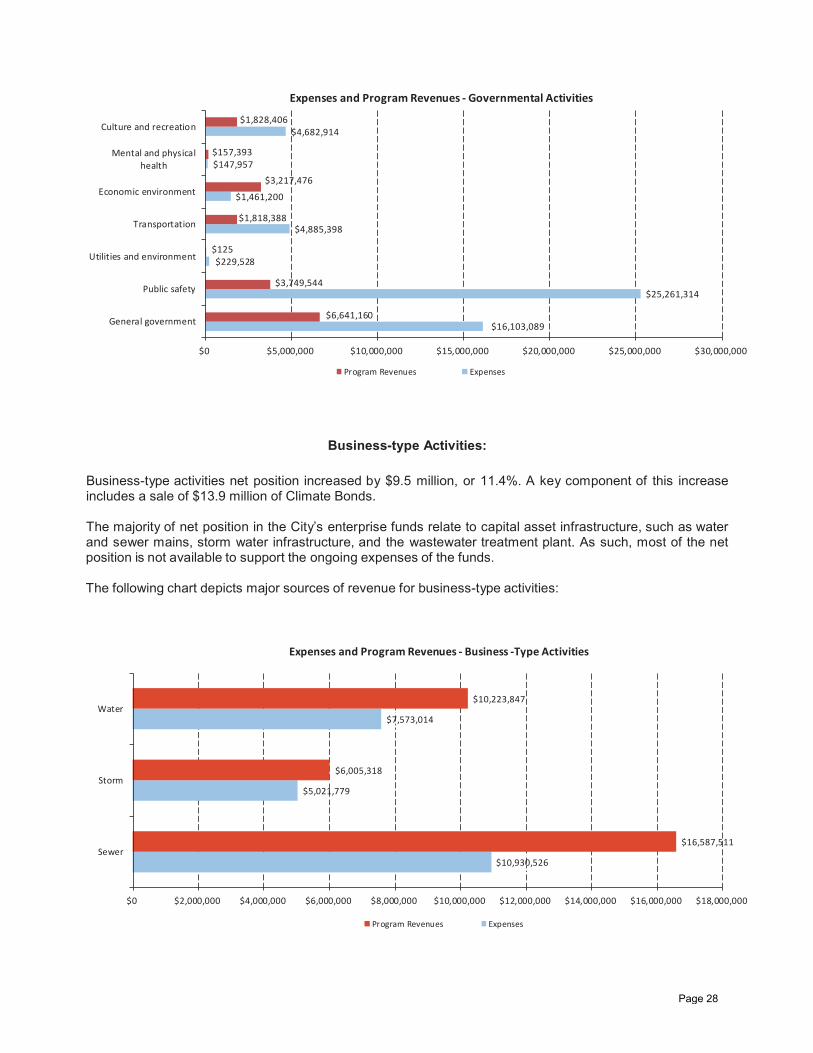
Business-type activities net position increased by $9.5 million, or 11.4%. A key component of this increase includes a sale of $13.9 million of Climate Bonds.
The majority of net position in the City’s enterprise funds relate to capital asset infrastructure, such as water and sewer mains, storm water infrastructure, and the wastewater treatment plant. As such, most of the net position is not available to support the ongoing expenses of the funds.
The following chart depicts major sources of revenue for business-type activities:
$10,930,526
$5,021,779
$7,573,014
$16,587,511
$6,005,318
$10,223,847
$0 $2,000,000 $4,000,000 $6,000,000 $8,000,000 $10,000,000 $12,000,000 $14,000,000 $16,000,000 $18,000,000
Sewer
Storm
Water
Expenses and Program Revenues - Business -Type Activities
Program Revenues Expenses
Page 28
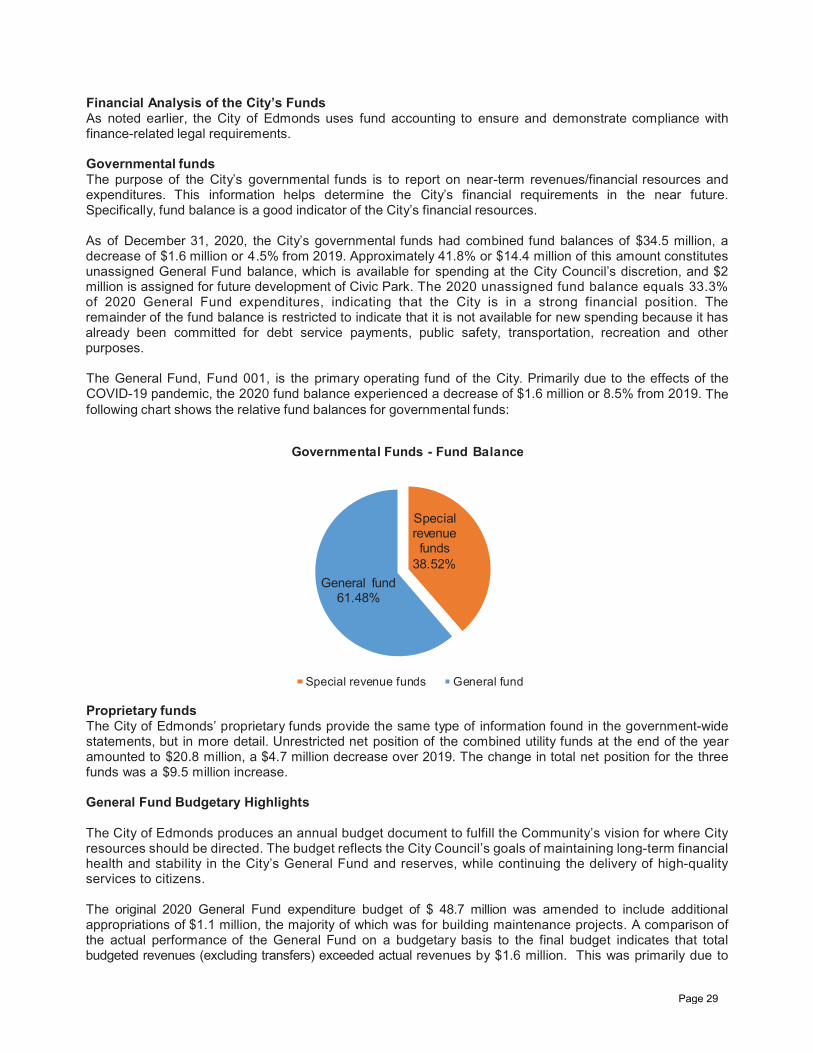
Financial Analysis of the City’s Funds As noted earlier, the City of Edmonds uses fund accounting to ensure and demonstrate compliance with finance-related legal requirements. Governmental funds The purpose of the City’s governmental funds is to report on near-term revenues/financial resources and expenditures. This information helps determine the City’s financial requirements in the near future. Specifically, fund balance is a good indicator of the City’s financial resources. As of December 31, 2020, the City’s governmental funds had combined fund balances of $34.5 million, a decrease of $1.6 million or 4.5% from 2019. Approximately 41.8% or $14.4 million of this amount constitutes unassigned General Fund balance, which is available for spending at the City Council’s discretion, and $2 million is assigned for future development of Civic Park. The 2020 unassigned fund balance equals 33.3% of 2020 General Fund expenditures, indicating that the City is in a strong financial position. The remainder of the fund balance is restricted to indicate that it is not available for new spending because it has already been committed for debt service payments, public safety, transportation, recreation and other purposes. The General Fund, Fund 001, is the primary operating fund of the City. Primarily due to the effects of the COVID-19 pandemic, the 2020 fund balance experienced a decrease of $1.6 million or 8.5% from 2019. The following chart shows the relative fund balances for governmental funds:
Special revenue funds
38.52%General fund
61.48%
Governmental Funds - Fund Balance
Special revenue funds General fund
Proprietary funds The City of Edmonds’ proprietary funds provide the same type of information found in the government-wide statements, but in more detail. Unrestricted net position of the combined utility funds at the end of the year amounted to $20.8 million, a $4.7 million decrease over 2019. The change in total net position for the three funds was a $9.5 million increase. General Fund Budgetary Highlights The City of Edmonds produces an annual budget document to fulfill the Community’s vision for where City resources should be directed. The budget reflects the City Council’s goals of maintaining long-term financial health and stability in the City’s General Fund and reserves, while continuing the delivery of high-quality services to citizens. The original 2020 General Fund expenditure budget of $ 48.7 million was amended to include additional appropriations of $1.1 million, the majority of which was for building maintenance projects. A comparison of the actual performance of the General Fund on a budgetary basis to the final budget indicates that total budgeted revenues (excluding transfers) exceeded actual revenues by $1.6 million. This was primarily due to
Page 29
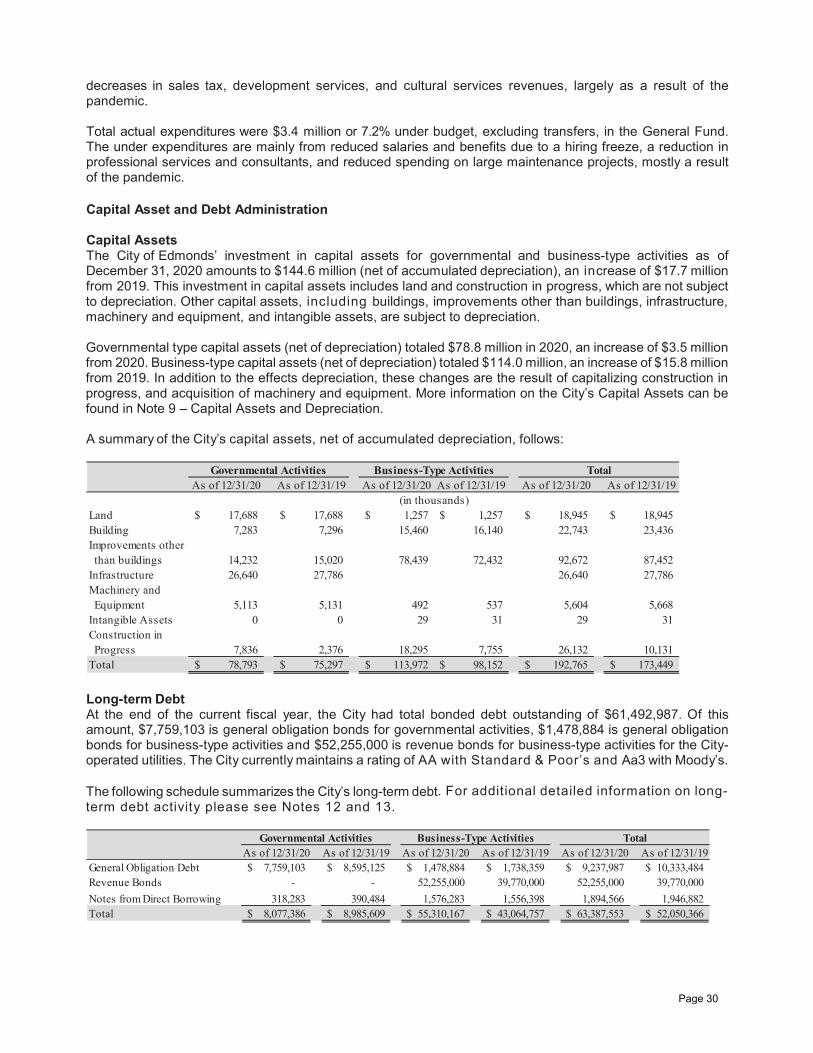
decreases in sales tax, development services, and cultural services revenues, largely as a result of the pandemic. Total actual expenditures were $3.4 million or 7.2% under budget, excluding transfers, in the General Fund. The under expenditures are mainly from reduced salaries and benefits due to a hiring freeze, a reduction in professional services and consultants, and reduced spending on large maintenance projects, mostly a result of the pandemic. Capital Asset and Debt Administration Capital Assets The City of Edmonds’ investment in capital assets for governmental and business-type activities as of December 31, 2020 amounts to $144.6 million (net of accumulated depreciation), an increase of $17.7 million from 2019. This investment in capital assets includes land and construction in progress, which are not subject to depreciation. Other capital assets, including buildings, improvements other than buildings, infrastructure, machinery and equipment, and intangible assets, are subject to depreciation. Governmental type capital assets (net of depreciation) totaled $78.8 million in 2020, an increase of $3.5 million from 2020. Business-type capital assets (net of depreciation) totaled $114.0 million, an increase of $15.8 million from 2019. In addition to the effects depreciation, these changes are the result of capitalizing construction in progress, and acquisition of machinery and equipment. More information on the City’s Capital Assets can be found in Note 9 – Capital Assets and Depreciation. A summary of the City’s capital assets, net of accumulated depreciation, follows:
As of 12/31/20 As of 12/31/19 As of 12/31/20 As of 12/31/19 As of 12/31/20 As of 12/31/19
Land 17,688$ 17,688$ 1,257$ 1,257$ 18,945$ 18,945$ Building 7,283 7,296 15,460 16,140 22,743 23,436 Improvements other than buildings 14,232 15,020 78,439 72,432 92,672 87,452 Infrastructure 26,640 27,786 26,640 27,786 Machinery and Equipment 5,113 5,131 492 537 5,604 5,668 Intangible Assets 0 0 29 31 29 31 Construction in Progress 7,836 2,376 18,295 7,755 26,132 10,131 Total 78,793$ 75,297$ 113,972$ 98,152$ 192,765$ 173,449$
(in thousands)
Governmental Activities Business-Type Activities Total
Long-term Debt At the end of the current fiscal year, the City had total bonded debt outstanding of $61,492,987. Of this amount, $7,759,103 is general obligation bonds for governmental activities, $1,478,884 is general obligation bonds for business-type activities and $52,255,000 is revenue bonds for business-type activities for the City-operated utilities. The City currently maintains a rating of AA with Standard & Poor’s and Aa3 with Moody’s. The following schedule summarizes the City’s long-term debt. For additional detailed information on long-term debt activity please see Notes 12 and 13.
As of 12/31/20 As of 12/31/19 As of 12/31/20 As of 12/31/19 As of 12/31/20 As of 12/31/19General Obligation Debt 7,759,103$ 8,595,125$ 1,478,884$ 1,738,359$ 9,237,987$ 10,333,484$ Revenue Bonds - - 52,255,000 39,770,000 52,255,000 39,770,000 Notes from Direct Borrowing 318,283 390,484 1,576,283 1,556,398 1,894,566 1,946,882 Total 8,077,386$ 8,985,609$ 55,310,167$ 43,064,757$ 63,387,553$ 52,050,366$
Governmental Activities Business-Type Activities Total
Page 30
Economic Factors and Next Year’s Budgets Principal factors influencing the City’s 2021 budget include continued improvement in sales tax and excise tax revenues stemming from the improving retail sales, sales of real estate, and construction activity in the City, and slow growth in the overall economy. The 2021 budget was adopted in December 2020 by the City Council. Our budget reflects the City Council’s goals, maintains long-term financial health and stability of our General Fund and reserves, and despite the uncertainty around the economic effects of the pandemic, continues the delivery of high-quality services for our community. The 2021 budget includes these priorities:
$500,000 to begin implementation of a new Human Services Program $50,000 to enhance our arts & culture through the Edmonds Center for the Arts $50,000 for Equity Diversity training for all staff and board and commission members $2.2 million for pedestrian safety improvements $500,000 to start a new Open Space fund that will grow every year $6.03 million for construction of Civic Park $22.2 million for the Wastewater Carbon Recover Project $900,000 for Daylighting of Willow Creek $100,000 for a new Greenhouse $875,000 for Highway 99 Revitalization $2.6 million for the City’s pavement overlay program
Requests for Information The City’s financial statements are designed to provide users with a general overview of the City’s finances as well as to demonstrate the City’s accountability to its citizens, investors, creditors, and other customers. If you have a question about this report, please contact the Finance Director, 121 Fifth Avenue North, Edmonds, Washington, WA 98020.
Page 31

Component Unit
Governmental Activities
Business-type Activities Total
Edmonds Public Facil ites District
ASSETSCurrent assets:
Cash & equity in pooled investments $ 19,046,314 $ 12,133,991 $ 31,180,305 $ 101,256 Investments 10,894,660 8,321,570 19,216,230 - Taxes receivable 383,437 - 383,437 - Customer accounts 634,325 3,946,665 4,580,990 40,157 Court receivable 384,265 - 384,265 - Other receivable - - - 127,702 Interest on investments 324,317 151,255 475,572 - Due from other governments 4,195,707 3,245,586 7,441,293 165,039 Due from component unit 400,000 - 400,000 - Inventory of materials & supplies 53,158 148,899 202,057 5,270 Prepayments - - - 59,523
Total current assets 36,316,183 27,947,966 64,264,149 498,947 Noncurrent assets:
Restricted cash and cash equivalents 8,288,515 12,196,199 20,484,714 138,071 Due from component unit - long-term 3,400,552 - 3,400,552 - Restricted net pension asset 4,656,343 - 4,656,343 - Investment in joint venture 1,766,977 - 1,766,977 - Depreciable capital assets (net) 53,268,149 94,419,813 147,687,962 6,845,623 Non Depreciable capital assets 25,524,853 19,552,190 45,077,043 3,607,031
Total noncurrent assets 96,905,389 126,168,202 223,073,591 10,590,725 Total assets 133,221,572 154,116,168 287,337,740 11,089,672
DEFERRED OUTFLOWS OF RESOURCESDeferred outflows of resources - Debt refunding 7,410 63,655 71,065 - Deferred outflows of resources - Pension 2,681,680 373,002 3,054,682 - Deferred outflows of resources - PFD - - - 143,489
Total deferred outflows of resources 2,689,090 436,657 3,125,747 143,489 Total assets and deferred outflows of resources 135,910,662 154,552,825 290,463,487 11,233,161
LIABILITIESCurrent liabilities:
Accounts payable 2,334,643 3,117,700 5,452,343 162,261 Accrued wages 1,254,719 223,511 1,478,230 39,889 Internal balances (231,144) 231,144 - - Due to other governmental units - 307,896 307,896 - Other current liabilities 206,158 582,697 788,855 - Accrued bond interest payable 17,206 155,892 173,098 4,635 Deposits payable - 6,148 6,148 28,255 Due within one year 2,739,127 2,335,214 5,074,341 703,509 Unearned Revenue - - - 468,131
Total current liabilities 6,320,709 6,960,202 13,280,911 1,406,680 Noncurrent liabilities:
Pension liabilities 4,558,174 936,895 5,495,069 390,704 Total other post employment liability 8,365,221 - 8,365,221 - Due in more than one year 8,303,964 53,735,296 62,039,260 5,714,363
Total noncurrent liabilities 21,227,359 54,672,191 75,899,550 6,105,067 Total liabilities 27,548,068 61,632,393 89,180,461 7,511,747
DEFERRED INFLOWS OF RESOURCESDeferred inflows of resources - Debt refunding 103,485 18,244 121,729 - Deferred inflows of resources - Pension 2,433,890 369,459 2,803,349 - Deferred inflows of resources - PFD - - - 108,664
Total deferred inflows of resources 2,537,375 387,703 2,925,078 108,664 Total liabilites and deferred inflows of resources 30,085,443 62,020,096 92,105,539 7,620,411
NET POSITIONNet investment in capital assets 76,233,673 68,391,695 144,625,368 4,101,920 Restricted for:
Customer Deposits - 6,148 6,148 - Debt Service - 3,290,576 3,290,576 985,585 Public Safety 74,303 - 74,303 - Transportation 3,220,074 - 3,220,074 - Economic Environment 86,073 - 86,073 - Social Services 78,441 - 78,441 - Culture and Recreation 8,129,745 - 8,129,745 - Other 10,363 - 10,363 - Pensions 4,656,343 - 4,656,343 -
Unrestricted 13,336,204 20,844,310 34,180,514 (1,474,755)Total net position $ 105,825,219 $ 92,532,729 $ 198,357,948 $ 3,612,750
The notes to financial statements are an integral part of this statement.
City of EdmondsStatement of Net Position
December 31, 2020Primary Government
Page 32
Page 1 of 2
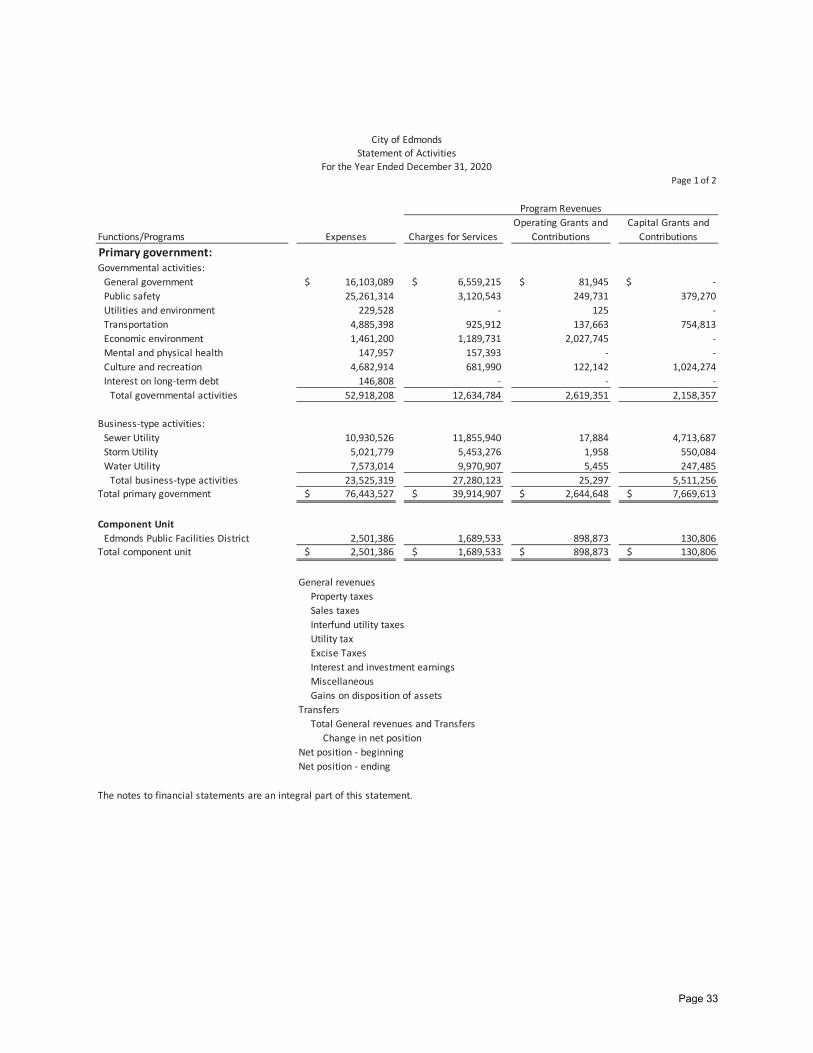
Functions/Programs Expenses Charges for ServicesOperating Grants and
ContributionsCapital Grants and
ContributionsPrimary government:Governmental activities:
General government $ 16,103,089 $ 6,559,215 $ 81,945 $ - Public safety 25,261,314 3,120,543 249,731 379,270 Utilities and environment 229,528 - 125 - Transportation 4,885,398 925,912 137,663 754,813 Economic environment 1,461,200 1,189,731 2,027,745 - Mental and physical health 147,957 157,393 - - Culture and recreation 4,682,914 681,990 122,142 1,024,274 Interest on long-term debt 146,808 - - -
Total governmental activities 52,918,208 12,634,784 2,619,351 2,158,357
Business-type activities:Sewer Utility 10,930,526 11,855,940 17,884 4,713,687 Storm Utility 5,021,779 5,453,276 1,958 550,084 Water Utility 7,573,014 9,970,907 5,455 247,485
Total business-type activities 23,525,319 27,280,123 25,297 5,511,256 Total primary government $ 76,443,527 $ 39,914,907 $ 2,644,648 $ 7,669,613
Component UnitEdmonds Public Facilities District 2,501,386 1,689,533 898,873 130,806
Total component unit $ 2,501,386 $ 1,689,533 $ 898,873 $ 130,806
For the Year Ended December 31, 2020Statement of Activities
City of Edmonds
The notes to financial statements are an integral part of this statement.
Program Revenues
General revenuesProperty taxesSales taxesInterfund utility taxesUtility taxExcise TaxesInterest and investment earningsMiscellaneousGains on disposition of assets
Total General revenues and TransfersChange in net position
Net position - beginningNet position - ending
Transfers
Page 33
Page 2 of 2
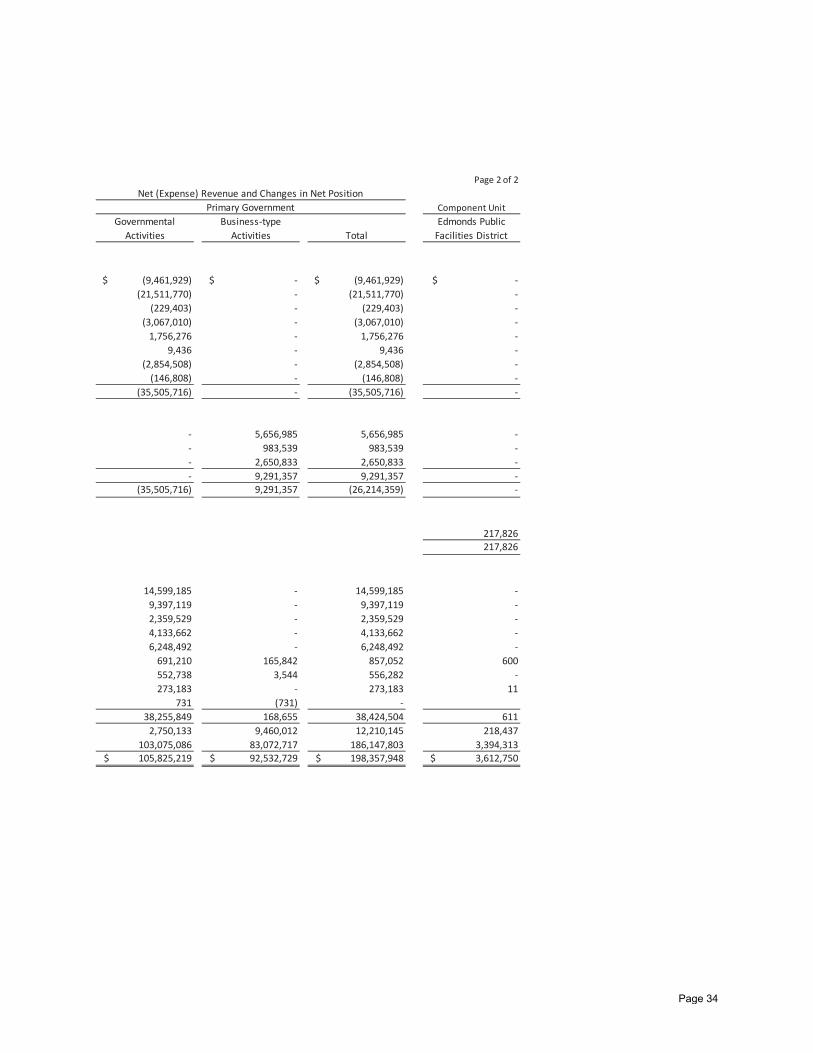
Component UnitGovernmental
ActivitiesBusiness-type
Activities TotalEdmonds Public
Facilities District
$ (9,461,929) $ - $ (9,461,929) $ - (21,511,770) - (21,511,770) - (229,403) - (229,403) - (3,067,010) - (3,067,010) - 1,756,276 - 1,756,276 - 9,436 - 9,436 - (2,854,508) - (2,854,508) - (146,808) - (146,808) - (35,505,716) - (35,505,716) -
- 5,656,985 5,656,985 - - 983,539 983,539 - - 2,650,833 2,650,833 - - 9,291,357 9,291,357 - (35,505,716) 9,291,357 (26,214,359) -
217,826 217,826
14,599,185 - 14,599,185 - 9,397,119 - 9,397,119 - 2,359,529 - 2,359,529 - 4,133,662 - 4,133,662 - 6,248,492 - 6,248,492 - 691,210 165,842 857,052 600 552,738 3,544 556,282 - 273,183 - 273,183 11 731 (731) - 38,255,849 168,655 38,424,504 611 2,750,133 9,460,012 12,210,145 218,437 103,075,086 83,072,717 186,147,803 3,394,313 $ 105,825,219 $ 92,532,729 $ 198,357,948 $ 3,612,750
Net (Expense) Revenue and Changes in Net PositionPrimary Government
Page 34
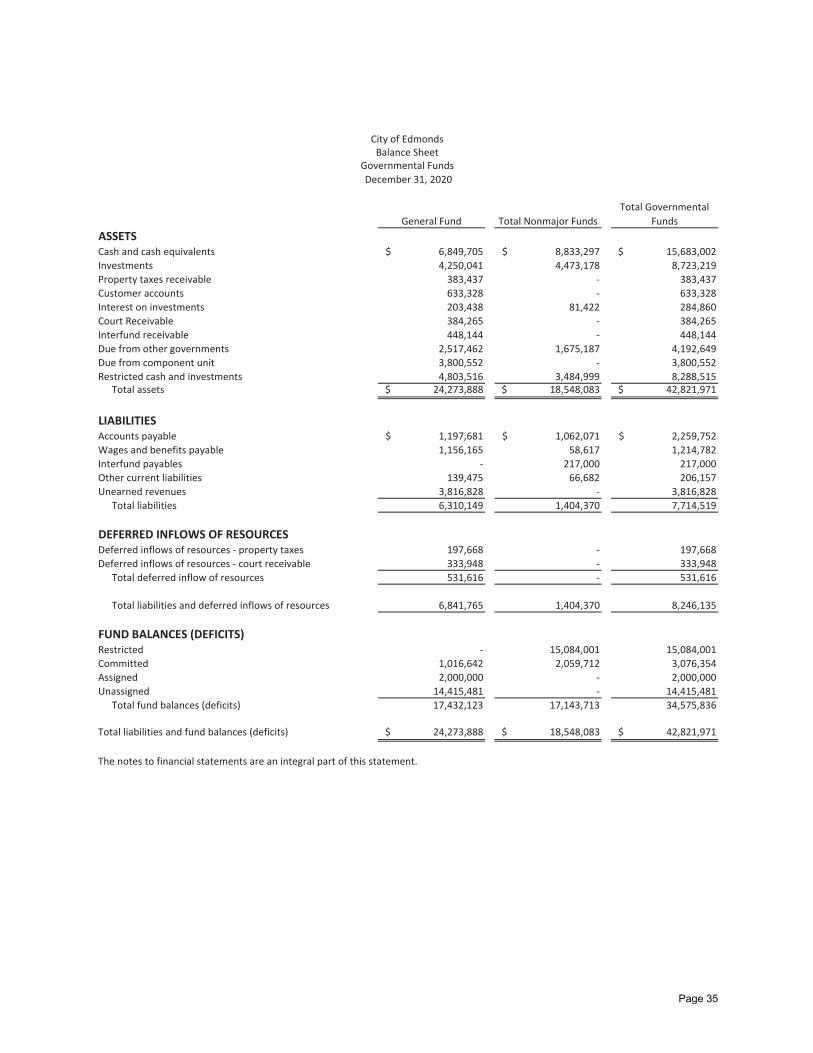
General Fund Total Nonmajor FundsTotal Governmental
FundsASSETSCash and cash equivalents $ 6,849,705 $ 8,833,297 $ 15,683,002 Investments 4,250,041 4,473,178 8,723,219 Property taxes receivable 383,437 - 383,437 Customer accounts 633,328 - 633,328 Interest on investments 203,438 81,422 284,860 Court Receivable 384,265 - 384,265 Interfund receivable 448,144 - 448,144 Due from other governments 2,517,462 1,675,187 4,192,649 Due from component unit 3,800,552 - 3,800,552 Restricted cash and investments 4,803,516 3,484,999 8,288,515
Total assets $ 24,273,888 $ 18,548,083 $ 42,821,971
LIABILITIESAccounts payable $ 1,197,681 $ 1,062,071 $ 2,259,752 Wages and benefits payable 1,156,165 58,617 1,214,782 Interfund payables - 217,000 217,000 Other current liabilities 139,475 66,682 206,157 Unearned revenues 3,816,828 - 3,816,828
Total liabilities 6,310,149 1,404,370 7,714,519
DEFERRED INFLOWS OF RESOURCESDeferred inflows of resources - property taxes 197,668 - 197,668 Deferred inflows of resources - court receivable 333,948 - 333,948
Total deferred inflow of resources 531,616 - 531,616
Total liabilities and deferred inflows of resources 6,841,765 1,404,370 8,246,135
FUND BALANCES (DEFICITS)Restricted - 15,084,001 15,084,001 Committed 1,016,642 2,059,712 3,076,354 Assigned 2,000,000 - 2,000,000 Unassigned 14,415,481 - 14,415,481
Total fund balances (deficits) 17,432,123 17,143,713 34,575,836
Total liabilities and fund balances (deficits) $ 24,273,888 $ 18,548,083 $ 42,821,971
The notes to financial statements are an integral part of this statement.
City of EdmondsBalance Sheet
Governmental Funds December 31, 2020
Page 35
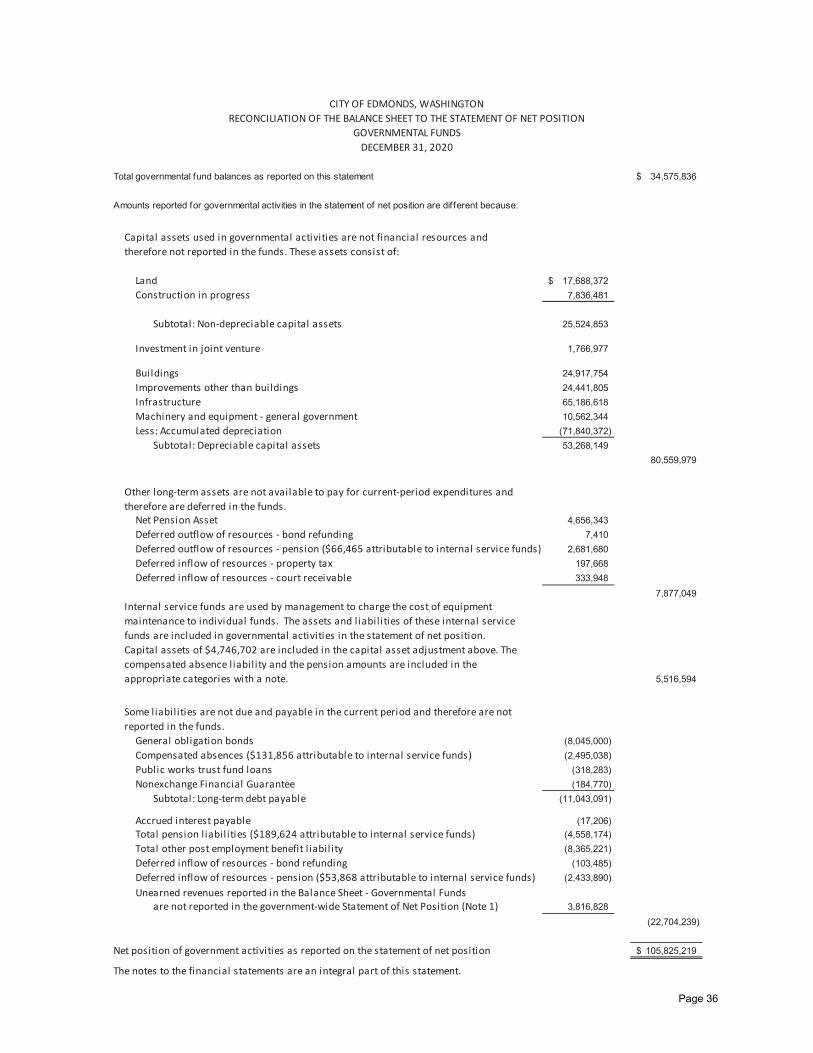
Total governmental fund balances as reported on this statement 34,575,836$
Amounts reported for governmental activities in the statement of net position are different because:
Land 17,688,372$ Construction in progress 7,836,481
Subtotal: Non-depreciable capital assets 25,524,853
Investment in joint venture 1,766,977
Buildings 24,917,754 Improvements other than buildings 24,441,805 Infrastructure 65,186,618 Machinery and equipment - general government 10,562,344 Less: Accumulated depreciation (71,840,372)
Subtotal: Depreciable capital assets 53,268,149 80,559,979
Net Pension Asset 4,656,343Deferred outflow of resources - bond refunding 7,410Deferred outflow of resources - pension ($66,465 attributable to internal service funds) 2,681,680Deferred inflow of resources - property tax 197,668Deferred inflow of resources - court receivable 333,948
7,877,049
5,516,594
General obligation bonds (8,045,000) Compensated absences ($131,856 attributable to internal service funds) (2,495,038)Public works trust fund loans (318,283)Nonexchange Financial Guarantee (184,770)
Subtotal: Long-term debt payable (11,043,091)
Accrued interest payable (17,206)Total pension l iabil ities ($189,624 attributable to internal service funds) (4,558,174)Total other post employment benefit l iabil ity (8,365,221)Deferred inflow of resources - bond refunding (103,485)Deferred inflow of resources - pension ($53,868 attributable to internal service funds) (2,433,890)Unearned revenues reported in the Balance Sheet - Governmental Funds
are not reported in the government-wide Statement of Net Position (Note 1) 3,816,828(22,704,239)
Net position of government activities as reported on the statement of net position 105,825,219$
The notes to the financial statements are an integral part of this statement.
Internal service funds are used by management to charge the cost of equipment maintenance to individual funds. The assets and liabil ities of these internal service funds are included in governmental activities in the statement of net position. Capital assets of $4,746,702 are included in the capital asset adjustment above. The compensated absence l iabil ity and the pension amounts are included in the appropriate categories with a note.
Some liabil ities are not due and payable in the current period and therefore are not reported in the funds.
CITY OF EDMONDS, WASHINGTONRECONCILIATION OF THE BALANCE SHEET TO THE STATEMENT OF NET POSITION
GOVERNMENTAL FUNDSDECEMBER 31, 2020
Capital assets used in governmental activities are not financial resources and therefore not reported in the funds. These assets consist of:
Other long-term assets are not available to pay for current-period expenditures and therefore are deferred in the funds.
Page 36
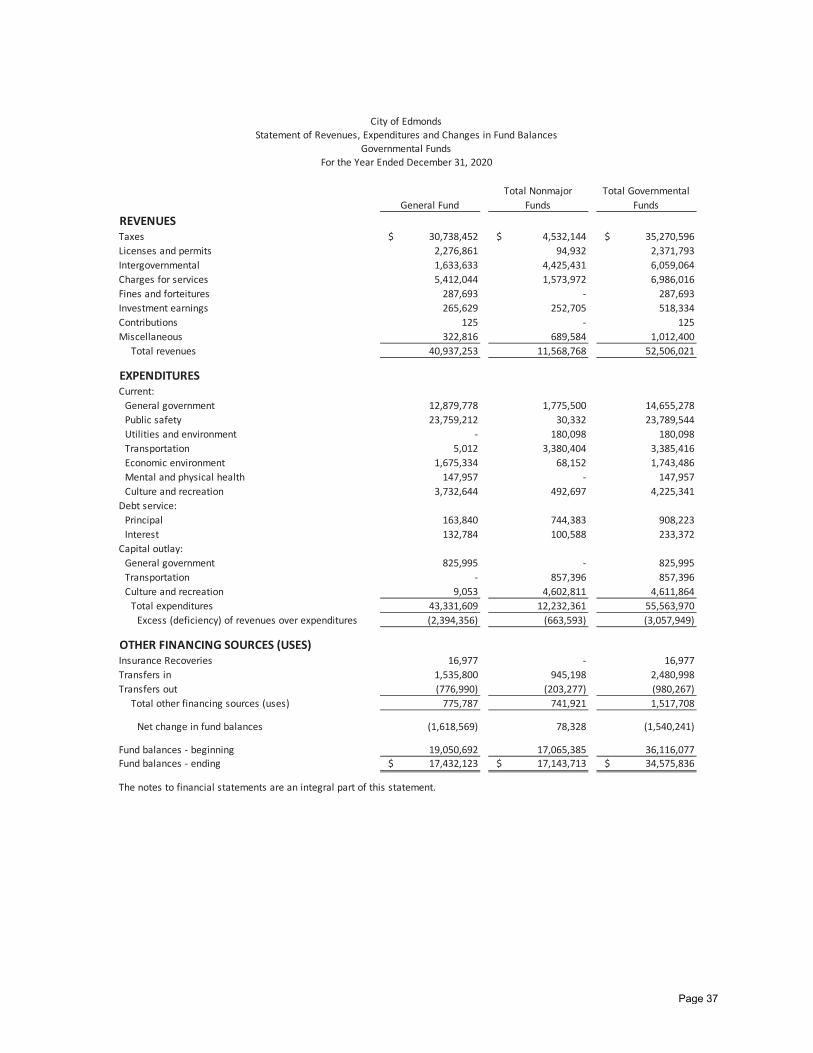
General FundTotal Nonmajor
FundsTotal Governmental
FundsREVENUESTaxes $ 30,738,452 $ 4,532,144 $ 35,270,596 Licenses and permits 2,276,861 94,932 2,371,793 Intergovernmental 1,633,633 4,425,431 6,059,064 Charges for services 5,412,044 1,573,972 6,986,016 Fines and forteitures 287,693 - 287,693 Investment earnings 265,629 252,705 518,334 Contributions 125 - 125 Miscellaneous 322,816 689,584 1,012,400
Total revenues 40,937,253 11,568,768 52,506,021
EXPENDITURESCurrent:
General government 12,879,778 1,775,500 14,655,278 Public safety 23,759,212 30,332 23,789,544 Utilities and environment - 180,098 180,098 Transportation 5,012 3,380,404 3,385,416 Economic environment 1,675,334 68,152 1,743,486 Mental and physical health 147,957 - 147,957 Culture and recreation 3,732,644 492,697 4,225,341
Debt service:Principal 163,840 744,383 908,223 Interest 132,784 100,588 233,372
Capital outlay:General government 825,995 - 825,995 Transportation - 857,396 857,396 Culture and recreation 9,053 4,602,811 4,611,864
Total expenditures 43,331,609 12,232,361 55,563,970 Excess (deficiency) of revenues over expenditures (2,394,356) (663,593) (3,057,949)
OTHER FINANCING SOURCES (USES)Insurance Recoveries 16,977 - 16,977 Transfers in 1,535,800 945,198 2,480,998 Transfers out (776,990) (203,277) (980,267)
Total other financing sources (uses) 775,787 741,921 1,517,708
Net change in fund balances (1,618,569) 78,328 (1,540,241)
Fund balances - beginning 19,050,692 17,065,385 36,116,077 Fund balances - ending $ 17,432,123 $ 17,143,713 $ 34,575,836
The notes to financial statements are an integral part of this statement.
City of EdmondsStatement of Revenues, Expenditures and Changes in Fund Balances
Governmental FundsFor the Year Ended December 31, 2020
Page 37
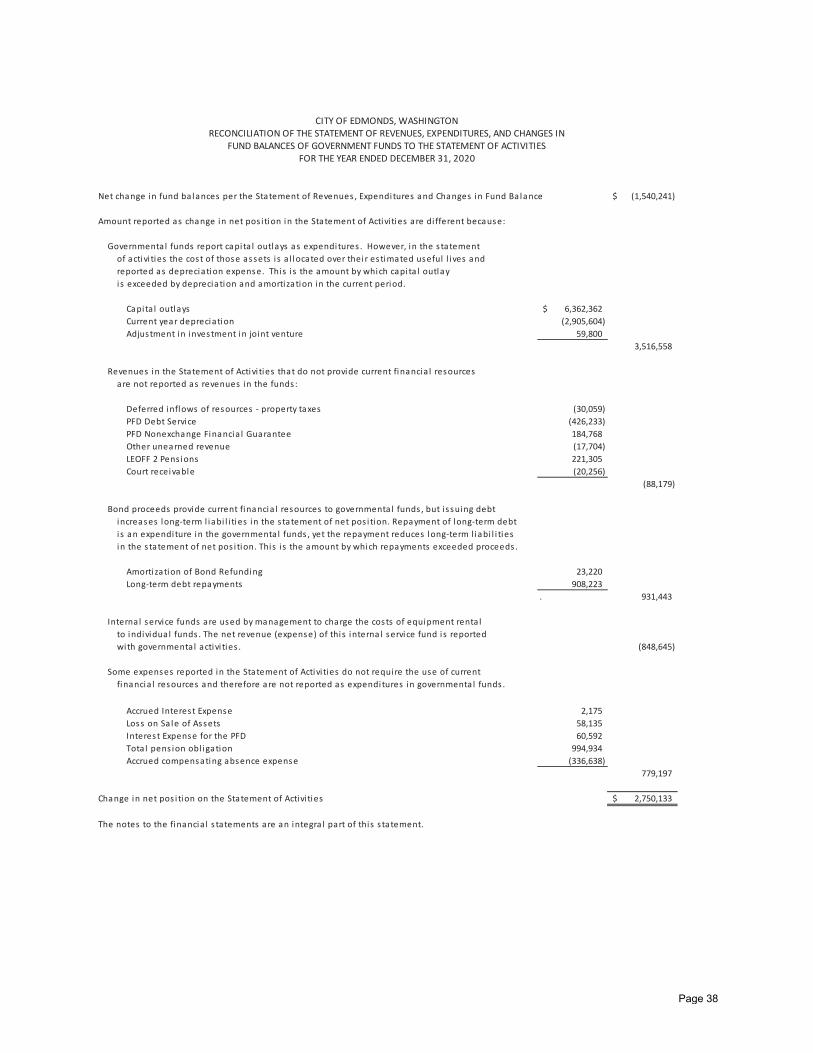
Net change in fund ba lances per the Statement of Revenues , Expenditures and Changes in Fund Balance (1,540,241)$
Amount reported as change in net pos i tion in the Statement of Activi ties are di fferent because:
Governmenta l funds report capi ta l outlays as expenditures . However, in the s tatementof activi ties the cost of those assets i s a l located over their estimated useful l ives andreported as depreciation expense. This i s the amount by which capi ta l outlay i s exceeded by depreciation and amortization in the current period.
Capita l outlays 6,362,362$ Current year depreciation (2,905,604)Adjustment in investment in joint venture 59,800
3,516,558
Revenues in the Statement of Activi ties that do not provide current financia l resourcesare not reported as revenues in the funds :
Deferred inflows of resources - property taxes (30,059)PFD Debt Service (426,233)PFD Nonexchange Financia l Guarantee 184,768Other unearned revenue (17,704)LEOFF 2 Pens ions 221,305 Court receivable (20,256)
(88,179)
Bond proceeds provide current financia l resources to governmenta l funds , but i s suing debtincreases long-term l iabi l i ties in the s tatement of net pos i tion. Repayment of long-term debtis an expenditure in the governmenta l funds , yet the repayment reduces long-term l iabi l i tiesin the s tatement of net pos i tion. This i s the amount by which repayments exceeded proceeds .
Amortization of Bond Refunding 23,220Long-term debt repayments 908,223
. 931,443
Internal service funds are used by management to charge the costs of equipment renta lto individual funds . The net revenue (expense) of this internal service fund i s reportedwith governmenta l activi ties . (848,645)
Some expenses reported in the Statement of Activi ties do not require the use of currentfinancia l resources and therefore are not reported as expenditures in governmenta l funds .
Accrued Interest Expense 2,175Loss on Sa le of Assets 58,135Interest Expense for the PFD 60,592Tota l pens ion obl igation 994,934 Accrued compensating absence expense (336,638)
779,197
Change in net pos i tion on the Statement of Activi ties 2,750,133$
The notes to the financia l s tatements are an integra l part of this s tatement.
CITY OF EDMONDS, WASHINGTONRECONCILIATION OF THE STATEMENT OF REVENUES, EXPENDITURES, AND CHANGES IN
FUND BALANCES OF GOVERNMENT FUNDS TO THE STATEMENT OF ACTIVITIESFOR THE YEAR ENDED DECEMBER 31, 2020
Page 38
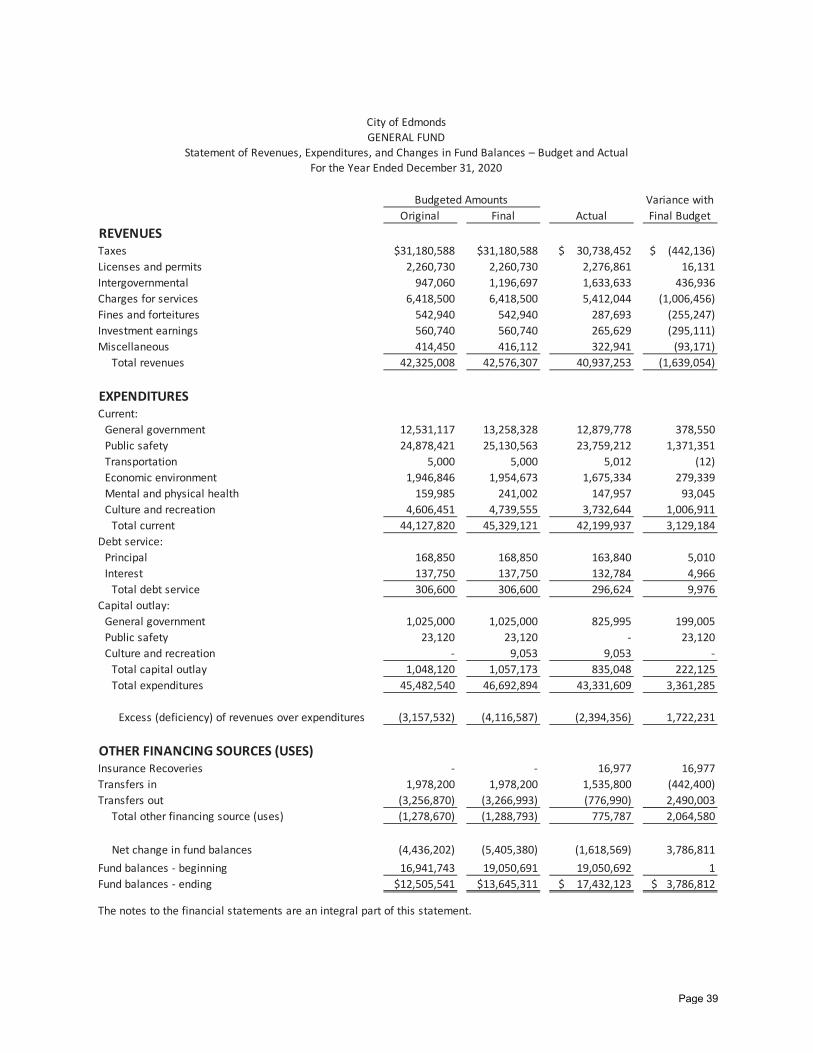
Variance withOriginal Final Actual Final Budget
REVENUESTaxes $31,180,588 $31,180,588 $ 30,738,452 $ (442,136)Licenses and permits 2,260,730 2,260,730 2,276,861 16,131 Intergovernmental 947,060 1,196,697 1,633,633 436,936 Charges for services 6,418,500 6,418,500 5,412,044 (1,006,456)Fines and forteitures 542,940 542,940 287,693 (255,247)Investment earnings 560,740 560,740 265,629 (295,111)Miscellaneous 414,450 416,112 322,941 (93,171)
Total revenues 42,325,008 42,576,307 40,937,253 (1,639,054)
EXPENDITURESCurrent:
General government 12,531,117 13,258,328 12,879,778 378,550 Public safety 24,878,421 25,130,563 23,759,212 1,371,351 Transportation 5,000 5,000 5,012 (12)Economic environment 1,946,846 1,954,673 1,675,334 279,339 Mental and physical health 159,985 241,002 147,957 93,045 Culture and recreation 4,606,451 4,739,555 3,732,644 1,006,911
Total current 44,127,820 45,329,121 42,199,937 3,129,184 Debt service:
Principal 168,850 168,850 163,840 5,010 Interest 137,750 137,750 132,784 4,966
Total debt service 306,600 306,600 296,624 9,976 Capital outlay:
General government 1,025,000 1,025,000 825,995 199,005 Public safety 23,120 23,120 - 23,120 Culture and recreation - 9,053 9,053 -
Total capital outlay 1,048,120 1,057,173 835,048 222,125 Total expenditures 45,482,540 46,692,894 43,331,609 3,361,285
Excess (deficiency) of revenues over expenditures (3,157,532) (4,116,587) (2,394,356) 1,722,231
OTHER FINANCING SOURCES (USES)Insurance Recoveries - - 16,977 16,977 Transfers in 1,978,200 1,978,200 1,535,800 (442,400)Transfers out (3,256,870) (3,266,993) (776,990) 2,490,003
Total other financing source (uses) (1,278,670) (1,288,793) 775,787 2,064,580
Net change in fund balances (4,436,202) (5,405,380) (1,618,569) 3,786,811 Fund balances - beginning 16,941,743 19,050,691 19,050,692 1 Fund balances - ending $12,505,541 $13,645,311 $ 17,432,123 $ 3,786,812
The notes to the financial statements are an integral part of this statement.
Budgeted Amounts
City of EdmondsGENERAL FUND
Statement of Revenues, Expenditures, and Changes in Fund Balances – Budget and ActualFor the Year Ended December 31, 2020
Page 39
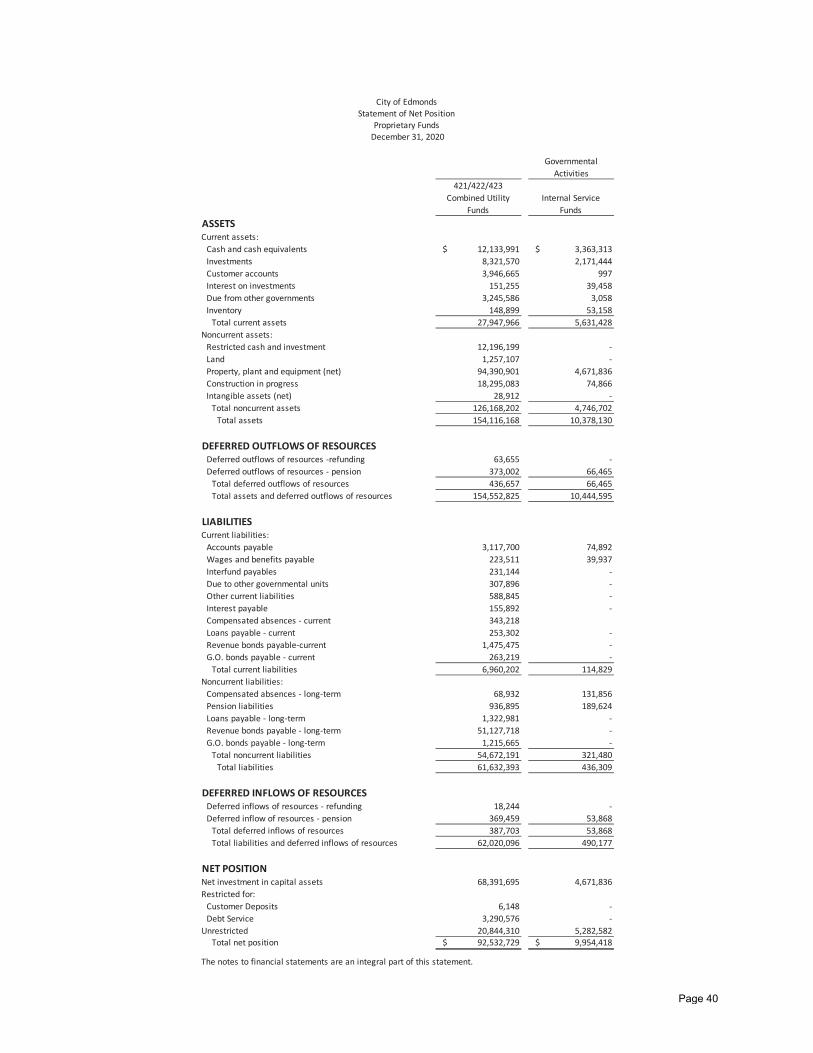
Governmental Activities
421/422/423 Combined Utility
FundsInternal Service
FundsASSETSCurrent assets:
Cash and cash equivalents $ 12,133,991 $ 3,363,313 Investments 8,321,570 2,171,444 Customer accounts 3,946,665 997 Interest on investments 151,255 39,458 Due from other governments 3,245,586 3,058 Inventory 148,899 53,158
Total current assets 27,947,966 5,631,428 Noncurrent assets:
Restricted cash and investment 12,196,199 - Land 1,257,107 - Property, plant and equipment (net) 94,390,901 4,671,836 Construction in progress 18,295,083 74,866 Intangible assets (net) 28,912 -
Total noncurrent assets 126,168,202 4,746,702 Total assets 154,116,168 10,378,130
DEFERRED OUTFLOWS OF RESOURCESDeferred outflows of resources -refunding 63,655 - Deferred outflows of resources - pension 373,002 66,465
Total deferred outflows of resources 436,657 66,465 Total assets and deferred outflows of resources 154,552,825 10,444,595
LIABILITIESCurrent liabilities:
Accounts payable 3,117,700 74,892 Wages and benefits payable 223,511 39,937 Interfund payables 231,144 - Due to other governmental units 307,896 - Other current liabilities 588,845 - Interest payable 155,892 - Compensated absences - current 343,218 Loans payable - current 253,302 - Revenue bonds payable-current 1,475,475 - G.O. bonds payable - current 263,219 -
Total current liabilities 6,960,202 114,829 Noncurrent liabilities:
Compensated absences - long-term 68,932 131,856 Pension liabilities 936,895 189,624 Loans payable - long-term 1,322,981 - Revenue bonds payable - long-term 51,127,718 - G.O. bonds payable - long-term 1,215,665 -
Total noncurrent liabilities 54,672,191 321,480 Total liabilities 61,632,393 436,309
DEFERRED INFLOWS OF RESOURCESDeferred inflows of resources - refunding 18,244 - Deferred inflow of resources - pension 369,459 53,868
Total deferred inflows of resources 387,703 53,868 Total liabilities and deferred inflows of resources 62,020,096 490,177
NET POSITIONNet investment in capital assets 68,391,695 4,671,836 Restricted for:
Customer Deposits 6,148 - Debt Service 3,290,576 -
Unrestricted 20,844,310 5,282,582 Total net position $ 92,532,729 $ 9,954,418
City of EdmondsStatement of Net Position
Proprietary Funds December 31, 2020
The notes to financial statements are an integral part of this statement.
Page 40
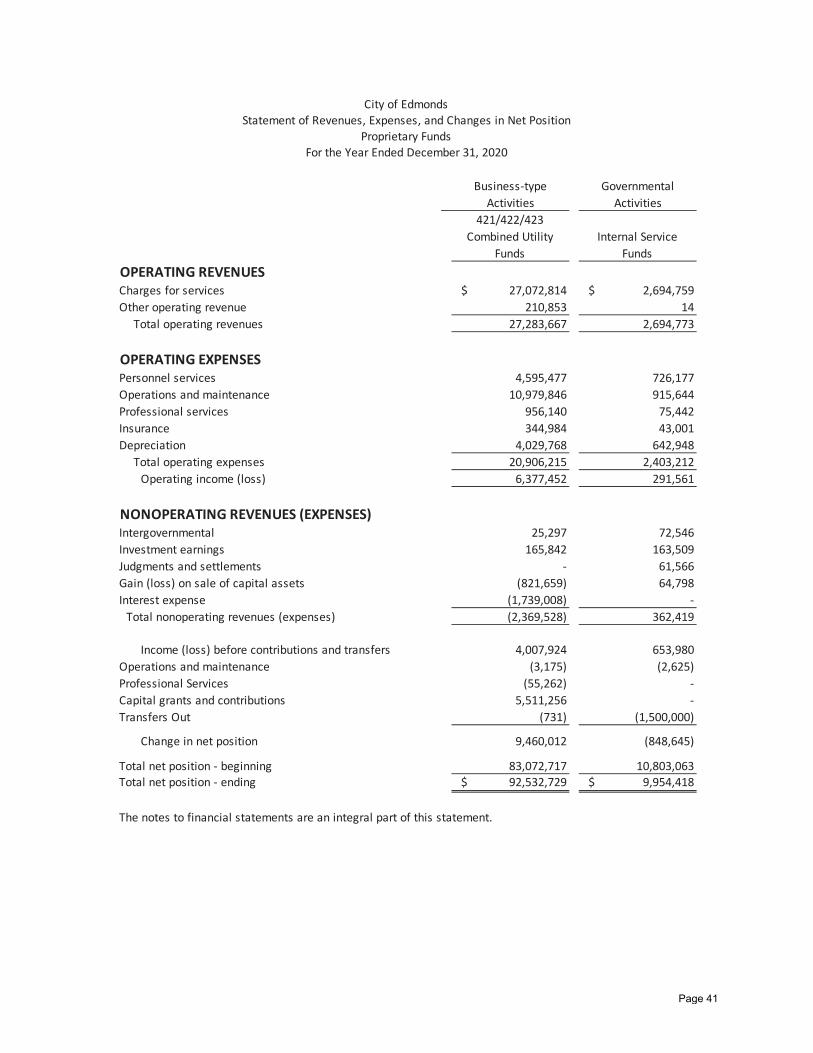
Business-type Activities
Governmental Activities
421/422/423 Combined Utility
FundsInternal Service
FundsOPERATING REVENUESCharges for services $ 27,072,814 $ 2,694,759 Other operating revenue 210,853 14
Total operating revenues 27,283,667 2,694,773
OPERATING EXPENSESPersonnel services 4,595,477 726,177 Operations and maintenance 10,979,846 915,644 Professional services 956,140 75,442 Insurance 344,984 43,001 Depreciation 4,029,768 642,948
Total operating expenses 20,906,215 2,403,212 Operating income (loss) 6,377,452 291,561
NONOPERATING REVENUES (EXPENSES)Intergovernmental 25,297 72,546 Investment earnings 165,842 163,509 Judgments and settlements - 61,566 Gain (loss) on sale of capital assets (821,659) 64,798 Interest expense (1,739,008) -
Total nonoperating revenues (expenses) (2,369,528) 362,419
Income (loss) before contributions and transfers 4,007,924 653,980 Operations and maintenance (3,175) (2,625)Professional Services (55,262) - Capital grants and contributions 5,511,256 - Transfers Out (731) (1,500,000)
Change in net position 9,460,012 (848,645)
Total net position - beginning 83,072,717 10,803,063 Total net position - ending $ 92,532,729 $ 9,954,418
City of EdmondsStatement of Revenues, Expenses, and Changes in Net Position
Proprietary FundsFor the Year Ended December 31, 2020
The notes to financial statements are an integral part of this statement.
Page 41
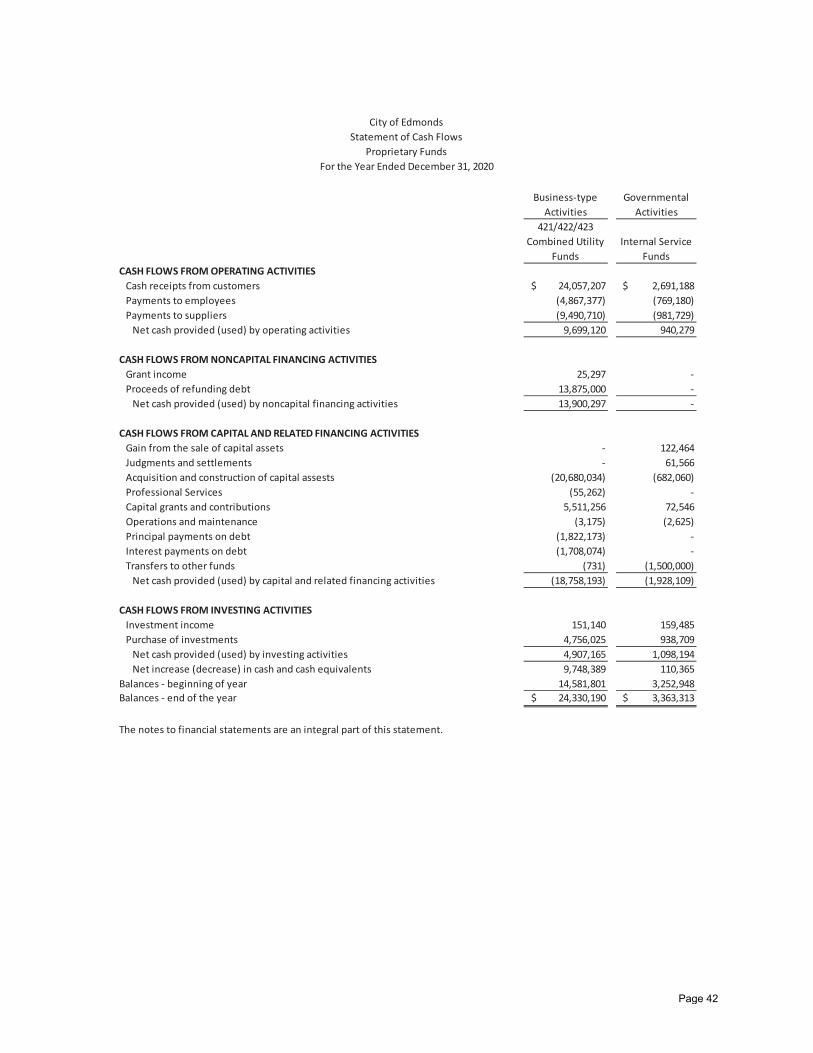
Business-type Activities
Governmental Activities
421/422/423 Combined Utility
FundsInternal Service
FundsCASH FLOWS FROM OPERATING ACTIVITIES
Cash receipts from customers $ 24,057,207 $ 2,691,188 Payments to employees (4,867,377) (769,180)Payments to suppliers (9,490,710) (981,729)
Net cash provided (used) by operating activities 9,699,120 940,279
CASH FLOWS FROM NONCAPITAL FINANCING ACTIVITIESGrant income 25,297 - Proceeds of refunding debt 13,875,000 -
Net cash provided (used) by noncapital financing activities 13,900,297 -
CASH FLOWS FROM CAPITAL AND RELATED FINANCING ACTIVITIESGain from the sale of capital assets - 122,464 Judgments and settlements - 61,566 Acquisition and construction of capital assests (20,680,034) (682,060)Professional Services (55,262) - Capital grants and contributions 5,511,256 72,546 Operations and maintenance (3,175) (2,625)Principal payments on debt (1,822,173) - Interest payments on debt (1,708,074) - Transfers to other funds (731) (1,500,000)
Net cash provided (used) by capital and related financing activities (18,758,193) (1,928,109)
CASH FLOWS FROM INVESTING ACTIVITIESInvestment income 151,140 159,485 Purchase of investments 4,756,025 938,709
Net cash provided (used) by investing activities 4,907,165 1,098,194 Net increase (decrease) in cash and cash equivalents 9,748,389 110,365
Balances - beginning of year 14,581,801 3,252,948 Balances - end of the year $ 24,330,190 $ 3,363,313
The notes to financial statements are an integral part of this statement.
City of EdmondsStatement of Cash Flows
Proprietary FundsFor the Year Ended December 31, 2020
Page 42
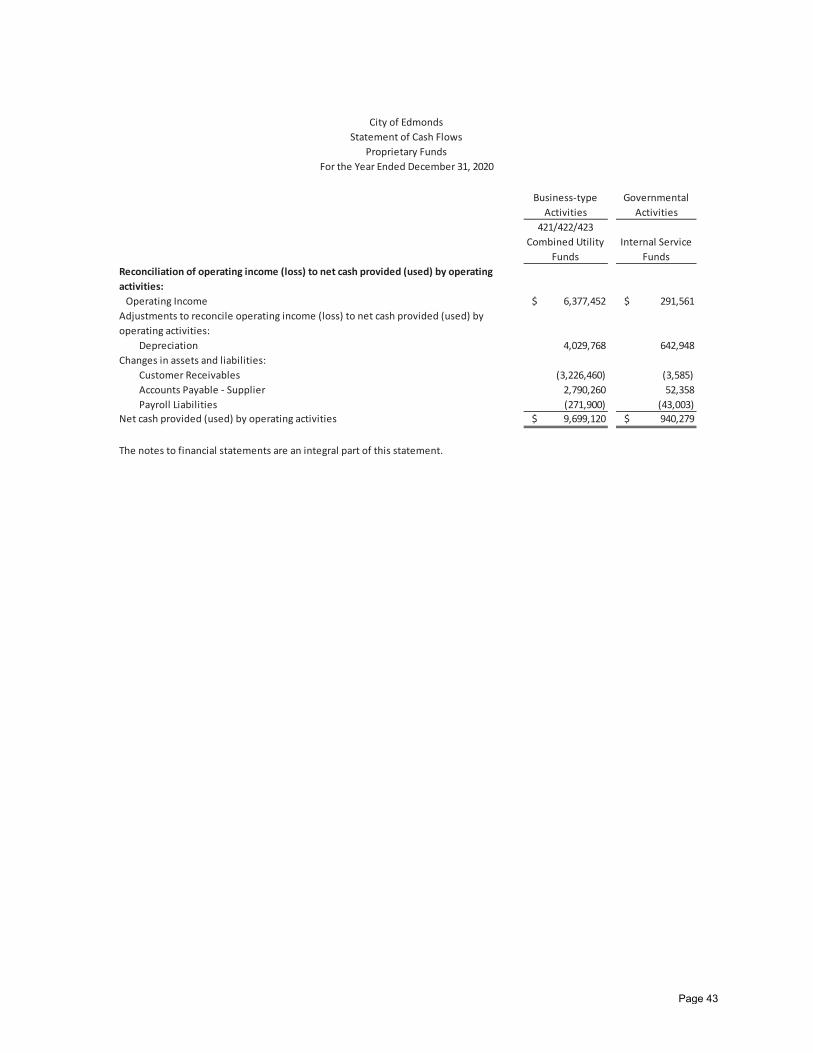
Business-type Activities
Governmental Activities
421/422/423 Combined Utility
FundsInternal Service
FundsReconciliation of operating income (loss) to net cash provided (used) by operating activities:
Operating Income $ 6,377,452 $ 291,561 Adjustments to reconcile operating income (loss) to net cash provided (used) by operating activities:
Depreciation 4,029,768 642,948 Changes in assets and liabilities: Customer Receivables (3,226,460) (3,585)
Accounts Payable - Supplier 2,790,260 52,358 Payroll Liabilities (271,900) (43,003)
Net cash provided (used) by operating activities $ 9,699,120 $ 940,279
The notes to financial statements are an integral part of this statement.
City of EdmondsStatement of Cash Flows
Proprietary FundsFor the Year Ended December 31, 2020
Page 43
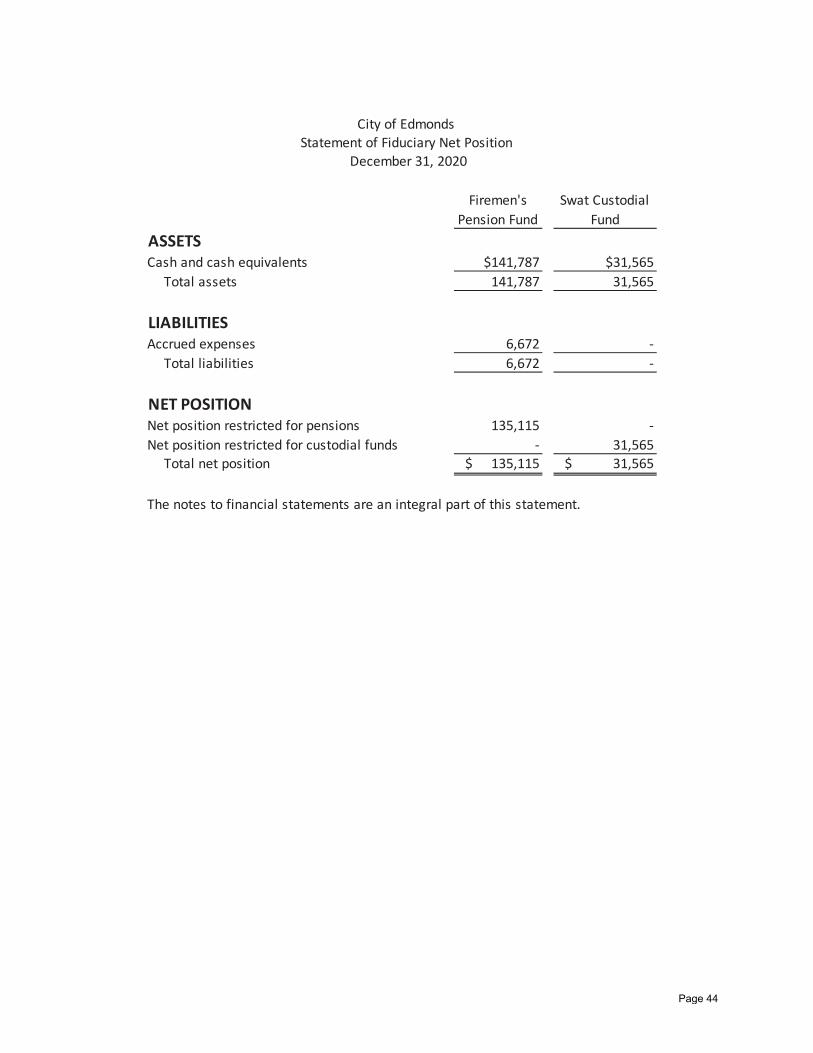
Firemen's Pension Fund
Swat Custodial Fund
ASSETSCash and cash equivalents $141,787 $31,565
Total assets 141,787 31,565
LIABILITIESAccrued expenses 6,672 -
Total liabilities 6,672 -
NET POSITION Net position restricted for pensions 135,115 - Net position restricted for custodial funds - 31,565
Total net position $ 135,115 $ 31,565
The notes to financial statements are an integral part of this statement.
City of EdmondsStatement of Fiduciary Net Position
December 31, 2020
Page 44
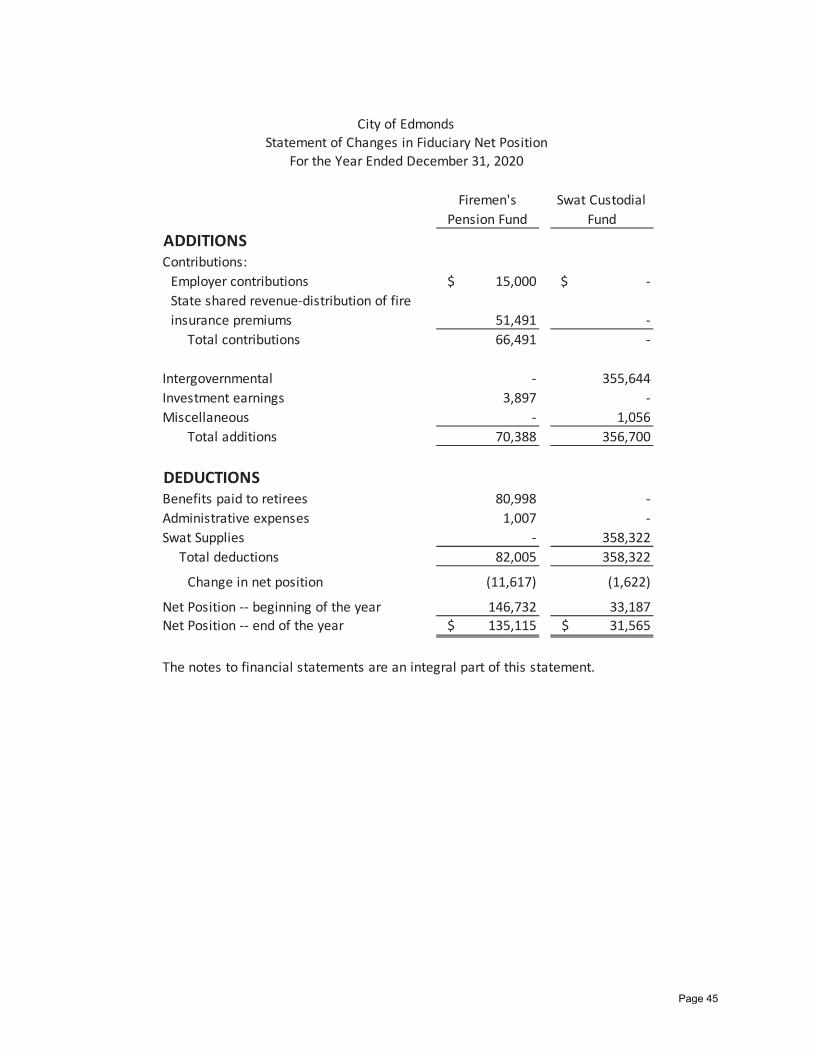
Firemen's Pension Fund
Swat Custodial Fund
ADDITIONSContributions:
Employer contributions $ 15,000 $ - State shared revenue-distribution of fire insurance premiums 51,491 -
Total contributions 66,491 -
Intergovernmental - 355,644 Investment earnings 3,897 - Miscellaneous - 1,056
Total additions 70,388 356,700
DEDUCTIONSBenefits paid to retirees 80,998 - Administrative expenses 1,007 - Swat Supplies - 358,322
Total deductions 82,005 358,322
Change in net position (11,617) (1,622)
Net Position -- beginning of the year 146,732 33,187 Net Position -- end of the year $ 135,115 $ 31,565
The notes to financial statements are an integral part of this statement.
City of EdmondsStatement of Changes in Fiduciary Net Position
For the Year Ended December 31, 2020
Page 45
CITY OF EDMONDS NOTES TO THE FINANCIAL STATEMENTS
NOTE 1 – SUMMARY OF SIGNIFICANT ACCOUNTING POLICIES The financial statements of the City of Edmonds have been prepared in conformity with generally accepted accounting principles (GAAP) as applied to governmental units. The Governmental Accounting Standards Board (GASB) is the accepted standard setting body for establishing governmental accounting and financial reporting principles. The significant accounting policies are described below. A. Reporting Entity The City of Edmonds was incorporated in 1890 and operates under the laws of the state of Washington applicable to cities. Edmonds operates with a Council/Mayor form of government. Both the Mayor and Council are elected to four-year terms. The City provides a full range of general government services including public safety; streets; parks and recreation; planning and zoning; permits and inspection; general administration; and water, sewer, storm water and wastewater treatment utilities. As required by Generally Accepted Accounting Principles the financial statements present the City of Edmonds, the primary government, and its component unit. The component unit discussed below is included in the City’s reporting entity because of the significance of their operational and financial relationships with the City. Discretely Presented Component Unit On April 24, 2001 the Edmonds City Council formed the Edmonds Public Facilities District (PFD) via Ordinance 3358, under the authority provided by RCW 35.57. The purpose of the PFD is to construct and operate a regional arts center in the City of Edmonds, defined by RCW 35.57 as a conference, convention or special events center, along with related parking. A five-member board governs the PFD and is appointed to four-year terms by the Edmonds City Council. The PFD has authority under state law to issue debt, levy certain taxes, and enter into contracts. In 2002 the City issued Limited Tax General Obligation Bonds in the amount of $7,015,000 for the acquisition, renovation and remodeling of a Performing Arts Center. The City transferred the proceeds of this issuance to the PFD. The City refinanced these bonds in 2012. These bonds are a debt of the City and not the PFD; however, the PFD is obligated by inter-local agreement to pay the entire amount of the PFD’s portion of the debt service over the life of the bonds. For more information on the Edmonds Public Facility District see Note 12, Long-Term Debt. Separate financial statements can be obtained from the Edmonds Center for the Arts, c/o Joe McIalwain, 410 Fourth Avenue N., Edmonds, WA 98020. Joint Ventures The City of Edmonds participates in two separate joint ventures: Snohomish County 911 The City of Edmonds and other Police and Fire entities jointly operate Snohomish County 911. Snohomish County 911, a cash basis, special purpose district, was created under the Interlocal Cooperation Act, as codified in RCW 39.34. This established the statutory authority necessary for Snohomish County, cities, towns, fire districts, police districts and other service districts to enter into a contract and agreement to jointly establish, maintain and operate a support communications center. Control of Snohomish County 911 is with a 16 member Board of Directors which is specified in the Interlocal Agreement. Snohomish County 911 takes 911 calls and performs emergency dispatch services for local governmental agencies including police, fire, and medical aid. In the event of the dissolution of Snohomish County 911, any money in the possession of
Page 46
Snohomish County 911 or the Board of Directors after payment of all costs, expenses and charges validly incurred shall be returned to the parties to this agreement and shall be apportioned between Principals based on the ratio that the average of each Principals’ contributions to the operating budget over the preceding five years bears to the total of all then remaining Principals’ User Fees paid during the five year period. Before deducting the payment of all costs, expenses, and charges validly incurred, the City of Edmonds share was $1,766,977 on December 31, 2020. Snohomish County 911’s 2020 operating budget was $24,575,191, operating revenues received were $24,285,981, and total operating expenditures were $23,917,807. Complete financial statements for Snohomish County 911 can be obtained from their administrative office at 1121 SE Everett Mall Way, Suite 200, Everett, WA 98208. The Alliance for Housing Affordability (AHA) In September 2013, the City of Edmonds joined the cities of Everett, Granite Falls, Lake Stevens, Lynnwood, Marysville, Mill Creek, Mountlake Terrace, Mukilteo, and Snohomish, the Town of Woodway, and Snohomish County to establish the Alliance for Housing Affordability (AHA). The agreement was amended in May, 2014 to add the City of Arlington and in June, 2014 to add the City of Stanwood. The purpose of AHA is to cooperatively formulate affordable housing goals and policies and to foster efforts to provide affordable housing by providing expertise and information to member jurisdictions. Operating funding is provided by member cities. AHA is governed by a Joint Board composed of an elected official from each member. The Joint Board is responsible for review and approval of all budgetary, financial, policy, and contractual matters. The Board is assisted by an administrative staff housed at the Housing Authority for Snohomish County (HASCO). Fiscal agent duties were transferred to HASCO during fiscal year 2018. The values included in the table below were audited and updated by the new fiscal agent and may be different than what was reported in previous years. Each member city is responsible for contributing operating revenues as determined from the AHA annual budget. Contributions from the member cities are based on each member’s population. A grant from the Gates Foundation provided $50,000 to assist with the first two years of organizational start-up. The City of Edmonds equity share to date is:
Fiscal YearEnding 6/30
2015 93,063$ 2,457$ 2.6%2016 43,652$ 2,381$ 5.5%2017 97,934$ 3,518$ 3.6%2018 102,586$ 3,841$ 3.7%2019 107,391$ 4,120$ 3.8%2020 112,408$ 4,344$ 3.9%2021 $ 117,673 4,368$ 3.7%
AHA’s Total Fiscal Year
BudgetEdmonds Share
of Budget
Edmonds Share as % of Total AHA Budget
Members withdrawing from the agreement relinquish all rights to any reserve funds, equipment, or material purchased. Upon dissolution, the agreement provides for distribution of net assets among the members based on the percentage of the total annual contributions during the period of the Agreement paid by each member. Budget monitoring information can be obtained from Pam Frost, Director of Finance, HASCO, 12711 4th Ave W, Everett WA 982014 (or email: [email protected]) or from Chris Collier, Program Manager, Alliance for Housing Affordability, 12711 4th Ave W, Everett WA 98204.
Page 47
B. Basis of Presentation – Government-Wide and Fund Financial Statements The government-wide financial statements (i.e. the statement of net position and the statement of activities) report information on all of the nonfiduciary activities of the primary government and its component unit. Governmental activities, which normally are supported by taxes and intergovernmental revenues, are reported separately from business-type activities, which rely to a significant extent on fees and charges for support. Likewise, the primary government is reported separately from a legally separate component unit for which the primary government is financially accountable. The statement of activities demonstrates the degree to which the direct expenses of a given function or segment is offset by program revenues. Direct expenses are those that are clearly identifiable with a specific function or segment. Our policy is to allocate indirect costs to a specific function or segment. Program revenues include 1) charges to customers or applicants who purchase, use, or directly benefit from goods, services, or privileges provided by a given function or segment and 2) grants and contributions that are restricted to meeting the operational or capital requirements of a particular function or segment. Internally dedicated resources are reported as general revenues rather than program revenues. Taxes and other items not properly included among program revenues are reported as general revenues. The effect of interfund activity has been eliminated from the government-wide financial statements. Exceptions are charges between the government’s water and sewer function and other functions of the government. Elimination of these charges would distort the direct costs and program revenues reported for the various functions concerned. Separate financial statements are provided for governmental funds, proprietary funds, and fiduciary funds, even though the latter are excluded from the government-wide financial statements. Major individual governmental funds and major individual enterprise funds are reported as separate columns in the fund financial statements. The City reports one major governmental fund, the General Fund. The General Fund is the City’s operating fund. It accounts for all financial resources of the general government, except those required or elected to be accounted for in another fund. The City also reports one major enterprise fund. The Combined Utility Fund accounts for all maintenance, construction, and debt service requirements associated with the City’s water, sewer, and stormwater systems. The City has two Internal Service Funds. The Equipment Rental Fund accounts for the cost of maintaining the City’s vehicle fleet. The Technology Rental Fund accounts for the cost of Information Technology equipment repair and replacement. The City has two Fiduciary Funds. The Firemen’s Pension Fund is used to account for payment of administrative costs and benefits for retired firefighters who were employed prior to March 1, 1970. The North Sound Metro Special Weapons and Tactics Team (SWAT) is a Custodial Fund that accounts for the administration and bookkeeping for a regional SWAT team. The City signed an interlocal agreement with surrounding cities in 2013 to form a SWAT team, and the City of Edmonds Police Department was designated as the host Police Department and is responsible for the holding of funds. C. Measurement Focus, Basis of Accounting Government-Wide and Governmental Funds The government-wide financial statements are reported using the economic resources measurement focus and the accrual basis of accounting, similar to the proprietary and fiduciary fund statements. Revenues are recorded when earned and expenses are recorded when a liability is incurred, regardless of the timing of related cash flows. Property taxes are recognized as revenue
Page 48
in the year in which they are levied. Grants and similar items are recognized as revenue as soon as eligibility requirements imposed by the provider have been met. Governmental fund financial statements are reported using the current financial resources measurement focus and the modified accrual basis of accounting. Revenues are recognized as soon as they are both measurable and available. Revenues are considered to be available when they are collectible within the current period or soon enough thereafter to pay liabilities of the current period. For this purpose, the City considers most revenues to be available if they are collected within 30 days of the end of the current fiscal period. The City considers property taxes, sales taxes, natural gas taxes and Hotel/Motel excise taxes as available if they are collected within 60 days after year end. Expenditures generally are recorded when a liability is incurred, as under accrual accounting. However, debt service expenditures, as well as expenditures related to compensated absences and claims and judgments, are recorded only when payment is due. All other revenue items are considered to be measurable and available only when cash is received. Proprietary Funds The proprietary fund statements are reported using the economic resources measurement focus and full-accrual basis of accounting. Revenues are recorded when earned and expenses are recorded when a liability is incurred regardless of the timing of the cash flows. Proprietary funds distinguish operating revenues and expenses from non-operating items. Operating revenues and expenses generally result from providing services and producing and delivering goods in connection with a proprietary fund’s principal ongoing operations. The principal operating revenues of the City’s Combined Utility Funds are charges to customers for sales and service. The City also recognizes as operating revenue the portion of utility connection fees intended to recover the cost of connecting new customers to the water and sewer systems. Operating expenses for enterprise funds include operating and maintenance costs, employee salaries and benefits, contracted services, insurance, and depreciation on capital assets. All revenues and expenses not meeting this definition are reported as non-operating revenues and expenses. D. Budgetary Information Scope of Budget Annual appropriated budgets are adopted for general fund and special revenue funds on the modified accrual basis of accounting. Budgets for debt service and capital projects funds are adopted at the level of the individual debt issue or project and for fiscal periods that correspond to the lives of debt issues or projects. Budgets for the General Fund and Special Revenue Funds are adopted at the Fund level. Purely as a management tool, budgets are broken out by department, activity and expense types. Appropriations for the General and Special Revenue funds lapse at year-end, except for appropriations for capital outlays, which are carried forward from year to year until fully expended or the purpose of the appropriation has been accomplished or abandoned. Amending the Budget The Mayor is authorized to transfer budgeted amounts between departments or between object classes within any department; however, any revisions that alter the total expenditures of a fund, or that affect the number of authorized employee positions, salary ranges, hours, or other conditions of employment must be approved by the City Council. When the Council determines that it is in the best interest of the City to increase or decrease the appropriation for a particular fund or department, it may do so by ordinance approved by one more than the majority after holding a public hearing.
Page 49
The budget amounts shown in the financial statements are the final authorized amounts as revised during the year. The financial statements contain the original and final budget information. The original budget is the first complete appropriated budget. The final budget is the original budget adjusted by supplemental appropriations and other legally authorized changes applicable for the fiscal year. E. Assets, Liabilities, Fund Balance, Net Position Cash and Cash Equivalents It is the City’s policy to invest all temporary cash surpluses. The City considers all highly liquid assets, including investments in the Washington State Local Government Investment Pool, the Snohomish County Investment Pool, and short-term investments with a maturity of three months or less when purchased to be cash equivalents. This amount is classified on the balance sheet as cash and cash equivalents in various funds. The interest on these investments is prorated to the various funds. For purposes of the statement of cash flows, the City considers all highly liquid investments with a maturity of three months or less when purchased to be cash equivalents. For more information on investments, see Note 3, Deposits and Investments. Receivables Taxes receivable consist of property taxes and related interest and penalties (See Note 4, Property Taxes). Accrued interest receivable consists of amounts earned on investments, notes, and contracts at the end of the year. Customer accounts receivable consist of amounts owed by private individuals and organizations for goods and services including amounts owed for which billings have not been prepared. Notes and contracts receivable consist of amounts owed on open account from private individuals or organizations for goods and services rendered. Receivables are shown net of allowances for uncollectible accounts. Amounts Due To/From Other Funds and Governments, Interfund Loans and Advances Receivable Activities between funds that are representative of lending/borrowing arrangements outstanding at the end of the fiscal year are referred to as either interfund loans receivable/payable or advances to/from other funds. All other outstanding balances between funds are reported as due to/from other funds. Any residual balances outstanding between the governmental activities and business-type activities are reported in the government-wide financial statements as internal balances. A separate schedule of interfund loans receivable and payable is furnished in Note 7, Interfund Activity. Advances between funds, as reported in the fund financial statements, are offset by a fund balance reserve account in applicable governmental funds to indicate that they are not available for appropriation and are not expendable available financial resources. Inventories Inventories are assets that are held for internal consumption or resale. The combined utility fund inventories are expensed as consumed, using the first-in, first-out valuation method, which approximates market. Internal service fund inventories are expensed when purchased. A physical inventory is taken at year-end. No inventory is maintained in Governmental Funds; however, the Internal Service fund inventories are included in the “Governmental Activities” on the Statement of Net Position. Restricted Assets These accounts contain resources for construction and debt service in enterprise funds. Specific debt service reserve requirements are described in Note 13, Long-Term Debt and certain cash and investments have been classified as restricted assets on the Statement of Net Position in accordance with utility bond resolutions, state law, or for other purposes. When both restricted and
Page 50
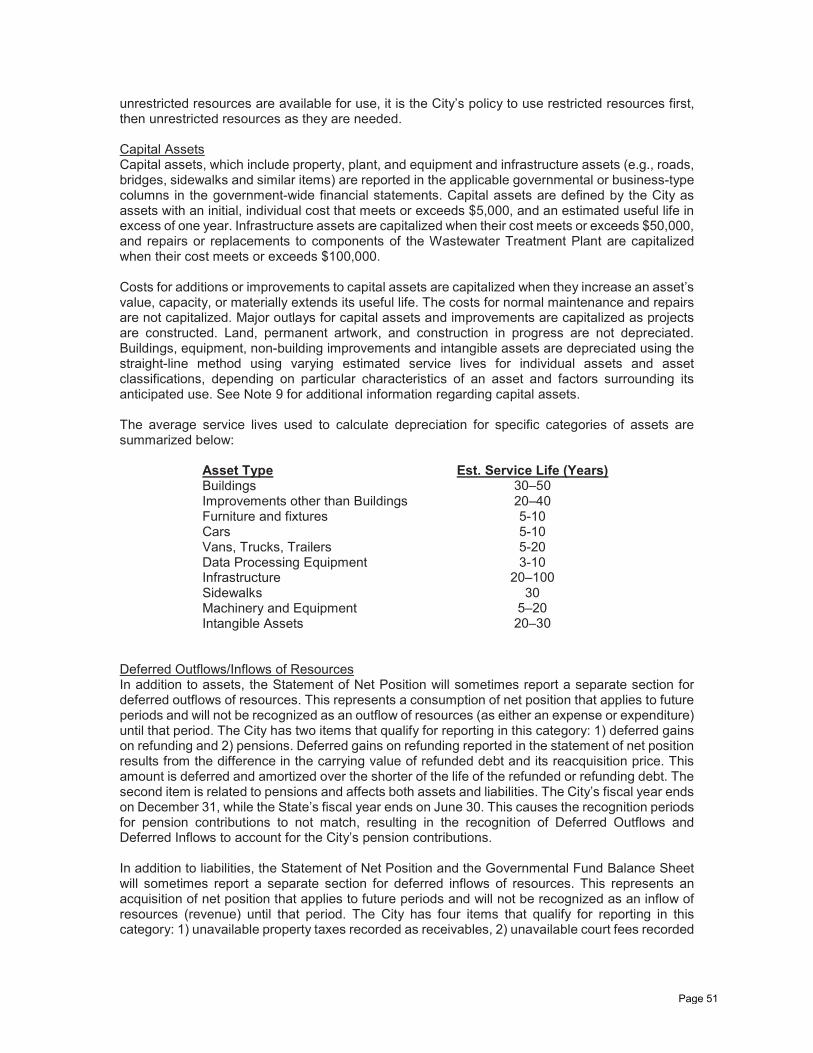
unrestricted resources are available for use, it is the City’s policy to use restricted resources first, then unrestricted resources as they are needed. Capital Assets Capital assets, which include property, plant, and equipment and infrastructure assets (e.g., roads, bridges, sidewalks and similar items) are reported in the applicable governmental or business-type columns in the government-wide financial statements. Capital assets are defined by the City as assets with an initial, individual cost that meets or exceeds $5,000, and an estimated useful life in excess of one year. Infrastructure assets are capitalized when their cost meets or exceeds $50,000, and repairs or replacements to components of the Wastewater Treatment Plant are capitalized when their cost meets or exceeds $100,000. Costs for additions or improvements to capital assets are capitalized when they increase an asset’s value, capacity, or materially extends its useful life. The costs for normal maintenance and repairs are not capitalized. Major outlays for capital assets and improvements are capitalized as projects are constructed. Land, permanent artwork, and construction in progress are not depreciated. Buildings, equipment, non-building improvements and intangible assets are depreciated using the straight-line method using varying estimated service lives for individual assets and asset classifications, depending on particular characteristics of an asset and factors surrounding its anticipated use. See Note 9 for additional information regarding capital assets. The average service lives used to calculate depreciation for specific categories of assets are summarized below:
Asset Type Buildings Improvements other than Buildings Furniture and fixtures Cars Vans, Trucks, Trailers Data Processing Equipment Infrastructure Sidewalks Machinery and Equipment Intangible Assets
Est. Service Life (Years) 30–50 20–40 5-10 5-10 5-20 3-10
20–100 30
5–20 20–30
Deferred Outflows/Inflows of Resources In addition to assets, the Statement of Net Position will sometimes report a separate section for deferred outflows of resources. This represents a consumption of net position that applies to future periods and will not be recognized as an outflow of resources (as either an expense or expenditure) until that period. The City has two items that qualify for reporting in this category: 1) deferred gains on refunding and 2) pensions. Deferred gains on refunding reported in the statement of net position results from the difference in the carrying value of refunded debt and its reacquisition price. This amount is deferred and amortized over the shorter of the life of the refunded or refunding debt. The second item is related to pensions and affects both assets and liabilities. The City’s fiscal year ends on December 31, while the State’s fiscal year ends on June 30. This causes the recognition periods for pension contributions to not match, resulting in the recognition of Deferred Outflows and Deferred Inflows to account for the City’s pension contributions. In addition to liabilities, the Statement of Net Position and the Governmental Fund Balance Sheet will sometimes report a separate section for deferred inflows of resources. This represents an acquisition of net position that applies to future periods and will not be recognized as an inflow of resources (revenue) until that period. The City has four items that qualify for reporting in this category: 1) unavailable property taxes recorded as receivables, 2) unavailable court fees recorded
Page 51
as a receivable, 3) deferred losses on refunding, and 4) pensions and other post-employment obligations, as explained above. Compensated Absences Compensated absences are absences for which employees will be paid, such as vacation and sick leave, and holiday earned by police employees, according to the terms of union contracts or per RCW. Also included is compensatory time earned in lieu of overtime. All such compensated absences are accrued when incurred in the government-wide, proprietary, and fiduciary fund financial statements, and are payable upon termination, retirement or death. Compensated absences including payroll taxes are reported as a current liability on the balance sheet. Actual balances are accrued for all types of compensated absences except sick leave, the liability for which is estimated using the termination method provided by GASB Statement No. 16. Pensions For purposes of measuring the net pension liability, deferred outflows of resources and deferred inflows of resources related to pensions, and pension expense, information about the fiduciary net position of all state sponsored pension plans and additions to/deductions from those plans’ fiduciary net position have been determined on the same basis as they are reported by the Washington State Department of Retirement Systems. For this purpose, benefit payments (including refunds of employee contributions) are recognized when due and payable in accordance with the benefit terms. Investments are reported at fair value. Other Accrued Liabilities Employees earn vacation pay based on their years of service, and may carry over accruals of up to two years’ accumulated leave from one year to the next. Unused vacation leave at time of termination, retirement or death is considered vested and payable to the employee. Unused sick leave is paid out upon termination, retirement or death based on a percentage of the employee’s accumulated sick leave, in accordance with the terms of their union contract, or in accordance with Edmonds City Code Chapter 2.35. Unearned Revenues This account includes amounts recognized as receivables but not revenues in governmental funds because the revenue recognition criteria have not been met. Fund Balance Classification The difference between fund Assets and Deferred Outflows of Resources, minus its Liabilities and Deferred Inflows of Resources, is referred to as Net Position on the government-wide, proprietary, and fiduciary fund statements, and as Fund Balance on the governmental fund statements. The fund balance amounts for governmental funds are classified in accordance with GASB Statement No. 54, and are reported as non-spendable, restricted, committed, assigned, or unassigned.
Non-spendable fund balance represents amounts that are either not in a spendable form (e.g. inventories or prepaid balances) or are legally or contractually required to remain intact.
Restricted fund balances include amounts that have constraints placed upon their use by
constitution, external resource providers, or through enabling legislation.
Committed fund balances include amounts that are limited by resolution of the City Council. A resolution must be taken to impose limitations on the use of these resources, and another resolution is required to modify or eliminate those limitations.
Assigned fund balances include amounts that are intended by the Mayor or department
Directors for an intended use, but are neither restricted nor committed. This type of
Page 52
limitation can be imposed by the highest levels of decision making within the City, but little or no formal action is required to modify or eliminate those limitations.
Unassigned fund balance is the residual amount of the general fund not included in the
four categories described above. Also, any deficit fund balances within the other governmental fund types are reported as unassigned.
When both restricted and unrestricted fund balances are available for use, the City considers restricted fund balance to have been spent first. When committed, assigned, or unassigned fund balance amounts are available for use, the City considers committed fund balance to be spent first, assigned fund balance second, and unassigned fund balance last. F. Revenues, Expenditures and Expenses The modified accrual basis of accounting is followed in all governmental funds of the City. Under the modified accrual basis of accounting: Charges for services, interest on investments, and rents generally are considered measurable and available when earned in governmental funds. Taxes and federal or state entitlements or shared revenues that have been collected but not remitted by an intermediary collection agency to the City are considered measurable and available. Grants are considered measurable and available to the extent that expenditures have been incurred. Other intergovernmental revenues are considered measurable and available when earned. Interfund revenues for goods and services are considered measurable and available when earned. Proceeds from the disposal of capital assets are recognized as other financing sources. Revenues from taxpayer-assessed taxes (e.g. sales tax), net of estimated refunds, are recognized when measurable and available to finance expenditures of the current period. All other revenues are either not measurable or considered not available until collected. Expenditures are generally recognized when incurred, except for principal and interest on general long-term debt, which are reported as expenditures when paid, and compensated absences, which are reported as expenditures when liquidated from expendable available financial resources. The accrual basis of accounting is followed in all proprietary and fiduciary funds. Under the accrual basis of accounting: Revenues are recognized when earned and expenses are recognized when incurred. Contributions of capital in proprietary fund financial statements arise from internal and external contributions of capital assets or from grants or outside contributions of resources restricted to capital acquisition and construction. Transfers between government and business-type activities on the government-wide statement of activities are reported as general revenues. Transfers between funds reported in the governmental activities column are eliminated, as are transfers between funds reported in the business-type activities column. G. Estimates The preparation of the financial statements in conformity with accounting principles generally accepted in the United States requires management to make estimates and assumptions that affect the amounts reported in the financial statements and accompanying notes. Actual results may differ from those estimates.
Page 53
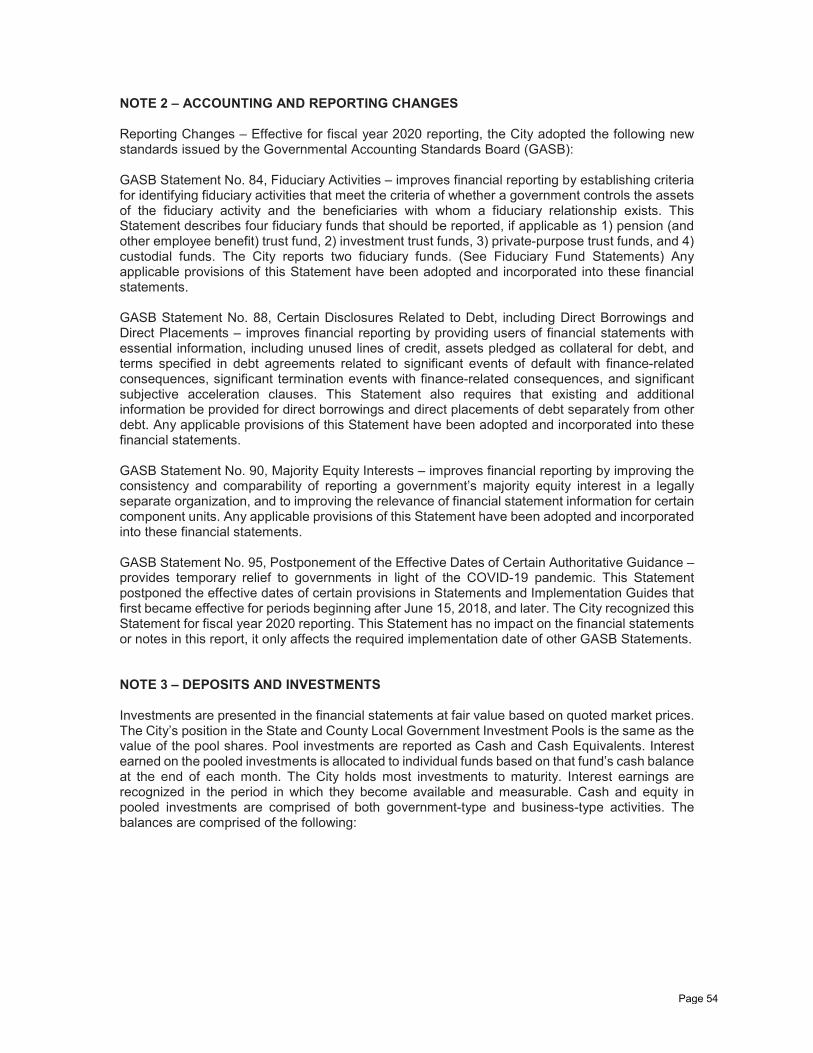
NOTE 2 – ACCOUNTING AND REPORTING CHANGES Reporting Changes – Effective for fiscal year 2020 reporting, the City adopted the following new standards issued by the Governmental Accounting Standards Board (GASB): GASB Statement No. 84, Fiduciary Activities – improves financial reporting by establishing criteria for identifying fiduciary activities that meet the criteria of whether a government controls the assets of the fiduciary activity and the beneficiaries with whom a fiduciary relationship exists. This Statement describes four fiduciary funds that should be reported, if applicable as 1) pension (and other employee benefit) trust fund, 2) investment trust funds, 3) private-purpose trust funds, and 4) custodial funds. The City reports two fiduciary funds. (See Fiduciary Fund Statements) Any applicable provisions of this Statement have been adopted and incorporated into these financial statements. GASB Statement No. 88, Certain Disclosures Related to Debt, including Direct Borrowings and Direct Placements – improves financial reporting by providing users of financial statements with essential information, including unused lines of credit, assets pledged as collateral for debt, and terms specified in debt agreements related to significant events of default with finance-related consequences, significant termination events with finance-related consequences, and significant subjective acceleration clauses. This Statement also requires that existing and additional information be provided for direct borrowings and direct placements of debt separately from other debt. Any applicable provisions of this Statement have been adopted and incorporated into these financial statements. GASB Statement No. 90, Majority Equity Interests – improves financial reporting by improving the consistency and comparability of reporting a government’s majority equity interest in a legally separate organization, and to improving the relevance of financial statement information for certain component units. Any applicable provisions of this Statement have been adopted and incorporated into these financial statements. GASB Statement No. 95, Postponement of the Effective Dates of Certain Authoritative Guidance – provides temporary relief to governments in light of the COVID-19 pandemic. This Statement postponed the effective dates of certain provisions in Statements and Implementation Guides that first became effective for periods beginning after June 15, 2018, and later. The City recognized this Statement for fiscal year 2020 reporting. This Statement has no impact on the financial statements or notes in this report, it only affects the required implementation date of other GASB Statements. NOTE 3 – DEPOSITS AND INVESTMENTS Investments are presented in the financial statements at fair value based on quoted market prices. The City’s position in the State and County Local Government Investment Pools is the same as the value of the pool shares. Pool investments are reported as Cash and Cash Equivalents. Interest earned on the pooled investments is allocated to individual funds based on that fund’s cash balance at the end of each month. The City holds most investments to maturity. Interest earnings are recognized in the period in which they become available and measurable. Cash and equity in pooled investments are comprised of both government-type and business-type activities. The balances are comprised of the following:
Page 54
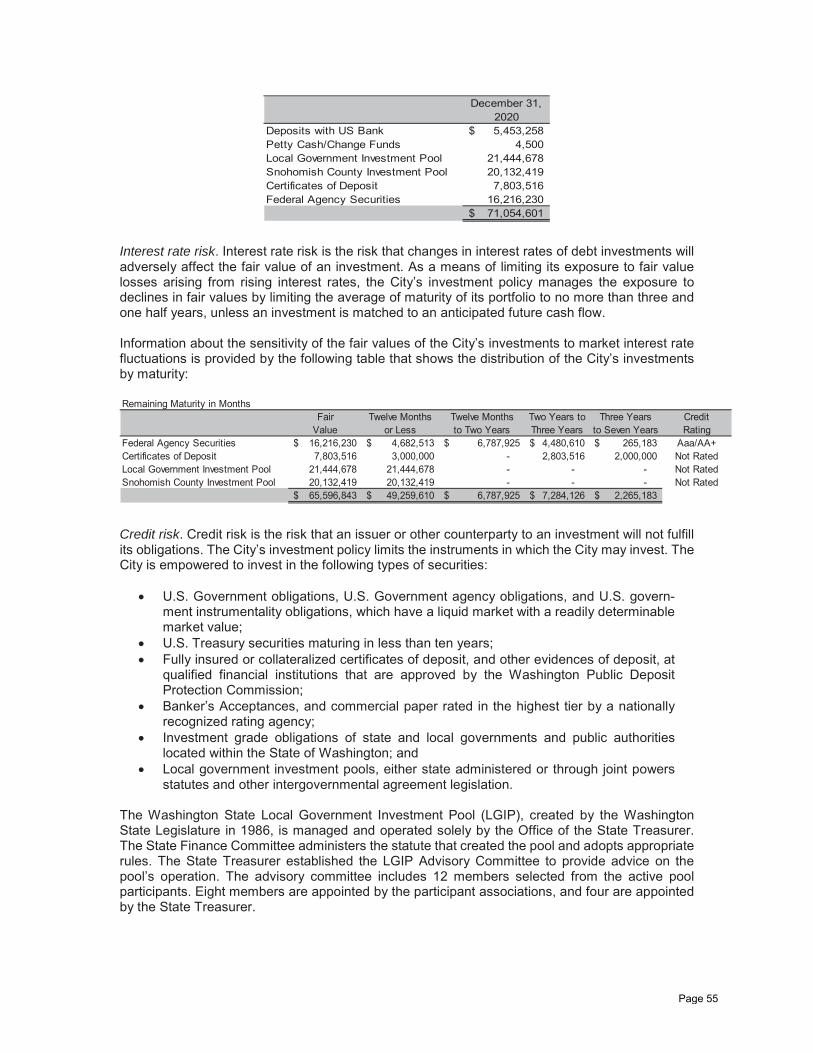
December 31, 2020
Deposits with US Bank 5,453,258$ Petty Cash/Change Funds 4,500 Local Government Investment Pool 21,444,678 Snohomish County Investment Pool 20,132,419 Certificates of Deposit 7,803,516 Federal Agency Securities 16,216,230
71,054,601$
Interest rate risk. Interest rate risk is the risk that changes in interest rates of debt investments will adversely affect the fair value of an investment. As a means of limiting its exposure to fair value losses arising from rising interest rates, the City’s investment policy manages the exposure to declines in fair values by limiting the average of maturity of its portfolio to no more than three and one half years, unless an investment is matched to an anticipated future cash flow. Information about the sensitivity of the fair values of the City’s investments to market interest rate fluctuations is provided by the following table that shows the distribution of the City’s investments by maturity: Remaining Maturity in Months
Fair Twelve Months Twelve Months Two Years to Three Years CreditValue or Less to Two Years Three Years to Seven Years Rating
Federal Agency Securities 16,216,230$ 4,682,513$ 6,787,925$ 4,480,610$ 265,183$ Aaa/AA+Certificates of Deposit 7,803,516 3,000,000 - 2,803,516 2,000,000 Not RatedLocal Government Investment Pool 21,444,678 21,444,678 - - - Not RatedSnohomish County Investment Pool 20,132,419 20,132,419 - - - Not Rated
65,596,843$ 49,259,610$ 6,787,925$ 7,284,126$ 2,265,183$
Credit risk. Credit risk is the risk that an issuer or other counterparty to an investment will not fulfill its obligations. The City’s investment policy limits the instruments in which the City may invest. The City is empowered to invest in the following types of securities:
U.S. Government obligations, U.S. Government agency obligations, and U.S. govern-
ment instrumentality obligations, which have a liquid market with a readily determinable market value;
U.S. Treasury securities maturing in less than ten years; Fully insured or collateralized certificates of deposit, and other evidences of deposit, at
qualified financial institutions that are approved by the Washington Public Deposit Protection Commission;
Banker’s Acceptances, and commercial paper rated in the highest tier by a nationally recognized rating agency;
Investment grade obligations of state and local governments and public authorities located within the State of Washington; and
Local government investment pools, either state administered or through joint powers statutes and other intergovernmental agreement legislation.
The Washington State Local Government Investment Pool (LGIP), created by the Washington State Legislature in 1986, is managed and operated solely by the Office of the State Treasurer. The State Finance Committee administers the statute that created the pool and adopts appropriate rules. The State Treasurer established the LGIP Advisory Committee to provide advice on the pool’s operation. The advisory committee includes 12 members selected from the active pool participants. Eight members are appointed by the participant associations, and four are appointed by the State Treasurer.
Page 55
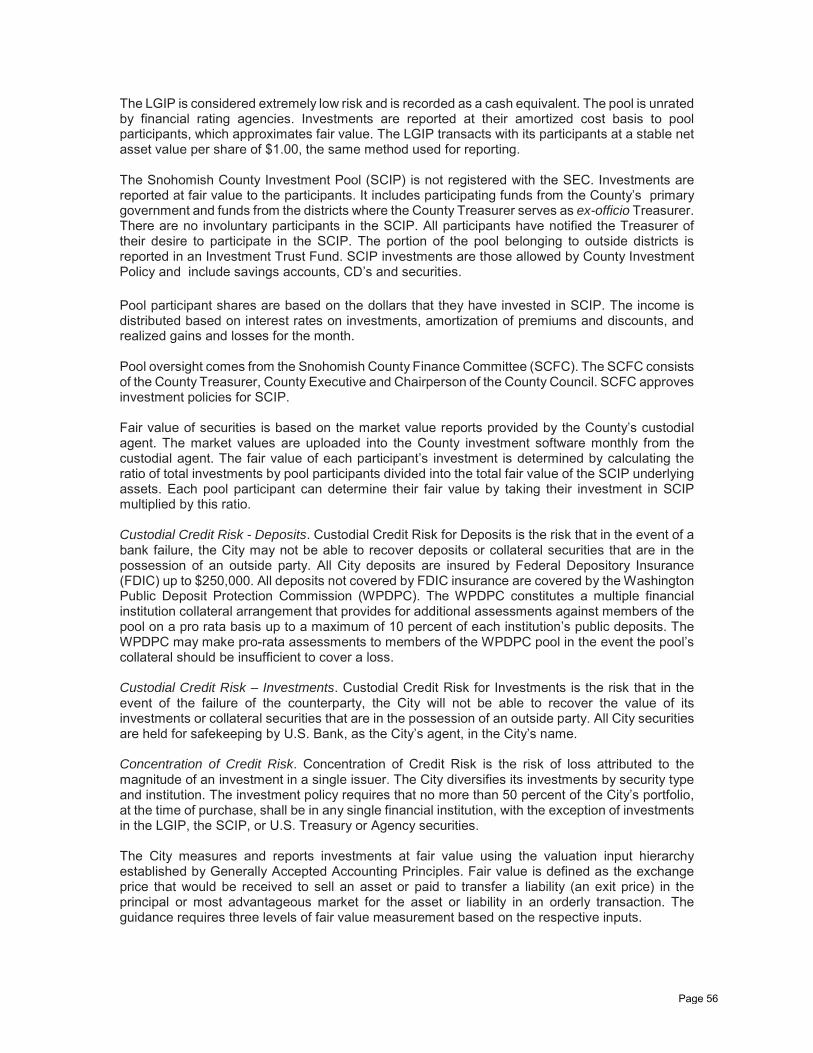
The LGIP is considered extremely low risk and is recorded as a cash equivalent. The pool is unrated by financial rating agencies. Investments are reported at their amortized cost basis to pool participants, which approximates fair value. The LGIP transacts with its participants at a stable net asset value per share of $1.00, the same method used for reporting. The Snohomish County Investment Pool (SCIP) is not registered with the SEC. Investments are reported at fair value to the participants. It includes participating funds from the County’s primary government and funds from the districts where the County Treasurer serves as ex-officio Treasurer. There are no involuntary participants in the SCIP. All participants have notified the Treasurer of their desire to participate in the SCIP. The portion of the pool belonging to outside districts is reported in an Investment Trust Fund. SCIP investments are those allowed by County Investment Policy and include savings accounts, CD’s and securities. Pool participant shares are based on the dollars that they have invested in SCIP. The income is distributed based on interest rates on investments, amortization of premiums and discounts, and realized gains and losses for the month. Pool oversight comes from the Snohomish County Finance Committee (SCFC). The SCFC consists of the County Treasurer, County Executive and Chairperson of the County Council. SCFC approves investment policies for SCIP. Fair value of securities is based on the market value reports provided by the County’s custodial agent. The market values are uploaded into the County investment software monthly from the custodial agent. The fair value of each participant’s investment is determined by calculating the ratio of total investments by pool participants divided into the total fair value of the SCIP underlying assets. Each pool participant can determine their fair value by taking their investment in SCIP multiplied by this ratio. Custodial Credit Risk - Deposits. Custodial Credit Risk for Deposits is the risk that in the event of a bank failure, the City may not be able to recover deposits or collateral securities that are in the possession of an outside party. All City deposits are insured by Federal Depository Insurance (FDIC) up to $250,000. All deposits not covered by FDIC insurance are covered by the Washington Public Deposit Protection Commission (WPDPC). The WPDPC constitutes a multiple financial institution collateral arrangement that provides for additional assessments against members of the pool on a pro rata basis up to a maximum of 10 percent of each institution’s public deposits. The WPDPC may make pro-rata assessments to members of the WPDPC pool in the event the pool’s collateral should be insufficient to cover a loss. Custodial Credit Risk – Investments. Custodial Credit Risk for Investments is the risk that in the event of the failure of the counterparty, the City will not be able to recover the value of its investments or collateral securities that are in the possession of an outside party. All City securities are held for safekeeping by U.S. Bank, as the City’s agent, in the City’s name. Concentration of Credit Risk. Concentration of Credit Risk is the risk of loss attributed to the magnitude of an investment in a single issuer. The City diversifies its investments by security type and institution. The investment policy requires that no more than 50 percent of the City’s portfolio, at the time of purchase, shall be in any single financial institution, with the exception of investments in the LGIP, the SCIP, or U.S. Treasury or Agency securities. The City measures and reports investments at fair value using the valuation input hierarchy established by Generally Accepted Accounting Principles. Fair value is defined as the exchange price that would be received to sell an asset or paid to transfer a liability (an exit price) in the principal or most advantageous market for the asset or liability in an orderly transaction. The guidance requires three levels of fair value measurement based on the respective inputs.
Page 56
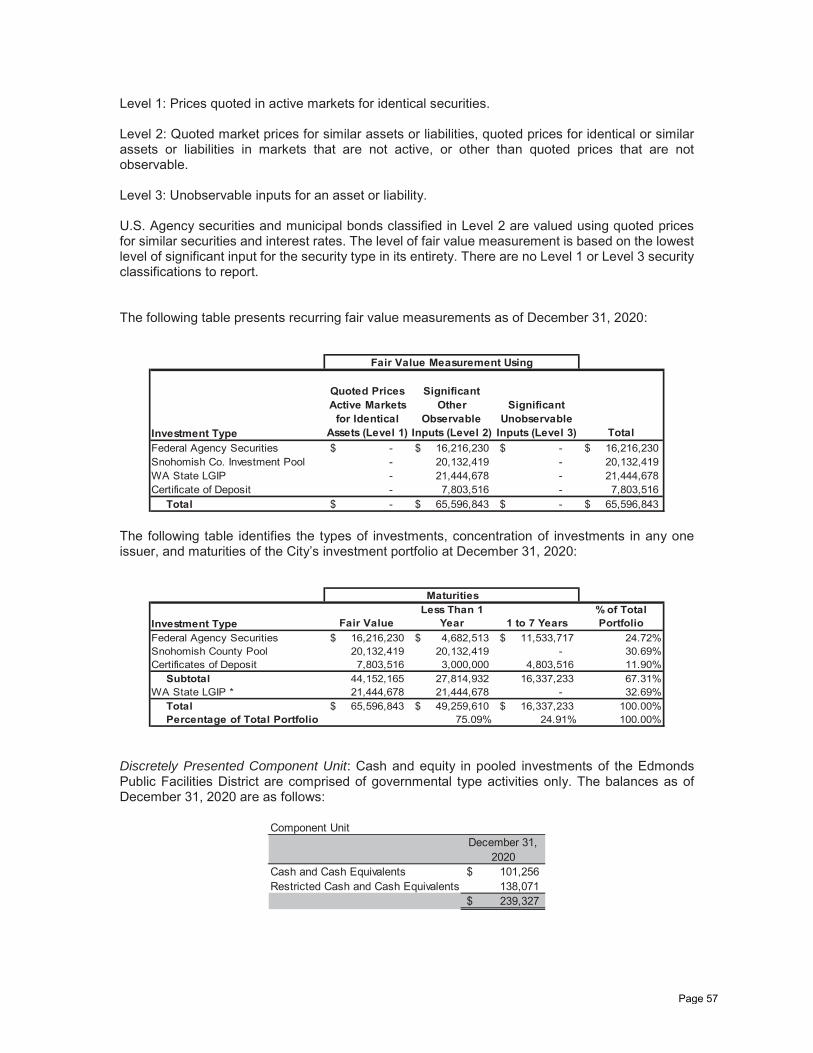
Level 1: Prices quoted in active markets for identical securities. Level 2: Quoted market prices for similar assets or liabilities, quoted prices for identical or similar assets or liabilities in markets that are not active, or other than quoted prices that are not observable. Level 3: Unobservable inputs for an asset or liability. U.S. Agency securities and municipal bonds classified in Level 2 are valued using quoted prices for similar securities and interest rates. The level of fair value measurement is based on the lowest level of significant input for the security type in its entirety. There are no Level 1 or Level 3 security classifications to report. The following table presents recurring fair value measurements as of December 31, 2020:
Investment Type
Quoted Prices Active Markets
for Identical Assets (Level 1)
Significant Other
Observable Inputs (Level 2)
Significant Unobservable
Inputs (Level 3) TotalFederal Agency Securities -$ 16,216,230$ -$ 16,216,230$ Snohomish Co. Investment Pool - 20,132,419 - 20,132,419 WA State LGIP - 21,444,678 - 21,444,678 Certificate of Deposit - 7,803,516 - 7,803,516
Total -$ 65,596,843$ -$ 65,596,843$
Fair Value Measurement Using
The following table identifies the types of investments, concentration of investments in any one issuer, and maturities of the City’s investment portfolio at December 31, 2020:
Investment Type Fair ValueLess Than 1
Year 1 to 7 Years% of Total Portfolio
Federal Agency Securities 16,216,230$ 4,682,513$ 11,533,717$ 24.72%Snohomish County Pool 20,132,419 20,132,419 - 30.69%Certificates of Deposit 7,803,516 3,000,000 4,803,516 11.90%
Subtotal 44,152,165 27,814,932 16,337,233 67.31%WA State LGIP * 21,444,678 21,444,678 - 32.69%
Total 65,596,843$ 49,259,610$ 16,337,233$ 100.00%Percentage of Total Portfolio 75.09% 24.91% 100.00%
Maturities
Discretely Presented Component Unit: Cash and equity in pooled investments of the Edmonds Public Facilities District are comprised of governmental type activities only. The balances as of December 31, 2020 are as follows:
Component UnitDecember 31,
2020Cash and Cash Equivalents 101,256$ Restricted Cash and Cash Equivalents 138,071
239,327$
Page 57
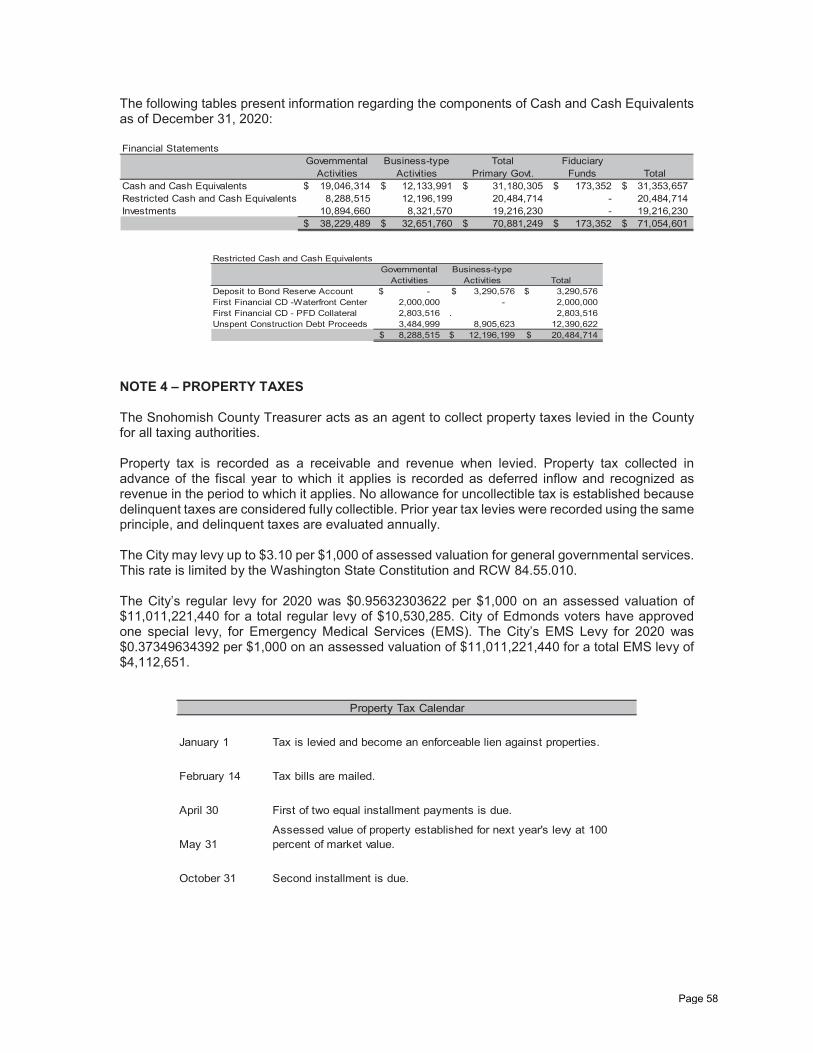
The following tables present information regarding the components of Cash and Cash Equivalents as of December 31, 2020: Financial Statements
Governmental Business-type Total FiduciaryActivities Activities Primary Govt. Funds Total
Cash and Cash Equivalents 19,046,314$ 12,133,991$ 31,180,305$ 173,352$ 31,353,657$ Restricted Cash and Cash Equivalents 8,288,515 12,196,199 20,484,714 - 20,484,714 Investments 10,894,660 8,321,570 19,216,230 - 19,216,230
38,229,489$ 32,651,760$ 70,881,249$ 173,352$ 71,054,601$
Restricted Cash and Cash Equivalents
Governmental Business-typeActivities Activities Total
Deposit to Bond Reserve Account -$ 3,290,576$ 3,290,576$ First Financial CD -Waterfront Center 2,000,000 - 2,000,000 First Financial CD - PFD Collateral 2,803,516 . 2,803,516 Unspent Construction Debt Proceeds 3,484,999 8,905,623 12,390,622
8,288,515$ 12,196,199$ 20,484,714$
NOTE 4 – PROPERTY TAXES The Snohomish County Treasurer acts as an agent to collect property taxes levied in the County for all taxing authorities. Property tax is recorded as a receivable and revenue when levied. Property tax collected in advance of the fiscal year to which it applies is recorded as deferred inflow and recognized as revenue in the period to which it applies. No allowance for uncollectible tax is established because delinquent taxes are considered fully collectible. Prior year tax levies were recorded using the same principle, and delinquent taxes are evaluated annually. The City may levy up to $3.10 per $1,000 of assessed valuation for general governmental services. This rate is limited by the Washington State Constitution and RCW 84.55.010. The City’s regular levy for 2020 was $0.95632303622 per $1,000 on an assessed valuation of $11,011,221,440 for a total regular levy of $10,530,285. City of Edmonds voters have approved one special levy, for Emergency Medical Services (EMS). The City’s EMS Levy for 2020 was $0.37349634392 per $1,000 on an assessed valuation of $11,011,221,440 for a total EMS levy of $4,112,651.
January 1 Tax is levied and become an enforceable lien against properties.
February 14 Tax bills are mailed.
April 30 First of two equal installment payments is due.
May 31 Assessed value of property established for next year's levy at 100 percent of market value.
October 31 Second installment is due.
Property Tax Calendar
Page 58
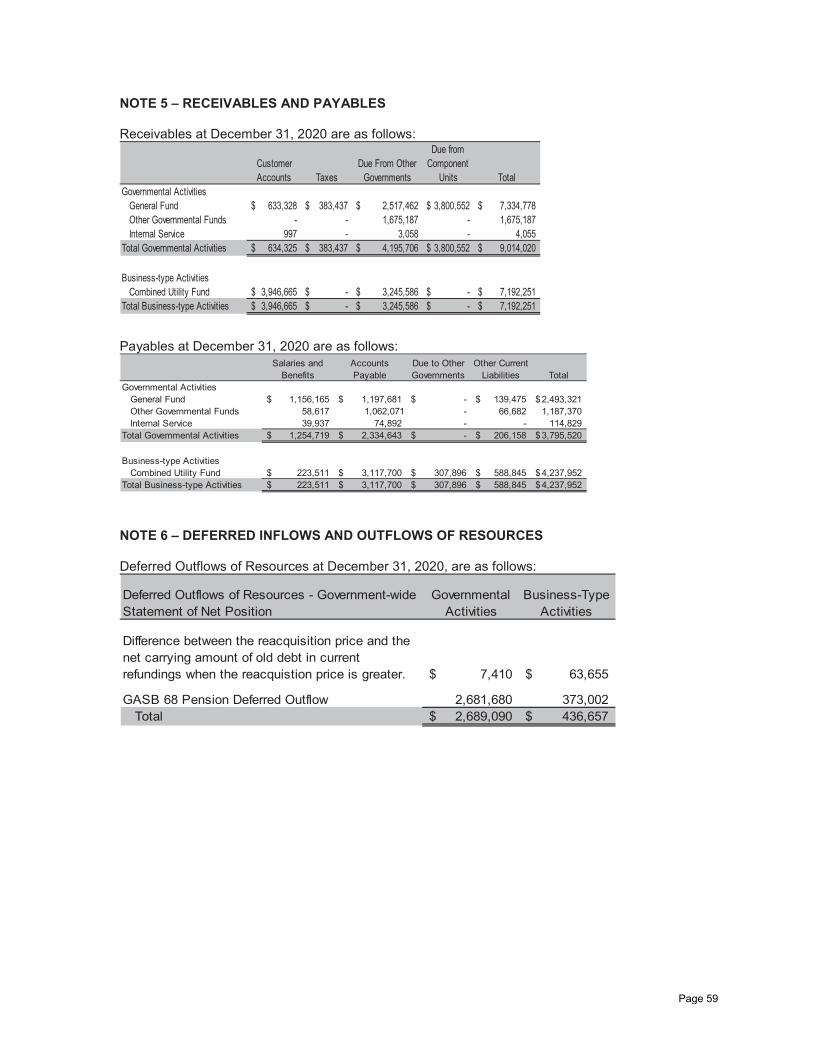
NOTE 5 – RECEIVABLES AND PAYABLES Receivables at December 31, 2020 are as follows:
Customer Due From OtherDue from
ComponentAccounts Taxes Governments Units Total
Governmental ActivitiesGeneral Fund 633,328$ 383,437$ 2,517,462$ 3,800,552$ 7,334,778$ Other Governmental Funds - - 1,675,187 - 1,675,187 Internal Service 997 - 3,058 - 4,055
Total Governmental Activities 634,325$ 383,437$ 4,195,706$ 3,800,552$ 9,014,020$
Business-type ActivitiesCombined Utility Fund 3,946,665$ -$ 3,245,586$ -$ 7,192,251$
Total Business-type Activities 3,946,665$ -$ 3,245,586$ -$ 7,192,251$
Payables at December 31, 2020 are as follows:
Salaries and Benefits
Accounts Payable
Due to Other Governments
Other Current Liabilities Total
Governmental ActivitiesGeneral Fund 1,156,165$ 1,197,681$ -$ 139,475$ 2,493,321$ Other Governmental Funds 58,617 1,062,071 - 66,682 1,187,370 Internal Service 39,937 74,892 - - 114,829
Total Governmental Activities 1,254,719$ 2,334,643$ -$ 206,158$ 3,795,520$
Business-type ActivitiesCombined Utility Fund 223,511$ 3,117,700$ 307,896$ 588,845$ 4,237,952$
Total Business-type Activities 223,511$ 3,117,700$ 307,896$ 588,845$ 4,237,952$
NOTE 6 – DEFERRED INFLOWS AND OUTFLOWS OF RESOURCES Deferred Outflows of Resources at December 31, 2020, are as follows:
Deferred Outflows of Resources - Government-wide Statement of Net Position
Governmental Activities
Business-Type Activities
Difference between the reacquisition price and the net carrying amount of old debt in current refundings when the reacquistion price is greater. 7,410$ 63,655$
GASB 68 Pension Deferred Outflow 2,681,680 373,002 Total 2,689,090$ 436,657$
Page 59
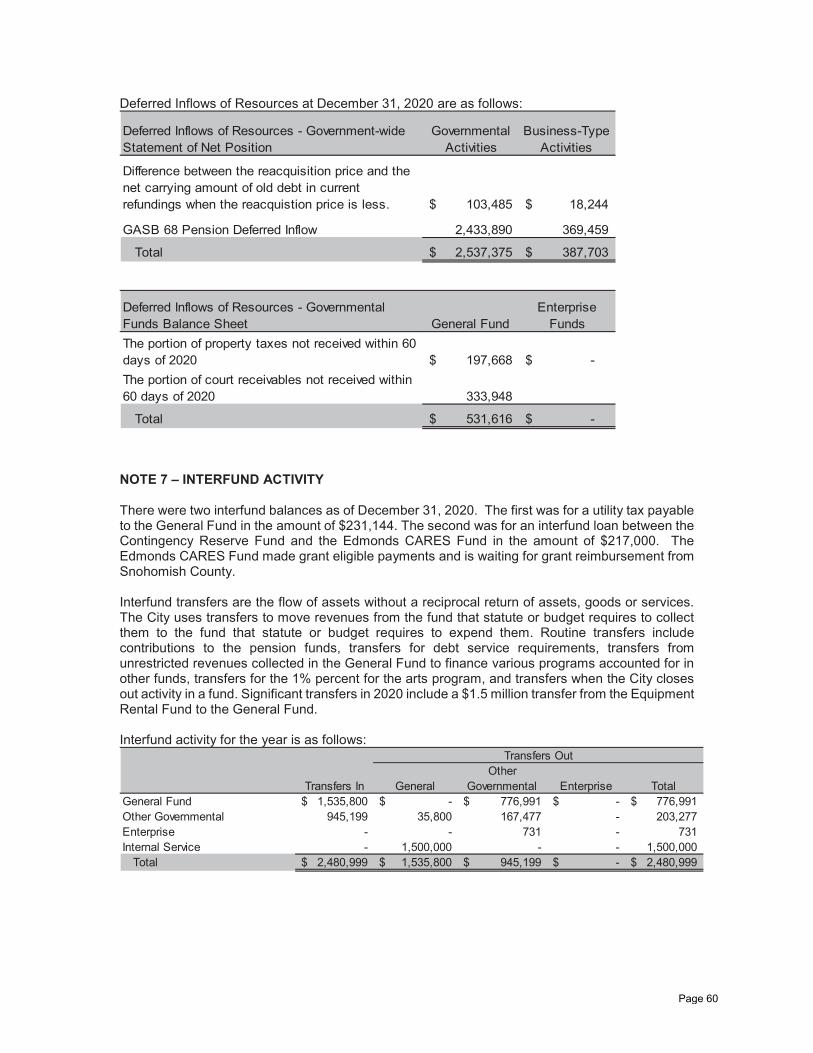
Deferred Inflows of Resources at December 31, 2020 are as follows:
Deferred Inflows of Resources - Government-wide Statement of Net Position
Governmental Activities
Business-Type Activities
Difference between the reacquisition price and the net carrying amount of old debt in current refundings when the reacquistion price is less. 103,485$ 18,244$
GASB 68 Pension Deferred Inflow 2,433,890 369,459
Total 2,537,375$ 387,703$
Deferred Inflows of Resources - Governmental Funds Balance Sheet General Fund
Enterprise Funds
The portion of property taxes not received within 60 days of 2020 197,668$ -$ The portion of court receivables not received within 60 days of 2020 333,948
Total 531,616$ -$
NOTE 7 – INTERFUND ACTIVITY There were two interfund balances as of December 31, 2020. The first was for a utility tax payable to the General Fund in the amount of $231,144. The second was for an interfund loan between the Contingency Reserve Fund and the Edmonds CARES Fund in the amount of $217,000. The Edmonds CARES Fund made grant eligible payments and is waiting for grant reimbursement from Snohomish County. Interfund transfers are the flow of assets without a reciprocal return of assets, goods or services. The City uses transfers to move revenues from the fund that statute or budget requires to collect them to the fund that statute or budget requires to expend them. Routine transfers include contributions to the pension funds, transfers for debt service requirements, transfers from unrestricted revenues collected in the General Fund to finance various programs accounted for in other funds, transfers for the 1% percent for the arts program, and transfers when the City closes out activity in a fund. Significant transfers in 2020 include a $1.5 million transfer from the Equipment Rental Fund to the General Fund. Interfund activity for the year is as follows:
Transfers In General Other
Governmental Enterprise TotalGeneral Fund 1,535,800$ -$ 776,991$ -$ 776,991$ Other Governmental 945,199 35,800 167,477 - 203,277 Enterprise - - 731 - 731 Internal Service - 1,500,000 - - 1,500,000 Total 2,480,999$ 1,535,800$ 945,199$ -$ 2,480,999$
Transfers Out
Page 60
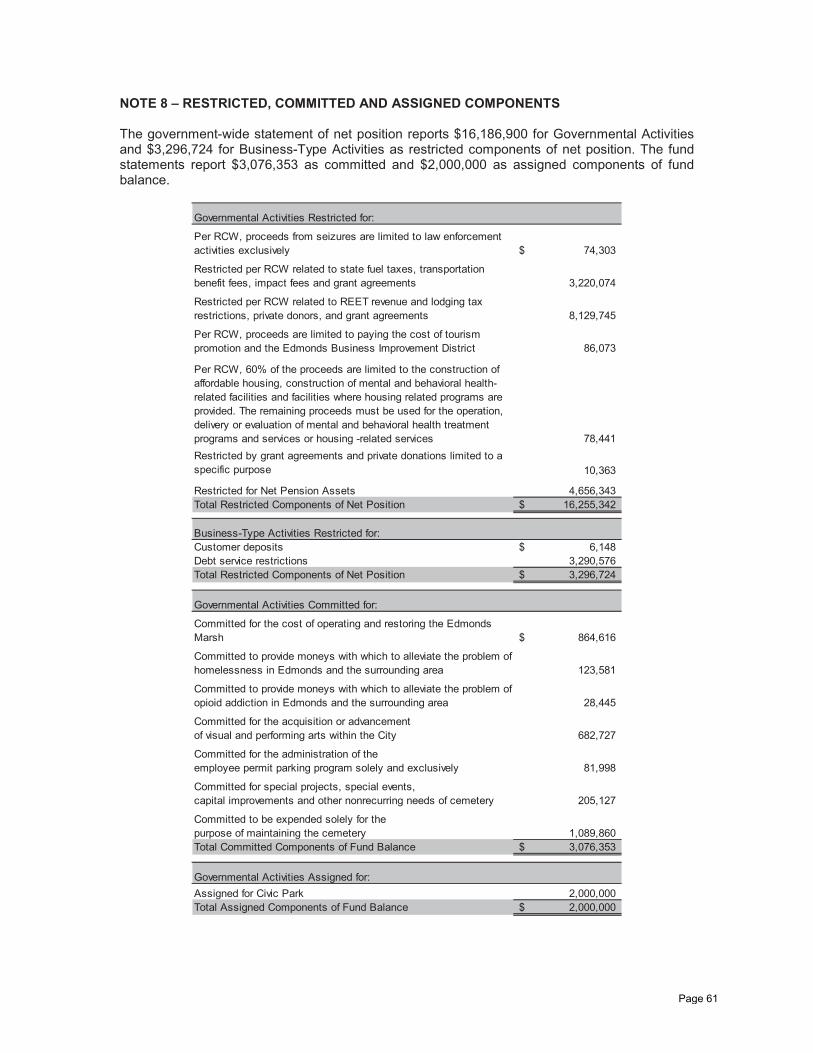
NOTE 8 – RESTRICTED, COMMITTED AND ASSIGNED COMPONENTS The government-wide statement of net position reports $16,186,900 for Governmental Activities and $3,296,724 for Business-Type Activities as restricted components of net position. The fund statements report $3,076,353 as committed and $2,000,000 as assigned components of fund balance.
Governmental Activities Restricted for:
Per RCW, proceeds from seizures are limited to law enforcement activities exclusively 74,303$
Restricted per RCW related to state fuel taxes, transportation benefit fees, impact fees and grant agreements 3,220,074
Restricted per RCW related to REET revenue and lodging tax restrictions, private donors, and grant agreements 8,129,745
Per RCW, proceeds are limited to paying the cost of tourism promotion and the Edmonds Business Improvement District 86,073
Per RCW, 60% of the proceeds are limited to the construction of affordable housing, construction of mental and behavioral health-related facilities and facilities where housing related programs are provided. The remaining proceeds must be used for the operation, delivery or evaluation of mental and behavioral health treatment programs and services or housing -related services 78,441 Restricted by grant agreements and private donations limited to a specific purpose 10,363
Restricted for Net Pension Assets 4,656,343Total Restricted Components of Net Position 16,255,342$
Business-Type Activities Restricted for:Customer deposits 6,148$ Debt service restrictions 3,290,576 Total Restricted Components of Net Position 3,296,724$
Governmental Activities Committed for:
Committed for the cost of operating and restoring the Edmonds Marsh 864,616$
Committed to provide moneys with which to alleviate the problem of homelessness in Edmonds and the surrounding area 123,581
Committed to provide moneys with which to alleviate the problem of opioid addiction in Edmonds and the surrounding area 28,445
Committed for the acquisition or advancementof visual and performing arts within the City 682,727
Committed for the administration of the employee permit parking program solely and exclusively 81,998
Committed for special projects, special events,capital improvements and other nonrecurring needs of cemetery 205,127
Committed to be expended solely for the purpose of maintaining the cemetery 1,089,860 Total Committed Components of Fund Balance 3,076,353$
Governmental Activities Assigned for:Assigned for Civic Park 2,000,000 Total Assigned Components of Fund Balance 2,000,000$
Page 61
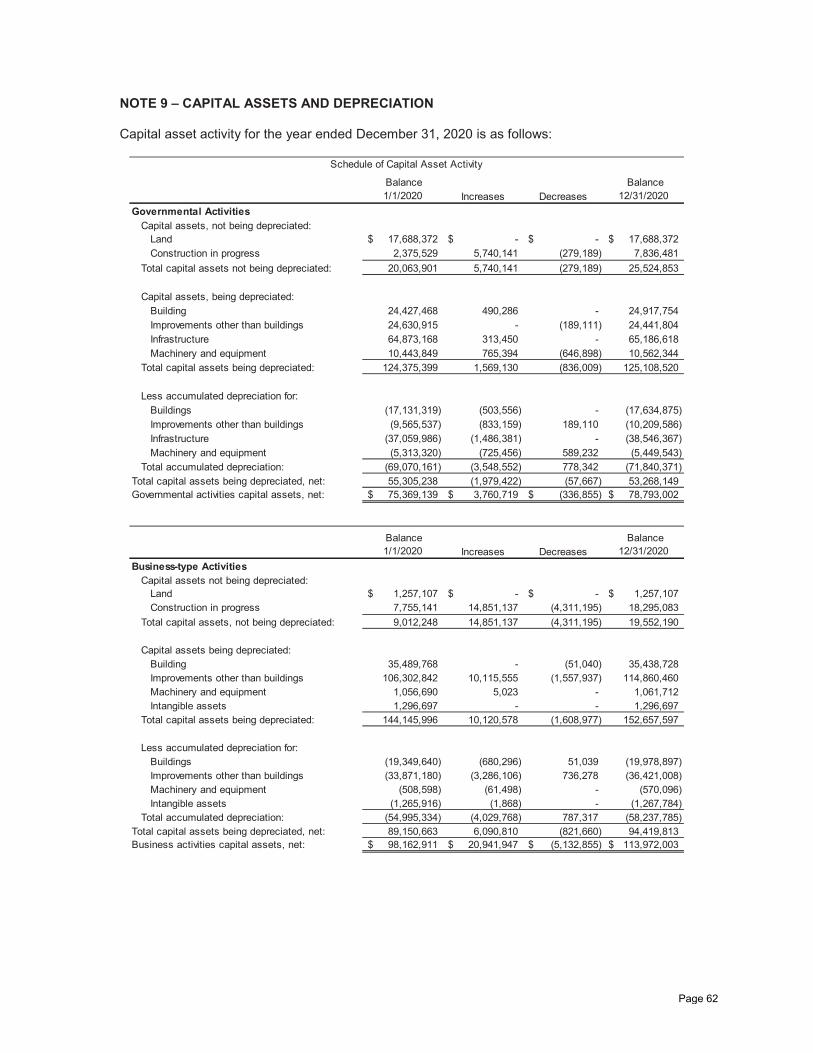
NOTE 9 – CAPITAL ASSETS AND DEPRECIATION Capital asset activity for the year ended December 31, 2020 is as follows:
Balance 1/1/2020 Increases Decreases
Balance 12/31/2020
Governmental ActivitiesCapital assets, not being depreciated:
Land 17,688,372$ -$ -$ 17,688,372$ Construction in progress 2,375,529 5,740,141 (279,189) 7,836,481
Total capital assets not being depreciated: 20,063,901 5,740,141 (279,189) 25,524,853
Capital assets, being depreciated:Building 24,427,468 490,286 - 24,917,754 Improvements other than buildings 24,630,915 - (189,111) 24,441,804 Infrastructure 64,873,168 313,450 - 65,186,618 Machinery and equipment 10,443,849 765,394 (646,898) 10,562,344
Total capital assets being depreciated: 124,375,399 1,569,130 (836,009) 125,108,520
Less accumulated depreciation for:Buildings (17,131,319) (503,556) - (17,634,875) Improvements other than buildings (9,565,537) (833,159) 189,110 (10,209,586) Infrastructure (37,059,986) (1,486,381) - (38,546,367) Machinery and equipment (5,313,320) (725,456) 589,232 (5,449,543)
Total accumulated depreciation: (69,070,161) (3,548,552) 778,342 (71,840,371) Total capital assets being depreciated, net: 55,305,238 (1,979,422) (57,667) 53,268,149 Governmental activities capital assets, net: 75,369,139$ 3,760,719$ (336,855)$ 78,793,002$
Schedule of Capital Asset Activity
Balance 1/1/2020 Increases Decreases
Balance 12/31/2020
Business-type ActivitiesCapital assets not being depreciated:
Land 1,257,107$ -$ -$ 1,257,107$ Construction in progress 7,755,141 14,851,137 (4,311,195) 18,295,083
Total capital assets, not being depreciated: 9,012,248 14,851,137 (4,311,195) 19,552,190
Capital assets being depreciated:Building 35,489,768 - (51,040) 35,438,728 Improvements other than buildings 106,302,842 10,115,555 (1,557,937) 114,860,460 Machinery and equipment 1,056,690 5,023 - 1,061,712 Intangible assets 1,296,697 - - 1,296,697
Total capital assets being depreciated: 144,145,996 10,120,578 (1,608,977) 152,657,597
Less accumulated depreciation for:Buildings (19,349,640) (680,296) 51,039 (19,978,897) Improvements other than buildings (33,871,180) (3,286,106) 736,278 (36,421,008) Machinery and equipment (508,598) (61,498) - (570,096) Intangible assets (1,265,916) (1,868) - (1,267,784)
Total accumulated depreciation: (54,995,334) (4,029,768) 787,317 (58,237,785) Total capital assets being depreciated, net: 89,150,663 6,090,810 (821,660) 94,419,813 Business activities capital assets, net: 98,162,911$ 20,941,947$ (5,132,855)$ 113,972,003$
Page 62
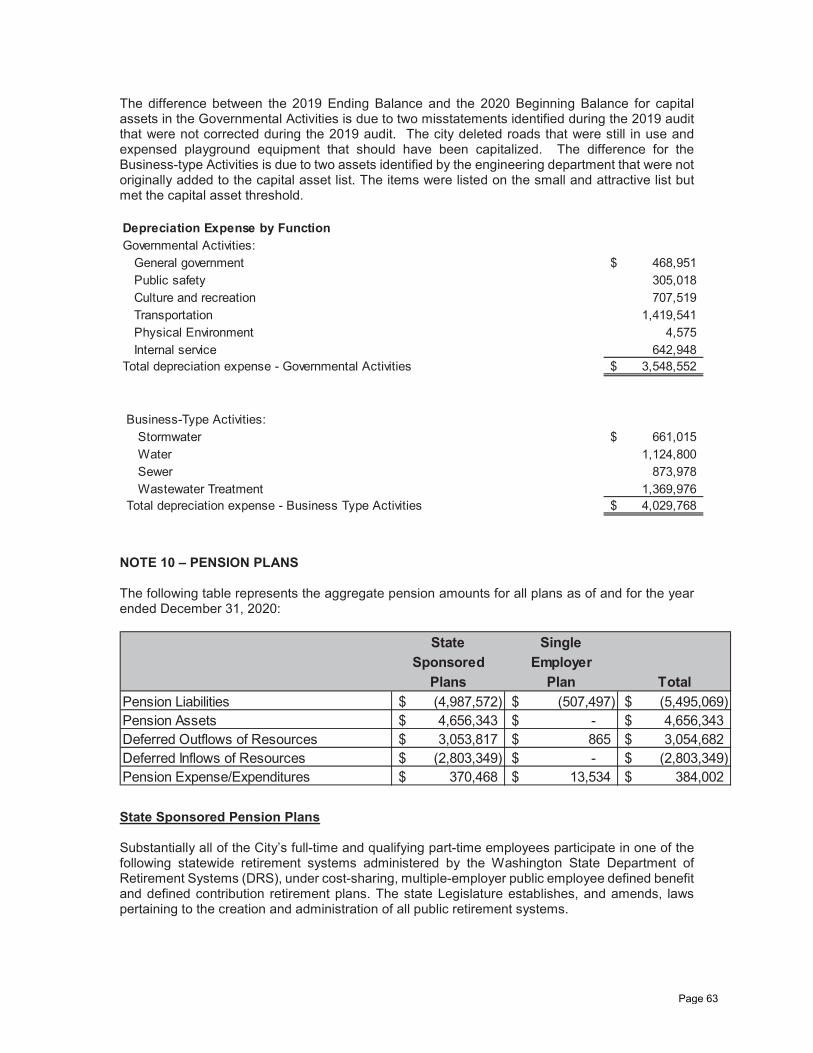
The difference between the 2019 Ending Balance and the 2020 Beginning Balance for capital assets in the Governmental Activities is due to two misstatements identified during the 2019 audit that were not corrected during the 2019 audit. The city deleted roads that were still in use and expensed playground equipment that should have been capitalized. The difference for the Business-type Activities is due to two assets identified by the engineering department that were not originally added to the capital asset list. The items were listed on the small and attractive list but met the capital asset threshold. Depreciation Expense by FunctionGovernmental Activities:
General government 468,951$ Public safety 305,018 Culture and recreation 707,519 Transportation 1,419,541 Physical Environment 4,575 Internal service 642,948
Total depreciation expense - Governmental Activities 3,548,552$
Business-Type Activities:Stormwater 661,015$ Water 1,124,800 Sewer 873,978 Wastewater Treatment 1,369,976
Total depreciation expense - Business Type Activities 4,029,768$
NOTE 10 – PENSION PLANS The following table represents the aggregate pension amounts for all plans as of and for the year ended December 31, 2020:
State Single
Sponsored EmployerPlans Plan Total
Pension Liabilities (4,987,572)$ (507,497)$ (5,495,069)$ Pension Assets 4,656,343$ -$ 4,656,343$ Deferred Outflows of Resources 3,053,817$ 865$ 3,054,682$ Deferred Inflows of Resources (2,803,349)$ -$ (2,803,349)$ Pension Expense/Expenditures 370,468$ 13,534$ 384,002$
State Sponsored Pension Plans Substantially all of the City’s full-time and qualifying part-time employees participate in one of the following statewide retirement systems administered by the Washington State Department of Retirement Systems (DRS), under cost-sharing, multiple-employer public employee defined benefit and defined contribution retirement plans. The state Legislature establishes, and amends, laws pertaining to the creation and administration of all public retirement systems.
Page 63
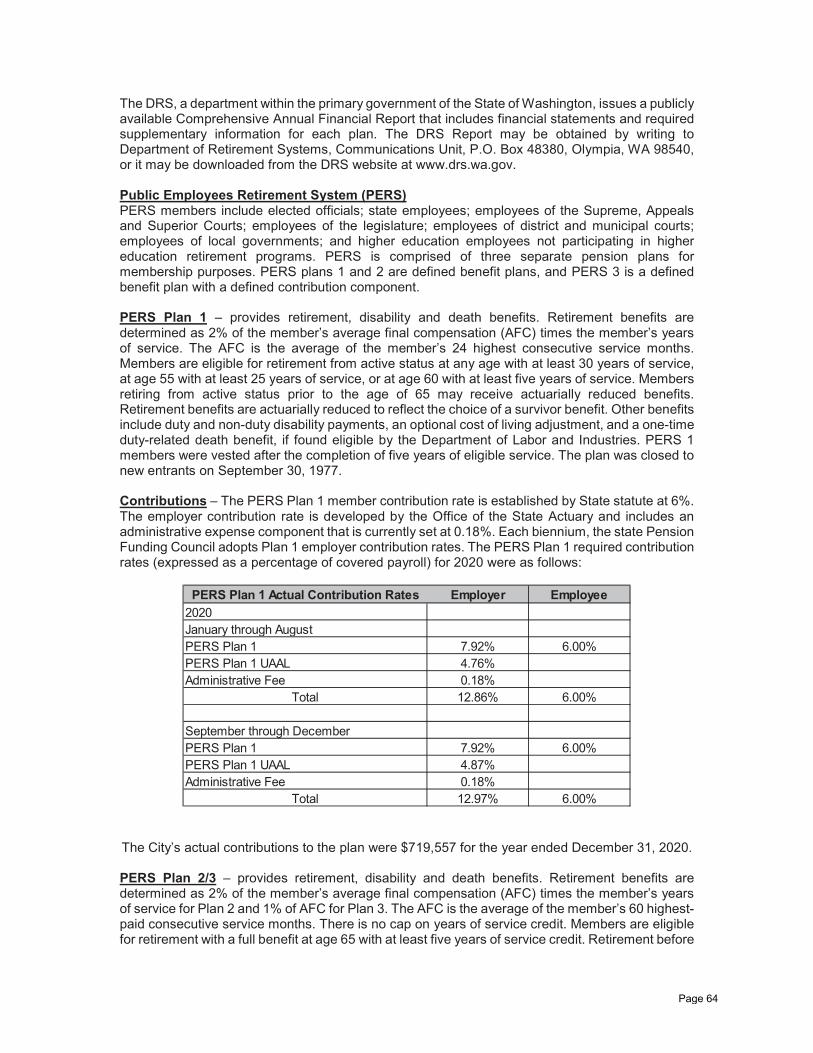
The DRS, a department within the primary government of the State of Washington, issues a publicly available Comprehensive Annual Financial Report that includes financial statements and required supplementary information for each plan. The DRS Report may be obtained by writing to Department of Retirement Systems, Communications Unit, P.O. Box 48380, Olympia, WA 98540, or it may be downloaded from the DRS website at www.drs.wa.gov. Public Employees Retirement System (PERS) PERS members include elected officials; state employees; employees of the Supreme, Appeals and Superior Courts; employees of the legislature; employees of district and municipal courts; employees of local governments; and higher education employees not participating in higher education retirement programs. PERS is comprised of three separate pension plans for membership purposes. PERS plans 1 and 2 are defined benefit plans, and PERS 3 is a defined benefit plan with a defined contribution component. PERS Plan 1 – provides retirement, disability and death benefits. Retirement benefits are determined as 2% of the member’s average final compensation (AFC) times the member’s years of service. The AFC is the average of the member’s 24 highest consecutive service months. Members are eligible for retirement from active status at any age with at least 30 years of service, at age 55 with at least 25 years of service, or at age 60 with at least five years of service. Members retiring from active status prior to the age of 65 may receive actuarially reduced benefits. Retirement benefits are actuarially reduced to reflect the choice of a survivor benefit. Other benefits include duty and non-duty disability payments, an optional cost of living adjustment, and a one-time duty-related death benefit, if found eligible by the Department of Labor and Industries. PERS 1 members were vested after the completion of five years of eligible service. The plan was closed to new entrants on September 30, 1977. Contributions – The PERS Plan 1 member contribution rate is established by State statute at 6%. The employer contribution rate is developed by the Office of the State Actuary and includes an administrative expense component that is currently set at 0.18%. Each biennium, the state Pension Funding Council adopts Plan 1 employer contribution rates. The PERS Plan 1 required contribution rates (expressed as a percentage of covered payroll) for 2020 were as follows:
PERS Plan 1 Actual Contribution Rates Employer Employee2020January through AugustPERS Plan 1 7.92% 6.00%PERS Plan 1 UAAL 4.76%Administrative Fee 0.18%
Total 12.86% 6.00%
September through DecemberPERS Plan 1 7.92% 6.00%PERS Plan 1 UAAL 4.87%Administrative Fee 0.18%
Total 12.97% 6.00%
The City’s actual contributions to the plan were $719,557 for the year ended December 31, 2020. PERS Plan 2/3 – provides retirement, disability and death benefits. Retirement benefits are determined as 2% of the member’s average final compensation (AFC) times the member’s years of service for Plan 2 and 1% of AFC for Plan 3. The AFC is the average of the member’s 60 highest-paid consecutive service months. There is no cap on years of service credit. Members are eligible for retirement with a full benefit at age 65 with at least five years of service credit. Retirement before
Page 64
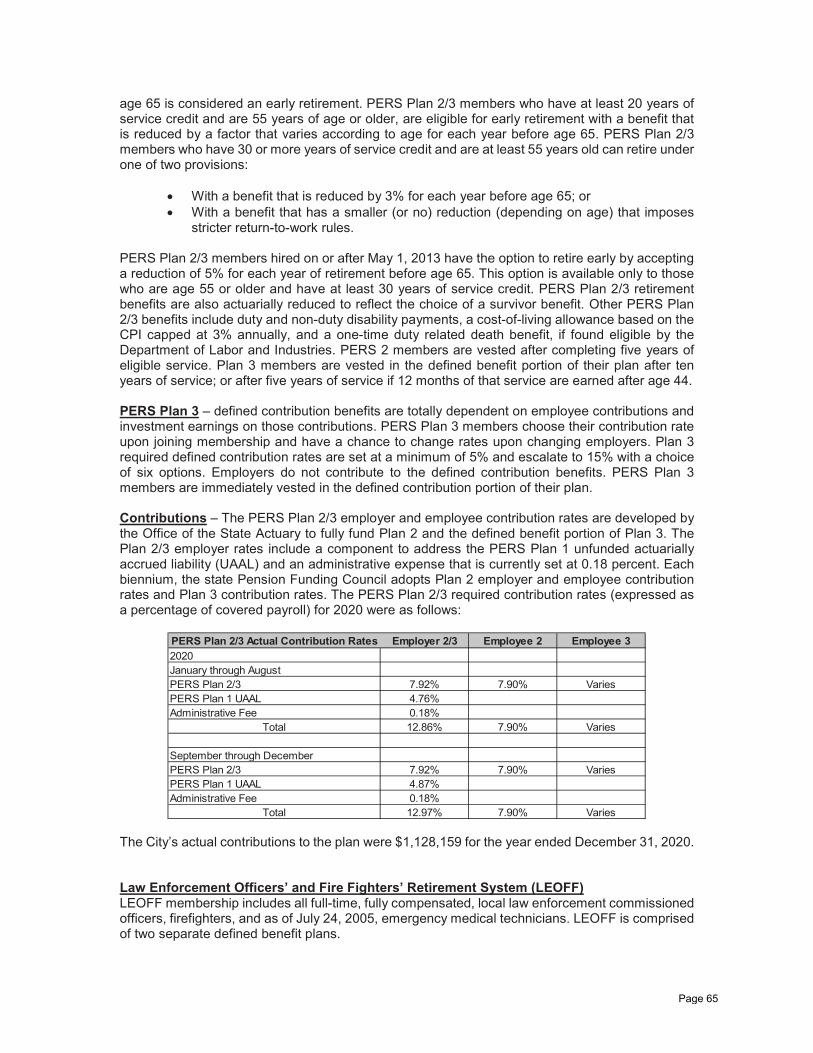
age 65 is considered an early retirement. PERS Plan 2/3 members who have at least 20 years of service credit and are 55 years of age or older, are eligible for early retirement with a benefit that is reduced by a factor that varies according to age for each year before age 65. PERS Plan 2/3 members who have 30 or more years of service credit and are at least 55 years old can retire under one of two provisions:
With a benefit that is reduced by 3% for each year before age 65; or With a benefit that has a smaller (or no) reduction (depending on age) that imposes
stricter return-to-work rules. PERS Plan 2/3 members hired on or after May 1, 2013 have the option to retire early by accepting a reduction of 5% for each year of retirement before age 65. This option is available only to those who are age 55 or older and have at least 30 years of service credit. PERS Plan 2/3 retirement benefits are also actuarially reduced to reflect the choice of a survivor benefit. Other PERS Plan 2/3 benefits include duty and non-duty disability payments, a cost-of-living allowance based on the CPI capped at 3% annually, and a one-time duty related death benefit, if found eligible by the Department of Labor and Industries. PERS 2 members are vested after completing five years of eligible service. Plan 3 members are vested in the defined benefit portion of their plan after ten years of service; or after five years of service if 12 months of that service are earned after age 44. PERS Plan 3 – defined contribution benefits are totally dependent on employee contributions and investment earnings on those contributions. PERS Plan 3 members choose their contribution rate upon joining membership and have a chance to change rates upon changing employers. Plan 3 required defined contribution rates are set at a minimum of 5% and escalate to 15% with a choice of six options. Employers do not contribute to the defined contribution benefits. PERS Plan 3 members are immediately vested in the defined contribution portion of their plan. Contributions – The PERS Plan 2/3 employer and employee contribution rates are developed by the Office of the State Actuary to fully fund Plan 2 and the defined benefit portion of Plan 3. The Plan 2/3 employer rates include a component to address the PERS Plan 1 unfunded actuarially accrued liability (UAAL) and an administrative expense that is currently set at 0.18 percent. Each biennium, the state Pension Funding Council adopts Plan 2 employer and employee contribution rates and Plan 3 contribution rates. The PERS Plan 2/3 required contribution rates (expressed as a percentage of covered payroll) for 2020 were as follows:
PERS Plan 2/3 Actual Contribution Rates Employer 2/3 Employee 2 Employee 32020January through AugustPERS Plan 2/3 7.92% 7.90% VariesPERS Plan 1 UAAL 4.76%Administrative Fee 0.18%
Total 12.86% 7.90% Varies
September through DecemberPERS Plan 2/3 7.92% 7.90% VariesPERS Plan 1 UAAL 4.87%Administrative Fee 0.18%
Total 12.97% 7.90% Varies
The City’s actual contributions to the plan were $1,128,159 for the year ended December 31, 2020. Law Enforcement Officers’ and Fire Fighters’ Retirement System (LEOFF) LEOFF membership includes all full-time, fully compensated, local law enforcement commissioned officers, firefighters, and as of July 24, 2005, emergency medical technicians. LEOFF is comprised of two separate defined benefit plans.
Page 65
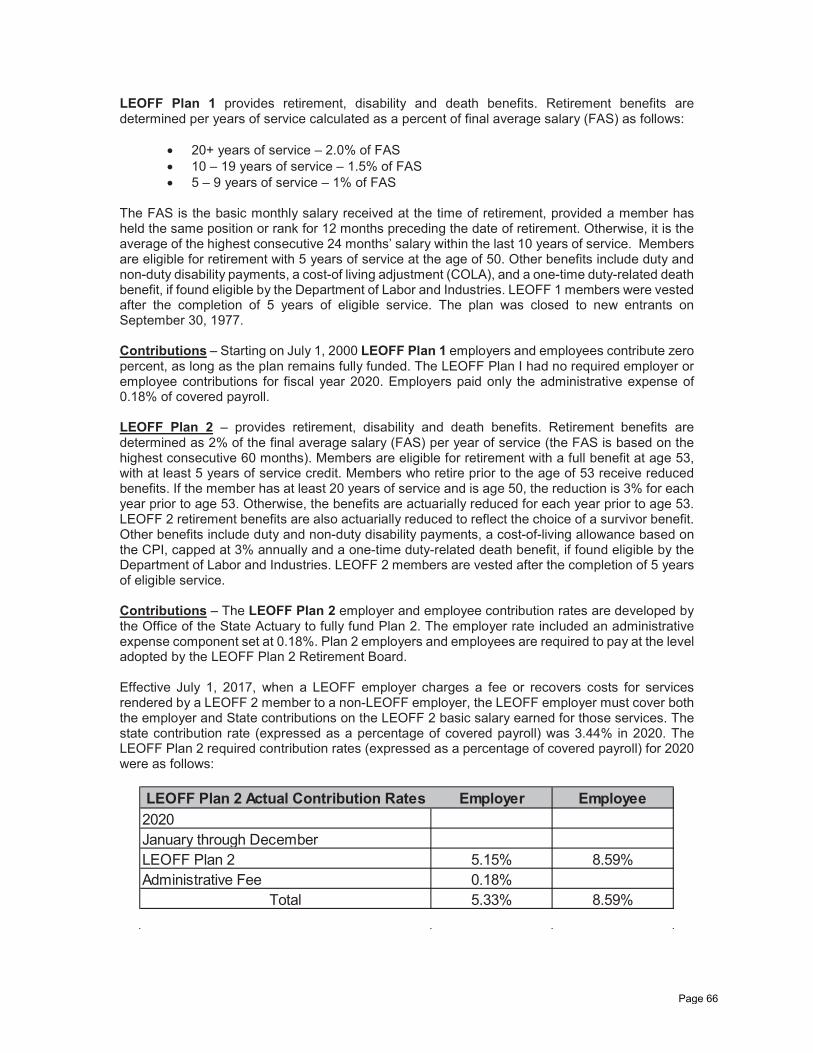
LEOFF Plan 1 provides retirement, disability and death benefits. Retirement benefits are determined per years of service calculated as a percent of final average salary (FAS) as follows:
20+ years of service – 2.0% of FAS 10 – 19 years of service – 1.5% of FAS 5 – 9 years of service – 1% of FAS
The FAS is the basic monthly salary received at the time of retirement, provided a member has held the same position or rank for 12 months preceding the date of retirement. Otherwise, it is the average of the highest consecutive 24 months’ salary within the last 10 years of service. Members are eligible for retirement with 5 years of service at the age of 50. Other benefits include duty and non-duty disability payments, a cost-of living adjustment (COLA), and a one-time duty-related death benefit, if found eligible by the Department of Labor and Industries. LEOFF 1 members were vested after the completion of 5 years of eligible service. The plan was closed to new entrants on September 30, 1977. Contributions – Starting on July 1, 2000 LEOFF Plan 1 employers and employees contribute zero percent, as long as the plan remains fully funded. The LEOFF Plan I had no required employer or employee contributions for fiscal year 2020. Employers paid only the administrative expense of 0.18% of covered payroll. LEOFF Plan 2 – provides retirement, disability and death benefits. Retirement benefits are determined as 2% of the final average salary (FAS) per year of service (the FAS is based on the highest consecutive 60 months). Members are eligible for retirement with a full benefit at age 53, with at least 5 years of service credit. Members who retire prior to the age of 53 receive reduced benefits. If the member has at least 20 years of service and is age 50, the reduction is 3% for each year prior to age 53. Otherwise, the benefits are actuarially reduced for each year prior to age 53. LEOFF 2 retirement benefits are also actuarially reduced to reflect the choice of a survivor benefit. Other benefits include duty and non-duty disability payments, a cost-of-living allowance based on the CPI, capped at 3% annually and a one-time duty-related death benefit, if found eligible by the Department of Labor and Industries. LEOFF 2 members are vested after the completion of 5 years of eligible service. Contributions – The LEOFF Plan 2 employer and employee contribution rates are developed by the Office of the State Actuary to fully fund Plan 2. The employer rate included an administrative expense component set at 0.18%. Plan 2 employers and employees are required to pay at the level adopted by the LEOFF Plan 2 Retirement Board. Effective July 1, 2017, when a LEOFF employer charges a fee or recovers costs for services rendered by a LEOFF 2 member to a non-LEOFF employer, the LEOFF employer must cover both the employer and State contributions on the LEOFF 2 basic salary earned for those services. The state contribution rate (expressed as a percentage of covered payroll) was 3.44% in 2020. The LEOFF Plan 2 required contribution rates (expressed as a percentage of covered payroll) for 2020 were as follows:
LEOFF Plan 2 Actual Contribution Rates Employer Employee2020January through DecemberLEOFF Plan 2 5.15% 8.59%Administrative Fee 0.18%
Total 5.33% 8.59%
Page 66
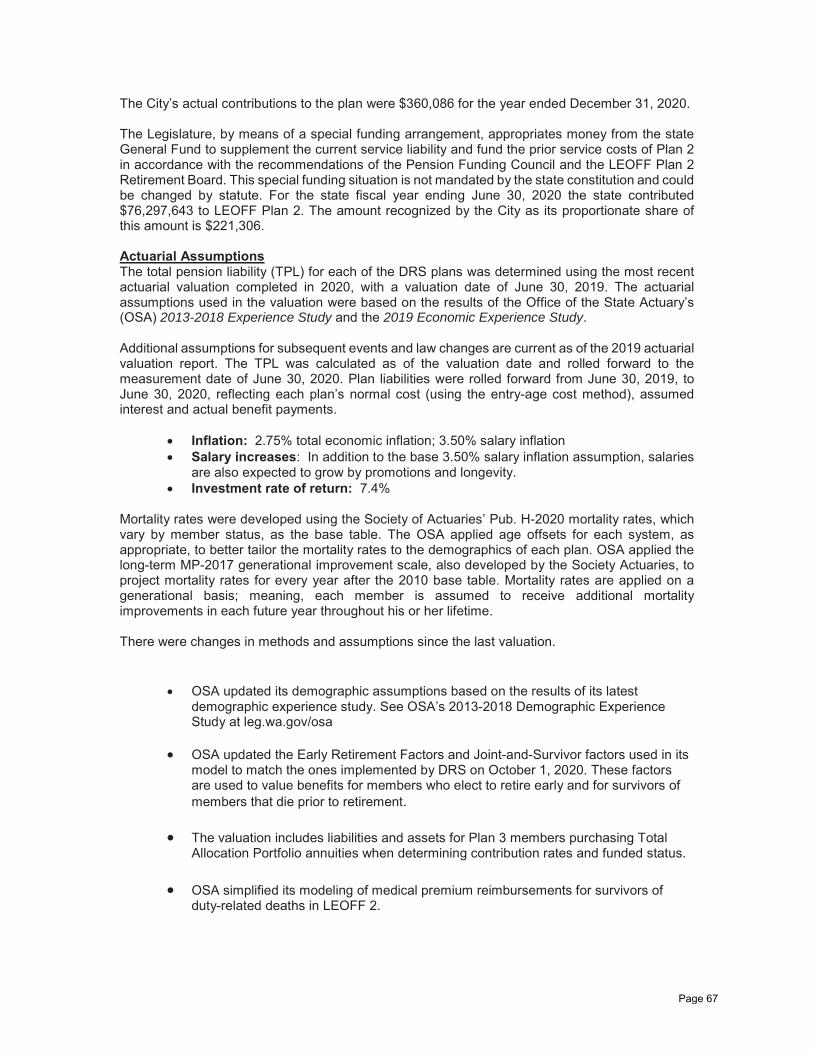
The City’s actual contributions to the plan were $360,086 for the year ended December 31, 2020. The Legislature, by means of a special funding arrangement, appropriates money from the state General Fund to supplement the current service liability and fund the prior service costs of Plan 2 in accordance with the recommendations of the Pension Funding Council and the LEOFF Plan 2 Retirement Board. This special funding situation is not mandated by the state constitution and could be changed by statute. For the state fiscal year ending June 30, 2020 the state contributed $76,297,643 to LEOFF Plan 2. The amount recognized by the City as its proportionate share of this amount is $221,306. Actuarial Assumptions The total pension liability (TPL) for each of the DRS plans was determined using the most recent actuarial valuation completed in 2020, with a valuation date of June 30, 2019. The actuarial assumptions used in the valuation were based on the results of the Office of the State Actuary’s (OSA) 2013-2018 Experience Study and the 2019 Economic Experience Study. Additional assumptions for subsequent events and law changes are current as of the 2019 actuarial valuation report. The TPL was calculated as of the valuation date and rolled forward to the measurement date of June 30, 2020. Plan liabilities were rolled forward from June 30, 2019, to June 30, 2020, reflecting each plan’s normal cost (using the entry-age cost method), assumed interest and actual benefit payments.
Inflation: 2.75% total economic inflation; 3.50% salary inflation Salary increases: In addition to the base 3.50% salary inflation assumption, salaries
are also expected to grow by promotions and longevity. Investment rate of return: 7.4%
Mortality rates were developed using the Society of Actuaries’ Pub. H-2020 mortality rates, which vary by member status, as the base table. The OSA applied age offsets for each system, as appropriate, to better tailor the mortality rates to the demographics of each plan. OSA applied the long-term MP-2017 generational improvement scale, also developed by the Society Actuaries, to project mortality rates for every year after the 2010 base table. Mortality rates are applied on a generational basis; meaning, each member is assumed to receive additional mortality improvements in each future year throughout his or her lifetime. There were changes in methods and assumptions since the last valuation.
OSA updated its demographic assumptions based on the results of its latest demographic experience study. See OSA’s 2013-2018 Demographic Experience Study at leg.wa.gov/osa
OSA updated the Early Retirement Factors and Joint-and-Survivor factors used in its model to match the ones implemented by DRS on October 1, 2020. These factors are used to value benefits for members who elect to retire early and for survivors of members that die prior to retirement.
The valuation includes liabilities and assets for Plan 3 members purchasing Total
Allocation Portfolio annuities when determining contribution rates and funded status. OSA simplified its modeling of medical premium reimbursements for survivors of
duty-related deaths in LEOFF 2.
Page 67
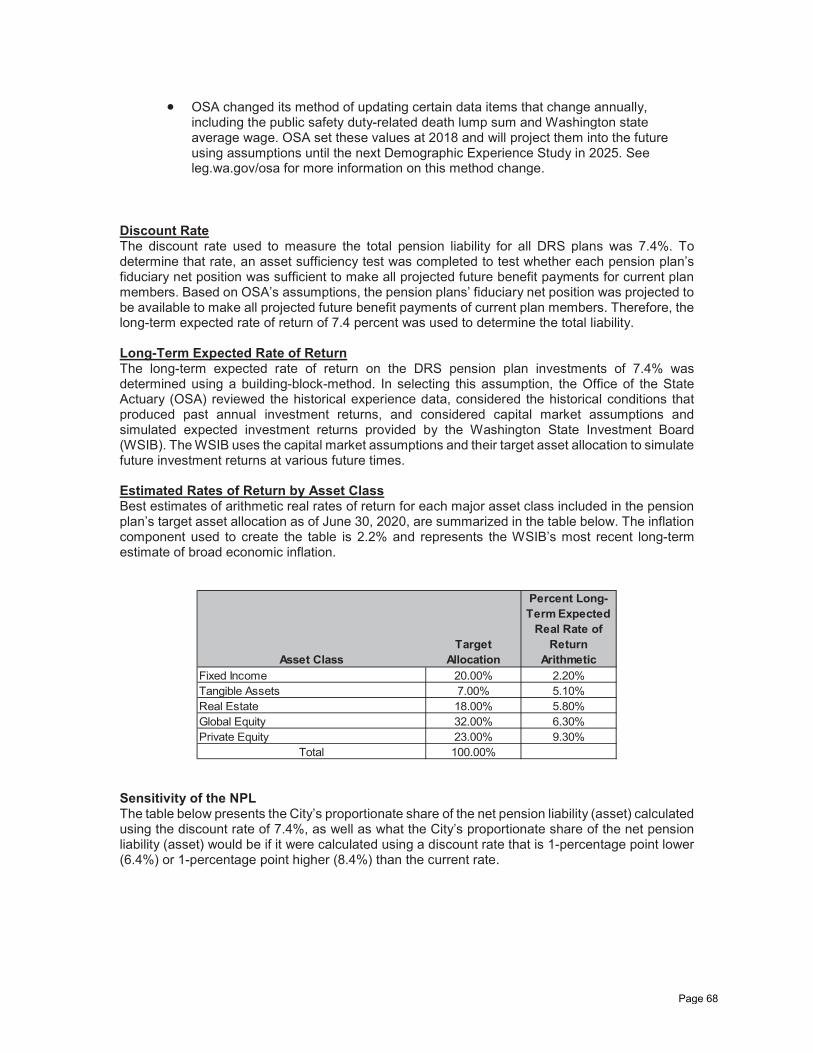
OSA changed its method of updating certain data items that change annually, including the public safety duty-related death lump sum and Washington state average wage. OSA set these values at 2018 and will project them into the future using assumptions until the next Demographic Experience Study in 2025. See leg.wa.gov/osa for more information on this method change.
Discount Rate The discount rate used to measure the total pension liability for all DRS plans was 7.4%. To determine that rate, an asset sufficiency test was completed to test whether each pension plan’s fiduciary net position was sufficient to make all projected future benefit payments for current plan members. Based on OSA’s assumptions, the pension plans’ fiduciary net position was projected to be available to make all projected future benefit payments of current plan members. Therefore, the long-term expected rate of return of 7.4 percent was used to determine the total liability. Long-Term Expected Rate of Return The long-term expected rate of return on the DRS pension plan investments of 7.4% was determined using a building-block-method. In selecting this assumption, the Office of the State Actuary (OSA) reviewed the historical experience data, considered the historical conditions that produced past annual investment returns, and considered capital market assumptions and simulated expected investment returns provided by the Washington State Investment Board (WSIB). The WSIB uses the capital market assumptions and their target asset allocation to simulate future investment returns at various future times. Estimated Rates of Return by Asset Class Best estimates of arithmetic real rates of return for each major asset class included in the pension plan’s target asset allocation as of June 30, 2020, are summarized in the table below. The inflation component used to create the table is 2.2% and represents the WSIB’s most recent long-term estimate of broad economic inflation.
Asset ClassTarget
Allocation
Percent Long-Term Expected
Real Rate of Return
ArithmeticFixed Income 20.00% 2.20%Tangible Assets 7.00% 5.10%Real Estate 18.00% 5.80%Global Equity 32.00% 6.30%Private Equity 23.00% 9.30%
Total 100.00%
Sensitivity of the NPL The table below presents the City’s proportionate share of the net pension liability (asset) calculated using the discount rate of 7.4%, as well as what the City’s proportionate share of the net pension liability (asset) would be if it were calculated using a discount rate that is 1-percentage point lower (6.4%) or 1-percentage point higher (8.4%) than the current rate.
Page 68
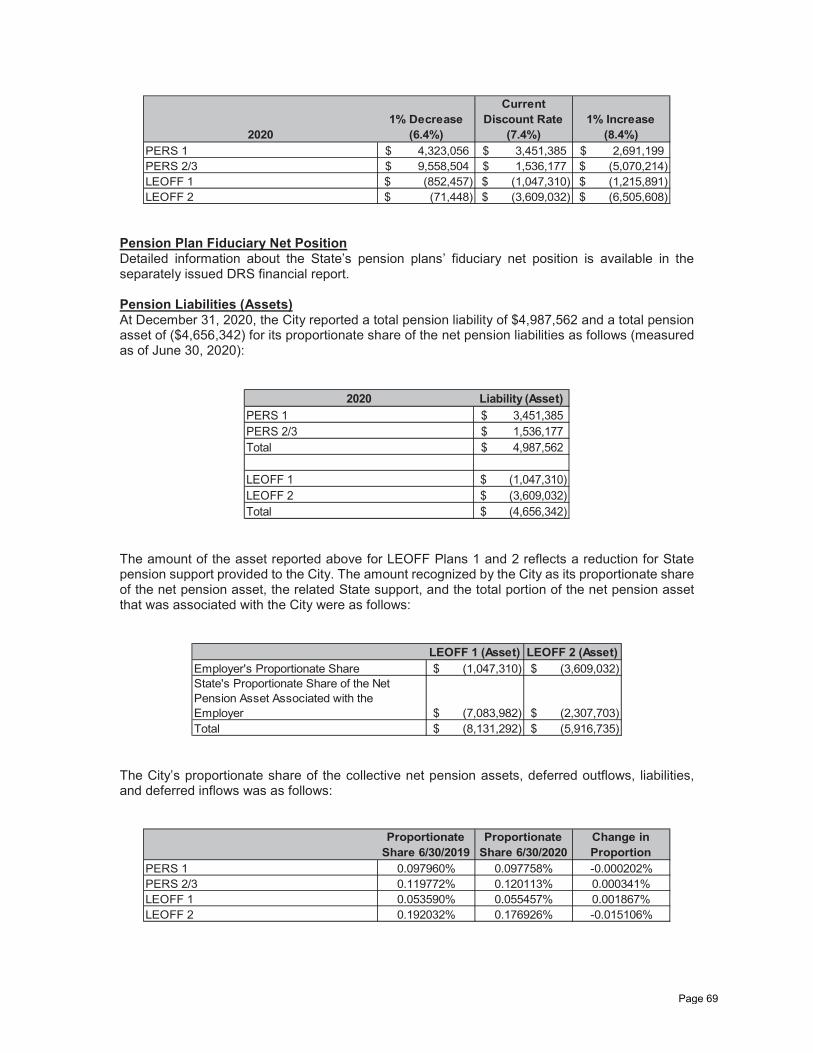
20201% Decrease
(6.4%)
Current Discount Rate
(7.4%)1% Increase
(8.4%)PERS 1 4,323,056$ 3,451,385$ 2,691,199$ PERS 2/3 9,558,504$ 1,536,177$ (5,070,214)$ LEOFF 1 (852,457)$ (1,047,310)$ (1,215,891)$ LEOFF 2 (71,448)$ (3,609,032)$ (6,505,608)$
Pension Plan Fiduciary Net Position Detailed information about the State’s pension plans’ fiduciary net position is available in the separately issued DRS financial report. Pension Liabilities (Assets) At December 31, 2020, the City reported a total pension liability of $4,987,562 and a total pension asset of ($4,656,342) for its proportionate share of the net pension liabilities as follows (measured as of June 30, 2020):
2020 Liability (Asset)PERS 1 3,451,385$ PERS 2/3 1,536,177$ Total 4,987,562$
LEOFF 1 (1,047,310)$ LEOFF 2 (3,609,032)$ Total (4,656,342)$
The amount of the asset reported above for LEOFF Plans 1 and 2 reflects a reduction for State pension support provided to the City. The amount recognized by the City as its proportionate share of the net pension asset, the related State support, and the total portion of the net pension asset that was associated with the City were as follows:
LEOFF 1 (Asset) LEOFF 2 (Asset)Employer's Proportionate Share (1,047,310)$ (3,609,032)$ State's Proportionate Share of the Net Pension Asset Associated with the Employer (7,083,982)$ (2,307,703)$ Total (8,131,292)$ (5,916,735)$
The City’s proportionate share of the collective net pension assets, deferred outflows, liabilities, and deferred inflows was as follows:
Proportionate Share 6/30/2019
Proportionate Share 6/30/2020
Change in Proportion
PERS 1 0.097960% 0.097758% -0.000202%PERS 2/3 0.119772% 0.120113% 0.000341%LEOFF 1 0.053590% 0.055457% 0.001867%LEOFF 2 0.192032% 0.176926% -0.015106%
Page 69
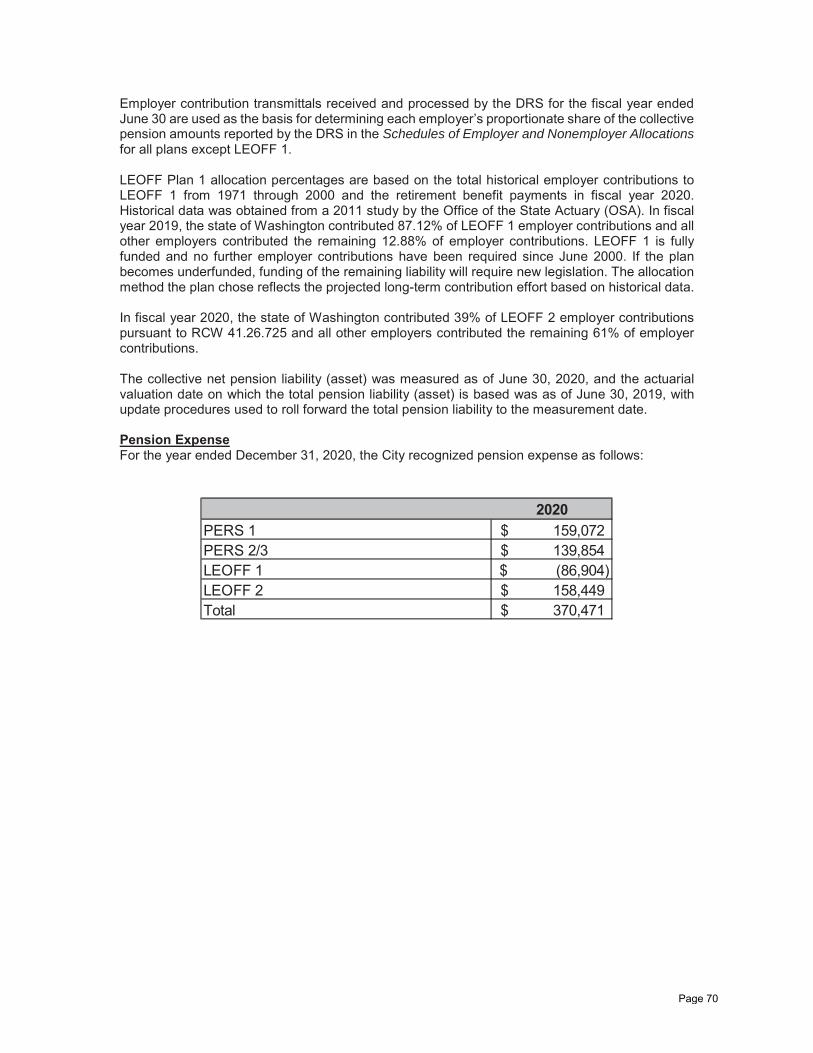
Employer contribution transmittals received and processed by the DRS for the fiscal year ended June 30 are used as the basis for determining each employer’s proportionate share of the collective pension amounts reported by the DRS in the Schedules of Employer and Nonemployer Allocations for all plans except LEOFF 1. LEOFF Plan 1 allocation percentages are based on the total historical employer contributions to LEOFF 1 from 1971 through 2000 and the retirement benefit payments in fiscal year 2020. Historical data was obtained from a 2011 study by the Office of the State Actuary (OSA). In fiscal year 2019, the state of Washington contributed 87.12% of LEOFF 1 employer contributions and all other employers contributed the remaining 12.88% of employer contributions. LEOFF 1 is fully funded and no further employer contributions have been required since June 2000. If the plan becomes underfunded, funding of the remaining liability will require new legislation. The allocation method the plan chose reflects the projected long-term contribution effort based on historical data. In fiscal year 2020, the state of Washington contributed 39% of LEOFF 2 employer contributions pursuant to RCW 41.26.725 and all other employers contributed the remaining 61% of employer contributions. The collective net pension liability (asset) was measured as of June 30, 2020, and the actuarial valuation date on which the total pension liability (asset) is based was as of June 30, 2019, with update procedures used to roll forward the total pension liability to the measurement date. Pension Expense For the year ended December 31, 2020, the City recognized pension expense as follows:
2020PERS 1 159,072$ PERS 2/3 139,854$ LEOFF 1 (86,904)$ LEOFF 2 158,449$ Total 370,471$
Page 70
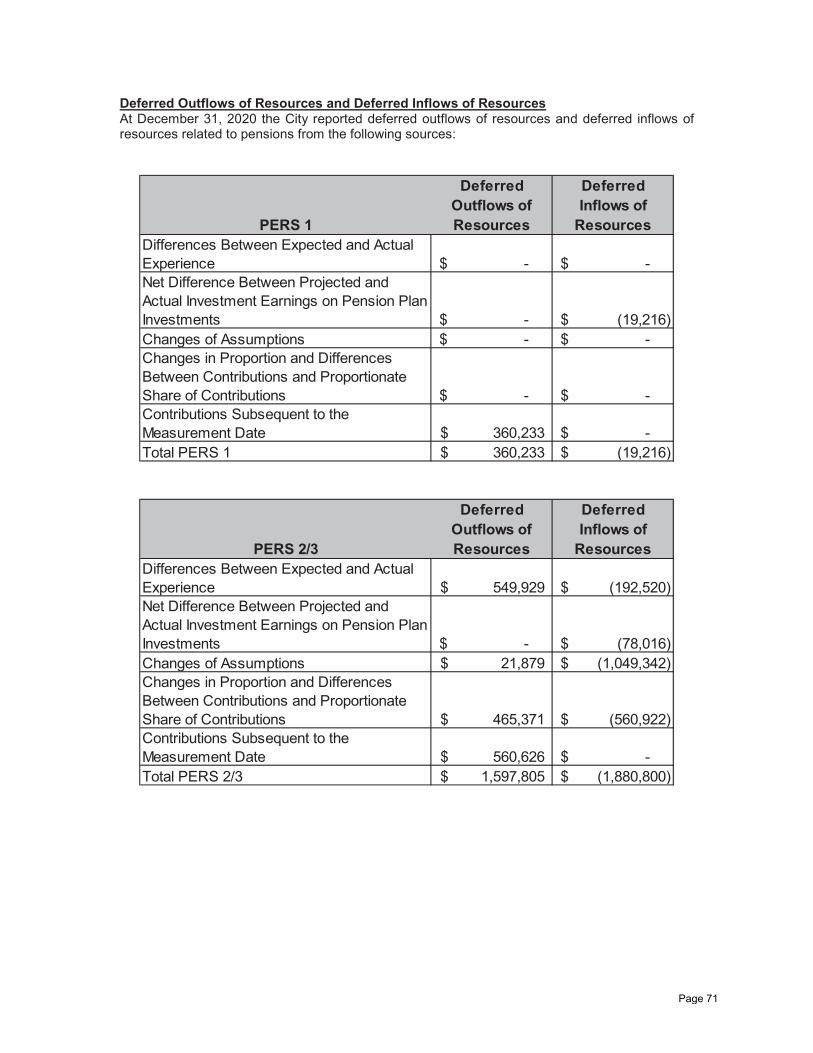
Deferred Outflows of Resources and Deferred Inflows of Resources At December 31, 2020 the City reported deferred outflows of resources and deferred inflows of resources related to pensions from the following sources:
PERS 1
Deferred Outflows of Resources
Deferred Inflows of
ResourcesDifferences Between Expected and Actual Experience -$ -$ Net Difference Between Projected and Actual Investment Earnings on Pension Plan Investments -$ (19,216)$ Changes of Assumptions -$ -$ Changes in Proportion and Differences Between Contributions and Proportionate Share of Contributions -$ -$ Contributions Subsequent to the Measurement Date 360,233$ -$ Total PERS 1 360,233$ (19,216)$
PERS 2/3
Deferred Outflows of Resources
Deferred Inflows of
ResourcesDifferences Between Expected and Actual Experience 549,929$ (192,520)$ Net Difference Between Projected and Actual Investment Earnings on Pension Plan Investments -$ (78,016)$ Changes of Assumptions 21,879$ (1,049,342)$ Changes in Proportion and Differences Between Contributions and Proportionate Share of Contributions 465,371$ (560,922)$ Contributions Subsequent to the Measurement Date 560,626$ -$ Total PERS 2/3 1,597,805$ (1,880,800)$
Page 71
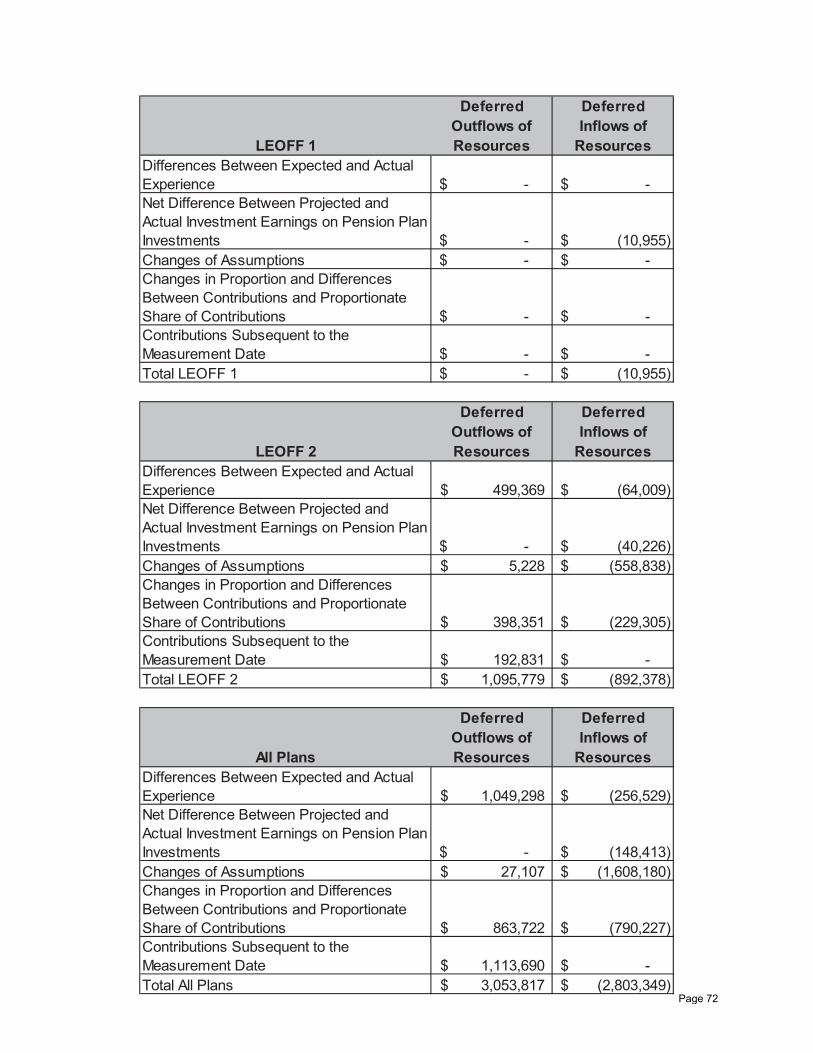
LEOFF 1
Deferred Outflows of Resources
Deferred Inflows of
ResourcesDifferences Between Expected and Actual Experience -$ -$ Net Difference Between Projected and Actual Investment Earnings on Pension Plan Investments -$ (10,955)$ Changes of Assumptions -$ -$ Changes in Proportion and Differences Between Contributions and Proportionate Share of Contributions -$ -$ Contributions Subsequent to the Measurement Date -$ -$ Total LEOFF 1 -$ (10,955)$
LEOFF 2
Deferred Outflows of Resources
Deferred Inflows of
ResourcesDifferences Between Expected and Actual Experience 499,369$ (64,009)$ Net Difference Between Projected and Actual Investment Earnings on Pension Plan Investments -$ (40,226)$ Changes of Assumptions 5,228$ (558,838)$ Changes in Proportion and Differences Between Contributions and Proportionate Share of Contributions 398,351$ (229,305)$ Contributions Subsequent to the Measurement Date 192,831$ -$ Total LEOFF 2 1,095,779$ (892,378)$
All Plans
Deferred Outflows of Resources
Deferred Inflows of
ResourcesDifferences Between Expected and Actual Experience 1,049,298$ (256,529)$ Net Difference Between Projected and Actual Investment Earnings on Pension Plan Investments -$ (148,413)$ Changes of Assumptions 27,107$ (1,608,180)$ Changes in Proportion and Differences Between Contributions and Proportionate Share of Contributions 863,722$ (790,227)$ Contributions Subsequent to the Measurement Date 1,113,690$ -$ Total All Plans 3,053,817$ (2,803,349)$
Page 72
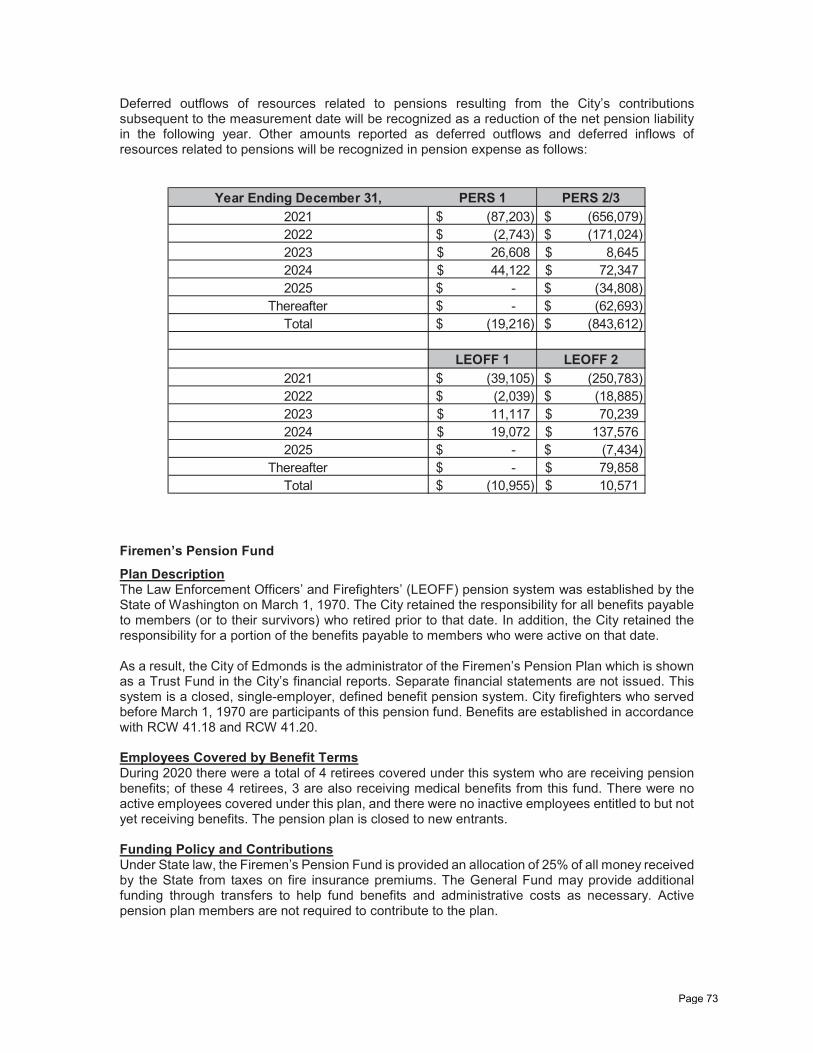
Deferred outflows of resources related to pensions resulting from the City’s contributions subsequent to the measurement date will be recognized as a reduction of the net pension liability in the following year. Other amounts reported as deferred outflows and deferred inflows of resources related to pensions will be recognized in pension expense as follows:
Year Ending December 31, PERS 1 PERS 2/3
2021 (87,203)$ (656,079)$ 2022 (2,743)$ (171,024)$ 2023 26,608$ 8,645$ 2024 44,122$ 72,347$ 2025 -$ (34,808)$
Thereafter -$ (62,693)$ Total (19,216)$ (843,612)$
LEOFF 1 LEOFF 22021 (39,105)$ (250,783)$ 2022 (2,039)$ (18,885)$ 2023 11,117$ 70,239$ 2024 19,072$ 137,576$ 2025 -$ (7,434)$
Thereafter -$ 79,858$ Total (10,955)$ 10,571$
Firemen’s Pension Fund Plan Description The Law Enforcement Officers’ and Firefighters’ (LEOFF) pension system was established by the State of Washington on March 1, 1970. The City retained the responsibility for all benefits payable to members (or to their survivors) who retired prior to that date. In addition, the City retained the responsibility for a portion of the benefits payable to members who were active on that date. As a result, the City of Edmonds is the administrator of the Firemen’s Pension Plan which is shown as a Trust Fund in the City’s financial reports. Separate financial statements are not issued. This system is a closed, single-employer, defined benefit pension system. City firefighters who served before March 1, 1970 are participants of this pension fund. Benefits are established in accordance with RCW 41.18 and RCW 41.20. Employees Covered by Benefit Terms During 2020 there were a total of 4 retirees covered under this system who are receiving pension benefits; of these 4 retirees, 3 are also receiving medical benefits from this fund. There were no active employees covered under this plan, and there were no inactive employees entitled to but not yet receiving benefits. The pension plan is closed to new entrants. Funding Policy and Contributions Under State law, the Firemen’s Pension Fund is provided an allocation of 25% of all money received by the State from taxes on fire insurance premiums. The General Fund may provide additional funding through transfers to help fund benefits and administrative costs as necessary. Active pension plan members are not required to contribute to the plan.
Page 73
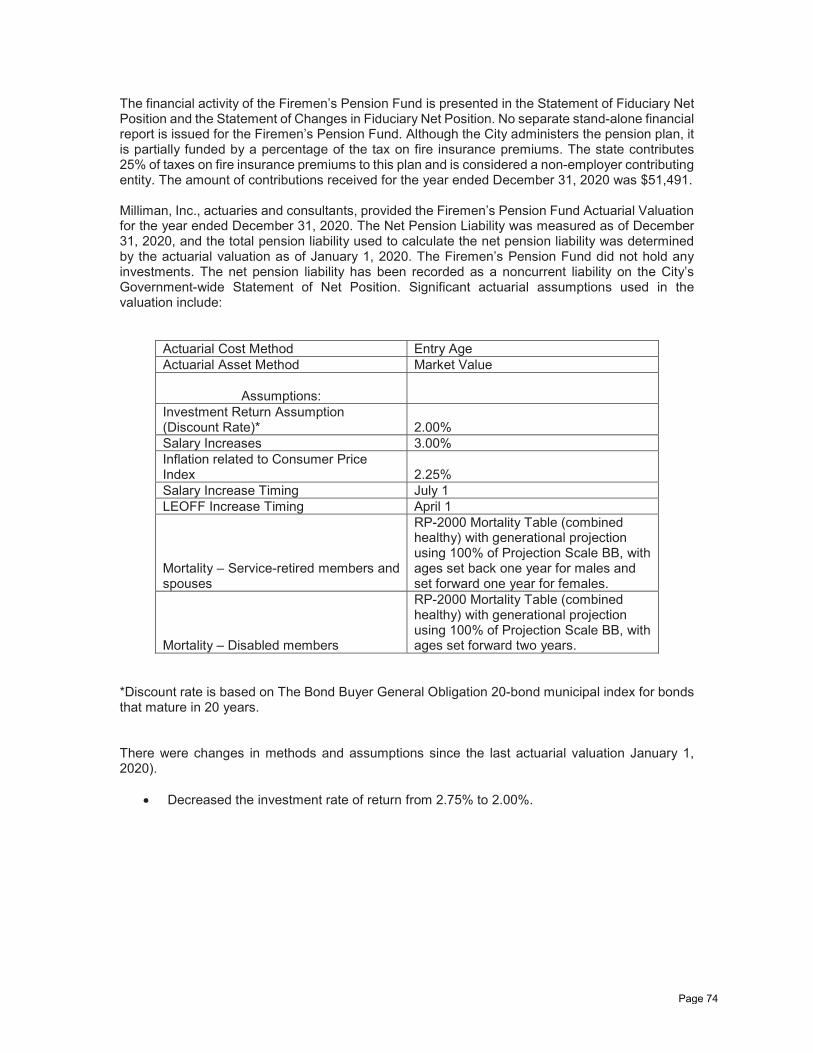
The financial activity of the Firemen’s Pension Fund is presented in the Statement of Fiduciary Net Position and the Statement of Changes in Fiduciary Net Position. No separate stand-alone financial report is issued for the Firemen’s Pension Fund. Although the City administers the pension plan, it is partially funded by a percentage of the tax on fire insurance premiums. The state contributes 25% of taxes on fire insurance premiums to this plan and is considered a non-employer contributing entity. The amount of contributions received for the year ended December 31, 2020 was $51,491. Milliman, Inc., actuaries and consultants, provided the Firemen’s Pension Fund Actuarial Valuation for the year ended December 31, 2020. The Net Pension Liability was measured as of December 31, 2020, and the total pension liability used to calculate the net pension liability was determined by the actuarial valuation as of January 1, 2020. The Firemen’s Pension Fund did not hold any investments. The net pension liability has been recorded as a noncurrent liability on the City’s Government-wide Statement of Net Position. Significant actuarial assumptions used in the valuation include:
Actuarial Cost Method Entry Age Actuarial Asset Method Market Value
Assumptions:
Investment Return Assumption (Discount Rate)*
2.00%
Salary Increases 3.00% Inflation related to Consumer Price Index
2.25%
Salary Increase Timing July 1 LEOFF Increase Timing April 1 Mortality – Service-retired members and spouses
RP-2000 Mortality Table (combined healthy) with generational projection using 100% of Projection Scale BB, with ages set back one year for males and set forward one year for females.
Mortality – Disabled members
RP-2000 Mortality Table (combined healthy) with generational projection using 100% of Projection Scale BB, with ages set forward two years.
*Discount rate is based on The Bond Buyer General Obligation 20-bond municipal index for bonds that mature in 20 years. There were changes in methods and assumptions since the last actuarial valuation January 1, 2020).
Decreased the investment rate of return from 2.75% to 2.00%.
Page 74
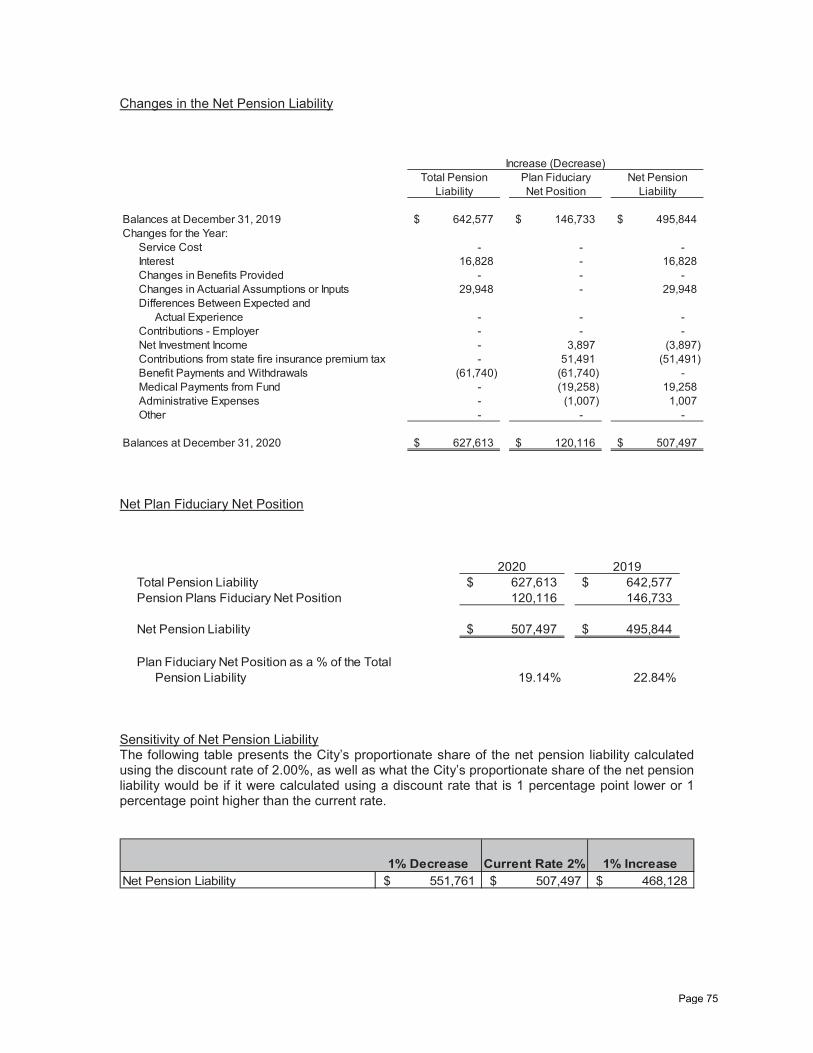
Changes in the Net Pension Liability
Total Pension Plan Fiduciary Net PensionLiability Net Position Liability
Balances at December 31, 2019 642,577$ 146,733$ 495,844$ Changes for the Year:
Service Cost - - - Interest 16,828 - 16,828 Changes in Benefits Provided - - - Changes in Actuarial Assumptions or Inputs 29,948 - 29,948 Differences Between Expected and
Actual Experience - - - Contributions - Employer - - - Net Investment Income - 3,897 (3,897) Contributions from state fire insurance premium tax - 51,491 (51,491) Benefit Payments and Withdrawals (61,740) (61,740) - Medical Payments from Fund - (19,258) 19,258 Administrative Expenses - (1,007) 1,007 Other - - -
Balances at December 31, 2020 627,613$ 120,116$ 507,497$
Increase (Decrease)
Net Plan Fiduciary Net Position
2020 2019Total Pension Liability 627,613$ 642,577$ Pension Plans Fiduciary Net Position 120,116 146,733
Net Pension Liability 507,497$ 495,844$
Plan Fiduciary Net Position as a % of the TotalPension Liability 19.14% 22.84%
Sensitivity of Net Pension Liability The following table presents the City’s proportionate share of the net pension liability calculated using the discount rate of 2.00%, as well as what the City’s proportionate share of the net pension liability would be if it were calculated using a discount rate that is 1 percentage point lower or 1 percentage point higher than the current rate.
1% Decrease Current Rate 2% 1% IncreaseNet Pension Liability 551,761$ 507,497$ 468,128$
Page 75
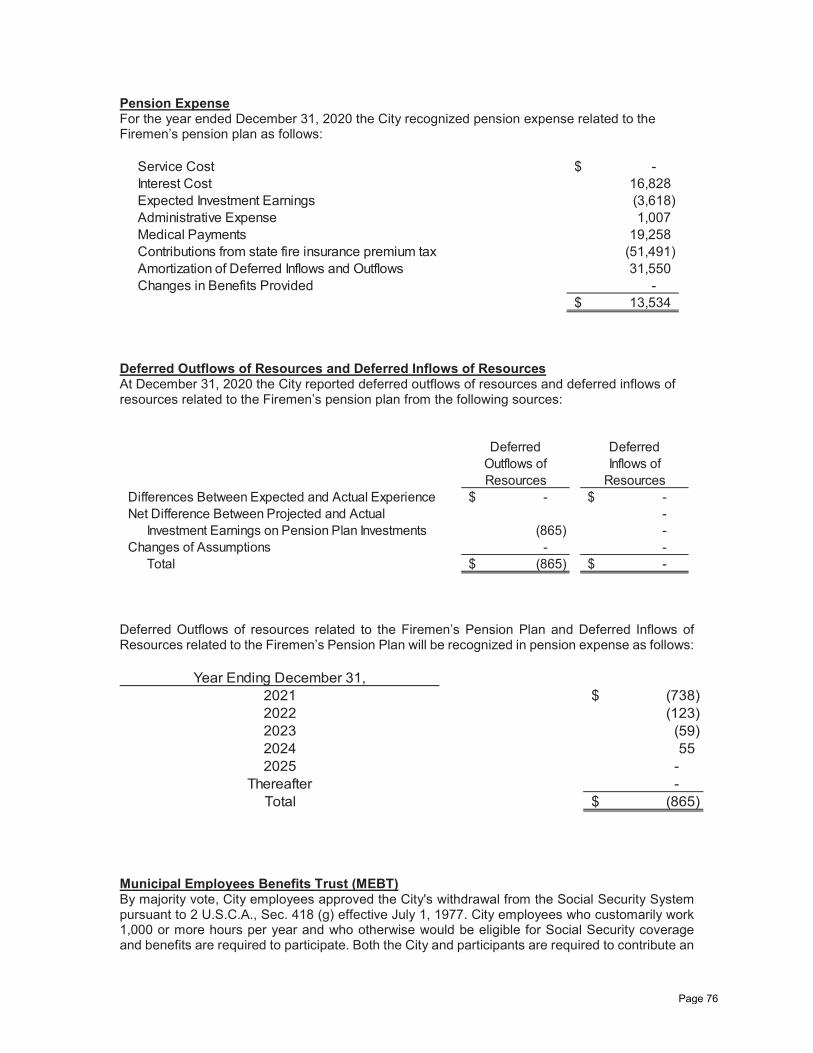
Pension Expense For the year ended December 31, 2020 the City recognized pension expense related to the Firemen’s pension plan as follows:
Service Cost -$ Interest Cost 16,828 Expected Investment Earnings (3,618) Administrative Expense 1,007 Medical Payments 19,258 Contributions from state fire insurance premium tax (51,491) Amortization of Deferred Inflows and Outflows 31,550 Changes in Benefits Provided -
13,534$
Deferred Outflows of Resources and Deferred Inflows of Resources At December 31, 2020 the City reported deferred outflows of resources and deferred inflows of resources related to the Firemen’s pension plan from the following sources:
Deferred DeferredOutflows of Inflows ofResources Resources
Differences Between Expected and Actual Experience -$ -$ Net Difference Between Projected and Actual -
Investment Earnings on Pension Plan Investments (865) - Changes of Assumptions - -
Total (865)$ -$
Deferred Outflows of resources related to the Firemen’s Pension Plan and Deferred Inflows of Resources related to the Firemen’s Pension Plan will be recognized in pension expense as follows:
Year Ending December 31,2021 (738)$ 2022 (123) 2023 (59) 2024 55 2025 -
Thereafter - Total (865)$
Municipal Employees Benefits Trust (MEBT) By majority vote, City employees approved the City's withdrawal from the Social Security System pursuant to 2 U.S.C.A., Sec. 418 (g) effective July 1, 1977. City employees who customarily work 1,000 or more hours per year and who otherwise would be eligible for Social Security coverage and benefits are required to participate. Both the City and participants are required to contribute an
Page 76
amount equal to the current Federal Insurance Contributions Act (FICA) tax rate. The City's contribution for fiscal year 2020 was $1,246,189 which represents its full liability. For the year ending December 31, 2020 the City's covered payroll was $21,910,021. No significant benefit changes occurred in 2020. The plan is administered by a Plan Committee consisting of two members appointed by the Mayor and five members elected by the employees who contribute to the plan. Members appointed by the Mayor serve at the pleasure of the Mayor; elected members serve a two-year term and may be re-elected for an additional two-year term. Plan assets are not City property, but are maintained in trust at American Stock Transfer and Trust Company. Plan assets, therefore, are not included in these financial statements. The City may amend the provisions of the plan, provided that no such amendment shall enlarge the duties or the liabilities of the plan trustee without its consent. The City has the right at any time to reduce, suspend, or completely discontinue its contributions to the plan. Actuarial determinations are not required because 1) long-term disability insurance and survivor income insurance are provided through Cigna Group Insurance, and 2) each participant shall, at their normal retirement, instruct the Trustee to (a) acquire a non-forfeitable, non-transferable annuity contract, (b) pay their retirement benefit from their account (no City or participant contributions are to be added to the account after retirement), or (c) pay a single cash sum. When a participant terminates, the Trustee shall be instructed to pay the full amount of the participant’s contributions plus the vested portion credited to their account. NOTE 11 – OTHER POST EMPLOYMENT BENEFITS (OPEB) The following table represents the aggregate OPEB amounts for all plans subject to the requirements of GASB 75 for the year ended December 31:
2020OPEB Liabilities (8,365,221)$ Deferred Outflows of Resources - Deferred Inflows of Resources - OPEB Expense 843,038
In addition to providing pension benefits described under “Fireman’s Pension,” the City provides other post-employment health care benefits. Firefighters hired between March 1, 1970 and September 30, 1977 are members of the LEOFF 1 pension system and are also eligible for a supplemental retirement benefit plus health benefits under the City plan. General Information about the OPEB Plan Plan Description This system is a closed, single-employer, defined benefit OPEB plan. Benefits Provided The City pays the medical insurance premiums and any additional medical expenses not covered by insurance, including long-term care. These benefits were paid from the LEOFF 1 Retiree Medical Reserve Fund. In accordance with RCW 41.26.150, all employees who become eligible after age 50 or become disabled while employed with at least 5 years of service in the LEOFF 1 system are eligible.
Page 77
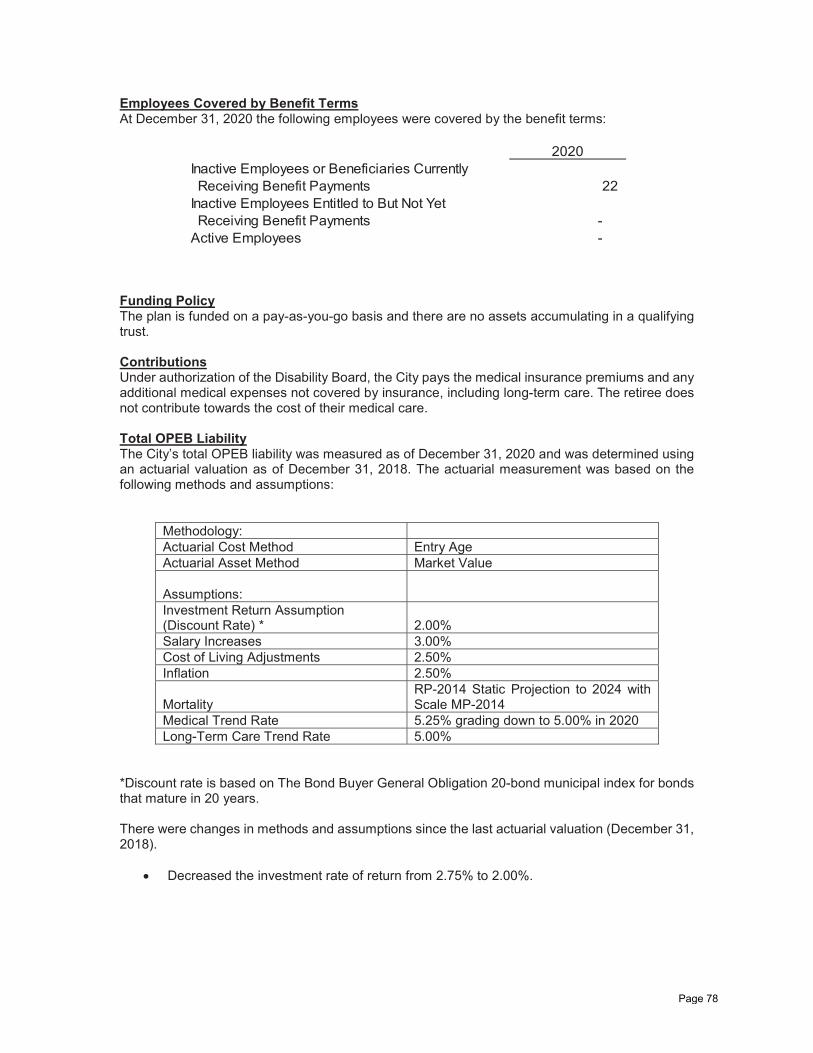
Employees Covered by Benefit Terms At December 31, 2020 the following employees were covered by the benefit terms:
2020Inactive Employees or Beneficiaries Currently Receiving Benefit Payments 22 Inactive Employees Entitled to But Not Yet Receiving Benefit Payments - Active Employees -
Funding Policy The plan is funded on a pay-as-you-go basis and there are no assets accumulating in a qualifying trust. Contributions Under authorization of the Disability Board, the City pays the medical insurance premiums and any additional medical expenses not covered by insurance, including long-term care. The retiree does not contribute towards the cost of their medical care. Total OPEB Liability The City’s total OPEB liability was measured as of December 31, 2020 and was determined using an actuarial valuation as of December 31, 2018. The actuarial measurement was based on the following methods and assumptions:
Methodology: Actuarial Cost Method Entry Age Actuarial Asset Method Market Value Assumptions:
Investment Return Assumption (Discount Rate) *
2.00%
Salary Increases 3.00% Cost of Living Adjustments 2.50% Inflation 2.50% Mortality
RP-2014 Static Projection to 2024 with Scale MP-2014
Medical Trend Rate 5.25% grading down to 5.00% in 2020 Long-Term Care Trend Rate 5.00%
*Discount rate is based on The Bond Buyer General Obligation 20-bond municipal index for bonds that mature in 20 years. There were changes in methods and assumptions since the last actuarial valuation (December 31, 2018).
Decreased the investment rate of return from 2.75% to 2.00%.
Page 78
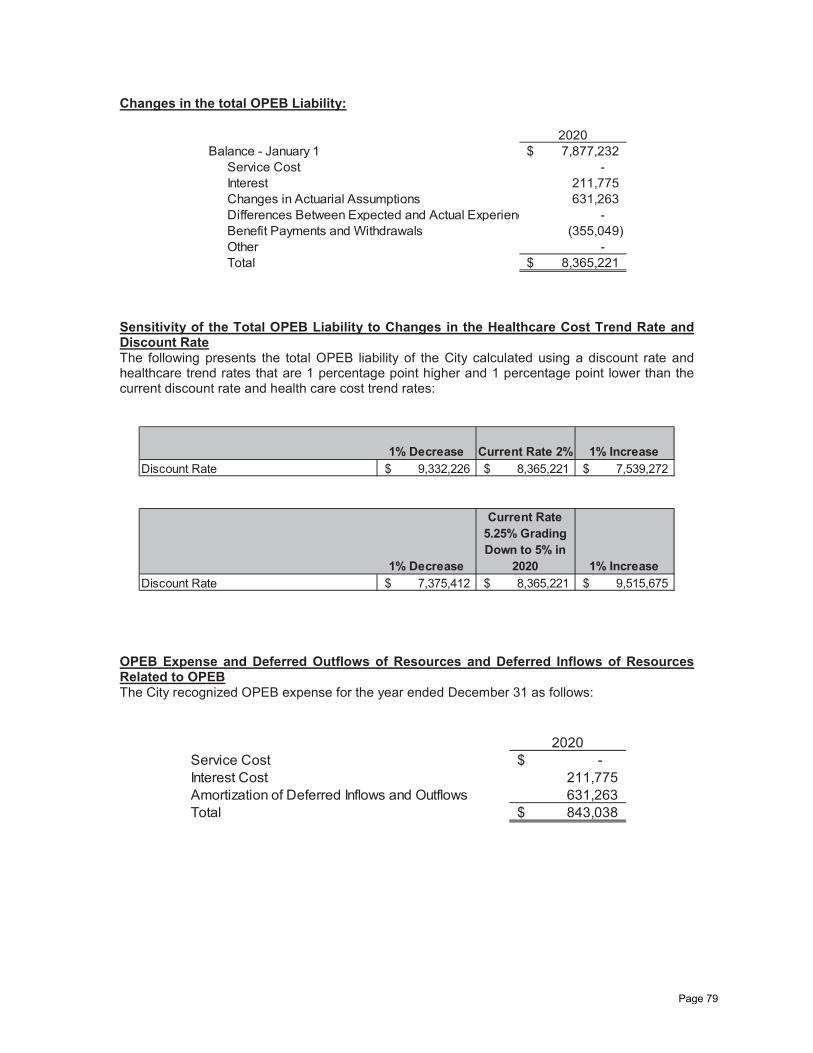
Changes in the total OPEB Liability:
2020Balance - January 1 7,877,232$
Service Cost - Interest 211,775 Changes in Actuarial Assumptions 631,263 Differences Between Expected and Actual Experienc - Benefit Payments and Withdrawals (355,049) Other - Total 8,365,221$
Sensitivity of the Total OPEB Liability to Changes in the Healthcare Cost Trend Rate and Discount Rate The following presents the total OPEB liability of the City calculated using a discount rate and healthcare trend rates that are 1 percentage point higher and 1 percentage point lower than the current discount rate and health care cost trend rates:
1% Decrease Current Rate 2% 1% IncreaseDiscount Rate 9,332,226$ 8,365,221$ 7,539,272$
1% Decrease
Current Rate 5.25% Grading Down to 5% in
2020 1% IncreaseDiscount Rate 7,375,412$ 8,365,221$ 9,515,675$
OPEB Expense and Deferred Outflows of Resources and Deferred Inflows of Resources Related to OPEB The City recognized OPEB expense for the year ended December 31 as follows:
2020Service Cost -$ Interest Cost 211,775 Amortization of Deferred Inflows and Outflows 631,263 Total 843,038$
Page 79
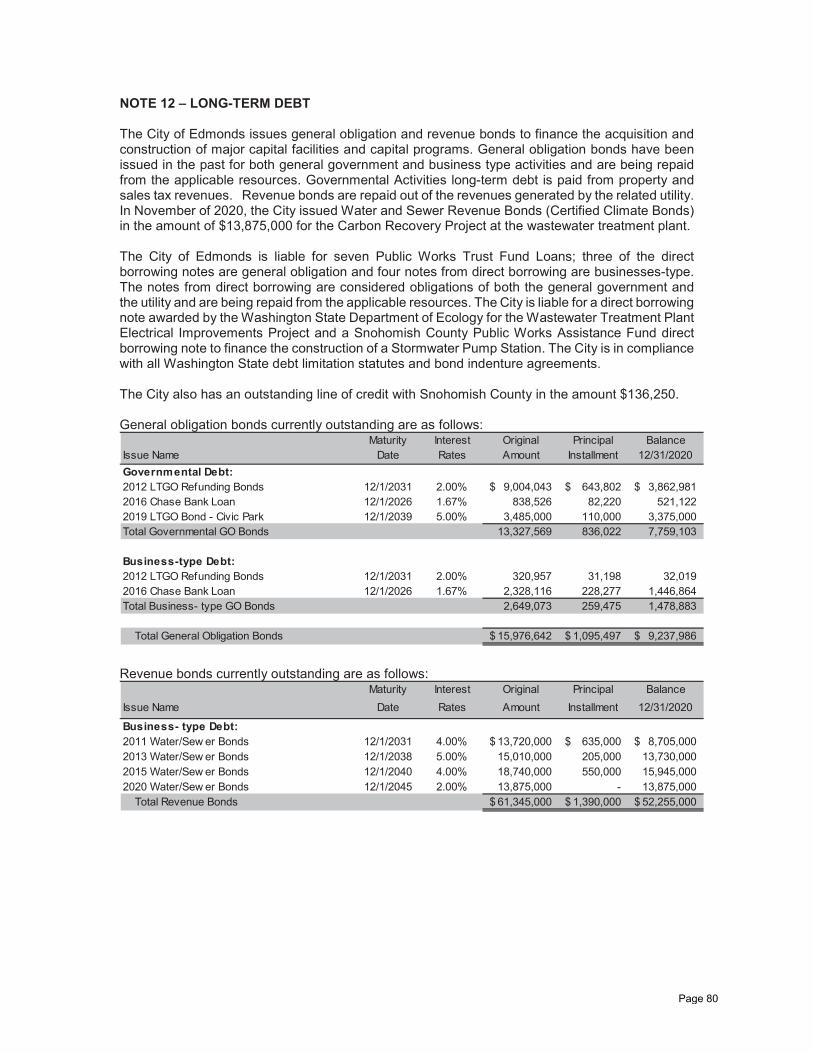
NOTE 12 – LONG-TERM DEBT The City of Edmonds issues general obligation and revenue bonds to finance the acquisition and construction of major capital facilities and capital programs. General obligation bonds have been issued in the past for both general government and business type activities and are being repaid from the applicable resources. Governmental Activities long-term debt is paid from property and sales tax revenues. Revenue bonds are repaid out of the revenues generated by the related utility. In November of 2020, the City issued Water and Sewer Revenue Bonds (Certified Climate Bonds) in the amount of $13,875,000 for the Carbon Recovery Project at the wastewater treatment plant. The City of Edmonds is liable for seven Public Works Trust Fund Loans; three of the direct borrowing notes are general obligation and four notes from direct borrowing are businesses-type. The notes from direct borrowing are considered obligations of both the general government and the utility and are being repaid from the applicable resources. The City is liable for a direct borrowing note awarded by the Washington State Department of Ecology for the Wastewater Treatment Plant Electrical Improvements Project and a Snohomish County Public Works Assistance Fund direct borrowing note to finance the construction of a Stormwater Pump Station. The City is in compliance with all Washington State debt limitation statutes and bond indenture agreements. The City also has an outstanding line of credit with Snohomish County in the amount $136,250. General obligation bonds currently outstanding are as follows:
Maturity Interest Original Principal BalanceIssue Name Date Rates Amount Installment 12/31/2020Governmental Debt:2012 LTGO Refunding Bonds 12/1/2031 2.00% 9,004,043$ 643,802$ 3,862,981$ 2016 Chase Bank Loan 12/1/2026 1.67% 838,526 82,220 521,122 2019 LTGO Bond - Civic Park 12/1/2039 5.00% 3,485,000 110,000 3,375,000 Total Governmental GO Bonds 13,327,569 836,022 7,759,103
Business-type Debt:2012 LTGO Refunding Bonds 12/1/2031 2.00% 320,957 31,198 32,019 2016 Chase Bank Loan 12/1/2026 1.67% 2,328,116 228,277 1,446,864 Total Business- type GO Bonds 2,649,073 259,475 1,478,883
Total General Obligation Bonds 15,976,642$ 1,095,497$ 9,237,986$
Revenue bonds currently outstanding are as follows:
Maturity Interest Original Principal BalanceIssue Name Date Rates Amount Installment 12/31/2020
Business- type Debt:2011 Water/Sew er Bonds 12/1/2031 4.00% 13,720,000$ 635,000$ 8,705,000$ 2013 Water/Sew er Bonds 12/1/2038 5.00% 15,010,000 205,000 13,730,000 2015 Water/Sew er Bonds 12/1/2040 4.00% 18,740,000 550,000 15,945,000 2020 Water/Sew er Bonds 12/1/2045 2.00% 13,875,000 - 13,875,000
Total Revenue Bonds 61,345,000$ 1,390,000$ 52,255,000$
Page 80
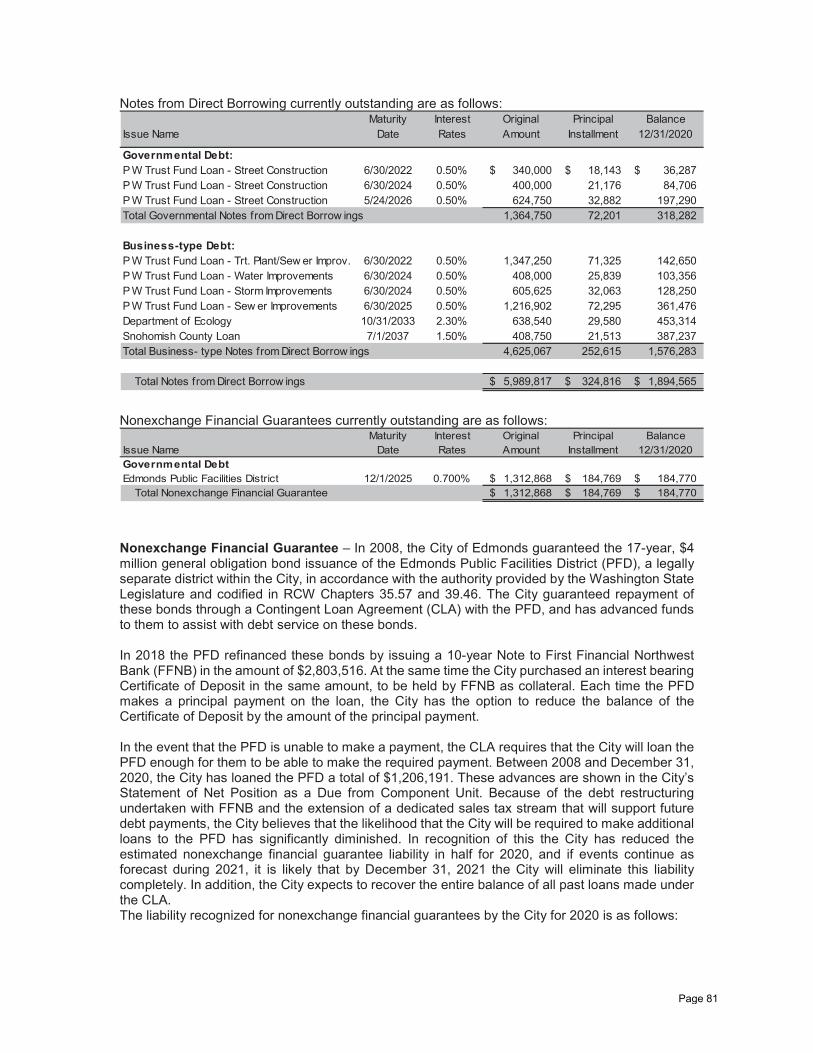
Notes from Direct Borrowing currently outstanding are as follows: Maturity Interest Original Principal Balance
Issue Name Date Rates Amount Installment 12/31/2020
Governmental Debt:P W Trust Fund Loan - Street Construction 6/30/2022 0.50% 340,000$ 18,143$ 36,287$ P W Trust Fund Loan - Street Construction 6/30/2024 0.50% 400,000 21,176 84,706 P W Trust Fund Loan - Street Construction 5/24/2026 0.50% 624,750 32,882 197,290 Total Governmental Notes from Direct Borrow ings 1,364,750 72,201 318,282
Business-type Debt:P W Trust Fund Loan - Trt. Plant/Sew er Improv. 6/30/2022 0.50% 1,347,250 71,325 142,650 P W Trust Fund Loan - Water Improvements 6/30/2024 0.50% 408,000 25,839 103,356 P W Trust Fund Loan - Storm Improvements 6/30/2024 0.50% 605,625 32,063 128,250 P W Trust Fund Loan - Sew er Improvements 6/30/2025 0.50% 1,216,902 72,295 361,476 Department of Ecology 10/31/2033 2.30% 638,540 29,580 453,314 Snohomish County Loan 7/1/2037 1.50% 408,750 21,513 387,237 Total Business- type Notes from Direct Borrow ings 4,625,067 252,615 1,576,283
Total Notes from Direct Borrow ings 5,989,817$ 324,816$ 1,894,565$
Nonexchange Financial Guarantees currently outstanding are as follows:
Maturity Interest Original Principal BalanceIssue Name Date Rates Amount Installment 12/31/2020Governmental DebtEdmonds Public Facilities District 12/1/2025 0.700% 1,312,868$ 184,769$ 184,770$
Total Nonexchange Financial Guarantee 1,312,868$ 184,769$ 184,770$
Nonexchange Financial Guarantee – In 2008, the City of Edmonds guaranteed the 17-year, $4 million general obligation bond issuance of the Edmonds Public Facilities District (PFD), a legally separate district within the City, in accordance with the authority provided by the Washington State Legislature and codified in RCW Chapters 35.57 and 39.46. The City guaranteed repayment of these bonds through a Contingent Loan Agreement (CLA) with the PFD, and has advanced funds to them to assist with debt service on these bonds. In 2018 the PFD refinanced these bonds by issuing a 10-year Note to First Financial Northwest Bank (FFNB) in the amount of $2,803,516. At the same time the City purchased an interest bearing Certificate of Deposit in the same amount, to be held by FFNB as collateral. Each time the PFD makes a principal payment on the loan, the City has the option to reduce the balance of the Certificate of Deposit by the amount of the principal payment. In the event that the PFD is unable to make a payment, the CLA requires that the City will loan the PFD enough for them to be able to make the required payment. Between 2008 and December 31, 2020, the City has loaned the PFD a total of $1,206,191. These advances are shown in the City’s Statement of Net Position as a Due from Component Unit. Because of the debt restructuring undertaken with FFNB and the extension of a dedicated sales tax stream that will support future debt payments, the City believes that the likelihood that the City will be required to make additional loans to the PFD has significantly diminished. In recognition of this the City has reduced the estimated nonexchange financial guarantee liability in half for 2020, and if events continue as forecast during 2021, it is likely that by December 31, 2021 the City will eliminate this liability completely. In addition, the City expects to recover the entire balance of all past loans made under the CLA. The liability recognized for nonexchange financial guarantees by the City for 2020 is as follows:
Page 81
Balance Balance12/31/2019 Increases Decreases 12/31/2020
369,539$ -$ 184,769$ 184,770$
Debt Limit – RCW 39.36.020 provides cities with three segments of debt capacity, each equal to 2.5% of the city’s assessed valuation, for a combined total of 7.5%. Allowable uses of these segments are as follows:
Segment 1 – General Governmental Purposes
The City can incur debt up to one and one-half percent (1.5%) of its assessed valuation solely with a vote of the legislative body (often referred to as “councilmanic” debt). To use the remaining one percent (1.0%), a 60 percent vote in favor of the issue by at least 40 percent of the number of voters who voted in the last general election is required. Segment 2 – City-Owned Water and Sewer Purposes
The City can incur debt up to an additional two and one-half percent (2.5%) for water and sewer purposes with a 60 percent vote in favor of the issue by at least 40 percent of the number of voters who voted in the last general election.
Segment 3 – Acquiring and Developing Open Space, Parks Facilities, and Capital Facilities Associated with Economic Development
The City can incur debt up to an additional two and one-half percent (2.5%) for acquiring and developing open space, parks facilities, and capital facilities associated with economic development purposes with a 60 percent vote in favor of the issue by at least 40 percent of the number of voters who voted in the last general election.
Debt Limit Capacity
Water & Sewer Purposes
Park & Capital Facilities
Item
Without Vote (Councilmanic)
1.5%With Vote
2.5%With Vote
2.5%With Vote
2.5%Legal Limits 165,168,322$ 110,112,214$ 275,280,536$ 275,280,536$ Net outstanding indebtedness (13,954,961) - - - Margin Available 151,213,361$ 110,112,214$ 275,280,536$ 275,280,536$
Governmental Purposes
Defeased Debt – In prior years, the City has defeased the 2007 general obligation bond and several revenue bond issues by creating separate irrevocable trust funds. New debt has been issued and the proceeds used to purchase U.S. Government securities that were placed in the trust funds. These investments and fixed earnings from the investments are sufficient to fully service the defeased debt until the debt is called or matures. For financial reporting purposes, the debt is considered defeased and therefore removed from City financial statements. Debt Service to Maturity – The requirements to amortize the long-term debt as of December 31, 2020 are presented below. Debt service for the LTGO bonds and governmental loans are met by the General Fund and certain special revenue funds, and reimbursements from proprietary funds
Page 82
of the City with the exception of the 2012 LTGO refunding bonds. The Public Facilities District (PFD) is obligated by inter-local agreement to pay the entire amount of the PFD’s portion of the 2012 debt service over the life of the bonds. (See Note 1). Debt service for the revenue bonds is paid by the Utility Fund. In prior years the City has typically used the General Fund to liquidate long-term liabilities other than debt. At December 31, 2020 the City had $3,290,576 in the Enterprise funds available for debt service. Following is a table which reflects debt service to maturity for Governmental Activities and Business-Type Activities.
Year Principal Interest Total Principal Interest Total2021 953,455 206,476 1,159,931 1,961,521 1,890,489 3,852,010 2022 831,443 178,385 1,009,828 1,982,898 1,817,347 3,800,245 2023 850,509 159,367 1,009,876 1,978,426 1,755,091 3,733,517 2024 886,280 141,003 1,027,283 2,036,304 1,691,922 3,728,227 2025 901,976 121,386 1,023,362 2,044,354 1,625,682 3,670,036
2026-2030 1,703,723 370,094 2,073,817 9,832,621 7,133,970 16,966,591 2031-2035 1,070,000 181,456 1,251,456 11,434,501 5,184,879 16,619,380 2036-2040 880,000 55,875 935,875 12,299,539 2,604,440 14,903,979 2041-2045 - - - 11,740,000 801,456 12,541,456
8,077,386$ 1,414,043$ 9,491,428$ 55,310,165$ 24,505,277$ 79,815,442$
GOVERNMENTAL ACTIVITIES BUSINESS TYPE ACTIVITIES
Terms specified in debt agreements related to significant (1) events of default with finance-related consequences, (2) termination events with finance-related consequences, and (3) subjective acceleration clauses. If the principal of any Bond is not paid when the Bond is properly presented at its maturity date or date fixed for redemption, the City will be obligated to pay interest on the Bond at the same rate provided in the Bond from and after its maturity or date fixed for redemption until the Bond, both principal and interest, is paid in full or until sufficient money for its payment in full is on deposit in the Bond Fund or in a trust account established to refund or defease the Bond, and the Bond has been called for payment by giving notice of that call to the Registered Owner. If Snohomish County finds that the City has failed to comply with the terms of the loan agreement, the County can declare the City in default and terminate the Agreement in whole. The City has 5 days from written notice to remedy said default. In the event the City fails to remedy the default, the County shall issue the City of Edmonds written notice of termination and declare the principle amount owing and interest due at the time to be immediately due and payable. The Washington State Public Works Trust Fund loans will assess a daily penalty beginning on the 31st day past the due date. The penalty will be assessed on the entire payment amount. The penalty will be 12% per annum calculated on a 360-day year for the delinquent amount. The Washington State Department of Ecology loan will assess a late charge of one percent per month on the past due amount starting on the date the debt becomes past due and until it is paid in full. If the Department of Ecology initiates a termination event or a loan default event occurs, the Department of Ecology may at its sole discretion demand that the City repay the outstanding balance of the loan amount and all accrued interest. In the event of a default, the Department may declare the principal of and interest on the loan immediately due and payable.
Page 83
Arbitrage – The Federal Tax Reform Act of 1986 requires tax-exempt debt issuers to pay investment income received at yields that exceed the issuer's borrowing rates to the United States Treasury. The liability is recorded at present value and payable every five years or 60 days after defeasance of the debt. At December 31, 2020, the City of Edmonds had no arbitrage liability. Revenue Bond Debt Service Coverage – The required debt service coverage for the utility revenue bonds is 1.25. Please refer to Schedule 15 in the Statistical Section. NOTE 13 – CHANGES IN LONG-TERM LIABILITIES During the year ended December 31, 2020, the following changes occurred in long-term liabilities:
BeginningBalance 1/1/2020 Additions Reductions
EndingBalance
12/31/2020 Due WithinOne Year
Governmental activitiesBonds payable:
General obligation bonds 8,595,125$ -$ (836,022)$ 7,759,103$ 881,253$ Less:
For issuance premiums 300,944 - (15,047) 285,897 15,047 Total bonds payable: 8,896,069 - (851,069) 8,045,000 896,300
Pension liabilities 4,510,105 48,069 - 4,558,174 - Total OPEB liability 7,877,232 487,989 - 8,365,221 - Compensated absences 2,136,462 2,660,388 (2,301,812) 2,495,038 1,770,626 Governmental loans 390,484 - (72,201) 318,283 72,201 Nonexchange Financial Guarantee 369,539 - (184,769) 184,770 - Governmental activity
long-term liabilities 24,179,891$ 3,196,446$ (3,409,851)$ 23,966,486$ 2,739,127$
Business-type activitiesBonds Payable:
General obligation bonds 1,738,359 -$ (259,475)$ 1,478,884$ 263,219$ Revenue bonds 39,770,000 13,875,000 (1,390,000) 52,255,000 1,445,000 Less:
For issuance premiums 547,260 - (36,959) 510,301 36,959 For issuance discount - (162,108) - (162,108) (6,484)
Total bonds payable: 42,055,619 13,712,892 (1,686,434) 54,082,077 1,738,694 Pension liabilities 916,052 21,884 (1,041) 936,895 - Compensated absences 414,416 443,919 (446,185) 412,150 343,218 Business-type loans 1,556,398 272,500 (252,615) 1,576,283 253,302 Business-type activity
long-term liabilities 44,942,485$ 14,451,195$ (2,386,275)$ 57,007,405$ 2,335,214$
Internal service funds predominately serve the governmental funds. Accordingly, the December 31, 2020 long-term liabilities for the fund are included as part of the above totals for governmental activities. At year-end internal service fund balances include $131,856 for compensated absences and $189,624 for the total pension obligation. The General Fund is typically used in prior years to liquidate long-term liabilities other than debt.
Page 84
NOTE 14 – CONTINGENCIES AND LITIGATIONS Other Contingencies – The City has recorded in its financial statement all material liabilities, including an estimate for situations which are not yet resolved but where, based on available information, management believes that it is probable that the City will have to make payment. In the opinion of management, the City’s insurance policies are adequate to pay all known or pending claims. Grants – The City participates in a number of federal- and state-assisted programs. These grants are subject to audit by the grantors or their representatives. Such audits could result in requests for reimbursement to grantor agencies for expenditures disallowed under the terms of the grants. City management believes that any such disallowances, if any, will be immaterial. NOTE 15 – RISK MANAGEMENT
Property and Liability Insurance – The City of Edmonds is exposed to various risks of loss from torts; thefts of damage or destruction of assets; business interruption; errors and omissions; injuries to employees; and natural disasters.
The City and its employees contribute to the State of Washington’s Department of Labor and Industries for Workers’ Compensation. There were no settlements in excess of coverage in any of the prior three years.
The City of Edmonds is a member of the Washington Cities Insurance Authority (WCIA). Utilizing Chapter 48.62 RCW and Chapter 39.34 RCW, nine cities originally formed the WCIA on January 1, 1981. The WCIA was created for the purpose of providing a pooling mechanism for jointly purchasing insurance, jointly self-insuring, and jointly contracting for risk management services. WCIA has a total of 162 members.
New members initially contract for a three-year term, and thereafter automatically renew on an annual basis. A one-year withdrawal notice is required before membership can be terminated. Termination does not relieve a former member from its unresolved loss history incurred during membership.
Liability coverage is written on an occurrence basis, without deductibles. Coverage includes general, automobile, police, errors or omissions, stop gap, employment practices and employee benefits liability. Limits are $4 million per occurrence in the self-insured layer, and $21 million in limits above the self-insured layer is provided by reinsurance. Total limits are $25 million per occurrence subject to aggregates and sublimits. The Board of Directors determines the limits and terms of coverage annually.
Insurance coverage for property, automobile physical damage, fidelity, inland marine, and boiler and machinery coverage are purchased on a group basis. Various deductibles apply by type of coverage. Property coverage is self-funded from the members’ deductible to $750,000, for all perils other than flood and earthquake, and insured above that to $400 million per occurrence subject to aggregates and sublimits. Automobile physical damage coverage is self-funded from the members’ deductible to $250,000 and insured above that to $100 million per occurrence subject to aggregates and sublimits.
In-house services include risk management consultation, loss control field services, and claims and litigation administration. WCIA contracts for certain claims investigations, consultants for personnel and land use issues, insurance brokerage, actuarial, and lobbyist services.
WCIA is fully funded by its members, who make annual assessments on a prospectively rated basis, as determined by an outside, independent actuary. The assessment covers loss, loss adjustment, reinsurance and other administrative expenses. As outlined in the interlocal, WCIA retains the right to additionally assess the membership for any funding shortfall. The City currently
Page 85
has no such assessments due to WCIA. The City incurred no settlements in excess of coverage in any of the past three years.
An investment committee, using investment brokers, produces additional revenue by investment of WCIA’s assets in financial instruments which comply with all State guidelines.
A Board of Directors governs WCIA, which is comprised of one designated representative from each member. The Board elects an Executive Committee and appoints a Treasurer to provide general policy direction for the organization. The WCIA Executive Director reports to the Executive Committee and is responsible for conducting the daily operations of WCIA.
Employee Benefit Trust Health Care Program – The City of Edmonds is a member of the Association of Washington Cities Employee Benefit Trust Health Care Program (AWC Trust HCP). Chapter 48.62 RCW provides that two or more local government entities may, by Interlocal agreement under Chapter 39.34 RCW, form together or join a pool or organization for the joint purchasing of insurance, and/or joint self-insurance, to the same extent that they may individually purchase insurance, or self-insure. An agreement to form a pooling arrangement was made pursuant to the provisions of Chapter 39.34 RCW, the Interlocal Cooperation Act. The AWC Trust HCP was formed on January 1, 2014 when participating cities, towns, and non-city entities of the AWC Employee Benefit Trust in the State of Washington joined together by signing an Interlocal Governmental Agreement to jointly self-insure certain health benefit plans and programs for participating employees, their covered dependents and other beneficiaries through a designated account within the Trust. As of December 31, 2020, 262 cities, towns, or non-city entities participate in the AWC Trust HCP. The AWC Trust HCP allows members to establish a program of joint insurance and provides health and welfare services to all participating members. In April 2020, The Board of Trustees adopted a large employer policy, requiring newly enrolling groups with 600 or more employees to submit medical claims without regard to individual member experience. The pool is actuarially rated each year with the assumption of projected claims run-out for all current members. The AWC Trust HCP includes medical, dental and vision insurance through the following carriers: Kaiser Foundation Health Plan of Washington, Kaiser Foundation Health Plan of Washington Options, Inc., Regence BlueShield, Asuris Northwest Health, Delta Dental of Washington, and Vision Service Plan. Eligible members are cities and towns within the state of Washington. Non-City Entities (public agency, public corporation, intergovernmental agency, or political subdivision within the state of Washington) are eligible to apply for coverage into the AWC Trust HCP, submitting application to the Board of Trustees for review as required in the Trust Agreement. Participating employers pay monthly premiums to the AWC Trust HCP. The AWC Trust HCP is responsible for payment of all covered claims. In 2020, the AWC Trust HCP purchased stop loss insurance for Regence/Asuris plans at an individual stop loss (ISL) of $1.5 million through Commencement Bay Risk Management, and Kaiser ISL at $1 million with Companion Life through ASG Risk Management. The aggregate policy is for 200% of expected medical claims. Participating employers contract to remain in the AWC Trust HCP for a minimum of three years. Participating employers with over 250 employees must provide written notice of termination of all coverage a minimum of 12 months in advance of the termination date, and participating employers with under 250 employees must provide written notice of termination of all coverage a minimum of 6 months in advance of termination date. When all coverage is being terminated, termination will only occur on December 31. Participating employers terminating a group or line of coverage must notify the AWC Trust HCP a minimum of 60 days prior to termination. A participating employer’s termination will not obligate that member to past debts, or further contributions to the AWC Trust HCP. Similarly, the terminating member forfeits all rights and interest to the AWC Trust HCP Account.
Page 86
The operations of the Health Care Program are managed by the Board of Trustees or its delegates. The Board of Trustees is comprised of four regionally elected officials from Trust member cities or towns, the Employee Benefit Advisory Committee Chair and Vice Chair, and two appointed individuals from the AWC Board of Directors, who are from Trust member cities or towns. The Trustees or its appointed delegates review and analyze Health Care Program related matters and make operational decisions regarding premium contributions, reserves, plan options and benefits in compliance with Chapter 48.62 RCW. The Board of Trustees has decision authority consistent with the Trust Agreement, Health Care Program policies, Chapter 48.62 RCW and Chapter 200-110-WAC. The accounting records of the AWC Trust HCP are maintained in accordance with methods prescribed by the State Auditor’s office under the authority of Chapter 43.09 RCW. The AWC Trust HCP also follows applicable accounting standards established by the Governmental Accounting Standards Board. In 2018, the retiree medical plan subsidy was eliminated, and is noted as such in the report for the fiscal year ending December 31, 2018. Year-end financial reporting is done on an accrual basis and submitted to the Office of the State Auditor as required by Chapter 200-110 WAC. The audit report for the AWC Trust HCP is available from the Washington State Auditor’s office.
Page 87
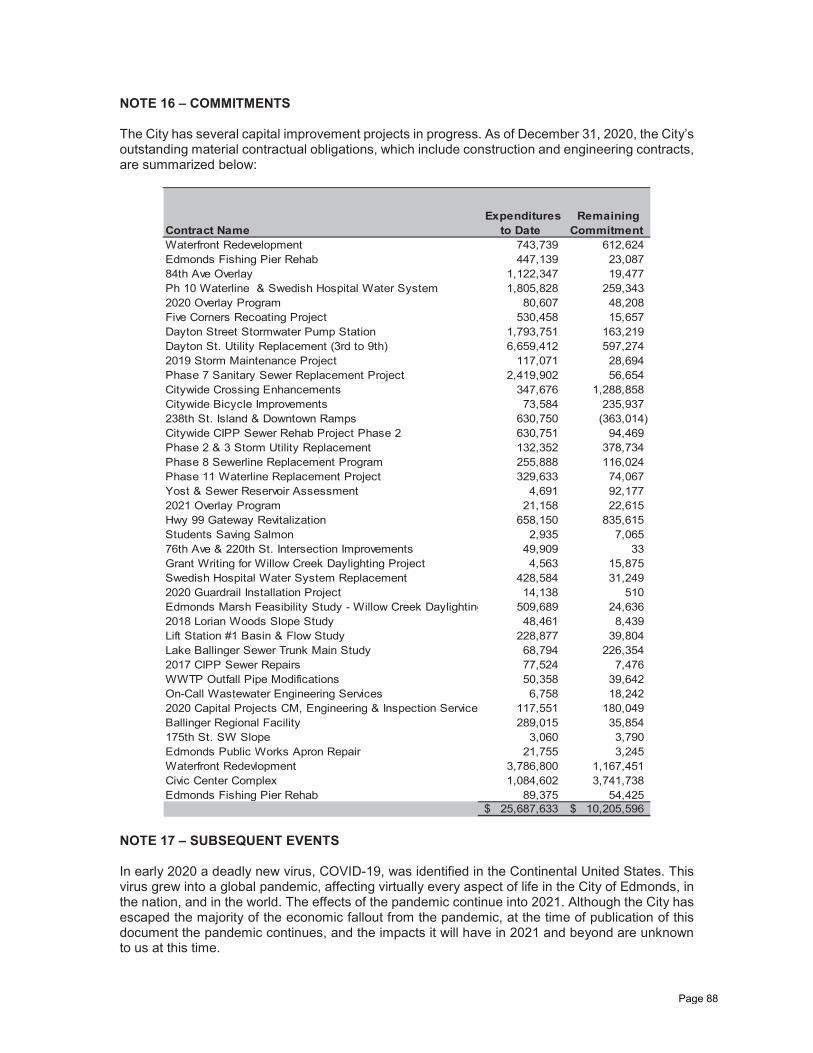
NOTE 16 – COMMITMENTS The City has several capital improvement projects in progress. As of December 31, 2020, the City’s outstanding material contractual obligations, which include construction and engineering contracts, are summarized below:
Contract Name Expenditures
to Date Remaining
Commitment Waterfront Redevelopment 743,739 612,624 Edmonds Fishing Pier Rehab 447,139 23,087 84th Ave Overlay 1,122,347 19,477 Ph 10 Waterline & Swedish Hospital Water System 1,805,828 259,343 2020 Overlay Program 80,607 48,208 Five Corners Recoating Project 530,458 15,657 Dayton Street Stormwater Pump Station 1,793,751 163,219 Dayton St. Utility Replacement (3rd to 9th) 6,659,412 597,274 2019 Storm Maintenance Project 117,071 28,694 Phase 7 Sanitary Sewer Replacement Project 2,419,902 56,654 Citywide Crossing Enhancements 347,676 1,288,858 Citywide Bicycle Improvements 73,584 235,937 238th St. Island & Downtown Ramps 630,750 (363,014) Citywide CIPP Sewer Rehab Project Phase 2 630,751 94,469 Phase 2 & 3 Storm Utility Replacement 132,352 378,734 Phase 8 Sewerline Replacement Program 255,888 116,024 Phase 11 Waterline Replacement Project 329,633 74,067 Yost & Sewer Reservoir Assessment 4,691 92,177 2021 Overlay Program 21,158 22,615 Hwy 99 Gateway Revitalization 658,150 835,615 Students Saving Salmon 2,935 7,065 76th Ave & 220th St. Intersection Improvements 49,909 33 Grant Writing for Willow Creek Daylighting Project 4,563 15,875 Swedish Hospital Water System Replacement 428,584 31,249 2020 Guardrail Installation Project 14,138 510 Edmonds Marsh Feasibility Study - Willow Creek Daylighting 509,689 24,636 2018 Lorian Woods Slope Study 48,461 8,439 Lift Station #1 Basin & Flow Study 228,877 39,804 Lake Ballinger Sewer Trunk Main Study 68,794 226,354 2017 CIPP Sewer Repairs 77,524 7,476 WWTP Outfall Pipe Modifications 50,358 39,642 On-Call Wastewater Engineering Services 6,758 18,242 2020 Capital Projects CM, Engineering & Inspection Service 117,551 180,049 Ballinger Regional Facility 289,015 35,854 175th St. SW Slope 3,060 3,790 Edmonds Public Works Apron Repair 21,755 3,245 Waterfront Redevlopment 3,786,800 1,167,451 Civic Center Complex 1,084,602 3,741,738 Edmonds Fishing Pier Rehab 89,375 54,425
25,687,633$ 10,205,596$ NOTE 17 – SUBSEQUENT EVENTS In early 2020 a deadly new virus, COVID-19, was identified in the Continental United States. This virus grew into a global pandemic, affecting virtually every aspect of life in the City of Edmonds, in the nation, and in the world. The effects of the pandemic continue into 2021. Although the City has escaped the majority of the economic fallout from the pandemic, at the time of publication of this document the pandemic continues, and the impacts it will have in 2021 and beyond are unknown to us at this time.
Page 88
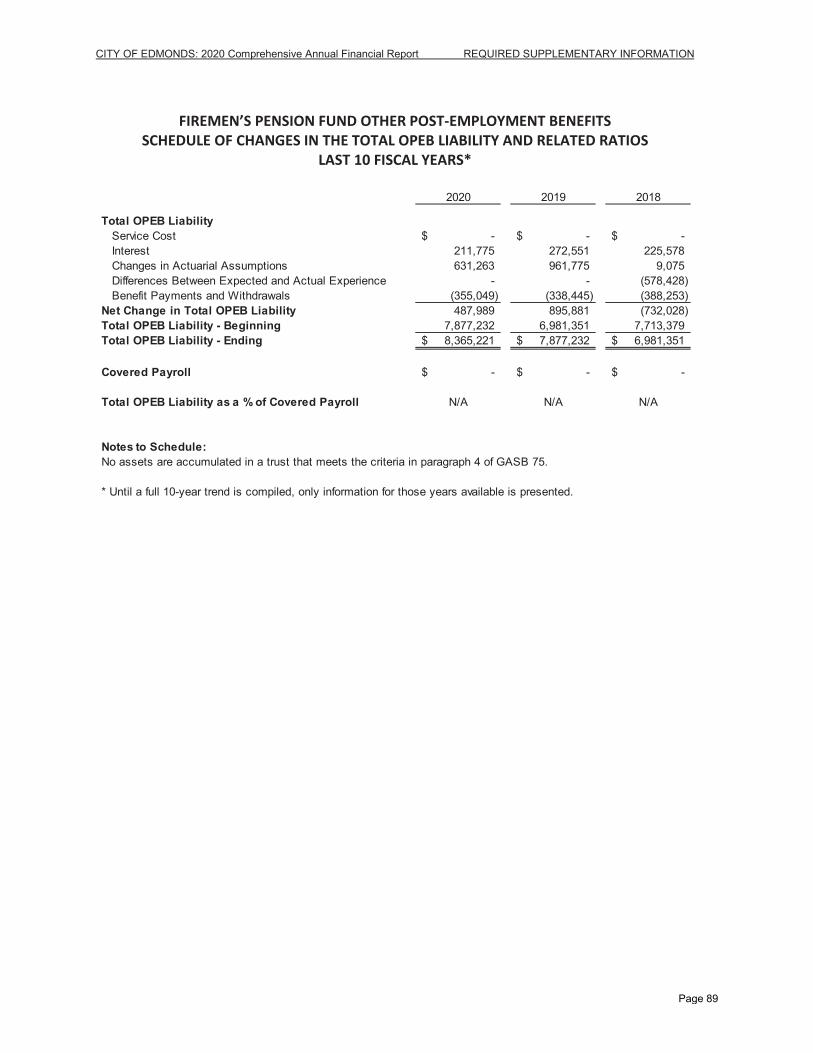
CITY OF EDMONDS: 2020 Comprehensive Annual Financial Report REQUIRED SUPPLEMENTARY INFORMATION
FIREMEN’S PENSION FUND OTHER POST-EMPLOYMENT BENEFITS
SCHEDULE OF CHANGES IN THE TOTAL OPEB LIABILITY AND RELATED RATIOS LAST 10 FISCAL YEARS*
2020 2019 2018
Total OPEB LiabilityService Cost -$ -$ -$ Interest 211,775 272,551 225,578 Changes in Actuarial Assumptions 631,263 961,775 9,075 Differences Between Expected and Actual Experience - - (578,428) Benefit Payments and Withdrawals (355,049) (338,445) (388,253)
Net Change in Total OPEB Liability 487,989 895,881 (732,028) Total OPEB Liability - Beginning 7,877,232 6,981,351 7,713,379 Total OPEB Liability - Ending 8,365,221$ 7,877,232$ 6,981,351$
Covered Payroll -$ -$ -$
Total OPEB Liability as a % of Covered Payroll N/A N/A N/A
Notes to Schedule:No assets are accumulated in a trust that meets the criteria in paragraph 4 of GASB 75.
* Until a full 10-year trend is compiled, only information for those years available is presented.
Page 89
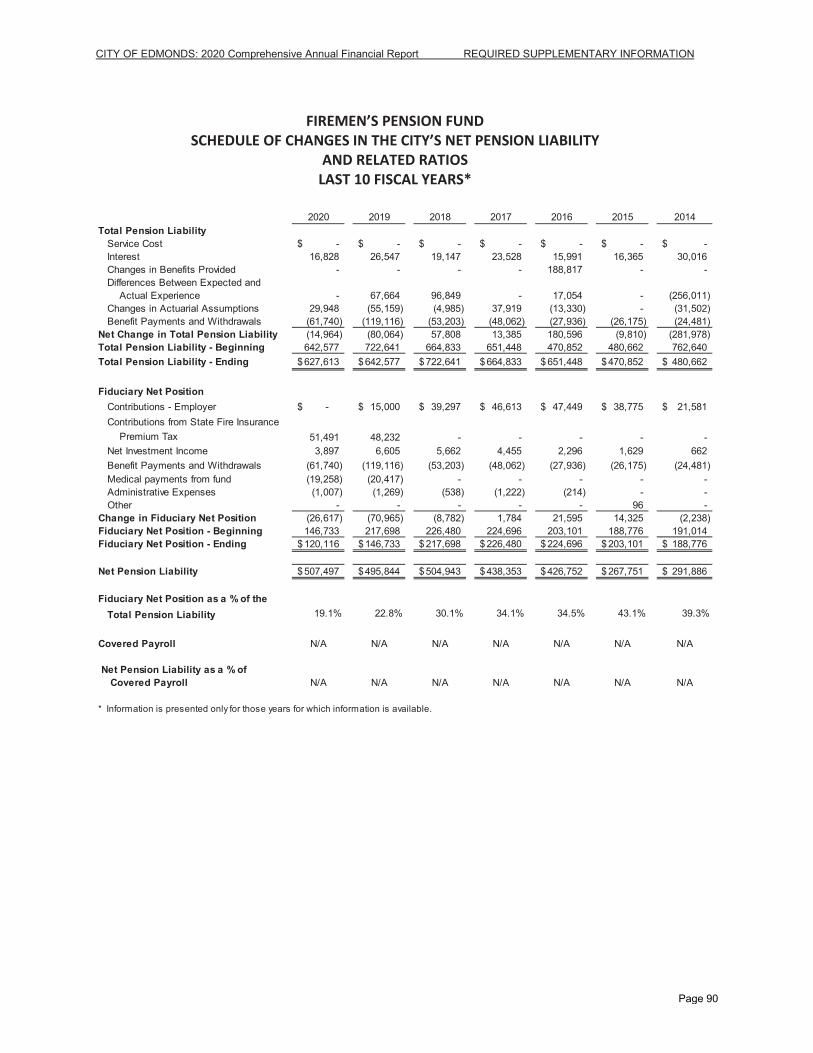
CITY OF EDMONDS: 2020 Comprehensive Annual Financial Report REQUIRED SUPPLEMENTARY INFORMATION
FIREMEN’S PENSION FUND
SCHEDULE OF CHANGES IN THE CITY’S NET PENSION LIABILITY AND RELATED RATIOS
LAST 10 FISCAL YEARS*
2020 2019 2018 2017 2016 2015 2014Total Pension Liability
Service Cost -$ -$ -$ -$ -$ -$ -$ Interest 16,828 26,547 19,147 23,528 15,991 16,365 30,016 Changes in Benefits Provided - - - - 188,817 - - Differences Between Expected and
Actual Experience - 67,664 96,849 - 17,054 - (256,011) Changes in Actuarial Assumptions 29,948 (55,159) (4,985) 37,919 (13,330) - (31,502) Benefit Payments and Withdrawals (61,740) (119,116) (53,203) (48,062) (27,936) (26,175) (24,481)
Net Change in Total Pension Liability (14,964) (80,064) 57,808 13,385 180,596 (9,810) (281,978)Total Pension Liability - Beginning 642,577 722,641 664,833 651,448 470,852 480,662 762,640 Total Pension Liability - Ending 627,613$ 642,577$ 722,641$ 664,833$ 651,448$ 470,852$ 480,662$
Fiduciary Net PositionContributions - Employer -$ 15,000$ 39,297$ 46,613$ 47,449$ 38,775$ 21,581$ Contributions from State Fire Insurance
Premium Tax 51,491 48,232 - - - - - Net Investment Income 3,897 6,605 5,662 4,455 2,296 1,629 662 Benefit Payments and Withdrawals (61,740) (119,116) (53,203) (48,062) (27,936) (26,175) (24,481) Medical payments from fund (19,258) (20,417) - - - - - Administrative Expenses (1,007) (1,269) (538) (1,222) (214) - - Other - - - - - 96 -
Change in Fiduciary Net Position (26,617) (70,965) (8,782) 1,784 21,595 14,325 (2,238) Fiduciary Net Position - Beginning 146,733 217,698 226,480 224,696 203,101 188,776 191,014 Fiduciary Net Position - Ending 120,116$ 146,733$ 217,698$ 226,480$ 224,696$ 203,101$ 188,776$
Net Pension Liability 507,497$ 495,844$ 504,943$ 438,353$ 426,752$ 267,751$ 291,886$
Fiduciary Net Position as a % of the Total Pension Liability 19.1% 22.8% 30.1% 34.1% 34.5% 43.1% 39.3%
Covered Payroll N/A N/A N/A N/A N/A N/A N/A
Net Pension Liability as a % of Covered Payroll N/A N/A N/A N/A N/A N/A N/A
* Information is presented only for those years for which information is available.
Page 90
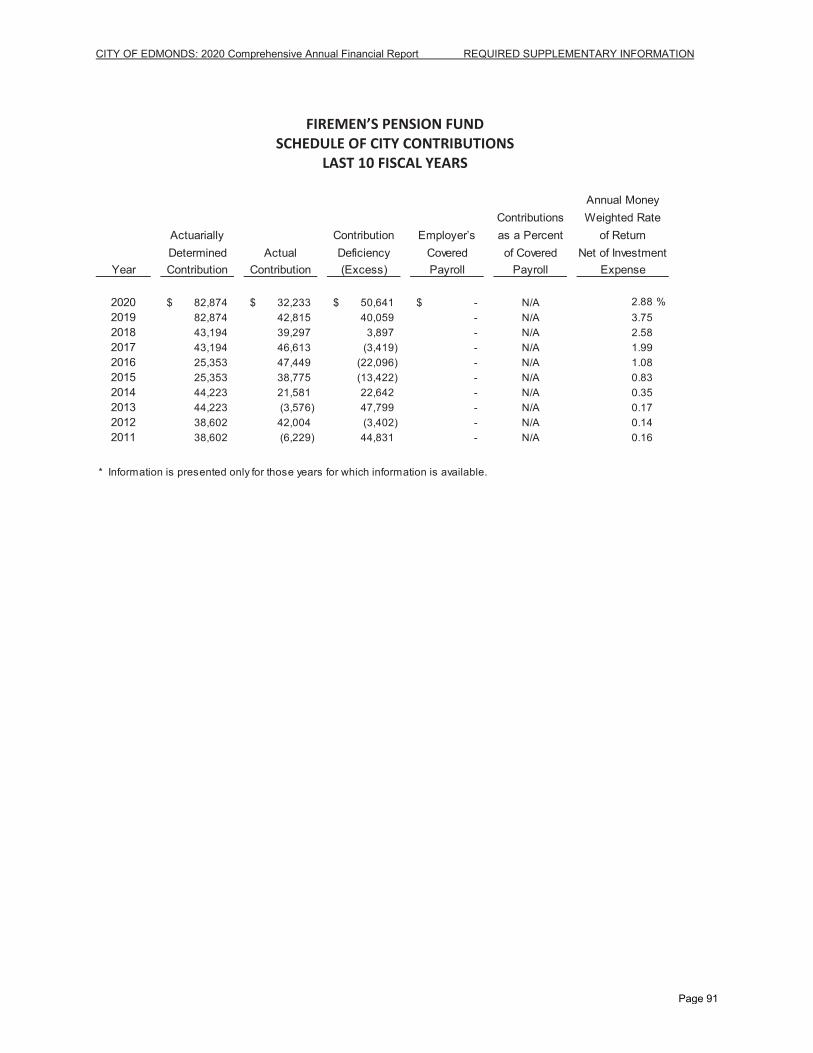
CITY OF EDMONDS: 2020 Comprehensive Annual Financial Report REQUIRED SUPPLEMENTARY INFORMATION
FIREMEN’S PENSION FUND
SCHEDULE OF CITY CONTRIBUTIONS LAST 10 FISCAL YEARS
Annual Money
Contributions Weighted RateActuarially Contribution Employer’s as a Percent of ReturnDetermined Actual Deficiency Covered of Covered Net of Investment
Year Contribution Contribution (Excess) Payroll Payroll Expense
2020 82,874$ 32,233$ 50,641$ -$ N/A 2.88 %2019 82,874 42,815 40,059 - N/A 3.752018 43,194 39,297 3,897 - N/A 2.582017 43,194 46,613 (3,419) - N/A 1.992016 25,353 47,449 (22,096) - N/A 1.082015 25,353 38,775 (13,422) - N/A 0.832014 44,223 21,581 22,642 - N/A 0.352013 44,223 (3,576) 47,799 - N/A 0.172012 38,602 42,004 (3,402) - N/A 0.142011 38,602 (6,229) 44,831 - N/A 0.16
* Information is presented only for those years for which information is available.
Page 91
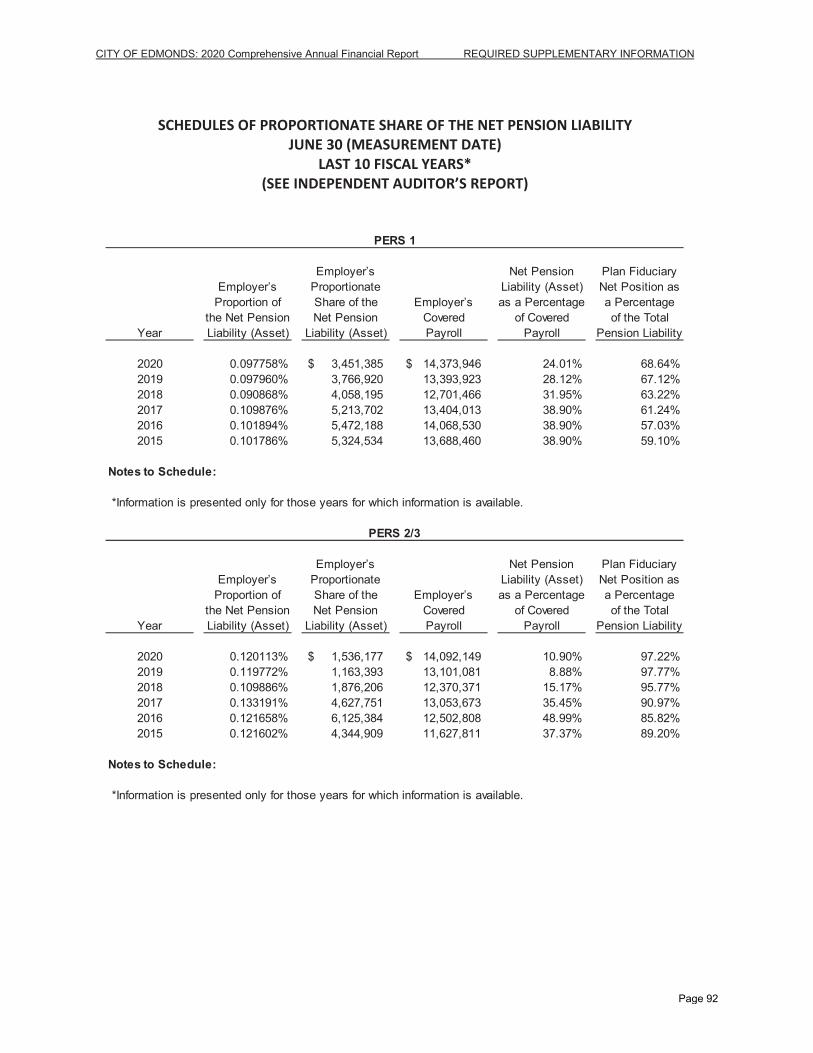
CITY OF EDMONDS: 2020 Comprehensive Annual Financial Report REQUIRED SUPPLEMENTARY INFORMATION
SCHEDULES OF PROPORTIONATE SHARE OF THE NET PENSION LIABILITY
JUNE 30 (MEASUREMENT DATE) LAST 10 FISCAL YEARS*
(SEE INDEPENDENT AUDITOR’S REPORT)
Employer’s Net Pension Plan FiduciaryEmployer’s Proportionate Liability (Asset) Net Position as
Proportion of Share of the Employer’s as a Percentage a Percentagethe Net Pension Net Pension Covered of Covered of the Total
Year Liability (Asset) Liability (Asset) Payroll Payroll Pension Liability
2020 0.097758% 3,451,385$ 14,373,946$ 24.01% 68.64%2019 0.097960% 3,766,920 13,393,923 28.12% 67.12%2018 0.090868% 4,058,195 12,701,466 31.95% 63.22%2017 0.109876% 5,213,702 13,404,013 38.90% 61.24%2016 0.101894% 5,472,188 14,068,530 38.90% 57.03%2015 0.101786% 5,324,534 13,688,460 38.90% 59.10%
Notes to Schedule:
Employer’s Net Pension Plan FiduciaryEmployer’s Proportionate Liability (Asset) Net Position as
Proportion of Share of the Employer’s as a Percentage a Percentagethe Net Pension Net Pension Covered of Covered of the Total
Year Liability (Asset) Liability (Asset) Payroll Payroll Pension Liability
2020 0.120113% 1,536,177$ 14,092,149$ 10.90% 97.22%2019 0.119772% 1,163,393 13,101,081 8.88% 97.77%2018 0.109886% 1,876,206 12,370,371 15.17% 95.77%2017 0.133191% 4,627,751 13,053,673 35.45% 90.97%2016 0.121658% 6,125,384 12,502,808 48.99% 85.82%2015 0.121602% 4,344,909 11,627,811 37.37% 89.20%
Notes to Schedule:
PERS 1
PERS 2/3
*Information is presented only for those years for which information is available.
*Information is presented only for those years for which information is available.
Page 92
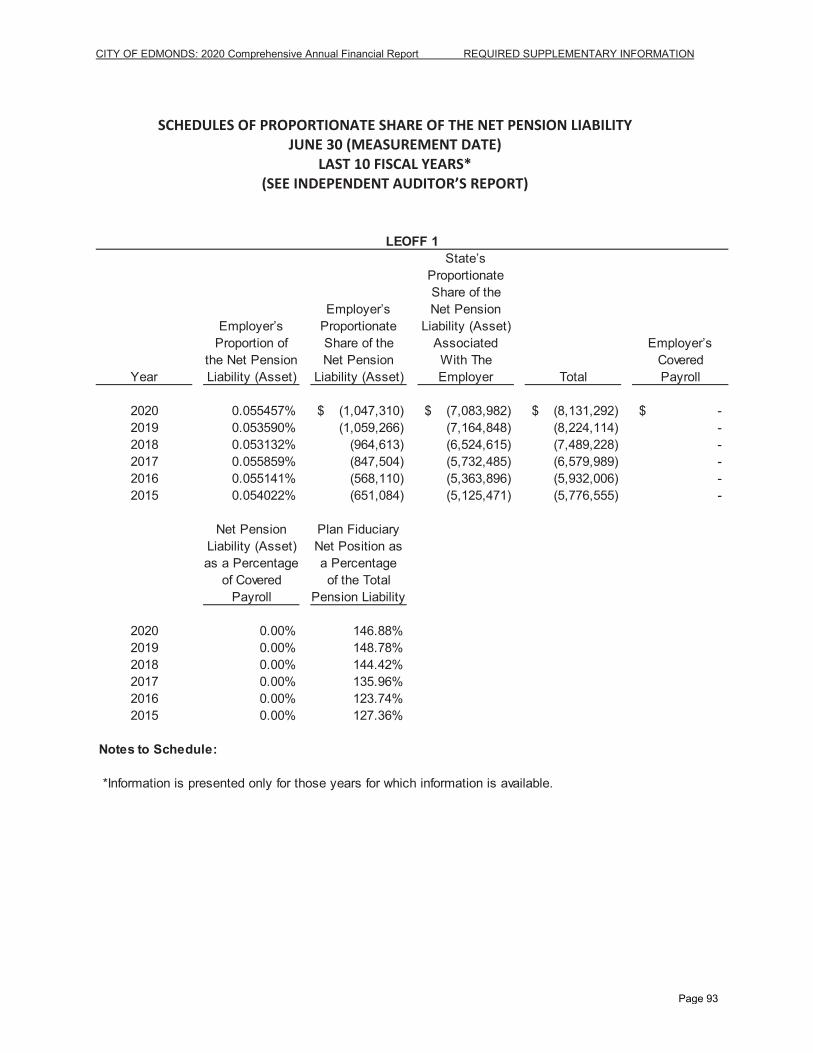
CITY OF EDMONDS: 2020 Comprehensive Annual Financial Report REQUIRED SUPPLEMENTARY INFORMATION
SCHEDULES OF PROPORTIONATE SHARE OF THE NET PENSION LIABILITY
JUNE 30 (MEASUREMENT DATE) LAST 10 FISCAL YEARS*
(SEE INDEPENDENT AUDITOR’S REPORT)
State’sProportionateShare of the
Employer’s Net PensionEmployer’s Proportionate Liability (Asset)
Proportion of Share of the Associated Employer’sthe Net Pension Net Pension With The Covered
Year Liability (Asset) Liability (Asset) Employer Total Payroll
2020 0.055457% (1,047,310)$ (7,083,982)$ (8,131,292)$ -$ 2019 0.053590% (1,059,266) (7,164,848) (8,224,114) - 2018 0.053132% (964,613) (6,524,615) (7,489,228) - 2017 0.055859% (847,504) (5,732,485) (6,579,989) - 2016 0.055141% (568,110) (5,363,896) (5,932,006) - 2015 0.054022% (651,084) (5,125,471) (5,776,555) -
Net Pension Plan FiduciaryLiability (Asset) Net Position asas a Percentage a Percentage
of Covered of the TotalPayroll Pension Liability
2020 0.00% 146.88%2019 0.00% 148.78%2018 0.00% 144.42%2017 0.00% 135.96%2016 0.00% 123.74%2015 0.00% 127.36%
Notes to Schedule:
LEOFF 1
*Information is presented only for those years for which information is available.
Page 93
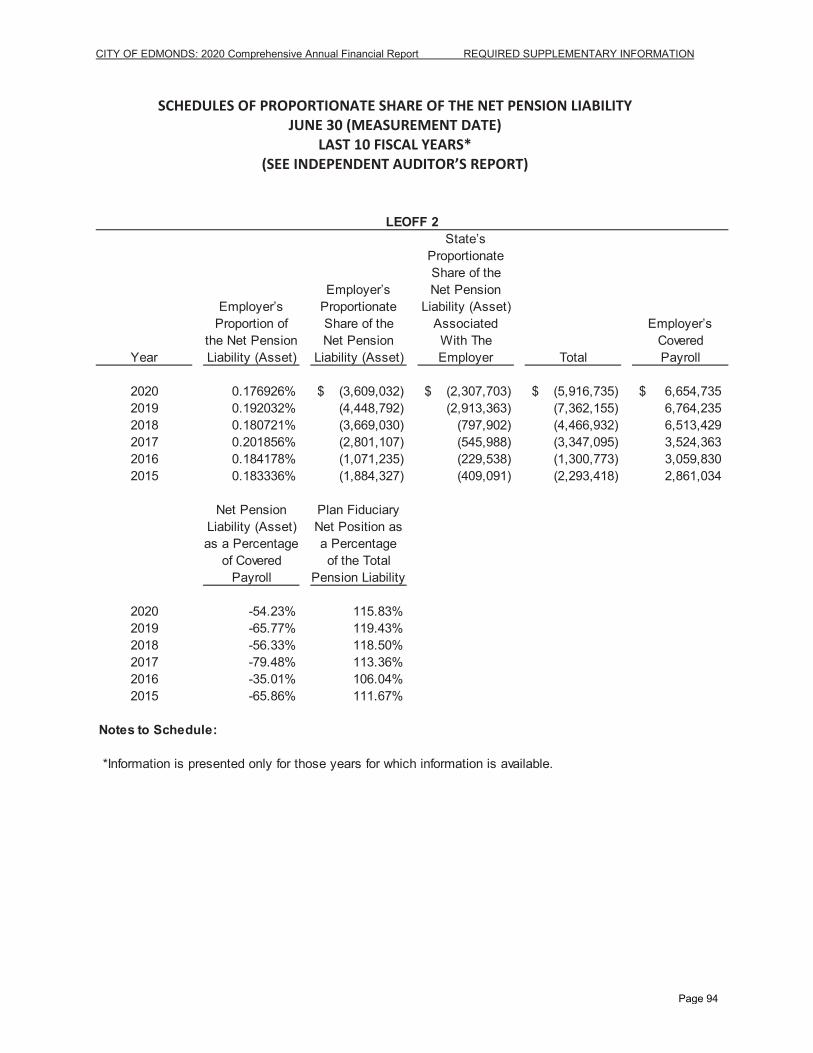
CITY OF EDMONDS: 2020 Comprehensive Annual Financial Report REQUIRED SUPPLEMENTARY INFORMATION
SCHEDULES OF PROPORTIONATE SHARE OF THE NET PENSION LIABILITY JUNE 30 (MEASUREMENT DATE)
LAST 10 FISCAL YEARS* (SEE INDEPENDENT AUDITOR’S REPORT)
State’sProportionateShare of the
Employer’s Net PensionEmployer’s Proportionate Liability (Asset)
Proportion of Share of the Associated Employer’sthe Net Pension Net Pension With The Covered
Year Liability (Asset) Liability (Asset) Employer Total Payroll
2020 0.176926% (3,609,032)$ (2,307,703)$ (5,916,735)$ 6,654,735$ 2019 0.192032% (4,448,792) (2,913,363) (7,362,155) 6,764,235 2018 0.180721% (3,669,030) (797,902) (4,466,932) 6,513,429 2017 0.201856% (2,801,107) (545,988) (3,347,095) 3,524,363 2016 0.184178% (1,071,235) (229,538) (1,300,773) 3,059,830 2015 0.183336% (1,884,327) (409,091) (2,293,418) 2,861,034
Net Pension Plan FiduciaryLiability (Asset) Net Position asas a Percentage a Percentage
of Covered of the TotalPayroll Pension Liability
2020 -54.23% 115.83%2019 -65.77% 119.43%2018 -56.33% 118.50%2017 -79.48% 113.36%2016 -35.01% 106.04%2015 -65.86% 111.67%
Notes to Schedule:
LEOFF 2
*Information is presented only for those years for which information is available.
Page 94
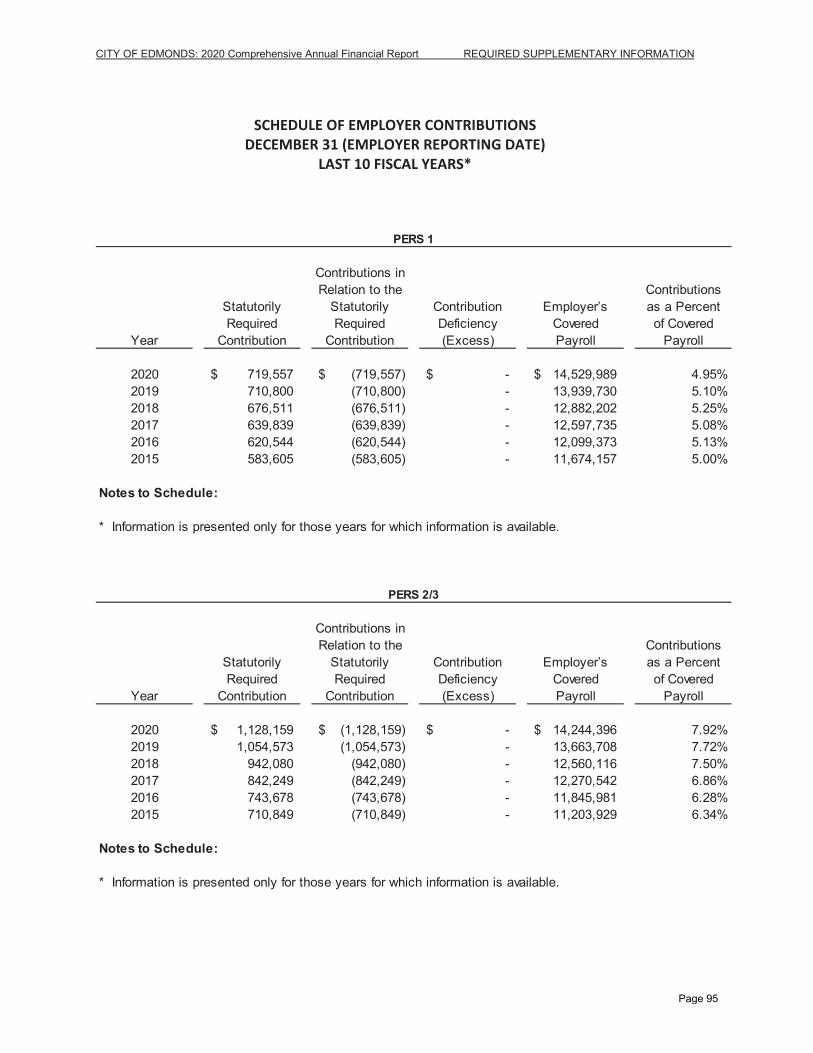
CITY OF EDMONDS: 2020 Comprehensive Annual Financial Report REQUIRED SUPPLEMENTARY INFORMATION
SCHEDULE OF EMPLOYER CONTRIBUTIONS
DECEMBER 31 (EMPLOYER REPORTING DATE) LAST 10 FISCAL YEARS*
Contributions inRelation to the Contributions
Statutorily Statutorily Contribution Employer’s as a PercentRequired Required Deficiency Covered of Covered
Year Contribution Contribution (Excess) Payroll Payroll
2020 719,557$ (719,557)$ -$ 14,529,989$ 4.95%2019 710,800 (710,800) - 13,939,730 5.10%2018 676,511 (676,511) - 12,882,202 5.25%2017 639,839 (639,839) - 12,597,735 5.08%2016 620,544 (620,544) - 12,099,373 5.13%2015 583,605 (583,605) - 11,674,157 5.00%
Notes to Schedule:
Contributions inRelation to the Contributions
Statutorily Statutorily Contribution Employer’s as a PercentRequired Required Deficiency Covered of Covered
Year Contribution Contribution (Excess) Payroll Payroll
2020 1,128,159$ (1,128,159)$ -$ 14,244,396$ 7.92%2019 1,054,573 (1,054,573) - 13,663,708 7.72%2018 942,080 (942,080) - 12,560,116 7.50%2017 842,249 (842,249) - 12,270,542 6.86%2016 743,678 (743,678) - 11,845,981 6.28%2015 710,849 (710,849) - 11,203,929 6.34%
Notes to Schedule:
PERS 1
* Information is presented only for those years for which information is available.
PERS 2/3
* Information is presented only for those years for which information is available.
Page 95
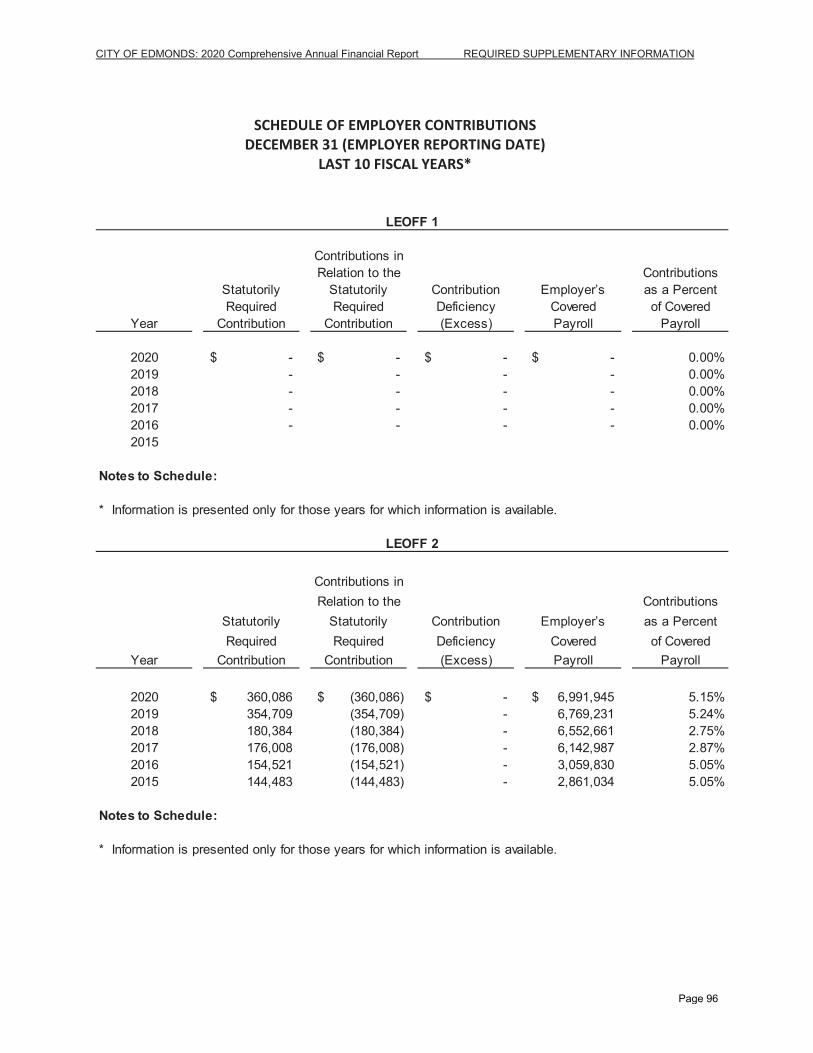
CITY OF EDMONDS: 2020 Comprehensive Annual Financial Report REQUIRED SUPPLEMENTARY INFORMATION
SCHEDULE OF EMPLOYER CONTRIBUTIONS
DECEMBER 31 (EMPLOYER REPORTING DATE) LAST 10 FISCAL YEARS*
Contributions inRelation to the Contributions
Statutorily Statutorily Contribution Employer’s as a PercentRequired Required Deficiency Covered of Covered
Year Contribution Contribution (Excess) Payroll Payroll
2020 -$ -$ -$ -$ 0.00%2019 - - - - 0.00%2018 - - - - 0.00%2017 - - - - 0.00%2016 - - - - 0.00%2015
Notes to Schedule:
Contributions inRelation to the Contributions
Statutorily Statutorily Contribution Employer’s as a PercentRequired Required Deficiency Covered of Covered
Year Contribution Contribution (Excess) Payroll Payroll
2020 360,086$ (360,086)$ -$ 6,991,945$ 5.15%2019 354,709 (354,709) - 6,769,231 5.24%2018 180,384 (180,384) - 6,552,661 2.75%2017 176,008 (176,008) - 6,142,987 2.87%2016 154,521 (154,521) - 3,059,830 5.05%2015 144,483 (144,483) - 2,861,034 5.05%
Notes to Schedule:
LEOFF 1
* Information is presented only for those years for which information is available.
LEOFF 2
* Information is presented only for those years for which information is available.
Page 96
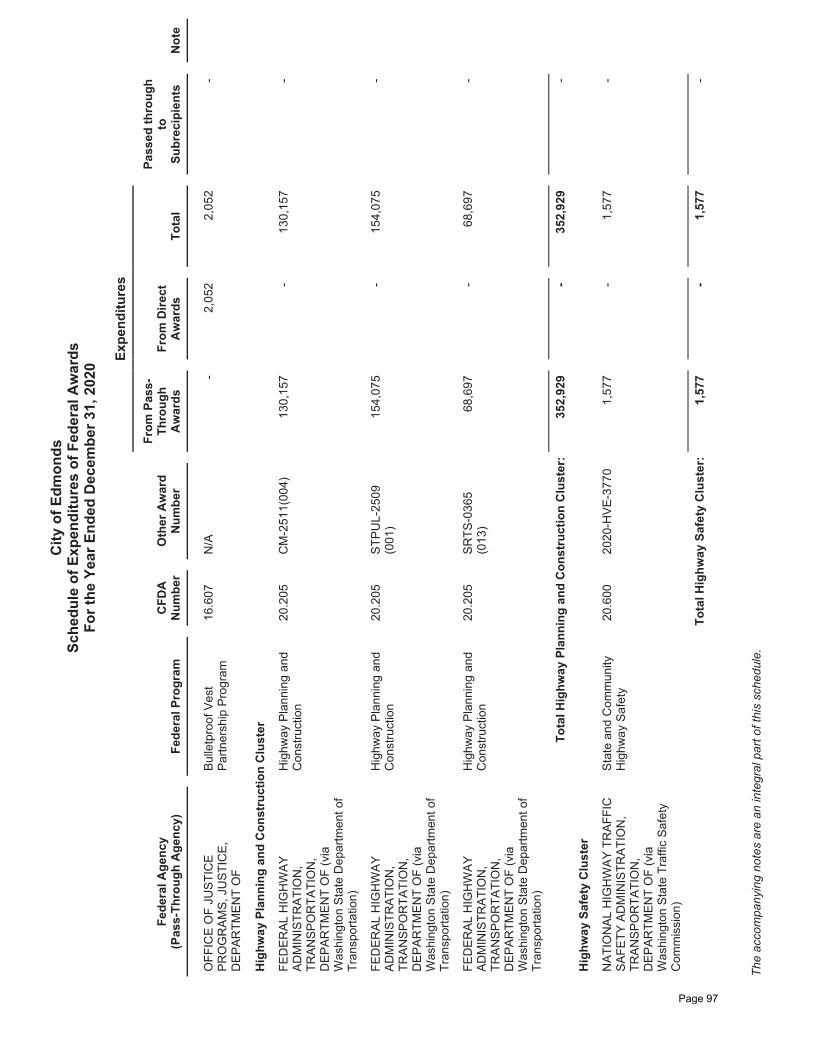
Fede
ral A
genc
y (P
ass-
Thro
ugh
Age
ncy)
Fede
ral P
rogr
amC
FDA
N
umbe
rO
ther
Aw
ard
Num
ber
Expe
nditu
res
Pass
ed th
roug
h to
Su
brec
ipie
nts
Not
e
From
Pas
s-Th
roug
h A
war
dsFr
om D
irect
A
war
dsTo
tal
OFF
ICE
OF
JUST
ICE
PRO
GR
AMS,
JU
STIC
E,
DEP
ARTM
ENT
OF
Bulle
tpro
of V
est
Partn
ersh
ip P
rogr
am16
.607
N/A
-2,
052
2,05
2-
Hig
hway
Pla
nnin
g an
d C
onst
ruct
ion
Clu
ster
FED
ERAL
HIG
HW
AY
ADM
INIS
TRAT
ION
, TR
ANSP
OR
TATI
ON
, D
EPAR
TMEN
T O
F (v
ia
Was
hing
ton
Stat
e D
epar
tmen
t of
Tran
spor
tatio
n)
Hig
hway
Pla
nnin
g an
d C
onst
ruct
ion
20.2
05C
M-2
511(
004)
130,
157
-13
0,15
7-
FED
ERAL
HIG
HW
AY
ADM
INIS
TRAT
ION
, TR
ANSP
OR
TATI
ON
, D
EPAR
TMEN
T O
F (v
ia
Was
hing
ton
Stat
e D
epar
tmen
t of
Tran
spor
tatio
n)
Hig
hway
Pla
nnin
g an
d C
onst
ruct
ion
20.2
05ST
PUL-
2509
(001
)15
4,07
5-
154,
075
-
FED
ERAL
HIG
HW
AY
ADM
INIS
TRAT
ION
, TR
ANSP
OR
TATI
ON
, D
EPAR
TMEN
T O
F (v
ia
Was
hing
ton
Stat
e D
epar
tmen
t of
Tran
spor
tatio
n)
Hig
hway
Pla
nnin
g an
d C
onst
ruct
ion
20.2
05SR
TS-0
365
(013
)68
,697
-68
,697
-
Tota
l Hig
hway
Pla
nnin
g an
d C
onst
ruct
ion
Clu
ster
: 35
2,92
9-
352,
929
-
Hig
hway
Saf
ety
Clu
ster
NAT
ION
AL H
IGH
WAY
TR
AFFI
C
SAFE
TY A
DM
INIS
TRAT
ION
, TR
ANSP
OR
TATI
ON
, D
EPAR
TMEN
T O
F (v
ia
Was
hing
ton
Stat
e Tr
affic
Saf
ety
Com
mis
sion
)
Stat
e an
d C
omm
unity
H
ighw
ay S
afet
y20
.600
2020
-HVE
-377
0 1,
577
-1,
577
-
Tota
l Hig
hway
Saf
ety
Clu
ster
: 1,
577
-1,
577
-
City
of E
dmon
dsSc
hedu
le o
f Exp
endi
ture
s of
Fed
eral
Aw
ards
For t
he Y
ear E
nded
Dec
embe
r 31,
202
0
The
acco
mpa
nyin
g no
tes
are
an in
tegr
al p
art o
f thi
s sc
hedu
le.
Page 97
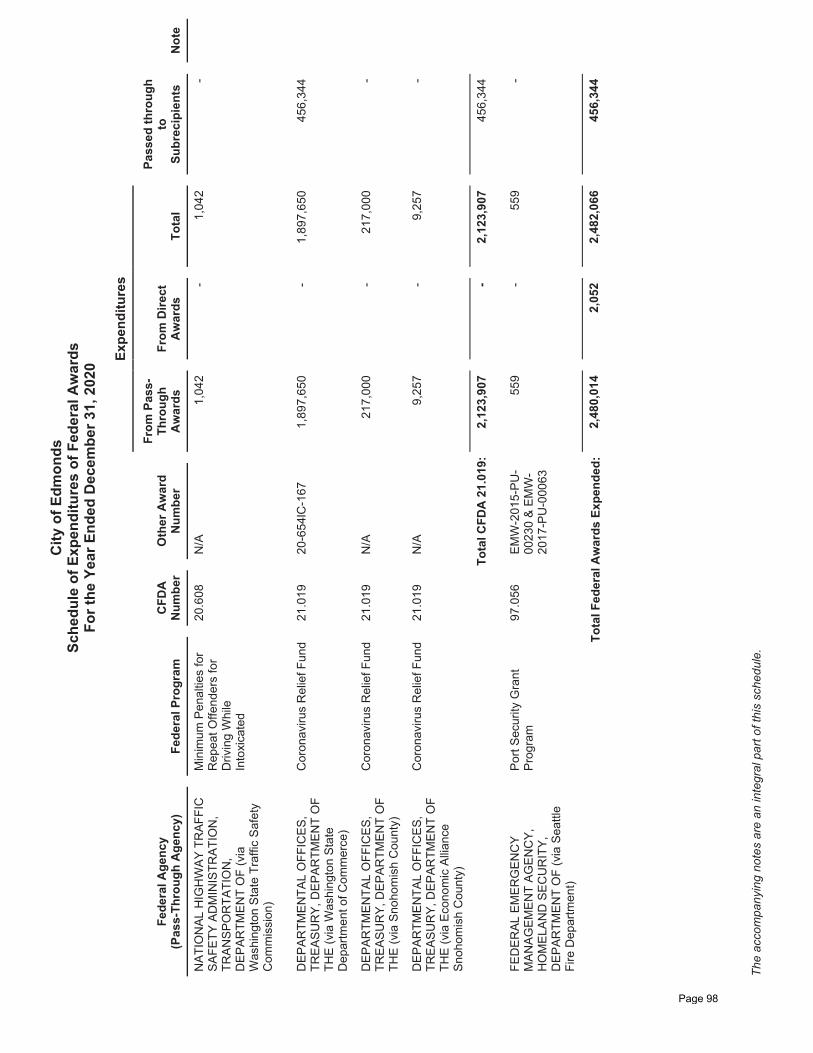
Fede
ral A
genc
y (P
ass-
Thro
ugh
Age
ncy)
Fede
ral P
rogr
amC
FDA
N
umbe
rO
ther
Aw
ard
Num
ber
Expe
nditu
res
Pass
ed th
roug
h to
Su
brec
ipie
nts
Not
e
From
Pas
s-Th
roug
h A
war
dsFr
om D
irect
A
war
dsTo
tal
NAT
ION
AL H
IGH
WAY
TR
AFFI
C
SAFE
TY A
DM
INIS
TRAT
ION
, TR
ANSP
OR
TATI
ON
, D
EPAR
TMEN
T O
F (v
ia
Was
hing
ton
Stat
e Tr
affic
Saf
ety
Com
mis
sion
)
Min
imum
Pen
altie
s fo
r R
epea
t Offe
nder
s fo
r D
rivin
g W
hile
In
toxi
cate
d
20.6
08N
/A1,
042
-1,
042
-
DEP
ARTM
ENTA
L O
FFIC
ES,
TREA
SUR
Y, D
EPAR
TMEN
T O
F TH
E (v
ia W
ashi
ngto
n St
ate
Dep
artm
ent o
f Com
mer
ce)
Cor
onav
irus
Rel
ief F
und
21.0
1920
-654
lC-1
671,
897,
650
-1,
897,
650
456,
344
DEP
ARTM
ENTA
L O
FFIC
ES,
TREA
SUR
Y, D
EPAR
TMEN
T O
F TH
E (v
ia S
noho
mis
h C
ount
y)
Cor
onav
irus
Rel
ief F
und
21.0
19N
/A21
7,00
0-
217,
000
-
DEP
ARTM
ENTA
L O
FFIC
ES,
TREA
SUR
Y, D
EPAR
TMEN
T O
F TH
E (v
ia E
cono
mic
Allia
nce
Snoh
omis
h C
ount
y)
Cor
onav
irus
Rel
ief F
und
21.0
19N
/A9,
257
-9,
257
-
Tota
l CFD
A 2
1.01
9:
2,12
3,90
7-
2,12
3,90
745
6,34
4
FED
ERAL
EM
ERG
ENC
Y M
ANAG
EMEN
T AG
ENC
Y,
HO
MEL
AND
SEC
UR
ITY,
D
EPAR
TMEN
T O
F (v
ia S
eattl
e Fi
re D
epar
tmen
t)
Port
Secu
rity
Gra
nt
Prog
ram
97
.056
EMW
-201
5-PU
-00
230
& EM
W-
2017
-PU
-000
63
559
-55
9-
Tota
l Fed
eral
Aw
ards
Exp
ende
d:2,
480,
014
2,05
22,
482,
066
456,
344
City
of E
dmon
dsSc
hedu
le o
f Exp
endi
ture
s of
Fed
eral
Aw
ards
For t
he Y
ear E
nded
Dec
embe
r 31,
202
0
The
acco
mpa
nyin
g no
tes
are
an in
tegr
al p
art o
f thi
s sc
hedu
le.
Page 98
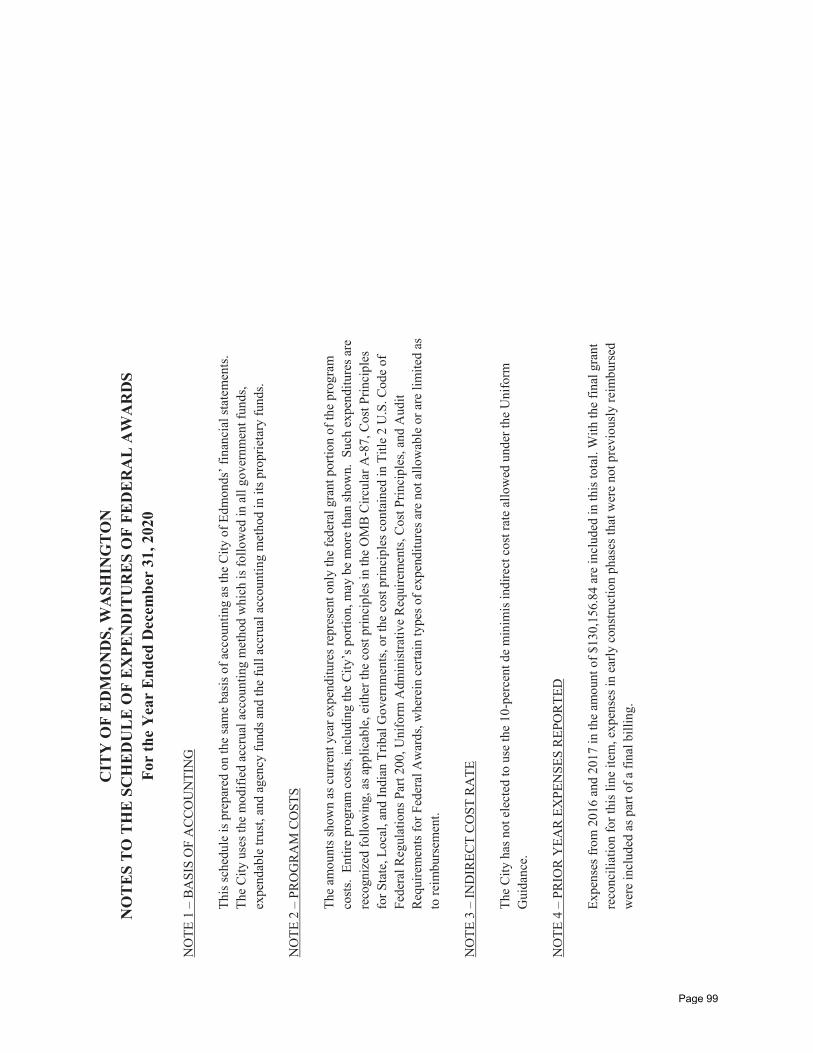
CIT
Y O
F E
DM
ON
DS,
WA
SHIN
GT
ON
N
OT
ES
TO
TH
E S
CH
ED
UL
E O
F E
XPE
ND
ITU
RE
S O
F FE
DE
RA
L A
WA
RD
S Fo
r th
e Y
ear
End
ed D
ecem
ber
31, 2
020
N
OTE
1 –
BA
SIS
OF
AC
COU
NTI
NG
This
sche
dule
is p
repa
red
on th
e sa
me
basi
s of a
ccou
ntin
g as
the
City
of E
dmon
ds’ f
inan
cial
stat
emen
ts.
The
City
use
s the
mod
ified
acc
rual
acc
ount
ing
met
hod
whi
ch is
follo
wed
in a
ll go
vern
men
t fun
ds,
expe
ndab
le tr
ust,
and
agen
cy fu
nds a
nd th
e fu
ll ac
crua
l acc
ount
ing
met
hod
in it
s pro
prie
tary
fund
s.
NO
TE 2
– P
ROG
RAM
CO
STS
Th
e am
ount
s sho
wn
as c
urre
nt y
ear e
xpen
ditu
res r
epre
sent
onl
y th
e fe
dera
l gra
nt p
ortio
n of
the
prog
ram
co
sts.
Ent
ire p
rogr
am c
osts
, inc
ludi
ng th
e Ci
ty’s
por
tion,
may
be
mor
e th
an sh
own.
Suc
h ex
pend
iture
s are
re
cogn
ized
follo
win
g, a
s app
licab
le, e
ither
the
cost
prin
cipl
es in
the
OM
B C
ircul
ar A
-87,
Cos
t Prin
cipl
es
for S
tate
, Loc
al, a
nd In
dian
Trib
al G
over
nmen
ts, o
r the
cos
t prin
cipl
es c
onta
ined
in T
itle
2 U
.S. C
ode
of
Fede
ral R
egul
atio
ns P
art 2
00, U
nifo
rm A
dmin
istra
tive
Req
uire
men
ts, C
ost P
rinci
ples
, and
Aud
it R
equi
rem
ents
for F
eder
al A
war
ds, w
here
in c
erta
in ty
pes o
f exp
endi
ture
s are
not
allo
wab
le o
r are
lim
ited
as
to re
imbu
rsem
ent.
NO
TE 3
– IN
DIR
ECT
CO
ST R
ATE
The
City
has
not
ele
cted
to u
se th
e 10
-per
cent
de
min
imis
indi
rect
cos
t rat
e al
low
ed u
nder
the
Uni
form
Gui
danc
e.
N
OTE
4 –
PRI
OR
YEA
R E
XPE
NSE
S R
EPO
RTE
D
Expe
nses
from
201
6 an
d 20
17 in
the
amou
nt o
f $13
0,15
6.84
are
incl
uded
in th
is to
tal.
With
the
final
gra
nt
reco
ncili
atio
n fo
r thi
s lin
e ite
m, e
xpen
ses i
n ea
rly c
onst
ruct
ion
phas
es th
at w
ere
not p
revi
ousl
y re
imbu
rsed
w
ere
incl
uded
as p
art o
f a fi
nal b
illin
g.
Page 99
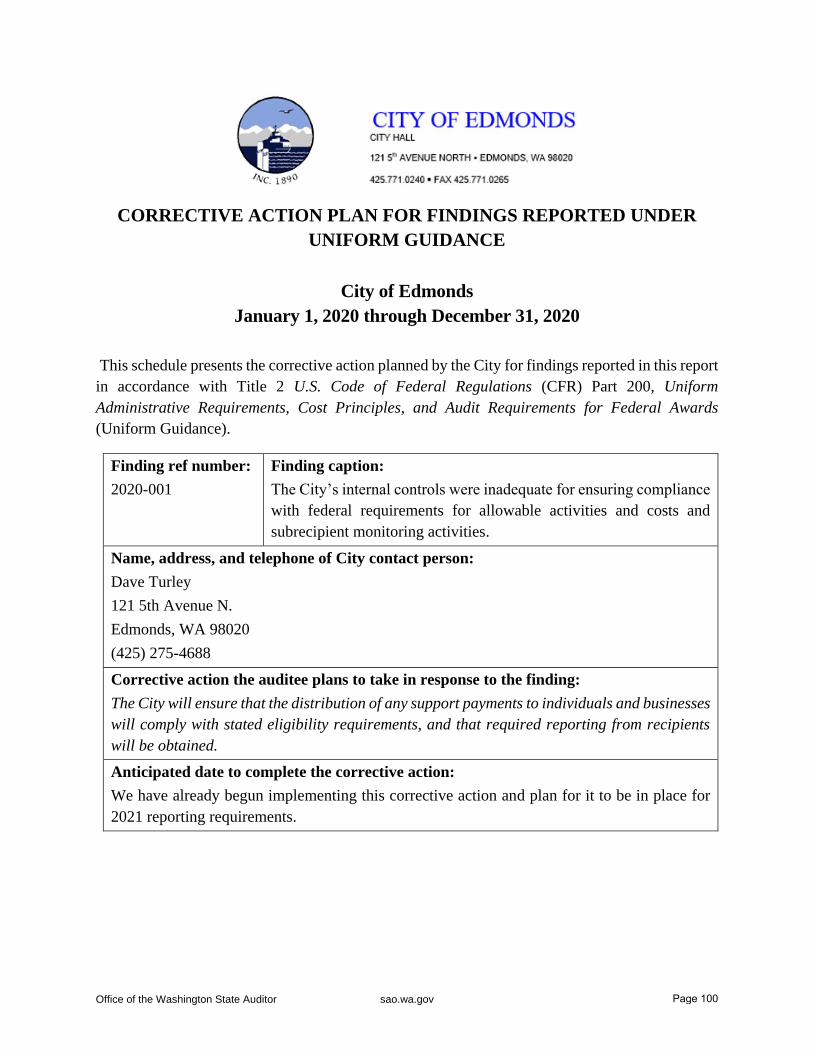
Office of the Washington State Auditor sao.wa.gov
CORRECTIVE ACTION PLAN FOR FINDINGS REPORTED UNDER
UNIFORM GUIDANCE
City of Edmonds
January 1, 2020 through December 31, 2020
This schedule presents the corrective action planned by the City for findings reported in this report
in accordance with Title 2 U.S. Code of Federal Regulations (CFR) Part 200, Uniform
Administrative Requirements, Cost Principles, and Audit Requirements for Federal Awards
(Uniform Guidance).
Finding ref number:
2020-001
Finding caption:
The City’s internal controls were inadequate for ensuring compliance
with federal requirements for allowable activities and costs and
subrecipient monitoring activities.
Name, address, and telephone of City contact person:
Dave Turley
121 5th Avenue N.
Edmonds, WA 98020
(425) 275-4688
Corrective action the auditee plans to take in response to the finding:
The City will ensure that the distribution of any support payments to individuals and businesses
will comply with stated eligibility requirements, and that required reporting from recipients
will be obtained.
Anticipated date to complete the corrective action:
We have already begun implementing this corrective action and plan for it to be in place for
2021 reporting requirements.
Page 100
Office of the Washington State Auditor sao.wa.gov
ABOUT THE STATE AUDITOR’S OFFICE
The State Auditor’s Office is established in the Washington State Constitution and is part of the
executive branch of state government. The State Auditor is elected by the people of Washington
and serves four-year terms.
We work with state agencies, local governments and the public to achieve our vision of increasing
trust in government by helping governments work better and deliver higher value.
In fulfilling our mission to provide citizens with independent and transparent examinations of how
state and local governments use public funds, we hold ourselves to those same standards by
continually improving our audit quality and operational efficiency, and by developing highly
engaged and committed employees.
As an agency, the State Auditor’s Office has the independence necessary to objectively perform
audits, attestation engagements and investigations. Our work is designed to comply with
professional standards as well as to satisfy the requirements of federal, state and local laws. The
Office also has an extensive quality control program and undergoes regular external peer review
to ensure our work meets the highest possible standards of accuracy, objectivity and clarity.
Our audits look at financial information and compliance with federal, state and local laws for all
local governments, including schools, and all state agencies, including institutions of higher
education. In addition, we conduct performance audits and cybersecurity audits of state agencies
and local governments, as well as state whistleblower, fraud and citizen hotline investigations.
The results of our work are available to everyone through the more than 2,000 reports we publish
each year on our website, www.sao.wa.gov. Additionally, we share regular news and other
information via an email subscription service and social media channels.
We take our role as partners in accountability seriously. The Office provides training and technical
assistance to governments both directly and through partnerships with other governmental support
organizations.
Stay connected at sao.wa.gov
Find your audit team
Request public records
Search BARS manuals (GAAP and
cash), and find reporting templates
Learn about our training workshops
and on-demand videos
Discover which governments serve you
— enter an address on our map
Explore public financial data
with the Financial Intelligence Tool
Other ways to stay in touch
Main telephone:
(564) 999-0950
Toll-free Citizen Hotline:
(866) 902-3900
Email:
Page 101


