Embed Size (px)
Citation preview
CLEAN WATER STATE REVOLVING FUND ANNUAL REPORT
FOR STATE FISCAL YEAR 2003/2004 (July 1, 2003 through June 30, 2004)
Division of Financial Assistance 1001 I Street, 16th Floor Sacramento, CA 95814
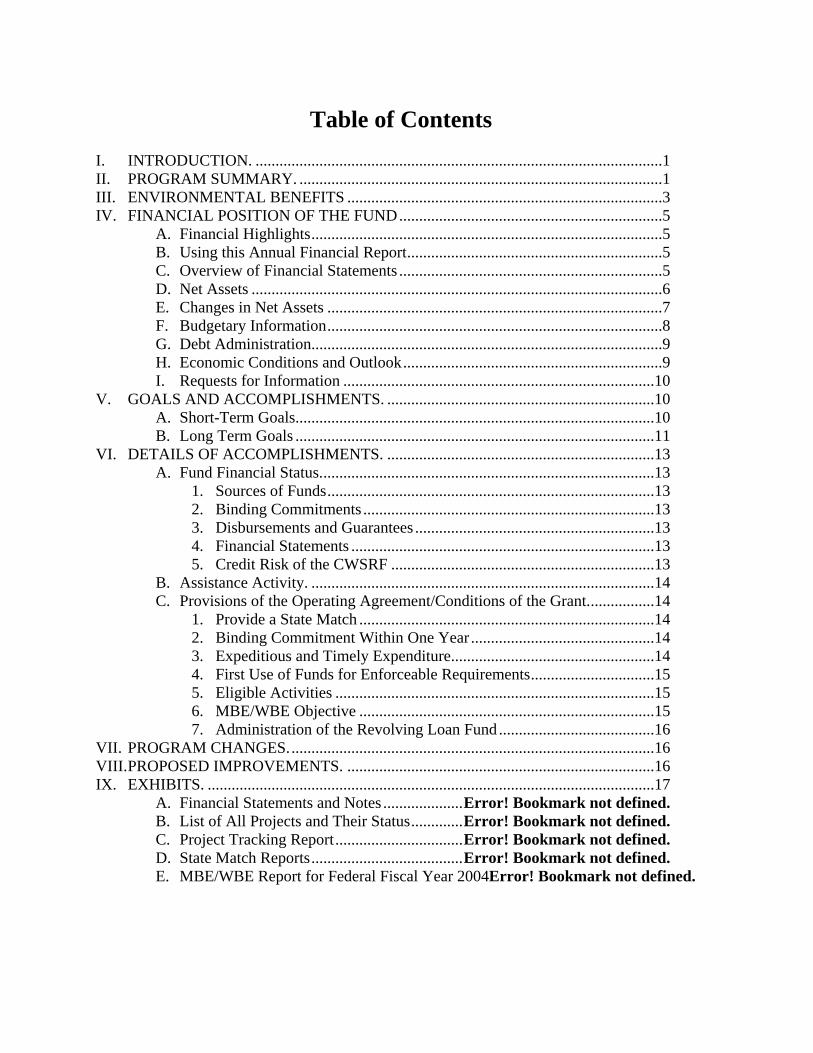
Table of Contents I. INTRODUCTION. ......................................................................................................1 II. PROGRAM SUMMARY. ...........................................................................................1 III. ENVIRONMENTAL BENEFITS ...............................................................................3 IV. FINANCIAL POSITION OF THE FUND..................................................................5
A. Financial Highlights........................................................................................5 B. Using this Annual Financial Report................................................................5 C. Overview of Financial Statements ..................................................................5 D. Net Assets .......................................................................................................6 E. Changes in Net Assets ....................................................................................7 F. Budgetary Information....................................................................................8 G. Debt Administration........................................................................................9 H. Economic Conditions and Outlook.................................................................9 I. Requests for Information ..............................................................................10
V. GOALS AND ACCOMPLISHMENTS. ...................................................................10 A. Short-Term Goals..........................................................................................10 B. Long Term Goals ..........................................................................................11
VI. DETAILS OF ACCOMPLISHMENTS. ...................................................................13 A. Fund Financial Status....................................................................................13
1. Sources of Funds..................................................................................13 2. Binding Commitments .........................................................................13 3. Disbursements and Guarantees ............................................................13 4. Financial Statements ............................................................................13 5. Credit Risk of the CWSRF ..................................................................13
B. Assistance Activity. ......................................................................................14 C. Provisions of the Operating Agreement/Conditions of the Grant.................14
1. Provide a State Match ..........................................................................14 2. Binding Commitment Within One Year ..............................................14 3. Expeditious and Timely Expenditure...................................................14 4. First Use of Funds for Enforceable Requirements...............................15 5. Eligible Activities ................................................................................15 6. MBE/WBE Objective ..........................................................................15 7. Administration of the Revolving Loan Fund .......................................16
VII. PROGRAM CHANGES............................................................................................16 VIII. PROPOSED IMPROVEMENTS. .............................................................................16 IX. EXHIBITS. ................................................................................................................17
A. Financial Statements and Notes ....................Error! Bookmark not defined. B. List of All Projects and Their Status.............Error! Bookmark not defined. C. Project Tracking Report................................Error! Bookmark not defined. D. State Match Reports......................................Error! Bookmark not defined. E. MBE/WBE Report for Federal Fiscal Year 2004Error! Bookmark not defined.
CCaalliiffoorrnniiaa WWaatteerr BBooaarrddss CCWWSSRRFF AAnnnnuuaall RReeppoorrtt 22000033//22000044
I. INTRODUCTION. The State Water Resources Control Board (Water Board) herewith submits a comprehensive Annual Report for its Clean Water State Revolving Fund (CWSRF) program for the period of July 1, 2003 through June 30, 2004. This period correspond with State Fiscal Year (SFY) 2003/2004. This report describes how the Water Board met the objectives identified in the SFY 2003/2004 Intended Use Plan (IUP) and reflects the actual use of the available funds.
II. PROGRAM SUMMARY. The Water Board has made CWSRF loans to assist in the financing of wastewater treatment facilities necessary to prevent water pollution, recycle wastewater, correct nonpoint source and storm drainage pollution problems, and provide for estuary enhancement. The CWSRF has protected and promoted the health, safety, and welfare of the inhabitants of the State since 1989. Many of the recipients of California’s loan program are those with wastewater discharge requirement violations resulting in enforcement actions or pending enforcement orders by the State’s Regional Water Quality Control Boards. Every project is directly related to improvement of water quality and public health. The revolving nature of the CWSRF loan program has allowed it to continue to grow. Currently the CWSRF has issued almost $3 billion in executed loan contracts and has averaged $279 million per year in loan commitments over the last five years. Figure 1 below shows both the yearly totals for loans issued and the cumulative amount of loans to date.
Figure 1: Total and Cumulative Amount of Projects Funded Each Year
$0$50
$100$150$200$250$300$350$400$450
1990
1991
1992
1993
1994
1995
1996
1997
1998
1999
2000
2001
2002
2003
2004
Fiscal Year Ending
Year
ly T
otal
(in
mill
ions
)
$0
$500
$1,000
$1,500
$2,000
$2,500
$3,000
$3,500
Cum
ulat
ive
Tota
l (i
n m
illio
ns)
Annual Total Cumulative
The CWSRF is used for a broad range of projects. Figure 2 illustrates the percentage of funding that has gone towards the three main categories of projects: wastewater treatment and water-
1
CCaalliiffoorrnniiaa WWaatteerr BBooaarrddss CCWWSSRRFF AAnnnnuuaall RReeppoorrtt 22000033//22000044
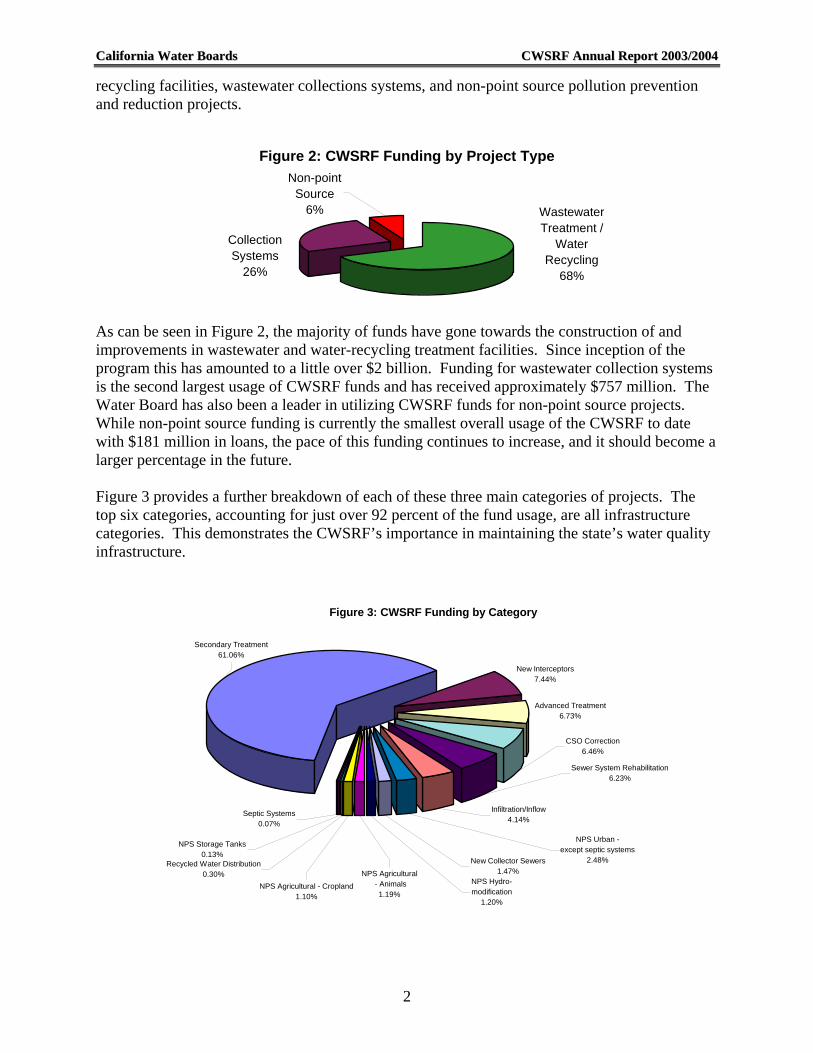
recycling facilities, wastewater collections systems, and non-point source pollution prevention and reduction projects.
Figure 2: CWSRF Funding by Project Type
Wastewater Treatment /
Water Recycling
68%
Non-point Source
6%
Collection Systems
26%
As can be seen in Figure 2, the majority of funds have gone towards the construction of and improvements in wastewater and water-recycling treatment facilities. Since inception of the program this has amounted to a little over $2 billion. Funding for wastewater collection systems is the second largest usage of CWSRF funds and has received approximately $757 million. The Water Board has also been a leader in utilizing CWSRF funds for non-point source projects. While non-point source funding is currently the smallest overall usage of the CWSRF to date with $181 million in loans, the pace of this funding continues to increase, and it should become a larger percentage in the future. Figure 3 provides a further breakdown of each of these three main categories of projects. The top six categories, accounting for just over 92 percent of the fund usage, are all infrastructure categories. This demonstrates the CWSRF’s importance in maintaining the state’s water quality infrastructure.
Figure 3: CWSRF Funding by Category
Secondary Treatment61.06%
New Interceptors7.44%
Advanced Treatment6.73%
CSO Correction6.46%
Sewer System Rehabilitation6.23%
NPS Urban - except septic systems
2.48%
Septic Systems0.07%
NPS Storage Tanks0.13%
NPS Agricultural - Cropland1.10%
New Collector Sewers1.47%NPS Agricultural
- Animals1.19%
Recycled Water Distribution0.30%
NPS Hydro-modification
1.20%
Infiltration/Inflow4.14%
2
CCaalliiffoorrnniiaa WWaatteerr BBooaarrddss CCWWSSRRFF AAnnnnuuaall RReeppoorrtt 22000033//22000044
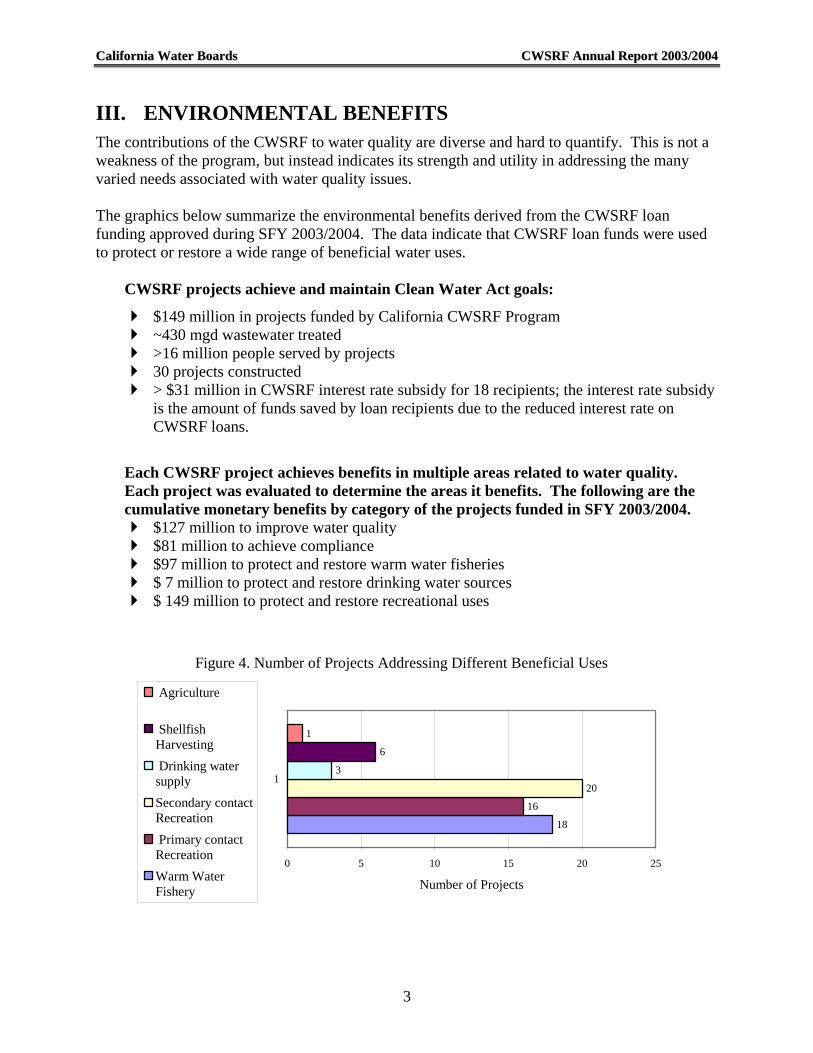
III. ENVIRONMENTAL BENEFITS The contributions of the CWSRF to water quality are diverse and hard to quantify. This is not a weakness of the program, but instead indicates its strength and utility in addressing the many varied needs associated with water quality issues. The graphics below summarize the environmental benefits derived from the CWSRF loan funding approved during SFY 2003/2004. The data indicate that CWSRF loan funds were used to protect or restore a wide range of beneficial water uses.
CWSRF projects achieve and maintain Clean Water Act goals:
$149 million in projects funded by California CWSRF Program ~430 mgd wastewater treated >16 million people served by projects 30 projects constructed > $31 million in CWSRF interest rate subsidy for 18 recipients; the interest rate subsidy
is the amount of funds saved by loan recipients due to the reduced interest rate on CWSRF loans.
Each CWSRF project achieves benefits in multiple areas related to water quality. Each project was evaluated to determine the areas it benefits. The following are the cumulative monetary benefits by category of the projects funded in SFY 2003/2004. $127 million to improve water quality $81 million to achieve compliance $97 million to protect and restore warm water fisheries $ 7 million to protect and restore drinking water sources $ 149 million to protect and restore recreational uses
Figure 4. Number of Projects Addressing Different Beneficial Uses
18
16
20
3
6
1
0 5 10 15 20 25
1
Number of Projects
Agriculture
ShellfishHarvesting Drinking watersupplySecondary contactRecreation Primary contactRecreationWarm WaterFishery
3
CCaalliiffoorrnniiaa WWaatteerr BBooaarrddss CCWWSSRRFF AAnnnnuuaall RReeppoorrtt 22000033//22000044
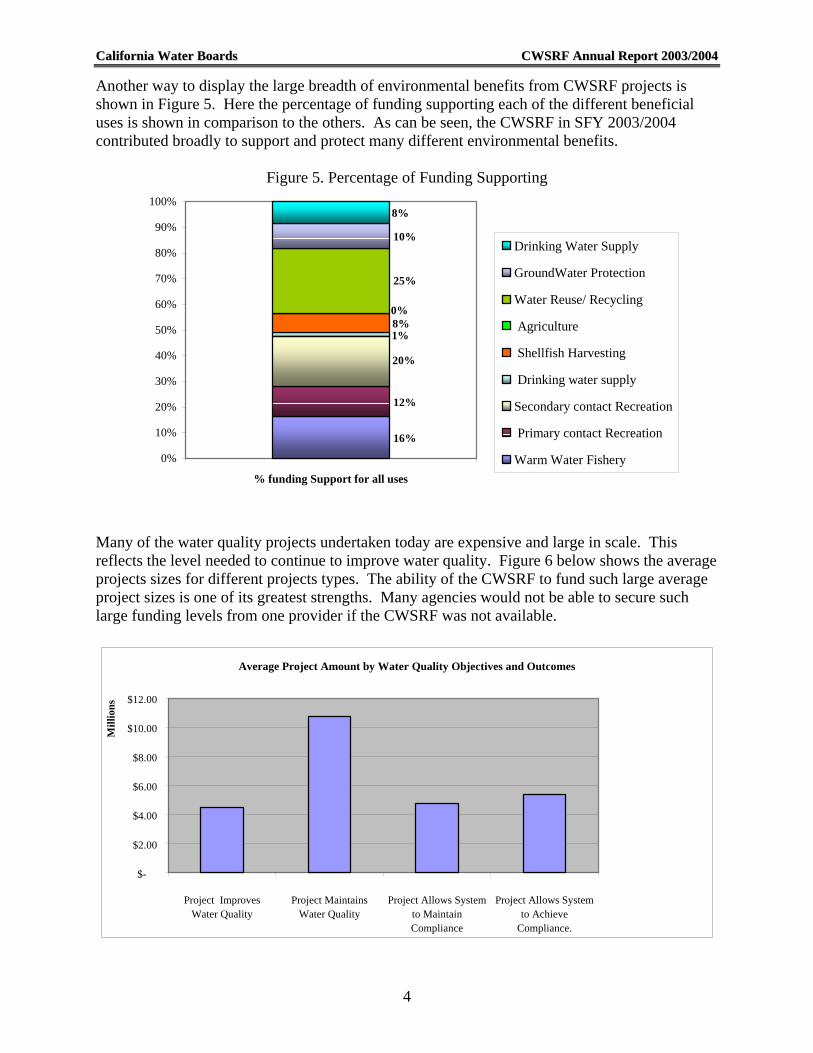
Another way to display the large breadth of environmental benefits from CWSRF projects is shown in Figure 5. Here the percentage of funding supporting each of the different beneficial uses is shown in comparison to the others. As can be seen, the CWSRF in SFY 2003/2004 contributed broadly to support and protect many different environmental benefits.
Figure 5. Percentage of Funding Supporting
16%
12%
20%
1%8%0%
25%
10%
8%
0%
10%
20%
30%
40%
50%
60%
70%
80%
90%
100%
% funding Support for all uses
Drinking Water Supply
GroundWater Protection
Water Reuse/ Recycling
Agriculture
Shellfish Harvesting
Drinking water supply
Secondary contact Recreation
Primary contact Recreation
Warm Water Fishery
Many of the water quality projects undertaken today are expensive and large in scale. This reflects the level needed to continue to improve water quality. Figure 6 below shows the average projects sizes for different projects types. The ability of the CWSRF to fund such large average project sizes is one of its greatest strengths. Many agencies would not be able to secure such large funding levels from one provider if the CWSRF was not available.
Average Project Amount by Water Quality Objectives and Outcomes
$-
$2.00
$4.00
$6.00
$8.00
$10.00
$12.00
Project ImprovesWater Quality
Project MaintainsWater Quality
Project Allows Systemto MaintainCompliance
Project Allows Systemto Achieve
Compliance.
Mill
ions
4
CCaalliiffoorrnniiaa WWaatteerr BBooaarrddss CCWWSSRRFF AAnnnnuuaall RReeppoorrtt 22000033//22000044
IV. FINANCIAL POSITION OF THE FUND The following Management’s Discussion and Analysis is a required supplement to the Water Board’s, CWSRF financial statements. It describes and analyzes the financial position of the CWSRF providing an overview of the CWSRF’s activities for the year ended June 30, 2004. We encourage readers to consider the information presented here in conjunction with information that is in the financial statements and notes presented in Exhibit A.
A. Financial Highlights In 2004, net assets increased by $84 million as compared to 2003 to a total of $2.08
billion in total net assets. Total capital contributions decreased by $98 million primarily due to increased utilization
of the Series 2002 Revenue Bonds for loan disbursements and deferring utilization of U.S. Environmental Protection Agency (EPA) capitalization grants.
Restricted portion of net assets decreased by $196 million primarily due to the disbursement of unspent revenue bond proceeds, as noted above, to fund loans and a decrease in pledged loans receivable due to repayments received during the year.
As a result of the disbursement of the unspent revenue bond proceeds, there is also a decrease in restricted cash and cash equivalents of $175 million.
Notes receivable increased $187 million due to the loan disbursements noted above net of loan principal repayments received during 2004.
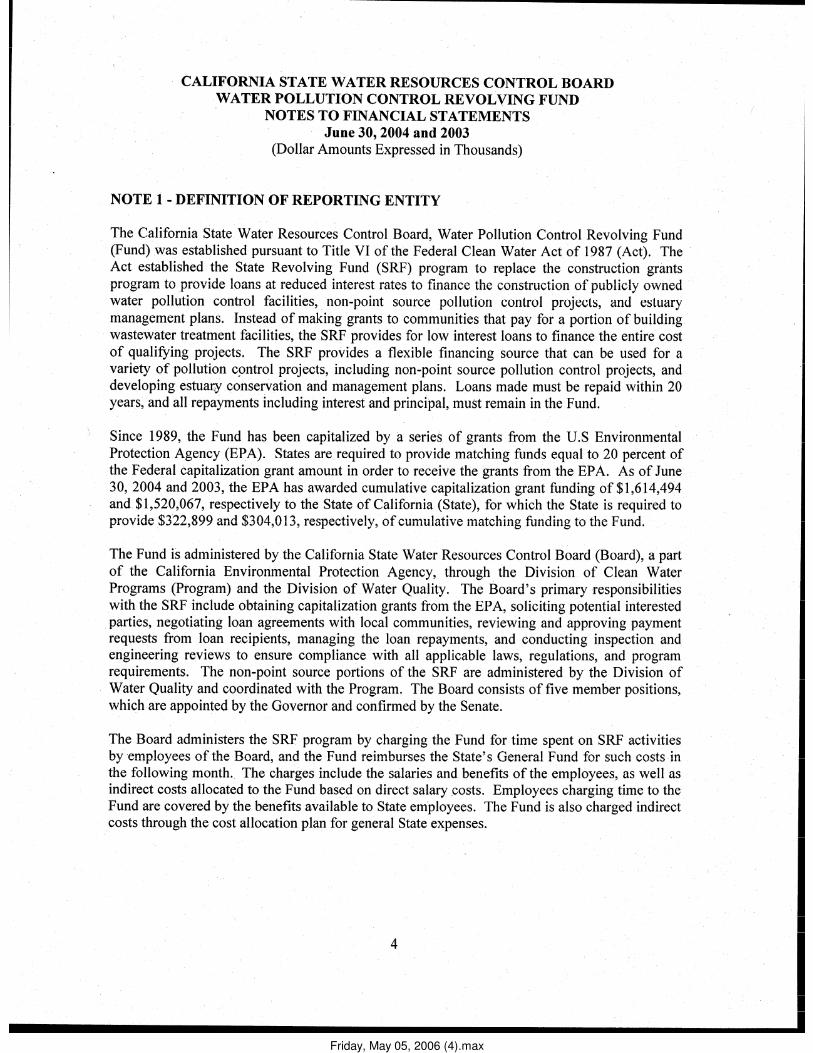
B. Using this Annual Financial Report The financial statements included in this annual financial report are those of the CWSRF. As discussed in Note 1, Definition of Reporting Entity, the basic financial statements of the CWSRF are intended to present the financial position, change in financial position and cash flows of only that portion of the financial reporting entity of the Board that is attributable to the transactions of the CWSRF. They do not purport to present the financial position of the California State Water Resources Control Board or the State of California as of June 30, 2004 and the change in their financial positions and their cash flows.
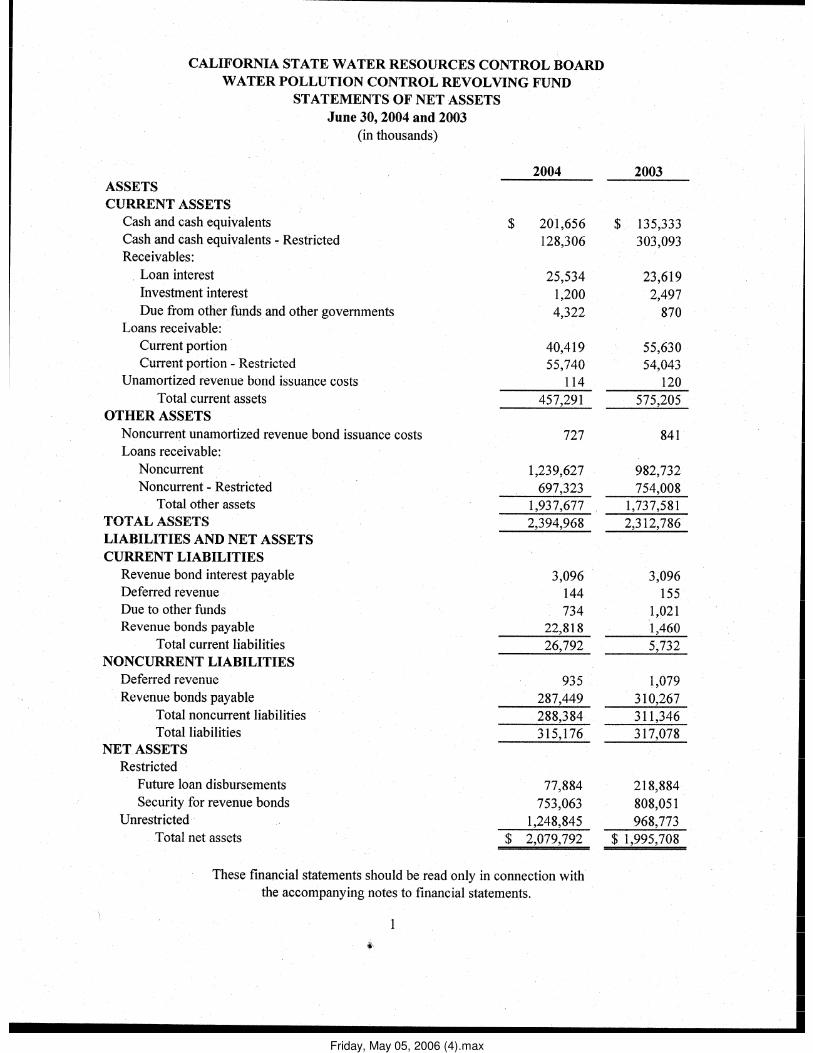
C. Overview of Financial Statements This discussion and analysis is an introduction to the CWSRF financial statements and accompanying notes to financial statements. This report also contains required and other supplementary information. The financial statements of the CWSRF are presented as a special purpose government engaged only in business type activities – providing loans to other governmental entities. The statements provide both short-term and long-term information about the CWSRF’s financial position, which assists the reader in assessing the CWSRF’s economic condition at the end of the fiscal year. These statements are prepared using the accrual basis of accounting. The financial statements include the following three statements:
• The Statements of Net Assets present information on all of the CWSRF’s assets and liabilities with the difference between the two reported as net assets. Over time, increases
5
CCaalliiffoorrnniiaa WWaatteerr BBooaarrddss CCWWSSRRFF AAnnnnuuaall RReeppoorrtt 22000033//22000044
or decreases in net assets are expected to serve as a useful indicator of whether the financial position of the CWSRF is improving or deteriorating.
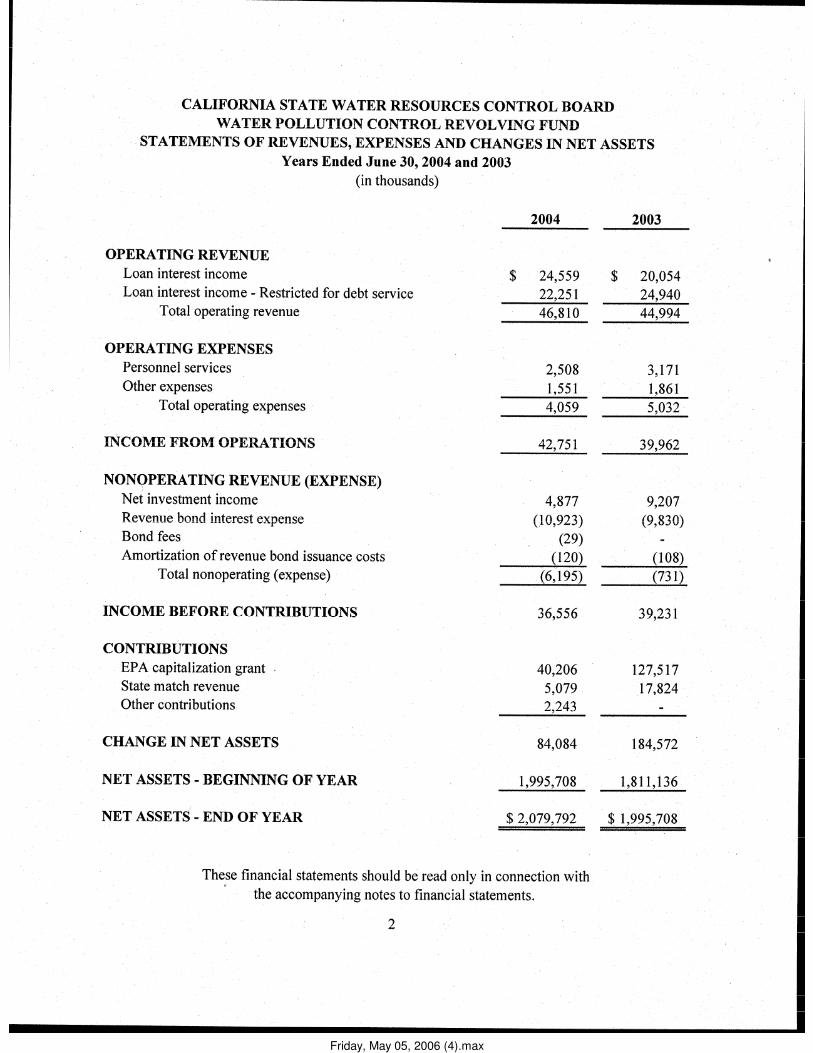
• The Statements of Revenues, Expenses, and Changes in Net Assets present information which reflects how the CWSRF’s net assets changed during the past year. All changes in the net assets are reported as soon as the underlying event giving rise to the change occurs, regardless of the timing of the cash flows. Thus, revenues and expenses are reported in the statement for some items that will only result in cash flows in future fiscal periods.
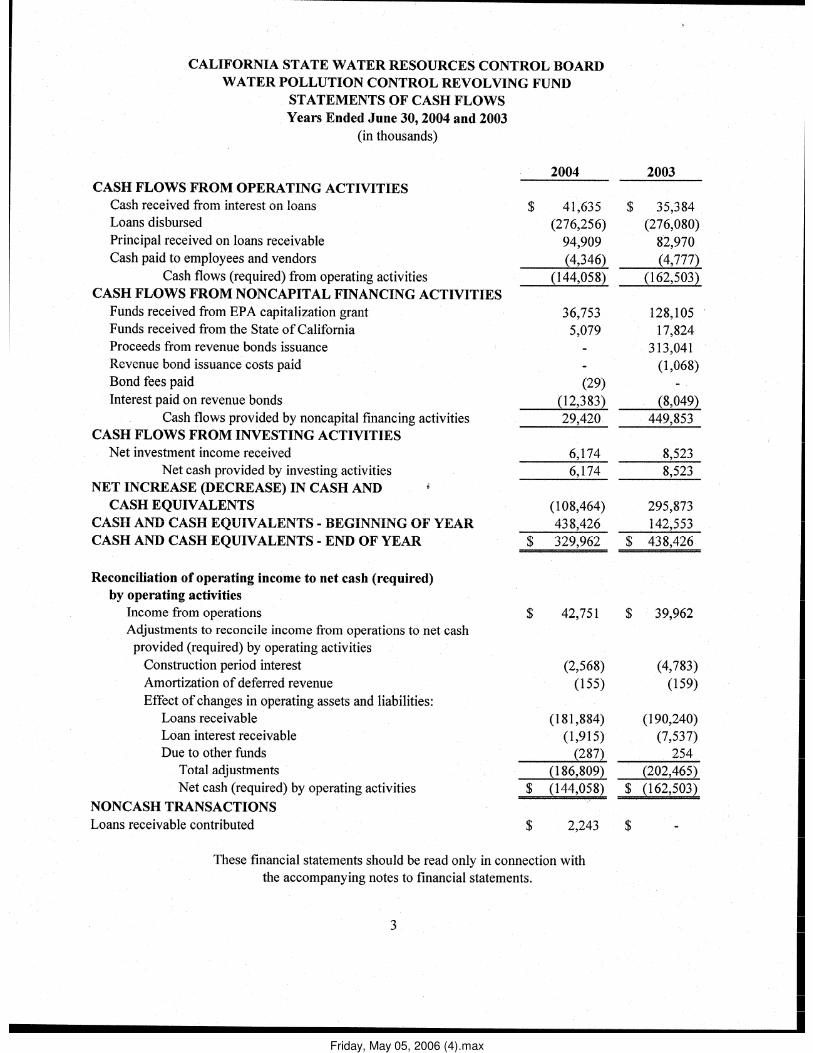
• The Statements of Cash Flows report the CWSRF’s cash flows from operating activities, non-capital financing activities, and investing activities.
The Notes to Financial Statements provide additional information that is essential to a full understanding of the data provided in the financial statements. These notes can be found immediately following the financial statements.
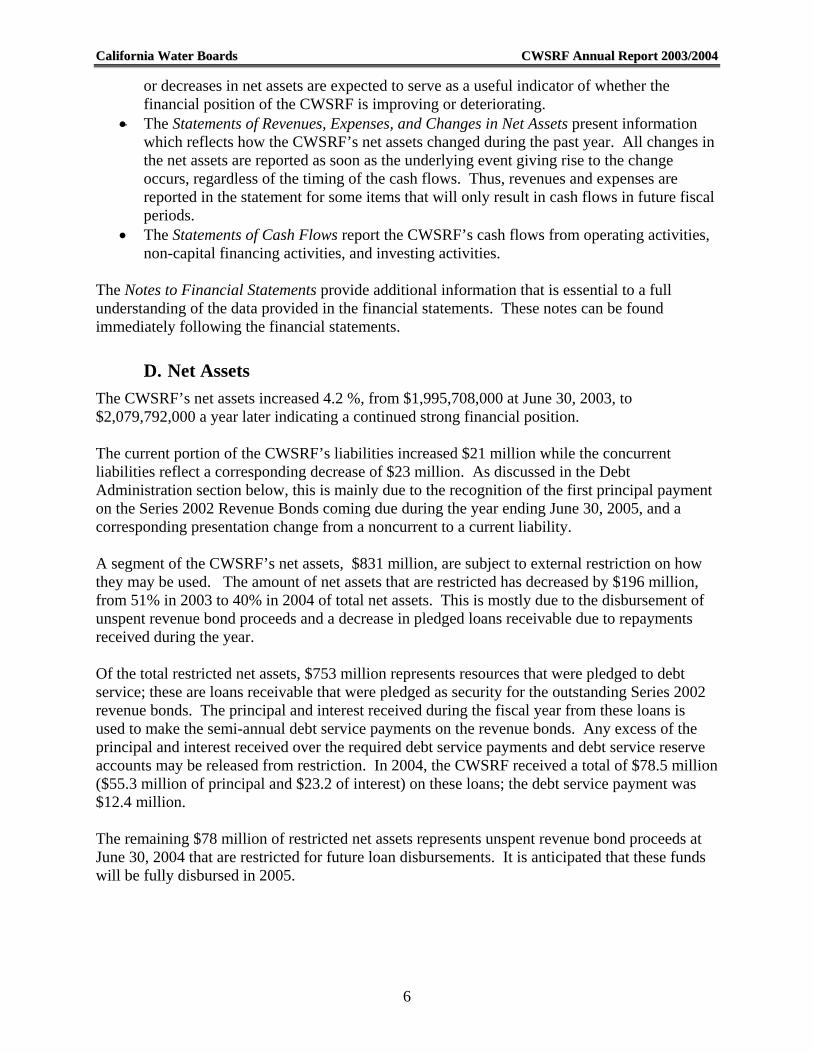
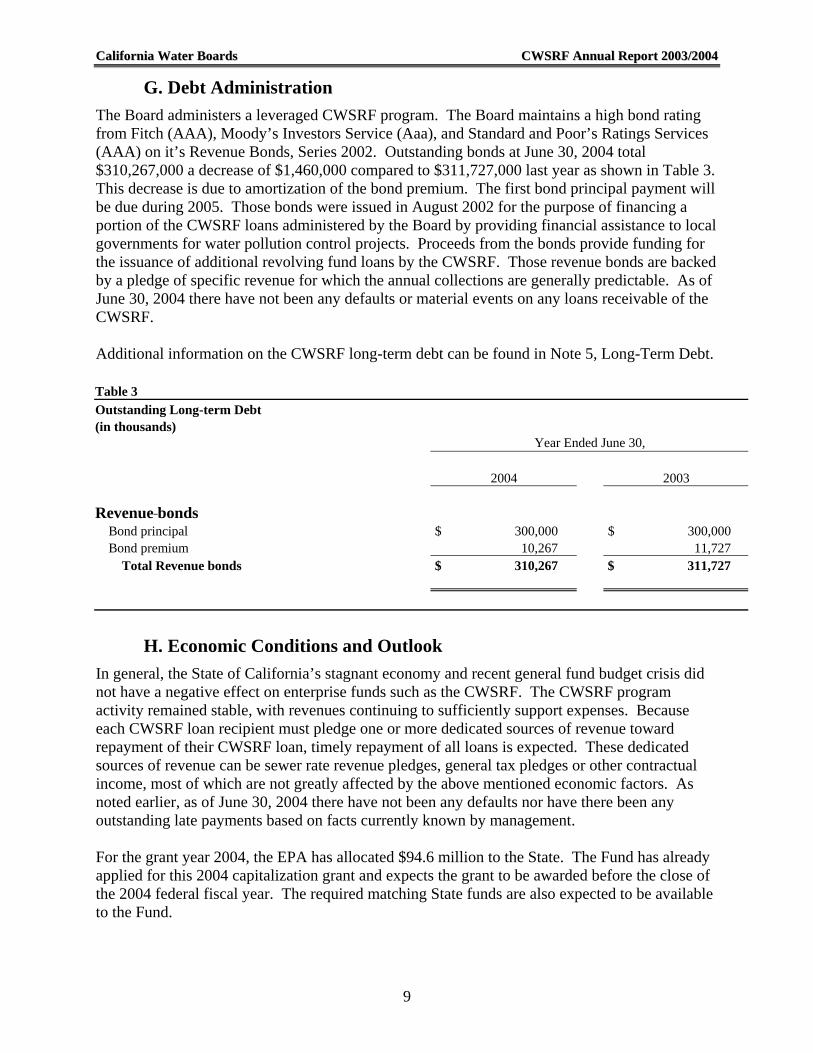
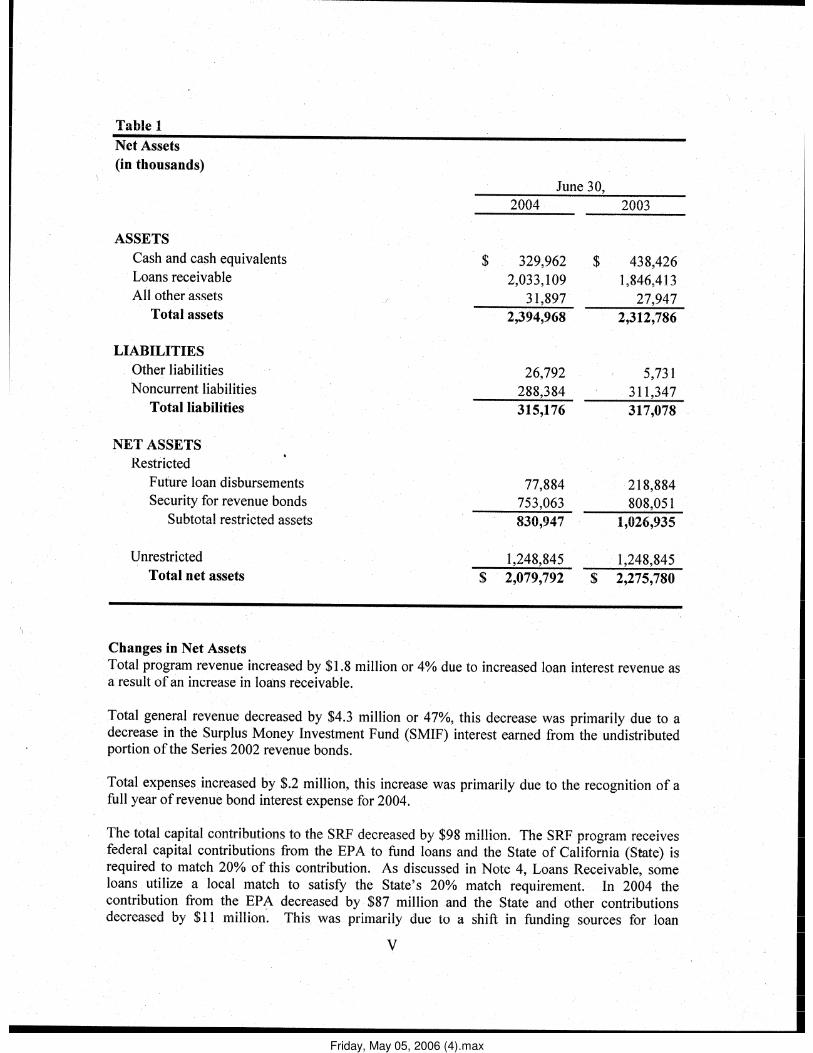
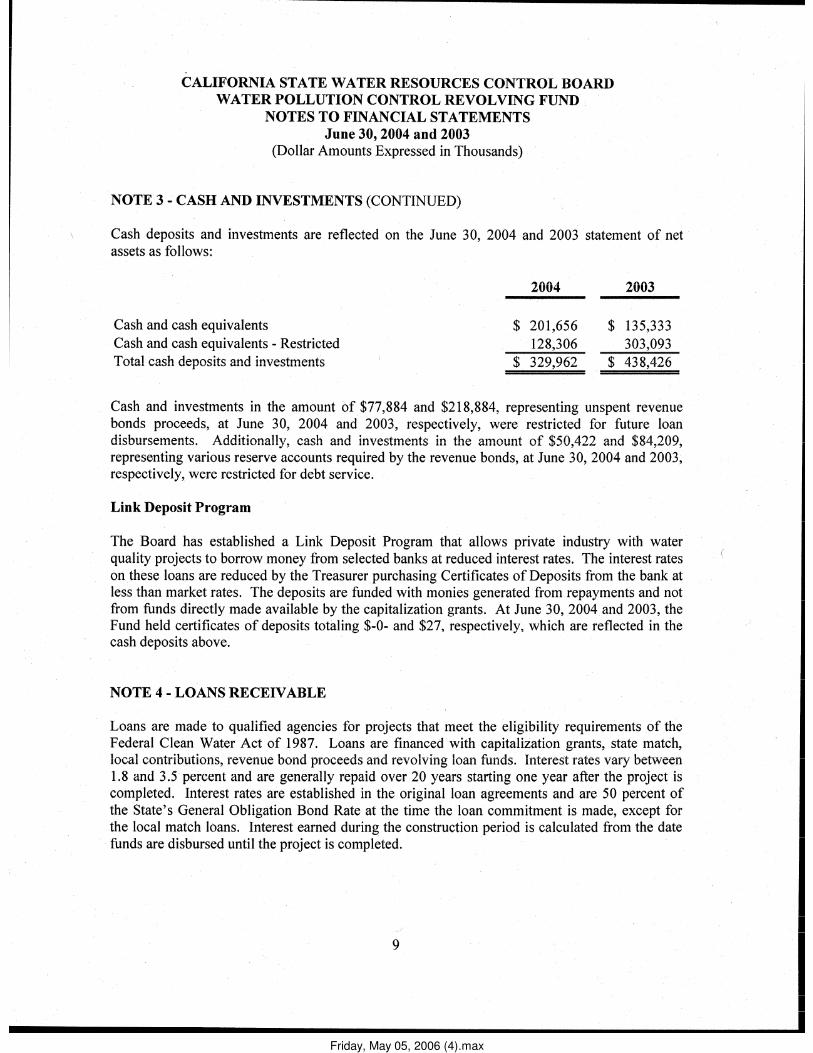
D. Net Assets The CWSRF’s net assets increased 4.2 %, from $1,995,708,000 at June 30, 2003, to $2,079,792,000 a year later indicating a continued strong financial position. The current portion of the CWSRF’s liabilities increased $21 million while the concurrent liabilities reflect a corresponding decrease of $23 million. As discussed in the Debt Administration section below, this is mainly due to the recognition of the first principal payment on the Series 2002 Revenue Bonds coming due during the year ending June 30, 2005, and a corresponding presentation change from a noncurrent to a current liability. A segment of the CWSRF’s net assets, $831 million, are subject to external restriction on how they may be used. The amount of net assets that are restricted has decreased by $196 million, from 51% in 2003 to 40% in 2004 of total net assets. This is mostly due to the disbursement of unspent revenue bond proceeds and a decrease in pledged loans receivable due to repayments received during the year. Of the total restricted net assets, $753 million represents resources that were pledged to debt service; these are loans receivable that were pledged as security for the outstanding Series 2002 revenue bonds. The principal and interest received during the fiscal year from these loans is used to make the semi-annual debt service payments on the revenue bonds. Any excess of the principal and interest received over the required debt service payments and debt service reserve accounts may be released from restriction. In 2004, the CWSRF received a total of $78.5 million ($55.3 million of principal and $23.2 of interest) on these loans; the debt service payment was $12.4 million. The remaining $78 million of restricted net assets represents unspent revenue bond proceeds at June 30, 2004 that are restricted for future loan disbursements. It is anticipated that these funds will be fully disbursed in 2005.
6
CCaalliiffoorrnniiaa WWaatteerr BBooaarrddss CCWWSSRRFF AAnnnnuuaall RReeppoorrtt 22000033//22000044
Table 1 Statement of Net Assets (in thousands) Year Ended June 30, 2004 2003 ASSETS Cash and equivalents $ 329,962 $ 438,426 Loans receivable 2,033,109 1,846,413 All other assets 31,897 27,947 Total assets 2,394,968 2,312,786 LIABILITIES Noncurrent liabilities 288,384 311,347 Other liabilities 26,792 5,731 Total liabilities 315,176 317,078 NET ASSETS Restricted Future loan disbursements 77,884 218,884 Security for revenue bonds 753,063 808,051 Subtotal Restricted Assets 830,947 1,026,935 Unrestricted 1,248,845 968,773 Total Net Assets $ 2,079,792 $ 1,995,708
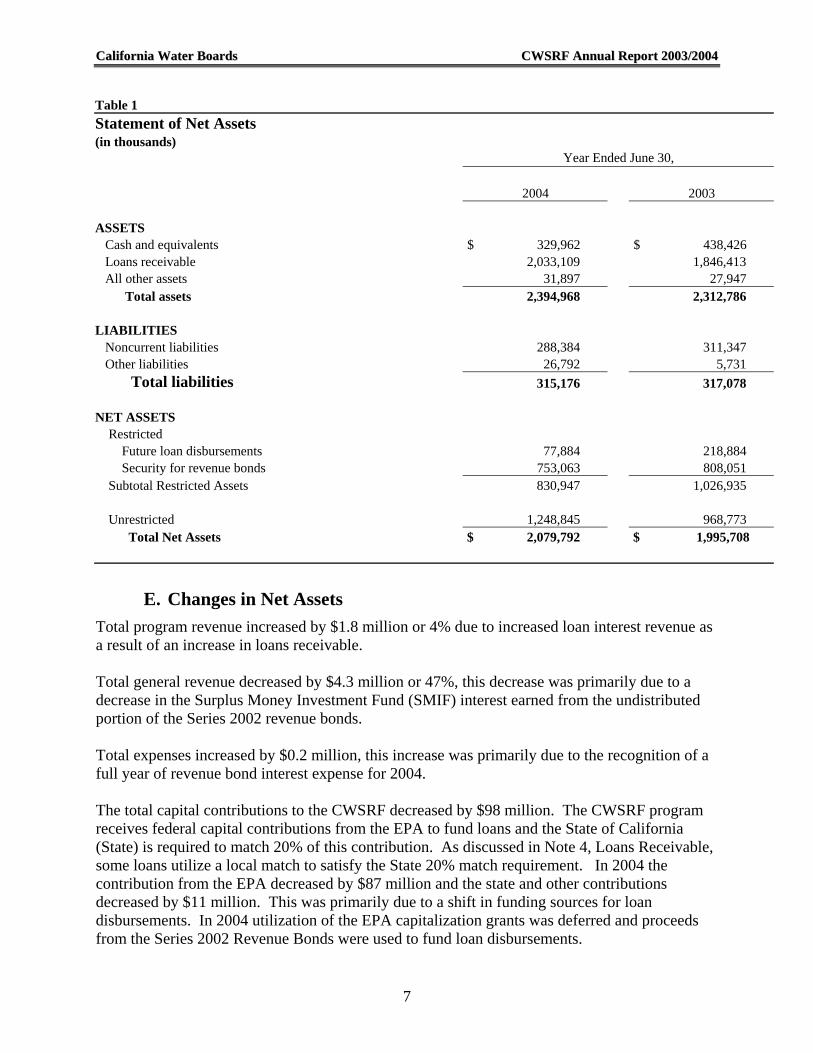
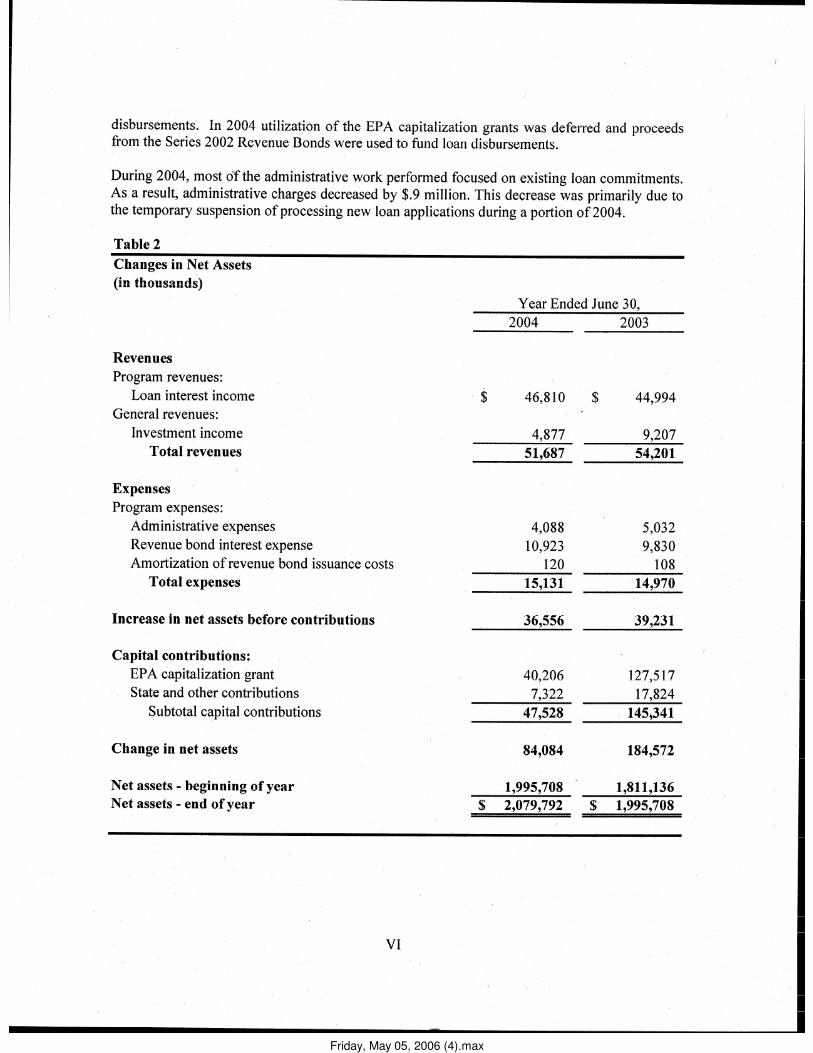
E. Changes in Net Assets Total program revenue increased by $1.8 million or 4% due to increased loan interest revenue as a result of an increase in loans receivable. Total general revenue decreased by $4.3 million or 47%, this decrease was primarily due to a decrease in the Surplus Money Investment Fund (SMIF) interest earned from the undistributed portion of the Series 2002 revenue bonds. Total expenses increased by $0.2 million, this increase was primarily due to the recognition of a full year of revenue bond interest expense for 2004. The total capital contributions to the CWSRF decreased by $98 million. The CWSRF program receives federal capital contributions from the EPA to fund loans and the State of California (State) is required to match 20% of this contribution. As discussed in Note 4, Loans Receivable, some loans utilize a local match to satisfy the State 20% match requirement. In 2004 the contribution from the EPA decreased by $87 million and the state and other contributions decreased by $11 million. This was primarily due to a shift in funding sources for loan disbursements. In 2004 utilization of the EPA capitalization grants was deferred and proceeds from the Series 2002 Revenue Bonds were used to fund loan disbursements.
7
CCaalliiffoorrnniiaa WWaatteerr BBooaarrddss CCWWSSRRFF AAnnnnuuaall RReeppoorrtt 22000033//22000044
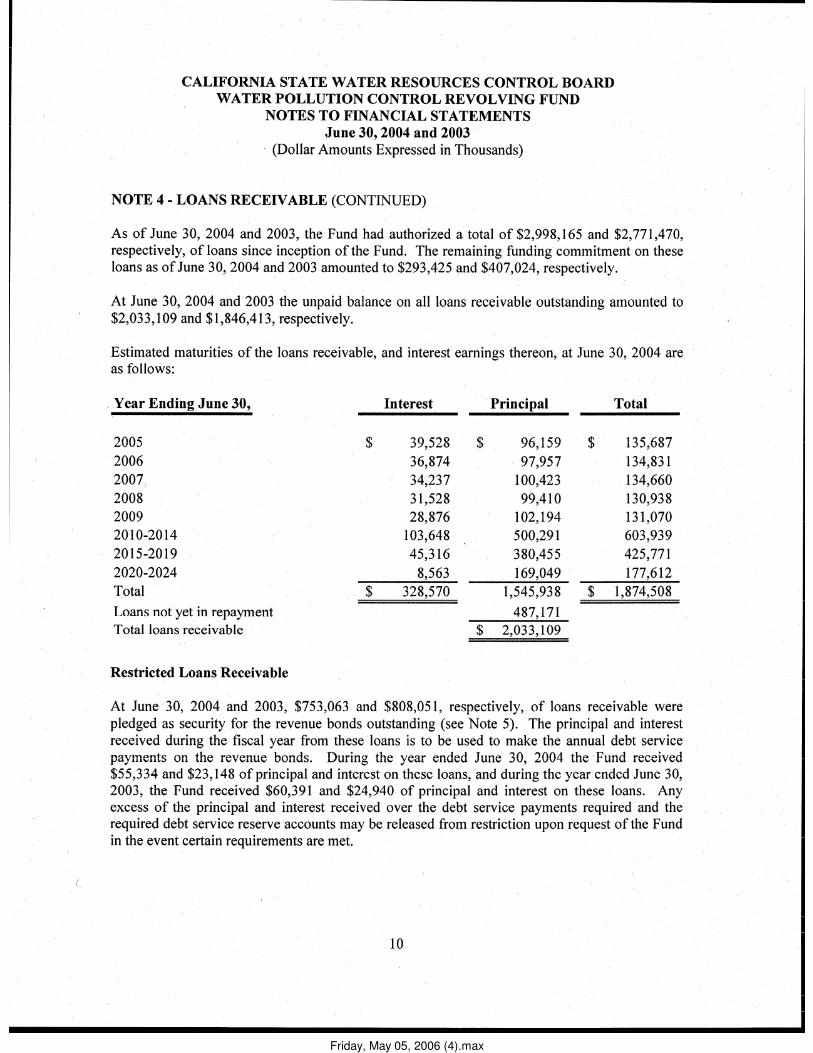
During 2004, most of the administrative work performed focused on existing loan commitments. As a result, administrative charges decreased by $0.9 million. This decrease was primarily due to the temporary suspension of processing new loan applications during a portion of 2004. Table 2 Changes in Net Assets (in thousands) Year Ended June 30, 2004 2003 Revenues Program revenues: Loan interest income $ 46,810 $ 44,994 General revenues: Investment income 4,877 9,207 Total revenues 51,687 54,201 Expenses Program expenses: Administrative expenses 4,088 5,032 Revenue bond interest expense 10,923 9,830 Amortization of revenue bond issuance costs 120 108 Total expenses 15,131 14,970 Increase in net assets before contributions 36,556 39,231 Capital contributions: EPA capitalization grant 40,206 127,517 State and other contributions 7,322 17,824 Subtotal Capital contributions 47,528 145,341 Change in net assets 84,084 184,572 Net assets – beginning of year 1,995,708 1,811,136 Net assets – end of year $ 2,079,792 $ 1,995,708
F. Budgetary Information Under the California constitution, money may only be drawn from the treasury by a legal appropriation. The State Legislature authorized the CWSRF to operate under a continuous appropriation. Continuous appropriation authority means that no further appropriations are necessary to expend all funds deposited into the CWSRF. This has the effect of allowing funds to be expended as soon as they are deposited into the CWSRF rather than waiting for appropriation authority.
8
CCaalliiffoorrnniiaa WWaatteerr BBooaarrddss CCWWSSRRFF AAnnnnuuaall RReeppoorrtt 22000033//22000044
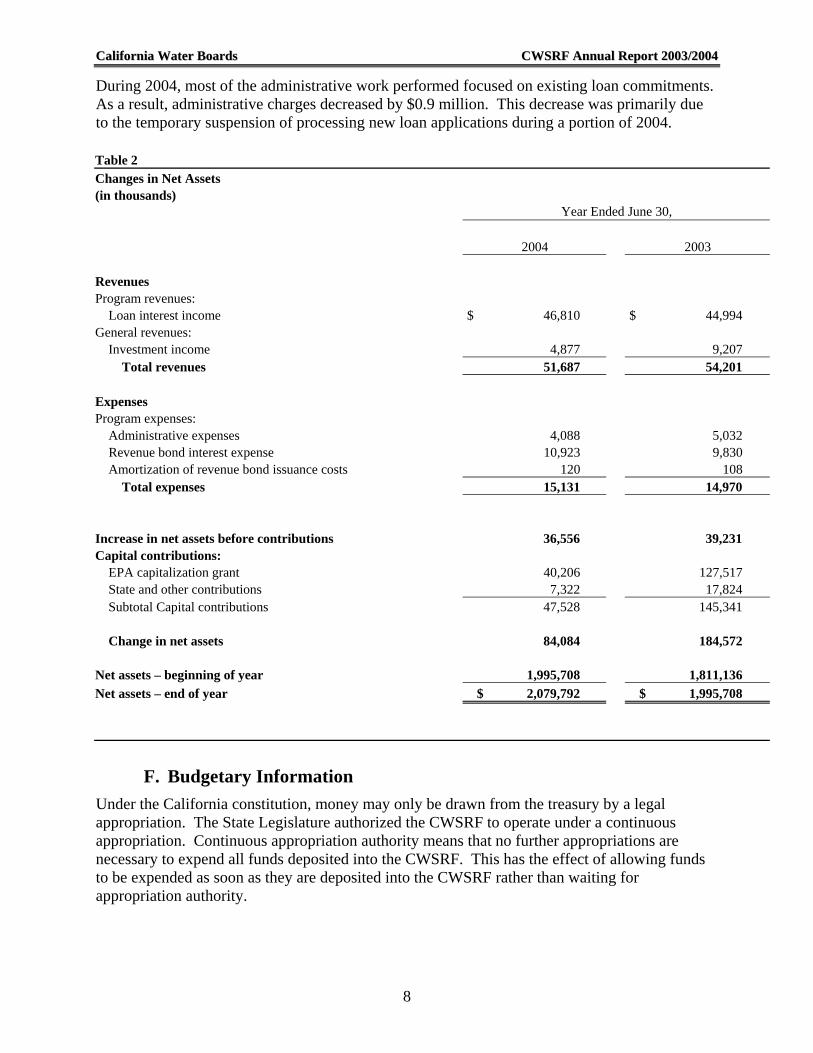
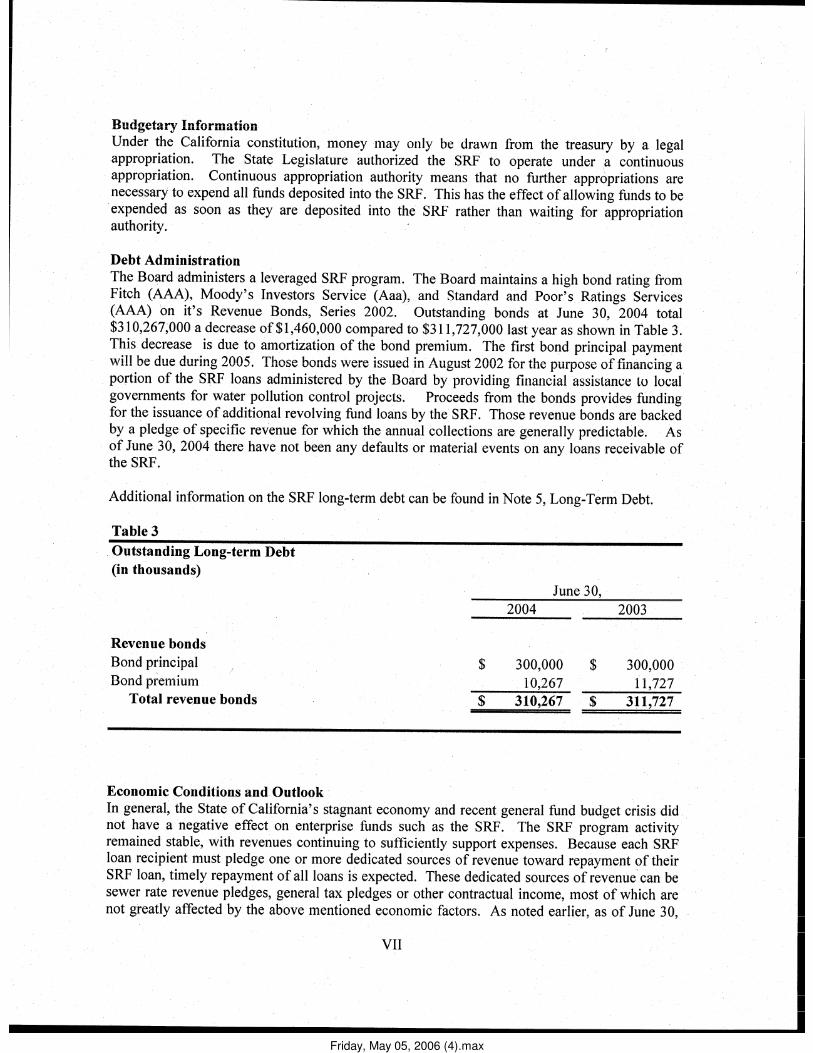
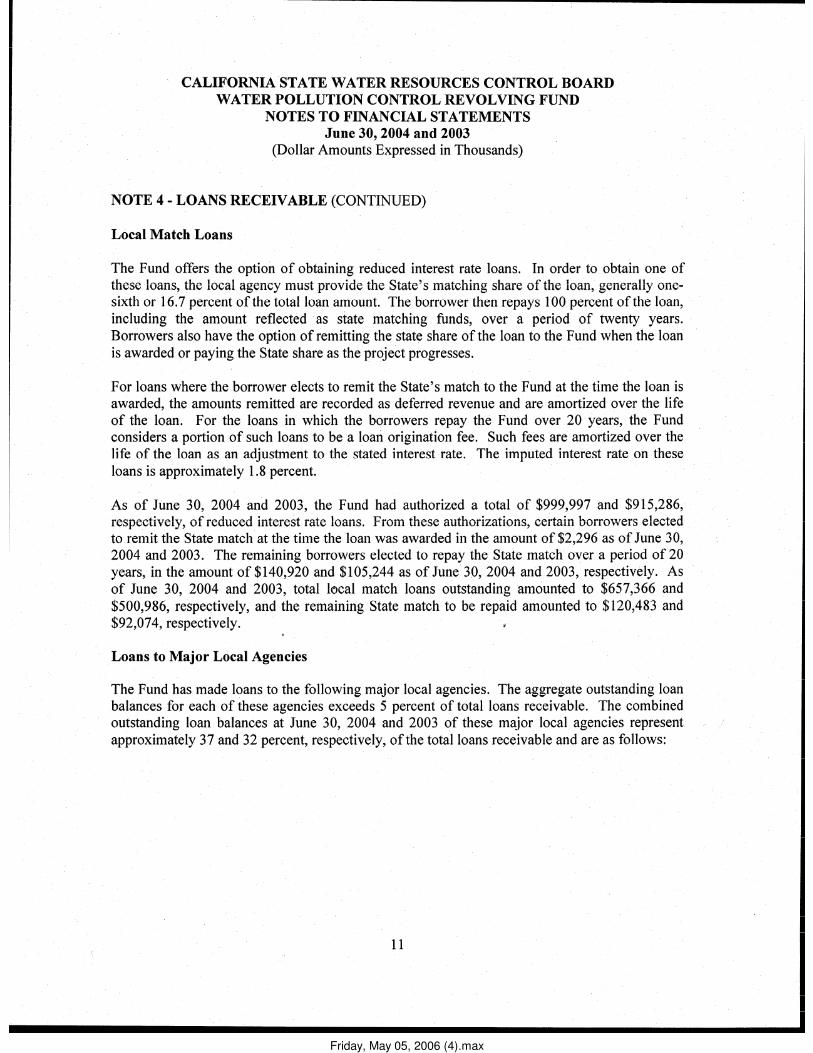
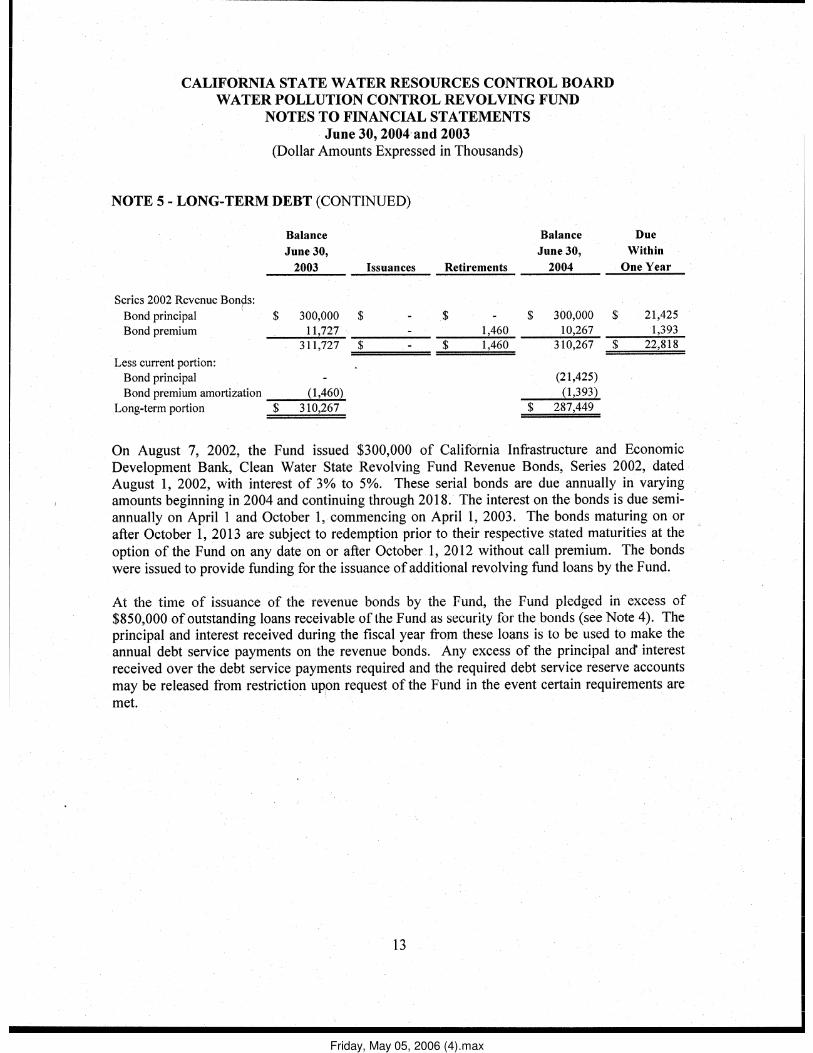
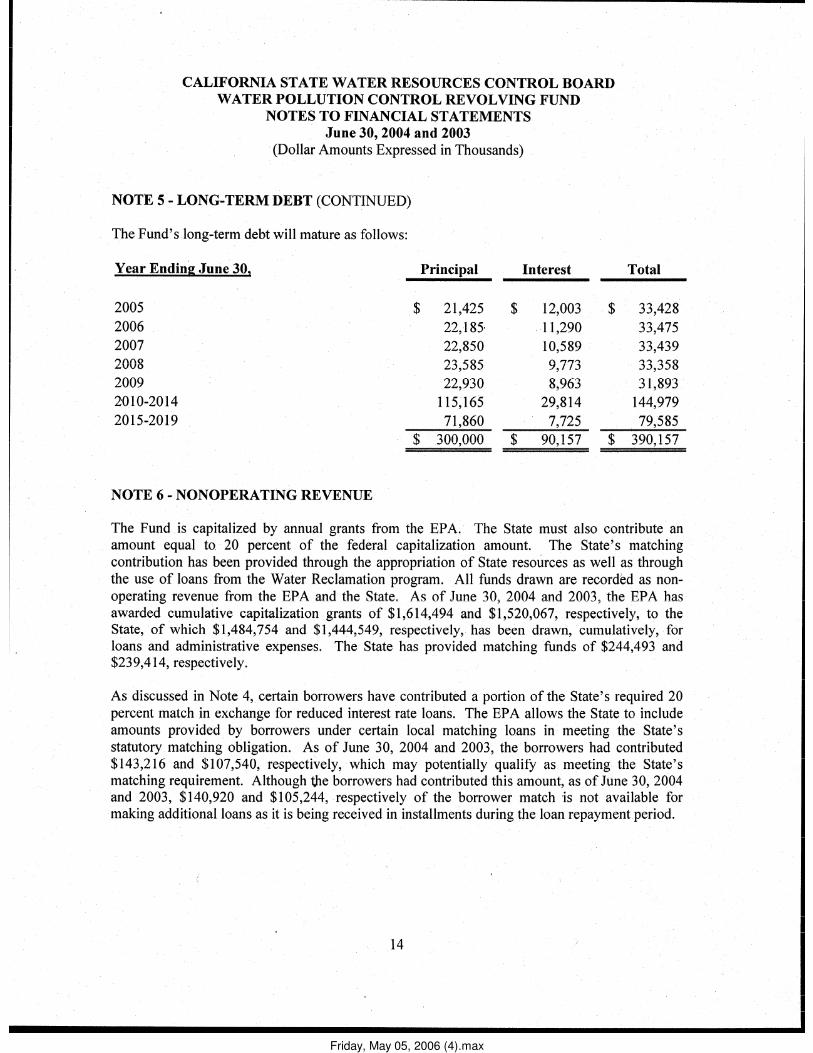
G. Debt Administration The Board administers a leveraged CWSRF program. The Board maintains a high bond rating from Fitch (AAA), Moody’s Investors Service (Aaa), and Standard and Poor’s Ratings Services (AAA) on it’s Revenue Bonds, Series 2002. Outstanding bonds at June 30, 2004 total $310,267,000 a decrease of $1,460,000 compared to $311,727,000 last year as shown in Table 3. This decrease is due to amortization of the bond premium. The first bond principal payment will be due during 2005. Those bonds were issued in August 2002 for the purpose of financing a portion of the CWSRF loans administered by the Board by providing financial assistance to local governments for water pollution control projects. Proceeds from the bonds provide funding for the issuance of additional revolving fund loans by the CWSRF. Those revenue bonds are backed by a pledge of specific revenue for which the annual collections are generally predictable. As of June 30, 2004 there have not been any defaults or material events on any loans receivable of the CWSRF. Additional information on the CWSRF long-term debt can be found in Note 5, Long-Term Debt. Table 3 Outstanding Long-term Debt (in thousands) Year Ended June 30, 2004 2003 Revenue bonds Bond principal $ 300,000 $ 300,000 Bond premium 10,267 11,727 Total Revenue bonds $ 310,267 $ 311,727
H. Economic Conditions and Outlook In general, the State of California’s stagnant economy and recent general fund budget crisis did not have a negative effect on enterprise funds such as the CWSRF. The CWSRF program activity remained stable, with revenues continuing to sufficiently support expenses. Because each CWSRF loan recipient must pledge one or more dedicated sources of revenue toward repayment of their CWSRF loan, timely repayment of all loans is expected. These dedicated sources of revenue can be sewer rate revenue pledges, general tax pledges or other contractual income, most of which are not greatly affected by the above mentioned economic factors. As noted earlier, as of June 30, 2004 there have not been any defaults nor have there been any outstanding late payments based on facts currently known by management. For the grant year 2004, the EPA has allocated $94.6 million to the State. The Fund has already applied for this 2004 capitalization grant and expects the grant to be awarded before the close of the 2004 federal fiscal year. The required matching State funds are also expected to be available to the Fund.
9
CCaalliiffoorrnniiaa WWaatteerr BBooaarrddss CCWWSSRRFF AAnnnnuuaall RReeppoorrtt 22000033//22000044
I. Requests for Information This financial report is designed to provide interested parties with a general overview of the CWSRF finances. Questions concerning the information provided in this report or requests for additional information should be addressed to Jerrel Bolds, Chief Accounting Officer, Division of Administrative Services, P.O. Box 100, Sacramento, California 95812.
V. GOALS AND ACCOMPLISHMENTS.
A. Short-Term Goals. The Water Board established the following short-term goals in the IUP for SFY 2003/2004:
1) Apply and receive the Federal Fiscal Year (FFY) 2004 Capitalization Grant within the first year of the allotment period.
The EPA awarded the FFY 2004 CWSRF Capitalization Grant for California in the amount of $94,613,887 on September 21, 2004. The award was within the first year of the two-year allotment period making California eligible for any re-allotment of Title VI funds.
2) To fund projects in SFY 2003/2004 that will enable local agencies to abate public health and water pollution problems, and that will reduce or abate nonpoint source pollution.
The SWRCB continued funding projects to abate water quality and public health problems (Public Health Hazards). These projects are classified as Priority Class “A” in the State of California CWSRF 2003/2004 Project Priority List.
3) To utilize the CWSRF Program in conjunction with the Water Board’s Small Community Wastewater Grant program so as to fully leverage available grant funds. Upon adoption of the 2004/2005 Priority List, the Water Board directed that projects that receive SCG funds from Propositions 40 and 50 be eligible for the fundable portion of the SFY 2004/2005 List. This will ensure that Small Community Wastewater Grant Projects will be able to utilize CWSRF funds in conjunction with their grants.
4) Prepare for the issuance of a second series of bonds to further leverage the CWSRF program and continue a higher rate of loan commitments. The Water Board has completed preliminary preparations necessary to conduct its second leverage bond sale. Over $500 million in possible projects has been identified.
10
CCaalliiffoorrnniiaa WWaatteerr BBooaarrddss CCWWSSRRFF AAnnnnuuaall RReeppoorrtt 22000033//22000044
5) To install and complete implementation of the new Loans and Grants Tracking System (LGTS). All past financial transaction data for the CWSRF program has been entered into the LGTS and verified. Currently the Water Board is recording all financial transactions in LGTS. All financial information used for the independent annual audit was derived from LGTS, and the audit found no major deficiencies in the system. Roll out of the system to all staff continues. The contractor developing LGTS has been working on transferring the system to an Oracle based application. Using Oracle software to support LGTS will provide greater stability and reliability for LGTS in the long run.
6) Complete closeout of the FFY 1998 Capitalization Grant. The final payment request for the 1998 Capitalization Grant has been requested, and the Water Board will proceed to submit a close-out request.
B. Long Term Goals In its SFY 2003/2004 IUP, California identified the following long-term goals:
1) To achieve statewide compliance with water quality objectives.
The Water Board continued its efforts to set and enforce water quality objectives. The Water Board provided loan assistance to correct both point and nonpoint source pollution problems to help meet these objectives.
2) To bring Publicly Owned Treatment Works (POTWs) into compliance with federal requirements. The Water Board continued to provide loan funds to municipalities to help them achieve compliance with Federal and State waste discharge requirements.
3) To perpetuate and expand the CWSRF. California’s CWSRF continues to grow. Nets assets for the program increased 4.2 percent, from approximately $1,996 million at June 30, 2003, to $2,078 million a year later. Binding loan commitments increased 8.2 percent with total loan commitments as of June 30, 2004 at $2,998 million. The increase in net assets and amount of binding loan commitments assure perpetuation of California’s CWSRF. California completed a $300 million revenue bond sale in August 2002. Approximately $222 million of the revenue bond sale proceeds were committed to projects as of June 30, 2004. The creation of new loans increases the repayment stream into the CWSRF program, and will further help to expand the program’s ability to fund additional loans in the future.
11
CCaalliiffoorrnniiaa WWaatteerr BBooaarrddss CCWWSSRRFF AAnnnnuuaall RReeppoorrtt 22000033//22000044
4) To maximize the ability of the CWSRF to assist local government in constructing needed water quality control facilities. The Water Board converted to a cash flow accounting system in SFY 1998/1999 for approving and awarding CWSRF loans. The cash flow system is designed to minimize a) the cash reserves in the Repayment Account, and b) idle cash from the Capitalization Grants, by balancing income with projected disbursements. The cash flow model has greatly accelerated the disbursement of program cash reserves.
5) To provide assistance for implementation of the Water Board’s Nonpoint Source Management Plan. The Water Board’s CWSRF program has funded over $181 million of nonpoint source projects. This amounts to approximately 6 percent of the CWSRF funds expended to date. The Water Board is committed to increasing this amount as the need for nonpoint source projects continues to increase.
6) To maintain at least an 80 percent rate of loan issuance in SFY 2003/2004 to comply with EPA directives. For SFY 2003/2004, the Water Board issued binding loan commitments (contracts) equaling 100 percent of the total funds available to the Water Board. This exceeds EPA’s goal of 80 percent. The Water Board continues to have success at meeting this goal using the current project selection system. The Water Board adopts its project priority list yearly in June. Projects that appear on the list are eligible to compete for binding loan commitments based on their readiness to proceed to construction. If projects do not proceed to the binding loan commitment stage due to delays in starting construction or because the applicant found an alternative funding source, other projects on the list that are ready to proceed are given binding loan commitments instead. The Water Board identified 25 projects with an estimated total commitment of approximately $164 million in its SFY 2004/2005 Intended Use Plan that appeared likely to receive a binding loan commitment during SFY 2004/2005. Even though a number of these projects did not receive binding loan commitments during SFY 2004/2005 due to changes in their readiness to proceed or use of alternative funding, the Water Board was still able to maintain a high loan issuance rate due to the high demand for CWSRF loan funds and its ability to fund other projects on the priority list.
7) To establish a fee supported program that is self-funding. Efforts are underway to establish a service charge on all future loans so that the program does not need to rely on federal capitalization grants to fund administration costs. This is especially important with the recent reduction in capitalization grant amounts. To accomplish this goal, legislation will be required to allow the Water Board to include the service charge as part of the authorized loan costs.
12
CCaalliiffoorrnniiaa WWaatteerr BBooaarrddss CCWWSSRRFF AAnnnnuuaall RReeppoorrtt 22000033//22000044
VI. DETAILS OF ACCOMPLISHMENTS.
A. Fund Financial Status.
1. Sources of Funds The four main sources of funds for the Water Board’s CWSRF and their contributions to the account for the period of this report are (Page 2 of Exhibit A):
• EPA capitalization grants contributions of $40.206 million. • State match revenue of $5.079 million. • Loan interest income of $46.810 million. • Other interest contributions of $2.243 million
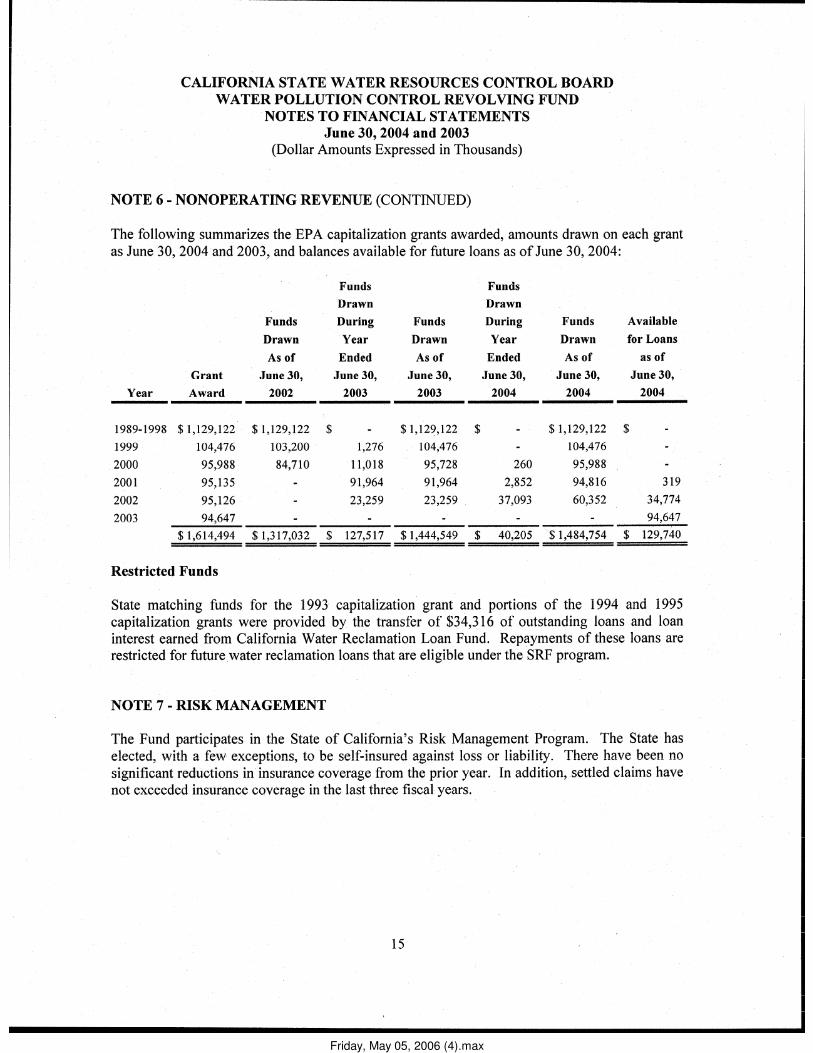
As of June 30, 2004, total federal funds awarded from the EPA amounted to $1,614,494,000 (Page 15 of Exhibit A).
2. Binding Commitments
The SWRCB executed a cumulative total of 278 binding loan commitments as of June 30, 2004 for a cumulative total of $2,998 million (Note 4, page 10 of Exhibit A). A list of all active CWSRF loans is provided in Exhibits B and C
3. Disbursements and Guarantees Total disbursements for SFY 2003/2004 were $293 million. Disbursements were made as follows (Page 3 of Exhibit A):
• Loan disbursements - $276.256 million • Interest paid on revenue bonds - $12.383 million • Cash paid to employees and vendors - $4.346 million
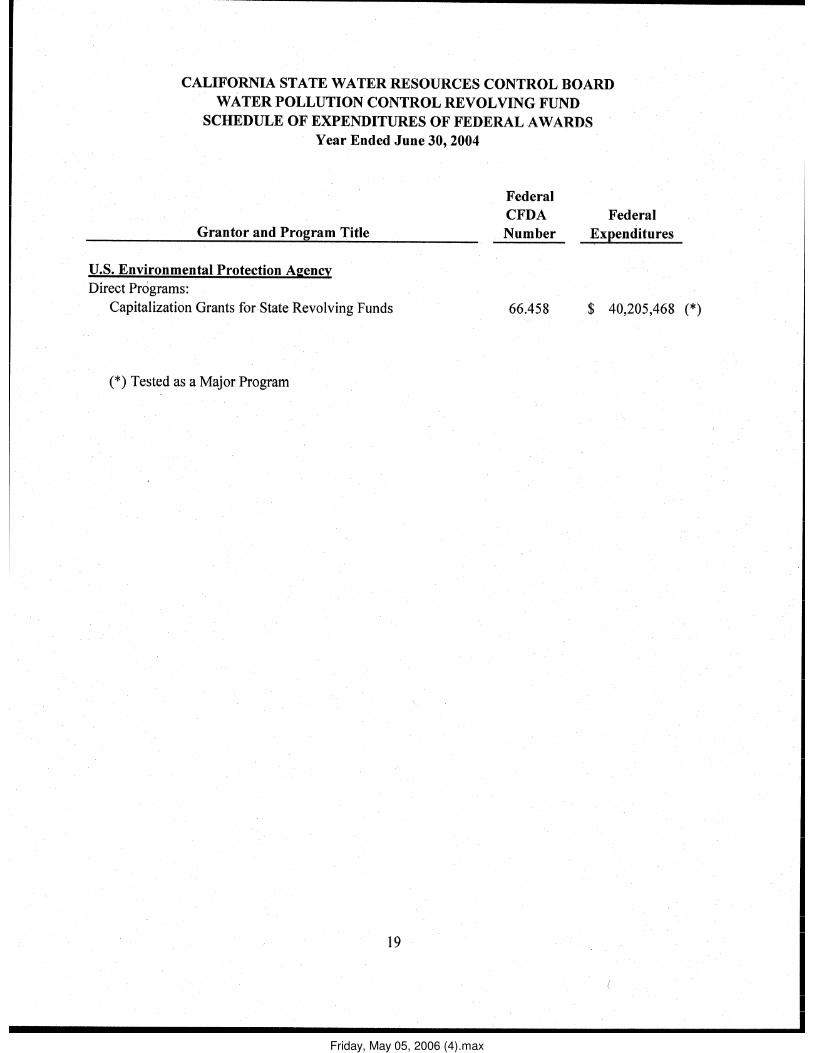
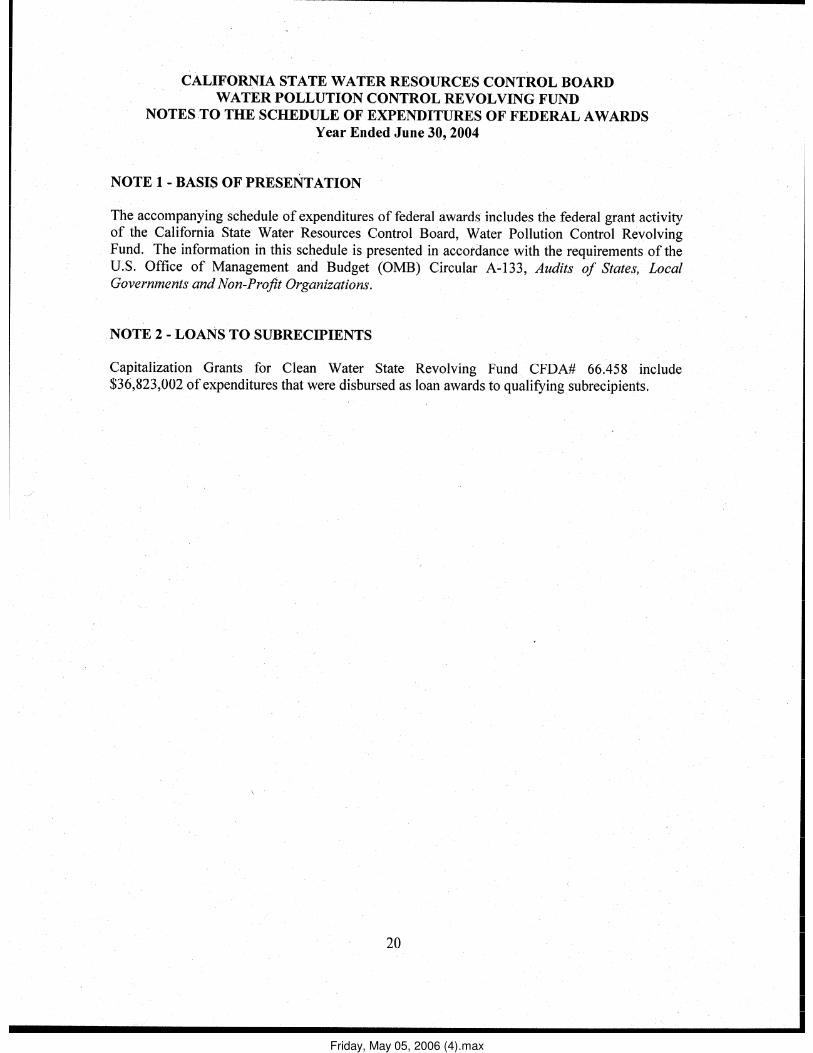
4. Financial Statements Financial Statements for the period ending June 30, 2004 are displayed in Exhibit A. Included in the exhibit are the Statement of Net Assets, Statement of Revenues, Expenses and Changes in Net Assets and Statement of Cash Flows, accompanying notes to the financial statements and reports required by the Single Audit Act Amendments of 1996.
5. Credit Risk of the CWSRF Each loan recipient must pledge one or more dedicated sources of revenue toward repayment of their CWSRF loan. Dedicated sources of revenue can be sewer rate revenue pledges, general tax pledges or other contractual income. To date, the Fund has no outstanding late payments and no defaults.
13
CCaalliiffoorrnniiaa WWaatteerr BBooaarrddss CCWWSSRRFF AAnnnnuuaall RReeppoorrtt 22000033//22000044
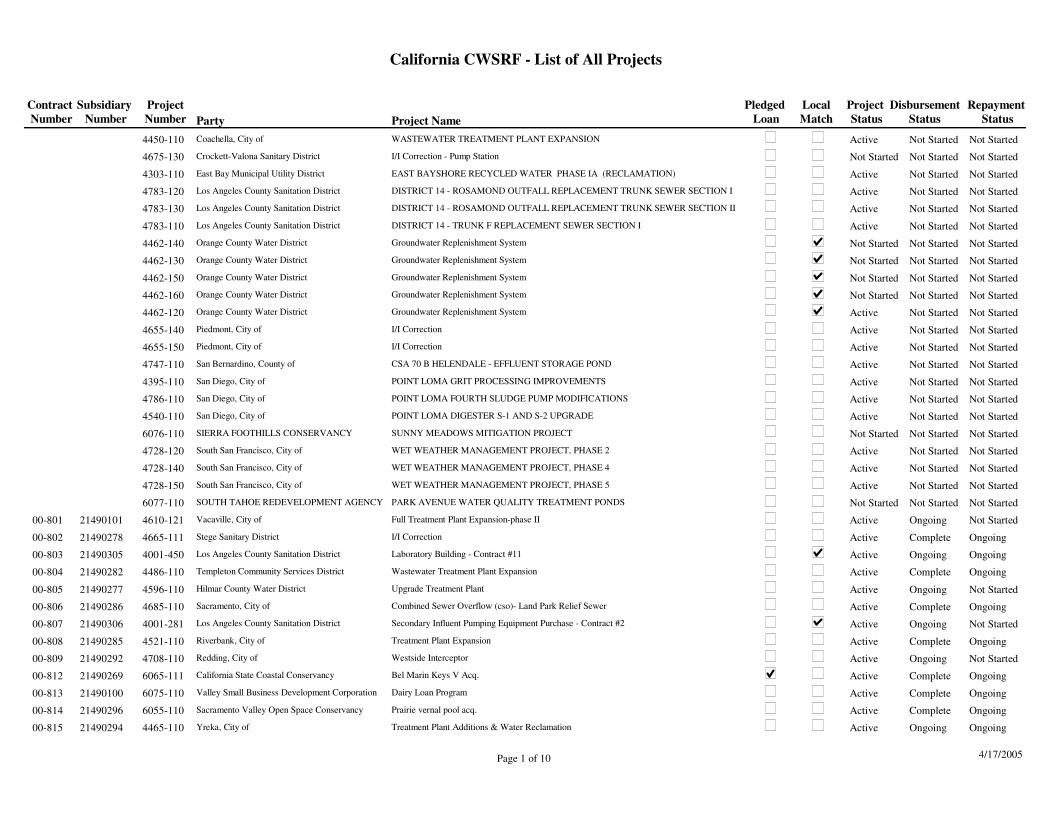
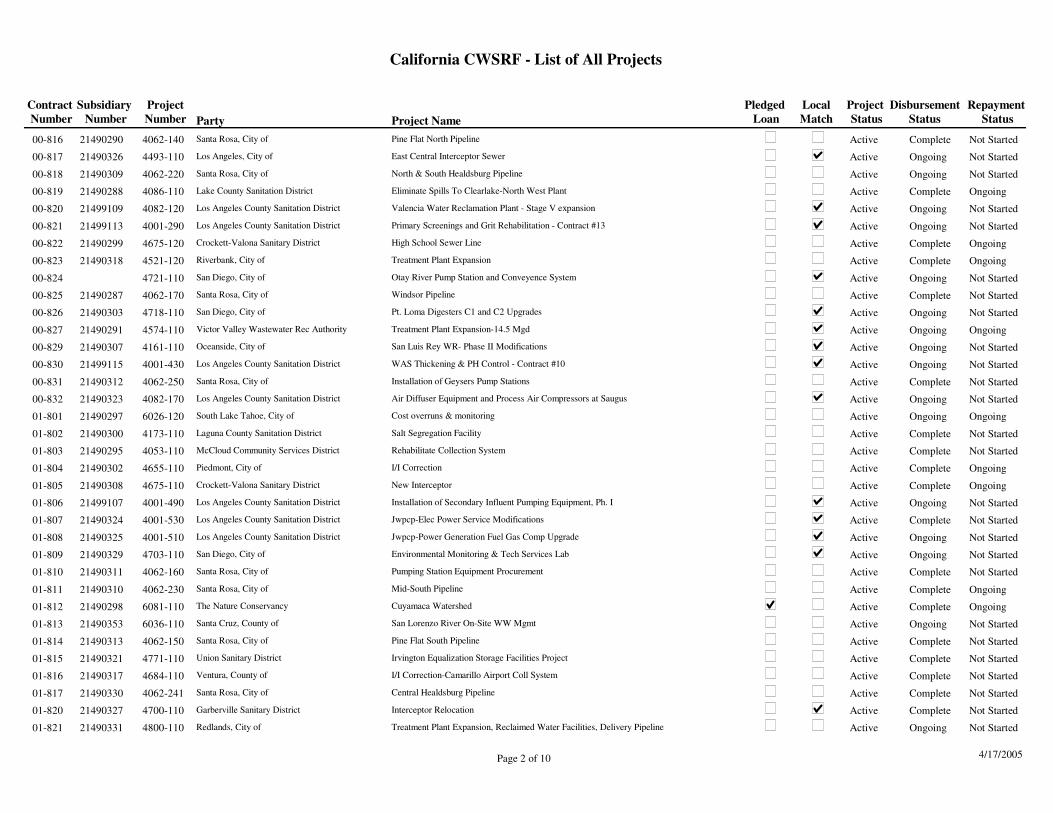
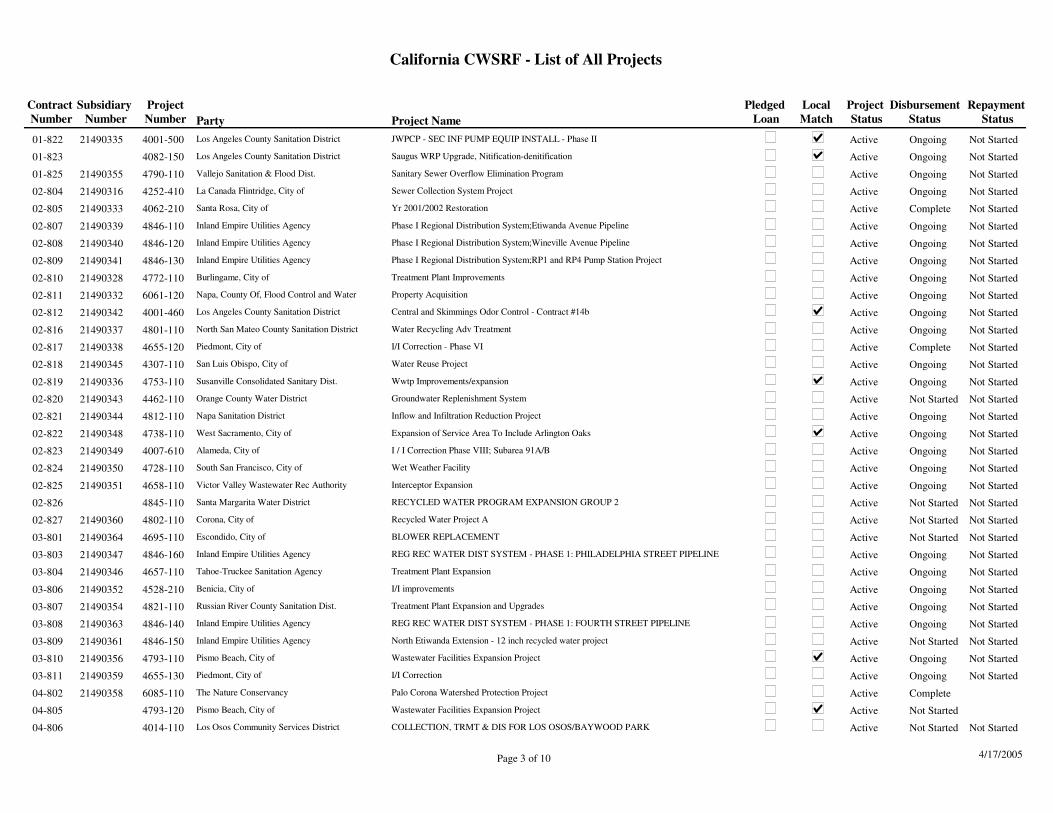
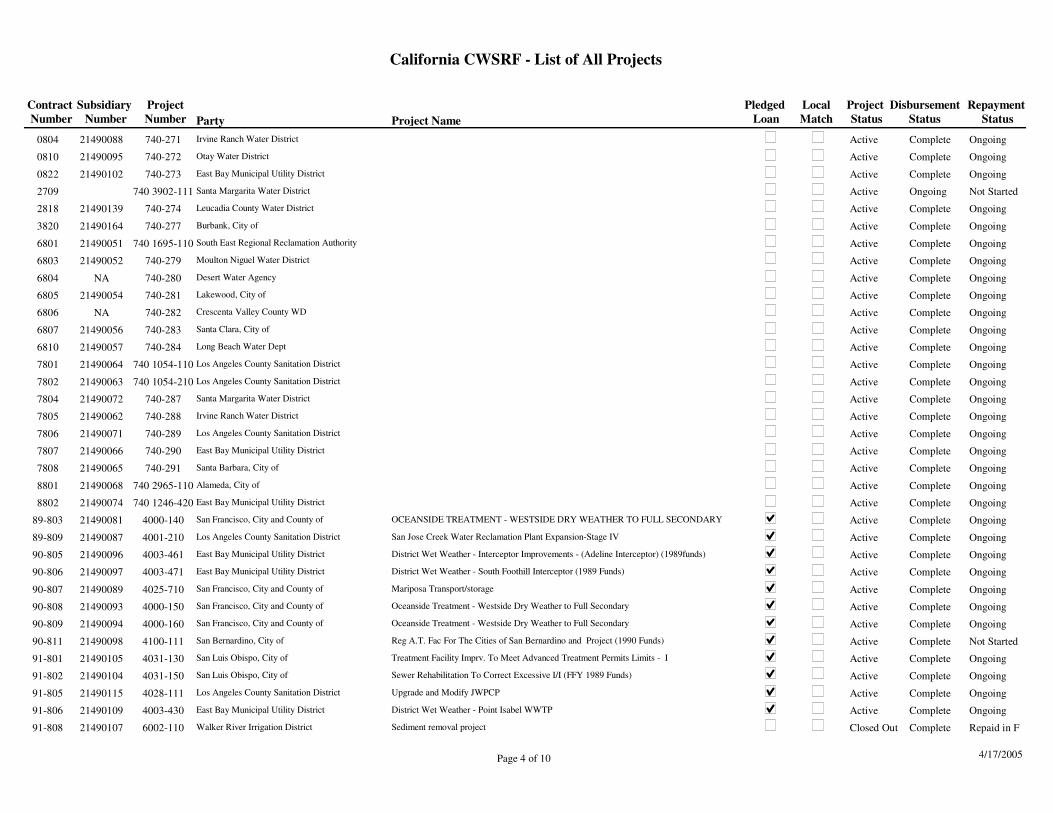
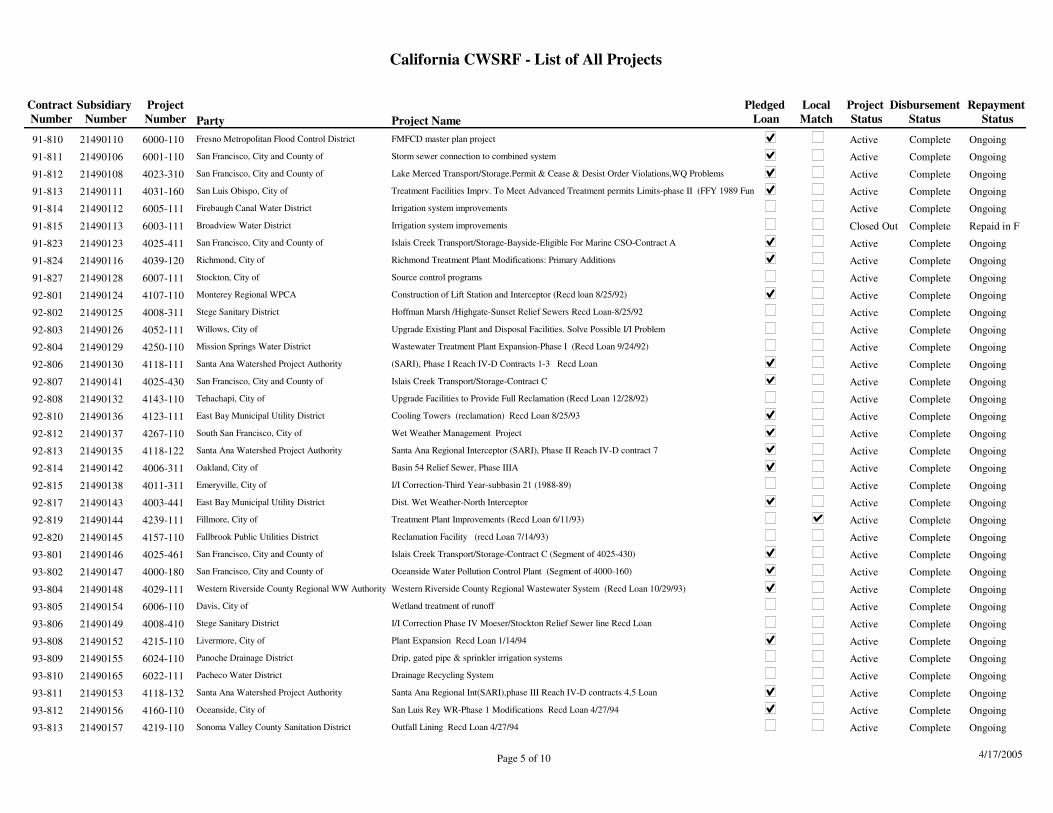
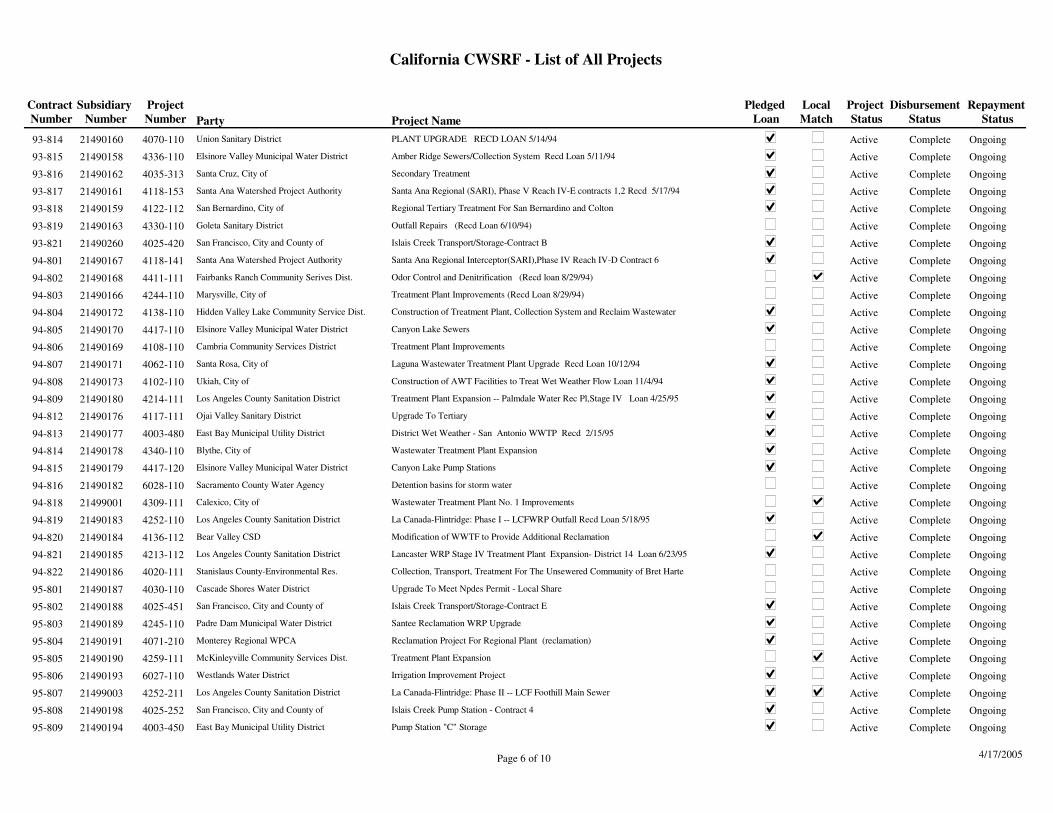
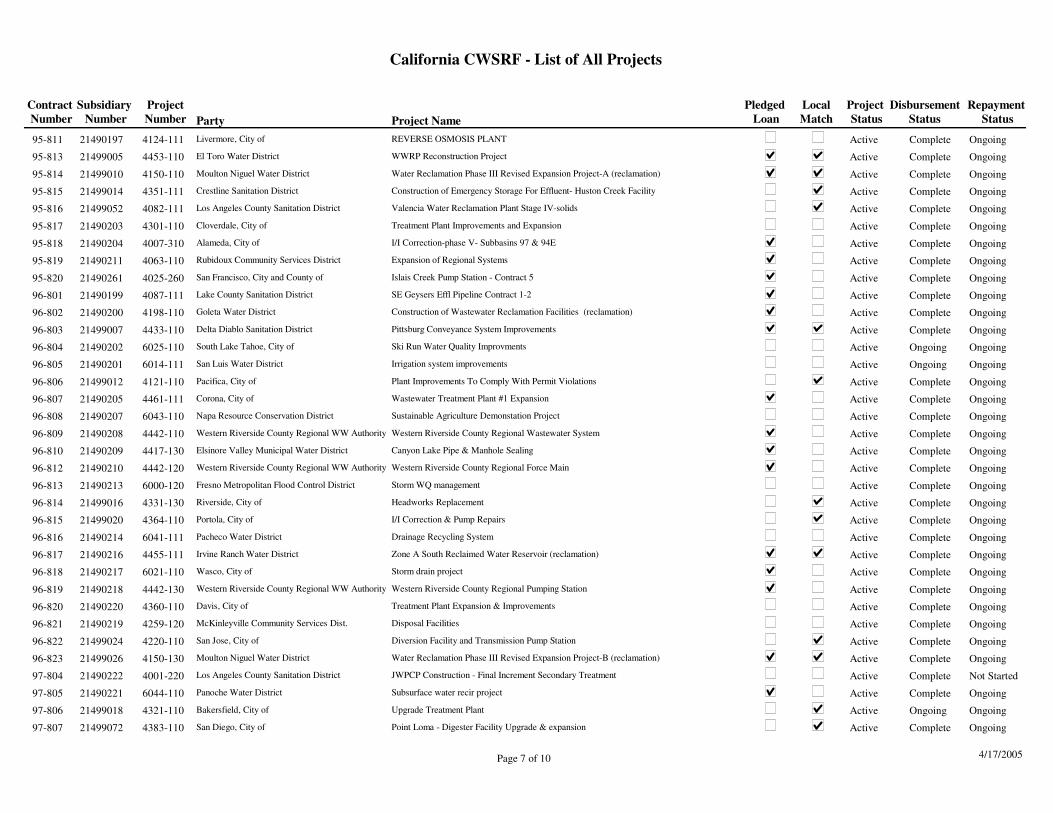
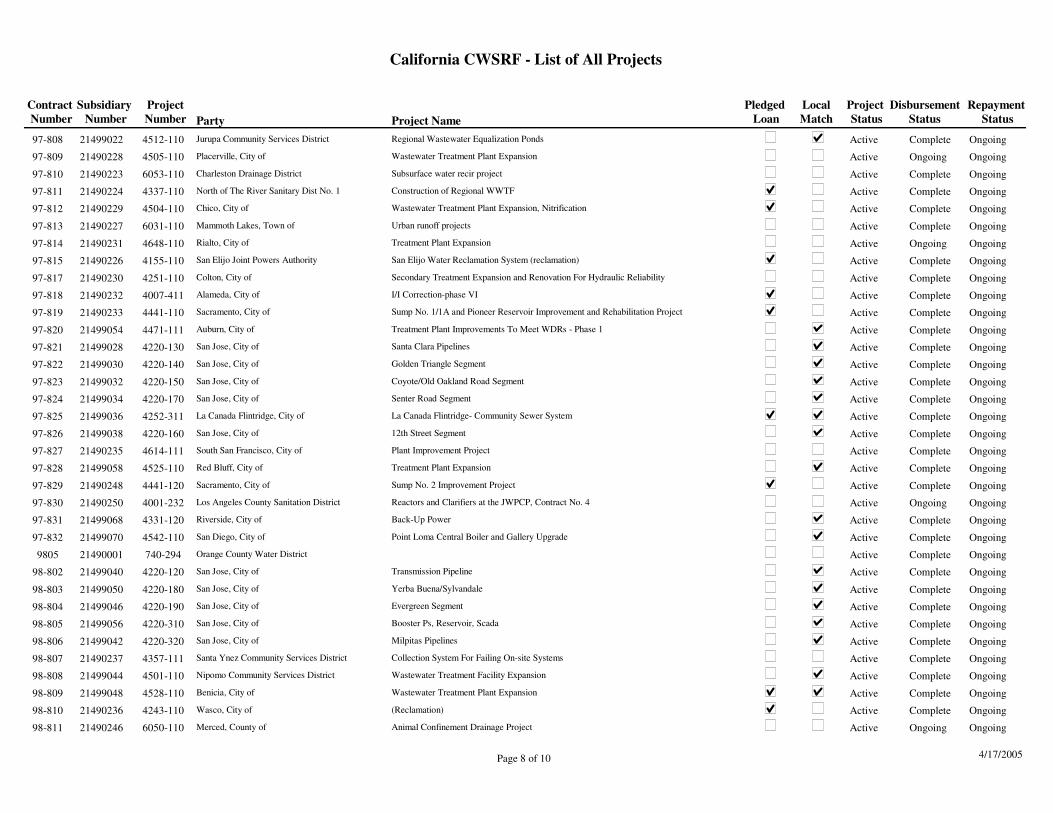
B. Assistance Activity. Exhibits B and C illustrate the activity level of the Fund. The exhibits also provide a complete listing of projects that have been funded or targeted for funding through SFY 2003/2004.
C. Provisions of the Operating Agreement/Conditions of the Grant. The Board has agreed to a number of conditions in the Operating Agreement or Grant Agreement. Conditions in the Operating Agreement have been met.
1. Provide a State Match The Board has met its State Match requirement by identifying State funds equal to 20% of the Capitalization Grant amount as detailed in the state match report from LGTS presented in Exhibit D. As of the end of SFY 2003/2004, the State has received $1,486,992,534 in payments. Required match was $297,398,507 and the state provided $297,991,464 resulting in an overmatch of $592,957.
2. Binding Commitment Within One Year
The State will make binding loan commitments, in the form of signed contracts, to provide assistance in an amount equal to 120% of each federal quarterly payment within one year of that payment. By the end of SFY 2003/2004 executed binding loan commitments totaled $2,998 million or 202% of the federal payments received as of SFY 2003/2004 (Page 10 of Exhibit A).
3. Expeditious and Timely Expenditure Expenditure (disbursement) of CWSRF loan funds occurs quickly after a binding loan commitment is made. Applicants request disbursement of funds as costs accrue during the construction of their projects; applicants can request disbursements as frequently as monthly. Disbursement requests are processed on a strict timeframe to ensure timely payment. Division staff review and approve disbursement requests within seven calendar days after submittal. The Division then transmits the request to the SWRCB’s accounting department; the accounting department processes the request within seven calendar days after it receives it and transmits the request to the State Controller’s office. The State Controller then has 10 calendar days to issue the warrant to the applicant. The SWRCB initiates requests for federal funds via the Automated Standard Application for Payments (ASAP) system. ASAP is a request and delivery system of federal funds developed by the Financial Management Service of the US Treasury and the Federal Reserve Bank. By using ASAP, the SWRCB is able to draw funds from the US Environmental Agency (USEPA) for expenditures incurred by the CWSRF in an expeditious and timely manner.
14
CCaalliiffoorrnniiaa WWaatteerr BBooaarrddss CCWWSSRRFF AAnnnnuuaall RReeppoorrtt 22000033//22000044
Federal draws are requested on a monthly basis for administration costs. Draws for loan disbursements are made as warrants are issued by the State Controller’s Office to pay the loan recipient. Loan disbursement draw requests are made within one business day of a warrant being issued. Requested funds are deposited electronically the next business day to the account(s) specified by the SWRCB. Another way to measure the expeditious and timely expenditure of funds is to compare the amount of Federal grant funds with the Federal outlays to the SWRCB. A total of $1,614,494,000 in Federal funds has been granted to the SWRCB. As of June 30, 2004, $1,486,992,534 has been transferred to the SWRCB through the ASAP system.
4. First Use of Funds for Enforceable Requirements California has met the first-use requirement by providing financial assistance to those projects on its National Municipal Policy (NMP) list, which do not meet any of the criteria under part III.B.5. (pp 11-12 of EPA’s “Initial Guidance for State Revolving Funds”). The State has ensured that all listed projects are on enforceable schedules. California’s program has now been expanded to other water quality needs.
5. Eligible Activities California monitors each project to ensure that EPA’s eligibility requirements are followed. All activities financed were eligible under Section 212 and Section 319 of the Clean Water Act.
6. Minority Business Enterprise/Woman Business Enterprise (MBE/WBE) Objective The Water Board negotiated a total fair share MBE/WBE objective with EPA beginning FFY 2000 for the CWSRF Program. This objective was 20.0 percent for MBE and 10.0 percent for WBE participation for a combined 30.0 percent goal.
The data presented in Exhibit E covers MBE/WBE participation from July 1, 2003 to June 30, 2004. The participation for CWSRF contract information reported by local agencies in SFY 2003/2004 was 1.18 percent for MBE and 1.65 percent for WBE. The overall MBE/WBE participation was 2.84 percent. The factors influencing the percentages reported are listed below:
• California now collects and reports data based on payments to contractors
and subcontractors rather than award information per EPA’s request. • Year-to-year fluctuations are inevitable based in large part on the
percentages of activity in metropolitan areas, which typically produce more MBE/WBE contract participation.
15
CCaalliiffoorrnniiaa WWaatteerr BBooaarrddss CCWWSSRRFF AAnnnnuuaall RReeppoorrtt 22000033//22000044
• Changes in California law and court decisions have resulted in a substantial reduction in affirmative action outreach services for contractors.
• Available data sources relied upon for establishing the MBE/WBE goals are unrefined and not specific to contractors who build wastewater treatment facilities.
The Water Board will continue to monitor participation to assure that the positive effort process is enforced by all local agencies.
7. Administration of the Revolving Loan Fund The Federal funding allowable for administration of the program is 4% of the total capitalization grants awarded. Total capitalization funds granted so far amount to $1,614,494,000. The administration costs (operating expenses) incurred for SFY 2003/2004 were $4,059,000 (Page 2 of Exhibit A (Basic Financial Statements)) and the cumulative total is $56,866,000. Therefore, 3.52 percent of the capitalization grant awards have been incurred in administering the program.
VII. PROGRAM CHANGES. One of the short-term goals for California’s CWSRF program for 2003/2004 was to install and implement the Loans and Grants Tracking System (LGTS). LGTS allows the CWSRF program to manage and track all technical and financial aspects of the CWSRF program. The original plan was to fully implement the system for use during SFY 2003/2004. However, significant time was devoted to documenting the history of financial transactions in the CWSRF program, uploading this information into LGTS, and completely reconciling the accounting records. Management decided it was most important to insure that the financial transaction information was correct in the LGTS so that the CWSRF program would be ready for its yearly audit in August 2004. As a result of this effort we are proud to state that LGTS contains a true and correct record of all financial transactions in the CWSRF program and was used entirely to provide all the needed information for our independent audit. Further work will be necessary to migrate the LGTS from an Access database platform to an Oracle platform. This will provide a more stabile and reliable system in the future. Final development and rollout of LGTS is expected to be completed in SFY 2004/2005.
VIII. PROPOSED IMPROVEMENTS. Increasing attention is focusing on the idea of “sustainability,” particularly in environmental programs. Although sustainability is not completely defined, sustainability implies that prudent policies are adopted and implemented by responsible agencies so that the quality of the environment for future citizens is comparable, or better, than it is today. The CWSRF policy incorporates several features that tend to support sustainability of water quality, but the Water Board has taken the initiative to review its policy to ensure that it is taking all reasonable steps in implementing the CWSRF program to ensure sustainability for future generations. The Water Board expects to complete this review during SFY 2004/2005.
16
CCaalliiffoorrnniiaa WWaatteerr BBooaarrddss CCWWSSRRFF AAnnnnuuaall RReeppoorrtt 22000033//22000044
Another area that the Water Board intends to expand the CWSRF program is in the tracking of environmental benefits derived from CWSRF projects. The contributions of the CWSRF to water quality are diverse and hard to quantify. This is not a weakness of the program, but instead indicates its strength and utility in addressing the many varied needs associated with water quality issues. Reporting the direct benefits of CWSRF projects will be difficult, but the Water Board is committed to working with EPA and the other states to develop methods and systems to effectively do this. To this end, the Water Board will be modifying LGTS to be able to track the different environmental benefits from projects.
IX. EXHIBITS. Exhibit A – Financial Statements and Notes Exhibit B – List of all Projects and their Status Exhibit C – Project Tracking Report Exhibit D – State Match Reports Exhibit E – MBE/WBE Report for Federal Fiscal Year 2004
17
CCaalliiffoorrnniiaa WWaatteerr BBooaarrddss CCWWSSRRFF AAnnnnuuaall RReeppoorrtt 22000033//22000044
Exhibit A – Financial Statements and Notes
Friday, May 05, 2006 (4).max
Friday, May 05, 2006 (4).max
Friday, May 05, 2006 (4).max
Friday, May 05, 2006 (4).max
Friday, May 05, 2006 (4).max
Friday, May 05, 2006 (4).max
Friday, May 05, 2006 (4).max
Friday, May 05, 2006 (4).max
Friday, May 05, 2006 (4).max
Friday, May 05, 2006 (4).max
Friday, May 05, 2006 (4).max
Friday, May 05, 2006 (4).max
Friday, May 05, 2006 (4).max
Friday, May 05, 2006 (4).max
Friday, May 05, 2006 (4).max
Friday, May 05, 2006 (4).max
Friday, May 05, 2006 (4).max
Friday, May 05, 2006 (4).max
Friday, May 05, 2006 (4).max
Friday, May 05, 2006 (4).max
Friday, May 05, 2006 (4).max
Friday, May 05, 2006 (4).max
Friday, May 05, 2006 (4).max
Friday, May 05, 2006 (4).max
Friday, May 05, 2006 (4).max
Friday, May 05, 2006 (4).max
Friday, May 05, 2006 (4).max
Friday, May 05, 2006 (4).max
Friday, May 05, 2006 (4).max
Friday, May 05, 2006 (4).max
Friday, May 05, 2006 (4).max
Friday, May 05, 2006 (4).max
Friday, May 05, 2006 (4).max
Friday, May 05, 2006 (4).max
Friday, May 05, 2006 (4).max
Friday, May 05, 2006 (4).max
Friday, May 05, 2006 (4).max
Friday, May 05, 2006 (4).max
Friday, May 05, 2006 (4).max
Friday, May 05, 2006 (4).max
CCaalliiffoorrnniiaa WWaatteerr BBooaarrddss CCWWSSRRFF AAnnnnuuaall RReeppoorrtt 22000033//22000044
Exhibit B – List of All Projects and Their Status
Party Project NameSubsidiary
NumberPledged
LoanLocal Match
Project Status
Disbursement Status
Repayment Status
California CWSRF - List of All Projects
Contract Number
ProjectNumber
Coachella, City of WASTEWATER TREATMENT PLANT EXPANSION4450-110 Active Not Started Not Started
Crockett-Valona Sanitary District I/I Correction - Pump Station4675-130 Not Started Not Started Not Started
East Bay Municipal Utility District EAST BAYSHORE RECYCLED WATER PHASE IA (RECLAMATION)4303-110 Active Not Started Not Started
Los Angeles County Sanitation District DISTRICT 14 - ROSAMOND OUTFALL REPLACEMENT TRUNK SEWER SECTION I4783-120 Active Not Started Not Started
Los Angeles County Sanitation District DISTRICT 14 - ROSAMOND OUTFALL REPLACEMENT TRUNK SEWER SECTION II4783-130 Active Not Started Not Started
Los Angeles County Sanitation District DISTRICT 14 - TRUNK F REPLACEMENT SEWER SECTION I4783-110 Active Not Started Not Started
Orange County Water District Groundwater Replenishment System4462-140 Not Started Not Started Not StartedOrange County Water District Groundwater Replenishment System4462-130 Not Started Not Started Not Started
Orange County Water District Groundwater Replenishment System4462-150 Not Started Not Started Not StartedOrange County Water District Groundwater Replenishment System4462-160 Not Started Not Started Not StartedOrange County Water District Groundwater Replenishment System4462-120 Active Not Started Not Started
Piedmont, City of I/I Correction4655-140 Active Not Started Not StartedPiedmont, City of I/I Correction4655-150 Active Not Started Not Started
San Bernardino, County of CSA 70 B HELENDALE - EFFLUENT STORAGE POND4747-110 Active Not Started Not Started
San Diego, City of POINT LOMA GRIT PROCESSING IMPROVEMENTS4395-110 Active Not Started Not Started
San Diego, City of POINT LOMA FOURTH SLUDGE PUMP MODIFICATIONS4786-110 Active Not Started Not Started
San Diego, City of POINT LOMA DIGESTER S-1 AND S-2 UPGRADE4540-110 Active Not Started Not Started
SIERRA FOOTHILLS CONSERVANCY SUNNY MEADOWS MITIGATION PROJECT6076-110 Not Started Not Started Not Started
South San Francisco, City of WET WEATHER MANAGEMENT PROJECT, PHASE 24728-120 Active Not Started Not Started
South San Francisco, City of WET WEATHER MANAGEMENT PROJECT, PHASE 44728-140 Active Not Started Not Started
South San Francisco, City of WET WEATHER MANAGEMENT PROJECT, PHASE 54728-150 Active Not Started Not Started
SOUTH TAHOE REDEVELOPMENT AGENCY PARK AVENUE WATER QUALITY TREATMENT PONDS6077-110 Not Started Not Started Not Started
Vacaville, City of Full Treatment Plant Expansion-phase II4610-12100-801 21490101 Active Ongoing Not Started
Stege Sanitary District I/I Correction4665-11100-802 21490278 Active Complete Ongoing
Los Angeles County Sanitation District Laboratory Building - Contract #114001-45000-803 21490305 Active Ongoing Ongoing
Templeton Community Services District Wastewater Treatment Plant Expansion4486-11000-804 21490282 Active Complete Ongoing
Hilmar County Water District Upgrade Treatment Plant4596-11000-805 21490277 Active Ongoing Not StartedSacramento, City of Combined Sewer Overflow (cso)- Land Park Relief Sewer4685-11000-806 21490286 Active Complete OngoingLos Angeles County Sanitation District Secondary Influent Pumping Equipment Purchase - Contract #24001-28100-807 21490306 Active Ongoing Not Started
Riverbank, City of Treatment Plant Expansion4521-11000-808 21490285 Active Complete OngoingRedding, City of Westside Interceptor4708-11000-809 21490292 Active Ongoing Not StartedCalifornia State Coastal Conservancy Bel Marin Keys V Acq.6065-11100-812 21490269 Active Complete Ongoing
Valley Small Business Development Corporation Dairy Loan Program6075-11000-813 21490100 Active Complete Ongoing
Sacramento Valley Open Space Conservancy Prairie vernal pool acq.6055-11000-814 21490296 Active Complete Ongoing
Yreka, City of Treatment Plant Additions & Water Reclamation4465-11000-815 21490294 Active Ongoing Ongoing
4/17/2005Page 1 of 10
Party Project NameSubsidiary
NumberPledged
LoanLocal Match
Project Status
Disbursement Status
Repayment Status
California CWSRF - List of All Projects
Contract Number
ProjectNumber
Santa Rosa, City of Pine Flat North Pipeline4062-14000-816 21490290 Active Complete Not Started
Los Angeles, City of East Central Interceptor Sewer4493-11000-817 21490326 Active Ongoing Not Started
Santa Rosa, City of North & South Healdsburg Pipeline4062-22000-818 21490309 Active Ongoing Not Started
Lake County Sanitation District Eliminate Spills To Clearlake-North West Plant4086-11000-819 21490288 Active Complete Ongoing
Los Angeles County Sanitation District Valencia Water Reclamation Plant - Stage V expansion4082-12000-820 21499109 Active Ongoing Not Started
Los Angeles County Sanitation District Primary Screenings and Grit Rehabilitation - Contract #134001-29000-821 21499113 Active Ongoing Not Started
Crockett-Valona Sanitary District High School Sewer Line4675-12000-822 21490299 Active Complete OngoingRiverbank, City of Treatment Plant Expansion4521-12000-823 21490318 Active Complete Ongoing
San Diego, City of Otay River Pump Station and Conveyence System4721-11000-824 Active Ongoing Not StartedSanta Rosa, City of Windsor Pipeline4062-17000-825 21490287 Active Complete Not StartedSan Diego, City of Pt. Loma Digesters C1 and C2 Upgrades4718-11000-826 21490303 Active Ongoing Not Started
Victor Valley Wastewater Rec Authority Treatment Plant Expansion-14.5 Mgd4574-11000-827 21490291 Active Ongoing OngoingOceanside, City of San Luis Rey WR- Phase II Modifications4161-11000-829 21490307 Active Ongoing Not Started
Los Angeles County Sanitation District WAS Thickening & PH Control - Contract #104001-43000-830 21499115 Active Ongoing Not Started
Santa Rosa, City of Installation of Geysers Pump Stations4062-25000-831 21490312 Active Complete Not Started
Los Angeles County Sanitation District Air Diffuser Equipment and Process Air Compressors at Saugus4082-17000-832 21490323 Active Ongoing Not Started
South Lake Tahoe, City of Cost overruns & monitoring6026-12001-801 21490297 Active Ongoing Ongoing
Laguna County Sanitation District Salt Segregation Facility4173-11001-802 21490300 Active Complete Not Started
McCloud Community Services District Rehabilitate Collection System4053-11001-803 21490295 Active Complete Not Started
Piedmont, City of I/I Correction4655-11001-804 21490302 Active Complete Ongoing
Crockett-Valona Sanitary District New Interceptor4675-11001-805 21490308 Active Complete Ongoing
Los Angeles County Sanitation District Installation of Secondary Influent Pumping Equipment, Ph. I4001-49001-806 21499107 Active Ongoing Not Started
Los Angeles County Sanitation District Jwpcp-Elec Power Service Modifications4001-53001-807 21490324 Active Complete Not Started
Los Angeles County Sanitation District Jwpcp-Power Generation Fuel Gas Comp Upgrade4001-51001-808 21490325 Active Ongoing Not Started
San Diego, City of Environmental Monitoring & Tech Services Lab4703-11001-809 21490329 Active Ongoing Not Started
Santa Rosa, City of Pumping Station Equipment Procurement4062-16001-810 21490311 Active Complete Not Started
Santa Rosa, City of Mid-South Pipeline4062-23001-811 21490310 Active Complete OngoingThe Nature Conservancy Cuyamaca Watershed6081-11001-812 21490298 Active Complete OngoingSanta Cruz, County of San Lorenzo River On-Site WW Mgmt6036-11001-813 21490353 Active Ongoing Not Started
Santa Rosa, City of Pine Flat South Pipeline4062-15001-814 21490313 Active Complete Not StartedUnion Sanitary District Irvington Equalization Storage Facilities Project4771-11001-815 21490321 Active Complete Not StartedVentura, County of I/I Correction-Camarillo Airport Coll System4684-11001-816 21490317 Active Complete Not Started
Santa Rosa, City of Central Healdsburg Pipeline4062-24101-817 21490330 Active Complete Not Started
Garberville Sanitary District Interceptor Relocation4700-11001-820 21490327 Active Complete Not Started
Redlands, City of Treatment Plant Expansion, Reclaimed Water Facilities, Delivery Pipeline4800-11001-821 21490331 Active Ongoing Not Started
4/17/2005Page 2 of 10
Party Project NameSubsidiary
NumberPledged
LoanLocal Match
Project Status
Disbursement Status
Repayment Status
California CWSRF - List of All Projects
Contract Number
ProjectNumber
Los Angeles County Sanitation District JWPCP - SEC INF PUMP EQUIP INSTALL - Phase II4001-50001-822 21490335 Active Ongoing Not Started
Los Angeles County Sanitation District Saugus WRP Upgrade, Nitification-denitification4082-15001-823 Active Ongoing Not Started
Vallejo Sanitation & Flood Dist. Sanitary Sewer Overflow Elimination Program4790-11001-825 21490355 Active Ongoing Not Started
La Canada Flintridge, City of Sewer Collection System Project4252-41002-804 21490316 Active Ongoing Not Started
Santa Rosa, City of Yr 2001/2002 Restoration4062-21002-805 21490333 Active Complete Not Started
Inland Empire Utilities Agency Phase I Regional Distribution System;Etiwanda Avenue Pipeline4846-11002-807 21490339 Active Ongoing Not Started
Inland Empire Utilities Agency Phase I Regional Distribution System;Wineville Avenue Pipeline4846-12002-808 21490340 Active Ongoing Not StartedInland Empire Utilities Agency Phase I Regional Distribution System;RP1 and RP4 Pump Station Project 4846-13002-809 21490341 Active Ongoing Not Started
Burlingame, City of Treatment Plant Improvements4772-11002-810 21490328 Active Ongoing Not StartedNapa, County Of, Flood Control and Water Property Acquisition6061-12002-811 21490332 Active Ongoing Not StartedLos Angeles County Sanitation District Central and Skimmings Odor Control - Contract #14b4001-46002-812 21490342 Active Ongoing Not Started
North San Mateo County Sanitation District Water Recycling Adv Treatment4801-11002-816 21490337 Active Ongoing Not StartedPiedmont, City of I/I Correction - Phase VI4655-12002-817 21490338 Active Complete Not Started
San Luis Obispo, City of Water Reuse Project4307-11002-818 21490345 Active Ongoing Not Started
Susanville Consolidated Sanitary Dist. Wwtp Improvements/expansion4753-11002-819 21490336 Active Ongoing Not Started
Orange County Water District Groundwater Replenishment System4462-11002-820 21490343 Active Not Started Not Started
Napa Sanitation District Inflow and Infiltration Reduction Project4812-11002-821 21490344 Active Ongoing Not Started
West Sacramento, City of Expansion of Service Area To Include Arlington Oaks4738-11002-822 21490348 Active Ongoing Not Started
Alameda, City of I / I Correction Phase VIII; Subarea 91A/B4007-61002-823 21490349 Active Ongoing Not Started
South San Francisco, City of Wet Weather Facility4728-11002-824 21490350 Active Ongoing Not Started
Victor Valley Wastewater Rec Authority Interceptor Expansion4658-11002-825 21490351 Active Ongoing Not Started
Santa Margarita Water District RECYCLED WATER PROGRAM EXPANSION GROUP 24845-11002-826 Active Not Started Not Started
Corona, City of Recycled Water Project A4802-11002-827 21490360 Active Not Started Not Started
Escondido, City of BLOWER REPLACEMENT4695-11003-801 21490364 Active Not Started Not Started
Inland Empire Utilities Agency REG REC WATER DIST SYSTEM - PHASE 1: PHILADELPHIA STREET PIPELINE4846-16003-803 21490347 Active Ongoing Not Started
Tahoe-Truckee Sanitation Agency Treatment Plant Expansion 4657-11003-804 21490346 Active Ongoing Not Started
Benicia, City of I/I improvements4528-21003-806 21490352 Active Ongoing Not StartedRussian River County Sanitation Dist. Treatment Plant Expansion and Upgrades4821-11003-807 21490354 Active Ongoing Not StartedInland Empire Utilities Agency REG REC WATER DIST SYSTEM - PHASE 1: FOURTH STREET PIPELINE4846-14003-808 21490363 Active Ongoing Not Started
Inland Empire Utilities Agency North Etiwanda Extension - 12 inch recycled water project4846-15003-809 21490361 Active Not Started Not StartedPismo Beach, City of Wastewater Facilities Expansion Project4793-11003-810 21490356 Active Ongoing Not StartedPiedmont, City of I/I Correction4655-13003-811 21490359 Active Ongoing Not Started
The Nature Conservancy Palo Corona Watershed Protection Project6085-11004-802 21490358 Active Complete
Pismo Beach, City of Wastewater Facilities Expansion Project4793-12004-805 Active Not Started
Los Osos Community Services District COLLECTION, TRMT & DIS FOR LOS OSOS/BAYWOOD PARK4014-11004-806 Active Not Started Not Started
4/17/2005Page 3 of 10
Party Project NameSubsidiary
NumberPledged
LoanLocal Match
Project Status
Disbursement Status
Repayment Status
California CWSRF - List of All Projects
Contract Number
ProjectNumber
Irvine Ranch Water District740-2710804 21490088 Active Complete Ongoing
Otay Water District740-2720810 21490095 Active Complete Ongoing
East Bay Municipal Utility District740-2730822 21490102 Active Complete Ongoing
Santa Margarita Water District740 3902-1112709 Active Ongoing Not Started
Leucadia County Water District740-2742818 21490139 Active Complete Ongoing
Burbank, City of740-2773820 21490164 Active Complete Ongoing
South East Regional Reclamation Authority740 1695-1106801 21490051 Active Complete OngoingMoulton Niguel Water District740-2796803 21490052 Active Complete Ongoing
Desert Water Agency740-2806804 NA Active Complete OngoingLakewood, City of740-2816805 21490054 Active Complete OngoingCrescenta Valley County WD740-2826806 NA Active Complete Ongoing
Santa Clara, City of740-2836807 21490056 Active Complete OngoingLong Beach Water Dept740-2846810 21490057 Active Complete Ongoing
Los Angeles County Sanitation District740 1054-1107801 21490064 Active Complete Ongoing
Los Angeles County Sanitation District740 1054-2107802 21490063 Active Complete Ongoing
Santa Margarita Water District740-2877804 21490072 Active Complete Ongoing
Irvine Ranch Water District740-2887805 21490062 Active Complete Ongoing
Los Angeles County Sanitation District740-2897806 21490071 Active Complete Ongoing
East Bay Municipal Utility District740-2907807 21490066 Active Complete Ongoing
Santa Barbara, City of740-2917808 21490065 Active Complete Ongoing
Alameda, City of740 2965-1108801 21490068 Active Complete Ongoing
East Bay Municipal Utility District740 1246-4208802 21490074 Active Complete Ongoing
San Francisco, City and County of OCEANSIDE TREATMENT - WESTSIDE DRY WEATHER TO FULL SECONDARY4000-14089-803 21490081 Active Complete Ongoing
Los Angeles County Sanitation District San Jose Creek Water Reclamation Plant Expansion-Stage IV4001-21089-809 21490087 Active Complete Ongoing
East Bay Municipal Utility District District Wet Weather - Interceptor Improvements - (Adeline Interceptor) (1989funds)4003-46190-805 21490096 Active Complete Ongoing
East Bay Municipal Utility District District Wet Weather - South Foothill Interceptor (1989 Funds)4003-47190-806 21490097 Active Complete Ongoing
San Francisco, City and County of Mariposa Transport/storage4025-71090-807 21490089 Active Complete OngoingSan Francisco, City and County of Oceanside Treatment - Westside Dry Weather to Full Secondary4000-15090-808 21490093 Active Complete OngoingSan Francisco, City and County of Oceanside Treatment - Westside Dry Weather to Full Secondary4000-16090-809 21490094 Active Complete Ongoing
San Bernardino, City of Reg A.T. Fac For The Cities of San Bernardino and Project (1990 Funds)4100-11190-811 21490098 Active Complete Not StartedSan Luis Obispo, City of Treatment Facility Imprv. To Meet Advanced Treatment Permits Limits - I4031-13091-801 21490105 Active Complete OngoingSan Luis Obispo, City of Sewer Rehabilitation To Correct Excessive I/I (FFY 1989 Funds)4031-15091-802 21490104 Active Complete Ongoing
Los Angeles County Sanitation District Upgrade and Modify JWPCP4028-11191-805 21490115 Active Complete Ongoing
East Bay Municipal Utility District District Wet Weather - Point Isabel WWTP4003-43091-806 21490109 Active Complete Ongoing
Walker River Irrigation District Sediment removal project6002-11091-808 21490107 Closed Out Complete Repaid in F
4/17/2005Page 4 of 10
Party Project NameSubsidiary
NumberPledged
LoanLocal Match
Project Status
Disbursement Status
Repayment Status
California CWSRF - List of All Projects
Contract Number
ProjectNumber
Fresno Metropolitan Flood Control District FMFCD master plan project6000-11091-810 21490110 Active Complete Ongoing
San Francisco, City and County of Storm sewer connection to combined system6001-11091-811 21490106 Active Complete Ongoing
San Francisco, City and County of Lake Merced Transport/Storage.Permit & Cease & Desist Order Violations,WQ Problems4023-31091-812 21490108 Active Complete Ongoing
San Luis Obispo, City of Treatment Facilities Imprv. To Meet Advanced Treatment permits Limits-phase II (FFY 1989 Fun4031-16091-813 21490111 Active Complete Ongoing
Firebaugh Canal Water District Irrigation system improvements6005-11191-814 21490112 Active Complete Ongoing
Broadview Water District Irrigation system improvements6003-11191-815 21490113 Closed Out Complete Repaid in F
San Francisco, City and County of Islais Creek Transport/Storage-Bayside-Eligible For Marine CSO-Contract A4025-41191-823 21490123 Active Complete OngoingRichmond, City of Richmond Treatment Plant Modifications: Primary Additions4039-12091-824 21490116 Active Complete Ongoing
Stockton, City of Source control programs6007-11191-827 21490128 Active Complete OngoingMonterey Regional WPCA Construction of Lift Station and Interceptor (Recd loan 8/25/92)4107-11092-801 21490124 Active Complete OngoingStege Sanitary District Hoffman Marsh /Highgate-Sunset Relief Sewers Recd Loan-8/25/924008-31192-802 21490125 Active Complete Ongoing
Willows, City of Upgrade Existing Plant and Disposal Facilities. Solve Possible I/I Problem4052-11192-803 21490126 Active Complete OngoingMission Springs Water District Wastewater Treatment Plant Expansion-Phase I (Recd Loan 9/24/92)4250-11092-804 21490129 Active Complete Ongoing
Santa Ana Watershed Project Authority (SARI), Phase I Reach IV-D Contracts 1-3 Recd Loan4118-11192-806 21490130 Active Complete Ongoing
San Francisco, City and County of Islais Creek Transport/Storage-Contract C4025-43092-807 21490141 Active Complete Ongoing
Tehachapi, City of Upgrade Facilities to Provide Full Reclamation (Recd Loan 12/28/92)4143-11092-808 21490132 Active Complete Ongoing
East Bay Municipal Utility District Cooling Towers (reclamation) Recd Loan 8/25/934123-11192-810 21490136 Active Complete Ongoing
South San Francisco, City of Wet Weather Management Project4267-11092-812 21490137 Active Complete Ongoing
Santa Ana Watershed Project Authority Santa Ana Regional Interceptor (SARI), Phase II Reach IV-D contract 74118-12292-813 21490135 Active Complete Ongoing
Oakland, City of Basin 54 Relief Sewer, Phase IIIA4006-31192-814 21490142 Active Complete Ongoing
Emeryville, City of I/I Correction-Third Year-subbasin 21 (1988-89)4011-31192-815 21490138 Active Complete Ongoing
East Bay Municipal Utility District Dist. Wet Weather-North Interceptor4003-44192-817 21490143 Active Complete Ongoing
Fillmore, City of Treatment Plant Improvements (Recd Loan 6/11/93)4239-11192-819 21490144 Active Complete Ongoing
Fallbrook Public Utilities District Reclamation Facility (recd Loan 7/14/93)4157-11092-820 21490145 Active Complete Ongoing
San Francisco, City and County of Islais Creek Transport/Storage-Contract C (Segment of 4025-430)4025-46193-801 21490146 Active Complete Ongoing
San Francisco, City and County of Oceanside Water Pollution Control Plant (Segment of 4000-160)4000-18093-802 21490147 Active Complete Ongoing
Western Riverside County Regional WW Authority Western Riverside County Regional Wastewater System (Recd Loan 10/29/93)4029-11193-804 21490148 Active Complete OngoingDavis, City of Wetland treatment of runoff6006-11093-805 21490154 Active Complete OngoingStege Sanitary District I/I Correction Phase IV Moeser/Stockton Relief Sewer line Recd Loan4008-41093-806 21490149 Active Complete Ongoing
Livermore, City of Plant Expansion Recd Loan 1/14/944215-11093-808 21490152 Active Complete OngoingPanoche Drainage District Drip, gated pipe & sprinkler irrigation systems6024-11093-809 21490155 Active Complete OngoingPacheco Water District Drainage Recycling System6022-11193-810 21490165 Active Complete Ongoing
Santa Ana Watershed Project Authority Santa Ana Regional Int(SARI),phase III Reach IV-D contracts 4,5 Loan4118-13293-811 21490153 Active Complete Ongoing
Oceanside, City of San Luis Rey WR-Phase 1 Modifications Recd Loan 4/27/944160-11093-812 21490156 Active Complete Ongoing
Sonoma Valley County Sanitation District Outfall Lining Recd Loan 4/27/944219-11093-813 21490157 Active Complete Ongoing
4/17/2005Page 5 of 10
Party Project NameSubsidiary
NumberPledged
LoanLocal Match
Project Status
Disbursement Status
Repayment Status
California CWSRF - List of All Projects
Contract Number
ProjectNumber
Union Sanitary District PLANT UPGRADE RECD LOAN 5/14/944070-11093-814 21490160 Active Complete Ongoing
Elsinore Valley Municipal Water District Amber Ridge Sewers/Collection System Recd Loan 5/11/944336-11093-815 21490158 Active Complete Ongoing
Santa Cruz, City of Secondary Treatment4035-31393-816 21490162 Active Complete Ongoing
Santa Ana Watershed Project Authority Santa Ana Regional (SARI), Phase V Reach IV-E contracts 1,2 Recd 5/17/944118-15393-817 21490161 Active Complete Ongoing
San Bernardino, City of Regional Tertiary Treatment For San Bernardino and Colton4122-11293-818 21490159 Active Complete Ongoing
Goleta Sanitary District Outfall Repairs (Recd Loan 6/10/94)4330-11093-819 21490163 Active Complete Ongoing
San Francisco, City and County of Islais Creek Transport/Storage-Contract B4025-42093-821 21490260 Active Complete OngoingSanta Ana Watershed Project Authority Santa Ana Regional Interceptor(SARI),Phase IV Reach IV-D Contract 64118-14194-801 21490167 Active Complete Ongoing
Fairbanks Ranch Community Serives Dist. Odor Control and Denitrification (Recd loan 8/29/94)4411-11194-802 21490168 Active Complete OngoingMarysville, City of Treatment Plant Improvements (Recd Loan 8/29/94)4244-11094-803 21490166 Active Complete OngoingHidden Valley Lake Community Service Dist. Construction of Treatment Plant, Collection System and Reclaim Wastewater4138-11094-804 21490172 Active Complete Ongoing
Elsinore Valley Municipal Water District Canyon Lake Sewers4417-11094-805 21490170 Active Complete OngoingCambria Community Services District Treatment Plant Improvements4108-11094-806 21490169 Active Complete Ongoing
Santa Rosa, City of Laguna Wastewater Treatment Plant Upgrade Recd Loan 10/12/944062-11094-807 21490171 Active Complete Ongoing
Ukiah, City of Construction of AWT Facilities to Treat Wet Weather Flow Loan 11/4/944102-11094-808 21490173 Active Complete Ongoing
Los Angeles County Sanitation District Treatment Plant Expansion -- Palmdale Water Rec Pl,Stage IV Loan 4/25/954214-11194-809 21490180 Active Complete Ongoing
Ojai Valley Sanitary District Upgrade To Tertiary4117-11194-812 21490176 Active Complete Ongoing
East Bay Municipal Utility District District Wet Weather - San Antonio WWTP Recd 2/15/954003-48094-813 21490177 Active Complete Ongoing
Blythe, City of Wastewater Treatment Plant Expansion4340-11094-814 21490178 Active Complete Ongoing
Elsinore Valley Municipal Water District Canyon Lake Pump Stations4417-12094-815 21490179 Active Complete Ongoing
Sacramento County Water Agency Detention basins for storm water6028-11094-816 21490182 Active Complete Ongoing
Calexico, City of Wastewater Treatment Plant No. 1 Improvements4309-11194-818 21499001 Active Complete Ongoing
Los Angeles County Sanitation District La Canada-Flintridge: Phase I -- LCFWRP Outfall Recd Loan 5/18/954252-11094-819 21490183 Active Complete Ongoing
Bear Valley CSD Modification of WWTF to Provide Additional Reclamation4136-11294-820 21490184 Active Complete Ongoing
Los Angeles County Sanitation District Lancaster WRP Stage IV Treatment Plant Expansion- District 14 Loan 6/23/954213-11294-821 21490185 Active Complete Ongoing
Stanislaus County-Environmental Res. Collection, Transport, Treatment For The Unsewered Community of Bret Harte4020-11194-822 21490186 Active Complete Ongoing
Cascade Shores Water District Upgrade To Meet Npdes Permit - Local Share4030-11095-801 21490187 Active Complete OngoingSan Francisco, City and County of Islais Creek Transport/Storage-Contract E4025-45195-802 21490188 Active Complete OngoingPadre Dam Municipal Water District Santee Reclamation WRP Upgrade4245-11095-803 21490189 Active Complete Ongoing
Monterey Regional WPCA Reclamation Project For Regional Plant (reclamation)4071-21095-804 21490191 Active Complete OngoingMcKinleyville Community Services Dist. Treatment Plant Expansion4259-11195-805 21490190 Active Complete OngoingWestlands Water District Irrigation Improvement Project6027-11095-806 21490193 Active Complete Ongoing
Los Angeles County Sanitation District La Canada-Flintridge: Phase II -- LCF Foothill Main Sewer4252-21195-807 21499003 Active Complete Ongoing
San Francisco, City and County of Islais Creek Pump Station - Contract 44025-25295-808 21490198 Active Complete Ongoing
East Bay Municipal Utility District Pump Station "C" Storage4003-45095-809 21490194 Active Complete Ongoing
4/17/2005Page 6 of 10
Party Project NameSubsidiary
NumberPledged
LoanLocal Match
Project Status
Disbursement Status
Repayment Status
California CWSRF - List of All Projects
Contract Number
ProjectNumber
Livermore, City of REVERSE OSMOSIS PLANT4124-11195-811 21490197 Active Complete Ongoing
El Toro Water District WWRP Reconstruction Project4453-11095-813 21499005 Active Complete Ongoing
Moulton Niguel Water District Water Reclamation Phase III Revised Expansion Project-A (reclamation)4150-11095-814 21499010 Active Complete Ongoing
Crestline Sanitation District Construction of Emergency Storage For Effluent- Huston Creek Facility4351-11195-815 21499014 Active Complete Ongoing
Los Angeles County Sanitation District Valencia Water Reclamation Plant Stage IV-solids4082-11195-816 21499052 Active Complete Ongoing
Cloverdale, City of Treatment Plant Improvements and Expansion4301-11095-817 21490203 Active Complete Ongoing
Alameda, City of I/I Correction-phase V- Subbasins 97 & 94E4007-31095-818 21490204 Active Complete OngoingRubidoux Community Services District Expansion of Regional Systems4063-11095-819 21490211 Active Complete Ongoing
San Francisco, City and County of Islais Creek Pump Station - Contract 54025-26095-820 21490261 Active Complete OngoingLake County Sanitation District SE Geysers Effl Pipeline Contract 1-24087-11196-801 21490199 Active Complete OngoingGoleta Water District Construction of Wastewater Reclamation Facilities (reclamation)4198-11096-802 21490200 Active Complete Ongoing
Delta Diablo Sanitation District Pittsburg Conveyance System Improvements4433-11096-803 21499007 Active Complete OngoingSouth Lake Tahoe, City of Ski Run Water Quality Improvments6025-11096-804 21490202 Active Ongoing Ongoing
San Luis Water District Irrigation system improvements6014-11196-805 21490201 Active Ongoing Ongoing
Pacifica, City of Plant Improvements To Comply With Permit Violations4121-11096-806 21499012 Active Complete Ongoing
Corona, City of Wastewater Treatment Plant #1 Expansion4461-11196-807 21490205 Active Complete Ongoing
Napa Resource Conservation District Sustainable Agriculture Demonstation Project6043-11096-808 21490207 Active Complete Ongoing
Western Riverside County Regional WW Authority Western Riverside County Regional Wastewater System4442-11096-809 21490208 Active Complete Ongoing
Elsinore Valley Municipal Water District Canyon Lake Pipe & Manhole Sealing4417-13096-810 21490209 Active Complete Ongoing
Western Riverside County Regional WW Authority Western Riverside County Regional Force Main4442-12096-812 21490210 Active Complete Ongoing
Fresno Metropolitan Flood Control District Storm WQ management6000-12096-813 21490213 Active Complete Ongoing
Riverside, City of Headworks Replacement4331-13096-814 21499016 Active Complete Ongoing
Portola, City of I/I Correction & Pump Repairs4364-11096-815 21499020 Active Complete Ongoing
Pacheco Water District Drainage Recycling System6041-11196-816 21490214 Active Complete Ongoing
Irvine Ranch Water District Zone A South Reclaimed Water Reservoir (reclamation)4455-11196-817 21490216 Active Complete Ongoing
Wasco, City of Storm drain project6021-11096-818 21490217 Active Complete Ongoing
Western Riverside County Regional WW Authority Western Riverside County Regional Pumping Station4442-13096-819 21490218 Active Complete OngoingDavis, City of Treatment Plant Expansion & Improvements4360-11096-820 21490220 Active Complete OngoingMcKinleyville Community Services Dist. Disposal Facilities4259-12096-821 21490219 Active Complete Ongoing
San Jose, City of Diversion Facility and Transmission Pump Station4220-11096-822 21499024 Active Complete OngoingMoulton Niguel Water District Water Reclamation Phase III Revised Expansion Project-B (reclamation)4150-13096-823 21499026 Active Complete OngoingLos Angeles County Sanitation District JWPCP Construction - Final Increment Secondary Treatment4001-22097-804 21490222 Active Complete Not Started
Panoche Water District Subsurface water recir project6044-11097-805 21490221 Active Complete Ongoing
Bakersfield, City of Upgrade Treatment Plant4321-11097-806 21499018 Active Ongoing Ongoing
San Diego, City of Point Loma - Digester Facility Upgrade & expansion4383-11097-807 21499072 Active Complete Ongoing
4/17/2005Page 7 of 10
Party Project NameSubsidiary
NumberPledged
LoanLocal Match
Project Status
Disbursement Status
Repayment Status
California CWSRF - List of All Projects
Contract Number
ProjectNumber
Jurupa Community Services District Regional Wastewater Equalization Ponds4512-11097-808 21499022 Active Complete Ongoing
Placerville, City of Wastewater Treatment Plant Expansion4505-11097-809 21490228 Active Ongoing Ongoing
Charleston Drainage District Subsurface water recir project6053-11097-810 21490223 Active Complete Ongoing
North of The River Sanitary Dist No. 1 Construction of Regional WWTF4337-11097-811 21490224 Active Complete Ongoing
Chico, City of Wastewater Treatment Plant Expansion, Nitrification4504-11097-812 21490229 Active Complete Ongoing
Mammoth Lakes, Town of Urban runoff projects6031-11097-813 21490227 Active Complete Ongoing
Rialto, City of Treatment Plant Expansion4648-11097-814 21490231 Active Ongoing OngoingSan Elijo Joint Powers Authority San Elijo Water Reclamation System (reclamation)4155-11097-815 21490226 Active Complete Ongoing
Colton, City of Secondary Treatment Expansion and Renovation For Hydraulic Reliability4251-11097-817 21490230 Active Complete OngoingAlameda, City of I/I Correction-phase VI4007-41197-818 21490232 Active Complete OngoingSacramento, City of Sump No. 1/1A and Pioneer Reservoir Improvement and Rehabilitation Project4441-11097-819 21490233 Active Complete Ongoing
Auburn, City of Treatment Plant Improvements To Meet WDRs - Phase 14471-11197-820 21499054 Active Complete OngoingSan Jose, City of Santa Clara Pipelines4220-13097-821 21499028 Active Complete Ongoing
San Jose, City of Golden Triangle Segment4220-14097-822 21499030 Active Complete Ongoing
San Jose, City of Coyote/Old Oakland Road Segment4220-15097-823 21499032 Active Complete Ongoing
San Jose, City of Senter Road Segment4220-17097-824 21499034 Active Complete Ongoing
La Canada Flintridge, City of La Canada Flintridge- Community Sewer System4252-31197-825 21499036 Active Complete Ongoing
San Jose, City of 12th Street Segment4220-16097-826 21499038 Active Complete Ongoing
South San Francisco, City of Plant Improvement Project4614-11197-827 21490235 Active Complete Ongoing
Red Bluff, City of Treatment Plant Expansion4525-11097-828 21499058 Active Complete Ongoing
Sacramento, City of Sump No. 2 Improvement Project4441-12097-829 21490248 Active Complete Ongoing
Los Angeles County Sanitation District Reactors and Clarifiers at the JWPCP, Contract No. 44001-23297-830 21490250 Active Ongoing Ongoing
Riverside, City of Back-Up Power4331-12097-831 21499068 Active Complete Ongoing
San Diego, City of Point Loma Central Boiler and Gallery Upgrade4542-11097-832 21499070 Active Complete Ongoing
Orange County Water District740-2949805 21490001 Active Complete Ongoing
San Jose, City of Transmission Pipeline4220-12098-802 21499040 Active Complete Ongoing
San Jose, City of Yerba Buena/Sylvandale4220-18098-803 21499050 Active Complete OngoingSan Jose, City of Evergreen Segment4220-19098-804 21499046 Active Complete OngoingSan Jose, City of Booster Ps, Reservoir, Scada4220-31098-805 21499056 Active Complete Ongoing
San Jose, City of Milpitas Pipelines4220-32098-806 21499042 Active Complete OngoingSanta Ynez Community Services District Collection System For Failing On-site Systems4357-11198-807 21490237 Active Complete OngoingNipomo Community Services District Wastewater Treatment Facility Expansion4501-11098-808 21499044 Active Complete Ongoing
Benicia, City of Wastewater Treatment Plant Expansion4528-11098-809 21499048 Active Complete Ongoing
Wasco, City of (Reclamation)4243-11098-810 21490236 Active Complete Ongoing
Merced, County of Animal Confinement Drainage Project6050-11098-811 21490246 Active Ongoing Ongoing
4/17/2005Page 8 of 10
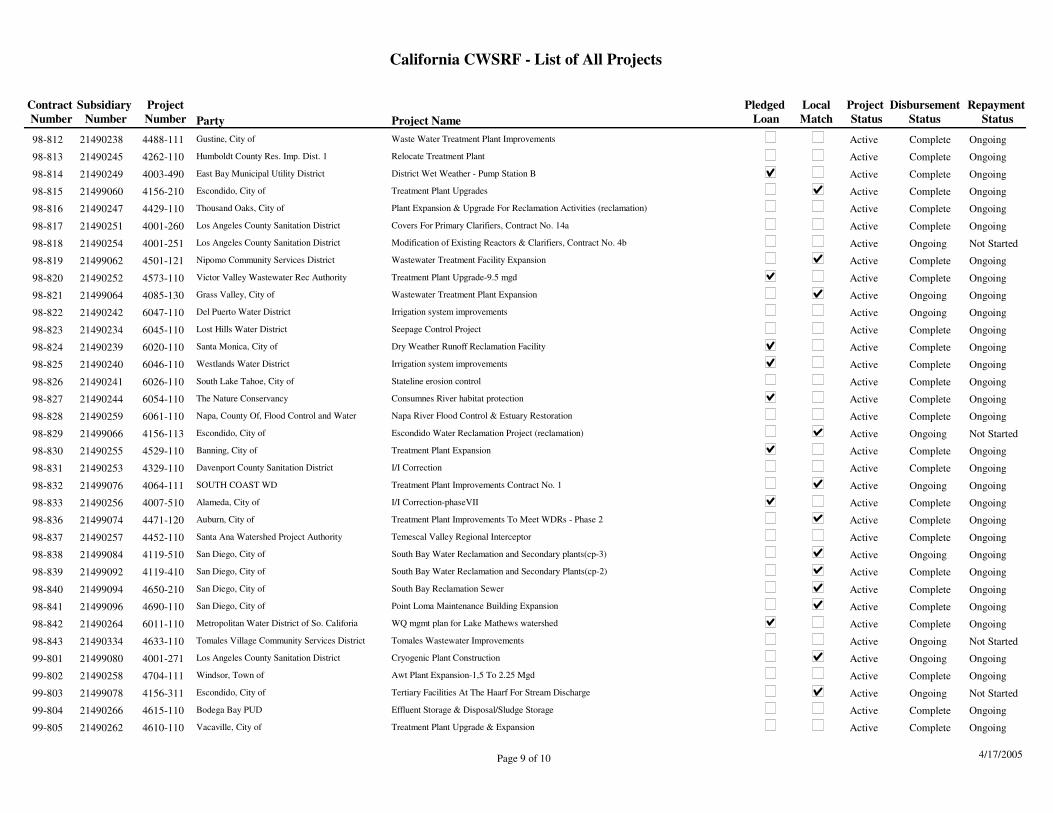
Party Project NameSubsidiary
NumberPledged
LoanLocal Match
Project Status
Disbursement Status
Repayment Status
California CWSRF - List of All Projects
Contract Number
ProjectNumber
Gustine, City of Waste Water Treatment Plant Improvements4488-11198-812 21490238 Active Complete Ongoing
Humboldt County Res. Imp. Dist. 1 Relocate Treatment Plant4262-11098-813 21490245 Active Complete Ongoing
East Bay Municipal Utility District District Wet Weather - Pump Station B4003-49098-814 21490249 Active Complete Ongoing
Escondido, City of Treatment Plant Upgrades4156-21098-815 21499060 Active Complete Ongoing
Thousand Oaks, City of Plant Expansion & Upgrade For Reclamation Activities (reclamation)4429-11098-816 21490247 Active Complete Ongoing
Los Angeles County Sanitation District Covers For Primary Clarifiers, Contract No. 14a4001-26098-817 21490251 Active Complete Ongoing
Los Angeles County Sanitation District Modification of Existing Reactors & Clarifiers, Contract No. 4b4001-25198-818 21490254 Active Ongoing Not StartedNipomo Community Services District Wastewater Treatment Facility Expansion4501-12198-819 21499062 Active Complete Ongoing
Victor Valley Wastewater Rec Authority Treatment Plant Upgrade-9.5 mgd4573-11098-820 21490252 Active Complete OngoingGrass Valley, City of Wastewater Treatment Plant Expansion4085-13098-821 21499064 Active Ongoing OngoingDel Puerto Water District Irrigation system improvements6047-11098-822 21490242 Active Ongoing Ongoing
Lost Hills Water District Seepage Control Project6045-11098-823 21490234 Active Complete OngoingSanta Monica, City of Dry Weather Runoff Reclamation Facility6020-11098-824 21490239 Active Complete Ongoing
Westlands Water District Irrigation system improvements6046-11098-825 21490240 Active Complete Ongoing
South Lake Tahoe, City of Stateline erosion control6026-11098-826 21490241 Active Complete Ongoing
The Nature Conservancy Consumnes River habitat protection6054-11098-827 21490244 Active Complete Ongoing
Napa, County Of, Flood Control and Water Napa River Flood Control & Estuary Restoration6061-11098-828 21490259 Active Complete Ongoing
Escondido, City of Escondido Water Reclamation Project (reclamation)4156-11398-829 21499066 Active Ongoing Not Started
Banning, City of Treatment Plant Expansion4529-11098-830 21490255 Active Complete Ongoing
Davenport County Sanitation District I/I Correction4329-11098-831 21490253 Active Complete Ongoing
SOUTH COAST WD Treatment Plant Improvements Contract No. 14064-11198-832 21499076 Active Ongoing Ongoing
Alameda, City of I/I Correction-phaseVII4007-51098-833 21490256 Active Complete Ongoing
Auburn, City of Treatment Plant Improvements To Meet WDRs - Phase 24471-12098-836 21499074 Active Complete Ongoing
Santa Ana Watershed Project Authority Temescal Valley Regional Interceptor4452-11098-837 21490257 Active Complete Ongoing
San Diego, City of South Bay Water Reclamation and Secondary plants(cp-3)4119-51098-838 21499084 Active Ongoing Ongoing
San Diego, City of South Bay Water Reclamation and Secondary Plants(cp-2)4119-41098-839 21499092 Active Complete Ongoing
San Diego, City of South Bay Reclamation Sewer4650-21098-840 21499094 Active Complete OngoingSan Diego, City of Point Loma Maintenance Building Expansion4690-11098-841 21499096 Active Complete OngoingMetropolitan Water District of So. Califoria WQ mgmt plan for Lake Mathews watershed6011-11098-842 21490264 Active Complete Ongoing
Tomales Village Community Services District Tomales Wastewater Improvements4633-11098-843 21490334 Active Ongoing Not StartedLos Angeles County Sanitation District Cryogenic Plant Construction4001-27199-801 21499080 Active Ongoing OngoingWindsor, Town of Awt Plant Expansion-1,5 To 2.25 Mgd4704-11199-802 21490258 Active Complete Ongoing
Escondido, City of Tertiary Facilities At The Haarf For Stream Discharge4156-31199-803 21499078 Active Ongoing Not Started
Bodega Bay PUD Effluent Storage & Disposal/Sludge Storage4615-11099-804 21490266 Active Complete Ongoing
Vacaville, City of Treatment Plant Upgrade & Expansion4610-11099-805 21490262 Active Complete Ongoing
4/17/2005Page 9 of 10
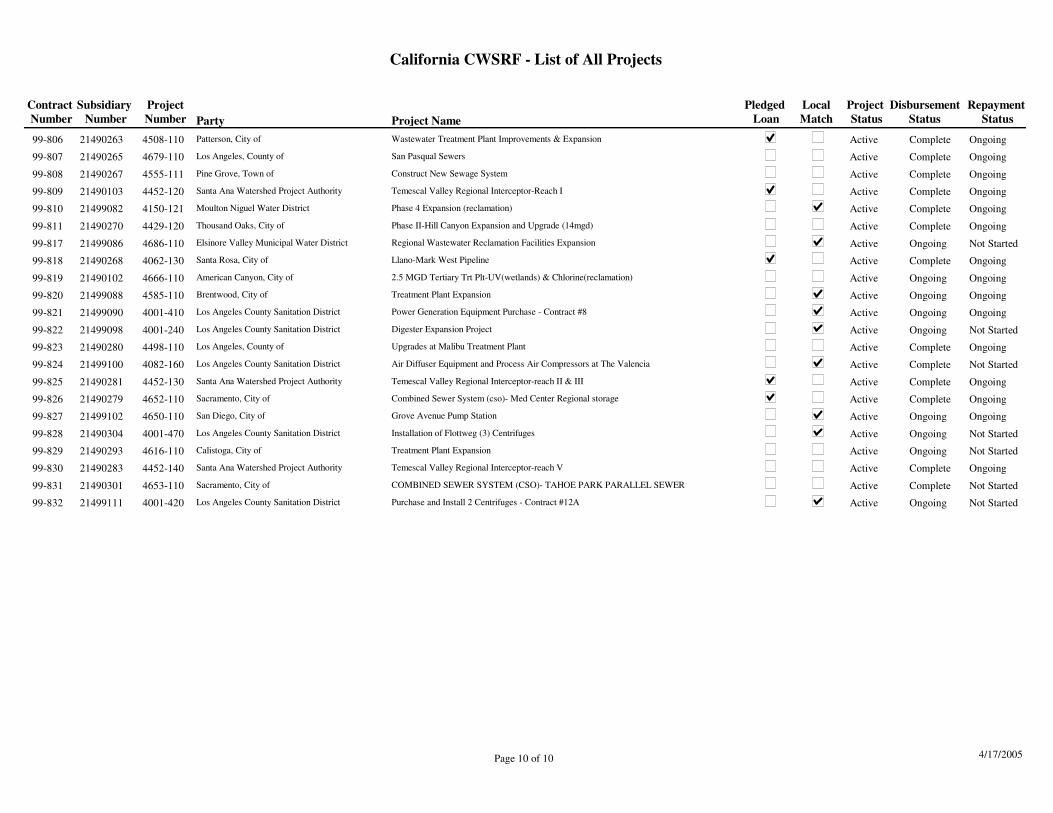
Party Project NameSubsidiary
NumberPledged
LoanLocal Match
Project Status
Disbursement Status
Repayment Status
California CWSRF - List of All Projects
Contract Number
ProjectNumber
Patterson, City of Wastewater Treatment Plant Improvements & Expansion4508-11099-806 21490263 Active Complete Ongoing
Los Angeles, County of San Pasqual Sewers4679-11099-807 21490265 Active Complete Ongoing
Pine Grove, Town of Construct New Sewage System4555-11199-808 21490267 Active Complete Ongoing
Santa Ana Watershed Project Authority Temescal Valley Regional Interceptor-Reach I4452-12099-809 21490103 Active Complete Ongoing
Moulton Niguel Water District Phase 4 Expansion (reclamation)4150-12199-810 21499082 Active Complete Ongoing
Thousand Oaks, City of Phase II-Hill Canyon Expansion and Upgrade (14mgd)4429-12099-811 21490270 Active Complete Ongoing
Elsinore Valley Municipal Water District Regional Wastewater Reclamation Facilities Expansion4686-11099-817 21499086 Active Ongoing Not StartedSanta Rosa, City of Llano-Mark West Pipeline4062-13099-818 21490268 Active Complete Ongoing
American Canyon, City of 2.5 MGD Tertiary Trt Plt-UV(wetlands) & Chlorine(reclamation)4666-11099-819 21490102 Active Ongoing OngoingBrentwood, City of Treatment Plant Expansion4585-11099-820 21499088 Active Ongoing OngoingLos Angeles County Sanitation District Power Generation Equipment Purchase - Contract #84001-41099-821 21499090 Active Ongoing Ongoing
Los Angeles County Sanitation District Digester Expansion Project4001-24099-822 21499098 Active Ongoing Not StartedLos Angeles, County of Upgrades at Malibu Treatment Plant4498-11099-823 21490280 Active Complete Ongoing
Los Angeles County Sanitation District Air Diffuser Equipment and Process Air Compressors at The Valencia4082-16099-824 21499100 Active Complete Not Started
Santa Ana Watershed Project Authority Temescal Valley Regional Interceptor-reach II & III4452-13099-825 21490281 Active Complete Ongoing
Sacramento, City of Combined Sewer System (cso)- Med Center Regional storage4652-11099-826 21490279 Active Complete Ongoing
San Diego, City of Grove Avenue Pump Station4650-11099-827 21499102 Active Ongoing Ongoing
Los Angeles County Sanitation District Installation of Flottweg (3) Centrifuges4001-47099-828 21490304 Active Ongoing Not Started
Calistoga, City of Treatment Plant Expansion4616-11099-829 21490293 Active Ongoing Not Started
Santa Ana Watershed Project Authority Temescal Valley Regional Interceptor-reach V4452-14099-830 21490283 Active Complete Ongoing
Sacramento, City of COMBINED SEWER SYSTEM (CSO)- TAHOE PARK PARALLEL SEWER4653-11099-831 21490301 Active Complete Not Started
Los Angeles County Sanitation District Purchase and Install 2 Centrifuges - Contract #12A4001-42099-832 21499111 Active Ongoing Not Started
4/17/2005Page 10 of 10
CCaalliiffoorrnniiaa WWaatteerr BBooaarrddss CCWWSSRRFF AAnnnnuuaall RReeppoorrtt 22000033//22000044
Exhibit C – Project Tracking Report
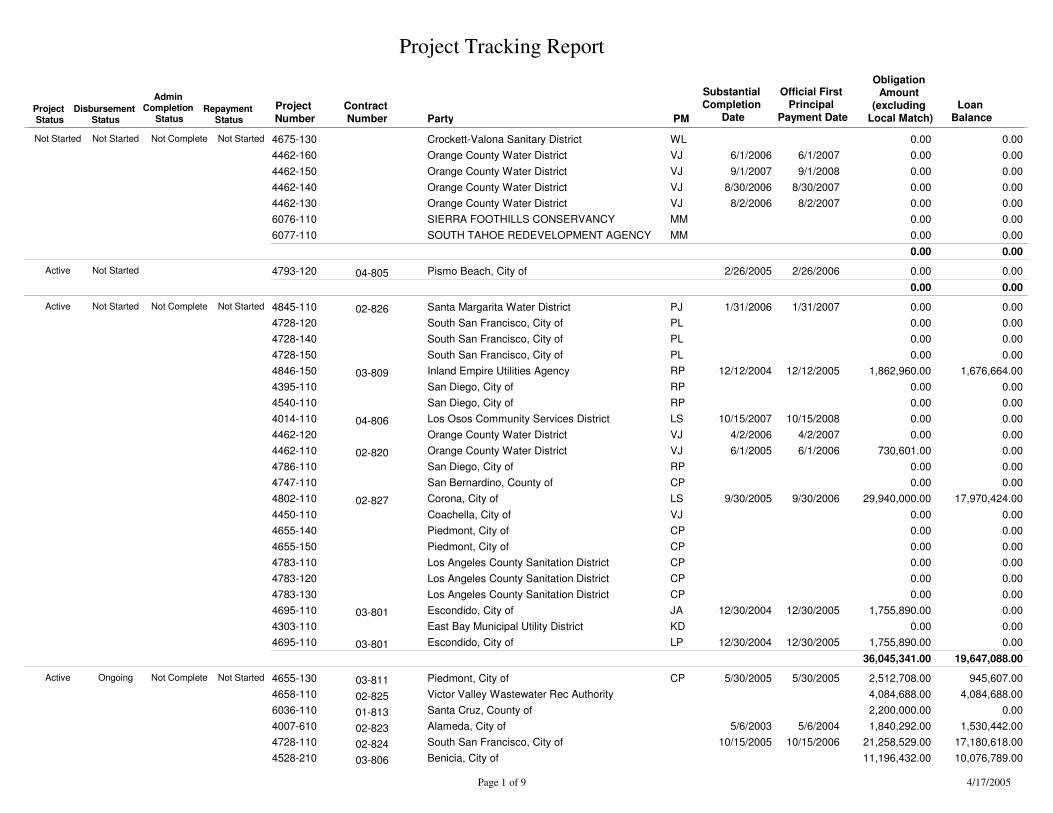
Project Tracking Report
Project Number Party
Contract Number
Substantial Completion
Date
Official First Principal
Payment Date
Obligation Amount
(excluding Local Match)PM
Project Status
Disbursement Status
Admin Completion
StatusRepayment
StatusLoan
Balance
Crockett-Valona Sanitary District4675-130 0.00WLNot Started Not Started Not StartedNot Complete 0.00Orange County Water District4462-160 6/1/2006 0.006/1/2007VJ 0.00Orange County Water District4462-150 9/1/2007 0.009/1/2008VJ 0.00Orange County Water District4462-140 8/30/2006 0.008/30/2007VJ 0.00Orange County Water District4462-130 8/2/2006 0.008/2/2007VJ 0.00SIERRA FOOTHILLS CONSERVANCY6076-110 0.00MM 0.00SOUTH TAHOE REDEVELOPMENT AGENCY6077-110 0.00MM 0.00
0.00 0.00
Pismo Beach, City of4793-120 04-805 2/26/2005 0.002/26/2006Active Not Started 0.000.00 0.00
Santa Margarita Water District4845-110 02-826 1/31/2006 0.001/31/2007PJActive Not Started Not StartedNot Complete 0.00South San Francisco, City of4728-120 0.00PL 0.00South San Francisco, City of4728-140 0.00PL 0.00South San Francisco, City of4728-150 0.00PL 0.00Inland Empire Utilities Agency4846-150 03-809 12/12/2004 1,862,960.0012/12/2005RP 1,676,664.00San Diego, City of4395-110 0.00RP 0.00San Diego, City of4540-110 0.00RP 0.00Los Osos Community Services District4014-110 04-806 10/15/2007 0.0010/15/2008LS 0.00Orange County Water District4462-120 4/2/2006 0.004/2/2007VJ 0.00Orange County Water District4462-110 02-820 6/1/2005 730,601.006/1/2006VJ 0.00San Diego, City of4786-110 0.00RP 0.00San Bernardino, County of4747-110 0.00CP 0.00Corona, City of4802-110 02-827 9/30/2005 29,940,000.009/30/2006LS 17,970,424.00Coachella, City of4450-110 0.00VJ 0.00Piedmont, City of4655-140 0.00CP 0.00Piedmont, City of4655-150 0.00CP 0.00Los Angeles County Sanitation District4783-110 0.00CP 0.00Los Angeles County Sanitation District4783-120 0.00CP 0.00Los Angeles County Sanitation District4783-130 0.00CP 0.00Escondido, City of4695-110 03-801 12/30/2004 1,755,890.0012/30/2005JA 0.00East Bay Municipal Utility District4303-110 0.00KD 0.00Escondido, City of4695-110 03-801 12/30/2004 1,755,890.0012/30/2005LP 0.00
36,045,341.00 19,647,088.00
Piedmont, City of4655-130 03-811 5/30/2005 2,512,708.005/30/2005CPActive Ongoing Not StartedNot Complete 945,607.00Victor Valley Wastewater Rec Authority4658-110 02-825 4,084,688.00 4,084,688.00Santa Cruz, County of6036-110 01-813 2,200,000.00 0.00Alameda, City of4007-610 02-823 5/6/2003 1,840,292.005/6/2004 1,530,442.00South San Francisco, City of4728-110 02-824 10/15/2005 21,258,529.0010/15/2006 17,180,618.00Benicia, City of4528-210 03-806 11,196,432.00 10,076,789.00
4/17/2005Page 1 of 9
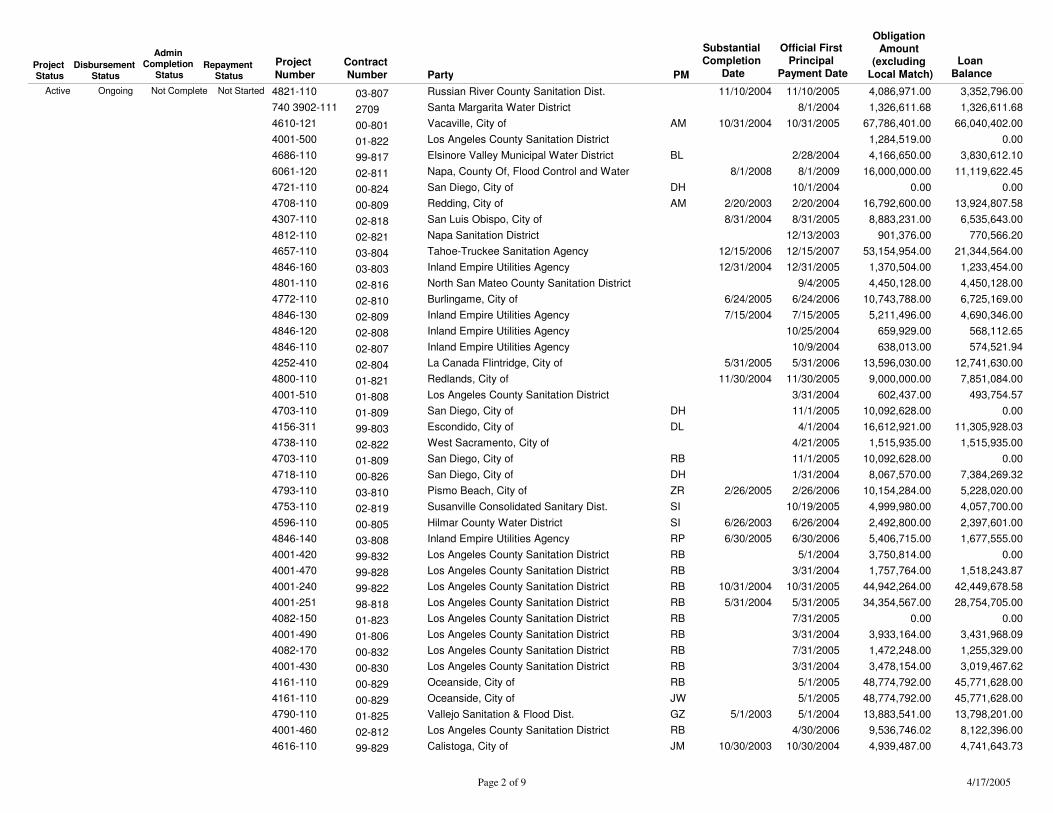
Project Number Party
Contract Number
Substantial Completion
Date
Official First Principal
Payment Date
Obligation Amount
(excluding Local Match)PM
Project Status
Disbursement Status
Admin Completion
StatusRepayment
Status
Loan Balance
Russian River County Sanitation Dist.4821-110 03-807 11/10/2004 4,086,971.0011/10/2005Active Ongoing Not StartedNot Complete 3,352,796.00Santa Margarita Water District740 3902-111 2709 1,326,611.688/1/2004 1,326,611.68Vacaville, City of4610-121 00-801 10/31/2004 67,786,401.0010/31/2005AM 66,040,402.00Los Angeles County Sanitation District4001-500 01-822 1,284,519.00 0.00Elsinore Valley Municipal Water District4686-110 99-817 4,166,650.002/28/2004BL 3,830,612.10Napa, County Of, Flood Control and Water6061-120 02-811 8/1/2008 16,000,000.008/1/2009 11,119,622.45San Diego, City of4721-110 00-824 0.0010/1/2004DH 0.00Redding, City of4708-110 00-809 2/20/2003 16,792,600.002/20/2004AM 13,924,807.58San Luis Obispo, City of4307-110 02-818 8/31/2004 8,883,231.008/31/2005 6,535,643.00Napa Sanitation District4812-110 02-821 901,376.0012/13/2003 770,566.20Tahoe-Truckee Sanitation Agency4657-110 03-804 12/15/2006 53,154,954.0012/15/2007 21,344,564.00Inland Empire Utilities Agency4846-160 03-803 12/31/2004 1,370,504.0012/31/2005 1,233,454.00North San Mateo County Sanitation District4801-110 02-816 4,450,128.009/4/2005 4,450,128.00Burlingame, City of4772-110 02-810 6/24/2005 10,743,788.006/24/2006 6,725,169.00Inland Empire Utilities Agency4846-130 02-809 7/15/2004 5,211,496.007/15/2005 4,690,346.00Inland Empire Utilities Agency4846-120 02-808 659,929.0010/25/2004 568,112.65Inland Empire Utilities Agency4846-110 02-807 638,013.0010/9/2004 574,521.94La Canada Flintridge, City of4252-410 02-804 5/31/2005 13,596,030.005/31/2006 12,741,630.00Redlands, City of4800-110 01-821 11/30/2004 9,000,000.0011/30/2005 7,851,084.00Los Angeles County Sanitation District4001-510 01-808 602,437.003/31/2004 493,754.57San Diego, City of4703-110 01-809 10,092,628.0011/1/2005DH 0.00Escondido, City of4156-311 99-803 16,612,921.004/1/2004DL 11,305,928.03West Sacramento, City of4738-110 02-822 1,515,935.004/21/2005 1,515,935.00San Diego, City of4703-110 01-809 10,092,628.0011/1/2005RB 0.00San Diego, City of4718-110 00-826 8,067,570.001/31/2004DH 7,384,269.32Pismo Beach, City of4793-110 03-810 2/26/2005 10,154,284.002/26/2006ZR 5,228,020.00Susanville Consolidated Sanitary Dist.4753-110 02-819 4,999,980.0010/19/2005SI 4,057,700.00Hilmar County Water District4596-110 00-805 6/26/2003 2,492,800.006/26/2004SI 2,397,601.00Inland Empire Utilities Agency4846-140 03-808 6/30/2005 5,406,715.006/30/2006RP 1,677,555.00Los Angeles County Sanitation District4001-420 99-832 3,750,814.005/1/2004RB 0.00Los Angeles County Sanitation District4001-470 99-828 1,757,764.003/31/2004RB 1,518,243.87Los Angeles County Sanitation District4001-240 99-822 10/31/2004 44,942,264.0010/31/2005RB 42,449,678.58Los Angeles County Sanitation District4001-251 98-818 5/31/2004 34,354,567.005/31/2005RB 28,754,705.00Los Angeles County Sanitation District4082-150 01-823 0.007/31/2005RB 0.00Los Angeles County Sanitation District4001-490 01-806 3,933,164.003/31/2004RB 3,431,968.09Los Angeles County Sanitation District4082-170 00-832 1,472,248.007/31/2005RB 1,255,329.00Los Angeles County Sanitation District4001-430 00-830 3,478,154.003/31/2004RB 3,019,467.62Oceanside, City of4161-110 00-829 48,774,792.005/1/2005RB 45,771,628.00Oceanside, City of4161-110 00-829 48,774,792.005/1/2005JW 45,771,628.00Vallejo Sanitation & Flood Dist.4790-110 01-825 5/1/2003 13,883,541.005/1/2004GZ 13,798,201.00Los Angeles County Sanitation District4001-460 02-812 9,536,746.024/30/2006RB 8,122,396.00Calistoga, City of4616-110 99-829 10/30/2003 4,939,487.0010/30/2004JM 4,741,643.73
4/17/2005Page 2 of 9
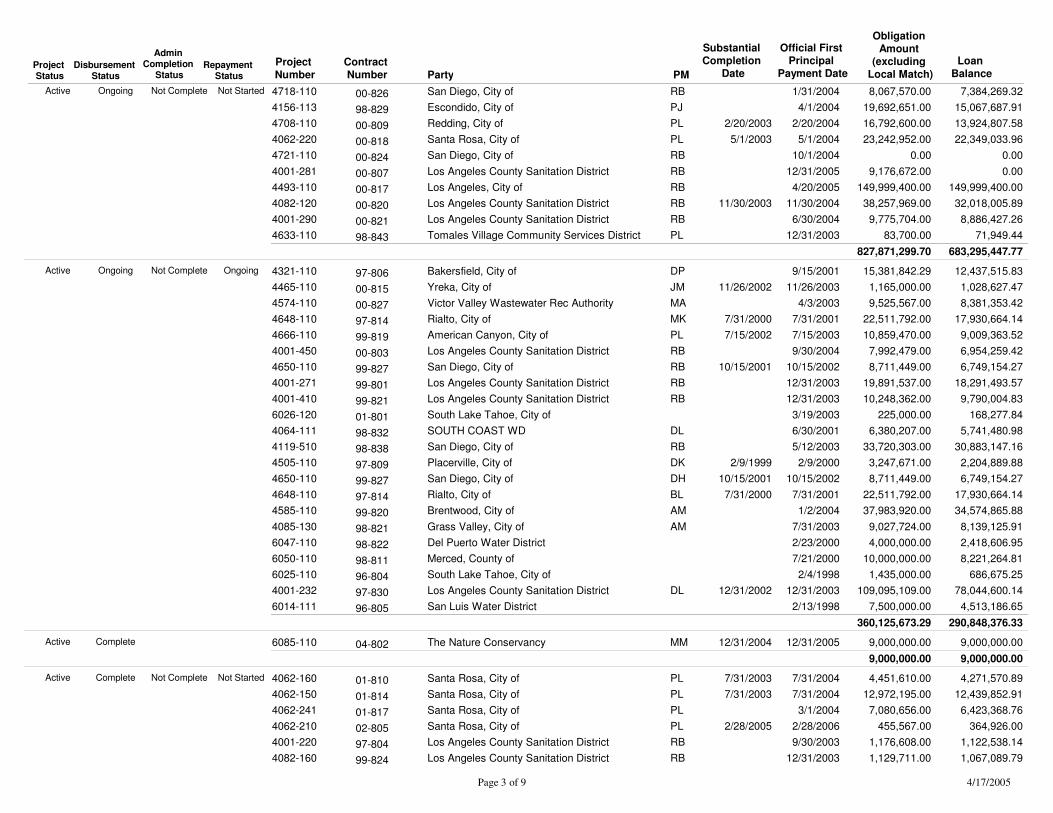
Project Number Party
Contract Number
Substantial Completion
Date
Official First Principal
Payment Date
Obligation Amount
(excluding Local Match)PM
Project Status
Disbursement Status
Admin Completion
StatusRepayment
Status
Loan Balance
San Diego, City of4718-110 00-826 8,067,570.001/31/2004RBActive Ongoing Not StartedNot Complete 7,384,269.32Escondido, City of4156-113 98-829 19,692,651.004/1/2004PJ 15,067,687.91Redding, City of4708-110 00-809 2/20/2003 16,792,600.002/20/2004PL 13,924,807.58Santa Rosa, City of4062-220 00-818 5/1/2003 23,242,952.005/1/2004PL 22,349,033.96San Diego, City of4721-110 00-824 0.0010/1/2004RB 0.00Los Angeles County Sanitation District4001-281 00-807 9,176,672.0012/31/2005RB 0.00Los Angeles, City of4493-110 00-817 149,999,400.004/20/2005RB 149,999,400.00Los Angeles County Sanitation District4082-120 00-820 11/30/2003 38,257,969.0011/30/2004RB 32,018,005.89Los Angeles County Sanitation District4001-290 00-821 9,775,704.006/30/2004RB 8,886,427.26Tomales Village Community Services District4633-110 98-843 83,700.0012/31/2003PL 71,949.44
827,871,299.70 683,295,447.77
Bakersfield, City of4321-110 97-806 15,381,842.299/15/2001DPActive Ongoing OngoingNot Complete 12,437,515.83Yreka, City of4465-110 00-815 11/26/2002 1,165,000.0011/26/2003JM 1,028,627.47Victor Valley Wastewater Rec Authority4574-110 00-827 9,525,567.004/3/2003MA 8,381,353.42Rialto, City of4648-110 97-814 7/31/2000 22,511,792.007/31/2001MK 17,930,664.14American Canyon, City of4666-110 99-819 7/15/2002 10,859,470.007/15/2003PL 9,009,363.52Los Angeles County Sanitation District4001-450 00-803 7,992,479.009/30/2004RB 6,954,259.42San Diego, City of4650-110 99-827 10/15/2001 8,711,449.0010/15/2002RB 6,749,154.27Los Angeles County Sanitation District4001-271 99-801 19,891,537.0012/31/2003RB 18,291,493.57Los Angeles County Sanitation District4001-410 99-821 10,248,362.0012/31/2003RB 9,790,004.83South Lake Tahoe, City of6026-120 01-801 225,000.003/19/2003 168,277.84SOUTH COAST WD4064-111 98-832 6,380,207.006/30/2001DL 5,741,480.98San Diego, City of4119-510 98-838 33,720,303.005/12/2003RB 30,883,147.16Placerville, City of4505-110 97-809 2/9/1999 3,247,671.002/9/2000DK 2,204,889.88San Diego, City of4650-110 99-827 10/15/2001 8,711,449.0010/15/2002DH 6,749,154.27Rialto, City of4648-110 97-814 7/31/2000 22,511,792.007/31/2001BL 17,930,664.14Brentwood, City of4585-110 99-820 37,983,920.001/2/2004AM 34,574,865.88Grass Valley, City of4085-130 98-821 9,027,724.007/31/2003AM 8,139,125.91Del Puerto Water District6047-110 98-822 4,000,000.002/23/2000 2,418,606.95Merced, County of6050-110 98-811 10,000,000.007/21/2000 8,221,264.81South Lake Tahoe, City of6025-110 96-804 1,435,000.002/4/1998 686,675.25Los Angeles County Sanitation District4001-232 97-830 12/31/2002 109,095,109.0012/31/2003DL 78,044,600.14San Luis Water District6014-111 96-805 7,500,000.002/13/1998 4,513,186.65
360,125,673.29 290,848,376.33
The Nature Conservancy6085-110 04-802 12/31/2004 9,000,000.0012/31/2005MMActive Complete 9,000,000.009,000,000.00 9,000,000.00
Santa Rosa, City of4062-160 01-810 7/31/2003 4,451,610.007/31/2004PLActive Complete Not StartedNot Complete 4,271,570.89Santa Rosa, City of4062-150 01-814 7/31/2003 12,972,195.007/31/2004PL 12,439,852.91Santa Rosa, City of4062-241 01-817 7,080,656.003/1/2004PL 6,423,368.76Santa Rosa, City of4062-210 02-805 2/28/2005 455,567.002/28/2006PL 364,926.00Los Angeles County Sanitation District4001-220 97-804 1,176,608.009/30/2003RB 1,122,538.14Los Angeles County Sanitation District4082-160 99-824 1,129,711.0012/31/2003RB 1,067,089.79
4/17/2005Page 3 of 9
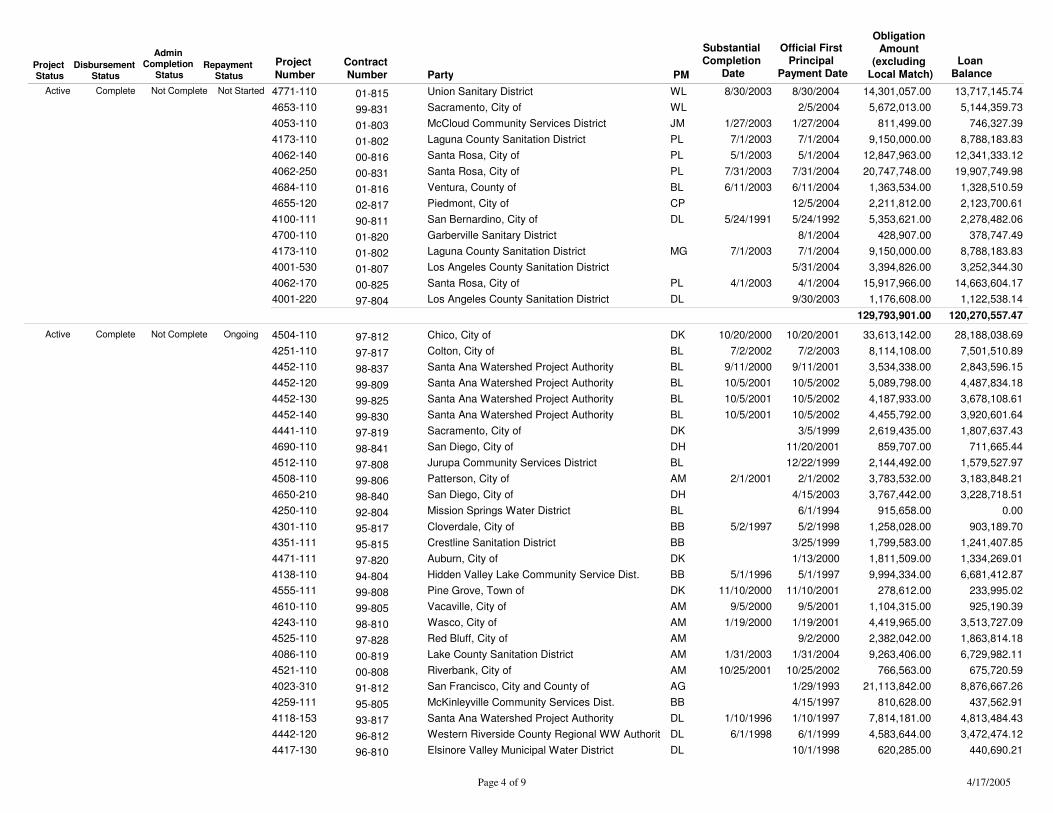
Project Number Party
Contract Number
Substantial Completion
Date
Official First Principal
Payment Date
Obligation Amount
(excluding Local Match)PM
Project Status
Disbursement Status
Admin Completion
StatusRepayment
Status
Loan Balance
Union Sanitary District4771-110 01-815 8/30/2003 14,301,057.008/30/2004WLActive Complete Not StartedNot Complete 13,717,145.74Sacramento, City of4653-110 99-831 5,672,013.002/5/2004WL 5,144,359.73McCloud Community Services District4053-110 01-803 1/27/2003 811,499.001/27/2004JM 746,327.39Laguna County Sanitation District4173-110 01-802 7/1/2003 9,150,000.007/1/2004PL 8,788,183.83Santa Rosa, City of4062-140 00-816 5/1/2003 12,847,963.005/1/2004PL 12,341,333.12Santa Rosa, City of4062-250 00-831 7/31/2003 20,747,748.007/31/2004PL 19,907,749.98Ventura, County of4684-110 01-816 6/11/2003 1,363,534.006/11/2004BL 1,328,510.59Piedmont, City of4655-120 02-817 2,211,812.0012/5/2004CP 2,123,700.61San Bernardino, City of4100-111 90-811 5/24/1991 5,353,621.005/24/1992DL 2,278,482.06Garberville Sanitary District4700-110 01-820 428,907.008/1/2004 378,747.49Laguna County Sanitation District4173-110 01-802 7/1/2003 9,150,000.007/1/2004MG 8,788,183.83Los Angeles County Sanitation District4001-530 01-807 3,394,826.005/31/2004 3,252,344.30Santa Rosa, City of4062-170 00-825 4/1/2003 15,917,966.004/1/2004PL 14,663,604.17Los Angeles County Sanitation District4001-220 97-804 1,176,608.009/30/2003DL 1,122,538.14
129,793,901.00 120,270,557.47
Chico, City of4504-110 97-812 10/20/2000 33,613,142.0010/20/2001DKActive Complete OngoingNot Complete 28,188,038.69Colton, City of4251-110 97-817 7/2/2002 8,114,108.007/2/2003BL 7,501,510.89Santa Ana Watershed Project Authority4452-110 98-837 9/11/2000 3,534,338.009/11/2001BL 2,843,596.15Santa Ana Watershed Project Authority4452-120 99-809 10/5/2001 5,089,798.0010/5/2002BL 4,487,834.18Santa Ana Watershed Project Authority4452-130 99-825 10/5/2001 4,187,933.0010/5/2002BL 3,678,108.61Santa Ana Watershed Project Authority4452-140 99-830 10/5/2001 4,455,792.0010/5/2002BL 3,920,601.64Sacramento, City of4441-110 97-819 2,619,435.003/5/1999DK 1,807,637.43San Diego, City of4690-110 98-841 859,707.0011/20/2001DH 711,665.44Jurupa Community Services District4512-110 97-808 2,144,492.0012/22/1999BL 1,579,527.97Patterson, City of4508-110 99-806 2/1/2001 3,783,532.002/1/2002AM 3,183,848.21San Diego, City of4650-210 98-840 3,767,442.004/15/2003DH 3,228,718.51Mission Springs Water District4250-110 92-804 915,658.006/1/1994BL 0.00Cloverdale, City of4301-110 95-817 5/2/1997 1,258,028.005/2/1998BB 903,189.70Crestline Sanitation District4351-111 95-815 1,799,583.003/25/1999BB 1,241,407.85Auburn, City of4471-111 97-820 1,811,509.001/13/2000DK 1,334,269.01Hidden Valley Lake Community Service Dist.4138-110 94-804 5/1/1996 9,994,334.005/1/1997BB 6,681,412.87Pine Grove, Town of4555-111 99-808 11/10/2000 278,612.0011/10/2001DK 233,995.02Vacaville, City of4610-110 99-805 9/5/2000 1,104,315.009/5/2001AM 925,190.39Wasco, City of4243-110 98-810 1/19/2000 4,419,965.001/19/2001AM 3,513,727.09Red Bluff, City of4525-110 97-828 2,382,042.009/2/2000AM 1,863,814.18Lake County Sanitation District4086-110 00-819 1/31/2003 9,263,406.001/31/2004AM 6,729,982.11Riverbank, City of4521-110 00-808 10/25/2001 766,563.0010/25/2002AM 675,720.59San Francisco, City and County of4023-310 91-812 21,113,842.001/29/1993AG 8,876,667.26McKinleyville Community Services Dist.4259-111 95-805 810,628.004/15/1997BB 437,562.91Santa Ana Watershed Project Authority4118-153 93-817 1/10/1996 7,814,181.001/10/1997DL 4,813,484.43Western Riverside County Regional WW Authorit4442-120 96-812 6/1/1998 4,583,644.006/1/1999DL 3,472,474.12Elsinore Valley Municipal Water District4417-130 96-810 620,285.0010/1/1998DL 440,690.21
4/17/2005Page 4 of 9
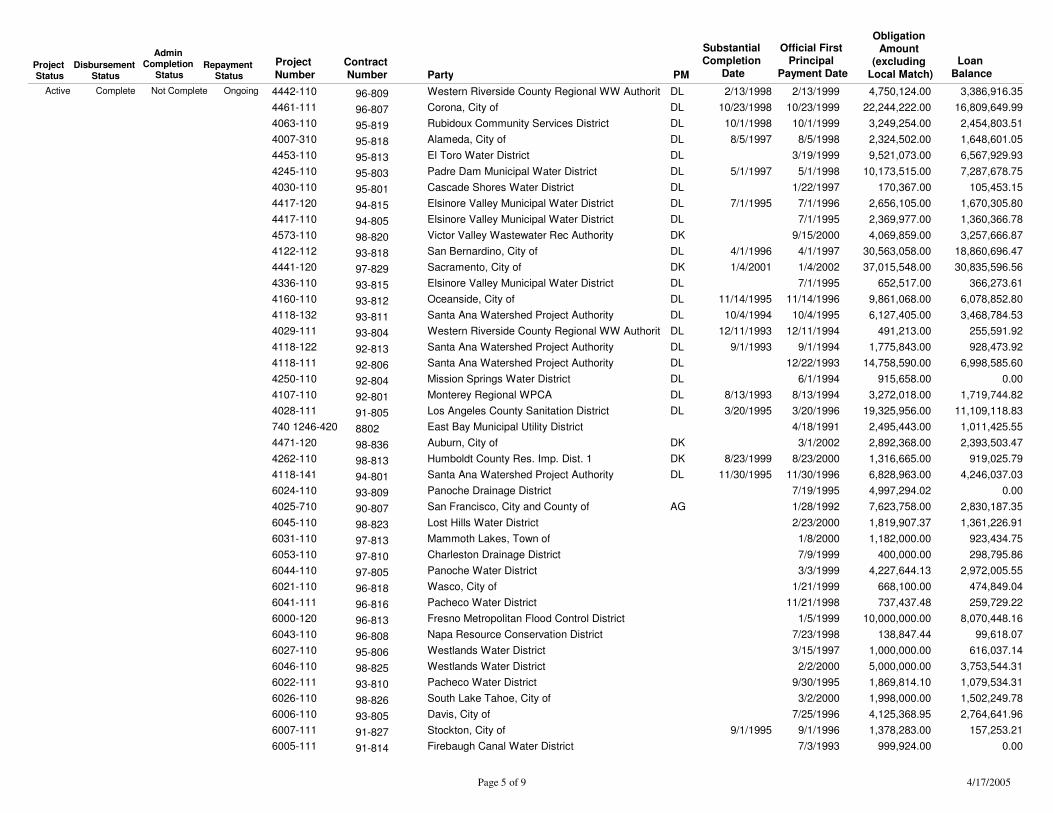
Project Number Party
Contract Number
Substantial Completion
Date
Official First Principal
Payment Date
Obligation Amount
(excluding Local Match)PM
Project Status
Disbursement Status
Admin Completion
StatusRepayment
Status
Loan Balance
Western Riverside County Regional WW Authorit4442-110 96-809 2/13/1998 4,750,124.002/13/1999DLActive Complete OngoingNot Complete 3,386,916.35Corona, City of4461-111 96-807 10/23/1998 22,244,222.0010/23/1999DL 16,809,649.99Rubidoux Community Services District4063-110 95-819 10/1/1998 3,249,254.0010/1/1999DL 2,454,803.51Alameda, City of4007-310 95-818 8/5/1997 2,324,502.008/5/1998DL 1,648,601.05El Toro Water District4453-110 95-813 9,521,073.003/19/1999DL 6,567,929.93Padre Dam Municipal Water District4245-110 95-803 5/1/1997 10,173,515.005/1/1998DL 7,287,678.75Cascade Shores Water District4030-110 95-801 170,367.001/22/1997DL 105,453.15Elsinore Valley Municipal Water District4417-120 94-815 7/1/1995 2,656,105.007/1/1996DL 1,670,305.80Elsinore Valley Municipal Water District4417-110 94-805 2,369,977.007/1/1995DL 1,360,366.78Victor Valley Wastewater Rec Authority4573-110 98-820 4,069,859.009/15/2000DK 3,257,666.87San Bernardino, City of4122-112 93-818 4/1/1996 30,563,058.004/1/1997DL 18,860,696.47Sacramento, City of4441-120 97-829 1/4/2001 37,015,548.001/4/2002DK 30,835,596.56Elsinore Valley Municipal Water District4336-110 93-815 652,517.007/1/1995DL 366,273.61Oceanside, City of4160-110 93-812 11/14/1995 9,861,068.0011/14/1996DL 6,078,852.80Santa Ana Watershed Project Authority4118-132 93-811 10/4/1994 6,127,405.0010/4/1995DL 3,468,784.53Western Riverside County Regional WW Authorit4029-111 93-804 12/11/1993 491,213.0012/11/1994DL 255,591.92Santa Ana Watershed Project Authority4118-122 92-813 9/1/1993 1,775,843.009/1/1994DL 928,473.92Santa Ana Watershed Project Authority4118-111 92-806 14,758,590.0012/22/1993DL 6,998,585.60Mission Springs Water District4250-110 92-804 915,658.006/1/1994DL 0.00Monterey Regional WPCA4107-110 92-801 8/13/1993 3,272,018.008/13/1994DL 1,719,744.82Los Angeles County Sanitation District4028-111 91-805 3/20/1995 19,325,956.003/20/1996DL 11,109,118.83East Bay Municipal Utility District740 1246-420 8802 2,495,443.004/18/1991 1,011,425.55Auburn, City of4471-120 98-836 2,892,368.003/1/2002DK 2,393,503.47Humboldt County Res. Imp. Dist. 14262-110 98-813 8/23/1999 1,316,665.008/23/2000DK 919,025.79Santa Ana Watershed Project Authority4118-141 94-801 11/30/1995 6,828,963.0011/30/1996DL 4,246,037.03Panoche Drainage District6024-110 93-809 4,997,294.027/19/1995 0.00San Francisco, City and County of4025-710 90-807 7,623,758.001/28/1992AG 2,830,187.35Lost Hills Water District6045-110 98-823 1,819,907.372/23/2000 1,361,226.91Mammoth Lakes, Town of6031-110 97-813 1,182,000.001/8/2000 923,434.75Charleston Drainage District6053-110 97-810 400,000.007/9/1999 298,795.86Panoche Water District6044-110 97-805 4,227,644.133/3/1999 2,972,005.55Wasco, City of6021-110 96-818 668,100.001/21/1999 474,849.04Pacheco Water District6041-111 96-816 737,437.4811/21/1998 259,729.22Fresno Metropolitan Flood Control District6000-120 96-813 10,000,000.001/5/1999 8,070,448.16Napa Resource Conservation District6043-110 96-808 138,847.447/23/1998 99,618.07Westlands Water District6027-110 95-806 1,000,000.003/15/1997 616,037.14Westlands Water District6046-110 98-825 5,000,000.002/2/2000 3,753,544.31Pacheco Water District6022-111 93-810 1,869,814.109/30/1995 1,079,534.31South Lake Tahoe, City of6026-110 98-826 1,998,000.003/2/2000 1,502,249.78Davis, City of6006-110 93-805 4,125,368.957/25/1996 2,764,641.96Stockton, City of6007-111 91-827 9/1/1995 1,378,283.009/1/1996 157,253.21Firebaugh Canal Water District6005-111 91-814 999,924.007/3/1993 0.00
4/17/2005Page 5 of 9
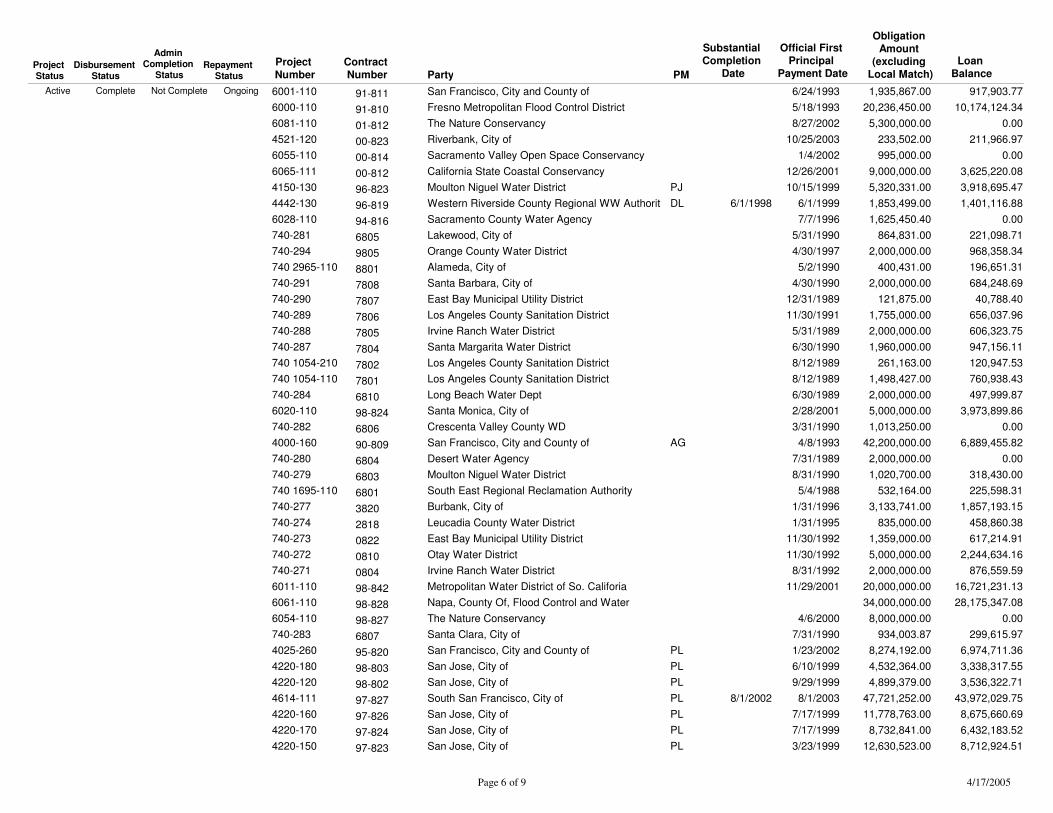
Project Number Party
Contract Number
Substantial Completion
Date
Official First Principal
Payment Date
Obligation Amount
(excluding Local Match)PM
Project Status
Disbursement Status
Admin Completion
StatusRepayment
Status
Loan Balance
San Francisco, City and County of6001-110 91-811 1,935,867.006/24/1993Active Complete OngoingNot Complete 917,903.77Fresno Metropolitan Flood Control District6000-110 91-810 20,236,450.005/18/1993 10,174,124.34The Nature Conservancy6081-110 01-812 5,300,000.008/27/2002 0.00Riverbank, City of4521-120 00-823 233,502.0010/25/2003 211,966.97Sacramento Valley Open Space Conservancy6055-110 00-814 995,000.001/4/2002 0.00California State Coastal Conservancy6065-111 00-812 9,000,000.0012/26/2001 3,625,220.08Moulton Niguel Water District4150-130 96-823 5,320,331.0010/15/1999PJ 3,918,695.47Western Riverside County Regional WW Authorit4442-130 96-819 6/1/1998 1,853,499.006/1/1999DL 1,401,116.88Sacramento County Water Agency6028-110 94-816 1,625,450.407/7/1996 0.00Lakewood, City of740-281 6805 864,831.005/31/1990 221,098.71Orange County Water District740-294 9805 2,000,000.004/30/1997 968,358.34Alameda, City of740 2965-110 8801 400,431.005/2/1990 196,651.31Santa Barbara, City of740-291 7808 2,000,000.004/30/1990 684,248.69East Bay Municipal Utility District740-290 7807 121,875.0012/31/1989 40,788.40Los Angeles County Sanitation District740-289 7806 1,755,000.0011/30/1991 656,037.96Irvine Ranch Water District740-288 7805 2,000,000.005/31/1989 606,323.75Santa Margarita Water District740-287 7804 1,960,000.006/30/1990 947,156.11Los Angeles County Sanitation District740 1054-210 7802 261,163.008/12/1989 120,947.53Los Angeles County Sanitation District740 1054-110 7801 1,498,427.008/12/1989 760,938.43Long Beach Water Dept740-284 6810 2,000,000.006/30/1989 497,999.87Santa Monica, City of 6020-110 98-824 5,000,000.002/28/2001 3,973,899.86Crescenta Valley County WD740-282 6806 1,013,250.003/31/1990 0.00San Francisco, City and County of4000-160 90-809 42,200,000.004/8/1993AG 6,889,455.82Desert Water Agency740-280 6804 2,000,000.007/31/1989 0.00Moulton Niguel Water District740-279 6803 1,020,700.008/31/1990 318,430.00South East Regional Reclamation Authority740 1695-110 6801 532,164.005/4/1988 225,598.31Burbank, City of740-277 3820 3,133,741.001/31/1996 1,857,193.15Leucadia County Water District740-274 2818 835,000.001/31/1995 458,860.38East Bay Municipal Utility District740-273 0822 1,359,000.0011/30/1992 617,214.91Otay Water District740-272 0810 5,000,000.0011/30/1992 2,244,634.16Irvine Ranch Water District740-271 0804 2,000,000.008/31/1992 876,559.59Metropolitan Water District of So. Califoria6011-110 98-842 20,000,000.0011/29/2001 16,721,231.13Napa, County Of, Flood Control and Water6061-110 98-828 34,000,000.00 28,175,347.08The Nature Conservancy6054-110 98-827 8,000,000.004/6/2000 0.00Santa Clara, City of740-283 6807 934,003.877/31/1990 299,615.97San Francisco, City and County of4025-260 95-820 8,274,192.001/23/2002PL 6,974,711.36San Jose, City of4220-180 98-803 4,532,364.006/10/1999PL 3,338,317.55San Jose, City of4220-120 98-802 4,899,379.009/29/1999PL 3,536,322.71South San Francisco, City of4614-111 97-827 8/1/2002 47,721,252.008/1/2003PL 43,972,029.75San Jose, City of4220-160 97-826 11,778,763.007/17/1999PL 8,675,660.69San Jose, City of4220-170 97-824 8,732,841.007/17/1999PL 6,432,183.52San Jose, City of4220-150 97-823 12,630,523.003/23/1999PL 8,712,924.51
4/17/2005Page 6 of 9
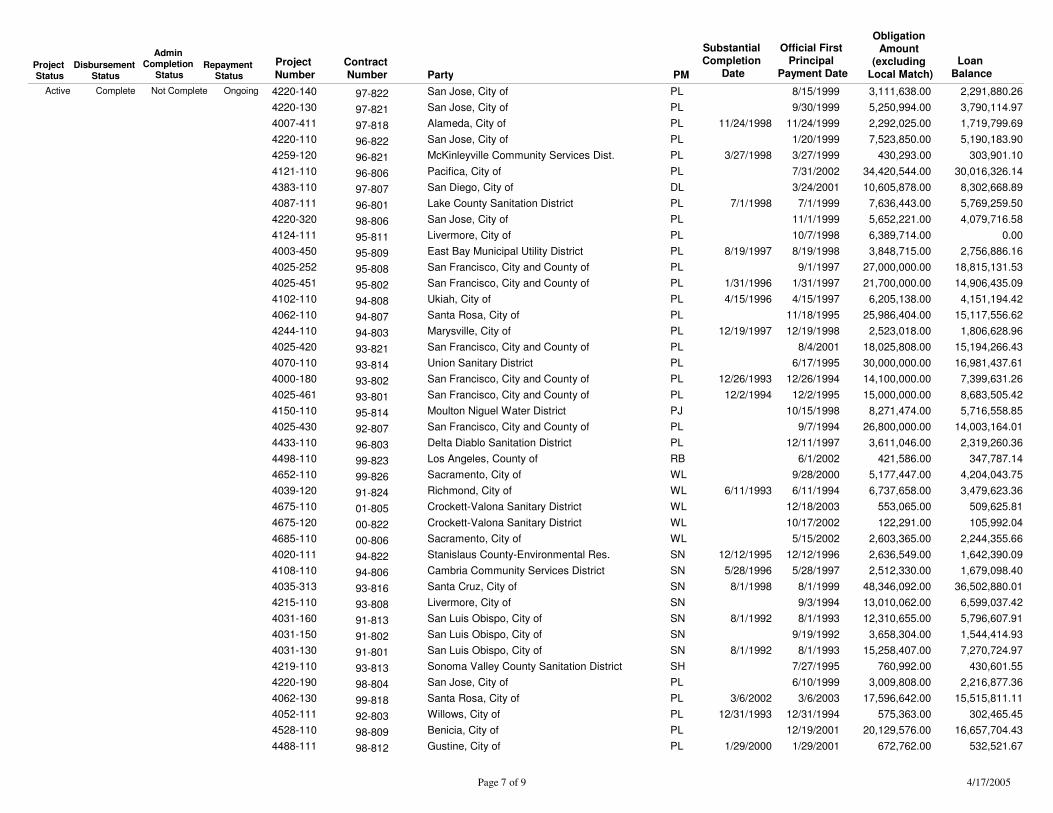
Project Number Party
Contract Number
Substantial Completion
Date
Official First Principal
Payment Date
Obligation Amount
(excluding Local Match)PM
Project Status
Disbursement Status
Admin Completion
StatusRepayment
Status
Loan Balance
San Jose, City of4220-140 97-822 3,111,638.008/15/1999PLActive Complete OngoingNot Complete 2,291,880.26San Jose, City of4220-130 97-821 5,250,994.009/30/1999PL 3,790,114.97Alameda, City of4007-411 97-818 11/24/1998 2,292,025.0011/24/1999PL 1,719,799.69San Jose, City of4220-110 96-822 7,523,850.001/20/1999PL 5,190,183.90McKinleyville Community Services Dist.4259-120 96-821 3/27/1998 430,293.003/27/1999PL 303,901.10Pacifica, City of4121-110 96-806 34,420,544.007/31/2002PL 30,016,326.14San Diego, City of4383-110 97-807 10,605,878.003/24/2001DL 8,302,668.89Lake County Sanitation District4087-111 96-801 7/1/1998 7,636,443.007/1/1999PL 5,769,259.50San Jose, City of4220-320 98-806 5,652,221.0011/1/1999PL 4,079,716.58Livermore, City of4124-111 95-811 6,389,714.0010/7/1998PL 0.00East Bay Municipal Utility District4003-450 95-809 8/19/1997 3,848,715.008/19/1998PL 2,756,886.16San Francisco, City and County of4025-252 95-808 27,000,000.009/1/1997PL 18,815,131.53San Francisco, City and County of4025-451 95-802 1/31/1996 21,700,000.001/31/1997PL 14,906,435.09Ukiah, City of4102-110 94-808 4/15/1996 6,205,138.004/15/1997PL 4,151,194.42Santa Rosa, City of4062-110 94-807 25,986,404.0011/18/1995PL 15,117,556.62Marysville, City of4244-110 94-803 12/19/1997 2,523,018.0012/19/1998PL 1,806,628.96San Francisco, City and County of4025-420 93-821 18,025,808.008/4/2001PL 15,194,266.43Union Sanitary District4070-110 93-814 30,000,000.006/17/1995PL 16,981,437.61San Francisco, City and County of4000-180 93-802 12/26/1993 14,100,000.0012/26/1994PL 7,399,631.26San Francisco, City and County of4025-461 93-801 12/2/1994 15,000,000.0012/2/1995PL 8,683,505.42Moulton Niguel Water District4150-110 95-814 8,271,474.0010/15/1998PJ 5,716,558.85San Francisco, City and County of4025-430 92-807 26,800,000.009/7/1994PL 14,003,164.01Delta Diablo Sanitation District4433-110 96-803 3,611,046.0012/11/1997PL 2,319,260.36Los Angeles, County of4498-110 99-823 421,586.006/1/2002RB 347,787.14Sacramento, City of4652-110 99-826 5,177,447.009/28/2000WL 4,204,043.75Richmond, City of4039-120 91-824 6/11/1993 6,737,658.006/11/1994WL 3,479,623.36Crockett-Valona Sanitary District4675-110 01-805 553,065.0012/18/2003WL 509,625.81Crockett-Valona Sanitary District4675-120 00-822 122,291.0010/17/2002WL 105,992.04Sacramento, City of4685-110 00-806 2,603,365.005/15/2002WL 2,244,355.66Stanislaus County-Environmental Res.4020-111 94-822 12/12/1995 2,636,549.0012/12/1996SN 1,642,390.09Cambria Community Services District4108-110 94-806 5/28/1996 2,512,330.005/28/1997SN 1,679,098.40Santa Cruz, City of4035-313 93-816 8/1/1998 48,346,092.008/1/1999SN 36,502,880.01Livermore, City of4215-110 93-808 13,010,062.009/3/1994SN 6,599,037.42San Luis Obispo, City of4031-160 91-813 8/1/1992 12,310,655.008/1/1993SN 5,796,607.91San Luis Obispo, City of4031-150 91-802 3,658,304.009/19/1992SN 1,544,414.93San Luis Obispo, City of4031-130 91-801 8/1/1992 15,258,407.008/1/1993SN 7,270,724.97Sonoma Valley County Sanitation District4219-110 93-813 760,992.007/27/1995SH 430,601.55San Jose, City of4220-190 98-804 3,009,808.006/10/1999PL 2,216,877.36Santa Rosa, City of4062-130 99-818 3/6/2002 17,596,642.003/6/2003PL 15,515,811.11Willows, City of4052-111 92-803 12/31/1993 575,363.0012/31/1994PL 302,465.45Benicia, City of4528-110 98-809 20,129,576.0012/19/2001PL 16,657,704.43Gustine, City of4488-111 98-812 1/29/2000 672,762.001/29/2001PL 532,521.67
4/17/2005Page 7 of 9
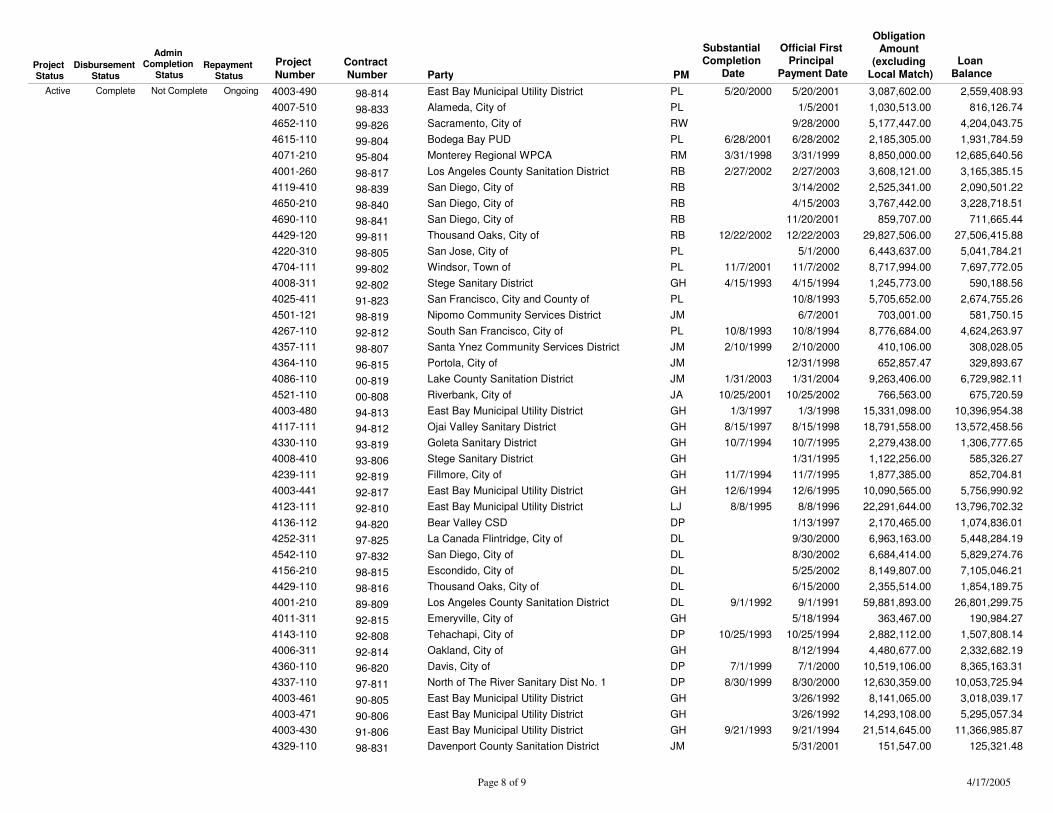
Project Number Party
Contract Number
Substantial Completion
Date
Official First Principal
Payment Date
Obligation Amount
(excluding Local Match)PM
Project Status
Disbursement Status
Admin Completion
StatusRepayment
Status
Loan Balance
East Bay Municipal Utility District4003-490 98-814 5/20/2000 3,087,602.005/20/2001PLActive Complete OngoingNot Complete 2,559,408.93Alameda, City of4007-510 98-833 1,030,513.001/5/2001PL 816,126.74Sacramento, City of4652-110 99-826 5,177,447.009/28/2000RW 4,204,043.75Bodega Bay PUD4615-110 99-804 6/28/2001 2,185,305.006/28/2002PL 1,931,784.59Monterey Regional WPCA4071-210 95-804 3/31/1998 8,850,000.003/31/1999RM 12,685,640.56Los Angeles County Sanitation District4001-260 98-817 2/27/2002 3,608,121.002/27/2003RB 3,165,385.15San Diego, City of4119-410 98-839 2,525,341.003/14/2002RB 2,090,501.22San Diego, City of4650-210 98-840 3,767,442.004/15/2003RB 3,228,718.51San Diego, City of4690-110 98-841 859,707.0011/20/2001RB 711,665.44Thousand Oaks, City of4429-120 99-811 12/22/2002 29,827,506.0012/22/2003RB 27,506,415.88San Jose, City of4220-310 98-805 6,443,637.005/1/2000PL 5,041,784.21Windsor, Town of4704-111 99-802 11/7/2001 8,717,994.0011/7/2002PL 7,697,772.05Stege Sanitary District4008-311 92-802 4/15/1993 1,245,773.004/15/1994GH 590,188.56San Francisco, City and County of4025-411 91-823 5,705,652.0010/8/1993PL 2,674,755.26Nipomo Community Services District4501-121 98-819 703,001.006/7/2001JM 581,750.15South San Francisco, City of4267-110 92-812 10/8/1993 8,776,684.0010/8/1994PL 4,624,263.97Santa Ynez Community Services District4357-111 98-807 2/10/1999 410,106.002/10/2000JM 308,028.05Portola, City of4364-110 96-815 652,857.4712/31/1998JM 329,893.67Lake County Sanitation District4086-110 00-819 1/31/2003 9,263,406.001/31/2004JM 6,729,982.11Riverbank, City of4521-110 00-808 10/25/2001 766,563.0010/25/2002JA 675,720.59East Bay Municipal Utility District4003-480 94-813 1/3/1997 15,331,098.001/3/1998GH 10,396,954.38Ojai Valley Sanitary District4117-111 94-812 8/15/1997 18,791,558.008/15/1998GH 13,572,458.56Goleta Sanitary District4330-110 93-819 10/7/1994 2,279,438.0010/7/1995GH 1,306,777.65Stege Sanitary District4008-410 93-806 1,122,256.001/31/1995GH 585,326.27Fillmore, City of4239-111 92-819 11/7/1994 1,877,385.0011/7/1995GH 852,704.81East Bay Municipal Utility District4003-441 92-817 12/6/1994 10,090,565.0012/6/1995GH 5,756,990.92East Bay Municipal Utility District4123-111 92-810 8/8/1995 22,291,644.008/8/1996LJ 13,796,702.32Bear Valley CSD4136-112 94-820 2,170,465.001/13/1997DP 1,074,836.01La Canada Flintridge, City of4252-311 97-825 6,963,163.009/30/2000DL 5,448,284.19San Diego, City of4542-110 97-832 6,684,414.008/30/2002DL 5,829,274.76Escondido, City of4156-210 98-815 8,149,807.005/25/2002DL 7,105,046.21Thousand Oaks, City of4429-110 98-816 2,355,514.006/15/2000DL 1,854,189.75Los Angeles County Sanitation District4001-210 89-809 9/1/1992 59,881,893.009/1/1991DL 26,801,299.75Emeryville, City of4011-311 92-815 363,467.005/18/1994GH 190,984.27Tehachapi, City of4143-110 92-808 10/25/1993 2,882,112.0010/25/1994DP 1,507,808.14Oakland, City of4006-311 92-814 4,480,677.008/12/1994GH 2,332,682.19Davis, City of4360-110 96-820 7/1/1999 10,519,106.007/1/2000DP 8,365,163.31North of The River Sanitary Dist No. 14337-110 97-811 8/30/1999 12,630,359.008/30/2000DP 10,053,725.94East Bay Municipal Utility District4003-461 90-805 8,141,065.003/26/1992GH 3,018,039.17East Bay Municipal Utility District4003-471 90-806 14,293,108.003/26/1992GH 5,295,057.34East Bay Municipal Utility District4003-430 91-806 9/21/1993 21,514,645.009/21/1994GH 11,366,985.87Davenport County Sanitation District4329-110 98-831 151,547.005/31/2001JM 125,321.48
4/17/2005Page 8 of 9
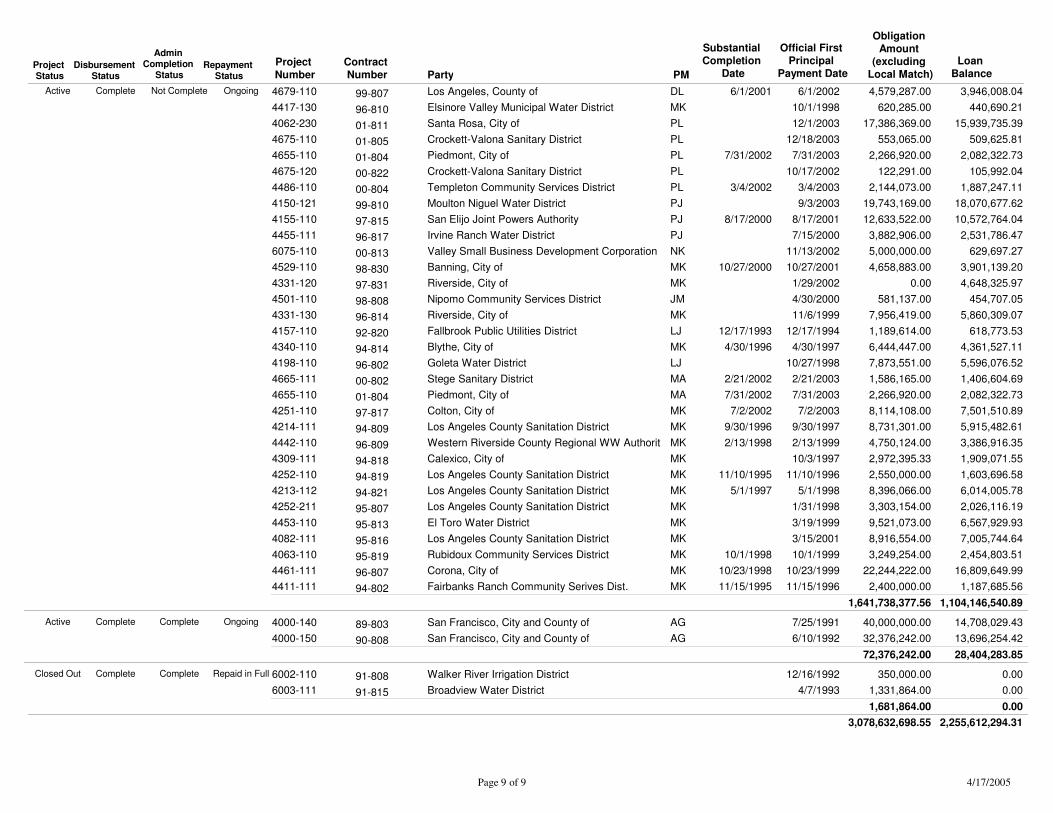
Project Number Party
Contract Number
Substantial Completion
Date
Official First Principal
Payment Date
Obligation Amount
(excluding Local Match)PM
Project Status
Disbursement Status
Admin Completion
StatusRepayment
Status
Loan Balance
Los Angeles, County of4679-110 99-807 6/1/2001 4,579,287.006/1/2002DLActive Complete OngoingNot Complete 3,946,008.04Elsinore Valley Municipal Water District4417-130 96-810 620,285.0010/1/1998MK 440,690.21Santa Rosa, City of4062-230 01-811 17,386,369.0012/1/2003PL 15,939,735.39Crockett-Valona Sanitary District4675-110 01-805 553,065.0012/18/2003PL 509,625.81Piedmont, City of4655-110 01-804 7/31/2002 2,266,920.007/31/2003PL 2,082,322.73Crockett-Valona Sanitary District4675-120 00-822 122,291.0010/17/2002PL 105,992.04Templeton Community Services District4486-110 00-804 3/4/2002 2,144,073.003/4/2003PL 1,887,247.11Moulton Niguel Water District4150-121 99-810 19,743,169.009/3/2003PJ 18,070,677.62San Elijo Joint Powers Authority4155-110 97-815 8/17/2000 12,633,522.008/17/2001PJ 10,572,764.04Irvine Ranch Water District4455-111 96-817 3,882,906.007/15/2000PJ 2,531,786.47Valley Small Business Development Corporation6075-110 00-813 5,000,000.0011/13/2002NK 629,697.27Banning, City of4529-110 98-830 10/27/2000 4,658,883.0010/27/2001MK 3,901,139.20Riverside, City of4331-120 97-831 0.001/29/2002MK 4,648,325.97Nipomo Community Services District4501-110 98-808 581,137.004/30/2000JM 454,707.05Riverside, City of4331-130 96-814 7,956,419.0011/6/1999MK 5,860,309.07Fallbrook Public Utilities District4157-110 92-820 12/17/1993 1,189,614.0012/17/1994LJ 618,773.53Blythe, City of4340-110 94-814 4/30/1996 6,444,447.004/30/1997MK 4,361,527.11Goleta Water District4198-110 96-802 7,873,551.0010/27/1998LJ 5,596,076.52Stege Sanitary District4665-111 00-802 2/21/2002 1,586,165.002/21/2003MA 1,406,604.69Piedmont, City of4655-110 01-804 7/31/2002 2,266,920.007/31/2003MA 2,082,322.73Colton, City of4251-110 97-817 7/2/2002 8,114,108.007/2/2003MK 7,501,510.89Los Angeles County Sanitation District4214-111 94-809 9/30/1996 8,731,301.009/30/1997MK 5,915,482.61Western Riverside County Regional WW Authorit4442-110 96-809 2/13/1998 4,750,124.002/13/1999MK 3,386,916.35Calexico, City of4309-111 94-818 2,972,395.3310/3/1997MK 1,909,071.55Los Angeles County Sanitation District4252-110 94-819 11/10/1995 2,550,000.0011/10/1996MK 1,603,696.58Los Angeles County Sanitation District4213-112 94-821 5/1/1997 8,396,066.005/1/1998MK 6,014,005.78Los Angeles County Sanitation District4252-211 95-807 3,303,154.001/31/1998MK 2,026,116.19El Toro Water District4453-110 95-813 9,521,073.003/19/1999MK 6,567,929.93Los Angeles County Sanitation District4082-111 95-816 8,916,554.003/15/2001MK 7,005,744.64Rubidoux Community Services District4063-110 95-819 10/1/1998 3,249,254.0010/1/1999MK 2,454,803.51Corona, City of4461-111 96-807 10/23/1998 22,244,222.0010/23/1999MK 16,809,649.99Fairbanks Ranch Community Serives Dist.4411-111 94-802 11/15/1995 2,400,000.0011/15/1996MK 1,187,685.56
1,641,738,377.56 1,104,146,540.89
San Francisco, City and County of4000-140 89-803 40,000,000.007/25/1991AGActive Complete OngoingComplete 14,708,029.43San Francisco, City and County of4000-150 90-808 32,376,242.006/10/1992AG 13,696,254.42
72,376,242.00 28,404,283.85
Walker River Irrigation District6002-110 91-808 350,000.0012/16/1992Closed Out Complete Repaid in FullComplete 0.00Broadview Water District6003-111 91-815 1,331,864.004/7/1993 0.00
1,681,864.00 0.003,078,632,698.55 2,255,612,294.31
4/17/2005Page 9 of 9

CCaalliiffoorrnniiaa WWaatteerr BBooaarrddss CCWWSSRRFF AAnnnnuuaall RReeppoorrtt 22000033//22000044
Exhibit D – State Match Reports
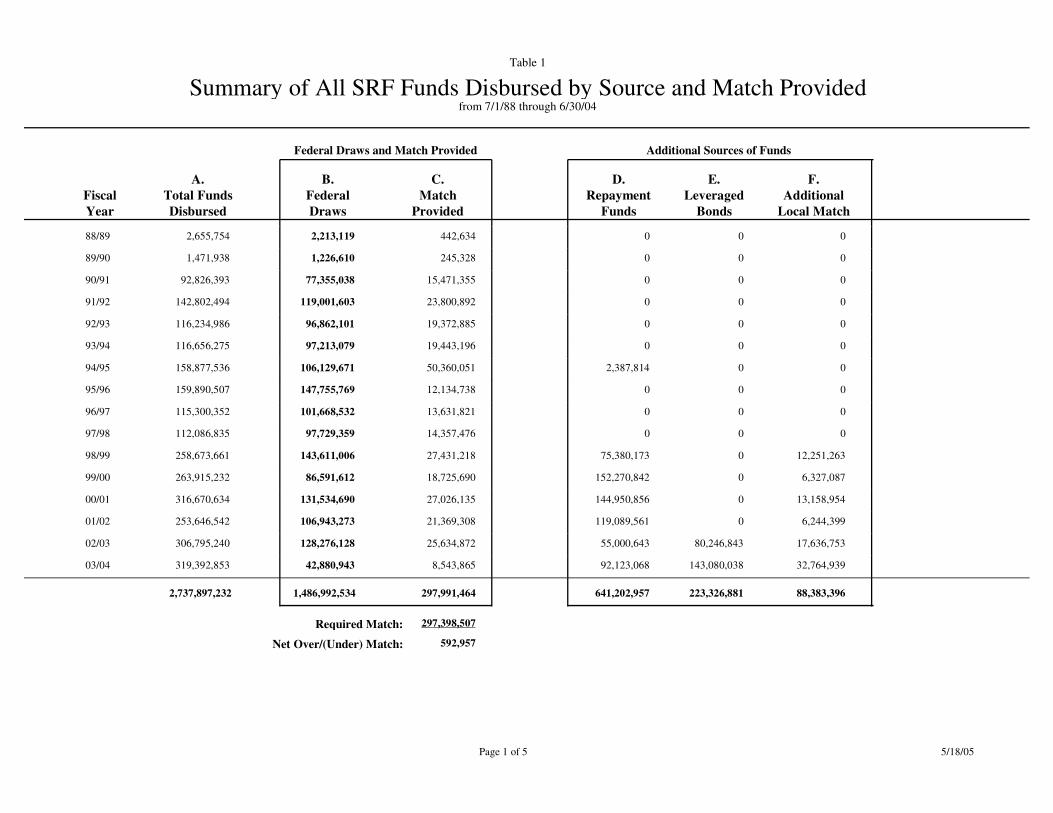
Summary of All SRF Funds Disbursed by Source and Match Providedfrom 7/1/88 through 6/30/04
Table 1
FiscalYear
F.Additional
Local Match
E.Leveraged
Bonds
D.Repayment
Funds
A.Total FundsDisbursed
B.FederalDraws
C.Match
Provided
Additional Sources of FundsFederal Draws and Match Provided
88/89 0002,655,754 2,213,119 442,634
89/90 0001,471,938 1,226,610 245,328
90/91 00092,826,393 77,355,038 15,471,355
91/92 000142,802,494 119,001,603 23,800,892
92/93 000116,234,986 96,862,101 19,372,885
93/94 000116,656,275 97,213,079 19,443,196
94/95 002,387,814158,877,536 106,129,671 50,360,051
95/96 000159,890,507 147,755,769 12,134,738
96/97 000115,300,352 101,668,532 13,631,821
97/98 000112,086,835 97,729,359 14,357,476
98/99 12,251,263075,380,173258,673,661 143,611,006 27,431,218
99/00 6,327,0870152,270,842263,915,232 86,591,612 18,725,690
00/01 13,158,9540144,950,856316,670,634 131,534,690 27,026,135
01/02 6,244,3990119,089,561253,646,542 106,943,273 21,369,308
02/03 17,636,75380,246,84355,000,643306,795,240 128,276,128 25,634,872
03/04 32,764,939143,080,03892,123,068319,392,853 42,880,943 8,543,865
88,383,396223,326,881641,202,9571,486,992,5342,737,897,232 297,991,464
297,398,507Required Match:592,957Net Over/(Under) Match:
5/18/05Page 1 of 5
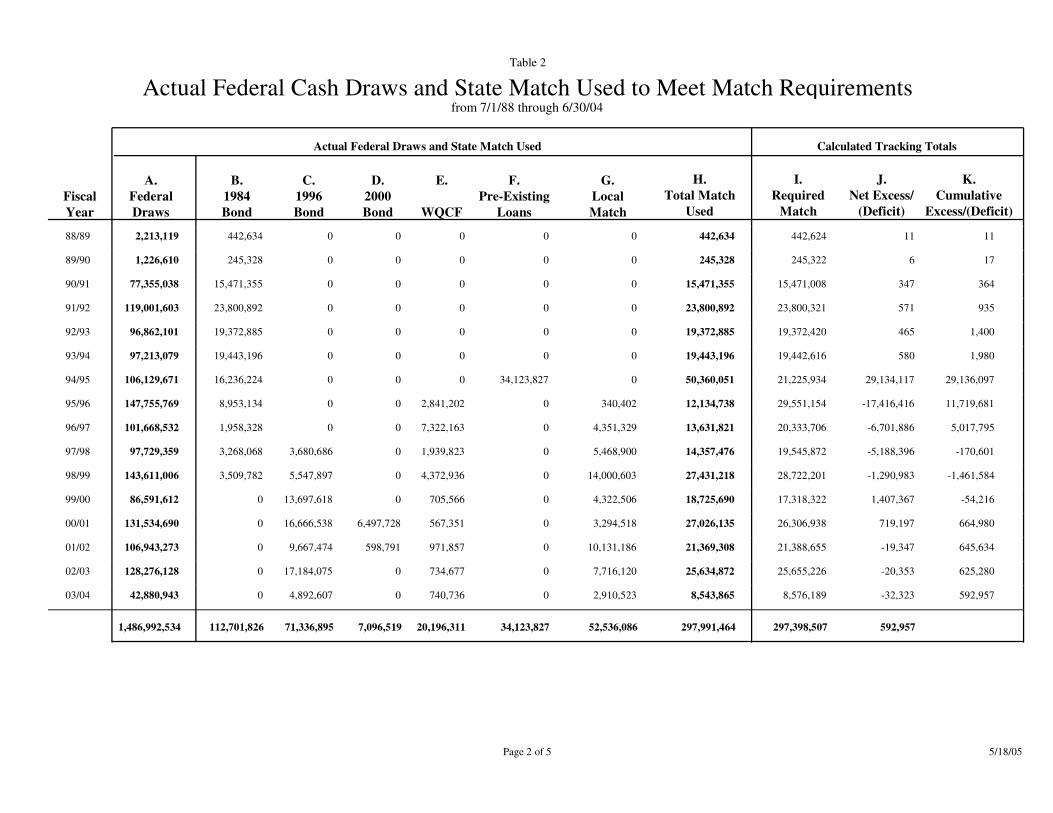
Actual Federal Cash Draws and State Match Used to Meet Match Requirementsfrom 7/1/88 through 6/30/04
Table 2
FiscalYear
A.FederalDraws
C.1996Bond
I.Required
Match
D.2000Bond
K.Cumulative
Excess/(Deficit)
B.1984Bond
E.
WQCF
J.Net Excess/
(Deficit)
G.LocalMatch
H.Total Match
Used
F.Pre-Existing
Loans
Actual Federal Draws and State Match Used Calculated Tracking Totals
88/89 2,213,119 0 442,6240 11 11442,634 0 0 442,6340
89/90 1,226,610 0 245,3220 6 17245,328 0 0 245,3280
90/91 77,355,038 0 15,471,0080 347 36415,471,355 0 0 15,471,3550
91/92 119,001,603 0 23,800,3210 571 93523,800,892 0 0 23,800,8920
92/93 96,862,101 0 19,372,4200 465 1,40019,372,885 0 0 19,372,8850
93/94 97,213,079 0 19,442,6160 580 1,98019,443,196 0 0 19,443,1960
94/95 106,129,671 0 21,225,9340 29,134,117 29,136,09716,236,224 0 0 50,360,05134,123,827
95/96 147,755,769 0 29,551,1540 -17,416,416 11,719,6818,953,134 2,841,202 340,402 12,134,7380
96/97 101,668,532 0 20,333,7060 -6,701,886 5,017,7951,958,328 7,322,163 4,351,329 13,631,8210
97/98 97,729,359 3,680,686 19,545,8720 -5,188,396 -170,6013,268,068 1,939,823 5,468,900 14,357,4760
98/99 143,611,006 5,547,897 28,722,2010 -1,290,983 -1,461,5843,509,782 4,372,936 14,000,603 27,431,2180
99/00 86,591,612 13,697,618 17,318,3220 1,407,367 -54,2160 705,566 4,322,506 18,725,6900
00/01 131,534,690 16,666,538 26,306,9386,497,728 719,197 664,9800 567,351 3,294,518 27,026,1350
01/02 106,943,273 9,667,474 21,388,655598,791 -19,347 645,6340 971,857 10,131,186 21,369,3080
02/03 128,276,128 17,184,075 25,655,2260 -20,353 625,2800 734,677 7,716,120 25,634,8720
03/04 42,880,943 4,892,607 8,576,1890 -32,323 592,9570 740,736 2,910,523 8,543,8650
1,486,992,534 71,336,895 297,398,507112,701,826 7,096,519 20,196,311 52,536,08634,123,827 297,991,464 592,957
5/18/05Page 2 of 5
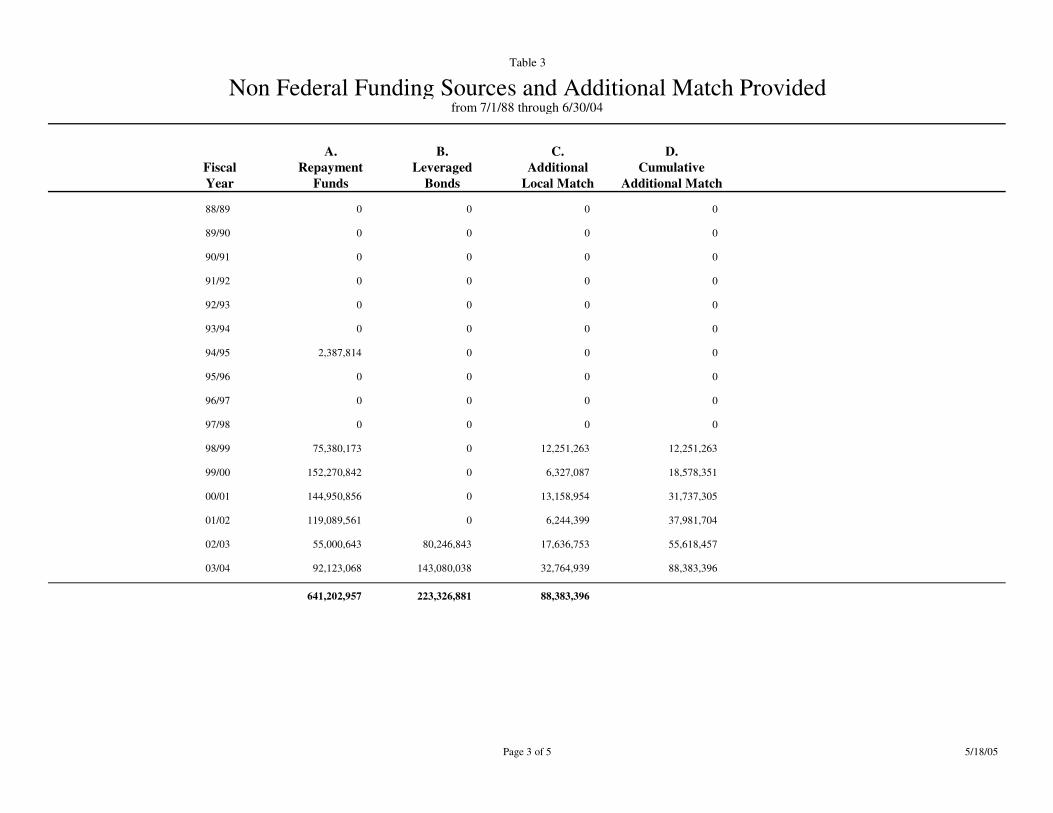
Non Federal Funding Sources and Additional Match Providedfrom 7/1/88 through 6/30/04
Table 3
FiscalYear
C.Additional
Local Match
B.Leveraged
Bonds
A.Repayment
Funds
D.Cumulative
Additional Match
88/89 000 0
89/90 000 0
90/91 000 0
91/92 000 0
92/93 000 0
93/94 000 0
94/95 002,387,814 0
95/96 000 0
96/97 000 0
97/98 000 0
98/99 12,251,263075,380,173 12,251,263
99/00 6,327,0870152,270,842 18,578,351
00/01 13,158,9540144,950,856 31,737,305
01/02 6,244,3990119,089,561 37,981,704
02/03 17,636,75380,246,84355,000,643 55,618,457
03/04 32,764,939143,080,03892,123,068 88,383,396
88,383,396223,326,881641,202,957
5/18/05Page 3 of 5
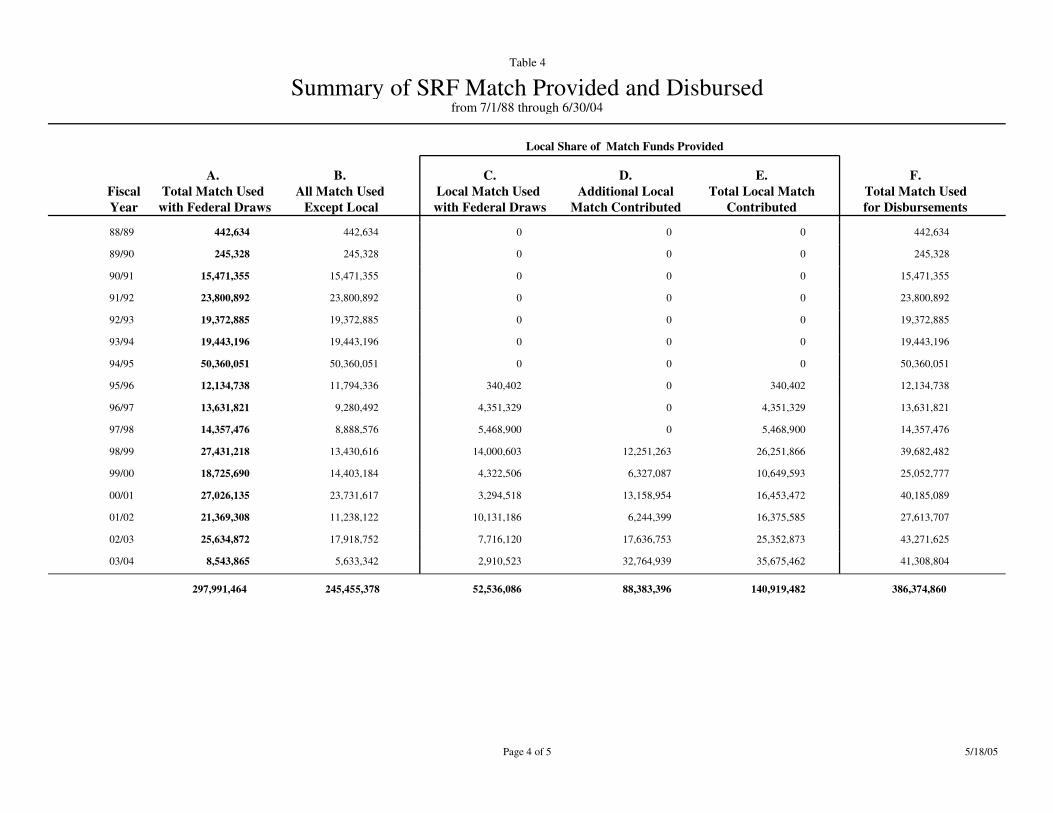
Summary of SRF Match Provided and Disbursedfrom 7/1/88 through 6/30/04
Table 4
FiscalYear
E.Total Local Match
Contributed
C.Local Match Used with Federal Draws
B.All Match Used Except Local
D.Additional Local
Match Contributed
F.Total Match Usedfor Disbursements
Local Share of Match Funds Provided
A.Total Match Used
with Federal Draws
88/89 00442,634 0 442,634442,634
89/90 00245,328 0 245,328245,328
90/91 0015,471,355 0 15,471,35515,471,355
91/92 0023,800,892 0 23,800,89223,800,892
92/93 0019,372,885 0 19,372,88519,372,885
93/94 0019,443,196 0 19,443,19619,443,196
94/95 0050,360,051 0 50,360,05150,360,051
95/96 340,402340,40211,794,336 0 12,134,73812,134,738
96/97 4,351,3294,351,3299,280,492 0 13,631,82113,631,821
97/98 5,468,9005,468,9008,888,576 0 14,357,47614,357,476
98/99 26,251,86614,000,60313,430,616 12,251,263 39,682,48227,431,218
99/00 10,649,5934,322,50614,403,184 6,327,087 25,052,77718,725,690
00/01 16,453,4723,294,51823,731,617 13,158,954 40,185,08927,026,135
01/02 16,375,58510,131,18611,238,122 6,244,399 27,613,70721,369,308
02/03 25,352,8737,716,12017,918,752 17,636,753 43,271,62525,634,872
03/04 35,675,4622,910,5235,633,342 32,764,939 41,308,8048,543,865
140,919,48252,536,086245,455,378 88,383,396 386,374,860297,991,464
5/18/05Page 4 of 5
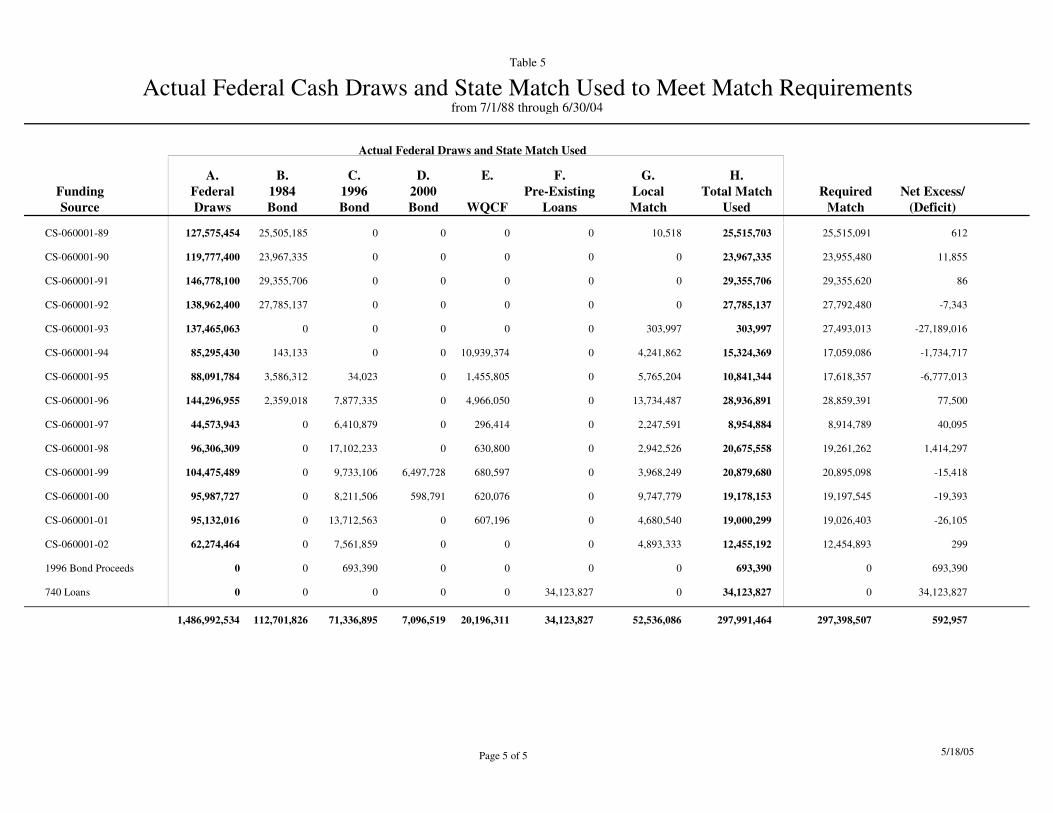
Actual Federal Cash Draws and State Match Used to Meet Match Requirementsfrom 7/1/88 through 6/30/04
Table 5
FundingSource
A.FederalDraws
C.1996Bond
RequiredMatch
D.2000Bond
B.1984Bond
E.
WQCFNet Excess/
(Deficit)
G.LocalMatch
H.Total Match
Used
F.Pre-Existing
Loans
Actual Federal Draws and State Match Used
CS-060001-89 127,575,454 0 25,515,0910 61225,505,185 0 10,518 25,515,7030
CS-060001-90 119,777,400 0 23,955,4800 11,85523,967,335 0 0 23,967,3350
CS-060001-91 146,778,100 0 29,355,6200 8629,355,706 0 0 29,355,7060
CS-060001-92 138,962,400 0 27,792,4800 -7,34327,785,137 0 0 27,785,1370
CS-060001-93 137,465,063 0 27,493,0130 -27,189,0160 0 303,997 303,9970
CS-060001-94 85,295,430 0 17,059,0860 -1,734,717143,133 10,939,374 4,241,862 15,324,3690
CS-060001-95 88,091,784 34,023 17,618,3570 -6,777,0133,586,312 1,455,805 5,765,204 10,841,3440
CS-060001-96 144,296,955 7,877,335 28,859,3910 77,5002,359,018 4,966,050 13,734,487 28,936,8910
CS-060001-97 44,573,943 6,410,879 8,914,7890 40,0950 296,414 2,247,591 8,954,8840
CS-060001-98 96,306,309 17,102,233 19,261,2620 1,414,2970 630,800 2,942,526 20,675,5580
CS-060001-99 104,475,489 9,733,106 20,895,0986,497,728 -15,4180 680,597 3,968,249 20,879,6800
CS-060001-00 95,987,727 8,211,506 19,197,545598,791 -19,3930 620,076 9,747,779 19,178,1530
CS-060001-01 95,132,016 13,712,563 19,026,4030 -26,1050 607,196 4,680,540 19,000,2990
CS-060001-02 62,274,464 7,561,859 12,454,8930 2990 0 4,893,333 12,455,1920
1996 Bond Proceeds 0 693,390 00 693,3900 0 0 693,3900
740 Loans 0 0 00 34,123,8270 0 0 34,123,82734,123,827
1,486,992,534 71,336,895 297,398,507112,701,826 7,096,519 20,196,311 52,536,08634,123,827 297,991,464 592,957
5/18/05Page 5 of 5
CCaalliiffoorrnniiaa WWaatteerr BBooaarrddss CCWWSSRRFF AAnnnnuuaall RReeppoorrtt 22000033//22000044
Exhibit E – Minority Business Enterprise/Woman Business Enterprise Report for State Fiscal Year 2004/2005
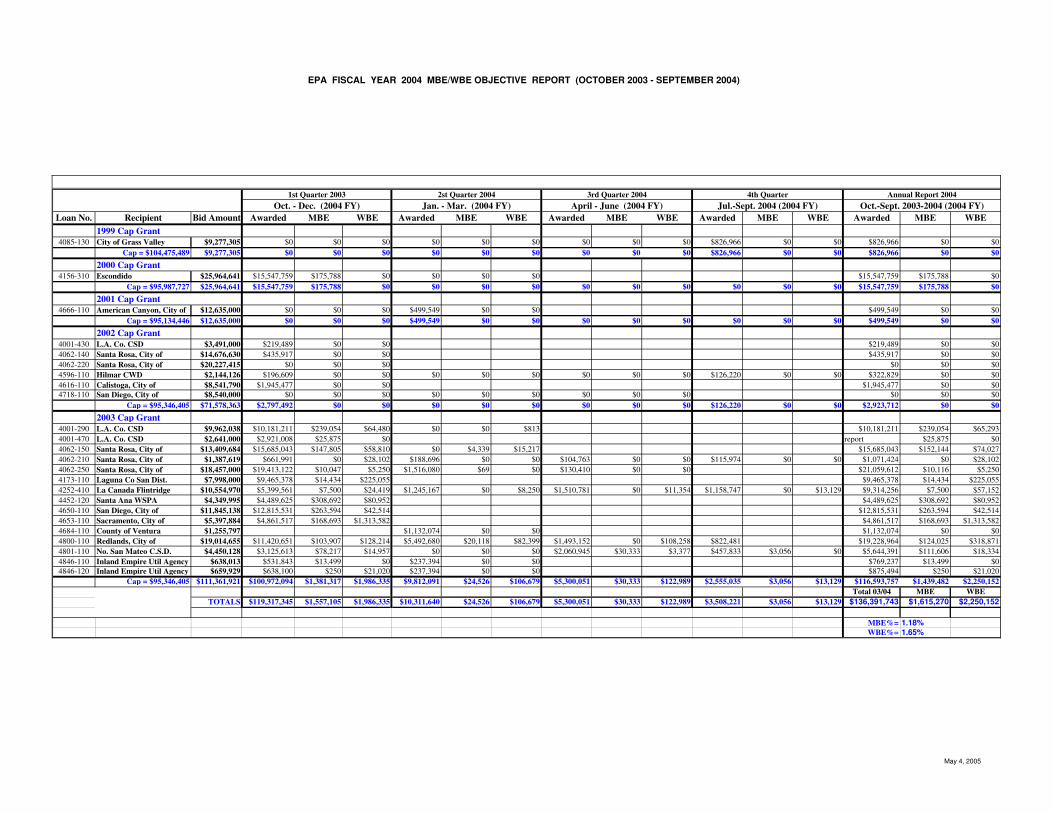
EPA FISCAL YEAR 2004 MBE/WBE OBJECTIVE REPORT (OCTOBER 2003 - SEPTEMBER 2004)
Oct. - Dec. (2004 FY) Jan. - Mar. (2004 FY) April - June (2004 FY) Jul.-Sept. 2004 (2004 FY) Oct.-Sept. 2003-2004 (2004 FY)Loan No. Recipient Bid Amount Awarded MBE WBE Awarded MBE WBE Awarded MBE WBE Awarded MBE WBE Awarded MBE WBE
1999 Cap Grant4085-130 City of Grass Valley $9,277,305 $0 $0 $0 $0 $0 $0 $0 $0 $0 $826,966 $0 $0 $826,966 $0 $0
Cap = $104,475,489 $9,277,305 $0 $0 $0 $0 $0 $0 $0 $0 $0 $826,966 $0 $0 $826,966 $0 $02000 Cap Grant
4156-310 Escondido $25,964,641 $15,547,759 $175,788 $0 $0 $0 $0 $15,547,759 $175,788 $0Cap = $95,987,727 $25,964,641 $15,547,759 $175,788 $0 $0 $0 $0 $0 $0 $0 $0 $0 $0 $15,547,759 $175,788 $0
2001 Cap Grant 4666-110 American Canyon, City of $12,635,000 $0 $0 $0 $499,549 $0 $0 $499,549 $0 $0
Cap = $95,134,446 $12,635,000 $0 $0 $0 $499,549 $0 $0 $0 $0 $0 $0 $0 $0 $499,549 $0 $02002 Cap Grant
4001-430 L.A. Co. CSD $3,491,000 $219,489 $0 $0 $219,489 $0 $04062-140 Santa Rosa, City of $14,676,630 $435,917 $0 $0 $435,917 $0 $04062-220 Santa Rosa, City of $20,227,415 $0 $0 $0 $0 $0 $04596-110 Hilmar CWD $2,144,126 $196,609 $0 $0 $0 $0 $0 $0 $0 $0 $126,220 $0 $0 $322,829 $0 $04616-110 Calistoga, City of $8,541,790 $1,945,477 $0 $0 $1,945,477 $0 $04718-110 San Diego, City of $8,540,000 $0 $0 $0 $0 $0 $0 $0 $0 $0 $0 $0 $0
Cap = $95,346,405 $71,578,363 $2,797,492 $0 $0 $0 $0 $0 $0 $0 $0 $126,220 $0 $0 $2,923,712 $0 $02003 Cap Grant
4001-290 L.A. Co. CSD $9,962,038 $10,181,211 $239,054 $64,480 $0 $0 $813 $10,181,211 $239,054 $65,2934001-470 L.A. Co. CSD $2,641,000 $2,921,008 $25,875 $0 report $25,875 $04062-150 Santa Rosa, City of $13,409,684 $15,685,043 $147,805 $58,810 $0 $4,339 $15,217 $15,685,043 $152,144 $74,0274062-210 Santa Rosa, City of $1,387,619 $661,991 $0 $28,102 $188,696 $0 $0 $104,763 $0 $0 $115,974 $0 $0 $1,071,424 $0 $28,1024062-250 Santa Rosa, City of $18,457,000 $19,413,122 $10,047 $5,250 $1,516,080 $69 $0 $130,410 $0 $0 $21,059,612 $10,116 $5,2504173-110 Laguna Co San Dist. $7,998,000 $9,465,378 $14,434 $225,055 $9,465,378 $14,434 $225,0554252-410 La Canada Flintridge $10,554,970 $5,399,561 $7,500 $24,419 $1,245,167 $0 $8,250 $1,510,781 $0 $11,354 $1,158,747 $0 $13,129 $9,314,256 $7,500 $57,1524452-120 Santa Ana WSPA $4,349,995 $4,489,625 $308,692 $80,952 $4,489,625 $308,692 $80,9524650-110 San Diego, City of $11,845,138 $12,815,531 $263,594 $42,514 $12,815,531 $263,594 $42,5144653-110 Sacramento, City of $5,397,884 $4,861,517 $168,693 $1,313,582 $4,861,517 $168,693 $1,313,5824684-110 County of Ventura $1,255,797 $1,132,074 $0 $0 $1,132,074 $0 $04800-110 Redlands, City of $19,014,655 $11,420,651 $103,907 $128,214 $5,492,680 $20,118 $82,399 $1,493,152 $0 $108,258 $822,481 $19,228,964 $124,025 $318,8714801-110 No. San Mateo C.S.D. $4,450,128 $3,125,613 $78,217 $14,957 $0 $0 $0 $2,060,945 $30,333 $3,377 $457,833 $3,056 $0 $5,644,391 $111,606 $18,3344846-110 Inland Empire Util Agency $638,013 $531,843 $13,499 $0 $237,394 $0 $0 $769,237 $13,499 $04846-120 Inland Empire Util Agency $659,929 $638,100 $250 $21,020 $237,394 $0 $0 $875,494 $250 $21,020
Cap = $95,346,405 $111,361,921 $100,972,094 $1,381,317 $1,986,335 $9,812,091 $24,526 $106,679 $5,300,051 $30,333 $122,989 $2,555,035 $3,056 $13,129 $116,593,757 $1,439,482 $2,250,152Total 03/04 MBE WBE
TOTALS $119,317,345 $1,557,105 $1,986,335 $10,311,640 $24,526 $106,679 $5,300,051 $30,333 $122,989 $3,508,221 $3,056 $13,129 $136,391,743 $1,615,270 $2,250,152
MBE%= 1.18%WBE%= 1.65%
Annual Report 20041st Quarter 2003 2st Quarter 2004 3rd Quarter 2004 4th Quarter
May 4, 2005