Embed Size (px)
Citation preview

Charlton et al. Genome Medicine (2015) 7:11 DOI 10.1186/s13073-015-0136-4
RESEARCH Open Access
Comparative methylome analysis identifiesnew tumour subtypes and biomarkers fortransformation of nephrogenic rests into WilmstumourJocelyn Charlton1, Richard D Williams1, Neil J Sebire1, Sergey Popov2, Gordan Vujanic3, Tasnim Chagtai1,Marisa Alcaide-German1, Tiffany Morris4, Lee M Butcher4, Paul Guilhamon4, Stephan Beck4* and Kathy Pritchard-Jones1*
Abstract
Background: Wilms tumours (WTs) are characterised by several hallmarks that suggest epimutations such as aberrantDNA methylation are involved in tumour progression: loss of imprinting at 11p15, lack of recurrent mutations andformation of nephrogenic rests (NRs), which are lesions of retained undifferentiated embryonic tissue that can give riseto WTs.
Methods: To identify such epimutations, we performed a comprehensive methylome analysis on 20 matched trios ofmicro-dissected WTs, NRs and surrounding normal kidneys (NKs) using Illumina Infinium HumanMethylation450 BeadChips and functionally validated findings using RNA sequencing.
Results: Comparison of NRs with NK revealed prominent tissue biomarkers: 629 differentially methylated regions, ofwhich 55% were hypermethylated and enriched for domains that are bivalent in embryonic stem cells and for genesexpressed during development (P = 2.49 × 10⁻⁵). Comparison of WTs with NRs revealed two WT subgroups; group-2WTs and NRs were epigenetically indistinguishable whereas group-1 WTs showed an increase in methylation variability,hypomethylation of renal development genes, hypermethylation and relative loss of expression of cell adhesion genesand known and potential new WT tumour suppressor genes (CASP8, H19, MIR195, RB1 and TSPAN32) and was stronglyassociated with bilateral disease (P = 0.032). Comparison of WTs and NRs to embryonic kidney highlighted thesignificance of polycomb target methylation in Wilms tumourigenesis.
Conclusions: Methylation levels vary during cancer evolution. We have described biomarkers related to WTevolution from its precursor NRs which may be useful to differentiate between these tissues for patients withbilateral disease.
BackgroundWilms tumour (WT) is the most common paediatricrenal cancer with a prevalence of 1 in 10,000 [1]. Al-though a few genes that predispose to an increased riskof WT have been identified, the underlying mechanismsof Wilms tumorigenesis remain largely uncharacterised.The commonly mutated genes in sporadic WT show low
* Correspondence: [email protected]; [email protected] Cancer Institute, University College London, 72 Huntley Street, LondonWC1E 6BT, UK1UCL Institute of Child Health, University College London, 30 Guilford Street,London WC1N 1EH, UKFull list of author information is available at the end of the article
© 2015 Charlton et al.; licensee BioMed CentraCommons Attribution License (http://creativecreproduction in any medium, provided the orDedication waiver (http://creativecommons.orunless otherwise stated.
mutation frequencies (WT1 (12%) [2], WTX (18%) [3],CTNNB1 (15%) [2], DROSHA (12%) [4], TP53 (5%) [5])and as most mutations often occur in the same tumour[3,6], approximately 65% of WTs are negative for all com-mon somatic mutations. Furthermore, a recent genome-wide association study identified only two susceptibilityloci of genome-wide significance and moderate effect size[7]. By contrast, up to two-thirds of WTs have abnormal-ities at the imprinted IGF2/H19 locus on 11p15 and anepigenetic biomarker common to 118 out of 120 WTsidentifiable in blood was found [8], indicating the possibleinvolvement of epimutations such as aberrant DNA
l. This is an Open Access article distributed under the terms of the Creativeommons.org/licenses/by/4.0), which permits unrestricted use, distribution, andiginal work is properly credited. The Creative Commons Public Domaing/publicdomain/zero/1.0/) applies to the data made available in this article,

Charlton et al. Genome Medicine (2015) 7:11 Page 2 of 11
methylation [2,9]. In addition, targeted analyses identifiedWT-specific differentially methylated regions (DMRs) atGLIPR1 [10], imprinted genes NNAT [11] and the WT1-antisense region [12], various satellite regions [13,14],HACE1 [15], RASSF1A [16], P16 and the protocadherincluster at 5q31 [17].In 40% of unilateral and almost 100% of bilateral cases,
nephrogenic rests (NRs) are found juxtaposed to WTsand are considered precursor lesions [18]. NRs appearmorphologically as lesions reminiscent of embryonickidney (EK) retained from improper renal development[18]. There are two types of NR, perilobar and intralo-bar, that differ in terms of their location within the renallobe and their morphological features [18]. Analysis ofsomatic aberrations found in WTs and their associatedNRs has not clearly implicated any of the known path-ways in either persistence of these presumed precursorlesions or their tumorigenic progression [19-22] and nocomprehensive epigenetic analysis has yet been under-taken on NR lesions. This is largely due to the limita-tions of NR samples, which are microscopic lesionsidentified by histopathological review of formalin fixedparaffin embedded (FFPE) tissue.Although previous studies have implicated epigenetics,
embryonic or stem-like cells and disrupted renal devel-opment in WT aetiology [23,24], a comprehensive longi-tudinal analysis of tumour formation has not yet beenundertaken. Therefore, we conducted the first longitu-dinal epigenetic study using NK, NR and WT trios togain new insights into the disruption in normal renal de-velopment and the steps leading to transformation inWTs.
MethodsSample collection and DNA extractionUse of patient samples in this study was conductedwith ethical approval granted by the NHS LondonBridge Research Ethics Committee (reference 12/LO/0101) with experiments performed in compliance withthe Helsinki Declaration. Patients included in this studywere enrolled in the UK into the International Societyof Paediatric Oncology (SIOP) Wilms Tumour 2001Clinical Trial and Study (clinical trial registration num-ber: EUDRACT 2007-004591-39) with appropriate par-ental consent and ethical approval. Post-nephrectomypathology reports were studied and from those indicat-ing the presence of NRs, FFPE blocks of the nephrec-tomy tissue were collected from the treatment centre.Haematoxylin and eosin-stained 3 μm sections taken fromthese FFPE blocks were examined independently by twopaediatric pathologists who identified clearly separated re-gions of normal kidney (NK), NR and WT. Due to the dif-ficulty in distinguishing between chemotherapy-treatedWT and NRs in a previous study [19], sample selection
was meticulous. In total 36 NKs, 24 NRs (5 intralobarNRs and 19 perilobar NRs) and 37 WTs were identifiedincluding a total of 23 matched trios. Microdissectionwas carried out by either a 2 μm core sample (forblocks composed entirely of NK or WT) or by cutting20 to 30 5-μm sections (dependent on region area) andremoving the desired tissue with a scalpel. DNA extractionfrom FFPE tissue was carried out using the DNeasy Blood& Tissue Kit (QIAGEN, Hilden, Germany). Manufacturer’sinstructions were modified with an additional 90°C heatingstep for 1 hour after overnight incubation at 56°C and a10 minute incubation at 70°C after adding AL buffer.
Genome-wide methylation analysis using Illumina 450 kBeadChipsAn optimised FFPE protocol was followed [25] whereby0.5 to 2 μg DNA (depending on available yield) wastreated using the REPLIg FFPE kit (QIAGEN) and theEZ DNA Methylation kit (Zymo Research Corp, CA,USA). Methylation-specific primers were used to con-firm bisulfite-conversion success of at least 98%. A totalof 97 samples were profiled using the Illumina Infinium450 k platform [26]; these were processed by UCL Gen-omics according to manufacturer’s instructions. Thescanned BeadChip microarray data were interpreted byGenomeStudio software (v1.9.0, Illumina) and then ana-lysed using R statistical software v3.02 [27]. Prior to stat-istical analyses, data were filtered to remove sampleswith low coverage and poor density profiles, resulting inthe exclusion of one NK, two NR and one WT sample,leaving a total of 20 matched trios. Further quality con-trol and data normalisation using the Bioconductorpackage ChAMP [28] implemented the removal of allprobes where at least one sample showed poor detection(detection P > 0.01), leaving 435,385 normalised β-values.The 450 k methylation data described in this study areavailable from the Gene Expression Omnibus with ac-cession ID GSE59157.
Statistical analysis of methylation β-valuesAll statistical analyses were performed using R. To makecomparisons between tissues, the Bioconductor packageLimma [29] was used to generate a Bayesian frameworklinear model that performed three-way contrasts be-tween the tissue types for the ANOVA analysis. Forcomparison of two tissue types, both histology type andpatient were considered in a Bayesian model whichmade intra-patient comparisons at each CpG and thencompared these across all patients to generate averageΔβ values with corresponding P-values which werecorrected for multiple testing using the Benjamini-Hochberg model [30]. DMRs were identified using theProbed Lasso algorithm implemented through the Bio-conductor package ChAMP [28]. This algorithm uses

Charlton et al. Genome Medicine (2015) 7:11 Page 3 of 11
the Illumina annotation to identify the nearest neighbourCpG for every probe and generates a category-specificaverage probe density based on the CpG location. Ittherefore considers the non-uniform distribution ofprobes across the genome with large between-probe dis-tances seen at intergenic regions and small distancesseen at TSS200 regions. From setting the minimum lassosize to 10 bp, the algorithm calculates the respectiveprobe-lasso size within each category and centres thislasso at each probe. Next, using the output topTablefrom Limma, only those probes with a false discoveryrate (FDR) <0.01 were called significant. DMRs werethen defined if the lasso connected three or more signifi-cant probes. Any non-significant probes within the lassoregion were also included in the DMR to better gaugeDMR significance and those DMRs within 1 kb of eachother were encompassed into one region.To compare tissues avoiding cell type composition ef-
fects, the RefFreeEWAS algorithm was applied [31]; thisuses single value decomposition to estimate the numberof cell types contributing to overall histology. In thisstudy, the number of cell types contributing to methyla-tion signal was estimated as d = 3. Using this parameter,the algorithm deconvoluted the β-values using a designmatrix specifying patient pairs and sample histology, andgenerated bootstrap-derived CpG-specific P-values (notcorrected for multiple testing) and covariates that cor-respond only to a ‘phenotype-specific’ methylation signalwith no cell mixture effects as previously described [32].To compare variance among groups, a Bartlett’s test
was run using R. Probe-wise comparisons were made toassess the difference in variance between groups. Embry-onic stem cell (ESC) chromatin data were extracted fromGene Expression Omnibus/NCBI (accession ID GSE8463).Enrichment of epigenetic or genetic features was deter-mined by comparison of significant CpGs against an equalsized cohort generated by multisampling all 450 k arrayprobes present after normalisation. To identify the fre-quency of tumours with hypermethylated tumour suppres-sor genes, tumours were classed as hypermethylated if theaverage β-value for all CpGs in a DMR was greater thanthe average for the NR cohort plus 1 standard deviation.Pathway and gene ontology process analysis was conductedusing GREAT [33] with all CpGs present after normalisa-tion used as a reference file. Processes with a significantfold enrichment (>2) were selected with the Bonferronicorrected P-value <0.01 and with at least four significantgenes per pathway.
Comparison with embryonic kidneyHuman EKs were provided by the Joint MRC/WellcomeTrust Human Developmental Biology Resource at theUCL Institute of Child Health. Ethical approval was cov-ered by the HDBR HTA tissue bank license and project
approval. Details of approval terms can be found at [34].DNA was extracted from four human EKs (from gesta-tional age 8 weeks and 12 weeks) using the AllPrepDNA/RNA Micro Kit (QIAGEN) according to the man-ufacturer’s instructions. Methylation levels for EK werederived using 450 k BeadChips as described above. The20 trios plus 4 EKs were re-normalised together includ-ing a between-array normalisation using wateRmelonpackage Dasen to correct for between-array effects [35].The final dataset included 330,731 CpGs with probesthat map to sex chromosomes, with known SNPs at thetarget site or that bind multiple genomic loci (definedfrom in silico analyses [36]) excluded. Comparisons be-tween tissues were performed using Limma andRefFreeEWAS with an unpaired design.
Validation by bisulfite sequencingIn total, 5 regions were selected for validation, which cov-ered 18 CpGs interrogated by the 450 k array. Primers weredesigned for bisulfite-converted DNA using MethPrimer[37]. In total, 10 ng of bisulfite-converted FFPE extractedDNA from four trios was used to amplify the specific gen-omic regions. The hot-start enzyme KAPA HiFi Uracil +(KAPA Biosystems Inc, Wilmington, MA, USA) was usedfor PCR and products were cleaned using magnetic beads(Beckman Coulter Inc, Brea, CA, USA) and quantifiedusing Picogreen reagents. Samples were tagged and pooledprior to sequencing on the Illumina MiSeq according to themanufacturer’s instructions.Raw MiSeq paired-end reads were mapped to human
genome build hg19 with Bismark v0.9.0 [38] using Bowtie2 [39] as the aligner. Methylated and unmethylated basecounts were generated with the bismark_methylation_extractor utility and exported as BedGraph files for furtheranalysis and display in Integrative Genomics Viewer [40].Aligned BAM files were sorted and indexed with SAM-tools [41] for assessment of the regions of interest inIntegrative Genomics Viewer. The number of C reads(methylated prior to conversion) was divided by thetotal number of reads per bisulfite-sequenced CpG siteto discern the percentage methylation. These were thencompared with the respective 450 k β-values to com-pare platforms.
RNA sequencingRNA was extracted from 12 samples (4 trios) by cuttingmultiple 5 μm sections of FFPE tissue and scraping thetarget region using a new sterile scalpel blade each time.Tissue was put into an Eppendorf then RNA was ex-tracted using the RNeasy FFPE kit (QIAGEN) accordingto the manufacturer’s instructions. Library preparationfor the 12 samples was performed using the TruSeqRNA access kit (Illumina) and run on the Illumina Next-Seq 500. Reads were aligned using TopHat2 [42] and

Charlton et al. Genome Medicine (2015) 7:11 Page 4 of 11
counted using HTseq [43] in Python. Two samples wereexcluded from the analysis due to poor read coverageand aberrant clustering in unsupervised analysis. TheBioconductor package DESeq [44] was used in R tomake group-wise comparisons between NK and NR,then NR and WT, run with default parameters.
ResultsMethylation profiles distinguish tissue types and showincreased variability in both NR and WT samples comparedto NKTo characterise tissue-specific methylation changes forNK (n = 35), NRs (n = 22) and WTs (n = 36; including 20matched trios) we derived methylation levels (β; 0 =unmethylated, 1 = methylated) for 435,385 CpGs usingIllumina Infinium HumanMethylation450 BeadChipsand validated β-values using bisulfite-sequencing, whichshowed good concordance (R = 0.8365, with a mediandifference in β-value of 0.09; Figure S1 in Additional file1; Additional file 2). Unsupervised clustering of the 1%most variable CpGs (excluding probes that map to sexchromosomes or with known SNPs at the target site;termed XYS probes) revealed clear separation of samplesinto tissue-related groups (Figure 1a), confirming thesignificant association between tissue type and methyla-tion. Although both intralobar NRs (n = 5) and perilobarNRs (n = 17) were present, unsupervised analysis did notdistinguish between them and as sample groups weresmall, we did not interrogate for further differences.Next, we performed multidimensional scaling of the top1% most variable CpGs to assess the inter-sample vari-ability within each dataset. The NK samples groupedtightly together; however, the NR and WT datasets bothshowed high variability as illustrated by the wide disper-sion of data points (Figure 1b). Furthermore, we foundthat for probes showing significant non-homogeneityof variances (Bartlett test), the vast majority exhibitedincreased variance in NR and WT groups comparedwith the NK group (NNK>NR = 9,334; NNR>NK = 94,546and NNK>WT = 14,933; NWT>NK = 158,189; Figure S2 inAdditional file 1).
Supervised analysis reveals two Wilms tumour groupsAs methylation status clearly distinguished betweentissue types (NK, NR and WT), we focussed on the setof 20 matched trios (clinical information in Additionalfile 3) and performed ANOVA on the full dataset withXYS probes excluded to identify CpGs that were differ-entially methylated between all three tissue types. Thisanalysis identified 7,921 CpGs reaching genome-widesignificance (P < 5 × 10⁻⁸). Upon clustering of theseCpGs, two clusters formed: cluster 1 (13 WT, 1 NR)and cluster 2, which further separated into cluster 2a(20 NK, 1 NR) and cluster 2b (7 WT, 18 NR; Figure 2).
All NK samples fell into cluster 2a but the WT samplesfell into two distinct groups. Cluster 1 WT (termedgroup-1 WT) appeared distinct from their NR whereascluster 2b WT (termed group-2 WT) clustered withtheir respective precursor lesion. Upon further investi-gation, we observed that all WTs from patients withbilateral disease fell into group-1, giving a significantassociation between distinction from NRs and bilateraldisease (P = 0.032, chi-square test). This was furthersupported by re-evaluation of the unsupervised multi-dimensional scaling analysis where group-2 WT ap-peared closer to NR samples (Figure S3 in Additionalfile 1). As this multidimensional scaling plot showed awider dispersion of group-1 WTs, a Bartlett test wasperformed to compare levels of probe-specific variancebetween group-1 and group-2 WTs. This test showedthat group-1 WTs had 2.4 times as many probes with asignificant increase in variance compared with group-2WTs (31,638 compared with 13,124; P < 0.01), suggest-ing that group-1 WTs have a more hypervariableepigenome.To further investigate whether two WT groups exist
that differ in terms of relationship with their respectiveNRs, we separated group-1 (n = 13) and group-2 (n = 7)WT-NR matched pairs and used a paired linear modelto identify intra-patient sites of differential methylationthat were common across samples. The matched studydesign avoids patient-specific SNPs from giving falsepositives and XYS probes were thus included. Forgroup-1 WT we identified 22,344 methylation variablepositions (MVPs; FDR <0.01). Conversely, group-2 WTsshowed no significant sites of differential methylationcompared with their associated NRs.
Wilms tumour cells show hypomethylation of key renaldevelopment genes and silence tumour suppressor genesby hypermethylationNext, group-1 MVPs were grouped into discreet clus-ters to further investigate their biological relevance[28]. In total, 625 DMRs were identified, of which 460(73.6%) were hypomethylated and 165 (26.4%) werehypermethylated in WTs with respect to NRs; termedhypo-WT-DMRs and hyper-WT-DMRs respectively.Hyper-WT-DMRs were smaller and were more oftenlocated at transcription start sites and within CpGshores, indicating a relationship with tissue identity aswell as gene expression [45,46] (Table S3 in Additionalfile 1). Conversely, hypo-WT-DMRs were enrichedwithin gene bodies and were not associated with CpGislands, shores or shelves. By interrogation with GREAT[33], which associates genomic positions with gene regula-tory domains to infer biological significance, we found thathypo-WT-DMRs were enriched within developmentalprocesses, including metanephric nephron development
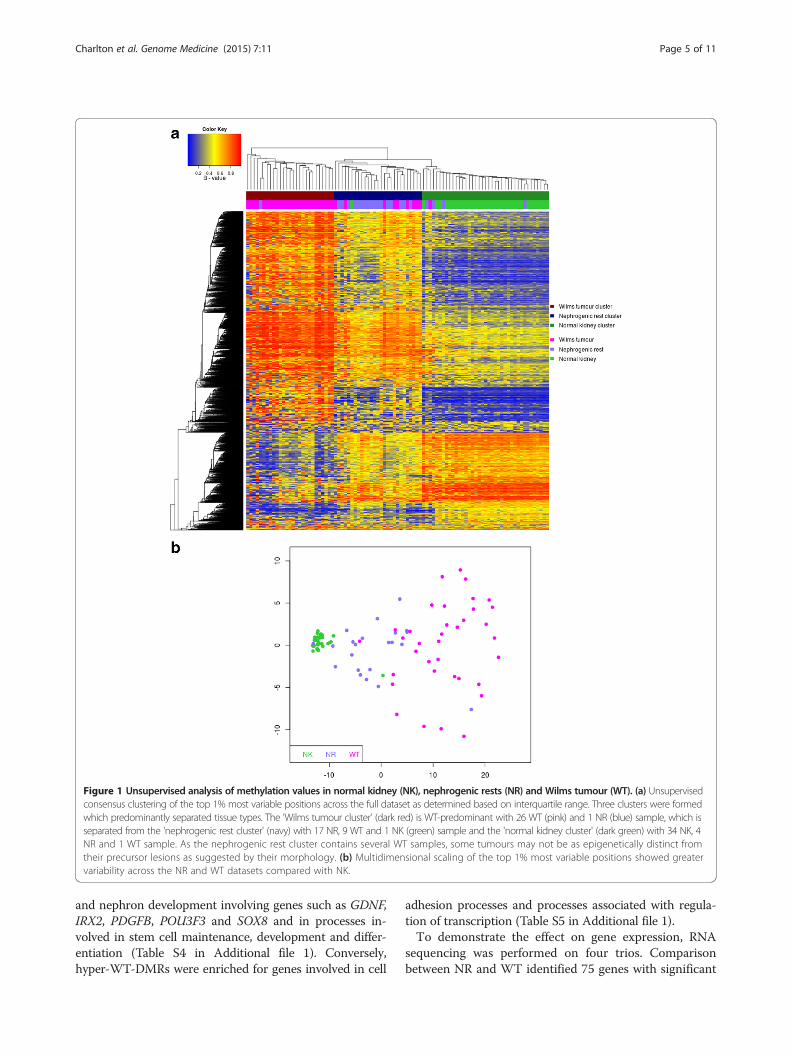
Figure 1 Unsupervised analysis of methylation values in normal kidney (NK), nephrogenic rests (NR) and Wilms tumour (WT). (a) Unsupervisedconsensus clustering of the top 1% most variable positions across the full dataset as determined based on interquartile range. Three clusters were formedwhich predominantly separated tissue types. The 'Wilms tumour cluster' (dark red) is WT-predominant with 26 WT (pink) and 1 NR (blue) sample, which isseparated from the 'nephrogenic rest cluster' (navy) with 17 NR, 9 WT and 1 NK (green) sample and the 'normal kidney cluster' (dark green) with 34 NK, 4NR and 1 WT sample. As the nephrogenic rest cluster contains several WT samples, some tumours may not be as epigenetically distinct fromtheir precursor lesions as suggested by their morphology. (b) Multidimensional scaling of the top 1% most variable positions showed greatervariability across the NR and WT datasets compared with NK.
Charlton et al. Genome Medicine (2015) 7:11 Page 5 of 11
and nephron development involving genes such as GDNF,IRX2, PDGFB, POU3F3 and SOX8 and in processes in-volved in stem cell maintenance, development and differ-entiation (Table S4 in Additional file 1). Conversely,hyper-WT-DMRs were enriched for genes involved in cell
adhesion processes and processes associated with regula-tion of transcription (Table S5 in Additional file 1).To demonstrate the effect on gene expression, RNA
sequencing was performed on four trios. Comparisonbetween NR and WT identified 75 genes with significant

Figure 2 ANOVA analysis identifies two Wilms tumour groups. Consensus clustering of the significant CpGs (n = 7,921; P < 5 × 10⁻⁸) fromANOVA analysis of 20 trios of normal kidney (green), nephrogenic rest (blue) and Wilms tumour (pink). Here, three clusters can be seen whichshow the presence of two distinct WT groups. Cluster 1 (grey) comprises group-1 WT (n = 13), which includes all bilateral WT (dark pink) and 4unilateral cases (light pink). Group-1 WT clusters separately from their associated NRs. The second cluster further separates into two, with cluster2a (purple) containing all NK samples and cluster 2b containing group-2 WTs (n = 7), which are all unilateral and cluster together with theirassociated NRs.
Table 1 Tumour suppressor genes hypermethylated ingroup-1 Wilms tumours
Gene DMRP-value
HypermethylatedWT
Averagereads in NR
Averagereads in WT
CASP8 0.0037 10 of 13 104 20
H19 0.0045 11 of 13 NA NA
MIR195 0.0049 13 of 13 NA NA
RB1 0.0020 13 of 13 55 11
TSPAN32 0.0091 10 of 13 18 8
Charlton et al. Genome Medicine (2015) 7:11 Page 6 of 11
differential expression (FDR <0.05) including genes in-volved in cell adhesion (CD200, GPR108, TSPAN2,ADAMTS8, MDK and NCAM1) and in regulation oftranscription (NFKB1, MYSM1, PREPL; Table S6 inAdditional file 1). These data support the dysregulation ofthese processes during progression from the precursor le-sion, as identified by interrogation of hyper-WT-DMRs.NCAM1 has previously been identified as being a markerfor cancer-propagating WTcells [47], suggesting its poten-tial as a marker of transformation from NRs.To identify methylation changes associated with trans-
formation, we studied the hyper-WT-DMRs further tosee whether we could link hypermethylation withtumour suppressor gene silencing. Of the 123 genes as-sociated with the 165 hyper-WT-DMRs, 5 were foundwithin TSgene, the Tumour Suppressor gene database[48] and we predicted they would be inactivated ingroup-1 WT (Table 1). Indeed, RNA sequencing showeddownregulation of CASP8, RB1 and TSPAN32 in WTscompared with NRs (Table 1); however, due to smallsample numbers, these differences did not reach
statistical significance. As MIR-195 and H19 are amiRNA and a non-coding RNA, respectively, these werenot detected by this assay. Of these, H19 DMR methyla-tion (and hence presumed loss of imprinting) has beenpreviously reported in approximately 70% all WTs [2].Here we see hypermethylation in 85% NR-associatedgroup-1 WT as an event associated with transformation.For the 11 of 13 WT samples with gain of methylationat H19, NK showed average methylation levels lowerthan NRs (0.70 versus 0.78), both of which were

Figure 3 Hypermethylated KR-DMRs are enriched in developmentalloci and genes involved in β-catenin localisation. HypermethylatedKR-DMRs showed 10.8% enrichment (empirical P≤ 0.01) for locationwithin domains that are bivalent in embryonic stem cells (consideredas developmental loci) compared with levels ascertained by repeatedmultiple sampling of all array CpGs.
Charlton et al. Genome Medicine (2015) 7:11 Page 7 of 11
significantly lower than WTs (0.88, P = 5.6 × 10⁻⁷ andP = 3.1 × 10⁻⁶, respectively), suggesting that, although amajor increase in methylation occurred upon trans-formation, NK may contain a proportion of cells withmethylated H19 DMR as this imprinted region showedhigher than expected methylation levels.
Cell composition correction identifies 'pheno-MVPs'Although the MVPs identified and described here arevalid tissue biomarkers that distinguish NRs from WTsencompassing the heterogenous nature of each tissue,these findings may also be due to the known variable celltype composition (as shown in Figure S4 in Additionalfile 1). To take this into consideration, the RefFreeEWASalgorithm was applied to the 20 NR-WT pairs. This al-gorithm uses single value decomposition to identifychanges in methylation associated with a cell mixture,providing adjusted covariates and P-values that representdirect epigenetic effects [31]. Such pheno-MVPs, as pre-viously described [32], most accurately reflect pheno-typic methylation changes. In total, 37,118 pheno-MVPswere identified (P < 0.01). Of these, 12,929 (35%) werehypermethylated and 24,189 (65%) were hypomethylatedin WTs with respect to NRs. As a cell-type compositioncorrected β-value matrix cannot be generated by thispackage, and no algorithm for DMR detection is in-cluded, we cannot comment on whether the two groupsor the biomarker DMRs were detected as a result of cellcomposition effects. Instead, we compared the MVPsidentified by each respective method and found that9,651 (36%) of MVPs identified by the non-correctedLimma algorithm were also detected by RefFreeEWAS.Genes with the largest number of pheno-MVPs includedARHGEF16, SIM2, H19, GALNT5, U6, ALG10, IRX4,TBX15, VAX2, and PRRT1 and significantly overlappedwith genes showing polycomb-associated H3K27me3 innormal tissue that gained methylation in cancer tissue [49](P = 9.11 × 10-126; 246 CpGs, identified using GREAT).
Aberrant hypermethylated DMRs in NR tissue suggestdevelopmental arrestAfter demonstrating the presence of two WT groupsaccording to the epigenetic relationship to their associ-ated NRs, we next focused on characterising the NRmethylome. There was no evidence of differences be-tween NRs as 18 out of 20 fell into ANOVA cluster 2b(Figure 2). Therefore, we performed linear modellingon the 20 NK-NR pairs to identify methylation changesassociated with incomplete renal development. Thecomparison between NK and NR identified 23,667 dif-ferentially methylated MVPs (FDR <0.01), which weregrouped into 629 DMRs with relatively equal proportionsof hyper- and hypomethylation (55% and 45%, respect-ively). We termed these kidney-rest DMRs (KR-DMRs;
Table S7 in Additional file 1) with hypo-KR-DMR andhyper-KR-DMR referring to hypomethylation and hyper-methylation in the NRs with respect to NK. Analysis ofhypo-KR-DMRs did not result in overrepresentation ofany processes that could be readily associated withdevelopmental arrest (Table S8 in Additional file 1);however, analysis of hyper-KR-DMRs, which were sig-nificantly enriched within CpG shores (9.9%, empiricalP-value = 0.01), showed overrepresentation of develop-mental or multicellular organismal processes (Table S9in Additional file 1). The overrepresented processes in-cluded early embryonic patterning, and we hypothesisedthat gain of methylation may be occurring at developmen-tal loci required to complete nephrogenesis.To test this hypothesis, we explored the overlap be-
tween the hyper-KR-DMRs and regions of active chro-matin (with chromatin mark H3K4me3) and regions ofrepressed chromatin (with H3K27me3) in ESCs [50,51].In ESCs, the combination of both marks (bivalent do-mains) allows for loci to be poised in a state awaiting dif-ferentiation signals that either rapidly repress or expressthe underlying gene. Multisampling analysis revealed astrong, significant enrichment of hyper-KR-DMRs withinbivalent domains (10.8%, empirical P = 0.01; Figure 3; bycomparison, hypomethylated KR-DMRs were negativelyenriched by -1.9%). As bivalent domains mark key devel-opmental genes poised for differentiation, this positiveenrichment suggests that DNA hypermethylation maycontribute to the developmental arrest seen in NRs.To take into consideration cell composition effects,
the RefFreeEWAS algorithm was also applied to the
Charlton et al. Genome Medicine (2015) 7:11 Page 8 of 11
comparison between 20 NR-NK pairs. This analysisidentified a total of 61,497 pheno-MVPs with 28,495(46%) hypo- and 33,002 (54%) hypermethylated in NRwith respect to NK. In total, 69% non-corrected MVPsoverlapped with the pheno-MVPs. These pheno-MVPsalso showed a significant association with genes that areH3K27me3 marked by polycomb proteins in normal tissuethat acquire cancer-specific methylation [49] (P = 1.76 ×10⁻²⁰; 141 CpGs).
Comparison with embryonic kidney shows aberrant gainof methylation at Polycomb sites is not associated withdevelopmental stageAs the WT cell-of-origin is embryonic, methylationlevels were compared between EK (n = 4), NRs andWTs. For these analyses, as we do not need to identifytissue-specific biomarkers and the EK was not matched,each comparison was performed using the RefFreeE-WAS algorithm [31]. To begin with, we focussed on thepheno-MVPs that differentiate between NRs and EK. Aspreviously mentioned, it was not possible to generateDMRs using the RefFreeEWAS package and we there-fore focussed on pheno-MVPs with P < 0.01 and Δβ >|0.2|. Of the 4,457 MVPs identified in this comparison,2,108 were hypo-MVPs and 2,349 were hyper-MVPs inNRs with respect to EK. Although MVP selection herewas different from the previous DMR selection, similarlyto the NR-NK comparison, many of the hyper-MVPs fellwithin key genes involved in renal development andwere therefore enriched in renal development processes.Hyper-MVPs also showed a significant association withregions identified as Polycomb repressive complex 2(PRC2) targets in ESCs (P = 2.79 × 10-66) [52], includinga set of 189 genes and 480 CpGs (20% of hyper-MVPs).This concordance of results between comparisons ofNRs with each of NK and EK suggests that the gain ofmethylation observed here is a true aberrant event asso-ciated with NR formation rather than an epigenetic fea-ture reminiscent of an early developmental stage.Next, we focussed on pheno-MVPs identified from
comparison of WTs with EK, of which 5,814 (44%) werehypomethylated and 7,538 (56%) were hypermethylatedin WTs with respect to EK. We first focussed on WThyper-MVPs and, by interrogation with GREAT, identi-fied similar developmental processes as identified in theNR-EK comparison, suggesting maintenance of the epi-genetic landscape from the NR. The surprising differ-ence was that the WT-EK comparison highlighted manymore processes involved in general embryonic develop-ment instead of specifically renal development, includ-ing, for example, 228 genes involved in embryonicpattern specification and 251 genes involved in embry-onic morphogenesis (the most differentially methylatedincluded FOXD1, GLI2, HOXA5, HOXD10, LBX1, PAX2,
SIM2, SIX3, TBX3, UNCX, VAX2 and WNT10A). Fur-thermore, a significant enrichment was again seen forhyper-MVPs within regions of PRC2 binding (P = 3.92 ×10-217), but there was also a very significant enrichmentfor regions of H3K27me3 (P = 2.91 × 10-247), PolycombEED targets (P = 1.08 × 10-241) and Suz12 targets (P =8.65 × 10-207), all identified by ChIP on chip in humanESCs [52]. This evidence suggests a further dysregula-tion of methylation at Polycomb target sites and devel-opmental loci as cells progress towards malignancy.
DiscussionIn this study, we show that regional differences in DNAmethylation can discriminate between NK, NRs andWTs. We highlight that both NRs and WTs have morebetween sample variability than NK with increased vari-ability associated with tumourigenesis, a finding consist-ent with adult adenocarcinoma of the colon [9]. In thisstudy, NR formation, by comparison with NK and EK,was associated with hypermethylation of genes involvedin renal development and loci that show bivalent chro-matin marks in ESCs. Although this enrichment at bi-valent domains suggests that DNA hypermethylationmay contribute to the developmental arrest seen in NRs,recent evidence [53] suggests that bivalent marking ismore ubiquitous than previously thought, thus poten-tially reducing its specificity as a marker for the poisedstate, if confirmed. These same loci were PRC2 targetsites that show H3K27me3 in normal tissue and arecommonly methylated in other cancers. These similarfindings, in both non-corrected and corrected analysesfor cell type composition and in comparison with bothNK and EK tissues, suggests that the initiating step inWilms tumourigenesis - that is, NR retention in post-natal kidney - involves PRC2-associated gain of methyla-tion (either by an active or passive mechanism) at renaldevelopment loci required for normal nephrogenic dif-ferentiation, which is not cell composition-mediated.NRs cannot, therefore, differentiate normally and remainas aberrant embryonic-like tissue in the post-natal kid-ney. Polycomb target hypermethylation has previouslybeen associated with the cancer phenotype and lesswell-differentiated tumours [52]. It has been proposedthat the disruption of normal Polycomb mechanisms iscentral to tumour initiation [54], and gain of methylationhas been detected in pre-malignant lesions for otheradult cancers [55].Supporting the role of Polycomb protein dysregulation
in WTs, evidence from a mouse model of in vivo repro-gramming associated formation of WT-like lesions withfailure of Polycomb gene targets to be repressed [56].Furthermore, upregulation of Polycomb genes BMI-1,EZH2, SUZ12 and EED was seen in progressiveblastemal-enriched WT xenografts in mice, suggesting

Charlton et al. Genome Medicine (2015) 7:11 Page 9 of 11
their expression correlated with tumourigenesis [57].The question that remains is what causes PRC overex-pression in the first place? Genetic mutation could be in-volved and DNA sequencing projects are currentlyunderway that may highlight novel mutations in WTsassociated with Polycomb gene regulation.This study presents novel evidence that WTs with as-
sociated NRs fall into two distinct subsets according towhether they have a similar (group-2) or distinct (group-1)methylome. We hypothesise that group-2 WTs may bedriven by somatic mutation and have a more stable epige-nome that remains close to that of their precursor NR asno significant common changes in methylation occur be-tween WTs and NRs. Furthermore, as group-1 WTs sig-nificantly associate with bilateral disease, we predict thatthe event leading to NR formation occurs at an earlier timepoint in embryogenesis as both kidneys are affected. Wetherefore hypothesise that the progenitor cells within thispopulation are more epigenetically unstable, regardless oftheir association with potentially epigenome-modifyinggenetic mutations, which results in hypermethylation oftumour suppressor genes, giving selective advantage andcausing transformation. CASP8 and H19 have been previ-ously associated with WTs [58,59], and H19 in particularhas been associated with sporadic bilateral disease [2],whereas RB1, Mir-195 and TSPAN32 aberrations have notpreviously been identified in WTs, although detected inother cancers [60-68]. This epigenetic plasticity will be rep-licated in the tumour-initiating cell, which would allow theresultant proliferating tumour to evolve into an entity witha distinct epigenetic profile from the NR. This is supportedby evidence showing that group-1 tumours have a greaternumber of significantly more variable probes than group-2tumours. In group-1 WT we saw hypomethylation of genesthat, if expressed as predicted, give WTs an EK-like profilesimilar to that observed in previous WTchromatin and ex-pression profiling studies [23,24]. This study shows thatobtaining this phenotype is associated with the stage oftransformation and not with the precursor lesion. Also as-sociated with transformation was gain of methylation atH19. The H19 DMR showed high levels of methylation inboth NK and NRs, but levels significantly increased upontransformation to WTs, which was not confounded by celltype composition.
ConclusionsMethylation profiles vary significantly between NK, NRsand WTs and changes in the methylome underlie bothNR formation and transformation to WTs in a subset ofcases. We have presented the first molecular associationbetween developmental arrest and NR formation andshowed the presence of two distinct WT groups bymethylome comparison with their associated NRs. Thesegenome-wide and gene-specific assays, which work well
on formalin-fixed tissue, have potential clinical utility todistinguish more accurately between NRs and treatedWTs in patients with bilateral disease. This distinction,which is often difficult to make unambiguously by histo-logical examination, would be useful for post-operativetreatment planning (determining whether the resectionmargin is clear of tumour, which dictates the need forradiotherapy) and would aid in the evaluation of the effi-cacy of nephron-sparing surgery in achieving completetumour excision. However, the potential use of a mo-lecular marker for this purpose requires validation in anindependent set of cases. Finally, as group-1 tumours ap-pear more epigenetically unstable, we propose that epi-genetic modifiers be considered as candidate therapeutictargets for WT and prevention of NR transformation inpre-disposed individuals, particularly as few targetedtherapies have emerged to date based on somatic muta-tional analysis.
Additional files
Additional file 1: Figure S1. Validation of the 450 k array usingbisulfite-sequencing. Figure S2. Probe-wise variance between groupsshows NRs and WTs are much more variable than NK. Figure S3.Unsupervised analysis shows two WT groups. Figure S4. Histologicalcomposition of microdissected tissue. Table S3. Mutation analysis ofWT1, WTX and CTNNB1 in WT. Table S4. Description of hypermethylatedand hypomethylated differentially methylated regions (DMRs) in group-1WT compared with matched nephrogenic rests. Table S5. Significantlyoverrepresented biological processes identified by hypomethylatedWT-DMRs. Table S6. Significantly overrepresented biological processesidentified by hypermethylated group-2 WT-DMRs. Table S7. Descriptionof hypermethylated and hypomethylated differentially methylated regions(DMRs) in nephrogenic rests compared with matched normal kidney.Table S8. Significantly overrepresented biological processes identified byhypomethylated KR-DMRs. Table S9. Significantly overrepresentedbiological processes identified by hypermethylated KR-DMRs.
Additional file 2: Table S1. Comparison of 450 k β-values and levels ofmethylation determined by bisulfite sequencing.
Additional file 3: Table S2. Clinical information for the patients fromwhich the 20 matched trios originated.
AbbreviationsDMR: differentially methylated region; EK: embryonic kidney; ESC: embryonicstem cell; FDR: false discovery rate; FFPE: formalin fixed paraffin embedded;H3K4me3: histone 3 lysine 4 trimethylation; H3K27me3: histone 3 lysine 27trimethylation; MVP: methylation variable position; NK: normal kidney;NR: nephrogenic rest; PCR: polymerase chain reaction; WT: Wilms tumour.
Competing interestsThe authors declare that they have no competing interests.
Authors’ contributionsJC, KP-J, RW and SB designed the study; NS and SP performed pathologicalreview of FFPE sections; GV identified cases with NRs in the national trialsand performed central pathological review of all cases; TC co-ordinated thesample collection from across multiple institutions; JC extracted DNA andprepared samples for analysis; JC performed bioinformatics analyses withhelp from RW, MA-G, PG, LMB and TM; JC prepared all figures; JC wrote themanuscript with input from all authors. All authors reviewed and approvedthe final version.

Charlton et al. Genome Medicine (2015) 7:11 Page 10 of 11
AcknowledgementsJC was funded by the UCL Grand Challenges Scheme and the Olivia Hodsonfund. The Pritchard-Jones laboratory was funded by Cancer Research UK(C1188/A4614), Great Ormond Street Hospital (GOSH) Children’s Charity andChildren with Cancer (11MH16) and EU-FP7 project ENCCA (261474). NJS andKPJ are part supported by the NIHR GOSH UCL Biomedical Research Centre.The Beck laboratory was funded by the Wellcome Trust (99148), the UCLBiomedical Research Centre (BRC84/CN/SB/5984), a Royal Society WolfsonResearch Merit Award (WM100023), IMI-JU OncoTrack (115234) and EU-FP7projects IDEAL (259679), EPIGENESYS (257082) and BLUEPRINT (282510). Theauthors would like to thank all the investigators at the contributing Children’sCancer and Leukaemia Group (CCLG) treatment centres and the CCLG tissuebank, which is funded by Cancer Research UK, for provision of samples. Wethank Kerra Pearce and Tony Brooks from UCL Genomics for their help withprocessing the Illumina 450 k arrays and the Illumina sequencing. The humanembryonic and foetal material was provided by the Joint MRC/Wellcome Trust(grant number 099175/Z/12/Z) Human Developmental Biology Resource(http://hdbr.org). We would also like to thank Paul Winyard and Karen Price forhelp with processing the embryonic kidney tissue.
Author details1UCL Institute of Child Health, University College London, 30 Guilford Street,London WC1N 1EH, UK. 2The Institute of Cancer Research, 15 Cotswold Road,Sutton, Surrey SM2 5NG, UK. 3Department of Pathology, Cardiff UniversitySchool of Medicine, Heath Park, Cardiff CF14 4XN, UK. 4UCL Cancer Institute,University College London, 72 Huntley Street, London WC1E 6BT, UK.
Received: 30 October 2014 Accepted: 21 January 2015
References1. Breslow N, Olshan A, Beckwith JB, Green DM. Epidemiology of Wilms tumor.
Med Pediatr Oncol. 1993;21:172–81.2. Scott RH, Murray A, Baskcomb L, Turnbull C, Loveday C, Al-Saadi R, et al.
Stratification of Wilms tumor by genetic and epigenetic analysis. Oncotarget.2012;3:327–35.
3. Ruteshouser EC, Robinson SM, Huff V. Wilms tumor genetics: mutations inWT1, WTX, and CTNNB1 account for only about one-third of tumors. GenesChromosomes Cancer. 2008;47:461–70. doi:10.1002/gcc.20553.
4. Torrezan GT, Ferreira EN, Nakahata AM, Barros BD, Castro MT, Correa BR, et al.Recurrent somatic mutation in DROSHA induces microRNA profile changes inWilms tumour. Nat Commun. 2014;5:4039. doi:10.1038/ncomms5039.
5. Bardeesy N, Falkoff D, Petruzzi M, Nowak N, Zabel B, Adam M, et al.Anaplastic Wilms' tumour, a subtype displaying poor prognosis, harboursp53 gene mutations. Nat Genet. 1994;7:91–7.
6. Rakheja D, Chen KS, Liu Y, Shukla AA, Schmid V, Chang TC, et al. Somaticmutations in DROSHA and DICER1 impair microRNA biogenesis throughdistinct mechanisms in Wilms tumours. Nat Commun. 2014;2:4802.doi:10.1038/ncomms5802.
7. Turnbull C, Perdeaux ER, Pernet D, Naranjo A, Renwick A, Seal S, et al. Agenome-wide association study identifies susceptibility loci for Wilms tumor.Nat Genet. 2012;44:681–4. doi:10.1038/ng.2251.
8. Charlton J, Williams RD, Weeks M, Sebire NJ, Popov S, Vujanic G, et al.Methylome analysis identifies a Wilms tumour epigenetic biomarkerdetectable in blood. Genome Biol. 2014;15:434.
9. Timp W, Feinberg AP. Cancer as a dysregulated epigenome allowingcellular growth advantage at the expense of the host. Nat Rev Cancer.2013;13:497–510. doi:10.1038/nrc3486.
10. Chilukamarri L, Hancock AL, Malik S, Zabkiewicz J, Baker JA, Greenhough A,et al. Hypomethylation and aberrant expression of the gliomapathogenesis-related 1 gene in Wilms tumors. Neoplasia. 2007;9:970–8.
11. Hubertus J, Zitzmann F, Trippel F, Muller-Hocker J, Stehr M, von SchweinitzD, et al. Selective methylation of CpGs at regulatory binding sitescontrols NNAT expression in Wilms tumors. PLoS One. 2013;8:e67605.doi:10.1371/journal.pone.0067605.
12. Malik K, Salpekar A, Hancock A, Moorwood K, Jackson S, Charles A, et al.Identification of differential methylation of the WT1 antisense regulatory regionand relaxation of imprinting in Wilms’ tumor. Cancer Res. 2000;60:2356–60.
13. Ehrlich M, Hopkins NE, Jiang G, Dome JS, Yu MC, Woods CB, et al. SatelliteDNA hypomethylation in karyotyped Wilms tumors. Cancer GenetCytogenet. 2003;141:97–105.
14. Ludgate JL, Le Mee G, Fukuzawa R, Rodger EJ, Weeks RJ, Reeve AE, et al.Global demethylation in loss of imprinting subtype of wilms tumor. GeneChromosome Canc. 2012. doi:10.1002/gcc.22017.
15. Zhang L, Anglesio MS, O’Sullivan M, Zhang F, Yang G, Sarao R, et al. The E3ligase HACE1 is a critical chromosome 6q21 tumor suppressor involved inmultiple cancers. Nat Med. 2007;13:1060–9. doi:10.1038/nm1621.
16. Wagner KJ, Cooper WN, Grundy RG, Caldwell G, Jones C, Wadey RB, et al.Frequent RASSF1A tumour suppressor gene promoter methylation in Wilms'tumour and colorectal cancer. Oncogene. 2002;21:7277–82. doi:10.1038/sj.onc.1205922.
17. Dallosso AR, Hancock AL, Szemes M, Moorwood K, Chilukamarri L, Tsai HH,et al. Frequent long-range epigenetic silencing of protocadherin geneclusters on chromosome 5q31 in Wilms' tumor. PLoS Genet. 2009;5:e1000745.doi:10.1371/journal.pgen.1000745.
18. Beckwith JB, Kiviat NB, Bonadio JF. Nephrogenic rests, nephroblastomatosis,and the pathogenesis of Wilms' tumor. Fetal Pediatr Pathol. 1990;10:1–36.doi:10.3109/15513819009067094.
19. Vuononvirta R, Sebire NJ, Dallosso AR, Reis-Filho JS, Williams RD, Mackay A,et al. Perilobar nephrogenic rests are nonobligate molecular geneticprecursor lesions of insulin-like growth factor-II-associated Wilms tumors.Clin Cancer Res. 2008;14:7635–44. doi:10.1158/1078-0432.ccr-08-1620.
20. Park S, Bernard A, Bove KE, Sens DA, Hazen-Martin DJ, Garvin AJ, et al.Inactivation of WT1 in nephrogenic rests, genetic precursors to Wilms'tumour. Nat Genet. 1993;5:363–7. doi:10.1038/ng1293-363.
21. Charles AK, Brown KW, Berry PJ. Microdissecting the genetic events innephrogenic rests and Wilms' tumor development. Am J Pathol.1998;153:991–1000. doi:10.1016/s0002-9440(10)65641-6.
22. Fukuzawa R, Heathcott RW, More HE, Reeve AE. Sequential WT1 andCTNNB1 mutations and alterations of β-catenin localisation in intralobarnephrogenic rests and associated Wilms tumours: two case studies. J ClinPathol. 2007;60:1013–6. doi:10.1136/jcp.2006.043083.
23. Li CM, Guo M, Borczuk A, Powell CA, Wei M, Thaker HM, et al. Geneexpression in Wilms' tumor mimics the earliest committed stage in themetanephric mesenchymal-epithelial transition. Am J Pathol. 2002;160:2181–90.doi:10.1016/s0002-9440(10)61166-2.
24. Aiden AP, Rivera MN, Rheinbay E, Ku M, Coffman EJ, Truong TT, et al. Wilmstumor chromatin profiles highlight stem cell properties and a renal developmentalnetwork. Cell Stem Cell. 2010;6:591–602. doi:10.1016/j.stem.2010.03.016.
25. Thirlwell C, Eymard M, Feber A, Teschendorff A, Pearce K, Lechner M, et al.Genome-wide DNA methylation analysis of archival formalin-fixedparaffin-embedded tissue using the Illumina Infinium HumanMethylation27BeadChip. Methods. 2010;52:248–54. doi:10.1016/j.ymeth.2010.04.012.
26. Bibikova M, Barnes B, Tsan C, Ho V, Klotzle B, Le JM, et al. High density DNAmethylation array with single CpG site resolution. Genomics. 2011;98:288–95.doi:10.1016/j.ygeno.2011.07.007.
27. R: A language and environment for statistical computing. http://www.r-project.org/.
28. Morris T, Butcher LM, Feber A, Teschendorff AE, Chakravarthy AR, WojdaczTK, et al. 450k Chip analysis methylation pipeline (ChAMP). Bioinformatics.2013. doi:10.1093/bioinformatics/btt684.
29. Bioconductor Limma package website. http://www.bioconductor.org/packages/release/bioc/html/limma.html.
30. Benjamini Y, Hochberg Y. Controlling the false discovery rate: a practicaland powerful approach to multiple testing. J Roy Stat Soc B. 1995;57:289–300.doi:10.2307/2346101.
31. Houseman EA, Molitor J, Marsit CJ. Reference-free cell mixture adjustmentsin analysis of DNA methylation data. Bioinformatics. 2014;30:1431–9.doi:10.1093/bioinformatics/btu029.
32. Paul DS, Beck S. Advances in epigenome-wide association studies for commondiseases. Trends Mol Med. doi:10.1016/j.molmed.2014.07.002. 2014.
33. GREAT website. http://bejerano.stanford.edu/great/public/html/.34. Human Developmental Biology Resource website. http://www.hdbr.org/.35. Pidsley R, Wong CCY, Volta M, Lunnon K, Mill J, Schalkwyk LC. A data-driven
approach to preprocessing Illumina 450 K methylation array data. BMCGenomics. 2013;14:293. doi:10.1186/1471-2164-14-293.
36. Price ME, Cotton AM, Lam LL, Farre P, Emberly E, Brown CJ, et al. Additionalannotation enhances potential for biologically-relevant analysis of theIllumina Infinium HumanMethylation450 BeadChip array. EpigeneticsChromatin. 2013;6:4. doi:10.1186/1756-8935-6-4.
37. Methprimer website. http://www.urogene.org/cgi-bin/methprimer/methprimer.cgi.

Charlton et al. Genome Medicine (2015) 7:11 Page 11 of 11
38. Bismark website. http://www.bioinformatics.babraham.ac.uk/projects/bismark/.39. Bowtie 2 website. http://bowtie-bio.sourceforge.net/bowtie2/.40. Broad Institute website. http://www.broadinstitute.org/igv/.41. SAMtools website. http://samtools.sourceforge.net/.42. Kim D, Pertea G, Trapnell C, Pimentel H, Kelley R, Salzberg SL. TopHat2:
accurate alignment of transcriptomes in the presence of insertions, deletionsand gene fusions. Genome Biol. 2013;14:R36. doi:10.1186/gb-2013-14-4-r36.
43. HTseq website. https://pypi.python.org/pypi/HTSeq.44. DESeq website. http://bioconductor.org/packages/release/bioc/html/DESeq.html.45. Doi A, Park IH, Wen B, Murakami P, Aryee MJ, Irizarry R, et al. Differential
methylation of tissue- and cancer-specific CpG island shores distinguisheshuman induced pluripotent stem cells, embryonic stem cells and fibroblasts.Nat Genet. 2009;41:1350–3. doi:10.1038/ng.471.
46. Irizarry RA, Ladd-Acosta C, Wen B, Wu Z, Montano C, Onyango P, et al. Thehuman colon cancer methylome shows similar hypo- and hypermethylationat conserved tissue-specific CpG island shores. Nat Genet. 2009;41:178–86.http://www.nature.com/ng/journal/v41/n2/suppinfo/ng.298_S1.html.
47. Pode-Shakked N, Shukrun R, Mark-Danieli M, Tsvetkov P, Bahar S, Pri-Chen S,et al. The isolation and characterization of renal cancer initiating cells fromhuman Wilms' tumour xenografts unveils new therapeutic targets. EMBOMol Med. 2013;5:18–37. doi:10.1002/emmm.201201516.
48. Tumour suppressor gene database. http://bioinfo.mc.vanderbilt.edu/TSGene/index.html.
49. Schlesinger Y, Straussman R, Keshet I, Farkash S, Hecht M, Zimmerman J,et al. Polycomb-mediated methylation on Lys27 of histone H3 pre-marksgenes for de novo methylation in cancer. Nat Genet. 2007;39:232–6.doi:10.1038/ng1950.
50. Pan G, Tian S, Nie J, Yang C, Ruotti V, Wei H, et al. Whole-genome analysisof histone H3 lysine 4 and lysine 27 methylation in human embryonic stem cells.Cell Stem Cell. 2007;1:299–312. http://dx.doi.org/10.1016/j.stem.2007.08.003.
51. Bernstein BE, Mikkelsen TS, Xie X, Kamal M, Huebert DJ, Cuff J, et al. Abivalent chromatin structure marks Key developmental genes in embryonicstem cells. Cell. 2006;125:315–26. http://dx.doi.org/10.1016/j.cell.2006.02.041.
52. Ben-Porath I, Thomson MW, Carey VJ, Ge R, Bell GW, Regev A, et al. Anembryonic stem cell-like gene expression signature in poorly differentiatedaggressive human tumors. Nat Genet. 2008;40:499–507. doi:10.1038/ng.127.
53. Wachter E, Quante T, Merusi C, Arczewska A, Stewart F, Webb S, et al.Synthetic CpG islands reveal DNA sequence determinants of chromatinstructure. Elife. 2014;3:e03397. doi:10.7554/eLife.03397.
54. Bracken AP, Helin K. Polycomb group proteins: navigators of lineagepathways led astray in cancer. Nat Rev Cancer. 2009;9:773–84.doi:10.1038/nrc2736.
55. Zhuang J, Jones A, Lee SH, Ng E, Fiegl H, Zikan M, et al. The dynamics andprognostic potential of DNA methylation changes at stem cell gene loci inwomen's cancer. PLoS Genet. 2012;8:e1002517. doi:10.1371/journal.pgen.1002517.
56. Ohnishi K, Semi K, Yamamoto T, Shimizu M, Tanaka A, Mitsunaga K, et al.Premature termination of reprogramming in vivo leads to cancerdevelopment through altered epigenetic regulation. Cell. 2014;156:663–77.doi:10.1016/j.cell.2014.01.005.
57. Metsuyanim S, Pode-Shakked N, Schmidt-Ott KM, Keshet G, Rechavi G,Blumental D, et al. Accumulation of malignant renal stem cells is associatedwith epigenetic changes in normal renal progenitor genes. Stem Cells.2008;26:1808–17. doi:10.1634/stemcells. 2007-0322.
58. Okamoto K, Morison IM, Taniguchi T, Reeve AE. Epigenetic changes at theinsulin-like growth factor II/H19 locus in developing kidney is an early eventin Wilms tumorigenesis. Proc Natl Acad Sci U S A. 1997;94:5367–71.
59. Morris MR, Hesson LB, Wagner KJ, Morgan NV, Astuti D, Lees RD, et al.Multigene methylation analysis of Wilms' tumour and adult renal cellcarcinoma. Oncogene. 2003;22:6794–801. doi:10.1038/sj.onc.1206914.
60. Nakamura M, Yonekawa Y, Kleihues P, Ohgaki H. Promoter hypermethylation ofthe RB1 gene in glioblastomas. Lab Invest. 2001;81:77–82.
61. Gonzalez-Gomez P, Bello MJ, Alonso ME, Arjona D, Lomas J, de Campos JM,et al. CpG island methylation status and mutation analysis of the RB1 geneessential promoter region and protein-binding pocket domain in nervoussystem tumours. Br J Cancer. 2003;88:109–14. doi:10.1038/sj.bjc.6600737.
62. Simpson DJ, Hibberts NA, McNicol AM, Clayton RN, Farrell WE. Loss of pRbexpression in pituitary adenomas is associated with methylation of the RB1CpG island. Cancer Res. 2000;60:1211–6.
63. Malekzadeh K, Sobti RC, Nikbakht M, Shekari M, Hosseini SA, Tamandani DK,et al. Methylation patterns of Rb1 and Casp-8 promoters and their impact
on their expression in bladder cancer. Cancer Invest. 2009;27:70–80.doi:10.1080/07357900802172085.
64. Li D, Zhao Y, Liu C, Chen X, Qi Y, Jiang Y, et al. Analysis of MiR-195 and MiR-497 expression, regulation and role in breast cancer. Clin Canc Res.2011;17:1722–30. doi:10.1158/1078-0432.ccr-10-1800.
65. Lakomy R, Sana J, Hankeova S, Fadrus P, Kren L, Lzicarova E, et al. MiR-195,miR-196b, miR-181c, miR-21 expression levels and O-6-methylguanine-DNA methyltransferase methylation status are associated with clinicaloutcome in glioblastoma patients. Cancer Sci. 2011;102:2186–90.doi:10.1111/j.1349-7006.2011.02092.x.
66. Kim MS, Chang X, Yamashita K, Nagpal JK, Baek JH, Wu G, et al. Aberrantpromoter methylation and tumor suppressive activity of the DFNA5 gene incolorectal carcinoma. Oncogene. 2008;27:3624–34. http://www.nature.com/onc/journal/v27/n25/suppinfo/1211021s1.html.
67. Akino K, Toyota M, Suzuki H, Imai T, Maruyama R, Kusano M, et al.Identification of DFNA5 as a target of epigenetic inactivation in gastriccancer. Cancer Sci. 2007;98:88–95. doi:10.1111/j.1349-7006.2006.00351.x.
68. Kim MS, Lebron C, Nagpal JK, Chae YK, Chang X, Huang Y, et al.Methylation of the DFNA5 increases risk of lymph node metastasis inhuman breast cancer. Biochem Biophys Res Commun. 2008;370:38–43.http://dx.doi.org/10.1016/j.bbrc.2008.03.026.
Submit your next manuscript to BioMed Centraland take full advantage of:
• Convenient online submission
• Thorough peer review
• No space constraints or color figure charges
• Immediate publication on acceptance
• Inclusion in PubMed, CAS, Scopus and Google Scholar
• Research which is freely available for redistribution
Submit your manuscript at www.biomedcentral.com/submit


