Embed Size (px)
Citation preview
Computer Safety,Reliability, and Security
31st International Conference, SAFECOMP 2012Magdeburg, Germany, September 2012ProceedingsFrank OrtmeierPeter Daniel (Eds.)
These Proceedings are based on the authors copy of the camera ready submissions.The document is structured according to the official Springer LNCS 7612conference proceedings:
– DOI: 10.1007/978-3-642-33678-2– ISBN: 978-3-642-33677-5
iii
PrefaceSince 1979, when the first SAFECOMP conference was organized by the Tech-nical Committee on Reliability, Safety and Security of the European Workshopon Industrial Computer Systems (EWICS TC7), the SAFECOMP conferenceseries has always been a mirror of actual trends and challenges in highly criticalsystems engineering.
The key theme of SAFECOMP 2012 is virtually safe making system safetytraceable. This ambiguous theme addresses two important aspects of criticalsystems. On the one hand, systems are always claimed to be virtually safe, whichoften means they are safe unless some very rare events happen. However, manyrecent accidents like Fukushima for example have shown that these assumptionsoften do not hold. As a consequence, we must reconsider what acceptable andresidual risk shall be. The second meaning of the theme addresses the questionof making system safety understandable. Safety case and arguments are oftenbased on deep understanding of the system and its behavior. Displaying suchdynamic behavior in a visual way or even a virtual reality scenario might helpunderstanding the arguments better and finding flaws more easily.
SAFECOMP has always seen itself as a conference connecting industry andacademia. To account for this, we introduced separate categories for industrialand academic papers. More than 70 submission from authors of 20 countrieswere reviewed and the best 33 papers were selected for presentation at the con-ference and publication in this volume. In addition three invited talks given byProf. Jürgen Leohold (CTO of Volkswagen), Prof. Marta Kwiatkowska (OxfordUniversity) and Prof. Hans Hansson (Märladen University) have been includedinto the conference program. Safety, security and reliability is a very broad topic,which touches many different domains of application. In 2012, we decided to co-locate five scientiffc workshops, which focus on different actual topics rangingfrom critical infrastructures to dependable cyber-physical systems. The SAFE-COMP workshops are not included in this volume but in a separate SAFECOMPLNCS volume.
As Program Chairs, we want to give a very warm thank you to all 60 membersof the international program committee. The comprehensive reviews providedthe basis for the productive discussions at the program committee meeting heldin May in Munich, which was hosted by Siemens. We also want to thank the localorganization team at the Otto-von-Guericke-Universität Magdeburg (OVGU),the local chairs Gunter Saake, Michael Schenk and Jana Dittmann, the Centerfor Digital Engineering (CDE) and the Virtual Development and Training Center(VDTC).
Finally, we wish you interesting reading of the articles in this volume. In thename of EWICS TC7, we are also inviting you to join the SAFECOMP com-munity and hope you will be joining us at the 2013 SAFECOMP conference inToulouse.
September 25th-28th, 2012 Frank OrtmeierMagdeburg Peter Daniel

Organization
Program Committee
Stuart Anderson University of Edinburgh, UKTom Anderson Newcastle University, UKFriedemann Bitsch Thales Transportation Systems, Stuttgart, GermanyRobin Bloomfield CSR, City University London, UKSandro Bologna Associazione Italiana Esperti in Infrastrutture
Critiche, ItalyAndrea Bondavalli University of Florence, ItalyJens Braband Siemens AG, GermanyManfred Broy TUM, GermanyBettina Buth HAW Hamburg, GermanyWerner Damm OFFIS e.V., GermanyPeter Daniel European Workshop on Industrial Computer Sys-
tems Reliability, Safety and Security, EWICS TC7,UK
Jana Dittmann Otto-von-Guericke-University of Magdeburg, Ger-many
Wolfgang Ehrenberger Fachhochschule Fulda, GermanyMassimo Felici University of Edinburgh, UKFrancesco Flammini Ansaldo STS Italy, University “Federico II” of
Naples, ItalyGeorg Frey Saarland University, GermanyHolger Giese Hasso Plattner Institute, GermanyMichael Glaß University of Erlangen-Nuremberg, GermanyJanusz Gorski Gdansk University of Technology, FETI, DSE,
PolandLars Grunske Swinburne University of Technology, AustraliaJérémie Guiochet Laboratoire d’Analyse et d’Architecture des Sys-
tèmes, CNRS, FrancePeter Göhner University of Stuttgart, GermanyWolfgang Halang Lehrgebiet Informationstechnik, Fernuniversität in
Hagen, GermanyMaritta Heisel University of Duisburg-Essen, GermanyConstance Heitmeyer Naval Research Laboratory, Washington DC, USAChris Johnson University of Glasgow, UKJan Jürjens Technical University of Dortmund and Fraunhofer
ISST, GermanyMohamed Kaaniche Laboratoire d’Analyse et d’Architecture des Sys-
tèmes, CNRS, FranceHubert B. Keller Karlsruhe Institute of Technology, Germany

v
Tim Kelly University of York, UKJohn Knight University of Virginia, USAFloor Koornneef Technical University of Delft, The NetherlandsPeter Ladkin University of Bielefeld, GermanyJean-Jacques Lesage ENS de Cachan, FrancePeter Liggesmeyer Technical University of Kaiserslautern, GermanySøren Lindskov-Hansen Nove Nordisk A/S, DenmarkBev Littlewood City University, UKJuergen Mottok University of Applied Sciences Regensburg, Ger-
manyOdd Nordland SINTEF, NorwayFrank Ortmeier Otto-von-Guericke-University of Magdeburg, Ger-
manyAndrás Pataricza Budapest University of Technology and Economics,
HungaryThomas Pfeiffenberger Salzburg Research Forschungsgesellschaft m.b.H,
AustraWolfgang Reif Augsburg University, GermanyGerhard Rieger TÜV Nord, GermanyAlexander Romanovsky Newcastle University, UKMartin Rothfelder Siemens AG, GermanyGunter Saake Otto-von-Guericke-University of Magdeburg, Ger-
manyFrancesca Saglietti University of Erlangen-Nuremberg, GermanyBernhard Schaetz Technical University of Munich, GermanyMichael Schenk IFF Magdeburg, GermanyChristoph Schmitz Zühlke, Zurich, SwitzerlandErwin Schoitsch Austrian Institute of Technology, AustriaWilhelm Schäfer University of Paderborn, GermanySahra Sedigh Missouri University of Science and Technology, USAAmund Skavhaug Norwegian University of Science and Technology,
NorwayMark-Alexander Sujan University of Warwick, UKKishor Trivedi Duke University, USAMeine Van Der Meulen Det Norske Veritas (DNV), NorwayBirgit Vogel-Heuser Technical University of Munich, Germany
vi
Sponsors
EWICS TC7 European Workshop on Industrial Computer SystemsReliability, Safety and Security
OVGU Otto von Guericke University of MagdeburgMETOP Mensch, Technik, Organisation und PlanungCDE Center for Digital EngineeringVDTC Virtual Development and Taining CentreSiemensTÜV NordMES Model Engineering Solutionszühlke empowering ideasGfSE Gesellschaft für System Engineering e.V.GI Gesellschaft für Informatik e.V.IEEE Advancing Technology for HumanityOCG Austrian Computer SocietyIFAC International Federation of Accountantsifip International Federation for Information ProcessingERCIM European Research Consortium for Informatics and
MathematicsARTEMIS AustriaENCRESS European Network of Clubs for Reliability and Safety of
SoftwareAIT Austrian Institute of TechnologyCSE Center for Digital EngineeringISOTEC Institut für innovative Softwaretechnologie
Organization Team
– Augustine, Marcus– Fietz, Gabriele– Gonschorek, Tim– Güdemann, Matthias– Köppen, Veit– Lipaczewski, Michael– Ortmeier, Frank– Struck, Simon– Weise, Jens
General Information on SAFECOMP
SAFECOMP is an annual event, which is internationally hosted around theworld. Further information on previous and upcoming SAFECOMP events maybe found at www.safecomp.org.
Towards Composable Safety(Invited Talk)
Prof. Hans Hansson
Mardalen University, Vasteras, Sweden
Increased levels of complexity of safety-relevant systems bring increased re-sponsibility on the system developers in terms of quality demands from thelegal perspectives as well as company reputation. Component based develop-ment of software systems provides a viable and cost-effective alternative in thiscontext provided one can address the quality and safety certification demandsin an efficient manner. This keynote targets component-based development andcomposable safety-argumentation for safety-relevant systems. Our overarchingobjective is to increase efficiency and reuse in development and certificationof safety-relevant embedded systems by providing process and technology thatenable composable qualification and certification, i.e. qualification/certificationof systems/subsystems based on reuse of already established arguments for andproperties of their parts. The keynote is based on on-going research in two largerresearch efforts; the EU/ARTEMIS project SafeCer and the Swedish nationalproject SYNOPSIS. Both projects started in 2011 and will end 2015. SafeCerincludes more than 30 partners in six different countries, and aims at adaptingprocesses, developing tools, and demonstrating applicability of composable cer-tification within the domains: Automotive, Avionics, Construction Equipment,Healthcare, and Rail, as well as addressing cross-domain reuse of safety-relevantcomponents. SYNOPSIS is a project at Mlardalen University sharing the Safe-Cer objective of composable certification, but emphasizing more the scientificbasis than industrial deployment.
Our research is motivated by several important and clearly perceivable trends:(1) The increase in software based solutions which has led to new legal directivesin several application domains as well as a growth in safety certification stan-dards. (2) The need for more information to increase the efficiency of production,reduce the cost of maintaining sufficient inventory, and enhance the safety of per-sonnel. (3) The rapid increase in complexity of software controlled products andproduction systems, mainly due to the flexibility and ease of adding new func-tions made possible by the software. As a result the costs for certification-relatedactivities increase rapidly. (4) Modular safety arguments and safety argumentcontracts have in recent years been developed to support the needs of incre-mental certification. (5) Component-Based Development (CBD) approaches, bywhich systems are built from pre-developed components, have been introducedto improve both reuse and the maintainability of systems. CBD has been in theresearch focus for some time and is gaining industrial acceptance, though fewapproaches are targeting the complex requirements of the embedded domain.
Our aim is to enhance existing CBD frameworks by extending them to in-clude dependability aspects so that the design and the certification of systems
can be addressed together more efficiently. This would allow reasoning aboutthe design and safety aspects of parts of the systems (components) in relativeisolation, without consideration of their interfaces and emergent behaviour, andthen deal with these remaining issues in a more structured manner without hav-ing to revert to the current holistic practices. The majority of research on suchcompositional aspects has concentrated on the functional properties of systemswith a few efforts dealing with timing properties. However, much less work hasconsidered non-functional properties, including dependability properties such assafety, reliability and availability.
This keynote provides an introduction to component-based software devel-opment and how it can be applied to development of safety-relevant embed-ded systems, together with an overview and motivation of the research beingperformed in the SafeCer and SYNOPSIS projects. Key verification and safetyargumentation challenges will be presented and solutions outlined.
viii H. Hansson
Sensing Everywhere: Towards Safer and MoreReliable Sensor-enabled Devices
(Invited Talk)
Marta Kwiatkowska
Department of Computer Science, University of Oxford, Wolfson Building, ParksRoad, Oxford OX1 3QD, UK
Abstract. In this age of ubiquitous computing we are witnessing everincreasing dependence on sensing technologies. Sensor-enabled smart de-vices are used in a broad range of applications, from environmental mon-itoring, where the main purpose is information gathering and appro-priate response, through smartphones capable of autonomous functionand localisation, to integrated and sometimes invasive control of phys-ical processes. The latter group includes, for example, self-parking andself-driving cars, as well as implantable devices such as glucose monitorsand cardiac pacemakers [1, 2]. Future potential developments in this areaare endless, with nanotechnology and molecular sensing devices alreadyenvisaged [3].
These trends have naturally prompted a surge of interest in methodologies forensuring safety and reliability of sensor-based devices. Device recalls [4] haveadded another dimension of safety concerns, leading FDA to tighten its oversightof medical devices. In seeking safety and reliability assurance, developers employtechniques to answer to queries such as “the smartphone will never disclose thebank account PIN number to unauthorised parties”, “the blood glucose levelreturns to a normal range in at most 3 hours” and “the probability of failure toraise alarm if the levels of airborne pollutant are unacceptably high is tolerablylow”. Model-based design and automated verification technologies offer a numberof advantages, particularly with regard to embedded software controllers: theyenable rigorous software engineering methods such as automated verification inaddition to testing, and have the potential to reduce the development effortthrough code generation and software reuse via product lines.
Automated verification has made great progress in recent years, resulting ina variety of software tools now integrated within software development environ-ments. Models can be extracted from high-level design notations or even sourcecode, represented as finite-state abstractions, and systematically analysed to es-tablish if, e.g., the executions never violate a given temporal logic property. Incases where the focus is on safety, reliability and performance, it is necessary toinclude in the models quantitative aspects such as probability, time and energyusage. The preferred technique here is quantitative verification [5], which em-ploys variants of Markov chains, annotated with reward structures, as models
and aims establish quantitative properties, for example, calculating the probabil-ity or expectation of a given event. Tools such as the probabilistic model checkerPRISM [6] are widely used to analyse safety, dependability and performabil-ity of system models in several application domains, including communicationprotocols, sensor networks and biological systems.
The lecture will give an overview of current research directions in automatedverification for sensor-enabled devices. This will include software verification forTinyOS [7], aimed at improving the reliability of embedded software written innesC; as well as analysis of sensor network protocols for collective decision mak-ing, where the increased levels of autonomy demand a stochastic games approach[8]. We will outline the promise and future challenges of the methods, includ-ing emerging applications at the molecular level [9] that are already attractingattention from the software engineering community [10].
Acknowledgement. This research has been supported in part by ERC grantVERIWARE and Oxford Martin School.
References
1. Sankaranarayanan, S., Fainekos, G.: Simulating insulin infusion pump risks byin-silico modeling of the insulin-glucose regulatory system. In: Proc. CMSB’12.LNCS, Springer (2012) To appear.
2. Jiang, Z., Pajic, M., Moarref, S., Alur, R., Mangharam, R.: Modeling and verifi-cation of a dual chamber implantable pacemaker. In: TACAS. (2012) 188–203
3. Kroeker, K.L.: The rise of molecular machines. Commun. ACM 54 (2011) 11–134. Food, U., Drug Admin.: (List of Device Recalls)5. Kwiatkowska, M.: Quantitative verification: Models, techniques and tools. In: Proc.
6th joint meeting of the European Software Engineering Conference and the ACMSIGSOFT Symposium on the Foundations of Software Engineering (ESEC/FSE),ACM Press (2007) 449–458
6. Kwiatkowska, M., Norman, G., Parker, D.: PRISM 4.0: Verification of probabilisticreal-time systems. In Gopalakrishnan, G., Qadeer, S., eds.: Proc. 23rd InternationalConference on Computer Aided Verification (CAV’11). Volume 6806 of LNCS.,Springer (2011) 585–591
7. Bucur, D., Kwiatkowska, M.: On software verification for TinyOS. Journal ofSoftware and Systems 84 (2011) 1693–1707
8. Chen, T., Forejt, V., Kwiatkowska, M., Parker, D., Simaitis, A.: Automatic verifica-tion of competitive stochastic systems. In: Proc. 18th International Conference onTools and Algorithms for the Construction and Analysis of Systems (TACAS’12).Volume 7214 of LNCS., Springer (2012) 315–330
9. Lakin, M., Parker, D., Cardelli, L., Kwiatkowska, M., Phillips, A.: Design andanalysis of DNA strand displacement devices using probabilistic model checking.Journal of the Royal Society Interface 9 (2012) 1470–1485
10. Lutz, R.R., Lutz, J.H., Lathrop, J.I., Klinge, T., Henderson, E., Mathur, D.,Sheasha, D.A.: Engineering and verifying requirements for programmable self-assembling nanomachines. In: ICSE, IEEE (2012) 1361–1364
x M. Kwiatkowska
Table of Contents
Invited Talks . . . . . . . . . . . . . . . . . . . . . . . . . . . . . . . . . . . . . . . . . . . . . . . . . vii
Towards Composable Safety . . . . . . . . . . . . . . . . . . . . . . . . . . . . . . . . . . . . . . . . viiH. Hansson
Sensing Everywhere: Towards Safer and More Reliable Sensor-enabledDevices . . . . . . . . . . . . . . . . . . . . . . . . . . . . . . . . . . . . . . . . . . . . . . . . . . . . . . . . . . ix
M. Kwiatkowska
Session I: Tools . . . . . . . . . . . . . . . . . . . . . . . . . . . . . . . . . . . . . . . . . . . . . . 1
A Lightweight Methodology for Safety Case Assembly . . . . . . . . . . . . . . . . . 1E. Denney and G. Pai
A Pattern-based Method for Safe Control Systems Exemplified withinNuclear Power Production . . . . . . . . . . . . . . . . . . . . . . . . . . . . . . . . . . . . . . . . . 13
A. Hauge and K. Stølen
Session II: Risk Analysis . . . . . . . . . . . . . . . . . . . . . . . . . . . . . . . . . . . 25
Risk assessment for airworthiness security . . . . . . . . . . . . . . . . . . . . . . . . . . . . 25S. Gil Casals, P. Owezarski, and G. Descargues
A Method for Guided Hazard Identification and Risk Mitigation forOffshore Operations . . . . . . . . . . . . . . . . . . . . . . . . . . . . . . . . . . . . . . . . . . . . . . . 37
C. Läsche, E. Böde, and T. Peikenkamp
Risk Analysis and Software Integrity Protection for 4G NetworkElements in ASMONIA . . . . . . . . . . . . . . . . . . . . . . . . . . . . . . . . . . . . . . . . . . . . 49
M. Schäfer
Session III: Testing . . . . . . . . . . . . . . . . . . . . . . . . . . . . . . . . . . . . . . . . . . 62
Applying Industrial-strength Testing Techniques to Critical CareMedical Equipment . . . . . . . . . . . . . . . . . . . . . . . . . . . . . . . . . . . . . . . . . . . . . . . 62
C. Woskowski
Requirement decomposition and testability in development ofsafety-critical automotive components . . . . . . . . . . . . . . . . . . . . . . . . . . . . . . . 74
V. Izosimov, U. Ingelsson, and A. Wallin
Model based specification, verification and test generation for a safetyfieldbus profile . . . . . . . . . . . . . . . . . . . . . . . . . . . . . . . . . . . . . . . . . . . . . . . . . . . . 87
J. Krause, E. Hintze, S. Magnus, and C. Diedrich
xii M. Kwiatkowska
Session IV: Quantitative Analysis . . . . . . . . . . . . . . . . . . . . . . . . . 99
Quantification of Priority-OR Gates in Temporal Fault Trees . . . . . . . . . . . 99E. Edifor, M. Walker, and N. Gordon
Cross-Level Compositional Reliability Analysis for Embedded Systems . . . 111M. Glaß, H. Yu, F. Reimann, and J. Teich
Session V: Security . . . . . . . . . . . . . . . . . . . . . . . . . . . . . . . . . . . . . . . . . . 125
IT-forensic automotive investigations on the example of routereconstruction on automotive system and communication data . . . . . . . . . . 125
T. Hoppe, S. Tuchscheerer, S. Kiltz, and J. Dittmann
Towards an IT Security Protection Profile for Safety-relatedCommunication in Railway Automation . . . . . . . . . . . . . . . . . . . . . . . . . . . . . . 137
J. Braband, B. Milius, H. Bock, and H. Schäbe
Towards Secure Fieldbus Communication . . . . . . . . . . . . . . . . . . . . . . . . . . . . 149F. Wieczorek, C. Krauß, F. Schiller, and C. Eckert
Extracting EFSMs of web applications for formal requirementsspecification . . . . . . . . . . . . . . . . . . . . . . . . . . . . . . . . . . . . . . . . . . . . . . . . . . . . . . 161
A. Zakonov and A. Shalyto
Session VI: Formal Methods 1 . . . . . . . . . . . . . . . . . . . . . . . . . . . . . 173
An ontological approach to systematization of SW-FMEA . . . . . . . . . . . . . . 173I. Bicchierai, G. Bucci, C. Nocentini, and E. Vicario
Online Black-box Failure Prediction for Mission Critical DistributedSystems . . . . . . . . . . . . . . . . . . . . . . . . . . . . . . . . . . . . . . . . . . . . . . . . . . . . . . . . . 185
R. Baldoni, G. Lodi, G. Mariotta, L. Montanari, and M. Rizzuto
On the Impact of Hardware Faults - An Investigation of theRelationship between Workload Inputs and Failure Mode Distributions . . 198
D. Di Leo, F. Ayatolahi, B. Sangchoolie, J. Karlsson, andR. Johansson
Session VII: Aeronautic . . . . . . . . . . . . . . . . . . . . . . . . . . . . . . . . . . . . 210
Formal development and assessment of a reconfigurable on-boardsatellite system . . . . . . . . . . . . . . . . . . . . . . . . . . . . . . . . . . . . . . . . . . . . . . . . . . . 210
A. Tarasyuk, I. Pereverzeva, E. Troubitsyna, T. Latvala, andL. Nummila
Impact of Soft Errors in a Jet Engine Controller . . . . . . . . . . . . . . . . . . . . . . 223O. Hannius and J. Karlsson
Sensing Everywhere: Towards Safer and More Reliable Sensor-enabledDevices xiii
Which automata for which safety assessment step of satellite FDIR ? . . . . 235L. Pintard, C. Seguin, and J. Blanquart
Session VIII: Automotive . . . . . . . . . . . . . . . . . . . . . . . . . . . . . . . . . . 247
A novel modelling pattern for establishing failure models and assistingarchitectural exploration in an automotive context . . . . . . . . . . . . . . . . . . . . 247
C. Bergenhem, R. Johansson, and H. Lönn
Reviewing Software Models in Compliance with ISO 26262 . . . . . . . . . . . . . 258I. Stuermer, H. Pohlheim, and E. Salecker
Software Architecture of a safety-related Actuator in TrafficManagement Systems . . . . . . . . . . . . . . . . . . . . . . . . . . . . . . . . . . . . . . . . . . . . . . 268
T. Novak and C. Stoegerer
Session IX: Formal Methods 2 . . . . . . . . . . . . . . . . . . . . . . . . . . . . . 279
Approximate Reliability Algebra for Architecture Optimization . . . . . . . . . 279P. Helle, M. Masin, and L. Greenberg
On the formal verification systems of synchronous software components . . 291H. Günther, S. Milius, and O. Möller
Session X: Process . . . . . . . . . . . . . . . . . . . . . . . . . . . . . . . . . . . . . . . . . . . 305
A Systematic Approach to Justifying Sufficient Confidence in SoftwareSafety Arguments . . . . . . . . . . . . . . . . . . . . . . . . . . . . . . . . . . . . . . . . . . . . . . . . . 305
A. Ayoub, B. Kim, O. Sokolsky, and I. Lee
Determining potential errors in tool chains . . . . . . . . . . . . . . . . . . . . . . . . . . . 317M. Wildmoser, J. Philipps, and O. Slotosch
Safety-Focused Deployment Optimization in Open Integrated Architectures 328B. Zimmer, M. Trapp, P. Liggesmeyer, J. Höfflinger, andS. Bürklen
Qualifying Software Tools, a Systems Approach . . . . . . . . . . . . . . . . . . . . . . . 340F. Asplund, J. El-Khoury, and M. Törngren
Session XI: Case Studies . . . . . . . . . . . . . . . . . . . . . . . . . . . . . . . . . . . 352
Adapting a Software Product Line Engineering Process for CertifyingSafety Critical Embedded Systems . . . . . . . . . . . . . . . . . . . . . . . . . . . . . . . . . . 352
R. Braga, O. Trindade, K. R. Castelo Branco, L. D. O. Neris, andJ. Lee
Failure Modes, Functional Resonance and Socio-Technical Hazards:Limitations of FMEA in Healthcare Settings . . . . . . . . . . . . . . . . . . . . . . . . . 364
M. Sujan and M. Felici
xiv M. Kwiatkowska
A STAMP Analysis on the China-Yongwen Railway Accident . . . . . . . . . . . 376T. Song, D. Zhong, and H. Zhong
Efficient Software Component Reuse in Safety-Critical Systems – AnEmpirical Study . . . . . . . . . . . . . . . . . . . . . . . . . . . . . . . . . . . . . . . . . . . . . . . . . . 388
R. Land, M. Åkerholm, and J. Carlson
Author Index . . . . . . . . . . . . . . . . . . . . . . . . . . . . . . . . . . . . . . . . . . . . . . . . 401
A Lightweight Methodology for Safety Case Assembly
Ewen Denney and Ganesh Pai
SGT / NASA Ames Research CenterMoffett Field, CA 94035, USA.
{ewen.denney, ganesh.pai}@nasa.gov
Abstract. We describe a lightweight methodology to support the automatic as-sembly of safety cases from tabular requirements specifications. The resultingsafety case fragments provide an alternative, graphical, view of the requirements.The safety cases can be modified and augmented with additional information. Inturn, these modifications can be mapped back to extensions of the tabular require-ments, with which they are kept consistent, thus avoiding the need for engineersto maintain an additional artifact. We formulate our approach on top of an ide-alized process, and illustrate the applicability of the methodology on excerpts ofrequirements specifications for an experimental Unmanned Aircraft System.
Keywords: Safety cases, Formal methods, Automation, Requirements, UnmannedAircraft Systems.
1 Introduction
Evidence-based safety arguments, i.e., safety cases, are increasingly being consideredin emerging standards [10] and guidelines [3], as an alternative means for showingthat critical systems are acceptably safe. The current practice for demonstrating safety,largely, is rather to satisfy a set of objectives prescribed by standards and/or guide-lines. Typically, these mandate the processes to be employed for safety assurance, andthe artifacts to be produced, e.g., requirements, traceability matrices, etc., as evidence(that the mandated process was followed). However, the rationale connecting the rec-ommended assurance processes, and the artifacts produced, to system safety is largelyimplicit [7]. Making this rationale explicit has been recognized as a desirable enhance-ment for “standards-based” assurance [14]; especially also in feedback received [4]during our own, ongoing, safety case development effort.
In effect, there is a need in practice to bridge the gap between the existing means,i.e., standards-based approaches, and the alternative means, i.e., argument-based ap-proaches, for safety assurance. Due to the prevalence of standards-based approaches,conventional systems engineering processes place significant emphasis on producinga variety of artifacts to satisfy process objectives. These artifacts show an apprecia-ble potential for reuse in evidence-based argumentation. Consequently we believe thatautomatically assembling a safety argument (or parts of it) from the artifacts, to theextent possible, is a potential way forward in bridging this gap.
In this paper, we describe a lightweight methodology to support the automatic as-sembly of (preliminary) safety cases. Specifically, the main contribution of our paper
is the definition of transformations from tabular requirements specifications to argu-ment structures, which can be assembled into safety case fragments. We accomplishthis, in part, by giving process idealizations and a formal, graph theoretic, definition ofa safety case. Consequently, we provide a way towards integrating safety cases in ex-isting (requirements) processes, and a basis for automation. We illustrate our approachby applying it to a small excerpt of requirements specifications for a real, experimentalUnmanned Aircraft System (UAS).
2 Context
The experimental Swift UAS being developed at NASA Ames comprises a single air-borne system, the electric Swift Unmanned Aerial Vehicle (UAV), with duplicatedground control stations and communication links. The development methodology usedadopts NASA mandated systems engineering procedures [15], and is further constrainedby other relevant standards and guidelines, e.g., for airworthiness and flight safety [13],which define some of the key requirements on UAS operations. To satisfy these require-ments, the engineers for the Swift UAS produce artifacts (e.g., requirements specifica-tions, design documents, results for a variety of analyses, tests, etc.) that are reviewed atpredefined intervals during development. The overall systems engineering process alsoincludes traditional safety assurance activities as well as range safety analysis.
3 Safety Argumentation Approach
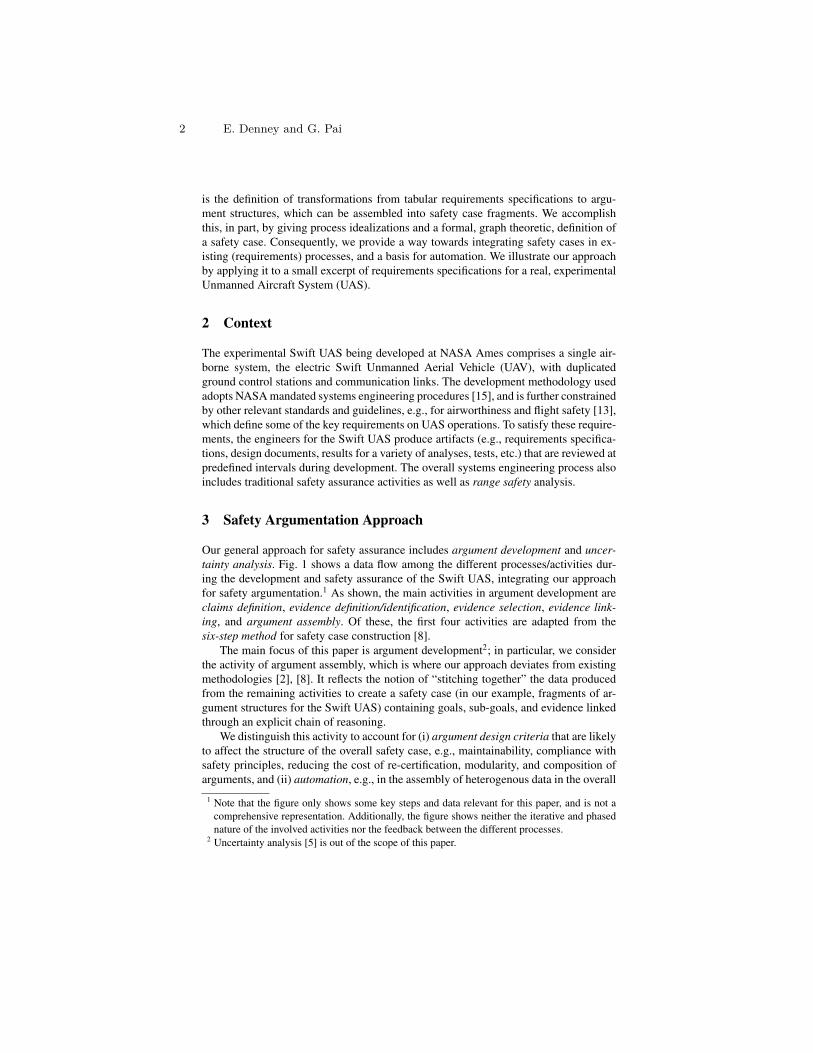
Our general approach for safety assurance includes argument development and uncer-tainty analysis. Fig. 1 shows a data flow among the different processes/activities dur-ing the development and safety assurance of the Swift UAS, integrating our approachfor safety argumentation.1 As shown, the main activities in argument development areclaims definition, evidence definition/identification, evidence selection, evidence link-ing, and argument assembly. Of these, the first four activities are adapted from thesix-step method for safety case construction [8].
The main focus of this paper is argument development2; in particular, we considerthe activity of argument assembly, which is where our approach deviates from existingmethodologies [2], [8]. It reflects the notion of “stitching together” the data producedfrom the remaining activities to create a safety case (in our example, fragments of ar-gument structures for the Swift UAS) containing goals, sub-goals, and evidence linkedthrough an explicit chain of reasoning.
We distinguish this activity to account for (i) argument design criteria that are likelyto affect the structure of the overall safety case, e.g., maintainability, compliance withsafety principles, reducing the cost of re-certification, modularity, and composition ofarguments, and (ii) automation, e.g., in the assembly of heterogenous data in the overall
1 Note that the figure only shows some key steps and data relevant for this paper, and is not acomprehensive representation. Additionally, the figure shows neither the iterative and phasednature of the involved activities nor the feedback between the different processes.
2 Uncertainty analysis [5] is out of the scope of this paper.
2 E. Denney and G. Pai
Argument Development
Uncertainty AnalysisSources of Uncertainty
Swift UAS Safety Case versions
Uncertainty Measurements Confidence assessment
Evidence definition / identification
Evidence Selection
Evidence linking
Claims definition
Safety Claims
Trustworthy evidence
Argument structureItems of evidence
(Sub-)Claims
Argument Assembly
Argument modules Safety Claims / sub-claims
Argument structure Argument Design Criteria
Safety Analysis
Swift UAS Development Methodology
Software Verification
Methodology
Hazards, Mitigations,Safety Requirements ...
Development artifacts e.g., Requirements, Design, ...
System/Software Safety Argumentation
SW verification artifacts e.g., Proofs, Tests, ...
Fig. 1. Safety assurance methodology showing the data flow between the processes for safetyanalysis, system development, software verification, and safety argumentation.
safety case, including argument fragments and argument modules created using manual,automatic, and semi-automatic means [6].
Safety argumentation, which is phased with system development, is applied startingat the level of the system and then repeated at the software level. Consequently, thesafety case produced itself evolves with system development. Thus, similar to [11], wemay define a preliminary, interim, and operational safety case reflecting the inclusionof specific artifacts at different points in the system lifecycle. Alternatively, we can alsodefine finer grained versions, e.g., at the different milestones defined in the plan forsystem certification3.
4 Towards a Lightweight Methodology
The goal of a lightweight version of our methodology (Fig. 1), is to give systems engi-neers a capability to (i) continue to maintain the existing set of artifacts, as per currentpractice, (ii) automatically generate (fragments of) a safety case, to the extent possible,rather than creating and maintaining an additional artifact from scratch, and (iii) providedifferent views on the relations between the requirements and the safety case.
Towards this goal, we characterize the processes involved and their relationshipto safety cases. In this paper, we specifically consider a subset of the artifacts, i.e.,tables of (safety) requirements and hazards, as an idealization4 of the safety analysis anddevelopment processes. Then, we transform the tables into (fragments of) a preliminarysafety case for the Swift UAS, documented in the Goal Structuring Notation (GSN) [8].Subsequently, we can modify the safety case and map the changes back to (extensionsof) the artifacts considered, thereby maintaining both in parallel.
3 Airworthiness certification in the case of the Swift UAS.4 We consider idealizations of the processes, i.e., the data produced, rather than a formal process
description since we are mainly interested in the relations between the data so as to define andautomate the transformations between them.
A Lightweight Methodology for Safety Case Assembly 3
Hazards Table
ID Hazard Cause / Mode Mitigation Safety Requirement
HR.1.3 Propulsion system hazardsHR.1.3.1 Motor overheating Insufficient airflow Monitoring RF.1.1.4.1.2
Failure during operation
HR.1.3.7 Incorrect programming of KD motor controller
Improper procedures to check programming before flight Checklist RF.1.1.4.1.9
System Requirements Table
ID Requirement Source Allocation Verification Method
Verification Allocation
RS.1.4.3 Critical systems must be redundant AFSRB RF.1.1.1.1.3
RS.1.4.3.1 The system shall provide independent and redundant channels to the pilot AFSRB
Functional Requirements Table
ID Requirement Source Allocation Verification Method
Verification Allocation
RF.1.1.1.1.3 FCS must be dually redundant RS.1.4.3 FCS Visual Inspection FCS-CDR-20110701,
TR20110826
RF.1.1.4.1.2
CPU/autopilot system must be able to monitor engine and motor controller temperature.
HR.1.3.1 Engine systems Checklist Pre-flight checklist
RF.1.1.4.1.9Engine software will be checked during pre-deployment checkout
HR.1.3.7 Pre-deployment checklist Checklist Pre-deployment
checklist
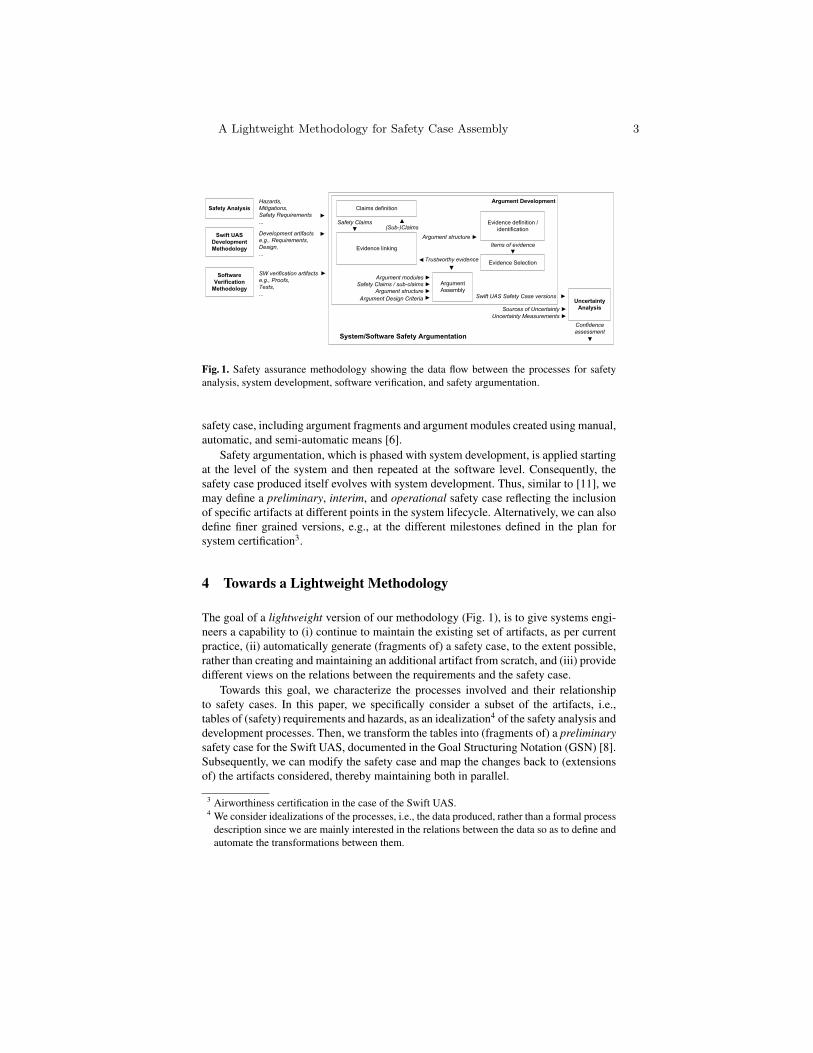
Fig. 2. Tables of hazards, system and functional requirements for the Swift UAS (excerpts).
4.1 Process Idealizations
We consider three inter-related tables as idealizations of the safety analysis and de-velopment processes for the Swift UAS; namely: the hazards table (HT), the systemrequirements table (SRT), and the functional requirements table (FRT)5.
Fig. 2 shows excerpts of the three tables produced in the (ongoing) developmentof the Swift UAS. As shown, the HT contains entries of identified hazards, potentialcauses, mitigation mechanisms and the corresponding safety requirements. The require-ments tables contain specified requirements, their sources, methods with which theymay be verified, and verification allocations, i.e., links to artifacts containing the re-sults of verification. Requirements can be allocated either to lower-level (functional)requirements or to elements of the physical architecture.
Fig. 2 mainly shows those parts of the tables that are relevant for defining transfor-mations to an argument structure. Additionally, we are concerned only with a subset ofthe set of requirements, i.e., those which have a bearing on safety. Since we are look-ing at snapshots of development, the tables are allowed to be incomplete, as shown inFig. 2. We further assume that the tables have undergone the necessary quality checksperformed on requirements, e.g., for consistency.
Entries in any of the tables can be hierarchically arranged. Identified safety require-ments in the HT need not have a corresponding entry in the SRT or FRT. Additionally,
5 Strictly speaking, this table contains lower-level requirements and not only functional require-ments; however, we use the terminology used by the engineers of the Swift UAS.
4 E. Denney and G. Pai
requirements identified as safety-relevant in either of the requirements tables need nothave a hazard, from the HT, as a source (although to ensure full traceability, both ofthese would be necessary). The HT, as shown, are a simplified view of hazard ana-lysis as it occurs at a system level. In practice, hazard analysis would be conducted atdifferent hierarchical levels, i.e., at a subsystem and component level.
For now, we consider no internal structure to the table contents, and simply assumethat there are disjoint, base sets of hazards (H), system requirements (Rs), functionalrequirements (Rf ), verification methods (V ), and external artifacts (Ar). The set of ex-ternal artifacts contains items such as constraints from stakeholders, artifacts producedfrom development, e.g., elements of the physical architecture, concepts of operation, re-sults of tests, etc. We also consider a set of causes (C) and mitigation mechanisms (M ).Without loss of generality, we assume that hazards and requirements have unique iden-tifiers. Additionally, we assume the sets V , Ar, C, and M each have a unique “blank”element, shown in the tables as a blank entry.
The HT consists of rows of type
hazard× cause∗ × mitigation
∗ × safety requirement∗ (1)
Definition 1. A hazards table, HT , is set of hazard entries ordered by a tree relation→h, where a hazard entry is a tuple 〈h, c,m, sr〉, in which h ∈ H , c ⊆ C, m ⊆ M ,and sr ⊆ (Rs ∪Rf ).
The SRT and FRT each have rows of type
requirement× source∗ × allocation
∗ × verif method∗ × verif alloc
∗ (2)
Definition 2. A system requirements table, RTs, is a set of system requirements en-tries ordered by a tree relation →s, where a system requirements entry is a tuple,〈r, so, al, vm, va〉, in which r ∈ Rs, so ⊆ (H ∪ Ar), al ⊆ (Rf ∪ Ar), vm ⊆ V ,and va ⊆ Ar.
Definition 3. A functional requirements table, RTf , is a set of functional requiremententries ordered by a tree relation→f , where a functional requirement entry is a tuple〈r, so, al, vm, va〉 in which r ∈ Rf , so ⊆ (H ∪ Ar ∪ Rs), al ⊆ Ar, vm ⊆ V , andva ⊆ Ar.
Thus, in an SRT (i) a source is one or more hazard or external artifact, (ii) an al-location is a set of functional requirements or a set of artifacts, and (iii) a verificationallocation is a set of artifacts. Whereas in a FRT (i) a source is a hazard, external arti-fact or system requirement, (ii) an allocation is a set of artifacts, and (iii) a verificationallocation links to a specific artifact that describes the result of applying a particularverification method.
Given the base sets and the definitions 1 – 3, we can now define:
Definition 4. A requirements specification, R, is a tuple 〈HT,RTs, RTf 〉.
We consider a safety case as the result of an idealized safety argumentation pro-cess, and document its structure using GSN. We are concerned here with development
A Lightweight Methodology for Safety Case Assembly 5
snapshots, however, so want to define a notion of partial safety case. Here, we ignore se-mantic concerns and use a purely structural definition. Assuming finite, disjoint sets ofgoals (G), strategies (S), evidence (E), assumptions (A), contexts (K) and justifications(J), we give the following graph-theoretic definition:
Definition 5. A partial safety case, S, is a tuple 〈G,S,E,A,K, J, sg, gs, gc, sa, sc,sj〉 with the functions
– sg : S → P(G), the subgoals to a strategy– gs : G→ P(S) ∪ P(E), the strategies of a goal or the evidence to a goal– gc : G→ P(K), the contexts of a goal– sa : S → P(A), the assumptions of a strategy– sc : S → P(K), the contexts of a strategy– sj : S → P(J), the justifications of a strategy
We say that g′ is a subgoal of g whenever there exists an s ∈ gs(g) such that g′ ∈ sg(s).Then, define the descendant goal relation, g g′ iff g′ is a subgoal of g or there is agoal g′′ such that g g′′ and g′ is a subgoal of g′′. We require that the relation is adirected acyclic graph (DAG) with roots R.6
4.2 Mapping Requirements Specifications to Safety Cases
We now show how a requirements specification (as defined above) can be embeddedin a safety case (or, alternatively, provide a safety case skeleton). Conversely, a safetycase can be mapped to an extension of a requirements specification. It is an exten-sion because there can be additional sub-requirements for intermediate claims, as wellas entries/columns accounting for additional context, assumptions and justifications.Moreover, a safety case captures an argument design that need not be recorded in therequirements.
In fact, the mapping embodies the design decisions encapsulated by a specific argu-ment design, e.g., argument over an architectural breakdown, and then over hazards. Agiven requirements specification can be embedded in a safety case (in many differentways), and we define this as a relation. Based on definitions 1 – 5, intuitively, we map:
– hazard, requirement, causes 7→ goal, sub-goal– allocated requirements 7→ sub-goals– mitigation, verification method 7→ strategy– verification allocation 7→ evidence– requirement source, allocated artifact 7→ goal contextWe want to characterize the minimal relation which should exist between a require-
ments specification and a corresponding partial safety case. There are various ways ofdoing this. Here, we simply require a correspondence between node types, and that“structure” be preserved.
We define x ≤ x′ whenever (i) x →s x, or (ii) x →f x, or (iii) x →h x, or(iv) x = r, x′ = al, 〈r, so, al, vm, va〉 ∈ RTs and al ∈ RTf , or (v) x = h, x′ = sr,〈h, c,m, sr〉 ∈ HT and sr ∈ (RTs ∪ RTf ).
6 Note that we do not require there to be a unique root. A partial safety case is, therefore, a forestof fragments. A (full) safety case can be defined as a partial safety case with a single root, butwe will not use that here. Informally, however, we refer to partial safety cases as safety cases.
6 E. Denney and G. Pai
Definition 6. We say that a partial safety case, S = 〈G,S,E,A,K, J, sg, gs, gc, sa,sc, sj〉, extends a requirements specification, R = 〈HT,RTs, RTf 〉, if there is anembedding (i.e., injective function), ι, on the base sets of R in S, such that:
– ι(H ∪ C ∪Rs ∪Rf ) ⊆ G– ι(V ∪M) ⊂ S
– 〈r, so, al, vm, va〉 ∈ (RTs ∪ RTf )⇒
ι(so) ∈ gc(ι(r)),
ι(vm) ∈ gs(ι(r)),
ι(va) ⊆ sg(ι(vm)) ∩ E– x ≤ x′ ⇒ ι(x) ι(x′)
Whereas goal contexts may be derived from the corresponding requirements sources,strategy contexts, assumptions and justifications are implicit and come from the map-ping itself, e.g., as boilerplate GSN elements (See Fig. 3, for an example of a boilerplateassumption element). Note that we do not specify the exact relations between the indi-vidual elements, just that there is a relation.
4.3 Architecture of the Argument
The structure of the tables, and the mapping defined for each table, induces two patternsof argument structures. In particular, the pattern arising from the transformation of theHT can be considered as an extension of the hazard-directed breakdown pattern [12].Thus, we argue over each hazard in the HT and, in turn, over the identified hazards in ahierarchy of hazards. Consequently, each defined goal is further developed by argumentover the strategies implicit in the HT, i.e., over the causes and mitigations.
Similarly, the pattern induced by transforming the SRT and FRT connects the argu-ment elements implicit in the tables, i.e., requirements (goals), and verification methodsand verification allocations (strategies), respectively. Additionally, it includes strategiesarising due to both the hierarchy of requirements in the tables, and the dependenciesbetween the tables. Specifically, for each requirement, we also argue over its allocation,e.g., the allocation of a functional requirement to a system requirement, and its chil-dren, i.e., lower-level requirements. The links between the tables in the requirementsspecification define how the two patterns are themselves related and, in turn, how theresulting safety case fragments are assembled.
4.4 Transformation Rules
One choice in the transformation is to create goals and strategies that are not markedas undeveloped (or uninstantiated, or both, as appropriate), i.e., to assume that thecompleteness and sufficiency of all hazards, their respective mitigations, and all re-quirements and their respective verification methods, is determined prior to the trans-formation, e.g., as part of the usual quality checks on requirements specifications. Analternative is to highlight the uncertainty in the completeness and sufficiency of thehazards/requirements tables, and mark all goals and strategies as undeveloped. We pickthe second option, i.e., in the transformation described next, all goals, strategies, andevidence that are created are undeveloped except where otherwise indicated.
A Lightweight Methodology for Safety Case Assembly 7
We give the transformation in a relational style, where the individual tables areprocessed in a top-to-bottom order, and no such order is required among the tables.
Hazards Table: For each entry in the HT (Fig. 2),(H1) For an entry {Hazard} in the Hazard column with no corresponding entries,
{Cause} in the Cause/Mode column, {Mitigation} in the Mitigation column,or {Requirement} in the Safety Requirement column, respectively,(a) Create a top-level goal “{Hazard} is mitigated”, with the hazard identi-
fier as context. Here, we are assuming that this top-level entry is a “con-tainer” for a hierarchy of hazards, rather than an incomplete entry.
(b) The default strategy used to develop this goal is “Argument over identi-fied hazards”, with the associated assumption “Hazards have been com-pletely and correctly identified to the extent possible”.
(H2) For each lower-level entry, {Hazard}, in the hierarchy,(a) Create a sub-goal, “{Hazard} is mitigated”, of the parent goal.(b) The way we further develop this sub-goal depends on the entries {Cause},{Mitigation} and {Requirement}; specifically,
i. For one or more causes, the default strategy is “Argument over identi-fied causes”, with “Causes have been completely and correctly iden-tified to the extent possible” as an assumption, and “{Cause} is man-aged” as the corresponding sub-goal for each identified cause. Thendevelop each of those sub-goals using “Argument by {Mitigation}”as a strategy.7
ii. For no identified causes, but one or more mitigations specified, createan “Argument by {Mitigation}” strategy, for each mitigation.
iii. When no cause/mitigation is given, but a safety requirement is spec-ified, then create a strategy “Argument by satisfaction of safety re-quirement”.
iv. If neither a cause, mitigation nor a safety requirement is given, thenassume that the entry starts a new hierarchy of hazards.
(c) The entry in the Safety Requirement column forms the sub-goal “{SafetyRequirement} holds”, attached to the relevant strategy, with the require-ment identifier forming a context element.
System/Functional Requirements Tables: For each entry in either of the SRT/FRT(Fig. 2),(R1) The contents of the Requirements column forms a goal “{System Require-
ment} holds” if the SRT is processed, or “{Functional requirement} holds”if the FRT is processed. Additionally, if the entry is the start of a hierarchy,create a strategy “Argument over lower-level requirements” connected to thisgoal. Subsequently, for each lower-level entry in the hierarchy, create a goal“{Lower-level requirement} holds” from the content of the Requirements col-umn.
7 An alternative strategy could be “Argument by satisfaction of safety requirement”, assumingthat the entry in the Safety Requirement column of the HT is a safety requirement that wasderived from the stated mitigation mechanism.
8 E. Denney and G. Pai
(R2) (a) the Source column forms the context for the created goal/sub-goal. Ad-ditionally, if the source is a hazard, i.e., (an ID of) an entry {Hazard} inthe HT, then the created goal is the same as the sub-goal that was createdfrom the Safety Requirement column of the HT, as in step (H2)(c).
(b) the Allocation column is either a strategy or a context element, dependingon the content. Thus, if it is
i. an allocated requirement (or its ID), then create and attach a strategy“Argument over allocated requirement”; the sub-goal of this strategyis the allocated requirement8.
ii. an element of the physical architecture, then create an additional con-text element for the goal.
(c) the Verification method column, if given, creates an additional strategy“Argument by {Verification Method}”, an uninstantiated sub-goal con-nected to this strategy9, and an item of evidence whose content is theentry in the column Verification allocation.
We now state (without proof), that the result of this transformation is a well-formedpartial safety case that extends the requirements specification.
5 Illustrative Example
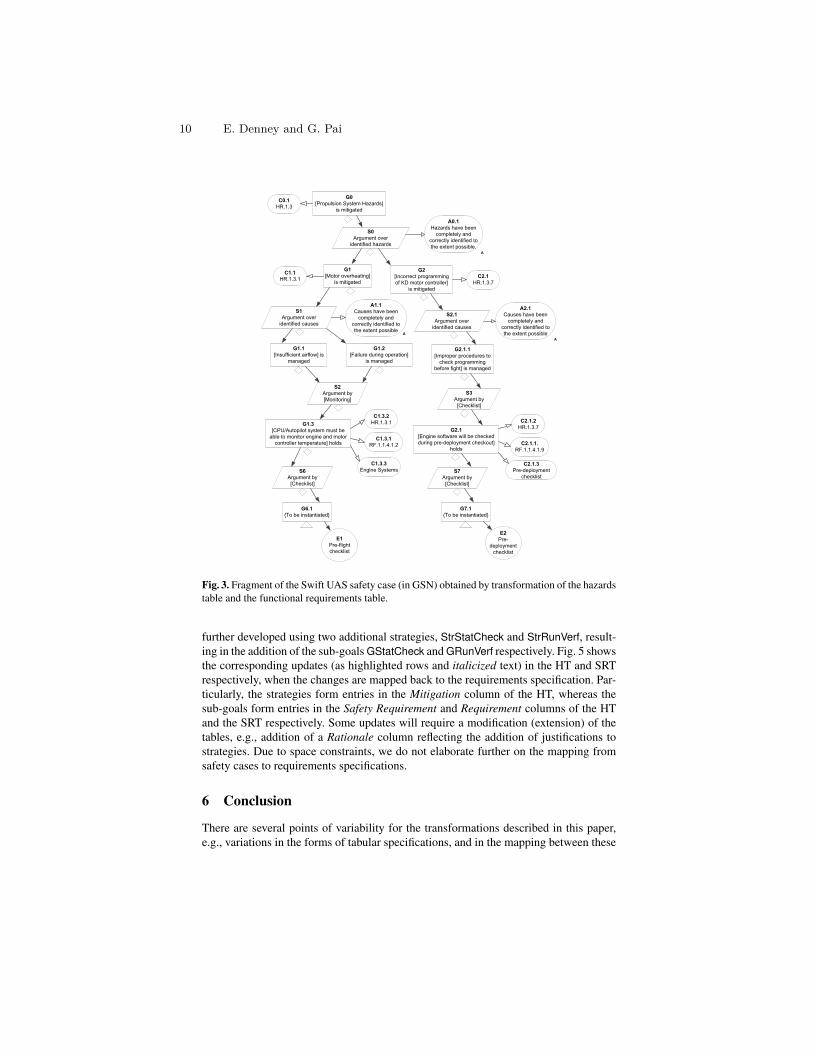
Fig. 3 shows a fragment of the Swift UAS safety case, in the GSN, obtained by apply-ing the transformation rules (Section 4.4) to the HT and FRT (Fig. 2), and assemblingthe argument structures. Note that a similar safety case fragment (not shown here) isobtained when the transformation is applied to the SRT and FRT.
We observe that (i) the argument chain starting from the top-level goal G0, to thesub-goals G1.3 and G2.1 can be considered as an instantiation of the hazard-directedbreakdown pattern, which has then been extended by an argument over the causes andthe respective mitigations in the HT (ii) the argument chains starting from these sub-goals to the evidence E1 and E2 reflects the transformation from the FRT, and that,again, it is an instantiation of a specific pattern of argument structures, and (iii) wheneach table is transformed, individual fragments are obtained which are then joined basedon the links between the tables (i.e., requirements common to either table). In general,the transformation can produce several unconnected fragments. Here, we have shownone of the two that are created.
The resulting partial safety case can be modified, e.g., by including additional con-text, justifications and/or assumptions, to the goals, sub-goals, and strategies. In fact, aset of allowable modifications can be defined, based on both a set of well-formednessrules, and the activities of argument development (Fig. 1). Subsequently, the modifica-tions can be mapped back to (extensions of) the requirements specification.
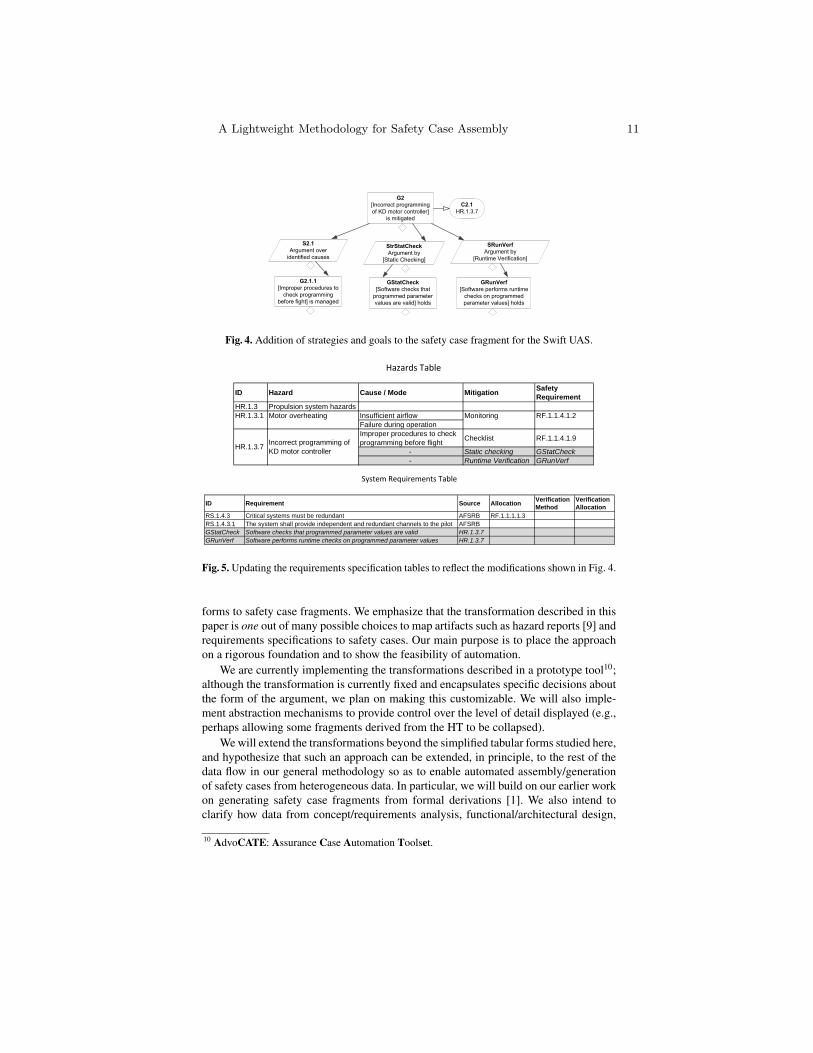
Fig. 4 shows an example of how the Claims definition and Evidence linking activ-ities (Fig. 1) modify the argument fragment in Fig. 3. Specifically, goal G2 has been
8 This will also be an entry in the Requirements column of the FT.9 A constraint, as per [8], is that each item of evidence is preceded by a goal, to be well-formed.
A Lightweight Methodology for Safety Case Assembly 9
G0[Propulsion System Hazards]
is mitigated
C0.1HR.1.3
S0Argument over
identified hazards
G2[Incorrect programming of KD motor controller]
is mitigated
G1[Motor overheating]
is mitigatedC2.1
HR.1.3.7
C1.1HR.1.3.1
S1Argument over
identified causes
S2.1Argument over
identified causes
G1.2[Failure during operation]
is managed
G1.1[Insufficient airflow] is
managed
G2.1.1[Improper procedures to
check programming before fight] is managed
S2Argument by [Monitoring]
S3Argument by [Checklist]
G1.3[CPU/Autopilot system must be
able to monitor engine and motor controller temperature] holds
G2.1[Engine software will be checked during pre-deployment checkout]
holds
C1.3.2HR.1.3.1
C1.3.1RF.1.1.4.1.2
C1.3.3Engine Systems
C2.1.2HR.1.3.7
C2.1.1.RF.1.1.4.1.9
C2.1.3Pre-deployment
checklistS6
Argument by [Checklist]
S7Argument by [Checklist]
G6.1{To be instantiated}
G7.1{To be instantiated}
E1Pre-flight checklist
E2Pre-
deployment checklist
A0.1Hazards have been
completely and correctly identified to the extent possible.
A
A2.1Causes have been
completely and correctly identified to the extent possible
A
A1.1Causes have been
completely and correctly identified to the extent possible
A
Fig. 3. Fragment of the Swift UAS safety case (in GSN) obtained by transformation of the hazardstable and the functional requirements table.
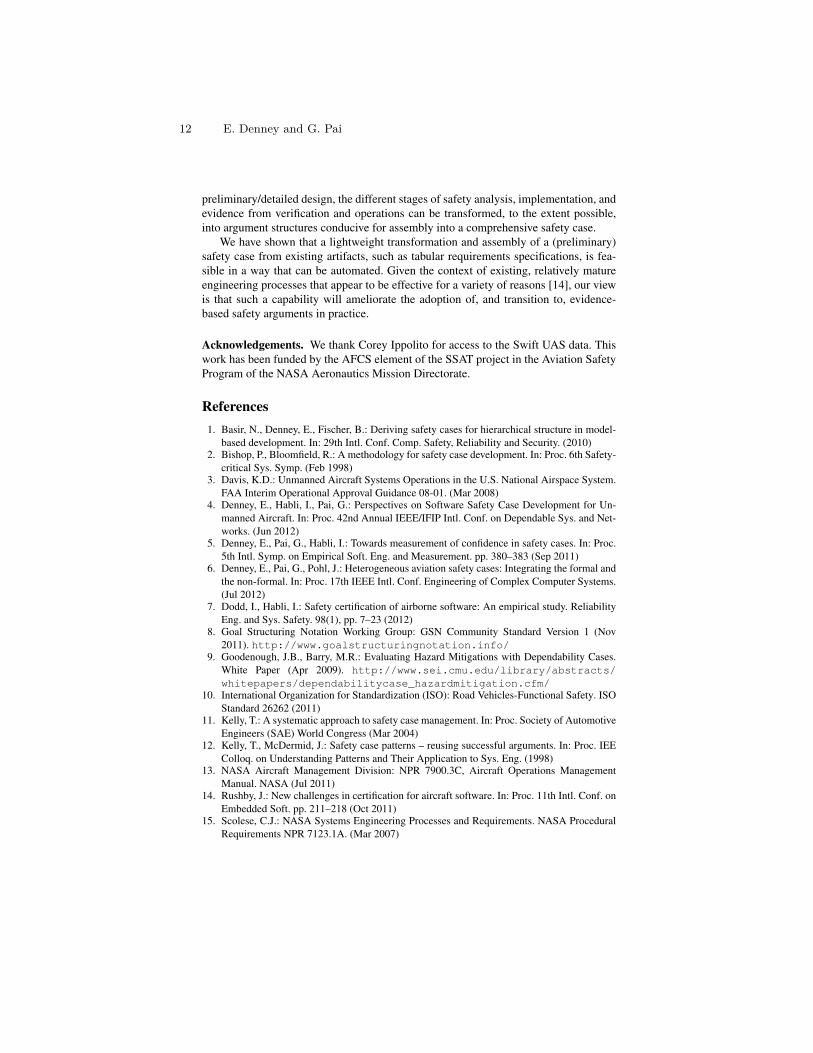
further developed using two additional strategies, StrStatCheck and StrRunVerf, result-ing in the addition of the sub-goals GStatCheck and GRunVerf respectively. Fig. 5 showsthe corresponding updates (as highlighted rows and italicized text) in the HT and SRTrespectively, when the changes are mapped back to the requirements specification. Par-ticularly, the strategies form entries in the Mitigation column of the HT, whereas thesub-goals form entries in the Safety Requirement and Requirement columns of the HTand the SRT respectively. Some updates will require a modification (extension) of thetables, e.g., addition of a Rationale column reflecting the addition of justifications tostrategies. Due to space constraints, we do not elaborate further on the mapping fromsafety cases to requirements specifications.
6 Conclusion
There are several points of variability for the transformations described in this paper,e.g., variations in the forms of tabular specifications, and in the mapping between these
10 E. Denney and G. Pai
G2[Incorrect programming of KD motor controller]
is mitigated
C2.1HR.1.3.7
S2.1Argument over
identified causes
G2.1.1[Improper procedures to
check programming before fight] is managed
StrStatCheckArgument by
[Static Checking]
GStatCheck[Software checks that
programmed parameter values are valid] holds
SRunVerfArgument by
[Runtime Verification]
GRunVerf[Software performs runtime
checks on programmed parameter values] holds
Fig. 4. Addition of strategies and goals to the safety case fragment for the Swift UAS.
Hazards Table
ID Hazard Cause / Mode Mitigation Safety Requirement
HR.1.3 Propulsion system hazardsHR.1.3.1 Motor overheating Insufficient airflow Monitoring RF.1.1.4.1.2
Failure during operationImproper procedures to check programming before flight Checklist RF.1.1.4.1.9
- Static checking GStatCheck- Runtime Verification GRunVerf
Incorrect programming of KD motor controllerHR.1.3.7
System Requirements Table
ID Requirement Source Allocation Verification Method
Verification Allocation
RS.1.4.3 Critical systems must be redundant AFSRB RF.1.1.1.1.3RS.1.4.3.1 The system shall provide independent and redundant channels to the pilot AFSRBGStatCheck Software checks that programmed parameter values are valid HR.1.3.7GRunVerf Software performs runtime checks on programmed parameter values HR.1.3.7
Fig. 5. Updating the requirements specification tables to reflect the modifications shown in Fig. 4.
forms to safety case fragments. We emphasize that the transformation described in thispaper is one out of many possible choices to map artifacts such as hazard reports [9] andrequirements specifications to safety cases. Our main purpose is to place the approachon a rigorous foundation and to show the feasibility of automation.
We are currently implementing the transformations described in a prototype tool10;although the transformation is currently fixed and encapsulates specific decisions aboutthe form of the argument, we plan on making this customizable. We will also imple-ment abstraction mechanisms to provide control over the level of detail displayed (e.g.,perhaps allowing some fragments derived from the HT to be collapsed).
We will extend the transformations beyond the simplified tabular forms studied here,and hypothesize that such an approach can be extended, in principle, to the rest of thedata flow in our general methodology so as to enable automated assembly/generationof safety cases from heterogeneous data. In particular, we will build on our earlier workon generating safety case fragments from formal derivations [1]. We also intend toclarify how data from concept/requirements analysis, functional/architectural design,
10 AdvoCATE: Assurance Case Automation Toolset.
A Lightweight Methodology for Safety Case Assembly 11
preliminary/detailed design, the different stages of safety analysis, implementation, andevidence from verification and operations can be transformed, to the extent possible,into argument structures conducive for assembly into a comprehensive safety case.
We have shown that a lightweight transformation and assembly of a (preliminary)safety case from existing artifacts, such as tabular requirements specifications, is fea-sible in a way that can be automated. Given the context of existing, relatively matureengineering processes that appear to be effective for a variety of reasons [14], our viewis that such a capability will ameliorate the adoption of, and transition to, evidence-based safety arguments in practice.
Acknowledgements. We thank Corey Ippolito for access to the Swift UAS data. Thiswork has been funded by the AFCS element of the SSAT project in the Aviation SafetyProgram of the NASA Aeronautics Mission Directorate.
References1. Basir, N., Denney, E., Fischer, B.: Deriving safety cases for hierarchical structure in model-
based development. In: 29th Intl. Conf. Comp. Safety, Reliability and Security. (2010)2. Bishop, P., Bloomfield, R.: A methodology for safety case development. In: Proc. 6th Safety-
critical Sys. Symp. (Feb 1998)3. Davis, K.D.: Unmanned Aircraft Systems Operations in the U.S. National Airspace System.
FAA Interim Operational Approval Guidance 08-01. (Mar 2008)4. Denney, E., Habli, I., Pai, G.: Perspectives on Software Safety Case Development for Un-
manned Aircraft. In: Proc. 42nd Annual IEEE/IFIP Intl. Conf. on Dependable Sys. and Net-works. (Jun 2012)
5. Denney, E., Pai, G., Habli, I.: Towards measurement of confidence in safety cases. In: Proc.5th Intl. Symp. on Empirical Soft. Eng. and Measurement. pp. 380–383 (Sep 2011)
6. Denney, E., Pai, G., Pohl, J.: Heterogeneous aviation safety cases: Integrating the formal andthe non-formal. In: Proc. 17th IEEE Intl. Conf. Engineering of Complex Computer Systems.(Jul 2012)
7. Dodd, I., Habli, I.: Safety certification of airborne software: An empirical study. ReliabilityEng. and Sys. Safety. 98(1), pp. 7–23 (2012)
8. Goal Structuring Notation Working Group: GSN Community Standard Version 1 (Nov2011). http://www.goalstructuringnotation.info/
9. Goodenough, J.B., Barry, M.R.: Evaluating Hazard Mitigations with Dependability Cases.White Paper (Apr 2009). http://www.sei.cmu.edu/library/abstracts/whitepapers/dependabilitycase_hazardmitigation.cfm/
10. International Organization for Standardization (ISO): Road Vehicles-Functional Safety. ISOStandard 26262 (2011)
11. Kelly, T.: A systematic approach to safety case management. In: Proc. Society of AutomotiveEngineers (SAE) World Congress (Mar 2004)
12. Kelly, T., McDermid, J.: Safety case patterns – reusing successful arguments. In: Proc. IEEColloq. on Understanding Patterns and Their Application to Sys. Eng. (1998)
13. NASA Aircraft Management Division: NPR 7900.3C, Aircraft Operations ManagementManual. NASA (Jul 2011)
14. Rushby, J.: New challenges in certification for aircraft software. In: Proc. 11th Intl. Conf. onEmbedded Soft. pp. 211–218 (Oct 2011)
15. Scolese, C.J.: NASA Systems Engineering Processes and Requirements. NASA ProceduralRequirements NPR 7123.1A. (Mar 2007)
12 E. Denney and G. Pai
A Pattern-based Method for Safe ControlSystems Exemplified within Nuclear Power
Production
Andre Alexandersen Hauge1,3 and Ketil Stølen2,3
1 Department of Software Engineering,Institute for energy technology, Halden, Norway
[email protected] Department of Networked Systems and Services,
SINTEF ICT, Oslo, [email protected]
3 Department of Informatics, University of Oslo, Norway
Abstract. This article exemplifies the application of a pattern-basedmethod, called SaCS (Safe Control Systems), on a case taken from thenuclear domain. The method is supported by a pattern language and pro-vides guidance on the development of design concepts for safety criticalsystems. The SaCS language offers six different kinds of basic patternsas well as operators for composition.
Keywords: conceptual design, pattern language, development process,safety
1 Introduction
This article presents a pattern-based method, referred to as SaCS (Safe Con-trol Systems), facilitating development of conceptual designs for safety criticalsystems. Intended users of SaCS are system developers, safety engineers andHW/SW engineers.
The method interleaves three main activities each of which is divided intosub-activities:
S Pattern Selection – The purpose of this activity is to support the concep-tion of a design with respect to a given development case by: a) selectingSaCS patterns for requirement elicitation; b) selecting SaCS patterns forestablishing design basis; c) selecting SaCS patterns for establishing safetycase.
C Pattern Composition – The purpose of this activity is to specify the in-tended use of the selected patterns by: a) specifying composite patterns; b)specifying composition of composite patterns.
I Pattern Instantiation – The purpose of this activity is to instantiate thecomposite pattern specification by: a) selecting pattern instantiation order;and b) conducting step wise instantiation.
A safety critical system design may be evaluated as suitable and sufficientlysafe for its intended purpose only when the necessary evidence supporting thisclaim has been established. Evidence in the context of safety critical systemsdevelopment is the documented results of the different process assurance andproduct assurance activities performed during development. The SaCS methodoffers six kinds of basic patterns categorised according to two development per-spectives: Process Assurance; and Product Assurance. Both perspectives detailspatterns according to three aspects: Requirement ; Solution; and Safety Case.Each basic pattern contains an instantiation rule that may be used for assessingwhether a result is an instantiation of a pattern. A graphical notation is usedto explicitly detail a pattern composition and may be used to assess whether aconceptual design is an instantiation of a pattern composition.
To the best of our knowledge, there exists no other pattern-based methodthat combines diverse kinds of patterns into compositions like SaCS. The sup-porting language is inspired by classical pattern language literature (e.g. [1–3]);the patterns are defined based on safety domain needs as expressed in inter-national safety standards and guidelines (e.g. [6, 9]); the graphical notation isinspired by languages for system modelling (e.g. [10]).
This article describes the SaCS method, and its supporting language, in anexample-driven manner based on a case taken from the nuclear domain.
The remainder of this article is structured as follows: Section 2 outlines ourhypothesis and main prediction. Section 3 describes the nuclear case. Section 4exemplifies how functional requirements are elicited. Section 5 exemplifies howa design basis is established. Section 6 exemplifies how safety requirements areelicited. Section 7 exemplifies how a safety case is established. Section 8 exempli-fies how intermediate pattern compositions are combined into an overall patterncomposition. Section 9 concludes.
2 Success Criteria
Success is evaluated based on satisfaction of predictions. The hypothesis (H) andpredictions (P) for the application of SaCS is defined below.
H: The SaCS method facilitates effective and efficient development of concep-tual designs that are: 1) consistent; 2) comprehensible; 3) reusable; and 4)implementable.
Definition A conceptual design is as a triple consisting of: a specification ofrequirements; a specification of design; and a specification of a safety case. Thesafety case characterises a strategy for demonstrating that the design is safe withrespect to safety requirements.
We deduce the following prediction from the hypothesis with respect to theapplication of SaCS on the case described in Section 3:
P: Application of the SaCS method on the load following case described inSection 3 results in a conceptual design that uniquely characterises the load
14 A. Hauge and K. Stølen
following case and is easily instantiated from a composite SaCS pattern.Furthermore, the conceptual design: 1) is consistent; 2) is expressed in amanner that is easily understood; 3) may be easily extended or detailed; 4)is easy to implement.
Definition A conceptual design instantiates a SaCS composite pattern if:each element of the triple can be instantiated from the SaCS composite patternaccording to the instantiation rules of the individual patterns and according tothe rules for composition.
3 The Case: Load Following Mode Control
In France, approximately 75% of the total electricity production is generatedby nuclear power which requires the ability to scale production according todemand. This is called load following [8]. The electricity production generatedby a PWR (Pressurised Water Reactor) [8] is typically controlled using:
– Control rods: Control rods are inserted into the core, leading to the controlrods absorbing neutrons and thereby reducing the fission process.
– Coolant as moderator : Boron acid is added to the primary cooling water,leading to the coolant absorbing neutrons and thereby reducing the fissionprocess.
Control rods may be efficiently used to adjust reactivity in the core; severalpercentage change in effect may be experienced within minutes as the core willreact immediately upon insertion or retraction. When using boron acid as mod-erator there is a time delay of several hours to reach destined reactivity level;reversing the process requires filtering out the boron from the moderator whichis a slow and costly process.
When using Boron acid as moderator, fuel is consumed evenly in the reactoras the coolant circulates in the core. When using the control rods as moderator,the fuel is consumed unevenly in the reactor as the control rods are inserted atspecific sections of the core and normally would not be fully inserted.
A successful introduction of load following mode control requires satisfyingthe following goals:
G1 Produce according to demand : assure high manoeuvrability so that produc-tion may be easily scaled and assure precision by compensating for fuel burnup.
G2 Cost optimisation: assure optimal balance of control means with respect tocost associated with the use of boron acid versus control rods.
G3 Fuel utilisation: assure optimal fuel utilisation.
The SaCS method is applied for deriving an adaptable load following modecontrol system intended as an upgrade of an existing nuclear power plant controlsystem. The adaptable feature is introduced as a means to calibrate the controllerperforming control rod control during operation in order to accommodate fuelburn up. The system will be referred to as ALF (Adaptable Load Following).The scope is limited to goal G1 only.
A Pattern-based Method for Safe Control Systems Exemplified withinNuclear Power Production 15
Basic Pattern
Process Assurance
Product Assurance
Product Requirement
Process Safety Case
Product Safety Case
Process Requirement
Overall Safety
Technical Safety
Safety Management
Quality Management
Code of Practise
Cross Reference
Explicit Risk Evaluation
Deterministic Evidence
Basic Assumption Evidence
Probabilistic Evidence
Hazard Identification
Hazard Analysis
Establish System Safety
Requirements
Risk Analysis
Establish Concept
Process Quality
Evidence
Process Compliance
Evidence
12
1 2
5
8
9
12
13
13
14
15
14
Product Solution
Trusted Backup
Safe Refinements
Online Evaluation
Safe By Numbers
4
5
Process Solution
CCA
HAZOP
FTA
ETA
HAZID
I&C Functions Categorisation
SIL Classification
DAL Classification
Nuc
Rail
Avi
6
9
10
11
FMEA
7
8
2
6
Legendn Selection point - Start
Selection flow pointerChoice
Selection point - Goto
Assessment Evidence
3
7
10
11
n
FMEA
Adapt Schedule of Functions
Variable Demand for
Service3
4
Adapt Function
Nuc
Nuc
Nuc
15
Fig. 1. Pattern Selection Activity Map
4 Elicit Functional Requirements
4.1 Pattern Selection
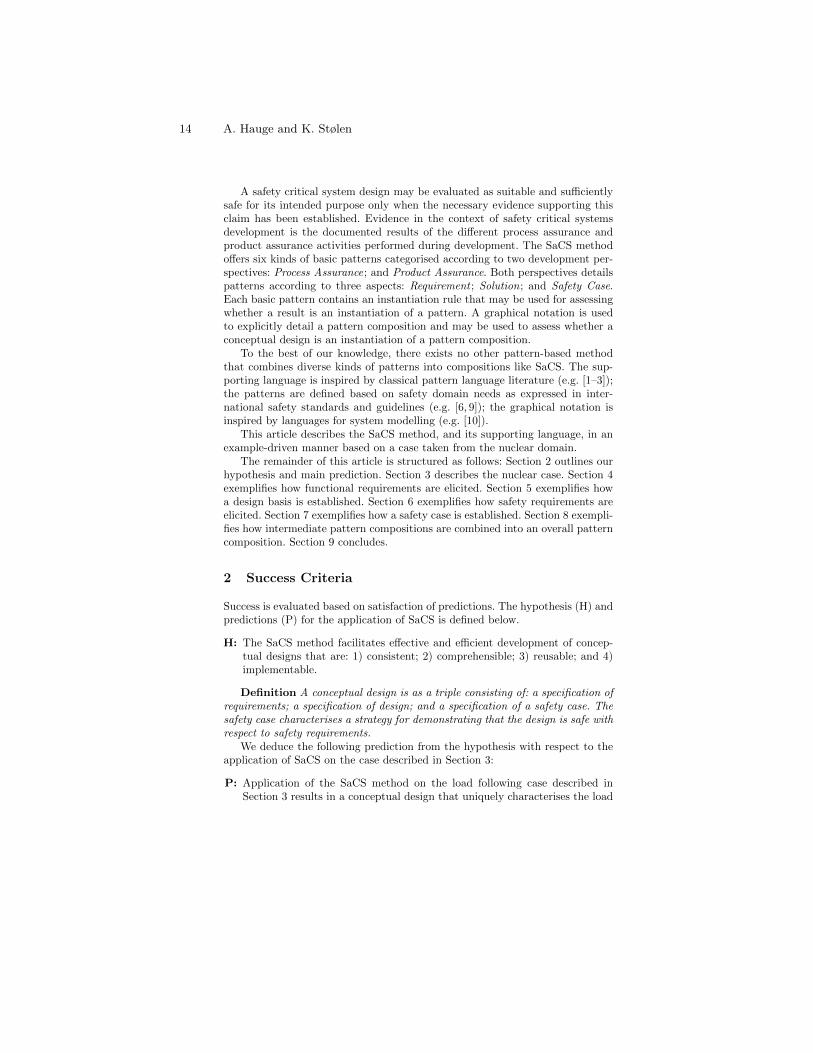
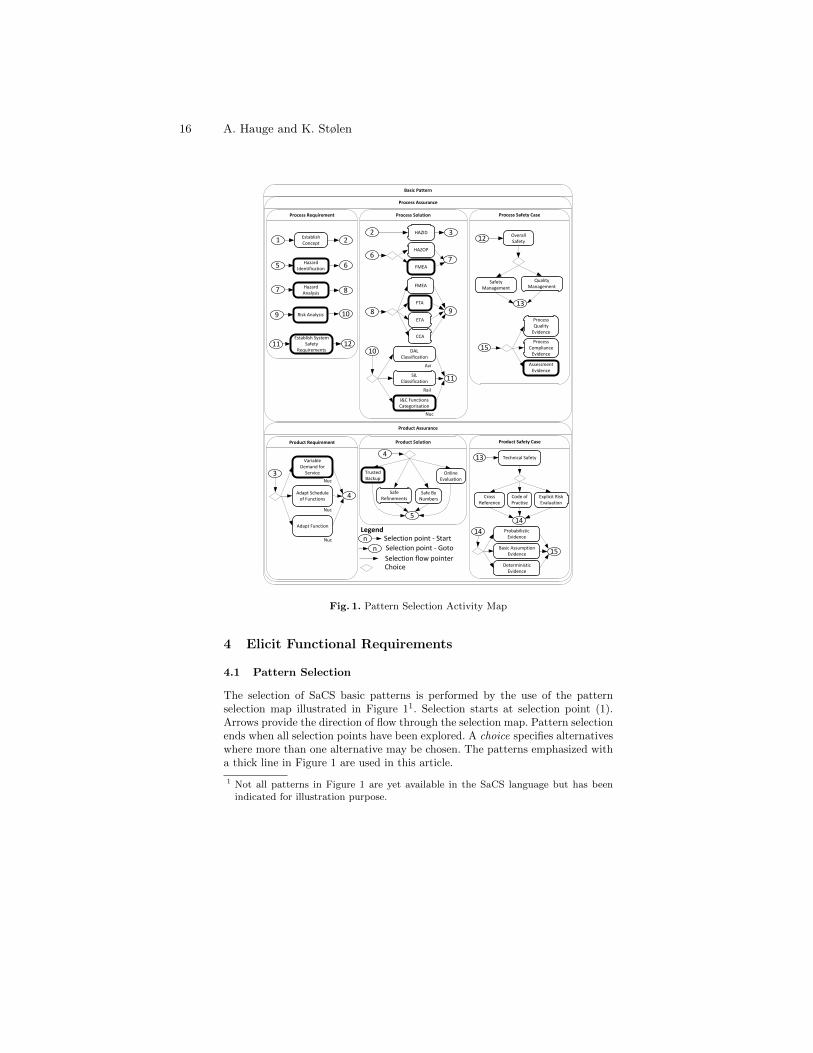
The selection of SaCS basic patterns is performed by the use of the patternselection map illustrated in Figure 11. Selection starts at selection point (1).Arrows provide the direction of flow through the selection map. Pattern selectionends when all selection points have been explored. A choice specifies alternativeswhere more than one alternative may be chosen. The patterns emphasized witha thick line in Figure 1 are used in this article.
1 Not all patterns in Figure 1 are yet available in the SaCS language but has beenindicated for illustration purpose.
16 A. Hauge and K. Stølen
The labelled frames in Figure 1 represent selection activities denoted as UML[10] activity diagrams. The hierarchy of selection activities may also be used asan indication of the categorisation of patterns into types. All patterns that maybe selected is of type Basic Pattern (indicated by the outermost frame). Thetype Basic Pattern is specialised into two pattern types: Process Assurance;and Product Assurance. These two are both specialised into three pattern types:Requirement ; Solution; and Safety Case. The Solution type within Process As-surance is for patterns on methods supporting the process of developing theproduct. The Solution type within Product Assurance is for patterns on designof the product to be developed.
All patterns indicated in Figure 1 should be understood as generally applica-ble unless otherwise specified. General patterns represent domain independentand thus common safety practices. Domain specific patterns are annotated by atag below the pattern reference. In Figure 1, the tag: “Nuc” is short for nuclear;“Avi” short for aviation; and “Rail” short for railway. Domain specific patternsreflect practices that are dependent on domain.
In selection point (3) of Figure 1 a set of product assurance requirement pat-terns may be reached. We assume in this article that the information provided inSection 3 sufficiently details the development objectives and context such thatthe patterns reached from selection point (1) and (2) may be passed. The pat-tern Variable Demand for Service reached from selection point (3) captures theproblem of specifying requirements for a system that shall accommodate changesarising in a nuclear power production environment. The pattern is regarded assuitable for elicitation of requirements related to the goal G1 (see Section 3).
4.2 Pattern Instantiation
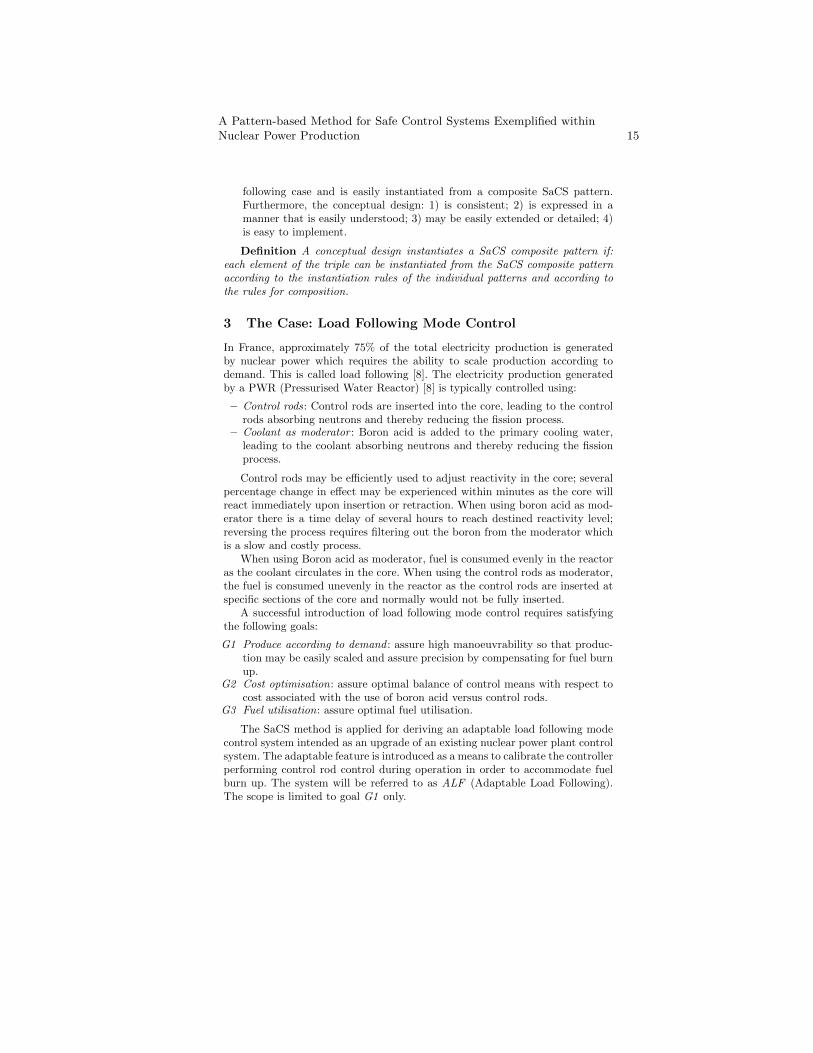
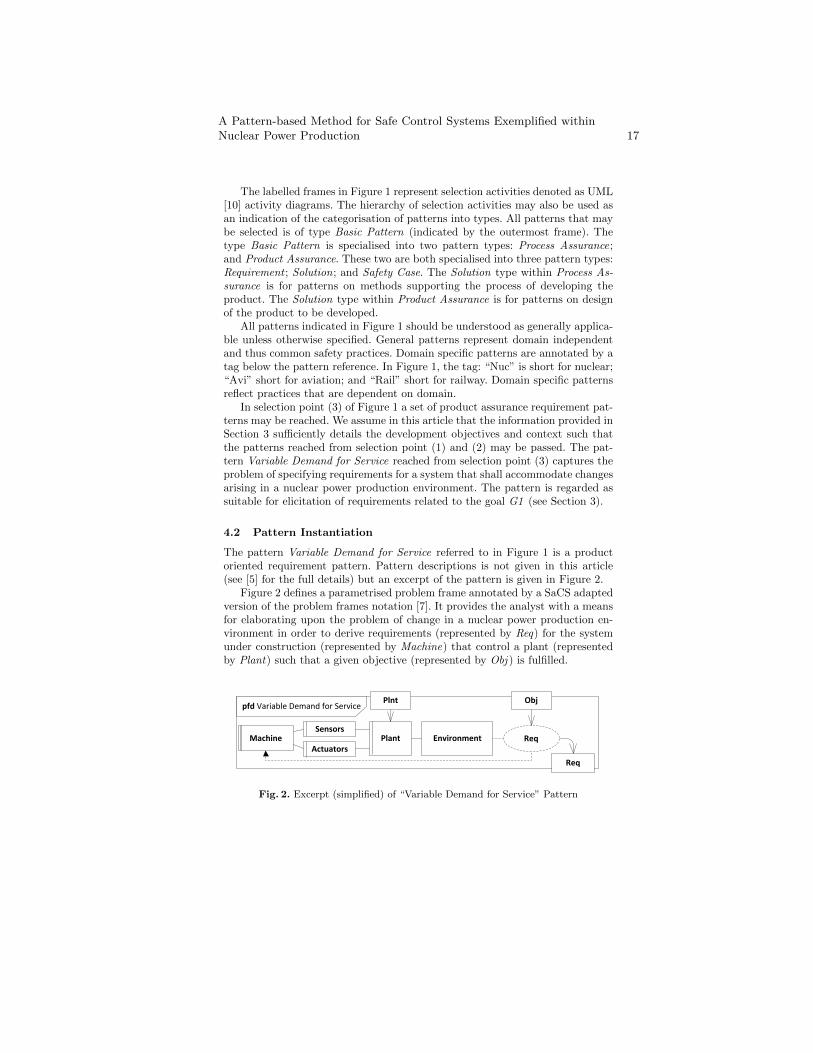
The pattern Variable Demand for Service referred to in Figure 1 is a productoriented requirement pattern. Pattern descriptions is not given in this article(see [5] for the full details) but an excerpt of the pattern is given in Figure 2.
Figure 2 defines a parametrised problem frame annotated by a SaCS adaptedversion of the problem frames notation [7]. It provides the analyst with a meansfor elaborating upon the problem of change in a nuclear power production en-vironment in order to derive requirements (represented by Req) for the systemunder construction (represented by Machine) that control a plant (representedby Plant) such that a given objective (represented by Obj ) is fulfilled.
pfd Variable Demand for ServiceObj
Req
Machine PlantSensors
ActuatorsEnvironment Req
Plnt
Fig. 2. Excerpt (simplified) of “Variable Demand for Service” Pattern
A Pattern-based Method for Safe Control Systems Exemplified withinNuclear Power Production 17
When Variable Demand for Service is instantiated, the Req artefact indicatedin Figure 2 is produced with respect to the context given by Obj and Plnt. InSection 4.1 we selected the pattern as support for eliciting requirements for aPWR system upgrade with respect to goal G1. The parameter Obj is then boundto G1, and the parameter Plnt is bound to the specification of the PWR systemthat the ALF upgrade is meant for.
Assume that the instantiation of Variable Demand for Service according toits instantiation rule provides a set of requirements where one of these is definedas: “FR.1: ALF system shall activate calibration of the control rod patterns whenthe need to calibrate is indicated”.
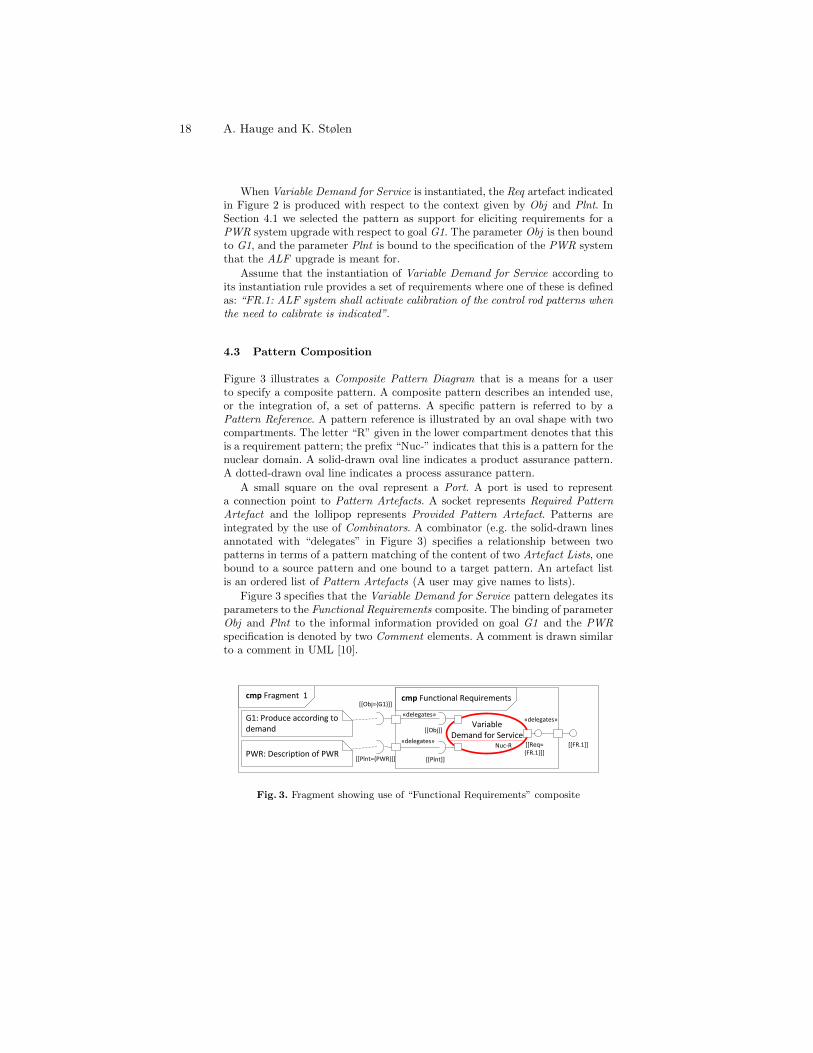
4.3 Pattern Composition
Figure 3 illustrates a Composite Pattern Diagram that is a means for a userto specify a composite pattern. A composite pattern describes an intended use,or the integration of, a set of patterns. A specific pattern is referred to by aPattern Reference. A pattern reference is illustrated by an oval shape with twocompartments. The letter “R” given in the lower compartment denotes that thisis a requirement pattern; the prefix “Nuc-” indicates that this is a pattern for thenuclear domain. A solid-drawn oval line indicates a product assurance pattern.A dotted-drawn oval line indicates a process assurance pattern.
A small square on the oval represent a Port. A port is used to representa connection point to Pattern Artefacts. A socket represents Required PatternArtefact and the lollipop represents Provided Pattern Artefact. Patterns areintegrated by the use of Combinators. A combinator (e.g. the solid-drawn linesannotated with “delegates” in Figure 3) specifies a relationship between twopatterns in terms of a pattern matching of the content of two Artefact Lists, onebound to a source pattern and one bound to a target pattern. An artefact listis an ordered list of Pattern Artefacts (A user may give names to lists).
Figure 3 specifies that the Variable Demand for Service pattern delegates itsparameters to the Functional Requirements composite. The binding of parameterObj and Plnt to the informal information provided on goal G1 and the PWRspecification is denoted by two Comment elements. A comment is drawn similarto a comment in UML [10].
cmp Fragment 1
Nuc-R
VariableDemand for Service
[[FR.1]][[Req={FR.1}]]
[[Obj]]
[[Plnt]]
[[Obj={G1}]]
[[Plnt={PWR}]]
cmp Functional Requirements
G1: Produce according to demand
PWR: Description of PWR
«delegates»
«delegates»
«delegates»
Fig. 3. Fragment showing use of “Functional Requirements” composite
18 A. Hauge and K. Stølen
5 Establish Design Basis
5.1 Pattern Selection
In selection point (4) of Figure 1, a set of alternative design patterns may beselected. All design patterns describe adaptable control concepts. The patternsdiffer in how adaptable control is approached and how negative effects due topotential erroneous adaptation are mitigated.
The Trusted Backup pattern describes a system concept where an adaptablecontroller may operate freely in a delimited operational state space. Safety isassured by a redundant non-adaptable controller that operates in a broaderstate space and in parallel with the adaptable controller. Control privileges aregranted by a control delegator to the most suitable controller at any given timeon the basis of switching rules and information from safety monitoring.
The Trusted Backup is selected as design basis for the ALF system on thebasis of an evaluation of the strengths and weaknesses of the different designpatterns with respect to functional requirements, e.g. FR.1 (see Section 4.2).
5.2 Pattern Instantiation
Requirements may be associated with the system described by the TrustedBackup pattern. No excerpt of the pattern is provided here due to space re-strictions (fully described in [5]). Assume a design specification identified asALF Dgn is provided upon instantiation of Trusted Backup according to its in-stantiation rule. The design specification describes the structure and behaviourof the ALF system and consists of component diagrams and sequence diagramsspecified in UML as well as textual descriptions.
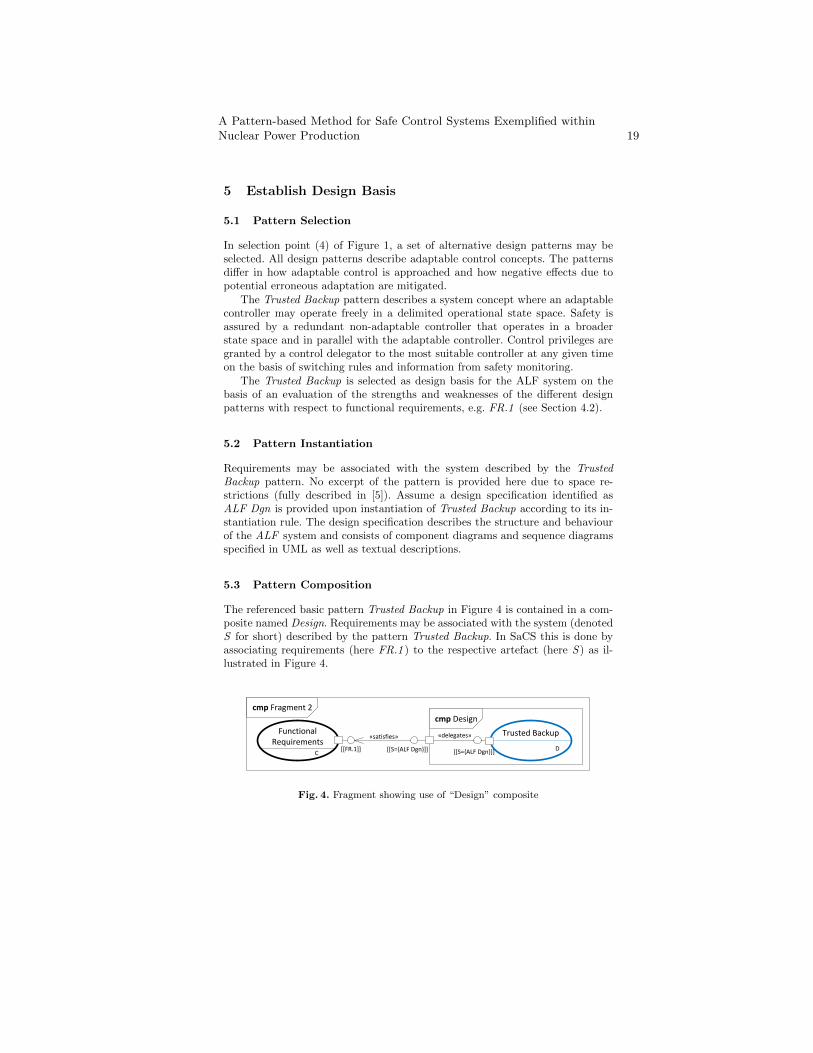
5.3 Pattern Composition
The referenced basic pattern Trusted Backup in Figure 4 is contained in a com-posite named Design. Requirements may be associated with the system (denotedS for short) described by the pattern Trusted Backup. In SaCS this is done byassociating requirements (here FR.1 ) to the respective artefact (here S ) as il-lustrated in Figure 4.
cmp Fragment 2
C
D
FunctionalRequirements
Trusted Backup
cmp Design
«satisfies»
[[FR.1]] [[S={ALF Dgn}]] [[S={ALF Dgn}]]
«delegates»
Fig. 4. Fragment showing use of “Design” composite
A Pattern-based Method for Safe Control Systems Exemplified withinNuclear Power Production 19
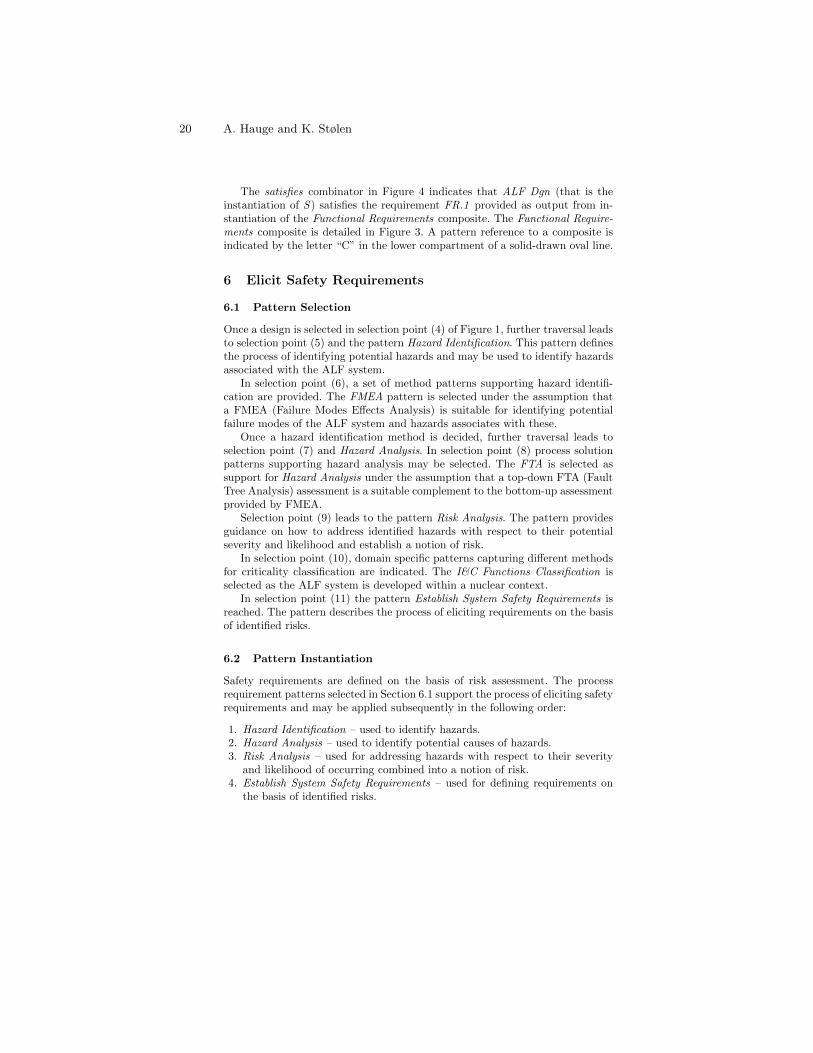
The satisfies combinator in Figure 4 indicates that ALF Dgn (that is theinstantiation of S ) satisfies the requirement FR.1 provided as output from in-stantiation of the Functional Requirements composite. The Functional Require-ments composite is detailed in Figure 3. A pattern reference to a composite isindicated by the letter “C” in the lower compartment of a solid-drawn oval line.
6 Elicit Safety Requirements
6.1 Pattern Selection
Once a design is selected in selection point (4) of Figure 1, further traversal leadsto selection point (5) and the pattern Hazard Identification. This pattern definesthe process of identifying potential hazards and may be used to identify hazardsassociated with the ALF system.
In selection point (6), a set of method patterns supporting hazard identifi-cation are provided. The FMEA pattern is selected under the assumption thata FMEA (Failure Modes Effects Analysis) is suitable for identifying potentialfailure modes of the ALF system and hazards associates with these.
Once a hazard identification method is decided, further traversal leads toselection point (7) and Hazard Analysis. In selection point (8) process solutionpatterns supporting hazard analysis may be selected. The FTA is selected assupport for Hazard Analysis under the assumption that a top-down FTA (FaultTree Analysis) assessment is a suitable complement to the bottom-up assessmentprovided by FMEA.
Selection point (9) leads to the pattern Risk Analysis. The pattern providesguidance on how to address identified hazards with respect to their potentialseverity and likelihood and establish a notion of risk.
In selection point (10), domain specific patterns capturing different methodsfor criticality classification are indicated. The I&C Functions Classification isselected as the ALF system is developed within a nuclear context.
In selection point (11) the pattern Establish System Safety Requirements isreached. The pattern describes the process of eliciting requirements on the basisof identified risks.
6.2 Pattern Instantiation
Safety requirements are defined on the basis of risk assessment. The processrequirement patterns selected in Section 6.1 support the process of eliciting safetyrequirements and may be applied subsequently in the following order:
1. Hazard Identification – used to identify hazards.2. Hazard Analysis – used to identify potential causes of hazards.3. Risk Analysis – used for addressing hazards with respect to their severity
and likelihood of occurring combined into a notion of risk.4. Establish System Safety Requirements – used for defining requirements on
the basis of identified risks.
20 A. Hauge and K. Stølen
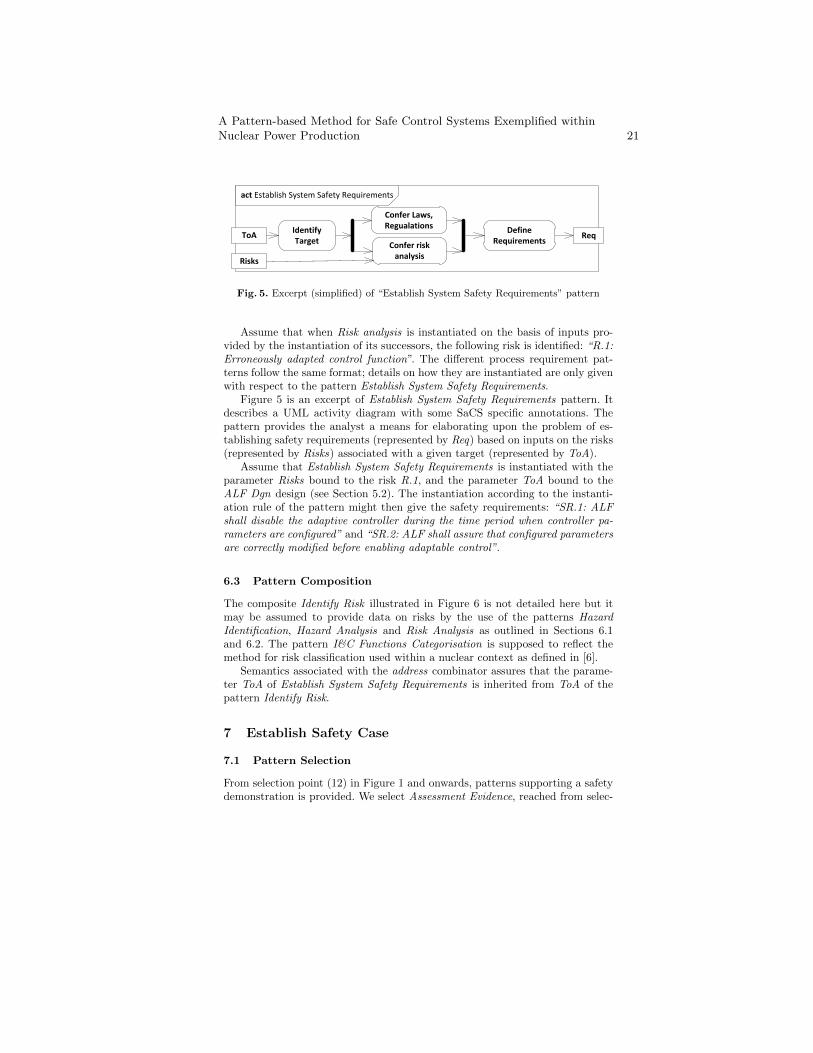
Identify Target
act Establish System Safety Requirements
Req
Confer Laws, Regualations
Confer risk analysis
Define Requirements
Risks
ToA
Fig. 5. Excerpt (simplified) of “Establish System Safety Requirements” pattern
Assume that when Risk analysis is instantiated on the basis of inputs pro-vided by the instantiation of its successors, the following risk is identified: “R.1:Erroneously adapted control function”. The different process requirement pat-terns follow the same format; details on how they are instantiated are only givenwith respect to the pattern Establish System Safety Requirements.
Figure 5 is an excerpt of Establish System Safety Requirements pattern. Itdescribes a UML activity diagram with some SaCS specific annotations. Thepattern provides the analyst a means for elaborating upon the problem of es-tablishing safety requirements (represented by Req) based on inputs on the risks(represented by Risks) associated with a given target (represented by ToA).
Assume that Establish System Safety Requirements is instantiated with theparameter Risks bound to the risk R.1, and the parameter ToA bound to theALF Dgn design (see Section 5.2). The instantiation according to the instanti-ation rule of the pattern might then give the safety requirements: “SR.1: ALFshall disable the adaptive controller during the time period when controller pa-rameters are configured” and “SR.2: ALF shall assure that configured parametersare correctly modified before enabling adaptable control”.
6.3 Pattern Composition
The composite Identify Risk illustrated in Figure 6 is not detailed here but itmay be assumed to provide data on risks by the use of the patterns HazardIdentification, Hazard Analysis and Risk Analysis as outlined in Sections 6.1and 6.2. The pattern I&C Functions Categorisation is supposed to reflect themethod for risk classification used within a nuclear context as defined in [6].
Semantics associated with the address combinator assures that the parame-ter ToA of Establish System Safety Requirements is inherited from ToA of thepattern Identify Risk.
7 Establish Safety Case
7.1 Pattern Selection
From selection point (12) in Figure 1 and onwards, patterns supporting a safetydemonstration is provided. We select Assessment Evidence, reached from selec-
A Pattern-based Method for Safe Control Systems Exemplified withinNuclear Power Production 21
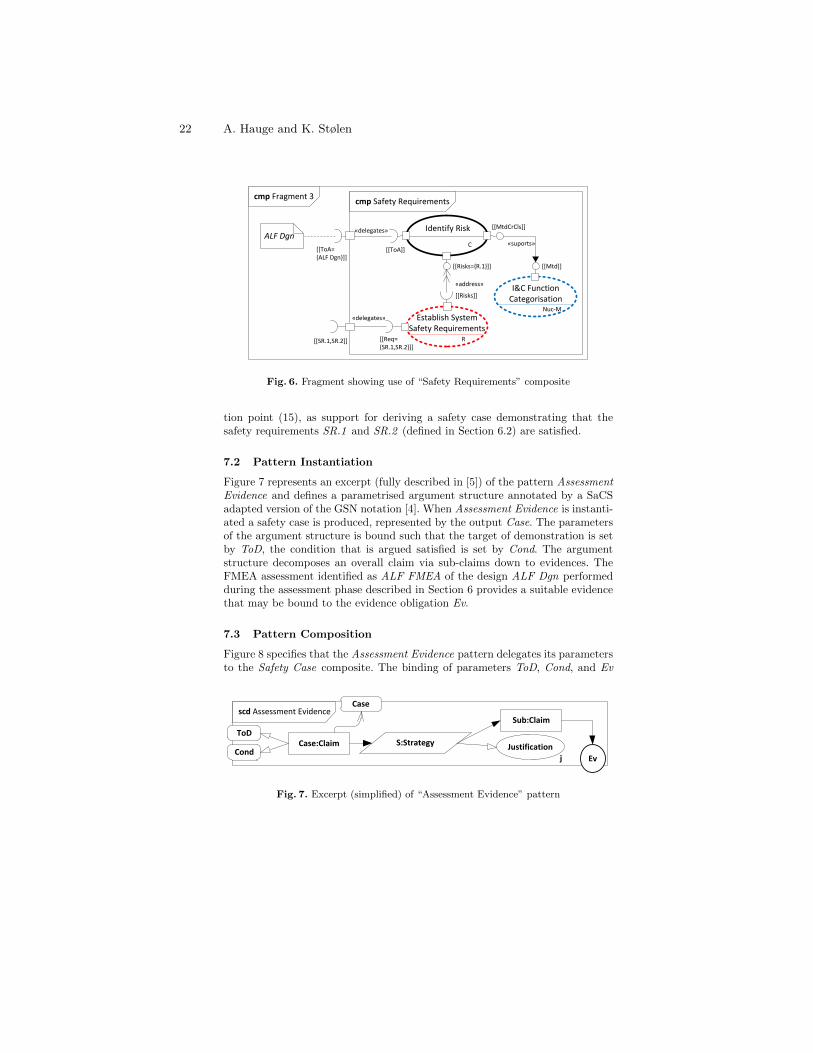
cmp Fragment 3
C
Identify Risk [[MtdCrCls]]
Nuc-M
I&C FunctionCategorisation
[[Mtd]]
R
Establish SystemSafety Requirements
«address»
«suports»
[[Risks={R.1}]]
[[Risks]]
cmp Safety Requirements
[[ToA]]
[[Req={SR.1,SR.2}]]
[[SR.1,SR.2]]
ALF Dgn
[[ToA={ALF Dgn}]]
«delegates»
«delegates»
Fig. 6. Fragment showing use of “Safety Requirements” composite
tion point (15), as support for deriving a safety case demonstrating that thesafety requirements SR.1 and SR.2 (defined in Section 6.2) are satisfied.
7.2 Pattern Instantiation
Figure 7 represents an excerpt (fully described in [5]) of the pattern AssessmentEvidence and defines a parametrised argument structure annotated by a SaCSadapted version of the GSN notation [4]. When Assessment Evidence is instanti-ated a safety case is produced, represented by the output Case. The parametersof the argument structure is bound such that the target of demonstration is setby ToD, the condition that is argued satisfied is set by Cond. The argumentstructure decomposes an overall claim via sub-claims down to evidences. TheFMEA assessment identified as ALF FMEA of the design ALF Dgn performedduring the assessment phase described in Section 6 provides a suitable evidencethat may be bound to the evidence obligation Ev.
7.3 Pattern Composition
Figure 8 specifies that the Assessment Evidence pattern delegates its parametersto the Safety Case composite. The binding of parameters ToD, Cond, and Ev
scd Assessment Evidence
ToD
CondCase:Claim
Sub:Claim
Justification
Evj
S:Strategy
Case
Fig. 7. Excerpt (simplified) of “Assessment Evidence” pattern
22 A. Hauge and K. Stølen
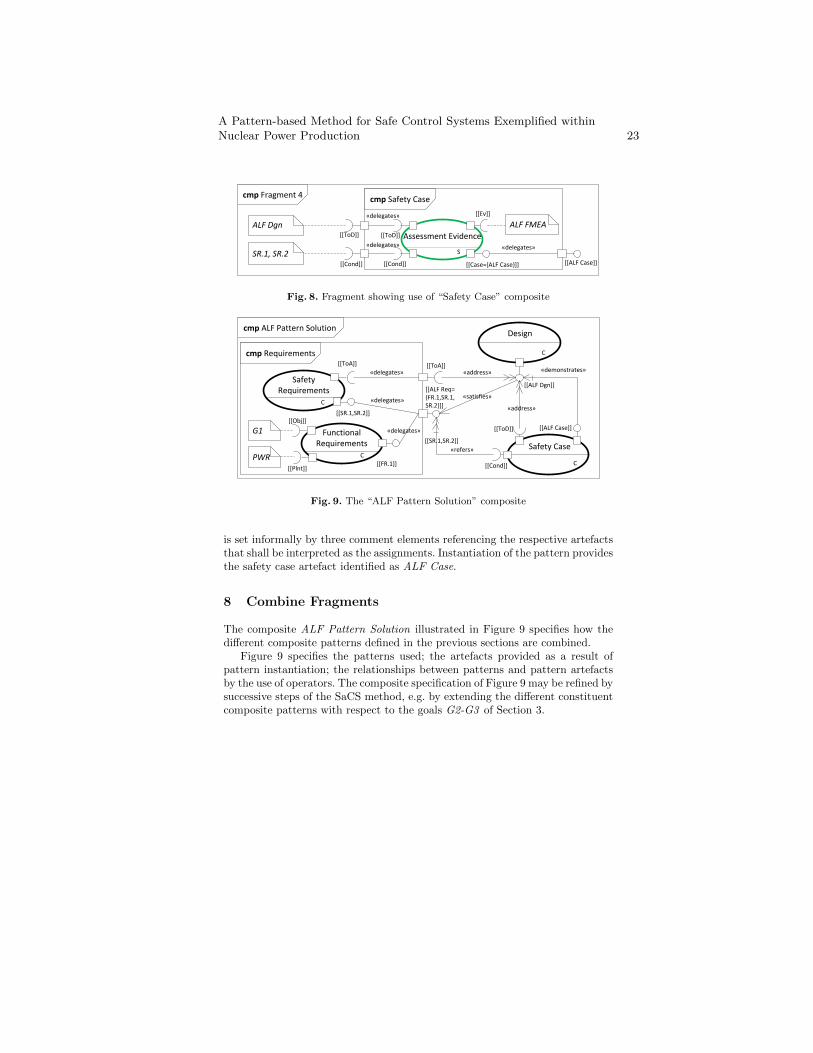
cmp Fragment 4 cmp Safety Case
S
Assessment Evidence
[[ALF Case]]
[[Ev]]
[[ToD]]
[[Cond]] [[Case={ALF Case}]]
ALF FMEAALF Dgn
SR.1, SR.2
[[ToD]]
[[Cond]]
«delegates»
«delegates»
«delegates»
Fig. 8. Fragment showing use of “Safety Case” composite
C
cmp ALF Pattern Solution
SafetyRequirements
FunctionalRequirements
Design
Safety CaseC
C
C
G1
PWR[[Plnt]]
[[Obj]]
cmp Requirements
«address»
[[Cond]]
«refers»
«address»
«demonstrates»
«satisfies»
«delegates»
«delegates»
«delegates» [[ToD]] [[ALF Case]]
[[ALF Dgn]][[ALF Req={FR.1,SR.1,SR.2}]]
[[SR.1,SR.2]]
[[FR.1]]
[[ToA]] [[ToA]]
[[SR.1,SR.2]]
Fig. 9. The “ALF Pattern Solution” composite
is set informally by three comment elements referencing the respective artefactsthat shall be interpreted as the assignments. Instantiation of the pattern providesthe safety case artefact identified as ALF Case.
8 Combine Fragments
The composite ALF Pattern Solution illustrated in Figure 9 specifies how thedifferent composite patterns defined in the previous sections are combined.
Figure 9 specifies the patterns used; the artefacts provided as a result ofpattern instantiation; the relationships between patterns and pattern artefactsby the use of operators. The composite specification of Figure 9 may be refined bysuccessive steps of the SaCS method, e.g. by extending the different constituentcomposite patterns with respect to the goals G2-G3 of Section 3.
A Pattern-based Method for Safe Control Systems Exemplified withinNuclear Power Production 23
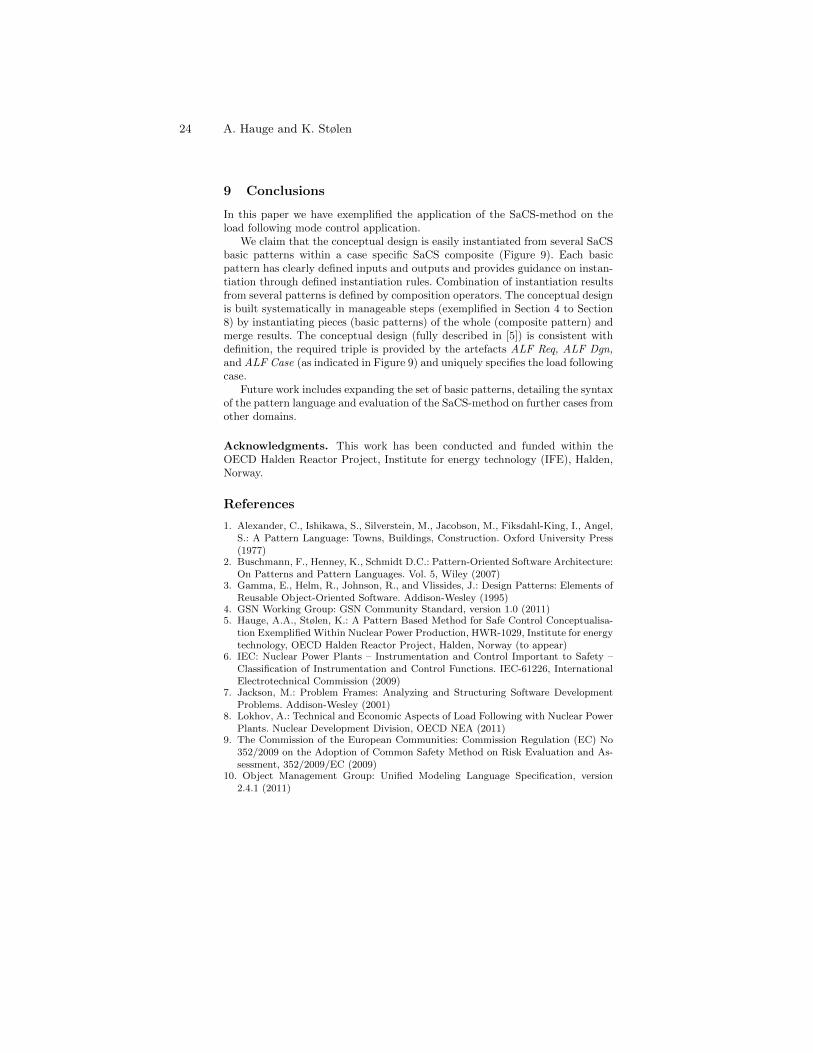
9 Conclusions
In this paper we have exemplified the application of the SaCS-method on theload following mode control application.
We claim that the conceptual design is easily instantiated from several SaCSbasic patterns within a case specific SaCS composite (Figure 9). Each basicpattern has clearly defined inputs and outputs and provides guidance on instan-tiation through defined instantiation rules. Combination of instantiation resultsfrom several patterns is defined by composition operators. The conceptual designis built systematically in manageable steps (exemplified in Section 4 to Section8) by instantiating pieces (basic patterns) of the whole (composite pattern) andmerge results. The conceptual design (fully described in [5]) is consistent withdefinition, the required triple is provided by the artefacts ALF Req, ALF Dgn,and ALF Case (as indicated in Figure 9) and uniquely specifies the load followingcase.
Future work includes expanding the set of basic patterns, detailing the syntaxof the pattern language and evaluation of the SaCS-method on further cases fromother domains.
Acknowledgments. This work has been conducted and funded within theOECD Halden Reactor Project, Institute for energy technology (IFE), Halden,Norway.
References
1. Alexander, C., Ishikawa, S., Silverstein, M., Jacobson, M., Fiksdahl-King, I., Angel,S.: A Pattern Language: Towns, Buildings, Construction. Oxford University Press(1977)
2. Buschmann, F., Henney, K., Schmidt D.C.: Pattern-Oriented Software Architecture:On Patterns and Pattern Languages. Vol. 5, Wiley (2007)
3. Gamma, E., Helm, R., Johnson, R., and Vlissides, J.: Design Patterns: Elements ofReusable Object-Oriented Software. Addison-Wesley (1995)
4. GSN Working Group: GSN Community Standard, version 1.0 (2011)5. Hauge, A.A., Stølen, K.: A Pattern Based Method for Safe Control Conceptualisa-
tion Exemplified Within Nuclear Power Production, HWR-1029, Institute for energytechnology, OECD Halden Reactor Project, Halden, Norway (to appear)
6. IEC: Nuclear Power Plants – Instrumentation and Control Important to Safety –Classification of Instrumentation and Control Functions. IEC-61226, InternationalElectrotechnical Commission (2009)
7. Jackson, M.: Problem Frames: Analyzing and Structuring Software DevelopmentProblems. Addison-Wesley (2001)
8. Lokhov, A.: Technical and Economic Aspects of Load Following with Nuclear PowerPlants. Nuclear Development Division, OECD NEA (2011)
9. The Commission of the European Communities: Commission Regulation (EC) No352/2009 on the Adoption of Common Safety Method on Risk Evaluation and As-sessment, 352/2009/EC (2009)
10. Object Management Group: Unified Modeling Language Specification, version2.4.1 (2011)
24 A. Hauge and K. Stølen
Risk Assessment for Airworthiness Security
Silvia Gil Casals1,2,3
, Philippe Owezarski1,3
, Gilles Descargues2
1CNRS, LAAS, 7 avenue du colonel Roche, F-31400 Toulouse, France {silvia.gil.casals, philippe.owezarski}@laas.fr
2THALES Avionics, 105 av. du General Eisenhower, F-31100 Toulouse, France
[email protected] 3Univ de Toulouse: INSA, LAAS, F-31400 Toulouse, France
Abstract. The era of digital avionics is opening a fabulous opportunity to im-
prove aircraft operational functions, airline dispatch and service continuity. But
arising vulnerabilities could be an open door to malicious attacks. Necessity for
security protection on airborne systems has been officially recognized and new
standards are actually under construction. In order to provide development as-
surance and countermeasures effectiveness evidence to certification authorities,
security objectives and specifications must be clearly identified thanks to a se-
curity risk assessment process. This paper gives main characteristics for a secu-
rity risk assessment methodology to be integrated in the early design of airborne
systems development and compliant with airworthiness security standards.
Keywords: airworthiness, risk assessment, security, safety, avionic networks
1 Introduction
The increasing complexity of aircraft networked systems exposes them to three ad-
verse effects likely to erode flight safety margins: intrinsic component failures, design
or development errors and misuse. Safety1 processes have been capitalizing on expe-
rience to counter such effects and standards were issued to provide guidelines for
safety assessment process and development assurance such as ARP-4754 [1], ARP-
4761 [2], DO-178B [3] and DO-254 [4]. But safety-critical systems segregation from
the Open World tends to become thinner due to the high integration level of airborne
networks: use of Commercial Off-The-Shelf equipments (COTS), Internet access for
passengers as part of the new In-Flight Entertainment (IFE) services, transition from
Line Replaceable Units to field loadable software, evolution from voice-ground-based
to datalink satellite-based communications, more autonomous navigation with e-
Enabled aircrafts, etc. Most of the challenging innovations to offer new services, ease
1 Please note that safety deals with intrinsic failures of a system or a component (due to ageing or design
errors) whereas security deals with the external threats that could cause such failures. Security being a
brand new field in aeronautics, instead of building a process from scratch, the industry is trying to ap-proximate to the well-known safety process, which has reached a certain level of maturity through its 50
years of experience.
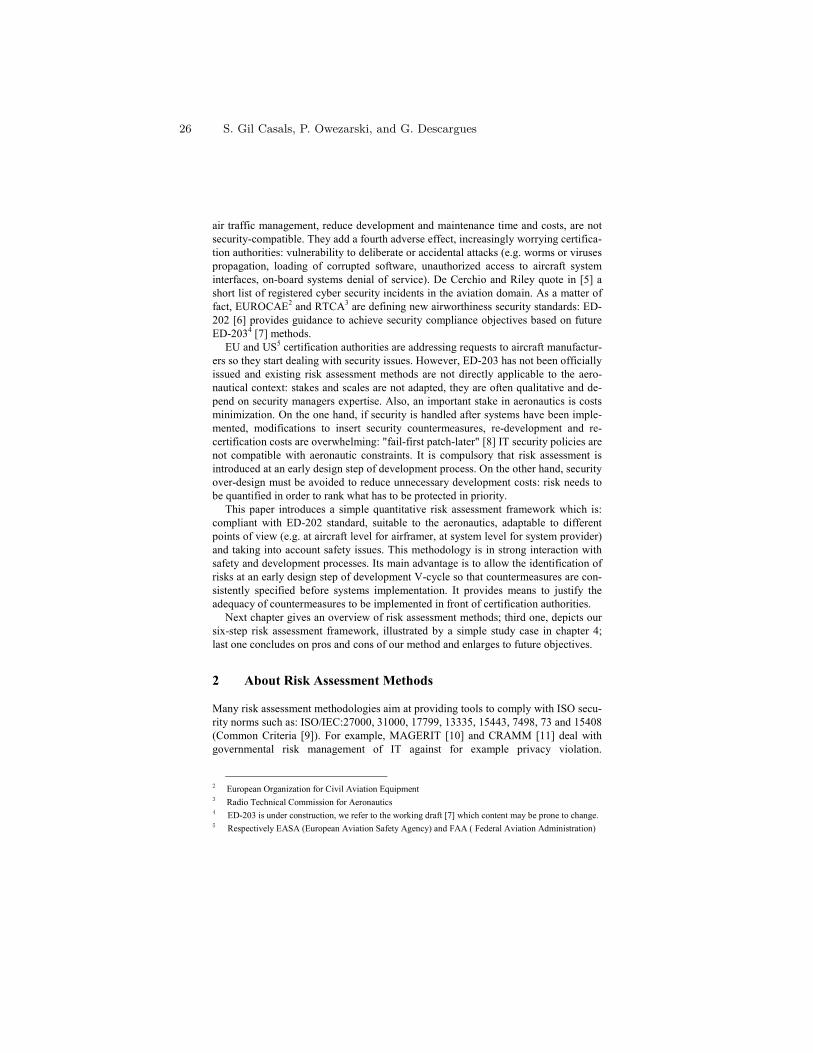
air traffic management, reduce development and maintenance time and costs, are not
security-compatible. They add a fourth adverse effect, increasingly worrying certifica-
tion authorities: vulnerability to deliberate or accidental attacks (e.g. worms or viruses
propagation, loading of corrupted software, unauthorized access to aircraft system
interfaces, on-board systems denial of service). De Cerchio and Riley quote in [5] a
short list of registered cyber security incidents in the aviation domain. As a matter of
fact, EUROCAE2 and RTCA
3 are defining new airworthiness security standards: ED-
202 [6] provides guidance to achieve security compliance objectives based on future
ED-2034 [7] methods.
EU and US5 certification authorities are addressing requests to aircraft manufactur-
ers so they start dealing with security issues. However, ED-203 has not been officially
issued and existing risk assessment methods are not directly applicable to the aero-
nautical context: stakes and scales are not adapted, they are often qualitative and de-
pend on security managers expertise. Also, an important stake in aeronautics is costs
minimization. On the one hand, if security is handled after systems have been imple-
mented, modifications to insert security countermeasures, re-development and re-
certification costs are overwhelming: "fail-first patch-later" [8] IT security policies are
not compatible with aeronautic constraints. It is compulsory that risk assessment is
introduced at an early design step of development process. On the other hand, security
over-design must be avoided to reduce unnecessary development costs: risk needs to
be quantified in order to rank what has to be protected in priority.
This paper introduces a simple quantitative risk assessment framework which is:
compliant with ED-202 standard, suitable to the aeronautics, adaptable to different
points of view (e.g. at aircraft level for airframer, at system level for system provider)
and taking into account safety issues. This methodology is in strong interaction with
safety and development processes. Its main advantage is to allow the identification of
risks at an early design step of development V-cycle so that countermeasures are con-
sistently specified before systems implementation. It provides means to justify the
adequacy of countermeasures to be implemented in front of certification authorities.
Next chapter gives an overview of risk assessment methods; third one, depicts our
six-step risk assessment framework, illustrated by a simple study case in chapter 4;
last one concludes on pros and cons of our method and enlarges to future objectives.
2 About Risk Assessment Methods
Many risk assessment methodologies aim at providing tools to comply with ISO secu-
rity norms such as: ISO/IEC:27000, 31000, 17799, 13335, 15443, 7498, 73 and 15408
(Common Criteria [9]). For example, MAGERIT [10] and CRAMM [11] deal with
governmental risk management of IT against for example privacy violation.
2 European Organization for Civil Aviation Equipment 3 Radio Technical Commission for Aeronautics 4 ED-203 is under construction, we refer to the working draft [7] which content may be prone to change. 5 Respectively EASA (European Aviation Safety Agency) and FAA ( Federal Aviation Administration)
26 S. Gil Casals, P. Owezarski, and G. Descargues
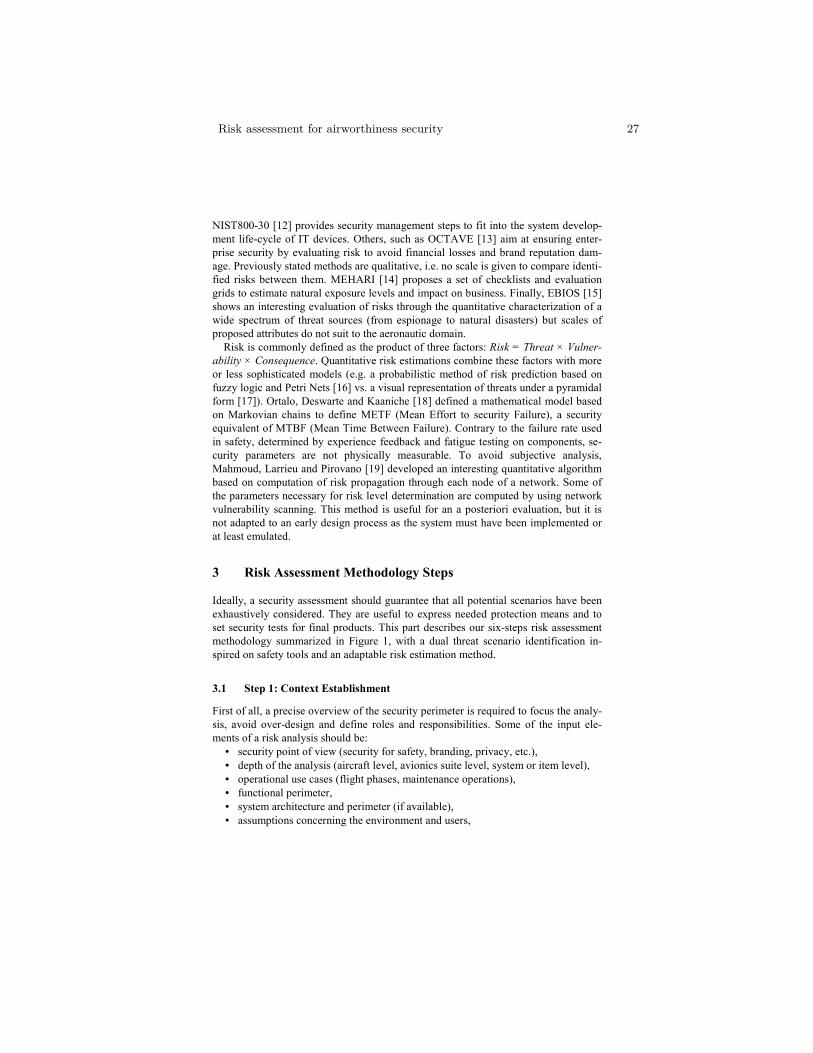
NIST800-30 [12] provides security management steps to fit into the system develop-
ment life-cycle of IT devices. Others, such as OCTAVE [13] aim at ensuring enter-
prise security by evaluating risk to avoid financial losses and brand reputation dam-
age. Previously stated methods are qualitative, i.e. no scale is given to compare identi-
fied risks between them. MEHARI [14] proposes a set of checklists and evaluation
grids to estimate natural exposure levels and impact on business. Finally, EBIOS [15]
shows an interesting evaluation of risks through the quantitative characterization of a
wide spectrum of threat sources (from espionage to natural disasters) but scales of
proposed attributes do not suit to the aeronautic domain.
Risk is commonly defined as the product of three factors: Risk = Threat × Vulner-
ability × Consequence. Quantitative risk estimations combine these factors with more
or less sophisticated models (e.g. a probabilistic method of risk prediction based on
fuzzy logic and Petri Nets [16] vs. a visual representation of threats under a pyramidal
form [17]). Ortalo, Deswarte and Kaaniche [18] defined a mathematical model based
on Markovian chains to define METF (Mean Effort to security Failure), a security
equivalent of MTBF (Mean Time Between Failure). Contrary to the failure rate used
in safety, determined by experience feedback and fatigue testing on components, se-
curity parameters are not physically measurable. To avoid subjective analysis,
Mahmoud, Larrieu and Pirovano [19] developed an interesting quantitative algorithm
based on computation of risk propagation through each node of a network. Some of
the parameters necessary for risk level determination are computed by using network
vulnerability scanning. This method is useful for an a posteriori evaluation, but it is
not adapted to an early design process as the system must have been implemented or
at least emulated.
3 Risk Assessment Methodology Steps
Ideally, a security assessment should guarantee that all potential scenarios have been
exhaustively considered. They are useful to express needed protection means and to
set security tests for final products. This part describes our six-steps risk assessment
methodology summarized in Figure 1, with a dual threat scenario identification in-
spired on safety tools and an adaptable risk estimation method.
3.1 Step 1: Context Establishment
First of all, a precise overview of the security perimeter is required to focus the analy-
sis, avoid over-design and define roles and responsibilities. Some of the input ele-
ments of a risk analysis should be:
• security point of view (security for safety, branding, privacy, etc.),
• depth of the analysis (aircraft level, avionics suite level, system or item level),
• operational use cases (flight phases, maintenance operations),
• functional perimeter,
• system architecture and perimeter (if available),
• assumptions concerning the environment and users,
Risk assessment for airworthiness security 27
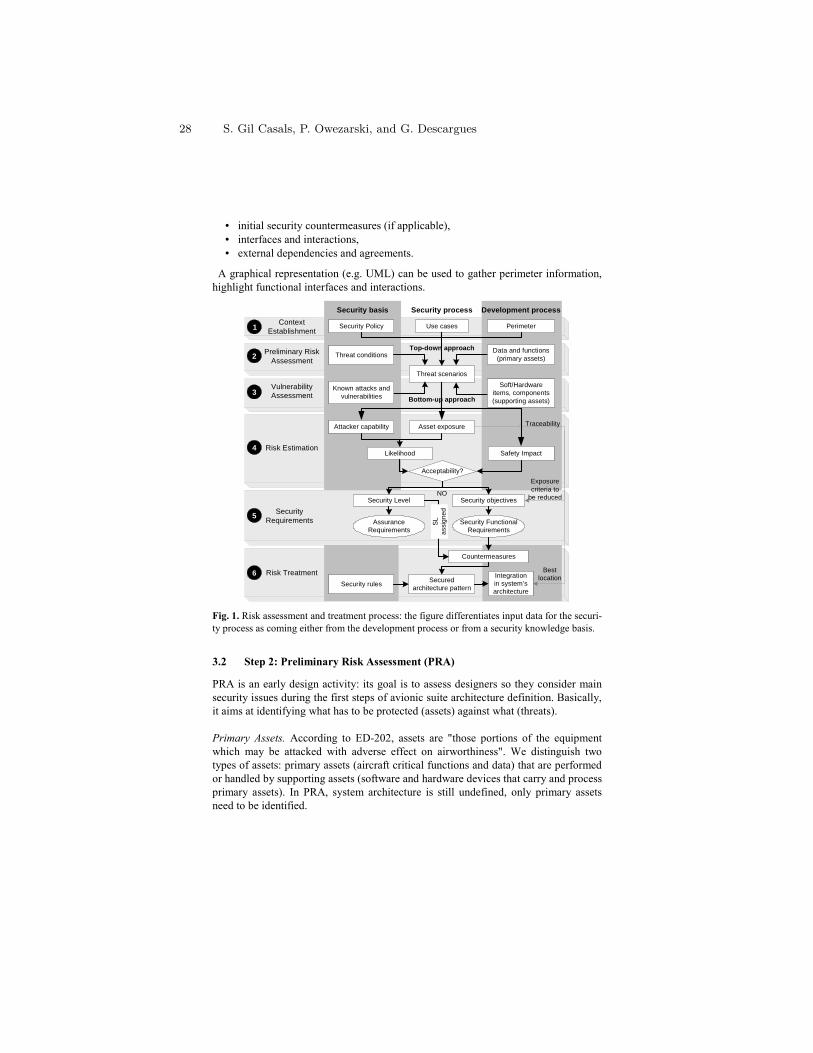
• initial security countermeasures (if applicable),
• interfaces and interactions,
• external dependencies and agreements.
A graphical representation (e.g. UML) can be used to gather perimeter information,
highlight functional interfaces and interactions.
PerimeterSecurity Policy Use cases
Threat conditions
Likelihood Safety Impact
Acceptability?
Security Level Security objectives
AssuranceRequirements
Security FunctionalRequirements
Countermeasures
SL
assi
gned
Threat scenarios
Securedarchitecture pattern
Integrationin system’sarchitecture
NO
Attacker capability Asset exposure
Security rules
Bestlocation
Security basis Development processSecurity process
Data and functions(primary assets)
Soft/Hardwareitems, components(supporting assets)
Known attacks andvulnerabilities
ContextEstablishment
Preliminary RiskAssessment
VulnerabilityAssessment
Risk Estimation
SecurityRequirements
Risk Treatment
1
2
3
4
5
6
Top-down approach
Bottom-up approach
Exposurecriteria to
be reduced
Traceability
Fig. 1. Risk assessment and treatment process: the figure differentiates input data for the securi-
ty process as coming either from the development process or from a security knowledge basis.
3.2 Step 2: Preliminary Risk Assessment (PRA)
PRA is an early design activity: its goal is to assess designers so they consider main
security issues during the first steps of avionic suite architecture definition. Basically,
it aims at identifying what has to be protected (assets) against what (threats).
Primary Assets. According to ED-202, assets are "those portions of the equipment
which may be attacked with adverse effect on airworthiness". We distinguish two
types of assets: primary assets (aircraft critical functions and data) that are performed
or handled by supporting assets (software and hardware devices that carry and process
primary assets). In PRA, system architecture is still undefined, only primary assets
need to be identified.
28 S. Gil Casals, P. Owezarski, and G. Descargues
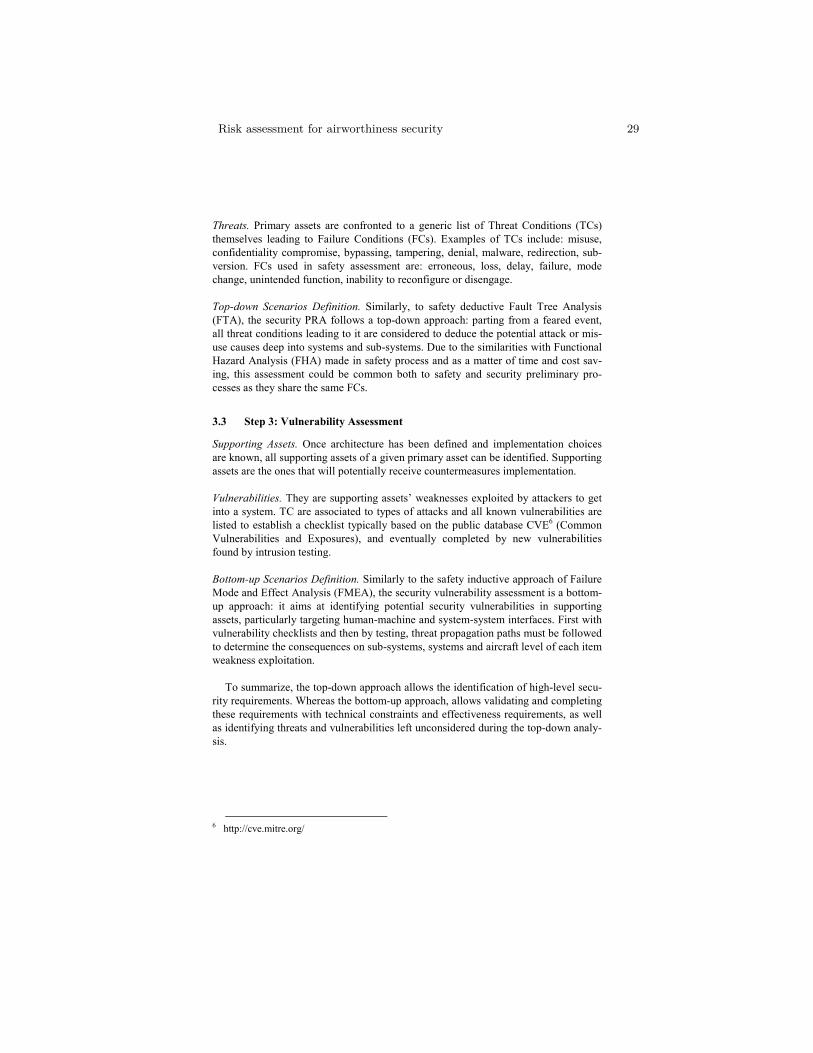
Threats. Primary assets are confronted to a generic list of Threat Conditions (TCs)
themselves leading to Failure Conditions (FCs). Examples of TCs include: misuse,
confidentiality compromise, bypassing, tampering, denial, malware, redirection, sub-
version. FCs used in safety assessment are: erroneous, loss, delay, failure, mode
change, unintended function, inability to reconfigure or disengage.
Top-down Scenarios Definition. Similarly, to safety deductive Fault Tree Analysis
(FTA), the security PRA follows a top-down approach: parting from a feared event,
all threat conditions leading to it are considered to deduce the potential attack or mis-
use causes deep into systems and sub-systems. Due to the similarities with Functional
Hazard Analysis (FHA) made in safety process and as a matter of time and cost sav-
ing, this assessment could be common both to safety and security preliminary pro-
cesses as they share the same FCs.
3.3 Step 3: Vulnerability Assessment
Supporting Assets. Once architecture has been defined and implementation choices
are known, all supporting assets of a given primary asset can be identified. Supporting
assets are the ones that will potentially receive countermeasures implementation.
Vulnerabilities. They are supporting assets’ weaknesses exploited by attackers to get
into a system. TC are associated to types of attacks and all known vulnerabilities are
listed to establish a checklist typically based on the public database CVE6 (Common
Vulnerabilities and Exposures), and eventually completed by new vulnerabilities
found by intrusion testing.
Bottom-up Scenarios Definition. Similarly to the safety inductive approach of Failure
Mode and Effect Analysis (FMEA), the security vulnerability assessment is a bottom-
up approach: it aims at identifying potential security vulnerabilities in supporting
assets, particularly targeting human-machine and system-system interfaces. First with
vulnerability checklists and then by testing, threat propagation paths must be followed
to determine the consequences on sub-systems, systems and aircraft level of each item
weakness exploitation.
To summarize, the top-down approach allows the identification of high-level secu-
rity requirements. Whereas the bottom-up approach, allows validating and completing
these requirements with technical constraints and effectiveness requirements, as well
as identifying threats and vulnerabilities left unconsidered during the top-down analy-
sis.
6 http://cve.mitre.org/
Risk assessment for airworthiness security 29
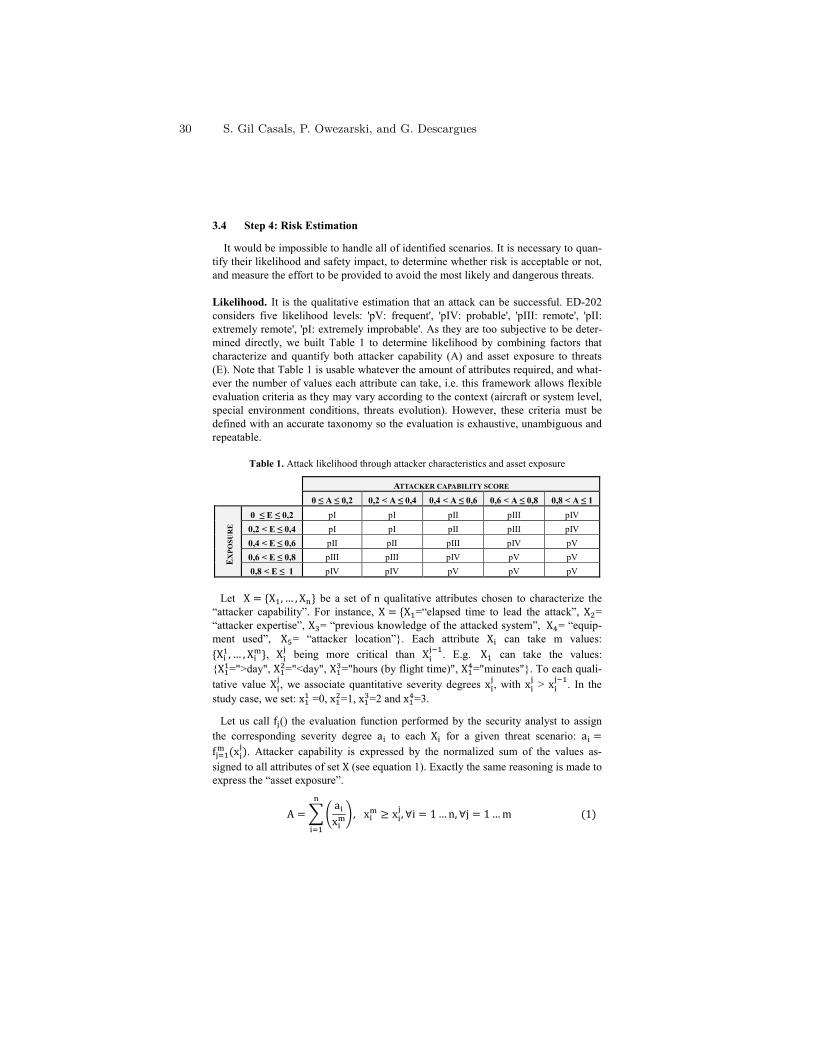
3.4 Step 4: Risk Estimation
It would be impossible to handle all of identified scenarios. It is necessary to quan-
tify their likelihood and safety impact, to determine whether risk is acceptable or not,
and measure the effort to be provided to avoid the most likely and dangerous threats.
Likelihood. It is the qualitative estimation that an attack can be successful. ED-202
considers five likelihood levels: 'pV: frequent', 'pIV: probable', 'pIII: remote', 'pII:
extremely remote', 'pI: extremely improbable'. As they are too subjective to be deter-
mined directly, we built Table 1 to determine likelihood by combining factors that
characterize and quantify both attacker capability (A) and asset exposure to threats
(E). Note that Table 1 is usable whatever the amount of attributes required, and what-
ever the number of values each attribute can take, i.e. this framework allows flexible
evaluation criteria as they may vary according to the context (aircraft or system level,
special environment conditions, threats evolution). However, these criteria must be
defined with an accurate taxonomy so the evaluation is exhaustive, unambiguous and
repeatable.
Table 1. Attack likelihood through attacker characteristics and asset exposure
ATTACKER CAPABILITY SCORE
0 ≤ A ≤ 0,2 0,2 < A ≤ 0,4 0,4 < A ≤ 0,6 0,6 < A ≤ 0,8 0,8 < A ≤ 1
EX
PO
SU
RE
0 ≤ E ≤ 0,2 pI pI pII pIII pIV
0,2 < E ≤ 0,4 pI pI pII pIII pIV
0,4 < E ≤ 0,6 pII pII pIII pIV pV
0,6 < E ≤ 0,8 pIII pIII pIV pV pV
0,8 < E ≤ 1 pIV pIV pV pV pV
Let X � �X�, … , X�� be a set of n qualitative attributes chosen to characterize the
“attacker capability”. For instance, X � �X�=“elapsed time to lead the attack”, X=
“attacker expertise”, X= “previous knowledge of the attacked system”, X�= “equip-
ment used”, X = “attacker location”}. Each attribute X� can take m values:
�X�� , … , X���, X�� being more critical than X����. E.g. X� can take the values:
{X��=">day", X�="<day", X�="hours (by flight time)", X��="minutes"}. To each quali-
tative value X��, we associate quantitative severity degrees x��, with x�� > x����. In the
study case, we set: x�� =0, x�=1, x�=2 and x��=3.
Let us call f�() the evaluation function performed by the security analyst to assign
the corresponding severity degree a� to each X� for a given threat scenario: a� �f���� �x���. Attacker capability is expressed by the normalized sum of the values as-
signed to all attributes of set X (see equation 1). Exactly the same reasoning is made to
express the “asset exposure”.
A � � � a�x���
�
���, x�� � x��, �i � 1 … n, �j � 1 … m �1�
30 S. Gil Casals, P. Owezarski, and G. Descargues
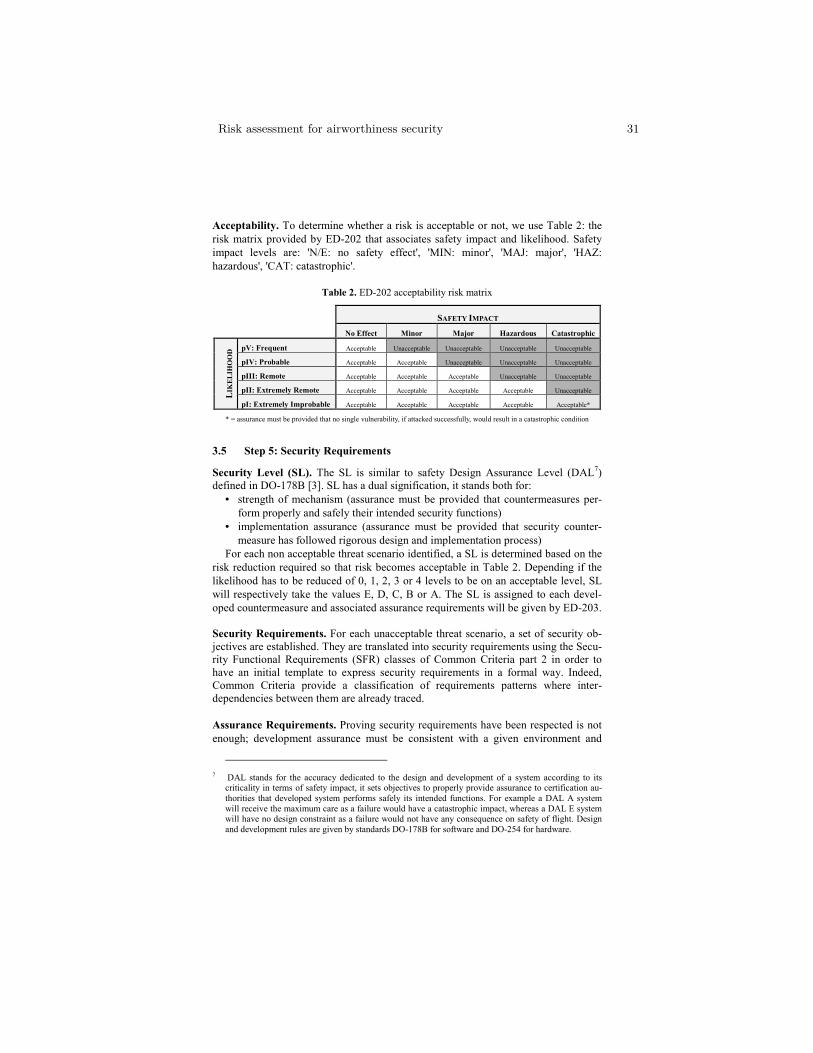
Acceptability. To determine whether a risk is acceptable or not, we use Table 2: the
risk matrix provided by ED-202 that associates safety impact and likelihood. Safety
impact levels are: 'N/E: no safety effect', 'MIN: minor', 'MAJ: major', 'HAZ:
hazardous', 'CAT: catastrophic'.
Table 2. ED-202 acceptability risk matrix
SAFETY IMPACT
No Effect Minor Major Hazardous Catastrophic
LIK
EL
IHO
OD
pV: Frequent Acceptable Unacceptable Unacceptable Unacceptable Unacceptable
pIV: Probable Acceptable Acceptable Unacceptable Unacceptable Unacceptable
pIII: Remote Acceptable Acceptable Acceptable Unacceptable Unacceptable
pII: Extremely Remote Acceptable Acceptable Acceptable Acceptable Unacceptable
pI: Extremely Improbable Acceptable Acceptable Acceptable Acceptable Acceptable*
* = assurance must be provided that no single vulnerability, if attacked successfully, would result in a catastrophic condition
3.5 Step 5: Security Requirements
Security Level (SL). The SL is similar to safety Design Assurance Level (DAL7)
defined in DO-178B [3]. SL has a dual signification, it stands both for:
• strength of mechanism (assurance must be provided that countermeasures per-
form properly and safely their intended security functions)
• implementation assurance (assurance must be provided that security counter-
measure has followed rigorous design and implementation process)
For each non acceptable threat scenario identified, a SL is determined based on the
risk reduction required so that risk becomes acceptable in Table 2. Depending if the
likelihood has to be reduced of 0, 1, 2, 3 or 4 levels to be on an acceptable level, SL
will respectively take the values E, D, C, B or A. The SL is assigned to each devel-
oped countermeasure and associated assurance requirements will be given by ED-203.
Security Requirements. For each unacceptable threat scenario, a set of security ob-
jectives are established. They are translated into security requirements using the Secu-
rity Functional Requirements (SFR) classes of Common Criteria part 2 in order to
have an initial template to express security requirements in a formal way. Indeed,
Common Criteria provide a classification of requirements patterns where inter-
dependencies between them are already traced.
Assurance Requirements. Proving security requirements have been respected is not
enough; development assurance must be consistent with a given environment and
7 DAL stands for the accuracy dedicated to the design and development of a system according to its criticality in terms of safety impact, it sets objectives to properly provide assurance to certification au-
thorities that developed system performs safely its intended functions. For example a DAL A system
will receive the maximum care as a failure would have a catastrophic impact, whereas a DAL E system will have no design constraint as a failure would not have any consequence on safety of flight. Design
and development rules are given by standards DO-178B for software and DO-254 for hardware.
Risk assessment for airworthiness security 31
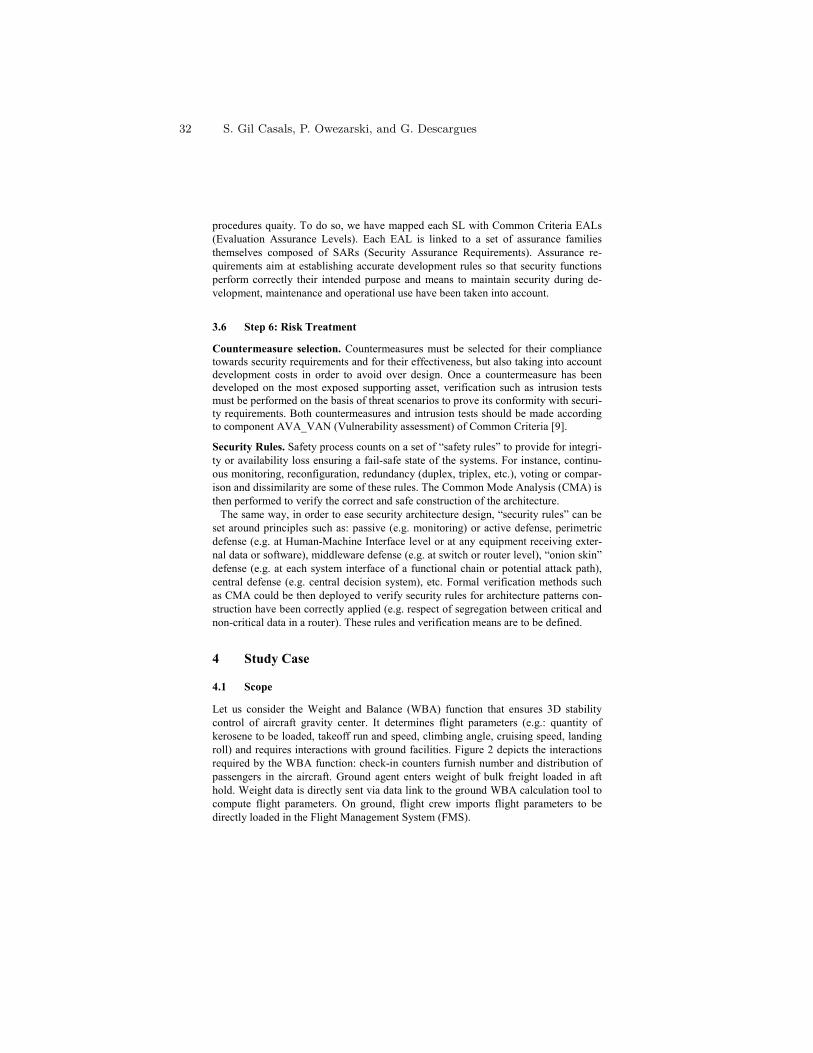
procedures quaity. To do so, we have mapped each SL with Common Criteria EALs
(Evaluation Assurance Levels). Each EAL is linked to a set of assurance families
themselves composed of SARs (Security Assurance Requirements). Assurance re-
quirements aim at establishing accurate development rules so that security functions
perform correctly their intended purpose and means to maintain security during de-
velopment, maintenance and operational use have been taken into account.
3.6 Step 6: Risk Treatment
Countermeasure selection. Countermeasures must be selected for their compliance
towards security requirements and for their effectiveness, but also taking into account
development costs in order to avoid over design. Once a countermeasure has been
developed on the most exposed supporting asset, verification such as intrusion tests
must be performed on the basis of threat scenarios to prove its conformity with securi-
ty requirements. Both countermeasures and intrusion tests should be made according
to component AVA_VAN (Vulnerability assessment) of Common Criteria [9].
Security Rules. Safety process counts on a set of “safety rules” to provide for integri-
ty or availability loss ensuring a fail-safe state of the systems. For instance, continu-
ous monitoring, reconfiguration, redundancy (duplex, triplex, etc.), voting or compar-
ison and dissimilarity are some of these rules. The Common Mode Analysis (CMA) is
then performed to verify the correct and safe construction of the architecture.
The same way, in order to ease security architecture design, “security rules” can be
set around principles such as: passive (e.g. monitoring) or active defense, perimetric
defense (e.g. at Human-Machine Interface level or at any equipment receiving exter-
nal data or software), middleware defense (e.g. at switch or router level), “onion skin”
defense (e.g. at each system interface of a functional chain or potential attack path),
central defense (e.g. central decision system), etc. Formal verification methods such
as CMA could be then deployed to verify security rules for architecture patterns con-
struction have been correctly applied (e.g. respect of segregation between critical and
non-critical data in a router). These rules and verification means are to be defined.
4 Study Case
4.1 Scope
Let us consider the Weight and Balance (WBA) function that ensures 3D stability
control of aircraft gravity center. It determines flight parameters (e.g.: quantity of
kerosene to be loaded, takeoff run and speed, climbing angle, cruising speed, landing
roll) and requires interactions with ground facilities. Figure 2 depicts the interactions
required by the WBA function: check-in counters furnish number and distribution of
passengers in the aircraft. Ground agent enters weight of bulk freight loaded in aft
hold. Weight data is directly sent via data link to the ground WBA calculation tool to
compute flight parameters. On ground, flight crew imports flight parameters to be
directly loaded in the Flight Management System (FMS).
32 S. Gil Casals, P. Owezarski, and G. Descargues
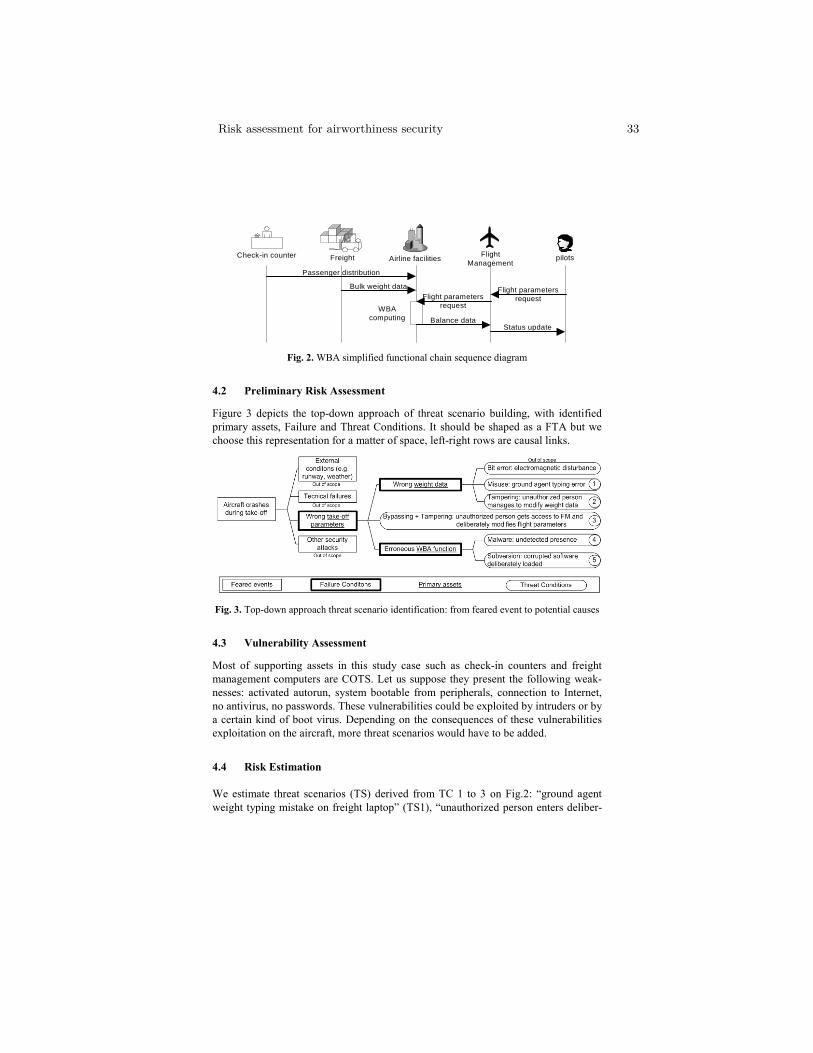
Check-in counter Airline facilitiesFreight
Passenger distribution
Bulk weight data
Balance dataStatus update
Flight parameters request
pilots
WBA computing
Flight parameters request
Flight Management
Fig. 2. WBA simplified functional chain sequence diagram
4.2 Preliminary Risk Assessment
Figure 3 depicts the top-down approach of threat scenario building, with identified
primary assets, Failure and Threat Conditions. It should be shaped as a FTA but we
choose this representation for a matter of space, left-right rows are causal links.
Fig. 3. Top-down approach threat scenario identification: from feared event to potential causes
4.3 Vulnerability Assessment
Most of supporting assets in this study case such as check-in counters and freight
management computers are COTS. Let us suppose they present the following weak-
nesses: activated autorun, system bootable from peripherals, connection to Internet,
no antivirus, no passwords. These vulnerabilities could be exploited by intruders or by
a certain kind of boot virus. Depending on the consequences of these vulnerabilities
exploitation on the aircraft, more threat scenarios would have to be added.
4.4 Risk Estimation
We estimate threat scenarios (TS) derived from TC 1 to 3 on Fig.2: “ground agent
weight typing mistake on freight laptop” (TS1), “unauthorized person enters deliber-
Risk assessment for airworthiness security 33
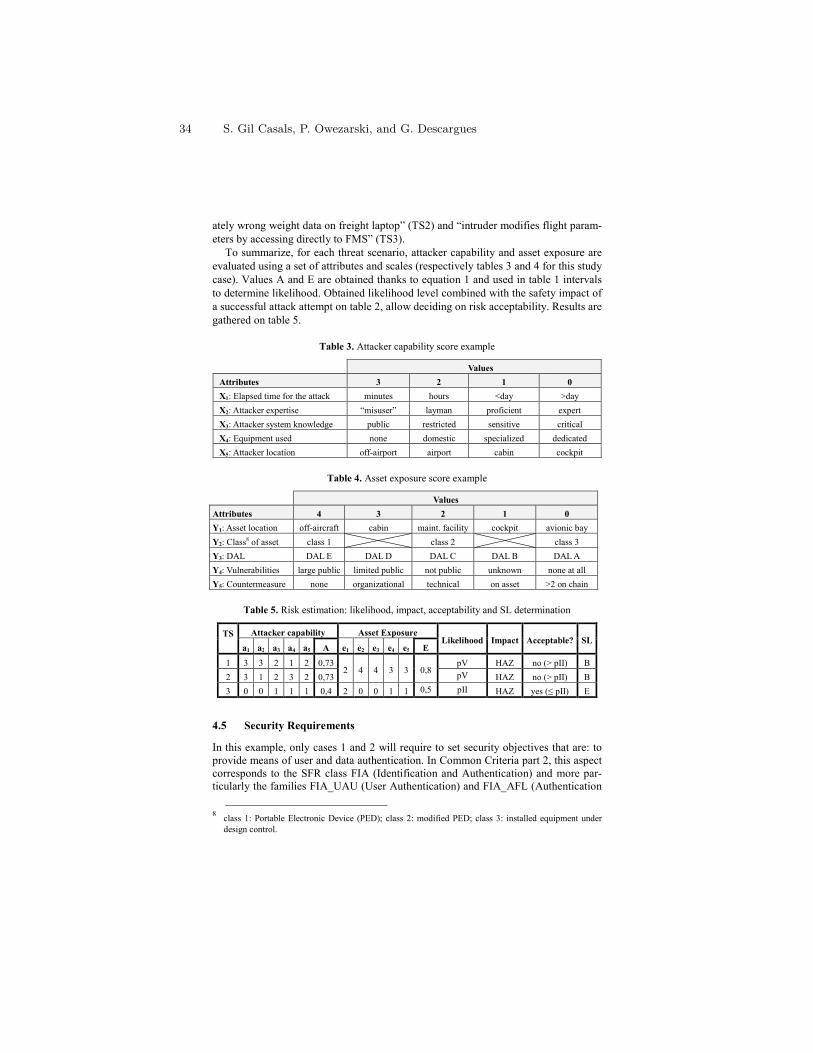
ately wrong weight data on freight laptop” (TS2) and “intruder modifies flight param-
eters by accessing directly to FMS” (TS3).
To summarize, for each threat scenario, attacker capability and asset exposure are
evaluated using a set of attributes and scales (respectively tables 3 and 4 for this study
case). Values A and E are obtained thanks to equation 1 and used in table 1 intervals
to determine likelihood. Obtained likelihood level combined with the safety impact of
a successful attack attempt on table 2, allow deciding on risk acceptability. Results are
gathered on table 5.
Table 3. Attacker capability score example
Values
Attributes 3 2 1 0
X1: Elapsed time for the attack minutes hours <day >day
X2: Attacker expertise “misuser” layman proficient expert
X3: Attacker system knowledge public restricted sensitive critical
X4: Equipment used none domestic specialized dedicated
X5: Attacker location off-airport airport cabin cockpit
Table 4. Asset exposure score example
Values
Attributes 4 3 2 1 0
Y1: Asset location off-aircraft cabin maint. facility cockpit avionic bay
Y2: Class8 of asset class 1 class 2 class 3
Y3: DAL DAL E DAL D DAL C DAL B DAL A
Y4: Vulnerabilities large public limited public not public unknown none at all
Y5: Countermeasure none organizational technical on asset >2 on chain
Table 5. Risk estimation: likelihood, impact, acceptability and SL determination
TS
Attacker capability Asset Exposure Likelihood Impact Acceptable? SL
a1 a2 a3 a4 a5 A e1 e2 e3 e4 e5 E
1 3 3 2 1 2 0,73 2 4 4 3 3 0,8
pV HAZ no (> pII) B
2 3 1 2 3 2 0,73 pV HAZ no (> pII) B
3 0 0 1 1 1 0,4 2 0 0 1 1 0,5 pII HAZ yes (≤ pII) E
4.5 Security Requirements
In this example, only cases 1 and 2 will require to set security objectives that are: to
provide means of user and data authentication. In Common Criteria part 2, this aspect
corresponds to the SFR class FIA (Identification and Authentication) and more par-
ticularly the families FIA_UAU (User Authentication) and FIA_AFL (Authentication
8 class 1: Portable Electronic Device (PED); class 2: modified PED; class 3: installed equipment under
design control.
34 S. Gil Casals, P. Owezarski, and G. Descargues
Failure Handling). An example of SFR is “FIA_UAU.2.1: The system shall require
each user to be successfully authenticated before allowing any other actions on behalf
of that user” [9]. Even if case 3 is not handled, the threat scenario and its risk evalua-
tion must be traced so that risk acceptance can be justifiable in front of certification
authorities. For case 3, the justification is that only an expert who has a critical
knowledge of the system can break into it. It is considered that company document
storage and security policy is trusted enough.
4.6 Risk Treatment
For cases 1 and 2, an organizational countermeasure is having a third party checking
the weight data entered by ground agent. For case 1, a technical countermeasure is
simply having the software used by ground agent asking to type twice the value to
avoid typing mistakes. For case 2, a personal authentication password should be add-
ed to ground agent computer. If case 3 was unacceptable, file security management
should be enhanced.
5 Conclusion
This paper justifies the need to develop an efficient risk assessment method to build
secured architectures for digital aircrafts. We aim at introducing security considera-
tions at an early design step of the development, allowing a certain degree of freedom
to use attributes that best fit to the scope of analysis. Criteria taxonomy rules are to be
improved by practice to make procedures as systematic and accurate as possible.
However the exhaustiveness of threat scenarios identification cannot be proved nor
guaranteed. Readjustments will have to be made to comply with future ED-203 modi-
fications. This methodology has been tested on various examples and then applied on
a real case of security certification. It has been agreed by the certification authority
provided that intrusion test results validate the coherence of identified threat scenarios
and eventually reveal new vulnerabilities.
References
1. SAE International (Society of Automotive Engineers, Inc.): Certification Considerations
for Highly-Integrated Or Complex Aircraft Systems (ARP-4754). USA (1996)
2. SAE International (Society of Automotive Engineers): Guidelines and methods for
constructing the safety assessment process on civil airborne systems and equipment (ARP-
4761). USA (1996)
3. Radio Technical Commission for Aeronautics (RTCA SC-167) and European Organization
for Civil Aviation Electronics (EUROCAE WG-12): Software considerations in airborne
systems and equipment certification (DO-178B/ED-12). Washington, USA (1992)
4. European Organization for Civil Aviation Electronics (EUROCAE WG-46) and Radio
Technical Commission for Aeronautics (RTCA SC-180): Design assurance guidance for
airborne electronic hardware (DO-254/ED-80). Paris, France (2000)
Risk assessment for airworthiness security 35
5. R. De Cerchio, C. Riley : Aircraft systems cyber security. In: IEEE/AIAA Digital
Avionics Systems Conference, pp.1C3.1-1C3.7. Seattle, USA (2011)
6. European Organization for Civil Aviation Equipment (EUROCAE WG-72) and Radio
Technical Commission for Aeronautics (RTCA SC-216): Airworthiness security process
specification (ED-202). (2010)
7. RTCA SC-216 and EUROCAE WG-72: Airworthiness security methods and
considerations (ED-203). Working draft version rev.9.5 (2011)
8. Jacob J.M.: High assurance security and safety for digital avionics. In: 23rd IEEE/AIAA
Digital Avionics Systems Conference, vol. 2, pp. 8.E.4-8.1-9. Salt Lake City, USA (2004)
9. International Organization for Standardization: Common Criteria for Information
Technology Security Evaluation (CC v.3.1). <http://www.commoncriteriaportal.org>,
(2009)
10. Ministerio de Administraciones Publicas (Spanish Ministry for Public Administrations),
MAGERIT. Spain (2005)
11. Insight Consulting: CRAMM (CCTA Risk Analysis and Management Method). United
Kingdom (2003)
12. National Institute for Standards and Technology (NIST): Risk Management Guide for In-
formation Technology systems. United States (2002)
13. Carnegie Mellon University, SEI (Software Engineering Institute): OCTAVE v2.0. USA
(2005)
14. CLUSIF (Club for the Security of Information in France): MEHARI (Method for Harmo-
nized Analysis of Risk). France (2010)
15. Direction Centrale de la Sécurité des Systèmes d’Information (DCSSI): EBIOS -
Expression des Besoins et Identification des Objectifs de Sécurité. Paris, France (2004)
16. Liao N., Li F., Song Y.: Research on real-time network security risk assessment and
forecast. In: 2010 International Conference on Intelligent Computation Technology and
Automation (ICICTA), Vol.3, pp.84-87. Changsha, China (2010)
17. Alhabeeb M., Almuhaideb A., Dung L.P., Srinivasan B.: Information Security Threats
Classification Pyramid. In: 24th IEEE International Conference on Advanced Information
Networking and Applications Workshops, pp. 208-213. Paderborn, Germany (2010)
18. Ortalo R., Deswarte Y., Kaaniche M.: Experimenting with quantitative evaluation tools for
monitoring operational security. In: 6th International Conference on Dependable
Computing for Critical Application (DCCA-6). Garmish, Germany (1997)
19. Ben Mahmoud M.S., Larrieu N., Pirovano A.: A risk propagation based quantitative
assessment methodology for network security. In: 2011 Conference on Network and
Information Systems Security (SAR-SSI), p.1-9. La Rochelle, France (2011)
36 S. Gil Casals, P. Owezarski, and G. Descargues
A Method for Guided Hazard Identification andRisk Mitigation for Offshore Operations ? ??
Christoph Lasche, Eckard Bode, and Thomas Peikenkamp
OFFIS - Institute for Information Technology,Escherweg 2, 26121 Oldenburg, Germany,
{christoph.laesche,eckard.boede,thomas.peikenkamp }@offis.de
Abstract. One of the effects of the radically changing energy marketis that more and more offshore wind turbines are being constructed. Tomeet the increasing demand for renewable energy, many new companieswith different levels of experience are entering the market. As the con-struction and maintenance of large offshore wind farms is a complex task,safety aspects of these operations are of crucial importance to avoid acci-dents. To this end, we introduce a method that assists in (1) identifyingand precisely describing hazards of a scenario of an offshore operation,(2) quantifying their safety impact, and (3) developing risk mitigationmeans. Based on a guided hazard identification process, a formalizationof hazardous scenarios will be proposed that unambiguously describesthe risks of a given offshore operation. We will demonstrate the feasibil-ity of our approach on a specific offshore scenario.
1 Introduction
The radical change in the energy market towards renewable energy productionthat has been initiated by politics causes a high demand for wind turbines to bebuilt. Because of concerns regarding noise emissions and scenic impacts, thereare ongoing plans to place more and more wind turbines into offshore wind parks.In Germany, 24 wind parks in the North Sea have been approved so far ([1], [2]).However, the construction of many of these wind parks is delayed.
As such a huge change in a short time can only be realized by a large amountof companies constructing multiple facilities concurrently, a lot new players rushinto the offshore wind energy market. Not all of these companies have extendedexperience in the maritime or offshore sector and are familiar with the requiredsafety assessment procedures. Implementing the necessary practices and pro-cesses is a highly complex task. Not supporting their adoption could be a de-laying factor for the energy change. Recent events ([3], [4]) have shown that
? This work was partially supported by the European Regional Develop-ment Fund (ERDF) within the project Safe Offshore Operations (SOOP),http://soop.offis.de/.
?? This work was partially supported by European Commission for funding the Large-scale integrating project (IP) proposal under the ICT Call 7 (FP7-ICT-2011-7) Designing for Adaptability and evolutioN in System of systems Engineering(DANSE) (No. 287716).
nevertheless these assessments have to take place to protect personnel and en-vironment In many aspects, offshore scenarios fulfil the criteria of a System ofSystem (SoS). Maier[5], for instance, uses five characteristics that, depending ontheir strength, impose different challenges for offshore operations:
• Operational independence of the elements: To a small extend, the people and sys-tems may act independently during an offshore operation. However, they are mostlydirected by guidelines and supervisors.
• Managerial independence of the elements: The systems (e.g. construction ships) areto some extend not depending on other systems during an operation. Nevertheless,a complete independence is not given.
• Evolutionary development: While the first offshore operations had prototypicalcharacter, new technological possibilities as well as political/legal constraints leadto an evolution of the operations, its procedures, and the involved systems.
• Emergent behavior: As of today, there has (to our knowledge) not been a sys-tematical investigation of the interaction of people and systems during offshoreoperations. To perform such an analysis, a model that consistently integrates thebehavior of the involved systems is a preferable solution.
• Geographic distribution: There might be a large geographic distribution as theguidance authorities for an operation might reside onshore whereas the operationitself takes place offshore. Further, the geographic distributions of involved systemsand people offshore has a strong impact on the efficiency.
Therefore, we consider the collection of all systems and persons involved in typi-cal offshore operations as an SoS.
The SOOP project1 aims at supporting planning and execution of safe off-shore operations for construction and maintenance of offshore wind turbines. Aspecial focus is set on the behavior of persons involved. To analyze an operation,a model based approach is used, including modeling the behavior of the involvedpersons, as described in [6]. Thus, a conceptual model is build and maintainedthat describes the interaction of systems and persons as well as the evolution ofthe system. The architecture of the system and thus the conceptual model willbe changing over time as new needs might arise during the project implemen-tation. Another aspect of the SOOP project is the identification and mitigationof possible risks during the planning process while also taking the situation intoconsideration. The results for this will also be used for an online assistant systemthat monitors the mission (e.g. the location of crew and cargo, cf. [7]) and warnsif a hazardous event is emerging. This is intended as a further way to avoid risksduring an offshore operation.
In this paper, we will focus on the risk assessment aspects of the project.We will discuss our current approach in performing those steps and presentour methods we developed for an improved risk identification process. Afterintroducing some terms and definitions, we will first give an overview aboutcurrent hazard identification and risk assessment approaches. Later, we showhow the conceptual model can be used to guide the hazard identification andformalization process and how it can be used for modeling the relevant scenariosand risk mitigation possibilities.
1 http://soop.offis.de/
38 C. Läsche, E. Böde, and T. Peikenkamp
2 Terms and Definitions
To ensure a common understanding of hazard related terms in this paper, wewill give an overview over our definitions for which we follow ISO 26262[8] andIEC 61508[9]. In sec. 4, we will further describe why we use parts of the auto-motive standard in addition to the maritime approaches.
We define a hazard as an event that might lead to harm of humans or ofthe environment. The event that might lead to a hazard is called failure, itis the inability of persons or systems to perform the normative functions. Afailure might be induced by an error which is an abnormal condition; its causeis called fault. An operational situation describes a process or setting duringan operation, and the combination with a hazard is called hazardous event.This term is most commonly used in the automotive context, less often in otherdomains. We introduce it to be able to further differentiate hazards as the impactof a hazard depends on the situation. An example for this is an injury happeningto a person working on a ship. It is less problematic happening while the ship isin the harbor, as transportation to the nearest hospital will take less time thantransporting the person from an offshore location.
According to Vinnem[10], the risk in the offshore sector can be quanti-fied by the expected harm that is caused by a hazard and its probability. Inour approach that takes some aspects of the ISO 26262 into consideration,we extend this with the controllability of a hazard. A quantification respectingthese parameters would describe the risk of an operation as Risk(Hazardous Event) =∑
i(Probability of independent causei)×Consequence×Controllability. The controllability reflectsthe ability to avoid harm or damage by timely reacting to a hazardous event.This could be realized by alerting persons of emerging risks, hence they are awareof it and have the possibility to deploy preventive measures. More details on ourextended risk definition can be found in sec. 4.
3 State of Practice in Risk Assessment
Oil and gas companies have collected a lot of experience in the offshore sector.Safety assessments have been performed in this area for a long time and a largeknowledge base exists. Nevertheless, these experiences cannot directly be appliedto offshore wind turbine operations as, although some similarities exist, most ofthe risks differ substantially. For example, there may be a lot of risks regardingfire and explosion when considering oil and gas rigs, as both of them handleignitable compounds. Those are not primary risks when talking about offshorewind turbines. Neither are there risks such as blowouts or leakage. Besides thesedifferences, some operations are common between both types of offshore opera-tions. Therefore, Vinnem[10] has been taken into consideration as a reference toplanning of oil rig related operations. It describes the state of the art in risk anal-ysis in the domain. In detail, it addresses the steps of Quantitative Risk Analysis(QRA), which is a type of risk assessment that is frequently applied to oil and gasrelated offshore operations. Its approach is based in the standards IEC 61508[9]
A Method for Guided Hazard Identification and Risk Mitigation forOffshore Operations 39
(which is also the base for ISO 26262) and IEC 61511[11]. The steps involvedin the QRA approach are depicted in fig. 1, which we have extended with theshaded box (along with annotations of our developed methods). They includeidentifying possible hazards, assessing their risks and developing risk mitigationmeasures if the identified risk is not tolerable. We further describe these stepswhen introducing our modified approach in sec. 4.
In order to identify all possible hazards, Vinnem further introduces HAZID(HAZard IDentification) as an analysis technique, which basically suggests whichsteps need to be performed and which sources should be taken into considerationwhen identifying hazards. The sources include check lists, previous studies, andaccident and failure statistics. Performing the approach requires a lot of manualwork which demands experienced personnel. In newly planned operations, this isa time consuming and expensive process. In addition to this, the HAZID processis not well defined, not structured, and has no source that completely lists therelevant potential hazards or risks. To improve this, we introduce a guided wayof identifying hazards, which is described in sec. 4.
A further approach is Formal Safety Analysis which is also used for offshoresafety assessment[12]. It is based on assigning risks (that are also identified usingHAZID) to three levels: intolerable, as low as is reasonably practicable (ALARP),and negligible. Risk assigned to the ALARP level are only accepted if it is shownthat serious hazards have been identified, associated risks are below a tolerancelimit and are reduced “as low as is reasonably practicable”. Because this conceptdoes not rely on quantification and rather uses an argumentative method forassessing risks, the analysis might not be complete and requires a lot of manualexpert effort. Because of this there are no concepts that are interesting for usagewith our model-based approach.
Of particular interest is the current automotive standard as in contrast tothe processes in the offshore sector, those in the automotive sector are moretime and cost efficient. This is due to the strong competition between differentmanufacturers in this industry, the large amount of sold units, the short innova-tion cycles and a high volume market with many different car configurations. Toachieve a cost efficient process of risk assessment, a specialized approach, definedin ISO 26262[8], is used by the automotive companies. In contrast to the offshoresector, the automotive industry also considers controllability as a factor for therisk assessment, which we have described in sec. 2.
4 Introducing a Modified Approach for Offshore RiskAssessment
We will introduce an improved approach of it in the current section as wellas additional methods to support the risk assessment process. Our approach ismodel-based because this kind of analysis has proven to us to be effective inother domains. It enables us to model the expected behavior as well as possibledysfunctional behavior. It also makes it possible to reuse methods and techniques
40 C. Läsche, E. Böde, and T. Peikenkamp
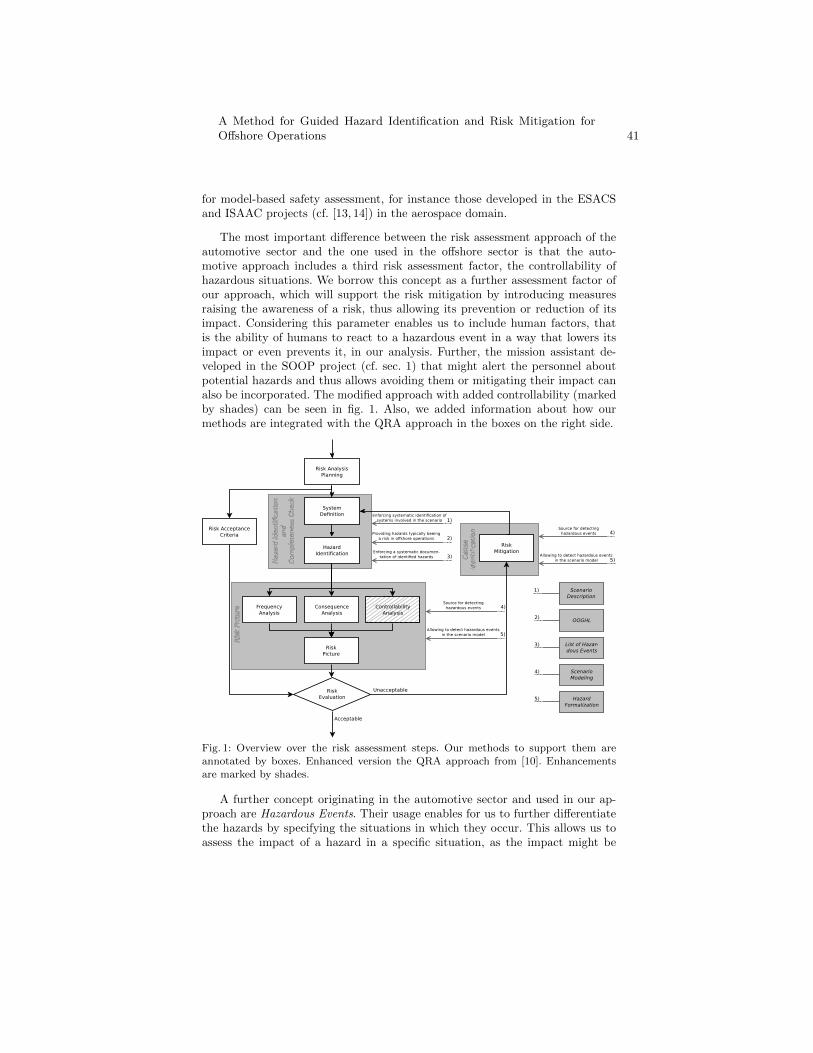
for model-based safety assessment, for instance those developed in the ESACSand ISAAC projects (cf. [13, 14]) in the aerospace domain.
The most important difference between the risk assessment approach of theautomotive sector and the one used in the offshore sector is that the auto-motive approach includes a third risk assessment factor, the controllability ofhazardous situations. We borrow this concept as a further assessment factor ofour approach, which will support the risk mitigation by introducing measuresraising the awareness of a risk, thus allowing its prevention or reduction of itsimpact. Considering this parameter enables us to include human factors, thatis the ability of humans to react to a hazardous event in a way that lowers itsimpact or even prevents it, in our analysis. Further, the mission assistant de-veloped in the SOOP project (cf. sec. 1) that might alert the personnel aboutpotential hazards and thus allows avoiding them or mitigating their impact canalso be incorporated. The modified approach with added controllability (markedby shades) can be seen in fig. 1. Also, we added information about how ourmethods are integrated with the QRA approach in the boxes on the right side.
Fig. 1: Overview over the risk assessment steps. Our methods to support them areannotated by boxes. Enhanced version the QRA approach from [10]. Enhancementsare marked by shades.
A further concept originating in the automotive sector and used in our ap-proach are Hazardous Events. Their usage enables for us to further differentiatethe hazards by specifying the situations in which they occur. This allows us toassess the impact of a hazard in a specific situation, as the impact might be
A Method for Guided Hazard Identification and Risk Mitigation forOffshore Operations 41
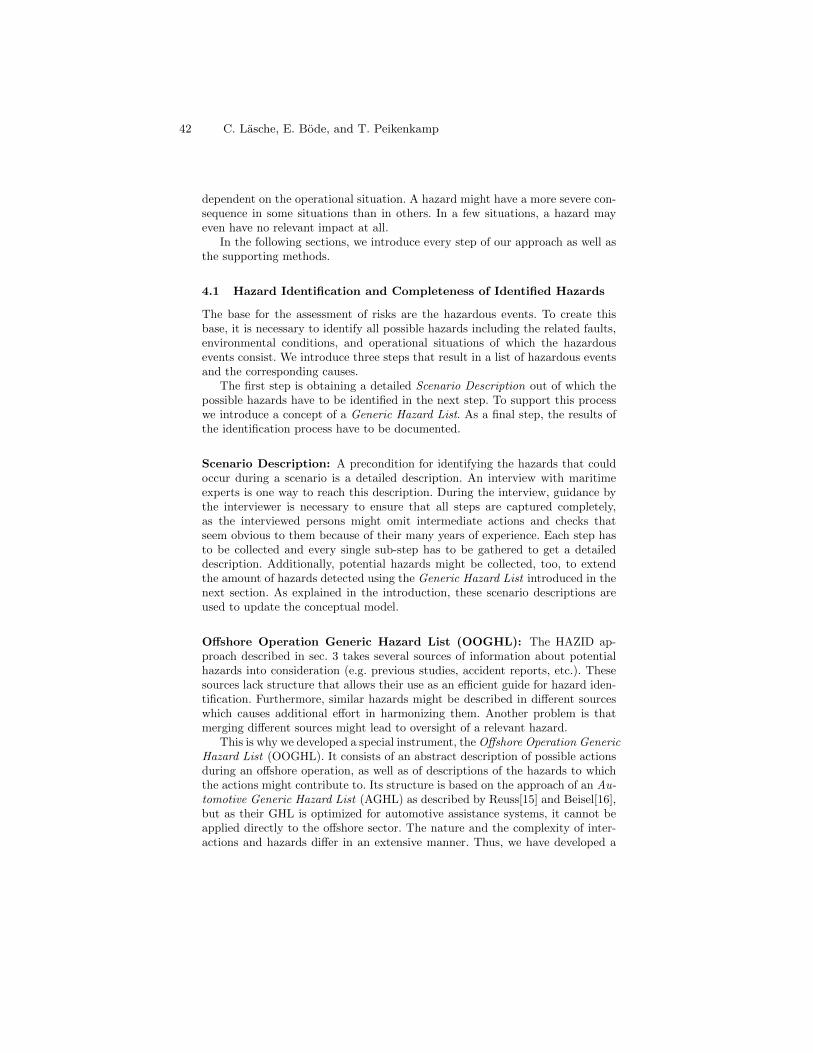
dependent on the operational situation. A hazard might have a more severe con-sequence in some situations than in others. In a few situations, a hazard mayeven have no relevant impact at all.
In the following sections, we introduce every step of our approach as well asthe supporting methods.
4.1 Hazard Identification and Completeness of Identified Hazards
The base for the assessment of risks are the hazardous events. To create thisbase, it is necessary to identify all possible hazards including the related faults,environmental conditions, and operational situations of which the hazardousevents consist. We introduce three steps that result in a list of hazardous eventsand the corresponding causes.
The first step is obtaining a detailed Scenario Description out of which thepossible hazards have to be identified in the next step. To support this processwe introduce a concept of a Generic Hazard List. As a final step, the results ofthe identification process have to be documented.
Scenario Description: A precondition for identifying the hazards that couldoccur during a scenario is a detailed description. An interview with maritimeexperts is one way to reach this description. During the interview, guidance bythe interviewer is necessary to ensure that all steps are captured completely,as the interviewed persons might omit intermediate actions and checks thatseem obvious to them because of their many years of experience. Each step hasto be collected and every single sub-step has to be gathered to get a detaileddescription. Additionally, potential hazards might be collected, too, to extendthe amount of hazards detected using the Generic Hazard List introduced in thenext section. As explained in the introduction, these scenario descriptions areused to update the conceptual model.
Offshore Operation Generic Hazard List (OOGHL): The HAZID ap-proach described in sec. 3 takes several sources of information about potentialhazards into consideration (e.g. previous studies, accident reports, etc.). Thesesources lack structure that allows their use as an efficient guide for hazard iden-tification. Furthermore, similar hazards might be described in different sourceswhich causes additional effort in harmonizing them. Another problem is thatmerging different sources might lead to oversight of a relevant hazard.
This is why we developed a special instrument, the Offshore Operation GenericHazard List (OOGHL). It consists of an abstract description of possible actionsduring an offshore operation, as well as of descriptions of the hazards to whichthe actions might contribute to. Its structure is based on the approach of an Au-tomotive Generic Hazard List (AGHL) as described by Reuss[15] and Beisel[16],but as their GHL is optimized for automotive assistance systems, it cannot beapplied directly to the offshore sector. The nature and the complexity of inter-actions and hazards differ in an extensive manner. Thus, we have developed a
42 C. Läsche, E. Böde, and T. Peikenkamp
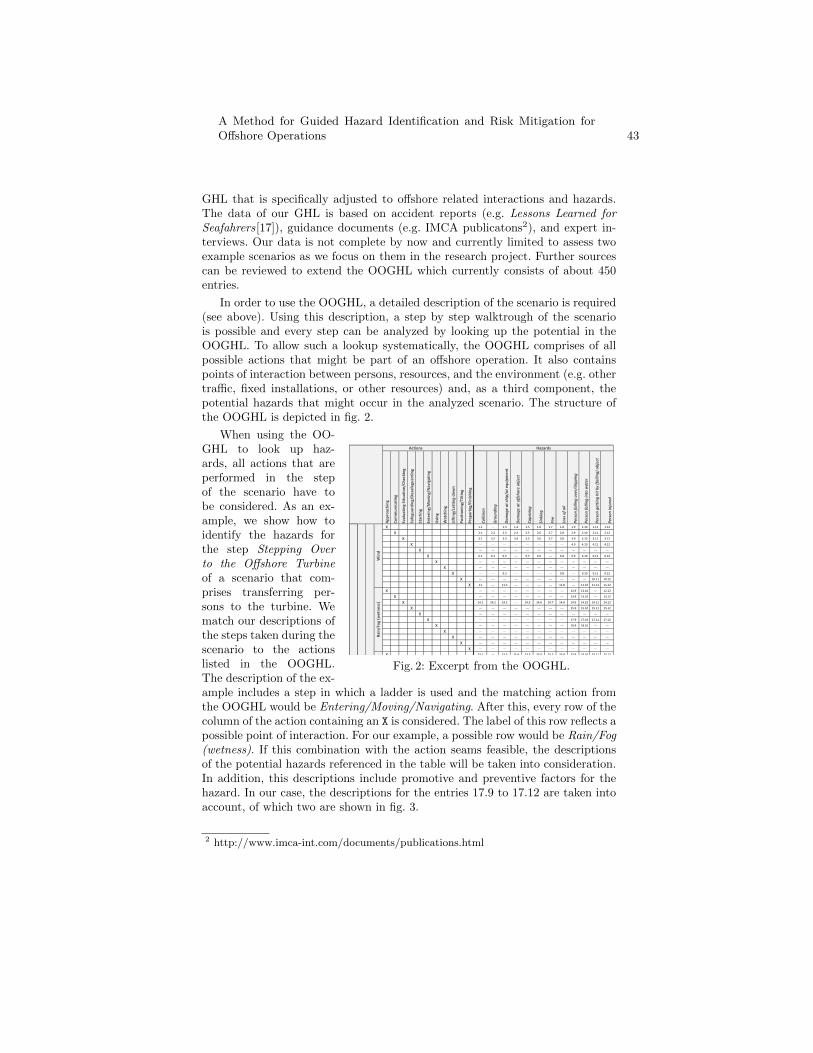
GHL that is specifically adjusted to offshore related interactions and hazards.The data of our GHL is based on accident reports (e.g. Lessons Learned forSeafahrers[17]), guidance documents (e.g. IMCA publicatons2), and expert in-terviews. Our data is not complete by now and currently limited to assess twoexample scenarios as we focus on them in the research project. Further sourcescan be reviewed to extend the OOGHL which currently consists of about 450entries.
In order to use the OOGHL, a detailed description of the scenario is required(see above). Using this description, a step by step walktrough of the scenariois possible and every step can be analyzed by looking up the potential in theOOGHL. To allow such a lookup systematically, the OOGHL comprises of allpossible actions that might be part of an offshore operation. It also containspoints of interaction between persons, resources, and the environment (e.g. othertraffic, fixed installations, or other resources) and, as a third component, thepotential hazards that might occur in the analyzed scenario. The structure ofthe OOGHL is depicted in fig. 2.
Approaching
Communicating
EvaluatingSituation/Checking
Safeguarding/Desafeguarding
Starting
Entering/Moving/Navigating
Using
Watching
Lifting/Lettingdown
Positioning/Tilting
Preparing/Finishing
Collision
Grounding
Damageatship/atequipment
Damageatoffshoreobject
Capsizing
Sinking
Fire
Lossofoil
Personfallingover/slipping
Personfallingintowater
Persongettinghitby(falling)object
Personinjured
X 1.1 ‐‐‐ 1.3 1.4 1.5 1.6 1.7 1.8 1.9 1.10 1.11 1.12
X 2.1 2.2 2.3 2.4 2.5 2.6 2.7 2.8 2.9 2.10 2.11 2.12
X 3.1 3.2 3.3 3.4 3.5 3.6 3.7 3.8 3.9 3.10 3.11 3.12
X ‐‐‐ ‐‐‐ ‐‐‐ ‐‐‐ ‐‐‐ ‐‐‐ ‐‐‐ ‐‐‐ 4.9 4.10 4.11 4.12
X ‐‐‐ ‐‐‐ ‐‐‐ ‐‐‐ ‐‐‐ ‐‐‐ ‐‐‐ ‐‐‐ ‐‐‐ ‐‐‐ ‐‐‐ ‐‐‐
X 6.1 6.2 6.3 ‐‐‐ 6.5 6.6 ‐‐‐ 6.8 6.9 6.10 6.11 6.12
X ‐‐‐ ‐‐‐ ‐‐‐ ‐‐‐ ‐‐‐ ‐‐‐ ‐‐‐ ‐‐‐ ‐‐‐ ‐‐‐ ‐‐‐ ‐‐‐
X ‐‐‐ ‐‐‐ ‐‐‐ ‐‐‐ ‐‐‐ ‐‐‐ ‐‐‐ ‐‐‐ ‐‐‐ ‐‐‐ ‐‐‐ ‐‐‐
X ‐‐‐ ‐‐‐ 9.3 ‐‐‐ ‐‐‐ ‐‐‐ ‐‐‐ 9.8 ‐‐‐ 9.10 9.11 9.12
X ‐‐‐ ‐‐‐ ‐‐‐ ‐‐‐ ‐‐‐ ‐‐‐ ‐‐‐ ‐‐‐ ‐‐‐ ‐‐‐ 10.11 10.12
X 11 ‐‐‐ 11.3 ‐‐‐ ‐‐‐ ‐‐‐ ‐‐‐ 11.8 ‐‐‐ 11.10 11.11 11.12
X ‐‐‐ ‐‐‐ ‐‐‐ ‐‐‐ ‐‐‐ ‐‐‐ ‐‐‐ ‐‐‐ 12.9 12.10 ‐‐‐ 12.12
X ‐‐‐ ‐‐‐ ‐‐‐ ‐‐‐ ‐‐‐ ‐‐‐ ‐‐‐ ‐‐‐ 13.9 13.10 ‐‐‐ 13.12
X 14.1 14.2 14.3 ‐‐‐ 14.5 14.6 14.7 14.8 14.9 14.10 14.11 14.12
X ‐‐‐ ‐‐‐ ‐‐‐ ‐‐‐ ‐‐‐ ‐‐‐ ‐‐‐ ‐‐‐ 15.9 15.10 15.11 15.12
X ‐‐‐ ‐‐‐ ‐‐‐ ‐‐‐ ‐‐‐ ‐‐‐ ‐‐‐ ‐‐‐ ‐‐‐ ‐‐‐ ‐‐‐ ‐‐‐
X ‐‐‐ ‐‐‐ ‐‐‐ ‐‐‐ ‐‐‐ ‐‐‐ ‐‐‐ ‐‐‐ 17.9 17.10 17.11 17.12
X ‐‐‐ ‐‐‐ ‐‐‐ ‐‐‐ ‐‐‐ ‐‐‐ ‐‐‐ ‐‐‐ 18.9 18.10 ‐‐‐ ‐‐‐
X ‐‐‐ ‐‐‐ ‐‐‐ ‐‐‐ ‐‐‐ ‐‐‐ ‐‐‐ ‐‐‐ ‐‐‐ ‐‐‐ ‐‐‐ ‐‐‐
X ‐‐‐ ‐‐‐ ‐‐‐ ‐‐‐ ‐‐‐ ‐‐‐ ‐‐‐ ‐‐‐ ‐‐‐ ‐‐‐ ‐‐‐ ‐‐‐
X ‐‐‐ ‐‐‐ ‐‐‐ ‐‐‐ ‐‐‐ ‐‐‐ ‐‐‐ ‐‐‐ ‐‐‐ ‐‐‐ ‐‐‐ ‐‐‐
X ‐‐‐ ‐‐‐ ‐‐‐ ‐‐‐ ‐‐‐ ‐‐‐ ‐‐‐ ‐‐‐ ‐‐‐ ‐‐‐ ‐‐‐ ‐‐‐
X 23.1 ‐‐‐ 23.3 23.4 23.5 23.6 23.7 23.8 23.9 23.10 23.11 23.12
HazardsActions
Wind
Rain/Fog(wetness)
Fig. 2: Excerpt from the OOGHL.
When using the OO-GHL to look up haz-ards, all actions that areperformed in the stepof the scenario have tobe considered. As an ex-ample, we show how toidentify the hazards forthe step Stepping Overto the Offshore Turbineof a scenario that com-prises transferring per-sons to the turbine. Wematch our descriptions ofthe steps taken during thescenario to the actionslisted in the OOGHL.The description of the ex-ample includes a step in which a ladder is used and the matching action fromthe OOGHL would be Entering/Moving/Navigating. After this, every row of thecolumn of the action containing an X is considered. The label of this row reflects apossible point of interaction. For our example, a possible row would be Rain/Fog(wetness). If this combination with the action seams feasible, the descriptionsof the potential hazards referenced in the table will be taken into consideration.In addition, this descriptions include promotive and preventive factors for thehazard. In our case, the descriptions for the entries 17.9 to 17.12 are taken intoaccount, of which two are shown in fig. 3.
2 http://www.imca-int.com/documents/publications.html
A Method for Guided Hazard Identification and Risk Mitigation forOffshore Operations 43
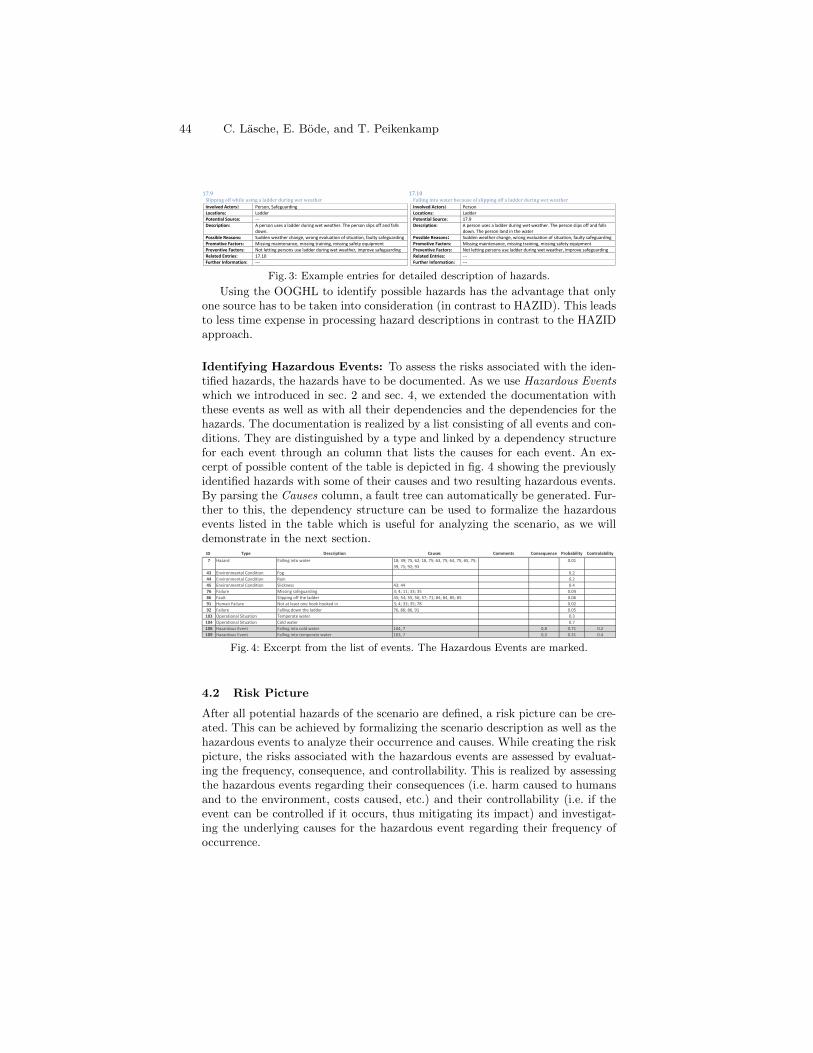
Slipping off while using a ladder during wet weatherInvolved Actors: Person, Safeguarding
Locations: Ladder
Potential Source: ‐‐‐
Description: A person uses a ladder during wet weather. The person slips off and fallsdown.
Possible Reasons: Sudden weather change, wrong evaluation of situation, faulty safeguarding
Promotive Factors: Missing maintenance, missing training, missing safety equipment
Preventive Factors: Not letting persons use ladder during wet weather, improve safeguarding
Related Entries: 17.10
Further Information: ‐‐‐
Falling into water because of slipping off a ladder during wet weatherInvolved Actors: Person
Locations: Ladder
Potential Source: 17.9
Description: A person uses a ladder during wet weather. The person slips off and fallsdown. The person land in the water
Possible Reasons: Sudden weather change, wrong evaluation of situation, faulty safeguarding
Promotive Factors: Missing maintenance, missing training, missing safety equipment
Preventive Factors: Not letting persons use ladder during wet weather, improve safeguarding
Related Entries: ‐‐‐
Further Information: ‐‐‐
17.9 17.10
Fig. 3: Example entries for detailed description of hazards.
Using the OOGHL to identify possible hazards has the advantage that onlyone source has to be taken into consideration (in contrast to HAZID). This leadsto less time expense in processing hazard descriptions in contrast to the HAZIDapproach.
Identifying Hazardous Events: To assess the risks associated with the iden-tified hazards, the hazards have to be documented. As we use Hazardous Eventswhich we introduced in sec. 2 and sec. 4, we extended the documentation withthese events as well as with all their dependencies and the dependencies for thehazards. The documentation is realized by a list consisting of all events and con-ditions. They are distinguished by a type and linked by a dependency structurefor each event through an column that lists the causes for each event. An ex-cerpt of possible content of the table is depicted in fig. 4 showing the previouslyidentified hazards with some of their causes and two resulting hazardous events.By parsing the Causes column, a fault tree can automatically be generated. Fur-ther to this, the dependency structure can be used to formalize the hazardousevents listed in the table which is useful for analyzing the scenario, as we willdemonstrate in the next section.ID Type Description Causes Comments Consequence Probability Controlability
7 Hazard Falling into water 18; 39; 75, 62; 18, 75; 63, 75; 64, 75; 65, 75;
39, 75; 92; 93
0.01
43 Environmental Condition Fog 0.2
44 Environmental Condition Rain 0.2
45 Environmental Condition Slickness 43; 44 0.4
76 Failure Missing safeguarding 3; 4; 11; 33; 35 0.04
86 Fault Slipping off the ladder 45; 54; 55; 56; 57; 71; 84; 84, 85; 85 0.06
91 Human Failure Not at least one hook hooked in 3; 4; 33; 35; 78 0.02
92 Failure Falling down the ladder 76, 86; 86, 91 0.05
103 Operational Situation Temperate water 0.3
104 Operational Situation Cold water 0.7
108 Hazardous Event Falling into cold water 104, 7 0,8 0.71 0.2
109 Hazardous Event Falling into temperate water 103, 7 0,3 0.31 0.4
Fig. 4: Excerpt from the list of events. The Hazardous Events are marked.
4.2 Risk Picture
After all potential hazards of the scenario are defined, a risk picture can be cre-ated. This can be achieved by formalizing the scenario description as well as thehazardous events to analyze their occurrence and causes. While creating the riskpicture, the risks associated with the hazardous events are assessed by evaluat-ing the frequency, consequence, and controllability. This is realized by assessingthe hazardous events regarding their consequences (i.e. harm caused to humansand to the environment, costs caused, etc.) and their controllability (i.e. if theevent can be controlled if it occurs, thus mitigating its impact) and investigat-ing the underlying causes for the hazardous event regarding their frequency ofoccurrence.
44 C. Läsche, E. Böde, and T. Peikenkamp
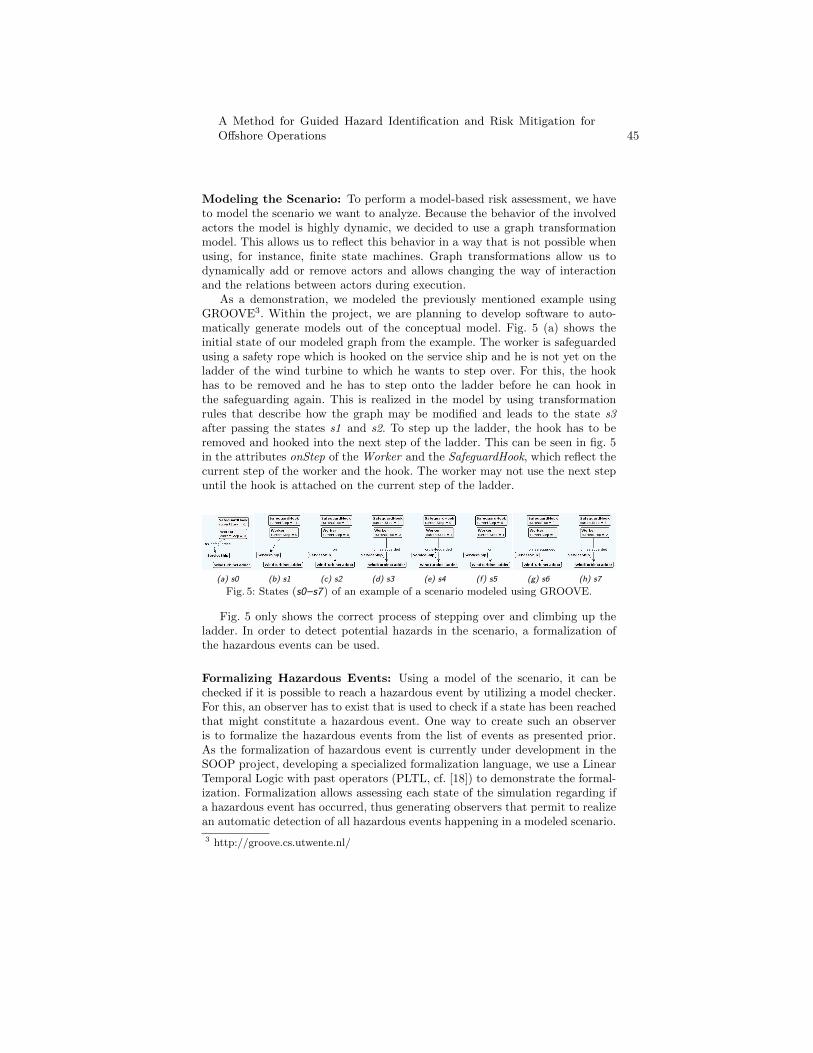
Modeling the Scenario: To perform a model-based risk assessment, we haveto model the scenario we want to analyze. Because the behavior of the involvedactors the model is highly dynamic, we decided to use a graph transformationmodel. This allows us to reflect this behavior in a way that is not possible whenusing, for instance, finite state machines. Graph transformations allow us todynamically add or remove actors and allows changing the way of interactionand the relations between actors during execution.
As a demonstration, we modeled the previously mentioned example usingGROOVE3. Within the project, we are planning to develop software to auto-matically generate models out of the conceptual model. Fig. 5 (a) shows theinitial state of our modeled graph from the example. The worker is safeguardedusing a safety rope which is hooked on the service ship and he is not yet on theladder of the wind turbine to which he wants to step over. For this, the hookhas to be removed and he has to step onto the ladder before he can hook inthe safeguarding again. This is realized in the model by using transformationrules that describe how the graph may be modified and leads to the state s3after passing the states s1 and s2. To step up the ladder, the hook has to beremoved and hooked into the next step of the ladder. This can be seen in fig. 5in the attributes onStep of the Worker and the SafeguardHook, which reflect thecurrent step of the worker and the hook. The worker may not use the next stepuntil the hook is attached on the current step of the ladder.
(a) s0 (b) s1 (c) s2 (d) s3 (e) s4 (f) s5 (g) s6 (h) s7
Fig. 5: States (s0–s7) of an example of a scenario modeled using GROOVE.
Fig. 5 only shows the correct process of stepping over and climbing up theladder. In order to detect potential hazards in the scenario, a formalization ofthe hazardous events can be used.
Formalizing Hazardous Events: Using a model of the scenario, it can bechecked if it is possible to reach a hazardous event by utilizing a model checker.For this, an observer has to exist that is used to check if a state has been reachedthat might constitute a hazardous event. One way to create such an observeris to formalize the hazardous events from the list of events as presented prior.As the formalization of hazardous event is currently under development in theSOOP project, developing a specialized formalization language, we use a LinearTemporal Logic with past operators (PLTL, cf. [18]) to demonstrate the formal-ization. Formalization allows assessing each state of the simulation regarding ifa hazardous event has occurred, thus generating observers that permit to realizean automatic detection of all hazardous events happening in a modeled scenario.
3 http://groove.cs.utwente.nl/
A Method for Guided Hazard Identification and Risk Mitigation forOffshore Operations 45
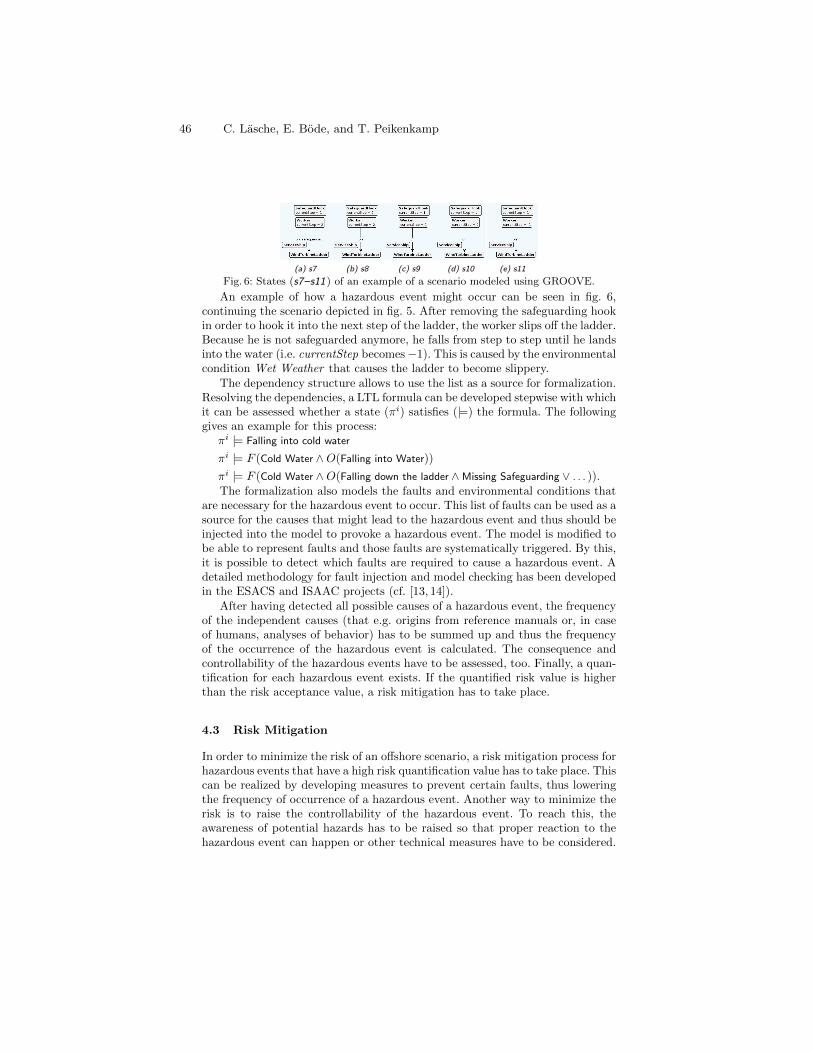
(a) s7 (b) s8 (c) s9 (d) s10 (e) s11
Fig. 6: States (s7–s11) of an example of a scenario modeled using GROOVE.
An example of how a hazardous event might occur can be seen in fig. 6,continuing the scenario depicted in fig. 5. After removing the safeguarding hookin order to hook it into the next step of the ladder, the worker slips off the ladder.Because he is not safeguarded anymore, he falls from step to step until he landsinto the water (i.e. currentStep becomes−1). This is caused by the environmentalcondition Wet Weather that causes the ladder to become slippery.
The dependency structure allows to use the list as a source for formalization.Resolving the dependencies, a LTL formula can be developed stepwise with whichit can be assessed whether a state (πi) satisfies (|=) the formula. The followinggives an example for this process:
πi |= Falling into cold water
πi |= F (Cold Water ∧O(Falling into Water))
πi |= F (Cold Water ∧O(Falling down the ladder ∧Missing Safeguarding ∨ . . . )).The formalization also models the faults and environmental conditions that
are necessary for the hazardous event to occur. This list of faults can be used as asource for the causes that might lead to the hazardous event and thus should beinjected into the model to provoke a hazardous event. The model is modified tobe able to represent faults and those faults are systematically triggered. By this,it is possible to detect which faults are required to cause a hazardous event. Adetailed methodology for fault injection and model checking has been developedin the ESACS and ISAAC projects (cf. [13, 14]).
After having detected all possible causes of a hazardous event, the frequencyof the independent causes (that e.g. origins from reference manuals or, in caseof humans, analyses of behavior) has to be summed up and thus the frequencyof the occurrence of the hazardous event is calculated. The consequence andcontrollability of the hazardous events have to be assessed, too. Finally, a quan-tification for each hazardous event exists. If the quantified risk value is higherthan the risk acceptance value, a risk mitigation has to take place.
4.3 Risk Mitigation
In order to minimize the risk of an offshore scenario, a risk mitigation process forhazardous events that have a high risk quantification value has to take place. Thiscan be realized by developing measures to prevent certain faults, thus loweringthe frequency of occurrence of a hazardous event. Another way to minimize therisk is to raise the controllability of the hazardous event. To reach this, theawareness of potential hazards has to be raised so that proper reaction to thehazardous event can happen or other technical measures have to be considered.
46 C. Läsche, E. Böde, and T. Peikenkamp
A third option is to minimize consequence of a hazardous event if it occurs.To minimize the risk in the example scenario, possible causes for risks can beavoided. The easiest way for this is not to allow the operation to be performedduring wet weather as this removes one cause for the hazardous event, thusreducing the probability.
Another way is to add additional safety measures. As described in the ex-ample description, there is only one safety hook that is attached while using theladder. The use of a second hook, attached in alternation with the first one, fixesthis flaw as there now is at least one hook that might catch the worker whenfalling down the ladder. This way the risk is reduced because of the improvedcontrollability. To minimize the consequence in the example, the worker fallingdown the ladder should be required to wear a life belt so that drowning wouldbecome less likely.
5 Conclusion
In this paper, we have presented a new method to improve risk assessment forconstruction and maintenance operations for offshore wind energy parks. Wehave based our approach on existing techniques used for risk assessment of off-shore and maritime operations. To extend the approach, we adopted methodsfrom the automotive domain for improving and optimizing the risk assessmentprocess by adding the factor Controllability (as defined in ISO 26262) to com-plement the existing factors Frequency and Consequence for forming the riskpicture. Taking controllability into account enables better distinction betweenpossible outcomes of a hazardous event (which is also a concept taken from theISO 26262), thereby improving the correct assessment of the actual risk. Further-more, it improves the ability to evaluate the effectiveness of mitigation measures.This is especially important with respect to the SOOP project in which we planto develop an assistant system that is intended to raise awareness of developingcritical situations and suggest mitigation measures in case a hazard has actuallyhappened (cf. sec. 1).
One of the central improvements is our Generic Hazard List that we arespecifically developing to systematically identify potential hazards and theircauses in offshore operations. The idea of a generic list of hazards was adoptedfrom a similar concept, originating from automotive projects. In our approach,we have taken this tool and further improved it to not only address the topic ofhazard identification, but also to include the possible causes leading to a hazard.Once this data has been captured, we were able to formalize the dependencyrelation between faults, errors, failures, and hazards.
Our next step is to model the behavior of the system, the environment,and participating persons. This behavior model is the necessary preconditionfor further model-based safety analysis of the system. Techniques to be usedinclude those developed during the ESACS and ISAAC projects which enablemodel-based FMEA (Failure Mode and Effect Analysis) and FTA (Fault TreeAnalysis) (cf. [13, 14]).
A Method for Guided Hazard Identification and Risk Mitigation forOffshore Operations 47
References
1. Bundesamt fur Seeschifffahrt und Hydrographie: Genehmigung von OffshoreWindenergieparks. http://www.bsh.de/de/Meeresnutzung/Wirtschaft/Windparks/index.jsp (2012)
2. Bundesministerium fur Umwelt, Naturschutz und Reaktorsicherheit: Entwicklungder Offshore-Windenergienutzung in Deutschland/Offshore wind power deploy-ment in Germany. (2007)
3. Brandt, J.: Stundenlange Suche nach dem Vermissten auf See. Ostfriesen-Zeitung(26.01.2012)
4. Vertikal.net: Fatal accident in Harwich. http://www.vertikal.net/en/news/story/10145/ (21.05.2010)
5. Maier, M.W.: Architecting Principles for Systems-of-Systems. TiAC White PaperRepository, http://www.infoed.com/Open/PAPERS/systems.htm (20.12.2010)
6. Lenk, J.C., Droste, R., Sobiech, C., Ludtke, A., Hahn, A.: Towards CooperativeCognitive Models in Multi-Agent Systems. In: International Conference on Ad-vanced Cognitive Technologies and Applications. (2012)
7. Wehs, T., Janssen, M., Koch, C., von Colln, G.: System Architecture for Data Com-munication and Localization under Harsh Environmental Conditions in MaritimeAutomation. In: IEEE 10th International Conference on Industrial Informatics.(2012)
8. International Organization for Standardization: ISO/DIS 26262 - Road vehiclesFunctional safety. (2011)
9. International Electrotechnical Commission : IEC 61508. (2010)10. Vinnem, J.E.: Offshore Risk Assessment. 2nd edition edn. Springer (2007)11. International Electrotechnical Commission : IEC 61511. (2003)12. Wang, J.: Offshore safety case approach and formal safety assessment of ships.
Journal of Safety Research 33(1) (2002) 81 – 11513. Peikenkamp, T., Cavallo, A., Valacca, L., Bode, E., Pretzer, M., Hahn, E.M.: To-
wards a Unified Model-Based Safety Assessment. In: Proceedings of SAFECOMP.(2006) 275–288
14. Akerlund, O., et al.: ISAAC, a framework for integrated safety analyses of func-tional, geometrical and human aspects. ERTS (2006)
15. Reuß, C.: Automotive Generic Hazard List. Technische Universitat Braunschweig(2009)
16. D. Beisel, C.R..E.S.: Approach of an Automotive Generic Hazard List. In: Pro-ceedings of European Safety and Reliability, ESREL. (2010)
17. IMO: Lessons Learned from Casualities for Presentation to Seafahrers.http://www.imo.org/blast/mainframe.asp?topic id=800 (2004/2006/2010)
18. Latvala, T., Biere, A., Heljanko, K., Junttila, T.: Simple is better: Efficient boundedmodel checking for past LTL. In: VMCAI. Volume 3385 of LNCS, Springer (2005)380–395
48 C. Läsche, E. Böde, and T. Peikenkamp
Risk Analysis and Software Integrity Protection for 4G Network Elements in ASMONIA
Manfred Schäfer
NSN Technology and Strategy - Security Research Nokia Siemens Networks Management International GmbH, Munich, Germany
e-mail: [email protected]
Abstract. The paper gives an insight into current ASMONIA research work on risk analysis, security requirements and defence strategies for 4G network ele-ments. It extends the 3GPP security architecture for 4G networks, in particular when being part of critical infrastructures. Based on identified requirements it focuses on enhanced protection concepts, aiming to improve implementation security of threatened elements in 4G networks through attack resistant mecha-nisms for integrity protection, covering attacks against a system during boot- and execution-time. The concepts concentrate on generic mechanisms that can be applied to 4G network elements and complete other methods researched in ASMONIA. The paper describes infrastructure aspects of software integrity in mobile networks and provides proposals for implementation of verification and enforcement processes inside self-validating target systems. The proposals are based on typical exemplary systems, relying on Linux and QEMU/KVM.
Keywords: Runtime integrity protection, TPM, PKI, certificates, signatures, secure boot, 3GPP security, eNB, HeNB, ASMONIA, Linux, QEMU, KVM.
1 Introduction
The overall goal in ASMONIA [1] is development of security concepts for 4G mo-bile network infrastructures, satisfying relevant security requirements. Research areas comprise integrity protection, attack and malware detection for network elements (NE) and devices, exploitation of attack resilient and flexible cloud computing tech-niques, as well as collaborative information exchange mechanisms. ASMONIA is partially funded by the German Federal Ministry of Education and Research within IT Security Research work program. Primarily, this paper addresses specific security aspects related to NEs in 4G networks, providing an insight into ongoing work. Re-flecting essential, identified security requirements it concentrates on concepts for software (SW) integrity protection. While correlative aspects of integrity protection for devices are examined in accompanying ASMONIA work, e.g., [22], these are not further considered in the context of this paper.
2 Risk Analysis and Requirements for 4G Network Elements
Increasingly, nodes in access network become sensitive parts of mobile communi-cation infrastructures. As 4G networks are completely moving to IP based techniques and widely tend to use general purpose components and open software architectures,
they successively become susceptible for various, partly well known attacks. While relevant security requirements already have been established by 3GPP standardiza-tion, room is left for fulfilment and in particular for attack resilient design and imple-mentation. Taking these aspects into account, below we identify specific challenges and resulting demands and elaborate proposals for typical system architectures and execution environments.
2.1 Security Requirements for 3GPP Access Network
Reflecting peculiarities of the 4G network architecture, relevant security require-ments have been stated in 3GPP standardization. In the context of this paper, particu-larly this affects elements in access networks, such as eNB and HeNB ([20], [21]) terminating security relations between user equipment and backhaul. While [21] ex-plicitly demands integrity for SW and setup of secure environments and stipulates exclusive use of authorized software, [20] postulates principles of secure SW updates, secure boot, and autonomous validation, implying reliable capabilities for self-validation. As 3GPP restricts its focus to co-operability and compatibility aspects (e.g., use of TR.069 in [20]), enough freedom is left for interpretation and implemen-tation. This pertains to the implementation of measures against malicious physical access – implicitly knowing that due to exposition in public areas (and even personal possession as in HeNB case) particular protection must be provided, e.g., for stored keys. Likewise, no explicit requirements exist for the runtime, to assure that a se-curely booted system withstands attacks while operating over weeks or even months.
2.2 ASMONIA related Requirements
The 4G risk analysis made in ASMONIA [3] provides a very detailed insight and assessment on threats and risk influence parameters, regarding individual NEs, also beyond the access network. It substantiates why and which risks are particularly high ranked - suggesting particular security accurateness in access networks. Accordingly, system compromising and insider attacks are among the most relevant threats, which in many cases manifest themselves in unauthorized SW manipulations that have to be made as difficult as possible. Such risks significantly can be lowered by SW integrity and sufficient access protection assuring only authorized firmware and SW to exe-cute. In [2] we consider requirements arising from the need to protect SW integrity mechanisms themselves, particularly when implemented into a target system, relying on sensitive functionalities for validation and enforcement. In addition to compliance with 3GPP (e.g., on proof of origin; autonomous and self-validation; secure boot process; authorized SW updates), enhanced implementation security and in particular runtime protection is motivated taking the typical conditions of 4G systems into ac-count (e.g., long lasting operation after boot; very long product life cycles and re-stricted possibilities for costly manual repair once systems like eNB are installed in field; avoidance of class break risks; preventing systems not to stay unnoticedly in vulnerable state; etc.). In addition, special requirements arise due to the obviating and warning nature of the ASMONIA cooperation and the underlying protection, imply-ing mechanisms for reporting and hardening of network elements. It is argued that the complexity of today’s systems and in particular ‘execution environments’ require a
50 M. Schäfer
combination of defence mechanisms beyond the protection that can be provided by crypto-graphical SW integrity paradigms themselves. Apart from security improve-ments organizational needs are addressed, such as the responsibility which falls to system manufacturers and operators, as well as the directive to keep infrastructure efforts minimal, in particular in highly standardized 3GPP network environment. Regarding practicability, it is advisable to rely on harmonized protection paradigms. These shall be applicable to a variety of products and use cases for integrity protec-tion covering the entire SW life cycle. Such use cases include SW delivery and stor-age, boot, installation, as well as runtime integrity protection, which is the central subject of research in this contribution.
3 Boot Paradigms – a View on TCG Technologies
During the last decade a variety of concepts have been developed assuring SW in-tegrity protection (SW-IP) during boot, many of them centring around Trusted Com-puting Group (TCG) technologies and in particular on usage of Trusted Platform Modules (TPM) [4], which represent available hardware (HW). Examining TPM-based solutions (also see [19]) the following findings deserve to be mentioned:
From paradigm point of view TPMs are based on hash values, calculated (by the system CPU) and sequentially extended during boot. Natively there is no local en-forcement (‘secure boot’) immediately blocking malicious software. Proof of trust-worthiness requires remote attestation, where TPM-signed assertions are assessed by external validators requiring validation processes, which are difficult to manage. Nev-ertheless, no inherent proof of origin for ‘authorized SW’ is included. This could be implemented by some administrative security around (and, e.g., use of sealing mechanisms requiring per-platform provisioning) implying specific extensions to TPM paradigms. Altogether this has implications complicating centralized trust and software management as well as for platform security. If systems are not enabled to take autonomous decisions they must connect to a validation entity in network, even in case the device already executes some malicious SW. Moreover, TPM specific and probably proprietary product specific infrastructure would be needed in highly stan-dardized (3GPP) mobile operator networks, raising many challenges and efforts from cost and integration perspective. Focusing on protecting the boot process TPM para-digms do not efficiently support other use cases for integrity protection. Particularly, missing runtime protection in long-time scenarios we may risk false reporting of in-tegrity, if a system actually has been compromised after boot, via manipulations of running or loaded code. An additional difficulty is that neither integrity protection of data is natively included nor protection of SW during delivery, downloads, installa-tion, or on repositories, and during system operation. Also, revocation is not part of the TPM paradigms and this, again would require proprietary extensions.
From design point of view the TPM is a coprocessor for the system CPU, commu-nicating over the so-called Low Pin Count (LPC) bus. There are many publications showing that the CPU involvement via ‘Core Root of Trust for Measurement (CRTM)’ and the LPC bus are the Achilles’ heel regarding physical attacks. For in-stance, we analysed the findings in [5], [6], [7] and [8], where several attack mecha-nisms have been examined. These are applicable with some low budget equipment –
Risk Analysis and Software Integrity Protection for 4G Network Ele-ments in ASMONIA 51
but requiring physical access to the board level design. It was shown that even ‘Dy-namic Root of Trust (DRTM)’ communication can be hijacked and also simpler tricks seem possible (e.g., blocking LPC communication when exiting DRTM measured code would keep a TPM in its previous state, which would be attested. Even worse, TPM-sealed secrets then would be accessible for malicious code). Even if DRTM has interesting capabilities it is restricted to a few CPUs and thus, could not be applied for general security concepts, as these would depend on decisions related to a system’s board design and to selectable processing units. Summarizing we may state that (wrt. physical attacks) the TPM itself may be secure, but due to its design particularities it does not provide chip-level security for assurance of trustworthy boot processes. Nev-ertheless, an indisputable advantage of TPMs is the hardware (HW) protection of private keys, which could be integrated in authentication processes, reliably prevent-ing a device identity from being cloned.
When looking for alternatives [19] we found that applying PKI based paradigms for SW signing would remove most organisational and cryptographic limitations of TCG’s hash-centric approaches and would reduce efforts in operator network. Signa-tures are well suited for approaches being applicable in very different use cases. Un-fortunately, at the time being supporting general purpose HW is missing and even if CPU vendors are going to implement related mechanisms, these may not be compati-ble among each other and thus may cause portability problems in concepts for secure HW design. Due to these findings and facing the requirements mentioned above, (CPU/OS independent) HW based concepts are advisable, particularly for use cases requiring higher attack resilience against unauthorized physical access.
4 Management of Trusted SW for Network Elements
In the following we introduce ASMONIA concepts to assure SW integrity protec-tion for 4G network elements at boot and at load-time. The proposals reflect security requirements as identified and take paradigmatic considerations into account, as given in Section 3. Consequently, our concepts are built on digital signatures and aligned with PKI principles, which likewise are well suited to cover other use cases for SW integrity protection, as listed above. First we consider the entire infrastructure and its impacts on involved stakeholders and associated domains. Then we describe required generic extensions for an implementation concept, as it could be applied for typical NEs. Built upon this, we present methods for event-triggered, file-based runtime in-tegrity protection in native or virtualized Linux-based execution environments.
4.1 Generic NW Architecture for Software Integrity Prot ection
ASMONIA introduces a generic SW-IP architecture where a NE-vendor is the main responsible party for establishing and controlling protection mechanisms, rely-ing on others to support or to contribute. Involved domains typically comprise:
• The NE vendor (manufacturer), which creates the product and provides means and control mechanisms for integrity protection and by setting policies for validation. The manufacturer also ensures that products are equipped with the components re-quired to reliably support validation and enforcement mechanisms.
52 M. Schäfer
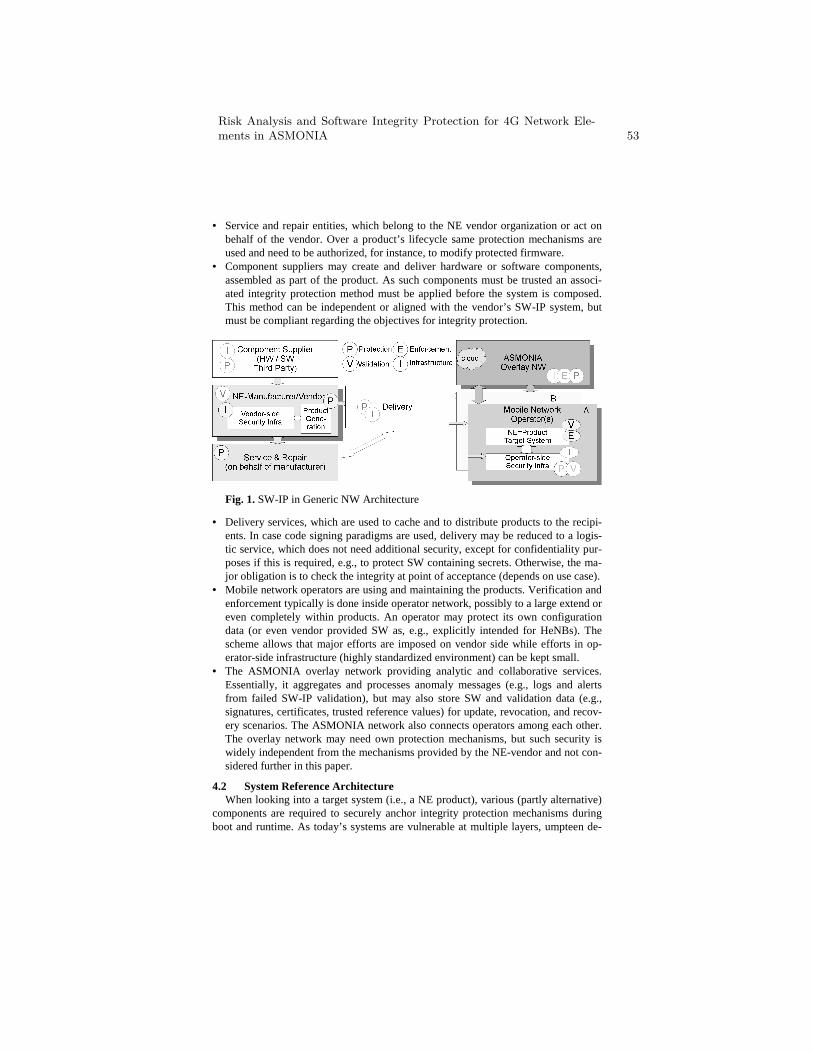
• Service and repair entities, which belong to the NE vendor organization or act on behalf of the vendor. Over a product’s lifecycle same protection mechanisms are used and need to be authorized, for instance, to modify protected firmware.
• Component suppliers may create and deliver hardware or software components, assembled as part of the product. As such components must be trusted an associ-ated integrity protection method must be applied before the system is composed. This method can be independent or aligned with the vendor’s SW-IP system, but must be compliant regarding the objectives for integrity protection.
Fig. 1. SW-IP in Generic NW Architecture
• Delivery services, which are used to cache and to distribute products to the recipi-ents. In case code signing paradigms are used, delivery may be reduced to a logis-tic service, which does not need additional security, except for confidentiality pur-poses if this is required, e.g., to protect SW containing secrets. Otherwise, the ma-jor obligation is to check the integrity at point of acceptance (depends on use case).
• Mobile network operators are using and maintaining the products. Verification and enforcement typically is done inside operator network, possibly to a large extend or even completely within products. An operator may protect its own configuration data (or even vendor provided SW as, e.g., explicitly intended for HeNBs). The scheme allows that major efforts are imposed on vendor side while efforts in op-erator-side infrastructure (highly standardized environment) can be kept small.
• The ASMONIA overlay network providing analytic and collaborative services. Essentially, it aggregates and processes anomaly messages (e.g., logs and alerts from failed SW-IP validation), but may also store SW and validation data (e.g., signatures, certificates, trusted reference values) for update, revocation, and recov-ery scenarios. The ASMONIA network also connects operators among each other. The overlay network may need own protection mechanisms, but such security is widely independent from the mechanisms provided by the NE-vendor and not con-sidered further in this paper.
4.2 System Reference Architecture When looking into a target system (i.e., a NE product), various (partly alternative)
components are required to securely anchor integrity protection mechanisms during boot and runtime. As today’s systems are vulnerable at multiple layers, umpteen de-
Risk Analysis and Software Integrity Protection for 4G Network Ele-ments in ASMONIA 53
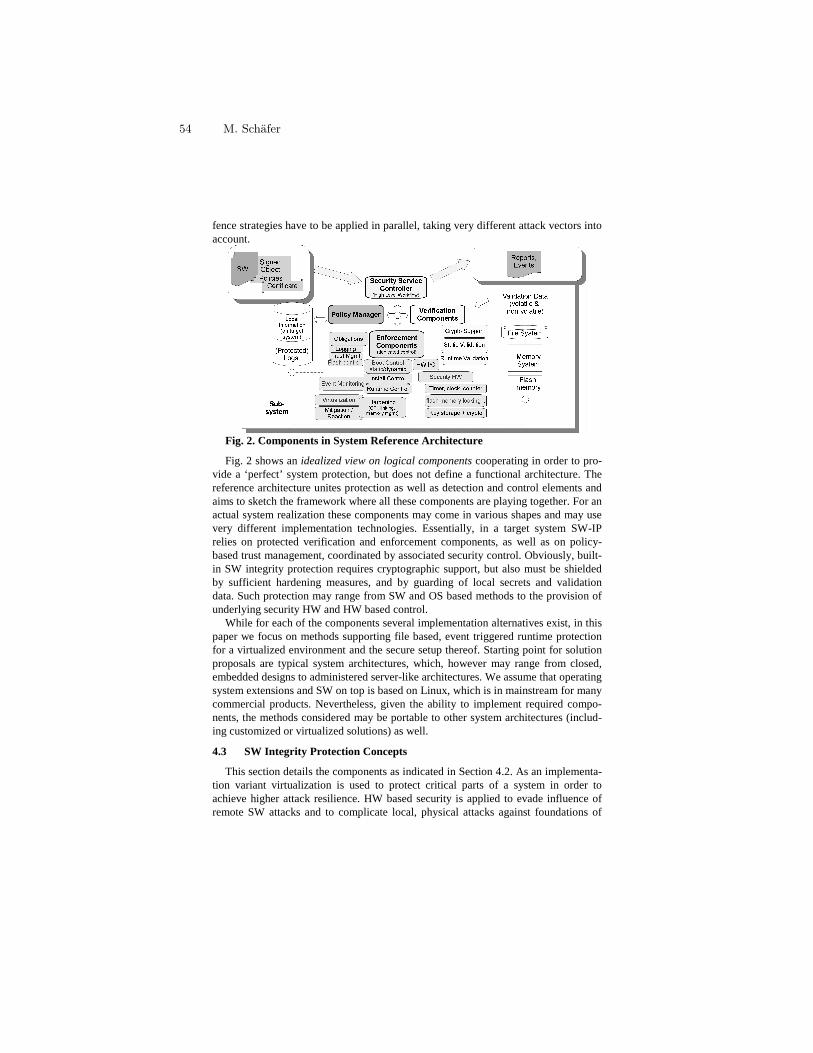
fence strategies have to be applied in parallel, taking very different attack vectors into account.
Fig. 2. Components in System Reference Architecture
Fig. 2 shows an idealized view on logical components cooperating in order to pro-vide a ‘perfect’ system protection, but does not define a functional architecture. The reference architecture unites protection as well as detection and control elements and aims to sketch the framework where all these components are playing together. For an actual system realization these components may come in various shapes and may use very different implementation technologies. Essentially, in a target system SW-IP relies on protected verification and enforcement components, as well as on policy-based trust management, coordinated by associated security control. Obviously, built-in SW integrity protection requires cryptographic support, but also must be shielded by sufficient hardening measures, and by guarding of local secrets and validation data. Such protection may range from SW and OS based methods to the provision of underlying security HW and HW based control.
While for each of the components several implementation alternatives exist, in this paper we focus on methods supporting file based, event triggered runtime protection for a virtualized environment and the secure setup thereof. Starting point for solution proposals are typical system architectures, which, however may range from closed, embedded designs to administered server-like architectures. We assume that operating system extensions and SW on top is based on Linux, which is in mainstream for many commercial products. Nevertheless, given the ability to implement required compo-nents, the methods considered may be portable to other system architectures (includ-ing customized or virtualized solutions) as well.
4.3 SW Integrity Protection Concepts
This section details the components as indicated in Section 4.2. As an implementa-tion variant virtualization is used to protect critical parts of a system in order to achieve higher attack resilience. HW based security is applied to evade influence of remote SW attacks and to complicate local, physical attacks against foundations of
54 M. Schäfer
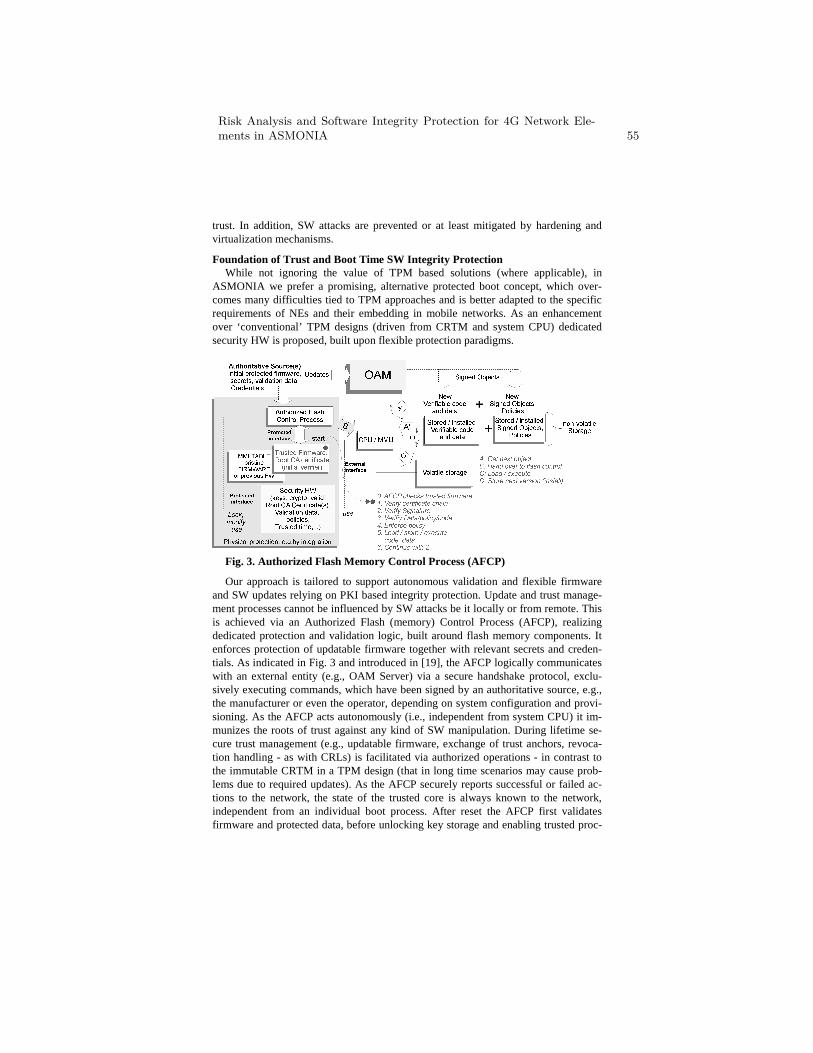
trust. In addition, SW attacks are prevented or at least mitigated by hardening and virtualization mechanisms.
Foundation of Trust and Boot Time SW Integrity Protection While not ignoring the value of TPM based solutions (where applicable), in
ASMONIA we prefer a promising, alternative protected boot concept, which over-comes many difficulties tied to TPM approaches and is better adapted to the specific requirements of NEs and their embedding in mobile networks. As an enhancement over ‘conventional’ TPM designs (driven from CRTM and system CPU) dedicated security HW is proposed, built upon flexible protection paradigms.
Fig. 3. Authorized Flash Memory Control Process (AFCP)
Our approach is tailored to support autonomous validation and flexible firmware and SW updates relying on PKI based integrity protection. Update and trust manage-ment processes cannot be influenced by SW attacks be it locally or from remote. This is achieved via an Authorized Flash (memory) Control Process (AFCP), realizing dedicated protection and validation logic, built around flash memory components. It enforces protection of updatable firmware together with relevant secrets and creden-tials. As indicated in Fig. 3 and introduced in [19], the AFCP logically communicates with an external entity (e.g., OAM Server) via a secure handshake protocol, exclu-sively executing commands, which have been signed by an authoritative source, e.g., the manufacturer or even the operator, depending on system configuration and provi-sioning. As the AFCP acts autonomously (i.e., independent from system CPU) it im-munizes the roots of trust against any kind of SW manipulation. During lifetime se-cure trust management (e.g., updatable firmware, exchange of trust anchors, revoca-tion handling - as with CRLs) is facilitated via authorized operations - in contrast to the immutable CRTM in a TPM design (that in long time scenarios may cause prob-lems due to required updates). As the AFCP securely reports successful or failed ac-tions to the network, the state of the trusted core is always known to the network, independent from an individual boot process. After reset the AFCP first validates firmware and protected data, before unlocking key storage and enabling trusted proc-
Risk Analysis and Software Integrity Protection for 4G Network Ele-ments in ASMONIA 55
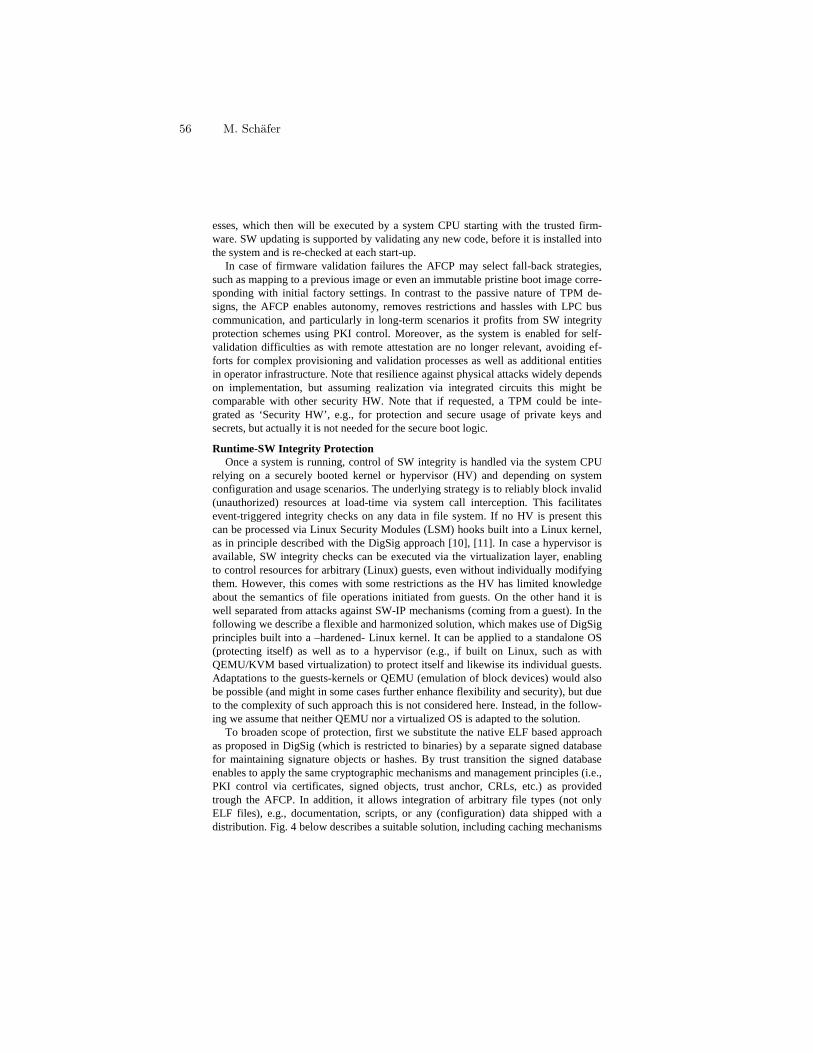
esses, which then will be executed by a system CPU starting with the trusted firm-ware. SW updating is supported by validating any new code, before it is installed into the system and is re-checked at each start-up.
In case of firmware validation failures the AFCP may select fall-back strategies, such as mapping to a previous image or even an immutable pristine boot image corre-sponding with initial factory settings. In contrast to the passive nature of TPM de-signs, the AFCP enables autonomy, removes restrictions and hassles with LPC bus communication, and particularly in long-term scenarios it profits from SW integrity protection schemes using PKI control. Moreover, as the system is enabled for self-validation difficulties as with remote attestation are no longer relevant, avoiding ef-forts for complex provisioning and validation processes as well as additional entities in operator infrastructure. Note that resilience against physical attacks widely depends on implementation, but assuming realization via integrated circuits this might be comparable with other security HW. Note that if requested, a TPM could be inte-grated as ‘Security HW’, e.g., for protection and secure usage of private keys and secrets, but actually it is not needed for the secure boot logic.
Runtime-SW Integrity Protection Once a system is running, control of SW integrity is handled via the system CPU
relying on a securely booted kernel or hypervisor (HV) and depending on system configuration and usage scenarios. The underlying strategy is to reliably block invalid (unauthorized) resources at load-time via system call interception. This facilitates event-triggered integrity checks on any data in file system. If no HV is present this can be processed via Linux Security Modules (LSM) hooks built into a Linux kernel, as in principle described with the DigSig approach [10], [11]. In case a hypervisor is available, SW integrity checks can be executed via the virtualization layer, enabling to control resources for arbitrary (Linux) guests, even without individually modifying them. However, this comes with some restrictions as the HV has limited knowledge about the semantics of file operations initiated from guests. On the other hand it is well separated from attacks against SW-IP mechanisms (coming from a guest). In the following we describe a flexible and harmonized solution, which makes use of DigSig principles built into a –hardened- Linux kernel. It can be applied to a standalone OS (protecting itself) as well as to a hypervisor (e.g., if built on Linux, such as with QEMU/KVM based virtualization) to protect itself and likewise its individual guests. Adaptations to the guests-kernels or QEMU (emulation of block devices) would also be possible (and might in some cases further enhance flexibility and security), but due to the complexity of such approach this is not considered here. Instead, in the follow-ing we assume that neither QEMU nor a virtualized OS is adapted to the solution.
To broaden scope of protection, first we substitute the native ELF based approach as proposed in DigSig (which is restricted to binaries) by a separate signed database for maintaining signature objects or hashes. By trust transition the signed database enables to apply the same cryptographic mechanisms and management principles (i.e., PKI control via certificates, signed objects, trust anchor, CRLs, etc.) as provided trough the AFCP. In addition, it allows integration of arbitrary file types (not only ELF files), e.g., documentation, scripts, or any (configuration) data shipped with a distribution. Fig. 4 below describes a suitable solution, including caching mechanisms
56 M. Schäfer
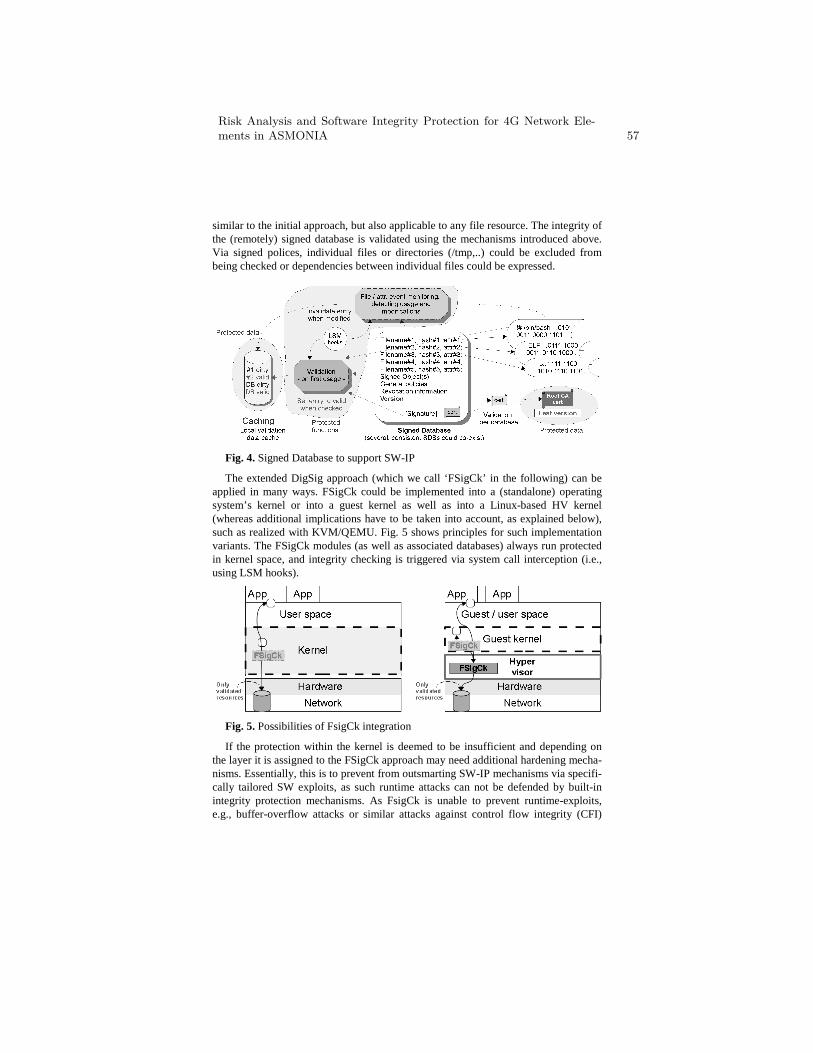
similar to the initial approach, but also applicable to any file resource. The integrity of the (remotely) signed database is validated using the mechanisms introduced above. Via signed polices, individual files or directories (/tmp,..) could be excluded from being checked or dependencies between individual files could be expressed.
Fig. 4. Signed Database to support SW-IP
The extended DigSig approach (which we call ‘FSigCk’ in the following) can be applied in many ways. FSigCk could be implemented into a (standalone) operating system’s kernel or into a guest kernel as well as into a Linux-based HV kernel (whereas additional implications have to be taken into account, as explained below), such as realized with KVM/QEMU. Fig. 5 shows principles for such implementation variants. The FSigCk modules (as well as associated databases) always run protected in kernel space, and integrity checking is triggered via system call interception (i.e., using LSM hooks).
Fig. 5. Possibilities of FsigCk integration
If the protection within the kernel is deemed to be insufficient and depending on the layer it is assigned to the FSigCk approach may need additional hardening mecha-nisms. Essentially, this is to prevent from outsmarting SW-IP mechanisms via specifi-cally tailored SW exploits, as such runtime attacks can not be defended by built-in integrity protection mechanisms. As FsigCk is unable to prevent runtime-exploits, e.g., buffer-overflow attacks or similar attacks against control flow integrity (CFI)
Risk Analysis and Software Integrity Protection for 4G Network Ele-ments in ASMONIA 57
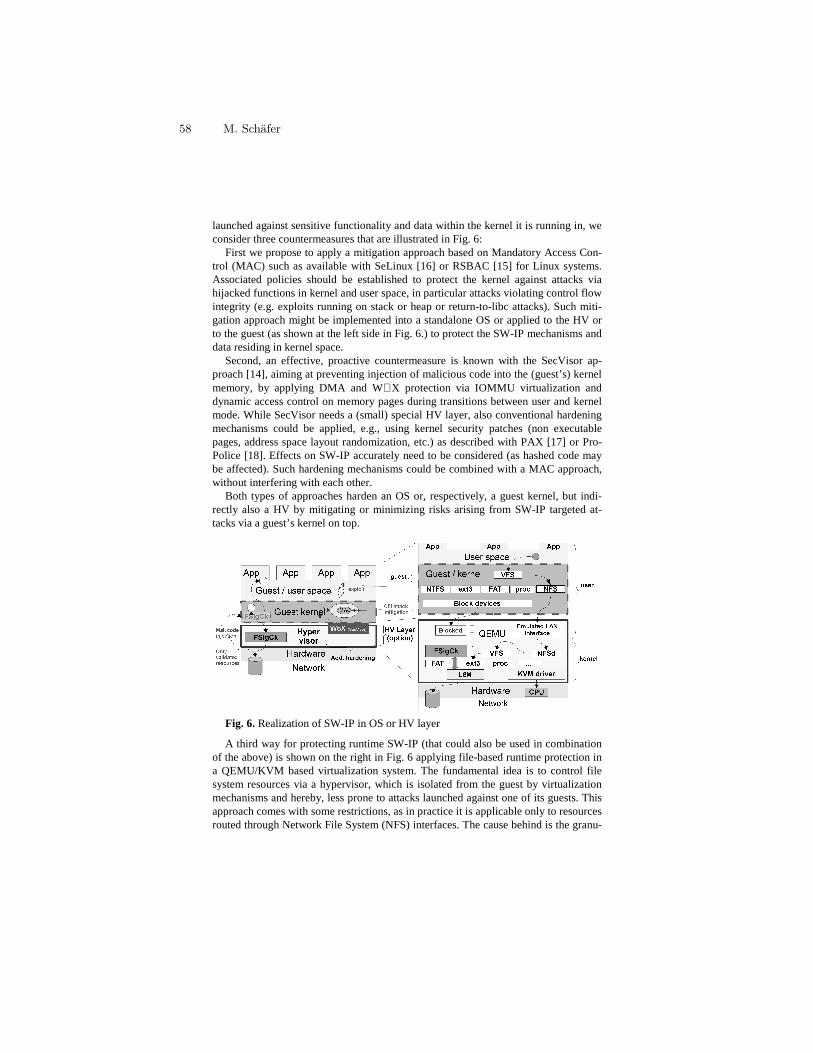
launched against sensitive functionality and data within the kernel it is running in, we consider three countermeasures that are illustrated in Fig. 6:
First we propose to apply a mitigation approach based on Mandatory Access Con-trol (MAC) such as available with SeLinux [16] or RSBAC [15] for Linux systems. Associated policies should be established to protect the kernel against attacks via hijacked functions in kernel and user space, in particular attacks violating control flow integrity (e.g. exploits running on stack or heap or return-to-libc attacks). Such miti-gation approach might be implemented into a standalone OS or applied to the HV or to the guest (as shown at the left side in Fig. 6.) to protect the SW-IP mechanisms and data residing in kernel space.
Second, an effective, proactive countermeasure is known with the SecVisor ap-proach [14], aiming at preventing injection of malicious code into the (guest’s) kernel memory, by applying DMA and W⊕X protection via IOMMU virtualization and dynamic access control on memory pages during transitions between user and kernel mode. While SecVisor needs a (small) special HV layer, also conventional hardening mechanisms could be applied, e.g., using kernel security patches (non executable pages, address space layout randomization, etc.) as described with PAX [17] or Pro-Police [18]. Effects on SW-IP accurately need to be considered (as hashed code may be affected). Such hardening mechanisms could be combined with a MAC approach, without interfering with each other.
Both types of approaches harden an OS or, respectively, a guest kernel, but indi-rectly also a HV by mitigating or minimizing risks arising from SW-IP targeted at-tacks via a guest’s kernel on top.
Fig. 6. Realization of SW-IP in OS or HV layer
A third way for protecting runtime SW-IP (that could also be used in combination of the above) is shown on the right in Fig. 6 applying file-based runtime protection in a QEMU/KVM based virtualization system. The fundamental idea is to control file system resources via a hypervisor, which is isolated from the guest by virtualization mechanisms and hereby, less prone to attacks launched against one of its guests. This approach comes with some restrictions, as in practice it is applicable only to resources routed through Network File System (NFS) interfaces. The cause behind is the granu-
58 M. Schäfer
larity of signatures, which for reasons of portability and computational complexity are assigned to ‘entire files’, but do not take into account the internal fragments and struc-ture of individual block devises. Otherwise, to enable handling of block devices, SW creation processes as well as QEMU had to be adapted, which causes additional ef-forts and difficulties of implementation. Thus, it is much easier and more effective to only allow NFS routed resources (where entire files are ‘seen’) and to validate and control requested resources by the HV via NFS interception while usage of block devices is strictly bared via the virtualization layers (i.e., QEMU).
Such solution beneficially can be applied for virtualized NE platforms, receiving their resources via an HV, provided locally or even from remote NFS storage through the network. An advantage is that arbitrary guests can be secured without modifica-tions in their kernel code in order to implement SW-IP mechanisms individually. Still, some dedicated hardening may be required, depending on the attack vectors that must be prevented. For NEs running within secured domains and mainly executing trans-port and routing functionality, user level applications are less relevant and thus, addi-tional individual hardening measures may be expendable.
When using encrypted NFS to remote servers (e.g., via ssh or TLS) special care has to be taken that the HV (not the guest) terminates the security relations, otherwise file operations are not visible and SW-IP mechanisms cannot be applied.
For embedded systems, where only restricted or even no virtualization support can be established, suitable combinations of the above building blocks can be selected.
5 Conclusion By extending integrity protection into the runtime, the methods presented allow
implementing attack resistant mechanisms for event triggered SW integrity protection into file-based systems. Due to the proposed protection paradigms and mechanisms (relying on signatures and PKI at vendor side and -if requested- on flexible HW based foundation of trust in target systems, as well as through Linux-based implementation concepts) the SW-IP approaches in this paper are well adapted to the security re-quirements for NEs in a mobile network. In particular, SW-IP paradigms can be ap-plied to a variety of products and use cases for integrity protection, while efforts in operator network can be kept minimal. It also allows re-using of an established SW signing infrastructure for several scenarios.
The feasibility of the runtime SW-IP approach has been shown by a proof of con-cept, where skeleton components have been implemented into a Fedora ‘Vanilla’ kernel and KVM/QEMU based virtualization. Still such a solution leaves some as-pects open, for example on how to validate sensitive code and data during execution in memory. Further, extended attack analysis examining tailored attacks against such a solution has not been done yet. However, related research work is in the scope of the ASMONIA protection concepts and is currently under study.
The authors acknowledge incitations and assistance by the ASMONIA consortium, the support by ‘Hochschule der Medien’ (Prof. J. Charzinski, Julius Flohr; Stuttgart, Germany) for a proof of concept implementation, and also like to thank the colleagues at Nokia Siemens Networks for valuable ideas, discussions, and comments contribut-ing to this work.
Risk Analysis and Software Integrity Protection for 4G Network Ele-ments in ASMONIA 59
6 References
1. Official ASMONIA Project web-page, http://www.asmonia.de/index.php?page=1 2. A. Egners, M. Schäfer, S. Wessel; ASMONIA Deliverable D2.1 “Evaluating Methods to
assure System Integrity and Requirements for Future Protection Concepts.”, April 2011 3. A. Egners, E. Rey, P. Schneider, S. Wessel; ASMONIA Deliverable D5.1, “Threat and
Risk Analysis for Mobile Communication Networks and Mobile Terminals”, March 2011 4. TCG, TPM Main Specifications, Parts 1-3, Specification Version 1.2, Level 2, Revisions
103, July 2007; https://www.trustedcomputinggroup.org/specs/TPM/ 5. K. Kursawe, D. Schellekens, and B. Preneel, "Analyzing trusted platform communication,"
In ECRYPT Workshop, CRASH - CRyptographic Advances in Secure Hardware, 2005, https://www.cosic.esat.kuleuven.be/publications/article-591.pdf
6. E. Sparks, “A Security Assessment of Trusted Platform Modules”, Computer Science Tech. Report TR2007-597, Department of Computer Science Dartmouth College, 2007
7. J. Winter, K. Dieterich, “A Hijacker’s Guide to the LPC bus”, Pre-Proceedings of the 8th European Workshop on Public Key Infrastructures, Services, and Applications, EuroPKI '11, pp. 126 ff.; www.cosic.esat.kuleuven.be/europki2011/pp/preproc.pdf
8. B. Kauer, “OSLO: Improving the security of Trusted Computing”, SS'07 Proceedings of 16th USENIX Security Symposium on USENIX Security Symposium, 2007
9. UEFI: Unified Extensible Firmware Interface, UEFI SPEC 2.3.1, 2011, www.uefi.org 10. A. Apvrille, D. Gordon, et.al., “Ericsson DigSig: Run-time Authentication of Binaries at
Kernel Level”, Proceedings of the 18th Large Installation System Administration Confer-ence (LISA'04), pp. 59-66, Atlanta, November 14-19, 2004
11. A. Apvrille, D. Gordon, “DigSig novelties”, Libre Software Meeting (LSM 2005), Secu-rity Topic, July 4-9 2005, Dijon, France, disec.sourceforge.net/docs/DigSig-novelties.pdf
12. KVM and QEMU see: http://www.linux-kvm.org/page/Documents 13. Network file system (NFS) vers. 4, RFC 3530, http://tools.ietf.org/html/rfc3530, 2003 14. S. Arvind, M. Luk, N. Qu, and A. Perrig, "SecVisor: A Tiny Hypervisor to Provide Life-
time Kernel Code Integrity for Commodity OSes", Proceed. of the ACM Symposium on Operating Systems Principles (SOSP 2007), Stevenson, WA. October, 2007.
15. RSBAC, Rule Set Bases Access Control, see: http://www.rsbac.org/ 16. SeLinux, Security Enhanced Linux, see: http://www.nsa.gov/research/selinux/docs.shtml 17. PAX, see: http://pax.grsecurity.net/docs/index.html 18. ProPolice / Stack Smashing Protector, see: http://www.trl.ibm.com/projects/security/ssp/,
http://www.x.org/wiki/ProPolice 19. M. Schäfer, W.D. Moeller, ‘Tailored Concepts for Software Integrity Protection in Mobile
Networks’, International Journal on Advances in Security, in vol. 4 no 1 & 2, August 2011 20. 3GPP TS 33.320, http://www.3gpp.org/ftp/Specs/archive/33_series/33.320/33320-b30.zip 21. 3GPP TS 33.401, http://www.3gpp.org/ftp/Specs/archive/33_series/33.401/33401-b10.zip 22. S. Wessel, F. Stumpf, “Page-based Runtime Integrity Protection of User and Kernel
Code”, Proceedings of {EuroSec}'12, 5th European Workshop on System Security, April 2012
60 M. Schäfer

Intentionally left blank to harmonize page numbering with printed version.
Applying Industrial-strength Testing Techniques to
Critical Care Medical Equipment
Christoph Woskowski
Zühlke Engineering GmbH
Landshuter Allee 12
80637 München, Germany
Abstract. Hardware and software development of embedded systems inter-
dependently gear into each other. Even more so if the device under develop-
ment is intended for use in critical care facilities such as intensive care units.
Especially in this case, safety measures and risk mitigation techniques are im-
plemented using both hardware and software components. Thus applying hard-
ware and software testing approaches in combination is inevitable as well.
The increasing utilization of test domain-specific languages (Test DSLs),
code generators and keyword-driven interpreters tends to raise the level of ab-
straction in test development. This approach aims to enhance productivity by
generating executable tests from a non-programming language created for de-
scribing test cases. A second goal is to increase coverage by generating tests for
as many as possible combinations of input values (black box test) or for all rea-
sonable paths of a program flow (white box test). In combination with hard-
ware-supported signal generation and fault injection this can be a very powerful
strategy for testing safety-critical embedded devices. This article introduces an
example of this strategy - the usage of a keyword-driven testing technique in
cooperation with additional test hardware - in the context of an embedded med-
ical device development, all the while emphasizing the benefit of combining
different approaches. It discusses the utilization of commercial off-the-shelf
(COTS) testing hardware as well as the application of an in-house developed
test box. It also highlights the integration of commercial software - for require-
ments engineering, test management and continuous integration - with a self-
developed testing framework powered by its own keyword-based test DSL.
Keywords: keyword-driven, embedded system, testing hardware, domain-
specific language, safety-critical, medical device
1 Introduction
New technologies have a hard time to gain a foothold in embedded systems develop-
ment for a couple of reasons. A lot of time and money has to be invested in reducing
size, average cost per unit and power consumption of a new hardware device until it is
applicable for special purpose embedded systems with limited power source. When
the development is finally finished, the next hardware generation is already available
for the non-embedded market.
Another reason is that, despite the huge progress creating small and extremely
powerful microcontrollers and increasing power density and lifetime of batteries,
there are still many limitations especially for the software part of embedded system
development, mainly both in available processing power and memory.
For a third reason, the intended use and application area of the device under devel-
opment can be another source of restrictions. Regulations and the obligation to prove
the effectiveness of risk mitigation techniques for safety-critical medical devices have
an impact on the hardware options as well as the choice of compiler, programming
language, operating system and test environment.
The bottom line is that modern object-oriented (OO) languages and incorporated
paradigms such as inheritance, encapsulation and information hiding are still uncom-
mon in embedded systems [1] - mainly for debatable performance reasons [2, 3, 4, 5].
Based thereon architectural and design patterns (i.e. event-driven architecture, pub-
lish-subscribe) as well as related, but non-OO concepts (i.e. component based devel-
opment) which in turn promote testability can only be found in some niche projects.
Other methods for introducing those higher-level concepts, like textual and graph-
ical domain-specific languages or UML profiles in conjunction with C-code genera-
tion can only emulate object orientation. Even today most programs for embedded
systems are written in more or less monolithic ANSI C code [1] or assembler lan-
guage. If unit testing is not applied from the very beginning of the project, reaching
adequate test coverage for a legacy code base like this is very time-consuming and
costly at a later stage.
How to adequately test such a system, given its limited external debugging and
tracing interfaces, its inherent complexity and the multitude of possible internal
states? In light of this, what can be done to improve the situation using industrial-
strength techniques?
This paper aims to provide possible solutions by presenting two case studies from a
software engineering point of view. The first case study describes the lessons learned
while introducing system tests in a late development state of a regulated medical sys-
tem. In the second case study the application of design for testability and unit testing
from the beginning on in combination with keyword-driven and hardware-supported
testing are documented in detail. This second part of the article is set against the
background of a medical device development, whereas the software part is classified
as critical (conforming to IEC 62304 [6]).
2 Learning the Lessons - a First Case Study
2.1 Initial Situation
The project for developing a regulated medical device is in a late state. Because of the
inherent complexity of the product - a touch screen device for controlling multiple
infusion pumps - manually testing the whole functionality is tedious and costly. Soft-
ware development has to finish well before the release day so that all necessary tests
Applying Industrial-strength Testing Techniques to Critical Care Med-ical Equipment 63
can be carried out in a manual manner. Since normally some regressions are discov-
ered during testing, some extra time needs to be planned for bug fixing and re-testing.
Unit tests exist for critical parts of the software but are carried out locally by the de-
velopers and are not part of a continuous integration process. The unit test coverage
does not allow performing the necessary software refactoring safely in favor of the
new features to be implemented. Even apparently small and local changes may or
may not break remote parts of the system.
2.2 Approaching the Problem
To further improve software quality and to support necessary refactoring and devel-
opment of new features, automated tests have to be implemented at customer site.
Increasing the unit test coverage adequately would be a huge effort considering the
large legacy code base of several 100.000 lines of code. Moreover, a prototypical
implementation of a mock object generator delivers the following result: although
some parts of the software are generated by an UML CASE tool, the costs of utilizing
the code generator for substantially extending the test coverage would exceed the
benefit.
Since the programming language of the system is ANSI C, the modular structure is
based upon single files. However, at least when working with the CASE tool, object-
oriented features, components and event based design are available. Although integra-
tion tests utilizing the event communication seem to be an option, due to the high
degree of interdependence between the software modules and the necessity to dissolve
those dependencies first, the complexity is too high to apply them.
The conclusion for a system not designed for testability is to apply tests from out-
side of system boundary - as system tests.
2.3 Automated System Testing
The system tests for evaluating the compliance with the system requirements specifi-
cation are not automated and therefore executed manually by the testers. The test
specification minutely describes each single step to carry out and the results are doc-
umented in a test report. Those documents have to be created and revised for each
new release of the system.
The idea behind introducing test automation at this point is to optimize both the
execution of tests and the documentation of the results. Depending on the type and
sophistication of the test automation tool, designing and planning tests becomes a
programming task - when using a programming language for building tests - or more
like composing a formal writing - when using a formal test domain-specific language
with interpreter or code generator.
64 C. Woskowski
2.4 Keyword-driven System Tests
According to M. Fowler [7] a general purpose programming language is meant to
address any kind of software problem, whereas a domain-specific language focusses
on a very particular kind of problem.
Although DSLs are no new phenomenon at all – HTML, VHDL, SQL and even
COBOL today are recognized as domain-specific languages - there is still a lack of
industrial-strength tools for easily implementing your own DSL. Programming and/or
language design skills as well as knowhow about the available tools and their specific
strengths and weaknesses are essential [8, 9, 10].
Even though testing as a whole can be seen as one domain - and there are already a
couple of testing DSLs - every testing project is different, especially because of dif-
ferent people fulfilling the particular tester roles. Depending on the programming
knowhow and overall background of the test team as well as on the system under test
itself, a completely different domain exists, that requires its own specific language.
Sometimes it is not necessary or even desirable to have a full-blown test language
with sophisticated syntax, though. A good compromise between easy to implement,
easy to use and particularly domain-specific can be a keyword-driven approach.
In keyword-driven testing, a simplified non-programming language is used to write
down test cases as a sequence of individual testing operations. Usually an operation is
very limited and consists only of an object (e.g. button, password), an action that is
applied on that object (e.g. click, enter) and optional data [11].
Generally, a keyword-based language is easy to write and read for human beings
and on the other hand easy to parse and interpret for computers. The limited syntax
can be a disadvantage though since writing complex statements like loops and deci-
sions depending on the capabilities of language and interpreter may not be possible.
Since test cases should be simply structured and linear, this limitation generally has
no negative impact on automated keyword-driven testing.
For the task at hand this approach has the following advantages:
• No additional 3rd party tool is necessary hence there is no need to validate it.
• The test team has enough programming capabilities to implement a simple inter-
preter for a keyword-based language.
• A keyword-based language can start very simple with a very small dictionary but
can be easily enhanced and extended for more complex testing tasks.
• A macro mechanism may be introduced to group commands that are used very
often in a particular order (e.g. for bringing the system into an initial state).
2.5 Challenges of System Test Implementation
For testing a system which is not designed for testability, from outside, the options are
restricted by the available external interfaces. The device under test at hand has a
graphical user interface using a touch screen for input and output. Additionally there
is an external industrial bus system for communication with other connected devices
(e.g. infusion pumps). A serial port is available for debugging and tracing purposes.
This port is, however, mechanically not accessible in the release version of the device.
Applying Industrial-strength Testing Techniques to Critical Care Med-ical Equipment 65
The external bus interface enables searching, monitoring and controlling of exter-
nal devices. From a testing point of view, this is an input/output port which can be
used to asynchronously insert test input and to inject errors (e.g. corrupt bus commu-
nication frames). On the other hand the output of this port needs to be traced for ex-
pected and unexpected system reactions.
Since most system functions are available and triggered by user input via touch
screen, the main focus of the system tests has to be performing touch input and han-
dling graphical user interface (GUI) output. As a result most keywords of the testing
DSL are vocabularies of the graphical user interface domain. The challenge is to au-
tomatically perform touch input and to validate GUI output by recognizing displayed
elements on the screen.
There are a couple of possible solutions for triggering the touch recognition of the
screen. An electromechanical or robotic "finger" is very expensive and error-prone.
The injection of a touch event via serial input annuls safety measures - like the diverse
touch recognition of functional and monitoring processor - and thus prevents effective
system testing. At the end of the day the problem is solved by utilizing a microcon-
troller to directly inject the corresponding voltage for touching the screen at specific
coordinates.
Recognizing GUI output is even more difficult, since the underlying structures like
windows and buttons are not accessible from outside of the software. Image recogni-
tion using a camera gets very complex when there are lots of colors, shapes, texts and
numbers in different fonts and sizes on the screen. As a compromise of benefit versus
costs the device software is exploited to calculate a checksum of the whole screen or
part of it when triggered via debug serial port and returns it using the same interface.
Having only some volatile views and explicitly excluding very frequently changing
parts like animations, this solution works well for recognizing screens that have been
recorded before.
For being able to recognize and reproduce deviations indicated by a failed check-
sum check at the same time a picture of the screen is taken. The test protocol contains
this proof, so a successful or failed test run is well-documented and reproducible.
2.6 Lessons Learned
For testing a system that is not designed for testability the available options are very
limited. In such a case, creating tests that cover all requirements as well as safety
measures and that form a safety net for refactoring and feature implementations can
be a huge effort. Viewed realistically, unit and integration test coverage cannot be
increased sufficiently in a late state of a meaningful and complex project. Enhancing
testability of legacy code requires major refactoring, which in turn requires adequate
test coverage.
It is possible though to add automated system tests to a project, which already is in
an advanced state, provided that the external interfaces of the system under test can be
utilized. The effort still is enormous and sufficient code coverage is very hard to reach
and measure without at least exploiting parts of the code for accessing internal inter-
faces and structures. Safety measures realized by hardware and software parts that
66 C. Woskowski
have no external interfaces generally are only testable by injecting errors using a
hardware or software exploit.
From a developer’s point of view, the necessary safety net provided by test cover-
age is continuously growing during system test implementation. Still, since new fea-
tures are being added at the same time, software development only benefits after sys-
tem test coverage reaches a certain level.
For project management, external auditors and other stakeholders the visibility of
automated system tests is very high as soon as the infrastructure is available and the
first tests are running. Generally, considerable return on investment is possible only:
• for large and medium sized projects that are continued for a longer period of time
after system test automation,
• for regulated projects with obligation to prove the effectiveness of risk mitigation
techniques
• and for projects that start a product line.
3 Applied Knowledge - a Second Case Study
3.1 Initial Situation
The project involves the new development of a medical product that combines preci-
sion mechanical, electrical and electronic components, as well as software parts. The
software is classified as critical according to criticality class C for medical products
(conforming to IEC 62304 [6]). Unlike the preceding case study, this system is devel-
oped from scratch, which allows considering design for testability from the very be-
ginning.
Although it is a "greenfield project" in some aspects, the development still is sub-
ject to restrictions. The final product has to comply with the applicable safety stand-
ards and regulations (e.g. IEC 60601-2-24 [12]). At the same time, it has to fulfill
non-functional requirements like usability, robustness, stability, safety and reliability.
Furthermore there are hard limits for production/per-unit costs as well as for power
consumption and minimum battery life.
According to the specification, the programming language is ANSI C, which has
no built-in support for object-orientation and other higher-level concepts.
3.2 Software Architecture
One of the main architectural drivers of the system is to establish a platform strategy
by separating a common part, which is applicable for similar devices of a product
line, and a device specific part. The latter contains and encapsulates the very specific
behavior of the device at hand.
Part of this strategy is the horizontal separation of concerns of the device domain
and the vertical decomposition in terms of layering. The lowest layer contains com-
ponents for hardware abstraction, the middle layer consists of services like event han-
dling, communication, graphical user interface handling and persistency, whereas the
Applying Industrial-strength Testing Techniques to Critical Care Med-ical Equipment 67
highest layer (called module layer) accommodates high-level modules representing
concerns of the device domain.
The behavior of a module-layer element (active object) is modeled as Finite State
Machine. An event bus realizes the completely event-based communication between
those modules.
The whole software architecture promotes testing on different levels, especially the
vertical and horizontal decomposition as well as its implementation of an event bus.
3.3 Static Analysis
In this project the static analysis methods used are code & specification review, com-
piler check (compiler warnings treated as errors) and static code analysis. The latter
involves tool-supported code inspection - using PC-lint [13] - to ensure compliance to
automatic verifiable MISRA C rules [14].
Compiler check and static code analysis are part of the continuous process of ap-
plying quality control. The continuous integration tool (Jenkins [15]) ensures that,
amongst others, both checks are carried out against the complete code base on the
build server every time a developer commits code changes. The results are available
within a few minutes. Additionally, each developer runs a pre-check on the modified
local version before committing the changes.
3.4 Hardware Support
Additional hardware is needed to run the software on the native target, especially as
long as no prototype with complete mechanical and electronic components is availa-
ble. For this reason the typical working environment for any developer consists of
three in-house developed hardware components:
• one microcontroller board, emulating the setup of the final main board,
• one I/O board, emulating parts of the final periphery using slide switches and po-
tentiometers,
• and one test board, also called "test box".
The latter facilitates the emulation of sensors that are not available during earlier de-
velopment stages and the evaluation of signals that will trigger actors in the final set-
ting. The test box also contains a web server and is programmable and configurable
via Representational State Transfer (REST) interface [16]. This way the test board
executes even complex sequences and macros by consecutively triggering several
sensors, for example to respond with valid data during the startup self-test of the sys-
tem under development.
The general-purpose programmable test box is deployed for developer tests, inte-
gration tests and system tests running on the target hardware. Two test stands based
on COTS [17] testing hardware (National Instruments) provide an additional option
particularly for executing in-depth system tests. This equipment is especially useful
for monitoring and generating complex signals and waveforms. It is also possible to
68 C. Woskowski
inject faulty or disturbing signals directly into circuits and communication lines in
order to test error detection and -recovery mechanisms. Exact timing measurements
enable the verification of safety-critical reactions like error stop and putting the sys-
tem into a safe state.
3.5 Testing Strategy
The main objective of all testing efforts is to be as comprehensive as possible in order
to minimize any threat to the patients' life or physical condition. For this reason per-
forming static analysis gets combined with applying dynamic testing at multiple lev-
els:
Unit Testing. The horizontal decomposition of the software architecture into modu-
lar units promotes unit testing at component level - as opposed to the implementation
of file-based unit tests. This approach results in a well-defined interface for each
component. Clients of that interface perform operations solely through it, thus the
internal structure and data of a component are hidden (information hiding). By replac-
ing the real environment of a specific component with generated mock objects for all
the interfaces it uses, the component can be tested standalone without external influ-
ences.
When implementing unit tests for any component of the system at hand, preferably
the operations of its external interfaces are called. Apart from that, the unit test
framework used in this project also supports the exporting and invoking of compo-
nent-internal methods. This way the very high test coverage required by the device's
criticality (up to 95 per cent condition/decision coverage) is accomplishable.
By introducing a hardware abstraction layer the vertical decomposition in terms of
layering confers independence of the hardware platform. Instead of exclusively de-
veloping directly on the target by using an IDE with cross-compiler and a (limited)
hardware debugger, logical parts and modules representing concerns of the device
domain can be implemented in a comfortable PC development environment with ad-
vanced debugging facilities. This accounts also for (unit) test development and cover-
age pre-analysis. In a first step, those tests can run against a PC simulation. The con-
clusive condition/decision coverage still has to be measured by running the tests on
the target hardware.
Integration Testing. Another advantage of the chosen software architecture, particu-
larly from a testing point of view, is its event-driven approach. Given that modules
which encapsulate the logic and concerns of the device domain are communicating
solely over the event bus, they can be tested separately and isolated from all other
modules. The build system also facilitates the possibility to form groups of related
components and modules as a deployment scenario. This enables integration testing
of complete features and feature sets.
Applying Industrial-strength Testing Techniques to Critical Care Med-ical Equipment 69
Integration tests are implemented based on the NUnit1 framework [18] and grouped
as smoke/sanity tests and as short and long-running tests. Like the unit tests men-
tioned above they also run on the build server, triggered by any source code change.
The long-running tests are part of the nightly build. The smoke tests are used by every
developer before committing any changes to verify that no apparently unrelated parts
of the system are broken. The platform independence of the event bus permits the
identical tests to run against the simulation and the target hardware.
The source code that performs serialization and deserialization of the various
events as well as the routing table used to transmit events from one module to another
is generated by a code generator. The corresponding textual, Xtext2-based [19] do-
main-specific language is utilized to describe all events, their associated payloads, the
interfaces they belong to and the modules that implement and/or use those interfaces.
The same DSL framework applies to the specification of deployment scenarios and
the definition of finite state machines that describe the behavior of module-layer ele-
ments. Parts of the development model formed by textual DSLs are also used in the
testing context. The library containing the application programming interface that is
deployed for sending and receiving events as part of the integration test framework
also gets generated based on the DSL event description.
System Testing. The system testing framework implemented specifically for the
critical embedded device at hand, benefits from experience and knowledge gained in
previous testing projects. As already introduced in the first case study a keyword-
based testing DSL is used to formally specify test cases based on system requirements
and system use cases. The goal is to reach significant requirements coverage by em-
ploying test automation, all the while reducing the number of remaining manual tests.
All project-specific data - for instance all requirements, use cases, test cases as well
as traceability information for impact and coverage analysis - are stored using com-
mercial project management software (Microsoft Team Foundation Server, TFS) [20].
Since the dictionary of the keyword-driven testing language primarily contains ex-
pressions that can also be found in the formal test case specification, it seems obvious
to use the same repository for both the formal and the machine-readable aspect of a
test case. Another advantage of this approach is the already existing linkage between
requirement, use case and test case. Therefore traceability from the concrete processi-
ble test script to the corresponding use cases and requirements (and vice versa) is
ensured and so is proving complete coverage of the system requirements.
The in-house developed testing framework [Fig. 1] automatically fetches the ma-
chine-readable test cases from the project-specific repository. Then a parser processes
the single test steps and generates a runnable test script which can be stored on the
test server. The corresponding script interpreter finally executes the test script against
the native target, reads back the results and stores them for further analysis.
1 NUnit is an open-source (unit) testing framework for Microsoft .NET languages. 2 Xtext is an open-source framework for developing domain-specific languages.
70 C. Woskowski
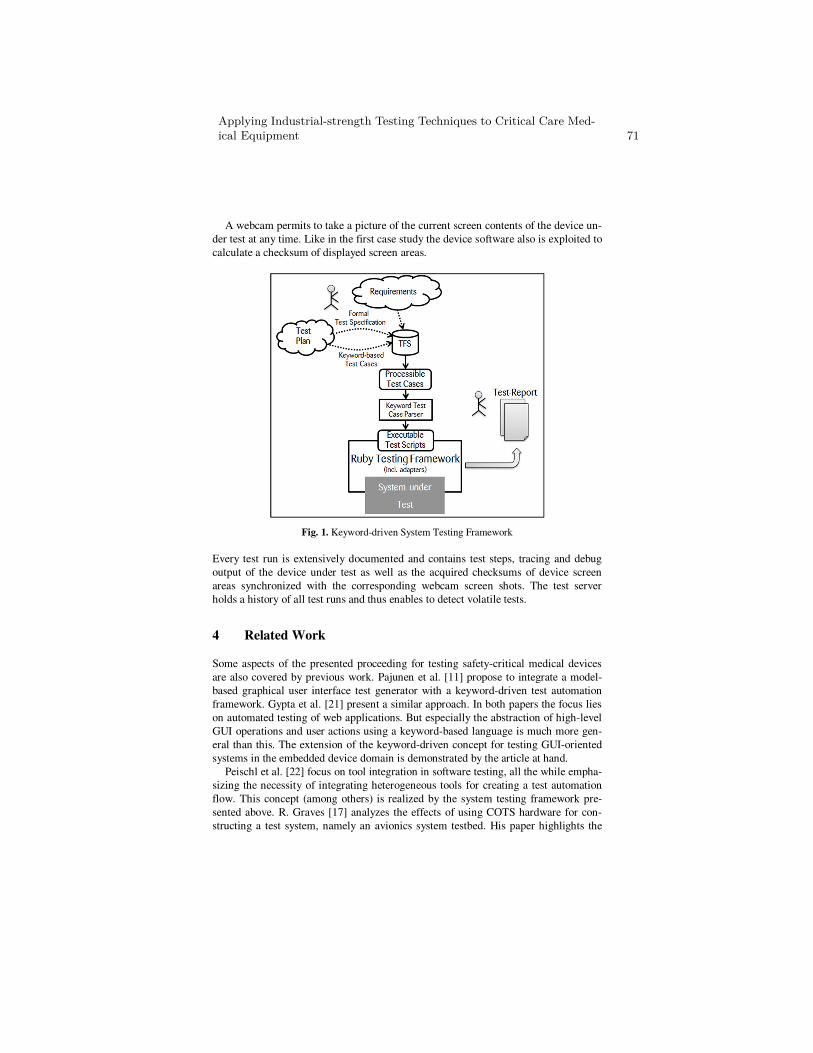
A webcam permits to take a picture of the current screen contents of the device un-
der test at any time. Like in the first case study the device software also is exploited to
calculate a checksum of displayed screen areas.
Fig. 1. Keyword-driven System Testing Framework
Every test run is extensively documented and contains test steps, tracing and debug
output of the device under test as well as the acquired checksums of device screen
areas synchronized with the corresponding webcam screen shots. The test server
holds a history of all test runs and thus enables to detect volatile tests.
4 Related Work
Some aspects of the presented proceeding for testing safety-critical medical devices
are also covered by previous work. Pajunen et al. [11] propose to integrate a model-
based graphical user interface test generator with a keyword-driven test automation
framework. Gypta et al. [21] present a similar approach. In both papers the focus lies
on automated testing of web applications. But especially the abstraction of high-level
GUI operations and user actions using a keyword-based language is much more gen-
eral than this. The extension of the keyword-driven concept for testing GUI-oriented
systems in the embedded device domain is demonstrated by the article at hand.
Peischl et al. [22] focus on tool integration in software testing, all the while empha-
sizing the necessity of integrating heterogeneous tools for creating a test automation
flow. This concept (among others) is realized by the system testing framework pre-
sented above. R. Graves [17] analyzes the effects of using COTS hardware for con-
structing a test system, namely an avionics system testbed. His paper highlights the
Applying Industrial-strength Testing Techniques to Critical Care Med-ical Equipment 71
effective use of COTS hardware for testing purposes. As illustrated above by the se-
cond case study, this also applies to combining a general-purpose programmable test
box based on COTS components with commercial test hardware.
Using a REST interface for controlling and monitoring embedded devices – e.g.
the test box mentioned above - is accepted practice and suggested by several articles.
Lelli et al. [16] focus on using REST for managing instruments and devices shared on
the grid while evaluating performance and compatibility with conventional web ser-
vices. Jari Kleimola [23] highlights the simplicity of a RESTful interface, resulting
into small footprint implementations predestinated for low power embedded devices.
On the other hand Guinard et al. [24] emphasize the ability of REST to integrate dif-
ferent devices for building up heterogeneous web mashups.
5 Conclusion
Exhaustive testing of safety-critical embedded devices is essential but tends to get
time-consuming and costly. It is advantageous though to consider design for testabil-
ity from the very beginning of a development project. In doing so, not only one test-
ing approach (e.g. system testing) has to deliver the appropriate coverage, but several
strategies can cooperate.
Combining different conventional (industrial-strength) approaches in unconven-
tional ways also improves testing deliverables significantly. Some examples presented
in this article are:
• webcam screenshots in combination with calculating checksums over screen areas
to test graphical user interfaces of embedded devices,
• combining scripting and parsing techniques to create a project-specific keyword-
based testing DSL,
• or using developed testing hardware in combination with a COTS test stand to
improve integration- and system testing.
From a developer’s point of view, high test coverage at the earliest possible develop-
ment state is helpful to enable refactoring in favor of new features to be implemented.
Hardware and tool support for short but significant developer tests helps to establish a
successful continuous integration process.
6 References
1. Nahas, M., Maaita, A.: Choosing Appropriate Programming Language to Implement Soft-
ware for Real-Time Resource-Constrained Embedded Systems. Embedded Systems - The-
ory and Design Methodology, Kiyofumi Tanaka (Ed.), ISBN: 978-953-51-0167-3, InTech
(2012)
2. Dutt S., Jamwal S., Devanand: Object Oriented Vs Procedural Programming in Embedded
Systems. In International Journal of Computer Science & Communication (IJCSC) (2010)
3. Chatzigeorgiou, A., Stephanides, G.: Evaluating Performance and Power of Object-
Oriented Vs. Procedural Programming in Embedded Processors. In Ada-Europe (2002)
72 C. Woskowski
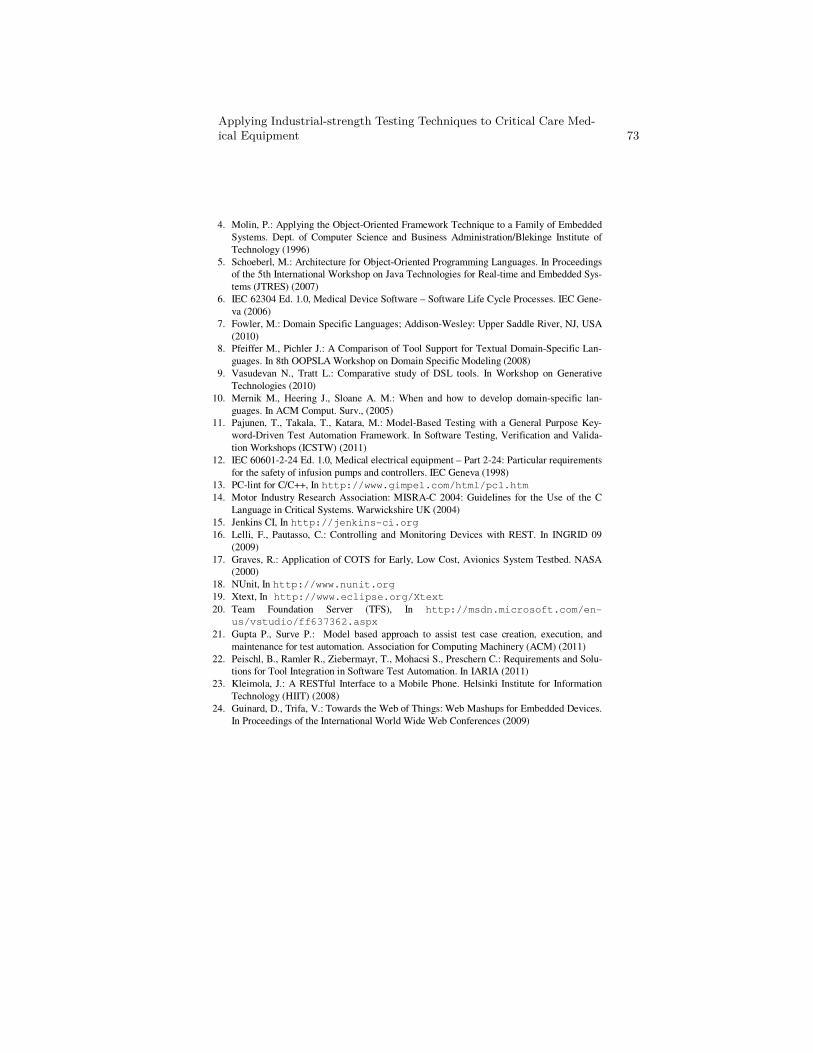
4. Molin, P.: Applying the Object-Oriented Framework Technique to a Family of Embedded
Systems. Dept. of Computer Science and Business Administration/Blekinge Institute of
Technology (1996)
5. Schoeberl, M.: Architecture for Object-Oriented Programming Languages. In Proceedings
of the 5th International Workshop on Java Technologies for Real-time and Embedded Sys-
tems (JTRES) (2007)
6. IEC 62304 Ed. 1.0, Medical Device Software – Software Life Cycle Processes. IEC Gene-
va (2006)
7. Fowler, M.: Domain Specific Languages; Addison-Wesley: Upper Saddle River, NJ, USA
(2010)
8. Pfeiffer M., Pichler J.: A Comparison of Tool Support for Textual Domain-Specific Lan-
guages. In 8th OOPSLA Workshop on Domain Specific Modeling (2008)
9. Vasudevan N., Tratt L.: Comparative study of DSL tools. In Workshop on Generative
Technologies (2010)
10. Mernik M., Heering J., Sloane A. M.: When and how to develop domain-specific lan-
guages. In ACM Comput. Surv., (2005)
11. Pajunen, T., Takala, T., Katara, M.: Model-Based Testing with a General Purpose Key-
word-Driven Test Automation Framework. In Software Testing, Verification and Valida-
tion Workshops (ICSTW) (2011)
12. IEC 60601-2-24 Ed. 1.0, Medical electrical equipment – Part 2-24: Particular requirements
for the safety of infusion pumps and controllers. IEC Geneva (1998)
13. PC-lint for C/C++, In http://www.gimpel.com/html/pcl.htm
14. Motor Industry Research Association: MISRA-C 2004: Guidelines for the Use of the C
Language in Critical Systems. Warwickshire UK (2004)
15. Jenkins CI, In http://jenkins-ci.org
16. Lelli, F., Pautasso, C.: Controlling and Monitoring Devices with REST. In INGRID 09
(2009)
17. Graves, R.: Application of COTS for Early, Low Cost, Avionics System Testbed. NASA
(2000)
18. NUnit, In http://www.nunit.org
19. Xtext, In http://www.eclipse.org/Xtext
20. Team Foundation Server (TFS), In http://msdn.microsoft.com/en-
us/vstudio/ff637362.aspx
21. Gupta P., Surve P.: Model based approach to assist test case creation, execution, and
maintenance for test automation. Association for Computing Machinery (ACM) (2011)
22. Peischl, B., Ramler R., Ziebermayr, T., Mohacsi S., Preschern C.: Requirements and Solu-
tions for Tool Integration in Software Test Automation. In IARIA (2011)
23. Kleimola, J.: A RESTful Interface to a Mobile Phone. Helsinki Institute for Information
Technology (HIIT) (2008)
24. Guinard, D., Trifa, V.: Towards the Web of Things: Web Mashups for Embedded Devices.
In Proceedings of the International World Wide Web Conferences (2009)
Applying Industrial-strength Testing Techniques to Critical Care Med-ical Equipment 73
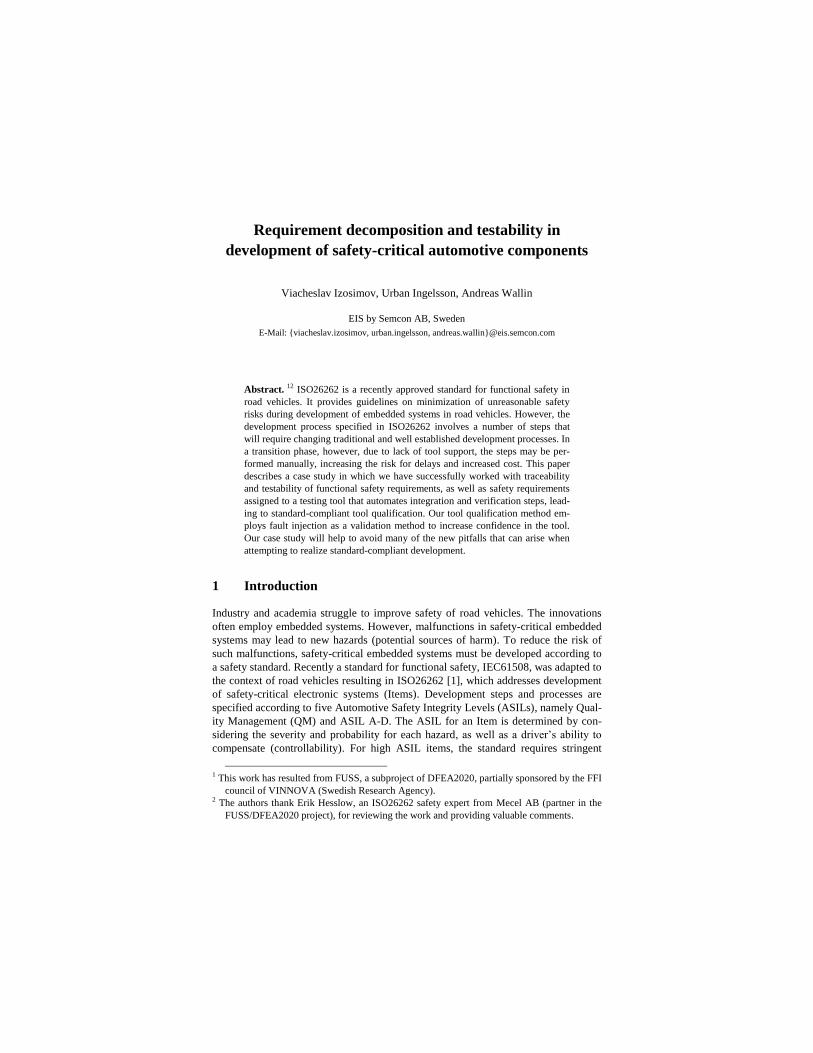
Requirement decomposition and testability in
development of safety-critical automotive components
Viacheslav Izosimov, Urban Ingelsson, Andreas Wallin
EIS by Semcon AB, Sweden
E-Mail: {viacheslav.izosimov, urban.ingelsson, andreas.wallin}@eis.semcon.com
Abstract. 12 ISO26262 is a recently approved standard for functional safety in
road vehicles. It provides guidelines on minimization of unreasonable safety
risks during development of embedded systems in road vehicles. However, the
development process specified in ISO26262 involves a number of steps that
will require changing traditional and well established development processes. In
a transition phase, however, due to lack of tool support, the steps may be per-
formed manually, increasing the risk for delays and increased cost. This paper
describes a case study in which we have successfully worked with traceability
and testability of functional safety requirements, as well as safety requirements
assigned to a testing tool that automates integration and verification steps, lead-
ing to standard-compliant tool qualification. Our tool qualification method em-
ploys fault injection as a validation method to increase confidence in the tool.
Our case study will help to avoid many of the new pitfalls that can arise when
attempting to realize standard-compliant development.
1 Introduction
Industry and academia struggle to improve safety of road vehicles. The innovations
often employ embedded systems. However, malfunctions in safety-critical embedded
systems may lead to new hazards (potential sources of harm). To reduce the risk of
such malfunctions, safety-critical embedded systems must be developed according to
a safety standard. Recently a standard for functional safety, IEC61508, was adapted to
the context of road vehicles resulting in ISO26262 [1], which addresses development
of safety-critical electronic systems (Items). Development steps and processes are
specified according to five Automotive Safety Integrity Levels (ASILs), namely Qual-
ity Management (QM) and ASIL A-D. The ASIL for an Item is determined by con-
sidering the severity and probability for each hazard, as well as a driver’s ability to
compensate (controllability). For high ASIL items, the standard requires stringent
1 This work has resulted from FUSS, a subproject of DFEA2020, partially sponsored by the FFI
council of VINNOVA (Swedish Research Agency). 2 The authors thank Erik Hesslow, an ISO26262 safety expert from Mecel AB (partner in the
FUSS/DFEA2020 project), for reviewing the work and providing valuable comments.
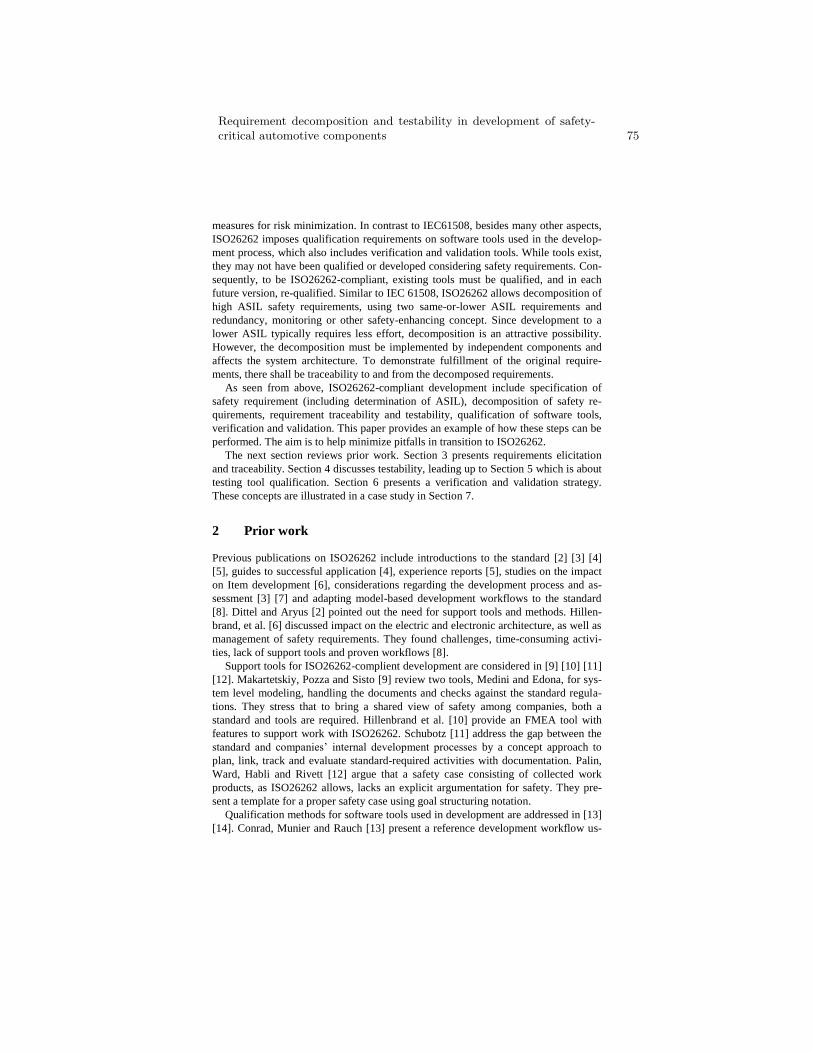
measures for risk minimization. In contrast to IEC61508, besides many other aspects,
ISO26262 imposes qualification requirements on software tools used in the develop-
ment process, which also includes verification and validation tools. While tools exist,
they may not have been qualified or developed considering safety requirements. Con-
sequently, to be ISO26262-compliant, existing tools must be qualified, and in each
future version, re-qualified. Similar to IEC 61508, ISO26262 allows decomposition of
high ASIL safety requirements, using two same-or-lower ASIL requirements and
redundancy, monitoring or other safety-enhancing concept. Since development to a
lower ASIL typically requires less effort, decomposition is an attractive possibility.
However, the decomposition must be implemented by independent components and
affects the system architecture. To demonstrate fulfillment of the original require-
ments, there shall be traceability to and from the decomposed requirements.
As seen from above, ISO26262-compliant development include specification of
safety requirement (including determination of ASIL), decomposition of safety re-
quirements, requirement traceability and testability, qualification of software tools,
verification and validation. This paper provides an example of how these steps can be
performed. The aim is to help minimize pitfalls in transition to ISO26262.
The next section reviews prior work. Section 3 presents requirements elicitation
and traceability. Section 4 discusses testability, leading up to Section 5 which is about
testing tool qualification. Section 6 presents a verification and validation strategy.
These concepts are illustrated in a case study in Section 7.
2 Prior work
Previous publications on ISO26262 include introductions to the standard [2] [3] [4]
[5], guides to successful application [4], experience reports [5], studies on the impact
on Item development [6], considerations regarding the development process and as-
sessment [3] [7] and adapting model-based development workflows to the standard
[8]. Dittel and Aryus [2] pointed out the need for support tools and methods. Hillen-
brand, et al. [6] discussed impact on the electric and electronic architecture, as well as
management of safety requirements. They found challenges, time-consuming activi-
ties, lack of support tools and proven workflows [8].
Support tools for ISO26262-complient development are considered in [9] [10] [11]
[12]. Makartetskiy, Pozza and Sisto [9] review two tools, Medini and Edona, for sys-
tem level modeling, handling the documents and checks against the standard regula-
tions. They stress that to bring a shared view of safety among companies, both a
standard and tools are required. Hillenbrand et al. [10] provide an FMEA tool with
features to support work with ISO26262. Schubotz [11] address the gap between the
standard and companies’ internal development processes by a concept approach to
plan, link, track and evaluate standard-required activities with documentation. Palin,
Ward, Habli and Rivett [12] argue that a safety case consisting of collected work
products, as ISO26262 allows, lacks an explicit argumentation for safety. They pre-
sent a template for a proper safety case using goal structuring notation.
Qualification methods for software tools used in development are addressed in [13]
[14]. Conrad, Munier and Rauch [13] present a reference development workflow us-
Requirement decomposition and testability in development of safety-critical automotive components 75
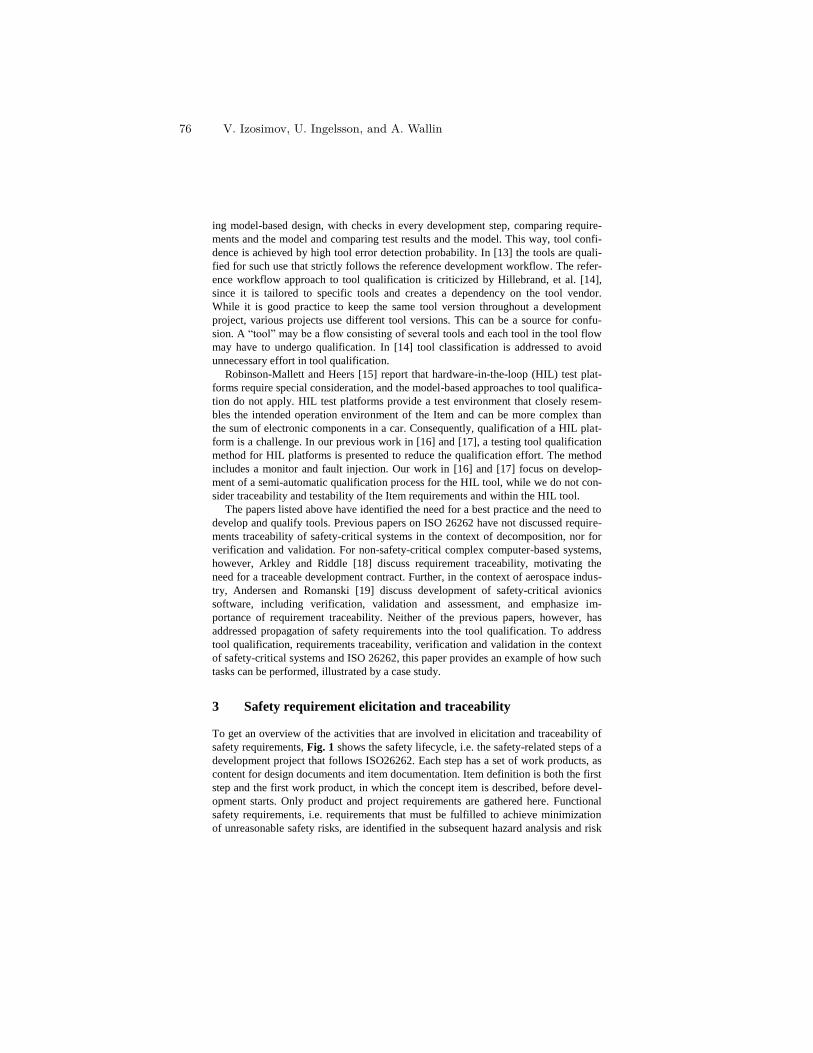
ing model-based design, with checks in every development step, comparing require-
ments and the model and comparing test results and the model. This way, tool confi-
dence is achieved by high tool error detection probability. In [13] the tools are quali-
fied for such use that strictly follows the reference development workflow. The refer-
ence workflow approach to tool qualification is criticized by Hillebrand, et al. [14],
since it is tailored to specific tools and creates a dependency on the tool vendor.
While it is good practice to keep the same tool version throughout a development
project, various projects use different tool versions. This can be a source for confu-
sion. A “tool” may be a flow consisting of several tools and each tool in the tool flow
may have to undergo qualification. In [14] tool classification is addressed to avoid
unnecessary effort in tool qualification.
Robinson-Mallett and Heers [15] report that hardware-in-the-loop (HIL) test plat-
forms require special consideration, and the model-based approaches to tool qualifica-
tion do not apply. HIL test platforms provide a test environment that closely resem-
bles the intended operation environment of the Item and can be more complex than
the sum of electronic components in a car. Consequently, qualification of a HIL plat-
form is a challenge. In our previous work in [16] and [17], a testing tool qualification
method for HIL platforms is presented to reduce the qualification effort. The method
includes a monitor and fault injection. Our work in [16] and [17] focus on develop-
ment of a semi-automatic qualification process for the HIL tool, while we do not con-
sider traceability and testability of the Item requirements and within the HIL tool.
The papers listed above have identified the need for a best practice and the need to
develop and qualify tools. Previous papers on ISO 26262 have not discussed require-
ments traceability of safety-critical systems in the context of decomposition, nor for
verification and validation. For non-safety-critical complex computer-based systems,
however, Arkley and Riddle [18] discuss requirement traceability, motivating the
need for a traceable development contract. Further, in the context of aerospace indus-
try, Andersen and Romanski [19] discuss development of safety-critical avionics
software, including verification, validation and assessment, and emphasize im-
portance of requirement traceability. Neither of the previous papers, however, has
addressed propagation of safety requirements into the tool qualification. To address
tool qualification, requirements traceability, verification and validation in the context
of safety-critical systems and ISO 26262, this paper provides an example of how such
tasks can be performed, illustrated by a case study.
3 Safety requirement elicitation and traceability
To get an overview of the activities that are involved in elicitation and traceability of
safety requirements, Fig. 1 shows the safety lifecycle, i.e. the safety-related steps of a
development project that follows ISO26262. Each step has a set of work products, as
content for design documents and item documentation. Item definition is both the first
step and the first work product, in which the concept item is described, before devel-
opment starts. Only product and project requirements are gathered here. Functional
safety requirements, i.e. requirements that must be fulfilled to achieve minimization
of unreasonable safety risks, are identified in the subsequent hazard analysis and risk
76 V. Izosimov, U. Ingelsson, and A. Wallin
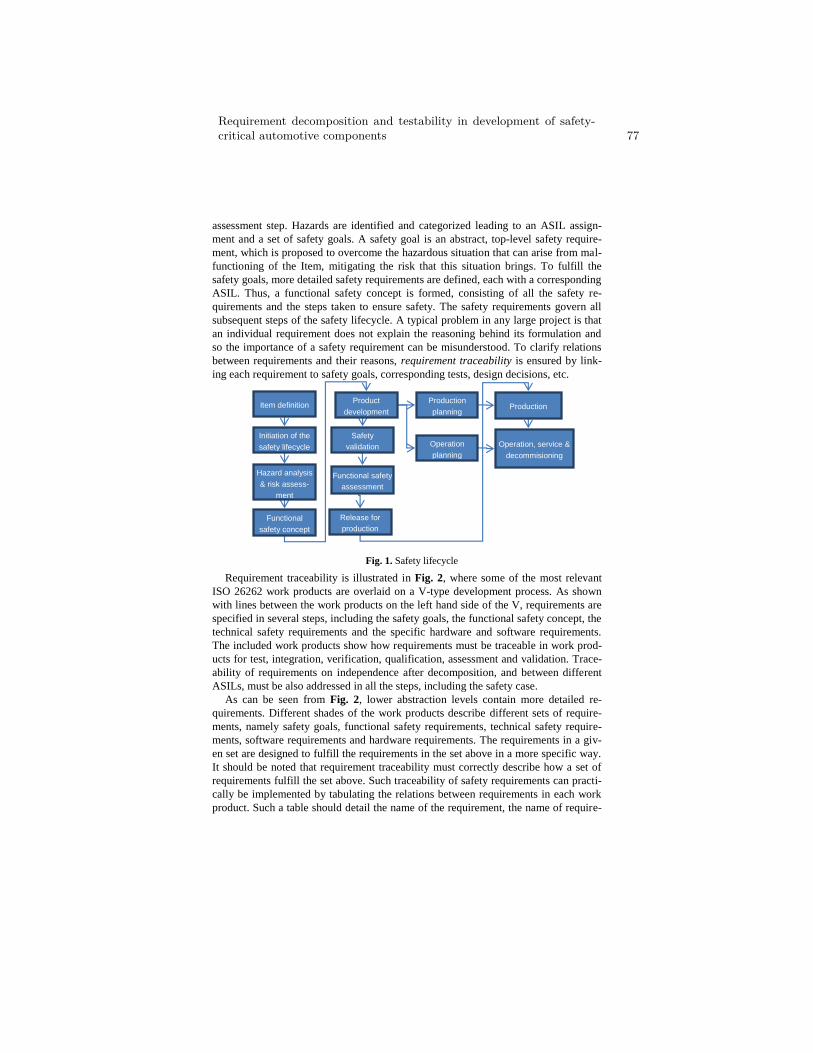
assessment step. Hazards are identified and categorized leading to an ASIL assign-
ment and a set of safety goals. A safety goal is an abstract, top-level safety require-
ment, which is proposed to overcome the hazardous situation that can arise from mal-
functioning of the Item, mitigating the risk that this situation brings. To fulfill the
safety goals, more detailed safety requirements are defined, each with a corresponding
ASIL. Thus, a functional safety concept is formed, consisting of all the safety re-
quirements and the steps taken to ensure safety. The safety requirements govern all
subsequent steps of the safety lifecycle. A typical problem in any large project is that
an individual requirement does not explain the reasoning behind its formulation and
so the importance of a safety requirement can be misunderstood. To clarify relations
between requirements and their reasons, requirement traceability is ensured by link-
ing each requirement to safety goals, corresponding tests, design decisions, etc.
Requirement traceability is illustrated in Fig. 2, where some of the most relevant
ISO 26262 work products are overlaid on a V-type development process. As shown
with lines between the work products on the left hand side of the V, requirements are
specified in several steps, including the safety goals, the functional safety concept, the
technical safety requirements and the specific hardware and software requirements.
The included work products show how requirements must be traceable in work prod-
ucts for test, integration, verification, qualification, assessment and validation. Trace-
ability of requirements on independence after decomposition, and between different
ASILs, must be also addressed in all the steps, including the safety case.
As can be seen from Fig. 2, lower abstraction levels contain more detailed re-
quirements. Different shades of the work products describe different sets of require-
ments, namely safety goals, functional safety requirements, technical safety require-
ments, software requirements and hardware requirements. The requirements in a giv-
en set are designed to fulfill the requirements in the set above in a more specific way.
It should be noted that requirement traceability must correctly describe how a set of
requirements fulfill the set above. Such traceability of safety requirements can practi-
cally be implemented by tabulating the relations between requirements in each work
product. Such a table should detail the name of the requirement, the name of require-
Item definition
Initiation of the
safety lifecycle
Hazard analysis
& risk assess-
ment
Functional
safety concept
Product
development
Safety
validation
Functional safety
assessment
Release for
production
Production
Operation, service &
decommisioning
Production
planning
Operation
planning
Fig. 1. Safety lifecycle
Requirement decomposition and testability in development of safety-critical automotive components 77
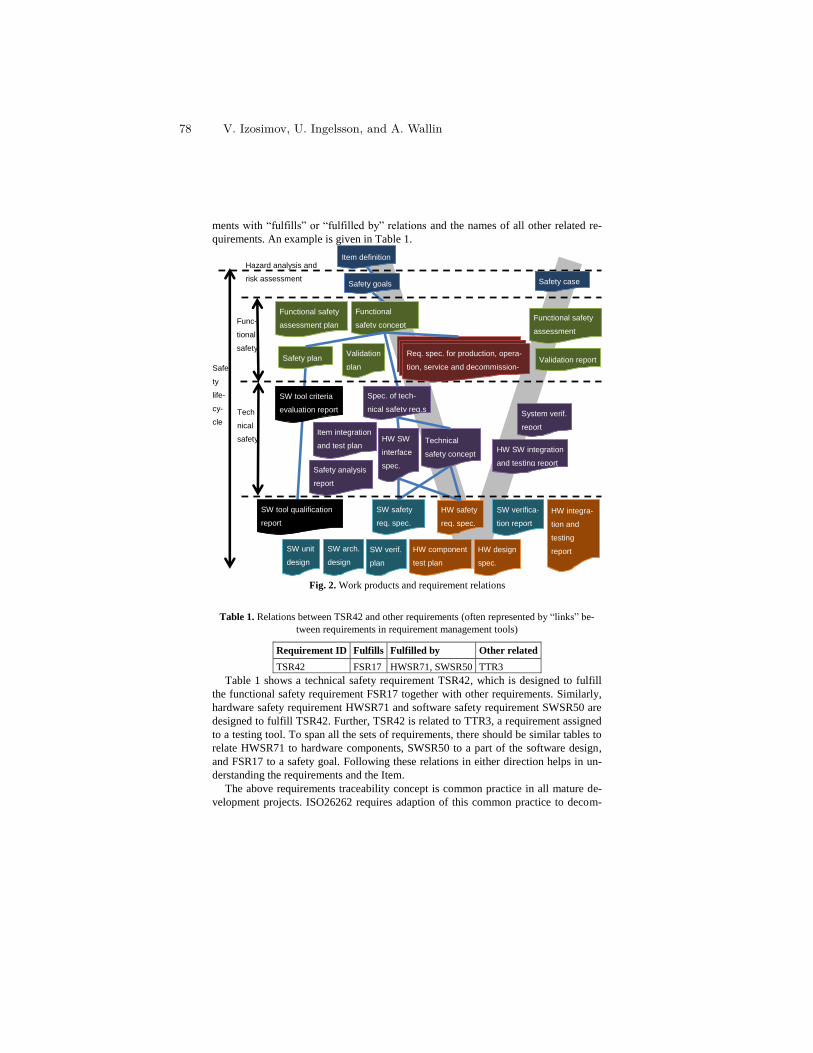
ments with “fulfills” or “fulfilled by” relations and the names of all other related re-
quirements. An example is given in Table 1.
Table 1. Relations between TSR42 and other requirements (often represented by “links” be-
tween requirements in requirement management tools)
Requirement ID Fulfills Fulfilled by Other related
TSR42 FSR17 HWSR71, SWSR50 TTR3
Table 1 shows a technical safety requirement TSR42, which is designed to fulfill
the functional safety requirement FSR17 together with other requirements. Similarly,
hardware safety requirement HWSR71 and software safety requirement SWSR50 are
designed to fulfill TSR42. Further, TSR42 is related to TTR3, a requirement assigned
to a testing tool. To span all the sets of requirements, there should be similar tables to
relate HWSR71 to hardware components, SWSR50 to a part of the software design,
and FSR17 to a safety goal. Following these relations in either direction helps in un-
derstanding the requirements and the Item.
The above requirements traceability concept is common practice in all mature de-
velopment projects. ISO26262 requires adaption of this common practice to decom-
Fig. 2. Work products and requirement relations
Item definition
Spec. of tech-
nical safety req.s
SW safety
req. spec.
HW safety
req. spec.
SW arch.
design
spec.
HW design
spec.
Safety goals
Functional
safety concept
SW verifica-
tion report
HW integra-
tion and
testing
report
Hazard analysis and
risk assessment
Func-
tional
safety
Tech
nical
safety
SW tool qualification
report
HW SW integration
and testing report
System verif.
report
Functional safety
assessment
report
Safe
ty
life-
cy-
cle
Functional safety
assessment plan
HW SW
interface
spec.
Req. spec. for production, opera-
tion, service and decommission-
ing
Safety analysis
report
Safety plan
Technical
safety concept
SW unit
design
spec.
SW verif.
plan
HW component
test plan
Item integration
and test plan
Validation
plan Validation report
SW tool criteria
evaluation report
Req. spec. for production, opera-
tion, service and decommission-
ing
Req. spec. for production, opera-
tion, service and decommission-
ing
Safety case
78 V. Izosimov, U. Ingelsson, and A. Wallin
position of requirements and tool qualification. Furthermore, requirement traceability
is a prerequisite for requirement testability, which is discussed next.
4 Testability
The claim that design and implementation fulfill the requirements shall be verified.
Verification is the task to determine completeness and correct specification of re-
quirements as well as correctness of the implementation that is to fulfill the require-
ments. Verification constitutes the right hand side of Fig. 2 and is performed for all
integration steps of the system design including implementation in software and
hardware. To be verified, the requirements should be testable. To ensure testability, a
semi-formal representation that is compatible with a definition of testability is uti-
lized. We present two representations to illustrate aspects to testability.
For the first representation, we define a requirement Ri as a logical expression Li:
<Object X> shall <Action Y> [applied to] <Subject Z>. The requirement is mapped
onto Object X which performs Action Y onto Subject Z. Testability of Ri is a property
of Ri that this logical expression Li can be verified. We suggest that, to fulfill testabil-
ity, the requirement has to consist of the object, the action and the subject and the
object, the action and the subject must be identifiable within and present in the sys-
tem. With these conditions valid, the requirement can be verified, and is testable.
Consider following “good” and “bad” examples of safety requirements, some that
fulfill, and some that do not fulfill the requirement pattern and, thus, shall be changed:
R1: We shall ensure presence of error correction codes (ECC) in the system for
correction of single-event upsets (SEUs).
R2: The MCU (microcontroller) shall include a logical watchdog.
In R1, neither Object nor Subject is clear, only Action is present, i.e., ensuring
presence of ECC codes, and the requirement is not testable. In R2, the elements are
clearly identifiable and physically present in the system. Thus, this requirement is
testable. However, this requirement will have to be detailed further to identify watch-
dog properties, relevant MCU software and monitoring strategy.
For the second representation of requirements, consider that although object, action
and subjects are obligatory attributes of requirements, it is often important to identify
conditions under which the requirements are applicable. R3 is an example require-
ment that is designed to prevent over-heating of a component.
R3: The MCU shall not enable a power supply to the central CPU if the ambient
temperature is above 95ºC.
In R3 there is an example of another important property of requirements, which is
the presence of measurable quantitative parameters. These parameters will ensure
operational intervals and applicability of requirements, i.e., as in R3, “above 95ºC”.
However, R3 is not easily refutable. The test that is necessary to check that the re-
quirement is fulfilled will be boundless. Therefore, it is good practice to either formu-
late requirements such that they are easily refutable or give a set of appropriate meas-
urement conditions for the test.
Requirement elicitation with respect to requirement testability and how it leads to
testing tool qualification can be shown in several steps (see Fig. 2 for work products):
Requirement decomposition and testability in development of safety-critical automotive components 79
Define safety goals: Safety goals cannot be tested since they are usually very ab-
stract. Note, however, that safety goals and functional safety requirements shall be
validated by studying behavior of the whole system, to ensure that the correct system
has been developed and potentially dangerous behavior successfully avoided.
Define safety requirements: Many functional safety requirements cannot be veri-
fied due to lack of technical details. In this step, however, it is usually clear which
testing tools will be needed. Thus, selection and classification of testing tools can be
done, resulting with an input to SW tool criteria evaluation reports.
Refine safety requirements: By considering system properties, decomposition of
requirement is performed. Requirements are also evaluated on their feasibility by
performing requirements reviews, design studies and testability assessments. This will
result in a verification strategy, part of which will be adaptation of the test tool.
Detailed safety requirements: Verification is possible only for technical safety
requirements, which are the most detailed safety requirements. In this step, it is neces-
sary to derive test cases and clearly demonstrate requirement testability. Several itera-
tions of requirement elicitation may be needed. Testing tool qualification is per-
formed, resulting with input to SW tool qualification reports.
Implementation: Here, verification activities are fully executed on implementa-
tion releases with testing tools providing test reports for the respective requirements.
Safety case: Test cases, test reports and tool qualification reports will provide in-
puts to the safety case, for demonstration of fulfillment of the requirements.
5 Testing tool aspects of testability
Verification of safety requirements is usually done with help of a testing tool, to
automate the verification process and increase its efficiency. A testing tool is used to
verify the logical expression of a requirement (see Section 4) by applying test cases,
generated or specifically provided for this requirement. Some testing tools, in particu-
lar hardware-in-the-loop test rigs, often need to be adapted for testing against safety
requirements. In the following, we consider such a testing tool with regard to the re-
quirement aspects. For the testing tool, we will have to specify functional safety re-
quirements. Such specification includes classification and qualification of a testing
tool. Classification will identify which measures are to be applied for ensuring cor-
rectness of the testing tool. The classification has three Tool Confidence Levels
(TCLs) and depends on tool error detection (TD) capability and tool impact (TI).
Tools that have a possibility of silent failures (TD3) with high impact to the Item
(TI2) motivate qualification to the highest confidence level, TCL3. A “silent” mal-
function in a testing tool used for an ASIL D Item can cause a test to miss detection of
a fault in a component of a road vehicle.
Qualification will ensure correctness and applicability of the testing tool based on
the classification. ISO26262 specifies qualification steps according to the TCL that is
required from the tool. For example, when classification determines that tool malfunc-
tion can cause an ASIL C or ASIL D safety hazard and this malfunction is likely not
to be detected, the standard recommends that the tool should be developed to the same
ASIL according to a safety standard, followed by validation. Development and valida-
80 V. Izosimov, U. Ingelsson, and A. Wallin
tion of the testing tool should complement each other to ensure that the risk of test
escapes in the safety-critical component is minimized. Note also that if the tools are
used for testing of decomposed requirements, i.e., ASIL B(D), the ASIL level of in-
dependence, in this case: ASIL D, shall be often considered as the ASIL level in qual-
ification of these software tools.
The results of qualification of a testing tool and verification against safety require-
ments of the safety-critical automotive component will be reflected in a work product
called the safety case (see Fig. 2), which will include arguments that safety is
achieved using qualification and verification work products, including testing tool
analysis report, testing tool qualification report, integration and verification plan, test
cases (for the respective requirements) and respective test reports.
It should be noted that verification includes more than testing against requirements.
A complete verification process includes activities such as fault injection experiments,
tests in the operation environmental of the Item and EMC tests.
6 Verification and Validation
As mentioned in Section 5, the main document to describe the argumentation for item
safety is the safety case, which includes content of the work packages that are re-
quired by ISO26262. A significant part of the safety case comes from work products
of verification and validation activities. All these activities and work products become
difficult to manage without a thought-through and proven strategy. Part of any such
strategy is to automate as much as possible, use templates to ensure information quali-
ty, and to have tool support for the activities and management of the work products.
However, automation requires extra effort with respect to tool qualification. In
[16], a testing tool qualification method was presented, with a monitor to detect test-
ing tool malfunction and fault injection into the testing tool to evaluate the capability
of the monitor to detect malfunctions. The method is semi-automatic and reduces the
effort for tool qualification as is described in the following case study. To enable effi-
cient ISO26262-compliant development, it is vital to gather such methods and tools.
7 Case Study
In this section, we provide an example where we apply the concepts discussed in the
previous sections, in particular decomposition, traceability and testability of require-
ments, as well as testing tool qualification and fault injection based verification.
7.1 ASIL C windshield wiper
Consider a car’s windshield wiper and washer liquid spray. When the washer liquid
spray is activated, the windshield wiper is also activated for a short duration.
Two failure modes of the windshield wiper controller may cause the driver’s view
to be obscured by washer fluid, by (1) failure of the windshield wiper or by (2) failure
of the washer liquid spray. Controller failure can impact a common driving scenario,
Requirement decomposition and testability in development of safety-critical automotive components 81
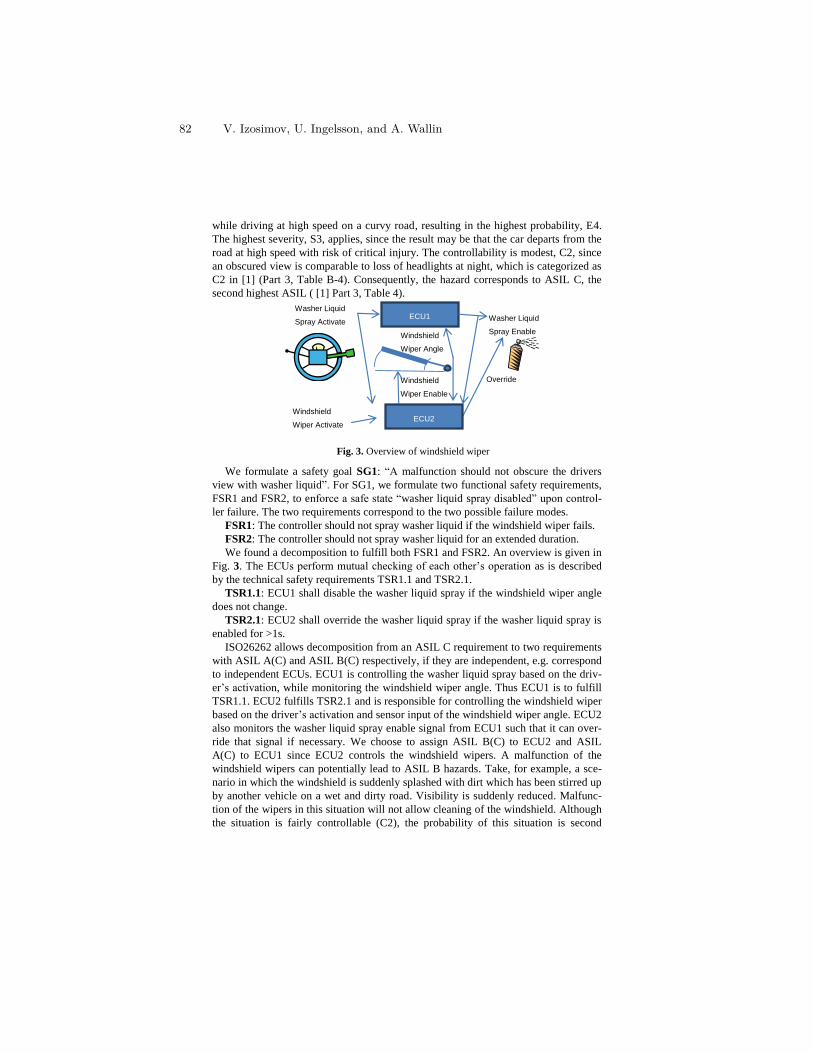
while driving at high speed on a curvy road, resulting in the highest probability, E4.
The highest severity, S3, applies, since the result may be that the car departs from the
road at high speed with risk of critical injury. The controllability is modest, C2, since
an obscured view is comparable to loss of headlights at night, which is categorized as
C2 in [1] (Part 3, Table B-4). Consequently, the hazard corresponds to ASIL C, the
second highest ASIL ( [1] Part 3, Table 4).
We formulate a safety goal SG1: “A malfunction should not obscure the drivers
view with washer liquid”. For SG1, we formulate two functional safety requirements,
FSR1 and FSR2, to enforce a safe state “washer liquid spray disabled” upon control-
ler failure. The two requirements correspond to the two possible failure modes.
FSR1: The controller should not spray washer liquid if the windshield wiper fails.
FSR2: The controller should not spray washer liquid for an extended duration.
We found a decomposition to fulfill both FSR1 and FSR2. An overview is given in
Fig. 3. The ECUs perform mutual checking of each other’s operation as is described
by the technical safety requirements TSR1.1 and TSR2.1.
TSR1.1: ECU1 shall disable the washer liquid spray if the windshield wiper angle
does not change.
TSR2.1: ECU2 shall override the washer liquid spray if the washer liquid spray is
enabled for >1s.
ISO26262 allows decomposition from an ASIL C requirement to two requirements
with ASIL A(C) and ASIL B(C) respectively, if they are independent, e.g. correspond
to independent ECUs. ECU1 is controlling the washer liquid spray based on the driv-
er’s activation, while monitoring the windshield wiper angle. Thus ECU1 is to fulfill
TSR1.1. ECU2 fulfills TSR2.1 and is responsible for controlling the windshield wiper
based on the driver’s activation and sensor input of the windshield wiper angle. ECU2
also monitors the washer liquid spray enable signal from ECU1 such that it can over-
ride that signal if necessary. We choose to assign ASIL B(C) to ECU2 and ASIL
A(C) to ECU1 since ECU2 controls the windshield wipers. A malfunction of the
windshield wipers can potentially lead to ASIL B hazards. Take, for example, a sce-
nario in which the windshield is suddenly splashed with dirt which has been stirred up
by another vehicle on a wet and dirty road. Visibility is suddenly reduced. Malfunc-
tion of the wipers in this situation will not allow cleaning of the windshield. Although
the situation is fairly controllable (C2), the probability of this situation is second
ECU1 Washer Liquid
Spray Activate
Windshield
Wiper Angle
Washer Liquid
Spray Enable
Windshield
Wiper Activate ECU2
Windshield
Wiper Enable
Override
Fig. 3. Overview of windshield wiper
82 V. Izosimov, U. Ingelsson, and A. Wallin
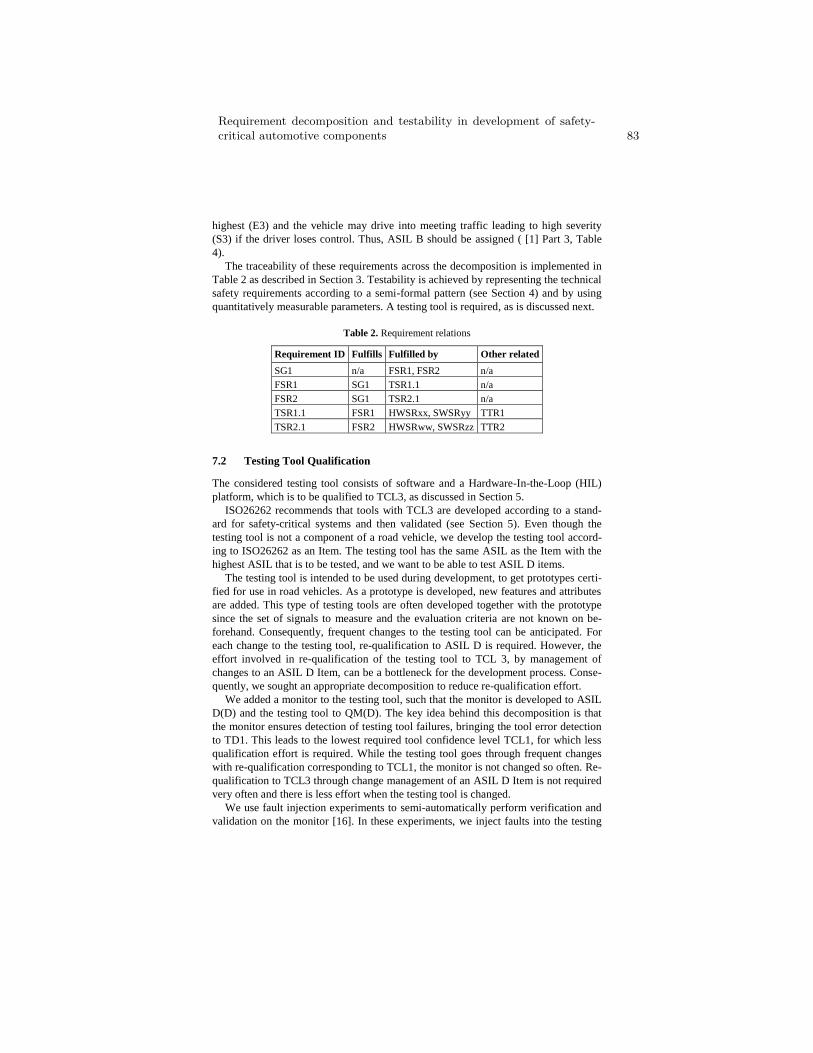
highest (E3) and the vehicle may drive into meeting traffic leading to high severity
(S3) if the driver loses control. Thus, ASIL B should be assigned ( [1] Part 3, Table
4).
The traceability of these requirements across the decomposition is implemented in
Table 2 as described in Section 3. Testability is achieved by representing the technical
safety requirements according to a semi-formal pattern (see Section 4) and by using
quantitatively measurable parameters. A testing tool is required, as is discussed next.
Table 2. Requirement relations
Requirement ID Fulfills Fulfilled by Other related
SG1 n/a FSR1, FSR2 n/a
FSR1 SG1 TSR1.1 n/a
FSR2 SG1 TSR2.1 n/a
TSR1.1 FSR1 HWSRxx, SWSRyy TTR1
TSR2.1 FSR2 HWSRww, SWSRzz TTR2
7.2 Testing Tool Qualification
The considered testing tool consists of software and a Hardware-In-the-Loop (HIL)
platform, which is to be qualified to TCL3, as discussed in Section 5.
ISO26262 recommends that tools with TCL3 are developed according to a stand-
ard for safety-critical systems and then validated (see Section 5). Even though the
testing tool is not a component of a road vehicle, we develop the testing tool accord-
ing to ISO26262 as an Item. The testing tool has the same ASIL as the Item with the
highest ASIL that is to be tested, and we want to be able to test ASIL D items.
The testing tool is intended to be used during development, to get prototypes certi-
fied for use in road vehicles. As a prototype is developed, new features and attributes
are added. This type of testing tools are often developed together with the prototype
since the set of signals to measure and the evaluation criteria are not known on be-
forehand. Consequently, frequent changes to the testing tool can be anticipated. For
each change to the testing tool, re-qualification to ASIL D is required. However, the
effort involved in re-qualification of the testing tool to TCL 3, by management of
changes to an ASIL D Item, can be a bottleneck for the development process. Conse-
quently, we sought an appropriate decomposition to reduce re-qualification effort.
We added a monitor to the testing tool, such that the monitor is developed to ASIL
D(D) and the testing tool to QM(D). The key idea behind this decomposition is that
the monitor ensures detection of testing tool failures, bringing the tool error detection
to TD1. This leads to the lowest required tool confidence level TCL1, for which less
qualification effort is required. While the testing tool goes through frequent changes
with re-qualification corresponding to TCL1, the monitor is not changed so often. Re-
qualification to TCL3 through change management of an ASIL D Item is not required
very often and there is less effort when the testing tool is changed.
We use fault injection experiments to semi-automatically perform verification and
validation on the monitor [16]. In these experiments, we inject faults into the testing
Requirement decomposition and testability in development of safety-critical automotive components 83
tool and thereby measure the monitor’s ability to detect unexpected behavior in the
testing tool. Through these experiments we identify three cases. The first case corre-
sponds to discovering a “bug” in the testing tool. In this case, the decision about
changing the monitor is deferred until the “bug” is corrected. In the second case, it is
discovered that the monitor is insufficient and requires a change and a change man-
agement to ASIL D(D) is performed, followed by further fault injection experiments.
In this case, the fault injection experiments must be adjusted. In [16] we describe a
semi-automatic procedure for adjusting the fault injection experiments. In the third
case, the monitor is able to detect all injected faults and no change to the monitor is
required. The relative frequency of the three cases depends on the type of testing tool
changes. We expect that the third case, which requires no changes to the monitor, will
be common enough to motivate the decomposition by its reduction in effort.
7.3 Case Study Summary
In the case study, we have seen two different applications of requirement decomposi-
tion, explicit requirement traceability and thorough management of requirement testa-
bility including testing tool qualification. Furthermore, we believe that the fault injec-
tion experiments applied to verify the testing tool monitor can be adapted also to other
software components and tools as an appropriate and time-saving verification method.
8 Conclusion
This paper addresses development of safety-critical embedded systems for use in road
vehicles according to ISO26262. Since the standard is new and introduces develop-
ment steps such as requirement decomposition and software tool qualification, we
have argued that this can lead to many manual steps and consequential pitfalls. For
example, software tool qualification can become a bottleneck in the development
process. To mitigate such pitfalls we have reviewed the important concepts require-
ment decomposition, traceability, testability, verification and validation. We have
showed application of the concepts in a case study involving two requirement decom-
positions, testing tool qualification using a monitor and fault injection experiments.
The chosen approach will increase efficiency of the development process of Items
with high ASIL levels, avoiding unnecessary bottlenecks and potential pitfalls that
might lead to hard-to-solve problems and compromise safety.
References
1 ISO, ISO 26262:2011 Functional safety - road vehicles, ISO, 2011.
2 T. Dittel and H.-J. Aryus, "How to "survive" a safety case according to ISO 26262," in
Lecture Notes in Computer Science: Computer Safety, Reliability, and Security, vol. 6351,
Springer, 2010, pp. 97-111.
3 R. Hamann, J. Sauler, S. Kriso, W. Grote and J. Mössinger, "Application of ISO 26262 in
84 V. Izosimov, U. Ingelsson, and A. Wallin
distributed development ISO 26262 in reality," SAE Technical Paper, 2009.
4 M. Born, J. Favaro and K. Olaf, "Application of ISO DIS 26262 in practice," in Proc. of the
1st Workshop on Critical Automotive applications: Robustness & Safety, 2010.
5 H. Schubotz, "Experience with ISO WD 26262 in Automotive Safety Projects," SAE Tech
Paper, 2008.
6 M. Hillenbrand, M. Heinz, N. Adler, K. Müller-Glaser, J. Matheis and C. Reichmann,
"ISO/DIS 26262 in the context of electric and electronic architecture modeling," in Lecture
Notes in Comp. Sci.: Architecting Critical Systems, Springer, 2010, pp. 179-192.
7 P. Johannessen, Ö. Halonen and O. Örsmark, "Functional safety extensions to Automotive
SPICE according to ISO 26262," Comm. in Computer and Information Science, Software
Process Improvement and Capability Determination, vol. 155, no. 2, pp. 52-63, 2011.
8 M. Hillenbrand, M. Heinz, K. Müller-Glaser, N. Adler, J. Matheis and C. Reichman, "An
approach for rapidly adapting the demands of ISO/DIS 26262 to electric/electronic
architecture modeling," in Proc. of the Intl. Symp. on Rapid System Prototyping, 2010.
9 D. Makartetskiy, D. Pozza and R. Sisto, "An Overview of software-based support tools for
ISO26262," in Intl. Workshop Innovation Inf. Tech. - Theory and Practice, 2010.
10 M. Hillenbrand, M. Heinz, N. Adler, J. Matheis and K. Müller-Glaser, "Failure mode and
effect analysis based on electric and electronic architectures of vehicles to support the safety
lifecycle ISO/DIS 26262," in Intl. Symp. on Rapid System Prototyping, 2010.
11 H. Schubotz, "Integrated safety planning according to ISO 26262," SAE Tech Paper, 2009.
12 B. Palin, D. Ward, I. Habli and R. Rivett, "ISO 26262 safety cases: compliance and
assurance," in IET Intl. System Safety Conf., 2011.
13 M. Conrad, P. Munier and F. Rauch, "Qualifying Software Tools According to ISO 26262,"
in Model-Based Development of Embedded Systems, 2010.
14 J. Hillebrand, P. Reichenpfader, I. Mandic, H. Siegl and C. Peer, "Establishing confidence
in the usage of software tools in context of ISO 26262," in Lecture Notes in Computer
Science: Computer Safety, Reliability and Security, Springer, 2011, pp. 257-269.
15 C. Robinson-Mallett and H. Heers, "Qualifizierung der Konfiguration eines Integrations-
HiL zum Nachweis einer Fahrerassistenzfunction im Kontext der ISO 26262," in Elektronik
im Kraftfahrzeug, Internationaler Kongress mit Fachausstellung, 2011.
16 Q. Wang, A. Wallin, V. Izosimov, U. Ingelsson and Z. Peng, "Test tool qualification
through fault simulation," in European Test Symp., 2012.
17 A. Åström, V. Izosimov and O. Örsmark, "Efficient software tool qualification for
automotive safety-critical systems," in Elektronik im Kraftfahrzeug, Internationaler
Kongress mit Fachausstellung, 2011.
18 P. Arkley and S. Riddle, "Overcoming the traceability benefit problem," in Proc. of the 13th
IEEE Intl. Conf. on Requirements Engineering, 2005.
19 B. S. Andersen and G. Romanski, "Verification of safety-critical software," ACM Queue,
vol. 9, no. 8, pp. 1-10, August 2011.
Requirement decomposition and testability in development of safety-critical automotive components 85

Intentionally left blank to harmonize page numbering with printed version.
adfa, p. 1, 2011.
© Springer-Verlag Berlin Heidelberg 2011
Model based specification, verification, and test
generation for a safety fieldbus profile
Jan Krause1, Elke Hintze
2, Stephan Magnus
3, Christian Diedrich
4
1,2,3Institut für Automation und Kommunikation (ifak)
Werner-Heisenberg-Str. 1
39106 Magdeburg
Germany
4Otto von Guericke Universität Magdeburg
Lehrstuhl Integrierte Automation
Universitätsplatz 2
39104 Magdeburg
Germany
[email protected], [email protected],
[email protected], [email protected]
Abstract. This paper suggests methods, and a tool chain for model based
specification, verification, and test generation for a safety fieldbus profile. The
basis of this tool chain is the use of an UML-profile as a specification notation,
a simple high level Petri net model called “Safe Petri Net with Attributes”
(SPENAT) and analysis methods found in Petri net theory. The developed
UML-profile contains UML class diagrams and UML state machines for speci-
fication modeling. Verification and developed test generation methods are
shown to be applicable after mapping the specification model onto SPENAT.
The practical use of this tool chain is exemplarily demonstrated for a safety
fieldbus profile.
Keywords: model based testing, verification, model based specification,
SPENAT
1 Introduction
More and more safety-relevant applications are being handled within industrial auto-
mation. The IEC 61508 standard describes requirements of functional safety. Micro-
processor based device solutions for safety-relevant applications are faced with this
standard. This forces the device manufacturer to contact third party partners such as
TÜV and IFA which verify the development process and the development result. This
results in a resource overhead for the device manufacturer. Therefore, these manufac-
turers are looking for methods and tools to automate some activities in order to de-
crease the overhead.
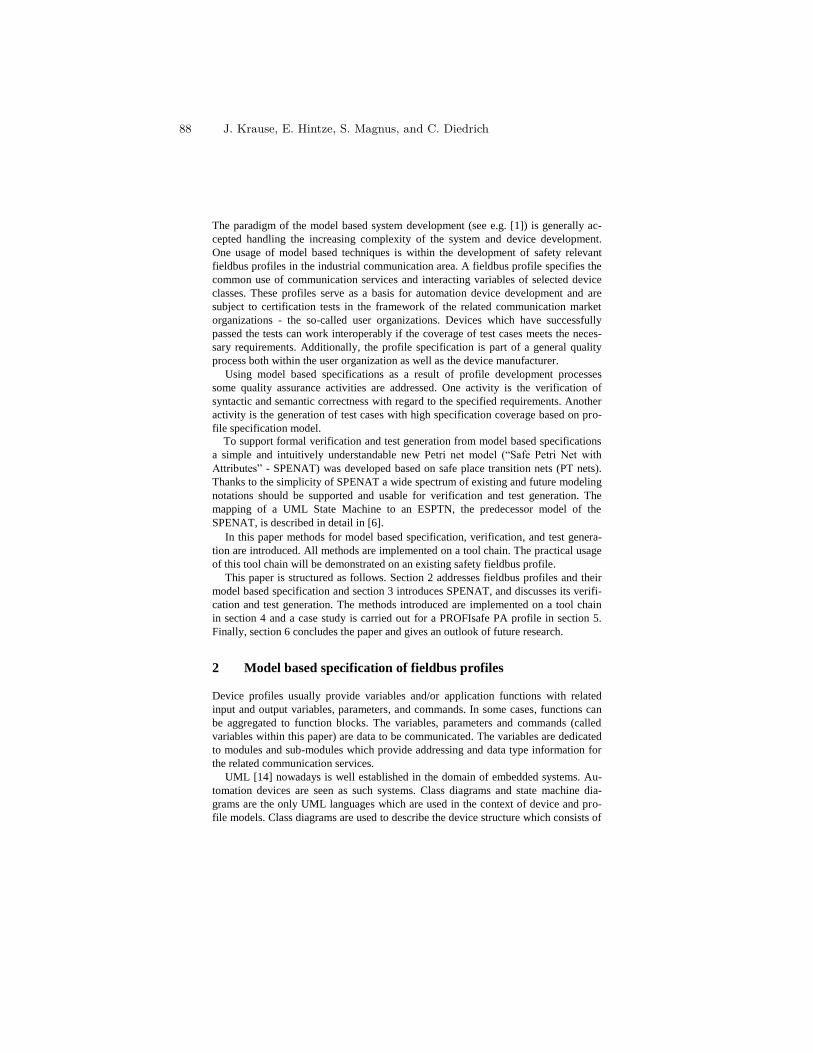
The paradigm of the model based system development (see e.g. [1]) is generally ac-
cepted handling the increasing complexity of the system and device development.
One usage of model based techniques is within the development of safety relevant
fieldbus profiles in the industrial communication area. A fieldbus profile specifies the
common use of communication services and interacting variables of selected device
classes. These profiles serve as a basis for automation device development and are
subject to certification tests in the framework of the related communication market
organizations - the so-called user organizations. Devices which have successfully
passed the tests can work interoperably if the coverage of test cases meets the neces-
sary requirements. Additionally, the profile specification is part of a general quality
process both within the user organization as well as the device manufacturer.
Using model based specifications as a result of profile development processes
some quality assurance activities are addressed. One activity is the verification of
syntactic and semantic correctness with regard to the specified requirements. Another
activity is the generation of test cases with high specification coverage based on pro-
file specification model.
To support formal verification and test generation from model based specifications
a simple and intuitively understandable new Petri net model (“Safe Petri Net with
Attributes” - SPENAT) was developed based on safe place transition nets (PT nets).
Thanks to the simplicity of SPENAT a wide spectrum of existing and future modeling
notations should be supported and usable for verification and test generation. The
mapping of a UML State Machine to an ESPTN, the predecessor model of the
SPENAT, is described in detail in [6].
In this paper methods for model based specification, verification, and test genera-
tion are introduced. All methods are implemented on a tool chain. The practical usage
of this tool chain will be demonstrated on an existing safety fieldbus profile.
This paper is structured as follows. Section 2 addresses fieldbus profiles and their
model based specification and section 3 introduces SPENAT, and discusses its verifi-
cation and test generation. The methods introduced are implemented on a tool chain
in section 4 and a case study is carried out for a PROFIsafe PA profile in section 5.
Finally, section 6 concludes the paper and gives an outlook of future research.
2 Model based specification of fieldbus profiles
Device profiles usually provide variables and/or application functions with related
input and output variables, parameters, and commands. In some cases, functions can
be aggregated to function blocks. The variables, parameters and commands (called
variables within this paper) are data to be communicated. The variables are dedicated
to modules and sub-modules which provide addressing and data type information for
the related communication services.
UML [14] nowadays is well established in the domain of embedded systems. Au-
tomation devices are seen as such systems. Class diagrams and state machine dia-
grams are the only UML languages which are used in the context of device and pro-
file models. Class diagrams are used to describe the device structure which consists of
88 J. Krause, E. Hintze, S. Magnus, and C. Diedrich
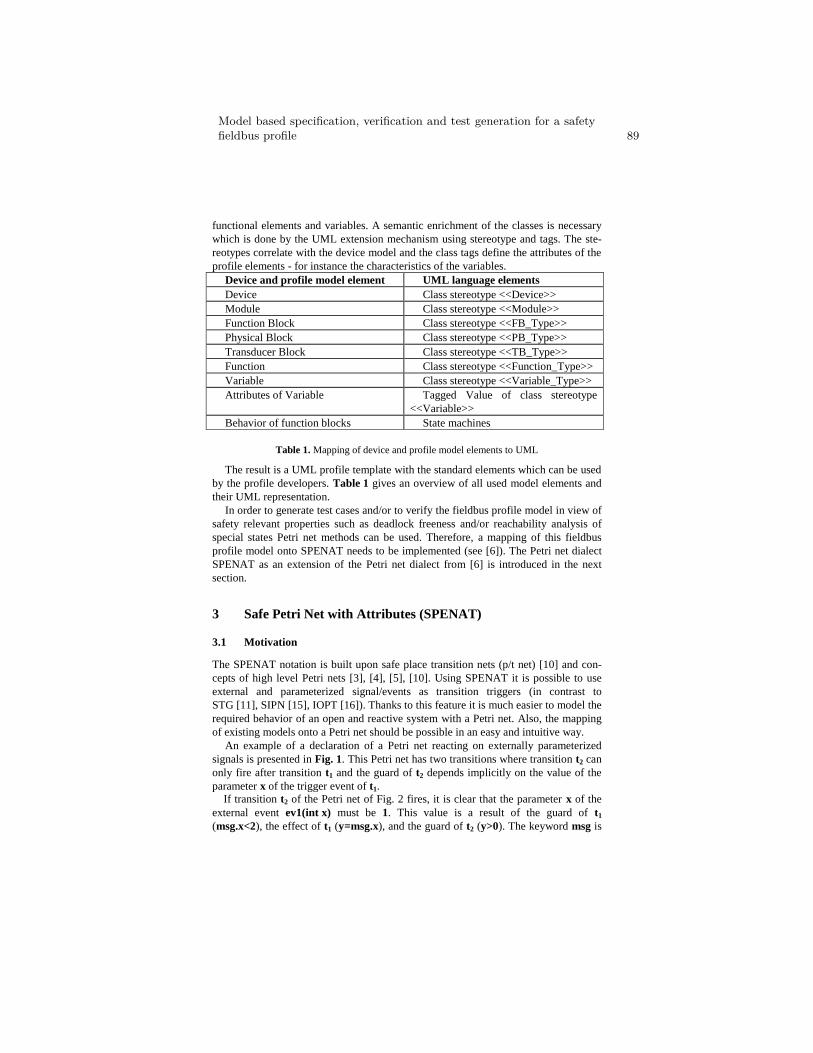
functional elements and variables. A semantic enrichment of the classes is necessary
which is done by the UML extension mechanism using stereotype and tags. The ste-
reotypes correlate with the device model and the class tags define the attributes of the
profile elements - for instance the characteristics of the variables.
Device and profile model element UML language elements
Device Class stereotype <<Device>>
Module Class stereotype <<Module>>
Function Block Class stereotype <<FB_Type>>
Physical Block Class stereotype <<PB_Type>>
Transducer Block Class stereotype <<TB_Type>>
Function Class stereotype <<Function_Type>>
Variable Class stereotype <<Variable_Type>>
Attributes of Variable Tagged Value of class stereotype
<<Variable>>
Behavior of function blocks State machines
Table 1. Mapping of device and profile model elements to UML
The result is a UML profile template with the standard elements which can be used
by the profile developers. Table 1 gives an overview of all used model elements and
their UML representation.
In order to generate test cases and/or to verify the fieldbus profile model in view of
safety relevant properties such as deadlock freeness and/or reachability analysis of
special states Petri net methods can be used. Therefore, a mapping of this fieldbus
profile model onto SPENAT needs to be implemented (see [6]). The Petri net dialect
SPENAT as an extension of the Petri net dialect from [6] is introduced in the next
section.
3 Safe Petri Net with Attributes (SPENAT)
3.1 Motivation
The SPENAT notation is built upon safe place transition nets (p/t net) [10] and con-
cepts of high level Petri nets [3], [4], [5], [10]. Using SPENAT it is possible to use
external and parameterized signal/events as transition triggers (in contrast to
STG [11], SIPN [15], IOPT [16]). Thanks to this feature it is much easier to model the
required behavior of an open and reactive system with a Petri net. Also, the mapping
of existing models onto a Petri net should be possible in an easy and intuitive way.
An example of a declaration of a Petri net reacting on externally parameterized
signals is presented in Fig. 1. This Petri net has two transitions where transition t2 can
only fire after transition t1 and the guard of t2 depends implicitly on the value of the
parameter x of the trigger event of t1.
If transition t2 of the Petri net of Fig. 2 fires, it is clear that the parameter x of the
external event ev1(int x) must be 1. This value is a result of the guard of t1
(msg.x<2), the effect of t1 (y=msg.x), and the guard of t2 (y>0). The keyword msg is
Model based specification, verification and test generation for a safetyfieldbus profile 89
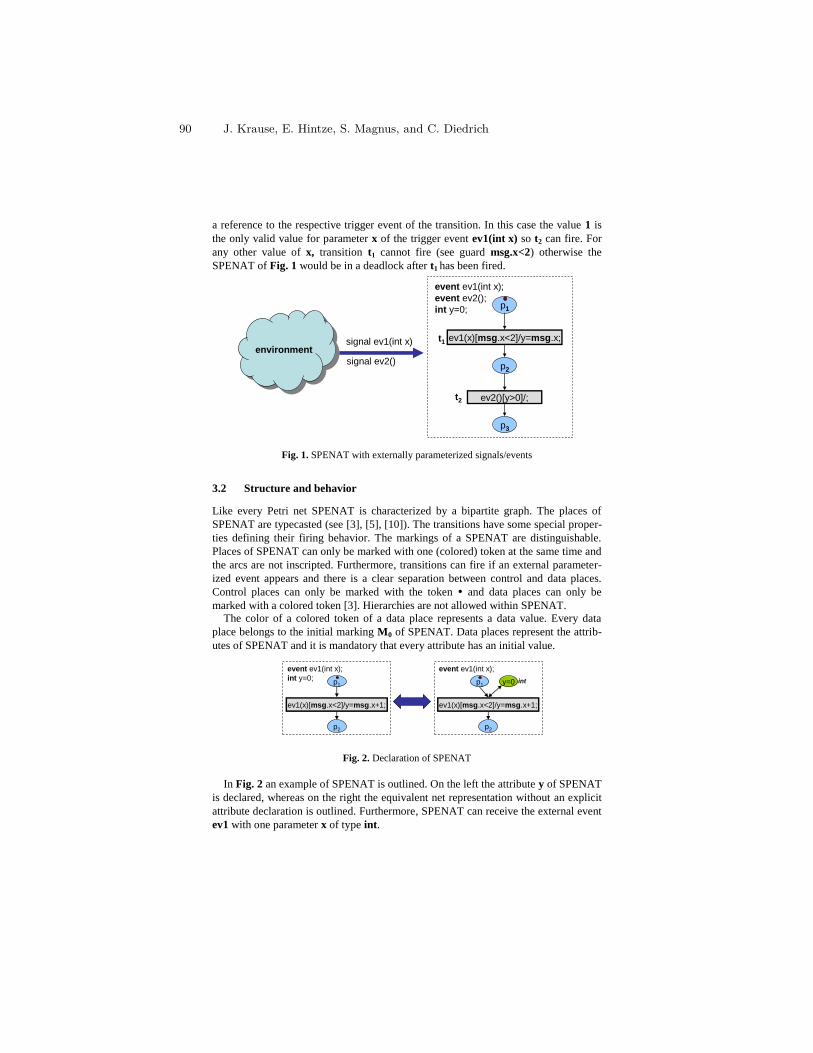
a reference to the respective trigger event of the transition. In this case the value 1 is
the only valid value for parameter x of the trigger event ev1(int x) so t2 can fire. For
any other value of x, transition t1 cannot fire (see guard msg.x<2) otherwise the
SPENAT of Fig. 1 would be in a deadlock after t1 has been fired.
p2
ev1(x)[msg.x<2]/y=msg.x;
p1
event ev1(int x);
event ev2();
int y=0;
p3
ev2()[y>0]/;
environmentenvironmentsignal ev1(int x)
signal ev2()
t1
t2
Fig. 1. SPENAT with externally parameterized signals/events
3.2 Structure and behavior
Like every Petri net SPENAT is characterized by a bipartite graph. The places of
SPENAT are typecasted (see [3], [5], [10]). The transitions have some special proper-
ties defining their firing behavior. The markings of a SPENAT are distinguishable.
Places of SPENAT can only be marked with one (colored) token at the same time and
the arcs are not inscripted. Furthermore, transitions can fire if an external parameter-
ized event appears and there is a clear separation between control and data places.
Control places can only be marked with the token and data places can only be
marked with a colored token [3]. Hierarchies are not allowed within SPENAT.
The color of a colored token of a data place represents a data value. Every data
place belongs to the initial marking M0 of SPENAT. Data places represent the attrib-
utes of SPENAT and it is mandatory that every attribute has an initial value.
p2
ev1(x)[msg.x<2]/y=msg.x+1;
p1 y=0 int
event ev1(int x);
p2
ev1(x)[msg.x<2]/y=msg.x+1;
p1
event ev1(int x);
int y=0;
Fig. 2. Declaration of SPENAT
In Fig. 2 an example of SPENAT is outlined. On the left the attribute y of SPENAT
is declared, whereas on the right the equivalent net representation without an explicit
attribute declaration is outlined. Furthermore, SPENAT can receive the external event
ev1 with one parameter x of type int.
90 J. Krause, E. Hintze, S. Magnus, and C. Diedrich
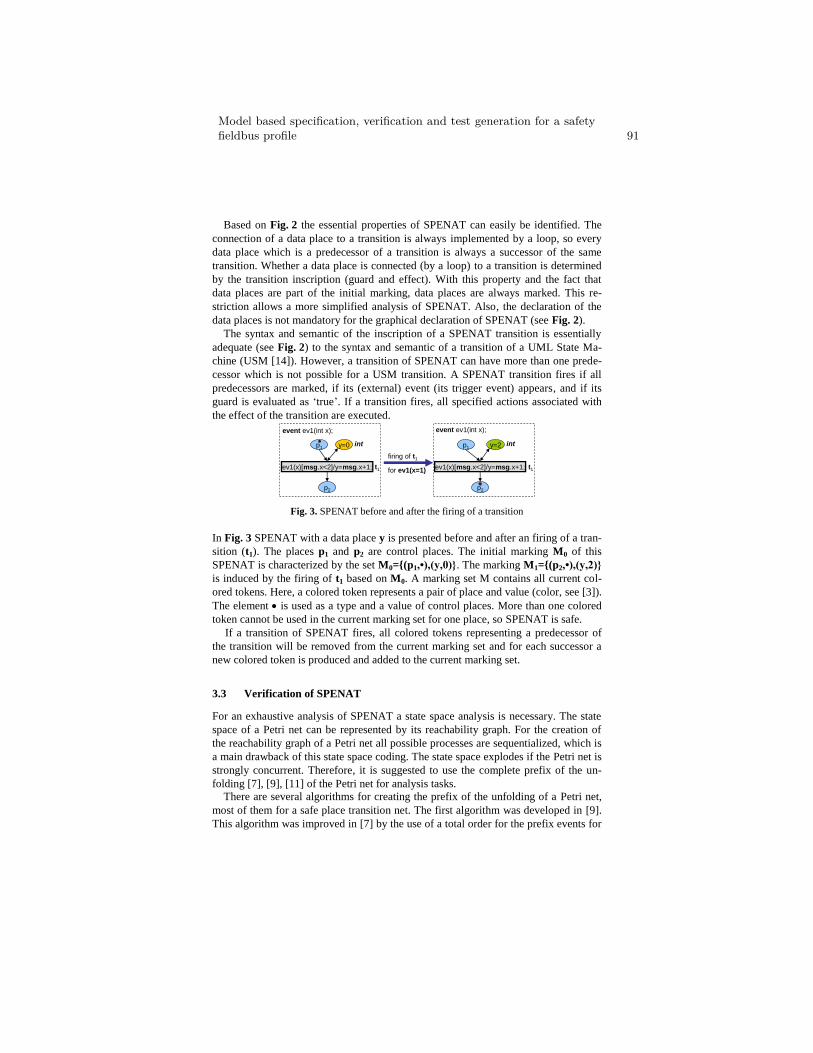
Based on Fig. 2 the essential properties of SPENAT can easily be identified. The
connection of a data place to a transition is always implemented by a loop, so every
data place which is a predecessor of a transition is always a successor of the same
transition. Whether a data place is connected (by a loop) to a transition is determined
by the transition inscription (guard and effect). With this property and the fact that
data places are part of the initial marking, data places are always marked. This re-
striction allows a more simplified analysis of SPENAT. Also, the declaration of the
data places is not mandatory for the graphical declaration of SPENAT (see Fig. 2).
The syntax and semantic of the inscription of a SPENAT transition is essentially
adequate (see Fig. 2) to the syntax and semantic of a transition of a UML State Ma-
chine (USM [14]). However, a transition of SPENAT can have more than one prede-
cessor which is not possible for a USM transition. A SPENAT transition fires if all
predecessors are marked, if its (external) event (its trigger event) appears, and if its
guard is evaluated as ‘true’. If a transition fires, all specified actions associated with
the effect of the transition are executed.
ev1(x)[msg.x<2]/y=msg.x+1;
p1
p2
y=2 int
event ev1(int x);
p2
ev1(x)[msg.x<2]/y=msg.x+1;
p1 y=0 int
event ev1(int x);
t1 t1
firing of t1
for ev1(x=1)
Fig. 3. SPENAT before and after the firing of a transition
In Fig. 3 SPENAT with a data place y is presented before and after an firing of a tran-
sition (t1). The places p1 and p2 are control places. The initial marking M0 of this
SPENAT is characterized by the set M0={(p1,•),(y,0)}. The marking M1={(p2,•),(y,2)}
is induced by the firing of t1 based on M0. A marking set M contains all current col-
ored tokens. Here, a colored token represents a pair of place and value (color, see [3]).
The element is used as a type and a value of control places. More than one colored
token cannot be used in the current marking set for one place, so SPENAT is safe.
If a transition of SPENAT fires, all colored tokens representing a predecessor of
the transition will be removed from the current marking set and for each successor a
new colored token is produced and added to the current marking set.
3.3 Verification of SPENAT
For an exhaustive analysis of SPENAT a state space analysis is necessary. The state
space of a Petri net can be represented by its reachability graph. For the creation of
the reachability graph of a Petri net all possible processes are sequentialized, which is
a main drawback of this state space coding. The state space explodes if the Petri net is
strongly concurrent. Therefore, it is suggested to use the complete prefix of the un-
folding [7], [9], [11] of the Petri net for analysis tasks.
There are several algorithms for creating the prefix of the unfolding of a Petri net,
most of them for a safe place transition net. The first algorithm was developed in [9].
This algorithm was improved in [7] by the use of a total order for the prefix events for
Model based specification, verification and test generation for a safetyfieldbus profile 91
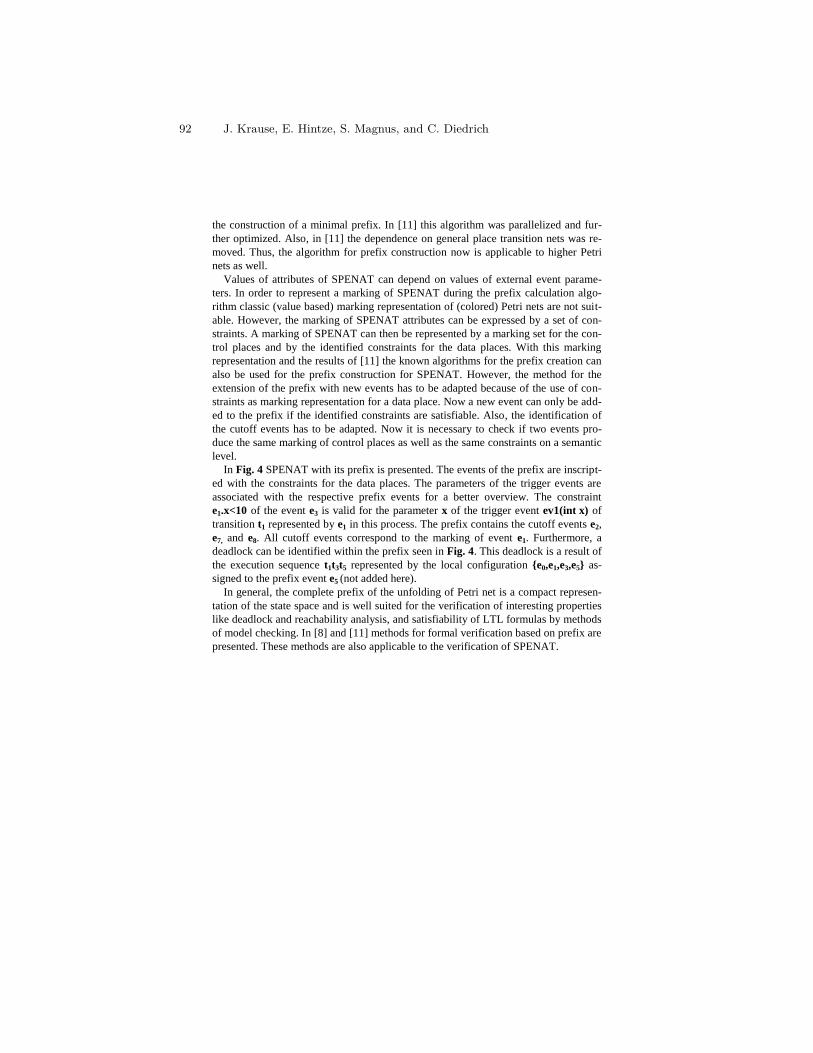
the construction of a minimal prefix. In [11] this algorithm was parallelized and fur-
ther optimized. Also, in [11] the dependence on general place transition nets was re-
moved. Thus, the algorithm for prefix construction now is applicable to higher Petri
nets as well.
Values of attributes of SPENAT can depend on values of external event parame-
ters. In order to represent a marking of SPENAT during the prefix calculation algo-
rithm classic (value based) marking representation of (colored) Petri nets are not suit-
able. However, the marking of SPENAT attributes can be expressed by a set of con-
straints. A marking of SPENAT can then be represented by a marking set for the con-
trol places and by the identified constraints for the data places. With this marking
representation and the results of [11] the known algorithms for the prefix creation can
also be used for the prefix construction for SPENAT. However, the method for the
extension of the prefix with new events has to be adapted because of the use of con-
straints as marking representation for a data place. Now a new event can only be add-
ed to the prefix if the identified constraints are satisfiable. Also, the identification of
the cutoff events has to be adapted. Now it is necessary to check if two events pro-
duce the same marking of control places as well as the same constraints on a semantic
level.
In Fig. 4 SPENAT with its prefix is presented. The events of the prefix are inscript-
ed with the constraints for the data places. The parameters of the trigger events are
associated with the respective prefix events for a better overview. The constraint
e1.x<10 of the event e3 is valid for the parameter x of the trigger event ev1(int x) of
transition t1 represented by e1 in this process. The prefix contains the cutoff events e2,
e7, and e8. All cutoff events correspond to the marking of event e1. Furthermore, a
deadlock can be identified within the prefix seen in Fig. 4. This deadlock is a result of
the execution sequence t1t3t5 represented by the local configuration {e0,e1,e3,e5} as-
signed to the prefix event e5 (not added here).
In general, the complete prefix of the unfolding of Petri net is a compact represen-
tation of the state space and is well suited for the verification of interesting properties
like deadlock and reachability analysis, and satisfiability of LTL formulas by methods
of model checking. In [8] and [11] methods for formal verification based on prefix are
presented. These methods are also applicable to the verification of SPENAT.
92 J. Krause, E. Hintze, S. Magnus, and C. Diedrich
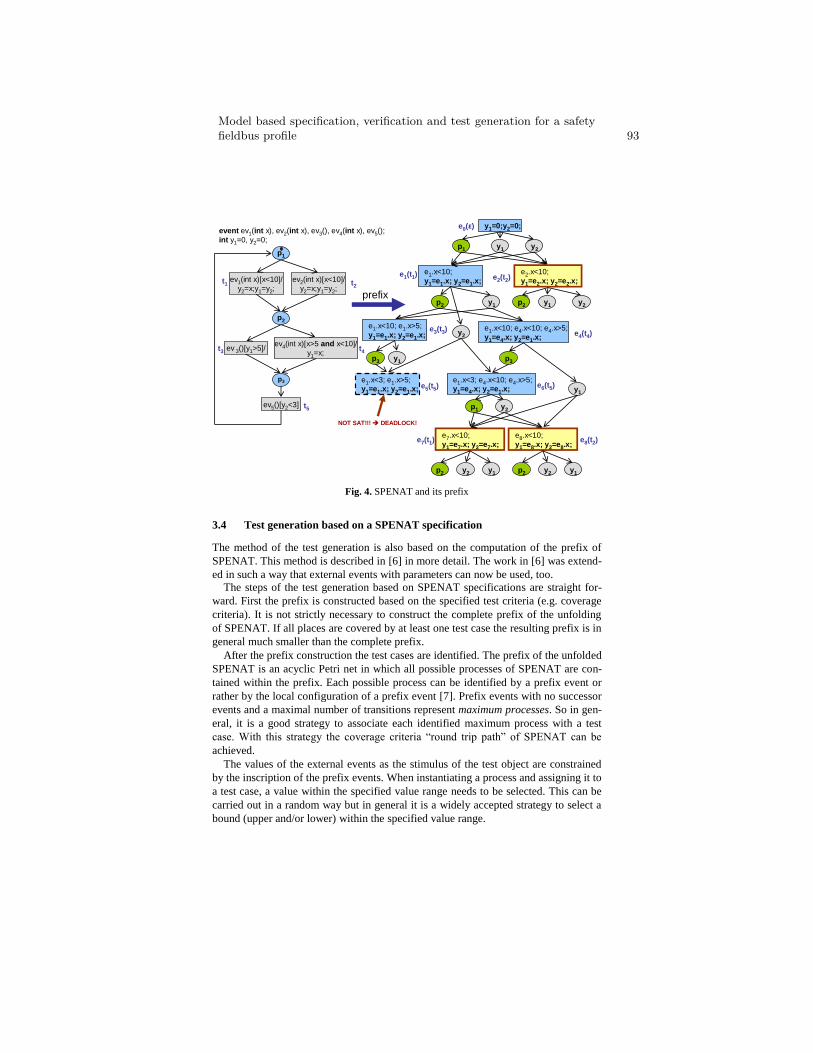
ev1(int x)[x<10]/
y2=x;y1=y2;
ev 3()[y1>5]/
ev5()[y2<3]
event ev1(int x), ev2(int x), ev3(), ev4(int x), ev5();
int y1=0, y2=0;p1
e1.x<10;
y1=e1.x; y2=e1.x;
p2
y1 y2
ev2(int x)[x<10]/
y2=x;y1=y2;
ev4(int x)[x>5 and x<10]/
y1=x;
p2
t1
NOT SAT!!! DEADLOCK!
t2
t3 t4
t5
e1(t1)
y1=0;y2=0;
e2.x<10;
y1=e2.x; y2=e2.x;e2(t2)
y1 y2y1
y2
e1.x<10; e1.x>5;
y1=e1.x; y2=e1.x;e3(t3) e1.x<10; e4.x<10; e4.x>5;
y1=e4.x; y2=e1.x;e4(t4)
p3 y1 p3
y1
e1.x<3; e1.x>5;y1=e1.x; y2=e1.x;
e1.x<3; e4.x<10; e4.x>5;y1=e4.x; y2=e1.x;e5(t5) e6(t5)
p1 y2
e8.x<10;
y1=e8.x; y2=e8.x;e8(t2)
p2 y1y2
p1
p2
p3
e0(ε)
prefix
e7.x<10;
y1=e7.x; y2=e7.x;e7(t1)
p2 y1y2
Fig. 4. SPENAT and its prefix
3.4 Test generation based on a SPENAT specification
The method of the test generation is also based on the computation of the prefix of
SPENAT. This method is described in [6] in more detail. The work in [6] was extend-
ed in such a way that external events with parameters can now be used, too.
The steps of the test generation based on SPENAT specifications are straight for-
ward. First the prefix is constructed based on the specified test criteria (e.g. coverage
criteria). It is not strictly necessary to construct the complete prefix of the unfolding
of SPENAT. If all places are covered by at least one test case the resulting prefix is in
general much smaller than the complete prefix.
After the prefix construction the test cases are identified. The prefix of the unfolded
SPENAT is an acyclic Petri net in which all possible processes of SPENAT are con-
tained within the prefix. Each possible process can be identified by a prefix event or
rather by the local configuration of a prefix event [7]. Prefix events with no successor
events and a maximal number of transitions represent maximum processes. So in gen-
eral, it is a good strategy to associate each identified maximum process with a test
case. With this strategy the coverage criteria “round trip path” of SPENAT can be
achieved.
The values of the external events as the stimulus of the test object are constrained
by the inscription of the prefix events. When instantiating a process and assigning it to
a test case, a value within the specified value range needs to be selected. This can be
carried out in a random way but in general it is a widely accepted strategy to select a
bound (upper and/or lower) within the specified value range.
Model based specification, verification and test generation for a safetyfieldbus profile 93
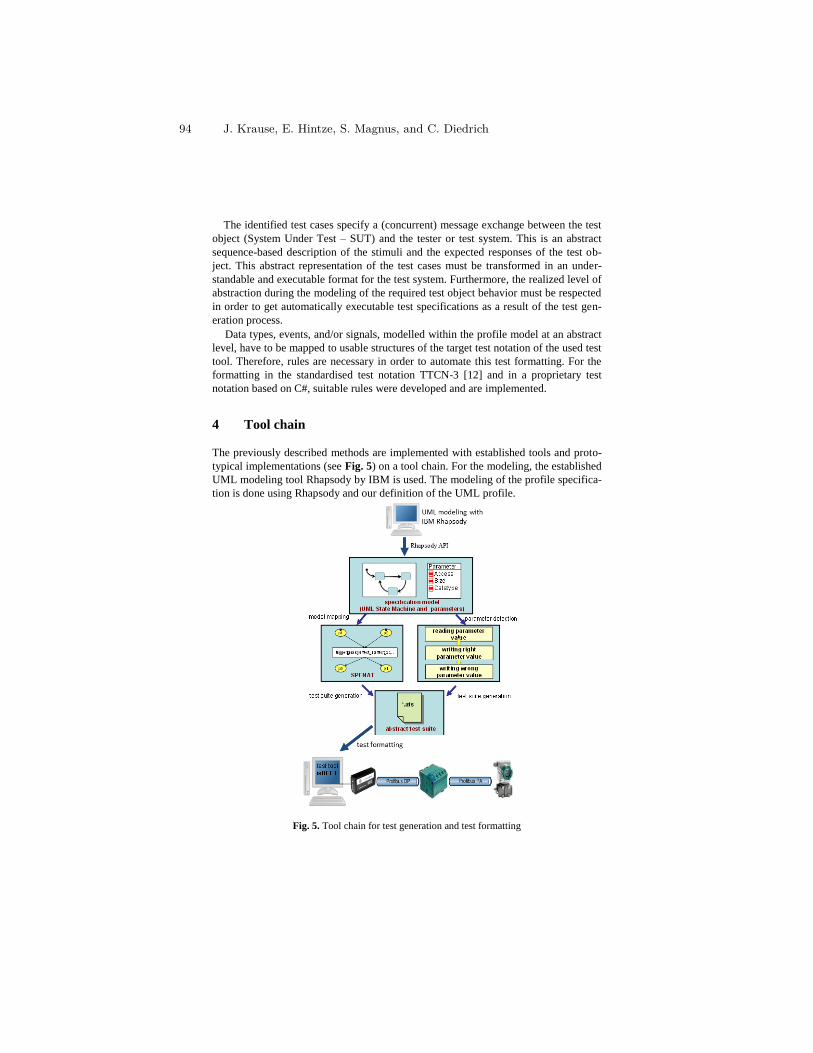
The identified test cases specify a (concurrent) message exchange between the test
object (System Under Test – SUT) and the tester or test system. This is an abstract
sequence-based description of the stimuli and the expected responses of the test ob-
ject. This abstract representation of the test cases must be transformed in an under-
standable and executable format for the test system. Furthermore, the realized level of
abstraction during the modeling of the required test object behavior must be respected
in order to get automatically executable test specifications as a result of the test gen-
eration process.
Data types, events, and/or signals, modelled within the profile model at an abstract
level, have to be mapped to usable structures of the target test notation of the used test
tool. Therefore, rules are necessary in order to automate this test formatting. For the
formatting in the standardised test notation TTCN-3 [12] and in a proprietary test
notation based on C#, suitable rules were developed and are implemented.
4 Tool chain
The previously described methods are implemented with established tools and proto-
typical implementations (see Fig. 5) on a tool chain. For the modeling, the established
UML modeling tool Rhapsody by IBM is used. The modeling of the profile specifica-
tion is done using Rhapsody and our definition of the UML profile.
Fig. 5. Tool chain for test generation and test formatting
94 J. Krause, E. Hintze, S. Magnus, and C. Diedrich
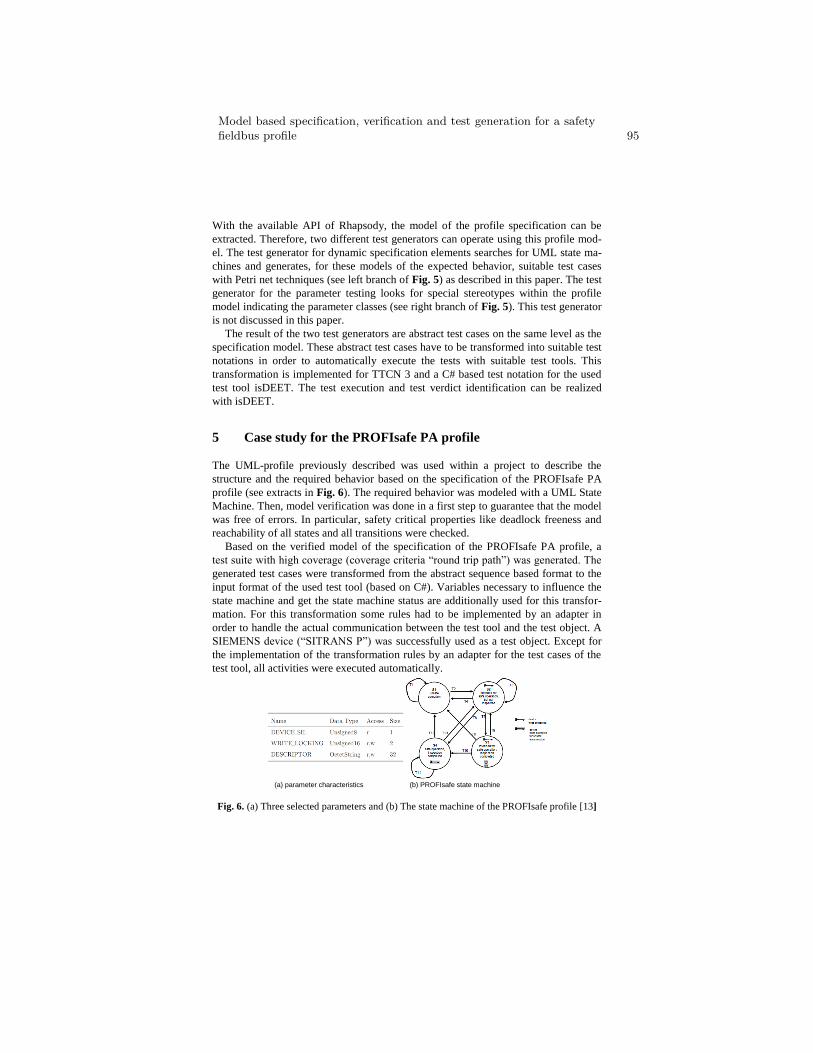
With the available API of Rhapsody, the model of the profile specification can be
extracted. Therefore, two different test generators can operate using this profile mod-
el. The test generator for dynamic specification elements searches for UML state ma-
chines and generates, for these models of the expected behavior, suitable test cases
with Petri net techniques (see left branch of Fig. 5) as described in this paper. The test
generator for the parameter testing looks for special stereotypes within the profile
model indicating the parameter classes (see right branch of Fig. 5). This test generator
is not discussed in this paper.
The result of the two test generators are abstract test cases on the same level as the
specification model. These abstract test cases have to be transformed into suitable test
notations in order to automatically execute the tests with suitable test tools. This
transformation is implemented for TTCN 3 and a C# based test notation for the used
test tool isDEET. The test execution and test verdict identification can be realized
with isDEET.
5 Case study for the PROFIsafe PA profile
The UML-profile previously described was used within a project to describe the
structure and the required behavior based on the specification of the PROFIsafe PA
profile (see extracts in Fig. 6). The required behavior was modeled with a UML State
Machine. Then, model verification was done in a first step to guarantee that the model
was free of errors. In particular, safety critical properties like deadlock freeness and
reachability of all states and all transitions were checked.
Based on the verified model of the specification of the PROFIsafe PA profile, a
test suite with high coverage (coverage criteria “round trip path”) was generated. The
generated test cases were transformed from the abstract sequence based format to the
input format of the used test tool (based on C#). Variables necessary to influence the
state machine and get the state machine status are additionally used for this transfor-
mation. For this transformation some rules had to be implemented by an adapter in
order to handle the actual communication between the test tool and the test object. A
SIEMENS device (“SITRANS P”) was successfully used as a test object. Except for
the implementation of the transformation rules by an adapter for the test cases of the
test tool, all activities were executed automatically.
Fig. 6. (a) Three selected parameters and (b) The state machine of the PROFIsafe profile [13]
(b) PROFIsafe state machine(a) parameter characteristics
Model based specification, verification and test generation for a safetyfieldbus profile 95
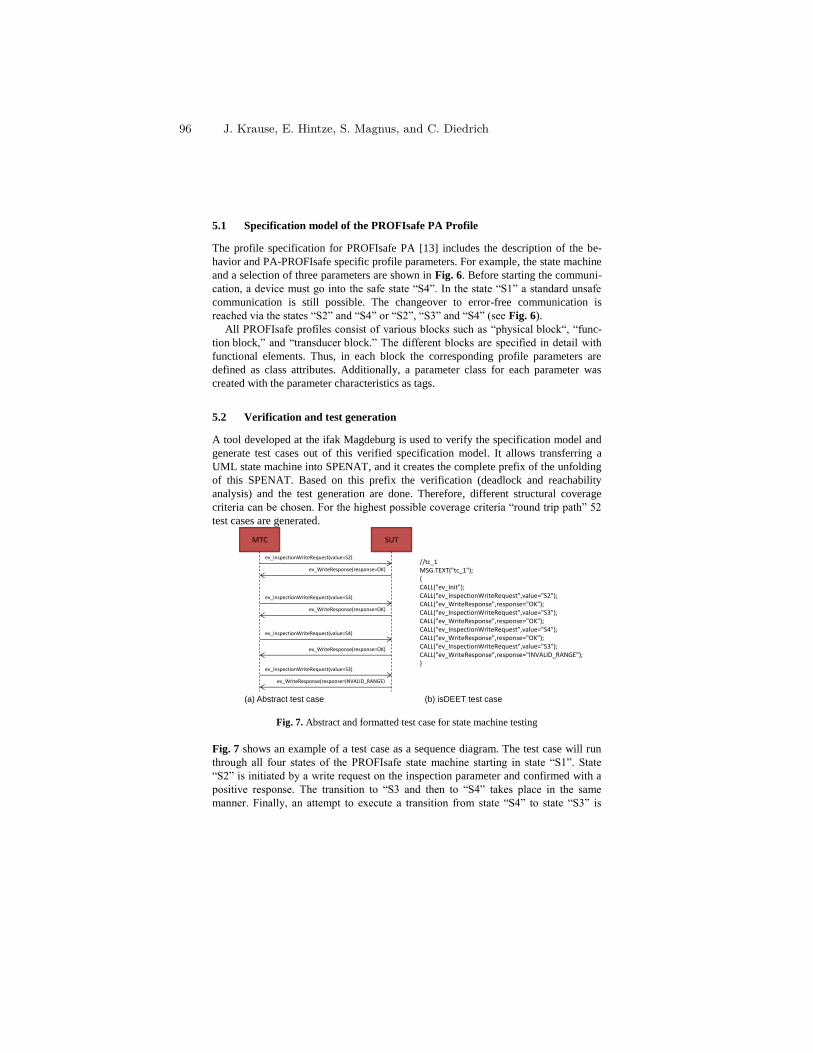
5.1 Specification model of the PROFIsafe PA Profile
The profile specification for PROFIsafe PA [13] includes the description of the be-
havior and PA-PROFIsafe specific profile parameters. For example, the state machine
and a selection of three parameters are shown in Fig. 6. Before starting the communi-
cation, a device must go into the safe state “S4”. In the state “S1” a standard unsafe
communication is still possible. The changeover to error-free communication is
reached via the states “S2” and “S4” or “S2”, “S3” and “S4” (see Fig. 6).
All PROFIsafe profiles consist of various blocks such as “physical block“, “func-
tion block,” and “transducer block.” The different blocks are specified in detail with
functional elements. Thus, in each block the corresponding profile parameters are
defined as class attributes. Additionally, a parameter class for each parameter was
created with the parameter characteristics as tags.
5.2 Verification and test generation
A tool developed at the ifak Magdeburg is used to verify the specification model and
generate test cases out of this verified specification model. It allows transferring a
UML state machine into SPENAT, and it creates the complete prefix of the unfolding
of this SPENAT. Based on this prefix the verification (deadlock and reachability
analysis) and the test generation are done. Therefore, different structural coverage
criteria can be chosen. For the highest possible coverage criteria “round trip path” 52
test cases are generated.
Fig. 7. Abstract and formatted test case for state machine testing
Fig. 7 shows an example of a test case as a sequence diagram. The test case will run
through all four states of the PROFIsafe state machine starting in state “S1”. State
“S2” is initiated by a write request on the inspection parameter and confirmed with a
positive response. The transition to “S3 and then to “S4” takes place in the same
manner. Finally, an attempt to execute a transition from state “S4” to state “S3” is
MTC SUT
ev_InspectionWriteRequest(value=S2)
ev_WriteResponse(response=OK)
ev_InspectionWriteRequest(value=S3)
ev_WriteResponse(response=OK)
ev_InspectionWriteRequest(value=S4)
ev_WriteResponse(response=OK)
ev_InspectionWriteRequest(value=S3)
ev_WriteResponse(response=INVALID_RANGE)
(a) Abstract test case
//tc_1MSG.TEXT("tc_1");{CALL("ev_Init");CALL("ev_InspectionWriteRequest",value="S2");CALL("ev_WriteResponse",response="OK"); CALL("ev_InspectionWriteRequest",value="S3");CALL("ev_WriteResponse",response="OK");CALL("ev_InspectionWriteRequest",value="S4");CALL("ev_WriteResponse",response="OK");CALL("ev_InspectionWriteRequest",value="S3");CALL("ev_WriteResponse",response="INVALID_RANGE");}
(b) isDEET test case
96 J. Krause, E. Hintze, S. Magnus, and C. Diedrich
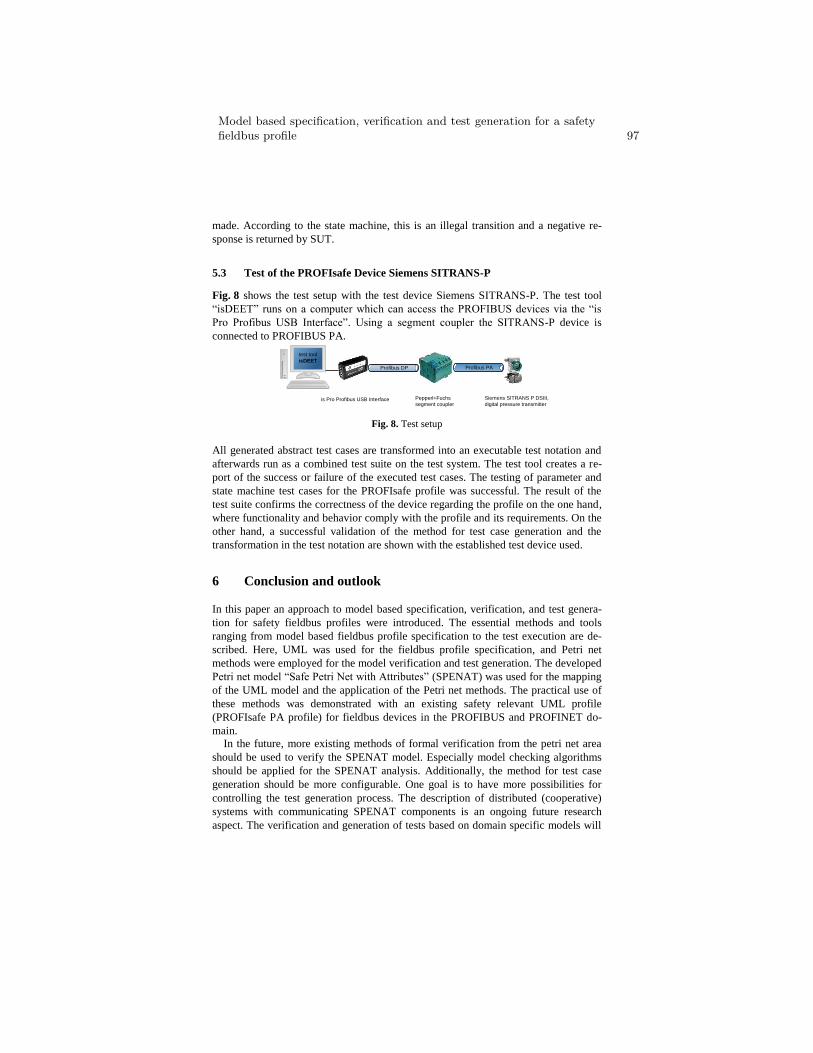
made. According to the state machine, this is an illegal transition and a negative re-
sponse is returned by SUT.
5.3 Test of the PROFIsafe Device Siemens SITRANS-P
Fig. 8 shows the test setup with the test device Siemens SITRANS-P. The test tool
“isDEET” runs on a computer which can access the PROFIBUS devices via the “is
Pro Profibus USB Interface”. Using a segment coupler the SITRANS-P device is
connected to PROFIBUS PA.
Fig. 8. Test setup
All generated abstract test cases are transformed into an executable test notation and
afterwards run as a combined test suite on the test system. The test tool creates a re-
port of the success or failure of the executed test cases. The testing of parameter and
state machine test cases for the PROFIsafe profile was successful. The result of the
test suite confirms the correctness of the device regarding the profile on the one hand,
where functionality and behavior comply with the profile and its requirements. On the
other hand, a successful validation of the method for test case generation and the
transformation in the test notation are shown with the established test device used.
6 Conclusion and outlook
In this paper an approach to model based specification, verification, and test genera-
tion for safety fieldbus profiles were introduced. The essential methods and tools
ranging from model based fieldbus profile specification to the test execution are de-
scribed. Here, UML was used for the fieldbus profile specification, and Petri net
methods were employed for the model verification and test generation. The developed
Petri net model “Safe Petri Net with Attributes” (SPENAT) was used for the mapping
of the UML model and the application of the Petri net methods. The practical use of
these methods was demonstrated with an existing safety relevant UML profile
(PROFIsafe PA profile) for fieldbus devices in the PROFIBUS and PROFINET do-
main.
In the future, more existing methods of formal verification from the petri net area
should be used to verify the SPENAT model. Especially model checking algorithms
should be applied for the SPENAT analysis. Additionally, the method for test case
generation should be more configurable. One goal is to have more possibilities for
controlling the test generation process. The description of distributed (cooperative)
systems with communicating SPENAT components is an ongoing future research
aspect. The verification and generation of tests based on domain specific models will
test tool
isDEET
Profibus PA Profibus DP
is Pro Profibus USB Interface Pepperl+Fuchs
segment coupler
Siemens SITRANS P DSIII,
digital pressure transmitter
Model based specification, verification and test generation for a safetyfieldbus profile 97
gain an increasing importance in the future for distributed and cooperative systems.
7 References
1. Schätz, B.; Pretschner, A.; Huber, F.; Philipps, J.: Model-Based Development of Embed-
ded Systems. Advances in Object-Oriented Information Systems - OOIS. Springer Verlag,
2002.
2. Frenzel, R.; Wollschlaeger, M.; Hadlich, T.; Diedrich, C.: Tool support for the develop-
ment of IEC 62390 compliant fieldbus profiles, Emerging Technologies and Factory Au-
tomation (ETFA), IEEE Conference, 2010
3. Jensen, K.: Coloured Petri Nets: Modeling and Validation of Concurrent Systems, Spring-
er-Verlag, Berlin, 2009
4. Best, E.; Fleischhack, H.; Fraczak, W.; Hopkins, R.; Klaudel, H.; Pelz, E.: A Class of
Composable High Level Petri Nets. ATPN'95. Springer-Verlag, 1995
5. ISO/IEC 15909-1: Software and system engineering – High-level Petri nets – Part 1: Con-
cepts, definitions and. 2004
6. Krause, J.; Herrmann, A.; Diedrich, Ch.: Test case generation from formal system specifi-
cations based on UML State Machines. atp - International 01/2008, Oldenbourg-Verlag,
2008.
7. Esparza, J.; Römer, S.; Vogler, W.: An Improvement of McMillan’s unfolding algorithm.
Formal Methods in Systems Design 20. Springer-Verlag, 2002
8. Heljanko, K.: Combining Symbolic and Partial Order Methods for Model Checking 1-safe
Petri Nets, PhD thesis. Helsinki, Helsinki University of Technology, 2002
9. McMillan, K. L.: Using Unfoldings to avoid the State Explosion Problem in the Verifica-
tion of Asynchronous Circuits. Proceedings of the 4th International Conference on Com-
puter–Aided Verification (CAV) ’92. Band volume 663 of LNCS. Montreal, Springer–
Verlag, 1992
10. Girault, C.; Valk, R.: Petri Nets for Systems Engineering: A Guide to Modelling, Verifica-
tion, and Applications, Berlin, Heidelberg, New York, 2003. Springer-Verlag
11. Khomenko, V: Model Checking Based on Prefixes of Petri Net Unfoldings. University of
Newcastle, 2003
12. ETSI: Testing and Test Control Notation, 2009, available at http://www.ttcn3.org/
13. PNO, 2009. PROFIBUS Specification: PROFIsafe for PA Devices. V1.01.
14. Object Management Group: Unified Modeling Language 2.2 Superstructure Specification.
2009, 08.01.2010 http://www.uml.org/.
15. Frey, G.: Design and formal Analysis of Petri Net based Logic Controllers, Dissertation,
Aachen, Shaker Verlag, 2002
16. Gomes, L.; Barros, J.; Costa, A.; Nunes, R.: The Input-Output Place-Transition Petri Net
Class and Associated Tools, Proceedings of the 5th IEEE International Conference on In-
dustrial Informatics (INDIN’07), Vienna, Austria, 2007
98 J. Krause, E. Hintze, S. Magnus, and C. Diedrich
adfa, p. 1, 2011.
© Springer-Verlag Berlin Heidelberg 2011
Quantification of Priority-OR Gates in Temporal Fault
Trees
Ernest Edifor, Martin Walker, Neil Gordon
Department of Computer Science, University of Hull, Hull, UK
{e.e.edifor@2007.,martin.walker@,n.a.gordon@}hull.ac.uk
Abstract. Fault Tree Analysis has been used in reliability engineering for many
decades and has seen various modifications to enable it to analyse fault trees
with dynamic and temporal gates so it can incorporate sequential failure in its
analysis. Pandora is a technique that analyses fault trees logically with three
temporal gates (PAND, SAND, POR) in addition to Boolean gates. However, it
needs extending so it can probabilistically analyse fault trees. In this paper, we
present three techniques to probabilistically analyse one of its temporal gates –
specifically the Priority-OR (POR) gate. We employ Monte Carlo simulation,
Markov analysis and Pandora’s own logical analysis in this solution. These
techniques are evaluated and applied to a case study. All three techniques are
shown to give essentially the same results.
Keywords: Safety, Fault Trees, Dynamic Fault Trees, Markov Chains, Monte
Carlo, Pandora
1 Introduction
Emerging complexity in modern technological systems brings with it new risks and
hazards. Most of today's systems will feature multiple modes of operation and many
offer some level of robustness built into the design. Nowhere is this truer than in the
field of safety-critical systems: those with the most serious consequences should they
fail. Frequently, such systems will make use of fault tolerance strategies with redun-
dant components, parallel architectures, and the ability to fall back to a degraded state
of operation without failing completely. However, such complexity also poses new
challenges for systems analysts, who need to understand how such systems behave
and estimate how reliable and safe they really are.
Fault Tree Analysis (FTA) is a classic technique for safety and reliability engineer-
ing that has stood the test of time – constantly being modified to meet changing re-
quirements. Fault trees (FTs) are graphical models based on Boolean logic which
depict how hazards of a system can arise from the combinations of basic failure
events in the system as well as any other contributing factors [1]. FTA begins with an
undesired event known as the 'top event', which is typically a system failure. The
analysis then decomposes this failure first into logical combinations of basic events,
which are usually component failures or contributory environmental conditions,
thereby determining the potential causes of the top event. Fault tree events are con-
nected by logical Boolean gates, such as AND or OR.
Once a fault tree is constructed, it can be analysed using Boolean algebra to reduce
it into 'Minimal Cut Sets' (MCSs). An MCS is a disjoint sum of products consisting of
a combination of events that are necessary and sufficient to cause the top event; for a
cut set to be minimal, no subset of it can be capable of causing the top event. This
process of logically analysing FTs to obtain the MCSs is called qualitative analysis.
Quantitative or probabilistic analysis usually follows qualitative analysis, and in-
volves the mathematical evaluation of the probability that the top event will occur
given the individual failure rates of the basic events.
FTA is typically static: it does not take into account the effects of sequences of or
dependencies between events [2]. This problem is not new and various solutions have
been proposed to solve it. One of the most prominent solutions is the 'Dynamic Fault
Tree' or DFT [3]. DFTs introduce dynamic gates, such as the Spare, Functional De-
pendency (FDEP), Sequential Enforcing (SEQ) and Priority-AND (PAND) gates, to
better model the dynamic behaviours of events. DFT analysis typically proceeds by
converting the fault tree into equivalent Markov models and deriving differential
equations from the model for quantitative analysis. Attempts have also been made to
qualitatively analyse DFTs [4-5].
A more recent modification of FTA is Pandora [6-7]. Pandora extends fault trees
with three temporal gates – PAND, POR, and SAND – and provides an associated
logic to allow qualitative analysis to take place.
PAND stands for "Priority-AND". In Pandora, PAND is true only if each input
event occurs strictly before next input event(s). Input events are arranged left-to-right
with the leftmost occurring first. It is represented with the symbol ‘<’, so A<B means
"A PAND B". It should be noted that the PAND gate predates both DFTs and Pandora
[8], but the precise semantics of the gate are not always consistent from one technique
to the next. POR means "Priority-OR". It represents the situation where an output
event occurs if its first input event occurs before its second input event, but the second
event is not required to occur. In Pandora, the symbol ‘|’ stands for POR; A|B means
"A POR B". SAND stands for "Simultaneous-AND". A SAND gate is used to repre-
sent the situation where all input events occur at the same time. ‘&’ is used to denote
a SAND gate; thus A&B means ‘A SAND B’.
Unlike static FTA, where Boolean laws are used to generate MCSs, Pandora uses
novel temporal laws [9] to generate Minimal Cut Sequences (MCSQs), which are
essentially partly-ordered MCSs. Thus MCSQs are analogous to MCSs: they contain
cut sequences that are sufficient and necessary to cause the top event.
Until now, Pandora analyses have been focused solely on qualitative analysis. The
purpose of this paper is to look at how the POR gate can be evaluated probabilisti-
cally, therefore helping to enable quantitative analysis of Pandora fault trees to take
place. The authors are only aware of one prior attempt [4] to probabilistically analyse
the POR gate. This paper proposes three new techniques for quantifying POR gates:
Monte Carlo simulation, Markov Chains, and an algebraic evaluation based on Pan-
100 E. Edifor, M. Walker, and N. Gordon
dora's definitions. A mathematical model for multiple POR gates is derived from first
principles. All techniques are applied to a case study and the results are discussed.
1.1 Notation
Pandora symbols in order of precedence (lowest first):
+ logical OR
. logical AND
| Priority-OR
< Priority-AND
& Simultaneous-AND
¬ logical NOT
Other notation:
⊲ Non-Inclusive Before
Failure rate of event i
time
2 Quantification of the POR Gate
2.1 POR Gate Semantics
The POR gate is derived from the unusual XOR gate featured in [10] and expands
the OR gate with additional temporal constraints. The term ‘priority’ is used because
the sequence of the events is taken into consideration, whereas the ‘OR’ indicates that
not all input events need to occur. Thus A POR B is true if either A occurs before B
(but both occur) or if A occurs but B does not. The POR gate is primarily used to
represent a situation involving some degree of mutual exclusion, i.e., where the occur-
rence of one event before a second event precludes the occurrence of an output event
caused by that second event.
A POR gate can be thought of as being equivalent to (A PAND B) OR (A AND
NOT B), i.e., , for quantitative purposes. However, the NOT
gate here is used only in an illustrative way: it means that B did not occur at any time,
and is not just a simple negation of B. This avoids the issue of non-coherency that the
NOT gate often introduces [11-12]; Pandora does not include the NOT gate and the
semantics of the POR gate are such that Pandora ensures coherency of the fault tree.
A full explanation of this is out of the scope of this paper, but essentially no event or
gate can ever go from true to false (i.e., from occurred to non-occurred), and thus the
structure function of a Pandora fault tree is monotonic [7]. Thus in this paper, it is
assumed that the system under consideration is coherent, i.e., it cannot improve as a
whole when one or more of its components fail [13]. Furthermore, all events are as-
sumed to be statistically independent. Finally, in cases of Markov analysis, Merle’s
algebraic solution and Pandora analysis (discussed further in this paper), it is assumed
that events are exponentially distributed with probability density function
Quantification of Priority-OR Gates in Temporal Fault Trees 101
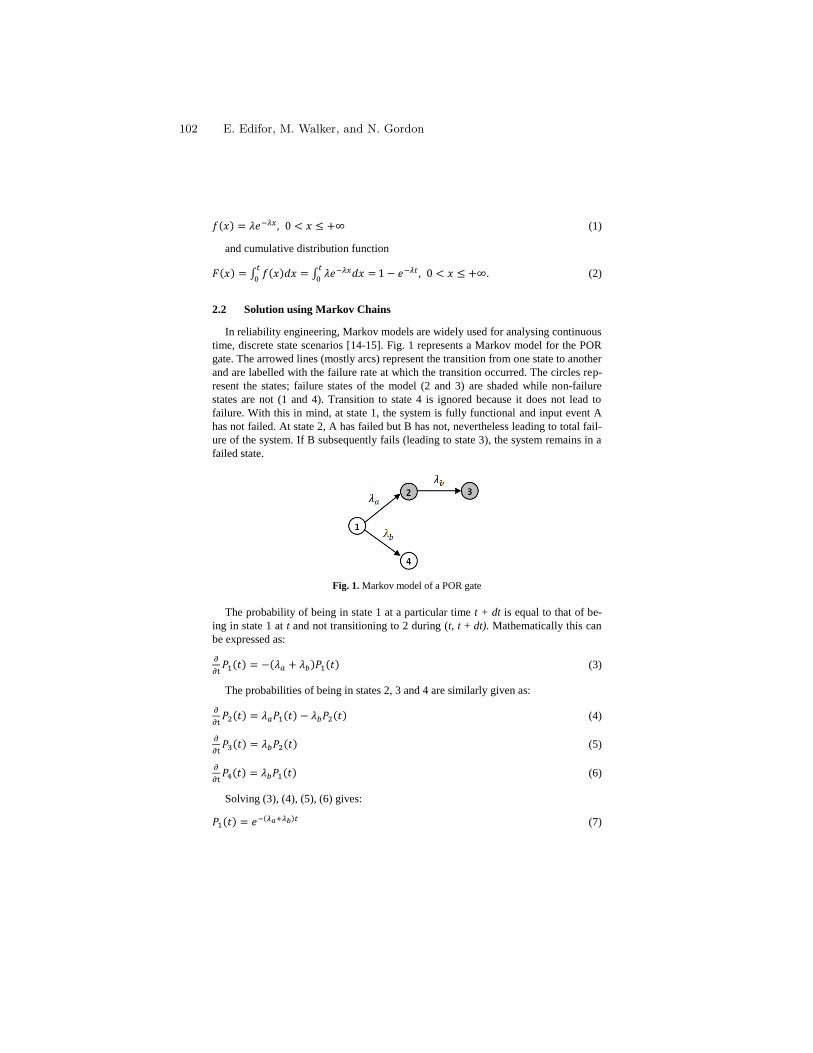
(1)
and cumulative distribution function
. (2)
2.2 Solution using Markov Chains
In reliability engineering, Markov models are widely used for analysing continuous
time, discrete state scenarios [14-15]. Fig. 1 represents a Markov model for the POR
gate. The arrowed lines (mostly arcs) represent the transition from one state to another
and are labelled with the failure rate at which the transition occurred. The circles rep-
resent the states; failure states of the model (2 and 3) are shaded while non-failure
states are not (1 and 4). Transition to state 4 is ignored because it does not lead to
failure. With this in mind, at state 1, the system is fully functional and input event A
has not failed. At state 2, A has failed but B has not, nevertheless leading to total fail-
ure of the system. If B subsequently fails (leading to state 3), the system remains in a
failed state.
Fig. 1. Markov model of a POR gate
The probability of being in state 1 at a particular time t + dt is equal to that of be-
ing in state 1 at t and not transitioning to 2 during (t, t + dt). Mathematically this can
be expressed as:
(3)
The probabilities of being in states 2, 3 and 4 are similarly given as:
(4)
(5)
(6)
Solving (3), (4), (5), (6) gives:
(7)
102 E. Edifor, M. Walker, and N. Gordon
(8)
(9)
(10)
(11)
2.3 Derivation from Pandora's definition of POR
From the definition of a POR gate (remembering that ‘|’ stands for POR and not
conditional probability) it is clear that the occurrence of a POR gate, e.g. a|b, is de-
pendent on the occurrence of either of two cases: a before b (i.e., a<b) and a without
b (i.e., a.¬b):
; where ‘a’ and ‘b’ are input events (12)
Thus by calculating the probabilities of these two cases, we can determine the
probability of the POR gate as a whole by using the principle of inclusion-exclusion
(and where (1-b) is the probability of event b not occurring, i.e., NOT(b)):
(13)
However, results in a logical contradiction because
both terms cannot occur at the same time – b cannot happen both after a and not at all.
Therefore , and thus:
(14)
(15)
(16)
2.4 Monte Carlo
The Monte Carlo (MC) simulation is an old mathematical technique used to pro-
vide numerical solutions to complex problems that are difficult to solve analytically
by generating suitable random numbers and observing that fraction of the numbers
which obey some properties [16]. Since its invention in the early 1940s, it has been
used in various fields, such as chemistry, engineering, medicine, games, finance and
so on. Its use has also been extended into reliability analysis [17-18]. The MC method
is entirely reliant on the use of random numbers for the computation of its results. The
Quantification of Priority-OR Gates in Temporal Fault Trees 103
general method involved in creating a MC model includes defining the probability
distribution of variables; calculating the cumulative probability distribution for each
of these models; generating random numbers; and finally simulating a series of trials.
Once the model is created, results can be evaluated after the simulation.
To model in Monte Carlo the following steps were taken:
1. Generate random numbers , for failure probabilities and
respectively.
2. Determine the Time-To-Failure (TTF)[17] of a and b using:
(17)
(18)
3. Keep count if
is TRUE.
4. The above steps are repeated for a specified number of times (called trials).
is finally evaluated by dividing the counts kept in step 3 by the total number
of trials. This gives the percentage of simulations in which the POR gate became true,
and thus an estimation of its probability.
2.5 Merle’s Algebraic Solution
Merle [4] provides an algebraic model for probabilistically analysing the PAND,
Spare, and FDEP gates of a DFT. He describes an equivalence between the POR gate
and a “Non-inclusive BEFORE”, represent by the symbol ‘⊲’. Using the definition of
f(x) and F(x) above, Merle provides a probabilistic expression for the Non-inclusive
BEFORE as:
⊲
(19)
⊲
(20)
It is evident that Merle’s algebraic solution (20) is exactly the same as the formulae
from Pandora’s definitions (11) and Markov analysis (16).
2.6 Deriving the Multiple POR formula
The expression for evaluating a MCSQ term with only two events has been dis-
cussed and derived from Markov Chains and Pandora's semantics. We derive the for-
mula for evaluating a MCSQ with more than one POR gates from first principle be-
low.
104 E. Edifor, M. Walker, and N. Gordon
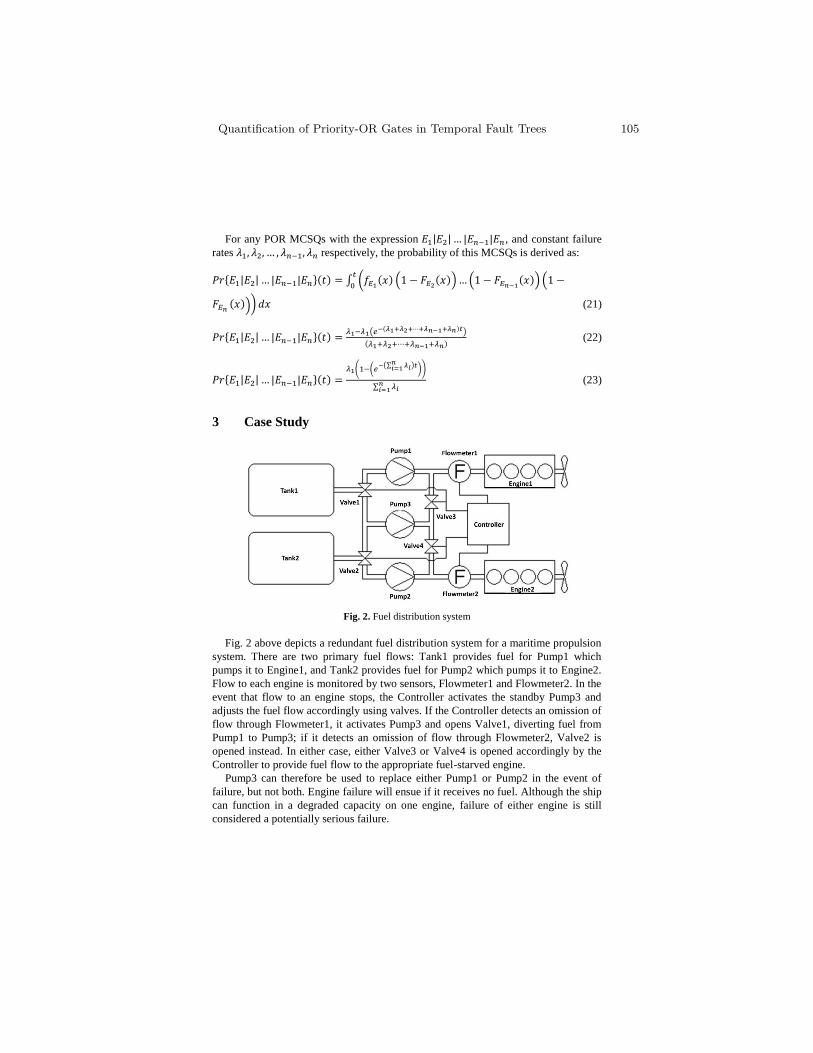
For any POR MCSQs with the expression , and constant failure
rates respectively, the probability of this MCSQs is derived as:
(21)
(22)
(23)
3 Case Study
Fig. 2. Fuel distribution system
Fig. 2 above depicts a redundant fuel distribution system for a maritime propulsion
system. There are two primary fuel flows: Tank1 provides fuel for Pump1 which
pumps it to Engine1, and Tank2 provides fuel for Pump2 which pumps it to Engine2.
Flow to each engine is monitored by two sensors, Flowmeter1 and Flowmeter2. In the
event that flow to an engine stops, the Controller activates the standby Pump3 and
adjusts the fuel flow accordingly using valves. If the Controller detects an omission of
flow through Flowmeter1, it activates Pump3 and opens Valve1, diverting fuel from
Pump1 to Pump3; if it detects an omission of flow through Flowmeter2, Valve2 is
opened instead. In either case, either Valve3 or Valve4 is opened accordingly by the
Controller to provide fuel flow to the appropriate fuel-starved engine.
Pump3 can therefore be used to replace either Pump1 or Pump2 in the event of
failure, but not both. Engine failure will ensue if it receives no fuel. Although the ship
can function in a degraded capacity on one engine, failure of either engine is still
considered a potentially serious failure.
Quantification of Priority-OR Gates in Temporal Fault Trees 105
Important failure logic for the engines is described below. Failure modes are ab-
breviated as follows:
P1, P2, P3 = Failure of Pump 1/2/3
V1, V2, V3, V4 = Valve 1/2/3/4 stuck
E1, E2 = Failure of Engine 1/2
S1, S2 = Failure of flowmeter sensors 1/2
CF = Controller failure
Valve1 initially provides flow from Tank1 to Pump1, but when activated, provides
flow from Tank1 to Pump3. Similarly, Valve2 initially provides flow to Pump2, but
when activated by the Controller, provides flow to Pump3. Either valve can become
stuck (failure modes V1 and V2 respectively), which will prevent the redirection of
flow if it happens before the valve is opened by the Controller. Thus omission of flow
to Pump3 from Valve1 is caused by 'V1 < ActivationSignalV1'. Failure to re-
ceive the control signal from the Controller will also cause a lack of flow to Pump 3.
Each primary pump takes fuel from its assigned fuel tank and pumps it to an en-
gine. Omission of flow from a pump can be caused by a lack of fuel flowing to the
pump or because the pump itself has failed (failure modes P1 and P2 for Pump1 and
Pump2 respectively). The flowmeters monitor the flow of fuel to each engine from
Pump1 and Pump2 and provide feedback to the Controller. If a sensor fails, it may not
provide any feedback, meaning that an omission of flow goes undetected and the
standby pump may not be activated. This is represented by S1 and S2.
The Controller is responsible for monitoring the feedback from the two sensors and
activating Pump3 if one of the two primary pumps fail. In this case, it sends signals to
the valves, diverting the flow of fuel to Pump3. It can also fail itself (failure mode
CF), in which case Pump3 may not be activated when needed. Once the Controller
has activated Pump3, a subsequent failure of the Controller has no effect on the sys-
tem, i.e., 'ActivationSignalV1 | CF' (or V2, V3, V4 for other valves).
Valves 3 and 4 direct the flow from Pump3 to either Engine1 or Engine2. Valve3 is
activated at the same time as Valve1 by Activate-Ctrl.UseTank1, whereas Valve4 is
activated at the same time as Valve2 by Activate-Ctrl.UseTank2. Like Valves 1 & 2,
both may get stuck closed (failure modes V3 and V4); however, unlike Valves 1 & 2,
they are only either open or closed. By default, they are closed.
Pump3 is the standby pump in the system. Once activated, it replaces one of the
two primary pumps, directing flow from one fuel tank to the appropriate engine
(Tank1 ==> Engine1 or Tank2 ==> Engine2). It has the same failure modes as the
other Pumps, but because it is a cold spare, it is assumed not to be able to fail until it
is activated. Input to Pump3 can come from either Valve1 or Valve2.
The engines provide propulsion for the ship. Each engine takes fuel from a differ-
ent fuel tank and can take its fuel from either its primary pump or Pump3. The order
in which the pumps fail determines which engine fails; for example, if Pump1 fails
first, then Engine1 can continue to function as long as Pump3 functions, but if Pump2
fails first, then Engine1 will be wholly reliant on Pump1. This is expressed by the
106 E. Edifor, M. Walker, and N. Gordon
logical expressions below, where 'O-' denotes an omission of output. For simplicity,
internal failure of the engines themselves is left out of the scope of this analysis.
O-Engine1 = ((O-Pump1 | O-Pump2) . O-Valve3)
+ (O-Pump2 < O-Pump1) + (O-Pump2 & O-Pump1)
O-Engine2 = ((O-Pump2 | O-Pump1) . O-Valve4)
+ (O-Pump1 < O-Pump2) + (O-Pump1 & O-Pump2)
The expanded fault tree expressions for the failure of each engine are as follows:
E1 = (P1+P1|P2|CF|V1)|(P2+P2|P1|CF|V2).(V3 + P3 + V1<P1|P2|CF
+ V1&P1|P2|CF + S1<P1|P2 + CF<P1|P2 + S1&P1|P2
+ CF&P1|P2 + V2<P2|P1|CF + V2&P2|P1|CF + S2<P2|P1
+ CF<P2|P1 + S2&P2|P1 + CF&P2|P1)+ (P2+P2|P1|CF|V2)
<(P1+P1|P2|CF|V1) + (P2+P2|P1|CF|V2)&(P1+P1|P2|CF|V1)
E2 = (P2+P2|P1|CF|V2)|(P1+P1|P2|CF|V1).(V4 + P3 + V1<P1|P2|CF
+ V1&P1|P2|CF + S1<P1|P2 + CF<P1|P2 + S1&P1|P2 + CF&P1|P2
+ V2<P2|P1|CF + V2&P2|P1|CF + S2<P2|P1 + CF<P2|P1
+ S2&P2|P1 + CF&P2|P1) + (P1+P1|P2|CF|V1)
<(P2+P2|P1|CF|V2) + (P1+P1|P2|CF|V1)&(P2+P2|P1|CF|V2)
Minimisation of the fault trees for E1 and E2 gives the following MCSQs:
E1 = (P1|P2).P3 + (P1|P2).V1 + (P1|P2).V3 + (S1<P1)|P2 +
(S1&P1)|P2 + (CF<P1)|P2 + (CF&P1)|P2 + P2<P1 + P1&P2
E2 = (P2|P1).P3 + (P2|P1).V2 + (P2|P1).V4 + (S2<P2)|P1 +
(S2&P2)|P1 + (CF<P2)|P1 + (CF&P2)|P1 + P1<P2 + P1&P2
As stated earlier, components are non-repairable, and furthermore, MCSQs with
SANDs will not be considered in quantification, because we assume in this case that
the probability of two independent events occurring simultaneously is effectively 0.
Failure rate information for the system is as follows:
Table 1. Failure rates for the fuel system
Component Failure Rate (constant)/hour
Tanks 1.5E-5
Valve1 & Valve2 1E-5
Valve3 & Valve4 6E-6
Pump1, Pump2 & Pump3 3.2E-5
Flowmeter sensors 2.5E-6
Controller 5E-7
Quantification of Priority-OR Gates in Temporal Fault Trees 107
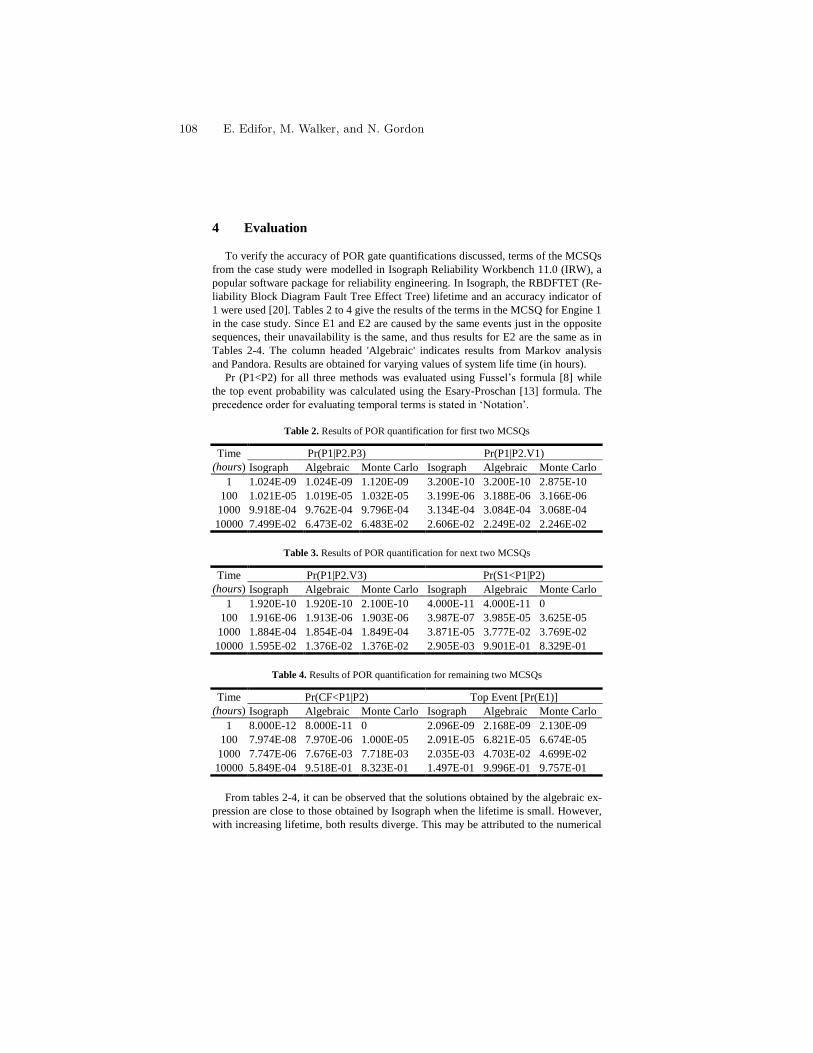
4 Evaluation
To verify the accuracy of POR gate quantifications discussed, terms of the MCSQs
from the case study were modelled in Isograph Reliability Workbench 11.0 (IRW), a
popular software package for reliability engineering. In Isograph, the RBDFTET (Re-
liability Block Diagram Fault Tree Effect Tree) lifetime and an accuracy indicator of
1 were used [20]. Tables 2 to 4 give the results of the terms in the MCSQ for Engine 1
in the case study. Since E1 and E2 are caused by the same events just in the opposite
sequences, their unavailability is the same, and thus results for E2 are the same as in
Tables 2-4. The column headed 'Algebraic' indicates results from Markov analysis
and Pandora. Results are obtained for varying values of system life time (in hours).
Pr (P1<P2) for all three methods was evaluated using Fussel’s formula [8] while
the top event probability was calculated using the Esary-Proschan [13] formula. The
precedence order for evaluating temporal terms is stated in ‘Notation’.
Table 2. Results of POR quantification for first two MCSQs
Time
(hours)
Pr(P1|P2.P3) Pr(P1|P2.V1)
Isograph Algebraic Monte Carlo Isograph Algebraic Monte Carlo
1 1.024E-09 1.024E-09 1.120E-09 3.200E-10 3.200E-10 2.875E-10
100 1.021E-05 1.019E-05 1.032E-05 3.199E-06 3.188E-06 3.166E-06
1000 9.918E-04 9.762E-04 9.796E-04 3.134E-04 3.084E-04 3.068E-04
10000 7.499E-02 6.473E-02 6.483E-02 2.606E-02 2.249E-02 2.246E-02
Table 3. Results of POR quantification for next two MCSQs
Time
(hours)
Pr(P1|P2.V3) Pr(S1<P1|P2)
Isograph Algebraic Monte Carlo Isograph Algebraic Monte Carlo
1 1.920E-10 1.920E-10 2.100E-10 4.000E-11 4.000E-11 0
100 1.916E-06 1.913E-06 1.903E-06 3.987E-07 3.985E-05 3.625E-05
1000 1.884E-04 1.854E-04 1.849E-04 3.871E-05 3.777E-02 3.769E-02
10000 1.595E-02 1.376E-02 1.376E-02 2.905E-03 9.901E-01 8.329E-01
Table 4. Results of POR quantification for remaining two MCSQs
Time
(hours)
Pr(CF<P1|P2) Top Event [Pr(E1)]
Isograph Algebraic Monte Carlo Isograph Algebraic Monte Carlo
1 8.000E-12 8.000E-11 0 2.096E-09 2.168E-09 2.130E-09
100 7.974E-08 7.970E-06 1.000E-05 2.091E-05 6.821E-05 6.674E-05
1000 7.747E-06 7.676E-03 7.718E-03 2.035E-03 4.703E-02 4.699E-02
10000 5.849E-04 9.518E-01 8.323E-01 1.497E-01 9.996E-01 9.757E-01
From tables 2-4, it can be observed that the solutions obtained by the algebraic ex-
pression are close to those obtained by Isograph when the lifetime is small. However,
with increasing lifetime, both results diverge. This may be attributed to the numerical
108 E. Edifor, M. Walker, and N. Gordon
integration method [20] Isograph uses. Unfortunately, Isograph does not have any
representation for the POR gate, and having to model it ‘from scratch’ every time can
be cumbersome and (human) error-prone due as it consists of 4 states with three tran-
sitions between them (using Markov Chains) or 4 gates with two basic events (using
FTA). Modelling the entire system this way would be far worse.
It is also clear that results from the algebraic expression and Monte Carlo (800000
trials) are much more similar. Both results tend to converge with increasing lifetime,
although results for MSCSs with more than one temporal gate (S1<P1|P2 and
CF<P1|P2) instead diverge considerably as the system lifetime t increases. Further
research is being carried out to determine the cause of this behaviour.
It is widely known that as the size of fault tree increases, Markov models become
increasingly prone to human error and are crippled by the state explosion problem
[17]. Markov models are usually limited to exponential failure and repair distribution
[15,17], although some efforts have been made to extend it to other distributions [19].
Merle's, Markov’s and Pandora’s methods are efficient because they are algebraic
expressions generated from first principle. Even though Merle’s method is restricted
to a cut sequence with only one POR gate, Pandora’s has been extended to two or
more. Modelling multiple POR scenarios with Markov can be very cumbersome and
error-prone. Unlike in Monte Carlo simulation, however, all three techniques are re-
stricted to exponential failure distribution.
It can be observed that some of Monte Carlo’s results are zero. This is due to the
use of small realistic constant failure rates. Monte Carlo simulation is hugely depend-
ent on the sample size, which greatly impacts accuracy and computational time: the
smaller the sample size, the less accurate the result and vice versa. The ready avail-
ability of high computing power means that such compromises are rarely necessary.
However, unlike Markov analysis, which starts to break down when presented with
complex fault trees, Monte Carlo is very efficient in handling complex situations
[15,17].
5 Conclusion
Fault Tree Analysis has been used in reliability engineering for many decades now.
Modifications to it have evolved over time to provide new capabilities, such as the
introduction of dynamic or temporal semantics, allowing them to analyse sequential
failure logic. One such technique is Pandora which introduces new temporal gates to
enable the logical analysis of temporal fault trees. In this paper, we have presented
three new ways of probabilistically analysing one of Pandora’s temporal gates –
Priority-OR. These techniques, Monte Carlo, Pandora analysis, and Markov analysis
have been evaluated against an algebraic solution from Merle and applied to a case
study. The three novel techniques produce very similar results. Results have been
discussed. A mathematical model for more than one POR gate has been derived.
Quantification of Priority-OR Gates in Temporal Fault Trees 109
6 Acknowledgements
This work has been developed in conjunction with the EU FP7 project MAENAD.
7 References
1. Vesely W E, Stamatelatos M, Dugan J B, et al (2002) Fault tree handbook with aerospace
applications. NASA office of safety and mission assurance, Washington DC
2. Merle G, Roussel J (2007) Algebraic modelling of fault trees with priority AND gates.
IFAC Workshop on Dependable Control of Discrete Systems p175-180
3. Dugan J. B, Bavuso S. J, Boyd M. A (1992) Dynamic fault-tree for fault-tolerant computer
systems. IEEE Transactions on Reliability 41(3):363–76
4. Merle G (2010) Algebraic modelling of dynamic fault trees, contribution to qualitative and
quantitative analysis. Dissertation, Décole Normale Supérieure De Cachan
5. Tang Z, Dugan J B (2004) Minimal cut set/sequence generation for dynamic fault trees. In:
Reliability And Maintainability Symposium (RAMS), Los Angeles, 26-29 Jan 2004
6. Walker M, Papadopoulos Y (2006) Synthesis and analysis of temporal fault trees with
PANDORA: The Time of Priority AND Gates. Nonlinear Analysis Hybrid Systems
2(2008):368-382
7. Walker M D (2009) Pandora: A Logic for the Qualitative Analysis of Temporal Fault
Trees. Dissertation, University of Hull
8. Fussel J B, Aber E F, Rahl R G (1976) On the quantitative analysis of Priority-AND fail-
ure logic. IEEE Transactions on Reliability R-25(5): 324-326
9. Walker M, Papadopoulos Y (2008) Qualitative Temporal Analysis: Towards a full imple-
mentation of the Fault Tree Handbook. Control Engineering Practice 17(2009):1115–1125
10. Vesely W E, Goldberg F F, Roberts N H and Haasl D F (1981) Fault Tree Handbook. US
Nuclear Regulatory Commission. Washington DC
11. Andrews J A (2000) To Not or Not to Not. In: Proceedings of the 18th International Sys-
tem Safety Conference, Fort Worth, Sept 2000. p 267-275.
12. Sharvia S, Papadopoulos Y (2008) Non-coherent modelling in compositional fault tree
analysis. In: The International Federation of Automatic Control, Seoul, 6-11 July 2008
13. Esary D, Proschan F (1963) Coherent Structures with Non-Identical Components. Tech-
nometrics 5(2):191-209.
14. Department of Defence (1998) Military Handbook: electronic reliability design handbook,
Webbooks. http:// webbooks.net/freestuff/mil-hdbk-338b.pdf. Accessed June 27, 2011
15. Pukite J, Pukite P (1998) Modelling for reliability analysis. Wiley-IEEE Press, New York
16. Weisstein, Eric W (2011) Monte Carlo Method, MathWorld. http://mathworld.wolfram.
com/MonteCarloMethod.html. Accessed 01 August 2011
17. Rao D K et al (2008) Dynamic fault tree analysis using Monte Carlo simulation in prob-
abilistic safety assessment, Reliability Engineering and System Safety. 94(4):872-883
18. Rocco C M, Muselli M (2004) A machine learning algorithm to estimate minimal cut and
path sets from a Monte Carlo simulation. In: Proceedings Probabilistic Safety Assessment
and Management PSAM7/ESREL'04Springer. Berlin, 2004, p 3142-3147
19. Manian R, Dugan B J, Coppit D, Sullivan K J (2002) Combining various solution tech-
niques for dynamic fault tree analysis of computer systems, In: Third IEEE international
high-assurance systems engineering symposium, IEEE Computer Society, 1998, p 21–28
20. Isograph Limited (2011) Reliability Workbench Version 11 User Guide, p 392
110 E. Edifor, M. Walker, and N. Gordon
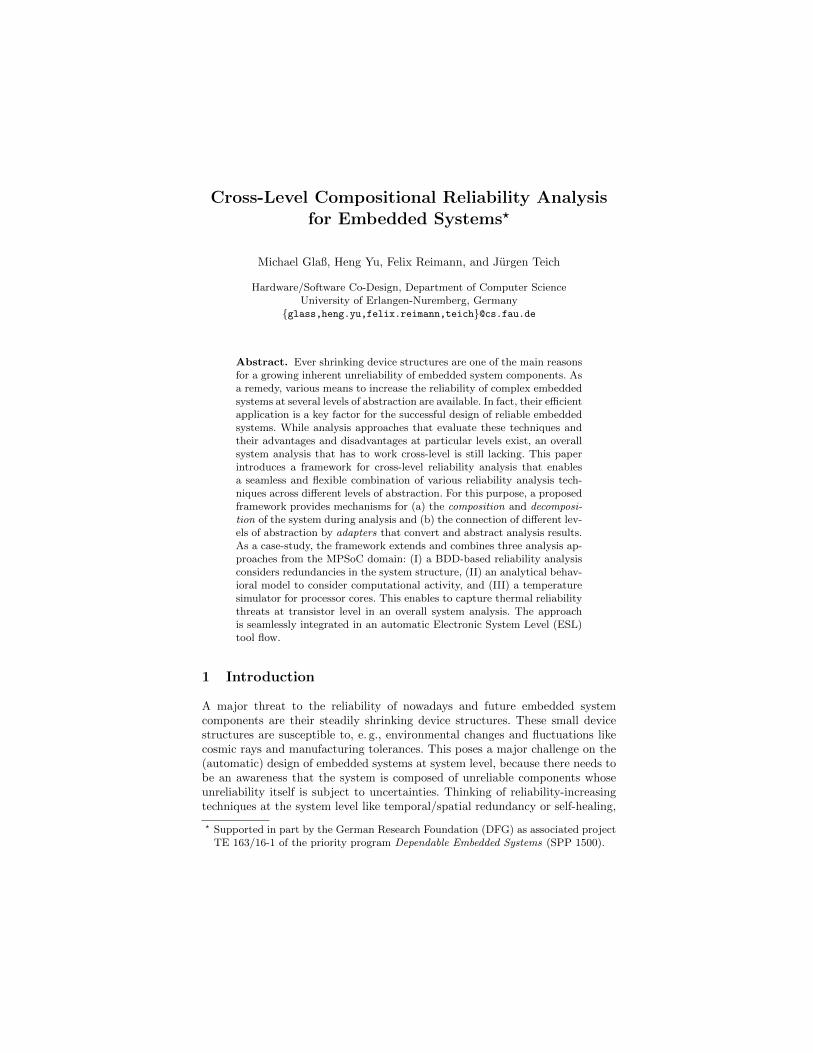
Cross-Level Compositional Reliability Analysisfor Embedded Systems?
Michael Glaß, Heng Yu, Felix Reimann, and Jurgen Teich
Hardware/Software Co-Design, Department of Computer ScienceUniversity of Erlangen-Nuremberg, Germany
{glass,heng.yu,felix.reimann,teich}@cs.fau.de
Abstract. Ever shrinking device structures are one of the main reasonsfor a growing inherent unreliability of embedded system components. Asa remedy, various means to increase the reliability of complex embeddedsystems at several levels of abstraction are available. In fact, their efficientapplication is a key factor for the successful design of reliable embeddedsystems. While analysis approaches that evaluate these techniques andtheir advantages and disadvantages at particular levels exist, an overallsystem analysis that has to work cross-level is still lacking. This paperintroduces a framework for cross-level reliability analysis that enablesa seamless and flexible combination of various reliability analysis tech-niques across different levels of abstraction. For this purpose, a proposedframework provides mechanisms for (a) the composition and decomposi-tion of the system during analysis and (b) the connection of different lev-els of abstraction by adapters that convert and abstract analysis results.As a case-study, the framework extends and combines three analysis ap-proaches from the MPSoC domain: (I) a BDD-based reliability analysisconsiders redundancies in the system structure, (II) an analytical behav-ioral model to consider computational activity, and (III) a temperaturesimulator for processor cores. This enables to capture thermal reliabilitythreats at transistor level in an overall system analysis. The approachis seamlessly integrated in an automatic Electronic System Level (ESL)tool flow.
1 Introduction
A major threat to the reliability of nowadays and future embedded systemcomponents are their steadily shrinking device structures. These small devicestructures are susceptible to, e. g., environmental changes and fluctuations likecosmic rays and manufacturing tolerances. This poses a major challenge on the(automatic) design of embedded systems at system level, because there needs tobe an awareness that the system is composed of unreliable components whoseunreliability itself is subject to uncertainties. Thinking of reliability-increasingtechniques at the system level like temporal/spatial redundancy or self-healing,
? Supported in part by the German Research Foundation (DFG) as associated projectTE 163/16-1 of the priority program Dependable Embedded Systems (SPP 1500).
there exists a significant gap between the level of abstraction where the faultsoccur, i. e., switching devices like CMOS transistors at gate level and higher lev-els like architecture level or system level where the interplay of hardware andsoftware is the main focus. This gap not only exists between the cause of faultsand the techniques to compensate them, but also between the techniques andtheir efficiency, e. g., what is the effect of hardening techniques at circuit levellike Razor [3] on the applications at system level.
Today, there exists a smorgasbord of reliability analysis techniques for both,the relatively low layers of abstraction that focus on technology as well as system-level analysis techniques that focus on the applications.1 However, there cur-rently exists no well-defined holistic and cross-level analysis technique that col-lects knowledge at the lower levels of abstraction by combining different analysistechniques and provide proper data for the analysis at higher levels of abstrac-tion by performing abstraction and conversion. Moreover, means to enhance thesystem’s reliability are not for free and typically deteriorate other design objec-tives like monetary costs, latency, or energy-consumption. The outlined lack ofsuitable cross-level analysis techniques, thus, prohibits an adequate system-widecost-benefit analysis during the design of embedded systems.
This work introduces a Cross-level Reliability Analysis (CRA) frameworkthat combines various reliability analysis techniques across different levels ofabstraction. It aims at closing the mentioned gaps and enables an efficient DesignSpace Exploration (DSE) [16] during which a system-wide cost-benefit analysisof reliability-increasing techniques is enabled. For this purpose, the frameworkuses two basic concepts: (I) Decomposition and composition tackle the growingcomplexity when considering lower levels of abstraction. (II) Adapters combinedifferent analysis techniques by converting between required and provided datalike temperature, radiation, and reliability-related measures. To give evidenceof the benefits of CRA, a case study investigates an embedded 8-core MPSoCplatform where a redundant task layout at system level is used as a means to copewith thermal effects at device level. This is achieved by seamlessly combiningthree analysis techniques from system level down to a temperature simulator ofthe cores in CRA.
2 Related Work
Up to now, several system-level reliability analysis approaches have been pre-sented for embedded systems and were integrated into design space explorationtechniques to automatically design reliable hardware/software systems. How-ever, they typically rely on simplistic analysis approaches based on constantfailure rates for both, permanent and transient errors and series-parallel sys-tem structures: An approach that unifies fault-tolerance via checkpointing andpower management through dynamic voltage scaling is introduced in [24]. In [7,
1 This work focuses on reliability issues for applications mapped to an embeddedsystem platform architecture and treats reliability of the (software) functionalityitself as an orthogonal aspect.
112 M. Glaß, H. Yu, F. Reimann, and J. Teich
2], fault-tolerant schedules with respect to performance requirements are syn-thesized using task re-execution, rollback recovery, and active replication. Otherapproaches such as [18, 23] try to maximize reliability by selectively introducingredundancy. On the other hand, reliability analysis at low levels of abstractionlike the level of switching devices goes back a long history: Not only CMOStechnology has been thoroughly studied, see, e.g., [13, 15], but also prospectiveswitching devices like carbon nano tubes, see [20].
Currently, there are very few approaches that try to upscale the knowledgegathered at low levels of abstraction to the system level: In [25, 5], thermal ef-fects of the task scheduling on the reliability of an MPSoC are considered foran optimization of task scheduling and binding at system level. The analysisis based on a simulation of the MPSoC and models to relate the component’stemperature profile and its resulting reliability, see [17, 1]. However, they do notinvestigate reliability-increasing techniques at system level such as temporal orspatial redundancy. Moreover, they are tailored to capture thermal effects only,without investigating the possibility to include and consider these effects in aholistic analysis that also takes into account, e.g., soft errors or a complex systemstructure like a networked embedded system consisting of several interconnectedprocessors or MPSoCs. A first approach that explicitly tries to close the gapon accurate power models for reliability analysis between the Electronic SystemLevel (ESL) and the gate level is presented in [12]. While the approach soundspromising with respect to modeling the influence of thermal effects on the com-ponent reliability, there, again, is no flexibility to integrate different analysistechniques cross-level. Although the purely software-related reliability analysisdomain is treated as an orthogonal problem here, it is worth mentioning thatcompositional approaches to reliability analysis that consider component-basedsoftware are, e. g., presented in [11] and [10]. However, the schemes of the latterapproaches do not put focus on automatic analysis as required during designspace exploration, but are mostly driven by the designer.
3 Compositional Reliability Analysis
This work targets the system-level design of embedded MPSoCs and distributedembedded systems that typically consist of several processor cores connectedby a communication infrastructure such as buses, networks-on-a-chip, or fieldbuses. The main challenge is to analyze and increase the reliability of applica-tions executed on the MPSoC by propagating the effects of faults and introducedreliability-increasing techniques at lower design levels of abstraction up to thesystem level. The work at hand targets this challenge by a cross-level Compo-sitional Reliability Analysis (CRA) whose mathematical concept as introducedin the following is directly reflected within a framework by means of a class andinterface structure. An important concept of the developed CRA is that for eachrelevant error-model at a specific design level of abstraction, an appropriate reli-ability analysis shall be applicable and seamlessly integrated into the CRA. As aresult, the developed concepts will become independent of an actual error-model
Cross-Level Compositional Reliability Analysis for Embedded Systems 113
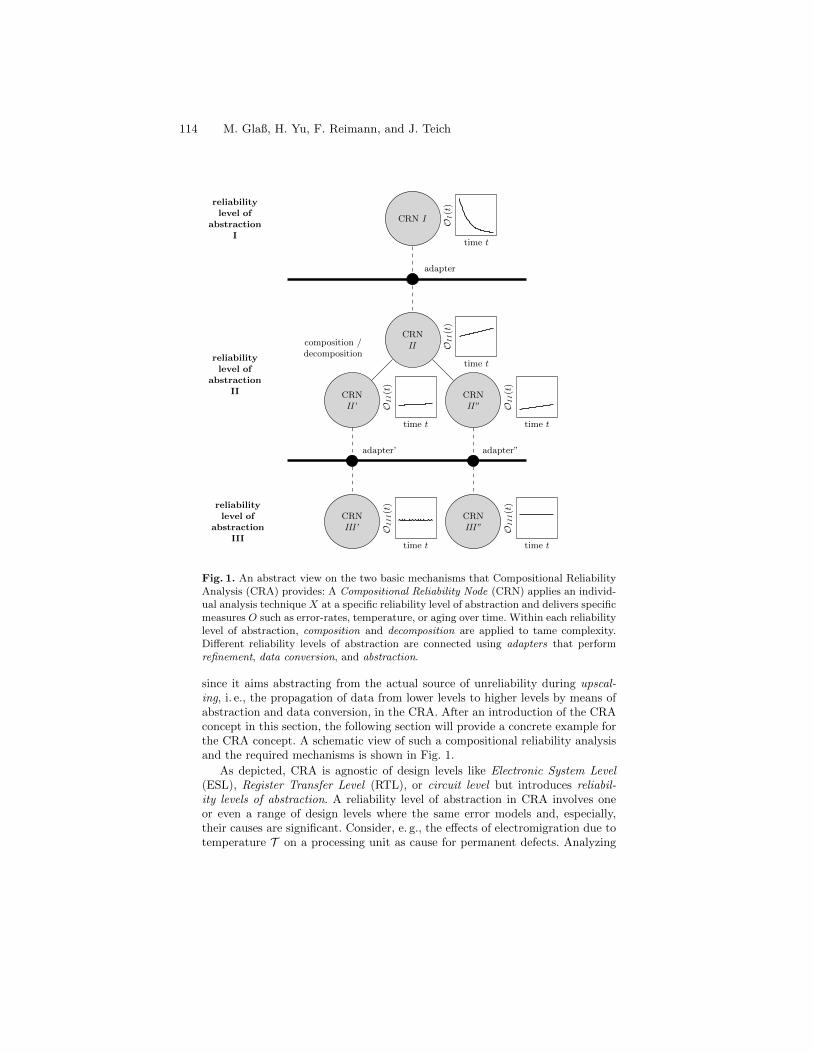
CRN I
CRNII
CRNII’
CRNII”
CRNIII’
CRNIII”
composition /decomposition
adapter
adapter’ adapter”
reliabilitylevel of
abstractionI
reliabilitylevel of
abstractionII
reliabilitylevel of
abstractionIII
time t
OI(t)
time t
OII(t)
time t
OII(t)
time t
OII(t)
time t
OIII(t)
time t
OIII(t)
Fig. 1. An abstract view on the two basic mechanisms that Compositional ReliabilityAnalysis (CRA) provides: A Compositional Reliability Node (CRN) applies an individ-ual analysis technique X at a specific reliability level of abstraction and delivers specificmeasures O such as error-rates, temperature, or aging over time. Within each reliabilitylevel of abstraction, composition and decomposition are applied to tame complexity.Different reliability levels of abstraction are connected using adapters that performrefinement, data conversion, and abstraction.
since it aims abstracting from the actual source of unreliability during upscal-ing, i. e., the propagation of data from lower levels to higher levels by means ofabstraction and data conversion, in the CRA. After an introduction of the CRAconcept in this section, the following section will provide a concrete example forthe CRA concept. A schematic view of such a compositional reliability analysisand the required mechanisms is shown in Fig. 1.
As depicted, CRA is agnostic of design levels like Electronic System Level(ESL), Register Transfer Level (RTL), or circuit level but introduces reliabil-ity levels of abstraction. A reliability level of abstraction in CRA involves oneor even a range of design levels where the same error models and, especially,their causes are significant. Consider, e. g., the effects of electromigration due totemperature T on a processing unit as cause for permanent defects. Analyzing
114 M. Glaß, H. Yu, F. Reimann, and J. Teich
these effects properly requires to (I) be aware of the processor’s workload and,hence, the task binding and scheduling defined at system level down to (II) thepower consumption and the actual floorplan of the processor at circuit level. Torealize a holistic cross-layer analysis, the CRA features three important aspects:(a) Individual analysis techniques are encapsulated in Compositional ReliabilityNodes (CRNs) at reliability levels of abstraction, (b) composition C and decom-position D is applied to tame system complexity, and (c) formerly incompatiblereliability levels of abstraction and, hence, analysis techniques are connected byadapters A. CRA combines CRNs and adapters in a tree-based fashion to aflexible and holistic system-wide analysis.
Compositional Reliability Nodes (CRNs) model and integrate a single analysisstep O = X(S, I). X is a concrete implementation of an AnalysisTechniquelike a fault-tree analysis. It requires as input a SystemModel S2 as well as aset of analysis technique-specific InputMeasures I. By applying the technique,it delivers a set of OutputMeasures O. Both input and output measures aretypically measures over continuous or discrete time t like the reliability functionR(t)3 with R : R+ → [0, 1] which determines the probability p of, e. g., theprocessing unit to work properly at time t. A set of CRNs may be instantiatedat each specific reliability level of abstraction to consider different subsystemsor analysis techniques.
Composition and Decomposition is an essential technique to tame the analysiscomplexity at one specific reliability level of abstraction and from that furtherdown. Composition and decomposition shall not be restricted to trivial caseswhere a (sub)system can be partitioned into a set of independent subsystems.In fact, in nowadays silicon systems, hardly any subsystem is independent ofall other subsystems. Decomposition delivers sound partitions of the inter-/independent (sub)systems with respect to the CRN. Composition compen-sates the effects of interdependencies that are neglected due to decompositionand, hence, independent analysis of the partitions. By considering different de-composition/composition techniques, the resulting error will vary. The flexibilityof CRA enables to manually choose or automatically determine a trade-off be-tween acceptable error versus complexity of the analysis as a combination ofCRNs, decomposition, and composition.
A decomposition and composition is said to be feasible in case the resultingerror in analysis accuracy is lower than a designer-specified value. More formally,a Decomposition D and Composition C of a system S into n subsystems
2 The (sub)system model S is assumed to be a complete system specification thatcontains required information for all considered design levels of abstraction from,e. g., task binding down to the floorplan of allocated processors.
3 Based on a given reliability function, all well-known reliability-related measures likethe Mean-Time-To-Failure (MTTF) MTTF =
∫∞0
R(t)dt or the Mission Time (MT)MT (p) = R−1(p) can be determined.
Cross-Level Compositional Reliability Analysis for Embedded Systems 115
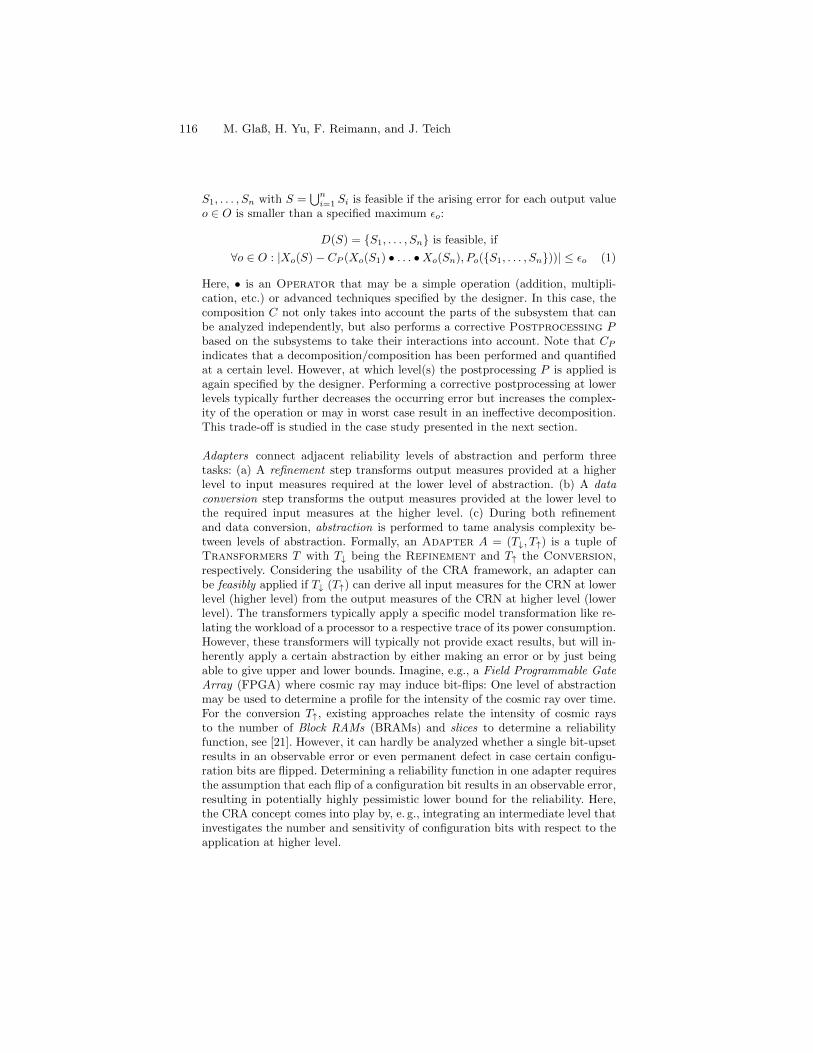
S1, . . . , Sn with S =⋃n
i=1 Si is feasible if the arising error for each output valueo ∈ O is smaller than a specified maximum εo:
D(S) = {S1, . . . , Sn} is feasible, if
∀o ∈ O : |Xo(S)− CP (Xo(S1) • . . . •Xo(Sn), Po({S1, . . . , Sn}))| ≤ εo (1)
Here, • is an Operator that may be a simple operation (addition, multipli-cation, etc.) or advanced techniques specified by the designer. In this case, thecomposition C not only takes into account the parts of the subsystem that canbe analyzed independently, but also performs a corrective Postprocessing Pbased on the subsystems to take their interactions into account. Note that CP
indicates that a decomposition/composition has been performed and quantifiedat a certain level. However, at which level(s) the postprocessing P is applied isagain specified by the designer. Performing a corrective postprocessing at lowerlevels typically further decreases the occurring error but increases the complex-ity of the operation or may in worst case result in an ineffective decomposition.This trade-off is studied in the case study presented in the next section.
Adapters connect adjacent reliability levels of abstraction and perform threetasks: (a) A refinement step transforms output measures provided at a higherlevel to input measures required at the lower level of abstraction. (b) A dataconversion step transforms the output measures provided at the lower level tothe required input measures at the higher level. (c) During both refinementand data conversion, abstraction is performed to tame analysis complexity be-tween levels of abstraction. Formally, an Adapter A = (T↓, T↑) is a tuple ofTransformers T with T↓ being the Refinement and T↑ the Conversion,respectively. Considering the usability of the CRA framework, an adapter canbe feasibly applied if T↓ (T↑) can derive all input measures for the CRN at lowerlevel (higher level) from the output measures of the CRN at higher level (lowerlevel). The transformers typically apply a specific model transformation like re-lating the workload of a processor to a respective trace of its power consumption.However, these transformers will typically not provide exact results, but will in-herently apply a certain abstraction by either making an error or by just beingable to give upper and lower bounds. Imagine, e.g., a Field Programmable GateArray (FPGA) where cosmic ray may induce bit-flips: One level of abstractionmay be used to determine a profile for the intensity of the cosmic ray over time.For the conversion T↑, existing approaches relate the intensity of cosmic raysto the number of Block RAMs (BRAMs) and slices to determine a reliabilityfunction, see [21]. However, it can hardly be analyzed whether a single bit-upsetresults in an observable error or even permanent defect in case certain configu-ration bits are flipped. Determining a reliability function in one adapter requiresthe assumption that each flip of a configuration bit results in an observable error,resulting in potentially highly pessimistic lower bound for the reliability. Here,the CRA concept comes into play by, e. g., integrating an intermediate level thatinvestigates the number and sensitivity of configuration bits with respect to theapplication at higher level.
116 M. Glaß, H. Yu, F. Reimann, and J. Teich
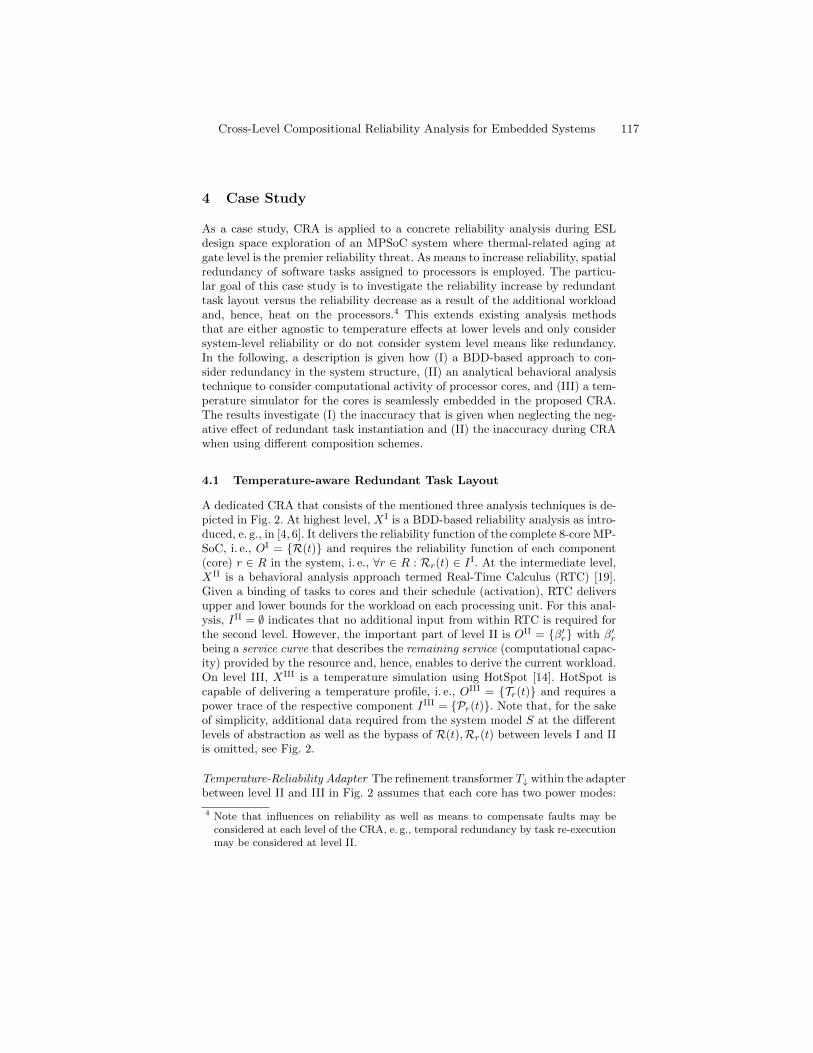
4 Case Study
As a case study, CRA is applied to a concrete reliability analysis during ESLdesign space exploration of an MPSoC system where thermal-related aging atgate level is the premier reliability threat. As means to increase reliability, spatialredundancy of software tasks assigned to processors is employed. The particu-lar goal of this case study is to investigate the reliability increase by redundanttask layout versus the reliability decrease as a result of the additional workloadand, hence, heat on the processors.4 This extends existing analysis methodsthat are either agnostic to temperature effects at lower levels and only considersystem-level reliability or do not consider system level means like redundancy.In the following, a description is given how (I) a BDD-based approach to con-sider redundancy in the system structure, (II) an analytical behavioral analysistechnique to consider computational activity of processor cores, and (III) a tem-perature simulator for the cores is seamlessly embedded in the proposed CRA.The results investigate (I) the inaccuracy that is given when neglecting the neg-ative effect of redundant task instantiation and (II) the inaccuracy during CRAwhen using different composition schemes.
4.1 Temperature-aware Redundant Task Layout
A dedicated CRA that consists of the mentioned three analysis techniques is de-picted in Fig. 2. At highest level, XI is a BDD-based reliability analysis as intro-duced, e. g., in [4, 6]. It delivers the reliability function of the complete 8-core MP-SoC, i. e., OI = {R(t)} and requires the reliability function of each component(core) r ∈ R in the system, i. e., ∀r ∈ R : Rr(t) ∈ II. At the intermediate level,XII is a behavioral analysis approach termed Real-Time Calculus (RTC) [19].Given a binding of tasks to cores and their schedule (activation), RTC deliversupper and lower bounds for the workload on each processing unit. For this anal-ysis, III = ∅ indicates that no additional input from within RTC is required forthe second level. However, the important part of level II is OII = {β′r} with β′rbeing a service curve that describes the remaining service (computational capac-ity) provided by the resource and, hence, enables to derive the current workload.On level III, XIII is a temperature simulation using HotSpot [14]. HotSpot iscapable of delivering a temperature profile, i. e., OIII = {Tr(t)} and requires apower trace of the respective component IIII = {Pr(t)}. Note that, for the sakeof simplicity, additional data required from the system model S at the differentlevels of abstraction as well as the bypass of R(t),Rr(t) between levels I and IIis omitted, see Fig. 2.
Temperature-Reliability Adapter The refinement transformer T↓ within the adapterbetween level II and III in Fig. 2 assumes that each core has two power modes:
4 Note that influences on reliability as well as means to compensate faults may beconsidered at each level of the CRA, e. g., temporal redundancy by task re-executionmay be considered at level II.
Cross-Level Compositional Reliability Analysis for Embedded Systems 117
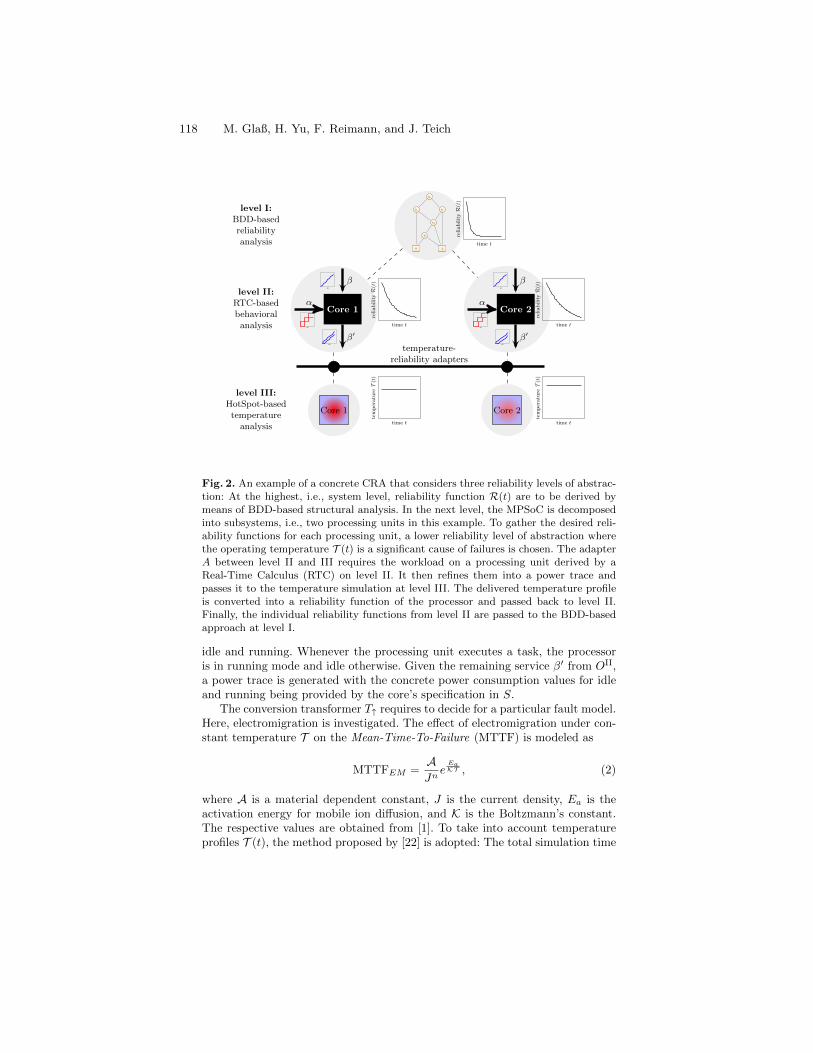
t2
t3 t3
t4
t5
0 1
Core 1 Core 2
Core 1 Core 2
temperature-reliability adapters
level I:BDD-basedreliabilityanalysis
level II:RTC-basedbehavioralanalysis
level III:HotSpot-basedtemperatureanalysis
α
β
α
β
β′ β′
time t
reliabilityR(t)
time t
reliabilityR(t)
time t
reliabilityR(t)
time t
temperature
T(t)
time t
temperature
T(t)
∆t ∆t
∆t
∆t
∆t
∆t
Fig. 2. An example of a concrete CRA that considers three reliability levels of abstrac-tion: At the highest, i.e., system level, reliability function R(t) are to be derived bymeans of BDD-based structural analysis. In the next level, the MPSoC is decomposedinto subsystems, i.e., two processing units in this example. To gather the desired reli-ability functions for each processing unit, a lower reliability level of abstraction wherethe operating temperature T (t) is a significant cause of failures is chosen. The adapterA between level II and III requires the workload on a processing unit derived by aReal-Time Calculus (RTC) on level II. It then refines them into a power trace andpasses it to the temperature simulation at level III. The delivered temperature profileis converted into a reliability function of the processor and passed back to level II.Finally, the individual reliability functions from level II are passed to the BDD-basedapproach at level I.
idle and running. Whenever the processing unit executes a task, the processoris in running mode and idle otherwise. Given the remaining service β′ from OII,a power trace is generated with the concrete power consumption values for idleand running being provided by the core’s specification in S.
The conversion transformer T↑ requires to decide for a particular fault model.Here, electromigration is investigated. The effect of electromigration under con-stant temperature T on the Mean-Time-To-Failure (MTTF) is modeled as
MTTFEM =AJn
eEaKT , (2)
where A is a material dependent constant, J is the current density, Ea is theactivation energy for mobile ion diffusion, and K is the Boltzmann’s constant.The respective values are obtained from [1]. To take into account temperatureprofiles T (t), the method proposed by [22] is adopted: The total simulation time
118 M. Glaß, H. Yu, F. Reimann, and J. Teich
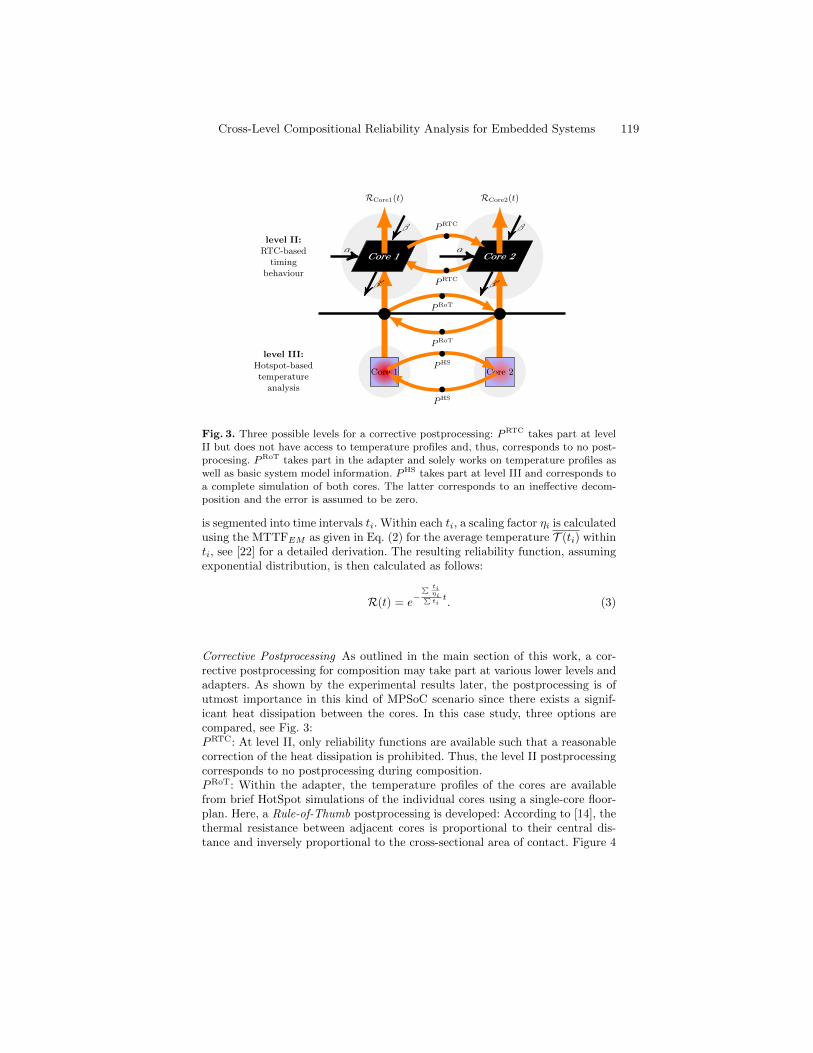
RCore1(t) RCore2(t)
Core 1 Core 2α
β
α
β
β ′β ′
Core 1 Core 2
PRTC
PRTC
PRoT
PRoT
PHS
PHS
level II:RTC-based
timingbehaviour
level III:Hotspot-basedtemperatureanalysis
Fig. 3. Three possible levels for a corrective postprocessing: PRTC takes part at levelII but does not have access to temperature profiles and, thus, corresponds to no post-procesing. PRoT takes part in the adapter and solely works on temperature profiles aswell as basic system model information. PHS takes part at level III and corresponds toa complete simulation of both cores. The latter corresponds to an ineffective decom-position and the error is assumed to be zero.
is segmented into time intervals ti. Within each ti, a scaling factor ηi is calculatedusing the MTTFEM as given in Eq. (2) for the average temperature T (ti) withinti, see [22] for a detailed derivation. The resulting reliability function, assumingexponential distribution, is then calculated as follows:
R(t) = e−
∑ tiηi∑ti
t. (3)
Corrective Postprocessing As outlined in the main section of this work, a cor-rective postprocessing for composition may take part at various lower levels andadapters. As shown by the experimental results later, the postprocessing is ofutmost importance in this kind of MPSoC scenario since there exists a signif-icant heat dissipation between the cores. In this case study, three options arecompared, see Fig. 3:PRTC: At level II, only reliability functions are available such that a reasonablecorrection of the heat dissipation is prohibited. Thus, the level II postprocessingcorresponds to no postprocessing during composition.PRoT: Within the adapter, the temperature profiles of the cores are availablefrom brief HotSpot simulations of the individual cores using a single-core floor-plan. Here, a Rule-of-Thumb postprocessing is developed: According to [14], thethermal resistance between adjacent cores is proportional to their central dis-tance and inversely proportional to the cross-sectional area of contact. Figure 4
Cross-Level Compositional Reliability Analysis for Embedded Systems 119
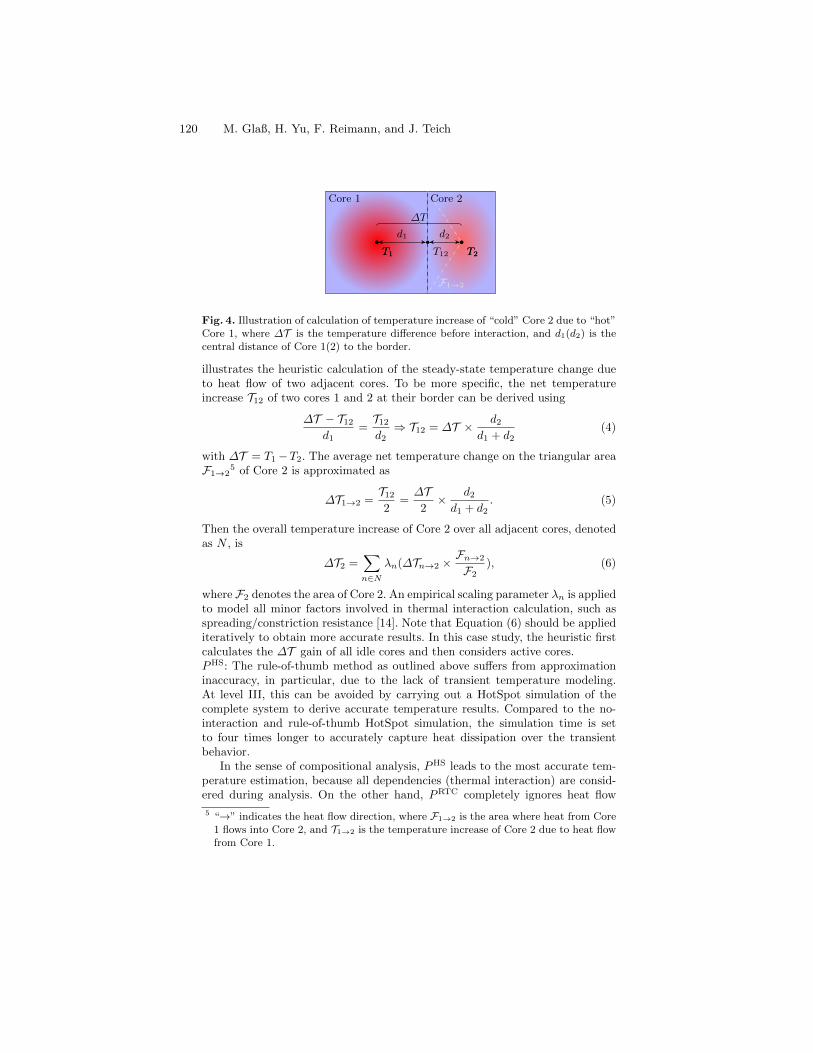
T1 T2
F1→2
T1 T2T12
d2d1
∆T
Core 1 Core 2
Fig. 4. Illustration of calculation of temperature increase of “cold” Core 2 due to “hot”Core 1, where ∆T is the temperature difference before interaction, and d1(d2) is thecentral distance of Core 1(2) to the border.
illustrates the heuristic calculation of the steady-state temperature change dueto heat flow of two adjacent cores. To be more specific, the net temperatureincrease T12 of two cores 1 and 2 at their border can be derived using
∆T − T12d1
=T12d2⇒ T12 = ∆T × d2
d1 + d2(4)
with ∆T = T1−T2. The average net temperature change on the triangular areaF1→2
5 of Core 2 is approximated as
∆T1→2 =T122
=∆T
2× d2d1 + d2
. (5)
Then the overall temperature increase of Core 2 over all adjacent cores, denotedas N , is
∆T2 =∑
n∈Nλn(∆Tn→2 ×
Fn→2
F2), (6)
where F2 denotes the area of Core 2. An empirical scaling parameter λn is appliedto model all minor factors involved in thermal interaction calculation, such asspreading/constriction resistance [14]. Note that Equation (6) should be appliediteratively to obtain more accurate results. In this case study, the heuristic firstcalculates the ∆T gain of all idle cores and then considers active cores.PHS: The rule-of-thumb method as outlined above suffers from approximationinaccuracy, in particular, due to the lack of transient temperature modeling.At level III, this can be avoided by carrying out a HotSpot simulation of thecomplete system to derive accurate temperature results. Compared to the no-interaction and rule-of-thumb HotSpot simulation, the simulation time is setto four times longer to accurately capture heat dissipation over the transientbehavior.
In the sense of compositional analysis, PHS leads to the most accurate tem-perature estimation, because all dependencies (thermal interaction) are consid-ered during analysis. On the other hand, PRTC completely ignores heat flow
5 “→” indicates the heat flow direction, where F1→2 is the area where heat from Core1 flows into Core 2, and T1→2 is the temperature increase of Core 2 due to heat flowfrom Core 1.
120 M. Glaß, H. Yu, F. Reimann, and J. Teich
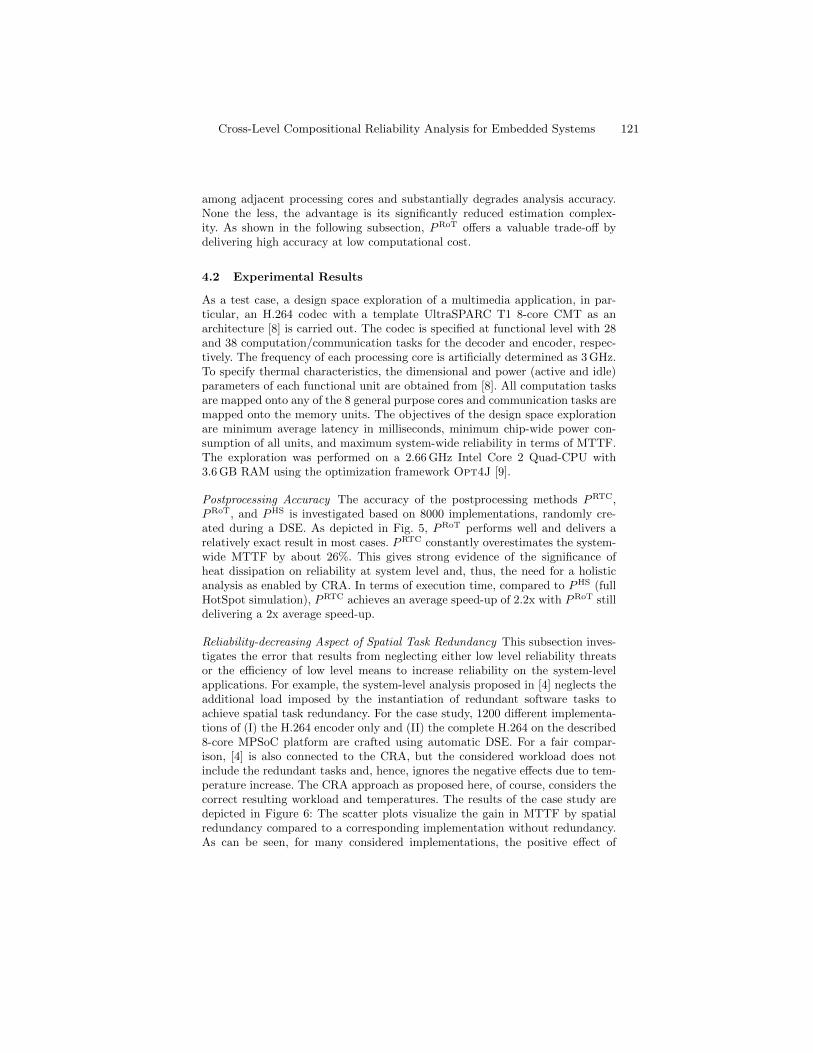
among adjacent processing cores and substantially degrades analysis accuracy.None the less, the advantage is its significantly reduced estimation complex-ity. As shown in the following subsection, PRoT offers a valuable trade-off bydelivering high accuracy at low computational cost.
4.2 Experimental Results
As a test case, a design space exploration of a multimedia application, in par-ticular, an H.264 codec with a template UltraSPARC T1 8-core CMT as anarchitecture [8] is carried out. The codec is specified at functional level with 28and 38 computation/communication tasks for the decoder and encoder, respec-tively. The frequency of each processing core is artificially determined as 3 GHz.To specify thermal characteristics, the dimensional and power (active and idle)parameters of each functional unit are obtained from [8]. All computation tasksare mapped onto any of the 8 general purpose cores and communication tasks aremapped onto the memory units. The objectives of the design space explorationare minimum average latency in milliseconds, minimum chip-wide power con-sumption of all units, and maximum system-wide reliability in terms of MTTF.The exploration was performed on a 2.66 GHz Intel Core 2 Quad-CPU with3.6 GB RAM using the optimization framework Opt4J [9].
Postprocessing Accuracy The accuracy of the postprocessing methods PRTC,PRoT, and PHS is investigated based on 8000 implementations, randomly cre-ated during a DSE. As depicted in Fig. 5, PRoT performs well and delivers arelatively exact result in most cases. PRTC constantly overestimates the system-wide MTTF by about 26%. This gives strong evidence of the significance ofheat dissipation on reliability at system level and, thus, the need for a holisticanalysis as enabled by CRA. In terms of execution time, compared to PHS (fullHotSpot simulation), PRTC achieves an average speed-up of 2.2x with PRoT stilldelivering a 2x average speed-up.
Reliability-decreasing Aspect of Spatial Task Redundancy This subsection inves-tigates the error that results from neglecting either low level reliability threatsor the efficiency of low level means to increase reliability on the system-levelapplications. For example, the system-level analysis proposed in [4] neglects theadditional load imposed by the instantiation of redundant software tasks toachieve spatial task redundancy. For the case study, 1200 different implementa-tions of (I) the H.264 encoder only and (II) the complete H.264 on the described8-core MPSoC platform are crafted using automatic DSE. For a fair compar-ison, [4] is also connected to the CRA, but the considered workload does notinclude the redundant tasks and, hence, ignores the negative effects due to tem-perature increase. The CRA approach as proposed here, of course, considers thecorrect resulting workload and temperatures. The results of the case study aredepicted in Figure 6: The scatter plots visualize the gain in MTTF by spatialredundancy compared to a corresponding implementation without redundancy.As can be seen, for many considered implementations, the positive effect of
Cross-Level Compositional Reliability Analysis for Embedded Systems 121
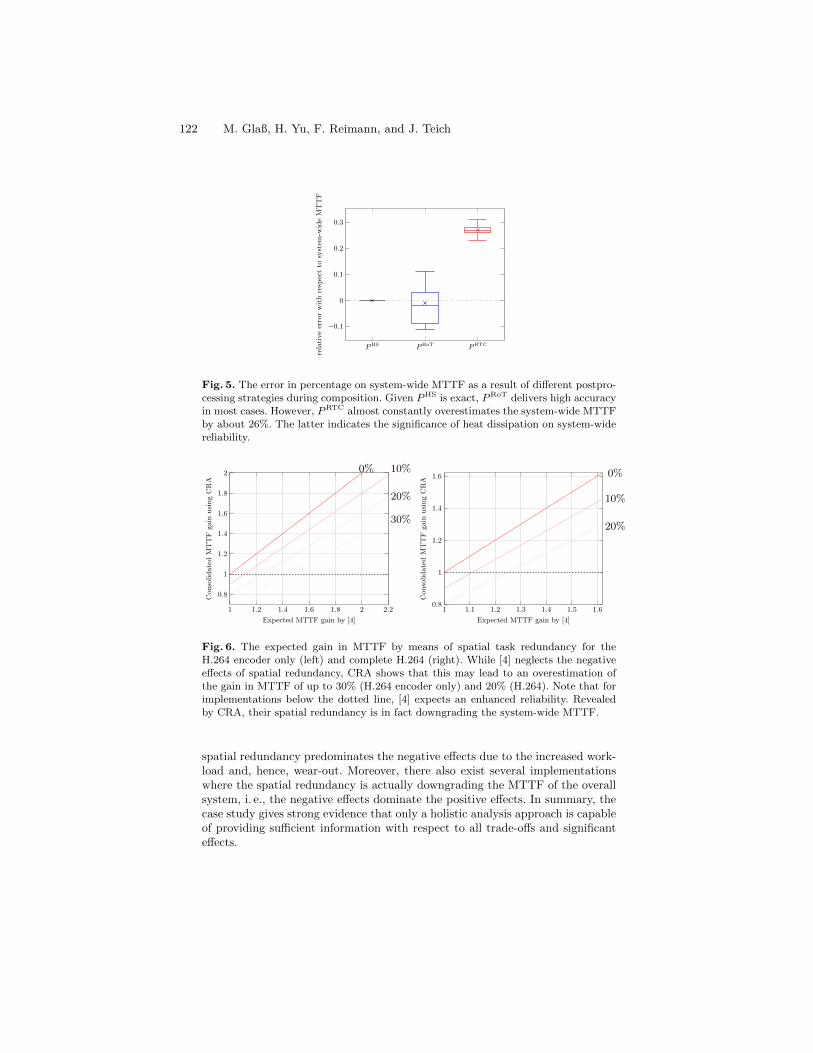
PHS PRoT PRTC
−0.1
0
0.1
0.2
0.3
relativeerrorwithresp
ectto
system
-wideMTTF
Fig. 5. The error in percentage on system-wide MTTF as a result of different postpro-cessing strategies during composition. Given PHS is exact, PRoT delivers high accuracyin most cases. However, PRTC almost constantly overestimates the system-wide MTTFby about 26%. The latter indicates the significance of heat dissipation on system-widereliability.
1 1.2 1.4 1.6 1.8 2 2.2
0.8
1
1.2
1.4
1.6
1.8
2
Expected MTTF gain by [4]
ConsolidatedMTTF
gain
usingCRA
0% 10%
20%
30%
1 1.1 1.2 1.3 1.4 1.5 1.60.8
1
1.2
1.4
1.6
Expected MTTF gain by [4]
ConsolidatedMTTF
gain
usingCRA
0%
10%
20%
Fig. 6. The expected gain in MTTF by means of spatial task redundancy for theH.264 encoder only (left) and complete H.264 (right). While [4] neglects the negativeeffects of spatial redundancy, CRA shows that this may lead to an overestimation ofthe gain in MTTF of up to 30% (H.264 encoder only) and 20% (H.264). Note that forimplementations below the dotted line, [4] expects an enhanced reliability. Revealedby CRA, their spatial redundancy is in fact downgrading the system-wide MTTF.
spatial redundancy predominates the negative effects due to the increased work-load and, hence, wear-out. Moreover, there also exist several implementationswhere the spatial redundancy is actually downgrading the MTTF of the overallsystem, i. e., the negative effects dominate the positive effects. In summary, thecase study gives strong evidence that only a holistic analysis approach is capableof providing sufficient information with respect to all trade-offs and significanteffects.
122 M. Glaß, H. Yu, F. Reimann, and J. Teich
5 Conclusion
This paper introduces a flexible framework for cross-level Compositional Relia-bility Analysis (CRA) that enables a seamless integration of various reliabilityanalysis techniques across different levels of abstraction. The framework providesmechanisms for (a) the composition and decomposition of the system duringanalysis and (b) the connection of different levels of abstraction by adapters.As a case-study, CRA combines three analysis approaches from the MPSoCdomain: (I) a BDD-based approach to consider redundancy in the system struc-ture, (II) an analytical behavioral model to consider computational activity, and(III) a temperature simulator. The experimental results highlight the flexibil-ity of the approach with respect to both, the integration of different techniquescross-level and the mechanisms to trade-off accuracy versus computational com-plexity. Moreover, the need for holistic and cross-level analysis as enabled byCRA is shown by investigating the error of existing work that, e. g., neglects thenegative effects of redundancy at system level on component wear-out at circuitlevel.
References
1. Council, J.E.D.E.: Failure mechanisms and models for semiconductor devices.JEDEC Publication JEP122-F (2010)
2. Eles, P., Izosimov, V., Pop, P., Peng, Z.: Synthesis of fault-tolerant embeddedsystems. In: Proc. of DATE ’08. pp. 1117–1122 (2008)
3. Ernst, D. et al.: Razor: A low-power pipeline based on circuit-level timing specu-lation. In: Microarchitecture ’03. pp. 7–18 (2003)
4. Glaß, M., Lukasiewycz, M., Reimann, F., Haubelt, C., Teich, J.: Symbolic systemlevel reliability analysis. In: Proc. of ICCAD ’10. pp. 185–189 (2010)
5. Gu, Z., Zhu, C., Shang, L., Dick, R.: Application-specific MPSoC reliability op-timization. IEEE Trans. on Very Large Scale Integration Systems 16(5), 603–608(2008)
6. Israr, A., Huss, S.: Specification and design considerations for reliable embeddedsystems. In: Proc. of DATE ’08. pp. 1111–1116 (2008)
7. Izosimov, V., Pop, P., Eles, P., Peng, Z.: Synthesis of fault-tolerant schedules withtransparency/performance trade-offs for distributed embedded systems. In: Proc.of DAC ’04. pp. 550–555 (2004)
8. Leon, A.S., Tam, K.W., Shin, J.L., Weisner, D., Schumacher, F.: A Power-EfficientHigh-Throughput 32-Thread SPARC Processor. IEEE Journal of Solid-State Cir-cuits 42(1), 7–16 (2007)
9. Lukasiewycz, M., Glaß, M., Reimann, F., Teich, J.: Opt4J - A Modular Frameworkfor Meta-heuristic Optimization. In: Proc. of GECCO ’11. pp. 1723–1730 (2011)
10. McGregor, J., Stafford, J., Cho, I.: Measuring component reliability. In: Proceed-ings of 6th ICSE Workshop on Component-based Software Engineering (2003)
11. Reussner, R., Schmidt, H., Poernomo, I.: Reliability prediction for component-based software architectures. Systems & Software 66(3), 241–252 (2003)
12. Sander, B., Schnerr, J., Bringmann, O.: ESL power analysis of embedded processorsfor temperature and reliability estimations. In: Proc. of CODES+ISSS ’09. pp.239–248 (2009)
13. Schnable, G., Comizzoli, R.: CMOS integrated circuit reliability. MicroelectronicsReliability 21, 33–50 (1981)
14. Skadron, K., Stan, M., Huang, W., Velusamy, S., Sankaranarayanan, K., Tarjan,D.: Temperature-aware microarchitecture. In: ACM SIGARCH Computer Archi-tecture News. vol. 31, pp. 2–13 (2003)
Cross-Level Compositional Reliability Analysis for Embedded Systems 123
15. Stathis, J.: Reliability limits for the gate insulator in CMOS technology. IBMJournal of Research and Development 46(2-3), 265–286 (2002)
16. Streichert, T., Glaß, M., Haubelt, C., Teich, J.: Design space exploration of reliablenetworked embedded systems. J. on Systems Architecture 53(10), 751–763 (2007)
17. Ting, L., May, J., Hunter, W., McPherson, J.: AC electromigration characteri-zation and modeling of multilayeredinterconnects. In: 31st Annual InternationalReliability Physics Symposium. pp. 311–316 (1993)
18. Tosun, S., Mansouri, N., Arvas, E., Kandemir, M., Xie, Y.: Reliability-centric high-level synthesis. In: Proc. of DATE ’05. pp. 1258 – 1263 (2005)
19. Wandeler, E., Thiele, L.: Real-Time Calculus (RTC) Toolbox,http://www.mpa.ethz.ch/Rtctoolbox
20. Wei, B., Vajtai, R., Ajayan, P.: Reliability and current carrying capacity of carbonnanotubes. Applied Physics Letters 79, 1172–1174 (2001)
21. Wirthlin, M., Johnson, E., Rollins, N., Caffrey, M., Graham, P.: The reliability ofFPGA circuit designs in the presence of radiation induced configuration upsets.In: Proc. of FCCM ’03. pp. 133–142 (2003)
22. Xiang, Y., Chantem, T., Dick, R.P., Hu, X.S., Shang, L.: System-Level ReliabilityModeling for MPSoCs. In: Proc. of CODES+ISSS ’10. pp. 297–306 (2010)
23. Xie, Y., Li, L., Kandemir, M., Vijaykrishnan, N., Irwin, M.: Reliability-aware co-synthesis for embedded systems. VLSI Signal Processing 49(1), 87–99 (2007)
24. Zhang, Y., Dick, R., Chakrabarty, K.: Energy-aware deterministic fault tolerancein distributed real-time embedded systems. In: Proc. of DATE ’05. pp. 372–377(2005)
25. Zhu, C., Gu, Z., Dick, R., Shang, L.: Reliable multiprocessor system-on-chip syn-thesis. In: Proc. of CODES+ISSS ’07. pp. 239–244 (2007)
124 M. Glaß, H. Yu, F. Reimann, and J. Teich
IT-forensic automotive investigations on the example of
route reconstruction on automotive system and
communication data
Tobias Hoppe, Sven Kuhlmann, Stefan Kiltz, Jana Dittmann
Otto-von-Guericke University, Magdeburg, Germany
{tobias.hoppe, sven.tuchscheerer, stefan.kiltz,
jana.dittmann}@iti.cs.uni-magdeburg.de
Abstract: As more and more complex IT systems, modern automobiles increas-
ingly bare safety and security risks – and have a growing relevance as sources of
potentially valuable traces or evidence. But existing procedures and tools, which
have proven so far in the field of IT forensics, mostly focus on desktop IT systems.
However, strategies and tools for IT forensic investigations on embedded systems
such as automotive IT networks increasingly come into the research focus.
Alongside a process model from an IT-forensics guideline by the German BSI, this
article examines how incident investigations could be performed with a focus on
automotive IT systems, e.g. to close weaknesses/vulnerabilities and increase the
dependability/trustworthiness of future systems. On the example of route recon-
struction in a hit-and-run scenario, appropriate strategies and tools for selected
process steps are proposed. These are exemplarily illustrated by practical tests on
real vehicle IT (especially CAN field bus and navigation systems) and applicable
ways to route reconstruction are shown.
Keywords: Automotive security and safety interplay, automotive IT forensics, fo-
rensic process models, investigation and treatment of safety/security incidents
1 Motivation: automotive incident investigation and applications
Compared to the broad operation of vehicles, IT forensic investigations of vehicular IT
are still very uncommon. Occasionally, similar techniques are used e.g. in the context of
accident reconstruction, in which – due to the growing potential of embedded automo-
tive IT – electronic evidence sources are increasingly included. One publicly known
example was the fatal accident of the Austrian politician Jörg Haider [1], where special-
ists of the vehicle manufacturer were involved in the subsequent investigation – mainly
to reconstruct the vehicle speed right before the crash. However, routine IT forensic
investigations of vehicle IT and processes compliant to the IT forensic principles consti-
tute a still largely uncharted territory. Also in the scientific community only sporadic
contributions as [2] address this young research field, to which this work should add
further contributions. The spectrum of application scenarios for IT-based automotive
incident investigations is broad and can exceed common accident research by far:
• Collection of (in- or exculpatory) evidence in general litigation cases
Already in cases where a vehicle plays no, or an only marginally relevant role in a
process (e.g. burglary, assault, robbery) it might provide important digital evidence.
In- or exculpatory evidence may already be derived from the fact, that a vehicle has
been used or was turned off at the time in question – especially if provably only one
person has access to it. The ability to link a vehicle with concrete identities of its driv-
ers may be further increased in future, especially in the presence of biometric authen-
tication systems for cars [3] (first fingerprint sensors, voice and face recognition sys-
tems are already available on the market).
By the collection of additional, complementary information a given hypothesis can
further be substantiated or disproved. For example, such data may include speed, po-
sition, seat occupation or the usage of telephone and infotainment systems.
• Investigation of incidents on the vehicle as a target of electronic manipulation
Also recognition and processing of electronic tampering with the vehicle itself, espe-
cially with the IT embedded in it, is of increasing relevance. A broad range of elec-
tronic manipulation can already be observed in practice. In 2011, the study [4]
showed that the vehicle owners (or drivers) themselves are the driving force behind
most current cases of electronic tampering with vehicle and infrastructure systems.
Usually these persons strive to optimise features/functionality of the vehicle. Because
they usually do not know about the complex dependencies and interactions in the
overall system, they consequently hazard unintended consequences of their manipula-
tions in many cases (which can range from simple malfunctions up to severe hazards).
Additionally, further attack scenarios can be expected in the future, potentially caus-
ing severe damage. The study [4] also shows that, in face of the increasingly intro-
duced wireless interfaces, also attack scenarios might gain future importance, which
are initiated by external attackers following intended, malicious motivations. Conse-
quently, investigations on vehicular IT should also consider external attackers and
their preferred strategies (e.g. non-physical system access via injection of malicious
software) as potential initiators of investigated incidents – as it is already common for
IT forensics in the desktop domain.
Scenario „hit-and-run suspect“: As an application example for an IT forensic investiga-
tion in the automotive domain the following scenario is referenced in this article (mainly
for the practical illustrations of the forensic procedures in section 3): After an accident with bodily injury the responsible driver of a green medium-class vehicle committed hit-
and-run. Since no eyewitness remembers the licence plate number, the law enforcement
agency performs a broad investigation of corresponding vehicles in the local district.
While only one car fulfils the reported criteria, its owner asserts his innocence – but
cannot provide an alibi for the time in question. He admits that he was driving the car at
that time, but since he was passing through a different district he was sure not to be the
person responsible for the investigated incident. His vehicle is equipped with a modern,
integrated navigation system, attached to the internal vehicular CAN bus network, and a
CAN bus data logger. On request by the investigating law enforcement agency he gives
his consent for a detailed analysis with the aim of a route reconstruction.
126 T. Hoppe, S. Tuchscheerer, S. Kiltz, and J. Dittmann
This article is structured as follows: Section 2 introduces an IT forensic process model
(being used in the later parts) and selected approaches from prior research, which could
be integrated in future cars as strategic preparation measures and this way serve as addi-
tional data sources. Section 3 starts with a conceptual overview over the application of
the different phases of the introduced process model during investigations on automotive
IT systems. Afterwards, the automotive application of selected IT-forensic process steps
is illustrated by presenting results from practical test setups. For the hit-and-run scenario
introduced above, this section shows, which findings can be gained from automotive IT
systems (in this case especially from integrated navigation systems and CAN field buses)
for route reconstruction purposes. Section 4 closes with a summary and an outlook.
2 Basics
This section provides relevant basics from the IT forensics domain as well as an over-
view on the spectrum of research on automotive IT security.
2.1 Process model for IT forensics
In IT forensics the usage of IT forensic models is an appropriate way to support me-
thodical procedures and completeness of all acquired and subsequently analysed data. In
many cases such models follow a distinction of different phases – which means that
correlating activities are grouped in a common phase. In the IT forensics domain a lot of
different models currently exist. Exemplary references are the „Forensic Process“ model
[5] defining four phases as well as the „Investigative Process Model “ [6], dividing the
process into 12 phases. Picking up the phase approach (i.e. the grouping of contextual
associated techniques and procedures), this article is based on the process model of the
„BSI Leitfaden IT-Forensik“ [7], which is an IT forensics guideline issued by the Ger-
man Federal Office for Information Security (“Bundesamt für Sicherheit in der Informa-
tionstechnik” / BSI). This model is further described in [8]. The rationale for that choice
is the inclusion of a phase of Strategic Preparation (SP), which covers measures to be
taken ahead of a suspected specific incident in a forensic fashion, including the inclusion
in the comprehensive documentation and the chain of custody (see section 3.1). Meas-
ures from the Strategic Preparation (SP) include the logging discussed in section 2.2. Furthermore, this model defines additional classes of forensic methods and data types,
which have already been reflected in the context of automotive IT systems in [9] and
which could become relevant in future work. In this article, especially the model’s divi-
sion into six phases is referenced (see Fig. 1), which is further described in section 3.1.
An important basic requirement for IT forensic investigations is the consequent protec-
tion of data integrity and authenticity as well as a complete documentation by maintain-
ing a chain of custody for digital evidence. Especially at the acquisition of person related
data additionally data confidentiality is an important aspect to protect the privacy of the
affected persons. Usually, these security aspects are respected by the inclusion of cryp-
tographic mechanisms like the application of cryptographic hash algorithms, digital sig-
natures and encryption.
IT-forensic automotive investigations on the example of route recon-struction on automotive system and communication data 127
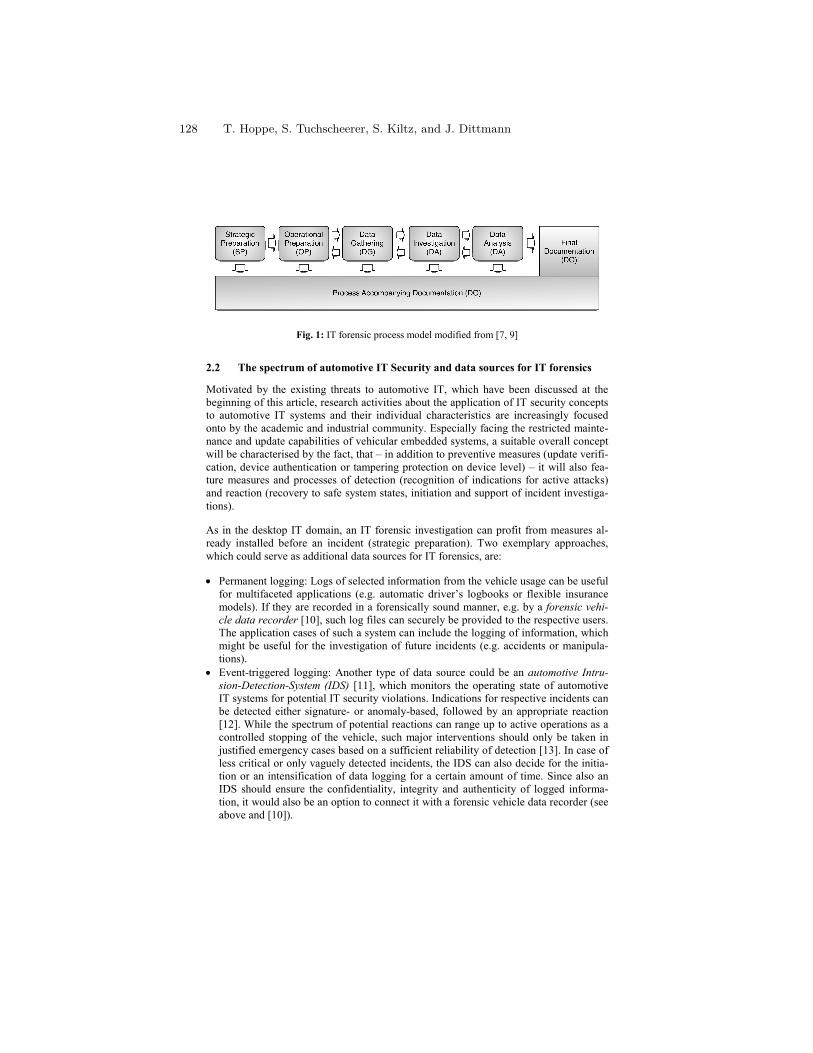
Fig. 1: IT forensic process model modified from [7, 9]
2.2 The spectrum of automotive IT Security and data sources for IT forensics
Motivated by the existing threats to automotive IT, which have been discussed at the
beginning of this article, research activities about the application of IT security concepts
to automotive IT systems and their individual characteristics are increasingly focused
onto by the academic and industrial community. Especially facing the restricted mainte-
nance and update capabilities of vehicular embedded systems, a suitable overall concept
will be characterised by the fact, that – in addition to preventive measures (update verifi-
cation, device authentication or tampering protection on device level) – it will also fea-
ture measures and processes of detection (recognition of indications for active attacks)
and reaction (recovery to safe system states, initiation and support of incident investiga-
tions).
As in the desktop IT domain, an IT forensic investigation can profit from measures al-
ready installed before an incident (strategic preparation). Two exemplary approaches,
which could serve as additional data sources for IT forensics, are:
• Permanent logging: Logs of selected information from the vehicle usage can be useful
for multifaceted applications (e.g. automatic driver’s logbooks or flexible insurance
models). If they are recorded in a forensically sound manner, e.g. by a forensic vehi-
cle data recorder [10], such log files can securely be provided to the respective users.
The application cases of such a system can include the logging of information, which
might be useful for the investigation of future incidents (e.g. accidents or manipula-
tions).
• Event-triggered logging: Another type of data source could be an automotive Intru-sion-Detection-System (IDS) [11], which monitors the operating state of automotive
IT systems for potential IT security violations. Indications for respective incidents can
be detected either signature- or anomaly-based, followed by an appropriate reaction
[12]. While the spectrum of potential reactions can range up to active operations as a
controlled stopping of the vehicle, such major interventions should only be taken in
justified emergency cases based on a sufficient reliability of detection [13]. In case of
less critical or only vaguely detected incidents, the IDS can also decide for the initia-
tion or an intensification of data logging for a certain amount of time. Since also an
IDS should ensure the confidentiality, integrity and authenticity of logged informa-
tion, it would also be an option to connect it with a forensic vehicle data recorder (see
above and [10]).
128 T. Hoppe, S. Tuchscheerer, S. Kiltz, and J. Dittmann
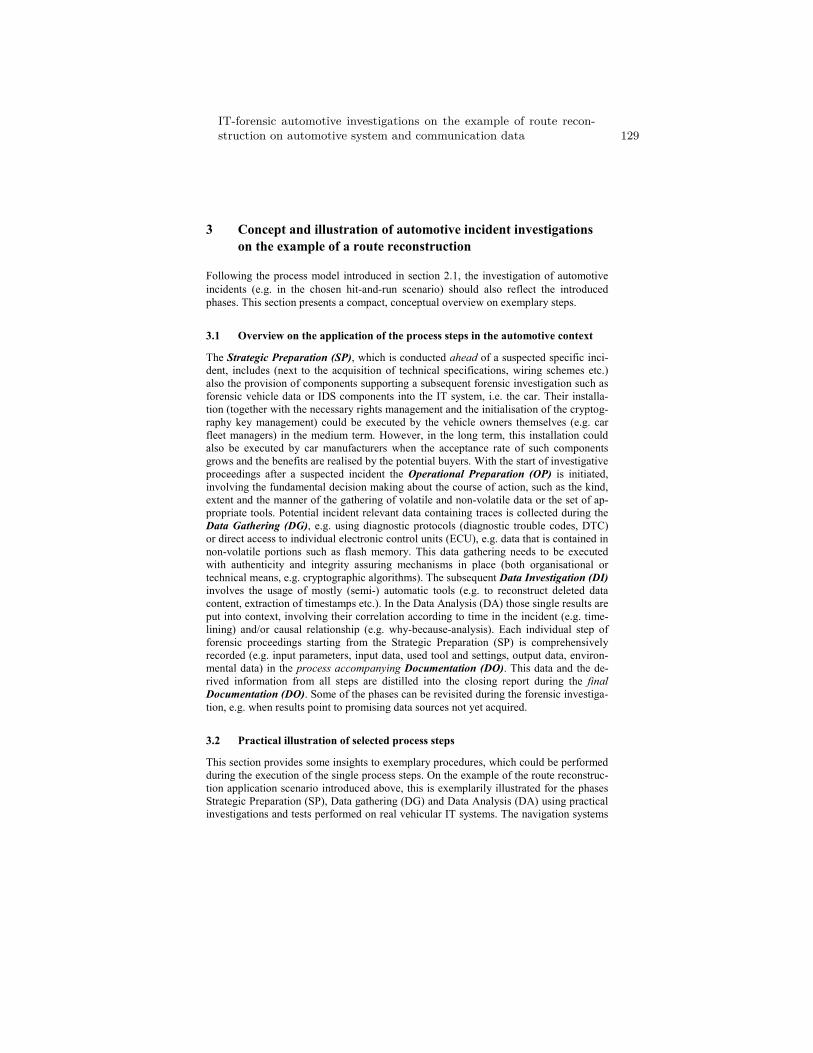
3 Concept and illustration of automotive incident investigations
on the example of a route reconstruction
Following the process model introduced in section 2.1, the investigation of automotive
incidents (e.g. in the chosen hit-and-run scenario) should also reflect the introduced
phases. This section presents a compact, conceptual overview on exemplary steps.
3.1 Overview on the application of the process steps in the automotive context
The Strategic Preparation (SP), which is conducted ahead of a suspected specific inci-
dent, includes (next to the acquisition of technical specifications, wiring schemes etc.)
also the provision of components supporting a subsequent forensic investigation such as
forensic vehicle data or IDS components into the IT system, i.e. the car. Their installa-
tion (together with the necessary rights management and the initialisation of the cryptog-
raphy key management) could be executed by the vehicle owners themselves (e.g. car
fleet managers) in the medium term. However, in the long term, this installation could
also be executed by car manufacturers when the acceptance rate of such components
grows and the benefits are realised by the potential buyers. With the start of investigative
proceedings after a suspected incident the Operational Preparation (OP) is initiated,
involving the fundamental decision making about the course of action, such as the kind,
extent and the manner of the gathering of volatile and non-volatile data or the set of ap-
propriate tools. Potential incident relevant data containing traces is collected during the
Data Gathering (DG), e.g. using diagnostic protocols (diagnostic trouble codes, DTC)
or direct access to individual electronic control units (ECU), e.g. data that is contained in
non-volatile portions such as flash memory. This data gathering needs to be executed
with authenticity and integrity assuring mechanisms in place (both organisational or
technical means, e.g. cryptographic algorithms). The subsequent Data Investigation (DI)
involves the usage of mostly (semi-) automatic tools (e.g. to reconstruct deleted data
content, extraction of timestamps etc.). In the Data Analysis (DA) those single results are
put into context, involving their correlation according to time in the incident (e.g. time-
lining) and/or causal relationship (e.g. why-because-analysis). Each individual step of
forensic proceedings starting from the Strategic Preparation (SP) is comprehensively
recorded (e.g. input parameters, input data, used tool and settings, output data, environ-
mental data) in the process accompanying Documentation (DO). This data and the de-
rived information from all steps are distilled into the closing report during the final
Documentation (DO). Some of the phases can be revisited during the forensic investiga-
tion, e.g. when results point to promising data sources not yet acquired.
3.2 Practical illustration of selected process steps
This section provides some insights to exemplary procedures, which could be performed
during the execution of the single process steps. On the example of the route reconstruc-
tion application scenario introduced above, this is exemplarily illustrated for the phases
Strategic Preparation (SP), Data gathering (DG) and Data Analysis (DA) using practical
investigations and tests performed on real vehicular IT systems. The navigation systems
IT-forensic automotive investigations on the example of route recon-struction on automotive system and communication data 129
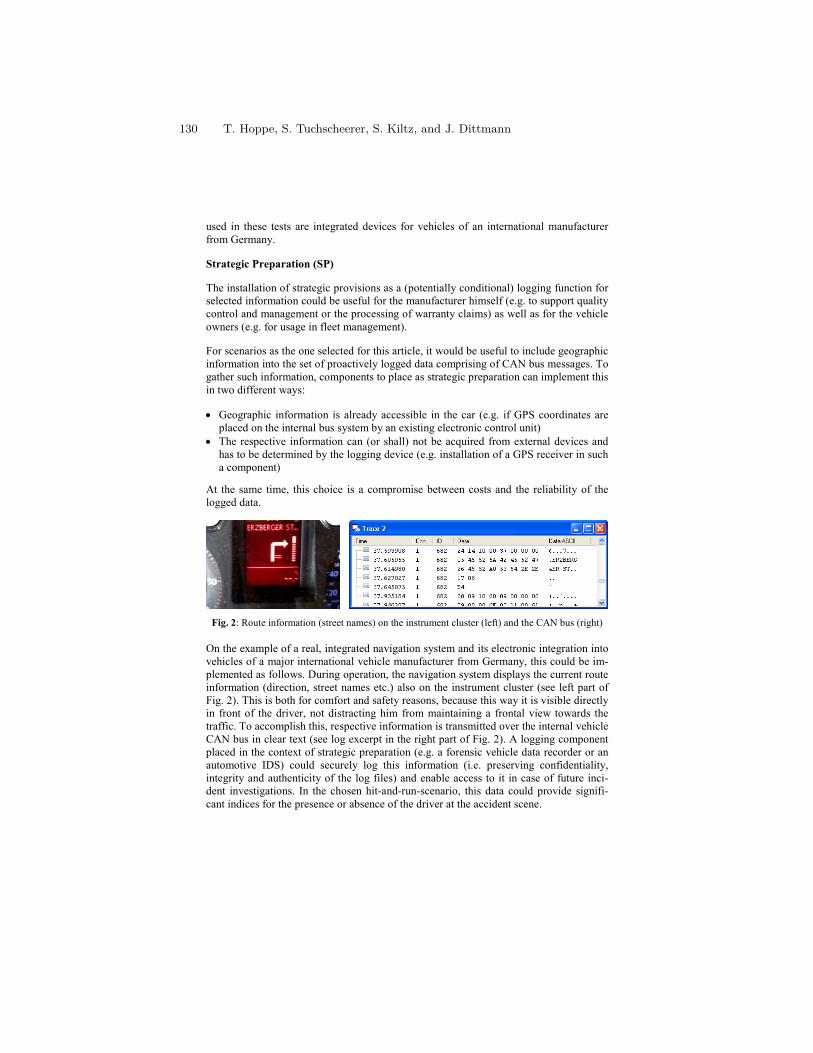
used in these tests are integrated devices for vehicles of an international manufacturer
from Germany.
Strategic Preparation (SP)
The installation of strategic provisions as a (potentially conditional) logging function for
selected information could be useful for the manufacturer himself (e.g. to support quality
control and management or the processing of warranty claims) as well as for the vehicle
owners (e.g. for usage in fleet management).
For scenarios as the one selected for this article, it would be useful to include geographic
information into the set of proactively logged data comprising of CAN bus messages. To
gather such information, components to place as strategic preparation can implement this
in two different ways:
• Geographic information is already accessible in the car (e.g. if GPS coordinates are
placed on the internal bus system by an existing electronic control unit)
• The respective information can (or shall) not be acquired from external devices and
has to be determined by the logging device (e.g. installation of a GPS receiver in such
a component)
At the same time, this choice is a compromise between costs and the reliability of the
logged data.
Fig. 2: Route information (street names) on the instrument cluster (left) and the CAN bus (right)
On the example of a real, integrated navigation system and its electronic integration into
vehicles of a major international vehicle manufacturer from Germany, this could be im-
plemented as follows. During operation, the navigation system displays the current route
information (direction, street names etc.) also on the instrument cluster (see left part of
Fig. 2). This is both for comfort and safety reasons, because this way it is visible directly
in front of the driver, not distracting him from maintaining a frontal view towards the
traffic. To accomplish this, respective information is transmitted over the internal vehicle
CAN bus in clear text (see log excerpt in the right part of Fig. 2). A logging component
placed in the context of strategic preparation (e.g. a forensic vehicle data recorder or an
automotive IDS) could securely log this information (i.e. preserving confidentiality,
integrity and authenticity of the log files) and enable access to it in case of future inci-
dent investigations. In the chosen hit-and-run-scenario, this data could provide signifi-
cant indices for the presence or absence of the driver at the accident scene.
130 T. Hoppe, S. Tuchscheerer, S. Kiltz, and J. Dittmann
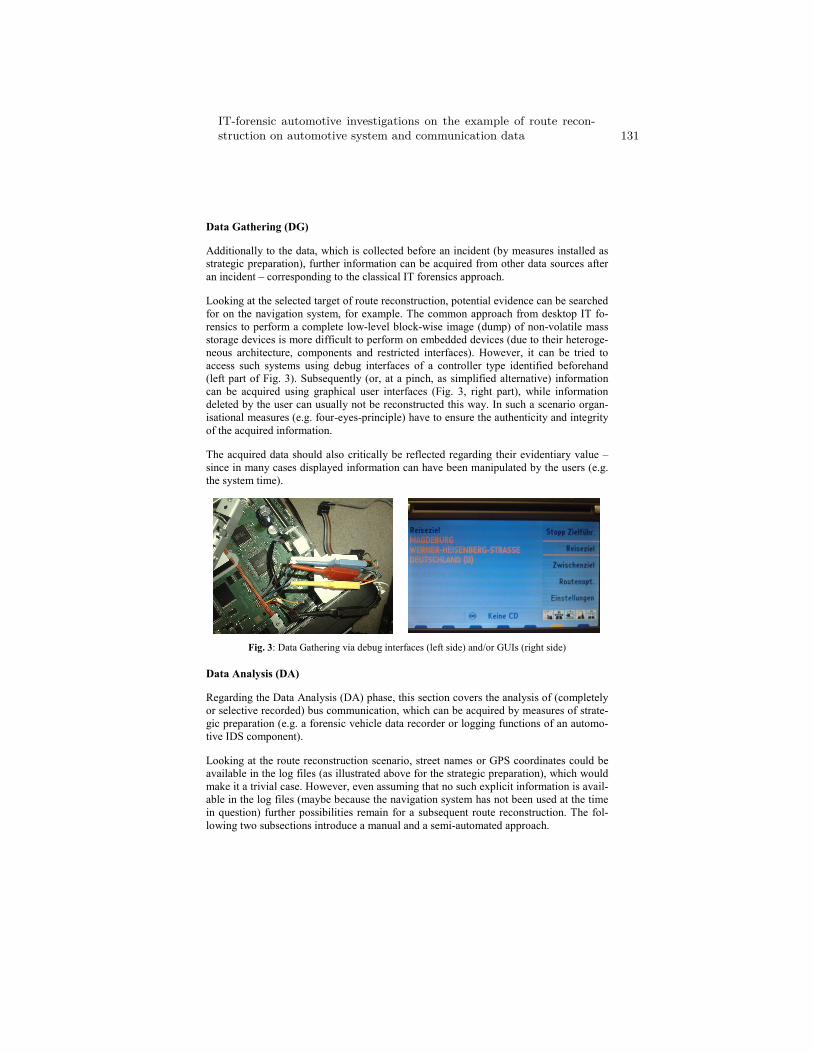
Data Gathering (DG)
Additionally to the data, which is collected before an incident (by measures installed as
strategic preparation), further information can be acquired from other data sources after
an incident – corresponding to the classical IT forensics approach.
Looking at the selected target of route reconstruction, potential evidence can be searched
for on the navigation system, for example. The common approach from desktop IT fo-
rensics to perform a complete low-level block-wise image (dump) of non-volatile mass
storage devices is more difficult to perform on embedded devices (due to their heteroge-
neous architecture, components and restricted interfaces). However, it can be tried to
access such systems using debug interfaces of a controller type identified beforehand
(left part of Fig. 3). Subsequently (or, at a pinch, as simplified alternative) information
can be acquired using graphical user interfaces (Fig. 3, right part), while information
deleted by the user can usually not be reconstructed this way. In such a scenario organ-
isational measures (e.g. four-eyes-principle) have to ensure the authenticity and integrity
of the acquired information.
The acquired data should also critically be reflected regarding their evidentiary value –
since in many cases displayed information can have been manipulated by the users (e.g.
the system time).
Fig. 3: Data Gathering via debug interfaces (left side) and/or GUIs (right side)
Data Analysis (DA)
Regarding the Data Analysis (DA) phase, this section covers the analysis of (completely
or selective recorded) bus communication, which can be acquired by measures of strate-
gic preparation (e.g. a forensic vehicle data recorder or logging functions of an automo-
tive IDS component).
Looking at the route reconstruction scenario, street names or GPS coordinates could be
available in the log files (as illustrated above for the strategic preparation), which would
make it a trivial case. However, even assuming that no such explicit information is avail-
able in the log files (maybe because the navigation system has not been used at the time
in question) further possibilities remain for a subsequent route reconstruction. The fol-
lowing two subsections introduce a manual and a semi-automated approach.
IT-forensic automotive investigations on the example of route recon-struction on automotive system and communication data 131
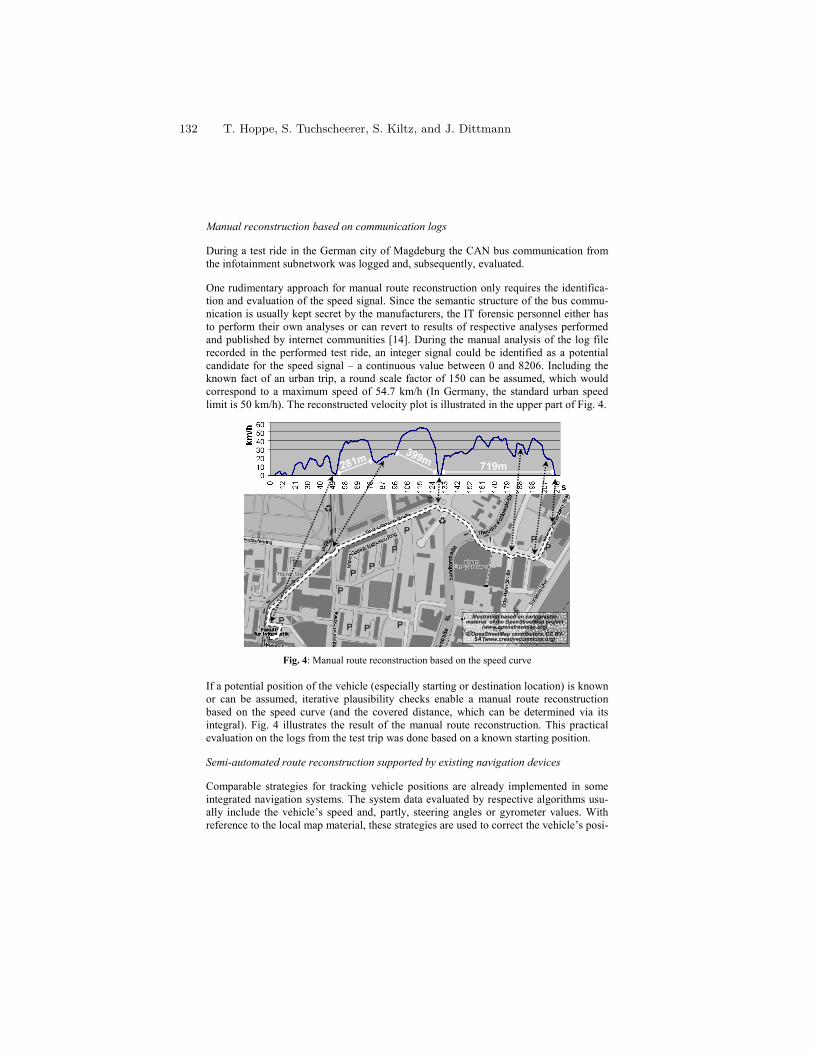
Manual reconstruction based on communication logs
During a test ride in the German city of Magdeburg the CAN bus communication from
the infotainment subnetwork was logged and, subsequently, evaluated.
One rudimentary approach for manual route reconstruction only requires the identifica-
tion and evaluation of the speed signal. Since the semantic structure of the bus commu-
nication is usually kept secret by the manufacturers, the IT forensic personnel either has
to perform their own analyses or can revert to results of respective analyses performed
and published by internet communities [14]. During the manual analysis of the log file
recorded in the performed test ride, an integer signal could be identified as a potential
candidate for the speed signal – a continuous value between 0 and 8206. Including the
known fact of an urban trip, a round scale factor of 150 can be assumed, which would
correspond to a maximum speed of 54.7 km/h (In Germany, the standard urban speed
limit is 50 km/h). The reconstructed velocity plot is illustrated in the upper part of Fig. 4.
Illustration based on cartographicmaterial of the OpenStreetMap project
(www.openstreetmap.org)
© OpenStreetMap contributors, CC BY-SA (www.creativecommons.org)
281m
399m719m
Fig. 4: Manual route reconstruction based on the speed curve
If a potential position of the vehicle (especially starting or destination location) is known
or can be assumed, iterative plausibility checks enable a manual route reconstruction
based on the speed curve (and the covered distance, which can be determined via its
integral). Fig. 4 illustrates the result of the manual route reconstruction. This practical
evaluation on the logs from the test trip was done based on a known starting position.
Semi-automated route reconstruction supported by existing navigation devices
Comparable strategies for tracking vehicle positions are already implemented in some
integrated navigation systems. The system data evaluated by respective algorithms usu-
ally include the vehicle’s speed and, partly, steering angles or gyrometer values. With
reference to the local map material, these strategies are used to correct the vehicle’s posi-
132 T. Hoppe, S. Tuchscheerer, S. Kiltz, and J. Dittmann
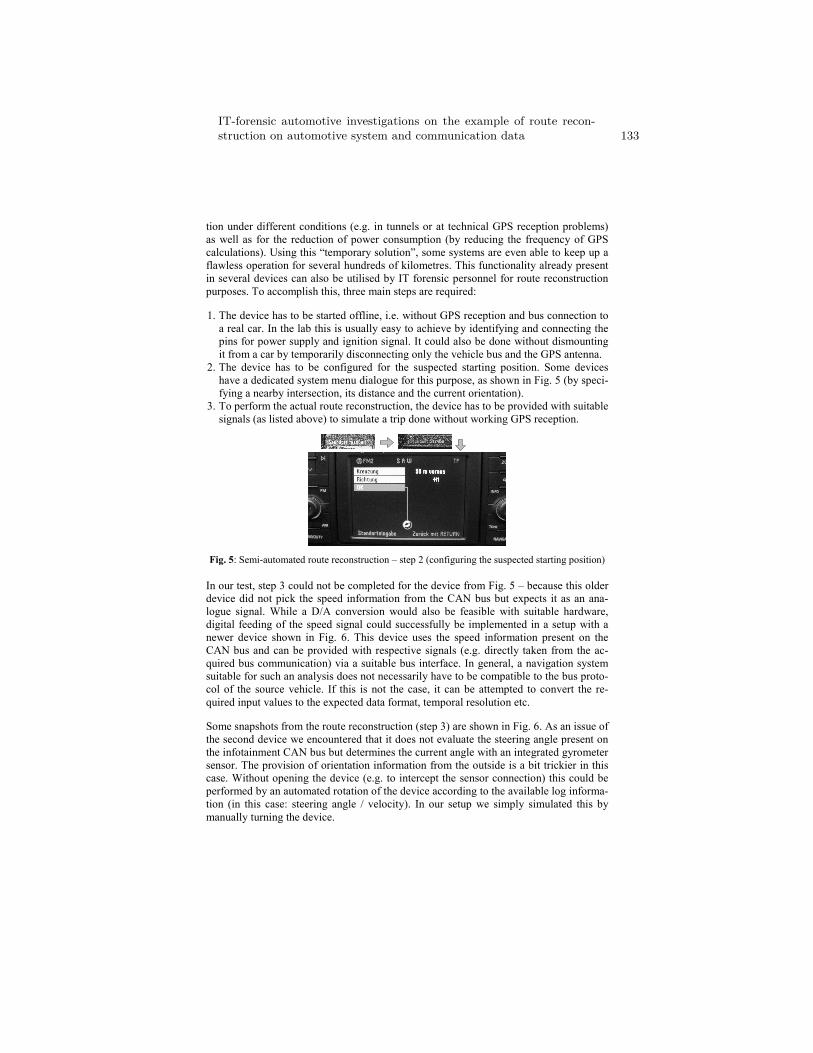
tion under different conditions (e.g. in tunnels or at technical GPS reception problems)
as well as for the reduction of power consumption (by reducing the frequency of GPS
calculations). Using this “temporary solution”, some systems are even able to keep up a
flawless operation for several hundreds of kilometres. This functionality already present
in several devices can also be utilised by IT forensic personnel for route reconstruction
purposes. To accomplish this, three main steps are required:
1. The device has to be started offline, i.e. without GPS reception and bus connection to a real car. In the lab this is usually easy to achieve by identifying and connecting the
pins for power supply and ignition signal. It could also be done without dismounting
it from a car by temporarily disconnecting only the vehicle bus and the GPS antenna.
2. The device has to be configured for the suspected starting position. Some devices
have a dedicated system menu dialogue for this purpose, as shown in Fig. 5 (by speci-
fying a nearby intersection, its distance and the current orientation).
3. To perform the actual route reconstruction, the device has to be provided with suitable
signals (as listed above) to simulate a trip done without working GPS reception.
Fig. 5: Semi-automated route reconstruction – step 2 (configuring the suspected starting position)
In our test, step 3 could not be completed for the device from Fig. 5 – because this older
device did not pick the speed information from the CAN bus but expects it as an ana-
logue signal. While a D/A conversion would also be feasible with suitable hardware,
digital feeding of the speed signal could successfully be implemented in a setup with a
newer device shown in Fig. 6. This device uses the speed information present on the
CAN bus and can be provided with respective signals (e.g. directly taken from the ac-
quired bus communication) via a suitable bus interface. In general, a navigation system
suitable for such an analysis does not necessarily have to be compatible to the bus proto-
col of the source vehicle. If this is not the case, it can be attempted to convert the re-
quired input values to the expected data format, temporal resolution etc.
Some snapshots from the route reconstruction (step 3) are shown in Fig. 6. As an issue of
the second device we encountered that it does not evaluate the steering angle present on
the infotainment CAN bus but determines the current angle with an integrated gyrometer
sensor. The provision of orientation information from the outside is a bit trickier in this
case. Without opening the device (e.g. to intercept the sensor connection) this could be
performed by an automated rotation of the device according to the available log informa-
tion (in this case: steering angle / velocity). In our setup we simply simulated this by
manually turning the device.
IT-forensic automotive investigations on the example of route recon-struction on automotive system and communication data 133
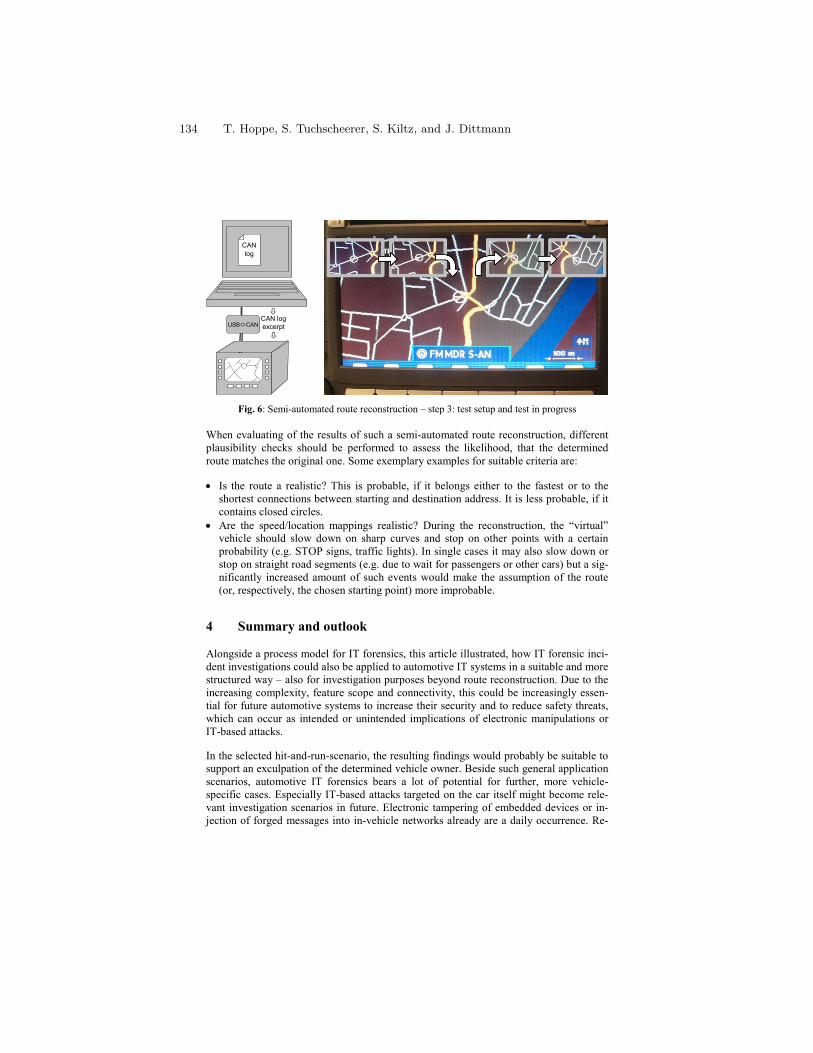
USB�CAN
�
CAN
log
CAN log
excerpt�
Fig. 6: Semi-automated route reconstruction – step 3: test setup and test in progress
When evaluating of the results of such a semi-automated route reconstruction, different
plausibility checks should be performed to assess the likelihood, that the determined
route matches the original one. Some exemplary examples for suitable criteria are:
• Is the route a realistic? This is probable, if it belongs either to the fastest or to the shortest connections between starting and destination address. It is less probable, if it
contains closed circles.
• Are the speed/location mappings realistic? During the reconstruction, the “virtual”
vehicle should slow down on sharp curves and stop on other points with a certain
probability (e.g. STOP signs, traffic lights). In single cases it may also slow down or
stop on straight road segments (e.g. due to wait for passengers or other cars) but a sig-
nificantly increased amount of such events would make the assumption of the route
(or, respectively, the chosen starting point) more improbable.
4 Summary and outlook
Alongside a process model for IT forensics, this article illustrated, how IT forensic inci-
dent investigations could also be applied to automotive IT systems in a suitable and more
structured way – also for investigation purposes beyond route reconstruction. Due to the
increasing complexity, feature scope and connectivity, this could be increasingly essen-
tial for future automotive systems to increase their security and to reduce safety threats,
which can occur as intended or unintended implications of electronic manipulations or
IT-based attacks.
In the selected hit-and-run-scenario, the resulting findings would probably be suitable to
support an exculpation of the determined vehicle owner. Beside such general application
scenarios, automotive IT forensics bears a lot of potential for further, more vehicle-
specific cases. Especially IT-based attacks targeted on the car itself might become rele-
vant investigation scenarios in future. Electronic tampering of embedded devices or in-
jection of forged messages into in-vehicle networks already are a daily occurrence. Re-
134 T. Hoppe, S. Tuchscheerer, S. Kiltz, and J. Dittmann
cent studies revealed that still the owners/drivers themselves are the most frequent pro-
tagonists of such incidents trying to “optimise” their car. But also the relevance of third
parties as initiating source of IT-based attacks on automotive systems might increase in
future. Since safety and security threats can arise as (direct or indirect) implications in
both cases, IT forensic investigations can help in such cases to identify and fix the ex-
ploited vulnerabilities (e.g. by providing software updates for current systems or includ-
ing design fixes for future ones). This makes IT forensics an essential part in the life
cycle chain to improve the dependability and trustworthiness of automotive IT systems.
Currently, the concept has still some practical boundaries, since the achievement of re-
spective findings from current vehicles is typically a difficult task due several multifac-
eted restrictions. The amount of vehicular information accessible via – still mostly pro-
prietary / manufacturer-dependent – diagnostic protocols is usually very limited. On the
other hand, extraction and analyses of complete memory dumps (e.g. from flash mem-
ory) out of heterogeneous embedded devices of different manufacturers currently de-
mand superior efforts. The alternate, comparably comfortable option of accessing poten-
tially incident-relevant information via existing graphical user interfaces (as the GUI of
the navigation system) is only possible for a small fraction of automotive systems and
only has a restricted reliability (e.g. due to editing/deletion features for the users).
Future automotive incident investigations could substantially be supported by the broad
introduction of logging mechanisms as vehicle data recorders, which is being demanded
by many accident researchers for several years. While these have also been identified in
this article as a basically suitable measure of strategic preparation, the design of such
systems should place a central focus on their IT security requirements. For the IT-
forensic chain of custody it is necessary to ensure integrity and authenticity of every log
entry, to be able to prove its correctness at later times. Facing the increasing amount of
person related (or relatable) information collected and processed by current vehicles,
especially the confidentiality of log data is an essential, additional security aspect to
protect the driver’s privacy.
Acknowledgements
The authors of this article would like to thank Thomas Rehse for his support and valu-
able input created in the context of his master thesis [15] at the Otto-von-Guericke-
University of Magdeburg, Germany.
References
1. SPIEGEL Online International: Autopsy Shows Haider Was Intoxicated, Web Article from
October 15th, 2008, http://www.spiegel.de/international/europe/0,1518,584382,00.html, last
access: March 2nd, 2012.
2. Nilsson, D.K.; Larson, U.E.: Conducting Forensic Investigations of Cyber Attacks on Auto-
mobile In-Vehicle Networks. In: Networking and Telecommunications: Concepts, Method-
ologies, Tools and Applications, pp. 647-660, IGI Global, ISBN 978-1-60566-986-1, 2010.
IT-forensic automotive investigations on the example of route recon-struction on automotive system and communication data 135
3. Biermann, M.; Hoppe, T.; Dittmann, J.; Vielhauer, C.: Vehicle Systems: Comfort & Security
Enhancement of Face/Speech Fusion with Compensational Biometrics; In: MM&Sec'08 -
Proceedings of the Multimedia and Security Workshop 2008, 22.-23. September, Oxford, UK,
ACM, pp.185-194; ISBN 978-1-60558-058-6, 2008.
4. Dittmann, J.; Hoppe, T.; Kiltz, S.; Tuchscheerer, T.: Elektronische Manipulation von Fahr-
zeug- und Infrastruktursystemen: Gefährdungspotentiale für die Straßenverkehrssicherheit;
Wirtschaftsverlag N. W. Verlag für neue Wissenschaft, ISBN 978-3869181158, 2011.
5. T. Grance, K. Kent, and B. Kim, “Computer incident handling guide, special publication 800-
61,” National Institute for Standards and Technology, NIST Special Publication 800-61, 2004.
6. Casey, E.: Digital Evidence and Computer Crime. ISBN 0-12-1631044. Academic Press,
2004.
7. Federal Office for Information Security: Leitfaden IT-Forensik, Version 1.0.1 / March 2011,
https://www.bsi.bund.de/ContentBSI/Themen/Internet_Sicherheit/Uebersicht/ITRevision/IT-
Forensik/it-forensik.html, 2011.
8. Kiltz, S.; Hoppe, T.; Dittmann, J.; Vielhauer C.; Video surveillance: A new forensic model for
the forensically sound retrieval of picture content off a memory dump; In Proceedings of In-
formatik2009 - Digitale Multimedia-Forensik, pp 1619–1633, 2009.
9. Kiltz, S.; Hildebrandt, M.; Dittmann, J.: Forensische Datenarten und -analysen in automotiven
Systemen; In: Patrick Horster, Peter Schartner (Hrsg.), D·A·CH Security 2009; Syssec; Bo-
chum; 19./20. Mai 2009, ISBN: 978-3-00027-488-6, 2009.
10. Hoppe, H.; Holthusen, S.; Tuchscheerer, S.; Kiltz, S.; Dittmann, J.: Sichere Datenhaltung im
Automobil am Beispiel eines Konzepts zur forensisch sicheren Datenspeicherung; In: Sicher-
heit 2010, LNI P-170, ISBN 978-3-88579-264-2. pp. 153-164, 2010.
11. Hoppe, T.; Kiltz, S.; Dittmann, J.: Applying Intrusion Detection to Automotive IT – Early In-
sights and Remaining Challenges; In: Journal of Information Assurance and Security (JIAS),
ISSN: 1554-1010, Vol. 4, Issue 6, pp. 226-235, 2009.
12. Hoppe, T.; Exler, F.; Dittmann, J.: IDS-Signaturen für automotive CAN-Netzwerke; In: Peter
Schartner, Jürgen Taeger (Hrsg.), D·A·CH Security 2011; Syssec; ISBN: 978-3-00-034960-7,
pp. 55-66; 2011.
13. Müter, M.; Hoppe, T.; Dittmann, J.: Decision Model for Automotive Intrusion Detection Sys-
tems; In: Automotive - Safety & Security 2010; Shaker Verlag, Aachen, ISBN 978-3-8322-
9172-3, pp. 103-116, 2010.
14. Working state of a community-created CAN-ID matrix; forum discussion in the
www.CANhack.de internet community, http://www.canhack.de/viewtopic.php?t=1017, last
access: February 29th, 2012.
15. Rehse, T.: Semantische Analyse von Navigationsgeräten und Abgleich von Daten aus dem
Fahrzeugbussystem mit dem Ziel der Rekonstruktion von Fahrtrouten für den IT-forensischen
Nachweis. Master thesis, Otto-von-Guericke-University of Magdeburg, 2011.
136 T. Hoppe, S. Tuchscheerer, S. Kiltz, and J. Dittmann
Towards an IT Security Protection Profile for Safety-related Communication in Railway Automation
Hans-Hermann Bock1, Jens Braband2, Birgit Milius3, Hendrik Schäbe4
1 Deutsche Bahn AG, Berlin, Germany [email protected]
2 Siemens AG, Braunschweig, Germany [email protected]
3 TU Braunschweig, Braunschweig, Germany [email protected]
4 TÜV Rheinland, Köln, Germany [email protected]
Abstract. Some recent incidents have shown that possibly the vulnerability of IT systems in railway automation has been underestimated so far. Fortunately so far almost only denial of service attacks have been successful, but due to several trends, such as the use of commercial IT and communication systems or privatization, the threat potential could increase in the near future. However, up to now, no harmonized IT security requirements for railway automation exist. This paper defines a reference communication architecture which aims to sepa-rate IT security and safety requirements as well as certification processes as far as possible, and discusses the threats and IT security objectives including typi-cal assumptions in the railway domain. Finally examples of IT security re-quirements are stated and discussed based on the approach advocated in the Common Criteria, in the form of a protection profile.
Keywords. Railway, IT Security, Safety, Threats, IT Security Requirements, Protection Profile.
1 Introduction
Recently, reports on IT security incidents related to railways have increased as well as public awareness. For example, it was reported that on December 1, 2011, “hackers, possibly from abroad, executed an attack on a Northwest rail company's computers that disrupted railway signals for two days” [1]. Although the details of the attack and also its consequences remain unclear, this episode clearly shows the threats to which railways are exposed when they rely on modern commercial-off-the-shelf (COTS) communication and computing technology. However, in most cases, the attacks are denial of service attacks leading to service interruptions, but so far not to safety-critical incidents. But also other services, such as satellite positioning systems, have
been shown to be susceptible to IT security attacks, leading to a recommendation that GNSS services should not be used as standalone positioning services for safety-related applications [4].
What distinguishes railway systems from many other systems is their inherent dis-
tributed and networked nature with tens of thousands of kilometer track length for large operators. Thus, it is not economical to completely protect against physical ac-cess to this infrastructure and, as a consequence, railways are very vulnerable to physical denial of service attacks leading to service interruptions.
Another distinguishing feature of railways from other systems is the long lifespan of their systems and components. Current contracts usually demand support for over 25 years and history has shown that many systems, e.g. mechanical or relay interlock-ings, last much longer. IT security analyses have to take into account such long life-spans. Nevertheless, it should also be noted that at least some of the technical prob-lems are not railway-specific, but are shared by other sectors such as Air Traffic Man-agement [5].
Publications and presentations related to IT security in the railway domain are in-creasing. Some are particularly targeted at the use of public networks such as Ethernet or GSM for railway purposes [2], while others, at least rhetorically, pose the question “Can trains be hacked?”[3]. As mentioned above, some publications give detailed security-related recommendations [4]. While in railway automation harmonized safety standards were elaborated more than a decade ago, up to now no harmonized IT secu-rity requirements for railway automation exist.
This paper starts with a discussion of the normative background, then defines a ref-erence communication architecture which aims to separate IT security and safety requirements as well as certification processes as far as possible, and discusses the threats and IT security objectives including typical assumptions in the railway do-main. Finally, examples of IT security requirements are stated and discussed based on the approach advocated in the Common Criteria, in the form of a protection profile.
2 Normative Background
In railway automation, there exists an established standard for safety-related commu-nication, EN 50159 [6]. The first version of the standard was elaborated in 2001. It has proved quite successful and is also used in other application areas, e.g. industry automation. This standard defines threats and countermeasures to ensure safe com-munication in railway systems. So, at an early stage, the standard established methods to build a safe channel (in security called tunnel) through an unsafe environment. However, the threats considered in EN 50159 arise from technical sources or the envi-ronment rather than from human beings. The methods described in the standard are partially able to protect the railway system also from intentional attacks, but not com-pletely. Until now, additional organizational and technical measures have been im-plemented in railway systems, such as separated networks, etc., to achieve a sufficient level of protection.
138 J. Braband, B. Milius, H. Bock, and H. Schäbe
The purely safety aspects of electronic hardware are covered by EN 50129 [7]. However, security issues are taken into account by EN 50129 only as far as they af-fect safety issues, but, for example, denial of service attacks often do not fall into this category. Questions such as intrusion protection are only covered by one requirement in Table E.10 (exist protection against sabotage). However, EN 50129 provides a structure for a safety case which explicitly includes a subsection on protection against unauthorized access (both physical and informational). Other security objectives could also be described in that structure.
On the other hand, industrial standards on information security exist. Here we can specify the following standards:
• ISO/IEC 15408 [8] provides evaluation criteria for IT security, the so-called Common Criteria [13 to15]. This standard is solely centered on information systems and has, of course, no direct relation to safety systems.
• ISA 99 [9] is a set of 12 standards currently elaborated by the Industrial Automation and Control System Security Committee of the International Society for Automation (ISA). This standard is not railway-specific and focuses on industrial control systems. It is dedicated to different hierarchical levels, starting from concepts and going down to components of control systems.
A more comprehensive overview on existing information security standards is pre-sented in [10]. From these standards, it can be learnt, that for information security, not only technical aspects of concrete technical systems need to be taken into account, but also circumstances, organization, humans, etc. Certainly, not all elements mentioned in the general information security standards can and need to be used for a railway system.
How is the gap between information security standards for general systems and railways to be bridged? The bridge is provided by the European Commission Regula-tion on common safety methods No. 352/2009 [11]. This Commission Regulation mentions three different methods to demonstrate that a railway system is sufficiently safe:
a) by following existing rules and standards (application of codes of prac-tice),
b) similarity analysis, i.e. showing that the given (railway) system is equivalent to an existing and used one,
c) explicit risk analysis, where risk is assessed explicitly and shown to be acceptable.
We assume that, from the process point of view, security can be treated just like safety, meaning that threats would be treated as particular hazards. Using the ap-proach under a), Common Criteria [8] or ISA 99 [9] may be used in railway systems, but a particular tailoring would have to be performed due to different safety require-ments and application conditions. By this approach, a code of practice that is ap-proved in other areas of technology and provides a sufficient level of security, can be adapted to railways. This ensures a sufficient level of safety.
However, application of the general standards [8] or [9] requires tailoring them to the specific needs of a railway system. This is necessary to cover the specific threats
Towards an IT Security Protection Profile for Safety-related Commu-nication in Railway Automation 139
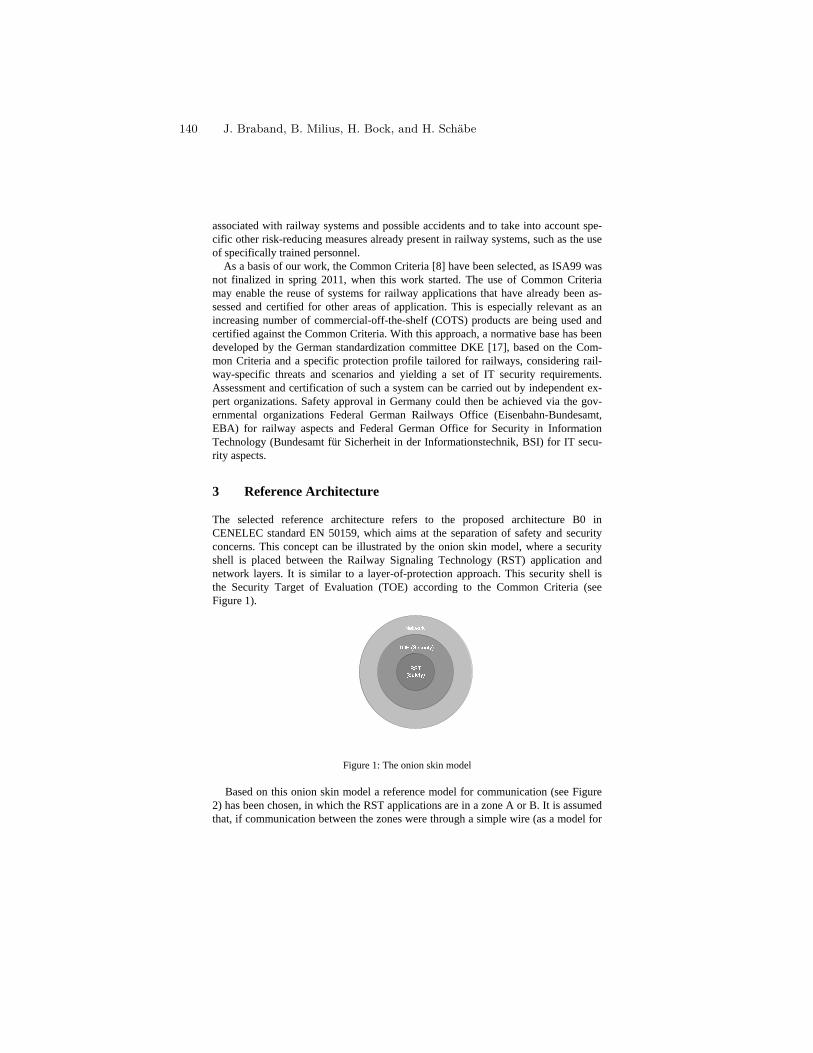
associated with railway systems and possible accidents and to take into account spe-cific other risk-reducing measures already present in railway systems, such as the use of specifically trained personnel.
As a basis of our work, the Common Criteria [8] have been selected, as ISA99 was not finalized in spring 2011, when this work started. The use of Common Criteria may enable the reuse of systems for railway applications that have already been as-sessed and certified for other areas of application. This is especially relevant as an increasing number of commercial-off-the-shelf (COTS) products are being used and certified against the Common Criteria. With this approach, a normative base has been developed by the German standardization committee DKE [17], based on the Com-mon Criteria and a specific protection profile tailored for railways, considering rail-way-specific threats and scenarios and yielding a set of IT security requirements. Assessment and certification of such a system can be carried out by independent ex-pert organizations. Safety approval in Germany could then be achieved via the gov-ernmental organizations Federal German Railways Office (Eisenbahn-Bundesamt, EBA) for railway aspects and Federal German Office for Security in Information Technology (Bundesamt für Sicherheit in der Informationstechnik, BSI) for IT secu-rity aspects.
3 Reference Architecture
The selected reference architecture refers to the proposed architecture B0 in CENELEC standard EN 50159, which aims at the separation of safety and security concerns. This concept can be illustrated by the onion skin model, where a security shell is placed between the Railway Signaling Technology (RST) application and network layers. It is similar to a layer-of-protection approach. This security shell is the Security Target of Evaluation (TOE) according to the Common Criteria (see Figure 1).
Figure 1: The onion skin model
Based on this onion skin model a reference model for communication (see Figure 2) has been chosen, in which the RST applications are in a zone A or B. It is assumed that, if communication between the zones were through a simple wire (as a model for
140 J. Braband, B. Milius, H. Bock, and H. Schäbe
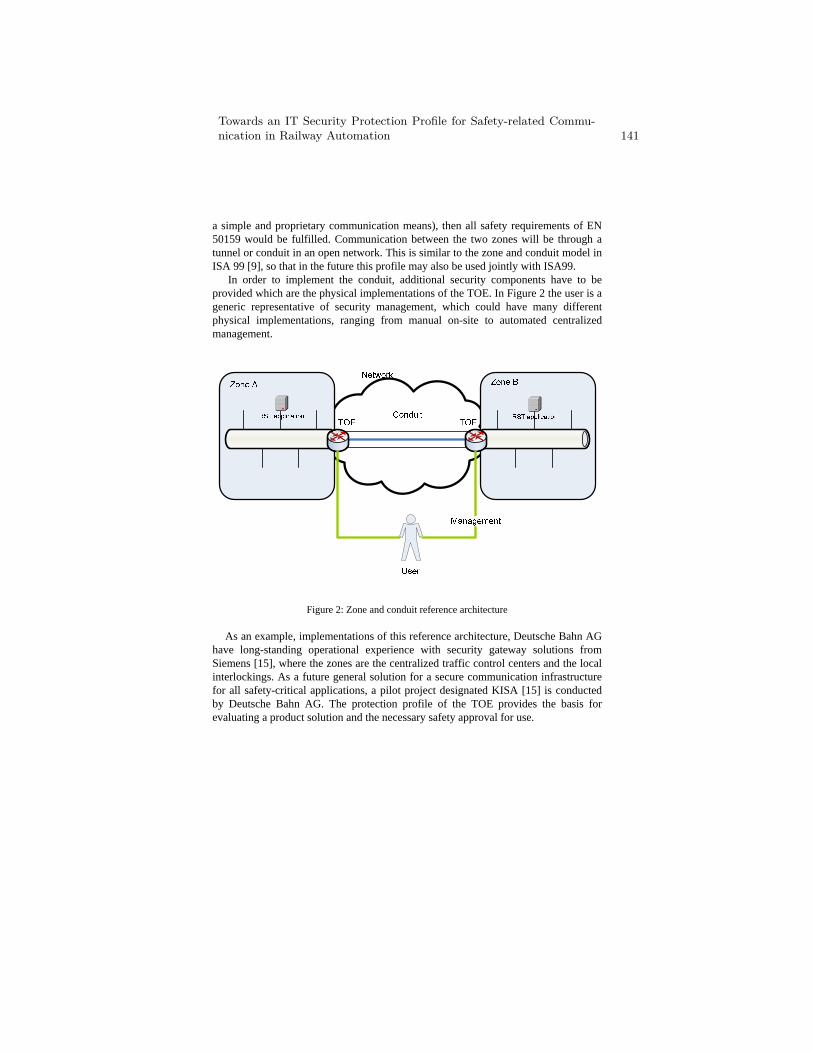
a simple and proprietary communication means), then all safety requirements of EN 50159 would be fulfilled. Communication between the two zones will be through a tunnel or conduit in an open network. This is similar to the zone and conduit model in ISA 99 [9], so that in the future this profile may also be used jointly with ISA99.
In order to implement the conduit, additional security components have to be provided which are the physical implementations of the TOE. In Figure 2 the user is a generic representative of security management, which could have many different physical implementations, ranging from manual on-site to automated centralized management.
Figure 2: Zone and conduit reference architecture
As an example, implementations of this reference architecture, Deutsche Bahn AG have long-standing operational experience with security gateway solutions from Siemens [15], where the zones are the centralized traffic control centers and the local interlockings. As a future general solution for a secure communication infrastructure for all safety-critical applications, a pilot project designated KISA [15] is conducted by Deutsche Bahn AG. The protection profile of the TOE provides the basis for evaluating a product solution and the necessary safety approval for use.
Towards an IT Security Protection Profile for Safety-related Commu-nication in Railway Automation 141
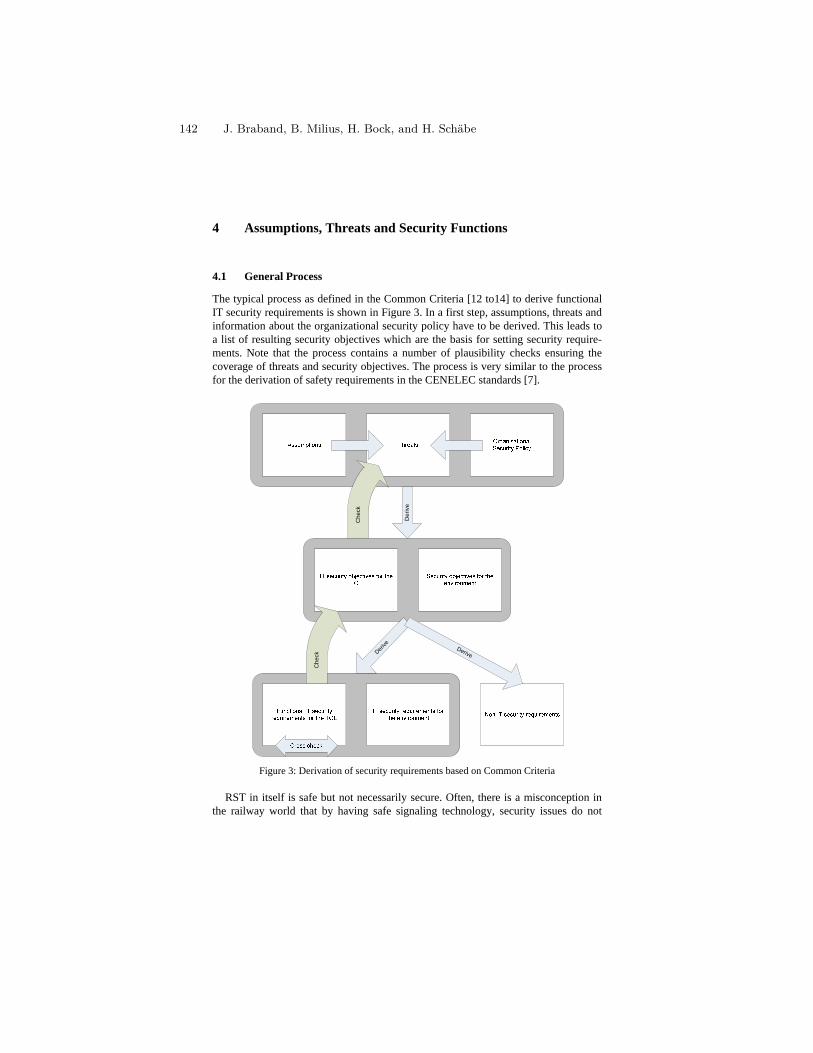
4 Assumptions, Threats and Security Functions
4.1 General Process
The typical process as defined in the Common Criteria [12 to14] to derive functional IT security requirements is shown in Figure 3. In a first step, assumptions, threats and information about the organizational security policy have to be derived. This leads to a list of resulting security objectives which are the basis for setting security require-ments. Note that the process contains a number of plausibility checks ensuring the coverage of threats and security objectives. The process is very similar to the process for the derivation of safety requirements in the CENELEC standards [7].
Der
ive
Derive Derive
Che
ck
Che
ck
Figure 3: Derivation of security requirements based on Common Criteria
RST in itself is safe but not necessarily secure. Often, there is a misconception in the railway world that by having safe signaling technology, security issues do not
142 J. Braband, B. Milius, H. Bock, and H. Schäbe
have to be taken care of. In this section, we will discuss the security threats which aim directly at signaling applications.
4.2 Threats
There is a common notion in the Common Criteria that threats are directed towards the three major IT security aspects: confidentiality, integrity and availability. One approach might be to analyze threats on this very high level. However, in our case experience has shown that only availability can be used directly as a threat; the other aspects need to be more detailed to derive security objectives.
In railway signaling, the starting point is EN 50129 where the safety case explicitly demands addressing the aspect of unauthorized access (physical and/or non-physical). In general, threats can be described on a higher system level.
The threats can be categorized into threats which are to be taken care of by the TOE and threats which have to be dealt with by the safety system or the environment. Some threats regarding communication issues can be taken from EN 50159. This standard explores in detail security issues inherent to communication networks. Threats taken from this standard are often defined on a lower level and are not dis-cussed in this paper.
The threats have been listed using the following structure:
t.<attack>{.<initiator>.<further properties>}
t stands for threat and initiator for the initiator of the attack, typically a user, an at-tacker or a technical problem, such as a software error. As the security profile is ge-neric, in most cases there has been no further detailing.
Is it is not prudent to list all threats in this paper; we will only list threats on the highest level. The lower levels give more properties e. g. regarding the particular types and means of an attack. We will name the initiators taken into account. The following threats have been used for the security profile. They deal with threats that have to be controlled by the IT system:
• t.availability: Authorized users cannot obtain access to their data and re-sources.
• t.entry: Persons who should not have access to the system may enter the sys-tem. The initiator of such a threat could be an attacker who masks him-self/herself as an authorized user.
• t.access: Authorized users gain access to resources which they are not enti-tled to according to the IT security policy. The initiator is an authorized user. The system is manipulated by negligence or operating errors.
• t.error: An error in part of the system leads to vulnerability in the IT security policy. An error can also be the result of a failure. The initiator of such a threat can be an attacker.
• t.crash: After a crash, the IT system is no longer able to correctly apply the IT security policy.
• t.repudiation: Incidents which are IT security-related are not documented or can not be attributed to an authorized user.
Towards an IT Security Protection Profile for Safety-related Commu-nication in Railway Automation 143
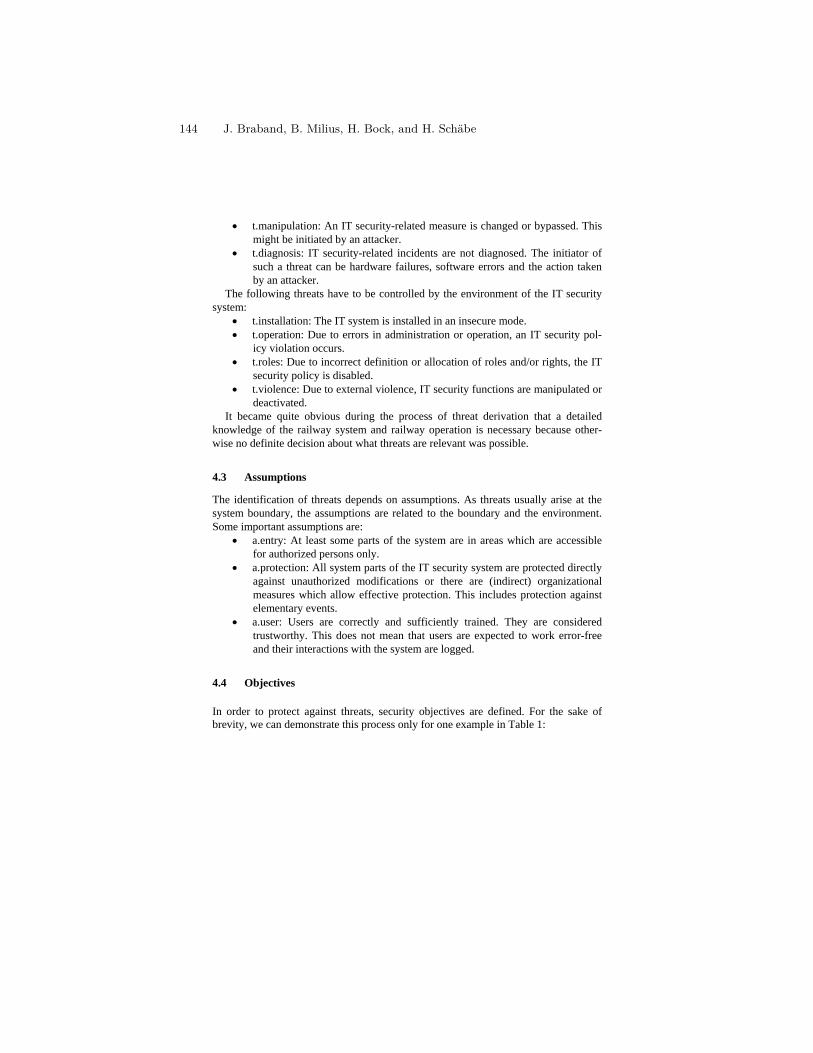
• t.manipulation: An IT security-related measure is changed or bypassed. This might be initiated by an attacker.
• t.diagnosis: IT security-related incidents are not diagnosed. The initiator of such a threat can be hardware failures, software errors and the action taken by an attacker.
The following threats have to be controlled by the environment of the IT security system:
• t.installation: The IT system is installed in an insecure mode. • t.operation: Due to errors in administration or operation, an IT security pol-
icy violation occurs. • t.roles: Due to incorrect definition or allocation of roles and/or rights, the IT
security policy is disabled. • t.violence: Due to external violence, IT security functions are manipulated or
deactivated. It became quite obvious during the process of threat derivation that a detailed
knowledge of the railway system and railway operation is necessary because other-wise no definite decision about what threats are relevant was possible.
4.3 Assumptions
The identification of threats depends on assumptions. As threats usually arise at the system boundary, the assumptions are related to the boundary and the environment. Some important assumptions are:
• a.entry: At least some parts of the system are in areas which are accessible for authorized persons only.
• a.protection: All system parts of the IT security system are protected directly against unauthorized modifications or there are (indirect) organizational measures which allow effective protection. This includes protection against elementary events.
• a.user: Users are correctly and sufficiently trained. They are considered trustworthy. This does not mean that users are expected to work error-free and their interactions with the system are logged.
4.4 Objectives
In order to protect against threats, security objectives are defined. For the sake of brevity, we can demonstrate this process only for one example in Table 1:
144 J. Braband, B. Milius, H. Bock, and H. Schäbe
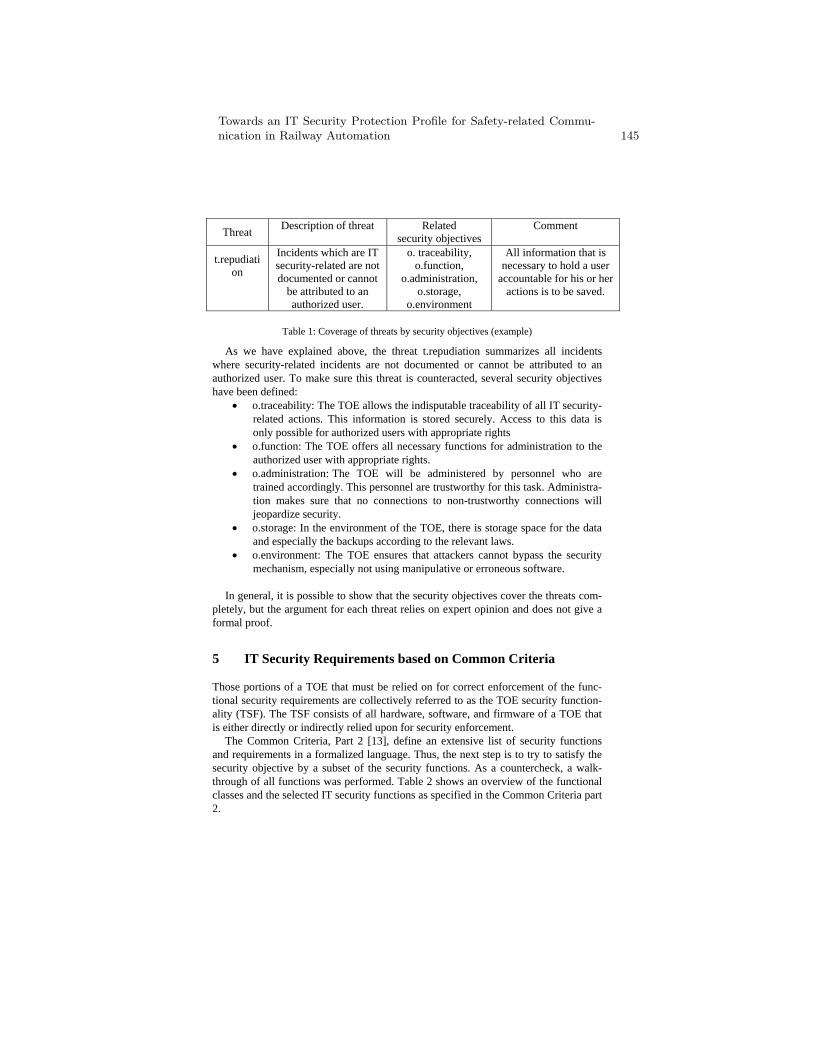
Threat Description of threat Related security objectives
Comment
t.repudiation
Incidents which are IT security-related are not documented or cannot
be attributed to an authorized user.
o. traceability, o.function,
o.administration, o.storage,
o.environment
All information that is necessary to hold a user
accountable for his or her actions is to be saved.
Table 1: Coverage of threats by security objectives (example)
As we have explained above, the threat t.repudiation summarizes all incidents where security-related incidents are not documented or cannot be attributed to an authorized user. To make sure this threat is counteracted, several security objectives have been defined:
• o.traceability: The TOE allows the indisputable traceability of all IT security-related actions. This information is stored securely. Access to this data is only possible for authorized users with appropriate rights
• o.function: The TOE offers all necessary functions for administration to the authorized user with appropriate rights.
• o.administration: The TOE will be administered by personnel who are trained accordingly. This personnel are trustworthy for this task. Administra-tion makes sure that no connections to non-trustworthy connections will jeopardize security.
• o.storage: In the environment of the TOE, there is storage space for the data and especially the backups according to the relevant laws.
• o.environment: The TOE ensures that attackers cannot bypass the security mechanism, especially not using manipulative or erroneous software.
In general, it is possible to show that the security objectives cover the threats com-
pletely, but the argument for each threat relies on expert opinion and does not give a formal proof.
5 IT Security Requirements based on Common Criteria
Those portions of a TOE that must be relied on for correct enforcement of the func-tional security requirements are collectively referred to as the TOE security function-ality (TSF). The TSF consists of all hardware, software, and firmware of a TOE that is either directly or indirectly relied upon for security enforcement.
The Common Criteria, Part 2 [13], define an extensive list of security functions and requirements in a formalized language. Thus, the next step is to try to satisfy the security objective by a subset of the security functions. As a countercheck, a walk-through of all functions was performed. Table 2 shows an overview of the functional classes and the selected IT security functions as specified in the Common Criteria part 2.
Towards an IT Security Protection Profile for Safety-related Commu-nication in Railway Automation 145
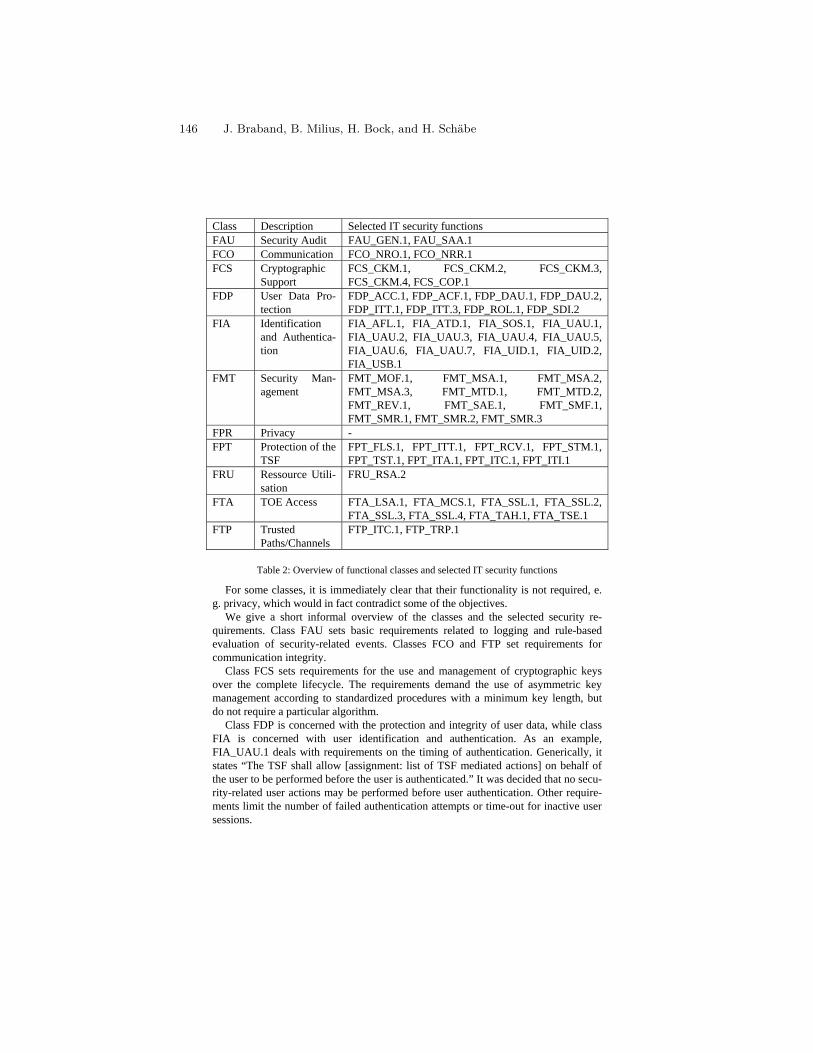
Class Description Selected IT security functions FAU Security Audit FAU_GEN.1, FAU_SAA.1 FCO Communication FCO_NRO.1, FCO_NRR.1 FCS Cryptographic
Support FCS_CKM.1, FCS_CKM.2, FCS_CKM.3, FCS_CKM.4, FCS_COP.1
FDP User Data Pro-tection
FDP_ACC.1, FDP_ACF.1, FDP_DAU.1, FDP_DAU.2, FDP_ITT.1, FDP_ITT.3, FDP_ROL.1, FDP_SDI.2
FIA Identification and Authentica-tion
FIA_AFL.1, FIA_ATD.1, FIA_SOS.1, FIA_UAU.1, FIA_UAU.2, FIA_UAU.3, FIA_UAU.4, FIA_UAU.5, FIA_UAU.6, FIA_UAU.7, FIA_UID.1, FIA_UID.2, FIA_USB.1
FMT Security Man-agement
FMT_MOF.1, FMT_MSA.1, FMT_MSA.2, FMT_MSA.3, FMT_MTD.1, FMT_MTD.2, FMT_REV.1, FMT_SAE.1, FMT_SMF.1, FMT_SMR.1, FMT_SMR.2, FMT_SMR.3
FPR Privacy - FPT Protection of the
TSF FPT_FLS.1, FPT_ITT.1, FPT_RCV.1, FPT_STM.1, FPT_TST.1, FPT_ITA.1, FPT_ITC.1, FPT_ITI.1
FRU Ressource Utili-sation
FRU_RSA.2
FTA TOE Access FTA_LSA.1, FTA_MCS.1, FTA_SSL.1, FTA_SSL.2, FTA_SSL.3, FTA_SSL.4, FTA_TAH.1, FTA_TSE.1
FTP Trusted Paths/Channels
FTP_ITC.1, FTP_TRP.1
Table 2: Overview of functional classes and selected IT security functions
For some classes, it is immediately clear that their functionality is not required, e. g. privacy, which would in fact contradict some of the objectives.
We give a short informal overview of the classes and the selected security re-quirements. Class FAU sets basic requirements related to logging and rule-based evaluation of security-related events. Classes FCO and FTP set requirements for communication integrity.
Class FCS sets requirements for the use and management of cryptographic keys over the complete lifecycle. The requirements demand the use of asymmetric key management according to standardized procedures with a minimum key length, but do not require a particular algorithm.
Class FDP is concerned with the protection and integrity of user data, while class FIA is concerned with user identification and authentication. As an example, FIA_UAU.1 deals with requirements on the timing of authentication. Generically, it states “The TSF shall allow [assignment: list of TSF mediated actions] on behalf of the user to be performed before the user is authenticated.” It was decided that no secu-rity-related user actions may be performed before user authentication. Other require-ments limit the number of failed authentication attempts or time-out for inactive user sessions.
146 J. Braband, B. Milius, H. Bock, and H. Schäbe
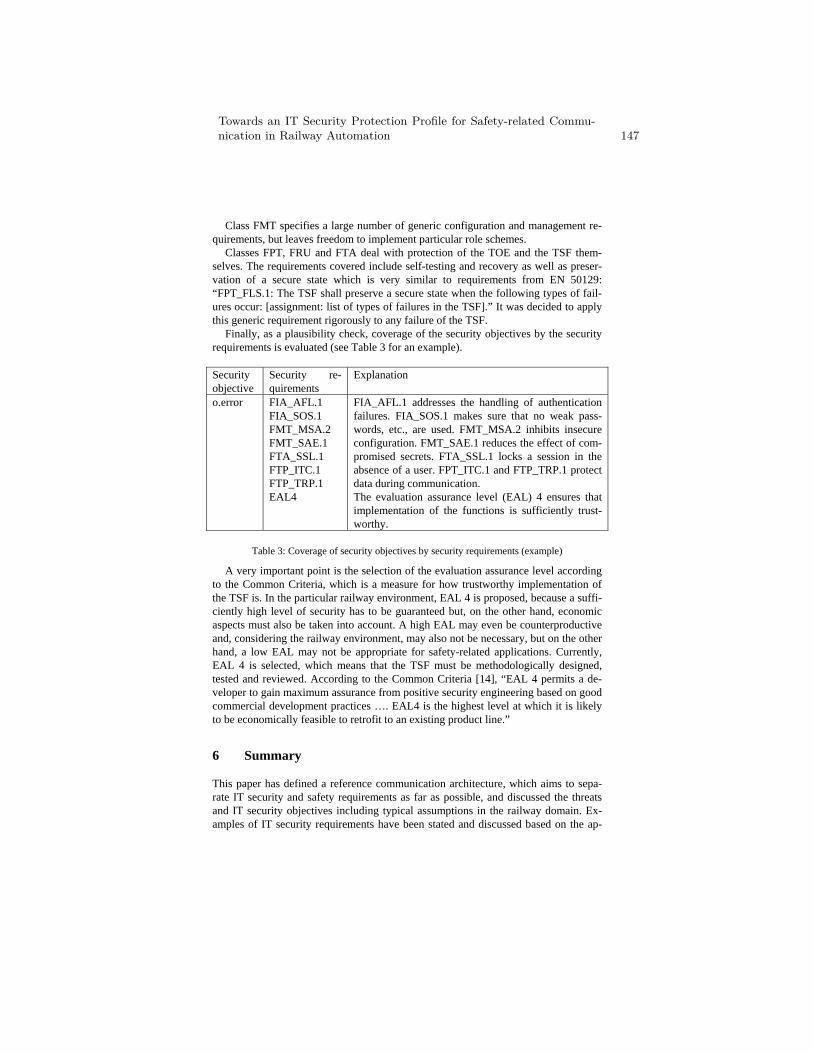
Class FMT specifies a large number of generic configuration and management re-quirements, but leaves freedom to implement particular role schemes.
Classes FPT, FRU and FTA deal with protection of the TOE and the TSF them-selves. The requirements covered include self-testing and recovery as well as preser-vation of a secure state which is very similar to requirements from EN 50129: “FPT_FLS.1: The TSF shall preserve a secure state when the following types of fail-ures occur: [assignment: list of types of failures in the TSF].” It was decided to apply this generic requirement rigorously to any failure of the TSF.
Finally, as a plausibility check, coverage of the security objectives by the security requirements is evaluated (see Table 3 for an example).
Security objective
Security re-quirements
Explanation
o.error
FIA_AFL.1 FIA_SOS.1 FMT_MSA.2 FMT_SAE.1 FTA_SSL.1 FTP_ITC.1 FTP_TRP.1 EAL4
FIA_AFL.1 addresses the handling of authentication failures. FIA_SOS.1 makes sure that no weak pass-words, etc., are used. FMT_MSA.2 inhibits insecure configuration. FMT_SAE.1 reduces the effect of com-promised secrets. FTA_SSL.1 locks a session in the absence of a user. FPT_ITC.1 and FTP_TRP.1 protect data during communication. The evaluation assurance level (EAL) 4 ensures that implementation of the functions is sufficiently trust-worthy.
Table 3: Coverage of security objectives by security requirements (example)
A very important point is the selection of the evaluation assurance level according to the Common Criteria, which is a measure for how trustworthy implementation of the TSF is. In the particular railway environment, EAL 4 is proposed, because a suffi-ciently high level of security has to be guaranteed but, on the other hand, economic aspects must also be taken into account. A high EAL may even be counterproductive and, considering the railway environment, may also not be necessary, but on the other hand, a low EAL may not be appropriate for safety-related applications. Currently, EAL 4 is selected, which means that the TSF must be methodologically designed, tested and reviewed. According to the Common Criteria [14], “EAL 4 permits a de-veloper to gain maximum assurance from positive security engineering based on good commercial development practices …. EAL4 is the highest level at which it is likely to be economically feasible to retrofit to an existing product line.”
6 Summary
This paper has defined a reference communication architecture, which aims to sepa-rate IT security and safety requirements as far as possible, and discussed the threats and IT security objectives including typical assumptions in the railway domain. Ex-amples of IT security requirements have been stated and discussed based on the ap-
Towards an IT Security Protection Profile for Safety-related Commu-nication in Railway Automation 147
proach advocated in the Common Criteria, in the form of a protection profile [17]. The goal is to use COTS security components which can be certified according to the Common Criteria, also in the railway signaling domain, instead of creating a new certification framework. The work presented is still ongoing (the public consultation ends September 2012), in particular with respect to approval of the protection profile and practical experience.
7 References
1. http://www.nextgov.com/nextgov/ng_20120123_3491.php?oref=topstory, accessed on February, 7, 2012
2. Stumpf, F.: Datenübertragung über öffentliche Netze im Bahnverkehr – Fluch oder Se-gen?, Proc. Safetronic 2010, Hanser, München
3. Katzenbeisser, S.: Can trains be hacked?, 28th Chaos Communication Congress, Hamburg, 2011
4. Thomas, M.: Accidental Systems, Hidden Assumptions and Safety Assurance, in: Dale, C. and Anderson, T, (eds.) Achieving System Safety, Proc. 20th Safety-Critical Systems Sym-posium, Springer, 2012
5. Johnson, C.: CyberSafety: CyberSecurity and Safety-Critical Software Engineering, in: Dale, C. and Anderson, T, (eds.) Achieving System Safety, Proc. 20th Safety-Critical Sys-tems Symposium, Springer, 2012
6. EN 50159 Railway applications, Communication, signaling and processing systems –Safety related communication in transmission systems, September 2010
7. EN 50129 Railway applications, Communication, signaling and processing systems – Safety-related electronic systems for signaling, February 2003
8. ISO/IEC 15408 Information technology — Security techniques — Evaluation criteria for IT security, 2009
9. ISA 99, Standards of the Industrial Automation and Control System Security Committee of the International Society for Automation (ISA) on information security, see http://en.wikipedia.org/wiki/Cyber_security_standards
10. BITKOM / DIN Kompass der IT-Sicherheitsstandards Leitfaden und Nachschlagewerk 4. Auflage, 2009
11. Commission Regulation (EC) No. 352/2009 of 24 April 2009 on the adoption of a com-mon safety method on risk evaluation and assessment as referred to in Article 6(3)(a) of Directive 2004/49/EC of the European Parliament and of the Council
12. Common Criteria for Information Technology Security Evaluation, Version 3.1, revision 3, July 2009. Part 1: Introduction and general model
13. Common Criteria for Information Technology Security Evaluation, Version 3.1, revision 3, July 2009. Part 2: Functional security components
14. Common Criteria for Information Technology Security Evaluation, Version 3.1, revision 3, July 2009. Part 3: Assurance security components
15. Wickinger, T.: Modern Security Management Systems (in German), Signal&Draht, No. 4, 2001
16. DB AG: European Patent Application EP 2 088 052 A2, 2000 17. DIN V VDE V 0831-102: Electric signaling systems for railways – Part 102: Protection
profile for technical functions in railway signaling (in German), Draft, 2012
148 J. Braband, B. Milius, H. Bock, and H. Schäbe
Towards Secure Fieldbus Communication
Felix Wieczorek1, Christoph Krauß2, Frank Schiller1, and Claudia Eckert3
1 Beckhoff Automation, Scientific Safety & SecurityOstendstraße 196, D-90482 Nuremberg
{f.wieczorek,f.schiller}@beckhoff.com2 Fraunhofer Research Institution AISEC
Parkring 4, D-85748 [email protected]
3 Technische Universitat MunchenBoltzmannstraße 3, D-85748 Garching
Abstract. In this paper, we present an approach to secure fieldbus com-munication of automation systems used in security-critical applications.We propose a protocol that applies a scheme combining a stream ci-pher and a Message Authentication Code (MAC) to ensure integrity,confidentiality, authenticity, and freshness of transmitted telegrams overa fieldbus while maintaining real-time constraints. The security discus-sion shows that the protocol is secure against an adversary attackingthe fieldbus communication. A first proof-of-concept implementation forthe EtherCAT fieldbus protocol is implemented to perform some initialruntime analyses.
Keywords: fieldbus, security, protocol
1 Introduction
Industrial automation systems use fieldbus communication for real-time dis-tributed control of systems such as water supply, energy distribution, or man-ufacturing. Security for fieldbus communication was not considered to be animportant issue, since these systems were deployed typically in closed environ-ments. However, since fieldbus installations become more and more automatedand cross-linked, security becomes more and more important. For example, thecables of the fieldbus-connections in a wind park used to connect the wind tur-bines with a central control system can be accessed by an adversary since it isnot possible to protect the whole area. If wireless fieldbuses [3] are used, attackssuch as eavesdropping on the communication are even much easier for an adver-sary. Thus, security mechanisms have to be applied. To enable the compliancewith real-time requirements as well as to provide transparent security to higherlayers, security mechanisms have to be integrated into the fieldbus layer.
These security mechanisms have to protect the confidentiality of the field-bus communication to prevent an adversary from eavesdropping to get sensitiveinformation such as the temperature profile of a beer brewing process, which
may be confidential intellectual property. Furthermore, the authenticity of thecommunication has to be ensured, i.e., the origin of data has to be genuine. Thisprevents an adversary from injecting false data such as false temperature settingsin order to destroy the mash. To detect any unauthorized modification of data,mechanisms for integrity protection are required. The detection of replayed olddata requires mechanisms to ensure the freshness of data. Finally, the availabilityof the communication should be ensured, i.e., all authorized entities have accessto services or information as intended. However, this is hard to achieve since anadversary may always perform Denial-of-Service (DoS) attacks, e.g., by simplycutting the wire or by performing a jamming attack if wireless fieldbuses areused. Thus, security mechanisms should at least not influence the availability ofthe fieldbus communication during operation.
In this paper, we present a protocol to ensure the security goals integrity,confidentiality, authenticity, and freshness of telegrams transmitted over a field-bus. The protocol is based on a scheme combining a stream cipher (SC) anda Message Authentication Code (MAC). It is designed in such a way that theused SC and MAC primitives can be easily substituted, e.g., if they become in-secure or more efficient primitives have been developed. The protocol is able tomaintain real-time requirements when integrated into a fieldbus as long as noattacks such as DoS are performed, i.e., it guarantees secure telegram transmis-sion within defined boundaries. We discuss the security of our protocol and howit meets the security goals. In addition, we present a first proof-of-concept im-plementation for the EtherCAT fieldbus and some initial results of our runtimeanalyses.
2 Related Work
Since most fieldbus systems have been used in closed systems, only a few ap-proaches are designed to provide security, e.g., [14] which is based on IEEE802.15.4 [13]. Here, Block Ciphers (BCs) in CCM-mode are used, which arepadded to full block length. This is a major disadvantage when many short tele-grams are transmitted like in typical fieldbus communication. Adding securitymechanisms such as IPsec for Internet Protocol (IP)-based fieldbuses is discussedin [20]. Introducing security mechanisms at higher levels is also discussed in [21].Secure industrial communication using Transmission Control Protocol/InternetProtocol (TCP/IP) is addressed in [4], where the necessary reaction times ofautomation fieldbuses cannot be reached.
In the area of Building Automation Control (BAC), an approach for securefieldbus communication is presented in [18] using Data Encryption Standard(DES) and Hashed MAC (HMAC) with SHA-1 on smartcards. In [7], the secu-rity of wireless BAC networks is discussed. BAC networks have smaller band-width and the presented solutions are not fast enough for general fieldbuses inautomation, where the data rate is much higher and the real-time constraintstighter than in BAC applications.
150 F. Wieczorek, C. Krauß, F. Schiller, and C. Eckert
In [19], a multicast authentication protocol for fieldbuses based on MACsis proposed. The focus is on automotive buses such as CAN. Mechanisms toprovide confidentiality are not discussed.
The bus systems used in the automotive domain such as CAN, LIN or Flexraydo not provide any security mechanisms [24,25]. In [24], an approach to secureautomotive bus communication is proposed, where the communication alwaysinvolves a central gateway as intermediary.
Some popular schemes that combine authentication and encryption on basisof block-ciphers are OCB [17] or EAX [2].
We decided to use stream ciphers, since they can be implemented in hardwareeasily to reach high performance and do not require padding of data. Streamcipher schemes, providing combination of encryption and authentication, areVMPC-MAC [27], Helix [6] and Phelix [22]. They create a Message Authenti-cation Code (MAC) that depends on the specific design of the stream-cipher.However, Phelix and Helix are considered insecure [26]. Another interesting ap-proach is ASC [23]. However, the receiver has to decrypt first and then checkthe integrity, which leads to more effort, than our approach, if telegrams arecorrupted.
To the best of our knowledge, there exists no efficient security protocol whichcan be used in fieldbuses with high bandwidth and hard real-time requirementsfor telegrams with various length. Previously proposed approaches cannot betransferred without adaption, due to restrictions of the performance require-ments. Thus, we developed a new approach which is based only on universalproperties of stream ciphers enabling the use of well evaluated stream ciphers aswell as an easy way to exchange them in case they become insecure.
3 Protocol Description
In this section, we describe our proposed protocol in detail. We first discuss therequirements we address. Then we describe our scheme to combine a SC with aMAC. Finally, we describe the protocol steps in detail.
3.1 Addressed Requirements
The protocol is designed to meet real-time requirements which are necessaryin fieldbus communication. Real-time in this context means the guarantee oftelegram transmission shorter than a fixed delay. This is commonly reachedby cyclic communication, which also allows detection of lost telegrams. Theworst-case execution time of all security algorithms, which is relevant for thefieldbus performance, has to be limited to a fixed upper bound. Our proposedprotocol meets this requirement in the regular operation phase, which is usableas long as all telegrams are correctly transmitted, by using only algorithms withdeterministic runtime. The tasks of the (not real-time capable) initial phaseneed to be accomplished once, to distribute trust-anchors and keys, afterwardsthe key-exchange has to be carried out periodically in maintenance intervals
Towards Secure Fieldbus Communication 151
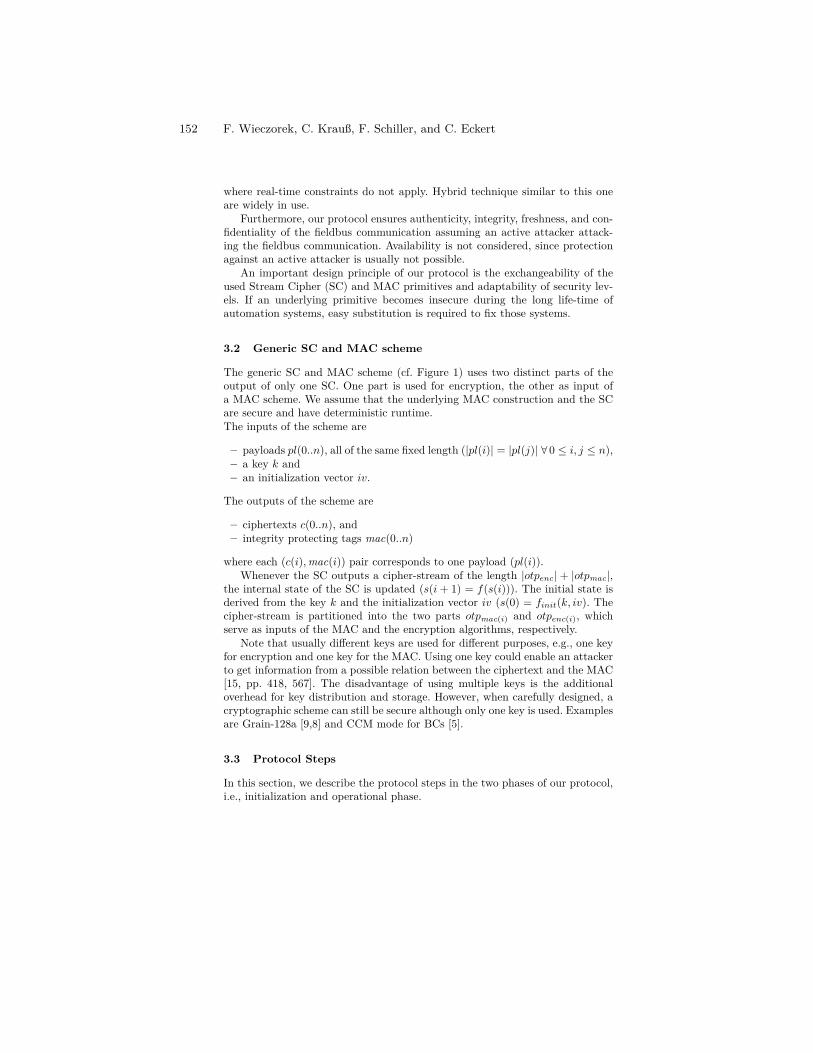
where real-time constraints do not apply. Hybrid technique similar to this oneare widely in use.
Furthermore, our protocol ensures authenticity, integrity, freshness, and con-fidentiality of the fieldbus communication assuming an active attacker attack-ing the fieldbus communication. Availability is not considered, since protectionagainst an active attacker is usually not possible.
An important design principle of our protocol is the exchangeability of theused Stream Cipher (SC) and MAC primitives and adaptability of security lev-els. If an underlying primitive becomes insecure during the long life-time ofautomation systems, easy substitution is required to fix those systems.
3.2 Generic SC and MAC scheme
The generic SC and MAC scheme (cf. Figure 1) uses two distinct parts of theoutput of only one SC. One part is used for encryption, the other as input ofa MAC scheme. We assume that the underlying MAC construction and the SCare secure and have deterministic runtime.The inputs of the scheme are
– payloads pl(0..n), all of the same fixed length (|pl(i)| = |pl(j)| ∀ 0 ≤ i, j ≤ n),– a key k and– an initialization vector iv.
The outputs of the scheme are
– ciphertexts c(0..n), and– integrity protecting tags mac(0..n)
where each (c(i), mac(i)) pair corresponds to one payload (pl(i)).Whenever the SC outputs a cipher-stream of the length |otpenc| + |otpmac|,
the internal state of the SC is updated (s(i + 1) = f(s(i))). The initial state isderived from the key k and the initialization vector iv (s(0) = finit(k, iv). Thecipher-stream is partitioned into the two parts otpmac(i) and otpenc(i), whichserve as inputs of the MAC and the encryption algorithms, respectively.
Note that usually different keys are used for different purposes, e.g., one keyfor encryption and one key for the MAC. Using one key could enable an attackerto get information from a possible relation between the ciphertext and the MAC[15, pp. 418, 567]. The disadvantage of using multiple keys is the additionaloverhead for key distribution and storage. However, when carefully designed, acryptographic scheme can still be secure although only one key is used. Examplesare Grain-128a [9,8] and CCM mode for BCs [5].
3.3 Protocol Steps
In this section, we describe the protocol steps in the two phases of our protocol,i.e., initialization and operational phase.
152 F. Wieczorek, C. Krauß, F. Schiller, and C. Eckert
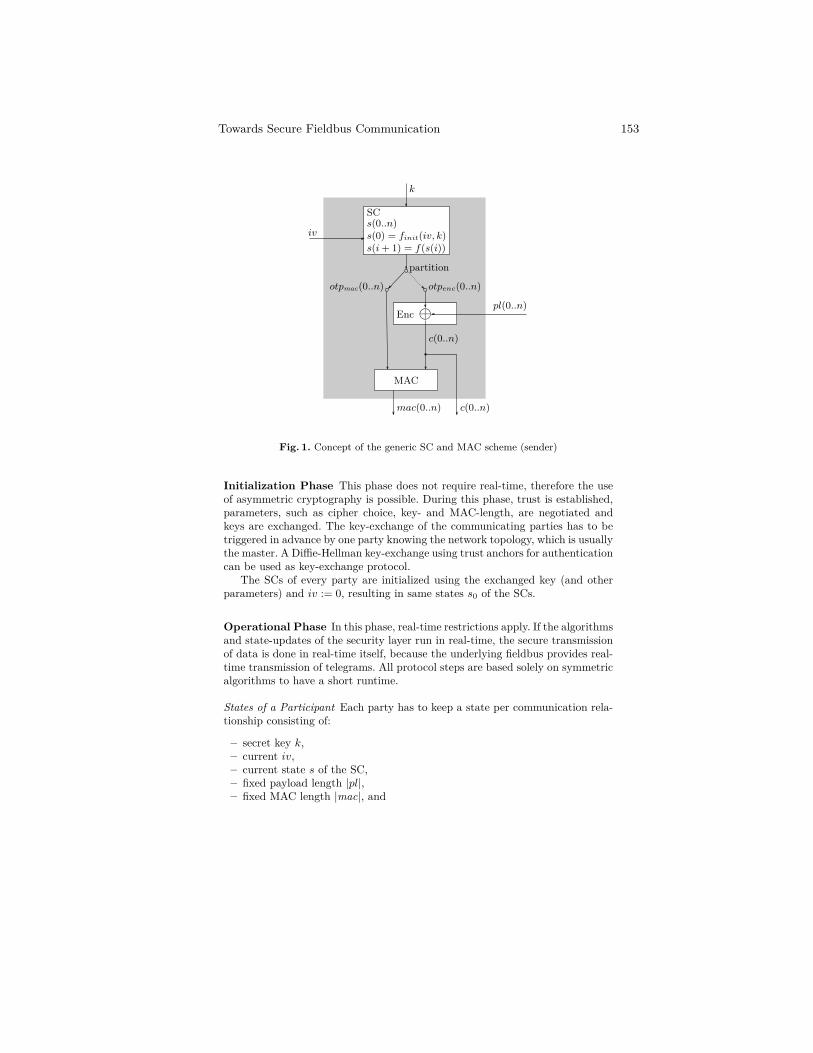
k
iv
partition
pl(0..n)Enc
otpmac(0..n)
MAC
mac(0..n)
c(0..n)
c(0..n)
otpenc(0..n)
s(0..n)SC
s(i + 1) = f(s(i))s(0) = finit(iv, k)
Fig. 1. Concept of the generic SC and MAC scheme (sender)
Initialization Phase This phase does not require real-time, therefore the useof asymmetric cryptography is possible. During this phase, trust is established,parameters, such as cipher choice, key- and MAC-length, are negotiated andkeys are exchanged. The key-exchange of the communicating parties has to betriggered in advance by one party knowing the network topology, which is usuallythe master. A Diffie-Hellman key-exchange using trust anchors for authenticationcan be used as key-exchange protocol.
The SCs of every party are initialized using the exchanged key (and otherparameters) and iv := 0, resulting in same states s0 of the SCs.
Operational Phase In this phase, real-time restrictions apply. If the algorithmsand state-updates of the security layer run in real-time, the secure transmissionof data is done in real-time itself, because the underlying fieldbus provides real-time transmission of telegrams. All protocol steps are based solely on symmetricalgorithms to have a short runtime.
States of a Participant Each party has to keep a state per communication rela-tionship consisting of:
– secret key k,– current iv,– current state s of the SC,– fixed payload length |pl|,– fixed MAC length |mac|, and
Towards Secure Fieldbus Communication 153
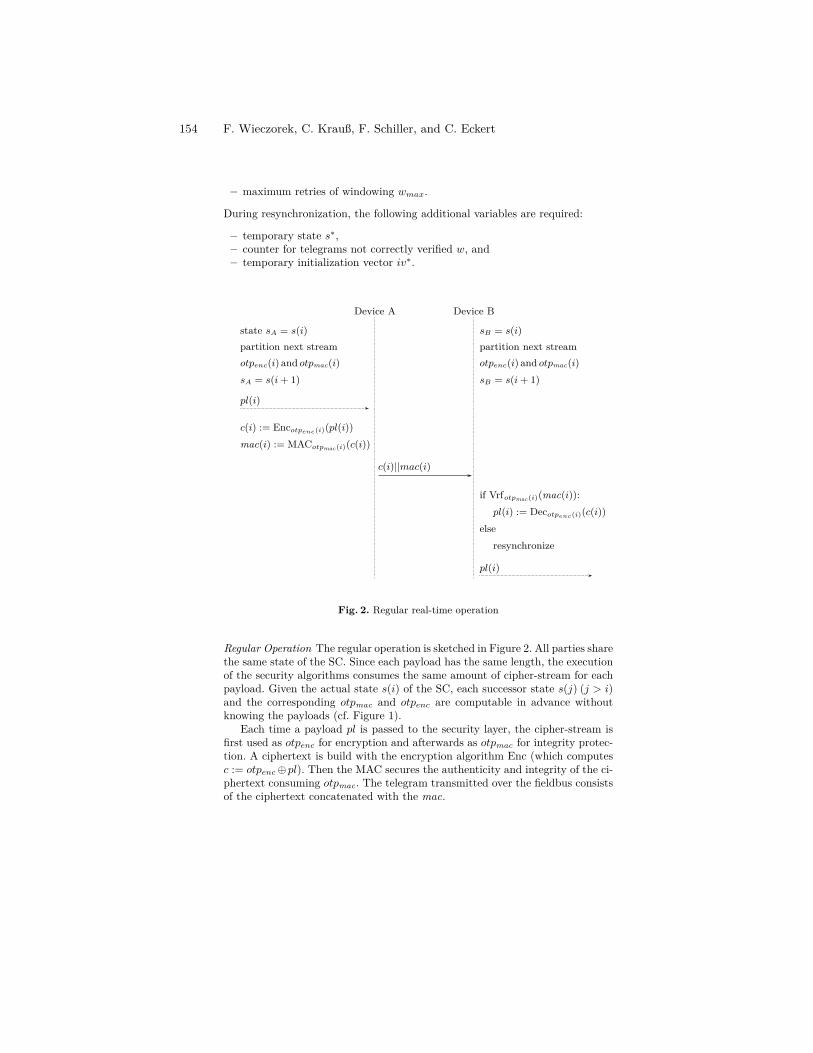
– maximum retries of windowing wmax.
During resynchronization, the following additional variables are required:
– temporary state s∗,– counter for telegrams not correctly verified w, and– temporary initialization vector iv∗.
state sA = s(i)
sA = s(i + 1)otpenc(i) and otpmac(i)partition next stream
pl(i)
c(i) := Encotpenc(i)(pl(i))mac(i) := MACotpmac(i)(c(i))
Device A Device B
c(i)||mac(i)
sB = s(i)partition next stream
sB = s(i + 1)
if Vrfotpmac(i)(mac(i)):pl(i) := Decotpenc(i)(c(i))
elseresynchronize
pl(i)
otpenc(i) and otpmac(i)
Fig. 2. Regular real-time operation
Regular Operation The regular operation is sketched in Figure 2. All parties sharethe same state of the SC. Since each payload has the same length, the executionof the security algorithms consumes the same amount of cipher-stream for eachpayload. Given the actual state s(i) of the SC, each successor state s(j) (j > i)and the corresponding otpmac and otpenc are computable in advance withoutknowing the payloads (cf. Figure 1).
Each time a payload pl is passed to the security layer, the cipher-stream isfirst used as otpenc for encryption and afterwards as otpmac for integrity protec-tion. A ciphertext is build with the encryption algorithm Enc (which computesc := otpenc⊕pl). Then the MAC secures the authenticity and integrity of the ci-phertext consuming otpmac. The telegram transmitted over the fieldbus consistsof the ciphertext concatenated with the mac.
154 F. Wieczorek, C. Krauß, F. Schiller, and C. Eckert
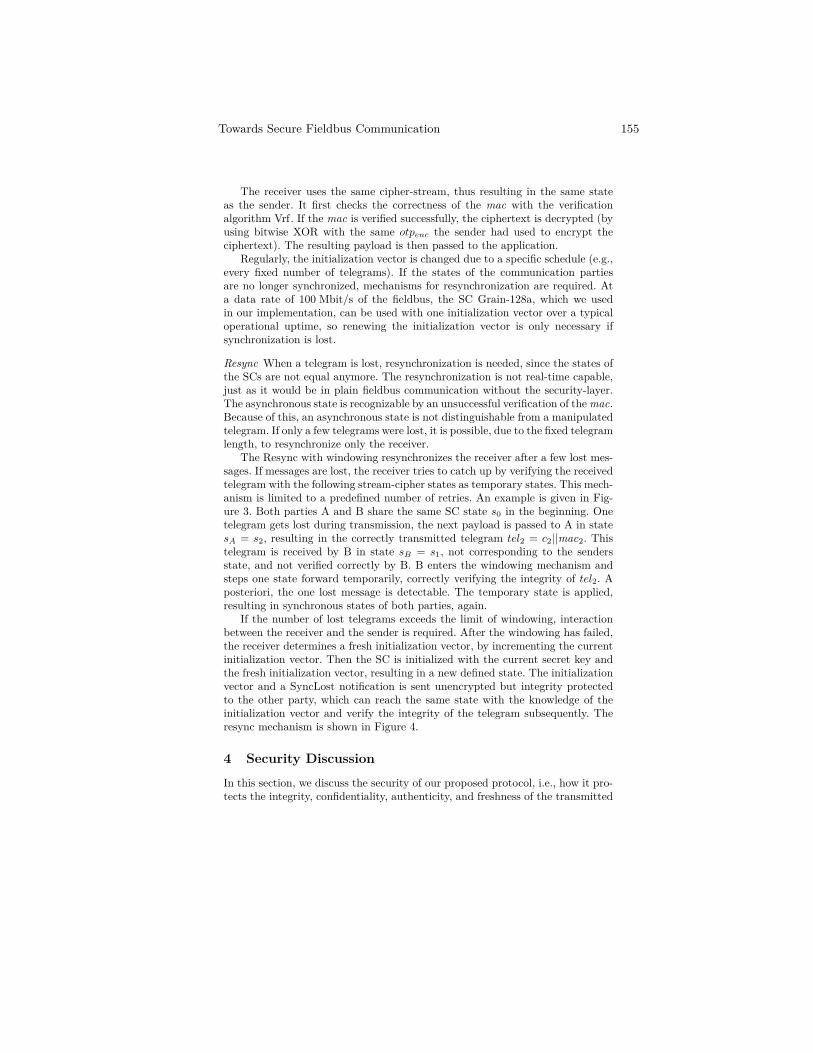
The receiver uses the same cipher-stream, thus resulting in the same stateas the sender. It first checks the correctness of the mac with the verificationalgorithm Vrf. If the mac is verified successfully, the ciphertext is decrypted (byusing bitwise XOR with the same otpenc the sender had used to encrypt theciphertext). The resulting payload is then passed to the application.
Regularly, the initialization vector is changed due to a specific schedule (e.g.,every fixed number of telegrams). If the states of the communication partiesare no longer synchronized, mechanisms for resynchronization are required. Ata data rate of 100 Mbit/s of the fieldbus, the SC Grain-128a, which we usedin our implementation, can be used with one initialization vector over a typicaloperational uptime, so renewing the initialization vector is only necessary ifsynchronization is lost.
Resync When a telegram is lost, resynchronization is needed, since the states ofthe SCs are not equal anymore. The resynchronization is not real-time capable,just as it would be in plain fieldbus communication without the security-layer.The asynchronous state is recognizable by an unsuccessful verification of the mac.Because of this, an asynchronous state is not distinguishable from a manipulatedtelegram. If only a few telegrams were lost, it is possible, due to the fixed telegramlength, to resynchronize only the receiver.
The Resync with windowing resynchronizes the receiver after a few lost mes-sages. If messages are lost, the receiver tries to catch up by verifying the receivedtelegram with the following stream-cipher states as temporary states. This mech-anism is limited to a predefined number of retries. An example is given in Fig-ure 3. Both parties A and B share the same SC state s0 in the beginning. Onetelegram gets lost during transmission, the next payload is passed to A in statesA = s2, resulting in the correctly transmitted telegram tel2 = c2||mac2. Thistelegram is received by B in state sB = s1, not corresponding to the sendersstate, and not verified correctly by B. B enters the windowing mechanism andsteps one state forward temporarily, correctly verifying the integrity of tel2. Aposteriori, the one lost message is detectable. The temporary state is applied,resulting in synchronous states of both parties, again.
If the number of lost telegrams exceeds the limit of windowing, interactionbetween the receiver and the sender is required. After the windowing has failed,the receiver determines a fresh initialization vector, by incrementing the currentinitialization vector. Then the SC is initialized with the current secret key andthe fresh initialization vector, resulting in a new defined state. The initializationvector and a SyncLost notification is sent unencrypted but integrity protectedto the other party, which can reach the same state with the knowledge of theinitialization vector and verify the integrity of the telegram subsequently. Theresync mechanism is shown in Figure 4.
4 Security DiscussionIn this section, we discuss the security of our proposed protocol, i.e., how it pro-tects the integrity, confidentiality, authenticity, and freshness of the transmitted
Towards Secure Fieldbus Communication 155
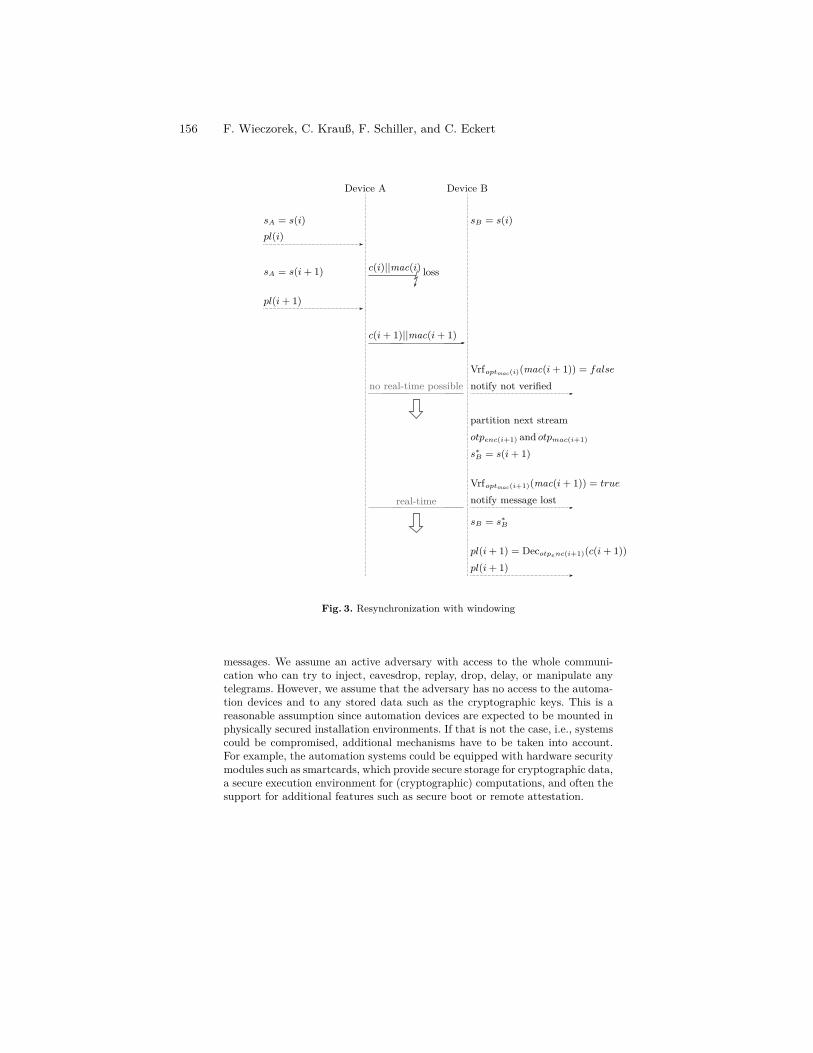
Device A Device B
sA = s(i) sB = s(i)
notify not verified
c(i)||mac(i) loss
pl(i + 1)
Vrfoptmac(i)(mac(i + 1)) = false
sA = s(i + 1)
c(i + 1)||mac(i + 1)
no real-time possible
real-time
pl(i)
partition next streamotpenc(i+1) and otpmac(i+1)
Vrfoptmac(i+1)(mac(i + 1)) = true
notify message lost
pl(i + 1)pl(i + 1) = Decotpenc(i+1)(c(i + 1))
s∗B = s(i + 1)
sB = s∗B
Fig. 3. Resynchronization with windowing
messages. We assume an active adversary with access to the whole communi-cation who can try to inject, eavesdrop, replay, drop, delay, or manipulate anytelegrams. However, we assume that the adversary has no access to the automa-tion devices and to any stored data such as the cryptographic keys. This is areasonable assumption since automation devices are expected to be mounted inphysically secured installation environments. If that is not the case, i.e., systemscould be compromised, additional mechanisms have to be taken into account.For example, the automation systems could be equipped with hardware securitymodules such as smartcards, which provide secure storage for cryptographic data,a secure execution environment for (cryptographic) computations, and often thesupport for additional features such as secure boot or remote attestation.
156 F. Wieczorek, C. Krauß, F. Schiller, and C. Eckert
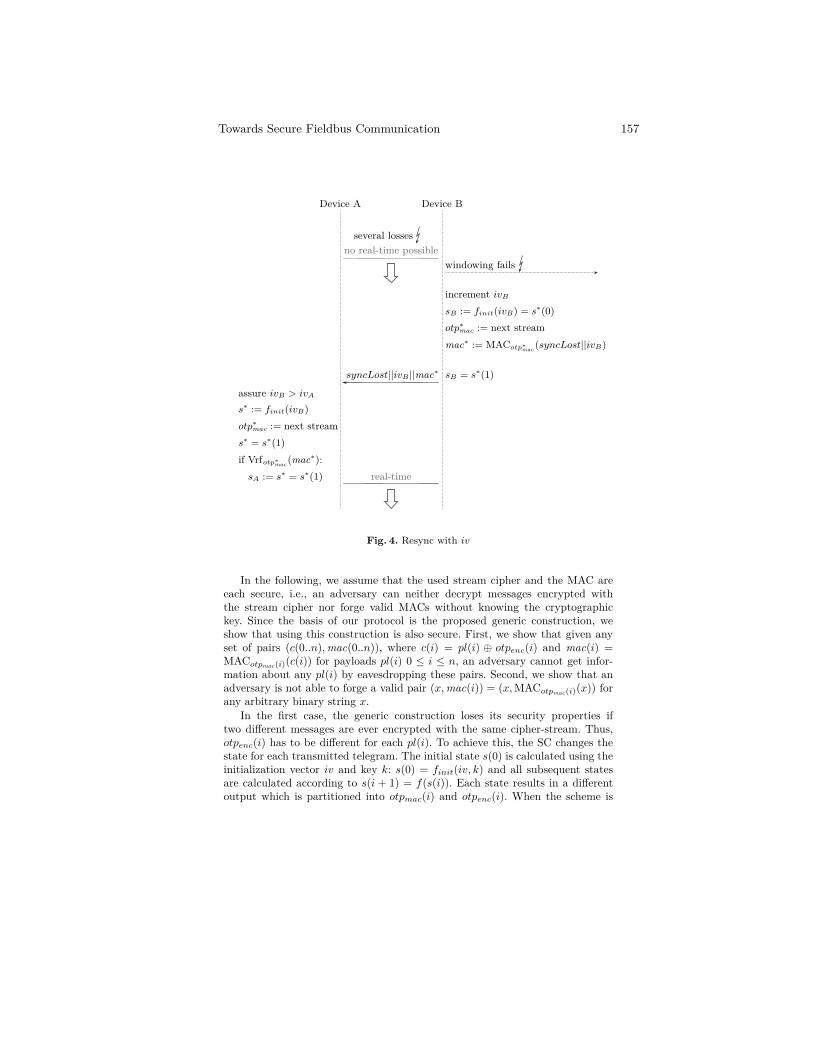
otp∗mac := next stream
Device A Device B
no real-time possiblewindowing fails
increment ivB
sB := finit(ivB) = s∗(0)otp∗
mac := next streammac∗ := MACotp∗
mac (syncLost||ivB)
syncLost||ivB ||mac∗
assure ivB > ivA
s∗ := finit(ivB)
sB = s∗(1)
s∗ = s∗(1)if Vrfotp∗
mac (mac∗):sA := s∗ = s∗(1) real-time
several losses
Fig. 4. Resync with iv
In the following, we assume that the used stream cipher and the MAC areeach secure, i.e., an adversary can neither decrypt messages encrypted withthe stream cipher nor forge valid MACs without knowing the cryptographickey. Since the basis of our protocol is the proposed generic construction, weshow that using this construction is also secure. First, we show that given anyset of pairs (c(0..n), mac(0..n)), where c(i) = pl(i) ⊕ otpenc(i) and mac(i) =MACotpmac(i)(c(i)) for payloads pl(i) 0 ≤ i ≤ n, an adversary cannot get infor-mation about any pl(i) by eavesdropping these pairs. Second, we show that anadversary is not able to forge a valid pair (x, mac(i)) = (x, MACotpmac(i)(x)) forany arbitrary binary string x.
In the first case, the generic construction loses its security properties iftwo different messages are ever encrypted with the same cipher-stream. Thus,otpenc(i) has to be different for each pl(i). To achieve this, the SC changes thestate for each transmitted telegram. The initial state s(0) is calculated using theinitialization vector iv and key k: s(0) = finit(iv, k) and all subsequent statesare calculated according to s(i + 1) = f(s(i)). Each state results in a differentoutput which is partitioned into otpmac(i) and otpenc(i). When the scheme is
Towards Secure Fieldbus Communication 157
reinitialized, a new iv is used by incrementing the old one. Assuming the sizeof the iv is carefully chosen to prevent overflows, an iv is only used once. Thus,for each pl(i) always a different otpenc(i) is used. This reduces the security ofthe scheme up to the security of the used stream cipher. Since we assumed thatthe stream cipher is secure and protects the confidentiality of the transmittedmessages, this is also true for the generic scheme.
In the second case, the security of the MAC is solely based on the secrecy ofthe used key since we assumed that the used MAC construction is secure. Thus,an adversary can only forge a valid (x, mac) pair if he can derive the key k orthe correct otpmac(x). However, since we assumed the applied stream cipher issecure, an adversary neither can get both of them by analyzing eavesdroppedpairs (c(0..n), mac(0..n)).
Thus, an adversary cannot successfully eavesdrop on telegrams or inject newtelegrams. Furthermore, an adversary cannot successfully replay telegrams, sincethe freshness is ensured by changing the internal state after each correctly verifiedtelegram. Likewise the dropping of telegrams is detected and a resynchronizationinitialized.
5 Implementation and Runtime Analysis
In our implementation, we have used Grain-128a [9] with 128 bit key and 96 bitinitialization vector as underlying stream-cipher of the generic scheme. TheGrain-128a cipher is based on the well-analyzed cipher Grain [10] which canbe easily implemented in hardware, provides high performance, and has deter-ministic runtime. As MAC, we have chosen the Toeplitz matrix based approach,which is easy to implement in hardware and also has deterministic runtime. Wechose a MAC length of 80 bit which provides a reasonable security level for mostapplications. The telegrams are embedded as process data in regular EtherCATtelegrams [12].
We have developed a corresponding prototype software implementation in C[16]. The implementation is currently not optimized for speed. In future appli-cations it might be possible to run the security stack in hardware in order toreach higher performance. The master and slave were both running on the sameMicrosoft Windows XP Professional SP3, Intel Core2Duo [email protected] GHz,2 GB RAM machine during the runtime measurements. This configuration re-sembles widely used IPC. The slave controller is a Beckhoff FC1100 card [1].For the proof-of-concept implementation, EtherCAT was used in a synchronousmode, triggering the slave application to run once on each incoming datagram.The master can not be executed in hard real-time (this is only possible with pro-gramming languages defined in [11]), as a replacement for the missing real-timecapabilities, the multimedia timer of Microsoft Windows was used to achieve ade-facto cycle-time of 1 ms.
The first measurements show, that the security layer only generates negligibleoverhead, at a cycle-time of 10 ms, the non-secure slave application runs in 7 µs,compared to the execution time of 8 µs of the slave application with enabled
158 F. Wieczorek, C. Krauß, F. Schiller, and C. Eckert
security layer. The execution times for resynchronization are not significantlylonger. Those measurements do not consider the transmission-time overhead ofthe MAC. More extensive measurements, also at shorter cycle-times, will be partof future work.
6 Conclusion
In this paper, we presented a protocol to secure the fieldbus communication ofautomation systems while maintaining real-time requirements. The basis of theprotocol is a generic scheme which combines a stream cipher with a MAC toensure integrity, confidentiality, authenticity, and freshness of transmitted mes-sages using only one key for cipher and MAC to facilitate key management.The scheme relies solely on symmetric primitives, which are much more efficientthan asymmetric primitives, to support the use in resource-constrained systemsas well as to enable small cycle times for real-time communication. We chose astream cipher since they typically execute at a higher speed than block ciphersand have lower hardware complexity. The security of our protocol relies on thesecurity of the used stream cipher and MAC construction. By adjusting the keylength, the protocol can be adapted according to the application requirements.Our proof-of-concept implementation and the first results of our performed per-formance analysis have shown the feasibility of our approach. As future work,we plan to implement the protocol in hardware and perform more detailed per-formance analyses. Another future topic is to provide exchangeability of SC andMAC in the prototype.
References1. Beckhoff Automation GmbH: FC1100 — PCI EtherCAT slave card (2011)2. Bellare, M., Rogaway, P., Wagner, D.: The EAX Mode of Operation. In: Fast
Software Encryption, LNCS, vol. 3017, pp. 389–407. Springer (2004)3. Bruhne, M.: IEEE 802.1n und WLAN-Controller – Lohnt der Einsatz auch in
der Industrie. In: SPS/IPC/DRIVES : Elektrische Automatisierung, Systeme undKomponenten (2011)
4. Damm, M., Leitner, S.H., Mahnke, W., Leitner, S.H.: Security. In: OPC UnifiedArchitecture, pp. 1–51. Springer (2009)
5. Dworkin, M.: Recommendation for Block Cipher Modes of Operation: The CCMMode for Authentication and Confidentiality. NIST Special Publication 800-38C,NIST - Computer Security Resource Center (2007)
6. Ferguson, N., Whiting, D., Schneier, B., Kelsey, J., Lucks, S., Kohno, T.: Helix:Fast Encryption and Authentication in a Single Cryptographic Primitive. FastSoftware Encryption pp. 330–346 (2003)
7. Granzer, W., Reinisch, C., Kastner, W.: Future Challenges for Building Automa-tion: Wireless and Security. In: Proc. IEEE Int Industrial Electronics (ISIE) Symp.pp. 4415–4467 (2010)
8. Agren, M., Hell, M., Johansson, T.: On Hardware-Oriented Message Authentica-tion with Applications towards RFID. In: Lightweight Security Privacy: Devices,Protocols and Applications (LightSec). pp. 26–33. IEEE Computer Society (2011)
Towards Secure Fieldbus Communication 159
9. Agren, M., Hell, M., Johansson, T., Meier, W.: A New Version of Grain-128 withAuthentication. In: Symmetric Key Encryption Workshop. European Network ofExcellence in Cryptology II (2011)
10. Hell, M., Johansson, T., Meier, W.: Grain – A Stream Cipher for ConstrainedEnvironments. International Journal of Wireless and Mobile Computing, SpecialIssue on Security of Computer Network and Mobile Systems. 2(1), 86–93 (2006)
11. IEC: IEC 61131-3, Programmable controllers — Part 3: Programming languages(2003), ed. 2
12. IEC: IEC 61158, Industrial communication networks — Fieldbus specifications(2010), ed. 2
13. IEEE: IEEE 802.15.4, Wireless Medium Access Control (MAC) and Physical Layer(PHY) Specifications for Low-Rate Wireless Personal Area Networks (WPANs)(2006)
14. ISA: ISA100.11a Wireless systems for industrial automation: Process control andrelated applications (2011)
15. Menezes, A.J., Vanstone, S.A., Oorschot, P.C.V.: Handbook of Applied Cryptog-raphy (Discrete Mathematics and Its Applications). CRC Press, Inc., 5th printingedn. (1996)
16. Microsoft Corporation: Microsoft Visual Studio 2010 Ultimate (2010), version10.0.4.0129.1 SP1Rel
17. Rogaway, P., Bellare, M., Black, J.: OCB: A block-cipher mode of operation forefficient authenticated encryption. ACM Trans. Inf. Syst. Secur. 6, 365–403 (2003)
18. Schwaiger, C., Treytl, A.: Smart Card Based Security for Fieldbus Systems. In:Proc. IEEE Conf. Emerging Technologies and Factory Automation ETFA ’03.vol. 1, pp. 398–406 (2003)
19. Szilagyi, C., Koopman, P.: Flexible Multicast Authentication for Time-TriggeredEmbedded Control Network Applications. In: DSN. pp. 165–174. IEEE (2009)
20. Treytl, A., Sauter, T., Schwaiger, C.: Security Measures for Industrial FieldbusSystems – State of the Art and Solutions for IP-based Approaches. In: Proc. IEEEInt Factory Communication Systems Workshop. pp. 201–209 (2004)
21. Treytl, A., Sauter, T., Schwaiger, C.: Security Measures in Automation Systems –a Practice-Oriented Approach. In: Proc. 10th IEEE Conf. Emerging Technologiesand Factory Automation ETFA. vol. 2, pp. 847–855 (2005)
22. Whiting, D., Schneier, B., Lucks, S., Muller, F.: Phelix Fast Encryption and Au-thentication in a Single Cryptographic Primitive. Tech. rep., ECRYPT StreamCipher Project Report 2005/027 (2005)
23. Wirt, K.T.: ASC – A Stream Cipher with Built–In MAC Functionality. WorldAcademy of Science, Engineering and Technology 29 (2007)
24. Wolf, M., Weimerskirch, A., Paar, C.: Security in Automotive Bus Systems. In:Proceedings of the Workshop on Embedded Security in Cars (escar)’04 (2004)
25. Wolf, M., Weimerskirch, A., Wollinger, T.: State of the Art: Embedding Securityin Vehicles. EURASIP Journal on Embedded Systems (2007)
26. Wu, H., Preneel, B.: Differential-Linear Attacks against the Stream Cipher Phelix.eSTREAM, ECRYPT Stream Cipher Project, Report 2006/056
27. Zoltak, B.: VMPC-MAC: A Stream Cipher Based Authenticated EncryptionScheme. Fast Software Encryption (2004)
160 F. Wieczorek, C. Krauß, F. Schiller, and C. Eckert
Extracting EFSMs of web applications forformal requirements specification
Andrey Zakonov and Anatoly Shalyto
National Research University of Information Technologies, Mechanics and Optics,Saint-Petersburg, Russia
[email protected],[email protected]
Abstract. Web applications have begun to be used in wide variety ofareas including social networks, shopping, online banking, control sys-tems and other critical systems. Complexity of applications have raisedas well as requirements for security and traceability. Due to short deliverytimes and changing requirements, quality assurance of web applicationsis usually an informal process. Formal methods have been proven to besafe approach to the specification, verification, and testing of systems.The aim of the proposed research is to make formal methods applicableto the web applications development. A technique that could extract ex-tended finite state model by combination of static and dynamic analysisis developed. This method supports both applications with transitionsbetween web pages and single-page applications with AJAX requests anddynamic DOM modifications. Two different algorithms are proposed thatsimplify the state model by merging similar states to achieve a humanreadable models even for the complex real world web applications. Theobtained model could be used to define formal requirements for the ap-plication and to make model checking part of the continuous integrationprocess for web development.
Keywords: Model-based testing, FSM, Model Checking, Web Applica-tions
1 Introduction
Continually increasing amounts of critical corporate and personal informationthat are managed and exchanged by web applications has heightened the need forapproaches that verify safety and secutiry of web applications. Model checkingand model-based testing have been proven to be safe approaches to reduce thetime and effort associated with security testing of complex systems, but to applysuch methods a model of an application and a formal spefication are required.
While source code is the most accurate description of the behavior of a webapplication, this description is expressed in the low-level program statementsand are hardly suitable for high-level understanding of an application’s intendedbehavior. Moreover formal methods of quality assurance are hardly applicable tothe source code, as it is hard or almost impossible to formulate functional require-ments. The goal of the presented research is to propose a method for automatic
extraction of an extended finite state machine (EFSM) that would describe givenweb application and would be suitable for writing formal specification require-ments and their automatic verification using existing model checking tools.
A web application could be described as number of states and transitionsbetween these states. A transition between states occurs when an action wastriggered by the user of the application or by some server event (timer event,push notification and etc.). Depending on the number of the parameters targetstate of the transition for the same action may vary. Such trigger conditions mayboth reside on the client side of the application (Javascript variables and userform inputs) and on the server side (database values, user permissions, etc.).
The research aims to propose solutions for number of various tasks:
1. Discover as many different application states as it is possible.2. Discover all variables and factors that define transition’s target state.3. An algorithm that would reveal on which conditions a transition in the ex-
tracted model could be made.4. An algorithm to measure similarity of the web application states.5. A tool that would automatically build a human-readable EFSM of the web
application provided discovered states, transitions, conditions for these tran-sitions and similarity measure function for states.
Extracted models of the web applications then can be used as the basis forautomated model-based test generation, writing better quality requirements fordesign and implementation, applying model checking to verify a model againstthe application requirements.
This paper is organized as follows. Section II contains a brief overview of therelated works and tools. In Section III details on the state discovery algorithmare given. The model extraction method, simplification algorithms and the simi-larity measure are introduced in Section IV. Section V describes an approach todiscover factors that define transitions’ target states. Overview of the developedproof-of-concept tool and case studies are presented in Section VI. Section VIIconcludes.
2 Related work
Web applications are usually tested by manually constructed test cases usingunit testing tools with capture-replay facilities such as Selenium [1] and Sahi [2].These tools provide functionality for recording the GUI actions performed bya user in test scripts, for running a suite of tests, and for visualizing test re-sults. However, even with such tool support, testing remains a challenging andtime-consuming activity because each test case has to be constructed manually.Moreover any change in the web application’s structure may require manualrevision of all the test cases or creation of a new test suite.
Several techniques that propose automatic model extraction and verificationof the existing web applications have been presented in the literature. In [3]authors survey 24 different modelling methods used in web site verification and
162 A. Zakonov and A. Shalyto
testing. There is little research on the problem of extracting models from theexisting web applications in order to support their maintenance and evolution [4–6]. The common drawback of such approaches is that they aim to create a model,useful for proper understanding of dynamic application behavior, but not a for-mal model that can be verified against given requirements.
In [7] the authors propose a runtime enforcement mechanism that restrictsthe control flow of a web application to a state machine model specified bythe developer, and use model checking to verify temporal properties on thesestate machines. This approach implies manual development of a state model bydeveloper, which is time consuming and error prone, especially for complex webapplications.
In [8] authors present an approach to model an existing web application usingcommunicating finite automata model based on the user defined properties tobe validated. Manual properties definition is required in order to build a specificmodel, while in our approach we automatically build the model first, whichgives a user a convenient way for formal specification of the requirements. Alsomodels retrieved in this approach could contain up to thousands of states andtransitions, which would not be human-readable representation and thereforenot suitable for analysis.
An attempt to automate verification and model extraction is done in [9], butthey focus only on page transitions in web applications and are limited only toweb applications that have been developed using a web application framework,such as Struts configuration files and Java Server Page templates. Our approachsupports a much wider range of web applications, due to the support of bothJava Server Page applications as well as Ajax Web applications that consistof a single page whose elements are updated in response to callbacks activatedasynchronously by the user or by a server message.
The work most similar to our approach is described in [10]. Paper proposesstate-based testing approach, specifically designed to exercise Ajax Web appli-cations. Test cases are derived from the state model based on the notion ofsemantically interacting events. The approach is limited to single page applica-tions and Ajax callbacks. Our approach handle all the possible state changes,which include page transitions and Javascript page elements manipulation in theevent handlers triggered by user actions, as well as Ajax callbacks. Handling aWeb application in whole makes it possible to apply our approach to real worldapplications and to achieve more accurate models.
Research on model checking of web applications [12–14] concentrates mostlyon the model checking process, but not on the model extraction. Model ex-traction is critically important for complex real world web applications becausestraight-forward model extraction would generate huge models with hundredsof states and transitions for complex applications, which would be practicallyuseless. Creating the model manually is error-prone and time consuming. Thispaper describes an approach that simplifies automatically extracted state andtransition information and generates human-readable models, which could sig-
Extracting EFSMs of web applications for formal requirements specifi-cation 163
nificantly improve processes of definition of the formal specification requirementsand model checking.
3 Algorithm to discover possible web application states
Each application state defines a set of possible user actions: buttons or hyperlinksto click, text inputs to fill, checkboxes or radio buttons to select, etc. Each actioncould trigger a page update (JavaScript event handler) or a page transition. Ingeneral it is impossible to guarantee discovery of all the web application states,as there are infinite number of various user action sequences and possible Ajaxcallbacks to these actions. Each action sequence potentially could lead to a newunknown application state. In the current research we propose an algorithm ofthe states discovery that is based on random user sequences generation. TheSelenium tool [1], which is able to emulate user actions, is employed to emulatea user interaction with a web application and to record the discovered states.Before and after each action snapshot of the web page’s Document Object Model(DOM) is recorded. The Document Object Model is a platform- and language-neutral interface that allows programs to dynamically access and update thecontent, structure and style of documents [15]. The DOM describes HTML,style sheets and scripts of a page and therefore is sufficient to identify the webapplication’s state.
The proposed algorithm consists of the following steps:
1. Static analysis of the page source code is used to get a list of the availableactions actionlist, which consists of all the html items, that are presenton the page and could trigger a page transition or a Javascript code: a,button, input or any other element with an action handler defined (onlick,onmousedown, jQuery handlers etc.). Items, which action would trigger apage transition to an external web site, are excluded from the list (theyare detected by checking href attribute of the link or the window.locationvariable assignment values in the JavaScript action handlers).
2. Randomly select an action from actionlist and execute it. If an action re-quires a user input, like filling in an input field, then a string value is gener-ated randomly or selected from a supplied list (the analyse tool is not ableto guess password/login/etc., so some values should be provided explicitly).
3. The triad < state1, action, state2 > is appended to the execution trace.4. Continue iterations if any of the last N actions has discovered at least one
new state. This stop condition would help if all the possible states werediscovered or the web application went to a dead end state or group ofstates. The algorithm should be tuned for specific tasks and value for Nshould be specified. The experimental results show that generally N around20 could be sufficient.
Finally, the execution trace is stored as a sequence of triads< state1, action, state2 >,where state holds the DOM tree of the page and action describes the taken ac-tion and the action object referenced using the XPath language.
164 A. Zakonov and A. Shalyto
4 Approach to measure similarity of web applicationstates
A web application could consist of hundreds or even thousands of pages withdifferent source codes. For example in a mail application an inbox page’s sourcecode depends on the number of messages that are currently in the inbox. Aninbox page with two messages differs from a page with three messages. Even twoinbox pages that display same number of messages but with different subjectswould differ. If we are building a model of such application all these pages shouldbe considered as one state, as they actually describe the same state of the ap-plication from the user/developer point of view. Another example is a web pagethat has an advertisement block that includes some code from other websites.Same application page would have different source codes due to the different ad-vertisement blocks included. All this insufficient page source codes’ differenceswould lead to a huge number of different states discovered even for a simple webapplication. A model that contains hundreds of states and transitions would bepractically useless as it would be impossible for a developer to understand theapplication logic from this model or to define any formal requirements. A sophis-ticated algorithm to merge similar states is required. Current section describesan approach that makes it possible to detect similar states by analyzing corre-sponding DOM trees and therefore to reduce number of states in the model toachieve human-readable models even for complex real world web applications.
4.1 Filter out DOM elements page state does not depend on
The DOM tree is traversed and all nodes of the following types are filteredout: link, script, meta. Nodes of these types do not directly affect the pagestate that the user could see or the set of actions that the user can make. Alsowe propose to ignore text values of the elements, but compare only the DOMstructures. All the element attributes are ignored except the style attribute. Thestyle attribute may not be completely ignored as CSS could directly affect user’spage perception: elements (including controls) could be made invisible or couldbe disabled using CSS styles. For example an element could be present in thesource code but be unreachable for the user until he correctly fills some textinputs. These two page states should be considered different as they supportdifferent sets of the possible user actions. For example, due to this step followingnodes would be considered similar:
– <p class=’big-text’>text</p>;– <p style=’color: red’>other text</p>.
As only DOM structures are compared then only different DOM nodes are con-sidered to be different. The following two nodes would be considered differenteven if in practice that could look similar:
– <span class=’big-text’>same text</span>;– <div class=’big-text’>same text</div>.
Extracting EFSMs of web applications for formal requirements specifi-cation 165
4.2 Filter out external dependencies
A web application could often contain links that lead to other web sites. It couldbe information links for the user (e.g. Google’s search results page), links topartner web sites or advertisement banners. It depends on the specific web siteif these external elements on the web page are part of the web application’sbusiness logic or are they unimportant and could be filtered out. For web siteswith advertisement blocks the case study showed that taking these externalelements into the account while comparing states leads to the multiple statesduplication problem. Same page of the application could be represented by thedifferent DOM trees as its source code is being generated on the server sideand from time to time it could contain one advertisement banner, two bannersor none of them. There is no way to automatically detect if the element isimportant to the application logic or not. Therefore for some web applicationsit is reasonable to exclude all external elements, for other applications this stepshould be omitted.
External dependencies are elements that depend on the external web sitesand are detected by the following set of rules:
– img or iframe elements’ src attributes point to external web sites;– link’s href attribute contains an external web site address;– an element that is associated with (or initialized by) a JavaScript code, which
contains AJAX get requests to an external web site.
4.3 Recursive node similarity definition
To discover similar states we introduce the following recursive definition of sim-ilarity: for the DOM nodes A and B similar(A,B) == True if and only if theyhave the same type and same number of children, where each child of A is similarto the corresponding child of B.
4.4 Collapse similar node sequences
An important feature of the proposed approach is the similar node “collapse”step. Let’s illustrate this idea on the example of the inbox messages page of themail web application. A page with 10 messages and a page with 11 messageswould have different DOM trees, but, from the user or developer point of views,they denote the same state of the application. As well as a page with 1000messages displayed. The important difference would be only in case when nomessages are in the inbox that is an empty inbox page. The empty inbox pageis a different state as the user has a different set of the possible actions to make,while pages with some messages present in the inbox are all the same from thispoint of view. Same situation occurs in many other popular web applications:different number of links in a list, search result items, task list todo items, etc.
A list of the consecutive nodes x1, ..., xn should be “collapsed” if ∀i, j ∈ [1;n]similar(xi, xj) == True && xi.parent == xj .parent. In this case the list of
166 A. Zakonov and A. Shalyto
nodes are replaced by one node, x1. Due to the “collapse” step pages like a mailinbox or a task list, which differ only by number of the similar items, wouldbecome similar and the extracted model would make much more sense.
The “Collapse” step is implemented be the following algorithm:
1. Traverse the DOM tree, starting from its leafs.2. For a given node fetch list of the children nodes listc.3. Check all the possible pairs xi, xj ∈ listc and ifsimilar(xi, xj) == True then remove xj node.
It should be noted that there could be more complex cases, where this algo-rithm would not work. For example, if a repeating page item consists of morethen one DOM subtree, but a sequence of the same DOM subtrees. For examplethe following listing gives an example of a list of the repeating items that shouldbe collapsed, but the proposed algorithm is not able to handle it:
<h1>Title1</h1>
<p>text1</p>
<h1>Title2</h1>
<p>text2</p>
...
<h1>TitleN</h1>
<p>textN</p>
The pattern discovery algorithms will be used to handle such situations.
4.5 Alternative approaches to state similarity detection
One more approach to the pages similarity measure is proposed and tested inthe research. A web page has two main goals:
– deliver the information to a user: text, pictures, charts, etc.;– provide controls for a user to make actions: add item to cart, send e-mail,
manage task list, go to another page, etc.;
We propose an action-based approach to the page similarity problem. Let’s definethat pages are similar, if they provide the same set of possible actions for the user.Such approach ignores all the page elements that can not trigger an action. Thepage source code is being analyzed and an actionset is created that contains onlylinks, form controls and elements with defined JavaScript action handlers. Tocheck whether the pages are similar or not the corresponding pages’ actionsetsare compared. The pages are denoted similar if their actionsets are equal, thatis they have same number of elements and each element from one set existsin the other. This approach also requires filtering out external dependenciesand collapse steps that reduce pages’ source codes to the correct state for thesimilarity detection.
Overall, the two different approaches to the similarity detection problem areproposed in the current research:
Extracting EFSMs of web applications for formal requirements specifi-cation 167
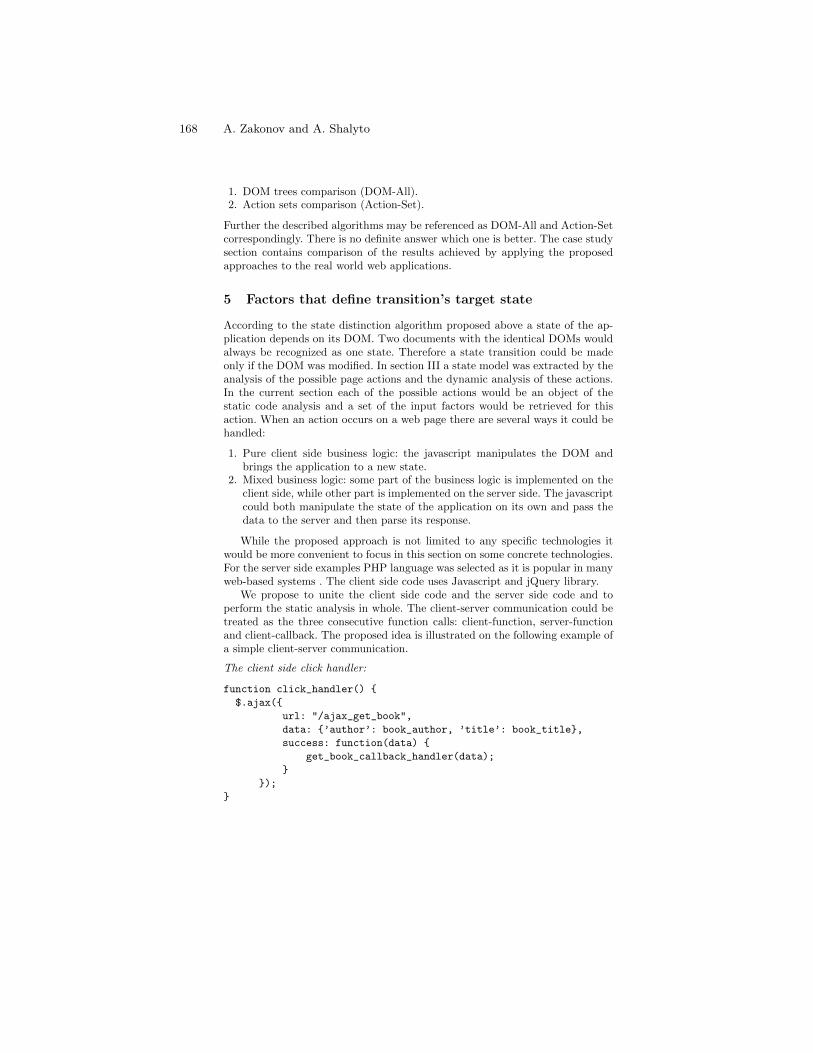
1. DOM trees comparison (DOM-All).2. Action sets comparison (Action-Set).
Further the described algorithms may be referenced as DOM-All and Action-Setcorrespondingly. There is no definite answer which one is better. The case studysection contains comparison of the results achieved by applying the proposedapproaches to the real world web applications.
5 Factors that define transition’s target state
According to the state distinction algorithm proposed above a state of the ap-plication depends on its DOM. Two documents with the identical DOMs wouldalways be recognized as one state. Therefore a state transition could be madeonly if the DOM was modified. In section III a state model was extracted by theanalysis of the possible page actions and the dynamic analysis of these actions.In the current section each of the possible actions would be an object of thestatic code analysis and a set of the input factors would be retrieved for thisaction. When an action occurs on a web page there are several ways it could behandled:
1. Pure client side business logic: the javascript manipulates the DOM andbrings the application to a new state.
2. Mixed business logic: some part of the business logic is implemented on theclient side, while other part is implemented on the server side. The javascriptcould both manipulate the state of the application on its own and pass thedata to the server and then parse its response.
While the proposed approach is not limited to any specific technologies itwould be more convenient to focus in this section on some concrete technologies.For the server side examples PHP language was selected as it is popular in manyweb-based systems . The client side code uses Javascript and jQuery library.
We propose to unite the client side code and the server side code and toperform the static analysis in whole. The client-server communication could betreated as the three consecutive function calls: client-function, server-functionand client-callback. The proposed idea is illustrated on the following example ofa simple client-server communication.
The client side click handler:
function click_handler() {
$.ajax({
url: "/ajax_get_book",
data: {’author’: book_author, ’title’: book_title},
success: function(data) {
get_book_callback_handler(data);
}
});
}
168 A. Zakonov and A. Shalyto
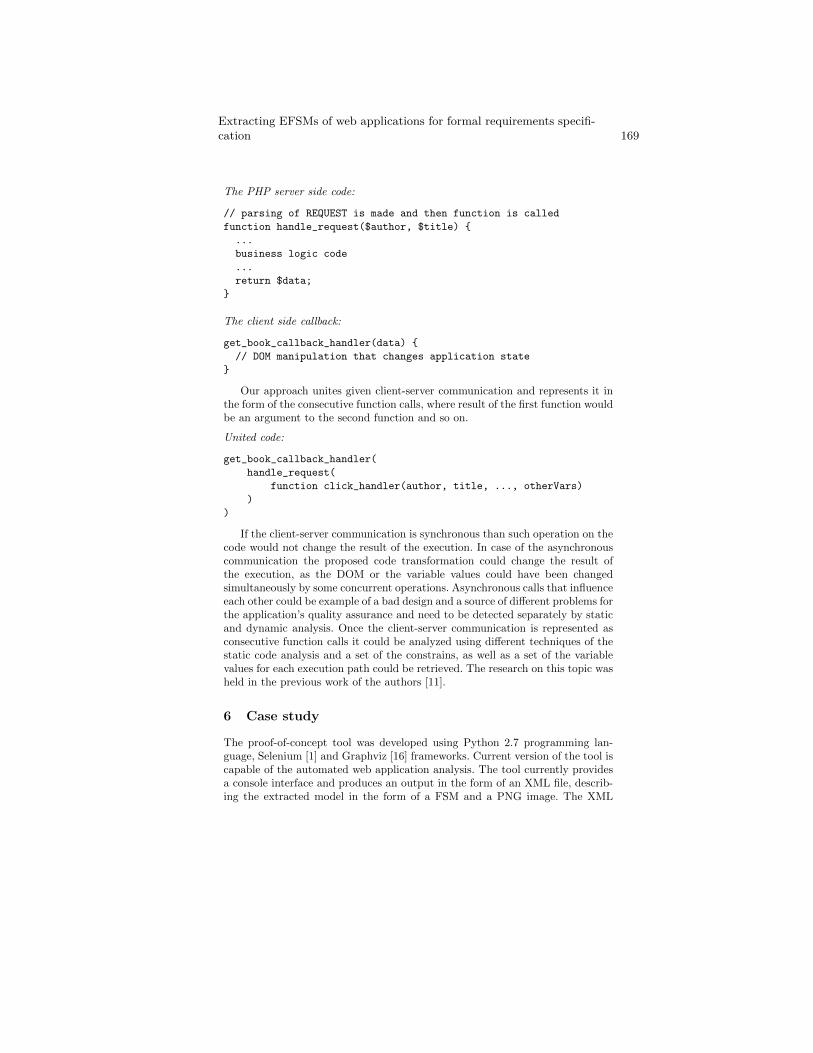
The PHP server side code:
// parsing of REQUEST is made and then function is called
function handle_request($author, $title) {
...
business logic code
...
return $data;
}
The client side callback:
get_book_callback_handler(data) {
// DOM manipulation that changes application state
}
Our approach unites given client-server communication and represents it inthe form of the consecutive function calls, where result of the first function wouldbe an argument to the second function and so on.
United code:
get_book_callback_handler(
handle_request(
function click_handler(author, title, ..., otherVars)
)
)
If the client-server communication is synchronous than such operation on thecode would not change the result of the execution. In case of the asynchronouscommunication the proposed code transformation could change the result ofthe execution, as the DOM or the variable values could have been changedsimultaneously by some concurrent operations. Asynchronous calls that influenceeach other could be example of a bad design and a source of different problems forthe application’s quality assurance and need to be detected separately by staticand dynamic analysis. Once the client-server communication is represented asconsecutive function calls it could be analyzed using different techniques of thestatic code analysis and a set of the constrains, as well as a set of the variablevalues for each execution path could be retrieved. The research on this topic washeld in the previous work of the authors [11].
6 Case study
The proof-of-concept tool was developed using Python 2.7 programming lan-guage, Selenium [1] and Graphviz [16] frameworks. Current version of the tool iscapable of the automated web application analysis. The tool currently providesa console interface and produces an output in the form of an XML file, describ-ing the extracted model in the form of a FSM and a PNG image. The XML
Extracting EFSMs of web applications for formal requirements specifi-cation 169
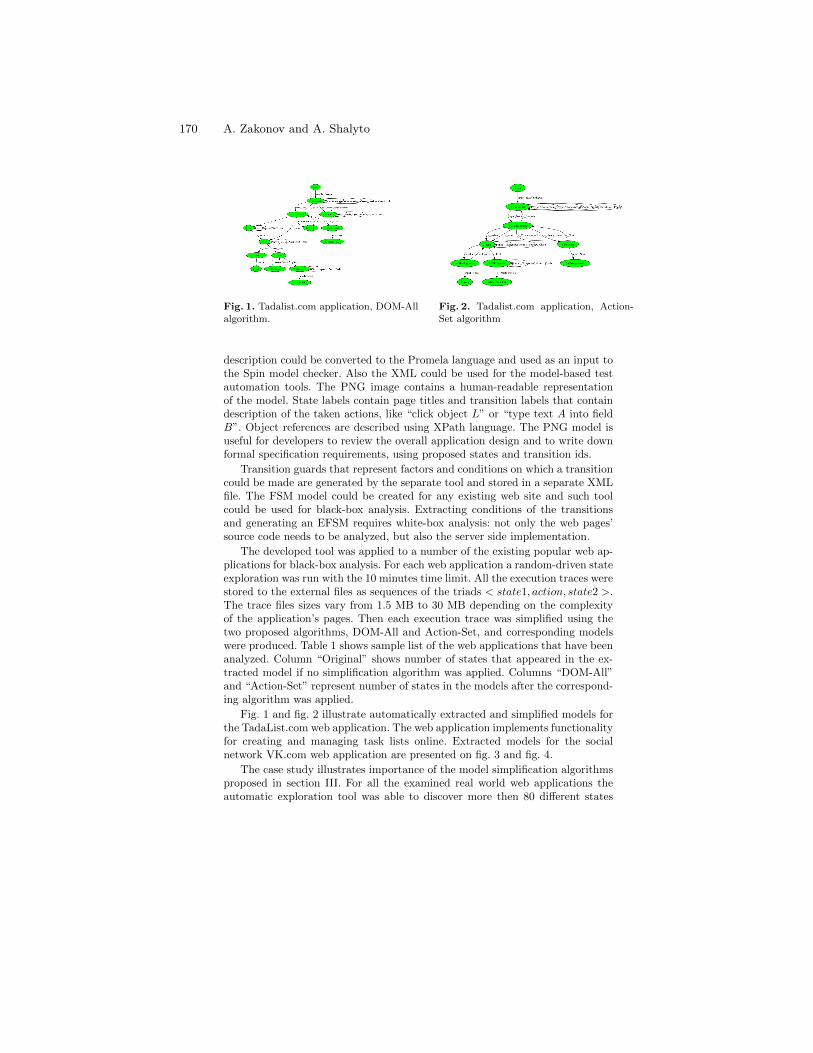
Fig. 1. Tadalist.com application, DOM-Allalgorithm.
Fig. 2. Tadalist.com application, Action-Set algorithm
description could be converted to the Promela language and used as an input tothe Spin model checker. Also the XML could be used for the model-based testautomation tools. The PNG image contains a human-readable representationof the model. State labels contain page titles and transition labels that containdescription of the taken actions, like “click object L” or “type text A into fieldB”. Object references are described using XPath language. The PNG model isuseful for developers to review the overall application design and to write downformal specification requirements, using proposed states and transition ids.
Transition guards that represent factors and conditions on which a transitioncould be made are generated by the separate tool and stored in a separate XMLfile. The FSM model could be created for any existing web site and such toolcould be used for black-box analysis. Extracting conditions of the transitionsand generating an EFSM requires white-box analysis: not only the web pages’source code needs to be analyzed, but also the server side implementation.
The developed tool was applied to a number of the existing popular web ap-plications for black-box analysis. For each web application a random-driven stateexploration was run with the 10 minutes time limit. All the execution traces werestored to the external files as sequences of the triads < state1, action, state2 >.The trace files sizes vary from 1.5 MB to 30 MB depending on the complexityof the application’s pages. Then each execution trace was simplified using thetwo proposed algorithms, DOM-All and Action-Set, and corresponding modelswere produced. Table 1 shows sample list of the web applications that have beenanalyzed. Column “Original” shows number of states that appeared in the ex-tracted model if no simplification algorithm was applied. Columns “DOM-All”and “Action-Set” represent number of states in the models after the correspond-ing algorithm was applied.
Fig. 1 and fig. 2 illustrate automatically extracted and simplified models forthe TadaList.com web application. The web application implements functionalityfor creating and managing task lists online. Extracted models for the socialnetwork VK.com web application are presented on fig. 3 and fig. 4.
The case study illustrates importance of the model simplification algorithmsproposed in section III. For all the examined real world web applications theautomatic exploration tool was able to discover more then 80 different states
170 A. Zakonov and A. Shalyto
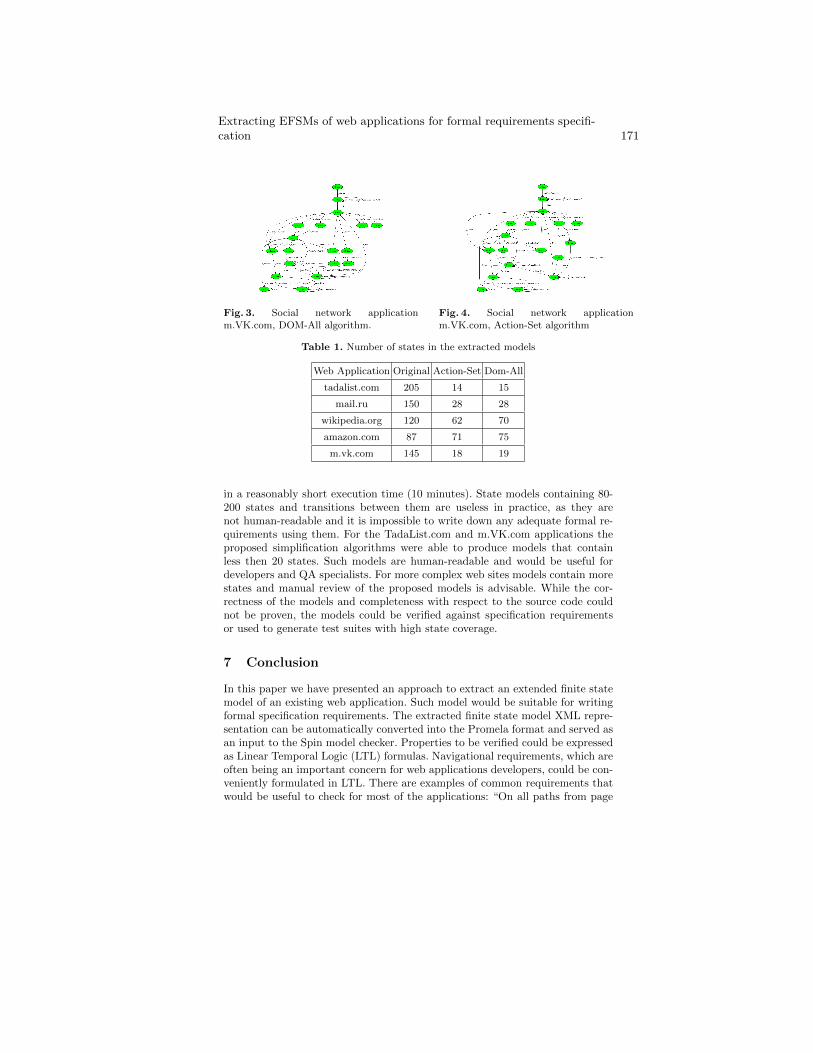
Fig. 3. Social network applicationm.VK.com, DOM-All algorithm.
Fig. 4. Social network applicationm.VK.com, Action-Set algorithm
Table 1. Number of states in the extracted models
Web Application Original Action-Set Dom-All
tadalist.com 205 14 15
mail.ru 150 28 28
wikipedia.org 120 62 70
amazon.com 87 71 75
m.vk.com 145 18 19
in a reasonably short execution time (10 minutes). State models containing 80-200 states and transitions between them are useless in practice, as they arenot human-readable and it is impossible to write down any adequate formal re-quirements using them. For the TadaList.com and m.VK.com applications theproposed simplification algorithms were able to produce models that containless then 20 states. Such models are human-readable and would be useful fordevelopers and QA specialists. For more complex web sites models contain morestates and manual review of the proposed models is advisable. While the cor-rectness of the models and completeness with respect to the source code couldnot be proven, the models could be verified against specification requirementsor used to generate test suites with high state coverage.
7 Conclusion
In this paper we have presented an approach to extract an extended finite statemodel of an existing web application. Such model would be suitable for writingformal specification requirements. The extracted finite state model XML repre-sentation can be automatically converted into the Promela format and served asan input to the Spin model checker. Properties to be verified could be expressedas Linear Temporal Logic (LTL) formulas. Navigational requirements, which areoften being an important concern for web applications developers, could be con-veniently formulated in LTL. There are examples of common requirements thatwould be useful to check for most of the applications: “On all paths from page
Extracting EFSMs of web applications for formal requirements specifi-cation 171
Welcome to page Inbox, page Login is present”. Such requirement is expressedwith the following LTL: [] (Welcome && ! Inbox → ((! Inbox) U ((Login && !Inbox) ‖ [] (! Inbox)))).
Further research is aimed at improving the similarity measure algorithms togenerate a better EFSM, using SAT-solvers and GA-based algorithms to revealall possible paths in the applications’ source code, both server and client side.It should be noted, that extracted models could not be expected to cover allthe possible states and transitions of a web application, as such model could beachieved only if an exhaustive execution trace is available. Such trace generallyis infeasible and the model only approximates the web application’s behavior.Nevertheless such model could be used to automate model checking and to makea step towards including Model Checking in continuous integration process andsignificantly improving software quality and defect detection rate.
References
1. Antawan Holmes , Marc Kellogg, Automating Functional Tests Using Selenium,AGILE 2006: .270–275
2. Web test automation tool. http://sahi.co.in/w/sahi3. Alalfi, M.H., Cordy, J.R., Dean, T.R.: Modelling methods for web application veri-
fication and testing: state of the art. Softw. Test., Verif. Reliab.(2009) 265–2964. Hassan AE, Holt RC. Architecture recovery of web applications. Proceedings of the
24th ICSE, ACM Press: New York, NY, USA, 2002; 349–359.5. Antoniol G, Di Penta M, Zazzara M. Understanding Web Applications through
Dynamic Analysis. Proceedings of the IWPC 2004; 120–131.6. Di Lucca GA, Di Penta M. Integrating Static and Dynamic Analysis to improve
the Comprehension of Existing Web Applications. Proceedings 7th IEEE WSE:Washington, DC, USA, 2005; 87–94.
7. Sylvain Hall, Taylor Ettema, Chris Bunch, Tevfik Bultan: Eliminating navigationerrors in web applications via model checking and runtime enforcement of navigationstate machines. ASE 2010: 235–244
8. Haydar, M.: Formal Framework for Automated Analysis and Verification of Web-Based Applications. ASE 2004: 410–413
9. Atsuto Kubo, Hironori Washizaki, Yoshiaki Fukazawa, ”Automatic Extraction andVerification of Page Transitions in a Web Application,” APSEC 2007: 350–357
10. Marchetto, A., Tonella, P., Ricca, F.: State-Based Testing of Ajax Web Applica-tions. ICST 2008: 121–130
11. Zakonov A., Stepanov O., Shalyto A.A. GA-Based and Design by Contract Ap-proach to Test Generation for EFSMs. IEEE EWDTS 2010: 152–155.
12. Y. Huang, F. Yu, C. Hang, C. Tsai, D.T. Lee, and S. Kuo, ”Verifying Web Appli-cations Using Bounded Model Checking”, DSN 2004: 199–208.
13. Homma, Kei and Izumi, Satoru and Abe, Yuki and Takahashi, et al.”Using theModel Checker Spin for Web Application Design”, SAINT 2010: 137–140
14. Homma, K. Izumi, S. Takahashi, K. Togashi, A., et al ”Modeling Web ApplicationsDesign with Automata and Its Verification”, ISADS 2011: 103– 112
15. Document Object Model by the World Wide Web Consortium,http://www.w3.org/DOM/
16. Kaufmann M., Wagner D. (editors) Drawing Graphs: Methods and Models,Springer, 2001. - 326 pages
172 A. Zakonov and A. Shalyto
An ontological approach to systematizationof SW-FMEA
I.Bicchierai, G.Bucci, C.Nocentini, E.Vicario
Dipartimento di Sistemi e Informatica - Universita di Firenze{irene.bicchierai,giacomo.bucci,carlo.nocentini,enrico.vicario}@unifi.it
Abstract. Failure Mode and Effects Analysis (FMEA) is a widely useddependability and safety technique aiming at systematically identifyingfailure modes, their generating causes and their effects on the system.
While FMEA has been mainly thought for hardware systems, its use isalso advocated for software (SW-FMEA). This involves several majorchallenges, such as the complexity of functional requirements, the diffi-culty to identify failure modes of SW components, the elusive nature offaults.
We present an approach for efficient and effective manipulation of datainvolved in the SW-FMEA process, introducing an ontological modelwhich formalizes concepts involved in the analysis. The methodologyprovides a common conceptual framework supporting cohesion acrossdifferent stages of a development life-cycle, giving a precise semantics toconcepts collected in the artifacts of an industrial documentation process.
This also opens the way to the implementation of a tool, built on topof a stack of semantic web technologies, for automating the SW-FMEAprocess. Results of the application of the methodology and the tool to areal scenario, in which activities and documents are regulated by well-established standards, are reported. The experience proves the suitabilityand the practical effectiveness of the approach, showing improvementson SW-FMEA practices.
Keywords: SW-FMEA, ontologies, automated reasoning, SW Engineering, Re-liability Availability Maintainability and Safety, V-Model
1 Introduction
Failure Modes and Effects Analysis (FMEA) is an analysis method used in thedevelopment of industrial systems subject to dependability and safety require-ments, for the identification of failure modes, their causes and effects, in orderto determine actions reducing the impact of failure events [18]. The analysis iscarried out since the initial phases of the development process, when mitigatingactions can be more easily taken.
FMEA was first standardized by the US Department of Defense in the MIL-STD-1629A standard [33], then it was extended to many other industrial contexts
[15,32]. Originally, FMEA was intended to be used in the development of hard-ware systems. Due to the increasing number of critical functionalities assigned tosoftware, several regulatory standards, addressing critical applications [4,7,21],dictate use of FMEA also for software systems (SW-FMEA). The extension ofthe analysis to SW context implies increased difficulties. In fact, requirementsallocated to SW are usually more complex than those allocated to hardware;failure modes can’t be collected from datasheets resulting from tests and feed-back of available operational experience (as in the case of hardware); SW faultscan remain hidden until some triggering conditions activate them [1,27] and theycannot be traced back to ageing, wearing or stressing causes [23]. In addition,existing tools [25,29] are mostly oriented towards hardware FMEA.
SW-FMEA is usually treated from the organizational point of view, focus-ing on possible decompositions of the activities involved in the process [28,10],and on the combination of the analysis with complementary approaches such asFault Trees Analysis (FTA) [19]. In [28], SW-FMEA is carried out during therequirements analysis phase and is decomposed into two steps: first, an analysisis performed to identify failure modes and their consequences, then countermea-sures for mitigation or elimination of failures are identified. The organization ofSW-FMEA into two phases is also suggested in [10], where System SW FMEAis performed early in the design process, while Detailed SW FMEA is performedlater during the system design, when a description of SW components is avail-able.
Data needed for SW-FMEA come from a lot of activities scattered along theSW life-cycle. Gathering such a large amount of diversified information may re-sult too expensive and not-effective with respect to the quality of the outcomesof the analysis. Efficient and effective management of the volume and the het-erogeneity of data have motivated research on methodologies for a systematicapproach to SW-FMEA. To this end, ontologies have been introduced in manyworks [8,17,5]. In [8], three ontological models are proposed to characterize rela-tions among components, functions and attributes concerning Security, Privacyand Dependability in complex embedded systems. The methodology introducedin [17] is based on a knowledge engineering framework for integrating designFMEA and diagnosis models around a central Domain Ontology in support ofmultiple product-modeling environments. A reference model, unifying and for-malizing FMEA concepts into an ontology expressed in F-Logic [16], has beenproposed in [5].
In this paper, we propose the application of ontologies in the formalizationof the SW-FMEA process, so as to provide a common conceptual frameworkcollecting concepts scattered along the life-cycle. We devise an ontological model(Sect. 2), illustrating how the concepts are linked to the documents produced ina standard development life-cycle, comprising a bridge between the documentprocess and the activities of SW-FMEA (Sect. 3). In particular, we show howthe generation of SW-FMEA worksheet can be accomplished through automatedreasoning on semantic data (Sect. 3.1) and how the analysis of the degree of rigorattained in the development is supported (Sect. 3.2). We finally address how the
174 I. Bicchierai, G. Bucci, C. Nocentini, and E. Vicario
ontological formalization is exploited in the implementation of a SW tool basedon well-established semantic web technologies. In particular, we report resultsof the tool experimentation at Selex Galileo in Florence, our reference context,where activities and artifacts are regulated by standards concerning productassurance [7], life-cycle [3] and documentation [34] (Sect. 4).
2 Applying ontologies to the SW-FMEA process
Reflecting the practice of our reference context, the SW-FMEA process is subdi-vided in three phases along the SW life-cycle: the Top Level Functional FMEAis mapped on the SW Requirements Analysis; the Detailed Functional FMEAis mapped on the SW Design and SW Coding activities; the SW DevelopmentAssurance Level (SW-DAL) Evaluation is mapped on the SW Coding and HW-in-the-loop Testing activities.
2.1 Ontologies overview
An ontology is an explicit specification of a conceptualization [11]. The fun-damental elements of an ontological model are classes and properties: classesrepresent categories or sets of elements; properties specify the internal structureof a class or the relations among classes. Classes and properties represent theintensional part of the ontology, while their instances represent the extensionalpart: individuals are realizations of concepts described by classes and attributesare realizations of properties.
Ontological technologies comprise a rich framework of integrating compo-nents, including ontological languages such as OWL [20], query languages, suchas SPARQL [24], and rule languages, such as SWRL [12]; in addition, off-the-shelf reasoners are available [31]. Altogether, they devise a new paradigm for theorganization of systems [2].
In order to provide a visual representation of the ontology elements, we useUML notation enriched with stereotypes for RDF and OWL concepts as stan-dardized in the Ontology Definition Metamodel (ODM) [22]. Ontological entitiesare represented as classes, datatype properties are represented as their attributes,and object properties are represented as relations among classes.
2.2 Top Level Functional FMEA
The first phase of the process is performed in the early stages of the SW life-cycle, where FMEA can help understanding system requirements and revealingflaws in the system, thus avoiding expensive late design changes.
Fig. 1 shows the involved ontological concepts. A Computer SW Configura-tion Item (CSCI) (i.e. an aggregation of SW with an individual configuration)is associated with Functional Requirements to be satisfied. Functional Require-ments are in turn associated with Operation Modes, specified by a CriticalityValue, and with some Failure Modes, that are the different ways in which the
An ontological approach to systematization of SW-FMEA 175
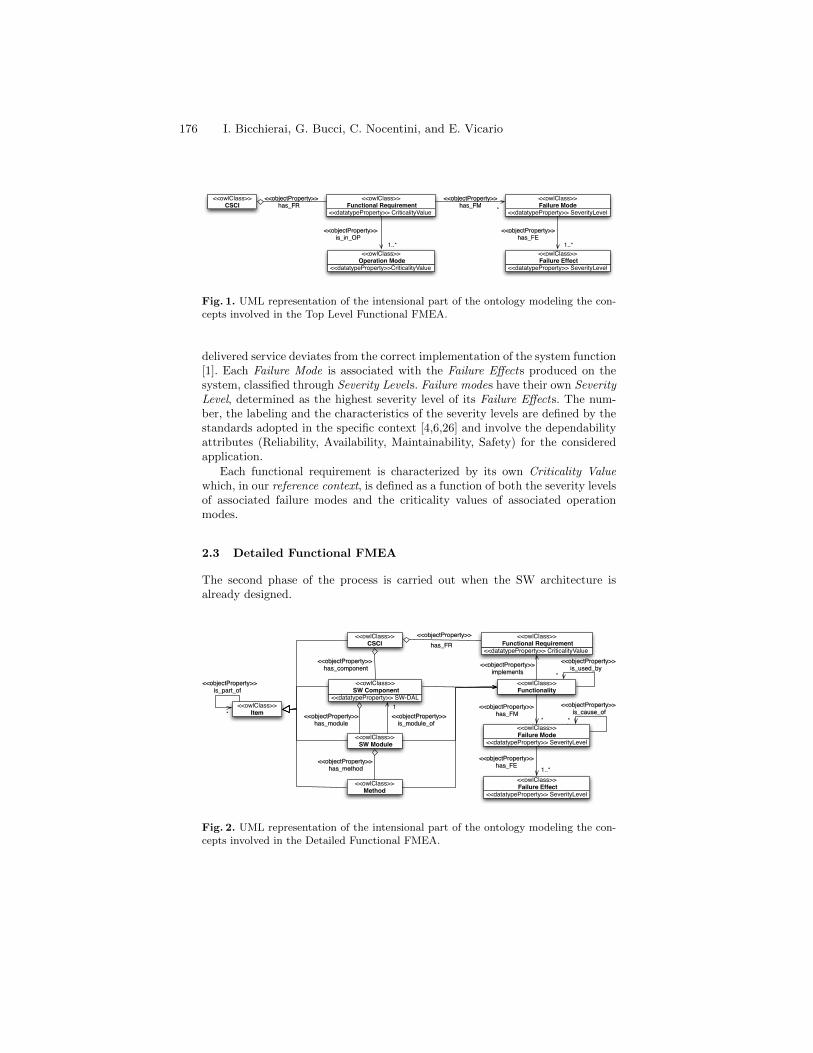
<<owlClass>>CSCI
<<datatypeProperty>> SeverityLevel
<<owlClass>> Failure Effect
<<datatypeProperty>>CriticalityValue
<<owlClass>> Operation Mode
<<datatypeProperty>> CriticalityValue
<<owlClass>> Functional Requirement
<<datatypeProperty>> SeverityLevel
<<owlClass>> Failure Mode
<<objectProperty>> <<objectProperty>>
<<objectProperty>> <<objectProperty>>
has_FR has_FM
is_in_OP has_FE
*
1..* 1..*
Fig. 1. UML representation of the intensional part of the ontology modeling the con-cepts involved in the Top Level Functional FMEA.
delivered service deviates from the correct implementation of the system function[1]. Each Failure Mode is associated with the Failure Effects produced on thesystem, classified through Severity Levels. Failure modes have their own SeverityLevel, determined as the highest severity level of its Failure Effects. The num-ber, the labeling and the characteristics of the severity levels are defined by thestandards adopted in the specific context [4,6,26] and involve the dependabilityattributes (Reliability, Availability, Maintainability, Safety) for the consideredapplication.
Each functional requirement is characterized by its own Criticality Valuewhich, in our reference context, is defined as a function of both the severity levelsof associated failure modes and the criticality values of associated operationmodes.
2.3 Detailed Functional FMEA
The second phase of the process is carried out when the SW architecture isalready designed.
<<owlClass>>Item
<<owlClass>>CSCI
<<objectProperty>>
*<<owlClass>> SW Module
<<owlClass>>Method
<<objectProperty>>has_FR
<<objectProperty>>
<<objectProperty>>
1<<objectProperty>>
has_method
has_component
has_module is_module_of
<<owlClass>>Functionality
<<datatypeProperty>> SeverityLevel
<<owlClass>> Failure Mode
<<datatypeProperty>> SeverityLevel
<<owlClass>> Failure Effect
<<objectProperty>>has_FE 1..*
<<objectProperty>>has_FM
<<objectProperty>>implements
<<objectProperty>>is_used_by
*
<<objectProperty>>is_cause_of
*
<<objectProperty>>is_part_of
*
<<datatypeProperty>> SW-DAL
<<owlClass>> SW Component
<<datatypeProperty>> CriticalityValue
<<owlClass>> Functional Requirement
*
Fig. 2. UML representation of the intensional part of the ontology modeling the con-cepts involved in the Detailed Functional FMEA.
176 I. Bicchierai, G. Bucci, C. Nocentini, and E. Vicario
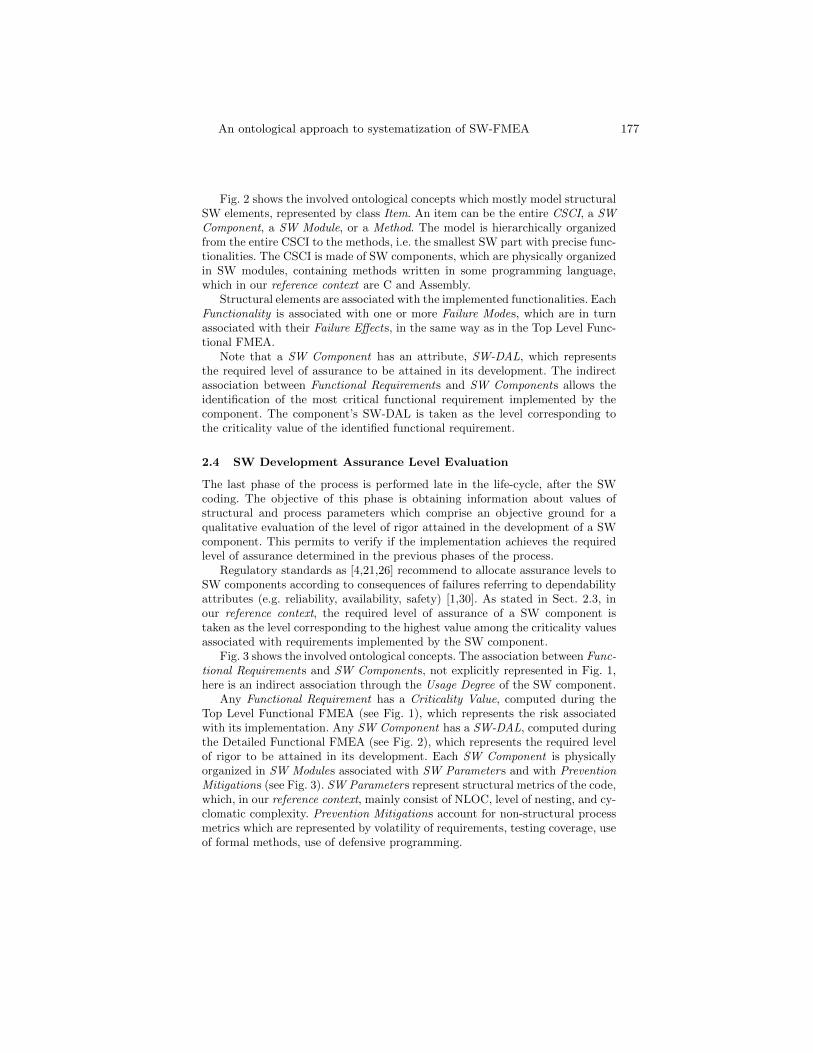
Fig. 2 shows the involved ontological concepts which mostly model structuralSW elements, represented by class Item. An item can be the entire CSCI, a SWComponent, a SW Module, or a Method. The model is hierarchically organizedfrom the entire CSCI to the methods, i.e. the smallest SW part with precise func-tionalities. The CSCI is made of SW components, which are physically organizedin SW modules, containing methods written in some programming language,which in our reference context are C and Assembly.
Structural elements are associated with the implemented functionalities. EachFunctionality is associated with one or more Failure Modes, which are in turnassociated with their Failure Effects, in the same way as in the Top Level Func-tional FMEA.
Note that a SW Component has an attribute, SW-DAL, which representsthe required level of assurance to be attained in its development. The indirectassociation between Functional Requirements and SW Components allows theidentification of the most critical functional requirement implemented by thecomponent. The component’s SW-DAL is taken as the level corresponding tothe criticality value of the identified functional requirement.
2.4 SW Development Assurance Level Evaluation
The last phase of the process is performed late in the life-cycle, after the SWcoding. The objective of this phase is obtaining information about values ofstructural and process parameters which comprise an objective ground for aqualitative evaluation of the level of rigor attained in the development of a SWcomponent. This permits to verify if the implementation achieves the requiredlevel of assurance determined in the previous phases of the process.
Regulatory standards as [4,21,26] recommend to allocate assurance levels toSW components according to consequences of failures referring to dependabilityattributes (e.g. reliability, availability, safety) [1,30]. As stated in Sect. 2.3, inour reference context, the required level of assurance of a SW component istaken as the level corresponding to the highest value among the criticality valuesassociated with requirements implemented by the SW component.
Fig. 3 shows the involved ontological concepts. The association between Func-tional Requirements and SW Components, not explicitly represented in Fig. 1,here is an indirect association through the Usage Degree of the SW component.
Any Functional Requirement has a Criticality Value, computed during theTop Level Functional FMEA (see Fig. 1), which represents the risk associatedwith its implementation. Any SW Component has a SW-DAL, computed duringthe Detailed Functional FMEA (see Fig. 2), which represents the required levelof rigor to be attained in its development. Each SW Component is physicallyorganized in SW Modules associated with SW Parameters and with PreventionMitigations (see Fig. 3). SW Parameters represent structural metrics of the code,which, in our reference context, mainly consist of NLOC, level of nesting, and cy-clomatic complexity. Prevention Mitigations account for non-structural processmetrics which are represented by volatility of requirements, testing coverage, useof formal methods, use of defensive programming.
An ontological approach to systematization of SW-FMEA 177
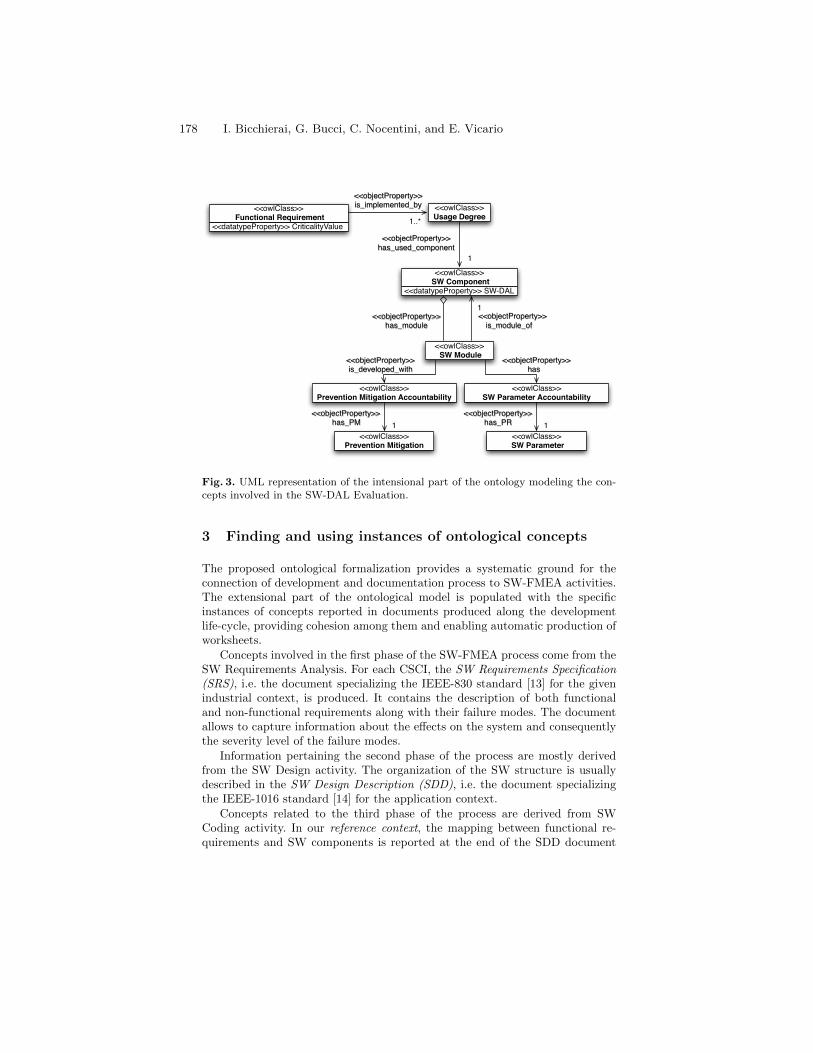
<<datatypeProperty>> CriticalityValue
<<owlClass>> Functional Requirement
<<owlClass>>Usage Degree
<<datatypeProperty>> SW-DAL
<<owlClass>> SW Component
<<owlClass>> SW Module
<<objectProperty>>1<<objectProperty>>
has_module is_module_of
<<objectProperty>>is_implemented_by
<<objectProperty>>has_used_component
1
1..*
<<owlClass>>Prevention Mitigation Accountability
<<owlClass>>SW Parameter Accountability
<<owlClass>>Prevention Mitigation
<<owlClass>> SW Parameter
<<objectProperty>>has_PR
<<objectProperty>>has_PM
<<objectProperty>>is_developed_with
<<objectProperty>>has
1 1
Fig. 3. UML representation of the intensional part of the ontology modeling the con-cepts involved in the SW-DAL Evaluation.
3 Finding and using instances of ontological concepts
The proposed ontological formalization provides a systematic ground for theconnection of development and documentation process to SW-FMEA activities.The extensional part of the ontological model is populated with the specificinstances of concepts reported in documents produced along the developmentlife-cycle, providing cohesion among them and enabling automatic production ofworksheets.
Concepts involved in the first phase of the SW-FMEA process come from theSW Requirements Analysis. For each CSCI, the SW Requirements Specification(SRS), i.e. the document specializing the IEEE-830 standard [13] for the givenindustrial context, is produced. It contains the description of both functionaland non-functional requirements along with their failure modes. The documentallows to capture information about the effects on the system and consequentlythe severity level of the failure modes.
Information pertaining the second phase of the process are mostly derivedfrom the SW Design activity. The organization of the SW structure is usuallydescribed in the SW Design Description (SDD), i.e. the document specializingthe IEEE-1016 standard [14] for the application context.
Concepts related to the third phase of the process are derived from SWCoding activity. In our reference context, the mapping between functional re-quirements and SW components is reported at the end of the SDD document
178 I. Bicchierai, G. Bucci, C. Nocentini, and E. Vicario
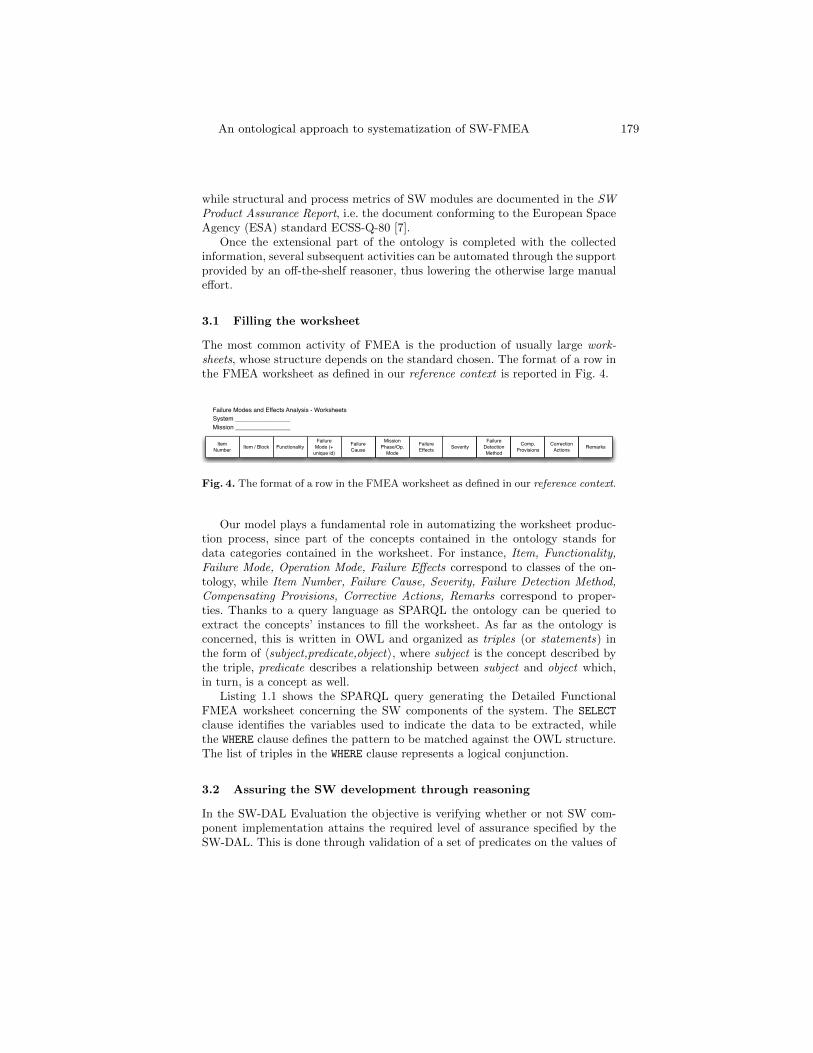
while structural and process metrics of SW modules are documented in the SWProduct Assurance Report, i.e. the document conforming to the European SpaceAgency (ESA) standard ECSS-Q-80 [7].
Once the extensional part of the ontology is completed with the collectedinformation, several subsequent activities can be automated through the supportprovided by an off-the-shelf reasoner, thus lowering the otherwise large manualeffort.
3.1 Filling the worksheet
The most common activity of FMEA is the production of usually large work-sheets, whose structure depends on the standard chosen. The format of a row inthe FMEA worksheet as defined in our reference context is reported in Fig. 4.
Item
NumberItem / Block Functionality
Failure
Mode (+
unique id)
Mission
Phase/Op.
Mode
Failure
EffectsSeverity
Failure
Detection
Method
Comp.
Provisions
Correction
Actions
Failure Modes and Effects Analysis - Worksheets
System ________________
Mission ________________
RemarksFailure
Cause
Fig. 4. The format of a row in the FMEA worksheet as defined in our reference context.
Our model plays a fundamental role in automatizing the worksheet produc-tion process, since part of the concepts contained in the ontology stands fordata categories contained in the worksheet. For instance, Item, Functionality,Failure Mode, Operation Mode, Failure Effects correspond to classes of the on-tology, while Item Number, Failure Cause, Severity, Failure Detection Method,Compensating Provisions, Corrective Actions, Remarks correspond to proper-ties. Thanks to a query language as SPARQL the ontology can be queried toextract the concepts’ instances to fill the worksheet. As far as the ontology isconcerned, this is written in OWL and organized as triples (or statements) inthe form of 〈subject,predicate,object〉, where subject is the concept described bythe triple, predicate describes a relationship between subject and object which,in turn, is a concept as well.
Listing 1.1 shows the SPARQL query generating the Detailed FunctionalFMEA worksheet concerning the SW components of the system. The SELECT
clause identifies the variables used to indicate the data to be extracted, whilethe WHERE clause defines the pattern to be matched against the OWL structure.The list of triples in the WHERE clause represents a logical conjunction.
3.2 Assuring the SW development through reasoning
In the SW-DAL Evaluation the objective is verifying whether or not SW com-ponent implementation attains the required level of assurance specified by theSW-DAL. This is done through validation of a set of predicates on the values of
An ontological approach to systematization of SW-FMEA 179
SELECT ?idComponent ?component ?functionality ?failureMode ?failureCause?opMode ?failureEffect ?detMethod ?severityLevel ?compProv ?corrAct?remarks
WHERE { ?component rdf:type <urn:ramses#SWComponent > .?component <urn:ramses#hasItemId > ?idComponent .?component <urn:ramses#hasFunctionality > ?functionality .?functReq <urn:ramases#isImplementedBy > ?component .?functReq <urn:ramses#isInOperationMode > ?opMode .?functionality <urn:ramses#hasFailureMode > ?failureMode .?failureCause <urn:ramses#isCausesOf > ?failureMode .?failureMode <urn:ramses#hasEffect > ?failureEffect .?failureMode <urn:ramses#hasSeverityLevel > ?severityLevel .?failureMode <urn:ramses#hasDetectionMethod > ?detMethod .?failureMode <urn:ramses#hasCompensatingProvision > ?compProv .?failureMode <urn:ramses#hasCorrectiveAction > ?corrAct .?failureMode <urn:ramses#hasRemarks > ?remarks }
Listing 1.1. A SPARQL query producing a result set comprising the values for theconstruction of the SW-FMEA woksheet.
structural and non structural parameters. For example, considering two relevantparameters in our reference context (i.e. McCabe’s cyclomatic complexity andtesting coverage), the corresponding set of predicates relative to the SW-DALassociated with the criticality value c of a functional requirement f takes thefollowing form:
Pc,f = {CC < 5, TC = “all edges”}where CC stands for the McCabe’s cyclomatic complexity and TC stands for thetesting coverage. CC, TC, 5, and “all edges” are instances of the classes SW Pa-rameter, Prevention Mitigation, SW Parameter Accountability, and PreventionMitigation Accountability, respectively (Fig. 3). Now, if all the SW componentscontributing to the realization of a functional requirement f , and not implement-ing a functional requirement with a criticality value greater than c, are realizedwith a cyclomatic complexity less than 5 and are tested with all edges cover-age, then the required SW-DAL is attained and f is considered to be rigorouslyimplemented.
4 Practical experimentation in an industrial context
The ontological organization has been directly captured in a tool, called RAMSES(Reliability Availability Maintainability and Safety Engineering Semantics), re-sorting to well-established semantic web technologies. RAMSES provides severalfunctionalities: it enables the collection of concepts in SW-FMEA projects ex-porting and importing them in OWL format; it automatically produces work-sheets with information required by standards; it enables the verification of thelevel of assurance attained in the SW development.
Specifically, we experimented the feasibility of the methodology and the effec-tiveness of the tool within the project of the APS Autonomous Star TRacker SW(AASTR SW), a star tracker developed by Selex Galileo for the Bepi ColomboMission under the control of Astrium Space Deutschland (ASD) and ESA.
180 I. Bicchierai, G. Bucci, C. Nocentini, and E. Vicario
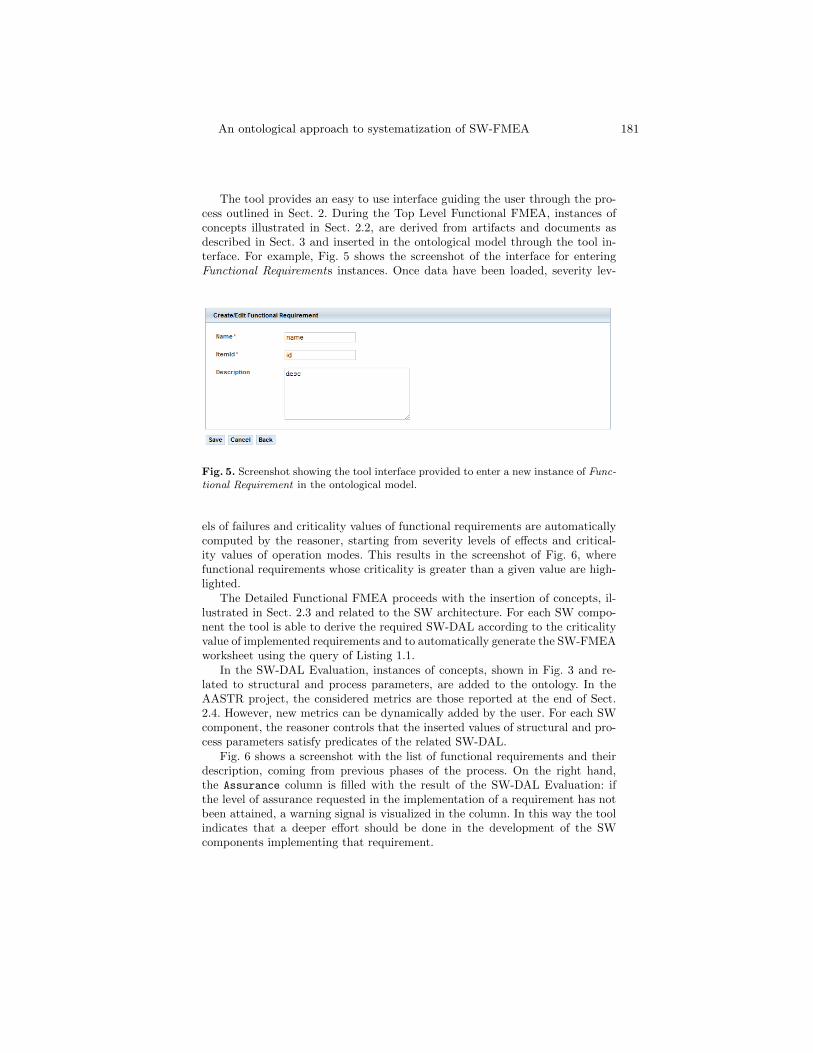
The tool provides an easy to use interface guiding the user through the pro-cess outlined in Sect. 2. During the Top Level Functional FMEA, instances ofconcepts illustrated in Sect. 2.2, are derived from artifacts and documents asdescribed in Sect. 3 and inserted in the ontological model through the tool in-terface. For example, Fig. 5 shows the screenshot of the interface for enteringFunctional Requirements instances. Once data have been loaded, severity lev-
Fig. 5. Screenshot showing the tool interface provided to enter a new instance of Func-tional Requirement in the ontological model.
els of failures and criticality values of functional requirements are automaticallycomputed by the reasoner, starting from severity levels of effects and critical-ity values of operation modes. This results in the screenshot of Fig. 6, wherefunctional requirements whose criticality is greater than a given value are high-lighted.
The Detailed Functional FMEA proceeds with the insertion of concepts, il-lustrated in Sect. 2.3 and related to the SW architecture. For each SW compo-nent the tool is able to derive the required SW-DAL according to the criticalityvalue of implemented requirements and to automatically generate the SW-FMEAworksheet using the query of Listing 1.1.
In the SW-DAL Evaluation, instances of concepts, shown in Fig. 3 and re-lated to structural and process parameters, are added to the ontology. In theAASTR project, the considered metrics are those reported at the end of Sect.2.4. However, new metrics can be dynamically added by the user. For each SWcomponent, the reasoner controls that the inserted values of structural and pro-cess parameters satisfy predicates of the related SW-DAL.
Fig. 6 shows a screenshot with the list of functional requirements and theirdescription, coming from previous phases of the process. On the right hand,the Assurance column is filled with the result of the SW-DAL Evaluation: ifthe level of assurance requested in the implementation of a requirement has notbeen attained, a warning signal is visualized in the column. In this way the toolindicates that a deeper effort should be done in the development of the SWcomponents implementing that requirement.
An ontological approach to systematization of SW-FMEA 181
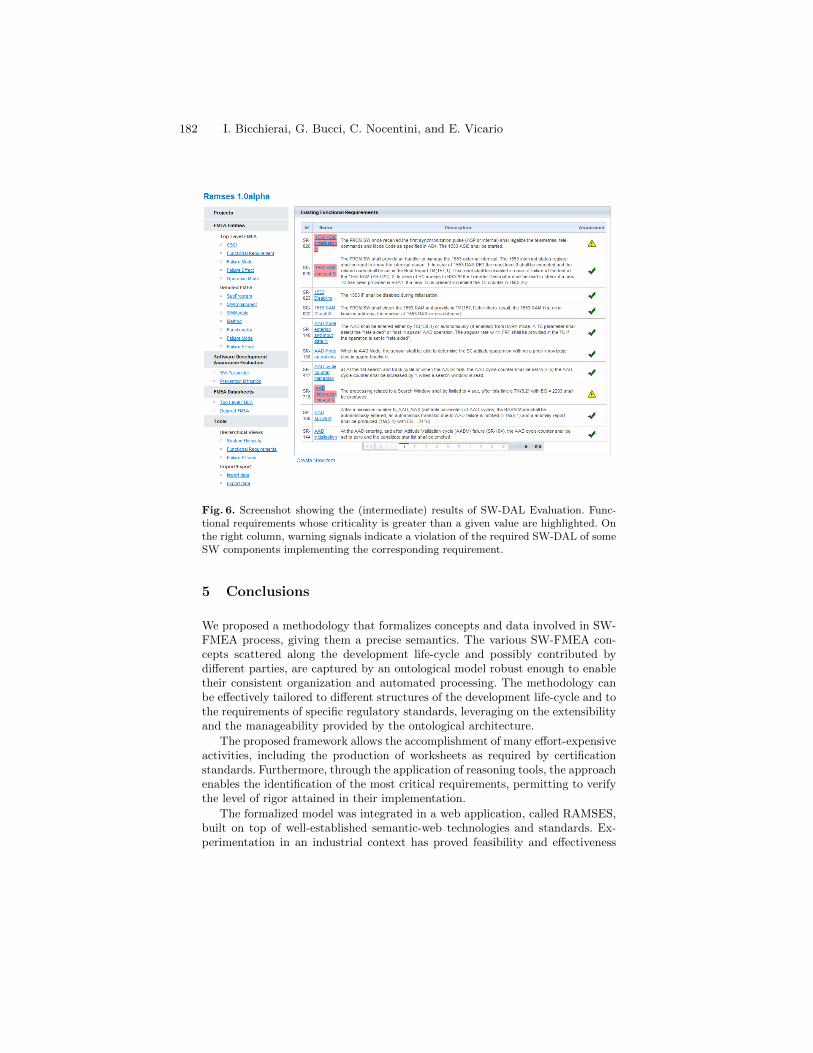
Fig. 6. Screenshot showing the (intermediate) results of SW-DAL Evaluation. Func-tional requirements whose criticality is greater than a given value are highlighted. Onthe right column, warning signals indicate a violation of the required SW-DAL of someSW components implementing the corresponding requirement.
5 Conclusions
We proposed a methodology that formalizes concepts and data involved in SW-FMEA process, giving them a precise semantics. The various SW-FMEA con-cepts scattered along the development life-cycle and possibly contributed bydifferent parties, are captured by an ontological model robust enough to enabletheir consistent organization and automated processing. The methodology canbe effectively tailored to different structures of the development life-cycle and tothe requirements of specific regulatory standards, leveraging on the extensibilityand the manageability provided by the ontological architecture.
The proposed framework allows the accomplishment of many effort-expensiveactivities, including the production of worksheets as required by certificationstandards. Furthermore, through the application of reasoning tools, the approachenables the identification of the most critical requirements, permitting to verifythe level of rigor attained in their implementation.
The formalized model was integrated in a web application, called RAMSES,built on top of well-established semantic-web technologies and standards. Ex-perimentation in an industrial context has proved feasibility and effectiveness
182 I. Bicchierai, G. Bucci, C. Nocentini, and E. Vicario
of both the approach and the tool, showing improvements on the SW-FMEApractices.
Acknowledgments. This work was partially supported by the SW Initiativeof FINMECCANICA group [9]. We are grateful to Marco Benetello of SelexGalileo - Firenze for his precious contribution in driving our investigation towardspractical yet intriguing objectives. We also thank Marco Magnatti for his helpin the preliminary definition of the approach.
References
1. A. Avizienis, J. Laprie, B. Randell, and C. Landwehr. Basic Concepts and Tax-onomy of Dependable and Secure Computing. Dependable and Secure Computing,IEEE Transactions on, 1(1):11 – 33, jan.-march 2004.
2. G. Bucci, V. Sandrucci, and E. Vicario. An Ontological SW Architecture Support-ing Agile Development of Semantic Portals. In Software and Data Technologies,volume 22 of Communications in Computer and Information Science, pages 185–200. Springer Berlin Heidelberg, 2009.
3. BWB - Federal Office for Military Technology and Procurement of Germany. V-Model 97, Lifecycle Process Model-Developing Standard for IT Systems of the Fed-eral Republic of Germany. General Directive No. 250, June 1997.
4. CENELEC European Committee for Electrotechnical Standardization. CENELECEN 50128 Railway applications - Communications, signalling and processing sys-tems - Software for railway control and protection systems, March 2001.
5. L. Dittmann, T. Rademacher, and S. Zelewski. Performing FMEA Using On-tologies. In Proceedings of 18th International Workshop on Qualitative Reasoning(QR04), pages 209–216, Northwestern University, Evanston, USA, August 2004.
6. European Cooperation for Space Standardization. ECSS-Q-ST-30-02C Space prod-uct assurance - Failure modes, effects (and criticality) analysis (FMEA/FMECA),March 2009.
7. European Cooperation for Space Standardization. ECSS-Q-ST-80C Space productassurance - Software product assurance, March 2009.
8. A. Fiaschetti, F. Lavorato, V. Suraci, A. Palo, A. Taglialatela, A. Morgagni,R. Baldelli, and F. Flammini. On the Use of Semantic Technologies to Model andControl Security, Privacy and Dependability in Complex Systems. In Proceedingsof the 30th international conference on Computer safety, reliability, and security,SAFECOMP’11, pages 467–479, Berlin, Heidelberg, 2011. Springer-Verlag.
9. FINMECCANICA. Iniziativa software. http://www.iniziativasoftware.it/.
10. P. Goddard. Software FMEA techniques. In Reliability and Maintainability Sym-posium, 2000. Proceedings. Annual, pages 118 –123, 2000.
11. T. R. Gruber. A Translation Approach to Portable Ontology Specifications. Knowl-edge Acquisition, 5(2):199–220, 1993.
12. I. Horrocks, P. F. Patel-Schneider, H. Boley, S. Tabet, B. Grosof, and M. Dean.SWRL: A Semantic Web Rule Language Combining OWL and RuleML.http://www.w3.org/Submission/SWRL/, May 2004.
13. IEEE Computer Society. IEEE Guide to Software Requirements Specifications(Std 830 - 1993) . Technical report, IEEE, 1993.
An ontological approach to systematization of SW-FMEA 183
14. IEEE Computer Society. IEEE Recommended Practice for Software Design De-scriptions (Std 1016 - 1998) . Technical report, IEEE, 1998.
15. International Electrotechnical Commission. IEC-60812 Analysis techniques forsystem reliability - Procedure for failure mode and effects analysis (FMEA), 1985.
16. M. Kifer, G. Lausen, and J. Wu. Logical foundations of object-oriented and frame-based languages. Journal of the Association for Computing Machinery, 42:741–843,1995.
17. B. H. Lee. Using FMEA models and ontologies to build diagnostic models. Artif.Intell. Eng. Des. Anal. Manuf., 15:281–293, September 2001.
18. N. Leveson. Safeware: system safety and computers. Addison-Wesley, 1995.19. R. R. Lutz and R. M. Woodhouse. Requirements analysis using forward and
backward search. Annals of Software Engineering, 3:459–475, 1997.20. D. L. McGuinness and F. van Harmelen. OWL Web Ontology Language.
http://www.w3.org/TR/owl-features/, February 2004.21. National Aeronautics and Space Administration. NASA Software Safety Guidebook
NASA-GB-8719.13 - NASA TECHNICAL STANDARD, March 2004.22. Object Management Group. Ontology Definition Metamodel v1.0, 2009.23. H. Pentti and H. Atte. Failure Mode and Effects Analysis of software-based au-
tomation systems - STUK-YTO-TR 190. VTT Industrial Systems - STUK, August2002.
24. E. Prud’hommeaux and A. Seaborne. SPARQL query language for RDF.http://www.w3.org/TR/rdf-sparql-query/, January 2008.
25. PTC Product Development Company. Windchill FMEA (formerly Relex FMEA)official website. http://www.ptc.com/product/windchill/fmea.
26. Radio Technical Commission for Aeronautics. DO-178B, Software Considerationsin Airborne Systems and Equipment Certification, 1992.
27. E. S. Raymond. The New Hacker’s Dictionary. The MIT Press, Cambridge, 1991.28. D. J. Reifer. Software Failure Modes and Effects Analysis. Reliability, IEEE
Transactions on, R-28(3):247 –249, aug. 1979.29. ReliaSoft. XFMEA official website. http://www.reliasoft.com/xfmea/.30. R. A. Sahner, K. S. Trivedi, and A. Puliafito. Performance and reliability analy-
sis of computer systems: an example-based approach using the SHARPE softwarepackage. Kluwer Academic Publishers, Norwell, MA, USA, 1996.
31. E. Sirin, B. Parsia, B. C. Grau, A. Kalyanpur, and Y. Katz. Pellet: A practicalOWL-DL reasoner. J. Web Sem., 5(2):51–53, 2007.
32. Society of Automotive Engineers. SAE J-1739 Potential Failure Mode and EffectsAnalysis in Design (Design FMEA) and Potential Failure Mode and Effects Anal-ysis in Manufacturing and assembly Processes (Process FMEA) Reference Manual,1994.
33. United States Department of Defense. MIL-STD-1629A, Procedures for Performinga Failure Mode, Effects and Criticality Analysis. Technical report, USDoD, 1980.
34. United States Department of Defense. MIL-STD-498, Military Standard For Soft-ware Development And Documentation. Technical report, USDoD, 1994.
184 I. Bicchierai, G. Bucci, C. Nocentini, and E. Vicario
Online Black-box Failure Prediction for MissionCritical Distributed Systems
Roberto Baldoni1, Giorgia Lodi1, Luca Montanari1, Guido Mariotta1, andMarco Rizzuto2
1 “Sapienza” University of Rome, Via Ariosto 25, 00185, Rome, Italy2 Selex Sistemi Integrati, Finmeccanica Group, Rome, Italy
Abstract. This paper introduces a novel approach to failure predictionfor mission critical distributed systems that has the distinctive features tobe black-box, non-intrusive and online. The approach combines ComplexEvent Processing (CEP) and Hidden Markov Models (HMM) so as toanalyze symptoms of failures that might occur in the form of anomalousconditions of performance metrics identified for such purpose. The paperdescribes an architecture named CASPER, based on CEP and HMM,that relies on sniffed information from the communication network of amission critical system, only, for predicting anomalies that can lead tosoftware failures. An instance of CASPER has been implemented, trainedand tuned to monitor a real Air Traffic Control (ATC) system. An ex-tensive experimental evaluation of CASPER is presented. The obtainedresults show (i) a very low percentage of false positives over both normaland under stress conditions, and (ii) a sufficiently high failure predictiontime that allows the system to apply appropriate recovery procedures.
1 Introduction
Context and Motivation. Distributed mission critical systems such as air traf-fic control, battlefield or naval command and control systems consist of severalapplications distributed over a number of nodes connected through a LAN orWAN. The applications are constructed out of communicating software compo-nents that are deployed on those nodes and may change over time. The dynamicnature of applications is principally due to (i) the employed policies for resilienceto software or hardware failures, (ii) the adopted load balancing strategies or (iii)the management of new comers. In such complex real time systems, failures mayhappen with potentially catastrophic consequences for their entire functioning.The industrial trend is to face failures by using, during operational system life,supervision services that are not only capable of detecting and certificating afailure, but also predicting and preventing it through an analysis of the overallsystem behavior. Such services shall have a minimum impact on the supervisedsystem and possibly no interaction with the operational applications. The goalis to plug-in a “ready-to-use observer” that acts at run time and is both non-intrusive and black-box, i.e., it considers nodes and applications as black boxes.In mission critical systems, a large amount of data deriving from communica-tions among applications transits on the network; thus, the ”observer” can focus
on that type of data, only, in order to recognize many aspects of the actual in-teractions among the components of the system. The motivation to adopt thisnon-intrusive and black-box approach is twofold. Firstly, applications changeand evolve over time: grounding failure prediction on the semantic of the appli-cations’ communications would require a deep knowledge of the specific systemdesign, a proven field experience, and a non-negligible effort to keep aligned thesupervision service to the controlled system. Secondly, interactions between theservice and system to be monitored might lead to unexpected behaviors, hardlymanageable as fully unknown and unpredictable.
Contribution. In this paper we introduce the design, implementation and ex-perimental evaluation of a novel online, non-intrusive and black-box failure pre-diction architecture we named CASPER that can be used for monitoring missioncritical distributed systems. CASPER is (i) online, as the failure prediction iscarried out during the normal functioning of the monitored system, (ii) non-intrusive, as the failure prediction does not use any kind of information on thestatus of the nodes (e.g., CPU, memory) of the monitored system; only infor-mation concerning the network to which the nodes are connected is exploitedas well as that regarding the specific network protocol used by the system toexchange information among the nodes (e.g., SOAP, GIOP); and (iii) black-box,as no knowledge of the application’s internals and of the application logic of thesystem is analyzed. Specifically, the aim of CASPER is to recognize any devi-ation from normal behaviors of the monitored system by analyzing symptomsof failures that might occur in the form of anomalous conditions of specific per-formance metrics. In doing so, CASPER combines, in a novel fashion, ComplexEvent Processing (CEP) [1] and Hidden Markov Models (HMM) [2]. The CEPengine computes at run time the performance metrics. These are then passedto the HMM in order to recognize symptoms of an upcoming failure. Finally,the symptoms are evaluated by a failure prediction module that filters out asmany false positives as possible and provides at the same time a failure pre-diction as early as possible. Note that we use HMM rather than other morecomplex dynamic bayesian networks [3] since it provides us with high accu-racy, with respect to the problem we wish to address, through simple and lowcomplexity algorithms. We deployed CASPER for monitoring a real Air TrafficControl (ATC) system. Using the network data of such a system in the presenceof both steady state performance behaviors and unstable state behaviors, wefirst trained CASPER in order to stabilize HMM and tune the failure predictionmodule. Then we conducted an experimental evaluation of CASPER that aimedto show its effectiveness in timely predicting failures in the presence of memoryand I/O stress conditions.
Related work. A large body of research is devoted to the investigation ofapproaches to online failure prediction. [4] presents an error monitoring-basedfailure prediction technique that uses Hidden Semi-Markov Model (HSMM) inorder to recognize error patterns that can lead to failures. This approach isevent-driven as no time intervals are defined: the errors are events that canbe triggered anytime. [5] describes two non-intrusive data driven modeling ap-proaches to error monitoring: one based on a Discrete Time Markov Model, and
186 R. Baldoni, G. Lodi, G. Mariotta, L. Montanari, and M. Rizzuto
a second approach based on function approximation. The difference betweenour approach and these works is twofold: firstly we propose a symptoms mon-itoring system in contrast to error monitoring, moreover, our approach is notevent-based but it can be defined period-based [6] as we use Hidden MarkovModels (discrete time) to recognize, in the short term, patterns of specific per-formance metrics exhibiting the evidence of symptoms of failures. In the contextof symptoms monitoring mechanisms, there exist research works that use black-box approaches [7]. [8] presents ALERT; an anomaly prediction system thatconsiders the hosts of the monitored system as black-boxes and that collectsmetrics concerning CPU consumption, memory usage, input/output data rate.The authors in [9] consider the problem of discovering performance bottlenecksin large scale distributed systems consisting of black-box software components.The system introduced in [9] solves the problem by using message-level tracesrelated to the activity of the monitored system in a non-intrusive fashion (pas-sively and without any knowledge of node internals or semantics of messages).[10] analyzes the correlation in time and space of failure events and implementsa long-term failure prediction framework named hPrefects for such a purpose.
We differ from the earlier mentioned works as we employ an approach thatis not only black-box but also non-intrusive. It is true that we use message-level traces as [9]; however, we combine in a novel fashion both CEP for networkperformance metrics computation and HMM to infer the system state. Note thattypically HMM is widely used in failure prediction to build a components’ statediagnosis [11]. In our architecture the entire system state is modeled as a hiddenstate and thus inferred by HMM.
Finally, there exist other types of researches [12] that apply online failureprediction to distributed stream processing systems, mostly using decision treeand classifiers. We do not specifically target these systems, and we use differenttechniques (CEP and HMM) to predict failures.Structure of the paper. Section 2 presents the failure and prediction modelwe adopt in the design of CASPER described in section 3. Section 4 introducesCASPER implementation for a real ATC mission critical system. Section 5 dis-cusses the experimental evaluation of CASPER we have conducted in ATC.Finally, section 6 concludes the paper highlighting our future works.
2 Failure and Prediction Model
We model the distributed system to be monitored as a set of nodes that runone or more services. Nodes exchange messages over a communication network.Nodes or services can be subject to failures. A failure is an event for whichthe service delivered by a system deviates from its specification [13]. A failureis always preceded by a fault (e.g., I/O error, memory misusage); however, thevice versa might not be always true. i.e., a fault inside a system could not alwaysbring to a failure as the system could tolerate, for example by design, such fault.
Faults that lead to failures, independently of the fault’s root cause, affectthe system in an observable and identifiable way. Thus, faults can generate side-effects in the monitored systems till the failure occurs. Our work is based on the
Online Black-box Failure Prediction for Mission Critical DistributedSystems 187
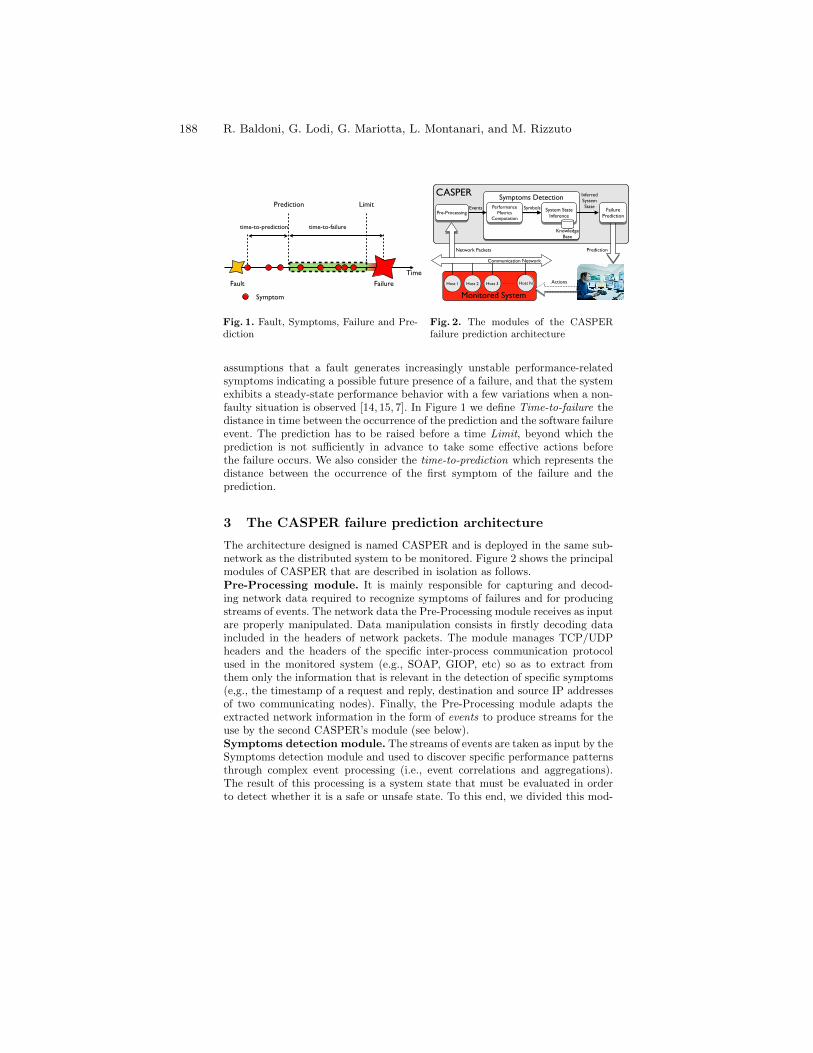
Time
Failure
Symptom
Fault
Time
FaultAlert
Failure Avoidance
Prediction Limit
time-to-prediction time-to-failure
Fig. 1. Fault, Symptoms, Failure and Pre-diction
CASPER Symptoms DetectionPerformance
Metrics Computation
System State Inference
Pre-ProcessingSymbolsEvents Failure
Prediction
Network Packets
InferredSystemState
Prediction
Host N
Monitored System
Host 1 Host 2 Host 3
Communication Network
Actions
KnowledgeBase
Fig. 2. The modules of the CASPERfailure prediction architecture
assumptions that a fault generates increasingly unstable performance-relatedsymptoms indicating a possible future presence of a failure, and that the systemexhibits a steady-state performance behavior with a few variations when a non-faulty situation is observed [14, 15, 7]. In Figure 1 we define Time-to-failure thedistance in time between the occurrence of the prediction and the software failureevent. The prediction has to be raised before a time Limit, beyond which theprediction is not sufficiently in advance to take some effective actions beforethe failure occurs. We also consider the time-to-prediction which represents thedistance between the occurrence of the first symptom of the failure and theprediction.
3 The CASPER failure prediction architecture
The architecture designed is named CASPER and is deployed in the same sub-network as the distributed system to be monitored. Figure 2 shows the principalmodules of CASPER that are described in isolation as follows.Pre-Processing module. It is mainly responsible for capturing and decod-ing network data required to recognize symptoms of failures and for producingstreams of events. The network data the Pre-Processing module receives as inputare properly manipulated. Data manipulation consists in firstly decoding dataincluded in the headers of network packets. The module manages TCP/UDPheaders and the headers of the specific inter-process communication protocolused in the monitored system (e.g., SOAP, GIOP, etc) so as to extract fromthem only the information that is relevant in the detection of specific symptoms(e,g., the timestamp of a request and reply, destination and source IP addressesof two communicating nodes). Finally, the Pre-Processing module adapts theextracted network information in the form of events to produce streams for theuse by the second CASPER’s module (see below).Symptoms detection module. The streams of events are taken as input by theSymptoms detection module and used to discover specific performance patternsthrough complex event processing (i.e., event correlations and aggregations).The result of this processing is a system state that must be evaluated in orderto detect whether it is a safe or unsafe state. To this end, we divided this mod-
188 R. Baldoni, G. Lodi, G. Mariotta, L. Montanari, and M. Rizzuto
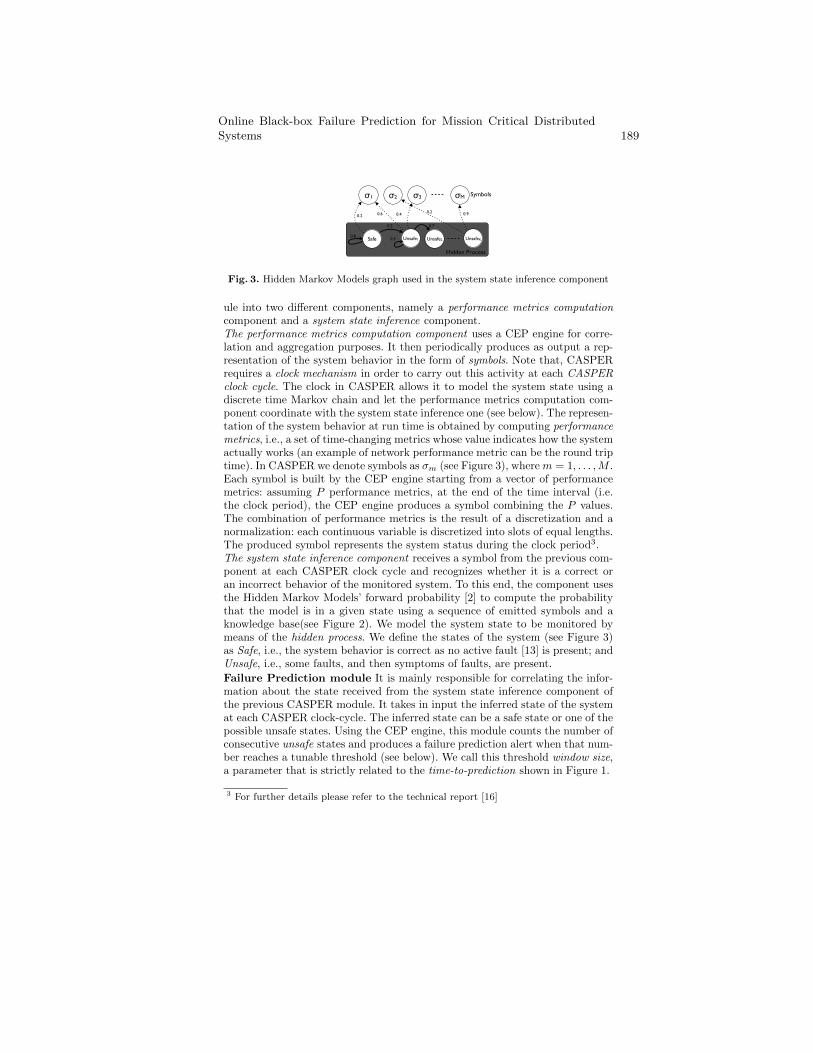
Safe Unsafe1
σ2σ1 σMσ3
Unsafe2 UnsafeK
Hidden Process
Symbols
0.8
0.2 0.6 0.4 0.2 0.9
0.2 0.7
0.3
Fig. 3. Hidden Markov Models graph used in the system state inference component
ule into two different components, namely a performance metrics computationcomponent and a system state inference component.The performance metrics computation component uses a CEP engine for corre-lation and aggregation purposes. It then periodically produces as output a rep-resentation of the system behavior in the form of symbols. Note that, CASPERrequires a clock mechanism in order to carry out this activity at each CASPERclock cycle. The clock in CASPER allows it to model the system state using adiscrete time Markov chain and let the performance metrics computation com-ponent coordinate with the system state inference one (see below). The represen-tation of the system behavior at run time is obtained by computing performancemetrics, i.e., a set of time-changing metrics whose value indicates how the systemactually works (an example of network performance metric can be the round triptime). In CASPER we denote symbols as σm (see Figure 3), where m = 1, . . . ,M .Each symbol is built by the CEP engine starting from a vector of performancemetrics: assuming P performance metrics, at the end of the time interval (i.e.the clock period), the CEP engine produces a symbol combining the P values.The combination of performance metrics is the result of a discretization and anormalization: each continuous variable is discretized into slots of equal lengths.The produced symbol represents the system status during the clock period3.The system state inference component receives a symbol from the previous com-ponent at each CASPER clock cycle and recognizes whether it is a correct oran incorrect behavior of the monitored system. To this end, the component usesthe Hidden Markov Models’ forward probability [2] to compute the probabilitythat the model is in a given state using a sequence of emitted symbols and aknowledge base(see Figure 2). We model the system state to be monitored bymeans of the hidden process. We define the states of the system (see Figure 3)as Safe, i.e., the system behavior is correct as no active fault [13] is present; andUnsafe, i.e., some faults, and then symptoms of faults, are present.
Failure Prediction module It is mainly responsible for correlating the infor-mation about the state received from the system state inference component ofthe previous CASPER module. It takes in input the inferred state of the systemat each CASPER clock-cycle. The inferred state can be a safe state or one of thepossible unsafe states. Using the CEP engine, this module counts the number ofconsecutive unsafe states and produces a failure prediction alert when that num-ber reaches a tunable threshold (see below). We call this threshold window size,a parameter that is strictly related to the time-to-prediction shown in Figure 1.
3 For further details please refer to the technical report [16]
Online Black-box Failure Prediction for Mission Critical DistributedSystems 189
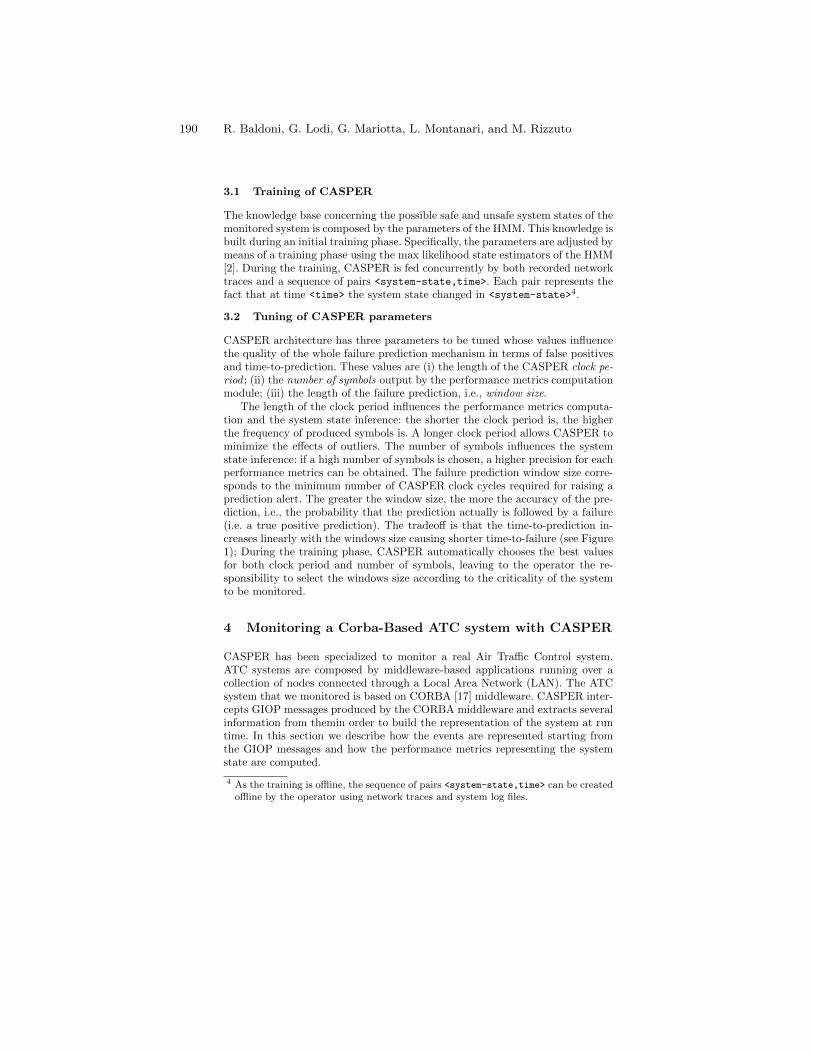
3.1 Training of CASPER
The knowledge base concerning the possible safe and unsafe system states of themonitored system is composed by the parameters of the HMM. This knowledge isbuilt during an initial training phase. Specifically, the parameters are adjusted bymeans of a training phase using the max likelihood state estimators of the HMM[2]. During the training, CASPER is fed concurrently by both recorded networktraces and a sequence of pairs <system-state,time>. Each pair represents thefact that at time <time> the system state changed in <system-state>4.
3.2 Tuning of CASPER parameters
CASPER architecture has three parameters to be tuned whose values influencethe quality of the whole failure prediction mechanism in terms of false positivesand time-to-prediction. These values are (i) the length of the CASPER clock pe-riod ; (ii) the number of symbols output by the performance metrics computationmodule; (iii) the length of the failure prediction, i.e., window size.
The length of the clock period influences the performance metrics computa-tion and the system state inference: the shorter the clock period is, the higherthe frequency of produced symbols is. A longer clock period allows CASPER tominimize the effects of outliers. The number of symbols influences the systemstate inference: if a high number of symbols is chosen, a higher precision for eachperformance metrics can be obtained. The failure prediction window size corre-sponds to the minimum number of CASPER clock cycles required for raising aprediction alert. The greater the window size, the more the accuracy of the pre-diction, i.e., the probability that the prediction actually is followed by a failure(i.e. a true positive prediction). The tradeoff is that the time-to-prediction in-creases linearly with the windows size causing shorter time-to-failure (see Figure1); During the training phase, CASPER automatically chooses the best valuesfor both clock period and number of symbols, leaving to the operator the re-sponsibility to select the windows size according to the criticality of the systemto be monitored.
4 Monitoring a Corba-Based ATC system with CASPER
CASPER has been specialized to monitor a real Air Traffic Control system.ATC systems are composed by middleware-based applications running over acollection of nodes connected through a Local Area Network (LAN). The ATCsystem that we monitored is based on CORBA [17] middleware. CASPER inter-cepts GIOP messages produced by the CORBA middleware and extracts severalinformation from themin order to build the representation of the system at runtime. In this section we describe how the events are represented starting fromthe GIOP messages and how the performance metrics representing the systemstate are computed.
4 As the training is offline, the sequence of pairs <system-state,time> can be createdoffline by the operator using network traces and system log files.
190 R. Baldoni, G. Lodi, G. Mariotta, L. Montanari, and M. Rizzuto
Event representation. Each GIOP message intercepted by CASPER becomesan event feeding the CEP engine of the performance metrics computation com-ponent. Each event contains (i)Request ID : The identifier of a request-replyinteraction between two CORBA entities; (ii)Message Type: A field that charac-terizes the message and that can assume different values (e.g., Request, Reply,Close Connection) and (iii)Reply Status: It specifies whether there were excep-tions during the request-reply interaction and, if so, the kind of the exception. Inaddition, we insert into the event further information related to the lower levelprotocols (TCP/UDP) such as source and destination IP, port, and timestamp.In order not to capture sensitive information of the ATC system (such as flightplans or routes), CASPER ignores the payload of the messages.Performance metrics. Events sent to the CEP engine are correlated online soas to produce so-called performance metrics. After long time of observations ofseveral metrics of the ATC CORBA-based system, we identified the followingsmall set of metrics that well characterize the system, showing a steady behaviorin case of absence of faults, and an unstable behavior in presence of faults:
– Round Trip Time: elapsed time between a request and the relative reply;– Rate of the messages carrying an exception: the number of reply messages
with exception over the number of caught messages;– Average message size: the mean of the messages size;– Percentage of Replies: the number of replies over the number of requests in
a given spatial or temporal window;– Number of Requests without Reply: the number of requests expecting a reply
that do not receive the reply;– Messages Rate: the number of messages exchanged in a fixed time.
To compute the performance metrics we correlate the sniffed network datausing the CEP engine ESPER [1]. This choice is motivated by its low cost ofownership compared to other similar systems (e.g. [18]) and its offered usability.
5 CASPER Experimental Evaluation
We deployed CASPER so as to monitor an Air Traffic Control system of SelexSistemi Integrati, one of the major players of the ATC market. The first part ofthe work on the field has been to collect a large amount of network traces fromthe ATC underlying communication network when in operation. These tracesrepresented steady state performance behaviors. Additionally, on the testingenvironment of the ATC system we stressed some of the nodes till achievingsoftware failure conditions, and we collected the relative traces. In our test field,we consider one of the nodes of the ATC system to be affected by either Memoryor I/O stress (according to the experience of the ATC designers, these two stressconditions are typical of the observed system). After collecting all these traces,we trained CASPER. At end of the training phase, we deployed CASPER againon the testing environment of the ATC system in order to conduct experimentsin operative conditions. Our evaluation assesses the system state inference com-ponent accuracy and the failure prediction module accuracy. In particular, we
Online Black-box Failure Prediction for Mission Critical DistributedSystems 191
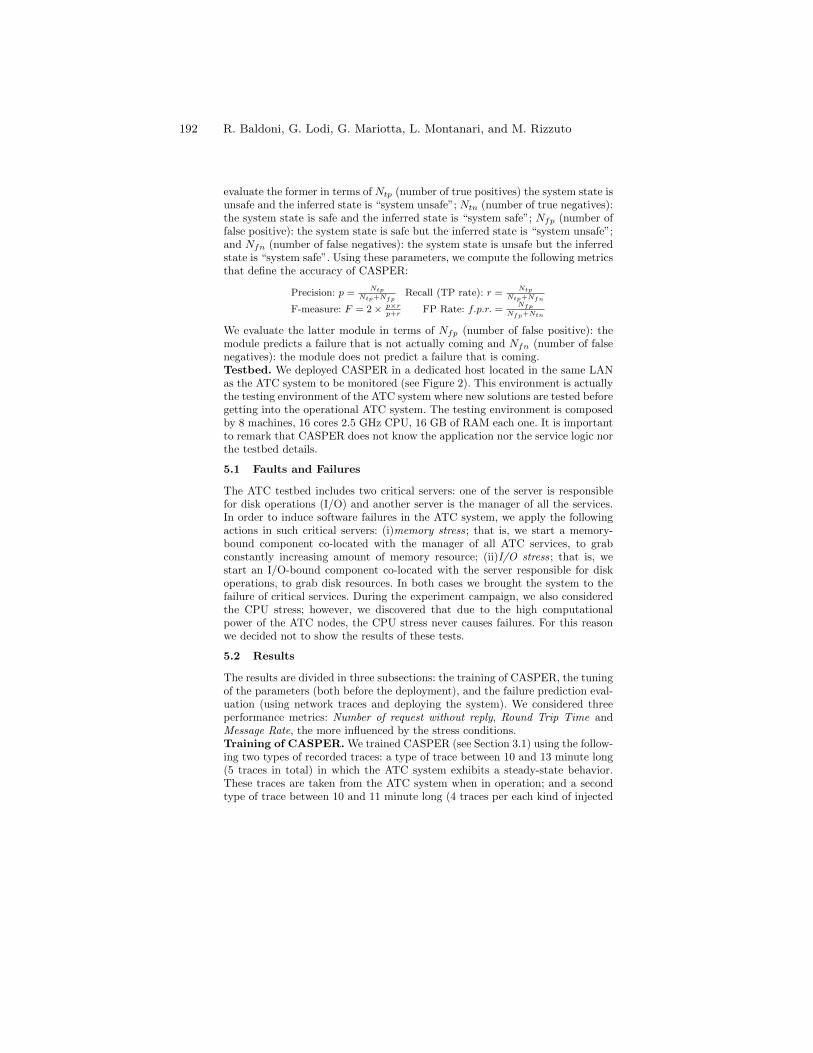
evaluate the former in terms of Ntp (number of true positives) the system state isunsafe and the inferred state is “system unsafe”; Ntn (number of true negatives):the system state is safe and the inferred state is “system safe”; Nfp (number offalse positive): the system state is safe but the inferred state is “system unsafe”;and Nfn (number of false negatives): the system state is unsafe but the inferredstate is “system safe”. Using these parameters, we compute the following metricsthat define the accuracy of CASPER:
Precision: p =Ntp
Ntp+NfpRecall (TP rate): r =
Ntp
Ntp+Nfn
F-measure: F = 2 × p×rp+r
FP Rate: f.p.r. =Nfp
Nfp+Ntn
We evaluate the latter module in terms of Nfp (number of false positive): themodule predicts a failure that is not actually coming and Nfn (number of falsenegatives): the module does not predict a failure that is coming.Testbed. We deployed CASPER in a dedicated host located in the same LANas the ATC system to be monitored (see Figure 2). This environment is actuallythe testing environment of the ATC system where new solutions are tested beforegetting into the operational ATC system. The testing environment is composedby 8 machines, 16 cores 2.5 GHz CPU, 16 GB of RAM each one. It is importantto remark that CASPER does not know the application nor the service logic northe testbed details.
5.1 Faults and Failures
The ATC testbed includes two critical servers: one of the server is responsiblefor disk operations (I/O) and another server is the manager of all the services.In order to induce software failures in the ATC system, we apply the followingactions in such critical servers: (i)memory stress; that is, we start a memory-bound component co-located with the manager of all ATC services, to grabconstantly increasing amount of memory resource; (ii)I/O stress; that is, westart an I/O-bound component co-located with the server responsible for diskoperations, to grab disk resources. In both cases we brought the system to thefailure of critical services. During the experiment campaign, we also consideredthe CPU stress; however, we discovered that due to the high computationalpower of the ATC nodes, the CPU stress never causes failures. For this reasonwe decided not to show the results of these tests.
5.2 Results
The results are divided in three subsections: the training of CASPER, the tuningof the parameters (both before the deployment), and the failure prediction eval-uation (using network traces and deploying the system). We considered threeperformance metrics: Number of request without reply, Round Trip Time andMessage Rate, the more influenced by the stress conditions.Training of CASPER. We trained CASPER (see Section 3.1) using the follow-ing two types of recorded traces: a type of trace between 10 and 13 minute long(5 traces in total) in which the ATC system exhibits a steady-state behavior.These traces are taken from the ATC system when in operation; and a secondtype of trace between 10 and 11 minute long (4 traces per each kind of injected
192 R. Baldoni, G. Lodi, G. Mariotta, L. Montanari, and M. Rizzuto
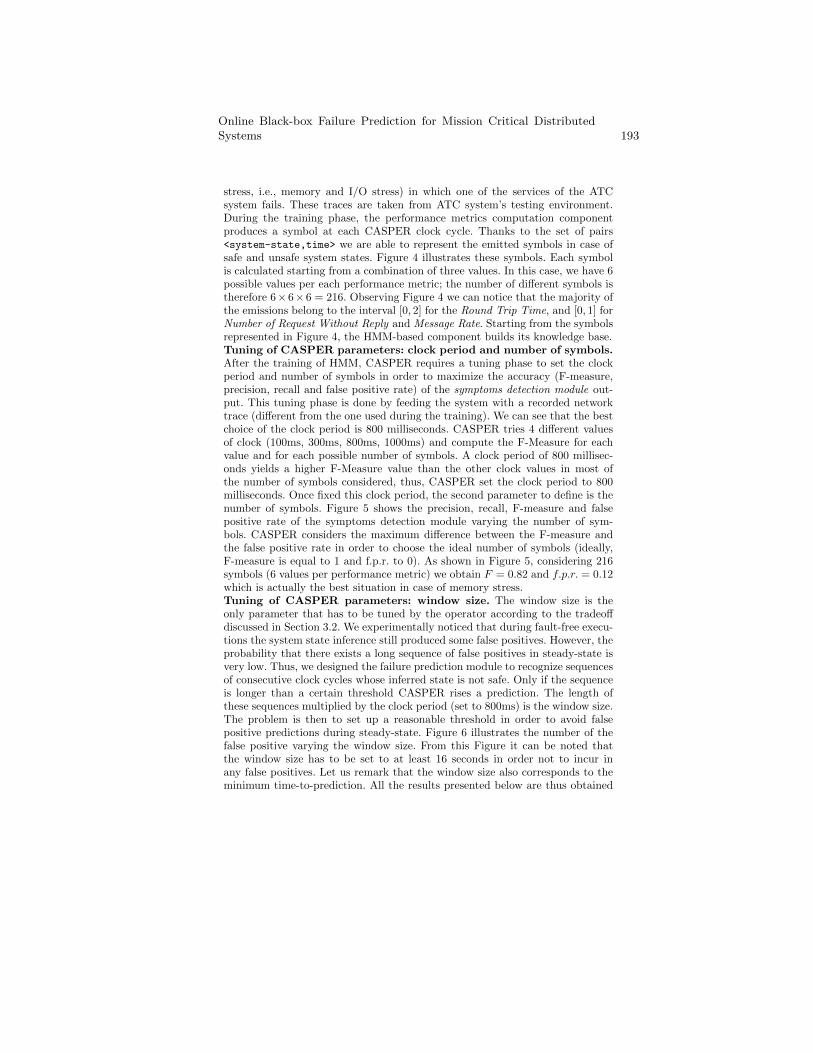
stress, i.e., memory and I/O stress) in which one of the services of the ATCsystem fails. These traces are taken from ATC system’s testing environment.During the training phase, the performance metrics computation componentproduces a symbol at each CASPER clock cycle. Thanks to the set of pairs<system-state,time> we are able to represent the emitted symbols in case ofsafe and unsafe system states. Figure 4 illustrates these symbols. Each symbolis calculated starting from a combination of three values. In this case, we have 6possible values per each performance metric; the number of different symbols istherefore 6× 6× 6 = 216. Observing Figure 4 we can notice that the majority ofthe emissions belong to the interval [0, 2] for the Round Trip Time, and [0, 1] forNumber of Request Without Reply and Message Rate. Starting from the symbolsrepresented in Figure 4, the HMM-based component builds its knowledge base.Tuning of CASPER parameters: clock period and number of symbols.After the training of HMM, CASPER requires a tuning phase to set the clockperiod and number of symbols in order to maximize the accuracy (F-measure,precision, recall and false positive rate) of the symptoms detection module out-put. This tuning phase is done by feeding the system with a recorded networktrace (different from the one used during the training). We can see that the bestchoice of the clock period is 800 milliseconds. CASPER tries 4 different valuesof clock (100ms, 300ms, 800ms, 1000ms) and compute the F-Measure for eachvalue and for each possible number of symbols. A clock period of 800 millisec-onds yields a higher F-Measure value than the other clock values in most ofthe number of symbols considered, thus, CASPER set the clock period to 800milliseconds. Once fixed this clock period, the second parameter to define is thenumber of symbols. Figure 5 shows the precision, recall, F-measure and falsepositive rate of the symptoms detection module varying the number of sym-bols. CASPER considers the maximum difference between the F-measure andthe false positive rate in order to choose the ideal number of symbols (ideally,F-measure is equal to 1 and f.p.r. to 0). As shown in Figure 5, considering 216symbols (6 values per performance metric) we obtain F = 0.82 and f.p.r. = 0.12which is actually the best situation in case of memory stress.Tuning of CASPER parameters: window size. The window size is theonly parameter that has to be tuned by the operator according to the tradeoffdiscussed in Section 3.2. We experimentally noticed that during fault-free execu-tions the system state inference still produced some false positives. However, theprobability that there exists a long sequence of false positives in steady-state isvery low. Thus, we designed the failure prediction module to recognize sequencesof consecutive clock cycles whose inferred state is not safe. Only if the sequenceis longer than a certain threshold CASPER rises a prediction. The length ofthese sequences multiplied by the clock period (set to 800ms) is the window size.The problem is then to set up a reasonable threshold in order to avoid falsepositive predictions during steady-state. Figure 6 illustrates the number of thefalse positive varying the window size. From this Figure it can be noted thatthe window size has to be set to at least 16 seconds in order not to incur inany false positives. Let us remark that the window size also corresponds to theminimum time-to-prediction. All the results presented below are thus obtained
Online Black-box Failure Prediction for Mission Critical DistributedSystems 193
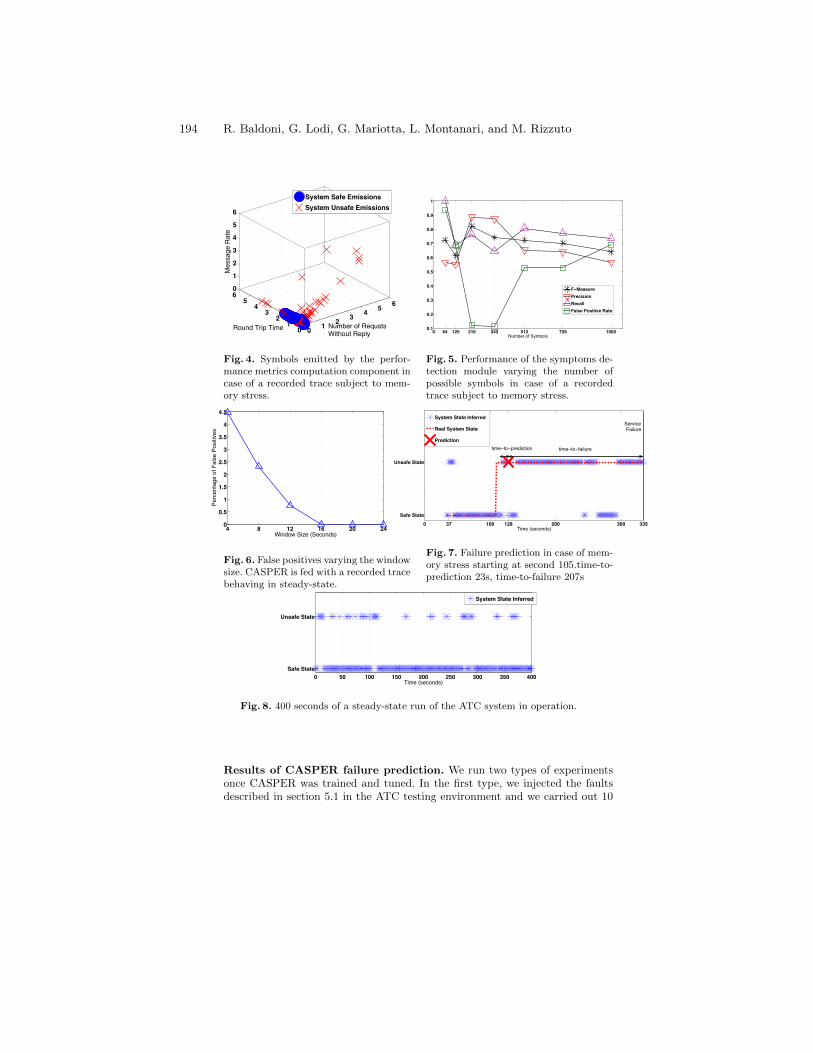
using a window size of 16 seconds.
0 1 2 3 4 5 6
01
23
45
60
1
2
3
4
5
6
Number of Requsts Without Reply
Round Trip Time
Mes
sage
Rat
e
System Safe EmissionsSystem Unsafe Emissions
Fig. 4. Symbols emitted by the perfor-mance metrics computation component incase of a recorded trace subject to mem-ory stress.
0 64 125 216 343 512 729 10000.1
0.2
0.3
0.4
0.5
0.6
0.7
0.8
0.9
1
Number of Symbols
F−MeasurePrecisionRecallFalse Positive Rate
Fig. 5. Performance of the symptoms de-tection module varying the number ofpossible symbols in case of a recordedtrace subject to memory stress.
4 8 12 16 20 240
0.5
1
1.5
2
2.5
3
3.5
4
4.5
Window Size (Seconds)
Perc
enta
ge o
f Fal
se P
ositi
ves
Fig. 6. False positives varying the windowsize. CASPER is fed with a recorded tracebehaving in steady-state.
0 37 100 200 300 335128Safe State
Unsafe State
Time (seconds)
System State Inferred
Real System State
Prediction
ServiceFailure
time−to−failuretime−to−prediction
Fig. 7. Failure prediction in case of mem-ory stress starting at second 105.time-to-prediction 23s, time-to-failure 207s
0 50 100 150 200 250 300 350 400Safe State
Unsafe State
Time (seconds)
System State Inferred
Fig. 8. 400 seconds of a steady-state run of the ATC system in operation.
Results of CASPER failure prediction. We run two types of experimentsonce CASPER was trained and tuned. In the first type, we injected the faultsdescribed in section 5.1 in the ATC testing environment and we carried out 10
194 R. Baldoni, G. Lodi, G. Mariotta, L. Montanari, and M. Rizzuto
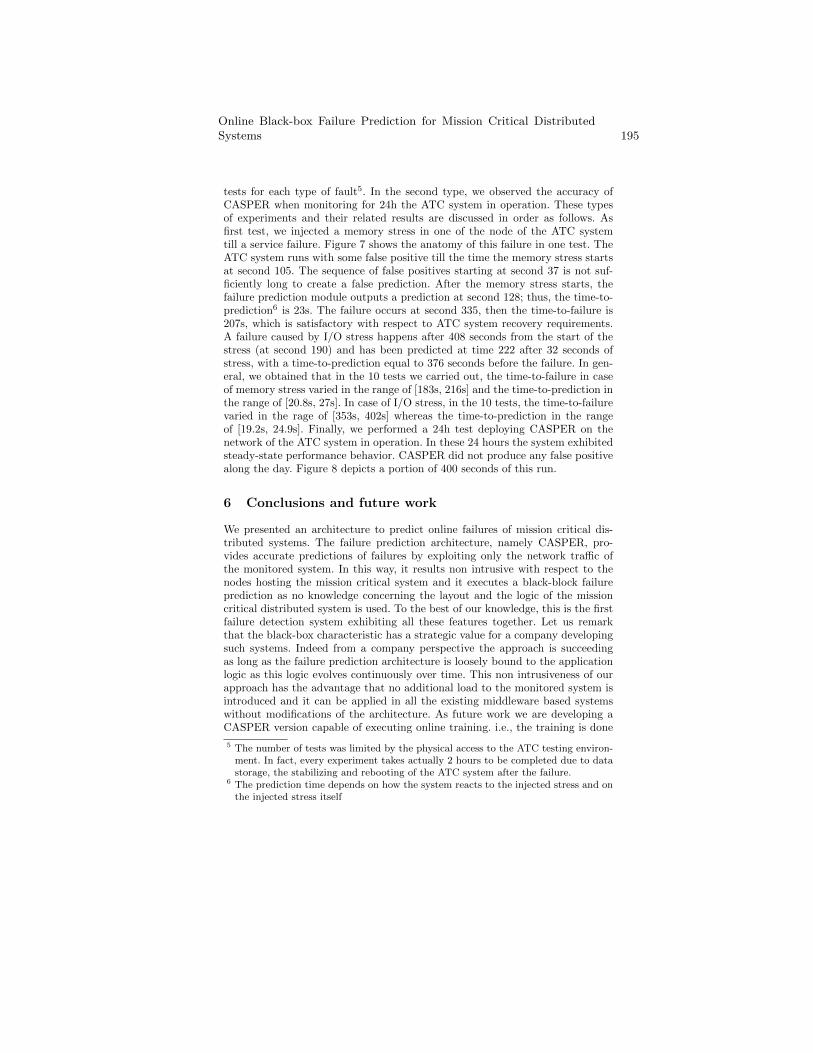
tests for each type of fault5. In the second type, we observed the accuracy ofCASPER when monitoring for 24h the ATC system in operation. These typesof experiments and their related results are discussed in order as follows. Asfirst test, we injected a memory stress in one of the node of the ATC systemtill a service failure. Figure 7 shows the anatomy of this failure in one test. TheATC system runs with some false positive till the time the memory stress startsat second 105. The sequence of false positives starting at second 37 is not suf-ficiently long to create a false prediction. After the memory stress starts, thefailure prediction module outputs a prediction at second 128; thus, the time-to-prediction6 is 23s. The failure occurs at second 335, then the time-to-failure is207s, which is satisfactory with respect to ATC system recovery requirements.A failure caused by I/O stress happens after 408 seconds from the start of thestress (at second 190) and has been predicted at time 222 after 32 seconds ofstress, with a time-to-prediction equal to 376 seconds before the failure. In gen-eral, we obtained that in the 10 tests we carried out, the time-to-failure in caseof memory stress varied in the range of [183s, 216s] and the time-to-prediction inthe range of [20.8s, 27s]. In case of I/O stress, in the 10 tests, the time-to-failurevaried in the rage of [353s, 402s] whereas the time-to-prediction in the rangeof [19.2s, 24.9s]. Finally, we performed a 24h test deploying CASPER on thenetwork of the ATC system in operation. In these 24 hours the system exhibitedsteady-state performance behavior. CASPER did not produce any false positivealong the day. Figure 8 depicts a portion of 400 seconds of this run.
6 Conclusions and future work
We presented an architecture to predict online failures of mission critical dis-tributed systems. The failure prediction architecture, namely CASPER, pro-vides accurate predictions of failures by exploiting only the network traffic ofthe monitored system. In this way, it results non intrusive with respect to thenodes hosting the mission critical system and it executes a black-block failureprediction as no knowledge concerning the layout and the logic of the missioncritical distributed system is used. To the best of our knowledge, this is the firstfailure detection system exhibiting all these features together. Let us remarkthat the black-box characteristic has a strategic value for a company developingsuch systems. Indeed from a company perspective the approach is succeedingas long as the failure prediction architecture is loosely bound to the applicationlogic as this logic evolves continuously over time. This non intrusiveness of ourapproach has the advantage that no additional load to the monitored system isintroduced and it can be applied in all the existing middleware based systemswithout modifications of the architecture. As future work we are developing aCASPER version capable of executing online training. i.e., the training is done
5 The number of tests was limited by the physical access to the ATC testing environ-ment. In fact, every experiment takes actually 2 hours to be completed due to datastorage, the stabilizing and rebooting of the ATC system after the failure.
6 The prediction time depends on how the system reacts to the injected stress and onthe injected stress itself
Online Black-box Failure Prediction for Mission Critical DistributedSystems 195
just connecting to the monitored system without any human intervention. Thiswill make CASPER a complete “plug-and-play” failure prediction system. Theadvantage of the online training solution is that CASPER can analyze a hugeamount of network data. The disadvantage is that the training phase can lastfor long time as CASPER does not have any external clue concerning the safeor faulty system state.
References
1. Esper: Esper project web page (2011) http://esper.codehaus.org/.2. Rabiner, L., Juang, B.: An introduction to hidden markov models. ASSP Magazine,
IEEE 3(1) (jan 1986) 4 – 163. Murphy, K.: Dynamic Bayesian Networks: Representation, Inference and Learning.
PhD thesis, UC Berkeley, Computer Science Division (2002)4. Salfner, F.: Event-based Failure Prediction: An Extended Hidden Markov Model
Approach. PhD thesis, Department of Computer Science, Humboldt-Universitatzu Berlin, Germany (2008)
5. Hoffmann, G.A., Salfner, F., Malek, M.: Advanced Failure Prediction in ComplexSoftware Systems. Technical Report 172, Berlin, Germany (2004)
6. Li Yu, Ziming Zheng, Z.L., Coghlan, S.: Practical online failure prediction forblue gene/p: Period-based vs event-driven. In: Proc. of IEEE/IFIP DSN-W 2011.(2011) 259 – 264
7. Williams, A.W., Pertet, S.M., Narasimhan, P.: Tiresias: Black-box failure predic-tion in distributed systems. In: Proc. of IEEE IPDPS 2007, Los Alamitos, CA,USA (2007)
8. Tan, Y., Gu, X., Wang, H.: Adaptive system anomaly prediction for large-scalehosting infrastructures. In: Proc. of ACM PODC 2010, New York, NY, USA, ACM(2010) 173–182
9. Aguilera, M.K., Mogul, J.C., Wiener, J.L., Reynolds, P., Muthitacharoen, A.: Per-formance debugging for distributed systems of black boxes. In SIGOPS Oper. Syst.Rev. 37 (2003) 74–89
10. Fu, S., zhong Xu, C.: Exploring event correlation for failure prediction in coalitionsof clusters. (2007)
11. Daidone, A., Di Giandomenico, F., Bondavalli, A., Chiaradonna, S.: Hiddenmarkov models as a support for diagnosis: Formalization of the problem and syn-thesis of the solution. In: SRDS 2006, Leeds, UK (2006) 245–256
12. Gu, X., Papadimitrioul, S., S.Yu, P., Chang, S.P.: Online failure forecast for fault-tolerant data stream processing. In: ICDE 2008. 1388 – 1390
13. Avizienis, A., Laprie, J.C., Randell, B., Landwehr, C.E.: Basic concepts and taxon-omy of dependable and secure computing. IEEE Trans. Dependable Sec. Comput.1(1) (2004) 11–33
14. Hood, C., Ji, C.: Proactive network-fault detection. In IEEE Transactions onReliability 46(3) (1997) 333 –341
15. Thottan, M., Ji, C.: Properties of network faults. In: NOMS 2000. 941–94216. Baldoni, R., Lodi, G., Mariotta, G., Montanari, L., Rizzuto, M.: On-
line Black-box Failure Prediction for Mission Critical Distributed Sys-tems. Technical report (2012) http://www.dis.uniroma1.it/~midlab/articoli/MidlabTechReport3-2012.pdf.
17. Group, O.M.: CORBA. Specification, Object Management Group (2011)18. IBM: System S Web Site (2011) http://domino.research.ibm.com/comm/
research_projects.nsf/pages/esps.index.html.
196 R. Baldoni, G. Lodi, G. Mariotta, L. Montanari, and M. Rizzuto

Intentionally left blank to harmonize page numbering with printed version.
On the Impact of Hardware Faults - An Investigation of
the Relationship between Workload Inputs and Failure
Mode Distributions
Domenico Di Leo*, Fatemeh Ayatolahi**, Behrooz Sangchoolie**, Johan Karls-
son**, Roger Johansson**
*Dipartimento di Informatica e Sistemistica, Università degli Studi di Napoli Federico II,
Via Claudio 21, 80125, Naples, Italy
**Department of Computer Science & Engineering, Chalmers University of Technology,
SE-41296, Gothenburg, Sweden
{fatemeh.ayatolahi,behrooz.sangchoolie,johan,roger}@chalmers.se
Abstract. Technology scaling of integrated circuits is making transistors in-
creasingly sensitive to process variations, wear-out effects and ionizing parti-
cles. This may lead to an increasing rate of transient and intermittent errors in
future microprocessors. In order to assess the risk such errors pose to safety
critical systems, it is essential to investigate how temporary errors in the in-
struction set architecture (ISA) registers and main memory locations influence
the behaviour of executing programs. To this end, we investigate – by means of
extensive fault injection experiments – how such errors affect the execution of
four target programs. The paper makes three contributions. First, we investigate
how the failure modes of the target programs vary for different input sets. Se-
cond, we evaluate the error coverage of a software-implemented hardware fault
tolerant technique that relies on triple-time redundant execution, majority vot-
ing and forward recovery. Third, we propose an approach based on assembly
language metrics which can be used to correlate the dynamic fault-free behav-
iour of a program with its failure mode distribution obtained by fault injection.
Keywords: microprocessor faults, fault injection, dependability assessment,
software-implemented hardware fault tolerance, failure mode distributions.
1 Introduction
Technology and voltage scaling is making transistors increasingly susceptible to pro-
cess variations, wear-out effects, and ionizing particles [1]. This is expected to in-
crease the rate of transient, intermittent and permanent transistors faults in future inte-
grated circuits. Modern microprocessors are therefore being equipped with increas-
ingly sophisticated hardware mechanisms for fault tolerance, error masking and error
detection. However, since such mechanisms cannot provide perfect error coverage,
and due to the fact that the number of transistors per chip is steadily increasing, it is
likely that future microprocessors will exhibit an increasing rate of incorrect program
executions caused by hardware related errors.
A cost-effective way of reducing the risk that such incorrect program executions
cause unacceptable or catastrophic system failures is to introduce a layer of software-
implemented error handling mechanisms. Numerous software techniques for detecting
and masking hardware errors have previously been proposed in the literature [2, 3].
The effectiveness of these techniques are often evaluated, or benchmarked, by means
of fault injection experiments that measure their ability to detect or mask single or
multiple bit errors (bit flips) in CPU registers and main memory [4]. Bit flipping is
used to emulate the effect of single event upset (SEU) errors caused by ionizing parti-
cles. The error coverage for software-implemented error handling techniques often
depends on the input processed by the target system. Thus, to assess the variability in
error coverage, it is essential to conduct fault injection experiments with different
inputs [5, 6].
This paper presents the results of extensive fault injection experiments with four
programs where single bit errors were injected in CPU registers and main memory of
the target systems. The aim of the study is to investigate how error coverage varies for
different inputs. We conducted experiments with programs protected by triple-time
redundant execution with forward recovery [7], and programs without software-
implemented hardware fault tolerance (SIHFT). In addition, we propose a technique
for identifying input sets that are likely to cause the measured error coverage to vary.
The remainder of the paper is organized as follows. We describe the target work-
loads in Section 2 and the TTR-FR mechanism in Section 3. The fault injection exper-
imental setup is described in Section 4. The analysis of the extensive fault injections
conducted on the workloads with/without TTR-FR mechanism is presented in Section
5. Based on the obtained results, we present the input selection approach in Section 6.
2 Target Workloads
In this section, we present the four workloads used in our set of experiments: secure
hash algorithm (SHA), cyclic redundancy check (CRC), quick sort (Qsort), and binary
string to integer convertor (BinInt). SHA is a cryptographic hash function which gen-
erates a 160-bit message digest. We use SHA-1 algorithm which is adopted in many
security protocols and applications such as SSL, SSH and IPsec. The CRC that we use
is a software implementation of CRC 32-bit polynomial which is mostly used to cal-
culate the end-to-end checksum. Qsort is a recursive implementation of the well-
known quick sort algorithm, which is also used as a target program for fault injection
experiments in [6, 8]. Finally, BinInt converts an ASCII binary string, 1s and 0s, into
its equivalent integer value.
Even though the implementation of our workloads can be found in the MiBench
suite [9], we only take CRC and BinInt from this suite. For the quick sort algorithm,
the MiBench implementation uses a built-in C function named qsort whose source
code is not available. This prevents us from performing detailed analysis. Further-
more, the MiBench implementation of SHA uses dynamic memory allocation which
On the Impact of Hardware Faults - An Investigation of the Relation-ship between Workload Inputs and Failure Mode Distributions 199
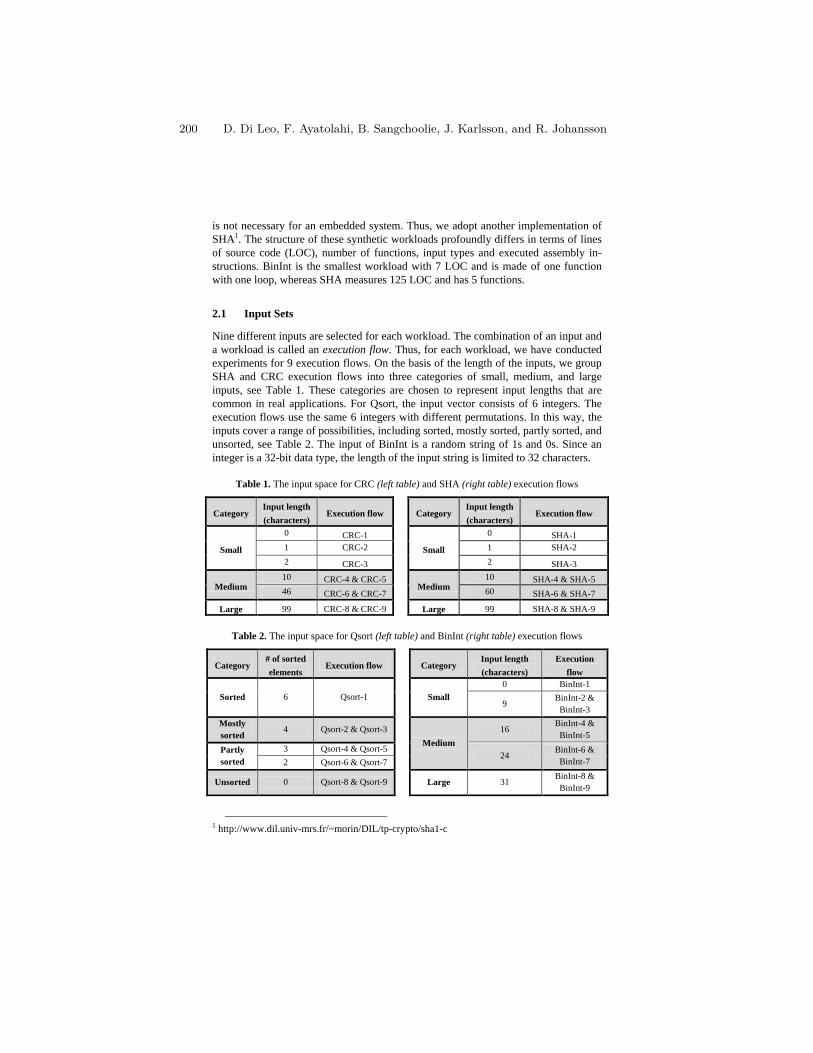
is not necessary for an embedded system. Thus, we adopt another implementation of
SHA1. The structure of these synthetic workloads profoundly differs in terms of lines
of source code (LOC), number of functions, input types and executed assembly in-
structions. BinInt is the smallest workload with 7 LOC and is made of one function
with one loop, whereas SHA measures 125 LOC and has 5 functions.
2.1 Input Sets
Nine different inputs are selected for each workload. The combination of an input and
a workload is called an execution flow. Thus, for each workload, we have conducted
experiments for 9 execution flows. On the basis of the length of the inputs, we group
SHA and CRC execution flows into three categories of small, medium, and large
inputs, see Table 1. These categories are chosen to represent input lengths that are
common in real applications. For Qsort, the input vector consists of 6 integers. The
execution flows use the same 6 integers with different permutations. In this way, the
inputs cover a range of possibilities, including sorted, mostly sorted, partly sorted, and
unsorted, see Table 2. The input of BinInt is a random string of 1s and 0s. Since an
integer is a 32-bit data type, the length of the input string is limited to 32 characters.
Table 1. The input space for CRC (left table) and SHA (right table) execution flows
Category Input length
(characters) Execution flow Category
Input length
(characters) Execution flow
Small
0 CRC-1
Small
0 SHA-1
1 CRC-2 1 SHA-2
2 CRC-3 2 SHA-3
Medium 10 CRC-4 & CRC-5
Medium 10 SHA-4 & SHA-5
46 CRC-6 & CRC-7 60 SHA-6 & SHA-7
Large 99 CRC-8 & CRC-9 Large 99 SHA-8 & SHA-9
Table 2. The input space for Qsort (left table) and BinInt (right table) execution flows
Category # of sorted
elements Execution flow
Category Input length
(characters)
Execution
flow
Sorted 6 Qsort-1 Small
0 BinInt-1
9 BinInt-2 &
BinInt-3
Mostly
sorted 4 Qsort-2 & Qsort-3
Medium
16 BinInt-4 &
BinInt-5
Partly
sorted
3 Qsort-4 & Qsort-5 24
BinInt-6 &
BinInt-7 2 Qsort-6 & Qsort-7
Unsorted 0 Qsort-8 & Qsort-9 Large 31 BinInt-8 &
BinInt-9
1 http://www.dil.univ-mrs.fr/~morin/DIL/tp-crypto/sha1-c
200 D. Di Leo, F. Ayatolahi, B. Sangchoolie, J. Karlsson, and R. Johansson
3 Software-Implemented Hardware Fault Tolerance (SIHFT)
In addition to the basic version of the workloads, we conducted experiments on the
triple time redundant execution with forward recovery (TTR-FR) [7]. In TTR-FR, the
target workload is executed three times and the result of each run is compared with
the other two runs using a software-implemented voter. If only one run of the program
generates a different output, the output of the other two runs will be selected (majority
voting). In case the workload is state-full, the state of the faulty run moves forward to
a fault-free point (forward recovery). If none of the outputs match, then error detec-
tion is signaled.
The non-fault tolerance version of the workloads consists of three major code
blocks; startup, main function, and core function. In the TTR-FR implementation we
add the voter to the main function to perform the majority voting. The core function,
which is called three times from the main function, performs the foremost functionali-
ty of each workload. As an example, in Qsort, the sorting procedure is done in the
Qsort’scorefunction, whereas in CRC, the core function is responsible for the check-
sum calculations.
4 Experimental Setup and Fault Model
The workloads are executed on a Freescale MPC565 microcontroller, which uses the
PowerPC architecture. Faults are injected into the microcontroller via a Nexus debug
interface using Goofi-2 [10], a tool developed in our research group. This environ-
ment allows us to inject faults, bit flips, into instruction set architecture (ISA) regis-
ters and main memory of the microcontroller. Ideally, the fault model to adopt for this
evaluation should exhibit real faults, i.e., it should account for multiple and single bit
flips. However, there is no commonly agreed model for multiple bit flips. Thus, we
adopt the single bit flip model as it has been done in other studies [11, 2, 3, 10].
The faults are injected in the main memory (stack, data, etc.) and all CPU registers
used by the execution flows. The registers include general purpose registers, program
counter register, link register, integer exception register, and condition register. As the
machine code of our workloads is stored in a Flash memory, it cannot be subjected to
fault injection. We define fault in terms of time-location pair, where the location is a
randomly selected bit in the memory word or CPU register, while the time corre-
sponds to the execution of a given machine instruction (i.e., a point in the execution
flow). Indeed, we make use of a pre-injection analysis [8] which is included in Goofi-
2. In this way, the fault injection takes place on a register or memory location, just
before it is read by the executing instruction. A fault injection experiment consists of
injecting one fault and observing its impact on a workload. A fault injection campaign
is a series of fault injection experiments with a given execution flow.
On the Impact of Hardware Faults - An Investigation of the Relation-ship between Workload Inputs and Failure Mode Distributions 201
5 Experimental Results
In this section, we present the outcomes of fault injection campaigns conducted on the
4 workloads. We carried out 9 campaigns per workload which resulted in a total of 36
campaigns for the basic version and 36 campaigns for the TTR-FR version. The cam-
paigns consist of 25000 experiments except for CRC campaigns that are subjected to
12000 experiments. The error classification scheme of each experiment is:
No Impact (NI), errors that do not affect the output of the execution flow.
Detected by Hardware (DHW), errors that are detected by the hardware exceptions.
Time Out (TO), errors that cause violation of the timeout2.
Value Failure (VF), erroneous output with no indication of failure (silent data cor-
ruption).
Detected by Software (DSW), errors that are detected by the software detection
mechanisms.
Corrected by Software (CSW), errors that are corrected by the software correction
mechanisms.
When presenting the results, we also refer to the coverage (COV) as the probability
that a fault does not cause value failures, which is calculated in equation (1):
COV = 1 - #VF/N (1)
Here N is the total number of experiments, and #VF is the total number of experi-
ments that resulted in value failure. In addition to the experiments classified as detect-
ed by hardware, the coverage includes no impact and timeout experiments. No impact
experiments can be the result of internal robustness of the workload; therefore they
contribute to the overall coverage of the system. Experiments that are resulted in
timeout are detected by Goofi-2. In a real application, watchdog timers are used to
detect these types of errors.
5.1 Results for Workloads without Software-Implemented Hardware Fault
Tolerance
Table 3 presents failure distributions for all the workloads. Each row shows the per-
centage of experiments that fall in different error classifications. Due to the large
number of experiments (25000 for SHA, BinInt, Qsort and 12000 for CRC), the 95%
confidence interval for the measures in this section varies from ±0.08% to ±0.89%.
For SHA and CRC, the percentage of experiments classified as value failures
grows as the length of the inputs is increased. If we consider that the value failure is
distributed as a normal variable with a mean value equals to the quotient between the
number of value failure experiments and the total number of experiments, we can
conduct one way analysis of variance (ANOVA). ANOVA is performed by testing the
hypothesis H0 whichstates“there is no linear correlation between the length of the
2 Timeout value is approximately 10 times larger than the execution time of the workload.
202 D. Di Leo, F. Ayatolahi, B. Sangchoolie, J. Karlsson, and R. Johansson
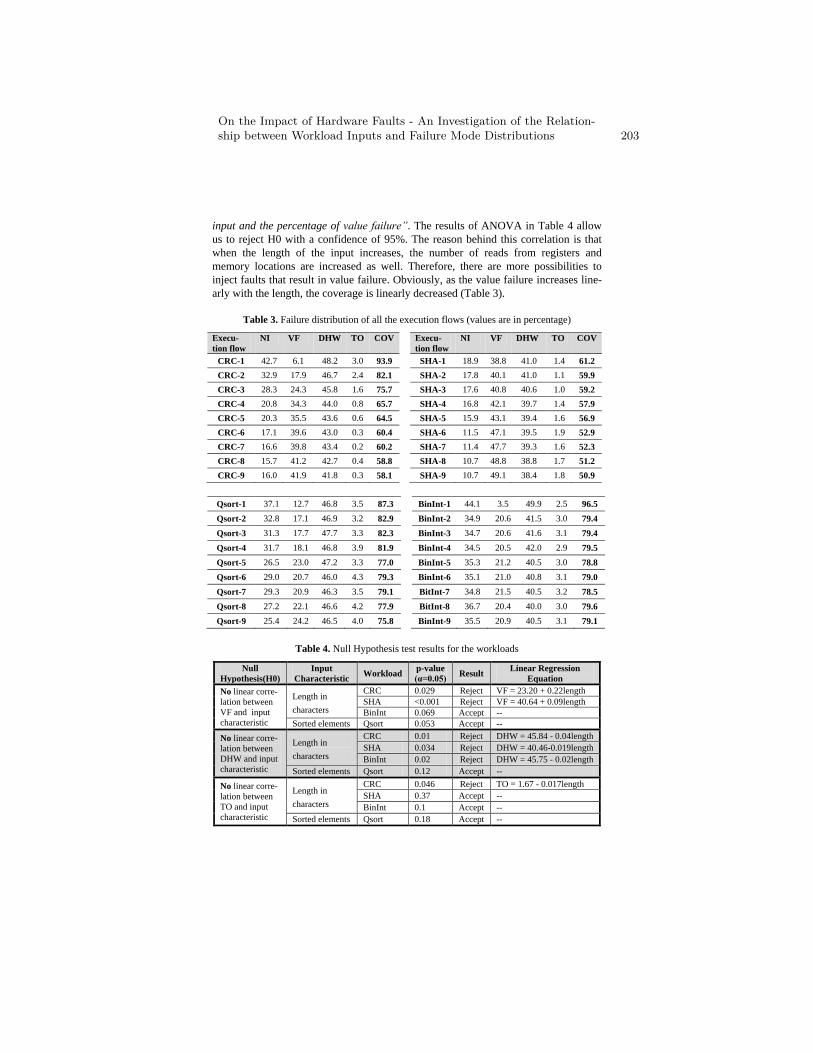
input and the percentage of value failure”. The results of ANOVA in Table 4 allow
us to reject H0 with a confidence of 95%. The reason behind this correlation is that
when the length of the input increases, the number of reads from registers and
memory locations are increased as well. Therefore, there are more possibilities to
inject faults that result in value failure. Obviously, as the value failure increases line-
arly with the length, the coverage is linearly decreased (Table 3).
Table 3. Failure distribution of all the execution flows (values are in percentage)
Execu-
tion flow
NI VF DHW TO COV Execu-
tion flow
NI VF DHW TO COV
CRC-1 42.7 6.1 48.2 3.0 93.9 SHA-1 18.9 38.8 41.0 1.4 61.2
CRC-2 32.9 17.9 46.7 2.4 82.1 SHA-2 17.8 40.1 41.0 1.1 59.9
CRC-3 28.3 24.3 45.8 1.6 75.7 SHA-3 17.6 40.8 40.6 1.0 59.2
CRC-4 20.8 34.3 44.0 0.8 65.7 SHA-4 16.8 42.1 39.7 1.4 57.9
CRC-5 20.3 35.5 43.6 0.6 64.5 SHA-5 15.9 43.1 39.4 1.6 56.9
CRC-6 17.1 39.6 43.0 0.3 60.4 SHA-6 11.5 47.1 39.5 1.9 52.9
CRC-7 16.6 39.8 43.4 0.2 60.2 SHA-7 11.4 47.7 39.3 1.6 52.3
CRC-8 15.7 41.2 42.7 0.4 58.8 SHA-8 10.7 48.8 38.8 1.7 51.2
CRC-9 16.0 41.9 41.8 0.3 58.1 SHA-9 10.7 49.1 38.4 1.8 50.9
Qsort-1 37.1 12.7 46.8 3.5 87.3 BinInt-1 44.1 3.5 49.9 2.5 96.5
Qsort-2 32.8 17.1 46.9 3.2 82.9 BinInt-2 34.9 20.6 41.5 3.0 79.4
Qsort-3 31.3 17.7 47.7 3.3 82.3 BinInt-3 34.7 20.6 41.6 3.1 79.4
Qsort-4 31.7 18.1 46.8 3.9 81.9 BinInt-4 34.5 20.5 42.0 2.9 79.5
Qsort-5 26.5 23.0 47.2 3.3 77.0 BinInt-5 35.3 21.2 40.5 3.0 78.8
Qsort-6 29.0 20.7 46.0 4.3 79.3 BinInt-6 35.1 21.0 40.8 3.1 79.0
Qsort-7 29.3 20.9 46.3 3.5 79.1 BitInt-7 34.8 21.5 40.5 3.2 78.5
Qsort-8 27.2 22.1 46.6 4.2 77.9 BitInt-8 36.7 20.4 40.0 3.0 79.6
Qsort-9 25.4 24.2 46.5 4.0 75.8 BinInt-9 35.5 20.9 40.5 3.1 79.1
Table 4. Null Hypothesis test results for the workloads
Null
Hypothesis(H0)
Input
Characteristic Workload
p-value
(α=0.05) Result
Linear Regression
Equation
No linear corre-
lation between
VF and input
characteristic
Length in
characters
CRC 0.029 Reject VF = 23.20 + 0.22length
SHA <0.001 Reject VF = 40.64 + 0.09length
BinInt 0.069 Accept --
Sorted elements Qsort 0.053 Accept --
No linear corre-
lation between
DHW and input
characteristic
Length in
characters
CRC 0.01 Reject DHW = 45.84 - 0.04length
SHA 0.034 Reject DHW = 40.46-0.019length
BinInt 0.02 Reject DHW = 45.75 - 0.02length
Sorted elements Qsort 0.12 Accept --
No linear corre-
lation between
TO and input
characteristic
Length in
characters
CRC 0.046 Reject TO = 1.67 - 0.017length
SHA 0.37 Accept --
BinInt 0.1 Accept --
Sorted elements Qsort 0.18 Accept --
On the Impact of Hardware Faults - An Investigation of the Relation-ship between Workload Inputs and Failure Mode Distributions 203
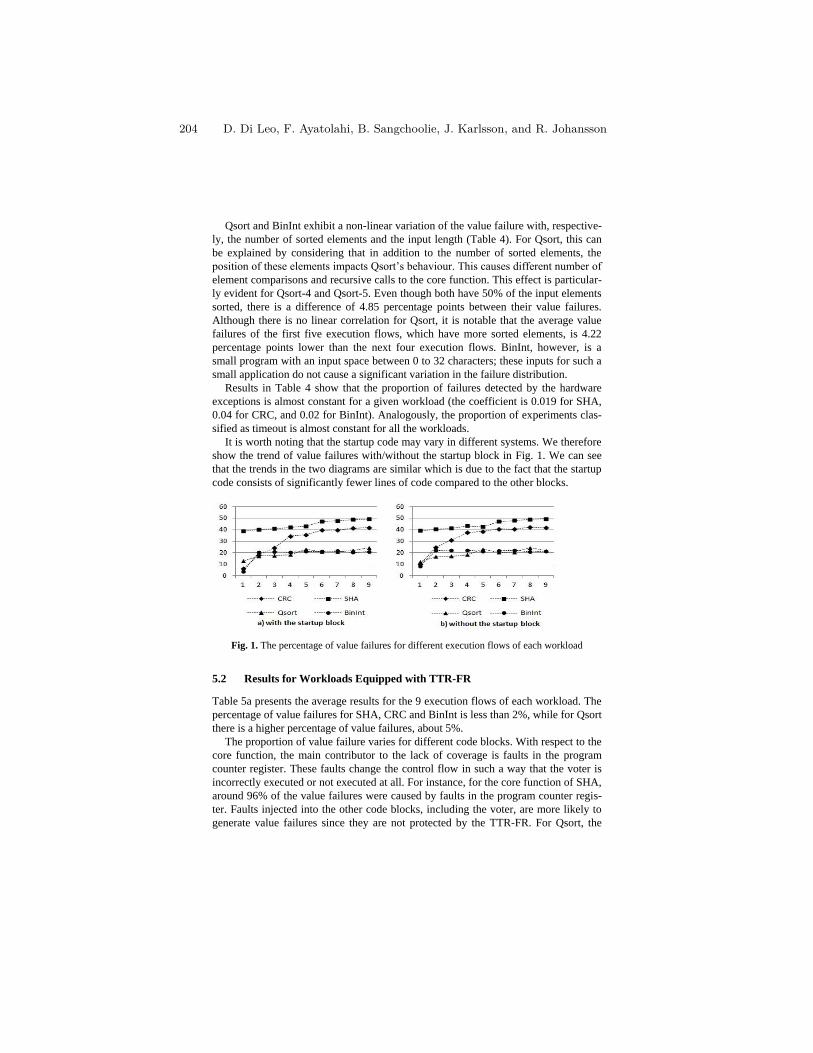
Qsort and BinInt exhibit a non-linear variation of the value failure with, respective-
ly, the number of sorted elements and the input length (Table 4). For Qsort, this can
be explained by considering that in addition to the number of sorted elements, the
positionoftheseelementsimpactsQsort’sbehaviour.Thiscausesdifferentnumberof
element comparisons and recursive calls to the core function. This effect is particular-
ly evident for Qsort-4 and Qsort-5. Even though both have 50% of the input elements
sorted, there is a difference of 4.85 percentage points between their value failures.
Although there is no linear correlation for Qsort, it is notable that the average value
failures of the first five execution flows, which have more sorted elements, is 4.22
percentage points lower than the next four execution flows. BinInt, however, is a
small program with an input space between 0 to 32 characters; these inputs for such a
small application do not cause a significant variation in the failure distribution.
Results in Table 4 show that the proportion of failures detected by the hardware
exceptions is almost constant for a given workload (the coefficient is 0.019 for SHA,
0.04 for CRC, and 0.02 for BinInt). Analogously, the proportion of experiments clas-
sified as timeout is almost constant for all the workloads.
It is worth noting that the startup code may vary in different systems. We therefore
show the trend of value failures with/without the startup block in Fig. 1. We can see
that the trends in the two diagrams are similar which is due to the fact that the startup
code consists of significantly fewer lines of code compared to the other blocks.
Fig. 1. The percentage of value failures for different execution flows of each workload
5.2 Results for Workloads Equipped with TTR-FR
Table 5a presents the average results for the 9 execution flows of each workload. The
percentage of value failures for SHA, CRC and BinInt is less than 2%, while for Qsort
there is a higher percentage of value failures, about 5%.
The proportion of value failure varies for different code blocks. With respect to the
core function, the main contributor to the lack of coverage is faults in the program
counter register. These faults change the control flow in such a way that the voter is
incorrectly executed or not executed at all. For instance, for the core function of SHA,
around 96% of the value failures were caused by faults in the program counter regis-
ter. Faults injected into the other code blocks, including the voter, are more likely to
generate value failures since they are not protected by the TTR-FR. For Qsort, the
204 D. Di Leo, F. Ayatolahi, B. Sangchoolie, J. Karlsson, and R. Johansson
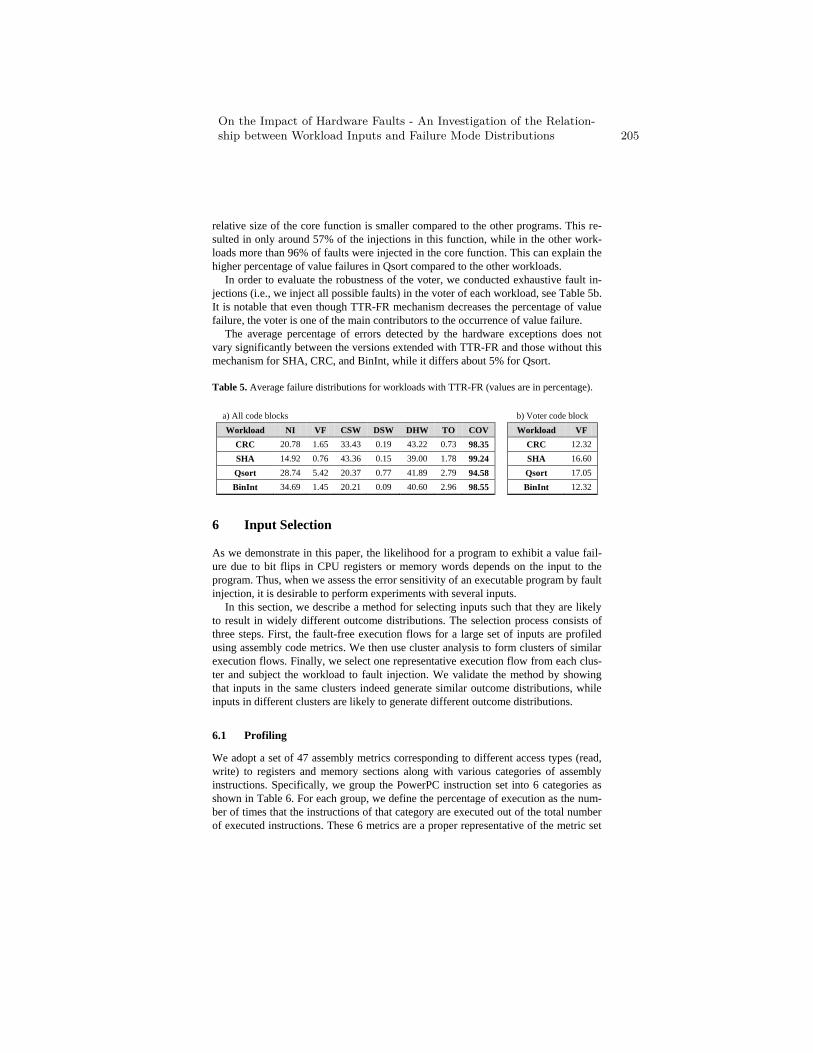
relative size of the core function is smaller compared to the other programs. This re-
sulted in only around 57% of the injections in this function, while in the other work-
loads more than 96% of faults were injected in the core function. This can explain the
higher percentage of value failures in Qsort compared to the other workloads.
In order to evaluate the robustness of the voter, we conducted exhaustive fault in-
jections (i.e., we inject all possible faults) in the voter of each workload, see Table 5b.
It is notable that even though TTR-FR mechanism decreases the percentage of value
failure, the voter is one of the main contributors to the occurrence of value failure.
The average percentage of errors detected by the hardware exceptions does not
vary significantly between the versions extended with TTR-FR and those without this
mechanism for SHA, CRC, and BinInt, while it differs about 5% for Qsort.
Table 5. Average failure distributions for workloads with TTR-FR (values are in percentage).
6 Input Selection
As we demonstrate in this paper, the likelihood for a program to exhibit a value fail-
ure due to bit flips in CPU registers or memory words depends on the input to the
program. Thus, when we assess the error sensitivity of an executable program by fault
injection, it is desirable to perform experiments with several inputs.
In this section, we describe a method for selecting inputs such that they are likely
to result in widely different outcome distributions. The selection process consists of
three steps. First, the fault-free execution flows for a large set of inputs are profiled
using assembly code metrics. We then use cluster analysis to form clusters of similar
execution flows. Finally, we select one representative execution flow from each clus-
ter and subject the workload to fault injection. We validate the method by showing
that inputs in the same clusters indeed generate similar outcome distributions, while
inputs in different clusters are likely to generate different outcome distributions.
6.1 Profiling
We adopt a set of 47 assembly metrics corresponding to different access types (read,
write) to registers and memory sections along with various categories of assembly
instructions. Specifically, we group the PowerPC instruction set into 6 categories as
shown in Table 6. For each group, we define the percentage of execution as the num-
ber of times that the instructions of that category are executed out of the total number
of executed instructions. These 6 metrics are a proper representative of the metric set
a) All code blocks b) Voter code block
Workload NI VF CSW DSW DHW TO COV Workload VF
CRC 20.78 1.65 33.43 0.19 43.22 0.73 98.35 CRC 12.32
SHA 14.92 0.76 43.36 0.15 39.00 1.78 99.24 SHA 16.60
Qsort 28.74 5.42 20.37 0.77 41.89 2.79 94.58 Qsort 17.05
BinInt 34.69 1.45 20.21 0.09 40.60 2.96 98.55 BinInt 12.32
On the Impact of Hardware Faults - An Investigation of the Relation-ship between Workload Inputs and Failure Mode Distributions 205
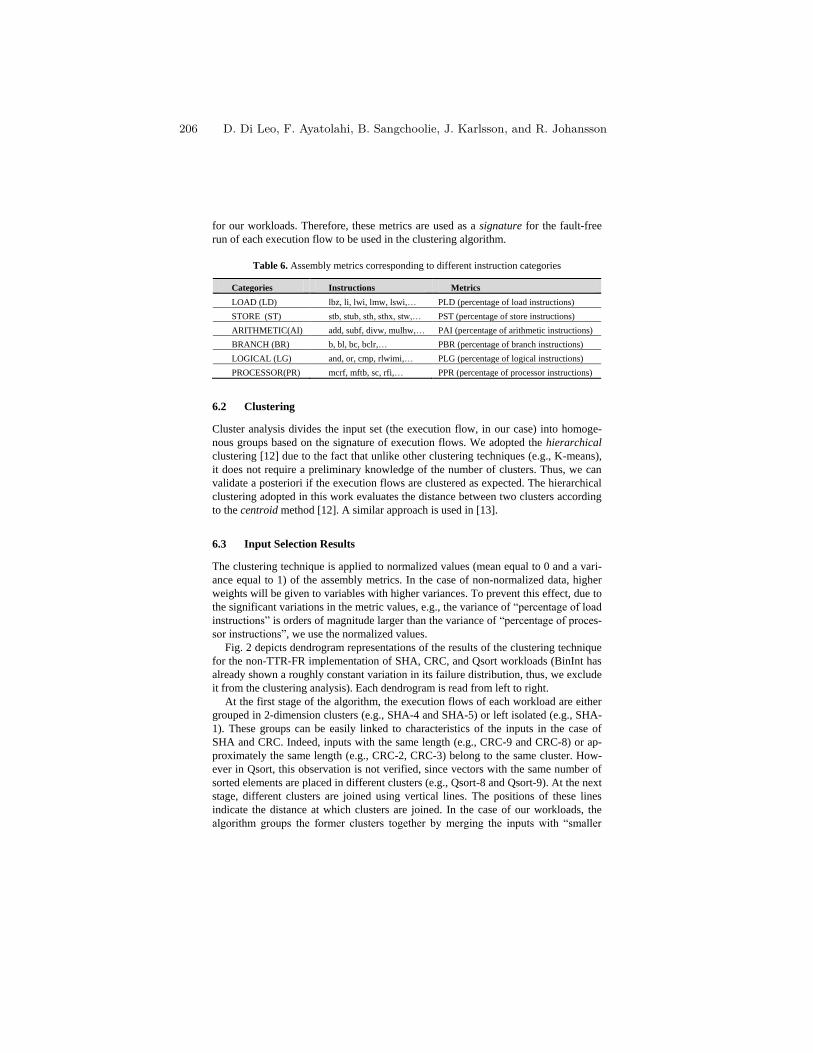
for our workloads. Therefore, these metrics are used as a signature for the fault-free
run of each execution flow to be used in the clustering algorithm.
Table 6. Assembly metrics corresponding to different instruction categories
Categories Instructions Metrics
LOAD (LD) lbz, li, lwi, lmw, lswi,… PLD (percentage of load instructions)
STORE (ST) stb,stub,sth,sthx,stw,… PST (percentage of store instructions)
ARITHMETIC(AI) add, subf, divw, mulhw,… PAI (percentage of arithmetic instructions)
BRANCH (BR) b, bl, bc, bclr,… PBR (percentage of branch instructions)
LOGICAL (LG) and, or, cmp, rlwimi,… PLG (percentage of logical instructions)
PROCESSOR(PR) mcrf, mftb, sc, rfi,… PPR (percentage of processor instructions)
6.2 Clustering
Cluster analysis divides the input set (the execution flow, in our case) into homoge-
nous groups based on the signature of execution flows. We adopted the hierarchical
clustering [12] due to the fact that unlike other clustering techniques (e.g., K-means),
it does not require a preliminary knowledge of the number of clusters. Thus, we can
validate a posteriori if the execution flows are clustered as expected. The hierarchical
clustering adopted in this work evaluates the distance between two clusters according
to the centroid method [12]. A similar approach is used in [13].
6.3 Input Selection Results
The clustering technique is applied to normalized values (mean equal to 0 and a vari-
ance equal to 1) of the assembly metrics. In the case of non-normalized data, higher
weights will be given to variables with higher variances. To prevent this effect, due to
the significant variations in the metric values, e.g., the variance of “percentageofload
instructions”is orders of magnitude larger than the variance of “percentageofproces-
sorinstructions”, we use the normalized values.
Fig. 2 depicts dendrogram representations of the results of the clustering technique
for the non-TTR-FR implementation of SHA, CRC, and Qsort workloads (BinInt has
already shown a roughly constant variation in its failure distribution, thus, we exclude
it from the clustering analysis). Each dendrogram is read from left to right.
At the first stage of the algorithm, the execution flows of each workload are either
grouped in 2-dimension clusters (e.g., SHA-4 and SHA-5) or left isolated (e.g., SHA-
1). These groups can be easily linked to characteristics of the inputs in the case of
SHA and CRC. Indeed, inputs with the same length (e.g., CRC-9 and CRC-8) or ap-
proximately the same length (e.g., CRC-2, CRC-3) belong to the same cluster. How-
ever in Qsort, this observation is not verified, since vectors with the same number of
sorted elements are placed in different clusters (e.g., Qsort-8 and Qsort-9). At the next
stage, different clusters are joined using vertical lines. The positions of these lines
indicate the distance at which clusters are joined. In the case of our workloads, the
algorithm groups the former clusters together bymerging the inputswith “smaller
206 D. Di Leo, F. Ayatolahi, B. Sangchoolie, J. Karlsson, and R. Johansson
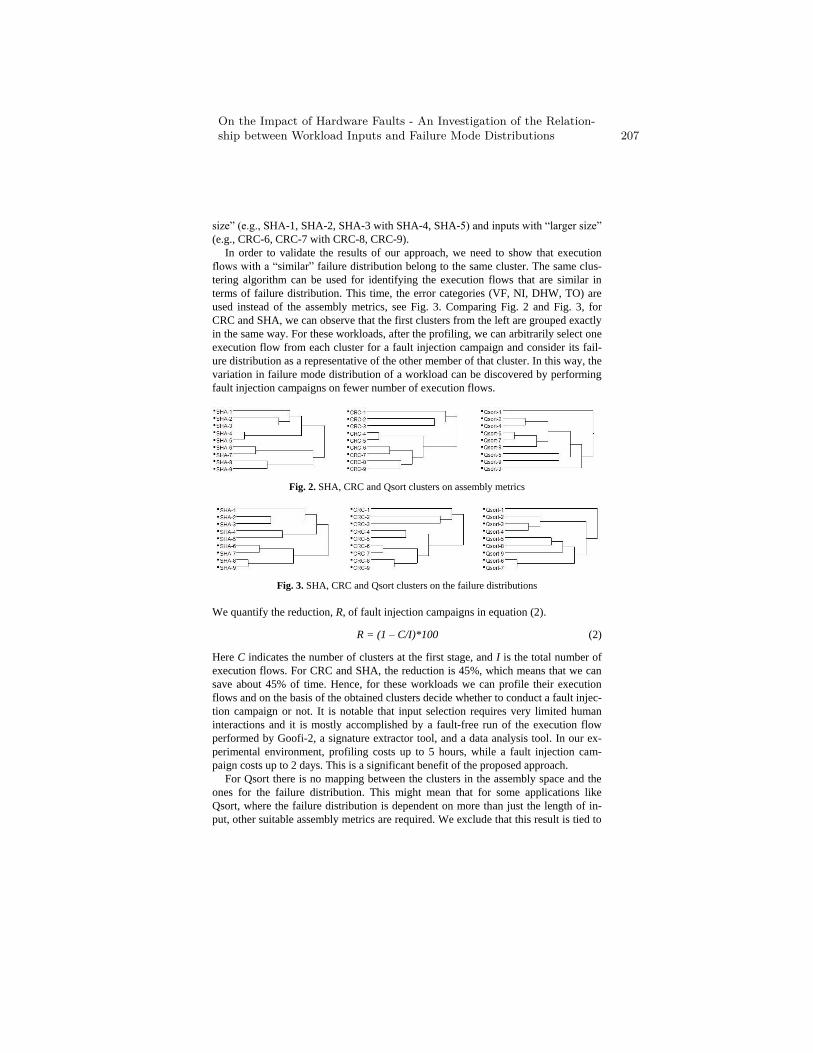
size”(e.g.,SHA-1, SHA-2, SHA-3 with SHA-4, SHA-5)andinputswith“largersize”
(e.g., CRC-6, CRC-7 with CRC-8, CRC-9).
In order to validate the results of our approach, we need to show that execution
flowswitha“similar” failure distribution belong to the same cluster. The same clus-
tering algorithm can be used for identifying the execution flows that are similar in
terms of failure distribution. This time, the error categories (VF, NI, DHW, TO) are
used instead of the assembly metrics, see Fig. 3. Comparing Fig. 2 and Fig. 3, for
CRC and SHA, we can observe that the first clusters from the left are grouped exactly
in the same way. For these workloads, after the profiling, we can arbitrarily select one
execution flow from each cluster for a fault injection campaign and consider its fail-
ure distribution as a representative of the other member of that cluster. In this way, the
variation in failure mode distribution of a workload can be discovered by performing
fault injection campaigns on fewer number of execution flows.
Fig. 2. SHA, CRC and Qsort clusters on assembly metrics
Fig. 3. SHA, CRC and Qsort clusters on the failure distributions
We quantify the reduction, R, of fault injection campaigns in equation (2).
R = (1 – C/I)*100 (2)
Here C indicates the number of clusters at the first stage, and I is the total number of
execution flows. For CRC and SHA, the reduction is 45%, which means that we can
save about 45% of time. Hence, for these workloads we can profile their execution
flows and on the basis of the obtained clusters decide whether to conduct a fault injec-
tion campaign or not. It is notable that input selection requires very limited human
interactions and it is mostly accomplished by a fault-free run of the execution flow
performed by Goofi-2, a signature extractor tool, and a data analysis tool. In our ex-
perimental environment, profiling costs up to 5 hours, while a fault injection cam-
paign costs up to 2 days. This is a significant benefit of the proposed approach.
For Qsort there is no mapping between the clusters in the assembly space and the
ones for the failure distribution. This might mean that for some applications like
Qsort, where the failure distribution is dependent on more than just the length of in-
put, other suitable assembly metrics are required. We exclude that this result is tied to
On the Impact of Hardware Faults - An Investigation of the Relation-ship between Workload Inputs and Failure Mode Distributions 207
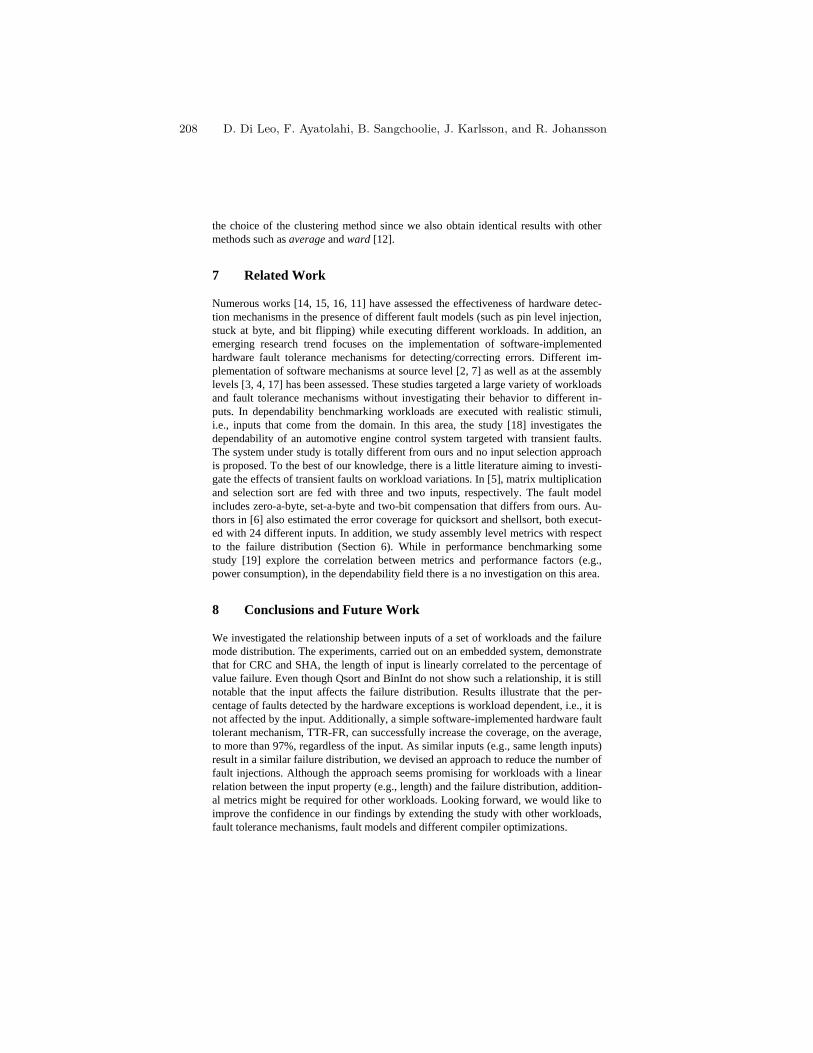
the choice of the clustering method since we also obtain identical results with other
methods such as average and ward [12].
7 Related Work
Numerous works [14, 15, 16, 11] have assessed the effectiveness of hardware detec-
tion mechanisms in the presence of different fault models (such as pin level injection,
stuck at byte, and bit flipping) while executing different workloads. In addition, an
emerging research trend focuses on the implementation of software-implemented
hardware fault tolerance mechanisms for detecting/correcting errors. Different im-
plementation of software mechanisms at source level [2, 7] as well as at the assembly
levels [3, 4, 17] has been assessed. These studies targeted a large variety of workloads
and fault tolerance mechanisms without investigating their behavior to different in-
puts. In dependability benchmarking workloads are executed with realistic stimuli,
i.e., inputs that come from the domain. In this area, the study [18] investigates the
dependability of an automotive engine control system targeted with transient faults.
The system under study is totally different from ours and no input selection approach
is proposed. To the best of our knowledge, there is a little literature aiming to investi-
gate the effects of transient faults on workload variations. In [5], matrix multiplication
and selection sort are fed with three and two inputs, respectively. The fault model
includes zero-a-byte, set-a-byte and two-bit compensation that differs from ours. Au-
thors in [6] also estimated the error coverage for quicksort and shellsort, both execut-
ed with 24 different inputs. In addition, we study assembly level metrics with respect
to the failure distribution (Section 6). While in performance benchmarking some
study [19] explore the correlation between metrics and performance factors (e.g.,
power consumption), in the dependability field there is a no investigation on this area.
8 Conclusions and Future Work
We investigated the relationship between inputs of a set of workloads and the failure
mode distribution. The experiments, carried out on an embedded system, demonstrate
that for CRC and SHA, the length of input is linearly correlated to the percentage of
value failure. Even though Qsort and BinInt do not show such a relationship, it is still
notable that the input affects the failure distribution. Results illustrate that the per-
centage of faults detected by the hardware exceptions is workload dependent, i.e., it is
not affected by the input. Additionally, a simple software-implemented hardware fault
tolerant mechanism, TTR-FR, can successfully increase the coverage, on the average,
to more than 97%, regardless of the input. As similar inputs (e.g., same length inputs)
result in a similar failure distribution, we devised an approach to reduce the number of
fault injections. Although the approach seems promising for workloads with a linear
relation between the input property (e.g., length) and the failure distribution, addition-
al metrics might be required for other workloads. Looking forward, we would like to
improve the confidence in our findings by extending the study with other workloads,
fault tolerance mechanisms, fault models and different compiler optimizations.
208 D. Di Leo, F. Ayatolahi, B. Sangchoolie, J. Karlsson, and R. Johansson
Acknowledgements. This work has partly been supported by VINNOVA-FFI BeSafe
project and the FP7 European Project CRITICAL-STEP IAPP no. 230672.
References 1. Borkar, S.; "Designing reliable systems from unreliable components: the challenges of
transistor variability and degradation," IEEE Micro, vol. 25, no. 6, pp. 10-16, 2005.
2. Rebaudengo, M.; Sonza Reorda, M.; Violante, M.; "A new approach to software-
implemented fault tolerance," Journal of Electronic Testing: Theory and Applications, vol.
20, no.4, pp. 433-437, 2004.
3. Reis, G.A.; et. al.; "SWIFT: Software implemented fault tolerance," Int. Symp. on Code
generation and optimization (CGO'05), pp. 243-254, 2005.
4. Skarin, D.; Karlsson, J.; "Software implemented detection and recovery of soft errors in a
brake-by-wire System," 7th European Dependable Computing Conf. (EDDC-07), pp. 145-
154, 2008.
5. Segall, Z.; et al.; "FIAT-fault injection based automated testing environment," 18th Int.
Symp. on Fault-Tolerant Computing (FTCS-18), pp. 102-107, 1988.
6. Folkesson, P.; Karlsson, J.; "Considering workload input variations in error coverage esti-
mation," 3rd European Dependable Computing Conf. (EDDC-03), pp. 171-190, 1999.
7. Alexandersson, R.; Karlsson, J.; "Fault injection-based assessment of aspect-oriented im-
plementation of fault tolerance," 41st Int. Dependable Systems & Networks Conf. (DSN),
pp. 303-314, 2011.
8. Barbosa, R.; Vinter, J.; Folkesson, P.; Karlsson, J.; "Assembly-level pre-injection analysis
for improving fault injection efficiency," 5th European Dependable Computing Conf.
(EDDC’05), pp. 246-262, 2005.
9. Mibench Version 1, [Online] http://www.eecs.umich.edu/mibench/
10. Skarin, D.; Barbosa, R.; Karlsson, J.; "GOOFI-2: A tool for experimental dependability as-
sessment," 40th Int. Dependable Systems & Networks Conf. (DSN), pp. 557-562, 2010.
11. Carreira, J.; Madeira, H.; Silva, J.G.; "Xception: A technique for the experimental evalua-
tion of dependability in modern computer system," IEEE Trans. Soft. Eng., vol. 24, no. 2,
pp. 125-136, 1998.
12. Jain, A.; Murty, M.; Flynn, P.; "Data clustering: a review," ACM Computing Surveys
(CSUR), vol. 31, no. 3, pp. 264-323, 1999.
13. Natella, R.; Cotroneo, D.; Duraes, J.; Madeira, H.;“Onfaultrepresentativenessofsoftware
faultinjection”,IEEE Trans Soft Eng, in press (PrePrint), 2011.
14. Kanawati, G.A.; Kanawati, N.A.; Abraham, J.A.; "FERRARI: a tool for the validation of
system dependability properties," 22nd Int. Symp. on Fault-Tolerant Computing (FTCS-
22), pp. 336-344 1992.
15. Madeira,H.; Rela, M.; Moreira, F.; Silva J.G; "RIFLE: A general purpose pin-level fault
injector" 1st European Dependable Computing Conf. (EDDC-01), pp. 199-216, 1994.
16. Arlat, J.; et al..; "Comparison of physical and software-implemented fault injection tech-
niques," IEEE Trans. on Computers, vol. 52, no. 9, pp. 1115-1133, 2003.
17. Martinez-Alvarez, A.; et. al; "Compiler-Directed soft error mitigation for embedded sys-
tems," IEEE Trans. on Dependable and Secure Computing, vol.9, no.2, pp. 159-172, 2012.
18. Ruiz, J.C.; Gil, P.; Yeste, P.; de Andrés, D.; Dependability benchmarking for computer
systems. John Wiley & Sons, Inc., 2008, ch. "Dependability Benchmarking of automotive
control system."
19. Eeckhout, L.; Sampson, J.; Calder, B.; "Exploiting program microarchitecture independent
characteristics and phase behavior for reduced benchmark suite simulation," IEEE Int.
Workload Characterization Symp., pp. 2-12, 2005.
On the Impact of Hardware Faults - An Investigation of the Relation-ship between Workload Inputs and Failure Mode Distributions 209
Formal Development and Assessment of aReconfigurable On-board Satellite System
Anton Tarasyuk1,2, Inna Pereverzeva1,2, Elena Troubitsyna1,Timo Latvala3, and Laura Nummila3
1 Abo Akademi University, Turku, Finland2 Turku Centre for Computer Science, Turku, Finland
3 Space Systems Finland, Espoo, Finland{inna.pereverzeva, anton.tarasyuk, elena.troubitsyna}@abo.fi
{timo.latvala, laura.nummila}@ssf.fi
Abstract. Ensuring fault tolerance of satellite systems is critical forachieving goals of the space mission. Since the use of redundancy isrestricted by the size and the weight of the on-board equipments, thedesigners need to rely on dynamic reconfiguration in case of failures ofsome components. In this paper we propose a formal approach to devel-opment of dynamically reconfigurable systems in Event-B. Our approachallows us to build the system that can discover possible reconfigurationstrategy and continue to provide its services despite failures of its vitalcomponents. We integrate probabilistic verification to evaluate reconfig-uration alternatives. Our approach is illustrated by a case study fromaerospace domain.
Keywords: Formal modelling, fault tolerance, Event-B, refinement, prob-abilistic verification.
1 Introduction
Fault tolerance is an important characteristics of on-board satellite systems.One of the essential means to achieve it is redundancy. However, the use of(hardware) component redundancy in spacecraft is restricted by the weight andvolume constraints. Thus, the system developers need to perform a careful cost-benefit analysis to minimise the use of spare modules yet achieve the requiredlevel of reliability.
Despite such an analysis, Space System Finland has recently experienced adouble-failure problem with a system that samples and packages scientific datain one of the operating satellites. The system consists of two identical modules.When one of the first module subcomponents failed, the system switched to theuse of the second module. However, after a while a subcomponent of the sparehas also failed, so it became impossible to produce scientific data. To not losethe entire mission, the company has invented a solution that relied on healthysubcomponents of both modules and a complex communication mechanism torestore system functioning. Obviously, a certain amount of data has been lostbefore a repair was deployed. This motivated our work on exploring proactive
solutions for fault tolerance, i.e., planning and evaluating of scenarios imple-menting a seamless reconfiguration using a fine-grained redundancy.
In this paper we propose a formal approach to modelling and assessment ofon-board reconfigurable systems. We generalise the ad-hoc solution created bySpace Systems Finland and propose an approach to formal development andassessment of fault tolerant satellite systems. The essence of our modelling ap-proach is to start from abstract modelling functional goals that the system shouldachieve to remain operational, and to derive reconfigurable architecture by re-finement in the Event-B formalism [1]. The rigorous refinement process allowsus to establish the precise relationships between component failures and goalreachability. The derived system architecture should not only satisfy functionalrequirements but also achieve its reliability objective. Moreover, since the re-configuration procedure requires additional inter-component communication, thedevelopers should also verify that system performance remains acceptable. Quan-titative evaluation of reliability and performance of probabilistically augmentedEvent-B models is performed using the PRISM model checker [8].
The main novelty of our work is in proposing an integrated approach to formalderivation of reconfigurable system architectures and probabilistic assessmentof their reliability and performance. We believe that the proposed approachfacilitates early exploration of the design space and helps to build redundancy-frugal systems that meet the desired reliability and performance requirements.
2 Reconfigurable Fault Tolerant Systems2.1 Case Study: Data Processing Unit
As mentioned in the previous section, our work is inspired by a solution proposedto circumvent the double failure occurred in a currently operational on-boardsatellite system. The architecture of that system is similar to Data ProcessingUnit (DPU) – a subsystem of the European Space Agency (ESA) mission Bepi-Colombo [2]. Space Systems Finland is one of the providers for BepiColombo.The main goal of the mission is to carry out various scientific measures to explorethe planet Mercury. DPU is an important part of the Mercury Planetary Orbiter.It consists of four independent components (computers) responsible for receiv-ing and processing data from four sensor units: SIXS-X (X-ray spectrometer),SIXS-P (particle spectrometer), MIXS-T (telescope) and MIXS-C (collimator).
The behaviour of DPU is managed by telecommands (TCs) received from thespacecraft and stored in a circular buffer (TC pool). With a predefined rate, DPUperiodically polls the buffer, decodes a TC and performs the required actions.Processing of each TC results in producing telemetry (TM). Both TC and TMpackages follow the syntax defined by the ESA Packet Utilisation Standard [12].As a result of TC decoding, DPU might produce a housekeeping report, switchto some mode or initiate/continue production of scientific data. The main pur-pose of DPU is to ensure a required rate of producing TM containing scientificdata. In this paper we focus on analysing this particular aspect of the systembehaviour. Hence, in the rest of the paper, TC will correspond to the telecom-mands requiring production of scientific data, while TM will designate packagescontaining scientific data.
Formal development and assessment of a reconfigurable on-board satel-lite system 211
2.2 Goal-Oriented Reasoning about Fault Tolerance
We use the notion of a goal as a basis for reasoning about fault tolerance. Goals– the functional and non-functional objectives that the system should achieve –are often used to structure the requirements of dependable systems [7, 9].
Let G be a predicate that defines a desired goal and M be a system model.Ideally, the system design should ensure that the goal can be reached “infinitelyoften”. Hence, while verifying the system, we should establish that
M |= 23G.The main idea of a goal-oriented development is to decompose the high-level
system goals into a set of subgoals. Essentially, subgoals define the intermediatestages of achieving a high-level goal. In the process of goal decomposition we as-sociate system components with tasks – the lowest-level subgoals. A componentis associated with a task if its functionality enables establishing the goal definedby the corresponding task.
For instance, in this paper we consider “produce scientific TM” as a goal ofDPU. DPU sequentially enquires each of its four components to produce its partof scientific data. Each component acquires fresh scientific data from the cor-responding sensor unit (SIXS-X, SIXS-P, MIXS-T or MIXS-C), preprocesses itand makes available to DPU that eventually forms the entire TM package. Thus,the goal can be decomposed into four similar tasks “sensor data production”.
Generally, the goal G can be decomposed into a finite set of tasks:
T = {taskj | j ∈ 1..n ∧ n ∈ N1},Let also C be a finite set of components capable of performing tasks from T :
C = {compj | j ∈ 1..m ∧m ∈ N1},where N1 is the set of positive integers. Then the relation Φ defined below asso-ciates components with the tasks:
Φ ∈ T ↔ C, such that ∀t ∈ T · ∃c ∈ C ·Φ(t, c),
where ↔ designates a binary relation.To reason about fault tolerance, we should take into account component un-
reliability. A failure of a component means that it cannot perform its associatedtask. Fault tolerance mechanisms employed to mitigate results of component fail-ures rely on various forms of component redundancy. Spacecraft have stringentlimitations on the size and weight of the on-board equipment, hence high degreeof redundancy is rarely present. Typically, components are either duplicated ortriplicated. Let us consider a duplicated system that consists of two identicalDPUs – DPUA and DPUB . As it was explained above, each DPU contains fourcomponents responsible for controlling the corresponding sensor.
Traditionally, satellite systems are designed to implement the following sim-ple redundancy scheme. Initially DPUA is active, while DPUB is a cold spare.DPUA allocates tasks on its components to achieve the system goal G – pro-cessing of a TC and producing the TM. When some component of DPUA fails,DPUB is activated to achieve the goal G. Failure of DPUB results in failure of
212 A. Tarasyuk, I. Pereverzeva, E. Troubitsyna, T. Latvala, and L. Nummila
the overall system. However, even though none of the DPUs can accomplish Gon its own, it might be the case that the operational components of both DPUscan together perform the entire set of tasks required to reach G. This observationallows us to define the following dynamic reconfiguration strategy.
Initially DPUA is active and assigned to reach the goal G. If some of itscomponents fails, resulting in a failure to execute one of four scientific tasks(let it be taskj), the spare DPUB is activated and DPUA is deactivated. DPUBperforms the taskj and the consecutive tasks required to reach G. It becomes fullyresponsible for achieving the goal G until some of its component fails. In this case,to remain operational, the system performs dynamic reconfiguration. Specifically,it reactivates DPUA and tries to assign the failed task to its correspondingcomponent. If such a component is operational then DPUA continues to executethe subsequent tasks until it encounters a failed component. Then the controlis passed to DPUB again. Obviously, the overall system stays operational untiltwo identical components of both DPUs have failed.
We generalise the architecture of DPU by stating that essentially a systemconsists of a number of modules and each module consists of n components:
C = Ca ∪ Cb, where Ca = {a compj | j ∈ 1..n ∧ n ∈ N1} etc.
Each module relies on its components to achieve the tasks required to accomplishG. An introduction of redundancy allows us to associate not a single but sev-eral components with each task. We reformulate the goal reachability propertyas follows: a goal remains reachable while there exists at least one operationalcomponent associated with each task. Formally, it can be specified as:
M |= 2Os, where Os ≡ ∀t ∈ T · (∃c ∈ C ·Φ(t, c) ∧ O(c))
and O is a predicate over the set of components C such that O(c) evaluates toTRUE if and only if the component c is operational.
2.3 Probabilistic Assessment
If a duplicated system with the dynamic reconfiguration achieves the desiredreliability level, it might allow the designers to avoid module triplication. How-ever, it also increases the amount of intercomponent communication that leadsto decreasing the system performance. Hence, while deciding on a fault tolerancestrategy, it is important to consider not only reachability of functional goals butalso their performance and reliability aspects.
In engineering, reliability is usually measured by the probability that thesystem remains operational under given conditions for a certain time interval. Interms of goal reachability, the system remains operational until it is capable ofreaching targeted goals. Hence, to guarantee that system is capable of performinga required functions within a time interval t, it is enough to verify that
M |= 2≤tOs. (1)
However, due to possible component failures we usually cannot guarantee theabsolute preservation of (1). Instead, to assess the reliability of a system, we needto show that the probability of preserving the property (1) is sufficiently high.
Formal development and assessment of a reconfigurable on-board satel-lite system 213
On the other hand, the system performance is a reward-based property that canbe measured by the number of successfully achieved goals within a certain timeperiod.
To quantitatively verify these quality attributes we formulate the followingCSL (Continuous Stochastic Logic) formulas [6]:
P=?{G ≤ t Os} and R(|goals|)=?{C ≤ t }.The formulas above are specified using PRISM notation. The operator P is usedto refer to the probability of an event occurrence, G is an analogue of 2, R is usedto analyse the expected values of rewards specified in a model, while C specifiesthat the reward should be cumulated only up to a given time bound. Thus, thefirst formula is used to analyse how likely the system remains operational astime passes, while the second one is used to compute the expected number ofachieved goals cumulated by the system over t time units.
In this paper we rely on modelling in Event-B to formally define the architec-ture of a dynamically reconfigurable system, and on the probabilistic extensionof Event-B to create models for assessing system reliability and performance.The next section briefly describes Event-B and its probabilistic extension.
3 Modelling in Event-B and Probabilistic Analysis
3.1 Modelling and Refinement in Event-B
Event-B is a state-based formal approach that promotes the correct-by-construc-tion development paradigm and formal verification by theorem proving. In Event-B, a system model is specified using the notion of an abstract state machine [1],which encapsulates the model state, represented as a collection of variables, anddefines operations on the state, i.e., it describes the behaviour of a modelled sys-tem. Usually, a machine has an accompanying component, called context, whichincludes user-defined sets, constants and their properties given as a list of modelaxioms. The model variables are strongly typed by the constraining predicates.These predicates and the other important properties that must be preserved bythe model constitute model invariants.
The dynamic behaviour of the system is defined by a set of atomic events.Generally, an event has the following form:
e = any a where Ge then Re end,
where e is the event’s name, a is the list of local variables, the guard Ge isa predicate over the local variables of the event and the state variables of thesystem. The body of the event is defined by the next-state relation Re. In Event-B, Re is defined by a multiple (possibly nondeterministic) assignment over thesystem variables. The guard defines the conditions under which the event isenabled. If several events are enabled at the same time, any of them can bechosen for execution nondeterministically.
Event-B employs a top-down refinement-based approach to system develop-ment. Development starts from an abstract specification that nondeterministi-cally models the most essential functional requirements. In a sequence of refine-ment steps we gradually reduce nondeterminism and introduce detailed design
214 A. Tarasyuk, I. Pereverzeva, E. Troubitsyna, T. Latvala, and L. Nummila
decisions. In particular, we can add new events, split events as well as replaceabstract variables by their concrete counterparts, i.e., perform data refinement.When data refinement is performed, we should define gluing invariants as a partof the invariants of the refined machine. They define the relationship between theabstract and concrete variables. The proof of data refinement is often supportedby supplying witnesses – the concrete values for the replaced abstract variablesand parameters. Witnesses are specified in the event clause with.
The consistency of Event-B models, i.e., verification of well-formedness andinvariant preservation as well as correctness of refinement steps, is demonstratedby discharging the relevant proof obligations generated by the Rodin platform[11]. The platform provides an automated tool support for proving.
3.2 Augmenting Event-B Models with Probabilities
Next we briefly describe the idea behind translating of an Event-B machine intocontinuous time Markov chain – CTMC (the details can be found in [15]). Toachieve this, we augment all events of the machine with information about theprobability and duration of all the actions that may occur during their execution,and refine them by their probabilistic counterparts.
Let Σ be a state space of an Event-B model defined by all possible values ofthe system variables. Let also I be the model invariant. We consider an event eas a binary relation on Σ, i.e., for any two states σ, σ′ ∈ Σ:
e(σ, σ′)def= Ge(σ) ∧Re(σ, σ′).
Definition 1. The behaviour of an Event-B machine is fully defined by a tran-sition relation →:
σ, σ′ ∈ Σ ∧ σ′ ∈ ⋃e∈Eσ
after(e)
σ → σ′,
where before(e) = {σ ∈ Σ | I(σ) ∧Ge(σ)}, Eσ = {e ∈ E | σ ∈ before(e)} and
after(e) = {σ′ ∈ Σ | I(σ′) ∧ (∃σ ∈ Σ · I(σ) ∧Ge(σ) ∧Re(σ, σ′))}.Furthermore, let us denote by λe(σ, σ
′) the (exponential) transition rate fromσ to σ′ via the event e, where σ ∈ before(e) and Re(σ, σ
′). By augmenting allthe event actions with transition rates, we can modify Definition 1 as follows.
Definition 2. The behaviour of a probabilistically augmented Event-B machine
is defined by a transition relationΛ−→:
σ, σ′ ∈ Σ ∧ σ′ ∈ ⋃e∈Eσ
after(e)
σΛ−→ σ′
, where Λ =∑
e∈Eσλe(σ, σ
′).
Definition 2 allows us to define the semantics of a probabilistically augmentedEvent-B model as a probabilistic transition system with the state space Σ, tran-
sition relationΛ−→ and the initial state defined by model initialisation (for prob-
abilistic models we require the initialisation to be deterministic). Clearly, sucha transition system corresponds to a CTMC.
In the next section we demonstrate how to formally derive an Event-B modelof the architecture of a reconfigurable system.
Formal development and assessment of a reconfigurable on-board satel-lite system 215
4 Deriving Fault Tolerant Architectures by Refinementin Event-B
The general idea behind our formal development is to start from an abstract goalmodelling, decompose it into tasks and introduce an abstract representation ofthe goal execution flow. Such a model can be refined into different fault tolerantarchitectures. Subsequently, these models are augmented with probabilistic dataand used for the quantitative assessment.
4.1 Modelling Goal Reaching
Goal Modelling. Our initial specification abstractly models the process ofreaching the goal. The progress of achieving the goal is modelled by the variablegoal that obtains values from the enumerated set STATUS = {not reached,reached, failed}. Initially, the system is not assigned any goals to accomplish,i.e., the variable idle is equal to TRUE. When the system becomes engagedin establishing the goal, idle obtains value FALSE as modelled by the eventActivation. In the process of accomplishing the goal, the variable goal mighteventually change its value from not reached to reached or failed, as modelledby the event Body. After the goal is reached the system becomes idle, i.e., a newgoal can be assigned. The event Finish defines such a behaviour. We treat thefailure to achieve the goal as a permanent system failure. It is represented bythe infinite stuttering defined in the event Abort.
Activation =when idle = TRUEthen idle := FALSEend
Body =when idle = FALSE ∧ goal = not reachedthen goal :∈ STATUSend
Finish =when idle = FALSE ∧ goal = reachedthen goal, idle := not reached, TRUEend
Abort =when goal = failedthen skipend
Goal Decomposition. The aim of our first refinement step is to define thegoal execution flow. We assume that the goal is decomposed into n tasks, andcan be achieved by a sequential execution of one task after another. We alsoassume that the id of each task is defined by its execution order. Initially, whenthe goal is assigned, none of the tasks is executed, i.e., the state of each taskis “not defined” (designated by the constant value ND). After the execution,the state of a task might be changed to success or failure, represented by theconstants OK and NOK correspondingly. Our refinement step is essentially datarefinement that replaces the abstract variable goal with the new variable taskthat maps the id of a task to its state, i.e., task ∈ 1..n→ {OK,NOK,ND}.
We omit showing the events of the refined model (the complete developmentcan be found in [13]). They represent the process of sequential selection of onetask after another until either all tasks are executed, i.e., the goal is reached, orexecution of some task fails, i.e., goal is not achieved. Correspondingly, the guardsensure that either the goal reaching has not commenced yet or the execution ofall previous task has been successful. The body of the events nondeterministically
216 A. Tarasyuk, I. Pereverzeva, E. Troubitsyna, T. Latvala, and L. Nummila
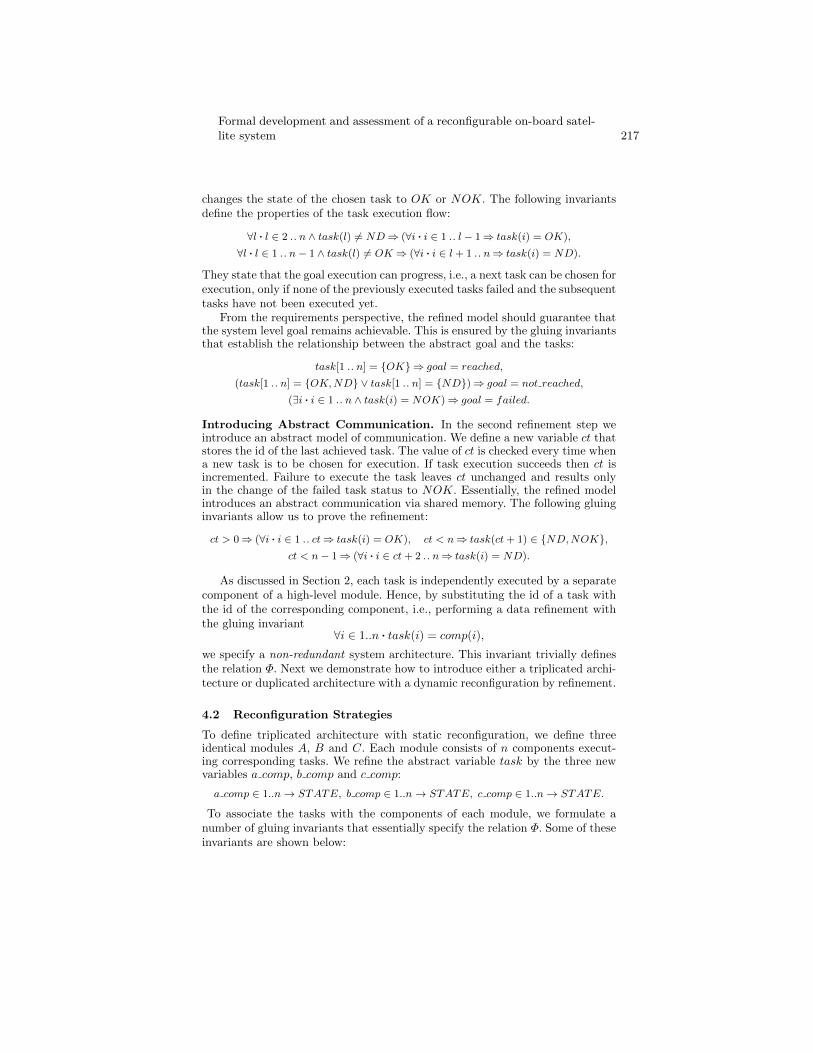
changes the state of the chosen task to OK or NOK. The following invariantsdefine the properties of the task execution flow:
∀l · l ∈ 2 .. n ∧ task(l) 6= ND⇒ (∀i · i ∈ 1 .. l − 1⇒ task(i) = OK),
∀l · l ∈ 1 .. n− 1 ∧ task(l) 6= OK⇒ (∀i · i ∈ l + 1 .. n⇒ task(i) = ND).
They state that the goal execution can progress, i.e., a next task can be chosen forexecution, only if none of the previously executed tasks failed and the subsequenttasks have not been executed yet.
From the requirements perspective, the refined model should guarantee thatthe system level goal remains achievable. This is ensured by the gluing invariantsthat establish the relationship between the abstract goal and the tasks:
task[1 .. n] = {OK}⇒ goal = reached,
(task[1 .. n] = {OK,ND} ∨ task[1 .. n] = {ND})⇒ goal = not reached,
(∃i · i ∈ 1 .. n ∧ task(i) = NOK)⇒ goal = failed.
Introducing Abstract Communication. In the second refinement step weintroduce an abstract model of communication. We define a new variable ct thatstores the id of the last achieved task. The value of ct is checked every time whena new task is to be chosen for execution. If task execution succeeds then ct isincremented. Failure to execute the task leaves ct unchanged and results onlyin the change of the failed task status to NOK. Essentially, the refined modelintroduces an abstract communication via shared memory. The following gluinginvariants allow us to prove the refinement:
ct > 0⇒ (∀i · i ∈ 1 .. ct⇒ task(i) = OK), ct < n⇒ task(ct+ 1) ∈ {ND,NOK},ct < n− 1⇒ (∀i · i ∈ ct+ 2 .. n⇒ task(i) = ND).
As discussed in Section 2, each task is independently executed by a separatecomponent of a high-level module. Hence, by substituting the id of a task withthe id of the corresponding component, i.e., performing a data refinement withthe gluing invariant
∀i ∈ 1..n · task(i) = comp(i),
we specify a non-redundant system architecture. This invariant trivially definesthe relation Φ. Next we demonstrate how to introduce either a triplicated archi-tecture or duplicated architecture with a dynamic reconfiguration by refinement.
4.2 Reconfiguration Strategies
To define triplicated architecture with static reconfiguration, we define threeidentical modules A, B and C. Each module consists of n components execut-ing corresponding tasks. We refine the abstract variable task by the three newvariables a comp, b comp and c comp:
a comp ∈ 1..n→ STATE, b comp ∈ 1..n→ STATE, c comp ∈ 1..n→ STATE.
To associate the tasks with the components of each module, we formulate anumber of gluing invariants that essentially specify the relation Φ. Some of theseinvariants are shown below:
Formal development and assessment of a reconfigurable on-board satel-lite system 217
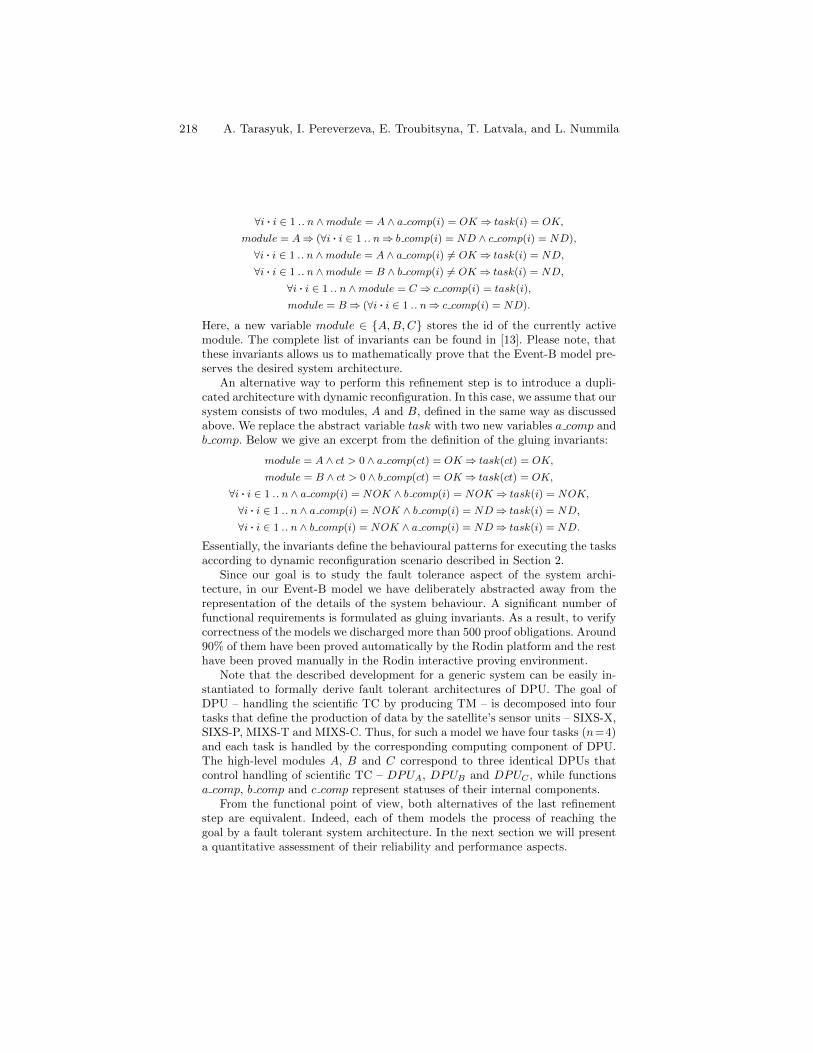
∀i · i ∈ 1 .. n ∧module = A ∧ a comp(i) = OK⇒ task(i) = OK,
module = A⇒ (∀i · i ∈ 1 .. n⇒ b comp(i) = ND ∧ c comp(i) = ND),
∀i · i ∈ 1 .. n ∧module = A ∧ a comp(i) 6= OK⇒ task(i) = ND,
∀i · i ∈ 1 .. n ∧module = B ∧ b comp(i) 6= OK⇒ task(i) = ND,
∀i · i ∈ 1 .. n ∧module = C⇒ c comp(i) = task(i),
module = B⇒ (∀i · i ∈ 1 .. n⇒ c comp(i) = ND).
Here, a new variable module ∈ {A,B,C} stores the id of the currently activemodule. The complete list of invariants can be found in [13]. Please note, thatthese invariants allows us to mathematically prove that the Event-B model pre-serves the desired system architecture.
An alternative way to perform this refinement step is to introduce a dupli-cated architecture with dynamic reconfiguration. In this case, we assume that oursystem consists of two modules, A and B, defined in the same way as discussedabove. We replace the abstract variable task with two new variables a comp andb comp. Below we give an excerpt from the definition of the gluing invariants:
module = A ∧ ct > 0 ∧ a comp(ct) = OK⇒ task(ct) = OK,
module = B ∧ ct > 0 ∧ b comp(ct) = OK⇒ task(ct) = OK,
∀i · i ∈ 1 .. n ∧ a comp(i) = NOK ∧ b comp(i) = NOK⇒ task(i) = NOK,
∀i · i ∈ 1 .. n ∧ a comp(i) = NOK ∧ b comp(i) = ND⇒ task(i) = ND,
∀i · i ∈ 1 .. n ∧ b comp(i) = NOK ∧ a comp(i) = ND⇒ task(i) = ND.
Essentially, the invariants define the behavioural patterns for executing the tasksaccording to dynamic reconfiguration scenario described in Section 2.
Since our goal is to study the fault tolerance aspect of the system archi-tecture, in our Event-B model we have deliberately abstracted away from therepresentation of the details of the system behaviour. A significant number offunctional requirements is formulated as gluing invariants. As a result, to verifycorrectness of the models we discharged more than 500 proof obligations. Around90% of them have been proved automatically by the Rodin platform and the resthave been proved manually in the Rodin interactive proving environment.
Note that the described development for a generic system can be easily in-stantiated to formally derive fault tolerant architectures of DPU. The goal ofDPU – handling the scientific TC by producing TM – is decomposed into fourtasks that define the production of data by the satellite’s sensor units – SIXS-X,SIXS-P, MIXS-T and MIXS-C. Thus, for such a model we have four tasks (n=4)and each task is handled by the corresponding computing component of DPU.The high-level modules A, B and C correspond to three identical DPUs thatcontrol handling of scientific TC – DPUA, DPUB and DPUC , while functionsa comp, b comp and c comp represent statuses of their internal components.
From the functional point of view, both alternatives of the last refinementstep are equivalent. Indeed, each of them models the process of reaching thegoal by a fault tolerant system architecture. In the next section we will presenta quantitative assessment of their reliability and performance aspects.
218 A. Tarasyuk, I. Pereverzeva, E. Troubitsyna, T. Latvala, and L. Nummila
5 Quantitative Assessment of Reconfiguration Strategies
The scientific mission of BepiColombo on the orbit of the Mercury will last forone year with possibility to extend this period for another year. Therefore, weshould assess the reliability of both architectural alternatives for this period oftime. Clearly, the triplicated DPU is able to tolerate up to three DPU failureswithin the two-year period, while the use of a duplicated DPU with a dynamicreconfiguration allows the satellite to tolerate from one (in the worst case) tofour (in the best case) failures of the components.
Obviously, the duplicated architecture with a dynamic configuration min-imises volume and the weight of the on-board equipment. However, the dynamicreconfiguration requires additional inter-component communication that slowsdown the process of producing TM. Therefore, we need to carefully analyse theperformance aspect as well. Essentially, we need to show that the duplicatedsystem with the dynamic reconfiguration can also provide a sufficient amount ofscientific TM within the two-year period.
To perform the probabilistic assessment of reliability and performance, werely on two types of data:
– probabilistic data about lengths of time delays required by DPU componentsand sensor units to produce the corresponding parts of scientific data
– data about occurrence rates of possible failures of these components
It is assumed that all time delays are exponentially distributed. We refinethe Event-B specifications obtained at the final refinement step by their proba-bilistic counterparts. This is achieved via introducing probabilistic informationinto events and replacing all the local nondeterminism with the (exponential)race conditions. Such a refinement relies on the model transformation presentedin Section 3. As a result, we represent the behaviour of Event-B machines byCTMCs. This allows us to use the probabilistic symbolic model checker PRISMto evaluate reliability and performance of the proposed models.
Due to the space constraints, we omit showing the PRISM specifications inthe paper, they can be found in [13]. The guidelines for Event-B to PRISM modeltransformation can be found in our previous work [14].
The results of quantitative verification performed by PRISM show that withprobabilistic characteristics of DPU presented, in Table 11, both reconfigurationstrategies lead to a similar level of system reliability and performance with in-significant advantage of the triplicated DPU. Thus, the reliability levels of bothsystems within the two-year period are approximately the same with the differ-ence of just 0.003 at the end of this period (0.999 against 0.996). Furthermore,the use of two DPUs under dynamic reconfiguration allows the satellite to han-dle only 2 TCs less after two years of work – 1104 against 1106 returned TMpackets in the case of the triplicated DPU. Clearly, the use of the duplicatedarchitecture with dynamic reconfiguration to achieve the desired levels of reliability and performance is optimal for the considered system.1 Provided information may differ form the characteristics of the real components. It is
used merely to demonstrate how the required comparison of reliability/performancecan be achieved
Formal development and assessment of a reconfigurable on-board satel-lite system 219
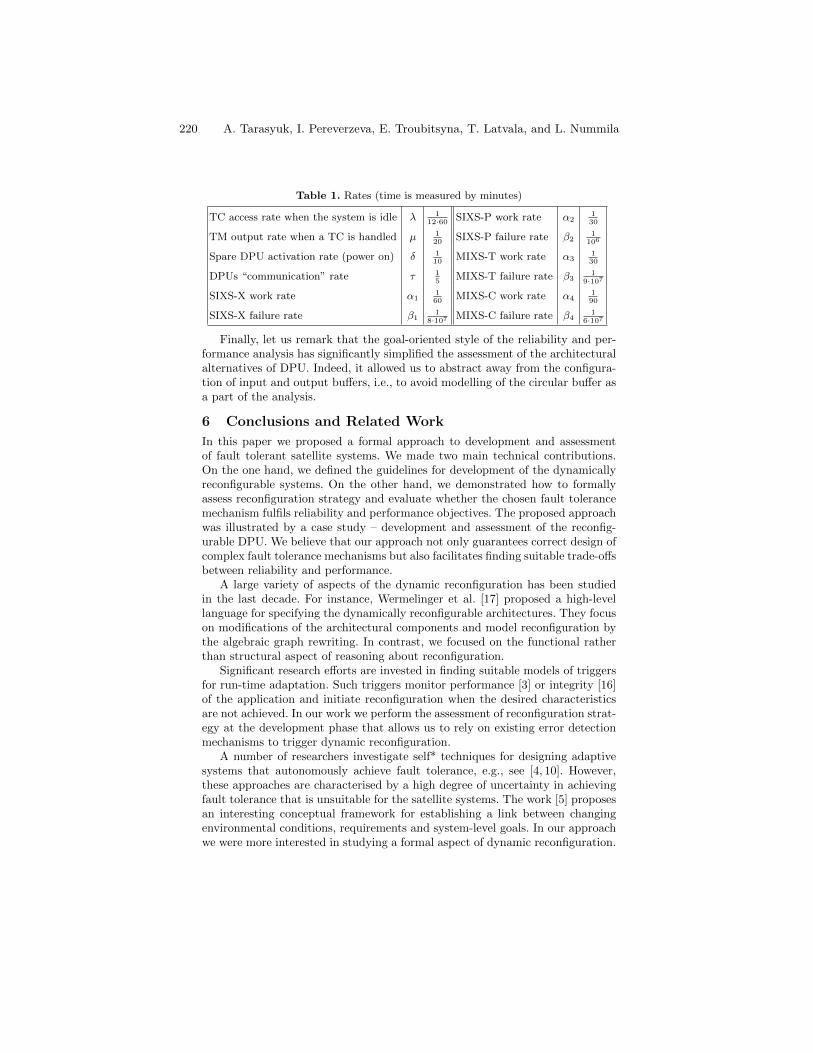
Table 1. Rates (time is measured by minutes)
TC access rate when the system is idle λ 112·60 SIXS-P work rate α2
130
TM output rate when a TC is handled µ 120
SIXS-P failure rate β21
106
Spare DPU activation rate (power on) δ 110
MIXS-T work rate α3130
DPUs “communication” rate τ 15
MIXS-T failure rate β31
9·107
SIXS-X work rate α1160
MIXS-C work rate α4190
SIXS-X failure rate β11
8·107 MIXS-C failure rate β41
6·107
Finally, let us remark that the goal-oriented style of the reliability and per-formance analysis has significantly simplified the assessment of the architecturalalternatives of DPU. Indeed, it allowed us to abstract away from the configura-tion of input and output buffers, i.e., to avoid modelling of the circular buffer asa part of the analysis.
6 Conclusions and Related Work
In this paper we proposed a formal approach to development and assessmentof fault tolerant satellite systems. We made two main technical contributions.On the one hand, we defined the guidelines for development of the dynamicallyreconfigurable systems. On the other hand, we demonstrated how to formallyassess reconfiguration strategy and evaluate whether the chosen fault tolerancemechanism fulfils reliability and performance objectives. The proposed approachwas illustrated by a case study – development and assessment of the reconfig-urable DPU. We believe that our approach not only guarantees correct design ofcomplex fault tolerance mechanisms but also facilitates finding suitable trade-offsbetween reliability and performance.
A large variety of aspects of the dynamic reconfiguration has been studiedin the last decade. For instance, Wermelinger et al. [17] proposed a high-levellanguage for specifying the dynamically reconfigurable architectures. They focuson modifications of the architectural components and model reconfiguration bythe algebraic graph rewriting. In contrast, we focused on the functional ratherthan structural aspect of reasoning about reconfiguration.
Significant research efforts are invested in finding suitable models of triggersfor run-time adaptation. Such triggers monitor performance [3] or integrity [16]of the application and initiate reconfiguration when the desired characteristicsare not achieved. In our work we perform the assessment of reconfiguration strat-egy at the development phase that allows us to rely on existing error detectionmechanisms to trigger dynamic reconfiguration.
A number of researchers investigate self* techniques for designing adaptivesystems that autonomously achieve fault tolerance, e.g., see [4, 10]. However,these approaches are characterised by a high degree of uncertainty in achievingfault tolerance that is unsuitable for the satellite systems. The work [5] proposesan interesting conceptual framework for establishing a link between changingenvironmental conditions, requirements and system-level goals. In our approachwe were more interested in studying a formal aspect of dynamic reconfiguration.
220 A. Tarasyuk, I. Pereverzeva, E. Troubitsyna, T. Latvala, and L. Nummila
In our future work we are planning to further study the properties of dynamicreconfiguration. It particular, it would be interesting to investigate reconfigura-tion in the presence of parallelism and complex component interdependencies.
References
1. Abrial, J.R.: Modeling in Event-B. Cambridge University Press (2010)2. BepiColombo: ESA Media Center, Space Science, online at
http://www.esa.int/esaSC/SEMNEM3MDAF 0 spk.html3. Caporuscio, M., Di Marco, A., Inverardi, P.: Model-Based System Reconfiguration
for Dynamic Performance Management. J. Syst. Softw. 80, 455–473 (2007)4. de Castro Guerra, P.A., Rubira, C.M.F., de Lemos, R.: A Fault-Tolerant Software
Architecture for Component-Based Systems. In: Architecting Dependable Systems.pp. 129–143. Springer (2003)
5. Goldsby, H., Sawyer, P., Bencomo, N., Cheng, B., Hughes., D.: Goal-Based Mod-eling of Dynamically Adaptive System Requirements. In: ECBS 2008. pp. 36–45.IEEE Computer Society (2008)
6. Grunske, L.: Specification Patterns for Probabilistic Quality Properties. In: ICSE2008. pp. 31–40. ACM (2008)
7. Kelly, T.P., Weaver, R.A.: The Goal Structuring Notation – A Safety ArgumentNotation. In: DSN 2004, Workshop on Assurance Cases (2004)
8. Kwiatkowska, M., Norman, G., Parker, D.: PRISM 4.0: Verification of ProbabilisticReal-time Systems. In: CAV’11. pp. 585–591. Springer (2011)
9. van Lamsweerde, A.: Goal-Oriented Requirements Engineering: A Guided Tour.In: RE’01. pp. 249–263. IEEE Computer Society (2001)
10. de Lemos, R., de Castro Guerra, P.A., Rubira, C.M.F.: A Fault-Tolerant Architec-tural Approach for Dependable Systems. Software, IEEE 23, 80–87 (2006)
11. Rodin: Event-B Platform, online at http://www.event-b.org/12. Space Engineering: Ground Systems and Operations – Telemetry and Telecom-
mand Packet Utilization: ECSS-E-70-41A. ECSS Secretariat, 30.01.2003, online athttp://www.ecss.nl/
13. Tarasyuk, A., Pereverzeva, I., Troubitsyna, E., Latvala, T., Nummila, L.: FormalDevelopment and Assessment of a Reconfigurable On-board Satellite System. Tech.Rep. 1038, Turku Centre for Computer Science (2012)
14. Tarasyuk, A., Troubitsyna, E., Laibinis, L.: Quantitative Reasoning about Depend-ability in Event-B: Probabilistic Model Checking Approach. In: Dependability andComputer Engineering: Concepts for Software-Intensive Systems, pp. 459–472. IGIGlobal (2011)
15. Tarasyuk, A., Troubitsyna, E., Laibinis, L.: Formal Modelling and Verification ofService-Oriented Systems in Probabilistic Event-B. In: IFM 2012. pp. 237–252.Springer (2012)
16. Warren, I., Sun, J., Krishnamohan, S., Weerasinghe, T.: An Automated Formal Ap-proach to Managing Dynamic Reconfiguration. In: ASE 2006. pp. 18–22. Springer(2006)
17. Wermelinger, M., Lopes, A., Fiadeiro, J.: A Graph Based Architectural Reconfig-uration Language. SIGSOFT Softw. Eng. Notes 26, 21–32 (2001)
Formal development and assessment of a reconfigurable on-board satel-lite system 221

Intentionally left blank to harmonize page numbering with printed version.
Impact of Soft Errors in a Jet Engine Controller
Olof Hannius1 and Johan Karlsson
2
1Volvo Aero Corporation
S-46181 Trollhättan, Sweden
2Department of Computer Science and Engineering
Chalmers University of Technology
S-412 96 Göteborg, Sweden
Abstract. We present an experimental study in which we investigate the impact
of particle induced soft errors occurring in the microprocessor of an experi-
mental FADEC system. The study focuses on the impact of single bit faults in
the instruction set architecture (ISA) registers. For such faults, we investigate
the effectiveness of the error detection mechanisms included in the FADEC sys-
tem, and determine the consequences of errors that escape detection. To this
end, we injected single bit faults in the ISA registers of a Freescale MC68340
microprocessor during execution of a prototype jet engine control program. Uti-
lizing both random fault injection and partially exhaustive injections, we con-
ducted six fault injection campaigns comprising in total more than 7000 inject-
ed faults. Twenty-three percent of the injected faults were effective, i.e., they
affected the outputs of the control program. Of these, the system detected 91%.
Of the 9 % that escaped detection, 7% caused a minor deviation in engine thrust
that would be harmless to flight safety, while 2% caused severe or potentially
catastrophic changes in engine thrust.
Keywords: jet-engine, controllers, FADEC, soft errors, cosmic neutrons, error
detection, coverage, fault injection
1 Introduction
Digital control systems for turbo-jet engines have been in operational use for almost
30 years. These systems are known as Full Authority Digital Engine Control systems,
or FADEC systems. To ensure aircraft safety, FADEC systems must be highly relia-
ble and fault-tolerant. A basic requirement is that a failure of a single hardware unit
should never cause the engine to deliver inadequate thrust.
Most FADEC systems are provided with two redundant control channels config-
ured as a primary/backup pair. Recently designed FADEC systems are typically
equipped with two electronic channels, while older designs often use a single elec-
tronic channel with a hydro-mechanical backup. Regardless of whether the backup
channel is electronic or hydro-mechanical, it is essential that the primary electronic
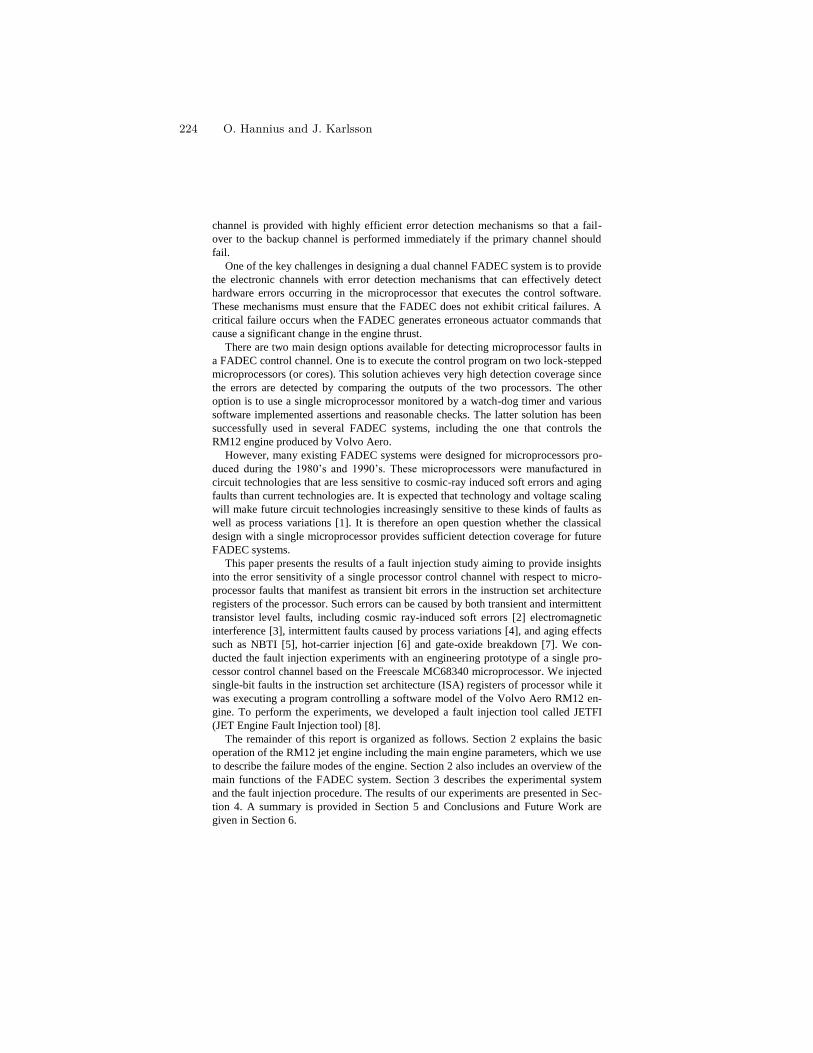
channel is provided with highly efficient error detection mechanisms so that a fail-
over to the backup channel is performed immediately if the primary channel should
fail.
One of the key challenges in designing a dual channel FADEC system is to provide
the electronic channels with error detection mechanisms that can effectively detect
hardware errors occurring in the microprocessor that executes the control software.
These mechanisms must ensure that the FADEC does not exhibit critical failures. A
critical failure occurs when the FADEC generates erroneous actuator commands that
cause a significant change in the engine thrust.
There are two main design options available for detecting microprocessor faults in
a FADEC control channel. One is to execute the control program on two lock-stepped
microprocessors (or cores). This solution achieves very high detection coverage since
the errors are detected by comparing the outputs of the two processors. The other
option is to use a single microprocessor monitored by a watch-dog timer and various
software implemented assertions and reasonable checks. The latter solution has been
successfully used in several FADEC systems, including the one that controls the
RM12 engine produced by Volvo Aero.
However, many existing FADEC systems were designed for microprocessors pro-
duced during the 1980’s and 1990’s. These microprocessors were manufactured in
circuit technologies that are less sensitive to cosmic-ray induced soft errors and aging
faults than current technologies are. It is expected that technology and voltage scaling
will make future circuit technologies increasingly sensitive to these kinds of faults as
well as process variations [1]. It is therefore an open question whether the classical
design with a single microprocessor provides sufficient detection coverage for future
FADEC systems.
This paper presents the results of a fault injection study aiming to provide insights
into the error sensitivity of a single processor control channel with respect to micro-
processor faults that manifest as transient bit errors in the instruction set architecture
registers of the processor. Such errors can be caused by both transient and intermittent
transistor level faults, including cosmic ray-induced soft errors [2] electromagnetic
interference [3], intermittent faults caused by process variations [4], and aging effects
such as NBTI [5], hot-carrier injection [6] and gate-oxide breakdown [7]. We con-
ducted the fault injection experiments with an engineering prototype of a single pro-
cessor control channel based on the Freescale MC68340 microprocessor. We injected
single-bit faults in the instruction set architecture (ISA) registers of processor while it
was executing a program controlling a software model of the Volvo Aero RM12 en-
gine. To perform the experiments, we developed a fault injection tool called JETFI
(JET Engine Fault Injection tool) [8].
The remainder of this report is organized as follows. Section 2 explains the basic
operation of the RM12 jet engine including the main engine parameters, which we use
to describe the failure modes of the engine. Section 2 also includes an overview of the
main functions of the FADEC system. Section 3 describes the experimental system
and the fault injection procedure. The results of our experiments are presented in Sec-
tion 4. A summary is provided in Section 5 and Conclusions and Future Work are
given in Section 6.
224 O. Hannius and J. Karlsson
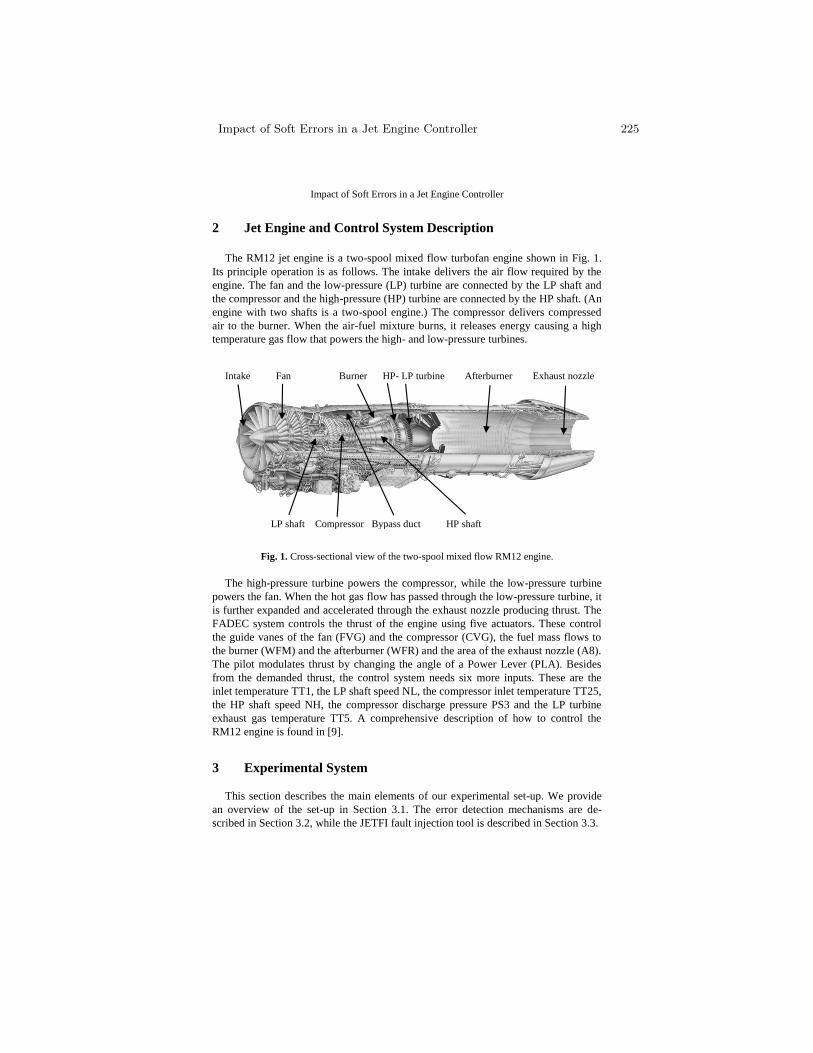
Impact of Soft Errors in a Jet Engine Controller
2 Jet Engine and Control System Description
The RM12 jet engine is a two-spool mixed flow turbofan engine shown in Fig. 1.
Its principle operation is as follows. The intake delivers the air flow required by the
engine. The fan and the low-pressure (LP) turbine are connected by the LP shaft and
the compressor and the high-pressure (HP) turbine are connected by the HP shaft. (An
engine with two shafts is a two-spool engine.) The compressor delivers compressed
air to the burner. When the air-fuel mixture burns, it releases energy causing a high
temperature gas flow that powers the high- and low-pressure turbines.
Intake Fan Burner HP- LP turbine Afterburner Exhaust nozzle
LP shaft Compressor Bypass duct HP shaft
Fig. 1. Cross-sectional view of the two-spool mixed flow RM12 engine.
The high-pressure turbine powers the compressor, while the low-pressure turbine
powers the fan. When the hot gas flow has passed through the low-pressure turbine, it
is further expanded and accelerated through the exhaust nozzle producing thrust. The
FADEC system controls the thrust of the engine using five actuators. These control
the guide vanes of the fan (FVG) and the compressor (CVG), the fuel mass flows to
the burner (WFM) and the afterburner (WFR) and the area of the exhaust nozzle (A8).
The pilot modulates thrust by changing the angle of a Power Lever (PLA). Besides
from the demanded thrust, the control system needs six more inputs. These are the
inlet temperature TT1, the LP shaft speed NL, the compressor inlet temperature TT25,
the HP shaft speed NH, the compressor discharge pressure PS3 and the LP turbine
exhaust gas temperature TT5. A comprehensive description of how to control the
RM12 engine is found in [9].
3 Experimental System
This section describes the main elements of our experimental set-up. We provide
an overview of the set-up in Section 3.1. The error detection mechanisms are de-
scribed in Section 3.2, while the JETFI fault injection tool is described in Section 3.3.
Impact of Soft Errors in a Jet Engine Controller 225
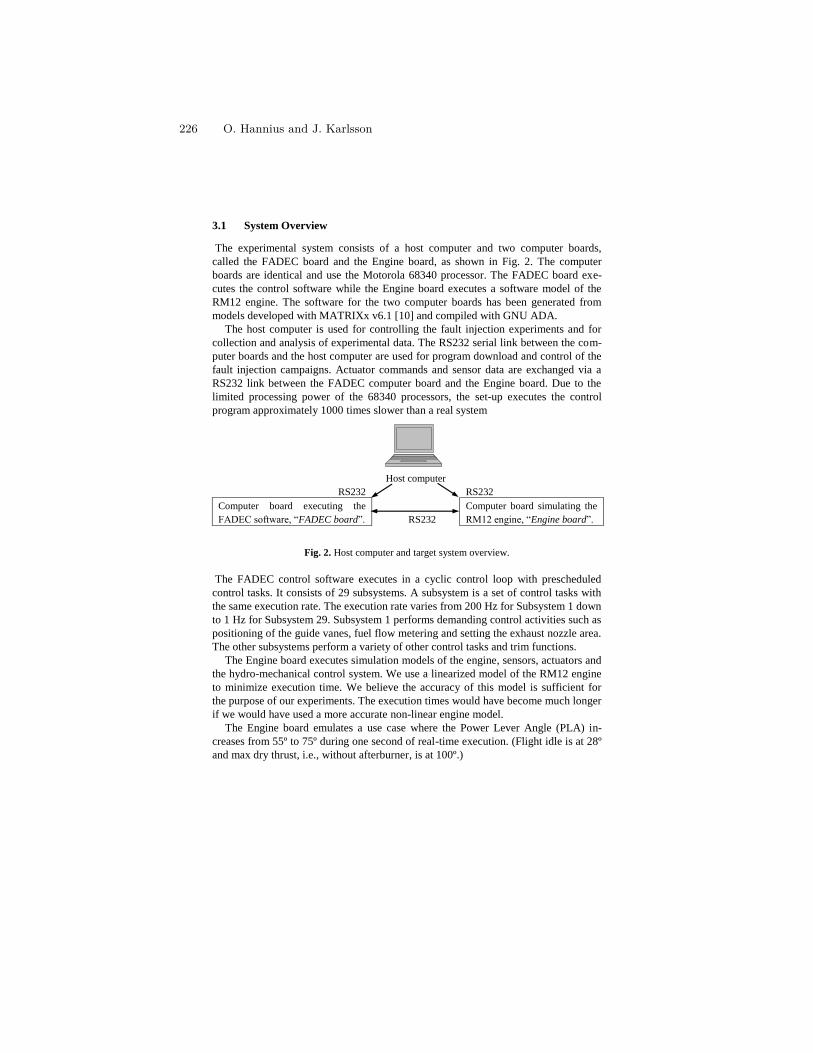
3.1 System Overview
The experimental system consists of a host computer and two computer boards,
called the FADEC board and the Engine board, as shown in Fig. 2. The computer
boards are identical and use the Motorola 68340 processor. The FADEC board exe-
cutes the control software while the Engine board executes a software model of the
RM12 engine. The software for the two computer boards has been generated from
models developed with MATRIXx v6.1 [10] and compiled with GNU ADA.
The host computer is used for controlling the fault injection experiments and for
collection and analysis of experimental data. The RS232 serial link between the com-
puter boards and the host computer are used for program download and control of the
fault injection campaigns. Actuator commands and sensor data are exchanged via a
RS232 link between the FADEC computer board and the Engine board. Due to the
limited processing power of the 68340 processors, the set-up executes the control
program approximately 1000 times slower than a real system
Host computer
RS232 RS232
Computer board executing the
FADEC software, “FADEC board”.
RS232
Computer board simulating the
RM12 engine, “Engine board”.
Fig. 2. Host computer and target system overview.
The FADEC control software executes in a cyclic control loop with prescheduled
control tasks. It consists of 29 subsystems. A subsystem is a set of control tasks with
the same execution rate. The execution rate varies from 200 Hz for Subsystem 1 down
to 1 Hz for Subsystem 29. Subsystem 1 performs demanding control activities such as
positioning of the guide vanes, fuel flow metering and setting the exhaust nozzle area.
The other subsystems perform a variety of other control tasks and trim functions.
The Engine board executes simulation models of the engine, sensors, actuators and
the hydro-mechanical control system. We use a linearized model of the RM12 engine
to minimize execution time. We believe the accuracy of this model is sufficient for
the purpose of our experiments. The execution times would have become much longer
if we would have used a more accurate non-linear engine model.
The Engine board emulates a use case where the Power Lever Angle (PLA) in-
creases from 55º to 75º during one second of real-time execution. (Flight idle is at 28º
and max dry thrust, i.e., without afterburner, is at 100º.)
226 O. Hannius and J. Karlsson
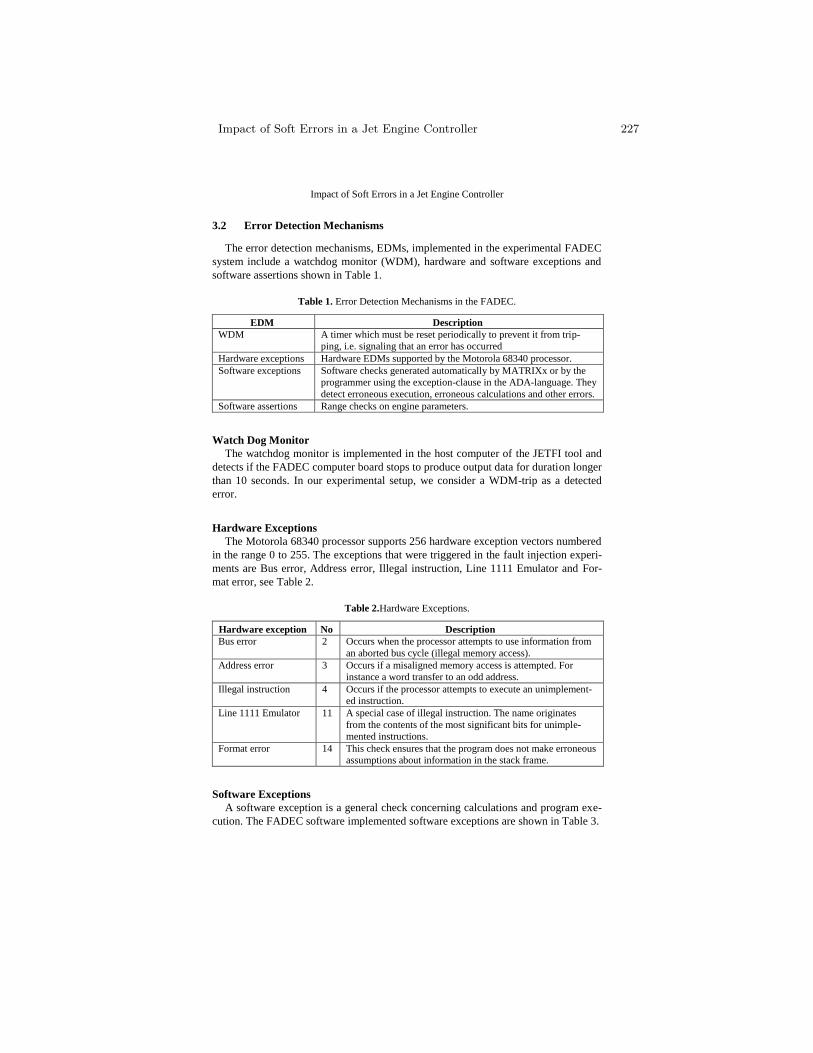
Impact of Soft Errors in a Jet Engine Controller
3.2 Error Detection Mechanisms
The error detection mechanisms, EDMs, implemented in the experimental FADEC
system include a watchdog monitor (WDM), hardware and software exceptions and
software assertions shown in Table 1.
Table 1. Error Detection Mechanisms in the FADEC.
EDM Description
WDM A timer which must be reset periodically to prevent it from trip-
ping, i.e. signaling that an error has occurred
Hardware exceptions Hardware EDMs supported by the Motorola 68340 processor.
Software exceptions Software checks generated automatically by MATRIXx or by the
programmer using the exception-clause in the ADA-language. They
detect erroneous execution, erroneous calculations and other errors.
Software assertions Range checks on engine parameters.
Watch Dog Monitor
The watchdog monitor is implemented in the host computer of the JETFI tool and
detects if the FADEC computer board stops to produce output data for duration longer
than 10 seconds. In our experimental setup, we consider a WDM-trip as a detected
error.
Hardware Exceptions
The Motorola 68340 processor supports 256 hardware exception vectors numbered
in the range 0 to 255. The exceptions that were triggered in the fault injection experi-
ments are Bus error, Address error, Illegal instruction, Line 1111 Emulator and For-
mat error, see Table 2.
Table 2.Hardware Exceptions.
Hardware exception No Description
Bus error 2 Occurs when the processor attempts to use information from
an aborted bus cycle (illegal memory access).
Address error 3 Occurs if a misaligned memory access is attempted. For
instance a word transfer to an odd address.
Illegal instruction 4 Occurs if the processor attempts to execute an unimplement-
ed instruction.
Line 1111 Emulator 11 A special case of illegal instruction. The name originates
from the contents of the most significant bits for unimple-
mented instructions.
Format error 14 This check ensures that the program does not make erroneous
assumptions about information in the stack frame.
Software Exceptions
A software exception is a general check concerning calculations and program exe-
cution. The FADEC software implemented software exceptions are shown in Table 3.
Impact of Soft Errors in a Jet Engine Controller 227
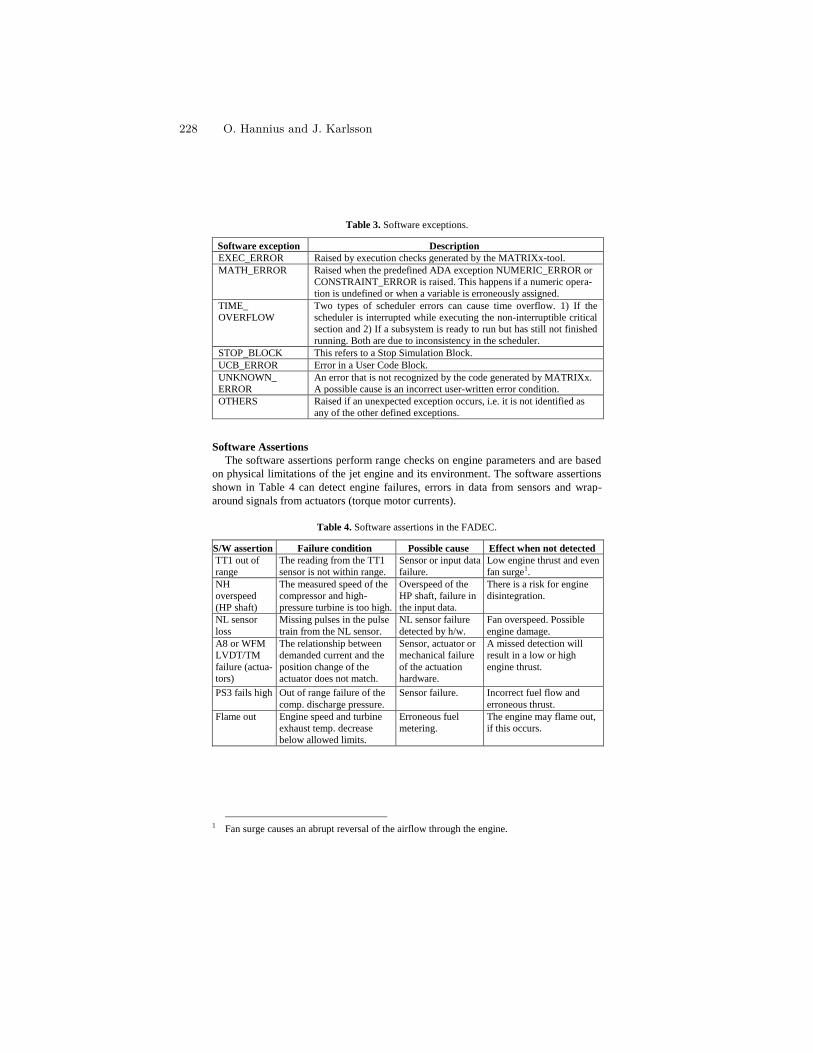
Table 3. Software exceptions.
Software exception Description
EXEC_ERROR Raised by execution checks generated by the MATRIXx-tool.
MATH_ERROR Raised when the predefined ADA exception NUMERIC_ERROR or
CONSTRAINT_ERROR is raised. This happens if a numeric opera-
tion is undefined or when a variable is erroneously assigned.
TIME_
OVERFLOW
Two types of scheduler errors can cause time overflow. 1) If the
scheduler is interrupted while executing the non-interruptible critical
section and 2) If a subsystem is ready to run but has still not finished
running. Both are due to inconsistency in the scheduler.
STOP_BLOCK This refers to a Stop Simulation Block.
UCB_ERROR Error in a User Code Block.
UNKNOWN_
ERROR
An error that is not recognized by the code generated by MATRIXx.
A possible cause is an incorrect user-written error condition.
OTHERS Raised if an unexpected exception occurs, i.e. it is not identified as
any of the other defined exceptions.
Software Assertions
The software assertions perform range checks on engine parameters and are based
on physical limitations of the jet engine and its environment. The software assertions
shown in Table 4 can detect engine failures, errors in data from sensors and wrap-
around signals from actuators (torque motor currents).
Table 4. Software assertions in the FADEC.
S/W assertion Failure condition Possible cause Effect when not detected
TT1 out of
range
The reading from the TT1
sensor is not within range.
Sensor or input data
failure.
Low engine thrust and even
fan surge1.
NH
overspeed
(HP shaft)
The measured speed of the
compressor and high-
pressure turbine is too high.
Overspeed of the
HP shaft, failure in
the input data.
There is a risk for engine
disintegration.
NL sensor
loss
Missing pulses in the pulse
train from the NL sensor.
NL sensor failure
detected by h/w.
Fan overspeed. Possible
engine damage.
A8 or WFM
LVDT/TM
failure (actua-
tors)
The relationship between
demanded current and the
position change of the
actuator does not match.
Sensor, actuator or
mechanical failure
of the actuation
hardware.
A missed detection will
result in a low or high
engine thrust.
PS3 fails high
Out of range failure of the
comp. discharge pressure.
Sensor failure. Incorrect fuel flow and
erroneous thrust.
Flame out Engine speed and turbine
exhaust temp. decrease
below allowed limits.
Erroneous fuel
metering.
The engine may flame out,
if this occurs.
1 Fan surge causes an abrupt reversal of the airflow through the engine.
228 O. Hannius and J. Karlsson
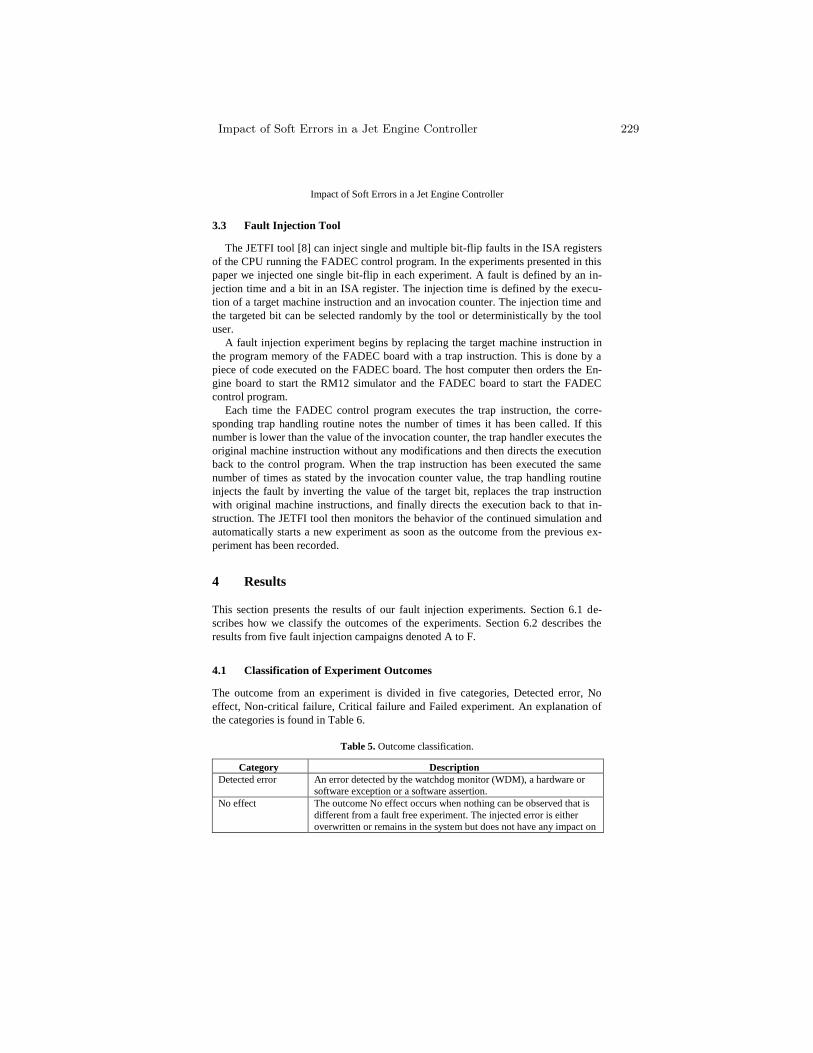
Impact of Soft Errors in a Jet Engine Controller
3.3 Fault Injection Tool
The JETFI tool [8] can inject single and multiple bit-flip faults in the ISA registers
of the CPU running the FADEC control program. In the experiments presented in this
paper we injected one single bit-flip in each experiment. A fault is defined by an in-
jection time and a bit in an ISA register. The injection time is defined by the execu-
tion of a target machine instruction and an invocation counter. The injection time and
the targeted bit can be selected randomly by the tool or deterministically by the tool
user.
A fault injection experiment begins by replacing the target machine instruction in
the program memory of the FADEC board with a trap instruction. This is done by a
piece of code executed on the FADEC board. The host computer then orders the En-
gine board to start the RM12 simulator and the FADEC board to start the FADEC
control program.
Each time the FADEC control program executes the trap instruction, the corre-
sponding trap handling routine notes the number of times it has been called. If this
number is lower than the value of the invocation counter, the trap handler executes the
original machine instruction without any modifications and then directs the execution
back to the control program. When the trap instruction has been executed the same
number of times as stated by the invocation counter value, the trap handling routine
injects the fault by inverting the value of the target bit, replaces the trap instruction
with original machine instructions, and finally directs the execution back to that in-
struction. The JETFI tool then monitors the behavior of the continued simulation and
automatically starts a new experiment as soon as the outcome from the previous ex-
periment has been recorded.
4 Results
This section presents the results of our fault injection experiments. Section 6.1 de-
scribes how we classify the outcomes of the experiments. Section 6.2 describes the
results from five fault injection campaigns denoted A to F.
4.1 Classification of Experiment Outcomes
The outcome from an experiment is divided in five categories, Detected error, No
effect, Non-critical failure, Critical failure and Failed experiment. An explanation of
the categories is found in Table 6.
Table 5. Outcome classification.
Category Description
Detected error An error detected by the watchdog monitor (WDM), a hardware or
software exception or a software assertion.
No effect The outcome No effect occurs when nothing can be observed that is
different from a fault free experiment. The injected error is either
overwritten or remains in the system but does not have any impact on
Impact of Soft Errors in a Jet Engine Controller 229
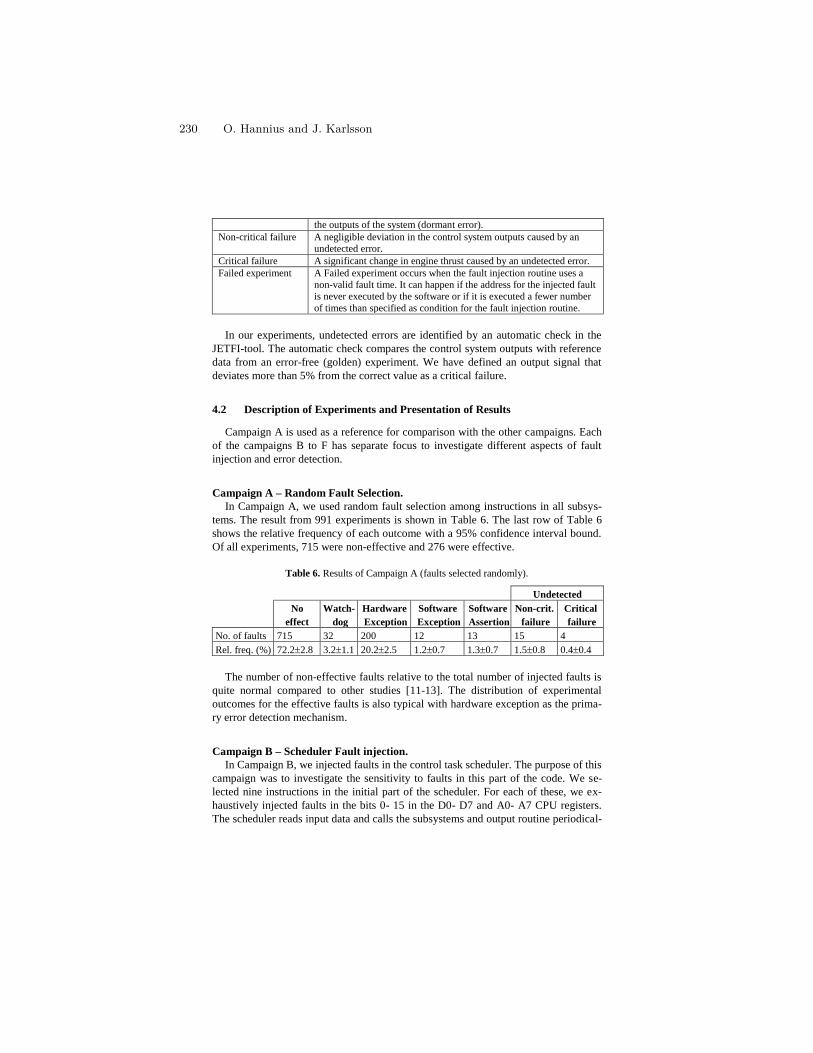
the outputs of the system (dormant error).
Non-critical failure A negligible deviation in the control system outputs caused by an
undetected error.
Critical failure A significant change in engine thrust caused by an undetected error.
Failed experiment A Failed experiment occurs when the fault injection routine uses a
non-valid fault time. It can happen if the address for the injected fault
is never executed by the software or if it is executed a fewer number
of times than specified as condition for the fault injection routine.
In our experiments, undetected errors are identified by an automatic check in the
JETFI-tool. The automatic check compares the control system outputs with reference
data from an error-free (golden) experiment. We have defined an output signal that
deviates more than 5% from the correct value as a critical failure.
4.2 Description of Experiments and Presentation of Results
Campaign A is used as a reference for comparison with the other campaigns. Each
of the campaigns B to F has separate focus to investigate different aspects of fault
injection and error detection.
Campaign A – Random Fault Selection.
In Campaign A, we used random fault selection among instructions in all subsys-
tems. The result from 991 experiments is shown in Table 6. The last row of Table 6
shows the relative frequency of each outcome with a 95% confidence interval bound.
Of all experiments, 715 were non-effective and 276 were effective.
Table 6. Results of Campaign A (faults selected randomly).
Undetected
No
effect
Watch-
dog
Hardware
Exception
Software
Exception
Software
Assertion
Non-crit.
failure
Critical
failure
No. of faults 715 32 200 12 13 15 4
Rel. freq. (%) 72.22.8 3.21.1 20.22.5 1.20.7 1.30.7 1.50.8 0.40.4
The number of non-effective faults relative to the total number of injected faults is
quite normal compared to other studies [11-13]. The distribution of experimental
outcomes for the effective faults is also typical with hardware exception as the prima-
ry error detection mechanism.
Campaign B – Scheduler Fault injection.
In Campaign B, we injected faults in the control task scheduler. The purpose of this
campaign was to investigate the sensitivity to faults in this part of the code. We se-
lected nine instructions in the initial part of the scheduler. For each of these, we ex-
haustively injected faults in the bits 0- 15 in the D0- D7 and A0- A7 CPU registers.
The scheduler reads input data and calls the subsystems and output routine periodical-
230 O. Hannius and J. Karlsson
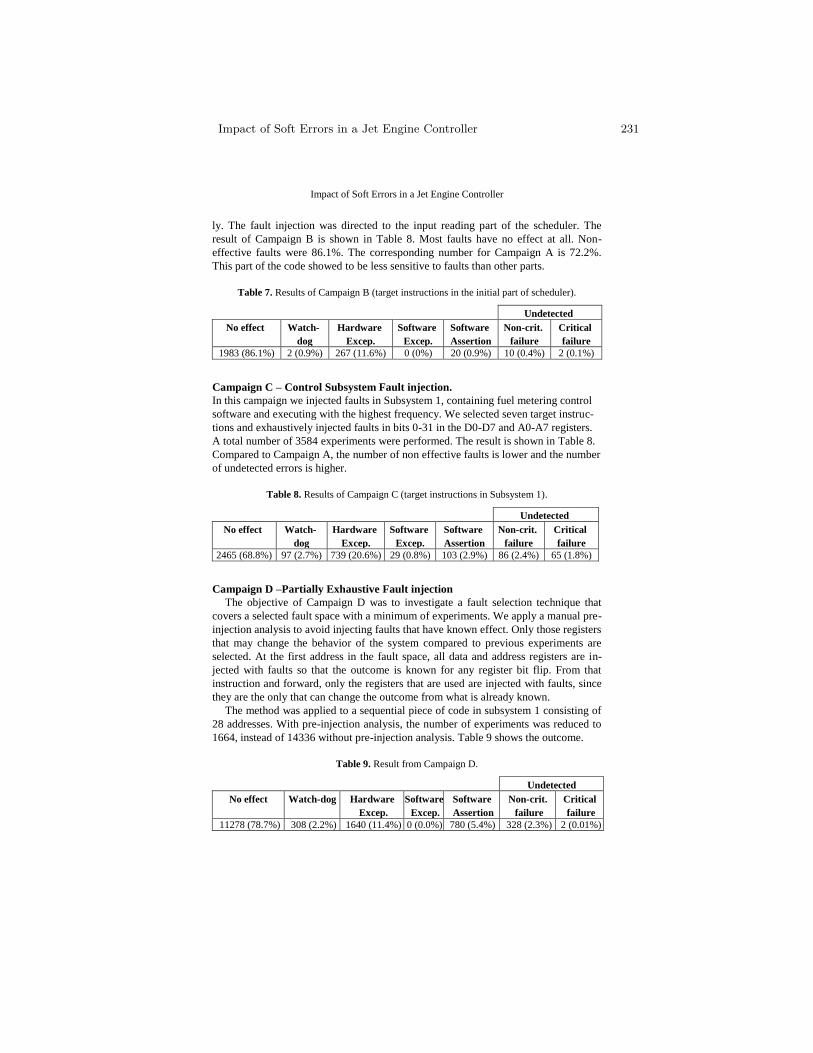
Impact of Soft Errors in a Jet Engine Controller
ly. The fault injection was directed to the input reading part of the scheduler. The
result of Campaign B is shown in Table 8. Most faults have no effect at all. Non-
effective faults were 86.1%. The corresponding number for Campaign A is 72.2%.
This part of the code showed to be less sensitive to faults than other parts.
Table 7. Results of Campaign B (target instructions in the initial part of scheduler).
Undetected
No effect Watch-
dog
Hardware
Excep.
Software
Excep.
Software
Assertion
Non-crit.
failure
Critical
failure
1983 (86.1%) 2 (0.9%) 267 (11.6%) 0 (0%) 20 (0.9%) 10 (0.4%) 2 (0.1%)
Campaign C – Control Subsystem Fault injection.
In this campaign we injected faults in Subsystem 1, containing fuel metering control
software and executing with the highest frequency. We selected seven target instruc-
tions and exhaustively injected faults in bits 0-31 in the D0-D7 and A0-A7 registers.
A total number of 3584 experiments were performed. The result is shown in Table 8.
Compared to Campaign A, the number of non effective faults is lower and the number
of undetected errors is higher.
Table 8. Results of Campaign C (target instructions in Subsystem 1).
Undetected
No effect Watch-
dog
Hardware
Excep.
Software
Excep.
Software
Assertion
Non-crit.
failure
Critical
failure
2465 (68.8%) 97 (2.7%) 739 (20.6%) 29 (0.8%) 103 (2.9%) 86 (2.4%) 65 (1.8%)
Campaign D –Partially Exhaustive Fault injection
The objective of Campaign D was to investigate a fault selection technique that
covers a selected fault space with a minimum of experiments. We apply a manual pre-
injection analysis to avoid injecting faults that have known effect. Only those registers
that may change the behavior of the system compared to previous experiments are
selected. At the first address in the fault space, all data and address registers are in-
jected with faults so that the outcome is known for any register bit flip. From that
instruction and forward, only the registers that are used are injected with faults, since
they are the only that can change the outcome from what is already known.
The method was applied to a sequential piece of code in subsystem 1 consisting of
28 addresses. With pre-injection analysis, the number of experiments was reduced to
1664, instead of 14336 without pre-injection analysis. Table 9 shows the outcome.
Table 9. Result from Campaign D.
Undetected
No effect Watch-dog Hardware
Excep.
Software
Excep.
Software
Assertion
Non-crit.
failure
Critical
failure
11278 (78.7%) 308 (2.2%) 1640 (11.4%) 0 (0.0%) 780 (5.4%) 328 (2.3%) 2 (0.01%)
Impact of Soft Errors in a Jet Engine Controller 231
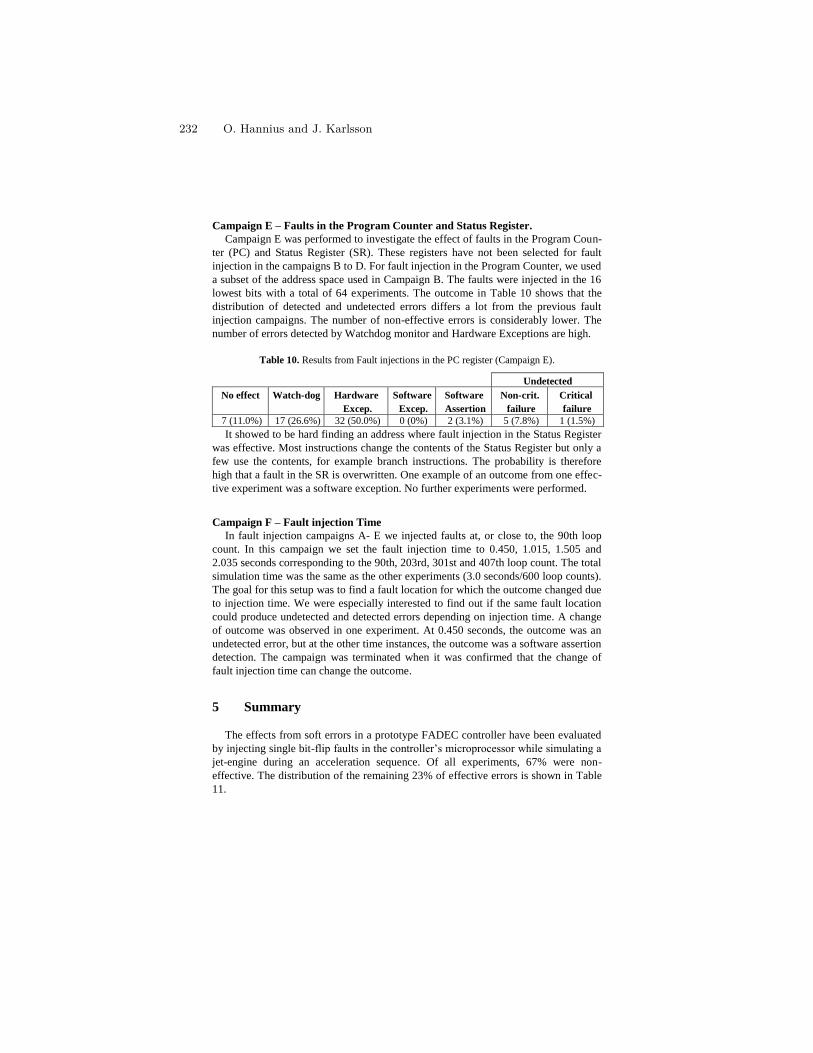
Campaign E – Faults in the Program Counter and Status Register.
Campaign E was performed to investigate the effect of faults in the Program Coun-
ter (PC) and Status Register (SR). These registers have not been selected for fault
injection in the campaigns B to D. For fault injection in the Program Counter, we used
a subset of the address space used in Campaign B. The faults were injected in the 16
lowest bits with a total of 64 experiments. The outcome in Table 10 shows that the
distribution of detected and undetected errors differs a lot from the previous fault
injection campaigns. The number of non-effective errors is considerably lower. The
number of errors detected by Watchdog monitor and Hardware Exceptions are high.
Table 10. Results from Fault injections in the PC register (Campaign E).
Undetected
No effect Watch-dog Hardware
Excep.
Software
Excep.
Software
Assertion
Non-crit.
failure
Critical
failure
7 (11.0%) 17 (26.6%) 32 (50.0%) 0 (0%) 2 (3.1%) 5 (7.8%) 1 (1.5%)
It showed to be hard finding an address where fault injection in the Status Register
was effective. Most instructions change the contents of the Status Register but only a
few use the contents, for example branch instructions. The probability is therefore
high that a fault in the SR is overwritten. One example of an outcome from one effec-
tive experiment was a software exception. No further experiments were performed.
Campaign F – Fault injection Time
In fault injection campaigns A- E we injected faults at, or close to, the 90th loop
count. In this campaign we set the fault injection time to 0.450, 1.015, 1.505 and
2.035 seconds corresponding to the 90th, 203rd, 301st and 407th loop count. The total
simulation time was the same as the other experiments (3.0 seconds/600 loop counts).
The goal for this setup was to find a fault location for which the outcome changed due
to injection time. We were especially interested to find out if the same fault location
could produce undetected and detected errors depending on injection time. A change
of outcome was observed in one experiment. At 0.450 seconds, the outcome was an
undetected error, but at the other time instances, the outcome was a software assertion
detection. The campaign was terminated when it was confirmed that the change of
fault injection time can change the outcome.
5 Summary
The effects from soft errors in a prototype FADEC controller have been evaluated
by injecting single bit-flip faults in the controller’s microprocessor while simulating a
jet-engine during an acceleration sequence. Of all experiments, 67% were non-
effective. The distribution of the remaining 23% of effective errors is shown in Table
11.
232 O. Hannius and J. Karlsson
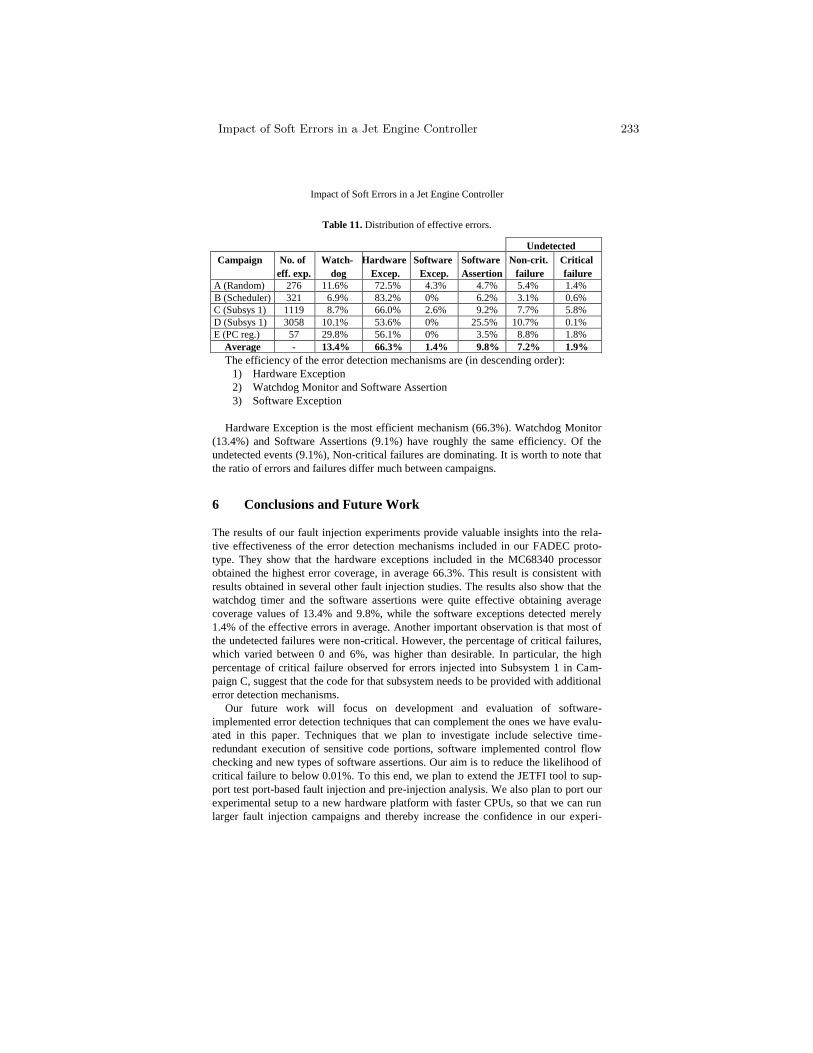
Impact of Soft Errors in a Jet Engine Controller
Table 11. Distribution of effective errors.
Undetected
Campaign No. of
eff. exp.
Watch-
dog
Hardware
Excep.
Software
Excep.
Software
Assertion
Non-crit.
failure
Critical
failure
A (Random) 276 11.6% 72.5% 4.3% 4.7% 5.4% 1.4%
B (Scheduler) 321 6.9% 83.2% 0% 6.2% 3.1% 0.6%
C (Subsys 1) 1119 8.7% 66.0% 2.6% 9.2% 7.7% 5.8%
D (Subsys 1) 3058 10.1% 53.6% 0% 25.5% 10.7% 0.1%
E (PC reg.) 57 29.8% 56.1% 0% 3.5% 8.8% 1.8%
Average - 13.4% 66.3% 1.4% 9.8% 7.2% 1.9%
The efficiency of the error detection mechanisms are (in descending order):
1) Hardware Exception
2) Watchdog Monitor and Software Assertion
3) Software Exception
Hardware Exception is the most efficient mechanism (66.3%). Watchdog Monitor
(13.4%) and Software Assertions (9.1%) have roughly the same efficiency. Of the
undetected events (9.1%), Non-critical failures are dominating. It is worth to note that
the ratio of errors and failures differ much between campaigns.
6 Conclusions and Future Work
The results of our fault injection experiments provide valuable insights into the rela-
tive effectiveness of the error detection mechanisms included in our FADEC proto-
type. They show that the hardware exceptions included in the MC68340 processor
obtained the highest error coverage, in average 66.3%. This result is consistent with
results obtained in several other fault injection studies. The results also show that the
watchdog timer and the software assertions were quite effective obtaining average
coverage values of 13.4% and 9.8%, while the software exceptions detected merely
1.4% of the effective errors in average. Another important observation is that most of
the undetected failures were non-critical. However, the percentage of critical failures,
which varied between 0 and 6%, was higher than desirable. In particular, the high
percentage of critical failure observed for errors injected into Subsystem 1 in Cam-
paign C, suggest that the code for that subsystem needs to be provided with additional
error detection mechanisms.
Our future work will focus on development and evaluation of software-
implemented error detection techniques that can complement the ones we have evalu-
ated in this paper. Techniques that we plan to investigate include selective time-
redundant execution of sensitive code portions, software implemented control flow
checking and new types of software assertions. Our aim is to reduce the likelihood of
critical failure to below 0.01%. To this end, we plan to extend the JETFI tool to sup-
port test port-based fault injection and pre-injection analysis. We also plan to port our
experimental setup to a new hardware platform with faster CPUs, so that we can run
larger fault injection campaigns and thereby increase the confidence in our experi-
Impact of Soft Errors in a Jet Engine Controller 233
mental results. In addition, we also intend to evaluate our FADEC prototype with
respect to multiple bit errors.
Acknowledgements
This work has partially been supported by the research project Reliable Jet Engines
funded by the NFFP programme.
References 1. Chandra, V., Aitken,R.: Impact of Technology and Voltage Scaling on the Soft Error Sus-
ceptibility in Nanoscale CMOS. IEEE International Symposium on Defect and Fault Tol-
erance of VLSI Systems (DFTVS '08), pp.114-122, Oct. 2008.
2. Ibe, E. Taniguchi, H., Yahagi, Y., Shimbo, K. S., Toba, T.: Impact of scaling on neutron-
induced soft error in SRAMs from a 250 nm to a 22 nm design rule. IEEE Transactions on
Electron Devices, vol. 57, no. 7, pp. 1527–1538, Jul. 2010.
3. Benso, A., Di Carlo, S., Di Natale, G., Prinetto, P.: A watchdog processor to detect data
and control flow errors. 9th IEEE International On-Line Testing Symposium, pp. 144-148,
Jul. 2003.
4. Jahinuzzaman, S.M., Sharifkhani, M., Sachdev, M.: Investigation of process impact on soft
error susceptibility of nanometric SRAMs using a compact critical charge model. 9th In-
ternational Symposium of Quality Electronic Design, 2008.
5. Islam, A.E., Kufluoglu, H., Varghese, D., Mahapatra, S., Alam, M.A.: Recent issues in
negative-bias temperature instability: Initial degradation, field dependence of interface trap
generation, hole trapping effects and relaxation. IEEE Trans. Electron Devices, vol. 54, no.
9, pp. 2143–2154, Sep. 2007.
6. Kufluoglu, H., Alam, M.A.: A Computational Model of NBTI and Hot Carrier Injection
Time-Exponents for MOSFET Reliability. Journal of Computational Electronics, vol. 3,
No. 3-4, pp.165–169, Oct. 2004.
7. Cannon, E.H., KleinOsowski, AJ., Kanj, R., Reinhardt, D.D.,Joshi, R.V.: The impact of
aging effects and manufacturing variation on SRAM soft-error rate. IEEE Transactions on
Device and Materials Reliability, Vol. 8, no. 1, pp. 145-152, Mar. 2008.
8. Hannius, O., Karlsson, J.: JETFI – A Fault Injection Tool for Assessment of Error Han-
dling Mechanisms in Jet-engine Control Systems. Technical Report 2012:06, ISSN 1652-
926X, Chalmers University of Technology, 2012.
9. Härefors, M.: A study in jet engine control - control structure selection and multivariable
design. Ph.D. Thesis, Chalmers University of Technology, Sweden, 1999.
10. Ward, D.K., Andrews, S.F., McComas, D.C., O’Donnell, J.R.: Use of the MATRIXx inte-
grated toolkit on the Microwave Anisotropy Probe Attitude Control System. NASA’s
Goddard Space Flight Center.
http://lambda.gsfc.nasa.gov/product/map/team_pubs/aas99.pdf
11. Autran, J. L., Roche, P., Sauze, S., Gasiot, G., Munteanu, D., Loaiza, P., Zampaolo, M.,
Borel, J.: Real-Time Neutron and Alpha Soft-Error Rate Testing of CMOS 130nm SRAM:
Altitude versus Underground Measurements. Proc. International Conference On IC Design
and Technology (ICICDT), pp. 233-236, Grenoble, 2008.
12. Autran, J. L., Roche, P., Sauze, S., Gasiot, G., Munteanu, D., Loaiza, P., Zampaolo, M.,
Borel, J.: Altitude and Underground Real-Time SER Characterization of CMOS 65 nm
SRAM. IEEE transactions on Nuclear Science, vol.56, no. 4, Aug. 2009.
13. Normand, E.: Single Event Upset at Ground Level. IEEE transactions on Nuclear Science,
vol. 43, no. 6, Dec. 1996.
14. Normand, E.: Single Event Effects in Avionics. IEEE transactions on Nuclear Science, vol.
43, no. 2, Apr. 1996.
234 O. Hannius and J. Karlsson
Which Automata for which Safety AssessmentStep of Satellite FDIR ?
Ludovic Pintard1, Christel Seguin2, and Jean-Paul Blanquart3
1 CNRS, LAAS, 7 avenue du colonel Roche, F-31400 Toulouse, [email protected]
2 ONERA-CERT, 2 av. E. Belin, B.P. 4025, 31055 Toulouse cedex, [email protected],
3 Astrium SAS, 31 rue des Cosmonautes, 31402 Toulouse cedex 4, [email protected],
Abstract. This paper presents how three kinds of automata can beused in a complementary way to progressively design and assess theFault Detection Isolation and Recovery (FDIR) mechanisms of a satellite.AltaRica language and tools are chosen to investigate how discrete modeautomata can be used to assess the overall system architecture againsthighest level safety and dependability requirements. SCADE languageand tools are chosen to model and verify the software part of the FDIRwith synchronous data flows. HyTech language and tools are used tovalidate the hypotheses about the physical behaviours of componentsthanks to hybrid automata. Each case tries to highlight the relevantsafety objectives, the granularity of model sufficient for these safety anddependability objectives and the model tractability with the existingtools.
Keywords: hybrid automata, model checking, FDIR
1 Introduction
Space systems become more and more autonomous and complex, which consider-ably increases the difficulties related to their validation. This is particularly truefor the FDIR functions – Failure Detection, Isolation and Recovery – which is anessential and critical part of space systems, so as to prevent mission interruptionor loss.
This introduces several interacting phenomena. E.g., a fault occurs while thesystem is in a given state (or behaviour mode) and propagates according to thisstate. A recovery action occurs while a fault is detected and may modify thestate of the system (for instance, a recovery action may switch off the powersupply of an electronic device). As a consequence, the initial fault propagationmay be modified, interrupted, or activate other faults potentially existing andpreviously hidden (passive faults).
Today, system specifications are generally produced in a textual form andresult from an intellectual process supported by analyses largely made by hand.
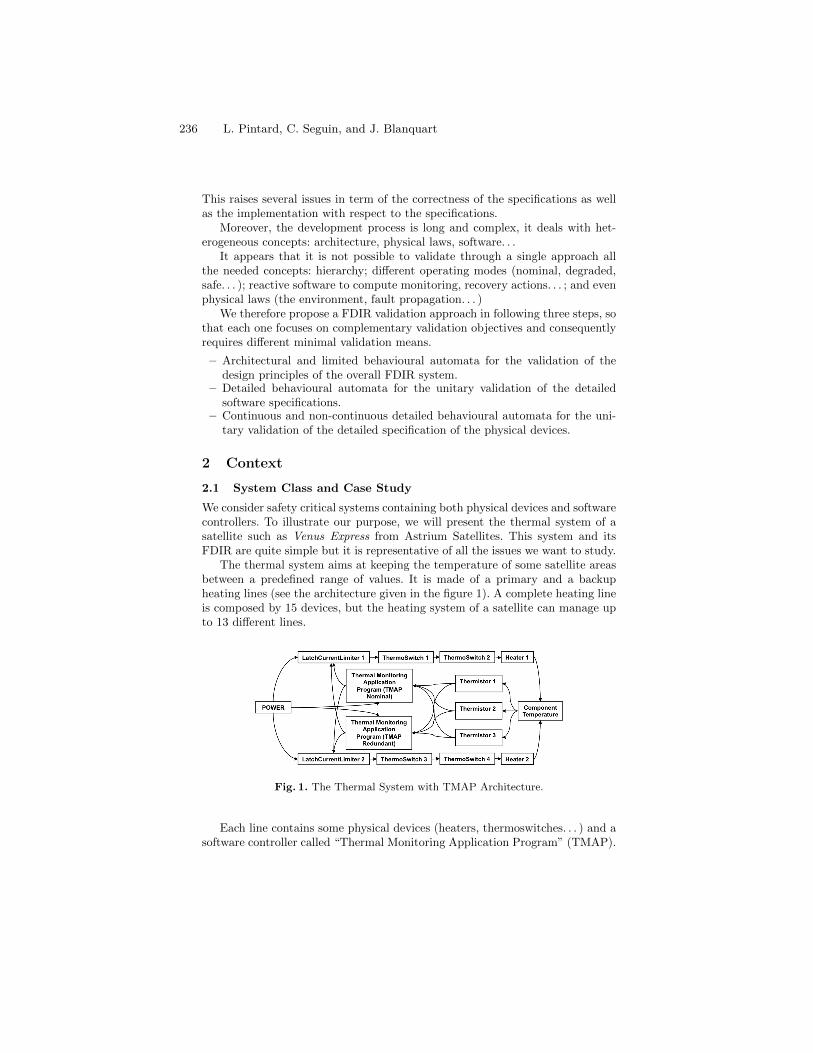
This raises several issues in term of the correctness of the specifications as wellas the implementation with respect to the specifications.
Moreover, the development process is long and complex, it deals with het-erogeneous concepts: architecture, physical laws, software. . .
It appears that it is not possible to validate through a single approach allthe needed concepts: hierarchy; different operating modes (nominal, degraded,safe. . . ); reactive software to compute monitoring, recovery actions. . . ; and evenphysical laws (the environment, fault propagation. . . )
We therefore propose a FDIR validation approach in following three steps, sothat each one focuses on complementary validation objectives and consequentlyrequires different minimal validation means.
– Architectural and limited behavioural automata for the validation of thedesign principles of the overall FDIR system.
– Detailed behavioural automata for the unitary validation of the detailedsoftware specifications.
– Continuous and non-continuous detailed behavioural automata for the uni-tary validation of the detailed specification of the physical devices.
2 Context
2.1 System Class and Case Study
We consider safety critical systems containing both physical devices and softwarecontrollers. To illustrate our purpose, we will present the thermal system of asatellite such as Venus Express from Astrium Satellites. This system and itsFDIR are quite simple but it is representative of all the issues we want to study.
The thermal system aims at keeping the temperature of some satellite areasbetween a predefined range of values. It is made of a primary and a backupheating lines (see the architecture given in the figure 1). A complete heating lineis composed by 15 devices, but the heating system of a satellite can manage upto 13 different lines.
Fig. 1. The Thermal System with TMAP Architecture.
Each line contains some physical devices (heaters, thermoswitches. . . ) and asoftware controller called “Thermal Monitoring Application Program” (TMAP).
236 L. Pintard, C. Seguin, and J. Blanquart
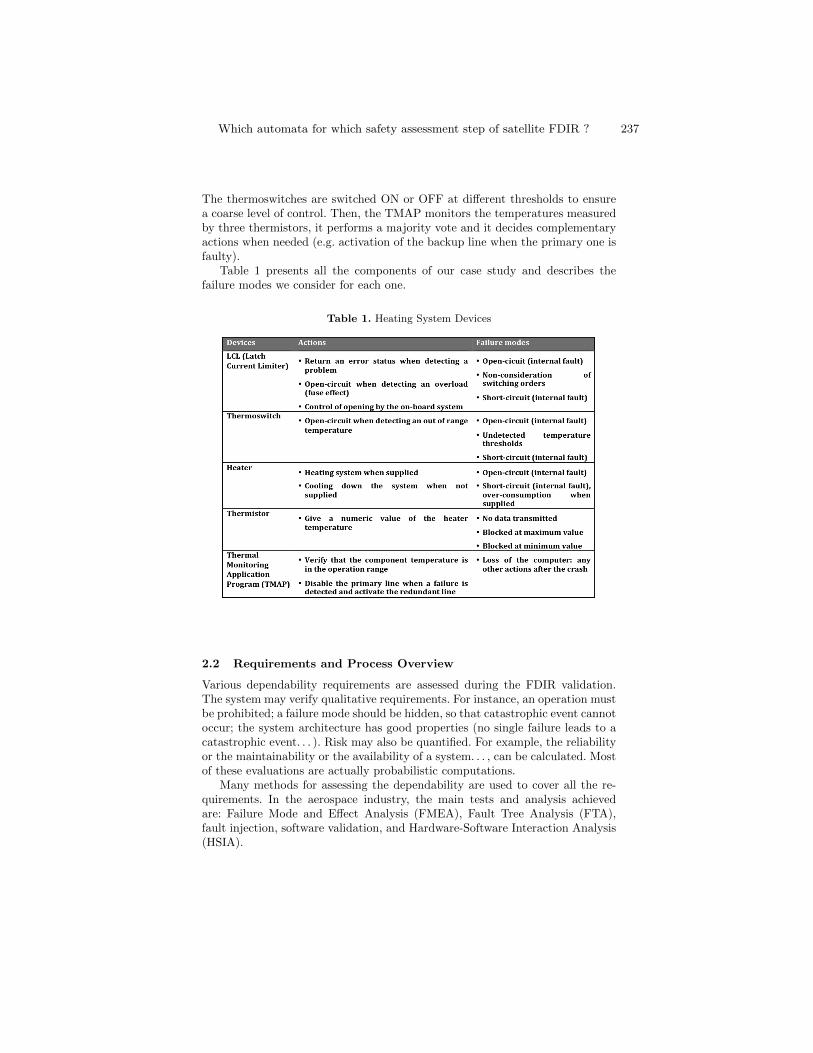
The thermoswitches are switched ON or OFF at different thresholds to ensurea coarse level of control. Then, the TMAP monitors the temperatures measuredby three thermistors, it performs a majority vote and it decides complementaryactions when needed (e.g. activation of the backup line when the primary one isfaulty).
Table 1 presents all the components of our case study and describes thefailure modes we consider for each one.
Table 1. Heating System Devices
2.2 Requirements and Process Overview
Various dependability requirements are assessed during the FDIR validation.The system may verify qualitative requirements. For instance, an operation mustbe prohibited; a failure mode should be hidden, so that catastrophic event cannotoccur; the system architecture has good properties (no single failure leads to acatastrophic event. . . ). Risk may also be quantified. For example, the reliabilityor the maintainability or the availability of a system. . . , can be calculated. Mostof these evaluations are actually probabilistic computations.
Many methods for assessing the dependability are used to cover all the re-quirements. In the aerospace industry, the main tests and analysis achievedare: Failure Mode and Effect Analysis (FMEA), Fault Tree Analysis (FTA),fault injection, software validation, and Hardware-Software Interaction Analysis(HSIA).
Which automata for which safety assessment step of satellite FDIR ? 237
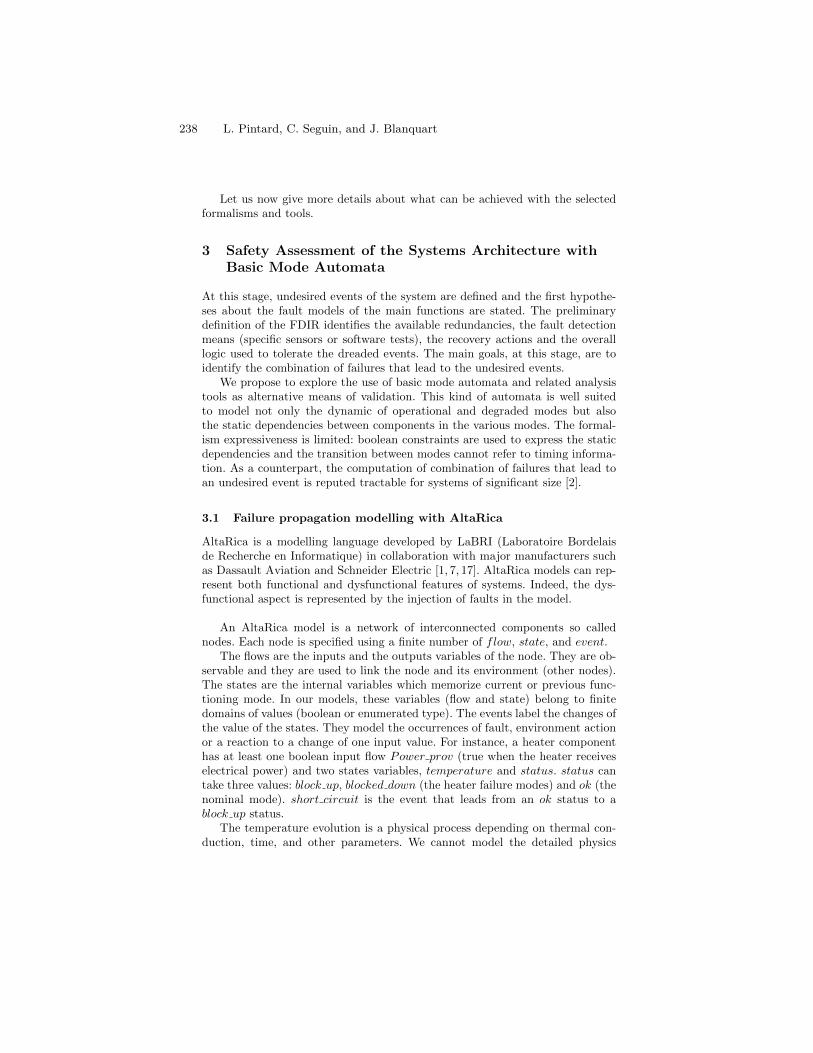
Let us now give more details about what can be achieved with the selectedformalisms and tools.
3 Safety Assessment of the Systems Architecture withBasic Mode Automata
At this stage, undesired events of the system are defined and the first hypothe-ses about the fault models of the main functions are stated. The preliminarydefinition of the FDIR identifies the available redundancies, the fault detectionmeans (specific sensors or software tests), the recovery actions and the overalllogic used to tolerate the dreaded events. The main goals, at this stage, are toidentify the combination of failures that lead to the undesired events.
We propose to explore the use of basic mode automata and related analysistools as alternative means of validation. This kind of automata is well suitedto model not only the dynamic of operational and degraded modes but alsothe static dependencies between components in the various modes. The formal-ism expressiveness is limited: boolean constraints are used to express the staticdependencies and the transition between modes cannot refer to timing informa-tion. As a counterpart, the computation of combination of failures that lead toan undesired event is reputed tractable for systems of significant size [2].
3.1 Failure propagation modelling with AltaRica
AltaRica is a modelling language developed by LaBRI (Laboratoire Bordelaisde Recherche en Informatique) in collaboration with major manufacturers suchas Dassault Aviation and Schneider Electric [1, 7, 17]. AltaRica models can rep-resent both functional and dysfunctional features of systems. Indeed, the dys-functional aspect is represented by the injection of faults in the model.
An AltaRica model is a network of interconnected components so callednodes. Each node is specified using a finite number of flow, state, and event.
The flows are the inputs and the outputs variables of the node. They are ob-servable and they are used to link the node and its environment (other nodes).The states are the internal variables which memorize current or previous func-tioning mode. In our models, these variables (flow and state) belong to finitedomains of values (boolean or enumerated type). The events label the changes ofthe value of the states. They model the occurrences of fault, environment actionor a reaction to a change of one input value. For instance, a heater componenthas at least one boolean input flow Power prov (true when the heater receiveselectrical power) and two states variables, temperature and status. status cantake three values: block up, blocked down (the heater failure modes) and ok (thenominal mode). short circuit is the event that leads from an ok status to ablock up status.
The temperature evolution is a physical process depending on thermal con-duction, time, and other parameters. We cannot model the detailed physics
238 L. Pintard, C. Seguin, and J. Blanquart
equations and we need only to reason about some intervals of temperatures val-ues (frost, cold. . . ). So we discretized the temperature values and we introducednominal cooling and heating actions that increase or decrease the temperature.
The node dynamic is formally specified by transitions and assertions. Eachtransition defines some conditions over the flows and the state variables (guard)that shall be satisfied to enable the transition. It specifies also the new values ofthe state variables after the transition and it is labelled by an event name. Thetransitions build the automaton part of the mode automaton. Figure 2 describesfor instance the automata built with the transitions related to the temperatureand status of the heater component. The event can also be associated with prob-
Fig. 2. AltaRica Model of a Heater.
ability laws to complete the transition specification. For instance the Dirac(0)law characterize instantaneous events that shall be triggered as soon as theirguard is true. They characterized for instance the reconfigurations that are au-tomatically triggered after failure detection in our case study. Exponential lawsare associated with stochastic events.
Finally, the assertions specify the values of the output flows according to theconstrained satisfied by the input flows in the current functioning mode.
The system model is made of several instances of generic nodes like theheater. For the analysis purpose, the model may also contains special nodes, theobservers of the undesired events of the system. They monitor some componentsflows to detect whether an undesired situation is reached.
3.2 FDIR Validation with AltaRica
As AltaRica is a formal language, it execution semantics is rigorously defined andexploited by several assessment tools (Altatools by LaBRI, AltaRica DataflowToolbox, Cecilia OCAS by Dassault Aviation, SIMFIA by EADS Apsys, BPA-SD9 by Dassault Systeme. . . We chose Cecilia-OCAS, because we already exper-imented it [2, 15].
Which automata for which safety assessment step of satellite FDIR ? 239
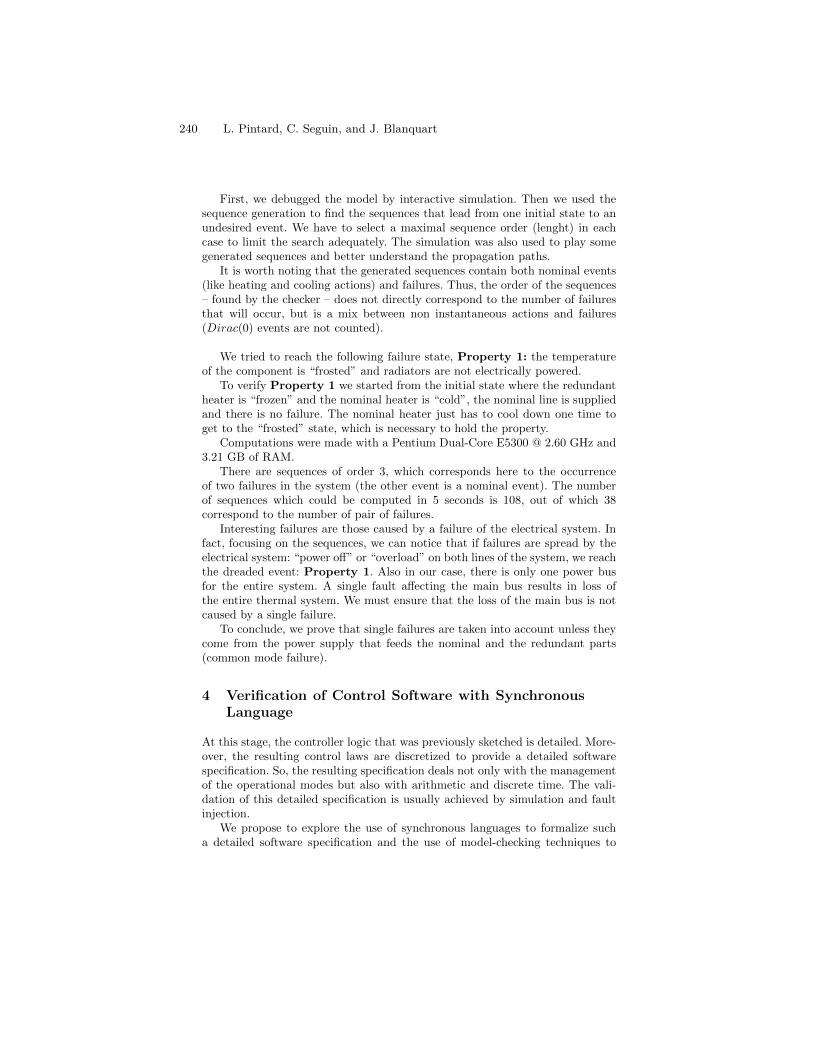
First, we debugged the model by interactive simulation. Then we used thesequence generation to find the sequences that lead from one initial state to anundesired event. We have to select a maximal sequence order (lenght) in eachcase to limit the search adequately. The simulation was also used to play somegenerated sequences and better understand the propagation paths.
It is worth noting that the generated sequences contain both nominal events(like heating and cooling actions) and failures. Thus, the order of the sequences– found by the checker – does not directly correspond to the number of failuresthat will occur, but is a mix between non instantaneous actions and failures(Dirac(0) events are not counted).
We tried to reach the following failure state, Property 1: the temperatureof the component is “frosted” and radiators are not electrically powered.
To verify Property 1 we started from the initial state where the redundantheater is “frozen” and the nominal heater is “cold”, the nominal line is suppliedand there is no failure. The nominal heater just has to cool down one time toget to the “frosted” state, which is necessary to hold the property.
Computations were made with a Pentium Dual-Core E5300 @ 2.60 GHz and3.21 GB of RAM.
There are sequences of order 3, which corresponds here to the occurrenceof two failures in the system (the other event is a nominal event). The numberof sequences which could be computed in 5 seconds is 108, out of which 38correspond to the number of pair of failures.
Interesting failures are those caused by a failure of the electrical system. Infact, focusing on the sequences, we can notice that if failures are spread by theelectrical system: “power off” or “overload” on both lines of the system, we reachthe dreaded event: Property 1. Also in our case, there is only one power busfor the entire system. A single fault affecting the main bus results in loss ofthe entire thermal system. We must ensure that the loss of the main bus is notcaused by a single failure.
To conclude, we prove that single failures are taken into account unless theycome from the power supply that feeds the nominal and the redundant parts(common mode failure).
4 Verification of Control Software with SynchronousLanguage
At this stage, the controller logic that was previously sketched is detailed. More-over, the resulting control laws are discretized to provide a detailed softwarespecification. So, the resulting specification deals not only with the managementof the operational modes but also with arithmetic and discrete time. The vali-dation of this detailed specification is usually achieved by simulation and faultinjection.
We propose to explore the use of synchronous languages to formalize sucha detailed software specification and the use of model-checking techniques to
240 L. Pintard, C. Seguin, and J. Blanquart
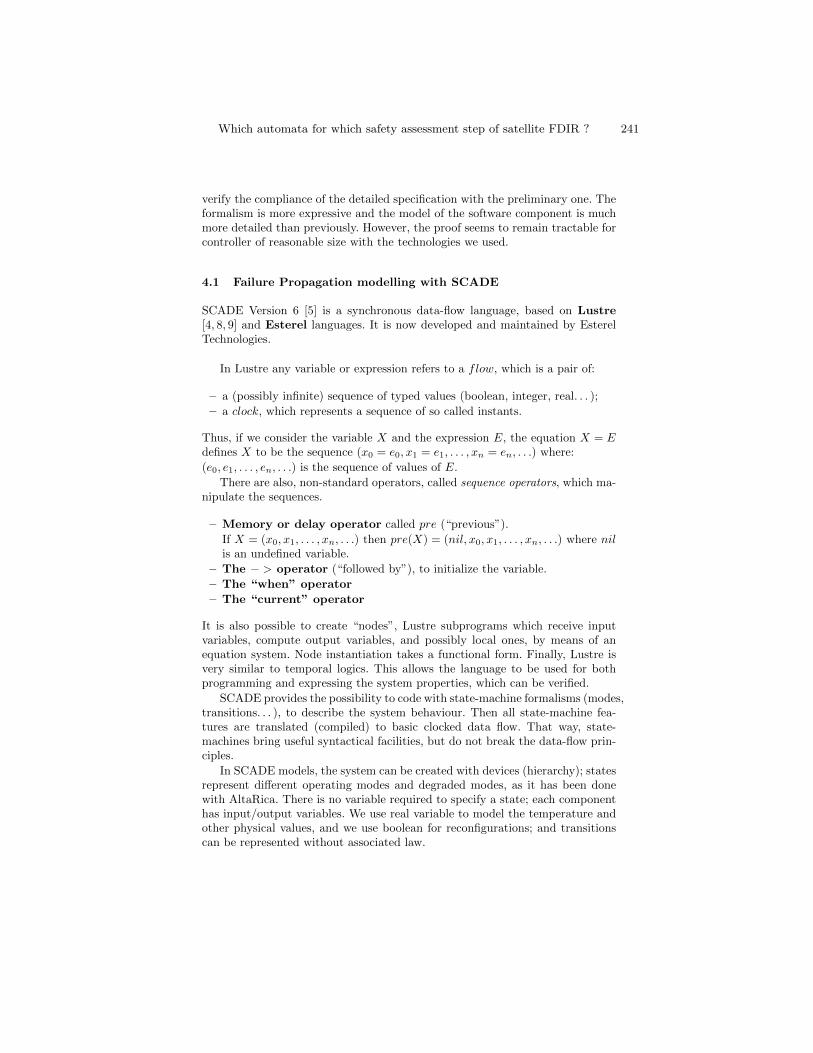
verify the compliance of the detailed specification with the preliminary one. Theformalism is more expressive and the model of the software component is muchmore detailed than previously. However, the proof seems to remain tractable forcontroller of reasonable size with the technologies we used.
4.1 Failure Propagation modelling with SCADE
SCADE Version 6 [5] is a synchronous data-flow language, based on Lustre[4, 8, 9] and Esterel languages. It is now developed and maintained by EsterelTechnologies.
In Lustre any variable or expression refers to a flow, which is a pair of:
– a (possibly infinite) sequence of typed values (boolean, integer, real. . . );
– a clock, which represents a sequence of so called instants.
Thus, if we consider the variable X and the expression E, the equation X = Edefines X to be the sequence (x0 = e0, x1 = e1, . . . , xn = en, . . .) where:
(e0, e1, . . . , en, . . .) is the sequence of values of E.
There are also, non-standard operators, called sequence operators, which ma-nipulate the sequences.
– Memory or delay operator called pre (“previous”).
If X = (x0, x1, . . . , xn, . . .) then pre(X) = (nil, x0, x1, . . . , xn, . . .) where nilis an undefined variable.
– The − > operator (“followed by”), to initialize the variable.
– The “when” operator
– The “current” operator
It is also possible to create “nodes”, Lustre subprograms which receive inputvariables, compute output variables, and possibly local ones, by means of anequation system. Node instantiation takes a functional form. Finally, Lustre isvery similar to temporal logics. This allows the language to be used for bothprogramming and expressing the system properties, which can be verified.
SCADE provides the possibility to code with state-machine formalisms (modes,transitions. . . ), to describe the system behaviour. Then all state-machine fea-tures are translated (compiled) to basic clocked data flow. That way, state-machines bring useful syntactical facilities, but do not break the data-flow prin-ciples.
In SCADE models, the system can be created with devices (hierarchy); statesrepresent different operating modes and degraded modes, as it has been donewith AltaRica. There is no variable required to specify a state; each componenthas input/output variables. We use real variable to model the temperature andother physical values, and we use boolean for reconfigurations; and transitionscan be represented without associated law.
Which automata for which safety assessment step of satellite FDIR ? 241
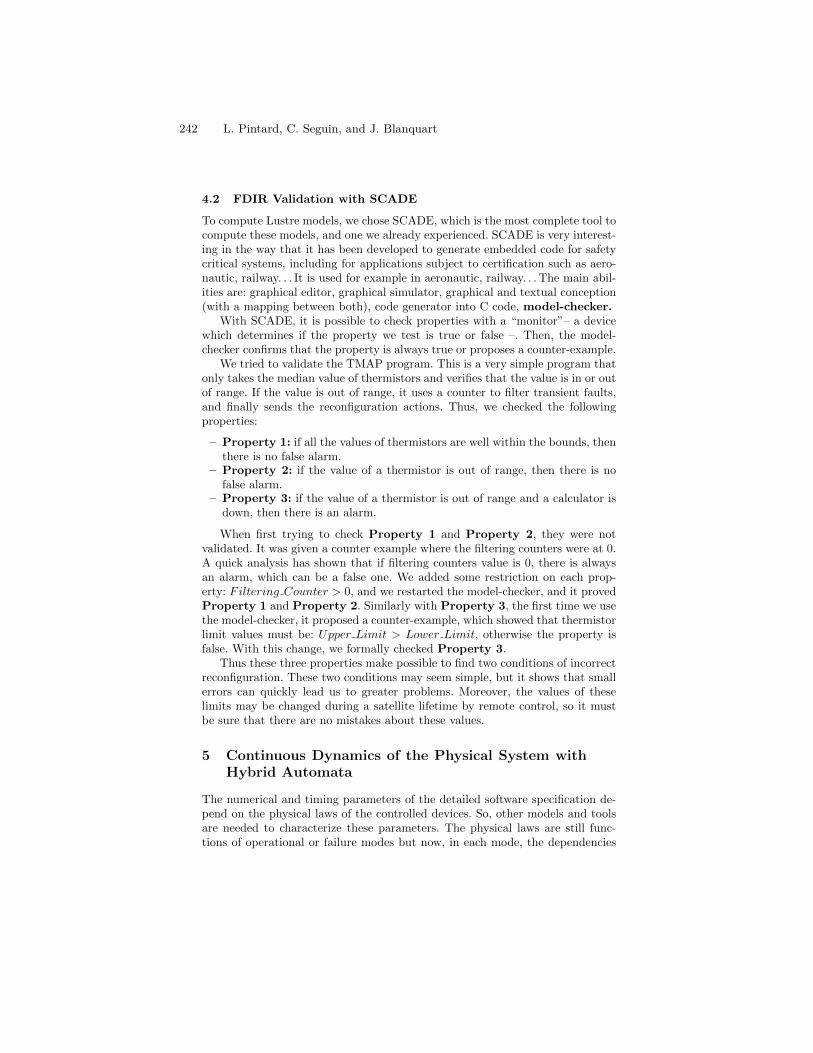
4.2 FDIR Validation with SCADE
To compute Lustre models, we chose SCADE, which is the most complete tool tocompute these models, and one we already experienced. SCADE is very interest-ing in the way that it has been developed to generate embedded code for safetycritical systems, including for applications subject to certification such as aero-nautic, railway. . . It is used for example in aeronautic, railway. . . The main abil-ities are: graphical editor, graphical simulator, graphical and textual conception(with a mapping between both), code generator into C code, model-checker.
With SCADE, it is possible to check properties with a “monitor”– a devicewhich determines if the property we test is true or false –. Then, the model-checker confirms that the property is always true or proposes a counter-example.
We tried to validate the TMAP program. This is a very simple program thatonly takes the median value of thermistors and verifies that the value is in or outof range. If the value is out of range, it uses a counter to filter transient faults,and finally sends the reconfiguration actions. Thus, we checked the followingproperties:
– Property 1: if all the values of thermistors are well within the bounds, thenthere is no false alarm.
– Property 2: if the value of a thermistor is out of range, then there is nofalse alarm.
– Property 3: if the value of a thermistor is out of range and a calculator isdown, then there is an alarm.
When first trying to check Property 1 and Property 2, they were notvalidated. It was given a counter example where the filtering counters were at 0.A quick analysis has shown that if filtering counters value is 0, there is alwaysan alarm, which can be a false one. We added some restriction on each prop-erty: Filtering Counter > 0, and we restarted the model-checker, and it provedProperty 1 and Property 2. Similarly with Property 3, the first time we usethe model-checker, it proposed a counter-example, which showed that thermistorlimit values must be: Upper Limit > Lower Limit, otherwise the property isfalse. With this change, we formally checked Property 3.
Thus these three properties make possible to find two conditions of incorrectreconfiguration. These two conditions may seem simple, but it shows that smallerrors can quickly lead us to greater problems. Moreover, the values of theselimits may be changed during a satellite lifetime by remote control, so it mustbe sure that there are no mistakes about these values.
5 Continuous Dynamics of the Physical System withHybrid Automata
The numerical and timing parameters of the detailed software specification de-pend on the physical laws of the controlled devices. So, other models and toolsare needed to characterize these parameters. The physical laws are still func-tions of operational or failure modes but now, in each mode, the dependencies
242 L. Pintard, C. Seguin, and J. Blanquart
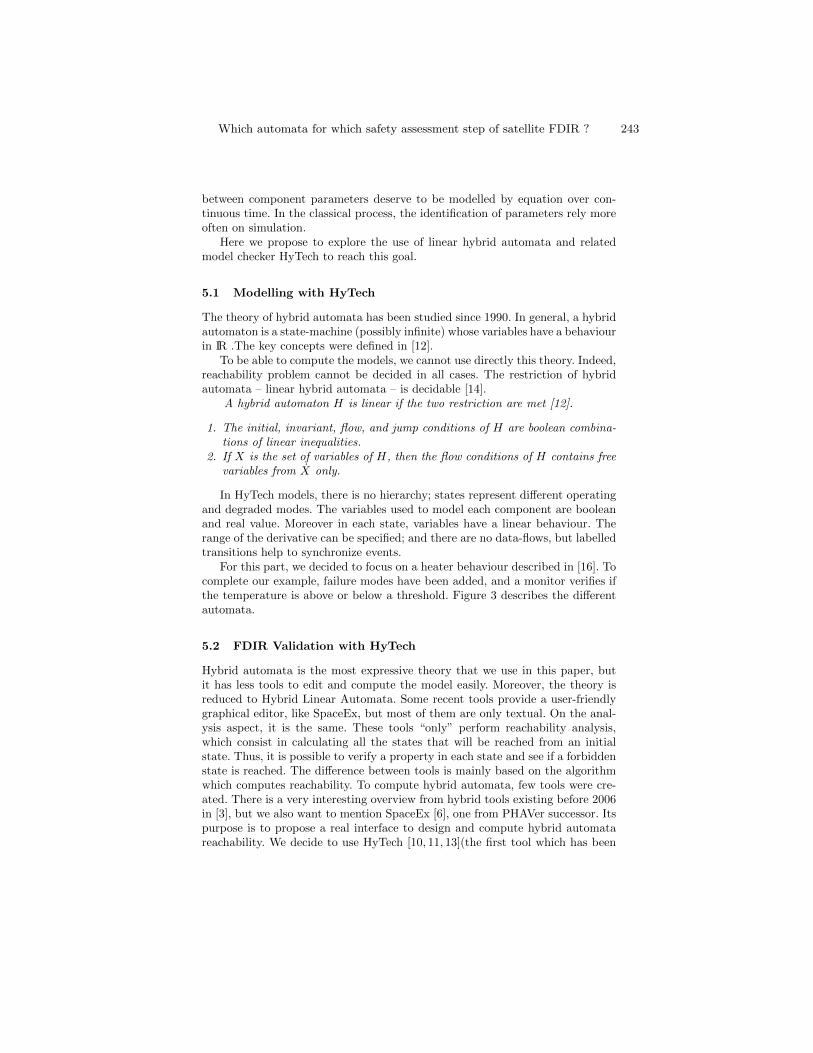
between component parameters deserve to be modelled by equation over con-tinuous time. In the classical process, the identification of parameters rely moreoften on simulation.
Here we propose to explore the use of linear hybrid automata and relatedmodel checker HyTech to reach this goal.
5.1 Modelling with HyTech
The theory of hybrid automata has been studied since 1990. In general, a hybridautomaton is a state-machine (possibly infinite) whose variables have a behaviourin IR .The key concepts were defined in [12].
To be able to compute the models, we cannot use directly this theory. Indeed,reachability problem cannot be decided in all cases. The restriction of hybridautomata – linear hybrid automata – is decidable [14].
A hybrid automaton H is linear if the two restriction are met [12].
1. The initial, invariant, flow, and jump conditions of H are boolean combina-tions of linear inequalities.
2. If X is the set of variables of H, then the flow conditions of H contains freevariables from X only.
In HyTech models, there is no hierarchy; states represent different operatingand degraded modes. The variables used to model each component are booleanand real value. Moreover in each state, variables have a linear behaviour. Therange of the derivative can be specified; and there are no data-flows, but labelledtransitions help to synchronize events.
For this part, we decided to focus on a heater behaviour described in [16]. Tocomplete our example, failure modes have been added, and a monitor verifies ifthe temperature is above or below a threshold. Figure 3 describes the differentautomata.
5.2 FDIR Validation with HyTech
Hybrid automata is the most expressive theory that we use in this paper, butit has less tools to edit and compute the model easily. Moreover, the theory isreduced to Hybrid Linear Automata. Some recent tools provide a user-friendlygraphical editor, like SpaceEx, but most of them are only textual. On the anal-ysis aspect, it is the same. These tools “only” perform reachability analysis,which consist in calculating all the states that will be reached from an initialstate. Thus, it is possible to verify a property in each state and see if a forbiddenstate is reached. The difference between tools is mainly based on the algorithmwhich computes reachability. To compute hybrid automata, few tools were cre-ated. There is a very interesting overview from hybrid tools existing before 2006in [3], but we also want to mention SpaceEx [6], one from PHAVer successor. Itspurpose is to propose a real interface to design and compute hybrid automatareachability. We decide to use HyTech [10, 11, 13](the first tool which has been
Which automata for which safety assessment step of satellite FDIR ? 243
Fig. 3. Hybrid Model of the Heater System and the Monitor.
developed), while it seems to be the most accurate tool to perform reachabilityanalysis and express properties.
As we have seen in section 4, in the Lustre experimentations there are timedrequirements to validate or not a detected error (false alarm case). As the thermalsystem has a continuous behaviour, and reconfigurations are periodic actions, thetemperature continues to change between reconfiguration periods. Thus we triedto determined the different relations between the “minimum validation time”, the“sample period”, and the temperature thresholds. To determine these relations,a reachability analysis is computed from an initial state and we intersect thereachable state with a final state. We choose:init_reg := t=0 & x=0 & y=0 & Temp>T_thr_min & Temp<T_thr_max
& loc[heater]= heater_is_on;
out_reg := y>0 & Temp<T_thr_min;
The result of this analysis is computed in 0.34 s is (a description of the reach-able regions see Fig.4):(a1)sample_period + T_thr_max <= Tmax & T_thr_min < T_thr_max
& Tmin < T_thr_max & (a1-b1)sample_period < (-b1)Min_Valid_Time
| T_thr_min < T_thr_max & Tmin < T_thr_max & T_thr_max <= Tmax
& (a2)sample_period + Tmax < (a2)Min_Valid_Time + T_thr_max
& Tmax <= (a2)sample_period + T_thr_max
& T_thr_max < (-b2)sample_period + Tmax
Thus, if the two expressions are verified, it is proved that the system will nothave false alarm.
This result is interesting because we can prove formally and exhaustively aproperty, when today, in automatic control, these verifications are generally per-
244 L. Pintard, C. Seguin, and J. Blanquart
Fig. 4. Reachable Heater’s Temperature on the High Threshold.
formed with tools such as Matlab/Simulink that can better model the behaviourof these continuous and non-continuous systems; unless all the verification aremostly simulations. Even if we test a worst case to determine the parameters ofa system, it is possible to not see a non-trivial case that will leads the systemto an unsafe mode. An approach with HyTech seems better, but it is difficult tohandle complex systems and to model accurately the behaviour as it is possibleto do with Matlab/Simulink.
6 Conclusion
The paper reports how three kinds of automata were used to assess comple-mentary features of satellites FDIR. The experiment shown that basic modeautomata are sufficient to handle efficiently assessments of the overall prelimi-nary specifications of the FDIR.
More detailed specifications need to be addressed with dedicated tools. Herewe choose to address the verification of the control software with synchronouslanguage widely used. The experiment shown that the proof of the specificationis tractable on such a limited case and fruitful.
The control specification was tested in an open loop way. It would be inter-esting to compare AltaRica models of the physical components with this spec-ification to close the loop. Indeed AltaRica expressiveness is compatible withLustre data-flow (see [18], a translator from AltaRica to Lustre).
Finally, the use of hybrid automata seems promising for rigorous validation(see [16]). However, this kind of tool is much less mature than the two othersand so applications remain limited.
7 Acknowledgements
The study reported in this paper has been partly funded by CNES (contract115205). The authors wish to thank CNES personnel and in particular RaymondSoumagne for their contribution and support. The authors wish also to thankthe anonymous referees for their valuable comments and suggestions to improvethis final version of the paper.
Which automata for which safety assessment step of satellite FDIR ? 245
References
1. A. Arnold, G. Point, A. Griffault, and A. Rauzy. The altarica formalism for de-scribing concurrent systems. Fundamenta Informaticae, 40(2):109–124, 1999.
2. P. Bieber, C. Bougnol, C. Castel, J.P. Christophe Kehren, S. Metge, and C. Seguin.Safety assessment with altarica. Building the Information Society, 156/2004:505–510, 2004.
3. L.P. Carloni, R. Passerone, and A. Pinto. Languages and tools for hybrid systemsdesign, volume 1. Now Pub, 2006.
4. P. Caspi, D. Pilaud, N. Halbwachs, and J.A. Plaice. Lustre: A declarative languagefor programming synchronous systems. In Conference Record of the 14th AnnualACM Symp. on Principles of Programming Languages, 1987.
5. F.X. Dormoy. Scade 6: a model based solution for safety critical software devel-opment. In Proceedings of the 4th European Congress on Embedded Real TimeSoftware (ERTS08), pages 1–9, 2008.
6. G. Frehse, C. Le Guernic, A. Donze, S. Cotton, R. Ray, O. Lebeltel, R. Ripado,A. Girard, T. Dang, and O. Maler. Spaceex: Scalable verification of hybrid systems.In Computer Aided Verification, pages 379–395. Springer, 2011.
7. A. Griffault and A. Vincent. Verification de modeles altarica. MAJECSTIC:Manifestation des jeunes chercheurs STIC, Marseille, 2003.
8. N. Halbwachs. Synchronous programming of reactive systems. Number 215.Springer, 1993.
9. N. Halbwachs, P. Caspi, P. Raymond, and D. Pilaud. The synchronous data flowprogramming language lustre. Proceedings of the IEEE, 79(9):1305–1320, 1991.
10. T. Henzinger, P. Ho, and H. Wong-Toi. A user guide to hytech. Tools and algo-rithms for the construction and analysis of systems, 1019/1995:41–71, 1995.
11. T. Henzinger and P.H. Ho. Hytech: The cornell hybrid technology tool. HybridSystems II, 999/1995:265–293, 1995.
12. T.A. Henzinger. The theory of hybrid automata. In Logic in Computer Science,1996. LICS’96. Proceedings., Eleventh Annual IEEE Symposium on, pages 278–292. IEEE, 1996.
13. T.A. Henzinger, P.H. Ho, and H. Wong-Toi. Hytech: A model checker for hybridsystems. International Journal on Software Tools for Technology Transfer (STTT),1(1):110–122, 1997.
14. Thomas A. Henzinger, Peter W. Kopke, Anuj Puri, and Pravin Varaiya. What’sdecidable about hybrid automata? Journal of Computer and System Sciences,57(1):94 – 124, 1998.
15. S. Humbert, JM Bosc, C. Castel, P. Darfeuil, Y. Dutuit, and C. Seguin.Methodologie de modelisation altarica pour la surete de fonctionnement d’unsysteme de propulsion helicoptere incluant une partie logicielle. In Proceedingsof Lambda Mu, volume 15, 2006.
16. S. Mazzini, S. Puri, F. Mari, I. Melatti, and E. Tronci. Formal verification atsystem level. In DASIA 2009: ESA SP-669, 2009.
17. G. Point. AltaRica: Contribution a l’unification des methodes formelles et de lasurete de fonctionnement. PhD thesis, Universite de Bordeaux, 2000.
18. G. Point, A. Griffault, et al. On the partial translation of lustre programs into thealtarica language and vice versa. 2006.
246 L. Pintard, C. Seguin, and J. Blanquart
A novel modelling pattern for establishing failure models
and assisting architectural exploration in an automotive
context
Carl Bergenhem1, Rolf Johansson1, Henrik Lönn2
1 SP - Technical Research Institute of Sweden, Department of Electronics, SE-501 15 Borås,
Sweden, {carl.bergenhem, rolf.johansson}sp.se 2 Volvo Technology Corp., SE-405 08 Gothenburg, Sweden,
Abstract. With the introduction of the automotive functional safety standard
ISO 26262, several challenges related to the representation of dependability
information has emerged. This paper addresses how safety requirements can be
formalized; which is mandatory for high-integrity requirements. Particular
focus is given to asymmetric failures. Such a failure can be caused by a
communication fault, and implies that data in a distributed system will be
inconsistent among system outputs or within the system (incorrect, corrupt or
omitted, etc.). We investigate along two lines; 1) The EAST-ADL automotive
architecture description language is extended with a capability to represent
asymmetric faults and failures. 2) The Compute-Distribute Results (CDR)
pattern is introduced to assist reasoning about distributed systems, in particular
potential inconsistencies. We show how this can support architectural decisions
regarding selection of communication topology and communication technology
for a given distributed system. A brake-by-wire application and FlexRay bus
are analysed to illustrate the concepts.
Keywords: System modelling, Taxonomy, Failure model, Distributed system,
Automotive, ISO 26262, Asymmetric failure, EAST-ADL, AUTOSAR,
FlexRay.
1 Introduction
With the introduction of the ISO 26262 standard [1] for functional safety of E/E
(Electric/Electronic) systems in road vehicles, a number of problems have arisen that
must be solved in the industry in order to be compliant with the prescriptions of the
standard. We address the entire reference life cycle of ISO 26262; looking at what
support that is needed at the different stages. In particular we investigate the support
needed when deciding both what communication topology and what communication
technology to use for a given distributed system. One particular challenge of such
systems is designing them to handle asymmetric failures. If unanticipated and
unhandled, these failures cause inconsistency in the system and potentially unsafe
situations. An asymmetric failure can be caused when data is distributed e.g. due to a
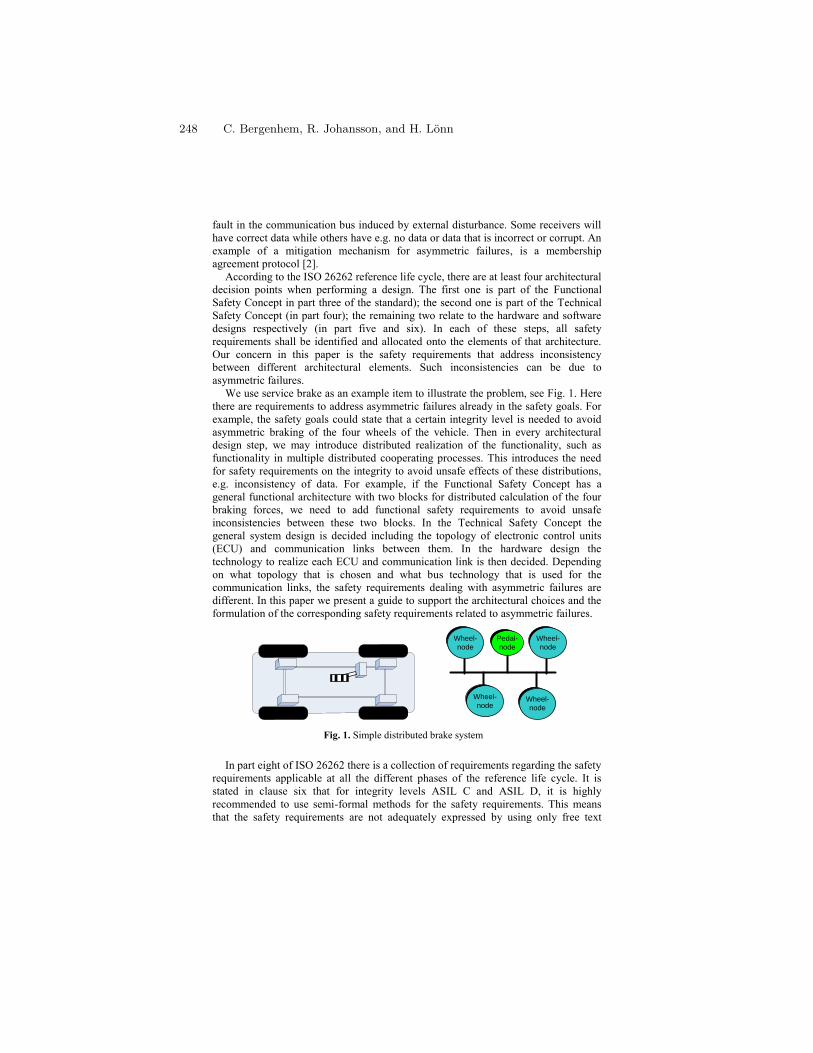
fault in the communication bus induced by external disturbance. Some receivers will
have correct data while others have e.g. no data or data that is incorrect or corrupt. An
example of a mitigation mechanism for asymmetric failures, is a membership
agreement protocol [2].
According to the ISO 26262 reference life cycle, there are at least four architectural
decision points when performing a design. The first one is part of the Functional
Safety Concept in part three of the standard); the second one is part of the Technical
Safety Concept (in part four); the remaining two relate to the hardware and software
designs respectively (in part five and six). In each of these steps, all safety
requirements shall be identified and allocated onto the elements of that architecture.
Our concern in this paper is the safety requirements that address inconsistency
between different architectural elements. Such inconsistencies can be due to
asymmetric failures.
We use service brake as an example item to illustrate the problem, see Fig. 1. Here
there are requirements to address asymmetric failures already in the safety goals. For
example, the safety goals could state that a certain integrity level is needed to avoid
asymmetric braking of the four wheels of the vehicle. Then in every architectural
design step, we may introduce distributed realization of the functionality, such as
functionality in multiple distributed cooperating processes. This introduces the need
for safety requirements on the integrity to avoid unsafe effects of these distributions,
e.g. inconsistency of data. For example, if the Functional Safety Concept has a
general functional architecture with two blocks for distributed calculation of the four
braking forces, we need to add functional safety requirements to avoid unsafe
inconsistencies between these two blocks. In the Technical Safety Concept the
general system design is decided including the topology of electronic control units
(ECU) and communication links between them. In the hardware design the
technology to realize each ECU and communication link is then decided. Depending
on what topology that is chosen and what bus technology that is used for the
communication links, the safety requirements dealing with asymmetric failures are
different. In this paper we present a guide to support the architectural choices and the
formulation of the corresponding safety requirements related to asymmetric failures.
In part eight of ISO 26262 there is a collection of requirements regarding the safety
requirements applicable at all the different phases of the reference life cycle. It is
stated in clause six that for integrity levels ASIL C and ASIL D, it is highly
recommended to use semi-formal methods for the safety requirements. This means
that the safety requirements are not adequately expressed by using only free text
Pedal-
node
Wheel-
nodeWheel-
node
Wheel-
node
Wheel-
node
Fig. 1. Simple distributed brake system
248 C. Bergenhem, R. Johansson, and H. Lönn
natural language. That is why there is a need for at least some patterns to guide the
system designer when identifying safety requirements including their allocations onto
a system architecture. In this paper we address this need with respect to asymmetric
failures. We show how the safety requirements can be described by semi-formal or
formal representation in architecture description languages (ADL) such as
AUTOSAR [3], EAST-ADL [4] and AADL [5, 6]. Then we introduce a dedicated
modelling pattern (Compute and Distribute Result, CDR) suited for supporting
decisions on bus topology and bus technology, and identifying the corresponding
safety requirements. This CDR pattern is not dependant on any given ADL.
Furthermore we give an example of analysis of a FlexRay bus with the CDR pattern.
The outcome is a failure model for the FlexRay bus based on analysis according to the
pattern.
1.1 Contribution and Paper Organisation
The contribution of the paper is threefold:
1. We show how the EAST-ADL dependability support can be extended with safety
constraints for asymmetrical failures.
2. We introduce the CDR pattern for characterizing the nominal system and
describing how it can fail.
3. We propose how failure models compliant with the CDR pattern can support
architectural exploration.
A brake-by-wire application and FlexRay bus are used to illustrate the concepts.
The remainder of this paper is organised as follows. Related work is presented in
Section 2. The CDR pattern, Taxonomy of CDR failures and CDR Failure Model are
presented in Section 3. The relation of the pattern to EAST-ADL and ISO 26262 are
discussed in Section 4. Finally, conclusions are drawn and a summary is given in
Section 5.
2 Related Work
EAST-ADL [4] is an architecture description language for automotive embedded
systems. It represents engineering information from abstract feature models to the
concrete system architecture. AUTOSAR elements [3] represent the realization of the
EAST-ADL model and form a consistent model together with the more abstract
EAST-ADL elements.
Safety extensions to EAST-ADL make it possible to capture ISO 26262
information in a model based manner [7, 8]. Hazards and safety goals are associated
to the abstract features while functional and Technical Safety Concepts relate to the
system architecture solution on analysis and design level. Hardware and software
safety requirements relate to AUTOSAR elements on implementation level. The
EAST-ADL system model and also the AUTOSAR elements can be extended with
error models that formalise error propagation and the failures on interfaces within and
on system borders.
A novel modelling pattern for establishing failure models and assistingarchitectural exploration in an automotive context 249
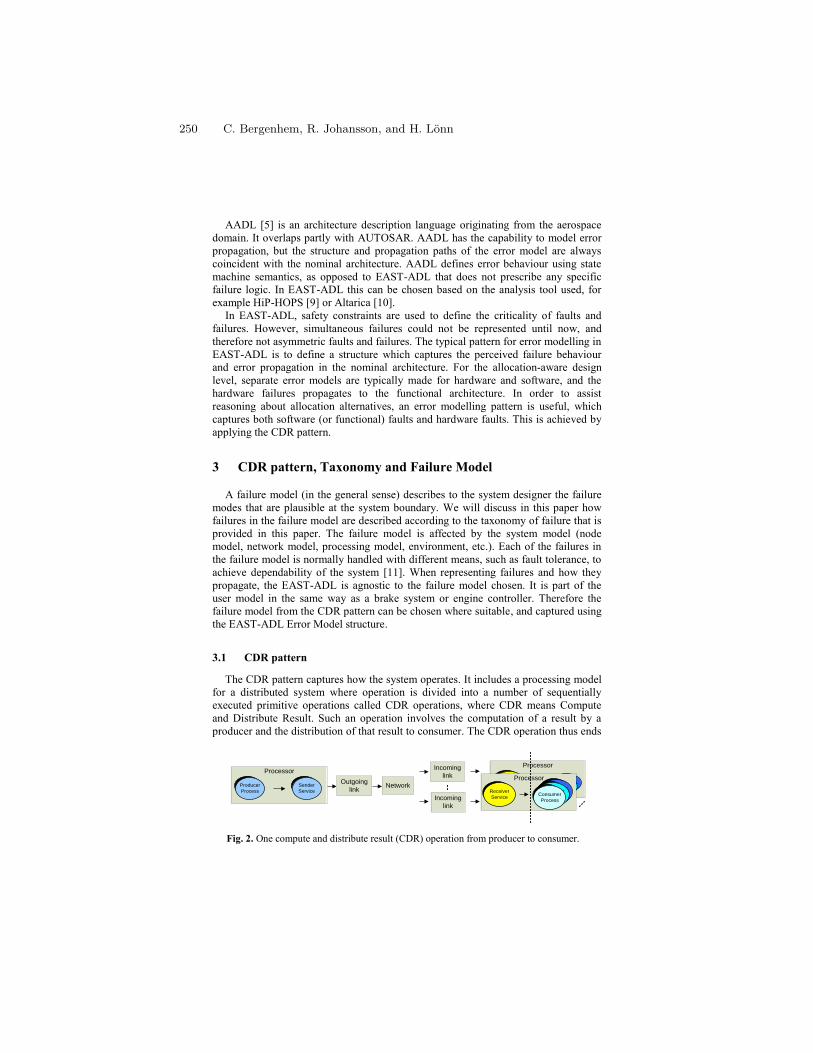
AADL [5] is an architecture description language originating from the aerospace
domain. It overlaps partly with AUTOSAR. AADL has the capability to model error
propagation, but the structure and propagation paths of the error model are always
coincident with the nominal architecture. AADL defines error behaviour using state
machine semantics, as opposed to EAST-ADL that does not prescribe any specific
failure logic. In EAST-ADL this can be chosen based on the analysis tool used, for
example HiP-HOPS [9] or Altarica [10].
In EAST-ADL, safety constraints are used to define the criticality of faults and
failures. However, simultaneous failures could not be represented until now, and
therefore not asymmetric faults and failures. The typical pattern for error modelling in
EAST-ADL is to define a structure which captures the perceived failure behaviour
and error propagation in the nominal architecture. For the allocation-aware design
level, separate error models are typically made for hardware and software, and the
hardware failures propagates to the functional architecture. In order to assist
reasoning about allocation alternatives, an error modelling pattern is useful, which
captures both software (or functional) faults and hardware faults. This is achieved by
applying the CDR pattern.
3 CDR pattern, Taxonomy and Failure Model
A failure model (in the general sense) describes to the system designer the failure
modes that are plausible at the system boundary. We will discuss in this paper how
failures in the failure model are described according to the taxonomy of failure that is
provided in this paper. The failure model is affected by the system model (node
model, network model, processing model, environment, etc.). Each of the failures in
the failure model is normally handled with different means, such as fault tolerance, to
achieve dependability of the system [11]. When representing failures and how they
propagate, the EAST-ADL is agnostic to the failure model chosen. It is part of the
user model in the same way as a brake system or engine controller. Therefore the
failure model from the CDR pattern can be chosen where suitable, and captured using
the EAST-ADL Error Model structure.
3.1 CDR pattern
The CDR pattern captures how the system operates. It includes a processing model
for a distributed system where operation is divided into a number of sequentially
executed primitive operations called CDR operations, where CDR means Compute
and Distribute Result. Such an operation involves the computation of a result by a
producer and the distribution of that result to consumer. The CDR operation thus ends
ProcessProcessConsumer
Process
Processor
Receiver
ServiceOutgoing
link
Processor
Sender
ServiceNetwork
Incoming
link
Incoming
link
Processor
Receiver
Service
Producer
ProcessConsumer
ProcessConsumer
ProcessConsumer
Process
Fig. 2. One compute and distribute result (CDR) operation from producer to consumer.
250 C. Bergenhem, R. Johansson, and H. Lönn
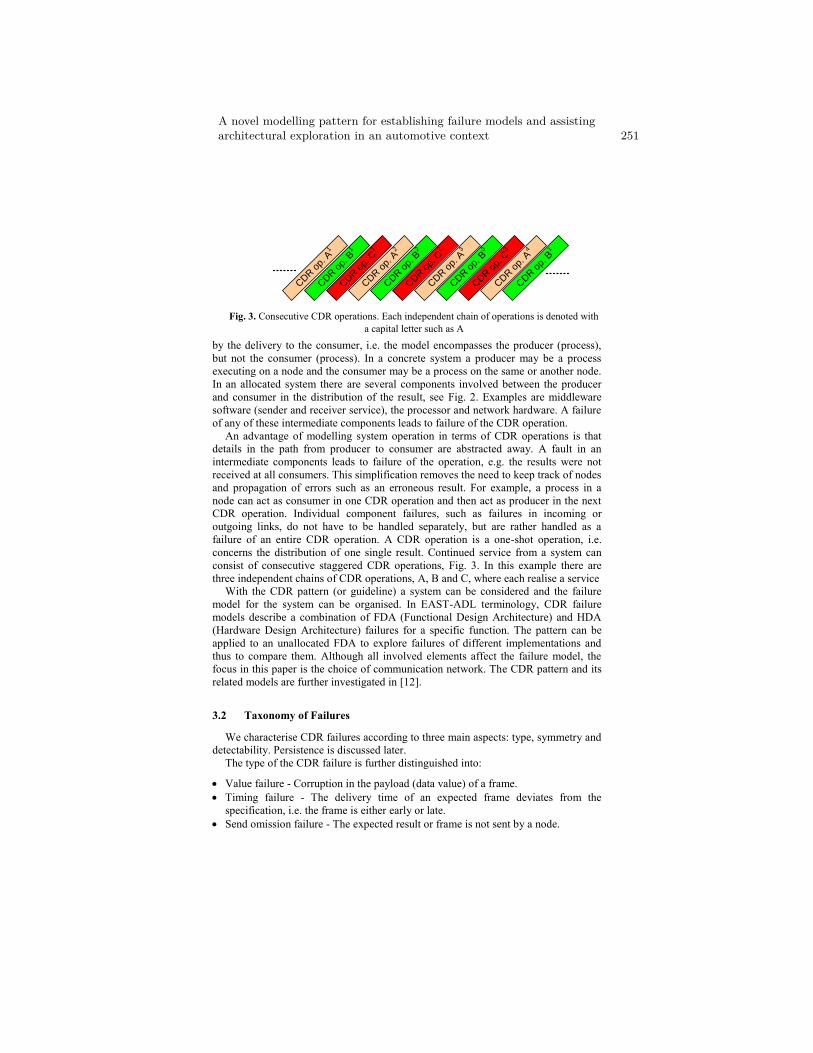
by the delivery to the consumer, i.e. the model encompasses the producer (process),
but not the consumer (process). In a concrete system a producer may be a process
executing on a node and the consumer may be a process on the same or another node.
In an allocated system there are several components involved between the producer
and consumer in the distribution of the result, see Fig. 2. Examples are middleware
software (sender and receiver service), the processor and network hardware. A failure
of any of these intermediate components leads to failure of the CDR operation.
An advantage of modelling system operation in terms of CDR operations is that
details in the path from producer to consumer are abstracted away. A fault in an
intermediate components leads to failure of the operation, e.g. the results were not
received at all consumers. This simplification removes the need to keep track of nodes
and propagation of errors such as an erroneous result. For example, a process in a
node can act as consumer in one CDR operation and then act as producer in the next
CDR operation. Individual component failures, such as failures in incoming or
outgoing links, do not have to be handled separately, but are rather handled as a
failure of an entire CDR operation. A CDR operation is a one-shot operation, i.e.
concerns the distribution of one single result. Continued service from a system can
consist of consecutive staggered CDR operations, Fig. 3. In this example there are
three independent chains of CDR operations, A, B and C, where each realise a service
With the CDR pattern (or guideline) a system can be considered and the failure
model for the system can be organised. In EAST-ADL terminology, CDR failure
models describe a combination of FDA (Functional Design Architecture) and HDA
(Hardware Design Architecture) failures for a specific function. The pattern can be
applied to an unallocated FDA to explore failures of different implementations and
thus to compare them. Although all involved elements affect the failure model, the
focus in this paper is the choice of communication network. The CDR pattern and its
related models are further investigated in [12].
3.2 Taxonomy of Failures
We characterise CDR failures according to three main aspects: type, symmetry and
detectability. Persistence is discussed later.
The type of the CDR failure is further distinguished into:
Value failure - Corruption in the payload (data value) of a frame.
Timing failure - The delivery time of an expected frame deviates from the
specification, i.e. the frame is either early or late.
Send omission failure - The expected result or frame is not sent by a node.
CDR o
p. A1
CDR o
p. B1
CDR o
p. C
1
CDR o
p. A2
CDR o
p. B2
CDR o
p. C
2
CDR o
p. A3
CDR o
p. B3
CDR o
p. C
3
CDR o
p. A4
CDR o
p. B1
Fig. 3. Consecutive CDR operations. Each independent chain of operations is denoted with
a capital letter such as A
A novel modelling pattern for establishing failure models and assistingarchitectural exploration in an automotive context 251
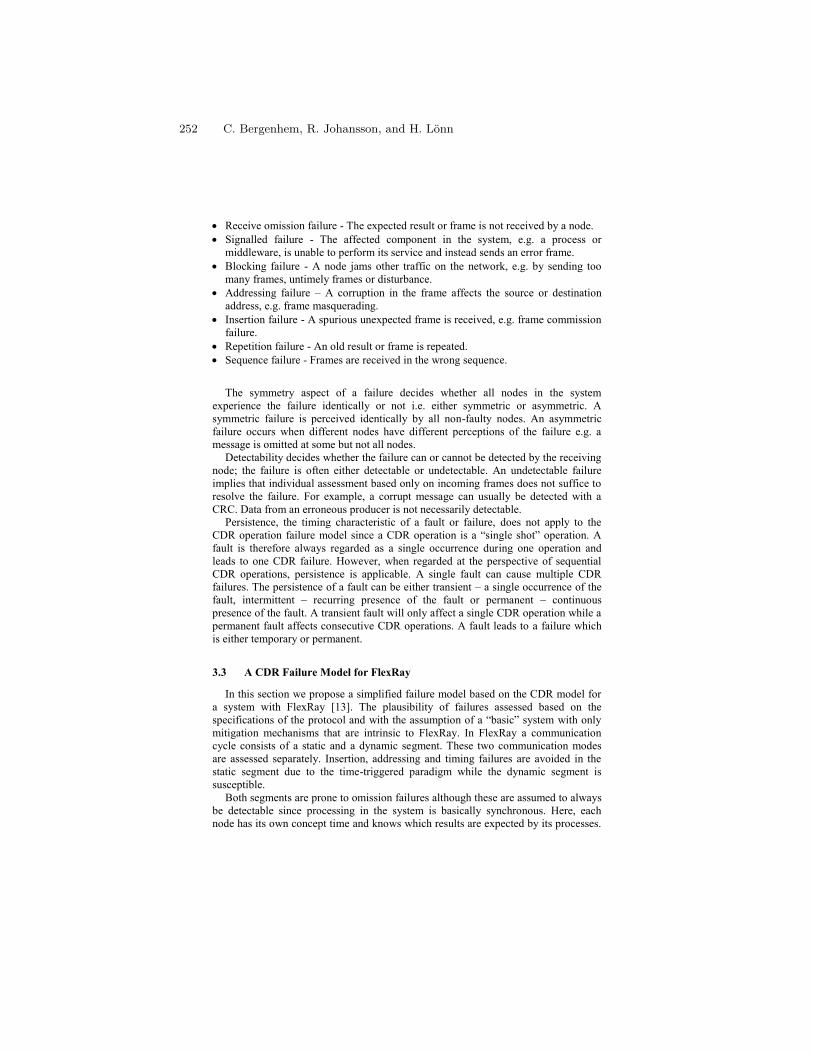
Receive omission failure - The expected result or frame is not received by a node.
Signalled failure - The affected component in the system, e.g. a process or
middleware, is unable to perform its service and instead sends an error frame.
Blocking failure - A node jams other traffic on the network, e.g. by sending too
many frames, untimely frames or disturbance.
Addressing failure – A corruption in the frame affects the source or destination
address, e.g. frame masquerading.
Insertion failure - A spurious unexpected frame is received, e.g. frame commission
failure.
Repetition failure - An old result or frame is repeated.
Sequence failure - Frames are received in the wrong sequence.
The symmetry aspect of a failure decides whether all nodes in the system
experience the failure identically or not i.e. either symmetric or asymmetric. A
symmetric failure is perceived identically by all non-faulty nodes. An asymmetric
failure occurs when different nodes have different perceptions of the failure e.g. a
message is omitted at some but not all nodes.
Detectability decides whether the failure can or cannot be detected by the receiving
node; the failure is often either detectable or undetectable. An undetectable failure
implies that individual assessment based only on incoming frames does not suffice to
resolve the failure. For example, a corrupt message can usually be detected with a
CRC. Data from an erroneous producer is not necessarily detectable.
Persistence, the timing characteristic of a fault or failure, does not apply to the
CDR operation failure model since a CDR operation is a “single shot” operation. A
fault is therefore always regarded as a single occurrence during one operation and
leads to one CDR failure. However, when regarded at the perspective of sequential
CDR operations, persistence is applicable. A single fault can cause multiple CDR
failures. The persistence of a fault can be either transient – a single occurrence of the
fault, intermittent – recurring presence of the fault or permanent – continuous
presence of the fault. A transient fault will only affect a single CDR operation while a
permanent fault affects consecutive CDR operations. A fault leads to a failure which
is either temporary or permanent.
3.3 A CDR Failure Model for FlexRay
In this section we propose a simplified failure model based on the CDR model for
a system with FlexRay [13]. The plausibility of failures assessed based on the
specifications of the protocol and with the assumption of a “basic” system with only
mitigation mechanisms that are intrinsic to FlexRay. In FlexRay a communication
cycle consists of a static and a dynamic segment. These two communication modes
are assessed separately. Insertion, addressing and timing failures are avoided in the
static segment due to the time-triggered paradigm while the dynamic segment is
susceptible.
Both segments are prone to omission failures although these are assumed to always
be detectable since processing in the system is basically synchronous. Here, each
node has its own concept time and knows which results are expected by its processes.
252 C. Bergenhem, R. Johansson, and H. Lönn
The static segment also has knowledge of the communication schedule, i.e. expected
arrival of each frame. In FlexRay, nodes have a common time-base due to clock-
synchronisation which implies that a receiving node always correctly concludes that
an expected but not received frame is due to a failure, i.e. detectable. Timing failures
in the dynamic segment are therefore assumed to be detectable.
Value failures are either undetectable or detectable depending how the failure is
caused. For example a frame CRC cannot mitigate an erroneous value caused by a
faulty producer. A potential cause of blocking failure is interference due to a faulty
node which sends a frame or nonsense in a communication slot which belongs to
another node. This failure mode is sometimes known as babbling-idiot failure or
interference failure. These failure modes are avoided by the use of bus-guardians in
static FlexRay while dynamic is susceptible.
Repetition failure can be caused e.g. by a fault in the sender service or sender node
hardware which prevents the update of outgoing communication buffers. This can
cause an old frame to be sent. All systems are susceptible to this failure but it can
easily be avoided e.g. by the use of sequence counters in frames. Sequence failure is
not applicable to the CDR operation failure model since a CDR operation is a “single
shot” operation, but is applicable when regarded at the perspective of sequential CDR
operations. All systems are susceptible to this failure but it can easily be avoided by
the use of sequence counters in frames.
Table 1 summarises the mappings between components faults and failure modes
for static and dynamic FlexRay communication. Asymmetric failures are assumed to
occur mainly due to faults in incoming link and the network. However a slightly-out-
of-specification (SOS) fault [14] can also cause asymmetric omission failure. The
cause can be external disturbance. SOS-faults can occur in the time-domain and value
domain. An example of the former is deviation of clocks in nodes e.g. due to faults
affecting clock synchronisation – a service provided by FlexRay. The synchrony of
clocks affects a node’s perception of what constitutes a timely frame, i.e. correct, and
what is a late or early frame, i.e. omission.
4 The CDR pattern applied to Architecture
4.1 ISO 26262 Implications
ISO 26262 part 8 clause 6, states that a semi-formal notation is highly
recommended for Safety Requirements of ASIL C & D functions. This applies to
Table 1: CDR failure modes in a system with FlexRay.
Asymmetric
omission
failure
Symmetric
Insertion,
Addressing
failure
Omission
Repetition
failure
Blocking
failure
Timing
failure
Detectable and
Undetectable
Value failure
Static X - X - - X
Dynamic X X X X p X
X: Susceptible; p: partial susceptible and –: not susceptible
A novel modelling pattern for establishing failure models and assistingarchitectural exploration in an automotive context 253
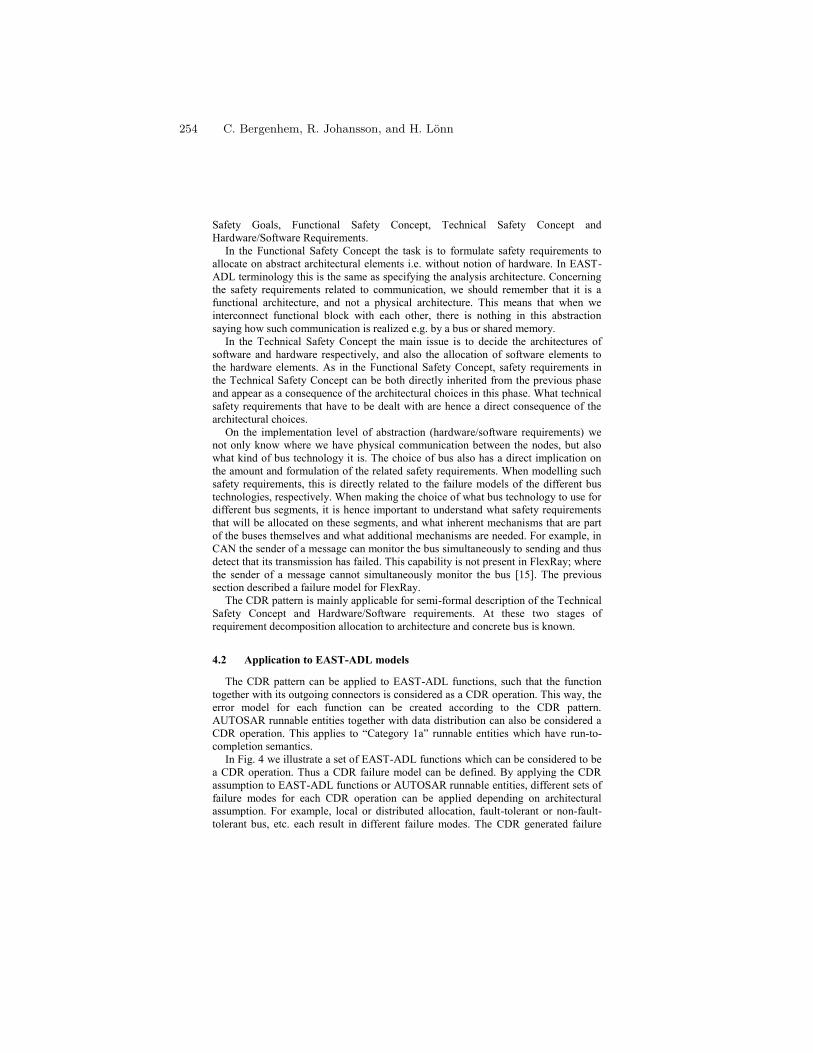
Safety Goals, Functional Safety Concept, Technical Safety Concept and
Hardware/Software Requirements.
In the Functional Safety Concept the task is to formulate safety requirements to
allocate on abstract architectural elements i.e. without notion of hardware. In EAST-
ADL terminology this is the same as specifying the analysis architecture. Concerning
the safety requirements related to communication, we should remember that it is a
functional architecture, and not a physical architecture. This means that when we
interconnect functional block with each other, there is nothing in this abstraction
saying how such communication is realized e.g. by a bus or shared memory.
In the Technical Safety Concept the main issue is to decide the architectures of
software and hardware respectively, and also the allocation of software elements to
the hardware elements. As in the Functional Safety Concept, safety requirements in
the Technical Safety Concept can be both directly inherited from the previous phase
and appear as a consequence of the architectural choices in this phase. What technical
safety requirements that have to be dealt with are hence a direct consequence of the
architectural choices.
On the implementation level of abstraction (hardware/software requirements) we
not only know where we have physical communication between the nodes, but also
what kind of bus technology it is. The choice of bus also has a direct implication on
the amount and formulation of the related safety requirements. When modelling such
safety requirements, this is directly related to the failure models of the different bus
technologies, respectively. When making the choice of what bus technology to use for
different bus segments, it is hence important to understand what safety requirements
that will be allocated on these segments, and what inherent mechanisms that are part
of the buses themselves and what additional mechanisms are needed. For example, in
CAN the sender of a message can monitor the bus simultaneously to sending and thus
detect that its transmission has failed. This capability is not present in FlexRay; where
the sender of a message cannot simultaneously monitor the bus [15]. The previous
section described a failure model for FlexRay.
The CDR pattern is mainly applicable for semi-formal description of the Technical
Safety Concept and Hardware/Software requirements. At these two stages of
requirement decomposition allocation to architecture and concrete bus is known.
4.2 Application to EAST-ADL models
The CDR pattern can be applied to EAST-ADL functions, such that the function
together with its outgoing connectors is considered as a CDR operation. This way, the
error model for each function can be created according to the CDR pattern.
AUTOSAR runnable entities together with data distribution can also be considered a
CDR operation. This applies to “Category 1a” runnable entities which have run-to-
completion semantics.
In Fig. 4 we illustrate a set of EAST-ADL functions which can be considered to be
a CDR operation. Thus a CDR failure model can be defined. By applying the CDR
assumption to EAST-ADL functions or AUTOSAR runnable entities, different sets of
failure modes for each CDR operation can be applied depending on architectural
assumption. For example, local or distributed allocation, fault-tolerant or non-fault-
tolerant bus, etc. each result in different failure modes. The CDR generated failure
254 C. Bergenhem, R. Johansson, and H. Lönn
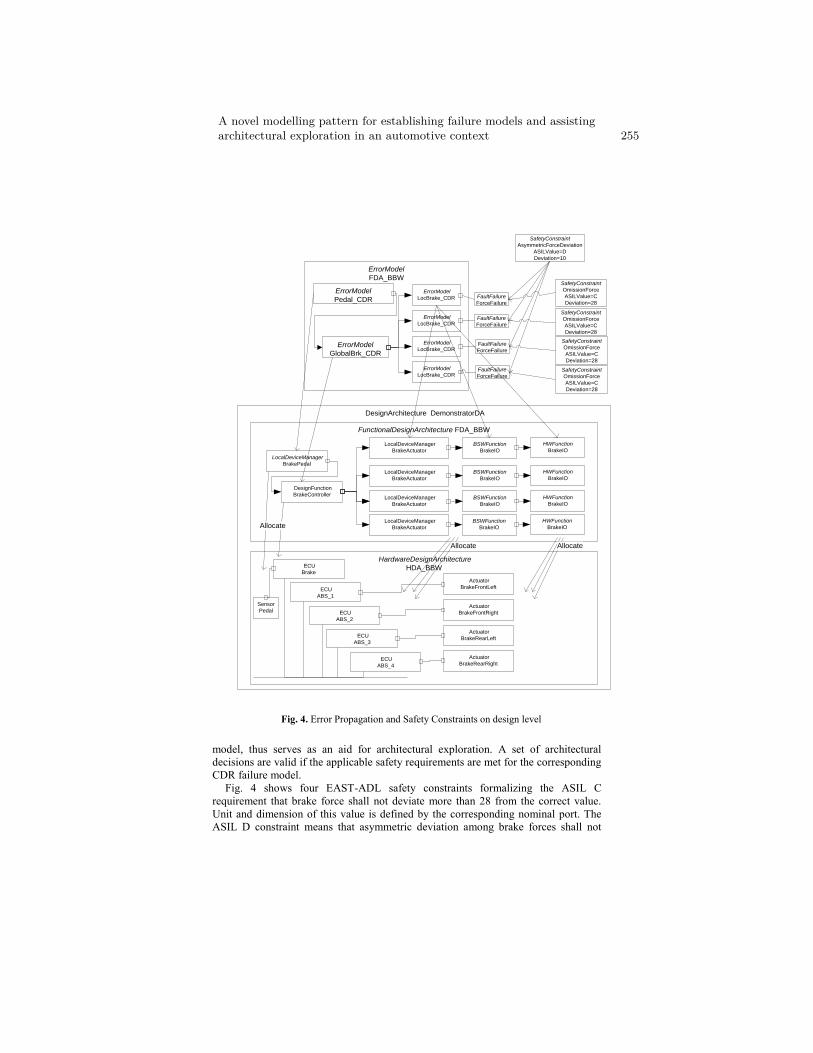
model, thus serves as an aid for architectural exploration. A set of architectural
decisions are valid if the applicable safety requirements are met for the corresponding
CDR failure model.
Fig. 4 shows four EAST-ADL safety constraints formalizing the ASIL C
requirement that brake force shall not deviate more than 28 from the correct value.
Unit and dimension of this value is defined by the corresponding nominal port. The
ASIL D constraint means that asymmetric deviation among brake forces shall not
ErrorModel
FDA_BBW
FunctionalDesignArchitecture FDA_BBW
ECU
ABS_1
HardwareDesignArchitecture
HDA_BBW
DesignArchitecture DemonstratorDA
LocalDeviceManager
BrakePedal
DesignFunction
BrakeController
LocalDeviceManager
BrakeActuator
LocalDeviceManager
BrakeActuator
LocalDeviceManager
BrakeActuator
LocalDeviceManager
BrakeActuator
BSWFunction
BrakeIO
ECU
ABS_2
ECU
ABS_3
ECU
ABS_4
ECU
Brake
Actuator
BrakeFrontLeft
Actuator
BrakeFrontRight
Actuator
BrakeRearLeft
Actuator
BrakeRearRight
ECU
ABS_1
BSWFunction
BrakeIO
BSWFunction
BrakeIO
BSWFunction
BrakeIO
HWFunction
BrakeIO
HWFunction
BrakeIO
HWFunction
BrakeIO
HWFunction
BrakeIO
ErrorModel
GlobalBrk_CDR
ErrorModel
LocBrake_CDR
ErrorModel
LocBrake_CDR
ErrorModel
LocBrake_CDR
ErrorModel
LocBrake_CDR
FaultFailure
ForceFailure
FaultFailure
ForceFailure
FaultFailure
ForceFailure
FaultFailure
ForceFailure
SafetyConstraint
AsymmetricForceDeviation
ASILValue=D
Deviation=10
SafetyConstraint
OmissionForce
ASILValue=C
Deviation=28
SafetyConstraint
OmissionForce
ASILValue=C
Deviation=28
SafetyConstraint
OmissionForce
ASILValue=C
Deviation=28
SafetyConstraint
OmissionForce
ASILValue=C
Deviation=28
Allocate
Allocate
ErrorModel
Pedal_CDR
Allocate
Sensor
Pedal
Fig. 4. Error Propagation and Safety Constraints on design level
A novel modelling pattern for establishing failure models and assistingarchitectural exploration in an automotive context 255
exceed 10. What these five constraints illustrate is that small asymmetric deviations
(10) are more critical than large symmetric deviations (28). The figure also shows the
hardware architecture, and suggests that the CDR pattern is used for the failure model
to assess different allocation choices.
5 Summary and Conclusions
The CDR pattern has been presented and put in relation to EAST-ADL and to ISO
26262. This pattern provides a recipe for creating an error model that describes how
the nominal system can fail. Failures in the CDR pattern are described according to a
taxonomy described in the paper. This is devised especially to capture asymmetric
failures. The CDR pattern can be used to characterise the nominal system and
supports architectural exploration so that architectural design decisions, such as
choice of communication bus, can be compared.
The pattern complements EAST-ADL with the capability to describe a
combination of functional and hardware design architectures (FDA & HDA). We
further show how the EAST-ADL dependability support can be extended with safety
constraints for asymmetrical failures. It improves the capabilities to semi-formally
describe safety requirements, such as the Technical Safety Concept and the
Hardware/Software Safety Requirements, thus fulfilling ISO 26262 part 8 clause 6.
A brake-by-wire application and FlexRay bus were used to illustrate the concepts.
The outcome is a failure model for the FlexRay bus based on analysis according to the
pattern.
6 Acknowledgements
This work was partially supported by the European Commission, through the
KARYON project, call FP7-ICT-2011-7, grant agreement number 288195; and
through the MAENAD project, call FP7-2010-ICT-GC, grant agreement number
260057.
References
[1] ISO, "International Standard 26262 Road vehicles -- Functional safety," ed,
2011.
[2] C. Bergenhem and J. Karlsson, "A Process Group Membership Service for
Active Safety Systems Using TT/ET Communication Scheduling," in
Dependable Computing (PRDC 2007). 13th Pacific Rim International
Symposium on, Melbourne, Australia, 2007, pp. 282-289.
[3] AUTOSAR, "AUTOSAR, An industry-wide initiative to manage the
complexity of emerging Automotive E/E-architectures," in Vehicle
Electronics to Digital Mobility: The Next Generation of Convergence. vol.
SAE/P-387, ed, 2004, pp. 325-332.
[4] P. Cuenot, et al., "Engineering Support for Automotive Embedded Systems -
Beyond AUTOSAR," ATZautotechnology 2009.
256 C. Bergenhem, R. Johansson, and H. Lönn
[5] "Architecture Analysis & Design Language (AADL) Version 2," in AS-5506,
ed: SAE, 2009.
[6] P. H. Feiler and A. E. Rugina, "Dependability Modeling with the
Architecture Analysis and Design Language (AADL)," Carnegie Mellon
Software Engineering Institute2007.
[7] R. Johansson, et al., "A road-map for enabling system analysis of
AUTOSAR-based systems," presented at the Proceedings of the 1st
Workshop on Critical Automotive applications: Robustness & Safety
(CARS), Valencia, Spain, 2010.
[8] D. Chen, et al., "Integrated Fault Modelling for Safety-Critical Automotive
Embedded Systems," Springer IE&I elektrotechnik und informationstechnik,
vol. 128, pp. 196-202, 2011.
[9] Y. Papadopoulos, "Safety-Directed System Monitoring Using Safety
Cases.," Ph.D. thesis, University of York,, UK, 2000
[10] Altarica. (2012, Altarica, a language designed to model both functional and
dysfunctional behaviours of critical systems.
[11] A. Avizienis, et al., "Basic concepts and taxonomy of dependable and secure
computing," Dependable and Secure Computing, IEEE Transactions on, vol.
1, pp. 11-33, 2004.
[12] C. Bergenhem and J. Karlsson, "A General System, Processing and Failure
Model for Fault Tolerance related Protocols in Safety-Critical Distributed
Real-Time Systems, TR 08-18," Chalmers University of Technology Dept.
of Computer Science and Engineering, Gothenburg, Sweden TR 08-18,
2008.
[13] Flexray, FlexRay Communications System Protocol Specification Version
2.1: FlexRay Consortium, 2005.
[14] A. Ademaj, "Slightly-off-specification failures in the time-triggered
architecture," presented at the Proceedings of the Seventh IEEE International
High-Level Design Validation and Test Workshop(HLDVT), 2002.
[15] T. M. Forest, "The FlexRay Communication Protocol and Some Implications
for Future Applications," in SAE Convergence, 2006.
A novel modelling pattern for establishing failure models and assistingarchitectural exploration in an automotive context 257
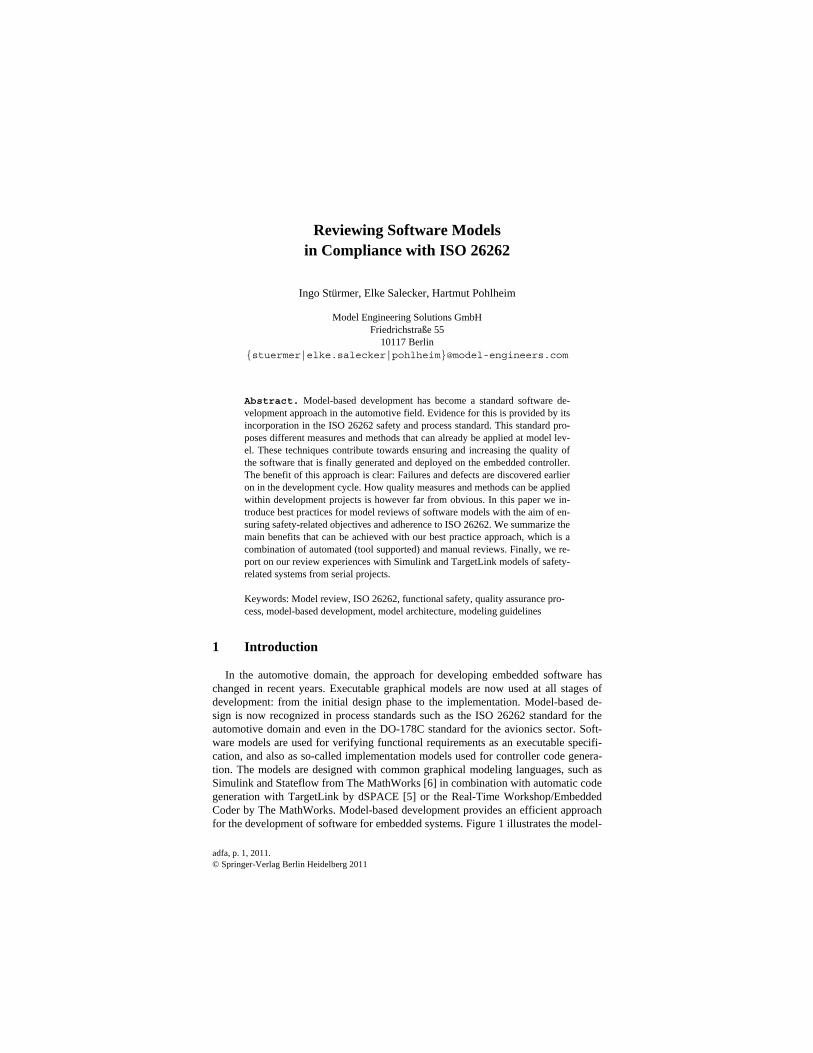
adfa, p. 1, 2011. © Springer-Verlag Berlin Heidelberg 2011
Reviewing Software Models in Compliance with ISO 26262
Ingo Stürmer, Elke Salecker, Hartmut Pohlheim
Model Engineering Solutions GmbH Friedrichstraße 55
10117 Berlin {stuermer|elke.salecker|pohlheim}@model-engineers.com
Abstract. Model-based development has become a standard software de-velopment approach in the automotive field. Evidence for this is provided by its incorporation in the ISO 26262 safety and process standard. This standard pro-poses different measures and methods that can already be applied at model lev-el. These techniques contribute towards ensuring and increasing the quality of the software that is finally generated and deployed on the embedded controller. The benefit of this approach is clear: Failures and defects are discovered earlier on in the development cycle. How quality measures and methods can be applied within development projects is however far from obvious. In this paper we in-troduce best practices for model reviews of software models with the aim of en-suring safety-related objectives and adherence to ISO 26262. We summarize the main benefits that can be achieved with our best practice approach, which is a combination of automated (tool supported) and manual reviews. Finally, we re-port on our review experiences with Simulink and TargetLink models of safety-related systems from serial projects.
Keywords: Model review, ISO 26262, functional safety, quality assurance pro-cess, model-based development, model architecture, modeling guidelines
1 Introduction
In the automotive domain, the approach for developing embedded software has changed in recent years. Executable graphical models are now used at all stages of development: from the initial design phase to the implementation. Model-based de-sign is now recognized in process standards such as the ISO 26262 standard for the automotive domain and even in the DO-178C standard for the avionics sector. Soft-ware models are used for verifying functional requirements as an executable specifi-cation, and also as so-called implementation models used for controller code genera-tion. The models are designed with common graphical modeling languages, such as Simulink and Stateflow from The MathWorks [6] in combination with automatic code generation with TargetLink by dSPACE [5] or the Real-Time Workshop/Embedded Coder by The MathWorks. Model-based development provides an efficient approach for the development of software for embedded systems. Figure 1 illustrates the model-
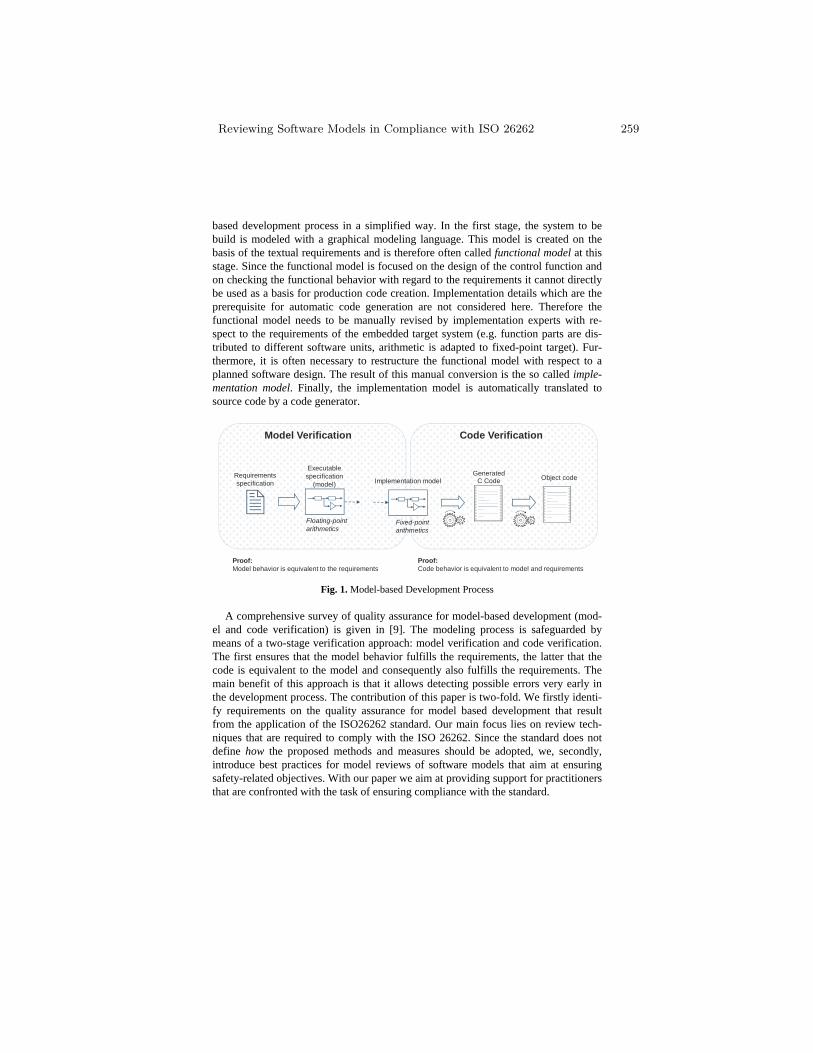
based development process in a simplified way. In the first stage, the system to be build is modeled with a graphical modeling language. This model is created on the basis of the textual requirements and is therefore often called functional model at this stage. Since the functional model is focused on the design of the control function and on checking the functional behavior with regard to the requirements it cannot directly be used as a basis for production code creation. Implementation details which are the prerequisite for automatic code generation are not considered here. Therefore the functional model needs to be manually revised by implementation experts with re-spect to the requirements of the embedded target system (e.g. function parts are dis-tributed to different software units, arithmetic is adapted to fixed-point target). Fur-thermore, it is often necessary to restructure the functional model with respect to a planned software design. The result of this manual conversion is the so called imple-mentation model. Finally, the implementation model is automatically translated to source code by a code generator.
Executablespecification
(model) Implementation modelGenerated
C Code
Fixed-point arithmetics
Model Verification
Requirementsspecification
Floating-pointarithmetics
Object code
Code Verification
Proof: Model behavior is equivalent to the requirements
Proof: Code behavior is equivalent to model and requirements
Fig. 1. Model-based Development Process
A comprehensive survey of quality assurance for model-based development (mod-el and code verification) is given in [9]. The modeling process is safeguarded by means of a two-stage verification approach: model verification and code verification. The first ensures that the model behavior fulfills the requirements, the latter that the code is equivalent to the model and consequently also fulfills the requirements. The main benefit of this approach is that it allows detecting possible errors very early in the development process. The contribution of this paper is two-fold. We firstly identi-fy requirements on the quality assurance for model based development that result from the application of the ISO26262 standard. Our main focus lies on review tech-niques that are required to comply with the ISO 26262. Since the standard does not define how the proposed methods and measures should be adopted, we, secondly, introduce best practices for model reviews of software models that aim at ensuring safety-related objectives. With our paper we aim at providing support for practitioners that are confronted with the task of ensuring compliance with the standard.
Reviewing Software Models in Compliance with ISO 26262 259
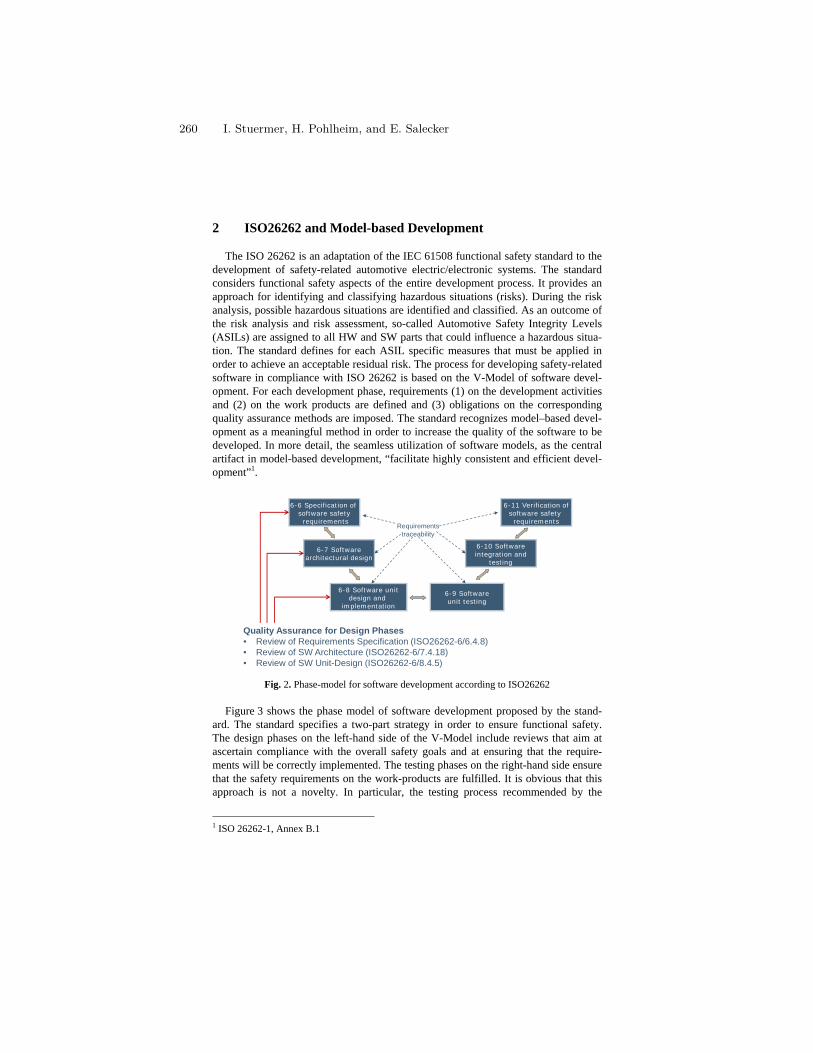
2 ISO26262 and Model-based Development
The ISO 26262 is an adaptation of the IEC 61508 functional safety standard to the development of safety-related automotive electric/electronic systems. The standard considers functional safety aspects of the entire development process. It provides an approach for identifying and classifying hazardous situations (risks). During the risk analysis, possible hazardous situations are identified and classified. As an outcome of the risk analysis and risk assessment, so-called Automotive Safety Integrity Levels (ASILs) are assigned to all HW and SW parts that could influence a hazardous situa-tion. The standard defines for each ASIL specific measures that must be applied in order to achieve an acceptable residual risk. The process for developing safety-related software in compliance with ISO 26262 is based on the V-Model of software devel-opment. For each development phase, requirements (1) on the development activities and (2) on the work products are defined and (3) obligations on the corresponding quality assurance methods are imposed. The standard recognizes model–based devel-opment as a meaningful method in order to increase the quality of the software to be developed. In more detail, the seamless utilization of software models, as the central artifact in model-based development, “facilitate highly consistent and efficient devel-opment”1.
Quality Assurance for Design Phases• Review of Requirements Specification (ISO26262-6/6.4.8)• Review of SW Architecture (ISO26262-6/7.4.18)• Review of SW Unit-Design (ISO26262-6/8.4.5)
6-6 Specification of software safetyrequirements
6-7 Softwarearchitectural design
6-8 Software unitdesign and
implementation
6-9 Softwareunit testing
6-10 Softwareintegration and
testing
6-11 Verification ofsoftware safety requirements
Requirementstraceability
Fig. 2. Phase-model for software development according to ISO26262
Figure 3 shows the phase model of software development proposed by the stand-ard. The standard specifies a two-part strategy in order to ensure functional safety. The design phases on the left-hand side of the V-Model include reviews that aim at ascertain compliance with the overall safety goals and at ensuring that the require-ments will be correctly implemented. The testing phases on the right-hand side ensure that the safety requirements on the work-products are fulfilled. It is obvious that this approach is not a novelty. In particular, the testing process recommended by the
1 ISO 26262-1, Annex B.1
260 I. Stuermer, H. Pohlheim, and E. Salecker
standard is successfully implemented by many OEMs and suppliers of the automotive industry for many years. Apart from testing aspects, the main goal of the software design phase is to ensure that the software architecture realizes the safety require-ments stated for the software. This goal can hardly be verified by testing. From our point of view, this can only be achieved efficiently by reviewing the software models used for code generation.
3 Model Reviews according to ISO 26262
The ISO26262 standard requires reviews for the work products that are created in the three design phases (ref. Fig. 2). The (1) safety requirements review investigates the safety requirements of the software in order to ensure their compliance and con-sistency with the overall safety requirements. Moreover, the hardware-software inter-face specification, which is refined during the specification phase, is validated to en-sure consistency with the overall system design. The (2) SW architecture review concludes the software architecture design phase. It aims at ensuring compliance of the software architecture with the software safety requirements defined in the preced-ing phase. Furthermore, the compliance of the architecture with the architecture de-sign principles imposed by the standard is approved. The (3) SW unit review investi-gates the software unit design and implementation and has to show the fulfillment of the software safety requirements and the compliance of the software unit with the hardware-software interface specification. Moreover, it has to be verified that the unit design is correctly implemented and that the implementation complies with the coding respectively modeling guidelines. The standard explicitly requires to provide evidence that the source code fulfills the safety requirements. An indispensable precondition for all three reviews that is imposed by the ISO26262 is the traceability for the soft-ware safety requirements.
Review procedures focused on verification of requirements specifications, e.g. Fa-gan inspections [8], can be adapted to perform model reviews. The general objectives of model reviews are: (1) to check whether or not the textual specified functional requirements are realized in the model; (2) to ensure that relevant modeling guidelines are fulfilled (e.g. naming conventions, structuring, modularization); (3) to check to be sure that a number of selected quality criteria such as portability, maintainability, testability are met; (4) to check to be sure that the implementation model meets the requirements for the generation of safe code (e.g. robustness) and efficient code (e.g. resource optimizations). To handle the complexity of this task, model reviews are often guided by an in-house set of specific modeling and review guidelines. These are commonly summarized as a review check list. During the model review, a series of findings with suggestions and comments on individual model parts are gathered and recorded with a reference to the affected model elements. The references to the model elements enable the developer to track which parts of the model must be revised.
Compliance with modeling guidelines is important to increase the comprehensibil-ity (readability) of the model, to facilitate maintenance, to ease testing, reuse, and extensibility, and to simplify the exchange of models between OEMs and suppliers.
Reviewing Software Models in Compliance with ISO 26262 261
According to our experience, several benefits can be achieved by establishing model-ing guidelines, particularly if modeling guideline violations can be checked and (part-ly) corrected automatically by guideline checkers such as the Model Examiner [12] or the Model Advisor [6]. A major benefit is the reduction of the effort to carry out a manual model review. Furthermore, guideline adherence is a constructive quality assurance method. Typical failures, e.g. inconsistence usage of data types or signals, can be detected and avoided. Within a company, it can be ensured that software mod-els are designed in a consistent and comparable manner such that the exchange of information is facilitated.
Over the last few years, various guidelines have been developed. In the following we provide a short overview on the most popular guidelines. Guidelines and patterns for model design, such as those published by the MathWorks Automotive Advisory Board (MAAB) [10] are often adopted in order to increase the quality of models. However, the MAAB guidelines do not directly address model design issues relevant for production code generation; rather they focus on overall model quality aspects such as readability, maintainability, testability etc. In the context of serial production code generation for safety-related systems other modeling guidelines should be taken into account. These include: (1) the MISRA Autocode Simulink/Stateflow Guidelines, (MISRA AC SLSF [2]), published by MISRA, and the Strong Data Typing Guide-lines for Simulink and TargetLink [1], published by MES. If a code generator is used for production code generation, the following guidelines are important. For the Tar-getLink codegenerator, the dSPACE Modeling Guidelines for TargetLink [4] as well as the MISRA Autocode TargetLink guidelines (MISRA AC TL [3] should be consid-ered; for the Embedded Coder, the Safety Integrity Guidelines [7] should be adhered to. Compliance with the modeling conventions, stated in the above guidelines, facili-tates the translation of software models into safe and efficient code. In our experience, we strongly recommend carrying out guideline checking before any quality assurance method such as model review or testing; otherwise unnecessary high effort can be required due to e.g. reduced readability or subtle modeling failures.
4 Our Model Review Approach
Our best practice approach for model review presented in this paper is restricted to the second and third design phase of the ISO reference model (ref. Fig. 2). We pro-vide an approach for the SW architecture review that concludes the software architec-tural design phase and the SW unit review that concludes the SW design and imple-mentation phase. Our experience has shown that the development approach has no influence on the safety requirements review. In contrast to the other two reviews for safety requirements reviews, it is not necessary to take specific aspects for model based development into consideration. For this reason, we do not address safety re-quirements reviews to the full extent in this paper. In the following, we present an overview of our review approach.
We aim to conduct the reviews required by ISO26262 as effective and efficient as possible. We achieve this goal by different means. First, we identify appropriate
262 I. Stuermer, H. Pohlheim, and E. Salecker
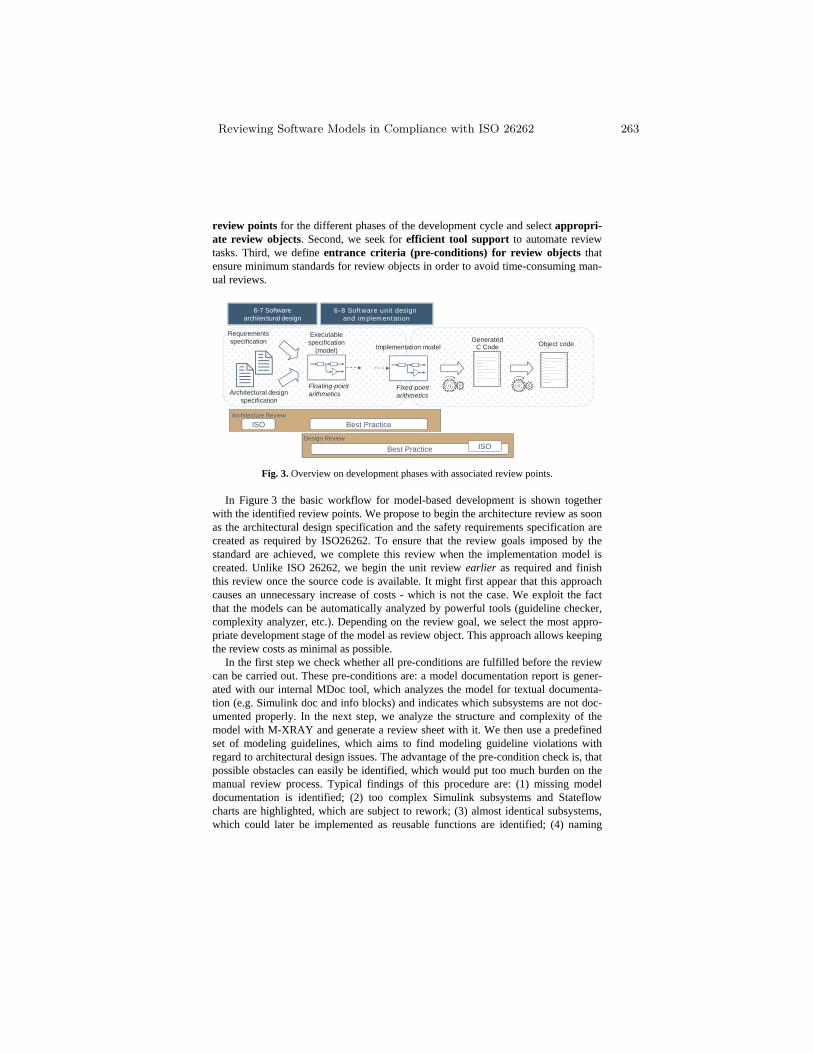
review points for the different phases of the development cycle and select appropri-ate review objects. Second, we seek for efficient tool support to automate review tasks. Third, we define entrance criteria (pre-conditions) for review objects that ensure minimum standards for review objects in order to avoid time-consuming man-ual reviews.
Architecture Review
ISO Best Practice
Executablespecification
(model) Implementation modelGenerated
C Code
Fixed-point arithmetics
Requirementsspecification
Floating-pointarithmetics
Object code
Architectural designspecification
Design Review
Best Practice ISO
6-7 Softwarearchitectural design
6-8 Software unit design and implementation
Fig. 3. Overview on development phases with associated review points.
In Figure 3 the basic workflow for model-based development is shown together with the identified review points. We propose to begin the architecture review as soon as the architectural design specification and the safety requirements specification are created as required by ISO26262. To ensure that the review goals imposed by the standard are achieved, we complete this review when the implementation model is created. Unlike ISO 26262, we begin the unit review earlier as required and finish this review once the source code is available. It might first appear that this approach causes an unnecessary increase of costs - which is not the case. We exploit the fact that the models can be automatically analyzed by powerful tools (guideline checker, complexity analyzer, etc.). Depending on the review goal, we select the most appro-priate development stage of the model as review object. This approach allows keeping the review costs as minimal as possible.
In the first step we check whether all pre-conditions are fulfilled before the review can be carried out. These pre-conditions are: a model documentation report is gener-ated with our internal MDoc tool, which analyzes the model for textual documenta-tion (e.g. Simulink doc and info blocks) and indicates which subsystems are not doc-umented properly. In the next step, we analyze the structure and complexity of the model with M-XRAY and generate a review sheet with it. We then use a predefined set of modeling guidelines, which aims to find modeling guideline violations with regard to architectural design issues. The advantage of the pre-condition check is, that possible obstacles can easily be identified, which would put too much burden on the manual review process. Typical findings of this procedure are: (1) missing model documentation is identified; (2) too complex Simulink subsystems and Stateflow charts are highlighted, which are subject to rework; (3) almost identical subsystems, which could later be implemented as reusable functions are identified; (4) naming
Reviewing Software Models in Compliance with ISO 26262 263
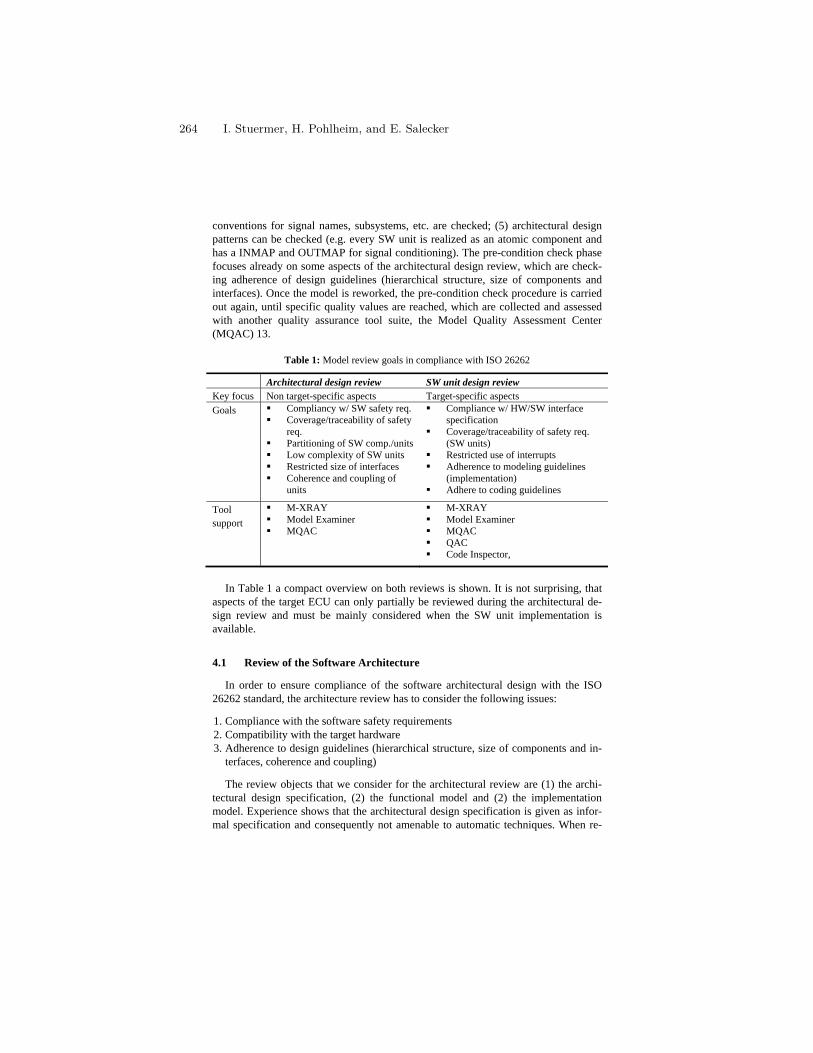
conventions for signal names, subsystems, etc. are checked; (5) architectural design patterns can be checked (e.g. every SW unit is realized as an atomic component and has a INMAP and OUTMAP for signal conditioning). The pre-condition check phase focuses already on some aspects of the architectural design review, which are check-ing adherence of design guidelines (hierarchical structure, size of components and interfaces). Once the model is reworked, the pre-condition check procedure is carried out again, until specific quality values are reached, which are collected and assessed with another quality assurance tool suite, the Model Quality Assessment Center (MQAC) 13.
Table 1: Model review goals in compliance with ISO 26262
Architectural design review SW unit design review Key focus Non target-specific aspects Target-specific aspects
Goals Compliancy w/ SW safety req. Coverage/traceability of safety
req. Partitioning of SW comp./units Low complexity of SW units Restricted size of interfaces Coherence and coupling of
units
Compliance w/ HW/SW interface specification
Coverage/traceability of safety req. (SW units)
Restricted use of interrupts Adherence to modeling guidelines
(implementation) Adhere to coding guidelines
Tool support
M-XRAY Model Examiner MQAC
M-XRAY Model Examiner MQAC QAC Code Inspector,
In Table 1 a compact overview on both reviews is shown. It is not surprising, that
aspects of the target ECU can only partially be reviewed during the architectural de-sign review and must be mainly considered when the SW unit implementation is available.
4.1 Review of the Software Architecture
In order to ensure compliance of the software architectural design with the ISO 26262 standard, the architecture review has to consider the following issues:
1. Compliance with the software safety requirements 2. Compatibility with the target hardware 3. Adherence to design guidelines (hierarchical structure, size of components and in-
terfaces, coherence and coupling)
The review objects that we consider for the architectural review are (1) the archi-tectural design specification, (2) the functional model and (2) the implementation model. Experience shows that the architectural design specification is given as infor-mal specification and consequently not amenable to automatic techniques. When re-
264 I. Stuermer, H. Pohlheim, and E. Salecker
viewing this artifact we put the focus on the first two review goals. It must be checked that all software safety requirements are considered. The review must be carried out jointly by the persons responsible for the functional model and the software architec-ture in order to avoid model designs that lead to costly, i.e. manual transformations of the functional model into the implementation model. Especially the evaluation of the compatibility with the target hardware requires expert knowledge, since this goal requires estimations with respect to the target architecture although only limited data is available. We postpone to check the adherence of design guidelines on architectural level until the functional model is available. We analyze the model for inappropriate distribution of functionality that might lead to very complex components which are prone to errors. We must also review these architectural design guidelines on the im-plementation model because in the functional model information on the mapping onto source code components is not available. We exploit the fact that this analysis can be carried out automatically by applying M-XRAY [11]. This tool measures the com-plexity of models and analyzes the model hierarchy and function distribution. The first automatic review allows to identify model parts, which can result into too com-plex code structures, very early in the development process. Because the analysis investigates the model architecture, the second automatic review of the implementa-tion model is necessary in order to verify the software architecture and achieve com-pliance with ISO26262.
4.2 Review of the Software Unit Design and Implementation
In order to ensure compliance of the software unit design and implementation with the ISO 26262 standard, the review has to consider the following issues:
1. Compliance with the hardware-software interface specification 2. Fulfillment of the software safety requirements as allocated to the software units
through traceability 3. Compliance of the source code with its design specification 4. Compliance of the source code with the coding guidelines 5. Compatibility of the software unit implementations with the target hardware
We consider as review objects (1) the functional model, (2) the implementation model and (3) the source code. We perform a combined review: first, we carry out a static review on the functional and on the implementation model with the Model Ex-aminer. In the next step, we conduct a manual review on the implementation model and the generated source code. The tool-assisted review ensures that the review arti-facts are sufficiently documented and that they comply with modeling guidelines. This includes an in-depth check of the usage of data-types in order to check the com-patibility with the target hardware. Our experience has shown that this approach eases the manual review considerably. ISO26262 requires verifying that the generated code is in compliancy with the safety goals and that the safety requirements can be traced down to code level. Especially the first requirement, i.e. compliancy with the safety goals, can only be achieved with a manual review. The traceability of the safety re-
Reviewing Software Models in Compliance with ISO 26262 265
quirements can often be facilitated by tool support. We conduct the review by investi-gating the implementation model in parallel with the generated source code. This approach also eases the understanding of the generated code.
5 Lessons learned
Our experience has shown that three conditions are extremely important to conduct the reviews required by ISO 26262: (1) the traceability of requirements, (2) the doc-umentation of the model and (3) the compliance with modeling guidelines. The effort that is required for the documentation of the model and the traceability of require-ments pays off. The same is true for the adherence to uniform guidelines. These con-ditions reduce the time required to understand the functionality of a model that is necessary to verify compliance with the safety requirements. Moreover, they expand the group of possible reviewers because they ease the review process for project-external personal. It is realistic to establish them because these conditions can be checked automatically with tools that can be easily integrated into the development process and employed by the model developer. The investment is also justified by the fact that they help to increase the overall quality of the models.
In the SW unit design phase we analyzed the model manually for compliance with the software safety requirements. Here, it is important that the stated requirements can easily be traced down to the model (in this case by textual ID’s noted in the model). The check, whether a model part is compliant with the specified safety-requirement can often not easily be answered. The reason for this is that even if the realization of a safety requirement is available on model level, e.g. a function has been implemented in a redundant way, it has to be verified in the following testing phase, whether this approach has been implemented correctly. As a result, we decided that it is enough to identify the ‘logical’ realization of the safety requirement, which must be verified with so-called safety test cases afterwards. The biggest challenge is then to show that safety-relevant subsystems are decoupled and not functional dependent from the other model parts, which are not safety-relevant. If this cannot be shown, the whole model has to be associated to the highest ASIL level. This review procedure includes, that all incoming interface signals are checked manually.
6 Conclusion
The new ISO 26262 is the first development standard in the automotive sector that recognizes model-based development as a paradigm that improves the quality of the software to be developed. Model reviews are regarded as an important quality assur-ance method in order to check the compliancy of the software model with the safety requirements. Several review tasks can be solved automatically because efficient tool support is available. However, it must be noted that the ISO26262 requires to validate that the generated source code fulfills the safety requirements. In this paper, we pro-vide an approach for conducting the required reviews for model-based development. Our approach is based on a combination of automatic and manual reviews. We identi-
266 I. Stuermer, H. Pohlheim, and E. Salecker
fied the artifacts that should be reviewed in order to achieve the required review goals as efficiently as possible. Although many review tasks can be solved automatically a manual review is always required because the fulfillment of the safety requirements cannot be checked automatically. The biggest challenge in model design and model review according to ISO 26262, however, is to ensure that the safety-related software functions (units) are decoupled from the non-safety-related SW units and that they are not functional dependent.
7 References
1 MES Strong Data Typing toolbox – guidelines and checks. http://www.model-engineers.com/en/our-products/model-examiner/sdt-toolbox.html.
2 MISRA AC SLSF: Modelling design and style guidelines for the application of Simulink and Stateflow, 2009. 978-906400-07-1.
3 MISRA AC TL: Modelling style guidelines for the application of TargetLink in the context of code generation, 2009. 978-906400-07-1.
4 dSPACE Modeling Guidelines for TargetLink, 2010. 5 dSPACE: TargetLink – Production Code Generator. http://www.dspace.com,
2011. 6 The MathWorks, (product information).
http://www.mathworks.com/products, 2011. 7 The MathWorks simulink modeling guidelines for high-integrity systems,
2011. 8 M. E. Fagan. Design and code inspections to reduce errors in program devel-
opment. IBM Syst. J., 38:258–287, June 1999. 9 Ines Fey and Ingo Stürmer. Quality assurance methods for model-based de-
velopment: A survey and assessment. In SAE World Congress & Exhibition, number 2007-01-0506, 2007.
10 MathWorks Automotive Advisory Board (MAAB). CONTROL ALGORITHM MODELING GUIDELINES USING MATLAB®, Sim-ulink®, and Stateflow®, July 2011.
11 Ingo Stürmer, Hartmut Pohlheim, and Thorsten Rogier. Calculation and vis-ualization of model complexity in model-based design of safety-related soft-ware. In B Keller, editor, Automotive - Safety & Security, pages 69–82. Shaker, 2010.
12 Ingo Stürmer, Stamat Stamatov, and Ulrich Eisemann. Automated checking of misra targetlink and autosar guidelines. In SAE Int. J. Passeng. Cars, pag-es 68–76, 2009.
13 Ingo Stürmer, Hartmut Pohlheim. Model Quality Assessment in Practice: How to Measure and Assess the Quality of Software Models During the Em-bedded Software Development Process, Proc. of Int. Congress of Embedded Real Time Software and Systems (ERTS 2012), Toulouse (France) (2012).
Reviewing Software Models in Compliance with ISO 26262 267
Software Architecture of a safety-related Actuator in Traffic Management Systems
Thomas Novak, Christoph Stoegerer
SWARCO FUTURIT, Muehlgasse 86, 2380 Perchtoldsdorf, Austria
{novak, stoegerer}[email protected]
Abstract. Traffic Management Systems are used in traffic technology for propagating information from a Higher Order Control Unit to the traffic participant. In today’s systems the user interface to the traffic participant is provided by actuators like Variable Message Signs. Such information can be either non-safety-critical (e.g., traffic jams warning) or safety-critical (e.g., green arrow opening the emergency lane on the motorway). According to international and national standards, software of Variable Message Signs displaying safety-critical information has to meet distinct safety requirements. This paper presents a general architecture of safety-related software in an actuator according to the product standard VDE 0832. It gives an introduction to the standard and the domain of traffic control. A hazard analysis is carried out and safety measures are derived. Afterwards, the corresponding software architecture is presented. Finally, a safety assessment is carried out to prove the concept.
Keywords: Safety-related embedded software, safety standard, traffic system
1 Introduction
The increasing traffic density in urban and inter-urban areas as well as the desire to increase road safety has resulted in a magnitude of measures. A possibility is the use of traffic management systems. Such a system does not decrease traffic per se, but supports the distribution of traffic in a more efficient way. Furthermore, it informs and guides drivers about upcoming dangerous situations like traffic jams. Both, optimizing traffic distribution and supporting road safety are accomplished by displaying aspects or textual information to drivers. The aspects are mostly shown by means of actuators – so-called Variable Message Signs (VMS). A typical VMS includes a graphical part, where speed limits or warning signs are displayed supplemented by a text part showing “traffic jam” or “accident”.
According to European and national standards such as EN50556 [3] or the German standard VDE 0832 [2], actuators within traffic control systems have to fulfill a number of requirements relating to the hardware, the software, the application, the integration within an overall system and the engineering process. Requirements on the software and its process are very similar to the generic international standard IEC 61508 [5]. Objective of this paper is to present a software architecture of a VMS
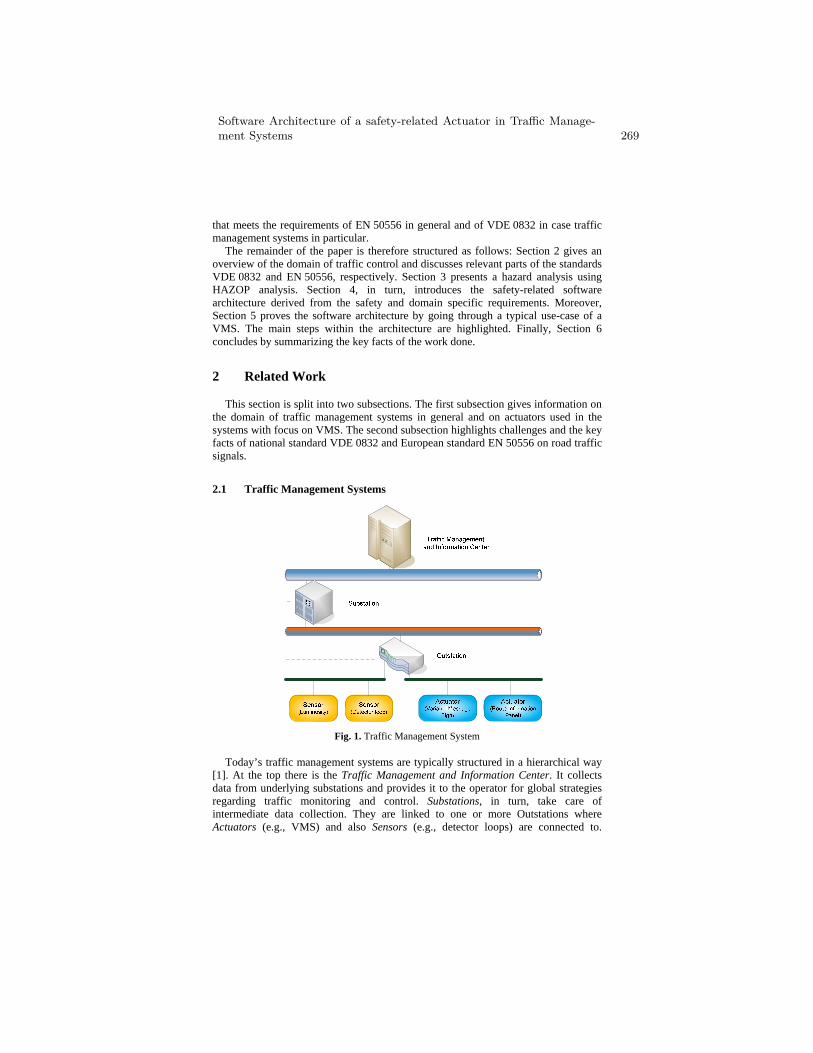
that meets the requirements of EN 50556 in general and of VDE 0832 in case traffic management systems in particular.
The remainder of the paper is therefore structured as follows: Section 2 gives an overview of the domain of traffic control and discusses relevant parts of the standards VDE 0832 and EN 50556, respectively. Section 3 presents a hazard analysis using HAZOP analysis. Section 4, in turn, introduces the safety-related software architecture derived from the safety and domain specific requirements. Moreover, Section 5 proves the software architecture by going through a typical use-case of a VMS. The main steps within the architecture are highlighted. Finally, Section 6 concludes by summarizing the key facts of the work done.
2 Related Work
This section is split into two subsections. The first subsection gives information on the domain of traffic management systems in general and on actuators used in the systems with focus on VMS. The second subsection highlights challenges and the key facts of national standard VDE 0832 and European standard EN 50556 on road traffic signals.
2.1 Traffic Management Systems
Fig. 1. Traffic Management System
Today’s traffic management systems are typically structured in a hierarchical way [1]. At the top there is the Traffic Management and Information Center. It collects data from underlying substations and provides it to the operator for global strategies regarding traffic monitoring and control. Substations, in turn, take care of intermediate data collection. They are linked to one or more Outstations where Actuators (e.g., VMS) and also Sensors (e.g., detector loops) are connected to.
Software Architecture of a safety-related Actuator in Traffic Manage-ment Systems 269
Outstations are responsible for data processing and autonomous control jobs. In the following, the aforementioned control entities are subsumed by the term Higher Order Control Unit (HOCU).
The VMS is composed of a graphical part and optionally of a text part below the graphical one as shown in [1]. LED modules equipped with LEDs of different colors (white, red, yellow or green) are in use to show different aspects. The LED modules include a LED driver and a hardware watchdog. Those modules are connected serially whereat the first module is connected via dedicated cables to a microcontroller. The controller runs software that includes functionality to receive commands via various protocols from a HOCU, and to process the commands and execute them by activating and deactivating aspects respectively.
2.2 Standards and related work
Challenges. The topic of safety-related software in traffic control systems was already tackled at the beginning of the 1990s by W. Reed [4]. This work outlines the following challenges regarding development of safety-related software which did not changed until today:
• Increasing complexity of the system • High demands on quality from costume side • Development within acceptable time and cost limits • Rapid change of technology
Thus, a lean and sustainable approach has to be undertaken in order to meet the requirements of a safety-related software for a VMS within tight cost and time limits. Up to now, no solution to that problem has been realized and is publically available.
Standard. The German standard VDE 0832 consists of seven parts (100, 110, 200,
300, 310, 400, 500) and defines requirements on the development, construction, validation and maintenance of road traffic signals. In contrast to generic standards like IEC 61508, this standard is relating to a defined product.
Part 100 of the standard is identical with the German version of EN 50556 including a national foreword. Part 400 is a prestandard and deals with the integration of VMS in traffic management systems. Additionally, it specifies requirements on VMS. Finally, the prestandard part 500 gives requirements on safety-related software of road traffic control systems. This part is referring to IEC 61508 and its requirements.
According to VDE 0832, part 400, three failure modes must be considered in case of a VMS:
1. Aspect unintentionally switched off: Due to a fault, the aspect is no longer shown although it was not switched off intentionally by the user.
2. Corrupted aspect shown: Due to a fault, the aspect is not shown as defined. Either too many or too few LEDs are switched on.
3. Aspect unintentionally switched on: Due to a fault, an aspect is shown although it was not switched on by the user.
270 T. Novak and C. Stoegerer
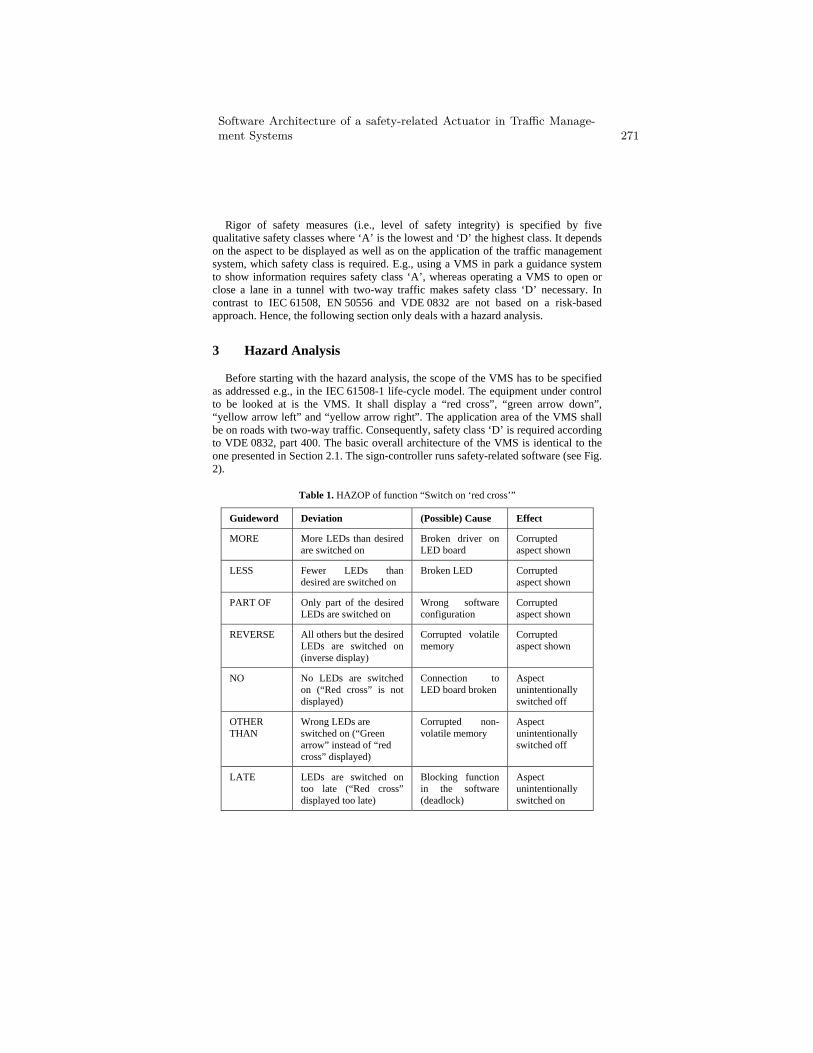
Rigor of safety measures (i.e., level of safety integrity) is specified by five qualitative safety classes where ‘A’ is the lowest and ‘D’ the highest class. It depends on the aspect to be displayed as well as on the application of the traffic management system, which safety class is required. E.g., using a VMS in park a guidance system to show information requires safety class ‘A’, whereas operating a VMS to open or close a lane in a tunnel with two-way traffic makes safety class ‘D’ necessary. In contrast to IEC 61508, EN 50556 and VDE 0832 are not based on a risk-based approach. Hence, the following section only deals with a hazard analysis.
3 Hazard Analysis
Before starting with the hazard analysis, the scope of the VMS has to be specified as addressed e.g., in the IEC 61508-1 life-cycle model. The equipment under control to be looked at is the VMS. It shall display a “red cross”, “green arrow down”, “yellow arrow left” and “yellow arrow right”. The application area of the VMS shall be on roads with two-way traffic. Consequently, safety class ‘D’ is required according to VDE 0832, part 400. The basic overall architecture of the VMS is identical to the one presented in Section 2.1. The sign-controller runs safety-related software (see Fig. 2).
Table 1. HAZOP of function “Switch on ‘red cross’”
Guideword Deviation (Possible) Cause Effect
MORE More LEDs than desired are switched on
Broken driver on LED board
Corrupted aspect shown
LESS Fewer LEDs than desired are switched on
Broken LED Corrupted aspect shown
PART OF Only part of the desired LEDs are switched on
Wrong software configuration
Corrupted aspect shown
REVERSE All others but the desired LEDs are switched on (inverse display)
Corrupted volatile memory
Corrupted aspect shown
NO No LEDs are switched on (“Red cross” is not displayed)
Connection to LED board broken
Aspect unintentionally switched off
OTHER THAN
Wrong LEDs are switched on (“Green arrow” instead of “red cross” displayed)
Corrupted non-volatile memory
Aspect unintentionally switched off
LATE LEDs are switched on too late (“Red cross” displayed too late)
Blocking function in the software (deadlock)
Aspect unintentionally switched on
Software Architecture of a safety-related Actuator in Traffic Manage-ment Systems 271
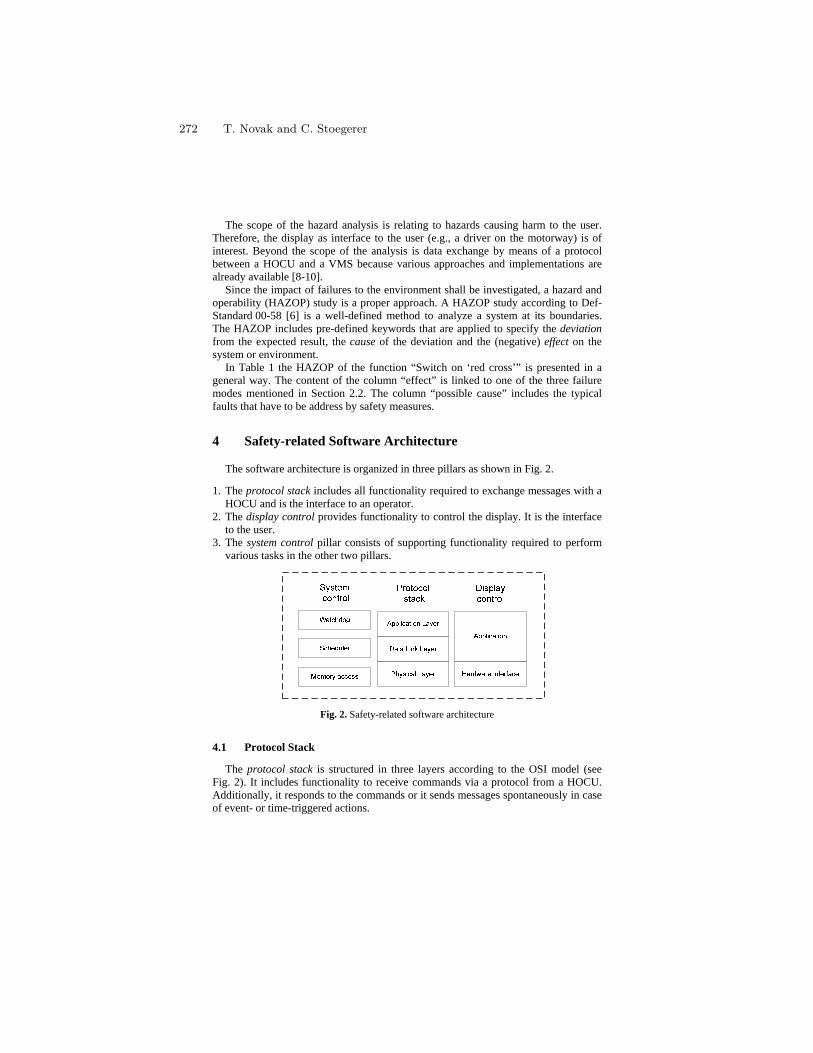
The scope of the hazard analysis is relating to hazards causing harm to the user. Therefore, the display as interface to the user (e.g., a driver on the motorway) is of interest. Beyond the scope of the analysis is data exchange by means of a protocol between a HOCU and a VMS because various approaches and implementations are already available [8-10].
Since the impact of failures to the environment shall be investigated, a hazard and operability (HAZOP) study is a proper approach. A HAZOP study according to Def-Standard 00-58 [6] is a well-defined method to analyze a system at its boundaries. The HAZOP includes pre-defined keywords that are applied to specify the deviation from the expected result, the cause of the deviation and the (negative) effect on the system or environment.
In Table 1 the HAZOP of the function “Switch on ‘red cross’” is presented in a general way. The content of the column “effect” is linked to one of the three failure modes mentioned in Section 2.2. The column “possible cause” includes the typical faults that have to be address by safety measures.
4 Safety-related Software Architecture
The software architecture is organized in three pillars as shown in Fig. 2.
1. The protocol stack includes all functionality required to exchange messages with a HOCU and is the interface to an operator.
2. The display control provides functionality to control the display. It is the interface to the user.
3. The system control pillar consists of supporting functionality required to perform various tasks in the other two pillars.
Fig. 2. Safety-related software architecture
4.1 Protocol Stack
The protocol stack is structured in three layers according to the OSI model (see Fig. 2). It includes functionality to receive commands via a protocol from a HOCU. Additionally, it responds to the commands or it sends messages spontaneously in case of event- or time-triggered actions.
272 T. Novak and C. Stoegerer
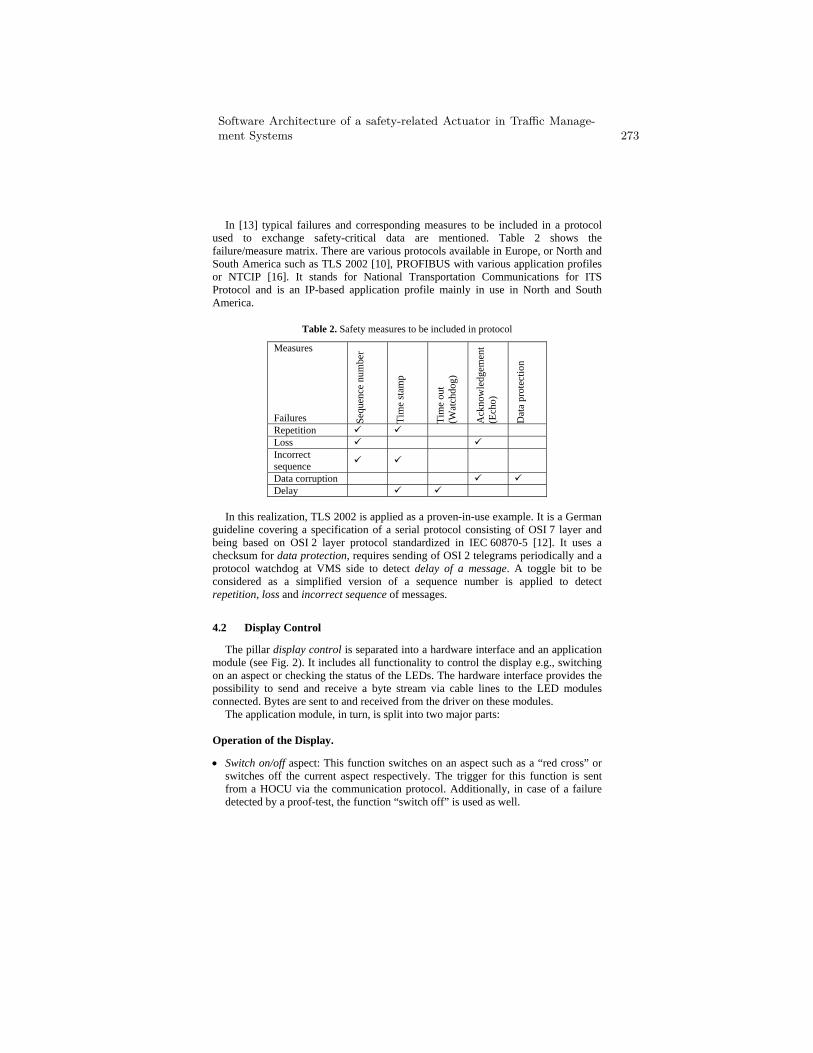
In [13] typical failures and corresponding measures to be included in a protocol used to exchange safety-critical data are mentioned. Table 2 shows the failure/measure matrix. There are various protocols available in Europe, or North and South America such as TLS 2002 [10], PROFIBUS with various application profiles or NTCIP [16]. It stands for National Transportation Communications for ITS Protocol and is an IP-based application profile mainly in use in North and South America.
Table 2. Safety measures to be included in protocol
Measures Failures Se
quen
ce n
umbe
r
Tim
e st
amp
Tim
e ou
t (W
atch
dog)
Ack
now
ledg
emen
t (E
cho)
Dat
a pr
otec
tion
Repetition Loss Incorrect sequence
Data corruption Delay
In this realization, TLS 2002 is applied as a proven-in-use example. It is a German
guideline covering a specification of a serial protocol consisting of OSI 7 layer and being based on OSI 2 layer protocol standardized in IEC 60870-5 [12]. It uses a checksum for data protection, requires sending of OSI 2 telegrams periodically and a protocol watchdog at VMS side to detect delay of a message. A toggle bit to be considered as a simplified version of a sequence number is applied to detect repetition, loss and incorrect sequence of messages.
4.2 Display Control
The pillar display control is separated into a hardware interface and an application module (see Fig. 2). It includes all functionality to control the display e.g., switching on an aspect or checking the status of the LEDs. The hardware interface provides the possibility to send and receive a byte stream via cable lines to the LED modules connected. Bytes are sent to and received from the driver on these modules.
The application module, in turn, is split into two major parts:
Operation of the Display.
• Switch on/off aspect: This function switches on an aspect such as a “red cross” or switches off the current aspect respectively. The trigger for this function is sent from a HOCU via the communication protocol. Additionally, in case of a failure detected by a proof-test, the function “switch off” is used as well.
Software Architecture of a safety-related Actuator in Traffic Manage-ment Systems 273
• Change brightness of aspect: Depending on the ambient luminosity, the brightness of the display is controlled via commands sent by the HOCU. During night time, the brightness is reduced whereas during day time the brightness is increased.
• Start/stop/synchronize flashing of aspect: Albeit legal issues in some countries outlaw, flashing of aspects is another basic functionality of a VMS. The most sophisticated task is to provide a deterministic mechanism so that two or more VMS’ flash the same aspect synchronously (e.g., “orange arrow right”) after being triggered by the HOCU.
Display Proof-tests. As mentioned in Section 2.2, VDE 0832 mentions three failure modes that have to be addressed in the design of the VMS. Three time-triggered proof-tests are presented that detect the “possible cause” and avoid effects as listed in Table 1. In case of detecting a fault, the fail-safe state of the display is “switch off aspect”.
• Cable test: In order to switch on or off aspects, a formatted byte stream has to be sent to the drivers on the LED modules. The connection from the microcontroller to the LED modules as well as the connection between two LED modules is provided by cables. To detect a broken cable, a predefined data stream is periodically sent from and received by the microcontroller. If the sent and received data stream match, the cable is not broken. Otherwise no data is received resulting stop of communication of the microcontroller and fail-safe state of the display, since the hardware watchdog on the LED modules (cf. Section 4.3) is not triggered any longer.
• Check of display status: As outlined in [7], VMS are manifold in their design and hence are adapted to the specific customer needs by means of configuration parameters. A wrongly set parameter might lead to displaying another aspect than expected. Consequently, that proof-test reads back data from each driver on the LED boards periodically and compares the received data with the actual one. If data sent and received match, the right aspect is shown. Otherwise, the fail-safe state is entered.
• LED test: The status of all LEDs is checked periodically to detect a broken LED or a broken driver. In most cases a predefined failure limit (e.g., above 5 or 10 broken LEDs) is specified. Only if the limit is exceeded, the fail-safe state of the display is entered.
4.3 System Control
The system control pillar is supporting functionality of the other two pillars. It is divided into three modules as illustrated in Fig. 2.
• The Scheduler is running the software. Therefore, the functionality is encapsulated in different tasks such as the OSI 2 task or the sign control task.
• The Watchdog comprises triggering the hardware watchdog on the LED boards periodically. In addition, it includes a software watchdog. Each task has to trigger it is own watchdog in equal time intervals. If the watchdog is not triggered by at
274 T. Novak and C. Stoegerer
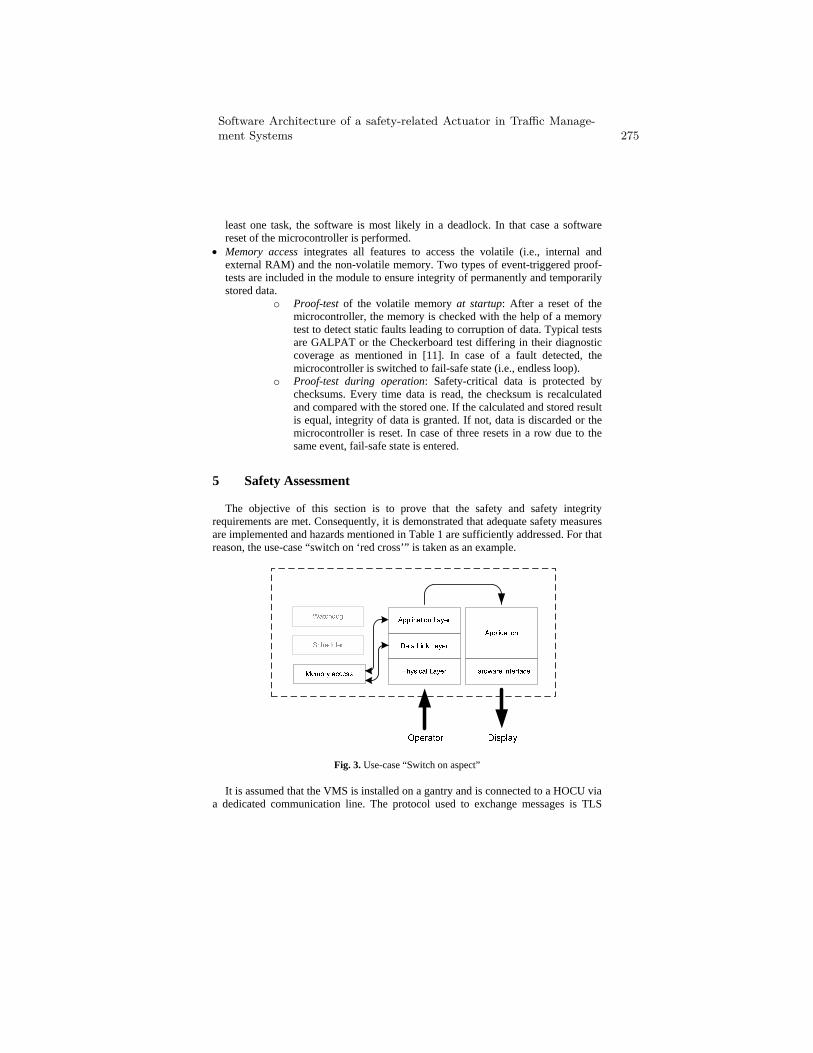
least one task, the software is most likely in a deadlock. In that case a software reset of the microcontroller is performed.
• Memory access integrates all features to access the volatile (i.e., internal and external RAM) and the non-volatile memory. Two types of event-triggered proof-tests are included in the module to ensure integrity of permanently and temporarily stored data.
o Proof-test of the volatile memory at startup: After a reset of the microcontroller, the memory is checked with the help of a memory test to detect static faults leading to corruption of data. Typical tests are GALPAT or the Checkerboard test differing in their diagnostic coverage as mentioned in [11]. In case of a fault detected, the microcontroller is switched to fail-safe state (i.e., endless loop).
o Proof-test during operation: Safety-critical data is protected by checksums. Every time data is read, the checksum is recalculated and compared with the stored one. If the calculated and stored result is equal, integrity of data is granted. If not, data is discarded or the microcontroller is reset. In case of three resets in a row due to the same event, fail-safe state is entered.
5 Safety Assessment
The objective of this section is to prove that the safety and safety integrity requirements are met. Consequently, it is demonstrated that adequate safety measures are implemented and hazards mentioned in Table 1 are sufficiently addressed. For that reason, the use-case “switch on ‘red cross’” is taken as an example.
Fig. 3. Use-case “Switch on aspect”
It is assumed that the VMS is installed on a gantry and is connected to a HOCU via a dedicated communication line. The protocol used to exchange messages is TLS
Software Architecture of a safety-related Actuator in Traffic Manage-ment Systems 275
[10]. The VMS includes predefined aspects “red cross”, “green arrow”, “orange arrow right” and “orange arrow left”. Every aspect has a unique ID.
An operator is triggering the command “switch on ‘red cross’” at the central station. The message with the ID and the command “switch on” is received by the VMS (see Fig. 3, input “operator”) and stored temporarily in a buffer in the volatile memory. The buffer is protected by a checksum provided by the memory access module.
After processing the message in the protocol stack successfully, the ID of the aspect “red cross” and the command “switch on” is sent to the display control via a queuing mechanism. Again, data in the queue is protected with a checksum. The next step is to prove availability of the aspect and integrity of corresponding data. Data to show the chosen aspect is stored in the non-volatile memory and protected by a CRC. If so, the last result of the time-triggered LED test is evaluated to check the status of the LEDs. Only if the failure limit is not exceeded and the cable test returns a positive result, the corresponding data byte stream to display the required aspect is sent to the LED drivers on the modules to activate the desired LEDs.
A further step is to check the display status. Thus, data of each driver on the LED modules is read back. That data is compared to the stored one in the non-volatile memory. If the comparison returns a positive result, the right aspect “red cross” is shown. Finally, a response message is transmitted to the HOCU including the result of the execution of the command returned by the display control to the protocol stack.
In case of a fault is detected during memory access, data is discarded and a response message is sent. Faults on the display result in a fail-safe state where the display is switched off and a proper message is sent to the HOCU.
Aforementioned safety measures and the presented flow of actions are an efficient solution where safety integrity of the VMS (see Table 3) is ensured according to requirements given by VDE 0832, part 400.
Table 3. Measures to ensure safety integrity
Integrity of display
Integrity of communication line Data integrity Software integrity
LED test Cable test with hardware watchdog mechanism
Checksum Software watchdog Check of display status
Startup memory test
Finally, it has to be mentioned that developing safety-related software for these
applications requires additional effort not covered by this work that is also part of a safety assessment. Whereas the paper presents a general technical solution, an overall safety development needs – among other things – detailed documentation of requirements and design. And a verification and validation approach has to be specified and executed as presented in [14]. Moreover, the installation and commissioning of the safety-related products is a crucial point. It has to be ensured that the right software and configuration parameters are uploaded correctly to the microcontroller. A possible solution of that problem is outlined in [15].
276 T. Novak and C. Stoegerer
6 Conclusion
The importance of traffic management systems as a measure to increase road safety and distribute traffic load is constantly growing. Increasingly, these systems are responsible for functions directly or indirectly affecting people’s safety and health. Therefore, the products used are supposed to be developed in a way that harm to the user is reduced to an acceptable minimum. Additionally, societal aspects especially in Europe result in a demand on higher safety standards.
The paper presented a general software architecture to be used for actuators such as VMS in traffic management systems being able to provide safety-critical functionality. The architecture fulfills requirements stated by standard VDE 0832 and European standard EN 50566, respectively. Therefore, the approach presented is a proper solution for designing safety-related software to be used in VMS.
7 References
1. H. Kulovits, C. Stoegerer, W. Kastner: System Architecture for Variable Message Signs. In Proceedings of 10th IEEE Conference on Emerging Technologies and Factory Automation (ETFA), Vol. 2, pp. 903-909 (2005)
2. DIN/VDE: Road Traffic Signal Systems. VDE 0832, part 100-500 (2008-2011) 3. EN: Road traffic signal systems. EN 50556, CENELEC (2011) 4. W. Reed: Safety critical software in traffic control systems. IEE Colloquium on Safety
Critical Software in Vehicle and Traffic Control (2002) 5. IEC: Functional safety of electric/electronic/programmable electronic safety-related
systems. IEC 61508-1 to -7, Edition 2 (2010) 6. Ministry of Defense: HAZOP Studies on Systems Containing Programmable Electronics,
Part 1, Requirements. Standard 00-58, Issue 2 (2000) 7. T. Novak, Ch. Stoegerer. The right degree of configurability for safety-critical embedded
software in Variable Message Signs. Computer Safety, Reliability, and Security, Proceedings of the 29th International Conference SAFECOMP 2010, LNCS 6351, pp. 418-430 (2010)
8. T. Novak, T. Tamandl. Architecture of a safe node for a fieldbus system. In Proceedings of the 5th IEEE International Conference on Industrial Informatics (INDIN), Vol. 1, pp. 101-106 (2007)
9. BG-PRÜFZERT, Fachausschuss Elektrotechnik. GS-ET-26 – Bussysteme für die Übertragung sicherheitsrelevanter Nachrichten. Prüfgrundsätze, Köln, Deutschland (2002)
10. Bundesanstalt fuer Strassenwesen (BASt). Technische Lieferbedingung fier Streckenstationen (TLS) (2002)
11. H. Hölscher, J. Rader. Microcomputers in Safety Technique, An Aid to orientation for Developer and Manufacturer. TÜV Rheinland, ch.7.22 (1986)
12. IEC. Telecontrol equipment and systems - Part 5: Transmission protocols. IEC 60870-5-1 (1990)
13. BG-PRÜFZERT, Fachausschuss Elektrotechnik. GS-ET-26 – Bussysteme für die Übertragung sicherheitsrelevanter Nachrichten. Prüfgrundsätze, Köln, Deutschland, (2002)
14. T. Tamandl, P. Preininger, T. Novak, P. Palensky. Testing Approach for Online Hardware Self Tests in Embedded Safety Related Systems. In Proceedings of the 12th IEEE
Software Architecture of a safety-related Actuator in Traffic Manage-ment Systems 277
International Conference on Emerging Technologies and Factory Automation (ETFA), pp. 1270-1277 (2007)
15. T. Novak, P. Fischer, M. Holz, M. Kieviet, T. Tamandl. Safe Commissioning and Maintenance Process for a Safe System. In Proceedings of the 7th IEEE International Workshop on Factory Communication Systems (WFCS), pp. 225-232 (2008)
16. AASHTO. NTCIP 9001, version v04. American Association of State Highway and Transportation Officials (2009)
278 T. Novak and C. Stoegerer
adfa, p. 1, 2011.
© Springer-Verlag Berlin Heidelberg 2011
Approximate Reliability Algebra for Architecture
Optimization
Philipp Helle¹, Michael Masin², Lev Greenberg²
¹EADS Innovation Works, Hamburg, Germany
²IBM Haifa Research Lab, Haifa, Israel
{michaelm, levg}@il.ibm.com
Abstract. A more recent trend in Systems Engineering is architecture optimiza-
tion. Evermore complex aircraft systems make it harder and harder to deter-
mine, with reasonable time and effort, optimal architectures by traditional trial-
and-error trade off studies. This can be alleviated by architecture optimization
techniques where System Engineers only defines boundaries for the design
space and then an optimization solver finds the optimal solution automatically.
If safety and reliability requirements are not considered during automatic archi-
tecture generation, given the high impact of safety on systems design, there is a
high probability that the optimized architectures are not valid. Therefore, it is
critical to model and take into account reliability and safety requirements during
Design Space Exploration in early architectural stages.
Traditional reliability calculations are both not denotational and not linear
which significantly narrows possible optimization techniques. In this work we
suggest a Mixed Integer Linear Programming (MILP) formulation of the relia-
bility calculus with the following features: (1) The order of magnitude of relia-
bility calculations is correct, (2) There exists an explicit theoretical bound on
potential “optimism” of the proposed algebra, (3) For a pool of representative
benchmark problems the proposed approximation provides highly accurate re-
sults compared to the classical reliability calculations. This paper presents an
approximate algebra for the safety analysis problem with explicit bounds and
provides representative examples of its application.
Keywords: Model-based Safety Analysis, Architecture optimization, Mixed In-
teger Linear Programming, Reliability evaluation
1 Motivation and related work
A more recent trend in Systems Engineering is architecture optimization [11]. Ever-
more complex aircraft systems make it harder and harder to determine, with reasona-
ble time and effort, optimal architectures by traditional trial-and-error methods. This
can be alleviated by architecture optimization techniques where the System Engineer
only defines boundaries for the design space and an optimization solver calculates the
optimal solution automatically. However, if safety and reliability requirements are not
considered during this automatic architecture generation, given the high impact of
safety on systems design, addressing safety requirements in later stages becomes ei-
ther impossible or very expensive.
Traditional reliability calculations are rather operational than denotational, i.e.,
they define a procedure how to calculate failure probabilities for a given architecture.
Denotational calculus defines a set of constraints depending on the architectural deci-
sion variables where the resulting failure probability is derived “automatically” from
the constraints. An additional problem with the classical reliability algebra is that its
calculations are combinatorial and highly non-linear. For example, [10] presents an
approach for architecture optimization for aircraft roll systems. The design problem of
a flight-control system on a large fly-by-wire airliner is to find combinations of actua-
tor(s), power circuit(s), computer(s) for each movable surface, so as to fulfill the con-
straints imposed by the safety regulations, while keeping the resulting system weight
as low as possible. Instead of a direct formulation of the safety problem suitable for
the optimization algorithm, they use a black-box function for the safety assessment of
potential solutions. This function provides an accurate evaluation of the safety re-
quirements but is rather costly, so the optimization algorithm had to be tailored so that
the safety assessment is not done for all possible solutions. The same limitation re-
mains for architectural design using evolutionary algorithms (see, e.g., [15]). Another
approach is to define Constraint Programming model [16] which is less scalable than
the best Mixed Integer Linear Programming (MILP) solvers available today, such as
Cplex [17] and Gurobi [18].
In this paper we present an approximate reliability algebra and its MILP formula-
tion supported by most optimization solvers. This reliability calculus has the follow-
ing features:
1. The order of magnitude of reliability calculations is correct.
2. There exists an explicit theoretical bound on potential “optimism” of the proposed
algebra.
3. For a pool of representative benchmark problems the proposed approximation pro-
vides highly accurate results compared to the classical reliability calculations.
The paper is organized as follows. In the next section we briefly describe the place of
safety analysis in the whole design process, show which part we address and describe
the gap versus existing methods. In Section 3, our modeling approach for safety re-
quirements is shown. In Section 4, the approximate reliability algebra is presented
where safety requirements are transformed to a set of algebraic equations. In Section
5 we check bounds of the approximation and in Section 6 the proposed algebra is
implemented on a set of representative examples. Section 7 summarizes the paper and
provides directions for future research.
2 System Safety
System safety uses systems theory and systems engineering approaches to prevent
foreseeable accidents and to minimize the result of unforeseen ones. It is a planned,
280 P. Helle, M. Masin, and L. Greenberg
disciplined, and systematic approach to identifying, analyzing, and controlling ha-
zards throughout the life cycle of a system in order to prevent or reduce accidents [1].
Whereas reliability deals with all potential failures, safety only deals with the hazard-
ous ones [2].
2.1 Safety in design process
Safety assessment standards generally agree on a common framework for the deriva-
tion of safety requirements which combines hazard assessment and risk analysis tech-
niques. The aim of the analysis is to determine:
the critical system functions, i.e. functions which may cause a hazard when lost or
malfunctioning.
the safety requirements for these functions, i.e. the maximum allowed failure prob-
abilities.
the demands, if any, for additional safety functions in order to achieve acceptable
levels of risk for the system.
In this work we focus on the system architecture development and the preliminary
system safety assessment.
2.2 Classical Methods
The focus of classical safety analysis techniques is in general on supporting the rea-
soning of possible failures and on recording the causal relationships of failure events.
The analysis normally requires a description of the functional and logical architecture
of the system.
Various causally based techniques for systems safety assessment based in known
designs have evolved. Usually, these fall into two classes - methods which work from
known causes to unknown effects (such as Failure Modes and Effects Analysis) [9] or
those which work from known effects back to initially unknown causes (such as Fault
Tree Analysis) [9].
The target usage of these techniques varies depending on the domain and the na-
ture of the problem. For example, fault trees are commonly used in the civil aerospace
domain at the Preliminary System Safety Assessment (PSSA) phase to examine
whether the system can achieve the safety requirements allocated from the hazard
identification [2].
With the help of analytical methods Fault Trees can be evaluated to get the systems
reliability [13]. But, since a Fault Tree can contain a component multiple times the
overall failure probabilities cannot be determined directly. Instead, a so called minim-
al cut set of the Fault Tree has to be found that contains each element only once. A cut
set is a "set of components which, when failed, [...leave] the system in a failed state
"[12]. A minimal cut set is a "cut set for which no component can be returned in
working state without […] returning the system into a working state" [12]. The mi-
Approximate Reliability Algebra for Architecture Optimization 281
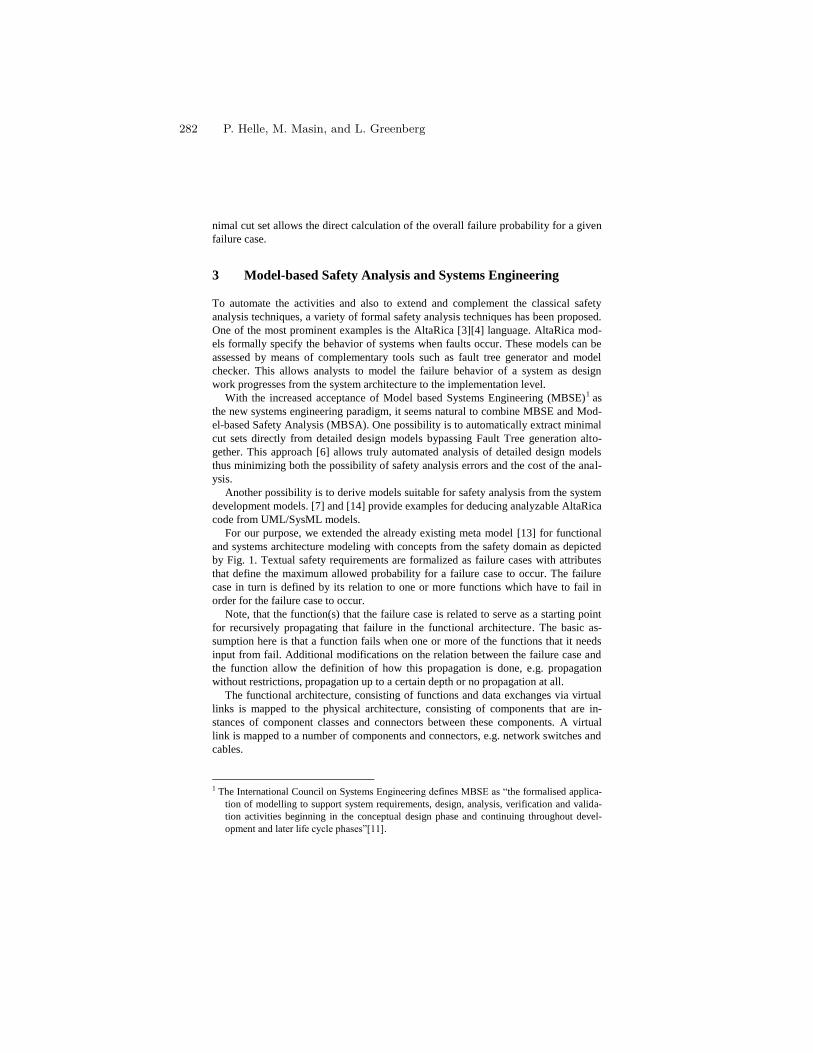
nimal cut set allows the direct calculation of the overall failure probability for a given
failure case.
3 Model-based Safety Analysis and Systems Engineering
To automate the activities and also to extend and complement the classical safety
analysis techniques, a variety of formal safety analysis techniques has been proposed.
One of the most prominent examples is the AltaRica [3][4] language. AltaRica mod-
els formally specify the behavior of systems when faults occur. These models can be
assessed by means of complementary tools such as fault tree generator and model
checker. This allows analysts to model the failure behavior of a system as design
work progresses from the system architecture to the implementation level.
With the increased acceptance of Model based Systems Engineering (MBSE)1 as
the new systems engineering paradigm, it seems natural to combine MBSE and Mod-
el-based Safety Analysis (MBSA). One possibility is to automatically extract minimal
cut sets directly from detailed design models bypassing Fault Tree generation alto-
gether. This approach [6] allows truly automated analysis of detailed design models
thus minimizing both the possibility of safety analysis errors and the cost of the anal-
ysis.
Another possibility is to derive models suitable for safety analysis from the system
development models. [7] and [14] provide examples for deducing analyzable AltaRica
code from UML/SysML models.
For our purpose, we extended the already existing meta model [13] for functional
and systems architecture modeling with concepts from the safety domain as depicted
by Fig. 1. Textual safety requirements are formalized as failure cases with attributes
that define the maximum allowed probability for a failure case to occur. The failure
case in turn is defined by its relation to one or more functions which have to fail in
order for the failure case to occur.
Note, that the function(s) that the failure case is related to serve as a starting point
for recursively propagating that failure in the functional architecture. The basic as-
sumption here is that a function fails when one or more of the functions that it needs
input from fail. Additional modifications on the relation between the failure case and
the function allow the definition of how this propagation is done, e.g. propagation
without restrictions, propagation up to a certain depth or no propagation at all.
The functional architecture, consisting of functions and data exchanges via virtual
links is mapped to the physical architecture, consisting of components that are in-
stances of component classes and connectors between these components. A virtual
link is mapped to a number of components and connectors, e.g. network switches and
cables.
1 The International Council on Systems Engineering defines MBSE as “the formalised applica-
tion of modelling to support system requirements, design, analysis, verification and valida-
tion activities beginning in the conceptual design phase and continuing throughout devel-
opment and later life cycle phases”[11].
282 P. Helle, M. Masin, and L. Greenberg
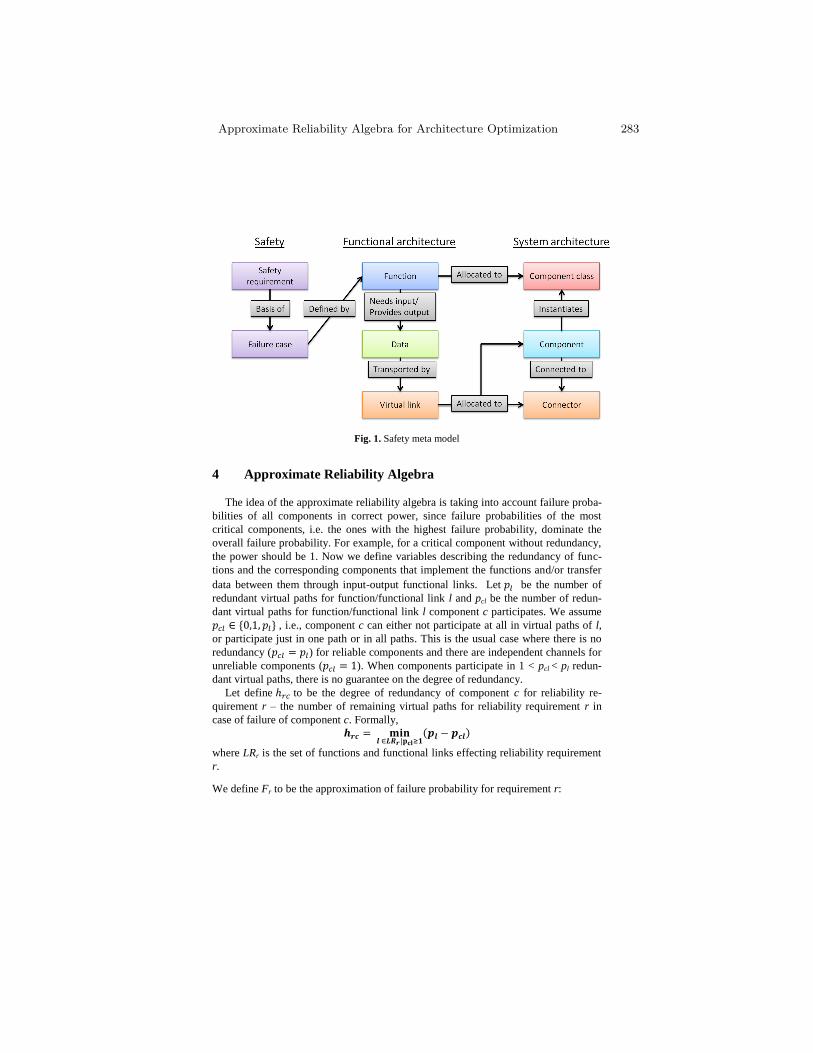
Fig. 1. Safety meta model
4 Approximate Reliability Algebra
The idea of the approximate reliability algebra is taking into account failure proba-
bilities of all components in correct power, since failure probabilities of the most
critical components, i.e. the ones with the highest failure probability, dominate the
overall failure probability. For example, for a critical component without redundancy,
the power should be 1. Now we define variables describing the redundancy of func-
tions and the corresponding components that implement the functions and/or transfer
data between them through input-output functional links. Let be the number of
redundant virtual paths for function/functional link l and pcl be the number of redun-
dant virtual paths for function/functional link l component c participates. We assume
, i.e., component c can either not participate at all in virtual paths of l,
or participate just in one path or in all paths. This is the usual case where there is no
redundancy ( ) for reliable components and there are independent channels for
unreliable components ( ). When components participate in 1 < pcl < pl redun-
dant virtual paths, there is no guarantee on the degree of redundancy.
Let define to be the degree of redundancy of component c for reliability re-
quirement r – the number of remaining virtual paths for reliability requirement r in
case of failure of component c. Formally,
where LRr is the set of functions and functional links effecting reliability requirement
r.
We define Fr to be the approximation of failure probability for requirement r:
Approximate Reliability Algebra for Architecture Optimization 283
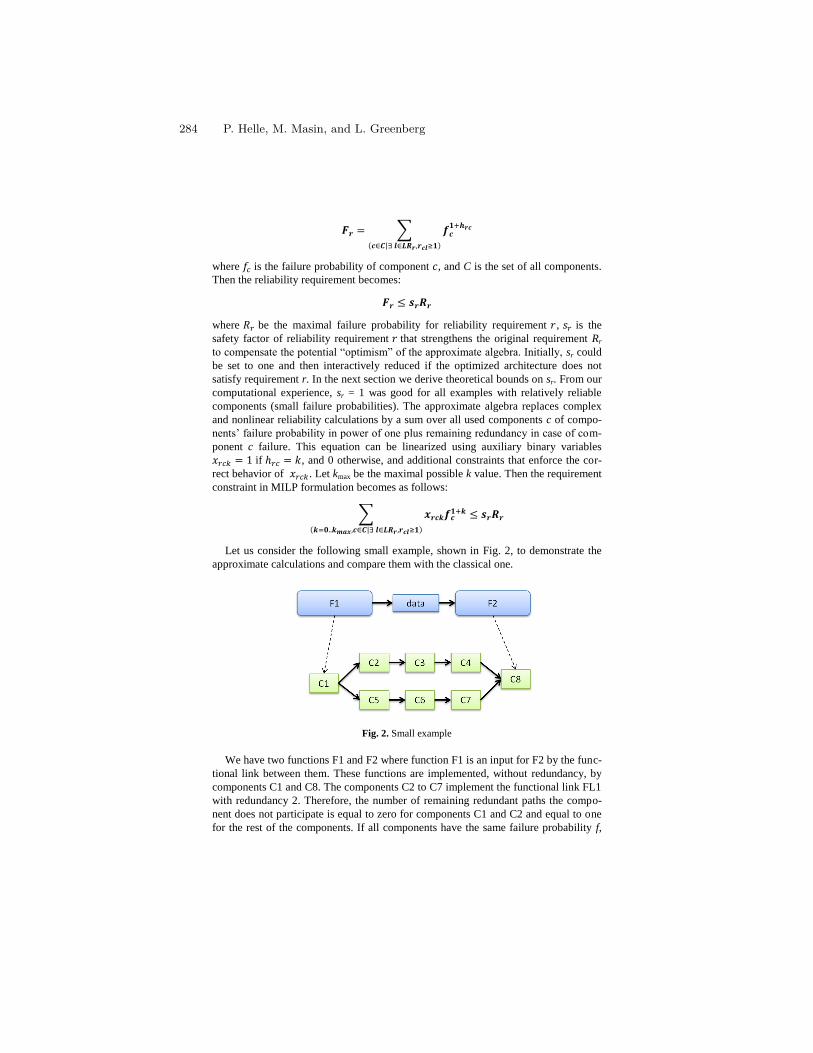
where is the failure probability of component , and C is the set of all components.
Then the reliability requirement becomes:
where be the maximal failure probability for reliability requirement , is the
safety factor of reliability requirement that strengthens the original requirement Rr
to compensate the potential “optimism” of the approximate algebra. Initially, sr could
be set to one and then interactively reduced if the optimized architecture does not
satisfy requirement r. In the next section we derive theoretical bounds on sr. From our
computational experience, sr = 1 was good for all examples with relatively reliable
components (small failure probabilities). The approximate algebra replaces complex
and nonlinear reliability calculations by a sum over all used components c of compo-
nents’ failure probability in power of one plus remaining redundancy in case of com-
ponent c failure. This equation can be linearized using auxiliary binary variables
if , and 0 otherwise, and additional constraints that enforce the cor-
rect behavior of . Let kmax be the maximal possible k value. Then the requirement
constraint in MILP formulation becomes as follows:
Let us consider the following small example, shown in Fig. 2, to demonstrate the
approximate calculations and compare them with the classical one.
Fig. 2. Small example
We have two functions F1 and F2 where function F1 is an input for F2 by the func-
tional link between them. These functions are implemented, without redundancy, by
components C1 and C8. The components C2 to C7 implement the functional link FL1
with redundancy 2. Therefore, the number of remaining redundant paths the compo-
nent does not participate is equal to zero for components C1 and C2 and equal to one
for the rest of the components. If all components have the same failure probability f,
284 P. Helle, M. Masin, and L. Greenberg
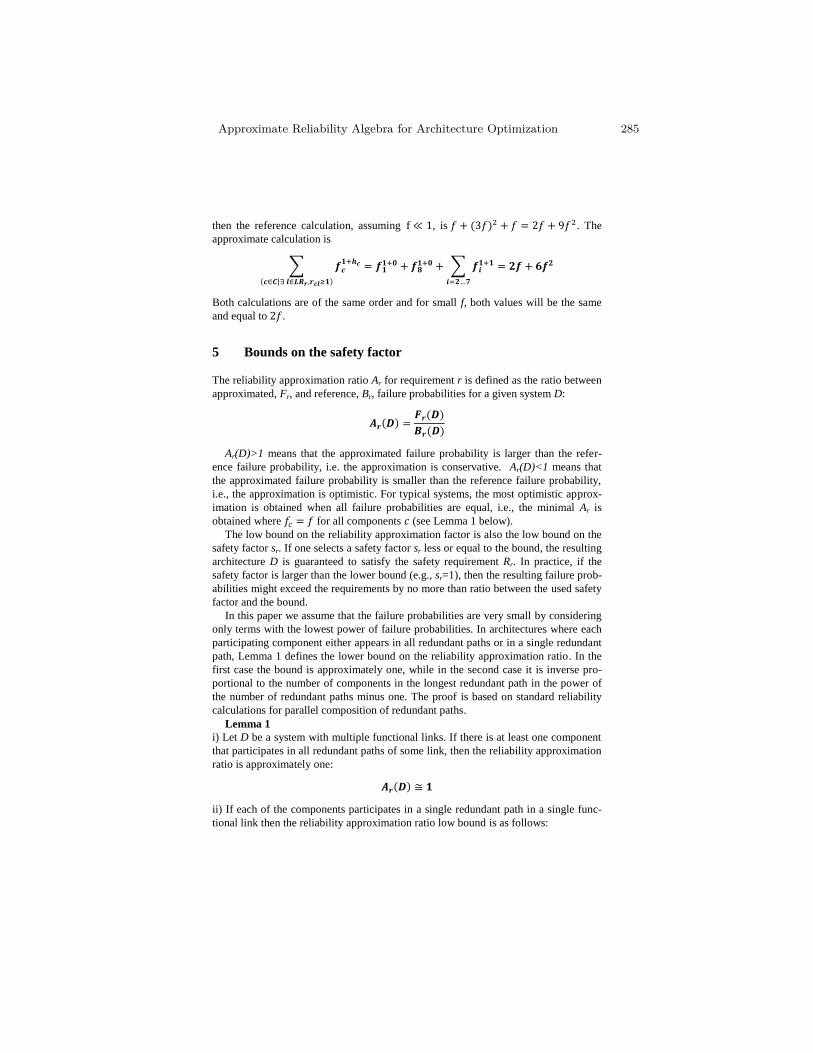
then the reference calculation, assuming , is . The
approximate calculation is
Both calculations are of the same order and for small f, both values will be the same
and equal to .
5 Bounds on the safety factor
The reliability approximation ratio Ar for requirement r is defined as the ratio between
approximated, Fr, and reference, Br, failure probabilities for a given system D:
Ar(D)>1 means that the approximated failure probability is larger than the refer-
ence failure probability, i.e. the approximation is conservative. Ar(D)<1 means that
the approximated failure probability is smaller than the reference failure probability,
i.e., the approximation is optimistic. For typical systems, the most optimistic approx-
imation is obtained when all failure probabilities are equal, i.e., the minimal Ar is
obtained where for all components (see Lemma 1 below).
The low bound on the reliability approximation factor is also the low bound on the
safety factor sr. If one selects a safety factor sr less or equal to the bound, the resulting
architecture D is guaranteed to satisfy the safety requirement Rr. In practice, if the
safety factor is larger than the lower bound (e.g., sr=1), then the resulting failure prob-
abilities might exceed the requirements by no more than ratio between the used safety
factor and the bound.
In this paper we assume that the failure probabilities are very small by considering
only terms with the lowest power of failure probabilities. In architectures where each
participating component either appears in all redundant paths or in a single redundant
path, Lemma 1 defines the lower bound on the reliability approximation ratio. In the
first case the bound is approximately one, while in the second case it is inverse pro-
portional to the number of components in the longest redundant path in the power of
the number of redundant paths minus one. The proof is based on standard reliability
calculations for parallel composition of redundant paths.
Lemma 1
i) Let D be a system with multiple functional links. If there is at least one component
that participates in all redundant paths of some link, then the reliability approximation
ratio is approximately one:
ii) If each of the components participates in a single redundant path in a single func-
tional link then the reliability approximation ratio low bound is as follows:
Approximate Reliability Algebra for Architecture Optimization 285
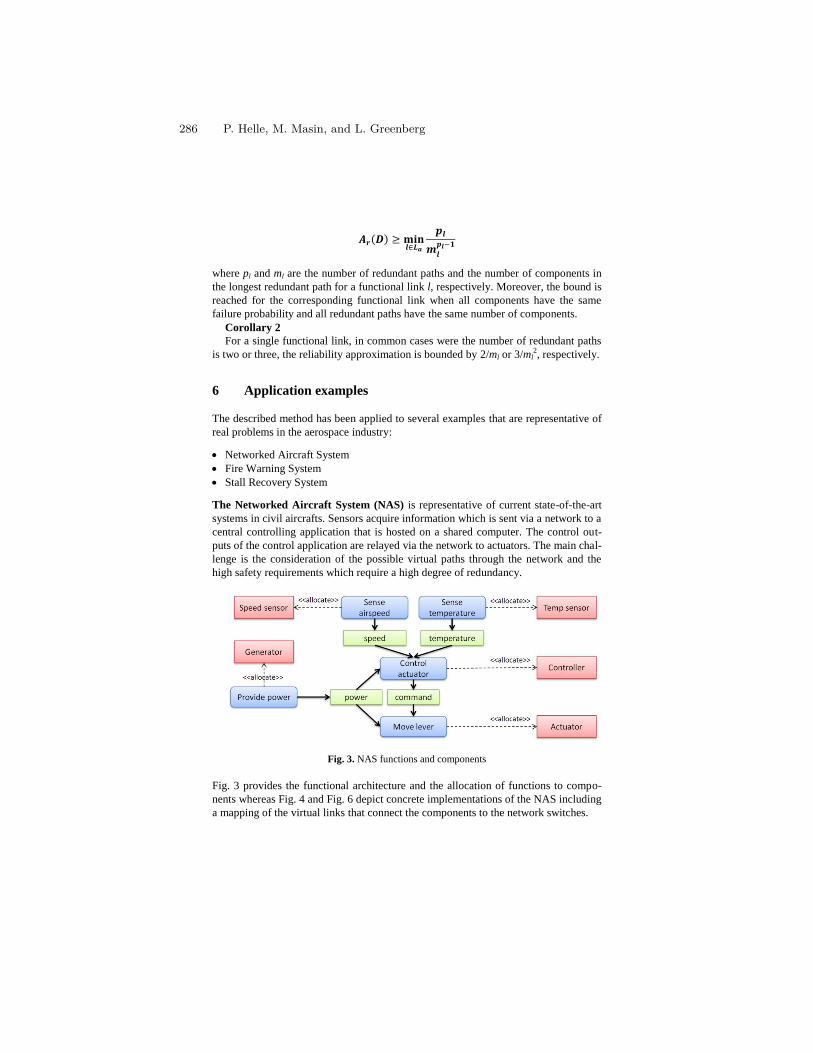
where pl and ml are the number of redundant paths and the number of components in
the longest redundant path for a functional link l, respectively. Moreover, the bound is
reached for the corresponding functional link when all components have the same
failure probability and all redundant paths have the same number of components.
Corollary 2
For a single functional link, in common cases were the number of redundant paths
is two or three, the reliability approximation is bounded by 2/ml or 3/ml2, respectively.
6 Application examples
The described method has been applied to several examples that are representative of
real problems in the aerospace industry:
Networked Aircraft System
Fire Warning System
Stall Recovery System
The Networked Aircraft System (NAS) is representative of current state-of-the-art
systems in civil aircrafts. Sensors acquire information which is sent via a network to a
central controlling application that is hosted on a shared computer. The control out-
puts of the control application are relayed via the network to actuators. The main chal-
lenge is the consideration of the possible virtual paths through the network and the
high safety requirements which require a high degree of redundancy.
Fig. 3. NAS functions and components
Fig. 3 provides the functional architecture and the allocation of functions to compo-
nents whereas Fig. 4 and Fig. 6 depict concrete implementations of the NAS including
a mapping of the virtual links that connect the components to the network switches.
286 P. Helle, M. Masin, and L. Greenberg
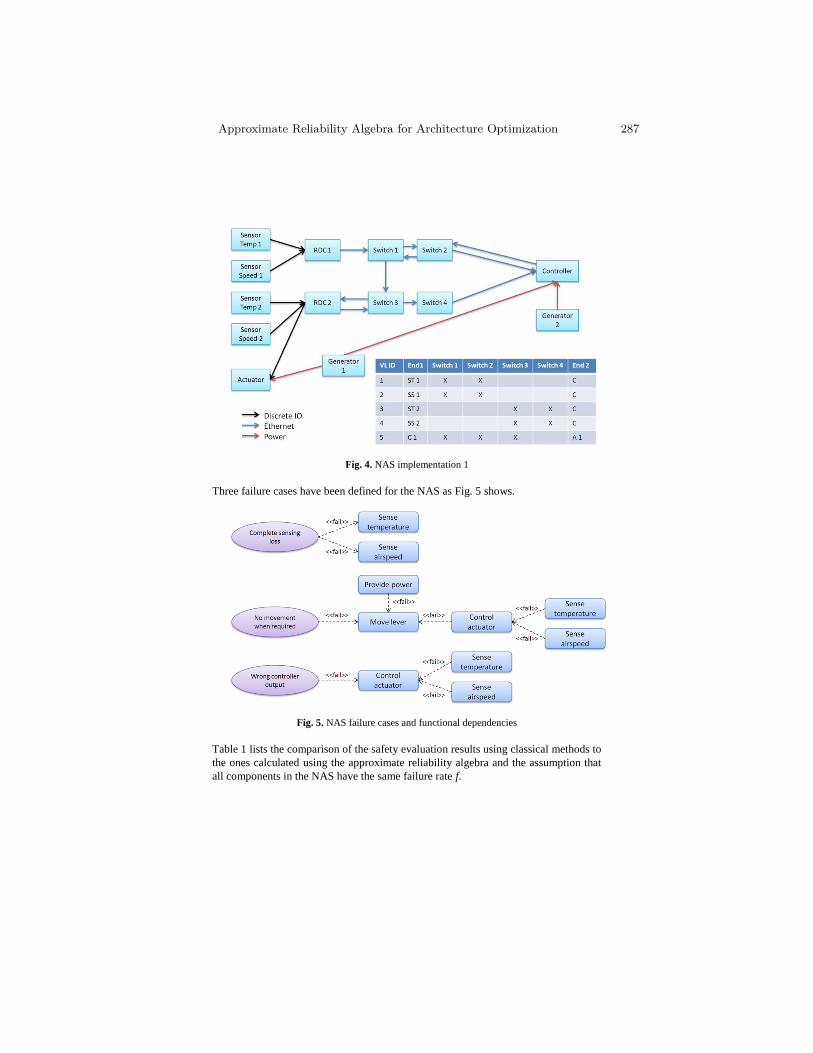
Fig. 4. NAS implementation 1
Three failure cases have been defined for the NAS as Fig. 5 shows.
Fig. 5. NAS failure cases and functional dependencies
Table 1 lists the comparison of the safety evaluation results using classical methods to
the ones calculated using the approximate reliability algebra and the assumption that
all components in the NAS have the same failure rate f.
Approximate Reliability Algebra for Architecture Optimization 287
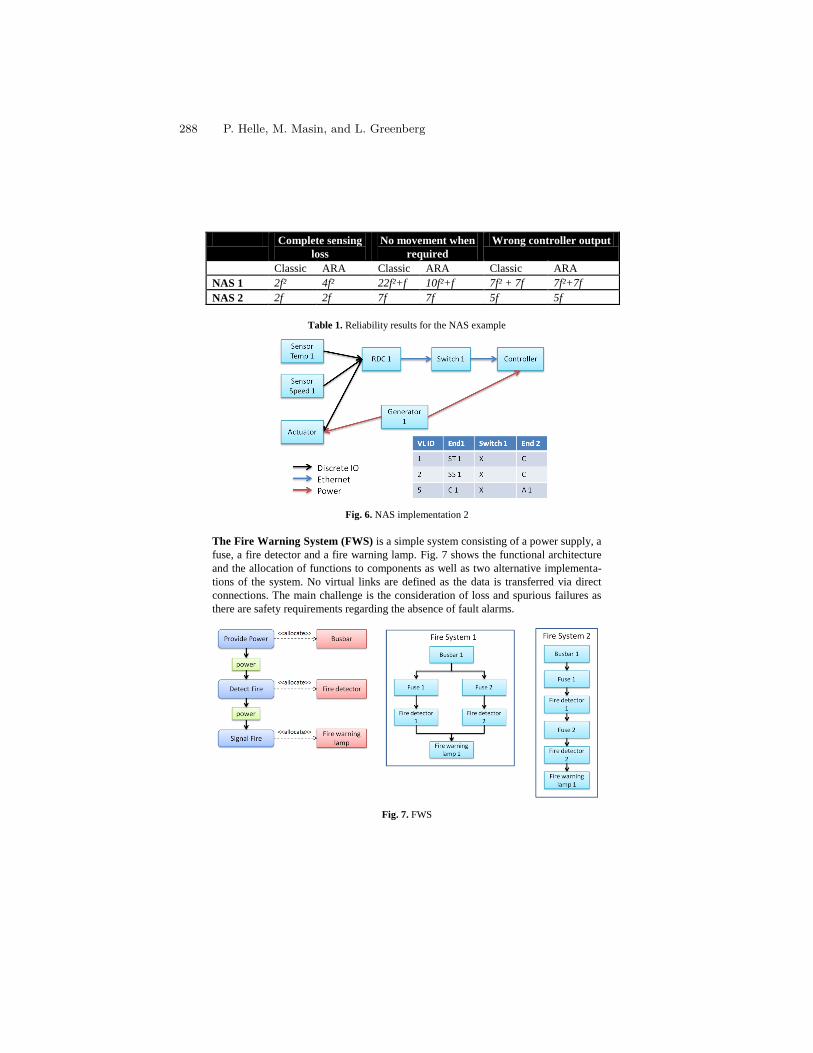
Complete sensing
loss
No movement when
required
Wrong controller output
Classic ARA Classic ARA Classic ARA
NAS 1 2f² 4f² 22f²+f 10f²+f 7f² + 7f 7f²+7f
NAS 2 2f 2f 7f 7f 5f 5f
Table 1. Reliability results for the NAS example
Fig. 6. NAS implementation 2
The Fire Warning System (FWS) is a simple system consisting of a power supply, a
fuse, a fire detector and a fire warning lamp. Fig. 7 shows the functional architecture
and the allocation of functions to components as well as two alternative implementa-
tions of the system. No virtual links are defined as the data is transferred via direct
connections. The main challenge is the consideration of loss and spurious failures as
there are safety requirements regarding the absence of fault alarms.
Fig. 7. FWS
288 P. Helle, M. Masin, and L. Greenberg
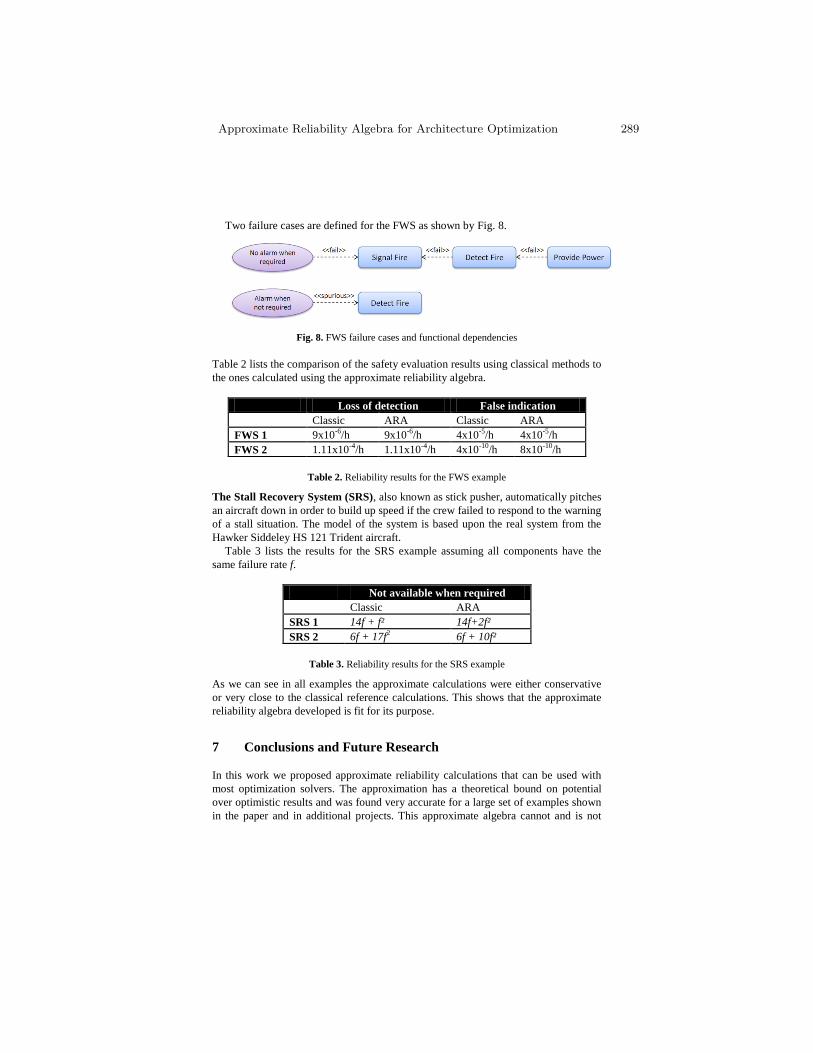
Two failure cases are defined for the FWS as shown by Fig. 8.
Fig. 8. FWS failure cases and functional dependencies
Table 2 lists the comparison of the safety evaluation results using classical methods to
the ones calculated using the approximate reliability algebra.
Loss of detection False indication
Classic ARA Classic ARA
FWS 1 9x10⁻⁶
/h 9x10⁻⁶
/h 4x10⁻⁵
/h 4x10⁻⁵
/h
FWS 2 1.11x10⁻⁴
/h 1.11x10⁻⁴
/h 4x10⁻¹⁰
/h 8x10⁻¹⁰
/h
Table 2. Reliability results for the FWS example
The Stall Recovery System (SRS), also known as stick pusher, automatically pitches
an aircraft down in order to build up speed if the crew failed to respond to the warning
of a stall situation. The model of the system is based upon the real system from the
Hawker Siddeley HS 121 Trident aircraft.
Table 3 lists the results for the SRS example assuming all components have the
same failure rate f.
Not available when required
Classic ARA
SRS 1 14f + f² 14f+2f²
SRS 2 6f + 17f2 6f + 10f²
Table 3. Reliability results for the SRS example
As we can see in all examples the approximate calculations were either conservative
or very close to the classical reference calculations. This shows that the approximate
reliability algebra developed is fit for its purpose.
7 Conclusions and Future Research
In this work we proposed approximate reliability calculations that can be used with
most optimization solvers. The approximation has a theoretical bound on potential
over optimistic results and was found very accurate for a large set of examples shown
in the paper and in additional projects. This approximate algebra cannot and is not
Approximate Reliability Algebra for Architecture Optimization 289
designed to replace the proper safety analysis using specialized tools required by the
certification authorities but can significantly improve the design space exploration
phase for driving the optimization to valid designs, from the safety perspective. For
future research we can suggest a relaxation of the assumption and fur-
ther exploration of the approach to different failure modes.
8 References
1. Leveson, N. G.: Safeware: System Safety and Computers. Addison-Wesley, Reading, MA
(1995).
2. Leveson, N. G.: Software Safety: Why, What, and How. In: ACM Computing Surveys,
Vol. 18, no. 2, pp. 125-163, ACM, New York (1986).
3. Arnold, A., Griffault, A., Point, G., Rauzy, A.: The AltaRica formalism for describing
concurrent systems. In: Fundamenta Informaticae, Vol. 40, no. 2, pp. 109-124, IOS Press,
Amsterdam (1999).
4. Bieber, P., et. al.: Safety assessment with Altarica. In: Building the Information Society.
505-510, Springer (2004).
5. Haskins, C. Ed.: Systems Engineering Handbook: A guide for system life cycle processes
and activities. INCOSE (2006).
6. Bozzano, M. et.al. ESACS: An integrated methodology for design and safety analysis of
complex systems. In: Proceedings of ESREL 2003, pp. 237-245, Balkema Publisher
(2003).
7. David, P., Idasiak, V., Kratz, F.: Towards a better interaction between design and depen-
dability analysis: FMEA derived from UML/SysML models. In: Proceedings of ESREL
2008 and 17th SRA-Europe Annual Conference, Valencia, Spain (2008).
8. David, P., Idasiak, V., Kratz, F.: Reliability study of complex physical systems using
SysML. In: Journal of Reliability Engineering and System Safety, Vol. 95, no. 4, pp. 431-
450 (2010).
9. Vesley, W., et. al.: Fault Tree Handbook with Aerospace Applications. NASA Office of
Safety and Mission Assurance, Washington DC (2002).
10. Bauer, C., et. al.: Flight-control system architecture optimization for fly-by-wire airliners.
In: Journal of Guidance Control and Dynamics, Vol. 30, no. 4, pp. 1023-1029, AIAA
(2007).
11. Tabbara, A., Sangiovanni-Vincentelli, A: Function/architecture optimization and co-design
of embedded systems. Springer (2000).
12. Todinov, M.T.: Risk-based reliability analysis and generic principles for risk reduction. El-
sevier Science, Amsterdam (2007).
13. Verma, A. K., Ajit, S., Karanki, D. R.: Reliability and Safety Engineering. Springer
(2010).
14. Helle, P., Strobel, C., Mitschke, A., Schamai, W., Rivière, A. and Vincent, L.: Improving
systems specifications a method proposal. CSEM, 2008.
15. Li R., Etemaadi R., Emmerich M.T.M., Chaudron M.R.V., Automated Design of Software
Architectures for Embedded Systems using Evolutionary Multiobjective Optimization. VII
ALIO/EURO, 2011.
16. Condat H., Strobel C., and Hein A., Model-based automatic generation and selection of
safe architectures. INCOSE, 2012.
17. http://www-01.ibm.com/software/integration/optimization/cplex-optimizer/
18. http://www.gurobi.com/
290 P. Helle, M. Masin, and L. Greenberg
On the formal verification of systems of synchronoussoftware components?
Henning Gunther1, Stefan Milius1, and Oliver Moller2
1 Institut fur Theoretische Informatik,Technische Universitat Braunschweig, Germany
2 Verified Systems International GmbHBremen, Germany
Abstract. Large asynchronous systems composed from synchronous compo-nents (so called GALS—globally asynchronous, locally synchronous—systems)pose a challenge to formal verification. We present an approach which abstractscomponents with contracts capturing the behavior by a mixture of temporal logicformulas and non-deterministic state machines. Formal verification of global sys-tem properties is then done transforming a network of contracts to model check-ing tools such as PROMELA/SPIN or UPPAAL. Synchronous components areimplemented in SCADE, and contract validation is done using the SCADE De-sign Verifier for formal verification. We also discuss first experiences from anongoing industrial case study applying our approach.
Keywords: formal verification, GALS systems, rely-guarantee, SCADE, SPIN,UPPAAL
1 IntroductionState-of-the-art safety critical systems are often composed of other distributed (compo-nent) systems (system of systems (SoS)). While industrial standards for the develop-ment of safety-critical software systems highly recommend formal model-based meth-ods, application of those methods to SoS still remains a challenge when scalability toreal industrial applications is concerned.
In this paper we report on work in progress concerning the development of an ap-proach to modeling and verification of SoS that is innovative for the industrial practiceand addresses the scalability problem. In our approach the nodes of a distributed sys-tem consist of controllers performing specialized tasks in hard real time by operatingcyclically and in a synchronous way. For such a controller the model-based approachof SCADE3 is an attractive solution providing code generation and good support formodel simulation and (formal) verification. But for a distributed system, a synchronousimplementation is neither realistic nor desirable. Hence, we focus on the model-based
? This work was developed during the course of the project “Verifikation von Systemen syn-chroner Softwarekomponenten” (VerSyKo) funded by the German ministry for education andresearch (BMBF).
3 SCADE is developed and distributed by Esterel Technologies:www.esterel-technologies.com
development and analysis of asynchronously communicating embedded control sys-tems that are composed from components that operate synchronously; this is known asa GALS (globally asynchronous – locally synchronous) architecture; this goes backto Chapiro [8], and it is the preferred solution for complex safety relevant control tasks.
The main idea to address the complexity issues of GALS systems is to provide foreach synchronous component an abstract model in the form of a contract that can belocally verified for the component (e. g. by SCADE Design Verifier, the formal veri-fication engine of SCADE). The network of component contracts then forms an ab-stract GALS model against which a system requirement (called system-level verifi-cation goal) can be formally verified. This is done by a model transformation of theabstract GALS model into an appropriate formalism/tool for model checking—we usePROMELA/SPIN and UPPAAL, respectively, for model checking system-level verifi-cation goals.
Integrating synchronous components within an asynchronous environment using theGALS approach and using abstraction to handle system’s complexity are not new ideas.What is new in our work is the combination of GALS verification with the idea of ab-straction by contracts and its application to networks of synchronous SCADE models.Hence, since SCADE is an industrial strength tool for synchronous controller software,our framework contributes towards closing the methodological gap between the ap-plicability of formal verification for single controllers and asynchronously composedsystems of such controllers in an industrial context.
In addition, the previous work on GALS systems pertains to systems whose compo-nents were designed to interact synchronously but are later integrated asynchronously.In our work we assume that GALS systems are designed to consist of synchronouscomponents that are intended to be composed asynchronously (GALS systems by de-sign). We introduce a new specification language for GALS systems, and we design andimplement model transformations between our language and appropriate model check-ing tools (PROMELA/SPIN, SCADE Design Verifier and UPPAAL). These are parts ofa larger framework for (formal) verification of GALS systems that also contains higherlevel, user-friendly and domain specific (graphical) languages as well as methods andtools for test automation and analysis. These other aspects of the framework cannot bepresented within the page constraints of this paper. More details on them can be foundin the technical report [33] and in [17]. We also do not discuss a systematic way to de-rive suitable contracts for given components—this can be a challenging task in practise,but we leave the solution of this problem for future work.
We begin in Sec. 2 with a discussion of our system level verification approach. InSec. 3 we introduce our modeling language for GALS systems—the GALS translationlanguage (GTL). Next we briefly describe the transformation algorithms used for localand global verification of GALS systems (Sec. 4) and we provide a benchmark for theverification back-ends using a simple example of a GALS system (Sec. 5). Finally, wereport about first experiences of our tools on an industrial case study in Sec. 6.
1.1 Related Work. Numerous publications are devoted to combining synchrony withasynchrony and the verification of GALS systems. For example, Doucet et al. [11] de-scribe how C-Code generated from synchronous components in SIGNAL is integratedin PROMELA abstracting the communication framework by FIFO channels. Thivolle
292 H. Günther, S. Milius, and O. Möller
and Garavel [12] explain the basic idea of combining a synchronous language and anasynchronous formalism, and they also show how synchronous components can be in-tegrated into an asynchronous verification tool and demonstrate this with one simpleexample. In these works components are not abstracted by contracts as in our approachbut synchronous models are directly integrated in an asynchronous formalism. How-ever, the results from our case study clearly indicate that component abstraction is nec-essary.
A different approach follows Milner’s result [26] that asynchrony can be encodedin a synchronous process calculus, see e. g. [20, 22, 28], and the tool Model build [5, 6]as well as the Polychrony workbench [25]. A disadvantage of these approaches is thatasynchrony and non-determinism are not built-in concepts in the underlying formalismsand so verification tools may not be optimized for asynchronous verification.
Other approaches extend synchronous formalisms in order to deal with some de-gree of asynchrony, e. g., Multiclock Esterel [29] or Communicating Reactive StateMachines [30, 31]. Again, components are not abstracted in these approaches, and ac-cording to [12]: “such extensions are not (yet) used in industry”.
Using contracts as specifications for parts of a program or system is also not a newidea; see for example work on rely/guarantee logic [23]. Abstracting system compo-nents by contracts appears recently, for example, in [15, 14] and in [7]. The formerwork uses component contracts in the form of time-annotated UML statecharts. So thisapproach does not deal directly with synchronous components or GALS systems. In ad-dition, component contracts cannot be specified by LTL formulas as in our framework.The latter work [7] describes a way to use contracts to specify the behaviour and inter-actions of hardware components. The focus is on the verification of contracts while ourwork also considers formal verification of system-level verification goals of composedcontract-systems.
Alur and Henzinger [3] treat the semantics of asynchronous component systems,their reactive modules can be used to give a semantics to our GALS system specifi-cations. Reactive modules are also the basis for the tool Mocha [1] which uses Alter-nating Temporal Logic (ATL) as a specification language for system requirements. Inour approach the specification language for contracts and global verification goals isseparate from the synchronous language in which components are implemented. So ourframework is more flexible—it allows to easily exchange the synchronous language forcomponents and it also allows to change the analysis tools used for formal verification.
Clarke et al. describe an automatic approach to generating contract abstractions [9].We did not apply this technique in our framework (yet) because we believe there areseveral difficulties with this approach: it can only generate abstractions with the sameexpressive power as regular languages, while our approach can also handle LTL abstrac-tions. Also, the number of iterations needed for finding the abstraction might outweighthe performance gains of the abstraction itself. But this still needs to be investigatedsystematically in the future.
To sum up, the various ingredients (contracts for abstraction, synchronous verifica-tion, GALS systems) of our work are well-established in the literature. However, to thebest of our knowledge these ingredients have not been brought together in this form forthe verification of GALS systems of synchronous SCADE models, and it is this gap weintend to fill with our work.
On the formal verification systems of synchronous software components 293
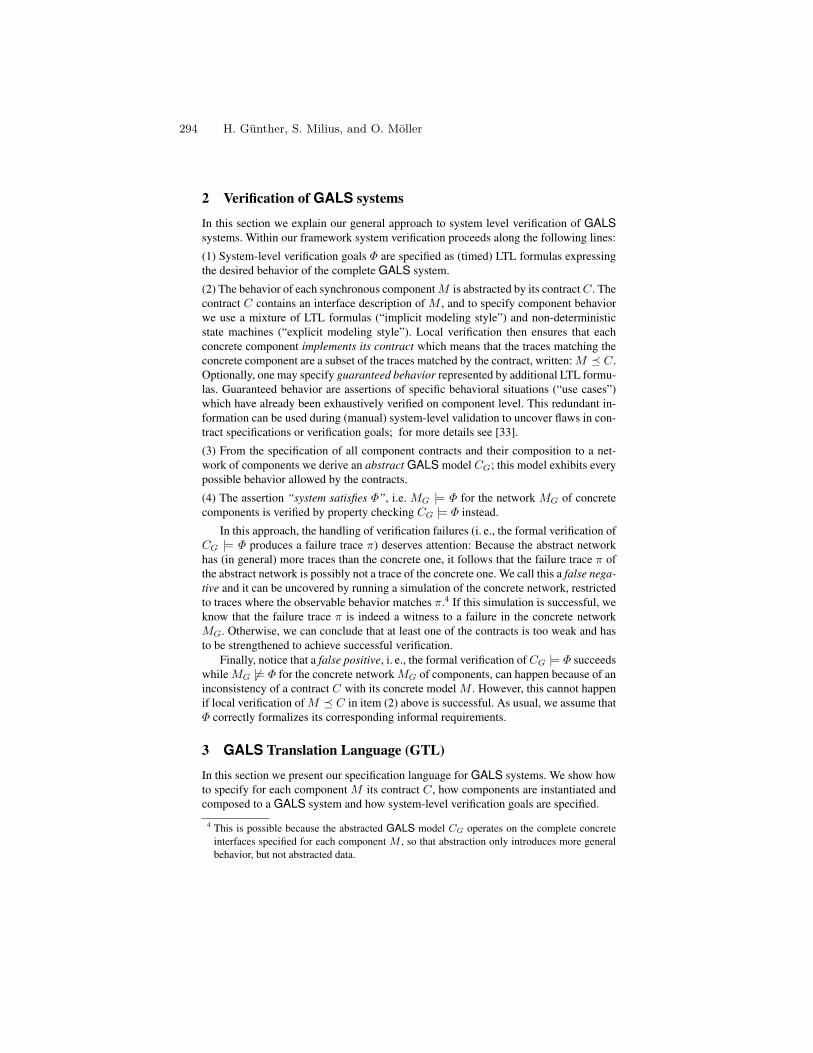
2 Verification of GALS systems
In this section we explain our general approach to system level verification of GALSsystems. Within our framework system verification proceeds along the following lines:
(1) System-level verification goals Φ are specified as (timed) LTL formulas expressingthe desired behavior of the complete GALS system.
(2) The behavior of each synchronous componentM is abstracted by its contractC. Thecontract C contains an interface description of M , and to specify component behaviorwe use a mixture of LTL formulas (“implicit modeling style”) and non-deterministicstate machines (“explicit modeling style”). Local verification then ensures that eachconcrete component implements its contract which means that the traces matching theconcrete component are a subset of the traces matched by the contract, written:M � C.Optionally, one may specify guaranteed behavior represented by additional LTL formu-las. Guaranteed behavior are assertions of specific behavioral situations (“use cases”)which have already been exhaustively verified on component level. This redundant in-formation can be used during (manual) system-level validation to uncover flaws in con-tract specifications or verification goals; for more details see [33].
(3) From the specification of all component contracts and their composition to a net-work of components we derive an abstract GALS model CG; this model exhibits everypossible behavior allowed by the contracts.
(4) The assertion “system satisfies Φ”, i.e. MG |= Φ for the network MG of concretecomponents is verified by property checking CG |= Φ instead.
In this approach, the handling of verification failures (i. e., the formal verification ofCG |= Φ produces a failure trace π) deserves attention: Because the abstract networkhas (in general) more traces than the concrete one, it follows that the failure trace π ofthe abstract network is possibly not a trace of the concrete one. We call this a false nega-tive and it can be uncovered by running a simulation of the concrete network, restrictedto traces where the observable behavior matches π.4 If this simulation is successful, weknow that the failure trace π is indeed a witness to a failure in the concrete networkMG. Otherwise, we can conclude that at least one of the contracts is too weak and hasto be strengthened to achieve successful verification.
Finally, notice that a false positive, i. e., the formal verification of CG |= Φ succeedswhileMG 6|= Φ for the concrete networkMG of components, can happen because of aninconsistency of a contract C with its concrete model M . However, this cannot happenif local verification of M � C in item (2) above is successful. As usual, we assume thatΦ correctly formalizes its corresponding informal requirements.
3 GALS Translation Language (GTL)
In this section we present our specification language for GALS systems. We show howto specify for each component M its contract C, how components are instantiated andcomposed to a GALS system and how system-level verification goals are specified.
4 This is possible because the abstracted GALS model CG operates on the complete concreteinterfaces specified for each component M , so that abstraction only introduces more generalbehavior, but not abstracted data.
294 H. Günther, S. Milius, and O. Möller
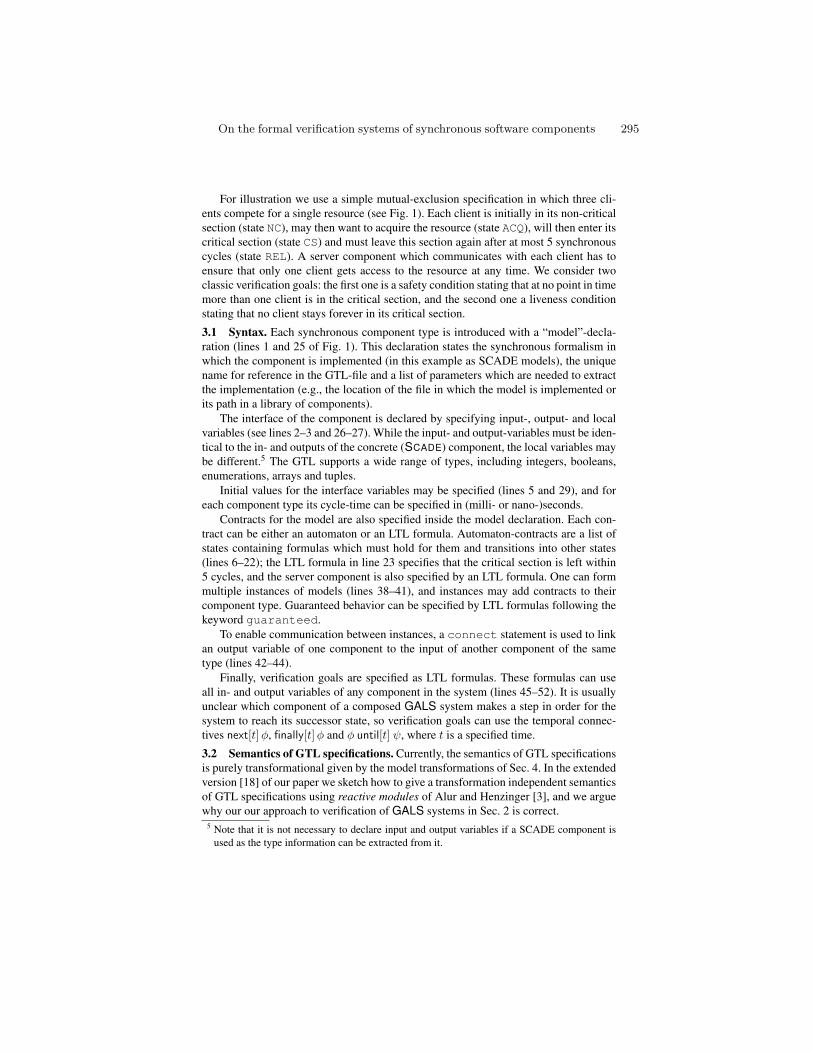
For illustration we use a simple mutual-exclusion specification in which three cli-ents compete for a single resource (see Fig. 1). Each client is initially in its non-criticalsection (state NC), may then want to acquire the resource (state ACQ), will then enter itscritical section (state CS) and must leave this section again after at most 5 synchronouscycles (state REL). A server component which communicates with each client has toensure that only one client gets access to the resource at any time. We consider twoclassic verification goals: the first one is a safety condition stating that at no point in timemore than one client is in the critical section, and the second one a liveness conditionstating that no client stays forever in its critical section.
3.1 Syntax. Each synchronous component type is introduced with a “model”-decla-ration (lines 1 and 25 of Fig. 1). This declaration states the synchronous formalism inwhich the component is implemented (in this example as SCADE models), the uniquename for reference in the GTL-file and a list of parameters which are needed to extractthe implementation (e.g., the location of the file in which the model is implemented orits path in a library of components).
The interface of the component is declared by specifying input-, output- and localvariables (see lines 2–3 and 26–27). While the input- and output-variables must be iden-tical to the in- and outputs of the concrete (SCADE) component, the local variables maybe different.5 The GTL supports a wide range of types, including integers, booleans,enumerations, arrays and tuples.
Initial values for the interface variables may be specified (lines 5 and 29), and foreach component type its cycle-time can be specified in (milli- or nano-)seconds.
Contracts for the model are also specified inside the model declaration. Each con-tract can be either an automaton or an LTL formula. Automaton-contracts are a list ofstates containing formulas which must hold for them and transitions into other states(lines 6–22); the LTL formula in line 23 specifies that the critical section is left within5 cycles, and the server component is also specified by an LTL formula. One can formmultiple instances of models (lines 38–41), and instances may add contracts to theircomponent type. Guaranteed behavior can be specified by LTL formulas following thekeyword guaranteed.
To enable communication between instances, a connect statement is used to linkan output variable of one component to the input of another component of the sametype (lines 42–44).
Finally, verification goals are specified as LTL formulas. These formulas can useall in- and output variables of any component in the system (lines 45–52). It is usuallyunclear which component of a composed GALS system makes a step in order for thesystem to reach its successor state, so verification goals can use the temporal connec-tives next[t]φ, finally[t]φ and φ until[t] ψ, where t is a specified time.
3.2 Semantics of GTL specifications. Currently, the semantics of GTL specificationsis purely transformational given by the model transformations of Sec. 4. In the extendedversion [18] of our paper we sketch how to give a transformation independent semanticsof GTL specifications using reactive modules of Alur and Henzinger [3], and we arguewhy our our approach to verification of GALS systems in Sec. 2 is correct.
5 Note that it is not necessary to declare input and output variables if a SCADE component isused as the type information can be extracted from it.
On the formal verification systems of synchronous software components 295
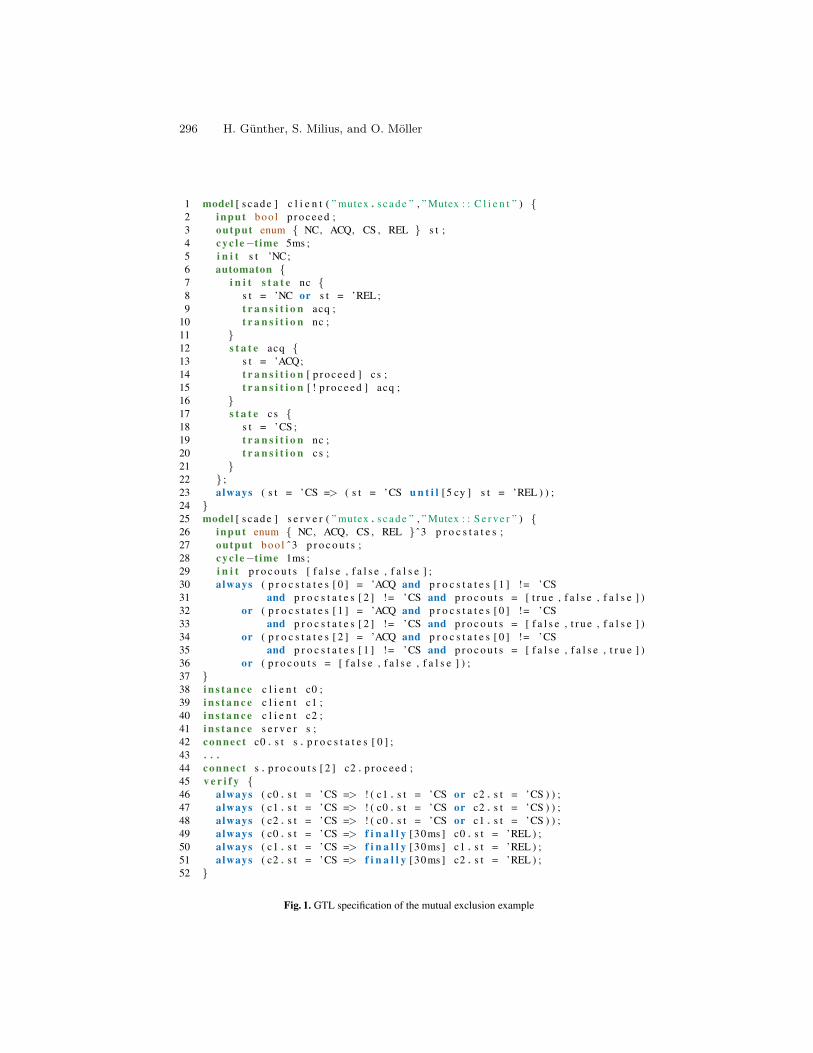
1 model [ s c a d e ] c l i e n t ( ” mutex . s c a d e ” , ” Mutex : : C l i e n t ” ) {2 input boo l p r o c e e d ;3 output enum { NC, ACQ, CS , REL } s t ;4 c y c l e−t ime 5ms ;5 i n i t s t ’NC;6 automaton {7 i n i t s t a t e nc {8 s t = ’NC or s t = ’REL ;9 t r a n s i t i o n acq ;
10 t r a n s i t i o n nc ;11 }12 s t a t e acq {13 s t = ’ACQ;14 t r a n s i t i o n [ p r o c e e d ] c s ;15 t r a n s i t i o n [ ! p r o c e e d ] acq ;16 }17 s t a t e cs {18 s t = ’CS ;19 t r a n s i t i o n nc ;20 t r a n s i t i o n cs ;21 }22 } ;23 always ( s t = ’CS => ( s t = ’CS u n t i l [5 cy ] s t = ’REL ) ) ;24 }25 model [ s c a d e ] s e r v e r ( ” mutex . s c a d e ” , ” Mutex : : S e r v e r ” ) {26 input enum { NC, ACQ, CS , REL } ˆ3 p r o c s t a t e s ;27 output boo l ˆ3 p r o c o u t s ;28 c y c l e−t ime 1ms ;29 i n i t p r o c o u t s [ f a l s e , f a l s e , f a l s e ] ;30 always ( p r o c s t a t e s [ 0 ] = ’ACQ and p r o c s t a t e s [ 1 ] != ’CS31 and p r o c s t a t e s [ 2 ] != ’CS and p r o c o u t s = [ t r u e , f a l s e , f a l s e ] )32 or ( p r o c s t a t e s [ 1 ] = ’ACQ and p r o c s t a t e s [ 0 ] != ’CS33 and p r o c s t a t e s [ 2 ] != ’CS and p r o c o u t s = [ f a l s e , t r u e , f a l s e ] )34 or ( p r o c s t a t e s [ 2 ] = ’ACQ and p r o c s t a t e s [ 0 ] != ’CS35 and p r o c s t a t e s [ 1 ] != ’CS and p r o c o u t s = [ f a l s e , f a l s e , t r u e ] )36 or ( p r o c o u t s = [ f a l s e , f a l s e , f a l s e ] ) ;37 }38 i n s t a n c e c l i e n t c0 ;39 i n s t a n c e c l i e n t c1 ;40 i n s t a n c e c l i e n t c2 ;41 i n s t a n c e s e r v e r s ;42 connect c0 . s t s . p r o c s t a t e s [ 0 ] ;43 . . .44 connect s . p r o c o u t s [ 2 ] c2 . p r o c e e d ;45 v e r i f y {46 always ( c0 . s t = ’CS => ! ( c1 . s t = ’CS or c2 . s t = ’CS ) ) ;47 always ( c1 . s t = ’CS => ! ( c0 . s t = ’CS or c2 . s t = ’CS ) ) ;48 always ( c2 . s t = ’CS => ! ( c0 . s t = ’CS or c1 . s t = ’CS ) ) ;49 always ( c0 . s t = ’CS => f i n a l l y [30 ms ] c0 . s t = ’REL ) ;50 always ( c1 . s t = ’CS => f i n a l l y [30 ms ] c1 . s t = ’REL ) ;51 always ( c2 . s t = ’CS => f i n a l l y [30 ms ] c2 . s t = ’REL ) ;52 }
Fig. 1. GTL specification of the mutual exclusion example
296 H. Günther, S. Milius, and O. Möller
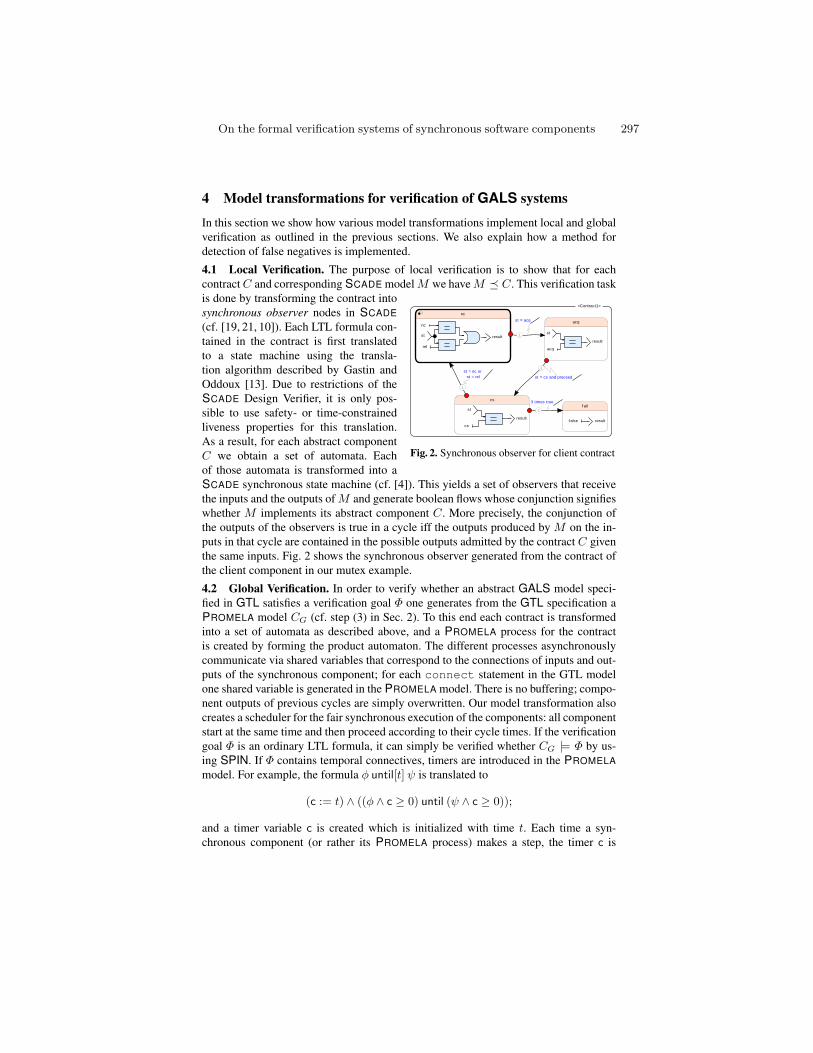
4 Model transformations for verification of GALS systems
In this section we show how various model transformations implement local and globalverification as outlined in the previous sections. We also explain how a method fordetection of false negatives is implemented.
4.1 Local Verification. The purpose of local verification is to show that for eachcontractC and corresponding SCADE modelM we haveM � C. This verification task
f alse result
f ail
cs
result
st
cs
result
acq
st
acq
rel
nc
st result
nc
<Contract1>
1
st = acq
1
st = cs and proceed
1
st = nc or st = rel
2
3 times true
Fig. 2. Synchronous observer for client contract
is done by transforming the contract intosynchronous observer nodes in SCADE(cf. [19, 21, 10]). Each LTL formula con-tained in the contract is first translatedto a state machine using the transla-tion algorithm described by Gastin andOddoux [13]. Due to restrictions of theSCADE Design Verifier, it is only pos-sible to use safety- or time-constrainedliveness properties for this translation.As a result, for each abstract componentC we obtain a set of automata. Eachof those automata is transformed into aSCADE synchronous state machine (cf. [4]). This yields a set of observers that receivethe inputs and the outputs ofM and generate boolean flows whose conjunction signifieswhether M implements its abstract component C. More precisely, the conjunction ofthe outputs of the observers is true in a cycle iff the outputs produced by M on the in-puts in that cycle are contained in the possible outputs admitted by the contract C giventhe same inputs. Fig. 2 shows the synchronous observer generated from the contract ofthe client component in our mutex example.
4.2 Global Verification. In order to verify whether an abstract GALS model speci-fied in GTL satisfies a verification goal Φ one generates from the GTL specification aPROMELA model CG (cf. step (3) in Sec. 2). To this end each contract is transformedinto a set of automata as described above, and a PROMELA process for the contractis created by forming the product automaton. The different processes asynchronouslycommunicate via shared variables that correspond to the connections of inputs and out-puts of the synchronous component; for each connect statement in the GTL modelone shared variable is generated in the PROMELA model. There is no buffering; compo-nent outputs of previous cycles are simply overwritten. Our model transformation alsocreates a scheduler for the fair synchronous execution of the components: all componentstart at the same time and then proceed according to their cycle times. If the verificationgoal Φ is an ordinary LTL formula, it can simply be verified whether CG |= Φ by us-ing SPIN. If Φ contains temporal connectives, timers are introduced in the PROMELAmodel. For example, the formula φ until[t] ψ is translated to
(c := t) ∧ ((φ ∧ c ≥ 0) until (ψ ∧ c ≥ 0));
and a timer variable c is created which is initialized with time t. Each time a syn-chronous component (or rather its PROMELA process) makes a step, the timer c is
On the formal verification systems of synchronous software components 297
decremented by the amount of time that has passed since the last step was performed bya (possibly different) synchronous component. For this translation to be sound, until[t]-formulas must not be nested on the right-hand side.
The translation of the network of contracts in a GTL specification to UPPAALworks similarly. However, it is not possible in general to translate all verification goalssince the supported logical language of UPPAAL is based on (timed) CTL [2]. However,if we restrict ourselves to so-called safety properties, translation to CTL is both soundand simple. While clearly inferior in the expressive power, this logical class of formulasis sufficient for many practical purposes. Currently, translation of safety properties hasto be done manually.
4.3 Detection of False Negatives. We implemented a third transformation from GTLthat can be used to validate verification results for an abstract GALS model CG. Sup-pose we have CG 6|= Φ for a verification goal Φ and the formal verification producesthe failure trace π. If each component comes with a SCADE implementation, we cancheck whether this is a real failure trace or a false negative as follows: using the GTLspecification one generates the concrete GALS model MG in PROMELA. This is doneby composing the SCADE models of the components (together with the scheduler) byintegrating the C-code generated from them. By using SPIN to simulate MG on theinputs from π we can verify whether π is a trace of MG.6
If so, we have found a real error, and one or several component implementationsneed to be corrected. To support this process one can project the global failure trace πon a local trace πM for each component M , which can be used in the ensuing analysis:from each πM one can generate a SCADE simulator script which can be used to correctthe SCADE models of the components.
If the simulation finds that π is not a legal trace of the concrete GALS model MG,then our verification result is a false negative, and one needs to analyze the contracts forweaknesses or inconsistencies.
For a concrete example of a false negative let us consider our mutex example. If weomit line 23 of the client contract, which prevents clients from staying forever in theircritical section, the global verification of the second verification goal in Fig. 1 will yielda failure trace: a client remains forever in the critical section. However, this does nothappen in the concrete model; the SCADE model of the client (not shown here) willleave its critical section after at most 5 cycles.
5 Benchmark: The Mutex Example
To evaluate the GTL transformation to back-end formalisms, we use the mutex examplefrom Sec. 3 as a benchmark.
To this end a sequence of GTL files is generated by increasing the number N ofclient processes that compete for the critical section. The server will (only) grant accessto the critical section to one requesting client (chosen non-deterministically), if no clientis currently in the critical section.
6 Again, this simulation is possible since CG operates on the complete concrete interfaces spec-ified by each component M .
298 H. Günther, S. Milius, and O. Möller
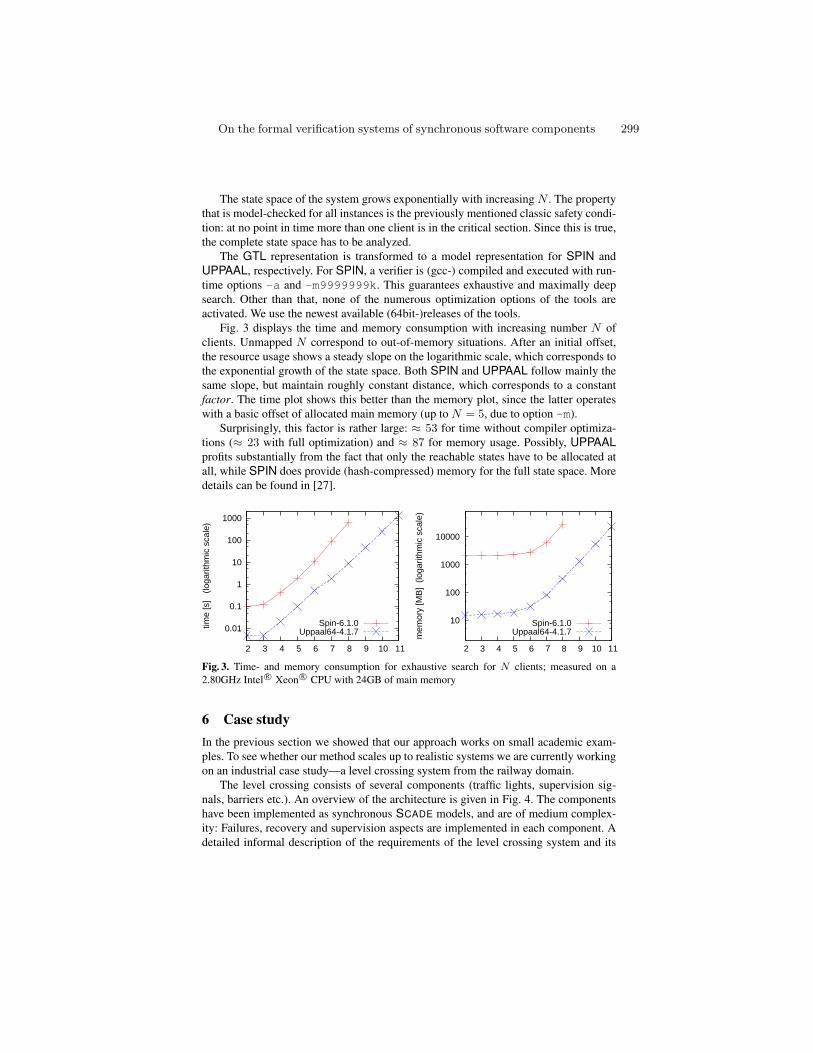
The state space of the system grows exponentially with increasing N . The propertythat is model-checked for all instances is the previously mentioned classic safety condi-tion: at no point in time more than one client is in the critical section. Since this is true,the complete state space has to be analyzed.
The GTL representation is transformed to a model representation for SPIN andUPPAAL, respectively. For SPIN, a verifier is (gcc-) compiled and executed with run-time options -a and -m9999999k. This guarantees exhaustive and maximally deepsearch. Other than that, none of the numerous optimization options of the tools areactivated. We use the newest available (64bit-)releases of the tools.
Fig. 3 displays the time and memory consumption with increasing number N ofclients. Unmapped N correspond to out-of-memory situations. After an initial offset,the resource usage shows a steady slope on the logarithmic scale, which corresponds tothe exponential growth of the state space. Both SPIN and UPPAAL follow mainly thesame slope, but maintain roughly constant distance, which corresponds to a constantfactor. The time plot shows this better than the memory plot, since the latter operateswith a basic offset of allocated main memory (up to N = 5, due to option -m).
Surprisingly, this factor is rather large: ≈ 53 for time without compiler optimiza-tions (≈ 23 with full optimization) and ≈ 87 for memory usage. Possibly, UPPAALprofits substantially from the fact that only the reachable states have to be allocated atall, while SPIN does provide (hash-compressed) memory for the full state space. Moredetails can be found in [27].
0.01
0.1
1
10
100
1000
2 3 4 5 6 7 8 9 10 11
time
[s]
(lo
garit
hmic
sca
le)
Spin-6.1.0Uppaal64-4.1.7
10
100
1000
10000
2 3 4 5 6 7 8 9 10 11
mem
ory
[MB
] (lo
garit
hmic
sca
le)
Spin-6.1.0Uppaal64-4.1.7
Fig. 3. Time- and memory consumption for exhaustive search for N clients; measured on a2.80GHz Intel R© Xeon R© CPU with 24GB of main memory
6 Case studyIn the previous section we showed that our approach works on small academic exam-ples. To see whether our method scales up to realistic systems we are currently workingon an industrial case study—a level crossing system from the railway domain.
The level crossing consists of several components (traffic lights, supervision sig-nals, barriers etc.). An overview of the architecture is given in Fig. 4. The componentshave been implemented as synchronous SCADE models, and are of medium complex-ity: Failures, recovery and supervision aspects are implemented in each component. Adetailed informal description of the requirements of the level crossing system and its
On the formal verification systems of synchronous software components 299
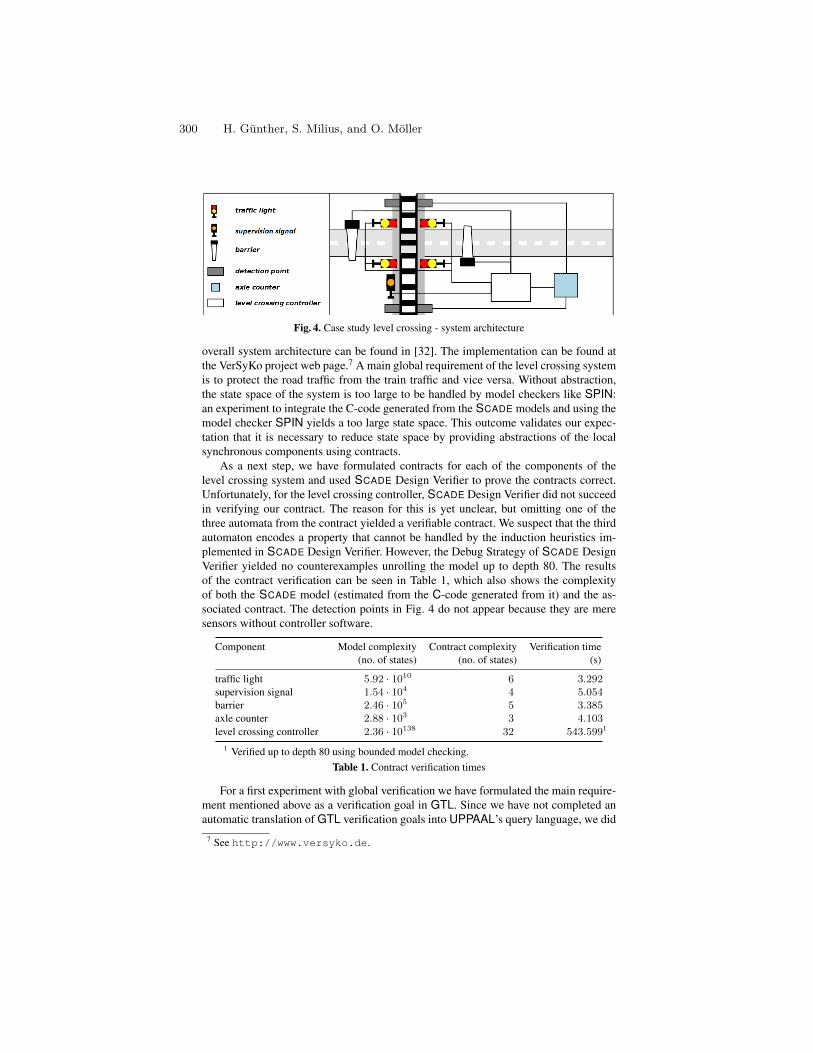
Fig. 4. Case study level crossing - system architecture
overall system architecture can be found in [32]. The implementation can be found atthe VerSyKo project web page.7 A main global requirement of the level crossing systemis to protect the road traffic from the train traffic and vice versa. Without abstraction,the state space of the system is too large to be handled by model checkers like SPIN:an experiment to integrate the C-code generated from the SCADE models and using themodel checker SPIN yields a too large state space. This outcome validates our expec-tation that it is necessary to reduce state space by providing abstractions of the localsynchronous components using contracts.
As a next step, we have formulated contracts for each of the components of thelevel crossing system and used SCADE Design Verifier to prove the contracts correct.Unfortunately, for the level crossing controller, SCADE Design Verifier did not succeedin verifying our contract. The reason for this is yet unclear, but omitting one of thethree automata from the contract yielded a verifiable contract. We suspect that the thirdautomaton encodes a property that cannot be handled by the induction heuristics im-plemented in SCADE Design Verifier. However, the Debug Strategy of SCADE DesignVerifier yielded no counterexamples unrolling the model up to depth 80. The resultsof the contract verification can be seen in Table 1, which also shows the complexityof both the SCADE model (estimated from the C-code generated from it) and the as-sociated contract. The detection points in Fig. 4 do not appear because they are meresensors without controller software.
Component Model complexity Contract complexity Verification time(no. of states) (no. of states) (s)
traffic light 5.92 · 1010 6 3.292supervision signal 1.54 · 104 4 5.054barrier 2.46 · 105 5 3.385axle counter 2.88 · 103 3 4.103level crossing controller 2.36 · 10138 32 543.5991
1 Verified up to depth 80 using bounded model checking.Table 1. Contract verification times
For a first experiment with global verification we have formulated the main require-ment mentioned above as a verification goal in GTL. Since we have not completed anautomatic translation of GTL verification goals into UPPAAL’s query language, we did
7 See http://www.versyko.de.
300 H. Günther, S. Milius, and O. Möller
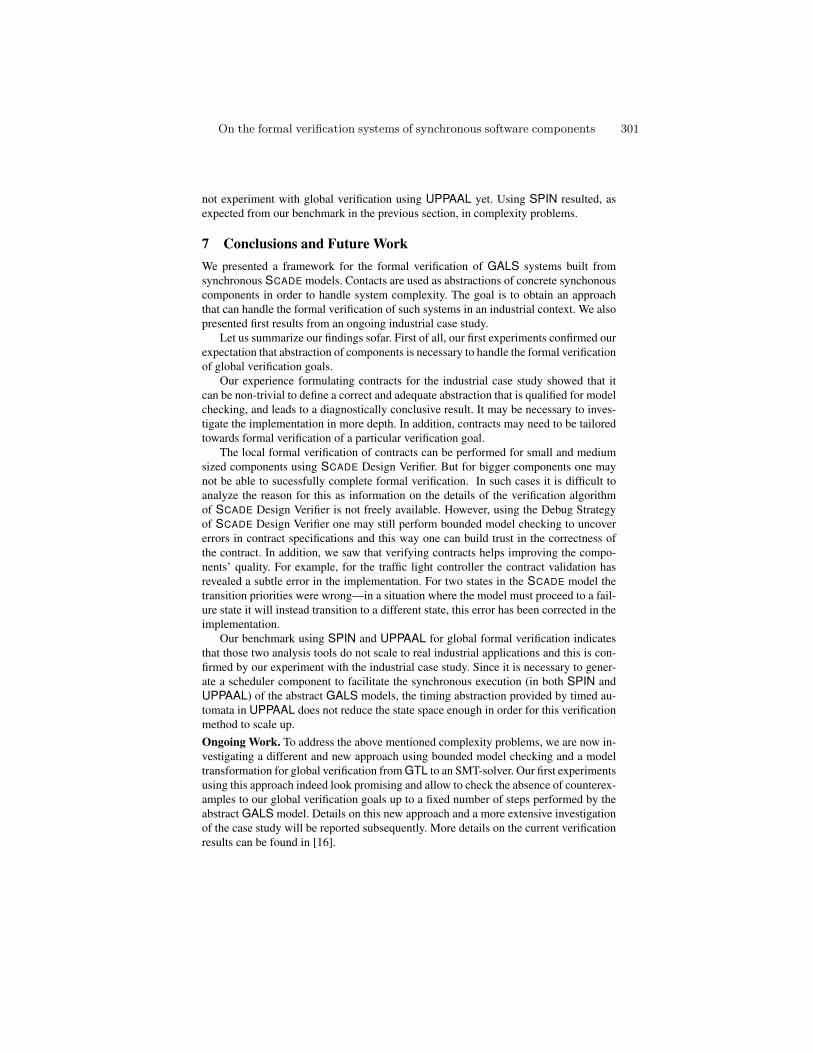
not experiment with global verification using UPPAAL yet. Using SPIN resulted, asexpected from our benchmark in the previous section, in complexity problems.
7 Conclusions and Future WorkWe presented a framework for the formal verification of GALS systems built fromsynchronous SCADE models. Contacts are used as abstractions of concrete synchonouscomponents in order to handle system complexity. The goal is to obtain an approachthat can handle the formal verification of such systems in an industrial context. We alsopresented first results from an ongoing industrial case study.
Let us summarize our findings sofar. First of all, our first experiments confirmed ourexpectation that abstraction of components is necessary to handle the formal verificationof global verification goals.
Our experience formulating contracts for the industrial case study showed that itcan be non-trivial to define a correct and adequate abstraction that is qualified for modelchecking, and leads to a diagnostically conclusive result. It may be necessary to inves-tigate the implementation in more depth. In addition, contracts may need to be tailoredtowards formal verification of a particular verification goal.
The local formal verification of contracts can be performed for small and mediumsized components using SCADE Design Verifier. But for bigger components one maynot be able to sucessfully complete formal verification. In such cases it is difficult toanalyze the reason for this as information on the details of the verification algorithmof SCADE Design Verifier is not freely available. However, using the Debug Strategyof SCADE Design Verifier one may still perform bounded model checking to uncovererrors in contract specifications and this way one can build trust in the correctness ofthe contract. In addition, we saw that verifying contracts helps improving the compo-nents’ quality. For example, for the traffic light controller the contract validation hasrevealed a subtle error in the implementation. For two states in the SCADE model thetransition priorities were wrong—in a situation where the model must proceed to a fail-ure state it will instead transition to a different state, this error has been corrected in theimplementation.
Our benchmark using SPIN and UPPAAL for global formal verification indicatesthat those two analysis tools do not scale to real industrial applications and this is con-firmed by our experiment with the industrial case study. Since it is necessary to gener-ate a scheduler component to facilitate the synchronous execution (in both SPIN andUPPAAL) of the abstract GALS models, the timing abstraction provided by timed au-tomata in UPPAAL does not reduce the state space enough in order for this verificationmethod to scale up.Ongoing Work. To address the above mentioned complexity problems, we are now in-vestigating a different and new approach using bounded model checking and a modeltransformation for global verification from GTL to an SMT-solver. Our first experimentsusing this approach indeed look promising and allow to check the absence of counterex-amples to our global verification goals up to a fixed number of steps performed by theabstract GALS model. Details on this new approach and a more extensive investigationof the case study will be reported subsequently. More details on the current verificationresults can be found in [16].
On the formal verification systems of synchronous software components 301
Directions for future work include: (a) exploring possible alternatives to SCADEDesign Verifier for local verification—an approach using bounded model checking withan SMT-solver similar to the KIND [24] model checker for LUSTRE will be investi-gated; (b) further investigations using bounded model checking for global verificationwill be made on our case study, in particular, the formalization of other requirements asglobal verification goals and the formulation of appropriate contracts for them; (c) fromthe point of view of applicability of our approach a systematic methodology how to findsuitable abstractions of components and to formulate good contracts is highly desirable.At the moment this is a creative process that needs expertise both with the system underinvestigation and with the formal verification methods used in our framework. Con-cerning this point, it should be investigated in how far tthe CEGAR approach of [9] isapplicable for automatic derivation of contracts.
Acknowledgments. We are grateful to ICS AG for providing the industrial case study,and to Axel Zechner and Ramin Hedayati for fruitful discussions and their support toformulate the contracts.
References
1. de Alfaro, L., Alur, R., Grosu, R., Henzinger, T., Kang, M., Majumdar, R., Mang, F., Meyer-Kirsch, C., Wang, B.: Mocha: Exploiting modularity in model checking (2000), http://www.cis.upenn.edu/˜mocha
2. Alur, R., Courcoubetis, C., Dill, D.L.: Model-checking in dense real-time. Information andComputation 104(1), 2–34 (1993)
3. Alur, R., Henzinger, T.: Reactive modules. FMSD 15, 7–48 (1999)4. Andre, C.: Semantics of S.S.M (safe state machine). Tech. Rep. UMR 6070, I3S Laboratory,
University of Nice-Sophia Antipolis (2003)5. Baufreton, P.: SACRES: A step ahead in the development of critical avionics applications
(abstract). In: Proc. of HSCC. LNCS, vol. 1569. Springer-Verlag, London, UK (1999)6. Baufreton, P.: Visual notations based on synchronous languages for dynamic validation
of GALS systems. In: CCCT’04 Computing, Communications and Control Technologies.Austin (Texas) (August 2004)
7. Bouhadiba, T., Maraninchi, F.: Contract-based coordination of hardware components for thedevelopment of embedded software. In: Proc. of COORDINATION. pp. 204–224. LNCS,Springer-Verlag, Berlin, Heidelberg (2009)
8. Chapiro, D.M.: Globally-asynchronous locally-synchronous systems. Ph.D. thesis, StanfordUniversity (1984)
9. Clarke, E., Grumberg, O., Jha, S., Lu, Y., Veith, H.: Counterexample-guided abstraction re-finement. In: Emerson, E., Sistla, A. (eds.) Computer Aided Verification, LNCS, vol. 1855,pp. 154–169. Springer Berlin / Heidelberg (2000)
10. Dajani-Brown, S., Cofer, D., Bouali, A.: Formal verification of an avionics sensor usingSCADE. In: Lakhnech, Y., Yovine, S. (eds.) Proc. FORMATS/FTRTFT. LNCS, vol. 3253,pp. 5–20. Springer-Verlag (2004)
11. Doucet, F., Menarini, M., Kruger, I.H., Gupta, R., Talpin, J.P.: A verification approach forGALS integration of synchronous components. ENTCS 146, 105–131 (January 2006)
12. Garavel, H., Thivolle, D.: Verification of GALS systems by combining synchronous lan-guages and process calculi. In: Proc. of SPIN. LNCS, vol. 5578, pp. 241–260 (2009)
13. Gastin, P., Oddoux, D.: Fast LTL to Buchi automata translation. In: Berry, G., Comon, H.,Finkel, A. (eds.) Computer Aided Verification. LNCS, vol. 2102, pp. 53–65 (2001)
302 H. Günther, S. Milius, and O. Möller
14. Giese, H., Tichy, M., Burmester, S., Schafer, W., Flake, S.: Towards the compositional veri-fication of real-time uml designs. SIGSOFT Softw. Eng. Notes 28, 38–47 (September 2003)
15. Giese, H., Vilbig, A.: Separation of non-orthogonal concerns in software architecture anddesign. Software and System Modeling 5(2), 136–169 (2006)
16. Gunther, H.: Bahnubergangsfallstudie: Verifikationsbericht. Tech. rep., Institut fur Theo-retische Informatik, Technische Universitat Braunschweig (February 2012), Available athttp://www.versyko.de
17. Gunther, H., Hedayati, R., Loding, H., Milius, S., Moller, O., Peleska, J., Sulzmann, M.,Zechner, A.: A framework for formal verification of systems of synchronous components.In: Proc. MBEES’12 (2012), available at http:\\www.versyko.de
18. Gunther, H., Milius, S., Moller, O.: On the formal verification of systems of synchronoussoftware components (extended version) (May 2012), Avaliable at www.versyko.de
19. Halbwachs, N., Lagnier, F., Raymond, P.: Synchronous observers and the verification ofreactive systems. In: Proc. of AMAST’93. pp. 83–96. Workshops in Computing, Springer-Verlag, London, UK (1994)
20. Halbwachs, N., Mandel, L.: Simulation and verification of asynchronous systems by meansof a synchronous model. In: Proc. of IFIP. pp. 3–14. IEEE Computer Society, Washington,DC, USA (2006)
21. Halbwachs, N., Raymond, P.: Validation of synchronous reactive systems: from formal veri-fication to automatic testing. In: Proc. of ASIAN (December 1999)
22. Jahier, E., Halbwachs, N., Raymond, P., Nicollin, X., Lesens, D.: Virtual execution of AADLmodels via a translation into synchronous programs. In: Proc. of EMSOFT. pp. 134–143.EMSOFT ’07, ACM, New York, NY, USA (2007)
23. Jones, C.B.: Specification and design of (parallel) programs. In: Proc. IFIP Congress. pp.321–332 (1983)
24. Kahsai, T., Tinelli, C.: PKind: A parallel k-induction based model checker. In: Barnat, J.,Heljanko, K. (eds.) PDMC. EPTCS, vol. 72, pp. 55–62 (2011)
25. Le Guernic, P., Talpin, J.P., Le Lann, J.L.: Polychrony for system design. Journal of Cir-cuits, Systems and Computers (2002), special issue on Application-Specific Hardware De-sign. World Scientific
26. Milner, R.: Calculi for synchrony and asynchrony. Theoret. Comput. Sci. 25(3) (July 1983)27. Moller, M.O.: Benchmark Analysis of GTL-Backends using Client-Server Mutex (2012),
http://www.verified.de/en/publications/, Verified Systems InternationalGmbH, Doc.Id.: Verified-WHITEPAPER-001-2012, Issue 1.2.
28. Mousavi, M.R., Le Guernic, P., Talpin, J., Shukla, S.K., Basten, T.: Modeling and validatingglobally asynchronous design in synchronous frameworks. In: Proc. of DATE. pp. 10384–.DATE ’04, IEEE Computer Society, Washington, DC, USA (2004)
29. Rajan, B., Shyamasundar, R.: Multiclock Esterel: a reactive framework for asynchronousdesign. In: Proc. of IPDPS. pp. 201–209 (2000)
30. Ramesh, S.: Communicating reactive state machines: Design, model and implementation. In:Proc. IFAC Workshop on Distributed Computer Control Systems. Pergamon Press (Septem-ber 1998)
31. Ramesh, S., Sonalkar, S., D’silva, V., Chandra R., N., Vijayalakshmi, B.: A toolset for mod-elling and verification of GALS systems. In: Alur, R., Peled, D. (eds.) CAV, LNCS, vol.3114, pp. 385–387. Springer Berlin / Heidelberg (2004)
32. Sulzmann, M., Zechner, A., Hedayati, R.: Anforderungsdokument fur die FallstudieBahnubergangssicherungsanlage. Tech. rep., ICS AG (2011)
33. Contract specification and domain specific modelling language for GALS systems, an ap-proach to system validation. Tech. rep., ICS AG, Verified Systems International GmbH, TUBraunschweig (2011), Available at www.versyko.de
On the formal verification systems of synchronous software components 303

Intentionally left blank to harmonize page numbering with printed version.
A Systematic Approach to Justifying SufficientConfidence in Software Safety Arguments?
Anaheed Ayoub, BaekGyu Kim, Insup Lee, Oleg Sokolsky
Computer and Information Science DepartmentUniversity of Pennsylvania
{anaheed,baekgyu,lee,sokolsky}@seas.upenn.edu
Abstract. Safety arguments typically have some weaknesses. To showthat the overall confidence in the safety argument is considered accept-able, it is necessary to identify the weaknesses associated with the aspectsof a safety argument and supporting evidence, and manage them. Confi-dence arguments are built to show the existence of sufficient confidencein the developed safety arguments. In this paper, we propose an approachto systematically constructing confidence arguments and identifying theweaknesses of the software safety arguments. The proposed approach isdescribed and illustrated with a running example.
Keywords: safety cases, confidence arguments, assurance deficits
1 Introduction
A safety case is a structured argument, supported by a body of evidence, thatprovides a compelling, comprehensible and valid case that a system is safe fora given application in a given environment [17]. Although creating a structuredsafety argument explicitly explains how the available evidence supports the over-all claim of acceptable safety, it cannot ensure that the argument itself is ‘good’ orthe evidence is sufficient. A justification for the sufficiency of confidence in safetyarguments is essential. Any gap that prohibits perfect confidence is referred toas an assurance deficit [11]. The argument about the assurance deficits is givenin a separate argument that is named confidence argument [11]. A confidenceargument demonstrates the existence of sufficient confidence in an element byshowing that the assurance deficits related to this element have been identifiedand managed. Showing overall confidence in a safety argument would requirethat all elements of the safety argument (such as evidence or contexts) have anaccompanying confidence argument.
In this paper, an approach to systematically identify the assurance deficitsin software safety arguments is proposed. Software safety arguments are safetyarguments that justify, based on evidence, that the software does not contributeto the system hazards. Following a systematic approach would help in effectively
? This work is supported in part by the NSF CPS grant CNS-1035715 and the NS-F/FDA Scholar-in-Residence grant CNS-1042829.
identifying the assurance deficits. To show sufficient confidence in a specific el-ement in a safety argument, a confidence argument developer first explores allconcerns about the confidence in this element, and then makes claims that theseconcerns are addressed. If a claim cannot be supported by convincing evidence,then a deficit is identified and should be addressed. However, one cannot definea complete list for all concerns about all elements used in the safety arguments.
In this work, we are taking advantages of a commonality among elementsused in software safety arguments. For example, tool qualification is one of theconcerns for all tool-derived evidence [19]. Addressing a concern like this typi-cally gives rise to several derived concerns. We collected common concerns forcommon elements used in software safety arguments. We call the set of derivedconcerns for a specific element characteristics of this element. We structuredthis collection of common concerns in what we called the common characteris-tics map. It is a map from a concern C from the characteristics set, to a set ofderived concerns that need to be argued about to justify sufficient confidence inC. We also propose a common characteristic mechanism to construct confidencearguments and identify assurance deficits by instantiating the map to specificconcerns. Any branch of the developed confidence argument not be supportedby evidence indicates an assurance deficit that needs to be addressed.
The paper is organized as follows: Section 2 gives a brief background on safetycases. The related work is listed in Section 3. Section 4 explains the basic idea ofthe proposed approach. The common characteristics map is presented in Section5. The common characteristics mechanism is described and illustrated with arunning example in Section 6. The mechanism evaluation is given in Section 7.Finally, the paper is concluded in Section 8.
2 Safety Cases
The safety of safety-critical systems is of a great concern. Many such systems arereviewed and approved or certified by regulatory agencies. For example, medicaldevices sold in the United States are regulated by the U.S. Food and Drug Ad-ministration (FDA). Some of these medical devices, such as infusion pumps, can-not be commercially distributed before receiving an approval from the FDA [18].Which means that manufacturers of such systems are expected not only toachieve safety but also to convince regulators that it has been achieved [20].Recently, safety cases have become popular and acceptable ways for communi-cating ideas and information about the safety-critical systems among the systemstakeholders. The manufactures submit safety cases (to present a clear, compre-hensive and defensible argument supported by evidence) to the regulators toshow that their products are acceptably safe to operate in the intended con-text [13]. There are different approaches to structure and present safety cases.The Goal Structuring Notation (GSN) [13] is one of the description techniquesthat have been proven to be useful for constructing safety cases. In this work,we use the GSN notation in presenting safety cases. There is often commonal-ity among the structures of arguments used in safety cases. This commonality
306 A. Ayoub, B. Kim, O. Sokolsky, and I. Lee
motivates the definition for the concept of argument patterns [13], which is anapproach to support the reuse of arguments among safety cases.
A new approach for creating clear safety cases was introduced in [11]. Thisnew approach basically separates the major components of the safety cases intosafety argument and confidence argument. A safety argument is limited to givearguments and evidence that directly target the system safety. For example,claiming why a specific hazard is sufficiently unlikely to occur and arguing thisclaim by testing results as evidence. A confidence argument is given separatelyto justify the sufficiency of confidence in this safety argument. Such as ques-tioning about the confidence in the given testing results (e.g., is that testingexhaustive?). These two components are given explicitly and separately. Theyare interlinked so that justification for having sufficient confidence in individualaspects of the safety component is clear and readily available but not confusedwith the safety component itself. This separation reduces the size of the coresafety argument. Consequently, this new structure is believed to facilitate thedevelopment and reviewing processes for safety cases.
3 Related Work
There exists a widely used method for systematically constructing safety argu-ments. This method is often referred to as the “Six-Step” method [12]. Althoughthis method has been used successfully in constructing many safety arguments,it does not explicitly consider the confidence of the constructed safety argu-ments [10]. In [16, 19], lists of major factors that should be considered in de-termining the confidence in arguments are defined. Questions to be consideredwhen determining the sufficiency of each factor are also given. We were inspiredby this work and focused on one of these factors (i.e., the trustworthiness).
Argument patterns for confidence are given in [11]. Those patterns are definedbased on identifying and managing the assurance deficits to show sufficient con-fidence in the safety argument. It is necessary to identify the assurance deficitsas completely as practicable. However, it is not quite clear how to do that. Thismotivates us to take a step back to reasonably identify the assurance deficits.Then the list of the recognized assurance deficits can be used in instantiatingthe confidence pattern given in [11]. The constructed confidence arguments canbe used in the appraisal process for assurance arguments (e.g., [6, 14]).
There are attempts to quantitatively measure confidence in safety cases suchas [5, 7]. We believe that qualitative reasoning about the confidence existence ismore consistent with the inherited subjectivity in safety cases.
4 Proposed Approach
The best practice for supporting the top-claim of safety arguments (i.e., thesystem is acceptably safe) is to show that the identified system hazards areadequately mitigated. We refer to this type of argument as a contrapositive ar-gument, since it refutes attempts to show that the system is unsafe. To build
A Systematic Approach to Justifying Sufficient Confidence in SoftwareSafety Arguments 307
this argument, one should first determine what could go wrong with this system(i.e., identify the system hazards). Similarly, the top claim for a confidence ar-gument is usually that sufficient confidence exists in an element E of the safetyargument. Such a claim can be supported by a contrapositive argument showingthat the identified assurance deficits associated with E are adequately miti-gated [11]. Extending the analogy, one should first determine the uncertaintiesassociated with the element (i.e., identify the assurance deficits). Following sys-tematic approaches helps in effectively identifying system hazards [1]. We believethat following a systematic approach would also help in effectively identifyingassurance deficits.
The proposed systematic approach to identifying the assurance deficits re-sults in the construction of positive confidence arguments. A positive argument isa direct argument that relies on the properties of the actions taken in the devel-opment (e.g., a well-established development process has been followed, a trustedtool has been used, etc.). This distinguishes our confidence arguments from thecontrapositive ones discussed above. We stress that the intent of our work is notto replace contrapositive arguments, but to aid in the identification of deficitsthat can then be argued over using a contrapositive argument. However, notethat if no deficits are identified through the construction of a positive argument,the resulting argument can be used as the requisite confidence argument.
We propose a common characteristics map to provide guidelines for system-atic construction for positive confidence arguments. Using the map, claims in thepositive confidence arguments can be decomposed until every goal is supportedby positive sufficient evidence. If all branches in the positive confidence argu-ments are supported by convinced evidence, that means all assurance deficitsare mitigated. For each goal in the resulting confidence arguments that cannotbe solved with sufficient evidence, an assurance deficit is identified and needs tobe addressed. After identifying the assurance deficits in this way, the confidencepattern [11] can be instantiated to demonstrate that the recognized assurancedeficits are managed.
5 The Common Characteristics Map
As given in [11], the overall confidence in a safety argument requires confidencearguments to be constructed for all context, all evidence and all inferences usedin the safety argument. There are several factors that influence our confidence insystem safety, such as appropriateness, independence, etc. In this paper, we con-centrate on one of these factors, namely trustworthiness. Trustworthiness (i.e.,the likelihood of freedom from errors) is a major factor that must be consideredin determining the assurance of evidence and contexts. According to [11], trust-worthiness is not a confidence factor for inferences. So the proposed work is usedfor context and evidence, but not inferences.
There are commonalities among contexts and evidences used within the soft-ware safety arguments. For example, software safety arguments are likely tocite tool-derived evidence. The tool qualification is one of the concerns for any
308 A. Ayoub, B. Kim, O. Sokolsky, and I. Lee
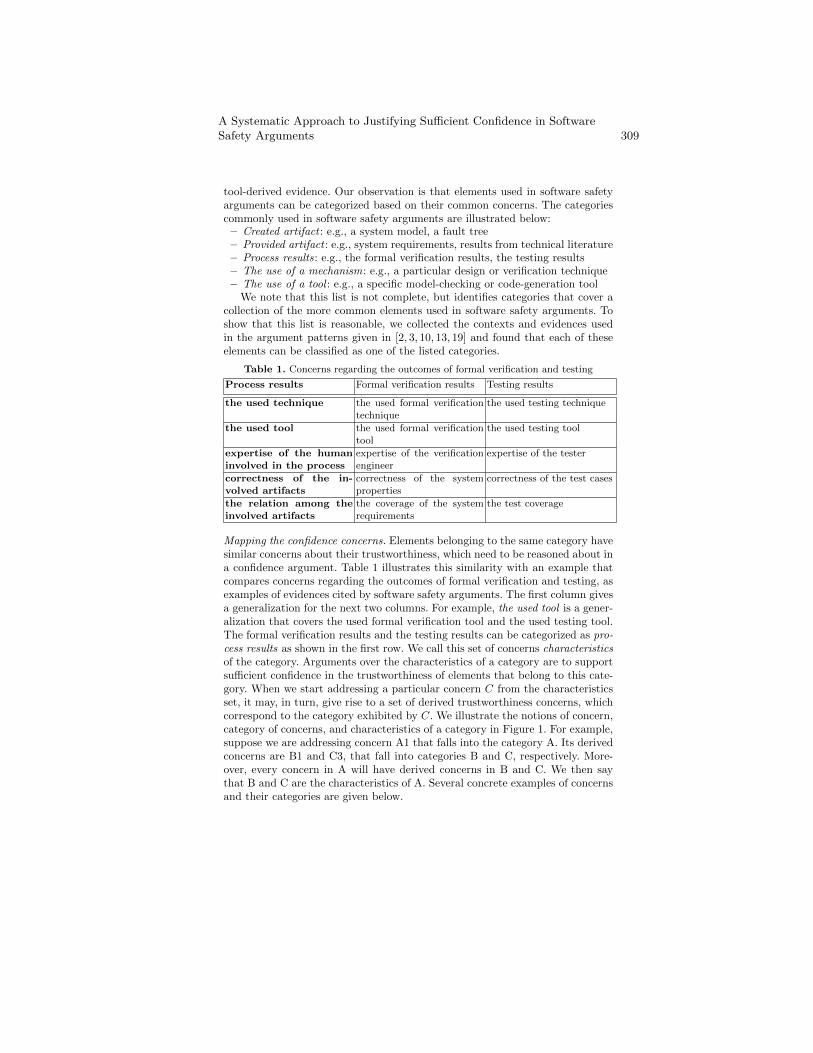
tool-derived evidence. Our observation is that elements used in software safetyarguments can be categorized based on their common concerns. The categoriescommonly used in software safety arguments are illustrated below:– Created artifact : e.g., a system model, a fault tree– Provided artifact : e.g., system requirements, results from technical literature– Process results: e.g., the formal verification results, the testing results– The use of a mechanism: e.g., a particular design or verification technique– The use of a tool : e.g., a specific model-checking or code-generation tool
We note that this list is not complete, but identifies categories that cover acollection of the more common elements used in software safety arguments. Toshow that this list is reasonable, we collected the contexts and evidences usedin the argument patterns given in [2, 3, 10, 13, 19] and found that each of theseelements can be classified as one of the listed categories.
Table 1. Concerns regarding the outcomes of formal verification and testing
Process results Formal verification results Testing results
the used technique the used formal verificationtechnique
the used testing technique
the used tool the used formal verificationtool
the used testing tool
expertise of the humaninvolved in the process
expertise of the verificationengineer
expertise of the tester
correctness of the in-volved artifacts
correctness of the systemproperties
correctness of the test cases
the relation among theinvolved artifacts
the coverage of the systemrequirements
the test coverage
Mapping the confidence concerns. Elements belonging to the same category havesimilar concerns about their trustworthiness, which need to be reasoned about ina confidence argument. Table 1 illustrates this similarity with an example thatcompares concerns regarding the outcomes of formal verification and testing, asexamples of evidences cited by software safety arguments. The first column givesa generalization for the next two columns. For example, the used tool is a gener-alization that covers the used formal verification tool and the used testing tool.The formal verification results and the testing results can be categorized as pro-cess results as shown in the first row. We call this set of concerns characteristicsof the category. Arguments over the characteristics of a category are to supportsufficient confidence in the trustworthiness of elements that belong to this cate-gory. When we start addressing a particular concern C from the characteristicsset, it may, in turn, give rise to a set of derived trustworthiness concerns, whichcorrespond to the category exhibited by C. We illustrate the notions of concern,category of concerns, and characteristics of a category in Figure 1. For example,suppose we are addressing concern A1 that falls into the category A. Its derivedconcerns are B1 and C3, that fall into categories B and C, respectively. More-over, every concern in A will have derived concerns in B and C. We then saythat B and C are the characteristics of A. Several concrete examples of concernsand their categories are given below.
A Systematic Approach to Justifying Sufficient Confidence in SoftwareSafety Arguments 309
This relationship between categories of concerns based on the notion of char-acteristics can be captured as a map. We constructed such a map, shown inFigure 3, that relates each category to its characteristics that need to be ar-gued about in order to justify sufficient confidence in elements that belong tothis category. Nodes in the map are categories, i.e., sets of concerns with simi-lar characteristics, where each characteristic is a derived concern, as illustratedabove. Solid arrows connect each node to the nodes that represent categories ofits characteristics. To address a claim about the trustworthiness in a node, weneed to argue over the trustworthiness in all nodes reached by solid arrows fromthis node. For example, to show that a process result is trustworthy, argumentabout trustworthiness in all aspects of this process should be given, which in-clude the use of a tool on which the process is based, the artifacts used in theprocess, etc. In turn, to address the claim about the trustworthiness in the useof a tool, we need to argue about the trustworthiness in the tool itself (the toolcategory), the person who used this tool (the human factor category), etc.
To show that a created artifact is trustworthy, argument about trustworthi-ness in its creation process should be given [9]. In addition, we need to arguethat the process of validating the artifact with respect to its requirements istrustworthy. For example, both the artifact creation process and validation re-sults exhibit the characteristics of the process results category and, for each, weshould explore the derived concerns of that category. The dotted arrows are usedin the map to demonstrate that the connected two nodes have the same char-acteristics. Note that we could eliminate dotted arrows altogether by combiningtogether the nodes connected by dotted arrows. However, we believe that keepingthem separate makes the map easier to follow and helps in map instantiation,described in Section 6.
Evaluation. The proposed common characteristics map guides to what shouldbe argued for the confidence in the trustworthiness. We say that the map is con-sidered reasonable if the concerns collected in the map cover at least all knownconcerns. As mentioned in Section 3, some existing work suggests questions to beasked and things to be considered for the trustworthiness factor. We collectedthe concerns and questions given in [11, 16, 19], and made sure that all theseconcerns and questions are covered in the common characteristics map. For ex-ample, concerns listed in [16] for trustworthiness are covered by the commoncharacteristics map as follows:
– Was the evidence gathered in accordance with any documented standard?This concern is covered by the category the use of a mechanism.
– Are the evidence-gathering personnel competent? Are they certified to anappropriate standard? Have they performed the tests before? These concernsare covered by the expertise of a person category.
– How valid are the assumptions and simplifications that were made? Thisconcern is covered by applicability of the tool assumptions and limitationsand applicability of the mechanism assumptions and limitations categories.
310 A. Ayoub, B. Kim, O. Sokolsky, and I. Lee
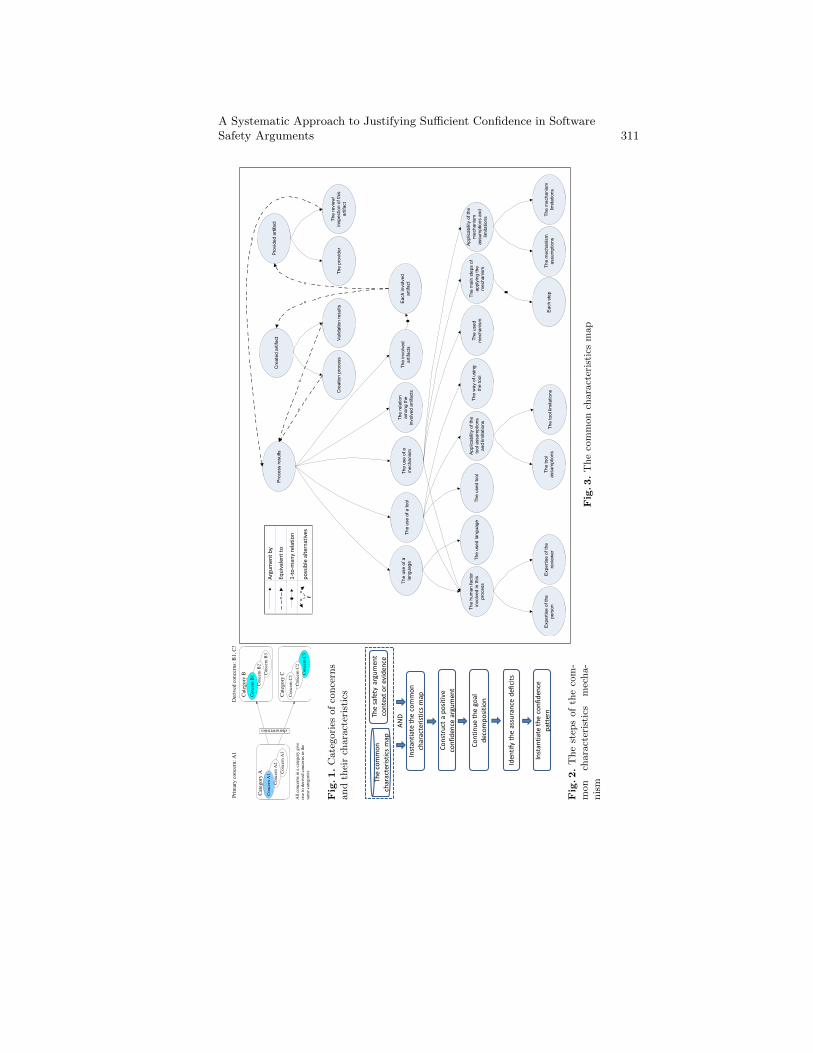
characteristics
Co
nce
rn A
1
Cat
egory
A
Co
nce
rn A
2
Co
nce
rn A
3
Cat
egory
B
Co
nce
rn B
1
Co
nce
rn B
2
Co
nce
rn B
3
Cat
egory
C
Co
nce
rn C
1
Co
nce
rn C
2
Co
nce
rn C
3
Pri
mar
y c
once
rn:
A1
All
co
nce
rns
in a
cat
ego
ry g
ive
sam
e ca
teg
ori
es
rise
to
der
ived
co
nce
rns
in t
he
Der
ived
conce
rns:
B1, C
3
Fig.1.
Cate
gori
esof
conce
rns
and
thei
rch
ara
cter
isti
cs
Iden
tify
th
e as
sura
nce
def
icit
s
The
safe
ty a
rgu
men
t co
nte
xt o
r ev
iden
ce
Inst
anti
ate
the
com
mo
n
char
acte
rist
ics
map
Co
nst
ruct
a p
osi
tive
co
nfi
den
ce a
rgu
men
t
AN
D
The
com
mo
n
char
acte
rist
ics
map
Co
nti
nu
e th
e go
al
dec
om
po
siti
on
Inst
anti
ate
the
con
fid
ence
p
atte
rn
Fig.2.
The
step
sof
the
com
-m
on
chara
cter
isti
csm
echa-
nis
m
Pro
vid
ed
art
ifa
ct T
he
re
vie
w/
insp
ectio
n o
f th
is
art
ifa
ct
Pro
ce
ss r
esu
lts
Th
e u
se
of a
me
ch
an
ism
Th
e u
se
of a
to
ol
Th
e h
um
an
fa
cto
r
invo
lve
d in
th
is
pro
ce
ss
Cre
ate
d a
rtifa
ct
Va
lida
tio
n r
esu
lts
Th
e u
se
d
me
ch
an
ism
Th
e m
ain
ste
ps o
f
ap
ply
ing
th
e
me
ch
an
ism
Th
e u
se
d to
ol
Th
e w
ay o
f u
sin
g
the
to
ol
Th
e to
ol
assu
mp
tio
ns
Th
e to
ol lim
ita
tio
ns
Ea
ch
ste
pE
xp
ert
ise
of th
e
revie
we
r
Exp
ert
ise
of th
e
pe
rso
n
=
Ea
ch
in
vo
lve
d
art
ifa
ct
==
Th
e u
se
of a
lan
gu
ag
e
Th
e in
vo
lve
d
art
ifa
cts
Th
e p
rovid
er
Cre
atio
n p
roce
ss
Th
e u
se
d la
ng
ua
ge
Th
e r
ela
tio
n
am
on
g th
e
invo
lve
d a
rtifa
cts
=
Ap
plic
ab
ility
of th
e
too
l a
ssu
mp
tio
ns
an
d lim
ita
tio
ns
Ap
plic
ab
ility
of th
e
me
ch
an
ism
assu
mp
tio
ns a
nd
limita
tio
ns
Th
e m
ech
an
ism
assu
mp
tio
ns
Th
e m
ech
an
ism
limita
tio
ns
=
Arg
um
ent
by
Equ
ival
ent
to
1-t
o-m
any
rela
tio
n
po
ssib
le a
lter
nat
ives
= ==
Fig.3.
The
com
mon
chara
cter
isti
csm
ap
A Systematic Approach to Justifying Sufficient Confidence in SoftwareSafety Arguments 311
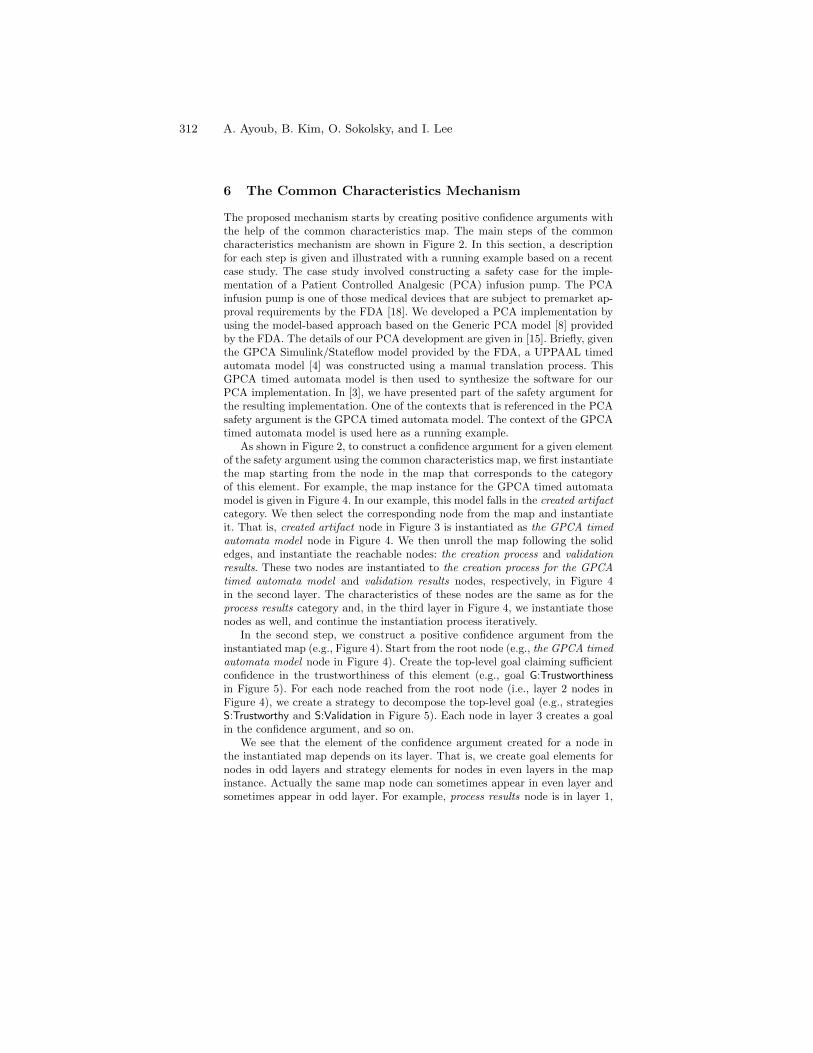
6 The Common Characteristics Mechanism
The proposed mechanism starts by creating positive confidence arguments withthe help of the common characteristics map. The main steps of the commoncharacteristics mechanism are shown in Figure 2. In this section, a descriptionfor each step is given and illustrated with a running example based on a recentcase study. The case study involved constructing a safety case for the imple-mentation of a Patient Controlled Analgesic (PCA) infusion pump. The PCAinfusion pump is one of those medical devices that are subject to premarket ap-proval requirements by the FDA [18]. We developed a PCA implementation byusing the model-based approach based on the Generic PCA model [8] providedby the FDA. The details of our PCA development are given in [15]. Briefly, giventhe GPCA Simulink/Stateflow model provided by the FDA, a UPPAAL timedautomata model [4] was constructed using a manual translation process. ThisGPCA timed automata model is then used to synthesize the software for ourPCA implementation. In [3], we have presented part of the safety argument forthe resulting implementation. One of the contexts that is referenced in the PCAsafety argument is the GPCA timed automata model. The context of the GPCAtimed automata model is used here as a running example.
As shown in Figure 2, to construct a confidence argument for a given elementof the safety argument using the common characteristics map, we first instantiatethe map starting from the node in the map that corresponds to the categoryof this element. For example, the map instance for the GPCA timed automatamodel is given in Figure 4. In our example, this model falls in the created artifactcategory. We then select the corresponding node from the map and instantiateit. That is, created artifact node in Figure 3 is instantiated as the GPCA timedautomata model node in Figure 4. We then unroll the map following the solidedges, and instantiate the reachable nodes: the creation process and validationresults. These two nodes are instantiated to the creation process for the GPCAtimed automata model and validation results nodes, respectively, in Figure 4in the second layer. The characteristics of these nodes are the same as for theprocess results category and, in the third layer in Figure 4, we instantiate thosenodes as well, and continue the instantiation process iteratively.
In the second step, we construct a positive confidence argument from theinstantiated map (e.g., Figure 4). Start from the root node (e.g., the GPCA timedautomata model node in Figure 4). Create the top-level goal claiming sufficientconfidence in the trustworthiness of this element (e.g., goal G:Trustworthinessin Figure 5). For each node reached from the root node (i.e., layer 2 nodes inFigure 4), we create a strategy to decompose the top-level goal (e.g., strategiesS:Trustworthy and S:Validation in Figure 5). Each node in layer 3 creates a goalin the confidence argument, and so on.
We see that the element of the confidence argument created for a node inthe instantiated map depends on its layer. That is, we create goal elements fornodes in odd layers and strategy elements for nodes in even layers in the mapinstance. Actually the same map node can sometimes appear in even layer andsometimes appear in odd layer. For example, process results node is in layer 1,
312 A. Ayoub, B. Kim, O. Sokolsky, and I. Lee
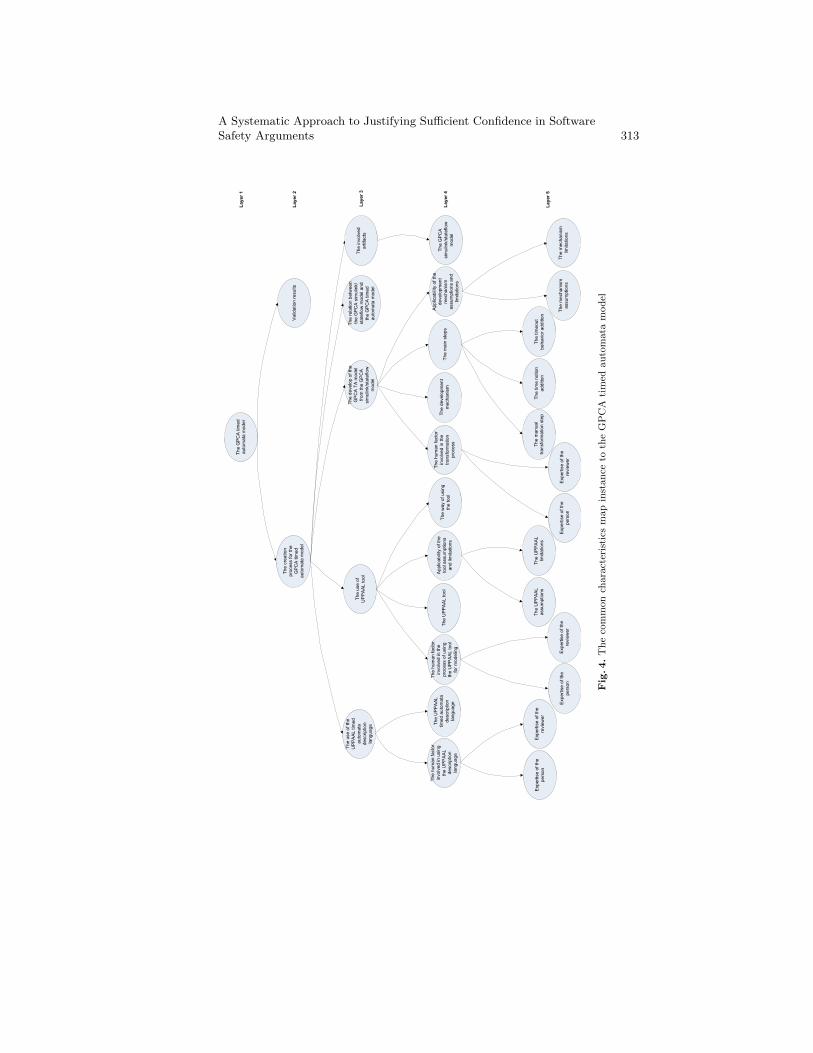
Th
e d
eve
lop
of th
e
GP
CA
TA
mo
de
l
fro
m th
e G
PC
A
sim
ulin
k/s
tate
flo
w
mo
de
l
Th
e u
se
of
UP
PA
AL
to
ol
Th
e h
um
an
fa
cto
r
invo
lve
d in
th
e
tra
nsfo
rma
tio
n
pro
ce
ss
Th
e G
PC
A tim
ed
au
tom
ata
mo
de
l
Va
lida
tio
n r
esu
lts
Th
e m
ain
ste
ps
Th
e m
an
ua
l
tra
nsfo
rma
tio
n s
tep
Exp
ert
ise
of th
e
revie
we
r
Exp
ert
ise
of th
e
pe
rso
n
Th
e u
se
of th
e
UP
PA
AL
tim
ed
au
tom
ata
de
scrip
tio
n
lan
gu
ag
e
Th
e h
um
an
fa
cto
r
invo
lve
d in
th
e
pro
ce
ss o
f u
sin
g
the
UP
PA
AL
to
ol
for
mo
de
ling
Exp
ert
ise
of th
e
revie
we
r
Exp
ert
ise
of th
e
pe
rso
n
Th
e U
PP
AA
L to
ol
Th
e h
um
an
fa
cto
r
invo
lve
d in
usin
g
the
UP
PA
AL
de
scrip
tio
n
lan
gu
ag
e
Exp
ert
ise
of th
e
revie
we
r
Exp
ert
ise
of th
e
pe
rso
n
Th
e tim
e n
otio
n
ad
ditio
n
Th
e tim
eo
ut
be
ha
vio
r a
dd
itio
n
Th
e c
rea
tio
n
pro
ce
ss fo
r th
e
GP
CA
tim
ed
au
tom
ata
mo
de
l
Th
e U
PP
AA
L
tim
ed
au
tom
ata
de
scrip
tio
n
lan
gu
ag
e
Th
e G
PC
A
sim
ulin
k/s
tate
flo
w
mo
de
l
Th
e w
ay o
f u
sin
g
the
to
ol
Th
e U
PP
AA
L
assu
mp
tio
ns
Th
e U
PP
AA
L
limita
tio
ns
Th
e d
eve
lop
me
nt
me
ch
an
ism
Th
e r
ela
tio
n b
etw
ee
n
the
GP
CA
sim
ulin
k/
sta
teflo
w m
od
el a
nd
the
GP
CA
tim
ed
au
tom
ata
mo
de
l
Th
e in
vo
lve
d
art
ifa
cts
Ap
plic
ab
ility
of th
e
too
l a
ssu
mp
tio
ns
an
d lim
ita
tio
ns
Ap
plic
ab
ility
of th
e
de
ve
lop
me
nt
me
ch
an
ism
assu
mp
tio
ns a
nd
limita
tio
ns
Th
e m
ech
an
ism
assu
mp
tio
ns
Th
e m
ech
an
ism
limita
tio
ns
La
ye
r 1
La
ye
r 2
La
ye
r 3
La
ye
r 4
La
ye
r 5
Fig.4.
The
com
mon
chara
cter
isti
csm
ap
inst
ance
toth
eG
PC
Ati
med
auto
mata
model
A Systematic Approach to Justifying Sufficient Confidence in SoftwareSafety Arguments 313
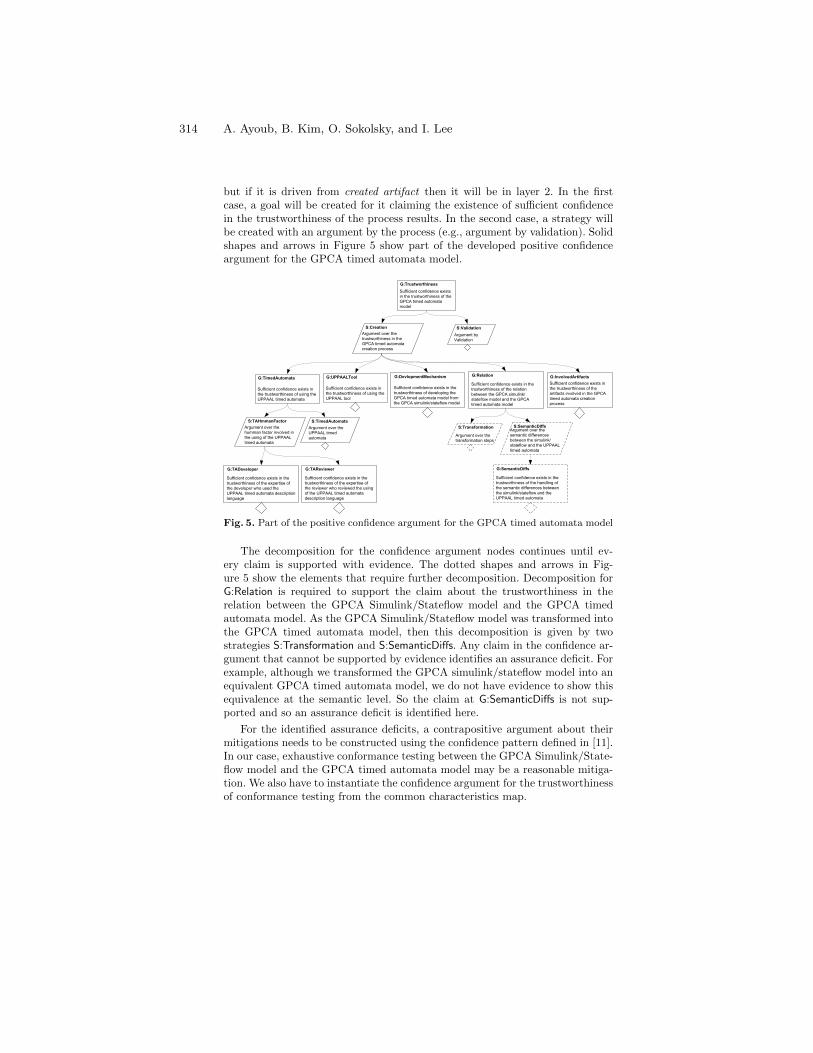
but if it is driven from created artifact then it will be in layer 2. In the firstcase, a goal will be created for it claiming the existence of sufficient confidencein the trustworthiness of the process results. In the second case, a strategy willbe created with an argument by the process (e.g., argument by validation). Solidshapes and arrows in Figure 5 show part of the developed positive confidenceargument for the GPCA timed automata model.
G:Trustworthiness
Sufficient confidence exists
in the trustworthiness of the
GPCA timed automata
model
S:Validation
Argument by
Validation
S:Creation
Argument over the
trustworthiness in the
GPCA timed automata
creation process
G:TimedAutomata
Sufficient confidence exists in
the trustworthiness of using the
UPPAAL timed automata
S:TAHmmanFactor
Argument over the
humman factor involved in
the using of the UPPAAL
timed automata
G:TADeveloper
Sufficient confidence exists in the
trustworthiness of the expertise of
the developer who used the
UPPAAL timed automata description
language
G:DevlopmentMechanism
Sufficient confidence exists in the
trustworthiness of developing the
GPCA timed automata model from
the GPCA simulink/stateflow model
G:TAReviewer
Sufficient confidence exists in the
trustworthiness of the expertise of
the reviewer who reviewed the using
of the UPPAAL timed automata
description language
S:TimedAutomata
Argument over the
UPPAAL timed
automata
G:UPPAALTool
Sufficient confidence exists in
the trustworthiness of using the
UPPAAL tool
G:Relation
Sufficient confidence exists in the
trustworthiness of the relation
between the GPCA simulink/
stateflow model and the GPCA
timed automata model
G:InvolvedArtifacts
Sufficient confidence exists in
the trustworthiness of the
artifacts involved in the GPCA
timed automata creation
process
S:Transformation
Argument over the
transformation steps
S:SemanticDiffsArgument over the
semantic differences
between the simulink/
stateflow and the UPPAAL
timed automata
G:SemanticDiffs
Sufficient confidence exists in the
trustworthiness of the handling of
the semantic differences between
the simulink/stateflow and the
UPPAAL timed automata
Fig. 5. Part of the positive confidence argument for the GPCA timed automata model
The decomposition for the confidence argument nodes continues until ev-ery claim is supported with evidence. The dotted shapes and arrows in Fig-ure 5 show the elements that require further decomposition. Decomposition forG:Relation is required to support the claim about the trustworthiness in therelation between the GPCA Simulink/Stateflow model and the GPCA timedautomata model. As the GPCA Simulink/Stateflow model was transformed intothe GPCA timed automata model, then this decomposition is given by twostrategies S:Transformation and S:SemanticDiffs. Any claim in the confidence ar-gument that cannot be supported by evidence identifies an assurance deficit. Forexample, although we transformed the GPCA simulink/stateflow model into anequivalent GPCA timed automata model, we do not have evidence to show thisequivalence at the semantic level. So the claim at G:SemanticDiffs is not sup-ported and so an assurance deficit is identified here.
For the identified assurance deficits, a contrapositive argument about theirmitigations needs to be constructed using the confidence pattern defined in [11].In our case, exhaustive conformance testing between the GPCA Simulink/State-flow model and the GPCA timed automata model may be a reasonable mitiga-tion. We also have to instantiate the confidence argument for the trustworthinessof conformance testing from the common characteristics map.
314 A. Ayoub, B. Kim, O. Sokolsky, and I. Lee
7 Discussion
Observations. The proposed common characteristics map is not complete andso it should not be used blindly. The generated confidence arguments may re-quire additional elements. In particular, generated goals and strategies may needcontexts, assumptions, and/or justifications. For example, a justification node,stating that the GPCA timed automata model was developed from the GPCASimulink/Stateflow model using a careful transformation process [15], should beconnected to goal G:DevelopmentMechanism in Figure 5. Note that if any contextor assumption is added then argument about sufficient confidence in it shouldbe also considered.
Nodes in the map instance cannot be omitted at will during the confidenceargument construction. Otherwise, confidence in the trustworthiness of the el-ement under concern is questionable and that identifies a potential assurancedeficit. For example, if tool assumptions are not known, the tool assumptionsnode indicates a weakness that should be addressed. However, not every pos-sible derived concern has to be present. If we decide to omit a branch in theinstantiation, we have to supply appropriate justification.Limitations. The common characteristics map presented in this paper coversonly the trustworthiness factor. However, similar maps can be constructed forother factors such as appropriateness. To do this, we need to identity categoriesof appropriateness concerns and their characteristics. We leave this as our futurework. The common characteristics mechanism is not an automatic approach, i.e.,it needs human interactions and decisions (e.g., what nodes can be ignored withjustification and what parts should be added as mentioned above).
While the structure of the argument is directly derived from the map in-stance, the created goals and strategies still need to be formulated correctly. Forexample, goal G:TADeveloper in Figure 5 is derived from the node expertise ofthe person in Figure 4. The statement of the goal in G:TADeveloper is formed asa proposition following the rules given in [12].
8 Conclusions
It is important to identify the assurance deficits and manage them to show suffi-cient confidence in the safety argument. In this paper, we propose an approach tosystematically construct confidence arguments and identify the assurance deficitsin software safety arguments. Although the proposed mechanism does not guar-antee to identify all assurance deficits, it helps to identify deficits that may havebeen overlooked otherwise. Similarly, following systematic hazard identificationmechanisms does not guarantee that all hazards are identified.
The paper focuses on constructing positive confidence arguments with thehelp of a proposed map. However, the map can also be used in the reviewingprocess to help regulators identify gaps in submitted confidence arguments.
Our preliminary experience of applying the proposed approach has revealedthat the common characteristics mechanism yields the expected benefits in ex-ploring important uncovered assurance deficits in software safety arguments.
A Systematic Approach to Justifying Sufficient Confidence in SoftwareSafety Arguments 315
References
1. Federal Aviation Administration. FAA System Safety Handbook, Chapter 8: SafetyAnalysis/Hazard Analysis Tasks . System, 40(4), 2000.
2. R. Alexander, T. Kelly, Z. Kurd, and J. Mcdermid. Safety Cases for AdvancedControl Software: Safety Case Patterns. Technical report, University of York,2007.
3. A. Ayoub, B. Kim, I. Lee, and O. Sokolsky. A Safety Case Pattern for Model-BasedDevelopment Approach. In NFM2012, pages 223–243, Virginia, USA, 2012.
4. G. Behrmann, A. David, and K. Larsen. A tutorial on UPPAAL. In FormalMethods for the Design of Real-Time Systems, LNCS, pages 200–237, 2004.
5. R. Bloomfield, B. Littlewood, and D. Wright. Confidence: Its Role in DependabilityCases for Risk Assessment. In Dependable Systems and Networks, 2007. DSN ’07.37th Annual IEEE/IFIP International Conference on, pages 338 –346, 2007.
6. L. Cyra and J. Gorski. Expert Assessment of Arguments: A Method and ItsExperimental Evaluation. In Computer Safety, Reliability, and Security, 27th In-ternational Conference, SAFECOMP, 2008.
7. E. Denney, G. Pai, and I. Habli. Towards Measurement of Confidence in SafetyCases. In International Symposium on Empirical Software Engineering and Mea-surement (ESEM’11), Washington, DC, USA, 2011. IEEE Computer Society.
8. The Generic Patient Controlled Analgesia Pump Model.http://rtg.cis.upenn.edu/gip.php3.
9. I. Habli and T. Kelly. Achieving Integrated Process and Product Safety Arguments.In the 15th Safety Critical Systems Symposium (SSS’07). Springer, 2007.
10. R. Hawkins and T. Kelly. Software Safety Assurance – What Is Sufficient? In 4thIET International Conference of System Safety, 2009.
11. R. Hawkins, T. Kelly, J. Knight, and P. Graydon. A New Approach to creatingClear Safety Arguments. In 19th Safety Critical Systems Symposium (SSS’11),pages 3–23. Springer London, 2011.
12. T. Kelly. A six-step Method for Developing Arguments in the Goal StructuringNotation (GSN). Technical report, York Software Engineering, UK, 1998.
13. T. Kelly. Arguing safety – a systematic approach to managing safety cases. PhDthesis, Department of Computer Science, University of York, 1998.
14. T. Kelly. Reviewing Assurance Arguments – A Step-by-Step Approach. In Work-shop on Assurance Cases for Security - The Metrics Challenge, Dependable Systemsand Networks (DSN), 2007.
15. B. Kim, A. Ayoub, O. Sokolsky, P. Jones, Y. Zhang, R. Jetley, and I. Lee. Safety-Assured Development of the GPCA Infusion Pump Software. In EMSOFT, pages155–164, Taipei, Taiwan, 2011.
16. C. Menon, R. Hawkins, and J. McDermid. Defence standard 00-56 issue 4: Towardsevidence-based safety standards. In Safety-Critical Systems: Problems, Process andPractice, pages 223–243. Springer London, 2009.
17. Ministry of Defence (MoD) UK. Defence Stanandard 00-56 Issue 4: Safety Man-agement Requirements for Defence Systems, 2007.
18. U.S. Food and Drug Administration, Center for Devices and Radiological Health.Guidance for Industry and FDA Staff - Total Product Life Cycle: Infusion Pump- Premarket Notification [510(k)] Submissions, April 2010.
19. R. Weaver. The Safety of Software - Constructing and Assuring Arguments. PhDthesis, Department of Computer Science, University of York, 2003.
20. F. Ye. Contract-based justification for COTS component within safety-critical ap-plications. PhD thesis, Department of Computer Science, University of York, 2005.
316 A. Ayoub, B. Kim, O. Sokolsky, and I. Lee
Determining Potential Errors in Tool Chains
Strategies to Reach Tool Confidence According to ISO 26262
Martin Wildmoser, Jan Philipps and Oscar Slotosch
Validas AG, Munich, Germany
{wildmoser,philipps,slotosch}@validas.de
Abstract. Due to failures of software tools faults compromising the safety of
the developed items may either be injected or not detected. Thus the safety
norm for road vehicles, ISO 26262, requires to evaluate all software tools by
identifying potential tool failures and measures to detect or avoid them. The re-
sult is a tool confidence level for each tool, which determines if and how a tool
needs to be qualified. This paper focuses on tool failure identification and pro-
poses two strategies for this task. The function-based strategy derives potential
tool failures from a functional decomposition of the tool. The artifact-based
strategy analyzes artifacts only. We introduce an analysis tool to support these
strategies and discuss their ability to produce lists of failures that are compre-
hensive, uniform and adequately abstract. This discussion is based on our expe-
rience with these strategies in a large scale industrial project.
Keywords: ISO 26262, Tool Chain Analysis, Tool Qualification, HAZOP, po-
tential tool failure, potential tool error
1 Introduction
The use of software to control technical systems – machinery, aircraft, cars - carries
risks in that software defects may endanger life and property. Safety standards, such
as the recent ISO 26262 [1] for the automotive domain aim to mitigate these risks
through a combination of demands on organization, structure and development meth-
ods. These standards and the practices they encode can also be seen as a sign of ma-
turity, a shift from an anything-goes attitude of programming to a more disciplined
engineering approach to software development.
As in any discipline, with growing maturity more emphasis is put not only on the
way of working, but also on the tools used. In safety standards, we can observe a
similar development. Earlier standards put only little emphasis on tool use, perhaps
roughly demanding an argument that each tool be "fit for use", mainly for tools used
in generating or transforming code or in testing software or systems. Recent stand-
ards, such as the ISO 26262 take a more holistic viewpoint. Not only tools, but also
their use in the development process must be analyzed, risks identified and counter-
measures employed. In this line of thinking, also requirement management tools,
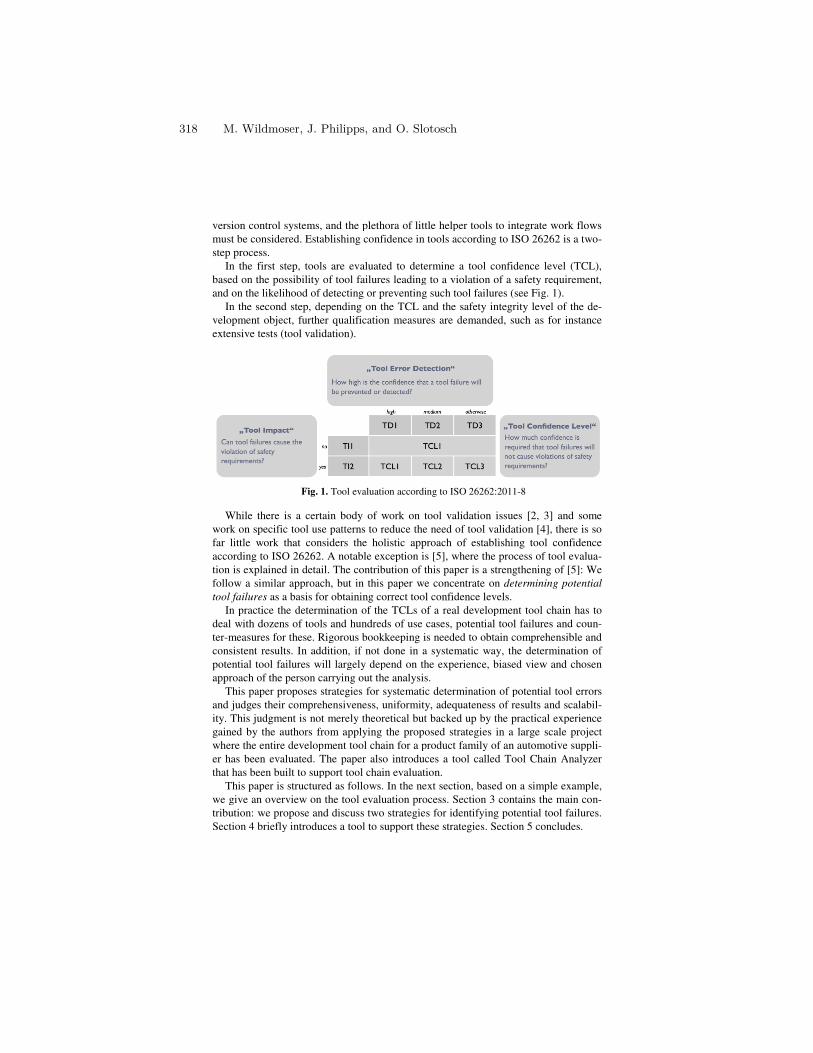
version control systems, an
must be considered. Establishing confidence in tools according to
step process.
In the first step, tools are evaluated
based on the possibility of
and on the likelihood of detecting
In the second step, depending on the TCL
velopment object, further qualification measures are demanded, such as for instance
extensive tests (tool valid
Fig
While there is a certain body
work on specific tool use patterns to reduce t
far little work that considers the holistic approach of
according to ISO 26262. A notable exception is
tion is explained in detail. The contribution of this paper is a strengthening of
follow a similar approach, but in this paper we concentrate on
tool failures as a basis for
In practice the determination of the TCLs of a real development tool chain has to
deal with dozens of tools and hundreds of
ter-measures for these. Rigorous bookkeepin
consistent results. In addi
potential tool failures will largely depend on the
approach of the person carrying out the analysis.
This paper proposes
and judges their comprehensiveness, uniform
ity. This judgment is not merely the
gained by the authors
where the entire development tool chain
er has been evaluated.
that has been built to suppo
This paper is structured as fo
we give an overview o
tribution: we propose and discuss two
Section 4 briefly introduces a tool to sup
version control systems, and the plethora of little helper tools to integrate work flows
Establishing confidence in tools according to ISO 26262 is a two
In the first step, tools are evaluated to determine a tool confidence level
ity of tool failures leading to a violation of a safety requirement,
and on the likelihood of detecting or preventing such tool failures (see Fig. 1
step, depending on the TCL and the safety integrity level of the d
velopment object, further qualification measures are demanded, such as for instance
extensive tests (tool validation).
Fig. 1. Tool evaluation according to ISO 26262:2011-8
While there is a certain body of work on tool validation issues [2, 3]
work on specific tool use patterns to reduce the need of tool validation [4], there is so
far little work that considers the holistic approach of establishing tool confidence
according to ISO 26262. A notable exception is [5], where the process of tool evalu
tail. The contribution of this paper is a strengthening of
proach, but in this paper we concentrate on determining potential
basis for obtaining correct tool confidence levels.
In practice the determination of the TCLs of a real development tool chain has to
deal with dozens of tools and hundreds of use cases, potential tool failures and cou
measures for these. Rigorous bookkeeping is needed to obtain comprehensi
results. In addition, if not done in a systematic way, the determination
ures will largely depend on the experience, biased view and chosen
approach of the person carrying out the analysis.
es strategies for systematic determination of potential tool errors
and judges their comprehensiveness, uniformity, adequateness of results and scalabi
is not merely theoretical but backed up by the practical experience
by the authors from applying the proposed strategies in a large scale
where the entire development tool chain for a product family of an automotive suppl
has been evaluated. The paper also introduces a tool called Tool Chain A
that has been built to support tool chain evaluation.
This paper is structured as follows. In the next section, based on a simple example,
we give an overview on the tool evaluation process. Section 3 contains the main co
tribution: we propose and discuss two strategies for identifying potential tool
briefly introduces a tool to support these strategies. Section 5 concludes.
d the plethora of little helper tools to integrate work flows
ISO 26262 is a two-
to determine a tool confidence level (TCL),
leading to a violation of a safety requirement,
1).
ety integrity level of the de-
velopment object, further qualification measures are demanded, such as for instance
and some
, there is so
confidence
cess of tool evalua-
tail. The contribution of this paper is a strengthening of [5]: We
determining potential
In practice the determination of the TCLs of a real development tool chain has to
tool failures and coun-
is needed to obtain comprehensible and
mination of
and chosen
potential tool errors
and scalabil-
experience
large scale project
for a product family of an automotive suppli-
a tool called Tool Chain Analyzer
lows. In the next section, based on a simple example,
contains the main con-
tool failures.
cludes.
318 M. Wildmoser, J. Philipps, and O. Slotosch
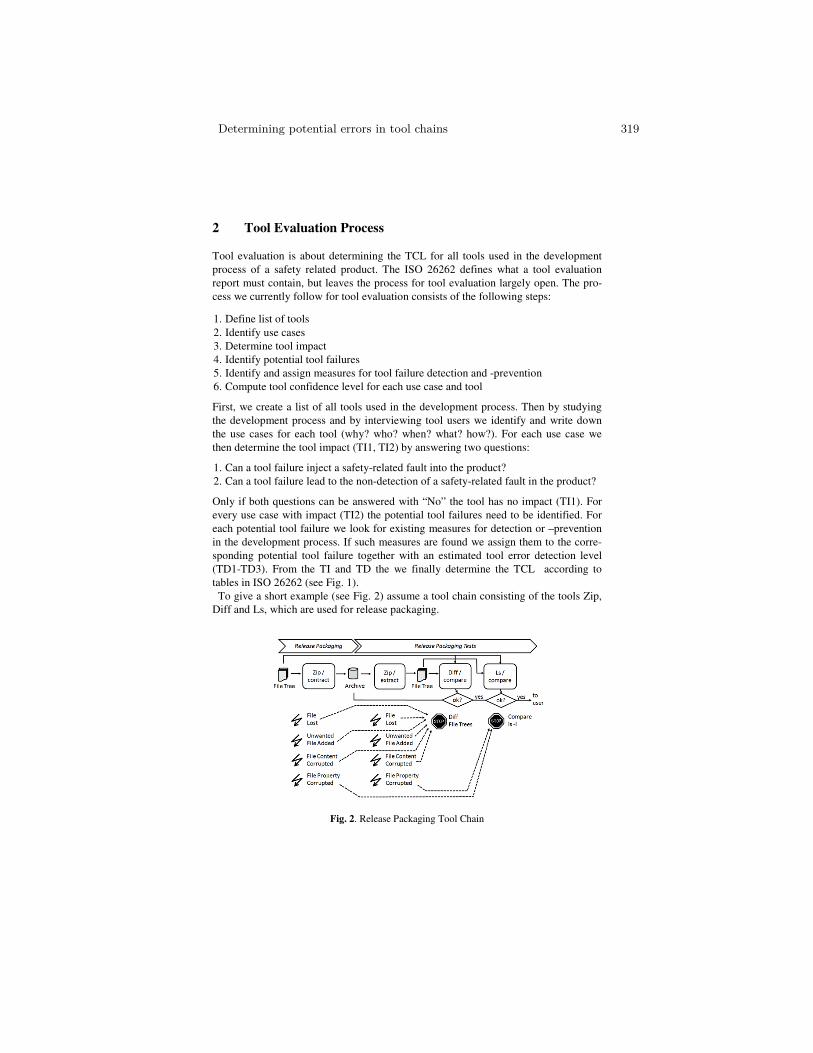
2 Tool Evaluation Process
Tool evaluation is about determining the TCL for all tools used in the development
process of a safety related product. The ISO 26262 defines what a tool evaluation
report must contain, but leaves the process for tool evaluation largely open. The pro-
cess we currently follow for tool evaluation consists of the following steps:
1. Define list of tools
2. Identify use cases
3. Determine tool impact
4. Identify potential tool failures
5. Identify and assign measures for tool failure detection and -prevention
6. Compute tool confidence level for each use case and tool
First, we create a list of all tools used in the development process. Then by studying
the development process and by interviewing tool users we identify and write down
the use cases for each tool (why? who? when? what? how?). For each use case we
then determine the tool impact (TI1, TI2) by answering two questions:
1. Can a tool failure inject a safety-related fault into the product?
2. Can a tool failure lead to the non-detection of a safety-related fault in the product?
Only if both questions can be answered with “No” the tool has no impact (TI1). For
every use case with impact (TI2) the potential tool failures need to be identified. For
each potential tool failure we look for existing measures for detection or –prevention
in the development process. If such measures are found we assign them to the corre-
sponding potential tool failure together with an estimated tool error detection level
(TD1-TD3). From the TI and TD the we finally determine the TCL according to
tables in ISO 26262 (see Fig. 1).
To give a short example (see Fig. 2) assume a tool chain consisting of the tools Zip,
Diff and Ls, which are used for release packaging.
Fig. 2. Release Packaging Tool Chain
Determining potential errors in tool chains 319
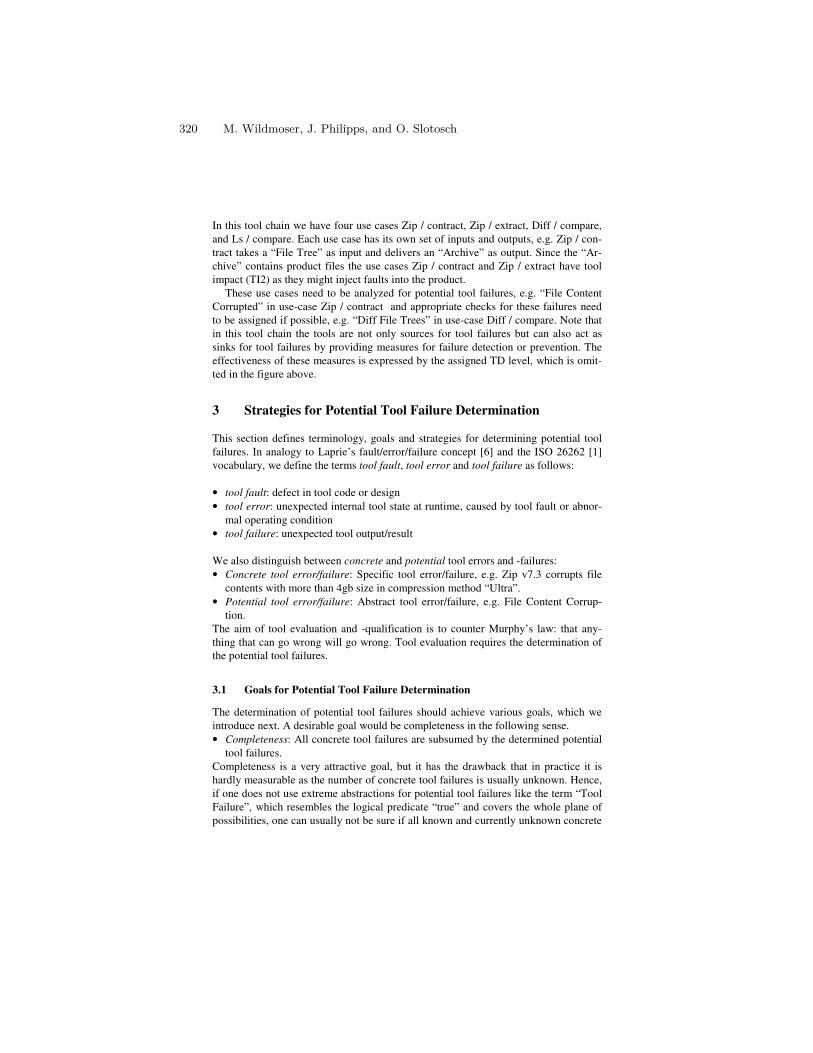
In this tool chain we have four use cases Zip / contract, Zip / extract, Diff / compare,
and Ls / compare. Each use case has its own set of inputs and outputs, e.g. Zip / con-
tract takes a “File Tree” as input and delivers an “Archive” as output. Since the “Ar-
chive” contains product files the use cases Zip / contract and Zip / extract have tool
impact (TI2) as they might inject faults into the product.
These use cases need to be analyzed for potential tool failures, e.g. “File Content
Corrupted” in use-case Zip / contract and appropriate checks for these failures need
to be assigned if possible, e.g. “Diff File Trees” in use-case Diff / compare. Note that
in this tool chain the tools are not only sources for tool failures but can also act as
sinks for tool failures by providing measures for failure detection or prevention. The
effectiveness of these measures is expressed by the assigned TD level, which is omit-
ted in the figure above.
3 Strategies for Potential Tool Failure Determination
This section defines terminology, goals and strategies for determining potential tool
failures. In analogy to Laprie’s fault/error/failure concept [6] and the ISO 26262 [1]
vocabulary, we define the terms tool fault, tool error and tool failure as follows:
• tool fault: defect in tool code or design
• tool error: unexpected internal tool state at runtime, caused by tool fault or abnor-
mal operating condition
• tool failure: unexpected tool output/result
We also distinguish between concrete and potential tool errors and -failures:
• Concrete tool error/failure: Specific tool error/failure, e.g. Zip v7.3 corrupts file
contents with more than 4gb size in compression method “Ultra”.
• Potential tool error/failure: Abstract tool error/failure, e.g. File Content Corrup-
tion.
The aim of tool evaluation and -qualification is to counter Murphy’s law: that any-
thing that can go wrong will go wrong. Tool evaluation requires the determination of
the potential tool failures.
3.1 Goals for Potential Tool Failure Determination
The determination of potential tool failures should achieve various goals, which we
introduce next. A desirable goal would be completeness in the following sense.
• Completeness: All concrete tool failures are subsumed by the determined potential
tool failures.
Completeness is a very attractive goal, but it has the drawback that in practice it is
hardly measurable as the number of concrete tool failures is usually unknown. Hence,
if one does not use extreme abstractions for potential tool failures like the term “Tool
Failure”, which resembles the logical predicate “true” and covers the whole plane of
possibilities, one can usually not be sure if all known and currently unknown concrete
320 M. Wildmoser, J. Philipps, and O. Slotosch
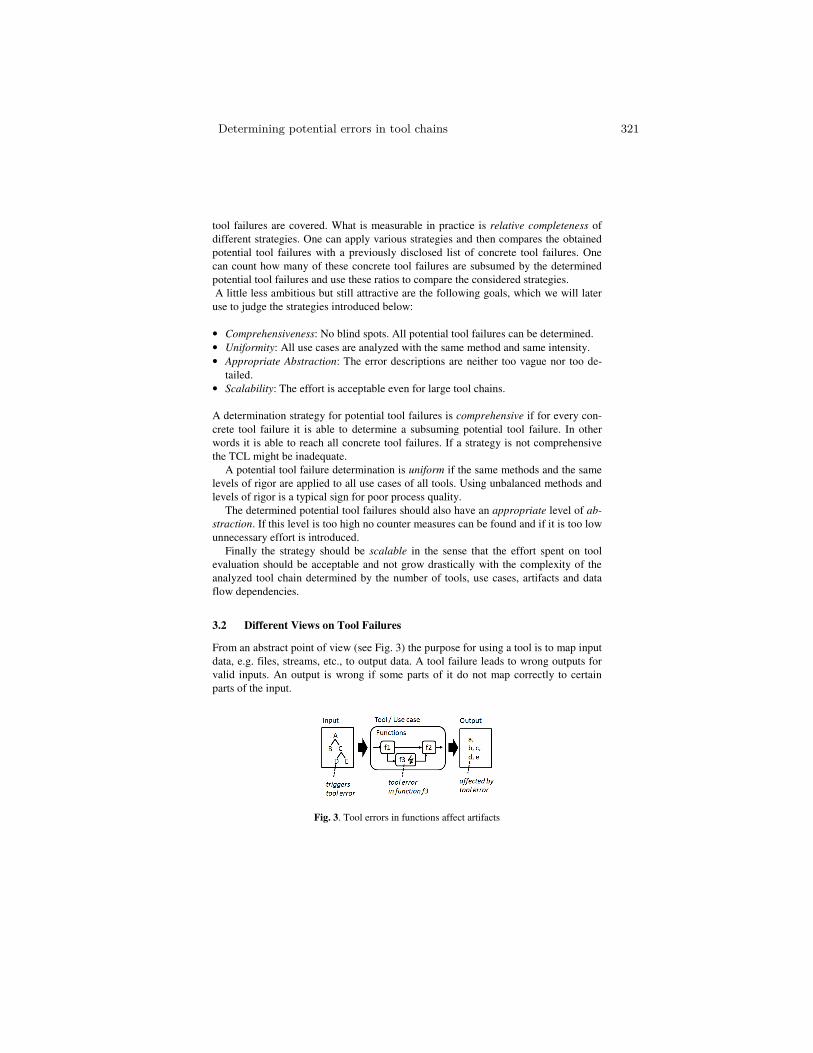
tool failures are covered. What is measurable in practice is relative completeness of
different strategies. One can apply various strategies and then compares the obtained
potential tool failures with a previously disclosed list of concrete tool failures. One
can count how many of these concrete tool failures are subsumed by the determined
potential tool failures and use these ratios to compare the considered strategies.
A little less ambitious but still attractive are the following goals, which we will later
use to judge the strategies introduced below:
• Comprehensiveness: No blind spots. All potential tool failures can be determined.
• Uniformity: All use cases are analyzed with the same method and same intensity.
• Appropriate Abstraction: The error descriptions are neither too vague nor too de-
tailed.
• Scalability: The effort is acceptable even for large tool chains.
A determination strategy for potential tool failures is comprehensive if for every con-
crete tool failure it is able to determine a subsuming potential tool failure. In other
words it is able to reach all concrete tool failures. If a strategy is not comprehensive
the TCL might be inadequate.
A potential tool failure determination is uniform if the same methods and the same
levels of rigor are applied to all use cases of all tools. Using unbalanced methods and
levels of rigor is a typical sign for poor process quality.
The determined potential tool failures should also have an appropriate level of ab-
straction. If this level is too high no counter measures can be found and if it is too low
unnecessary effort is introduced.
Finally the strategy should be scalable in the sense that the effort spent on tool
evaluation should be acceptable and not grow drastically with the complexity of the
analyzed tool chain determined by the number of tools, use cases, artifacts and data
flow dependencies.
3.2 Different Views on Tool Failures
From an abstract point of view (see Fig. 3) the purpose for using a tool is to map input
data, e.g. files, streams, etc., to output data. A tool failure leads to wrong outputs for
valid inputs. An output is wrong if some parts of it do not map correctly to certain
parts of the input.
Fig. 3. Tool errors in functions affect artifacts
Determining potential errors in tool chains 321
One the other hand tool failures are caused by errors in tool functions. For example an
error occurring in a function f3 might lead to a wrong mapping of input part D to
output part d. In order to describe a tool failure one can take two angles of view:
• describe what goes wrong inside the tool, e.g. error in function f3.
• describe what is wrong in the produced outputs, e.g. wrong part d in output file.
In the first description technique one refers to the internals of the tool, that is func-
tions needed to accomplish the use case, whereas in the second one refers to proper-
ties or structure of the output data. Both descriptions may in addition refer to the
properties of tool inputs that trigger the error. Note that both descriptions refer to the
same tool failure. They mainly characterize this tool failure from different views.
These two views give rise for two tool failure determination strategies: Analyze
what can go wrong in a tool or analyze what can be wrong with the artifacts.
The first strategy systematically refines the abstract error “Tool Failure” by analyz-
ing the functions in the tool. We call this strategy Function-based failure determina-
tion. The second strategy only looks at the output data of tools and we call it thus
Artifact-based failure determination. By going along the structure of output data one
can systematically refine the abstract error “Artifact broken” into more concrete po-
tential tool failures, e.g. output part d broken.
3.3 Function-based Strategy for Potential Tool Failure Determination
The function-based strategy analyses what can go wrong inside a tool and does this by
decomposing the tool functionally. In this case functions can either be conceptual, e.g.
sorting in a database, or in case the architecture or code of the tool are known also
modeled from the internal structure of the tool.
Note that the same functions may take part in different use cases. There are also
functions that are used by many tools for standard activities, e.g. “Iterating Files”, and
we call these standard functions. Standard functions characterize the tools and cause
typical sets of potential tool errors. For examples in tools with the standard function
“Iterating Files”, typical tool errors are “File Lost” or “Unwanted File Added”.
For each function or standard function we can associate a set of potential tool er-
rors that may occur in tools having this function.
Once the sets of potential tool errors for functions and standard functions are de-
fined, the function-based strategy essentially becomes a matter of selecting the appro-
priate functions or standard functions for each use case (see Fig. 4).
The potential tool errors for a use case are simply the union of the sets of potential
tool errors of the functions selected for this use case. Sometimes similar tool errors
are introduced from different functions.
Hence, after this selection phase the set of potential tool errors for a use case needs
to be consolidated by subsuming similar tool errors. By now the function-based strat-
egy has produced sets of potential tool errors, but the aim of tool evaluation is to
determine potential tool failures. Only the externally observable effects of tool errors
in terms of wrong artifacts being produced matter. To transform the set of potential
322 M. Wildmoser, J. Philipps, and O. Slotosch
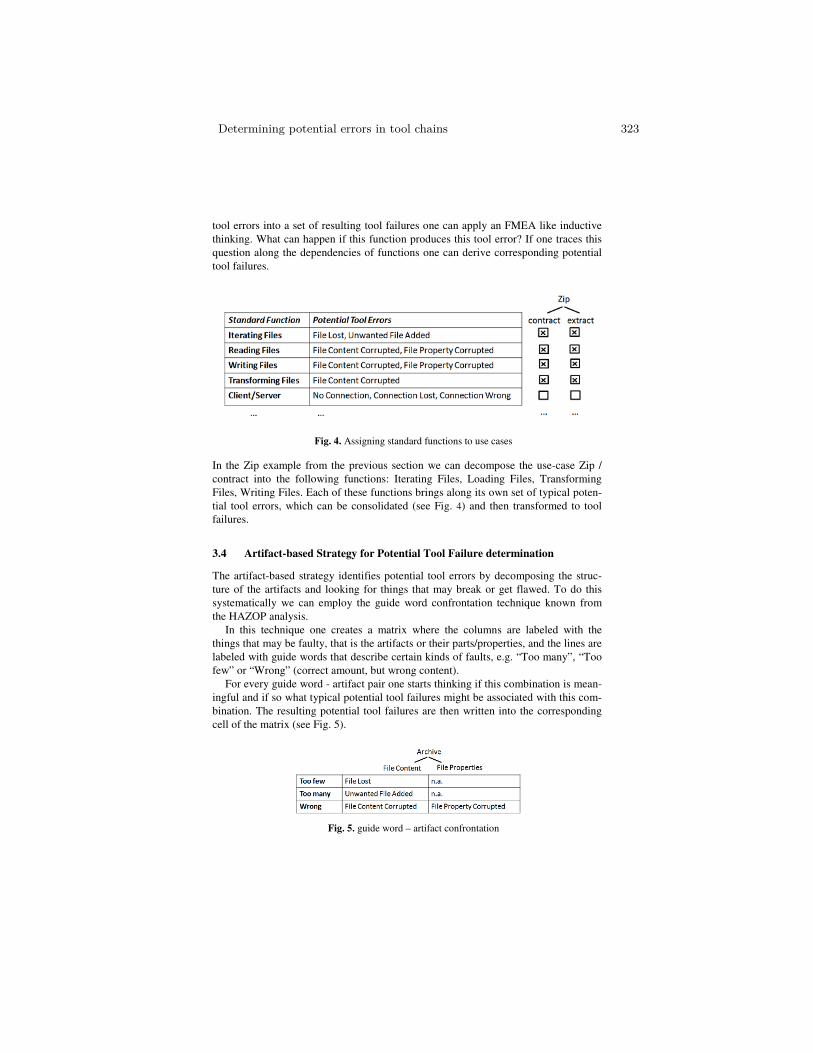
tool errors into a set of resulting tool failures one can apply an FMEA like inductive
thinking. What can happen if this function produces this tool error? If one traces this
question along the dependencies of functions one can derive corresponding potential
tool failures.
Fig. 4. Assigning standard functions to use cases
In the Zip example from the previous section we can decompose the use-case Zip /
contract into the following functions: Iterating Files, Loading Files, Transforming
Files, Writing Files. Each of these functions brings along its own set of typical poten-
tial tool errors, which can be consolidated (see Fig. 4) and then transformed to tool
failures.
3.4 Artifact-based Strategy for Potential Tool Failure determination
The artifact-based strategy identifies potential tool errors by decomposing the struc-
ture of the artifacts and looking for things that may break or get flawed. To do this
systematically we can employ the guide word confrontation technique known from
the HAZOP analysis.
In this technique one creates a matrix where the columns are labeled with the
things that may be faulty, that is the artifacts or their parts/properties, and the lines are
labeled with guide words that describe certain kinds of faults, e.g. “Too many”, “Too
few” or “Wrong” (correct amount, but wrong content).
For every guide word - artifact pair one starts thinking if this combination is mean-
ingful and if so what typical potential tool failures might be associated with this com-
bination. The resulting potential tool failures are then written into the corresponding
cell of the matrix (see Fig. 5).
Fig. 5. guide word – artifact confrontation
Determining potential errors in tool chains 323
Sometimes the potential tool failures that come out of such an analysis are too
coarse. A way out is often to further decompose the artifacts by their structure or
some other properties and then to confront each part/property with the guide words
again.
In our case we can decompose the artifact “Archive” into the parts “File Content”
and “File Properties”. By doing this we do not end up with the potential tool failure
“File Corrupted”, but with two finer potential tool failures “File Content Corrupted”
and “File Properties Corrupted”, which can now be detected by different measures,
e.g. “Diff File Trees” and “Compare ls -l” (see Fig. 2).
3.5 Do these Strategies Achieve the Goals?
Above we have stated comprehensiveness, uniformity, adequate error abstractions
and scalability as goals for potential tool failure determination. As every tool failure
that is of interest must have a cause inside the tool and an effect on some artifact out-
side the tool, both strategies can principally identify every potential tool failure.
Hence, both strategies are comprehensive.
Since both strategies use systematic confrontation techniques (standard function to
use-cases, guide word to artifact) they can also be regarded as uniform.
According to our practical experience the abstractions of the identified potential
tool failures are often inadequate in both strategies. Sometimes the descriptions are
too coarse, e.g. “File Fault”, and one cannot assign an appropriate detection or pre-
vention measure. Sometimes the descriptions are unnecessarily detailed and one ends
up with many slightly different tool failure descriptions that all can be handled by the
same detection or prevention measure. In our tool chain example the function-based
strategy in practice tends to give us many versions of the failure “File Content Cor-
rupted” depending on the function that has failed, e.g. “File Content Corrupted due to
false reading”. In the end it does not matter if the corruption happens while reading,
transforming, or writing files as all these corruptions can be detected by the same
check (Diff File Trees).
Nevertheless there is a way to deal with inadequate abstractions. If appropriate
measures for detection or prevention are in sight, but the current failure descriptions
are too coarse for them one can refine the decomposition of functions or artifacts and
re-apply the identification strategy for potential tool failures.
If the tool failure descriptions are too detailed one can subsume a multitude of de-
tailed descriptions with one more abstract tool failure description. If we include the
decomposition refinement and the failure consolidation as a post processing step for
both strategies, we can achieve the goal of having failure descriptions with an ade-
quate level of abstraction.
What about scalability? In theory both strategies should scale well for large tool
chains as they only analyze isolated pieces of a tool chain, one tool/use-case or one
artifact at a time. In practice we observed the function-based strategy to cause signifi-
cantly more effort. One reason was tool error consolidation. We typically had to as-
sign many standard functions to use cases and ended up with large sets of similar
potential errors that had to be subsumed. A second reason was the difficulty to trans-
324 M. Wildmoser, J. Philipps, and O. Slotosch
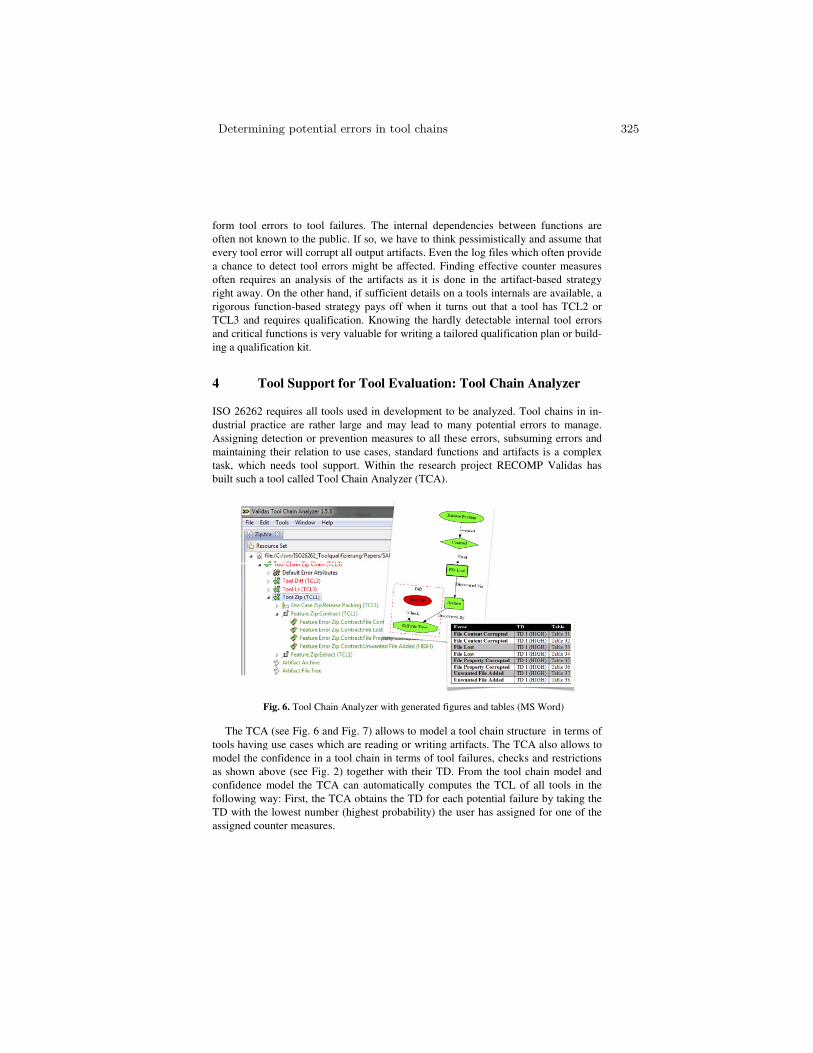
form tool errors to tool failures. The internal dependencies betwee
often not known to the public
every tool error will co
a chance to detect tool errors might be affec
often requires an analy
right away. On the other hand
rigorous function-based strategy pays off when it turns out that a tool has TCL2 or
TCL3 and requires qualification. Knowing the hardly detectable internal tool errors
and critical functions is very valuable for writing a tailored qualification plan
ing a qualification kit.
4 Tool Suppor
ISO 26262 requires all tools
dustrial practice are rather large and
Assigning detection or prevention measures
maintaining their relation to
task, which needs tool
built such a tool called
Fig. 6. Tool Chain Analyzer with generated figures and tables (MS Word)
The TCA (see Fig. 6
tools having use cases which are reading or writing artifacts. The TCA also allows to
model the confidence in a tool chain in terms
as shown above (see Fig
confidence model the TCA
following way: First, the TCA obtains the TD for each pote
TD with the lowest number (
assigned counter measure
form tool errors to tool failures. The internal dependencies between functions are
to the public. If so, we have to think pessimistically and as
ry tool error will corrupt all output artifacts. Even the log files which often provide
tool errors might be affected. Finding effective counter measures
ysis of the artifacts as it is done in the artifact-based strategy
On the other hand, if sufficient details on a tools internals are availa
based strategy pays off when it turns out that a tool has TCL2 or
TCL3 and requires qualification. Knowing the hardly detectable internal tool errors
and critical functions is very valuable for writing a tailored qualification plan
fication kit.
Support for Tool Evaluation: Tool Chain Analyzer
all tools used in development to be analyzed. Tool chain
dustrial practice are rather large and may lead to many potential errors to m
Assigning detection or prevention measures to all these errors, subsuming errors and
taining their relation to use cases, standard functions and artifacts is a complex
tool support. Within the research project RECOMP Validas ha
Tool Chain Analyzer (TCA).
Tool Chain Analyzer with generated figures and tables (MS Word)
6 and Fig. 7) allows to model a tool chain structure in terms of
tools having use cases which are reading or writing artifacts. The TCA also allows to
model the confidence in a tool chain in terms of tool failures, checks and restrictions
Fig. 2) together with their TD. From the tool chain model
the TCA can automatically computes the TCL of all tools
First, the TCA obtains the TD for each potential failure by taking t
TD with the lowest number (highest probability) the user has assigned for one of the
counter measures.
n functions are
ssume that
which often provide
ter measures
based strategy
s internals are available, a
based strategy pays off when it turns out that a tool has TCL2 or
TCL3 and requires qualification. Knowing the hardly detectable internal tool errors
and critical functions is very valuable for writing a tailored qualification plan or build-
Tool Chain Analyzer
ool chains in in-
errors to manage.
errors, subsuming errors and
is a complex
Within the research project RECOMP Validas has
Tool Chain Analyzer with generated figures and tables (MS Word)
structure in terms of
tools having use cases which are reading or writing artifacts. The TCA also allows to
, checks and restrictions
tool chain model and
tools in the
tial failure by taking the
the user has assigned for one of the
Determining potential errors in tool chains 325
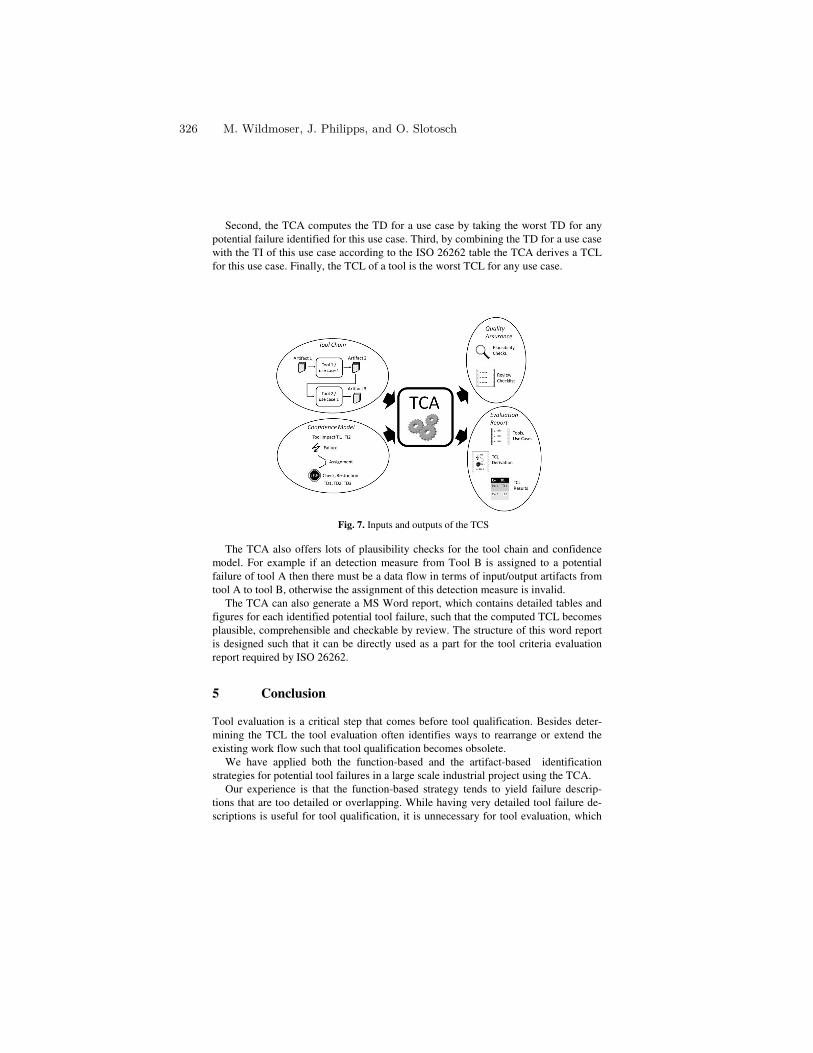
Second, the TCA computes the TD for a use case by taking the worst TD for any
potential failure identified for this use case. Third, by combining the TD for a use case
with the TI of this use case according to the ISO 26262 table the TCA derives a TCL
for this use case. Finally, the TCL of a tool is the worst TCL for any use case.
Fig. 7. Inputs and outputs of the TCS
The TCA also offers lots of plausibility checks for the tool chain and confidence
model. For example if an detection measure from Tool B is assigned to a potential
failure of tool A then there must be a data flow in terms of input/output artifacts from
tool A to tool B, otherwise the assignment of this detection measure is invalid.
The TCA can also generate a MS Word report, which contains detailed tables and
figures for each identified potential tool failure, such that the computed TCL becomes
plausible, comprehensible and checkable by review. The structure of this word report
is designed such that it can be directly used as a part for the tool criteria evaluation
report required by ISO 26262.
5 Conclusion
Tool evaluation is a critical step that comes before tool qualification. Besides deter-
mining the TCL the tool evaluation often identifies ways to rearrange or extend the
existing work flow such that tool qualification becomes obsolete.
We have applied both the function-based and the artifact-based identification
strategies for potential tool failures in a large scale industrial project using the TCA.
Our experience is that the function-based strategy tends to yield failure descrip-
tions that are too detailed or overlapping. While having very detailed tool failure de-
scriptions is useful for tool qualification, it is unnecessary for tool evaluation, which
326 M. Wildmoser, J. Philipps, and O. Slotosch
is only concerned with TCL determination. We experienced the artifact-based strategy
to produce failure descriptions with more adequate levels of abstractions right away.
In contrast to a tools internals the structure of artifacts is often known and allows to
refine failure descriptions on demand.
Our experience with the tool TCA is that it greatly helps to improve the quality of
the obtained evaluation report. In particular the support it offers in form of plausibility
checks, review assistance and refactoring helps to iteratively develop a comprehen-
sive and consistent model of the tool chain.
However, both the strategies and the tool have potential for further research and
improvements. For the strategies further experience is required, e.g. measuring rela-
tive completeness and the reproducibility of results by letting multiple people with
different backgrounds apply the strategies.
Also the TCA could be improved, e.g. by establishing reusable catalogues for
standard functions, patterns for functional decompositions for various kinds of tools
or appropriate structural decompositions for various kinds of artifacts, e.g. source
code files or object code files. Nevertheless the current TCA forms a good platform
for analyzing tool chains and confidence models and to try out various approaches.
Acknowledgment
This work has been supported by ARTEMIS and the German Federal Ministry of
Research and Education (BMBF) within project RECOMP under research grant
1IS10001A.
References
1. International Organization for Standardization: ISO 26262 Road Vehicles – Functional safe-
ty–. 1st Edition, 2011-11-15
2. Stürmer I. and Conrad M.: Code Generator Certification: a Testsuite-Oriented Approach. In:
Proceedings of Automotive-Safety & Security, 2004.
3. Schneider S., Slotosch O.: A Validation Suite for Model-based Development
Tools. In: Proceedings of the 10th International Conference on Quality Engineering in Soft-
ware Technology, CONQUEST 2007.
4. Beine M.: A Model-Based Reference Workflow for the Development of Safety-Critical
Software. In: Embedded Real Time Software and Systems, 2010.
5. Hillebrand J., Reichenpfader P., Mandic I., Siegl H., and Peer C.: Establishing Confidence
in the Usage of Software Tools in Context of ISO 26262. In: Flammini F., Iologna V.,
Vittorini V. (eds.) SAFECOMP 2011. LNCS, vol. 6894. Springer, Heidelberg (2011)
6. Laprie J.C. (ed.): Dependability: Basic Concepts and Terminology. Book. Springer-Verlag,
1992. ISBN 0-387-82296-8
Determining potential errors in tool chains 327
Safety-Focused Deployment Optimization inOpen Integrated Architectures?
Bastian Zimmer1, Susanne Burklen2, Jens Hofflinger2, Mario Trapp1, andPeter Liggesmeyer1,3
1 Fraunhofer IESE, Fraunhofer Platz 1, 67663 Kaiserslautern, Germany2 Robert Bosch GmbH, Postfach 30 02 40, 70442 Stuttgart, Germany
3 TU Kaiserslautern Postfach 3049 67653 Kaiserslautern
Abstract. Open Integrated Architectures like AUTOSAR or IMA en-able a flexible deployment, which can potentially help to reduce thenumber of computer platforms in a distributed embedded system, andtherefore reduce weight, energy consumption and costs. Finding a bene-ficial deployment is, however, a complicated, multi-criteria optimizationproblem. One criterion that requires exceptionally careful examinationis safety, since an adverse deployment can compromise system safety andinflict significant costs. In this paper we present a technique that assiststhe developer in optimizing a deployment from the safety perspective.The technique consists of two metrics to evaluate the safety-related costsof a deployment that have been tested and evaluated in an industrial con-text using a genetic algorithm. System developers can use these metricsto evaluate and optimize a specific deployment with respect to safety.
Keywords: safety, deployment optimization, distributed embedded sys-tems, integrated architectures, IMA, AUTOSAR
1 Introduction
Architectures, like AUTOSAR[1] in the automotive domain, and IMA in theaviation domain (civil: ARINC 653[2], military: Def Stan 00-74[12] are oftencalled integrated and open. In contrast to the term “federated”, the term “in-tegrated” refers to the architectures’ characteristic of allowing multiple appli-cations to share computational resources and to collaborate via shared com-munication networks. As a consequence, the developer can reduce the numberof computer platforms, and thus reduce weight, energy consumption and costs.The term “open” refers to the fact that the architectures have a public applica-tion programming interface (API), standardizing the way applications interfacewith the platform’s middleware to access the platform’s shared resources. As aconsequence, applications and platforms are portable, which allows exchangingcomputer platforms to fight hardware obsolescence, adding new applications to
? This work was funded by the German Federal Ministry of Education and Research(BMBF), grant SPES2020, O1IS08045I
upgrade a system’s functionality or deploying the applications into the system’scomputer infrastructure in a beneficial way.
Finding a beneficial deployment, however, is a challenging task. The devel-oper has to consider various criteria like response time, bus load, maintainability,or safety, while at the same time being confronted with a large solution space.Especially the criterion of safety requires careful consideration. A deploymentthat is adverse regarding safety can invalidate safety concepts and increase thecriticality classification of software-components, resulting in additional costs.
Therefore, we present a technique to support the developer in optimizing adeployment with respect to safety-related costs. The technique is based on twometrics that are combined and subsequently optimized using a genetic algorithm(GA). Both the metrics as well as the technique itself were evaluated in anindustrial context showing that the choice of metrics and the projection to costsare applicable and expressive.
This paper is organized as follows. Chapter 2 contains an overview of therelated work in the field of deployment optimization. Chapter 3 provides a de-tailed description of the problem addressed by our approach and introduces anexample. We present the deployment evaluation in chapter 4, and the deploy-ment optimization with the GA in chapter 5. We conclude the paper and presentour plans for future work in chapter 6.
2 Related Work
Deployment optimization is an active field of research, especially since objectorientation and standards like the Common Object Request Broker Architecture(CORBA) have been providing deployment flexibility. In this context, the ObjectManagement Group (OMG) standardized a meta-model to specify deploymentcharacteristics [6], upon which our meta-model (see chapter 3) is loosely based.
For these systems, which are typically non-safety-critical, deployment opti-mization considers criteria like effective platform utilization, schedulability, bustraffic load or other resource constraints [8][3]. All these aspects are importantfor safety critical embedded system as well, but safety criticality adds anotherset of relevant criteria.
The approach presented in [4] combines the optimization of non-safety-specificcriteria with the optimization of system reliability. To do so, the authors evaluatefailure rates of nodes and communication links that are involved in the imple-mentation of a system service. Redundancy is not regarded. On the contrary, [7]focuses on the efficient use of redundancy, as the proposed technique allows fora design space exploration to find an optimal redundancy/cost trade-off.
Our optimization metrics do not regard fixed failure rates of communicationlinks or platforms. We approached the problem from a different angle since wedeveloped our technique for the early concept phase of system development. Atthis phase, we assume that every component can be developed as reliable asrequired, at the expense of higher costs.
Safety-Focused Deployment Optimization in Open Integrated Architec-tures 329
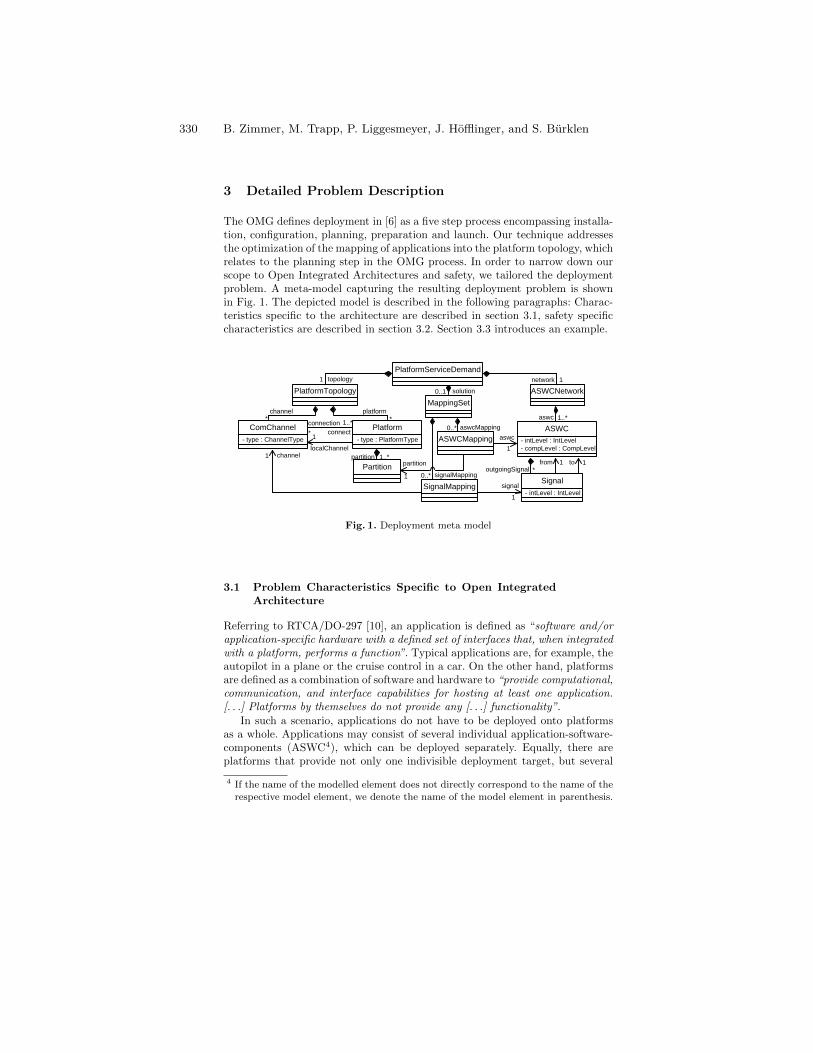
3 Detailed Problem Description
The OMG defines deployment in [6] as a five step process encompassing installa-tion, configuration, planning, preparation and launch. Our technique addressesthe optimization of the mapping of applications into the platform topology, whichrelates to the planning step in the OMG process. In order to narrow down ourscope to Open Integrated Architectures and safety, we tailored the deploymentproblem. A meta-model capturing the resulting deployment problem is shownin Fig. 1. The depicted model is described in the following paragraphs: Charac-teristics specific to the architecture are described in section 3.1, safety specificcharacteristics are described in section 3.2. Section 3.3 introduces an example.
MappingSet
PlatformTopology
PlatformServiceDemand
solution
1
ASWCNetwork
ASWC
- intLevel : IntLevel
- compLevel : CompLevel
Signal
- intLevel : IntLevel
ASWCMapping
SignalMapping
Platform
- type : PlatformType
ComChannel
- type : ChannelType
Partition
localChannel
connection
connect
1..*
*
channel*
platform*
partition 1..*channel1
0..* signalMapping
aswcMapping0..*
0..1
networktopology 11
aswc 1..*
outgoingSignalfrom to1 1
*
1
partition
1
1
signal
aswc
Fig. 1. Deployment meta model
3.1 Problem Characteristics Specific to Open IntegratedArchitecture
Referring to RTCA/DO-297 [10], an application is defined as “software and/orapplication-specific hardware with a defined set of interfaces that, when integratedwith a platform, performs a function”. Typical applications are, for example, theautopilot in a plane or the cruise control in a car. On the other hand, platformsare defined as a combination of software and hardware to “provide computational,communication, and interface capabilities for hosting at least one application.[. . .] Platforms by themselves do not provide any [. . .] functionality”.
In such a scenario, applications do not have to be deployed onto platformsas a whole. Applications may consist of several individual application-software-components (ASWC4), which can be deployed separately. Equally, there areplatforms that provide not only one indivisible deployment target, but several
4 If the name of the modelled element does not directly correspond to the name of therespective model element, we denote the name of the model element in parenthesis.
330 B. Zimmer, M. Trapp, P. Liggesmeyer, J. Höfflinger, and S. Bürklen
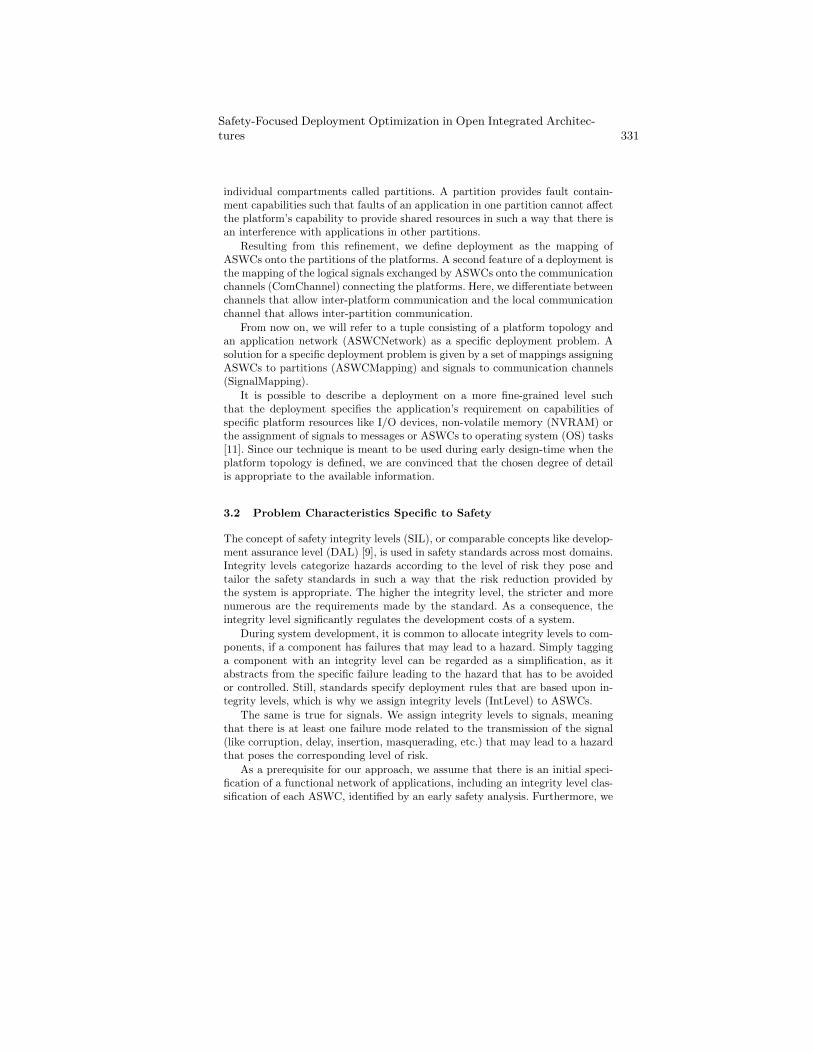
individual compartments called partitions. A partition provides fault contain-ment capabilities such that faults of an application in one partition cannot affectthe platform’s capability to provide shared resources in such a way that there isan interference with applications in other partitions.
Resulting from this refinement, we define deployment as the mapping ofASWCs onto the partitions of the platforms. A second feature of a deployment isthe mapping of the logical signals exchanged by ASWCs onto the communicationchannels (ComChannel) connecting the platforms. Here, we differentiate betweenchannels that allow inter-platform communication and the local communicationchannel that allows inter-partition communication.
From now on, we will refer to a tuple consisting of a platform topology andan application network (ASWCNetwork) as a specific deployment problem. Asolution for a specific deployment problem is given by a set of mappings assigningASWCs to partitions (ASWCMapping) and signals to communication channels(SignalMapping).
It is possible to describe a deployment on a more fine-grained level suchthat the deployment specifies the application’s requirement on capabilities ofspecific platform resources like I/O devices, non-volatile memory (NVRAM) orthe assignment of signals to messages or ASWCs to operating system (OS) tasks[11]. Since our technique is meant to be used during early design-time when theplatform topology is defined, we are convinced that the chosen degree of detailis appropriate to the available information.
3.2 Problem Characteristics Specific to Safety
The concept of safety integrity levels (SIL), or comparable concepts like develop-ment assurance level (DAL) [9], is used in safety standards across most domains.Integrity levels categorize hazards according to the level of risk they pose andtailor the safety standards in such a way that the risk reduction provided bythe system is appropriate. The higher the integrity level, the stricter and morenumerous are the requirements made by the standard. As a consequence, theintegrity level significantly regulates the development costs of a system.
During system development, it is common to allocate integrity levels to com-ponents, if a component has failures that may lead to a hazard. Simply tagginga component with an integrity level can be regarded as a simplification, as itabstracts from the specific failure leading to the hazard that has to be avoidedor controlled. Still, standards specify deployment rules that are based upon in-tegrity levels, which is why we assign integrity levels (IntLevel) to ASWCs.
The same is true for signals. We assign integrity levels to signals, meaningthat there is at least one failure mode related to the transmission of the signal(like corruption, delay, insertion, masquerading, etc.) that may lead to a hazardthat poses the corresponding level of risk.
As a prerequisite for our approach, we assume that there is an initial speci-fication of a functional network of applications, including an integrity level clas-sification of each ASWC, identified by an early safety analysis. Furthermore, we
Safety-Focused Deployment Optimization in Open Integrated Architec-tures 331
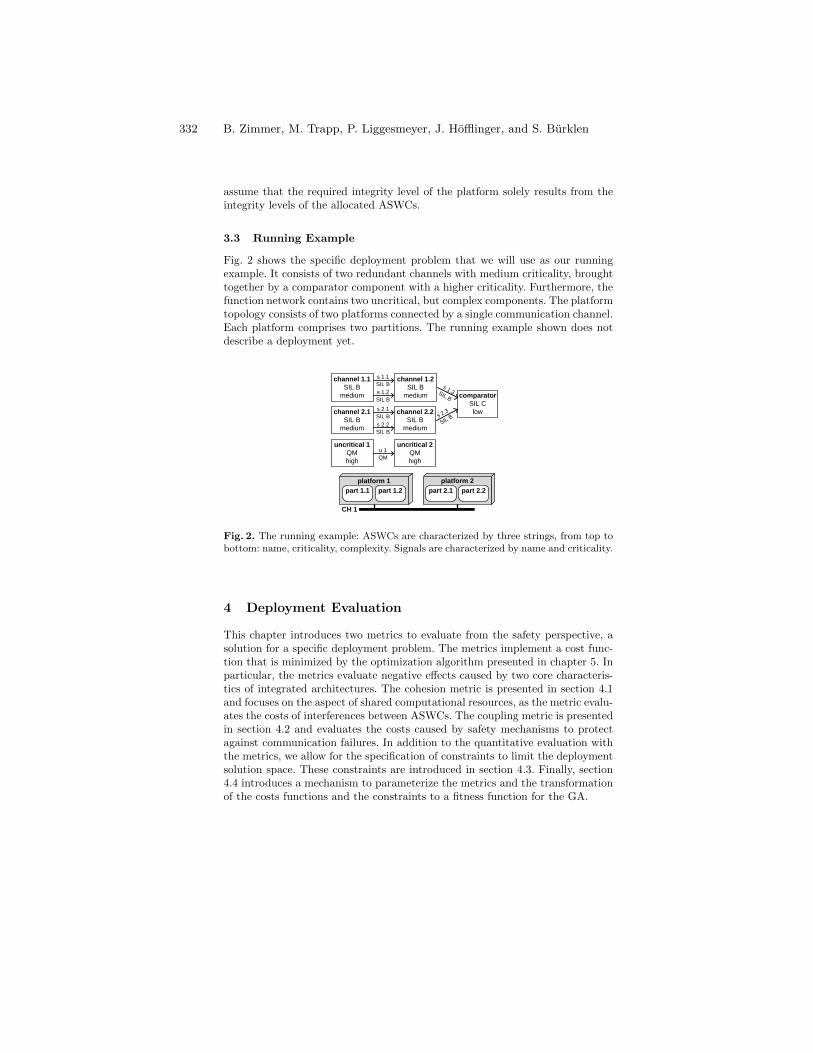
assume that the required integrity level of the platform solely results from theintegrity levels of the allocated ASWCs.
3.3 Running Example
Fig. 2 shows the specific deployment problem that we will use as our runningexample. It consists of two redundant channels with medium criticality, broughttogether by a comparator component with a higher criticality. Furthermore, thefunction network contains two uncritical, but complex components. The platformtopology consists of two platforms connected by a single communication channel.Each platform comprises two partitions. The running example shown does notdescribe a deployment yet.
channel 1.1
SIL B
medium
channel 1.2
SIL B
medium
channel 2.1
SIL B
medium
channel 2.2
SIL B
medium
uncritical 1
QM
high
uncritical 2
QM
high
u 1
QM
comparator
SIL C
low
s 2.2
SIL B
s 2.1
SIL B
s 1.2
SIL B
s 1.1
SIL B
s 2.3
SIL B
s 1.3SIL B
ECU 1
part 1.2part 1.1
platform 2
part 2.2part 2.1
platform 1
CH 1
Fig. 2. The running example: ASWCs are characterized by three strings, from top tobottom: name, criticality, complexity. Signals are characterized by name and criticality.
4 Deployment Evaluation
This chapter introduces two metrics to evaluate from the safety perspective, asolution for a specific deployment problem. The metrics implement a cost func-tion that is minimized by the optimization algorithm presented in chapter 5. Inparticular, the metrics evaluate negative effects caused by two core characteris-tics of integrated architectures. The cohesion metric is presented in section 4.1and focuses on the aspect of shared computational resources, as the metric evalu-ates the costs of interferences between ASWCs. The coupling metric is presentedin section 4.2 and evaluates the costs caused by safety mechanisms to protectagainst communication failures. In addition to the quantitative evaluation withthe metrics, we allow for the specification of constraints to limit the deploymentsolution space. These constraints are introduced in section 4.3. Finally, section4.4 introduces a mechanism to parameterize the metrics and the transformationof the costs functions and the constraints to a fitness function for the GA.
332 B. Zimmer, M. Trapp, P. Liggesmeyer, J. Höfflinger, and S. Bürklen
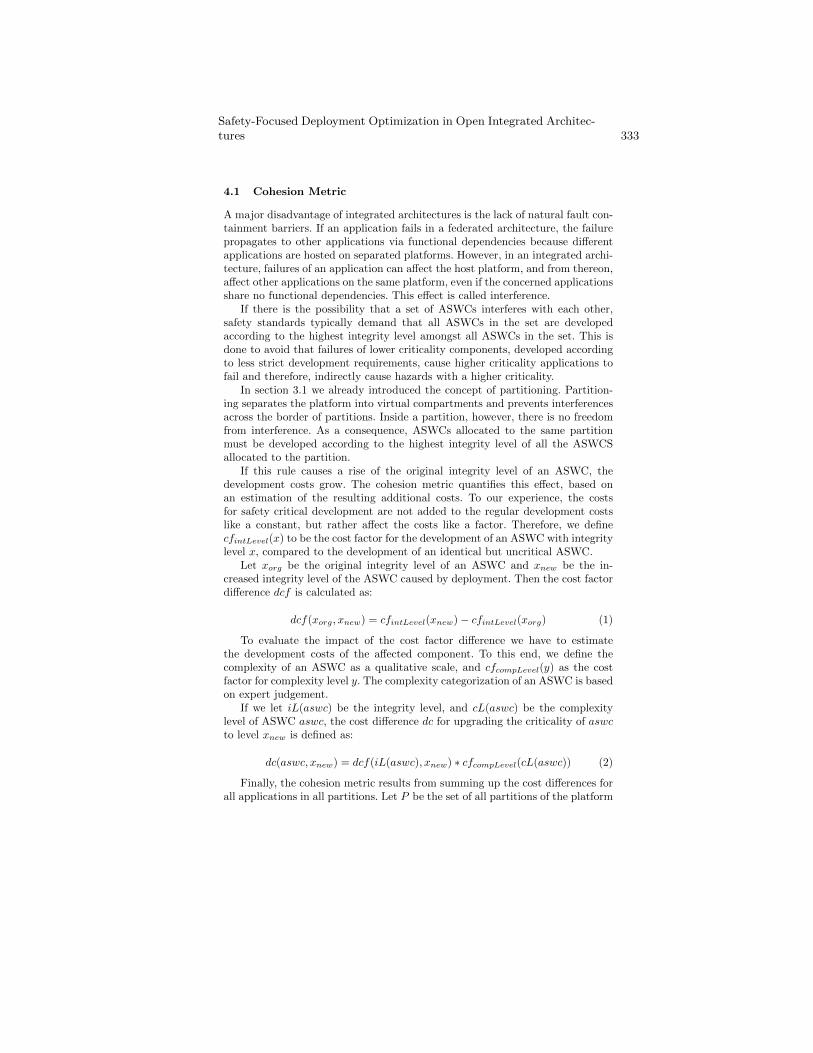
4.1 Cohesion Metric
A major disadvantage of integrated architectures is the lack of natural fault con-tainment barriers. If an application fails in a federated architecture, the failurepropagates to other applications via functional dependencies because differentapplications are hosted on separated platforms. However, in an integrated archi-tecture, failures of an application can affect the host platform, and from thereon,affect other applications on the same platform, even if the concerned applicationsshare no functional dependencies. This effect is called interference.
If there is the possibility that a set of ASWCs interferes with each other,safety standards typically demand that all ASWCs in the set are developedaccording to the highest integrity level amongst all ASWCs in the set. This isdone to avoid that failures of lower criticality components, developed accordingto less strict development requirements, cause higher criticality applications tofail and therefore, indirectly cause hazards with a higher criticality.
In section 3.1 we already introduced the concept of partitioning. Partition-ing separates the platform into virtual compartments and prevents interferencesacross the border of partitions. Inside a partition, however, there is no freedomfrom interference. As a consequence, ASWCs allocated to the same partitionmust be developed according to the highest integrity level of all the ASWCSallocated to the partition.
If this rule causes a rise of the original integrity level of an ASWC, thedevelopment costs grow. The cohesion metric quantifies this effect, based onan estimation of the resulting additional costs. To our experience, the costsfor safety critical development are not added to the regular development costslike a constant, but rather affect the costs like a factor. Therefore, we definecfintLevel(x) to be the cost factor for the development of an ASWC with integritylevel x, compared to the development of an identical but uncritical ASWC.
Let xorg be the original integrity level of an ASWC and xnew be the in-creased integrity level of the ASWC caused by deployment. Then the cost factordifference dcf is calculated as:
dcf(xorg, xnew) = cfintLevel(xnew)− cfintLevel(xorg) (1)
To evaluate the impact of the cost factor difference we have to estimatethe development costs of the affected component. To this end, we define thecomplexity of an ASWC as a qualitative scale, and cfcompLevel(y) as the costfactor for complexity level y. The complexity categorization of an ASWC is basedon expert judgement.
If we let iL(aswc) be the integrity level, and cL(aswc) be the complexitylevel of ASWC aswc, the cost difference dc for upgrading the criticality of aswcto level xnew is defined as:
dc(aswc, xnew) = dcf(iL(aswc), xnew) ∗ cfcompLevel(cL(aswc)) (2)
Finally, the cohesion metric results from summing up the cost differences forall applications in all partitions. Let P be the set of all partitions of the platform
Safety-Focused Deployment Optimization in Open Integrated Architec-tures 333
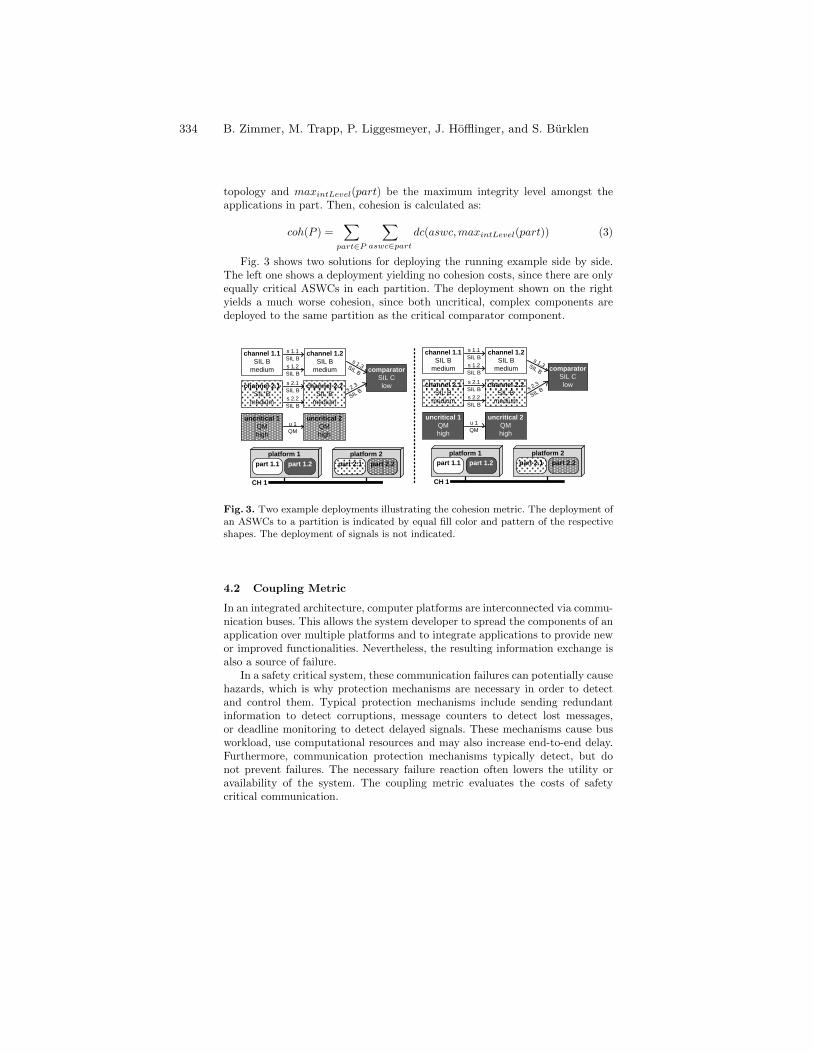
topology and maxintLevel(part) be the maximum integrity level amongst theapplications in part. Then, cohesion is calculated as:
coh(P ) =∑
part∈P
∑
aswc∈part
dc(aswc,maxintLevel(part)) (3)
Fig. 3 shows two solutions for deploying the running example side by side.The left one shows a deployment yielding no cohesion costs, since there are onlyequally critical ASWCs in each partition. The deployment shown on the rightyields a much worse cohesion, since both uncritical, complex components aredeployed to the same partition as the critical comparator component.
channel 1.1
SIL B
medium
channel 1.2
SIL B
medium
channel 2.1
SIL B
medium
channel 2.2
SIL B
medium
uncritical 1
QM
high
uncritical 2
QM
high
u 1
QM
comparator
SIL C
low
s 2.2
SIL B
s 2.1
SIL B
s 1.2
SIL B
s 1.1
SIL B
s 2.3
SIL B
s 1.3SIL B
part 1.2part 1.1
platform 2
part 2.2part 2.1
platform 1
channel 1.1
SIL B
medium
channel 1.2
SIL B
medium
channel 2.1
SIL B
medium
channel 2.2
SIL B
medium
uncritical 1
QM
high
uncritical 2
QM
high
u 1
QM
comparator
SIL C
low
s 2.2
SIL B
s 2.1
SIL B
s 1.2
SIL B
s 1.1
SIL B
s 2.3
SIL B
s 1.3SIL B
part 1.2part 1.1
platform 2
part 2.2part 2.1
platform 1
CH 1 CH 1
Fig. 3. Two example deployments illustrating the cohesion metric. The deployment ofan ASWCs to a partition is indicated by equal fill color and pattern of the respectiveshapes. The deployment of signals is not indicated.
4.2 Coupling Metric
In an integrated architecture, computer platforms are interconnected via commu-nication buses. This allows the system developer to spread the components of anapplication over multiple platforms and to integrate applications to provide newor improved functionalities. Nevertheless, the resulting information exchange isalso a source of failure.
In a safety critical system, these communication failures can potentially causehazards, which is why protection mechanisms are necessary in order to detectand control them. Typical protection mechanisms include sending redundantinformation to detect corruptions, message counters to detect lost messages,or deadline monitoring to detect delayed signals. These mechanisms cause busworkload, use computational resources and may also increase end-to-end delay.Furthermore, communication protection mechanisms typically detect, but donot prevent failures. The necessary failure reaction often lowers the utility oravailability of the system. The coupling metric evaluates the costs of safetycritical communication.
334 B. Zimmer, M. Trapp, P. Liggesmeyer, J. Höfflinger, and S. Bürklen
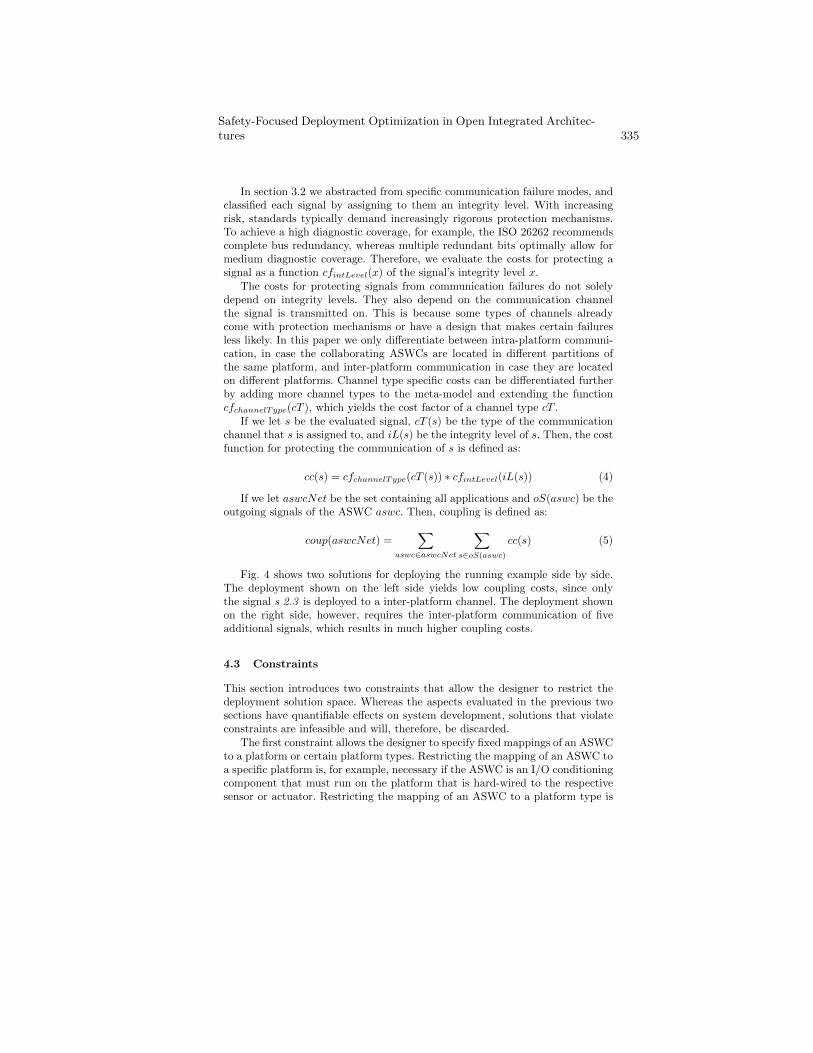
In section 3.2 we abstracted from specific communication failure modes, andclassified each signal by assigning to them an integrity level. With increasingrisk, standards typically demand increasingly rigorous protection mechanisms.To achieve a high diagnostic coverage, for example, the ISO 26262 recommendscomplete bus redundancy, whereas multiple redundant bits optimally allow formedium diagnostic coverage. Therefore, we evaluate the costs for protecting asignal as a function cfintLevel(x) of the signal’s integrity level x.
The costs for protecting signals from communication failures do not solelydepend on integrity levels. They also depend on the communication channelthe signal is transmitted on. This is because some types of channels alreadycome with protection mechanisms or have a design that makes certain failuresless likely. In this paper we only differentiate between intra-platform communi-cation, in case the collaborating ASWCs are located in different partitions ofthe same platform, and inter-platform communication in case they are locatedon different platforms. Channel type specific costs can be differentiated furtherby adding more channel types to the meta-model and extending the functioncfchannelType(cT ), which yields the cost factor of a channel type cT .
If we let s be the evaluated signal, cT (s) be the type of the communicationchannel that s is assigned to, and iL(s) be the integrity level of s. Then, the costfunction for protecting the communication of s is defined as:
cc(s) = cfchannelType(cT (s)) ∗ cfintLevel(iL(s)) (4)
If we let aswcNet be the set containing all applications and oS(aswc) be theoutgoing signals of the ASWC aswc. Then, coupling is defined as:
coup(aswcNet) =∑
aswc∈aswcNet
∑
s∈oS(aswc)
cc(s) (5)
Fig. 4 shows two solutions for deploying the running example side by side.The deployment shown on the left side yields low coupling costs, since onlythe signal s 2.3 is deployed to a inter-platform channel. The deployment shownon the right side, however, requires the inter-platform communication of fiveadditional signals, which results in much higher coupling costs.
4.3 Constraints
This section introduces two constraints that allow the designer to restrict thedeployment solution space. Whereas the aspects evaluated in the previous twosections have quantifiable effects on system development, solutions that violateconstraints are infeasible and will, therefore, be discarded.
The first constraint allows the designer to specify fixed mappings of an ASWCto a platform or certain platform types. Restricting the mapping of an ASWC toa specific platform is, for example, necessary if the ASWC is an I/O conditioningcomponent that must run on the platform that is hard-wired to the respectivesensor or actuator. Restricting the mapping of an ASWC to a platform type is
Safety-Focused Deployment Optimization in Open Integrated Architec-tures 335
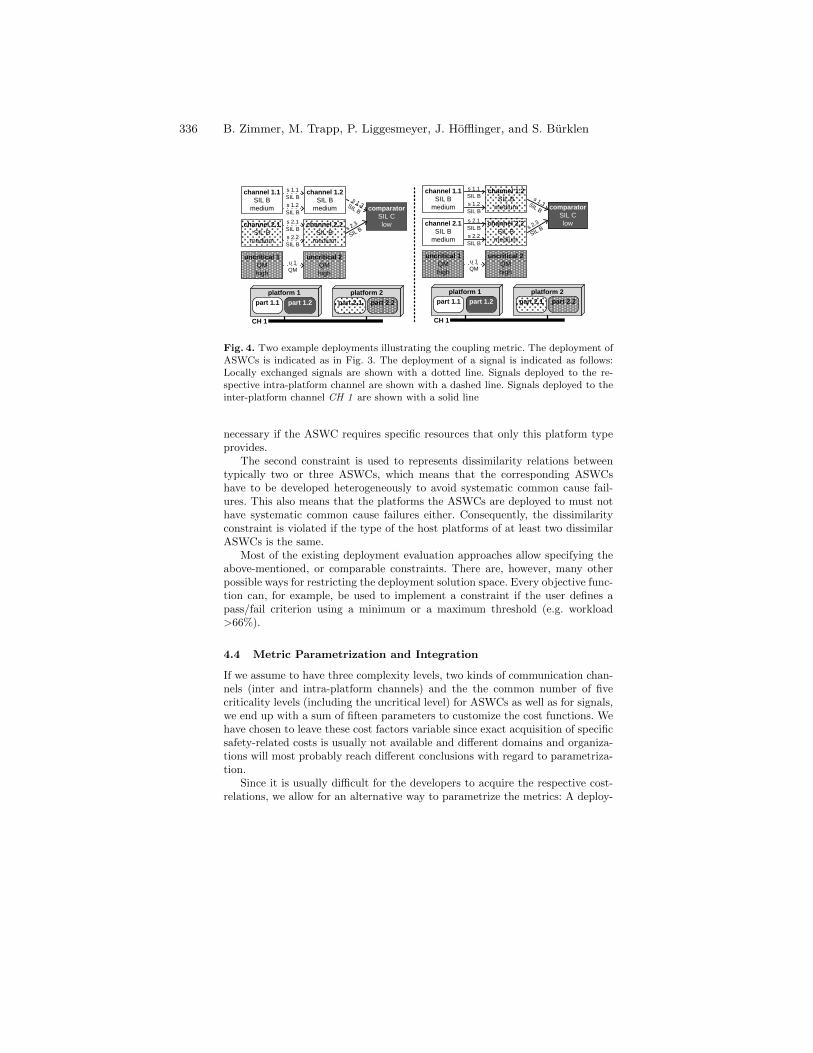
channel 1.1
SIL B
medium
channel 1.2
SIL B
medium
channel 2.1
SIL B
medium
channel 2.2
SIL B
medium
uncritical 1
QM
high
uncritical 2
QM
high
u 1
QM
comparator
SIL C
low
s 2.2
SIL B
s 2.1
SIL B
s 1.2
SIL B
s 1.1
SIL B
s 2.3
SIL B
s 1.3SIL B
ECU 1
part 1.2part 1.1
platform 2
part 2.2part 2.1
platform 1
channel 1.1
SIL B
medium
channel 1.2
SIL B
medium
channel 2.1
SIL B
medium
channel 2.2
SIL B
medium
uncritical 1
QM
high
uncritical 2
QM
high
u 1
QM
comparator
SIL C
low
s 2.2
SIL B
s 2.1
SIL B
s 1.2
SIL B
s 1.1
SIL B
s 2.3
SIL B
s 1.3SIL B
part 1.2part 1.1
platform 2
part 2.2part 2.1
platform 1
CH 1 CH 1
Fig. 4. Two example deployments illustrating the coupling metric. The deployment ofASWCs is indicated as in Fig. 3. The deployment of a signal is indicated as follows:Locally exchanged signals are shown with a dotted line. Signals deployed to the re-spective intra-platform channel are shown with a dashed line. Signals deployed to theinter-platform channel CH 1 are shown with a solid line
necessary if the ASWC requires specific resources that only this platform typeprovides.
The second constraint is used to represents dissimilarity relations betweentypically two or three ASWCs, which means that the corresponding ASWCshave to be developed heterogeneously to avoid systematic common cause fail-ures. This also means that the platforms the ASWCs are deployed to must nothave systematic common cause failures either. Consequently, the dissimilarityconstraint is violated if the type of the host platforms of at least two dissimilarASWCs is the same.
Most of the existing deployment evaluation approaches allow specifying theabove-mentioned, or comparable constraints. There are, however, many otherpossible ways for restricting the deployment solution space. Every objective func-tion can, for example, be used to implement a constraint if the user defines apass/fail criterion using a minimum or a maximum threshold (e.g. workload>66%).
4.4 Metric Parametrization and Integration
If we assume to have three complexity levels, two kinds of communication chan-nels (inter and intra-platform channels) and the the common number of fivecriticality levels (including the uncritical level) for ASWCs as well as for signals,we end up with a sum of fifteen parameters to customize the cost functions. Wehave chosen to leave these cost factors variable since exact acquisition of specificsafety-related costs is usually not available and different domains and organiza-tions will most probably reach different conclusions with regard to parametriza-tion.
Since it is usually difficult for the developers to acquire the respective cost-relations, we allow for an alternative way to parametrize the metrics: A deploy-
336 B. Zimmer, M. Trapp, P. Liggesmeyer, J. Höfflinger, and S. Bürklen
ment expert is confronted with an artificial but humanly manageable calibrationdeployment problem. The deployment expert is allowed to change the parame-ters, and after each change, the optimizer immediately calculates a deploymentsolution and presents it to the expert. This cycle is repeated until the optimizercomes to a solution that the expert expects.
The parameter set that produced the expected solution for the calibrationdeployment problem can then be used for real world deployment problems.Please note that the quality of the resulting parameters depend on the expert’sestimation and might not correlate with the real cost factors. To our experi-ence, however, this process yields better parameters than a completely manualparametrization.
If a parameter set is found, the cohesion and coupling cost functions canbe calculated. Since we want to use a GA to evaluate our objective functions,we have to transform the cost functions into a fitness function. To that end wedefine a function to pessimistically estimate the worst case costs for a specificdeployment problem and subtracted the cost functions to get a non-negativefitness function.
Let sdp be a specific deployment problem. Then parts(sdp) yields all par-titions of all platforms, and aswcs(sdp) yields all ASWCs in sdp. Further-more, wce(sdp) is defined as the corresponding worst case cost estimation andconst(sdp) as a function that yields 1 if no constraint is violated and 0 if at leastone constraint is violated. Then, we define the fitness function as:
fit(sdp) = const(sdp) ∗ (wce(sdp)− coh(parts(sdp))− coup(aswcs(sdp))) (6)
Using a number of exemplary architectures and corresponding deployments,we conducted a qualitative analysis of the fitness function with practitioners inthe automotive domain. During the analysis, several iterations were necessary inorder to adapt the problem description and the metrics, such that we were able tomodel the relevant aspects of the deployment and to evaluate them appropriately.After a final evaluation of the technique, the metrics were identified as adequatelyexpressive and the expert estimations allowed for an applicable parametrizationof the metrics.
5 Deployment Optimization
In this section we present a deployment optimization algorithm based on theintroduced fitness function and a GA. As stated before, the focus of our worklies on the presented metrics and not on the selection of this specific optimizationalgorithm. We used a GA to test and evaluate our metrics, because they wereintegrated in a larger scale optimization running a GA as well. Other techniqueslike linear programming, however, are also suitable for deployment optimization.
A GA is a stochastic search algorithm using techniques adopted from naturalevolution to find near optimal solutions for complex optimization problems[5].The optimization process starts with a number of typically randomized solutions,
Safety-Focused Deployment Optimization in Open Integrated Architec-tures 337
the so-called initial population. After initialization, each member of the popula-tion is evaluated for its fitness, and then a new population is reproduced fromthe old population using techniques like crossover and mutation. Members witha higher fitness are more likely to participate in the reproduction than memberswith a low fitness. After the new population is generated, it is evaluated for itsfitness which is followed by another reproduction of the next new population.This optimization loop typically terminates after a fixed number of cycles orwhen one individual reached a sufficient predefined fitness.
To be able to use standard algorithms like crossover and mutation, solu-tions of a specific problem have to be represented by so called chromosomes.A chromosome is divided into several genes, each gene representing a distinctpart of a potential solution. In our case, the intuitive chromosome for a specificdeployment problem with k ASWCs and n signals would be an array of k genesrepresenting ASWC mappings, concatenated with n genes representing signalmappings.
Nevertheless, we decided to include only the ASWC mappings into the chro-mosome and let the GA optimize only the ASWC mappings. This is becausethe signal mapping highly depends on the ASWC mapping and, we are able tocalculate the optimal signal mapping directly when the ASWC mapping is de-termined. For a specific deployment problem with k ASWCs and m partitions,our chromosome therefore consists of the genes gj ∈ {1, . . . ,m} , j ∈ {1, . . . , k}.Each of the k genes is represented by an integer between 1 and m, where ga = bdenotes that ASWC a is assigned to partition b. This results in a slightly adaptedversion of the aforementioned GA optimization loop, since we have to add thesignal mappings to the ASWC mappings generated by the GA for our fitnessfunction to work. The resulting loop consists of three steps: (1) calculate thefitness for each individual, (2) reproduce a new set of ASWC mappings, (3) cal-culate optimal signal mappings for each individual. The optimization stops ifthe fitness improvement within the last 30 generations was below 5%.
The optimal signal mapping can be determined in a straight forward fashion,since the costs for individual signal mappings do not influence each other. First,we check the deployment of the receiver and sender ASWC of each signal. Ifboth are in the same partition, no channel is needed, and if both are on thesame platform, we deploy the signal to the local channel. If both are hosted ondifferent platforms, we search for all available channels connecting the respectiveplatforms. In case there is no such channel, we flag the ASWC mapping as invalid.In case there is more than one channel, we search for the channel that yields thelowest costs and deploy the signal accordingly.
Optimizing the running example presented in Fig. 2, the GA converged inaverage within 2.3 seconds. Optimizing a real-world example based on a real-world system consisting of 27 ASWCs, 51 signals, 13 platforms and 2 channels,the GA terminated in average within 18.5 seconds. All measurements were takenon a commercially available mobile CPU running with 2.40 GHz. The GA isimplemented using the Java Genetic Algorithms Package (JGAP) and a Java-based implementation of our fitness function.
338 B. Zimmer, M. Trapp, P. Liggesmeyer, J. Höfflinger, and S. Bürklen
6 Conclusion and Future Work
As open integrated architectures are gaining more and more ground, developersof safety-critical embedded systems are confronted with the possibility to flexiblydeploy their component-based applications. Therefore, we presented a techniquethat assists the developer in finding an optimal deployment with respect tosafety-related costs. We first introduced a meta-model tailored to the specifics ofsafety-critical open integrated architectures, that allows a developer to specifydeployment scenarios. Based on this model, we presented two cost functions anda set of constraints to evaluate solution candidates. Finally, we showed how touse the evaluation algorithms together with a genetic algorithm to calculate anoptimized deployment solution.
In the future, we plan to extend the functionality of our evaluation algorithmto include aspects like communication gateways. Furthermore, we are workingon the integration of our current work with the approach presented in [13]. Thisapproach allows for a contract-based specification of safety-related dependenciesbetween applications and platform in an integrated architecture, which enablesa more detailed, failure-mode specific deployment evaluation.
References
1. Website of the autosar standard, http://www.autosar.org/2. ARINC: ARINC 653 P1-2, Avionic application software standard interface, Part
1 - Required services (2005)3. Bastarrica, M.C., Caballero, R.E., Demurjian, S.A., Shvartsman, A.A.: Two op-
timization techniques for component-based systems deployment. In: Proc. of the13th Int. Conf. on Software & Knowledge Engineering. pp. 153–162 (2001)
4. Boone, B., de Turck, F., Dhoedt, B.: Automated deployment of distributed softwarecomponents with fault tolerance guarantees. In: Proc. of the 6th Int. Conf. onSoftware Engineering Research, Management and Applications. pp. 21–27 (2008)
5. Goldberg, D.E.: Genetic algorithms in search, optimization, and machine learning.Addison-Wesley (1989)
6. OMG: Deployment and configuration of component-based distributed applicationsspecification (April 2006)
7. Pinello, C., Carloni, L., Sangiovanni-Vincentelli, A.: Fault-tolerant distributed de-ployment of embedded control software. IEEE Transactions on Computer-AidedDesign of Integrated Circuits and Systems 27(5), 906–919 (2008)
8. Purao, S., Jain, H., Narareth, D.: Effective distribution of object-oriented applica-tions. Communications of the ACM 41, 100–108 (1998)
9. RTCA: DO-178B – Software consideration in airborne systems and equipmentcertification (1993)
10. RTCA: DO-297 – Integrated Modular Avionics (IMA) – Development guidanceand certification considerations (2005)
11. Sangiovanni-Vincentelli, A., Di Natale, M.: Embedded system design for automo-tive applications. IEEE Computer 40(10), 42–51 (2007)
12. UK MoD: Def Stan 00-74: ASAAC standards part 1: Standards for software13. Zimmer, B., Burklen, S., Knoop, M., Hofflinger, J., Trapp, M.: Vertical safety
interfaces – Improving the efficiency of modular certification. In: Computer Safety,Reliability, and Security, pp. 29–42. Springer Berlin / Heidelberg (2011)
Safety-Focused Deployment Optimization in Open Integrated Architec-tures 339
Qualifying Software Tools, a Systems Approach
Fredrik Asplund, Jad El-khoury, and Martin Torngren
KTH Royal Institute of Technology, Department of Machine Design, Division ofMechatronics, Brinellvagen 83, 10044 Stockholm, Sweden
Abstract. Modern safety standards designed to ensure safety in em-bedded system products often take a descriptive approach, focusing ondescribing appropriate requirements on management, processes, methodsand environments during development. While the qualification of soft-ware tools has been included in several such standards, how to handle thesafety implications of tools integrated into tool chains has been largelyignored. This problem is aggravated by an increase both in automationof tool integration and the size of development environments.
In this paper we define nine safety goals for tool chains and suggest aqualification method that takes a systems approach on certifying soft-ware tools as parts of tool chains. With this method, software tools aredeveloped and pre-qualified under the assumption that certain proper-ties will be supported by the development environment they are to bedeployed in. The proposed method is intended to (1) achieve a strongerfocus on the relevant parts of tool chains in regard to safety and (2) sep-arate the extra effort these parts imply from the effort already stipulatedby safety standards.
Keywords: Certification, Safety, Tool Integration
1 Introduction
The development of embedded systems is a multi-disciplinary effort, undertakenby organizations working with software tools provided by external suppliers.These tools are often Commercial Of The Shelf products, i.e. generic softwareprograms designed to function on as many operating systems as possible, built tosupport a multitude of different use cases, etc. This generalization has its cost inrelation to safety, since it makes it harder to ensure that tools operate flawlesslywhen deployed in a specific context. There is a risk that software tools introduceerrors in the development artifacts during the development process. These errorsmay then lead to hazards1 in the end product. This has prompted the introduc-tion of guidelines on the qualification of software tools in several safety standards[1]. Unfortunately the guidelines focus on qualifying tools in isolation, leaving theimportance of the interaction between tools largely ignored. This omission has
1 A hazard can be defined as a system state or set of conditions that, together with aparticular set of worst-case environmental conditions, will lead to an accident.
been of less importance in the past, since related safety issues could then be han-dled by restrictions on the processes used by the operators2 manually handlingthese interactions. However, modern development environments are introducingan increased support for automated tool integration, decreasing the possibilityfor operators to monitor and act on safety issues due to tool integration.
In this paper we present nine safety goals and propose a method for qualify-ing software tools as parts of tool chains, which together highlight the hithertoobscured safety issues caused by tool integration and allow for being more ex-act when identifying software in need of qualification during certification. Thesafety goals and method build upon systems thinking [2] to approach a moderndevelopment environment as a whole, i.e. they do not analyze parts of develop-ment environments in isolation (which would risk failing to take the relationshipsbetween the parts into account).
In Section 2 we present the relevant State of the Art to orient the readerwithin the field of software tool qualification. In Section 3 we describe the domainof tool integration and the possibilities to take a systems approach to allow for thequalification of software tools as parts of tool chains. This is followed in Section4 by a summary of a technical report in which we explored the relationshipbetween tool integration and safety through a detailed case study. The resultsfrom this report, after being put into a system context in Section 4 through amapping into safety goals, allow us to propose a method for qualifying softwaretools as parts of tool chains in Section 5. Conclusions are found in Section 6.
2 State of the Art
Several modern safety standards such as IEC 61508:2010 [3] (and domain adap-tations of this standard such as IEC 61511:2003 [4], ISO 26262:2011 [5] andEN 50128:2001 [6]) and DO-178C [7] increasingly deal with the issue of softwaretool qualification (noticeable both when comparing between standards and whencomparing between different versions of the same standard). This has lead to alarge effort by the scientific community on analyzing tools, categorizing tools,discussing how to certify tools, etc. ([8] gives examples related to DO-178B).Much of the effort seems to be focused on finding a good combination of toolsand then enabling them to communicate in a reliable way, while the safety impli-cations of the tool integration is not explicitly discussed (see [9] for an example).
This is not surprising, since either the safety standards themselves or thediscussion in relation to them try to limit qualification efforts to avoid softwareassociated primarily with tool integration (see Subsection 3.1 for a detailed dis-cussion on this subject). This means that there is a limited number of approacheson how to benefit from the fact that tools are deployed in tool chains. In fact,we could only identify one such approach, which suggests the use of reference
2 This text uses the word operators in the generic sense, i.e. to indicate anyone whoat some point of time is involved in the day-to-day matters of a development effort(such as engineers, tool chain developers, managers, etc.).
Qualifying Software Tools, a Systems Approach 341
tool chains3 [1]. There has been little effort to analyze the implications on safetydue to tool integration, leaving methods and metrics for evaluating differentapproaches to tool integration for qualification purposes largely unknown.
3 Tool Integration and Software Tool Qualification
To develop an embedded system there is typically a need for a multitude of engi-neering tools, i.e. tools that provide functionality to fulfill one or more activitieswithout which the end product cannot be cost-efficiently developed. Examplesof engineering tools include requirements tools, design tools and test tools.
Each engineering tool executes in the context of a development environment,defined as the integrated set of all other tools and any supporting software usedduring development. An important aspect of a development environment is thatthe development processes it supports will define orderings of the engineeringtools it contains, i.e. tool chains, which the development of a product will tran-sit through. Tool integration can be defined as what supports the developmentprocess in correctly moving from one engineering tool to another in a tool chain.Examples of tool integration include data transformation tools, scripts that reactto the actions of a user and process engines. When discussing tool chains, toolintegration software is usually implicitly included as something needed “behind-the-scenes” to enable the transition between engineering tools.
3.1 Qualification of Software Tools
There are a number of classification schemes for safety standards, although stan-dards are not always possible to strictly assign to one category. For the discussionin this paper we differ between two types of safety standards, those that take aprimarily prescriptive approach and those that take a primarily descriptive ap-proach on how to enforce safety. By prescriptive standards we refer to those thatfocus on giving an exhaustive list of product features that a safety-critical prod-uct should exhibit (for instance CS-VLR:2008 [10]). By descriptive standards werefer to those that instead focus on defining requirements on appropriate environ-ments, methods and processes to develop safety-critical products (for instanceISO 26262:2011, EN 50128:2001 and DO-178C).
Due to the fact that malfunctions in tools during development can lead to theintroduction of hazards in the end product, some of the descriptive standardscontain guidelines on qualification of software tools. For this reason, we focus inthis paper on the latter set of standards, where assurance is partly provided byan evaluation on how the product was developed. For certification according tothe former set of standards the discussion in this paper is only of reference value,since assurance according to these standards is typically provided by inspectionor a means detailed in the standard itself.
3 A reference tool chain is a pre-qualified set of tools and an associated workflow,which only requires a limited qualification effort in regard to the changes madeduring deployment.
342 F. Asplund, J. El-Khoury, and M. Törngren
Tool qualification guidelines can take different forms, such as requiring toolsto be suitable and of a certain quality [6], or requiring the development of relevanttools to fulfill the same objectives as the development of the products handledby the standard itself [7], etc. The many different forms are not surprising, sincethe standards state different objectives for qualifying tools. Nevertheless, fromsuch standards as ISO 26262:2011 and DO-178C one can deduce generic safetygoals for software tool qualification:
– No tool shall introduce errors in development artifacts that may lead tohazards in the end product.4
– No tool shall fail to detect errors in development artifacts it is designed toanalyze or monitor that may lead to hazards in the end product.5
In practice one can discern between two approaches to tool integration in relationto these safety goals.
– The approach that allows a stricter limitation of the qualification effort, ex-emplified by for instance DO-178C. In DO-178C the objective of the qualifi-cation effort is only to ensure that tools provide confidence at least equivalentto that of relevant process(es) they eliminate, reduce or automate [7].
– The approach that strives towards the same generic applicability, exemplifiedby ISO 26262:2011. One could interpret this standard to indicate that almosteverything in the development environment has to be qualified [11] (includingall tool integration mechanisms6).
Both of these approaches are associated with practical problems.In the first approach one needs to draw a line between tools that need to be
qualified and other parts of the development environment that only warrant at-tention in an indirect fashion. In traditional development environments this wasacceptable, since they consisted of separate tools between which users handledthe transition of the development manually. This meant that the control of pro-cesses and methods could ensure safety to a high degree. Modern developmentenvironments can consist of several hundreds of tools [11] (albeit the numberof engineering tools is probably far less). Hazards can, in such a developmentenvironment, be introduced into the end product from such diverse sources ascontradicting data transformations between artifacts at different developmentphases, scripts causing tools to be executed in the wrong order, the wrong ver-sion of data being handed over to the next process activity, etc. These sourcescan be difficult to identify when the focus of a qualification effort is primarily
4 The introduction of errors in development artifacts can lead to hazards in a directfashion (i.e. if the artifact is used directly, like the output from a compiler) or in anindirect fashion (i.e. if the artifact is used indirectly, like the output of a high-leveldesign tool).
5 Tools can be assigned to handle the output of other tools or include functionality toverify its own output.
6 A tool integration mechanism is a tool integration software (or a part of it) thatprovides a distinct integration functionality.
Qualifying Software Tools, a Systems Approach 343
focused on separate tools, since they are not necessarily directly associated withany of the actions of a particular tool (if the output of a certain tool is latertransformed, that action does not necessarily have to be associated with the toolitself during qualification). Furthermore, the control of these sources throughprocesses and methods is aggravated by the difficulty users usually have withcomprehending automation [12]. This leads to the problem that as developmentenvironments scale up and become more integrated, the first approach becomesless sufficient for ensuring safety.
In the second approach the qualification effort becomes tremendous in amodern development environment [11]. If one keeps to this approach the likelyoutcome is sweeping generalizations of the danger posed by most parts of thedevelopment environments at hand. This leads to the problem that as develop-ment environments scale up and become more integrated, the second approachalso becomes less sufficient for ensuring safety.
The reason for these mutually exclusive approaches sharing the same prac-tical problem is that they stem from the miscomprehension that the increasedintegration of software tools through automation is nothing more than the intro-duction of more software. To overcome this miscomprehension we need a thirdapproach which analyzes the result of the increased integration of tools as awhole (i.e. as highly integrated tool chains) and not simply as a collection ofseparate parts. We need to take a systems approach to tool integration.
3.2 A System Approach to Tool Integration
To take a systems approach to tool integration we have defined a hierarchy oflevels of organization7, which reflects the state of a likely development effort.In such a hierarchy, an upper level is more complex than the one below andcharacterized by having emergent properties8. These properties are given by therelationships of the components at the lower levels, which in turn are controlledby the upper levels through the constraints they impose. Our hierarchy is illus-trated by the conceptual illustration of Figure 1.
7 We recommend [2] for an overview of systems theory, [12] for how systems theoryrelates to safety and [13] as an introduction to hierarchy theory.
8 In systems theory an emergent property at one level of organization cannot be pre-dicted even by a thorough understanding of the parts of lower levels. Such a propertyis meaningless at lower levels, i.e. it is irreducible. The opposite are composable prop-erties, which can be shown to originate from one or several parts clearly discernibleat lower levels. Checkland uses the genetic coding of DNA as an example of an emer-gent property [2], since it cannot be explained at the level of the bases (i.e. at thechemistry level any arrangement of nucleobases is allowed, yet not all are meaningfulat the higher level of biology). A related composable property is the inability of hu-mans to cope with too much ultraviolet light, since this can be directly attributed tothe way two adjacent thymine or cytosine nucleobases may form pyrimidine dimers(which cause skin cancer).
344 F. Asplund, J. El-Khoury, and M. Törngren
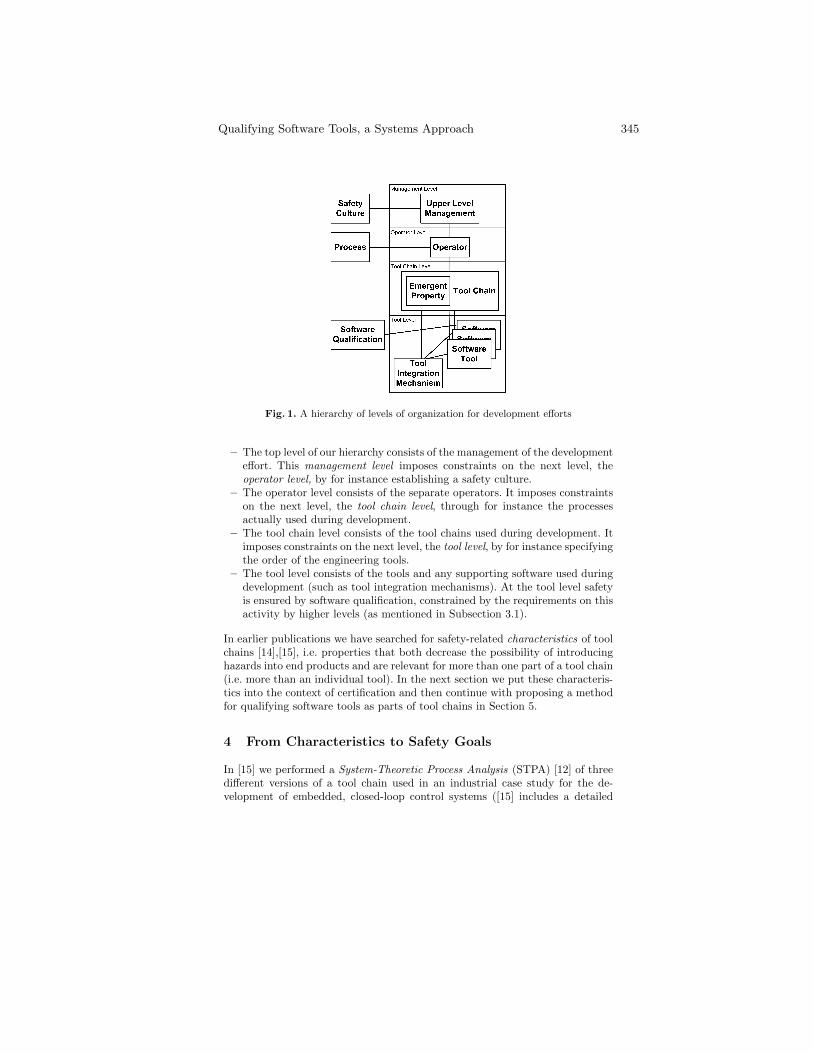
Fig. 1. A hierarchy of levels of organization for development efforts
– The top level of our hierarchy consists of the management of the developmenteffort. This management level imposes constraints on the next level, theoperator level, by for instance establishing a safety culture.
– The operator level consists of the separate operators. It imposes constraintson the next level, the tool chain level, through for instance the processesactually used during development.
– The tool chain level consists of the tool chains used during development. Itimposes constraints on the next level, the tool level, by for instance specifyingthe order of the engineering tools.
– The tool level consists of the tools and any supporting software used duringdevelopment (such as tool integration mechanisms). At the tool level safetyis ensured by software qualification, constrained by the requirements on thisactivity by higher levels (as mentioned in Subsection 3.1).
In earlier publications we have searched for safety-related characteristics of toolchains [14],[15], i.e. properties that both decrease the possibility of introducinghazards into end products and are relevant for more than one part of a tool chain(i.e. more than an individual tool). In the next section we put these characteris-tics into the context of certification and then continue with proposing a methodfor qualifying software tools as parts of tool chains in Section 5.
4 From Characteristics to Safety Goals
In [15] we performed a System-Theoretic Process Analysis (STPA) [12] of threedifferent versions of a tool chain used in an industrial case study for the de-velopment of embedded, closed-loop control systems ([15] includes a detailed
Qualifying Software Tools, a Systems Approach 345
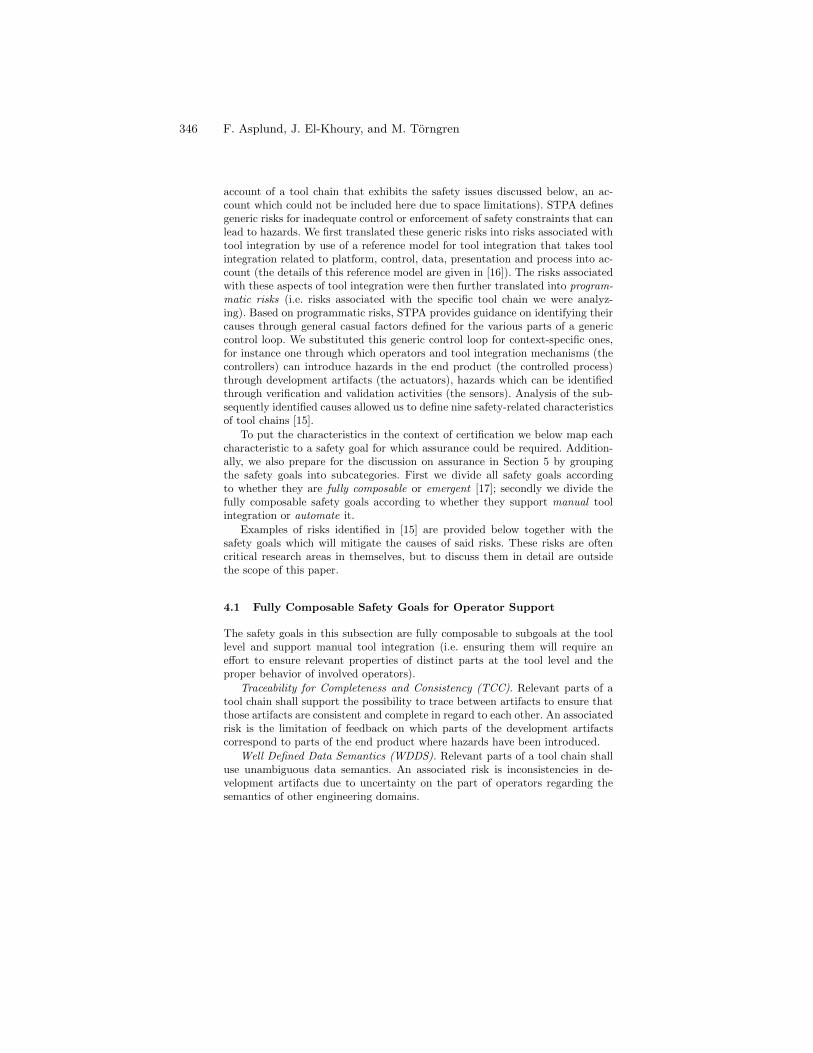
account of a tool chain that exhibits the safety issues discussed below, an ac-count which could not be included here due to space limitations). STPA definesgeneric risks for inadequate control or enforcement of safety constraints that canlead to hazards. We first translated these generic risks into risks associated withtool integration by use of a reference model for tool integration that takes toolintegration related to platform, control, data, presentation and process into ac-count (the details of this reference model are given in [16]). The risks associatedwith these aspects of tool integration were then further translated into program-matic risks (i.e. risks associated with the specific tool chain we were analyz-ing). Based on programmatic risks, STPA provides guidance on identifying theircauses through general casual factors defined for the various parts of a genericcontrol loop. We substituted this generic control loop for context-specific ones,for instance one through which operators and tool integration mechanisms (thecontrollers) can introduce hazards in the end product (the controlled process)through development artifacts (the actuators), hazards which can be identifiedthrough verification and validation activities (the sensors). Analysis of the sub-sequently identified causes allowed us to define nine safety-related characteristicsof tool chains [15].
To put the characteristics in the context of certification we below map eachcharacteristic to a safety goal for which assurance could be required. Addition-ally, we also prepare for the discussion on assurance in Section 5 by groupingthe safety goals into subcategories. First we divide all safety goals accordingto whether they are fully composable or emergent [17]; secondly we divide thefully composable safety goals according to whether they support manual toolintegration or automate it.
Examples of risks identified in [15] are provided below together with thesafety goals which will mitigate the causes of said risks. These risks are oftencritical research areas in themselves, but to discuss them in detail are outsidethe scope of this paper.
4.1 Fully Composable Safety Goals for Operator Support
The safety goals in this subsection are fully composable to subgoals at the toollevel and support manual tool integration (i.e. ensuring them will require aneffort to ensure relevant properties of distinct parts at the tool level and theproper behavior of involved operators).
Traceability for Completeness and Consistency (TCC). Relevant parts of atool chain shall support the possibility to trace between artifacts to ensure thatthose artifacts are consistent and complete in regard to each other. An associatedrisk is the limitation of feedback on which parts of the development artifactscorrespond to parts of the end product where hazards have been introduced.
Well Defined Data Semantics (WDDS). Relevant parts of a tool chain shalluse unambiguous data semantics. An associated risk is inconsistencies in de-velopment artifacts due to uncertainty on the part of operators regarding thesemantics of other engineering domains.
346 F. Asplund, J. El-Khoury, and M. Törngren
Possibility to Create Customized GUIs (PCCG). Relevant parts of a toolchain shall support the creation of additional GUIs for tools, GUIs that areeither simplified or adapted to operators from a different engineering domain (forinstance a customized GUI for a requirement tool that simplifies the interactionfor use by operators other than requirement engineers). An associated risk is theintroduction of errors in development artifacts due to unsafe experimentation bynon-expert operators.
Coherent Time Stamp Information (CTSI). Relevant parts of a tool chainshall support common time stamps on development artifacts. An associated riskis the use of incomplete versions of artifacts by operators who misunderstandhow recently they were created.
Process Notifications (PN). Relevant parts of a tool chain shall support eventnotification to operators. An associated risk is the use of obsolete developmentartifacts by operators unaware of the release of new versions.
4.2 Fully Composable Safety Goals for Automation
The safety goals of this subsection are also fully composable to subgoals at thetool level, but their implementation will not involve operators (i.e. they onlyrequire an effort to ensure relevant properties of distinct parts at the tool level).
Automated Transformations of Data (ATD). Relevant parts of a tool chainshall support the automated transfer of data between tools. An associated riskis the incorrect reproduction of artifacts by tired or untrained operators.
Possibility to Automate Tool Usage (PATU). Relevant parts of a tool chainshall support the automation of tool usage. An associated risk is the introductionof errors in development artifacts due to untrained operators.
4.3 Emergent Safety Goals
The safety goals in this subsection are emergent at the tool chain level. Thesesafety goals cannot be fully ensured through the properties of different parts atthe tool level, since they depend on the interaction of parts at that level.
Data Integrity (DI). A tool chain shall ensure that the data used reflects thecurrent state of the development. An associated risk is that obsolete or erroneousversions of development artifacts lead to the incorrect reproduction of data. DIcan manifest itself locally (for instance when a file is corrupted by a file systemservice or a database updates the wrong parameters), but also emerge from howtools are used or interact with each other (for instance when a process enginechooses the wrong version of a data artifact).
Data Mining (DM). A tool chain shall ensure that it is possible to (1) extractall the data necessary to handle all safety goals correctly during development and(2) present this data in a human-understandable form. An associated risk is thatoperators are not aware that project deadlines are forcing the premature releaseof artifacts and fail to take mitigating action. Which data needs to and canbe extracted emerge from the dynamic interaction between tools (for instance
Qualifying Software Tools, a Systems Approach 347
through different sequences of service calls that determine what data can begathered and when).
5 A Method for Qualifying Software Tools as Parts ofTool Chains
The safety goals defined in Section 4 highlight the hitherto obscured safety issuescaused by tool integration, but they would be of limited value if they (1) could notsolve the problems with current software tool qualification approaches describedin Subsection 3.1 or (2) could not be combined with the qualification effortsstipulated by modern safety standards. In this section we suggest a method fordealing with each of the subcategories mentioned in Section 4 while taking bothof these issues into account. This means the safety goals detailed in Section 4that are relevant to a particular part of a tool chain first need to be identifiedand then associated with a limited part of the development environment (a partthat then needs to be qualified).
5.1 Fully Composable Safety Goals for Operator Support
Fully composable safety goals for operator support could be ensured by thebrute-force approach of analyzing each and every tool integration mechanismthat fulfills a related subgoal, but with similar disadvantages to those describedfor the second approach in Subsection 3.1. To limit and guide the qualificationeffort we take inspiration from the tool chain approach in [1] and the SafetyElement out of Context concept from [5] and suggest the following four steps:
1. Pre-qualification of engineering tools is performed by tool vendors based onrepresentative tool use cases and a relevant safety standard.
2. Pre-qualification at the tool chain level by tool vendors or certification agen-cies is made possible by the deduction of requirements on which safety goalsneed to be supported at which points of tool chains to avoid unacceptablerisks. This is (at least partially) based on the information defined in step1 and one or several reference workflows. These requirements, the points inthe tool chains where they apply and mitigating efforts required (for instancequalification means, qualification of tool integration mechanisms, guidelinesfor processes and requirements for operator training) are documented andincluded in reference tool chain descriptions. In effect, one is decomposingthe relevant safety goals at the tool chain level to the relevant subgoals atthe tool level.
3. Qualification of the tool chain identifies the differences between the assump-tions of step 2 and the actual use cases, workflow and development environ-ment used when deploying the tool chain.
4. Qualification at the tool level is based on the actual use cases, workflow anddevelopment environment used when deploying the tool chain and performedaccording to a relevant safety standard. Three issues could therefore requirefurther efforts at this step:
348 F. Asplund, J. El-Khoury, and M. Törngren
(a) An engineering tool has not been qualified by the tool vendor.(b) The relevant safety standard differs between tool vendors and tool users
and requires additional efforts in regard to engineering tools if the vendorand user are different (an example of such a standard is DO-178C).
(c) The actual use cases, workflow or development environment are differentfrom those assumed during pre-qualification, which means that toolsand/or tool integration mechanisms will have to be (re)qualified by thetool user.
These four steps allow qualification of a development environment to be dis-tributed, but one can of course envision the tool user performing all these steps.What is important is that these steps do not have the problems mentioned inthe introduction to this section. They both allow (1) a stronger focus on therelevant parts of tool chains in regard to safety and (2) a clear separation of theengineering tool qualification stipulated by safety standards (step 1, 4.a and 4.bare consistent with safety standards such as ISO 26262:2011, IEC 61508:2010and DO-178C) and extra efforts to ensure safety goals relevant to tool integra-tion. They also have the additional benefits of allowing comparisons betweendifferent setups for mitigating safety issues already after step 2 (giving an earlyindication of the effort required) and favoring early planning in regard to thedevelopment environment (helping to avoid fragmentation of the developmentenvironment into several islands of automation [16]).
5.2 Fully Composable Safety Goals for Automation
Fully composable safety goals for automation can also be qualified according tothe steps described in Subsection 5.1. The difference is primarily the implicationson step 2. Fully composable safety goals for operator support will indicate whatparts of the development environment require qualification efforts, but as longas an operator is still providing oversight these qualification efforts could focusmore on reliability. Efforts at the operator level could instead ensure that morecomplicated risks are handled properly.
Automation, on the other hand, will require additional efforts to transferexpert knowledge from tool chain users to tool chain developers. An example iswhen ATD is supported to mitigate the lack of training of application designers,but then requires tool chain developers to be trained to understand the domainsto a corresponding level of detail. One can argue that this will be more difficultto achieve than simply assuring that the manual handling is correct, however,the automation can be verified more formally through analysis and comparison.
5.3 Emergent Safety Goals
Safety related to the emergent safety goals at the tool chain level cannot be fullyensured only by efforts at the tool level, because there will always remain someuncertainty in regard to how to decompose these safety goals [17]. However,if a safety goal is not fully composable, it may still be possible to isolate some
Qualifying Software Tools, a Systems Approach 349
portion of the goal behavior that is partially composable [17]. We have focused onthe safety implications of modern, highly integrated development environments,i.e. the way increased automation of tool integration hides what occurs to theoperators, rendering efforts (such as processes) at high levels of organizationless effective. Based on this new problem, we below define relevant, partiallycomposable safety goals of the emergent safety goals. Another focus could definemore parts of the development environment as important to qualify for DI andDM. Partially composable safety goals therefore have to be defined during step2 of a qualification effort, based on any considerations specific to the domain ofthe development effort.
Data Integrity A tool chain shall ensure that development artifacts cannotbecome corrupted or handled inappropriately without detection in automated,unsupervised process activities. This safety goal can be partially decomposedinto the requirement for qualified tool integration mechanisms for verificationof version handling and avoidance of data corruption (for instance a qualifiedversion control system that can notify operators of such things as file corruption).
Data Mining A tool chain shall ensure that data regarding safety-related de-velopment artifacts that is not handled by operators directly is automaticallygathered, analyzed and presented to operators. This safety goal can be partiallydecomposed into the requirement for qualified tool integration mechanisms fordata mining and analysis (for instance a qualified project dashboard).
6 Conclusions
The implications on safety due to tool integration are largely ignored, eventhough it leads to practical problems for the approaches stipulated by modernsafety standards in regard to software qualification. Based on previously definedsafety-related characteristics of tool chains we are able to identify nine safetygoals for ensuring safety in regard to tool integration. Based on these safetygoals, we suggest a systems approach to qualification for dealing with softwaretools as reusable entities deployed in the context of different tool chains.
This approach allows for a stronger focus on the relevant parts of tool chainsin regard to safety, solving the problems that current safety standards have witheither stipulating a too wide or a too narrow qualification effort in regard to toolintegration. The approach also provides a clear separation of the engineering toolqualification stipulated by current safety standards and extra efforts to ensuresafety goals relevant to tool integration, allowing for combining the approachwith said standards.
Important issues in need of validation and elaboration in future publicationsinclude quantifying the effects of the method on cost efficiency by distributingthe software qualification effort, allowing a stronger focus on software whichactually has implications for end product safety and a stronger focus on earlyplanning.
350 F. Asplund, J. El-Khoury, and M. Törngren
Acknowledgments. We thank all participants of the ARTEMIS iFEST project,who have given us continuous access to an additional breadth of expertise onand experience of software engineering in relation to the life cycle of embeddedsystems.
8 References
1. Conrad et al., “Qualifying software tools according to ISO 26262,” in Dagstuhl-Workshop MBEES: Modellbasierte Entwicklung eingebetteter Systeme VI, 2010,pp. 117–128.
2. P. Checkland, Systems Thinking, Systems Practice. John Wiley & Sons Ltd.,1985.
3. BS/IEC 61508:2010, Functional Safety of Electrical/Electronic/ProgrammableElectronic Safety-Related Systems, International Electrotechnical Commission Std.
4. BS/IEC 61511:2003, Functional safety - Safety instrumented systems for the pro-cess industry sector, International Electrotechnical Commission Std.
5. ISO 26262:2011, Road vehicles - Functional safety, International Organization forStandardization Std., 2011.
6. BS/EN 50128:2001, Railway applications - Communications, signalling and pro-cessing systems - Software for railway control and protection systems, CENELEC,European Committee for Electrotechnical Standardization Std., 2001.
7. DO-178C, Software Considerations in Airborne Systems and Equipment Certifica-tion, Special Committee 205 of RTCA, Inc. Std., 2011.
8. Kornecki et al., “Certification of software for real-time safety-critical systems: stateof the art,” Innovations in Systems and Software Engineering, vol. 5, pp. 149–161,2009.
9. Gonczy et al., “Tool support for engineering certifiable software,” Electronic Notesin Theoretical Computer Science, vol. 238, pp. 79–85, 2009.
10. Certification Specifications for Very Light Rotorcraft, CS-VLR, European AviationSafety Agency Std., 2008.
11. Hamann et al. (2011, April) ISO 26262 release just ahead - remaining problemsand proposals for solutions, SAE 2011 world congress & exhibition.
12. N. Leveson, Engineering a Safer World, Systems Thinking Applied to Safety(Draft). MIT Press, 2011.
13. Ahl et al., Hierarchy Theory, A Vision, Vocabulary, and Epistemology. ColumbiaUniversity Press, 1996.
14. Asplund et al., “Tool integration, from tool to tool chain with ISO 26262,” in SAE2012 World Congress & Exhibition, 2012.
15. F. Asplund, “Safety and tool integration, a system-theoretic process analysis,”KTH Royal Institute of Technlogy, Tech. Rep., 2012.
16. Asplund et al., “Tool integration beyond Wasserman,” in Advanced InformationSystems Engineering Workshops: CAiSE 2011 International Workshops, London,UK, June 20-24, 2011, Proceedings, 2011, pp. 270–281.
17. J. A. Black, “System safety as an emergent property in composite systems,” Ph.D.dissertation, Carnegie Mellon University, Carnegie Institute of Technology, 2009.
Qualifying Software Tools, a Systems Approach 351
Adapting a Software Product Line EngineeringProcess for Certifying Safety Critical Embedded
Systems
Rosana T. Vaccare Braga1, Onofre Trindade Junior1, Kalinka C. Branco1,Luciano O. Neris2, and Jaejoon Lee3
1 Instituto de Ciencias Matematicas e de ComputacaoUniversidade de Sao PauloSao Carlos – SP – Brazil
{rtvb,otjunior,kalinka}@icmc.usp.br
http://www.icmc.usp.br2 AGX Technology
Sao Carlos – SP – [email protected]
http://www.agx.com.br3 School of Computing and Communications
Lancaster UniversityLancaster – UK
http://www.lancs.ac.uk
Abstract. Software Product Line Engineering (SPLE) is a software de-velopment paradigm that aims at reducing the development effort andshorting time-to-market through systematic software reuse. While thisparadigm has been successfully applied for the development of embed-ded systems in various domains, new challenges have emerged from thedevelopment of safety critical systems that require certification againsta specific standard. Existing SPLE approaches do not explicitly considerthe various certification standards or levels that products should satisfy.In this paper, we focus on several practical issues involved in the SPLEprocess, establishing an infrastructure of a product line engineering forcertified products. A metamodel is proposed to capture the entities in-volved in SPL certification and the relationships among them. ProLiCES,which is a model-driven process for the development of SPLs, was mod-ified to serve as an example of our approach, in the context of the UAV(Unmanned Aerial Vehicle) domain.
Keywords: Safety-Critical Embedded Systems, Software Certification,Development Process
1 Introduction
The development of safety critical systems often requires certification under pre-established standards, and this poses several challenges to software engineers:
besides balancing costs, schedule and performance, it is necessary to produceall the evidences to prove that required quality goals have been achieved duringthe process. In this type of system, failures can cause catastrophic results thatwould involve loosing lives or large amounts of money.
Software product line engineering (SPLE) has been successfully used in thedevelopment of embedded systems, in particular safety critical systems [13,5,8].A software product line (SPL) [17] explores commonalities within a family ofproducts by developing and maintaining a set of core assets. Our work is mainlyconcerned with the avionics domain, more specifically avionics for UnmannedAerial Vehicles (UAV). For this domain we have developed a SPL [3] based onour SPL approach named ProLiCES [4].
Although quality is a very important concern in the SPL development, avion-ics certification has some peculiarities. The number of possible configurations ofdifferent avionics for UAV products grows in such a way that certifying all ofthem would be not feasible (or at least, very difficult). Besides, not all productsneed the same certification level, as each product is for a different market seg-ment with different usage context. The DO-178B [14] and its new release, theDO-178C4, are the current standards adopted for certifying avionic systems inseveral countries. They focus on single system certification and do not presentguidelines to certify SPLs.
Standards like the DO-178B normally do not dictate a process itself, but onlyestablish the objectives to be met to get the certification, listing activities to beperformed and expected evidence to show that the objectives were accomplished.This makes possible the inclusion of certification activities in a SPL developmentprocess such as ProLiCES [4], FAST [17], FORM [10], etc.
SPL development processes are customizable according to project needs. Ingeneral, they are composed of phases or steps, where a set of activities are per-formed by people playing certain roles, with input and output artefacts (e.g.analysis and design models, code, testing artefacts, etc.). Some phases or activi-ties can be optional depending on the specific project, so this is how customiza-tion takes place. In the context of our current research, it is important to knowwhich activities/artefacts of the process are required to achieve a certain certifi-cation level. We also want to avoid unnecessary activities for a low certificationlevel, e.g. the choice of the most adequate testing process for a certain certifica-tion level. Moreover, certain optional or alternative features of the SPL mightaffect software quality, leading to get certification easier (e.g., a master-slave,dual controller may contribute to achieve certification). Thus, the knowledgeabout mapping features to possible certification levels is also important.
The goal of this paper is to propose an infrastructure to adapt SPL develop-ment processes considering certification, exemplified through a real world SPLfor UAVs. A metamodel is proposed to capture the entities involved in SPL cer-tification and the relationships among them. This metamodel is the first steptowards the creation of a tool to support certifiable SPLs.
4 www.rtca.org
Adapting a Software Product Line Engineering Process for CertifyingSafety Critical Embedded Systems 353
The remainder of this paper is organized as follows. Section 2 presents re-lated work concerning SPLs for UAVs and certification. Section 3 discusses howSPL development should be conducted to ease certification and, based on thisdiscussion, it is proposed an infrastructure to support SPL development andthe associated metamodel. Section 4 illustrates how adaptations can be carriedout in a SPL development process, using ProLiCES [4] as an example. Finally,section 5 presents our concluding remarks and future work.
2 Related work
Several works regarding avionics systems certification have been published [11,16,1].Schoitsch et al. [15] present an integrated architecture for embedded systems de-velopment that includes a complete test bench to ease validation and verification(V&V) according to existing standards. It provides guidance for the integrationof external tools, for example to format input data for V&V tools using modeltransformation. Abdul-Baki et al. [1] also use the avionics domain to illustratetheir approach to V&V, which comprises specification-based testing, analysistools and associated processes in the context of a system to avoid collisions.This system is specified using a formal language, and the system generated iscompliant with DO-178B. They are, however, mainly concerned with single sys-tems, i.e., a software component that is part of an aircraft system.
SPLs require a different approach to certification, as the complete validationof SPLs requires a lot of effort. Indeed, validating all combinations of featuresthat could produce a particular SPL instance is often an impossible (or at least avery difficult) task. Several approaches are beginning to emerge to support SPLcertification, as for example the work by Hutchesson and McDermid [8,9], whichaims at the development of high-assurance SPLs based on model transforma-tions. Model-based transformations are applied to instantiate variability modelsof a large avionics SPL, ensuring that the transformation does not introduceerrors. The approach can be useful during certification, as it is able to generatesome evidences required for certification. However, they still need integrationand system testing.
We did not find related works where the focus is on associating certificationrequirements to a SPL development process, which is the key idea of our ap-proach. The closest we could find was the work proposed by Habli and Kelly [7],where a notation was proposed to capture safety cases variations and tracingthese variations to an architectural model. This allows the explicit definition ofthe possible behaviours of a derived product and how the safety case deals withthe variation. Nothing was mentioned about the process itself or the decisionsmade to achieve particular certification levels or standards.
354 R. Braga, O. Trindade, K. R. Castelo Branco, L. D. O. Neris, and J. Lee
3 SPL Certification
3.1 Description of our case study
The motivation for this work is originated from a real world problem regardinga UAV SPL. A UAV is an aerial vehicle where no human operator is physicallypresent in the aircraft and, thus, it flies autonomously or is controlled by a remotepilot on the ground. UAVs are often thought of as part of an Unmanned AircraftSystem (UAS), where other elements such as the payload, ground control stationand communications links [6] are considered.
Tiriba [3] is a family of small, electric powered UAVs that were designedfor civilian applications, especially for agriculture, environment monitoring andsecurity. Examples of applications include the detection of crop diseases, to-pographical surveys, traffic monitoring, urban planning and transmission lineinspection. Tiriba was initially designed as a single system, but the demand forseveral slightly different versions motivated the development of its product lineassets based on a SPL process named ProLiCES [4].
Avionics software is mainly regulated by DO-178B [14] and its updated ver-sion, DO-178C5. They were developed by the Radio Technical Commission forAeronautics (RTCA) and were adopted by many government entities to supportthe certification process for airborne systems. The ANAC (National Agency forCivil Aviation) in Brazil is also considering its adoption for the development anduse of UAVs, although previous certification is not required yet 6. Therefore, thiswork is being done in anticipation for the future release of these rules.
After the deployment of several members of the Tiriba family, we started anew project, named Sarvant, involving a heavy and more complex UAV system.The resulting software is estimated to be ten times bigger than Tiriba, as newfeatures have to be included to provide a more reliable aircraft with betterperformance and safety. Both Sarvant and Tiriba products will need certificationin the near future.
3.2 SPL development processes and certification
From the development process point of view, we face two major problems toachieve certification: 1) standards such as DO-178B do not ask to follow a spe-cific process, but define a set of activities with corresponding evidences thatthey were performed properly. Thus, the organization should adapt its processesin accordance with the standards; and 2) when a SPL is developed to leveragesoftware reuse, standards such as DO-178B do not provide any recommenda-tion to certification agencies about how to certify reusable assets. Only concreteproducts are considered for certification.
At the same time, organizations do not want to waste resources in activi-ties/artefacts that are not required, or for parts of a system that do not need
5 http://www.rtca.org6 http://www.anac.gov.br
Adapting a Software Product Line Engineering Process for CertifyingSafety Critical Embedded Systems 355
high certification levels. As such, the relationships between SPL developmentprocess activities/artefacts and the certification level to be achieved must becaptured and documented, as this knowledge can be highly valuable for futuredevelopments. In the specific case of SPLs, as there are many variations of pos-sible activities/artefacts depending on several factors such as context, designdecisions, etc., their use can be weighted according to the importance to achievethe desired certification level.
The key idea of our work is to identify the activities of the SPL developmentprocess that have impact on the certification of products instantiated from theSPL. The knowledge associated with the certification of products of a SPL for aparticular domain could be stored to support decision making when new productsare developed. Decisions can be associated either with activities or artefactsto be produced during the instantiation process, e.g., a mandatory test reportaccordingly with a specific standard, or with features that should or shouldnot be included in the product e.g., a flight termination controller based onparachute deploying. Feature models [10] are an essential means of representingSPL commonalities and variabilities. Features refer to abstractions that bothcustomers and developers understand, such as functional and non-functionalcharacteristics of the products. In this paper, we adopt the features classificationproposed by Lee and Kang [12], where a feature model is split in three models:usage context, quality attribute and product (this last itself split into capabilities,operating environment and domain technologies/implementation techniques).
In the following, we discuss several issues concerning certification in a SPLfor UAVs:
– I1 - Certification level of complex products: a product from the SPLcan be complex, so it could be split into smaller components, each of whichdoes not necessarily need the same certification level. For example, a UAVcan be equipped with several types of payloads, e.g., cameras, weapons orfirst-aid kits. A fault in the component that controls the payload not alwaysleads to a dangerous situation. Therefore, it could require a lower certificationlevel than other components in the system.
– I2 - Usage context and the certification level: usage of the product alsoaffects the certification level. For example, a UAV flying over crowded areascertainly requires a higher certification level than a UAV used in agriculturalapplications flying over a private farm. These different contexts could implydifferent certification levels. Further, in some contexts the system must beequipped with special sensors/equipment or specific algorithms to guaranteea safe operation. More details about how feature modelling can be doneconsidering certification can be found elsewhere [2].
– I3 - Additional features and certification levels: some features of theSPL could be specially designed to help achieving a particular certificationlevel. For example, in UAVs, a quality feature like Data Integrity Checkingcould be an optional feature in the feature model, but it must be selectedwhen higher certification levels need to be attained, being not an option forthe level.
356 R. Braga, O. Trindade, K. R. Castelo Branco, L. D. O. Neris, and J. Lee
– I4 - Features can contribute (positive/negatively) to obtain a par-ticular certification level: some features can facilitate certification, whileothers can hinder or retard certification. For example, a Weather resistancefeature contributes to certification, but a Cost effective airframe may not.
– I5 - Features associated to design decisions can impact certifica-tion: the alternative choice among domain technologies or implementationtechniques are provided specifically to enable higher certification levels. Ifalternative cheaper solutions exist, they can be used for parts of the productthat require lower certification levels, helping balance the product cost. Forexample, the system architecture can have two alternative designs, with orwithout redundancy to improve reliability and this decision impacts certifi-cation.
– I6 - The development process should be adapted according to thecertification level: in issues I1 to I5, product features have impact on thecertification level. But, to achieve a certain level, the development processmust comply with pre-established standards. Thus, the development processis also subject to changes according to the targeted certification level orstandard. Examples include: 1) requirements engineering activities can beperformed in different ways, with varying costs and time depending on thedocumentation to be produced. For example, to attend DO-178B levels Aand B, it is required that high level requirements are compatible with thetarget hardware, so an activity to verify this should be included in the pro-cess. Alternatively, formal techniques could be used, but they would requirecertified tools that can be quite expensive considering the available budget.2) testing activities should be conducted using certified tools to guarantee itseffectiveness when high certification levels are targeted. Alternative verifica-tion processes can be chosen, e.g., verifying the source code is different fromverifying the object code, because errors could be introduced by the compiler[16]. So, when it is decided to perform the verification based on source code,the compiler tool should also be certified. 3) model based checking techniquesshould be employed to validate the design for certain levels, while for othersa conventional inspection is enough.
3.3 Infrastructure for SPL processes aiming at certification
Based on the discussions provided in Section 3.2, we propose an infrastructureto support SPL development processes and its mapping to certification activ-ities. Figure 1 shows the several elements used to help aligning certificationwith the SPL development process. A repository of SPL development processesstores metadata about existing processes and how they are related to standardsduring certification. For certain domains, it is possible that more than one stan-dard is required by certification agencies. This mapping between processes andstandards is continually updated according to the feedback supplied by SPL de-velopers and certification agencies, to incrementally build a knowledge base tosupport decision making. SPL products can be divided into smaller products(components in the figure). Since products are implemented by SPL assets and,
Adapting a Software Product Line Engineering Process for CertifyingSafety Critical Embedded Systems 357
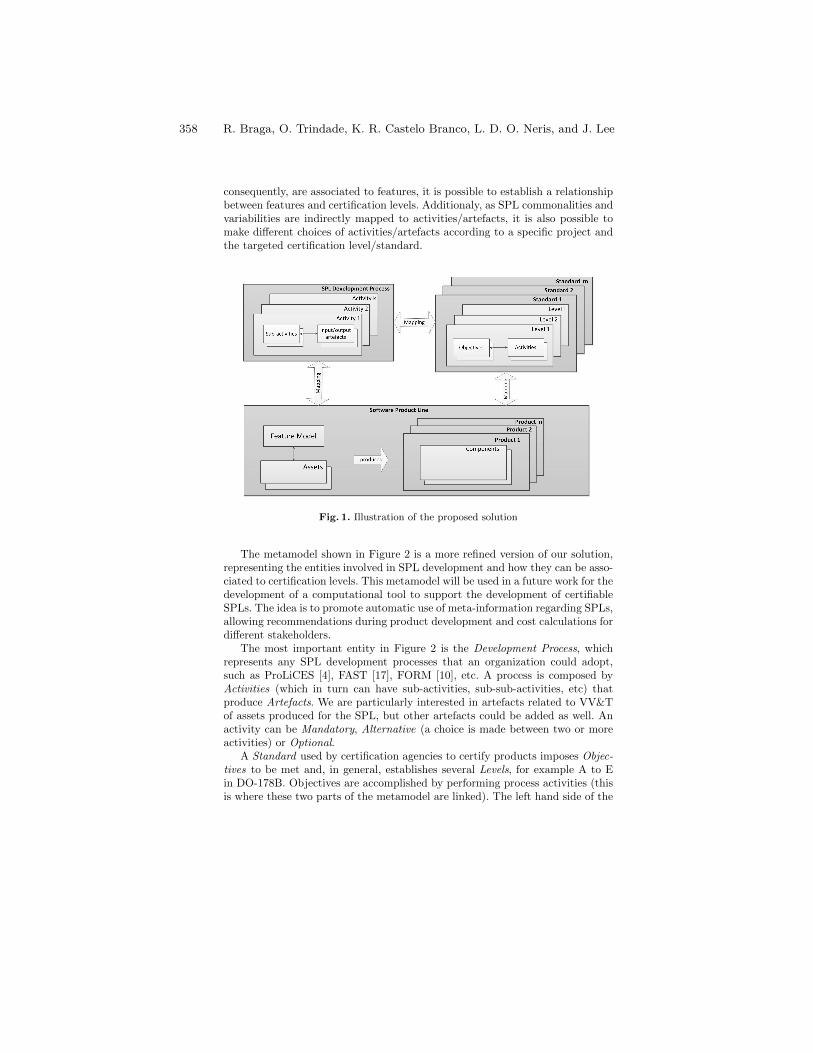
consequently, are associated to features, it is possible to establish a relationshipbetween features and certification levels. Additionaly, as SPL commonalities andvariabilities are indirectly mapped to activities/artefacts, it is also possible tomake different choices of activities/artefacts according to a specific project andthe targeted certification level/standard.
Fig. 1. Illustration of the proposed solution
The metamodel shown in Figure 2 is a more refined version of our solution,representing the entities involved in SPL development and how they can be asso-ciated to certification levels. This metamodel will be used in a future work for thedevelopment of a computational tool to support the development of certifiableSPLs. The idea is to promote automatic use of meta-information regarding SPLs,allowing recommendations during product development and cost calculations fordifferent stakeholders.
The most important entity in Figure 2 is the Development Process, whichrepresents any SPL development processes that an organization could adopt,such as ProLiCES [4], FAST [17], FORM [10], etc. A process is composed byActivities (which in turn can have sub-activities, sub-sub-activities, etc) thatproduce Artefacts. We are particularly interested in artefacts related to VV&Tof assets produced for the SPL, but other artefacts could be added as well. Anactivity can be Mandatory, Alternative (a choice is made between two or moreactivities) or Optional.
A Standard used by certification agencies to certify products imposes Objec-tives to be met and, in general, establishes several Levels, for example A to Ein DO-178B. Objectives are accomplished by performing process activities (thisis where these two parts of the metamodel are linked). The left hand side of the
358 R. Braga, O. Trindade, K. R. Castelo Branco, L. D. O. Neris, and J. Lee
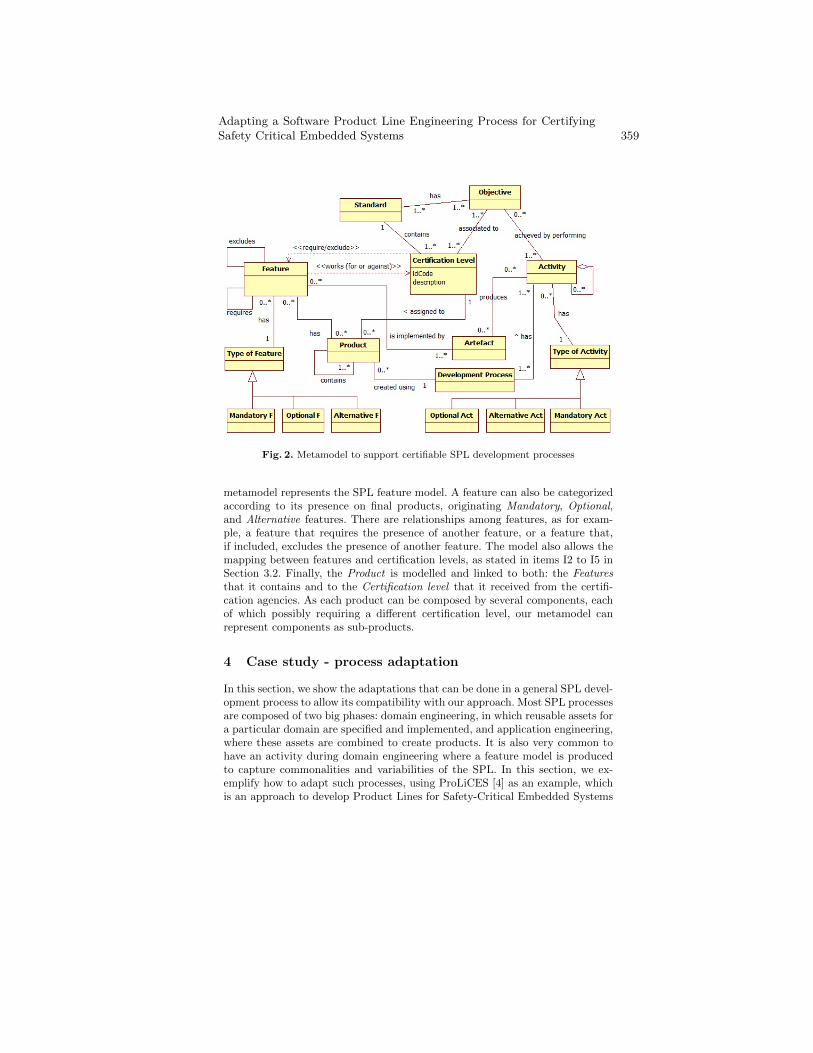
Fig. 2. Metamodel to support certifiable SPL development processes
metamodel represents the SPL feature model. A feature can also be categorizedaccording to its presence on final products, originating Mandatory, Optional,and Alternative features. There are relationships among features, as for exam-ple, a feature that requires the presence of another feature, or a feature that,if included, excludes the presence of another feature. The model also allows themapping between features and certification levels, as stated in items I2 to I5 inSection 3.2. Finally, the Product is modelled and linked to both: the Featuresthat it contains and to the Certification level that it received from the certifi-cation agencies. As each product can be composed by several components, eachof which possibly requiring a different certification level, our metamodel canrepresent components as sub-products.
4 Case study - process adaptation
In this section, we show the adaptations that can be done in a general SPL devel-opment process to allow its compatibility with our approach. Most SPL processesare composed of two big phases: domain engineering, in which reusable assets fora particular domain are specified and implemented, and application engineering,where these assets are combined to create products. It is also very common tohave an activity during domain engineering where a feature model is producedto capture commonalities and variabilities of the SPL. In this section, we ex-emplify how to adapt such processes, using ProLiCES [4] as an example, whichis an approach to develop Product Lines for Safety-Critical Embedded Systems
Adapting a Software Product Line Engineering Process for CertifyingSafety Critical Embedded Systems 359
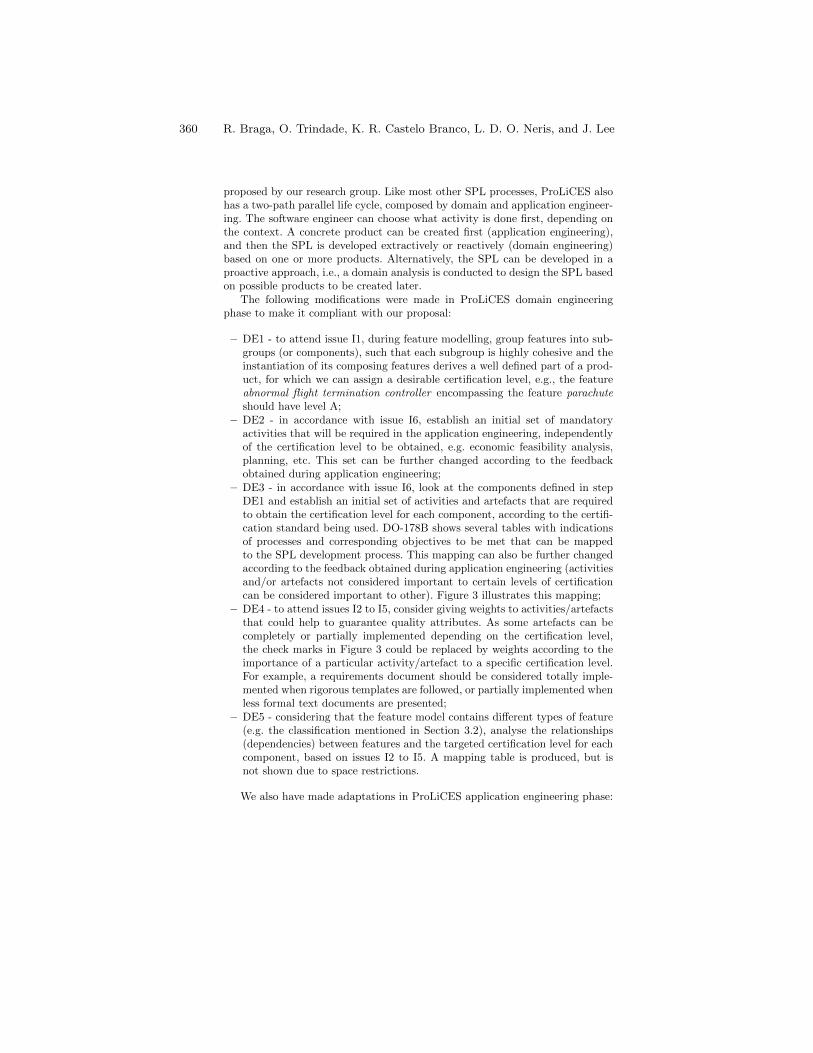
proposed by our research group. Like most other SPL processes, ProLiCES alsohas a two-path parallel life cycle, composed by domain and application engineer-ing. The software engineer can choose what activity is done first, depending onthe context. A concrete product can be created first (application engineering),and then the SPL is developed extractively or reactively (domain engineering)based on one or more products. Alternatively, the SPL can be developed in aproactive approach, i.e., a domain analysis is conducted to design the SPL basedon possible products to be created later.
The following modifications were made in ProLiCES domain engineeringphase to make it compliant with our proposal:
– DE1 - to attend issue I1, during feature modelling, group features into sub-groups (or components), such that each subgroup is highly cohesive and theinstantiation of its composing features derives a well defined part of a prod-uct, for which we can assign a desirable certification level, e.g., the featureabnormal flight termination controller encompassing the feature parachuteshould have level A;
– DE2 - in accordance with issue I6, establish an initial set of mandatoryactivities that will be required in the application engineering, independentlyof the certification level to be obtained, e.g. economic feasibility analysis,planning, etc. This set can be further changed according to the feedbackobtained during application engineering;
– DE3 - in accordance with issue I6, look at the components defined in stepDE1 and establish an initial set of activities and artefacts that are requiredto obtain the certification level for each component, according to the certifi-cation standard being used. DO-178B shows several tables with indicationsof processes and corresponding objectives to be met that can be mappedto the SPL development process. This mapping can also be further changedaccording to the feedback obtained during application engineering (activitiesand/or artefacts not considered important to certain levels of certificationcan be considered important to other). Figure 3 illustrates this mapping;
– DE4 - to attend issues I2 to I5, consider giving weights to activities/artefactsthat could help to guarantee quality attributes. As some artefacts can becompletely or partially implemented depending on the certification level,the check marks in Figure 3 could be replaced by weights according to theimportance of a particular activity/artefact to a specific certification level.For example, a requirements document should be considered totally imple-mented when rigorous templates are followed, or partially implemented whenless formal text documents are presented;
– DE5 - considering that the feature model contains different types of feature(e.g. the classification mentioned in Section 3.2), analyse the relationships(dependencies) between features and the targeted certification level for eachcomponent, based on issues I2 to I5. A mapping table is produced, but isnot shown due to space restrictions.
We also have made adaptations in ProLiCES application engineering phase:
360 R. Braga, O. Trindade, K. R. Castelo Branco, L. D. O. Neris, and J. Lee
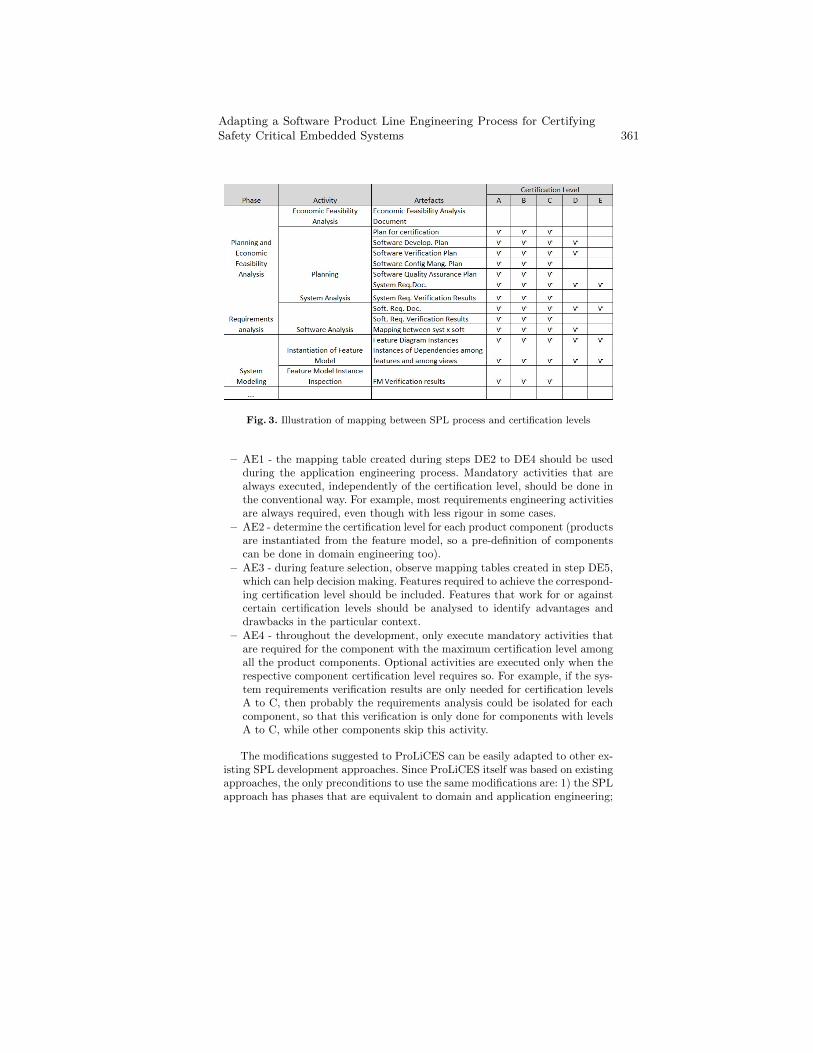
Fig. 3. Illustration of mapping between SPL process and certification levels
– AE1 - the mapping table created during steps DE2 to DE4 should be usedduring the application engineering process. Mandatory activities that arealways executed, independently of the certification level, should be done inthe conventional way. For example, most requirements engineering activitiesare always required, even though with less rigour in some cases.
– AE2 - determine the certification level for each product component (productsare instantiated from the feature model, so a pre-definition of componentscan be done in domain engineering too).
– AE3 - during feature selection, observe mapping tables created in step DE5,which can help decision making. Features required to achieve the correspond-ing certification level should be included. Features that work for or againstcertain certification levels should be analysed to identify advantages anddrawbacks in the particular context.
– AE4 - throughout the development, only execute mandatory activities thatare required for the component with the maximum certification level amongall the product components. Optional activities are executed only when therespective component certification level requires so. For example, if the sys-tem requirements verification results are only needed for certification levelsA to C, then probably the requirements analysis could be isolated for eachcomponent, so that this verification is only done for components with levelsA to C, while other components skip this activity.
The modifications suggested to ProLiCES can be easily adapted to other ex-isting SPL development approaches. Since ProLiCES itself was based on existingapproaches, the only preconditions to use the same modifications are: 1) the SPLapproach has phases that are equivalent to domain and application engineering;
Adapting a Software Product Line Engineering Process for CertifyingSafety Critical Embedded Systems 361
2) a feature model is produced during domain engineering and instantiated in ap-plication engineering; and 3) the process has mandatory and optional activitiesthat can be customized for each particular project. Additionally, the modifica-tions proposed are not exclusively related to the DO-178B standard. They couldbe adapted to other standards required by specific domain regulations.
5 Conclusion
This paper presented an infrastructure to support SPL development in domainswhere certification will be required. After identifying the activities of the SPLdevelopment process that have potential to help the certification of instantiatedproducts, the software engineer can store this knowledge to support decisionmaking when new products are developed.
The main advantages of the approach are: 1) a knowledge base is incremen-tally built to ease the customization of the development process, according tospecific certification needs of each project. Thus, there is less risk that impor-tant information is lost during the process; 2) the certification process is morestraightforward, as the required activities established by pertinent standards areperformed and features related to safety are included in the product; and 3) theapproach helps balance the product cost, as only the activities and artefacts thateffectively contribute to the specific certification needs are performed.
At the time of this writing, an adapted version of ProLiCES is being usedin the development of the SARVant avionics, a distributed and redundant flightcontrol system composed by tens of processor boards. It is expected more than200.000 lines of code to be automatically generated, split among several compo-nents certified under DO-178B and deployed in one or more processor boards.The validation of the approach, where we will try to collect evidences that iteases certification, is also an ongoing work.
Acknowledgments. The authors acknowledge the support granted by CNPqand FAPESP to the INCT-SEC (National Institute of Science and Technol-ogy - safety-critical Embedded Systems - Brazil), processes 573963/2008-9 and08/57870-9, as well as the FAPESP support to the postgraduate research atLancaster University, process 2011/02392-8.
References
1. B. Abdul-Baki, J. Baldwin, and M.-P. Rudel. Independent validation and veri-fication of the TCAS II collision avoidance subsystem. IEEE Aerosp. ElectronicSystems Magazine, 15(8):3–9, 2000.
2. R. T. V. Braga, O. Jr. Trindade, K. R. L. J. C. Branco, and J. Lee. Incorpo-rating certification in feature modelling of an unmanned aerial vehicle productline. In 16th International Software Product Line Conference (SPLC), pages 1–10(accepted for publication, to appear), Salvador, Brazil, 2012.
362 R. Braga, O. Trindade, K. R. Castelo Branco, L. D. O. Neris, and J. Lee
3. R.T.V. Braga, K. R. L. J. C. Branco, O. Jr. Trindade, and I. Gimenes. Evolvingtiriba design towards a product line of small electric-powered uavs. In Procs. ofCBSEC - I Brazilian Conf. on Critical Embedded Systems, pages 67–72, 2011.
4. R.T.V. Braga, K. R. L. J. C. Branco, O. Jr. Trindade, P. C. Masiero, L. O. Neris,and M. Becker. The prolices approach to develop product lines for safety-criticalembedded systems and its application to the unmanned aerial vehicles domain.CLEI Electronic Journal, 15(2):1–13, 2012.
5. F. Dordowsky and W. Hipp. Adopting software product line principles to managesoftware variants in a complex avionics system. In Proceedings of the 13th Inter-national Software Product Line Conference, SPLC ’09, pages 265–274, Pittsburgh,PA, USA, 2009. Carnegie Mellon University.
6. GAO. Unmanned aircraft systems - federal actions needed to ensure safety and ex-pand their potential uses within the national airspace system, GAO-08-511. Tech-nical report, GAO, 2008, 2008.
7. I. Habli and T. Kelly. A safety case approach to assuring configurable architecturesof safety-critical product lines. In ISARCS, pages 142–160, 2010.
8. S. Hutchesson and J. McDermid. Development of high-integrity software productlines using model transformation. In Proceedings of the 29th international confer-ence on Computer safety, reliability, and security, SAFECOMP’10, pages 389–401,Berlin, Heidelberg, 2010. Springer-Verlag.
9. S. Hutchesson and J. A. McDermid. Towards cost-effective high-assurance soft-ware product lines: The need for property-preserving transformations. In SoftwareProduct Line Conference (SPLC), pages 55–64, 2011.
10. K. C. Kang, S. Kim, J. Lee, K. Kim, G. Jounghyun Kim, and E. Shin. Form: Afeature-oriented reuse method with domain-specific reference architectures. Annalsof Software Engineering, 5:143–168, 1998.
11. A. Kornecki and J. Zalewski. Certification of software for real-time safety-criticalsystems: state of the art. Innovations in Systems and Software Engineering,5(2):149–161, 2009.
12. K. Lee and K.C. Kang. Usage context as key driver for feature selection. InProceedings of the 14th international conference on Software product lines: goingbeyond, SPLC’10, pages 32–46, Berlin, Heidelberg, 2010. Springer-Verlag.
13. A. Polzer, S. Kowalewski, and G. Botterweck. Applying software product line tech-niques in model-based embedded systems engineering. In Procs. of the Workshopon Model-based Methodologies for Pervasive and Embedded Software (MOMPES2009), at the 31st Int. Conf. on Software Engineering, pages 2–10, 2009.
14. RTCA. DO-178B – software considerations in airborne systems and equipmentcertification. Radio Technical Commission for Aeronautics/EUROCAE Std ed-12B/DO178B, dec 1992.
15. E. Schoitsch, E. Althammer, H. Eriksson, J. Vinter, L. Gonczy, A. Pataricza, andG. Csertan. Validation and certification of safety-critical embedded systems: theDECOS test bench. In Proceedings of the 25th international conference on Com-puter Safety, Reliability, and Security, SAFECOMP’06, pages 372–385, Berlin, Hei-delberg, 2006. Springer-Verlag.
16. J. Souyris, V. Wiels, D. Delmas, and H. Delseny. Formal verification of avionicssoftware products. In Proceedings of the 2nd World Congress on Formal Methods,pages 532–546, Berlin, Heidelberg, 2009. Springer-Verlag.
17. D. Weiss and C. T. R. Lai. Software product-line engineering: a family-based soft-ware development process. Addison-Wesley, Boston, MA, USA, 2004.
Adapting a Software Product Line Engineering Process for CertifyingSafety Critical Embedded Systems 363
Combining Failure Mode and FunctionalResonance Analyses in Healthcare Settings
Mark-Alexander Sujan1 and Massimo Felici2
1 Warwick Medical School, University of Warwick, Coventry CV4 7AL, [email protected]
2 Deep Blue S.r.l., Piazza Buenos Aires 20, 00198 Roma, Italyhttp://www.dblue.it/
Abstract. Socio-technical systems rely on technological artefacts aswell as human and professional practices in order to achieve organi-sational safety. From an organisational viewpoint of analysis, differentsafety barriers are often put in place in order to mitigate risks. The com-plexity of such systems poses challenges to safety assessment approachesthat rely on simple, identifiable cause and effect links. Failure Modeand Effects Analysis (FMEA), for instance, is an established techniquefor the safety analysis of technical systems, but the assessment of theseverity of consequences is difficult in socio-technical settings like health-care. This paper argues that such limitations need to be addressed bycombining diverse methodologies in order to assess vulnerabilities thatmight affect complex socio-technical settings. The paper describes theapplication of FMEA for the identification of vulnerabilities related tocommunication and handover within an emergency care pathway. It re-views and discusses the applicability of the Functional Resonance Analy-sis Method (FRAM) as a complementary approach. Finally, a discussionabout different aspects of emerging technological risk argues that takinginto account socio-technical hazards could be useful in order to over-come limitations of analytical approaches that tend to narrow the scopeof analysis.
Keywords: Failure Mode and Effects Analysis (FMEA), FunctionalResonance Analysis Method (FRAM), Healthcare.
1 Introduction
Since the publication of the Institute of Medicine report “To err is human” in1999 [1], the safety of patients has received unprecedented attention. Researchersand healthcare organisations have turned to high-risk industries [27] such as com-mercial aviation for inspiration about appropriate theories and methods throughwhich patient safety could be improved. For example, learning from past expe-rience through incident reporting systems and Root Cause Analysis are nowstandard practices through-out the National Health Service (NHS) in the UK,triggered by the influential Department of Health Report, “An organisation with
a memory” [2]. The report led to the foundation of the National Patient SafetyAgency (NPSA) and the development of the National Reporting and LearningSystem (NRLS), a national system to collect patient safety incidents and to sharerelevant learning throughout the NHS. In addition to such reactive approaches,healthcare policy makers have recognised the need for proactive assessmentsof threats to patient safety. In particular, the use of Failure Mode and EffectsAnalysis (FMEA) is now recommended widely in healthcare as an appropriatetool for proactive safety analysis. For example, the Joint Commission in the US— the organisation that accredits hospitals — requires from participating or-ganisations evidence that they carry out at least one proactive assessment of ahigh-risk process every year [3], FMEA being the approach recommended. TheUS Department of Veterans Affairs (VA) has developed an FMEA version tai-lored to healthcare, Health Care Failure Mode and Effects Analysis (HFMEA)[4]. During the past few years FMEA has been used in healthcare to assess therisks associated with, for example, organ procurement and transplantation [5],intravenous drug infusions [6], and communication in emergency care [7].
As healthcare organisations are gaining experience in using FMEA, therestarts to become available documented evidence of some of the problems thatpractitioners experience with the application of the method. Habraken and col-leagues carried out a large evaluation of HFMEA in the Netherlands [8]. Whilethey concluded that the method might be useful in Dutch healthcare, they re-marked that practitioners commonly felt that the method was very time con-suming, the identification of failure modes was poorly supported and the riskassessment part was very difficult to carry out. FMEA was also used as part of theHealth Foundation’s Safer Patient Initiative in the UK, and a study evaluatingthe perceptions of participating healthcare professionals found that participantsfelt that while the structured nature of the process was beneficial, there werenegative aspects that may prevent the useful adoption of the method in the NHS,including the time required to perform the analysis and the subjective nature ofthe risk evaluation [9].
This paper addresses some of the difficulties related to the use of FMEA inhealthcare settings by investigating the application of an alternative, comple-mentary methodology in order to conduct a proactive safety analysis. It arguesthat some issues of adopting FMEA can be eased by combining diverse method-ologies in order to assess vulnerabilities in complex socio-technical settings. Thispaper is organised as follows. Section 2 summarises some of the research findingsaround communication and handover failures in emergency care. Section 3 de-scribes the application of FMEA for the identification of vulnerabilities relatedto communication and handover within a specific emergency care pathway. Itthen discusses the suitability of FMEA to assess risks in healthcare settings, andinvestigates its possible combination with an alternative approach, the Func-tional Resonance Analysis Method (FRAM). It also discusses and argues thattaking into account socio-technical hazards could be useful in order to overcomelimitations of analytical approaches that tend to narrow the scope of analysis.Section 4 draws some concluding remarks.
Failure Modes, Functional Resonance and Socio-Technical Hazards:Limitations of FMEA in Healthcare Settings 365
2 Communication and Handover Failures
Communication failures are a recognised threat to patient safety [10]. Handoverdenotes “the transfer of professional responsibility and accountability for someor all aspects of care for a patient, or group of patients, to another person orprofessional group on a temporary or permanent basis” [11]. Handover may oc-cur between members of the same profession, for example during nursing shiftchange, or between individuals belonging to different medical professions or evendifferent organisations, such as the Ambulance Service handover to the Emer-gency Department. Handover is a frequent and highly critical task in clinicalpractice as it ensures continuity of care and provides clinicians with an opportu-nity to share information and plan patient care [12]. Ideally, handover should bethought of as a dialogue that creates shared awareness and provides an opportu-nity for discussion and recovery as participants bring different perspectives andexperiences to this interaction [13, 14]. There is now a large body of evidence anda number of systematic reviews that suggest that inadequate handover practicesare putting patients at risk [15–19]. Inadequate handover can create gaps in thecontinuity of care and contribute to adverse events [20]. Some of the adverseevents associated with inadequate handover include in-creased length of stay[21], treatment delays [13, 22], repetition of assessments and confusion regardingcare [23]. In time-critical environments such as Emergency Departments, the ad-ditional burden put on already stretched resources due to inadequate handoverposes a risk not only to the individual patients handed over, but also to otherpatients in need of urgent care [13].
3 Proactive Risk Analysis
As described in the previous section, communication and handover failures area significant threat to patient safety. This has been recognised and organisationsare experimenting with different solutions to the problem, including standard-ised communication protocols, electronic handovers and electronic documenta-tion available on PDAs or tablets at the point of handover. In the research projectthat provides the background to this paper, it was decided to conduct a system-atic risk assessment prior to the adoption of any technological or proceduralsolution in order to ensure that risks have been properly understood.
3.1 Description of the Emergency Care Pathway
For the purpose of our case study, the emergency care pathway consists of theAmbulance Service bringing a patient to hospital (typically two paramedics in anambulance), the Emergency Department (ED), and hospital departments thatreceive patients from the ED – in the UK often a Clinical Decision Unit (CDU)or Medical Assessment Unit (MAU). As part of the FMEA process, staff work-ing within the pathway were invited to participate in a process mapping sessionin order to describe the pathway for the subsequent risk analysis. Participants
366 M. Sujan and M. Felici
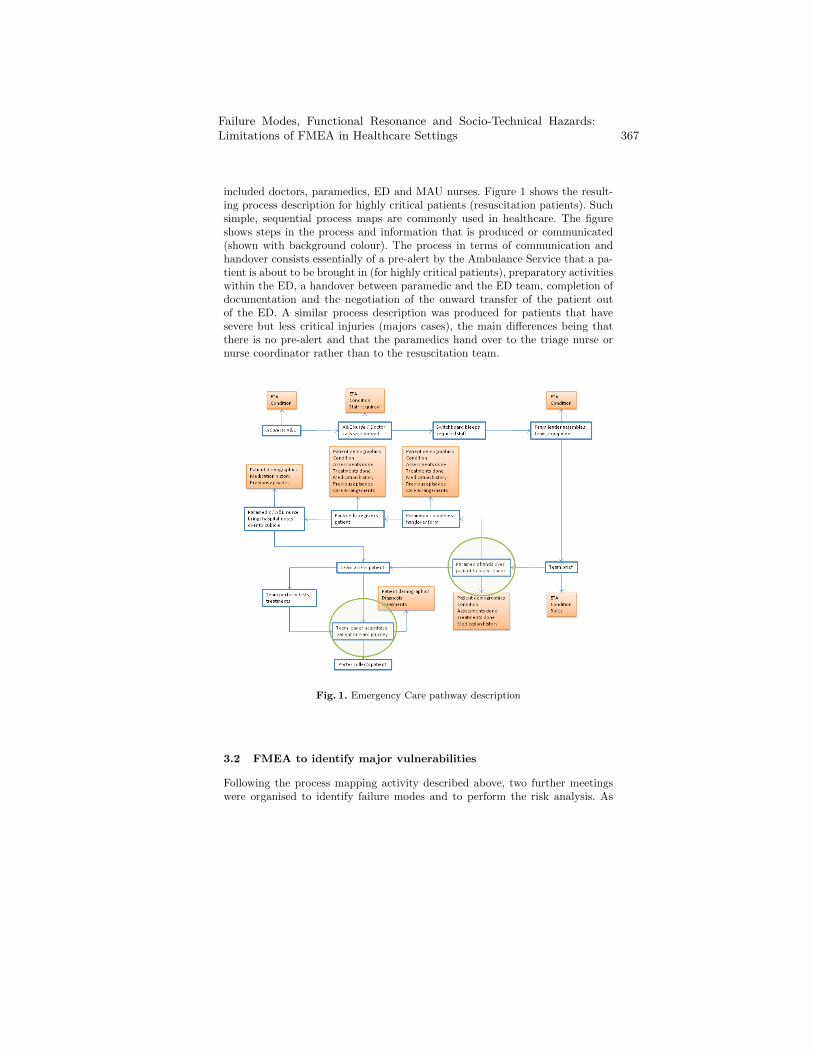
included doctors, paramedics, ED and MAU nurses. Figure 1 shows the result-ing process description for highly critical patients (resuscitation patients). Suchsimple, sequential process maps are commonly used in healthcare. The figureshows steps in the process and information that is produced or communicated(shown with background colour). The process in terms of communication andhandover consists essentially of a pre-alert by the Ambulance Service that a pa-tient is about to be brought in (for highly critical patients), preparatory activitieswithin the ED, a handover between paramedic and the ED team, completion ofdocumentation and the negotiation of the onward transfer of the patient outof the ED. A similar process description was produced for patients that havesevere but less critical injuries (majors cases), the main differences being thatthere is no pre-alert and that the paramedics hand over to the triage nurse ornurse coordinator rather than to the resuscitation team.
Fig. 1. Emergency Care pathway description
3.2 FMEA to identify major vulnerabilities
Following the process mapping activity described above, two further meetingswere organised to identify failure modes and to perform the risk analysis. As
Failure Modes, Functional Resonance and Socio-Technical Hazards:Limitations of FMEA in Healthcare Settings 367
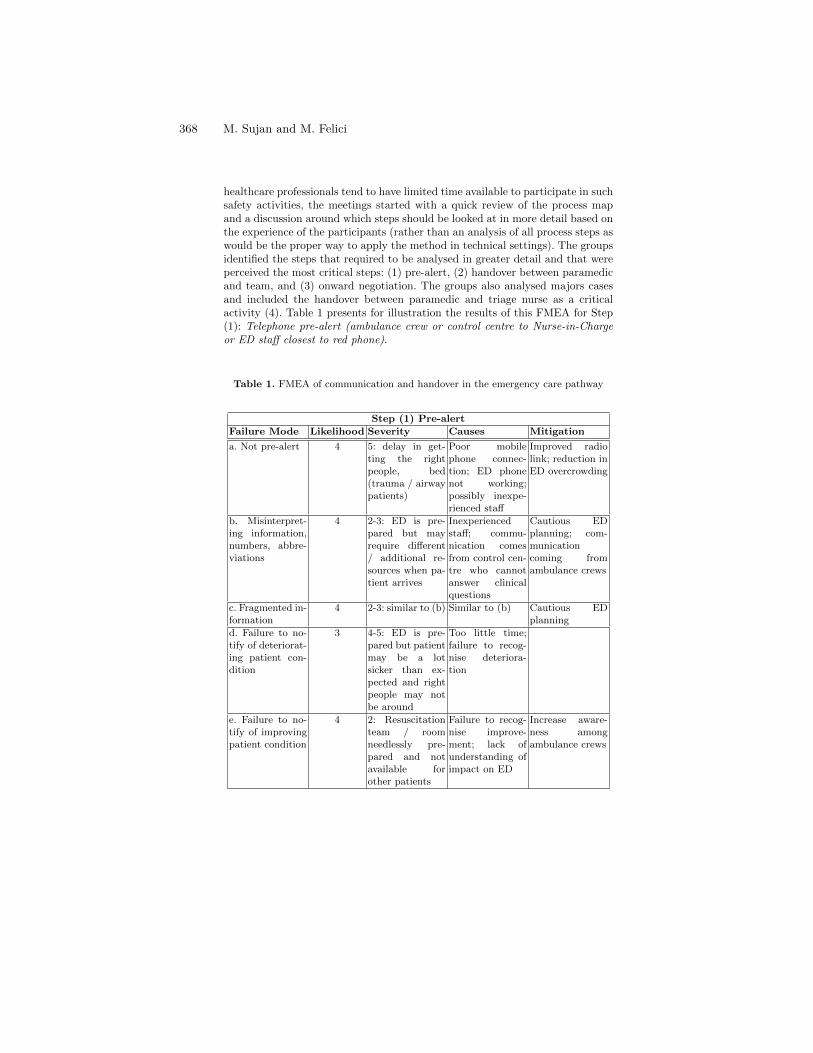
healthcare professionals tend to have limited time available to participate in suchsafety activities, the meetings started with a quick review of the process mapand a discussion around which steps should be looked at in more detail based onthe experience of the participants (rather than an analysis of all process steps aswould be the proper way to apply the method in technical settings). The groupsidentified the steps that required to be analysed in greater detail and that wereperceived the most critical steps: (1) pre-alert, (2) handover between paramedicand team, and (3) onward negotiation. The groups also analysed majors casesand included the handover between paramedic and triage nurse as a criticalactivity (4). Table 1 presents for illustration the results of this FMEA for Step(1): Telephone pre-alert (ambulance crew or control centre to Nurse-in-Chargeor ED staff closest to red phone).
Table 1. FMEA of communication and handover in the emergency care pathway
Step (1) Pre-alert
Failure Mode Likelihood Severity Causes Mitigation
a. Not pre-alert 4 5: delay in get-ting the rightpeople, bed(trauma / airwaypatients)
Poor mobilephone connec-tion; ED phonenot working;possibly inexpe-rienced staff
Improved radiolink; reduction inED overcrowding
b. Misinterpret-ing information,numbers, abbre-viations
4 2-3: ED is pre-pared but mayrequire different/ additional re-sources when pa-tient arrives
Inexperiencedstaff; commu-nication comesfrom control cen-tre who cannotanswer clinicalquestions
Cautious EDplanning; com-municationcoming fromambulance crews
c. Fragmented in-formation
4 2-3: similar to (b) Similar to (b) Cautious EDplanning
d. Failure to no-tify of deteriorat-ing patient con-dition
3 4-5: ED is pre-pared but patientmay be a lotsicker than ex-pected and rightpeople may notbe around
Too little time;failure to recog-nise deteriora-tion
e. Failure to no-tify of improvingpatient condition
4 2: Resuscitationteam / roomneedlessly pre-pared and notavailable forother patients
Failure to recog-nise improve-ment; lack ofunderstanding ofimpact on ED
Increase aware-ness amongambulance crews
368 M. Sujan and M. Felici
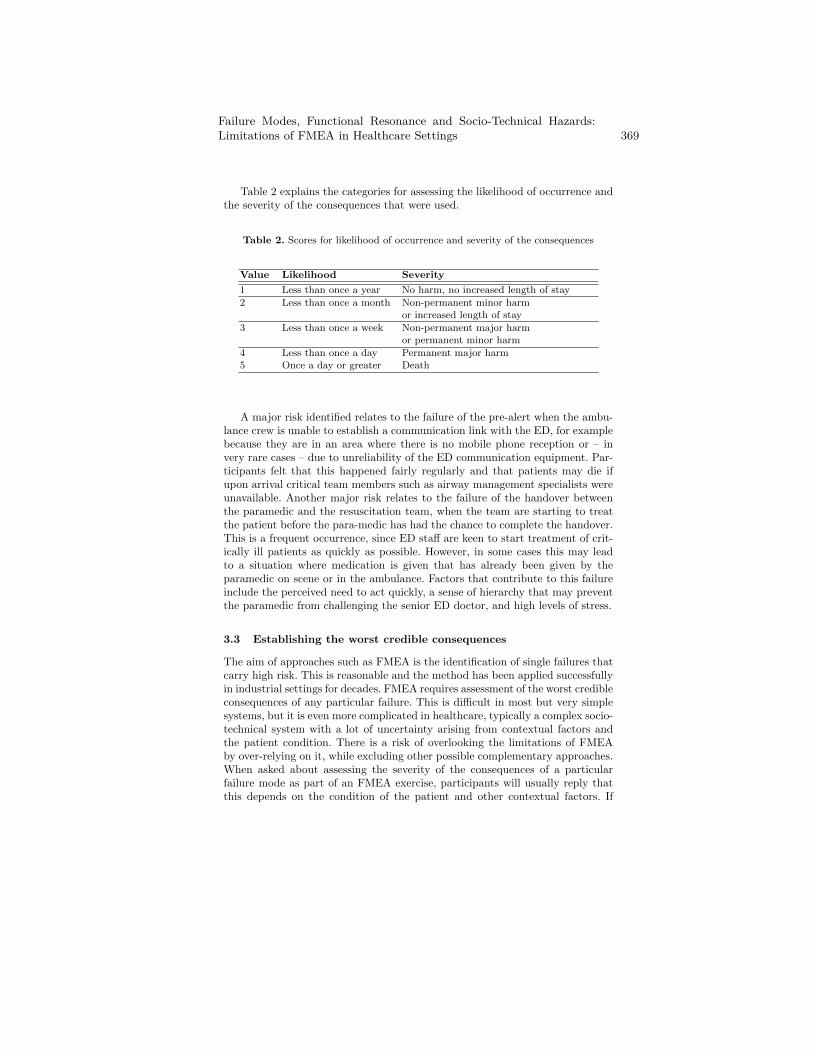
Table 2 explains the categories for assessing the likelihood of occurrence andthe severity of the consequences that were used.
Table 2. Scores for likelihood of occurrence and severity of the consequences
Value Likelihood Severity
1 Less than once a year No harm, no increased length of stay
2 Less than once a month Non-permanent minor harmor increased length of stay
3 Less than once a week Non-permanent major harmor permanent minor harm
4 Less than once a day Permanent major harm5 Once a day or greater Death
A major risk identified relates to the failure of the pre-alert when the ambu-lance crew is unable to establish a communication link with the ED, for examplebecause they are in an area where there is no mobile phone reception or – invery rare cases – due to unreliability of the ED communication equipment. Par-ticipants felt that this happened fairly regularly and that patients may die ifupon arrival critical team members such as airway management specialists wereunavailable. Another major risk relates to the failure of the handover betweenthe paramedic and the resuscitation team, when the team are starting to treatthe patient before the para-medic has had the chance to complete the handover.This is a frequent occurrence, since ED staff are keen to start treatment of crit-ically ill patients as quickly as possible. However, in some cases this may leadto a situation where medication is given that has already been given by theparamedic on scene or in the ambulance. Factors that contribute to this failureinclude the perceived need to act quickly, a sense of hierarchy that may preventthe paramedic from challenging the senior ED doctor, and high levels of stress.
3.3 Establishing the worst credible consequences
The aim of approaches such as FMEA is the identification of single failures thatcarry high risk. This is reasonable and the method has been applied successfullyin industrial settings for decades. FMEA requires assessment of the worst credibleconsequences of any particular failure. This is difficult in most but very simplesystems, but it is even more complicated in healthcare, typically a complex socio-technical system with a lot of uncertainty arising from contextual factors andthe patient condition. There is a risk of overlooking the limitations of FMEAby over-relying on it, while excluding other possible complementary approaches.When asked about assessing the severity of the consequences of a particularfailure mode as part of an FMEA exercise, participants will usually reply thatthis depends on the condition of the patient and other contextual factors. If
Failure Modes, Functional Resonance and Socio-Technical Hazards:Limitations of FMEA in Healthcare Settings 369
the condition of the patient is sufficiently critical, even minor failures may leadto death. The problem with FMEA in such settings is that it assumes fairlyimmediate cause and effect links and does not by itself encourage considerationand differentiation of contextual factors. In the FMEA example above, cliniciansoften contextualised the consequences of a particular failure mode by addingstatements such as “if we have a trauma patient”, or “when a patient comes inand their airway is difficult to manage”. But even with this additional patient-related information, it was difficult to establish the worst credible effect, sincesingle failures rarely kill patients, but usually have the potential to do so inconjunction with other circumstances.
FMEA works well for technical systems and there is also scope for its ap-plication in healthcare. However, the particular way of looking at a system andof representing risk that is inherent in the method needs to be properly under-stood by people applying it in healthcare. The method can be applied usefullywhen these characteristics are taken into account, and when the method is com-plemented by other approaches. This highlights some of the problems of usingFMEA in healthcare. The complexity and richness of the domain expose the lim-itations of FMEA. Combining FMEA with complementary methodologies thatextend technical approaches could address such limitations. The next sectionuses FRAM to identify vulnerabilities that may result from the propagation ofvariation rather than from single failures.
3.4 From Failure Modes to Functional Resonance
An alternative approach has been described by Hollnagel [28] based on the con-cept of functional resonance. Functional resonance is defined as the detectablesignal that emerges from the unintended interaction of the everyday variabilityof multiple signals. The variability is mainly due to the approximate adjustmentsof people, individually and collectively, and of organisations that are the basisof everyday functioning. Each system function has a normal, weak variability.The other functions constitute the environment for this particular function, andtheir variability can be represented as random noise. However, on occasion thepooled variability of the environment may lead to a situation of resonance, i.e. toa detectable signal that emerges from the unintended interaction of the normalvariability of many signals. The Functional Resonance Analysis Method (FRAM)proposes to model the functions of a system with six aspects, namely input, out-put, time, resources, control and preconditions (I: Input, O: Output, T: Time,R: Resources, C: Control, P: Precondition). The application of FRAM then triesto establish the variability of the output of functions and the propagation of thisvariability. System failures may emerge not necessarily as a result of failures,but due to the propagation and resonance of variability. We have modelled forsimplicity only five steps of the above emergency care pathway as functions: (1)Provide pre-alert to emergency department, (2) Prepare emergency department,(3) Bring patient to the emergency department, (4) Hand over relevant infor-mation to emergency department team, (5) Treat patient. FRAM prompts the
370 M. Sujan and M. Felici
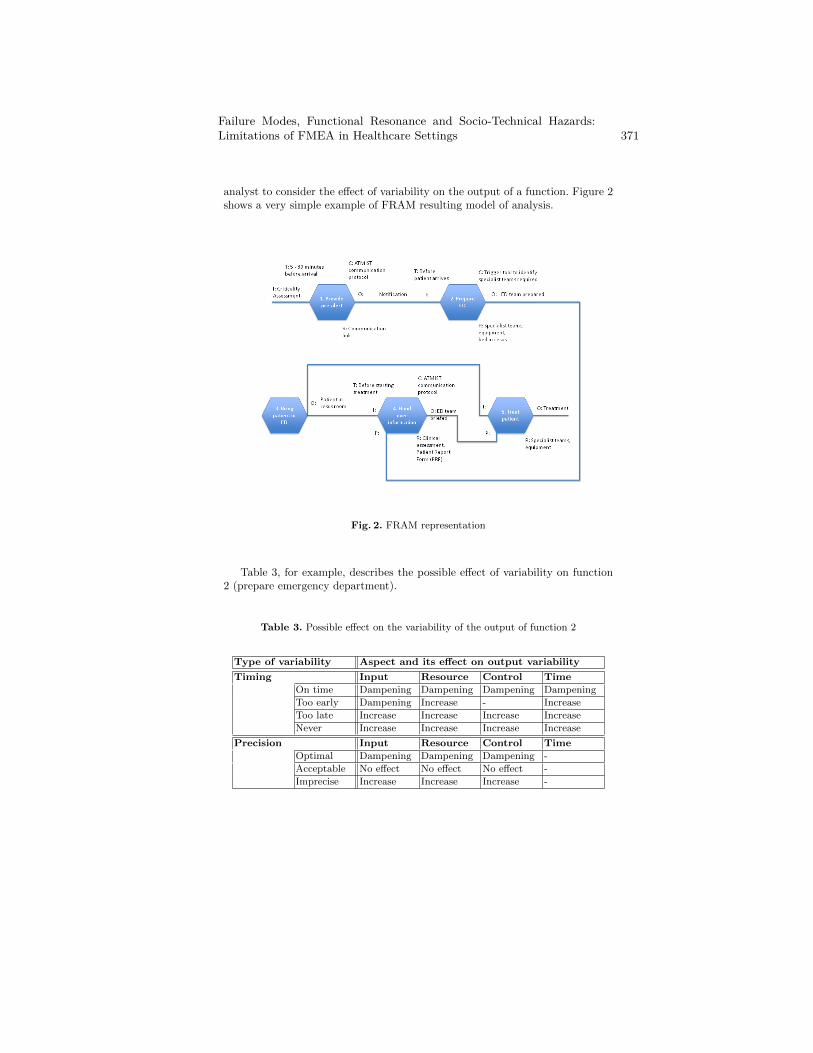
analyst to consider the effect of variability on the output of a function. Figure 2shows a very simple example of FRAM resulting model of analysis.
Fig. 2. FRAM representation
Table 3, for example, describes the possible effect of variability on function2 (prepare emergency department).
Table 3. Possible effect on the variability of the output of function 2
Type of variability Aspect and its effect on output variability
Timing Input Resource Control Time
On time Dampening Dampening Dampening Dampening
Too early Dampening Increase - Increase
Too late Increase Increase Increase Increase
Never Increase Increase Increase Increase
Precision Input Resource Control Time
Optimal Dampening Dampening Dampening -
Acceptable No effect No effect No effect -
Imprecise Increase Increase Increase -
Failure Modes, Functional Resonance and Socio-Technical Hazards:Limitations of FMEA in Healthcare Settings 371
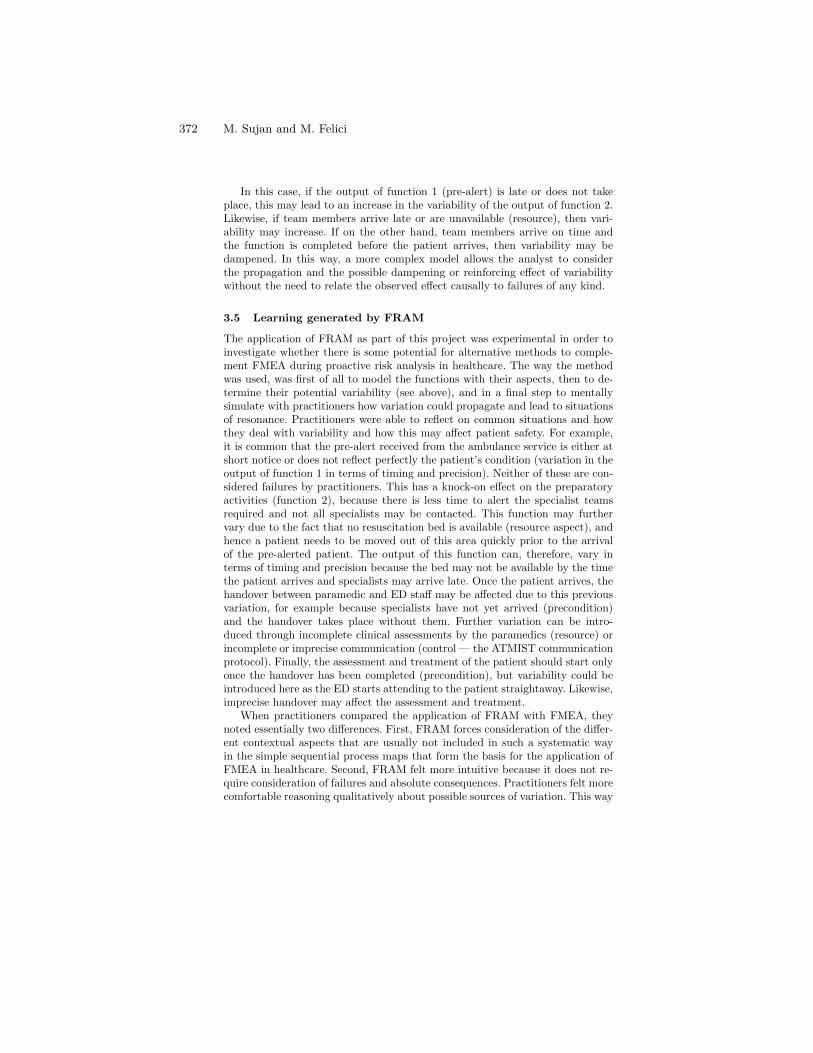
In this case, if the output of function 1 (pre-alert) is late or does not takeplace, this may lead to an increase in the variability of the output of function 2.Likewise, if team members arrive late or are unavailable (resource), then vari-ability may increase. If on the other hand, team members arrive on time andthe function is completed before the patient arrives, then variability may bedampened. In this way, a more complex model allows the analyst to considerthe propagation and the possible dampening or reinforcing effect of variabilitywithout the need to relate the observed effect causally to failures of any kind.
3.5 Learning generated by FRAM
The application of FRAM as part of this project was experimental in order toinvestigate whether there is some potential for alternative methods to comple-ment FMEA during proactive risk analysis in healthcare. The way the methodwas used, was first of all to model the functions with their aspects, then to de-termine their potential variability (see above), and in a final step to mentallysimulate with practitioners how variation could propagate and lead to situationsof resonance. Practitioners were able to reflect on common situations and howthey deal with variability and how this may affect patient safety. For example,it is common that the pre-alert received from the ambulance service is either atshort notice or does not reflect perfectly the patient’s condition (variation in theoutput of function 1 in terms of timing and precision). Neither of these are con-sidered failures by practitioners. This has a knock-on effect on the preparatoryactivities (function 2), because there is less time to alert the specialist teamsrequired and not all specialists may be contacted. This function may furthervary due to the fact that no resuscitation bed is available (resource aspect), andhence a patient needs to be moved out of this area quickly prior to the arrivalof the pre-alerted patient. The output of this function can, therefore, vary interms of timing and precision because the bed may not be available by the timethe patient arrives and specialists may arrive late. Once the patient arrives, thehandover between paramedic and ED staff may be affected due to this previousvariation, for example because specialists have not yet arrived (precondition)and the handover takes place without them. Further variation can be intro-duced through incomplete clinical assessments by the paramedics (resource) orincomplete or imprecise communication (control — the ATMIST communicationprotocol). Finally, the assessment and treatment of the patient should start onlyonce the handover has been completed (precondition), but variability could beintroduced here as the ED starts attending to the patient straightaway. Likewise,imprecise handover may affect the assessment and treatment.
When practitioners compared the application of FRAM with FMEA, theynoted essentially two differences. First, FRAM forces consideration of the differ-ent contextual aspects that are usually not included in such a systematic wayin the simple sequential process maps that form the basis for the application ofFMEA in healthcare. Second, FRAM felt more intuitive because it does not re-quire consideration of failures and absolute consequences. Practitioners felt morecomfortable reasoning qualitatively about possible sources of variation. This way
372 M. Sujan and M. Felici
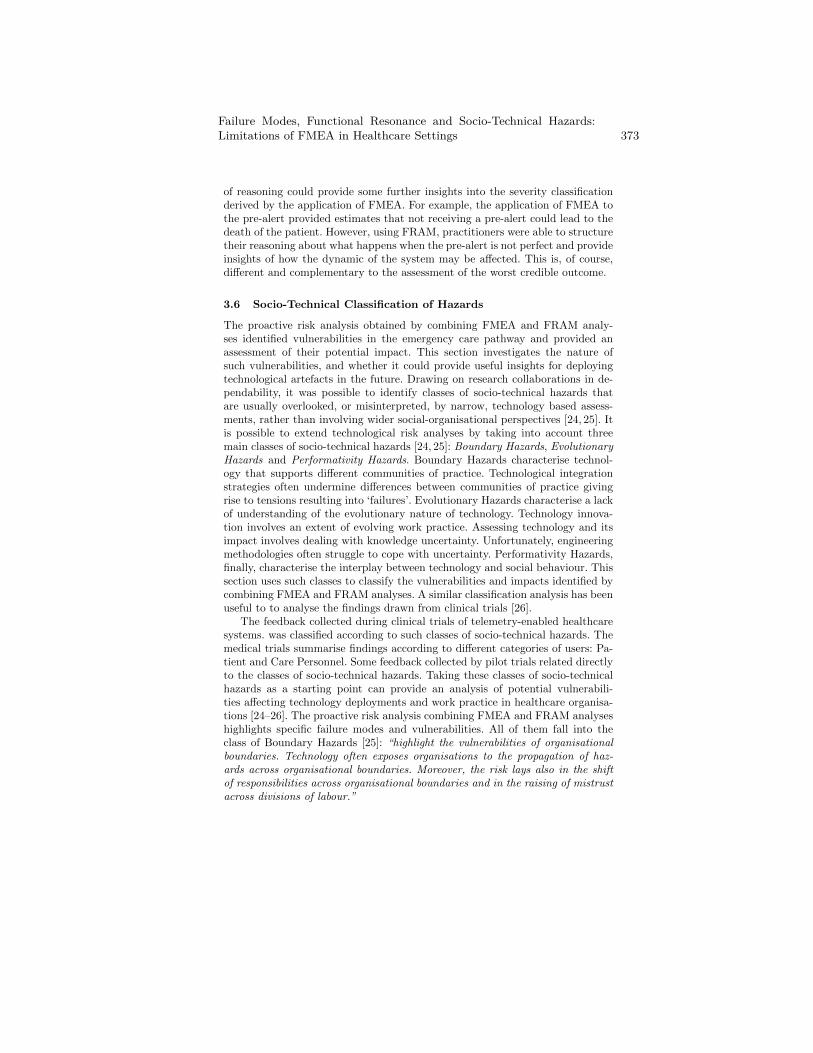
of reasoning could provide some further insights into the severity classificationderived by the application of FMEA. For example, the application of FMEA tothe pre-alert provided estimates that not receiving a pre-alert could lead to thedeath of the patient. However, using FRAM, practitioners were able to structuretheir reasoning about what happens when the pre-alert is not perfect and provideinsights of how the dynamic of the system may be affected. This is, of course,different and complementary to the assessment of the worst credible outcome.
3.6 Socio-Technical Classification of Hazards
The proactive risk analysis obtained by combining FMEA and FRAM analy-ses identified vulnerabilities in the emergency care pathway and provided anassessment of their potential impact. This section investigates the nature ofsuch vulnerabilities, and whether it could provide useful insights for deployingtechnological artefacts in the future. Drawing on research collaborations in de-pendability, it was possible to identify classes of socio-technical hazards thatare usually overlooked, or misinterpreted, by narrow, technology based assess-ments, rather than involving wider social-organisational perspectives [24, 25]. Itis possible to extend technological risk analyses by taking into account threemain classes of socio-technical hazards [24, 25]: Boundary Hazards, EvolutionaryHazards and Performativity Hazards. Boundary Hazards characterise technol-ogy that supports different communities of practice. Technological integrationstrategies often undermine differences between communities of practice givingrise to tensions resulting into ‘failures’. Evolutionary Hazards characterise a lackof understanding of the evolutionary nature of technology. Technology innova-tion involves an extent of evolving work practice. Assessing technology and itsimpact involves dealing with knowledge uncertainty. Unfortunately, engineeringmethodologies often struggle to cope with uncertainty. Performativity Hazards,finally, characterise the interplay between technology and social behaviour. Thissection uses such classes to classify the vulnerabilities and impacts identified bycombining FMEA and FRAM analyses. A similar classification analysis has beenuseful to to analyse the findings drawn from clinical trials [26].
The feedback collected during clinical trials of telemetry-enabled healthcaresystems. was classified according to such classes of socio-technical hazards. Themedical trials summarise findings according to different categories of users: Pa-tient and Care Personnel. Some feedback collected by pilot trials related directlyto the classes of socio-technical hazards. Taking these classes of socio-technicalhazards as a starting point can provide an analysis of potential vulnerabili-ties affecting technology deployments and work practice in healthcare organisa-tions [24–26]. The proactive risk analysis combining FMEA and FRAM analyseshighlights specific failure modes and vulnerabilities. All of them fall into theclass of Boundary Hazards [25]: “highlight the vulnerabilities of organisationalboundaries. Technology often exposes organisations to the propagation of haz-ards across organisational boundaries. Moreover, the risk lays also in the shiftof responsibilities across organisational boundaries and in the raising of mistrustacross divisions of labour.”
Failure Modes, Functional Resonance and Socio-Technical Hazards:Limitations of FMEA in Healthcare Settings 373
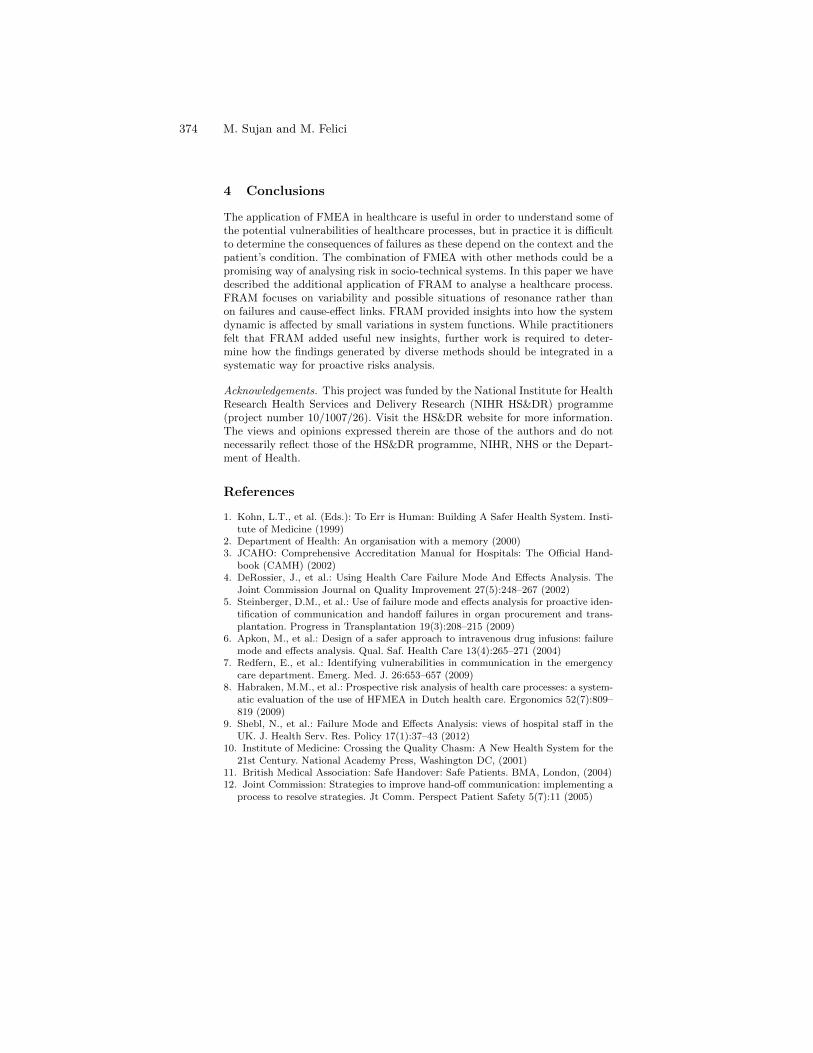
4 Conclusions
The application of FMEA in healthcare is useful in order to understand some ofthe potential vulnerabilities of healthcare processes, but in practice it is difficultto determine the consequences of failures as these depend on the context and thepatient’s condition. The combination of FMEA with other methods could be apromising way of analysing risk in socio-technical systems. In this paper we havedescribed the additional application of FRAM to analyse a healthcare process.FRAM focuses on variability and possible situations of resonance rather thanon failures and cause-effect links. FRAM provided insights into how the systemdynamic is affected by small variations in system functions. While practitionersfelt that FRAM added useful new insights, further work is required to deter-mine how the findings generated by diverse methods should be integrated in asystematic way for proactive risks analysis.
Acknowledgements. This project was funded by the National Institute for HealthResearch Health Services and Delivery Research (NIHR HS&DR) programme(project number 10/1007/26). Visit the HS&DR website for more information.The views and opinions expressed therein are those of the authors and do notnecessarily reflect those of the HS&DR programme, NIHR, NHS or the Depart-ment of Health.
References
1. Kohn, L.T., et al. (Eds.): To Err is Human: Building A Safer Health System. Insti-tute of Medicine (1999)
2. Department of Health: An organisation with a memory (2000)3. JCAHO: Comprehensive Accreditation Manual for Hospitals: The Official Hand-
book (CAMH) (2002)4. DeRossier, J., et al.: Using Health Care Failure Mode And Effects Analysis. The
Joint Commission Journal on Quality Improvement 27(5):248–267 (2002)5. Steinberger, D.M., et al.: Use of failure mode and effects analysis for proactive iden-
tification of communication and handoff failures in organ procurement and trans-plantation. Progress in Transplantation 19(3):208–215 (2009)
6. Apkon, M., et al.: Design of a safer approach to intravenous drug infusions: failuremode and effects analysis. Qual. Saf. Health Care 13(4):265–271 (2004)
7. Redfern, E., et al.: Identifying vulnerabilities in communication in the emergencycare department. Emerg. Med. J. 26:653–657 (2009)
8. Habraken, M.M., et al.: Prospective risk analysis of health care processes: a system-atic evaluation of the use of HFMEA in Dutch health care. Ergonomics 52(7):809–819 (2009)
9. Shebl, N., et al.: Failure Mode and Effects Analysis: views of hospital staff in theUK. J. Health Serv. Res. Policy 17(1):37–43 (2012)
10. Institute of Medicine: Crossing the Quality Chasm: A New Health System for the21st Century. National Academy Press, Washington DC, (2001)
11. British Medical Association: Safe Handover: Safe Patients. BMA, London, (2004)12. Joint Commission: Strategies to improve hand-off communication: implementing a
process to resolve strategies. Jt Comm. Perspect Patient Safety 5(7):11 (2005)
374 M. Sujan and M. Felici
13. Apker, J., Mallak, M.A., Gibbson, S.C.: Communicating in the ”gray zone”: per-ceptions about emergency physician hospitalist handoffs and patient safety. Acad.Emerg. Med. 14(10):884–894 (2007)
14. Jeffcot, S.A., Ibrahim, J.E., Cameron, P.A.: Resilience in healthcare and clinicalhandover. Qual. Saf. Health Care 18(4):256–260 (2009)
15. Raduma-Tomas, M.A., et al.: Doctors’ handovers in hospitals: a literature review.BMJ Qual. Saf. 20:128–133 (2011)
16. Wong, M.C., Yee, K.C., Turner, P.: Clinical Handover Literature Review. eHealthServices Research Group, University of Tasmania, Australia, (2008)
17. Bost, N., et al.: Clinical handover of patients arriving by ambulance to the emer-gency department — A literature review. Int. Emerg. Nursing 18(4):210–220 (2010)
18. Cohen, M.D., Hilligoss, P.B.: The published literature on handoffs in hospitals:deficiencies identified in an extensive review. Qual. Saf. Health Care 19(6):493–497(2010)
19. Patterson, W.S., Wears, R.L.: Patient handoffs: standardised and reliable measure-ment tools remain elusive. Joint Commission Journal on Quality and Patient Safety36(2):52–61 (2010)
20. Cook, R.I., Render, M., Woods, D.D.: Gaps in the continuity of care and progresson patient safety. BMJ 320(7237):791-794 (2010)
21. Horwitz, L.I., et al.: Transfers of patient care between house staff on internalmedicine wards. Arch. Intern. Med. 166(11):1173–1177 (2006)
22. Solet, D.J., et al.: Lost in translation: challenges and opportunities in physician-to-physician communication during patient handoffs. Acad. Med. 80(12):1094–1099(2005)
23. Ye, K., et al.: Handover in the emergency department: deficiencies and adverseeffects. Emerg. Med. Australas. 19(5):433–441 (2007)
24. Anderson, S., Felici, M.: Classes of socio-technical hazards: Microscopic and macro-scopic scales of risk analysis. Risk Management, Palgrave Macmillan, 11(3-4):208–240 (2009)
25. Anderson, S., Felici, M.: Emerging Technological Risk: Underpinning the Risk ofTechnology Innovation, Springer (2012)
26. Anderson, S., et al.: From Hazards to Resilience in Socio-Technical HealthcareSystems. In E. Hollnagel, E., Rigaud, E., Besnard, D. (Eds.), Proceedings of thefourth Resilience Engineering Symposium, pp. 15–21, (2011)
27. Perrow, C.: Normal Accidents: Living with High-Risk Technologies. Princeton, NJ:Princeton University Press (1999)
28. Hollnagel, E.: The Functional Resonance Analysis Method. Ashgate (2012)
Failure Modes, Functional Resonance and Socio-Technical Hazards:Limitations of FMEA in Healthcare Settings 375
A STAMP Analysis on the China-Yongwen Railway
Accident
Tian Song, Deming Zhong, Hang Zhong
School of Reliability and System Engineering, Beihang University, Beijing 100191, PR China.
Abstract. Traditional accident models regard accidents as resulting from a li-
near chain of events. They are limited in their ability to handle accidents in
complex systems including non-linear interactions among components, soft-
ware errors, human decision-making, and organizational factors. A new acci-
dent model called Systems-theoretic Accident Modeling and Processes
(STAMP) has been developed by Leveson to explain such accidents. In this pa-
per, we will use the STAMP accident model to analyze the China-Yongwen
railway accident for a more comprehensive view of the accident and propose
some improvement measures to prevent similar accidents in the future.
Keywords: accident model, STAMP, railway accident
1 Introduction
On July 23, 2011, a very grave railway accident happened in the suburbs of Wenzhou,
Zhejiang Province, China. Train D301 from Beijing to Fuzhou rear-ended train
D3115 from Hangzhou to Fuzhou at 20:30 China Standard Time (CST) on a viaduct
in the suburbs of Wenzhou. The two trains derailed each other, and four cars fell off
the viaduct. The accident caused 40 fatalities and 172 injuries [1].
Accident models explain why accidents occur and lie at the foundation of accident
investigation and prevention. Traditionally, accidents have been viewed as resulting
from a linear chain of events. But as in this case, many more factors were involved in
the accident, including environment factors, component failures, design flaws, human
errors, and organizational factors, the interactions between system components were
complex and the relationships between events were non-linear. Traditional accident
models are limited in their ability to handle these important factors in the accident.
A systems-theoretic approach to understanding accident causation allows more
complex relationships between events (e.g., feedback and indirect relationships) to be
considered and also provides a way to look more deeply at why the events occurred
[2]. A new accident model called Systems-theoretic Accident Modeling and Processes
(STAMP) has been developed by Leveson. In STAMP, accidents are conceived as
resulting from inadequate enforcement or violation of safety-related constraints on the
design, development, and operation of the system. STAMP uses hierarchical struc-
tures to model socio-technical systems considering technical, human and organiza-
tional factors. In this paper, we will use the STAMP accident model to analyze the
China-Yongwen railway accident and propose some improvement measures to pre-
vent similar accidents in the future.
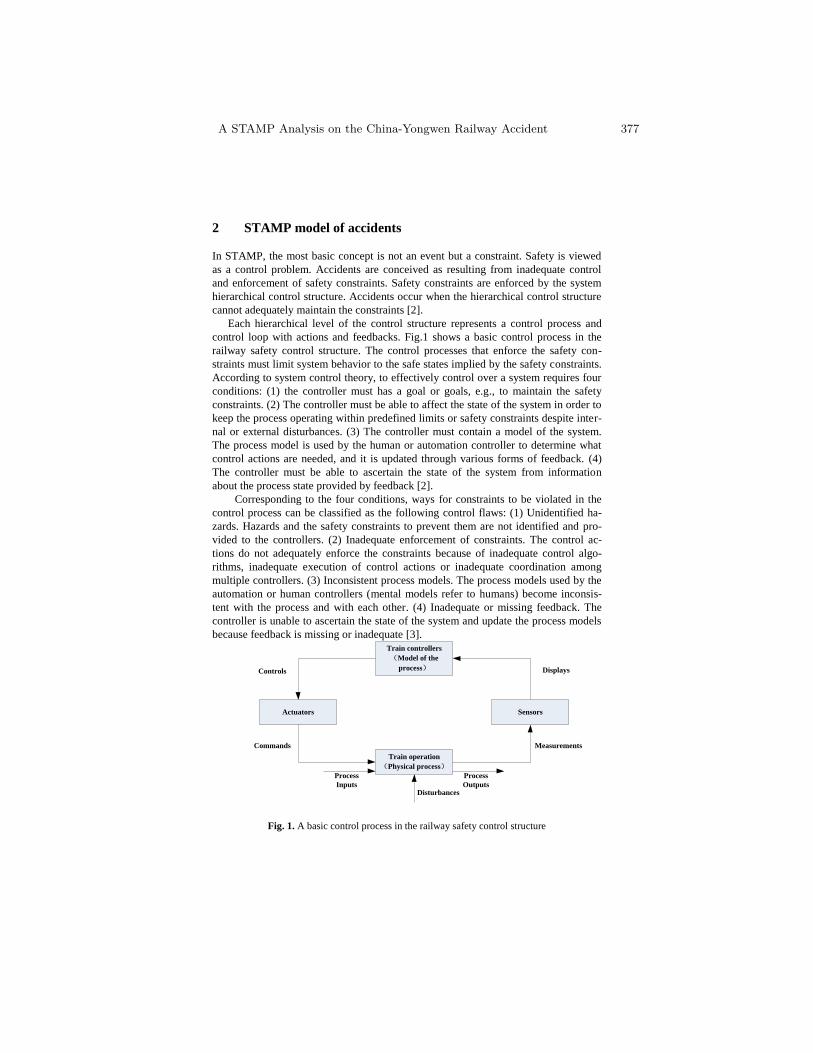
2 STAMP model of accidents
In STAMP, the most basic concept is not an event but a constraint. Safety is viewed
as a control problem. Accidents are conceived as resulting from inadequate control
and enforcement of safety constraints. Safety constraints are enforced by the system
hierarchical control structure. Accidents occur when the hierarchical control structure
cannot adequately maintain the constraints [2].
Each hierarchical level of the control structure represents a control process and
control loop with actions and feedbacks. Fig.1 shows a basic control process in the
railway safety control structure. The control processes that enforce the safety con-
straints must limit system behavior to the safe states implied by the safety constraints.
According to system control theory, to effectively control over a system requires four
conditions: (1) the controller must has a goal or goals, e.g., to maintain the safety
constraints. (2) The controller must be able to affect the state of the system in order to
keep the process operating within predefined limits or safety constraints despite inter-
nal or external disturbances. (3) The controller must contain a model of the system.
The process model is used by the human or automation controller to determine what
control actions are needed, and it is updated through various forms of feedback. (4)
The controller must be able to ascertain the state of the system from information
about the process state provided by feedback [2].
Corresponding to the four conditions, ways for constraints to be violated in the
control process can be classified as the following control flaws: (1) Unidentified ha-
zards. Hazards and the safety constraints to prevent them are not identified and pro-
vided to the controllers. (2) Inadequate enforcement of constraints. The control ac-
tions do not adequately enforce the constraints because of inadequate control algo-
rithms, inadequate execution of control actions or inadequate coordination among
multiple controllers. (3) Inconsistent process models. The process models used by the
automation or human controllers (mental models refer to humans) become inconsis-
tent with the process and with each other. (4) Inadequate or missing feedback. The
controller is unable to ascertain the state of the system and update the process models
because feedback is missing or inadequate [3].
Train controllers
(Model of the
process)
Actuators
Train operation
(Physical process)
Sensors
Disturbances
Controls Displays
Commands Measurements
Process
Inputs
Process
Outputs
Fig. 1. A basic control process in the railway safety control structure
A STAMP Analysis on the China-Yongwen Railway Accident 377
So the process that leads to accidents can be understood in terms of flaws in con-
trol structures to enforce constraints during design, implementation, manufacturing,
and operation. Therefore, to analyze an accident, the system hierarchical control
structure must be examined to determine why the control process for each component
at each hierarchical level was inadequate to maintain the safety constraints [2]. The
procedure of STAMP-based accident analysis can be described as follows: (1) Identi-
fy the system hazards and related safety constraints involved in the accident. (2) Con-
struct the system hierarchical safety control structure and identify safety constraints
for each controller. (3) Identify the inadequate actions that violated the constraints and
the control flaws in the control structure. In the following sections, we will use the
STAMP approach to analyze the China-Yongwen railway accident and propose some
improvement measures.
3 STAMP-based analysis on the China-Yongwen railway
accident
3.1 Accident chronology
The accident happened On July 23, 2011, in the suburbs of Wenzhou, Zhejiang Prov-
ince, China.
At about 19:30, a fuse in the power supply circuit of the data acquisition drive unit
in Wenzhou South Station train control center fused after a thunder strike. Before the
fusing, the rails controlled by the Wenzhou South Station train control center were not
occupied by trains. With a serious design flaw in the equipment, while the rails were
occupied after the fusing, the outputs of the train control center still remained in the
state before the fusing (not occupied) and the passing signal controlled by the equip-
ment remained green. Lightning also caused the communication failure between track
circuit 5829AG and the control center, which resulted the code sent by the 5829AG
was abnormal. As a result, a red band was showed on the computer terminal in the
Wenzhou South Station. The red band indicated the track section was occupied by a
train or in a failure state.
At 19:39, the watchman in Wenzhou South Station noticed the red band and re-
ported the problem to the train dispatcher in Shanghai railway bureau. He also in-
formed the engineer of the signaling branch to do inspection and maintenance.
At about 19:45, the engineers of the signaling branch started to deal with the prob-
lem. They replaced some transmitters of 5829AG in Wenzhou South Station train
control center without putting the equipment out of service. The code was turned to
green at the time of the accident.
At 19:54, the train dispatcher found displays on the terminal in the dispatching of-
fice were inconsistent with the actual conditions. According to the regulations, he
turned Wenzhou South Station into the emergency control mode.
At 20:09, the assistant train dispatcher in Shanghai railway bureau informed the
D3115 driver: there is a red band failure near the Wenzhou South Station, and the
signals for movement authority are closed. If the train stops as a result of missing
378 T. Song, D. Zhong, and H. Zhong
signals, switch to the visual driving mode and continue driving. The driver confirmed
this with the train dispatcher.
At 20:12, D301 stopped at Yongjia Station (the station before Wenzhou South Sta-
tion) waiting for the signals (it was 36 minutes behind schedule). At 20:14, D3115 left
Yongjia Station.
At 20:17, the train dispatcher informed the D3115 driver to switch to the visual
driving mode to drive at the speed less than 20 km/h when the passing signal was red.
At 20:21, because of the track circuit failure, the Automatic Train Protection (ATP)
system on D3115 activated the automatic braking function. D3115 stopped in the
faulted 5829AG track section. From 20:21 to 20:28, the D3115 driver had failed 3
times to drive in visual mode due to abnormal track circuit code.
From 20:22 to 20:27, the D3115 driver had called the train dispatcher 6 times and
the watchman in Wenzhou South Station had called the D3115 driver 3 times but all
failed due to communication failure.
At 20:24, D301 left Yongjia station heading for Wenzhou South Station.
At 20:26, the train dispatcher asked the watchman in Wenzhou South Station about
D3115’s information, the watchman replied: ―D3115 is close to the faulted track sec-
tion but the driver is out of reach, I will continue to contact him.‖
At 20:27, the watchman reached the driver of D3115, and the driver reported: the
train is 3 block sections to the Wenzhou South Station, but I failed to switch to visual
driving mode due to abnormal track signals. I cannot reach the train dispatcher be-
cause the communication system has no signal and I will try again.
From 20:28 to 20:29, the driver of D3115 called the dispatcher twice but both
failed. At 20:29:26, D3115 succeeded in starting the train by switching to the visual
driving mode.
At 20:29:32, the engineer in Wenzhou South Station called the D301 driver and
said: D301 you must be careful, train D3115 is in the same block section (the call was
interrupted unfinished).At the same time, D301 entered the faulted track section. The
driver of D301 saw the slowly moving D3115 and launched emergency brake.
At 20:30:05, D301 travelling at the speed of 99km/h collided with D3115 travel-
ling at the speed of 16km/h.
3.2 Accident analysis
The first step of a STAMP analysis is to identify the system hazards and related safety
constraints. The system hazard related to the China-Yongwen railway accident is the
rear-end collision between two trains. The safety constraint to this hazard is: the train
safety control structure must prevent the collision between two trains.
Fig.2 shows the basic safety control structure in the accident. Each component of
the railway safety control structure plays a role in enforcing the overall system safety
constraint. And they also have their own safety constraints to enforce related to their
particular function in the overall system. Together, the safety constraints enforced by
all of these system control components must be adequate to enforce the overall system
safety constraints.
A STAMP Analysis on the China-Yongwen Railway Accident 379
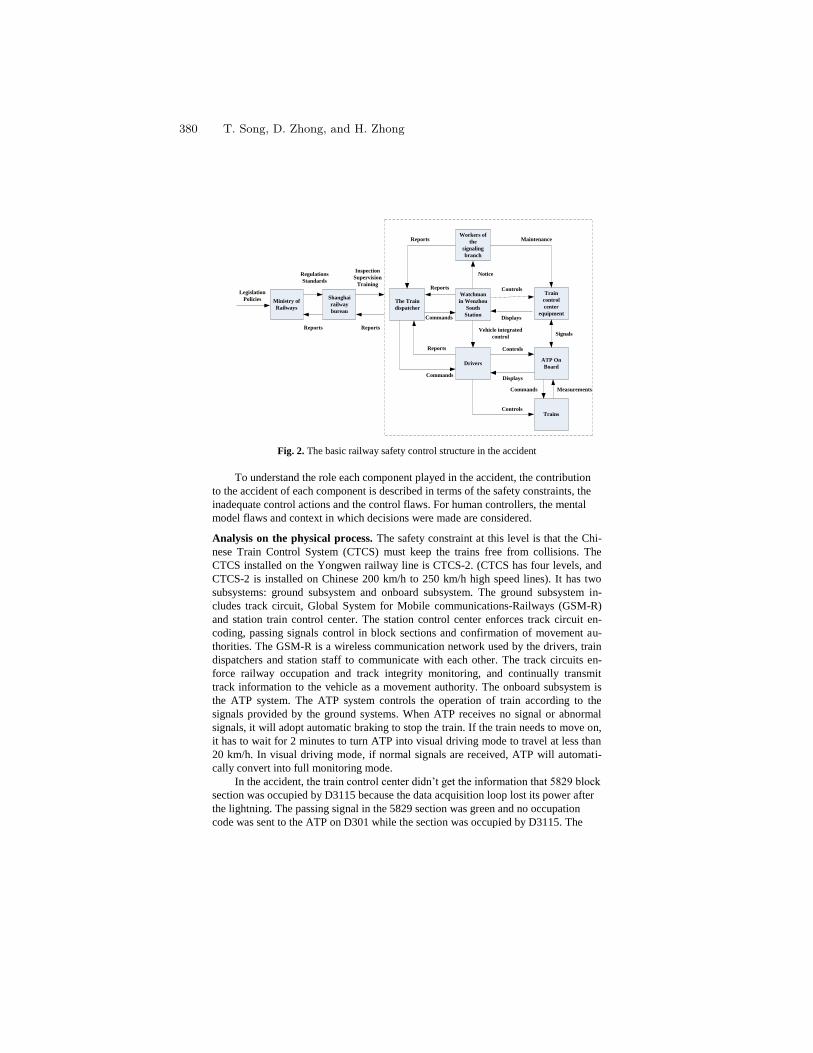
The Train
dispatcher
Watchman
in Wenzhou
South
Station
Drivers
Workers of
the
signaling
branch
Train
control
center
equipment
ATP On
Board
Trains
Commands
Vehicle integrated
control
Reports
Reports
Commands
Reports Maintenance
Signals
Controls
Displays
Controls
Displays
Controls
Notice
Legislation
Policies
Regulations
Standards
Reports
Inspection
Supervision
Training
Reports
Shanghai
railway
bureau
Ministry of
Railways
Commands Measurements
Fig. 2. The basic railway safety control structure in the accident
To understand the role each component played in the accident, the contribution
to the accident of each component is described in terms of the safety constraints, the
inadequate control actions and the control flaws. For human controllers, the mental
model flaws and context in which decisions were made are considered.
Analysis on the physical process. The safety constraint at this level is that the Chi-
nese Train Control System (CTCS) must keep the trains free from collisions. The
CTCS installed on the Yongwen railway line is CTCS-2. (CTCS has four levels, and
CTCS-2 is installed on Chinese 200 km/h to 250 km/h high speed lines). It has two
subsystems: ground subsystem and onboard subsystem. The ground subsystem in-
cludes track circuit, Global System for Mobile communications-Railways (GSM-R)
and station train control center. The station control center enforces track circuit en-
coding, passing signals control in block sections and confirmation of movement au-
thorities. The GSM-R is a wireless communication network used by the drivers, train
dispatchers and station staff to communicate with each other. The track circuits en-
force railway occupation and track integrity monitoring, and continually transmit
track information to the vehicle as a movement authority. The onboard subsystem is
the ATP system. The ATP system controls the operation of train according to the
signals provided by the ground systems. When ATP receives no signal or abnormal
signals, it will adopt automatic braking to stop the train. If the train needs to move on,
it has to wait for 2 minutes to turn ATP into visual driving mode to travel at less than
20 km/h. In visual driving mode, if normal signals are received, ATP will automati-
cally convert into full monitoring mode.
In the accident, the train control center didn’t get the information that 5829 block
section was occupied by D3115 because the data acquisition loop lost its power after
the lightning. The passing signal in the 5829 section was green and no occupation
code was sent to the ATP on D301 while the section was occupied by D3115. The
380 T. Song, D. Zhong, and H. Zhong
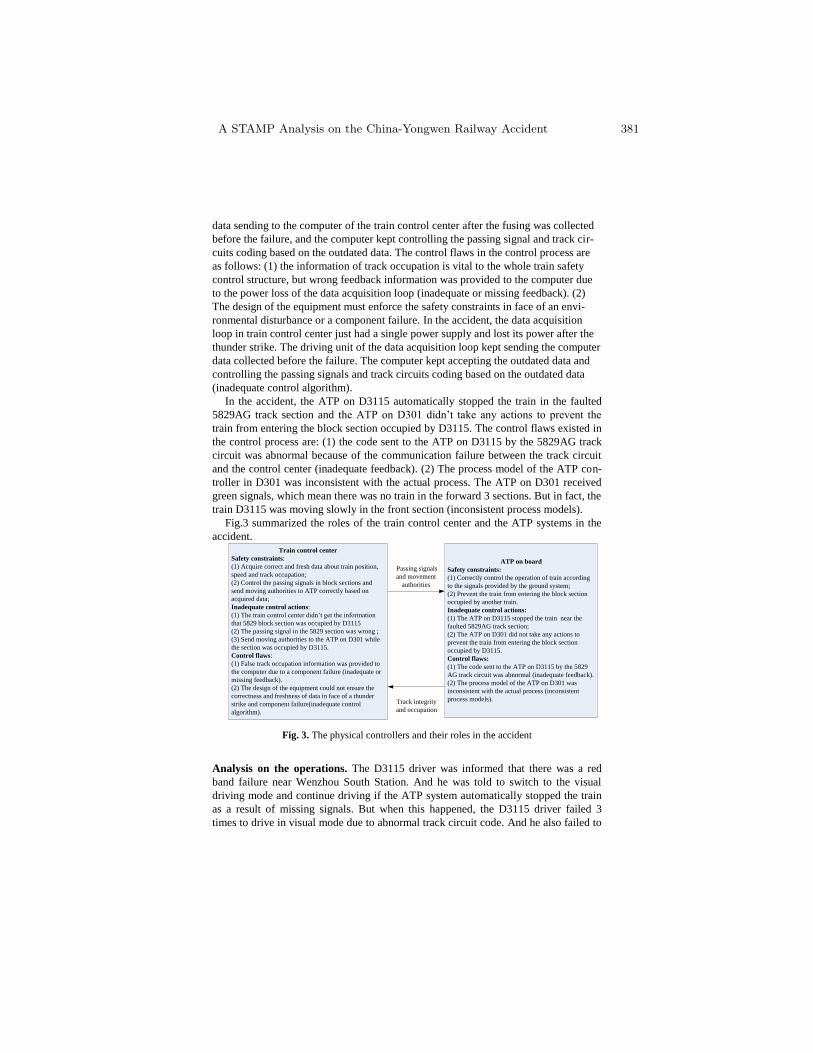
data sending to the computer of the train control center after the fusing was collected
before the failure, and the computer kept controlling the passing signal and track cir-
cuits coding based on the outdated data. The control flaws in the control process are
as follows: (1) the information of track occupation is vital to the whole train safety
control structure, but wrong feedback information was provided to the computer due
to the power loss of the data acquisition loop (inadequate or missing feedback). (2)
The design of the equipment must enforce the safety constraints in face of an envi-
ronmental disturbance or a component failure. In the accident, the data acquisition
loop in train control center just had a single power supply and lost its power after the
thunder strike. The driving unit of the data acquisition loop kept sending the computer
data collected before the failure. The computer kept accepting the outdated data and
controlling the passing signals and track circuits coding based on the outdated data
(inadequate control algorithm).
In the accident, the ATP on D3115 automatically stopped the train in the faulted
5829AG track section and the ATP on D301 didn’t take any actions to prevent the
train from entering the block section occupied by D3115. The control flaws existed in
the control process are: (1) the code sent to the ATP on D3115 by the 5829AG track
circuit was abnormal because of the communication failure between the track circuit
and the control center (inadequate feedback). (2) The process model of the ATP con-
troller in D301 was inconsistent with the actual process. The ATP on D301 received
green signals, which mean there was no train in the forward 3 sections. But in fact, the
train D3115 was moving slowly in the front section (inconsistent process models).
Fig.3 summarized the roles of the train control center and the ATP systems in the
accident.
Track integrity
and occupation
Train control center
Safety constraints:
(1) Acquire correct and fresh data about train position,
speed and track occupation;
(2) Control the passing signals in block sections and
send moving authorities to ATP correctly based on
acquired data;
Inadequate control actions:
(1) The train control center didn’t get the information
that 5829 block section was occupied by D3115
(2) The passing signal in the 5829 section was wrong ;
(3) Send moving authorities to the ATP on D301 while
the section was occupied by D3115.
Control flaws:
(1) False track occupation information was provided to
the computer due to a component failure (inadequate or
missing feedback).
(2) The design of the equipment could not ensure the
correctness and freshness of data in face of a thunder
strike and component failure(inadequate control
algorithm).
ATP on board
Safety constraints:
(1) Correctly control the operation of train according
to the signals provided by the ground system;
(2) Prevent the train from entering the block section
occupied by another train.
Inadequate control actions:
(1) The ATP on D3115 stopped the train near the
faulted 5829AG track section;
(2) The ATP on D301 did not take any actions to
prevent the train from entering the block section
occupied by D3115.
Control flaws:
(1) The code sent to the ATP on D3115 by the 5829
AG track circuit was abnormal (inadequate feedback).
(2) The process model of the ATP on D301 was
inconsistent with the actual process (inconsistent
process models).
Passing signals
and movement
authorities
Fig. 3. The physical controllers and their roles in the accident
Analysis on the operations. The D3115 driver was informed that there was a red
band failure near Wenzhou South Station. And he was told to switch to the visual
driving mode and continue driving if the ATP system automatically stopped the train
as a result of missing signals. But when this happened, the D3115 driver failed 3
times to drive in visual mode due to abnormal track circuit code. And he also failed to
A STAMP Analysis on the China-Yongwen Railway Accident 381
report to the dispatcher due to communication failure. The driver of D301 didn’t
know that D3115 was trapped in the 5829 section and didn’t take any actions to pre-
vent the train from entering the section. The control flaws existed in the control
processes are: (1) the train has two controllers, the ATP and the driver. The ATP
stopped the D3115 automatically due to abnormal signals, but for the same reason, the
driver failed to drive the train in visual mode (inadequate coordination among control-
lers). (2) The D3115 driver tried to report to the dispatcher but failed due to commu-
nication flaw (inadequate execution of control actions). (3) The display on the D301
ATP system indicated there was no train in the forward 3 sections. And the driver
wasn’t informed by the dispatcher or Wenzhou South Station about the situation of
D3115. So his mental model thought there was no train ahead and controlled the train
according to this process model. Because of an inadequate feedback in the control
loop, the mental model of the driver became inconsistent with the actual process. The
usual performance of the driver was no longer safe (inconsistent process models).
The dispatcher turned the Wenzhou South Station into the emergency control mode
after receiving the report of the ―red band‖ problem according to regulations. But he
didn’t take further insight into the problem. He didn’t look into the situation of the
maintenance by the signaling branch and didn’t know the passing signal was wrong.
Moreover, he didn’t monitor the situation of D3115 carefully. Before the collision, the
watchman in Wenzhou South Station reported to the dispatcher: ―D3115 is close to
the faulted track section but the driver is out of reach. I will continue to contact him.‖
But the dispatcher didn’t take any measures. When D3115 was moving slowly and
D301 entered the same section, he didn’t give a warning to the D301 driver. There
may be several reasons for the mistakes. First, high work intensity increased the pos-
sibility of ignorance of paying attention to monitoring the situation of D3115. Accord-
ing to the investigation report, during 20:17 to 20:24, the dispatcher had confirmed
the equipment conditions in stations along the line, learned the information about
another train, and done the reception and departure work of 8 trains. Second, it may
be a result of inadequate training. The dispatcher did not take his responsibility care-
fully. His safety consciousness was weak and ignored the importance of the problem.
Third, the feedback to the dispatcher was missing due to the communication failure
between the driver and the dispatcher.
Before the collision, Wenzhou South Station was in the emergency control
mode. In this mode, the railway station was responsible for implementing the ―Ve-
hicle Integrated Control‖ with the passing trains and confirming the safety informa-
tion with the drivers in standard phrases using wireless communication equipment
according to the regulations. But the watchman in Wenzhou South Station didn’t im-
plement the ―Vehicle Integrated Control‖ with the D301driver. In addition, the
watchman had failed 3 times to connect the D3115 driver. When he reached the driver
finally, the driver reported: ―The train is three sections to Wenzhou South Station. I
failed to drive in visual driving mode due to abnormal track signals. I cannot reach the
train dispatcher because GSM-R has no signals and I will try again.‖ However, the
watchman didn’t report the situation of D3115 to the dispatcher in time. The watch-
man didn’t perform his duty correctly due to inadequate training or weak safety con-
sciousness.
382 T. Song, D. Zhong, and H. Zhong
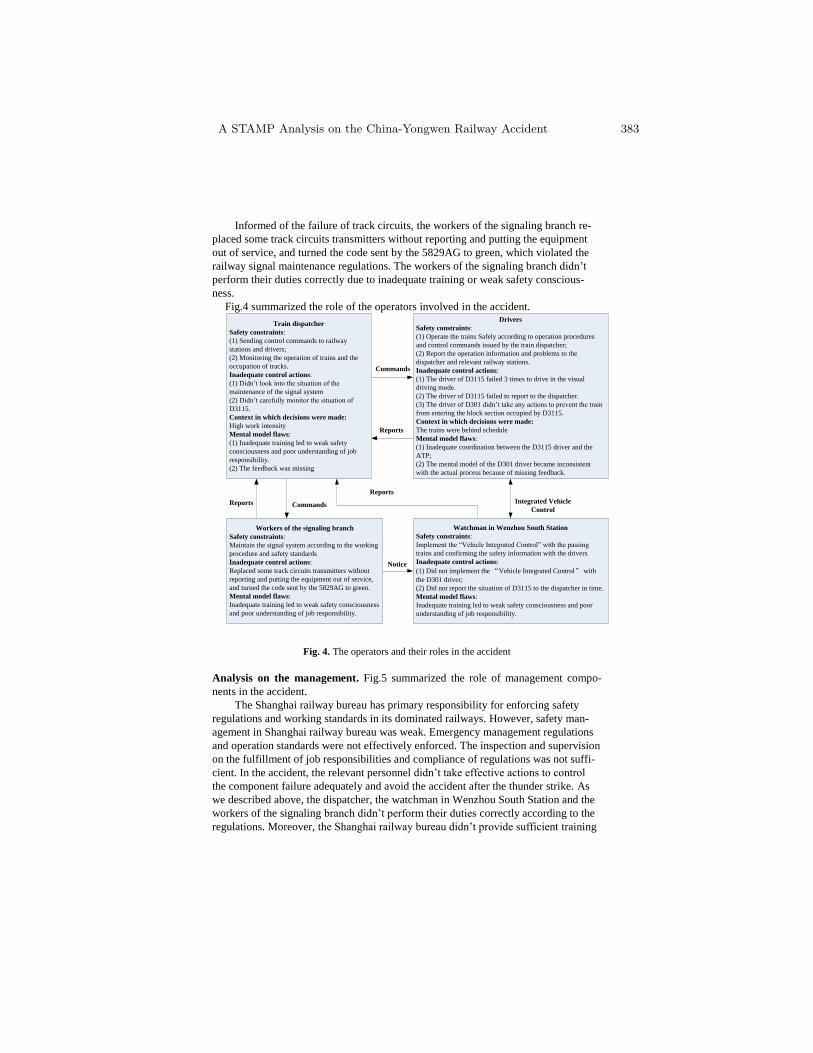
Informed of the failure of track circuits, the workers of the signaling branch re-
placed some track circuits transmitters without reporting and putting the equipment
out of service, and turned the code sent by the 5829AG to green, which violated the
railway signal maintenance regulations. The workers of the signaling branch didn’t
perform their duties correctly due to inadequate training or weak safety conscious-
ness.
Fig.4 summarized the role of the operators involved in the accident.
Watchman in Wenzhou South Station
Safety constraints:
Implement the ―Vehicle Integrated Control‖ with the passing
trains and confirming the safety information with the drivers
Inadequate control actions:
(1) Did not implement the “Vehicle Integrated Control” with
the D301 driver;
(2) Did not report the situation of D3115 to the dispatcher in time.
Mental model flaws:
Inadequate training led to weak safety consciousness and poor
understanding of job responsibility.
Drivers
Safety constraints:
(1) Operate the trains Safely according to operation procedures
and control commands issued by the train dispatcher;
(2) Report the operation information and problems to the
dispatcher and relevant railway stations.
Inadequate control actions:
(1) The driver of D3115 failed 3 times to drive in the visual
driving mode.
(2) The driver of D3115 failed to report to the dispatcher.
(3) The driver of D301 didn’t take any actions to prevent the train
from entering the block section occupied by D3115.
Context in which decisions were made:
The trains were behind schedule
Mental model flaws:
(1) Inadequate coordination between the D3115 driver and the
ATP;
(2) The mental model of the D301 driver became inconsistent
with the actual process because of missing feedback.
Workers of the signaling branch
Safety constraints:
Maintain the signal system according to the working
procedure and safety standards
Inadequate control actions:
Replaced some track circuits transmitters without
reporting and putting the equipment out of service,
and turned the code sent by the 5829AG to green.
Mental model flaws:
Inadequate training led to weak safety consciousness
and poor understanding of job responsibility.
Train dispatcher
Safety constraints:
(1) Sending control commands to railway
stations and drivers;
(2) Monitoring the operation of trains and the
occupation of tracks.
Inadequate control actions:
(1) Didn’t look into the situation of the
maintenance of the signal system
(2) Didn’t carefully monitor the situation of
D3115.
Context in which decisions were made:
High work intensity
Mental model flaws:
(1) Inadequate training led to weak safety
consciousness and poor understanding of job
responsibility.
(2) The feedback was missing
Reports Commands
Notice
Integrated Vehicle
Control
Reports
Commands
Reports
Fig. 4. The operators and their roles in the accident
Analysis on the management. Fig.5 summarized the role of management compo-
nents in the accident.
The Shanghai railway bureau has primary responsibility for enforcing safety
regulations and working standards in its dominated railways. However, safety man-
agement in Shanghai railway bureau was weak. Emergency management regulations
and operation standards were not effectively enforced. The inspection and supervision
on the fulfillment of job responsibilities and compliance of regulations was not suffi-
cient. In the accident, the relevant personnel didn’t take effective actions to control
the component failure adequately and avoid the accident after the thunder strike. As
we described above, the dispatcher, the watchman in Wenzhou South Station and the
workers of the signaling branch didn’t perform their duties correctly according to the
regulations. Moreover, the Shanghai railway bureau didn’t provide sufficient training
A STAMP Analysis on the China-Yongwen Railway Accident 383
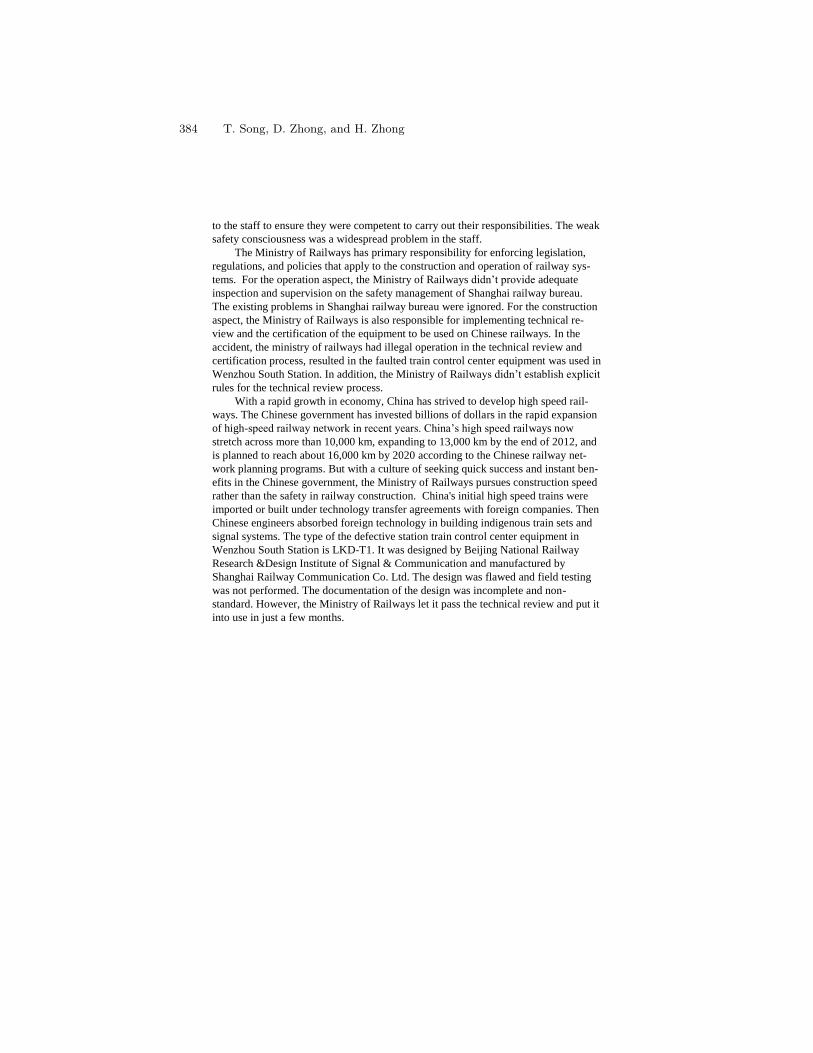
to the staff to ensure they were competent to carry out their responsibilities. The weak
safety consciousness was a widespread problem in the staff.
The Ministry of Railways has primary responsibility for enforcing legislation,
regulations, and policies that apply to the construction and operation of railway sys-
tems. For the operation aspect, the Ministry of Railways didn’t provide adequate
inspection and supervision on the safety management of Shanghai railway bureau.
The existing problems in Shanghai railway bureau were ignored. For the construction
aspect, the Ministry of Railways is also responsible for implementing technical re-
view and the certification of the equipment to be used on Chinese railways. In the
accident, the ministry of railways had illegal operation in the technical review and
certification process, resulted in the faulted train control center equipment was used in
Wenzhou South Station. In addition, the Ministry of Railways didn’t establish explicit
rules for the technical review process.
With a rapid growth in economy, China has strived to develop high speed rail-
ways. The Chinese government has invested billions of dollars in the rapid expansion
of high-speed railway network in recent years. China’s high speed railways now
stretch across more than 10,000 km, expanding to 13,000 km by the end of 2012, and
is planned to reach about 16,000 km by 2020 according to the Chinese railway net-
work planning programs. But with a culture of seeking quick success and instant ben-
efits in the Chinese government, the Ministry of Railways pursues construction speed
rather than the safety in railway construction. China's initial high speed trains were
imported or built under technology transfer agreements with foreign companies. Then
Chinese engineers absorbed foreign technology in building indigenous train sets and
signal systems. The type of the defective station train control center equipment in
Wenzhou South Station is LKD-T1. It was designed by Beijing National Railway
Research &Design Institute of Signal & Communication and manufactured by
Shanghai Railway Communication Co. Ltd. The design was flawed and field testing
was not performed. The documentation of the design was incomplete and non-
standard. However, the Ministry of Railways let it pass the technical review and put it
into use in just a few months.
384 T. Song, D. Zhong, and H. Zhong
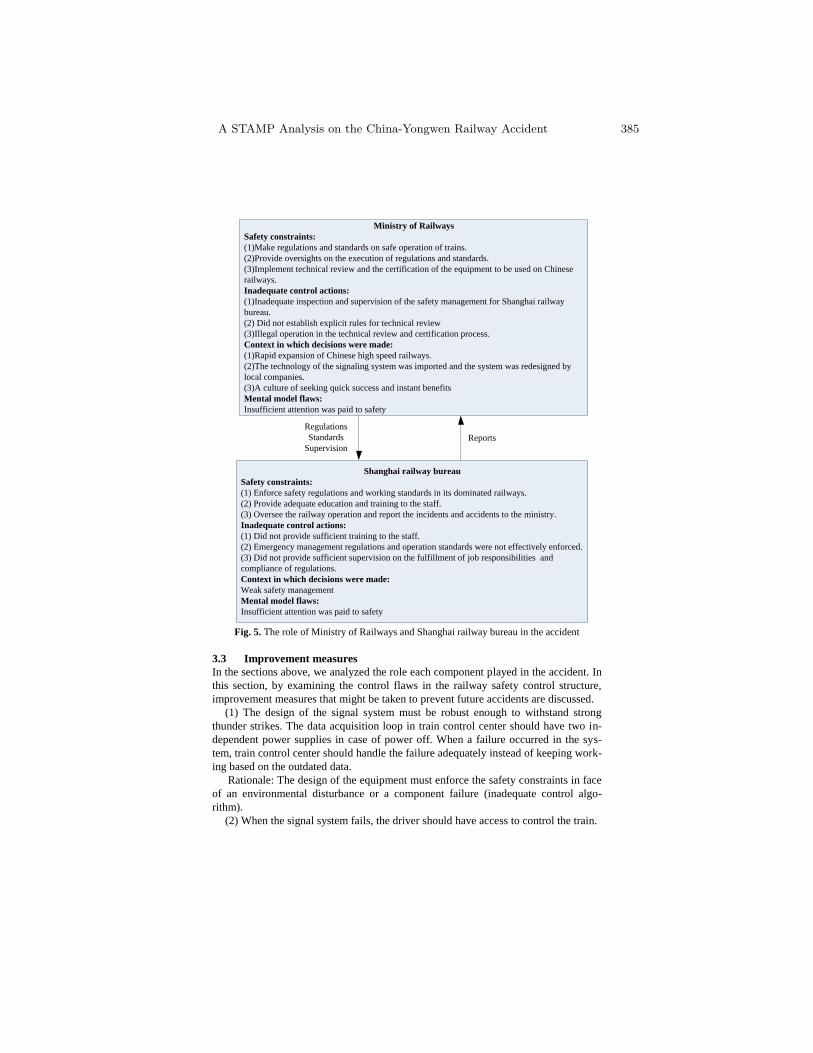
Ministry of Railways
Safety constraints:
(1)Make regulations and standards on safe operation of trains.
(2)Provide oversights on the execution of regulations and standards.
(3)Implement technical review and the certification of the equipment to be used on Chinese
railways.
Inadequate control actions:
(1)Inadequate inspection and supervision of the safety management for Shanghai railway
bureau.
(2) Did not establish explicit rules for technical review
(3)Illegal operation in the technical review and certification process.
Context in which decisions were made:
(1)Rapid expansion of Chinese high speed railways.
(2)The technology of the signaling system was imported and the system was redesigned by
local companies.
(3)A culture of seeking quick success and instant benefits
Mental model flaws:
Insufficient attention was paid to safety
Shanghai railway bureau
Safety constraints:
(1) Enforce safety regulations and working standards in its dominated railways.
(2) Provide adequate education and training to the staff.
(3) Oversee the railway operation and report the incidents and accidents to the ministry.
Inadequate control actions:
(1) Did not provide sufficient training to the staff.
(2) Emergency management regulations and operation standards were not effectively enforced.
(3) Did not provide sufficient supervision on the fulfillment of job responsibilities and
compliance of regulations.
Context in which decisions were made:
Weak safety management
Mental model flaws:
Insufficient attention was paid to safety
Regulations
Standards
Supervision
Reports
Fig. 5. The role of Ministry of Railways and Shanghai railway bureau in the accident
3.3 Improvement measures
In the sections above, we analyzed the role each component played in the accident. In
this section, by examining the control flaws in the railway safety control structure,
improvement measures that might be taken to prevent future accidents are discussed.
(1) The design of the signal system must be robust enough to withstand strong
thunder strikes. The data acquisition loop in train control center should have two in-
dependent power supplies in case of power off. When a failure occurred in the sys-
tem, train control center should handle the failure adequately instead of keeping work-
ing based on the outdated data.
Rationale: The design of the equipment must enforce the safety constraints in face
of an environmental disturbance or a component failure (inadequate control algo-
rithm).
(2) When the signal system fails, the driver should have access to control the train.
A STAMP Analysis on the China-Yongwen Railway Accident 385
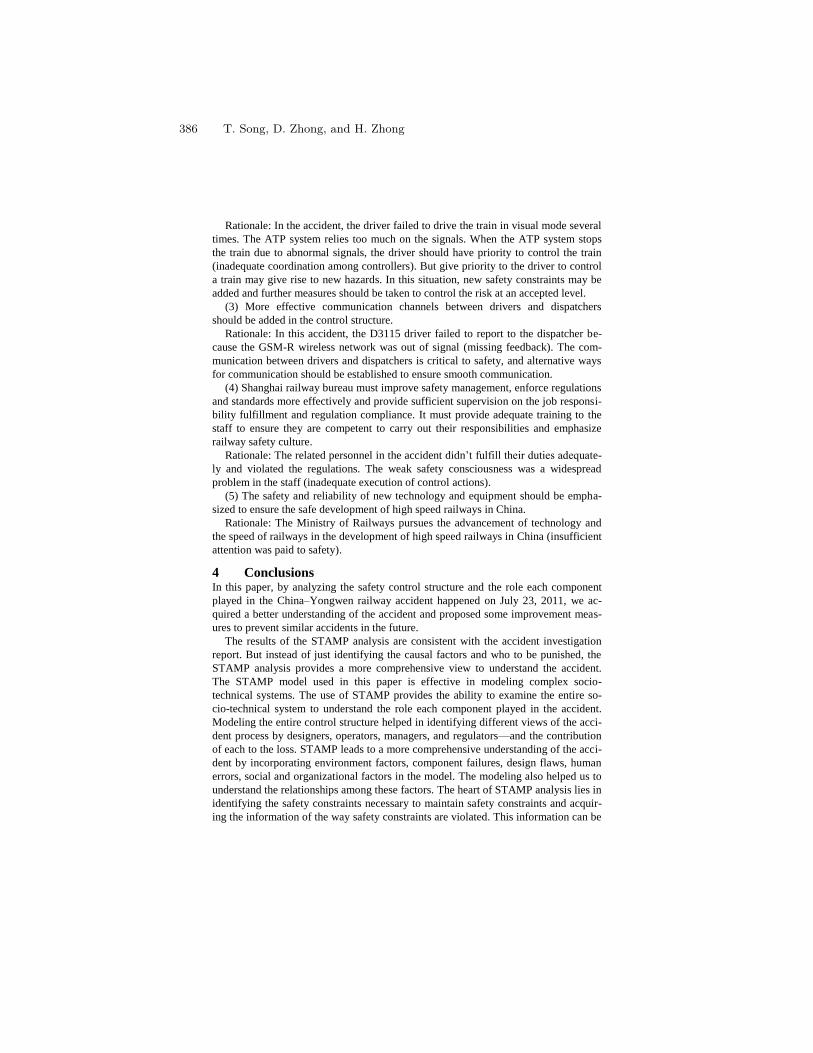
Rationale: In the accident, the driver failed to drive the train in visual mode several
times. The ATP system relies too much on the signals. When the ATP system stops
the train due to abnormal signals, the driver should have priority to control the train
(inadequate coordination among controllers). But give priority to the driver to control
a train may give rise to new hazards. In this situation, new safety constraints may be
added and further measures should be taken to control the risk at an accepted level.
(3) More effective communication channels between drivers and dispatchers
should be added in the control structure.
Rationale: In this accident, the D3115 driver failed to report to the dispatcher be-
cause the GSM-R wireless network was out of signal (missing feedback). The com-
munication between drivers and dispatchers is critical to safety, and alternative ways
for communication should be established to ensure smooth communication.
(4) Shanghai railway bureau must improve safety management, enforce regulations
and standards more effectively and provide sufficient supervision on the job responsi-
bility fulfillment and regulation compliance. It must provide adequate training to the
staff to ensure they are competent to carry out their responsibilities and emphasize
railway safety culture.
Rationale: The related personnel in the accident didn’t fulfill their duties adequate-
ly and violated the regulations. The weak safety consciousness was a widespread
problem in the staff (inadequate execution of control actions).
(5) The safety and reliability of new technology and equipment should be empha-
sized to ensure the safe development of high speed railways in China.
Rationale: The Ministry of Railways pursues the advancement of technology and
the speed of railways in the development of high speed railways in China (insufficient
attention was paid to safety).
4 Conclusions In this paper, by analyzing the safety control structure and the role each component
played in the China–Yongwen railway accident happened on July 23, 2011, we ac-
quired a better understanding of the accident and proposed some improvement meas-
ures to prevent similar accidents in the future.
The results of the STAMP analysis are consistent with the accident investigation
report. But instead of just identifying the causal factors and who to be punished, the
STAMP analysis provides a more comprehensive view to understand the accident.
The STAMP model used in this paper is effective in modeling complex socio-
technical systems. The use of STAMP provides the ability to examine the entire so-
cio-technical system to understand the role each component played in the accident.
Modeling the entire control structure helped in identifying different views of the acci-
dent process by designers, operators, managers, and regulators—and the contribution
of each to the loss. STAMP leads to a more comprehensive understanding of the acci-
dent by incorporating environment factors, component failures, design flaws, human
errors, social and organizational factors in the model. The modeling also helped us to
understand the relationships among these factors. The heart of STAMP analysis lies in
identifying the safety constraints necessary to maintain safety constraints and acquir-
ing the information of the way safety constraints are violated. This information can be
386 T. Song, D. Zhong, and H. Zhong
used in an accident investigation to identify the flaws in an existing structure and
changes to prevent future accidents. And recommendations for changes to prevent
future accidents were directly linked to the analysis and the STAMP model of the
accident.
In applying the STAMP approach, we also encountered some difficulties and found
some limits of the method. First, the modeling method is not clearly defined. But The
STAMP method has little guidance on how to create the model and conduct the anal-
ysis. And it also lacks ways to validate the validity of the model and the analysis.
Second, it is difficult to build the control structure representing the complex relation-
ships among components. It is also hard to present the relationships among compo-
nents between different hierarchical levels. Third, the control flaws are not explicitly
defined and classified. It may cause confusion in some situations. Fourth, in order to
acquire a better understanding of the accident, more detailed information and profes-
sional knowledge are required. But we found some critical information was missing
due to the news embargo by the government.
References
1. The state investigation team of the China-Yongwen railway accident. The investigation
report on the ―7.23‖ Yongwen line major railway accident. (in Chi-
nese)http://www.chinasafety.gov.cn/newpage/Contents/Channel_5498/2011/1228/1605
77/content_160577.htm (2011)
2. Leveson, N.G. A New Accident Model for Engineering Safer Systems. Safety Science
42(4): 237-270 (2004)
3. Leveson, N.G., Daouk, M., Dulac, N., & Marais, K. Applying STAMP in Accident
Analysis. Workshop on Investigation and Reporting of Incidents and Accidents (2003)
4. Leveson, N.G. Model-Based Analysis of Socio-Technical Risk. Technical Report, En-
gineering Systems Division, Massachusetts Institute of Technology.
http://sunnyday.mit.edu/papers/stpa-tech-report.doc (2002)
5. Qureshi, Z.H. A Review of Accident Modeling Approaches for Complex Socio-
Technical Systems. Proc. 12th Australian Conference on Safety-Related Programmable
Systems, Adelaide, Australia (2007)
6. Nelson, P.S. A STAMP analysis of the LEX COMAIR 5191 accident. Thesis, Lund
University, Sweden (2008)
7. Ouyang, Min., Hong, Liu., Yu, Ming-Hui., Fei, Qi. STAMP-based analysis on the rail-
way accident and accident spreading: Taking the China–Jiaoji railway accident for ex-
ample. Safety Science, 48(5): 544-555 (2010)
A STAMP Analysis on the China-Yongwen Railway Accident 387
adfa, p. 1, 2011.
© Springer-Verlag Berlin Heidelberg 2011
Efficient Software Component Reuse in Safety-Critical
Systems – An Empirical Study
Rikard Land1, Mikael Åkerholm
1, Jan Carlson
2
1 CrossControl, Västerås, Sweden 2 School of Innovation, Design, and Engineering, Mälardalen University, Västerås, Sweden
[email protected], [email protected],
Abstract. The development of software components to be reused in safety-
critical systems involves a number of challenges. These are related to both the
goals of using the component in several systems, with different definitions of
system-specific hazards, and on the high demands of today’s safety standards,
which assume a top-down system and software development process. A large
part of the safety-related activities is therefore left for integrator, and there is a
risk that a pre-existing component will neither be feasible nor more efficient to
use than internal development of the same functionality. In this paper we ad-
dress five important challenges, based on an empirical study consisting of inter-
views with experts in the field, and a case study. The result is twelve concrete
practices found to improve the overall efficiency of such component develop-
ment, and their subsequent reuse. These are related to the component architec-
ture and configuration interface, component and system testing and verification,
and the information to be provided with the component.
1 Introduction
Safety-critical systems are systems which may, should they fail, harm people and/or
the environment – such as vehicles, power plants, and machines. To develop such
systems, one must demonstrate that potential hazards have been analyzed, and that all
prescribed activities listed in an applicable safety standard have been performed.
There are generally applicable safety standards, such as the IEC-61508, and domain-
specific standards, such as IEC-61511, ISO-15998, ISO-26262, RTCA DO-178B/C,
EN50126/8/9, ISO-13849, and IEC-62061. In the daily development work, achieving
a sufficient level of safety boils down to adhering to the relevant standard(s).
These standards are based on an assumed top-down approach to system construc-
tion. Each system must be analyzed for its specific hazards and risks in its specific
environment, and the system requirements must be traced throughout the development
to design decisions, to implementation units, to test cases, and to final validation. The
standards’ general approach to the inclusion of pre-existing software components in a
system is to present them as being an integrated part of the development project, and
let them undergo the same close scrutiny as newly developed software for the specific
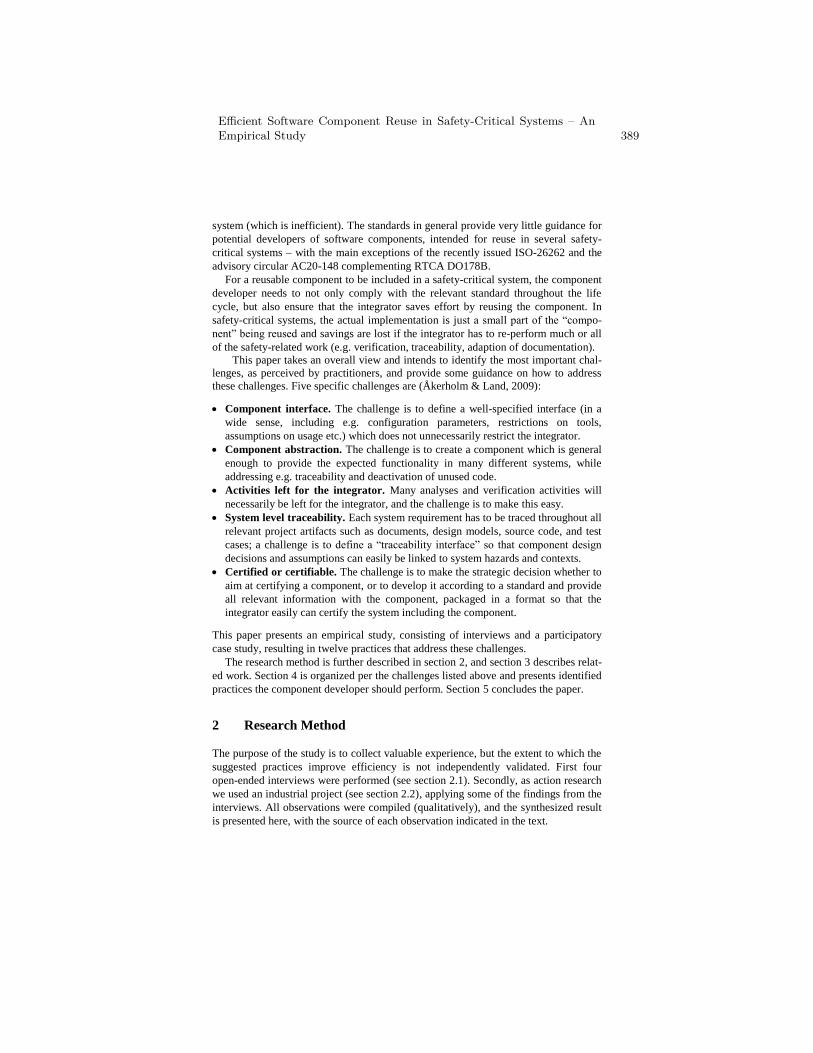
system (which is inefficient). The standards in general provide very little guidance for
potential developers of software components, intended for reuse in several safety-
critical systems – with the main exceptions of the recently issued ISO-26262 and the
advisory circular AC20-148 complementing RTCA DO178B.
For a reusable component to be included in a safety-critical system, the component
developer needs to not only comply with the relevant standard throughout the life
cycle, but also ensure that the integrator saves effort by reusing the component. In
safety-critical systems, the actual implementation is just a small part of the “compo-
nent” being reused and savings are lost if the integrator has to re-perform much or all
of the safety-related work (e.g. verification, traceability, adaption of documentation).
This paper takes an overall view and intends to identify the most important chal-
lenges, as perceived by practitioners, and provide some guidance on how to address
these challenges. Five specific challenges are (Åkerholm & Land, 2009):
Component interface. The challenge is to define a well-specified interface (in a
wide sense, including e.g. configuration parameters, restrictions on tools,
assumptions on usage etc.) which does not unnecessarily restrict the integrator.
Component abstraction. The challenge is to create a component which is general
enough to provide the expected functionality in many different systems, while
addressing e.g. traceability and deactivation of unused code.
Activities left for the integrator. Many analyses and verification activities will
necessarily be left for the integrator, and the challenge is to make this easy.
System level traceability. Each system requirement has to be traced throughout all
relevant project artifacts such as documents, design models, source code, and test
cases; a challenge is to define a “traceability interface” so that component design
decisions and assumptions can easily be linked to system hazards and contexts.
Certified or certifiable. The challenge is to make the strategic decision whether to
aim at certifying a component, or to develop it according to a standard and provide
all relevant information with the component, packaged in a format so that the
integrator easily can certify the system including the component.
This paper presents an empirical study, consisting of interviews and a participatory
case study, resulting in twelve practices that address these challenges.
The research method is further described in section 2, and section 3 describes relat-
ed work. Section 4 is organized per the challenges listed above and presents identified
practices the component developer should perform. Section 5 concludes the paper.
2 Research Method
The purpose of the study is to collect valuable experience, but the extent to which the
suggested practices improve efficiency is not independently validated. First four
open-ended interviews were performed (see section 2.1). Secondly, as action research
we used an industrial project (see section 2.2), applying some of the findings from the
interviews. All observations were compiled (qualitatively), and the synthesized result
is presented here, with the source of each observation indicated in the text.
Efficient Software Component Reuse in Safety-Critical Systems – AnEmpirical Study 389
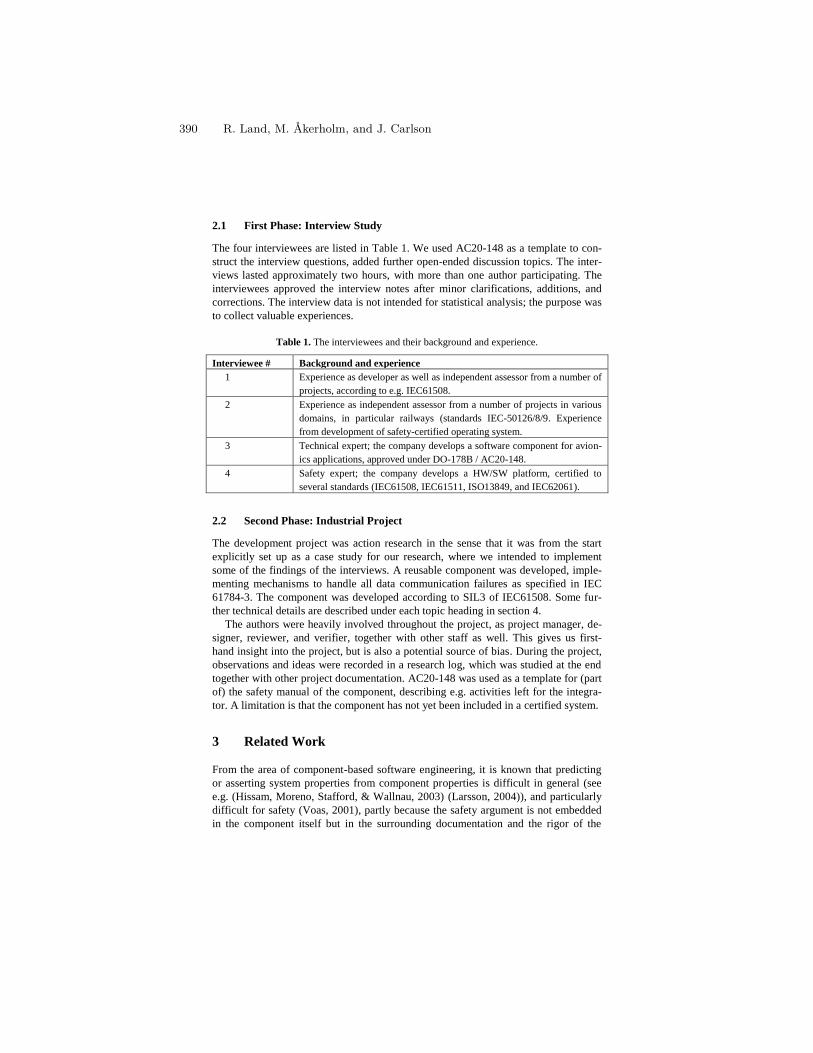
2.1 First Phase: Interview Study
The four interviewees are listed in Table 1. We used AC20-148 as a template to con-
struct the interview questions, added further open-ended discussion topics. The inter-
views lasted approximately two hours, with more than one author participating. The
interviewees approved the interview notes after minor clarifications, additions, and
corrections. The interview data is not intended for statistical analysis; the purpose was
to collect valuable experiences.
Table 1. The interviewees and their background and experience.
Interviewee # Background and experience
1 Experience as developer as well as independent assessor from a number of
projects, according to e.g. IEC61508.
2 Experience as independent assessor from a number of projects in various
domains, in particular railways (standards IEC-50126/8/9. Experience
from development of safety-certified operating system.
3 Technical expert; the company develops a software component for avion-
ics applications, approved under DO-178B / AC20-148.
4 Safety expert; the company develops a HW/SW platform, certified to
several standards (IEC61508, IEC61511, ISO13849, and IEC62061).
2.2 Second Phase: Industrial Project
The development project was action research in the sense that it was from the start
explicitly set up as a case study for our research, where we intended to implement
some of the findings of the interviews. A reusable component was developed, imple-
menting mechanisms to handle all data communication failures as specified in IEC
61784-3. The component was developed according to SIL3 of IEC61508. Some fur-
ther technical details are described under each topic heading in section 4.
The authors were heavily involved throughout the project, as project manager, de-
signer, reviewer, and verifier, together with other staff as well. This gives us first-
hand insight into the project, but is also a potential source of bias. During the project,
observations and ideas were recorded in a research log, which was studied at the end
together with other project documentation. AC20-148 was used as a template for (part
of) the safety manual of the component, describing e.g. activities left for the integra-
tor. A limitation is that the component has not yet been included in a certified system.
3 Related Work
From the area of component-based software engineering, it is known that predicting
or asserting system properties from component properties is difficult in general (see
e.g. (Hissam, Moreno, Stafford, & Wallnau, 2003) (Larsson, 2004)), and particularly
difficult for safety (Voas, 2001), partly because the safety argument is not embedded
in the component itself but in the surrounding documentation and the rigor of the
390 R. Land, M. Åkerholm, and J. Carlson
activities during its development. Among the few attempts to describe reuse of soft-
ware in safety-critical software from a practical, industrial point of view, we most
notably find descriptions of components pre-certified according to the AC20-148
(Lougee, 2004) (Khanna & DeWalt:, 2005) (Wlad, 2006), which describe some of the
potential benefits of reusing pre-certified software, rather than provide guidance on
how to develop a reusable software component efficiently as we do in this paper.
Common challenges of software reuse (Karlsson, 1995) also hold true for reuse of
safety-critical software components; for example, there are various methods and prac-
tices addressing the need of designing a system with potential components in mind
(Land, Blankers, Chaudron, & Crnković, 2008) (Land, Sundmark, Lüders, Krasteva,
& Causevic, 2009). In general, there is more data and experiences on development
with reusable components than development of reusable components (Land,
Sundmark, Lüders, Krasteva, & Causevic, 2009), while the present study takes a
broad perspective and includes both.
Literature on modularized safety argumentation provide several promising research
directions, such as how to extend e.g. fault tree analysis (Lu & Lutz, 2002) and state-
based modeling (Liu, Dehlinger, & Lutz, 2005) to cover product lines, that should in
principle work also for composition of component models. A bottom-up, component-
based process is described in (Conmy & Bate, 2010), where internal faults in an
FPGA (e.g. bit flips) are traced to its output and potential system hazards. Such anal-
yses should be possible to apply to components being developed for reuse, leading to
a description at the component interface level, e.g. of the component’s behavior in the
presence. In the direction of modularized safety arguments, there are initiatives relat-
ed to GSN (Goal Structuring Notation) (Despotou & Kelly, 2008) and safety contracts
(Bate, Hawkins, & McDermid, 2003).
4 Twelve Practices that Address the Challenges
This section contains the observations made in the study, based both on the interviews
and the development project, formulated as concrete practices the component devel-
oper should perform. The section is organized according to the five challenges listed
in (Åkerholm & Land, 2009) and in the introduction of the present paper.
4.1 Addressing Challenge #1: Component Interface
The component’s interface in a wide sense must be fully specified, including not only
input and output parameters but also configuration parameters, restrictions on tools,
the requirements on memory, execution time and other resources, and communication
mechanisms (see e.g. AC20-148) (Åkerholm & Land, 2009).
Identification of Documentation Interface. A large amount of documentation re-
lated to the reusable component must be integrated into the integrator’s life cycle
data; the AC20-148 lists e.g. plans, limitations, compliance statement, and software
approval approach. To make this as straightforward as possible, interviewees #2 and
#3 give the advice to both component developers and integrators to follow the rele-
Efficient Software Component Reuse in Safety-Critical Systems – AnEmpirical Study 391
vant safety standard as closely as possible with regards to e.g. terminology and re-
quired documents. According to the experience of interviewee #2, companies unnec-
essarily create a problem when using an internal project terminology and then provid-
ing a mapping to the standard. Interviewee #4 on the other hand, describes such a
mapping from the platform’s terminology to that of the standards it is certified
against; however, since the same assessor (i.e. the same individual person at the certi-
fication authority) is appointed for all standards, this poses no major obstacles.
Still, the safety standards assume that the documentation structure is a result from a
top-down system construction, and a component will need to specify for which part of
this structure it provides (some of) the required documentation, and how it should be
integrated into the system’s documentation structure. When we followed the structure
outlined in (Åkerholm & Land, 2009) in our project, we observed that the documenta-
tion interface is highly dependent on the technical content, due to the fact that design
decisions on one level are treated as requirements on the level below. When defining
a component for reuse, there are some specific challenges involved: the perhaps not
obvious distinction between the architecture and requirements of the component, and
it was realized in the project that the documentation needs to distinguish these more
clearly than we did at the outset. Hazard and risk analysis for the component need to
be performed backwards and documented as a chain of assumptions rather than as a
chain of consequences; this needs to be documented very clearly to make the hazard
analysis and safety argumentation of the system as straightforward as possible. Fur-
ther research is needed to provide more detailed suggestions on how to structure the
component documentation in order to provide an efficient base for integration.
Practice I: Follow the requirements of the standard(s) on documentation structure
and terminology as closely as possible. Two important parts of a component’s docu-
mentation interface are the component requirements and the component hazard and
risk analysis, which should aim for easy integration into the system’s design and haz-
ard/risk analysis.
Identification of Configuration Interface. A reusable component should have a
modular design and configuration possibilities, so that “hot spots” where future antic-
ipated changes are identified and isolated (Interviewee #3; see also e.g. (Lougee,
2004)). Knowledge of the specific differences between customers and systems is re-
quired; interviewee #3 describes that their operating system has support for different
CPUs, its ability to let the integrator add specific initialization code, and its support
for statically modifying the memory map. With configurability come requirements on
verification and testing of a specific configuration of a component in a specific system
(interviewees #1 and #3). In our industrial project, we clearly separated the user con-
figurable data from other data in the system, by setting up a file structure where only
two files with a strict format are user modifiable. We used mechanisms provided by
the source code language to both provide an easy-to-use configuration interface and
the possibility of being able to statically include this data into the program with ap-
propriate static checks (see also section 4.3 for construction of adaptable test suites).
Interviewee #3 describes that with configuration variables which are read from
non-volatile memory during startup, the integrator needs to show that the parameters
cannot change between startups. See section 4.2 on deactivation of dead code.
392 R. Land, M. Åkerholm, and J. Carlson
Practice II: Create a modular design where known points of variability can be eas-
ily expressed as configuration settings which are clearly separated and easy to under-
stand for the user.
4.2 Addressing Challenge #2: Component Abstraction
Components suitable for reuse, in particular for safety-critical systems, need to ad-
dress well-defined, commonly occurring design problems or commonly needed ser-
vices (Khanna & DeWalt:, 2005). The product of interviewees #3 and #4 are indeed
“platforms”, in the sense that their components provide basic services on top of which
applications are built. As such, the services they provide are of a general nature, such
as partitioning of memory, which are not directly connected to a system’s functional
requirements. In the industrial project case, our main functional requirements come
from the IEC 61784-3 standard on data communication in industrial networks, which
defines all conceivable communication errors that need to be addressed, and which
will be the same in many different systems, independently of the safety-critical func-
tions they perform. All these components, as well as the published examples (Khanna
& DeWalt:, 2005) (Wlad, 2006) of components constructed according to AC20-148,
provide general functionality needed to address needs at the design level.
Practice III: Define the component functionality as well-defined abstractions solv-
ing commonly recurring problems on the system design level, rather than on the sys-
tem requirements level.
Deactivation and Removal of Unused Code. Some of the features of a reusable
component may not be used. In safety-critical systems, there is a very important dif-
ference between “dead code”, i.e. unreachable statements left by mistake, and “deac-
tivated code”, i.e. program code deactivated with a hardware switch, configuration
parameter in the program, or a runtime parameter (see e.g. RTCA DO-178B). Alt-
hough it is preferable to identify unexecuted code and remove it altogether from the
executable, the interviewees refer to the standards which do not prohibit deactivated
code per se (e.g. RTCA DO-178B). In such cases, however, the interviewees stress
that an argument must be provided showing that the code will not cause harm even if
executed, and this must be supported by careful testing, including fault injection tests.
Also, one must reason about possible side effects such as I/O operations and writes to
shared variables or permanent storage in deactivated code (interviewee #2). The inte-
grator also needs to provide an argument that the parameters cannot change between
startups (interviewee #3; see also section 4.1); such argumentation is avoided if the
code is statically excluded (interviewee #3 and case study). In our project, the source
code used only by either senders or recipients are protected with macro definitions.
Practice IV: For deactivated code, base the safety argumentation on the avoidance
of hazards, and be particularly observant on code with side effects. Whenever possi-
ble, replace runtime mechanisms for deactivating code with static mechanisms to
remove the code completely from the executable. (Related to Practice II.)
Definition of High-Level Design/Architecture. Although some of the design of a
reusable component is hidden from the integrator, and should remain so, the defini-
tion of a reusable component’s high-level design is also, to a large extent, a definition
Efficient Software Component Reuse in Safety-Critical Systems – AnEmpirical Study 393
of the architecture of an assumed system: interaction paradigms (i.e., messages, func-
tions, etc.), execution models (i.e., passive libraries, active tasks, etc.), expected inter-
action patterns, semantics of the source code functions, etc. Standardization of these
aspects have led to the definition of formalisms such as AADL (As-2 Embedded
Computing Systems Committee, 2009), EAST-ADL, AUTOSAR, SysML and
MARTE1. Interviewee #1 stresses that the architecture of the component reflects what
the component developer believes to be useful for the integrator. This is strongly sup-
ported by our experiences from the industrial project, where we investigated four
conceivable execution models on the receiving side of the communication:
Time-triggered. Execution of a task is started periodically, which retrieves all
newly arrived messages and processes them; this is suitable approach for a node
with a real-time operating system.
Event-triggered (using hardware interrupts). Execution of code is trigged by
hardware interrupts, which are either “a message has arrived” or a timeout. This is
suitable for an otherwise interrupt-driven system.
Event-triggered (infinite loop with blocking wait). The code hangs on a “wait
for message” function call, which returns when a message has arrived or when a
timeout limit has been reached. This blocking approach may be suitable when
communication with other tasks is limited.
Continuous polling. The application implements an infinite loop, that first reads
data (if any) from the bus and then handles it, in one single thread without any de-
lays or interrupts. This “busy waiting” approach is suitable for a node which have
no other tasks to do, or where those tasks can also be performed in the same loop.
Our component is a passive library component to be called by the application to
process messages rather than an abstraction layer.
Practice V: Define the execution models, interaction paradigms, etc., of the com-
ponent, to support the assumed architecture(s) of many potential target systems.
To verify in the design phase that our designed API would support the four execu-
tion models, we a) wrote pseudocode for each of these (this later became part of the
component’s usage documentation), and b) let developers review the design given the
question: “Could you create a good system design with this component?” Through
this somewhat iterative analysis and design work, we were able to create an API, i.e.
functions and rules for interaction, supporting all four execution models. However,
due to the lack of firm boundaries in terms of requirements from a specific system,
this activity required significantly more effort than expected.
Practice VI: Allocate a team to evaluate the feasibility and usefulness of your
component at the early conceptual and architectural design stage. Allocate sufficient
time in this phase for the necessary development and iterations of design proposals.
Structure of Component Design Artefacts. In our project, we first planned for
one single software architecture document. We realized later in the project that the
architecture of a reusable component is a mixture of both 1) inputs to the require-
ments (e.g., “the component shall support the following four execution models”) and
1 http://www.autosar.org/, http://www.sysml.org/, http://www.omgmarte.org/
394 R. Land, M. Åkerholm, and J. Carlson
2) implementation decisions made to fulfill the requirements (e.g. definition of data
structures and functions, including traceability information to requirements). This
caused an unnecessary circular dependency between requirements and architectural
design documents. We therefore recommend that these two types of architectural
information are kept distinct in separate documents, one being an input document to
the requirements specification and one being a downstream document. However, this
was perceived to be a clarity issue, not a real threat to safety or project efficiency.
Practice VII: Use separate documents for the external architecture (the assumed
architecture of the system) and the component’s internal architecture and design.
4.3 Addressing Challenge #3: Activities left for the integrator
There will remain a number of activities for the integrator, related to the context and
environment of the component in a specific system. The challenge for the component
developer is to aid the integrator in these activities by providing the component with
certain information and artefacts. In the studies, we identified what can be labeled
“analysis interface”, and adaptable test suites as two important means for this.
Identification of Analysis Interface. Data coupling analysis, control coupling
analysis, and timing analysis are examples of activities that can only be performed by
the integrator, when the complete software is available (AC20-148). However, some
analyses may in principle be partially performed at the component level, or some
useful data or evidence may be constructed at the component level. In spite of re-
search on composing system properties from component properties (see e.g. (Hissam,
Moreno, Stafford, & Wallnau, 2003) (Larsson, 2004) and the TIMMO project2), the
challenge remains to identify such analysis interfaces, including assertions that need
to be made by the component developer, properties that need to be specified, and how
to use these automatically in a system-level analysis. In the study, interviewees #3 and
#4 mentioned timing issues to be especially important. With a simple application
design, and certain component information, it may be sufficient to perform timing
measurements of the integrated system, given that the component developer makes
assertions on the behavior of the component. The current state of practice includes,
according to interviewees #3 and #4, component assertions that the function calls are
non-blocking, or information that the component disables interrupts, which is valua-
ble for the integrator’s more detailed timing analysis. Also, a specification of input
data which will cause the longest path through a function to be executed, and/or the
path that includes the most time-consuming I/O operations, is useful for finding upper
bounds on the timing within a specific system and on a specific hardware.
Practice VIII: Provide information on the component’s (non-)blocking behavior,
disabling and enabling of interrupts, and input data which is likely to cause the upper
bounds on timing, to facilitate the integrator’s system level analysis of e.g. timing.
Adaptable Test Suites. The component of our project is delivered with a module
test suite which automatically adapts itself to the configuration. The component con-
figuration is made through macro definitions and filling static data structures with
2 http://www.timmo.org/
Efficient Software Component Reuse in Safety-Critical Systems – AnEmpirical Study 395
values, and the test suite is conditionally compiled based on the same macros, and
uses the actual values of the data structures to identify e.g. boundary values to use in
testing, and of course determine the expected correct output. The test suite includes all
necessary fault injection in order to always achieve sufficient code coverage (for the
SIL 3 according to IEC-61508).
The creation of a module test suite on this higher level of abstraction forced us to
reason about many boundary values, possible overflow in computations, and similar
border conditions. Also, it helped us identify user errors, such as what would happen
if the component is configured with empty lists or inconsistent configuration parame-
ters. In addition, the resulting number of actual tests executed on a single configura-
tion is significantly higher than we would otherwise have created, which also increas-
es our confidence in the component, although strictly the number of test cases can
never in itself be an argument for testing being sufficient. Thus, as a side effect, this
greatly helped us to design for testability, and to design good test suites.
The main purpose of providing adaptable test suites is that the integrator easily can
perform module tests on the specific configuration used in the system. To verify the
configuration mechanisms and the test suite itself, we created a number of configura-
tions and re-executed the tests with very little effort (a matter of minutes). This in-
creased our confidence, not only in the component itself but in that we are saving a
significant amount of effort for integrators. (However the integrator must learn and
understand how to run the test suite correctly for a specific configuration, and how to
interpret the test output (including verification of the code coverage reached).) Anoth-
er extra benefit is that some changes (e.g. addition of messages on the bus) can be
made late in the development process and easily re-tested.
The test suite is written in ANSI-C and is therefore as portable as the component
itself, but the fault injection mechanism and the code coverage analysis rely on exter-
nal tools and therefore somewhat restrict the integrator’s freedom. To account for this,
we have designed the test suite and test environment so that adapting the suite to an-
other tool set should not be too effort-consuming.
Practice IX: Deliver an adaptable test suite with the component, so that the inte-
grator can (re-)perform configuration-specific testing with little effort.
4.4 Addressing Challenge #4: System level traceability
Demonstrating traceability means tracing each requirement to design items, imple-
mentation items, test cases, etc. This requires extra attention when a part of the system
is developed by an external company prior to and/or independently of specific system
requirements since the traceability chain goes across organization boundaries.
Identification of Traceability Interface. Some steps towards defining a traceabil-
ity interface were identified in the study: if the component provides an abstraction
with error handling (such as operating systems, communication layers, or platforms in
some other sense), it may be sufficient to demonstrate that the component’s functional
interface solves some of the design goals of the system (e.g., that it handles certain
types of communication failures with a certain level of integrity) without introducing
new hazards, that the component is verified sufficiently (e.g. using code coverage
396 R. Land, M. Åkerholm, and J. Carlson
metrics), and that it is used as intended and its safety manual has been followed (in-
terviewee #4; our project). Interviewee #2 in particular stresses that the objective
when arguing safety is to perform the argumentation in relation to the system hazards;
if a fault analysis (e.g. a fault tree analysis) shows that a component does not contrib-
ute to a specific hazard, the tracing may stop there.
Practice X: Specify component requirements and functional interface, so that a de-
tailed traceability analysis is not required when integrated into a system. This includes
providing a safety manual with assumptions and rules for component usage.
Standardization of Traceability Tools. Often traceability is managed manually as
tables in electronic documents, and even if a traceability tool is used, there are prob-
lems to share the same database, and it is also likely that the component developer
uses a different tool than its customers (interviewee #1). This is a challenge for stand-
ardization and tool developers, rather than for component developers or integrators.
Meeting the Requirements on System Hazard and Risk Analysis. Normally, the
system hazards are used, with their estimated frequency, consequence etc., to deter-
mine the SIL level (or similar; the standards have different classifications), which
influences all downstream activities. When developing a component for reuse, the risk
analysis is instead performed backwards: a target market is selected, and the compo-
nent is developed according to common requirements and a SIL level which it is be-
lieved that integrators will require. It is only in a system context safe external behav-
iors in case of detected failures can be determined (e.g. to shut down the unit immedi-
ately, apply a brake, or notify the operator; it may or may not be safe and desirable to
first wait for X more messages in case the communication recovers; etc.). It is always
the responsibility of the system developer to focus the argumentation around the haz-
ards and show that they cannot conceivably occur. “A general software component
does not have safety properties, but a quality stamp. Only in a specific context do
safety properties exist.” (interviewee #2)
In the case study we performed some analysis based on assumed, realistic, values
for usage and disturbances to demonstrate that an average system or application using
our component also meets the hardware requirements at the target SIL level. (It may
be noted that there is no major differences in the requirements on development of
software between SIL2 and SIL3 according to IEC61508; the requirements on hard-
ware however typically impose more expensive solutions including redundancy etc.)
Practice XI: Lacking a definition of system hazards, identify component error-
handling, fault tolerance mechanisms, and behavior that are common for many sys-
tems, as independently as possible of the specific system hazards. (See also Practice
III.)
4.5 Addressing Challenge #5: Certified or certifiable?
A developer of a component intended for reuse needs to make a decision between
certifying the component, or developing the component according to a target standard
and handing over all the safety-related documentation for the certification of each
system. This decision is dependent on the situation of the component developer. This
Efficient Software Component Reuse in Safety-Critical Systems – AnEmpirical Study 397
section lists the goals that were mentioned by the interviewees in the study, and de-
scribes some of their considerations in meeting these goals.
Goal 1: Saving Effort, Time and Money for the Integrator. Since component
development is carried out according to the standard, and much of the required docu-
mentation and evidence is created, the integrator may potentially save the same effort
(interviewee #1; see section 4.1). However, for interviewees #3 and #4, the effort
savings for the integrator are not so significant. Interviewee #4 shared his experience
of a component not developed according to the required safety standards, which
brought a significant additional cost to construct the required evidence and document-
ing it. Interviewee #3 states that with AC20-148, the effort spent by the certification
authority is decreased since only changes of the component have to be investigated.
Goal 2: Reducing Risk for the Integrator. Interviewees #1, #3, and #4, all state
that with a pre-certified component (or a certifiable component, which has been used
in another, certified, system), the confidence is high that the component will not cause
any problems during system certification. Interviewee #3 specifically mentions that
the customers using the component from his organization do it because the compo-
nent is pre-certified according to AC20-148 and thus is a low-risk choice.
Practice XII: If the main goal is to present a component as risk-reducing, the
component developer should consider certifying the component. If the main goal is to
save efforts for the integrator, it may be sufficient to develop it according to a stand-
ard, and address effort savings in the ways outlined in this paper.
5 Conclusions and Future Work
Twelve practices for development of reusable software components for safety-critical
systems were identified in an empirical study with interviews with industrial experts
and an industrial case study. Being based on five previously identified challenges
(Åkerholm & Land, 2009), they potentially represent important effort savings.
Further empirical studies, complemented by theoretical research, are needed, to
further define many of the details relevant for a component interface, such as guaran-
teed behavior in the presence of (certain) faults, or a demonstration that “component-
level hazards” have been appropriately analyzed and addressed.
Not to be underestimated is the potential gain in efficiency through standardization
of platforms, tools, languages, etc. In the long term, safety standards also need to
evolve to recognize the possibilities of reusable software components, while continu-
ing to ensure systems’ safety integrity. Our participation in the large European
SafeCer3 project provides an opportunity to study also other industrial cases in order
to collect further good practices and to validate the conclusions brought forward in the
present paper. Methods and notations to support modularized safety argumentation,
such as those described in the related work section, will also be further developed,
applied, and evaluated. Finally, the project aims at influencing future editions of safe-
ty standards to incorporate sound practices and methods that will make it easier and
3 http://www.safecer.eu
398 R. Land, M. Åkerholm, and J. Carlson
more economical to build safety-critical systems from pre-existing components, while
ensuring that they are still at least as safe as with the current standards.
5.1 Acknowledgements
We want to thank the interviewees for sharing their experiences with us. This study
was partially funded by The Knowledge Foundation (KKS), CrossControl, ARTEMIS
Joint Undertaking, and Vinnova.
6 References
1. Mikael Åkerholm and Rikard Land, “Towards Systematic Software Reuse in Certifiable
Safety-Critical Systems”, in RESAFE - International Workshop on Software Reuse and
Safety, Falls Church, VA, 2009.
2. Scott A. Hissam, A. G. Moreno, Judith Stafford, and Kurt C. Wallnau, “Enabling Predict-
able Assembly”, Journal of Systems & Software, vol. 65, no. 3, 2003.
3. Magnus Larsson, “Predicting Quality Attributes in Component-based Software Systems”,
Ph.D. Thesis, Mälardalen University, 2004.
4. Jeffrey Voas, “Why Is It So Hard to Predict Software System Trustworthiness from Soft-
ware Component Trustworthiness?”, in 20th IEEE Symposium on Reliable Distributed
Systems (SRDS'01), 2001.
5. Hoyt Lougee, “Reuse and DO-178B Certified Software: Beginning With Reuse Basics”,
Crosstalk – the Journal of Defense Software Engineering, December, 2004.
6. Varun Khanna and Mike DeWalt:, “Reusable Sw components (RSC) in real life”, in
Software/CEH conference, Norfolk, VA, 2005.
7. Joe Wlad, “Software Reuse in Safety-Critical Airborne Systems”, in 25th Digital Avion-
ics Systems Conference, 2006.
8. Even-André Karlsson, Software Reuse : A Holistic Approach. ISBN 0 471 95819 0: John
Wiley & Sons Ltd., 1995.
9. Rikard Land, Laurens Blankers, Michel Chaudron, and Ivica Crnković, “COTS Selection
Best Practices in Literature and in Industry”, in Proceedings of 10th International Con-
ference on Software Reuse (ICSR), Beijing, China, 2008.
10. Rikard Land, Daniel Sundmark, Frank Lüders, Iva Krasteva, and Adnan Causevic, “Re-
use with Software Components – A Survey of Industrial State of Practice”, in 11th Inter-
national Conference on Software Reuse (ICSR), Falls Church, VA, USA, 2009.
11. Dingding Lu and Robyn R. Lutz, “Fault Contribution Trees for Product Families”, in 13th
International Symposium on Software Reliability Engineering (ISSRE’02), 2002.
12. Jing Liu, Josh Dehlinger, and Robyn Lutz, “Safety Analysis of Software Product Lines
Using State-Based Modeling”, in 16th IEEE International Symposium on Software Relia-
bility Engineering (ISSRE’05), 2005.
13. Philippa Conmy and Iain Bate, “Component-Based Safety Analysis of FPGAs”, IEEE
Transactions on Industrial Informatics, vol. 6, no. 2, 2010.
14. George Despotou and T. Kelly, “Investigating The Use Of Argument Modularity To
Optimise Through-Life System Safety Assurance”, in 3rd IET International Conference
on System Safety (ICSS), Birmingham, 2008.
15. I Bate, R Hawkins, J McDermid, “A Contract-based Approach to Designing Safe Sys-
tems”, in 8th Australian Workshop on Safety Critical Systems and Software (SCS'03),
2003.
16. As-2 Embedded Computing Systems Committee, “Architecture Analysis & Design Lan-
guage (AADL)”, Document Number AS5506, 2009.
Efficient Software Component Reuse in Safety-Critical Systems – AnEmpirical Study 399


Author Index
Åkerholm, Mikael, 388
Asplund, Fredrik, 340Ayatolahi, Fatemeh, 198Ayoub, Anaheed, 305
Böde, Eckard, 37Bürklen, Susanne, 328Baldoni, Roberto, 185Bergenhem, Carl, 247Bicchierai, Irene, 173Blanquart, Jean-Paul, 235Bock, Hans-Herrmann, 137Braband, Jens, 137Braga, Rosana, 352Bucci, Giacomo, 173
Carlson, Jan, 388Castelo Branco, Kalinka Regina, 352
Denney, Ewen, 1Descargues, Gilles, 25Di Leo, Domenico, 198Diedrich, Christian, 87Dittmann, Jana, 125
Eckert, Claudia, 149Edifor, Ernest, 99El-Khoury, Jad, 340
Felici, Massimo, 364
Günther, Henning, 291Gil Casals, Silvia, 25Glaß, Michael, 111Gordon, Neil, 99Greenberg, Lev, 279
Höfflinger, Jens, 328Hannius, Olof, 223Hansson, Hans, viiHauge, André, 13Helle, Philipp, 279Hintze, Elke, 87Hoppe, Tobias, 125
Ingelsson, Urban, 74Izosimov, Viacheslav, 74
Johansson, Roger, 198Johansson, Rolf, 247
Karlsson, Johan, 198, 223Kiltz, Stefan, 125Kim, Baekgyu, 305Krauß, Christoph, 149Krause, Jan, 87Kwiatkowska, Marta, ix
Läsche, Christoph, 37Lönn, Henrik, 247Land, Rikard, 388Latvala, Timo, 210Lee, Insup, 305Lee, Jaejoon, 352Liggesmeyer, Peter, 328Lodi, Giorgia, 185
Möller, Oliver, 291Magnus, Stephan, 87Mariotta, Guido, 185Masin, Michael, 279Milius, Birgit, 137Milius, Stefan, 291Montanari, Luca, 185
Neris, Luciano De Oliveira, 352Nocentini, Carlo, 173Novak, Thomas, 268Nummila, Laura, 210
Owezarski, Philippe, 25
Pai, Ganesh, 1Peikenkamp, Thomas, 37Pereverzeva, Inna, 210Philipps, Jan, 317Pintard, Ludovic, 235Pohlheim, Hartmut, 258
Reimann, Felix, 111Rizzuto, Marco, 185

402
Salecker, Elke, 258Sangchoolie, Behrooz, 198Schäbe, Hendrik, 137Schäfer, Manfred, 49Schiller, Frank, 149Seguin, Christel, 235Shalyto, Anatoly, 161Slotosch, Oscar, 317Sokolsky, Oleg, 305Song, Tian, 376Stølen, Ketil, 13Stoegerer, Christoph, 268Stuermer, Ingo, 258Sujan, Mark, 364
Törngren, Martin, 340Tarasyuk, Anton, 210Teich, Jürgen, 111
Trapp, Mario, 328Trindade, Onofre, 352Troubitsyna, Elena, 210Tuchscheerer, Sven, 125
Vicario, Enrico, 173
Walker, Martin, 99Wallin, Andreas, 74Wieczorek, Felix, 149Wildmoser, Martin, 317Woskowski, Christoph, 62
Yu, Heng, 111
Zakonov, Andrey, 161Zhong, Deming, 376Zhong, Hang, 376Zimmer, Bastian, 328


