Embed Size (px)
Citation preview
American Society of Nephrology1401 H St NW, Suite 900Washington, DC 20005Phone: 202-640-4660 | Fax [email protected]
How to Cite this article: Vipin Varghese, Maria Soledad Rivera, Ali Alalwan, Ayman Alghamdi, Akanksh Ramanand, Sumayyah Khan, Jose Najul-Seda, and Juan Carlos Velez, Concomitant Identification of Muddy Brown Granular Casts and Low FENa in Acute Kidney Injury, Kidney360, PublishAhead of Print, 10.34067/KID.0005692021
Article Type: Original Investigation
Concomitant Identification of Muddy Brown Granular Casts and Low FENa in Acute Kidney Injury
DOI: 10.34067/KID.0005692021
Vipin Varghese, Maria Soledad Rivera, Ali Alalwan, Ayman Alghamdi, Akanksh Ramanand, Sumayyah Khan, Jose Najul-Seda, and Juan Carlos Velez
Key Points:*There is discordance between presence of muddy brown granular casts and the value of FENa in the determination of acute tubular injury
*Muddy brown granular casts represent acute tubular injury as confirmed by tissue biopsy diagnosis.
*Muddy brown granular casts have greater prognostic value than FENa.
Abstract:Background. Fractional excretion of urinary sodium (FENa) is a widely utilized test to evaluate acute kidney injury (AKI). A low FENa (<1%) is deemed consistent with prerenal azotemia and inconsistent with acute tubular injury (ATI). Muddy brown granular casts (MBGC) on microscopic examination of the urinary sediment (MicrExUrSed) are highly suggestive of ATI. We hypothesized that there is poor concordance between the presence of MBGC and FENa in ATI. Methods. We conducted a prospective observational study in patients with AKI seen during inpatient consultation. We extracted cases who underwent assessment of percentage of low power fields (LPF) with MBGC by MicrExUrSed and concomitant measurement of FENa. Diagnostic concordance between MBGC and FENa as well as prognostic value were examined. Results. Our cohort included 270 patients with 111 (41%) women. Median age was 61 (27-92) and median serum creatinine was 3.7 (1.2-22.0) mg/dL. MBGC were found in 49% (133/270). FENa <1% was found in 50/133 (38%), 38/115 (33%) and 16/45 (36%) of those with >0%, {greater than or equal to}10%, and {greater than or equal to}50% LPF with MBGC, respectively. Concordance between FENa and MBGC for ATI diagnosis was deemed fair (estimated kappa coefficient 0.2), and poor (kappa -0.11) within a subgroup of patients with preexisting chronic kidney disease (n=139). In patients with biopsy-proven ATI (n=49), MBGC had 100% specificity and 100% positive predictive value for ATI. MBGC were associated with greater risk for {greater than or equal to}50% increase in creatinine from baseline at discharge [acute kidney disease (AKD)]. Conclusion. About 2/5 of patients with MBGC presented with FENa <1%. Presence of MBGC was consistent with ATI, as verified by biopsy, and were predictive of AKD. These data suggest that the sole reliance in low FENa to exclude ATI should be abandoned and MicrExUrSed should be pursued for AKI diagnosis.
Disclosures: J. Velez reports the following: Consultancy: Mallinckrodt Pharmaceuticals, Bayer, Travere; Honoraria: Mallinckrodt, Otsuka, Travere, Bayer; Advisory or Leadership Role: Mallinckrodt, Advisory Board; Travere, Advisory Board; and Speakers Bureau: Otsuka Pharmaceuticals. None of the products manufactured by those companies are discussed in this manuscript. The remaining authors have nothing to disclose.
Funding: Ochsner Health System: Clinical and Translational & Innovation Support Program: Juan Carlos Q. Velez, 851111051
Author Contributions: Vipin Varghese: Conceptualization; Data curation; Formal analysis; Investigation; Methodology; Project administration; Resources; Software; Validation; Visualization; Writing - original draft; Writing - review and editing Maria Soledad Rivera: Data curation; Investigation Ali Alalwan: Data curation; Investigation Ayman Alghamdi: Data curation; Investigation Akanksh Ramanand: Data curation; Investigation Sumayyah Khan: Data curation; Investigation Jose Najul-Seda: Data curation; Investigation Juan Carlos Velez: Conceptualization; Data curation; Formal analysis; Funding acquisition; Investigation; Methodology; Project administration; Resources; Software; Supervision; Validation; Visualization; Writing - original draft; Writing - review and editing
Data Sharing Statement: All data is included in the manuscript and/or supporting information.
Clinical Trials Registration:
Kidney360 Publish Ahead of Print, published on January 19, 2022 as doi:10.34067/KID.0005692021
Copyright 2022 by American Society of Nephrology.

Registration Number:
Registration Date:
The information on this cover page is based on the most recent submission datafrom the authors. It may vary from the final published article. Any fields remaining
blank are not applicable for this manuscript.

Concomitant Identification of Muddy Brown Granular Casts and Low FENa in Acute Kidney
Injury
Vipin Varghese1,2, Maria S. Rivera1, Ali Alalwan2, Ayman M. Alghamdi2, Akanksh Ramanand1,
Sumayyah M. Khan1, Jose E. Najul-Seda2, Juan Carlos Q. Velez1,2
1Ochsner Clinical School - The University of Queensland, New Orleans, LA, USA
2Department of Nephrology, Ochsner Health, New Orleans, LA, USA
Corresponding Author:
Juan Carlos Q. Velez, MD
1514 Jefferson Hwy, Clinic Tower 5th Floor, Rm 5E328
Ochsner Medical Center
New Orleans, LA 70121, USA

Key Points
• There is discordance between presence of muddy brown granular casts and the value of FENa
in the determination of acute tubular injury
• Muddy brown granular casts represent acute tubular injury as confirmed by tissue biopsy
diagnosis.
• Muddy brown granular casts have greater prognostic value than FENa.
Abstract
Background. Fractional excretion of urinary sodium (FENa) is a widely utilized clinical test to evaluate
acute kidney injury (AKI). A low FENa (<1%) is deemed consistent with prerenal azotemia and
inconsistent with acute tubular injury (ATI). Muddy brown granular casts (MBGC) on microscopic
examination of the urinary sediment (MicrExUrSed) are highly suggestive of ATI. We hypothesized that
there is poor concordance between the presence of MBGC and FENa in ATI.
Methods. We conducted a prospective observational study in patients with AKI seen during inpatient
consultation. We extracted cases who underwent assessment of percentage of low power fields (LPFs)
with MBGC by MicrExUrSed and concomitant measurement of FENa. Diagnostic concordance between
MBGC and FENa as well as their individual prognostic value were examined.
Results. Our cohort included 270 patients with 111 (41%) women. Median age was 61 (27-92) and
median serum creatinine was 3.7 (1.2-22.0) mg/dL. MBGC were found in 49% (133/270). FENa <1%
(inconsistent with ATI) was found in 50/133 (38%), 38/115 (33%) and 16/45 (36%) of those with >0%,
≥10%, and ≥50% LPFs with MBGC, respectively. Concordance between FENa and MBGC for ATI
diagnosis was deemed fair (estimated kappa coefficient 0.2), and poor (kappa -0.11) within a subgroup
of patients with preexisting chronic kidney disease (n=139). In patients with biopsy-proven ATI (n=49),
MBGC had 100% specificity and 100% positive predictive value for ATI. MBGC were associated with
greater risk for ≥50% increase in creatinine from baseline at discharge [acute kidney disease (AKD)].
Conclusion. About 2/5 of patients with MBGC identified by MicrExUrSed presented with FENa <1%.
Presence of MBGC was consistent with ATI, as verified by biopsy, and were predictive of AKD. These
data suggest that the sole reliance in low FENa to exclude ATI should be abandoned and MicrExUrSed
should be pursued for AKI diagnosis.
Introduction
Fractional excretion of urinary sodium (FENa) is a widely utilized diagnostic test in the evaluation of
acute kidney injury (AKI). Seminal studies described the diagnostic value of FENa in differentiating
prerenal azotemia from acute tubular necrosis (1,2). Thereafter, a low FENa (< 1%) has been
considered consistent with prerenal azotemia and not due to acute tubular injury (ATI). However, these
early studies excluded patients with chronic kidney disease (CKD), acute glomerular disease, urinary
tract obstruction, or those who received diuretic therapy. In the presence of diuretics, FENa has been
found to be less reliable (3). Furthermore, other studies have shown suboptimal performance of FENa
to differentiate prerenal azotemia from ATI (4). Despite these pitfalls, FENa remains deeply embedded
in medical education as a leading tool in differentiating the etiology of AKI.
Identification of muddy brown granular casts (MBGC) by microscopic examination of urinary sediment
(MicrExUrSed) constitutes a finding highly suggestive of ATI (5,6). Several studies have demonstrated
the diagnostic and prognostic potential of urine microscopy scores based on the presence and
quantification of granular casts (7–9). In clinical practice, discrepancy between MicrExUrSed findings
and FENa value is often encountered. Therefore, we hypothesized that there is a lack of concordance
between FENa and the presence of MBGC, and that MBGC are a more reliable indicator of ATI, even
in the presence of a low FENa.
Methods
This study was conducted with approval by the Institutional Board Review and in accordance with the
Declaration of Helsinki. Urine specimens were collected from patients with AKI stage ≥ 2 (Kidney
Disease: Improving Global Outcomes (KDIGO)) (10) who were seen on consultation in an inpatient
nephrology service over a 2-year period at Ochsner Medical Center when an intrinsic etiology of AKI
was suspected and members of the research staff were available.

MicrExUrSed was performed as soon as possible and always within 1 hour of specimen collection.
Once collected, specimens were kept at room temperature and transferred to the laboratory for
processing (11). A 10 mL aliquot of urine was placed in a 15 mL high-clarity polypropylene conical tube
and centrifuged at 800 g for 5 mins. The supernatant was poured off and the pellet was resuspended
by manual agitation in the remaining 0.2 ml of supernatant. A plastic transfer pipette was used to place
a single drop onto a standard microscope slide and a coverslip was placed over it. This process was
done with and without Sternheimer-Malbin stain (Kova®, Garden Grove, California). Then, each sample
was examined by a trained operator using a Nikon Eclipse E200 microscope (Melville, New York) with
10x, and 40x magnification objectives and a 10x magnification eyepiece. The entirety of the slide was
examined at both low power field (LPF) (100x magnification) and high power field (HPF) (400x
magnification). Representative images of all sample slides were taken using an Apple iPhone 6S
camera (Cupertino, California) and LabCam microscope adaptor (iDu Optics, New York, New York) on
a Leica CME microscope (Buffalo Grove, Illinois). At least 2 operators independently assessed and
scored each specimen, 1 operator was blinded to the clinical data and 1 operator was unblinded.
Operators included nephrologists, nephrology fellows, internal medicine residents, and medical
students who were trained to quantify the percentage of LPFs with MBGC. A LPF was considered
positive for MBGC if it contained at least one MBGC. A minimum of 36 LPFs per slide were assessed.
Of note, several patients received up to 3 repeated MicrExUrSed on subsequent days (11).
A presumptive etiology of AKI was determined based on available clinical information: ischemic ATI
was considered in cases when AKI occurred following hemodynamic instability (shock, hypotension,
large fall in systolic blood pressure, tachyarrhythmia, bradyarrhythmia), volume depletion unresponsive
to intravenous expansion or exposure to vasomotor drugs (angiotensin converting enzyme inhibitors,
angiotensin receptor blockers, calcineurin inhibitors) that did not resolve upon drug discontinuation;
toxic ATI was considered when AKI occurred following exposure to an exogenous toxin (e.g., iodinated
radiocontrast, vancomycin) or endogenous toxin (e.g., myoglobin, light chains); presence of MBGC in

MicrExUrSed was also taken into account for clinical diagnosis of ATI; acute glomerulonephritis was
considered when it was biopsy-proven or when AKI included suggestive elements such as serological
values, clinical context and/or urinary acanthocytes; hepatorenal syndrome was considered based on
the established diagnostic criteria (12); prerenal azotemia was considered when AKI occurred following
a history of volume depletion and the AKI resolved after some form of fluid resuscitation; cardiorenal
syndrome was considered when AKI occurred in the context of acute decompensated heart failure; and
obstructive uropathy was considered when AKI occurred with radiological evidence of obstruction of the
urinary outlet.
To assess the concordance of FENa and MBGC, the percentage of LPFs with MBGC in each sample
with a recorded FENa was determined. FENa obtained within 24 hours of MicrExUrSed were eligible. A
similar analysis was completed for fractional excretion of urea nitrogen (FEUN). A Cohen’s kappa
coefficient was calculated to assess the degree of concordance or agreement between the tests in
diagnosis ATI (presence of MBGC or FENa ≥ 1%). Kappa coefficient values range from -1,
representing no agreement, to 1, representing perfect agreement. Additionally, a one-way analysis of
variance (ANOVA) was performed to examine the relationship between MBGC abundance and
variance of FENa between 0-1% as well as above 1%. To further assess the performance of
MicrExUrSed or FENa for ATI diagnoses, we examined a subgroup of patients with confirmed
pathological evidence of ATI from a kidney biopsy specimen. Sensitivity, specificity, positive predictive
value (PPV), and negative predictive value (NPV) were determined for both MBGC and FENa with
respect to identifying biopsy-proven ATI.
To assess and compare the prognostic value of MBGC, we computed 2 clinical outcomes: a) ≥ 50%
increase from baseline serum creatinine at discharge [acute kidney disease (AKD)]; and b) acute need
for dialysis (AKI-RRT) during the hospitalization. Odds ratio (OR) and positive likelihood ratio (+LR)
were calculated to assess the ability of FENa ≥ 1, ≥ 2, and ≥ 5% compared to FENa < 1%, respectively,
and presence of MBGC expressed as > 0, ≥ 10, and ≥ 50% of LPFs compared to absence of MBGC,

respectively, to predict AKD and AKI-RRT. Statistical analyses were performed using GraphPad Prism
7 software package (San Diego, California). A P value < 0.05 was deemed significant. A sub-analysis
was performed among patients without end stage liver disease (non-ESLD).
Results
From a primary cohort of 371 patients who underwent MicrExUrSed during the study period, 270 also
had a FENa value obtained concomitantly and those were included in the study. Females accounted for
111 (41%) patients. The median age was 61 (27-92) years, black race accounted for 40%. The median
sCr at the time of MicrExUrSed was 3.7 (1.2-22.0) md/dL. The etiology of AKI (pure de novo AKI 62%,
AKI on CKD 38%) was ischemic ATI (47%), toxic ATI (9%), ischemic/toxic ATI (14%) and others (30%).
The baseline characteristics of the patients included in the study cohort were comparable to those of
the primary cohort (Table 1).
MBGC were identified in 133/270 (49%) of cases. Among those, 115/270 (44%) of cases had ≥ 10%
LPFs with MBGC and 45/270 (17%) of cases had ≥ 50% LPFs with MBGC. In addition, FENa was <
1% in 50/133 (38%), 38/115 (33%), and 16/45 (36%) of those with > 0%, ≥ 10%, and ≥ 50% LPFs with
MBGC, respectively (Figure 1). Thus, the concordance between FENa and MicrExUrSed for ATI
diagnosis was deemed fair (estimated kappa coefficient 0.2 (95% CI:0.08-0.3). When the data were
sub-analyzed based on presence of preexisting CKD, i.e., AKI on CKD, FENa was < 1% in 20/52
(38%), 15/45 (33%) and 6/13 (46%) of those with > 0%, ≥ 10%, and ≥ 50% LPFs with MBGC,
respectively. Thus, the concordance between FENa and MicrExUrSed for ATI diagnosis for those with
AKI on CKD was deemed poor (estimated kappa coefficient -0.11(95% CI:-0.3-0.1)). Additionally, within
a subgroup of patients with a recorded FEUN (n = 95), MBGC were found in 52 cases (55%). Among
those, 52 (57%), 46 (51%), 19 (21%) had > 0%, ≥ 10%, and ≥ 50% LPFs with MBGC, respectively.
FEUN was < 35% in 28/52 (54%), 25/46 (48%), and 12/19 (63%) of those with > 0%, ≥ 10%, and ≥

50% LPFs with MBGC, respectively. Thus, the concordance between FEUN and MicrExUrSed for ATI
diagnosis was deemed poor (estimated kappa coefficient -0.09 (95% CI: -0.3-0.1). To further assess
whether the dichotomy of quantifying FENa as below or above 1% masked a relationship between the
abundance of MBGC and the value of FENa, we examined the distribution of FENa values between 0-
1% respect to the abundance of MBGC. An ANOVA for trend analysis revealed no significant
relationship between the variance of FENa values between 0 - 1% and MBGC abundance (grouped as
no MBGC, 0 - 10%, 10 - 50% and ≥ 50%); F value 1.73 (p = 0.17) (Figure 2). Furthermore, we
examined the distribution of FENa values above 1% with respect to the abundance of MBGC. Similarly,
an ANOVA for trend analysis revealed no significant relationship between the variance of FENa values
≥ 1% and MBGC abundance, F value 0.26 (p = 0.86) (Figure 2). In addition, based on adjudicated
clinical diagnoses, the sensitivity, specificity, PPV and NPV of FENa (n = 158) to distinguish ATI from
prerenal azotemia were 54%, 67%, 94% and 8%. When comparing patients with abundant MBGC and
high FENa to those with abundant MBGC and low FENa, there was no difference in age, gender, race
or presence of preexisting CKD. However, there was a greater percentage with toxic ATN (26% vs. 8%,
p = 0.02) and a lesser percentage of concomitant glomerular pathology (3% vs. 19%, p = 0.03) in the
low FENa group (Table 2).
A total of 49 patients in the overall cohort underwent kidney biopsy and had a pathology-based
diagnosis (Table 3). MBGC were identified prior to the biopsy [median time between MicrExUrSed and
biopsy: 6 (1-18) days] in 28 cases (57%) and were absent in 21 cases [median time between
MicrExUrSed and biopsy: 5 (1-11) days]. All 28 (100%) cases with MBGC were found to have
confirmatory evidence of ATI by histopathology. Among those without the presence of MBGC, 8 (38%)
were noted to have evidence of ATI by histopathology. Thus, the sensitivity, specificity, PPV, and NPV
of MBGC to identify ATI as confirmed by kidney biopsy was 78%, 100%, 100%, and 62%. FENa was
recorded prior to 28 biopsies and FENa was ≥ 1% [median time between FENa and biopsy: 5 (1-15)
days] in 21 cases (75%) and FENa was < 1% in 7 cases [median time between FENa and biopsy: 4 (1-
10) days]. The sensitivity, specificity, PPV, and NPV of FENa ≥ 1% to identify ATI on kidney biopsy was
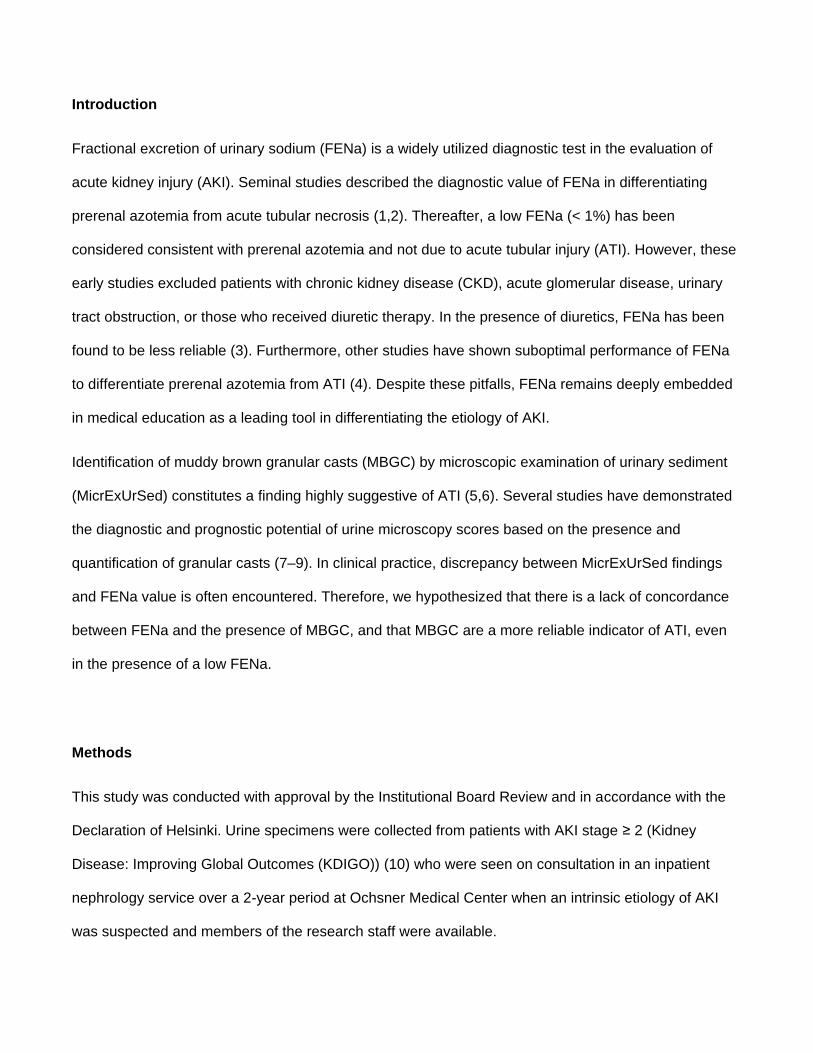
90%, 71%, 90%, and 71%. In addition, the sensitivity, specificity, PPV, and NPV of the combination of
FENa ≥ 1% and presence of MBGC to identify ATI on kidney biopsy was 94%, 100%, 100%, 84%.
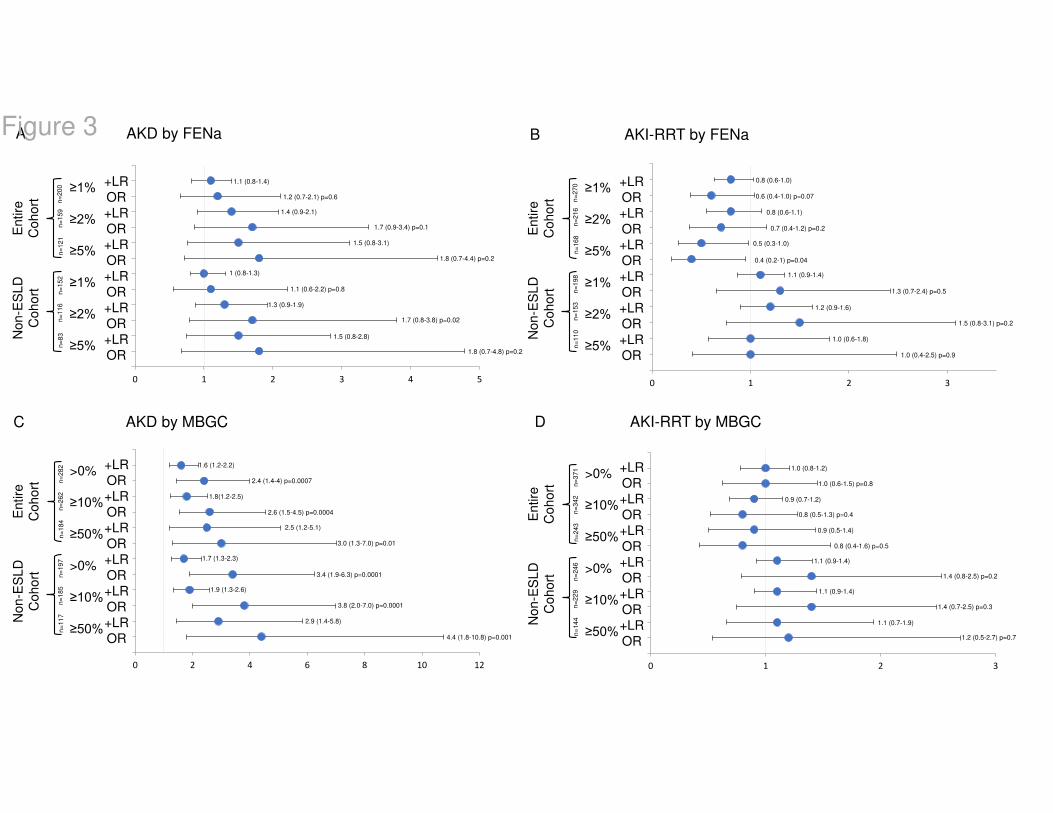
With respect to prognosis, there was a significant number of events. Among those with MicrExUrSed
assessed (n = 371), 68% had AKD and 37% had AKI-RRT (Table 4). The presence of MBGC was
associated with greater probability for AKD at discharge, whereas FENa ≥ 1% was not associated with
the outcome. However, neither presence of MBGC nor FENa ≥ 1% were associated with AKI-RRT
(Figure 3). Omitting patients with end stage liver disease (ESLD), the OR and +LR of AKD at discharge
further increased among those patients with MBGC identified by MicrExUrSed, whereas the OR and
+LR of FENa ≥ 1% for AKD remained non-significant in this subgroup (Figure 3). With respect to AKI-
RRT, although the OR and +LR were numerically higher compared to those for the overall cohort,
presence of MBGC was not associated with greater probability of AKI-RRT in the non-ESLD subgroup.
Similarly, FENa ≥ 1% was not associated with AKI-RRT in this subgroup (Figure 3). The prognostic
value of the combination of FENa ≥ 5% and MBGC ≥ 50% LPFs compared to that of either FENa or
MBGC alone was similarly non-significant for AKI-RRT but inferior to MBGC alone for AKD (Figure S1).
Discussion
FENa remains a heavily utilized test in current clinical practice as a “go-to” test to differentiate prerenal
azotemia from ATI (13). The diagnostic and prognostic value of urinary cast scores obtained by
MicrExUrSed that incorporate the identification of MBGC as markers of ATI has been previously
demonstrated and validated by others (7–9,14). Our study aimed at assessing the concordance
between these tests. Based on clinical observations, we hypothesized that there is discordance
between the FENa and MicrExUrSed findings. We showed that coexistence of presence of MBGC
(abundant in many instances) and a FENa < 1% is a frequent phenomenon that was captured in 37%

of patients in our AKI cohort who underwent MicrExUrSed and had a FENa obtained within 24 hours of
the MicrExUrSed. In agreement with our findings, a previous study reported that FENa was < 1% in ~
50% of those with high urinary cast scores consistent with ATI (9). Although abundant MBGC denote
ATI, a low FENa theoretically denotes a prerenal state. Thus, this discordance challenges the
established notion of low FENa as means to exclude ATI as AKI etiology. Notably, the discordance
between FENa and MBGC was even more pronounced in the context of AKI superimposed on CKD.
Similarly, a FEUN of < 35% is considered consistent with prerenal azotemia (3). Carvounis et al.
identified 89% of patients with prerenal azotemia and diuretic use with FEUN < 35% (15). However, we
found even greater discordance between FEUN and MBGC.
The degree of discordance between MBGC and FENa may be perceived as surprising given the
expectation that there would be preserved sodium reabsorption in a prerenal state and decreased
reabsorption of those molecules in intrinsic tubular injury. We speculate that this disagreement is likely
related to the heterogeneity of renal injury in ATI (16). However, it remains to be fully elucidated what is
unique about the subgroup of patients with abundant MBGC and low (< 1%) FENa compared to those
with abundant MBGC and high (≥ 1%) FENa. One explanation could be that the greater severity of
tubular damage, the greater the FENa. However, no difference was observed in clinical outcomes (AKI-
RRT, AKD) between the groups (Table 2). Certain factors may theoretically lead to coexistence of low
FENa and abundant MBGC, such as degree of damage to the early (S1) and distal segments (S3) of
the proximal tubule (which may affect the integrity of sodium and organic transporters) or to the
medullary thick ascending loop of Henle (which may affect urinary concentration mechanisms), factors
that ultimately influence the value of FENa (17–24) (Figure 4). Overlap or relative dominance of toxic
versus ischemic tubular insult may also play a role. In fact, more patients with toxic ATI exhibited a low
FENa, as described by others (25,26). Moreover, less patients with concomitant glomerular pathology
presented with low FENa, finding that challenges previous reports. Thus, the multifactorial aspect of
many cases of ATI and its associated heterogeneity in tubular injury may lead to the observed

variability in FENa. Because uromodulin, the matrix of MBGC, is synthesized in the mTALH, MBGC
may tacitly indicate injury to the mTALH (27). However, the formation of casts also depends on
electrolyte composition of the filtrate which can be affected by the integrity of the proximal tubule.
Ultimately, MBGC provide tangible evidence of ATI. (Figure 4).
Early studies suggested that FENa could be an optimal test for AKI diagnosis. Espinel et al. reported a
statistically different value of FENa in prerenal azotemia compared to ATI (p < 0.001) and noted 87.5%
of patients with prerenal azotemia had FENa values < 1% (2). Similarly, Miller et al. reported that 90%
of patients with prerenal azotemia were found to have FENa values < 1% (1). Notably, those studies
excluded patients with preexisting CKD, acute glomerular disease, urinary tract obstruction, or those
who had received diuretic therapy. Therefore, generalizability of their findings to in-hospital AKI is
limited. Later, work by others questioned the diagnostic utility of FENa in AKI diagnosis. Forms of toxic
ATI such as rhabdomyolysis and contrast-induced AKI have been reported to present with FENa < 1%
(25,26). Similarly, FENa < 1% performs poorly as a threshold to eliminate ATI in patients with AKI in the
context of cirrhosis (28). A meta-analysis found urinary indices to be deceptive in states of sodium
avidity, obstruction, and in situations with altered intrarenal hemodynamics, documenting 84 patients
with low FENa in cases of intrinsic renal failure (29).
Our primary objective was not to reassess the diagnostic utility of MicrExUrSed for distinguishing ATI
from prerenal states. Perazella et al reported a PPV of 100% to diagnose ATI if the pre-test probability
was high (8). We concur with their conclusions and have incorporated this notion into our clinical
practice. On the other hand, in our study, FENa values were not considered for adjudication of AKI
etiology. As a result, we were able to assess the diagnostic performance of FENa. The PPV of FENa ≥
1% to diagnose ATI was optimal at 94%. However, FENa < 1% had a NPV of only 8% to exclude ATI.
Therefore, a FENa ≥ 1% performs well as an indicator of ATI and a FENa < 1% performed poorly as

indicator of prerenal azotemia. Notably, the high prevalence of ATI in our cohort may have driven the
large discrepancy between the PPV and the NPV of FENa.
Studies in AKI assessing the diagnostic utility of various clinical tests are hindered by the fact that the
gold standard for diagnosis of ATI by which the tests in question are measured against are usually
based on retrospective chart review and/or clinical judgment. Ideally, tissue diagnosis constitutes
definite proof of ATI. A previous study reported correlation of MicrExUrSed with tissue diagnosis and
found a sensitivity of 75% in identifying ATI on biopsy using supravital staining techniques (30),
whereas others noted a poor correlation between FENa values and tubular injury on histopathology (R
= 0.267) (31). In our cohort, MBGC had a 100% specificity and 100% PPV for prediction of ATI based
on biopsy. FENa ≥ 1% also performed well as a predictor of ATI with a PPV of 90%. On the other hand,
FENa < 1% had a NPV of 71%. However, only 7 patients who underwent kidney biopsy had a FENa <
1%. Therefore, it is not possible to draw clear conclusions about the NPV of FENa < 1%. More
importantly, these histologically-based data from a subset of patients within the cohort validates the
established notion that MBGC are a definite indicator of ATI and strongly suggests that in cases of
discordance between FENa and MicrExUrSed, identification of MBGC by MicrExUrSed should override
a low FENa. However, a FENa ≥ 1% had greater sensitivity and NPV than MBGC in identifying ATI on
biopsy. Our analysis of FENa ≥ 5% and presence of MBGC found the combined diagnostic value of
these two measures to be superior to one in isolation when in agreeance. Additionally, it should be
noted that ATI can often coexist with other glomerular pathologies on biopsy (Table 3)
Our cohort included 50% of patients receiving diuretics. Diuretics can promote natriuresis and increase
the value of FENa thereby impairing its diagnostic power. However, our main observation relates to
misleading values of FENa < 1% coexisting with MBGC rather than misleading values of FENa ≥ 1%. In
fact, diuretics might have masked an even greater percentage of patients with FENa < 1% and
concomitant MBGC. Nevertheless, we assessed the performance of FEUN as an alternative to FENa

based on previous reports suggesting that it is a better test in cases of AKI in patients exposed to
diuretics (3,15). Interestingly, we found an even greater discordance between MBGC and FEUN.
Although our primary objective was centered on diagnosis, we examined the performance of
MicrExUrSed as a prognostic indicator of AKI and contrasted it against that of FENa. For this task, we
performed separate analyses for a subset of non-ESLD patients because of the preestablished notion
that patients with ESLD can acquire AKI due to hepatorenal syndrome type 1 (HRS-1), a severe form of
AKI characterized by minimal to no presence of MBGC by virtue of its pathogenesis and that is known
to often progress to ominous outcomes (inclusive of AKD and AKI-RRT) (12). Presence of MBGC
predicted AKD but not AKI-RRT, whereas FENa performed poorly on both prognostic endpoints.
Additionally, while combining both FENa and MBGC improved the identification of ATI, MBGC in
isolation were superior in predicting AKD. Unlike this study, MicrExUrSed-based cast scores have
previously shown strong prognostic value to predict AKI-RRT. However, by virtue of study design, our
cohort was heavily enriched with patients with ATI. Only 5% of patients had prerenal azotemia
compared to 40% in the study completed by Perazella et al (8). Thus, our study was not optimally
suited to assess prognosis. In addition, MicrExUrSed-based cast scores incorporate not only MBGC but
also renal epithelial cells (RTEC) or RTEC casts. Therefore, inclusion of RTEC-based elements might
have improved the prognostic estimates in our study.
There are several limitations associated with our study. First, we rely on the interpretation of trained
operators to score the MicrExUrSed of each specimen. Although each operator was thoroughly trained
to assess and score each sample, variability is plausible. However, interobserver agreement has been
reported to be acceptable among nephrologists and/or nephrology providers (7). Notably, the highest
interobserver reliability was seen among granular and MBGC (32). Additionally, observation bias is
possible as one observer was unblinded. The selection of our cohort could also limit generalization. Our
study cohort is enriched with intrinsic causes of AKI as it was based on patients for whom nephrology
was consulted. We caution generalization to other populations where intrinsic renal injury is not the

predominant etiology of AKI. Also, the timing between MicrExUrSed and kidney biopsies may have
introduced a confounder given the fact that degree of histological injury can evolve over time.
Nonetheless, most biopsies were performed within few days of the MicrExUrSed or determination of
FENa. Additionally, we have reported predictive values of both FENa and MBGC in determining ATI.
These values are highly influenced by prevalence and can be considered an additional limitation.
Finally, we were unable to extract accurate urine output data. Since the diagnostic value of FENa is
greater in oliguric states, our results may have been affected by the relative number of non-oliguric AKI
cases.
In conclusion, our findings suggest that the isolated use of FENa < 1% as means to exclude as etiology
of AKI should be discouraged. To the contrary, identification of MBGC by MicrExUrSed in patients with
AKI should be pursued as a reliable test for diagnosis of ATI.

Disclosure
J. Velez reports the following: Consultancy: Mallinckrodt Pharmaceuticals, Bayer, Travere; Honoraria:
Mallinckrodt, Otsuka, Travere, Bayer; Advisory or Leadership Role: Mallinckrodt, Advisory Board;
Travere, Advisory Board; and Speakers Bureau: Otsuka Pharmaceuticals. None of the products
manufactured by those companies are discussed in this manuscript. The remaining authors have
nothing to disclose.
Funding
This work was supported by the Ochsner Health System by a Clinical and Translational & Innovation
Support Program grant 851111051 (to J.C.Q. Velez).
Acknowledgments
We thank Luis Matute Trochez for his assistance in this project.
Author Contributions
Vipin Varghese: Conceptualization; Data curation; Formal analysis; Investigation; Methodology; Project
administration; Resources; Software; Validation; Visualization; Writing - original draft; Writing - review
and editing. Maria Soledad Rivera: Data curation; Investigation. Ali Alalwan: Data curation;
Investigation. Ayman Alghamdi: Data curation; Investigation. Akanksh Ramanand: Data curation;
Investigation. Sumayyah Khan: Data curation; Investigation. Jose Najul-Seda: Data curation;
Investigation. Juan Carlos Velez: Conceptualization; Data curation; Formal analysis; Funding
acquisition; Investigation; Methodology; Project administration; Resources; Software; Supervision;
Validation; Visualization; Writing - original draft; Writing - review and editing.
Data Sharing Statement
All data is included in the manuscript and/or supporting information.
Supplemental Materials
Figure S1. Assessment of combined prognostication of FENa ≥5% and MBGC ≥ 50% per LPF in the
entire cohort and sub-analyzed by presence of end-stage liver disease.

References
1. Miller TR: Urinary Diagnostic Indices in Acute Renal Failure: A Prospective Study. Ann Intern
Med 89: 47, 1978
2. Espinel CH: The FeNa Test: Use in the Differential Diagnosis of Acute Renal Failure. JAMA
236: 579, 1976
3. Kaplan AA, Kohn OF: Fractional Excretion of Urea as a Guide to Renal Dysfunction. Am J
Nephrol 12: 49–54, 1992
4. Pépin M-N, Bouchard J, Legault L, Éthier J: Diagnostic Performance of Fractional Excretion of
Urea and Fractional Excretion of Sodium in the Evaluations of Patients With Acute Kidney Injury With or
Without Diuretic Treatment. American Journal of Kidney Diseases 50: 566–573, 2007
5. Nowak R, Haber M, Blomberg D, Galagan K, Glassy E, Ward P, Zimmerman R, Cimbaluk D,
Rafferty M: Color atlas of the urinary sediment. College of American Pathologists
6. Feehally J, editor: Comprehensive clinical nephrology. Sixth edition. Edinburgh ; New York,
Elsevier
7. Chawla LS, Dommu A, Berger A, Shih S, Patel SS: Urinary sediment cast scoring index for
acute kidney injury: a pilot study. Nephron Clin Pract 110: c145-150, 2008
8. Perazella MA, Coca SG, Kanbay M, Brewster UC, Parikh CR: Diagnostic Value of Urine
Microscopy for Differential Diagnosis of Acute Kidney Injury in Hospitalized Patients. CJASN 3: 1615–
1619, 2008
9. Bagshaw SM, Haase M, Haase-Fielitz A, Bennett M, Devarajan P, Bellomo R: A prospective
evaluation of urine microscopy in septic and non-septic acute kidney injury. Nephrol Dial Transplant 27:
582–588, 2012
10. Kidney Disease Improving Global Outcomes [Internet]. Available from:
https://www.kdigo.org/wp-content/uploads/2016/10/KDIGO-2012-AKI-Guideline-English.pdf [cited 2022
Jun 21]
11. Varghese V, Rivera MS, Alalwan AA, Alghamdi AM, Gonzalez ME, Velez JCQ: Diagnostic Utility
of Serial Microscopic Examination of the Urinary Sediment in Acute Kidney Injury. Kidney360 2: 182–
191, 2021
12. Velez JCQ, Therapondos G, Juncos LA: Reappraising the spectrum of AKI and hepatorenal
syndrome in patients with cirrhosis. Nat Rev Nephrol 16: 137–155, 2020
13. Pahwa AK, Sperati CJ: Urinary fractional excretion indices in the evaluation of acute kidney
injury: Urinary Excretion Indices in AKI. J Hosp Med 11: 77–80, 2016
14. Perazella MA, Coca SG, Hall IE, Iyanam U, Koraishy M, Parikh CR: Urine Microscopy Is
Associated with Severity and Worsening of Acute Kidney Injury in Hospitalized Patients. CJASN 5:
402–408, 2010
15. Carvounis CP, Nisar S, Guro-Razuman S: Significance of the fractional excretion of urea in the
differential diagnosis of acute renal failure. Kidney Int 62: 2223–2229, 2002
16. Conger JD, Robinette JB, Kelleher SP: Nephron heterogeneity in ischemic acute renal failure.
Kidney Int 26: 422–429, 1984
17. Lieberthal W, Nigam SK: Acute renal failure. I. Relative importance of proximal vs. distal tubular
injury. Am J Physiol 275: F623-631, 1998
18. Venkatachalam MA, Bernard DB, Donohoe JF, Levinsky NG: Ischemic damage and repair in
the rat proximal tubule: differences among the S1, S2, and S3 segments. Kidney Int 14: 31–49, 1978
19. Olsen TS, Hansen HE: Ultrastructure of medullary tubules in ischemic acute tubular necrosis
and acute interstitial nephritis in man. APMIS 98: 1139–1148, 1990
20. Solez K, Morel-Maroger L, Sraer JD: The morphology of “acute tubular necrosis” in man:
analysis of 57 renal biopsies and a comparison with the glycerol model. Medicine (Baltimore) 58: 362–
376, 1979
21. Racusen LC, Fivush BA, Li YL, Slatnik I, Solez K: Dissociation of tubular cell detachment and
tubular cell death in clinical and experimental “acute tubular necrosis.” Lab Invest 64: 546–556, 1991
22. Pfaller W, Gstraunthaler G, Willinger CC: Morphology of renal tubular damage from
nephrotoxins. Toxicol Lett 53: 39–43, 1990
23. Fillastre JP, Raguenez-Viotte G: Cisplatin nephrotoxicity. Toxicol Lett 46: 163–175, 1989
24. Kunin M, Holtzman EJ, Melnikov S, Dinour D: Urinary organic anion transporter protein profiles
in AKI. Nephrol Dial Transplant 27: 1387–1395, 2012
25. Fang LS, Sirota RA, Ebert TH, Lichtenstein NS: Low fractional excretion of sodium with contrast
media-induced acute renal failure. Arch Intern Med 140: 531–533, 1980
26. Corwin HL: Low Fractional Excretion of Sodium: Occurrence With Hemoglobinuric- and
Myoglobinuric-Induced Acute Renal Failure. Arch Intern Med 144: 981, 1984
27. Wangsiripaisan A, Gengaro PE, Edelstein CL, Schrier RW: Role of polymeric Tamm-Horsfall
protein in cast formation: oligosaccharide and tubular fluid ions. Kidney Int 59: 932–940, 2001
28. Belcher JM, Garcia-Tsao G, Sanyal AJ, Thiessen-Philbrook H, Peixoto AJ, Perazella MA, Ansari
N, Lim J, Coca SG, Parikh CR: Urinary Biomarkers and Progression of AKI in Patients with Cirrhosis.
CJASN 9: 1857–1867, 2014
29. Zarich S, Fang LS, Diamond JR: Fractional excretion of sodium. Exceptions to its diagnostic
value. Arch Intern Med 145: 108–112, 1985
30. Dinda AK, Singh C, Dash SC, Tiwari SC, Aggarwal SK, Bhowmik D, Bagga A: Role of supravital
staining of urine sediment and bright field microscopy in diagnosis of acute renal failure in bedside
medicine. J Assoc Physicians India 48: 958–961, 2000
31. Saha H, Mustonen J, Helin H, Pasternack A: Limited value of the fractional excretion of sodium
test in the diagnosis of acute renal failure. Nephrol Dial Transplant 2: 79–82, 1987
32. Palsson R, Colona MR, Hoenig MP, Lundquist AL, Novak JE, Perazella MA, Waikar SS:
Assessment of Interobserver Reliability of Nephrologist Examination of Urine Sediment. JAMA Netw
Open 3: e2013959, 2020

Table 1. Baseline characteristics of the patients included in the cohort.
Baseline characteristics
Entire Cohort
(n = 371)
Cohort with MicrExUrSed
and FENa (n = 270)
Age 61 (20-92) 61 (27-92)
Gender Female Male
38% (140) 62% (231)
41% (111) 59% (159)
Race
White Black Hispanic Asian Native American Unknown
59% (219) 33%(124) 3% (12) 1% (4)
<1% (1) 3% (11)
54% (147) 40% (109)
3% (7) <1% (1) <1% (1) 2% (5)
Etiology of AKI
Ischemic ATI Toxic ATI Ischemic/toxic ATI Hepatorenal syndrome Acute glomerulonephritis Prerenal azotemia Interstitial nephritis Cardiorenal syndrome Obstructive nephropathy Other
50% (184) 10% (36) 10% (37) 10% (38) 9% (33) 5% (19) 2% (6)
3% (10) <1% (3) 1% (5)
47% (126) 9% (23)
14% (37) 9% (24)
11% (29) 4% (11) 1% (4) 2% (5) 1% (4) 3% (7)
CKD 37% (139) 38% (102)
Baseline serum creatinine (mg/dL)^ 1.4 (0.8-4.2) 1 (0.6-4.2)
Serum creatinine at first urine microscopy (mg/dL)^ 3.4 (1.2-22.0) 3.7 (1.2-22)
^ expressed as median (range); MicrExUrSed: microscopic examination of the urinary sediment, FENa: fractional excretion of urinary sodium, ATI: acute tubular injury, CKD: chronic kidney disease.

Table 2. Demographics and clinical characteristics of patients with abundant muddy brown granular
casts (MBGC) categorized based on value of fractional excretion of urinary sodium (FENa)
>10% MBGC + FENa ≥ 1%
(n = 59) >10% MBGC + FENa < 1%
(n = 31)
Age 62 (29-89) 62 (36-88)
Gender Female Male
23 (39%) 36 (61%)
7 (23%) 24 (77%)
Race White Black
32 (55%) 25 (43%)
15 (48%) 12 (39%)
Etiology of AKI Ischemic ATI Toxic ATI* Ischemic/toxic ATI
45 (76%) 5 (8%)
9 (15%)
19 (61%) 8 (26%) 4 (13%)
CKD 21 (36%) 12 (39%)
Concomitant glomerular pathology/diagnosis^
11 (19%) 1 (3%)
Serum creatinine at first urine microscopy (mg/dL)
4 (2.0-22) 3.2 (1.5-7.0)
AKD 35 (78%) 18 (82%)
AKI-RRT 19 (32%) 11 (35%)
*p = 0.02 for difference between groups; ^p =0.03 for difference between groups; AKI: acute kidney injury, ATI: acute tubular injury, AKD: acute kidney disease, AKI-RRT: AKI with need for renal replacement therapy.

Table 3. Histopathological findings of a subgroup of patients who underwent kidney biopsy.
Histopathologic Findings (n = 49)
ATI (isolated finding) 8 (16%)
ATI with other concomitant pathology 28 (57%)
ATI + glomerulonephritis ATI + podocytopathy^ ATI + diabetic nephropathy ATI + interstitial nephritis ATI + miscellaneous pathology*
14 (28.6%) 7 (14.3%) 4 (8.2%)
6 (12.2%) 6 (12.2%)
Glomerulonephritis 6 (12.2%)
Podocytopathy^ 1 (2.0%)
Diabetic nephropathy 3 (6%)
Interstitial nephritis 3 (6%)
Miscellaneous pathology* 3 (6%)
The percentages overall do not add to 100% because of 2-3 overlapping diagnoses within the same specimen.*Miscellaneous pathology includes crystalline nephropathy, light chain cast nephropathy, thrombotic microangiopathy. ^Podocytopathy includes minimal change disease, focal segmental glomerulosclerosis, collapsing glomerulopathy. ATI: acute tubular injury.

Table 4. Proportion of patients reaching clinical endpoints [increase in serum creatinine ≥ 50%
from baseline at discharge (AKD) or need for renal replacement therapy (AKI-RRT)]
FENa measured and
MicrExUrSed assessed MicrExUrSed assessed
AKD n = 200 n = 282
130 (65%) 193 (68%)
AKI-RRT
n = 270 n = 371
103 (38%) 139 (37%)
FENa: fractional excretion of urinary sodium, MicrExUrSed: microscopic examination of the urinary sediment
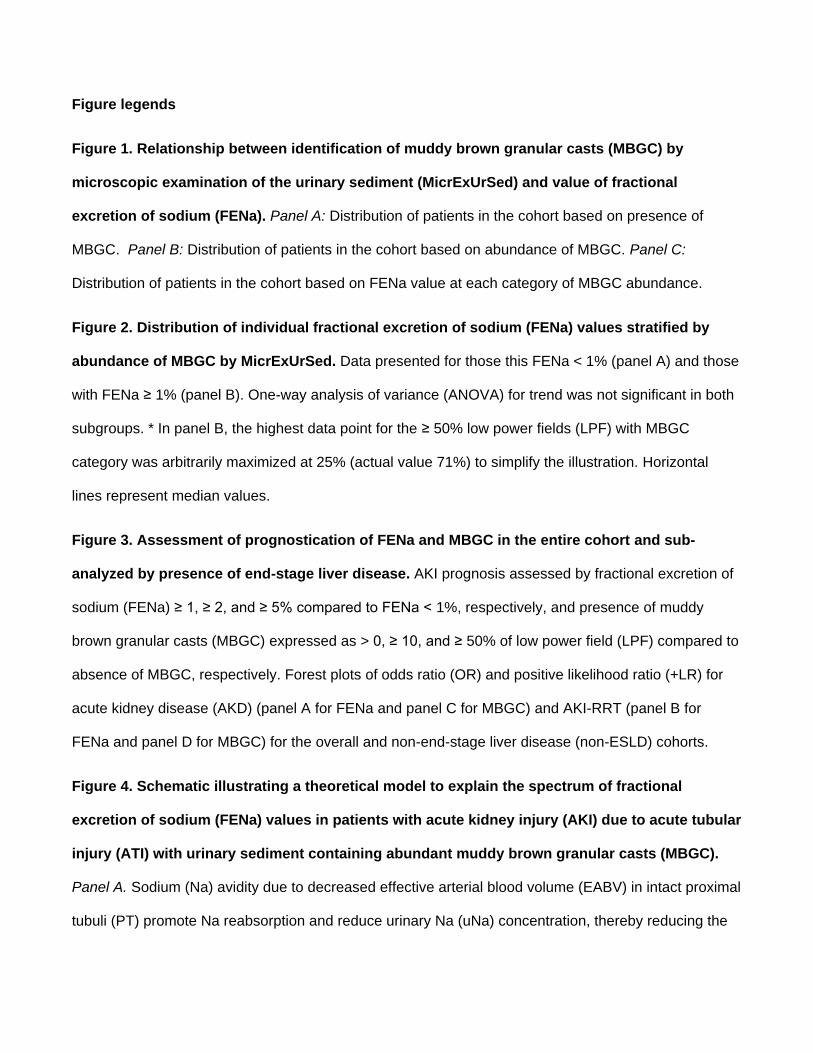
Figure legends
Figure 1. Relationship between identification of muddy brown granular casts (MBGC) by
microscopic examination of the urinary sediment (MicrExUrSed) and value of fractional
excretion of sodium (FENa). Panel A: Distribution of patients in the cohort based on presence of
MBGC. Panel B: Distribution of patients in the cohort based on abundance of MBGC. Panel C:
Distribution of patients in the cohort based on FENa value at each category of MBGC abundance.
Figure 2. Distribution of individual fractional excretion of sodium (FENa) values stratified by
abundance of MBGC by MicrExUrSed. Data presented for those this FENa < 1% (panel A) and those
with FENa ≥ 1% (panel B). One-way analysis of variance (ANOVA) for trend was not significant in both
subgroups. * In panel B, the highest data point for the ≥ 50% low power fields (LPF) with MBGC
category was arbitrarily maximized at 25% (actual value 71%) to simplify the illustration. Horizontal
lines represent median values.
Figure 3. Assessment of prognostication of FENa and MBGC in the entire cohort and sub-
analyzed by presence of end-stage liver disease. AKI prognosis assessed by fractional excretion of
sodium (FENa) ≥ 1, ≥ 2, and ≥ 5% compared to FENa < 1%, respectively, and presence of muddy
brown granular casts (MBGC) expressed as > 0, ≥ 10, and ≥ 50% of low power field (LPF) compared to
absence of MBGC, respectively. Forest plots of odds ratio (OR) and positive likelihood ratio (+LR) for
acute kidney disease (AKD) (panel A for FENa and panel C for MBGC) and AKI-RRT (panel B for
FENa and panel D for MBGC) for the overall and non-end-stage liver disease (non-ESLD) cohorts.
Figure 4. Schematic illustrating a theoretical model to explain the spectrum of fractional
excretion of sodium (FENa) values in patients with acute kidney injury (AKI) due to acute tubular
injury (ATI) with urinary sediment containing abundant muddy brown granular casts (MBGC).
Panel A. Sodium (Na) avidity due to decreased effective arterial blood volume (EABV) in intact proximal
tubuli (PT) promote Na reabsorption and reduce urinary Na (uNa) concentration, thereby reducing the

numerator in the FENa equation. Conversely, damaged PT, back-leak of filtrate and replenished EABV
increase uNa and FENa. As the glomerular filtration rate (GFR) declines and the serum creatinine (Cr)
increases in AKI, the relative contribution of tubular secretion of Cr to the total urinary excretion of Cr
increases, i.e., influencing urinary Cr (uCr) concentration. Intact organic cationic transporters (OCTs)
and organic anion transporters (OATs) permit Cr secretion, whereas plasma sulfates (SO4=) compete
with Cr to occupy the OATs. Viable Na+K+2Cl- cotransporter in the medullary thick ascending loop of
Henle maintain interstitial tonicity and allow for water reabsorption and urine concentration. All these
parameters (sCr, OCTs/OATs, SO4= and urine concentration) affect the uCr and thus the value of
FENa. Differences in absolute and relative dysfunction/injury to the early (S1) or distal segment (S3) of
the proximal tubule (PT) or to the medullary thick ascending loop of Henle (mTALH) are expected in
ischemic/toxic ATI and may influence the FENa. On the other hand, MBGC formation depends on
synthesis of the cast matrix uromodulin, degree of cellular injury and resulting protein and solute
composition of the urine. Panel B. Heterogeneity in ischemic or toxic tubular insults may lead to
variable compromise of cortical (C) and juxtamedullary (JM) nephrons which may further influence the
FENa via the mechanisms outlined above.

[CATEGORY
NAME] 137
(51%)
[CATEGORY
NAME] 133
(49%)
MBGC >0-10% 18 (13%)
[CATEGORY NAME] 10-50%
70 (53%)
MBGC >50%[CAT
EGORY NAME]
45 (34%)
FENa >1%
6 (33%)
FENa <1%
12 (66%)
FENa >1%
48 (69%)
FENa <1%
22 (31%)
FENa >1%
29 (64%)
FENa <1%
16 (36%)
MBGC
0-10%
n = 18
MBGC
10-50%
n = 70
MBGC
>50%
n = 45
n = 270 n = 133 A
C
B
Figure 1

no
ne
0-9
% L
PF
10-4
9%
LP
F
>50%
LP
F
0 .0 0
0 .2 5
0 .5 0
0 .7 5
1 .0 0
M B G C
FE
Na
(%
)
no
ne
0-9
% L
PF
10-4
9%
LP
F
>50%
LP
F
0
5
1 0
1 5
2 0
2 5
M B G C
FE
Na
(%
)
A B
Figure 2
0 1 2 30 1 2 3 4 5
0 1 2 30 2 4 6 8 10 12
+LR
OR
+LR
OR
+LR
OR
+LR
OR
+LR
OR
+LR
OR
≥1%
≥2%
≥5%
≥1%
≥2%
≥5%
Entire
Coh
ort
N
on-E
SL
D
Coh
ort
A AKD by FENa B AKI-RRT by FENa
1.1 (0.8-1.4)
1.2 (0.7-2.1) p=0.6
+LR
OR
+LR
OR
+LR
OR
+LR
OR
+LR
OR
+LR
OR
≥1%
≥2%
≥5%
≥1%
≥2%
≥5%
Entire
Coh
ort
N
on-E
SL
D
Coh
ort
+LR
OR
+LR
OR
+LR
OR
+LR
OR
+LR
OR
+LR
OR
>0%
≥10%
≥50%
>0%
≥10%
≥50%
Entire
Coh
ort
N
on-E
SL
D
Coh
ort
+LR
OR
+LR
OR
+LR
OR
+LR
OR
+LR
OR
+LR
OR
>0%
≥10%
≥50%
>0%
≥10%
≥50%
Entire
Coh
ort
N
on-E
SL
D
Coh
ort
1.4 (0.9-2.1)
1.7 (0.9-3.4) p=0.1
1.5 (0.8-3.1)
1.8 (0.7-4.4) p=0.2
1 (0.8-1.3)
1.1 (0.6-2.2) p=0.8
1.3 (0.9-1.9)
1.7 (0.8-3.8) p=0.02
1.5 (0.8-2.8)
1.8 (0.7-4.8) p=0.2
1.6 (1.2-2.2)
2.4 (1.4-4) p=0.0007
1.8(1.2-2.5)
2.6 (1.5-4.5) p=0.0004
2.5 (1.2-5.1)
3.0 (1.3-7.0) p=0.01
1.7 (1.3-2.3)
3.4 (1.9-6.3) p=0.0001
1.9 (1.3-2.6)
3.8 (2.0-7.0) p=0.0001
2.9 (1.4-5.8)
4.4 (1.8-10.8) p=0.001
0.8 (0.6-1.0)
0.6 (0.4-1.0) p=0.07
0.8 (0.6-1.1)
0.7 (0.4-1.2) p=0.2
0.5 (0.3-1.0)
0.4 (0.2-1) p=0.04
1.1 (0.9-1.4)
1.3 (0.7-2.4) p=0.5
1.2 (0.9-1.6)
1.5 (0.8-3.1) p=0.2
1.0 (0.6-1.8)
1.0 (0.4-2.5) p=0.9
1.0 (0.8-1.2)
1.0 (0.6-1.5) p=0.8
0.9 (0.7-1.2)
0.8 (0.5-1.3) p=0.4
0.9 (0.5-1.4)
0.8 (0.4-1.6) p=0.5
1.1 (0.9-1.4)
1.4 (0.8-2.5) p=0.2
1.1 (0.9-1.4)
1.4 (0.7-2.5) p=0.3
1.1 (0.7-1.9)
1.2 (0.5-2.7) p=0.7
C AKD by MBGC D AKI-RRT by MBGC
n=
28
2
n=
26
2
n=
18
4
n=
19
7
n=
18
5
n=
11
7
n=
37
1
n=
34
2
n=
24
3
n=
24
6
n=
22
9
n=
14
4
n=
20
0
n=
15
9
n=
12
1
n=
15
2
n=
11
6
n=
83
n=
27
0
n=
21
6
n=
16
8
n=
19
8
n=
15
3
n=
11
0
Figure 3

Figure 4

0 2 4 6 8 10 12
+LR
OR
+LR
OR
+LR
OR
+LR
OR
AKD
AKI-RRT
AKD
AKI-RRT
En
tire
Coh
ort
No
n-E
SL
D
Coh
ort
A FENa ≥5% and MBGC ≥50%
2.2 (0.7-7)
2.5 (0.7-9.7) p= 0.2
0.7 (0.3-1.6)
0.6 (0.2-1.7) p=0.3
2.0 (0.7-6)
2.6 (0.6-10.7) p=0.2
1.2 (0.6-2.7)
1.3 (0.4-4.4) p=-.6
Figure S1. Assessment of combined prognostication of FENa ≥5% and MBGC ≥ 50% per LPF in the entire cohort and sub-analyzed by presence of end-stage liver disease. AKI prognosis assessed by fractional excretion of sodium (FENa) ≥5% and muddy brown granular casts (MBGC) ≥50% per LPF. Forest plots of odds ratio (OR) and positive likelihood ratio (+LR) for ≥50% increase in creatinine from baseline [acute kidney disease (AKD)] and AKI-RRT among overall and non-end-stage liver disease (non-ESLD) cohorts.
n=84
n=109
n=51
n=62


